
jazlina.pdf - UM Students' Repository
423
CLINICAL AND GENETIC ASSOCIATIONS OF DIPEPTIDYL PEPTIDASE-4 INHIBITOR TREATMENT RESPONSE IN TYPE 2 DIABETES JAZLINA LIZA BT. JAMALUDDIN FACULTY OF MEDICINE UNIVERSITY OF MALAYA KUALA LUMPUR 2017 University of Malaya
-
Upload
khangminh22 -
Category
Documents
-
view
0 -
download
0
Transcript of jazlina.pdf - UM Students' Repository

CLINICAL AND GENETIC ASSOCIATIONS OF DIPEPTIDYL PEPTIDASE-4 INHIBITOR TREATMENT
RESPONSE IN TYPE 2 DIABETES
JAZLINA LIZA BT. JAMALUDDIN
FACULTY OF MEDICINE UNIVERSITY OF MALAYA
KUALA LUMPUR
2017
Univers
ity of
Mala
ya

CLINICAL AND GENETIC ASSOCIATIONS OF DIPEPTIDYL PEPTIDASE-4 INHIBITOR TREATMENT
RESPONSE IN TYPE 2 DIABETES
JAZLINA LIZA BT. JAMALUDDIN
THESIS SUBMITTED IN FULFILMENT OF THE
REQUIREMENTS FOR THE DEGREE OF DOCTOR OF PHILOSOPHY
FACULTY OF MEDICINE UNIVERSITY OF MALAYA
KUALA LUMPUR
2017Univ
ersity
of M
alaya

UNIVERSITY OF MALAYA
ORIGINAL LITERARY WORK DECLARATION
Name of Candidate: JAZLINA LIZA BT. JAMALUDDIN (I.C No: )
Matric No: MHA120005
Name of Degree: DOCTOR OF PHILOSOPHY
Title of Project Paper/Research Report/Dissertation/Thesis (“this Work”):
CLINICAL AND GENETIC ASSOCIATIONS OF DIPEPTIDYL PEPTIDASE-4
INHIBITOR TREATMENT RESPONSE IN TYPE 2 DIABETES
Field of Study: PHARMACY
I do solemnly and sincerely declare that:
(1) I am the sole author/writer of this Work; (2) This Work is original; (3) Any use of any work in which copyright exists was done by way of fair
dealing and for permitted purposes and any excerpt or extract from, or reference to or reproduction of any copyright work has been disclosed expressly and sufficiently and the title of the Work and its authorship have been acknowledged in this Work;
(4) I do not have any actual knowledge nor do I ought reasonably to know that the making of this work constitutes an infringement of any copyright work;
(5) I hereby assign all and every rights in the copyright to this Work to the University of Malaya (“UM”), who henceforth shall be owner of the copyright in this Work and that any reproduction or use in any form or by any means whatsoever is prohibited without the written consent of UM having been first had and obtained;
(6) I am fully aware that if in the course of making this Work I have infringed any copyright whether intentionally or otherwise, I may be subject to legal action or any other action as may be determined by UM.
Candidate’s Signature Date:
Subscribed and solemnly declared before,
Witness’s Signature Date:
Name:
Designation:
ii
Univers
ity of
Mala
ya

ABSTRACT
Incretin-based therapies are a recent class of antidiabetic agents that modulate
glucose homeostasis in type 2 diabetes (T2D) via the incretin pathway. Oral incretin-
based therapy namely the dipeptidyl peptidase-4 (DPP-4) inhibitors, block the DPP-4
enzyme, thus preventing the degradation of active glucagon-like peptide-1 (GLP-1) and
glucose-dependent insulinotropic peptide (GIP), thereby activating the expression of
multiple genes resulting in insulin secretion, β-cell proliferation, and survival. Despite
the wide use of DPP-4 inhibitors, little is known of clinical and pharmacogenomic
factors that specifically associated with DPP-4 inhibitor treatment response, especially
in Malaysian subjects. Aim: The aim of this study is to determine the clinical and
genetic associations of DPP-4 inhibitor treatment response in Malaysian with T2D.
Based on disease pathogenesis and the incretin pathway, we hypothesized that three
genes, DPP4, WFS1, and KCNJ11, play a role in the response to DPP-4 inhibitors. The
genes include the drug target, pathway genes, and disease genes. We also hypothesized
that two main clinical factors, dipeptidyl peptidase (sCD26) and homeostasis model
assessment of insulin resistance (HOMAIR), would be associated with the response to
DPP-4 inhibitors. The selection of these clinical factors was based on an understanding
of the disease pathogenesis and the mechanism of drug action. Patients and methods:
In this observational cross-sectional study, we recruited 331 patients with T2D who had
been treated with DPP-4 inhibitors (sitagliptin, vildagliptin and linagliptin) for at least 3
months and 331 control subjects with T2D treated with oral non-DPP-4 inhibitor
therapies. All participants were recruited from the Diabetes Clinic (tertiary care) at the
University of Malaya Medical Centre (UMMC), Malaysia. All subjects were genotyped
for DPP4, WFS1 and KCNJ11 gene polymorphisms. Genotyping was performed by
Applied Biosystems TaqMan SNP genotyping assay. Fasting venous blood samples
were taken from all subjects for the determination of A1c, fasting plasma glucose
iii
Univers
ity of
Mala
ya

(FPG), fasting insulin, fasting lipids, liver enzymes and sCD26. Results: 44.7%
experienced good glycemic control with DPP-4 inhibitor therapy. Upon univariate
analysis; triglycerides, waist circumference, LDL cholesterol, aspartate
aminotransferase (AST), DPP-4 inhibitor regimens (with biguanide + sulphonylurea
with/without thiazolidinedione), WFS1 rs734312 and KCNJ11 rs2285676 predicted
response to DPP-4 inhibitor therapy (defined as A1c <7%). Upon multivariate analysis,
patients with triglycerides levels less than 1.7 mmol/L (OR: 2.4; 95% CI: 1.152–5.097),
and KCNJ11 rs2285676 (genotype CC) (OR: 2.0; 95% CI: 1.065-3.856) were found to
be more likely to respond to DPP-4 inhibitor treatment compared with other patients.
Triglyceride and KCNJ11 rs2285676 (genotype CC) gene polymorphism were not
associate of good glycemic control (A1c <7%) in the control group. Conclusions: An
overall model of DPP-4 inhibitor treatment response was developed using clinical and
genetic variables to determine the optimal DPP-4 inhibitor treatment response in
patients with T2D. From this model, patients with T2D most likely to benefit from
DPP-4 inhibitor treatment are those with a KCNJ11 rs2285676 (genotype CC) gene
polymorphism and triglycerides values within normal range. These pharmacogenomic
findings by identifying those most likely to respond to DPP-4 inhibitor treatment will
enable cost-effective personalized treatment of patients with T2D.
iv
Univers
ity of
Mala
ya

ABSTRAK
Terapi berdasarkan inkretin adalah sebuah kelas agen antidiabetik terbaru yang
memodulasi homeostasis glukosa dalam diabetes jenis 2 (T2D) melalui laluan inkretin.
Terapi oral berdasarkan inkretin iaitu perencat dipeptidil peptidase-4 (DPP-4),
menghalang enzim DPP-4 dan seterusnya menghalang degradasi iras-glukagon peptida-
1 (GLP-1) dan glukosa-dependensi insulinotropik peptida (GIP) yang aktif, lalu
mengaktifkan ekpresi pelbagai gen yang menghasilkan pengeluaran insulin, proliferasi
dan survival sel-β. Disebalik penggunaan meluas perencat DPP-4, hanya sedikit
diketahui mengenai faktor klinikal dan farmakogenomik yang secara khususnya
dikaitkan respon kepada perencat DPP-4, terutamanya pada subjek-subjek Malaysia.
Tujuan: Tujuan penyelidikan ini adalah untuk menentukan kaitan-kaitan klinikal dan
genetik kepada respon rawatan perencat DPP-4 dalam pesakit-pesakit Malaysia yang
mempunyai T2D. Berdasarkan patogenesis penyakit dan laluan inkretin, kami
menghipotesiskan bahawa ketiga-tiga gen, DPP4, WFS1, dan KCNJ11, memainkan
peranan di dalam respon kepada perencat DPP-4. Gen-gen ini termasuklah gen yang
terlibat dalam sasaran ubat, gen-gen laluan, dan gen-gen penyakit. Kami juga
menghipothesiskan bahawa dua faktor utama klinikal, dipeptidil peptidase (sCD26) dan
model homeostasis ujian kerintangan insulin (HOMAIR), berkemungkinan berkait
dengan respon kepada perencat DPP-4. Pemilihan faktor-faktor klinikal ini adalah
berdasarkan pemahaman patogenesis penyakit dan mekanisma tindakan ubat. Pesakit
dan kaedah penyelidikan: Dalam kajian keratan rentas pemerhatian ini, kami merekrut
seramai 331 pesakit T2D yang dirawat dengan perencat DPP-4 (sitagliptin, vildagliptin
dan linagliptin) sekurang-kurangnya selama 3 bulan dan seramai 331 pesakit T2D yang
dirawat dengan terapi oral antidiabetes selain perencat DPP-4. Semua peserta direkrut
daripada Klinik Diabetes (penjagaan tertiari) di Pusat Perubatan Universiti Malaya
(PPUM), Malaysia. Semua subjek digenotip untuk mengenalpasti polimorfisme gen
v
Univers
ity of
Mala
ya

DPP4, WFS1 dan KCNJ11. Proses genotip dijalankan dengan menggunakan asai
genotip Applied Biosystems TaqMan SNP. Sampel-sampel darah vena berpuasa telah
diambil dari semua subjek untuk penentuan A1c, glukosa plasma puasa (FPG), insulin
puasa, lipid puasa, enzim-enzim hati dan sCD26. Hasil kajian: 44.7% subjek mendapat
kawalan glisemik yang baik dengan rawatan perencat DPP-4. Analisis univariat
menunjukkan trigliserida, ukur lilit pinggang, kolesterol LDL, AST, regimen perencat
DPP-4 (bersama biguanide + sulphonylurea bersama/tidak bersama thiazolidinedione),
WFS1 rs734312 dan KCNJ11 rs2285676 meramal respon kepada terapi perencat DPP-4
(ditakrifkan sebagai A1c <7%). Didapati bahawa etnik bukan peramal bagi perencat
DPP-4. Analisis multivariat menunjukkan bahawa pesakit dengan paras trigliserida
kurang daripada 1.7 mmol/L (OR: 2.4; 95% CI: 1.152–5.097) dan KCNJ11 rs2285676
(genotype CC) (OR: 2.0; 95% CI: 1.065-3.856) adalah lebih responsif kepada rawatan
perencat DPP-4 berbanding dengan pesakit-pesakit lain. Triglyserida dan polimorfisme
gen KCNJ11 rs2285676 (genotype CC) didapati bukan kaitan kepada kawalan glisemik
baik (A1c <7%) dalam kumpulan kawalan. Kesimpulan: Sebuah model keseluruhan
respon kepada rawatan perencat DPP-4 telah dibangunkan dengan menggunakan
variabel-variabel klinikal dan genetik untuk menentukan respon optimal kepada rawatan
perencat DPP-4 di dalam pesakit T2D. Daripada model ini, pesakit-pesakit T2D yang
berkemungkinan besar bermanfaat daripada rawatan perencat DPP-4 adalah pesakit
yang mempunyai polimorfisme gen KCNJ11 rs2285676 (genotype CC) dan nilai
trigliserida di dalam skala normal. Hasil farmakogenomik ini yang mengenalpasti
pesakit paling responsif kepada rawatan perencat DPP-4 akan membolehkan rawatan
peribadi pesakit T2D yang kos-efektif.
vi
Univers
ity of
Mala
ya

ACKNOWLEDGEMENTS
I would like to express my highest gratitude to Prof. Tan Sri Dr. Ghauth Jasmon for
discovering me, and Assoc. Prof. Dr. Mohamed Ibrahim b. Nordin for the opportunity
to carry out this work in the Pharmacy Department, Faculty of Medicine, University of
Malaya.
I would like to express my deepest and lifelong appreciation to my supervisors lead
by Prof. Dr. Hasniza bt. Zaman Huri and Prof. Dr. Shireene Ratna Vethakkan for giving
me the opportunity to experience a fascinating adventure and challenging project, and
providing me with help and advice throughout the course of my study.
Thank you to the Ministry of Health and Government of Malaysia for the awarded
scholarship which has greatly support me during my study.
My deepest love and appreciation to my dedicated parents, Dato’ Brig. Gen. (B)
Jamaluddin b. Mohammad and Datin Zarina bt. Ishak. Thank you for the love, the
prayers, and believing in me. I also would like to expressed my grateful to my siblings,
Jamal Abd. Nasir and Dr. Jazmin Hezleen for the most beautiful encouragement in my
life.
I am grateful to Dr. Shamsul b. Mohd Zain for his guidance in genomic analysis
and also to Prof. Dr. Karuthan Chinna for his guidance in statistical analysis. I am also
thankful to Ray Mond, Bahirah and Dr. Nany for their help in sample collections,
software solutions, and most of all; their friendship.
Finally, I would like to express my special gratitude to the late, the most
charismatic Prof. Datuk Dr. Ir. Radin Umar b. Radin Sohadi for the right path you had
shown to me. I finally found my ‘light in dark tunnel’. You are always an inspiration to
all. There was never a dull moment with you around. May you rest in peace.
vii
Univers
ity of
Mala
ya

TABLE OF CONTENTS
Abstract ........................................................................................................................... iii
Abstrak ............................................................................................................................. v
Acknowledgements ........................................................................................................ vii
Table of Contents ......................................................................................................... viii
List of Figures ............................................................................................................... xxi
List of Tables .............................................................................................................. xxiv
List of Symbols and Abbreviations ........................................................................... xxix
List of Appendices .................................................................................................... xxxix
CHAPTER 1: INTRODUCTION .................................................................................. 1
1.1 Problem Statement and Justification of Research ................................................... 5
1.2 Aims and Objectives ................................................................................................ 7
1.2.1 Aims ............................................................................................................. 7
1.2.2 Objectives .................................................................................................... 7
1.2.3 Hypothesis ................................................................................................... 7
CHAPTER 2: LITERATURE REVIEW ...................................................................... 8
2.1 Diabetes and Impact of the Disease ......................................................................... 8
2.1.1 World Diabetes Statistics ............................................................................. 8
2.1.2 Malaysian Diabetes Statistics .................................................................... 10
2.2 Type 2 Diabetes ..................................................................................................... 12
2.3 Management of Diabetes ....................................................................................... 13
2.3.1 Goals of Diabetes Management in Adults ................................................. 13
2.3.1.1 Glycemic therapy goals ............................................................. 13
2.3.1.2 Non-glycemic therapy goals ...................................................... 14
viii
Univers
ity of
Mala
ya

2.3.2 Antidiabetic Therapy ................................................................................. 14
2.3.3 The Choice of Oral Antihyperglycemic Agents ........................................ 17
2.4 The ‘Incretin Effect’ .............................................................................................. 19
2.5 GLP-1 and GIP ...................................................................................................... 20
2.6 Incretin-based Therapy .......................................................................................... 21
2.7 Biology of Dipeptidyl Peptidase-4 ........................................................................ 22
2.8 Potential Receptors of Soluble Dipeptidyl Peptidase 4 ......................................... 25
2.9 Dipeptidyl Peptidase-4 Inhibitors .......................................................................... 26
2.9.1 Mechanism of Action of DPP-4 Inhibitors ................................................ 28
2.9.2 Recommendations for DPP-4 Inhibitor Usage in the Therapy of Type 2
Diabetes .................................................................................................... 31
2.9.3 DPP-4 Inhibitors: Usual Adult Dosing ...................................................... 32
2.10 DPP-4 Inhibitors Investigated in this Study .......................................................... 33
2.10.1 Pharmaceutical Information : DPP-4 Inhibitors Drug Substance ............ 37
2.11 Factors Associated with DPP-4 Inhibitor Treatment Response ............................ 39
2.12 Genetics Factors Affecting DPP-4 Inhibitor Treatment Response ........................ 39
2.12.1.1 Candidate Gene Studies ............................................................ 40
2.12.1.2 Drug Target and Pathway .......................................................... 41
2.12.1.3 Disease Genes ........................................................................... 41
2.12.2 Selection of Genes .................................................................................... 42
2.12.2.1 Reasons for not selecting PAX4, KCNQ1, TCF7L2, ABCC8
and MTNR1B ............................................................................ 45
2.12.2.2 Dipeptidyl peptidase 4 gene (DPP4) ......................................... 48
2.12.2.3 Wolfram syndrome 1 gene (WFS1) .......................................... 51
2.12.2.4 Potassium channel Kir6.2 gene (KCNJ11)................................ 55
2.13 Single Nucleotide Polymorphisms (SNPs) Selection ............................................ 58
ix
Univers
ity of
Mala
ya

2.14 Gene Expression .................................................................................................... 64
2.14.1 DPP-4 Inhibitors and Gene Expression .................................................... 65
2.14.2 DPP4 Expression in Relation to DPP-4 Inhibitor Treatment Response ... 66
2.14.3 WFS1 Expression in Relation to DPP-4 Inhibitor Treatment Response .. 67
2.14.4 KCNJ11 Expression in Relation to DPP-4 Inhibitor Treatment
Response… ............................................................................................... 68
2.15 Clinical Measures of DPP4 Inhibitor Treatment Response ................................... 69
2.15.1 Soluble CD26 (sCD26) ............................................................................ 71
2.15.2 Insulin Resistance ..................................................................................... 73
2.15.3 Fasting Plasma Glucose ............................................................................ 74
2.15.4 A1c ........................................................................................................... 75
2.15.4.1 Factors that limit the accuracy of A1c ...................................... 77
2.15.4.2 A1c and DPP-4 inhibitors ......................................................... 80
2.16 Demographic, Anthropometric and Biochemical Characteristics Affecting DPP-4
Inhibitors Treatment Response .............................................................................. 81
2.16.1 Demographic Characteristics Affecting DPP-4 Inhibitors Treatment
Response ................................................................................................... 81
2.16.1.1 Age…. ....................................................................................... 81
2.16.1.2 Duration of T2D ........................................................................ 83
2.16.1.3 Gender ....................................................................................... 84
2.16.1.4 Ethnicity .................................................................................... 85
2.16.2 Anthropometric Characteristics Affecting DPP-4 Inhibitors Treatment
Response ................................................................................................... 88
2.16.2.1 Body mass index (BMI) ............................................................ 88
2.16.2.2 Waist circumference .................................................................. 90
x
Univers
ity of
Mala
ya

2.16.3 Biochemical Characteristics Affecting DPP-4 Inhibitors Treatment
Response ................................................................................................... 92
2.16.3.1 Lipid profiles ............................................................................. 92
2.16.3.2 Blood pressure ........................................................................... 94
2.16.3.3 Liver profiles ............................................................................. 95
2.17 Other Comorbidities and Complications of Diabetes That May Affect DPP-4
Inhibitors Treatment Response .............................................................................. 96
2.17.1 Retinopathy .............................................................................................. 96
2.17.2 Nephropathy ............................................................................................. 97
2.17.3 Neuropathy ............................................................................................... 99
2.17.4 Cardiovascular Disease .......................................................................... 100
CHAPTER 3: METHODOLOGY ............................................................................. 102
3.1 Study Design and Setting .................................................................................... 102
3.2 Sampling Frame and Sampling Size .................................................................... 103
3.2.1 Sample Size Calculation .......................................................................... 103
3.2.1.1 Sample size calculation for genotyping study ......................... 103
3.2.1.2 Sample size calculation for gene expression study ................. 105
3.3 Definition of Subjects Groups Used in the Study ................................................ 106
3.3.1 Case.......................................................................................................... 106
3.3.2 Control ..................................................................................................... 106
3.3.3 Study Population ...................................................................................... 106
3.3.4 Patients with Good Response .................................................................. 106
3.3.5 Patients with Poor Response .................................................................... 106
3.3.6 Patients with Good Glycemic Control ..................................................... 107
3.3.7 Patients with Suboptimal Glycemic Control ........................................... 107
3.4 The Reasons of Having a Control Group ............................................................ 107
xi
Univers
ity of
Mala
ya

3.5 Inclusion and Exclusion Criteria ......................................................................... 109
3.6 Selection of A1c Cut-off Point for Definition of Antidiabetic Treatment
Response.. ............................................................................................................ 110
3.7 Patient Recruitment ............................................................................................. 113
3.7.1 Patient Recruitment Process .................................................................... 113
3.7.1.1 Patient recruitment process for cases group ............................ 114
3.7.1.2 Patient recruitment process for controls group ....................... 115
3.8 Blood Collection and Storage Procedures ........................................................... 115
3.8.1 Blood Collection for Clinical Markers .................................................... 116
3.8.2 Blood Collection for Genetic Markers .................................................... 116
3.8.3 Blood Sample Processing and Storage .................................................... 117
3.9 Experimental Methods for Clinical Markers ....................................................... 118
3.9.1 A1c Experimental Method ....................................................................... 118
3.9.2 Serum ALT, AST, HDL Cholesterol, LDL Cholesterol, Total Cholesterol
and Triglyceride Experimental Method.................................................. 120
3.9.3 Determination of Insulin Concentration and HOMAIR .......................... 120
3.9.3.1 Insulin assay and materials ...................................................... 120
3.9.3.2 Insulin assay method ............................................................... 121
3.9.4 Insulin Resistance (HOMAIR) Procurement Method ............................. 122
3.9.5 Determination of sCD26 concentration ................................................... 122
3.9.5.1 sCD26 assay and materials ...................................................... 122
3.9.5.2 sCD26 assay methods .............................................................. 123
3.10 Experimental Methods for Evaluation of Genetic Markers ................................. 126
3.10.1 Genotyping Experimental Method ......................................................... 126
3.10.2 Isolation of DNA .................................................................................... 128
3.10.3 Real-Time PCR and Selection of TaqMan® SNP Genotyping Assay .... 130
xii
Univers
ity of
Mala
ya

3.10.4 Amplification of DNA via Polymerase Chain Reaction ........................ 132
3.10.5 Genotype Determination Principles ....................................................... 133
3.11 Gene Expression Study Experimental Method .................................................... 135
3.11.1 Isolation of RNA .................................................................................... 136
3.11.2 RNA Isolation Materials and Procedure ................................................ 136
3.11.3 Standardization of RNA Samples Concentration ................................... 139
3.11.4 Conversion of RNA to cDNA ................................................................ 139
3.11.5 Selection of Housekeeping Gene ........................................................... 140
3.11.6 Standard Curve Dilution Protocol .......................................................... 141
3.11.7 Standard Curve Plate Preparation ........................................................... 141
3.11.8 Gene Expression Plate Preparation ........................................................ 142
3.12 Statistical Techniques .......................................................................................... 143
3.12.1 Preliminary Statistics .............................................................................. 143
3.12.2 Statistics Used for Genetic Markers ....................................................... 144
3.12.3 Genotypes Association Study ................................................................. 144
3.12.4 Linkage Disequilibrium Measurements of the DPP4, WFS1 and KCNJ11
Genes Polymorphisms ............................................................................ 145
3.12.5 Estimations of Haplotype Effects of DPP4, WFS1 and KCNJ11 Gene
Polymorphisms ....................................................................................... 146
3.12.6 Gene Expression Analyses ..................................................................... 146
3.12.7 Development of Association Models for DPP-4 Inhibitor Treatment
Response in T2D .................................................................................... 147
3.12.7.1 Assumptions in selection of SNPs for association modeling .. 148
3.12.7.2 Association model testing ....................................................... 149
CHAPTER 4: RESULTS ............................................................................................ 150
4.1 Patient Recruitment and Disposition ................................................................... 150
xiii
Univers
ity of
Mala
ya

4.2 Characteristics of DPP-4 Inhibitor Users and Non-users .................................... 152
4.2.1 Comparison of Demographic and Anthropometric Characteristics of DPP-
4 Inhibitor Users and Non-users (Table 4.1) .......................................... 152
4.2.2 Determination of Categorizations of Significant Variables Obtained From
Table 4.1 for Further Analyses in Predictive Models ............................ 157
4.3 Comparison of Demographic, Anthropometric, Clinical, and Biochemical
Characteristics in Good and Poor Responders to DPP-4 Inhibitor Therapy (Table
4.3)….. ................................................................................................................. 161
4.3.1 Dichotomization of Significant Variables Obtained From Table 4.3 for
Further Analyses in Association Models ................................................ 164
4.4 Comparison of Demographic, Anthropometric, Clinical and Biochemical
Characteristics in Controls with Optimal and Suboptimal Glycemic Control
(Table 4.5)............................................................................................................ 166
4.4.1 Determination of Categorizations of Significant Variables Obtained From
Table 4.5 for Further Analyses in Association Models .......................... 169
4.5 Comparison of Demographic, Anthropometric, Clinical and Biochemical
Characteristics in Participants with Good and Suboptimal Glycemic Control on
Oral Antidiabetics (with or without DPP-4 Inhibitor Therapy) in Overall Study
Population (Table 4.7) ......................................................................................... 172
4.5.1 Dichotomization of Significant Variables Obtained From Table 4.7 for
Further Analyses in Association Models ................................................ 176
4.6 Genetic Polymorphisms Study ............................................................................ 179
4.6.1 Genotyping Results for Case Group on DPP-4 Inhibitor Therapy .......... 179
4.6.2 Genotyping Results for Control Group Not on DPP-4 Inhibitor
Therapy….. ............................................................................................. 180
xiv
Univers
ity of
Mala
ya

4.6.3 Genotyping Results for Whole Study Population Group on Any Oral
Antidiabetic Therapy (n=662) Excluding SGLT2 Inhibitors ................. 180
4.6.4 Genotype Selection for Association Model ............................................. 181
4.6.5 Summary of Positive Genotyping Results: Comparison Between
Groups…. ............................................................................................... 191
4.6.6 Linkage Disequilibrium of DPP4, WFS1 and KCNJ11 Gene
Polymorphisms ....................................................................................... 192
4.6.6.1 Linkage Disequilibrium Between DPP4 Gene Polymorphisms in
Patients with T2D According to the Response to DPP-4
Inhibitors ................................................................................. 192
4.6.6.2 Linkage Disequilibrium Between WFS1 Gene Polymorphisms
in Patients with T2D According to the Response to DPP-4
Inhibitors ................................................................................. 194
4.6.6.3 Linkage Disequilibrium Between KCNJ11 Gene Polymorphisms
in Patients with T2D According to the Response to DPP-4
Inhibitors ................................................................................. 196
4.6.6.4 Linkage Disequilibrium Between DPP4 Gene Polymorphisms in
Patients with T2D According to the Response to Other Non-
DPP-4 Inhibitor Oral Antidiabetics ......................................... 198
4.6.6.5 Linkage Disequilibrium Between WFS1 Gene Polymorphisms
in Patients with T2D According to the Response to Other Non-
DPP-4 Inhibitor Oral Antidiabetics ......................................... 200
4.6.6.6 Linkage Disequilibrium Between KCNJ11 Gene Polymorphisms
in Patients with T2D According to the Response to Other Non-
DPP-4 Inhibitor Oral Antidiabetics ......................................... 202
xv
Univers
ity of
Mala
ya

4.6.7 Effect of Interaction Within Polymorphisms of Pancreatic β-cell Genes in
T2D Patients on Any Oral Antidiabetic Treatment Except for SGLT2
Inhibitors ................................................................................................ 204
4.6.8 Linkage Disequilibrium of DPP4, WFS1 and KCNJ11 Gene
Polymorphisms in Whole Study Population on Any Oral Antidiabetic
Treatment Except for SGLT2 Inhibitors (n=662) .................................. 205
4.6.8.1 Linkage disequilibrium between DPP4 gene polymorphisms in
patients with T2D according to the response to any oral
antidiabetic .............................................................................. 205
4.6.8.2 Linkage disequilibrium between WFS1 gene polymorphisms in
patients with T2D according to the response to any oral
antidiabetics ............................................................................. 207
4.6.8.3 Linkage disequilibrium between KCNJ11 gene polymorphisms
in patients with T2D according to the response to any oral
antidiabetic .............................................................................. 209
4.6.9 Effect of Haplotype Interaction of DPP4, WFS1 and KCNJ11 Gene
Polymorphisms ....................................................................................... 211
4.6.9.1 Effect of haplotype interaction of DPP4 gene polymorphisms
with DPP-4 inhibitor treatment response (in case group
(n=331)).. ................................................................................. 211
4.6.9.2 Effect of haplotype interaction of WFS1 gene polymorphisms
with DPP-4 inhibitor treatment response (in case group
(n=331)). .................................................................................. 212
4.6.9.3 Effect of haplotype interaction of KCNJ11 gene polymorphisms
in patients with T2D treated with DPP-4 inhibitors (in case
group (n=331)) ........................................................................ 213
xvi
Univers
ity of
Mala
ya

4.6.9.4 Effect of haplotype interaction of DPP4 gene polymorphisms in
patients with T2D treated with other oral antidiabetics (in
control group (n=331)) ............................................................ 214
4.6.9.5 Effect of haplotype interaction of WFS1 gene polymorphisms in
patients with T2D treated with other oral antidiabetics (in
control group (n=331)) ............................................................ 215
4.6.9.6 Effect of haplotype interaction of KCNJ11 gene polymorphisms
in patients with T2D treated with other oral antidiabetics (in
control group (n=331)) ............................................................ 216
4.6.9.7 Effect of haplotype interaction of DPP4 gene polymorphisms
with oral antidiabetic (except SGLT2 inhibitor) treatment
response (in study population (n=662)) .................................. 217
4.6.9.8 Effect of haplotype interaction of WFS1 gene polymorphisms
with oral antidiabetic (except SGLT2 inhibitor) treatment
response (in study population (n=662)) .................................. 218
4.6.9.9 Effect of haplotype interaction of KCNJ11 gene polymorphisms
with oral antidiabetic (except SGLT2 inhibitor) treatment
response (in study population (n=662)) .................................. 219
4.6.10 Comparison of Haplotype Interactions Between Case, Control and
Overall Study Population Groups ........................................................... 221
4.6.11 Gene Expression Studies ........................................................................ 223
4.6.11.1 Relative quantification of DPP, WFS1 and KCNJ11 genes in
DPP-4 inhibitors users and non-users ..................................... 224
4.6.11.2 Absolute quantification of DPP, WFS1 and KCNJ11 genes in
DPP-4 inhibitors users and non-users ..................................... 226
xvii
Univers
ity of
Mala
ya

4.7 Determination of Associations of Response to DPP-4 Inhibitor Therapy in
Patients with T2D by Multivariate Analysis ....................................................... 229
4.7.1 MODEL 1 : Incorporating Significant Variables on Comparison of
Subjects on DPP-4 Inhibitor Therapy with Optimal Glycemic Control
(A1c <7%) versus Suboptimal Control (A1c >7%) ............................... 230
4.7.2 MODEL 2 : Incorporating Significantly Differing Variables in Those with
A1c <7% Compared with A1c >7% in All 662 Patients with T2D on Oral
Antidiabetic Therapy (Excluding SGLT2 Inhibitors) ............................ 233
4.7.3 MODEL 3 : Incorporating Significant Associations on Univariate Analysis
of Good Glycemic Control in Patients Not on DPP-4 Inhibitor
Therapy….. ............................................................................................. 238
4.7.4 MODEL 4 : Incorporating Significantly Different Variables in the Case
Group on DPP-4 Inhibitor Therapy Compared with Non-DPP-4 Inhibitor
Therapy Group ....................................................................................... 242
4.7.5 Comparison between case, control and study population models ........... 246
CHAPTER 5: DISCUSSIONS ................................................................................... 248
5.1 Baseline Demographic and Clinical Characteristics............................................ 248
5.1.1 Comparison of baseline characteristics of cases and controls ................. 250
5.2 Demographic, Anthropometric, Clinical Associations of DPP-4 Inhibitor
Treatment Response............................................................................................. 253
5.2.1 Demographic Associations ...................................................................... 253
5.2.1.1 Age…. ..................................................................................... 253
5.2.1.2 Duration of T2D ...................................................................... 259
5.2.1.3 Ethnicity .................................................................................. 261
5.2.2 Anthropometric Associations .................................................................. 265
5.2.2.1 Body Mass Index (BMI) and Waist Circumference (WC) ..... 265
xviii
Univers
ity of
Mala
ya

5.2.3 Clinical Associations ............................................................................... 266
5.2.3.1 Insulin resistance: Fasting insulin concentration and
HOMAIR… ............................................................................. 266
5.2.3.2 Triglycerides ............................................................................ 269
5.2.3.3 LDL cholesterol ....................................................................... 273
5.2.3.4 Systolic (SBP) and Diastolic blood pressure (DBP) ............... 275
5.2.3.5 AST levels ............................................................................... 278
5.2.3.6 sCD26 levels ........................................................................... 281
5.2.4 Comorbidities and Complications of Diabetes ........................................ 282
5.2.5 The Effect of Concomitant Antidiabetic Therapies in Combination
Regimens ................................................................................................ 283
5.2.5.1 Biguanides ............................................................................... 284
5.2.5.2 Sulphonylureas ........................................................................ 284
5.2.5.3 Thiazolidinediones .................................................................. 284
5.2.6 Number of antidiabetic agents used: Monotherapy, dual and triple
therapy… ................................................................................................ 285
5.2.6.1 Dual Therapy ........................................................................... 285
5.3 Genetic Variants Associated with DPP-4 Inhibitor Treatment Response ........... 286
5.3.1 Baseline Genotypic Characteristics of Case Population in Response to
DPP-4 Inhibitor Treatment ..................................................................... 286
5.3.2 Baseline Genotypic Characteristics of Control Population in Response to
Oral Antidiabetics (Except DPP-4 Inhibitor) Treatment ........................ 288
5.3.3 Baseline Genotypic Characteristics of Study Population in Response to
Oral Antidiabetics (Including DPP-4 Inhibitor) Treatment ................... 290
5.4 Genetic Associations of DPP-4 Inhibitor Treatment Response ........................... 291
5.5 Effect of Gene-gene Interactions (Linkage Disequilibrium) ............................... 292
xix
Univers
ity of
Mala
ya

5.6 Effect of Haplotypes Interaction .......................................................................... 295
5.7 Gene Expression and Treatment Response.......................................................... 296
5.8 Summary of Association Models Incorporating Clinical and Genetic Markers that
Associate to DPP-4 Inhibitor Treatment Response. ............................................ 301
5.8.1 MODEL 1 : Incorporating Significant Variables on Comparison of
Subjects on DPP-4 Inhibitor Therapy with Optimal Glycemic Control
(A1c <7%) versus Suboptimal Control (A1c > 7%) .............................. 301
5.8.2 MODEL 2 : Incorporating Significantly Differing Variables in Those with
A1c <7% Compared With A1c > 7% in All 662 Patients with Type 2
Diabetes on Oral Antidiabetic Therapy (Excluding SGLT2 Inhibitors) 302
5.8.3 MODEL 3 : Incorporating Significant Associations on Univariate Analysis
of Good Glycemic Control in Patients Not on DPP-4 Inhibitor
Therapy….. ............................................................................................. 303
5.8.4 MODEL 4 : Incorporating Significantly Different Variables in the Case
Group on DPP-4 Inhibitor Therapy Compared with Non-DPP-4 Inhibitor
Therapy Group ....................................................................................... 304
5.8.5 Comparison Between Association Models .............................................. 305
5.9 Overall Findings .................................................................................................. 307
5.10 Strengths and Limitations of Study ..................................................................... 308
CHAPTER 6: CONCLUSION ................................................................................... 312
References .................................................................................................................... 314
List of Publications and Papers Presented ............................................................... 382
Appendix ...................................................................................................................... 391
xx
Univers
ity of
Mala
ya

LIST OF FIGURES
Figure 2.1: Prevalence of diabetes: Malaysia versus world, in 2015. ............................. 10
Figure 2.2: The prevalence of diabetes in Malaysia (NHMS, 2015). ............................. 11
Figure 2.3: The general recommendations for antidiabetic therapy in T2D (Inzucchi et al., 2015). ........................................................................................................................ 16
Figure 2.4: Membrane-bound DPP4 monomer. .............................................................. 23
Figure 2.5: Mechanism of action of DPP-4 inhibitors therapy of Type 2 diabetes. Adapted from (Duez et al., 2012).................................................................................... 29
Figure 2.6: The general recommendations for DPP-4 inhibitor utilization. ................... 31
Figure 2.7: Packaging of sitagliptin. (2012). .................................................................. 33
Figure 2.8: Tablet of Sitagliptin (2012). ......................................................................... 33
Figure 2.9: Tablet of sitagliptin plus metformin hydrochloride (2012). ......................... 34
Figure 2.10: Vildagliptin. (2012). ................................................................................... 34
Figure 2.11: Tablet of vildagliptin (2012)....................................................................... 34
Figure 2.12: Tablet of vildagliptin plus metformin hydrochloride (2012)...................... 35
Figure 2.13: Linagliptin. (2011). ..................................................................................... 35
Figure 2.14: Tablet of linagliptin (2011)......................................................................... 35
Figure 2.15: Tablet of linagliptin plus metformin hydrochloride (2011)........................ 36
Figure 2.16: The location of DPP4 gene (2q24.3) at the chromosome 2. ....................... 50
Figure 2.17: The location of WFS1 gene (4p16.1) at chromosome 4. ........................... 52
Figure 2.18: WFS1 gene pathway in insulin production by pancreatic β-cells. ............. 54
Figure 2.19: The location of KCNJ11 gene (11p15.1) at the chromosome 11. .............. 56
Figure 2.20: Expression of KCNJ11 leads to insulin release from pancreatic β-cell. .... 57
Figure 2.21: Detailed mechanism of action of DPP-4 inhibitors and clinical markers of treatment response. .......................................................................................................... 71
xxi
Univers
ity of
Mala
ya

Figure 3.1: Model 1 was the aim of the study, while the other models were used as comparative models to Model 1. ................................................................................... 108
Figure 3.2: Flow-chart of patient recruitment process for case and control group. ...... 113
Figure 3.3: Data collection process after patient recruitment and consent. .................. 118
Figure 3.4: The genotyping process. ............................................................................. 126
Figure 3.5: The dilution formula for genotyping sample preparation. .......................... 130
Figure 3.6: The experimental method for gene expression studies. .............................. 135
Figure 3.7: Genotypes association study diagram......................................................... 145
Figure 3.8: Association models for DPP-4 inhibitor treatment response were constructed from clinical and genetic factors. .................................................................................. 148
Figure 4.1: CONSORT diagram: Patient recruitment & disposition ............................ 151
Figure 4.2: Linkage disequilibrium (LD) structure of DPP4 polymorphisms (rs2970932, rs2268889 and rs1861975) for good DPP-4 inhibitor treatment response (A1c < 7%) and poor DPP-4 inhibitor treatment response (A1c ≥ 7%) in case group. .................... 192
Figure 4.3: LD structure of WFS1 polymorphisms (rs10010131 and rs734312) for good DPP-4 inhibitor treatment response (A1c < 7%) and poor DPP-4 inhibitor treatment response (A1c ≥ 7%) in case group............................................................................... 194
Figure 4.4: LD structure of KCNJ11 polymorphisms (rs2285676, rs5210 and rs5218) for good DPP-4 inhibitor treatment response (A1c < 7%) and poor DPP-4 inhibitor treatment response (A1c ≥ 7%) in case group. ............................................................. 196
Figure 4.5: LD structure of DPP4 polymorphisms (rs2970932, rs2268889 and rs1861975) for good treatment response (A1c < 7%) and suboptimal response (A1c ≥ 7%) to non DPP-4 inhibitor oral antidiabetic therapy in control group. ....................... 198
Figure 4.6: LD structure of WFS1 (rs10010131, rs734312 and rs1046320) for good treatment response (A1c < 7%) and suboptimal response (A1c ≥ 7%) to non DPP-4 inhibitor oral antidiabetic therapy in control group. ..................................................... 200
Figure 4.7: LD structure of KCNJ11 (rs2285676, rs5210 and rs5218) for good treatment response (A1c < 7%) and suboptimal response (A1c ≥ 7%) to non-DPP-4 inhibitor oral antidiabetic therapy in control group. ..................................................... 202
Figure 4.8: LD structure of DPP4 polymorphisms (rs2970932, rs2268889 and rs1861975) for good glycemic control (A1c < 7%) and suboptimal glycemic control (A1c ≥ 7%) in whole study population (n=662). .......................................................... 205
xxii
Univers
ity of
Mala
ya

Figure 4.9: LD structure of WFS1 polymorphisms (rs10010131 and rs734312) for good glycemic control (A1c < 7%) and suboptimal glycemic control (A1c ≥ 7%) in whole study population (n=662). ............................................................................................. 207
Figure 4.10: LD structure of KCNJ11 polymorphisms (rs2285676, rs5210 and rs5218) for good glycemic control (A1c < 7%) and suboptimal glycemic control (A1c ≥ 7%) in whole study population (n=662). .................................................................................. 209
Figure 4.11: Relative expression of DPP4, WFS1 and KCNJ11 genes of cases (n=12) and controls (n=12), were obtained by the relative expression (ΔCt) method. ............. 223
Figure 4.12: MODEL 1 : Incorporating significant variables on comparison of subjects on DPP-4 inhibitor therapy with optimal glycemic control (A1c <7%) versus suboptimal control (A1c >7%). ....................................................................................................... 230
Figure 4.13: MODEL 2 : Incorporating significantly differing variables in those with A1c <7% compared with A1c >7% in all 662 patients with T2D on oral antidiabetic therapy (excluding SGLT2 inhibitors). ......................................................................... 233
Figure 4.14: MODEL 3 : Incorporating significant associations on univariate analysis of good glycemic control in patients not on DPP-4 inhibitor therapy. ......................... 238
Figure 4.15: MODEL 4 : Incorporating significantly different variables in the case group on DPP-4 inhibitor therapy compared with non-DPP-4 inhibitor therapy group. ....................................................................................................................................... 242
xxiii
Univers
ity of
Mala
ya

LIST OF TABLES
Table 2.1 : Prevalence of diabetes in 2011 and estimated prevalence of diabetes in 2030 by region among subjects aged 20-79 years old. Adapted from Whiting et al. (Whiting et al., 2011). ....................................................................................................................... 9
Table 2.2: The differences between antihyperglycemic agents based on A1c reduction, hypoglycemia risk, effect on weight, cardiovascular risk factors, dosing (times/day) and diabetes comorbidity contraindications (Daniel J. Drucker et al., 2010). ....................... 19
Table 2.3: Food and Drug Administration (FDA) approved DPP-4 inhibitors (FDA, 2016). .............................................................................................................................. 27
Table 2.4: The recommended adult daily dosage of the DPP-4 inhibitors. .................... 32
Table 2.5: Pharmaceutical information of sitagliptin drug substance. ............................ 37
Table 2.6: Pharmaceutical information of vildagliptin drug substance. ......................... 38
Table 2.7: Pharmaceutical information of linagliptin drug substance. ........................... 38
Table 2.8: The polymorphisms selected for each DPP4, WFS1 and KCNJ11 genes. .... 61
Table 2.9: Summary of the intronic functions. ............................................................... 63
Table 3.1: Quanto calculation of sample size for genes with minor allele frequency (MAF) of 10%. .............................................................................................................. 104
Table 3.2: Inclusion and exclusion criteria for case selection. ..................................... 109
Table 3.3: Inclusion and exclusion criteria for control selection. ................................. 110
Table 3.4: Target A1c level recommendation. .............................................................. 111
Table 3.5: Criteria used in the study. ............................................................................ 112
Table 3.6: The comparison of A1c determination methods, based on the interference with hemoglobin traits. ................................................................................................. 119
Table 3.7: The arrangement of blanks, standards and samples in the microwell strips. ....................................................................................................................................... 124
Table 3.8: The TaqMan® SNP genotyping assay used for each of the gene polymorphisms. ............................................................................................................. 130
Table 3.9: The Master Mix cocktail preparation. .......................................................... 131
xxiv
Univers
ity of
Mala
ya

Table 3.10: The TaqMan® gene expression assay used for each of the genes. ............. 142
Table 3.11: The TaqMan® Fast Advance Master Mix cocktail was prepared for 4 genes; β-actin (housekeeping gene), DPP4, WFS1 and KCNJ11 separately. .......................... 143
Table 4.1: Comparison of demographic, anthropometric, clinical, biochemical and genetic characteristics in DPP-4 inhibitor users (cases) and non-users (controls)........ 154
Table 4.2: Dichotomization of significant associations in the case group (obtained from Table 4.1) (n=331). ....................................................................................................... 159
Table 4.3: Comparison of demographic, anthropometric, clinical and biochemical characteristics between good and poor responders to DPP-4 inhibitor therapy............ 161
Table 4.4: Categorical comparison of dichotomized significant variables derived from Table 4.3 between responders and non-responders....................................................... 164
Table 4.5: Comparison of demographic, anthropometric, clinical, laboratory and genetic characteristics of T2D patients in control group with good and suboptimal glycemic control. .......................................................................................................................... 167
Table 4.6: Comparison of dichotomized variables from Table 4.5 with p value <0.25 between controls with optimal and suboptimal glycemic control. ................................ 170
Table 4.7: Comparison of demographic, anthropometric, clinical and laboratory characteristics of T2D patients (n=662) with good and suboptimal glycemic control. 173
Table 4.8: Comparison of dichotomized variables from Table 4.7 with p value <0.25 between participants with optimal and suboptimal glycemic control on any oral antidiabetic agent (except SGLT2 inhibitors) in overall study population (n=662). .... 176
Table 4.9: The DPP4 gene polymorphisms, genotypes, allele distributions and associations with DPP-4 inhibitor treatment response in case group. .......................... 182
Table 4.10: The WFS1 gene polymorphisms, genotypes, allele distributions and associations with DPP-4 inhibitor treatment response in case group. .......................... 183
Table 4.11: The KCNJ11 gene polymorphisms, genotypes, allele distributions and associations with DPP-4 inhibitor treatment response in case group. .......................... 184
Table 4.12: The DPP4 gene polymorphisms, genotypes, allele distributions and associations with DPP-4 inhibitor treatment response in control group. ...................... 185
Table 4.13: The WFS1 gene polymorphisms, genotypes, allele distributions and associations with DPP-4 inhibitor treatment response in control group. ...................... 186
xxv
Univers
ity of
Mala
ya

Table 4.14: The KCNJ11 gene polymorphisms, genotypes, allele distributions and associations with DPP-4 inhibitor treatment response in control group. ...................... 187
Table 4.15: The DPP4 gene polymorphisms, genotypes, allele distributions and associations with DPP-4 inhibitor treatment response in study population (n=662). ... 188
Table 4.16: The WFS1 gene polymorphisms, genotypes, allele distributions and associations with DPP-4 inhibitor treatment response in study population (n=662). ... 189
Table 4.17: The KCNJ11 gene polymorphisms, genotypes, allele distributions and associations with DPP-4 inhibitor treatment response in study population (n=662). ... 190
Table 4.18: Summary of positive genotyping results: comparison between groups..... 191
Table 4.19: The correlation coefficient D’ and r2 between DPP4 rs2970932, rs2268889 and rs1861975 polymorphisms (in case group). ........................................................... 193
Table 4.20: The correlation coefficient D’ and r2 between WFS1 rs1046320, rs734312 and rs10010131 polymorphisms (in case group). ......................................................... 195
Table 4.21: The correlation coefficient D’ and r2 between KCNJ11 rs2285676, rs5210 and rs5218 polymorphisms (in case group). ................................................................. 197
Table 4.22: The correlation coefficient D’ and r2 between DPP4 rs2970932, rs2268889 and rs1861975 polymorphisms (in control group). ....................................................... 199
Table 4.23: The correlation coefficient D’ and r2 between WFS1 rs1046320, rs734312 and rs10010131 polymorphisms (in control group). ..................................................... 201
Table 4.24: The correlation coefficient D’ and r2 between KCNJ11 rs2285676, rs5210 and rs5218 polymorphisms (in control group). ............................................................. 203
Table 4.25: The correlation coefficient D’ and r2 between DPP4 rs2970932, rs2268889 and rs1861975 polymorphisms (in study population (n=662)). .................................... 206
Table 4.26: The correlation coefficient D’ and r2 between WFS1 rs1046320, rs734312 and rs10010131 polymorphisms (in study population (n=662)). .................................. 208
Table 4.27: The correlation coefficient D’ and r2 between KCNJ11 rs2285676, rs5210 and rs5218 polymorphisms (in study population (n=662)). .......................................... 210
Table 4.28: Estimations of haplotype effects of DPP4 gene polymorphisms (in case group). ........................................................................................................................... 211
Table 4.29: Estimations of haplotype effects of WFS1 gene polymorphisms (in case group). ........................................................................................................................... 212
xxvi
Univers
ity of
Mala
ya

Table 4.30: Estimations of haplotype effects of KCNJ11 gene polymorphisms (in case group). ........................................................................................................................... 213
Table 4.31: Estimations of haplotype effects of DPP4 gene polymorphisms (in control group). ........................................................................................................................... 214
Table 4.32: Estimations of haplotype effects of WFS1 gene polymorphisms (in control group). ........................................................................................................................... 215
Table 4.33: Estimations of haplotype effects of KCNJ11 gene polymorphisms (in control group). ............................................................................................................... 216
Table 4.34: Estimations of haplotype effects of DPP4 gene polymorphisms (in study population (n=662)). ..................................................................................................... 217
Table 4.35: Estimations of haplotype effects of WFS1 gene polymorphisms (in study population (n=662)). ..................................................................................................... 218
Table 4.36: Estimations of haplotype effects of KCNJ11 gene polymorphisms (in study population (n=662)). ..................................................................................................... 220
Table 4.37: Summary of positive haplotype interactions significance results comparison between groups.............................................................................................................. 221
Table 4.38: The DPP-4 inhibitor treatment responses according to the expression of DPP4, WFS1 and KCNJ11 genes. ................................................................................ 225
Table 4.39: Absolute quantification of target genes; DPP4, WFS1 and KCNJ11 (n=12 subjects)......................................................................................................................... 227
Table 4.40: Type of models developed. ........................................................................ 229
Table 4.41: Regression model of DPP-4 inhibitor treatment response incorporating all significant variables derived from comparison of patients on DPP-4 inhibitor therapy with A1c <7% and A1c ≥7%. ....................................................................................... 231
Table 4.42: Stepwise (Forward Likelihood Ratio (LR)) regression model of DPP-4 inhibitor treatment response incorporating all significant variables derived from comparison of patients on DPP-4 inhibitor therapy with A1c <7% and A1c ≥ 7%...... 232
Table 4.43: Regression model of treatment response to any oral antidiabetic (except SGLT2 inhibitors) in whole study population (n=662). ............................................... 235
Table 4.44: Stepwise (Backward LR) regression model of treatment response to any oral antidiabetic (except SGLT2 inhibitors) in whole study population (n=662). ............... 237
xxvii
Univers
ity of
Mala
ya

Table 4.45: Regression model incorporating significant associations on univariate analysis of good glycemic control (A1c <7%) in control patients not on DPP-4 inhibitor therapy. .......................................................................................................................... 240
Table 4.46: Stepwise (Forward LR) regression model incorporating significant associations on univariate analysis of good glycemic control (A1c<7%) in control patients not on DPP-4 inhibitor therapy. ....................................................................... 241
Table 4.47: Regression model incorporating significantly different variables in the case group on DPP-4 inhibitor therapy compared with non-DPP-4 inhibitor therapy group. ....................................................................................................................................... 244
Table 4.48: Stepwise (Forward LR) regression model incorporating significantly different variables in the case group on DPP-4 inhibitor therapy compared with non-DPP-4 inhibitor therapy group. ..................................................................................... 245
Table 4.49: Comparison between models (based on Stepwise regression models). ..... 246
xxviii
Univers
ity of
Mala
ya

LIST OF SYMBOLS AND ABBREVIATIONS
T2D : Type 2 diabetes
DM : Diabetes mellitus
IDF : International Diabetes Federation
WHO : World Health Organization
DPP-4 : dipeptidyl peptidase-4 (refers to the drug & enzyme)
DPP4 : dipeptidyl peptidase-4 (gene)
WFS1 : Wolfram syndrome 1
KCNJ11 : Potassium channel Kir6.2
GLP-1 : glucagon-like peptide-1
GLP-1R : glucagon-like peptide-1 receptor
PI3K : phosphoinositide 3-kinase
ATP : adenosine triphosphate
CD26 : dipeptidyl peptidase-4 (protein)
sCD26 : soluble dipeptidyl peptidase-4 (protein)
NCBI : National Center for Biotechnology Information
CAD : coronary artery disease
MI : myocardial infarction
HOMAIR : Homeostatic Model Assessment of Insulin Resistance
FPG : fasting plasma glucose
A1c : glycated haemoglobin
HDL : high density lipoprotein
LDL : low density lipoprotein
SBP : systolic blood pressure
xxix
Univers
ity of
Mala
ya

DBP : diastolic blood pressure
ALT : alanine transferase
AST : aspartate aminotransferase
WC : waist circumference
ADA : American Diabetes Association
AFR : Africa
EUR : Europe
MENA : Middle East and North Africa
NAC : North America and Caribbean
SACA : South and Central America
SEA : Southeast Asia
WP : Western Pacific
DOSM : Department of Statistics Malaysia
NHMS : National Health and Morbidity Survey
NPH : Neutral Protamin Hagedorn
MTF : metformin
SU : sulphonylurea
TZD : thiazolidinedione
DPP-4-i : DPP-4 inhibitor
SGLT2-i : SGLT2 inhibitor
GLP-1 RA : GLP-1 receptor agonist
SGLT2 : sodium-glucose co-transporter 2
GIP : glucose-dependent insulinotropic polypeptide
GIPR : glucose-dependent insulinotropic polypeptide receptor
TMD : transmembrane domain
MMP : matrix metalloproteinase
xxx
Univers
ity of
Mala
ya

M6P/IGFII : mannose-6 phosphate/insulin-like growth factor 2
FAP : fibroblast-activation protein
PAR2 : protease-activated receptor 2
ERK : extracellular signal-regulated kinase
Gly : glysine
Trp : tryptophan
Ser : serine
Asp : aspartic acid
His : histidine
FDA : Food and Drug Administration
XR : extended release
ADR : adverse drug reactions
NEC : not elsewhere classified
CYP : cytochrome
QID : quater in die (four times a day)
UMMC : University Malaya Medical Centre
MOH : Ministry of Health
MSD : Merck Sharp & Dohme
C : carbon
H : hydrogen
O : oxygen
N : nitrogen
CTD™ : Comparative Toxicogenomics Database™
OMIM® : Online Mendelian Inheritance in Man®
NHGRI : National Human Genome Research Institute
EBI : European Bioinformatics Institute
xxxi
Univers
ity of
Mala
ya

GWAS : Genome Wide Association Study
PAX4 : Paired box gene 4
KCNQ1 : Potassium voltage-gated channel KQT-like subfamily member 1
TCF7L2 : Transcription factor 7-like-2
ABCC8 : Sulphonylurea receptor SUR1
MTNR1B : Melatonin receptor 1B
EPAC2 : exchange protein directly activated by cAMP 2
PKA : protein kinase A
Ca²+ : calcium ion
K+ : potassium ion
PIP2 : phosphatidylinositol 4,5-biphosphate
IP3 : inositol triphosphate
ER : endoplasmic reticulum
MLT : melatonin
VAT : visceral adipose tissue
DNA : deoxyribonucleic acid
RNA : ribonucleic acid
mRNA : messenger RNA
EpiDREAM : Epidemiologic study of the Screenes for DREAM
DREAM : Diabetes Reduction Assessment with Ramipril and Rosiglitazone
Medication
INTERHEART : Effect of potentially modifiable risk factors associated with
myocardial infarction in 52 countries
OGTT : Oral Glucose Tolerance Test
IVGTT : Intravenous Glucose Tolerance Test
DESIR : Data from Epidemiological Study on the Insulin Resistance
xxxii
Univers
ity of
Mala
ya

Syndrome
AC : adenylyl cyclase
KV : voltage-gated potassium channel
SUR1 : sulphonylurea receptor
E23K : rs5219
HapMap : haplotype map
MAF : Minor Allele Frequency
ApoB : apolipoprotein B
G : guanine
T : thymine
C : cytosine
A : adenine
3’UTR : three prime untranslated region
UK : United Kingdom
EJC : exon-junction complex
CTBP2 : C-Terminal Binding Protein 2
NADK : nicotinamide adenine dinucleotide kinase
AZU1 : azurocidin 1
CTSH : cathepsin H
FSTL1 : follistatin like 1
HDLBP : high density lipoprotein binding protein
ERα : estrogen receptor α
GJA1 : gap junction protein alpha 1
Cx43 : encoding connexin 43
TWIST1 : Twist Family BHLH (Basic helix-loop-helix) Transcription
Factor 1
xxxiii
Univers
ity of
Mala
ya

IL-6 : Interleukin-6
TNFα : tumor necrosis factor-α
IL-12 : Interleukin-12
FABP4 : fatty acid binding protein 4
MCP-1 : monocyte chemoattractant protein-1
PTP1B : protein-tyrosine phosphatase 1B
SOCS3 : suppressor of cytokine signaling 3
CD45 : lymphocyte common antigen
PKR : protein kinase R
PERK : PKR-like endoplasmic reticulum (ER) kinase
UPR : unfolded protein response
IGF1 : insulin-like growth factor-1
HNF4a : hepatocyte nuclear factor 4 alpha
SDF-1 : stromal-cell-derived factor-1
GPCR : G protein-coupled receptor
CXCD4 : C-X-C chemokine receptor type 4
Th1 : T-helper type 1
SLE : systemic lupus erythematosus
RCT : Randomized Controlled Trial
NGSP : National Glycohemoglobin Standardization Program
DCCT : Diabetes Control and Complications Trial
Hb : haemoglobin
HbS : sickle haemoglobin
HbC : haemoglobin C
HbE : haemoglobin E
HbF : fetal haemoglobin
xxxiv
Univers
ity of
Mala
ya

CKD : chronic kidney disease
DECODE : Diabetes Epidemiology: Collaborative analysis of Diagnostic
criteria in Europe
HHS : Health and Human Services
VE-cadherin : vascular endothelial-cadherin
CDC : Centers for Disease Control and Prevention
CARMELINA :
Cardiovascular and Renal Microvascular Outcome Study With
Linagliptin in Patients With Type 2 Diabetes Mellitus at High
Vascular Risk Study
ESRD : end stage renal disease
CVD : cardiovascular disease
WMA : World Medical Association
USC : University of Southern California
HIV : human immunodeficiency virus
HIS : Hospital Information System
PIS : Pharmacy Information System
RN : Registration Number
BTC : Blood Taking Centre
ELISA : enzyme-linked immunosorbent assay
NJ : New Jersey
CA : California
MA : Massachusetts
NY : New York
IL : Illinois
DE : Delaware
GE : gene expression
xxxv
Univers
ity of
Mala
ya

HPLC : High Performance Liquid Chromatography
IRI : Immunoreactive Insulin
IRP : Implementation Research Platform
DTU : Diabetes Trial Unit
TMB : tetramethyl-benzidine
RT-PCR : Real-Time Polymerase Chain Reaction
NTC : Non Template Control
dATP : deoxyadenosine triphosphate
dCTP : deoxycytidine triphosphate
dGTP : deoxyguanosine triphosphate
dTTP : thymidine triphosphate
cDNA : complementary DNA
RT : reverse transcriptase
GAPDH : glyceraldehyde-3-phosphate dehydrogenase
SPSS : Statistical package for Social Science
IBM : International Business Machines Corporation
SD : standard deviation
HWE : Hardy-Weinburg Equilibrium
YRI : Yoruba from Ibadan, Nigeria
JPT : Japanese from Tokyo, Japan
CEU : Caucasian from Utah, USA populations with Northern and
Western European ancestry
LD : linkage disequilibrium
SNP : single nucleotide polymorphisms
ICD-10 : International Statistical Classification of Diseases Tenth Revision
X2 : Chi square test
xxxvi
Univers
ity of
Mala
ya

OR : Odds Ratio
95%CI : 95% Confidence Interval
CV : coefficient of variation
MET : metabolic equivalents
GLUT2 : glucose transporter 2
ROS : reactive oxygen species
mTOR : mechanistic target of rapamycin
pdx1 : pancreatic and duodenal homeobox 1
p16Ink4a : cyclin-dependent kinase inhibitor 2A
PPG : postprandial glucose
VLDL : very low density lipoprotein
cGMP : cyclic guanosine monophosphate
NAFLD : non-alcoholic fatty liver disease
ϒGT : gamma-glut amyl-transpeptidase
MRI-PDFF : MRI-derived proton density-fat fraction
MTT : Meal Tolerance Test
HAEC : human aortic endothelial cells
HMVEC : human microvascular dermal endothelial cells
IRE1 : inositol requiring 1
GRP94 : heat shock protein 90kDa beta
IGT : impaired glucose tolerance
PO : Baseline risk specified
RG : Range of odds ratio
kP : Overall disease risk in general population
N : Number of sample
∞ : infinity
xxxvii
Univers
ity of
Mala
ya

Hs : Homo sapiens
_s : An assay whose primers and probes are designed within a single
exon. Such assays, by definition, detect genomic DNA
_m1 : An assay whose probe spans an exon junction, at a region within
exon 1
ΔCt : relative expression
D’ : linkage disequilibrium coefficient
r2 : correlation
xxxviii
Univers
ity of
Mala
ya

LIST OF APPENDICES
Appendix A: Western Pacific countries………………………………………… 391
Appendix B: UMMC Ethic Committee approval letter………………………… 392
Appendix C: Consent Form (English & Malay version)……………………….. 393
Appendix D: Data Collection Form…………………………………………….. 397
Appendix E: Patient Information Sheet (English & Malay version)…………… 399
Appendix F: Additional genotyping and gene expression methodology………. 403
Appendix G: Standard curve for gene expression results………………………. 407
xxxix
Univers
ity of
Mala
ya
CHAPTER 1: INTRODUCTION
Diabetes is a chronic disease of epidemic proportions with a growing worldwide
prevalence. It currently afflicts approximately 415 million people and this figure is
targeted to increase to 642 million adults by 2040 (International Diabetes Federation
((IDF, 2015)). Type 2 diabetes (T2D) comprises up to 90% of the worldwide diabetes
population (World Health Organization (WHO, 2016)). In Malaysia, T2D prevalence
has increased from 11.6% in 2006 to 22.6% in 2013 amongst the population aged 18
years and above (Wan Nazaimoon et al., 2013).
Incretin-based therapy is the most recent class of anti-diabetic agent used to control
blood glucose levels in T2D. Dipeptidyl peptidase-4 (DPP-4) inhibitors are a category
of oral incretin-based therapy and sitagliptin, a widely used agent from this drug class
was first introduced in 2006 (Dicker, 2011). Sitagliptin become an instant hit as DPP-4
inhibitors are safer than sulphonylureas in terms of causing hypoglycemia (Dicker,
2011), and do not cause weight gain (Barbara, 2009). However there have been few
studies that examined predictors of DPP-4 inhibitor treatment response. With this in
mind, we designed this study aiming to investigate the association of clinical and
genetic variables in T2D patients with DPP-4 inhibitor treatment response. The final
aim of this study is to produce a prediction model of DPP-4 inhibitor treatment
response.
We hypothesized that 3 candidate genes ; DPP4, WFS1 and KCNJ11 would be of
possible relevance to the response to DPP-4 inhibitors treatment according to the drug
pathway and disease pathogenesis. The selection of these genes was based on the
understanding of the disease pathogenesis and the mechanism of drug action. Therefore,
the gene selected includes the drug target, pathway genes, and also the disease genes.
1
Univers
ity of
Mala
ya

According to the incretin pathway, following meal ingestion; the intestinal L-cells
mediate the release of glucagon-like peptide-1 (GLP-1) into the circulation (Mussig,
Staiger, Machicao, Haring, & Fritsche, 2010). Dipeptidyl peptidase-4 is an enzyme that
inactivates GLP-1. To prevent the GLP-1 from being inactivated, a DPP-4 inhibitor
inhibits the DPP-4 enzyme (encoded by the DPP4 gene (Kameoka, Tanaka, Nojima,
Schlossman, & Morimoto, 1993)) resulting in increased levels of active GLP-1 which
bind with its receptor (glucagon-like peptide-1 receptor (GLP-1R)) on the pancreatic β-
cell (Lacy, 2009), thus transmitting signals in the phosphoinositide 3-kinase (PI3K)
pathway (Kaneko et al., 2010) activating a cascade of action that results in insulin
secretion. One component of the cascade is the WFS1 gene at the pancreas endoplasmic
reticulum which its expression plays a significant role in insulin secretion in the β-cell
(S. G. Fonseca et al., 2005; Ishihara et al., 2004). Next, following the incretin pathway;
the release of insulin (Masana & Dubocovich, 2001) is modulated by the pancreatic β-
cell adenosine triphosphate (ATP)-sensitive potassium channel and mediated by the
KCNJ11 gene (Gloyn et al., 2003; Miki & Seino, 2005). With the identification of these
3 genes involved in the incretin pathway, we are hoping that this may provide a set of
pharmacogenomic markers in order to explore or determine the response to existing
DPP-4 inhibitor therapies.
Dipeptidyl peptidase-4 gene, also known as CD26 is a protein coding gene and acts
mainly by cleaving the X-proline dipeptides from the N-terminal dipeptides in sequence
(National Center for Biotechnology Information (NCBI, 2016b) ). DPP4 gene
polymorphisms were found to be related with severe obesity (Turcot et al., 2011),
dyslipidemia (Bailey et al., 2014; Turcot et al., 2011), and coronary artery disease
(CAD) with myocardial infarction (MI) (Aghili et al., 2012), which are common
features associations of T2D/Metabolic Syndrome. WFS1 was found to be associated
with decreased insulin secretion and increased risk of T2D (Cheurfa et al., 2011) and
2
Univers
ity of
Mala
ya

studies have shown that the loss of WFS1 gene results in impaired glucose-stimulated
insulin secretion and a reduction of β-cells in pancreatic islets (Riggs et al., 2005).
There is good evidence that KCNJ11 gene is associated with insulin secretion
(Chistiakov et al., 2009; Florez et al., 2007) and since DPP-4 inhibitor therapy results in
improved insulin secretion (Dicker, 2011; Lacy, 2009), we hypothesized that KCNJ11
gene may potentially be associated with DPP-4 inhibitor treatment response.
We hypothesized these 2 clinical factors; soluble dipeptidyl peptidase-4 (sCD26) and
Homeostatic Model Assessment of Insulin Resistance (HOMAIR); would potentially be
altered in response to treatment with DPP-4 inhibitors based on the drug pathway,
metabolism and disease pathogenesis. The selection of these clinical factors are based
on the understanding of the disease pathogenesis and the mechanism of drug action.
Other general clinical outcome parameters reflecting treatment response investigated are
fasting plasma glucose (FPG), fasting insulin, total cholesterol, triglycerides, high
density lipoprotein (HDL) and low density lipoprotein (LDL) cholesterol, alanine
transferase (ALT), aspartate aminotransferase (AST), diastolic blood pressure (DBP),
systolic blood pressure (SBP), body mass index (BMI) and waist circumference (WC).
CD26 is a multifunctional type II transmembrane glycoprotein (DPP4) (EC 3.4.14.5)
(De Meester, Korom, Van Damme, & Scharpe, 1999), and exerts its enzymatic activity
by cleaving the N-terminal dipeptides from polypeptides with either X-Pro or X-Ala
dipeptides in the penultimate position (Durinx et al., 2000; Iwaki-Egawa, Watanabe,
Kikuya, & Fujimotot, 1998). Serum sCD26 concentration was found to be correlated
strongly with circulating DPP-4 activity in humans (Kobayashi et al., 2002) .Studies
have found that DPP-4 inhibitors improved insulin resistance (M.-K. Kim et al., 2012;
Kusunoki et al., 2015), hence the idea that insulin resistance may be associated with
DPP-4 inhibitor treatment response. HOMAIR was used as the indicator of insulin
3
Univers
ity of
Mala
ya

resistance (Matthews et al., 1985). DPP-4 inhibitors were found to improve A1c levels
in T2D patients (T. Forst et al., 2011; Pattzi et al., 2010) and these findings suggest that
A1c is a measure of DPP-4 inhibitor treatment response.
Demographics are the characteristics of a population. In our study, demographics
were included as predictors because we wanted to establish the exact patient
characteristics (phenotype) indicative of the greatest potential response to DPP-4
inhibitor therapy. Generally, our demographic parameters take the form of age, gender,
ethnicity and duration of T2D.
Patients with diabetes will grow older and aging complications (Gregg, Engelgau, &
Narayan, 2002) may introduce a great challenge in establishing desired drug treatment
response. To the best of our knowledge, it is currently unknown if gender plays a role in
response to DPP-4 inhibitor therapy. Therefore we decided to investigate the gender
differences in DPP-4 inhibitor treatment response. Since the population is formed by a
mixture of separate ancestral groups which can lead to unusually high levels of linkage
disequilibrium (Nordborg, 1998), and random marital associations between ethnicities
may affect allele frequencies in populations (Bamshad & Wooding, 2003), ethnicity is
worth including in our study as it may potentially affect the DPP-4 inhibitor treatment
response. Studies found that duration of T2D correlated positively with A1c (Arnetz,
Kallner, & Theorell, 1982; Kilpatrick, Dominiczak, & Small, 1996), and increased
levels of insulin (Mykkänen, Zaccaro, Hales, Festa, & Haffner, 1999). Therefore,
duration of T2D may be associated with DPP-4 inhibitor treatment response.
Diabetes accelerates the risk of cardiovascular disease: 80% of patients with diabetes
die of heart disease and 75% of these deaths are due to myocardial infarction (Dokken,
2008). Neuropathy in diabetes is categorized into peripheral neuropathy and autonomic
neuropathy (American Diabetes Association (ADA, 2015)). Approximately 1% of
4
Univers
ity of
Mala
ya

global blindness is attributable to diabetes as diabetic retinopathy results in
microvascular long-term accumulated damage to the small blood vessels in the retina
(WHO, 2016). Diabetes is one of the leading cause of kidney failure (WHO, 2016).
Patients with diabetes have double the risk of death compared to non-diabetics (Roglic
et al., 2005). In this study, we also investigated the associations of comorbidities and
complications of diabetes with the DPP-4 inhibitor treatment response.
1.1 Problem Statement and Justification of Research
DPP-4 inhibitors form a new group of oral anti-diabetic agents introduced to treat
T2D, and despite the rapid increase in prescribing of this class of drugs and utilization,
less is known of factors that specifically associate the outcome of DPP-4 inhibitor
treatment response, especially with regards to specific demographic profiles such as age
(treatment outcomes for the elderly may differ from other patients), as well as other
clinical characteristics that may modulate the degree of therapeutic impact. Given that
the human genome contains between 30,000 and 40,000 genes and the genomes of two
different individuals differ by approximately one nucleotide in every thousand, or a
difference of approximately 3 million base pairs (Zdanowicz, 2010), therefore, the
genetic variability in drug response differs from one individual to another. To the best
of our knowledge, there have been no study on genetic determinants of treatment
response to DPP-4 inhibitors, especially in Asian populations. There is also no study
been done on the selected genes; DPP4, WFS1 and KCNJ11 to associate with DPP-4
inhibitor treatment response. Furthermore, there is no study that found that the lower
triglyceride level to be associative of response to DPP-4 inhibitor therapy.
5
Univers
ity of
Mala
ya

Our study specifically addressed the factors that may influence DPP-4 inhibitor
treatment response in T2D. The factors that we were interested in were the clinical and
genetic factors. In this study, we investigated the following:
• What clinical characteristics may be associated with DPP-4 inhibitor treatment
response?
• What genetic polymorphisms may associated with DPP-4 inhibitor treatment
response?
• Are gene expression is associated with gene polymorphisms that correlates DPP-
4 inhibitor treatment response?
• How does the combination of clinical and genetic characteristics influence DPP-
4 inhibitor treatment response?
By the end of our study, we hope to develop association models for determining
DPP-4 inhibitor treatment response in T2D. We also hope that our study findings may
provide new insights in exploring and updating DPP-4 inhibitor treatment strategies for
the treatment of T2D.
Therefore with the aforementioned in mind, we recruited 331 subjects on DPP-4
inhibitor therapy for at least 3 months and evaluated demographic, clinical, and genetic
characteristics that we hypothesized would associated with treatment response defined
as A1c < 7%. Our aims, objectives and hypotheses were as follows:
6
Univers
ity of
Mala
ya

1.2 Aims and Objectives
1.2.1 Aims
To investigate the clinical and genetic factors associated with DPP-4 inhibitor
treatment response in Type 2 Diabetes patients.
1.2.2 Objectives
To identify the clinical markers associated with DPP-4 inhibitor treatment
response.
To identify the genetic variants associated with DPP-4 inhibitor treatment
response.
To investigate the association of gene expression levels with DPP-4 inhibitor
treatment response.
To develop models incorporating clinical and genetic markers that associated
with DPP-4 inhibitor treatment response.
1.2.3 Hypothesis
Null hypothesis : DPP-4 inhibitor treatment response is not associated with
clinical and genetic variables in T2D.
Study hypothesis : DPP-4 inhibitors treatment response is associated with
clinical and genetic variables in T2D.
7
Univers
ity of
Mala
ya

CHAPTER 2: LITERATURE REVIEW
2.1 Diabetes and Impact of the Disease
Diabetes is a chronic metabolic disorder hyperglycemia and abnormalities in fat,
protein and carbohydrate metabolism; that requires life-long continuous medical care,
education on self-management and support to prevent the emergence of any acute and
chronic complications (L. W. Barrett, Fletcher, & Wilton, 2013) (Inzucchi et al., 2015).
World Health Organization (WHO) defines diabetes as a chronic disease occurring
when insulin produced by the pancreas is insufficient, or when insulin produced cannot
be efficiently consumed by the body (WHO, 2015). The chronic complications of
diabetes impose a significant societal burden in terms of healthcare costs (Fu, Qiu,
Radican, & Wells, 2009). Diabetes is the primary reason behind dialysis-requiring renal
disease (Hahr & Molitch, 2015) and adult blindness (T. Khan et al., 2013). Diabetes is
also the main cause of nontraumatic limb amputation (Morbach et al., 2012). Patients
with diabetes, especially those developed into diabetes kidney disease have substantially
elevated mortality rates (Fox et al., 2015) due to cardiovascular diseases such as cardiac
fibrosis, myocardial hypertrophy, atherosclerosis, and medial artery calcification,
leading to myocardial infarction, congestive heart failure, sudden cardiac arrest, stroke,
and peripheral vascular disease (Tuttle et al., 2014).
2.1.1 World Diabetes Statistics
According to the global diabetes report by WHO, the number of people with diabetes
has been estimated to be 171 million in the year 2000 and 366 million by 2030 (Wild,
Roglic, Green, Sicree, & King, 2004), and the International Diabetes Federation (IDF)
had estimated the global diabetes prevalence to be 151 million in 2000 (IDF, 2000), 194
8
Univers
ity of
Mala
ya

million in 2003 (IDF, 2003), 246 million in 2006 (IDF, 2006), and 285 million in 2010
(IDF, 2009); where each subsequent estimation had been higher than the previous
report. In 2011, IDF published a report on prevalence of diabetes (among adults of 20-
79 years old) in specific IDF membership regions (Table 2.1), showing that the
prevalence of diabetes throughout worldwide was estimated to increase from 2011 to
2030 (Whiting, Guariguata, Weil, & Shaw, 2011).
According to a global diabetes projection study by Mathers and Loncar (2006), it is
estimated that over 80% of fatalities due to diabetes may occur in low and middle
income countries and diabetes will be the 7th leading cause of death by 2030 (Mathers &
Loncar, 2006).
Table 2.1 : Prevalence of diabetes in 2011 and estimated prevalence of diabetes in 2030 by region among subjects aged 20-79 years old. Adapted from Whiting et
al. (Whiting et al., 2011).
IDF Membership Regions 2011 2030
AFR 5 5.9
EUR 6 7.1
MENA 12.5 14.3
NAC 11.1 12.6
SACA 8.6 10.1
SEA 8.6 10.5
WP 10.1 11.6
World Bank 8.3 9.9 AFR: Africa; EUR: Europe; MENA: Middle East and North Africa; NAC: North America and Caribbean; SACA: South and Central America; SEA: Southeast Asia; WP: Western Pacific; World Bank: low-income, lower middle income, upper middle-income and high income.
9
Univers
ity of
Mala
ya

2.1.2 Malaysian Diabetes Statistics
Malaysia is one of the rapidly developing Asian countries with current population of
approximately 31 million (Department of Statistics Malaysia (DOSM, 2015)). In
Malaysia, the prevalence of diabetes is increasing because of numerous contributing
factors such as urbanization, population growth, obesity and physical inactivity.
According to the International Diabetes Federation (IDF), there were 2.2 million cases
of diabetes reported in Malaysia until the year to 2015 (IDF, 2015). In fact, mean
prevalence of diabetes in Malaysia far exceeds the worldwide or even the Western
Pacific rates (Figure 2.1), which is alarming and reflecting the unhealthy lifestyle of
majority Malaysian.
IDF: International Diabetes Federation; WP: Western Pacific (Appendix 1)
Figure 2.1: Prevalence of diabetes: Malaysia versus world, in 2015.
The Figure 2.1 shows the age groups in the population that have the highest
proportion of diabetes. The black line represents the diabetes prevalence for the Western
Pacific region, the dotted line represents the world diabetes prevalence, and the red line
represents diabetes prevalence in Malaysia. Adapted from IDF Diabetes Atlas 7th Ed.
(IDF, 2015). 10
Univers
ity of
Mala
ya

The National Health and Morbidity Survey (NHMS) is a nationwide population
survey of Malaysian adults aimed to provide a community-based data on the pattern of
health issues, health service utilisation and health expenditure in Malaysian population
(NHMS, 2015). NHMS I, II, III, and IV conducted in the years 1986, 1996, 2006 and
2011 respectively, found that prevalence of diabetes (in those over 30 years old)
increased exponentially from 4.5% in 1986 to 15.2% in 2011 (NHMS, 2015) (Figure
2.2).
The latest NHMS V conducted in 2015, showed the prevalence of diabetes (in those
over 18 years old) was 17.5% (Figure 2.2), with an increment of 5.5% in the 18 to 19
years age category and 39.1% in the 70 to 74 years age category (NHMS, 2015). The
diabetes prevalence was higher in Indians at 22.1%, followed by Malay at 14.6%, and
Chinese at 12.0% (NHMS, 2015).
NHMS: National Health and Morbidity Survey
Figure 2.2: The prevalence of diabetes in Malaysia (NHMS, 2015).
In Figure 2.2, samples were known diabetes with the age of 30 years old and above
for NHMS I, II, III and IV, and for NHMS V; the samples were known and undiagnosed
11
Univers
ity of
Mala
ya

diabetes among adults of 18 years old and above. Year of publications: NHMS I (1986)
(NHMS, 1986), NHMS II (1996) (NHMS, 1996), NHMS III (2006) (NHMS, 2006),
NHMS IV (2011) (NHMS, 2011) and NHMS V (2015) (NHMS, 2015).
2.2 Type 2 Diabetes
Type 2 diabetes (T2D) which was known as non-insulin-dependent diabetes or adult-
onset diabetes, make up 90% of all diabetes (Saisho, 2015). T2D is due to a progressive
defect in insulin secretory upon a background of insulin resistance (Inzucchi et al.,
2015). There is no single cause for T2D, its aetiopathogenesis is multifactorial;
however, most T2D patients are obese, thus obesity especially abdominal obesity, in
particular, visceral adiposity may cause a substantial degree of insulin resistance (ADA,
2015). Insulin resistance is due to rise in lipolysis and free fatty acid production rise in
hepatic glucose production and slowdown in skeletal muscle uptake of glucose (ADA,
2015).
Insulin secretion is defective in T2D and insufficient to compensate for insulin
resistance. T2D is linked to a β-cell secretory defect. Progressive β-cell dysfunction
worsens blood glucose control over time thus resulting in overt diabetes especially in
individuals with susceptibility to diabetes (DeFronzo, Eldor, & Abdul-Ghani, 2013;
Saisho, 2015). T2D commonly goes undetected for many years and patients are usually
asymptomatic until the presence of diabetes complications which may reflect on the
diabetes extent (Dall et al., 2014; Tankova, Chakarova, Dakovska, & Atanassova,
2012).
12
Univers
ity of
Mala
ya

Common risk factors for developing T2D are increasing age (Araki et al., 2012),
obesity (Nguyen, Nguyen, Lane, & Wang, 2011), (especially with central adiposity
(Bray et al., 2008)), and lack of physical activity (Jeon, Lokken, Hu, & van Dam, 2007).
Additionally, T2D frequently occurs in women, hypertensive or dyslipidemic patients,
and in specific ethnicities such as African Americans, American Indians, Hispanics or
Latinos, Asian Americans (Chow, Foster, Gonzalez, & McIver, 2012), Asian Indians
(India, Pakistan and Bangladesh) (Abate & Chandalia, 2007; Retnakaran, Cull, Thorne,
Adler, & Holman, 2006), Malaysian Indians (Rampal et al., 2009). Although the
occurrence of T2D is associated with a susceptible genotype coupled with a
diabetogenic lifestyle including the excessive daily intake of calories, lack of exercise
and obesity (Nissen & Wolski 2007), the exact mechanisms related to the predisposing
genetics of T2D are poorly understood (ADA, 2015).
2.3 Management of Diabetes
The primary aim when managing diabetes is to prevent the onset of acute
hyperglycemic emergencies and chronic microvascular (nephropathy, retinopathy, and
neuropathy) and macrovascular complications (coronary artery disease, cerebrovascular
disease, peripheral arterial disease).
2.3.1 Goals of Diabetes Management in Adults
2.3.1.1 Glycemic therapy goals
In general, the American Diabetes Association recommends that the A1c is targeted
at less than 7.0% for the non-pregnant diabetes adult (ADA, 2016). The ADA
13
Univers
ity of
Mala
ya

recommends that A1c is checked every 6 months for patients at goal, whilst in patients
with uncontrolled glycemia, A1c should be monitored every 4 months. However, for
patients with advanced diabetes complications, uncontrolled long-standing diabetes,
those who have shorter life expectancy, or extensive other comorbidities; less-stringent
A1c targets can be applied. Optimal glycemia control is also characterized by a fasting
glucose less than 7 mmol/L and a 2-hour glucose level of less than 10mmol/l (ADA,
2016).
2.3.1.2 Non-glycemic therapy goals
Blood pressure in patients with diabetes is targeted to be less than 140/90 mmHg
(ADA, 2016). The lipid profile also has to be monitored in patients with T2D as this
condition is often associated with dyslipidemia. Low-density lipoprotein (LDL)
cholesterol for diabetes patients is targeted to be below 2.6 mmol/L according to ADA
2016 guidelines (ADA, 2016). However, initiating statins based on calculation of risk
and using predefined doses of statins that aim to lower LDL levels by a certain
minimum percentage from baseline is advocated in the ADA 2016 guidelines (ADA,
2016). Meanwhile, the triglyceride is targeted to be less than 1.7 mmol/L(ADA, 2016).
2.3.2 Antidiabetic Therapy
Based on general recommendations, the initial pharmacological diabetes treatment is
metformin as monotherapy (Inzucchi et al., 2015). However, if the target A1c fails to be
achieved after 3 months of treatment duration or when A1c is at 9% or more, dual
therapy should be started (Inzucchi et al., 2015). For dual therapy, metformin can either
14
Univers
ity of
Mala
ya

be combined with sulphonylurea, DPP-4 inhibitors, thiazolidinedione, SGLT2
inhibitors, GLP-1 receptor agonist or basal insulin(Inzucchi et al., 2015). If the target
A1c fails to be achieved after 3 months of dual therapy, triple therapy will be initiated
(Inzucchi et al., 2015). The triple therapy regimen may consist of metformin and an
additional 2 more antidiabetics agents (Inzucchi et al., 2015) as shown in Figure 2.3.
Patients may be started with combination insulin therapy (basal + mealtime) if the target
A1c fails to be attained after quarter a year of triple therapy, or when the blood glucose
is 16.7-19.4 mmol/L, or A1c is at 10% or more to 12%; specifically when symptomatic
or catabolic features are displayed by patient (Inzucchi et al., 2015). Another alternative
treatment regimen at this stage is a combination of basal insulin with the injectable
GLP1 receptor agonist.
15
Univers
ity of
Mala
ya

MTF: Metformin; SU: Sulphonylurea; TZD: Thiazolidinedione; DPP-4-i: DPP-4 inhibitor; SGLT2-i: SGLT2 inhibitor; GLP-1 RA: GLP-1 receptor agonist; DPP-4: dipeptidyl peptidase-4; SGLT2: sodium-glucose co-transporter 2; GLP-1: glucagon-like peptide-1.
Figure 2.3: The general recommendations for antidiabetic therapy in T2D
(Inzucchi et al., 2015).
In Figure 2.3, the insulin in dual and triple therapy is referring to basal insulin. Basal
insulin is a long-acting insulin (ie. NPH, glargine and detemir). Mealtime insulin is also
known as fast-acting or bolus insulin (ie. Insulin Lispro, Insulin Aspart and Insulin
Glulisin).
16
Univers
ity of
Mala
ya

2.3.3 The Choice of Oral Antihyperglycemic Agents
The selection of a particular oral antihyperglycemic agent in managing the T2D is
dependent upon several factors: efficacy, side effect profile, the risk of hypoglycaemia,
chances of weight gain and patient phenotype. Sulphonylureas, for example, although
very effective with A1c lowering capacity ranging from 1.0% to 1.5% (Sherifali,
Nerenberg, Pullenayegum, Cheng, & Gerstein, 2010) and cheap (Gallwitz & Häring,
2010), often cause hypoglycemia especially in the elderly (Holstein, Hammer, Hahn,
Kulamadayil, & Kovacs, 2010). Glibenclamide and gliclazide are the most commonly
used sulphonylureas used to treat T2D (Rendell, 2004). Glibenclamide, in the elderly
who have reduced renal function secondary to aging, poses a high risk of
hypoglycaemia (ADA, 2016). Thiazolidinediones such as Rosiglitazone (Kendall &
Wooltorton, 2006) and Pioglitazone (Shah & Mudaliar, 2010) are associated with
edema, heart failure, and fractures as its side effects (Inzucchi et al., 2015; Nissen &
Wolski 2007) thus limiting widespread use in treating T2D. SGLT2 inhibitors such as
Dapagliflozin (Sabale, Ekman, Granstrom, Bergenheim, & McEwan, 2015),
Canagliflozin (Elkinson & Keating, 2013) and Empagliflozin (Ndefo, Anidiobi,
Basheer, & Eaton, 2015), are the newest oral antihyperglycemic agents introduced in
the market and they function by reducing the amount of glucose being reabsorbed
absorbed in the kidney tubules so that glucose is eliminated through urine the urine. The
SGLT2 inhibitors as they have an insulin-independent mechanism of action do not
result in hypoglycaemia. In addition, they result in weight loss. Therefore, this class of
agents is useful in patients with T2D who have an obese phenotype. On the other hand,
the SGLT2 inhibitors are costlier than the second-generation sulphonylureas and in
comparison have a lesser A1c-lowering capacity. Incretin-based therapies such as the
GLP-1 receptor agonist and DPP-4 inhibitors work via the incretin pathway and are
17
Univers
ity of
Mala
ya

currently a popular choice in treating T2D because drug action is glucose dependent
(meal activated), thus resulting in a lower risk of hypoglycemia than other older choices
of oral antihyperglycemic agents. GLP-1 receptor agonists such as exenatide (Triplitt &
Chiquette, 2003), liraglutide (S. H. Jackson, Martin, Jones, Seal, & Emanuel, 2010),
lixisenatide (Elkinson & Keating, 2013), albiglutide (Poole & Nowlan, 2014) and
dulaglutide (Sanford, 2014) have lower hypoglycemic risk than sulphonylureas (Gitt,
Bramlage, Schneider, & Tschöpe, 2015). However, GLP-1 receptor agonist is only
available in injectable form. Although GLP-1 receptor agonists are more potent than
DPP-4 inhibitors, the DPP-4 inhibitors are a more favourable choice in treating T2D as
the drug is available in oral dosing form (easier consumption, handling, and storage as
compared to GLP-1 receptor agonist), neutral with regards to weight, has no
hypoglycemia risk, and side effects are rare(Daniel J. Drucker et al., 2010) (Table 2.2).
In comparison with other antihyperglycemic agents (Table 2.2); although metformin
and sulphonylureas give the A1c reduction higher than DPP-4 inhibitors (1.5% over
0.6% – 0.8%, respectively), DPP-4 inhibitors does not cause hypoglycemia and weight
gain as sulphonylureas, and DPP-4 inhibitors also have no cardiovascular risk factors
and diabetes comorbidities contraindications as metformin (Daniel J. Drucker et al.,
2010). Insulin therapy gives the highest A1c reduction (1.5% – 2.5%) among
antihyperglycemic agents but it caused weight gain (Daniel J. Drucker et al., 2010).
18
Univers
ity of
Mala
ya

Table 2.2: The differences between antihyperglycemic agents based on A1c reduction, hypoglycemia risk, effect on weight, cardiovascular risk factors, dosing (times/day) and diabetes comorbidity contraindications (Daniel J. Drucker et al.,
2010).
MTF SU TZD DPP-4-i
Insulin
(long-
acting)
Insulin
(rapid-
acting)
GLP-1 RA
A1c reduction
1.5 1.5 0.5 – 1.4 0.6 – 0.8 1.5 – 2.5 1.5 – 2.5 0.5 – 1.0
Hypoglycemia
risk No Yes No No Yes Yes No
Effect on weight
Neutral
Gain
weight
Gain
weight Neutral
Gain
weight
Gain
weight Loss weight
CVD risk factors Minimal None Variable None TG TG With weight
loss
Dosing
(times/day) 2 1 1 1 1 1 - 4 2
Diabetes
comorbidities
contraindications
Kidney,
liver None None None None None Kidney
MTF: Metformin; SU: Sulphonylurea; TZD: Thiazolidinedione; DPP-4-i: DPP-4 inhibitor; GLP-1 RA: GLP-1 receptor agonist; DPP-4: dipeptidyl peptidase-4; SGLT2: sodium-glucose co-transporter 2; GLP-1: glucagon-like peptide-1; CVD: cardiovascular; TG; triglycerides.
2.4 The ‘Incretin Effect’
The ‘incretin effect’ phenomenon is attributed to the gastrointestinal peptides, i.e.
incretin hormones, which are released as a response to the ingestion of nutrients and
result in glucose-induced secretion of insulin from pancreatic β-cells (Henquin,
Dufrane, Kerr-Conte, & Nenquin, 2015). In other words, Tolhurst et al (2009) describe
the ‘incretin effect’ as the phenomenon of greater insulin release, triggered by oral
ingestion of glucose as compared to the exact glucose amount administered
intravenously (Tolhurst, Reimann, & Gribble, 2009). In humans, the incretin effect is
brought about by two incretin hormones; glucagon-like peptide-1 (GLP-1) and glucose-
dependent insulinotropic polypeptide (GIP) (Mussig et al., 2010). GLP-1 and GIP
mediate their effects via the glucagon-like peptide-1 receptor (GLP-1R) and glucose-19
Univers
ity of
Mala
ya

dependent insulinotropic polypeptide receptor (GIPR), respectively (Mussig et al.,
2010). GLP-1R is located on pancreatic alpha (α-) and β-cells, and also in the heart,
central nervous system, kidney, lung and gastrointestinal tract (Mussig et al., 2010).
GIPR is especially located on pancreatic β-cells, the central nervous system, adipose
tissue and osteoblasts (Mussig et al., 2010).
In T2D, the incretin response is expected to be defective due to the lack of β-cell
responsiveness to exogenously administered GIP (Holst, Knop, Vilsbøll, Krarup, &
Madsbad, 2011). However, the GLP-1 levels were maintained in the immediate
postprandial period as the defect in GLP-1 secretion in patients with T2D were only
observed within 2-3 hours after meal (Vollmer et al., 2009). This indicated that the
defect in the GLP-1 release does not coexist with the alterations in insulin secretion by
the β-cells indicating a partial incretin defect with GLP-1 (Juris J. Meier & Nauck,
2010). Therefore, as a result of these impacts on β-cell, GLP-1 became popular as the
new pharmacological target as in developing new antidiabetics drugs such as DPP-4
inhibitors and GLP-1 receptor agonists (Stonehouse, Darsow, & Maggs, 2012).
2.5 GLP-1 and GIP
GLP-1 is produced primarily by enteroendocrine L-cells in the distal intestine. GLP-
1 exists in two molecular forms, GLP-1 (7-37) and GLP-1 (7-36) amide. Although both
forms are equipotent, only GLP-1 (7-36) amide circulates in high levels after food
ingestion (D. J. Drucker & Nauck, 2006). GLP-1 potentiates secretion of glucose-
dependent insulin from pancreatic β-cells in responding to ingestion of carbohydrates
and lipid-rich meals. Furthermore, GLP-1 exerts other effects: glucagon secretion
suppression, stimulation of β-cell neogenesis and insulin biosynthesis, acid secretion
20
Univers
ity of
Mala
ya

and gastric emptying inhibition, food intake reduction via central nervous system (CNS)
effects, and trophic effects on the pancreas (Gautier, Choukem, & Girard, 2008; Seino,
Fukushima, & Yabe, 2010). In addition, this hormone contributes to the regulation of
glucose homeostasis by GLP-1 receptor-dependent (GLP-1R-dependent) via the
modulation of gastric emptying and involvement of neural circuits in the portal region
and CNS (Lamont et al., 2012). Two SNPs in the GLP1R gene, rs6923761 and
rs3765467 were found to be nominally associated with altered insulin secretory
response to GLP-1 infusion, in the presence of hyperglycemia in nondiabetic subjects
(Sathananthan et al., 2010). Up till the present-day, the GLP1R gene variations have not
been associated with T2D (Stolerman & Florez, 2009).
GIP is a 42-amino acid peptide predominantly secreted by proximal small intestinal
K-cells as a response to carbohydrates and lipids ingestion (D. J. Drucker & Nauck,
2006). GIP potentiates glucose-stimulated insulin release through G-protein coupled
receptors, mainly placed on pancreatic β-cells (Foukas & Okkenhaug, 2003). GIPR
mRNA expression has been found to be reduced in human islets in T2D, where the A
allele of GIPR rs10423928 was associated with impaired glucose- and GIP-stimulated
insulin secretion (Lyssenko et al., 2011).
2.6 Incretin-based Therapy
Incretin-based therapy is a latest class of anti-diabetic agent employed in controlling
blood glucose levels. This control is achieved by modifying the patient’s incretin
pathway. Charbonnel and Cariou (2011) in a review summarized 23 randomized
controlled trials of DPP-4 inhibitor therapies, finding that DPP-4 inhibitors as
monotherapy or combination therapy with one oral antidiabetic produce moderate A1c
21
Univers
ity of
Mala
ya

reductions, do not induce hypoglycemia and are neutral on weight (B. Charbonnel &
Cariou, 2011). The incretin-based therapies can be divided into two groups, dipeptidyl
peptidase-4 (DPP-4) inhibitors, and GLP-IR agonists. GLP-IR agonists molecules that
are encoded by a unique gene in a lizard (Gila monster (Heloderma suspectrum))
venom, which is a potent degradation-resistant agonist at mammalian GLP-1R (D. J.
Drucker & Nauck, 2006; Pabreja, Mohd, Koole, Wootten, & Furness, 2014). GLP-1R
agonists that are commercially available include exenatide and liraglutide. Lixisenatide,
taspoglutide, and albiglutide are in phase III of clinical trials at present (Addison &
Aguilar, 2011). The second class of incretin–based therapies is based on a molecule that
inhibits degradation of endogenous circulating GLP-1 and GIP. Endogenous GLP-1 (7-
36) amide and GIP (1-42) amide are rapidly broken down into the inactive forms, GLP-
1 (9-36) amide and GIP (3-42) amide, respectively (Duez, Cariou, & Staels, 2012). This
inactivation shortens the duration of action of both circulating endogenously produced
active compounds, and as result, the secretion of glucose-stimulated insulin is reduced
(Baggio & Drucker, 2014; Mussig et al., 2010). This inactivation process is catalyzed
by the DPP-4 enzyme, which rapidly degrades circulating GIP and GLP-1: resulting in a
plasma half-life of five to seven minutes for GIP, and a plasma half-life of one to two
minutes for GLP-1 (Addison & Aguilar, 2011; Gautier et al., 2008). The DPP-4
inhibitors prevent this inactivation process thus raising circulating concentrations of
endogenously secreted GLP-1 and GIP.
2.7 Biology of Dipeptidyl Peptidase-4
DPP4 is an ubiquitously expressed glycoprotein of 110kDa, first distinguished by
Hopsu-Havu and Glenner in 1966 (Röhrborn, Wronkowitz, & Eckel, 2015). The
22
Univers
ity of
Mala
ya

functionality of DPP4 is described based on the respective relevance domains
architecture of the DPP4 itself. The DPP4 protein has four domains, which are a short
cytoplasmic domain (1-6), a transmembrane domain (TMD) (7-28), a flexible stalk
segment (29-39), and the extracellular domain (40-766) (Figure 2.4) (Röhrborn et al.,
2015). The extracellular domain is divided further into a highly glycosylated, the
cysteine-rich and the catalytic area (Figure 2.4) (Röhrborn et al., 2015). According to a
review, DPP4 was first found present in serum and saliva, followed by in the
cerebrospinal fluid, seminal fluid and bile (Mulvihill & Drucker, 2014).Which later,
Avogaro & Fadini (2014) and Mulvihill & Drucker (2014) had discovered that the
protein was expressed in many other cell types and tissue, specifically in the brain,
lungs, heart, gut, liver, pancreas, uterus, endothelial capillaries, thymus, spleen, lymph
node, acinar cells of mucous and salivary glands, and highest levels detected in the
kidney (Avogaro & Fadini, 2014; Mulvihill & Drucker, 2014).
MMP: matrix metalloproteinase; M6P/IGFII: mannose-6 phosphate/insulin-like growth factor 2
Figure 2.4: Membrane-bound DPP4 monomer.
Matrix metalloproteinases (MMPs) shedding DPP4 from membrane (Lambeir, Durinx, Scharpe, & De Meester, 2003). Adapted from Lambeir et al. (2003) (Lambeir et
al., 2003). 23
Univers
ity of
Mala
ya

DPP4 is a type two transmembrane protein, which has a typical signal peptide used
to target the endoplasmic reticulum and initiate the translocation across cell membrane
(Röhrborn et al., 2015). However, the signal is not split and it acts as a membrane
anchor instead (Röhrborn et al., 2015). According to Röhrborn et al. in 2014, the
circulating DPP4 (in the form of sDPP4 lacking in cytoplasmic domain and TMD) is
split from the human adipocyte and smooth muscle cell membrane by a shedding
process involving matrix metalloproteases (MMPs) (Röhrborn, Eckel, & Sell, 2014).
The proline residues in the TMD region are involved in the translocation of DPP4
(Röhrborn et al., 2015). Chung et al. (2011) showed that the integration and
translocation into the membrane are decided by the hydrophobicity, location and the
conformation of proline in the TMD (K. M. Chung et al., 2011). Glycosylation of DPP4
is significant for the exact trafficking DPP4 (Röhrborn et al., 2015). The two glutamate
residues (205 and 206) within proline in the TMD glycosylated region are crucial for
DPP4 activity (Abbott, McCaughan, & Gorrell, 1999). These glycosylated sites (i.e. N-
glycosylation at Asn319) are required for the stability, folding and intracellular
trafficking of DPP4 protein (H. Fan, Meng, Kilian, Grams, & Reutter, 1997).
DPP4 exists as a monomer, homodimer or homotetramer, which can be found on cell
surfaces (Röhrborn et al., 2015). The dimerized predominant form of DPP4 is important
for enzymatic activity (Röhrborn et al., 2015). Dimerization may occur through
interaction with the region that is cycteine-rich (Röhrborn et al., 2015) or through DPP4
itself, or via other binding partners such as fibroblast-activation protein α (FAP) (Ghersi
et al., 2003; Scanlan et al., 1994). DPP4 is also connected to several mechanisms such
as tumor invasion and immune response through the interaction in the cysteine-rich
region (Röhrborn et al., 2015). Additionally, since the area of DPP-4 that is high in
cysteine contains a sequence that is highly homologous to the auto-activating tethered
24
Univers
ity of
Mala
ya
ligand of protease-activated receptor 2 (PAR2), Wronkowitz et al. (2014) suggested that
sDPP4 might be the activator of PAR2 by substantiating that the upregulation of
inflammatory cytokines, and s4PP4-mediated ERK activation and proliferation can be
avoided when the PAR2 is silenced (Wronkowitz et al., 2014).
The catalytic region of DPP4 contains serine at DPP4’s active site located in the
sequence of Gly-Trp-Ser-Tyr-Gly, which is a portion of the catalytic triad (Ser 630, Asp
708, His 740) (Röhrborn et al., 2015). Since DPP4 is an exopeptidase, it actively splits
dipeptides from its substrate’s penultimate N-terminal position causing either
inactivation of these peptides and/or generation of new bioactive compounds (Cordero,
Salgado, & Nogueira, 2009).
2.8 Potential Receptors of Soluble Dipeptidyl Peptidase 4
DPP4 can exert its biological functions in an endocrine or paracrine manner due to
its intact enzymatic and area rich in cysteine, which may too be involved in intracellular
signaling events in targeted cells (Röhrborn et al., 2015). To the best of our knowledge,
not much is made known about DPP4 receptors, thus minimizing information to exactly
comprehend the role of sDPP4 in different cells and in different disease conditions that
have serum DPP4 levels elevated (Röhrborn et al., 2015).
In order to exert its function as a T-cell activator, DPP4 needs to be internalized
(Ikushima et al., 2000). Nevertheless, since DPP4 lacks an exocytosis signal, in order to
exert its biological functions, DPP4 needs to be linked to mannose-6 phosphate/IGF-
IIR, which takes place through M6P residues in the carbohydrate moiety of DPP4
causing an internalized complex (Ikushima et al., 2000).
25
Univers
ity of
Mala
ya

2.9 Dipeptidyl Peptidase-4 Inhibitors
The DPP-4 inhibitor is a common 2nd line agent currently utilized in the therapy of
T2D as it is as efficacious as other antidiabetics, safer than sulphonylureas in terms of
hypoglycaemia risk (Dicker, 2011), and does not cause weight gain (Lacy, 2009). DPP-
4 inhibitors are also the preferred prescription to treat T2D in the elderly due to its
strictly glucose-dependent effect on lowering blood glucose (reducing the risk of
hypoglycaemia) but have a neutral effect on calories consumed, thus preserving muscle
and total body protein mass (Dicker, 2011). Sitagliptin was the pioneer DPP-4 inhibitor
introduced in 2006 to treat diabetes (Godinho et al., 2015), followed by its combination
with metformin in 2007 (Dicker, 2011; B. J. Goldstein, Feinglos, Lunceford, Johnson,
& Williams-Herman, 2007). Saxagliptin was the second DPP-4 inhibitor approved in
the United States (US) in 2009 as monotherapy and by combining metformin,
sulphonylureas or thiazolidinediones (Hollander & Kushner, 2010). Vildagliptin was
later approved in 2008 in Europe (Dave, 2011), and Latin America (Dicker, 2011), as
monotherapy and with the combination of metformin, thiazolidinediones or
sulphonylureas (Vilar et al., 2011). The great success of DPP-4 inhibitors resulted in
rapid development and emergence of linagliptin and alogliptin as the latest additions to
this drug class (V. Gupta & Kalra, 2011). Although the different DPP-4 inhibitors have
comparable efficiency in reducing A1c, safety profile, and patient tolerance; they differ
in their metabolism, excretion and recommended effective daily dosage (Deacon, 2011;
Dicker, 2011). A review by Davidson et al. (2009) on the effect of DPP-4 inhibitors on
A1c as monotherapy or as combination therapy with other antidiabetics found that
sitagliptin had on average decreased A1c by 0.65% after 12 treatment-week, 0.84%
after 24 treatment-week, 1.0% after 30 weeks of treatment and 0.67% after 52 weeks of
treatment (Davidson, 2009). Meanwhile, saxagliptin therapy resulted in an average A1c
26
Univers
ity of
Mala
ya

reduction of 0.43-1.17% (Davidson, 2009). As for vildagliptin, the A1c decreased by
an average of 1.4% after 12 weeks of monotherapy in newly treated diabetes patients
(Davidson, 2009). A meta-analysis by Amori et al. (2007) on the treatment of T2D with
vildagliptin and sitagliptin for 12 weeks or more as compared to placebo and other
antidiabetics, found a reduction of A1c levels by 0.74% (Amori, Lau, & Pittas, 2007).
Sitagliptin, vildagliptin, and saxagliptin were the first three DPP-4 inhibitors
approved by the US Food and Drug Administration (FDA) for their therapeutic use in
T2D (Addison & Aguilar, 2011; Nathan et al., 2009) (Table 2.3). However, saxagliptin
was only approved for use in Europe in 2011 to treat T2D with renal insufficiency of
moderate to severe level and mild hepatic insufficiency (Duez et al., 2012). Alogliptin
and linagliptin are the most recent DPP-4 inhibitors to be launched onto the market
(Duez et al., 2012). Dutogliptin, teneligliptin, and SYR472 are currently under phase III
(Duez et al., 2012), while other more recently developed DPP-4 inhibitors, such as
KRP104, LC15-0444, and melogliptin are under phase II clinical trials (Duez et al.,
2012). At present, four DPP-4 inhibitors are available for utilization in Malaysia:
sitagliptin, vildagliptin, linagliptin and saxagliptin (Ministry of Health, Malaysia (MOH,
2017)). These agents are prescribed to patients in both government and private
hospitals and clinics (MOH, 2017).
Table 2.3: Food and Drug Administration (FDA) approved DPP-4 inhibitors (FDA, 2016).
DPP-4 inhibitor Brand name
Sitagliptin Januvia (NCBI, 2016b; Yazbeck,
Howarth, & Abbott, 2009)
Sitagliptin and Metformin Janumet (Reynolds, Neumiller, &
Campbell, 2008)
27
Univers
ity of
Mala
ya

Table 2.3, continued
DPP-4 inhibitor Brand name
Sitagliptin and Metformin XR Janumet XR (Aschenbrenner, 2016)
Vildagliptin Galvus (Braunstein & Zhong, 2015)
Vildagliptin and Metformin Galvus Met (Mkele, 2015)
Saxagliptin Onglyza (Karagiannis, Bekiari,
Boura, & Tsapas, 2016)
Saxagliptin and Metformin XR Kombiglyze XR (Karagiannis et al.,
2016)
Linagliptin Trajenta (Aschenbrenner, 2016)
Linagliptin and Empagliflozin Glyxambi (Aschenbrenner, 2016)
Linagliptin and Metformin Jentadueto (Aschenbrenner, 2016)
Alogliptin Nesina (Tanz, 2013)
Alogliptin and Metformin Kazano (Mullard, 2014)
Alogliptin and Pioglitazone Oseni (Mullard, 2014)
XR: Extended Release
2.9.1 Mechanism of Action of DPP-4 Inhibitors
DPP-4 enzyme rapidly deactivates GIP (1-42) amide and GLP-1 (7-36) amide into
the inactive forms, GIP (3-42) amide and GLP-1 (9-36) amide, respectively (Duez et al.,
2012). This inactivation shortens the action period for both circulating active
compounds, causing reduction in the secretion of the glucose-stimulated insulin and the
proliferation and survival of pancreatic β-cells (Baggio & Drucker, 2014; Mussig et al.,
2010). DPP-4 enzyme rapidly degrades circulating GIP resulting in a plasma half-life of
5-7 minutes and similarly results in a plasma half-life of circulating GLP-1 of 1-2
minutes (Addison & Aguilar, 2011; Gautier et al., 2008). The DPP-4 enzyme targets
numerous substrates, which include neuropeptides, cytokines, and other gastrointestinal
peptides (Gautier et al., 2008). Consequently, the enzyme is distributed in numerous
tissues, which include endothelial cells, lymphocytes, the central nervous system,
28
Univers
ity of
Mala
ya

kidney, lung and pancreas (Gautier et al., 2008). The distribution and rapid inactivating
action of the DPP-4 enzyme on both incretin hormones ultimately determine the
outcome of glucose-stimulated insulin secretion, hence glycemic control.
GLP-1: Glucagon-like peptide-1; GLP-1:, Glucagon-like peptide-1 receptor; DPP-4: Dipeptidyl peptidase-4.
Figure 2.5: Mechanism of action of DPP-4 inhibitors therapy of Type 2 diabetes. Adapted from (Duez et al., 2012).
As shown in Figure 2.5, DPP-4 inhibitor blocks DPP-4 enzyme, and the degradation
of active GLP-1 (7-36) amide into inactive GLP-1 (9-36) amide is prevented (Lacy,
2009). Active GLP-1 binds the GLP-1R on the pancreatic β-cell, thus activating
multiple genes the expression resulting in insulin secretion, β-cell proliferation and
survival (Jamaluddin, Huri, Vethakkan, & Mustafa, 2014). Insulin is secreted from the
29
Univers
ity of
Mala
ya

β-cell into blood circulation in order to control blood-glucose levels (Ye et al., 2010).
DPP-4 inhibitors increase circulating GLP-1 to physiological levels (Nauck, Vardarli,
Deacon, Holst, & Meier, 2011). The full efficacy of any selected DPP-4 inhibitor should
be achieved at a dose that inhibits more than 80% of the DPP-4 enzyme for 24 hours
because elevating the dose above this threshold does not raise its efficacy (B.
Charbonnel & Cariou, 2011). Since the DPP-4 inhibitors bind to the DPP-4 enzyme and
hence enhance GLP-1 concentrations, the efficacy of the DPP-4 inhibitors could be
affected by the expression of DPP4 gene variants (O. Kwon, et al., 2013; Lacy, 2009).
A study (2013) was conducted to explore associations of DPP4 gene variants with
vildagliptin efficacy using 12 SNPs;g-234A/C, rs13015258, IVS8-128A/G, rs17848920,
IVS8+46C/T, rs10930040, IVS11-143A/G, rs2302873, G645G, rs17848910,
IVS22+4C/T and rs2268891; however, the study could not find any significant
association because of inadequate sample size (O. Kwon, et al., 2013).
DPP-4 inhibitors are further broken down into peptidomimetics and non-
peptidomimetics (O. Kwon, et al., 2013). The peptidomimetics imitates the DPP-4
molecule, thus when the peptidomimetics append to the DPP-4 enzyme, dissociation
will take place, leading to persistent DPP4 inhibition even after inactivation, though
they are relatively quickly cleared from the plasma (O. Kwon, et al., 2013). Meanwhile,
the non-peptidomimetics form non-covalent interactions with the residues in the
catalytic site, which cause immediate and potent inhibition (O. Kwon, et al., 2013).
Saxagliptin, vildagliptin, and linagliptin are examples of peptidomimetics, while
sitagliptin, linagliptin and alogliptin are examples of non-peptidomimetics (O. Kwon, et
al., 2013; Nabeno et al., 2013).
30
Univers
ity of
Mala
ya

2.9.2 Recommendations for DPP-4 Inhibitor Usage in the Therapy of Type 2
Diabetes
Following the failure of Metformin to reach A1c target after 3 months of therapy, the
American Diabetes Association (ADA) recommends DPP-4 inhibitors as: (1) an add-on
2nd line therapy, (2) a third-line triple oral therapy selection (if the A1c target was
unachievable after 3 months), (3) an option if sulphonylurea therapy was
contraindicated, or (4) an option when the risk of hypoglycemia is a major issue
(Inzucchi et al., 2015). The general recommendations for DPP-4 inhibitor utilization are
presented in Figure 2.6. According to ADA statements in 2009 by Nathan et al., DPP-4
inhibitor monotherapy will not cause hypoglycemia and is expected to reduce glycated
hemoglobin (A1c) by 0.5-0.8% with no effect on weight (Nathan et al., 2009). Although
DPP-4 inhibitors exhibit fewer side effects, their long-term safety is still not established
(Nathan et al., 2009). Furthermore, their high cost may limit their usage to higher
income patients (ADA, 2015).
DPP-4; dipeptidyl peptidase-4, SGLT2-1; sodium-glucose co-transporter 2 inhibitor
Figure 2.6: The general recommendations for DPP-4 inhibitor utilization. 31
Univers
ity of
Mala
ya

Adapted from Inzucchi et al. (Inzucchi et al., 2012).
As shown in Figure 2.6, if target A1c is not achieved within 3 months of T2D
monotherapy, the physician may proceed to dual therapy. Similarly, subsequently after
3 months, failure to attain target A1c should lead to utilization of the triple therapy. The
choice of combination therapy is dependent on patient- and disease-specific factors.
2.9.3 DPP-4 Inhibitors: Usual Adult Dosing
The recommended daily dosage of the DPP-4 inhibitors for adults: vildagliptin,
sitagliptin, saxagliptin, linagliptin, and alogliptin are presented in Table 2.4.
Table 2.4: The recommended adult daily dosage of the DPP-4 inhibitors.
DPP-4 inhibitor Recommended adult dose
Sitagliptin 25-100 mg once daily, with or without food (Tatosian et al., 2013)
Sitagliptin and Metformin Sitagliptin/metformin 50/500 mg twice daily, with meal or may be
increased to the maximum of 50/1000 mg twice daily, with meal (Juang &
Henry, 2013)
Sitagliptin and Metformin XR Maximum of sitagliptin 100 mg and metformin 2000mg once daily, with
food (Juang & Henry, 2013)
Vildagliptin 100 mg in two divided doses daily, with or without food (Marfella et al.,
2010)
Vildagliptin and Metformin Maximum of vildagliptin 100 mg and metformin 2000mg in two divided
doses daily, with food (Tatosian et al., 2013)
Saxagliptin 2.5 or 5 mg once daily, with or without food (Tatosian et al., 2013)
Saxagliptin and Metformin XR Maximum of saxagliptin 5 mg and metformin 2000mg once daily, with
food (Juang & Henry, 2013)
Linagliptin 5 mg once daily, with or without food (Del Prato et al., 2011)
Linagliptin and Metformin Maximum linagliptin 5 mg and metformin 2000 mg daily, with food
(White, Buchanan, Li, & Frederich, 2014)
Alogliptin 25 mg once daily, with or without food (Dineen, Law, Scher, & Pyon,
2014)
Alogliptin and Metformin Maximum alogliptin 25 mg and metformin 2000 mg daily, with food
(Juang & Henry, 2013)
Alogliptin and Pioglitazone Maximum linagliptin 25 mg and pioglitazone 45 mg daily, with or
without food (Juang & Henry, 2013)
XR: extended released
32
Univers
ity of
Mala
ya

2.10 DPP-4 Inhibitors Investigated in this Study
The DPP-4 inhibitors investigated in this study were sitagliptin, vildagliptin, and
linagliptin; as these were the only DPP-4 inhibitors available in University Malaya
Medical Centre (UMMC) during the data collection period. In Malaysia, DPP-4
inhibitors are listed as A* items in the Ministry of Health (MOH) Drug Formulary, as
they can be prescribed by consultants or specialists for specific indications only
(Ministry of Health, Malaysia (MOH, 2016)).
Figure 2.7: Packaging of sitagliptin. (2012).
(Picture illustration of sitagliptin product named Januvia™, 2012). Retrieved from
(MIMS, 2014).
Figure 2.8: Tablet of Sitagliptin (2012).
(Picture illustration of sitagliptin product named Januvia™ by Merck Sharp &
Dohme, 2012) (MSD, 2012b). Retrieved from (MSD, 2012b).
33
Univers
ity of
Mala
ya

Figure 2.9: Tablet of sitagliptin plus metformin hydrochloride (2012).
(Picture illustration of sitagliptin product named Janumet™ by Merck Sharp &
Dohme, 2012) (MSD, 2012a). Retrieved from (MSD, 2012a).
Figure 2.10: Vildagliptin. (2012).
(Picture illustration of vildagliptin product named Galvus™, 2012). Retrieved from
(MIMS, 2012).
Figure 2.11: Tablet of vildagliptin (2012).
(Picture illustration of vildagliptin product named Galvus™ by Novartis, 2012)
(Novartis, 2012b). Retrieved from (Novartis, 2012b).
34
Univers
ity of
Mala
ya

Figure 2.12: Tablet of vildagliptin plus metformin hydrochloride (2012).
(Picture illustration of vildagliptin product named Galvus Met™ by Novartis, 2012)
(Novartis, 2012a). Retrieved from (Novartis, 2012a).
Figure 2.13: Linagliptin. (2011).
(Picture illustration of linagliptin product named Tradjenta™, 2011). Retrieved from
(Young, 2011).
Figure 2.14: Tablet of linagliptin (2011).
(Picture illustration of linagliptin product named Tradjenta™ by Boehringer
Ingelheim, 2011) (Ingelheim, 2011b). Retrieved from (Ingelheim, 2011b).
35
Univers
ity of
Mala
ya

Figure 2.15: Tablet of linagliptin plus metformin hydrochloride (2011).
(Picture illustration of linagliptin product named Tradjenta Duo™ by Boehringer
Ingelheim, 2011) (Ingelheim, 2011a). Retrieved from (Ingelheim, 2011a).
36
Univers
ity of
Mala
ya

2.10.1 Pharmaceutical Information : DPP-4 Inhibitors Drug Substance
The pharmaceutical information on sitagliptin is presented in Table 2.9, vildagliptin
in Table 2.10, and linagliptin in Table 2.11.
Table 2.5: Pharmaceutical information of sitagliptin drug substance.
Adapted from ((MSD, 2012b).
Common name Sitagliptin phosphate monohydrate
Chemical name 7-[(3R)-3-amino-1-oxo-4-(2,4,5-trifluorophenyl)butyl]-5,6,7,8-
tetrahydro-3-(trifluoromethyl)-1,2,4-triazolo[4,3-a]pyrazine phosphate
(1:1) monohydrate
Molecular formula C16H15F6N5OH3PO4H2O
Molecular mass 523.32
Structural formula
Physicochemical
properties
Sitagliptin phosphate monohydrate is a white to off-white, crystalline,
non-hygroscopic powder, which is soluble in water and N, N-dimethyl
formamide. It is also slightly soluble in methanol, and very slightly
soluble in ethanol, acetone, and acetonitrile. However, sitagliptin is
insoluble in isopropanol and isopropyl acetate.
C: carbon; H: hydrogen; F: fluorine; OH: hydroxide; PO4: phosphate; O: oxygen; N: nitrogen
37
Univers
ity of
Mala
ya

Table 2.6: Pharmaceutical information of vildagliptin drug substance.
Adapted from (Novartis, 2012b).
Common name Vildagliptin
Chemical name 1-[(3-Hydroxy-adamant-1-ylamino)acetyl]-pyrrolidine-2(S)-carbonitrile
Molecular formula C17H25N3O2
Molecular mass 303.40
Structural formula
Physicochemical
properties
Vildagliptin is a white to slightly yellowish or slightly greyish crystalline
powder with a melting point of approximately 150 oC and it is soluble in
water. C: carbon; H: hydrogen; O: oxygen; N: nitrogen
Table 2.7: Pharmaceutical information of linagliptin drug substance.
Adapted from (Ingelheim, 2011b).
Common name Linagliptin
Chemical name 8-[(3R)-3-aminopiperidin-1-yl]-7-(but-2-yn-1-yl)-3-methyl-1-[(4-
methylquinazolin-2-yl)methyl]-3,7-dihydro-1H-purine-2,6-dione
Molecular formula C25H28N8O2
Molecular mass 472.54
Structural formula
Physicochemical
properties
Linagliptin is a white to yellowish and slightly hygroscopic solid
substance, which is very slightly soluble in water, isopropanol and
acetone. Linagliptin is soluble in methanol and sparingly soluble in
ethanol.
C: carbon; H: hydrogen; O: oxygen; N: nitrogen
38
Univers
ity of
Mala
ya

2.11 Factors Associated with DPP-4 Inhibitor Treatment Response
Provided that DPP-4 inhibitors act on pancreatic β-cells, that has a vital role in the
T2D pathogenesis, we examined the association of genetic, clinical characteristics and
demographic factors involved in the function of pancreatic β-cells as putative candidates
for predicting DPP-4 inhibitor treatment response in T2D. Thus, this chapter aims to
review (1) the genetic variants associated with DPP-4 inhibitor therapy, (2) the clinical
characteristics associated with DPP-4 inhibitor therapy, and (3) the demographic factors
associated with DPP-4 inhibitor therapy. In this review, we have determined DPP-4
inhibitor treatment responses based on the insulin secretion outcome, in which good
treatment responses were signified by gene-activated pancreatic β-cell insulin secretion,
and vice versa. We also explored several genes in the phosphoinositide 3-kinase (PI3K)
and Wingless (Wnt) pathways, which are evident in playing vital roles in response to
DPP-4 inhibitors. The genes investigated in this review include DPP4, WFS1, and
KCNJ11. While the clinical characteristics investigated in this review include sCD26
and HOMAIR. Basic demographic anthropometric factors investigated in this study
were gender, age, duration of T2D and ethnicity, while clinical characteristics
investigated were waist circumference (WC) and body mass index (BMI). Other
biochemical parameters investigated were lipid profiles, liver enzymes (AST and ALT)
and blood pressure.
2.12 Genetics Factors Affecting DPP-4 Inhibitor Treatment Response
Candidate gene approach was used to select the genes potentially associated with the
response to DPP-4 inhibitor treatment. This method is clinically significant as a
valuable potential disease diagnostic tool in the personalised medicine era as the efforts
39
Univers
ity of
Mala
ya

in upcoming treatments for many diseases (Peters, Rodin, De Boer, & Maitland-van der
Zee, 2010). Candidate gene approach has been proven successful in the identification of
genes for trait variation in human diseases (H. Ueda et al., 2003).
2.12.1.1 Candidate Gene Studies
The candidate gene studies in pharmacogenomics utilize existing drug metabolism
knowledge, pathway or disease pathogenesis to identify genes that could be linked to
drug response (J. J. McCarthy, 2003). Candidate gene studies are cheap, quick and easy
to conduct. This approach focuses on the selection of genes that are related to a disease
and/or gene function (Patnala, Clements, & Batra, 2013). The single nucleotide
polymorphisms of these genes or associated with these genes are later assessed in a
patient population exposed to the drug of interest and investigated for statistical link
with the drug response (J. J. McCarthy, 2003). If the investigated SNPs are associated
with the predicted outcomes, these susceptibility genes will be hypothesized to directly
influence a patient’s tendency to respond to the drug (J. J. McCarthy, 2003). Therefore,
the crucial part of this approach is the ability in identifying the most suitable candidate
genes which can be either drug target and pathway genes, drug metabolizing enzyme
genes, or disease genes (J. J. McCarthy, 2003). The selection of a putative candidate
gene must be based on detailed knowledge and comprehension of its relevance to the
disease’s mechanism (trait) being investigated (J. M. Kwon & Goate, 2000), and the
mechanism of drug action (J. J. McCarthy, 2003).
40
Univers
ity of
Mala
ya

2.12.1.2 Drug Target and Pathway
Currently, the development of new drug therapies revolves primarily around target
cell membrane receptors and enzymes (J. J. McCarthy, 2003). Genomic approaches
accelerate the emergence of new drugs with novel gene target discovery (J. J.
McCarthy, 2003). Initially in 1997, Drews & Ryser estimated about 482 molecular
target genes for all marketed drug substances, from 100,000 hypothesized protein-
coding sequences (Drews & Ryser, 1997); however, in 2002, after human genome
sequencing, only 5,000 protein-coding sequences could potentially be the target for drug
substances, where nearly 2,400 were targets for antibodies and 800 targets for protein
pharmaceuticals (Burgess, 2002). A target is selected as a suitable pharmacogenomic
candidate if the targets interact and associate with the therapeutic compounds to affect
the disease of interest (J. J. McCarthy, 2003). The genetic variation in the regulatory
region of a target may affect transcription resulting in either increased or decreased the
available amount of target to the drug, while the variance of genetic in the gene target’s
coding region that alters the resultant proteins may affect the efficiency of a compound
binding to a protein target (J. J. McCarthy, 2003).
2.12.1.3 Disease Genes
Genomics technology has facilitated the classification of disease at a molecular level
where the SNPs of the disease gene can be used to predict the response to drug therapy
(J. J. McCarthy, 2003). There are many databases available online that provide the
updated list of disease genes such as Comparative Toxicogenomics Database (CTD™)
(Davis et al., 2013), OMIM® (Hamosh, Scott, Amberger, Bocchini, & McKusick,
2005), NHGRI-EBI GWAS catalog (Welter et al., 2014), and the latest; DisGeNET
41
Univers
ity of
Mala
ya

database. The DisGeNET database includes human gene-disease associations from
numerous expert databases and associations including Mendelian and many diseases
(Piñero et al., 2015). This database is comprised of 17,381 genes of more than 15,000
diseases and phenotypes (DisGeNET, 2016). The carrier of a variant in a disease gene
may respond differently to several drugs of the same drug group (J. J. McCarthy, 2003).
Although many studies have been conducted and the results are not entirely validated, it
is a valid hypothesis that a molecular classification of disease based on disease genes
could affect the response to drug therapy (J. J. McCarthy, 2003).
2.12.2 Selection of Genes
There are 190 genes associated with T2D (Prasad & Groop, 2015) with 110 genes
associated with T2D, 22 genes associated with pancreatic β-cell function and insulin
secretion , 8 genes associated with insulin resistance, 2 genes associated with BMI and
insulin resistance, 7 genes associated with BMI, 27 genes associated with glucose and
14 genes associated with insulin (Prasad & Groop, 2015), and from these amount of
genes, it was further narrowed into the genes that potentially associated with DPP-4
inhibitors treatment response (Jamaluddin et al., 2014).
Eight genes were identified ; Paired box gene 4 (PAX4), Potassium voltage-gated
channel KQT-like subfamily member 1 (KCNQ1), Dipeptidyl peptidase-4 (DPP4),
Transcription factor 7-like-2 (TCF7L2), Potassium channel Kir6.2 (KCNJ11),
Sulphonylurea receptor SUR1 (ABCC8), Melatonin receptor 1B (MTNR1B) and
Wolfram syndrome 1 (WFS1) as having the potential of possible relevance to be linked
with DPP-4inhibitors response treatment according to the drug pathway, metabolism
and disease pathogenesis (Jamaluddin, Huri, & Vethakkan, 2016; Jamaluddin et al.,
42
Univers
ity of
Mala
ya

2014). The selection of these genes is contingent upon the comprehension of disease
pathogenesis and mechanism of drug action. Therefore, the gene selected could be
inclusive of the drug target, pathway genes, drug metabolizing enzymes, and also the
disease genes.
According to the incretin pathway, following a meal ingestion; KCNQ1 in the
intestinal L cells mediates the release of GLP-1 into the gastrointestinal circulation
(Mussig et al., 2010). To prevent the GLP-1 from being inactivated, a DPP-4 inhibitor
inhibits the DPP-4 enzyme resulting active GLP-1 to bind with its receptor (GLP-1R)
on the pancreatic β-cell (Lacy, 2009; Nauck et al., 2011). Thus transmitting signal in the
PI3K pathway (Kaneko et al., 2010) activating cascades of action in producing insulin
including the WFS1 gene in the pancreas endoplasmic reticulum which its expression
playing a significant function in insulin secretion in the β-cell (S. G. Fonseca et al.,
2005; Ishihara et al., 2004). Following the incretin pathway; the expression of
MTNR1B gene may trigger the insulin release into circulation (Masana & Dubocovich,
2001) through the pancreatic β-cell ATP-sensitive potassium channels mediated by 2
genes; KCNJ11 and ABCC8 (Gloyn et al., 2003; Miki & Seino, 2005). The PAX4 and
TCF7L2 genes are required in maintaining the pancreatic β-cell proliferation and
survival through PI3K and Wnt pathway respectively (Damcott et al., 2006; Nelson &
Nusse, 2004; J. Wang et al., 2004). Altered expression of PAX4 and TCF7L2 genes
may influence the insulin production and secretion (Chandak et al., 2007; Horikoshi et
al., 2007; Lehman et al., 2007; Villareal et al., 2010; J. Wang et al., 2004), thus giving
the potential of poor response to DPP-4 inhibitors via the loss of pancreatic β-cell
differentiation function (Schepers & Clevers, 2012; J. Wang et al., 2004).
43
Univers
ity of
Mala
ya

Although GLP-1 receptor agonists and DPP-4 inhibitors work in the same incretin
pathway, in T2D; GLP-1 still requires the DPP-4 inhibitors to block the DPP-4 enzyme
in order to stop the inactivation of GLP-1. In an oral glucose tolerance test in
nondiabetic subjects, KCNQ1 was linked to lowered GLP-1 concentrations while not
affecting the GLP-1 signalling (Mussig et al., 2010). This provides evidence that active
GLP-1 concentration is crucial in incretin pathway for producing insulin secretion,
which is maintained by the DPP-4 inhibitors.
Since the study focused on the pancreatic β-cell region, from the 8 genes, the
selection of genes was further pinpointed into these 3 genes; DPP4, WFS1, and
KCNJ11 would be of potential, possible relevance to the DPP-4 inhibitors response
according to the drug pathway and disease pathogenesis. The selection of these genes is
based on the comprehension of the disease pathogenesis and drug action mechanism.
Therefore, the genes selected can be inclusive of the drug target genes, pathway genes,
and also the disease genes.
According to the incretin pathway, following meal ingestion; the intestinal L cells
mediate the release of glucagon-like peptide-1 (GLP-1) into the gastrointestinal
circulation (Mussig et al., 2010). To prevent GLP-1 from being inactivated, DPP-4
inhibitor inhibits the DPP-4 enzyme (encoded by DPP4 gene (Kameoka et al., 1993))
resulting in higher concentrations of active GLP-1 which attach with its receptor (GLP-
1R) on the pancreatic β-cell (Lacy, 2009). Thus, this results in transmitting signals in
the PI3K pathway 125 activating a cascade of action leading to the production of
insulin, that involves the WFS1 gene expression of which plays a significant role in
stimulus-secretion of insulin in the β-cell (S. G. Fonseca et al., 2005; Ishihara et al.,
2004). Next, following the incretin pathway; the insulin release into the circulation
44
Univers
ity of
Mala
ya

(Masana & Dubocovich, 2001) is mediated by the closing the pancreatic β-cell ATP-
sensitive potassium channels and these potassium channels are a product of the KCNJ11
gene (Gloyn et al., 2003; Miki & Seino, 2005). With the identification of these 3
candidate genes according to the incretin pathway, we are hoping that these could
provide a set of pharmacogenomic markers in order to explore or determine the
response to existing DPP-4 inhibitor therapies.
2.12.2.1 Reasons for not selecting PAX4, KCNQ1, TCF7L2, ABCC8 and
MTNR1B
PAX4 encodes a family of transcription factors crucial for pancreatic β-cell
development and differentiation at the embryonic stage, thus promoting cellular
proliferation, migration, and survival (Mellado-Gil et al., 2016; Shimajiri et al., 2001).
PAX4 is located at the cytogenetic location of 7q32.1 (NCBI, 2016f). PAX4 is
important for the generation of islet cell progenitors, the maturation of both α- and β-
cells during embryogenesis stage, and the maturation of duodenal and jejunal endocrine
cells (Greenwood, Li, Jones, & Melton, 2007). PAX4 function is necessary for the
formation of insulin-producing cells. However, as the pancreas matures, PAX4 activity
is only needed for the proliferation and survival of β-cells (J. Wang et al., 2004).
Therefore, since the study is focusing on how the genes work in producing insulin,
PAX4 was rejected from this study.
KCNQ1 is one of the risk-conferring genes susceptible to T2D in East Asian,
Japanese and European populations (Kasuga, 2011; J. T. Tan et al., 2009; Yasuda,
Zhang, & Huang, 2008). Its cytogenetic location is at 11p15.5-p15.4 (NCBI, 2016e).
KCNQ1 is expressed in epithelial cells of the exocrine and endocrine glands of the
45
Univers
ity of
Mala
ya

pancreas, where it mediates the GIP’s release from the intestine K-cells and GLP-1
from the intestine L-cells in response to food (Mussig et al., 2010). Although the
involvement of KCNQ1 in the incretin secretion has not been shown, the KCNQ1 is
reported to be associated with hormones and electrolyte transport process in the
gastrointestinal tract (Rieg & Dominguez, 2009). Therefore, due to KCNQ1’s
expression in the epithelial cells, the genetic variants of KCNQ1 could affect the
efficacy of the incretin transport mechanism in the gastrointestinal tract (Mussig et al.,
2010). The incretin hormones; GLP-1 and GIP binds to pancreatic β-cell GLP-1R and
GIPR respectively, thereby activating a cascade of actions via cAMP-mediated
induction of exchange protein directly activated by cAMP 2 (EPAC2) and protein
kinase A (PKA), resulting in an increase of intracellular calcium. High concentration of
calcium mediates the release of insulin into the circulation (Mussig et al., 2010). Since
the involvement of KCNQ1 in insulin release started from the intestines cells which are
not the focused cell (pancreatic β-cell) in this study. Thus, this gene was excluded from
the study.
TCF7L2 gene (cytogenetic location 10q25.2-q25.3 (NCBI, 2016g) is a common gene
associated with T2D (Chandak et al., 2007; Damcott et al., 2006; Florez et al., 2006;
Horikoshi et al., 2007; Lehman et al., 2007; Villareal et al., 2010) but we did not choose
this gene for our study because TCF7L2 promotes β-cells proliferation and survival in
pancreas via the Wnt pathway (Damcott et al., 2006; Nelson & Nusse, 2004), thus the
T2D risk by TFC7L2 variants were found to be linked to impaired β-cell function but
not with insulin resistance (Florez et al., 2006). Since our study focusing on the insulin
resistance (HOMAIR) as one of the DPP-4 inhibitors treatment response predictors,
TCF7L2 is not suitable to be chosen for this study.
46
Univers
ity of
Mala
ya

Pancreatic β-cell ATP-sensitive potassium (KATP) channels are made of two
subunits, the potassium channel, Kir6.2, and the sulphonylurea receptor, SUR1. Both
subunits have an important role in controlling the secretion of insulin (Gloyn et al.,
2003; Miki & Seino, 2005). Genes KCNJ11 and ABCC8 (cytogenetic location of
11q15.1 for both subunits (NCBI, 2016a, 2016d) encode Kir6.2 and SUR1, respectively.
Generation of ATP occurs via the influx of glucose (Miki & Seino, 2005). ATP efflux
from pancreatic β-cells happens via the KATP channels, thereby activating KCNJ11
and ABCC8 resulting in membrane depolarization of potassium (K+), leading to the
influx of calcium (Ca²+) and prompting insulin release from the β-cell into the
circulation (Miki & Seino, 2005). Both KCNJ11 and ABCC8 mediate the insulin
exocytosis from the pancreatic β-cell into circulation via the KATP channels (Gloyn et
al., 2003; Miki & Seino, 2005) to complete the incretin signaling pathway for insulin
secretion. Investigation of the association of common polymorphisms of KCNJ11 and
ABCC8 with T2D revealed that KCNJ11 rs5219 polymorphism was linked to diabetes
in a case-control group, despite no evidence of a familial association with diabetes in
this group (Gloyn et al., 2003). However, the ABCC8 polymorphisms, exon 16-3t/c,
and exon 18 T/C, were found to not be associated with diabetes (Gloyn et al., 2003).
Since there was not enough evidence regarding the association of ABCC8 with T2D,
this gene was excluded from the study.
Melatonin (MLT) is a hormone produced by the pineal gland and regulates
cardiovascular, visual, circadian and neuroendocrine systems (Gerdin, Mseeh, &
Dubocovich, 2003). The effects of melatonin are mediated by melatonin receptor 1B
(MT2), which are encoded by MTNR1B gene. MTNR1B gene is expressed in
pancreatic islets (Dubocovich, 2007) and located at the cytogenetic location 11q14.3
(NCBI, 2015c). Through the phosphatidylinositol 4,5-biphosphate (PIP2) and inositol
47
Univers
ity of
Mala
ya

triphosphate (IP3) pathway, MLT binds with MT2 thus, activating the release of Ca²+
from the endoplasmic reticulum (ER) into the cytoplasm of the β-cell (Peschke, Bähr, &
Mühlbauer, 2015). The accumulation of intracellular Ca²+ triggers the release of insulin
into circulation (Masana & Dubocovich, 2001). Although the effect of ‘insulin release
due to high intracellular calcium’ of MTNR1B (Masana & Dubocovich, 2001) is almost
similar with KCNJ11 (Miki & Seino, 2005), this study decided to choose KCNJ11 as
the pathway is activated by glucose presence (Miki & Seino, 2005) thus, in line with the
action of DPP-4 inhibitors which is also activated by the presence of ingested glucose
(Ahrén, 2012). The high intracellular calcium in the MTNR1B route was activated by
MLT (Masana & Dubocovich, 2001), not glucose. Thus, MTNR1B gene was excluded
from this study.
2.12.2.2 Dipeptidyl peptidase 4 gene (DPP4)
Dipeptidyl peptidase 4 gene, also known as CD26 is a protein coding gene and the
protein encoded by this gene is a membrane-bound enzyme that is the same as the
adenosine deaminase complexing protein-2 and T-cell activation antigen CD26 (NCBI,
2016b), which is mainly involved in the endocrine system, metabolism, immune system,
cancer growth, cell adhesion, bone marrow mobilization, and nutrition (Klemann,
Wagner, Stephan, & von Hörsten, 2016; D. M. Yu et al., 2010). Dipeptidyl peptidase-4
acts mainly by splitting the X-proline dipeptides from the N-terminal dipeptides in
sequence. DPP4 gene cytogenetic location is at 2q24.3 (Chromosome 2) (Figure 2.16)
(NCBI, 2016b). Dipeptidyl peptidase-4 gene has a crucial role in glucose metabolism
where it is directly involved in degrading the incretin hormones especially GLP-1
(Barnett, 2006). As previously described in Figure 2.6, the DPP-4 enzyme as expressed
48
Univers
ity of
Mala
ya

by the DPP4 gene, rapidly inactivates the active GLP-1 (7-36 amide) compound to
inactive GLP-1 (9-36 amide) in order to avoid it from attaching to the GLP-1R receptor,
that leads to poor glycemic control due to inadequate insulin production by the
pancreatic β-cells (Duez et al., 2012). According to the China National Diabetes and
Metabolic Disorders Study (2014) conducted on 2042 adult subjects, increased DPP4
activities from baseline (over 4 years) was found to be a predictor of the onset of insulin
resistance in healthy Chinese (F. Yang et al., 2014).
In 2011, Turcot et al. suggested that higher expression of DPP4 gene in visceral
adipose tissue (VAT) could function as a marker of VAT inflammation known to be
linked with metabolic disturbances (Turcot et al., 2011). This study of severely obese
women found that DPP4 polymorphisms rs13015258 (p=0.001), rs17848915
(p=0.0004), and c.1926 G>A (p=0.001) have differing mean methylation rates (%Meth
(94-102)) between genotypes, and the %Meth (94-102) linked negatively with DPP4
mRNA abundance (r=-0.25, p<0.05) and positively with plasma high-density
lipoprotein (HDL) cholesterol concentrations (r=0.22, p<0.05) (Turcot et al., 2011). On
the other hand, DPP4 mRNA abundance correlated positively with plasma total-/HDL-
cholesterol ratio (r=0.25, p<0.05), signifying that DPP4 gene expression could be linked
to lipid profiles in extremely obese women (Turcot et al., 2011). Meanwhile, Bailey et
al. (2014) found that the positive link between DPP4 rs4664443 and apolipoprotein B
among all EpiDREAM individuals (in South Asians) with BMI <25 kg/m(2) was
significant (n=2,972, p<0.001) compared with those with a BMI ≥ 25 kg/m(2)
(n=11,559, p=0.81), and there was proof of linkage between all genotyped individuals
with a BMI <25 kg/m2, including the INTERHEART South Asians (n=3,601, p<0.001)
(Bailey et al., 2014). Aghili et al. (2012) has found that DPP4 rs3788979 was
significantly linked to angiographic coronary artery disease (CAD) with myocardial
49
Univers
ity of
Mala
ya

infarction (MI) compared to without MI (OR=1.36, p=0.03), suggesting that DPP4
rs3788979 could elevate the risk of MI in patients with known CAD, as DPP4 has
proinflammatory actions that may add to progression of atherosclerosis (Aghili et al.,
2012). Based on these studies, the DPP4 gene was found to be related to severe obesity,
dyslipidemia, and coronary artery disease (CAD) with myocardial infarction (MI),
which are the common features of T2D and the metabolic syndrome. A recent study in
2016 found that DPP4 rs12617656 was associated with T2D in Malaysian subjects of
the Indians ethnicity (OR=3.21, p=0.019), and the study also found that DPP4
rs4664443 and rs7633162 polymorphisms were both linked to T2D (OR=1.53, p=0.039;
OR=1.42,p=0.020, respectively) (Ahmed et al., 2016). There was no other study
investigating the associations of DPP4 gene polymorphisms with T2D conducted in
Malaysia. Therefore, we hypothesized that the DPP4 gene may potentially be associated
with DPP-4 inhibitors treatment response in T2D.
Figure 2.16: The location of DPP4 gene (2q24.3) at the chromosome 2.
Adapted from (NCBI, 2016b). The red line shows the location of DPP4 gene. The
DPP4 gene is located from base pair 161,624,335 to base pair 162,090,276 on
chromosome 2, and the DPP4 gene consists of 26 exons (NCBI, 2016b).
50
Univers
ity of
Mala
ya

2.12.2.3 Wolfram syndrome 1 gene (WFS1)
The WFS1 gene with the cytogenetic location at 4p16.1 (chromosome 4) (Figure
2.17) (NCBI, 2016h) has a major role in maintaining homeostasis of the endoplasmic
reticulum (ER) in pancreatic β-cells (S. G. Fonseca et al., 2005). ER homeostasis is
significant for insulin secretion because this organelle is responsible for the prohormone
precursor maturation, proinsulin to insulin, and for its release into the pancreatic β-cell
matrix subsequently (S. G. Fonseca et al., 2005). The incretin hormones, GLP-1 and
GIP, bind to the pancreatic β cell receptors, GLP-1R and GIPR, respectively, thereby
activating a cascade of actions via cAMP-mediated induction of exchange protein
directly activated by cAMP 2 (EPAC2) and PKA, resulting in an increase in
intracellular calcium which results in the insulin release from the pancreatic β-cell into
the circulation (Mussig et al., 2010) (Figure 2.18). Therefore, WFS1 gene expression
plays a major role in the secretion of insulin by the human pancreas (Mussig et al.,
2010). Deactivating the β-cell WFS1 disrupts ER homeostasis, leading to the β-cell
dysfunction, and thus resulting to T2D (S. G. Fonseca et al., 2005).
Schäfer et al. (2009) found that WFS1 rs10010131 polymorphism specifically
reduced GLP-1-induced insulin secretion in a total of 1,578 subjects with increased risk
of T2D undergoing Oral Glucose Tolerance Test (OGTT) and (Intravenous Glucose
Tolerance Test (IVGTT) during the first and second phase of insulin secretion
(reduction of 36% and 26%, respectively; p=0.007 and p=0.04, respectively) (Schäfer et
al., 2009). Data from Epidemiological Study on the Insulin Resistance Syndrome
(DESIR) study (2011) on 5110 French men and women (T2D and non-diabetics)
observed significant associations of WFS1 rs10010131, rs1801213/rs7672996, and
rs734312 with FPG, A1c, and insulin secretion (Cheurfa et al., 2011). These WFS1
variants were linked to lowered insulin secretion and elevated risk of T2D (Cheurfa et
51
Univers
ity of
Mala
ya

al., 2011). Riggs et al. (2005) who studied the role of WFS1 gene in β-cells have found
that the loss of WFS1 gene leads to impaired glucose-stimulated insulin secretion and β-
cells reduction in pancreatic islets (Riggs et al., 2005). A recent study in 2014 by Batool
et al had found the association of WFS1 rs734312 with T2D (p<0.010) in Pakistani
population (Batool, Jahan, Sun, Hanif, & Xue, 2014). WFS1 rs734312 was also found
to be linked with T2D (p=0.013) in Japanese populations (T. Kawamoto et al., 2004). In
a genetic risk assessment study (in year 2012) of T2D-associated polymorphisms in
African Americans, WFS1 rs10010131 was found to have an elevated risk of T2D (OR:
1.13, p=0.029) (Cooke et al., 2012). Based on these findings, we concluded that WFS1
gene could be linked with DPP-4 inhibitors treatment response.
Figure 2.17: The location of WFS1 gene (4p16.1) at chromosome 4.
Adapted from (NCBI, 2016h). The WFS1 gene is located from the base pair
6,269,850 to base pair 6,303,265 on chromosome 4 (NCBI, 2016h), and the WFS1 gene
consists of 8 exons (NCBI, 2016h).
WFS1 plays a key role in stimulus-secretion of insulin coupling (Ishihara et al.,
2004). This role is present in subjects with both Wolfram syndrome and diabetes,
whereby the progressive loss of β-cells impaired stimulus-secretion of insulin by these 52
Univers
ity of
Mala
ya

cells (Ishihara et al., 2004). Wolfram syndrome is a rare autosomal recessive
neurodegenerative disorder characterized by juvenile-onset diabetes, progressive optic
atrophy, sensorineural deafness, and diabetes insipidus (T. G. Barrett & Bundey, 1997;
Takeda et al., 2001). The findings were also supported by Fonseca et al (2005), who
showed that WFS1 gene expression in mouse islets was increased with 16.7 mМ
glucose and 30 mМ KCl, and thereby concluded that WFS1 up-regulation is crucial for
insulin secretion (S. G. Fonseca et al., 2005). WFS1 rs10010131 was found to
specifically impair incretin-induced insulin secretion independently of insulin
sensitivity (Schäfer et al., 2009). A study by Heni et al. in 2010 also concluded that
diabetes risk gene variants of WFS1 are associated with impaired incretin signaling
(Heni et al., 2010). Since the results of both studies confirmed the association of WFS1
gene variants with incretin-induced insulin secretion, the response of oral incretin
therapy as DPP-4 inhibitors may potentially be predicted by these gene variants based
on knowledge of the incretin signaling pathway.
Studies of the SNPs of WFS1 genes associated with T2D revealed that among the 31
tagged SNPs, the strongest association was with rs1046320 (Fawcett et al., 2010). This
strong association may thus lead to low levels of insulin secretion, despite treatment
with anti-diabetic agents, including DPP-4 inhibitors.
53
Univers
ity of
Mala
ya

GLP-1: Glucagon-like peptide-1; GLP-1R: Glucagon-like peptide-1 receptor; GIP: Glucose-dependent insulinotropic peptide; GIPR: Glucose-dependent insulinotropic peptide receptor; G: G-protein; AC: adenylyl cyclase; cAMP: cyclic adenosine monophosphate; EPAC2: Exchange protein directly activated by cAMP 2; PKA: Protein kinase A; Ca2+: Calcium ion; ER: endoplasmic reticulum; WFS1: Wolfram syndrome 1; KATP: ATP-sensitive potassium channel; KV: voltage-gated potassium channel.
Figure 2.18: WFS1 gene pathway in insulin production by pancreatic β-cells.
Adapted from (Mussig et al., 2010).
WFS1 genes have been reproducibly shown to be associated with T2D (Florez et al.,
2008; Franks et al., 2008; Sandhu et al., 2007; Wasson & Permutt, 2008), with rs734312
and rs10010131 being the most frequent WFS1 polymorphisms shown to be associated
with T2D (Cheng, Wu, Wu, & Zhang, 2013; Franks et al., 2008; Sandhu et al., 2007), as
the G allele of rs734312 polymorphism and the A allele of rs10010131 polymorphism
had significant protective effects on risk of T2D (Cheng et al., 2013).
54
Univers
ity of
Mala
ya

2.12.2.4 Potassium channel Kir6.2 gene (KCNJ11)
Pancreatic β-cell ATP-sensitive potassium (KATP) channels are made of two
subunits, the potassium channel, Kir6.2, and the sulphonylurea receptor, SUR1 (Gloyn
et al., 2003; Miki & Seino, 2005). Both subunits have an important role in controlling
the secretion of insulin (Gloyn et al., 2003; Miki & Seino, 2005). Genes KCNJ11 and
ABCC8 (cytogenetic location of 11q15.1 (chromosome 11) (Figure 2.19) for both
subunits (NCBI, 2016d)) encode Kir6.2 and SUR1, respectively. Generation of ATP
occurs via the influx of glucose (Miki & Seino, 2005) (Figure 2.20). Efflux of ATP
from pancreatic β-cells occurs via the KATP channels, thus activating KCNJ11 and
ABCC8 (Miki & Seino, 2005) (Figure 2.20). Activation of these genes causes
membrane depolarization of potassium (K+), triggering the influx of calcium (Ca²+) and
causing the release of insulin from the β-cell into the circulation (Miki & Seino, 2005)
(Figure 2.20). Both KCNJ11 and ABCC8 mediate insulin exocytosis from the
pancreatic β-cell into the circulation via the KATP channels (Gloyn et al., 2003; Miki &
Seino, 2005) to fulfill the incretin signaling pathway for insulin secretion (Figure 2.20).
KATP channel expression could be reduced by mutations in the KATP channel
subunits, resulting in ‘overactive’ channels that may decrease the pancreatic β-cell
membrane excitability and, thus, insulin secretion will be reduced (Cartier, Conti,
Vandenberg, & Shyng, 2001).
Chistiakov et al. (2009) found that KCNJ11 E23K and ABCC8 exon 31 variants
were linked to increasing risk of T2D (OR=1.53, p=0.023, and OR=2.41, p=1.95×10⁻⁵,
respectively) and contributed to susceptibility to T2D, glucose intolerance and altered
insulin secretion in a Russian population (Chistiakov et al., 2009). On the other hand, a
study by Florez et al. (2007) investigating the link of KCNJ11 E23K with the
progression from impaired glucose tolerance (IGT) to diabetes, has found that a lysine
55
Univers
ity of
Mala
ya

variant in KCNJ11 E23K had low protection through the 1-year metformin treatment
than E/E homozygotes (p<0.02) which results in lowered insulin secretion in individuals
with impaired glucose tolerance (IGT) (Florez et al., 2007). A more recent study by
Sokolova et al. in 2015 found that the variation of KCNJ11 E23K and ABCC8
(p.S1369A) may cause T2D by 1.15 times in Caucasians and Asians (Sokolova, Bondar,
Shabelnikova, Pyankova, & Filipenko, 2015). These findings resulted in the authors’
conclusion that KCNJ11 gene is associated with insulin secretion (Chistiakov et al.,
2009; Florez et al., 2007) and since DPP-4 inhibitor therapy outcome is insulin secretion
(Dicker, 2011; Lacy, 2009), we hypothesized that KCNJ11 gene polymorphisms may
potentially be linked to the response to the DPP-4 inhibitor treatment. Contrary to
ABCC8, no study currently available that proved the association of this gene with T2D.
Therefore, KCNJ11 was chosen for this study.
Figure 2.19: The location of KCNJ11 gene (11p15.1) at the chromosome 11.
Adapted from (NCBI, 2016d). In precision, the KCNJ11 gene is located from the
base pair 17,364,824 to base pair 17,389,331 on chromosome 11 (NCBI, 2016d), and
KCNJ11 gene consists of 4 exons (NCBI, 2016d).
56
Univers
ity of
Mala
ya

GLUT: glucose transporter; TCA, tricarboxylic acid cycle; ATP: adenosine triphosphate; ABCC8: Sulphonylurea receptor SUR1; KCNJ11: Potassium channel Kir6.2; VDCC: voltage-dependent calcium channel
Figure 2.20: Expression of KCNJ11 leads to insulin release from pancreatic β-cell.
Adapted from Miki & Seino. (Miki & Seino, 2005).
Investigation of the association of common polymorphisms of KCNJ11 and ABCC8
with T2D revealed that KCNJ11 rs5219 polymorphism was linked to diabetes in a case-
control group, despite no evidence of a familial association with diabetes in this group
(Gloyn et al., 2003). However, the ABCC8 polymorphisms, exon 16-3t/c, and exon 18
T/C were found to not be associated with diabetes (Gloyn et al., 2003). In the
57
Univers
ity of
Mala
ya

association study of the ABCC8 gene variants with T2D in south Indians (in year 2014)
had found that the Thr759Thr polymorphisms of the ABCC8 gene was not associated
with T2D (Venkatesan, Bodhini, Narayani, & Mohan, 2014). Meanwhile, ABCC8
rs757110 polymorphism was found not to be associated with T2D in Siberian
population (Sokolova et al., 2015). For this reasons, the ABCC8 gene was not included
in this study.
KCNJ11 has approximately 219 single nucleotide polymorphisms (SNPs), where six
of the SNPs are highly noticeable due to their association with diabetes
(Haghvirdizadeh et al., 2015). These six SNPs are rs5215, rs5218 and rs5219, which are
located in the coding region, and rs2285676, rs5210 and rs886288, which are located in
the non-coding region (Haghvirdizadeh et al., 2015).
2.13 Single Nucleotide Polymorphisms (SNPs) Selection
The selection of single nucleotide polymorphisms (SNPs) for WFS1, KCNJ11 and
DPP4 genes was contingent upon HapMap phase III studies of Asian populations
(NCBI, 2016c, 2016d, 2016h) with minor allele frequency (MAF) of more than 5%
(Table 2.12). To the best of our knowledge, till date, no studies have been conducted on
the DPP4 gene polymorphisms rs2970932 and rs2268889 association with T2D; we
chose both polymorphisms for evaluation as DPP4 is linked to T2D due to its major
DPP4 substrates; the incretin hormones which are the key regulators of post-prandial
insulin release (Röhrborn et al., 2015), and also due to the associations of DPP4 gene
polymorphisms with ApoB level which was mentioned earlier in Bailey et al study in
2014, where ApoB is the quantifiable measurement of dyslipidemia; which is the
common feature of T2D (Bailey et al., 2014), and these polymorphisms were mainly
58
Univers
ity of
Mala
ya

genotyped in 12 populations including an Asian (Japanese) population (NCBI, 2015a,
2015b) and therefore regarded significant to our subject population (Table 2.12).
Schosser et al. (2011) studied on DPP4 gene polymorphism rs1861975 as the diabetes
risk factor linked to depression due to possible role of DPP4 in depression through its
incretin effects and found that DPP4 is known to modulate neurotransmission by
degradation of neuromodulatory peptides (Schosser et al., 2011), whereby inactivation
of DPP4 brings about anxiolytic-like profile (Karl, Hoffmann, Pabst, & von Hörsten,
2003); a phenomenon that is currently not aimed by DPP-4 inhibitors (Schosser et al.,
2011). Therefore, we selected the following polymorphisms of the DPP4 gene
(rs2268889, rs2970932 and rs1861975) based on the work of Schosser et al. in 2011
(Table 2.12). Cheng et al. (2013) found that WFS1 gene polymorphisms rs10010131
and rs734312 had profound protective effects on the risk of developing T2D (Cheng et
al., 2013). Whereas, Fawcett et al. (2010) found a high correlation between rs10010131
and rs1046320 polymorphisms (r2=0.92) that showed strong and comparable association
with risk of T2D (Fawcett et al., 2010). Cheurfa et al. (2011) reported that rs10010131
and rs734312 were associated with decreased insulin secretion and increased risk of
T2D in French populations (Cheurfa et al., 2011) (Table 2.12). From these results, we
chose rs10010131, rs734312, and rs1046320 as the WFS1 gene polymorphisms to be
studied (Table 2.12). For KCNJ11 gene; rs5218, rs2285676, and rs5210 were chosen as
these were previously found to be common KCNJ11 polymorphisms associated with
diabetes (Haghvirdizadeh et al., 2015) (Table 2.12). KCNJ11 rs2285676 was reported to
be linked with T2D in the Chinese Han population (Liu et al., 2006), while rs5218 was
reported to be linked with T2D in the Korean population (Koo et al., 2007).
Additionally, KCNJ11 rs5210 was found to be linked with T2D in both the Korean and
Chinese Han populations (Koo et al., 2007; Liu et al., 2006). In 2015, KCNJ11 rs5210
59
Univers
ity of
Mala
ya

was found to have an elevated risk of T2D and post-transplant diabetes in the Asian
Indian populations (I. A. Khan et al., 2015). These findings strengthen our decision of
selecting the KCNJ11; rs5218, rs2285676, and rs5210 gene polymorphisms to be
studied.
60
Univers
ity of
Mala
ya

Table 2.8: The polymorphisms selected for each DPP4, WFS1 and KCNJ11 genes.
DPP4: dipeptidyl peptidase-4; WFS1: Wolfram syndrome 1; KCNJ11: Potassium channel Kir6.2; G: guanine; T: thymine; C: cytosine; A: adenine; 3’UTR: three prime untranslated region; T2D: type 2
diabetes; UK: United Kingdom.
Genes SNPs Variant
allele
RefSeq Molecular
consequence
Study populations References
DPP4
rs2970320 G NM_001935.3 Intron variant T2D in Japanese population. Röhrborn et al., 2015
rs2268889 T NM_001935.3 Intron variant T2D in Japanese population. Röhrborn et al., 2015
rs1861975 C NM_001935.3 Intron variant T2D in Caucasian population, Germany. Schosser et al., 2011
WFS1
rs1046320 A NM_001145853.1 3’ UTR variant T2D in UK population. Fawcett et al., 2010
rs734312
A
NM_001145853.1
3’ UTR variant
T2D in French population. Cheurfa et al., 2011
T2D in Pakistani population. Batool et al., 2014
T2D in Japanese population. Kawamoto et al., 2004
rs10010131 G NM_001145853.1 Intron variant T2D in French population. Cheurfa et al., 2011
T2D in African American population. Cooke et al., 2012
KCNJ11
rs2285676 G NM_000525.3 3’ UTR variant T2D in Chinese Han population. Liu et al., 2006
rs5218 A NM_000525.3 Synonymous
variant
T2D in the Korean population. Koo et al., 2007
rs5210
A
NM_000525.3
3’ UTR variant
T2D in Korean & Chinese Han populations. Koo et al., 2007 & Liu et
al., 2006
T2D in Asian Indian population. Khan et al., 2015
61
Univers
ity of
Mala
ya

The DPP4 polymorphisms (rs2268889, rs2970932 and rs1861975) and WFS1
rs10010131 polymorphisms chosen are intron variants. Although intron variants are
from the non-coding region of a gene strand, they have several important intronic
functions based on its phases; (1) the first phase is the genomic intron (the DNA
sequence of the intron), (2) the second phase is the transcribed intron ( the phase where
the intron is under active transcription at the moment), (3) the third phase is the spliced
intron (whereby the spliceosome is assembled on the intron and is actively excised), (4)
the fourth phase is the excised intron (intronic RNA sequence is released upon the
completion of the splicing reaction), and finally the (5) exon-junction complex (EJC)-
harbouring transcript whereby the mature mRNA in the location of the exon-exon
junctions is marked by the EJC (Chorev & Carmel, 2012) (Table 2.13). To the best of
our knowledge, there are still no researchers that have identified the exact intronic
functions of each DPP4 rs2970932, rs2268889 and rs1861975 polymorphism. However,
we believe that the association of these polymorphisms with T2D are based on the
intronic properties (Table 2.13).
WFS1 rs734312 and rs1046320 polymorphisms, and KCNJ11 rs5210 and rs2285676
polymorphisms are 3’ UTR variants. The 3’ UTR variants have an important role in
post-transcriptional gene expression (L. W. Barrett et al., 2013), including mRNAs
modulation of transportation exiting the nucleus and of translation efficiency (van der
Velden & Thomas, 1999), subcellular localization (Jansen, 2001), and stability
(Bashirullah, Cooperstock, & Lipshitz, 2001). Also, the 3’ UTR region plays a role in
the particular incorporation of the modified amino acid selenocysteine at mRNAs’ UGA
codons encoding selenoproteins in a process interceded by a conserved stem-loop
structure (Walczak, Westhof, Carbon, & Krol, 1996).
62
Univers
ity of
Mala
ya

KCNJ11 rs5218 is the only synonymous variant chosen in this study. Synonymous
variant often called silent mutation occurs with a substitution of a single base for
another on the third position of the codon (Langaee, 2010). This usually does not result
in a new amino acid (Langaee, 2010). Synonymous variants that have been found to
affect protein function splicing, expression, and some may contribute to disease
(Cartegni, Chew, & Krainer, 2002; Chamary, Parmley, & Hurst, 2006; Chew, Mastura,
Cheong, & Syed Alwi, 2010; Sauna & Kimchi-Sarfaty, 2011). A synonymous variant
may contribute to a phenotype by altering the splicing pattern, the folding energy, or the
pre-mRNA structure (Cartegni et al., 2002). According to Drögemüller et al., (2011),
the initiation or modification of an acceptor site or a splice donor, or a splicing
enhancer, silencer or regulator binding site may result in intron inclusion or alternative
splicing of the exon, thus resulting in a different protein product as the outcome
(Drögemüller et al., 2011).
Table 2.9: Summary of the intronic functions.
Introns are able to alter the expression level of a gene in many different ways
(Chorev & Carmel, 2012). Adapted from Chorev, 2012 (Chorev & Carmel, 2012).
Phase Function Intronic property
Genomic intron Transcription initiation Sequence, position
Transcription termination Sequence, position
Genomic organization Sequence, position, length
Transcribed intron Time delays Length
Spliced intron Transcription regulation Splicing
Alternative splicing Splicing, sequence
Excised intron Expressing non-coding RNAs Splicing, sequence
EJC-harboring
transcript
Nonsense-mediated decay Splicing
Nuclear export Splicing
Cytoplasmic localization Splicing, sequence
Translation yield Splicing EJC: exon-junction complex
63
Univers
ity of
Mala
ya

2.14 Gene Expression
Gene expression is a process of generating a functional gene product (such as a
protein) from the information encoded by a gene (nucleotide sequence) via transcription
and translation process (Nature, 2016). Transcription process involved the production of
messenger RNA (mRNA) via the usage of enzyme RNA polymerase (Collins & Tansey,
2006). Then, the resultant mRNA molecule will undergo translation process to direct
protein synthesis where it serves as a template to join a series of amino acids in order to
produce a polypeptide with a specific amino acid sequence (Kornienko, Guenzl,
Barlow, & Pauler, 2013). Gene expression is regulated at both mRNA and protein level
(Silva & Vogel, 2016). According to Csardi et al. (2015) based on yeast samples,
mRNA concentration can be used to predict the concentration of protein (Csárdi,
Franks, Choi, Airoldi, & Drummond, 2015), which differs in human where the
correlation between mRNA/protein concentration may depend on cell type and state
(Silva & Vogel, 2016).
Gene expression had long been associated with treatment responses. Cha, Li & Yi
(2016) identified C-Terminal Binding Protein 2 (CTBP2), NAD Kinase (NADK),
Azurocidin 1 (AZU1), Cathepsin H (CTSH), Follistatin-like 1 (FSTL1) and High
Density Lipoprotein Binding Protein (HDLBP) genes as markers of response to tyrosine
kinase inhibitor treatment in chronic myeloid leukemia based on the high expression of
these genes (Cha, Li, & Yi, 2016). A study conducted to identify a gene expression
profile linked with anti-estrogen treatment in estrogen receptor α (ERα)-positive breast
cancer in old patients, had found that among all of the genes tested, only 53 genes were
profoundly linked to treatment response, where the genes involved in cell cycle and
proliferation were upregulated more often in treatment responders as compared to non-
responders (Cappelletti et al., 2008). Li et al. (2006) had found that Gap Junction
64
Univers
ity of
Mala
ya

Protein Alpha 1 (GJA1) (encoding connexin 43 (Cx43)) and Twist Family BHLH
(Basic helix-loop-helix) Transcription Factor 1 (TWIST1) genes which were highly
upregulated in cisplatin-resistant cells, which is very useful information to target for
therapy focusing at reversing drug resistance (J. Li, Wood, Becker, Weeraratna, &
Morin, 2006).
2.14.1 DPP-4 Inhibitors and Gene Expression
Sitagliptin was found to reduce the mRNA expression of inflammatory genes, like
Interleukin-6 (IL-6), Tumor Necrosis Factor-α (TNFα), Interleukin-12 (IL-12)(p35) and
IL-12(p40) from 2.5 to 5-fold and 12-lipoxygenase protein expression in a diet-induced
obesity model (Dobrian et al., 2011). Sitagliptin was also found to reduce the fatty acid
binding protein 4 (FABP4) expression in patients with T2D (Furuhashi et al., 2015). A
study by Han et al. in 2011 found that the therapy of combining sitagliptin and
metformin had increased the expression of genes involved in cell survival and growth,
and also downregulated the apoptosis-associated genes of the pancreatic β-cell, as
compared to monotherapy (Han et al., 2011).
Vildagliptin was found to reduce the vascular endothelial growth factor’s gene
expression, intercellular adhesion molecule-1, pigment epithelium-derived factor and
plasminogen activator inhibitor-1 which leads to the inhibition of inflammatory and
thrombogenic reactions in the retina of T2D rats that were obese concluded the
beneficial effects of vildagliptin in diabetic retinopathy (S. Maeda et al., 2013). In 2016,
Jojima et al. found that the combination of linagliptin and empagliflozin reduced the
hepatic expression of mRNA for inflammatory genes; TNF-α, IL-6, and monocyte
65
Univers
ity of
Mala
ya

chemoattractant protein-1 (MCP-1) in subjects with diabetes and non-alcoholic
steatohepatitis (Jojima et al., 2016).
Linagliptin was found to reduce the mRNA expression of reduced liver mRNA
expression of Protein-tyrosine phosphatase 1B (PTP1B) and Suppressor of cytokine
signaling 3 (SOCS3) in diet-induced obese mice (Kern et al., 2012).
2.14.2 DPP4 Expression in Relation to DPP-4 Inhibitor Treatment Response
The expression of DPP4 gene is dysregulated diversely following the types of
disease states including diabetes, obesity, inflammation and cancer (Röhrborn et al.,
2015). DPP4 gene expression was upregulated in proinflammatory states including
obesity and T2D (Zhong, Maiseyeu, Davis, & Rajagopalan, 2015). Insulin resistance
and T2D are largely contributed by inflammation mediated by the binding of DPP4
gene on the surface of T-cells to matrix proteins such as adenosine deaminase and the
co-association with CD45 leads to co-stimulatory signals in immunology synapse (R.
Pacheco et al., 2005; Zhong et al., 2015). Factors that influenced the regulation of DPP4
leading to different DPP-4 activity at many cell levels may include the control of gene
and protein expression, modulation of the sCD26 activity, and also the interactions with
DPP-4 binding partners (Shi, Koya, & Kanasaki, 2016). DPP-4 inhibitors inhibit the
DPP-4 enzyme (encoded by the DPP4 gene (Kameoka et al., 1993)) (Lacy, 2009).
Therefore, the presence of DPP-4 treatment may lead to the suppression of the DPP4
expression; leading to the idea that patients with good response to the DPP-4 inhibitor
treatment may be presented with downregulated expression of DPP4 gene and vice
versa. However, there was currently no evidence or literature to support the idea thus,
more studies are needed in future to confirm the theory.
66
Univers
ity of
Mala
ya

2.14.3 WFS1 Expression in Relation to DPP-4 Inhibitor Treatment Response
To the best of our knowledge, there were no studies that investigated the association
of gene expression to DPP-4 inhibitors treatment response. The expression of WFS1 is
monitored by inositol requiring 1 and PKR-like endoplasmic reticulum (ER) kinase,
both are the unfolded protein response (UPR)’s central regulators (S. G. Fonseca et al.,
2005). UPR at the ER is an important aspect of specialized secretory cells and also
involved in the pathogenesis of human diseases (Hetz, 2012). During insulin secretion,
WFS1 is normally upregulated and the inactivation of WFS1 in pancreatic β-cell
resulted to β-cell dysfunction and ER stress (S. G. Fonseca et al., 2005). Based on these
facts, the WFS1 expression should be upregulated in the presence of DPP-4 inhibitor,
since the objective of the treatment is to reduce blood glucose levels via insulin
secretion. In other words, upregulated WFS1 expression leads to good response to the
DPP-4 inhibitor treatment and vice versa.
The expression of WFS1 gene had sparked interests as it was reported that WFS1
may be accounted for insulin resistance and weight gain development (Chateauvieux,
Morceau, Dicato, & Diederich, 2010) due to the usage of valproic acid as anticonvulsant
and mood stabilizer, as WFS1 induced impaired ER stress response in bipolar disorder
(Kato, 2008). WFS1 expression was showed to be elevated by valproic acid treatment
but no interaction was found between the valproic acid treatment with WFS1 genotype
(Punapart et al., 2014). ER stress involved in the pancreatic β-cell apoptotic death and
reduced β-cell proliferation resulting in decreasing β-cell mass in patients with T2D (K.
Ueda et al., 2005). Yamaguchi et al. (2004) reported that WFS1 expression increased in
isolated mouse pancreatic islets treated with ER stress inducers (Yamaguchi et al.,
2004). DPP-4 inhibitors are not an ER stress inducer (Shimizu et al., 2012; Shirakawa et
al., 2011) thus, WFS1 expression expected not to be increased during the treatment.
67
Univers
ity of
Mala
ya

Shimizu et al. (2012) showed that vildagliptin conserved pancreatic β-cell via the
improvement of ER stress, as this drug increased β-cell mass, improved aggravated ER
stress and restored attenuated insulin/Insulin-Like Growth Factor-1 (IGF1) signaling in
studied diabetic transgenic mice (Shimizu et al., 2012). Shirakawa et al. (2011) showed
that desfluorositagliptin protected β-cells against apoptosis restored β-cell mass and
normalized pancreatic islet morphology in subject mice fed with sucrose and linoleic
acid diet (Shirakawa et al., 2011). These findings suggested that DPP-4 inhibitors
treatment may lead to beneficial effects through pancreatic β-cell preservation via the
possibility of downregulation of WFS1 expression.
2.14.4 KCNJ11 Expression in Relation to DPP-4 Inhibitor Treatment Response
Ideally, for the DPP-4 inhibitor to give a good response, high blood glucose levels
must be reduced by insulin, and insulin is released from the pancreatic β-cell through
the expression of KCNJ11 at the KATP channel subunit. Therefore, expression of
KCNJ11 will lead to good DPP-4 inhibitor treatment response and no expression of
KCNJ11 will result to poor response to the DPP-4 inhibitor treatment. However, this
idea may have its limitation where there was currently no literature to support the
theory.
There were few studies investigating the effect of KCNJ11 expression in pancreatic
β-cells but not in relation to DPP-4 inhibitors treatment response. In a comparison of
gene expression in both pancreatic α- and β-cells, Kirkpatrick et al. (2010) found a
significant enrichment of KCNJ11 expression in pancreatic β-cells as compared to α-
cells (Kirkpatrick et al., 2010). Another study (in year 2005) reported the reduced
KCNJ11’s expression encoding the KATP channel subunit Kir6.2 resulted to mildly
68
Univers
ity of
Mala
ya

reduced blood glucose levels and increased insulin levels in β-cell Hepatocyte Nuclear
Factor 4 Alpha (HNF4a)-deficient mice (R. K. Gupta et al., 2005). A study by Pearson
et al. (2007) showed no abnormality in KCNJ11 expression following insulin levels
suggesting that the hyperinsulinaemic phenotype in HNF4a deficiency is not linked to
KATP channel expression (Pearson et al., 2007).
2.15 Clinical Measures of DPP4 Inhibitor Treatment Response
We identified these 2 clinical factors; HOMAIR and sCD26 as having the possible
relevance to the treatment response to the DPP-4 inhibitors according to the drug
pathway, metabolism and disease pathogenesis. The selection of these clinical factors
was contingent upon comprehension of the mechanism of drug action and the disease
pathogenesis (Figure 2.21).
According to the incretin pathway, as illustrated in Figure 2.21, following meal
ingestion; active GLP-1 (7-36 amide) is released by the intestinal L cells into the
gastrointestinal circulation (Müssig, Staiger, Machicao, Häring, & Fritsche, 2010).
Ideally, active GLP-1 binds to the GLP-1R receptor to activate the insulin secretion
cascade. However, the DPP-4 enzyme may convert the active GLP-1 (7-36 amide) into
inactive GLP-1 (9-36 amide) (Duez et al., 2012) thus reducing the efficacy of insulin
production by pancreatic β-cells (Figure 2.21) (Baggio & Drucker, 2014; Müssig et al.,
2010). Therefore, the presence of DPP-4 inhibitors inhibits the DPP-4 enzyme thus
permitting the active GLP-1 to bind with the GLP-1R receptor in order to initiate the
glycemic control process through insulin production (Lacy, 2009). At this point, sCD26
also known as dipeptidyl peptidase-4 may be used to measure the level of the DPP-4
69
Univers
ity of
Mala
ya

enzyme in the circulation to find out the exact degree of inhibition by the DPP-4
inhibitors that may produce significant response to the DPP-4 inhibitor treatment.
When GLP-1 joins to the GLP-1R receptor, the insulin production process in the
pancreatic β-cell is activated (Lacy, 2009) and matured insulin is released into blood
circulation in a process called insulin exocytosis (Figure 2.21) (Ye et al., 2010).
Peripheral insulin reuptake by skeletal muscle and adipose tissue will take place and at
this point; HOMAIR may be used to determine the level of insulin resistance of the
adipose tissue and skeletal muscle, also in order to produce required DPP-4 inhibitor
treatment response (Figure 2.21). Fasting plasma insulin and glucose are required for
the determination of HOMAIR. Lastly, the fasting plasma glucose and A1c may be
measured as the final outcome of the response to the DPP-4 inhibitor treatment (Figure
2.21).
70
Univers
ity of
Mala
ya

sCD26: soluble CD26; GLP-1: Glucagon-like peptide-1; GLP-1R: Glucagon-like peptide-1 receptor; FPI: Fasting Plasma Insulin; HOMAIR: Homeostatic model of insulin resistance; FPG: fasting Plasma Glucose; A1c: Glycated hemoglobin
Figure 2.21: Detailed mechanism of action of DPP-4 inhibitors and clinical markers of treatment response.
Adapted from Duez et al. (Duez et al., 2012).
2.15.1 Soluble CD26 (sCD26)
CD26 is a multifunctional type II transmembrane glycoprotein and it is also known
as dipeptidyl peptidase-4 (DPP-4) (EC 3.4.14.5) (De Meester et al., 1999). CD26 is
expressed in epithelial cells, few kinds of endothelial cells and fibroblasts, and
leukocyte subsets such as T and B lymphocytes and macrophages (Busso et al., 2005).
A soluble form of CD26 (sCD26) exerts its enzymatic activity by cleaving the N-
terminal dipeptides from polypeptides with either X-Pro or X-Ala dipeptides in the
penultimate position (Durinx et al., 2000; Iwaki-Egawa et al., 1998). The soluble CD26
has low cytoplasmic tail and transmembrane area and can be found in plasma and other 71
Univers
ity of
Mala
ya

biological fluids (Busso et al., 2005). CD26/DPP-4-mediated changes to substrates have
serious impacts on the biological activity of function of affected systems. For example,
chemokine stromal-cell-derived factor-1 (SDF-1) is a proinflammatory chemokine that
binds to the CXCD4 receptor (a 352 amino acid rhodopsin-like transmembrane-specific
G protein-coupled receptor (GPCR)) in order to stimulate chemotaxis in leukocytes (Ho,
Shiwen, Abraham, Tsui, & Baker, 2012). However, the N-terminal processing of SDF-1
by CD26 results in reduced lymphocyte chemotaxis and CXCR4-signalling properties
(Devine et al., 2008). Since CD26 directly regulates activated T-helper type 1 (Th1)
lymphocytes, it also may potentially induce a cellular type immune responses (Delezuch
et al., 2012). Additionally, CD26 exhibits a co-stimulatory function on human T cells
(Hatano, Ohnuma, Yamamoto, Dang, & Morimoto, 2013), thus exerting a crucial role in
the immune system through its ability to bind with adenosine deaminase (Martinez-
Navio, Climent, Gallart, Lluis, & Franco, 2012), and mediate the signals by directly
interacting with the cytoplasmic domain of CD45 (Prabhash et al., 2010). Apart from
that, CD26 is also involved in interactions with extracellular matrix proteins, fibronectin
and collagen (Prabhash et al., 2010).
A study by Kobayashi et al. in 2002 investigated CD26’s role in the pathophysiology
of systemic lupus erythematosus (SLE) by measuring the level of sCD26 and DPP-4
activity in serum (Kobayashi et al., 2002). Kobayashi et al. (2002) found that serum
sCD26 levels and DPP-4 activity were largely reduced in SLE and were inversely
correlated with the SLE disease activity index score (Kobayashi et al., 2002). The study
also showed that the serum sCD26 levels linked strongly with circulating DPP-4
activity in humans (Kobayashi et al., 2002). In 2005, Busso et al. investigated the link
of CD26 levels with the severity of inflammation in rheumatoid arthritis; finding that
serum sCD26 levels linked strongly with circulating DPP-4 activity (Busso et al., 2005).
72
Univers
ity of
Mala
ya

The findings in both studies (Busso et al., 2005; Kobayashi et al., 2002), led to the idea
that human serum sCD26 may mirror DPP-4 activity. In 2012, Aso et al. researching the
link of serum sCD26 levels with sitagliptin treatment response in T2D; found that a
high serum level of sCD26 could be linked to reduced efficacy of sitagliptin, thus the
serum sCD26 level might predict the sitagliptin treatment response in T2D controlled
inadequately by metformin or/and sulphonylurea (Aso et al., 2012). Since there is an
association of sCD26 with DPP-4 activity (Aso et al., 2012), we used the sCD26 levels
as one of our markers in determining the response to DPP-4 inhibitors treatment in our
study.
2.15.2 Insulin Resistance
In a study to compare the efficacy of alogliptin coupled with pioglitazone in
metformin treated patients with T2D, HOMAIR was found to be reduced in test subjects
but not significantly greater than in group treated with pioglitazone alone (DeFronzo et
al., 2012). Ahrén (2008) investigated the combination treatment of DPP-4 inhibitors
(vildagliptin and sitagliptin) with metformin and found a betterment in insulin
sensitivity where the addition of DPP-4 inhibitors into T2D therapy able to reduce
HOMAIR to 41% (2.7 from a baseline of 6.2) (Ahrén, 2008). A study by Aschner et al.
(2006) investigated the effect of sitagliptin as monotherapy on glycemic control in
patients with T2D had found that sitagliptin had no effect on the insulin resistance
(HOMAIR) (Aschner et al., 2006). These studies showed the possibility of an
association between lower levels of HOMAIR and good response to DPP-4 inhibitors.
As for our study, we predict that insulin resistance is one of the important factors
determining DPP-4 inhibitors treatment response in T2D patients. The inhibition of the
73
Univers
ity of
Mala
ya

DPP-4 enzyme results in increased active GLP-1 which binds to the GLP1R (Lacy,
2009), thus sparking the incretin signaling pathway in the pancreatic β-cells to produce
and release insulin into blood circulation as the response to elevated blood glucose post-
ingested meal (Ye et al., 2010). Insulin will regulate the assimilation and distribution of
many nutrients via processes such as amino acid synthesis, protein synthesis, fatty acid
uptake, fatty acid synthesis, cholesterol synthesis and most importantly glucose uptake
(Matthews et al., 1985; Olson, 2012). However, if there is insulin resistance at the
cellular level, the homeostasis process will be disrupted and blood glucose will remain
elevated (Schinner, Scherbaum, Bornstein, & Barthel, 2005). Although the objective of
inhibiting the DPP-4 enzyme is achievable with DPP-4 inhibitors, but the therapy will
fail eventually if cells are insulin resistant. In conclusion, insulin resistance serves as the
last clinical factor or marker in determining DPP-4 inhibitors treatment response. In
other words, T2D patients with insulin resistance will not benefit from DPP-4 inhibitor
therapy.
2.15.3 Fasting Plasma Glucose
Fasting plasma glucose (FPG) is one of the criteria used in diagnosing diabetes, apart
from A1c and the 2-hour plasma glucose value after a 75g oral glucose tolerance test
(OGTT) (ADA, 2015). In our study, FPG is used to determine the effectiveness of the
DPP-4 inhibitor treatment as FPG is the final outcome of DPP-4 inhibitor usage, as
resulting increases in insulin secretion will stabilise blood glucose concurrently (Lacy,
2009; MSD, 2012b). Ideally, we predict that low FPG will reflect good DPP-4 inhibitor
treatment response and high FPG will determine otherwise. FPG can serve as the final
indicator or marker for DPP-4 inhibitor therapy response as many studies found that
FPG was strongly correlated with diabetes and served as a risk factor that is independent 74
Univers
ity of
Mala
ya

in nature for T2D (Bogardus, Lillioja, Howard, Reaven, & Mott, 1984; Muggeo et al.,
2000; Tirosh et al., 2005).
Kawamoto et al. (2016) found that alogliptin significantly reduced FPG in patients
with T2D undergoing hemodialysis after 2 weeks of treatment (S. Kawamoto, Koda,
Imanishi, Yoshino, & Takeda, 2016). A study by Solis-Herrera et al. (2013) investigated
the glucose-lowering effects of sitagliptin and metformin therapy had found that the
combination therapy of both agents had significantly lowered FPG compared to
sitagliptin or metformin alone (Solis-Herrera et al., 2013). Aschner et al. (2006) found
that sitagliptin reduced FPG dose-dependently as -1.0 mmol/L and -1.2 mmol/L (1mg
and 2mg, respectively) after 24 weeks of therapy (Aschner et al., 2006). Vildagliptin
was also found to exhibit the FPG lowering effect after 24 weeks of treatment which
was accompanied by the improvements in A1c (Pi-Sunyer, Schweizer, Mills, &
Dejager, 2007). Earlier in 2006, vildagliptin was found to reduced FPG effectively from
baseline within 12 weeks of treatment (Pratley, Jauffret-Kamel, Galbreath, & Holmes,
2006). All of these studies support the possibility that FPG may be linked to the
response to DPP-4 inhibitor treatment.
2.15.4 A1c
A meta-analysis of random controlled trials of selected DPP-4 inhibitors (sitagliptin,
vildagliptin, linagliptin, saxagliptin, and alogliptin) had found that the mean reduction
of A1c from a mean baseline of 8.05% was -0.77% within 1 year of therapy (Katherine
Esposito et al., 2015). Previously, many other studies showed that sitagliptin and
vildagliptin reduced A1c levels by 0.65-1.1% after 3-12 months from baseline levels of
7.2%-8.7% (Ahrén, 2007; Aschner et al., 2006; Pratley et al., 2006; Raz et al., 2006;
75
Univers
ity of
Mala
ya

Ristic, Byiers, Foley, & Holmes, 2005; Rosenstock, Baron, Dejager, Mills, &
Schweizer, 2007; Schweizer & Dejager, 2013; Scott, Wu, Sanchez, & Stein, 2007). A
report by Monami et al. (2011) concluded that A1c was significantly reduced by DPP-4
inhibitors at 24 weeks by 0.6 (0.5-0.7%), as compared to placebo (Monami, Cremasco,
Lamanna, Marchionni, & Mannucci, 2011). The study also identified no difference in
A1c in comparison with thiazolidinediones and α-glucosidase inhibitors (Monami et al.,
2011). On the other hand, sulfonylureas and metformin generated greater A1c lowering
effects as compared to DPP-4 inhibitors (Monami et al., 2011). Monami et al. (2011)
made a conclusion that DPP-4 inhibitors are more efficient in patients who are older
with mild to moderate fasting hyperglycemia (Monami et al., 2011). In 2015, Esposito
et al. detected a decreased A1c from baseline (by -0.77% (95% CI -0.82 to -0.72%)
from 98 RCTs with 100 arms composed of 26 arms with 37 with sitagliptin,
vildagliptin, 13 with linagliptin, 13 with saxagliptin, and 11 with alogliptin (Katherine
Esposito et al., 2015). Duration of treatment, age, and previous diabetes drugs provided
low predictive power (less than 1%) to the response of the DPP-4 inhibitor treatment
(Katherine Esposito et al., 2015). A retrospective study was done to clarify the patient’s
characteristics in whom vildagliptin exerts A1c lowering effect fully; had found that
age, gender, and BMI had no profound variances among categories, and also no
profound variances in the A1c lowering effect of concomitant oral antidiabetics with
vildagliptin, nor antidiabetics replacing vildagliptin (Masami Tanaka et al., 2015). The
usage of A1c as the reflection of the effect of DPP-4 inhibitors are common. Yagi et al.
used A1c as the measurement of DPP-4 inhibitors efficacy in his study and found that
the predictors of DPP-4 inhibitors A1c lowering efficacy after 12 months of therapy
were, reduced A1c levels after 3 months of treatment, high A1c baseline level, low
baseline BMI and the coronary artery disease absence (Yagi et al., 2015).
76
Univers
ity of
Mala
ya

A1c is defined as glycated haemoglobin and it is used as a measure of mean
glycemic control over a period of 3 months (ADA, 2015). The method for measuring
A1c must have certification by the National Glycohemoglobin Standardization Program
(NGSP) and standardized to the Diabetes Control and Complications Trial (DCCT)
reference assay (ADA, 2015). Compared with FPG, A1c provides greater preanalytical
stability, is more convenient to patients (no fasting required), and is less perturbed
during stress and illness (ADA, 2015). However, the A1c test is done at a greater cost
than FPG and standardized methods of measurement are only available in certain
regions around the world (ADA, 2015). Since most epidemiology studies recommend
an A1c cut-off point for diabetes diagnosis were done in the adult population, it is
controversial whether the same A1c cut-off point should also be employed in children
and adolescents (Cowie et al., 2010; Garcia de Guadiana Romualdo et al., 2012;
Nowicka et al., 2011).
2.15.4.1 Factors that limit the accuracy of A1c
(a) Factors that interfere with A1c measurement
Genetic variants of haemoglobin (Hb) has shown to give different readings on the
A1c test results. There are more than 700 Hb variants reported with the majority with
point mutations at the α, β, γ, or δ Hb chains (Bry, Chen, & Sacks, 2001). Sickle trait
(HbS (β6Glu→Val)) and HbC (β6Glu→Lys) variant are the most commonly
encountered among 16 million diabetes patients in the United States (Franks et al.,
2008; Reid, Famodu, Photiades, & Osamo, 1992), and HbS was also reported to be
found in diabetes patients in other parts of the world (Reid et al., 1992). There are many
types of commercially methods to determine the A1c level available worldwide in the
laboratories field. These laboratory methods use either the Boronate affinity or affinity-77
Univers
ity of
Mala
ya

binding chromatography, immunoassays form, or cation-exchange chromatography, to
measure the A1c levels accurately (CAP, 1999). However, inaccurate A1c reading may
occur if the Hb variant or its glycated derivative unable to be separated from A1c.
Fascinatingly, the same variant may yield either falsely decreased or increased A1c
levels, according to the method used (Bry et al., 2001).
Uremic patients may have high carbamyl-Hb concentrations (3% of total
haemoglobin) which may shorten red cell life span in hemodialysis patients thus
affecting the accuracy of A1c results (Bry et al., 2001). HbE (β26Glu→Lys) are
commonly found in the Southeast Asia region (Beutler, 1996), and it can either
increased or decreased the resultant A1c value, depending on the methods used (Roberts
et al., 2000). The elevated fetal haemoglobin (HbF) encompasses 70% of total Hb at
birth, and the value will be reduced to less than 5% upon 6 months of age (Ohls, 2000).
HbF concentrations less than 5% of total Hb have no effects on the majority of Hb
methods (Bry et al., 2001). However, persons with hereditary persistent HbF may have
high concentrations of HbF (up to 30% of total Hb) (Cox, Hess, Thompson, &
Levinson, 1993), thus since the immunoassay result is computed relative to the total Hb
in the sample, the result may produce false decreased A1c values (Bry et al., 2001).
(b) Factors that affect the interpretation of A1c test results
According to Goldstein et al. (2004), regardless of the assay method used, false A1c
will occur if blood samples were taken from people with haemolytic anemia, or
undergoing recovery from acute blood loss (D. E. Goldstein et al., 2004). Iron
deficiency anemia is linked to higher A1c level (Sundaram et al., 2007), as iron
replacement therapy lowers A1c level (Coban, Ozdogan, & Timuragaoglu, 2004;
Sundaram et al., 2007). The iron deficiency anemia is linked with reduced erythrocyte
and erthropoiesis turnover rate which elevate the A1c levels (Coban et al., 2004). The 78
Univers
ity of
Mala
ya

fluctuations of the A1c levels in these conditions is due to the increased
malondialdehyde levels in individuals with iron deficiency anemia (Sundaram et al.,
2007). Malondialdehyde is the end product of lipid peroxidation in cells 286 and has
been used as an oxidative stress marker in patients with diabetes complications such as
diabetic retinopathy (Kundu et al., 2014), due to its rapid reaction with thiobarbituric
acid to produce the marker test result (Esterbauer & Cheeseman, 1990; Giera,
Lingeman, & Niessen, 2012). Other types of anemia such as acute haemorrhage,
haemolytic anemia, and hemoglobinopathies are associated with elevated erythropoiesis
and reduced erythrocyte life span, which lead to decreased A1c levels (Gallagher, Le
Roith, & Bloomgarden, 2009).
In chronic kidney disease (CKD), the glycemic control is made complex by modified
glucose and insulin homeostasis (Vos, Schollum, & Walker, 2011). Moreover, the
reduction in renal metabolism and clearance in patients with CKD lengthen the duration
of insulin action (Mak, 2000). Malnutrition and reduced renal gluconeogenesis in
progressive nephropathy may cause the blood glucose concentrations to deteriorate
(Gerich, Meyer, Woerle, & Stumvoll, 2001). Additionally, hemodialysis procedure may
directly affect the glucose and insulin levels by the usage of high-glucose concentrate
dialysate (Marshall, Jennings, Scott, Fluck, & McIntyre, 2003) and by the increase of
renal clearance of both substance (M. Abe, Kikuchi, Kaizu, & Matsumoto, 2008). For
chronic renal failure patient undergoing dialysis, glycated albumin is a more preferable
method as it is more robust glycemic control indicator than A1c (Freedman et al., 2010).
A1c levels may also not accurate in patients with thalassemia as transfusion and
hemoglobinopathies may interfere with the A1c analysis (Choudhary, Giardina, Antal,
& Vogiatzi, 2013), resulting in either falsely increased or decreased of A1c levels
depending on the proximity to transfusion, the assay used and shortened erythrocyte 79
Univers
ity of
Mala
ya

lifespan (Sacks, 2003; Spencer, Grossman, & Scott, 2011). Oral glucose tolerance test
(OGTT) is preferable than A1c for thalassemia patients in the method of screening
glycemic control (Choudhary et al., 2013).
It is also reported that rheumatoid arthritis can decrease the A1c levels due to the
reduced erythrocyte life span (Gallagher et al., 2009).
2.15.4.2 A1c and DPP-4 inhibitors
A report by Monami et al. (2011) found that A1c was significantly reduced by DPP-4
inhibitors at 24 weeks by 0.6 (0.5-0.7%), as compared to placebo (Monami et al.,
2011). The study also identified no difference in A1c in comparison with
thiazolidinediones and α-glucosidase inhibitors, whereas sulfonylureas and metformin
generated greater A1c lowering effects as compared to DPP-4 inhibitors (Monami et al.,
2011). Monami et al. (2011) concluded that DPP-4 inhibitors are more effective in older
patients with mild to moderate fasting hyperglycemia (Monami et al., 2011). In 2015,
Esposito et al. detected a decreased of A1c from baseline (by -0.77% (95% CI -0.82 to -
0.72%) from 98 RCTs with 100 arms consisting of 37 arms with sitagliptin, 26 with
vildagliptin, 13 with linagliptin, 13 with saxagliptin, and 11 with alogliptin (Katherine
Esposito et al., 2015). Duration of treatment, age, and previous diabetes drugs provided
low predictive power (less than 1%) to the response of the DPP-4 inhibitor treatment
(Katherine Esposito et al., 2015). A retrospective study was done to clarify the
characteristics of patients in whom vildagliptin exerts A1c lowering effect fully; had
found that age, gender, and BMI showed no significant differences among categories,
and also no significant difference in A1c lowering effect of concomitant oral
80
Univers
ity of
Mala
ya

antidiabetics with vildagliptin, nor antidiabetics replaced to vildagliptin (Masami
Tanaka et al., 2015).
2.16 Demographic, Anthropometric and Biochemical Characteristics Affecting
DPP-4 Inhibitors Treatment Response
Demographics are the characteristics of a population. In our study, demographics
were included as predictors because we wanted to determine the patient characteristics
that would render them suitable for and probably to benefit from DPP-4 inhibitor
therapy. Our demographic parameters included duration of T2D, age, gender and
ethnicity. Meanwhile, the anthropometric parameters were waist circumference (WC)
and body mass index (BMI). Other biochemical parameters investigated were blood
pressure, lipid profiles, and liver profiles.
2.16.1 Demographic Characteristics Affecting DPP-4 Inhibitors Treatment
Response
2.16.1.1 Age
Age may have an impact on treatment response to DPP4 inhibitors because of
reduced β-cell function and increased insulin resistance with age (De Tata, 2014), that
may potentially lead to poor treatment response. There were studies that tried to
incorporate age as a predictor of DPP-4 inhibitors therapy. A systematic review and
meta-analysis by Esposito et al. (2015) to predict the A1c response to different types of
DPP-4 inhibitors indicated that age had no influence in A1c response to vildagliptin
(Katherine Esposito et al., 2015). Yagi et al. (2015) included age as one of the
predictors for the efficacy of DPP-4 inhibitors in patients with T2D, which was 81
Univers
ity of
Mala
ya

excluded in the final predictor model because of lack of statistical significance (Yagi et
al., 2015). In response to Yagi et al. (2015), Kim (2015) commented that since the
studied patients were relatively old (aged 68.3±35.8 years old) and had mildly elevated
A1c level (baseline A1c were 7.5%±1.3%), Yagi et al. (2015) need to justify the reasons
for adding DPP-4 inhibitor therapy into existing T2D therapies so that it will aid in
better understanding and validate the efficiency of DPP-4 inhibitors (Y. A. Kim, 2015).
Although these studies ended up with negative results regarding age, age had
increasingly become a common predictor variable to be included into the DPP-4
inhibitors treatment response predictor model.
Diabetes has increasingly become a disease of the elderly and some of its underrated
elderly complications should be taken into consideration such as physical disability,
cognitive disorders, falls, fractures and other geriatric syndromes (Gregg, Engelgau, et
al., 2002). The results of these complications may result in a poor quality of life, loss of
independence and ultimate dependence on caregivers. These complications pose a great
challenge to drug therapy compliance thus affecting treatment response. The association
between physical disability and diabetes are found to be mediated by several
prospective modifiable factors such as stroke, visual impairment, coronary heart
disease, obesity, physical inactivity and depression (Gregg et al., 2000; Gregg,
Mangione, et al., 2002), suggesting that avoiding secondary cardiovascular disease,
weight loss, exercise schedules, depression screening and its treatment may be able to
prevent disability, however no data on the outcome of such interventions were found or
recorded (Gregg, Engelgau, et al., 2002). The management of diabetes in older patients
is complex especially since the presence of other concomitant diseases also require
numerous polypharmacy/medications, added to the fact that at least half of the older
adults with diabetes may have a major cognitive or physical disability (Gregg,
82
Univers
ity of
Mala
ya

Engelgau, et al., 2002). While the IDF has specific guidelines on how to manage the
elderly with diabetes (Dunning, 2014), treating these patients does remain a clinical
challenge (Gregg, Engelgau, et al., 2002). Thus, assessing the impact of age on
treatment response to DPP4 inhibitors may at least provide some perspective in treating
and managing diabetes in the elderly.
Elderly is long associated with the decrease in glucose tolerance as initial
investigations found modest increases in plasma glucose levels after an oral glucose
challenge (Stevic et al., 2007). Carbohydrate intolerance occurs as part of the aging
process, which is explained by a post-receptor defect in target tissue insulin action/
dose-response curve (Fink, Kolterman, Griffin, & Olefsky, 1983). In the elderly
population, the severity level of carbohydrate intolerance is directly correlated to the
degree of peripheral insulin resistance (Fink et al., 1983). Elderly with chronic diseases
may also experience multiple organ failures (Xiao et al., 2014) and this may further
complicate therapy as the presence of concomitant renal impairment may modulate
treatment response to DPP4 inhibitors given that some of the drugs are excreted by the
kidney.
2.16.1.2 Duration of T2D
We included duration of T2D in our investigation as many studies recently had found
the relevance of duration of T2D with DPP-4 inhibitors response. In 2012, Nomiyama et
al. found that shorter duration of diabetes may be a predictor of greater improvements in
A1c prior DPP-4 inhibitor treatment in Japanese populations (Nomiyama et al., 2012).
Additionally, Fonseca (2009) had categorized duration of T2D as a predictor in her
study of defining and characterizing the progression of T2D, as the disease may worsen
83
Univers
ity of
Mala
ya

over time (V. A. Fonseca, 2009). Moreover, declining pancreatic β-cell function with
time along with insulin resistance is the sign of T2D progression (V. A. Fonseca, 2009).
An earlier study in 2006, showed that A1c levels increased with the increased duration
of T2D (Verma, Paneri, Badi, & Raman, 2006), which showed the probability that the
duration of T2D may influence the outcome of T2D treatment. Duration of T2D may,
therefore, have the possibility to be a predictor of DPP-4 inhibitor treatment response.
2.16.1.3 Gender
Zhang et al. (2014) studied the efficacy of adding DPP-4 inhibitors in patients with
T2D inadequately controlled by sulphonylurea and metformin therapy, and found that
gender did not influence the outcome of the treatment (X. Zhang et al., 2014). A study
by Brath et al. in 2016 found that women aged more or at 45 years old were less likely
to achieve the glycemic target (A1c less than 7%) without significant weight gain as
compared to women aged less than 45 years old (Brath, Paldánius, Bader, Kolaczynski,
& Nilsson, 2016). There were no other studies that investigate the influence of gender in
DPP-4 inhibitor treatment response. This study included gender as the potential
predictor of DPP-4 inhibitor treatment response since many studies have investigated
the influence of gender on diabetes and other diabetes treatment but not exclusively on
DPP-4 inhibitors in the Malaysian population. Diabetes and impaired fasting
hyperglycemia were prevalent in men than in women aged 30 to 69 years old, whereas
the prevalence of impaired glucose tolerance was higher in women than in men,
especially in individuals of age more than 70 years old (DECODE, 2003).
In high-income regions, Western Europe had the lowest rise in FPG of 0.07 mmol/L
per decade for men and 0.03 mmol/L per decade for women; while North America had
84
Univers
ity of
Mala
ya

the largest rise in FPG of 0.18 mmol/L per decade for men and 0.14 mmol/L per decade
for women (Danaei et al., 2011). These findings suggest that women had better
glycemic control than men thus leading up to the idea that response to T2D therapies
may vary between gender.
Although women may have better T2D treatment outcomes than men, but as they
age; non-compliance to medications should be suspected as the aging process may
affect their normal daily activities. One fourth of women with diabetes of 60 years old
of age and older are reported to be unable to walk 400 metres, as compared to less than
16.67% of women without diabetes of the same age (Gregg, Mangione, et al., 2002).
Additionally, women with diabetes have approximately twice the rate of becoming
disabled compared to women without diabetes, and also have an increased risk of falls
and hip fractures (Gregg, Mangione, et al., 2002; Schwartz et al., 2001). In our study,
we are investigating whether gender has a significant impact on the DPP-4 inhibitors
treatment response in T2D.
2.16.1.4 Ethnicity
Most of the studies of DPP-4 inhibitors lowering effects on A1c were from Western
and less were from Asian populations (Wong et al., 2014). Asians had a higher risk of
T2D than Westerns at the same BMI where Asians were more likely to have abdominal
obesity and increased insulin resistance (Chan, Malik, Jia, & et al., 2009). In fact, Asian
population presented with diversity in ethnicity along with unique demographic, cultural
and socioeconomic characteristics (P. Singh & vom Hau, 2016), which resulted in
different presentations of T2D in each Asian regions. For example, patients with T2D in
South Asian were characterized by lower BMI but with a higher amount of abdominal
85
Univers
ity of
Mala
ya

fat at a given BMI or waist circumference, while patients with T2D in East-Asians have
stronger insulin secretory defect as compared to their Westerns counterparts (Chan et
al., 2009; Ramachandran, Wan Ma, & Snehalatha, 2010). A study by Kim et al. in 2013
found that DPP-4 inhibitors were more effective in Asians as compared to other
ethnicity, specifically in patients with lower BMI of less than 30 kg/m2 (Y. G. Kim et
al., 2013). A systematic review by Singh et al. found that Indians and Koreans showed
better A1c lowering effect of DPP-4 inhibitors (-1.4% each) as compared to Chinese (-
0.7%), against the placebo group (A. K. Singh, 2015). Contrary, in 2014, Zhang et al.
found that ethnicity was not a significant determinant of A1c response in patients
treated with DPP-4 inhibitor (X. Zhang et al., 2014). This study was interested in
investigating the influence of Malaysian ethnicity on DPP-4 inhibitor treatment
response.
Malaysia is located in Southeast Asia and its population is comprised of multiple
ethnic groups. The 3 major ethnic groups in Peninsular Malaysia where our study was
conducted are the Chinese (24.6%), Malays (67.4%), and Indians (7.3%). The capital of
Malaysia, Kuala Lumpur has a population of 1,627,172 people within a 243 km2 area
(DOSM, 2010). According to the National Census 2010, the estimated breakdown of the
main races were 45.9%, 43.2% and 10.3% for Bumiputera (including Malay), Chinese
and Indians, respectively (DOSM, 2010).
The effect of ethnicity on DPP-4 inhibitor treatment response is not very clear,
especially less studied groups such as the Malays and Indians. Asian Indians have an
escalated risk of developing T2D, along with the characteristics of higher body fat
percentage but a lower lean mass for a given BMI, and central obesity leading to high
insulin resistance; making them more susceptible to the disease (V. Mohan, Sandeep,
Deepa, Shah, & Varghese, 2007). Others have shown that interleukin-6 gene 86
Univers
ity of
Mala
ya

polymorphism rs1800796 and rs2097677 may reduce the risk of being a non-responder
to DPP-4 inhibitors in Japanese patients (Matsui et al., 2015). In another study
conducted in Japanese population found that higher baseline A1c level, shorter duration
of diabetes and greater C-peptide immunoreactivity (CPR) index (plasma CPR
(ng/ml)/glucose (mg/dL) x 100) are associated to Sitagliptin treatment responders
(change of A1c from baseline by ≤-0.4% at 2 years) compared to non-responders
(change of A1c from baseline by >-0.4% at 2 years) (Nishimura et al., 2015). In Korean
subjects, the responders (change in A1c from baseline by >10%, or change in FPG
levels from baseline by >20% at 24 weeks) to DPP-4 inhibitor (sitagliptin) had a lower
mean body mass index (23.70±2.40 vs. 26.00±2.26, p≤0.01) and were younger
(58.83±11.57 years vs. 62.87±12.09, p=0.03) compared to the non-responders (change
in A1c from baseline by <10%, or change in FPG levels from baseline by <20% at 24
weeks) group (S. A. Kim et al., 2011). A recent study in United Kingdom population
(data from 25,386 patients with T2D treated with DPP-4 inhibitors from 2007 to 2013)
found that responses to DPP-4 inhibitor are significantly lower with increased diabetes
duration (per every year increase) (OR: 0.85; 95% CI: 0.83-0.88) and patients with high
A1c levels at baseline (OR: 0.64, 95% CI: 0.61-0.68) (Jil, Rajnikant, Richard, &
Iskandar, 2016). A pool analysis of 5 clinical trials to assess the treatment response to
saxagliptin at 24 weeks from baseline at 12 weeks (among patients with T2D aged 18 to
77 years old); had found that the baseline characteristics that were associated with
saxagliptin treatment response (responders: A1c decrease ≥0.5%; intermediate
responders: A1c decrease ≥0.2% and <0.5%; non-responders: A1c decrease <0.2%) are
lower fasting insulin (p=0.0006), shorter duration of T2D (p=0.033), higher baseline
A1c (p<0.0001), higher HOMA-2%β (p<0.0001), and male sex (p=0.031) (Sjöstrand,
Iqbal, Lu, & Hirshberg, 2016). A study to evaluate the efficacy of sitagliptin
monotherapy for 18 weeks in Chinese, Indian and Korean patients with T2D had found 87
Univers
ity of
Mala
ya

that sitagliptin significantly reduced mean A1c (-1.0%, p<0.001), fasting plasma
glucose (-1.7 mmol/L), and 2-hour postprandial glucose (-3.1 mmol/L), and a
significantly greater proportion of better glycemic response (A1c<7.0%) found in
sitagliptin group (p<0.001) compared to placebo group (Viswanathan Mohan et al.,
2009). All of these researches showed the response to DPP-4 inhibitors treatment in
various ethnicities, thus, it is fascinating to know the impact of Malaysian ethnicities on
the DPP-4 inhibitors treatment response.
2.16.2 Anthropometric Characteristics Affecting DPP-4 Inhibitors Treatment
Response
2.16.2.1 Body mass index (BMI)
A review by Kim et al., in 2013 showed that DPP-4 inhibitors were more effective in
Asians than other ethnic group specifically those with BMI < 30 kg/m2 (Y. G. Kim et
al., 2013). Meanwhile, Nomiyama et al. (2012) and Maeda et al. (2012) found that
patients with lower BMI, higher A1c baseline and shorter duration of T2D were
significantly related to a higher A1c reduction in Japanese patients with T2D treated
with sitagliptin (H. Maeda, Kubota, Tanaka, Terauchi, & Matsuba, 2012; Nomiyama et
al.). Low BMI was found as the predictor of the response to DPP-4 inhibitor treatment,
where DPP-4 inhibitors were more effective in patients with low BMI as the drug group
also improve insulin secretion and insulin resistance (Yagi et al., 2015). Based on these
recent findings, we investigated BMI as the predictor of the response to DPP-4 inhibitor
treatment.
World Health Organization (WHO) estimated over 1.9 billion adults were
overweight/obesity worldwide in 2014 (WHO, 2014). The worldwide prevalence of
88
Univers
ity of
Mala
ya

overweight and obesity had risen greatly from 1980 to 2013; from 8.1% to 12.9% in
male and 8.4% to 13.4% in female (Ng et al., 2014). According to the Malaysian Adults
Nutrition Survey (MANS) in 2009, the overall BMI for Malaysian is 24.37 kg/m2,
where more women were obese (14.66%) compared to men whose were more on the
overweight (28.55%) category (Azmi et al., 2009). The prevalence of obesity was
greatest in Malays (15.28%), while the prevalence of overweight category was highest
in Indians (31.01%) (Azmi et al., 2009). As compared to Caucasians, Asians
(Indonesian of Malays and Chinese ancestry, Singaporean Chinese, Malays, Indians and
Hong Kong Chinese) had a higher body fat percentage (3% to 5% more) at a lower
BMI; which may be explained by differences in body build such as differences in trunk-
to-leg-length ratio and in muscularity (Deurenberg, Deurenberg-Yap, & Guricci, 2002).
BMI can be associated as one of the factors in determining the response to DPP-4
inhibitor treatment, based on the effect of associated insulin resistance on β-cell
function (J. O. Chung, Cho, Chung, & Chung, 2012). BMI was considered to be
positively associated with the reduced insulin sensitivity in patients with T2D, as BMI
is directly linked to insulin resistance (E. C. Chang, Yu, & Kahle, 2014).
A study was done to define the relationship between BMI and insulin resistance in a
group of healthy, non-diabetic individuals had found that the greater the BMI, the more
insulin-resistance the individual, and insulin resistance may accentuate the risk of T2D
(Abbasi, Brown Jr, Lamendola, McLaughlin, & Reaven, 2002). A study to investigate
the associations among BMI, insulin resistance and β-cell function in Korean patients
with T2D had found that BMI had positive associations with insulin resistance and an
inverse association with β-cell function (J. O. Chung et al., 2012). In an investigation of
an independent long-term predictors of insulin sensitivity in a large population-based
sample (the Uppsala longitudinal Study of Adult Men cohort) of 50 years old men 89
Univers
ity of
Mala
ya

(n=770) who went an euglycemic clamp 20 years later, had found that BMI remained as
the strongest predictor (β = - 0.67 (95% CI -0.83 to -0.51), p<0.001) of insulin
resistance, followed by physical activity, HDL cholesterol, saturated fat and
socioeconomic status (all p<0.05) (Risérus, Ärnlöv, & Berglund, 2007). After the
adjustment for baseline insulin concentrations, BMI still remained as the strongest
predictor (p<0.001) of insulin resistance (Risérus et al., 2007). A pooled analysis of 24-
week efficacy data of vildagliptin 50mg twice daily as add-on to metformin (n=2478)
study was performed and had found that the reduction from baseline in A1c with
vildagliptin were very similar across HOMAIR (mean 2.8 and 8.6), BMI (mean 24.9,
28.5 and 35.3 kg/m2 ), T2D duration (mean 0.6, 2.9 and 9.7 years), duration of
metformin use (mean 0.6, 2.6 and 7.9 years) categories, showing significant decreased
in A1c of -0.7% (baseline 7.7%); indicating that vildagliptin as the add-on therapy to
metformin was efficacious independent of insulin resistance, BMI, T2D duration, and
duration of prior metformin use (Schweizer, Dejager, & Foley, 2012). The study
showed that vildagliptin is still efficacious in obese patients and also in patients with
long-standing T2D (Schweizer et al., 2012).
2.16.2.2 Waist circumference
Waist circumference (WC) is a common clinical characteristic included in many
diabetes and obesity studies. To the best of our knowledge, this is the first study
incorporating waist circumference as a predictor of DPP-4 inhibitor treatment response.
Waist circumference is the best anthropometric indicator of central obesity (Taylor,
Jones, Williams, & Goulding, 2000), which provides an inexpensive, rapid and non-
invasive way of detecting the presence of insulin resistance (Rodríguez-Rodríguez,
Palmeros-Exsome, López-Sobaler, & Ortega, 2011). According to the United States 90
Univers
ity of
Mala
ya

Department of Health and Human Services (HHS), women with a waist circumference
of more than 89 cm and men with a waist circumference of more than 102 cm are at
increased risk of developing chronic diseases (Dalvand et al., 2015). For Asian
populations, women with a waist circumference of more than 79 cm and men with a
waist circumference of more than 89 cm are at increased risk of chronic diseases
(Dalvand et al., 2015).
According to the International Diabetes Federation (IDF), waist is a gender and
ethnicity-specific indicator, where different cut-offs were adopted for waist
circumference in different ethnicities (Alberti et al., 2009). The cut-offs points for
Europeans are 94 cm in men and 80 cm in women, while the cut-offs points for Chinese
and South Asians are 90 cm in men and 80 cm in women (Alberti et al., 2009). For
Iranians, the cut-offs point for waist circumference is 95 cm for both men and women,
in order to diagnose metabolic syndrome (Azizi et al., 2010; Delavari, Forouzanfar,
Alikhani, Sharifian, & Kelishadi, 2009).
Abdominal adiposity was found to remain as a significant predictor of insulin
resistance (r=-0.52, p<0.0001) in older people aged 50 to 95 years old (Racette, Evans,
Weiss, Hagberg, & Holloszy, 2006), as aging generally related to decreased aerobic
capacity (Fleg et al., 2005), which caused to age-associated reductions in cardiac and
skeletal muscle cell mass and function, as well as the decline in vital capacity (Racette
et al., 2006).
BMI and WC are both recommended measurements for assessing weight-related
health risk (Racette et al., 2006). BMI was chosen because of its associations with
adiposity, disease risk (Must et al., 1999) and mortality (Calle , Thun , Petrelli ,
Rodriguez , & Heath 1999). Meanwhile, waist circumference was chosen because of its
91
Univers
ity of
Mala
ya

associations with visceral adipose tissue (Janssen, Heymsfield, Allison, Kotler, & Ross,
2002), metabolic syndrome 914), insulin resistance (Karter et al., 1996) and T2D
(Edelstein et al., 1997). Comparing BMI and waist circumference, BMI may not
accurately reflect health risk in older adults with healthy BMI value range despite
muscle loss and excess abdominal fat (Racette et al., 2006).
2.16.3 Biochemical Characteristics Affecting DPP-4 Inhibitors Treatment
Response
2.16.3.1 Lipid profiles
We included lipid profiles; triglycerides, LDL cholesterol, HDL cholesterols and
total cholesterol in our investigation as many studies recently had found the relevance of
these lipid profiles with DPP-4 inhibitors response. Matikainen et al. (2006) found that
DPP-4 inhibitors had an effect on the postprandial lipid levels, where patients with T2D
treated with vildagliptin treatment for 4 weeks showed improved postprandial plasma
triglycerides and apolipoprotein B-48-containing triglyceride-rich lipoprotein particle
metabolism following consumption of a lipid-rich meal (Matikainen et al., 2006). DPP4
gene itself is highly expressed in human adipocytes, and further increased in
subcutaneous and visceral adipose tissue of obese persons (Lamers et al., 2011; Sell et
al., 2013). Studies found that elevated DPP4 gene expression in the adipose tissue of
obese patients correlates with numerous metabolic syndrome markers such as plasma
triglycerides, waist circumference, BMI, fat cell volume, HOMAIR, and adipokine
leptin (Lamers et al., 2011; Sell et al., 2013). DPP-4 release also increased significantly
during vitro adipocyte differentiation (Lamers et al., 2011; Sell et al., 2013), a finding
reinforced by Rosmaninho-Salgadoa et al. (2012) showed that DPP-4 stimulates PPAR-
γ expression, lipid accumulation, and neuropeptide Y cleavage, suggesting that it might 92
Univers
ity of
Mala
ya

stimulate adipocyte differentiation (Rosmaninho-Salgado et al., 2012). Turcot et al.
(2011) suggested that increased DPP4 gene expression in visceral adipose tissue may
serve as a marker of visceral adipose tissue inflammation, identified to be associated
with metabolic disturbance (Turcot et al., 2011). The study also found that DPP-4
mRNA abundance correlated positively with the plasma total-/HDL-cholesterol ratio,
suggesting that DPP-4 gene expression is potentially associated with lipid profiles in
severely obese persons (Turcot et al., 2011). Shirakawa et al. (2011) examined the effect
of DPP-4 inhibition on adipose tissue and concluded that the DPP-4 inhibitor des-
fluoro-sitagliptin improved linoleic acid-induced adipose tissue hypertrophy in β-cell-
specific glucokinase haploinsufficient mice, a non-obese model of T2D (Shirakawa et
al., 2011). Shimasaki et al. (2013) stated that des-fluoro-sitagliptin reduced body
adiposity without affecting food intake in C57BL/6 mice with diet-induced obesity
(Shimasaki et al., 2013). Similar findings were found by Fukuda-Tsuru et al. (2014)
using teneligliptin as the DPP-4 inhibitor (Fukuda-Tsuru, Kakimoto, Utsumi, Kiuchi, &
Ishii, 2014). Based on these findings, we concluded that DPP-4 inhibitors improve lipid
profiles, therefore given the possibility that lipid profiles may have an effect on the
response to the DPP-4 inhibitors treatment. Possible mechanisms supporting our theory
are the DPP-4 inhibitors suppressed postprandial elevation of triglycerides as a result of
the largely mediation by the inhibition of intestinal lipid absorption (Monami, Vitale, &
Ambrosio, 2012) and partly by the delayed gastric emptying (Stevens et al., 2012).
Lipid profiles may, therefore, have the possibility to be a predictor of response to DPP-4
inhibitor treatment.
93
Univers
ity of
Mala
ya

2.16.3.2 Blood pressure
We included blood pressure; systolic blood pressure (SBP) and diastolic blood
pressure (DBP) in our investigation as many previous studies had found the relevance
of blood pressure with DPP-4 inhibitors response. In 2015, Sufiun et al. observed that
vildagliptin significantly increased urine sodium excretion and normalized blood
pressure in Dahl salt-sensitive rats, indicating that vildagliptin may have
antihypertensive effects (Sufiun et al., 2015). Meanwhile, Mason et al. (2012) found
that saxagliptin treatment (10 mg/kg/day) for 8 weeks reduced mean arterial pressure by
12 mmHg (p < 0.001) in hypertensive rats, indicating that DPP-4 inhibition reduces
blood pressure (Mason et al., 2012). Mistry et al. (2008) disclosed that sitagliptin
significantly reduced DBP and SBP (1.6–1.8 mmHg and 2–3 mmHg, respectively) in a
24-h period in non-diabetic individuals with mild to moderate hypertension (Mistry et
al., 2008). Conversely, Jackson et al. (2008) observed that the inhibition of DPP-4
increased arterial blood pressure through Y(1) receptors when elevated blood pressure
was reduced with antihypertensive drugs, given that the sympathetic nervous system
was functional (E. K. Jackson, Dubinion, & Mi, 2008). Marney et al. (2010) indicated
that sitagliptin reduced blood pressure during low-dose angiotensin-converting enzyme
(ACE) inhibition (enalapril, 5 mg) however the reverse was observed during high-dose
ACE inhibition (enalapril, 10 mg), indicating that the combination of a DPP-4 inhibitor
with a high-dose ACE inhibitor can trigger the activation of sympathetic tone, hence
impairing blood pressure reduction (Marney, Kunchakarra, Byrne, & Brown, 2010).
Pacheco et al. (2011) argued that the possible mechanism of blood pressure reduction by
DPP-4 inhibitor was because of the decreasing expression of hydrogen/sodium
exchanger isoform 3 in the microvilli membranes of the proximal renal tubule (B. P.
Pacheco et al., 2011). This may increase the urinary sodium excretion as well as the
urinary volume, leading to blood pressure reduction (B. P. Pacheco et al., 2011). 94
Univers
ity of
Mala
ya

Nonetheless, to the best of our knowledge, there is no exact mechanism explaining how
DPP-4 inhibitor reduces diastolic blood pressure alone. Our literature findings
concluded that the possibility that blood pressure may affect the response to the DPP-4
inhibitor treatment in patients with T2D, thus suitable to be considered as a predictive
candidate in our investigation.
2.16.3.3 Liver profiles
We included liver profiles; aspartate transaminase (AST) and alanine
aminotransferase (ALT) in our study since there is an increasing trend in investigating
liver function in patients with T2D treated with DPP-4 inhibitors. This is because of the
DPP-4 inhibitors were suspected to have pleiotropic effects independent of incretin
activity (Kanazawa, Tanaka, & Sugimoto, 2014). Pleiotropic effects refer to a single
gene affecting multiple systems or influencing more than one phenotype traits
(Kavalipati, Shah, Ramakrishan, & Vasnawala, 2015). Studies had found that sitagliptin
was safe to be used in patients with liver diseases or injury, and significantly reduced
A1c levels, along with AST and ALT levels (Asakawa et al., 2015; Iwasaki et al., 2011;
Shirakawa et al., 2011). In 2014, Kanazawa et al. established that DPP-4 inhibitors
significantly reduced both ALT and AST levels in Japanese patients irrespective of the
A1c levels (Kanazawa et al., 2014). To the best of our knowledge, there was no exact
mechanism on how DPP-4 inhibitors improved liver function. However, there was the
possibility that DPP-4 inhibitors improved liver function by stimulating GLP-1 activity
and by inhibiting local DPP4 activity in liver (N. A. Gupta et al., 2010; Kanazawa et al.,
2014). Thus, this served as the reasons for liver profiles as to be investigated as the
predictor for DPP-4 inhibitors treatment response in our study.
95
Univers
ity of
Mala
ya

2.17 Other Comorbidities and Complications of Diabetes That May Affect
DPP-4 Inhibitors Treatment Response
This study also investigated the relevance of comorbidities and complications of
diabetes to DPP-4 inhibitor treatment response. We studied the effects of the
traditionally recognized microvascular (nephropathy, retinopathy, and neuropathy) and
macrovascular (stroke, coronary heart disease, and peripheral arterial disease)
complications of diabetes, along with other comorbidities of diabetes found in our
subjects. It is possible that the presence of complications of diabetes denotes longer
duration of disease and greater beta cell dysfunction which may mitigate the impact of
therapy with DPP-4 inhibitors. In addition, the presence of nephropathy and diminished
eGFR may alter the pharmacokinetics of DPP-4 inhibitors and increase exposure hence
enhancing treatment response.
2.17.1 Retinopathy
A study by Chung, Park, Kim, Kim & Lee in 2016 had found that DPP-4 inhibitors
had the protective effect against the progression of diabetic retinopathy in patients with
T2D (p=0.009) (Y. R. Chung, Park, Kim, Kim, & Lee, 2016). However, DPP-4
inhibitor was known to accumulate stromal cell-derived factor-1α (SDF-1α) which is an
inducer of vascular leakage and angiogenesis that caused diabetic retinopathy (C.-S. Lee
et al., 2016). A study by Lee et al in 2016, found that DPP-4 inhibitor-induced vascular
leakage in the retina in the diabetic retinopathy model by augmenting the SDF-1α/
CXCR4 (receptor of SDF-1α)/Scr/VE-cadherin (vascular endothelial-cadherin)
signaling pathway (C.-S. Lee et al., 2016). The contradicting findings in both studies
may suggest that retinopathy may potentially be associated with the DPP-4 inhibitor
96
Univers
ity of
Mala
ya

response. Thus, this may give rise to a possibility that retinopathy may become a factor
in predicting DPP-4 inhibitor treatment response.
Diabetic retinopathy is accountable for 12,000 to 24,000 of new vision loss cases in
the US each year (Centers for Disease Control and Prevention) (CDC, 2007). The
presence of hypertensive retinopathy along with diabetic retinopathy may accelerate the
risk of vision loss (Congdon, Friedman, & Lietman, 2003). According to the Wisconsin
Epidemiologic report of Diabetic Retinopathy, T2D patients had developed diabetic
retinopathy within 5 years of the diagnosis of diabetes (Varma, 2008). Diabetic
retinopathy is classified into nonproliferative and proliferative (Long & Dagogo-Jack,
2011). Nonproliferative diabetic retinopathy is characterized by the pathologies of
increased capillary permeability, macular edema and hemorrhage , and may lead to
proliferative retinopathy (Long & Dagogo-Jack, 2011). The progression into
proliferative retinopathy are triggered by the neovascularization on the vitreous surface
of the retina, vitreous cavity and the iris (Long & Dagogo-Jack, 2011). Eventually, over
time, scarring and fibrosis develop and may cause traction of the retina which may lead
to retinal detachment and vision loss (Long & Dagogo-Jack, 2011).
2.17.2 Nephropathy
This is the first study that investigated nephropathy as the predictor of response to
DPP-4 inhibitor treatment. Since DPP-4 inhibitors had demonstrated antifibrotic effect
in major organs such as heart and liver (Kaji et al., 2014; Shi et al., 2016), we consider
the possibility of nephropathy in affecting the response to DPP-4 inhibitors.
Additionally, Cardiovascular and Renal Microvascular outcome study with Linagliptin
in patients with type 2 diabetes mellitus at high vascular risk (CARMELINA) found that
97
Univers
ity of
Mala
ya

more than 8000 patients with T2D, are currently going on and this study may include
the investigation of the antifibrotic effect of DPP-4 inhibitor on kidney, where the renal
outcome will be measured as composite renal death, sustained end-stage renal disease
and sustained decrease of more than 50% of estimated glomerular filtration rate
(Panchapakesan & Pollock, 2014). The outcome of the CARMELINA study whether or
not DPP-4 inhibitors are potentially antifibrotic may be useful if our study manages to
get nephropathy as the predictor of DPP-4 inhibitor treatment response.
Diabetic nephropathy is characterized by hypertension, continuous albuminuria,
glomerulosclerosis, and decline in glomerular filtration rate resulting in end-stage renal
disease (ESRD) (Van Buren & Toto, 2011). Specifically, diabetic nephropathy is
distinguished by urine albumin excretion greater than 300mg/24hrs and is associated
with a 1ml/min/1.73m2 decline in glomerular filtration rate (GFR) per month (Long &
Dagogo-Jack, 2011). Diabetic nephropathy is the main cause of ESRD in the US with
an incidence rate of 158 per million population (Excerpts from the United States Renal
Data System-2009 Annual Data Report (EXCERPTS, 2010b)). In the US, diabetes is
reported to be associated with a prevalence of CKD of 8.9% (stage I), 12.8% (stage II),
19.4% (stage III), and 2.7% (stage IV and V combined); with an overall odds ratio of
having CKD for a patient with diabetes of 2.51 (CI 2.07-3.05) (EXCERPTS, 2010a).
Diabetic nephropathy occurs in 40% of patients with diabetes and hypertension and this
magnifies the risk of this complication (Sowers & Epstein, 1995). In T2D, hypertension
commonly exists prior to the kidney disease (Van Buren & Toto, 2011). Hypertension
may lead to the progression of kidney disease and contributes to accelerating the
incidence of cardiovascular disease in populations with diabetes (Van Buren & Toto,
2011). The major cause of hypertension in T2D is volume expansion due to increased
peripheral vasoconstriction and renal sodium reabsorption due to the dysregulation of
factors that regulate peripheral vascular resistance (Van Buren & Toto, 2011). The 98
Univers
ity of
Mala
ya

activation of the renin-angiotensin-aldosterone system, upregulation of endothelin1,
upregulation of reactive oxygen species, and downregulation of nitric oxide all
contribute to produce hypertension in this setting, thus potentially accelerating kidney
disease among patients with diabetes (Van Buren & Toto, 2011). Diabetic nephropathy
differs from other aetiologies of kidney disease at the histo-pathological level (Long &
Dagogo-Jack, 2011). Initially, when the glomerular basement membrane thickens, the
amount of the mesangial matrix increases which leads to the progressive increase in
more severe diffuse or nodular glomerulosclerosis (Sowers & Epstein, 1995). The
basement membrane is gradually lost in people with diabetes leading to the loss of its
perm-selectivity and thus resulting in progressive proteinuria (Myers, 1990).
Microalbuminuria is the earliest indicator of diabetic nephropathy and it is also
associated with an increased risk of cardiovascular disease (CVD) (Adler et al., 2003).
2.17.3 Neuropathy
To the best of our knowledge, there was no study conducted to investigate
neuropathy as the predictor of the response to DPP-4 inhibitor treatment. However,
there was a review in 2014 that found the possibility of DPP-4 inhibitors to interfere
with the inception and progression of diabetic microangiopathy based on experimental
findings and preliminary clinical data published in between 1st January 1980 to 1st
March 2014; through the improvement of GLP-1 bioavailability, glucose control, and
by modifying non-incretin substrates (Avogaro & Fadini, 2014). We included
neuropathy in our study to investigate the possibility of becoming a predictor of the
response to DPP-4 inhibitor treatment.
Peripheral neuropathy is a common diabetes complication which affects
approximately 70% of patients with diabetes and it is the major cause of foot 99
Univers
ity of
Mala
ya

amputation (Long & Dagogo-Jack, 2011). Although the pathogenesis of peripheral
neuropathy is poorly understood, it is most likely related to demyelinization of nerves,
impaired blood flow, and inflammation (Long & Dagogo-Jack, 2011). Specifically, it
develops with long-standing hyperglycemia and its associated metabolic derangements
such as accumulation of advanced glycosylation end products, increased polyol flux,
lipid derangements, and oxidative stress (Tesfaye et al., 2010). Hyperglycemic exposure
is the most significant factor causing diabetic neuropathy and complete tight glycemic
control is highly recommended to stabilize and improve symptoms of neuropathy
(Tesfaye et al., 2010). Therefore, if neuropathy was found as the predictor for the
response to DPP-4 inhibitor treatment, we at least may know if patients with neuropathy
may benefit from the DPP-4 inhibitor therapy.
2.17.4 Cardiovascular Disease
A study by Yagi et al. in 2015 had found that that absence of coronary artery disease
may be a predictor of the efficacy of DPP-4 inhibitor (Yagi et al., 2015). DPP-4
inhibitors were more operational in patients without coronary artery disease than in
patients with coronary artery disease (Yagi et al., 2015). DPP-4 inhibitors were reported
to have a cardioprotective impacts including reduction of blood pressure, improvement
of lipid profile and endothelial dysfunction, reduction of the macrophage-mediated
inflammatory response and prevention of myocardial injury (Yousefzadeh & Wang,
2013). In 2010, Read et al. identified that sitagliptin improved myocardial response to
coronary artery perfusion and stress in patients with T2D suffering with coronary artery
disease (Read, Khan, Heck, Hoole, & Dutka, 2010). Meanwhile, Koska, Sands, Burciu
& Reaven (2015) had found that saxagliptin and alogliptin had neither increased or
decreased major adverse cardiovascular events in patients with T2D of at high risk of 100
Univers
ity of
Mala
ya

adverse cardiovascular events (Koska, Sands, Burciu, & Reaven, 2015). However, in
2016, a study in China had found that DPP-4 inhibitors may potentially increase the risk
of heart failure in patients with existing cardiovascular diseases or multiple risk factors
for vascular diseases (L. Li et al., 2016). These findings had sparked the interest in us of
finding the relevance of cardiovascular disease as the predictor of response to DPP-4
inhibitors.
Cardiovascular disease (CVD) is the main cause of mortality for patients with
diabetes (ADA, 2015). The exact mechanism through which diabetes increase
cardiovascular mortality and morbidity is not entirely clear (Dokken, 2008). Studies
suggest that although hyperglycemia is the hallmark of diabetes, thus contributing to
myocardial damage after ischemic events, it is not the only factor since both subjects
with pre-diabetes and metabolic syndrome, even in normoglycemic subjects, have
increased risk of CVD (Muhlestein et al., 2003; Nielson & Lange, 2005; Thrainsdottir et
al., 2005). CVD is listed as the source of death in approximately 65% of people with
diabetes in the US (Geiss, Wang, Cheng, & et al., 2014). Since hypertension and
dyslipidemia are risk factors for CVD, as they are the common conditions co-existing
with T2D as part of the metabolic syndrome (ADA, 2015), the investigations toward
finding the associations of these CVD complications with the response to DPP-4
inhibitors treatment remains relevant.
101
Univers
ity of
Mala
ya

CHAPTER 3: METHODOLOGY
3.1 Study Design and Setting
This was a cross-sectional observational study following a group of patients with
T2D receiving treatment at diabetes clinics in the University of Malaya Medical Centre
(UMMC), Malaysia. The study protocol was reviewed and approved by the Medical
Ethics Committee of University Malaya Medical Centre (UMMC) (Institutional Review
Board Reference Number: 944.59) (Appendix 2) and each subject provided written
informed consent (Appendix 3) after a full explanation of the research purpose. The
study was compliant with the Declaration of Helsinki (World Medical Association
(WMA, 2008)).
Patients were recruited at the diabetes clinics in UMMC as per the inclusion criteria
and exclusion criteria detailed in section 3.4. The population of this study consisted of
patients with T2D at UMMC currently receiving and having been on DPP-4 inhibitor
therapy for at least 3 months. Patients on other drugs that influence glucose levels and
patients with anemia and hemoglobinopathies that make A1c evaluation inaccurate were
excluded. Good treatment response was defined as an A1c < 7% (ADA, 2012). A
standardized data collection form was used to record patient data (Appendix 4).
Different types of DPP-4 inhibitor therapies available in Malaysia were also included in
this study. Patient’s demographic and anthropometric information such as age, gender,
ethnicity, height, weight, BMI and WC were collected. Height and WC were measured
using Seca 200 Girth Measuring Tape (Seca Deutschland, Seca GMBH & Co,
Hamburg, Germany), while weight was measured using a weight scale (Oserio BLG-
261A, Taichung, Taiwan). BMI was calculated using the formula: weight in kilograms
divided by height in meters squared (Lopez, 2004). Blood pressure (DBP and SBP) was
measured using Welch Allyn Spot LXi Vital Signs Monitor (Welch Allyn, Skaneateles
102
Univers
ity of
Mala
ya

Falls, New York, USA). Other data such as duration of diabetes, complications of
diabetes and comorbidities were also collected and reviewed.
A venous blood sample was drawn for the determination of A1c, FPG, lipids, liver
enzymes, sCD26 levels, genotyping and gene expression studies. Genotyping, gene
expression and sCD26 laboratory work were done in the Pharmacy Department’s
laboratory and Medical Biotechnology Laboratory (Faculty of Medicine) by the
researcher whilst the lipid profile, insulin levels & liver profiles were performed by the
UMMC via routine laboratory tests.
3.2 Sampling Frame and Sampling Size
The sampling frame for this study was 18 months, from 1st June 2012 to 31st
December 2013.
3.2.1 Sample Size Calculation
Sample size was determined for genotyping and gene expression studies.
3.2.1.1 Sample size calculation for genotyping study
Quanto version 1.2.4 software (University of Southern California (USC, 2014)) was
used to calculate the sample size required (Gauderman, 2002) for this study. In this
calculation, we aimed for a sample size with the effect size (or odds ratio) in the range
of 1.5 to 2.0 with at least 80% power in a dominance model. Therefore, minor allele
frequency of 10% for each gene was chosen, and a type 1 error level of 0.05.
Calculations are as shown in Table 3.1. The resulting sample size was 262 samples each
for case and control group, to obtain the effect size of 1.5 (moderate) to 2.0 (strong)
(USC, 2014).
103
Univers
ity of
Mala
ya

Outcome : Disease
Design : Unmatched case-control(1:1)
Hypothesis : Gene only
Desired power : 0.8
Significance : 0.05, 2-sided
Gene
Model of inheritance : Dominant
Allele frequency : 0.1
Disease model
PO : 0.1
RG : 1.3
*kP : 0.104981
Table 3.1: Quanto calculation of sample size for genes with minor allele frequency (MAF) of 10%.
N kP
RG Minimum sample size
1.3 1396 0.104981
1.8 262 0.112667
2.3 126 0.119673
2.8 81 0.126085
PO : Baseline risk specified RG : Range of odds ratio kP : Overall disease risk in general population N : Number of sample (*) : Indicates calculated value
104
Univers
ity of
Mala
ya

The minimum sample size for MAF 10% is 262. However, according to Gauderman,
2002; number (N) required for 80% power to detect a gene-gene interaction with
magnitude Rgh = 3.0, assuming Rg = 1, Rh = 1, and various genetic-susceptibility
prevalences and dominance models; is 312 (Rg is the relative risk of locus g, Rh is the
relative risk of locus h, and Rgh is the relative-risk ratio of both locus g and h; with the
assumption made that the dominance models are dominant for locus g and recessive for
locus h) (Gauderman, 2002). Therefore, we can conclude that sample size should be
maximized to more than 312 samples for case and controls respectively. By the end of
the sampling; this study managed to secure approximately 331 samples for the case and
control groups each.
3.2.1.2 Sample size calculation for gene expression study
The minimum sample size for the gene expression study was calculated using a
microarray sample size calculator developed by Lee & Whitmore at the Department of
Epidemiology and Biostatistics, of the University of Maryland (Lee & Whitmore,
2012), and was set at the specified power level for an individual gene (Power) at 90%,
hence resulting in a minimum sample size calculated at 3 for each gene in the case and
control group.
Under the same conditions, a microarray sample size calculator developed by
Bioinformatics Unit, of the University of Texas MD Anderson Cancer Center
(Bioinformatics, 2010), computed the a minimal sample size of 5 for each gene in the
case and control groups each. Nevertheless, we ensured sample size was maximized to
13 for each gene in both groups.
105
Univers
ity of
Mala
ya

3.3 Definition of Subjects Groups Used in the Study
3.3.1 Case
Patients with T2D who include DPP-4 inhibitors in their oral diabetes therapy
(n=331).
3.3.2 Control
Patients with T2D who use oral antidiabetics except DPP-4 inhibitors in their
diabetes therapy (n=331).
3.3.3 Study Population
Patients with T2D who use oral antidiabetics including DPP-4 inhibitors in their
diabetes therapy (n=662).
3.3.4 Patients with Good Response
Patients in cases group that had good DPP-4 inhibitors treatment response (A1c <
7%)
3.3.5 Patients with Poor Response
Patients in cases group that had poor DPP-4 inhibitors treatment response (A1c ≥7%)
106
Univers
ity of
Mala
ya

3.3.6 Patients with Good Glycemic Control
Patients in controls group that had good glycemic control with oral antidiabetics
except DPP-4 inhibitors (A1c < 7%)
3.3.7 Patients with Suboptimal Glycemic Control
Patients in controls group that had poor glycemic control with oral antidiabetics
except DPP-4 inhibitors (A1c ≥7%)
3.4 The Reasons of Having a Control Group
Initially, cases group was already sufficient to attained the aims of this
pharmacogenomics study. However, we decided to add a control group because we need
to see the differences between patients that received DPP-4 inhibitor versus those who
did not, given that both groups had the same characteristics and came from the same
population, thus, enable this study to detect the pharmacogenomic exclusivity of those
using DPP-4 inhibitor therapies. Therefore, the model that predicts DPP-4 inhibitor
treatment response was the MODEL 1, while the other models were used as the
comparisons to MODEL 1 (Figure 3.1).
107
Univers
ity of
Mala
ya

Figure 3.1: Model 1 was the aim of the study, while the other models were used as comparative models to Model 1.
The list of Models generated from this study:
• MODEL 1 : model that predicts DPP-4 inhibitor treatment response (cases
group only, n=331)
• MODEL 2 : model that predicts oral antidiabetics (including DPP-4 inhibitors)
treatment response (study population, n=662)
• MODEL 3 : model that predicts oral antidiabetics (excluding DPP-4 inhibitors)
treatment response (control group only, n=331)
• MODEL 4 : model that predicts DPP-4 inhibitor treatment response (using the
significance variables of obtained from overall study population; cases group
only, n=331
108
Univers
ity of
Mala
ya

3.5 Inclusion and Exclusion Criteria
Table 3.2: Inclusion and exclusion criteria for case selection.
Inclusion criteria
1 Patients diagnosed with T2D (Nathan et al., 2009)
2 Age 18 – 75 years old (Viljoen et al., 2013)
3 On DPP-4 inhibitor (sitagliptin, vildagliptin or linagliptin) therapy for at least 3 months
(Nathan et al., 2009);
• sitagliptin dose of 100mg daily (Bernard Charbonnel, Karasik, Liu,
Wu, & Meininger, 2006)
• vildagliptin dose of 100mg daily (Marfella et al., 2010)
• linagliptin dose of 5mg daily (Del Prato et al., 2011)
4 Enrolled for T2D management in the UMMC (UMMC, 2012a, 2012b)
Exclusion criteria
1 Patients with Type 1 diabetes (Nathan et al., 2009)
2 Not on GLP-1 receptor agonist therapy (Rhinehart, 2015)
3 Patients with anemia (Sundaram et al., 2007), and/or hemoglobinopathy (Gallagher et
al., 2009)
4 Patients with insulin therapy (Nathan et al., 2009)
5 Patients not on DPP-4 inhibitor treatment (Nathan et al., 2009)
6 Non compliance to medication (Morisky, Ang, Krousel-Wood, & Ward, 2008)
7 Patients with a history of pancreas injury (Ilahi, Bochicchio, & Scalea, 2002; Raraty,
Connor, Criddle, Sutton, & Neoptolemos, 2004)
8 Immunocompromised patients such as HIV positive patients (Ohtsuki, Tsuda, &
Morimoto, 2000) or patients with cancer (Hübel et al., 1999)
9 On drugs that can result in hyper- and/or hypo-glycemia (other than antidiabetic agents)
such as quinolones, atypical antipsychotics, β-blockers, corticosteroids, calcineurin
inhibitors, protease inhibitors, thiazide and thiazide-like diuretics (Rehman, Setter, &
Vue, 2011), clofibrate, disopyramide, pentamidine, and salicylates (Vue & Setter,
2011).
109
Univers
ity of
Mala
ya

Table 3.3: Inclusion and exclusion criteria for control selection.
Inclusion criteria
1 Patients diagnosed with T2D (Nathan et al., 2009)
2 Age 18 – 75 years old (Viljoen et al., 2013)
3 Patients on any antidiabetic agents but not DPP-4 inhibitors for at least 3 months
(Nathan et al., 2009)
4 Enrolled for T2D management in the UMMC (UMMC, 2012a, 2012b)
Exclusion criteria
1 Patients with Type 1 diabetes (Nathan et al., 2009)
2 Not on GLP-1 receptor agonist therapy (Rhinehart, 2015)
3 Patients not on pharmacological therapy for diabetes (Tuomilehto et al., 2009)
4 Patients with anemia (Sundaram et al., 2007) and/or hemoglobinopathy (Gallagher et
al., 2009)
5 Patients with insulin therapy (Nathan et al., 2009)
6 Non compliance to medication (Morisky et al., 2008)
7 Patients with history of pancreas injury (Ilahi et al., 2002; Raraty et al., 2004)
8 Immunocompromised patients such as HIV positive patients (Ohtsuki et al., 2000) or
patients with cancer (Hübel et al., 1999)
9 On drugs that can result in hyper- and/or hypo-glycemia (other than antidiabetic
agents) such as quinolones, atypical antipsychotics, β-blockers, corticosteroids,
calcineurin inhibitors, protease inhibitors, thiazide and thiazide-like diuretics (Rehman
et al., 2011), clofibrate, disopyramide, pentamidine, and salicylates (Vue & Setter,
2011).
3.6 Selection of A1c Cut-off Point for Definition of Antidiabetic Treatment
Response
The study started in 2012, therefore, we used ADA 2012 as the initial guideline for
the selection of A1c cut-off point. ADA 2012 standards of care advocates patient
centered care and individualized targets for A1c; i.e. less than or 6.5%, less than or 7%,
or less than or 8% respectively (Table 3.4) (ADA, 2012).
110
Univers
ity of
Mala
ya

Table 3.4: Target A1c level recommendation.
Adapted from (ADA, 2012).
A1c (%) Recommendations (ADA, 2012)
< 6.5
For patients that can achieve this target without significant
hypoglycemia or other adverse effects of treatment (ADA, 2012).
Usually implemented in patients with T2D with short duration of
diabetes, long life expectancy, and no significant cardiovascular disease
(ADA, 2012).
< 7
Immediate implementation after the diagnosis of T2D, shown to be
associated with long-term reduction of macrovascular disease,
meanwhile tailoring A1c to below or around 7% or less shown to
decrease microvascular complications of diabetes (ADA, 2012).
< 8
Implemented in T2D with a history of severe hypoglycemia, limited
life expectancy, advanced microvascular or macrovascular
complications, extensive comorbid conditions, or long-standing
diabetes; where the general goal of A1c is difficult to achieve in spite
of appropriate glucose monitoring, diabetes self-management
education, and effective doses of multiple glucose-lowering agents
including insulin (ADA, 2012).
A1c target of < 7% was chosen as the A1c cut-off point in our study as we excluded
critically ill patients or those in an immunocompromised condition as HIV positivity or
cancer. Achieving an A1c less or around 7% has been shown to reduce the
microvascular complications of diabetes and is also associated with long-term reduction
of macrovascular disease if implemented soon after the diagnosis of diabetes (ADA,
2012). Hence A1c less than 7% was recommended by the ADA in 2012 as the A1c goal
for many nonpregnant adults (ADA, 2012). Meanwhile, according to Esposito et al.
(2011), A1c 7% is the starting point of the emergence of microvascular complications of
diabetes (K. Esposito et al., 2011). Thus, this was our justification for selecting A1c <
111
Univers
ity of
Mala
ya

7% as cut-off to define our outcome of good treatment response to pharmacological
anti-diabetic therapy for this study (Table 3.5).
Table 3.5: Criteria used in the study.
Good antidiabetic
treatment response
Targeted glycated haemoglobin (A1c) levels below 7%
within 3 months (ADA, 2012)
Poor antidiabetic
treatment response
Undesirable glycated haemoglobin (A1c) levels at 7% and
above within 3 months (ADA, 2012) Antidiabetic : DPP-4 inhibitors, biguanide, sulphonylureas and thiazolidinedione.
112
Univers
ity of
Mala
ya

3.7 Patient Recruitment
T2D : Type 2 diabetes ; DM : diabetes mellitus; DPP-4 : dipeptidyl peptidase-4
Figure 3.2: Flow-chart of patient recruitment process for case and control group.
3.7.1 Patient Recruitment Process
To recruit patients, this study targeted patients with T2D that were managed by
Diabetes Mellitus (DM) clinic in UMMC from 1st June 2012 to 31st December 2013
(Figure 3.2). Subjects were targeted within that period of time in-line with the starting
time of the study which was on 4th September 2012. Therefore, study had to consider 3
months prior to the study starting date to make sure that subjects of interest already
taken oral antidiabetics and had a stable A1c readings after 3 months of treatment.
113
Univers
ity of
Mala
ya

Hospital Information System (HIS) was used to procure the registration numbers
(RN) of diabetes patients in DM clinic, UMMC. It was done by procuring patient’s
appointment date from 1st June 2012 until 31st December 2013. Next, the Pharmacy
Information System (PIS) in the Drug Information Pharmacy Unit in the UMMC was
used to trace the DPP-4 inhibitors users, as the keywords were ‘sitagliptin’,
‘vildagliptin’ and ‘linagliptin’. We matched the RN of the DPP-4 inhibitors users from
the PIS with the ones that we procured earlier from HIS, where the matched RNs were
considered potential patients for cases group and the unmatched RN were considered
potential patients for controls group.
3.7.1.1 Patient recruitment process for cases group
Towards procuring candidates for cases group, this study traced the patient’s medical
records using their RNs obtained as described in section 3.7.1. Study only included
patients with available medical records and screening process further eliminating
patients with incomplete data/information in their medical records (Figure 3.2). For the
resulting potential patients, only those who met the inclusion criteria were approached
to get their agreement for participation (Figure 3.2). Patient information sheet to explain
the purpose and methodology of the study was given to the patients. Patients who
agreed to participate signed a consent form to signify their agreement. Upon agreement,
an appointment date was set for blood collection process and other measurements (such
as blood pressure, height, weight and WC) held in UMMC’s Blood Taking Centre
(BTC), DM and Cardiology clinics (Figure 3.2). Patients would have to fast for at least
8 hours before the blood withdrawal for the purpose to obtain the HOMAIR value
(Matthews et al., 1985). Final exclusion of patients may occurred in case of defaulting
appointment, refused blood collection, etc (Figure 3.2). 114
Univers
ity of
Mala
ya

3.7.1.2 Patient recruitment process for controls group
The procurement of patients for controls group were the same as cases except that
the patients selected did not used DPP-4 inhibitor therapy in their diabetes treatment.
The study used the RNs that were unmatched with those in PIS system as described in
section 3.7.1. to get the patient’s medical records. Only those with available medical
records were chosen for screening. Upon medical records screening, patients with
incomplete data were excluded from the study (Figure 3.2). As for the resulting
potential patients, study only included patients that met the inclusion criteria which
were approached for agreement on participation. Patients were explained on the purpose
and methodology of the study, and Patient Information Sheet (Appendix 5) was given to
the patients. Patient’s signature on the Consent Form was a requirement upon
participation in this study. Upon agreement, an appointment date was set for blood
collection process and other measurements (such as blood pressure, height, weight and
WC) held in UMMC’s Blood Taking Centre (BTC), DM and Cardiology clinics (Figure
3.2). This group of patients would also have to fast for at least 8 hours before the blood
withdrawal in order to obtain the HOMAIR value (Matthews et al., 1985). Final
exclusion of patients may included defaulting appointment, refused blood collection,
etc.
3.8 Blood Collection and Storage Procedures
Fasting venous blood samples were taken from all subjects for the determination of
A1c, FPG, lipids, and liver enzymes; and all biochemical analysis was performed at the
diagnostic laboratory of UMMC using standard clinical laboratory protocols
(Department of Pathology, UMMC). Blood was also collected for genotyping and gene
expression studies. All of the blood taking procedures were illustrated in Figure 3.3. 115
Univers
ity of
Mala
ya

Full assay and instruments used were discussed in section 3.10 for genotyping and in
section 3.11 for gene expression.
3.8.1 Blood Collection for Clinical Markers
For clinical markers, blood samples were collected separately in four standard BD
Vacutainer® SST™ II Advance tubes (Becton Dickinson® Systems SST™ II,
Plymouth, UK) for the enzyme-linked immunosorbent assay (ELISA) study, insulin,
lipids (total cholesterol, HDL, and LDL), and liver enzymes (AST and ALT),
respectively. Blood sample for FPG was collected by using BD Vacutainer®
Fluoride/Oxalate tube (BD Vacutainer®, Plymouth, UK). Meanwhile, one standard BD
Vacutainer® EDTA tube (BD Vacutainer®, BD Biosciences, Oxford, UK) was used to
collect the blood sample for A1c assessment. Each tube was filled up with
approximately 2.5ml blood. BD Vacutainer® One Use Holder with a luer adapter (BD
Vacutainer®, Franklin Lakes, NJ, USA) with attached 20 gauge (G) needle (BD
Vacutainer® Eclipse Blood Collection Needle, Number 381702, NJ, USA) was used for
easy blood withdrawal. 20G needle (BD Vacutainer® Eclipse Blood Collection Needle,
Number 381702, NJ, USA) have the length of 1 inch (1.1mm x 25mm) that gave the
blood flow rate of 65ml per minute (Techert et al., 2007), therefore suitable for this
study that required rapid blood collection in multiple tubes.
3.8.2 Blood Collection for Genetic Markers
For genetic markers, blood samples were collected separately for genotyping and
gene expression protocol. Standard BD Vacutainer® EDTA tube (BD Vacutainer®, BD
Biosciences, Oxford, UK) was used to collect DNA blood sample for genotyping, while 116
Univers
ity of
Mala
ya

PAXgene Blood RNA tube (PreAnalytiX, Qiagen, Valencia, CA, USA) was used to
collect RNA blood sample for gene expression protocol. Each tube was filled up with
approximately 2.5ml blood. BD Vacutainer® One Use Holder with a luer adapter (BD
Vacutainer®, Franklin Lakes, NJ, USA) with attached 20G needle was used for easy
blood withdrawal.
3.8.3 Blood Sample Processing and Storage
Blood samples for A1c, AST, ALT, HDL cholesterol, LDL cholesterol, total
cholesterol, triglyceride, insulin, FPG, sCD26 and genotyping were centrifuged at 5000
x g for 10 minutes using Sorvall Legend XTR Centrifuge (Thermo Scientific, Waltham,
MA, USA) and the resultant serums were extracted into individuals microcentrifuge
tubes and stored at -20°C. Meanwhile, the blood samples for gene expression were
incubated in the PAXgene Blood RNA tubes for a minimum of 2 hours at room
temperature (15° to 25°C) prior to RNA extraction process and the resultant extracted
RNA was stored at -20°C.
117
Univers
ity of
Mala
ya

T2D: type 2 diabetes; WC: waist circumference; BP: blood pressure; GE: gene expression; ELISA: enzyme-linked immunosorbent assay; A1c: glycated hemoglobin; FPG: fasting plasma glucose
Figure 3.3: Data collection process after patient recruitment and consent.
The data collection process is comprised of retrieving data from patient’s medical
records, blood samples, and standard biochemical and clinical measurements.
3.9 Experimental Methods for Clinical Markers
3.9.1 A1c Experimental Method
A1c was measured using a Bio-Rad VARIANT™ Hemoglobin Testing System (Bio-
Rad Laboratories, Inc., Hercules, CA, USA); the system of National Glycohemoglobin
Standardization Program (NGSP)-certified (Roberts et al., 2005) and traceable to the
Diabetes Control and Complications Trial (DCCT) reference assay (Craig et al., 2002),
which have the ability to report A1c in the presence of HbC (Rohlfing et al., 2016),
HbD (Little et al., 2008), HbE (Little et al., 2008; Rohlfing et al., 2016) and HbS 118
Univers
ity of
Mala
ya

(Rohlfing et al., 2016) traits, and also in the presence of carbamylated hemoglobin
(Little et al., 2013) (Table 3.6).
The assay used was VARIANT™ II Hemoglobin A1c Program Reorder Pack (Bio-
Rad Laboratories, Inc., Richmond, CA, USA, normal range: 4.8-6.0% (De Block et al.,
2004)) which is an automated assay using a High Performance Liquid Chromatography
(HPLC) technology to process and report accurate A1c results (De Block et al., 2004).
Table 3.6: The comparison of A1c determination methods, based on the interference with hemoglobin traits.
Method Interference with A1c result (yes/no)
HbC trait HbS trait HbE trait HbD trait Elevated HbF
Carbamylated Hb
Bio-Rad VARIANT™
Hemoglobin Testing System
No (Rohlfing et al., 2016)
No (Rohlfing et al., 2016)
No (Little et al., 2008;
Rohlfing et al., 2016)
No (Little et al., 2008)
α No (Little et al., 2013)
Bio-Rad D-100
No (Rohlfing et al., 2016)
No (Rohlfing et al., 2016)
No (Rohlfing et al., 2016)
No (Rohlfing et
al., 2016) α α
Bio-Rad VARIANT™
II Turbo
No (Mongia et al., 2008)
No (Mongia et al., 2008)
Yes (Little et al., 2008)
Yes (Little et al., 2008)
No (Little et al., 2012)
No (Little et al., 2013)
Siemens ADVIA A1c
No (Little, Rohlfing,
Hanson, & Roberts,
2010)
No (Little et al., 2010) β β β α
Abbott Architect c Enzymatic
No (Rohlfing et al., 2016)
No (Rohlfing et al., 2016)
No (Rohlfing et al., 2016)
No (Rohlfing et
al., 2016) α α
α : no information β : conflicting data in literature, assumptions made that the immunoassay methods do not have any clinically significant
interference from HbE and HbD due to the E and D substitution that are distant from the N-terminus of the hemoglobin beta chain (Little et al., 2008)
119
Univers
ity of
Mala
ya

3.9.2 Serum ALT, AST, HDL Cholesterol, LDL Cholesterol, Total Cholesterol
and Triglyceride Experimental Method
For serum ALT, serum AST, serum HDL cholesterol, serum LDL cholesterol, serum
total cholesterol and serum triglycerides; ADVIA® Chemistry XPT System (Global
Siemens Headquaters, Munich, Germany) was used. All samples from every subject
were analyzed in the same assay run (Pena-Bello et al., 2016).
3.9.3 Determination of Insulin Concentration and HOMAIR
3.9.3.1 Insulin assay and materials
For the determination of insulin concentration in each sample, Insulin
(Immunoreactive Insulin (IRI)) assay (ADVIA Centaur®, SIEMENS, IL, USA) was
used. The assay is standardized by World Health Organization (WHO) 1st IRP 66/304.
The assay requires serum sample type with a volume of 25 μl, with IRI as the calibrator,
the range sensitivity of the assay will be from 0.5 to 300 mU/L. The instrument required
was the ADVIA Centaur® CP Immunoassay system (Siemens Healthcare Diagnostics
Inc. Tarrytown, NY, USA).
The ADVIA Centaur IRI Ready Pack primary reagent pack consists of 2 reagents
which is the Lite Reagent and Solid Phase reagent. The Lite Reagent contains a
monoclonal mouse anti-insulin antibody at approximately 0.24 μg/ml concentration, and
is labeled with acridinium ester in buffered saline with bovine serum albumin, sodium
azide (less than 0.1% concentration), and preservatives. Meanwhile, the Solid Phase
reagent consists of a monoclonal mouse anti-insulin antibody at approximately 6.0
μg/ml concentration covalently coupled to paramagnetic particles in a buffered saline
120
Univers
ity of
Mala
ya

with bovine serum albumin, sodium azide less than 0.1% concentration, and
preservatives. Both of the reagents were stored at 2° to 8° C.
3.9.3.2 Insulin assay method
The ADVIA Centaur Insulin assay is a two-site sandwich immunoassay using direct
chemiluminescent technology which utilizes two antibodies which are in the Lite
Reagent and the Solid Phase (Insulin (IRI) assay, ADVIA Centaur®, SIEMENS, IL,
USA). The antibody in the Lite Reagent is a monoclonal mouse anti-insulin antibody
labeled with acridinium ester, while the antibody in Solid Phase is a monoclonal mouse
anti-insulin antibody that is covalently coupled to paramagnetic particles (Insulin (IRI)
assay, ADVIA Centaur®, SIEMENS, IL, USA).
The ADVIA Centaur system automatically dispenses 25 uL of sample into a cuvette,
followed by 50uL of Lite Reagent which is incubated for 5 minutes at 37°C (Insulin
(IRI) assay, ADVIA Centaur®, SIEMENS, IL, USA). Next, approximately 50 uL of
Solid Phase is added into the mix, followed by 2.5 minutes of incubation at 37°C
(Insulin (IRI) assay, ADVIA Centaur®, SIEMENS, IL, USA). Then, the system
automatically separates, aspirates and washes the cuvettes with reagent water (Insulin
(IRI) assay, ADVIA Centaur®, SIEMENS, IL, USA). Finally, 300 uL of Acid Reagent
and Base Reagent each is added into the mix to initiate the chemiluminescent reaction
(Insulin (IRI) assay, ADVIA Centaur®, SIEMENS, IL, USA). Insulin levels are
determined by the amount of insulin present in the sample and the amount of relative
light units detected by the ADVIA Centaur system (Insulin (IRI) assay, ADVIA
Centaur®, SIEMENS, IL, USA).
121
Univers
ity of
Mala
ya

3.9.4 Insulin Resistance (HOMAIR) Procurement Method
Insulin resistance (HOMAIR) was calculated using the online HOMA calculator
developed by the Diabetes Trial Unit (DTU) of the University of Oxford, United
Kingdom (DTU, 2004); based on the original homeostatic model assessment (HOMA2)
manual calculation as [fasting serum insulin (μU/ml)] x [fasting plasma glucose
(mmol/L)] / 22.5 (Matthews et al., 1985).
3.9.5 Determination of sCD26 concentration
All sCD26 concentrations were assayed using the enzyme-linked immunosorbent
assay (ELISA) kits (Human sCD26 Platinum ELISA, Bender MedSystems GmbH,
Vienna, Austria), and measured using a spectrophotometer (model 550, Bio-Rad, USA)
with the primary wavelength of 450 nm (620 nm as the reference wavelength).
3.9.5.1 sCD26 assay and materials
sCD26 concentrations were measured using the enzyme-linked immunosorbent assay
kits (Human sCD26 Platinum ELISA; Bender MedSystems GmbH, Vienna, Austria).
The Human sCD26 ELISA BMS235 kit is comprised of 100 μl Biotin-Conjugate anti-
human sCD26 monoclonal antibody, 150 μl Streptavidin-HRP, 50 μl human sCD26
Standard (500 ng/ml upon dilution), 12 ml Sample Diluent, 5 ml Assay Buffer
Concentrate 20x (PBS with 1% Tween and 10% BSA) 20, 50 ml Wash Buffer
Concentrate 20x, 15 ml Subtrate Solution (tetramethyl-benzidine (TMB)), 15 ml Stop
Solution (1M Phosphoric acid), 0.4 ml Blue-Dye, 0.4 ml Green-Dye, and 0.4 ml Red-
Dye.
122
Univers
ity of
Mala
ya

3.9.5.2 sCD26 assay methods
In order to determine the number of microwell strips required to test the desired
number of samples with additional appropriate number of wells needed for running
blanks and standards, each of the samples, standard, blank and optional control samples
were assayed in duplicate. Extra microwell strips were removed from a holder and
stored in a foil bag with the desiccant provided with the kit, at 2° - 8°C and sealed
tightly.
Then, the microwell strips were washed twice with approximately 400 μl Wash
Buffer per well with thorough aspiration of microwell contents between washes. The
Wash Buffer was allowed to sit in the wells for about 10-15 seconds before aspiration.
Careful efforts were made to ensure the surface of the microwells was not scratched.
After the last wash step, the wells were emptied and the microwell strips tapped on an
absorbent pad or paper towel in order to remove excess Wash Buffer. The microwell
strips were used immediately after washing. As an alternative, the microwell strips were
placed upside down on a wet absorbent paper for not more than 15 minutes.
Precautionary measures were taken to avoid drying of the wells.
For the preparation of standard dilution on the microwell plate, 100 μl of Sample
Diluent was added in duplicate to standard wells (Table 3.7) B1 and B2 until F1 and F2,
leaving A1 and A2 empty. Next, 200 μl of prepared standard was pipetted in duplicate
into well A1 and A2. Then, 100 μl of solution in A1 and A2 wells were transferred into
B1 and B2 wells, respectively. The contents of B1 and B2 were mixed thoroughly by
repeated aspiration and ejection. The process was repeated by transferring 100 μl
contents of B1 and B2 wells into C1 and C2 wells, respectively. The procedure was
repeated 3 times thus producing two rows of human sCD26 standard dilutions ranging
123
Univers
ity of
Mala
ya

from 500.0 ng/ml to 15.6 ng/ml. Finally, 100 μl of the used contents from the last
microwells (F1 and F2) was discarded.
Table 3.7: The arrangement of blanks, standards and samples in the microwell strips.
1 2 3 4
A Standard 1
(500.0 ng/ml)
Standard 1
(500.0 ng/ml)
Sample 2 Sample 2
B Standard 2
(250.0 ng/ml)
Standard 2
(250.0 ng/ml)
Sample 3 Sample 3
C Standard 3
(125.0 ng/ml)
Standard 3
(125.0 ng/ml)
Sample 4 Sample 4
D Standard 4
(62.5 ng/ml)
Standard 4
(62.5 ng/ml)
Sample 5 Sample 5
E Standard 5
(31.3 ng/ml)
Standard 5
(31.3 ng/ml)
Sample 6 Sample 6
F Standard 6
(15.6 ng/ml)
Standard 6
(15.6 ng/ml)
Sample 7 Sample 7
G Blank Blank Sample 8 Sample 8
H Sample 1 Sample 1 Sample 9 Sample 9
Approximately 100 μl of Sample Diluent was added in duplicate into the blank wells
and 80 μl of the Sample Diluent into the sample wells. Next, 20 μl of each sample was
added in duplicate into the sample wells. The next step was to prepare Biotin-Conjugate
solution. Approximately 0.06 ml of Biotin-Conjugate was added into 5.94 ml Assay
Buffer in a clean plastic tube in order to make a 1:100 dilution. Then, 50 μl of the
diluted Biotin-Conjugate was added into all wells. The wells were covered with
adhesive film and incubated at room temperature (18° to 25°C) for 3 hours, on a
microplate shaker set at 100 rpm. Next, the 1:200 dilution of Streptavidin-HRP was
prepared by adding 0.06 ml of concentrated Streptavidin-HRP into 11.94 ml Assay
124
Univers
ity of
Mala
ya

Buffer. The diluted Streptavidin-HRP was to be used within 30 minutes after dilution.
After the 3 hours of incubation, the adhesive flim was removed and the wells were
emptied. Next, the microwell strips were washed 4 times as previously described above.
Immediately after, 100 μl of diluted Streptavidin-HRP was added into all wells,
including the blank wells. Then, the microwell plate was covered with an adhesive film
and incubated at room temperature (18° to 25°C) for 1 hour, on a microplate shaker set
at 100 rpm. After that, the adhesive film was removed and the wells were emptied. The
microwell strips were washed 4 times as previously described. Next, 100 μl of TMB
Substrate Solution was pipetted into all wells. Then, the microwell strips were incubated
at room temperature (18° to 25°C) for 10 minutes. Direct exposure to intense light was
avoided. When the highest standard had developed a dark blue colour, 100 μl of Stop
Solution was added into each well in order to stop the enzyme reaction. Results was
read immediately on a spectrophotometer (model 550, Bio-Rad, USA) using 450 nm as
the primary wavelength (620 nm as the reference wavelength).
125
Univers
ity of
Mala
ya

3.10 Experimental Methods for Evaluation of Genetic Markers
In this study, genotyping was used to evaluate the genetic markers and the process
was illustrated in Figure 3.4. Full description of the genotyping process were presented
in this section 3.10.
DNA: Deoxyribonucleic acid; RT PCR: Real-Time Polymerase Chain Reaction
Figure 3.4: The genotyping process.
3.10.1 Genotyping Experimental Method
The Applied Biosystems (ABI) Step-One Plus RT-PCR instrument (Applied
Biosystems™, Foster City, CA) was used for TaqMan® genotyping. TaqMan® is an
automated medium-to-high throughput genotyping system that relies on allele-specific
hybridization as the allele discrimination method, and fluorescence as the allele
detection method, capable of determining approximately 1,000 to 10,000 genotypes per
day (X. Chen & Sullivan, 2003; Jenkins & Gibson, 2002; S. Kim & Misra, 2007; Livak,
2003). The principle of TaqMan® is the use of fluorescence-labeled probes to drive the
allele-specific hybridization reaction (Kofiadi & Rebrikov, 2006). The fluorescence-126
Univers
ity of
Mala
ya

labeled probes are short length nucleotides that are designed to bind complementarily to
the template sequence of interest. In the case of biallelic polymorphisms, one probe is
designed to bind complementarily to the polymorphic allele and another probe is
designed to bind with the wild-type allele. Each probe is labeled with a quencher dye on
the 3’ end and a reporter dye on the 5’ end. The reporter dye will cause the release of a
fluorescence signal while the quencher dye will then neutralize the fluorescence signal
(Schmittgen & Livak, 2008). When the probes are intact, the quencher dye close to the
reporter dye prevents fluorescence but when the probe is disrupted or cleaved, both of
the dyes become separated and fluorescence is emitted (Livak, Flood, Marmaro, Giusti,
& Deetz, 1995).
The advantages of TaqMan® over PCR-Restriction Fragment Length Polymorphism
(PCR-RFLP) and pyrosequencing are that both the PCR amplification step and the allele
discrimination step are conducted in the same reaction (Livak, 2003). Nonetheless, the
TaqMan® reaction mixture consists of both PCR primers and two allele specific
fluorescence-labeled probes. During the annealing process in the amplification cycles,
both of the fluorescence-labeled probes and PCR primers bind complementarily to the
DNA target sequence. According to the TaqMan® concept, the probe that binds
specifically to the target sequence will form a stable complex, while the probe that
contains a mismatch will not form a stable duplex (X. Chen & Sullivan, 2003; Livak,
2003). DNA polymerase extends the complementary DNA strand from the 3’ end of the
PCR primer during the extension step of the amplification process but when the DNA
polymerase finds the probe that is bound tightly to the strand, it will cleaves the probe at
the 5’ end, resulting the separation of the 5’ reporter dye from the 3’ quencher dye on
the probe. As a result, fluorescence is emitted and measured subsequently. Analytical
software is used to process the fluorescence data and assign a genotype.
127
Univers
ity of
Mala
ya

TaqMan® system requires a real-time PCR thermal cycler, which is more expensive
than an ordinary traditional thermal cycler. However, since it provides lower sample
processing times and reduced labor costs, TaqMan® is currently a favoured method in
genomic laboratories (S. Kim & Misra, 2007).
3.10.2 Isolation of DNA
The reagents required for the DNA isolation are Buffer AL, Buffer AW1, Buffer
AW2, Buffer AE, QIAGEN Protease, Protease solvent and ethanol (96 to 100%). The
apparatus required for the DNA isolation protocol are QIAamp Mini spin columns, 2 ml
collection tubes, 1.5 ml microcentrifuge tubes and pipet tips. The instruments required
for the DNA isolation protocol are the microcentrifuge (Thermo Sorvall™ Legend™
Micro 17R, Thermo Fisher Scientific™ LLC, Asheville, NC, USA), vortexer (Thermo
Scientific™ LP Vortex Mixer, US), water bath (Memmert WB14, Schwabach,
Germany) at 56°C, pipettes and Nanodrop 2000c spectrometer (Thermo Fisher
Scientific™, Wilmington, DE, USA).
Genomic DNA was extracted from peripheral blood lymphocytes using the QIAamp
DNA Blood Mini Kit (QIAGEN, Valencia, CA) according to the manufacture protocol.
Before starting the DNA isolation procedure, the samples and Buffer AE were
equilibrated to room temperature (15° to 25°C), and the water bath (Memmert WB14,
Schwabach, Germany) was heated to 56°C. Isolation procedure started by pipetting 20
μl QIAGEN Protease into the bottom of a 1.5 ml microcentrifuge tube. Then
approximately 200 μl sample was added into the microcentrifuge tube. Next, 200 μl of
Buffer AL was added to the sample, mixed by pulse-vortexing for 15 seconds, and sent
for incubation at 56°C for 10 minutes. Then, the 1.5 ml microcentrifuge tube was briefly
128
Univers
ity of
Mala
ya

centrifuged to remove drops from the inside of the lid. Next, 200 μl ethanol (96 to
100%) was added to the sample, and mixed again by pulse-vortexing for 15 seconds.
After mixing, the 1.5 ml microcentrifuge tube was briefly centrifuged again to remove
drops from inside the lid. Approximately 200 μl of the mix (as described above) was
carefully added into the QIAamp Mini spin column (in a 2 ml collection tube) without
wetting the rim. The cap was closed and centrifuged at 6000 x g (8000 rpm) for 1
minute. The QIAamp Mini spin column was placed in a clean 2 ml collection tube, and
the tube containing the filtrate was discarded. Next, the QIAamp Mini spin column was
opened and approximately 500 μl Buffer AW1 was added without wetting the rim. The
cap was closed and centrifuged at 6000 x g (8000 rpm) for 1 minute. Then the QIAamp
Mini spin column was placed in a clean 2 ml collection tube, and the collection tube
containing the filtrate was discarded. After that, the QIAamp Mini spin column was
carefully opened and 500 μl Buffer AW2 was added without wetting the rim. The cap
was closed and centrifuged at 20,000 x g (14,000 rpm) for 3 minutes. As final spin step,
the QIAamp Mini spin column was place in a clean 1.5 ml microcentrifuge tube, with
the previous collection tube containing filtrate discarded. The cap was opened carefully
and 200 μl Buffer AE was added. Then it was sent for incubation at room temperature
(15° to 25°C) for 1 minute, then centrifuged at 6000 x g (8000 rpm) for 1 minute. The
concentration of the isolated DNA was determined using NanoDrop 2000c
spectrophotometer (Thermo Scientific™, Wilmington, DE, USA) in the wavelength
values of 260 nm and 280 nm. Additionally, the isolated DNA was eluted in Buffer AE
and stored at -20°C for long term storage.
129
Univers
ity of
Mala
ya

3.10.3 Real-Time PCR and Selection of TaqMan® SNP Genotyping Assay
Real-Time PCR was done using the ABI StepOnePlus™ instrument (Applied
Biosystems™, Foster City, CA). Each of the DPP4, WFS1 and KCNJ11 SNPs were
genotyped using a predesigned TaqMan® SNP genotyping assay each (Applied
Biosystems™, Foster City, CA, USA) as described in the user protocol. The selection of
TaqMan® SNP genotyping assay (Table 3.8), for the Real-Time PCR protocol was
based on the gene variants which were previously mentioned. For Real-Time PCR
genotyping, we standardised all samples to 5 ng/μl. Buffer AE from the QIAamp DNA
Blood Mini Kit (QIAGEN, Valencia, CA) was used to dilute the samples. Dilution
calculation was used to achieve accurate 5 ng/μl concentration (Figure 3.5).
M: concentration; V: volume
Figure 3.5: The dilution formula for genotyping sample preparation.
Table 3.8: The TaqMan® SNP genotyping assay used for each of the gene polymorphisms.
Gene Polymorphisms TaqMan® SNP genotyping assay
DPP4 rs2970932 C__2789677_10
rs2268889 C__15875589_10
rs1861975 C__2789730_10
WFS1 rs1046320 C__2873369_10
rs734312 C__2401729_1_
rs10010131 C__30473796_10
KCNJ11 rs2285676 C__16177637_20
rs5218 C__2991149_20
rs5210 C__2991147_10
130
Univers
ity of
Mala
ya

For genotyping plate preparation, MicroAmp® Fast 96-Wells Reaction Plate was
used. The master mix cocktail was prepared for 96 reactions according to the
manufacturer’s guidelines (TaqMan®, Applied Biosystems™) (Table 3.9).
Table 3.9: The Master Mix cocktail preparation.
Ingredients for Master Mix cocktail 1 reaction / well (μl) 96 reactions plus 10%
extra (μl)
GTXpress Master Mix 5.0 525
TaqMan® genotyping assay mix 0.5 52.5
Dnase-free water 2.5 262.5
Total 8.0 840.0
Each well of the MicroAmp® Fast 96-Wells Reaction Plate is able to contain 10 μl to
20 μl solution for PCR reaction, therefore we had chosen the minimum amount of 10 μl
contents for each well to prevent any source wastage. Since the minimum amount of
DNA detected by the PCR Step-One Plus instrument (Applied Biosystems™, Foster
City, CA) is 2 μl, each well will received approximately 8 μl of Master mix cocktail,
except for 1 control well (Non Template Control) that received 10 μl of Master Mix
cocktail. After all of the wells were filled with their specific contents, the plate was
sealed with a MicroAMP® Optical adhesive film and briefly centrifuged for 10 seconds
using a bucket centrifuge (Thermo Sorvall™ ST 16R, MA, USA). Finally, the plate was
loaded into a Step-One plus PCR machine (Applied Biosystems™, Foster City, CA) and
set to run on the selected Fast Advance (Applied Biosystems™, Foster City, CA)
protocol for 40 minutes. The genotyping protocol was done for all genes; DPP4, WFS1
and KCNJ11, for both case and control groups. The results were collected for analysis.
131
Univers
ity of
Mala
ya

3.10.4 Amplification of DNA via Polymerase Chain Reaction
Polymerase chain reaction (PCR) is a method used to target and amplify a specific
DNA sequence within a genome (Metzker & Caskey, 2001). The method was developed
based on the inherent physiochemical properties of DNA (Zdanowicz, 2010). The DNA
consists of two strands bound together in antiparallel form, 5’ to 3’ and 3’ to 5’
(Strachan & Read, 2010). There are four nucleotide bases in the two strands namely
adenine, thymine, cytosine and guanine, that are bound complementarily to each other
by hydrogen bonds (Strachan & Read, 2010). Adenine binds exclusively to thymine
and cytosine to guanine (Strachan & Read, 2010). There are three major steps involved
in the PCR reaction which are denaturation, primer annealing and strand extension; all
cycled in different temperatures, in the presence of key reaction components, to target
and exponentially amplify a specific DNA target sequence, hence the hallmark of PCR
(Zdanowicz, 2010).
Basically, a PCR mixture may contain genomic DNA, deoxynucleoside triphosphates
(dATP, dCTP, dGTP, and dTTP), buffer, cations (either magnesium or potassium),
primers, and DNA polymerase (Baumforth, Nelson, Digby, O'Neil, & Murray, 1999).
During denaturation process at approximately 95°C, the hydrogen bonds of the double-
stranded DNA molecule are broken and the DNA molecule is separated into two single-
stranded molecules (Zdanowicz, 2010). Following the denaturation, two single-stranded
oligonucleotides, also known as primers, will anneal to the single-stranded DNA
molecules (Zdanowicz, 2010). A primer, generally consisting of 17 to 30 base pairs in
length, will bind complementarily to the nucleotides in the single-stranded DNA
molecule (Markham, 1993). Ideally, one primer will bind complementarily to a single-
stranded DNA molecule in a forward direction (5’ to 3’), and another one primer will
bind complementarily to the other DNA molecule strand in a reverse direction (3’ to 5’)
132
Univers
ity of
Mala
ya

(Markham, 1993). The annealing temperature is highly dependent on the sequence of
nucleotides in the template DNA (Zdanowicz, 2010).
Generally, the annealing temperature is between 40°C to 70°C (Zdanowicz, 2010).
The extension process starts once the two primers are annealed to the single-stranded
DNA molecules (Zdanowicz, 2010). The extension step needs to be carried out at 72°C
and is catalyzed by DNA polymerase (Zdanowicz, 2010). The DNA polymerase
promotes the synthesis of a complementary DNA strand in 5’ to 3’ direction by adding
deoxynucleoside triphosphates (dATP, dCTP, dGTP, and dTTP) to the 3’ end of each
primer annealed to the single-stranded DNA molecule (Baumforth et al., 1999). This is
to ensure that each single-stranded DNA template strand is constructed into a double-
stranded DNA replicate (Zdanowicz, 2010). The most common DNA polymerases used
in PCR reaction are Taq polymerase from the bacterium Thermus aquaticus (Ishino &
Ishino, 2014).
The complete cycle of PCR involving denaturation, annealing and extension will be
repeated 30 to 40 times resulting in an exponentially high number of DNA replicates
(Zdanowicz, 2010). The millions of DNA target sequence copies will be present in the
reaction mixture at the end of the PCR process (Zdanowicz, 2010).
3.10.5 Genotype Determination Principles
Once the target DNA sequence is amplified, a sample’s genotype can be determined
at a particular site within the DNA sequence by genotyping. Newly advanced
genotyping methods and technologies are readily available to be used for the purpose.
133
Univers
ity of
Mala
ya

There are two basic principles used to differentiate the genotyping methods, either
the methods involved allele discrimination or allele detection (S. Kim & Misra, 2007;
Kwok, 2001). Allele discrimination refers to the chemistry used to differentiate between
polymorphic (for example variant) and nonpolymorphic (for example wild-type) alleles
that are present at a particular locus in a DNA sample (Zdanowicz, 2010). Meanwhile,
allele detection refers to the chemistry used to detect the obtained information from the
allele discrimination reaction (Zdanowicz, 2010). However, the selection of genotyping
methods is usually influenced by crucial factors such as the number of samples, the
throughput, type of polymorphism that can be genotyped using the method, equipment
acquisition, genotyping costs (including labour, consumables), technical expertise
requirement, time consumed, and the ability of the selected method to do multiplex
genotyping in the case of more than one polymorphism at a time requiring genotyping
(Aquilante, Zineh, Beitelshees, & Langaee, 2006; X. Chen & Sullivan, 2003; S. Kim &
Misra, 2007; Kwok, 2001).
An ideal genotyping method should be able to determine a genotype in one attempt,
should allow fast and easy assay development and validation, and should provide the
genotyping results interpreted in an analytical software (Aquilante et al., 2006). A good
genotyping analytical software may reduce the possibility of human interpretation errors
and ambiguous genotyping determinations (Isler, Vesterqvist, & Burczynski, 2007). As
pharmacogenomic tests begin to be applied into the clinical environment, new
additional analytical parameters were also considered in the genotyping methods such
as specificity, sensitivity, reproducibility, and accuracy (Flockhart et al., 2008; Isler et
al., 2007).
For genetic testing, analytical sensitivity refers to the probability that a test will be
positive when a particular DNA sequence is present, meanwhile the analytical 134
Univers
ity of
Mala
ya

specificity refers to the probability that a test will be negative when a particular DNA
sequence is absent (Burke, 2014; Kalle, Kubista, & Rensing, 2014). Reproducibility
refers to the probability of a test repeatedly producing the same results for the same
subjects (Weiss et al., 2008). Meanwhile, accuracy in genetic testing refers to the degree
to which the observed genotype matches the true genotype (Isler et al., 2007).
3.11 Gene Expression Study Experimental Method
Gene expression studies were done for DPP4, WFS1 and KCNJ11 genes. Gene
expression for all 3 genes were compared between cases and controls. The gene
expression experimental process was illustrated in Figure 3.6.
RNA: ribonucleic acid; cDNA: complementary DNA; GE: gene expression
Figure 3.6: The experimental method for gene expression studies.
135
Univers
ity of
Mala
ya

3.11.1 Isolation of RNA
This study used a PAXgene Blood RNA assay kit (PreAnalytiX, Hombrechtikon,
Switzerland) in preparing RNA samples for gene expression.
3.11.2 RNA Isolation Materials and Procedure
The chemicals and reagents supplied per assay kit includes 20 ml of Resuspension
Buffer, 18 ml of Binding Buffer, 45 ml of Wash Buffer 1, 11 ml of concentrated Wash
Buffer 2, 6 ml of Elution Buffer, 2 vials of 125 ml RNase-Free Water, 2 vials of 1.4 ml
Proteinase K, 1500 Kunitz of Rnase-Free Dnase I, 2 vials of 2 ml DNA Digestion
Buffer, and 2 ml of Dnase Resuspension Buffer. Other reagent required but not supplied
by the assay kit was ethanol 96%. As for apparatus, the kit was supplied with 50 units of
PAXgene RNA Spin Columns, 300 units of 2 ml Processing Tubes, 50 units of
Secondary BD Hemogard™ Closures, 160 units of 1.5 ml microcentrifuge tubes, and 50
units of PAXgene Shredder Spin Columns. Other apparatus required to perform the
assay were 10 μl to 4 ml pipets, Rnase-free pipet tips with aerosol barrier, a graduated
cylinder, crushed ice, and a permanent pen for labeling. The equipments required for the
assay were a variable-speed microcentrifuge (Thermo Sorvall™ Legend™ Micro 17R,
Thermo Fisher Scientific™ LLC, Ashville, NC, US), a vortexer (Thermo Scientific™
LP Vortex Mixer, US), and a shaker-incubator (Thermo Fisher Scientific™, Model
4450, Waltham, MA).
The procedure started by centrifuging the PAXgene Blood RNA tube containing
sample for 10 minutes at 3000 to 5000 x g using a swing-out rotor (Thermo Sorvall™
Legend™ Micro 17R, Thermo Fisher Scientific™ LLC, Ashville, NC, US). The blood
sample was ensured to be incubated in the PAXgene Blood RNA tubes for a minimum
136
Univers
ity of
Mala
ya

of 2 hours at room temperature (15° to 25°C) in order to achieve complete lysis of blood
cells. Next, the resulting supernatant was removed by decanting or pipetting, and
approximately 4 ml of RNase-free water was added into the pellet. Then, the tube was
closed using a new secondary BD Hemogard closure. The tube was vortexed until the
pellet is visibly dissolved, and centrifuged for 10 minutes at 3000 to 5000 x g using a
swing-out rotor. After that, the entire resultant supernatant was removed and discarded.
Next, approximately 350 μl resuspension buffer was added and the mix was vortexed
until the pellet was visibly dissolved.
As for the next step, the sample was pipetted into a 1.5 ml microcentrifuge tube, and
300 μl of binding buffer and 40 μl of proteinase K was added. The mixture was mixed
thoroughly by 5 seconds of vortexing and sent to incubation for 10 minutes at 55°C
using a shaker-incubator at 400 to 1400 rpm. After incubation, the temperature of the
shaker-incubator was set to 65°C for later. Next, the lysate was pipetted directly into a
PAXgene Shredder spin column placed in a 2 ml processing tube, and centrifuged for 3
minutes at maximum speed (not exceeding 20,000 x g). Then, the entire supernatant of
the flow-through fraction was carefully transferred to a fresh 1.5 ml microcentrifuge
tube without disturbing the pellet in the process tube. After that, approximately 350 μl
of ethanol (96 to 100%) was added and the mix was mixed thoroughly by vortexing, and
centrifuged briefly for 1 to 2 seconds at 500 to 1000 x g to remove any drops from the
inside of the tube lid. Then, 700 μl of sample was pipetted into the PAXgene RNA spin
column placed in a 2 ml processing tube, and centrifuged for 1 minute at 8000 to 20,000
x g. The spin column was placed in a new 2 ml processing tube, and the old processing
tube containing the flow-through was discarded. The remaining sample was pipetted
into the PAXgene spin column and centrifuged for 1 minute at 8000 to 20,000 x g. The
spin column was placed in a new 2 ml processing tube, and the old processing tube
137
Univers
ity of
Mala
ya

containing the flow-through was discarded. Next, approximately 350 μl of wash buffer
was pipetted into the PAXgene RNA spin column and centrifuged for 1 minute at 8000
to 20,000 x g. The spin column was placed in a new 2 ml processing tube, and the old
processing tube containing the flow-through was discarded. Next, approximately 10 μl
of Dnase I stock solution was added to 70 μl DNA digestion buffer in a 1.5 ml
microcentrifuge tube, and gently mixed by flicking the tube to avoid any physical
denaturation. Then, 80 μl of the Dnase I incubation mix was pipetted directly onto the
PAXgene RNA spin column membrane, and placed on the bench top at 20°C to 30°C
for 15 minutes. After that, approximately 350 μl of wash buffer was pipetted into the
PAXgene spin column and centrifuged for 1 minute at 8000 to 20,000 x g. The spin
column was placed in a new 2 ml processing tube and the old processing tube
containing flow-through was discarded. Next, 500 μl of wash buffer 2 was pipetted into
the PAXgene RNA spin column and centrifuged for 1 minute at 8000 to 20,000 x g. The
spin column was placed in a new 2 ml processing tube and the old processing tube
containing the flow-through was discarded. Then, another 500 μl of wash buffer 2 was
added to the PAXgene RNA spin column and centrifuged for 3 minutes at 8000 to
20,000 x g. The processing tube containing the flow-through was discarded and the
PAXgene RNA spin column was placed in a 1.5 ml microcentrifuge tube.
Approximately 40 μl of elution buffer was directly pipetted onto the PAXgene RNA
spin column membrane, and centrifuged for 1 minute at 8000 to 20,000 x g to elute the
RNA. The elution step was repeated as described above, using 40 μl elution buffer and
the same microcentrifuge tube. The eluate was incubated for 5 minutes at 65°C in the
shaker-incubator without shaking. After incubation, the isolated RNA was chilled
immediately on ice, and stored at -20°C. The concentration of the isolated RNA was
determined using Nanodrop 2000c (Thermo Scientific™, Wilmington, DE, USA)
138
Univers
ity of
Mala
ya

spectrophotometer at wavelength 260 nm and 280 nm. The resulted RNA samples were
stored in -20°C.
3.11.3 Standardization of RNA Samples Concentration
As for ABI Step-One Plus RT-PCR (Applied Biosystems™, Foster City, CA) gene
expression protocol, we standardized all samples to 50 ng/μl. RNase free-water was
used to dilute the samples. Dilution calculation was used to achieve accurate 50 ng/μl
concentration (Figure 3.5).
3.11.4 Conversion of RNA to cDNA
Conversion of RNA to cDNA is required for gene expression protocol. cDNA or
complementary DNA is a double-stranded DNA synthesized from a specific single
stranded RNA template in a reaction catalysed by reverse transcriptase (Krug & Berger,
1987). High Capacity RNA-to-cDNA kit (Applied Biosystems™, Foster City, CA) was
used for this purpose. The kit can be used either with reverse transcriptase (RT) or
without RT. For this study, conversion of RNA to cDNA with RT was chosen. The kit
consists of 2x RT Buffer Mix and 20x RT Enzyme Mix. The protocol also required a
MicroAmp® Fast 96-Wells Reaction Plate and an adhesive film. The conversion of
RNA to cDNA protocol required a Real-Time PCR instrument (Applied Biosystems™,
Foster City, CA), a swinging-bucket centrifuge (Thermo Sorvall™ ST 16R, MA,
USA), a microcentrifuge (Thermo Sorvall™ Legend™ Micro 17R, Thermo Fisher
Scientific™ LLC, Ashville, NC), and a vortexer (Thermo Scientific™ LP Vortex
Mixer, US).
139
Univers
ity of
Mala
ya

For 1 well reaction, 1 μl of 20x RT Enzyme Buffer was added to 10 μl of 2x RT
Buffer, both mixed gently and placed on ice. Since 1 well required approximately 9 μl
sample and will resulted in 20 μl cDNA, we had calculated that up to 76 wells RT
reaction mix needed to be prepared.
For reverse transcriptase plate preparation, approximately 11 μl RT reaction mix was
pipetted into all designated wells in a MicroAmp™ Fast 96-Wells Reaction Plate. Next,
9 μl of sample was added into each designated well. The plate was sealed with an
MicroAMP® Optical adhesive film and centrifuged briefly with a bucket centrifuge
(Thermo Sorvall™ ST 16R, MA, USA) for 1 minute. To perform the RT process, the
Real-Time PCR instrument (Applied Biosystems™, Foster City, CA) was programed
according to the parameter settings. Next, the plate was loaded into the instrument and
the RT run proceeded with. The resulting cDNA samples were stored at -20°C.
3.11.5 Selection of Housekeeping Gene
The ideal housekeeping gene used to normalize mRNA quantitation should be stable,
expressed in cells or tissues of interest and does not influenced by the experimental
conditions or disease state (Rebouças et al., 2013). Glyceraldehyde-3-phosphate
dehydrogenase (GAPDH) and β-actin are the most common housekeeping genes used in
gene expression to normalize mRNA quantitation in study samples. In this study, β-
actin was selected as the housekeeping gene because it exhibits moderately abundant
expression in most cell types and the expression level of this gene does not vary
severely due to subject treatment (Weber et al., 2014). GAPDH was rejected because
the expression levels of this gene is stimulated by insulin levels and since the study
140
Univers
ity of
Mala
ya

treatment aim is to raised insulin levels, GAPDH expression levels may be influenced
by study samples (Caradec, Sirab, Revaud, Keumeugni, & Loric, 2010).
3.11.6 Standard Curve Dilution Protocol
For the development of a standard curve for each gene, 1 sample each from case and
control groups were diluted to the dilution factor of 1:5, resulting in concentrations of
50, 10, 2, 0.4 and 0.08 ng/μl.
3.11.7 Standard Curve Plate Preparation
TaqMan® Fast Advance Master Mix cocktail was prepared for 4 genes; β-actin
(housekeeping gene), DPP4, WFS1 and KCNJ11 separately according to the protocol.
The TaqMan® gene expression assays chosen for the 4 genes are shown in Table 3.10.
For gene expression, all tests were done in triplicate. Then, the Fast Advance Master
Mix cocktail was pipetted: approximately 19 μl into each well according to each gene
column from row A until E, and 20 μl into row F. Next, 1 μl of the diluted sample was
pipetted into each designated well. Rows G and F were left empty. After that, the plate
was sealed with a MicroAMP® Optical adhesive film and sent for a brief centrifuge
(Thermo Sorvall™ ST 16R, MA, USA) for 1 minute. Finally, the plate was inserted into
the ABI Step-One Plus RT-PCR instrument (Applied Biosystems™, Foster City, CA)
and set to run on a standard curve protocol. Results were collected and reviewed. The
protocol was repeated for a complete set of standard curves for both case and control
groups.
141
Univers
ity of
Mala
ya

Table 3.10: The TaqMan® gene expression assay used for each of the genes.
Genes TaqMan® gene expression assay
β-actin Hs01101944_s1
DPP4 Hs00175210_m1
WFS1 Hs00903605_m1
KCNJ11 Hs00265026_s1 Hs: Homo sapiens; _s: an assay whose primers and probes are designed within a single exon. Such assays, by definition, detect genomic DNA; _m: an assay whose probe spans an exon junction; 1: a region within exon 1 (Applied Biosystems™ (ABI, 2010)).
3.11.8 Gene Expression Plate Preparation
Similar to the preparation for standard curve, the TaqMan® Fast Advance Master
Mix cocktail was prepared separately for 4 genes; β-actin (housekeeping gene), DPP4,
WFS1 and KCNJ11 separately according to the protocol shown in Table 3.11. The
TaqMan® gene expression assays chosen for the 4 genes are shown previously in Table
3.10. For gene expression, all tests will be done in triplicates. Then, the TaqMan® Fast
Advance Master Mix cocktail was pipetted- approximately 19 μl into each well
according to each gene columns from row A until G, and 20 μl into row H. Row H
served as control. Next, 1 μl of the diluted samples was pipetted into each designated
well. After that step, the plate was sealed with a MicroAMP® Optical adhesive film and
sent for a brief centrifuge (Thermo Sorvall™ ST 16R, MA, USA) for 1 minute. Finally,
the plate was inserted into the Real-Time PCR instrument (Applied Biosystems™,
Foster City, CA) and set to run on a gene expression protocol. Results were collected
and reviewed. The protocol was repeated for a complete set of 13 subjects for both case
and control groups.
142
Univers
ity of
Mala
ya

Table 3.11: The TaqMan® Fast Advance Master Mix cocktail was prepared for 4 genes; β-actin (housekeeping gene), DPP4, WFS1 and KCNJ11 separately.
Components for Fast Advance Master Mix
cocktail
1 reaction /
well (μl)
26 reactions (μl)
for 1 gene
Fast Advance Master Mix 10 260
TaqMan® gene expression assay 1 26
RNase free water 8 208
Total 19 494
3.12 Statistical Techniques
All statistical analyses were performed by the researcher and verified by an
experienced statistician.
3.12.1 Preliminary Statistics
All statistical analyses were performed using statistical sofware: Statistical package
for Social Science (SPSS) (Version 20.0, International Business Machines Corporation
(IBM, 2011). Descriptive statistics such as frequencies, percentages, means, ranges and
standard deviation (SD) were used to describe the data. All categorical data were
expressed as absolute number and percentage whereas continuous data were expressed
as mean ± standard deviation if normally distributed or median (interquartile range) if
skewed. Kolmogrov-Smimov test or Shapiro-Wilk test was used to test normality of a
continuous variable (IBM, 2011). Pearson Chi-square test with continuity correction
was used to examine the association between categorical variables, and Independent t-
test was used to examine the association between continuous variables (IBM, 2011).
When the expected cell count was more than 20% or less than 5, Fisher Exact Test was
used (IBM, 2011). In univariate analysis, all variables with p value of < 0.250 (Hosmer
143
Univers
ity of
Mala
ya

& Lemeshow, 2004) were considered in multivariate analysis. In multivariate analysis,
all variables with the p value of < 0.05 were considered as statistically significant.
3.12.2 Statistics Used for Genetic Markers
All genetic analyses were performed by using a genomic analysis software,
Haploview 4.2 (J. C. Barrett, Fry, Maller, & Daly, 2005). Hardy-Weinburg Equilibrium
(HWE) was applied using a goodness-of fit χ2 test with one degree of freedom for all
groups (J. C. Barrett et al., 2005). Bonferroni adjustment was used to obtain the
predefined p value for genetic associations (Lunetta, 2008). A resulting p value
threshold of more than 0.05 was considered to be significant in agreement with HWE (J.
C. Barrett et al., 2005).
3.12.3 Genotypes Association Study
The laboratory methods for the genotypes association study were as described in the
genotyping method. The analyses between the genes were done using Haploview 4.2 (J.
C. Barrett et al., 2005) and SPSS software (IBM, 2011). Genotypes association study
included the linkage disequilibrium measurements and the estimation of haplotype
effects of the DPP4, WFS1 and KCNJ11 polymorphisms (Figure 3.7).
144
Univers
ity of
Mala
ya

Figure 3.7: Genotypes association study diagram.
3.12.4 Linkage Disequilibrium Measurements of the DPP4, WFS1 and KCNJ11
Genes Polymorphisms
The Haplotype Map (HapMap) is a list of common DNA variations across the whole
human genome (Gibbs et al., 2003). The HapMap comprises of four populations which
are Yoruba from Ibadan, Nigeria (YRI), Japanese from Tokyo, Japan (JPT), Han
Chinese from Beijing, China (CHB) and Caucasians from Utah, USA populations with
Northern and Western European ancestry (CEU) (Gibbs et al., 2003). This resource has
provided great advantages for many studies to utilize linkage disequilibrium for finding
genetic variations related to drug treatment responses (Gibbs et al., 2003).
The Haploview 4.2 software was used to compute the allele and haplotype analyses
(J. C. Barrett et al., 2005). For this study, HWE test was used to analyse the probable
haplotype frequencies based on linkage disequilibrium (LD). The parameters used to
measure linkage disequilibrium in this study were D’ and r2 (J. C. Barrett et al., 2005).
D’ is the amount an observed frequency of a haplotype differs from its expected
frequency, where the value is also adjusted for allele frequency (Licinio & Wong,
2003). r2 is the measure of the correlation strength of two variables (Licinio & Wong,
145
Univers
ity of
Mala
ya

2003). The LD was used to measure the effect of interaction between polymorphisms of
DPP4, WFS1 and KCNJ11 genes.
3.12.5 Estimations of Haplotype Effects of DPP4, WFS1 and KCNJ11 Gene
Polymorphisms
Logistic regression (IBM, 2011) was used to estimate the haplotype effects of the
DPP4, WFS1 and KCNJ11 gene polymorphisms. The estimation of haplotype effects
was expressed as the odds ratio (OR) and compared to the reference haplotype with
95% confidence intervals (95% CI). A p value of less than 0.05 was considered
significant.
3.12.6 Gene Expression Analyses
For gene expression analyses, relative quantification and absolute quantification
were done for all genes in cases and controls. Relative quantification was used to
determine the fold changes in expression between two samples, while absolute
quantification was used to determine the gene expression levels in absolute number of
copies by using standard curves (QIAGEN, 2013). In relative quantification, the gene of
interest is normalized to that of a housekeeping gene in the same sample, and then the
normalized samples were compared between samples to obtain the fold change
(QIAGEN, 2013).
Real-time PCR data were expressed as fold-change of target gene expression relative
to the geometric mean. The fold change in gene expression was computed by StepOne
Plus™ software (Applied Biosystems™, Foster City, CA). Descriptive statistics such as
146
Univers
ity of
Mala
ya

frequencies, percentages, means, ranges and standard deviation (SD) were used to
describe the data. All categorical data were expressed as absolute number and
percentage whereas continuous data were expressed as mean ± standard deviation if
normally distributed or median (interquartile range) if skewed. Kolmogorov-Smirnov
test or Shapiro-Wilk test was used to test normality of continuous data. Pearson Chi-
square test with continuity correction was used to examine the association between
categorical variables. Significance level was accepted at p < 0.05.
3.12.7 Development of Association Models for DPP-4 Inhibitor Treatment
Response in T2D
Association models for DPP-4 inhibitor treatment response were developed based on
two main elements: (1) clinical factors and (2) genetic factors (Figure 3.8). Binary
logistic regressions were used to produce association models of treatment response. The
predictor variables were selected based on significant outcomes during preliminary
regression analysis.
147
Univers
ity of
Mala
ya

DPP-4 : dipeptidyl peptidase-4
Figure 3.8: Association models for DPP-4 inhibitor treatment response were constructed from clinical and genetic factors.
3.12.7.1 Assumptions in selection of SNPs for association modeling
For association modeling, the selection of SNPs were based on the assumptions that
there is Hardy-Weinburg equilibrium in the population and the disease risks are
multiplicative (Clarke et al., 2011). As null hypothesis is of no association between SNP
and disease, the first condition to be assumed was that there is HWE in both cases and
controls (Clarke et al., 2011). As for the alternative hypothesis, the second condition
was to assume that controls will be in HWE, as well as the final condition i.e. to
assume that cases will also be in HWE (Clarke et al., 2011). Based on these
assumptions, the allelic frequencies in unaffected and affected subjects may be
estimated through case-control studies (Clarke et al., 2011).
148
Univers
ity of
Mala
ya

3.12.7.2 Association model testing
To test the association models; Hosmer and Lemeshow method was used and value
at p>0.05 indicates that chosen data are suitable for a test model (IBM, 2011).
Meanwhile, Omnibus test value at p<0.05 (significant) was taken to represent model
efficiency (IBM, 2011). The Nagelkerke R square is the estimation of R2 value in
logistic regression model (IBM, 2011), where it shows the amount of variance in the
dependent variable that can be explained by the independent variable (Nagelkerke,
1991), The ranking of associations of a model is determined by the OR and significance
(p<0.05) value (IBM, 2011).
149
Univers
ity of
Mala
ya

CHAPTER 4: RESULTS
RESULTS PART 1: SUBJECTS CHARACTERISTICS
4.1 Patient Recruitment and Disposition
A total of 3398 patients with T2D (ICD-10 code E 11.0-E 11.8) were identified using
a computerized database i.e. the UMMC Hospital Information System (HIS), which is
based on International Statistical Classification of Diseases Tenth Revision (ICD-10)
(Figure 4.1). Their hospital registration numbers were identified and keyed into the
Pharmacy Information System (PIS) database and it was then determined if they were
on DPP-4 inhibitors. Of the 3398 patients with T2D, identified, 1306 were on DPP-4
inhibitor therapy and the rest (2092 patients) on other antidiabetics therapy (Figure 4.1).
150
Univers
ity of
Mala
ya

T2D : Type 2 diabetes; DM : Diabetes Mellitus; DPP-4 : dipeptidyl peptidase-4; HIV : Human immunodeficiency virus; SBP : systolic blood pressure; DBP : diastolic blood pressure; WC : waist circumference
Figure 4.1: CONSORT diagram: Patient recruitment & disposition
Exactly 21.5% of the 1306 cases (on DPP-4 inhibitor therapy) (n=281) were
excluded due to the unavailability of patient medical records resulting in 1025 potential
participants in the case group (Figure 4.1). A further 280 more of these cases were
excluded due to either incomplete data in patient medical records (6.0%) or not meeting
inclusion criteria (22.7%) (insulin-use (56.6%), advanced age (>75 years old) (9.6%),
anemia (8.7%), HIV-infection (0.4%), and use of other medications that can affect
glycemic status (24.7%)). Next, among the 745 eligible patients on DPP-4 inhibitor
therapy with complete medical records that fulfilled the inclusion criteria (57%), 34.4%
refused to participate. Of the remaining 489, 158 were excluded including 56.3% who
151
Univers
ity of
Mala
ya

refused blood-taking, 23.4% who failed to show up for blood-taking, 19.7% who had
insufficient blood for analysis and one patient (0.6%) who withdrew consent; resulting
in a final participation of 331 patients in the case group (Figure 4.1).
The initial number of controls (patients on other agents besides DPP-4 inhibitors)
identified from HIS was 2092 but 29.8% of these were excluded because we were
unable to retrieve medical records and 20.5% were excluded because data in the
medical records were incomplete (Figure 4.1). From the resultant 1168 patients, we
further excluded 40.8% of patients due to failure to satisfy study inclusion criteria:
insulin-use (49.6%), advanced age (>75 years old) (6.7%), anemia (8.6%), HIV
infection (1.3%), cancer (0.4%), and other medications that affect glycemia (33.4%).
Among all of the patients in the control group that met the inclusion criteria (20.4%),
361/692 were excluded due to refusal to participate, refusing blood sampling, ‘no show’
in appointment and insufficient blood withdrawn for analysis (46.7%). The final number
of participants in the control group reached up to 331 patients (Figure 4.1).
4.2 Characteristics of DPP-4 Inhibitor Users and Non-users
Overall, 44.7% of patients who were DPP-4 inhibitor users exhibited good treatment
response (A1c <7%) in comparison with only 28.7% of non-DPP-4 inhibitor users.
4.2.1 Comparison of Demographic and Anthropometric Characteristics of
DPP-4 Inhibitor Users and Non-users (Table 4.1)
An equal number of (331) T2D DPP-4 inhibitor users and (331) T2D non-DPP-4
inhibitor users were recruited into the case and control group respectively. There were
152
Univers
ity of
Mala
ya

an equal proportion of male and female gender in both the case and control group.
There were no significant differences in ethnic composition between the 2 groups with
Malay-descent patients making up the majority of patients (45.3% of case group, 51.1%
of control group) followed by those of Chinese (29.9% of case group, 26.9% of control
group), and Indian (19% of case group, 17.2% of control group) ethnicity.
Subjects in the case group were younger (case group (56.3 years old) versus control
group (58 years old), p<0.05) and had a longer duration of diabetes (case group (9.1
years) versus control group (8.8 years), p<0.05). Mean BMI and mean WC were similar
in both groups. The majority in both groups were either overweight or obese. Both
groups were also abdominally obese with mean WC of 103 cm and 106.4 cm in case
and control groups respectively.
The mean A1c in case group was significantly lower by 1.0% compared to control
group (7.4% (±1.4) and 8.4% (±2.3), respectively). Additionally, the case group had
lower mean FPG than the control group, with a difference of 0.7 mmol/L (Table 4.1).
Mean fasting triglycerides, LDL cholesterol, fasting insulin and HOMAIR were
significantly higher in the control group (Table 4.1). T2D patients who were DPP-4
inhibitors users were found to have better glycemic control (A1c <7.0%, 44.7%)
compared to the T2D patients who were not on DPP-4 inhibitors (A1c <7.0%, 28.7%)
(Table 4.1).
153
Univers
ity of
Mala
ya

Table 4.1: Comparison of demographic, anthropometric, clinical, biochemical and genetic characteristics in DPP-4 inhibitor users (cases) and non-users
(controls).
Variables N=662 Case
(n=331)
Control
(n=331)
p-value
Good glycemic control (A1c
<7.0%)
243
(36.7%)
148
(44.7%)
95
(28.7%)
<0.001 δ
Suboptimal glycemic control
(A1c ≥7.0%)
419
(63.3%)
183
(55.3%)
236
(71.3%)
Gender
Male 331
(50.0%)
168
(50.8%)
163
(49.2%)
0.687 δ
Female 331
(50.0%)
163
(49.2%)
168
(50.8%)
Ethnicity
Malay 319
(48.2%)
150
(45.3%)
169
(51.1%)
0.462 δ
Chinese 188
(28.4%)
99 (29.9%) 89 (26.9%)
Indian 120
(18.1%)
63 (19.0%) 57 (17.2%)
Others 35 (5.3%) 19 (5.7%) 16 (4.8%)
Age (year) 57.5 (±7.3) 56.3 (±6.8) 58.0 (±7.3) 0.036 γ,a
Duration of T2D (year) 8.9 (±4.3) 9.1 (±4.5) 8.8 (±4.2) 0.043 γ,a
BMI (kg/m2)
Underweight (<18.50) 19 (2.9%) 16 (4.8%) 3 (0.9%) 0.449 δ
Normal weight (18.50 –
24.99)
213
(32.2%)
112
(33.8%)
94 (28.4%)
Overweight (25.00 – 29.99) 362
(54.7%)
165
(49.8%)
174
(52.6%)
Obesity (≥30.00) 68 (10.3%) 38 (11.6%) 60 (18.1%)
154
Univers
ity of
Mala
ya

Table 4.1, continued Variables N=662 Case
(n=331)
Control
(n=331)
p-value
WC (cm) 104.7
(±13.0)
103.0
(±12.4)
106.4
(±13.3)
0.284 γ
Male (cm) 103.7
(±12.8)
106.5
(±13.8)
103.9
(±12.3)
-
Female (cm) 102.4
(±12.0)
105.1
(±14.5)
104.3
(±12.0)
-
Laboratory values
FPG (mmol/L) 9.1 (±2.1) 8.8 (±1.6) 9.5 (±2.4) 0.008 γ,a
A1c (%) 7.9 (±2.0) 7.4 (±1.4) 8.4 (±2.3) <0.001 δ
Fasting Insulin (pmol/L) 132.8
(±78.8)
123.7
(±77.7)
141.8
(±79.0)
0.047 γ,a
Total
cholesterol
(mmol/L)
5.0 (±1.3) 4.9 (±1.1) 5.0 (±1.2) 0.654 γ
Triglyceride (mmol/L) 1.6 (±0.7) 2.0 (±1.0) 2.2 (±0.9) 0.029 γ,a
HDL cholesterol (mmol/L) 1.2 (±0.4) 1.1 (±0.3) 1.4 (±0.5) 0.392 γ
LDL cholesterol (mmol/L) 2.5 (±0.8) 2.5 (±0.7) 2.6 (±0.9) 0.016 γ,a
DBP (mmHg) 79.6 (±9.2) 77.4 (±9.1) 81.2 (±8.8) 0.009 γ,a
SBP (mmHg) 131.4
(±14.3)
129.5
(±12.7)
133.4
(±15.6)
0.317 γ
ALT (IU/L) 26.8 (±6.9) 25.8 (±7.0) 27.5 (±6.7) 0.559 γ
AST (IU/L) 20.2
(±5.5)
20.9
(±5.6)
19.4
(±5.3)
0.038 γ,a
HOMAIR (%) 2.8 (±1.6) 2.5 (±1.6) 3.1 (±1.7) 0.013 γ,a
sCD26 level (ng/ml) 547.0
(±107.6)
485.3
(±77.8)
608.6
(±97.3)
0.441 γ
155
Univers
ity of
Mala
ya

Table 4.1, continued Variables N=662 Case
(n=331)
Control
(n=331)
p-value
Comorbidities
Hypertension Yes
626
(94.6%)
No
36 (5.4%)
Yes
308
(93.1%)
No
23 (6.9%)
Yes
318
(96.1%)
No
13 (3.9%)
0.666 δ
Peripheral Neuropathy Yes
96 (14.5%)
No
566
(85.5%)
Yes
55 (16.6%)
No
276
(83.4%)
Yes
41 (12.4%)
No
290
(87.6%)
0.687 δ
Dyslipidemia Yes
506
(76.4%)
No
156
(23.6%)
Yes
236
(71.3%)
No
95
(28.7%)
Yes
270
(81.6%)
No
61
(18.4%)
0.276 δ
Treatment regimen 0.059 δ,a
Monotherapy 87 (13.1%) - 87 (26.3%) 0.018 δ,a
Dual therapy 514(77.6%) 278(84.0%) 236(71.3%) 0.107 δ,a
Triple therapy 61 (9.3%) 53 (16.0%) 8 (2.4%) 0.654 δ
Antidiabetic drug
Biguanide 662
(100%)
331
(100%)
331
(100%)
-
Sulphonylureas 257(38.8%) 43 (13.0%) 214(64.7%) 0.027 δ,a
Thiazolidinedione 48 (7.3%) 10 (3.0%) 38 (11.5%) 0.615 δ Data are expressed n (%) or mean values (SD). In univariate analysis, all variables with p value of < 0.250 (Hosmer & Lemeshow, 2004) were considered in multivariate analysis. No p value generated for 'Biguanide' because Biguanide is a constant. T2D: Type 2 diabetes; FPG: Fasting Plasma Glucose; A1c: glycated haemoglobin; HDL: High Density Lipoprotein; LDL: Low Density Lipoprotein; SBP: Systolic Blood Pressure; DBP: Diastolic Blood Pressure; ALT: Alanine Transferase; AST: Aspartate Aminotransferase. δ Pearson Chi-Square γ Independent t-test a considered in multivariate analysis
156
Univers
ity of
Mala
ya

The variables in Table 4.1, which attained clinical significance of p<0.25 such as
age, duration of T2D, FPG, fasting insulin , triglyceride, LDL cholesterol, DBP, AST,
HOMAIR, dual therapy and sulphonylurea use were hypothesized to predict glycemic
control in T2D on oral therapy (excluding SGLT2 inhibitors), and thus subjected to
further analyses in predictive models. ‘Monotherapy’ was excluded from this table and
regression model because only control group used monotherapy; cases group did not
used monotherapy.
4.2.2 Determination of Categorizations of Significant Variables Obtained From
Table 4.1 for Further Analyses in Predictive Models
The American Diabetes Association has defined older adults as those aged 65 years
old and above in a Consensus Development Conference on Diabetes and Older Adults
in February 2012 (Kirkman et al., 2012). Since then, many studies of diabetes in older
adults have used age 65 years as the cut-off point for defining older age in diabetes
(Caspersen, Thomas, Boseman, Beckles, & Albright, 2012; Hammami et al., 2012;
Kirkman et al., 2012; Suzuki, Mistuma, Sato, & Hatta, 2015). Therefore, based on these
studies, we categorized subjects into two age categories; (1) less than 65 years (younger
adults with diabetes), and (2) 65 years or above (older adults with diabetes). As for the
duration of T2D, we categorized patients into duration (1) less than 10 years and (2) 10
or more years, as according to Fox et al. (2004); the risk of cardiovascular diseases or
all-cause mortality raises per 10-year duration of diabetes (Fox et al., 2004) (Table 4.2).
According to the American Diabetes Association, the target FPG level for glycemic
control in patients with diabetes is less than 7 mmol/L (ADA, 2015). Therefore, FPG
results were categorized into two categories; (1) greater than or equal to 7 mmol/L, and
157
Univers
ity of
Mala
ya

(2) less than 7 mmol/L. FPI levels less than 174 pmol/L are recommended (Wallach et
al., 1996), therefore in this study, the FPI levels were categorized into two categories;
(1) less than 174 pmol/L, and (2) equal or greater than 174 pmol/L (Table 4.2). Normal
triglycerides levels are less than 1.7 mmol/L (ADA, 2015), therefore triglycerides data
were categorized into (1) greater than or equal to 1.7 mmol/L, and (2) less than 1.7
mmol/L (Table 4.2). The target LDL cholesterol for patients with diabetes is less than
2.6 mmol/L (ADA, 2015), so LDL cholesterol levels were categorized into (1) less than
2.6 mmol/L, and (2) greater than or equal to 2.6 mmol/L (Table 4.2). The DBP target in
diabetes is less than 90 mmHg (ADA, 2015), therefore the DBP data were categorized
into (1) less than 90 mmHg, and (2) greater than or equal to 90 mmHg (Table 4.2). The
normal AST range is 1–31 U/L (Harris, 2005), therefore the AST data were categorized
into (1) 1 to 31 U/L, and (2) greater than or equal to 31 U/L (Table 4.2). The HOMAIR
values for patients with normal glucose tolerance are within 1.7 and 2.5 (Bonora et al.,
1998; Tripathy et al., 2000). However, insulin resistance is found to be higher in
diabetes patients (Esteghamati et al., 2010). In 2010, Esteghamati et al. conducted a
study in 3,071 Iranian subjects to evaluate HOMAIR values in populations with or
without diabetes and determined that 3.875 was the optimal cut-off point in T2D
patients (Esteghamati et al., 2010). We therefore categorized the HOMAIR results into
(1) less than 3.875 (insulin sensitive), and (2) greater than or equal to 3.875 (insulin
resistance) (Table 4.2).
158
Univers
ity of
Mala
ya

Table 4.2: Dichotomization of significant associations in the case group (obtained from Table 4.1) (n=331).
Significant
variables
Case
(n=331)
A1c < 7%
(n=148)
A1c ≥ 7%
(n=183)
p value
Age
< 65 years old 272 (82.2%)* 131 (88.5%) 141 (77.0%) 0.036 δ,a
≥ 65 years old 59 (17.8%) 17 (11.5%) 42 (23.0%)
Duration of T2D
< 10 years 237 (71.6%)* 115 (77.7%) 122 (66.7%) 0.043 δ,a
≥ 10 years 94 (28.4%) 33 (22.3%) 61 (33.3%)
FPG 148 183
< 7 mmol/L 34 (10.3%) 19 (12.8%) 15 (8.2%) 0.167 δ,a
≥ 7 mmol/L 297 (89.7%)* 129 (87.2%) 168 (91.8%)
Insulin
< 174 pmol/L 239 (72.2%)* 107 (72.3%) 132 (72.1%) 0.973 δ
≥ 174 pmol/L 92 (27.8%) 41 (27.7%) 51 (27.9%)
Triglycerides
< 1.7 mmol/L 290 (87.6%)* 137 (92.6%) 153 (83.6%) 0.014 δ,a
≥ 1.7 mmol/L 41 (12.4%) 11 (7.4%) 30 (16.4%)
LDL cholesterol
< 2.6 mmol/L 208 (62.8%)* 87 (58.8%) 121 (66.1%) 0.017 δ,a
≥ 2.6 mmol/L 123 (37.2%) 61 (41.2%) 62 (33.9%)
DBP
< 90 mmHg 237 (71.6%)* 115 (77.7%) 122 (66.7%) 0.027 δ,a
≥ 90 mmHg 94 (28.4%) 33 (22.3%) 61 (33.3%)
AST
≤ 31 U/L 327 (98.8%)* 145 (98.0%) 182 (99.5%) 0.220 δ,a
> 31 U/L 4 (1.2%) 3 (2.0%) 1 (0.5%)
HOMAIR
< 3.875 256 (77.3%)* 116 (78.4%) 140 (76.5%) 0.685 δ
≥ 3.875 75 (22.7%) 32 (21.6%) 43 (23.5%)
Dual therapy
Yes 278 (84.0%)* 121 (81.8%) 157 (85.8%) 0.157 δ,a
No 53 (16.0%) 27 (18.2%) 26 (14.2%)
159
Univers
ity of
Mala
ya

Table 4.2, continued
Significant
variables
Case
(n=331)
A1c < 7%
(n=148)
A1c ≥ 7%
(n=183)
p value
Sulphonylurea
Yes 43 (13.0%) 23 (15.5%) 20 (89.1%) 0.464 δ
No 288 (87.0%)* 125 (84.5%) 163 (10.9%) * Chosen as reference category. Data are expressed n (%) or mean values (SD). In univariate analysis, all variables with p value of < 0.250 (Hosmer & Lemeshow, 2004) were considered in multivariate analysis. T2D: Type 2 diabetes; FPG: Fasting plasma glucose; LDL: Low-density lipoprotein; DBP: Diastolic blood pressure; AST: aspartate aminotransferase; HOMAIR: Homeostasis Model Assessment of Insulin Resistance. δ Pearson Chi-Square a considered in multivariate analysis
160
Univers
ity of
Mala
ya

4.3 Comparison of Demographic, Anthropometric, Clinical, and Biochemical
Characteristics in Good and Poor Responders to DPP-4 Inhibitor Therapy
(Table 4.3)
Overall, 44.7% of patients who were DPP-4 inhibitor users exhibited good treatment
response.
Table 4.3: Comparison of demographic, anthropometric, clinical and biochemical characteristics between good and poor responders to DPP-4 inhibitor
therapy.
Variables Good response
(A1c <7%)
(n=148)
Poor response
(A1c ≥7%)
(n=183)
p-value
Gender
Male 76 (51.4%) 92 (50.3%) 0.845 δ
Female 72 (48.6%) 91 (49.7%)
Ethnicity
Malay 70 (47.3%) 80 (43.7%) 0.700 δ
Chinese 45 (30.4%) 54 (29.5%)
Indian 24 (16.2%) 39 (21.3%)
Others 9 (6.1%) 10 (5.5%)
Age (year) 56.6 (±7.0) 56.0 (±6.6) 0.415 γ
Duration of T2D (year) 8.8 (±4.2) 9.2 (±4.6) 0.329 γ
BMI (kg/m2)
Underweight (<18.50) 9 (6.1%) 7 (3.8%) 0.726 δ
Normal weight (18.50 – 24.99) 47 (31.8%) 65 (35.5%)
Overweight (25.00 – 29.99) 81 (54.7%) 84 (45.9%)
Obesity (≥30.00) 11 (7.4%) 27 (14.8%)
WC (cm) 104.2 (±13.4) 102.1 (±11.6) 0.135 γ,a
Male (cm) 106.1 (±13.9) 101.7 (±11.6) -
Female (cm) 102.2 (±12.6) 102.5 (±11.6) -
161
Univers
ity of
Mala
ya

Table 4.3, continued
Variables Good response
(A1c <7%)
(n=148)
Poor response
(A1c ≥7%)
(n=183)
p-value
Laboratory values
FPG (mmol/L) 8.7 (±1.7) 8.9 (±1.6) 0.300 γ
A1c (%) 6.3 (±0.5) 8.3 (±1.3) <0.001 δ
Fasting Insulin (pmol/L) 120.5 (±75.2) 126.4 (±79.8) 0.498 γ
Total cholesterol
(mmol/L)
4.9 (±1.2) 4.9 (±1.1) 0.675 γ
Triglyceride (mmol/L) 1.8 (±0.9) 2.0 (±1.0) 0.025 γ,a
HDL cholesterol (mmol/L) 1.1 (±0.4) 1.1 (±0.3) 0.267 γ
LDL cholesterol (mmol/L) 2.6 (±0.7) 2.4 (±0.7) 0.044 γ,a
DBP (mmHg) 77.5 (±8.9) 77.4 (±9.3) 0.917 γ
SBP (mmHg) 130.0 (±12.9) 129.0 (±12.5) 0.480 γ
ALT (IU/L) 26.2 (±7.3) 25.5 (±6.8) 0.332 γ
AST (IU/L) 21.4 (±5.5) 20.6 (±5.7) 0.197 γ
HOMAIR (%) 2.5 (±1.5) 2.6 (±1.6) 0.444 γ
sCD26 level (ng/ml) 486.4 (±81.6) 484.4 (±74.9) 0.823 γ
Comorbidities
Hypertension Yes
140 (94.6%)
No
8 (5.4%)
Yes
168 (91.8%)
No
15 (8.2%)
0.321 δ
Peripheral Neuropathy Yes
22 (14.9%)
No
126 (85.1%)
Yes
33 (18.0%)
No
150 (82.0%)
0.441 δ
Dyslipidemia Yes
103 (69.6%)
No
45 (30.4%)
Yes
133 (72.7%)
No
50 (27.3%)
0.538 δ
162
Univers
ity of
Mala
ya

Table 4.3, continued
Variables Good response
(A1c <7%)
(n=148)
Poor response
(A1c ≥7%)
(n=183)
p-value
DPP-4 inhibitor regimens 0.196 δ,a
DPP-4 inhibitor + biguanide 121 (81.8%) 157 (85.8%) 0.157 δ,a
DPP-4 inhibitor + biguanide +
sulphonylurea
23 (15.5%) 20 (10.9%) 0.464 δ
DPP-4 inhibitor + biguanide +
thiazolidinedione
4 (2.7%) 6 (3.3%) 0.195 δ,a
Treatment regimen
Dual therapy 121 (81.8%) 157 (85.8%) 0.157 δ,a
Triple therapy 27 (18.2%) 26 (14.2%) 0.687 δ
Antidiabetic drug n=169 n=215
Sitagliptin 108 (63.9%) 127 (59.1%) 0.476 δ
Vildagliptin 33 (19.5%) 43 (20.0%) 0.796 δ
Linagliptin 7 (4.1%) 13 (6.0%) 0.367 δ
Sulphonylurea 17 (10.1%) 26 (12.1%) 0.464 δ
Thiazolidinedione 4 (2.4%) 6 (2.8%) 0.195 Ω,a
Biguanide 148 (100%) 183 (100%) - Results expressed a n (%) or mean values (SD). Chi-square test or t-test was used for p value where appropriate. In univariate analysis, all variables with p value of < 0.250 (Hosmer & Lemeshow, 2004) were considered in multivariate analysis. No p value generated for 'Biguanide' because Biguanide is a constant. T2D: Type 2 diabetes; FPG: Fasting Plasma Glucose; A1c: glycated haemoglobin; WC: waist circumference; HDL: High Density Lipoprotein; LDL: Low Density Lipoprotein; SBP: Systolic Blood Pressure; DBP: Diastolic Blood Pressure; ALT: Alanine Transferase; AST: Aspartate Aminotransferase. δ Pearson Chi-Square Ω Fisher’s exact test
γ Independent t-test a considered in multivariate analysis
Fasting triglyceride and LDL cholesterol were statistically different between
responders and non-responders (p<0.05). Use of sulphonlyureas, biguanides and
thiazolidinediones however were not statistically significantly different (p<0.05)
between those with optimal and suboptimal glycemic control on DPP-4 inhibitor
therapy. Only WC, fasting triglyceride, LDL cholesterol levels, AST and treatment 163
Univers
ity of
Mala
ya

regimes reached the threshold of clinical significance (p<0.25) for a difference between
responders and non-responders to DPP-4 inhibitor therapy that allowed inclusion in the
final predictor model. Although thiazolidinedione also reached the threshold of clinical
significance (p<0.25) for a difference between responders and non-responders to DPP-4
inhibitor therapy, we excluded this variable because of low sample size (subjects using
thiazolidinedione were less than 3% in each groups; responders and non-responders).
Use of sulphonlyureas, biguanides and thiazolidinediones were not statistically
significantly different (p<0.05) between those with optimal and suboptimal glycemic
control on DPP-4 inhibitor therapy (Table 4.3).
4.3.1 Dichotomization of Significant Variables Obtained From Table 4.3 for
Further Analyses in Association Models
Variables were dichotomized into categories based on the rationale presented in
Section 4.2.2.
Table 4.4: Categorical comparison of dichotomized significant variables derived from Table 4.3 between responders and non-responders.
Significant
variables
Case
(n=331)
A1c < 7%
(n=148)
A1c ≥ 7%
(n=183)
p value
WC
WC male < 90 cm 8 (2.5%) 2 (1.4%) 6 (3.3%) 0.489 δ
WC male ≥ 90 cm 160 (48.3%) 74 (50.0%) 86 (47.0%)
WC female < 80 cm - - -
WC female ≥ 80 cm 163 (49.2%)* 72 (48.6%) 91 (49.7%)
Triglycerides
< 1.7 mmol/L 290 (87.6%)* 137 (92.6%) 153 (83.6%) 0.014 δ,a
≥ 1.7 mmol/L 41 (12.4%) 11 (7.4%) 30 (16.4%)
LDL cholesterol
< 2.6 mmol/L 208 (62.8%)* 87 (58.8%) 121 (66.1%) 0.017 δ,a
≥ 2.6 mmol/L 123 (37.2%) 61 (41.2%) 62 (33.9%)
164
Univers
ity of
Mala
ya

Table 4.4, continued
Significant
variables
Case
(n=331)
A1c < 7%
(n=148)
A1c ≥ 7%
(n=183)
p value
AST
≤31 U/L 327 (98.8%)* 145 (98.0%) 182 (99.5%) 0.328 ρ
> 31 U/L 4 (1.2%) 3 (2.0%) 1 (0.5%)
DPP-4 inhibitor +
biguanide
Yes 278 (84.0%)* 121 (81.8%) 157 (85.8%) 0.157 δ,a
No 53 (16.0%) 27 (18.2%) 26 (14.2%)
DPP-4 inhibitor +
biguanide +
sulphonylurea
Yes 43 (12.3%) 23 (15.5%) 20 (10.9%) 0.464 δ
No 288 (87.7%) 125 (84.5%) 163 (89.1%)
DPP-4 inhibitor +
biguanide +
thiazolidinedione
Yes 10 (3.0%) 4 (2.7%) 6 (3.3%) 0.195 δ,a
No 321 (97.0%)* 144 (97.3%) 177 (96.7%)
Thiazolidinedione
Yes 10 (3.0%) 4 (2.7%) 6 (3.3%) 0.195 δ,a
No 321 (97.0%)* 144 (97.3%) 177 (96.7%) * Chosen as reference category. In univariate analysis, all variables with p value of < 0.250 (Hosmer & Lemeshow, 2004) were considered in multivariate analysis. Although 'Dual therapy' was significant (p<0.25), we did not included it into this dichotomization section for multivariate analysis because it was the same as "DPP-4 inhibitor + biguanide'. WC: Waist circumference; LDL: Low-density lipoprotein; AST: aspartate aminotransferase; DPP-4: Dipeptidyl peptidase. δ Pearson Chi-Square
ρ Fisher’s Exact test a considered in multivariate analysis
165
Univers
ity of
Mala
ya

4.4 Comparison of Demographic, Anthropometric, Clinical and Biochemical
Characteristics in Controls with Optimal and Suboptimal Glycemic
Control (Table 4.5)
Overall, only 28.7% of patients in the control group were found to have good
glycemic control on their oral anti-diabetic regimen. Patients in the control group with
good glycemic control were significantly younger with shorter duration of diabetes and
lower FPG (p<0.05). Ethnicity and BMI each showed a significant difference between
controls with good and suboptimal glycemic control. Those with good glycemic control
had a significantly higher LDL and lower DBP. Those with good glycemic control also
had significantly higher sCD26 levels. A significantly higher proportion of subjects
with good glycemic control were on triple therapy with biguanide + sulphonylurea +
thiazolidinedione. In addition, ethnicity, BMI, fasting insulin, fasting triglycerides,
HOMAIR, SBP, peripheral neuropathy and thiazolidinedione use reached the threshold
of clinical significance (p<0.25) and were incorporated into the final predictor model.
166
Univers
ity of
Mala
ya

Table 4.5: Comparison of demographic, anthropometric, clinical, laboratory and genetic characteristics of T2D patients in control group with good and
suboptimal glycemic control.
Variables Good glycemic
control
(A1c <7%)
(n=95)
Suboptimal
glycemic
control
(A1c ≥7%)
(n=236)
p-value
Gender
Male 48 (50.5%) 115 (48.7%) 0.767 δ
Female 47 (49.5%) 121 (51.3%)
Ethnicity
Malay 57 (60.0%) 112 (47.5%) 0.111 δ
Chinese 18 (18.9%) 71 (30.1%)
Indian 17 (17.9%) 40 (16.9%)
Others 3 (3.2%) 13 (5.5%)
Age (year) 56.0 (±7.8) 58.8 (±6.9) 0.002 γ,a
Duration of T2D (year) 8.0 (±3.3) 9.1 (±4.5) 0.028 γ,a
BMI (kg/m2)
Underweight (<18.50) - 3 (1.3%) 0.210 δ
Normal weight (18.50 – 24.99) 34 (35.8%) 67 (28.4%)
Overweight (25.00 – 29.99) 52 (54.7%) 128 (54.2%)
Obesity (≥30.00) 9 (9.5%) 38 (16.1%)
WC (cm) 107.4 (±15.0) 106.0 (±12.6) 0.393 γ
Male (cm) 106.8 (±13.6) 106.0 (±13.0) -
Female (cm) 108.0 (±16.4) 106.0 (±12.3) -
Laboratory values
FPG (mmol/L) 8.7 (±1.7) 9.6 (±2.6) 0.065 γ,a
A1c (%) 6.2 (±0.4) 9.2 (±2.2) <0.001 δ
Fasting Insulin (pmol/L) 131.4 (±70.9) 146.0 (±81.9) 0.130 γ,a
Total cholesterol
(mmol/L)
5.3 (±1.5) 5.2 (±1.3) 0.612 γ
Triglyceride (mmol/L) 2.1 (±0.9) 2.3 (±1.0) 0.113 γ,a
167
Univers
ity of
Mala
ya

Table 4.5, continued Variables Good glycemic
control
(A1c <7%)
(n=95)
Suboptimal
glycemic
control
(A1c ≥7%)
(n=236)
p-value
Laboratory values
HDL cholesterol (mmol/L) 1.4 (±0.5) 1.4 (±0.4) 0.960 γ
LDL cholesterol (mmol/L) 2.7 (±0.8) 2.5 (±0.9) 0.015 γ,a
DBP (mmHg) 79.1 (±9.1) 82.1 (±8.5) 0.005 γ,a
SBP (mmHg) 131.8
(±15.4)
134.1
(±15.6)
0.227 γ,a
ALT (IU/L) 27.2
(±6.9)
28.1
(±6.4)
0.279 γ
AST (IU/L) 19.7
(±5.3)
19.2
(±5.3)
0.429 γ
HOMAIR (%) 2.8 (±1.4) 3.2 (±1.8) 0.057 γ,a
sCD26 level (ng/ml) 630.6
(±99.0)
484.4
(±74.9)
0.009 γ,a
Comorbidities
Hypertension Yes
91 (95.8%)
No
4 (4.2%)
Yes
227 (96.2%)
No
9 (3.8%)
0.866 δ
Peripheral Neuropathy Yes
15 (15.8%)
No
80 (84.2%)
Yes
26 (11.0%)
No
210 (89.0%)
0.233 δ
Dyslipidemia Yes
77 (81.1%)
No
18 (18.9%)
Yes
193 (81.8%)
No
43 (18.2%)
0.877 δ
168
Univers
ity of
Mala
ya

Table 4.5, continued Variables Good glycemic
control
(A1c <7%)
(n=95)
Suboptimal
glycemic
control
(A1c ≥7%)
(n=236)
p-value
Antidiabetic
regimens
0.173 δ,a
Biguanide 21 (22.1%) 66 (28.0%) 0.412 δ
Biguanide + Sulphonylurea 58 (61.1%) 148 (62.7%) 0.975 δ
Biguanide + Thiazolidinedione 13 (13.7%) 17 (7.2%) 0.869 δ
Biguanide + Sulphonylurea +
Thiazolidinedione
3 (3.2%) 5 (2.1%) 0.046 δ,a
Treatment regimen
Monotherapy 21 (22.1%) 66 (28.0%) 0.412 δ
Dual therapy 71 (74.7%) 165 (69.9%) 0.789 δ
Triple therapy 3 (3.2%) 5 (2.1%) 0.046 δ,a
Antidiabetic class n=77 n=175
Sulphonylurea 61 (79.2%) 153 (87.4%) 0.512 δ
Thiazolidinedione 16 (20.8%) 22 (12.6%) 0.238 δ,a
Biguanide 95 (100%) 236 (100%) - Results expressed as n (%) or mean values (SD). Chi-square test or t-test was used for P value where appropriate. ). In univariate analysis, all variables with p value of < 0.250 (Hosmer & Lemeshow, 2004) were considered in multivariate analysis. No p value generated for 'Biguanide' in the 'Antidiabetic class' because that 'Biguanide' is a constant. T2D: Type 2 diabetes; FPG: Fasting Plasma Glucose; A1c: glycated haemoglobin; WC: waist circumference; HDL: High Density Lipoprotein; LDL: Low Density Lipoprotein; SBP: Systolic Blood Pressure; DBP: Diastolic Blood Pressure; ALT: Alanine Transferase; AST: Aspartate Aminotransferase. δ Pearson Chi-Square γ Independent t-test a considered in multivariate analysis
4.4.1 Determination of Categorizations of Significant Variables Obtained From
Table 4.5 for Further Analyses in Association Models
Variables were dichotomized into categories based on the rationale presented in
Section 4.2.2.
169
Univers
ity of
Mala
ya

In addition, BMI was categorized into underweight (<18.50 kg/m2), normal weight
(18.50 – 24.99 kg/m2), overweight (25.00 – 29.99 kg/m2) and obesity (≥30.00 kg/m2) as
per WHO recommendations (Nuttall, 2015). The SBP target in diabetes is less than 130
mmHg (ADA, 2015), so SBP data were categorized into (1) less than 130 mmHg, and
(2) greater than or equal to 130 mmHg (Table 4.6).
We used ROC curve to determine the cut-off point for sCD26 levels. However, since
the AUC was not significant (p=0.117 (95%CI 0.488-0.623), area=0.56), this variable
was excluded from the predictor model.
Table 4.6: Comparison of dichotomized variables from Table 4.5 with p value <0.25 between controls with optimal and suboptimal glycemic control.
Significant variables Control
(n=331)
A1c < 7% A1c ≥ 7% p value
Ethnicity
Malay 169 (51.1%)* 57 (60.0%) 112 (47.5%) 0.111 δ,a
Chinese 89 (26.9%) 18 (18.9%) 71 (30.1%)
Indian 57 (17.2%) 17 (17.9%) 40 (16.9%)
Others 16 (4.8%) 3 (3.2%) 13 (5.5%)
Age
< 65 years old 267 (80.7%)* 82 (86.3%) 185 (78.4%) 0.099 δ,a
≥ 65 years old 64 (19.3%) 13 (13.7%) 51 (21.6%)
Duration of T2D
< 10 years 248 (74.9%)* 77 (81.1%) 171 (72.5%) 0.103 δ,a
≥ 10 years 83 (25.1%) 18 (18.9%) 65 (27.5%)
BMI
Underweight
(<18.50)
3 (0.9%) - 3 (1.3%) 0.233 ρ,a
Normal weight
(18.50 – 24.99)
101 (30.5%) 34 (35.8%) 67 (28.4%)
Overweight (25.00 –
29.99)
180 (54.4%)* 52 (54.7%) 128 (54.2%)
Obesity (≥30.00) 47 (14.2%) 9 (9.5%) 38 (16.1%)
170
Univers
ity of
Mala
ya

Table 4.6, continued
Significant variables Control
(n=331)
A1c < 7% A1c ≥ 7% p value
FPG
< 7 mmol/L 26 (7.9%) 8 (8.4%) 18 (7.6%) 0.808 δ
≥ 7 mmol/L 305 (92.1%)* 87 (91.6%) 218 (92.4%)
Insulin
< 174 pmol/L 216 (65.3%)* 66 (69.5%) 150 (63.6%) 0.307 δ
≥ 174 pmol/L 115 (34.7%) 29 (30.5%) 86 (36.4%)
Triglycerides
< 1.7 mmol/L 87 (26.3%) 26 (27.4%) 61 (25.8%) 0.776 δ
≥ 1.7 mmol/L 244 (73.7%)* 69 (72.6%) 175 (74.2%)
LDL cholesterol
< 2.6 mmol/L 179 (54.1%)* 44 (46.3%) 135 (57.2%) 0.072 δ,a
≥ 2.6 mmol/L 152 (45.9%) 51 (53.7%) 101 (42.8%)
DBP
< 90 mmHg 228 (68.9%)* 70 (73.7%) 158 (66.9%) 0.231 δ,a
≥ 90 mmHg 103 (31.1%) 25 (26.3%) 78 (33.1%)
SBP
< 130 mmHg 106 (32.0%) 35 (36.8%) 71 (30.1%) 0.233 δ,a
≥ 130 mmHg 225 (68.0%)* 60 (63.2%) 165 (69.9.3%)
HOMAIR
< 3.875 220 (66.5%)* 70 (73.7%) 150 (63.6%) 0.078 δ,a
≥ 3.875 111 (33.5%) 25 (26.3%) 86 (36.4%)
Peripheral
Neuropathy
Yes 41 (12.4%) 15 (15.8%) 26 (11.0%) 0.233 δ,a
No 290 (87.6%)* 80 (84.2%) 210 (89.0%)
Biguanide +
Sulphonylurea +
Thiazolidinedione
Yes 8 (2.4%) 3 (37.5%) 5 (62.5%) 0.032 δ,a
No 323 (97.6%)* 92 (28.5%) 231 (71.5%)
171
Univers
ity of
Mala
ya

Table 4.6, continued
Significant variables Control
(n=331)
A1c < 7% A1c ≥ 7% p value
Thiazolidinedione
Yes 38 (11.5%) 16 (42.1%) 22 (57.9%) 0.238 δ,a
No 293 (88.5%)* 79 (27.0%) 214 (73.0%) * Chosen as reference category. In univariate analysis, all variables with p value of < 0.250 (Hosmer & Lemeshow, 2004) were considered in multivariate analysis. Although 'Triple therapy was significant (Table 4.5), we did not included it in this dichotomization table because it is the same with 'Biguanide + SU + TZD'. T2D: Type 2 diabetes; FPG: Fasting plasma glucose; LDL: Low-density lipoprotein; DBP: Diastolic blood pressure; HOMAIR: Homeostasis Model Assessment of Insulin Resistance. δ Pearson Chi-Square ρ Fisher’s Exact test a considered in multivariate analysis
4.5 Comparison of Demographic, Anthropometric, Clinical and Biochemical
Characteristics in Participants with Good and Suboptimal Glycemic
Control on Oral Antidiabetics (with or without DPP-4 Inhibitor Therapy)
in Overall Study Population (Table 4.7)
Overall, 36.7% of patients who were oral antidiabetics users exhibited optimal
glycemic control of A1c<7%. Age, duration of T2D, FPG, fasting insulin levels,
triglycerides, LDL cholesterol, DBP, AST and HOMAIR were found to be statistically
significantly different (p<0.05) between patients with good and suboptimal glycemic
control on any oral antidiabetic therapy (except for SGLT2 inhibitors) (Table 4.7). DPP-
4 inhibitor therapy use was significantly higher in those with optimal glycemic control
and use of sulphonylureas significantly higher in those with suboptimal glycemic
control (p<0.05). Use of monotherapy and dual therapy reached the threshold of clinical
significant difference (p<0.25) between those with optimal and suboptimal glycemic
control on oral antidiabetic therapy. All significant variables with p<0.25 were
subjected for further analysis in association model.
172
Univers
ity of
Mala
ya
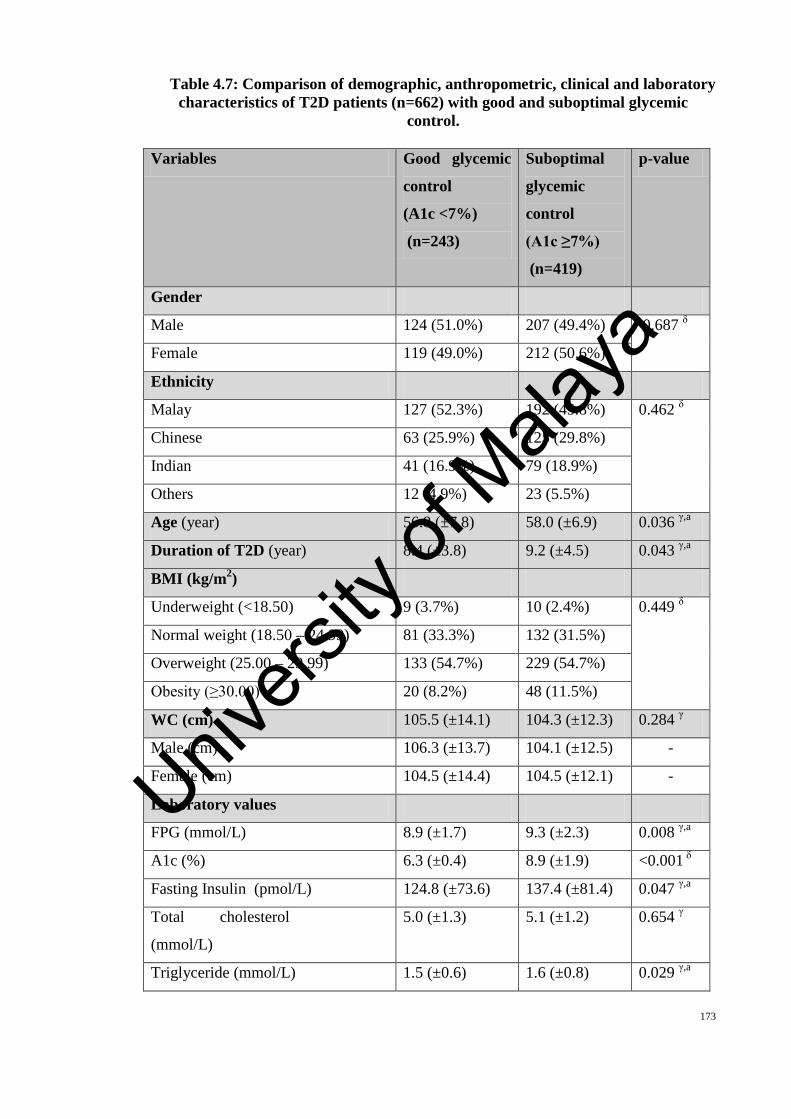
Table 4.7: Comparison of demographic, anthropometric, clinical and laboratory characteristics of T2D patients (n=662) with good and suboptimal glycemic
control.
Variables Good glycemic
control
(A1c <7%)
(n=243)
Suboptimal
glycemic
control
(A1c ≥7%)
(n=419)
p-value
Gender
Male 124 (51.0%) 207 (49.4%) 0.687 δ
Female 119 (49.0%) 212 (50.6%)
Ethnicity
Malay 127 (52.3%) 192 (45.8%) 0.462 δ
Chinese 63 (25.9%) 125 (29.8%)
Indian 41 (16.9%) 79 (18.9%)
Others 12 (4.9%) 23 (5.5%)
Age (year) 56.8 (±7.8) 58.0 (±6.9) 0.036 γ,a
Duration of T2D (year) 8.4 (±3.8) 9.2 (±4.5) 0.043 γ,a
BMI (kg/m2)
Underweight (<18.50) 9 (3.7%) 10 (2.4%) 0.449 δ
Normal weight (18.50 – 24.99) 81 (33.3%) 132 (31.5%)
Overweight (25.00 – 29.99) 133 (54.7%) 229 (54.7%)
Obesity (≥30.00) 20 (8.2%) 48 (11.5%)
WC (cm) 105.5 (±14.1) 104.3 (±12.3) 0.284 γ
Male (cm) 106.3 (±13.7) 104.1 (±12.5) -
Female (cm) 104.5 (±14.4) 104.5 (±12.1) -
Laboratory values
FPG (mmol/L) 8.9 (±1.7) 9.3 (±2.3) 0.008 γ,a
A1c (%) 6.3 (±0.4) 8.9 (±1.9) <0.001 δ
Fasting Insulin (pmol/L) 124.8 (±73.6) 137.4 (±81.4) 0.047 γ,a
Total cholesterol
(mmol/L)
5.0 (±1.3) 5.1 (±1.2) 0.654 γ
Triglyceride (mmol/L) 1.5 (±0.6) 1.6 (±0.8) 0.029 γ,a
173
Univers
ity of
Mala
ya

Table 4.7, continued Variables Good glycemic
control
(A1c <7%)
(n=243)
Suboptimal
glycemic
control
(A1c ≥7%)
(n=419)
p-value
HDL cholesterol (mmol/L) 1.2 (±0.4) 1.3 (±0.4) 0.392 γ
LDL cholesterol (mmol/L) 2.6 (±0.8) 2.5 (±0.8) 0.016 γ,a
DBP (mmHg) 78.1 (±9.0) 80.4 (±9.3) 0.009 γ,a
SBP (mmHg) 130.7 (±14.0) 131.9 (±14.6) 0.317 γ
ALT (IU/L) 26.6 (±7.1) 26.9 (±6.7) 0.559 γ
AST (IU/L) 20.7 (±5.5) 19.8 (±5.5) 0.038 γ,a
HOMAIR (%) 2.6 (±1.5) 2.9 (±1.7) 0.013 γ,a
sCD26 level (ng/ml) 542.7 (±113.2) 549.4 (±104.1) 0.441 γ
Comorbidities
Hypertension Yes
231 (95.1%)
No
12 (4.9%)
Yes
395 (94.3%)
No
24 (5.7%)
0.666 δ
Peripheral Neuropathy Yes
37 (15.2%)
No
206 (84.8%)
Yes
59 (14.1%)
No
360 (85.9%)
0.687 δ
Dyslipidemia Yes
180 (76.1%)
No
63 (25.9%)
Yes
326 (77.8%)
No
93 (22.2%)
0.276 δ
Antidiabetic regimens <0.001 δ,a
DPP-4 inhibitor + biguanide 121 (49.8%) 157 (37.5%) <0.001 δ,a
DPP-4 inhibitor + biguanide + SU 23 (9.5%) 20 (4.8%) 0.691 δ
DPP-4 inhibitor + biguanide + TZD 4 (1.6%) 6 (1.4%) 0.339 ρ
Biguanide 21 (8.6%) 66 (15.8%) 0.018 δ,a
Biguanide + SU 58 (23.9%) 148 (35.3%) 0.004 δ,a
174
Univers
ity of
Mala
ya

Table 4.7, continued Variables Good glycemic
control
(A1c <7%)
(n=243)
Suboptimal
glycemic
control
(A1c ≥7%)
(n=419)
p-value
Antidiabetic regimens
Biguanide + TZD 13 (5.3%) 17 (4.1%) 0.435 δ
Biguanide + SU + TZD 3 (1.3%) 5 (1.1%) 0.151 ρ,a
Treatment regimen
Monotherapy 21 (8.6%) 66 (15.8%) 0.018 δ,a
Dual therapy 197 (81.1%) 317 (75.7%) 0.107 δ,a
Triple therapy 24 (9.9%) 37 (8.8%) 0.654 δ
Antidiabetic class n=252 n=384
DPP-4 inhibitors 148 (58.7%) 183 (47.7%) <0.001 δ,a
Sulphonylureas 84 (33.3%) 173 (45.1%) 0.027 δ,a
Thiazolidinedione 20 (8.0%) 28 (7.2%) 0.615 δ
Biguanide 243 (100%) 419 (100%) - Results expressed as n (%) or mean values (SD). Chi-square test or t-test was used for P value where appropriate. In univariate analysis, all variables with p value of < 0.250 (Hosmer & Lemeshow, 2004) were considered in multivariate analysis. No p value generated for 'Biguanide' in the 'Antidiabetic class' because that 'Biguanide' is a contant. T2D: Type 2 diabetes; FPG: Fasting Plasma Glucose; A1c: glycated haemoglobin; WC: waist circumference; HDL: High Density Lipoprotein; LDL: Low Density Lipoprotein; SBP: Systolic Blood Pressure; DBP: Diastolic Blood Pressure; ALT: Alanine Transferase; AST: Aspartate Aminotransferase; SU: sulphonylurea; TZD: thiazolidinedione. δ Pearson Chi-Square ρ Fisher’s Exact test
γ Independent t-test a considered in multivariate analysis
175
Univers
ity of
Mala
ya

4.5.1 Dichotomization of Significant Variables Obtained From Table 4.7 for
Further Analyses in Association Models
Variables were dichotomized into categories based on the rationale presented in
Section 4.2.2.
Table 4.8: Comparison of dichotomized variables from Table 4.7 with p value <0.25 between participants with optimal and suboptimal glycemic control on any
oral antidiabetic agent (except SGLT2 inhibitors) in overall study population (n=662).
All significant variables from Table 4.7 were each divided into categories before
they were entered into the regression model.
Significant
variables
n=662 A1c < 7%
(n=243)
A1c ≥ 7%
(n=419)
p value
Age
< 65 years old 539 (81.4%)* 213 (87.7%) 326 (77.8%) 0.607 δ
≥ 65 years old 123 (18.6%) 30 (12.3%) 93 (22.2%)
Duration of T2D
< 10 years 485 (73.3%)* 192 (79.0%) 293 (69.9%) 0.011 δ,a
≥ 10 years 177 (26.7%) 51 (21.0%) 126 (30.1%)
FPG
< 7 mmol/L 323 (48.8%) 137 (56.4%) 186 (44.4%) 0.003 δ,a
≥ 7 mmol/L 339 (51.2%)* 106 (43.6%) 233 (55.6%)
Insulin
< 174 pmol/L 455 (68.7%)* 173 (71.2%) 282 (67.3%) 0.298 δ
≥ 174 pmol/L 207 (31.3%) 70 (28.8%) 137 (32.7%)
Triglycerides
< 1.7 mmol/L 377 (56.9%)* 163 (67.1%) 214 (51.1%) <0.001 δ,a
≥ 1.7 mmol/L 285 (43.1%) 80 (32.9%) 205 (48.9%)
LDL cholesterol
< 2.6 mmol/L 387 (58.5%)* 131 (53.9%) 256 (61.1%) 0.070 δ
≥ 2.6 mmol/L 275 (41.5%) 112 (46.1%) 163 (38.9%)
176
Univers
ity of
Mala
ya

Table 4.8, continued
Significant
variables
n=662 A1c < 7%
(n=243)
A1c ≥ 7%
(n=419)
p value
DBP
< 90 mmHg 465 (70.2%)* 185 (76.1%) 280 (66.8%) 0.012 δ,a
≥ 90 mmHg 197 (29.8%) 58 (23.9%) 139 (33.2%)
AST
≤31 U/L 651 (98.3%)* 238 (97.9%) 413 (98.6%) 0.544 δ
> 31 U/L 11 (1.7%) 5 (2.1%) 6 (1.4%)
HOMAIR
< 3.875 476 (71.9%)* 186 (76.5%) 290 (69.2%) 0.043 δ,a
≥ 3.875 186 (28.1%) 57 (23.5%) 129 (30.8%)
DPP-4 inhibitor +
biguanide
Yes 278 (42.0%) 121 (49.8%) 157 (37.5%) <0.001 δ,a
No 384 (58.0%)* 122 (50.2%) 262 (62.5%)
DPP-4 inhibitor +
biguanide + SU
Yes 43 (6.5%) 23 (9.5%) 20 (4.8%) 0.691 δ
No 619 (93.5%)* 220 (90.5%) 399 (95.2%)
DPP-4 inhibitor +
biguanide + TZD
Yes 10 (1.5%) 4 (1.6%) 6 (1.4%) 0.339 ρ
No 652 (98.5%)* 239 (98.4%) 413 (98.6%)
Biguanide
Yes 87 (13.1%) 21 (8.6%) 66 (15.8%) 0.018 δ,a
No 575 (86.9%)* 222 (91.4%) 353 (84.2%)
Biguanide + SU
Yes 206 (31.1%) 58 (23.9%) 148 (35.3%) 0.004 δ,a
No 456 (68.9%)* 185 (76.1%) 271 (64.7%)
Biguanide + TZD
Yes 30 (4.5%) 13 (5.3%) 17 (4.1%) 0.435 δ
No 632 (95.5%)* 230 (94.7%) 402 (95.9%)
177
Univers
ity of
Mala
ya

Table 4.8, continued
Significant
variables
n=662 A1c < 7%
(n=243)
A1c ≥ 7%
(n=419)
p value
Biguanide + SU +
TZD
Yes 8 (1.2%) 3 (1.3%) 5 (1.1%) 0.151 ρ,a
No 654 (98.8%)* 240 (98.7%) 414 (98.9%)
Monotherapy
Yes 87 (13.1%) 22 (9.1%) 65 (15.5%) 0.018 δ,a
No 575 (86.9%)* 221 (90.9%) 354 (84.5%)
Dual therapy
Yes 514 (77.6%)* 278 (54.1%) 236 (45.9%) 0.107 δ,a
No 148 (22.4%) 53 (35.8%) 95 (64.2%)
* Designated the reference category. In univariate analysis, all variables with p value of < 0.250 (Hosmer & Lemeshow, 2004, p95) were considered in multivariate analysis. T2D: Type 2 diabetes; FPG: Fasting plasma glucose; LDL: Low-density lipoprotein; DBP: Diastolic blood pressure; AST: aspartate aminotransferase; HOMAIR: Homeostasis Model Assessment of Insulin Resistance; SU: sulphonylurea; TZD: thiazolidinedione δ Pearson Chi-Square ρ Fisher’s Exact test
a considered in multivariate analysis
178
Univers
ity of
Mala
ya

RESULTS PART 2 : GENETICS STUDY
4.6 Genetic Polymorphisms Study
Genotyping of 9 single nucleotide polymorphisms (SNPs) were done for the 3
candidate genes: DPP4, WFS1 and KCNJ11 genes. The DPP4 SNPs genotyped were
rs2970932, rs2268889 and rs1861975. Meanwhile, the WFS1 SNPs genotyped were
rs1046320, rs734312 and rs10010131 and the KCNJ11 SNPs genotyped were
rs2285676, rs5218 and rs5210 (Table 4.9-4.17).
4.6.1 Genotyping Results for Case Group on DPP-4 Inhibitor Therapy
For DPP4 gene polymorphisms, none of the genotypes were found to be
significantly associated with DPP-4 inhibitor treatment response (i.e. A1c <7%).
However, all of the DPP4 gene polymorphisms were in HWE in the case population
(Table 4.9).
Among the WFS1 gene polymorphisms studied, only WFS1 rs734312 polymorphism
was found to be associated with DPP-4 inhibitor treatment response (OR= 1.7 (1.086-
2.650), p=0.019) (Table 4.10). Patients with WFS1 rs734312 (allele A) were 1.7 times
more likely to respond to DPP-4 inhibitor therapy compared to other patients. WFS1
rs734312 and rs10010131 in the case population were in HWE. However, WFS
rs1046320 polymorphism in the case population was not in HWE (Table 4.10).
As for KCNJ11 gene polymorphisms, analyses found that the KCNJ11 rs2285676
polymorphism was associated with DPP-4 inhibitor treatment response (OR= 1.5
(1.083-2.019), p=0.033) (Table 4.11). Patients with KCNJ11 rs2285676 (allele C) were 179
Univers
ity of
Mala
ya

1.5 times more likely to respond to DPP-4 inhibitor therapy compared to other patients.
All of the KCNJ11 gene polymorphisms studied in the case population were in HWE
(Table 4.11).
4.6.2 Genotyping Results for Control Group Not on DPP-4 Inhibitor Therapy
For DPP4 gene polymorphisms, although all of the genotypes were not found to be
associated with non DPP-4 inhibitor therapy oral antidiabetic treatment response (A1c
<7%), DPP4 rs2970932 polymorphism and DPP4 rs1861975 polymorphism in the
control population are in HWE (Table 4.12).
Additionally, no significant associations were found between non DPP-4 inhibitor
therapy oral antidiabetic treatment response (A1c <7%) and each of the WFS1
polymorphisms (rs1046320, rs734312 and rs10010131) (Table 4.13). However, all of
these polymorphisms were found to be in HWE in the population (Table 4.13).
Similar findings were also observed with KCNJ11 gene polymorphisms, wherein
non DPP-4 inhibitor oral antidiabetic therapy showed no significant associations with
these genotypes in terms of optimal glycemic control (A1c<7%). All of the KCNJ11
gene polymorphisms in the population were in HWE (Table 4.14).
4.6.3 Genotyping Results for Whole Study Population Group on Any Oral
Antidiabetic Therapy (n=662) Excluding SGLT2 Inhibitors
In the whole population on any oral antidiabetic therapy (excluding SGLT2
inhibitors) none of the genotypes of the DPP4 gene polymorphisms were significantly
associated with treatment response (i.e. optimal glycemia of A1c<7%). DPP4
rs2970932 and rs1861975 polymorphisms were in HWE in the study population.
180
Univers
ity of
Mala
ya

However, the DPP4 rs2268889 polymorphism was not in HWE in study population
(Table 4.15).
All of the WFS1 gene polymorphisms studied were not found to be associated with
oral antidiabetic treatment response (A1c < 7%) in the study population (Table 4.16).
WFS1 rs734312 and rs10010131 in the study population were in HWE. However, WFS
rs1046320 polymorphism in the study population was not in HWE (Table 4.16).
As for KCNJ11 gene polymorphisms, analyses found that the KCNJ11 rs2285676
polymorphism was found to be associated with oral antidiabetic treatment response
(A1c<7%) (OR= 1.2 (0.934-1.467), p=0.037) (Table 4.17). All of the KCNJ11 gene
polymorphisms studied in the whole population were in HWE (Table 4.17).
4.6.4 Genotype Selection for Association Model
The genotypes of WFS1 rs734312 (X2=5.479, p=0.019, HWE=0.7759) and KCNJ11
rs2285676 (X2=4.559, p=0.033, HWE=0.9596) were subjected to further analysis and
incorporated into the association model in case group. Additionally, only KCNJ11
rs2285676 (X2=4.387, p=0.037, HWE=0.5997) was included in the association model
for the whole study population group. None of the gene polymorphisms were included
in the association model for the control group due to lack of significance (Table 4.9,
Table 4.10 and Table 4.11). Although the p-values did not achieve significant levels
after the Bonferroni adjustment (p<0.0056) for both polymorphisms, both WFS1
rs734312 and KCNJ11 rs2285676 polymorphisms were nominally significant (p<0.05)
in case and whole study population groups and commonly associated with T2D (Cheng
et al., 2013; Haghvirdizadeh et al., 2015).
181
Univers
ity of
Mala
ya

Table 4.9: The DPP4 gene polymorphisms, genotypes, allele distributions and associations with DPP-4 inhibitor treatment response in case group.
MAF: Minor Allele Frequency; X2: Chi square test; OR: Odds Ratio; 95%CI: 95% Confidence Interval Hardy-Weinberg Equilibrium (HWE) p value of more than 0.05 is considered consistent with the HWE test
Gene SNP Genotype [n (%)] Alleles [n(%)] MAF HWE
p value
X2 Unadjusted
OR (95% CI)
P value
DPP4
rs2970932 A1c <7% A1c ≥7% Total
C/C
108 (73.0)
141 (77.0)
249 (75.2)
C/T
37 (25.0)
39 (21.3)
76 (23.0)
T/T
3 (2.0)
3 (1.6)
6 (1.8)
C
253 (85.5)
321 (87.7)
574 (86.7)
T
43 (14.5)
45 (12.3)
88 (13.3)
0.127 0.8735 1.088 0.8 (0.526-1.293) 0.297
rs2268889 A1c <7% A1c ≥7% Total
A/A
22 (14.9)
34 (18.6)
56(16.9)
A/G
72 (48.9)
81 (44.3)
153(46.2)
G/G
54 (36.5)
68 (37.2)
122(36.9)
A
116 (39.2)
149 (40.7)
265 (40.0)
G
180 (60.8)
217 (59.3)
397 (60.0)
0.400 0.5537 0.158 0.9 (0.686-1.283) 0.691
rs1861975 A1c <7% A1c ≥7% Total
A/A
25 (16.9)
24 (13.1)
49(14.8)
A/C
62 (41.9)
82 (44.8)
144(43.5)
C/C
61 (41.2)
77 (42.1)
138(41.7)
A
112 (37.8)
130 (35.5)
242 (36.6)
C
184 (62.2)
236 (64.5)
420 (63.4)
0.366 0.2985 0.379 1.1 (0.804-1.518) 0.538
182
Univers
ity of
Mala
ya

Table 4.10: The WFS1 gene polymorphisms, genotypes, allele distributions and associations with DPP-4 inhibitor treatment response in case group.
* statistically significant (p<0.05) MAF: Minor Allele Frequency; X2: Chi square test; OR: Odds Ratio; 95%CI: 95% Confidence Interval
Hardy-Weinberg Equilibrium (HWE) p value of more than 0.05 is considered consistent with the HWE test.
Gene SNP Genotype [n (%)] Alleles [n(%)] MAF HWE
p value
X2 Unadjusted
OR (95% CI)
P value
WFS1
rs1046320
A1c <7%
A1c ≥7%
Total
A/A
96 (64.9)
113 (61.7)
209(63.1)
A/G
29 (19.6)
48 (26.2)
77(23.3)
G/G
23 (15.5)
22 (12.0)
45(13.6)
A
221 (74.7)
274 (74.9)
495 (74.8)
G
75 (25.3)
92 (25.1)
167 (25.2)
0.252 4.3859 x
10-11 0.004 1.0 (0.695-1.408) 0.953
rs734312
A1c <7%
A1c ≥7%
Total
A/A
2 (1.4)
3 (1.6)
5(1.5)
A/G
47 (31.8)
34 (18.6)
81(24.5)
G/G
99 (66.9) 146 (79.8)
245(74.0)
A
51 (17.2)
40 (10.9)
91 (13.7)
G
245 (82.8)
326 (89.1)
571 (86.3)
0.137 0.7759 5.479 1.7 (1.086-2.650) 0.019*
rs10010131
A1c <7%
A1c ≥7%
Total
A/A
78 (52.7)
87 (47.5)
165(49.8)
A/G
57 (38.5)
82 (44.8)
139(42.0)
G/G
13 (8.8)
14 (7.7)
27(8.2)
A
213 (72.0)
256 (69.9)
469 (70.8)
G
83 (28.0)
110 (30.1)
193 (29.2)
0.292 0.8938 0.321 1.1 (0.786-1.546) 0.571
183
Univers
ity of
Mala
ya

Table 4.11: The KCNJ11 gene polymorphisms, genotypes, allele distributions and associations with DPP-4 inhibitor treatment response in case group.
* statistically significant (p<0.05) MAF: Minor Allele Frequency; X2: Chi square test; OR: Odds Ratio; 95%CI: 95% Confidence Interval
Hardy-Weinberg Equilibrium (HWE) p value of more than 0.05 is considered consistent with the HWE test.
Gene SNP Genotype [n (%)] Alleles [n(%)] MAF HWE
p value
X2 Unadjusted
OR (95% CI)
P value
KCNJ11
rs2285676
A1c<7%
A1c ≥7%
Total
C/C
60 (40.5)
46 (25.1)
106(32.0)
C/T
62 (41.9)
98 (53.6)
160(48.3)
T/T
26 (17.6)
39 (21.3)
65(19.6)
C
182 (59.1)
190 (51.9)
372 (56.2)
T
114 (40.9)
176 (48.1)
290 (43.8)
0.441 0.9596 4.559 1.5 (1.083-2.019) 0.033*
rs5218
A1c<7%
A1c ≥7%
Total
A/A
17 (11.5)
27 (14.8)
44(13.3)
A/G
78 (52.7)
76 (41.5)
154(46.5)
G/G
53 (35.8)
80 (43.7)
133(40.2)
A
112 (37.8)
130 (35.5)
242 (36.6)
G
184 (62.2)
236 (64.5)
420 (63.4)
0.366 1.0000 0.379 1.1 (0.804-1.518) 0.538
rs5210
A1c<7%
A1c ≥7%
Total
A/A
24 (16.2)
38 (20.8)
62(18.7)
A/G
84 (56.8)
95 (51.9)
179(54.1)
G/G
40 (27.0)
50 (27.3)
90(27.2)
A
132 (44.6)
171 (46.7)
303 (45.8)
G
164 (55.4)
195 (53.3)
359 (54.2)
0.458 0.1363 0.298 0.9 (0.674-1.249) 0.585
184
Univers
ity of
Mala
ya

Table 4.12: The DPP4 gene polymorphisms, genotypes, allele distributions and associations with DPP-4 inhibitor treatment response in control group.
MAF: Minor Allele Frequency; X2: Chi square test; OR: Odds Ratio; 95%CI: 95% Confidence Interval Hardy-Weinberg Equlibrium (HWE) p value of more than 0.05 is considered consistent with the HWE test.
Gene SNP Genotype [n (%)] Alleles [n(%)] MAF HWE
p value
X2 Unadjusted
OR (95% CI)
P value
DPP4
rs2970932
A1c<7%
A1c ≥7%
Total
C/C
65 (68.4)
172 (72.9)
237 (71.6)
C/T
26 (27.4)
52 (22.0)
78 (23.6)
T/T
4 (4.2)
12 (5.1)
16 (4.8)
C
156 (82.1)
396 (83.9)
552 (83.4)
T
34 (17.9)
76 (16.1)
110 (16.6)
0.177 0.0545 0.102 0.9 (0.564-1.374) 0.749
rs2268889
A1c<7%
A1c ≥7%
Total
A/A
17 (17.9)
54 (22.9)
71(21.5)
A/G
39 (41.1)
95 (40.3)
134(40.5)
G/G
39 (41.1)
87 (36.9)
126(38.1)
A
73 (38.4)
203 (43.0)
276 (41.7)
G
117 (61.6)
269 (57.0)
386 (58.3)
0.417 0.0031 1.173 0.8 (0.586-1.169) 0.279
rs1861975
A1c<7%
A1c ≥7%
Total
A/A
17 (17.9)
37 (15.7)
54(16.3)
A/C
41 (43.2) 123(52.1)
164(49.5)
C/C
37 (38.9)
76 (32.2)
113(34.1)
A
75 (39.5)
197 (41.7)
272 (41.1)
C
115 (60.5)
275 (58.3)
390 (58.9)
0.411 0.7759 0.287 0.9 (0.646-1.284) 0.592
185
Univers
ity of
Mala
ya

Table 4.13: The WFS1 gene polymorphisms, genotypes, allele distributions and associations with DPP-4 inhibitor treatment response in control group.
MAF: Minor Allele Frequency; X2: Chi square test; OR: Odds Ratio; 95%CI: 95% Confidence Interval
Hardy-Weinberg Equilibrium (HWE) p value of more than 0.05 is considered consistent with the HWE test.
Gene SNP Genotype [n (%)] Alleles [n(%)] MAF HWE
p value
X2 Unadjusted
OR (95% CI)
P value
WFS1
rs1046320
A1c<7%
A1c ≥7%
Total
A/A
63 (66.3)
167 (70.8)
230(69.5)
A/G
27 (28.4)
58 (24.6)
85(25.7)
G/G
5 (5.3)
11 (4.7)
16(4.8)
A
153 (80.5)
392 (83.1)
545 (82.3)
G
37 (19.5)
80 (16.9)
117 (17.7)
0.177 0.0545 0.593 0.8 (0.548-1.300) 0.441
rs734312
A1c<7%
A1c ≥7%
Total
A/A
4 (4.2)
11 (4.7)
15(4.5)
A/G
20 (21.1)
55 (23.3)
75(22.7)
G/G
71 (74.7) 170 (72.0)
241(72.8)
A
28 (14.7)
77 (16.3)
105 (15.9)
G
162 (85.3)
395 (83.7)
557 (84.1)
0.177 0.1162 0.338 0.9 (0.554-1.418) 0.561
rs10010131
A1c<7%
A1c ≥7%
Total
A/A
49 (51.6)
113(47.9)
162(48.9)
A/G
40 (42.1)
97 (41.1)
137(41.4)
G/G
6 (6.3)
26 (11.0)
32(9.7)
A
138 (72.6)
323 (68.4)
461 (69.6)
G
52 (27.4)
149 (31.6)
201 (30.4)
0.313 0.5629 1.412 1.2 (0.843-1.778) 0.235
186
Univers
ity of
Mala
ya

Table 4.14: The KCNJ11 gene polymorphisms, genotypes, allele distributions and associations with DPP-4 inhibitor treatment
response in control group.
MAF: Minor Allele Frequency; X2: Chi square test; OR: Odds Ratio; 95%CI: 95% Confidence Interval Hardy-Weinberg Equilibrium (HWE) p value of more than 0.05 is considered consistent with the HWE test.
Gene SNP Genotype [n (%)] Alleles [n(%)] MAF HWE
p value
X2 Unadjusted
OR (95% CI)
P value
KCNJ11
rs2285676
A1c<7%
A1c ≥7%
Total
C/C
21 (22.1)
70 (29.7)
91(27.5)
C/T
57 (60.0) 122 (51.7)
179(54.1)
T/T
17 (17.9)
44 (18.6)
61(18.4)
C
99 (52.1)
262 (55.5)
361 (54.5)
T
91 (47.9)
210 (44.5)
301 (45.5)
0.450 0.2258 0.359 0.9 (0.662-1.222) 0.549
rs5218
A1c<7%
A1c ≥7%
Total
A/A
14 (14.7)
29 (12.3)
43(13.0)
A/G
45 (47.4)
94 (39.8)
139(42.0)
G/G
36 (37.9) 113 (47.9)
149(45.0)
A
73 (38.4)
152 (32.2)
225 (34.0)
G
117 (61.6)
320 (67.8)
437 (66.0)
0.340 0.2834 2.334 1.3 (0.925-1.865) 0.127
rs5210
A1c<7%
A1c ≥7%
Total
A/A
26 (27.4)
73 (30.9)
99(29.9)
A/G
43 (45.3) 108 (45.8)
151(45.6)
G/G
26 (27.4)
55 (23.3)
81(24.5)
A
95 (50.0)
254 (53.8)
349 (52.7)
G
95 (50.0)
218 (46.2)
313 (47.3)
0.473 0.1433 0.790 0.9 (0.613-1.202) 0.374
187
Univers
ity of
Mala
ya

Table 4.15: The DPP4 gene polymorphisms, genotypes, allele distributions and associations with DPP-4 inhibitor treatment response in study population (n=662).
MAF: Minor Allele Frequency; X2: Chi square test; OR: Odds Ratio; 95%CI: 95% Confidence Interval
Hardy-Weinberg Equilibrium (HWE) p value of more than 0.05 is considered consistent with the HWE test.
Gene SNP Genotype [n (%)] Alleles [n(%)] MAF HWE
p value
X2 Unadjusted
OR (95% CI)
P value
DPP4 rs2970932
A1c<7%
A1c ≥7%
Total
C/C
173 (71.2)
313 (74.7)
486 (73.4)
C/T
63 (25.9)
91 (21.7)
154 (23.3)
T/T
7 (2.9)
15 (3.6)
22 (3.3)
C
409 (84.2)
717 (85.6)
1126 (85.0)
T
77 (15.8)
121 (14.4)
198 (15.0)
0.152 0.0636 0.262 0.8 (0.657-1.223) 0.609
rs2268889
A1c<7%
A1c ≥7%
Total
A/A
39 (16.0)
88 (21.0)
127 (19.2)
A/G
111 (45.7)
176 (42.0)
287 (43.4)
G/G
93 (38.3)
155 (37.0)
248 (37.4)
A
189 (38.4)
352 (42.0)
541 (40.9)
G
297 (61.6)
486 (58.0)
783 (59.1)
0.409 0.0097 1.236 0.9 (0.699-1.104) 0.266
rs1861975
A1c<7%
A1c ≥7%
Total
A/A
42 (17.3)
61 (14.6)
103 (15.6)
A/C
103 (42.4) 205 (48.9)
308 (46.5)
C/C
98 (40.3)
153 (36.5)
251 (37.9)
A
187 (38.5)
327 (39.0)
514 (38.8)
C
299 (61.5)
511 (61.0)
810 (61.2)
0.388 0.6404 0.038 1.0 (0.777-1.229) 0.845
188
Univers
ity of
Mala
ya

Table 4.16: The WFS1 gene polymorphisms, genotypes, allele distributions and associations with DPP-4 inhibitor treatment response in study population (n=662).
MAF: Minor Allele Frequency; X2: Chi square test; OR: Odds Ratio; 95%CI: 95% Confidence Interval
Hardy-Weinberg Equilibrium (HWE) p value of more than 0.05 is considered consistent with the HWE test.
Gene SNP Genotype [n (%)] Alleles [n(%)] MAF HWE
p value
X2 Unadjusted
OR (95% CI)
P value
WFS1
rs1046320
A1c<7%
A1c ≥7%
Total
A/A
159 (65.4)
280 (66.8)
439 (66.3)
A/G
56 (23.0)
106 (25.3)
162 (24.5)
G/G
28 (11.6)
33 (7.9)
61 (9.2)
A
374 (77.0)
666 (79.5) 1040 (78.5)
G
112 (23.0)
172 (20.5)
284 (21.5)
0.215 4.4452 x
10-11 1.160 0.9 (0.659-1.129) 0.282
rs734312
A1c<7%
A1c ≥7%
Total
A/A
6 (2.5)
14 (3.3)
20 (3.0)
A/G
67 (27.6)
89 (21.2)
156 (23.6)
G/G
170 (69.9) 316 (75.5)
486 (73.4)
A
79 (16.3)
117 (14.0)
196 (14.8)
G
407 (83.7)
721 (86.0) 1128 (85.2)
0.157 0.3411 0.784 1.2 (0.877-1.631) 0.376
rs10010131
A1c<7%
A1c ≥7%
Total
A/A
127 (52.3)
200 (47.7)
327 (49.4)
A/G
97 (39.9)
179 (42.7)
276 (41.7)
G/G
19 (7.8)
40 (9.6)
59 (8.9)
A
351 (72.2)
579 (69.1)
930 (70.2)
G
135 (27.8)
259 (30.9)
394 (29.8)
0.302 0.8238 1.808 1.2 (0.910-1.489) 0.179
189
Univers
ity of
Mala
ya

Table 4.17: The KCNJ11 gene polymorphisms, genotypes, allele distributions and associations with DPP-4 inhibitor treatment response in study population (n=662).
* statistically significant (p<0.05)
MAF: Minor Allele Frequency; X2: Chi square test; OR: Odds Ratio; 95%CI: 95% Confidence Interval Hardy-Weinberg Equilibrium (HWE) p value of more than 0.05 is considered consistent with the HWE test.
Gene SNP Genotype [n (%)] Alleles [n(%)] MAF HWE
p value
X2 Unadjusted
OR (95% CI)
P value
KCNJ11
rs2285676
A1c<7%
A1c ≥7%
Total
C/C
81 (33.3)
116 (27.7)
197 (29.8)
C/T
119 (49.0) 220 (52.5)
339 (51.2)
T/T
43 (17.7)
83 (19.8)
126 (19.0)
C
281 (57.8)
452 (53.9)
733 (55.4)
T
205 (42.2)
386 (46.1)
591 (44.6)
0.499 0.5997 4.387 1.2 (0.934-1.467) 0.037*
rs5218
A1c<7%
A1c ≥7%
Total
A/A
31 (12.8)
56 (13.4)
87 (13.1)
A/G
123 (50.6)
170 (40.6)
293 (44.3)
G/G
89 (36.6) 193 (46.0)
282 (42.6)
A
185 (38.1)
282 (33.7)
467 (35.3)
G
301 (61.9)
556 (66.3)
857 (64.7)
0.353 0.4680 2.625 1.2 (0.960-1.529) 0.105
rs5210
A1c<7%
A1c ≥7%
Total
A/A
50 (20.6)
111 (26.5)
161 (24.3)
A/G
127 (52.3) 203 (48.4)
330 (49.8)
G/G
66 (27.1)
105 (25.1)
171 (25.9)
A
227 (46.7)
425 (50.7)
652 (49.2)
G
259 (53.3)
413 (49.3)
672 (50.8)
0.492 0.9892 1.977 0.9 (0.681-1.065) 0.160
190
Univers
ity of
Mala
ya

4.6.5 Summary of Positive Genotyping Results: Comparison Between Groups
Table 4.18: Summary of positive genotyping results: comparison between groups.
Results obtained from Table 4.10, Table 4.11 and Table 4.17.
Characteristics Unadjusted OR
(95% CI)
for
case group
(n=331)
Unadjusted OR
(95% CI)
for
control group
(n=331)
Unadjusted OR
(95% CI)
for
study population
(n=662)
WFS1 rs734312 1.7 (1.086-2.650)* - -
KCNJ11 rs2285676 1.5 (1.083-2.019)* - 1.2 (0.934-1.467)* * p<0.05: statistically significant
KCNJ11 rs2285676 polymorphism was found to be positively associated with DPP-4
inhibitor treatment response (Table 4.11 and Table 4.17). By comparing the odds ratio
between the case and the whole study population group (Table 4.18), KCNJ11
rs2285676 polymorphism in the case group was more likely to be associated with DPP-
4 inhibitor treatment response than in the whole study population group (OR: 1.5 vs.
1.2; case group vs. study population group, respectively) and not at all in the control
group. This indicates the possibility of KCNJ11 rs2285676 polymorphism being
exclusively correlative of response to DPP-4 inhibitor treatment rather than other oral
antidiabetic treatments. WFS1 rs734312 polymorphism however as not found to be
associated with oral antidiabetic (including DPP-4 inhibitors) treatment response in the
whole study population (Table 4.18) indicating the possibility that this gene might not
be strongly associated with DPP-4 inhibitor treatment response.
191
Univers
ity of
Mala
ya

4.6.6 Linkage Disequilibrium of DPP4, WFS1 and KCNJ11 Gene
Polymorphisms
4.6.6.1 Linkage Disequilibrium Between DPP4 Gene Polymorphisms in Patients
with T2D According to the Response to DPP-4 Inhibitors
Figure 4.2: Linkage disequilibrium (LD) structure of DPP4 polymorphisms (rs2970932, rs2268889 and rs1861975) for good DPP-4 inhibitor treatment
response (A1c < 7%) and poor DPP-4 inhibitor treatment response (A1c ≥ 7%) in case group.
The upper diagram shows the relative position of single nucleotide polymorphisms
(SNPs) as vertical lines. Pairwise D’ (linkage disequilibrium coefficient) values are
shown in the diamond boxes.
192
Univers
ity of
Mala
ya

Table 4.19: The correlation coefficient D’ and r2 between DPP4 rs2970932, rs2268889 and rs1861975 polymorphisms (in case group).
DPP4 gene polymorphisms (A1c < 7%)
D’ rs2970932
(T > C)
rs2268889
(G > A)
rs1861975
(A > C)
rs2970932
(T > C)
- 0.531 0.144
rs2268889
(G > A)
0.030 - 0.047
rs1861975
(A > C)
0.002 0.002 r2
DPP4 gene polymorphisms (A1c ≥ 7%)
D’ rs2970932
(T > C)
rs2268889
(G > A)
rs1861975
(A > C)
rs2970932
(T > C)
- 0.135 0.342
rs2268889
(G > A)
0.003 - 0.160
rs1861975
(A > C)
0.008 0.010 r2
D’: linkage disequilibrium coefficient r2: correlation
In both responders and non-responders groups, all three DPP4 gene polymorphisms
were located far from each other in the DPP4 gene (Figure 4.2) and the D’ values of
rs2970932 and rs2268889 in the responders group showed moderate linkage
disequilibrium, while other polymorphisms in both groups showed mild linkage
disequilibrium (Table 4.19). Although there was presence of linkage between these
polymorphisms in this gene, the correlation between these polymorphisms were weak;
showing that the interaction between these polymorphisms does not contribute much to
the effect (treatment response) (Table 4.19).
193
Univers
ity of
Mala
ya

4.6.6.2 Linkage Disequilibrium Between WFS1 Gene Polymorphisms in Patients
with T2D According to the Response to DPP-4 Inhibitors
Figure 4.3: LD structure of WFS1 polymorphisms (rs10010131 and rs734312) for good DPP-4 inhibitor treatment response (A1c < 7%) and poor DPP-4 inhibitor
treatment response (A1c ≥ 7%) in case group.
WFS1 rs1046320 was excluded from the LD structure because the allele frequency
was less than 0.05 (Bonnen, Wang, Kimmel, Chakraborty, & Nelson, 2002). The upper
diagram shows the relative position of single nucleotide polymorphisms (SNPs) as
vertical lines. Pairwise D’ (linkage disequilibrium coefficient) values were shown in the
diamond boxes.
194
Univers
ity of
Mala
ya

Table 4.20: The correlation coefficient D’ and r2 between WFS1 rs1046320, rs734312 and rs10010131 polymorphisms (in case group).
WFS1 gene polymorphisms (A1c < 7%)
D’ rs1046320
(G > A)
rs734312
(G > A)
rs10010131
(A > G)
rs1046320
(G > A)
- - -
rs734312
(G > A)
- - 0.009
rs10010131
(A > G)
- 0.004 r2
WFS1 gene polymorphisms (A1c ≥ 7%)
D’ rs1046320
(G > A)
rs734312
(G > A)
rs10010131
(A > G)
rs1046320
(G > A)
- - -
rs734312
(G > A)
- - 0.113
rs10010131
(A > G)
- 0.004 r2
D’: linkage disequilibrium coefficient r2: correlation
In both responder and non-responder groups, both WFS1 gene polymorphisms
(rs10010131 and rs734312) were located not close to each other in the WFS1 gene
(Figure 4.3) and the D’ values of each polymorphism showed mild linkage
disequilibrium (Table 4.20). Although there was presence of linkage between these
polymorphisms in this gene, the correlation between these polymorphisms were weak
showing that the interaction between these polymorphisms does not contribute much to
the effect (treatment response) (Table 4.20).
195
Univers
ity of
Mala
ya

4.6.6.3 Linkage Disequilibrium Between KCNJ11 Gene Polymorphisms in
Patients with T2D According to the Response to DPP-4 Inhibitors
Figure 4.4: LD structure of KCNJ11 polymorphisms (rs2285676, rs5210 and rs5218) for good DPP-4 inhibitor treatment response (A1c < 7%) and poor DPP-4
inhibitor treatment response (A1c ≥ 7%) in case group.
The upper diagram shows the relative position of single nucleotide polymorphisms
(SNPs) as vertical lines. Pairwise D’ (linkage disequilibrium coefficient) values were
shown in the diamond boxes.
196
Univers
ity of
Mala
ya

Table 4.21: The correlation coefficient D’ and r2 between KCNJ11 rs2285676, rs5210 and rs5218 polymorphisms (in case group).
KCNJ11 gene polymorphisms (A1c < 7%)
D’ rs2285676
(T > C)
rs5210
(G > A)
rs5218
(G > A)
rs2285676
(T > C)
- 0.023 0.117
rs5210
(G > A)
0.0 - 0.246
rs5218
(G > A)
0.005 0.030 r2
KCNJ11 gene polymorphisms (A1c ≥ 7%)
D’ rs2285676
(T > C)
rs5210
(G > A)
rs5218
(G > A)
rs2285676
(T > C)
- 0.007 0.041
rs5210
(G > A)
0.0 - 0.079
rs5218
(G > A)
0.001 0.003 r2
D’: linkage disequilibrium coefficient r2: correlation
In both responders and non-responders groups, all three KCNJ11 gene
polymorphisms were located not close to each other in the KCNJ11 gene (Figure 4.4)
and the D’ values of each polymorphism showed mild linkage disequilibrium (Table
4.21). Although there was presence of linkage between these polymorphisms in this
gene, the correlation between these polymorphisms were weak showing that the
interaction between these polymorphisms does not contribute much to the effect
(treatment response) (Table 4.21).
197
Univers
ity of
Mala
ya

4.6.6.4 Linkage Disequilibrium Between DPP4 Gene Polymorphisms in Patients
with T2D According to the Response to Other Non-DPP-4 Inhibitor Oral
Antidiabetics
Figure 4.5: LD structure of DPP4 polymorphisms (rs2970932, rs2268889 and rs1861975) for good treatment response (A1c < 7%) and suboptimal response (A1c ≥ 7%) to non DPP-4 inhibitor oral antidiabetic therapy in control group.
The upper diagram shows the relative position of single nucleotide polymorphisms
(SNPs) as vertical lines. Pairwise D’ (linkage disequilibrium coefficient) values are
shown in the diamond boxes.
198
Univers
ity of
Mala
ya

Table 4.22: The correlation coefficient D’ and r2 between DPP4 rs2970932, rs2268889 and rs1861975 polymorphisms (in control group).
DPP4 gene polymorphisms (A1c < 7%)
D’ rs2970932
(T > C)
rs2268889
(G > A)
rs1861975
(A > C)
rs2970932
(T > C)
- 0.052 0.440
rs2268889
(G > A)
0.001 - 0.022
rs1861975
(A > C)
0.067 0.0 r2
DPP4 gene polymorphisms (A1c ≥ 7%)
D’ rs2970932
(T > C)
rs2268889
(G > A)
rs1861975
(A > C)
rs2970932
(T > C)
- 0.085 0.185
rs2268889
(G > A)
0.001 - 0.031
rs1861975
(A > C)
0.005 0.001 r2
D’: linkage disequilibrium coefficient r2: correlation
In both patients with good glycemic control and patients with suboptimal glycemic
control, all three DPP4 gene polymorphisms were located not close to each other in the
DPP4 gene (Figure 4.5) and the D’ values of each polymorphisms showed mild linkage
disequilibrium (Table 4.22). Although there was presence of linkage between these
polymorphisms in this gene, the correlation between these polymorphisms were weak
and there was no correlation between rs2268889 and rs1861975 (Table 4.22).
199
Univers
ity of
Mala
ya

4.6.6.5 Linkage Disequilibrium Between WFS1 Gene Polymorphisms in Patients
with T2D According to the Response to Other Non-DPP-4 Inhibitor Oral
Antidiabetics
Figure 4.6: LD structure of WFS1 (rs10010131, rs734312 and rs1046320) for good treatment response (A1c < 7%) and suboptimal response (A1c ≥ 7%) to non
DPP-4 inhibitor oral antidiabetic therapy in control group.
The upper diagram shows the relative position of single nucleotide polymorphisms
(SNPs) as vertical lines. Pairwise D’ (linkage disequilibrium coefficient) values were
shown in the diamond boxes.
200
Univers
ity of
Mala
ya

Table 4.23: The correlation coefficient D’ and r2 between WFS1 rs1046320, rs734312 and rs10010131 polymorphisms (in control group).
WFS1 gene polymorphisms (A1c < 7%)
D’ rs1046320
(G > A)
rs734312
(G > A)
rs10010131
(A > G)
rs1046320
(G > A)
- 0.010 0.159
rs734312
(G > A)
0.0 - 0.076
rs10010131
(A > G)
0.016 0.003 r2
WFS1 gene polymorphisms (A1c ≥ 7%)
D’ rs1046320
(G > A)
rs734312
(G > A)
rs10010131
(A > G)
rs1046320
(G > A)
- 0.033 0.027
rs734312
(G > A)
0.001 - 0.036
rs10010131
(A > G)
0.0 0.0 r2
D’: linkage disequilibrium coefficient r2: correlation
In both patients with good glycemic control and patients with suboptimal glycemic
control, all three WFS1 gene polymorphisms were located not close to each other in the
WFS1 gene (Figure 4.6) and the D’ values of each polymorphisms showed mild linkage
disequilibrium (Table 4.23). Although there was presence of linkage between these
polymorphisms in this gene, the correlation between these polymorphisms were weak
and there was no correlation between rs734312 and rs1046320 in the group of patients
with good glycemic control, and between rs10010131 and rs1046320, and rs10010131
and rs734312 in the group of patients with suboptimal glycemic control (Table 4.23).
201
Univers
ity of
Mala
ya

4.6.6.6 Linkage Disequilibrium Between KCNJ11 Gene Polymorphisms in
Patients with T2D According to the Response to Other Non-DPP-4
Inhibitor Oral Antidiabetics
Figure 4.7: LD structure of KCNJ11 (rs2285676, rs5210 and rs5218) for good treatment response (A1c < 7%) and suboptimal response (A1c ≥ 7%) to non-DPP-
4 inhibitor oral antidiabetic therapy in control group.
The upper diagram shows the relative position of single nucleotide polymorphisms
(SNPs) as vertical lines. Pairwise D’ (linkage disequilibrium coefficient) values were
shown in the diamond boxes.
202
Univers
ity of
Mala
ya

Table 4.24: The correlation coefficient D’ and r2 between KCNJ11 rs2285676, rs5210 and rs5218 polymorphisms (in control group).
KCNJ11 gene polymorphisms (A1c < 7%)
D’ rs2285676
(T > C)
rs5210
(G > A)
rs5218
(G > A)
rs2285676
(T > C)
- 0.058 0.014
rs5210
(G > A)
0.003 - 0.051
rs5218
(G > A)
0.0 0.002 r2
KCNJ11 gene polymorphisms (A1c ≥ 7%)
D’ rs2285676
(T > C)
rs5210
(G > A)
rs5218
(G > A)
rs2285676
(T > C)
- 0.023 0.136
rs5210
(G > A)
0.0 - 0.032
rs5218
(G > A)
0.007 0.001 r2
D’: linkage disequilibrium coefficient r2: correlation
In both patients with good glycemic control and patients with suboptimal glycemic
control, all three KCNJ11 gene polymorphisms were located not close to each other in
the KCNJ11 gene (Figure 4.7) and the D’ values of each polymorphisms showed mild
linkage disequilibrium (Table 4.24). Although there was presence of linkage between
these polymorphisms in this gene, the correlation between these polymorphisms were
weak showing that the interaction between these polymorphisms does not contributing
much to the effect (treatment response) (Table 4.24). There was no correlation between
rs2285676 and rs5218 in the group of patients with good glycemic control, and between
203
Univers
ity of
Mala
ya

rs2285676 and rs5210 in the group of patients with suboptimal glycemic control (Table
4.24).
4.6.7 Effect of Interaction Within Polymorphisms of Pancreatic β-cell Genes in
T2D Patients on Any Oral Antidiabetic Treatment Except for SGLT2
Inhibitors
For estimating the haplotype effects; the relationship between haplotype and
phenotype in comparison to the most frequent haplotype, were used as the estimated
regression parameters. Odds ratio was used for the estimations of haplotype effects, and
were compared to the most frequent haplotype (intercept/reference) in each
polymorphism, with 95% confidence intervals.
204
Univers
ity of
Mala
ya

4.6.8 Linkage Disequilibrium of DPP4, WFS1 and KCNJ11 Gene
Polymorphisms in Whole Study Population on Any Oral Antidiabetic
Treatment Except for SGLT2 Inhibitors (n=662)
4.6.8.1 Linkage disequilibrium between DPP4 gene polymorphisms in patients
with T2D according to the response to any oral antidiabetic
Figure 4.8: LD structure of DPP4 polymorphisms (rs2970932, rs2268889 and rs1861975) for good glycemic control (A1c < 7%) and suboptimal glycemic control
(A1c ≥ 7%) in whole study population (n=662).
The upper diagram shows the relative position of single nucleotide polymorphisms
(SNPs) as vertical lines. Pairwise D’ (linkage disequilibrium coefficient) values are
shown in the diamond boxes.
205
Univers
ity of
Mala
ya

Table 4.25: The correlation coefficient D’ and r2 between DPP4 rs2970932, rs2268889 and rs1861975 polymorphisms (in study population (n=662)).
DPP4 gene polymorphisms (A1c < 7%)
D’ rs2970932
(T > C)
rs2268889
(G > A)
rs1861975
(A > C)
rs2970932
(T > C)
- 0.265 0.142
rs2268889
(G > A)
0.008 - 0.034
rs1861975
(A > C)
0.006 0.001 r2
DPP4 gene polymorphisms (A1c ≥ 7%)
D’ rs2970932
(T > C)
rs2268889
(G > A)
rs1861975
(A > C)
rs2970932
(T > C)
- 0.010 0.192
rs2268889
(G > A)
0.0 - 0.043
rs1861975
(A > C)
0.004 0.001 r2
D’: linkage disequilibrium coefficient r2: correlation
In both patients with good glycemic control and patients with suboptimal glycemic
control, all three DPP4 gene polymorphisms were located not close to each other in the
DPP4 gene (Figure 4.8) and the D’ values of each polymorphisms showed mild linkage
disequilibrium (Table 4.25). Although there was presence of linkage between these
polymorphisms in this gene, the correlation between these polymorphisms were weak
and there was no correlation between rs2268889 and rs2970932 polymorphisms in
patients with suboptimal glycemic control (Table 4.25).
206
Univers
ity of
Mala
ya

4.6.8.2 Linkage disequilibrium between WFS1 gene polymorphisms in patients
with T2D according to the response to any oral antidiabetics
Figure 4.9: LD structure of WFS1 polymorphisms (rs10010131 and rs734312) for good glycemic control (A1c < 7%) and suboptimal glycemic control (A1c ≥ 7%)
in whole study population (n=662).
WFS1 rs1046320 was excluded from the LD structure because the allele frequency
was less than 0.05 (Bonnen et al., 2002). The upper diagram shows the relative position
of single nucleotide polymorphisms (SNPs) as vertical lines. Pairwise D’ (linkage
disequilibrium coefficient) values were shown in the diamond boxes.
207
Univers
ity of
Mala
ya

Table 4.26: The correlation coefficient D’ and r2 between WFS1 rs1046320, rs734312 and rs10010131 polymorphisms (in study population (n=662)).
WFS1 gene polymorphisms (A1c < 7%)
D’ rs1046320
(G > A)
rs734312
(G > A)
rs10010131
(A > G)
rs1046320
(G > A)
- - -
rs734312
(G > A)
- - 0.084
rs10010131
(A > G)
- 0.004 r2
WFS1 gene polymorphisms (A1c ≥ 7%)
D’ rs1046320
(G > A)
rs734312
(G > A)
rs10010131
(A > G)
rs1046320
(G > A)
- - -
rs734312
(G > A)
- - 0.029
rs10010131
(A > G)
- 0.0 r2
D’: linkage disequilibrium coefficient r2: correlation
In both patients with good glycemic control and patients with suboptimal glycemic
control, all three WFS1 gene polymorphisms were located not close to each other in the
WFS1 gene (Figure 4.9) and the D’ values of each polymorphisms showed mild linkage
disequilibrium (Table 4.26). Although there was presence of linkage between these
polymorphisms in this gene, the correlation between these polymorphisms were weak
and there was no correlation between rs734312 and rs1046320 in the group of patients
with suboptimal glycemic control showing that the interaction between these
polymorphisms did not contributed to the effect (treatment response) (Table 4.26).
208
Univers
ity of
Mala
ya

4.6.8.3 Linkage disequilibrium between KCNJ11 gene polymorphisms in patients
with T2D according to the response to any oral antidiabetic
Figure 4.10: LD structure of KCNJ11 polymorphisms (rs2285676, rs5210 and rs5218) for good glycemic control (A1c < 7%) and suboptimal glycemic control
(A1c ≥ 7%) in whole study population (n=662).
The upper diagram shows the relative position of single nucleotide polymorphisms
(SNPs) as vertical lines. Pairwise D’ (linkage disequilibrium coefficient) values were
shown in the diamond boxes.
209
Univers
ity of
Mala
ya

Table 4.27: The correlation coefficient D’ and r2 between KCNJ11 rs2285676, rs5210 and rs5218 polymorphisms (in study population (n=662)).
KCNJ11 gene polymorphisms (A1c < 7%)
D’ rs2285676
(T > C)
rs5210
(G > A)
rs5218
(G > A)
rs2285676
(T > C)
- 0.012 0.060
rs5210
(G > A)
0.0 - 0.101
rs5218
(G > A)
0.002 0.005 r2
KCNJ11 gene polymorphisms (A1c ≥ 7%)
D’ rs2285676
(T > C)
rs5210
(G > A)
rs5218
(G > A)
rs2285676
(T > C)
- 0.023 0.042
rs5210
(G > A)
0.0 - 0.055
rs5218
(G > A)
0.001 0.002 r2
D’: linkage disequilibrium coefficient r2: correlation
In both patients with good glycemic control and patients with suboptimal glycemic
control, all three KCNJ11 gene polymorphisms were located not close to each other in
the KCNJ11 gene (Figure 4.10) and the D’ values of each polymorphisms showed mild
linkage disequilibrium (Table 4.27). Although there was presence of linkage between
these polymorphisms in this gene, the correlation between these polymorphisms were
weak showing that the interaction between these polymorphisms does not contributing
much to the effect (treatment response) (Table 4.27). There was no correlation between
rs2285676 and rs5210 in the group of patients with good glycemic control, and between
210
Univers
ity of
Mala
ya

rs2285676 and rs5210 in the group of patients with suboptimal glycemic control (Table
4.27).
4.6.9 Effect of Haplotype Interaction of DPP4, WFS1 and KCNJ11 Gene
Polymorphisms
4.6.9.1 Effect of haplotype interaction of DPP4 gene polymorphisms with DPP-4
inhibitor treatment response (in case group (n=331))
No effect of haplotype interactions of DPP4 gene polymorphisms with DPP-4
inhibitor treatment response was observed (Table 4.28).
Table 4.28: Estimations of haplotype effects of DPP4 gene polymorphisms (in case group).
Predictor variables OR 95% CI p value
Low High
DPP4 gene polymorphisms
rs2970932
Interaction between CC and CT 1.1 0.879 1.378 0.402
Interaction between CC and TT 1.0 0.951 1.127 0.423
Interaction between CT and TT 1.0 0.882 1.046 0.357
rs2268889
Interaction between AG and GG 0.9 0.855 1.052 0.314
Interaction between AG and AA 1.0 0.884 1.202 0.697
Interaction between GG and AA 1.1 0.951 1.169 0.314
rs1861975
Interaction between AC and CC 1.1 0.955 1.183 0.264
Interaction between AC and AA 1.0 0.824 1.121 0.610
Interaction between CC and AA 1.0 0.853 1.058 0.346 OR: odds ratio CI: confidence interval
211
Univers
ity of
Mala
ya

4.6.9.2 Effect of haplotype interaction of WFS1 gene polymorphisms with DPP-4
inhibitor treatment response (in case group (n=331))
The interaction between haplotype GG and AA of WFS1 rs734312 polymorphism
was 1.3 times more likely to have an effect on DPP-4 inhibitor treatment response
(Table 4.29). However, the interaction between haplotype GG and AG of WFS1
rs734312 polymorphism was 0.8 times less likely to have an effect on DPP-4 inhibitor
treatment response (Table 4.29).
Table 4.29: Estimations of haplotype effects of WFS1 gene polymorphisms (in case group).
Predictor variables OR 95% CI p value
Low High
WFS1 gene polymorphism
rs1046320
Interaction between AA and AG 1.0 0.864 1.166 0.960
Interaction between AA and GG 1.0 0.885 1.047 0.372
Interaction between AG and GG 1.0 0.955 1.129 0.372
rs734312
Interaction between GG and AG 0.8 0.604 0.940 0.012*
Interaction between GG and AA 1.3 1.040 1.632 0.022*
Interaction between AG and AA 1.0 0.864 1.166 0.960
rs10010131
Interaction between AA and AG 1.0 0.802 1.128 0.568
Interaction between AA and GG 1.0 0.891 1.036 0.298
Interaction between AG and GG 1.0 0.965 1.122 0.298 * statistically significant (p<0.05) OR: odds ratio CI: confidence interval
212
Univers
ity of
Mala
ya

4.6.9.3 Effect of haplotype interaction of KCNJ11 gene polymorphisms in
patients with T2D treated with DPP-4 inhibitors (in case group (n=331))
The interaction between haplotype CT and TT of KCNJ11 rs2285676 polymorphism
was 1.1 times more likely to have an effect on DPP-4 inhibitor treatment response
(Table 4.30). However, the interaction between haplotype CC and TT of KCNJ11
rs2285676 polymorphism was 0.9 times less likely to have an effect on DPP-4 inhibitor
treatment response (Table 4.30).
Table 4.30: Estimations of haplotype effects of KCNJ11 gene polymorphisms (in case group).
Predictor variables OR 95% CI p value
Low High
KCNJ11 gene polymorphisms
rs2285676
Interaction between CT and CC 0.9 0.741 1.010 0.067
Interaction between CT and TT 1.1 1.024 1.210 0.012*
Interaction between CC and TT 0.9 0.826 0.977 0.012*
rs5218
Interaction between AG and GG 0.9 0.815 1.025 0.123
Interaction between AG and AA 1.0 0.811 1.115 0.537
Interaction between GG and AA 1.1 0.982 1.232 0.099
rs5210
Interaction between AG and GG 0.9 0.858 1.043 0.263
Interaction between AG and AA 1.0 0.892 1.232 0.567
Interaction between GG and AA 1.1 0.959 1.166 0.263 * statistically significant (p<0.05) OR: odds ratio CI: confidence interval
213
Univers
ity of
Mala
ya

4.6.9.4 Effect of haplotype interaction of DPP4 gene polymorphisms in patients
with T2D treated with other oral antidiabetics (in control group (n=331))
No effect of haplotype interactions of DPP4 gene polymorphisms with other oral
antidiabetics treatment response was observed (Table 4.31).
Table 4.31: Estimations of haplotype effects of DPP4 gene polymorphisms (in control group).
Predictor variables OR 95% CI p value
Low High
DPP4 gene polymorphisms
rs2970932
Interaction between CC and CT 1.1 0.859 1.300 0.601
Interaction between CC and TT 1.0 0.953 1.141 0.364
Interaction between CT and TT 1.0 0.876 1.050 0.364
rs2268889
Interaction between AG and GG 1.0 0.859 1.067 0.431
Interaction between AG and AA 1.1 0.925 1.273 0.317
Interaction between GG and AA 1.0 0.937 1.164 0.431
rs1861975
Interaction between AC and CC 1.0 0.912 1.132 0.768
Interaction between AC and AA 1.0 0.846 1.201 0.929
Interaction between CC and AA 0.9 0.845 1.053 0.298 OR: odds ratio CI: confidence interval
214
Univers
ity of
Mala
ya

4.6.9.5 Effect of haplotype interaction of WFS1 gene polymorphisms in patients
with T2D treated with other oral antidiabetics (in control group (n=331))
No effect of haplotype interactions of WFS1 gene polymorphisms with other oral
antidiabetics treatment response was observed (Table 4.32).
Table 4.32: Estimations of haplotype effects of WFS1 gene polymorphisms (in control group).
Predictor variables OR 95% CI p value
Low High
WFS1 gene polymorphism
rs1046320
Interaction between AA and AG 1.1 0.879 1.323 0.467
Interaction between AA and GG 1.0 0.949 1.132 0.429
Interaction between AG and GG 1.0 0.833 1.054 0.429
rs734312
Interaction between GG and AG 1.0 0.842 1.230 0.859
Interaction between GG and AA 1.0 0.813 1.188 0.859
Interaction between AG and AA 1.1 0.846 1.312 0.640
rs10010131
Interaction between AA and AG 0.9 0.752 1.090 0.294
Interaction between AA and GG 1.0 0.906 1.070 0.714
Interaction between AG and GG 1.0 0.935 1.104 0.714 OR: odds ratio CI: confidence interval
215
Univers
ity of
Mala
ya

4.6.9.6 Effect of haplotype interaction of KCNJ11 gene polymorphisms in
patients with T2D treated with other oral antidiabetics (in control group
(n=331))
No effect of haplotype interactions of KCNJ11 gene polymorphisms with other oral
antidiabetics treatment response was observed (Table 4.33).
Table 4.33: Estimations of haplotype effects of KCNJ11 gene polymorphisms (in control group).
Predictor variables OR 95% CI p value
Low High
KCNJ11 gene polymorphisms
rs2285676
Interaction between CT and CC 0.9 0.777 1.107 0.405
Interaction between CT and TT 1.0 0.861 1.071 0.471
Interaction between CC and TT 1.0 0.933 1.161 0.471
rs5218
Interaction between AG and GG 1.0 0.866 1.112 0.766
Interaction between AG and AA 0.9 0.742 1.043 0.140
Interaction between GG and AA 1.0 0.893 1.147 0.849
rs5210
Interaction between AG and GG 1.0 0.895 1.080 0.730
Interaction between AG and AA 1.1 0.914 1.263 0.382
Interaction between GG and AA 1.0 0.929 1.121 0.669 OR: odds ratio CI: confidence interval
216
Univers
ity of
Mala
ya

4.6.9.7 Effect of haplotype interaction of DPP4 gene polymorphisms with oral
antidiabetic (except SGLT2 inhibitor) treatment response (in study
population (n=662))
No effect of haplotype interactions of DPP4 gene polymorphisms with oral
antidiabetic treatment response were observed (Table 4.34).
Table 4.34: Estimations of haplotype effects of DPP4 gene polymorphisms (in study population (n=662)).
Predictor variables OR 95% CI p value
Low High
DPP4 gene polymorphisms
rs2970932
Interaction between CC and CT 1.1 0.906 1.221 0.508
Interaction between CC and TT 1.0 0.972 1.098 0.289
Interaction between CT and TT 1.0 0.908 1.026 0.258
rs2268889
Interaction between AG and GG 0.9 0.877 1.016 0.125
Interaction between AG and AA 1.1 0.951 1.182 0.290
Interaction between GG and AA 1.1 0.984 1.141 0.125
rs1861975
Interaction between AC and CC 1.0 0.969 1.125 0.254
Interaction between AC and AA 1.0 0.893 1.122 0.987
Interaction between CC and AA 0.9 0.877 1.020 0.150 OR: odds ratio CI: confidence interval
217
Univers
ity of
Mala
ya

4.6.9.8 Effect of haplotype interaction of WFS1 gene polymorphisms with oral
antidiabetic (except SGLT2 inhibitor) treatment response (in study
population (n=662))
The interaction between haplotype AG and AA of WFS1 rs734312 polymorphism
was 0.9 times less likely to have an effect on oral antidiabetic treatment response (Table
4.35).
Table 4.35: Estimations of haplotype effects of WFS1 gene polymorphisms (in study population (n=662)).
Predictor variables OR 95% CI p value
Low High
WFS1 gene polymorphism
rs1046320
Interaction between AA and AG 1.1 0.941 1.194 0.340
Interaction between AA and GG 1.0 0.943 1.064 0.960
Interaction between AG and GG 1.0 0.940 1.060 0.960
rs734312
Interaction between GG and AG 0.9 0.759 1.007 0.063
Interaction between GG and AA 1.1 0.978 1.303 0.097
Interaction between AG and AA 0.9 0.808 0.969 0.008*
rs10010131
Interaction between AA and AG 0.9 0.820 1.049 0.231
Interaction between AA and GG 1.0 0.920 1.027 0.306
Interaction between AG and GG 1.0 0.974 1.087 0.306 * statistically significant (p<0.05) OR: odds ratio CI: confidence interval
218
Univers
ity of
Mala
ya

4.6.9.9 Effect of haplotype interaction of KCNJ11 gene polymorphisms with oral
antidiabetic (except SGLT2 inhibitor) treatment response (in study
population (n=662))
The interaction between haplotype CT and TT of KCNJ11 rs2285676 polymorphism
was 1.1 times more likely to have an effect on oral antidiabetic treatment response
(Table 4.36). However, the interaction between haplotype CT and CC, and haplotype
CC and TT of KCNJ11 rs2285676 polymorphism were both 0.9 times less likely to
have an effect on oral antidiabetic treatment response (Table 4.36).
The interaction between haplotype AG and GG, and GG and AA of KCNJ11 rs5218
polymorphism were both 1.1 times more likely to have an effect on oral antidiabetic
treatment response (Table 4.36). However, the interaction between haplotype AG and
AA of KCNJ11 rs5218 polymorphism was 0.9 times less likely to have an effect on oral
antidiabetic treatment response (Table 4.36).
The interaction between haplotype AG and GG, and GG and AA of KCNJ11 rs5210
polymorphism were both 1.1 times more likely to have an effect on oral antidiabetic
treatment response (Table 4.36). However, the interaction between haplotype AG and
AA of KCNJ11 rs5210 polymorphism was 0.9 times less likely to have an effect on oral
antidiabetic treatment response (Table 4.36).
219
Univers
ity of
Mala
ya

Table 4.36: Estimations of haplotype effects of KCNJ11 gene polymorphisms (in study population (n=662)).
Predictor variables OR 95% CI p value
Low High
KCNJ11 gene polymorphisms
rs2285676
Interaction between CT and CC 0.9 0.771 0.970 0.013*
Interaction between CT and TT 1.1 1.003 1.139 0.041*
Interaction between CC and TT 0.9 0.878 0.997 0.041*
rs5218
Interaction between AG and GG 1.1 1.026 1.093 <0.001*
Interaction between AG and AA 0.9 0.865 1.022 0.150
Interaction between GG and AA 1.1 1.053 1.196 <0.001*
rs5210
Interaction between AG and GG 1.0 0.934 0.976 <0.001*
Interaction between AG and AA 0.9 0.866 0.981 0.010*
Interaction between GG and AA 1.1 1.063 1.187 <0.001* * statistically significant (p<0.05) OR: odds ratio CI: confidence interval
220
Univers
ity of
Mala
ya

4.6.10 Comparison of Haplotype Interactions Between Case, Control and
Overall Study Population Groups
Table 4.37: Summary of positive haplotype interactions significance results comparison between groups.
Results obtained from Table 4.29, Table 4.30, Table 4.35 and Table 4.36.
Characteristics OR (95% CI)
for
case group
(n=331)
OR (95% CI)
for
control group
(n=331)
OR (95% CI)
for
study population
(n=662)
WFS1 rs734312
Interaction between GG and AG 0.8 (0.604-0.940)* - -
Interaction between GG and AA 1.3 (1.040-1.632)* - -
Interaction between AG and AA - - 0.9 (0.808-0.969)*
KCNJ11 rs2285676
Interaction between CT and CC - - 0.9 (0.771-0.970)*
Interaction between CT and TT 1.1 (1.024-1.210)* - 1.1 (1.003-1.139)*
Interaction between CC and TT 0.9 (0.826-0.977)* - 0.9 (0.878-0.997)*
KCNJ11 rs5218
Interaction between AG and GG - - 1.1 (1.026-1.093)*
Interaction between AG and AA - - -
Interaction between GG and AA - - 1.1 (1.053-1.196)*
KCNJ11 rs5210
Interaction between AG and GG - - 1.0 (0.934-0.976)*
Interaction between AG and AA - - 0.9 (0.866-0.981)*
Interaction between GG and AA - - 1.1 (1.063-1.187)*
* p<0.05: significant
The haplotype interactions between CT and TT, and CC and TT of the KCNJ11
rs2285676 (Table 4.37; in yellow rows) were found to be associated with DPP-4
inhibitor treatment response in the case group and also found to be associated with any
oral antidiabetic (including DPP-4 inhibitors) treatment response in the whole study
population. These haplotypes however, were not found to be associated with response to 221
Univers
ity of
Mala
ya
other non-DPP-4 inhibitor oral antidiabetics (other than DPP-4 inhibitors) in control
group (Table 4.37). This indicates the possibility that the haplotype interaction between
CT and TT, and CC ad TT of KCNJ11 rs2285676 are exclusive to DPP-4 inhibitors
treatment response.
The haplotype interactions between GG and AG, GG and AA of WFS1 rs734312
were only found to be associated with DPP-4 inhibitor treatment response in case group
but not in the whole study population which also included the same DPP-4 inhibitor
users in the case group (Table 4.37), which indicates the possibility that these haplotype
interactions were not exclusive to DPP-4 inhibitor treatment response. Other haplotype
interactions of KCNJ11 rs5218 and KCNJ11 rs5210 were only found to be associated
with any oral antidiabetic treatment response in the whole study population but not in
the case and control groups respectively (Table 4.37), therefore excluded from the
possibility of being exclusive for DPP-4 inhibitor treatment response.
222
Univers
ity of
Mala
ya

4.6.11 Gene Expression Studies
Gene expression studies were done for DPP4, WFS and KCNJ11 gene, and the
results were shown in Figure 4.11-15 and Table 4.38-39.
A. DPP4 gene
B. WFS1 gene
C. KCNJ11 gene
DPP4: dipeptidyl peptidase-4; WFS1: Wolfram syndrome 1; KCNJ11: Potassium channel Kir6.2
Figure 4.11: Relative expression of DPP4, WFS1 and KCNJ11 genes of cases (n=12) and controls (n=12), were obtained by the relative expression (ΔCt) method.
Values were normalized to β-actin expression and then compared to the normalized
expression of DPP4, WFS1 and KCNJ11 genes, which was considered as 1.
223
Univers
ity of
Mala
ya

4.6.11.1 Relative quantification of DPP, WFS1 and KCNJ11 genes in DPP-4
inhibitors users and non-users
The gene expression results (Figure 4.11) showed that expression of DPP4 gene was
downregulated (median 0.708 (0.566-0.900) fold change) in case group, and the DPP4
gene in control subjects was upregulated (median 2.665 (2.355-3.028) fold change)
compared to reference DPP4 gene. For WFS1 gene, the expression of the gene in case
group was downregulated (median 0.842 (0.686-1.039) fold change), in contrast to the
control group which was found to be upregulated (median 2.314 (1.874-2.891) fold
change) (Figure 4.11). We observed the expression of KCNJ11 gene was downregulated
(median 0.966 (0.789-1.206) fold change) in the case group, while in the control group;
the expression of this gene was upregulated (median 1.434 (1.044-2.034) fold change)
(Figure 4.11).
Overall, the expression of DPP4, WFS1 and KCNJ11 genes were found to be
downregulated in patients on DPP-4 inhibitors therapy, with the DPP4 gene having the
greatest degree of downregulated expression, followed by WFS1 and KCNJ11 genes
(Figure 4.11). Additionally in the control group, the expression of DPP4, WFS1 and
KCNJ11 gene were found to be upregulated, with DPP4 gene having the highest degree
of upregulated expression, followed by WFS1 and KCNJ11 genes (Figure 4.11).
224
Univers
ity of
Mala
ya

Table 4.38: The DPP-4 inhibitor treatment responses according to the expression of DPP4, WFS1 and KCNJ11 genes.
Results expressed as n (%). Fisher’s exact test was used for p value where
appropriate.
Genes Case (n=12) Control (n=12) p value
(n=24) Responders
(A1c <7%)
Non-
responders
(A1c ≥7%)
Good
glycemic
control
(A1c <7%)
Suboptimal
glycemic
control
(A1c ≥7%)
DPP4
Down regulated 2 (16.6%) 8 (66.8%) 1 (8.3%) 2 (16.7%)
0.095γ Up regulated 2 (16.6%) nil 5 (41.7%) 4 (33.3%)
WFS1
Down regulated 2 (16.6%) 7 (58.5%) 1 (8.3%) 1(8.3%)
0.240γ Up regulated 2 (16.6%) 1 (8.3%) 5 (41.7%) 5 (41.7%)
KCNJ11
Down regulated 3 (25.0%) 7 (58.4%) 2 (16.7%) 3 (25.0%)
0.403γ Up regulated 1 (8.3%) 1 (8.3%) 4 (33.3%) 3 (25.0%) γ Fisher’s exact test p <0.05 : statistically significant DPP4: dipeptidyl peptidase-4; WFS1: Wolfram syndrome 1; KCNJ11: Potassium channel Kir6.2
Comparing responders and non-responders to DPP-4 inhibitor treatment, it was
found that; for the case group, 4 subjects were found to be DPP-4 inhibitor responders.
Of the responders in the case group, 2 subjects had down regulated expression of both
DPP4 and WFS1 genes, and 3 subjects down regulated expression of KCNJ11 gene;
Conversely, of the responders 2 subjects had up regulated expression of DPP4 and
WFS1 genes, and only 1 subject had up regulated expression of KCNJ11 gene (Table
4.38). There were 8 non-responders with down regulated expression of DPP4 gene, 7
non-responders with down regulated expression of both WFS1 and KCNJ11 genes, and
225
Univers
ity of
Mala
ya

1 non-responders each with upregulated expression of both WFS1 and KCNJ11 genes
(Table 4.38).
For controls, 6 subjects were found to be on other antidiabetics (other than DPP-4
inhibitors) with A1c < 7%. 1 subject had down regulated expression of both DPP4 and
WFS1 genes, and 2 subjects had down regulated expression of KCNJ11 gene; 5
subjects had up regulated expression of DPP4 and WFS1 genes, and only 3 subjects had
up regulated expression of KCNJ11 gene (Table 4.38). There were 6 subjects in the
control group with A1c ≥ 7%, 2 had down regulated expression of DPP4 and 4
upregulation of DPP4 gene expression (Table 4.38). There was also 1 with down
regulated expression, and 5 with up regulated expression of WFS1 gene (Table 4.38).
As for KCNJ11 gene, there were 3 with down regulated expression, and 3 with up
regulated expression (Table 4.38).
4.6.11.2 Absolute quantification of DPP, WFS1 and KCNJ11 genes in DPP-4
inhibitors users and non-users
Absolute quantification analyses were done for DPP4, WFS1 and KCNJ11 genes for
both case (n=12) and control (n=12) groups.
226
Univers
ity of
Mala
ya

Table 4.39: Absolute quantification of target genes; DPP4, WFS1 and KCNJ11 (n=12).
DPP4: dipeptidyl peptidase-4; WFS1: Wolfram syndrome 1; KCNJ11: Potassium channel Kir6.2; CV: coefficient of variation
Genes Case Control
CT mean Quantity amplified
(pg/μl)
CV CT mean Quantity amplified
(pg/μl)
CV
DPP4 28.23 ± 0.44 28.81 ± 7.76 0.15 ± 0.13 27.48 ± 1.83 4313.20 ± 5072.81 1.31 ± 0.14
WFS1 32.77 ± 0.41 131.07 ± 80.20 0.77 ± 0.21 33.09 ± 0.89 1199.32 ± 1058.38 1.25 ± 0.13
KCNJ11 32.95 ± 0.84 879.50 ± 1305.90 1.10 ± 0.25 33.73 ± 0.66 323.13 ± 178.26 1.05 ± 0.24
Β-actin 19.50 ± 0.30 183.62 ± 35.35 1.13 ± 0.05 19.61 ± 0.60 1310.44 ± 491.26 1.37 ± 0.02
227
Univers
ity of
Mala
ya

Our results showed that DPP4 gene quantity was lower in cases compared to the
control group (Table 4.39). The findings were similar for WFS1 gene, the quantity of
this gene amplified was lower in cases compared with the control group (Table 4.39).
However, the KCNJ11 gene was highly amplified in case group compared to the control
group (Table 4.39).
228
Univers
ity of
Mala
ya

RESULTS PART 3 : MODELS DEVELOPED
4.7 Determination of Associations of Response to DPP-4 Inhibitor Therapy in
Patients with T2D by Multivariate Analysis
Four models were developed; Model 1 is the main model that associates the response
to DPP-4 inhibitor therapy, while Model 2, 3 and 4 are the comparative models to
Model 1 (Table 4.40).
Table 4.40: Type of models developed.
MODEL 1 Main model
MODEL 2 Comparative model
MODEL 3 Comparative model
MODEL 4 Comparative model
229
Univers
ity of
Mala
ya
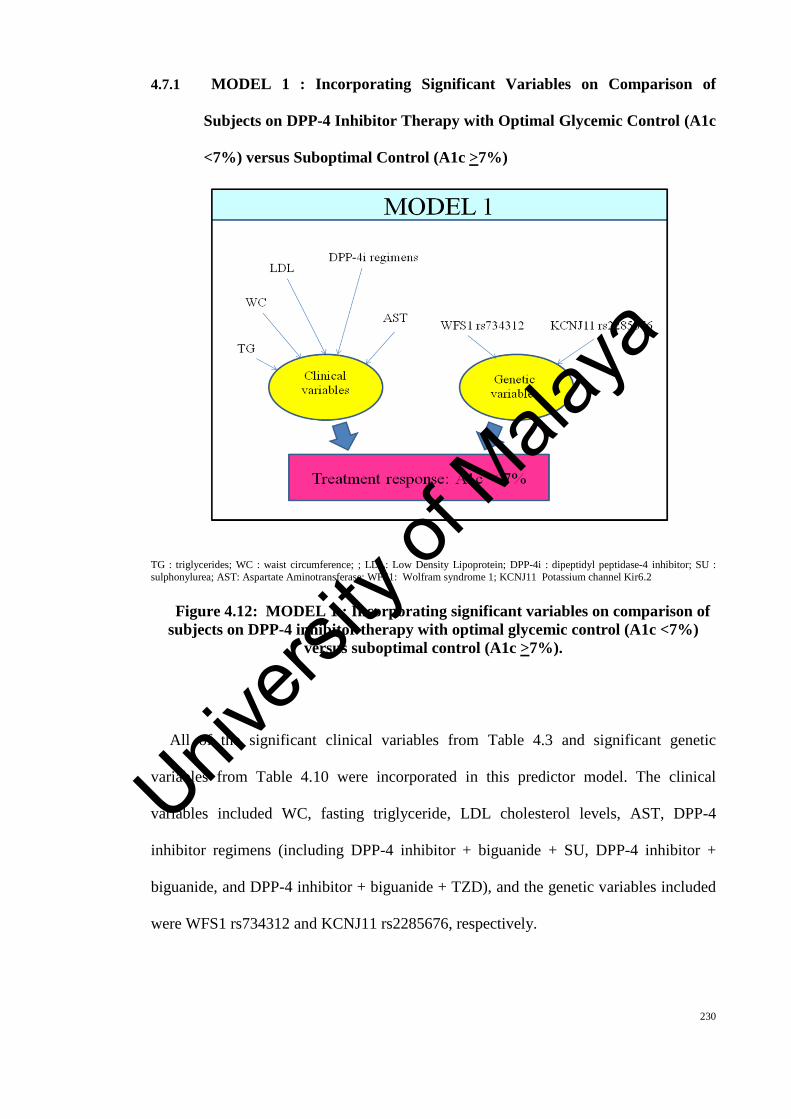
4.7.1 MODEL 1 : Incorporating Significant Variables on Comparison of
Subjects on DPP-4 Inhibitor Therapy with Optimal Glycemic Control (A1c
<7%) versus Suboptimal Control (A1c >7%)
TG : triglycerides; WC : waist circumference; ; LDL: Low Density Lipoprotein; DPP-4i : dipeptidyl peptidase-4 inhibitor; SU : sulphonylurea; AST: Aspartate Aminotransferase; WFS1: Wolfram syndrome 1; KCNJ11 Potassium channel Kir6.2
Figure 4.12: MODEL 1 : Incorporating significant variables on comparison of subjects on DPP-4 inhibitor therapy with optimal glycemic control (A1c <7%)
versus suboptimal control (A1c >7%).
All of the significant clinical variables from Table 4.3 and significant genetic
variables from Table 4.10 were incorporated in this predictor model. The clinical
variables included WC, fasting triglyceride, LDL cholesterol levels, AST, DPP-4
inhibitor regimens (including DPP-4 inhibitor + biguanide + SU, DPP-4 inhibitor +
biguanide, and DPP-4 inhibitor + biguanide + TZD), and the genetic variables included
were WFS1 rs734312 and KCNJ11 rs2285676, respectively.
230
Univers
ity of
Mala
ya

Logistic regression analysis showed that patients with triglycerides less than 1.7
mmol/L were 2.4 times more likely to respond to DPP-4 inhibitor treatment compared
to those with levels > 1.7 (OR: 2.4; 95% CI: 1.115-5.042) (Table 4.41). The analysis
also showed that patients with KCNJ11 rs2285676 (genotype CC) were 2 times more
likely to respond to DPP-4 inhibitor treatment compared to those without the
polymorphism (OR: 2.0; 95% CI: 1.039-3.869) (Table 4.41).
Table 4.41: Regression model of DPP-4 inhibitor treatment response incorporating all significant variables derived from comparison of patients on
DPP-4 inhibitor therapy with A1c <7% and A1c ≥7%.
Predictor variables OR 95% CI p value
Low High
WC (WC male ≥ 90 cm) 2.8 0.498 15.981 0.241
WC (WC female ≥ 80 cm) 2.8 0.489 15.805 0.249
Triglycerides (< 1.7 mmol/L) 2.4 1.115 5.042 0.025*
LDL cholesterol (<2.6 mmol/L) 0.7 0.451 1.165 0.184
AST (≤31 U/L) 0.4 0.035 4.098 0.426
DPP-4 inhibitor + biguanides 1.3 0.638 2.550 0.490
DPP-4 inhibitor + biguanide +
sulphonylurea
1.5 0.076 31.583 0.777
WFS1 rs734312 (genotype AA) 1.8 0.276 11.597 0.542
WFS1 rs734312 (genotype AG) 0.8 0.132 5.166 0.837
KCNJ11 rs2285676 (genotype CC) 2.0 1.039 3.869 0.038*
KCNJ11 rs2285676 (genotype CT) 0.9 0.490 1.679 0.757
Omnibus test of model coefficients : χ2 =30.710, p=0.002 Nagelkerke r2 : 0.119 Hosmer and Lemeshow Test : χ2 =13.198, p=0.105 * statistically significant (p<0.05) OR: odds ratio; CI: confidence interval; TG : triglycerides; WC : waist circumference; ; LDL: Low Density Lipoprotein; DPP-4i : dipeptidyl peptidase-4 inhibitor; SU : sulphonylurea; AST: Aspartate Aminotransferase; WFS1: Wolfram syndrome 1; KCNJ11 Potassium channel Kir6.2
231
Univers
ity of
Mala
ya

Then in Stepwise regression analysis, the results were slightly the same as patients
with triglycerides less than 1.7 mmol/L were 2.4 times more likely to respond to DPP-4
inhibitor treatment compared to those with levels > 1.7 (OR: 2.4; 95% CI: 1.152-5.097)
(Table 4.42). The analysis also showed that patients with KCNJ11 rs2285676 (genotype
CC) were 2 times more likely to respond to DPP-4 inhibitor treatment compared to
those without the polymorphism (OR: 2.0; 95% CI: 1.065-3.856) (Table 4.42). In
conclusion, we found that low triglyceride levels and KCNJ11 rs2285676 are
independent predictors of DPP-4 inhibitor treatment response in T2D.
Table 4.42: Stepwise (Forward Likelihood Ratio (LR)) regression model of DPP-4 inhibitor treatment response incorporating all significant variables derived from comparison of patients on DPP-4 inhibitor therapy with A1c <7% and A1c ≥
7%.
Predictor variables OR 95% CI p value
Low High
Triglycerides (< 1.7 mmol/L) 2.4 1.152 5.097 0.020*
WFS1 rs734312 (genotype AA) 1.9 0.296 12.031 0.502
WFS1 rs734312 (genotype AG) 0.9 0.139 5.293 0.869
KCNJ11 rs2285676 (genotype CC) 2.0 1.065 3.856 0.031*
KCNJ11 rs2285676 (genotype CT) 0.9 0.514 1.715 0.838
Omnibus test of model coefficients : χ2 =23.605, p<0.001 Nagelkerke r2 : 0.092 Hosmer and Lemeshow Test : χ2 =4.556, p=0.602 * statistically significant (p<0.05) OR: odds ratio; CI: confidence interval; WFS1: Wolfram syndrome 1; KCNJ11 Potassium channel Kir6.2
232
Univers
ity of
Mala
ya

4.7.2 MODEL 2 : Incorporating Significantly Differing Variables in Those with
A1c <7% Compared with A1c >7% in All 662 Patients with T2D on Oral
Antidiabetic Therapy (Excluding SGLT2 Inhibitors)
T2D: Type 2 diabetes; DPP-4i : dipeptidyl peptidase-4 inhibitor; HOMAIR: Homeostasis Model Assessment of Insulin Resistance.; SU: sulphonylurea; LDL: Low Density Lipoprotein; FPG: Fasting Plasma Glucose; AST: Aspartate Aminotransferase; DBP: Diastolic Blood Pressure; KCNJ11 Potassium channel Kir6.2
Figure 4.13: MODEL 2 : Incorporating significantly differing variables in those with A1c <7% compared with A1c >7% in all 662 patients with T2D on oral
antidiabetic therapy (excluding SGLT2 inhibitors).
All of the significant variables from Table 4.7 and 4.17 were incorporated into
Model 2. The clinical variables included age, duration of T2D, FPG, fasting insulin
levels, triglycerides, LDL cholesterol, DBP, AST, HOMAIR, antidiabetic regimes,
DPP-4 inhibitor, sulphonylurea, monotherapy and dual therapy use, and the genetic
variable included was KCNJ11 rs2285676, respectively.
233
Univers
ity of
Mala
ya

Using the Enter method, logistic regression analysis showed that patients aged less
than 65 years old were 1.9 times more likely more likely to respond to any antidiabetic
treatment compared to those aged more than 65 years old (OR: 1.9; 95% CI: 1.218-
3.096) (Table 4.43). Patients with triglyceride levels less than 1.7 mmol/L were 1.5
times more likely to respond to any antidiabetic treatment compared to other patients
(OR: 1.5; 95% CI: 0.986-2.367), contrary to LDL cholesterol levels in value less than
2.6 mmol/L will caused patients 0.7 times less likely to respond to any antidiabetic
treatment compared to other patients (OR: 0.7; 95% CI: 0.511-1.013) (Table 4.43).
Meanwhile, patients with HOMAIR less than 3.875 were 2 times more likely to respond
to any antidiabetic treatment compared to other patients (OR: 2; 95% CI: 0.990-4.184)
(Table 4.43).
The regression analysis also showed that patients whom received the combination
therapy of DPP-4 inhibitor + biguanide + TZD were 0.1 times less likely to have good
glycemic control (OR: 0.1; 95% CI: 0.010-0.881) (Table 4.43). The analysis also
showed that patients on biguanide alone, and biguanide + TZD therapies were each 0.1
times less likely to have good glycemic control compared with patients with other
therapies (OR: 0.1; 95% CI: 0.026-0.631; OR: 0.1; 95% CI: 0.026-0.820, respectively)
(Table 4.43). Meanwhile, patients that received biguanide + SU combination therapies
were 0.2 times less likely to have good glycemic control compared with patients with
other therapies (OR: 0.2; 95% CI: 0.033-0.720) (Table 4.43).
The analysis also showed that patients with KCNJ11 rs2285676 (genotype CC) were
1.8 times more likely to respond to oral antidiabetic treatment compared to those
without the polymorphism (OR: 1.8; 95% CI: 1.091-2.883) (Table 4.43).
234
Univers
ity of
Mala
ya

Table 4.43: Regression model of treatment response to any oral antidiabetic (except SGLT2 inhibitors) in whole study population (n=662).
Predictor variables OR 95% CI p value
Low High
Age (< 65 years old) 1.9 1.218 3.096 0.005*
Duration of T2D (< 10 years) 1.4 0.880 2.259 0.153
FPG (< 7 mmol/L) 1.3 0.734 2.381 0.353
Insulin (< 174 pmol/L) 0.6 0.313 1.233 0.174
Triglycerides (< 1.7 mmol/L) 1.5 0.986 2.367 0.058**
LDL cholesterol (<2.6 mmol/L) 0.7 0.511 1.013 0.059**
DBP (<90 mmHg) 1.2 0.780 1.923 0.379
AST (≤ 31 U/L) 0.7 0.212 2.568 0.632
HOMAIR (< 3.875) 2.0 0.990 4.184 0.053**
DPP-4 inhibitor + biguanide 0.3 0.058 1.579 0.156
DPP-4 inhibitor + biguanide + SU 0.2 0.041 1.356 0.105
DPP-4 inhibitor + biguanide + TZD 0.1 0.010 0.881 0.038*
Biguanide 0.1 0.026 0.631 0.011*
Biguanide + SU 0.2 0.033 0.720 0.017*
Biguanide + TZD 0.1 0.026 0.820 0.029*
KCNJ11 rs2285676 (genotype CC) 1.8 1.091 2.883 0.021*
KCNJ11 rs2285676 (genotype CT) 1.2 0.769 1.809 0.448
Omnibus test of model coefficients : χ2 =62.900, p<0.001 Nagelkerke r2 : 0.124 Hosmer and Lemeshow Test : χ2 =9.859, p=0.275 * statistically significant (p<0.05) ** trending towards significance OR: odds ratio; CI: confidence interval; T2D: Type 2 diabetes; DPP-4i : dipeptidyl peptidase-4 inhibitor; HOMAIR: Homeostasis Model Assessment of Insulin Resistance.; SU: sulphonylurea; TZD: thiazolidinedione; LDL: Low Density Lipoprotein; FPG: Fasting Plasma Glucose; AST: Aspartate Aminotransferase; DBP: Diastolic Blood Pressure; KCNJ11 Potassium channel Kir6.2 ‘DPP-4 inhibitors’, ‘Sulphonylurea’, ‘Monotherapy’ & ‘Dual therapy’ were eliminated from the model analysis by the SPSS system due to redundancies with ‘Antidiabetic regimes’ categories.
235
Univers
ity of
Mala
ya

Then in Stepwise regression analysis, patients with age less than 65 years old were
1.9 times more likely to respond to antidiabetics treatment compared to those aged more
than 65 years old (OR: 1.9; 95% CI: 1.219-3.093) (Table 4.44). Patients with the
duration of T2D of less than 10 years were 1.6 times more likely to respond to
antidiabetics treatment compared to other patients (OR: 1.6; 95% CI: 1.077-2.354)
(Table 4.44).
The model also showed that patients with triglyceride levels less than 1.7 mmol/L
were 1.5 times more likely to respond to antidiabetics treatment compared to those with
levels >1.7 mmol/L (OR: 1.5; 95% CI: 0.989-2.372) (Table 4.44). Contrary, patients
with LDL cholesterol of less than 2.6 mmol/L were 0.7 times less likely to respond to
antidiabetic treatment (OR: 0.7; 95% CI: 0.526-1.035) (Table 4.44). Patients with the
HOMAIR levels of less than 3.875 were 2 times more likely to respond to antidiabetics
treatment compared to other patients (OR: 2; 95% CI: 0.996-4.177) (Table 4.44).
The regression analysis also showed that patients whom received the combination
therapy of DPP-4 inhibitor + biguanide + TZD were 0.1 times less likely to have good
glycemic control (OR: 0.1; 95% CI: 0.010-0.861) (Table 4.44). The analysis also
showed that patients on biguanide alone, biguanide + SU, and biguanide + TZD
therapies were each 0.1 times less likely to have good glycemic control compared with
patients with other therapies (OR: 0.1; 95% CI: 0.025-0.602; OR: 0.1; 95% CI: 0.032-
0.705; OR: 0.1; 95% CI: 0.025-0.803, respectively) (Table 4.44).
Patients with KCNJ11 rs2285676 (genotype CC) were 1.8 times more likely to
respond to antidiabetics treatment compared to other patients (OR: 1.8; 95% CI: 1.095-
2.887) (Table 4.44).
236
Univers
ity of
Mala
ya

Table 4.44: Stepwise (Backward LR) regression model of treatment response to any oral antidiabetic (except SGLT2 inhibitors) in whole study population (n=662).
Predictor variables OR 95% CI p value
Low High
Age (< 65 years old) 1.9 1.219 3.093 0.005*
Duration of T2D (< 10 years) 1.6 1.077 2.354 0.020*
FPG (< 7 mmol/L) 1.3 0.739 2.389 0.342
Insulin (< 174 pmol/L) 0.6 0.314 1.228 0.171
Triglycerides (< 1.7 mmol/L) 1.5 0.989 2.372 0.056**
LDL cholesterol (<2.6 mmol/L) 0.7 0.526 1.035 0.052**
HOMAIR (< 3.875) 2.0 0.996 4.177 0.051**
DPP-4i + biguanide 0.3 0.056 1.558 0.151
DPP-4i + biguanide + SU 0.2 0.039 1.333 0.101
DPP-4i + biguanide + TZD 0.1 0.010 0.861 0.037*
Biguanide 0.1 0.025 0.602 0.010*
Biguanide + SU 0.1 0.032 0.705 0.016*
Biguanide + TZD 0.1 0.025 0.803 0.027*
KCNJ11 rs2285676 (genotype CC) 1.8 1.095 2.887 0.020*
KCNJ11 rs2285676 (genotype CT) 1.2 0.772 1.812 0.441
Omnibus test of model coefficients : χ2 =56.982, p<0.001 Nagelkerke r2 : 0.113 Hosmer and Lemeshow Test : χ2 =8.504, p=0.386 * statistically significant (p<0.05) ** trending towards significance OR: odds ratio; CI: confidence interval; T2D: Type 2 diabetes; ; DPP-4i : dipeptidyl peptidase-4 inhibitor; HOMAIR: Homeostasis Model Assessment of Insulin Resistance.; SU: sulphonylurea; TZD: thiazolidinedione; LDL: Low Density Lipoprotein; FPG: Fasting Plasma Glucose; AST: Aspartate Aminotransferase; DBP: Diastolic Blood Pressure; KCNJ11 Potassium channel Kir6.2
237
Univers
ity of
Mala
ya

4.7.3 MODEL 3 : Incorporating Significant Associations on Univariate
Analysis of Good Glycemic Control in Patients Not on DPP-4 Inhibitor
Therapy
T2D: Type 2 diabetes; HOMAIR: Homeostasis Model Assessment of Insulin Resistance.; SU : sulphonylurea; LDL: Low Density Lipoprotein; FPG: Fasting Plasma Glucose; DBP: Diastolic Blood Pressure; SBP: Systolic Blood Pressure; TZD : Thiazolidinedione
Figure 4.14: MODEL 3 : Incorporating significant associations on univariate analysis of good glycemic control in patients not on DPP-4 inhibitor therapy.
None of the genetic variables were significant to be incorporated into this model.
All of the significant variables from Table 4.5 were incorporated into the model.
Clinical variables included were age, duration of T2D, ethnicity, BMI, LDL cholesterol
levels, DBP, fasting insulin, fasting triglycerides, HOMAIR, SBP, peripheral
neuropathy, sulphonylurea + biguanide + TZD, and TZD use. No genetic variables were
entered into this association model because of lack of significance (Table 4.12-14).
238
Univers
ity of
Mala
ya

Using the Enter method, logistic regression analysis did not revealed any significant
clinical associations of A1c < 7%. The logistic regression analysis showed that controls
who did not receive DPP-4 inhibitors were 0.1 times less likely to have good glycemic
control on biguanide + SU + TZD therapy compared to other patients (OR: 0.1; 95% CI:
0.024-0.712) (Table 4.45).
239
Univers
ity of
Mala
ya

Table 4.45: Regression model incorporating significant associations on univariate analysis of good glycemic control (A1c <7%) in control patients not on
DPP-4 inhibitor therapy.
Predictor variables OR 95% CI p value
Low High
Ethnicity (Malay) 2.0 0.480 8.178 0.345
Ethnicity (Chinese) 0.9 0.206 3.963 0.893
Ethnicity (Indian) 1.6 0.362 7.273 0.527
Age (< 65 years old) 1.7 0.821 3.385 0.157
Duration of T2D (< 10 years) 1.8 0.935 3.278 0.080
BMI (Underweight) 4.3 x10⁻⁸ 0.000 - 0.999
BMI (Normal weight) 3.4 x10⁻⁸ 0.000 - 0.999
BMI (Overweight) 2.1 x10⁻⁸ 0.000 - 0.999
FPG (< 7 mmol/L) 1.0 0.388 2.578 0.999
Insulin (< 174 pmol/L) 0.6 0.223 1.605 0.308
Triglycerides (< 1.7 mmol/L) 0.8 0.473 1.491 0.551
LDL cholesterol (<2.6 mmol/L) 0.7 0.422 1.185 0.189
DBP (<90 mmHg) 1.4 0.782 2.427 0.267
SBP (≥ 130 mmHg) 0.8 0.439 1.296 0.307
HOMAIR (< 3.875) 2.7 0.938 7.035 0.066
Peripheral neuropathy 0.8 0.367 1.610 0.486
Biguanide + SU + TZD 0.1 0.024 0.712 0.019*
TZD 1.1 0.480 2.655 0.782
Omnibus test of model coefficients : χ2 =31.886, p=0.023 Nagelkerke r2 : 0.131 Hosmer and Lemeshow Test : χ2 =13.824, p=0.086 * statistically significant (p<0.05) OR: odds ratio; CI: confidence interval; T2D: Type 2 diabetes; BMI: body mass index; HOMAIR: Homeostasis Model Assessment of Insulin Resistance.; SU : sulphonylurea; LDL: Low Density Lipoprotein; FPG: Fasting Plasma Glucose; DBP: Diastolic Blood Pressure; SBP: Systolic Blood Pressure; TZD : Thiazolidinedione
240
Univers
ity of
Mala
ya

Similar outcome found with Stepwise regression analysis, where patients treated
with biguanide + SU + TZD therapy were 0.2 times less likely to have good glycemic
control compared to patients with other therapies (OR: 0.2; 95% CI: 0.054-0.990)
(Table 4.46).
Table 4.46: Stepwise (Forward LR) regression model incorporating significant associations on univariate analysis of good glycemic control (A1c<7%) in control
patients not on DPP-4 inhibitor therapy.
Predictor variables OR 95% CI p value
Low High
Biguanide + SU + TZD 0.2 0.054 0.990 0.048*
Omnibus test of model coefficients : χ2 =4.038, p=0.044 Nagelkerke r2 : 0.017 Hosmer and Lemeshow Test : χ2 =14.245, p=0.097 * statistically significant (p<0.05) OR: odds ratio; CI: confidence interval; SU: sulphonylurea; TZD; thiazolidinedione
241
Univers
ity of
Mala
ya

4.7.4 MODEL 4 : Incorporating Significantly Different Variables in the Case
Group on DPP-4 Inhibitor Therapy Compared with Non-DPP-4 Inhibitor
Therapy Group
TG: triglycerides; T2D: Type 2 diabetes; HOMAIR: Homeostasis Model Assessment of Insulin Resistance ; SU : sulphonylurea; LDL: Low Density Lipoprotein; FPG: Fasting Plasma Glucose; AST: Aspartate Aminotransferase; WFS1: Wolfram syndrome 1; KCNJ11: Potassium channel Kir6.2
Figure 4.15: MODEL 4 : Incorporating significantly different variables in the case group on DPP-4 inhibitor therapy compared with non-DPP-4 inhibitor
therapy group.
All of the significant clinical variables from Table 4.1 and genetic variables from
Table 4.10 and Table 4.11 were categorized and entered into the regression model. The
significant clinical variables included age, duration of T2D, FPG, fasting insulin,
triglyceride, LDL cholesterol, DBP, AST, HOMAIR, dual therapy and Sulphonylurea
242
Univers
ity of
Mala
ya

use. The significant genetic variables were the WFS1 rs734312 and KCNJ11 rs2285676
polymorphisms. A graphic representation of Model 4 is depicted in Figure 4.15.
Using the Enter method, the logistic regression analysis revealed that patients aged
less than 65 years old were 2.2 times more likely to respond to DPP-4 inhibitor
treatment compared to older subjects (OR: 2.2; 95% CI: 1.120-4.208) (Table 4.47). The
model also showed that patients with triglyceride levels less than 1.7 mmol/L were 2.2
times more likely to respond to DPP-4 inhibitor treatment compared to those with levels
>1.7 (OR: 2.2; 95% CI: 1.006-4.799) (Table 4.47). Patients with KCNJ11 rs2285676
(genotype CC) were 1.9 times more likely to respond to DPP-4 inhibitor treatment
compared to other patients (OR: 1.9; 95% CI: 0.988-3.718) (Table 4.47) and this
trended towards significance with a p of 0.054.
243
Univers
ity of
Mala
ya

Table 4.47: Regression model incorporating significantly different variables in the case group on DPP-4 inhibitor therapy compared with non-DPP-4 inhibitor
therapy group.
Predictor variables OR 95% CI p value
Low High
Age (< 65 years old) 2.2 1.120 4.208 0.022*
Duration of T2D (< 10 years) 1.1 0.036 33.947 0.952
FPG (< 7 mmol/L) 0.6 0.260 1.317 0.195
Insulin (< 174 pmol/L) 0.7 0.248 2.024 0.520
Triglycerides (< 1.7 mmol/L) 2.2 1.006 4.799 0.048*
LDL cholesterol (<2.6 mmol/L) 0.8 0.479 1.289 0.340
DBP (< 90 mmHg) 1.5 0.049 45.493 0.817
AST (≤ 31 U/L) 0.4 0.038 3.945 0.424
HOMAIR (< 3.875) 1.4 0.463 4.328 0.543
Dual therapy 3.1 0.612 15.827 0.171
Sulphonylurea 0.4 0.073 2.360 0.321
WFS1 rs734312 (genotype AA) 1.7 0.250 12.032 0.578
WFS1 rs734312 (genotype AG) 0.8 0.113 5.046 0.772
KCNJ11 rs2285676 (genotype CC) 1.9 0.988 3.718 0.054**
KCNJ11 rs2285676 (genotype CT) 0.9 0.477 1.657 0.711
Omnibus test of model coefficients : χ2 =41.238, p<0.001 Nagelkerke r2 : 0.157 Hosmer and Lemeshow Test : χ2 =6.383, p=0.604 * statistically significant (p<0.05) ** trending towards significance OR: odds ratio; CI: confidence interval; TG: triglycerides; T2D: Type 2 diabetes; HOMAIR: Homeostasis Model Assessment of Insulin Resistance ; SU : sulphonylurea; LDL: Low Density Lipoprotein; FPG: Fasting Plasma Glucose; AST: Aspartate Aminotransferase; WFS1: Wolfram syndrome 1; KCNJ11: Potassium channel Kir6.2
244
Univers
ity of
Mala
ya

Then in Stepwise regression analysis, patients with age less than 65 years old were
2.3 times more likely to respond to DPP-4 inhibitor treatment compared to those aged
more than 65 years old (OR: 2.3; 95% CI: 1.180-4.296) (Table 4.48). Patients with the
duration of T2D of less than 10 years were 1.7 times more likely to respond to DPP-4
inhibitor treatment compared to other patients (OR: 1.7; 95% CI: 1.009-2.892) (Table
4.48). The model also showed that patients with triglyceride levels less than 1.7 mmol/L
were 2.2 times more likely to respond to DPP-4 inhibitor treatment compared to those
with levels >1.7 (OR: 2.2; 95% CI: 1.031-4.732) (Table 4.48). Patients with KCNJ11
rs2285676 (genotype CC) were 2 times more likely to respond to DPP-4 inhibitor
treatment compared to other patients (OR: 2; 95% CI: 1.025-3.767) (Table 4.48).
Table 4.48: Stepwise (Forward LR) regression model incorporating significantly different variables in the case group on DPP-4 inhibitor therapy compared with
non-DPP-4 inhibitor therapy group.
Predictor variables OR 95% CI p value
Low High
Age (< 65 years old) 2.3 1.180 4.296 0.014*
Duration of T2D (< 10 years) 1.7 1.009 2.892 0.046*
Triglycerides (< 1.7 mmol/L) 2.2 1.031 4.732 0.041*
WFS1 rs734312 (genotype AA) 1.9 0.280 12.491 0.519
WFS1 rs734312 (genotype AG) 0.8 0.120 5.041 0.793
KCNJ11 rs2285676 (genotype CC) 2.0 1.025 3.767 0.042*
KCNJ11 rs2285676 (genotype CT) 0.9 0.498 1.696 0.786
Omnibus test of model coefficients : χ2 =34.611, p<0.001 Nagelkerke r2 : 0.133 Hosmer and Lemeshow Test : χ2 =10.199, p=0.117 * statistically significant (p<0.05) OR: odds ratio; CI: confidence interval; T2D: Type 2 diabetes; WFS1: Wolfram syndrome 1; KCNJ11: Potassium channel Kir6.2
245
Univers
ity of
Mala
ya

4.7.5 Comparison between case, control and study population models
Table 4.49: Comparison between models (based on Stepwise regression models).
* p<0.05: statistically significant ** trending towards significance T2D: Type 2 diabetes; LDL: Low Density Lipoprotein; HOMAIR: Homeostasis Model of Insulin Resistance; KCNJ11: Potassium channel Kir6.2; DPP-4i: dipeptidyl peptidase-4 inhibitor; SU: sulphonylurea; TZD: thiazolodinedione ΩMODEL 4 : Incorporating significantly different variables in the case group on DPP-4 inhibitor therapy compared with non-DPP-4 inhibitor therapy group. In Chapter 5 (Discussion): Model 1,2 & 3 were discussed for comparison. Meanwhile, Model 4 was discussed accordingly.
Characteristics
MODEL 1 MODEL 2 MODEL 3 ΩMODEL 4
Adjusted OR (95% CI)
for
case group
(from Table 4.42)
Adjusted OR (95% CI)
for
study population, n=662
(from Table 4.44)
Adjusted OR (95% CI)
for
control group
(from Table 4.46)
Adjusted OR (95% CI)
for
case group
(from Table 4.48)
Age (< 65 years old) - 1.9 (1.219-3.093)* - 2.3 (1.180-4.296)*
Duration of T2D (< 10 years) - 1.6 (1.077-2.354)* - 1.7 (1.009-2.892)*
LDL cholesterol (< 2.6 mmol/L) - 0.7 (0.526-1.035)** - -
HOMAIR (< 3.875) - 2.0 (0.996-4.177)** - -
Triglycerides (< 1.7 mmol/L) 2.4 (1.152-5.097)* 1.5 (0.989-2.372)** - 2.2 (1.031-4.732)*
KCNJ11 rs2285676 (genotype CC) 2.0 (1.065-3.856)* 1.8 (1.095-2.887)* - 2.0 (1.025-3.767)*
246
Univers
ity of
Mala
ya

Triglycerides less than 1.7 mmol/L and KCNJ11 rs2285676 (genotype CC) were
strongly found to be associated with DPP-4 inhibitors treatment response. In
comparison between case and control groups, triglycerides less than 1.7 mmol/L and
KCNJ11 rs2285676 (genotype CC) were only significant in the case group, vice versa
for control group (Table 4.49). In the association model for the whole study population,
KCNJ11 rs2285676 (genotype CC) was still a significant association of oral
antidiabetics treatment response, with additional age (< 65 years old), duration of T2D
(< 10 years), HOMAIR (< 3.875) and triglycerides (< 1.7 mmol/L) as other significant
predictors. When study excluded controls from the study population but uses the same
significant variables to construct the DPP-4 inhibitor treatment response association
model, triglycerides less than 1.7 mmol/L, KCNJ11 rs2285676 (genotype CC), age less
than 65 years old and duration of T2D (< 10 years) were still remained as the significant
association of DPP-4 inhibitor treatment response. Study progressed into more strict
selection of variables for DPP-4 inhibitor treatment response association model, where
the variables chosen were only significant in case group. Hence, triglycerides less than
1.7 mmol/L and KCNJ11 rs2285676 (genotype CC) emerged as stronger associations
(with higher OR) for DPP-4 inhibitor treatment response compared to other association
models (Table 4.49). Study may concluded that triglycerides less than 1.7 mmol/L and
KCNJ11 rs2285676 (genotype CC) were exclusive for DPP-4 inhibitor treatment
response.
247
Univers
ity of
Mala
ya

CHAPTER 5: DISCUSSIONS
The main objective of this study was to determine genetic associations of response to
pharmacotherapy with DPP-4 inhibitors in patients with T2D. However in order to
exclude the possibility that genetic polymorphisms that associate response to DPP-4
inhibitor therapy also associate treatment response to non-DPP-4 inhibitor therapy, we
also included a control group of 331 patients on other oral antidiabetic drugs. The
inclusion of the control group was meant to corroborate the exclusivity of genetic
association variables of DPP-4 inhibitor treatment response. At the time of recruitment,
SGLT2 inhibitors had not yet been introduced into the prescribing formulary of our
recruitment site, the University of Malaya Medical Centre (UMMC); hence none of the
patients recruited were on this therapy.
5.1 Baseline Demographic and Clinical Characteristics
The entire sample population (Table 4.1) of subjects with T2D of 662 subjects on
any oral anti-diabetic therapy (including those on DPP-4 inhibitor therapy) had a mean
age of 57.5 (±7.3) years, equal gender distribution of male:female (1:1) and an ethnic
composition of 48.2% Malays, 18.1% Indians and 28.4% Chinese. Mean BMI was 26.2
(±3.4) kg/m2. The majority of subjects were overweight (10.3% BMI > 30 kg/m2, 54.7%
BMI > 25 kg/m2, 32.2% BMI 18.5-24.99 kg/m2) with elevated waist circumference
(94% of males WC > 90 cm, 100% of females WC > 80 cm) 26.7% had a duration of
diabetes ≥ 10 years. Mean A1c was 7.9 (±2.0)%. Only 36.7% attained an optimal A1c
of <7%. All patients were on metformin, 38.8% were on sulphonylureas, and 7.3% were
on TZDs.
248
Univers
ity of
Mala
ya

Cases group was significantly younger than the controls and the duration of T2D in
cases group was significantly longer than the controls. Similar ethnicity ratio was seen
in both cases and controls groups. Most of the subjects in both cases and controls
groups were overweight with high waist circumference (>90cm) in both male and
female.
The ethnicity ratio found in this study is consistent with the ethnicity ratio in the
urban Malaysian population. To the best of our knowledge, no census is available
regarding the ethnicity profile of those residing in Petaling Jaya currently, the area
where the UMMC hospital situated (Lembah Pantai). However, according to the 2010
census by Department of Statistics of Malaysia, the population in Kuala Lumpur mainly
consisted of Malays 45.9%, Chinese 43.2% and Indians 10.3% (DOSM, 2011), which
is reflected by UMMC patient statistics.
Overall, glycemic control was poor with mean A1c in the total population (cases +
controls =662) of 7.9% and that in the case population 7.4%. 36.7% of our total
population and 44.7% of DPP-4 inhibitor users attained optimal glycemic control as
defined by the ADA as an A1c of < 7%. In comparison the only available paper on the
state of glycemic control in Malaysia, obtained from data collected in 2009 which was
published as part of DIABCARE Malaysia in 2011, found that 22% of 1549 patients
with T2D sampled from secondary and tertiary centres in Malaysia achieved an A1c
<7% (Mafauzy, Hussein, & Chan, 2011). The DIABCARE Malaysia population
however included patients with more advanced diabetes, as 53.6% of these patients
were on insulin therapy (Mafauzy et al., 2011).
249
Univers
ity of
Mala
ya

5.1.1 Comparison of baseline characteristics of cases and controls
Glycemic control was better in the case group. Mean A1c in the case group on DPP-
4 inhibitors was lower than controls. The proportion of subjects with A1c <7% was
significantly higher in the case group compared with controls (44.7% versus 28.7%,
p<0.05). These findings are consistent with Mu et al. (2009) who found that sitagliptin
showed superior efficacy to glipizide in terms of glycemic control by causing significant
improvement in glucose-dependent insulin secretion and restoration of pancreatic β-
cells (Mu et al., 2009). The better glycemic control in the case group may also be
accounted for by the significantly greater proportion of subjects on monotherapy in the
control group.
The case and control groups had some differences (Table 4.1). Aside from glycemic
control, there were differences in age, duration of diabetes, insulin sensitivity, lipid
profile and AST. There were differences in usage of non-DPP-4 inhibitor drug therapy
between groups with greater use of sulphonylureas and lower use of metformin in the
control group. Participants in the case group were significantly younger (case:56.3
(±6.8) versus control:58.0 (±7.3) years, p<0.05) than controls albeit with a slightly
longer duration of diabetes (case:9.1 (±4.5) versus control:8.8 (±4.2), p<0.05). There
were no significant differences in the proportion of overweight and obese patients
between cases and controls. Neither were there differences in ethnic distribution. The
mean fasting insulin concentration in case group was significantly lower than the
controls as was HOMAIR, indicating better insulin sensitivity and hence better glucose
uptake by cells. This difference in insulin sensitivity may account for the better
glycemic control in case group and be a result of treatment with DPP-4 inhibitors. DPP-
4 inhibitors have been reported to improve insulin sensitivity (Kusunoki et al., 2015).
Although there were only slight differences in magnitude in total cholesterol, 250
Univers
ity of
Mala
ya

triglyceride, HDL cholesterol and LDL cholesterol between groups, DPP-4 inhibitor
users had better lipid profiles compared to controls group. Both triglyceride and LDL
were significantly lower in the DPP-4 inhibitor group. The relationship/association of
DPP-4 inhibitor use with changes in lipids are not new, in fact, many studies show that
DPP-4 inhibitors reduce lipid levels (as discussed in section 5.2.3.2-3) The latest study
by Duvnjak & Blaslov in 2016, observed an improvement in lipid profiles in patients
with T2D treated with sitagliptin and vildagliptin (Duvnjak & Blaslov, 2016).
Mean serum AST concentration was significantly albeit slightly higher in case group
compared to controls. This study also found that insulin resistance (HOMAIR) was
lower in the case group compared to controls, and the majority of the patients in case
group were insulin sensitive. This may indicate that the use of DPP-4 inhibitors
improved insulin sensitivity (as discussed in further detail in section 5.2.3.1).
The mean sCD26 level in case group was lower than the controls, as expected from
the DPP-4 inhibitor users as DPP-4 inhibitor inhibits the DPP-4 enzyme which is also
known as sCD26. However this difference was not statistically significant. Based on
previously published results by Chiara et al., normal sCD26 values were considered to
range between 460-850 ng/ml as measured using the Soluble CD26 ELISA Kit
(eBioscience, Vienna, Austria) (De Chiara et al., 2014). Serum levels of sCD26 have
been found to be higher in patients with T2D complicated with metabolic syndrome
compared to patients with T2D without metabolic syndrome (1199 ng/ml and 1195
ng/ml, respectively) (Ahmed, Huri, Al-Hamodi, Salem, & Muniandy, 2015). The
reference sCD26 range for healthy female adolescents and male adolescents are 400-
1800 ng/ml and 700-2000 ng/ml, respectively (Delezuch et al., 2012). Our study results
were consistent and within the normal range of the findings from all above studies
251
Univers
ity of
Mala
ya

mentioned (Ahmed et al., 2015; De Chiara et al., 2014; Delezuch et al., 2012; Otero-
Estevez et al., 2015).
As for comorbidities, our study found that most of the patients in both groups had
associated hypertension. Hypertension is common and frequently occurs in patients with
diabetes (Cheung & Li, 2012) as part of the metabolic syndrome. In fact, hypertension
was found to affect 70% of patients with diabetes (Lago, Singh, & Nesto, 2007), and
recent work by Nakamura et al. found that hypertension was the most common
additional cardiovascular risk factor found in their study population consisting of
patients with T2D undergoing sitagliptin treatment (Nakamura et al., 2016). These
findings are in line with our results in this study population wherein more than 90% of
subjects had hypertension. Dyslipidemia was also common in both groups at rates of
>70% in both groups. This is a reflection of the association of T2D with dyslipidemia as
part of the metabolic syndrome and is borne out in the literature (Schofield, Liu, Rao-
Balakrishna, Malik, & Soran, 2016). Subjects in both case and control groups also
showed the typical common pattern of dyslipidemia with elevated triglyceride levels
and decreased HDL cholesterol levels (Basak, Chatterjee, & Sarma, 2013), although
there was only slightly lower HDL cholesterol level in the case group perhaps due to the
antihyperlipidemic agents taken by these subjects that may lessen dyslipidemia. The
case group had a higher proportion of patients with peripheral neuropathy compared to
control group although this difference was not statistically significant. Peripheral
neuropathy is a common complication of poorly controlled diabetes that occurs up to
50% of patients with diabetes (Tesfaye et al., 2016) and it is characterized by pain,
parathesia and sensory loss (Tesfaye et al., 2010), which may later develop into foot
ulcerations and amputations (Tesfaye et al., 2016), However, we only found a minority
of patients with this complication as our study inclusion and exclusion criteria
252
Univers
ity of
Mala
ya

eliminated all subjects with nephropathy in order to minimize the impact of CKD on
pharmacodynamics of anti-diabetic agents and hence glycemic control, as well as the
impact of erythropoietin on A1c. This would have excluded patients with longer
duration of diabetes and hence higher rates of peripheral neuropathy. The exclusion of
patients using insulin therapy would also have limited our study population to subjects
with shorter duration of diabetes and hence less peripheral neuropathy.
5.2 Demographic, Anthropometric, Clinical Associations of DPP-4 Inhibitor
Treatment Response
5.2.1 Demographic Associations
5.2.1.1 Age
Our univariate analyses showed that younger age was a significant associate of
glycemic control in controls on non-DPP-4 inhibitor oral antidiabetics (except DPP-4
inhibitors) and the total population of T2D patients on any oral antidiabetic treatment
(except for SGLT2 inhibitors). However, age was not significant a significant associate
of treatment response to DPP-4 inhibitors in the case group (n=331). Multivariate
analysis however showed that age (<65 years old) is not an independent associate of
good DPP-4 inhibitor treatment response in the case group or control group. Younger
age was associate of good glycemic control thoughin patients on any oral antidiabetic
treatment (except SGLT2 inhibitor) in the whole group 662 patients with T2D.
There are conflicting reports in the literature with regards to the impact of age on the
efficacy of DPP-4 inhibitors. Our findings of good DPP-4 inhibitor treatment response
regardless of age are similar those by Monami et al. (2011) & Del Prato et al. (2016),
253
Univers
ity of
Mala
ya

where age was not found as a predictor of linagliptin treatment response (Del Prato,
Patel, Crowe, & von Eynatten, 2016; Monami et al., 2011). In contrast, a prospective
trial examining predictors of treatment response to sitagliptin therapy in 251 Korean
subjects found that younger age was predictive of good treatment response in T2D (S.
A. Kim et al., 2011).
There have been several studies demonstrating the efficacy of DPP-4 inhibitors in the
management of elderly patients with T2D, lending credence to our observation that age
was not a significant associate of treatment response to DPP-4 inhibitors. A study to
determine the role of vildagliptin, a DPP-4 inhibitor, in managing T2D in elderly
population has found that the A1c reduction in the elderly is as good as that achieved in
younger patients and associated with low risk of hypoglycemia. Vildagliptin was also
found to improve the β-cells’ capability to respond accurately to the changes in plasma
glucose levels in elderly (Halimi, Raccah, Schweizer, & Dejager, 2010). Elderly
patients treated with vildagliptin do not experience hyperglucagonaemia and elevated
postprandial glucose (PPG). During periods of high glucose concentration, vildagliptin
caused a reduction in inappropriate glucagon secretion and PPG excursions, while in the
presence of low glucose levels, the protective glucagon response is well-maintained
(Halimi et al., 2010). In 2013, a multinational study assessing the feasibility of attaining
individualised glycemic targets over 24 weeks using vildagliptin versus placebo, has
found that individualised glycemic targets are achievable in elderly subjects (aged 70
years old or older) with T2D with vildagliptin without any tolerability issues with low
occurrence of hypoglycemia (Strain, Lukashevich, Kothny, Hoellinger, & Paldánius,
2013). As aging is associated with an age-related reduction in renal function, elderly
patients with T2D are at high risk for renal impairment, thus complicating T2D
treatment as the treatment options are limited in the elderly especially those with renal
254
Univers
ity of
Mala
ya

impairment. Another study was conducted in 2013 to assess the efficacy and tolerability
of vildagliptin (albeit at?half the maximum dose) versus placebo in elderly (aged 75
years or more) with T2D complicated with moderate or severe renal impairment
(Schweizer & Dejager, 2013). The study found that vildagliptin was well tolerated,
caused no increment in the risk of hypoglycemia and effective in improving glycemic
control in an elderly population with T2D and moderate or severe renal impairment as
compared to placebo (Schweizer & Dejager, 2013). A more recent study in 2015
investigated the effectiveness and tolerability of vildagliptin in addition to metformin in
elderly with T2D in Greece has found that glycemic control improved significantly with
a minor number of cases with hypoglycemia (Grigorios, Elena, George, Katopodis, &
Skoutas, 2015). The findings of our study were consistent with all previous studies as
discussed above. A study by Bramlage et al. in 2012 identifying the predictor for
hypoglycemia in elderly patients with T2D treated with either oral monotherapy or dual
antidiabetics therapy (except insulin and/or GLP-1 analogues), had found that those
with the age ≥ 70 years had better response to sulphonylurea therapy compared to those
aged < 60 years, and 60-70 years old (Bramlage et al., 2012).
Given all the evidence of the detrimental effect of age on β-cell function it is
puzzling that age was not predictive of treatment response. Other prospective studies
such as that by S.A. Kim et al. (2011) found that younger age was predictive of better
response to DPP-4 inhibitors in Korean subjects (S. A. Kim et al., 2011). It is likely that
our small sample size and cross-sectional design was unable to detect a significant
impact of age in the case group on DPP-4 inhibitors because of the nonprospective
nature of the study, In addition, the majority of our patients (82.2%) on DPP-4
inhibitors were less than 65 years of age. It is possible that had we included more
elderly subjects, older age might have been a negative predictor of treatment response to
255
Univers
ity of
Mala
ya

DPP-4 inhibitors. When sample population was enlarged to 662 patients however, by
including both controls on non-DPP-4 inhibitor therapy as well as cases on DPP-4
inhibitor therapy, older age did emerge as a significant independent negative association
of good glycemic control (A1c <7%).
Age at diagnosis of diabetes has not been shown to impact on response to
sulphonylurea treatment in the observational GoDART study which found that TCF7L2
polymorphisms were independently predictive of treatment response to SUs in T2D
(E.R. Pearson et al., 2007). Holstein et al. (2011) also found in a small observational
study of 189 patients with T2D, age did not predict treatment response to SUs (Holstein,
Hahn, Korner, Stumvoll, & Kovacs, 2011).
Aging is well known as a risk factor for T2D (Gong & Muzumdar, 2012), where the
prevalence of T2D is twice higher in older adults compared to middle-aged adults and
peaks at 60-74 years old (Gunasekaran & Gannon, 2011). Impairment of glucose
tolerance and progressive deterioration in endocrine function are the common features
of normal aging process (Vitale, Salvioli, & Franceschi, 2013). Aging is associated with
a decrease of insulin action (De Tata, 2014), which usually starts with the diminished
insulin sensitivity of target tissues and leads to the progression of age-related glucose
tolerance (De Tata, 2014). Factors that may contribute to age-related insulin resistance
are increased central adiposity (Michalakis et al., 2013), declining lean muscle mass
(Atkins, Whincup, Morris, & Wannamethee, 2014; J. E. Kim et al., 2014; Ostler et al.,
2014), mitochondrial dysfunction (Bertrand et al., 2013; Dela & Helge, 2013; Toledo &
Goodpaster, 2013), increased oxidative stress and inflammation (Y. G. Kim et al., 2013;
Rains & Jain, 2011), hormonal changes (Barzilai, Huffman, Muzumdar, & Bartke,
2012), dietary habit changes, and declining physical activity (Bunprajun, Henriksen,
Scheele, Pedersen, & Green, 2013; Leon-Latre et al., 2014). However, these factors 256
Univers
ity of
Mala
ya

cannot be fully held responsible for the age-related glucose intolerance as pancreatic β-
cell dysfunction is still the fundamental factor in causing T2D (Ashcroft & Rorsman,
2012) and it has been repeatedly reported in many studies that the ability of pancreatic
β-cell to maintain the insulin secretory function adequate for daily metabolic
requirement is impaired with increased age in both human and animal studies
characterized by a significant degree of variability (De Tata, 2014). The age-related
impairment of β-cell secretory abilities secondary to many factors such as decreased
GLUT2 levels (Ihm et al., 2007), mitochondrial dysfunction (Barzilai et al., 2012;
Supale et al., 2013), the buildup of advanced glycation end products (Coughlan et al.,
2011), telomerase deficiency and decreased telomere length (Guo et al., 2011; Kuhlow
et al., 2010), impaired Ca2+ handling (Lin & Sun, 2012; Ribeiro et al., 2012), decreased
expression of β2-adrenergic receptors (Santulli et al., 2012), increased autophagy (S.
Wang, Sun, Xiang, & Li, 2013), decreased response to GLP-1 stimulation (Geloneze et
al., 2014; Trahair et al., 2012), and decreased expression of β-cell specific genes and
transcription factors (Ihm et al., 2007).
Mitochondrial dysfunction is worth considering as the main cause of age-related
glucose intolerance secondary to pancreatic β-cell dysfunction; as mitochondria have an
important role in the stimulus-secretion coupling in β-cells (De Tata, 2014). In the
pancreatic β-cells, mitochondria sense nutrients and thus generate signals for insulin
secretion; in particular, the mitochondrial metabolism of pyruvate which is derived from
glucose may generate ATP thus causing the closure of the ATP-sensitive K+ channels,
followed by cell membrane depolarization, inducing Ca2+ influx through the voltage-
gated Ca2+ channels resulting in elevated cytosolic concentration of Ca2+ which triggers
insulin exocytosis (Maechler, Carobbio, & Rubi, 2006). Another theory that relates
mitochondrial dysfunction to age-related glucose intolerance secondary to pancreatic β-
257
Univers
ity of
Mala
ya

cell dysfunction is the mitochondrial free radical theory of aging (De Tata, 2014).
Mitochondia have been proposed to represent the primary target of reactive oxygen
species (ROS) damage due to their central role in the generation of ROS at the level of
the electron transport chain and ATP production (De Tata, 2014). Current evidence
suggests that abnormal mitochondrial ROS production and detoxification may
contribute to mitochondrial dysfunction thus resulting in reduction in β-cell function
and insulin secretion in elderly (Dai, Chiao, Marcinek, Szeto, & Rabinovitch, 2014;
Liesa & Shirihai, 2013).
Pancreatic β-cell senescence is a process that may contribute to age-related β-cell
dysfunction (De Tata, 2014), through decreased β-cell secretory function (De Tata,
2014). Cellular senescence is a process of limiting the proliferation of normal
fibroblasts in a culture which is used to indicate the essentially irreversible growth arrest
that occurs when cells that can divide are challenged by an oncogenic stress (Rodier &
Campisi, 2011; Tchkonia, Zhu, van Deursen, Campisi, & Kirkland, 2013). The
senescent cells disrupt normal tissue structures and differentiated functions in complex
cell culture models (Campisi, Andersen, Kapahi, & Melov, 2011). mTOR is a nutrient-
sensing cytoplasmic protein kinase that regulates cell growth and metabolism in
response to nutrients, mitogens and hormones in eukaryotic cells.Later in life where
growth has been completed, mTOR can operate cellular aging (Blandino-Rosano et al.,
2012) and is involved in age-related diseases (such as T2D) (De Tata, 2014). Although
glucose, fatty acids, and amino acids may activate mTOR in β-cells to increase the β-
cell mass and function, thus compensating for age-related development of insulin
resistance (Blagosklonny, 2013); chronic hyperstimulation of mTOR during aging, may
contribute to the development of β-cell failure (Blagosklonny, 2013). The proliferation
of pancreatic β-cells is reduced in humans with age (Reers et al., 2009), and this has
258
Univers
ity of
Mala
ya

been found to be associated with a decline in pancreatic and duodenal homeobox 1
(pdx1) expression (Gannon et al., 2008; Reers et al., 2009), obesity, patients with T2D
and lean individuals aged 61-83 years old (Gunasekaran & Gannon, 2011). The reduced
expression of cell cycle inhibitor; p16Ink4a was also found to contribute to the decline
in proliferative capacities of the older β-cell (Gunasekaran & Gannon, 2011).
Elderly patients with T2D pose unique treatment challenges and have not been well-
represented in clinical trials, thus further studies to better define more suitable or
accurate glucose targets and to obtain the best management strategies for achieving and
maintaining the targeted glycemic levels. Since DPP-4 inhibitors are less likely to cause
hypoglycemic risk and seem to be effective independent of age, this class of drugs may
be the best oral antidiabetic therapy for the elderly population with T2D.
5.2.1.2 Duration of T2D
Our univariate analysis revealed that duration of T2D was not a significant associate
of DPP-4 inhibitor treatment response in cases. However shorter duration of diabetes
was a significant associate of good glycemic control (A1c <7%) in controls on non-
DPP-4 inhibitor oral antidiabetic therapy, and the whole population of 662 patients on
all oral antidiabetics (except SGLT2 inhibitor). Upon multivariate analysis however
shorter duration of DM predicted good glycemic control only in the whole sample
population on oral anti-diabetics (except for SGLT2 inhibitor).
There are conflicting reports as to the impact of duration of diabetes on efficacy of
DPP-4 inhibitors in the published literature. Our findings contrast with those of Lim et
al. (2012) who found that shorter duration of DM was independently predictive of better
259
Univers
ity of
Mala
ya

response to sitagliptin in combination with metformin in 150 Korean subjects enrolled
in a prospective trial (Lim et al., 2012). A prospective study by Nomiyama et al. (2012)
of 345 subjects also found that shorter duration of diabetes is a predictor of greater
improvement in A1c in response to DPP-4 inhibitor treatment in the Japanese
population (Nomiyama et al., 2012) On the other hand, S. A. Kim et al. (2011) did not
find that shorter duration of diabetes was predictive of efficacy of sitagliptin as add-on
therapy in a similar Korean population (S. A. Kim et al., 2011).
What of the impact of duration of T2D on other oral anti-diabetics? Our findings of
no impact of duration of diabetes are consistent with those of Nichols et al. in 2007,
wherein the duration of T2D was found not to be a predictor of poor sulphonylurea
treatment response (Nichols, Alexander, Girman, Kamal-Bahl, & Brown, 2007). A more
recent study by Brown, Conner & Nichols in 2010 found that duration of T2D was not a
predictor of metformin monotherapy treatment failure in 1,799 patients with T2D from
the year 2004 to 2006 (Brown, Conner, & Nichols, 2010). On the other hand, a
systematic review of predictors of response to metformin and sulphonylureas based on
articles reporting from the year 2003-2012 by Martono et al. (2015) found that while
age was not predictive of treatment response to sulphonylureas, shorter duration of
diabetes was predictive of good response to SUs (Martono et al., 2015).
Duration of T2D was categorized as a predictor in the analysis, as the severity of the
disease may worsen over time (V. A. Fonseca, 2009), and determining DPP-4 inhibitor
efficacy in T2D of long duration is thus important. The hallmark of T2D progression is
declining β-cell function with time on top of insulin resistance, processes characterized
by deterioration in clinical parameters including A1c, FPG, and postprandial glucose
levels (V. A. Fonseca, 2009). The differences in our findings may be due to the
differences in the cut-off point for the duration of diabetes in other studies. 260
Univers
ity of
Mala
ya

A study evaluated the effects of duration of T2D on insulin secretion in a group of
patients with the mean duration of T2D of 12 years (range 6 to 14 years) has found that
insulin secretion decreases over time, however, the rate of decline was variable among
subjects (Zangeneh et al., 2006). A1c values showed a significant increase with the
increase in the duration of diabetes (Verma et al., 2006). The study also found that
insulin resistance increases with the duration of diabetes (Verma et al., 2006). Fasting
and PPG were also found to showed a significant increase with the duration of diabetes
(Verma et al., 2006). There are also reports that insulin resistance increases with the
increase in duration of T2D (Verma et al., 2006).
In conclusion, our finding that duration of diabetes was not independently associative
of treatment response to DPP-4 inhibitor therapy is likely due to the smaller sample
population coupled with the cross-sectional study design. It is also possible that the fact
that the majority of our patients in the case group (71.6%) had duration of diabetes less
than 10 years has resulted in this negative result. A prospective study with a larger
sample size including more patients with duration of diabetes >10 years, might most
likely have revealed an impact of duration of diabetes given the natural history of
decline in β-cell mass with increasing duration of T2D. Indeed once the sample
population was enlarged (n=662) to include patients on other oral antidiabetics, shorter
duration of diabetes became independently association of good glycemic control.
5.2.1.3 Ethnicity
Ethnicity was not found to be a significant associate of treatment response to DPP-4
inhibitor therapy in case group and any oral antidiabetic therapy (except SGLT2
inhibitor) in the combined study population of 662 subjects (cases + controls). Upon 261
Univers
ity of
Mala
ya

univariate analysis, ethnicity was a significant associate (p <0.25) of good glycemic
control in the control group on non-DPP-4 inhibitor oral antidiabetic therapy. This
association between good glycemic control and ethnicity in the control group however
was not present on multivariate analysis. Our findings are consistent with those of
Zhang et al. (2014) wherein ethnicity was also found not to be a significant determinant
of A1c response in patients with T2D undergoing oral triple therapy with DPP-4
inhibitors, sulphonylurea and metformin (Zhang et al., 2014). Neither was ethnicity
found to be a significant predictor of metformin and sulphonylurea treatment response
in a systematic review by Martono et al. in 2015 (Martono et al., 2015).
Our findings differ from a recent study by Del Prato et al. in 2016 where Asian
ethnicity was found to be a predictor of better treatment response to linagliptin (Del
Prato et al., 2016). DPP-4 inhibitor therapies had shown greater A1c-lowering efficacy
in Asian-dominant studies (where study participants were >50% Asian) compared to
non-Asian dominant studies (S. A. Kim et al., 2011). Another study by James et al. in
2012, investigating the impact of ethnicity on improvement in A1c, had found that
while A1c was improved after 1 and 2 years of antidiabetic treatment (metformin only,
metformin + other oral antidiabetics, other oral antidiabetics, insulin, and insulin + oral
antidiabetics) in south Asian (Bangladeshi, Indian, Pakistani, other Asian and mixed
Asian), white (British, Irish and other white), black African/Caribbean (African,
Caribbean, black British and mixed black) and other ethnic groups, participants of
south Asian ethnicity had significantly less benefit from each diabetes treatment (James
et al., 2012). South Asian participants were found to have a lower reduction of A1c
compared to white participants, while the reduction in A1c between black
African/Caribbean and white participants did not vary significantly from each other
(James et al., 2012).
262
Univers
ity of
Mala
ya

Our sample population did not have sufficient numbers of patients of Indian descent
(South Asians) to find a statistically significant impact of ethnicity on treatment
response. Based on these findings from James et al. (2012) and Del Prato et al. (2016),
which found an impact of South Asian ethnicity on treatment response (Del Prato et al.,
2016; James et al., 2012), further prospective studies are required that incorporate more
patients of Indian ethnicity in Malaysia in order to study the association between
ethnicity and treatment response.
Several studies of the T2D population in Southeast Asia have noted differences
between the 3 main ethnic groups i.e. those of Malay, Chinese and Indian descent with
regards to risk factors, glycemic control, complications and prevalence of comorbidities.
Hence it is highly plausible that by recruiting larger numbers patients and ensuring a
more equal ethnic distribution in the study population we might detect an impact of
ethnicity on DPP-4 inhibitor treatment response. A study to determine the ethnic
differences among Malay, Chinese, and Indians patients with T2D in Singapore had
found that ethnic differences exist with regard to diabetes control (A1c), BMI, family
history of diabetes, presence of hypertension and the severity of albuminuria; for
instance, the study found that Malays had the highest BMI (27.4 kg/m2), followed by
Indians (25.74 kg/m2) and Chinese (24.9 kg/m2). As for glycemic control, Indians had
the highest A1c levels (8.3%), followed by Malay (8.0%) and Chinese (7.7%) (Hong,
Chia, Hughes, & Ling, 2004). Among all three ethnicities, Indians were more likely to
have a positive family history of diabetes and poorer control of diabetes as compared to
Chinese and Malay (Hong et al., 2004). Ethnic differences in T2D are caused by genetic
and environmental factors (Hong et al., 2004). Ethnicity also was found to be one of the
major determinants of diabetic dyslipidemia in Malaysia, apart from glycemic control
(Ismail et al., 2001). There exist ethnic differences in serum lipid concentrations, with
263
Univers
ity of
Mala
ya

Malay having the highest total cholesterol (mean 6.19 mmol/l) and the highest LDL
cholesterol (mean 4.16 mmol/l), while Chinese had the highest HDL cholesterol (mean
1.24 mmol/l) (Ismail et al., 2001). This study concluded that ethnicity was an important
determinant of total cholesterol, LDL cholesterol and HDL cholesterol in T2D (Ismail et
al., 2001). This information on ethnic differences will aid in managing patients with
diabetes. Since Indians are more prone to T2D due to family history of diabetes, they
should be encouraged to screening for T2D as early as possible or regularly.
Additionally, since glycemic control is the least optimal in Indians, healthcare
professionals should investigate the health beliefs and dietary habits of the Indian
patients so that the advice given is specially tailored and culturally acceptable to them.
As for Malay, the healthcare professionals may target strategies of lifestyle changes
including tailored dietary advice and cooking tips to prevent the onset of obesity. A
study was done to identify the relationship of health beliefs and complication prevention
behaviors among Chinese patients with T2D in Malaysia. This study found significant
correlation between complication prevention behaviors and perceived severity,
perceived susceptibility and perceived barriers. There were also significant correlations
between subjects’ education level and perceived severity, perceived susceptibility and
complication prevention behavior. The study finally concluded that the poor
complication preventive behavior among Malaysian Chinese with T2D was associated
with lack of perceived seriousness of diabetes and lack of perceived susceptibility to
diabetes complications (M. Y. Tan, 2004).
264
Univers
ity of
Mala
ya

5.2.2 Anthropometric Associations
5.2.2.1 Body Mass Index (BMI) and Waist Circumference (WC)
Our univariate analyses showed that BMI was a significant associate (p<0.25) of
good glycemic control in controls on non-DPP-4 inhibitor oral antidiabetics. This
association however did not persist on multivariate analysis. BMI was not found to be a
significant associate of DPP-4 inhibitor treatment response in cases and good glycemic
control in the combined total population on any oral antidiabetic (except SGLT2
inhibitor).
There are conflicting reports in the literature as to whether BMI impacts on DPP-4
inhibitor treatment response. Our findings of no association of BMI with treatment
response are consistent with a study by Chen et al. in 2015, that found that BMI was not
a predictor for efficacy of linagliptin monotherapy in Asian patients (Yuhong Chen et
al., 2015). Our findings differ from Kim et al. in 2011, where patients with T2D with
low BMI were found to respond better to sitagliptin add-on therapy in a Korean study
population (S. A. Kim et al., 2011). A more recent study by Yagi et al. in 2015 also
found that low baseline BMI is a predictor for good DPP-4 inhibitor treatment response
in Japanese patients with T2D (Yagi et al., 2015). Similarly, Nomiyama et al. (2012)
also found baseline BMI to be predictive of treatment response to sitagliptin in a
prospective trial (Nomiyama et al., 2012).
Upon univariate analysis, WC was significantly higher (p<0.25) in those on DPP-4
inhibitors with good treatment response (A1c < 7%) in the case group. This association
however did not persist upon multivariate analysis. WC was not significantly associated
with A1c < 7% in the control group or the combined study population. To the best of
our knowledge, there have been no studies that specifically assessed WC as an associate
265
Univers
ity of
Mala
ya

of DPP-4 inhibitor treatment response, most studies used BMI as a variable. Therefore,
we were unable to make a comparison with studies by other groups. It is possible that
we were unable to find any significant association between treatment response and waist
circumference in the final analysis because of the uneven group distribution for
comparisons, with >90% of the study population having a central obesity and WC
above the normal range.
In conclusion, we could not find an association between BMI and WC with treatment
response to DPP-4 inhibitors. The cross-sectional nature of our study methodology
prevents comparison with prospective trials that examined the impact of baseline BMI
on treatment response to DPP-4 inhibitors. The fact that DPP-4 inhibitors are often
prescribed to overweight and obese subjects as these agents are weight neutral (as
opposed to sulphonylureas that are often associated with weight gain) may also
confound the picture. Nevertheless, further prospective randomized controlled trials are
the best study design to obtain the most accurate findings.
5.2.3 Clinical Associations
5.2.3.1 Insulin resistance: Fasting insulin concentration and HOMAIR
Upon univariate analysis, fasting insulin (<174 pmol/L) and HOMAIR <3.85 were
significant predictors of optimal glycemic control (A1c <7%) in the combined
population of cases and controls (n=662) on any oral anti-diabetic therapy (except for
SGLT2 inhibitors). After multivariate analysis only HOMAIR remained significantly
associative of A1c <7% in the total population of subjects. Measures of insulin
266
Univers
ity of
Mala
ya

resistance (fasting insulin and HOMAIR) were not associative of treatment response on
multivariate analysis in the case or control groups.
Our findings of a lack of impact of insulin resistance on treatment response to DPP-
4 inhibitors are consistent with those of a prospective study by S. A. Kim et al. (2011)
in 251 Korean patients who found that fasting insulin and HOMAIR were not
significantly different between responders and non-responders to 24 weeks of sitagliptin
therapy as an add-on (S. A. Kim et al., 2011). Lim et al. (2011) also found that while
lower fasting insulin and HOMAIR were predictive of treatment response to
combination therapy with sitagliptin and metformin on univariate analysis, this
association did not persist on multivariate analysis (Lim et al., 2012).
In contrast, a more recent study by Ku et al. in 2015, found that high HOMAIR at
baseline was a significant predictor of positive treatment response to 4 years therapy
with sitagliptin in combination with metformin in patients with T2D in South Korea (Ku
et al., 2015).
Our failure to find a relationship between better insulin sensitivity and treatment
response in the case group on univariate and therefore multivariate analysis may be
because our study is underpowered. Alternatively the lack of demonstrable influence of
insulin resistance at baseline on treatment response to DPP-4 inhibitors may be
secondary to the cross-sectional nature of our study design. There is evidence that
treatment with DPP-4 inhibitors improve insulin resistance, therefore a difference in
insulin sensitivity between responders and non-responders is simply an outcome of
treatment and not a predictor of treatment response. There have been many reports that
DPP-4 inhibitors improve insulin resistance (Apaijai, Chinda, Palee, Chattipakorn, &
Chattipakorn, 2014; Derosa et al., 2012; Kern et al., 2012; Lim et al., 2012; Zhuge et al.,
267
Univers
ity of
Mala
ya

2016). A 2-year study evaluation of sitagliptin treatment in patients with T2D found that
sitagliptin is effective in improving insulin resistance based on the reductions in fasting
plasma insulin and HOMAIR levels from baseline, thus leading to a better glycemic
profile, as well as improving body weight and lipid profiles (Derosa et al., 2014). Three
months therapy with sitagliptin was found to significantly reduce postprandial glucose
levels and increased the insulinogenic index measured during Meal Tolerance Test
(MTT), suggesting that sitagliptin was effective in improving acute insulin response and
suppressing postprandial hyperglycemia in Japanese patients with T2D who displayed
impaired acute insulin responses (Ohkura et al., 2014). Sitagliptin therapy with the
addition of metformin was also found to have a positive effect on insulin resistance in
Indian populations based on the findings that this combination therapy significantly
reduced A1c and FPG levels from baseline (Sen, Sinha, Nyati, & Joshit, 2012). A study
comparing the effect of metformin versus sitagliptin plus metformin combination
against insulin resistance in patients with T2D had found that the presence of sitagliptin
in combination with metformin as part of a regimen was more effective in reducing
insulin resistance leading to improved glycemic control, compared to metformin therapy
alone (Derosa et al., 2012). A more recent study also found that vildagliptin in
combination with metformin improved insulin resistance and exerted a cardioprotective
effect in obese-insulin resistant rats with ischemia-reperfusion injury (Apaijai et al.,
2014). A common perception is that DPP-4 inhibitor treatment may be less effective
with increasing insulin resistance and disease progression with concomitant loss of
pancreatic β-cell function. This has been proven wrong in a study by Schweizer,
Dejager & Foley in 2012; where individuals with higher insulin resistance, obesity and
longer duration of T2D were shown to benefit from vildagliptin therapy in combination
with metformin (Schweizer et al., 2012). In a recent study determining the effect of
DPP4 inhibition by linagliptin on macrophage migration and polarization in white 268
Univers
ity of
Mala
ya

adipose tissue and liver of high-fat diet–induced mice, linagliptin impaired the obesity-
related insulin resistance and inflammation (Zhuge et al., 2016). Linagliptin reduced the
(macrophage1)M1-polarized macrophage migration while inducing an
(macrophage2)M2 dominant shift of macrophages within white adipose tissue and liver,
resulting in the impairment of obesity-related insulin resistance and inflammation in test
subjects (Zhuge et al., 2016). Four weeks of linagliptin therapy were found to reduce
insulin resistance and improve insulin sensitivity in diet-induced obese mice, as well as
reducing liver fat content (Kern et al., 2012).
In summary, our group failed to find an association between insulin resistance and
treatment response to DPP-4 inhibitors. This may have been because our sample
population was underpowered or because of the cross-sectional study design. The
interpretation of the association of insulin resistance and treatment response in a cross-
sectional study is confounded by the fact that treatment with DPP-4 inhibitors in itself
can improve insulin resistance.
5.2.3.2 Triglycerides
Our univariate analyses showed that triglyceride (<1.7 mmol/L) was significantly
associated with good glycemic control in case group on DPP-4 inhibitor therapy and the
total population on any oral antidiabetic drug treatment (except SGLT2 inhibitors)
(p<0.05). Upon multivariate analyses these relationships remained significant in both
the aforementioned groups. There was no association between triglyceride <1.7 mmol/L
and good glycemic control in the control group.
269
Univers
ity of
Mala
ya

There is a vast body of literature that corroborates our finding of an independent
association of lower triglyceride levels with DPP-4 inhibitor treatment response. Many
studies have investigated the effects of DPP-4 inhibitor treatment on triglycerides levels
with results consistent with our findings. Sitagliptin was found to significantly reduce
postprandial triglyceride concentrations after 12 weeks of treatment in Japanese patients
with T2D (Kubota et al., 2012). Sakamoto et al. (2013) found that sitagliptin was able to
reduce serum triglyceride after three months of therapy (Sakamoto et al., 2013). Derosa
et al. (2014) observed a reduction in triglyceride levels from baseline in a group of
patients with T2D undergoing sitagliptin therapy within 2 years of treatment duration
(Derosa et al., 2014). Similar findings were demonstrated in Brazilian populations
(Barros et al., 2014). In 2014, sitagliptin was also found to significantly reduced
triglyceride-rich lipoprotein (apolipoprotein (apo)B-48, VLDL apoB-100, apoE, and
apoC-III) in patients with T2D within 6 weeks by reducing the synthesis of these
lipoproteins (Tremblay et al., 2014). The addition of linagliptin to pioglitazone was
found to reduce triglyceride levels from baseline after 24 weeks in a group of patients
with T2D (McGill, 2012). According to Tremblay et al. (2014), the mechanisms of
reducing these triglyceride-rich lipoprotein of both hepatic and intestinal origin in
patients with T2D, involves increasing incretin hormone (GLP-1) levels, reducing
circulating free fatty acids concentrations and improving pancreatic β-cell function and
insulin sensitivity (Tremblay et al., 2014). Another possible mechanism postulated for
the triglyceride-lowering effect by sitagliptin includes the inhibition of intestinal
triglyceride absorption and hepatic VLDL release, declining blood glucose levels and
complementary improvements in metabolic status due to GLP-1 (Kubota et al., 2012). A
recent study by Macauley et al. (2015) demonstrated that vildagliptin caused a
significant decrease in hepatic triglyceride levels within 6 months of therapy regardless
of change in body weight (Macauley et al., 2015). Vildagliptin reduces postprandial 270
Univers
ity of
Mala
ya

triglyceride levels and lipolysis more than it causes changes in plasma insulin
concentrations (Matikainen et al., 2006) resulting in a decline in liver triglyceride
concentration (Macauley et al., 2015). A study by McGill found that triglyceride levels
decreased from baseline after 24 weeks of linagliptin therapy in a group of patients with
T2D (McGill, 2012). However, a similar study conducted earlier by Gomis et al. found
that the triglyceride levels remained stable above the normal reference range at 24 week
s of linagliptin treatment in a group of T2D patients (Gomis, Espadero, Jones, Woerle,
& Dugi, 2011). Kern et al. (2012) found that the reductions in liver triglyceride content
mediated by linagliptin were significantly correlated with blood glucose improvement,
and the study concluded that long-term linagliptin treatment may decrease liver fat
content in subjects with diet-induced hepatic steatosis and insulin resistance, as well as
improving insulin sensitivity (Kern et al., 2012). These were explained by the ability of
linagliptin to reverse liver triglyceride content and dose-dependently improve hepatic
steatosis which was found to be correlated with improvements in blood glucose and A1c
(Kern et al., 2012). Tanaka et al. (2016) found that serum levels of triglyceride changed
significantly after linagliptin administration in patients with diabetic nephropathy (M.
Tanaka et al., 2016). Treatment with GLP-1 was reported to reduce serum triglyceride
levels pre- and post-meal (J. J. Meier et al., 2006), - postulated mechanisms include
inhibition of postprandial hyperlipidemia by GLP-1, reduction of triglyceride absorption
caused by delayed gastric emptying and also inhibition of lipolysis by improved insulin
secretion (Shigematsu, Yamakawa, Kadonosono, & Terauchi, 2014). Other groups have
hypothesized that GLP-1 signaling in the incretin pathway results in reduced
triglyceride levels, cholesterol, and apoB48 produced by the small intestine (Hsieh et
al., 2010). The increment of triglyceride due to the consumption of a high-fat diet can be
inhibited by vildagliptin (Matikainen et al., 2006). All of these studies are consistent
with our findings that lower triglycerides are associated with DPP-4 inhibitor treatment 271
Univers
ity of
Mala
ya

response. Our analysis confirmed that triglycerides concentrations <1.7 mmol/L are a
predictor of good response to DPP-4 inhibitor therapy.
There have also been a few reports of no association of triglyceride levels with
glycemic control in patients treated with DPP-4 inhibitors. Our findings differ from
Yagi et al. in 2015, who did not find triglycerides to be a predictor of DPP-4 inhibitor
treatment response in Japanese patients with T2D, after 12 weeks of therapy (Yagi et
al., 2015). Lim et al. in 2012 also found that triglycerides were not a predictor of
treatment response to the combination of sitagliptin + metformin (Lim et al., 2012).
Shigematsu et al. in 2014 found that sitagliptin did not reduce the triglyceride levels of
subjects with T2D with dyslipidemia (Shigematsu et al., 2014). In a group of patients
with T2D complicated by dyslipidemia, sitagliptin was found to significantly reduce
total cholesterol, LDL cholesterol, and non-HDL cholesterol in a group with high
triglyceride levels (≥150 mg/dL) (Shigematsu et al., 2014). In the case of statin users,
sitagliptin reduced the total cholesterol and LDL cholesterol in a group with high
triglyceride levels (≥150 mg/dL) (Shigematsu et al., 2014).
In conclusion, our study found a significant association of a lower triglyceride level
with treatment response to DPP-4 inhibitors defined as A1c <7% , after adjustment for
all other variables i.e. demographic, drug therapy, genetic or metabolic. However given
the cross-sectional design of our study, one cannot exclude the possibility that the lower
triglyceride in the case group with good treatment response is merely another outcome
of treatment with DPP-4 inhibitors rather than an associate of treatment response. The
former is more likely.
272
Univers
ity of
Mala
ya

5.2.3.3 LDL cholesterol
Our univariate analyses demonstrated that a lower LDL cholesterol (<2.6 mmol/L)
was significantly associated with poorer glycemic control in the case group on DPP-4
inhibitors, controls on non-DPP-4 inhibitor oral antidiabetics and the total population on
any oral antidiabetic (except SGLT2 inhibitor) (cases + controls). Upon multivariate
analyses however only the association in the whole study population remained
statistically significant.
Yagi et al. (2015) found that a reduced level of LDL cholesterol was significantly
associated with DPP-4 inhibitor treatment response over 12 months but this association
did not persist upon multivariate analysis (Yagi et al., 2015). Lim et al. (2012) was one
of the few groups that analysed the impact of baseline LDL cholesterol on treatment
response to DPP-4 inhibitors but found no effect on even univariate analysis (Lim et al.,
2012). Additionally, Eppinga et al. in 2016, found that lower LDL cholesterol
significantly predicted good treatment response to metformin (Eppinga et al., 2016).
However, as the limitation of our study; the LDL cholesterol levels was not measured
from baseline thus, we unable to conclude the effect of reduced level of LDL
cholesterol on antidiabetics treatment response as studies above.
There have been several studies that reported an LDL lowering effect of DPP-4
inhibitors. Vildagliptin was found to reduce the hepatic expression of genes required for
cholesterol synthesis. (Flock, Baggio, Longuet, & Drucker, 2007). Linagliptin has been
found to reduce the serum LDL cholesterol in patients with T2D undergoing
hemodialysis, regardless of its effect on lowering plasma glucose levels (Terawaki et
al., 2015). A study by Katamani et al. (2013) comparing the clinical efficacy between
sitagliptin and linagliptin had found that both sitagliptin and linagliptin significantly
273
Univers
ity of
Mala
ya

reduced both LDL and HDL levels leading to lipid profile improvements in patients
with T2D (Katamani et al., 2013). All of these studies demonstrated that DPP-4
inhibitors significantly reduced LDL cholesterol levels in patients with T2D.
Sitagliptin had positive effects on the lipid profile, where it was found to reduce LDL
cholesterol, total cholesterol, and also found to elevate HDL cholesterol after 2 years of
therapy in patients with T2D (Derosa et al., 2014). Shigematsu et al. (2014), have also
reported that sitagliptin significantly decreases LDL cholesterol, as well as HDL
cholesterol and total cholesterol after 12 weeks of treatment in patients with T2D
(Shigematsu et al., 2014). Sitagliptin was repeatedly reported to improve lipid profiles
in patients with T2D, with a recent study by Fan, Li & Zhang in 2016 observing that
LDL cholesterol, HDL cholesterol, and total cholesterol can be improved by either
sitagliptin monotherapy or sitagliptin in a combination therapy regime. However,
treatment with sitagliptin alone produced greater improvement in these lipid profile
parameters compared to the combination therapy (M. Fan, Li, & Zhang, 2016). In
contrast, in a study comparing metabolic effects of sitagliptin in obese and non-obese
patients with T2D, Katsuyama et al. (2015) reported that at 6 months of sitagliptin
treatment, there was no change in LDL cholesterol, plasma glucose, blood pressure and
eGFR indicating that sitagliptin and sitagliptin-mediated changes may not influence
these parameters (Katsuyama, Sako, Adachi, Hamasaki, & Yanai, 2015).
Extended DPP-4 inhibition modifies expression of genes essential for fatty acid
oxidation, comprised of acyl-coenzyme dehydrogenase medium chain and Acyl-CoA
synthetase (Sakamoto et al., 2013). Additionally, DPP-4 inhibitors also reduce the levels
of hepatic mRNA transcripts for acetyl coenzyme A acyltransferase 1 and carnitine
palmitoyltransferase 1, regardless of the incretin receptor actions (Flock et al., 2007).
Since these regulations rely on and/or are independent of the incretin receptor actions, 274
Univers
ity of
Mala
ya

Sakamoto et al. (2013) suggested that sitagliptin may have the capability of lowering
triglyceride levels in patients with T2D (Sakamoto et al., 2013).
In conclusion, although the majority of the studies above demonstrated that DPP-4
inhibitors significantly reduced LDL cholesterol levels, we did not find LDL cholesterol
to be significantly associated with good glycemic control in cases on DPP-4 inhibitor
treatment upon multivariate analysis. This is most likely because this was not a
prospective study design and hence we did not have a baseline LDL cholesterol for our
analyses. Any association between LDL cholesterol and A1c in the case group could
have been secondary to the LDL-lowering treatment effect of DPP-4 inhibitors. Another
confounding factor that effects interpretation of the impact of antidiabetic therapy on
LDL is the contribution of concomitant statin therapy in patients with diabetes, which
we did not analyse.
5.2.3.4 Systolic (SBP) and Diastolic blood pressure (DBP)
Upon univariate analysis, lower SBP was significantly associated with good
glycemic control in the controls on non-DPP-4 inhibitor therapy but not in cases and the
whole population. This association however did not persist upon multivariate analysis in
the control group.
Upon univariate analysis, DBP (< 90 mmHg) was significantly associated with good
glycemic control in those on any oral antidiabetic (except SGLT2 inhibitor) in the total
combined study population and the control group on non-DPP-4 inhibitor therapy.
However, DBP (< 90 mmHg) was not a significant associate of treatment response to
275
Univers
ity of
Mala
ya

DPP-4 inhibitors in the case group. Upon multivariate analysis however these
associations between lower DBP and good glycemic control did not persist.
Our findings are consistent with Martono et al. in 2015 who found that blood
pressure was not an associate of response to metformin and sulphonylurea; in a
systematic analysis regarding patients variabile response to metformin and
sulphonylurea therapies between the year 2003 and 2012 (Martono et al., 2015). It is
also difficult to interpret differences in blood pressure as we have not controlled for the
effect of concomitant use of antihypertensive medications.
Although DPP-4 inhibitors are known to lower systolic and diastolic blood pressure,
we did not find blood pressure to be significantly lower in those with A1c <7% in the
DPP-4 inhibitor therapy case group (Table 4.3). DBP however was significantly lower
in case group compared with controls not on DPP-4 inhibitors (Table 4.1). Sitagliptin
was found to significantly reduce diastolic blood pressure after 12 weeks of treatment in
Japanese populations (Kubota et al., 2012). Sakamoto et al. (2013) found that sitagliptin
was able to reduce SBP and DBP after three months of treatment duration (Sakamoto et
al., 2013). Early stipulated possible mechanisms include GLP-1 action in the proximal
renal tubule which induces increased urinary sodium excretion, which might contribute
to blood pressure reduction with sitagliptin therapy (Gutzwiller et al., 2004; Sakamoto
et al., 2013). It has also been proposed that sitagliptin causes a decline in blood pressure
due to the sodium-diuretic action of GLP-1 (Kubota et al., 2012).
Vildagliptin was also found to decrease blood pressure by increasing urine sodium
excretion. Sufiun et al. (2015) suggested that vildagliptin may have beneficial
antihypertensive effects including the refinement of the abnormal circadian blood
pressure pattern (Sufiun et al., 2015). In 2011, vildagliptin was reported to cause
276
Univers
ity of
Mala
ya

improvement of endothelium-dependent vasodilatation in patients with T2D (van
Poppel, Netea, Smits, & Tack, 2011); due to the vasodilatory actions of GLP-1
involving the GLP-1 receptor in the vascular endothelium which is mediated by
metabolites of GLP-1 (Ban et al., 2008). Cosenso-Martin et al. (2015 & 2012)
postulated that vildagliptin reduces blood pressure by reversing endothelial
dysfunction.However, glucose control can also ameliorate the endothelium dysfunction
thus, more studies are required to confirm these findings (Cosenso-Martin et al., 2015;
Cosenso-Martin, Vilela-Martin, & Giollo-Junior, 2012). Duvnjak and Blaslov (2016)
showed that both sitagliptin and vildagliptin improved arterial stiffness (Duvnjak &
Blaslov, 2016) due to the cardiovascular effects mediated by GLP-1 via its specific
GLP-1 receptor on cardiomyocytes, vascular endothelium and vascular smooth muscle
cells resulting in vasodilatory effects (Ban et al., 2008) thus, leading to the reduction of
blood pressure in patients with T2D (Duvnjak & Blaslov, 2016). An early study by
Bosi, Byiers & Cohen in 2007, also showed that vildagliptin reduced DBP in patients
with T2D complicated with hypertension (Bosi, Byiers, & Cohen, 2007).
There has been work exploring possible mechanisms which involve the active
isoform of GLP-1 which is GLP-1 (7-36) (Sakamoto et al., 2013). GLP-1 (7-36)
manifests vascular actions through GLP-1 receptor signaling, where its metabolite, the
GLP-1 (9-36) exhibits vasodilatory effects regardless of the GLP-1 receptor in a nitrous
oxide/cyclic guanosine monophosphate (cGMP)-dependent manner (Ban et al., 2008).
In the presence of DPP-4 inhibitors, GLP-1 levels are increased resulting in
vasodilatation, thus causing the reduction in blood pressure (Sakamoto et al., 2013).
277
Univers
ity of
Mala
ya

5.2.3.5 AST levels
Upon univariate analysis, AST levels (≤ 31 U/L) were significantly associated with
(p<0.25) glycemic control in case group on DPP-4 inhibitors and in the total population
on any oral antidiabetic (except SGLT2 inhibitor). Upon multivariate analysis however
the association in both the case group and total population disappeared. Most subjects
had AST levels within the normal range as subjects with serious illnesses were excluded
from the study. Chronic mild elevation of transaminases however is commonly found in
T2D owing to a hepatic steatosis (Bhatt & Smith, 2015).
To the best of our knowledge, there are currently no studies that associate AST levels
as the associate for DPP-4 inhibitors treatment response. In this study, the mean AST
levels were slightly but significantly higher in the case group on DPP-4 inhibitors (20.9
(±5.6) IU/l) compared with the control group (19.4 (±5.3) IU/l) (Table 4.1). The upper
limit of normal range AST in our instituitions’s laboratory is 31 IU/L. However, the
majority patients in the case group on DPP-4 inhibitor therapy (>95% ) had AST levels
< 31 IU/l regardless of A1c levels in the optimal or suboptimal range (Table 4.4).
GLP-1 is reported to be expressed in various cells including hepatocytes (N. A.
Gupta et al., 2010) thus, DPP-4 inhibitors are suspected to have pleiotropic effects
independent of incretin activity (other than reducing plasma glucose concentrations and
stimulating pancreatic β-cells insulin secretion) (Kanazawa et al., 2014). Pleiotropic
effects refer to a single gene affecting multiple systems or influencing more than one
phenotype traits (Kavalipati et al., 2015). Since non-alcoholic fatty liver disease
(NAFLD) is severe, more prevalent and increases the mortality rates in patients with
T2D (Tziomalos, Athyros, & Karagiannis, 2012), many studies have been conducted to
278
Univers
ity of
Mala
ya

evaluate and examine the effects of DPP-4 inhibitors on liver function in patients with
T2D.
Our findings are not consistent with many studies that have reported that liver
enzyme levels are lowered by DPP-4 inhibitor therapy. Studies have shown that
sitagliptin can safely be used in patients with T2D complicated by liver disease or injury
(Asakawa et al., 2015) and it also improves fatty liver with a significant reduction in
AST, ALT, A1c and gamma-glut amyl-transpeptidase (ϒGT) levels (Iwasaki et al.,
2011; Shirakawa et al., 2011). DPP-4 inhibitors have been found to significantly reduce
AST and ALT levels regardless of A1c levels, after six months of treatment in Japanese
populations with T2D (Kanazawa et al., 2014). A study by Miyazaki et al. (2012) found
that DPP4 expression was significantly greater in patients with NAFLD compared to
healthy individuals as the DPP4 was locally expressed in liver (Miyazaki et al., 2012),
suggesting that the inhibition of DPP4 activity by the DPP-4 inhibitors may be useful
for the treatment of NAFLD (Kanazawa et al., 2014). A randomized controlled trial
conducted to compare the efficacy of sitagliptin versus placebo in reducing liver fat by
measuring the MRI-derived proton density-fat fraction (MRI-PDFF) had found that
sitagliptin was no more effective than placebo in improving fatty liver in patients with
NAFLD (Cui et al., 2016). A comparison between the clinical efficacy of sitagliptin and
linagliptin had found that although both effects on glycemic control were virtually the
same (Gross et al., 2013), sitagliptin showed significant improvements in AST and ALT
compared to linagliptin (Katamani et al., 2013). Linagliptin was found to significantly
decrease the serum levels of AST in patients with T2D undergoing hemodialysis
(Terawaki et al., 2015).
Vildagliptin was found to have a protective effect for the liver against cyclosporin A-
induced hepatotoxicity via reducing the DPP4 activity as vildagliptin improved AST, 279
Univers
ity of
Mala
ya

ALT and ϒGT levels within 28 days of therapy (El-Sherbeeny & Nader, 2016). On the
other hand,an earlier study by Su et al. (2014) in subjects from China found that the
levels of AST, ALT, urea and creatine had slightly increased after 24 weeks treatment
with vildagliptin (Su et al., 2014). However, a similar increment was also observed in
placebo group, this plus small sample size and the use of other antihypoglycemic agents
may have contributed to these results; and suggestthat vildagliptin does not negatively
affect the liver function of patients with T2D (Su et al., 2014). Meta-analyses involving
more than 7000 individuals with T2D treated with vildagliptin indicate that vildagliptin
is not associated with increased risk of hepatic events or drug-induced liver injury due
to hepatic enzyme elevations (Ligueros-Saylan, Foley, Schweizer, Couturier, & Kothny,
2010). However, there have been a few cases of DPP-4 inhibitor-induced liver injury
reported recently; one case of sitagliptin-induced hepatic injury (Kutoh, 2014), one case
of vildagliptin-induced idiosyncratic liver injury (Kurita, Ito, Shimizu, Hirata, &
Uchihara, 2014), and one case of linagliptin-induced liver toxicity (Toyoda-Akui et al.,
2011). Since these adverse events occurred in the presence of other antidiabetics and/or
diseases (Kurita et al., 2014; Kutoh, 2014; Toyoda-Akui et al., 2011), the causality is
questionable and more studies are required to explore the effect of DPP-4 inhibitors on
the liver. The DPP-4 inhibitors improved liver function by stimulating GLP-1 activity
and by inhibiting local DPP4 activity in liver (N. A. Gupta et al., 2010; Kanazawa et al.,
2014), however, the exact mechanisms of improved liver function in individuals with
NAFLD remains unknown.
To summarize, in our study there was no significant association between lower liver
enzyme levels and DPP-4 inhibitor use. This is not consistent with the majority of
studies that report a lowering of liver enzymes secondary to DPP-4 inhibitor use.
However, AST levels were not measured from baseline thus, changes in AST levels
280
Univers
ity of
Mala
ya
cannot be determined. Other limitations include the absence of other supportive data
such as liver biopsy and ultrasonography in order to exclude NAFLD in our study
population. It has been reported that a significant proportion of patients with T2D and
NAFLD can have liver enzymes well within the upper range of normal hence the need
for imaging and biopsy studies to examine the true prevalence of NAFLD in patients on
DPP-4 inhibitor therapy (Pearce, Thosani, & Pan, 2013).
5.2.3.6 sCD26 levels
Upon univariate analysis sCD26 levels were a significantly higher in those with good
glycemic control in the control group on non-DPP-4 inhibitor oral antidiabetic therapy.
This association did not however persist on multivariate analysis. sCD26 levels were
not found to be significantly associated with DPP-4 inhibitor treatment response in case
group and good glycemic control in the total study population on any oral antidiabetic
(except SGLT2 inhibitors).
Our findings of no significant difference in sCD26 levels between patients with
good response to DPP-4 inhibitor therapy and those that respond poorly were not
concordant with findings by Ahmed et al. in 2015, where sCD26 levels were
significantly associated with higher A1c levels (poor response) in patients with T2D
treated with DPP-4 inhibitors. (Ahmed et al., 2015). The reason for these differences
may be due to the choices of the study population where ours were all diabetics and
Ahmed’s study (2015) included patients without diabetes as the control groups (Ahmed
et al., 2015). Although sCD26 levels was a significant variable in the control group, we
had to exclude this variable from further analysis since the ROC curve was not
significant and we cannot proceed with sCD26 levels categorization, plus we could not 281
Univers
ity of
Mala
ya

find any references or guidelines on sCD26 cut-off point for patients with T2D within
this specific age group, to be used in our study. Additionally, since this study was about
DPP-4 inhibitors and its users, sCD26 will not be discussed any further in this chapter
as it was only significant in non-DPP-4 inhibitor therapy group.
5.2.4 Comorbidities and Complications of Diabetes
We evaluated differences in the prevalence of other comorbidities associated with the
metabolic syndrome such as hypertension and dyslipidemia and its association with
glycemic control. We also evaluated the presence of complications such as peripheral
neuropathy. Patients with chronic kidney disease (CKD) were excluded from
participation so are therefore not relevant to this discussion. There were very few
subjects with documented retinopathy in our sample population, and therefore this will
not be discussed further either. Neither hypertension or dyslipidemia was associated
with glycemic control. Peripheral neuropathy was associated with glycemic control on
univariate analysis in the control group but this was not found to be independently
predictive on multivariate analysis. Peripheral neuropathy had no impact on glycemic
control in the case group however or the total population on univariate analysis.
The presence of complications is a function of time and past glycemic control and
therefore is likely to be associated with longer duration of diabetes (Cortez, Reis, Souza,
Macedo, & Torres, 2015), and therefore reduced β-cell mass. Therefore the presence of
microvascular complications (potentially associated with reduced β-cell mass) is more
likely to have an impact on patients treated with insulin secretagogues such as DPP-4
inhibitors and ulphonylureas (Del Guerra et al., 2005; Maedler et al., 2005; Page &
282
Univers
ity of
Mala
ya

Reisman, 2013). However we were not able to find an association between the presence
of peripheral neuropathy and treatment response to DPP-4 inhibitor therapy.
5.2.5 The Effect of Concomitant Antidiabetic Therapies in Combination
Regimens
Upon univariate analysis, particular combinations of antidiabetic treatments (eg.
DPP-4 inhibitor + biguanide, DPP-4 inhibitor + biguanide + TZD, etc.) were
significantly associated with glycemic control in the case group on DPP-4 inhibitors, the
control group and the total group on any oral antidiabetic therapy (p<0.25). However,
multivariate analysis showed that none of the combination antidiabetic regimens was an
associate of good glycemic control in DPP-4 inhibitors users as well as the control
group and the total group.
Neither did we find an association between subtype of DPP-4 inhibitor and glycemic
control. The majority of cases were on sitagliptin, with vildagliptin being the second
most commonly prescribed DPP-4 inhibitor.
We did analysed the significance of each of the treatment regimens and examined
overall significance additionally. However, because of the uneven numbers of subjects
in each of the treatment regimen groups, the resultant p-values might potentially false-
significance. These are the limitations of our study and in future, it may be best to
incorporate a balanced and sufficiently large number of subjects on each of the different
combination antidiabetic treatment regimens.
283
Univers
ity of
Mala
ya

5.2.5.1 Biguanides
All patients in the case and control groups were on metformin (biguanide) treatment.
5.2.5.2 Sulphonylureas
38.8% of the total population of combined cases and controls were on sulphonylurea
therapy. 13% of cases were also on SUs ( in addition to DPP-4 inhibitors ) while 64.7%
of controls were on SUs. Upon univariate analysis, SU use was significantly associated
with glycemic control only in the combined population of cases and controls (n=662)
but this association lost its significance upon multivariate analysis.
5.2.5.3 Thiazolidinediones
Univariate analysis revealed that use of thiazolidinediones was significantly
associated with glycemic control in the case group on DPP-4 inhibitors and also in the
control group. However, these associations did not persist on multivariate analysis. The
very small numbers of patients on TZDs (7.3% of the total population) however bring
into question the validity of these statistical results. In order to draw significant
conclusions larger and even numbers of patients on individual classes of drugs need to
be included in the study population.
284
Univers
ity of
Mala
ya
5.2.6 Number of antidiabetic agents used: Monotherapy, dual and triple
therapy
Univariate analysis revealed that monotherapy was significantly associated with
glycemic control in the total group on any oral antidiabetic (except SGLT2 inhibitor)
(Table 4.7). However, since only the control group had patients on monotherapy
(biguanide), this variable was excluded from further analysis. As very few people were
on triple therapy, this variable will also not be discussed further.
5.2.6.1 Dual Therapy
Upon univariate analysis, dual therapy (DPP-4 inhibitor + biguanide) was
significantly associated with glycemic control in the case group on DPP-4 inhibitors
(p<0.25) (Table 4.3) and also in the total study population on any oral antidiabetic
treatment (p<0.25) (Table 4.7). In cases, patients with dual therapy presented as the
majority of patients with good DPP-4 inhibitor treatment response. In the overall study
population, patients with dual therapy were also formed the majority with good
glycemic control. This was expected since 77.6% of study subjects were on dual therapy
treatment for T2D. However, multivariate analysis showed that dual therapy was not an
associate of DPP-4 inhibitor treatment response, and neither was it an associate of
treatment response to any oral antidiabetics (except SGLT2 inhibitor) in the overall
population.
285
Univers
ity of
Mala
ya

5.3 Genetic Variants Associated with DPP-4 Inhibitor Treatment Response
Among 9 SNPs investigated in this study, only WFS1 rs734312 and KCNJ11
rs2285676 were found to be associated with DPP-4 inhibitors treatment response in
cases group. No SNPs were found to be associated with oral antidiabetics treatment
response in controls group.
KCNJ11 rs2285676 was found to be exclusive for DPP-4 inhibitors treatment
response based on these findings; (1) KCNJ11 rs2285676 significant in cases group but
not in controls group, (2) KCNJ11 rs2285676 remained significant in study population
(cases group in study population), and (3) KCNJ11 rs2285676 Odds Ratio (OR) in cases
group (solely DPP-4 inhibitor users) was stronger compared to the OR in study
population (combination of DPP-4 inhibitor users and non-users).
5.3.1 Baseline Genotypic Characteristics of Case Population in Response to
DPP-4 Inhibitor Treatment
In this study, genotype analyses were used to detect the patients that have a definite
good response to DPP-4 inhibitor treatment. This genotype screening was a crucial part
in studying a population thoroughly, along with the phenotype screenings that were
done earlier. Based on these screening, we detected patients with specific genotypes that
will respond positively to DPP-4 inhibitors.
No significant differences were found between each of the DPP-4 rs2970932,
rs2268889 and rs1861975 polymorphisms with DPP-4 inhibitors treatment response
(Table 4.9). Nevertheless, based on the descriptive results, this study discover the
possibilities that patients with DPP4 rs2970932 (genotype CT or TT), rs2268889
286
Univers
ity of
Mala
ya

(genotype AG), and rs1861975 (genotype AA) polymorphisms had a better response to
DPP-4 inhibitors treatment and may benefit greatly from this therapy.
Among the WFS1 gene polymorphisms investigated, rs735312 was the only
polymorphism found to be significantly associated with DPP-4 inhibitors treatment
response. Patients with WFS1 rs734312 (genotype AG) were found to have the highest
good response to DPP-4 inhibitors treatment compared to those with genotype AA and
GG, and allele A carriers responded greater to DPP-4 inhibitors treatment than allele G
carriers (Table 4.10). WFS1 rs1046320 polymorphism was found not in Hardy-
Weinberg equilibrium in the cases group, but vice versa in controls group; since both
case-control groups came from the same population, this study concluded that there was
the possibility of some technical error happened that lead to this results. Thus, this was
considered as the limitation of this study as more strict techniques to be adopted in the
case of replicating this study in future. As for WFS1 rs10010131 polymorphism, those
with genotype AA and GG responded better to DPP-4 inhibitors treatment compared to
those with genotype AG, and allele A carriers responded greatly to DPP-4 inhibitors
treatment compared to allele G carriers.
KCNJ11 rs2285676 polymorphism was found to be significantly associated with
DPP-4 inhibitors treatment response (Table 4.11). Additionally, patients with genotype
CC responded better to DPP-4 inhibitors treatment compared to those with genotype CT
and TT, and this study also found that allele C carriers responded greatly to DPP-4
inhibitors treatment compared to allele T carriers. The other two investigated KCNJ11
polymorphisms; rs5218 and rs5210 were not significantly associated with DPP-4
inhibitors treatment response. However, based on the descriptive data, there was a
possibility that patients with rs5218 (genotype AG) and rs5219 (genotype AG) may
287
Univers
ity of
Mala
ya

respond well to DPP-4 inhibitors treatment compared to patients with other genotypes.
Thus, this may spark interest of further investigations in future.
5.3.2 Baseline Genotypic Characteristics of Control Population in Response to
Oral Antidiabetics (Except DPP-4 Inhibitor) Treatment
Subjects in the controls group were obtained from the same population as cases
group, the difference was those in controls group did not use DPP-4 inhibitors as T2D
treatment. Nevertheless, this study had not found any investigated polymorphisms that
were significance to the oral antidiabetics treatment (Table 4.12-14). The study had
come to the possibility that maybe those investigated polymorphisms were only
exclusive to DPP-4 inhibitors treatment. Many will argue as these results were expected
as these genes were selected based on the DPP-4 inhibitors mechanism of action
pathway, thus it was common sense that these results will not be significant in patients
that did not use DPP-4 inhibitors. However, we would like to make a point here that
these genes (DPP4, WFS1, and KCNJ11) are equally important for sulphonylureas and
thiazolidinediones to exert their actions. DPP4 gene (rs12617656, rs4664443, and
rs7633162) polymorphisms were found to be associated with T2D in Malaysian
population (Ahmed et al., 2016), due to its role in encoding a CD26/DPP4 protein that
caused the catalytic degradation of active GLP-1 in glucose homeostasis (Aschner et al.,
2006; Deacon & Holst, 2009; D. J. Drucker & Nauck, 2006); which may affect the
outcome of sulphonylureas and thiazolidinediones response (Brunham et al., 2007;
Fagerholm, Haaparanta, & Scheinin, 2011). Meanwhile, WFS1 gene plays a major role
in the secretion of insulin by the human pancreas (Mussig et al., 2010), where the
inactivation of β-cell WFS1 disrupts ER homeostasis, resulting in β-cell dysfunction,
288
Univers
ity of
Mala
ya

and thus contributing poor insulin secretion leading to poor sulphonylurea and
thiazolidinedione response (Arora, Mehrotra, & Gulati, 2012; S. G. Fonseca et al., 2005;
Shibasaki, Takahashi, Takahashi, & Seino, 2014). A study by Becker et al. (2013)
reported that KCNJ11 genes play an important role in encoding proteins of the ATP-
sensitive K+ channel which is the exact therapeutic target for sulphonylureas (Becker et
al., 2013). All of these studies showed that DPP4, WFS1, and KCNJ11 genes are also
important for sulphonylureas and thiazolidinediones treatment response.
This study described which genotypes of each studied polymorphisms that responded
greatly to oral antidiabetics therapy. Patients with DPP4 rs2970932 (genotype CT),
rs2268889 (genotype AG and GG), and rs1861975 (genotype AA and CC) responded
greatly to oral antidiabetics treatment compared to those with other genotypes (Table
4.12). As for WFS1 gene, patients with WFS1 rs1046320 (genotype AG and GG),
rs734312 (genotype GG), and rs10010131 (genotype AA and AG) responded greatly to
oral antidiabetics treatment compared to those with other genotypes (Table 4.13).
Finally, for KCNJ11 gene; patients with KCNJ11 rs2285676 (genotype CT), rs5218
(genotype AA and AG), and rs5210 (genotype GG) responded greatly to oral
antidiabetics treatment compared to those with other genotypes (Table 4.14). Although
these were only descriptives results, we hope that this information may be useful for
future references in studies involving genotype characteristics of oral antidiabetics
therapies.
289
Univers
ity of
Mala
ya

5.3.3 Baseline Genotypic Characteristics of Study Population in Response to
Oral Antidiabetics (Including DPP-4 Inhibitor) Treatment
This study combined both case and control groups to further analysed the genotype
characteristics of the whole study population. Interestingly, this study found that
KCNJ11 rs2285676 emerged as the sole polymorphism significantly associated with
oral antidiabetics (including DPP-4 inhibitors) treatment response (Table 4.17).
Meaning that, KCNJ11 rs2285676 sensitive to the presence of DPP-4 inhibitors users,
as previously discussed that this polymorphism was not found to be significant in
controls group. Patients with KCNJ11 rs2285676 (genotype CC) responded better to
oral antidiabetics (including DPP-4 inhibitors) treatment compared to those with
genotype CT and TT, and allele C carriers responded greater than allele T carriers to
oral antidiabetics (including DPP-4 inhibitors) treatment.
Descriptively, patients with DPP4 rs2970932 (genotype CT), rs2268889 (genotype
AG and GG), and rs1861975 (genotype AA and CC) responded greatly to oral
antidiabetics (including DPP-4 inhibitors) treatment compared to those with other
genotypes (Table 4.15). As for WFS1 gene, patients with WFS1 rs1046320 (genotype
GG), rs734312 (genotype AG), and rs10010131 (genotype AA) responded greatly to
oral antidiabetics (including DPP-4 inhibitors) treatment compared to those with other
genotypes (Table 4.16). Finally, for KCNJ11 gene; patients with KCNJ11 rs2285676
(genotype CC), rs5218 (genotype AG), and rs5210 (genotype AG and GG) responded
greatly to oral antidiabetics (including DPP-4 inhibitors) treatment compared to those
with other genotypes (Table 4.17).
By analysing all groups; cases, controls and overall study population, this study had
come to a conclusion that KCNJ11 rs2285676 is a strong significant genetic variable for
290
Univers
ity of
Mala
ya

DPP-4 inhibitors treatment response, thus it need to be analysed thoroughly to confirm
its association with DPP-4 inhibitors treatment response.
5.4 Genetic Associations of DPP-4 Inhibitor Treatment Response
Upon univariate analysis, we found that the KCNJ11 rs2285676 (genotype CC)
polymorphisms were more prevalent in those with good response to DPP-4 inhibitor
therapy in the case group and those with A1c <7% of the entire population on any oral
antidiabetic therapy, but not in the control population who were not on DPP-4 inhibitor
therapy. Upon univariate analysis, the WFS1 rs734312 polymorphism was also more
prevalent in those with good response to DPP-4 inhibitor therapy in the case group but
not in the whole group or the control group with A1c <7%. Upon multivariate analysis
however only the KCNJ11 rs2285676 (genotype CC) polymorphism was independently
predictive of good glycemic control in DPP-4 inhibitor users regardless of ethnicity,
anthropometrics, age and duration of antidiabetics and concomitant use of other oral
agents used in combination regimens. This suggests that the KCNJ11 rs2285676
(genotype CC) polymorphism might be uniquely relevant to the response to therapy
with the DPP-4 inhibitor class rather than to other pharmacological classes such as SUs,
TZDs, and biguanides. The control group of patients on non-DPP-4 inhibitor oral
therapy serves as a comparator model. The lack of a significant effect of these
polymorphisms in the control group underlines the fact that these genes play a unique
role in the pharmacogenomics of the DPP-4 inhibitor class of agents in Asian subjects.
To the best of our knowledge, there were no studies that directly assessed KCNJ11
rs2285676 as the predictor of DPP-4 inhibitor treatment response. However, we
compared our findings closely to the studies that found an association of KCNJ11 291
Univers
ity of
Mala
ya

rs2285676 to T2D. Therefore, based on corroborating studies by Haghvirdizadeh et al.
in 2015, where KCNJ11 rs2285676 polymorphism was identified as common a
KCNJ11 polymorphism associated with diabetes (Haghvirdizadeh et al., 2015), and
KCNJ11 rs2285676 was also reported to be associated with T2D in Chinese Han
population (Liu et al., 2006); our finding that KCNJ11 rs2285676 polymorphism is an
independent associate of DPP-4 inhibitor treatment response in Asian patients with T2D
was a plausible and reasonable one that is consistent with what exists in the published
literature. We were unable to compare the inconsistency of our findings due the fact
there were no similar published studies. Neither are there any published reports as to the
mechanism of the impact of this particular KCNJ11 rs2285676 gene polymorphism on
risk of diabetes, although presumably as with the other KCNJ11 polymorphisms, it
impacts on glucose stimulated insulin secretion via alterations in the activity and
function of the KATP channel on the β-cell. KCNJ11 gene is important in insulin
secretion where the gene encoded the Kir6.2 protein that coupled with SUR1 protein in
the KATP channel that mediates insulin secretion from the β-cell into the circulation
(Miki & Seino, 2005), triggered by elevated blood glucose levels that generate the ATP
efflux (Haghvirdizadeh et al., 2015). Therefore, the mutations in the KCNJ11 gene can
cause an impact on β-cell function where it caused reduced ability of the ATP thus
resulting to ‘overactive’ channels that may decreased the pancreatic β-cell membrane
excitability resulting to reduced insulin secretion (Cartier et al., 2001).
5.5 Effect of Gene-gene Interactions (Linkage Disequilibrium)
Haploview 4.2 software (J. C. Barrett et al., 2005) was used in this study to
investigate the interactions between the DPP4, WFS1, and KCNJ11 polymorphisms.
292
Univers
ity of
Mala
ya

SNPs can alter the risk of a disease occurrence, either alone or in linkage disequilibrium
within a gene or with neighboring genes (Haghvirdizadeh et al., 2015). Linkage
disequilibrium (LD) is defined as the non-random association of alleles at different sites
either at two or more loci (Slatkin, 2008), as the alleles in LD are tightly bound together
and more likely found together in a population (Zdanowicz, 2010). Linkage
disequilibrium is important in this study as it was used to survey the polymorphisms to
associate a phenotype, which in this study; DPP-4 inhibitor treatment response.
For DPP4 gene polymorphisms investigated, linkage disequilibrium showed that the
alleles in each of these DPP4 polymorphisms were not tightly linked together and they
were not likely to be found together in the population studied. This can be explained
theoretically by the recombination process that occurs during meiosis, where genetic
materials were exchanged between a pair of homologous chromosome. Theoretically,
alleles that are closed to each other on a chromosome are more likely to be passed along
together. However, in this study, the alleles of these DPP4 polymorphisms were far
apart thus were more likely to be regrouped during the recombination process
(Zdanowicz, 2010). The impact of recombination process on single DPP4 gene
polymorphism will be caused the next generation to have four haplotypes thus,
confirming DPP4 gene diversity in the study population (Ahmed et al., 2016).
For WFS1 gene polymorphisms in cases group, WFS1 rs1046320 was excluded from
the linkage disequilibrium analysis because this polymorphism had an allele frequency
of less than 0.05 in the case population but vice versa in control population. Linkage
disequilibrium in both cases and controls group regardless the outcome of antidiabetics
treatment response showed that the alleles in each of these WFS1 polymorphisms were
far from each other and they were not likely to be found together in the population
studied. 293
Univers
ity of
Mala
ya

The linkage disequilibrium in all of the KCNJ11 gene polymorphisms in both cases
and controls were weak indicated that the alleles in each of these DPP4 polymorphisms
were not closely linked together and they were not likely to be found together in the
population studied. The correlation between these KCNJ11 gene polymorphisms was
also weak showing that the interaction between these polymorphisms does not
contribute much to the effect (treatment response) studied. In overall, since the linkage
disequilibrium of all of the SNPs of the genes studied were weak, we concluded the
possibility of the study population had achieved diversity via recombination process
during meiosis that occurred throughout generations. However, many intensive studies
are required to prove this hypothesis. The correlations between each of the gene
polymorphisms studied were also weak indicating that antidiabetics treatment response
were not affected by the interaction between the polymorphisms of these three genes.
The strength of LD become the limitation of this study where a polymorphism in a
complete LD (D’=1.0) yields a relative risk of 2.5, but as the D’ reduces to 0.5, the
detectable relative risk will be only at 1.6, concluding that the weaker the LD, the
smaller the relative risk and the more difficult to detect the association of the
polymorphisms to treatment response, unless the sample size was increased
proportionately (J.J. McCarthy, 2002). We already increased our sample size initially
from 262 to 331 (Section 3.2.1.1) to minimise this problem. However, in future a larger
sample size may be used to replicate the study in order to yield better LD results.
Our findings suggested that these regions do indeed harbour DPP-4 inhibitor-
treatment-response-susceptibility loci. Although all of the LOD value is less than 3, we
believe that the weight of evidence for linkage to the chromosome 2q24.3, 4p16.1 and
11p15.1 is sufficient to sparks further intensive investigation of these regions regarding
their associations to the DPP-4 inhibitor treatment response, based on linkage 294
Univers
ity of
Mala
ya

disequilibrium. In future, we hope that such studies will able to identify the mutations
that have a direct effect on susceptibility to DPP-4 inhibitor treatment response.
5.6 Effect of Haplotypes Interaction
In this study, haplotype analysis was used to investigate the genetic interaction
between haplotype within the same chromosome for an effect, which was the response
to DPP-4 inhibitors treatment in cases group and response to other oral antidiabetics in
controls group.
This study found that the interaction between haplotype GG and AA of the WFS1
rs734312 polymorphism was more likely to have an effect on DPP-4 inhibitor treatment
response. The study also found that the interaction between haplotype CT and TT of
KCNJ11 rs2285676 was more likely to have an effect on DPP-4 inhibitor treatment
response. The interaction between other haplotypes of the genes polymorphisms studied
was found to have no effect on antidiabetics treatment response in both cases and
controls groups. To the best of our knowledge, there were no studies reporting on the
haplotype interactions of the WFS1 rs734312 and KCNJ11 rs2285676 relating to the
effect on DPP-4 inhibitor treatment response. Thus, we were unable to make a
comparison of our findings with other similar studies. Nevertheless, since both; WFS1
rs734312 and KCNJ11 rs2285676 were associated with T2D (Batool et al., 2014;
Cheurfa et al., 2011; T. Kawamoto et al., 2004; Liu et al., 2006), our findings were at
least relevant to the consistency of these genes being associated with T2D, thus the
haplotype interactions of both genes associated with the response of DPP-4 inhibitors in
treating T2D was reasonable.
295
Univers
ity of
Mala
ya

In overall, the results demonstrated that, by considering the interactions between
haplotypes of the disease genes potentially related to DPP-4 inhibitor treatment
response, we may succeed in identifying the predisposing-treatment-response disease-
genetic variants that might otherwise have remained undetected. The discovery of
haplotype interactions effects in this section is in-line with our early findings that WFS1
rs734312 (Table 4.10) and KCNJ11 rs2285676 (Table 4.11) polymorphisms were
associated with DPP-4 inhibitors treatment response.
5.7 Gene Expression and Treatment Response
The expression of DPP4 gene in the case subjects group was suppressed contrary to
the DPP4 gene expression in controls group when compared with each reference DPP4
genes. Since the DPP-4 enzyme is encoded by the DPP4 gene (Kameoka et al., 1993),
and in our result; the DPP4 gene showed a reduced expression in the presence of DPP-4
inhibition, the DPP-4 inhibitor is suggested to potentially have the influence on DPP4
gene expression through the inhibition of the DPP-4 enzyme. Supporting our findings,
we observed 3.9-fold increment in relative expression of DPP4 gene without the
presence of DPP-4 inhibitors (Figure 4.14). Additionally, the specific quantity of DPP4
gene amplified was highly reduced (28.81 ± 7.76) in case of subjects group compared to
the controls group (4313.20 ± 5072.81) (Table 4.34). DPP4 gene is expressed most
prominently in small intestine (The Human Protein Atlas (THPA, 2016a)), which is the
location of intestinal L cells (D. J. Drucker & Nauck, 2006) in releasing GLP-1 into the
gastrointestinal circulation (Müssig et al., 2010); in order to initiate insulin production
in the insertion pathway, in response to ingestion of food (D. J. Drucker & Nauck,
2006), thus the downregulated DPP4 expression of our case subjects group suggested
296
Univers
ity of
Mala
ya

that the DPP-4 inhibitors effectively exerting its effect by inhibiting the DPP-4 enzyme
(Lacy, 2009). Several studies reported that the widely used antidiabetics such as
metformin (Green, 2007; Lenhard, Croom, & Minnick, 2004; Lindsay et al., 2005) and
pioglitazone (Lenhard et al., 2004), reduced the circulating levels of DPP4 activity in
vivo (Kirino et al., 2009). However, a study by Pala et al. (2012) measured the DPP4
activity and mRNA expression in cultured human aortic endothelial cells (HAEC) and
human microvascular dermal endothelial cells (HMVEC) treated with high glucose,
metformin and rosiglitazone, had found that hyperglycemia increased the DPP4 activity
in microvascular endothelial cells; suggesting that DPP4 activity increased at specific
site (Pala et al., 2012). In the current study, we failed to find the significant difference
between the DPP4 expressions and DPP-4 inhibitor treatment response. However, we
observed downregulated DPP4 expression subjects had poor DPP-4 inhibitors treatment
response in both cases and controls (66.8% and 16.7%, respectively) (Table 4.33).
As for WFS1 gene, we observed a reduced expression in case subjects group and
increased expression in controls group, as compared to the reference WFS1 gene
(Figure 4.14). Absolute quantification showed that the WFS1 gene quantity amplified in
cases group (131.07 ± 80.20) were lower than the controls group (1199.32 ± 1058.38)
(Table 4.34). Although the expected WFS1 expression in case subjects group is to be
higher than the reference WFS1 gene; since DPP-4 inhibitors inhibit DPP-4 enzyme
resulting to increase production of insulin by WFS1 gene in the endoplasmic reticulum,
the WFS1 expression at least was higher than the DPP4 expression in the case subjects
group (Figure 4.14). Nevertheless, we observed 2.9-fold increment in relative
expression of WFS1 gene without the presence of DPP-4 inhibitors (Figure 4.14).
WFS1 gene is highly expressed in pancreatic β-cells, renal tubules, trophoblast, cells in
ductus seminiferous and purkinje cells (THPA, 2016b). In pancreatic β-cells, the WFS1
297
Univers
ity of
Mala
ya

gene expression is regulated by inositol-requiring 1 (IRE1) and PKR-like endoplasmic
reticulum (ER) kinase (PERK), which are the central regulators of the unfolded protein
(such as proinsulin) response (S. G. Fonseca et al., 2005). IRE1 is a sensor for the
unfolded and misfolded proteins in ER, which is also a central regulator of the unfolded
protein response (UPR) (Yani Chen & Brandizzi, 2013; Iwawaki, Akai, Yamanaka, &
Kohno, 2009). While PERK is also a sensor of unfolded or misfolded proteins and is
highly expressed in pancreatic β-cells (Herbert, 2007; Oslowski & Urano, 2011). In
normal condition, WFS1 is upregulated during insulin secretion (S. G. Fonseca et al.,
2005). However, since our sampling were fasting blood glucose, we may conclude that
the reason for our downregulated WFS1 expression in cases subjects group is probably
due to the absence of food in the gastrointestinal tract hence low insulin production by
the pancreatic β-cells. Supporting our theory, DPP-4 inhibitors are activated by the
ingestion of meal (Lacy, 2009), and insulin is released in a biphasic manner; which is in
a rapid transient first phase followed by a slowly developed but sustained phase
(Rosengren et al., 2012), thus in relevant with our findings. WFS1 mRNA expression is
regulated by a 500-base-pair promoter region located at its transcriptional start point
(Kakiuchi et al., 2009). Based on this fact, many studies have been conducted to
determine whether this WFS1 promoter can be activated by specific drugs (Kakiuchi et
al., 2009; Punapart et al., 2014). For instance, Kakiuchi et al. (2009) investigated the
associations of valproate to WFS1 expression in bipolar disorder, had found that
valproate increases WFS1 expression levels in a dose-dependent pattern (Kakiuchi et
al., 2009). Interestingly, the therapeutic concentrations of valproate induce WFS1
mRNA expression and activate the WFS1 promoter, in which valproate dose-
dependently intensify the separation of WFS1 from GRP94 (an ER stress-response
protein complex) (Kakiuchi et al., 2009). Meanwhile, Punapart et al. (2014) found that
the regulation of peroxisome proliferator-activated receptor delta (Ppard) by valproic 298
Univers
ity of
Mala
ya

acid is dependent on WFS1 genotype (Punapart et al., 2014). In our study, no significant
relationship was observed between the WFS1 expression with DPP-4 inhibitors
treatment response (p=0.240), thus further analysis unable to be ruled out.
KCNJ11 is largely known as the component of the ATP-sensitive potassium (KATP)
channel for many years, and the SNPs reported to be associated with increased risk of
T2D (Qiu et al., 2014; Sokolova et al., 2015). However, the KCNJ11 expression
patterns within the human pancreatic islets are not known although, in previous report
(Kirkpatrick et al., 2010), KCNJ11 has been shown to be enriched in alpha cells in rat
pancreatic islets (Franklin, Gromada, Gjinovci, Theander, & Wollheim, 2005).
Nevertheless, the latest study by Kirkpatrick et al. in 2010 found that KCNJ11 is
enriched in human pancreatic β-cells relative to alpha cells (Kirkpatrick et al., 2010).
Our results showed that KCNJ11 gene expression was slightly suppressed in the
presence of DPP-4 inhibitors, as we observed 1.5-fold increment in relative expression
of this gene in controls group (Figure 4.14). Additionally, the number of KCNJ11 gene
amplified in the case subjects group (879.50 ± 1305.90) was higher than the controls
group (323.13 ± 178.26) (Table 4.34). Theoretically, KCNJ11 gene expression should
be upregulated since DPP-4 inhibitors inhibit the DPP-4 enzyme, thus through cascades
of actions in the incretin pathway; which excites the KCNJ11 gene to releases insulin
via KATP channel (Miki & Seino, 2005). However, our results showed that KCNJ11
gene had the highest relative expression than DPP4 and WFS1 gene (as compared to
each reference genes) in the presence of DPP-4 inhibitors, suggesting that DPP-4
inhibitors potentially affecting the expression of KCNJ11 gene through the incretin
pathway (Jamaluddin et al., 2014). A study by Schwanstecher, Meyer & Schwanstecher
(2002) found that E23K alters the KATP channel function by inducing spontaneous
overactivity of pancreatic β-cells, thus increasing the threshold ATP concentration for
299
Univers
ity of
Mala
ya

insulin release into circulation (Schwanstecher, Meyer, & Schwanstecher, 2002). Florez
et al. (2007) investigated the effect of genotype on insulin secretion and insulin
sensitivity at 1 year in 3,534 participants with impaired glucose tolerance (IGT), had
found that lysine variant in KCNJ11 E23K were less protected by 1-year metformin
treatment than E/E homozygotes (p<0.02), suggesting the lysine variant causing
decreased in insulin secretion in subjects with IGT (Florez et al., 2007). These reports
suggest that the presence of diabetes risk allele in the KCNJ11 SNPs may alter the
insulin secretion pattern (Florez et al., 2007; Schwanstecher et al., 2002), and explained
the downregulated KCNJ11 expression we found in our case subjects group.
Understanding the DPP4, WFS1 and KCNJ11 gene expression in the incretin
pathway might be of importance in treating T2D with DPP-4 inhibitors and may provide
additional targets for therapy intervention. We consider that our analysis of mRNA
expression of T2D susceptibility genes (DPP4, WFS1, and KCNJ11) in a cohort of
patients prescribed with DPP-4 inhibitors, has revealed interesting patterns of genes
expression between DPP-4 inhibitor users and other antidiabetic users, which may add
points on the mechanisms of action of T2D susceptibility genes. To what extent the
effects of these genes expressions on the DPP-4 inhibitors treatment responses may
require further intensive investigation.
Limitations of study may include the inability to avoid the high amplification
frequency of the standard curve for WFS1 and KCNJ11 genes. Reasons for high
amplification frequency may be due to the poor pipetting technique and poor samples
assembling technique onto the MicroAmp® Fast 96-Wells Reaction Plate (ABI, 2010).
300
Univers
ity of
Mala
ya

5.8 Summary of Association Models Incorporating Clinical and Genetic
Markers that Associate to DPP-4 Inhibitor Treatment Response.
5.8.1 MODEL 1 : Incorporating Significant Variables on Comparison of
Subjects on DPP-4 Inhibitor Therapy with Optimal Glycemic Control (A1c
<7%) versus Suboptimal Control (A1c > 7%)
Model 1 generated from regression analysis showed that patients with triglycerides
less than 1.7 mmol/L were 2.4 times more likely to respond to DPP-4 inhibitor
treatment compared to other patients. The model also showed that showed that patients
with KCNJ11 rs2285676 (genotype CC) were 2 times more likely to respond to DPP-4
inhibitor treatment compared to those without the polymorphism. Similar findings were
found with stepwise regression analysis along with stronger significance for both
variables. These findings can be used to select patients best suited for DPP-4 inhibitors
therapies or it can be used in selecting best T2D treatment exclusively for a patient of
known triglycerides level and KCNJ11 polymorphism. Thus, the use of Model 1 to
associate the outcome of a DPP-4 inhibitor therapy may possibly change the usual
practice of selecting drug therapy and may serve as important key aspects to improve
T2D management in future.
301
Univers
ity of
Mala
ya

5.8.2 MODEL 2 : Incorporating Significantly Differing Variables in Those with
A1c <7% Compared With A1c > 7% in All 662 Patients with Type 2
Diabetes on Oral Antidiabetic Therapy (Excluding SGLT2 Inhibitors)
Model 2 generated from regression analysis showed that patients with age less than
65 years old were 1.9 times more likely more likely to respond to oral antidiabetic
treatment compared to other patients. The model also showed that patients with
KCNJ11 rs2285676 (genotype CC) were 1.9 times more likely to respond to oral
antidiabetic treatment compared to those without the polymorphism. Further refinement
of Model 2 by using Stepwise regression analysis had found additional associative
variables apart from those found in earlier regression analysis including that the patients
with the duration of T2D of less than 10 years were 1.6 times more likely to respond to
oral antidiabetics treatment compared to other patients. These findings may aid in
predicting response to oral antidiabetic therapies providing that the information on
patient’s age, duration of T2D and KCNJ11 polymorphisms were known before
initiating any T2D treatments.
Interestingly, this study had found few variables that were trending towards
significance and might be considered as potential associations for oral antidiabetics
treatment response. Those variables included patients with triglyceride levels less than
1.7 mmol/L were 1.5 times more likely to respond to antidiabetics treatment compared
to other patients, and patients with the HOMAIR levels of less than 3.875 were 2 times
more likely to respond to antidiabetics treatment compared to other patients. This model
also found that patients with LDL cholesterol of less than 2.59 mmol/L were 0.7 times
less likely to respond to antidiabetic treatment compared to other patients. Although
these variables were only near to significance, it was also good to know the possibilities
of HOMAIR, triglycerides and LDL cholesterol of being the predictor for oral 302
Univers
ity of
Mala
ya

antidiabetics treatment response. Maybe in future, all of these variables can be taken
into consideration whenever a decision need to be made in selecting a perfect T2D
treatment for a specific type of patient especially when good glycemic control is highly
desirable for a given small time frame that requires no room for treatment failure.
Simple example as preparing patient with T2D for a major surgery or a radiation
therapy, the glycemic control preferably must be on-point before the procedures so that
any post-procedure complications relating to glycemic levels may be avoided.
Stepwise regression analysis enables this study to detect of which antidiabetic
treatment regimes that have the propensity of resulting poor glycemic control to patients
with T2D. Those treatment regimes were the combination therapy of DPP-4 inhibitor +
biguanide + thiazolidinedione, biguanide alone, biguanide + sulphonylurea, and
biguanide + thiazolidinedione therapies; which means that other antidiabetic treatment
regimes were better choices to aim for a good glycemic control. However, more
thorough investigations were needed to further evaluate these findings.
5.8.3 MODEL 3 : Incorporating Significant Associations on Univariate
Analysis of Good Glycemic Control in Patients Not on DPP-4 Inhibitor
Therapy
Model 3 did not found any significant clinical associations of oral antidiabetics
treatment response in patients that did not use DPP-4 inhibitors. However, the model
did show that patient who did not receive DPP-4 inhibitors were 0.1 times less likely to
have good glycemic control on biguanide + sulphonylurea + thiazolidinedione therapy
compared to other patients, which means the possibility of the presence of DPP-4 in
antidiabetic treatment may resulted to better glycemic control. However, in cases group, 303
Univers
ity of
Mala
ya

this study had not obtained subjects undergoing quadruple T2D therapy involving DPP-
4 inhibitor + biguanide + sulphonylurea + thiazolidinedione, thus any conclusion
regarding this matter cannot be made. Nevertheless, based on this study current
findings, there was still a possibility that adding DPP-4 inhibitor to antidiabetic
treatment may make a difference to glycemic control. Further refinement of Model 3
using Stepwise regression analysis had also lead to the same conclusion with even
stronger odds ratio indicating that the combination of biguanide + sulphonylurea +
thiazolidinedione was definitely a poor choice of treatment to treat patients with T2D
with the similar characteristic as described in our control group. However, in future,
more depth investigation may be required to further confirm these findings.
5.8.4 MODEL 4 : Incorporating Significantly Different Variables in the Case
Group on DPP-4 Inhibitor Therapy Compared with Non-DPP-4 Inhibitor
Therapy Group
Model 4 was a special model in this study because we incorporated the significantly
different variables in the case group on DPP-4 inhibitor therapy compared with non-
DPP-4 inhibitor therapy group so that we can see the difference between the case and
control groups thoroughly. Model 4 showed that patients aged less than 65 years old
were 2.2 times more likely to respond to DPP-4 inhibitor treatment compared to other
patients. The model also showed that patients with triglyceride levels less than 1.7
mmol/L were 2.2 times more likely to respond to DPP-4 inhibitor treatment compared
to other patients. Although the p-value was trending to significance, this study would
like to make a point here that model showed that patients with KCNJ11 rs2285676
(genotype CC) were 1.9 times more likely to respond to DPP-4 inhibitor treatment
304
Univers
ity of
Mala
ya

compared to other patients. Nevertheless, further refinement of the Model 4 (by
Stepwise regression analysis) had shown that patients with KCNJ11 rs2285676
(genotype CC) were a valid association variable for DPP-4 inhibitor treatment response
as it was presented with significance (p < 0.05). Age less than 65 years old and
triglyceride levels less than 1.7 mmol/L were also maintained as the association
variables for DPP-4 inhibitor treatment response. Interestingly, duration of T2D of less
than 10 years emerged as one of the association variables in the new refined Model 4
inversely with our previous findings in Model 1 that only triglycerides levels and
KCNJ11 rs2285676 (genotype CC) were the sole association variables for DPP-4
inhibitors. The effect of duration of T2D on antidiabetics treatment response may be
exclusive to DPP-4 inhibitors users as this variable was not found to be a significant
predictor variable in controls group. However, further investigation regarding this
matter may be required in future.
5.8.5 Comparison Between Association Models
Triglycerides less than 1.7 mmol/L and KCNJ11 rs2285676 (genotype CC) were
strongly found to be associated with DPP-4 inhibitors treatment response. In
comparison between case and control groups, triglycerides less than 1.7 mmol/L and
KCNJ11 rs2285676 (genotype CC) were only significant in the case group, vice versa
for the control group (Table 4.49).
In the association model for the whole study population, triglycerides less than 1.7
mmol/L and KCNJ11 rs2285676 (genotype CC) were still significant associations of
oral antidiabetics treatment response, with additional age less than 65 years old and
duration of T2D less than 10 years as another significant predictors. When study 305
Univers
ity of
Mala
ya

excluded controls from the study population but uses the same significant variables to
construct the DPP-4 inhibitor treatment response association model, triglycerides less
than 1.7 mmol/L, KCNJ11 rs2285676 (genotype CC), age less than 65 years old and
duration of T2D less than 10 years still remained as the significant associations of DPP-
4 inhibitor treatment response.
Study progressed into the more strict selection of variables for DPP-4 inhibitor
treatment response association model, where the variables were chosen were only
significant in case group. Hence, triglycerides less than 1.7 mmol/L and KCNJ11
rs2285676 (genotype CC) emerged as stronger associations (with higher OR) for DPP-4
inhibitor treatment response compared to other association models (Table 4.49).
The study concluded that the association variables; triglycerides less than 1.7
mmol/L and KCNJ11 rs2285676 (genotype CC) were exclusive for DPP-4 inhibitor
treatment response. Our findings in-line with many studies worldwide (Barros et al.,
2014; Derosa et al., 2014; Kern et al., 2012; Kubota et al., 2012; Macauley et al., 2015;
Matikainen et al., 2006; McGill, 2012; Sakamoto et al., 2007; Sakamoto et al., 2013; M.
Tanaka et al., 2016; Tremblay et al., 2014), that had found the triglyceride-lowering
effect of DPP-4 inhibitor thus, we hope that in future, the triglycerides levels may serve
as an important factor to consider while deciding DPP-4 inhibitor therapy to treat
patients with T2D. Although there was no study yet claiming the effect of KCNJ11
rs2285676 (genotype CC) on DPP-4 inhibitor treatment response, we would like to
make a point that KCNJ11 rs2285676 polymorphism was previously identified as one
of the common KCNJ11 polymorphisms associated with diabetes (Haghvirdizadeh et
al., 2015) and was also reported to be associated with T2D in Chinese Han population
(Liu et al., 2006); and obtaining this same polymorphism with strong significance in our
study making it a valid argument that this polymorphism is associated with DPP-4 306
Univers
ity of
Mala
ya

inhibitor treatment response and the way this study found that KCNJ11 rs2285676
(genotype CC) may lead to good response to DPP-4 inhibitor; was definitely fascinating
and might sparks interest in the realm of clinical practice in refining criteria of choosing
the best T2D treatment for this specific type of patient. Nevertheless, replication studies
in a controlled environment (for example; randomized controlled trial) may be required
in future to refine this finding.
5.9 Overall Findings
This study had found the association of lipid profiles to oral antidiabetics therapy.
Triglycerides were found to be associated with DPP-4 inhibitors treatment response
consistent with the findings of other recent studies (as described in section 5.2.3.2).
Meanwhile, LDL cholesterol was found to be associated with other oral antidiabetics
treatment response. Patients with T2D may benefit with good DPP-4 inhibitors
treatment response if their triglycerides level are less than 1.7 mmol/L.
In terms of genetic point of view, among all gene polymorphisms studied, WFS1
rs734312 (Table 4.10) and KCNJ11 rs2285676 (Table 4.11) were found to be associated
with DPP-4 inhibitors treatment response. However, since WFS1 rs734312 was
eliminated in association model (Table 4.42), this gene will not be discussed in this
section. Focusing on KCNJ11 rs2285676, further analysis (Table 4.20) showed that the
interaction between CT and TT was 1.1 times more likely to have an effect on DPP-4
inhibitor treatment response. The more discrete analysis in the association model (Table
4.42) showed that haplotype CC of the KCNJ11 rs2285676 reigned as the causative
variable that caused good DPP-4 inhibitor treatment response. This concluded to the
highest possibility that the allele C in KCNJ11 rs2285676 is associated with good DPP-307
Univers
ity of
Mala
ya

4 inhibitor treatment response consistent with our preliminary findings (Table 4.11) that
majority of subjects with allele C presented with good DPP-4 inhibitor treatment
response (A1c < 7%) as compared to allele T. In future, more intensive study is required
to investigate the therapeutic effects of DPP-4 inhibitors to C allele carriers of the
KCNJ11 rs2285676 polymorphism.
A cross sectional study main and primarily usefulness is for the purposes of
hypotheses generation. This will enable better design and planning of a genuine
prospective and predictive study, with multiple time points. This is done in the clinical
development of all drugs, where genetic and other measurements are done at the
beginning of a prospective study, and then analysis is conducted after the completion of
a blinded randomised (and often placebo controlled) study with the drug. However, the
pharma companies use of such data is restricted to marketing purposes only and not for
other important scientific uses. Thus, the study in this thesis is important and useful in
identifying new clinical and genetic factors, where the significance remains unknown
(and unproven in prediction) still.
5.10 Strengths and Limitations of Study
This study has several limitations. The majority of the study’s subjects had a shorter
duration of T2D of less than 10 years, as a result the study’s findings might not be
relevant to patients with longer duration of diabetes or even with comorbidities and
diabetes-related complications other than dyslipidemia, hypertension, and peripheral
neuropathy. Nevertheless, we stand firm with the genetic association variable as it is
definite and will not change in any circumstances, thus remaining as a strong associate
of DPP-4 inhibitors treatment response. 308
Univers
ity of
Mala
ya

Relatively few published reports were available for KCNJ11 rs2285676 in diabetes,
let alone its associations with DPP-4 inhibitor treatment response, thereby raising the
question of the reliability of our findings. However, we overcame that by carrying out
intensive genomic analyses to make sure that our findings are accurate. The novelty of
our study findings is the strength of our study. The fact that our subjects are Asian is
also a strength because of the scarcity of pharmacogenomic studies in Asian subjects, in
particular Malay ethnic descent subjects. Asian subjects with diabetes are widely
believed to have a different phenotype of diabetes characterized by greater visceral
adiposity at a lower BMI/waist circumference, greater insulin resistance (secondary to
higher levels of inflammation/free fatty acids) and greater β-cell secretory dysfunction.
Our work adds to the scant body of literature on Asian pharmacogenomics, and may
lead to the delineation of an Asian diabetes genotype (Y. G. Kim et al., 2013; King et
al., 2012; Yoon et al., 2006).
The cross-sectional design of this study is a limitation. Most researchers will argue
that baseline A1c and reduction of A1c after treatment should have been considered.
The statistical significance for reduction of A1c or change in A1c should be calculated
and included as part of an additive genetic model adjusted for baseline A1c, thus
demonstrating the expected value of higher reduction for each variable; for example C-
allele of rs2285676. However, in our study, A1c measurement was only taken once as
all of the data were based on a single cross-sectional sample. However, study inclusion
criteria did specify that all subjects should have been on antidiabetics (including DPP-4
inhibitors) for at least 3 months in order to reflect the change in A1c caused by the
antidiabetics taken. The ideal study design would be a prospective clinical trial wherein
the study design provides control over treatment dose, therapy indication, the timing of
treatment, and takes into account many other possible confounders we could not
309
Univers
ity of
Mala
ya

consider such as adherence and lifestyle measures to treat diabetes such as diet and
exercise (J. J. McCarthy, 2003).
DPP-4 inhibitors improve glycemia by increasing insulin secretion and suppressing
glucagon. Therefore another limitation of our study is that we did not evaluate insulin
either as HOMA2-%B or insulin secretion secondary to dynamic stimulation with oral
or IV glucose. Neither did we evaluate glucagon suppression by DPP-4 inhibitors as a
predictive factor for treatment response. Many studies have found that DPP-4 inhibitors
significantly improve β-cell function (Riche, East, & Riche, 2009), thus, since β-cell
dysfunction is a major component of the pathophysiology of T2D in Asian populations,
this is a significant limitation (Y. A. Kim, 2015)
There was quite a high rate of non-participation (331 patients out of an initial sample
size of 1,306 patients on DPP-4 inhibitor therapy, eg., n=281 medical record not
available; n=256 did not agree to participate). Since we were using the HIS system, the
numbers of diabetes patients generated by the keyword ‘diabetes mellitus’ was high
(1,306 patients) as it generated the whole diabetes patients RN numbers registered in the
HIS system itself. That is the reason of the high in number of potential subjects. As the
Diabetes Clinic operates for the average of 50 patients per clinic day, the number n=256
of ‘did not agree to participate’ is justified as data collections were done in few months
time. As for the unavailability of the medical records (n=281), thats just represent a
small percentage of the potential subjects which is 21.5%, and it is also common for the
potential subjects to have appointments at clinics other that Diabetes Clinic that made
their medical records unavailable at the UMMC’s Patient Information Department. This
was a significant limitation of the study.
Another limitation of this study was the exclusion of DPP-4 inhibitor dose as a
310
Univers
ity of
Mala
ya

variable as the variability of the multiple doses of the different types of DPP-4 inhibitors
utilized by study subjects would result in a very small sample size for each of the dose
categories and thus insignificant statistical results. Larger sample size population would
have been preferable in order to consider DPP-4 inhibitor dose as a variable. The
unequal ethnic distribution is also a limitation and prevented us from exploring genetic
differences linked to ethnicity. There were less participants of Chinese descent and even
fewer Indians recruited, as the majority population in Malaysia is Malay. Future
directions of our work should include a prospective trial design with a large sample size
and inclusion of equal numbers of patients from all 3 ethnic groups. The prospective
trial design should include the DPP-4 inhibitor dose as one of the variables for the
predictors of DPP-4 inhibitors treatment response, as well as baseline A1c and change
in A1c. Further studies should also be conducted to determine the impact of the
KCNJ11 rs2285676 polymorphism in terms of b-cell secretory dysfunction with
evaluation of insulin secretion with indexes such as HOMA B, the insulinogenic index
derived from the OGTT as well as the intravenous glucose tolerance test.
311
Univers
ity of
Mala
ya

CHAPTER 6: CONCLUSION
This cross-sectional observational study investigated the association between 9
genetic polymorphisms in 3 selected genes involved in the incretin and insulin secretion
pathway i.e. the DPP4 gene, WFS1 gene and KCNJ11 gene; with DPP-4 inhibitor
treatment response in patients with T2D, in the Malaysian population. We achieved our
study objectives : (i) to identify the clinical, and and genetic markers associated with
DPP-4 inhibitor treatment response, (ii) to investigate the association of gene expression
levels with DPP-4 inhibitor treatment response, and finally, (iii) to develop a model
incorporating clinical and genetic markers that associated with DPP-4 inhibitor
treatment response. Initial univariate analysis found that waist circumference, triple
therapy incorporating DPP-4 inhibitors, biguanides and sulphonylureas, dual therapy
with DPP-4 inhibitors and biguanides, serum triglyceride, serum LDL cholesterol,
serum AST, KCNJ11 rs2285676 polymorphism and WFS1 rs734312 polymorphism
were associated with Alc <7% in subjects on DPP-4 inhibitor therapy. However upon
multivariate analysis of the case group on DPP-4 inhibitor therapy, only a lower
triglyceride level and KCNJ11 rs2285676 polymorphism (genotype CC) were
associated with A1c <7%. Importantly, these variables were independently associated
with optimal glycemic control after adjustment for age, duration of diabetes, BMI,
HOMAIR and use of oral antidiabetic drug combination therapy regimens and classes
such as sulphonylureas, biguanides and thiazolidinediones. The low triglyceride level in
this cross-sectional study associated with A1c <7% in case subjects on DPP-4 inhibitors
however is more likely to be an outcome of DPP-4 inhibitor treatment and not a
predictor of response given the fact that DPP-4 inhibitors are known to lower
triglyceride levels. In contrast, in the control group on non-DPP-4 inhibitor oral
antidiabetic therapy, none of the 9 SNPs tested for were predictive of good glycemic
312
Univers
ity of
Mala
ya

control (A1c <7%). The lack of associative value KCNJ11 rs2285676 polymorphism
(genotype CC) in the control group implies its as an associate of response to DPP-4
inhibitors rather than other oral antidiabetics/insulin secretagogues. However, we found
no significant relationships between the DPP4, WFS1 and KCNJ11 expression with
DPP-4 inhibitor treatment response. Our association model that found that that patients
with triglyceride concentrations less than 1.7 mmol/L were 2.4 times more likely to
respond to DPP-4 inhibitor treatment compared to other patients, and patients with
KCNJ11 rs2285676 (genotype CC) polymorphism were 2.0 times more likely to
respond to DPP-4 inhibitor treatment. This work sheds light on the relatively
unexplored field of Asian pharmacogenomics, in particular treatment response to a
recent addition to the pharmacological armamentarium of T2D, i.e. DPP-4 inhibitors. It
is necessary to design prospective trials that examine the impact of these
polymorphisms on changes from baseline A1c in a larger sample size with equal
numbers of the 3 ethnicities that comprise the Malaysian population. The
pathophysiological impact of this polymorphism on insulin secretion should also be
evaluated with the use of indices such as the 30 minutes insulinogenic index (derived
from the oral glucose tolerance test) and first phase insulin secretion (derived from the
intravenous glucose tolerance test). Confirmation of these preliminary findings might
contribute towards the achieving the goal of truly individualized pharmacotherapy in
T2D based on gene profiling. We hope findings of this study may trigger more research
regarding the impact of KCNJ11 rs2285676 gene polymorphism in diabetes, especially
as an associate of DPP-4 inhibitor treatment response; perhaps in a better study design
like a prospective controlled trial.
313
Univers
ity of
Mala
ya

REFERENCES
Abate, N., & Chandalia, M. (2007). Ethnicity, type 2 diabetes & migrant Asian Indians. Indian J Med Res, 125(3), 251-258.
Abbasi, F., Brown Jr, B. W., Lamendola, C., McLaughlin, T., & Reaven, G. M. (2002).
Relationship between obesity, insulin resistance, and coronary heart disease risk. Journal of the American College of Cardiology, 40(5), 937-943.
Abbott, C. A., McCaughan, G. W., & Gorrell, M. D. (1999). Two highly conserved
glutamic acid residues in the predicted beta propeller domain of dipeptidyl peptidase IV are required for its enzyme activity. FEBS Lett, 458(3), 278-284.
Abe, M., Kikuchi, F., Kaizu, K., & Matsumoto, K. (2008). The influence of
hemodialysis membranes on the plasma insulin level of diabetic patients on maintenance hemodialysis. Clin Nephrol, 69(5), 354-360.
Abe, M., Okada, K., & Soma, M. (2011). Antidiabetic Agents in Patients with Chronic
Kidney Disease and End-Stage Renal Disease on Dialysis: Metabolism and Clinical Practice. Current Drug Metabolism, 12(1), 57-69.
ABI. (2010). TaqMan® Gene Expression Assays Protocol. Retrieved 25/12/2012, from
http://www3.appliedbiosystems.com/cms/groups/mcb_support/documents/generaldocuments/cms_041280.pdf
ADA. (2012). Standards of Medical Care in Diabetes—2012. Diabetes Care,
35(Supplement 1), S11-S63. ADA. (2015). Standards of Medical Care in Diabetes—2015. Diabetes Care,
38(Supplement 1), S4-S4. ADA. (2016). Standards of Medical Care in Diabetes-2016. Diabetes Care,
39(Supplement 1). Addison, D., & Aguilar, D. (2011). Diabetes and Cardiovascular Disease: The Potential
Benefit of Incretin-Based Therapies. Current atherosclerosis reports, 13(2), 115-122.
314
Univers
ity of
Mala
ya

Adler, A. I., Stevens, R. J., Manley, S. E., Bilous, R. W., Cull, C. A., Holman, R. R., &
Group, U. (2003). Development and progression of nephropathy in type 2 diabetes: The United Kingdom Prospective Diabetes Study (UKPDS 64). Kidney International, 63(1), 225-232.
Aghili, N., Devaney, J. M., Alderman, L. O., Zukowska, Z., Epstein, S. E., & Burnett,
M. S. (2012). Polymorphisms in dipeptidyl peptidase IV gene are associated with the risk of myocardial infarction in patients with atherosclerosis. Neuropeptides, 46(6), 367-371.
Ahmed, R. H., Huri, H. Z., Al-Hamodi, Z., Salem, S. D., Al-absi, B., & Muniandy, S.
(2016). Association of DPP4 Gene Polymorphisms with Type 2 Diabetes Mellitus in Malaysian Subjects. PLOS ONE, 11(4), e0154369.
Ahmed, R. H., Huri, H. Z., Al-Hamodi, Z., Salem, S. D., & Muniandy, S. (2015). Serum
Levels of Soluble CD26/Dipeptidyl Peptidase-IV in Type 2 Diabetes Mellitus and Its Association with Metabolic Syndrome and Therapy with Antidiabetic Agents in Malaysian Subjects. PLOS ONE, 10(10), e0140618.
Ahrén, B. (2007). Dipeptidyl Peptidase-4 Inhibitors. Clinical data and clinical
implications, 30(6), 1344-1350. Ahrén, B. (2008). Novel combination treatment of type 2 diabetes DPP-4 inhibition +
metformin. Vascular Health and Risk Management, 4(2), 383-394. Ahrén, B. (2012). DPP-4 inhibition and islet function. Journal of Diabetes
Investigation, 3(1), 3-10. Alberti, K. G. M. M., Eckel, R. H., Grundy, S. M., Zimmet, P. Z., Cleeman, J. I.,
Donato, K. A., . . . Smith, S. C. (2009). Harmonizing the Metabolic Syndrome. A Joint Interim Statement of the International Diabetes Federation Task Force on Epidemiology and Prevention; National Heart, Lung, and Blood Institute; American Heart Association; World Heart Federation; International Atherosclerosis Society; and International Association for the Study of Obesity, 120(16), 1640-1645.
Amori, R. E., Lau, J., & Pittas, A. G. (2007). Efficacy and safety of incretin therapy in
type 2 diabetes: systematic review and meta-analysis. JAMA, 298(2), 194-206. Apaijai, N., Chinda, K., Palee, S., Chattipakorn, S., & Chattipakorn, N. (2014).
Combined Vildagliptin and Metformin Exert Better Cardioprotection than 315
Univers
ity of
Mala
ya

Monotherapy against Ischemia-Reperfusion Injury in Obese-Insulin Resistant Rats. PLOS ONE, 9(7), e102374.
Aquilante, C. L., Zineh, I., Beitelshees, A. L., & Langaee, T. Y. (2006). Common
laboratory methods in pharmacogenomics studies. American Journal of Health-System Pharmacy, 63(21), 2101-2110.
Araki, S.-i., Nishio, Y., Araki, A., Umegaki, H., Sakurai, T., Iimuro, S., . . . the
Japanese Elderly Intervention Trial Research, G. (2012). Factors associated with progression of diabetic nephropathy in Japanese elderly patients with type 2 diabetes: Sub-analysis of the Japanese Elderly Diabetes Intervention Trial. Geriatrics & Gerontology International, 12, 127-133.
Arnetz, B. B., Kallner, A., & Theorell, T. (1982). The Influence of Aging on
Hemoglobin A1c(HbA1c). Journal of Gerontology, 37(6), 648-650. Arora, S., Mehrotra, A., & Gulati, S. C. (2012). Incretins and thiazolidinediones in
glucose homeostasis and cancer: Role of common polymorphisms. Cancer Letters, 323(2), 128-134.
Asakawa, M., Mitsui, H., Akihisa, M., Sekine, T., Niitsu, Y., Kobayashi, A., . . .
Ogawa, Y. (2015). Efficacy and safety of sitagliptin for the treatment of diabetes mellitus complicated by chronic liver injury. SpringerPlus, 4, 346.
Aschenbrenner, D. S. (2016). The FDA Revises Restrictions on Metformin Use in
Kidney Impairment. AJN The American Journal of Nursing, 116(8), 22,23. Aschner, P., Kipnes, M. S., Lunceford, J. K., Sanchez, M., Mickel, C., & Williams-
Herman, D. E. (2006). Effect of the Dipeptidyl Peptidase-4 Inhibitor Sitagliptin as Monotherapy on Glycemic Control in Patients With Type 2 Diabetes. Diabetes Care, 29(12), 2632-2637.
Ashcroft, Frances M., & Rorsman, P. (2012). Diabetes Mellitus and the β Cell: The Last
Ten Years. Cell, 148(6), 1160-1171. Aso, Y., Ozeki, N., Terasawa, T., Naruse, R., Hara, K., Suetsugu, M., . . . Inukai, T.
(2012). Serum level of soluble CD26/dipeptidyl peptidase-4 (DPP-4) predicts the response to sitagliptin, a DPP-4 inhibitor, in patients with type 2 diabetes controlled inadequately by metformin and/or sulfonylurea. Translational Research, 159(1), 25-31.
316
Univers
ity of
Mala
ya

Atkins, J. L., Whincup, P. H., Morris, R. W., & Wannamethee, S. G. (2014). Low muscle mass in older men: The role of lifestyle, diet and cardiovascular risk factors. The journal of nutrition, health & aging, 18(1), 26-33.
Augeri, D. J., Robl, J. A., Betebenner, D. A., Magnin, D. R., Khanna, A., Robertson, J.
G., . . . Hamann, L. G. (2005). Discovery and preclinical profile of Saxagliptin (BMS-477118): a highly potent, long-acting, orally active dipeptidyl peptidase IV inhibitor for the treatment of type 2 diabetes. J Med Chem, 48(15), 5025-5037.
Avogaro, A., & Fadini, G. P. (2014). The effects of dipeptidyl peptidase-4 inhibition on
microvascular diabetes complications. Diabetes Care, 37(10), 2884-2894. Ayalasomayajula, S. P., Dole, K., He, Y. L., Ligueros-Saylan, M., Wang, Y.,
Campestrini, J., . . . Sunkara, G. (2007). Evaluation of the potential for steady-state pharmacokinetic interaction between vildagliptin and simvastatin in healthy subjects. Curr Med Res Opin, 23(12), 2913-2920.
Azizi, F., Hadaegh, F., Khalili, D., Esteghamati, A., Hosseinpanah, F., Delavari, A., . . .
Aghajani, H. (2010). Appropriate definition of metabolic syndrome among Iranian adults: report of the Iranian National Committee of Obesity. Arch Iran Med, 13(5), 426-428.
Azmi, M. Y., Jr., Junidah, R., Siti Mariam, A., Safiah, M. Y., Fatimah, S., Norimah, A.
K., . . . Tahir, A. (2009). Body Mass Index (BMI) of Adults: Findings of the Malaysian Adult Nutrition Survey (MANS). Malays J Nutr, 15(2), 97-119.
Baggio, L. L., & Drucker, D. J. (2014). Glucagon-like peptide-1 receptors in the brain:
controlling food intake and body weight. The Journal of Clinical Investigation, 124(10), 4223-4226.
Bailey, S. D., Xie, C., Paré, G., Montpetit, A., Mohan, V., Yusuf, S., . . . Anand, S. S.
(2014). Variation at the DPP4 locus influences apolipoprotein B levels in South Asians and exhibits heterogeneity in Europeans related to BMI. Diabetologia, 57(4), 738-745.
Bamshad, M., & Wooding, S. P. (2003). Signatures of natural selection in the human
genome. Nat Rev Genet, 4(2), 99-111. Ban, K., Noyan-Ashraf, M., Hoefer, J., Bolz, S. S., Drucker, D. J., & Husain, M. (2008).
Cardioprotective and vasodilatory actions of glucagon-like peptide 1 receptor
317
Univers
ity of
Mala
ya

are mediated through both glucagon-like peptide 1 receptor-dependent and -independent pathways. Circulation, 117.
Barbara, G. W., Dipiro, J.T., Schwinghammer, T.L., Dipiro, C.V. (2009). Diabetes
Mellitus. In M. Weitz, Davis,K.J. (Ed.), Pharmacotherapy Handbook (7th ed., pp. 210-266): McGraw Hill.
Barnett, A. (2006). DPP-4 inhibitors and their potential role in the management of type
2 diabetes. International Journal of Clinical Practice, 60(11), 1454-1470. Barrett, J. C., Fry, B., Maller, J., & Daly, M. J. (2005). Haploview: analysis and
visualization of LD and haplotype maps. Bioinformatics, 21(2), 263-265. Barrett, L. W., Fletcher, S., & Wilton, S. D. (2013). Untranslated Gene Regions and
Other Non-Coding Elements: SpringerBriefs in Biochemistry and Molecular Biology.
Barrett, T. G., & Bundey, S. E. (1997). Wolfram (DIDMOAD) syndrome. Journal of
Medical Genetics, 34(10), 838-841. Barros, J. I. T., Fechine, F. V., Montenegro Júnior, R. M., Vale, O. C. d., Fernandes, V.
O., Souza, M. H. L. P. d., . . . Moraes, M. E. A. d. (2014). Effect of treatment with sitagliptin on somatosensory-evoked potentials and metabolic control in patients with type 2 diabetes mellitus. Arquivos Brasileiros de Endocrinologia & Metabologia, 58, 369-376.
Barzilai, N., Huffman, D. M., Muzumdar, R. H., & Bartke, A. (2012). The Critical Role
of Metabolic Pathways in Aging. Diabetes, 61(6), 1315-1322. Basak, R. C., Chatterjee, M., & Sarma, P. S. A. (2013). An overview on management of
diabetic dyslipidemia. Journal of Diabetes and Endocrinology, 4(3), 27-36. Bashirullah, A., Cooperstock, R. L., & Lipshitz, H. D. (2001). Spatial and temporal
control of RNA stability. Proceedings of the National Academy of Sciences, 98(13), 7025-7028.
Batool, A., Jahan, N., Sun, Y., Hanif, A., & Xue, H. (2014). Genetic association of IDE,
POU2F1, PON1, IL1α and IL1β with type 2 diabetes in Pakistani population. Molecular Biology Reports, 41(5), 3063-3069.
318
Univers
ity of
Mala
ya

Baumforth, K. R., Nelson, P. N., Digby, J. E., O'Neil, J. D., & Murray, P. G. (1999). Demystified ... the polymerase chain reaction. Molecular Pathology, 52(1), 1-10.
Becker, M. L., Pearson, E. R., Tk, #xe1, #x10d, & , I. (2013). Pharmacogenetics of Oral
Antidiabetic Drugs. International Journal of Endocrinology, 2013, 10. Bergman, A. J., Cote, J., Yi, B., Marbury, T., Swan, S. K., Smith, W., . . . Herman, G.
A. (2007). Effect of renal insufficiency on the pharmacokinetics of sitagliptin, a dipeptidyl peptidase-4 inhibitor. Diabetes Care, 30(7), 1862-1864.
Bertrand, C., Blanchet, E., Pessemesse, L., Annicotte, J. S., Feillet-Coudray, C., Chabi,
B., . . . Casas, F. (2013). Mice Lacking the p43 Mitochondrial T3 Receptor Become Glucose Intolerant and Insulin Resistant during Aging. PLOS ONE, 8(9), e75111.
Beutler, E. (1996). Disorders of haemoglobin. In A. Fauci, Braunwald, E., Isselbacher,
K., Wilson, J., Martin, J., Kasper, D., Longo, D. (Ed.), Harrison’s principles of internal medicine (14th ed., pp. 645-652). New York: McGraw-Hill.
Bhatt, H. B., & Smith, R. J. (2015). Fatty liver disease in diabetes mellitus.
Hepatobiliary Surgery Nutrition, 4(2), 101-108. Bioinformatics. (2010). Microarray sample size calculator. Retrieved 29/12/2012, from
http://bioinformatics.mdanderson.org/MicroarraySampleSize/ Blagosklonny, M. V. (2013). TOR-centric view on insulin resistance and diabetic
complications: perspective for endocrinologists and gerontologists. Cell Death Dis, 4, e964.
Blandino-Rosano, M., Chen, A. Y., Scheys, J. O., Alejandro, E. U., Gould, A. P.,
Taranukha, T., . . . Bernal-Mizrachi, E. (2012). mTORC1 signaling and regulation of pancreatic β-cell mass. Cell Cycle, 11(10), 1892-1902.
Blech, S., Ludwig-Schwellinger, E., Grafe-Mody, E. U., Withopf, B., & Wagner, K.
(2010). The metabolism and disposition of the oral dipeptidyl peptidase-4 inhibitor, linagliptin, in humans. Drug Metab Dispos, 38(4), 667-678.
Bogardus, C., Lillioja, S., Howard, B. V., Reaven, G., & Mott, D. (1984). Relationships
between insulin secretion, insulin action, and fasting plasma glucose concentration in nondiabetic and noninsulin-dependent diabetic subjects. Journal of Clinical Investigation, 74(4), 1238-1246.
319
Univers
ity of
Mala
ya
Bonnen, P. E., Wang, P. J., Kimmel, M., Chakraborty, R., & Nelson, D. L. (2002).
Haplotype and Linkage Disequilibrium Architecture for Human Cancer-Associated Genes. Genome Research, 12(12), 1846-1853.
Bonora, E., Kiechl, S., Willeit, J., Oberhollenzer, F., Egger, G., Targher, G., . . .
Muggeo, M. (1998). Prevalence of insulin resistance in metabolic disorders: the Bruneck Study. Diabetes, 47(10), 1643-1649.
Bosi, E., Byiers, S. R., & Cohen, S. E. (2007). Vildagliptin Significantly Decreases
Blood Pressure (BP) in Hypertensive Patients (pts) with Type 2 Diabetes (T2DM) Compared with Metformin. . Diabetes, Suppl. 1(56), A139-A139.
Boulton, D., Li, L., Frevert, E. U., Tang, A., Castaneda, L., Vachharajani, N. N., . . .
Patel, C. G. (2011). Influence of Renal or Hepatic Impairment on the Pharmacokinetics of Saxagliptin. Clinical Pharmacokinetics, 50(4), 253-265.
Bramlage, P., Gitt, A. K., Binz, C., Krekler, M., Deeg, E., & Tschope, D. (2012). Oral
antidiabetic treatment in type-2 diabetes in the elderly: balancing the need for glucose control and the risk of hypoglycemia. Cardiovascular Diabetology, 11(122).
Brath, H., Paldánius, P. M., Bader, G., Kolaczynski, W. M., & Nilsson, P. M. (2016).
Differences in glycemic control across world regions: a post-hoc analysis in patients with type 2 diabetes mellitus on dual antidiabetes drug therapy. Nutrition & Diabetes, 6(7), e217.
Braunstein, Z., & Zhong, J. (2015). Relieving hepatic steatosis: Another benefit of
dipeptidyl peptidase-4 (DPP4) inhibitors. Int J Hepatobiliary Pancreat Dis, 5, 67-69.
Bray, G. A., Jablonski, K. A., Fujimoto, W. Y., Barrett-Connor, E., Haffner, S., Hanson,
R. L., . . . Diabetes Prevention Program Research, G. (2008). Relation of central adiposity and body mass index to the development of diabetes in the Diabetes Prevention Program. The American Journal of Clinical Nutrition, 87(5), 1212-1218.
Brown, J. B., Conner, C., & Nichols, G. A. (2010). Secondary Failure of Metformin
Monotherapy in Clinical Practice. Diabetes Care, 33(3), 501-506.
320
Univers
ity of
Mala
ya

Brunham, L. R., Kruit, J. K., Pape, T. D., Timmins, J. M., Reuwer, A. Q., Vasanji, Z., . . . Hayden, M. R. (2007). [beta]-cell ABCA1 influences insulin secretion, glucose homeostasis and response to thiazolidinedione treatment. Nat Med, 13(3), 340-347.
Bry, L., Chen, P. C., & Sacks, D. B. (2001). Effects of Hemoglobin Variants and
Chemically Modified Derivatives on Assays for Glycohemoglobin. Clinical Chemistry, 47(2), 153-163.
Bunprajun, T., Henriksen, T. I., Scheele, C., Pedersen, B. K., & Green, C. J. (2013).
Lifelong Physical Activity Prevents Aging-Associated Insulin Resistance in Human Skeletal Muscle Myotubes via Increased Glucose Transporter Expression. PLOS ONE, 8(6), e66628.
Burgess, J. G., J. . (2002). Cracking the druggable genome. Retrieved from
http://www.bio-itworld.com/archive/100902/firstbase.html Burke, W. (2014). Genetic Tests:Clinical Validity and Clinical Utility. Current
protocols in human genetics / editorial board, Jonathan L. Haines ... [et al.], 81, 9.15.11-19.15.18.
Busso, N., Wagtmann, N., Herling, C., Chobaz-Peclat, V., Bischof-Delaloye, A., So, A.,
& Grouzmann, E. (2005). Circulating CD26 is negatively associated with inflammation in human and experimental arthritis. Am J Pathol, 166(2), 433-442.
Calle , E. E., Thun , M. J., Petrelli , J. M., Rodriguez , C., & Heath , C. W. J. (1999).
Body-Mass Index and Mortality in a Prospective Cohort of U.S. Adults. New England Journal of Medicine, 341(15), 1097-1105.
Campisi, J., Andersen, J., Kapahi, P., & Melov, S. (2011). Cellular senescence: a link
between cancer and age-related degenerative disease? Seminars in cancer biology, 21(6), 354-359.
CAP. (1999). CAP Survey Set GH2-B CAP. Northfield, IL, USA. Cappelletti, V., Gariboldi, M., De Cecco, L., Toffanin, S., Reid, J. F., Lusa, L., . . .
Daidone, M. G. (2008). Patterns and changes in gene expression following neo-adjuvant anti-estrogen treatment in estrogen receptor-positive breast cancer. Endocrine-Related Cancer, 15(2), 439-449.
321
Univers
ity of
Mala
ya

Caradec, J., Sirab, N., Revaud, D., Keumeugni, C., & Loric, S. (2010). Is GAPDH a relevant housekeeping gene for normalisation in colorectal cancer experiments? British Journal of Cancer, 103(9), 1475-1476.
Cartegni, L., Chew, S. L., & Krainer, A. R. (2002). Listening to silence and
understanding nonsense: exonic mutations that affect splicing. Nat Rev Genet, 3(4), 285-298.
Cartier, E. A., Conti, L. R., Vandenberg, C. A., & Shyng, S.-L. (2001). Defective
trafficking and function of K(ATP) channels caused by a sulfonylurea receptor 1 mutation associated with persistent hyperinsulinemic hypoglycemia of infancy. Proceedings of the National Academy of Sciences of the United States of America, 98(5), 2882-2887.
Caspersen, C. J., Thomas, G. D., Boseman, L. A., Beckles, G. L. A., & Albright, A. L.
(2012). Aging, Diabetes, and the Public Health System in the United States. American Journal of Public Health, 102(8), 1482-1497.
CDC. (2007). National diabetes fact sheet. Retrieved 19/07/2016, from
http://www.cdc.gov/diabetes/pubs/estimates07.htm#8 Cha, K., Li, Y., & Yi, G.-S. (2016). Discovering gene expression signatures responding
to tyrosine kinase inhibitor treatment in chronic myeloid leukemia. BMC Medical Genomics, 9(1), 29.
Chamary, J. V., Parmley, J. L., & Hurst, L. D. (2006). Hearing silence: non-neutral
evolution at synonymous sites in mammals. Nat Rev Genet, 7(2), 98-108. Chan, J. N., Malik, V., Jia, W., & et al. (2009). Diabetes in asia: Epidemiology, risk
factors, and pathophysiology. JAMA, 301(20), 2129-2140. Chandak, G. R., Janipalli, C. S., Bhaskar, S., Kulkarni, S. R., Mohankrishna, P.,
Hattersley, A. T., . . . Yajnik, C. S. (2007). Common variants in the TCF7L2 gene are strongly associated with type 2 diabetes mellitus in the Indian population. Diabetologia, 50(1), 63-67.
Chang, E. C., Yu, E. A., & Kahle, E. R. (2014). BMI, body discrepancy, and self-
construal as predictors of eating disturbances in European and Asian American females. Eating Behaviors, 15(2), 328-330.
322
Univers
ity of
Mala
ya

Charbonnel, B., & Cariou, B. (2011). Pharmacological management of type 2 diabetes: the potential of incretin-based therapies. Diabetes, Obesity and Metabolism, 13(2), 99-117.
Charbonnel, B., Karasik, A., Liu, J., Wu, M., & Meininger, G. (2006). Efficacy and
Safety of the Dipeptidyl Peptidase-4 Inhibitor Sitagliptin Added to Ongoing Metformin Therapy in Patients With Type 2 Diabetes Inadequately Controlled With Metformin Alone. Diabetes Care, 29(12), 2638-2643.
Chateauvieux, S., Morceau, F., Dicato, M., & Diederich, M. (2010). Molecular and
Therapeutic Potential and Toxicity of Valproic Acid. Journal of Biomedicine and Biotechnology, 2010, 479364.
Chen, X., & Sullivan, P. F. (2003). Single nucleotide polymorphism genotyping:
biochemistry, protocol, cost and throughput. Pharmacogenomics J, 3(2), 77-96. Chen, Y., & Brandizzi, F. (2013). IRE1: ER stress sensor and cell fate executor. Trends
in cell biology, 23(11), 10.1016/j.tcb.2013.1006.1005. Chen, Y., Ning, G., Wang, C., Gong, Y., Patel, S., Zhang, C., . . . Wang, W. (2015).
Efficacy and safety of linagliptin monotherapy in Asian patients with inadequately controlled type 2 diabetes mellitus: A multinational, 24-week, randomized, clinical trial. Journal of Diabetes Investigation, 6(6), 692-698.
Cheng, S., Wu, Y., Wu, W., & Zhang, D. (2013). Association of rs734312 and
rs10010131 polymorphisms in WFS1 gene with type 2 diabetes mellitus: a meta-analysis. Endocrine Journal, 60(4), 441-447.
Cheung, B. M. Y., & Li, C. (2012). Diabetes and Hypertension: Is There a Common
Metabolic Pathway? Current atherosclerosis reports, 14(2), 160-166. Cheurfa, N., Brenner, G. M., Reis, A. F., Dubois-Laforgue, D., Roussel, R., Tichet, J., .
. . Velho, G. (2011). Decreased insulin secretion and increased risk of type 2 diabetes associated with allelic variations of the WFS1 gene: the Data from Epidemiological Study on the Insulin Resistance Syndrome (DESIR) prospective study. Diabetologia, 54(3), 554-562.
Chew, B. H., Mastura, I., Cheong, A. T., & Syed Alwi, S. A. R. (2010). Diabetic
Hypertensive Control and Treatment: A Descriptive Report from the Audit Diabetes Control and Management (Adcm) Registry. Malaysian Family Physician : the Official Journal of the Academy of Family Physicians of Malaysia, 5(3), 134-139.
323
Univers
ity of
Mala
ya

Chistiakov, D. A., Potapov, V. A., Khodirev, D. C., Shamkhalova, M. S., Shestakova,
M. V., & Nosikov, V. V. (2009). Genetic variations in the pancreatic ATP-sensitive potassium channel, β-cell dysfunction, and susceptibility to type 2 diabetes. Acta Diabetologica, 46(1), 43-49.
Chorev, M., & Carmel, L. (2012). The Function of Introns. Frontiers in Genetics, 3, 55. Choudhary, A., Giardina, P., Antal, Z., & Vogiatzi, M. (2013). Unreliable oral glucose
tolerance test and HbA1C in Beta Thalassaemia Major-A case for continuous glucose monitoring? British journal of haematology, 162(1), 132-135.
Chow, E. A., Foster, H., Gonzalez, V., & McIver, L. (2012). The Disparate Impact of
Diabetes on Racial/Ethnic Minority Populations. Clinical Diabetes, 30(3), 130-133.
Chung, J. O., Cho, D. H., Chung, D. J., & Chung, M. Y. (2012). Associations among
Body Mass Index, Insulin Resistance, and Pancreatic β-Cell Function in Korean Patients with New-Onset Type 2 Diabetes. The Korean Journal of Internal Medicine, 27(1), 66-71.
Chung, K. M., Huang, C. H., Cheng, J. H., Tsai, C. H., Suen, C. S., Hwang, M. J., &
Chen, X. (2011). Proline in transmembrane domain of type II protein DPP-IV governs its translocation behavior through endoplasmic reticulum. Biochemistry, 50(37), 7909-7918.
Chung, Y. R., Park, S. W., Kim, J. W., Kim, J. H., & Lee, K. (2016). Protective Effects
of Dipeptidyl Peptidase-4 Inhibitors on Progression of Diabetic Retinopathy in Patients with Type 2 Diabetes. Retina, 36(12), 2357-2363.
Clarke, G. M., Anderson, C. A., Pettersson, F. H., Cardon, L. R., Morris, A. P., &
Zondervan, K. T. (2011). Basic statistical analysis in genetic case-control studies. Nature protocols, 6(2), 121-133.
Coban, E., Ozdogan, M., & Timuragaoglu, A. (2004). Effect of iron deficiency anemia
on the levels of hemoglobin A1c in nondiabetic patients. Acta Haematol, 112(3), 126-128.
Collins, G. A., & Tansey, W. P. (2006). The proteasome: a utility tool for transcription?
Current Opinion in Genetics & Development, 16(2), 197-202.
324
Univers
ity of
Mala
ya

Congdon, N. G., Friedman, D. S., & Lietman, T. (2003). Important causes of visual
impairment in the world today. JAMA, 290(15), 2057-2060. Cooke, J. N., Ng, M. C. Y., Palmer, N. D., An, S. S., Hester, J. M., Freedman, B. I., . . .
Bowden, D. W. (2012). Genetic Risk Assessment of Type 2 Diabetes–Associated Polymorphisms in African Americans. Diabetes Care, 35(2), 287-292.
Cordero, O. J., Salgado, F. J., & Nogueira, M. (2009). On the origin of serum CD26 and
its altered concentration in cancer patients. Cancer Immunol Immunother, 58(11), 1723-1747.
Cortez, D. N., Reis, I. A., Souza, D. b. A. S., Macedo, M. s. M. L., & Torres, H. d. C.
(2015). Complicações e o tempo de diagnóstico do diabetes mellitus na atenção primária. Acta Paulista de Enfermagem, 28, 250-255.
Cosenso-Martin, L. N., Giollo-Júnior, L. T., Martineli, D. D., Cesarino, C. B.,
Nakazone, M. A., Cipullo, J. P., & Vilela-Martin, J. F. (2015). Twelve-week randomized study to compare the effect of vildagliptin vs. glibenclamide both added-on to metformin on endothelium function in patients with type 2 diabetes and hypertension. Diabetology & Metabolic Syndrome, 7, 70.
Cosenso-Martin, L. N., Vilela-Martin, J. F., & Giollo-Junior, L. T. (2012). Effect of
Vildagliptin on Central Aortic Blood Pressure in Diabetic and Hypertensive Individual Diabetes & Insulin Resistance: Uncommon Case Reports (Clinical) (pp. SAT-212-SAT-212).
Coughlan, M. T., Yap, F. Y. T., Tong, D. C. K., Andrikopoulos, S., Gasser, A., Thallas-
Bonke, V., . . . Forbes, J. M. (2011). Advanced Glycation End Products Are Direct Modulators of β-Cell Function. Diabetes, 60(10), 2523-2532.
Cowie, C. C., Rust, K. F., Byrd-Holt, D. D., Gregg, E. W., Ford, E. S., Geiss, L. S., . . .
Fradkin, J. E. (2010). Prevalence of diabetes and high risk for diabetes using A1C criteria in the U.S. population in 1988-2006. Diabetes Care, 33(3), 562-568.
Cox, T., Hess, P. P., Thompson, G. D., & Levinson, S. S. (1993). Interference with
Glycated Hemoglobin by Hemoglobin F May Be Greater Than Is Generally Assumed. American Journal of Clinical Pathology, 99(2), 137-141.
325
Univers
ity of
Mala
ya

Craig, M. E., Handelsman, P., Donaghue, K. C., Chan, A., Blades, B., Laina, R., . . . Silink, M. (2002). Predictors of glycaemic control and hypoglycaemia in children and adolescents with type 1 diabetes from NSW and the ACT. Med J Aust, 177(5), 235-238.
Csárdi, G., Franks, A., Choi, D. S., Airoldi, E. M., & Drummond, D. A. (2015).
Accounting for Experimental Noise Reveals That mRNA Levels, Amplified by Post-Transcriptional Processes, Largely Determine Steady-State Protein Levels in Yeast. PLOS Genetics, 11(5), e1005206.
Cui, J., Philo, L., Nguyen, P., Hofflich, H., Hernandez, C., Bettencourt, R., . . . Loomba,
R. (2016). Sitagliptin vs. placebo for non-alcoholic fatty liver disease: A randomized controlled trial. Journal of Hepatology, 65(2), 369-376.
Dai, D.-F., Chiao, Y. A., Marcinek, D. J., Szeto, H. H., & Rabinovitch, P. S. (2014).
Mitochondrial oxidative stress in aging and healthspan. Longevity & Healthspan, 3, 6-6.
Dall, T. M., Yang, W., Halder, P., Pang, B., Massoudi, M., Wintfeld, N., . . . Hogan, P.
F. (2014). The Economic Burden of Elevated Blood Glucose Levels in 2012: Diagnosed and Undiagnosed Diabetes, Gestational Diabetes Mellitus, and Prediabetes. Diabetes Care, 37(12), 3172-3179.
Dalvand, S., Koohpayehzadeh, J., Karimlou, M., Asgari, F., Rafei, A., Seifi, B., . . .
Bakhshi, E. (2015). Assessing Factors Related to Waist Circumference and Obesity: Application of a Latent Variable Model. Journal of Environmental and Public Health, 2015, 9.
Damcott, C. M., Pollin, T. I., Reinhart, L. J., Ott, S. H., Shen, H., Silver, K. D., . . .
Shuldiner, A. R. (2006). Polymorphisms in the Transcription Factor 7-Like 2 (TCF7L2) Gene Are Associated With Type 2 Diabetes in the Amish. Replication and Evidence for a Role in Both Insulin Secretion and Insulin Resistance, 55(9), 2654-2659.
Danaei, G., Finucane, M. M., Lu, Y., Singh, G. M., Cowan, M. J., Paciorek, C. J., . . .
Ezzati, M. (2011). National, regional, and global trends in fasting plasma glucose and diabetes prevalence since 1980: systematic analysis of health examination surveys and epidemiological studies with 370 country-years and 2.7 million participants. Lancet, 378(9785), 31-40.
Dave, D. J. (2011). Saxagliptin: A dipeptidyl peptidase-4 inhibitor in the treatment of
type 2 diabetes mellitus. Journal of Pharmacology & Pharmacotherapeutics, 2(4), 230-235.
326
Univers
ity of
Mala
ya

Davidson, J. A. (2009). Advances in therapy for type 2 diabetes: GLP-1 receptor
agonists and DPP-4 inhibitors. Cleve Clin J Med, 76(5), 05. Davis, A. P., Murphy, C. G., Johnson, R., Lay, J. M., Lennon-Hopkins, K., Saraceni-
Richards, C., . . . Mattingly, C. J. (2013). The Comparative Toxicogenomics Database: update 2013. Nucleic Acids Research, 41(Database issue), D1104-D1114.
De Block, C. E. M., Colpin, G., Thielemans, K., Coopmans, W., Bogers, J. J. P. M.,
Pelckmans, P. A., . . . Van Gaal, L. F. (2004). Neuroendocrine Tumor Markers and Enterochromaffin-Like Cell Hyper/Dysplasia in Type 1 Diabetes. Diabetes Care, 27(6), 1387-1393.
De Chiara, L., Rodríguez-Piñeiro, A. M., Cordero, O. J., Vázquez-Tuñas, L., Ayude, D.,
Rodríguez-Berrocal, F. J., & de la Cadena, M. P. (2014). Postoperative Serum Levels of sCD26 for Surveillance in Colorectal Cancer Patients. PLOS ONE, 9(9), e107470.
De Meester, I., Korom, S., Van Damme, J., & Scharpe, S. (1999). CD26, let it cut or cut
it down. Immunol Today, 20(8), 367-375. De Tata, V. (2014). Age-Related Impairment of Pancreatic Beta-Cell Function:
Pathophysiological and Cellular Mechanisms. Frontiers in Endocrinology, 5, 138.
Deacon, C. F. (2011). Dipeptidyl peptidase-4 inhibitors in the treatment of type 2
diabetes: a comparative review. Diabetes, Obesity and Metabolism, 13(1), 7-18. Deacon, C. F., & Holst, J. J. (2009). Immunoassays for the incretin hormones GIP and
GLP-1. Best Practice & Research Clinical Endocrinology & Metabolism, 23(4), 425-432.
DECODE. (2003). Age- and Sex-Specific Prevalences of Diabetes and Impaired
Glucose Regulation in 13 European Cohorts. Diabetes Care, 26(1), 61-69. DeFronzo, R. A., Burant, C. F., Fleck, P., Wilson, C., Mekki, Q., & Pratley, R. E.
(2012). Efficacy and Tolerability of the DPP-4 Inhibitor Alogliptin Combined with Pioglitazone, in Metformin-Treated Patients with Type 2 Diabetes. The Journal of Clinical Endocrinology & Metabolism, 97(5), 1615-1622.
327
Univers
ity of
Mala
ya

DeFronzo, R. A., Eldor, R., & Abdul-Ghani, M. (2013). Pathophysiologic Approach to Therapy in Patients With Newly Diagnosed Type 2 Diabetes. Diabetes Care, 36(Supplement 2), S127-S138.
Del Guerra, S., Marselli, L., Lupi, R., Boggi, U., Mosca, F., Benzi, L., . . . Marchetti, P.
(2005). Effects of prolonged in vitro exposure to sulphonylureas on the function and survival of human islets. Journal of Diabetes and Its Complications, 19(1), 60-64.
Del Prato, S., Barnett, A. H., Huisman, H., Neubacher, D., Woerle, H. J., & Dugi, K. A.
(2011). Effect of linagliptin monotherapy on glycaemic control and markers of β-cell function in patients with inadequately controlled type 2 diabetes: a randomized controlled trial. Diabetes, Obesity and Metabolism, 13(3), 258-267.
Del Prato, S., Patel, S., Crowe, S., & von Eynatten, M. (2016). Efficacy and safety of
linagliptin according to patient baseline characteristics: A pooled analysis of three phase 3 trials. Nutrition, Metabolism and Cardiovascular Diseases, 26(10), 886-892.
Dela, F., & Helge, J. W. (2013). Insulin resistance and mitochondrial function in
skeletal muscle. The International Journal of Biochemistry & Cell Biology, 45(1), 11-15.
Delavari, A., Forouzanfar, M. H., Alikhani, S., Sharifian, A., & Kelishadi, R. (2009).
First Nationwide Study of the Prevalence of the Metabolic Syndrome and Optimal Cutoff Points of Waist Circumference in the Middle East: The National Survey of Risk Factors for Noncommunicable Diseases of Iran. Diabetes Care, 32(6), 1092-1097.
Delezuch, W., Marttinen, P., Kokki, H., Heikkinen, M., Vanamo, K., Pulkki, K., &
Matinlauri, I. (2012). Serum and CSF soluble CD26 and CD30 concentrations in healthy pediatric surgical outpatients. Tissue Antigens, 80(4), 368-375.
Derosa, G., Carbone, A., Franzetti, I., Querci, F., Fogari, E., Bianchi, L., . . . Maffioli, P.
(2012). Effects of a combination of sitagliptin plus metformin vs metformin monotherapy on glycemic control, beta-cell function and insulin resistance in type 2 diabetic patients. Diabetes Res Clin Pract, 98(1), 51-60.
Derosa, G., Ragonesi, P. D., Fogari, E., Cicero, A. F. G., Bianchi, L., Bonaventura, A., .
. . Maffioli, P. (2014). Sitagliptin added to previously taken antidiabetic agents on insulin resistance and lipid profile: a 2-year study evaluation. Fundamental & Clinical Pharmacology, 28(2), 221-229.
328
Univers
ity of
Mala
ya

Deurenberg, P., Deurenberg-Yap, M., & Guricci, S. (2002). Asians are different from
Caucasians and from each other in their body mass index/body fat per cent relationship. Obesity Reviews, 3(3), 141-146.
Devine, S. M., Vij, R., Rettig, M., Todt, L., McGlauchlen, K., Fisher, N., . . . DiPersio,
J. F. (2008). Rapid mobilization of functional donor hematopoietic cells without G-CSF using AMD3100, an antagonist of the CXCR4/SDF-1 interaction. Blood, 112(4), 990-998.
Dicker, D. (2011). DPP-4 Inhibitors: Impact on glycemic control and cardiovascular
risk factors. Diabetes Care, 34(Suppl 2), S276-S278. Dineen, L., Law, C., Scher, R., & Pyon, E. (2014). Alogliptin (Nesina) for Adults With
Type-2 Diabetes. Pharmacy and Therapeutics, 39(3), 186-202. DisGeNET. (2016) Retrieved 15/09/2016, from
http://www.disgenet.org/web/DisGeNET/menu/home Dobrian, A. D., Ma, Q., Lindsay, J. W., Leone, K. A., Ma, K., Coben, J., . . . Nadler, J.
L. (2011). Dipeptidyl peptidase IV inhibitor sitagliptin reduces local inflammation in adipose tissue and in pancreatic islets of obese mice. American Journal of Physiology - Endocrinology and Metabolism, 300(2), E410-E421.
Dokken, B. B. (2008). The Pathophysiology of Cardiovascular Disease and Diabetes:
Beyond Blood Pressure and Lipids. Diabetes Spectrum, 21(3), 160-165. DOSM. (2010). National Census 2010. Retrieved 29/01/2016, from
http://web.archive.org/web/20110830200524/http://www.statistics.gov.my/portal/download_Population/files/census2010/Taburan_Penduduk_dan_Ciri-ciri_Asas_Demografi.pdf
DOSM. (2011). Population distribution and basic characteristic report 2010, from
https://www.dosm.gov.my/v1/index.php?r=column/ctwoByCat&parent_id=115&menu_id=L0pheU43NWJwRWVSZklWdzQ4TlhUUT09
DOSM. (2015). Vital Statistic Malaysia 2015. Retrieved 25/07/2015, from
https://www.dosm.gov.my/v1/index.php?r=column/cthemeByCat&cat=165&bul_id=eUM5SGRBZndGUHRCZTc2RldqNGMrUT09&menu_id=L0pheU43NWJwRWVSZklWdzQ4TlhUUT09
329
Univers
ity of
Mala
ya

Drews, J., & Ryser, S. (1997). Drug Development: The role of innovation in drug development. Nat Biotech, 15(13), 1318-1319.
Drögemüller, C., Reichart, U., Seuberlich, T., Oevermann, A., Baumgartner, M., Kühni
Boghenbor, K., . . . Leeb, T. (2011). An Unusual Splice Defect in the Mitofusin 2 Gene (MFN2) Is Associated with Degenerative Axonopathy in Tyrolean Grey Cattle. PLOS ONE, 6(4), e18931.
Drucker, D. J., & Nauck, M. A. (2006). The incretin system: glucagon-like peptide-1
receptor agonists and dipeptidyl peptidase-4 inhibitors in type 2 diabetes. Lancet, 368(9548), 1696-1705.
Drucker, D. J., Sherman, S. I., Gorelick, F. S., Bergenstal, R. M., Sherwin, R. S., &
Buse, J. B. (2010). Incretin-Based Therapies for the Treatment of Type 2 Diabetes: Evaluation of the Risks and Benefits. Diabetes Care, 33(2), 428-433.
DTU. (2004). HOMA calculator. Retrieved 19/08/2015, from
http://www.dtu.ox.ac.uk/homacalculator/ Dubocovich, M. L. (2007). Melatonin receptors: Role on sleep and circadian rhythm
regulation. Sleep Medicine, 8, 34-42. Duez, H., Cariou, B., & Staels, B. (2012). DPP-4 inhibitors in the treatment of type 2
diabetes. Biochemical Pharmacology, 83(7), 823-832. Dunning, T. S., A. (2014). The IDF global guideline for managing older people with
type 2 diabetes: Implications for nurses. Journal of Diabetes Nursing, 18(4), 145-150.
Durinx, C., Lambeir, A.-M., Bosmans, E., Falmagne, J.-B., Berghmans, R., Haemers,
A., . . . De Meester, I. (2000). Molecular characterization of dipeptidyl peptidase activity in serum. European Journal of Biochemistry, 267(17), 5608-5613.
Duvnjak, L., & Blaslov, K. (2016). Dipeptidyl peptidase-4 inhibitors improve arterial
stiffness, blood pressure, lipid profile and inflammation parameters in patients with type 2 diabetes mellitus. Diabetology & Metabolic Syndrome, 8(1), 26.
Eckhardt, M., Langkopf, E., Mark, M., Tadayyon, M., Thomas, L., Nar, H., . . .
Himmelsbach, F. (2007). 8-(3-(R)-aminopiperidin-1-yl)-7-but-2-ynyl-3-methyl-1-(4-methyl-quinazolin-2-ylme thyl)-3,7-dihydropurine-2,6-dione (BI 1356), a
330
Univers
ity of
Mala
ya

highly potent, selective, long-acting, and orally bioavailable DPP-4 inhibitor for the treatment of type 2 diabetes. J Med Chem, 50(26), 6450-6453.
Edelstein, S. L., Knowler, W. C., Bain, R. P., Reubin, A., Barrett-Connor, E. L., Dowse,
G. K., . . . Hamman, R. F. (1997). Predictors of Progression From Impaired Glucose Tolerance to NIDDM: An Analysis of Six Prospective Studies. Diabetes, 46(4), 701-710.
El-Sherbeeny, N. A., & Nader, M. A. (2016). The protective effect of vildagliptin in
chronic experimental cyclosporine A-induced hepatotoxicity. Can J Physiol Pharmacol, 94(3), 251-256.
Elkinson, S., & Keating, G. M. (2013). Lixisenatide: first global approval. Drugs, 73(4),
383-391. Eppinga, R. N., Hartman, M. H. T., van Veldhuisen, D. J., Lexis, C. P. H., Connelly, M.
A., Lipsic, E., . . . Dullaart, R. P. F. (2016). Effect of Metformin Treatment on Lipoprotein Subfractions in Non-Diabetic Patients with Acute Myocardial Infarction: A Glycometabolic Intervention as Adjunct to Primary Coronary Intervention in ST Elevation Myocardial Infarction (GIPS-III) Trial. PLOS ONE, 11(1), e0145719.
Esposito, K., Chiodini, P., Maiorino, M. I., Capuano, A., Cozzolino, D., Petrizzo, M., . .
. Giugliano, D. (2015). A nomogram to estimate the HbA1c response to different DPP-4 inhibitors in type 2 diabetes: a systematic review and meta-analysis of 98 trials with 24 163 patients. BMJ Open, 5(2), e005892.
Esposito, K., Cozzolino, D., Bellastella, G., Maiorino, M. I., Chiodini, P., Ceriello, A.,
& Giugliano, D. (2011). Dipeptidyl peptidase-4 inhibitors and HbA1c target of <7% in type 2 diabetes: meta-analysis of randomized controlled trials. Diabetes, Obesity and Metabolism, 13(7), 594-603.
Esteghamati, A., Ashraf, H., Khalilzadeh, O., Zandieh, A., Nakhjavani, M., Rashidi, A.,
. . . Asgari, F. (2010). Optimal cut-off of homeostasis model assessment of insulin resistance (HOMA-IR) for the diagnosis of metabolic syndrome: third national surveillance of risk factors of non-communicable diseases in Iran (SuRFNCD-2007). Nutrition & Metabolism, 7, 26-26.
Esterbauer, H., & Cheeseman, K. H. (1990). Determination of aldehydic lipid
peroxidation products: malonaldehyde and 4-hydroxynonenal. Methods Enzymol, 186, 407-421.
331
Univers
ity of
Mala
ya

EXCERPTS. (2010a). Atlas of Chronic Kidney Disease and End Stage Renal Disease in the United States. Chronic Kidney Disease in the NHANES Population. . Am J Kidney Dis., 55(Suppl. 1), S35-S48.
EXCERPTS. (2010b). Atlas of Chronic Kidney Disease and End Stage Renal Disease in
the United States. Incidence and Prevalence. . Am J Kidney Dis., 55(Suppl. 1), S231-S240.
Fagerholm, V., Haaparanta, M., & Scheinin, M. (2011). α2-Adrenoceptor Regulation of
Blood Glucose Homeostasis. Basic & Clinical Pharmacology & Toxicology, 108(6), 365-370.
Fan, H., Meng, W., Kilian, C., Grams, S., & Reutter, W. (1997). Domain-specific N-
glycosylation of the membrane glycoprotein dipeptidylpeptidase IV (CD26) influences its subcellular trafficking, biological stability, enzyme activity and protein folding. Eur J Biochem, 246(1), 243-251.
Fan, M., Li, Y., & Zhang, S. (2016). Effects of Sitagliptin on Lipid Profiles in Patients
With Type 2 Diabetes Mellitus: A Meta-analysis of Randomized Clinical Trials. Medicine, 95(2), e2386.
Fawcett, K. A., Wheeler, E., Morris, A. P., Ricketts, S. L., Hallmans, G., Rolandsson,
O., . . . Barroso, I. (2010). Detailed Investigation of the Role of Common and Low-Frequency WFS1 Variants in Type 2 Diabetes Risk. Diabetes, 59(3), 741-746.
FDA, U. (2016). FDA Drug Safety Communication: FDA warns that DPP-4 inhibitors
for type 2 diabetes may cause severe joint pain Retrieved 19/09/2016, from http://www.fda.gov/Drugs/DrugSafety/ucm459579.htm
Feng, J., Zhang, Z., Wallace, M. B., Stafford, J. A., Kaldor, S. W., Kassel, D. B., . . .
Gwaltney, S. L. (2007). Discovery of Alogliptin: A Potent, Selective, Bioavailable, and Efficacious Inhibitor of Dipeptidyl Peptidase IV. Journal of Medicinal Chemistry, 50(10), 2297-2300.
Fink, R. I., Kolterman, O. G., Griffin, J., & Olefsky, J. M. (1983). Mechanisms of
Insulin Resistance in Aging. Journal of Clinical Investigation, 71(6), 1523-1535. Fleg, J. L., Morrell, C. H., Bos, A. G., Brant, L. J., Talbot, L. A., Wright, J. G., &
Lakatta, E. G. (2005). Accelerated Longitudinal Decline of Aerobic Capacity in Healthy Older Adults. Circulation, 112(5), 674-682.
332
Univers
ity of
Mala
ya

Flock, G., Baggio, L. L., Longuet, C., & Drucker, D. J. (2007). Incretin Receptors for Glucagon-Like Peptide 1 and Glucose-Dependent Insulinotropic Polypeptide Are Essential for the Sustained Metabolic Actions of Vildagliptin in Mice. Diabetes, 56(12), 3006-3013.
Flockhart, D. A., O'Kane, D., Williams, M. S., Watson, M. S., Gage, B., Gandolfi, R., . .
. Veenstra, D. (2008). Pharmacogenetic testing of CYP2C9 and VKORC1 alleles for warfarin. Genet Med, 10(2), 139-150.
Florez , J. C., Jablonski , K. A., Bayley , N., Pollin , T. I., de Bakker , P. I. W.,
Shuldiner , A. R., . . . Altshuler , D. (2006). TCF7L2 Polymorphisms and Progression to Diabetes in the Diabetes Prevention Program. New England Journal of Medicine, 355(3), 241-250.
Florez, J. C., Jablonski, K. A., Kahn, S. E., Franks, P. W., Dabelea, D., Hamman, R. F.,
. . . Altshuler, D. (2007). Type 2 Diabetes–Associated Missense Polymorphisms KCNJ11 E23K and ABCC8 A1369S Influence Progression to Diabetes and Response to Interventions in the Diabetes Prevention Program. Diabetes, 56(2), 531-536.
Florez, J. C., Jablonski, K. A., McAteer, J., Sandhu, M. S., Wareham, N. J., Barroso, I.,
. . . Knowler, W. C. (2008). Testing of diabetes-associated WFS1 polymorphisms in the Diabetes Prevention Program. Diabetologia, 51(3), 451-457.
Fonseca, S. G., Fukuma, M., Lipson, K. L., Nguyen, L. X., Allen, J. R., Oka, Y., &
Urano, F. (2005). WFS1 Is a Novel Component of the Unfolded Protein Response and Maintains Homeostasis of the Endoplasmic Reticulum in Pancreatic β-Cells. Journal of Biological Chemistry, 280(47), 39609-39615.
Fonseca, V. A. (2009). Defining and Characterizing the Progression of Type 2 Diabetes.
Diabetes Care, 32(suppl 2), S151-S156. Forst, T., Uhlig-Laske, B., Ring, A., Ritzhaupt, A., Graefe-Mody, U., & Dugi, K. A.
(2011). The oral DPP-4 inhibitor linagliptin significantly lowers HbA1c after 4 weeks of treatment in patients with type 2 diabetes mellitus. Diabetes, Obesity and Metabolism, 13(6), 542-550.
Foukas, L. C., & Okkenhaug, K. (2003). Gene-targeting reveals physiological roles and
complex regulation of the phosphoinositide 3-kinases. Arch Biochem Biophys, 414(1), 13-18.
333
Univers
ity of
Mala
ya

Fox, C. S., Golden, S. H., Anderson, C., Bray, G. A., Burke, L. E., de Boer, I. H., . . . Vafiadis, D. K. (2015). Update on Prevention of Cardiovascular Disease in Adults With Type 2 Diabetes Mellitus in Light of Recent Evidence: A Scientific Statement From the American Heart Association and the American Diabetes Association. Diabetes Care, 38(9), 1777-1803.
Franklin, I., Gromada, J., Gjinovci, A., Theander, S., & Wollheim, C. B. (2005). β-Cell
Secretory Products Activate α-Cell ATP-Dependent Potassium Channels to Inhibit Glucagon Release. Diabetes, 54(6), 1808-1815.
Franks, P. W., Rolandsson, O., Debenham, S. L., Fawcett, K. A., Payne, F., Dina, C., . .
. Sandhu, M. S. (2008). Replication of the association between variants in the WFS1 gene and risk of type 2 diabetes in European populations. Diabetologia, 51(3), 458-463.
Freedman, B. I., Shenoy, R. N., Planer, J. A., Clay, K. D., Shihabi, Z. K., Burkart, J. M.,
. . . Bleyer, A. J. (2010). Comparison of glycated albumin and hemoglobin A1c concentrations in diabetic subjects on peritoneal and hemodialysis. Peritoneal Dialysis International, 30(1), 72-79.
Fu, A. Z., Qiu, Y., Radican, L., & Wells, B. J. (2009). Health Care and Productivity
Costs Associated With Diabetic Patients With Macrovascular Comorbid Conditions. Diabetes Care, 32(12), 2187-2192.
Fukuda-Tsuru, S., Kakimoto, T., Utsumi, H., Kiuchi, S., & Ishii, S. (2014). The novel
dipeptidyl peptidase-4 inhibitor teneligliptin prevents high-fat diet-induced obesity accompanied with increased energy expenditure in mice. European Journal of Pharmacology, 723, 207-215.
Furuhashi, M., Hiramitsu, S., Mita, T., Fuseya, T., Ishimura, S., Omori, A., . . . Miura,
T. (2015). Reduction of serum FABP4 level by sitagliptin, a DPP-4 inhibitor, in patients with type 2 diabetes mellitus. Journal of Lipid Research, 56(12), 2372-2380.
Gallagher, E. J., Le Roith, D., & Bloomgarden, Z. (2009). Review of hemoglobin A1c
in the management of diabetes. Journal of Diabetes, 1(1), 9-17. Gallwitz, B., & Häring, H. U. (2010). Future perspectives for insulinotropic agents in
the treatment of type 2 diabetes–DPP-4 inhibitors and sulphonylureas. Diabetes, Obesity and Metabolism, 12(1), 1-11.
334
Univers
ity of
Mala
ya

Gannon, M., Tweedie Ables, E., Crawford, L., Lowe, D., Offield, M. F., Magnuson, M. A., & Wright, C. V. E. (2008). pdx-1 function is specifically required in embryonic β cells to generate appropriate numbers of endocrine cell types and maintain glucose homeostasis. Developmental Biology, 314(2), 406-417.
Garcia de Guadiana Romualdo, L., Gonzalez Morales, M., Albaladejo Oton, M. D.,
Martin Garcia, E., Martin-Ondarza Gonzalez Mdel, C., Nuevo Garcia, J., & Jimenez Santos, E. (2012). The value of hemoglobin A1c for diagnosis of diabetes mellitus and other changes in carbohydrate metabolism in women with recent gestational diabetes mellitus. Endocrinol Nutr, 59(6), 362-366.
Gauderman, W. J. (2002). Sample Size Requirements for Association Studies of Gene-
Gene Interaction. American Journal of Epidemiology, 155(5), 478-484. Gautier, J. F., Choukem, S. P., & Girard, J. (2008). Physiology of incretins (GIP and
GLP-1) and abnormalities in type 2 diabetes. Diabetes Metab, 34(2), 73397-73394.
Geiss, L. S., Wang, J., Cheng, Y. J., & et al. (2014). Prevalence and incidence trends for
diagnosed diabetes among adults aged 20 to 79 years, united states, 1980-2012. JAMA, 312(12), 1218-1226.
Geloneze, B., de Oliveira, M. d. S., Vasques, A. C. J., Novaes, F. S., Pareja, J. C., &
Tambascia, M. A. (2014). Impaired incretin secretion and pancreatic dysfunction with older age and diabetes. Metabolism - Clinical and Experimental, 63(7), 922-929.
Gerdin, M. J., Mseeh, F., & Dubocovich, M. L. (2003). Mutagenesis studies of the
human MT2 melatonin receptor. Biochemical Pharmacology, 66(2), 315-320. Gerich, J. E., Meyer, C., Woerle, H. J., & Stumvoll, M. (2001). Renal Gluconeogenesis.
Its importance in human glucose homeostasis, 24(2), 382-391. Ghersi, G., Dong, H., Goldstein, L. A., Yeh, Y., Hakkinen, L., Larjava, H. S., & Chen,
W.-T. (2003). Seprase-DPPIV Association and Prolyl Peptidase and Gelatinase Activities of the Protease Complex. In N. Back, I. R. Cohen, D. Kritchevsky, A. Lajtha & R. Paoletti (Eds.), Dipeptidyl Aminopeptidases in Health and Disease (pp. 87-94). Boston, MA: Springer US.
Gibbs, R. A., Belmont, J. W., Hardenbol, P., Willis, T. D., Yu, F., Yang, H., . . . Huang,
W. (2003). The International HapMap Project. Nature, 426(6968), 789-796.
335
Univers
ity of
Mala
ya

Giera, M., Lingeman, H., & Niessen, W. M. A. (2012). Recent Advancements in the LC- and GC-Based Analysis of Malondialdehyde (MDA): A Brief Overview. Chromatographia, 75(9-10), 433-440.
Gitt, A. K., Bramlage, P., Schneider, S., & Tschöpe, D. (2015). A real world
comparison of sulfonylurea and insulin vs. incretin-based treatments in patients not controlled on prior metformin monotherapy. Cardiovascular Diabetology, 14, 13.
Gloyn, A. L., Weedon, M. N., Owen, K. R., Turner, M. J., Knight, B. A., Hitman, G., . .
. Frayling, T. M. (2003). Large-Scale Association Studies of Variants in Genes Encoding the Pancreatic β-Cell KATP Channel Subunits Kir6.2 (KCNJ11) and SUR1 (ABCC8) Confirm That the KCNJ11 E23K Variant Is Associated With Type 2 Diabetes. Diabetes, 52(2), 568-572.
Godinho, R., Mega, C., Teixeira-de-Lemos, E., Carvalho, E., #xe9, nia, . . . vio. (2015).
The Place of Dipeptidyl Peptidase-4 Inhibitors in Type 2 Diabetes Therapeutics: A1C or the Special Antidiabetic Class? Journal of Diabetes Research, 2015, 28.
Goldstein, B. J., Feinglos, M. N., Lunceford, J. K., Johnson, J., & Williams-Herman, D.
E. (2007). Effect of Initial Combination Therapy With Sitagliptin, a Dipeptidyl Peptidase-4 Inhibitor, and Metformin on Glycemic Control in Patients With Type 2 Diabetes. Diabetes Care, 30(8), 1979-1987.
Goldstein, D. E., Little, R. R., Lorenz, R. A., Malone, J. I., Nathan, D., Peterson, C. M.,
& Sacks, D. B. (2004). Tests of Glycemia in Diabetes. Diabetes Care, 27(7), 1761-1773.
Gomis, R., Espadero, R. M., Jones, R., Woerle, H. J., & Dugi, K. A. (2011). Efficacy
and safety of initial combination therapy with linagliptin and pioglitazone in patients with inadequately controlled type 2 diabetes: a randomized, double-blind, placebo-controlled study. Diabetes, Obesity and Metabolism, 13(7), 653-661.
Gong, Z., & Muzumdar, R. H. (2012). Pancreatic Function, Type 2 Diabetes, and
Metabolism in Aging. International Journal of Endocrinology, 2012, 13. Graefe-Mody, U., Friedrich, C., Port, A., Ring, A., Retlich, S., Heise, T., . . . Woerle, H.
J. (2011). Effect of renal impairment on the pharmacokinetics of the dipeptidyl peptidase-4 inhibitor linagliptin(*). Diabetes Obes Metab, 13(10), 939-946.
336
Univers
ity of
Mala
ya

Green, B. (2007). Gliptins: DPP-4 inhibitors to treat type 2 diabetes. . Future Prescriber, 8(3), 1-12.
Greenwood, A. L., Li, S., Jones, K., & Melton, D. A. (2007). Notch signaling reveals
developmental plasticity of Pax4+ pancreatic endocrine progenitors and shunts them to a duct fate. Mechanisms of Development, 124(2), 97-107.
Gregg, E. W., Beckles, G. L., Williamson, D. F., Leveille, S. G., Langlois, J. A.,
Engelgau, M. M., & Narayan, K. M. (2000). Diabetes and physical disability among older U.S. adults. Diabetes Care, 23(9), 1272-1277.
Gregg, E. W., Engelgau, M. M., & Narayan, V. (2002). Complications of diabetes in
elderly people : Underappreciated problems include cognitive decline and physical disability. BMJ : British Medical Journal, 325(7370), 916-917.
Gregg, E. W., Mangione, C. M., Cauley, J. A., Thompson, T. J., Schwartz, A. V.,
Ensrud, K. E., & Nevitt, M. C. (2002). Diabetes and Incidence of Functional Disability in Older Women. Diabetes Care, 25(1), 61-67.
Grigorios, R., Elena, P., George, S. V., Katopodis, P., & Skoutas, D. (2015).
Effectiveness and Safety of Vildagliptin in Addition to Metformin in Elderly (>=70 years) Greek Patients - the Esteem Study Type 2 Diabetes Therapies (pp. THR-640-THR-640): Endocrine Society.
Gross, J. L., Rogers, J., Polhamus, D., Gillespie, W., Friedrich, C., Gong, Y., . . .
Retlich, S. (2013). A novel model-based meta-analysis to indirectly estimate the comparative efficacy of two medications: an example using DPP-4 inhibitors, sitagliptin and linagliptin, in treatment of type 2 diabetes mellitus. BMJ Open, 3(3), e001844.
Gunasekaran, U., & Gannon, M. (2011). Type 2 Diabetes and the Aging Pancreatic Beta
Cell. Aging (Albany NY), 3(6), 565-575. Guo, N., Parry, E. M., Li, L.-S., Kembou, F., Lauder, N., Hussain, M. A., . . . Armanios,
M. (2011). Short Telomeres Compromise β-Cell Signaling and Survival. PLOS ONE, 6(3), e17858.
Gupta, N. A., Mells, J., Dunham, R. M., Grakoui, A., Handy, J., Saxena, N. K., &
Anania, F. A. (2010). Glucagon-like Peptide-1 Receptor (GLP-1R) is present on human hepatocytes and has a direct role in decreasing hepatic steatosis in vitro by modulating elements of the insulin signaling pathway. Hepatology (Baltimore, Md.), 51(5), 1584-1592.
337
Univers
ity of
Mala
ya

Gupta, R. K., Vatamaniuk, M. Z., Lee, C. S., Flaschen, R. C., Fulmer, J. T.,
Matschinsky, F. M., . . . Kaestner, K. H. (2005). The MODY1 gene HNF-4α regulates selected genes involved in insulin secretion. Journal of Clinical Investigation, 115(4), 1006-1015.
Gupta, V., & Kalra, S. (2011). Choosing a Gliptin. [Review Article]. Indian Journal of
Endocrinology and Metabolism, 15(4), 298-308. Gutzwiller, J. P., Tschopp, S., Bock, A., Zehnder, C. E., Huber, A. R., Kreyenbuehl, M.,
. . . Goeke, B. (2004). Glucagon-like peptide 1 induces natriuresis in healthy subjects and in insulin-resistant obese men. J Clin Endocrinol Metab, 89.
Haghvirdizadeh, P., Mohamed, Z., Abdullah, N. A., Haghvirdizadeh, P., Haerian, M. S.,
& Haerian, B. S. (2015). KCNJ11: Genetic Polymorphisms and Risk of Diabetes Mellitus. Journal of Diabetes Research, 2015, 9.
Hahr, A. J., & Molitch, M. E. (2015). Management of diabetes mellitus in patients with
chronic kidney disease. Clinical Diabetes and Endocrinology, 1(1), 2. Halimi, S., Raccah, D., Schweizer, A., & Dejager, S. (2010). Role of vildagliptin in
managing type 2 diabetes mellitus in the elderly. Curr Med Res Opin, 26(7), 1647-1656.
Hammami, S., Mehri, S., Hajem, S., Koubaa, N., Souid, H., & Hammami, M. (2012).
Prevalence of diabetes mellitus among non institutionalized elderly in Monastir City. BMC Endocrine Disorders, 12, 15-15.
Hamosh, A., Scott, A. F., Amberger, J. S., Bocchini, C. A., & McKusick, V. A. (2005).
Online Mendelian Inheritance in Man (OMIM), a knowledgebase of human genes and genetic disorders. Nucleic Acids Research, 33(Database Issue), D514-D517.
Han, S. J., Choi, S.-E., Kang, Y., Jung, J. G., Yi, S.-A., Kim, H. J., . . . Kim, D. J.
(2011). Effect of sitagliptin plus metformin on b-cell function, islet integrity and islet gene expression in Zucker diabetic fatty rats. Diabetes Research and Clinical Practice, 92(2), 213-222.
Harris, E. H. (2005). Elevated Liver Function Tests in Type 2 Diabetes. Clinical
Diabetes, 23(3), 115-119.
338
Univers
ity of
Mala
ya

Hatano, R., Ohnuma, K., Yamamoto, J., Dang, N. H., & Morimoto, C. (2013). CD26-
mediated co-stimulation in human CD8(+) T cells provokes effector function via pro-inflammatory cytokine production. Immunology, 138(2), 165-172.
He, H., Tran, P., Yin, H., Smith, H., Batard, Y., Wang, L., . . . Howard, D. (2009).
Absorption, metabolism, and excretion of [14C]vildagliptin, a novel dipeptidyl peptidase 4 inhibitor, in humans. Drug Metab Dispos, 37(3), 536-544.
Heni, M., Ketterer, C., Thamer, C., Herzberg-Schäfer, S. A., Guthoff, M., Stefan, N., . .
. Häring, H.-U. (2010). Glycemia Determines the Effect of Type 2 Diabetes Risk Genes on Insulin Secretion. Diabetes, 59(12), 3247-3252.
Henquin, J.-C., Dufrane, D., Kerr-Conte, J., & Nenquin, M. (2015). Dynamics of
glucose-induced insulin secretion in normal human islets. American Journal of Physiology - Endocrinology and Metabolism.
Herbert, T. P. (2007). PERK in the life and death of the pancreatic beta-cell. Biochem
Soc Trans, 35(Pt 5), 1205-1207. Herman, G. A., Bergman, A., Yi, B., & Kipnes, M. (2006). Tolerability and
pharmacokinetics of metformin and the dipeptidyl peptidase-4 inhibitor sitagliptin when co-administered in patients with type 2 diabetes. Curr Med Res Opin, 22(10), 1939-1947.
Hetz, C. (2012). The unfolded protein response: controlling cell fate decisions under ER
stress and beyond. Nat Rev Mol Cell Biol, 13(2), 89-102. Ho, T. K., Shiwen, X., Abraham, D., Tsui, J., & Baker, D. (2012). Stromal-Cell-Derived
Factor-1 (SDF-1)/CXCL12 as Potential Target of Therapeutic Angiogenesis in Critical Leg Ischaemia. Cardiology Research and Practice, 2012, 143209.
Hollander, P. A., & Kushner, P. (2010). Type 2 diabetes comorbidities and treatment
challenges: rationale for DPP-4 inhibitors. Postgrad Med, 122(3), 71-80. Holst, J. J., Knop, F. K., Vilsbøll, T., Krarup, T., & Madsbad, S. (2011). Loss of
Incretin Effect Is a Specific, Important, and Early Characteristic of Type 2 Diabetes. Diabetes Care, 34(Supplement 2), S251-S257.
339
Univers
ity of
Mala
ya

Holstein, A., Hahn, M., Korner, A., Stumvoll, M., & Kovacs, P. (2011). TCF7L2 and the therapeutic response to sulphonylureas in patients with type 2 diabetes. BMC Med Genet, 12(30).
Holstein, A., Hammer, C., Hahn, M., Kulamadayil, N. S., & Kovacs, P. (2010). Severe
sulfonylurea-induced hypoglycemia: a problem of uncritical prescription and deficiencies of diabetes care in geriatric patients. Expert Opin Drug Saf, 9(5), 675-681.
Hong, C. Y., Chia, K. S., Hughes, K., & Ling, S. L. (2004). Ethnic differences among
Chinese, Malay and Indian patients with type 2 diabetes mellitus in Singapore. Singapore Med J, 45(4), 154-160.
Horikoshi, M., Hara, K., Ito, C., Nagai, R., Froguel, P., & Kadowaki, T. (2007). A
genetic variation of the transcription factor 7-like 2 gene is associated with risk of type 2 diabetes in the Japanese population. Diabetologia, 50(4), 747-751.
Hosmer, D. W., & Lemeshow, S. (2004). Applied Logistic Regression. (2nd ed.): John
Wiley & Sons, Inc. Hsieh, J., Longuet, C., Baker, C. L., Qin, B., Federico, L. M., Drucker, D. J., & Adeli,
K. (2010). The glucagon-like peptide 1 receptor is essential for postprandial lipoprotein synthesis and secretion in hamsters and mice. Diabetologia, 53(3), 552-561.
Hübel, K., Hegener, K., Schnell, R., Mansmann, G., Oberhäuser, F., Staib, P., . . .
Engert, A. (1999). Suppressed neutrophil function as a risk factor for severe infection after cytotoxic chemotherapy in patients with acute nonlymphocytic leukemia. Annals of Hematology, 78(2), 73-77.
IBM. (2011). Statistical package for Social Science (SPSS). (Version 20.0): IBM Corp. IDF. (2000). IDF Diabetes Atlas (1st ed.). IDF. (2003). IDF Diabetes Atlas (2nd ed.). IDF. (2006). IDF Diabetes Atlas (3rd ed.). IDF. (2009). IDF Diabetes Atlas (4th ed.).
340
Univers
ity of
Mala
ya

IDF. (2015). IDF Diabetes Atlas (7th ed.). Brussels, Belgium. Ihm, S.-H., Moon, H. J., Kang, J. G., Park, C. Y., Oh, K. W., Jeong, I. K., . . . Park, S.
W. (2007). Effect of aging on insulin secretory function and expression of beta cell function-related genes of islets. Diabetes Research and Clinical Practice, 77(3, Supplement), S150-S154.
Ikushima, H., Munakata, Y., Ishii, T., Iwata, S., Terashima, M., Tanaka, H., . . .
Morimoto, C. (2000). Internalization of CD26 by mannose 6-phosphate/insulin-like growth factor II receptor contributes to T cell activation. Proc Natl Acad Sci U S A, 97(15), 8439-8444.
Ilahi, O., Bochicchio, G. V., & Scalea, T. M. (2002). Efficacy of computed tomography
in the diagnosis of pancreatic injury in adult blunt trauma patients: a single-institutional study. Am Surg, 68(8), 704-707.
Ingelheim, B. (2011a). Tradjenta Duo™. Retrieved 17/02/2016, from
http://online1.mimsgateway.com.my/ Ingelheim, B. (2011b). Tradjenta™. Retrieved 17/02/2016, from
http://online1.mimsgateway.com.my/ Inzucchi, S. E., Bergenstal, R. M., Buse, J. B., Diamant, M., Ferrannini, E., Nauck, M., .
. . Matthews, D. R. (2012). Management of Hyperglycemia in Type 2 Diabetes: A Patient-Centered Approach. Position Statement of the American Diabetes Association (ADA) and the European Association for the Study of Diabetes (EASD), 35(6), 1364-1379.
Inzucchi, S. E., Bergenstal, R. M., Buse, J. B., Diamant, M., Ferrannini, E., Nauck, M., .
. . Matthews, D. R. (2015). Management of Hyperglycemia in Type 2 Diabetes, 2015: A Patient-Centered Approach: Update to a Position Statement of the American Diabetes Association and the European Association for the Study of Diabetes. Diabetes Care, 38(1), 140-149.
Ishihara, H., Takeda, S., Tamura, A., Takahashi, R., Yamaguchi, S., Takei, D., . . . Oka,
Y. (2004). Disruption of the WFS1 gene in mice causes progressive β-cell loss and impaired stimulus–secretion coupling in insulin secretion. Human Molecular Genetics, 13(11), 1159-1170.
341
Univers
ity of
Mala
ya

Ishino, S., & Ishino, Y. (2014). DNA polymerases as useful reagents for biotechnology – the history of developmental research in the field. Frontiers in Microbiology, 5, 465.
Isler, J. A., Vesterqvist, O. E., & Burczynski, M. E. (2007). Analytical validation of
genotyping assays in the biomarker laboratory. Pharmacogenomics, 8(4), 353-368.
Ismail, I. S., Nazaimoon, W., Mohamad, W., Letchuman, R., Singaraveloo, M., Hew, F.
L., . . . Khalid, B. A. K. (2001). Ethnicity and glycaemic control are major determinants of diabetic dyslipidaemia in Malaysia. Diabetic Medicine, 18(6), 501-508.
Ito, M., Abe, M., Okada, K., Sasaki, H., Maruyama, N., Tsuchida, M., . . . Soma, M.
(2011). The dipeptidyl peptidase-4 (DPP-4) inhibitor vildagliptin improves glycemic control in type 2 diabetic patients undergoing hemodialysis. Endocrine Journal, 58(11), 979-987.
Iwaki-Egawa, S., Watanabe, Y., Kikuya, Y., & Fujimotot, Y. (1998). Dipeptidyl
Peptidase IV from Human Serum: Purification, Characterization, and N-Terminal Amino Acid Sequence. The Journal of Biochemistry, 124(2), 428-433.
Iwasaki, T., Yoneda, M., Inamori, M., Shirakawa, J., Higurashi, T., Maeda, S., . . .
Nakajima, A. (2011). Sitagliptin as a novel treatment agent for non-alcoholic Fatty liver disease patients with type 2 diabetes mellitus. Hepatogastroenterology, 58(112), 2103-2105.
Iwawaki, T., Akai, R., Yamanaka, S., & Kohno, K. (2009). Function of IRE1 alpha in
the placenta is essential for placental development and embryonic viability. Proceedings of the National Academy of Sciences of the United States of America, 106(39), 16657-16662.
Jackson, E. K., Dubinion, J. H., & Mi, Z. (2008). Effects of dipeptidyl peptidase IV
inhibition on arterial blood pressure. . Clinical and Experimental Pharmacology and Physiology, 35(1), 29-34.
Jackson, S. H., Martin, T. S., Jones, J. D., Seal, D., & Emanuel, F. (2010). Liraglutide
(Victoza): The First Once-Daily Incretin Mimetic Injection For Type-2 Diabetes. Pharmacy and Therapeutics, 35(9), 498-529.
342
Univers
ity of
Mala
ya

Jamaluddin, J. L., Huri, H. Z., & Vethakkan, S. R. (2016). Clinical and genetic predictors of dipeptidyl peptidase-4 inhibitor treatment response in Type 2 diabetes mellitus. Pharmacogenomics, 17(8), 867-881.
Jamaluddin, J. L., Huri, H. Z., Vethakkan, S. R., & Mustafa, N. (2014). Pancreatic gene
variants potentially associated with dipeptidyl peptidase-4 inhibitor treatment response in Type 2 diabetes. Pharmacogenomics, 15(2), 235-249.
James, G. D., Baker, P., Badrick, E., Mathur, R., Hull, S., & Robson, J. (2012). Type 2
diabetes: a cohort study of treatment, ethnic and social group influences on glycated haemoglobin. BMJ Open, 2(5).
Jansen, R.-P. (2001). mRNA localization: message on the move. Nat Rev Mol Cell Biol,
2(4), 247-256. Janssen, I., Heymsfield, S. B., Allison, D. B., Kotler, D. P., & Ross, R. (2002). Body
mass index and waist circumference independently contribute to the prediction of nonabdominal, abdominal subcutaneous, and visceral fat. The American Journal of Clinical Nutrition, 75(4), 683-688.
Jenkins, S., & Gibson, N. (2002). High-Throughput SNP Genotyping. Comparative and
Functional Genomics, 3(1), 57-66. Jeon, C. Y., Lokken, R. P., Hu, F. B., & van Dam, R. M. (2007). Physical Activity of
Moderate Intensity and Risk of Type 2 Diabetes. A systematic review, 30(3), 744-752.
Jil, M., Rajnikant, M., Richard, D., & Iskandar, I. (2016). Determinants of Glycemic
Response to Add-On Therapy with a Dipeptidyl Peptidase-4 Inhibitor: A Retrospective Cohort Study Using a United Kingdom Primary Care Database. Diabetes Technology & Therapeutics, 18(2), 85-92.
Jojima, T., Tomotsune, T., Iijima, T., Akimoto, K., Suzuki, K., & Aso, Y. (2016).
Empagliflozin (an SGLT2 inhibitor), alone or in combination with linagliptin (a DPP-4 inhibitor), prevents steatohepatitis in a novel mouse model of non-alcoholic steatohepatitis and diabetes. Diabetology & Metabolic Syndrome, 8, 45.
Juang, P. S., & Henry, R. R. (2013). Treatment for Type 2 Diabetes. Retrieved
25/12/2016, from http://www.ncbi.nlm.nih.gov/books/NBK278942/
343
Univers
ity of
Mala
ya

Kaji, K., Yoshiji, H., Ikenaka, Y., Noguchi, R., Aihara, Y., Douhara, A., . . . Fukui, H. (2014). Dipeptidyl peptidase-4 inhibitor attenuates hepatic fibrosis via suppression of activated hepatic stellate cell in rats. Journal of Gastroenterology, 49(3), 481-491.
Kajiwara, A., Saruwatari, J., Sakata, M., Morita, K., Kita, A., Oniki, K., . . . Nakagawa,
K. (2013). Risk Factors for Adverse Symptoms During Dipeptidyl Peptidase-IV Inhibitor Therapy: A Questionnaire-Based Study Carried Out by the Japan Pharmaceutical Association Drug Event Monitoring Project in Kumamoto Prefecture. Drug Safety, 36(10), 981-987.
Kakiuchi, C., Ishigaki, S., Oslowski, C. M., Fonseca, S. G., Kato, T., & Urano, F.
(2009). Valproate, a Mood Stabilizer, Induces WFS1 Expression and Modulates Its Interaction with ER Stress Protein GRP94. PLOS ONE, 4(1), e4134.
Kalle, E., Kubista, M., & Rensing, C. (2014). Multi-template polymerase chain reaction.
Biomolecular Detection and Quantification, 2, 11-29. Kameoka, J., Tanaka, T., Nojima, Y., Schlossman, S., & Morimoto, C. (1993). Direct
association of adenosine deaminase with a T cell activation antigen, CD26. Science, 261(5120), 466-469.
Kanazawa, I., Tanaka, K.-i., & Sugimoto, T. (2014). DPP-4 Inhibitors Improve Liver
Dysfunction in Type 2 Diabetes Mellitus. Medical Science Monitor : International Medical Journal of Experimental and Clinical Research, 20, 1662-1667.
Kaneko, K., Ueki, K., Takahashi, N., Hashimoto, S., Okamoto, M., Awazawa, M., . . .
Kadowaki, T. (2010). Class IA Phosphatidylinositol 3-Kinase in Pancreatic β Cells Controls Insulin Secretion by Multiple Mechanisms. Cell metabolism, 12(6), 619-632.
Karagiannis, T., Bekiari, E., Boura, P., & Tsapas, A. (2016). Cardiovascular risk with
DPP-4 inhibitors: latest evidence and clinical implications. Therapeutic Advances in Drug Safety, 7(2), 36-38.
Karim, A., Bridson, W., & Fleck, P. (2007). Disposition of the dipeptidyl peptidase-4
inhibitor [14C] alogliptin benzoate ([14C]SYR-322) after oral administration to healthy male subjects. AAPS Journal, 9(S2), T3552.
344
Univers
ity of
Mala
ya

Karl, T., Hoffmann, T., Pabst, R., & von Hörsten, S. (2003). Extreme reduction of dipeptidyl peptidase IV activity in F344 rat substrains is associated with various behavioral differences. Physiology & Behavior, 80(1), 123-134.
Karter, A. J., Mayer-Davis, E. J., Selby, J. V., D'Agostino, R. B., Haffner, S. M.,
Sholinsky, P., . . . Hamman, R. F. (1996). Insulin Sensitivity and Abdominal Obesity in African-American, Hispanic, and Non-Hispanic White Men and Women: The Insulin Resistance and Atherosclerosis Study. Diabetes, 45(11), 1547-1555.
Kasuga, M. (2011). KCNQ1, a susceptibility gene for type 2 diabetes. Journal of
Diabetes Investigation, 2(6), 413-414. Katamani, N., Katoh, T., Sawai, Y., Kanayama, H., Katada, N., & Itoh, M. (2013).
Comparison between the clinical efficacy of linagliptin and sitagliptin. Journal of Diabetes and Endocrinology, 4(4), 51-54.
Kato, T. (2008). Molecular neurobiology of bipolar disorder: a disease of 'mood-
stabilizing neurons'? Trends Neurosci, 31(10), 495-503. Katsuyama, H., Sako, A., Adachi, H., Hamasaki, H., & Yanai, H. (2015). Effects of 6-
Month Sitagliptin Treatment on Metabolic Parameters in Diabetic Patients Taking Oral Glucocorticoids: A Retrospective Cohort Study. Journal of Clinical Medicine Research, 7(6), 479-484.
Kavalipati, N., Shah, J., Ramakrishan, A., & Vasnawala, H. (2015). Pleiotropic effects
of statins. Indian Journal of Endocrinology and Metabolism, 19(5), 554-562. Kawamoto, S., Koda, R., Imanishi, Y., Yoshino, A., & Takeda, T. (2016). The
dipeptidyl peptidase-4 inhibitor may improve the insulin secretion in type 2 diabetes patients just after starting hemodialysis treatment: preliminary study. Renal Replacement Therapy, 2(1), 39.
Kawamoto, T., Horikawa, Y., Tanaka, T., Kabe, N., Takeda, J., & Mikuni, M. (2004).
Genetic variations in the WFS1 gene in Japanese with type 2 diabetes and bipolar disorder. Molecular Genetics and Metabolism, 82(3), 238-245.
Kendall, C., & Wooltorton, E. (2006). Rosiglitazone (Avandia) and macular edema.
Canadian Medical Association Journal, 174(5), 623.
345
Univers
ity of
Mala
ya
Kern, M., Klöting, N., Niessen, H. G., Thomas, L., Stiller, D., Mark, M., . . . Blüher, M. (2012). Linagliptin Improves Insulin Sensitivity and Hepatic Steatosis in Diet-Induced Obesity. PLOS ONE, 7(6), e38744.
Khan, I. A., Vattam, K. K., Jahan, P., Mukkavali, K. K., Hasan, Q., & Rao, P. (2015).
Correlation between KCNQ1 and KCNJ11 gene polymorphisms and type 2 and post-transplant diabetes mellitus in the Asian Indian population. Genes & Diseases, 2(3), 276-282.
Khan, T., Bertram, M. Y., Jina, R., Mash, B., Levitt, N., & Hofman, K. (2013).
Preventing diabetes blindness: Cost effectiveness of a screening programme using digital non-mydriatic fundus photography for diabetic retinopathy in a primary health care setting in South Africa. Diabetes Research and Clinical Practice, 101(2), 170-176.
Kilpatrick, E. S., Dominiczak, M. H., & Small, M. (1996). The effects of ageing on
glycation and the interpretation of glycaemic control in Type 2 diabetes. QJM, 89(4), 307-308.
Kim, D., Wang, L., Beconi, M., Eiermann, G. J., Fisher, M. H., He, H., . . . Weber, A.
E. (2005). (2R)-4-Oxo-4-[3-(Trifluoromethyl)-5,6-dihydro[1,2,4]triazolo[4,3-a]pyrazin- 7(8H)-yl]-1-(2,4,5-trifluorophenyl)butan-2-amine: A Potent, Orally Active Dipeptidyl Peptidase IV Inhibitor for the Treatment of Type 2 Diabetes. Journal of Medicinal Chemistry, 48(1), 141-151.
Kim, J. E., Lee, Y.-h., Huh, J. H., Kang, D. R., Rhee, Y., & Lim, S.-K. (2014). Early-
stage chronic kidney disease, insulin resistance, and osteoporosis as risk factors of sarcopenia in aged population: The Fourth Korea National Health and Nutrition Examination Survey (KNHANES IV), 2008–2009. Osteoporosis International, 25(9), 2189-2198.
Kim, M.-K., Chae, Y. N., Kim, H. D., Yang, E. K., Cho, E. J., Choi, S.-h., . . . Shin, C.
Y. (2012). DA-1229, a novel and potent DPP4 inhibitor, improves insulin resistance and delays the onset of diabetes. Life Sciences, 90(1–2), 21-29.
Kim, S., & Misra, A. (2007). SNP Genotyping: Technologies and Biomedical
Applications. Annual Review of Biomedical Engineering, 9, 289-320. Kim, S. A., Shim, W. H., Lee, E. H., Lee, Y. M., Beom, S. H., Kim, E. S., . . . Kim, K.
R. (2011). Predictive Clinical Parameters for the Therapeutic Efficacy of Sitagliptin in Korean Type 2 Diabetes Mellitus. Diabetes & Metabolism Journal, 35(2), 159-165.
346
Univers
ity of
Mala
ya

Kim, Y. A. (2015). Letter: Predictive Factors for Efficacy of Dipeptidyl Peptidase-4
Inhibitors in Patients with Type 2 Diabetes Mellitus (Diabetes Metab J 2015;39:342-7). Diabetes & Metabolism Journal, 39(5), 444-445.
Kim, Y. G., Hahn, S., Oh, T. J., Kwak, S. H., Park, K. S., & Cho, Y. M. (2013).
Differences in the glucose-lowering efficacy of dipeptidyl peptidase-4 inhibitors between Asians and non-Asians: a systematic review and meta-analysis. Diabetologia, 56(4), 696-708.
King, G. L., McNeely, M. J., Thorpe, L. E., Mau, M. L., Ko, J., Liu, L. L., . . . Chow, E.
A. (2012). Understanding and addressing unique needs of diabetes in Asian Americans, native Hawaiians, and Pacific Islanders. Diabetes Care, 35(5), 1181-1188.
Kirino, Y., Sato, Y., Kamimoto, T., Kawazoe, K., Minakuchi, K., & Nakahori, Y.
(2009). Interrelationship of dipeptidyl peptidase IV (DPP4) with the development of diabetes, dyslipidaemia and nephropathy: a streptozotocin-induced model using wild-type and DPP4-deficient rats. Journal of Endocrinology, 200, 53-61.
Kirkman, M. S., Briscoe, V. J., Clark, N., Florez, H., Haas, L. B., Halter, J. B., . . .
Swift, C. S. (2012). Diabetes in Older Adults. Diabetes Care, 35(12), 2650-2664.
Kirkpatrick, C. L., Marchetti, P., Purrello, F., Piro, S., Bugliani, M., Bosco, D., . . .
Wollheim, C. B. (2010). Type 2 Diabetes Susceptibility Gene Expression in Normal or Diabetic Sorted Human Alpha and Beta Cells: Correlations with Age or BMI of Islet Donors. PLOS ONE, 5(6), e11053.
Klemann, C., Wagner, L., Stephan, M., & von Hörsten, S. (2016). Cut to the chase: a
review of CD26/dipeptidyl peptidase-4's (DPP4) entanglement in the immune system. Clinical & Experimental Immunology, 185(1), 1-21.
Kobayashi, H., Hosono, O., Mimori, T., Kawasaki, H., Dang, N. H., Tanaka, H., &
Morimoto, C. (2002). Reduction of serum soluble CD26/dipeptidyl peptidase IV enzyme activity and its correlation with disease activity in systemic lupus erythematosus. The Journal of Rheumatology, 29(9), 1858-1866.
Kofiadi, I. A., & Rebrikov, D. V. (2006). Methods for detecting single nucleotide
polymorphisms: Allele-specific PCR and hybridization with oligonucleotide probe. Russian Journal of Genetics, 42(1), 16-26.
347
Univers
ity of
Mala
ya

Koo, B. K., Cho, Y. M., Park, B. L., Cheong, H. S., Shin, H. D., Jang, H. C., . . . Park,
K. S. (2007). Polymorphisms of KCNJ11 (Kir6.2 gene) are associated with Type 2 diabetes and hypertension in the Korean population. Diabetic Medicine, 24(2), 178-186.
Kornienko, A. E., Guenzl, P. M., Barlow, D. P., & Pauler, F. M. (2013). Gene
regulation by the act of long non-coding RNA transcription. BMC Biology, 11(1), 59.
Koska, J., Sands, M., Burciu, C., & Reaven, P. (2015). Cardiovascular effects of
dipeptidyl peptidase-4 inhibitors in patients with type 2 diabetes. Diabetes and Vascular Disease Research, 12(3), 154-163.
Ku, E. J., Jung, K. Y., Kim, Y. J., Kim, K. M., Moon, J. H., Choi, S. H., . . . Ahrén, B.
(2015). Four-Year Durability of Initial Combination Therapy with Sitagliptin and Metformin in Patients with Type 2 Diabetes in Clinical Practice; COSMIC Study. PLOS ONE, 10(6), e0129477.
Kubota, A., Maeda, H., Kanamori, A., Matoba, K., Jin, Y., Minagawa, F., . . . Matsuba,
I. (2012). Pleiotropic Effects of Sitagliptin in the Treatment of Type 2 Diabetes Mellitus Patients. Journal of Clinical Medicine Research, 4(5), 309-313.
Kuhlow, D., Florian, S., von Figura, G., Weimer, S., Schulz, N., Petzke, K. J., . . .
Ristow, M. (2010). Telomerase deficiency impairs glucose metabolism and insulin secretion. Aging (Albany NY), 2(10), 650-658.
Kundu, D., Mandal, T., Nandi, M., Osta, M., Bandyopadhyay, U., & Ray, D. (2014).
Oxidative stress in diabetic patients with retinopathy. Ann Afr Med, 13(1), 41-46.
Kurita, N., Ito, T., Shimizu, S., Hirata, T., & Uchihara, H. (2014). Idiosyncratic Liver
Injury Induced by Vildagliptin With Successful Switch to Linagliptin in a Hemodialyzed Diabetic Patient. Diabetes Care, 37(9), e198-e199.
Kusunoki, M., Sato, D., Nakamura, T., Oshida, Y., Tsutsui, H., Natsume, Y., . . .
Miyata, T. (2015). DPP-4 Inhibitor Teneligliptin Improves Insulin Resistance and Serum Lipid Profile in Japanese Patients with Type 2 Diabetes. Drug Res (Stuttg), 65(10), 532-534.
Kutoh, E. (2014). Probable linagliptin-induced liver toxicity: A case report. Diabetes &
Metabolism, 40(1), 82-84. 348
Univers
ity of
Mala
ya

Kwok, P. Y. (2001). Methods for genotyping single nucleotide polymorphisms. Annu
Rev Genomics Hum Genet, 2, 235-258. Kwon, J. M., & Goate, A. M. (2000). The candidate gene approach. Alcohol Res Health,
24(3), 164-168. Kwon, O., et al. (2013). Discovery of DiPeptidyl Peptidase-4 Gene Variants and the
Associations with Efficacy of Vildagliptin in Patients with Type 2 Diabetes - A Pilot Study. J Diabetes Metab, S13(006).
Lacy, C. F. (2009). Sitagliptin. In L. L. Armstrong, Goldman, M.P. & Lance, L.L. (Ed.),
Drug Information Handbook (18th ed., pp. 1375-1376). Ohio, USA: Lexi-Comp Inc.
Lago, R. M., Singh, P. P., & Nesto, R. W. (2007). Diabetes and hypertension. Nat Clin
Pract End Met, 3(10), 667-667. Lambeir, A. M., Durinx, C., Scharpe, S., & De Meester, I. (2003). Dipeptidyl-peptidase
IV from bench to bedside: an update on structural properties, functions, and clinical aspects of the enzyme DPP IV. Crit Rev Clin Lab Sci, 40(3), 209-294.
Lamers, D., Famulla, S., Wronkowitz, N., Hartwig, S., Lehr, S., Ouwens, D. M., . . .
Eckel, J. (2011). Dipeptidyl peptidase 4 is a novel adipokine potentially linking obesity to the metabolic syndrome. Diabetes, 60.
Lamont, B. J., Li, Y., Kwan, E., Brown, T. J., Gaisano, H., & Drucker, D. J. (2012).
Pancreatic GLP-1 receptor activation is sufficient for incretin control of glucose metabolism in mice. The Journal of Clinical Investigation, 122(1), 388-402.
Langaee, T. Y., & Shin, J. (2010). The genetic basis of pharmacogenomic. In Concepts
of Pharmacogenomics (pp. 26): American Society of Health-System Pharmacists.
Lee, & Whitmore. (2012). Microarray sample size calculator. Retrieved 25/12/2012,
from http://sph.umd.edu/department/epib/sample-size-calculation-completely-randomized-treatment-control-designs
349
Univers
ity of
Mala
ya

Lee, C.-S., Kim, Y. G., Cho, H.-J., Park, J., Jeong, H., Lee, S.-E., . . . Kim, H.-S. (2016). Dipeptidyl Peptidase-4 Inhibitor Increases Vascular Leakage in Retina through VE-cadherin Phosphorylation. Scientific Reports, 6, 29393.
Lehman, D. M., Hunt, K. J., Leach, R. J., Hamlington, J., Arya, R., Abboud, H. E., . . .
Stern, M. P. (2007). Haplotypes of Transcription Factor 7–Like 2 (TCF7L2) Gene and Its Upstream Region Are Associated With Type 2 Diabetes and Age of Onset in Mexican Americans. Diabetes, 56(2), 389-393.
Lenhard, J. M., Croom, D. K., & Minnick, D. T. (2004). Reduced serum dipeptidyl
peptidase-IV after metformin and pioglitazone treatments. Biochemical and Biophysical Research Communications, 324(1), 92-97.
Leon-Latre, M., Moreno-Franco, B., Andres-Esteban, E. M., Ledesma, M., Laclaustra,
M., Alcalde, V., . . . Casasnovas, J. A. (2014). Sedentary lifestyle and its relation to cardiovascular risk factors, insulin resistance and inflammatory profile. Rev Esp Cardiol, 67(6), 449-455.
Li, J., Wood, W. H., III, Becker, K. G., Weeraratna, A. T., & Morin, P. J. (2006). Gene
expression response to cisplatin treatment in drug-sensitive and drug-resistant ovarian cancer cells. Oncogene, 26(20), 2860-2872.
Li, L., Li, S., Deng, K., Liu, J., Vandvik, P. O., Zhao, P., . . . Sun, X. (2016). Dipeptidyl
peptidase-4 inhibitors and risk of heart failure in type 2 diabetes: systematic review and meta-analysis of randomised and observational studies. BMJ, 352.
Licinio, J., & Wong, M.-L. (2003). Pharmacogenomics.The search for individualized
therapies. (1st ed.): Wiley-VCH. Liesa, M., & Shirihai, O. S. (2013). Mitochondrial Dynamics in the Regulation of
Nutrient Utilization and Energy Expenditure. Cell metabolism, 17(4), 491-506. Ligueros-Saylan, M., Foley, J. E., Schweizer, A., Couturier, A., & Kothny, W. (2010).
An assessment of adverse effects of vildagliptin versus comparators on the liver, the pancreas, the immune system, the skin and in patients with impaired renal function from a large pooled database of Phase II and III clinical trials. Diabetes, Obesity and Metabolism, 12(6), 495-509.
Lim, S., An, J. H., Shin, H., Khang, A. R., Lee, Y., Ahn, H. Y., . . . Jang, H. C. (2012).
Factors predicting therapeutic efficacy of combination treatment with sitagliptin and metformin in type 2 diabetic patients: the COSMETIC study. Clinical Endocrinology, 77(2), 215-223.
350
Univers
ity of
Mala
ya

Lin, Y., & Sun, Z. (2012). Antiaging Gene Klotho Enhances Glucose-Induced Insulin
Secretion by Up-Regulating Plasma Membrane Levels of TRPV2 in MIN6 β-Cells. Endocrinology, 153(7), 3029-3039.
Lindsay, J. R., Duffy, N. A., McKillop, A. M., Ardill, J., O'Harte, F. P. M., Flatt, P. R.,
& Bell, P. M. (2005). Inhibition of dipeptidyl peptidase IV activity by oral metformin in Type 2 diabetes. Diabetic Medicine, 22(5), 654-657.
Little, R. R., Rohlfing, C. L., Hanson, S., Connolly, S., Higgins, T., Weykamp, C. W., .
. . Roberts, W. L. (2008). Effects of Hemoglobin (Hb) E and HbD Traits on Measurements of Glycated Hb (HbA1c) by 23 Methods. Clinical Chemistry, 54(8), 1277-1282.
Little, R. R., Rohlfing, C. L., Hanson, S. E., & Roberts, W. L. (2010). Effects of
hemoglobin C and S traits on Tosoh G8 and Siemens Advia HbA1c assays. Clinica Chimica Acta, 411(9–10), 779-780.
Little, R. R., Rohlfing, C. L., Hanson, S. E., Schmidt, R. L., Lin, C.-N., Madsen, R. W.,
& Roberts, W. L. (2012). The Effect of Increased Fetal Hemoglobin on 7 Common Hb A1c Assay Methods. Clinical Chemistry, 58(5), 945-947.
Little, R. R., Rohlfing, C. L., Tennill, A. L., Hanson, S. E., Connolly, S., Higgins, T., . .
. Roberts, W. (2013). Measurement of Hba1C in patients with chronic renal failure. Clinica Chimica Acta, 418, 73-76.
Liu, Z., Zhang, Y. W., Feng, Q. P., Li, Y. F., Wu, G. D., Zuo, J., . . . Fang, F. D. (2006).
Association analysis of 30 type 2 diabetes candidate genes in Chinese Han population. Zhongguo Yi Xue Ke Xue Yuan Xue Bao, 28(2), 124-128.
Livak, K. J. (2003). SNP Genotyping by the Nuclease Reaction. In P.-Y. Kwok (Ed.),
Single Nucleotide Polymorphisms:Methods and Protocols (pp. 129-147). Totowa, NJ: Springer New York.
Livak, K. J., Flood, S. J., Marmaro, J., Giusti, W., & Deetz, K. (1995). Oligonucleotides
with fluorescent dyes at opposite ends provide a quenched probe system useful for detecting PCR product and nucleic acid hybridization. PCR Methods Appl, 4(6), 357-362.
351
Univers
ity of
Mala
ya

Long, A. N., & Dagogo-Jack, S. (2011). The Comorbidities of Diabetes and Hypertension: Mechanisms and Approach to Target Organ Protection. Journal of clinical hypertension (Greenwich, Conn.), 13(4), 244-251.
Lunetta, K. L. (2008). Genetic Association Studies. Circulation, 118(1), 96-101. Lyssenko, V., Eliasson, L., Kotova, O., Pilgaard, K., Wierup, N., Salehi, A., . . . Groop,
L. (2011). Pleiotropic Effects of GIP on Islet Function Involve Osteopontin. Diabetes, 60(9), 2424-2433.
Macauley, M., Hollingsworth, K. G., Smith, F. E., Thelwall, P. E., Al-Mrabeh, A.,
Schweizer, A., . . . Taylor, R. (2015). Effect of Vildagliptin on Hepatic Steatosis. The Journal of Clinical Endocrinology and Metabolism, 100(4), 1578-1585.
Maechler, P., Carobbio, S., & Rubi, B. (2006). In beta-cells, mitochondria integrate and
generate metabolic signals controlling insulin secretion. The International Journal of Biochemistry & Cell Biology, 38(5–6), 696-709.
Maeda, H., Kubota, A., Tanaka, Y., Terauchi, Y., & Matsuba, I. (2012). The safety,
efficacy and predictors for HbA1c reduction of sitagliptin in the treatment of Japanese type 2 diabetes. Diabetes Research and Clinical Practice, 95(1), e20-e22.
Maeda, S., Yamagishi, S., Matsui, T., Nakashima, S., Ojima, A., Nishino, Y., . . .
Yamakawa, R. (2013). Beneficial effects of vildagliptin on retinal injury in obese type 2 diabetic rats. Ophthalmic Res, 50(4), 221-226.
Maedler, K., Carr, R. D., Bosco, D., Zuellig, R. A., Berney, T., & Donath, M. Y.
(2005). Sulfonylurea Induced β-Cell Apoptosis in Cultured Human Islets. The Journal of Clinical Endocrinology & Metabolism, 90(1), 501-506.
Mafauzy, M., Hussein, Z., & Chan, S. P. (2011). The status of diabetes control in
Malaysia: results of DiabCare 2008. Med J Malaysia, 66(3), 175-181. Mak, R. H. K. (2000). Impact of End-Stage Renal Disease and Dialysis on
Glycemic Control. Seminars in Dialysis, 13(1), 4-8. Marfella, R., Barbieri, M., Grella, R., Rizzo, M. R., Nicoletti, G. F., & Paolisso, G.
(2010). Effects of vildagliptin twice daily vs. sitagliptin once daily on 24-hour acute glucose fluctuations. Journal of Diabetes and Its Complications, 24(2), 79-83.
352
Univers
ity of
Mala
ya

Markham, A. F. (1993). The polymerase chain reaction: a tool for molecular medicine.
BMJ : British Medical Journal, 306(6875), 441-446. Marney, A., Kunchakarra, S., Byrne, L., & Brown, N. J. (2010). Interactive
hemodynamic effects of dipeptidyl peptidase -IV inhibition and angiotensin-converting enzyme inhibition in humans. Hypertension, 56.
Marshall, J., Jennings, P., Scott, A., Fluck, R. J., & McIntyre, C. W. (2003). Glycemic
control in diabetic CAPD patients assessed by continuous glucose monitoring system (CGMS). Kidney Int, 64(4), 1480-1486.
Martinez-Navio, J. M., Climent, N., Gallart, T., Lluis, C., & Franco, R. (2012). An old
enzyme for current needs: adenosine deaminase and a dendritic cell vaccine for HIV. Immunol Cell Biol, 90(6), 594-600.
Martono, D. P., Lub, R., Lambers Heerspink, H. J., Hak, E., Wilffert, B., & Denig, P.
(2015). Predictors of response in initial users of metformin and sulphonylurea derivatives: a systematic review. Diabetic Medicine, 32(7), 853-864.
Masana, M. I., & Dubocovich, M. L. (2001). Melatonin Receptor Signaling: Finding the
Path Through the Dark. Science's STKE, 2001(107), pe39-pe39. Mason, R. P., Jacob, R., Corbalan, J. J., Kubant, R., Ciszewski, A., & Malinski, T.
(2012). Effects of dipeptidyl peptidase-4 inhibition on endothelial nitric oxide release, blood pressure and SICAM-1 levels in hypertensive rats. Journal of American College of Cardiology (JACC), 59(13), E1543.
Mathers, C. D., & Loncar, D. (2006). Projections of Global Mortality and Burden of
Disease from 2002 to 2030. PLoS Medicine, 3(11), e442. Matikainen, N., Mänttäri, S., Schweizer, A., Ulvestad, A., Mills, D., Dunning, B. E., . . .
Taskinen, M.-R. (2006). Vildagliptin therapy reduces postprandial intestinal triglyceride-rich lipoprotein particles in patients with type 2 diabetes. Diabetologia, 49(9), 2049-2057.
Matsui, M., Takahashi, Y., Takebe, N., Takahashi, K., Nagasawa, K., Honma, H., . . .
Satoh, J. (2015). Response to the dipeptidyl peptidase-4 inhibitors in Japanese patients with type 2 diabetes might be associated with a diplotype of two single nucleotide polymorphisms on the interleukin-6 promoter region under a certain level of physical activity. Journal of Diabetes Investigation, 6(2), 173-181.
353
Univers
ity of
Mala
ya

Matthews, D. R., Hosker, J. P., Rudenski, A. S., Naylor, B. A., Treacher, D. F., &
Turner, R. C. (1985). Homeostasis model assessment: insulin resistance and beta-cell function from fasting plasma glucose and insulin concentrations in man. Diabetologia, 28(7), 412-419.
McCarthy, J. J. (2002). Turning SNPs into useful markers of drug response. In
Pharmacogenomics. The search for individual therapies. (pp. 36-37): WILEY-VCH Verlag GmbH Weinheim (Germany).
McCarthy, J. J. (2003). Turning SNPs into Useful Markers of Drug Response
Pharmacogenomics (pp. 35-55): Wiley-VCH Verlag GmbH & Co. KGaA. McGill, J. B. (2012). Linagliptin for type 2 diabetes mellitus: a review of the pivotal
clinical trials. Therapeutic Advances in Endocrinology and Metabolism, 3(4), 113-124.
Meier, J. J., Gethmann, A., Götze, O., Gallwitz, B., Holst, J. J., Schmidt, W. E., &
Nauck, M. A. (2006). Glucagon-like peptide 1 abolishes the postprandial rise in triglyceride concentrations and lowers levels of non-esterified fatty acids in humans. Diabetologia, 49(3), 452-458.
Meier, J. J., & Nauck, M. A. (2010). Is the Diminished Incretin Effect in Type 2
Diabetes Just an Epi-Phenomenon of Impaired β-Cell Function? Diabetes, 59(5), 1117-1125.
Mellado-Gil, J. M., Jiménez-Moreno, C. M., Martin-Montalvo, A., Alvarez-Mercado,
A. I., Fuente-Martin, E., Cobo-Vuilleumier, N., . . . Gauthier, B. R. (2016). PAX4 preserves endoplasmic reticulum integrity preventing beta cell degeneration in a mouse model of type 1 diabetes mellitus. Diabetologia, 59, 755-765.
Metzker, M. L., & Caskey, C. T. (2001). Polymerase Chain Reaction (PCR) eLS: John
Wiley & Sons, Ltd. Michalakis, K., Goulis, D. G., Vazaiou, A., Mintziori, G., Polymeris, A., &
Abrahamian-Michalakis, A. (2013). Obesity in the ageing man. Metabolism - Clinical and Experimental, 62(10), 1341-1349.
354
Univers
ity of
Mala
ya

Miki, T., & Seino, S. (2005). Roles of KATP channels as metabolic sensors in acute metabolic changes. Journal of molecular and cellular cardiology, 38(6), 917-925.
MIMS. (2012). EU approval for new indications of Galvus and Eucreas. Retrieved
19/05/2016, from http://www.mims.ie/news/eu-approval-for-new-indications-of-galvus-and-eucreas-01-12-2012/
MIMS. (2014). Januvia. Retrieved 19/05/2016, from
http://www.mims.com/malaysia/drug/info/januvia/mechanism-of-action Ministry of Health Malaysia, Drug Formulary, Ministry of Health Malaysia, 2017. Mistry, G. C., Bergman, A. J., Luo, W. L., Cilissen, C., Haazen, W., Davies, M. J., . . .
Herman, G. A. (2007). Multiple-dose administration of sitagliptin, a dipeptidyl peptidase-4 inhibitor, does not alter the single-dose pharmacokinetics of rosiglitazone in healthy subjects. J Clin Pharmacol, 47(2), 159-164.
Mistry, G. C., Maes, A. L., Lasseter, K. C., Davies, M. J., Gottesdiener, K. M., Wagner,
J. A., & Herman, G. A. (2008). Effect of sitagliptin, a dipeptidyl peptidase-4 inhibitor, on blood pressure in non diabetic patients with mild to moderate hypertension. J Clin Pha rmacol, 48.
Miyazaki, M., Kato, M., Tanaka, K., Tanaka, M., Kohjima, M., Nakamura, K., . . .
Takayanagi, R. (2012). Increased hepatic expression of dipeptidyl peptidase-4 in non-alcoholic fatty liver disease and its association with insulin resistance and glucose metabolism. Mol Med Rep, 5(3), 729-733.
Mkele, G. (2015). Dipeptidyl peptidase-4 inhibitors: their role in the management of
type 2 diabetes. S Afr Pharm J, 80(2), 18-20. MOH. (2016). MOH Drug Formulary. Retrieved 15/02/2016, from
http://www.pharmacy.gov.my/v2/en/apps/fukkm Mohan, V., Sandeep, S., Deepa, R., Shah, B., & Varghese, C. (2007). Epidemiology of
type 2 diabetes: Indian scenario. Indian J Med Res, 125(3), 217-230. Mohan, V., Yang, W., Son, H.-Y., Xu, L., Noble, L., Langdon, R. B., . . . Kaufman, K.
D. (2009). Efficacy and safety of sitagliptin in the treatment of patients with type 2 diabetes in China, India, and Korea. Diabetes Research and Clinical Practice, 83(1), 106-116.
355
Univers
ity of
Mala
ya

Monami, M., Cremasco, F., Lamanna, C., Marchionni, N., & Mannucci, E. (2011).
Predictors of response to dipeptidyl peptidase-4 inhibitors: evidence from randomized clinical trials. Diabetes/Metabolism Research and Reviews, 27(4), 362-372.
Monami, M., Vitale, V., & Ambrosio, V. L. (2012). Effects on lipid profile of
dipeptidyl peptidase 4 inhibitors, pioglitazone, acarbose, and sulfonylureas: meta-analysis of placebo-controlled trials. Adv Ther, 29.
Mongia, S. K., Little, R. R., Rohlfing, C. L., Hanson, S., Roberts, R. F., Owen, W. E., . .
. Roberts, W. L. (2008). Effects of Hemoglobin C and S Traits on the Results of 14 Commercial Glycated Hemoglobin Assays. American Journal of Clinical Pathology, 130(1), 136-140.
Morbach, S., Furchert, H., Gröblinghoff, U., Hoffmeier, H., Kersten, K., Klauke, G.-T.,
. . . Armstrong, D. G. (2012). Long-Term Prognosis of Diabetic Foot Patients and Their Limbs. Amputation and death over the course of a decade, 35(10), 2021-2027.
Morisky, D. E., Ang, A., Krousel-Wood, M., & Ward, H. J. (2008). Predictive Validity
of A Medication Adherence Measure in an Outpatient Setting. Journal of clinical hypertension (Greenwich, Conn.), 10(5), 348-354.
MSD. (2012a). Janumet™. Retrieved 17/02/2016, from
http://online1.mimsgateway.com.my/ MSD. (2012b). Januvia™. Retrieved 12/02/2016, from
http://online1.mimsgateway.com.my/ Mu, J., Petrov, A., Eiermann, G. J., Woods, J., Zhou, Y.-P., Li, Z., . . . Zhang, B. B.
(2009). Inhibition of DPP-4 with sitagliptin improves glycemic control and restores islet cell mass and function in a rodent model of type 2 diabetes. European Journal of Pharmacology, 623(1–3), 148-154.
Muggeo, M., Zoppini, G., Bonora, E., Brun, E., Bonadonna, R. C., Moghetti, P., &
Verlato, G. (2000). Fasting plasma glucose variability predicts 10-year survival of type 2 diabetic patients: the Verona Diabetes Study. Diabetes Care, 23(1), 45-50.
356
Univers
ity of
Mala
ya

Muhlestein, J. B., Anderson, J. L., Horne, B. D., Lavasani, F., Allen Maycock, C. A., Bair, T. L., . . . Carlquist, J. F. (2003). Effect of fasting glucose levels on mortality rate in patients with and without diabetes mellitus and coronary artery disease undergoing percutaneous coronary intervention. American Heart Journal, 146(2), 351-358.
Mullard, A. (2014). 2013 FDA drug approvals. Nat Rev Drug Discov, 13(2), 85-89. Mulvihill, E. E., & Drucker, D. J. (2014). Pharmacology, physiology, and mechanisms
of action of dipeptidyl peptidase-4 inhibitors. Endocr Rev, 35(6), 992-1019. Müssig, K., Staiger, H., Machicao, F., Häring, H.-U., & Fritsche, A. (2010). Genetic
variants affecting incretin sensitivity and incretin secretion. Diabetologia, 53(11), 2289-2297.
Mussig, K., Staiger, H., Machicao, F., Haring, H. U., & Fritsche, A. (2010). Genetic
variants affecting incretin sensitivity and incretin secretion. Diabetologia, 53(11), 2289-2297.
Must, A., Spadano, J., Coakley, E. H., Field, A. E., Colditz, G., & Dietz, W. H. (1999).
The disease burden associated with overweight and obesity. JAMA, 282(16), 1523-1529.
Myers, B. D. (1990). Pathophysiology of proteinuria in diabetic glomerular disease.
Journal of Hypertension, 8, S41-S46. Mykkänen, L., Zaccaro, D. J., Hales, C. N., Festa, A., & Haffner, S. M. (1999). The
relation of proinsulin and insulin to insulin sensitivity and acute insulin response in subjects with newly diagnosed Type II diabetes: the Insulin Resistance Atherosclerosis Study. Diabetologia, 42(9), 1060-1066.
Nabeno, M., Akahoshi, F., Kishida, H., Miyaguchi, I., Tanaka, Y., Ishii, S., &
Kadowaki, T. (2013). A comparative study of the binding modes of recently launched dipeptidyl peptidase IV inhibitors in the active site. Biochem Biophys Res Commun, 434(2), 191-196.
Nagelkerke, N. J. D. (1991). A note on a general definition of the coefficient of
determination. Biometrika, 78(3), 691-692. Nakamura, T., Iwanaga, Y., Miyaji, Y., Nohara, R., Ishimura, T., Miyazaki, S., & on
behalf of the Sitagliptin Registry Kinki Cardiologists’ Study, I. (2016). 357
Univers
ity of
Mala
ya

Cardiovascular efficacy of sitagliptin in patients with diabetes at high risk of cardiovascular disease: a 12-month follow-up. Cardiovascular Diabetology, 15, 54.
Nathan, D. M., Buse, J. B., Davidson, M. B., Ferrannini, E., Holman, R. R., Sherwin,
R., & Zinman, B. (2009). Medical Management of Hyperglycemia in Type 2 Diabetes: A Consensus Algorithm for the Initiation and Adjustment of Therapy. A consensus statement of the American Diabetes Association and the European Association for the Study of Diabetes, 32(1), 193-203.
Nature. (2016). Gene expression. Retrieved 12/02/2016, from
http://www.nature.com/subjects/gene-expression Nauck, M. A., Vardarli, I., Deacon, C. F., Holst, J. J., & Meier, J. J. (2011). Secretion of
glucagon-like peptide-1 (GLP-1) in type 2 diabetes: what is up, what is down? Diabetologia, 54(1), 10-18.
NCBI. (2015a). DPP4 rs2268889. Retrieved 19/02/2015, from
https://www.ncbi.nlm.nih.gov/projects/SNP/snp_ref.cgi?rs=rs2268889 NCBI. (2015b). DPP4 rs2970932. Retrieved 12/02/2015, from
https://www.ncbi.nlm.nih.gov/projects/SNP/snp_ref.cgi?rs=rs2970932 NCBI. (2015c). MTNR1B melatonin receptor 1B [Homo sapiens (human)]. Retrieved
12/02/2015, from https://www.ncbi.nlm.nih.gov/gene/4544 NCBI. (2016a). ABCC8 ATP binding cassette subfamily C member 8 [ Homo sapiens
(human) ]. Retrieved 12/02/2016, from https://www.ncbi.nlm.nih.gov/gene/6833
NCBI. (2016b). DPP4 dipeptidyl peptidase 4 [ Homo sapiens (human) ] Retrieved
25/12/2016, from https://www.ncbi.nlm.nih.gov/gene/1803 NCBI. (2016c). DPP4 dipeptidyl peptidase 4 [ Homo sapiens (human) ]. Retrieved
26/12/2016, from https://www.ncbi.nlm.nih.gov/gene/1803 NCBI. (2016d). KCNJ11 potassium voltage-gated channel subfamily J member 11 [
Homo sapiens (human) ] Retrieved 25/06/2016, from https://www.ncbi.nlm.nih.gov/gene/3767
358
Univers
ity of
Mala
ya

NCBI. (2016e). KCNQ1 potassium voltage-gated channel subfamily Q member 1 [ Homo sapiens (human) ]. Retrieved 12/02/2016, from https://www.ncbi.nlm.nih.gov/gene/3784
NCBI. (2016f). PAX4 paired box 4 [ Homo sapiens (human) ]. Retrieved 12/02/2016,
from https://www.ncbi.nlm.nih.gov/gene/5078 NCBI. (2016g). TCF7L2 transcription factor 7 like 2 [ Homo sapiens (human) ].
Retrieved 12/02/2016, from https://www.ncbi.nlm.nih.gov/gene/6934 NCBI. (2016h). WFS1 wolframin ER transmembrane glycoprotein [ Homo sapiens
(human) ]. Retrieved 12/01/2016, from https://www.ncbi.nlm.nih.gov/gene/7466
Ndefo, U. A., Anidiobi, N. O., Basheer, E., & Eaton, A. T. (2015). Empagliflozin
(Jardiance): A Novel SGLT2 Inhibitor for the Treatment of Type-2 Diabetes. Pharmacy and Therapeutics, 40(6), 364-368.
Nelson, W. J., & Nusse, R. (2004). Convergence of Wnt, β-Catenin, and Cadherin
Pathways. Science (New York, N.y.), 303(5663), 1483-1487. Ng, M., Fleming, T., Robinson, M., Thomson, B., Graetz, N., Margono, C., . . .
Gakidou, E. (2014). Global, regional, and national prevalence of overweight and obesity in children and adults during 1980&2013: a systematic analysis for the Global Burden of Disease Study 2013. The Lancet, 384(9945), 766-781.
Nguyen, N. T., Nguyen, X.-M. T., Lane, J., & Wang, P. (2011). Relationship Between
Obesity and Diabetes in a US Adult Population: Findings from the National Health and Nutrition Examination Survey, 1999–2006. Obesity Surgery, 21(3), 351-355.
NHMS. (1986). National Health Morbidity Survey 1986-1987. Diabetes Mellitus (Vol.
4). Malaysia: Institute for Public Health NHMS. (1996). National Health Morbidity Survey 1996. Diabetes (Vol. 9). Malaysia:
Institute for Public Health. NHMS. (2006). National Health Morbidity Survey 2006. Retrieved 21/09/2016, from
http://www.iku.gov.my/index.php/research-eng/list-of-research-eng/iku-eng/nhms-eng/nhms-2006-eng
359
Univers
ity of
Mala
ya

NHMS. (2011). National Health Morbidity Survey 2011. Retrieved 21/09/2016, from
http://www.iku.gov.my/index.php/research-eng/list-of-research-eng/iku-eng/nhms-eng/nhms-2011-eng
NHMS. (2015). National Health and Morbidity Survey 2015. Retrieved 21/09/2016,
from http://www.iku.gov.my/index.php/research-eng/list-of-research-eng/iku-eng/nhms-eng/nhms-2015
Nichols, G. A., Alexander, C. M., Girman, C. J., Kamal-Bahl, S. J., & Brown, J. B.
(2007). Contemporary analysis of secondary failure of successful sulfonylurea therapy. Endocr Pract, 13(1), 37-44.
Nielson, C., & Lange, T. (2005). Blood Glucose and Heart Failure in Nondiabetic
Patients. Diabetes Care, 28(3), 607-611. Nishimura, T., Meguro, S., Sekioka, R., Tanaka, K., Saisho, Y., Irie, J., . . . Itoh, H.
(2015). A Reduction of HbA1c after 3 Months Predicts 2-year Responsiveness to Sitagliptin Treatment. Internal Medicine, 54(23), 2981-2989.
Nissen , S. E., & Wolski , K. (2007). Effect of Rosiglitazone on the Risk of Myocardial
Infarction and Death from Cardiovascular Causes. New England Journal of Medicine, 356(24), 2457-2471.
Nomiyama, T., Akehi, Y., Takenoshita, H., Nagaishi, R., Terawaki, Y., Nagasako, H., .
. . Yanase, T. Contributing factors related to efficacy of the dipeptidyl peptidase-4 inhibitor sitagliptin in Japanese patients with type 2 diabetes. Diabetes Research and Clinical Practice, 95(2), e27-e28.
Nomiyama, T., Akehi, Y., Takenoshita, H., Nagaishi, R., Terawaki, Y., Nagasako, H., .
. . Yanase, T. (2012). Contributing factors related to efficacy of the dipeptidyl peptidase-4 inhibitor sitagliptin in Japanese patients with type 2 diabetes. Diabetes Research and Clinical Practice, 95(2), e27-e28.
Nordborg, M. (1998). On the probability of Neanderthal ancestry. American Journal of
Human Genetics, 63(4), 1237-1240. Novartis. (2012a). Galvus Met™. Retrieved 17/02/2016, from
http://online1.mimsgateway.com.my/
360
Univers
ity of
Mala
ya

Novartis. (2012b). Galvus™. Retrieved 17/02/2016, from http://online1.mimsgateway.com.my/
Nowicka, P., Santoro, N., Liu, H., Lartaud, D., Shaw, M. M., Goldberg, R., . . . Caprio,
S. (2011). Utility of hemoglobin A(1c) for diagnosing prediabetes and diabetes in obese children and adolescents. Diabetes Care, 34(6), 1306-1311.
Nuttall, F. Q. (2015). Body Mass Index: Obesity, BMI, and Health: A Critical Review.
Nutrition Today, 50(3), 117-128. Ohkura, T., Fujioka, Y., Sumi, K., Nakanishi, R., Shiochi, H., Yamamoto, N., . . .
Yamamoto, K. (2014). Sitagliptin Improves the Impaired Acute Insulin Response during a Meal Tolerance Test in Japanese Patients with Type 2 Diabetes Mellitus: A Small-Scale Real-World Study. Diabetes Therapy, 5(1), 285-297.
Ohls, R. K. C., R.D. (2000). Development of the hemotopoietic system. In R. E.
Behrman, Kliegman, R., Jenson, H.B. (Ed.), Nelson’s textbook of paediatrics (16th ed. ed., Vol. 16th ed. , pp. 1456-1460). Philadelphia: WB Saunders.
Ohtsuki, T., Tsuda, H., & Morimoto, C. (2000). Good or evil: CD26 and HIV infection.
Journal of Dermatological Science, 22(3), 152-160. Olson, A. L. (2012). Regulation of GLUT4 and Insulin-Dependent Glucose Flux. ISRN
Molecular Biology, 2012, 12. Oslowski, C. M., & Urano, F. (2011). Measuring ER stress and the unfolded protein
response using mammalian tissue culture system. Methods in enzymology, 490, 71-92.
Ostler, J. E., Maurya, S. K., Dials, J., Roof, S. R., Devor, S. T., Ziolo, M. T., &
Periasamy, M. (2014). Effects of insulin resistance on skeletal muscle growth and exercise capacity in type 2 diabetic mouse models. American Journal of Physiology - Endocrinology and Metabolism, 306(6), E592-E605.
Otero-Estevez, O., De Chiara, L., Rodriguez-Berrocal, F. J., de la Cadena, M. P.,
Cubiella, J., Castro, I., . . . Martinez-Zorzano, V. S. (2015). Serum sCD26 for colorectal cancer screening in family-risk individuals: comparison with faecal immunochemical test. Br J Cancer, 112(2), 375-381.
361
Univers
ity of
Mala
ya

Pabreja, K., Mohd, M. A., Koole, C., Wootten, D., & Furness, S. G. B. (2014). REVIEWMolecular mechanisms underlying physiological and receptor pleiotropic effects mediated by GLP-1R activation. British Journal of Pharmacology, 171(5), 1114-1128.
Pacheco, B. P., Crajoinas, R. O., Couto, G. K., Davel, A. P., Lessa, L. M., Rossoni, L.
V., & Girardi, A. C. (2011). Dipeptidyl peptidase IV inhibition attenuates blood pressure rising in young spontaneously hypertensive rats. J Hypertens, 29(3), 520-528.
Pacheco, R., Martinez-Navio, J. M., Lejeune, M., Climent, N., Oliva, H., Gatell, J. M., .
. . Franco, R. (2005). CD26, adenosine deaminase, and adenosine receptors mediate costimulatory signals in the immunological synapse. Proceedings of the National Academy of Sciences of the United States of America, 102(27), 9583-9588.
Page, K. A., & Reisman, T. (2013). Interventions to Preserve Beta-Cell Function in the
Management and Prevention of Type 2 Diabetes. Current diabetes reports, 13(2), 252-260.
Pala, L., Pezzatini, A., Dicembrini, I., Ciani, S., Gelmini, S., Vannelli, B. G., . . .
Rotella, C. M. (2012). Different modulation of dipeptidyl peptidase-4 activity between microvascular and macrovascular human endothelial cells. Acta Diabetologica, 49(1), 59-63.
Panchapakesan, U., & Pollock, C. A. (2014). DPP-4 Inhibitors—Renoprotection in
Diabetic Nephropathy? Diabetes, 63(6), 1829-1830. Patel, C. G., Li, L., Girgis, S., Kornhauser, D. M., Frevert, E. U., & Boulton, D. W.
(2011). Two-way pharmacokinetic interaction studies between saxagliptin and cytochrome P450 substrates or inhibitors: simvastatin, diltiazem extended-release, and ketoconazole. Clinical pharmacology : advances and applications, 3, 13-25.
Patnala, R., Clements, J., & Batra, J. (2013). Candidate gene association studies: a
comprehensive guide to useful in silico tools. BMC Genetics, 14, 39-39. Pattzi, H. M. R., Pitale, S., Alpizar, M., Bennett, C., O’Farrell, A. M., Li, J., . . . Group,
P.-P. S. (2010). Dutogliptin, a selective DPP4 inhibitor, improves glycaemic control in patients with type 2 diabetes: a 12-week, double-blind, randomized, placebo-controlled, multicentre trial. Diabetes, Obesity and Metabolism, 12(4), 348-355.
362
Univers
ity of
Mala
ya

Pearce, S. G., Thosani, N. C., & Pan, J.-J. (2013). Noninvasive biomarkers for the
diagnosis of steatohepatitis and advanced fibrosis in NAFLD. Biomarker Research, 1(7).
Pearson, E. R., Boj, S. F., Steele, A. M., Barrett, T., Stals, K., Shield, J. P., . . .
Hattersley, A. T. (2007). Macrosomia and Hyperinsulinaemic Hypoglycaemia in Patients with Heterozygous Mutations in the HNF4A Gene. PLoS Medicine, 4(4), e118.
Pearson, E. R., Donnelly, L. A., Kimber, C., Whitley, A., Doney, A. S., McCarthy, M.
I., . . . Palmer, C. N. (2007). Variation in TCF7L2 influences therapeutic response to sulphonylureas: a GoDARTs study. Diabetes, 56(8), 2178-2182.
Pena-Bello, L., Pértega-Diaz, S., Sangiao-Alvarellos, S., Outeiriño-Blanco, E., Eiras-
Leal, R., Varela-Rodriguez, B., . . . Cordido, F. (2016). Circulating Levels of Irisin in Hypopituitary and Normal Subjects. PLOS ONE, 11(7), e0160364.
Peschke, E., Bähr, I., & Mühlbauer, E. (2015). Experimental and clinical aspects of
melatonin and clock genes in diabetes. Journal of Pineal Research, 59(1), 1-23. Peters, B. J. M., Rodin, A. S., De Boer, A., & Maitland-van der Zee, A.-H. (2010).
Methodological and statistical issues in pharmacogenomics. Journal of Pharmacy and Pharmacology, 62(2), 161-166.
Pi-Sunyer, F. X., Schweizer, A., Mills, D., & Dejager, S. (2007). Efficacy and
tolerability of vildagliptin monotherapy in drug-naive patients with type 2 diabetes. Diabetes Research and Clinical Practice, 76(1), 132-138.
Piñero, J., Queralt-Rosinach, N., Bravo, À., Deu-Pons, J., Bauer-Mehren, A., Baron, M.,
. . . Furlong, L. I. (2015). DisGeNET: a discovery platform for the dynamical exploration of human diseases and their genes. Database, 2015.
Poole, R. M., & Nowlan, M. L. (2014). Albiglutide: first global approval. Drugs, 74(8),
929-938. Prabhash, K., Khattry, N., Bakshi, A., Karandikar, R., Joshi, A., Kannan, S., . . . Kode,
J. A. (2010). CD26 expression in donor stem cell harvest and its correlation with engraftment in human haematopoietic stem cell transplantation: potential predictor of early engraftment. Annals of Oncology, 21(3), 582-588.
363
Univers
ity of
Mala
ya

Prasad, R. B., & Groop, L. (2015). Genetics of Type 2 Diabetes—Pitfalls and Possibilities. Genes, 6(1), 87-123.
Pratley, R. E., Jauffret-Kamel, S., Galbreath, E., & Holmes, D. (2006). Twelve-week
monotherapy with the DPP-4 inhibitor vildagliptin improves glycemic control in subjects with type 2 diabetes. Horm Metab Res, 38(6), 423-428.
Punapart, M., Eltermaa, M., Oflijan, J., #xfc, tt, S., Must, A., . . . Terasmaa, A. (2014).
Effect of Chronic Valproic Acid Treatment on Hepatic Gene Expression Profile in Wfs1 Knockout Mouse. PPAR Research, 2014, 11.
QIAGEN. (2013). Gene expression analysis. Retrieved 29/09/2015, from
https://www.qiagen.com/my/products/life-science-research/neurodegenerative-disease/gene-expression-analysis/
Qiu, L., Na, R., Xu, R., Wang, S., Sheng, H., Wu, W., & Qu, Y. (2014). Quantitative
Assessment of the Effect of KCNJ11 Gene Polymorphism on the Risk of Type 2 Diabetes. PLOS ONE, 9(4), e93961.
Racette, S. B., Evans, E. M., Weiss, E. P., Hagberg, J. M., & Holloszy, J. O. (2006).
Abdominal Adiposity Is a Stronger Predictor of Insulin Resistance Than Fitness Among 50–95 Year Olds. Diabetes Care, 29(3), 673-678.
Rains, J. L., & Jain, S. K. (2011). Oxidative stress, insulin signaling and diabetes. Free
radical biology & medicine, 50(5), 567-575. Ramachandran, A., Wan Ma, R. C., & Snehalatha, C. (2010). Diabetes in Asia. The
Lancet, 375(9712), 408-418. Rampal, S., Rampal, L., Rahmat, R., Azhar Md, Z., Yee Guan, Y., Mohamed, M., &
Taha, M. (2009). Variation in the Prevalence, Awareness, and Control of Diabetes in a Multiethnic Population: A Nationwide Population Study in Malaysia. Asia Pacific Journal of Public Health, 22(2), 194-202.
Raraty, M. G. T., Connor, S., Criddle, D. N., Sutton, R., & Neoptolemos, J. P. (2004).
Acute pancreatitis and organ failure: Pathophysiology, natural history, and management strategies. Current Gastroenterology Reports, 6(2), 99-103.
Raz, I., Hanefeld, M., Xu, L., Caria, C., Williams-Herman, D., & Khatami, H. (2006).
Efficacy and safety of the dipeptidyl peptidase-4 inhibitor sitagliptin as
364
Univers
ity of
Mala
ya

monotherapy in patients with type 2 diabetes mellitus. Diabetologia, 49(11), 2564-2571.
Read, P. A., Khan, F. Z., Heck, P. M., Hoole, S. P., & Dutka, D. P. (2010). DPP-4
Inhibition by Sitagliptin Improves the Myocardial Response to Dobutamine Stress and Mitigates Stunning in a Pilot Study of Patients With Coronary Artery Disease. Circulation: Cardiovascular Imaging, 3(2), 195-201.
Rebouças, E. d. L., Costa, J. J. d. N., Passos, M. J., Passos, J. R. d. S., Hurk, R. v. d., &
Silva, J. R. V. (2013). Real time PCR and importance of housekeepings genes for normalization and quantification of mRNA expression in different tissues. Brazilian Archives of Biology and Technology, 56, 143-154.
Reers, C., Erbel, S., Esposito, I., Schmied, B., Buchler, M. W., Nawroth, P. P., & Ritzel,
R. A. (2009). Impaired islet turnover in human donor pancreata with aging. Eur J Endocrinol, 160(2), 185-191.
Rehman, A., Setter, S. M., & Vue, M. H. (2011). Drug-Induced Glucose Alterations
Part 2: Drug-Induced Hyperglycemia. Diabetes Spectrum, 24(4), 234-238. Reid, H. L., Famodu, A. A., Photiades, D. P., & Osamo, O. N. (1992). Glycosylated
haemoglobin HbA1c and HbS1c in non-diabetic Nigerians. Trop Geogr Med, 44(1-2), 126-130.
Rendell, M. (2004). The role of sulphonylureas in the management of type 2 diabetes
mellitus. Drugs, 64(12), 1339-1358. Retnakaran, R., Cull, C. A., Thorne, K. I., Adler, A. I., & Holman, R. R. (2006). Risk
Factors for Renal Dysfunction in Type 2 Diabetes. U.K. Prospective Diabetes Study 74, 55(6), 1832-1839.
Reynolds, J. K., Neumiller, J. J., & Campbell, R. K. (2008). Janumet: a combination
product suitable for use in patients with Type 2 diabetes. Expert Opin Investig Drugs, 17(10), 1559-1565.
Rhinehart, A. S. (2015). Adding GLP-1 Receptor Agonist Therapy to Basal Insulin for
Postprandial Glucose Control. Clinical Diabetes : A Publication of the American Diabetes Association, 33(2), 73-75.
365
Univers
ity of
Mala
ya

Ribeiro, R. A., Batista, T. M., Coelho, F. M., Boschero, A. C., Lopes, G. S., & Carneiro, E. M. (2012). Decreased β-cell insulin secretory function in aged rats due to impaired Ca2+ handling. Experimental Physiology, 97(9), 1065-1073.
Riche, D. M., East, H. E., & Riche, K. D. (2009). Impact of Sitagliptin on Markers of
Beta-cell Function: A Meta-Analysis. The American Journal of the Medical Sciences, 337(5), 321-328.
Rieg, T., & Dominguez, J. A. (2009). Unravelling a role for KCNQ1 in K(+) recycling
and gastric acid secretion. The Journal of Physiology, 587(Pt 17), 4149-4150. Riggs, A. C., Bernal-Mizrachi, E., Ohsugi, M., Wasson, J., Fatrai, S., Welling, C., . . .
Permutt, M. A. (2005). Mice conditionally lacking the Wolfram gene in pancreatic islet beta cells exhibit diabetes as a result of enhanced endoplasmic reticulum stress and apoptosis. [journal article]. Diabetologia, 48(11), 2313-2321.
Risérus, U., Ärnlöv, J., & Berglund, L. (2007). Long-Term Predictors of Insulin
Resistance. Role of lifestyle and metabolic factors in middle-aged men, 30(11), 2928-2933.
Ristic, S., Byiers, S., Foley, J., & Holmes, D. (2005). Improved glycaemic control with
dipeptidyl peptidase-4 inhibition in patients with type 2 diabetes: vildagliptin (LAF237) dose response. Diabetes, Obesity and Metabolism, 7(6), 692-698.
Roberts, W. L., Frank, E. L., Moulton, L., Papadea, C., Noffsinger, J. K., & Ou, C.-N.
(2000). Effects of Nine Hemoglobin Variants on Five Glycohemoglobin Methods. Clinical Chemistry, 46(4), 560-576.
Roberts, W. L., Safar-Pour, S., De, B. K., Rohlfing, C. L., Weykamp, C. W., & Little,
R. R. (2005). Effects of Hemoglobin C and S Traits on Glycohemoglobin Measurements by Eleven Methods. Clinical Chemistry, 51(4), 776-778.
Rodier, F., & Campisi, J. (2011). Four faces of cellular senescence. The Journal of Cell
Biology, 192(4), 547-556. Rodríguez-Rodríguez, E., Palmeros-Exsome, C., López-Sobaler, A. M., & Ortega, R.
M. (2011). Preliminary data on the association between waist circumference and insulin resistance in children without a previous diagnosis. European Journal of Pediatrics, 170(1), 35-43.
366
Univers
ity of
Mala
ya

Roglic, G., Unwin, N., Bennett, P. H., Mathers, C., Tuomilehto, J., Nag, S., . . . King, H. (2005). The Burden of Mortality Attributable to Diabetes. Realistic estimates for the year 2000, 28(9), 2130-2135.
Rohlfing, C., Hanson, S., Weykamp, C., Siebelder, C., Higgins, T., Molinaro, R., . . .
Little, R. R. (2016). Effects of hemoglobin C, D, E and S traits on measurements of hemoglobin A1c by twelve methods. Clinica Chimica Acta, 455, 80-83.
Röhrborn, D., Eckel, J., & Sell, H. (2014). Shedding of dipeptidyl peptidase 4 is
mediated by metalloproteases and up-regulated by hypoxia in human adipocytes and smooth muscle cells. FEBS Letters, 588(21), 3870-3877.
Röhrborn, D., Wronkowitz, N., & Eckel, J. (2015). DPP4 in Diabetes. Frontiers in
Immunology, 6, 386. Rosengren, A. H., Braun, M., Mahdi, T., Andersson, S. A., Travers, M. E., Shigeto, M.,
. . . Eliasson, L. (2012). Reduced Insulin Exocytosis in Human Pancreatic β-Cells With Gene Variants Linked to Type 2 Diabetes. Diabetes, 61(7), 1726-1733.
Rosenstock, J., Baron, M. A., Dejager, S., Mills, D., & Schweizer, A. (2007).
Comparison of Vildagliptin and Rosiglitazone Monotherapy in Patients With Type 2 Diabetes. A 24-week, double-blind, randomized trial, 30(2), 217-223.
Rosmaninho-Salgado, J., Marques, A. P., Estrada, M., Santana, M., Cortez, V.,
Grouzmann, E., & Cavadas, C. (2012). Dipeptidyl-peptidase-IV by cleaving neuropeptide Y induces lipid accumulation and PPAR-γ expression. Peptides, 37(1), 49-54.
Sabale, U., Ekman, M., Granstrom, O., Bergenheim, K., & McEwan, P. (2015). Cost-
effectiveness of dapagliflozin (Forxiga(R)) added to metformin compared with sulfonylurea added to metformin in type 2 diabetes in the Nordic countries. Prim Care Diabetes, 9(1), 39-47.
Sacks, D. B. (2003). Hemoglobin Variants and Hemoglobin A<sub>1c</sub> Analysis:
Problem Solved? Clinical Chemistry, 49(8), 1245-1247. Saisho, Y. (2015). β-cell dysfunction: Its critical role in prevention and management of
type 2 diabetes. World Journal of Diabetes, 6(1), 109-124. Sakamoto, Y., Inoue, H., Keshavarz, P., Miyawaki, K., Yamaguchi, Y., Moritani, M., . .
. Itakura, M. (2007). SNPs in the KCNJ11-ABCC8 gene locus are associated 367
Univers
ity of
Mala
ya

with type 2 diabetes and blood pressure levels in the Japanese population. J Hum Genet, 52(10), 781-793.
Sakamoto, Y., Oyama, J.-i., Ikeda, H., Kuroki, S., Gondo, S., Iwamoto, T., . . . Node, K.
(2013). Effects of sitagliptin beyond glycemic control: focus on quality of life. Cardiovascular Diabetology, 12(1), 35.
Sandhu, M. S., Weedon, M. N., Fawcett, K. A., Wasson, J., Debenham, S. L., Daly, A.,
. . . Barroso, I. (2007). Common variants in WFS1 confer risk of type 2 diabetes. Nat Genet, 39(8), 951-953.
Sanford, M. (2014). Dulaglutide: first global approval. Drugs, 74(17), 2097-2103. Santulli, G., Lombardi, A., Sorriento, D., Anastasio, A., Del Giudice, C., Formisano, P.,
. . . Iaccarino, G. (2012). Age-Related Impairment in Insulin Release. The Essential Role of β2-Adrenergic Receptor, 61(3), 692-701.
Sathananthan, A., Man, C. D., Micheletto, F., Zinsmeister, A. R., Camilleri, M., Giesler,
P. D., . . . Vella, A. (2010). Common Genetic Variation in GLP1R and Insulin Secretion in Response to Exogenous GLP-1 in Nondiabetic Subjects: A pilot study. Diabetes Care, 33(9), 2074-2076.
Sauna, Z. E., & Kimchi-Sarfaty, C. (2011). Understanding the contribution of
synonymous mutations to human disease. Nat Rev Genet, 12(10), 683-691. Scanlan, M. J., Raj, B. K., Calvo, B., Garin-Chesa, P., Sanz-Moncasi, M. P., Healey, J.
H., . . . Rettig, W. J. (1994). Molecular cloning of fibroblast activation protein alpha, a member of the serine protease family selectively expressed in stromal fibroblasts of epithelial cancers. Proceedings of the National Academy of Sciences of the United States of America, 91(12), 5657-5661.
Schäfer, S. A., Müssig, K., Staiger, H., Machicao, F., Stefan, N., Gallwitz, B., . . .
Fritsche, A. (2009). A common genetic variant in WFS1 determines impaired glucagon-like peptide-1-induced insulin secretion. Diabetologia, 52(6), 1075.
Schepers, A., & Clevers, H. (2012). Wnt Signaling, Stem Cells, and Cancer of the
Gastrointestinal Tract. Cold Spring Harbor Perspectives in Biology, 4(4), a007989.
Schinner, S., Scherbaum, W. A., Bornstein, S. R., & Barthel, A. (2005). Molecular
mechanisms of insulin resistance. Diabetic Medicine, 22(6), 674-682. 368
Univers
ity of
Mala
ya

Schmittgen, T. D., & Livak, K. J. (2008). Analyzing real-time PCR data by the
comparative CT method. Nat. Protocols, 3(6), 1101-1108. Schofield, J. D., Liu, Y., Rao-Balakrishna, P., Malik, R. A., & Soran, H. (2016).
Diabetes Dyslipidemia. Diabetes Therapy, 7(2), 203-219. Schosser, A., Gaysina, D., Cohen-Woods, S., Domenici, E., Perry, J., Tozzi, F., . . .
McGuffin, P. (2011). A follow-up case–control association study of tractable (druggable) genes in recurrent major depression. American Journal of Medical Genetics Part B: Neuropsychiatric Genetics, 156(6), 640-650.
Schwanstecher, C., Meyer, U., & Schwanstecher, M. (2002). K<sub>IR</sub>6.2
Polymorphism Predisposes to Type 2 Diabetes by Inducing Overactivity of Pancreatic β-Cell ATP-Sensitive K+ Channels. Diabetes, 51(3), 875-879.
Schwartz, A. V., Sellmeyer, D. E., Ensrud, K. E., Cauley, J. A., Tabor, H. K., Schreiner,
P. J., . . . Cummings, S. R. (2001). Older Women with Diabetes Have an Increased Risk of Fracture: A Prospective Study. The Journal of Clinical Endocrinology & Metabolism, 86(1), 32-38.
Schweizer, A., & Dejager, S. (2013). Experience with Vildagliptin in Patients
≥75 Years with Type 2 Diabetes and Moderate or Severe Renal Impairment. Diabetes Therapy, 4(2), 257-267.
Schweizer, A., Dejager, S., & Foley, J. E. (2012). Impact of Insulin Resistance, Body
Mass Index, Disease Duration, and Duration of Metformin Use on the Efficacy of Vildagliptin. Diabetes Therapy, 3(1), 8.
Scott, R., Wu, M., Sanchez, M., & Stein, P. (2007). Efficacy and tolerability of the
dipeptidyl peptidase-4 inhibitor sitagliptin as monotherapy over 12 weeks in patients with type 2 diabetes. International Journal of Clinical Practice, 61(1), 171-180.
Seino, Y., Fukushima, M., & Yabe, D. (2010). GIP and GLP-1, the two incretin
hormones: Similarities and differences. Journal of Diabetes Investigation, 1(1-2), 8-23.
Sell, H., Blüher, M., Klöting, N., Schlich, R., Willems, M., Ruppe, F., . . . Eckel, J.
(2013). Adipose Dipeptidyl Peptidase-4 and Obesity: Correlation with insulin
369
Univers
ity of
Mala
ya

resistance and depot-specific release from adipose tissue in vivo and in vitro. Diabetes Care, 36(12), 4083-4090.
Sen, S., Sinha, S., Nyati, P., & Joshit, P. (2012). Evaluation Of Glycaemic Control And
Insulin Resistance On Addition Of Sitagliptin To Ongoing Metformin Monotherapy In Type2 Diabetes Mellitus Patients. . Journal Of Advance Researches In Biological Sciences (A Peer Reviewed Indexed Medical Journal, 4(1), 10-13.
Serra, D., He, Y. L., Bullock, J., Riviere, G. J., Balez, S., Schwartz, S., . . . Dole, W. P.
(2008). Evaluation of pharmacokinetic and pharmacodynamic interaction between the dipeptidyl peptidase IV inhibitor vildagliptin, glyburide and pioglitazone in patients with Type 2 diabetes. Int J Clin Pharmacol Ther, 46(7), 349-364.
Shah, P., & Mudaliar, S. (2010). Pioglitazone: side effect and safety profile. Expert
Opin Drug Saf, 9(2), 347-354. Sherifali, D., Nerenberg, K., Pullenayegum, E., Cheng, J. E., & Gerstein, H. C. (2010).
The Effect of Oral Antidiabetic Agents on A1C Levels. A systematic review and meta-analysis, 33(8), 1859-1864.
Shi, S., Koya, D., & Kanasaki, K. (2016). Dipeptidyl peptidase-4 and kidney fibrosis in
diabetes. Fibrogenesis & Tissue Repair, 9, 1. Shibasaki, T., Takahashi, T., Takahashi, H., & Seino, S. (2014). Cooperation between
cAMP signalling and sulfonylurea in insulin secretion. Diabetes, Obesity and Metabolism, 16(S1), 118-125.
Shigematsu, E., Yamakawa, T., Kadonosono, K., & Terauchi, Y. (2014). Effect of
Sitagliptin on Lipid Profile in Patients With Type 2 Diabetes Mellitus. Journal of Clinical Medicine Research, 6(5), 327-335.
Shimajiri, Y., Sanke, T., Furuta, H., Hanabusa, T., Nakagawa, T., Fujitani, Y., . . .
Nanjo, K. (2001). A Missense Mutation of Pax4 Gene (R121W) Is Associated With Type 2 Diabetes in Japanese. Diabetes, 50(12), 2864-2869.
Shimasaki, T., Masaki, T., Mitsutomi, K., Ueno, D., Gotoh, K., Chiba, S., . . .
Yoshimatsu, H. (2013). The Dipeptidyl Peptidase-4 Inhibitor Des-Fluoro-Sitagliptin Regulates Brown Adipose Tissue Uncoupling Protein Levels in Mice with Diet-Induced Obesity. PLOS ONE, 8(5), e63626.
370
Univers
ity of
Mala
ya

Shimizu, S., Hosooka, T., Matsuda, T., Asahara, S.-i., Koyanagi-Kimura, M., Kanno,
A., . . . Kido, Y. (2012). DPP4 inhibitor vildagliptin preserves β-cell mass through amelioration of endoplasmic reticulum stress in C/EBPB transgenic mice. Journal of Molecular Endocrinology, 49(2), 125-135.
Shirakawa, J., Amo, K., Ohminami, H., Orime, K., Togashi, Y., Ito, Y., . . . Terauchi, Y.
(2011). Protective Effects of Dipeptidyl Peptidase-4 (DPP-4) Inhibitor against Increased β Cell Apoptosis Induced by Dietary Sucrose and Linoleic Acid in Mice with Diabetes. The Journal of Biological Chemistry, 286(29), 25467-25476.
Silva, G. M., & Vogel, C. (2016). Quantifying gene expression: the importance of being
subtle. Molecular Systems Biology, 12(10), 885. Singh, A. K. (2015). Incretin response in Asian type 2 diabetes: Are Indians different?
Indian Journal of Endocrinology and Metabolism, 19(1), 30-38. Singh, P., & vom Hau, M. (2016). Ethnicity in Time. Comparative Political Studies,
49(10), 1303-1340. Singh, S., Chang, H. Y., Richards, T. M., Weiner, J. P., Clark, J. M., & Segal, J. B.
(2013). Glucagonlike peptide 1-based therapies and risk of hospitalization for acute pancreatitis in type 2 diabetes mellitus: a population-based matched case-control study. JAMA Intern Med, 173(7), 534-539.
Sjöstrand, M., Iqbal, N., Lu, J., & Hirshberg, B. (2016). Saxagliptin improves glycemic
control by modulating postprandial glucagon and C-peptide levels in Chinese patients with type 2 diabetes. Diabetes Research and Clinical Practice, 105(2), 185-191.
Slatkin, M. (2008). Linkage disequilibrium — understanding the evolutionary past and
mapping the medical future. Nature reviews. Genetics, 9(6), 477-485. Sokolova, E. A., Bondar, I. A., Shabelnikova, O. Y., Pyankova, O. V., & Filipenko, M.
L. (2015). Replication of KCNJ11 (p.E23K) and ABCC8 (p.S1369A) Association in Russian Diabetes Mellitus 2 Type Cohort and Meta-Analysis. PLOS ONE, 10(5), e0124662.
Solis-Herrera, C., Triplitt, C., Garduno-Garcia, J. d. J., Adams, J., DeFronzo, R. A., &
Cersosimo, E. (2013). Mechanisms of Glucose Lowering of Dipeptidyl
371
Univers
ity of
Mala
ya

Peptidase-4 Inhibitor Sitagliptin When Used Alone or With Metformin in Type 2 Diabetes: A double-tracer study. Diabetes Care, 36(9), 2756-2762.
Sowers, J. R., & Epstein, M. (1995). Diabetes Mellitus and Associated Hypertension,
Vascular Disease, and Nephropathy. An Update, 26(6), 869-879. Spencer, D. H., Grossman, B. J., & Scott, M. G. (2011). Red Cell Transfusion
Decreases Hemoglobin A<sub>1c</sub> in Patients with Diabetes. Clinical Chemistry, 57(2), 344-346.
Stevens, J. E., Horowitz, M., Deacon, C. F., Nauck, M., Rayner, C. K., & Jones, K. L.
(2012). The effects of sitagliptin on gastric emptying in healthy humans – a randomised, controlled study. Alimentary Pharmacology & Therapeutics, 36(4), 379-390.
Stevic, R., Zivkovic, T. B., Erceg, P., Milosevic, D., Despotovic, N., & Davidovic, M.
(2007). Oral glucose tolerance test in the assessment of glucose-tolerance in the elderly people. Age and Ageing, 36(4), 459-462.
Stolerman, E. S., & Florez, J. C. (2009). Genomics of type 2 diabetes mellitus:
implications for the clinician. Nat Rev Endocrinol, 5(8), 429-436. Stonehouse, A. H., Darsow, T., & Maggs, D. G. (2012). Incretin-based therapies.
Journal of Diabetes, 4(1), 55-67. Strachan, T., & Read, A. P. (2010). Human Molecular Genetics. (4th ed.). United
States: Garland Science/Taylor & Francis Group. Strain, W. D., Lukashevich, V., Kothny, W., Hoellinger, M.-J., & Paldánius, P. M.
(2013). Individualised treatment targets for elderly patients with type 2 diabetes using vildagliptin add-on or lone therapy (INTERVAL): a 24 week, randomised, double-blind, placebo-controlled study. The Lancet, 382(9890), 409-416.
Su, Y., Su, Y.-L., Lv, L.-F., Wang, L.-M., Li, Q.-Z., & Zhao, Z.-G. (2014). A
randomized controlled clinical trial of vildagliptin plus metformin combination therapy in patients with type II diabetes mellitus. Experimental and Therapeutic Medicine, 7(4), 799-803.
Sufiun, A., Rafiq, K., Fujisawa, Y., Rahman, A., Mori, H., Nakano, D., . . . Nishiyama,
A. (2015). Effect of dipeptidyl peptidase-4 inhibition on circadian blood pressure during the development of salt-dependent hypertension in rats.
372
Univers
ity of
Mala
ya

Hypertension research : official journal of the Japanese Society of Hypertension, 38(4), 237-243.
Sundaram, R. C., Selvaraj, N., Vijayan, G., Bobby, Z., Hamide, A., & Rattina Dasse, N.
(2007). Increased plasma malondialdehyde and fructosamine in iron deficiency anemia: effect of treatment. Biomed Pharmacother, 61(10), 682-685.
Supale, S., Thorel, F., Merkwirth, C., Gjinovci, A., Herrera, P. L., Scorrano, L., . . .
Maechler, P. (2013). Loss of Prohibitin Induces Mitochondrial Damages Altering β-Cell Function and Survival and Is Responsible for Gradual Diabetes Development. Diabetes, 62(10), 3488-3499.
Suzuki, K., Mistuma, Y., Sato, T., & Hatta, M. (2015). Sitagliptin for Elderly Patients
Aged 75 Years or Older with Inadequately Controlled Type 2 Diabetes with Common Antidiabetes Treatments. International Journal of Clinical Medicine, 6, 672-681.
Takeda, K., Inoue, H., Tanizawa, Y., Matsuzaki, Y., Oba, J., Watanabe, Y., . . . Oka, Y.
(2001). WFS1 (Wolfram syndrome 1) gene product: predominant subcellular localization to endoplasmic reticulum in cultured cells and neuronal expression in rat brain. Human Molecular Genetics, 10(5), 477-484.
Tan, J. T., Nurbaya, S., Gardner, D., Ye, S., Tai, E. S., & Ng, D. P. K. (2009). Genetic
Variation in KCNQ1 Associates With Fasting Glucose andβ-Cell Function: A Study of 3,734 Subjects Comprising Three Ethnicities Living in Singapore. Diabetes, 58(6), 1445-1449.
Tan, M. Y. (2004). The relationship of health beliefs and complication prevention
behaviors of Chinese individuals with Type 2 Diabetes Mellitus. Diabetes Research and Clinical Practice, 66(1), 71-77.
Tanaka, M., Nishimura, T., Sekioka, R., Kawai, T., Meguro, S., Irie, J., . . . Itoh, H.
(2016). Comparison of Glycemic Control Indicators and Safety Evaluation during Linagliptin Treatment over 6 Months in Japanese Type 2 Diabetic Patients with and without Nephropathy. J Diabetes Metab 7(648).
Tanaka, M., Sekioka, R., Nishimura, T., Kawai, T., Meguro, S., Irie, J., . . . Itoh, H.
(2015). Serum C-peptide to plasma glucose ratio may be associated with efficacy of vildagliptin in Japanese patients with type 2 diabetes mellitus. Diabetology International, 6(3), 197-205.
373
Univers
ity of
Mala
ya

Tankova, T., Chakarova, N., Dakovska, L., & Atanassova, I. (2012). Assessment of HbA1c as a diagnostic tool in diabetes and prediabetes. Acta Diabetologica, 49(5), 371-378.
Tanz, M. G. (2013). Alogliptin: Fourth DPP-4 enters the market. Pharmacy Today,
19(3), 39. Tatosian, D. A., Guo, Y., Schaeffer, A. K., Gaibu, N., Popa, S., Stoch, A., . . . Kauh, E.
A. (2013). Dipeptidyl Peptidase-4 Inhibition in Patients with Type 2 Diabetes Treated with Saxagliptin, Sitagliptin, or Vildagliptin. Diabetes Therapy, 4(2), 431-442.
Taylor, R. W., Jones, I. E., Williams, S. M., & Goulding, A. (2000). Evaluation of waist
circumference, waist-to-hip ratio, and the conicity index as screening tools for high trunk fat mass, as measured by dual-energy X-ray absorptiometry, in children aged 3–19 y. The American Journal of Clinical Nutrition, 72(2), 490-495.
Tchkonia, T., Zhu, Y., van Deursen, J., Campisi, J., & Kirkland, J. L. (2013). Cellular
senescence and the senescent secretory phenotype: therapeutic opportunities. The Journal of Clinical Investigation, 123(3), 966-972.
Techert, F., Techert, S., Woo, L., Beck, W., Lebsanft, H., & Wizemann, V. (2007).
High blood flow rates with adjustment of needle diameter do not increase hemolysis during hemodialysis treatment. J Vasc Access, 8(4), 252-257.
Terawaki, Y., Nomiyama, T., Takahashi, H., Tsutsumi, Y., Murase, K., Nagaishi, R., . .
. Yanase, T. (2015). Efficacy of dipeptidyl peptidase-4 inhibitor linagliptin in patients with type 2 diabetes undergoing hemodialysis. Diabetology & Metabolic Syndrome, 7, 44.
Tesfaye, S., Boulton, A. J. M., Dyck, P. J., Freeman, R., Horowitz, M., Kempler, P., . . .
on behalf of the Toronto Diabetic Neuropathy Expert, G. (2010). Diabetic Neuropathies: Update on Definitions, Diagnostic Criteria, Estimation of Severity, and Treatments. Diabetes Care, 33(10), 2285-2293.
Tesfaye, S., Selvarajah, D., Gandhi, R., Greig, M., Shillo, P., Fang, F., & Wilkinson, I.
D. (2016). Diabetic peripheral neuropathy may not be as its name suggests: evidence from magnetic resonance imaging. Pain, 157(1), 0000000000000465.
THPA. (2016a). DPP4. Retrieved 29/05/2016, from
http://www.proteinatlas.org/ENSG00000197635-DPP4/tissue 374
Univers
ity of
Mala
ya

THPA. (2016b). WFS1. Retrieved 29/05/2016, from
http://www.proteinatlas.org/ENSG00000109501-WFS1/tissue Thrainsdottir, I. S., Aspelund, T., Thorgeirsson, G., Gudnason, V., Hardarson, T.,
Malmberg, K., . . . Rydén, L. (2005). The Association Between Glucose Abnormalities and Heart Failure in the Population-Based Reykjavík Study. Diabetes Care, 28(3), 612-616.
Tirosh , A., Shai , I., Tekes-Manova , D., Israeli , E., Pereg , D., Shochat , T., . . .
Rudich , A. (2005). Normal Fasting Plasma Glucose Levels and Type 2 Diabetes in Young Men. New England Journal of Medicine, 353(14), 1454-1462.
Toledo, F. G. S., & Goodpaster, B. H. (2013). The role of weight loss and exercise in
correcting skeletal muscle mitochondrial abnormalities in obesity, diabetes and aging. Molecular and Cellular Endocrinology, 379(1–2), 30-34.
Tolhurst, G., Reimann, F., & Gribble, F. M. (2009). Nutritional regulation of glucagon-
like peptide-1 secretion. The Journal of Physiology, 587(Pt 1), 27-32. Toyoda-Akui, M., Yokomori, H., Kaneko, F., Shimizu, Y., Takeuchi, H., Tahara, K., . .
. Hibi, T. (2011). A case of drug-induced hepatic injury associated with sitagliptin. Intern Med, 50(9), 1015-1020.
Trahair, L. G., Horowitz, M., Rayner, C. K., Gentilcore, D., Lange, K., Wishart, J. M.,
& Jones, K. L. (2012). Comparative Effects of Variations in Duodenal Glucose Load on Glycemic, Insulinemic, and Incretin Responses in Healthy Young and Older Subjects. The Journal of Clinical Endocrinology & Metabolism, 97(3), 844-851.
Tremblay, A. J., Lamarche, B., Kelly, I., Charest, A., Lépine, M. C., Droit, A., &
Couture, P. (2014). Effect of sitagliptin therapy on triglyceride-rich lipoprotein kinetics in patients with type 2 diabetes. Diabetes, Obesity and Metabolism, 16(12), 1223-1229.
Tripathy, D., Carlsson, M., Almgren, P., Isomaa, B., Taskinen, M. R., Tuomi, T., &
Groop, L. C. (2000). Insulin secretion and insulin sensitivity in relation to glucose tolerance: lessons from the Botnia Study. Diabetes, 49(6), 975-980.
Triplitt, C., & Chiquette, E. (2003). Exenatide: from the Gila monster to the pharmacy.
J Am Pharm Assoc, 46(1), 44-52. 375
Univers
ity of
Mala
ya

Tuomilehto, H., Peltonen, M., Partinen, M., Lavigne, G., Eriksson, J. G., Herder, C., . . .
Lindström, J. (2009). Sleep Duration, Lifestyle Intervention, and Incidence of Type 2 Diabetes in Impaired Glucose Tolerance. The Finnish Diabetes Prevention Study, 32(11), 1965-1971.
Turcot, V., Bouchard, L., Faucher, G., Tchernof, A., Deshaies, Y., Pérusse, L., . . .
Vohl, M.-C. (2011). DPP4 Gene DNA Methylation in the Omentum is Associated With Its Gene Expression and Plasma Lipid Profile in Severe Obesity. Obesity, 19(2), 388-395.
Tuttle, K. R., Bakris, G. L., Bilous, R. W., Chiang, J. L., de Boer, I. H., Goldstein-
Fuchs, J., . . . Molitch, M. E. (2014). Diabetic Kidney Disease: A Report From an ADA Consensus Conference. Diabetes Care, 37(10), 2864-2883.
Tziomalos, K., Athyros, V. G., & Karagiannis, A. (2012). Non-alcoholic fatty liver
disease in type 2 diabetes: pathogenesis and treatment options. Curr Vasc Pharmacol, 10(2), 162-172.
Ueda, H., Howson, J. M. M., Esposito, L., Heward, J., Snook, Chamberlain, G., . . .
Gough, S. C. L. (2003). Association of the T-cell regulatory gene CTLA4 with susceptibility to autoimmune disease. Nature, 423(6939), 506-511.
Ueda, K., Kawano, J., Takeda, K., Yujiri, T., Tanabe, K., Anno, T., . . . Tanizawa, Y.
(2005). Endoplasmic reticulum stress induces Wfs1 gene expression in pancreatic β-cells via transcriptional activation. European Journal of Endocrinology, 153(1), 167-176.
UMMC. (2012a). Hospital Information System. Kuala Lumpur: University Malaya
Medical Centre. UMMC. (2012b). Pharmacy Information System. Kuala Lumpur: University Malaya
Medical Centre. USC. (2014). Quanto Retrieved 29/01/2013, from http://biostats.usc.edu/software Van Buren, P. N., & Toto, R. (2011). Hypertension in Diabetic Nephropathy:
Epidemiology, Mechanisms, and Management. Advances in chronic kidney disease, 18(1), 28-41.
376
Univers
ity of
Mala
ya

van der Velden, A. W., & Thomas, A. A. M. (1999). The role of the 5′ untranslated region of an mRNA in translation regulation during development. The International Journal of Biochemistry & Cell Biology, 31(1), 87-106.
van Poppel, P. C. M., Netea, M. G., Smits, P., & Tack, C. J. (2011). Vildagliptin
Improves Endothelium-Dependent Vasodilatation in Type 2 Diabetes. Diabetes Care, 34(9), 2072-2077.
Varma, R. (2008). From A Population to Patients: The Wisconsin Epidemiologic Study
of Diabetic Retinopathy. Ophthalmology, 115(11), 1857-1858. Venkatesan, R., Bodhini, D., Narayani, N., & Mohan, V. (2014). Association study of
the ABCC8 gene variants with type 2 diabetes in south Indians. Indian Journal of Human Genetics, 20(1), 37-42.
Verma, M., Paneri, S., Badi, P., & Raman, P. G. (2006). Effect of increasing duration of
diabetes mellitus type 2 on glycated hemoglobin and insulin sensitivity. Indian Journal of Clinical Biochemistry, 21(1), 142-146.
Vigilize, W. (2016). DPP-4 inhibitors. , from http://vigilize-who-umc.org Vilar, L., Gusmão, A., Albuquerque, J. L., Pontes, L., Montenegro, L., Pontes, S., . . .
Lima, J. G. d. (2011). Effectiveness of adding vildagliptin to the treatment of diabetic patients nonresponsive to the combination of metformin and a sulphonylurea. Arquivos Brasileiros de Endocrinologia & Metabologia, 55, 260-265.
Viljoen, A., Meek, C. L., Gadsby, R., Viljoen, S., Langerman, H., & Sinclair, A. J.
(2013). The tolerability and safety of DPP-4 inhibitors for the treatment of older people with type 2 diabetes mellitus: an observational study. The British Journal of Diabetes & Vascular Disease, 13(4), 187-191.
Villareal, D. T., Robertson, H., Bell, G. I., Patterson, B. W., Tran, H., Wice, B., &
Polonsky, K. S. (2010). TCF7L2 Variant rs7903146 Affects the Risk of Type 2 Diabetes by Modulating Incretin Action. Diabetes, 59(2), 479-485.
Villhauer, E. B., Brinkman, J. A., Naderi, G. B., Burkey, B. F., Dunning, B. E., Prasad,
K., . . . Hughes, T. E. (2003). 1-[[(3-hydroxy-1-adamantyl)amino]acetyl]-2-cyano-(S)-pyrrolidine: a potent, selective, and orally bioavailable dipeptidyl peptidase IV inhibitor with antihyperglycemic properties. J Med Chem, 46(13), 2774-2789.
377
Univers
ity of
Mala
ya

Vincent, S. H., Reed, J. R., Bergman, A. J., Elmore, C. S., Zhu, B., Xu, S., . . . Herman,
G. A. (2007). Metabolism and excretion of the dipeptidyl peptidase 4 inhibitor [14C]sitagliptin in humans. Drug Metab Dispos, 35(4), 533-538.
Vitale, G., Salvioli, S., & Franceschi, C. (2013). Oxidative stress and the ageing
endocrine system. Nat Rev Endocrinol, 9(4), 228-240. Vollmer, K., Gardiwal, H., Menge, B. A., Goetze, O., Deacon, C. F., Schmidt, W. E., . .
. Meier, J. J. (2009). Hyperglycemia Acutely Lowers the Postprandial Excursions of Glucagon-Like Peptide-1 and Gastric Inhibitory Polypeptide in Humans. The Journal of Clinical Endocrinology & Metabolism, 94(4), 1379-1385.
Vos, F. E., Schollum, J. B., & Walker, R. J. (2011). Glycated albumin is the preferred
marker for assessing glycaemic control in advanced chronic kidney disease. NDT Plus, 4(6), 368-375.
Vue, M. H., & Setter, S. M. (2011). Drug-Induced Glucose Alterations Part 1: Drug-
Induced Hypoglycemia. Diabetes Spectrum, 24(3), 171-177. Walczak, R., Westhof, E., Carbon, P., & Krol, A. (1996). A novel RNA structural motif
in the selenocysteine insertion element of eukaryotic selenoprotein mRNAs. RNA, 2(4), 367-379.
Wan Nazaimoon, W. M., Md Isa, S. H., Wan Mohamad, W. B., Khir, A. S.,
Kamaruddin, N. A., Kamarul, I. M., . . . Khalid, B. A. K. (2013). Prevalence of diabetes in Malaysia and usefulness of HbA1c as a diagnostic criterion. Diabetic Medicine, 30(7), 825-828.
Wang, J., Elghazi, L., Parker, S. E., Kizilocak, H., Asano, M., Sussel, L., & Sosa-
Pineda, B. (2004). The concerted activities of Pax4 and Nkx2.2 are essential to initiate pancreatic β-cell differentiation. Developmental Biology, 266(1), 178-189.
Wang, S., Sun, Q. Q., Xiang, B., & Li, X. J. (2013). Pancreatic islet cell autophagy
during aging in rats. Clin Invest Med, 36(2), E72-80. Wasson, J., & Permutt, M. A. (2008). Candidate gene studies reveal that the WFS1 gene
joins the expanding list of novel type 2 diabetes genes. Diabetologia, 51(3), 391-393.
378
Univers
ity of
Mala
ya

Weber, R., Bertoni, A. P. S., Bessestil, L. W., Brasil, B. M. d. A. A., Brum, l. S., &
Furlanetto, T. W. (2014). Validation of Reference Genes for Normalization Gene Expression in Reverse Transcription Quantitative PCR in Human Normal Thyroid and Goiter Tissue. BioMed Research International, 2014, 5.
Weiss, S. T., McLeod, H. L., Flockhart, D. A., Dolan, M. E., Benowitz, N. L., Johnson,
J. A., . . . Giacomini, K. M. (2008). Creating and evaluating genetic tests predictive of drug response. Nature reviews. Drug discovery, 7(7), 568-574.
Welter, D., MacArthur, J., Morales, J., Burdett, T., Hall, P., Junkins, H., . . . Parkinson,
H. (2014). The NHGRI GWAS Catalog, a curated resource of SNP-trait associations. Nucleic Acids Research, 42(Database issue), D1001-D1006.
White, J. L., Buchanan, P., Li, J., & Frederich, R. (2014). A randomized controlled trial
of the efficacy and safety of twice-daily saxagliptin plus metformin combination therapy in patients with type 2 diabetes and inadequate glycemic control on metformin monotherapy. BMC Endocrine Disorders, 14, 17-17.
Whiting, D. R., Guariguata, L., Weil, C., & Shaw, J. (2011). IDF Diabetes Atlas: Global
estimates of the prevalence of diabetes for 2011 and 2030. Diabetes Research and Clinical Practice, 94(3), 311-321.
WHO. (2014). Obesity and overweight. Retrieved 12/01/2016, from
http://www.who.int/mediacentre/factsheets/fs311/en/ WHO. (2015). Diabetes Retrieved 14/05/2015, from http://www.who.int/diabetes/en/ WHO. (2016). Diabetes Retrieved 15/09/2016, from http://www.who.int/diabetes/en Wild, S., Roglic, G., Green, A., Sicree, R., & King, H. (2004). Global Prevalence of
Diabetes. Estimates for the year 2000 and projections for 2030, 27(5), 1047-1053.
WMA. (2008). Declaration of Helsinki. Ethical principles for medical research
involving human subjects. 59th WMA General Assembly. Retrieved 19/08/2014, from http://www.wma.net/en/30publications/10policies/b3/
Wong, M. C. S., Wang, H. H. X., Kwan, M. W. M., Zhang, D. D. X., Liu, K. Q. L.,
Chan, S. W. M., . . . Griffiths, S. M. (2014). Comparative Effectiveness of Dipeptidyl Peptidase-4 (DPP-4) Inhibitors and Human Glucagon-Like Peptide-1
379
Univers
ity of
Mala
ya

(GLP-1) Analogue as Add-On Therapies to Sulphonylurea among Diabetes Patients in the Asia-Pacific Region: A Systematic Review. PLOS ONE, 9(3), e90963.
Wronkowitz, N., Gorgens, S. W., Romacho, T., Villalobos, L. A., Sanchez-Ferrer, C. F.,
Peiro, C., . . . Eckel, J. (2014). Soluble DPP4 induces inflammation and proliferation of human smooth muscle cells via protease-activated receptor 2. Biochim Biophys Acta, 9(21), 11.
Xiao, K., Su, L., Han, B., Guo, C., Feng, L., Jiang, Z., . . . Xie, L. (2014). Prognosis and
weaning of elderly multiple organ dysfunction syndrome patients with invasive mechanical ventilation. Chin Med J, 127(1), 11-17.
Yagi, S., Aihara, K.-i., Akaike, M., Fukuda, D., Salim, H. M., Ishida, M., . . . Sata, M.
(2015). Predictive Factors for Efficacy of Dipeptidyl Peptidase-4 Inhibitors in Patients with Type 2 Diabetes Mellitus. Diabetes & Metabolism Journal, 39(4), 342-347.
Yamaguchi, S., Ishihara, H., Tamura, A., Yamada, T., Takahashi, R., Takei, D., . . .
Oka, Y. (2004). Endoplasmic reticulum stress and N-glycosylation modulate expression of WFS1 protein. Biochemical and Biophysical Research Communications, 325(1), 250-256.
Yang, F., Zheng, T., Gao, Y., Baskota, A., Chen, T., Ran, X., & Tian, H. (2014).
Increased Plasma DPP4 Activity Is an Independent Predictor of the Onset of Metabolic Syndrome in Chinese over 4 Years: Result from the China National Diabetes and Metabolic Disorders Study. PLOS ONE, 9(3), e92222.
Yasuda, S. U., Zhang, L., & Huang, S. M. (2008). The Role of Ethnicity in Variability
in Response to Drugs: Focus on Clinical Pharmacology Studies. Clinical Pharmacology & Therapeutics, 84(3), 417-423.
Yazbeck, R., Howarth, G. S., & Abbott, C. A. (2009). Dipeptidyl peptidase inhibitors,
an emerging drug class for inflammatory disease? Trends Pharmacol Sci, 30(11), 600-607.
Ye, Y., Keyes, K. T., Zhang, C., Perez-Polo, J. R., Lin, Y., & Birnbaum, Y. (2010). The
myocardial infarct size-limiting effect of sitagliptin is PKA-dependent, whereas the protective effect of pioglitazone is partially dependent on PKA. American Journal of Physiology - Heart and Circulatory Physiology, 298(5), H1454-H1465.
380
Univers
ity of
Mala
ya
Yoon, K. H., Lee, J. H., Kim, J. W., Cho, J. H., Choi, Y. H., Ko, S. H., . . . Son, H. Y. (2006). Epidemic obesity and type 2 diabetes in Asia. Lancet, 368(9548), 1681-1688.
Young, M. (2011). Linagliptin (Trajenta ) Type 2 Diabetes Drug Now Approved in
Europe. Retrieved 15/09/2016, from http://www.diabetesinspain.com/featured/linagliptin-approved-in-europe
Yousefzadeh, P., & Wang, X. (2013). The Effects of Dipeptidyl Peptidase-4 Inhibitors
on Cardiovascular Disease Risks in Type 2 Diabetes Mellitus. Journal of Diabetes Research, 2013, 459821.
Yu, D. M., Yao, T. W., Chowdhury, S., Nadvi, N. A., Osborne, B., Church, W. B., . . .
Gorrell, M. D. (2010). The dipeptidyl peptidase IV family in cancer and cell biology. Febs J, 277(5), 1126-1144.
Zangeneh, F., Arora, P. S., Dyck, P. J., Bekris, L., Lernmark, A., Achenbach, S. J., . . .
Rizza, R. A. (2006). Effects of duration of type 2 diabetes mellitus on insulin secretion. Endocr Pract, 12(4), 388-393.
Zdanowicz, M. M. (2010). Concepts in Pharmacogenomics American Society of
Health-System Pharmacists. Zhang, X., Brooks, B., Molyneaux, L., Landy, E., Banatwalla, R., Wu, T., . . . Yue, D.
K. (2014). Dipeptidyl Peptidase-4 Inhibitors as a Third-Line Oral Antihyperglycaemic Agent in Patients with Type 2 Diabetes Mellitus: The Impact of Ethnicity. International Journal of Endocrinology, 2014, 5.
Zhong, J., Maiseyeu, A., Davis, S. N., & Rajagopalan, S. (2015). DPP4 in
cardiometabolic disease: recent insights from the laboratory and clinical trials of DPP4 inhibition. Circulation research, 116(8), 1491-1504.
Zhuge, F., Ni, Y., Nagashimada, M., Nagata, N., Xu, L., Mukaida, N., . . . Ota, T.
(2016). DPP-4 inhibition by linagliptin attenuates obesity-related inflammation and insulin resistance by regulating M1/M2 macrophage polarization. Diabetes.
381
Univers
ity of
Mala
ya

LIST OF PUBLICATIONS AND PAPERS PRESENTED
Publications
1. Jamaluddin JL, Huri HZ, Vethakkhan SR, Mustafa N. (2014). Pancreatic gene
variants potentially associated with dipeptidyl peptidase-4 inhibitor treatment
response in Type 2 diabetes. Pharmacogenomics. 15 (2), 1-15. (ISSN 1462-
2416).
2. Jamaluddin JL, Huri HZ, Vethakkhan SR. (2016). Clinical and genetic
predictors of dipeptidyl peptidase-4 inhibitor treatment response in Type 2
diabetes. Pharmacogenomics. 17(8), 867-881. (ISSN 1462-2416).
Papers presentations
1. Jamaluddin JL, Huri HZ, Vethakkhan SR, Mustafa N, Ahmad WAW. (2015).
Pathway mechanism of potential genomic markers of dipeptidyl peptidase-4
inhibitor treatment response in Type 2 diabetes. Public Health Genomics.
18(Suppl.1):151 (DOI: 10.1159/000381430) - presented at Golden Helix
Symposia 2015 from 11th-13th March 2015 at Kuala Lumpur, Malaysia.
2. Jamaluddin JL, Huri HZ, Vethakkhan SR, Mustafa N. (2015). The association of
WFS1 gene polymorphisms with the DPP-4 inhibitors treatment response in
Type 2 diabetes. J Diabetes Metab. 6:10 (ISSN 2155-6156) - presented at 8th
Euro Global Diabetes Summit and Medicare Expo from 3rd-5th November
2015 at Valencia, Spain.
382
Univers
ity of
Mala
ya

Award
1. Best Poster Award at the 8th Euro Global Diabetes Summit and Medicare Expo
held on November 3-5, 2015 in Valencia, Spain.
National Bulletin
1. Jazlina JL. Pharmacogenomics in determining drug response. Malaysian
Adverse Drug Reactions Advisory Committee (MADRAC) Newsletter April
2016. National Pharmaceutical Regulatory Agency (NPRA), Ministry of Health
Malaysia - MADRAC Newsletter April 2016 is available at:
http://npra.moh.gov.my/images/Publications/Newsletter_MADRAC_Bulletin/Bul
letin_MADRAC_April_2016.pdf
383
Univers
ity of
Mala
ya