chapter 2 - UM Students' Repository
63
34 CHAPTER 2 LITERATURE REVIEW 2.0 Introduction The 60:40 policy has become a prerequisite for the achievement of Vision 2020 (Aini Abdullah & Madinah Hussin, 1996,) The driving forces for Malaysia to achieve the said policy are due to the following developments: (1) Malaysia has to import foreign works for the plantations, construction industry, domestic help, restaurant and service stations. In the long term this foreign workforce will become costly to maintain and the costs of production and service will eventually increase. (2) The manufacturing sector is facing competition from Thailand, Indonesia, China, Vietnam and Cambodia with their low wages and rich resources. Furthermore, Malaysia does not have the capabilities and competencies that exist in South Korea, Japan and Taiwan. If the manufacturing sector adopts the modern production technology, it still has to depend on foreign skilled workers even though it is possible to outsource parts and services from other places with intensive labour. (3) It is also statistically determined that if the employment continues to increase (e.g. 3.4%, 1996), Malaysia will still be short of labour because the natural growth rate of the local force (e.g. 2.18% in 1995) cannot match the increase in demand (Aini Abdullah & Madinah Hussin, 1997). (4) Globalization has created a convergent impact on countries in terms of common goods and services. As a consequence, goods and services can be sourced from different places by the firms to take advantage of their costs and production qualities in order to reduce the overall cost or to gain better quality or functionality of their product offerings. All these enable organisations to compete more effectively. Malaysia
-
Upload
khangminh22 -
Category
Documents
-
view
1 -
download
0
Transcript of chapter 2 - UM Students' Repository

34
CHAPTER 2
LITERATURE REVIEW
2.0 Introduction
The 60:40 policy has become a prerequisite for the achievement of Vision 2020 (Aini
Abdullah & Madinah Hussin, 1996,)
The driving forces for Malaysia to achieve the said policy are due to the following
developments:
(1) Malaysia has to import foreign works for the plantations, construction industry,
domestic help, restaurant and service stations. In the long term this foreign workforce
will become costly to maintain and the costs of production and service will eventually
increase.
(2) The manufacturing sector is facing competition from Thailand, Indonesia, China,
Vietnam and Cambodia with their low wages and rich resources. Furthermore,
Malaysia does not have the capabilities and competencies that exist in South Korea,
Japan and Taiwan. If the manufacturing sector adopts the modern production
technology, it still has to depend on foreign skilled workers even though it is possible to
outsource parts and services from other places with intensive labour.
(3) It is also statistically determined that if the employment continues to increase (e.g.
3.4%, 1996), Malaysia will still be short of labour because the natural growth rate of the
local force (e.g. 2.18% in 1995) cannot match the increase in demand (Aini Abdullah &
Madinah Hussin, 1997).
(4) Globalization has created a convergent impact on countries in terms of common
goods and services. As a consequence, goods and services can be sourced from
different places by the firms to take advantage of their costs and production qualities in
order to reduce the overall cost or to gain better quality or functionality of their product
offerings. All these enable organisations to compete more effectively. Malaysia
35
requires the capability to meet global challenges and to compete with the global
products and services (Azman Mohd. Yusof, 1997).
(5) Countries are liberalizing their economies and removing the barriers to trade and
investment and business organisations are able to reach the economies of scale to
produce quality products at a lower cost. Countries with their firms attaining strategic
competitiveness are able to gain competitive advantage over their neighbouring
countries. Malaysia needs the human capability to sustain its competitiveness with the
neighbouring countries.
(6) In this 21st century, knowledge has become the principal driver of economic growth.
Countries that are able to develop their workers to become knowledge-based are able to
produce products or services that are of higher technological value and of greater
benefits to the users. In this way, these countries can gain a better competitive edge over
those that do not have the knowledge-based workers (or k-workers).
(7) Information Communication Technology (ICT) has made manufacturing processes
more flexible, improved the quality of products and the manufacturing cost as well as
customer services. As a consequence, firms are able to expand their businesses to other
countries. Furthermore, ICT is also the facilitator of learning and knowledge
advancement among the people in terms of lifelong learning.
Malaysia therefore needs to develop the human resources to meet the challenges
in the competitive global markets or it will lose its competitiveness.
Education has been the key player to bring about the development of human
resources as seen in the developed countries and in countries that do not have other
natural resources like Japan, Taiwan, Holland, Denmark and Singapore. Malaysia has
gone through a period of capital investment to spearhead economic growth and moved
towards science and technological education with the strategic intent to make the
country a developed nation since the 1990s.
36
Knowledge in science and technology creates values in the economic activities of a
country and brings about economic growth. For example, Germany and the
Scandinavian countries invest heavily in education, vocational training and research on
the fundamental basis to create “a highly educated and skilled workforce” as well as
“for the development of advanced scientific and technological knowledge” (Harrison et.
al., 2000, p.287). According to Gary Hamel and C. K. Prahalad (1996):
In the information age, things are ancillary, knowledge is central. A company’s value
derives not from things, but from knowledge, know-how, intellectual assets,
competencies – all embedded in people.
This implies that industries need the necessary knowledge to be able to create values
in their activities and products or services to meet the needs of the buyers. This has
become a prerequisite for industries to remain strategically competitive. The industries
can only do this effectively if they have workers who possessed the knowledge in
science and technology. This aspect is further emphasized by Dess and Lumpkin (2003,
p.119) when they said:
Human capital is the foundation of intellectual capital and that for companies to be
successful organizations they must recruit talented people – employees at all levels with
the proper sets of skills and capabilities coupled with the right values and attitudes.
Such skills and attitudes must be continually developed, strengthened, and reinforced.
As existing industries acquire more knowledge, they in turn create new knowledge-
based industries which become the important contributors of employment opportunities,
exports and the economic growth of the country. Eventually, knowledge in science and
technology becomes a valuable commodity.
The idea to improve the labour force with tertiary education is to create a critical
mass of scientific and technical manpower to attain the knowledge economy. This
reinforces the importance of the 60:40 policy in the schools which are the providers of
the student inputs for the tertiary education institutions to create the required scientific
and technical manpower. A paradigm shift was made in 2002 for the mathematics and
science subjects to be taught in English at the primary schools and secondary schools
37
from 2003. The seriousness of the Government towards the 60:40 policy, has led to the
creation of the Ministry of Higher Education (MOHE) in 2002 to enhance the
development of the higher education in the country. Prior to this development, the
Private Higher Educational Institutions Act 1996 has enabled more than 500 private
universities and colleges to be established to complement and supplement the efforts of
public sector to provide higher education opportunities. Subsequently it is shown that
the percentage of 17-23 cohorts having access to higher education had increased to
29.9% in 2006 from a mere 12% in 1985. The Government set up the National Higher
Education Fund (PTPTN) to enable students to get access to higher education. To date
more than RM13 billion are disbursed from the Fund benefiting more than 1.1 million
students in both private and public sectors.
2.1 Information-Communication Technology (ICT)
The adaptation of ICT in the schools is to restructure the teaching-learning practices and
school management in preparing children for the information age. The memory-based
learning approach is to be replaced by the enquiry or discovery learning approach where
students take responsibility for their own learning with the aid of computer generated
programmes especially in the science and technology subjects. The ICT is expected to
enable more students to participate in the science streams in schools and to achieve the
60:40 policy (The Malaysian Smart Schools Project: An Innovation to Address
Sustainability, 2006).
2.2 Status of Science and Technology Education in Malaysia
As Malaysia inspired to become a developed nation by 2020, it has drawn the attention
of the government of the important role of science and technology to bring about the
necessary transformation. It recognizes the importance of science and technology to
38
develop a scientific and progressive society that is creative enough to respond to
environmental changes and capable of contributing to the scientific and technological
advances for the country. The developed countries have achieved more than 5 in their
human resource capital indicators. It implied that each developed country has at least 5
professionals, scientists and technocrats in every 1,000 population. The Scandinavian
countries have more than 10 in their human resource capital indicators, while Japan has
about 7 and Singapore 8. These developed countries have the necessary knowledge-
based workforces to sustain their competitive advantages in terms of productivity and
innovations.
Malaysia has to improve its number of scientists and technocrats from 2 to 10 in
every 1000 population by 2020 (Malaysia, Ministry of Science, Technology &
Innovation, 2008). With a population of 30 million, Malaysia should have a pool of
300,000 professionals, scientists and technocrats to be in the position of a developed
nation.
The creation of the scientists and technocrats has to start from the secondary schools
and that more students should be encouraged to study science and technology. These
schools are the cradles for such students to provide the inputs for the institutions of
higher learning. Unfortunately only about 30% of the students in the upper secondary
schools are interested to study science and technology subjects (Malaysian Education
Statistics, MOE, July 2012). The position of the science and technology education in
the secondary schools can be viewed from five aspects:
2.2.1 The Philosophy and Aims of Science Education
The National Philosophy of Science Education stated that science education
should “nurture a science and technology culture.”
According to Sharifah Maimunah (2000), science education is directed:

39
To develop the potential abilities of individual citizens to become scientifically
and technologically literate, competent in scientific skills, practice good moral
values, capable of coping with the changes of scientific and technological
advances and be able to manage nature with wisdom and responsibility for the
betterment of mankind.
2.2.2 Science Education
Science is a compulsory subject for all students in the primary and lower
secondary schools. At the upper secondary schools students are given the choice
to study pure science or science electives. The science curriculum is designed to
enable students to master three scientific skills:
(a) Process skills – mental processes that encourage critical, creative, analytical
and systematic thinking.
(b) Manipulative skills – psychomotor skills used in scientific investigations
such as proper handling of scientific equipment, substances, living and non-
living things.
(c) Thinking skills – creative thinking and innovation, problem solving,
reasoning and thinking critically.
From the teaching approaches students learn the desirable values and attitudes to
appreciate the learning of science and technology subjects.
2.2.3 Technology Education
Elements of technology-based education are introduced at the upper primary level
i.e. year 4 to year 6 through the living skills curriculum, which covered various
aspects of manipulative skills. This subject is taught to all students until the lower
secondary level. The central aim is to enable the students to have an early
prevocational education at the primary level of schooling.
At the upper secondary level, technology-based education courses become
more specialized and are offered as electives. These include invention,
40
information technology, engineering drawing (offered in general academic
schools) and the very highly specialized technical and vocational subjects are
done in the technical and vocational schools.
The technical education is aimed at developing the potentials of students who
have the interest and inclination towards a technology-oriented programme. On
the other hand, the vocational education is to provide students with general and
technical subjects towards providing them with employable skills and a good
foundation for admission into polytechnics and other institutions of higher
learning.
According to Sharifah Maimunah (2000) the “main problems encountered in
the teaching of science and technology” are that the teaching is too much
examination-oriented with little opportunities for learning of scientific thinking
skills and individual practical activities; abstract topics are taught and questions
are not challenging to the higher intellectual level skills of students; inquiry-
discovery approach of teaching and learning is not applied; science and
technology teachers are not enough and dissemination of curricular changes at the
federal and state levels are not well coordinated. However, with the incorporation
of the information communication technology (ICT) into the school systems the
teaching and learning environment is expected to improve but it has not turned out
to be so.
2.2.4 Issues Relating to the Development of Technical/Vocational Education
According to Sufean Hussin (2004) the fundamental purpose of the technical and
vocational education is to produce a group of young semi-skilled entrepreneurial
for the various requirements in industries to bring about the economic and
41
technological advances in the country. He is of the opinion that such an education
should have objectives such as:
(1) It should be more practical oriented, more professional and more intensive
and to make these things possible, the technical and vocational students
should be given the opportunities to study at the polytechnics and then to the
institutions for further professional training. This should enable them to
have more and effective practical training from 2 to 3 years. On the other
hand, the school sessions for vocation training should be extended to three
times a week.
(2) The technical and vocational students should be trained in entrepreneurship
and given the opportunities to work in other agencies.
(3) The technical and vocational education should be an alternative non-
academic education to those students who completed the SMR.
(4) The quality of the curriculum and teaching of technical and vocational
subjects should be improved through getting the local firms and government
agencies involved in the apprentice programmes and entrepreneurial
courses.
2.2.5 Financial Issues in Technical and Vocational Secondary Education
Technical and vocational secondary schools involve higher cost per student
compared to other secondary schools. As a consequence, technical education is
offered to a small number of students as seen in Table 1.4 page 19, only 4.4% of
the schools offer such courses. The cost and benefits of the provision of technical
and vocational education at the secondary schools are provided by Sufean Hussin
(2004) in his book Dasar Pembangunan Malaysia, Teori dan Analisis. Here he
provides an illustration of how the cost-benefit ratio is derived when investing in
42
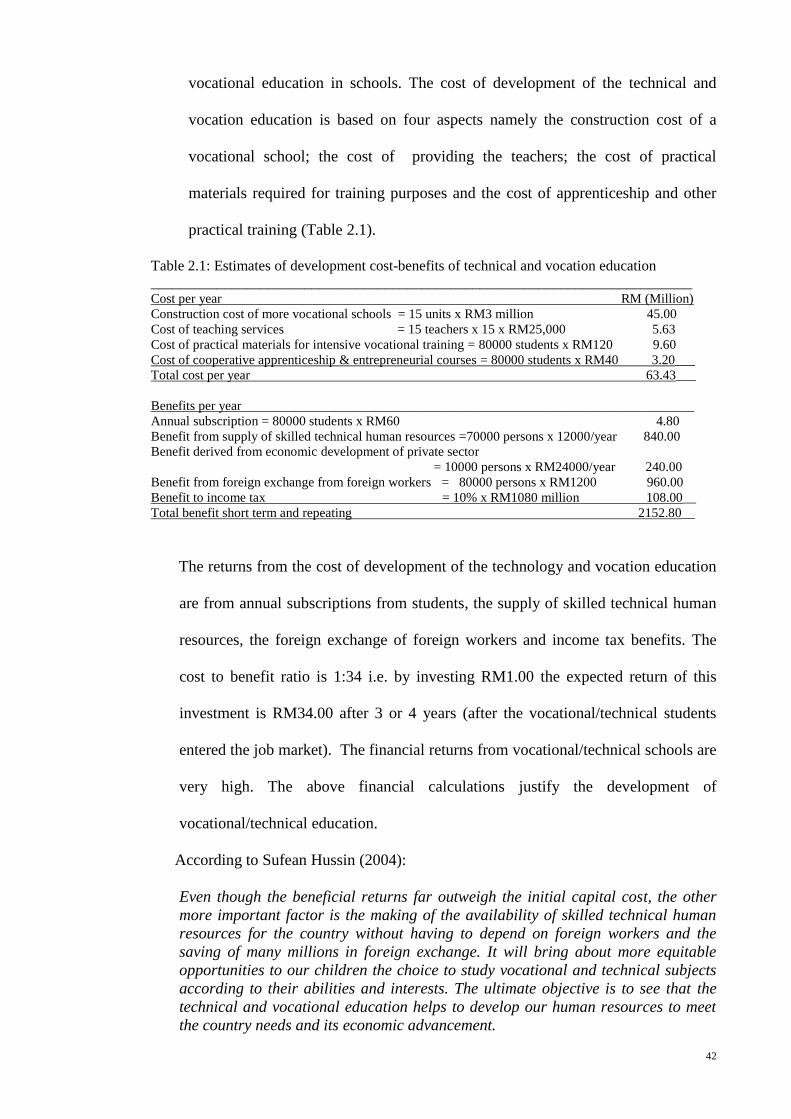
vocational education in schools. The cost of development of the technical and
vocation education is based on four aspects namely the construction cost of a
vocational school; the cost of providing the teachers; the cost of practical
materials required for training purposes and the cost of apprenticeship and other
practical training (Table 2.1).
Table 2.1: Estimates of development cost-benefits of technical and vocation education
__________________________________________________________________________ Cost per year RM (Million)
Construction cost of more vocational schools = 15 units x RM3 million 45.00
Cost of teaching services = 15 teachers x 15 x RM25,000 5.63
Cost of practical materials for intensive vocational training = 80000 students x RM120 9.60
Cost of cooperative apprenticeship & entrepreneurial courses = 80000 students x RM40 3.20___
Total cost per year 63.43___
Benefits per year____________________________________________________________________
Annual subscription = 80000 students x RM60 4.80
Benefit from supply of skilled technical human resources =70000 persons x 12000/year 840.00
Benefit derived from economic development of private sector
= 10000 persons x RM24000/year 240.00
Benefit from foreign exchange from foreign workers = 80000 persons x RM1200 960.00
Benefit to income tax = 10% x RM1080 million 108.00__
Total benefit short term and repeating 2152.80__
The returns from the cost of development of the technology and vocation education
are from annual subscriptions from students, the supply of skilled technical human
resources, the foreign exchange of foreign workers and income tax benefits. The
cost to benefit ratio is 1:34 i.e. by investing RM1.00 the expected return of this
investment is RM34.00 after 3 or 4 years (after the vocational/technical students
entered the job market). The financial returns from vocational/technical schools are
very high. The above financial calculations justify the development of
vocational/technical education.
According to Sufean Hussin (2004):
Even though the beneficial returns far outweigh the initial capital cost, the other
more important factor is the making of the availability of skilled technical human
resources for the country without having to depend on foreign workers and the
saving of many millions in foreign exchange. It will bring about more equitable
opportunities to our children the choice to study vocational and technical subjects
according to their abilities and interests. The ultimate objective is to see that the
technical and vocational education helps to develop our human resources to meet
the country needs and its economic advancement.

43
Other possible benefits from the investment in the vocational and technical
education are the increase in productivity and according to Machlup (1970, cited in
Alexander and Salmon, 1995, p. 68) this can be derived from five positive effects
such as:
(1) Better working habits and discipline, increase labour efforts and greater
reliability are achieved.
(2) Better health exists through more wholesome and sanitary ways of living.
(3) Improved skills prevail due to better comprehension of working requirement
and increase efficiency.
(4) Quick adaptability is made possible to momentary changes especially in jobs
which require quick evaluation of new information and in general, fast
reactions.
(5) Increased capability prevails to move into more productive occupation when
opportunities exist.
According to Brown (1977, cited in Alexander and Salmon, 1995, p.68) the
productivity of workers brings about improvements in:
(1) Producing more and better quality of products or services.
(2) Producing more highly prized goods and services.
(3) Lessening loss of time due to unemployment and illness.
(4) Assessing own talents, achieving better skills and becoming more receptive
to new technologies, new products and new ideas.
(5) Tending to have greater job satisfaction.
Other studies done on vocational education programmes found that the rates of
returns were high for both the individual (private) and the State (society). For
example, Hu, Lee, Stromdorfer and Kaufman (1969) found that by comparing a
vocational educational programme to the academic programmes at the secondary
44
school level in three large cities, the private rates of return were found to be
extremely high with an estimated Internal Rate of Return (IRR) of 56.8%. This was
further supported by the findings of Alexander and Melcher (1980) of the
substantial rates of return to certain post-secondary education courses for licensed
practical nursing and heating and air conditioning, but found negative private and
social returns for cosmetology. However, Corazzini (1968) and Taussig (1968)
found lower rates of return in vocational education (cited in Alexander & Salmon,
1995, p. 65). As with regard to undergraduate and graduate programmes, the rates
of return varied substantially among the courses and programmes in vocational
education.
The general opinion is that vocational education appears to be quite productive
(Alexander & Salmon, 1995, p. 65).
2.3 Smart Schools (Sekolah Bestari) Project
In 1996 the Ministry of Education introduced the Smart Schools Project. A Smart
School is defined as a school that is equipped with the “state-of-the–art
multimedia/computing equipment and comprehensive teaching and learning materials in
four subject areas, Bahasa Malaysia, English, Science and Mathematics” (Malaysia
2000: 373). On 9/3/2008, an article entitled “Smart schools shaping up well” appeared
in the New Sunday Times. It reported that there are actually 88 smart schools in the
country and at the end of 2007 (9 years after the project started in 1999), 47 have done
well while 41 still need to be given special attention. Of these 47 Smart schools, 25 are
given a 5 star ranking the maximum rating under the Smart School Qualification
Standards (SSQSs) while all the other smart schools have achieved 2 to 4 stars ranking.
A team from the University of Kebangsaan Malaysia’s School of Language Studies
and Linguistic did the research on the efficacy of Smart schools in 2004, and after
45
updating the findings in 2007, they found four main problems are faced by the Smart
Schools:
(1) Students and teachers become more IT literate and have leant the basic skills no
doubt, but the better students have not benefitted from the interactive learning
because the learning programmes are too basic and taken from the textbook.
(2) Teachers are not creative enough to generate learning programmes for
individual needs or to bring about interactive teaching but are only concerned
to complete the syllabus. Some teachers have no idea of the Smart teaching
concept.
(3) There are not enough computers and no funds for maintenance of the
hardware and no system analyst to assist the teachers.
(4) Teachers, administrators and students ca not use ICT creatively for teaching
and learning purposes.
Fundamentally the team advised that it needs a cultural shift to occur first for the
Smart School concept to work. The process of such a transformation requires more than
just the facilities. It requires first of all the right teachers who possessed the skill,
knowledge and competency to bring about the required school cultural changes.
Perhaps Edward Victor and Marjorie S. Lerner (1975, pp. 189-190) can help to provide
the idea of what the school cultural changes are expected to be in the teaching and
learning of science and technology. They said that “wherever possible the discovery
approach should be used to teach science. This approach enables students to acquire
knowledge by discovering it for themselves.” They pointed out that “the use of audio-
visual aids like the computers can definitely facilitate self-discovery learning by the
students.” They also emphasized that “science teaching and learning could be made
effective if appropriate problems are given to the students to solve through the
discovery learning approach” and that “teachers actually play the important role to
46
select or create appropriate learning programmes for the students to learn science by the
discovery approach.” The activities to be done by the students “should challenge their
intellectual ability and extend their knowledge.” Furthermore, Frederick H. Bell (1978,
p.242) conferred that discovery learning serves four useful and beneficial purposes:
(1) Students on their own will learn to figure out things.
(2) Students will develop the attitudes, practices and strategies in problem-
solving.
(3) Students will enhance their ability to analyze, synthesize and evaluate
information in a rational manner. These were the higher forms of cognitive
development.
(4) Students will attain intrinsic rewards in terms of interest and satisfaction in
learning tasks and discovering things and becoming motivated to learn better.
These are possible ways by which Smart schools can do to facilitate the teaching and
learning of science and technology subjects. By encouraging the creative learning
process, students will continue to learn science and technology on their own when they
move on to the institutions of higher learning or when they decide to work. The
teachers are to play a crucial role as smart and innovative facilitators. They can use the
enquiry or discovery approach to bring about the learning of science and technology
among the students and develop creative learning programmes to challenge the
intellectual capability of the students. In this way more students will be encouraged and
motivated to study science and technology because of the intrinsic rewards they will
receive.
2.4 Challenges in Education in Southeast Asia
Looking at the development of the education systems in the countries in this region of
the world provides a better perspective of how these countries respond to the challenges
47
of globalization. At the same time it shows the position of Malaysia in relation to these
countries in the advancement of education. According to Arief S. Sadiman (2004) other
countries in “South-East Asia like Brunei, Cambodia, Indonesia, Lao PDR, Myanmar,
Philippines, Singapore, Thailand and Vietnam” have similar emphasis on education as
Malaysia. These countries are interested to make education accessible to all their
people. They enhance the quality of education and encourage the study of science and
technology in schools and higher institutions of learning. However the rapid expansion
of education has lowered the quality of education. They have their unique problems like
differences in population size, geography, culture and social-economic development.
They lack schools, facilities, good text books and teaching materials, financial resources
and shortage of teachers. Other than Singapore and Brunei, they have problem with
poverty for example “Lao PDR (40%), Philippines (40%), Vietnam (37%), Cambodia
(36%), Indonesia (27%), Myanmar (25%), Thailand (10.4%) and Malaysia (8%)” (The
World Fact book, 2004).
The countries in this part of the world are making attempts to improve their
education systems but with different outcomes. On the other hand, Brunei provides free
education up to the university level while Singapore has free education only at the
primary school level and Malaysia has fee education up to the secondary school level.
Basing on the human resource capital indicators in 2011, Singapore has achieved a
value of 7.9, while Malaysia attained a value of 2 which is better than Thailand and
Indonesia. Malaysia is second to Singapore in its development of science and
technology education in this part of the world. Currently Malaysia has a population size
which is about six times that of Singapore and requires more financial resources and
time to reach a human resource capital indicator of 10 per 1000 population.
48
2.5 The Asian ‘Tiger Economies’ (http://student.bton.ac.uk)
The Asian ‘Tiger Economies’ like South Korea, Taiwan, Hong Kong and Singapore
have common aims and purposes of higher education and the needs of the economy.
They are interested “to improve the quality and relevance of courses offered so as to
match national manpower requirements; increase the capacity of enrolment in science,
engineering and technical-related courses and increase the capacity and capability to
undertake research and development.” Furthermore there is also the emphasis on “the
economic role of higher education on the balance of subjects to be taken at the
undergraduate level.” For example in Taiwan 55% of students studied either
engineering or business administration while in Singapore the emphasis is on science
and technology. The second aspect of the role of higher education is “the development
of social and moral values.” South Korea is under pressure to increase the number of
higher education places from the current 30% level. Singapore is planning for a modest
increase to 60% participation in the higher education level.
From here, Malaysia’s 60:40 policy and the 40% participation of higher education
are realistic when compared with those of the Asian Tigers. Even China too advocates
Science and Education to revitalize the nation; its education has been geared to cater for
China’s industrialization and modernization.
2.6 Education, Economic Growth and National Competitiveness
If education can help to improve the economic environment of a country then it will be
of strategic importance to any country. In order to understand how this is possible it is
necessary to explore the concept of how nations achieved their competitiveness at two
different levels i.e. national level and organizational level.
2.6.1 National Level of Competitiveness
At this national level three aspects concerning national competitiveness are examined:
49
1. Porter’s Diamond
2. Factor Endowments and cultural Values
3. Malaysian Situation
1. Porter’s Diamond
Firm strategy,
structure
and rivalry
Factor Demand
conditions conditions
Related and
supporting
industries
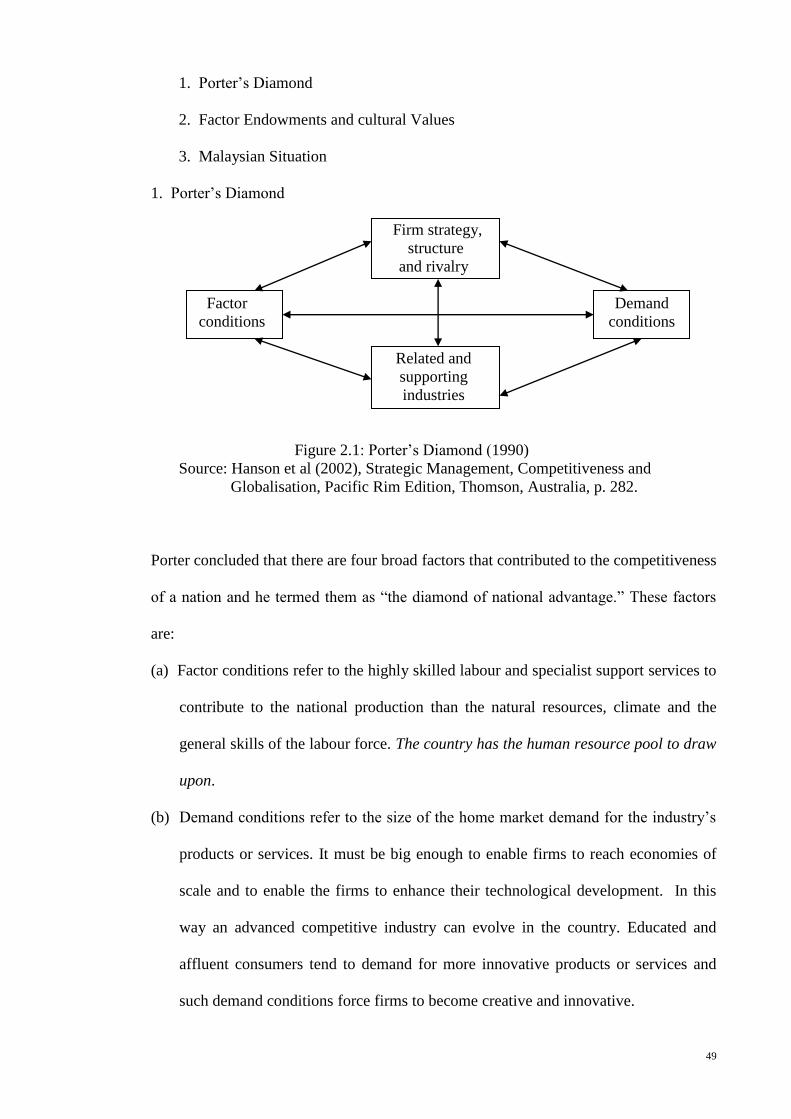
Figure 2.1: Porter’s Diamond (1990)
Source: Hanson et al (2002), Strategic Management, Competitiveness and
Globalisation, Pacific Rim Edition, Thomson, Australia, p. 282.
Porter concluded that there are four broad factors that contributed to the competitiveness
of a nation and he termed them as “the diamond of national advantage.” These factors
are:
(a) Factor conditions refer to the highly skilled labour and specialist support services to
contribute to the national production than the natural resources, climate and the
general skills of the labour force. The country has the human resource pool to draw
upon.
(b) Demand conditions refer to the size of the home market demand for the industry’s
products or services. It must be big enough to enable firms to reach economies of
scale and to enable the firms to enhance their technological development. In this
way an advanced competitive industry can evolve in the country. Educated and
affluent consumers tend to demand for more innovative products or services and
such demand conditions force firms to become creative and innovative.
50
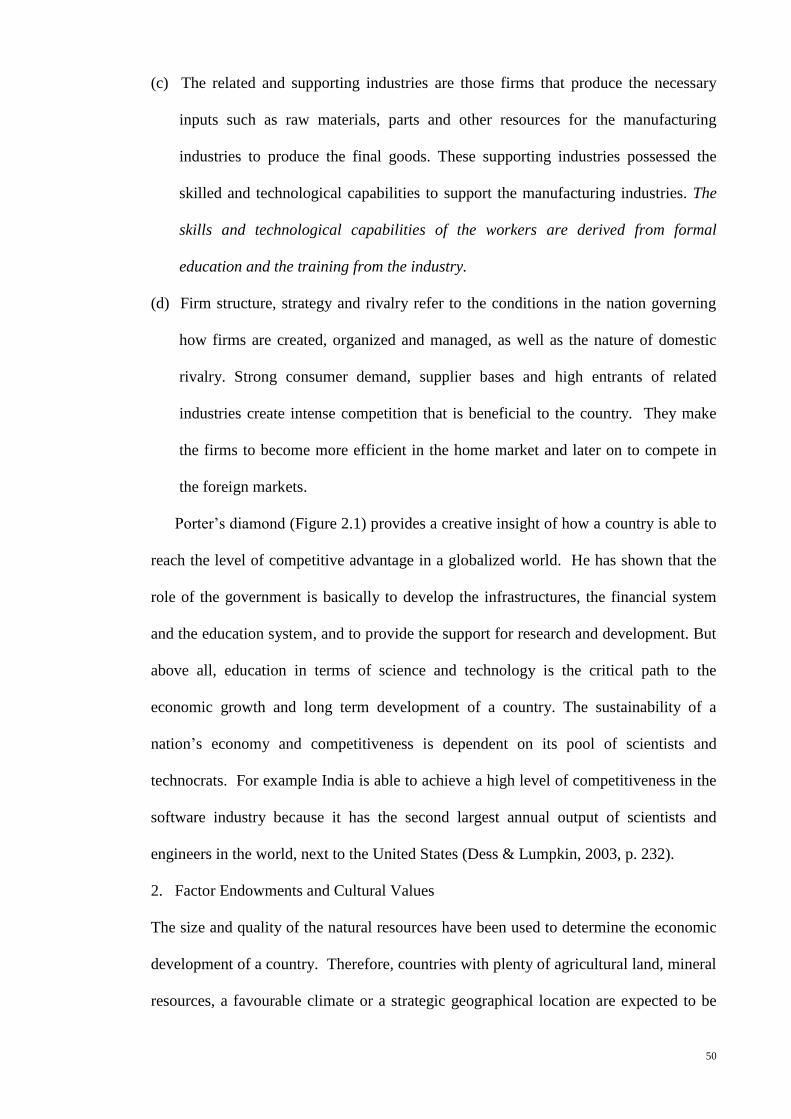
(c) The related and supporting industries are those firms that produce the necessary
inputs such as raw materials, parts and other resources for the manufacturing
industries to produce the final goods. These supporting industries possessed the
skilled and technological capabilities to support the manufacturing industries. The
skills and technological capabilities of the workers are derived from formal
education and the training from the industry.
(d) Firm structure, strategy and rivalry refer to the conditions in the nation governing
how firms are created, organized and managed, as well as the nature of domestic
rivalry. Strong consumer demand, supplier bases and high entrants of related
industries create intense competition that is beneficial to the country. They make
the firms to become more efficient in the home market and later on to compete in
the foreign markets.
Porter’s diamond (Figure 2.1) provides a creative insight of how a country is able to
reach the level of competitive advantage in a globalized world. He has shown that the
role of the government is basically to develop the infrastructures, the financial system
and the education system, and to provide the support for research and development. But
above all, education in terms of science and technology is the critical path to the
economic growth and long term development of a country. The sustainability of a
nation’s economy and competitiveness is dependent on its pool of scientists and
technocrats. For example India is able to achieve a high level of competitiveness in the
software industry because it has the second largest annual output of scientists and
engineers in the world, next to the United States (Dess & Lumpkin, 2003, p. 232).
2. Factor Endowments and Cultural Values
The size and quality of the natural resources have been used to determine the economic
development of a country. Therefore, countries with plenty of agricultural land, mineral
resources, a favourable climate or a strategic geographical location are expected to be
51
highly developed economies for example in the United States and Canada. Norway has
made good use of its North Sea oil reserves, Spain of its favourable climate and Hong
Kong of its strategic location at the hub of the Asia Pacific region. But there are many
countries which are underdeveloped in spite of natural advantages: Nigeria and several
other OPEC members have rich oil deposits but remain poor; Ukraine has high-quality
coal, iron ore, oil and chemical raw materials but remains poor economically; Turkey in
a key strategic location between Europe, Asia and the Middle East cannot sustain its
political and economic importance. Japan, with few natural resources apart from its
people becomes one of the most developed countries in the world (Harrison et al, 2000,
p.119). It is also one of the triad nations standing side-by-side with USA and EU.
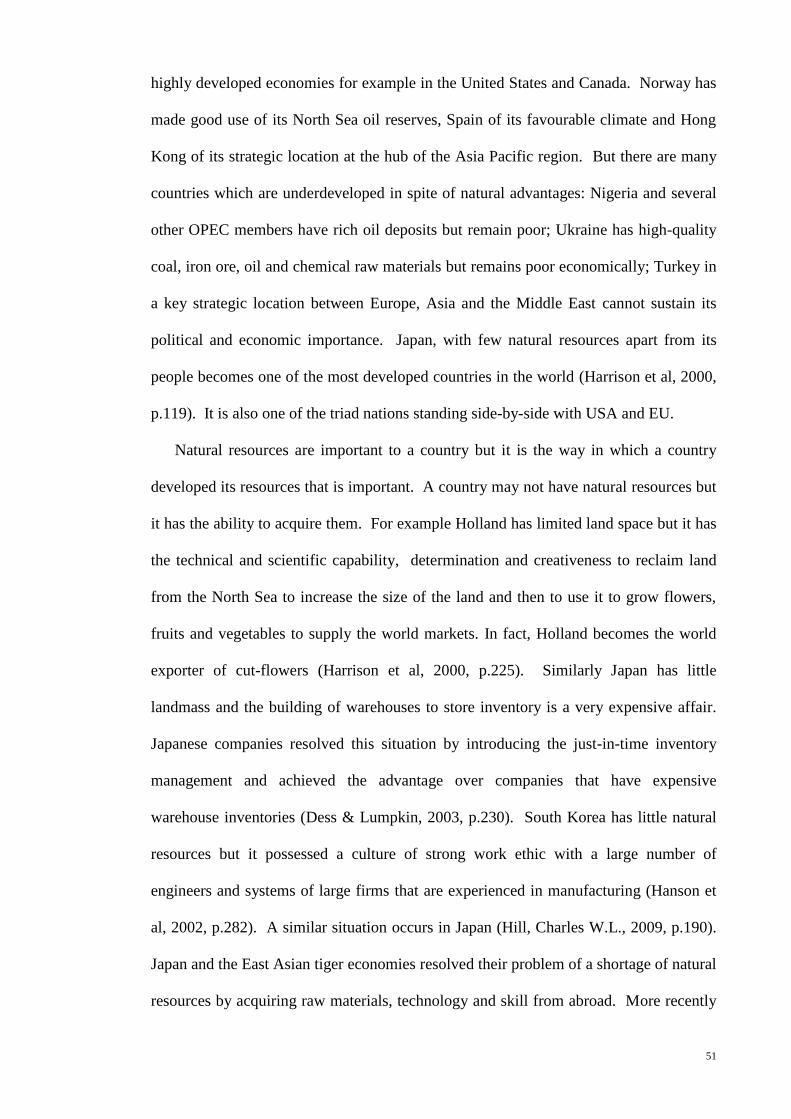
Natural resources are important to a country but it is the way in which a country
developed its resources that is important. A country may not have natural resources but
it has the ability to acquire them. For example Holland has limited land space but it has
the technical and scientific capability, determination and creativeness to reclaim land
from the North Sea to increase the size of the land and then to use it to grow flowers,
fruits and vegetables to supply the world markets. In fact, Holland becomes the world
exporter of cut-flowers (Harrison et al, 2000, p.225). Similarly Japan has little
landmass and the building of warehouses to store inventory is a very expensive affair.
Japanese companies resolved this situation by introducing the just-in-time inventory
management and achieved the advantage over companies that have expensive
warehouse inventories (Dess & Lumpkin, 2003, p.230). South Korea has little natural
resources but it possessed a culture of strong work ethic with a large number of
engineers and systems of large firms that are experienced in manufacturing (Hanson et
al, 2002, p.282). A similar situation occurs in Japan (Hill, Charles W.L., 2009, p.190).
Japan and the East Asian tiger economies resolved their problem of a shortage of natural
resources by acquiring raw materials, technology and skill from abroad. More recently
52
they improved the quality of their resources by concentrating on education, the quality
of their workforce and work practice, and investment in research and development.
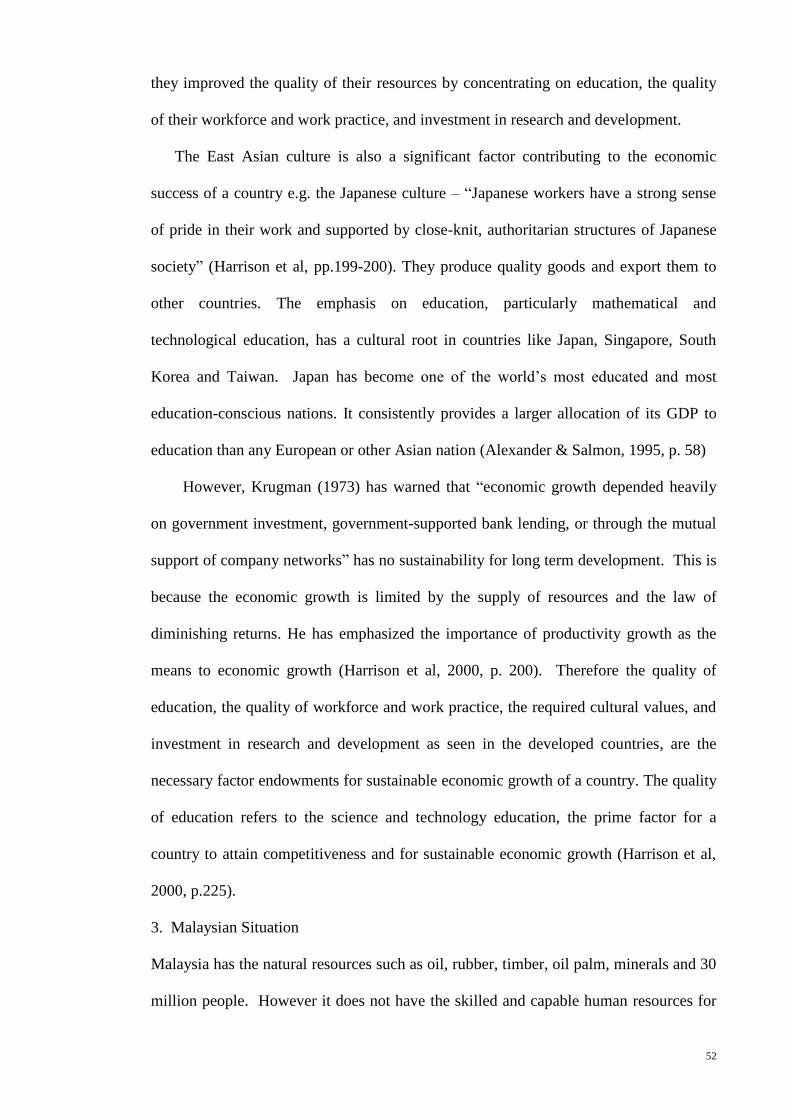
The East Asian culture is also a significant factor contributing to the economic
success of a country e.g. the Japanese culture – “Japanese workers have a strong sense
of pride in their work and supported by close-knit, authoritarian structures of Japanese
society” (Harrison et al, pp.199-200). They produce quality goods and export them to
other countries. The emphasis on education, particularly mathematical and
technological education, has a cultural root in countries like Japan, Singapore, South
Korea and Taiwan. Japan has become one of the world’s most educated and most
education-conscious nations. It consistently provides a larger allocation of its GDP to
education than any European or other Asian nation (Alexander & Salmon, 1995, p. 58)
However, Krugman (1973) has warned that “economic growth depended heavily
on government investment, government-supported bank lending, or through the mutual
support of company networks” has no sustainability for long term development. This is
because the economic growth is limited by the supply of resources and the law of
diminishing returns. He has emphasized the importance of productivity growth as the
means to economic growth (Harrison et al, 2000, p. 200). Therefore the quality of
education, the quality of workforce and work practice, the required cultural values, and
investment in research and development as seen in the developed countries, are the
necessary factor endowments for sustainable economic growth of a country. The quality
of education refers to the science and technology education, the prime factor for a
country to attain competitiveness and for sustainable economic growth (Harrison et al,
2000, p.225).
3. Malaysian Situation
Malaysia has the natural resources such as oil, rubber, timber, oil palm, minerals and 30
million people. However it does not have the skilled and capable human resources for
53
the industries to reach the sophisticated technological level to gain the competitiveness
of advanced countries. It has become imperative for Malaysia to develop the science
and technology education in order to reach the level that is comparable with the
developed nations.
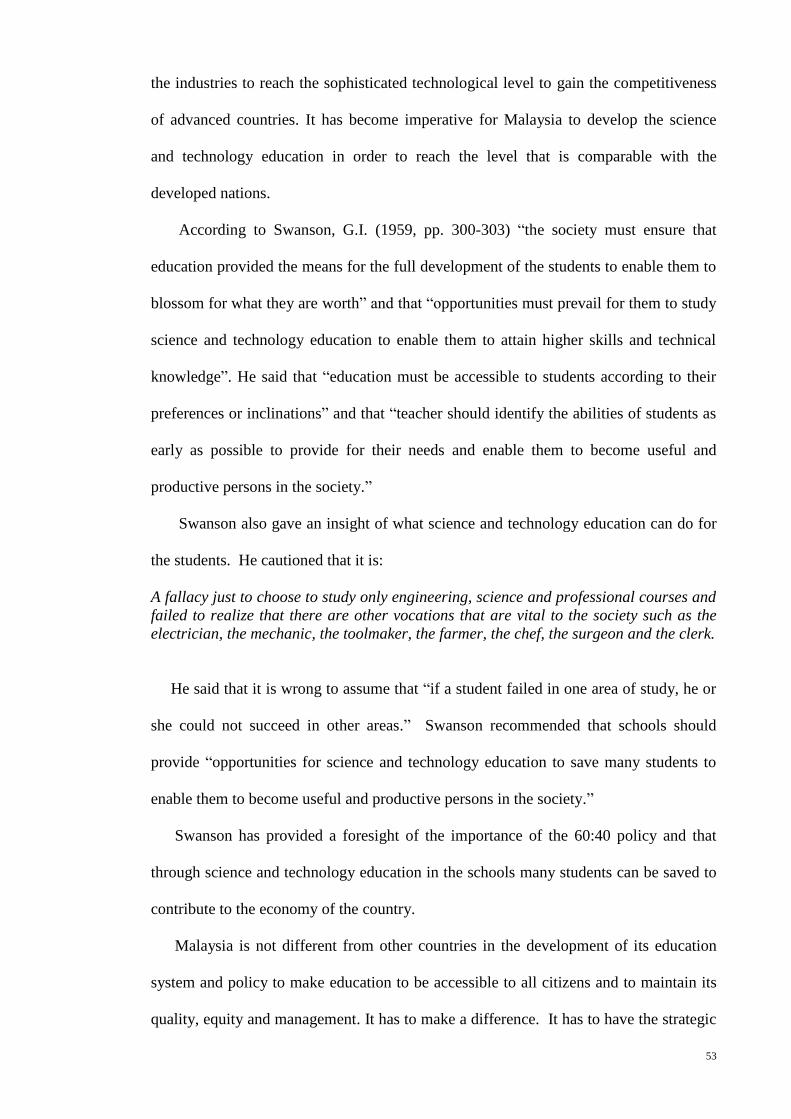
According to Swanson, G.I. (1959, pp. 300-303) “the society must ensure that
education provided the means for the full development of the students to enable them to
blossom for what they are worth” and that “opportunities must prevail for them to study
science and technology education to enable them to attain higher skills and technical
knowledge”. He said that “education must be accessible to students according to their
preferences or inclinations” and that “teacher should identify the abilities of students as
early as possible to provide for their needs and enable them to become useful and
productive persons in the society.”
Swanson also gave an insight of what science and technology education can do for
the students. He cautioned that it is:
A fallacy just to choose to study only engineering, science and professional courses and
failed to realize that there are other vocations that are vital to the society such as the
electrician, the mechanic, the toolmaker, the farmer, the chef, the surgeon and the clerk.
He said that it is wrong to assume that “if a student failed in one area of study, he or
she could not succeed in other areas.” Swanson recommended that schools should
provide “opportunities for science and technology education to save many students to
enable them to become useful and productive persons in the society.”
Swanson has provided a foresight of the importance of the 60:40 policy and that
through science and technology education in the schools many students can be saved to
contribute to the economy of the country.
Malaysia is not different from other countries in the development of its education
system and policy to make education to be accessible to all citizens and to maintain its
quality, equity and management. It has to make a difference. It has to have the strategic

54
ability to create a pool of professionals and technocrats as quickly as possible to have
the scientific and technological capability to develop highly skilled technological
industries for the country to gain the competitive advantage. It has to begin by
achieving the 60: 40 policy.
As shown in Table 2.2, in 1977–1985 and 1986–1996, Malaysia experienced
economic growth rates that ranged from an average of 6.3% per annum to an average of
7.8% per annum respectively.
Table 2.2: Growth Rates of Selected East Asian Economies
(Average % per annum)
___________________________________________________________________
1977 - 1985* 1986 – 1996* 2006 2011___
China 7.9 9.9 7.0 5.0
Hong Kong 9.2 6.3 7.0 5.0
Indonesia 5.7 7.4 5.5 6.5
South Korea 7.6 8.6 5.2 3.6
Malaysia 6.3 7.8 5.8 5.5
Philippines 2.0 3.7 5.2 3.7
Singapore 7.2 8.4 8.8 4.9
Taiwan 8.3 7.7 5.4 4.0
Thailand 6.6 9.1 5.1 0.1__
Sources: (a) * IMF World Economic Outlook, 1998, table 3.11, 101 quoted in
Harrison et al, Table 9.1, p. 194. (1977-1985 and 1986-1996)
(b) World Bank East Asia & Pacific Economic Update 2012 Vol 1–
Appendix: Table 2 p. 88 (2006 & 2011)
Table 2.2 also illustrates the growth rates of the best performing economies in East
Asia and South-East Asia in the 1980s and 1990s. Except Philippines the remaining
countries have experienced being the Tiger economies in this region. Malaysia became
a tiger economy in early 1990s.
When the Asian financial crisis started in mid 1997, Thailand, South Korea,
Indonesia and Malaysia were badly affected. However, in the subsequent years after the
financial crisis, Malaysia together with Thailand, South Korea and Indonesia started to
recover economically. By 2006 Malaysia attained a growth rate of 5.8% which was
comparable with Thailand and South Korea and 5.5% in 2011. Malaysia has learnt
55
from this past experience that it is not just the quantity of investment but its quality that
really matters.
The economic growth can no longer be based on the use of large quantities of
factor inputs but on productivity growth. The East Asian model is not the sound basis
for long term development. For the last 15 years, Malaysia has taken the necessary
steps to recover its economic position.
It has established key industries (the car industry, petrochemical industry, and
construction industry) to stimulate economic growth; invested in infrastructures;
established institutions for learning and training; instituted sound monetary and fiscal
policies and promoted confidence in businesses, consumers and investors.
It has brought about many changes to transform the institutions of learning and the
industries to play a critical role to provide the education and to bring about the
transformation of the human capability to sustain the country’s economic growth and
competitiveness. However the course of actions to transform the human resources
towards the science and technology aspects has faltered along the way and by 2011
Malaysia has achieved only a value of 2 in its human resource capital indicator while
South Korea has been steadfast in its course of action and attained a value of 6.9 in its
human resource capital indicator. South Korea has achieved the status comparable to
Japan since 2011 (Table 1.1). Malaysia was in the same position with South Korea in
1997.
2.6.2 The Organisational Level
According to Gary Hamel and C. K. Prahalad (1996), “knowledge, know-how,
intellectual assets and competencies” are the important things in organisations.
Furthermore, “knowledge, information, intellectual property and experience” are known
56
as the intellectual capital (Tom Stewart, a Fortune writer, cited in Dess & Lumpkin,
2003, pp.116-117).
Therefore the intellectual capital i.e. the intangible assets that are imbedded in
human resources is the source of the wealth of a nation. It is through the firms that this
intellectual capital creates wealth for the nation.
This concept is based on the resource-based view which stipulates that the
intangible assets in firms provide the means to utilize the tangible resources (assets) to
create capabilities. Many of these capabilities are related to scientific and technological
processes in the production activities. When these capabilities become rare, valuable,
difficult to be imitated or substituted, they create sustainable core competencies for
firms to attain sustainable competitive advantage (J.B. Barney, 1991). Therefore when
firms in the country are capable of achieving competitive advantages, the country in
which these firms operate attains competitive advantage over other countries.
Intellectual capital is therefore the thing to bring about productivity growth before it
is possible to create wealth for the nation. The process of building intellectual capital
requires “attracting, recruiting and hiring the best and the brightest as the first critical
step” (Dess & Lumpkin, 2003, p.119). The sources of supply of these people are from
the institutions of learning such as schools, colleges and universities where the science
and technology education plays a pivotal role to provide the best and the brightest for
the country to meet the challenges of this new century.
Globalization has made the world a big playing field and created so much
competition among organizations in almost all industries and services in terms of
technological improvements, management processes and innovations. The rapid rate at
which technological developments are taking place is aided by the advancement of
information-communication technology (ICT).
57
ICT has caused information to flow rapidly to those who need it and this sharing of
information has led to greater creativity and the innovation of more value-added
products and services. A consequential effect is the shortening of the product’s life
cycle. This has created the impetus for organisations to look for people who are
educated in science and technology to make changes to meet the new challenges (Dess
& Lumpkin, 2003, p.230). This is a serious challenge for the country to achieve the
60:40 policy.
2.7 Investment in Education
This section examines four aspects of investment in education:
1. Investment in Education and Economic Growth;
2. Human Capital and the Wealth of the Nation
3. Education and K-Workers
4. Benefits of Education
2.7.1 Investment in Education and Economic Growth
Adam Smith (1776) gave a wrong concept that human was a fixed capital and was
eventually consumed as part of a product cost. Seventy two years later, Horace Mann
(1848) recognised the worth of human intelligence as the true wealth of a nation (cited
in Alexander & Salmon, 1995, p.49). In 1858, the economist H. Von Thunen affirmed
the fact that human is part of a nation’s capital and that a more highly educated person
earned a much higher income than an uneducated person and that this higher intellectual
ability is acquired through an educational process (cited by Alexander & Salmon, 1995,
p.49). After this, economists and educators become interested to quantify the value of
human capital.
58
The World Bank in 1991 reported that sustained development in many countries,
especially the Scandinavian countries after 1870 and the East Asian economies after
World War 2, is due to education. In the same year, the Economist reported that the rise
of the economic Tigers of Asia namely China, South Korea, Hong Kong, Taiwan,
Malaysia, Singapore and Indonesia, is mainly due to their investment in education and
that has been the single biggest source of comparative advantage in terms of making
available well-educated workers for the industries. Then in 1992 the Economist
identified 3 powerhouse economic systems of the world – USA, Europe and Asia (Japan
in particular) and predicted that their future depended on “their ability to educate their
workforces and to create high value-adding jobs” (Alexander & Salmon, 1995, p.47).
Further impetus is given to education as an economic tool to national
advancement, because in 1992 John W. Meyer and others referred to “education as a
critical path to economic development and progress.” Many countries begin to see
education as an economic tool to national advancement. As a result, most countries
want to have comparable level of student enrollments in institutions of learning because
they know that education can improve their societies in terms of skills, attitudes,
behaviours and knowledge. This affirms what Psacharopoulos (1981) has pointed out
that the development of a country will greatly improve if there is investment in
education (cited in Cullen & Parboteeah, 2005, p.102).
Companies compete intensely in the global market and education has implications
to organizations that intend to go international. At a very fundamental level,
educational levels give an indication of the skills and productivity of workers in any
society. Workers who are more educated have more skills and they are more likely to
contribute to a country’s production, in term of products and services. A country with
an abundant supply of well-educated individuals has the advantage to be able to absorb
the technology from developed countries. For example if a country’s education system
59
is not set for high level technical skills then it is incapable to get involved in high
technological projects (Barro, R. J. & Jong, W. L., 2000).
Undoubtedly education is an investment for any country to achieve its long term
well-being and that this human capital investment provides the way to a productive
economy. Psacharopoulos (1991) has affirmed that education makes important
contribution to economic growth in terms of two aspects:
(1) It increases the total number of educated people and gives rise to a society more
prepared to face the development of a country.
(2) It prepares a knowledgeable and skillful human capital that will contribute the
expertise for the technological progress and economic development.
Malaysia has invested in its human capital especially in the fields of science and
technology. This aspect of education has become the indicator of the human resource
inventory because it contributes to technological development (OECD, 1999). The
areas that provide high investment returns are found to be in the engineering, science
and medicine. The research done by MOE with Harvard University in 1997 has shown
that the rate of return in Malaysia is very high at the higher education (BPPDP, 1997).
Investment in education provides returns to individuals and to society because it
improves the living standard and the health of a society as well as reduces the crime rate
(OECD, 1999). In Malaysia it is found that increasing education level provides higher
returns to individual and society (BPPDP, 1997 cited by Sufean & Norliza, 2009, p. 22).
However, the main problem faced by Malaysia and other developing countries is the
lack of candidates at the higher education level in the science and technology courses
(MOE, 2001; OECD, 1999). This has put the country in a disadvantaged position in not
having sufficient workforce for innovative process in technology and new product
development for the world market (Chew & Lee 2001, 1995). This is because
knowledge and skill in science and technology are like agents to achieve economic

60
development of a country especially in this era of challenging globalization (Malaysia,
2001).
Figure 2.2 summarises the process of investment in education and economic growth
of a country.
Investment Increased Demand for
in Education in Income more & better
quality goods &
services
Creation
of
employment
Economic Improve Increase in supplies
growth GDP of goods & services
Figure 2.2: Process of Investment in Education and Economic Growth of a Country
2.7.2 Human Capital and the Wealth of the Nation
Frederick H. Harbison (1973) has maintained that the human resources are responsible
for the wealth of nations. He has stressed that if a country cannot “develop the skills
and knowledge of its people” or “to utilize them effectively in national economy” then it
will not be able to develop anything else.
It is inappropriate to measure the wealth of a nation purely in term of GDP or GNP
without taking into consideration of the value and conditions of human capital. It is
because the strength of the national economy depends on the capability of the human
resources. If there is an economic problem because of underdevelopment or
underutilization of human resources, education is the primary instrument to resolve this
problem (Alexander & Salmon, 1995, p.50).
Lewis, W. A. (1977) has observed that a certain level of education is necessary for
the people to be able to appreciate and to take advantage of technological advances. He
61
has advocated that government should invest in elementary and secondary schools to
provide the foundation of a quality education to enable the absorption of technological
advances. This is because more people can be benefited at the elementary and secondary
schools than fewer people at the high education levels. He is referring to the science
and technology education.
2.7.3 Education and K-Workers
Malaysia has identified education as the best machinery to bring about the
transformation of a production based economy to a k-economy and the
institutionalization of a flexible, creative and innovative and a morally ethical culture.
The Education Development Plan (2001-2010) identified four broad aspects to create k-
workers: accessibility to education, equity in education, quality of education and
effectiveness and efficiency in education management and they are similar to those of
the US (Alexander & Salmon, 1995, pp. 12-13). The US has a history of 365 years of
development in its education system (Alexander & Salmon, 1995, p.3) while Malaysia
has a history of about 55 years. For a country to attain the state of k-economy it needs
k-workers to provide the intellectual capital. This can only be made possible by the
education system (Becker, 1993 cited in Dess & Lumpkin 2003, p.118).
K-workers are those who have acquired the knowledge and skills especially in
science and technology and which are critical to organizations for operational
sustainability and also to improve their intellectual capitals. They never stop learning
and that their knowledge, skills and creativity continue to enhance the intellectual
capital and the worth of organisations. They become the most important assets in
organisations (Hamel & Prahalad, 1996).
In the k-economy, wealth is constantly being created through the effective
management of k-workers but not by the efficient control of physical and financial
62
assets. Knowledge is coming more important not only indicated by the labour market
but by the way companies are being acquired or by which investments are made in
companies. In essence, investments or acquisitions are made based on the talents,
capabilities, experience, skills, knowledge and information in the organisations but not
so much on the tangible assets of the organisations (Dess & Lumpkin, 2002, p. 116).
This is because intellectual capital brings about the generation of creative ideas for the
development of innovative products and services and which help organizations to
achieve sustainable competitive advantage.
The k-worker is recognized as an important key besides others, to succeed in the
market place. It is found that “more than 50% of the GDP in developed economies is by
knowledge-based i.e. based on intellectual assets and intangible people skills” (Dess &
Lumpkin, 2003, pp. 116).
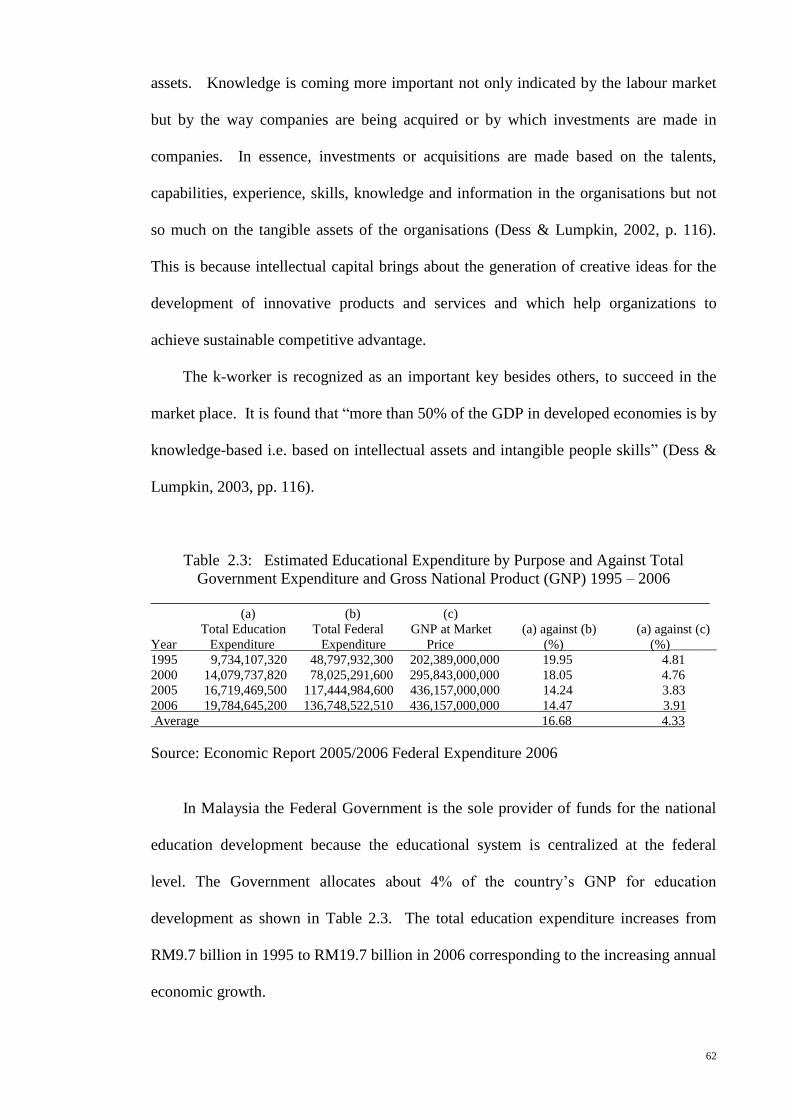
Table 2.3: Estimated Educational Expenditure by Purpose and Against Total
Government Expenditure and Gross National Product (GNP) 1995 – 2006
______________________________________________________________________ (a) (b) (c)
Total Education Total Federal GNP at Market (a) against (b) (a) against (c)
Year Expenditure Expenditure Price (%) (%)_______
1995 9,734,107,320 48,797,932,300 202,389,000,000 19.95 4.81
2000 14,079,737,820 78,025,291,600 295,843,000,000 18.05 4.76
2005 16,719,469,500 117,444,984,600 436,157,000,000 14.24 3.83
2006 19,784,645,200 136,748,522,510 436,157,000,000 14.47 3.91
Average 16.68 4.33
Source: Economic Report 2005/2006 Federal Expenditure 2006
In Malaysia the Federal Government is the sole provider of funds for the national
education development because the educational system is centralized at the federal
level. The Government allocates about 4% of the country’s GNP for education
development as shown in Table 2.3. The total education expenditure increases from
RM9.7 billion in 1995 to RM19.7 billion in 2006 corresponding to the increasing annual
economic growth.
63
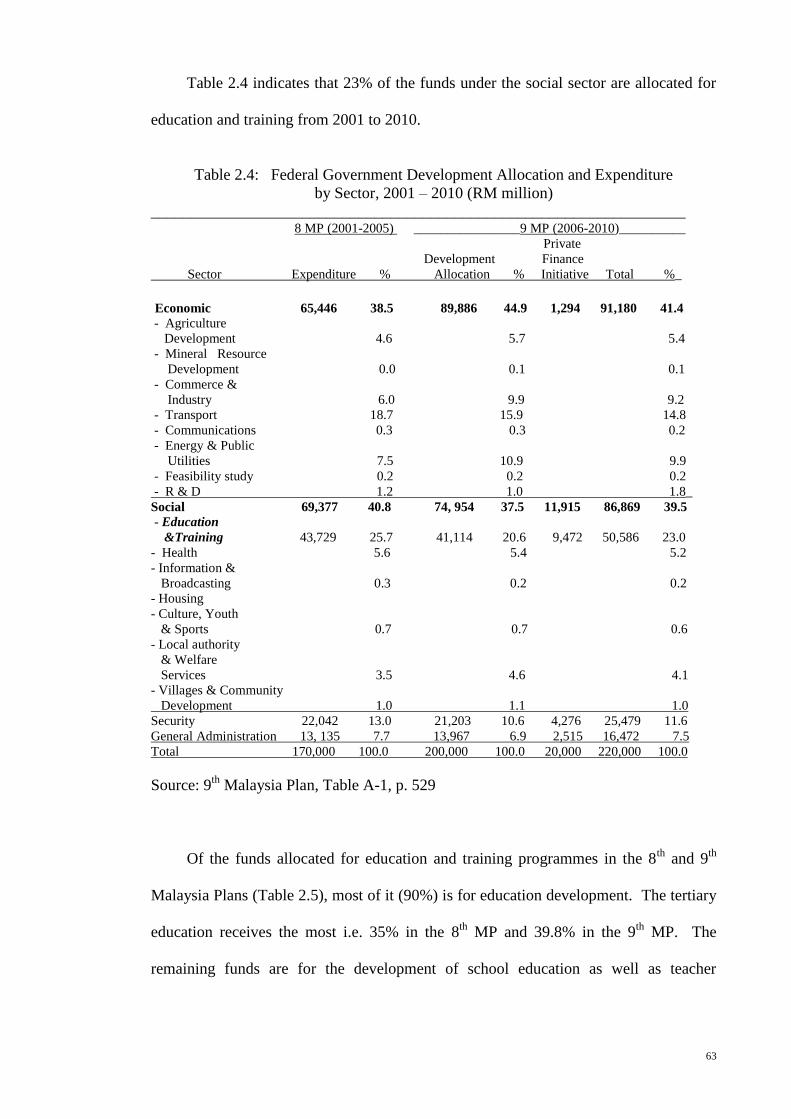
Table 2.4 indicates that 23% of the funds under the social sector are allocated for
education and training from 2001 to 2010.
Table 2.4: Federal Government Development Allocation and Expenditure
by Sector, 2001 – 2010 (RM million)
___________________________________________________________________ 8 MP (2001-2005) ________________9 MP (2006-2010)__________
Private
Development Finance
Sector Expenditure % Allocation % Initiative Total %_ Economic 65,446 38.5 89,886 44.9 1,294 91,180 41.4
- Agriculture
Development 4.6 5.7 5.4
- Mineral Resource
Development 0.0 0.1 0.1
- Commerce &
Industry 6.0 9.9 9.2
- Transport 18.7 15.9 14.8
- Communications 0.3 0.3 0.2
- Energy & Public
Utilities 7.5 10.9 9.9
- Feasibility study 0.2 0.2 0.2
- R & D 1.2 1.0 1.8_
Social 69,377 40.8 74, 954 37.5 11,915 86,869 39.5
- Education
&Training 43,729 25.7 41,114 20.6 9,472 50,586 23.0
- Health 5.6 5.4 5.2
- Information &
Broadcasting 0.3 0.2 0.2
- Housing
- Culture, Youth
& Sports 0.7 0.7 0.6
- Local authority
& Welfare
Services 3.5 4.6 4.1
- Villages & Community Development 1.0 1.1 1.0
Security 22,042 13.0 21,203 10.6 4,276 25,479 11.6
General Administration 13, 135 7.7 13,967 6.9 2,515 16,472 7.5
Total 170,000 100.0 200,000 100.0 20,000 220,000 100.0
Source: 9th
Malaysia Plan, Table A-1, p. 529
Of the funds allocated for education and training programmes in the 8th
and 9th
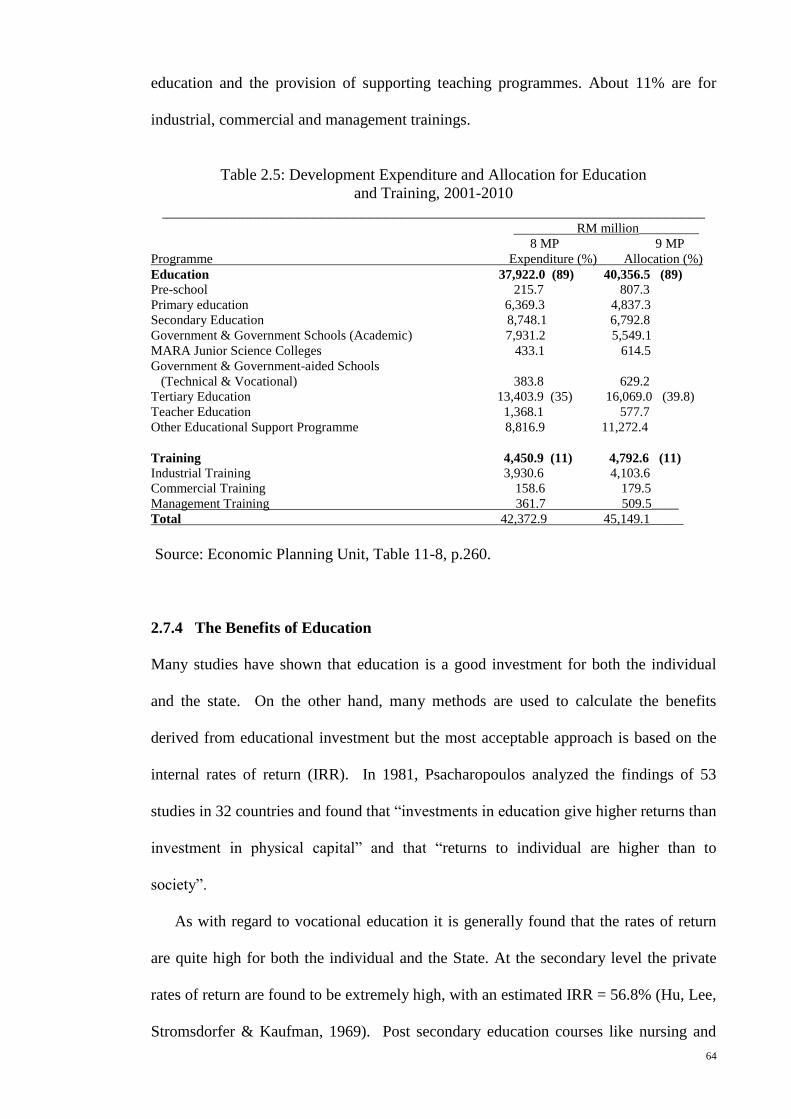
Malaysia Plans (Table 2.5), most of it (90%) is for education development. The tertiary
education receives the most i.e. 35% in the 8th
MP and 39.8% in the 9th
MP. The
remaining funds are for the development of school education as well as teacher
64
education and the provision of supporting teaching programmes. About 11% are for
industrial, commercial and management trainings.
Table 2.5: Development Expenditure and Allocation for Education
and Training, 2001-2010
____________________________________________________________________ RM million_________
8 MP 9 MP
Programme Expenditure (%) Allocation (%)
Education 37,922.0 (89) 40,356.5 (89)
Pre-school 215.7 807.3
Primary education 6,369.3 4,837.3
Secondary Education 8,748.1 6,792.8
Government & Government Schools (Academic) 7,931.2 5,549.1
MARA Junior Science Colleges 433.1 614.5
Government & Government-aided Schools
(Technical & Vocational) 383.8 629.2
Tertiary Education 13,403.9 (35) 16,069.0 (39.8)
Teacher Education 1,368.1 577.7
Other Educational Support Programme 8,816.9 11,272.4
Training 4,450.9 (11) 4,792.6 (11)
Industrial Training 3,930.6 4,103.6
Commercial Training 158.6 179.5
Management Training 361.7 509.5____
Total 42,372.9 45,149.1_____
Source: Economic Planning Unit, Table 11-8, p.260.
2.7.4 The Benefits of Education
Many studies have shown that education is a good investment for both the individual
and the state. On the other hand, many methods are used to calculate the benefits
derived from educational investment but the most acceptable approach is based on the
internal rates of return (IRR). In 1981, Psacharopoulos analyzed the findings of 53
studies in 32 countries and found that “investments in education give higher returns than
investment in physical capital” and that “returns to individual are higher than to
society”.
As with regard to vocational education it is generally found that the rates of return
are quite high for both the individual and the State. At the secondary level the private
rates of return are found to be extremely high, with an estimated IRR = 56.8% (Hu, Lee,
Stromsdorfer & Kaufman, 1969). Post secondary education courses like nursing and
65
healing and air-conditioning substantial rates of return are achieved. However it is
found that cosmetology gives negative private and social returns (Alexander and
Salmon, pp.62-66).
From the national point of view according to Alexander & Salmon (1995, pp. 66-
74) investment in education provides advantages such as:
(1) It improves efficiency in terms of increase in “labour productivity” where more
and better quality and higher priced goods and services are produced in a given
time.
(2) Educated workers are more receptive to new technologies, new products and
new ideas. They are more consistent in their work and have fewer problems in
terms of absenteeism and turnover.
(3) There is more effective use of inputs resulting in decreasing the costs of
production as well as adding values to the products. Both outcomes reinforce the
competitiveness of the country.
(4) There is a reduction of the “need for other services” and the government
expenditures for crime prevention, fire protection, public health and medical
care are reduced. Furthermore, people who are educated are healthier, more
employable and therefore do not depend on welfare assistance from the
government or commit crimes.
(5) Education increases the individual’s capacity to earn a better income and to
improve saving. On the other hand, better educated mothers spend more time
with their children and bring about the “intergenerational transfer of
knowledge”.
(6) It makes the people to be more effective in contributing to national productivity
and improving national GDP and economic growth where more goods and
services are produced and more employment opportunities created.
66
2.8 Multinational Companies, Foreign Direct Investment (FDI) and Education
Multinational companies (MNCs) normally gauge the educational levels of various
countries they want to get involved to determine what to expect from their workers.
They are interested in the skills and experience that they can gain from the education of
the country. If the countries are engaging in high-level research and development, they
want to locate their operations in these countries. Many MNCs are located in “East
Asian countries like Japan, Hong Kong, South Korea and Singapore” because they
“have very active and innovative economic sectors and they rely heavily on scientific
progress” (Cullen & Parboteeah, 2004, p. 103).
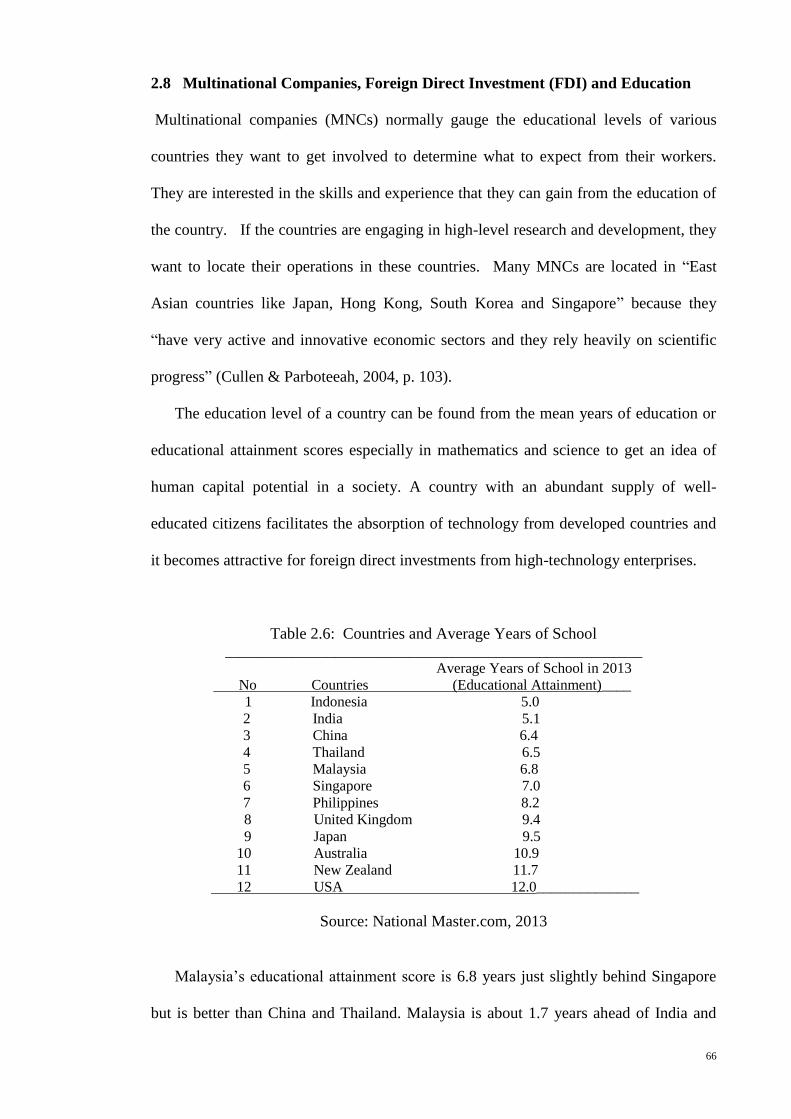
The education level of a country can be found from the mean years of education or
educational attainment scores especially in mathematics and science to get an idea of
human capital potential in a society. A country with an abundant supply of well-
educated citizens facilitates the absorption of technology from developed countries and
it becomes attractive for foreign direct investments from high-technology enterprises.
Table 2.6: Countries and Average Years of School _________________________________________________________
Average Years of School in 2013
No Countries (Educational Attainment)____
1 Indonesia 5.0
2 India 5.1
3 China 6.4
4 Thailand 6.5
5 Malaysia 6.8
6 Singapore 7.0
7 Philippines 8.2
8 United Kingdom 9.4
9 Japan 9.5
10 Australia 10.9
11 New Zealand 11.7
12 USA 12.0______________
Source: National Master.com, 2013
Malaysia’s educational attainment score is 6.8 years just slightly behind Singapore
but is better than China and Thailand. Malaysia is about 1.7 years ahead of India and
67
Indonesia. On the other hand, Malaysia is 5 years behind the USA and New Zealand,
and about 2 years behind Japan (Table 2.6). The score differences among countries
provide an indication of how education has affected the economic structure and the
nature of the workforce in countries.
For Malaysia to go into the manufacturing sector of the economy its education
system should be capable to produce the workforce for the needs of the manufacturing
industries. If it wanted to get involved in high-level research and development then the
workforce should reach the level of skills in science and mathematics.
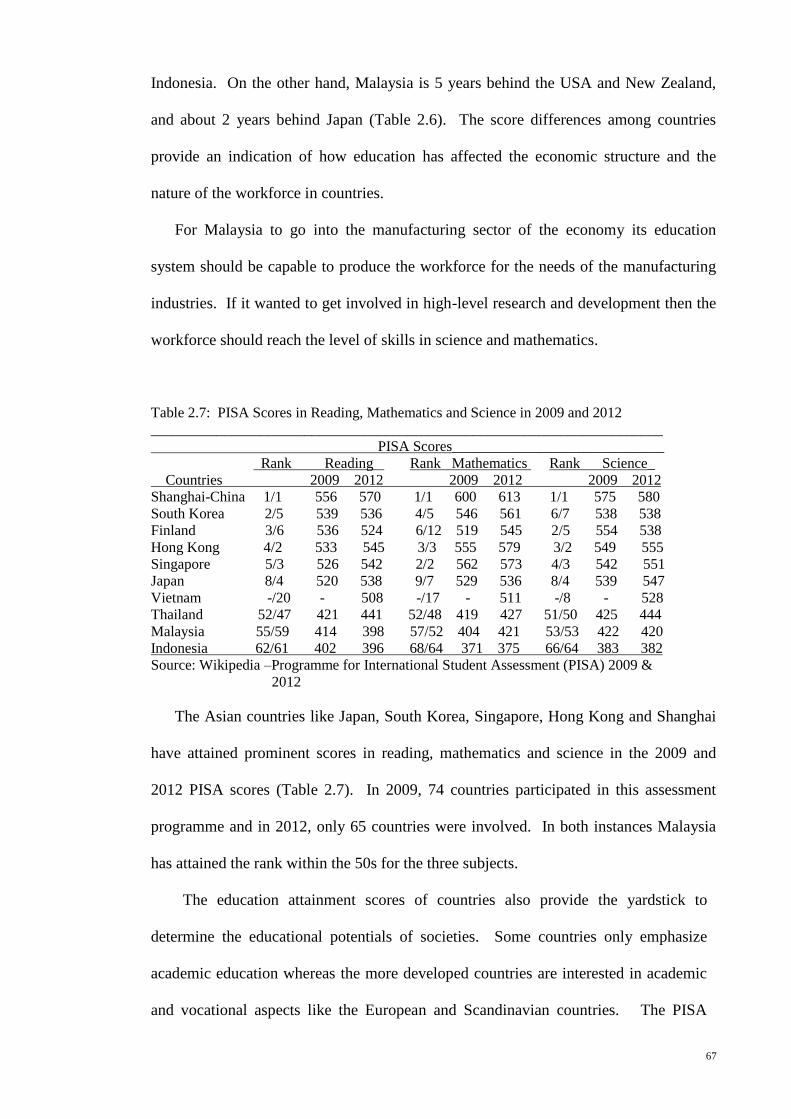
Table 2.7: PISA Scores in Reading, Mathematics and Science in 2009 and 2012
______________________________________________________________________
PISA Scores_____________________________
Rank Reading Rank Mathematics Rank Science_
Countries 2009 2012 2009 2012 2009 2012
Shanghai-China 1/1 556 570 1/1 600 613 1/1 575 580
South Korea 2/5 539 536 4/5 546 561 6/7 538 538
Finland 3/6 536 524 6/12 519 545 2/5 554 538
Hong Kong 4/2 533 545 3/3 555 579 3/2 549 555
Singapore 5/3 526 542 2/2 562 573 4/3 542 551
Japan 8/4 520 538 9/7 529 536 8/4 539 547
Vietnam -/20 - 508 -/17 - 511 -/8 - 528
Thailand 52/47 421 441 52/48 419 427 51/50 425 444
Malaysia 55/59 414 398 57/52 404 421 53/53 422 420
Indonesia 62/61 402 396 68/64 371 375 66/64 383 382
Source: Wikipedia –Programme for International Student Assessment (PISA) 2009 &
2012
The Asian countries like Japan, South Korea, Singapore, Hong Kong and Shanghai
have attained prominent scores in reading, mathematics and science in the 2009 and
2012 PISA scores (Table 2.7). In 2009, 74 countries participated in this assessment
programme and in 2012, only 65 countries were involved. In both instances Malaysia
has attained the rank within the 50s for the three subjects.
The education attainment scores of countries also provide the yardstick to
determine the educational potentials of societies. Some countries only emphasize
academic education whereas the more developed countries are interested in academic
and vocational aspects like the European and Scandinavian countries. The PISA
68
scores provide an idea of the availability of the future workforce and the emphasis in
terms of science and mathematics and reading proficiency. These scores are of
interest to MNCs for the location of their companies in other countries.
Malaysia, Thailand and Indonesia have achieved scores around the 400 range for
the three subjects. This achievement has two implications:
1. An MNC can invest in any of the three countries based on the PISA scores. Other
factors are needed to decide on the preference of the country for investment such as
low wage, ample supply of workforce, political-economic stability and government
incentives and encouragement.
2. The level of cognitive ability of the 15 years old students in problem-solving in
these three countries is not up to the level with many other countries. This implies
that the teaching of the three subjects in the secondary schools needs to be
improved and that qualified and creative teachers are required. The PISA scores
from the three subjects indicate that the 15 years old students in Malaysia have less
than 3 years of schooling compared to those in Singapore, South Korea, Hong
Kong and Shanghai.
Alexander and Salmon (1995, p.66) has cited three ways to support the fact that
employers looked for educated candidates from the labour market:
(1) Employers believe that “the education of the employees improves the financial
potential of the firm and that a definite positive relationship prevails between the
amount of formal education of employees and the amount on-the-job training
they received” (Jacob Mincer, 1962).
(2) Employers select candidates who are educated from the labour market. They
recognize that “educated workers have favourable influence on other workers
69
and on the firm” and this interdependence between the two parties “have a
financial interest in the education of fellow workers” (Weisbrod, B.A., 1971).
(3) Firms find that “greater productivity is achieved with less cost by investing in the
more educated employees” and that “greater benefits can be obtained by grafting
job training to the knowledge already acquired from formal education”
(Perlman, R., 1973).
J. Ronnie Davis (1970) found that “inexperienced and uneducated workers who
earned less than the minimum wages have higher unemployment” because “better
educated workers have the edge in communication, discipline of the mind, flexibility
and adaptability” as well as “be receptive to new idea and knowledge”(cited by
Alexander & Salmon, 1995, pp. 67-68). Therefore better educated workers are more
effective to contribute to economic competitiveness.
John D. Owen (1974) cautioned that eventually the “less educated labour force” will
be replaced by advanced technology and production process (cited by Alexander &
Salmon, 1995, p. 67). The Economist (1989) identified:
People who leave school early rapidly run out of rungs on the earnings ladder;
university graduates not only find plenty of rungs, they also discover that each step
upwards is increasingly remunerative. One reason for this is that the well-educated
land jobs that provide them with more training, while the uneducated are locked out of
opportunities to improve their skills (Cited in Alexander & Salmon, 1995, p.67).
It is apparent that education in science and technology is the way to prevent being
replaced by technological advances.
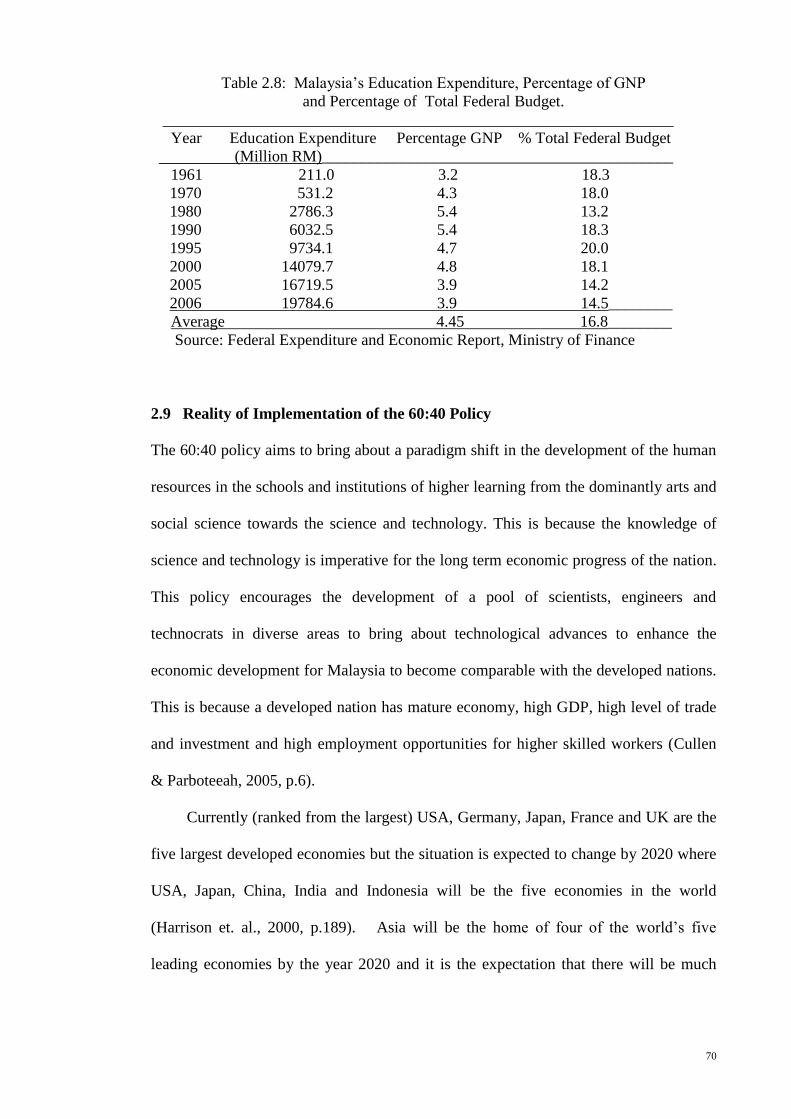
Malaysia, like other countries, has nurtured educational development in order to
attain economic competitiveness. A consistent education expenditure budget prevails
over the years as shown in Table 2.8 from 1961 to 2006. On the average, about 4.4% of
the GNP is allocated for the development of education in each year and this is
equivalent to 16.8 % of the Federal Expenditure Budget.
70
Table 2.8: Malaysia’s Education Expenditure, Percentage of GNP
and Percentage of Total Federal Budget.
________________________________________________________________
Year Education Expenditure Percentage GNP % Total Federal Budget
(Million RM)____________________________________________
1961 211.0 3.2 18.3
1970 531.2 4.3 18.0
1980 2786.3 5.4 13.2
1990 6032.5 5.4 18.3
1995 9734.1 4.7 20.0
2000 14079.7 4.8 18.1
2005 16719.5 3.9 14.2
2006 19784.6 3.9 14.5________
Average 4.45 16.8________
Source: Federal Expenditure and Economic Report, Ministry of Finance
2.9 Reality of Implementation of the 60:40 Policy
The 60:40 policy aims to bring about a paradigm shift in the development of the human
resources in the schools and institutions of higher learning from the dominantly arts and
social science towards the science and technology. This is because the knowledge of
science and technology is imperative for the long term economic progress of the nation.
This policy encourages the development of a pool of scientists, engineers and
technocrats in diverse areas to bring about technological advances to enhance the
economic development for Malaysia to become comparable with the developed nations.
This is because a developed nation has mature economy, high GDP, high level of trade
and investment and high employment opportunities for higher skilled workers (Cullen
& Parboteeah, 2005, p.6).
Currently (ranked from the largest) USA, Germany, Japan, France and UK are the
five largest developed economies but the situation is expected to change by 2020 where
USA, Japan, China, India and Indonesia will be the five economies in the world
(Harrison et. al., 2000, p.189). Asia will be the home of four of the world’s five
leading economies by the year 2020 and it is the expectation that there will be much
71
economic development especially in term of technological advances and the
development of advanced industries in this region of the world.
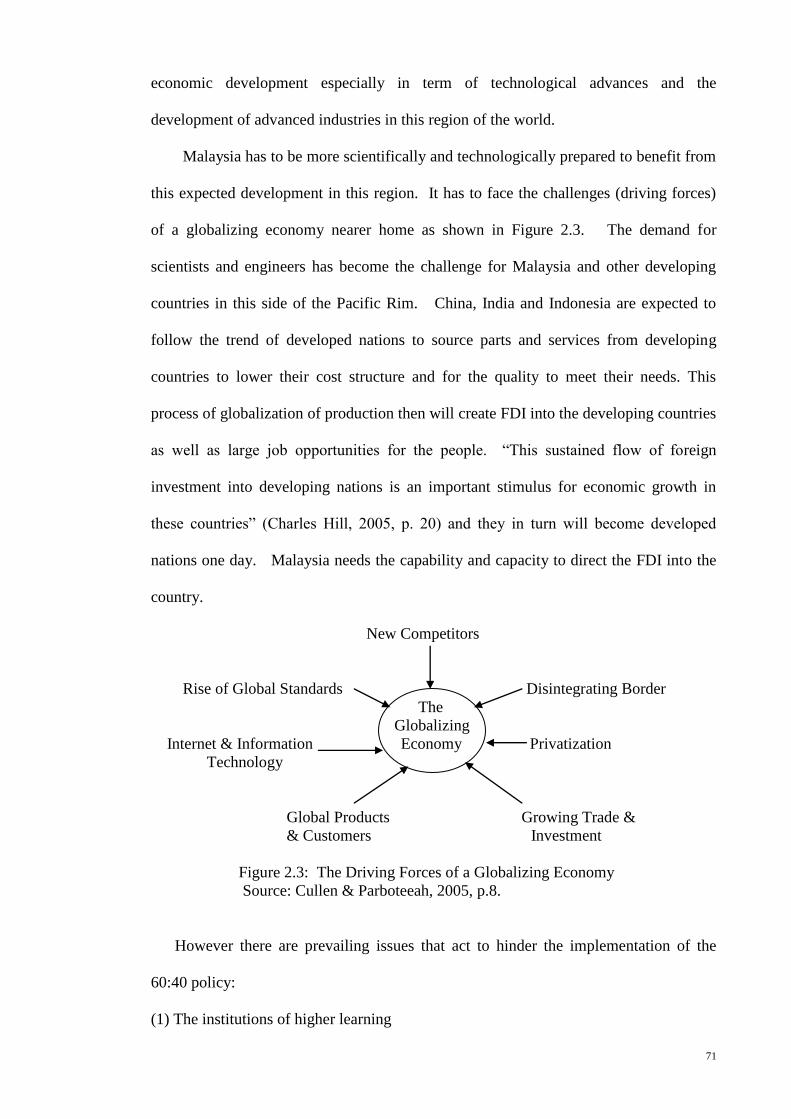
Malaysia has to be more scientifically and technologically prepared to benefit from
this expected development in this region. It has to face the challenges (driving forces)
of a globalizing economy nearer home as shown in Figure 2.3. The demand for
scientists and engineers has become the challenge for Malaysia and other developing
countries in this side of the Pacific Rim. China, India and Indonesia are expected to
follow the trend of developed nations to source parts and services from developing
countries to lower their cost structure and for the quality to meet their needs. This
process of globalization of production then will create FDI into the developing countries
as well as large job opportunities for the people. “This sustained flow of foreign
investment into developing nations is an important stimulus for economic growth in
these countries” (Charles Hill, 2005, p. 20) and they in turn will become developed
nations one day. Malaysia needs the capability and capacity to direct the FDI into the
country.
New Competitors
Rise of Global Standards Disintegrating Border
The
Globalizing
Internet & Information Economy Privatization
Technology
Global Products Growing Trade &
& Customers Investment
Figure 2.3: The Driving Forces of a Globalizing Economy
Source: Cullen & Parboteeah, 2005, p.8.
However there are prevailing issues that act to hinder the implementation of the
60:40 policy:
(1) The institutions of higher learning

72
They need to have the capacity and capability to encourage the enrollment of students to
take up the courses offered (Wetzel et al, 1998 cited by Sufean & Norliza, 2009, p.3).
The World Development Indicator 2000 has shown that Malaysia committed the least
expenditure allocation for science and technology development (0.24% of GDP)
compared to USA (2.63%) and Japan (2.8%) (cited in Sufean & Norliza, 2009, p.12).
There is a tendency to limit rather than encourage student enrollments into the public
universities (Education Development Plan 2001-2010, p. 6, paragraph 6.33). This issue
has given rise to restrictions such as “the intake quota, vacancy of places limited and
students may not get the choices of the university or the courses”.
The consequential effect is good students choose to go to private universities and
the enrolments at the public universities decline over the years. For example the total
enrollments of Private Higher Educational Institutions are consistently higher than those
at the Public Universities in 2005 and 2010 (Table 2.9).
Table 2.9: Enrollment of students at the Public Universities and Private Higher
Education Institutions
___________________________________________________________
Year Public Universities Private Higher Edn. Institutions
2000 258,314 212,034
2005 309,054 313,972
2010 462,780 541,629____________
Source: Ministry of Higher Education, Malaysia
Table 2.10: Enrollments of students for first degree in four instances
_____________________________________________________________________
Year 1990 1995 2000 2005 2010_
1st degree enrollment 50,127 75,709 170,794 209,148 274690
Annual increase 10.2% 25.1% 4.5% 6.3%
Sources: Education Development Plan 2001-2010 & Planning, Research & Policy
Coordination Division, MOE, 2000-2012.
Table 2.10 shows that the enrollments of students for the first degree in 5 different
years. In terms of annual increase of the first degree enrollment, it shows an increasing
73
trend in the first three instances but at the fourth and fifth instances the enrollments have
declined considerably.
This situation is not consistent with the findings by MOE and Harvard University
(1977) that in Malaysia the rates of return in education for individuals is the highest at
the tertiary level (35.7%) compared to primary level at 21.6% and secondary level at the
lowest 12%. In fact more students should be encouraged to have a tertiary education.
According to MOE in 2001, every public university should have 20,000 student
enrollments a year and that appropriate funds should be provided to fulfill this role. But
the government could not provide the necessary funds and as a consequence MOE had
to limit its activities (Education Development Plan 2001-2010, p.6.8, paragraphs 6.32-
6.33).
The impact of this mismatching phenomenon at the universities slows down the pace
of economic development in the country. This is in line with the findings of Ramli
(1996) and Ramirez & Lee (1990) that a positive correlation exists between the level of
number of science and technology students at the university and the level of growth of
the economy in developing countries and the third world (cited by Sufean & Norliza,
2009, pp. 11-13). Therefore it is really difficult to ignore the 60:40 policy.
(2) The employment opportunities.
In Malaysia, the manufacturing industry relies on labour-intensive and low-value added
technology. In the absence of heavy capital investment the manufacturing sector faces a
slow process to move to high-technology, knowledge-based and capital intensive
industries. Besides, it needs technological expertise to enable the production process to
move-up the activities in the value chain. The consequential effect is that the creation of
job opportunities to absorb the science and technology graduates becomes limited.
74
These situations of slow economic activity and poor demand for scientists who just
passed out become factors that affect the success of the 60:40 policy.
Another important aspect is the kind of science and technology courses offered at
the higher institutions of learning. The traditional courses are not attractive to the
students. Students are attracted to courses that can bring about economic activities such
as agriculture, biotechnology, biomedicine, genetic engineering, petrochemical sciences,
technological processes and food sciences (Sufean & Norliza, 2009, p. 29). University
courses are not flexible to match the needs of the industries and the market demand.
Furthermore new courses that are to be developed should diversify the programmes of
study and widen the professional opportunities. These are the forces of change
universities have to face to improve student enrollments in the science and technology
areas.
(3) From the student’s perspectives.
Students play a role in increasing the enrollment in the university when they accept the
offers made by the university (Wetzel, O’Toole & Peterson, 1998). Researchers found
many factors that influence the interest of students to follow the science and technology
courses at institutions of higher learning such as academic achievement, family
background, school environment, teachers, education aspiration, work aspiration, the
society and higher education policy (Artwater, Gardner & Wiggins, 1995; Chew, Lee &
Quek, 1995; Gallagher, 1994; Fouts & Myers, 1992).
2.10 Factors Pertaining to Students
Factors influencing students to follow the study of science and technology are found to
be:
(1) Self-confidence/Self-concept
75
A student who has constantly achieved good results in the study of science or
technology has the confidence and readiness to continue the study of science or
technology at the higher level (Cavallo & Laubach, 2001 and Freedman, 1997). When
students have lost their self-confidence their interest to study science and mathematics
diminishes especially among girl students (Seymour, 2001 and Jones & Young, 1995).
Sufean and Norliza (2009) found that students who studied science and technology at
the university have the desire to improve and widen their knowledge and to obtain skill
and professional expertise in their fields of interest in order to get good jobs.
(2) Concept Pertaining to Science
Ferguson & Fraser (1998) found that the environmental situation and the relationship
between students and teachers have positive influence on the students’ attitude towards
science and mathematics. This occurs especially in the primary school level where the
relationship between teachers and girl students is intimate. Jones (1991) found that girl
students consider physical science and engineering to have images of masculine
attributes, unfriendly and impersonal. This caused the girl students to favour the
biological science like medicine or studies not related to science. However Vochell &
Labone (1981) discovered that girl students in all girls’ schools do not considered
science to have masculine or unfriendly images. They are more interested to study
science at the higher level. Other studies have shown that male students have positive
attitude towards science and they prefer professions like engineering, while the girl
students are more interested in professions like science (Simpson & Oliver, 1990;
Cansambis, 1995; Kahle et. al. 1983). Sufean and Norliza (2009) found that students
who have done pure sciences in the secondary schools are more certain to enter the
university to do the science, medicine, dentistry, engineering and pharmacy courses and
that most of them have done the matriculation or the STPM to get to the university.
These students realized that more opportunities prevail for them in studying science and
76
technology and earning better incomes. In their study of 270 students from 5 local
public universities, Sufean and Norliza found that personal factors generally encourage
both sexes to take up the study of science and technology at the universities but boys
have a greater tendency than girls to do so. However, the male and female students
have similar career aspiration for studying science and technology fields.
(3) Motivation for Success
Artwater, Gardner & Wiggins (1995) and Simpson & Oliver, (1990) found that students
who are used to a form of teaching tend to obtain good achievement and be motivated to
learn the subject. But students who are frightened and uncomfortable towards science
subjects have little interest towards science. According to Crawley & Black (1992)
students who have no confidence to get good results consider science to be difficult
from the early stage and they will not further their study in science at the higher level.
It is found that the secondary schools do not provide a good indication of the students’
choices of study at the university or their entry to the university (Sufean and Norliza,
2009). It implies that students who do science or technology subjects at the secondary
school level may not necessary enter the university to do the same courses but instead
do the arts courses.
2.11 Family and Society
According to Jean Piaget (1952) (cited by Barry J. Wadsworth (1977, p.21) “intellectual
development of a child depended on the interaction between the child and the
environment.” This same principle applies to the development of a child’s interest in
the field of science if a child has been engaging in game activities in science or has been
integrating with parents and society with respect to activities in science (Farenga &
Joyce, 1999 and Halliman, 1994). Furthermore, Khale and others (1993) found that
socialization process at the children stage has caused boys to be more interested in the
77
field of science because the games boys have played are exploratory in nature. They
also found that encouragement and support from people who are close like parents,
teachers and colleagues influence a student to follow courses in science and
mathematics.
Furthermore, Woolnough (1994) found that a relationship exists between the
education background of the parents and the interest of the students towards science and
engineering. They also found that a parent or a relative who is close to the student and
who has succeeded in the field of science, the student tends to follow that field of study.
Sufean & Norliza (2009), Panizzon & Levin (1997) and Thomas & Schibeci
(1986) found that images and information about science and technology from the media
of various sources influence the students’ interest in science and technology subjects.
Young, Fraser & Woolnough (1997) found that students are more likely to choose
the professions that they have experienced from the socio-cultural aspects in terms of
the family, community and school environment beside their interest and achievement in
school.
Stein & McRobbie (1997) and Talton & Simpson (1986) found that professional
aspiration is a precursor toward the choice of work of a person and this has started as
early as in preschool but the important time for connecting the interest towards a
particular profession starts as early as 9 to 10 years old. On the other hand, Thomas
(1986) discovered that a student from a poor family in the rural area has more
knowledge and experience about working conditions than a student from the same
social status in the urban area and that such a student has greater aspiration for a science
and technology profession.
Sufean & Norliza (2009) found that most of the students (72%) who studied science
and technology at the universities are from families with low incomes (RM501 to
78
RM2,500 per month) and this is followed by families with high incomes (above
RM2,500 per month) and a few from very high incomes (above RM5,500 per month).
Furthermore it is found that the parental education level or their involvement in the
science and technology fields do not influence the students to take up the study of
science or technology at the university. On the other hand, many students admitted that
their parents and family members encouraged them to study science and technology.
2.12 School Factors
Many studies have shown that the role of teachers and the presence of positive climate
for study have improved the interest and achievement of students in the academic area.
Fouts & Myers (1992) found that the “teacher’s enthusiasm and attitude towards science
attracted students’ interest towards science”. This is confirmed by Cavallo & Laubach
(2001) that students, who are “perceptive of the teacher’s positive attitude and
experience in the area of science, take up science and technology studies at the higher
level”. The same situation is found by Sufean and Norliza (2009) that the teacher’s
encouragement and the way of their presentation of the lessons play a role in nurturing
the interest of the students in science and technology.
The research report from TIMSS-R (2001) has caused a great concern when it is
found that 70% of the “science teachers in Malaysia do not have the preparation and
conviction to teach science subjects or the enthusiasm and motivation for teaching
science subjects”. Furthermore research done by HEFCE (2003) (cited by Sufean &
Norliza, 2009, p. 47) found “that lecturers who educate students to become teachers at
the secondary and primary schools do not provide effective knowledge and this
phenomenon continues until the university”.
However, King (1991) found that the understanding of new teachers who are
teaching science is slightly better than their students. It is found that these teachers have
79
studied science by rote learning of the factors and concepts without understanding.
These teachers have a shallow understanding of concepts in science. The problem of
preparation of science teachers who do not have the experience has still occurred and it
has remained difficult to be resolved.
The studies done by TIMSS-R (2001) and Roth & Robottom (1998) found that
teachers do not teach with high conviction because they themselves cannot integrate
science concepts with daily life. The possible explanations for such an occurrence are:
(a) According to Anderson (1983) teachers have failed to understand differences
between “the formulated curriculum and the implemented curriculum for
science”.
(b) Costa (1995) has found that the curriculum for science is not related to “the
students’ character, experience and relevance in their daily lives”, but “only has
taken it just as a subject for study” and therefore it “makes teaching boring and
students become uninterested in the science and have considered it to be very
difficult.”
(c) Gray (1999) and Tan (1991) found that “the form of science concepts” at the
student level is difficult to be implemented in Malaysia because of “mismatch”
between the formation of the curriculum and the background of students. They
attributed to the fact that the curriculum is adapted from developed countries and
it does not fit into the conditions in a developing country.
(d) Gray (1999) and Olugbemiro (1997) said that “science itself is universal but
culture and language caused its acceptance to be different in different countries.”
The relevance of science education that is taught in schools and the daily
livelihood are factors that influenced students’ interest in science (Panizzon & Levins,
1997). The study done by Woolnough (1994) found that students who do science have
80
different views from students who do not do science. Those who studied science said
“that the understanding of the theories and factors are important” in studying science,
“experiments that are done” have improved knowledge in the area of science and “co-
curriculum activities such as science society and science competition” are very
beneficial. Young et al (1997) and Woolnough (1994) supported the fact that co-
curriculum activities pertaining to science and technology have very positive correlation
with participation in science but this has been given less emphasis in schools e.g.
administrators give less attention to co-curriculum activities.
Science students are more delighted in study that is laboratory centered because they
are given more responsibility to carry out their respective duties. Past studies have
shown that laboratory centered and inquiry based teaching resulted in the students going
for science courses at the higher level (Cavallo & Laubach, 2001; Freedman, 1997;
Gallagher, 1994). Unfortunately one of the reasons for not having practical done in
school is because the teachers are “not confident to conduct experiments and not
experienced in the enquiry approach to teaching, thereby causing the objectives for
learning science not to be achieved” (Cavallo & Laubach, 2001; Gray, 1999; Freedman.
1997; Young et. al. 1997).
Simpson & Oliver (1990) discovered that conducive classroom environment
enhances the student’s desire to study science subjects. They reasoned that the
classroom is a place where strategy and innovation in teaching and studying occur,
where events like communication between teachers and students exist and where
teacher’s involvement and encouragement of students take place.
Furthermore, studies done by Woolnough (1994) and Remick & Miller (1978)
found that the attitude and integrity of teachers in teaching encourage the students to
enjoy studying science. The study done by Cavallo & Laubach (2001) found that the

81
lack of emphasis on experiments in science while studying affects the motivation of the
students to study science.
According to the measuring scale for science used in TIMSS-R, many students in
Malaysia have very low level of scientific skill. About 85% of the students in Form 2
who studied science only remember and know few factors about the life and physical
sciences in daily language. Malaysian students still have not achieved the high
scientific skills in the secondary level and this has caused them to have low interest in
studying science at the higher level (Molly et. al., 1996; Sharifah et. al., 1993).
The study done by BPPDP (Education Ministry, 1996) pertaining to the academic
achievement of students in the rural areas has affirmed the study done internationally
and come up with 4 school factors that influence academic performance of students in
the rural areas in all subjects of study including science and mathematics as shown in
Figure 2.4.
Teacher Curriculum & Students
- Teacher motivation - Motivation of student
- Lacking of trained teacher - Mental readiness
- Experience - Health and food
- Location and mismatch - Competition
- Place of residence - Daily experience vs.
- Initiative Issues of academic teaching programme
performance
Resources & Organisation Environment & Society
of School - Knowledge
- Basic facilities - Needs
- Merging of classes - Financial
- Positions - Supervisory body
- Management
Diagram 2.4: Factors Relating to Student’s Academic Performance
Source: Sufean Hussin & Norliza Zakuan, 2009, pp. 47-49.
(1) The teacher
The teacher plays the key role in the teaching and learning process in the classroom but
to be able to successfully accomplish this demanding role they need experience, skill,
knowledge, creativeness, leadership, initiative and emotional intelligence.

82
(2) Curriculum and students
The curriculum for science or mathematics that is developed for a student at a particular
grade should match the intellectual level of the student to enable learning to take place
effectively. Students should be mentally alert, in good health and motivated to learn.
(3) School resources and organization
The structure of the school and its environment should have the facilities, tangible and
intangible resources and management capability to enable the development of a climate
that is conducive for teaching and learning to take place.
(4) Environment and society
It is not just the internal environment; the external environment too played a supportive
role for the students in the school to achieve academic success. The society makes
demand on the kind of citizens it wants to have coming out from the schools and higher
institutions of learning. The industries the kind of job prospects and the employees they
want. It is necessary to supervise this development and funds to be provided by the
government for the schools to facilitate the study science and technology subjects.
2.13 Environment and Society
It is a norm to use academic achievement as the indicator to determine the courses of
study to be taken by students at the higher level in many developing countries (Sufean
& Norliza, 2009, p. 51). In secondary schools the Form 3 examination results (SRP) are
used to place students in the arts or science streams in Form 4 classes. It leads to more
girls further their studies at the higher level compared with boys. For example Chew,
Lee and Quek (1995, pp. 30 & 37) found that more girls are studying in Form 5 and
Form 6 classes. The girls prefer to study arts-based stream while boys the science
stream. On 21/7/2011, the Sin Chew Daily reported that at the tertiary education, there
83
are more girls (65%) than boys (35%). Two reasons have attributed to this
development:
(1) The girls are more precocious and have better understanding of the need to study
hard than boys and that they have a solid foundation at the primary schools.
(2) Boys on the other hand, only begin to realize later that they need to study hard but
they have a weaker foundation at the primary school level.
Beside the gender factor, the community also influences the interest of the students
towards science and technology. Chew and others (1995, p. 74) found that in Malaysia
the community influences the choice of study at the higher education level. They found
that the Indian community prefers the study medicine and sciences; this is followed by
the Chinese community and lastly the Bumiputra community.
Young and others (1997) and Woolnough (1994) found that students who followed
the science and engineering studies are convergent in their thinking. On the other hand,
students who do not follow the sciences are more divergent in their thinking. Young and
others (1997) also found that students who studied science and technology have positive
self-concept, are resourceful and have the determination to succeed. It is found that the
boys do better in science than the girls. It is also discovered that academic
achievements have enabled students to follow the science and technology fields, but
those who have attained average achievements do not go for the science and technology
studies (Fitzgerald, 1993). Sufean and Norliza (2009) found that students who achieved
good results in the science and technology subjects at the secondary schools pursue
those studies at the universities.
Chew et. al. (1995, 2001) did a longitudinal study and found that students, whose
fathers with high levels of income and education, tend to have high education aspiration
and high expectation and they prefer to study medical science, natural science,
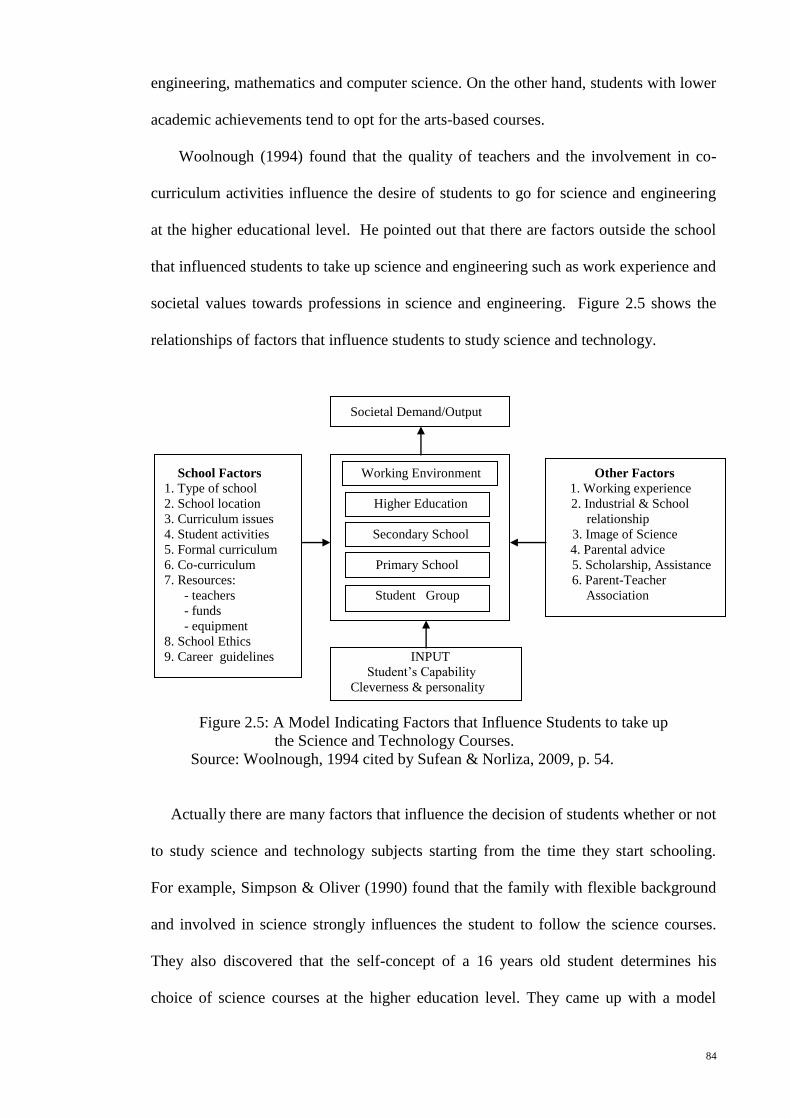
84
engineering, mathematics and computer science. On the other hand, students with lower
academic achievements tend to opt for the arts-based courses.
Woolnough (1994) found that the quality of teachers and the involvement in co-
curriculum activities influence the desire of students to go for science and engineering
at the higher educational level. He pointed out that there are factors outside the school
that influenced students to take up science and engineering such as work experience and
societal values towards professions in science and engineering. Figure 2.5 shows the
relationships of factors that influence students to study science and technology.
Societal Demand/Output
School Factors Working Environment Other Factors
1. Type of school 1. Working experience
2. School location Higher Education 2. Industrial & School
3. Curriculum issues relationship
4. Student activities Secondary School 3. Image of Science
5. Formal curriculum 4. Parental advice
6. Co-curriculum Primary School 5. Scholarship, Assistance
7. Resources: 6. Parent-Teacher
- teachers Student Group Association
- funds
- equipment
8. School Ethics
9. Career guidelines INPUT
Student’s Capability
Cleverness & personality
Figure 2.5: A Model Indicating Factors that Influence Students to take up
the Science and Technology Courses.
Source: Woolnough, 1994 cited by Sufean & Norliza, 2009, p. 54.
Actually there are many factors that influence the decision of students whether or not
to study science and technology subjects starting from the time they start schooling.
For example, Simpson & Oliver (1990) found that the family with flexible background
and involved in science strongly influences the student to follow the science courses.
They also discovered that the self-concept of a 16 years old student determines his
choice of science courses at the higher education level. They came up with a model

85
(Figure 2.6) to show the interactions of various factors relating to the decision of a
person to follow the science and technology areas in his life time. The model shows the
four important stages in decision making to come to the conclusion to be involved in the
life-time learning of science, starting from primary stage, lower secondary, upper
secondary and post-secondary.
Life Phases Factors & Special Influencers Stages in Decision Making
Preschool &
Primary School
---------------------
Lower Secondary
Level
---------------------
Upper Secondary
Level
---------------------
Post Secondary
Level
Personal Home
Early exposure to science &
---- mathematics in school ----
Attitude & Early
motivation achievement
towards in the science
science subjects
---- Personal concept towards science ----
Selection & Achievement
following in science &
science & technology
technology courses
courses
Commitment to science and
--- technology courses ---
Life long Life long
interest learning in
towards science &
science & technology
technology courses
Decision by family & school
towards enrollment in
science course
----------------------------------
Decision on the importance
of courses related to science.
----------------------------------
Decision in the selection and
following the core studying
subjects and science
electives.
----------------------------------
Decision to have a career in
science and technology.
Figure 2.6: A Model of Factors and Special Influencers that Influence Decisions
for Life Long Involvement in Science and Technology.
Source: Adapted from Simpson & Oliver, 1990, cited by Sufean Hussin & Norliza
Zakuan, 2009, p.55.
Another encouraging factor is the higher rate of return for science graduates
than the arts graduates and that the science graduates earn higher starting salaries than
the arts graduates. The salaries are highest among the engineering graduates, followed
by the science graduates. The commerce (business, economics and accounting)

86
graduates enter the labour market at a low starting salary; they enjoy increments that
greatly superseded the earnings of the arts graduates in the first few years of their career
(Nagaraj, Chew, Lee & Rahimah, 2009, pp. 204-205).
2.14 Low demand of science and technology studies in secondary schools
Chew et al (1995, p.101) found that only 17% of the Fifth Form students and 11.5% of
the Sixth Form students are interested to pursue engineering and science at the higher
level of education.
One of the most crucial and pertinent findings of the research done by Sufean and
Norliza (2009) is that students who studied pure science in secondary school and at the
STPM level, enter the university to do science, medicine, dentistry, engineering and
pharmacy courses. This clearly indicates the path of studies the students have taken after
doing pure science at the secondary school and at the STPM level when they enter the
university.
However after the introduction of the KBSM programme in the secondary school in
1989, the situation started to change, there are fewer students going for the science and
technology courses at the higher institutions of learning. As a consequence, less science
and technology graduates are available to meet the need of the country. This has
affected the achievement of the 60:40 policy and the process to create a k-economy
becomes uncertain. The consequential effect is the delaying of the transformation
process to make Malaysia a developed nation. Students are not attracted to pursue
science and technology studies in secondary schools, even though there are significant
advantages such as:
The private rate of returns is the highest for science graduates compared with
arts and business graduates where the rate of returns is the lowest.
There is a demand for science and technological graduates in the country.
87
Industries are looking for workers who are skilled and knowledgeable in the
scientific and technological areas.
What possibly has gone wrong to the implementation of the 60:40 policy?
Some of the answers:
(1) Absence of incentives.
The government wants the 60:40 policy to be implemented in order to have the
necessary human resource educated in science and technology knowledge to bring about
the transformation of the nation into a developed economy. Furthermore, industries
prefer to have workers with the science and technology knowledge and skills to
complement their human resource requirements.
These two convergent factors should play an important role to encourage more
students to take up science and technical studies in the secondary schools. In reality it
has not happened. Students are not motivated by these two factors to take up the
challenge to study science and technology based subjects. The possible explanation is
that these two factors have no immediate effect on the students in spite of the findings
that students are encouraged to pursue formal education because of their interest in the
course; ability to pursue the course; belief that the course will enable them to obtain an
interesting job; belief that the course provides good financial returns; and family
members urged them to do so.
From the point of expectancy there are no rewards to induce the students to take up
the study of science and technology. They prefer immediate rewards but not what they
will get in the future. Therefore scholarships, bursaries, loans and other incentives are
necessary to encourage and motivate students to go for the science and technology
streams in the secondary schools as well as to instill in them the sense of importance
and pride as the future contributors to the economic and social development of the
88
nation (Lee, Quek & Chew, 2001, p. 174). These rewards will in a way give them some
form of certainty of their future.
(2) Absence of career guidance and counseling.
Chew et al. (1995, p.49 & p.102) found that most students in the fifth and sixth forms
admitted that career guidance and counseling they have received in their schools is very
useful. Therefore they strongly emphasized the importance of giving proper career
guidance and counseling in orienting students towards the fields of specialization in
science and technology as early as possible.
(3) Inadequate concern for upgrading science and technology facilities.
The total enrollment in tertiary education has increased, but the proportion of students in
the science-based courses in relation to total enrollment is relatively low. There is an
apparent lack of comprehensive strategy to upgrade science and technical facilities in
the secondary schools for teaching and learning, increasing the quality and quantity of
science and technology teachers and introducing special incentives. (Nagaraj, Chew,
Lee & Rahimah, 2009, p.268).
Several research findings (for example, Leong et al. 1990; Siow et al., 1999, 2007)
have shown that adequate physical facilities, instructional materials and effective
teaching are positively related to academic achievement (Nagaraj, Chew, Lee &
Rahimah, 2009, p.262). Therefore strategies should be developed to upgrade science
facilities in the primary and lower secondary schools as well.
(4) Limited accessibility to courses at the tertiary education.
More up-to-date science and technology-based courses at the tertiary education should
be made available to provide for diversified interests among the students in their areas
of study. Augmenting to this aspect of development should be the creation of greater
accessibility to the study of science and technological courses for students from the
89
secondary schools. These developments would then encourage more students to study
science and technical subjects in schools.
(5) No creative students.
Sufean and Norliza (2009, p.93) identified that the ability to generate creative ideas and
the attainment of intellectual satisfaction has been among the factors that encourage
students to take up courses of study involving science and technology at the university.
This implies that these students want to have the knowledge to solve problems in a
creative way, open discussion with others and the intellectual ability to think
divergently and independently as well as the personality to cope with criticism of their
ideas. They are also highly motivated and prepared to experiment and take risk. They
want the implicit capabilities of a creative person (DuBrin, A.J., 2005, pp. 89-91).
Creative students tend to join the science-based stream but there are not many of
them at the secondary school level. This aspect of the teaching and learning to generate
creative students is apparently absent in the schools (Nagaraj, Chew, Lee & Rahimah,
2009, p.268).
(6) No risk-taking or experimentation
The research findings of a longitudinal study done on two cohorts (Form V and Form
VI) of school-leavers started by a group of researchers at the Faculty of Education,
University of Malaya in 1989 and completed in 1996 found that about 6% of the 1697
respondents are willing to take risk while the 94% of the respondents have the other
four behavioural traits such as autonomy (independence), complexity, motivation and
openness. Since all the five behavioural traits are crucial to creativity it is apparent that
the current output of the educational system falls short of providing the five
characteristics of creativity, particularly in understanding the importance of risk-taking
in terms of experimenting. Risk-taking through experimentation is considered necessary
to bring about learning and discovery of new ideas. However, the absence of creative

90
thinking discourages students from entering the science stream in the secondary schools.
This is because science by its nature is creative (Nagaraj, Chew, Lee & Rahimah, 2009,
p. 249).
(7) Lacking of opportunity for creative learning.
Creativity is a gift to some people. Children can be taught the creative skills from the
primary school level. Children by nature are curious and this provides a good
opportunity to parent them on creative skill development right from the time they enter
prior primary school level, and through the primary school level to the lower secondary
level. This is be done by creating a rich, nurturing and stimulating environment filled
with interesting materials, toys, games and books to lay the foundation for children to
explore and exercise all of their intelligence and learn the skills of creativity. Students
who have these kinds of experience know many ways to learn almost anything,
especially science and technical areas.
However, a “memory-based learning designed for the average student” system of
education tends to kill creativity among the children, rather than a system that stimulates
and fosters creative thinking and excellence (Ministry of Education, 1997, p. 9) is no
longer appropriate for this 21st century. Memorization and rote-learning together with
the emphasis on conformity and uniformity and risk-aversion, hinders the development
of creative thinkers.
The approach to encourage more students to take up the study of science and
technology is to get them to become creative individuals from the early age. By the
time these students reach the upper secondary school level they will able to appreciate
the creative nature of science and technology and that real learning will take place
through the process of enquiry and discovery but not the memorization of facts. This
approach does not seem to take place in schools (Nagaraj, Chew, Lee & Rahimah, 2009
pp. 246-251).

91
(8) Narrow scope of courses at the university
Not every student who followed the science-based study wants to pursue the traditional
courses at the university. Many of them prefer other courses of study that are of
practical demand in today’s world and universities should cater for their needs.
(9) Open policy of SPM discouraging students
The open policy of SPM allows students to make choices of studies and dilutes science
knowledge with other unrelated areas. The consequential effect is that it creates a
barrier that hinders the implementation of the 60:40 policy.
(10) Divergent objectives
The achievement of the 60:40 policy is affected by the manner in which it is being
implemented. The objectives of the planners of the policy and the implementers are not
converging. Implementation of the policy has become a political issue rather than the
long term interest of the nation. There is no consistent and integrated effort to ensure
the success of the 60:40 policy.
(11) Poor employment opportunities
Table 2.11: Employment by Major Occupational Group, 2006-2015 ___________________________________________________________________________________ Thousand Persons__________________________________
Estimated Estimated Estimated
Major Occupational Group 2006 2007 2008 2009 2010 2012 2015 (%) (%)_____________________
1 Senior Officials and Managers 903.9 832.1 810.4 906.4 941.9 100.9 1097.7
(8.1) (8.0) (8.1) (8.3) 2 Professionals 613.8 649.7 671.4 697.2 741.7 827.9 1031.6
(5.5) (6.3) (6.7) (7.8)
3 Technicians & Associate 1417.2 1515.9 1620.7 1656.1 1660.0 1915.3 2248.4 Professionals (12.7) (14.1) (15.5) (17.0)_
Subtotal 2934.9 2997.7 3102.5 3259.7 3343.6 2844.1 4377.7_
4 Clerical Workers 1048.9 1117.0 1146.1 1115.6 1142.0 1210.9 1256.4
(9.4) (9.7) (9.8) (9.5)
5 Service Workers & Shop & 1729.6 1846.5 1933.3 1917.4 1942.6 2112.9 2274.8
Market Sales Workers (15.5) (16.5) (17.1) (17.2) 6 Skilled Agricultural & Fishery 1450.7 1470.3 1377.6 1347.9 1295.1 1297.4 1230.0
Workers (13.0) (11.0) (10.8) (9.3)
7 Craft & Related Trade Workers 1249.8 1231.0 1250.3 1196.9 1259.7 1272.7 1322.6 (11.2) (10.7) (10.3) (10.3)
8 Plant & Machine Operators and 1528.8 1458.9 1458.1 475.8 1495.2 1371.6 1362.2
Assemblers (13.7) (12.7) (11.1) (10.3) 9 Elementary Occupants 1216.3 1276.6 1308.1 1313.2 1295.1 1346.9 1401.9
(10.9) (10.9) (10.9) (10.6)_
10 Total Employment 11159.0 11398.0 11576.5 11620.5 11773.3 12356.5 13225.6 (100) (100) (100) (100)_
Source: Economic Planning Unit & Department of Statistic Malaysia, Table 12,
Appendix 1, pp. 380- 381, 10th Malaysia Plan.
92
Students are not encouraged to take up the study of science and technology when there
are poor employment opportunities for science and technology graduates.
Table 2.11 (portrayed in Table 1.11 in page 21) shows that there were 102,000 jobs
created annually from 2006 to 2010 for the first three categories of the professional
groups. However, from 2011 to 2012 a decline of 250,000 jobs annually is expected. It
is estimated that from 2013-2015 the increase in jobs for the professional groups would
exceed half a million a year. There is apparently more uncertainty about the prospect of
job opportunities for the professional and technocrats in the near future.
The industries prefer qualified personnel because they do not want to spend time and
money to train unqualified people to reach the expected level of knowledge and skills.
However, by 2020 the country is expected to require 500,000 science and technology
graduates as crucial for the Malaysian development and that the MOE has allocated
RM300 million to improve and upgrade secondary schools and primary schools
laboratories, reintroduce practical science examination and increase pure science
subjects’ teaching hours to 5 times a week. This is to reinforce the 60:40 policy in the
secondary schools to get more science students to universities (Universities News,
14/7/2013).
In 2011 there were only 180,000 undergraduates studying science and technology
courses at the public universities and it was expected that 40% of them would swift to
the arts courses, resulting in 102,000 of them continued their study in science and
technology courses. It is not be possible to provide the science and technology graduates
required in 2020. The situation is further compounded by the declining enrollment of
students at the public universities (Table 2.9 in p. 72). The situation of poor
employment opportunities for science and technology graduates discourages students to
study science and technology subjects at the secondary school level.
93
(12) Lacking of flexibility and interdisciplinary of courses.
Chew, Lee and Quek (1995, pp. 72-73) found that most of the students aim to enter the
university and the increase of the university fees do not discouraged them. Their
parents are prepared to bear the costs for their university study. The team also found
that most of the students prefer the arts-based courses at the university.
The team suggested that a shift has to be made to include “science based and
professional based courses into the fully arts based courses” thereby creating
“interdisciplinary courses” to improve the job opportunities of the graduates and to
improve “their flexibility and adaptability in their workplace” (Lee, Quek & Chew,
2001, p.174 & Nagaraj, Chew, Lee & Rahimah, 2009, p.268-269). This approach
enhances the implementation of the 60:40 policy.
(13) Mismatch with the need of labour market
Organizations generally prefer to have people who possessed knowledge and
specialization in few areas such as “science, law, business administration, accountancy,
production process and human resource management”. In like manner, “a non-
professional graduate should have studied some elements of professional or science
based courses” in order to be more employable (Lee, Quek & Chew, 2001, p. 174).
In schools students need to acquire “skills beyond basic mathematics, science,
languages and humanities” to include “critical thinking, interpersonal skills,
intrapersonal skills” to enhance their intellectual capabilities to meet life challenges in
this globalized world (Nagaraj, Chew, Lee & Rahimah, 2009, pp. 263-264). Then the
students are able to make better decisions and choices to succeed in their lives. They
can see better the wisdom in science and technology. This is in line with the words of
Hobbs and Chernotsky (2007, p. 2) “First students need to develop an increasing
awareness of the world’s complexity and interdependence. Second they must appreciate
94
differences. Third, they will require the ability to communicate across cultures” (cited
in Nagaraj, Chew, Lee & Rahimah, 2009, p. 264).
2.15 Conclusion
The process of globalization has generated so much of interest in terms of competition
and rivalry among firms everywhere. It has brought new demands on firms to make the
necessary responses to the shortening of the product life cycles, market volatility and
sophisticated and knowledgeable customers. Firms are literally pressured to become
more flexible, creative and innovative in order to remain competitive in a dynamic and
changing landscape. On the other hand, the advances in ICT has made information so
readily available to firms thereby enabling them to make better decisions and to gain
competitive advantages. Furthermore, manufacturing firms are adopting new
technologies to support the strategy of flexibility and align their structures and
management processes to reap the benefits of the new technologies.
Adapting to new technologies and production processes also requires the role of the
human resource to bring about changes and improvements. It also involves shifting a
rigid and traditional culture to a flexible and learning culture among the people in
organisations like schools. The people in the organisations must be prepared to learn all
the time in order to acquire the knowledge, skills and capabilities to meet the challenges
brought about by globalization. The organisations need the knowledge-based workers
(in short k-workers) in order to succeed in a competitive landscape of this information
era.
Firms that are dealing in international business are basically the Multinational
Enterprises (MNEs) and they dominate the world trade and foreign direct investments.
Most of the MNEs are found in the developed economies such as the USA, EU and
Japan and they do most of their investments and trading in these regions. This is an
95
expected outcome because the kinds of workers they need are found in these developed
nations i.e. the k-workers. Therefore any country that wants to attract FDI must have the
k-workers or the MNEs will by-pass the country and go to those that have the k-
workers. Attracting FDI into a country is imperative to bring about economic growth
and technological skill advancement, besides creating job opportunities.
Knowledge actually is referred to as “a conclusion that is drawn from the
information after it is linked to other information and compared to what is already
known” (Daft, 2007, p.297). This is what is expected of the k-workers. However before
they are able to become k-workers they have to learn about science and technology
which is about the orderly acquisition of knowledge. The 60:40 policy is conceptualized
to bring about this development in the students while they are still in schools and
tertiary educational institutions.
In the Education Development Plan 2001–2010, it is noted that the 60:40 policy has
created so much impact on the restructuring of the education system in this 10-year
timeframe for example the creation of the Smart schools and the emergence of private
colleges and foreign universities.
The wealth of a nation can no longer be based only on the physical capital but more
importantly on the human capital. This is because the quality of the human capital
determines the effective and efficient use of the physical resources to achieve economic
growth and economic competitiveness. This quality of the human capital is derived
from its intellectual capital that is found in the human resources. The sources of this
capital are the schools, colleges and universities where the “best and brightest” are
found. A nation can have all the necessary resources but without the education to
enhance the knowledge and skill of its people, it will not grow.
The 60:40 policy challenges the government to provide adequate funds for the
development and implementation of the science and technology education in the
96
country. Investing in education is a form of human capital investment that leads the way
to more productive economy and economic growth. Having an abundant supply of well-
educated individuals enables the country to facilitate the absorption of technology from
developed countries and the development of high technological projects. Furthermore
the type and quality of education especially in science and technology indicates the type
of products and services that can be offered in the country and to the world.
The 60:40 policy, therefore, is the programme for Malaysia to transform its
education system to bring about the institutionalization of a set of cultural attributes in
the creation of k-workers. Factors should be made attractive for students and parents to
want their children to study science and technology to make the 60:40 policy works. So
far the efforts to get more students to take up the science and technology courses at the
higher learning institutions have not been encouraging. There is much to be done to
motivate students in the secondary schools to do these courses.
Many factors have been identified as the possible causes for the lack of interest
among the secondary school students to study science and technology subjects at the
schools such as lack of science teachers, ill-equipped laboratories, poor teaching
methods and lack of career incentives. So much has been known about the negative
aspects that slowed down the achievement of the 60:40 policy and yet there is little that
has been achieved to bring about the positive change.
The value of education is an undisputed fact that it is of paramount importance to the
advancement and survival of a nation in a competitive landscape in this century.
The 60:40 policy on the other hand is to encourage more students to study science
and technology-based areas in order to establish a society with a scientifically creative
human resource to transform the nation into a modern world.