Research Proposal March03
26
Republic of the Philippines Eastern Visayas State University Tacloban City THE SOLVENT EXTRACTION OF ROSA ROSA (RED ROSE) FLOWER PETALS AND ITS APPLICATION AS PH INDICATOR ___________________________ A Research Proposal In Partial Fulfillment of the Requirements for the Course (ChE 361) Chemical Engineering Methods of Research II ___________________________ Submitted by: Sarahster A. Alejandre Almira O. Ripalda BSChE- 4A Submitted to: Engr. Nida B. Lacaba, MA Professor
-
Upload
independent -
Category
Documents
-
view
2 -
download
0
Transcript of Research Proposal March03
Republic of the PhilippinesEastern Visayas State University
Tacloban City
THE SOLVENT EXTRACTION OF ROSA ROSA (RED ROSE) FLOWER PETALS AND ITS APPLICATION
AS PH INDICATOR___________________________
A Research Proposal
In Partial Fulfillment
of the Requirements for the Course
(ChE 361)
Chemical Engineering Methods of Research II
___________________________
Submitted by:Sarahster A. Alejandre
Almira O. RipaldaBSChE- 4A
Submitted to:Engr. Nida B. Lacaba, MA
Professor
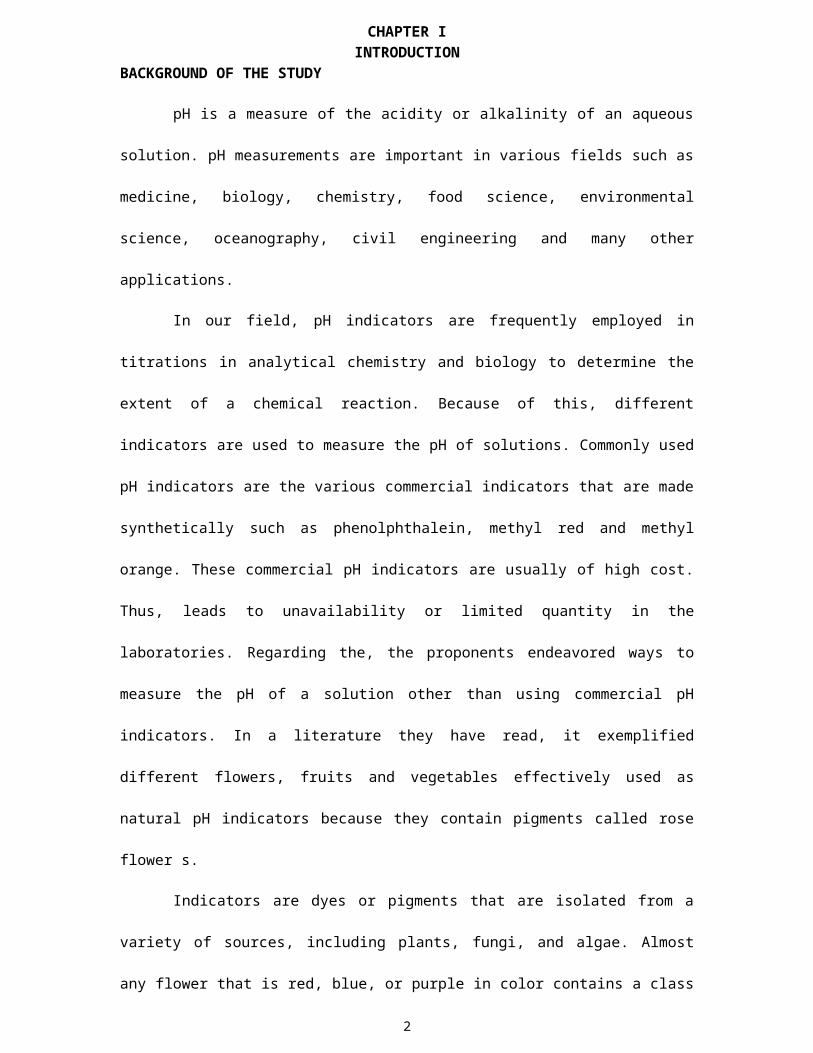
CHAPTER IINTRODUCTION
BACKGROUND OF THE STUDY
pH is a measure of the acidity or alkalinity of an aqueous
solution. pH measurements are important in various fields such as
medicine, biology, chemistry, food science, environmental
science, oceanography, civil engineering and many other
applications.
In our field, pH indicators are frequently employed in
titrations in analytical chemistry and biology to determine the
extent of a chemical reaction. Because of this, different
indicators are used to measure the pH of solutions. Commonly used
pH indicators are the various commercial indicators that are made
synthetically such as phenolphthalein, methyl red and methyl
orange. These commercial pH indicators are usually of high cost.
Thus, leads to unavailability or limited quantity in the
laboratories. Regarding the, the proponents endeavored ways to
measure the pH of a solution other than using commercial pH
indicators. In a literature they have read, it exemplified
different flowers, fruits and vegetables effectively used as
natural pH indicators because they contain pigments called rose
flower s.
Indicators are dyes or pigments that are isolated from a
variety of sources, including plants, fungi, and algae. Almost
any flower that is red, blue, or purple in color contains a class
2
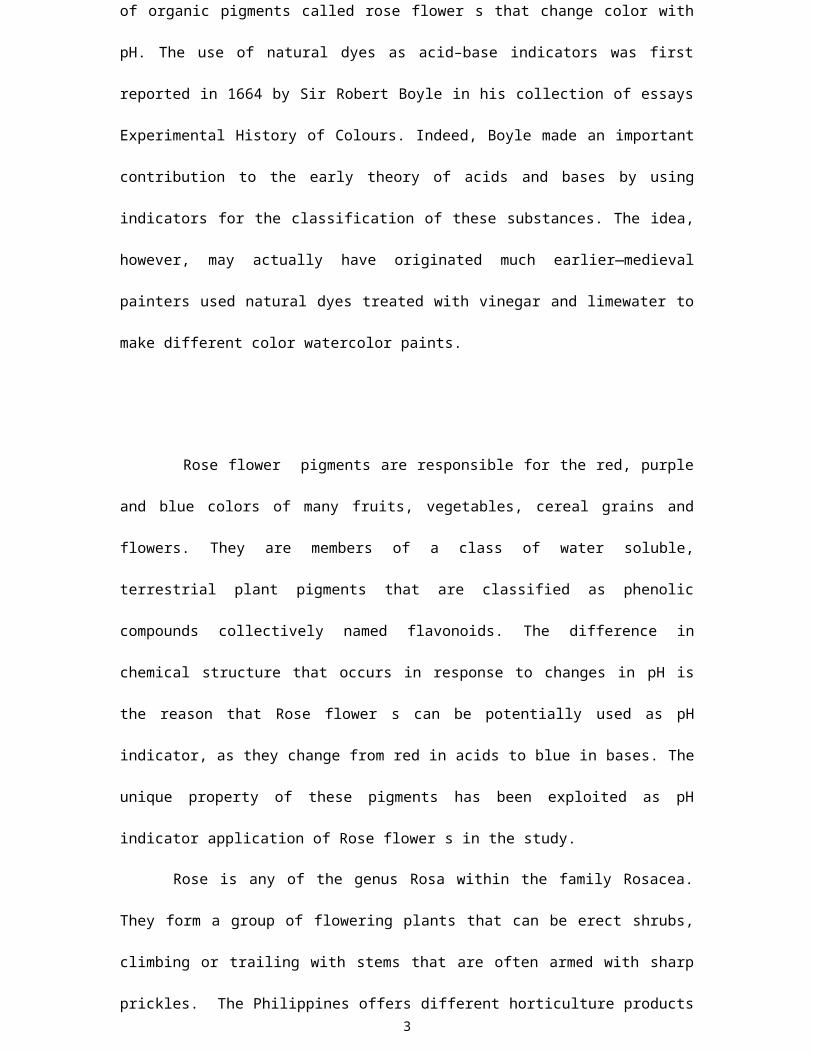
of organic pigments called rose flower s that change color with
pH. The use of natural dyes as acid–base indicators was first
reported in 1664 by Sir Robert Boyle in his collection of essays
Experimental History of Colours. Indeed, Boyle made an important
contribution to the early theory of acids and bases by using
indicators for the classification of these substances. The idea,
however, may actually have originated much earlier—medieval
painters used natural dyes treated with vinegar and limewater to
make different color watercolor paints.
Rose flower pigments are responsible for the red, purple
and blue colors of many fruits, vegetables, cereal grains and
flowers. They are members of a class of water soluble,
terrestrial plant pigments that are classified as phenolic
compounds collectively named flavonoids. The difference in
chemical structure that occurs in response to changes in pH is
the reason that Rose flower s can be potentially used as pH
indicator, as they change from red in acids to blue in bases. The
unique property of these pigments has been exploited as pH
indicator application of Rose flower s in the study.
Rose is any of the genus Rosa within the family Rosacea.
They form a group of flowering plants that can be erect shrubs,
climbing or trailing with stems that are often armed with sharp
prickles. The Philippines offers different horticulture products3
for both domestic and external trade and Roses are one of these
products usually used for aesthetic purposes. Different species
of Roses are widely cultivated in our country, even in simple
household gardens. The most common variety is the red Rose. Its
vibrant red coloration is caused by the abundance of rose flower
pigments in its petals. Thus, Roses is chosen as the suitable raw
material of the study.
STATEMENT OF THE PROBLEM
The research study aimed to form a natural pH Indicator
sourced from Rosa rosa (red Rose) flower petals extract.
Specifically, the study seeks to answer the following questions:
1. What is the pH of the acidified methanol rose flower extract
and water rose flower extract?
2. What color change does the rose flower extracts exhibit during
pH indication application?
3. Is there any significant difference between the results of the
application of extracted pH indicators with phenolphthalein pH
indicator in determining the equivalence point in different
types of titrimetric analysis?
NULL HYPOTHESIS
1. The efficacy measured in terms of precision in
obtaining sharp color change in titration by using such4
rose flower extract as pH indicators do not give
quantitative results compared with phenolphthalein
synthetic indicator.
2. There is no effective substitute to the frequently used
pH indicators in measuring the precise pH of the solution
other than the phenolphthalein synthetic indicators.
SIGNIFICANCE OF THE STUDY
It is hoped that through a successful result of the
research study, the will give benefit to the following:
1. To the students. They will be able to use the rose flower
extract as an effective and safe substitute to
those expensive commercial indicators in
measuring the pH of a solution.
2. To the institution. They can introduce the rose flower
extract in their science laboratories as an
effective substitute to the frequently used
commercial indicators such as phenolpthalein,
provided that these rose flower extract sourced
from rose petals extract is less expensive and
safe to use.
3. To the community. The study will give great value to the
common flower Rose (rosa). Thus, the study will
give the needed interest to the people of the
community to become motivated in cultivating5
Roses.
4. To the researchers. The success of the study would bring a
sense of fulfillment and accomplishment to the
researchers.
DEFINITION OF TERMS
These are some of the terminologies used that will
help us provide a better understanding of the study:
Acids (often represented by the general formula HA) is
generally a chemical compound that when dissolved in
water will produce a solution with a pH less than 7.
In the modern definition, an acid is a substance that
can give a proton (H + ions) to other substances
(called bases), or may receive a free electron pair of
the bases.
Rose flower s water-soluble vacuolar pigments that may appear
red, purple, or blue depending on the pH. They belong
to a parent class of molecules called flavonoids
synthesized via the phenylpropanoid pathway; they are
odorless and nearly flavorless, contributing to taste
as a moderately astringent sensation.
Bases are chemical compounds that release hydroxide ions
(OH -) when dissolved in water. Base is the opposite
of acid, which is intended to elements / compounds
6
that have a pH more than 7.
Extract a product (as an essence or concentrate prepared by
extracting) especially a solution(as in alcohol) of
essential constituents of a complex material (as an
aromatic plant).
Extraction a separation process consisting in the separation of
a substance from a matrix. .
Flavonoid any of a group of oxygen-containing aromatic
antioxidant compounds that includes many common
pigments (as the rose flower s and flavones).
pH indicator is a halo-chromic chemical compound that is added in
small amounts to a solution so that the pH (acidity or
basicity) of the solution can be determined
visually.It is a chemical detector for hydroniumions (
H3O+) or hydrogen ions (H+) and
changes color depending on whether they donate or
accept proton.
pH a measure of acidity and alkalinity of a solution that
is a pH value of a neutral solution is 7.0. Solutions
with a pH value below 7.0 are considered acidic,
whereas solutions with pH value above 7.0 are basic
(alkaline)..
Purificationis defined as to remove impurities and undesired
7
substances from the extract.
Rose a woody perennial of the genus Rosa, within the
family Rosacea.
Titrimetric analysis refer to quantitative chemical analysis
carried out by determining the volume of solution of
accurately known concentration which is required to
react quantitatively with a measured volume of a
solution of the substance to be determined.
8
SCOPE AND DELIMITATION OF THE STUDY
The study focused on the extraction of rose flower petals
and its application as pH indicator. The extracted rose flower
from Rosa rosa (red rose) petals will be utilized as pH indicator
and its precision will be tested in determining the equivalence
point in different types of titrations(titrimetric analysis)
compared to that of conventional synthetic pH indicators. The
comparison of the extracted pH indicator with the conventional
synthetic indicators will be limited to those available in the
area.
Furthermore, the duration of the research will be limited
to the allotted time of experimentation which is 1st Semester,
School Year 2014-2015. The study will also be limited to the
equipment and facilities available at Eastern Visayas State
University-Main Campus Tacloban City laboratories, and other
authorities and institutions found in the province of Leyte if it
will be necessary.
9

CONCEPTUAL FRAMEWORK
10
Gathering of Rosa rosa (red rose) petalsAcidified Methanolic Extraction of Rose petalsPhenolphthalein Synthetic Indicator TitrationComparison of rose flower extract to phenolphthalein indicator in Titrimetric AnalysisTesting of pH indication applicationDeliberate and Analyze DataForm Conclusion and recommendations
CHAPTER II
REVIEW OF RELATED LITERATURE AND STUDIES
The chapter presents the various literature and studies reviewed
by the researchers for the purpose of gaining more insights relevant
to the present study. Hence, the literature and studies are presented
and discussed showing the similarities and differences in some aspect
of the present study.
RELATED LITERATURE
pH.
According to the New Lexicon Webster’s dictionary of the
English language (Encyclopaedic Edition), pH is a symbol
signifying the negative logarithm (base 10) of the hydrogen ion
concentration of a solution or pure liquid expressed in gram per
liter. The range of value of pH extends from 0 to 14, 7 being the
negative logarithm of the hydrogen ion concentration in pure
water of 25 degree Celsius or neutrality. Smaller numbers signify
increasing acidity while greater one is increasing alkalinity.
To determine the pH (acidity and alkalinity) of the solution
a halochromic chemical com
pound in small amount is being added into a solution. Hence, the
chemical detector is called pH
11
indicator. (Steven S. Zumdahl (2009). Chemical Principles 6th Ed
pages 319–324)
According to acid-base theory Bronsted-Lowry, an acid is a
species that gives (donors)
protons, while bases are acting as the recipient (acceptor)
protons in a proton transfer reaction.
(Analytical Chemistry 8th Ed)
12
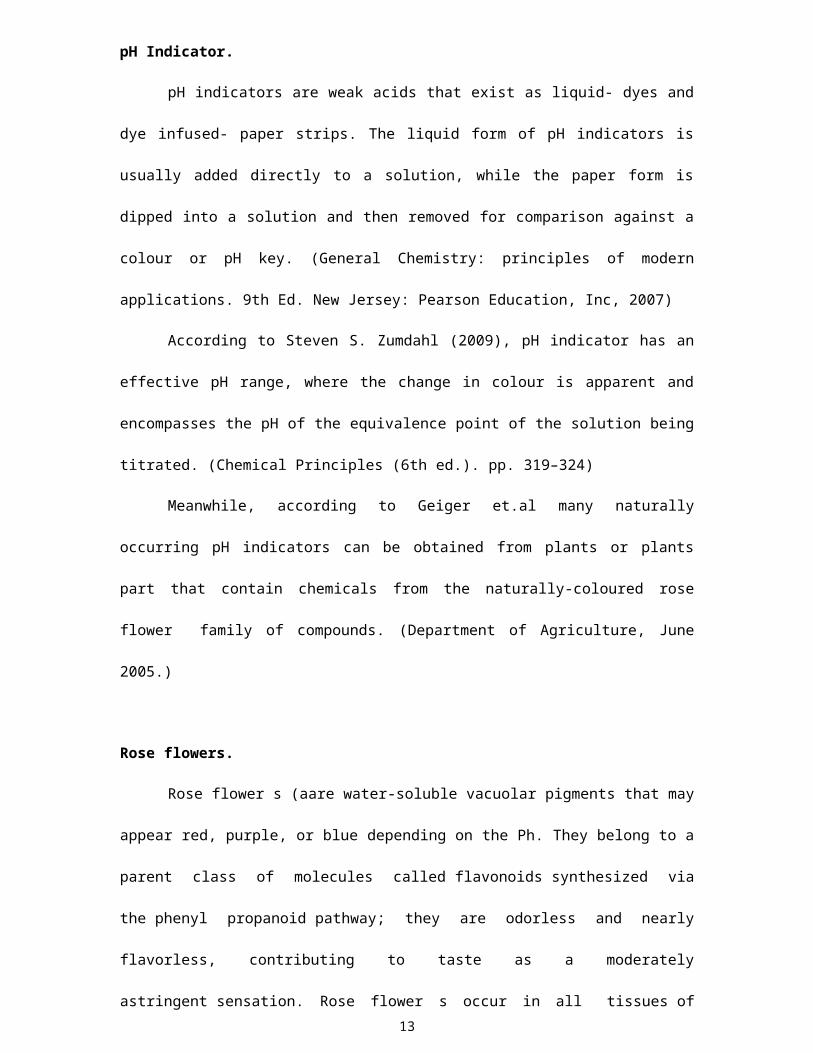
pH Indicator.
pH indicators are weak acids that exist as liquid- dyes and
dye infused- paper strips. The liquid form of pH indicators is
usually added directly to a solution, while the paper form is
dipped into a solution and then removed for comparison against a
colour or pH key. (General Chemistry: principles of modern
applications. 9th Ed. New Jersey: Pearson Education, Inc, 2007)
According to Steven S. Zumdahl (2009), pH indicator has an
effective pH range, where the change in colour is apparent and
encompasses the pH of the equivalence point of the solution being
titrated. (Chemical Principles (6th ed.). pp. 319–324)
Meanwhile, according to Geiger et.al many naturally
occurring pH indicators can be obtained from plants or plants
part that contain chemicals from the naturally-coloured rose
flower family of compounds. (Department of Agriculture, June
2005.)
Rose flowers.
Rose flower s (aare water-soluble vacuolar pigments that may
appear red, purple, or blue depending on the Ph. They belong to a
parent class of molecules called flavonoids synthesized via
the phenyl propanoid pathway; they are odorless and nearly
flavorless, contributing to taste as a moderately
astringent sensation. Rose flower s occur in all tissues of13

higher plants, including leaves, stems, roots, flowers,
and fruits. (Andersen et.al 2001)
Rose flower can be obtained from the rose petals through
the process of extraction. According to Xuejun Pan et.al,
extraction is a separation process consisting in the separation
of a substance from a matrix. It may refer to Liquid-liquid
extraction, and Solid phase extraction. (Chemical Engineering and
Processing, Volume 42, Issue 2, February 2003, pp 129-133)
On the other hand, most commonly used indicators are the
various commercial indicators that are made synthetically. The
indicator such as phenolphthalein, methyl red and methyl orange
are usually in high cost. Thus, lead to its unavailability or
limited quantity in the laboratories.
Therefore, it is indeed the researchers endeavor to develop an
alternative pH indicator from extract rose flower that is not
expensive, yet capable in measuring the pH of the solution.
Roses. Rose (member of Rosa) a family of rosaceae is
believed to have an rose flower compound. They form a group of
plants that can be erect shrubs, climbing or trailing with stems
that are often armed with sharp prickles. Flowers vary in size
and shape and are usually large and showy, in colours ranging
from white through yellows and reds. (Britannica.com. 2007)
14
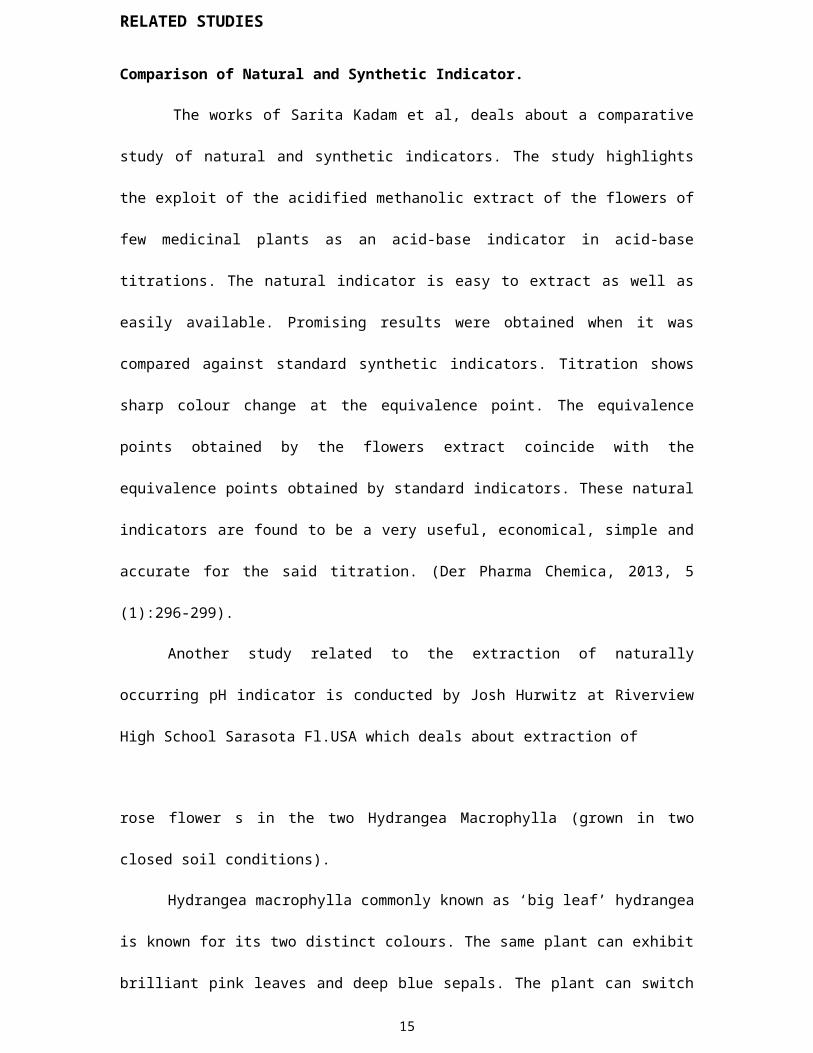
RELATED STUDIES
Comparison of Natural and Synthetic Indicator.
The works of Sarita Kadam et al, deals about a comparative
study of natural and synthetic indicators. The study highlights
the exploit of the acidified methanolic extract of the flowers of
few medicinal plants as an acid-base indicator in acid-base
titrations. The natural indicator is easy to extract as well as
easily available. Promising results were obtained when it was
compared against standard synthetic indicators. Titration shows
sharp colour change at the equivalence point. The equivalence
points obtained by the flowers extract coincide with the
equivalence points obtained by standard indicators. These natural
indicators are found to be a very useful, economical, simple and
accurate for the said titration. (Der Pharma Chemica, 2013, 5
(1):296-299).
Another study related to the extraction of naturally
occurring pH indicator is conducted by Josh Hurwitz at Riverview
High School Sarasota Fl.USA which deals about extraction of
rose flower s in the two Hydrangea Macrophylla (grown in two
closed soil conditions).
Hydrangea macrophylla commonly known as ‘big leaf’ hydrangea
is known for its two distinct colours. The same plant can exhibit
brilliant pink leaves and deep blue sepals. The plant can switch
15
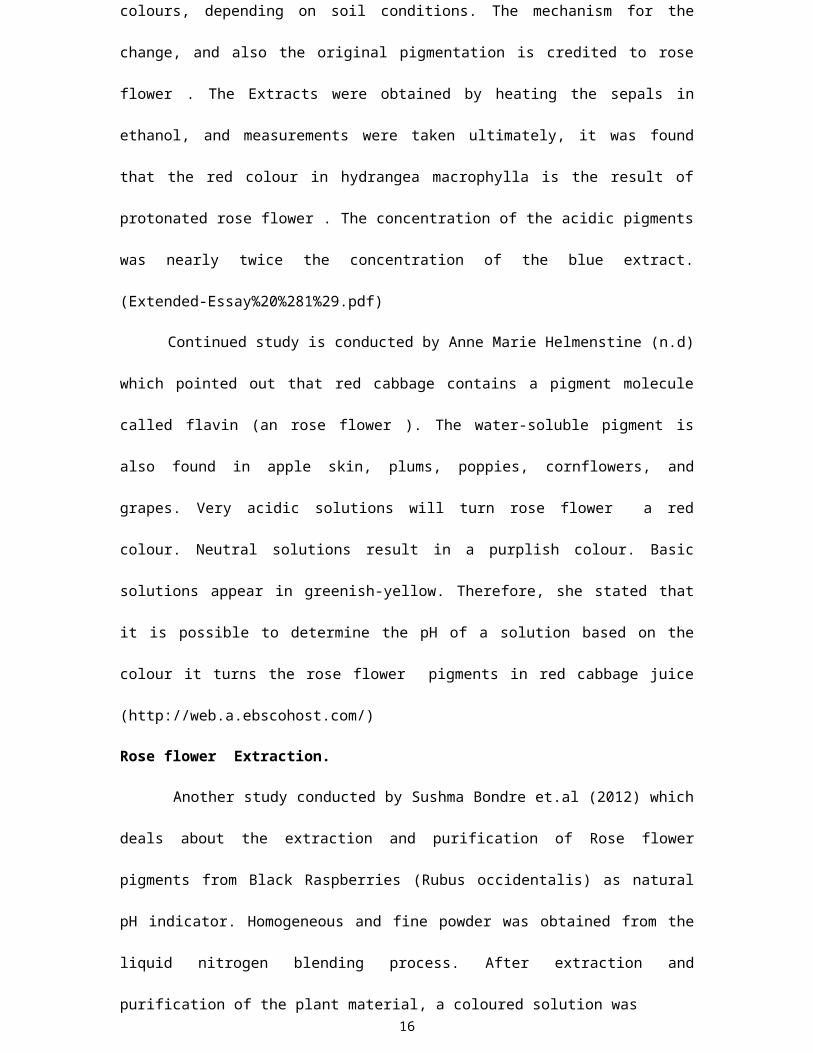
colours, depending on soil conditions. The mechanism for the
change, and also the original pigmentation is credited to rose
flower . The Extracts were obtained by heating the sepals in
ethanol, and measurements were taken ultimately, it was found
that the red colour in hydrangea macrophylla is the result of
protonated rose flower . The concentration of the acidic pigments
was nearly twice the concentration of the blue extract.
(Extended-Essay%20%281%29.pdf)
Continued study is conducted by Anne Marie Helmenstine (n.d)
which pointed out that red cabbage contains a pigment molecule
called flavin (an rose flower ). The water-soluble pigment is
also found in apple skin, plums, poppies, cornflowers, and
grapes. Very acidic solutions will turn rose flower a red
colour. Neutral solutions result in a purplish colour. Basic
solutions appear in greenish-yellow. Therefore, she stated that
it is possible to determine the pH of a solution based on the
colour it turns the rose flower pigments in red cabbage juice
(http://web.a.ebscohost.com/)
Rose flower Extraction.
Another study conducted by Sushma Bondre et.al (2012) which
deals about the extraction and purification of Rose flower
pigments from Black Raspberries (Rubus occidentalis) as natural
pH indicator. Homogeneous and fine powder was obtained from the
liquid nitrogen blending process. After extraction and
purification of the plant material, a coloured solution was 16
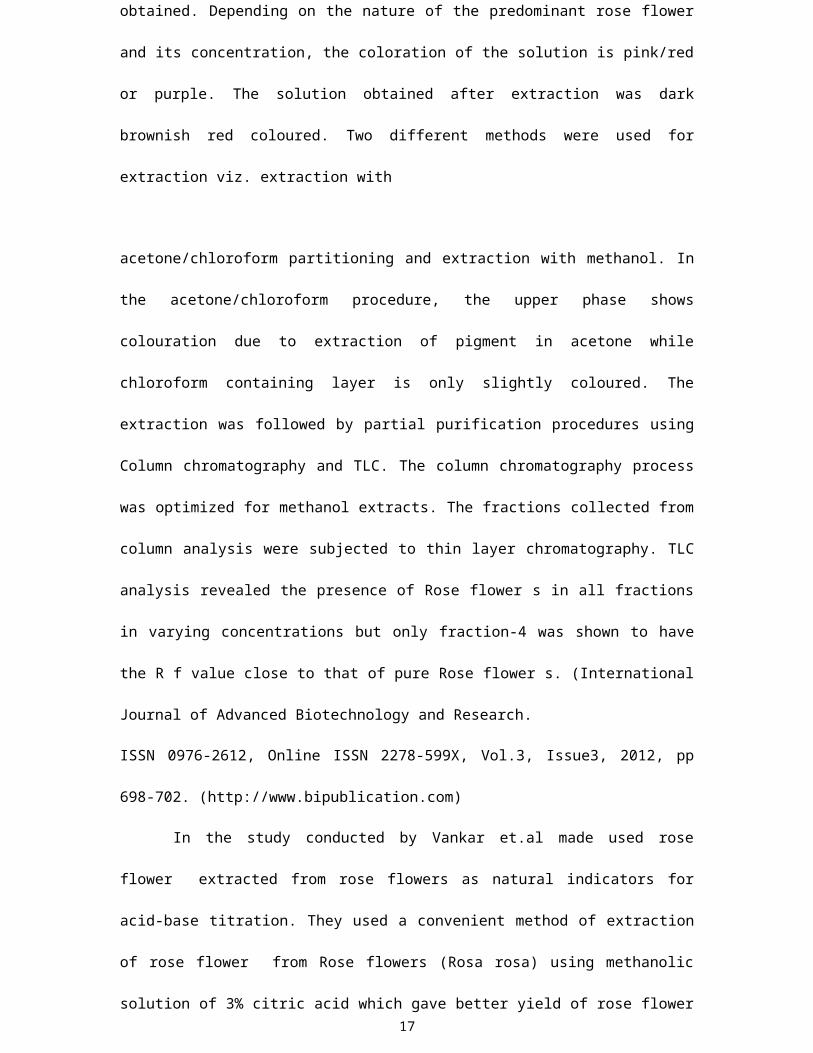
obtained. Depending on the nature of the predominant rose flower
and its concentration, the coloration of the solution is pink/red
or purple. The solution obtained after extraction was dark
brownish red coloured. Two different methods were used for
extraction viz. extraction with
acetone/chloroform partitioning and extraction with methanol. In
the acetone/chloroform procedure, the upper phase shows
colouration due to extraction of pigment in acetone while
chloroform containing layer is only slightly coloured. The
extraction was followed by partial purification procedures using
Column chromatography and TLC. The column chromatography process
was optimized for methanol extracts. The fractions collected from
column analysis were subjected to thin layer chromatography. TLC
analysis revealed the presence of Rose flower s in all fractions
in varying concentrations but only fraction-4 was shown to have
the R f value close to that of pure Rose flower s. (International
Journal of Advanced Biotechnology and Research.
ISSN 0976-2612, Online ISSN 2278-599X, Vol.3, Issue3, 2012, pp
698-702. (http://www.bipublication.com)
In the study conducted by Vankar et.al made used rose
flower extracted from rose flowers as natural indicators for
acid-base titration. They used a convenient method of extraction
of rose flower from Rose flowers (Rosa rosa) using methanolic
solution of 3% citric acid which gave better yield of rose flower17

s than the methanolic solution of 0.1% hydrochloric acid. It has
been shown that by changing the pH of the extract from 2-9, the
hue colour changes from dark pink to mehdi green. The extract
showed wavelength maxima change from 517 nm (dark pink) to 592 nm
(green) between the Ph ranges 2 to 9. The intrinsic pH of the
extract was 2.88. Significant changes were observed when stannous
salt was added to the rose rose flower extract. The
spectroscopic data of the extracted rose flower pigments
indicate a shift in wavelength maxima
of the colours by addition of stannous salt and the complex with
a change in pH of the aqueous medium.
(chemistry.about.com/od/acidsbase1/a/red-cabbage-ph-
indicator.htm)
The studies mentioned above are somewhat similar to the
present study for it also dealt with the extraction of rose
flower compound from a natural source to form a pH
indicator. However, they differ in some aspect of the present
study like the method of extraction proce raw materials and the
locale of the study.
18
CHAPTER III
METHODOLOGY
The chapter focuses on the methods applied in forming pH
indicator from rose flower extracts isolated from Rose flower
petals.
Research Design
The study will be conducted with the experimental research
method. Experimental studies are done in carefully controlled and
structured environments and enable the causal relationships of
phenomena to be identified and analyzed. The variables can be
manipulated or controlled to observe the effects on the subjects
studied. One method of rose flower extraction will be employed
viz. methanol extraction. The rose flower extracts obtained will
be further purified using column chromatography. The rose flower
extracts’ color development in varying pH will be observed using
standardized solutions. In testing the pH indication application
of the extracts, the researchers will conduct, set-up 1
(negative control), where the rose flower extracts will be
utilized as pH indicators in different types of titrations and
the mean equivalence point obtained will be compared to that of
set-up 2 (positive control) where the titrations will employ the
use of specific synthetic indicators. The set-up 1 and set-up 2
will be carried out three times.
19
Materials, tools and equipments
The raw material used in the study is the fresh Rose
petals. While the chemicals used are the Methanol, Liquid
Nitrogen, Chloroform, Sodium Hydroxide, Acetic Acid, De-ionized
water, Hydrochloric Acid, Ammonium Hydroxide, Hexane, Alumina,
and Silica Gel. The equipments and apparatus used are the mortar
and pestle, test tubes, beakers, Pasteur pipette, microcentrifuge
tubes, dropper thermometer clamps, Spectrophotometer, pH meter
and Centrifuge machine.
Gathering of Rose flower petals
Fresh rose flowers will be collected from the local gardens
of the province of Leyte, and will be authenticated by the
College of Arts and Sciences, EVSU (Tacloban City Campus).
Preparation of raw material for Rose flower Extraction
The plant material will be frozen with Liquid Nitrogen, powdered
using a mortar and pestle suitable for use under extremely low
temperatures. The use of liquid nitrogen minimizes Rose flower
degradation by lowering the temperature and providing a nitrogen
environment. The fine powder maximizes pigment recoveries due to
its high surface area and favors disruption of cellular
compartments. Later on from the crushed material rose flower
will be extracted by following Methanol extraction method (Neff,
Chory 1998) 20
Rose flower Extraction Procedure
Using scissors remove individual flowers from the rose
plant and remove the petals from the flowers using tweezers.
Measure the weight and place in a 1.5 mL microfuge tube. Place
the tube directly into liquid N2 to freeze plant tissue.
Remove tubes from the liquid N2 and quickly grind the plant
tissue with a pestle. Add 300 micro-L of Methanol 1%HCl and
continue to grind the plant tissue. Allow extraction to occur
overnight in a dark refrigerator.
Add 200 micro-L De-ionized H20 to each tube. Next, go to
the fume hood and add 500 micro-L of chloroform to each tube.
Spin the tubes in a centrifuge set at the highest rpm for 2-5
minutes.
Return to the fume hood and extract the supernatant/aqueous
(top) solution from the tube using a pipette. To do the start by
setting the pipette to 400 micro-L. Slightly tilt the tube to
one side, place the tip of the pipette just below the surface and
remove the supernatant while moving the tip toward the bottom of
the tube. Place the supernatant in a new 1.5 mL microfuge tube.
Bring the volume up to 800 micro-L by adding 400micro-L of a 60%
Methanol 1% HCl : 40% De-ionized H20 solution to each tube.
21
Rose flower Extract Purification
Preparation of Column Chromatography System
Construct a column chromatography system by making a straw
stand and clamp in 96-well tray. Use a plastic column tip (with a
small wad of polyester fiber in the tip) on the end of a straw as
the chromatography column. Rinse with water. Allow to drain to a
small cup or beaker. Transfer neutral aqueous slurry of fine-mesh
resin to the column an try to make the column about 5 cm long.
Add a little water to the column and then push wetted ¼”
circle of filter paper (already punched out for you) onto the top
of the resin. Use slim straw to guide the circle down and to
gently tamp it on to the top of the resin.
Add a little more water and allow water to drain under
gravity to make sure there is good flow through the column and
that the water level stops at the paper circle. Note: Capillary
action will stop the column from draining completely. It is
important that the liquid level not go below the circle or
channeling will occur. Cut above 4cm off the column straw.
Rose flower Extract Purification
Obtain 3 drops of rose flower rose flower extract. Use a
well from the 96-well tray. Use a thin-stem pipet to transfer 1
drop of the extract to the top of the column. Allow it to flow22
into the packing.
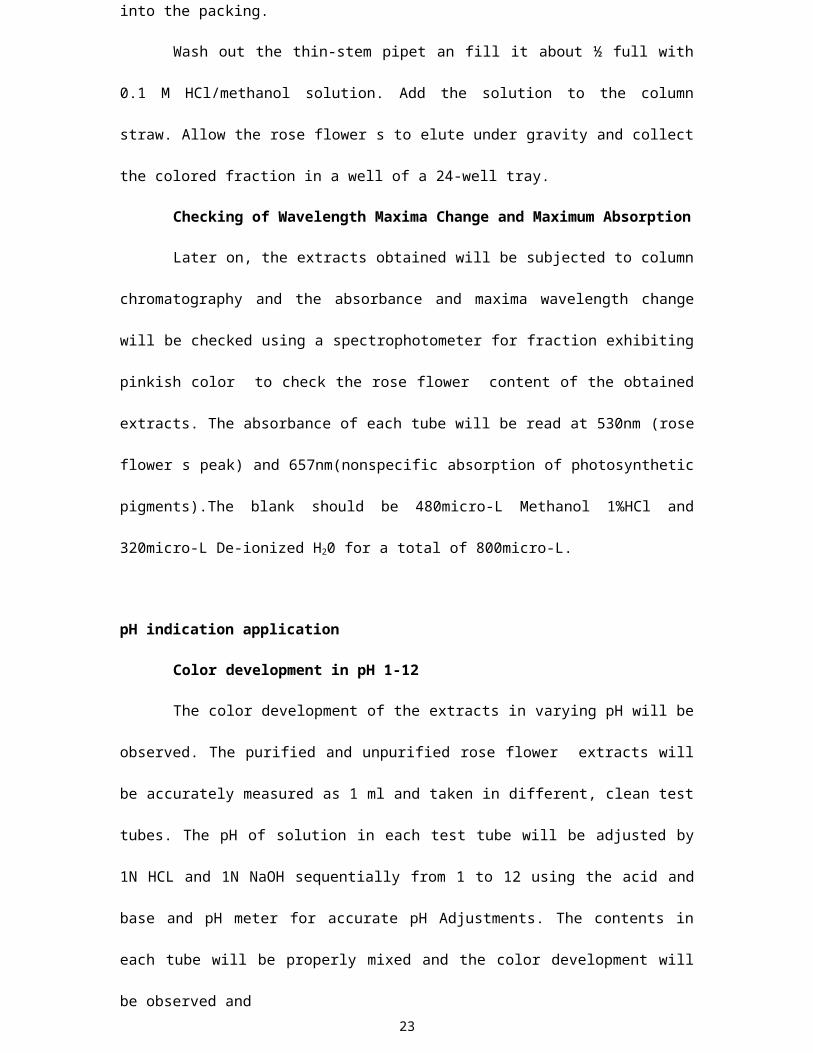
Wash out the thin-stem pipet an fill it about ½ full with
0.1 M HCl/methanol solution. Add the solution to the column
straw. Allow the rose flower s to elute under gravity and collect
the colored fraction in a well of a 24-well tray.
Checking of Wavelength Maxima Change and Maximum Absorption
Later on, the extracts obtained will be subjected to column
chromatography and the absorbance and maxima wavelength change
will be checked using a spectrophotometer for fraction exhibiting
pinkish color to check the rose flower content of the obtained
extracts. The absorbance of each tube will be read at 530nm (rose
flower s peak) and 657nm(nonspecific absorption of photosynthetic
pigments).The blank should be 480micro-L Methanol 1%HCl and
320micro-L De-ionized H20 for a total of 800micro-L.
pH indication application
Color development in pH 1-12
The color development of the extracts in varying pH will be
observed. The purified and unpurified rose flower extracts will
be accurately measured as 1 ml and taken in different, clean test
tubes. The pH of solution in each test tube will be adjusted by
1N HCL and 1N NaOH sequentially from 1 to 12 using the acid and
base and pH meter for accurate pH Adjustments. The contents in
each tube will be properly mixed and the color development will
be observed and 23
recorded.
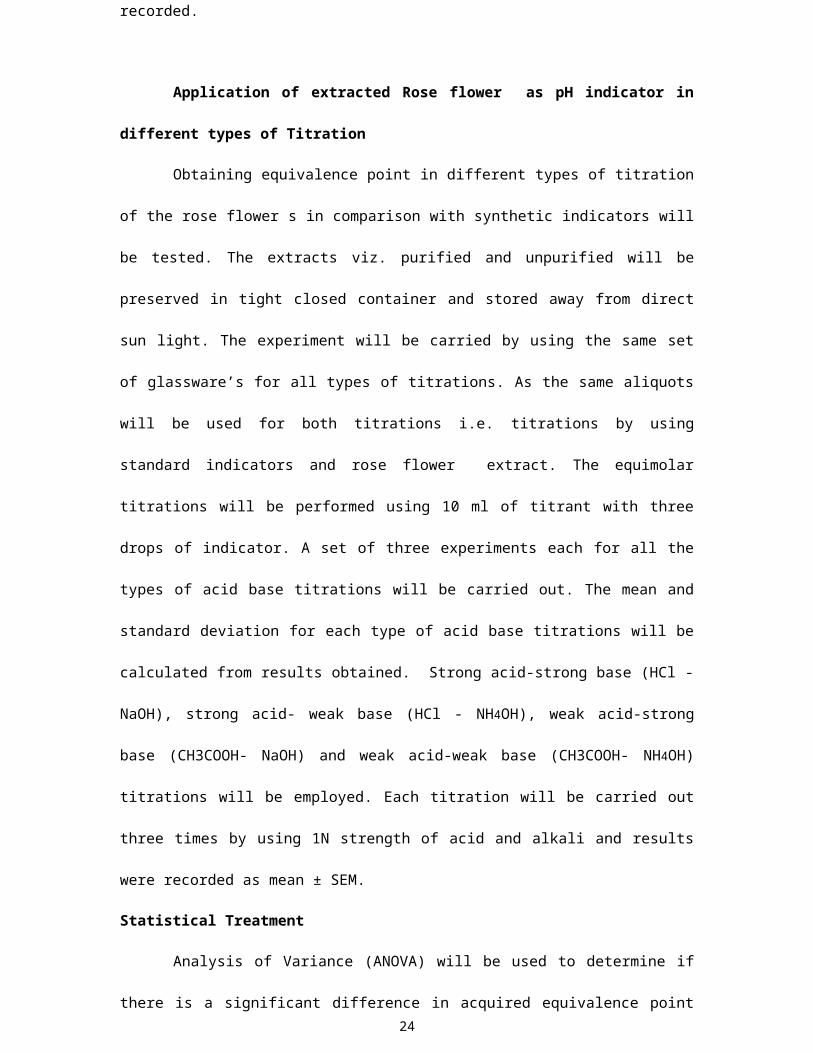
Application of extracted Rose flower as pH indicator in
different types of Titration
Obtaining equivalence point in different types of titration
of the rose flower s in comparison with synthetic indicators will
be tested. The extracts viz. purified and unpurified will be
preserved in tight closed container and stored away from direct
sun light. The experiment will be carried by using the same set
of glassware’s for all types of titrations. As the same aliquots
will be used for both titrations i.e. titrations by using
standard indicators and rose flower extract. The equimolar
titrations will be performed using 10 ml of titrant with three
drops of indicator. A set of three experiments each for all the
types of acid base titrations will be carried out. The mean and
standard deviation for each type of acid base titrations will be
calculated from results obtained. Strong acid-strong base (HCl -
NaOH), strong acid- weak base (HCl - NH4OH), weak acid-strong
base (CH3COOH- NaOH) and weak acid-weak base (CH3COOH- NH4OH)
titrations will be employed. Each titration will be carried out
three times by using 1N strength of acid and alkali and results
were recorded as mean ± SEM.
Statistical Treatment
Analysis of Variance (ANOVA) will be used to determine if
there is a significant difference in acquired equivalence point24
between purified and unpurified methanolic rose flower extracts
(negative control) compared to synthetic indicator (positive
control). The basic principle of ANOVA is to test for differences
among the means of the two set-ups by examining the amount of
variation within each of these samples, relative to the amount of
variation between the samples.
While, the t-test of independence will be also used to
determine if there is a significant difference between the
purified and unpurified extracts’ rose flower content, the main
component of the natural pH indicator.
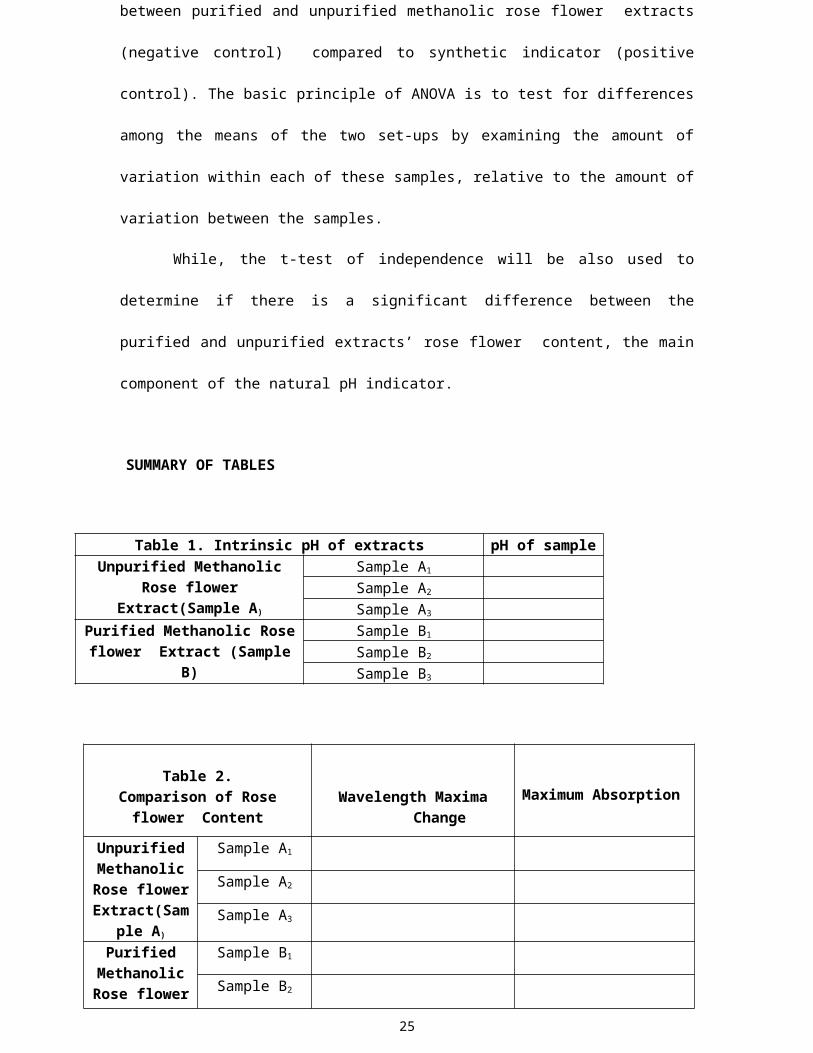
SUMMARY OF TABLES
Table 1. Intrinsic pH of extracts pH of sampleUnpurified Methanolic
Rose flowerExtract(Sample A)
Sample A1
Sample A2
Sample A3
Purified Methanolic Roseflower Extract (Sample
B)
Sample B1
Sample B2
Sample B3
Table 2. Comparison of Roseflower Content
Wavelength MaximaChange
Maximum Absorption
UnpurifiedMethanolicRose flowerExtract(Sam
ple A)
Sample A1
Sample A2
Sample A3
PurifiedMethanolicRose flower
Sample B1
Sample B2
25

Extract(Sample B)
Sample B3
HCl:
Hydrochloric Acid, CH3COOH: Acetic Acid, NaOH: Sodium Hydroxide,NH4OH: Ammonium Hydroxide, Sample A: Unpurified Rose flowerExtract, Sample B : Purified Rose flower Extract
26
Table 3. Color Development in varying pH Application
UnpurifiedMethanolic Roseflower Extract
PurifiedMethanolicRose flower
ExtractSample A1 Sample B1
Color of ExtractColor Change as a Function of pH
pH value of StandardSolution
Color Development of Solution
pH 1pH 2pH 3pH 4pH 5pH 6pH 7pH 8pH 9pH 10pH 11pH 12
Table4.Equivalencepointin
different
typesof
Titration
Acid(Titrant)Vs. Base(Titrate)
Synthetic
Indicator
used (Positive
control)
Mean
±S.D.*of
EquivalencePoint
Color
Change
Negative
Control
Group
Mean±S.D.*of
EquivalencePoint
ColorChange
pH
StrongAcid-StrongBase
HClvs.NaOH
SampleA1
SampleB1
StrongAcid-WeakBase
HClvs.NH4OH
SampleA1
SampleB1
WeakAcid-StrongBase
CH3COOH vs.NaOH
SampleA1
SampleB1
WeakAcid-WeakBase
CH3COOHvs.NH4OH
SampleA1
SampleB1