Characterizing the stress/defense transcriptome of Arabidopsis
Upload
khangminh22Category
view
0download
0
Olson et al. EvoDevo (2018) 9:21 https://doi.org/10.1186/s13227-018-0110-5
RESEARCH
Genome-wide transcriptome profiling and spatial expression analyses identify signals and switches of development in tapewormsPeter D. Olson1*, Magdalena Zarowiecki1,2, Katherine James1, Andrew Baillie1, Georgie Bartl1, Phil Burchell1, Azita Chellappoo1, Francesca Jarero1, Li Ying Tan1, Nancy Holroyd2 and Matt Berriman2
Abstract
Background: Tapeworms are agents of neglected tropical diseases responsible for significant health problems and economic loss. They also exhibit adaptations to a parasitic lifestyle that confound comparisons of their development with other animals. Identifying the genetic factors regulating their complex ontogeny is essential to understand-ing unique aspects of their biology and for advancing novel therapeutics. Here we use RNA sequencing to identify up-regulated signalling components, transcription factors and post-transcriptional/translational regulators (genes of interest, GOI) in the transcriptomes of Larvae and different regions of segmented worms in the tapeworm Hyme-nolepis microstoma and combine this with spatial gene expression analyses of a selection of genes.
Results: RNA-seq reads collectively mapped to 90% of the > 12,000 gene models in the H. microstoma v.2 genome assembly, demonstrating that the transcriptome profiles captured a high percentage of predicted genes. Contrasts made between the transcriptomes of Larvae and whole, adult worms, and between the Scolex-Neck, mature strobila and gravid strobila, resulted in 4.5–30% of the genes determined to be differentially expressed. Among these, we identified 190 unique GOI up-regulated in one or more contrasts, including a large range of zinc finger, homeobox and other transcription factors, components of Wnt, Notch, Hedgehog and TGF-β/BMP signalling, and post-transcrip-tional regulators (e.g. Boule, Pumilio). Heatmap clusterings based on overall expression and on select groups of genes representing ‘signals’ and ‘switches’ showed that expression in the Scolex-Neck region is more similar to that of Larvae than to the mature or gravid regions of the adult worm, which was further reflected in large overlap of up-regulated GOI.
Conclusions: Spatial expression analyses in Larvae and adult worms corroborated inferences made from quantitative RNA-seq data and in most cases indicated consistency with canonical roles of the genes in other animals, including free-living flatworms. Recapitulation of developmental factors up-regulated during larval metamorphosis suggests that strobilar growth involves many of the same underlying gene regulatory networks despite the significant dispar-ity in developmental outcomes. The majority of genes identified were investigated in tapeworms for the first time, setting the stage for advancing our understanding of developmental genetics in an important group of flatworm parasites.
Keywords: Hymenolepis, Tapeworms, RNA-seq, Transcriptomics, Differential gene expression, Transcription factors, Signalling factors, Post-transcriptional regulators
© The Author(s) 2018. This article is distributed under the terms of the Creative Commons Attribution 4.0 International License (http://creat iveco mmons .org/licen ses/by/4.0/), which permits unrestricted use, distribution, and reproduction in any medium, provided you give appropriate credit to the original author(s) and the source, provide a link to the Creative Commons license, and indicate if changes were made. The Creative Commons Public Domain Dedication waiver (http://creat iveco mmons .org/publi cdoma in/zero/1.0/) applies to the data made available in this article, unless otherwise stated.
Open Access
EvoDevo
*Correspondence: [email protected] 1 Division of Parasites and Vectors, Department of Life Sciences, The Natural History Museum, Cromwell Road, London SW7 5BD, UKFull list of author information is available at the end of the article
Page 2 of 29Olson et al. EvoDevo (2018) 9:21
BackgroundTapeworms are parasitic flatworms (Platyhelminthes) characterised by complex life cycles and a segmented, or strobilar, body plan, considered to be evolutionarily novel adaptations to parasitism [1–3]. As agents of neglected tropical diseases, they are estimated to be responsible for over 2.8 million disability-adjusted life years [4] and account for up to 30% of cases of epilepsy in regions of high endemicity [5]. Less acute, but more prevalent and widespread cestodiases caused by Hymenolepis species and other tapeworms contribute to further morbidity, particular of children, and frequently co-occur with other helminth infections [6]. The dwarf tapeworm, H. nana, is the most commonly reported cestode in humans [7] and has been shown to be the causative agent of proliferative, metastatic ‘tumours’ in immunosuppressed individuals, making its ubiquity especially important in areas where there is high prevalence of HIV AIDS [8, 9].
The genetic signals and switches that underpin the complex development of parasitic flatworms have just begun to be investigated [10–12] despite their diversity in form, ontogeny and potentially unique somatic stem cell systems [13–15] that are central to their life histories and the diseases they cause [16, 17]. In contrast, free-living planarian flatworms have been classical models in devel-opmental biology for well over a century, and in the last two decades the availability of genomic resources [18, 19], functional methods [20–22] and a wide range of cell-type markers in Schmidtea mediterranea have made pla-narians a preeminent model system for investigating the biology of regeneration [23]. Their somatic stem cells [24, 25], called neoblasts, have been studied intensively [26], and neoblast-like proliferative cell compartments under-pin the development of all flatworms [27]. Gene regula-tory networks that pattern their axes during growth and regeneration have been elucidated [28], including the seminal discovery of canonical Wnt signalling as the basis for head/tail decision-making [29–31]. This rapidly growing canon of literature provides an important frame-work for comparative investigations of gene regulation in other flatworms and will help to ameliorate the historic gulf between the fields of development and parasitology [10].
More recently, genomic resources [32–35] and meth-ods for investigating gene expression have been devel-oped in trematode (fluke) and cestode (tapeworm) model systems, including the human bloodfluke Schistosoma mansoni, the fox tapeworm Echinococcus multilocu-laris and the mouse bile-duct tapeworm Hymenolepis microstoma. Somatic stem cells are central to the com-plex life cycles of flukes and tapeworms, and neo-blast-like proliferative cell compartments have been characterised in both groups [14, 15, 36, 37]. New tissue
and organ-specific markers have been developed for use with confocal microscopy [38, 39] as have colorimetric and fluorescent in situ hybridisation methods for exam-ining spatial gene expression [15, 40]. Genomic resources and empirical tools are thus now available to facilitate the study of their developmental genetics, enabling more direct comparisons with free-living flatworms and more distantly related animal groups.
Few previous attempts have been made to identify the genetic factors regulating major developmental processes in tapeworms such as strobilation or larval metamor-phosis. Prior to the advent of whole-genome sequencing methods, Bizarro et al. [41] employed empirical cDNA subtraction to address the process of strobilation, com-paring differentially expressed genes in tetrathyridia and segmenting adults of Mesocestoides corti. Functional characterisation of the transcripts showed significant differences between the samples across the entire range of cellular processes, but pre-NGS methods only ena-bled a small number of factors to be identified. Here we use quantitative, whole-genome transcriptome profiling of the tapeworm Hymenolepis microstoma [42] to iden-tify differentially expressed (DE) genes in Larvae and adults, and in the ‘Scolex-Neck’, ‘Mid’ and ‘End’ regions of the strobilar worm, broadly encompassing the major phases of development in the typical tapeworm life cycle (Fig. 1a). RNA-seq data were mapped to the H. micros-toma genome (version 2), and details of this update to the published version 1 assembly [35] are presented here for the first time. Contrasts were made among the sam-ples to identify DE signalling components (e.g. ligands and receptors) and transcription factors, often broadly referred to as ‘developmental control genes’ [43], as well as post-transcriptional/translational regulators, rea-soning that these broad categories of genes are likely to include key regulators of the underlying developmental processes. Whole-mount in situ hybridisation (WMISH) in Larvae and adult worms was used to elucidate the spa-tial expression of a selection of these ‘genes of interest’ (GOI), enabling their expression to be linked to tissues, regions or organs in tapeworms for the first time. We present an overview of the sample transcriptome profiles and sets of DE gene models, and discuss factors exam-ined by WMISH in detail, using their putative identities and spatial patterns together with published accounts of orthologs in planarians and/or other animals to infer potential roles of the gene products in tapeworms.
Results and discussionThe Hymenolepis microstoma v.2 genomeOur analyses utilised the unpublished v.2 release of the H. microstoma genome which is based on the inclusion
Page 3 of 29Olson et al. EvoDevo (2018) 9:21
of an additional Illumina HiSeq lane of data and re-assembly of the v.1 genome as described in Methods. In comparison with the v.1 genome published in Tsai et al. [35], the new assembly is larger (182 MB) and contains over 2,000 additional gene models supported by a com-bination of empirical RNA-seq data and bioinformatic predictions. All genome and gene model data are avail-able online via WormBase ParaSite (WBP) (parasite.wormbase.org; [44, 45]) which includes a wide suite of bioinformatic tools for data access and interrogation, including the ability to dynamically generate gene trees
and motif annotations using the most recent release of WBP and other major sequence databases.
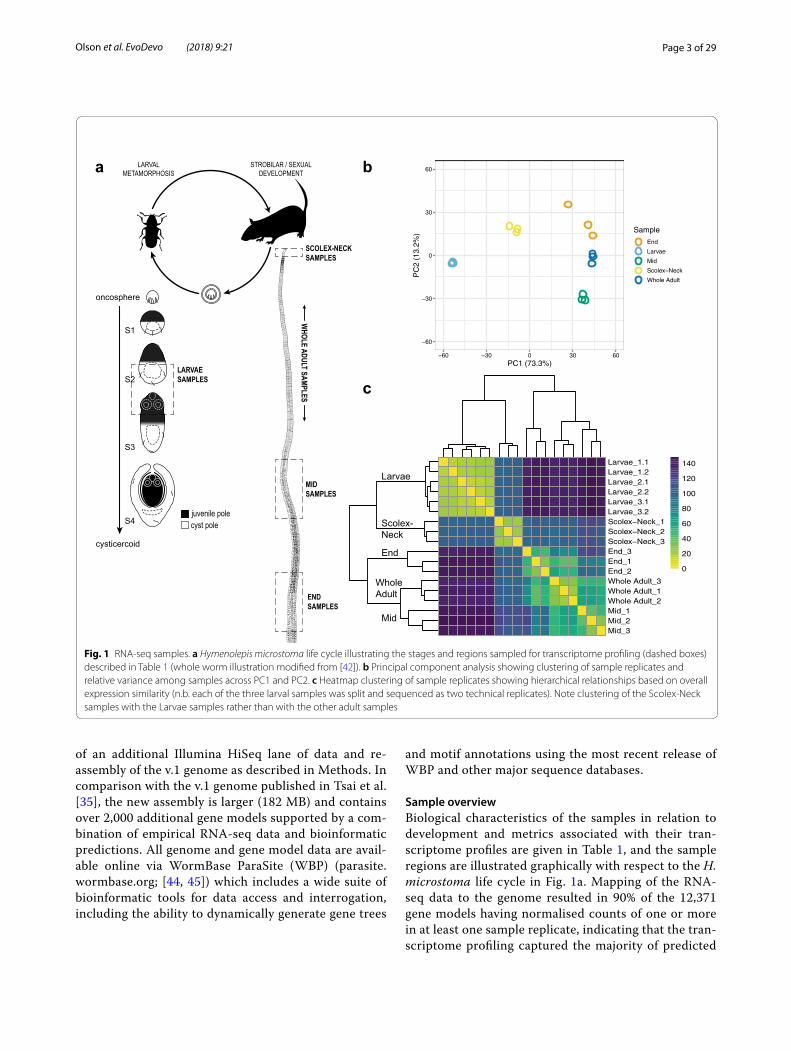
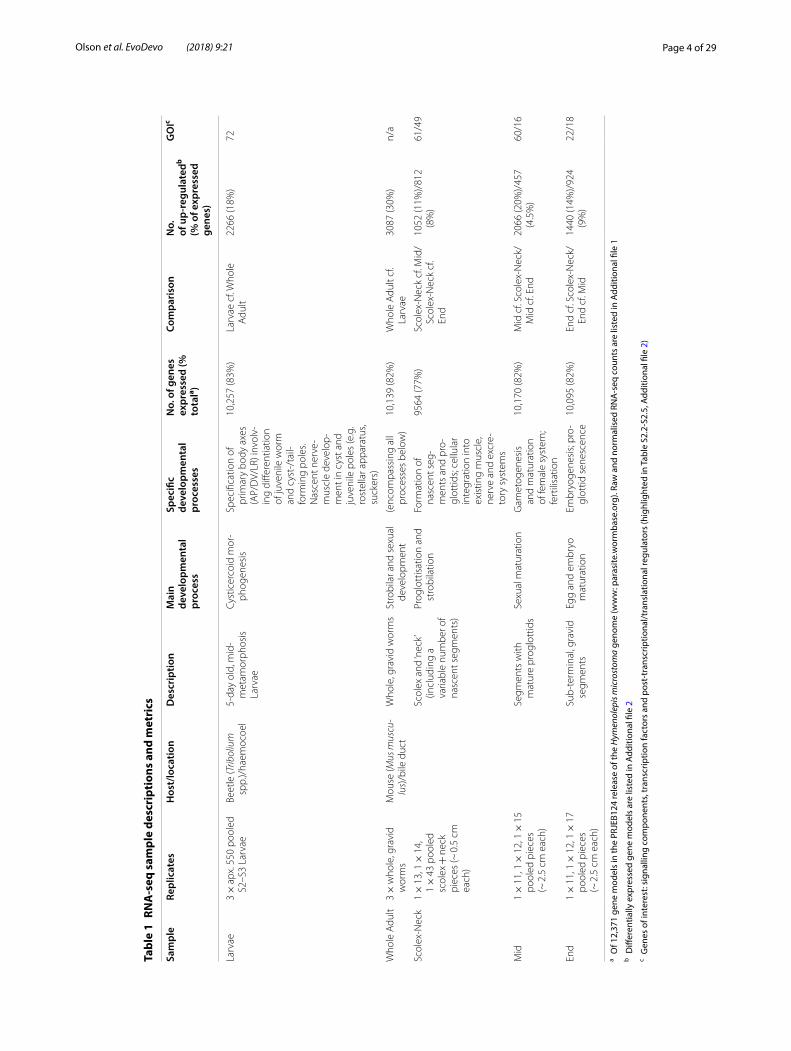
Sample overviewBiological characteristics of the samples in relation to development and metrics associated with their tran-scriptome profiles are given in Table 1, and the sample regions are illustrated graphically with respect to the H. microstoma life cycle in Fig. 1a. Mapping of the RNA-seq data to the genome resulted in 90% of the 12,371 gene models having normalised counts of one or more in at least one sample replicate, indicating that the tran-scriptome profiling captured the majority of predicted
SCOLEX-NECKSAMPLES
MIDSAMPLES
ENDSAMPLES
WHOLE ADULT SAMPLES
STROBILAR / SEXUALDEVELOPMENT
LARVALMETAMORPHOSIS
juvenile polecyst pole
LARVAESAMPLES
oncosphere
cysticercoid
S1
S2
S3
S4
a b
c
−60
−30
0
30
60
−60 −30 0 30 60PC1 (73.3%)
PC
2 (1
3.2%
) Sample
End
Larvae
Mid
Scolex−Neck
Whole Adult
Larvae_1.1Larvae_1.2Larvae_2.1Larvae_2.2Larvae_3.1Larvae_3.2Scolex−Neck_1Scolex−Neck_2Scolex−Neck_3End_3End_1End_2Whole Adult_3Whole Adult_1Whole Adult_2Mid_1Mid_2Mid_3
0
20
40
60
80
100
120
140
Larvae
Scolex-Neck
End
Mid
WholeAdult
Fig. 1 RNA-seq samples. a Hymenolepis microstoma life cycle illustrating the stages and regions sampled for transcriptome profiling (dashed boxes) described in Table 1 (whole worm illustration modified from [42]). b Principal component analysis showing clustering of sample replicates and relative variance among samples across PC1 and PC2. c Heatmap clustering of sample replicates showing hierarchical relationships based on overall expression similarity (n.b. each of the three larval samples was split and sequenced as two technical replicates). Note clustering of the Scolex-Neck samples with the Larvae samples rather than with the other adult samples
Page 4 of 29Olson et al. EvoDevo (2018) 9:21
Tabl
e 1
RNA
-seq
sam
ple
desc
ript
ions
and
met
rics
a Of 1
2,37
1 ge
ne m
odel
s in
the
PRJE
B124
rele
ase
of th
e H
ymen
olep
is m
icro
stom
a ge
nom
e (w
ww
: par
asite
.wor
mba
se.o
rg).
Raw
and
nor
mal
ised
RN
A-s
eq c
ount
s ar
e lis
ted
in A
dditi
onal
file
1b D
iffer
entia
lly e
xpre
ssed
gen
e m
odel
s ar
e lis
ted
in A
dditi
onal
file
2c G
enes
of i
nter
est:
sign
allin
g co
mpo
nent
s, tr
ansc
riptio
n fa
ctor
s an
d po
st-t
rans
crip
tiona
l/tra
nsla
tiona
l reg
ulat
ors
(hig
hlig
hted
in T
able
S2.
2-S2
.5, A
dditi
onal
file
2)
Sam
ple
Repl
icat
esH
ost/
loca
tion
Des
crip
tion
Mai
n de
velo
pmen
tal
proc
ess
Spec
ific
deve
lopm
enta
l pr
oces
ses
No.
of g
enes
ex
pres
sed
(%
tota
la )
Com
pari
son
No.
of
up-
regu
late
db (%
of e
xpre
ssed
ge
nes)
GO
Ic
Larv
ae3 ×
apx
. 550
poo
led
S2–S
3 La
rvae
Beet
le (T
ribol
ium
sp
p.)/
haem
ocoe
l5-
day
old,
mid
-m
etam
orph
osis
La
rvae
Cyst
icer
coid
mor
-ph
ogen
esis
Spec
ifica
tion
of
prim
ary
body
axe
s (A
P/D
V/LR
) inv
olv-
ing
diffe
rent
iatio
n of
juve
nile
wor
m
and
cyst
-/ta
il-fo
rmin
g po
les.
Nas
cent
ner
ve-
mus
cle
deve
lop-
men
t in
cyst
and
ju
veni
le p
oles
(e.g
. ro
stel
lar a
ppar
atus
, su
cker
s)
10,2
57 (8
3%)
Larv
ae c
f. W
hole
A
dult
2266
(18%
)72
Who
le A
dult
3 ×
who
le, g
ravi
d w
orm
sM
ouse
(Mus
mus
cu-
lus)
/bile
duc
tW
hole
, gra
vid
wor
ms
Stro
bila
r and
sex
ual
deve
lopm
ent
(enc
ompa
ssin
g al
l pr
oces
ses
belo
w)
10,1
39 (8
2%)
Who
le A
dult
cf.
Larv
ae30
87 (3
0%)
n/a
Scol
ex-N
eck
1 ×
13,
1 ×
14,
1 ×
43
pool
ed
scol
ex +
nec
k pi
eces
(~ 0
.5 c
m
each
)
Scol
ex a
nd ‘n
eck’
(incl
udin
g a
varia
ble
num
ber o
f na
scen
t seg
men
ts)
Prog
lott
isat
ion
and
stro
bila
tion
Form
atio
n of
na
scen
t seg
-m
ents
and
pro
-gl
ottid
s; ce
llula
r in
tegr
atio
n in
to
exis
ting
mus
cle,
ne
rve
and
excr
e-to
ry s
yste
ms
9564
(77%
)Sc
olex
-Nec
k cf
. Mid
/Sc
olex
-Nec
k cf
. En
d
1052
(11%
)/81
2 (8
%)
61/4
9
Mid
1 ×
11,
1 ×
12,
1 ×
15
pool
ed p
iece
s (~
2.5
cm
eac
h)
Segm
ents
with
m
atur
e pr
oglo
ttid
sSe
xual
mat
urat
ion
Gam
etog
enes
is
and
mat
urat
ion
of fe
mal
e sy
stem
; fe
rtili
satio
n
10,1
70 (8
2%)
Mid
cf.
Scol
ex-N
eck/
Mid
cf.
End
2066
(20%
)/45
7 (4
.5%
)60
/16
End
1 ×
11,
1 ×
12,
1 ×
17
pool
ed p
iece
s (~
2.5
cm
eac
h)
Sub-
term
inal
, gra
vid
segm
ents
Egg
and
embr
yo
mat
urat
ion
Embr
yoge
nesi
s; pr
o-gl
ottid
sen
esce
nce
10,0
95 (8
2%)
End
cf. S
cole
x-N
eck/
End
cf. M
id14
40 (1
4%)/
924
(9%
)22
/18
Page 5 of 29Olson et al. EvoDevo (2018) 9:21
protein-coding genes. The overall percentage of mod-els expressed was nearly identical among samples (82–83%), save the Scolex-Neck in which it was ~ 5% less (77%; Table 1). Full listings of raw and normalised counts are given in Additional file 1: Tables S1.2 and S1.3, respectively.
Principal component analysis of the sample repli-cates (Fig. 1b) showed that they cluster tightly, save the End samples that showed a higher degree of dispersion. Eighty-six percent of the total variation was characterised by the first two principal components, with PC1 broadly separating the Larvae and Scolex-Neck samples from the Mid, End and Whole Adult samples, and PC2 separating the Mid and End samples from the others. The degree of similarity among replicates was higher than might have been expected, given that all samples were based on mul-tiple individuals (save the Whole Adult samples; Table 1) and that there was inherent variability in both the degree of development among Larvae (which nevertheless showed the least dispersion) and in the ability to sample precisely the same regions of the strobila from different individuals. Heatmap analysis of sample-to-sample dis-tances (Fig. 1c) showed that the Scolex-Neck samples were more similar in overall expression to the Larvae than to the other adult samples. Meanwhile, the Mid, End and Whole Adult samples formed a nested relationship in which the Whole Adult samples were closest to the Mid samples, suggesting that the profiles for Whole Adults were dominated by factors relating to sexual develop-ment, as would be expected given the proportion of the adult worm represented by the strobila.
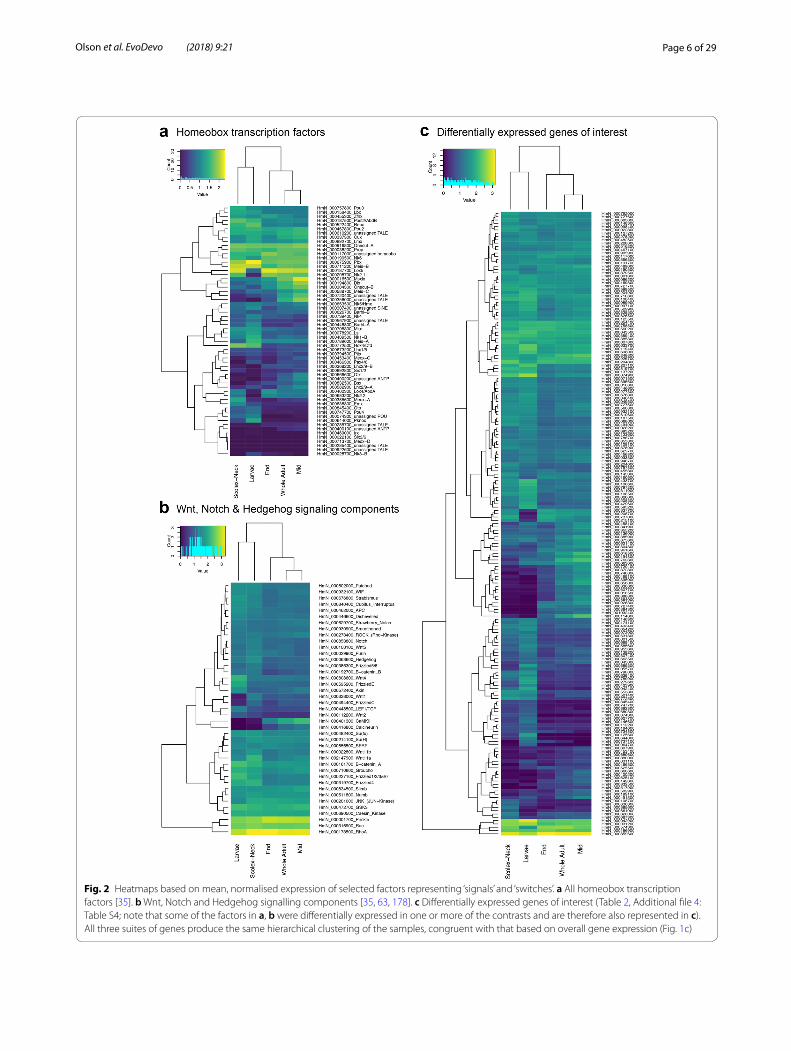
To examine similarities and differences among the samples in relation to our GOI, we constructed heat-maps based on normalised, mean expression values of three suites of genes: all homeobox transcription factors (Fig. 2a), components of Wnt, Notch and Hedgehog sig-nalling pathways (Fig. 2b) and the GOI identified here (Fig. 2c), discussed below. In all cases, clustering of the samples produced the same branching pattern as the sample-to-sample comparisons based on all gene mod-els. Moreover, hierarchical clustering united the Scolex-Neck and Larvae as sister groups, whereas independent branches would be more likely if their relationship was simply a reflection of their relative dissimilarity to the other samples. This relationship was further illustrated by large overlap in GOI DE in both the Larvae (cf. Whole Adults) and Scolex-Neck (cf. Mid and/or End) samples (Table 2; Additional file 1: Table S1), discussed below. We suggest that these groupings reflect the overarching similarities and differences in the underlying develop-mental processes represented by the samples (Table 1): mid-metamorphosis Larvae and the neck region of adult worms both exhibit extensive tissue re-modelling and
patterning, whereas the Mid and End, and consequently, Whole Adult samples, exhibit growth predominately in relation to sexual and reproductive development.
Overview of differentially expressed genesWe considered a gene model to be differentially expressed if the difference between the mean, normal-ised sample counts was greater or less than zero at a confidence level of 1e-05, irrespective of the magnitude of difference. We ranked results by their log2fold change but did not impose an arbitrary cut-off to limit the num-ber of DE genes taken into consideration. To identify up-regulated genes in the Larvae, we contrasted it with the Whole Adult sample, and not with the regional adult samples. To identify DE genes in adults, we made inde-pendent contrasts of each of the three regional samples with the other two, enabling DE gene models to be asso-ciated with different phases of strobilar and sexual devel-opment that are confounded by the Whole Adult sample. Full lists of DE gene models are given in Additional file 2: Tables S2.2–S2.5 for both sides of each contrast. For the reasons above, gene models up-regulated in the Whole Adult relative to Larvae are not considered further here but are included in Additional file 2: Table S2.2.
The percentage of gene models DE among the contrasts ranged from as low as 4.5% in the Mid sample (cf. End) to 30% in the Whole Adult sample (cf. Larvae; Table 1). The majority of the highest DE genes (e.g. top 20) among the contrasts were ‘novel’ proteins: predicted protein sequences lacking any significant similarity against the BLAST nr database (i.e. e values < 0.0001) or recognisable protein domains that were variously annotated as ‘n/a’ (no annotation), ‘expressed protein’, ‘expressed conserved protein’ (when supported by > 100 RNA-seq reads [35]), ‘hypothetical protein’ or ‘hypothetical transcript’. Puta-tively novel proteins make up just over half of all gene models (6455 of 12,371) and among contrasts ranged from 31 to 47% of the DE genes. In general, there were ~ 10% more novel gene models DE in contrasts involv-ing the Whole Adult, Mid or End samples as compared to contrasts involving the Larvae or Scolex-Neck (Addi-tional file 2: Table S2.1), suggesting that reproductive growth involves a larger percentage of putatively tape-worm-specific factors than either larval metamorphosis or strobilation.
Gene OntologyGene Ontology (GO) [46, 47] terms associated with DE gene models were retrieved from WormBase ParaSite (parasite.wormbase.org; [44, 45]) and used to try and identify differences in term annotations among the sam-ples (GO ‘hits’ to DE gene models are given in Additional file 2: Tables S2.2–S2.5). In total, 1962 unique terms were
Page 6 of 29Olson et al. EvoDevo (2018) 9:21
Fig. 2 Heatmaps based on mean, normalised expression of selected factors representing ‘signals’ and ‘switches’. a All homeobox transcription factors [35]. b Wnt, Notch and Hedgehog signalling components [35, 63, 178]. c Differentially expressed genes of interest (Table 2, Additional file 4: Table S4; note that some of the factors in a, b were differentially expressed in one or more of the contrasts and are therefore also represented in c). All three suites of genes produce the same hierarchical clustering of the samples, congruent with that based on overall gene expression (Fig. 1c)
Page 7 of 29Olson et al. EvoDevo (2018) 9:21
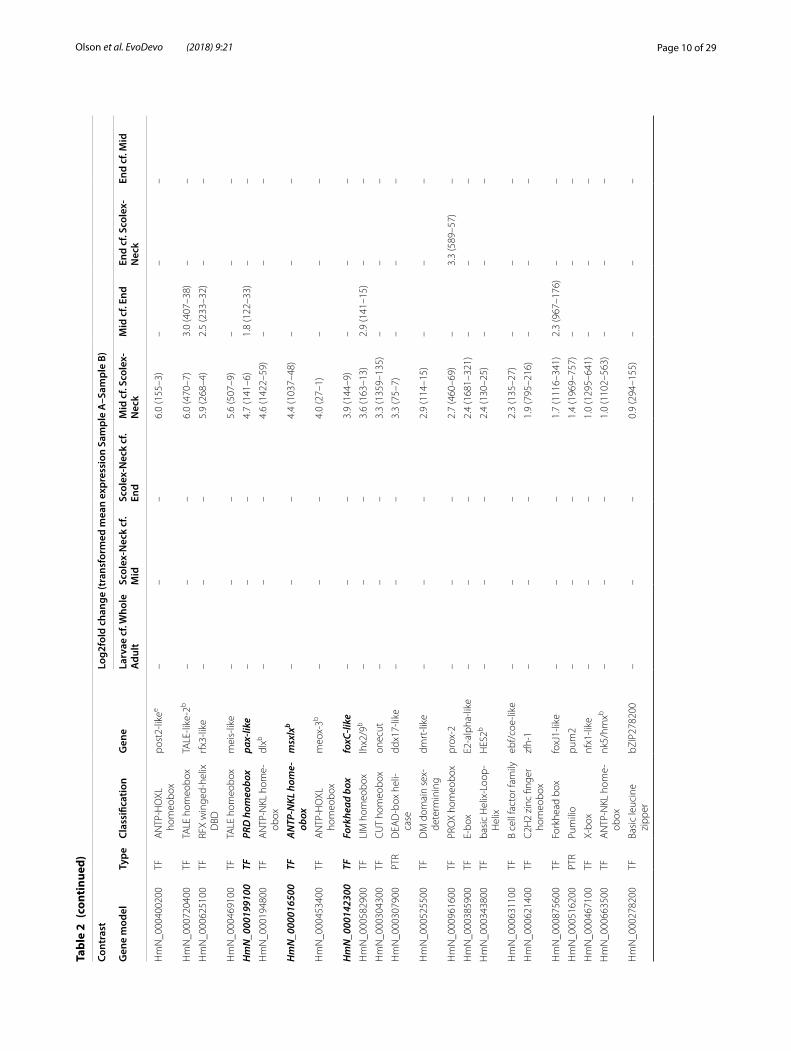
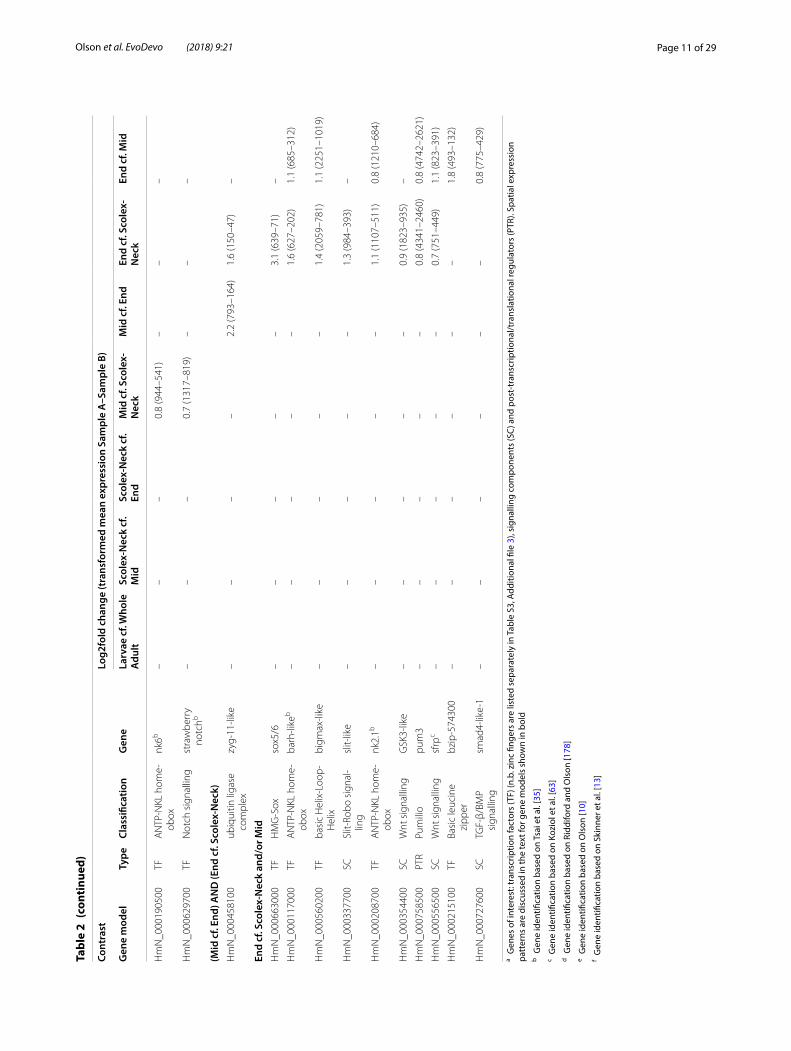
Tabl
e 2
Up-
regu
late
d ge
nes
of in
tere
st
Cont
rast
Log2
fold
cha
nge
(tra
nsfo
rmed
mea
n ex
pres
sion
Sam
ple
A–S
ampl
e B)
Gen
e m
odel
Type
Clas
sific
atio
nG
ene
Larv
ae c
f. W
hole
A
dult
Scol
ex-N
eck
cf.
Mid
Scol
ex-N
eck
cf.
End
Mid
cf.
Scol
ex-
Nec
kM
id c
f. En
dEn
d cf
. Sco
lex-
Nec
kEn
d cf
. Mid
Larv
ae c
f. W
hole
Adu
ltH
mN
_000
0647
00TF
PRD
hom
eobo
xar
is-li
keb
7.4
(160
–0)
––
––
––
Hm
N_0
0064
4000
TFTA
LE h
omeo
box
pkno
xb6.
9 (6
69–4
)–
––
––
–
Hm
N_0
0042
3900
SCRT
K si
gnal
ling
FGFR
13.
5 (1
125–
96)
––
––
––
Hm
N_0
0073
7100
TFET
Sel
f2-li
ke3.
3 (1
31–1
3)–
––
––
–
Hm
N_0
0062
7700
TFH
MG
-SO
Xso
x15
3.1
(331
–37)
––
––
––
Hm
N_0
0059
5200
SCW
nt s
igna
lling
fzdE
c2.
7 (1
875–
282)
––
––
––
Hm
N_0
0068
0300
TFFo
rkhe
ad b
oxfo
xJ3-
like
2.5
(134
–22)
––
––
––
Hm
N_0
0089
2300
TFLI
M h
omeo
box
lhm
3/4
2.4
(57–
10)
––
––
––
Hm
N_0
0017
4100
TFT-
box
tbx2
-like
1.9
(902
–249
)–
––
––
–
Hm
N_0
0011
2200
SCW
nt s
igna
lling
wnt
2d1.
8 (1
66–4
6)–
––
––
–
Hm
N_0
0005
5700
SCN
otch
sig
nalli
ngde
lta-1
1.6
(500
–168
)–
––
––
–
Hm
N_0
0008
9900
TFE2
Fe2
f4-li
ke1.
3 (1
084–
432)
––
––
––
Hm
N_0
0059
9500
PTR
RNA
-bin
ding
pr
otei
nbr
uno4
-like
1.1
(228
4–10
93)
––
––
––
Hm
N_0
0030
7400
TFSI
NE
hom
eobo
xun
assi
gned
b1.
0 (1
96–9
6)–
––
––
–
Hm
N_0
0044
6600
SCW
nt s
igna
lling
dish
evel
ledb
0.6
(115
3–78
1)–
––
––
–
(Lar
vae
cf. W
hole
Adu
lt) A
ND
(End
cf.
Scol
ex-N
eck
and
Mid
)H
mN
_000
6893
00SC
RTK
sign
allin
gFG
FR2
3.8
(179
7–12
5)–
––
–2.
0 (1
45–3
6)1.
7 (1
59–4
6)
Hm
N_0
0020
4900
TFFo
rkhe
ad b
oxfo
xO3/
41.
2 (3
274–
1441
)–
––
–0.
8 (1
337–
758)
1.2
(146
4–63
4)
Hm
N_0
0019
1700
TFC
UT
hom
eobo
xcu
x/C
ASP
-like
0.6
(126
0–84
3)–
––
–0.
9 (8
92–4
82)
1.2
(976
–414
)
(Lar
vae
cf. W
hole
Adu
lt) A
ND
(Sco
lex-
Nec
k cf
. Mid
and
/or E
nd)
Hm
N_0
0012
5600
TFFo
rkhe
ad b
oxfo
xQ2
9.0
(866
–0.5
)6.
2 (2
2–0)
––
––
–
Hm
N_0
0007
4300
TFPO
U h
omeo
box
pou-
likeb
6.8
(100
–0)
4.2
(44–
2)4.
5 (3
6–0)
––
––
Hm
N_0
0004
2400
TFPR
OX
hom
eobo
xpr
ox1
5.8
(103
5–17
)4.
2 (1
27–7
)3.
4 (1
05–7
)–
––
–
Hm
N_0
0077
2500
TFA
NTP
-HO
XL
hom
eobo
xho
x4/d
fde
3.8
(122
6–91
)4.
7 (1
424–
53)
4.5
(117
3–47
)–
––
–
Hm
N_0
0084
5400
TFPR
D h
omeo
box
otpb
3.7
(157
–12)
3.1
(89–
10)
––
––
–
Hm
N_0
0074
7700
TFPO
U h
omeo
box
pou4
b3.
3 (1
30–1
3)3.
4 (5
8–5)
––
––
–
Hm
N_0
0087
4900
TFH
MG
-SO
Xso
xPF2
3.2
(839
0–88
9)2.
1 (2
621–
632)
2.8
(215
9–31
0)–
––
–
Hm
N_0
0063
9400
SCN
otch
sig
nalli
ngde
lta-2
3.0
(169
7–21
0)3.
1 (7
73–9
2)3.
0 (6
36–7
5)–
––
–
Hm
N_0
0031
1000
TFFo
rkhe
ad b
oxfo
xD-li
ke2.
6 (8
08–1
36)
1.4
(279
–105
)–
––
––
Hm
N_0
0055
3800
TFba
sic
Hel
ix-L
oop-
Hel
ixm
yoD
2.5
(920
–158
)3.
2 (9
09–1
03)
3.5
(749
–65)
––
––
Page 8 of 29Olson et al. EvoDevo (2018) 9:21
Tabl
e 2
(con
tinu
ed)
Cont
rast
Log2
fold
cha
nge
(tra
nsfo
rmed
mea
n ex
pres
sion
Sam
ple
A–S
ampl
e B)
Gen
e m
odel
Type
Clas
sific
atio
nG
ene
Larv
ae c
f. W
hole
A
dult
Scol
ex-N
eck
cf.
Mid
Scol
ex-N
eck
cf.
End
Mid
cf.
Scol
ex-
Nec
kM
id c
f. En
dEn
d cf
. Sco
lex-
Nec
kEn
d cf
. Mid
Hm
N_0
0022
7100
SCW
nt s
igna
lling
fzd1
/2/3
/6/7
b2.
4 (4
783–
883)
1.4
(161
6–59
3)1.
6 (1
331–
439)
––
––
Hm
N_0
0020
8300
TFH
MG
-SO
Xso
xPF-
12.
2 (1
211–
260)
–1.
0 (3
08–1
50)
––
––
Hm
N_0
0052
1400
TFp5
4 fa
mily
p54-
like
1.8
(475
–134
)2.
5 (5
19–9
1)4.
1 (4
27–2
3)–
––
–
Hm
N_0
0079
7200
TFp5
3 fa
mily
p53-
like
1.8
(228
7–64
0)1.
1 (7
14–3
43)
––
––
–
Hm
N_0
0067
6800
SCW
nt s
igna
lling
stra
bism
us-2
b1.
6 (1
810–
586)
0.7
(731
–442
)0.
9 (6
02–3
26)
––
––
Hm
N_0
0031
9700
SCW
nt s
igna
lling
fzd4
/FzB
c1.
6 (2
942–
994)
2.1
(300
6–68
7)2.
2 (2
476–
530)
––
––
Hm
N_0
0049
4900
TFH
MG
-SO
Xso
xPF-
31.
4 (4
82–1
85)
1.9
(680
–182
)2.
6 (5
60–9
1)–
––
–
Hm
N_0
0004
9300
TFFo
rkhe
ad b
oxfo
xK2-
like
1.3
(830
–346
)–
1.3
(327
–133
)–
––
–
Hm
N_0
0018
7500
TFA
NTP
-HO
XL
hom
eobo
xpo
st2/
abdB
e1.
2 (8
43–3
55)
2.1
(102
7–23
3)2.
1 (8
46–2
01)
––
––
Hm
N_0
0071
0800
SCN
otch
sig
nalli
nggr
ouch
o2b
1.0
(435
0–21
41)
–0.
9 (1
895–
1037
)–
––
–
Hm
N_0
0085
3800
SCN
otch
sig
nalli
ngno
tch1
b0.
5 (1
086–
759)
1.4
(114
3–43
8)0.
8 (9
42–5
37)
––
––
Scol
ex-N
eck
cf. M
id a
nd/o
r End
Hm
N_0
0063
8300
TFA
NTP
-NKL
hom
e-ob
oxem
xb–
3.6
(97–
7)3.
2 (8
0–7)
––
––
Hm
N_0
0038
5600
TFA
NTP
-HO
XL
hom
eobo
xm
eox-
1b–
3.3
(184
–17)
5.3
(152
–2)
––
––
Hm
N_0
0079
0000
TFLo
zeng
elz
-2–
2.7
(240
–36)
3.0
(198
–24)
––
––
Hm
N_0
0013
7200
TFbZ
IPbZ
IP13
7200
–2.
3 (1
535–
312)
––
––
–
Hm
N_0
0078
9900
TFLo
zeng
elz
-1–
2.2
(182
–39)
1.8
(150
–41)
––
––
Hm
N_0
0066
1900
SCTG
F-β/
BMP
sign
allin
gbm
p2-li
ke–
2.2
(87–
19)
––
––
–
Hm
N_0
0014
6600
TFET
SFl
i-1-li
ke–
2.2
(48–
11)
––
––
–
Hm
N_0
0006
8600
SCH
edge
hog
sign
al-
ling
hedg
ehog
b–
1.8
(710
–203
)1.
8 (5
85–1
63)
––
––
Hm
N_0
0075
7800
TFPO
U h
omeo
box
pou3
b–
1.8
(576
–167
)1.
5 (4
75–1
68)
––
––
Hm
N_0
0032
8000
SCW
nt s
igna
lling
wnt
1d–
1.8
(409
–119
)1.
4 (3
37–1
23)
––
––
Hm
N_0
0080
1500
TFG
ATA
G
ATA
2-lik
e–
1.5
(194
–68)
––
––
–
Hm
N_0
0073
7000
TFET
Sel
f-1-li
ke–
1.5
(423
–151
)–
––
––
Hm
N_0
0010
8100
SCW
nt s
igna
lling
wnt
5d–
1.3
(304
–120
)–
––
––
Hm
N_0
0009
8400
SCTG
F-β/
BMP
sign
allin
gno
ggin
-like
–1.
3 (6
58–2
66)
0.9
(542
–280
)–
––
–
Hm
N_0
0002
2800
SCW
nt s
igna
lling
wnt
11bd
–1.
2 (8
77–3
73)
1.4
(723
–267
)–
––
–
Page 9 of 29Olson et al. EvoDevo (2018) 9:21
Tabl
e 2
(con
tinu
ed)
Cont
rast
Log2
fold
cha
nge
(tra
nsfo
rmed
mea
n ex
pres
sion
Sam
ple
A–S
ampl
e B)
Gen
e m
odel
Type
Clas
sific
atio
nG
ene
Larv
ae c
f. W
hole
A
dult
Scol
ex-N
eck
cf.
Mid
Scol
ex-N
eck
cf.
End
Mid
cf.
Scol
ex-
Nec
kM
id c
f. En
dEn
d cf
. Sco
lex-
Nec
kEn
d cf
. Mid
Hm
N_0
0001
0800
TFH
ippo
sig
nalli
ngTE
F-5-
like
–1.
2 (8
54–3
68)
––
––
–
Hm
N_0
0007
1500
TFET
Sel
f-lik
e–
1.2
(453
–195
)–
––
––
Hm
N_0
0035
9400
SCW
nt s
igna
lling
sfrp
-like
/SFL
c–
0.9
(293
0–15
23)
––
––
–
Hm
N_0
0068
3800
TFM
AD
S-bo
xm
ef2-
like
–0.
9 (1
220–
656)
––
––
–
Hm
N_0
0020
4800
TFCC
AAT
/EBP
c/eb
p-lik
e–
0.9
(132
1–72
5)–
––
––
Hm
N_0
0076
2000
TFFo
rkhe
ad b
oxfo
xP1-
like
–0.
8 (1
182–
657)
––
––
–
Hm
N_0
0039
5600
TFN
ucle
ar re
cept
or2D
BD-li
ke–
0.8
(800
–449
)–
––
––
Hm
N_0
0072
7700
SCTG
F-β/
BMP
sign
allin
gsm
ad4-
like-
2–
0.8
(435
–246
)–
––
––
Hm
N_0
0003
1200
PTR
RNA
bin
ding
PA2G
4-lik
e–
0.5
(461
0–32
18)
––
––
–
Hm
N_0
0043
3400
TFW
nt s
igna
lling
stra
bism
us-1
––
2.2
(603
–131
)–
––
–
Hm
N_0
0020
4000
SCTG
F-β/
BMP
sign
allin
gtg
fb-li
ke–
–2.
0 (5
32–1
29)
––
––
Hm
N_0
0087
8900
SCTG
F-β/
BMP
sign
allin
gad
mp-
like
––
1.3
(373
–152
)–
––
–
Hm
N_0
0093
2100
SCW
nt s
igna
lling
WIF
c–
–1.
2 (2
36–1
04)
––
––
Hm
N_0
0099
7100
PTR
DEA
D-b
ox h
eli-
case
unid
entifi
ed–
–0.
9 (7
91–4
13)
––
––
Hm
N_0
0012
5500
PTR
Pum
ilio
pum
1–
–0.
8 (1
107–
634)
––
––
Mid
cf.
Scol
ex-N
eck
Hm
N_0
0072
7400
TFFo
rkhe
ad b
oxfo
xA-li
ke–
––
8.0
(267
–0.9
)–
7.4
(330
–0.8
)
Hm
N_0
0011
4300
PTR
Piw
i-lik
e ar
go-
naut
egr
oup
4 ar
gona
utef
––
–7.
2 (5
463–
31)
––
–
Hm
N_0
0066
6600
TFPR
D h
omeo
box
otxb
––
–7.
2 (1
53–0
.8)
2.6
(132
–17)
––
Hm
N_0
0035
6000
TFTA
LE h
omeo
box
TALE
-like
b–
––
7.1
(905
–6)
––
–
Hm
N_0
0076
2300
PTR
Boul
e/D
AZL
boul
e2–
––
7.0
(320
7–25
)2.
9 (2
783–
225)
––
Hm
N_0
0099
5400
ubiq
uitin
liga
se
com
plex
zyg1
1-lik
e–
––
7.0
(138
4–11
)–
6.1
(733
–9)
–
Hm
N_0
0083
2500
TFA
NTP
-NKL
hom
e-ob
oxbs
xb–
––
6.8
(44–
0)–
––
Hm
N_0
0060
7700
SCRT
K si
gnal
ling
aFG
F-lik
e-2
––
–6.
4 (3
72–4
)–
––
Hm
N_0
0046
6300
TFPR
D h
omeo
box
pax4
/6b
––
–6.
3 (5
0–0.
3)–
––
Hm
N_0
0001
8500
SCRT
K si
gnal
ling
aFG
F-lik
e-2
––
–6.
2 (3
31–4
)–
––
Page 10 of 29Olson et al. EvoDevo (2018) 9:21
Tabl
e 2
(con
tinu
ed)
Cont
rast
Log2
fold
cha
nge
(tra
nsfo
rmed
mea
n ex
pres
sion
Sam
ple
A–S
ampl
e B)
Gen
e m
odel
Type
Clas
sific
atio
nG
ene
Larv
ae c
f. W
hole
A
dult
Scol
ex-N
eck
cf.
Mid
Scol
ex-N
eck
cf.
End
Mid
cf.
Scol
ex-
Nec
kM
id c
f. En
dEn
d cf
. Sco
lex-
Nec
kEn
d cf
. Mid
Hm
N_0
0040
0200
TFA
NTP
-HO
XL
hom
eobo
xpo
st2-
likee
––
–6.
0 (1
55–3
)–
––
Hm
N_0
0072
0400
TFTA
LE h
omeo
box
TALE
-like
-2b
––
–6.
0 (4
70–7
)3.
0 (4
07–3
8)–
–
Hm
N_0
0062
5100
TFRF
X w
inge
d-he
lix
DBD
rfx3
-like
––
–5.
9 (2
68–4
)2.
5 (2
33–3
2)–
–
Hm
N_0
0046
9100
TFTA
LE h
omeo
box
mei
s-lik
e–
––
5.6
(507
–9)
––
–
Hm
N_0
0019
9100
TFPR
D h
omeo
box
pax-
like
––
–4.
7 (1
41–6
)1.
8 (1
22–3
3)–
–
Hm
N_0
0019
4800
TFA
NTP
-NKL
hom
e-ob
oxdl
xb–
––
4.6
(142
2–59
)–
––
Hm
N_0
0001
6500
TFAN
TP-N
KL h
ome-
obox
msx
lxb
––
–4.
4 (1
037–
48)
––
–
Hm
N_0
0045
3400
TFA
NTP
-HO
XL
hom
eobo
xm
eox-
3b–
––
4.0
(27–
1)–
––
Hm
N_0
0014
2300
TFFo
rkhe
ad b
oxfo
xC-li
ke–
––
3.9
(144
–9)
––
–
Hm
N_0
0058
2900
TFLI
M h
omeo
box
lhx2
/9b
––
–3.
6 (1
63–1
3)2.
9 (1
41–1
5)–
–
Hm
N_0
0030
4300
TFC
UT
hom
eobo
xon
ecut
––
–3.
3 (1
359–
135)
––
–
Hm
N_0
0030
7900
PTR
DEA
D-b
ox h
eli-
case
ddx1
7-lik
e–
––
3.3
(75–
7)–
––
Hm
N_0
0052
5500
TFD
M d
omai
n se
x-de
term
inin
gdm
rt-li
ke–
––
2.9
(114
–15)
––
–
Hm
N_0
0096
1600
TFPR
OX
hom
eobo
xpr
ox-2
––
–2.
7 (4
60–6
9)–
3.3
(589
–57)
–
Hm
N_0
0038
5900
TFE-
box
E2-a
lpha
-like
––
–2.
4 (1
681–
321)
––
–
Hm
N_0
0034
3800
TFba
sic
Hel
ix-L
oop-
Hel
ixH
ES2b
––
–2.
4 (1
30–2
5)–
––
Hm
N_0
0063
1100
TFB
cell
fact
or fa
mily
ebf/
coe-
like
––
–2.
3 (1
35–2
7)–
––
Hm
N_0
0062
1400
TFC
2H2
zinc
fing
er
hom
eobo
xzf
h-1
––
–1.
9 (7
95–2
16)
––
–
Hm
N_0
0087
5600
TFFo
rkhe
ad b
oxfo
xJ1-
like
––
–1.
7 (1
116–
341)
2.3
(967
–176
)–
–
Hm
N_0
0051
6200
PTR
Pum
ilio
pum
2–
––
1.4
(196
9–75
7)–
––
Hm
N_0
0046
7100
TFX-
box
nfx1
-like
––
–1.
0 (1
295–
641)
––
–
Hm
N_0
0066
3500
TFA
NTP
-NKL
hom
e-ob
oxnk
5/hm
xb–
––
1.0
(110
2–56
3)–
––
Hm
N_0
0027
8200
TFBa
sic
leuc
ine
zipp
erbZ
IP27
8200
––
–0.
9 (2
94–1
55)
––
–
Page 11 of 29Olson et al. EvoDevo (2018) 9:21
Tabl
e 2
(con
tinu
ed)
Cont
rast
Log2
fold
cha
nge
(tra
nsfo
rmed
mea
n ex
pres
sion
Sam
ple
A–S
ampl
e B)
Gen
e m
odel
Type
Clas
sific
atio
nG
ene
Larv
ae c
f. W
hole
A
dult
Scol
ex-N
eck
cf.
Mid
Scol
ex-N
eck
cf.
End
Mid
cf.
Scol
ex-
Nec
kM
id c
f. En
dEn
d cf
. Sco
lex-
Nec
kEn
d cf
. Mid
Hm
N_0
0019
0500
TFA
NTP
-NKL
hom
e-ob
oxnk
6b–
––
0.8
(944
–541
)–
––
Hm
N_0
0062
9700
TFN
otch
sig
nalli
ngst
raw
berr
y no
tchb
––
–0.
7 (1
317–
819)
––
–
(Mid
cf.
End)
AN
D (E
nd c
f. Sc
olex
-Nec
k)H
mN
_000
4581
00ub
iqui
tin li
gase
co
mpl
exzy
g-11
-like
––
––
2.2
(793
–164
)1.
6 (1
50–4
7)–
End
cf. S
cole
x-N
eck
and/
or M
idH
mN
_000
6630
00TF
HM
G-S
oxso
x5/6
––
––
–3.
1 (6
39–7
1)–
Hm
N_0
0011
7000
TFA
NTP
-NKL
hom
e-ob
oxba
rh-li
keb
––
––
–1.
6 (6
27–2
02)
1.1
(685
–312
)
Hm
N_0
0056
0200
TFba
sic
Hel
ix-L
oop-
Hel
ixbi
gmax
-like
––
––
–1.
4 (2
059–
781)
1.1
(225
1–10
19)
Hm
N_0
0033
7700
SCSl
it-Ro
bo s
igna
l-lin
gsl
it-lik
e–
––
––
1.3
(984
–393
)–
Hm
N_0
0020
8700
TFA
NTP
-NKL
hom
e-ob
oxnk
2.1b
––
––
–1.
1 (1
107–
511)
0.8
(121
0–68
4)
Hm
N_0
0035
4400
SCW
nt s
igna
lling
GSK
3-lik
e–
––
––
0.9
(182
3–93
5)–
Hm
N_0
0075
8500
PTR
Pum
ilio
pum
3–
––
––
0.8
(434
1–24
60)
0.8
(474
2–26
21)
Hm
N_0
0055
6500
SCW
nt s
igna
lling
sfrp
c–
––
––
0.7
(751
–449
)1.
1 (8
23–3
91)
Hm
N_0
0021
5100
TFBa
sic
leuc
ine
zipp
erbz
ip-5
7430
0–
––
––
–1.
8 (4
93–1
32)
Hm
N_0
0072
7600
SCTG
F-β/
BMP
sign
allin
gsm
ad4-
like-
1–
––
––
–0.
8 (7
75–4
29)
a Gen
es o
f int
eres
t: tr
ansc
riptio
n fa
ctor
s (T
F) (n
.b. z
inc
finge
rs a
re li
sted
sep
arat
ely
in T
able
S3,
Add
ition
al fi
le 3
), si
gnal
ling
com
pone
nts
(SC)
and
pos
t-tr
ansc
riptio
nal/t
rans
latio
nal r
egul
ator
s (P
TR).
Spat
ial e
xpre
ssio
n pa
tter
ns a
re d
iscu
ssed
in th
e te
xt fo
r gen
e m
odel
s sh
own
in b
old
b Gen
e id
entifi
catio
n ba
sed
on T
sai e
t al.
[35]
c Gen
e id
entifi
catio
n ba
sed
on K
ozio
l et a
l. [6
3]d G
ene
iden
tifica
tion
base
d on
Rid
difo
rd a
nd O
lson
[178
]e G
ene
iden
tifica
tion
base
d on
Ols
on [1
0]f G
ene
iden
tifica
tion
base
d on
Ski
nner
et a
l. [1
3]
Page 12 of 29Olson et al. EvoDevo (2018) 9:21
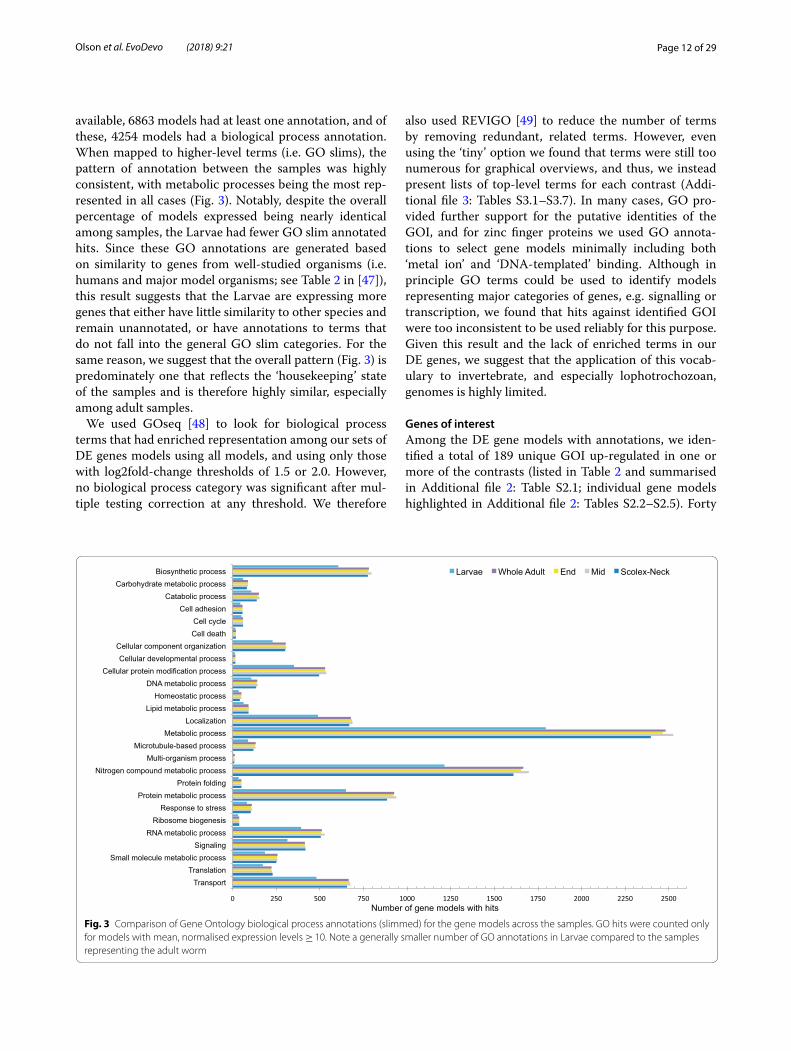
available, 6863 models had at least one annotation, and of these, 4254 models had a biological process annotation. When mapped to higher-level terms (i.e. GO slims), the pattern of annotation between the samples was highly consistent, with metabolic processes being the most rep-resented in all cases (Fig. 3). Notably, despite the overall percentage of models expressed being nearly identical among samples, the Larvae had fewer GO slim annotated hits. Since these GO annotations are generated based on similarity to genes from well-studied organisms (i.e. humans and major model organisms; see Table 2 in [47]), this result suggests that the Larvae are expressing more genes that either have little similarity to other species and remain unannotated, or have annotations to terms that do not fall into the general GO slim categories. For the same reason, we suggest that the overall pattern (Fig. 3) is predominately one that reflects the ‘housekeeping’ state of the samples and is therefore highly similar, especially among adult samples.
We used GOseq [48] to look for biological process terms that had enriched representation among our sets of DE genes models using all models, and using only those with log2fold-change thresholds of 1.5 or 2.0. However, no biological process category was significant after mul-tiple testing correction at any threshold. We therefore
also used REVIGO [49] to reduce the number of terms by removing redundant, related terms. However, even using the ‘tiny’ option we found that terms were still too numerous for graphical overviews, and thus, we instead present lists of top-level terms for each contrast (Addi-tional file 3: Tables S3.1–S3.7). In many cases, GO pro-vided further support for the putative identities of the GOI, and for zinc finger proteins we used GO annota-tions to select gene models minimally including both ‘metal ion’ and ‘DNA-templated’ binding. Although in principle GO terms could be used to identify models representing major categories of genes, e.g. signalling or transcription, we found that hits against identified GOI were too inconsistent to be used reliably for this purpose. Given this result and the lack of enriched terms in our DE genes, we suggest that the application of this vocab-ulary to invertebrate, and especially lophotrochozoan, genomes is highly limited.
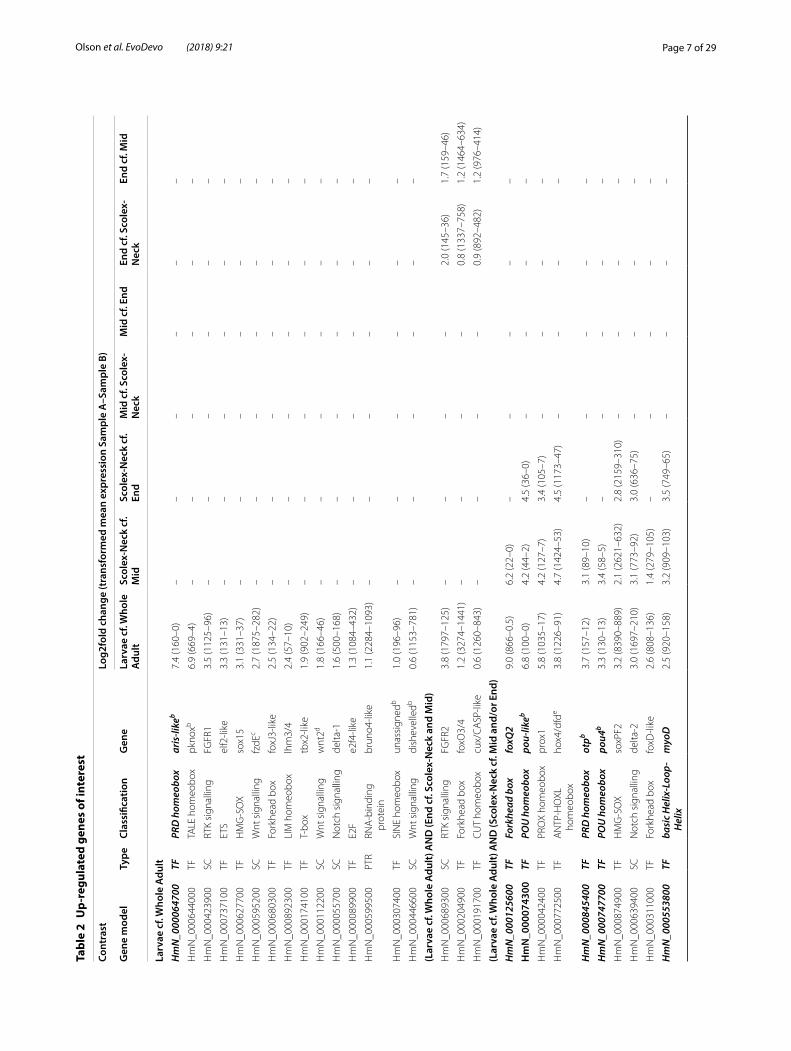
Genes of interestAmong the DE gene models with annotations, we iden-tified a total of 189 unique GOI up-regulated in one or more of the contrasts (listed in Table 2 and summarised in Additional file 2: Table S2.1; individual gene models highlighted in Additional file 2: Tables S2.2–S2.5). Forty
0 250 500 750 1000 1250 1500 1750 2000 2250 2500
Transport Translation
Small molecule metabolic process Signaling
RNA metabolic process Ribosome biogenesis
Response to stress Protein metabolic process
Protein folding Nitrogen compound metabolic process
Multi-organism process Microtubule-based process
Metabolic process Localization
Lipid metabolic process Homeostatic process
DNA metabolic process Cellular protein modification process
Cellular developmental process Cellular component organization
Cell death Cell cycle
Cell adhesion Catabolic process
Carbohydrate metabolic process Biosynthetic process
Number of gene models with hits
Larvae Whole Adult End Mid Scolex-Neck
Fig. 3 Comparison of Gene Ontology biological process annotations (slimmed) for the gene models across the samples. GO hits were counted only for models with mean, normalised expression levels ≥ 10. Note a generally smaller number of GO annotations in Larvae compared to the samples representing the adult worm
Page 13 of 29Olson et al. EvoDevo (2018) 9:21
percent of these were putative zinc finger transcrip-tion factors, the most abundant class of transcriptional regulators in animal genomes [50], and are compiled separately in Additional file 4: Table S4. The largest num-ber of GOI (and DE genes in general) was identified in Larvae compared to the Whole Adult (Table 1; Addi-tional file 2: Table S2.1), reflecting the coarseness of this contrast relative to those involving samples represent-ing different regions of the adult worm which would be expected to share more similar constitutive (i.e. back-ground) gene expression profiles, and thus a smaller per-centage of genes DE. Not considering zinc fingers, 39 GOI were identified in Larvae, more than half of which were also found to be up-regulated in the Scolex-Neck sample when compared to the Mid and/or End samples. Conversely, little overlap in up-regulated GOI was found among other contrasts (Table 2).
Among the regional adult samples, contrasts involving the Scolex-Neck and Mid regions resulted in comparable numbers of GOI (60–61), whereas only ~ 1/3 as many were identified in the End sample (Table 1). This relative lack of up-regulated GOI could be explained by a loss of power due to the larger variation among replicates of the End sample (Fig. 1b). However, the overall number of DE gene models was comparable or greater in contrasts involving the End sample than in those involving other regions. Similarly, although there was a higher percent-age (~ 10%) of novel DE genes in the End sample com-pared to the Scolex-Neck (and thus fewer annotated gene models from which GOI could be identified), this was equally true for the Mid sample. It therefore seems more likely that the relative lack of GOI identified from the End sample is due to developmental pathways up-regulated in the Mid and/or Scolex-Neck samples also operating in the End sample, and thus not found to be DE. For exam-ple, pathways regulating sexual development in the End are likely to be largely the same as those operating in the Mid sample, while pathways regulating some aspects of embryogenesis (e.g. axial patterning) may also be involved in strobilar growth in the Scolex-Neck sample. Thus, although developmental processes such as embryo-genesis and senescence are uniquely represented by the End sample, the quantitative approach taken here was limited in its ability to identify associated factors.
Differential expression during larval metamorphosisCharacteristically, the two most DE transcripts in Lar-vae were paralogs of the larval-specific tapeworm ‘anti-gen B-like’ protein [34] which were massively expressed (24,000 in Larvae cf. 0.5 in Whole Adults; Table S.2.2, Additional file 2). However, among DE GOI, more than half were also found to be up-regulated in the Scolex-Neck sample. Those with the highest fold change were
the forkhead box gene foxQ2 that was also up-regulated in the Scolex-Neck, followed by an aristaless-like home-obox which was DE only in Larvae. Other zinc finger, homeobox, forkhead box and high mobility group genes comprised the majority of transcription factors DE in Larvae only or in both the Larvae and Scolex-Neck sam-ples. Among signalling components, two FGF recep-tors were identified, one of which was also up-regulated in the End sample, whereas components of Wnt and Notch pathways were enriched in both the Larvae and Scolex-Neck samples. A total of six Wnt components were identified in Larvae including a Wnt ligand and frizzled receptor DE only in Larvae, and two frizzleds up-regulated in both the Larvae and Scolex-Neck. Simi-larly, the Notch receptor delta-1 was DE only in Larvae, whereas delta-2 and the ligand notch-1 were DE in both the Larvae and Scolex-Neck. Genes with putative roles in regulating stem cells included the post-translational reg-ulator bruno [51], DE only in Larvae, and members of the p53/54 transcription factor families [52], DE in both the Larvae and Scolex-Neck samples.
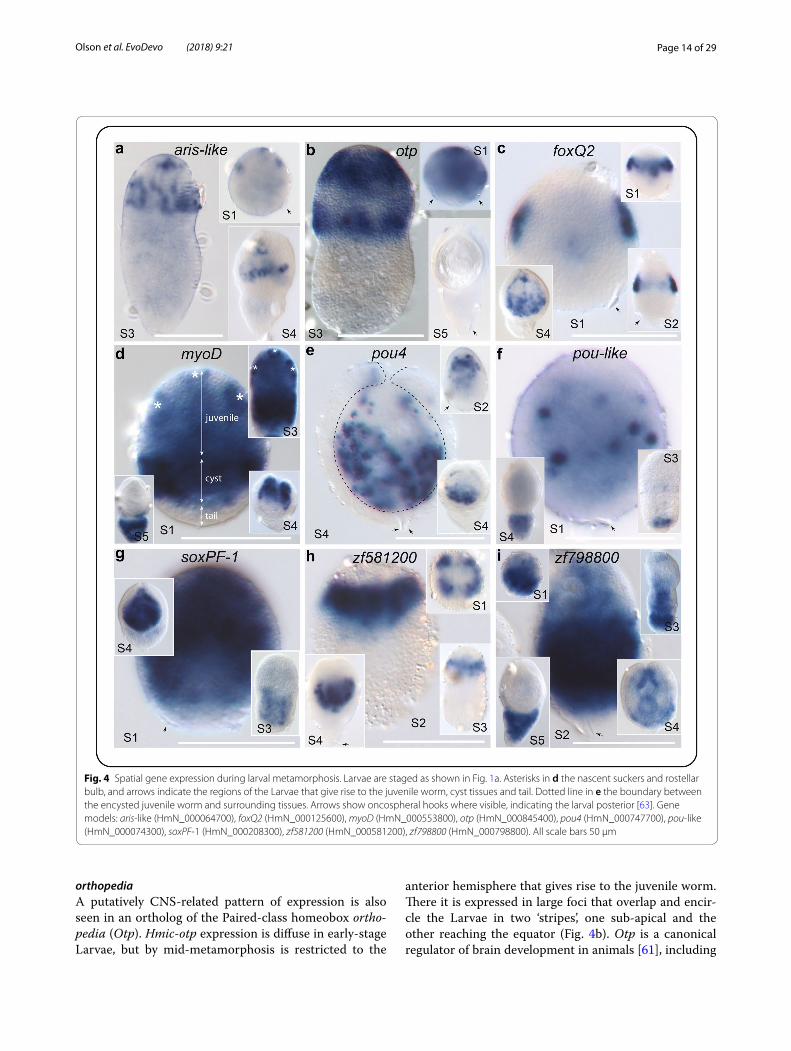
Below we discuss spatial gene expression during larval metamorphosis of nine transcripts (Fig. 4), the majority of which were DE in both the Larvae and Scolex-Neck samples (Table 2). Included are two putative zinc finger transcription factors that were not part of those identi-fied in Additional file 4: Table S4, but were previously identified in DE analyses based on an earlier version of the genome.
aristalessAn aristaless-like Paired-class homeobox was highly DE in Larvae and had a transformed mean of zero in the Whole Adult (Table 2). It is expressed around the devel-oping suckers and rostellum of the scolex, starting as one apical and two bilateral foci that expand and continue to be expressed post-encystment (Fig. 4a). At mid-met-amorphosis, expression is broadly consistent with the spatial arrangement of the neurological connections that form together with the principal structures of the scolex (i.e. the apical rostellum and suckers) [39, 53], consist-ent with a role in the development of the central nerv-ous system (CNS). In vertebrates, the aristaless-related homeobox gene ARX plays a pivotal role in neurogenesis and dysregulation is implicated in multiple neurological disorders [54], whereas it is involved in distal append-age formation in insects [55–57] and tentacle formation in Hydra [58]. Paired genes represent the second most diverse class of homeoboxes after ANTP [59], and many Paired-family genes are expressed in the nervous system of animals (e.g. otp, discussed below), including lopho-trochozoans [60].
Page 14 of 29Olson et al. EvoDevo (2018) 9:21
orthopediaA putatively CNS-related pattern of expression is also seen in an ortholog of the Paired-class homeobox ortho-pedia (Otp). Hmic-otp expression is diffuse in early-stage Larvae, but by mid-metamorphosis is restricted to the
anterior hemisphere that gives rise to the juvenile worm. There it is expressed in large foci that overlap and encir-cle the Larvae in two ‘stripes’, one sub-apical and the other reaching the equator (Fig. 4b). Otp is a canonical regulator of brain development in animals [61], including
Fig. 4 Spatial gene expression during larval metamorphosis. Larvae are staged as shown in Fig. 1a. Asterisks in d the nascent suckers and rostellar bulb, and arrows indicate the regions of the Larvae that give rise to the juvenile worm, cyst tissues and tail. Dotted line in e the boundary between the encysted juvenile worm and surrounding tissues. Arrows show oncospheral hooks where visible, indicating the larval posterior [63]. Gene models: aris-like (HmN_000064700), foxQ2 (HmN_000125600), myoD (HmN_000553800), otp (HmN_000845400), pou4 (HmN_000747700), pou-like (HmN_000074300), soxPF-1 (HmN_000208300), zf581200 (HmN_000581200), zf798800 (HmN_000798800). All scale bars 50 μm
Page 15 of 29Olson et al. EvoDevo (2018) 9:21
planarians in which it is expressed in the outer branches of the brain during homoeostasis and in an apical patch in head blastemas during regeneration [62]. Although the expression pattern of Hmic-otp is more dispersed than that of Hmic-aris, it is broadly consistent with the areas where the cerebral ganglia and innervation of the suckers and rostellum.
foxQ2An ortholog of foxQ2 is expressed in bilateral foci at the sides of the larva during the initial phase of metamor-phosis and post-encystment becomes dispersed around the suckers (Fig. 4c). This is similar to the pattern seen in developing protoscoleces of the fox tapeworm Echinococ-cus multilocularis [63] and consistent with the patterning of the main branches of the CNS and innervation of the scolex. FoxQ2 is a key regulator in the earliest stages of anterior patterning in animal embryos and in the devel-opment of the CNS [64–67]. As in tapeworms, foxQ2 is not expressed apically in planarians, but in various parts of the nervous system, including photoreceptor neurons [68] and neural progenitor cells [69]. FoxQ2 is also up-regulated in the Scolex-Neck sample, albeit at levels that are orders of magnitude less than in Larvae (Table 2), whereas no read mapped to this gene model in the Mid and End samples (Additional file 1: Table S1.2).
myoDNeurogenesis occurs in concert with muscle develop-ment, and in both the Larvae and Scolex-Neck samples we find strong up-regulation of a myoD ortholog, a uni-versal regulator of myogenesis in animals [70]. WMISH shows clear spatial and temporal changes throughout metamorphosis, and the three regions of the nascent cys-ticercoid larva are readily demarcated by its expression (Fig. 4d). The anterior hemisphere shows diffuse expres-sion throughout, whereas more concentrated expres-sion makes visible the nascent suckers and rostellar bulb (marked by asterisks). The posterior hemisphere shows a strong band of expression in the cyst tissues around the ‘primary lacuna’ (i.e. larval cavity) in which thin sheets of muscle develop. Meanwhile, cells posterior to the cyst region that will subsequently form the ‘tail’ show no expression during early stages of metamorphosis. Hmic-myoD continues to be expressed strongly in the develop-ing juvenile post-encystment (S4) and becomes restricted to the tail in the mature cysticercoid (Fig. 4d).
MyoD is a basic helix-loop-helix (bHLH) type tran-scription factor that has been described as a ‘master switch’ capable of inducing and orchestrating the dif-ferentiation of skeletal muscle cells in vertebrates [71]. Muscle development has been well described in planar-ians [72–74], and a myoD ortholog is expressed in both
putative myogeneic progenitor cells [69] as well as fully differentiated myocytes [74]. More recently, Scimone et al. [75] showed that Smed-myoD does not play a gen-eralised role in planarian muscle development, but is instead specific to the formation of a single muscle layer: the longitudinal muscles. Selectively inhibiting their for-mation via RNA interference revealed that the different muscle layers play distinct instructive roles during regen-eration [75]. MyoD expression in Hymenolepis shows pat-terns consistent with the development of its larval muscle architecture, but further work is required to test whether its expression is specific to a particular layer.
pou4 and pou-likeTwo POU-class homeoboxes show scattered, punc-tate expression. Spatial expression of pou4 is restricted to the anterior, juvenile-forming half of the larva, with increased expression following encystment (Fig. 4e). Pou-like shows fewer foci more equatorially distrib-uted during early metamorphosis, becoming diffuse and restricted to the posterior tail of the Larvae post-encyst-ment (Fig. 4f ). POU-class genes are found in all animals and are characterised by possession of separate POU and homeobox DNA-binding domains tethered by a variable linker region [76]. Parasitic flatworms possess orthologs of POU2, POU3, POU4 and POU6 family genes together with a single ‘orphan’ POU-like gene [35]. They have thus lost members of the POU1 family hypothesised to be pre-sent in the ancestor of the Lophotrochozoa, whereas the POU5 class is novel to vertebrates [77]. POU genes are involved extensively in nervous system development and in the regulation of stem cell pluripotency in vertebrates [76, 78, 79], and CNS-related expression has been shown in a range of lophotrochozoans, including planarians [80] and octopi [81]. POU genes are enriched in planar-ian neoblasts [82], and Scimone et al. [83] demonstrated the role of a pou2/3 gene (putatively orthologous to pou3 orthologs in parasitic flatworms [35]) in the development of the planarian’s protonephridial system. Restriction of Hmic-pou4 to the areas of the developing scolex com-bined with conserved roles of POU genes in neurogenesis is consistent with its involvement in CNS development, like aris, otp and foxQ2. In contrast, the posterior, cyst-restricted expression of the ‘orphan’ pou-like gene makes it unlikely to be involved in either CNS or protonephrid-ial development.
soxPF-1A Sox (SYR-like box) family transcription factor is expressed in a diffuse and dynamic fashion, appearing ubiquitous in S1 Larvae save the most posterior region, then seen in the nascent cyst tissues in S3, and finally restricted to the developing juvenile post-encystment (S4;
Page 16 of 29Olson et al. EvoDevo (2018) 9:21
Fig. 4g). SoxPF-1 is one of three paralogs that are part of a parasitic flatworm-specific expansion of Sox genes, all of which show up-regulation in both the Larvae and Scolex-Neck samples (Table 2). In planarians, the Schmidtea soxP1 gene and the presumably paralogous genes Smed-soxP2 and Smed-soxP3 are all expressed in neoblasts, but only soxP1 is required for their long-term maintenance [84]. Sox genes are canonical regulators of metazoan stem cells capable of reprogramming differentiated cells [85, 86]. Spatial expression of soxPF-1 in Hymenolepis may reflect cell proliferation during the different phases of metamorphosis, such as the formation of the cyst tis-sues and morphogenesis of the juvenile worm, and if so would be consistent with the gene product having a canonical role in regulating stem cells, as they comprise the only proliferative cell compartment in flatworms [27].
zf581200 and zf798800Two unclassified, C2H2-type zinc finger transcription factors show strong expression in Larvae: zf581200 is expressed in a quartet pattern in the anterior of the Lar-vae, prefiguring development of the suckers (Fig. 4h), while zf798800 exhibits diffuse expression that becomes restricted posteriorly through the course of metamor-phosis (Fig. 4i). In the present analyses, zf581200 shows only 2 fragments mapped to Larvae (Additional file 1: Table S1.2), whereas gene model HmN_000798800 is not supported in the v.2 assembly, albeit our empirical data show that it represents a bona fide gene transcript. At least 37 types of specific binding domains character-ise the zinc finger super-family, of which the C2H2 type is the most abundant [87, 88] and there are nearly 200 zinc finger genes in the H. microstoma genome [35]. It is hypothesised that lineage-specific expansion of tran-scription factors such as these plays a role in the changes in gene regulatory networks that produce unique traits in animals [88, 89], and thus, although almost all of the putative zinc fingers identified are unclassified (Addi-tional file 4: Table S4), their spatial expression patterns would be nevertheless valuable to survey.
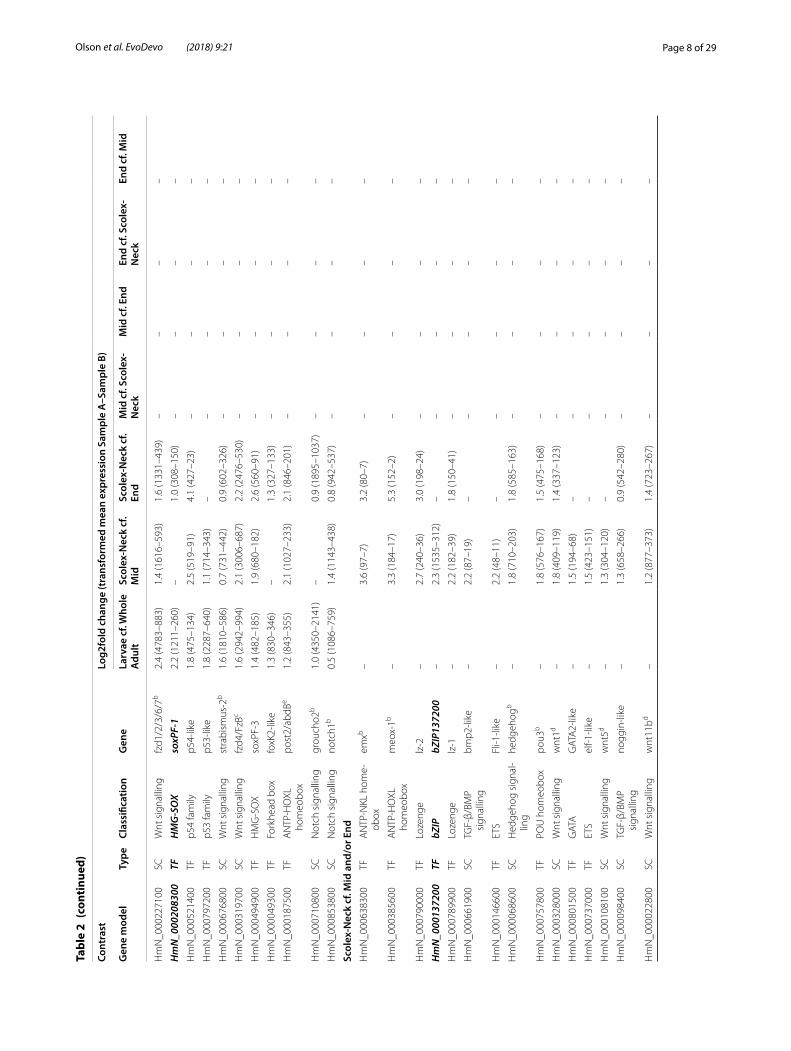
Differential expression in the Scolex-Neck regionDifferentially expressed GOI in the Scolex-Neck con-trasts included a wide diversity of major types of tran-scription factors and more signalling components (18) than were found among the other contrasts. As previ-ously discussed, nearly half of the GOI up-regulated in Scolex-Neck cf. Mid and/or End samples (35 of 77) were also up-regulated in the Larvae sample (Table 2 and Additional file 4: Table S4). Components of Wnt signal-ling included two Wnt ligands (wnt1 and wnt11b) and repressors (sfrp-like and wif) and a paralog of strabis-mus, DE only in the Scolex-Neck, in addition to another
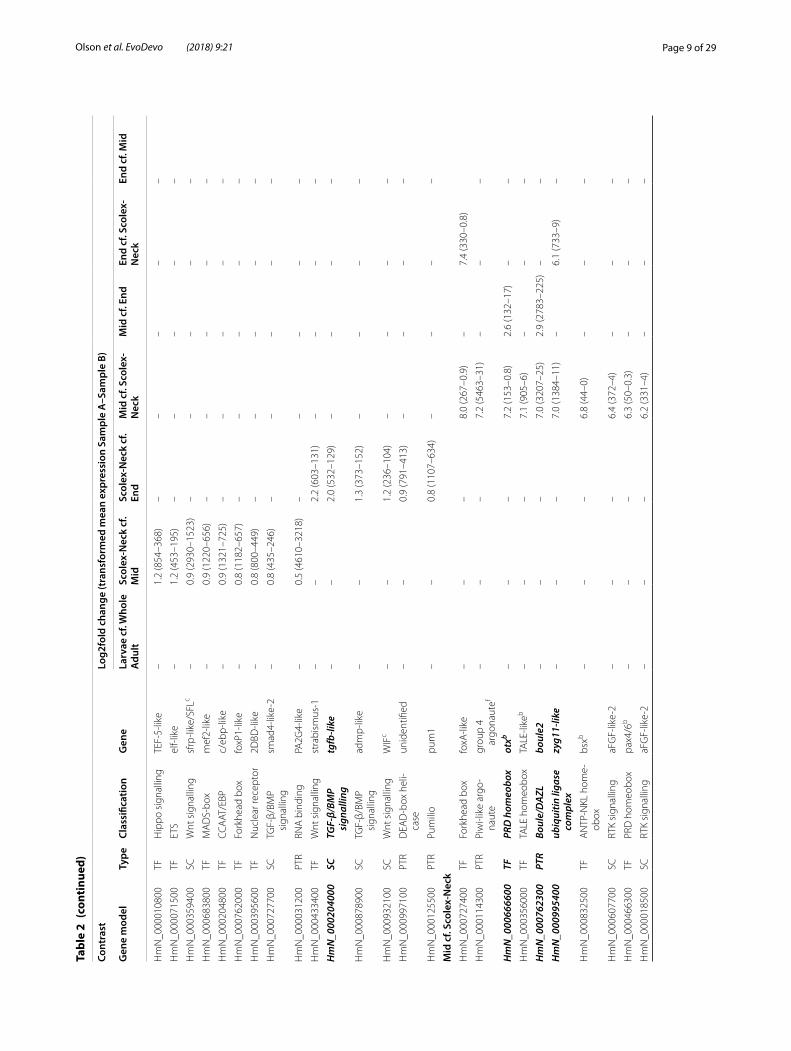
strabismus paralog and two frizzled receptors DE in both the Scolex-Neck and Larvae. Notch signalling compo-nents, including orthologs of a Notch ligand and a Delta receptor, were also up-regulated in both the Scolex-Neck and Larvae samples, as noted above. Unlike the Larvae, however, DE GOI in the Scolex-Neck also included five components of TGF-β/BMP signalling, including tgfb and bmp2-like genes, an ortholog of Hedgehog, the primary ligand of the Hedgehog signalling pathway, and a tef-5-like transcript associated with Hippo signalling [90, 91]. One of three paralogs of the stem cell regulator Pumilio [92, 93] (pum1) is up-regulated relative to the End sam-ple (but not to the Mid), whereas the remaining paralogs, pum2 and pum3, are independently up-regulated in the Mid and End samples, respectively (Table 2).
Below we discuss spatial expression patterns in the Scolex-Neck and immature strobila of five genes:
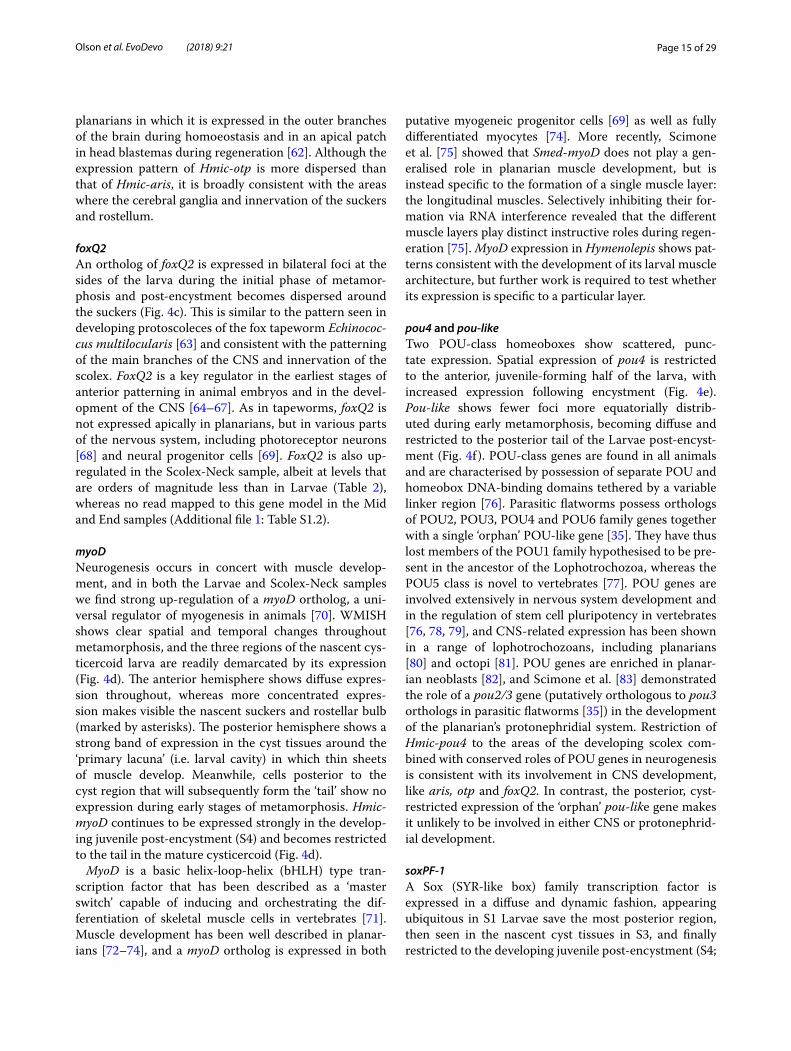
snailAn ortholog of snail is expressed in a gradient around the medullary region and fades after the transition with the strobila (Fig. 5a). Further down the strobila, it is weakly expressed in the genital primordia (Fig. 5f ). Here the gene model was not found to be DE but had been pre-viously identified as such when the RNA-seq data were mapped to an earlier version of the genome assembly. Snail is a C2H2-type zinc finger transcription factor [94] encoding a protein that negatively regulates binding of myoD in progenitor myoblasts in mice, controlling their transcriptional state from one of proliferation to differ-entiation [95]. In Schmidtea, a direct ortholog of Hmic-snail is expressed together with Smed-myoD in a distinct population of muscle-related progenitor neoblasts [69]. Myogenesis in the neck is clearly required for the contin-ual extension of the body by intercalation of new muscle cells. If snail plays a canonical role in tapeworms, then neoblast specialisation in planarians suggests that its expression pattern most likely represents a sub-popula-tion of germinative cells with a myogenic fate. Moreover, it would follow that what appears to be a lack of expres-sion in the cortical (outer) region would be explained by migrating myogenic cells transitioning from a state of proliferation to one of differentiation [95].
bZIP137200An unclassified, basic-region leucine zipper (bZIP) tran-scription factor exhibits intense, diffuse expression in the neck that fades in a gradient at the transition with the strobila (Fig. 5b), as well as secondary foci of expression in the nascent seminal receptacle (Fig. 5g). Like bHLH transcription factors, bZIP proteins dimerise to form DNA-binding motifs and predate the origin of Meta-zoa [96]. The repertoire of bZIP class genes is largely
Page 17 of 29Olson et al. EvoDevo (2018) 9:21
unknown outside of major animal and plant models, especially in regard to lophotrochozoan taxa. However, a total of 29 bZIP genes were identified among the gene models of the Japanese oyster [97], including putative orthologs of many genes found in ecdysozoans and deu-terostomes. The restricted expression of bZIP137200 in the neck region and in the nascent reproductive organs points towards a role in a proliferative (= stem) cell compartment.
The patterns of both snail and bZIP137200 appear to involve expression near the boundary of the medullary and cortical regions where there is a confluence of pri-mary nerve elements, thick longitudinal muscle bundles and germinative cells [37, 39, 53]. Signalling between
the nerve-muscle system and neoblasts is central to the developmental regulatory networks of planarians [98, 99], suggesting that this boundary in tapeworms repre-sents a putative ‘signalling cylinder’ found not only the neck region, but extending the length of the strobila [12, 100]. As transcription factors act as up-stream or down-stream elements in signalling pathways, those DE in the Scolex-Neck are likely to be linked to developmental pro-cesses specific to the region.
TGF-β-likeA TGF-β-like ortholog is expressed in multiple foci throughout the worm. In the neck, it is expressed in the genital primordia (misnamed the ‘primitive streak’ in
Fig. 5 Spatial gene expression in the Scolex-Neck. a–d Expression in the scolex, neck and immature strobila. f Expression of snail in the genital primordia. g Expression of bZIP137200 in the nascent seminal receptacle. h, i Expression of tgfb-like in immature segments. Arrows in h segmental, dorsoventrally paired foci, and dotted box in i punctate stripe of expression across the segments, both patterns consistent with the positions of segmentally repeated elements of the nervous system [39]. j Expression of zf631300 showing punctate expression in the cortex. Gene models: bZIP137200 (HmN_000137200), six3/6 (HmN_000022100), snail (HmN_000348000), tgfb-like (HmN_000204000), zf631300 (HmN_000631300). Scale bars 200 μm (a–e), 50 μm (f–j)

Page 18 of 29Olson et al. EvoDevo (2018) 9:21
tapeworms) and in a dense, punctate pattern that extends into the scolex (Fig. 5c). Beyond the neck a more regular, segmental pattern emerges that includes a central foci of expression representing the genital primorida that can be seen later to split antero-posteriorly (Fig. 5h) into the putative anlagen of the seminal vesicle/vagina and the ovary/vitellarium, or alternatively as a split between the male and female systems, as described in the rat tape-worm Hymenolepis diminuta by Sulgatowska [101]). Also visible is a quartet of dorsoventrally paired foci at the inter-segmental boundaries (Fig. 4h) correspond-ing in position to the junction of the medial longitudinal and traverse nerve cords, suggesting that these may act as centres of inter-segmental signalling. Finally, we observe a ‘stripe’ of expressing cells that circumscribes each seg-ment at their equator (Fig. 5i).
TGF-β-like orthologs encode ligands of the highly con-served metazoan TGF-β/BMP signalling pathway and are involved in a wide range of morphogenic processes, often with pleiotropic effects [102, 103]. Ligands of TGF-β/BMP signalling fall into two broad superfamilies that stimulate different intracellular transducers (Smad pro-teins) resulting in the transcriptional regulation of dif-ferent target genes. A direct ortholog of Hmic-tgfb-like in the bloodfluke Schistosoma mansoni (Add. File 1) was shown by Freitas et al. [104] to be expressed in the ovary and vitellaria of female worms (and sub-tegumentally in association with the oral and ventral suckers of males) and was deduced to have a role in embryogenesis. In Hymenolepis, we also see expression in the female system as well as many additional foci, suggesting multiple roles of TGF-β signalling throughout tapeworm development.
Using data from the S. mansoni genome [32] to rep-resent flatworms, Kenny et al. [105] identified a total of five type I/II receptors and five Smads, but found only two TGF-β-type genes and no BMP-type gene. The large number of receptors relative to ligands suggested that some of the S. mansoni receptors may be responding to host ligands [106]. However, using the latest assemblies of the S. mansoni genome [33] on WBP we do find both TGF-β- and BMP-type orthologs in all major groups of parasitic flatworms, as well as in planarians. Moreover, a bmp2-like ligand is up-regulated in the Scolex-Neck (Table 2), but its spatial expression was not examined. The roles of TGF-β signalling via Smad2/3 in flatworms have not been identified, whereas the highly conserved role of BMP signalling in dorsoventral patterning of ani-mals [107] has been well studied in planarians in which it is involved in both dorsoventral and midline patterning [108–113], and we would expect to find the same in other flatworms.
six3/6An ortholog of the sine oculus/Six homeobox family six3/6 is expressed in three vertical ‘stripes’ in the neck and anterior strobila. Expression begins immediately following the scolex and runs along the dorsoventral midline just to the sides of the osmoregulatory canals and in the central ‘primitive streak’ (Fig. 5d). Posteri-orly, expression becomes more punctate in the imma-ture region of the strobila and then fades. Six3/6 family genes, like foxQ2, are canonical regulators of anterior neural patterning during embryonic development [114, 115], and more generally, of early head patterning in ani-mals [65, 116]. An Echinococcus multilocularis six3/6 ortholog is expressed in protoscolices in the area of the rostellar nerve ring, the most apical region of the tape-worm CNS [63, 117]. In planarians, it is expressed in the outer cephalic branches of the brain [118] and in neu-ral progenitor neoblasts [69]. Its spatial expression dur-ing strobilar growth in Hymenolepis is associated with the main longitudinal nerve cords, consistent with hav-ing a canonical role in the development and/or mainte-nance of the nervous system during strobilation and early stages of segment maturation, whereas expression in the genital primordia indicates an additional role in proglot-tid development. Like snail discussed above, six3/6 was previously identified as DE in the Scolex-Neck and our empirical data corroborate this. However, only a few RNA-seq reads mapped against this gene model in the v.2 assembly (Additional file 1: Table S1.2).
zf631300Zf631300 is an unclassified C2H2-type zinc finger DE in both the Larvae and Scolex-Neck (Additional file 4: Table S4) that in adults shows strong expression in asso-ciation with the main elements of the CNS (Fig. 5e), as well as more dispersed, punctate expression in the tis-sues of the strobila (Fig. 5j). Expression associated with the nervous system is tightly clustered around the main longitudinal nerve cords and cerebrial ganglia in the scolex, appearing as individual foci (‘dots’) of expression surrounding the main nerve cords. One possibility is that this pattern represents expression by the nerves them-selves which have been shown to be distinctly vesicular in tapeworms [53, 119, 120], suggesting that the CNS may act as a neurocrine organ [120, 121].
Differential expression in the mature strobilaGOI in the Mid sample were dominated by transcription factors (Table 2; Additional file 3: Table S3), which made up 90% of the 59 GOI DE relative to the Scolex-Neck. Although zinc fingers were the most abundant type of transcription factor, as in all contrasts, homeoboxes made up a larger percentage of the total GOI in the Mid sample
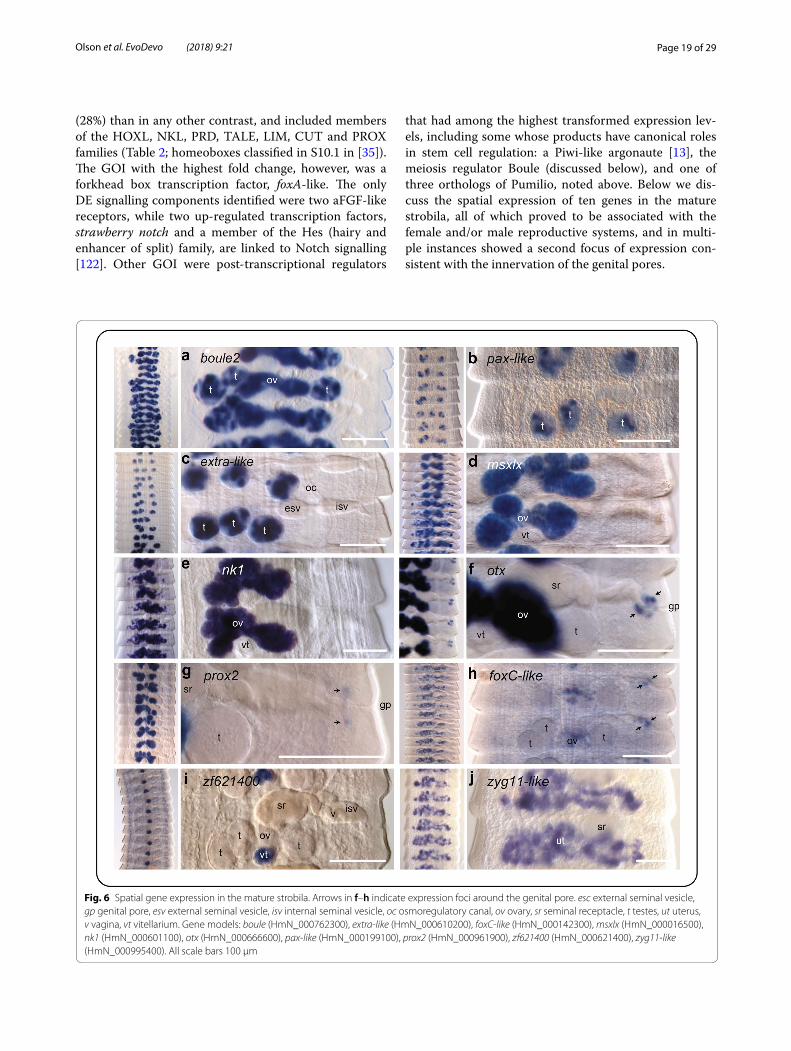
Page 19 of 29Olson et al. EvoDevo (2018) 9:21
(28%) than in any other contrast, and included members of the HOXL, NKL, PRD, TALE, LIM, CUT and PROX families (Table 2; homeoboxes classified in S10.1 in [35]). The GOI with the highest fold change, however, was a forkhead box transcription factor, foxA-like. The only DE signalling components identified were two aFGF-like receptors, while two up-regulated transcription factors, strawberry notch and a member of the Hes (hairy and enhancer of split) family, are linked to Notch signalling [122]. Other GOI were post-transcriptional regulators
that had among the highest transformed expression lev-els, including some whose products have canonical roles in stem cell regulation: a Piwi-like argonaute [13], the meiosis regulator Boule (discussed below), and one of three orthologs of Pumilio, noted above. Below we dis-cuss the spatial expression of ten genes in the mature strobila, all of which proved to be associated with the female and/or male reproductive systems, and in multi-ple instances showed a second focus of expression con-sistent with the innervation of the genital pores.
Fig. 6 Spatial gene expression in the mature strobila. Arrows in f–h indicate expression foci around the genital pore. esc external seminal vesicle, gp genital pore, esv external seminal vesicle, isv internal seminal vesicle, oc osmoregulatory canal, ov ovary, sr seminal receptacle, t testes, ut uterus, v vagina, vt vitellarium. Gene models: boule (HmN_000762300), extra-like (HmN_000610200), foxC-like (HmN_000142300), msxlx (HmN_000016500), nk1 (HmN_000601100), otx (HmN_000666600), pax-like (HmN_000199100), prox2 (HmN_000961900), zf621400 (HmN_000621400), zyg11-like (HmN_000995400). All scale bars 100 μm
Page 20 of 29Olson et al. EvoDevo (2018) 9:21
boule2An ortholog of the Boule/DAZL-family RNA regula-tor boule is strongly up-regulated in both the testes and ovaries (Fig. 6a). Boule2 encodes an RNA-binding protein essential to germline development [51] and has been shown to regulate meiosis throughout the Cnidaria + Bilateria [123]. Boule expression in animals is generally male specific [123] but is associated with both the male and female germlines in flatworms, consistent with the expression foci seen in H. microstoma. The free-living flatworm Macrostomum lignano has three copies of boule, two of which are associated with the testes (one involved directly in spermiogenesis) and one with oogen-esis in the ovaries [124]. In Schmidtea, there are also two paralogs, both of which are involved in spermatogenesis and oogenesis: Iyer et al. [125] showed that Smed-boule1 has a canonical role in the regulation of meiosis, whereas Smed-boule2 has a pre-meiotic role in the maintenance of early male germ cells, analogous but not homologous to the role played by DAZL genes in vertebrates. In the same year, Steiner et al. [126] showed that a Schmid-tea boule ortholog (= Smed-boule2 in [125]) is required for both male and female gamete production, but that whereas Smed-boule2(RNAi) results in sterility, it does not inhibit the production of egg capsules. Gene trees generated via WBP (not shown) indicate that a major-ity of parasitic flatworms have two paralogous Boule-DAZL-type genes that form separate clades, one of which includes Smed-boule1 and Smed-boule2, whereas the other clade appears to be specific to neodermatans and includes the Hmic-boule2 paralog analysed here.
pax-like and extra-likeTestes-specific, regionalised expression was seen in a pax-like PRD-class gene (Fig. 6b) and an unclassified extradenticle-like TALE-class gene (Fig. 6c). Pax genes have been shown to regulate cell lineage specification and maintain progenitor cell populations through alter-native splicing and gene activation/repression [127], and in mammals pax7 expression is also specific to the male germline [128]. BLAST identification of the TALE-class gene returns extradenticle as the best match, but gene trees (not shown) suggest that it is one of at least eight unassignable genes that are part of a TALE-class expan-sion specific to parasitic flatworms [35]. Moreover, it is not orthologous to planarian PBX/extradenticle which is involved in anteroposterior (AP) polarity during regen-eration by affecting Wnt signalling [129]. While there is scarcely information on the roles of these genes in inver-tebrates, spatial expression in Hymenolepis demonstrates their involvement in the male reproductive system.
msxlx and nk1Spatial expression of other up-regulated genes exam-ined from the Mid sample was specific to the female system. Two ANTP-type homeoboxes, msxlx and nk1, are strongly up-regulated in the ovaries and continue to show expression in fertilised ova in the uterus (Fig. 6d, e). Msx/msh genes encode conserved proteins that act as transcriptional repressors involved in cell prolifera-tion, differentiation and organogenesis during embryonic development [130]. Principal roles include differentiation of mesoderm into muscle and dorsoventral patterning of the neuroectoderm in concert with BMP signalling [131–133]. In Lophotrochozoa, roles in the differentiation of muscle and nerve precursors have been implicated in the polychaete Platynereis [134], and in dugesiid planarians msh genes have been shown to regulate neoblast prolifer-ation and BMP signalling during head regeneration [135]. Ovarian and uterine expression of msx genes has been shown also in mice, including a direct role in the regula-tion of meiosis in the female germline [136, 137]. Tape-worms lack direct orthologs of Msx family genes [35] but do possess single copies of the closely related Msxlx fam-ily which has been lost in tunicates and vertebrates [138]. Msxlx expression in Hymenolepis is clearly related to the female system, and it would be informative to know whether it is also expressed in the ovaries of planarians. However, expression in planarians has only been exam-ined in the context of regeneration [135].
Hmic-nk1 is one of two paralogs found in tapeworms [35] and is a principal member of the NKL sub-class of ANTP-type homeoboxes that also includes the closely related Msx/Msxlx family genes [139, 140]. There is a large diversity of nk-like genes in animals which, similar to msx genes, play fundamental roles in differentiation, proliferation and apoptosis, often in relation to neuro-genesis [134, 141] and muscle patterning [142], and an nk1 gene has been shown to be essential for the forma-tion of circular muscles in Schmidtea [75]. However, a recent study of the transcriptomes of the testes and ova-ries of Schistosoma mansoni showed up-regulation of an nk2 gene in the ovaries of paired females, but not in the testes of males or ovaries of un-paired females [143]. Thus together with the present study, results indicate a role of NK homeobox genes in the female reproductive system in both tapeworms and flukes.
otx and prox3In addition to the above NKL-type homeobox genes, the ovaries also express the PRD-class gene otx (Fig. 6f ) and the PROS/Prox-class homeobox prox/prospero (Fig. 6g). Notably, otx and prox3 also show another focus of expres-sion around the genital pores, which are highly inner-vated [39, 119]. Otx is orthologous [35] to Drosophila
Page 21 of 29Olson et al. EvoDevo (2018) 9:21
orthodenticle (otd) and vertebrate otx genes, canonical regulators of brain development [144]. Planarians have two otx genes that are expressed in the brain [145, 146], in photoreceptor neurons [68, 147] and in CNS-related neoblast progenitors [69].
Prospero/prox genes are also broadly involved in nerv-ous system development and in the regulation of neu-ral progenitor cells [148–150] and in Schmidtea have been shown to be up-regulated in proliferating cells [84] including neural progenitor neoblasts [69]. Prox2 is one of two paralogs in Hymenolepis and had few reads mapped against the v.2 genome (Additional file 1: Table S1.2) despite the strong expression seen in the ovaries, whereas Hmic-prox1 was highly up-regulated in both the Larvae and Scolex-Neck samples (Table 2). A role of Hmic-prox2 in the female germline of tapeworms is thus broadly consistent with stem cell-related roles in planarians. As both prox and otx genes are canonically associated with the nervous system, expression around the genital atrium is likely to be associated with its inner-vation. In contrast, otx has not been previously associ-ated with the germline or reproductive tissues of animals. Simultaneous expression of these genes in the ovary and around the genital ducts points towards an intriguing link in gene regulation between these two parts of the reproductive system.
foxC-likeA tapeworm-specific foxC-like forkhead box gene shows a similar, albeit weaker, pattern of expression in both the ovary and around the genital ducts (Fig. 6h). Weak expression is also observed in the nascent genital primor-idia of the female system in immature segments, appear-ing as central dots (not shown). Gene trees produced via WBP (not shown) indicate foxC-like to be a divergent member of the family with direct flatworm orthologs identified only in the closely related species H. nana and H. diminuta. Thus although comparison with orthologs in other animals may be dubious, the foxl2 gene has been shown to be central to ovarian differentiation and main-tenance in mammals [151].
zf621400Of the transcripts found to be specific to the female sys-tem, only one showed expression in the vitellarium: an unclassified C2H2-type zinc finger. Vitellaria represent a division of the female system between the germarium (i.e. ovary; producing oocytes) and the vitellarium (pro-ducing vitellocytes) that is found in euneoophoran flat-worms, which includes the parasitic flatworms and a subset of derived, free-living groups that includes pla-narians (i.e. Tricladia) [152, 153]. Ectolecithal eggs are produced in which fertilised oocytes are packaged with
varying numbers of vitellocytes that provide both yolk and proteins for the production of the egg shell [154]. Typical of cyclophyllidean tapeworms, H. microstoma has a single, compact vitellarium situated centrally, below the bi-lobed ovary [42]. Hmic-zf621400 expression is seen throughout the developing and mature vitellaria in the strobila (Fig. 6i) and in individual cells (putatively vitellocytes) in the uterus, showing that it continues to be expressed during embryogenesis (Additional file 5: Figure S1). However, in addition to the vitellaria, expression is also observed in somatic cells and in the genital primor-dia of immature segments (Additional file 5: Figure S1). Hence, it may be that this transcription factor had a more general role in flatworms and secondarily evolved a role in vitellogenesis in the Euneophora. A molecular marker for tapeworm vitellaria has not been reported previously, and thus, the gene may find utility for this purpose. A large number of vitellaria- and/or vitellocyte-specific genes were identified in blood flukes through a similar combination of RNA-seq and WMISH [155], and many of these may prove to be useful markers in other parasitic flatworms and other euneophoran groups.
zyg11-likeA zyg11-like gene is up-regulated in the Mid and End samples (cf. Scolex-Neck) and was one of a small number of tapeworm orthologs identified among a list of candi-date senescence-related genes in C. elegans (unpub. data). In Hymenolepis, it shows diffuse expression throughout the uterus, revealing the anastomosing structure of the organ (Fig. 6j). Zyg11 encodes a member of a large pro-tein family characterised by leucine-rich repeats and is involved in several functions in C. elegans including meiotic progression and AP polarity during embryogen-esis [156, 157]. Functions of the gene family outside of C. elegans are not known. Hmic-zyg11-like is one of 12 paralogs in the H. microstoma genome, and phylogenetic analysis via WBP (not shown) indicates that it is part of a large expansion of this gene family in parasitic flatworms. Its spatial expression suggests it could be a marker for the uterus.
Differential expression in the gravid strobilaA comparatively small number of DE GOI were identified in the End sample (Table 2) as discussed previously, and none showed high log2fold-change values. In addition to five putative zinc fingers, there was a small number of homeoboxes, high mobility group and basic leucine zipper transcription factors identified (Table 2). Among signalling components was an FGF receptor also up-reg-ulated in Larvae (discussed above) and a slit-like protein sequence that was the only example among GOI of the Slit/Robo pathway which is canonically involved in axon
Page 22 of 29Olson et al. EvoDevo (2018) 9:21
repulsion during neural development [158]. A paralog of the smad-like factor DE in the Mid sample was identi-fied as were components of Wnt signalling, including the Wnt antagonist sfrp which is involved in establishing pri-mary AP polarity in animals [159] and in tapeworms is expressed at the site(s) of scolex formation in developing Larvae [63]. A paralog of the stem cell regulator pumillio (cf. Mid sample) was highly expressed, albeit only around twice the level of its expression in the Mid and Scolex-Neck samples (log2fold change of 0.8; Table 2). No gene was examined by WMISH in the End sample.
ConclusionsThrough genome-wide transcriptome profiling we have identified genes DE in association with the major stages of the H. microstoma life cycle, revealing candidate regu-lators of the underlying developmental processes. Spa-tial analyses corroborate quantitative RNA-seq data and provide insights into the putative roles of the genes by linking their expression to organs, tissues and cells in tapeworms for the first time. The overarching picture shows that their complex development involves factors with canonical roles in axial specification, neurogenesis, myogenesis and stem cell regulation and that their under-lying developmental ‘toolkit’ therefore resembles that of free-living flatworms and metazoan animals in gen-eral. The striking similarity in transcriptome profiles of the Scolex-Neck region and Larvae, both in general and specifically in relation to genes known to be involved in animal development, suggests that strobilation in adults involves recapitulation of many of the same gene regula-tory networks employed during larval metamorphosis. In contrast, reproductive development involves a larger per-centage of up-regulated genes that lack clear orthologs in other animal groups.
Our work represents a course-grained survey of differ-ential gene expression in tapeworms and a finer-grained approach including more time points during larval meta-morphosis and smaller divisions of the adult body would reveal additional DE genes and provide a more refined overview of their temporal expression dynamics. Broad surveys of this type are especially critical in new model organisms and have been integral to elucidating gene regulatory networks in planarians [21]. Recent addition of long-read and optical mapping data has now improved H. microstoma genome assembly to the level of full chro-mosomes (unpub. data), which will make it among, if not the, most complete genome of a lophotrochozoan, and will stabilise gene model estimates. The develop-ment of such genomic resources for parasitic flatworms and their curation via WormBase ParaSite [45] has accel-erated our ability to investigate their developmental
genetics. Moreover, increased representation of species through the 50 Helminth Genomes Project [160] means that we can make more comprehensive investigations of the diversity and interrelationships of developmentally related genes to determine their degree of taxonomic restriction (i.e. ‘orphan-ness’) [161, 162] and to identify where direct orthologs exist between free-living and par-asitic species.
Understanding the somatic stem cell systems of para-sitic flatworms is essential to investigations of all aspects of their growth and differentiation. Germinative cells of tapeworms and neoblast-like cells of blood flukes have been a focus of recent studies that demonstrate similari-ties with planarians as well as potentially significant dif-ferences in their underlying regulation [14, 15, 36, 37, 100, 163, 164]. Transcriptional profiling of their prolifera-tive cell compartments will allow us to determine the full extent to which regulation differs from the well-charac-terised neoblast system of planarians, and we expect that single-cell profiling will reveal sub-populations of partly differentiated progenitor stem cells, as recently charac-terised in Schmidtea mediterranea [69, 165]. Such studies would provide new candidate targets for chemotherapy as well as an abundance of cell-specific markers that will enable expressed genes to be associated with different cellular compartments.
MethodsAnimal cultures and samplesThe Nottingham strain [42] of the mouse bile-duct tape-worm, Hymenolepis microstoma, was maintained in vivo using flour beetles (Tribolium confusum and T. cas-taneum) and inbred strains of laboratory mice (Mus mus-culus) in accordance with project licence PPL70/8684 issued by the UK Home Office to PDO. To produce lar-val samples representing the approximate mid-point in the metamorphosis from oncosphere to cysticercoid, beetles were starved for five days and then exposed to macerated, gravid proglottids of H. microstoma for ~ 6 h. Gravid tissues were removed, and the beetles allowed to feed on flour ad libitum. Beetles were dissected five days post-exposure to eggs and the Larvae collected from the haemocoel and transferred live into RNAlater (Qiagen). Morphologically, most Larvae were elongated and well differentiated at both poles, equating to stage 3 follow-ing Voge [166]. However, individual variation in devel-opmental rates meant that some Larvae were closer to ‘stages’ 2 or 4. Approximately 550 individuals were combined for each of three replicate larval samples and stored in RNAlater at − 80 °C.
For the Whole Adult samples, fully grown, gravid worms > 1 month old were dissected from the bile ducts of mice into vertebrate saline (0.85% w/v NaCl), rinsed
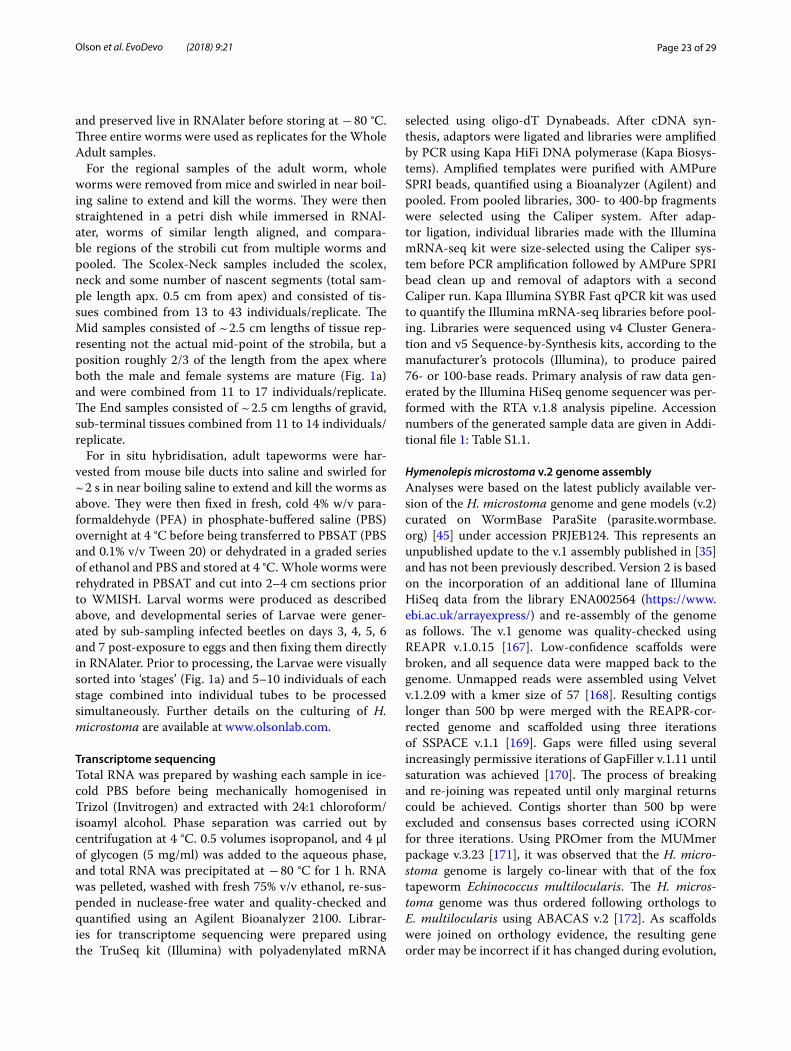
Page 23 of 29Olson et al. EvoDevo (2018) 9:21
and preserved live in RNAlater before storing at − 80 °C. Three entire worms were used as replicates for the Whole Adult samples.
For the regional samples of the adult worm, whole worms were removed from mice and swirled in near boil-ing saline to extend and kill the worms. They were then straightened in a petri dish while immersed in RNAl-ater, worms of similar length aligned, and compara-ble regions of the strobili cut from multiple worms and pooled. The Scolex-Neck samples included the scolex, neck and some number of nascent segments (total sam-ple length apx. 0.5 cm from apex) and consisted of tis-sues combined from 13 to 43 individuals/replicate. The Mid samples consisted of ~ 2.5 cm lengths of tissue rep-resenting not the actual mid-point of the strobila, but a position roughly 2/3 of the length from the apex where both the male and female systems are mature (Fig. 1a) and were combined from 11 to 17 individuals/replicate. The End samples consisted of ~ 2.5 cm lengths of gravid, sub-terminal tissues combined from 11 to 14 individuals/replicate.
For in situ hybridisation, adult tapeworms were har-vested from mouse bile ducts into saline and swirled for ~ 2 s in near boiling saline to extend and kill the worms as above. They were then fixed in fresh, cold 4% w/v para-formaldehyde (PFA) in phosphate-buffered saline (PBS) overnight at 4 °C before being transferred to PBSAT (PBS and 0.1% v/v Tween 20) or dehydrated in a graded series of ethanol and PBS and stored at 4 °C. Whole worms were rehydrated in PBSAT and cut into 2–4 cm sections prior to WMISH. Larval worms were produced as described above, and developmental series of Larvae were gener-ated by sub-sampling infected beetles on days 3, 4, 5, 6 and 7 post-exposure to eggs and then fixing them directly in RNAlater. Prior to processing, the Larvae were visually sorted into ‘stages’ (Fig. 1a) and 5–10 individuals of each stage combined into individual tubes to be processed simultaneously. Further details on the culturing of H. microstoma are available at www.olson lab.com.
Transcriptome sequencingTotal RNA was prepared by washing each sample in ice-cold PBS before being mechanically homogenised in Trizol (Invitrogen) and extracted with 24:1 chloroform/isoamyl alcohol. Phase separation was carried out by centrifugation at 4 °C. 0.5 volumes isopropanol, and 4 µl of glycogen (5 mg/ml) was added to the aqueous phase, and total RNA was precipitated at − 80 °C for 1 h. RNA was pelleted, washed with fresh 75% v/v ethanol, re-sus-pended in nuclease-free water and quality-checked and quantified using an Agilent Bioanalyzer 2100. Librar-ies for transcriptome sequencing were prepared using the TruSeq kit (Illumina) with polyadenylated mRNA
selected using oligo-dT Dynabeads. After cDNA syn-thesis, adaptors were ligated and libraries were amplified by PCR using Kapa HiFi DNA polymerase (Kapa Biosys-tems). Amplified templates were purified with AMPure SPRI beads, quantified using a Bioanalyzer (Agilent) and pooled. From pooled libraries, 300- to 400-bp fragments were selected using the Caliper system. After adap-tor ligation, individual libraries made with the Illumina mRNA-seq kit were size-selected using the Caliper sys-tem before PCR amplification followed by AMPure SPRI bead clean up and removal of adaptors with a second Caliper run. Kapa Illumina SYBR Fast qPCR kit was used to quantify the Illumina mRNA-seq libraries before pool-ing. Libraries were sequenced using v4 Cluster Genera-tion and v5 Sequence-by-Synthesis kits, according to the manufacturer’s protocols (Illumina), to produce paired 76- or 100-base reads. Primary analysis of raw data gen-erated by the Illumina HiSeq genome sequencer was per-formed with the RTA v.1.8 analysis pipeline. Accession numbers of the generated sample data are given in Addi-tional file 1: Table S1.1.
Hymenolepis microstoma v.2 genome assemblyAnalyses were based on the latest publicly available ver-sion of the H. microstoma genome and gene models (v.2) curated on WormBase ParaSite (parasite.wormbase.org) [45] under accession PRJEB124. This represents an unpublished update to the v.1 assembly published in [35] and has not been previously described. Version 2 is based on the incorporation of an additional lane of Illumina HiSeq data from the library ENA002564 (https ://www.ebi.ac.uk/array expre ss/) and re-assembly of the genome as follows. The v.1 genome was quality-checked using REAPR v.1.0.15 [167]. Low-confidence scaffolds were broken, and all sequence data were mapped back to the genome. Unmapped reads were assembled using Velvet v.1.2.09 with a kmer size of 57 [168]. Resulting contigs longer than 500 bp were merged with the REAPR-cor-rected genome and scaffolded using three iterations of SSPACE v.1.1 [169]. Gaps were filled using several increasingly permissive iterations of GapFiller v.1.11 until saturation was achieved [170]. The process of breaking and re-joining was repeated until only marginal returns could be achieved. Contigs shorter than 500 bp were excluded and consensus bases corrected using iCORN for three iterations. Using PROmer from the MUMmer package v.3.23 [171], it was observed that the H. micro-stoma genome is largely co-linear with that of the fox tapeworm Echinococcus multilocularis. The H. micros-toma genome was thus ordered following orthologs to E. multilocularis using ABACAS v.2 [172]. As scaffolds were joined on orthology evidence, the resulting gene order may be incorrect if it has changed during evolution,
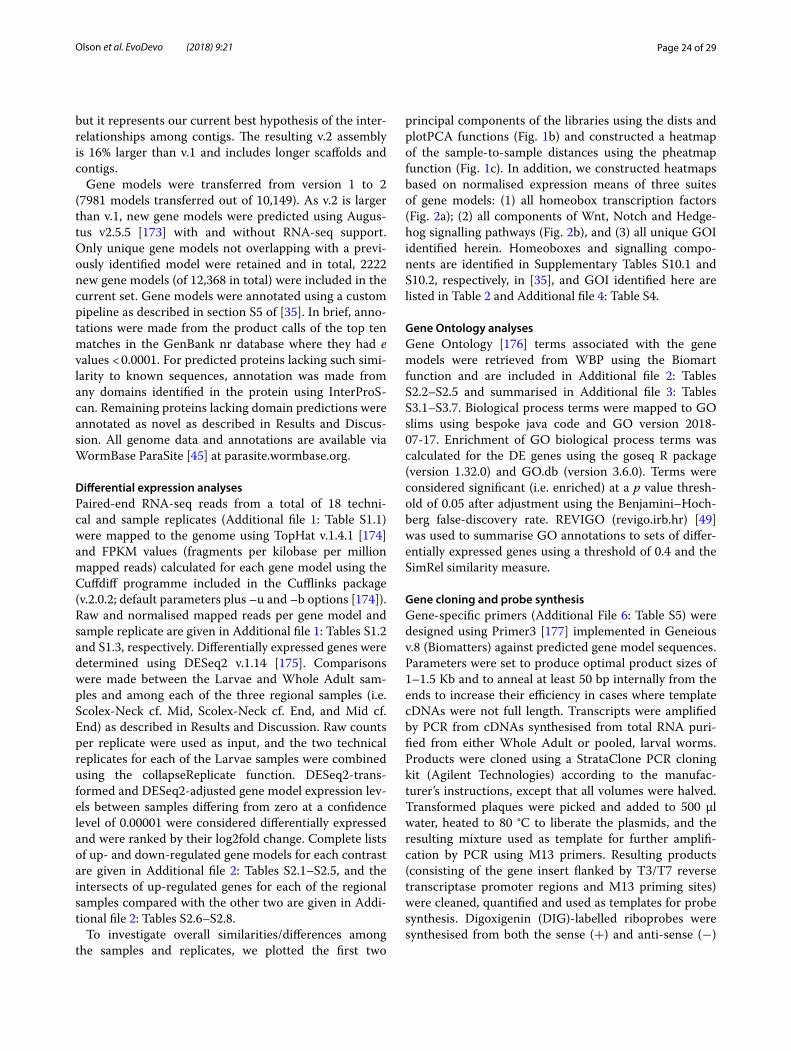
Page 24 of 29Olson et al. EvoDevo (2018) 9:21
but it represents our current best hypothesis of the inter-relationships among contigs. The resulting v.2 assembly is 16% larger than v.1 and includes longer scaffolds and contigs.
Gene models were transferred from version 1 to 2 (7981 models transferred out of 10,149). As v.2 is larger than v.1, new gene models were predicted using Augus-tus v2.5.5 [173] with and without RNA-seq support. Only unique gene models not overlapping with a previ-ously identified model were retained and in total, 2222 new gene models (of 12,368 in total) were included in the current set. Gene models were annotated using a custom pipeline as described in section S5 of [35]. In brief, anno-tations were made from the product calls of the top ten matches in the GenBank nr database where they had e values < 0.0001. For predicted proteins lacking such simi-larity to known sequences, annotation was made from any domains identified in the protein using InterProS-can. Remaining proteins lacking domain predictions were annotated as novel as described in Results and Discus-sion. All genome data and annotations are available via WormBase ParaSite [45] at parasite.wormbase.org.
Differential expression analysesPaired-end RNA-seq reads from a total of 18 techni-cal and sample replicates (Additional file 1: Table S1.1) were mapped to the genome using TopHat v.1.4.1 [174] and FPKM values (fragments per kilobase per million mapped reads) calculated for each gene model using the Cuffdiff programme included in the Cufflinks package (v.2.0.2; default parameters plus –u and –b options [174]). Raw and normalised mapped reads per gene model and sample replicate are given in Additional file 1: Tables S1.2 and S1.3, respectively. Differentially expressed genes were determined using DESeq2 v.1.14 [175]. Comparisons were made between the Larvae and Whole Adult sam-ples and among each of the three regional samples (i.e. Scolex-Neck cf. Mid, Scolex-Neck cf. End, and Mid cf. End) as described in Results and Discussion. Raw counts per replicate were used as input, and the two technical replicates for each of the Larvae samples were combined using the collapseReplicate function. DESeq2-trans-formed and DESeq2-adjusted gene model expression lev-els between samples differing from zero at a confidence level of 0.00001 were considered differentially expressed and were ranked by their log2fold change. Complete lists of up- and down-regulated gene models for each contrast are given in Additional file 2: Tables S2.1–S2.5, and the intersects of up-regulated genes for each of the regional samples compared with the other two are given in Addi-tional file 2: Tables S2.6–S2.8.
To investigate overall similarities/differences among the samples and replicates, we plotted the first two
principal components of the libraries using the dists and plotPCA functions (Fig. 1b) and constructed a heatmap of the sample-to-sample distances using the pheatmap function (Fig. 1c). In addition, we constructed heatmaps based on normalised expression means of three suites of gene models: (1) all homeobox transcription factors (Fig. 2a); (2) all components of Wnt, Notch and Hedge-hog signalling pathways (Fig. 2b), and (3) all unique GOI identified herein. Homeoboxes and signalling compo-nents are identified in Supplementary Tables S10.1 and S10.2, respectively, in [35], and GOI identified here are listed in Table 2 and Additional file 4: Table S4.
Gene Ontology analysesGene Ontology [176] terms associated with the gene models were retrieved from WBP using the Biomart function and are included in Additional file 2: Tables S2.2–S2.5 and summarised in Additional file 3: Tables S3.1–S3.7. Biological process terms were mapped to GO slims using bespoke java code and GO version 2018-07-17. Enrichment of GO biological process terms was calculated for the DE genes using the goseq R package (version 1.32.0) and GO.db (version 3.6.0). Terms were considered significant (i.e. enriched) at a p value thresh-old of 0.05 after adjustment using the Benjamini–Hoch-berg false-discovery rate. REVIGO (revigo.irb.hr) [49] was used to summarise GO annotations to sets of differ-entially expressed genes using a threshold of 0.4 and the SimRel similarity measure.
Gene cloning and probe synthesisGene-specific primers (Additional File 6: Table S5) were designed using Primer3 [177] implemented in Geneious v.8 (Biomatters) against predicted gene model sequences. Parameters were set to produce optimal product sizes of 1–1.5 Kb and to anneal at least 50 bp internally from the ends to increase their efficiency in cases where template cDNAs were not full length. Transcripts were amplified by PCR from cDNAs synthesised from total RNA puri-fied from either Whole Adult or pooled, larval worms. Products were cloned using a StrataClone PCR cloning kit (Agilent Technologies) according to the manufac-turer’s instructions, except that all volumes were halved. Transformed plaques were picked and added to 500 μl water, heated to 80 °C to liberate the plasmids, and the resulting mixture used as template for further amplifi-cation by PCR using M13 primers. Resulting products (consisting of the gene insert flanked by T3/T7 reverse transcriptase promoter regions and M13 priming sites) were cleaned, quantified and used as templates for probe synthesis. Digoxigenin (DIG)-labelled riboprobes were synthesised from both the sense (+) and anti-sense (−)
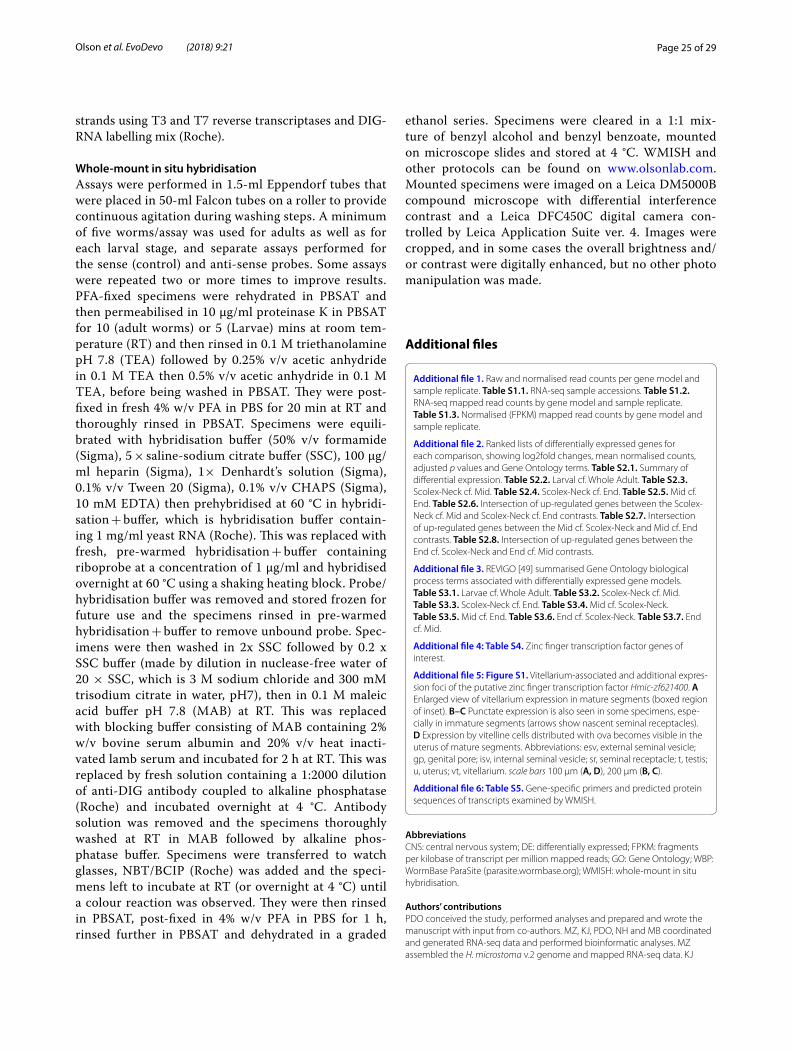
Page 25 of 29Olson et al. EvoDevo (2018) 9:21
strands using T3 and T7 reverse transcriptases and DIG-RNA labelling mix (Roche).
Whole-mount in situ hybridisationAssays were performed in 1.5-ml Eppendorf tubes that were placed in 50-ml Falcon tubes on a roller to provide continuous agitation during washing steps. A minimum of five worms/assay was used for adults as well as for each larval stage, and separate assays performed for the sense (control) and anti-sense probes. Some assays were repeated two or more times to improve results. PFA-fixed specimens were rehydrated in PBSAT and then permeabilised in 10 μg/ml proteinase K in PBSAT for 10 (adult worms) or 5 (Larvae) mins at room tem-perature (RT) and then rinsed in 0.1 M triethanolamine pH 7.8 (TEA) followed by 0.25% v/v acetic anhydride in 0.1 M TEA then 0.5% v/v acetic anhydride in 0.1 M TEA, before being washed in PBSAT. They were post-fixed in fresh 4% w/v PFA in PBS for 20 min at RT and thoroughly rinsed in PBSAT. Specimens were equili-brated with hybridisation buffer (50% v/v formamide (Sigma), 5 × saline-sodium citrate buffer (SSC), 100 μg/ml heparin (Sigma), 1× Denhardt’s solution (Sigma), 0.1% v/v Tween 20 (Sigma), 0.1% v/v CHAPS (Sigma), 10 mM EDTA) then prehybridised at 60 °C in hybridi-sation + buffer, which is hybridisation buffer contain-ing 1 mg/ml yeast RNA (Roche). This was replaced with fresh, pre-warmed hybridisation + buffer containing riboprobe at a concentration of 1 μg/ml and hybridised overnight at 60 °C using a shaking heating block. Probe/hybridisation buffer was removed and stored frozen for future use and the specimens rinsed in pre-warmed hybridisation + buffer to remove unbound probe. Spec-imens were then washed in 2x SSC followed by 0.2 x SSC buffer (made by dilution in nuclease-free water of 20 × SSC, which is 3 M sodium chloride and 300 mM trisodium citrate in water, pH7), then in 0.1 M maleic acid buffer pH 7.8 (MAB) at RT. This was replaced with blocking buffer consisting of MAB containing 2% w/v bovine serum albumin and 20% v/v heat inacti-vated lamb serum and incubated for 2 h at RT. This was replaced by fresh solution containing a 1:2000 dilution of anti-DIG antibody coupled to alkaline phosphatase (Roche) and incubated overnight at 4 °C. Antibody solution was removed and the specimens thoroughly washed at RT in MAB followed by alkaline phos-phatase buffer. Specimens were transferred to watch glasses, NBT/BCIP (Roche) was added and the speci-mens left to incubate at RT (or overnight at 4 °C) until a colour reaction was observed. They were then rinsed in PBSAT, post-fixed in 4% w/v PFA in PBS for 1 h, rinsed further in PBSAT and dehydrated in a graded
ethanol series. Specimens were cleared in a 1:1 mix-ture of benzyl alcohol and benzyl benzoate, mounted on microscope slides and stored at 4 °C. WMISH and other protocols can be found on www.olson lab.com. Mounted specimens were imaged on a Leica DM5000B compound microscope with differential interference contrast and a Leica DFC450C digital camera con-trolled by Leica Application Suite ver. 4. Images were cropped, and in some cases the overall brightness and/or contrast were digitally enhanced, but no other photo manipulation was made.
Additional files
Additional file 1. Raw and normalised read counts per gene model and sample replicate. Table S1.1. RNA-seq sample accessions. Table S1.2. RNA-seq mapped read counts by gene model and sample replicate. Table S1.3. Normalised (FPKM) mapped read counts by gene model and sample replicate.
Additional file 2. Ranked lists of differentially expressed genes for each comparison, showing log2fold changes, mean normalised counts, adjusted p values and Gene Ontology terms. Table S2.1. Summary of differential expression. Table S2.2. Larval cf. Whole Adult. Table S2.3. Scolex-Neck cf. Mid. Table S2.4. Scolex-Neck cf. End. Table S2.5. Mid cf. End. Table S2.6. Intersection of up-regulated genes between the Scolex-Neck cf. Mid and Scolex-Neck cf. End contrasts. Table S2.7. Intersection of up-regulated genes between the Mid cf. Scolex-Neck and Mid cf. End contrasts. Table S2.8. Intersection of up-regulated genes between the End cf. Scolex-Neck and End cf. Mid contrasts.
Additional file 3. REVIGO [49] summarised Gene Ontology biological process terms associated with differentially expressed gene models. Table S3.1. Larvae cf. Whole Adult. Table S3.2. Scolex-Neck cf. Mid. Table S3.3. Scolex-Neck cf. End. Table S3.4. Mid cf. Scolex-Neck. Table S3.5. Mid cf. End. Table S3.6. End cf. Scolex-Neck. Table S3.7. End cf. Mid.
Additional file 4: Table S4. Zinc finger transcription factor genes of interest.
Additional file 5: Figure S1. Vitellarium-associated and additional expres-sion foci of the putative zinc finger transcription factor Hmic-zf621400. A Enlarged view of vitellarium expression in mature segments (boxed region of inset). B–C Punctate expression is also seen in some specimens, espe-cially in immature segments (arrows show nascent seminal receptacles). D Expression by vitelline cells distributed with ova becomes visible in the uterus of mature segments. Abbreviations: esv, external seminal vesicle; gp, genital pore; isv, internal seminal vesicle; sr, seminal receptacle; t, testis; u, uterus; vt, vitellarium. scale bars 100 μm (A, D), 200 μm (B, C).
Additional file 6: Table S5. Gene-specific primers and predicted protein sequences of transcripts examined by WMISH.
AbbreviationsCNS: central nervous system; DE: differentially expressed; FPKM: fragments per kilobase of transcript per million mapped reads; GO: Gene Ontology; WBP: WormBase ParaSite (parasite.wormbase.org); WMISH: whole-mount in situ hybridisation.
Authors’ contributionsPDO conceived the study, performed analyses and prepared and wrote the manuscript with input from co-authors. MZ, KJ, PDO, NH and MB coordinated and generated RNA-seq data and performed bioinformatic analyses. MZ assembled the H. microstoma v.2 genome and mapped RNA-seq data. KJ
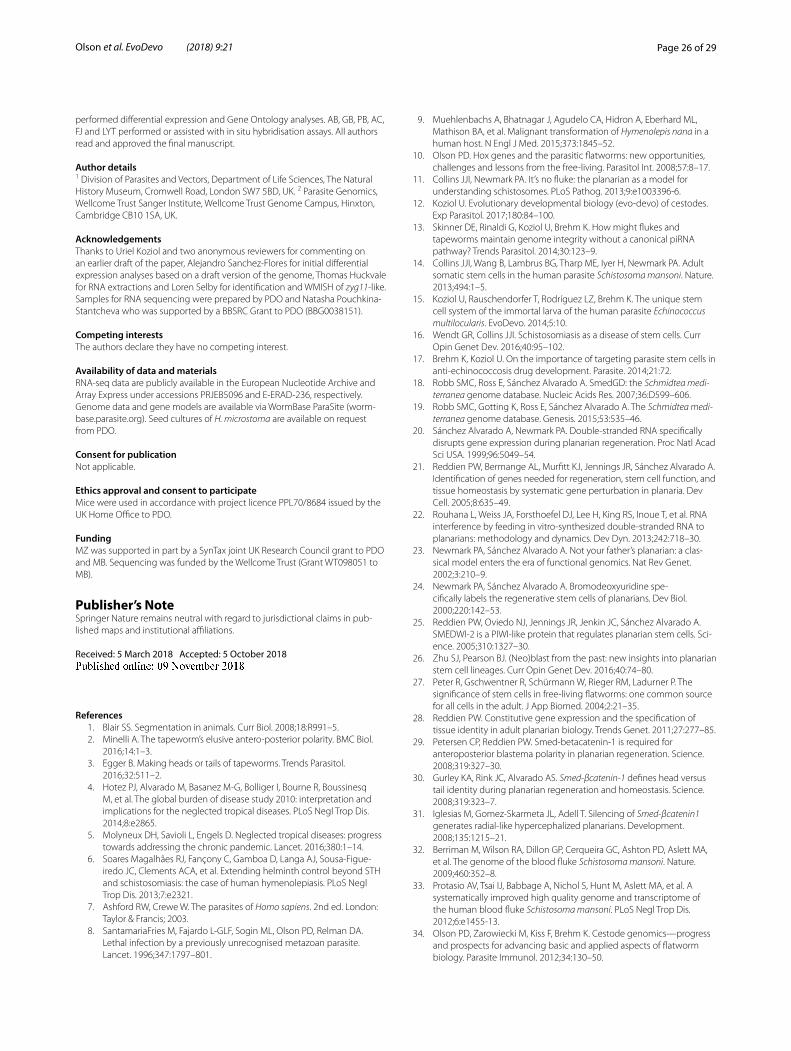
Page 26 of 29Olson et al. EvoDevo (2018) 9:21
performed differential expression and Gene Ontology analyses. AB, GB, PB, AC, FJ and LYT performed or assisted with in situ hybridisation assays. All authors read and approved the final manuscript.
Author details1 Division of Parasites and Vectors, Department of Life Sciences, The Natural History Museum, Cromwell Road, London SW7 5BD, UK. 2 Parasite Genomics, Wellcome Trust Sanger Institute, Wellcome Trust Genome Campus, Hinxton, Cambridge CB10 1SA, UK.
AcknowledgementsThanks to Uriel Koziol and two anonymous reviewers for commenting on an earlier draft of the paper, Alejandro Sanchez-Flores for initial differential expression analyses based on a draft version of the genome, Thomas Huckvale for RNA extractions and Loren Selby for identification and WMISH of zyg11-like. Samples for RNA sequencing were prepared by PDO and Natasha Pouchkina-Stantcheva who was supported by a BBSRC Grant to PDO (BBG0038151).
Competing interestsThe authors declare they have no competing interest.
Availability of data and materialsRNA-seq data are publicly available in the European Nucleotide Archive and Array Express under accessions PRJEB5096 and E-ERAD-236, respectively. Genome data and gene models are available via WormBase ParaSite (worm-base.parasite.org). Seed cultures of H. microstoma are available on request from PDO.
Consent for publicationNot applicable.
Ethics approval and consent to participateMice were used in accordance with project licence PPL70/8684 issued by the UK Home Office to PDO.
FundingMZ was supported in part by a SynTax joint UK Research Council grant to PDO and MB. Sequencing was funded by the Wellcome Trust (Grant WT098051 to MB).
Publisher’s NoteSpringer Nature remains neutral with regard to jurisdictional claims in pub-lished maps and institutional affiliations.
Received: 5 March 2018 Accepted: 5 October 2018
References 1. Blair SS. Segmentation in animals. Curr Biol. 2008;18:R991–5. 2. Minelli A. The tapeworm’s elusive antero-posterior polarity. BMC Biol.
2016;14:1–3. 3. Egger B. Making heads or tails of tapeworms. Trends Parasitol.
2016;32:511–2. 4. Hotez PJ, Alvarado M, Basanez M-G, Bolliger I, Bourne R, Boussinesq
M, et al. The global burden of disease study 2010: interpretation and implications for the neglected tropical diseases. PLoS Negl Trop Dis. 2014;8:e2865.
5. Molyneux DH, Savioli L, Engels D. Neglected tropical diseases: progress towards addressing the chronic pandemic. Lancet. 2016;380:1–14.
6. Soares Magalhães RJ, Fançony C, Gamboa D, Langa AJ, Sousa-Figue-iredo JC, Clements ACA, et al. Extending helminth control beyond STH and schistosomiasis: the case of human hymenolepiasis. PLoS Negl Trop Dis. 2013;7:e2321.
7. Ashford RW, Crewe W. The parasites of Homo sapiens. 2nd ed. London: Taylor & Francis; 2003.
8. SantamariaFries M, Fajardo L-GLF, Sogin ML, Olson PD, Relman DA. Lethal infection by a previously unrecognised metazoan parasite. Lancet. 1996;347:1797–801.
9. Muehlenbachs A, Bhatnagar J, Agudelo CA, Hidron A, Eberhard ML, Mathison BA, et al. Malignant transformation of Hymenolepis nana in a human host. N Engl J Med. 2015;373:1845–52.
10. Olson PD. Hox genes and the parasitic flatworms: new opportunities, challenges and lessons from the free-living. Parasitol Int. 2008;57:8–17.
11. Collins JJI, Newmark PA. It’s no fluke: the planarian as a model for understanding schistosomes. PLoS Pathog. 2013;9:e1003396-6.
12. Koziol U. Evolutionary developmental biology (evo-devo) of cestodes. Exp Parasitol. 2017;180:84–100.
13. Skinner DE, Rinaldi G, Koziol U, Brehm K. How might flukes and tapeworms maintain genome integrity without a canonical piRNA pathway? Trends Parasitol. 2014;30:123–9.
14. Collins JJI, Wang B, Lambrus BG, Tharp ME, Iyer H, Newmark PA. Adult somatic stem cells in the human parasite Schistosoma mansoni. Nature. 2013;494:1–5.
15. Koziol U, Rauschendorfer T, Rodríguez LZ, Brehm K. The unique stem cell system of the immortal larva of the human parasite Echinococcus multilocularis. EvoDevo. 2014;5:10.
16. Wendt GR, Collins JJI. Schistosomiasis as a disease of stem cells. Curr Opin Genet Dev. 2016;40:95–102.
17. Brehm K, Koziol U. On the importance of targeting parasite stem cells in anti-echinococcosis drug development. Parasite. 2014;21:72.
18. Robb SMC, Ross E, Sánchez Alvarado A. SmedGD: the Schmidtea medi-terranea genome database. Nucleic Acids Res. 2007;36:D599–606.
19. Robb SMC, Gotting K, Ross E, Sánchez Alvarado A. The Schmidtea medi-terranea genome database. Genesis. 2015;53:535–46.
20. Sánchez Alvarado A, Newmark PA. Double-stranded RNA specifically disrupts gene expression during planarian regeneration. Proc Natl Acad Sci USA. 1999;96:5049–54.
21. Reddien PW, Bermange AL, Murfitt KJ, Jennings JR, Sánchez Alvarado A. Identification of genes needed for regeneration, stem cell function, and tissue homeostasis by systematic gene perturbation in planaria. Dev Cell. 2005;8:635–49.
22. Rouhana L, Weiss JA, Forsthoefel DJ, Lee H, King RS, Inoue T, et al. RNA interference by feeding in vitro-synthesized double-stranded RNA to planarians: methodology and dynamics. Dev Dyn. 2013;242:718–30.
23. Newmark PA, Sánchez Alvarado A. Not your father’s planarian: a clas-sical model enters the era of functional genomics. Nat Rev Genet. 2002;3:210–9.
24. Newmark PA, Sánchez Alvarado A. Bromodeoxyuridine spe-cifically labels the regenerative stem cells of planarians. Dev Biol. 2000;220:142–53.
25. Reddien PW, Oviedo NJ, Jennings JR, Jenkin JC, Sánchez Alvarado A. SMEDWI-2 is a PIWI-like protein that regulates planarian stem cells. Sci-ence. 2005;310:1327–30.
26. Zhu SJ, Pearson BJ. (Neo)blast from the past: new insights into planarian stem cell lineages. Curr Opin Genet Dev. 2016;40:74–80.
27. Peter R, Gschwentner R, Schürmann W, Rieger RM, Ladurner P. The significance of stem cells in free-living flatworms: one common source for all cells in the adult. J App Biomed. 2004;2:21–35.
28. Reddien PW. Constitutive gene expression and the specification of tissue identity in adult planarian biology. Trends Genet. 2011;27:277–85.
29. Petersen CP, Reddien PW. Smed-betacatenin-1 is required for anteroposterior blastema polarity in planarian regeneration. Science. 2008;319:327–30.
30. Gurley KA, Rink JC, Alvarado AS. Smed-βcatenin-1 defines head versus tail identity during planarian regeneration and homeostasis. Science. 2008;319:323–7.
31. Iglesias M, Gomez-Skarmeta JL, Adell T. Silencing of Smed-βcatenin1 generates radial-like hypercephalized planarians. Development. 2008;135:1215–21.
32. Berriman M, Wilson RA, Dillon GP, Cerqueira GC, Ashton PD, Aslett MA, et al. The genome of the blood fluke Schistosoma mansoni. Nature. 2009;460:352–8.
33. Protasio AV, Tsai IJ, Babbage A, Nichol S, Hunt M, Aslett MA, et al. A systematically improved high quality genome and transcriptome of the human blood fluke Schistosoma mansoni. PLoS Negl Trop Dis. 2012;6:e1455-13.
34. Olson PD, Zarowiecki M, Kiss F, Brehm K. Cestode genomics—progress and prospects for advancing basic and applied aspects of flatworm biology. Parasite Immunol. 2012;34:130–50.
Page 27 of 29Olson et al. EvoDevo (2018) 9:21
35. Tsai IJ, Zarowiecki M, Holroyd N, Brooks KL, Tracey A, Bobes RJ, et al. The genomes of four tapeworm species reveal adaptations to parasitism. Nature. 2013;496:57–63.
36. Wang B, Collins JJI, Newmark PA. Functional genomic characteriza-tion of neoblast-like stem cells in larval Schistosoma mansoni. eLife. 2013;2:e00768.
37. Koziol U, Domínguez MF, Marín M, Kun A, Castillo E. Stem cell prolifera-tion during in vitro development of the model cestode Mesocestoides corti from larva to adult worm. Front Zool. 2010;7:22.
38. Collins JJI, King RS, Cogswell AA, Williams DL, Newmark PA. An atlas for Schistosoma mansoni organs and life-cycle stages using cell type-specific markers and confocal microscopy. PLoS Negl Trop Dis. 2011;5:e1009.
39. Rozario T, Newmark PA. A confocal microscopy-based atlas of tissue architecture in the tapeworm Hymenolepis diminuta. Exp Parasitol. 2015;158:31–41.
40. Cogswell AA, Collins JJI, Newmark PA, Williams DL. Whole mount in situ hybridization methodology for Schistosoma mansoni. Mol Biochem Parasitol. 2011;178:46–50.
41. Bizarro CV, Bengtson MH, Ricachenevsky FK, Zaha A, Sogayar MC, Fer-reira HB. Differentially expressed sequences from a cestode parasite reveals conserved developmental genes in platyhelminthes. Mol Biochem Parasitol. 2005;144:114–8.
42. Cunningham LJ, Olson PD. Description of Hymenolepis microstoma (Nottingham strain): a classical tapeworm model for research in the genomic era. Parasites Vectors. 2010;3:123.
43. Zeitlinger J, Stark A. Developmental gene regulation in the era of genomics. Dev Biol. 2010;339:230–9.
44. Howe KL, Bolt BJ, Cain S, Chan J, Chen WJ, Davis P, et al. WormBase 2016: expanding to enable helminth genomic research. Nucleic Acids Res. 2015;44:D774–80.
45. Howe KL, Bolt BJ, Shafie M, Kersey P, Berriman M. WormBase ParaSite—a comprehensive resource for helminth genomics. Mol Biochem Parasitol. 2017;215:2–10.
46. Ashburner M, Ball CA, Blake JA, Botstein D, Butler H, Cherry JM, et al. Gene Ontology: tool for the unification of biology. Nat Genet. 2000;25:25–9.
47. The Gene Ontology Consortium. Expansion of the Gene Ontology knowledgebase and resources. Nucleic Acids Res. 2017;45:D331–8.
48. Young MD, Wakefield MJ, Smyth GK, Oshlack A. Gene ontology analysis for RNA-seq: accounting for selection bias. Genome Biol. 2010;11:R14.
49. Supek F, Bošnjak M, Skunca N, Šmuc T. REVIGO summarizes and visu-alizes long lists of gene ontology terms. PLoS ONE. 2011;6:e21800–9.
50. Mar Albà M. Zinc-finger domains in metazoans: evolution gone wild. Genome Biol. 2017;18:168.
51. Juliano CE, Swartz SZ, Wessel GM. A conserved germline multipo-tency program. Development. 2010;137:4113–26.
52. Pearson BJ, Sánchez Alvarado A. A planarian p53 homolog regulates proliferation and self-renewal in adult stem cell lineages. Develop-ment. 2010;137:213.
53. Halton DW, Maule AG. Flatworm nerve-muscle: structural and func-tional analysis. Can J Zool. 2004;82:316–33.
54. Bozzi Y, Casarosa S, Caleo M. Epilepsy as a neurodevelopmental disorder. Front Psychiatry. 2012;3:19.
55. Beermann A, Schröder R. Functional stability of the aristaless gene in appendage tip formation during evolution. Dev Genes Evol. 2004;214:303–8.
56. Campbell G, Tomlinson A. The roles of the homeobox genes aristaless and Distal-less in patterning the legs and wings of Drosophila. Devel-opment. 1998;125:4483–93.
57. Miyawaki K, Inoue Y, Mito T, Fujimoto T, Matsushima K, Shinmyo Y, et al. Expression patterns of aristaless in developing appendages of Gryllus bimaculatus (cricket). Mech Dev. 2002;113:181–4.
58. Smith KM, Gee L, Bode HR. HyAlx, an aristaless-related gene, is involved in tentacle formation in hydra. Development. 2000;127:4743–52.
59. Holland P. Evolution of homeobox genes. WIREs Dev Biol. 2013;2:31–45. 60. Fröbius AC, Seaver EC. Capitella sp., I homeobrain-like, the first lophotro-
chozoan member of a novel paired-like homeobox gene family. Gene Expr Patterns. 2006;6:985–91.
61. Mazza ME, Pang K, Reitzel AM, Martindale MQ, Finnerty JR. A conserved cluster of three PRD-class homeobox genes (homeobrain, rx and ortho-pedia) in the Cnidaria and Protostomia. EvoDevo. 2010;1:3.
62. Umesono Y, Watanabe K, Agata K. A planarian orthopedia homolog is specifically expressed in the branch region of both the mature and regenerating brain. Dev Growth Differ. 1997;39:723–7.
63. Koziol U, Jarero F, Olson PD, Brehm K. Comparative analysis of Wnt expression identifies a highly conserved developmental transition in flatworms. BMC Biol. 2016;14:10.
64. Yu JK, Holland ND, Holland LZ. AmphiFoxQ2, a novel winged helix/forkhead gene, exclusively marks the anterior end of the amphioxus embryo. Dev Genes Evol. 2003;213:102–5.
65. Sinigaglia C, Busengdal H, Leclère L, Technau U, Rentzsch F. The bilate-rian head patterning gene six3/6 controls aboral domain development in a cnidarian. PLoS Biol. 2013;11:e1001488.
66. Fritzenwanker JH, Gerhart J, Freeman RM, Lowe CJ. The Fox/Forkhead transcription factor family of the hemichordate Saccoglossus kowalevs-kii. EvoDevo. 2014;5:17.
67. Hunnekuhl VS, Akam M. An anterior medial cell population with an api-cal-organ-like transcriptional profile that pioneers the central nervous system in the centipede Strigamia maritima. Dev Biol. 2014;396:136–49.
68. Lapan SW, Reddien PW. dlx and sp6-9 Control optic cup regeneration in a prototypic eye. PLoS Genet. 2011;7:e1002226.
69. Scimone ML, Kravarik KM, Lapan SW, Reddien PW. Neoblast specializa-tion in regeneration of the planarian Schmidtea mediterranea. Stem Cell Rep. 2014;3:339–52.
70. Andrikou C, Arnone MI. Too many ways to make a muscle: evolution of GRNs governing myogenesis. Zool Anz. 2015;256:2–13.
71. Tapscott SJ. The circuitry of a master switch: myod and the regulation of skeletal muscle gene transcription. Development. 2005;132:2685–95.
72. Cebrià F, Bueno D, Reigada S, Romero R. Intercalary muscle cell renewal in planarian pharynx. Dev Genes Evol. 1999;209:249–53.
73. Cebrià F, Vispo M, Newmark P, Bueno D, Romero R. Myocyte differen-tiation and body wall muscle regeneration in the planarian Girardia tigrina. Dev Genes Evol. 1997;207:306–16.
74. Cebrià F. Planarian body-wall muscle: regeneration and function beyond a simple skeletal support. Front Cell Dev Biol. 2016;4:8.
75. Scimone ML, Cote LE, Reddien PW. Orthogonal muscle fibres have dif-ferent instructive roles in planarian regeneration. Nature. 2017;126:1–22.
76. Ryan AK, Rosenfeld MG. POU domain family values: flexibility, partner-ships, and developmental codes. Genes Dev. 1997;11:1207–25.
77. Gold DA, Gates RD, Jacobs DK. The early expansion and evolutionary dynamics of POU class genes. Mol Biol Evol. 2014;31:3136–47.
78. Nichols J, Zevnik B, Anastassiadis K, Niwa H, Klewe-Nebenius D, Chambers I, et al. Formation of pluripotent stem cells in the mam-malian embryo depends on the POU transcription factor Oct4. Cell. 1998;95:379–91.
79. Takahashi K, Yamanaka S. Induction of pluripotent stem cells from mouse embryonic and adult fibroblast cultures by defined factors. Cell. 2006;126:663–76.
80. Munoz-Marmol AM, Casali A, Miralles A, Bueno D, Bayascs JR, Romero R, et al. Characterization of platyhelminth POU domain genes: ubiquitous and specific anterior nerve cell expression of different epitopes of GtPOU-1. Mech Dev. 1998;76:127–40.
81. Wollesen T, McDougall C, Degnan BM, Wanninger A. POU genes are expressed during the formation of individual ganglia of the cephalo-pod central nervous system. EvoDevo. 2014;5:41.
82. Onal P, Grün D, Adamidi C, Rybak A, Solana J, Mastrobuoni G, et al. Gene expression of pluripotency determinants is conserved between mam-malian and planarian stem cells. EMBO J. 2012;31:2755–69.
83. Scimone ML, Srivastava M, Bell GW, Reddien PW. A regulatory program for excretory system regeneration in planarians. Development. 2011;138:4387–98.
84. Wagner DE, Ho JJ, Reddien PW. Genetic regulators of a pluripotent adult stem cell system in planarians identified by RNAi and clonal analy-sis. Stem Cell. 2012;10:299–311.
85. Jager M, Quéinnec E, Houliston E, Manuel M. Expansion of the SOX gene family predated the emergence of the Bilateria. Mol Phylogenet Evol. 2006;39:468–77.
Page 28 of 29Olson et al. EvoDevo (2018) 9:21
86. Sarkar A, Hochedlinger K. The sox family of transcription factors: versatile regulators of stem and progenitor cell fate. Cell Stem Cell. 2013;12:15–30.
87. Vaquerizas JM, Kummerfeld SK, Teichmann SA, Luscombe NM. A census of human transcription factors: function, expression and evolution. Nat Rev Genet. 2009;10:252–63.
88. Seetharam A, Stuart GW. A study on the distribution of 37 well con-served families of C2H2 zinc finger genes in eukaryotes. BMC Genom. 2013;14:420.
89. de Mendoza A, Sebé-Pedrós A, Šestak MS, Matejčić M, Torruella G, Domazet-Lošo T, et al. Transcription factor evolution in eukaryotes and the assembly of the regulatory toolkit in multicellular lineages. Proc Natl Acad Sci USA. 2013;110:E4858–66.
90. Demircan T, Berezikov E. The Hippo pathway regulates stem cells during homeostasis and regeneration of the flatworm Macrostomum lignano. Stem Cells Dev. 2013;22:2174–85.
91. Lin AYT, Pearson BJ. Yorkie is required to restrict the injury responses in planarians. PLoS Genet. 2017;13:e1006874.
92. Salvetti A, Rossi L, Lena A, Batistoni R, Deri P, Rainaldi G, et al. DjPum, a homologue of Drosophila Pumilio, is essential to planarian stem cell maintenance. Development. 2005;132:1863–74.
93. Koziol U, Marín M, Castillo E. Pumilio genes from the Platyhelminthes. Dev Genes Evol. 2008;218:47–53.
94. Nieto MA. The snail superfamily of zinc-finger transcription factors. Nat Rev Mol Cell Biol. 2002;3:155–66.
95. Soleimani VD, Yin H, Jahani-Asl A, Ming H, Kockx CEM, van Ijcken WFJ, et al. Snail regulates MyoD binding-site occupancy to direct enhancer switching and differentiation-specific transcription in myogenesis. Mol Cell. 2012;47:457–68.
96. Amoutzias GD, Veron AS, Weiner J, Robinson-Rechavi M, Bornberg-Bauer E, Oliver SG, et al. One billion years of bZIP transcription factor evolution: conservation and change in dimerization and DNA-binding site specificity. Mol Biol Evol. 2007;24:827–35.
97. Koga H, Hashimoto N, Suzuki DG, Ono H. A genome-wide survey of genes encoding transcription factors in Japanese pearl oyster Pinctada fucata: II. Tbx, Fox, Ets, HMG, NFκB, bZIP, and C2H2 zinc fingers. Zool Sci. 2013;30:858–67.
98. Umesono Y, Tasaki J, Nishimura Y, Hrouda M, Kawaguchi E, Yazawa S, et al. The molecular logic for planarian regeneration along the anterior–posterior axis. Nature. 2014;500:73–6.
99. Witchley JN, Mayer M, Wagner DE, Owen JH, Reddien PW. Muscle cells provide instructions for planarian regeneration. Cell Rep. 2013;4:633–41.
100. Koziol U, Brehm K. Recent advances in Echinococcus genomics and stem cell research. Vet Parasitol. 2015;213:92–102.
101. Sulgostowska T. The development of organ systems in cestodes. II. His-togenesis of the reproductive system in Hymenolepis diminuta (Rudol-phi, 1819) (Hymenolepididae). Acta Parasitol Polonica. 1974;22:179–90.
102. Heldin CH, Miyazono K, Tendijke P. TGF-beta signalling from cell mem-brane to nucleus through SMAD proteins. Nature. 1997;390:465–71.
103. Derynck R, Zhang YE. Smad-dependent and Smad-independent path-ways in TGF-beta family signalling. Nature. 2003;425:577–84.
104. Freitas TC, Jung E, Pearce EJ. TGF-β signaling controls embryo develop-ment in the parasitic flatworm Schistosoma mansoni. PLoS Pathog. 2007;3:e52.
105. Kenny NJ, Namigai EKO, Dearden PK, Hui JHL, Grande C, Shimeld SM. The Lophotrochozoan TGF-β signalling cassette—diversification and conservation in a key signalling pathway. Int J Dev Biol. 2014;58:533–49.
106. Osman A, Niles EG, Verjovski-Almeida S, LoVerde PT. Schistosoma mansoni TGF-β receptor II: role in host ligand-induced regulation of a schistosome target gene. PLoS Pathog. 2006;2:e54.
107. de Robertis EM, Sasai Y. A common plan for dorsoventral patterning in Bilateria. Nature. 1996;380:37–40.
108. Molina MD, Salo E, Cebrià F. Organizing the DV axis during planarian regeneration. Commun Integr Biol. 2011;4:498–500.
109. Molina MD, Neto A, Maeso I, Gómez-Skarmeta JL, Salo E, Cebrià F. Nog-gin and noggin-like genes control dorsoventral axis regeneration in planarians. Curr Biol. 2011;21:300–5.
110. Molina MD, Salo E, Cebrià F. The BMP pathway is essential for re-specification and maintenance of the dorsoventral axis in regenerating and intact planarians. Dev Biol. 2007;311:79–94.
111. Orii H, Watanabe K. Bone morphogenetic protein is required for dorso-ventral patterning in the planarian Dugesia japonica. Dev Growth Differ. 2007;49:345–9.
112. Gaviño MA, Reddien PW. A Bmp/Admp regulatory circuit controls main-tenance and regeneration of dorsal-ventral polarity in planarians. Curr Biol. 2011;21:294–9.
113. Reddien PW, Bermange A, Kicza A, Sánchez Alvarado A. BMP signaling regulates the dorsal planarian midline and is needed for asymmetric regeneration. Development. 2007;134:4043.
114. Range RC, Wei Z. An anterior signaling center patterns and sizes the anterior neuroectoderm of the sea urchin embryo. Development. 2016;143:1523–33.
115. Wei Z, Yaguchi J, Yaguchi S, Angerer RC, Angerer LM. The sea urchin animal pole domain is a Six3-dependent neurogenic patterning center. Development. 2009;136:1179–89.
116. Steinmetz PRH, Urbach R, Posnien N, Eriksson J, Kostyuchenko RP, Brena C, et al. Six3 demarcates the anterior-most developing brain region in bilaterian animals. EvoDevo. 2010;1:14.
117. Koziol U, Brehm K. Anatomy and development of the larval nervous system in Echinococcus multilocularis. Front Zool. 2013;10:24.
118. Pineda D, Salo E. Planarian Gtsix3, a member of the Six/so gene fam-ily, is expressed in brain branches but not in eye cells. Mech Dev. 2002;2:169–73.
119. Wilson V, Schiller E. The neuroanatomy of Hymenolepis diminuta and H. nana. J Parasitol. 1969;55:261–70.
120. Webb RA. Putative neurosecretory cells of the cestode Hymenolepis microstoma. J Parasitol. 1976;62:756–60.
121. Reuter M, Gustafsson M. Neuronal signal substances in asexual multiplication and development in flatworms. Cell Mol Neurobiol. 1996;16:591–616.
122. Rivera AS, Weisblat DA. And Lophotrochozoa makes three: Notch/Hes signaling in annelid segmentation. Dev Genes Evol. 2008;219:37–43.
123. Shah C, Vangompel MJW, Naeem V, Chen Y, Lee T, Angeloni N, et al. Widespread presence of human BOULE homologs among animals and conservation of their ancient reproductive function. PLoS Genet. 2010;6:e1001022.
124. Kuales G, de Mulder K, Glashauser J, Salvenmoser W, Takashima S, Hartenstein V, et al. Boule-like genes regulate male and female gametogenesis in the flatworm Macrostomum lignano. Dev Biol. 2011;357:117–32.
125. Iyer H, Issigonis M, Sharma PP, Extavour CGM, Newmark PA. A premei-otic function for boule in the planarian Schmidtea mediterranea. Proc Natl Acad Sci USA. 2016;113:E3509–18.
126. Steiner JK, Tasaki J, Rouhana L. Germline defects caused by Smed-boule RNA-interference reveal that egg capsule deposition occurs indepen-dently of fertilization, ovulation, mating, or the presence of gametes in planarian flatworms. PLoS Genet. 2016;12:e1006030.
127. Blake JA, Ziman MR. Pax genes: regulators of lineage specification and progenitor cell maintenance. Development. 2014;141:737–51.
128. Aloisio GM, Nakada Y, Saatcioglu HD, Peña CG, Baker MD, Tarnawa ED, et al. PAX7 expression defines germline stem cells in the adult testis. J Clin Investig. 2014;124:3929–44.
129. Blassberg RA, Felix DA, Tejada-Romero B, Aboobaker AA. PBX/extraden-ticle is required to re-establish axial structures and polarity during planarian regeneration. Development. 2013;140:730–9.
130. Takahashi H, Kamiya A, Ishiguro A, Suzuki AC, Saitou N, Toyoda A, et al. Conservation and diversification of Msx protein in metazoan evolution. Mol Biol Evol. 2008;25:69–82.
131. Ramos C, Robert B. msh/Msx gene family in neural development. Trends Genet. 2005;21:624–32.
132. Galle S, Yanze N, Seipel K. The homeobox gene Msx in development and transdifferentiation of jellyfish striated muscle. Int J Dev Biol. 2005;49:961–7.
133. Shimeld SM, McKay IJ, Sharpe PT. The murine homeobox gene Msx-3 shows highly restricted expression in the developing neural tube. Mech Dev. 1996;55:201–10.
134. Saudemont A, Dray N, Hudry B, Le Gouar M, Vervoort M, Balavoine G. Complementary striped expression patterns of NK homeobox genes during segment formation in the annelid Platynereis. Dev Biol. 2008;317:430–43.
Page 29 of 29Olson et al. EvoDevo (2018) 9:21
135. Mannini L, Deri P, Gremigni V, Rossi L, Salvetti A, Batistoni R. Two msh/msx-related genes, Djmsh1 and Djmsh2, contribute to the early blastema growth during planarian head regeneration. Int J Dev Biol. 2008;52:943–52.
136. Le Bouffant R, Souquet B, Duval N, Duquenne C, Herve R, Frydman N, et al. Msx1 and Msx2 promote meiosis initiation. Development. 2011;138:5393–402.
137. Nallasamy S, Li Q, Bagchi MK, Bagchi IC. Msx homeobox genes critically regulate embryo implantation by controlling paracrine signaling between uterine stroma and epithelium. PLoS Genet. 2012;8:e1002500–13.
138. Ryan JF, Burton PM, Mazza ME, Kwong GK, Mullikin JC, Finnerty JR. The cnidarian-bilaterian ancestor possessed at least 56 homeoboxes: evi-dence from the starlet sea anemone, Nematostella vectensis. Genome Biol. 2006;7:R64.
139. Zhong Y-F, Butts T, Holland PW. HomeoDB: a database of homeobox gene diversity. Evol Dev. 2008;10:516–8.
140. Zhong Y-F, Holland P. HomeoDB2: functional expansion of a compara-tive homeobox gene database for evolutionary developmental biology. Evol Dev. 2011;13:567–8.
141. Homminga I, Pieters R, Meijerink JPP. NKL homeobox genes in leukemia. Leukemia. 2011;26:572–81.
142. Knirr S, Azpiazu N, Frasch M. The role of the NK-homeobox gene slouch (S59) in somatic muscle patterning. Development. 1999;126:4525–35.
143. Lu Z, Sessler F, Holroyd N, Hahnel S, Quack T, Berriman M, et al. Schisto-some sex matters: a deep view into gonad-specific and pairing-dependent transcriptomes reveals a complex gender interplay. Sci Rep. 2016;6:1–14.
144. Acampora D, Gulisano M, Broccoli V, Simeone A. Otx genes in brain morphogenesis. Prog Neurobiol. 2001;64:69–95.
145. Umesono Y, Watanabe K, Agata K. Distinct structural domains in the planarian brain defined by the expression of evolutionarily conserved homeobox genes. Dev Genes Evol. 1999;209:31–9.
146. Cebrià F, Kudome T, Nakazawa M, Mineta K, Ikeo K, Gojobori T, et al. The expression of neural-specific genes reveals the structural and molecular complexity of the planarian central nervous system. Mech Dev. 2002;116:199–204.
147. Lapan SW, Reddien PW. Transcriptome analysis of the planarian eye identifies ovo as a specific regulator of eye regeneration. Cell Rep. 2012;2:294–307.
148. Hassan B, Li L, Bremer KA, Chang WR, Pinsonneault J, Vaessin H. Pros-pero is a panneural transcription factor that modulates homeodomain protein activity. Proc Natl Acad Sci USA. 1997;94:10991–6.
149. Lai S-L, Doe CQ. Transient nuclear Prospero induces neural progenitor quiescence. eLife. 2014;3:379–82.
150. Choksi SP, Southall TD, Bossing T, Edoff K, de Wit E, Fischer BE, et al. Pros-pero acts as a binary switch between self-renewal and differentiation in Drosophila neural stem cells. Dev Cell. 2006;11:775–89.
151. Georges A, Auguste A, Bessiere L, Vanet A, Todeschini AL, Veitia RA. FOXL2: a central transcription factor of the ovary. J Mol Endocrinol. 2013;52:R17–33.
152. Laumer CE, Hejnol A, Giribet G. Nuclear genomic signals of the “micro-turbellarian” roots of platyhelminth evolutionary innovation. eLife. 2015;4:e05503.
153. Egger B, Lapraz F, Tomiczek B, Müller S, Dessimoz C, Girstmair J, et al. A transcriptomic-phylogenomic analysis of the evolutionary relationships of flatworms. Curr Biol. 2015;25:1347–53.
154. Martín-Durán JM, Egger B. Developmental diversity in free-living flat-worms. EvoDevo. 2012;3:7.
155. Wang J, Collins JJI. Identification of new markers for the Schistosoma mansoni vitelline lineage. Int J Parasitol. 2016;46:405–10.
156. Vasudevan S, Starostina NG, Kipreos ET. The Caenorhabditis elegans cell-cycle regulator ZYG-11 defines a conserved family of CUL-2 complex components. EMBO Rep. 2007;8:279–86.
157. Liu J, Vasudevan S, Kipreos ET. CUL-2 and ZYG-11 promote meiotic anaphase II and the proper placement of the anterior-posterior axis in C. elegans. Development. 2004;131:3513–25.
158. Blockus H, Chédotal A. Slit-Robo signaling. Development. 2016;143:3037–44.
159. Petersen CP, Reddien PW. Wnt signaling and the polarity of the primary body axis. Cell. 2009;139:1056–68.
160. International Helminth Genomes Consortium, Coghlan A, Mitreva M, Berriman M. Comparative genomics of the major parasitic worms. Nat Genet. 2018 (in press).
161. Nelson PA, Buggs RJA. Next generation apomorphy: the ubiquity of taxonomically restricted genes. In: Olson PD, Hughes J, Cotton JA, editors. Next generation systematics. Cambridge: Cambridge University Press; 2016. p. 237–63.
162. Khalturin K, Hemmrich G, Fraune S, Augustin R. More than just orphans: are taxonomically-restricted genes important in evolution? Trends Genet. 2009;25:404–13.
163. Domínguez MF, Koziol U, Porro V, Costábile A, Estrade S, Tort JF, et al. A new approach for the characterization of proliferative cells in cestodes. Exp Parasitol. 2014;138:25–9.
164. Collins JJI, Wendt GR, Iyer H, Newmark PA. Stem cell progeny contribute to the schistosome host-parasite interface. eLife. 2016;5:e12473.
165. van Wolfswinkel JC, Wagner DE, Reddien PW. Single-cell analysis reveals functionally distinct classes within the planarian stem cell compart-ment. Cell Stem Cell. 2014;15:326–39.
166. Voge M. Development of Hymenolepis microstoma (Cestoda: Cyclo-phyllidea) in the intermediate host Tribolium confusum. J Parasitol. 1964;50:77–80.
167. Hunt M, Kikuchi T, Sanders M, Newbold C, Berriman M, Otto TD. REAPR: a universal tool for genome assembly evaluation. Genome Biol. 2013;14:R47.
168. Zerbino DR. Using the Velvet de novo assembler for short-read sequencing technologies. New York: Wiley Online Library; 2010.
169. Boetzer M, Henkel CV, Jansen HJ, Butler D, Pirovano W. Scaffolding pre-assembled contigs using SSPACE. Bioinformatics. 2010;27:578–9.
170. Nadalin F, Vezzi F, Policriti A. GapFiller: a de novo assembly approach to fill the gap within paired reads. BMC Bioinform. 2012;13:S8.
171. Kurtz S, Phillippy A, Delcher AL, Smoot M, Shumway M, Antonescu C, et al. Versatile and open software for comparing large genomes. Genome Biol. 2004;5:R12–9.
172. Assefa S, Keane TM, Otto TD, Newbold C, Berriman M. ABACAS: algorithm-based automatic contiguation of assembled sequences. Bioinformatics. 2009;25:1968–9.
173. Keller O, Kollmar M, Stanke M, Waack S. A novel hybrid gene prediction method employing protein multiple sequence alignments. Bioinfor-matics. 2011;27:757–63.
174. Trapnell C, Roberts A, Goff L, Pertea G, Kim D, Kelley DR, et al. Differential gene and transcript expression analysis of RNA-seq experiments with TopHat and Cufflinks. Nat Protoc. 2012;7:562–78.
175. Love MI, Huber W, Anders S. Moderated estimation of fold change and dispersion for RNA-seq data with DESeq2. Genome Biol. 2014;15:31–41.
176. du Plessis L, Skunca N, Dessimoz C. The what, where, how and why of gene ontology-a primer for bioinformaticians. Brief Bioinform. 2011;12:723–35.
177. Untergasser A, Cutcutache I, Koressaar T, Ye J, Faircloth BC, Remm M, et al. Primer3—new capabilities and interfaces. Nucleic Acids Res. 2012;40:e115-5.
178. Riddiford N, Olson PD. Wnt gene loss in flatworms. Dev Genes Evol. 2011;221:187–97.
Copyright © 2022 FDOKUMEN