Transcriptome profiling of PBMCs and formalin-fixed autopsy ...
16
Protocol Transcriptome profiling of PBMCs and formalin-fixed autopsy tissues from COVID-19 patients Here we present an optimized protocol for transcriptome profiling of COVID-19 patient samples, including peripheral blood mononuclear cells (PBMCs) and formalin-fixed paraffin-embedded tissue samples obtained from the lung, liver, heart, kidney, and spleen, with the matched controls. We describe RNA extraction and subsequent transcriptome analysis using NanoString technology of the patient samples. The protocol provides information about sample preparation, RNA extraction, and NanoString profiling and analysis. It can be also applied to differentiated Th17 and Treg subsets or formalin-fixed colon tissue samples. Marta Vuerich, Na Wang, Ahmadreza Kalbasi, Jonathon J. Graham, Maria Serena Longhi [email protected]. edu Highlights We present a protocol for RNA isolation and transcriptome analysis using NanoString The protocol is applicable to PBMC and formalin fixed paraffin-embedded tissue samples We inform about sample preparation, RNA extraction and NanoString profiling Vuerich et al., STAR Protocols 3, 101156 March 18, 2022 ª 2022 The Author(s). https://doi.org/10.1016/ j.xpro.2022.101156 ll OPEN ACCESS
-
Upload
khangminh22 -
Category
Documents
-
view
0 -
download
0
Transcript of Transcriptome profiling of PBMCs and formalin-fixed autopsy ...

llOPEN ACCESS
Protocol
Transcriptome profiling of PBMCs andformalin-fixed autopsy tissues from COVID-19patients
Marta Vuerich, Na
Wang, Ahmadreza
Kalbasi, Jonathon J.
Graham, Maria
Serena Longhi
edu
Highlights
We present a
protocol for RNA
isolation and
transcriptome
analysis using
NanoString
The protocol is
applicable to PBMC
and formalin fixed
paraffin-embedded
tissue samples
We inform about
sample preparation,
RNA extraction and
NanoString profiling
Here we present an optimized protocol for transcriptome profiling of COVID-19 patient samples,
including peripheral blood mononuclear cells (PBMCs) and formalin-fixed paraffin-embedded
tissue samples obtained from the lung, liver, heart, kidney, and spleen, with the matched
controls. We describe RNA extraction and subsequent transcriptome analysis using NanoString
technology of the patient samples. The protocol provides information about sample preparation,
RNA extraction, and NanoString profiling and analysis. It can be also applied to differentiated
Th17 and Treg subsets or formalin-fixed colon tissue samples.
Vuerich et al., STAR Protocols
3, 101156
March 18, 2022 ª 2022 The
Author(s).
https://doi.org/10.1016/
j.xpro.2022.101156
Protocol
Transcriptome profiling of PBMCs and formalin-fixedautopsy tissues from COVID-19 patients
Marta Vuerich,1,4 Na Wang,1,2,3,4 Ahmadreza Kalbasi,1,4 Jonathon J. Graham,1
and Maria Serena Longhi1,5,6,*
1Department of Anesthesia, Critical Care & Pain Medicine, Beth Israel Deaconess Medical Center, Harvard Medical School,Boston, MA 02215, USA
2Department of Hematology, Shandong Provincial Hospital Affiliated to Shandong First Medical University, Jinan, Shandong250021, China
3School of Medicine, Shandong University, Jinan, Shandong 250021, China
4These authors contributed equally
5Technical contact
6Lead contact
*Correspondence: [email protected]://doi.org/10.1016/j.xpro.2022.101156
SUMMARY
Here we present an optimized protocol for transcriptome profiling of COVID-19patient samples, including peripheral blood mononuclear cells (PBMCs) andformalin-fixed paraffin-embedded tissue samples obtained from the lung, liver,heart, kidney, and spleen, with the matched controls. We describe RNA extrac-tion and subsequent transcriptome analysis using NanoString technology ofthe patient samples. The protocol provides information about sample prepara-tion, RNA extraction, andNanoString profiling and analysis. It can be also appliedto differentiated Th17 and Treg subsets or formalin-fixed colon tissue samples.For complete details on the use and execution of this protocol, please refer toWang et al. (2021).
BEFORE YOU BEGIN
The protocol below has been validated for the RNA extraction and NanoString profiling of periph-
eral blood mononuclear cells (PBMCs), obtained from patients with COVID-19 at different stages of
disease (severe, moderate, convalescent) and healthy controls; and from formalin-fixed paraffin-
embedded (FFPE) tissue samples, obtained at autopsy from lung, liver, heart, kidney and spleen
of deceased COVID-19 patients and matched controls. We have also used this protocol for T cell
subsets like Th17 and regulatory T cells, differentiated fromCD4 lymphocytes and other FFPE tissue,
like colon, with comparable results.
The studies described in this protocol received IRB approval (IRB # 2020P000675) by the Committee
of Clinical Investigations, Beth Israel Deaconess Medical Center (Boston, MA).
PBMC isolation and storage
Timing: 1 h, it takes longer if more than 6 samples are processed at the same time
1. Collect 10–15 mL peripheral blood in plastic whole blood tubes with spray-coated K2EDTA (BD
Vacutainer, BD, Franklin Lanes, NJ). Keep the sample at room temperature (20�C–22�C) untilprocessing.
STAR Protocols 3, 101156, March 18, 2022 ª 2022 The Author(s).This is an open access article under the CC BY-NC-ND license (http://creativecommons.org/licenses/by-nc-nd/4.0/).
1
llOPEN ACCESS

2. Gently layer the blood onto 5–7.5mL Ficoll-Paque Plus (GE Healthcare Life Sciences, Pittsburgh,
PA) in a 15 mL conical tube.
3. Centrifuge at 6003g at room temperature for 20 min. Make sure that the centrifuge decelera-
tion is set to ‘0’ to avoid disruption of layers obtained after centrifugation.
4. Collect the PBMC layer at the interface between plasma and Ficoll-Paque Plus and transfer it
into a new 15 mL conical tube.
5. Wash the cell suspension with 10 mL of 1xPBS (Thermo Fisher Scientific, Waltham, MA) and
centrifuge at 3003g at room temperature for 5 min.
6. Discard the supernatant and flick the tube to detach the cell pellet. Repeat step 5.
7. Resuspend the cell pellet using 1–2 mL 1xPBS. Check the cell viability using Trypan Blue Stain
0.4% (Thermo Fisher Scientific).
8. Centrifuge at 3003g at room temperature for 5 min to pellet the cells.
9. Resuspend the cells at 1 3 106/mL fetal bovine serum supplemented with 10% dimethyl sulf-
oxide (DMSO) (Fisher Scientific, Waltham, MA).
10. Transfer the cell suspension into a 1.2 mL cryovial and store at �80�C. When longer storage is
planned, transfer the sample into�140�C or liquid nitrogen between 1 to 7 days after storage at
�80�C.
Note: We recommend processing samples within 6 h from the collection.
Note: When checking cell viability, we suggest diluting Trypan Blue Stain 0.4% at 1:1 with
1xPBS, and then use 1:1 Trypan Blue/cell suspension dilution for counting.
Note:We recommend transferring samples to �140�C or liquid nitrogen 24 h after storage at
�80�C. However, please note that we did not observe significant changes in cell viability if
storage at �80�C is prolonged for up to 7 days.
Note: When processing PBMC samples obtained from COVID-19 infected individuals, pro-
cedures are carried out in a Biosafety Level 2 with Enhanced Biocontainment Practices (BSL-
2+) facility. Although the steps for sample processing are the same as indicated above, it is
important that laboratory personnel strictly adhere to the safety measures outlined below: 1)
Personal Protective Equipment: laboratory personnel should wear disposable lab coats or
cloth lab coats with disposable sleeves, double gloves (latex over nitrile or nitrile over
nitrile). Face protection shields, or goggles and a surgical mask must be worn (Figure 1).
Personnel should wash their hands after removing gloves. 2) Biosafety cabinet: this should
be turned on 5 min before initiating the work and will remain on at least 5 min after the work
is ended. A waste container (i.e., small biohazard bag or pipette tray) should be placed in-
side the cabinet, so that personnel do not have to remove waste frequently while working.
At the end of the work session all the supplies that have been used inside the cabinet should
be disinfected before being removed from the hood. The interior walls of the cabinet should
be disinfected too. We recommend using 10% bleach, followed by 70% ethanol (Fisher Sci-
entific) to disinfect suppliers and surfaces. 3) Centrifuge: the centrifuge inside the BSL-2+
facility should be cleaned and disinfected with 10% bleach followed by 70% ethanol after
the work session has ended. 4) Waste disposal: Liquid waste: all liquid waste generated dur-
ing the work session should be immediately decontaminated by mixing with 10% bleach for
at least 30 min. The solution is then disposed of in the sink, which should be washed and
decontaminated thereafter. Solid waste: the solid waste generated during a work session
(i.e., pipettes, vials, tubes, tips) must be placed into a beaker containing 10% bleach and
left soak for at least 15 min before being removed from the hood. Decontaminated waste
and used gloves should be collected in a small biohazard bag inside the biosafety cabinet
and then disposed of in a larger biohazard bag outside the cabinet when the work is
completed.
llOPEN ACCESS
2 STAR Protocols 3, 101156, March 18, 2022
Protocol

CRITICAL: If outer gloves become contaminated while working inside the biosafety cab-
inet, keep your hands inside the cabinet, remove the contaminated outer gloves and
dispose them in the small biohazard bag inside the hood.
PBMC thawing
Timing: approximately 1 h, it takes longer if more than 6 samples are thawed at the same
time
11. Thaw the cryovials containing the PBMC solution in a water bath at 37�C.12. Transfer the cell suspension into a 15 mL conical tube containing 10 mL ice-cold 1xPBS and
centrifuge at 3003g at 4�C for 5 min.
13. Discard the supernatant and flick the tube to detach the cell pellet. Repeat the wash by adding
10 mL ice-cold 1xPBS and centrifuge at 3003g at 4�C for 5 min.
14. Discard the supernatant. Make sure that supernatant is removed completely to avoid interfer-
ence with the next steps of RNA isolation.
Note:We recommend gentle shaking of the cryovials when in the water bath. We also recom-
mend thawing no more than 12 PBMC samples at once to minimize the time thawed PBMCs
are left at room temperature.
CRITICAL: Do not leave the cryovials in the water bath at 37�C after thawing as this would
decrease cell viability.
Collection of biopsies at autopsy and storage
Timing: approximately 2 days
Figure 1. Personal protective equipment (PPE) worn in a Biosafety Level 2 with Enhanced Biocontainment Practices
(BSL-2+) facility when processing PBMC samples obtained from COVID-19 infected individuals
PPE includes disposable lab coat, surgical mask, goggles and double gloves (depicted nitrile over nitrile).
llOPEN ACCESS
STAR Protocols 3, 101156, March 18, 2022 3
Protocol

15. Ultrasound guided biopsies are collected at autopsy from the lung, heart, kidney, liver and
spleen.
16. Place the biopsies in a small tube containing 10% Buffered Formalin Phosphate (Fisher Scienti-
fic), immediately after collection.
17. Place the biopsies into Processing and Embedding plastic cassettes (Fisher Scientific) and keep
them in a container with 10% Buffered Formalin Phosphate on gentle shaking.
18. 24 h later, place the cassettes in a tissue processor.
19. We recommend the following protocol for tissue processing:
a. Step 1: 70% ethanol for 40 min
b. Step 2: 80% ethanol for 40 min
c. Step 3: 95% ethanol for 50 min
d. Step 4: 95% ethanol for 50 min
e. Step 5: 100% ethanol for 50 min
f. Step 6: 100% ethanol for 50 min
g. Step 7: 100% ethanol for 50 min
h. Step 8: xylene (StatLab, McKinney, TX) for 50 min
i. Step 9: xylene for 43 min
j. Step 10: xylene for 50 min
k. Step 11: paraffin (Paraplast Plus, McCormick Scientific, Hunt Valley, MD) for 45 min
l. Step 12: paraffin for 45 min.
20. Once the tissue processing has ended, proceed with paraffin embedding:
a. Turn on the paraffin wax machine
b. Coat the bottom layer of a disposable base mold (StatLab) with melted paraffin
c. Take the sample and place it on top of the base mold. Orient it as you wish and add more
paraffin
d. Place the cassette on top of the mold and completely fill the mold
e. Place the mold with the sample on the ‘cold side’ of the embedding station. The paraffin will
solidify in 10–15 min
f. Remove the embedded sample from the mold
21. Keep FFPE samples at 4�C until cutting.
Note: Fixation should not exceed 24 h. Longer fixation time may result in nucleic acid frag-
mentation and lower performance in downstream applications.
Alternatives: The Shandon Citadel Tissue Processor 2000 (Thermo Fisher Scientific) and the
Shandon HistoCentre 2 (Thermo Fisher Scientific) were used as tissue processor and paraffin
embedding machine respectively; however, comparable tissue processors might be also
found from Leica Microsystems (Buffalo Grove, IL) or Histo-Line Laboratories (Pantigliate, Mi-
lan, Italy). Similar paraffin embedding machines are also found from Leica Microsystems and
Sakura Finetek USA (Torrance, CA).
Note: Samples should be thoroughly deparaffinized before embedding because residual
formalin can inhibit proteinase K digestion.
Obtaining tissue slices from paraffin embedded blocks
Timing: 1 h for 12 samples
22. Before cutting the tissue slices, make sure to trim the area around the sample with a scalpel, to
remove the excess of paraffin.
23. Obtain 3 tissue slices of 15 mm each using a microtome.
24. Leave the tissue slices at 4�C until RNA extraction.
llOPEN ACCESS
4 STAR Protocols 3, 101156, March 18, 2022
Protocol

Note: The number of tissue slices to be obtained for effective RNA isolation may vary consid-
erably across samples. We recommend performing a trial to define the exact number of slices
to cut, in order to obtain enough RNA for the subsequent steps of the protocol. However,
avoid cutting and pooling too many slices as paraffin removal in these cases might be chal-
lenging and could affect RNA purity.
CRITICAL: RNA should be extracted within 12 h after the slices are cut to minimize the risk
of dehydration.
KEY RESOURCES TABLE
REAGENT or RESOURCE SOURCE IDENTIFIER
Biological samples
COVID-19 PBMC samples (human,24–81 years, 20 females, 23 males)
Massachusetts GeneralHospital and Brigham’sand Women’s Hospital
https://www.massgeneral.orghttps://www.brighamandwomens.org
COVID-19 and non-COVID-19FFPE samples (human, 58–91years, 4 females, 3 males)
Beth Israel DeaconessMedical Center
https://www.bidmc.org
Healthy control PBMCsamples (human, 26–55years, 4 females, 6 males)
Blood Donor Center atBoston Children’s Hospital
https://www.childrenshospital.org/ways-to-help/donate-blood
Chemicals, peptides, and recombinant proteins
K2 EDTA (K2E) Plus Blood Collection Tubes BD Vacutainer Cat. # 366643
Ficoll-Paque Plus GE Healthcare Life Sciences Cat. # GE17-1440-02
Dimethyl Sulfoxide (DMSO) Fisher Scientific Cat. # BP231-100
Trypan Blue Stain 0.4% Thermo Fisher Scientific Cat. # T10282
10% Buffered Formalin Phosphate Fisher Scientific Cat. # SF100-4
Xylene StatLab Cat. # 8400-1
Paraplast Plus - Tissue Infiltration/Embedding Medium
McCormick Scientific Cat. # 39502004
b-mercaptoethanol Sigma-Aldrich Cat. # M3148
Isopropanol Molecular Biology Grade Fisher Scientific Cat. # BP26181
Critical commercial assays
RNeasy Mini kit (50) QIAGEN Cat. # 74104
AllPrep DNA/RNA FFPE kit QIAGEN Cat. # 80234
nCounter CAR-T Characterization Panel NanoString Cat. # XT-CSO-CART1-12
Coronavirus Panel Plus NanoString n/a
Deposited data
NanoString raw data Wang et al. (2021);Mendeley Data
https://doi.org/10.17632/mkmv3mgz86.1
Software and algorithms
nSolver Analysis Software, 4.0 NanoString Technologies https://www.nanostring.com/products/analysis-solutions/ncounter-advanced-analysis-software/
R software, 4.0.2 R https://cran.r-project.org
GraphPad Prism, 9.3.0 GraphPad Software https://www.graphpad.com
Other
Thermolyne 16500 Dri Bath Marshall Scientific Cat. # TH-16500
SureSeal S MicroTubes MTC Bio Cat. # C2000
NanoDrop 1000 Spectrophotometer, 3.7.0 Thermo Fisher Scientific n/a
2100 Bioanalyzer Agilent Technologies Cat. # G2939BA
C1000 Touch Thermal Cycler with dual48/48 Fast Reaction Module
Bio-Rad Laboratories Cat. # 1851148
nCounter MAX Analysis System NanoString Technologies https://www.nanostring.com/products/ncounter-analysis-system/max-analysis-system/
(Continued on next page)
llOPEN ACCESS
STAR Protocols 3, 101156, March 18, 2022 5
Protocol

MATERIALS AND EQUIPMENT
For the deparaffinization step, a thermal mixer or, alternatively, a heating block or water bath
capable of incubation at 56�C, 80�C and 90�C is needed.
For RNA extraction, a conventional benchtop microcentrifuge is needed. When isolating RNA
from FFPE samples, we recommend using SureSeal S MicroTubes (MTC Bio, Sayreville, NJ) or
locks for reaction tubes. RNA quantification was determined using NanoDrop Spectrophotometer,
whereas RNA integrity was verified using Agilent Bioanalyzer (Agilent Technologies, Santa
Clara, CA).
For hybridization, the C1000 Touch Thermal Cycler (Bio-Rad Laboratories, Hercules, CA) was used,
although other thermocyclers (e.g., from Qiagen) are also compatible. The nCounter MAX Analysis
System (NanoString Technologies, Seattle, WA) was used for the NanoString assay.
Alternatives: The Agilent TapeStation (Agilent Technologies) or the QIAxcel Advanced Sys-
tem (Qiagen, Germantown, MD) can be used instead of Agilent Bioanalyzer.
STEP-BY-STEP METHOD DETAILS
RNA isolation
Timing: approximately 1 h for PBMC samples and 2 h for FFPE samples
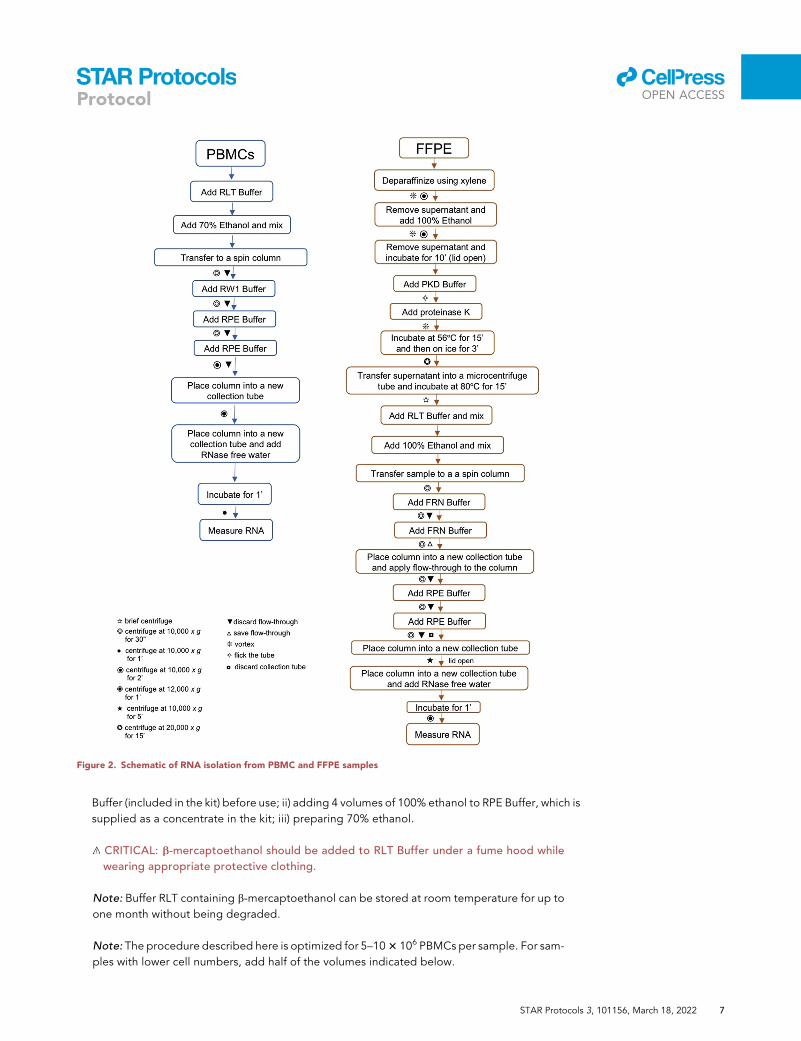
This step will enable RNA isolation from PBMC and FFPE samples. The protocols and timing
below are described for 12 samples. This corresponds to the number of samples that can be
run in one NanoString cartridge. Please note that steps 1 and 2 under ‘RNA isolation’ can be car-
ried out independently as they refer to RNA isolation of PBMC and FFPE samples respectively
(Figure 2).
RNA is isolated using the RNeasy Mini Kit (Qiagen) when using PBMC samples and the AllPrep DNA/
RNA FFPE Kit (Qiagen) when using FFPE samples, according to the manufacturer’s protocols (please
refer to https://www.qiagen.com/us/resources/resourcedetail?id=14e7cf6e-521a-4cf7-8cbc-bf9f6f
a33e24&lang=en for RNeasy Mini Kit; and to https://www.qiagen.com/us/resources/resource
detail?id=3ff86eb0-d95b-4941-95c3-252ad30fe3e6&lang=en for AllPrep DNA/RNA FFPE Kit).
Changes from the original protocols have been indicated.
Note: For both PBMC and FFPE samples, we recommend including control and
patients’ samples in the same run. This will enable avoiding a batch effect potentially
confounding the analysis of results. This recommended experimental setup will also enable
assessing whether differences between control and patients’ samples are consistent
between runs.
1. RNA isolation from PBMC samples
Reagents preparation for RNeasy Mini Kit: Before starting RNA isolation from PBMC samples, we
recommend i) adding 10 mL b-mercaptoethanol (Sigma Aldrich, St. Louis, MO) to 1 mL of RLT
Continued
REAGENT or RESOURCE SOURCE IDENTIFIER
Disposable Lab Coat Fisher Scientific Cat. # 12-893-0063A
Fisherbrand Disposable Face Mask Fisher Scientific Cat. # 12-888-001A
Bolle Safety Override OTG Goggles Fisher Scientific Cat. # 18-072-109
Nitrile Powder Free Examination Gloves Nest Cat. # 902021
llOPEN ACCESS
6 STAR Protocols 3, 101156, March 18, 2022
Protocol
Buffer (included in the kit) before use; ii) adding 4 volumes of 100% ethanol to RPE Buffer, which is
supplied as a concentrate in the kit; iii) preparing 70% ethanol.
CRITICAL: b-mercaptoethanol should be added to RLT Buffer under a fume hood while
wearing appropriate protective clothing.
Note: Buffer RLT containing b-mercaptoethanol can be stored at room temperature for up to
one month without being degraded.
Note: The procedure described here is optimized for 5–103 106 PBMCs per sample. For sam-
ples with lower cell numbers, add half of the volumes indicated below.
Figure 2. Schematic of RNA isolation from PBMC and FFPE samples
llOPEN ACCESS
STAR Protocols 3, 101156, March 18, 2022 7
Protocol

a. Add 600 mL RLT Buffer and pipet to resuspend the pellet. Do not centrifuge.
b. Add 600 mL 70% ethanol to the homogenized cell pellet and mix by pipetting.
c. Transfer 600 mL sample to a RNeasy spin column placed in a 2 mL collection tube, supplied
with the kit.
Note: We recommend adding no more than 600 mL sample to avoid unnecessary spillage
when closing the lid.
d. Centrifuge at 10,0003g for 30 s. Discard the flow-through and re-use the collection tube.
e. Centrifuge the remaining 600 mL sample at 10,0003g for 30 s, using the same RNeasy spin
column. Discard the flow-through after centrifugation.
f. Add 700 mL RW1 Buffer to the column and carefully close the lid. Centrifuge at 10,0003g for
30 s and subsequently discard the flow-through. Please re-use the same collection tube.
Note: After centrifugation carefully remove the column from the collection tube to avoid the
column getting in contact with the discarded flow-through.
g. Add 500 mL RPE Buffer to the column and spin at 10,0003g for 30 s. This step enables washing
the column membrane. After discarding the flow-through, please re-use the collection tube.
h. Add 500 mL RPE Buffer to the column and spin at 10,0003g for 2 min. This centrifugation en-
ables drying the spin column membrane from ethanol, which may interfere with subsequent
steps. Remove the spin column and discard the flow-through.
i. Place the column into a new 2 mL collection tube (supplied with the kit) and centrifuge at
12,0003g for 1 min. This step enables removal of residual RPE Buffer.
j. Place the column into a new 1.5 mL collection tube (supplied with the kit) and add 25 mL RNase
free water to the column membrane. After closing the lid, leave the columns on the bench for
1 min and then centrifuge at 10,0003g for 1 min. This step will enable RNA elution.
Note: The volume of RNase free water depends on the initial number of cells. For large cell
numbers, the volume of water applied to the column should be adjusted.
2. RNA isolation from FFPE samples
Reagents preparation for AllPrep DNA/RNA FFPE kit: Before starting the protocol, we recom-
mend preparing i) RLT Buffer by adding 10 mL b-mercaptoethanol/mL Buffer; ii) FRN Buffer by
addition of 42 mL 100% isopropanol to the 14 mL concentrate (then tick the box on the bottle
to indicate that isopropanol addition has been made); if precipitation is noted for RLT and/or
FRN Buffer, we recommend dissolving by warming the solution with gentle agitation; iii) RPE
Buffer by adding 4 volumes of ethanol (i.e., 44 mL) to the bottle containing 11 mL concentrate
RPE Buffer.
Note: Shake the bottles before use to ensure mixing of the solutions.
a. Deparaffinize using xylene; add 1 mL xylene and vortex vigorously for 10 s, then centrifuge at
10,0003g for 2 min.
b. Remove the supernatant by either pipetting without disturbing the pellet, or, alternatively, by
pouring it into a fresh tube. We prefer this second option.
c. Add 1 mL 100% ethanol, vortex and centrifuge at 10,0003g for 2 min.
d. Remove the supernatant as indicated in ‘b’.
e. Incubate at room temperature for 10 min with the lid open.
f. Add 150 mL PKD Buffer and flick the tube to loosen the pellet. Add 10 mL proteinase K and
vortex.
g. Incubate at 56�C for 15 min.
h. Incubate on ice for 3 min.
llOPEN ACCESS
8 STAR Protocols 3, 101156, March 18, 2022
Protocol

i. Centrifuge at 20,0003g for 15 min.
Note: During centrifugation, set the heating block at 80�C.
j. Transfer the supernatant without disturbing the pellet into a new 2 mL safe-lock microcentri-
fuge tube for RNA purification.
k. Incubate the supernatant at 80�C for 15 min.
Note: Do not exceed the 15-min incubation. If the heat block has not reached the 80�C yet,
the sample should be left at room temperature while the desired temperature is achieved.
l. Briefly centrifuge to remove the drops from the lid.
m. Add 320 mL RLT Buffer and mix by pipetting.
n. Add 1,120 mL 100% ethanol and mix by pipetting.
o. Transfer 700 mL sample (including precipitates that may have formed) to a RNeasy MinElute
spin column, which is placed in a 2 mL collection tube (supplied with the kit). Centrifuge at
10,0003g for 30 s. Repeat the step until the entire sample volume has passed through the
column.
p. Add 350 mL FRN Buffer to the column and centrifuge at 10,0003g for 30 s and discard the
flow-through.
Note: Although indicated in the manufacturer’s protocol, we do not perform DNase treat-
ment. However, we recommend you test this additional step in your experiment. For
example, if the analysis of RNA integrity indicates strong genomic DNA contamination,
DNAse treatment step becomes necessary.
q. Add 500 mL FRN Buffer to the column and centrifuge at 10,0003g for 30 s. Save the flow-
through as this contains RNA.
r. Place the column into a new 2 mL collection tube (supplied with the kit) and apply the flow-
through to the column. Centrifuge at 10,0003g for 30 s and discard the flow-through.
s. Add 500 mL RPE Buffer to the column, centrifuge at 10,0003g for 30 s and discard the flow-
through.
t. Add 500 mL RPE Buffer to the column and centrifuge at 10,0003g for 30 s to wash the column
membrane. After centrifugation, discard the collection tube and the flow-through.
u. Place the column into a new 2 mL collection tube (supplied with the kit) and centrifuge at
10,0003g for 5 min keeping the lid open.
v. Place the column into a new 1.5 mL collection tube (supplied) and add 20 mL RNase free water
to the column membrane. Close the lid and incubate at room temperature for 1 min.
w. Centrifuge at 12,0003g for 1 min.
Note:When adding water to the columnmembrane, please consider that the dead volume in
the column is 2 mL.
RNA quantification and purity assessment
Timing: 1 h
In this step, measurement of RNA concentration will be carried out using NanoDrop Spectropho-
tometer. RNA integrity will be evaluated using Agilent Bioanalyzer.
3. Measure the concentration of RNA isolated from PBMC and/or FFPE samples using NanoDrop
Spectrophotometer:
llOPEN ACCESS
STAR Protocols 3, 101156, March 18, 2022 9
Protocol

a. Bring the RNA samples along with RNase free water used to elute them on ice to the Nano-
Drop Spectrophotometer Station.
b. Clean the sample reader with molecular grade water and wipe with a KimWipe.
c. Load 1.2 mL of RNase free water and initialize the system.
d. Select ‘RNA’ and click ‘blank’.
e. Load 1.2 mL of RNA sample and click ‘measure’.
f. Record the A260/280 and A260/A230 ratios along with the RNA concentration (ng/mL).
g. Wipe the sample reader between samples with a clean KimWipe and repeat steps e-f.
Note: RNA samples with a A260/A280 ratio ranging from 1.8 to 2.1 are considered of good
purity. A A260/A280 ratio lower than 1.8 may indicate DNA or protein contamination. This
is, however, more frequent when other protocols of RNA isolation are applied (e.g., TRizol).
The optimal A260/A230 ratio should be above 2. Lower values are indicative of contamination
with the wash solutions, phenols and proteins. Troubleshooting 1. Troubleshooting 2.
4. Check RNA integrity using Agilent Bioanalyzer. 2.5 mL per sample is used.
Note: RNA integrity is assessed as an additional measure of the sample RNA quality. The Dis-
tribution Value 200 (DV200) is the percentage of RNA fragments longer than 200 nucleotides.
The lower is the DV200 value, the more degraded is the RNA in the sample. Reportedly,
DV200 < 30% are considered being degraded for further experiments (Wimmer et al.,
2018); values of DV200 between 50% and 70% are of acceptable quality but might require
higher input volumes for transcriptome analysis (Wimmer et al., 2018). DV200 values higher
than 70% are usually associated with high RNA quality (Wimmer et al., 2018). Based on this
evidence, we recommend using samples with DV200 higher than 70% to maximize the chan-
ces of success in the NanoString assay. For additional information on how the DV200 is calcu-
lated, please refer to https://www.agilent.com/en/promotions/dv200-determination.
NanoString assay
Timing: approximately 2 days
NanoString technology enables detection and counting of hybridized transcripts using barcodes. In this
protocol step, RNA hybridization and post-hybridization processing are carried out as per manu-
facturer’s instructions at https://www.nanostring.com/support-documents/ncounter-xt-assay-user-
manual/. (Figure 3).
Day 1
5. Pre-heat the thermocycler to 65�C (lid temperature 70�C). Program the thermocycler for 18 mL
volume.
6. Thaw the Reporter Code Set (nCounter CAR T Characterization Panel), the Capture Probe Set
(nCounter CAR T Characterization Panel), PLUS COVID-19 Reporter and PLUS COVID-19 Capture
(Coronavirus Panel Plus). Thawing is carried out at room temperature. Invert or flick the tubes
several times and spin at less than 1,0003g for less than 30 s.
CRITICAL: Do not vortex or pipette vigorously as this may shear the Reporter Code Set.
When using the microcentrifuge to spin down the tube, please do not use speed higher
than 1,0003g for more than 30 s. Pulse centrifugation should be avoided too.
7. Add 28 mL of PLUS COVID-19 Reporter to Reporter Code Set. Invert or flick several times and
spin down tubes, as indicated in step 6.
llOPEN ACCESS
10 STAR Protocols 3, 101156, March 18, 2022
Protocol

8. Prepare a master mix by adding 70 mL of hybridization Buffer to the tube containing PLUS
COVID-19 Reporter and Reporter Code Set. The Reporter Code Set should not be removed
from the tube.
9. After labeling tubes, add 10 mL of the master mix into each tube.
10. Add 100 ng of RNA sample per tube. The volume should not exceed 5 mL; if less, adjust with
RNase free water. The total volume per tube should be 15 mL.
11. Add 14 mL of Capture PLUS Reagent to the thawed aliquot of Capture Probe Set. Invert several
times to mix and spin down reagents.
12. Add 3 mL of Capture Probe Set and Capture Plus Reagent mix into each tube immediately before
placing it at 65�C.
Note: It is important minimizing the time between the addition of the Capture Probe Set and
the incubation at 65�C as this will improve assay sensitivity.
13. Incubate in the thermocycler at 65�C for 18 h. Ramp the reaction down to 4�C (see table) and
process the following day.
Figure 3. Schematic of NanoString assay procedure. Critical steps are highlighted
llOPEN ACCESS
STAR Protocols 3, 101156, March 18, 2022 11
Protocol

Note: We recommend not leaving the samples at 4�C for more than 24 h as this may result in
increased background.
Note: It is recommended not hybridizing more than 12 samples at the same time.
Day 2
14. Remove the samples from the thermocycler and spin them down.
Note: Make sure that no evaporation has occurred, and all samples have the same volume.
15. Take the two 96-well plates (supplied with the NanoString kit) from the refrigerator at 4�C and
spin them down at 2,0003g for 2 min. Remove the cartridge from �20�C freezer.
16. Bring the samples, 96-well plates, tips and cartridge to the nCounter Prep Station.
17. Prepare the nCounter Prep Station based on the manufacturer’s instructions, shown on the
display. Please also refer to the manual https://www.nanostring.com/wp-content/uploads/
2020/12/MAN-C0035_nCounter_Analysis_System_MAX_FLEX.pdf
18. Follow the instructions on the screen without changing any setting. The run is already pre-set for
‘high sensitivity’.
19. Place the plates on the deck with labels forward. Discard the lids.
20. Remove the foil from the cartridge. Before loading the cartridge, make sure the bottom is not
cracked or damaged. Place the cartridge under the electrode fixture with the notch in the
back and the barcode on the right. The right side should bounce up and down after applying
a light pressure from your finger. Lower the electrode fixture to insert the electrodes in the car-
tridge.
Note: When loading the tips (supplied with the kit and kept at room temperature until use),
you can facilitate the procedure by covering them with a plate lid.
21. Place the tip sheaths in the slot in front of the tip rack.
22. Place empty strip tubes, provided with the kit, into the heater block.
23. Uncap the sample strip tubes and place them into the metal tube holder.
24. Close the heater lid and click ‘Start Processing’. The processing will take approximately 3 h.
Note: We recommend waiting for 10 min until the ‘System Processing’ message appears on
the display (this indicates that the validation automatically carried out by the machine is
completed and the run is starting).
25. After 3 h, remove the cartridge from the nCounter Prep Station and seal it with the clear adhesive
film (supplied with the kit).
CRITICAL: Make sure to seal the cartridge within 1 h after processing, to avoid evapora-
tion and subsequent data loss.
Note: Cartridges can be scanned immediately after processing or stored in the dark at 4�C for
up to 1 week.
Temperature (lid) Volume Time
65�C (70�C) 18 mL 18 h*
*This includes 16 h hybridization and 2 h at 4�C.
llOPEN ACCESS
12 STAR Protocols 3, 101156, March 18, 2022
Protocol

26. Clean the nCounter Prep Station following the instructions shown on the display and proceed to
the nCounter Digital Analyzer.
27. Retrieve the NanoString supplied USB from �80�C. The CodeSet from NanoString is shipped
with a Reporter Library File (RLF) that can be found on the NanoString USB inside the�80�C Co-
deSet box. The RFL contains the barcode definitions for the group of probes included in the Co-
deSet.
28. Insert the NanoString supplied USB into the nCounter Digital Analyzer (port on the right-hand
side of the Digital Analyzer touch screen) and follow the instructions on the screen and as indi-
cated in the manufacturer’s protocol https://www.nanostring.com/wp-content/uploads/2020/
12/MAN-C0035_nCounter_Analysis_System_MAX_FLEX.pdf
29. Click on ‘Upload Files’ and then ‘Upload RLF’.
Note: This is done for the first run of each NanoString panel. RLF files are saved in the
analyzer).
30. Click on ‘Start Counting’ and select a stage position on the touch screen.
31. Place the cartridge in the selected stage position by holding it lengthwise. Close the magnetic
clip and push down to ensure the cartridge is flat.
32. Under Cartridge Definition Mode, select ‘Create New’. This option is for use with generic sam-
ple names. If specific names are used, please refer to ‘Creating aCDF section’ in the nCounter Anal-
ysis System Manual https://www.nanostring.com/wp-content/uploads/2021/02/MAN-C0035-
08-nCounter-Analysis-System-User-Manual.pdf
33. Enter a cartridge ID.
34. Select ‘fields of view (FOV) count’ for scanning.
Note: Higher FOV counts result in longer scanning time and generate less noisy data. In our
protocol, the maximum FOV count (i.e., 555) was used.
35. Click ‘Samples’ and select all sample tubes.
36. Enter a ‘Sample ID’; individual samples will be differentiated by lane numbers.
37. Click ‘Library RLF’ and select the RLF that corresponds to the CodeSet being run.
38. Click ‘Done’ to return to the Cartridge Information Screen; click ‘Done’ again to return to the
Select Stage Position Screen; and then ‘Done’ for the third time, if no additional scans are
planned.
39. Click ‘Start’.
Note: The run will take approximately 5 h. The cartridge can be left in the counter until the next
day and then placed at 4�C, covered by aluminum foil. This would enable scanning the car-
tridge again, if needed.
40. Once the scan has completed, insert a USB drive into the Digital Analyzer USB port.
41. Click ‘Download data’ from the touch screen.
42. Select the file corresponding to the cartridge ID and click ‘Download data’ and export Reporter
Code Count (RCC) files.
EXPECTED OUTCOMES
For a successful experimental outcome, we recommend using 100 ng RNA per sample. In the case of
PBMCs, fresh or recently collected samples are preferable to maximize the chances of obtaining
higher RNA concentrations. Selection of RNA samples with DV200 higher than 70% at the bio-
analyzer further enhances the chances of a successful run. By applying these parameters, we were
able to show significant differences in gene metabolism, TCR repertoires and ENTPD1/CD39 (Savio
et al., 2020; Longhi et al., 2021; Wang et al., 2021) levels between COVID-19 impacted organs and
llOPEN ACCESS
STAR Protocols 3, 101156, March 18, 2022 13
Protocol
non-COVID-19 controls (Wang et al., 2021). When considering PBMCs, we noted that samples ob-
tained from severe COVID-19 patients displayed limited TCR repertoires and lower ENTPD1/CD39
levels compared to moderate COVID-19 patients, convalescents and healthy controls (Wang et al.,
2021).
Importantly, NanoString data were validated using other approaches, namely flow cytometry, qPCR
and immunohistochemistry (Wang et al., 2021).
QUANTIFICATION AND STATISTICAL ANALYSIS
RCC files are exported from the nCounter Digital Analyzer and initially analyzed using nSolver
Advanced Analysis software, based on the manufacturer’s instructions (https://www.nanostring.
com/wp-content/uploads/2020/12/MAN-10030-03_nCounter_Advanced_Analysis_2.
0_User_Manual.pdf). As indicated in the original manuscript (Wang et al., 2021), further analysis of
normalized data, differentially expressed genes (DEGs) and gene set scores, was conducted using R
software (version 4.0.2). DEGs were defined based on P value % 10-4 when analyzing samples from
organs; and P value % 10-3 when analyzing PBMC samples. Different thresholds were applied
because we noted more substantial differences in the organs than PBMCs, between COVID-19
and control samples. False discovery rate was controlled by the Benjamini-Yekutieli method (Benja-
mini and Yekutieli, 2001). When comparing mRNA levels in the organs of COVID-19 patients and
controls, unpaired t test was used; when considering PBMCs, comparisons of mRNA levels between
patients at different disease stage and controls were performed using one-way ANOVA test, fol-
lowed by Tukey’s multiple comparison test. P%0.05 was considered significant. Statistical analysis
was performed using GraphPad Prism, version 9.3.0 (GraphPad Software, San Diego, CA).
LIMITATIONS
The NanoString assay described here enables obtain a comprehensive gene profiling of PBMCs and
FFPE samples. Using this approach, correlations between gene sets can be performed; however, the
technique does not enable obtain data at the single cell level. If analyses at the single cell level are
required, single-cell RNAseq techniques are preferable, especially when analyzing whole tissue sam-
ples (Gohil et al., 2021; Delorey et al., 2021). In this regard, the recent introduction of GeoMx Digital
Spatial Profiler has enabled whole transcriptome profiling at the single cell level in a spatial context,
providing critical information about the expression of key targets specific to a certain tissue region
(Delorey et al., 2021; Kulasinghe et al., 2021; Park et al., 2021).
NanoString enables identifying gene pathways that may be altered during disease. However, anal-
ysis at the functional level should be incorporated to determine whether alterations at the gene level
impact cell function.
TROUBLESHOOTING
Problem 1 (step 3)
Low RNA concentration after isolation from PBMCs and/or FFPE samples.
Potential solution
In the presence of low RNA yield, increase the initial cell number or the number of paraffin
embedded slices. We recommend not to exceed 4-5 slices per sample as excess of paraffin is
hard to remove.
Problem 2 (step 3)
Low A260/A230 ratio.
llOPEN ACCESS
14 STAR Protocols 3, 101156, March 18, 2022
Protocol
Potential solution
As this might be due to contamination with washing buffers, we recommend being careful when per-
forming the spin column washes, especially when removing the spin column from the collection tube
containing the flow-through.
RESOURCE AVAILABILITY
Lead contact
Further information and requests for resources and reagents should be directed to and will be ful-
filled by the lead contact, Dr. Maria Serena Longhi ([email protected]).
Materials availability
This study did not generate new unique reagents.
Data and code availability
The NanoString bulk transcriptomic data generated during this study are available from Mendeley
data at https://doi.org/10.17632/mkmv3mgz86.1.
This study did not generate code.
ACKNOWLEDGMENTS
Grant support: This work has been supported by the National Institutes of Health (R01 DK108894
and R01 DK124408 to M.S.L.); Seed Grant Award (Department of Anesthesia, Critical Care & Pain
Medicine to M.S.L.).
AUTHOR CONTRIBUTIONS
M.V., N.W., A.K., and J.J.G. performed the experiments, analyzed data, and drafted themanuscript.
M.S.L. wrote the manuscript and acquired funding.
DECLARATION OF INTERESTS
The authors declare no competing interests.
REFERENCES
Benjamini, Y., and Yekutieli, D. (2001). The controlof the false discovery rate in multiple testing underdependency. Ann. Stat. 29, 1165–1188.
Delorey, T.M., Ziegler, C.G.K., Heimberg, G.,Normand, R., Yang, Y., Segerstolpe, A.,Abbondanza, D., Fleming, S.J., Subramanian, A.,Montoro, D.T., et al. (2021). COVID-19 tissueatlases reveal SARS-CoV-2 pathology and cellulartargets. Nature 595, 107–113.
Gohil, S.H., Iorgulescu, J.B.,Braun,D.A., Keskin,D.B.,and Livak, K.J. (2021). Applying high-dimensionalsingle-cell technologies to the analysis of cancerimmunotherapy. Nat. Rev. Clin. Oncol. 18, 244–256.
Kulasinghe, A., Tan, C.W., Dos Santos Miggiolaro,A.F.R., Monkman, J., Sadeghirad, H., Bhuva, D.D.,da Silva Motta Junior, J., vaz de Paula, C.B.,
Nagashima, S., Baena, C.P., et al. (2021). Profiling oflung SARS-CoV-2 and influenza virus infectiondissects virus-specific host responses and genesignatures. Eur. Respir. J.. 10.1183/13993003.01881-2021
Longhi, M.S., Feng, L., and Robson, S.C. (2021).Targeting ectonucleotidases to treat inflammationand halt cancer development in the gut. Biochem.Pharmacol. 187, 114417.
Park, J., Foox, J., Hether, T., Danko, D., Warren, S.,Kim, Y., Reeves, J., Butler, D.J., Mozsary, C.,Rosiene, J., et al. (2021). Systemic tissue and cellulardisruption from SARS-CoV-2 infection revealed inCOVID-19 autopsies and spatial omics tissuemaps.bioRxiv. https://doi.org/10.1101/2021.03.08.434433.
Savio, L.E.B., Robson, S.C., and Longhi, M.S. (2020).Ectonucleotidase modulation of lymphocytefunction in gut and liver. Front Cell Dev. Biol. 8,621760.
Wang, N., Vuerich, M., Kalbasi, A., Graham, J.J.,Csizmadia, E., Manickas-Hill, Z.J., Woolley, A.,David, C., Miller, E.M., Gorman, K., et al. (2021).Limited TCR repertoire and ENTPD1 dysregulationmark late-stage COVID-19. iScience 24, 103205.
Wimmer, I., Troscher, A.R., Brunner, F., Rubino,S.J., Bien, C.G., Weiner, H.L., Lassmann, H., andBauer, J. (2018). Systematic evaluation of RNAquality, microarray data reliability and pathwayanalysis in fresh, fresh frozen and formalin-fixedparaffin-embedded tissue samples. Sci. Rep. 8,6351.
llOPEN ACCESS
STAR Protocols 3, 101156, March 18, 2022 15
Protocol