Fouling characteristics and autopsy of a PES ultrafiltration membrane in cyclodextrins separation
16
Fouling characteristics and autopsy of a PES ultrafiltration membrane in cyclodextrins separation A.M. Mimi Sakinah a,b , A.F. Ismail a* , Rosli Md Illias a,c , Osman Hassan d a Membrane Research Unit, Faculty of Chemical Engineering and Natural Resources, University Technology of Malaysia, 81310 Skudai Johor, Malaysia Tel. +60 (07) 553-5592; Fax: +60 (07) 581463; email: [email protected] b Faculty of Chemical Engineering and Natural Resources, University of College Engineering and Technology of Malaysia, KUKTEM, Kuantan Pahang, Malaysia c Bioprocess Department, Faculty of Chemical Engineering and Natural Resources, University Technology of Malaysia, 81310 Skudai Johor, Malaysia d School of Chemistry and Food Science, Faculty of Science and Technology, Universiti Kebangsaan Malaysia, 43000 Bangi Selangor, Malaysia Received 23 January 2006; Accepted 15 August 2006 Abstract This paper studies the fouling characteristics and effect of chemical cleaning (alkaline and acidic solution) on PES ultrafiltration membrane during separation of cyclodextrins from starch and CGTase. The fouled membrane surface was observed under scanning electron microscopy (SEM). The ATR/FTIR spectrometry was applied to examine the adsorption of organic elements. The quantitative analysis of the extracted chemical solution was measured by using UV-spectrophotometer and total organic carbon (TOC). The Resistance-In-Series Model was used to identify the responsible hydraulic resistances. The overall results indicated that the adsorption of solutes (CDs or starch by- products) onto the membrane surface and pores exhibited the highest percentage compared to other fouling mechanisms due to the steric conditions. The measured flux recovery of enzymatic membrane reactor for CDs production was about 95% after chemical cleaning with the alkaline solution. Keywords: Cyclodextrins; Ultrafiltration; Membrane autopsy; Fouling mechanisms; Hollow fiber membrane 1. Introduction Cyclodextrins (CDs) are cyclic and doughnut shaped oligosaccharide composed of α-1,4- *Corresponding author. glycosidic-linked glucosyl residues. CDs are pro- duced from starch by digestion with the enzyme cyclodextrin glucosyltransferase (CGTase, EC 2.4.1.19). There are three types of CDs which are α-CD, β-CD and γ-CD, containing six, seven and Desalination 207 (2007) 227–242 0011-9164/07/$– See front matter © 2007 Published by Elsevier B.V. doi:10.1016/j.desal.2006.08.007
-
Upload
independent -
Category
Documents
-
view
0 -
download
0
Transcript of Fouling characteristics and autopsy of a PES ultrafiltration membrane in cyclodextrins separation

Fouling characteristics and autopsy of a PES ultrafiltrationmembrane in cyclodextrins separation
A.M. Mimi Sakinaha,b, A.F. Ismaila*, Rosli Md Illiasa,c, Osman Hassand
aMembrane Research Unit, Faculty of Chemical Engineering and Natural Resources,University Technology of Malaysia, 81310 Skudai Johor, Malaysia
Tel. +60 (07) 553-5592; Fax: +60 (07) 581463; email: [email protected] of Chemical Engineering and Natural Resources, University of College Engineering and Technology
of Malaysia, KUKTEM, Kuantan Pahang, MalaysiacBioprocess Department, Faculty of Chemical Engineering and Natural Resources,
University Technology of Malaysia, 81310 Skudai Johor, MalaysiadSchool of Chemistry and Food Science, Faculty of Science and Technology, Universiti Kebangsaan Malaysia,
43000 Bangi Selangor, Malaysia
Received 23 January 2006; Accepted 15 August 2006
Abstract
This paper studies the fouling characteristics and effect of chemical cleaning (alkaline and acidic solution) on PESultrafiltration membrane during separation of cyclodextrins from starch and CGTase. The fouled membrane surfacewas observed under scanning electron microscopy (SEM). The ATR/FTIR spectrometry was applied to examine theadsorption of organic elements. The quantitative analysis of the extracted chemical solution was measured by usingUV-spectrophotometer and total organic carbon (TOC). The Resistance-In-Series Model was used to identify theresponsible hydraulic resistances. The overall results indicated that the adsorption of solutes (CDs or starch by-products) onto the membrane surface and pores exhibited the highest percentage compared to other foulingmechanisms due to the steric conditions. The measured flux recovery of enzymatic membrane reactor for CDsproduction was about 95% after chemical cleaning with the alkaline solution.
Keywords: Cyclodextrins; Ultrafiltration; Membrane autopsy; Fouling mechanisms; Hollow fiber membrane
1. Introduction
Cyclodextrins (CDs) are cyclic and doughnutshaped oligosaccharide composed of α-1,4-
*Corresponding author.
glycosidic-linked glucosyl residues. CDs are pro-duced from starch by digestion with the enzymecyclodextrin glucosyltransferase (CGTase, EC2.4.1.19). There are three types of CDs which areα-CD, β-CD and γ-CD, containing six, seven and
Desalination 207 (2007) 227–242
0011-9164/07/$– See front matter © 2007 Published by Elsevier B.V.doi:10.1016/j.desal.2006.08.007

A.M. Mimi Sakinah et al. / Desalination 207 (2007) 227–242228
eight glucose residues, respectively. CDs have aunique structure with hydrophobic CH groups onthe inside of the ring and hydrophilic hydroxylgroups on the outside of the ring [1]. CDs cansolublize hydrophobic materials and entrap vola-tile components by forming inclusion complexeswith organic compounds and thus enhance theirchemical and physical properties [2–6]. Theseproperties have led to the commercial applicationof CDs [7,8] in food, pharmaceutical, cosmetic,agricultural and plastic industries as emulsifiers,antioxidants and stabilizing agent [9]. However,the extensive use of CDs is still restricted by highproduction cost of CDs [10].
CDs can be synthesized using chemical pro-cess or through enzymatic reactor. The CDs canbe separated using selective chemical precipi-tation, chemical precipitation coupled with filtra-tion or an integrated reaction–purification systemutilizing size exclusion separation mode such asmembrane separation [10–12].
In CDs production, the starch source, CGTaseand CDs can be selectively separated from thereaction mixture by ultrafiltration (UF) membraneunder the action of a driving force across themembrane that causes the movement (diffusion,convection) of solutes [13]. The CGTase andstarch degradation products were retained withinthe system by membrane, allowing the estab-lishment of a continuous operation with starchand enzyme feed and CDs withdrawal [13–15].
Membrane technology has been applied inbiotechnology industries since last two decades.It is gradually emerging as a powerful biosepa-ration process for purification, fractionation,separation and concentration of bioproducts suchas therapeutic drugs, enzymes, hormones, anti-bodies, fruit juice and cheese. Membrane thatcouples with reactor is called membrane reactor(MR) which is widely used in fermentations,enzyme-catalyzed reactions, and biotranforma-tions [16]. One of the membrane reactor types isan enzymatic membrane reactor (EMR), whichcombined the membrane separation and enzy-
matic reactor. In EMR, the semi-permeableultrafiltration (UF) membrane is used to retain theenzyme in the reactor. According to Lopez et al.[13], EMR can be classified into three typeswhich are stirred tank reactor combined withseparation-membrane unit, stirred tank withenzyme immobilized within the membrane matrixitself and stirred tank with enzyme entrapped ingels, fibers or microcapsules as shown in Fig. 1.
EMR is designed to obtain an accurate sepa-ration of the substrate and product based on thedifferences in molecular size and/or chemicalproperties in response to a specific driving force.The membrane which is attached to EMR rejectedthe solutes that have larger molecular weight(MW) than the molecular weight cut-off(MWCO) of the membrane [17]. According toIsmail and Lai [18], the membrane with higherflux leads to higher productivity and lower capitalcosts whereas membrane with higher rejectionleads to more efficient separations, higher recov-ery and lower power costs. The EMR presentadvantages such as high enzyme loads, prolongedenzyme activity, high flow rates, reductions incosts, energy and waste products by recycling,easy reactor operation and control, straight-forward scale-up to large systems and high yieldsof pure material [13,19].
Although there are many advantages offeredby membrane, the application of membranetechnology in EMR is still limited. This is due tothe fouling problem which reduces the membraneperformance. In addition, membrane foulingreduces the production rate and increases com-plexity of membrane operations. Fouling can bedefined as a declination in flux with time ofoperation due to the increment of hydraulicresistance when all operating parameters such astransmembrane pressure, flowrate, temperatureand feed concentration are kept constant. Themembrane fouling is dependent on several para-meters such as membrane characteristics, feedproperties, operational conditions and solutionchemistry. On the way to overcome membrane

A.M. Mimi Sakinah et al. / Desalination 207 (2007) 227–242 229
(a) (b) (c)
Fig. 1. Configurations of enzymatic membrane reactors: (a) stirred tank reactor combined with separation-membrane unit,(b) stirred tank with enzyme immobilized within the membrane matrix itself and (c) stirred tank with enzyme entrappedin gels, fibers or microcapsules [13].
fouling problem, backwashing or chemical clean-ing method has been widely applied in manyindustries. However, this method has only beenreported in the application of water andwastewater treatment but not in CDs separation.In conjunction with this scenario, the presentstudy focuses in determining the fouling charac-teristics of fouled membrane and the cleaningstrategies in order to optimize the separationprocess and in turn the flux recovery during CDsproduction can be determined.
2. Materials and methods
2.1. Fabrication of hollow fiber UF membranes
The polyethersulfone (PES) polymer wassupplied by Solvay Advanced Polymer Company.The additive polymer of polyethylene glycol(PEG 400) was bought from Fluka Milwaukeewhile the solvent 1-methyl-2-pyrolidon (NMP)was purchased from Merck Darmstadt Germany.Initially, the PES polymer was dried in an oven atabout 60EC for about 5 hours in order to removethe moisture content. After that, a spinning dopeof PES/PEG (400)/NMP/additive (water) wasmixed thoroughly until the mixture was homo-genous. The schematic diagram of spinning dopepreparation apparatus is shown in Fig. 3. Based
Fig. 2. Schematic diagram of spinning dope preparationapparatus.
on Fig. 2, the solution mixture was well mixturewith mechanical stirrer at 60±2ºC. After the spin-ning dope was completely dissolved, the homo-genous solution was degassed to remove anymicro-bubbles by using ultrasonic bath.
The hollow fiber UF membrane was preparedusing dry/wet phase spinning process as shown inFig. 3 [20]. In Fig. 3, the spinning solution wasfed into the tube-in-orifice spinneret while the

A.M. Mimi Sakinah et al. / Desalination 207 (2007) 227–242230
Fig. 3. Schematic diagram of dry/wet spinning process (1) nitrogen cylinder; (2) dope reservoir; (3) gear pump; (4) on-linefilter, 7 mm; (5) syringe pump; (6) spinneret; (7) Perspex cylinder; (8) roller; (9) wind-up drum; (10) refrigeration/heatingunit; (11) coagulation bath; (12) washing/treatment bath; (13) wind-up bath; (14) Schematic spinneret [20].
bore fluid was fed through the inner tube of thespinneret. The dope reservoir that containsformulated dope was kept under pressurizednitrogen gas. The fiber passed through a con-trolled environment air gap before entering thecoagulant bath. The fibers were then soaked inmethanol for two days. This is to generate thesolvent exchange process for the membrane.Next, the fibers were soaked in the water for twodays to rinse out all the solvent that are unneces-sary. Then, the hollow fiber UF membrane wasair-dried vertically at room temperature for aboutseven days before ready for testing.
2.2. Production and separation of CDs
The EMR system was developed to evaluatethe performance of our locally produced hollowfiber ultrafiltration membrane. As shown inFig. 4, the EMR system comprises an enzymaticstirred reactor with installed temperature con-
troller, a membrane module unit, a pump, feedand retentate pressure gauges. The locally pro-duced PES membrane with a MWCO of 32,000Dalton was used in this experiment. Membranediameter and effective area are respectively600 µm and 0.027 m2. The membrane was hori-zontally assembled beside the reactor. Theenzymatic reactor consists of a stainless steelvessel with a mechanical stirrer attached. Themixing intensity of the process is 200 rpm.
This reactor was filled with 2% of raw tapiocastarch (food grade) solution mixed with CGTaseenzyme (200 µl/100 ml reaction volume whichhas an enzyme activity of 0.8 unit/ml-optimalconditions suggested by Novo Nordisk, Den-mark). The reaction temperature was conductedunder starch gelatinization temperature as thisoperating condition would help to avoid starchfrom becoming more viscous and consequentlycan led to fast membrane fouling. After 4 hoursreaction, the reaction mixture was then

A.M. Mimi Sakinah et al. / Desalination 207 (2007) 227–242 231
Fig. 4. Schematic diagram of EMR system.
continuously pumped to the membrane moduleand recycled back to the enzymatic reactor in theform of retentate. The temperature and pH of theenzymatic reactor was maintained at 60EC and6.0, respectively. The experiment was performedat three transmembrane pressures (TMP), whichwere 0.5, 1.0 and 1.5 bars at the constant crossflow velocity (CFV). The two types of chemicalcleaning which were 0.1 N NaOH and 0.1 N HClwere applied as to determine the solutionseffectiveness. The analysis of organics and inor-ganic content in both alkaline and acidic extrac-ted solution was investigated in this study.
2.3. Resistances-In-Series Model
The parameters in Eqs. (1) and (2) wereapplied to identify the flux declination and theefficiency of membrane processes:
(1)QJA
=
where J is the flux through the membrane (LMH),Q is the permeate flowrate (LPM) and A is the
effective membrane area (m2). There are fiveparameters of membrane resistance-in-seriesmodel based on Darcy’s law which were used toquantify their influences on flux decline [21]:
(2)1 2( )m cp g a a
PJr r r r r
Δ=μ + + + +
where J is flux through the membrane (m/hr), Pis the transmembrane pressure (Pa), µ is thedynamic viscosity (Pa hr), rm is the membranehydraulic resistance, rcp is the concentrationpolarization resistance, rg is the gel layer resis-tance, ra1 is the weak adsorption resistance, ra2 isthe strong adsorption resistance (all resistance arein m!1). In this investigation, the osmotic pressureis considered into the concentration polarization.
In this study, there several types of resistancescontributed to both reversible and irreversiblefouling mechanisms. The concentration polari-zation (rcp) and gel layer resistance (rg) wereassumed as reversible fouling mechanisms, whichcould be removed by through water rinsing.However, the weak and strong adsorptions werecategorized as an irreversible fouling mechanism.The weak adsorption was irreversible foulant thatcan be removed by chemical cleaning, while thestrong adsorption would remain onto the mem-brane surface.
The distilled water (DI) and reaction mixturewere cross-flow filtered using the followingprocedure to obtain all hydraulic resistancesquantitatively. Clean water was first filteredthrough the membrane to obtain the pure waterflux of membrane (Jpwp) until a constant flux wasachieved. Then, the reaction mixture was fed andthe permeate rate was monitored over the time.After the permeate rate reached a constant value(that is, the permeate of fouled membrane), theapplied pressure was released to remove theconcentration polarization layer and DI replacedthe reaction mixture. The next Jpwp of the mem-brane was taken in order to determine the

A.M. Mimi Sakinah et al. / Desalination 207 (2007) 227–242232
concentration polarization resistance value. Thefouled membrane was then rinsed with DI athigher applied pressure. This procedure was toensure the gel layer was totally removed from themembrane surface. Next a third Jpwp was taken sothat rg value could be determined. The membranewas then rinsed with 0.1 M NaOH solution for20 minutes in order to dissolve the weak adsorp-tion layer off the membrane surface and pores.Next the fourth Jpwp was measured and the ra2were calculated using Eq. (2).
2.4. Total Organic Carbon (TOC)
TOC was measured by a carbon analyzer(Shimadzu TOC-5000). All samples were acidi-fied with the addition of 2N HCl. The analyzerfurnace was set at 600ºC and samples wereaspirated into the furnace by purified air (carbondioxide free). TOC reading was obtained fromdifference of total carbon (TC) and inorganiccarbon (IC), which was burnt into CO2. Standardsolution of organic and inorganic carbon usedwere potassium hydrogen phthalate and sodiumhydrogen carbonate. Calibration curves area of aseries of standard solutions in the range of 1 to20 ppm was prepared before injecting thesamples.
2.5. Determination of the residual starchconcentration
The starch concentration in the extracted alka-line and acidic solution was determined by usingthe Fuwa methods [22]. 5 ml of iodine solution(0.5% KI and 0.15% I2) and known volumes ofsamples were mixed. The final volume was com-pleted to 15 ml by addition of distilled water. Theabsorbency was measured using the HitachiModel U-100 spectrophotometer at 550 nmagainst a blank containing 5 ml iodine solutionand 10 ml of distilled water. Absorbencies wereconverted to starch concentration using a cali-bration chart.
2.6. Modified Lowry protein assay
Lowry’s method [23] is applied to estimate theprotein content in the extracted alkaline andacidic solution by using Hitachi model U-100spectrophotometer. A reaction mixture containing1.0 ml Modified Lowry reagent and 0.2 mlsample was incubated at room temperature for10 minutes. Distilled water was used as a blank.At the end of the incubation period, 0.1 ml of 1 NFolin-Ciocalteu reagent, which was bought fromMerck Darmstadt Germany was added into thereaction mixture and left at room temperature for30 minutes. The absorbance of the sample wasmeasured at 750 nm. A standard curve was pre-pared by plotting the average blank corrected750 nm reading for each BSA (bovine serumalbumin) standard, which was purchased fromMerck Darmstadt Germany versus its concen-tration in µg/ml. The protein concentration wasdetermined for each sample using the standardcurve.
2.7. ATR/FTIR analysis
The infrared spectra were recorded using aattenuated total reflection-Fourier transformspectroscopy (ATR/FTIR) with OMNIC ESPsoftware (Thermo Nicolet Instrument Corpora-tion, Madison, WI). The clean and fouled mem-branes were dried at room temperature for threedays before analyzed with FTIR. The resolutionwas 2.0 cm!1 and the result of averaging 100scans. All measurements were carried out at 20 ±1ºC. The ATR accessory contained a zinc sele-nide (ZnSe) crystal at nominal incident angle of45º. This FTIR was used to determine functionalgroups associated with the membrane surfacematerials and foulants. The spectra of the new,fouled and cleaned membranes were analyzedusing the OMNIC software.
2.8. Scanning electron microscopy
A digital scanning electron microscopy (SEM)

A.M. Mimi Sakinah et al. / Desalination 207 (2007) 227–242 233
was used to study the surface of clean and fouledmembrane. The membrane was cut into smalltubular about 5 mm in length. The membranethen was coated with a gold-palladium before thephotographs were taken.
3. Results and discussion3.1. PES membrane fouling characteristics
3.1.1. Flux decline in the UF crossflowfiltration during the CDs separation
Fig. 5 shows the declination of flux in theultrafiltration cross flow membrane. Before themembrane was introduced to the reaction mix-ture, it was initially flushed with DI water toobtain the intrinsic resistance of the membrane(Rm). Subsequently, by using the Darcy’s law, thedeclination of flux was obtained as the amount oftotal resistances. Based on Fig. 5, the permeateflux continuously decrease with time until theflux reached a steady state in 70 minutes of theseparation. The permeate flux decreases about 50to 60% of the initial permeate flux. In this stage,the cake layer has achieved an equilibrium thick-ness where the hydraulic resistance of the sepa-
ration was also constant. Even though the appliedpressure was increased, there was still no signi-ficant change in the permeate flux at the equili-brium stage. In order to recover the initial flux,hydraulic and chemical cleaning or backwashmethod has been applied onto the fouledmembrane.
In this study, flux declines as a function oftime were observed at all TMP applied during theCDs separation. TMP is one of the critical opera-ting parameters which influence the efficiency ofthe membrane filtration. Increment in the opera-tional TMP enhances flux declination thusaccelerated the operation to achieve a steady stateflux condition. This is due to the effect of com-paction of the gel/cake layer. As the fluxincreases, more solute mass was brought to themembrane surface, which increases pore pluggingand resistance to flow. The later might be a resultof the gel/cake layer which resulted in morecompactness with an increase in transmembranepressure. Therefore, in this investigation, it washypothesized that the gel/cake layer depositedover the membrane plays an important role in theCDs separation.
Fig. 5. Flux decline at constant cross flow velocity (CFV). Comparison of normalized flux (filled symbols) and ratio ofresistance (open symbols) against time for the three TMP: 0.5 bar (Ë), 1.0 bar (#G) and 1.5 bar (•Δ).

A.M. Mimi Sakinah et al. / Desalination 207 (2007) 227–242234
3.1.2. Microcosmic appearance of fouledmembrane surface
The inner and exterior surfaces of the mem-brane fiber were observed under SEM, and theresult is shown in Fig. 6. The exterior of themembrane surface under 5000 magnificationclearly showed the surface was covered with athick and coarse cake layer.
The membrane used in this study had a poresize of 32,000 Dalton. However the starch,CGTase and CDs were about 105 Dalton, 75,000Dalton and 1135 Dalton (β-CD), respectively astabulated in Table 1. In theory, because of thesteric properties of the membrane, no starch andCGTase could pass through the membrane exceptfor the CDs and the starch by-products. As aresult, it was presumed that the outer membranesurface was covered by starch and CGTase(reversible fouling), while the inner membranesurface was mainly formed by CDs and starch by-product (irreversible fouling). As reported byother researchers, the reversible fouling mainlycould cause concentration polarization and gel/cake layer onto the membrane surface, while theirreversible fouling mainly could cause adsorp-tion (weak and strong) into the membrane matrix.
Table 1Physical characteristics of the feed components
MW (Dalton)
Starch (substrate) 105 (minimum) CGTase (enzyme) 75,000 (average)β-CD (product) 1135Maltose (by-product) 360.3Glucose (by-product) 180
3.1.3. Spectral analysis of UF fouledmembrane
An autopsy of fouled membranes was con-ducted using attenuated total reflection-Fouriertransform spectroscopy (ATR-FTIR). The FTIR
spectra identified functional groups of organicmaterials depositing on the membrane surface.When a membrane was fouled, the FTIR peaks ofthe clean membrane were changed in absorbanceintensity, indicating the covering of the originalclean surface by functional groups of foulants.Fig. 7 illustrates the IR peaks of the PES mem-brane fouled compared to a new PES membrane.The membrane fouled with colloids (starch,CGTase, CDs and starch byproduct) exhibitedsignificant FTIR peak at wave numbers of 723,866, 1014, 1074, 1151, 1238, 1310, 1490 and1584 cm!1, indicating possible foulants such asproteins, polysaccharides, and/or amino sugars.
Fig. 8 shows the subtraction of FTIR spectrumof components in reaction mixture that fouled apolyethersulfone (PES) membrane (the PESmembrane spectrum has been digitally subtracted;the negative peaks near 1240, 1460 and1580 cm!1 were due to over subtraction of C-Ostretching bands, aliphatic C-H and COO- sym-metric stretching band, respectively). The stron-gest absorption band was observed at 1009 cm!1.Absorption in this region is due to C-O or Si-Obonds and is commonly associated with alcohols,ethers, polysaccharides, and silicates. As reportedby Cho et al. [21], FTIR absorption in this regionwas attributed to polysaccharides or poly-accharide-like membrane foulant, while theabsorption to silicate was attributed from sampleimpurities [24,25]. The further investigation ofother regions of spectrum could identify whetherthe foulant was polysaccharides or silicates. Poly-saccharides contain a significant number ofhydroxyl groups, which shows a broad roundedabsorption band in IR peak range 3100–3500 cm!1. As shown in Fig. 8, there was arounded absorption band at peak 3329 cm!1,which exhibited the foulants was polysaccharides.In addition, the peaks observed at 772 cm!1
(ethyl), 1128 cm!1 (tertiary alcohol), 1359 cm!1
(alkane), 1427 cm!1 (alkane) and 2928 cm!1
(alkane) exhibited the conformation of absorptionby polysaccharide. The absorption peak at

A.M. Mimi Sakinah et al. / Desalination 207 (2007) 227–242 235
Fig. 6. SEM micrograph of (a) new and (b) fouled PES membrane (magnification 5000×).
Fig. 7. ATR/FTIR spectra of new and fouled PES membranes.
2490 cm!1 correspond to -OH stretching byhydrogen bonded carboxylic acid, while the peakat 1088 cm!1 is probably due to ester. DifferentIR spectra from Fig. 9 show that the peak at2490 cm!1 is due to the IR spectrum of β-CD.
As discussed before, the major foulant of CDsseparation was polysaccharides. In theory, CDs,starch and starch byproduct were in a group ofpolysaccharides. Fig. 9 shows the comparison ofATR/FTIR spectra of tapioca starch powder,

A.M. Mimi Sakinah et al. / Desalination 207 (2007) 227–242236
Fig. 8. Subtraction ATR/FTIR spectra of foulant on PES membrane.
Fig. 9. ATR/FTIR spectra of raw tapioca starch and fouled membrane.
A.M. Mimi Sakinah et al. / Desalination 207 (2007) 227–242 237
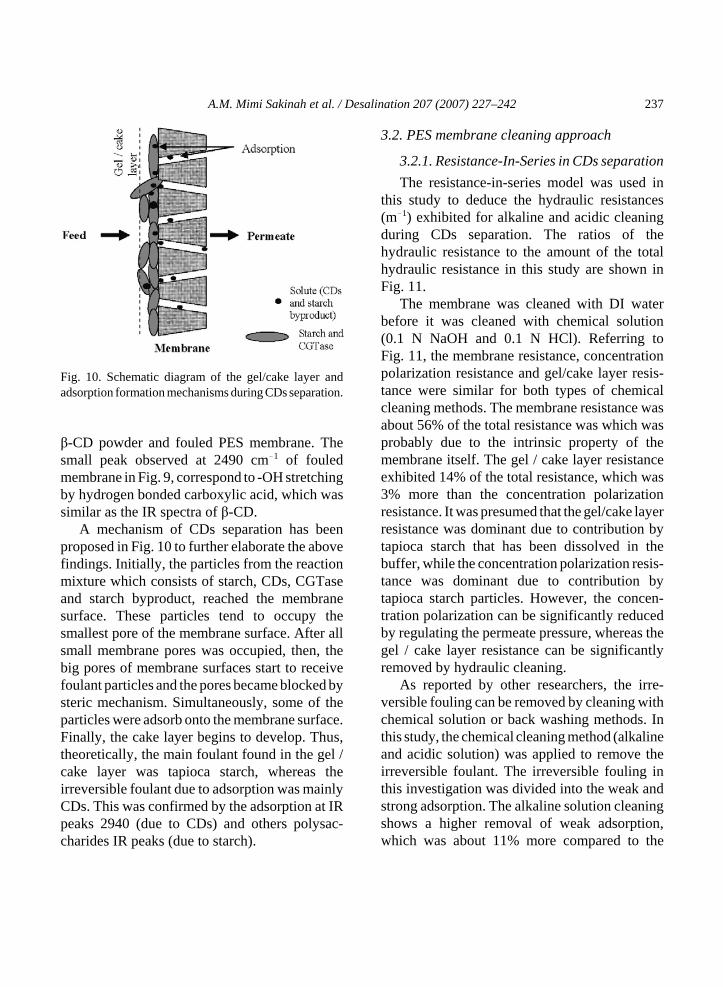
Fig. 10. Schematic diagram of the gel/cake layer andadsorption formation mechanisms during CDs separation.
β-CD powder and fouled PES membrane. Thesmall peak observed at 2490 cm!1 of fouledmembrane in Fig. 9, correspond to -OH stretchingby hydrogen bonded carboxylic acid, which wassimilar as the IR spectra of β-CD.
A mechanism of CDs separation has beenproposed in Fig. 10 to further elaborate the abovefindings. Initially, the particles from the reactionmixture which consists of starch, CDs, CGTaseand starch byproduct, reached the membranesurface. These particles tend to occupy thesmallest pore of the membrane surface. After allsmall membrane pores was occupied, then, thebig pores of membrane surfaces start to receivefoulant particles and the pores became blocked bysteric mechanism. Simultaneously, some of theparticles were adsorb onto the membrane surface.Finally, the cake layer begins to develop. Thus,theoretically, the main foulant found in the gel /cake layer was tapioca starch, whereas theirreversible foulant due to adsorption was mainlyCDs. This was confirmed by the adsorption at IRpeaks 2940 (due to CDs) and others polysac-charides IR peaks (due to starch).
3.2. PES membrane cleaning approach
3.2.1. Resistance-In-Series in CDs separationThe resistance-in-series model was used in
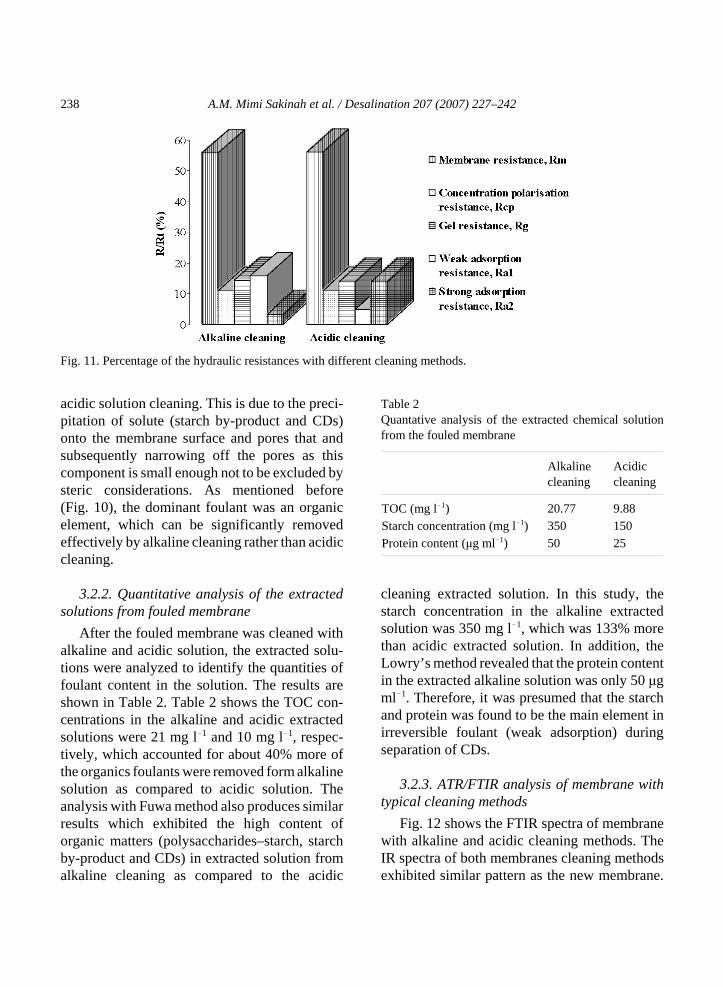
this study to deduce the hydraulic resistances(m!1) exhibited for alkaline and acidic cleaningduring CDs separation. The ratios of thehydraulic resistance to the amount of the totalhydraulic resistance in this study are shown inFig. 11.
The membrane was cleaned with DI waterbefore it was cleaned with chemical solution(0.1 N NaOH and 0.1 N HCl). Referring toFig. 11, the membrane resistance, concentrationpolarization resistance and gel/cake layer resis-tance were similar for both types of chemicalcleaning methods. The membrane resistance wasabout 56% of the total resistance was which wasprobably due to the intrinsic property of themembrane itself. The gel / cake layer resistanceexhibited 14% of the total resistance, which was3% more than the concentration polarizationresistance. It was presumed that the gel/cake layerresistance was dominant due to contribution bytapioca starch that has been dissolved in thebuffer, while the concentration polarization resis-tance was dominant due to contribution bytapioca starch particles. However, the concen-tration polarization can be significantly reducedby regulating the permeate pressure, whereas thegel / cake layer resistance can be significantlyremoved by hydraulic cleaning.
As reported by other researchers, the irre-versible fouling can be removed by cleaning withchemical solution or back washing methods. Inthis study, the chemical cleaning method (alkalineand acidic solution) was applied to remove theirreversible foulant. The irreversible fouling inthis investigation was divided into the weak andstrong adsorption. The alkaline solution cleaningshows a higher removal of weak adsorption,which was about 11% more compared to the
A.M. Mimi Sakinah et al. / Desalination 207 (2007) 227–242238
Fig. 11. Percentage of the hydraulic resistances with different cleaning methods.
acidic solution cleaning. This is due to the preci-pitation of solute (starch by-product and CDs)onto the membrane surface and pores that andsubsequently narrowing off the pores as thiscomponent is small enough not to be excluded bysteric considerations. As mentioned before(Fig. 10), the dominant foulant was an organicelement, which can be significantly removedeffectively by alkaline cleaning rather than acidiccleaning.
3.2.2. Quantitative analysis of the extractedsolutions from fouled membrane
After the fouled membrane was cleaned withalkaline and acidic solution, the extracted solu-tions were analyzed to identify the quantities offoulant content in the solution. The results areshown in Table 2. Table 2 shows the TOC con-centrations in the alkaline and acidic extractedsolutions were 21 mg l!1 and 10 mg l!1, respec-tively, which accounted for about 40% more ofthe organics foulants were removed form alkalinesolution as compared to acidic solution. Theanalysis with Fuwa method also produces similarresults which exhibited the high content oforganic matters (polysaccharides–starch, starchby-product and CDs) in extracted solution fromalkaline cleaning as compared to the acidic
Table 2Quantative analysis of the extracted chemical solutionfrom the fouled membrane
Alkalinecleaning
Acidiccleaning
TOC (mg l!1) 20.77 9.88Starch concentration (mg l!1) 350 150Protein content (μg ml!1) 50 25
cleaning extracted solution. In this study, thestarch concentration in the alkaline extractedsolution was 350 mg l!1, which was 133% morethan acidic extracted solution. In addition, theLowry’s method revealed that the protein contentin the extracted alkaline solution was only 50 μgml!1. Therefore, it was presumed that the starchand protein was found to be the main element inirreversible foulant (weak adsorption) duringseparation of CDs.
3.2.3. ATR/FTIR analysis of membrane withtypical cleaning methods
Fig. 12 shows the FTIR spectra of membranewith alkaline and acidic cleaning methods. TheIR spectra of both membranes cleaning methodsexhibited similar pattern as the new membrane.

A.M. Mimi Sakinah et al. / Desalination 207 (2007) 227–242 239
Fig. 12. ATR/FTIR spectra of membrane with typical cleaning methods.
Fig. 13. Subtraction ATR/FTIR spectra of foulant on PES membrane after cleaning with 0.1 N NaOH and 0.1 N HCl.
However, the membrane cleaned with alkalinesolution showed similar spectrum to the newmembrane as compared to the membrane cleanedwith acidic solution (especially the spectrum
intensity at peaks 1664, 1066, 1021, 840 and 710cm!1 of the membrane). Fig. 13 shows the IRspectra of foulant on PES membrane after chemi-cal cleaning. Based on Fig. 13, the membrane

A.M. Mimi Sakinah et al. / Desalination 207 (2007) 227–242240
cleaned with acidic solution (the PES membranespectrum has been digitally subtracted) has astrong absorption band at 1049 cm!1, which is a60% broader (area) compared to the membranecleaned with alkaline solution. Besides that,examination of the other regions of the spectrumcan further clarify whether the foulants on themembrane surface after alkaline cleaning was lessthan acidic cleaning. The foulant on the mem-brane surface of acidic solution has a peak area ofthe FTIR absorption at peaks 2490 and 1049 cm!1
which are 11% and 20% more than foulant on themembrane surface of alkaline cleaning, respec-tively. This result confirmed that the alkalinecleanings more effective compared to the acidiccleaning.
3.3. Flux recovery during the separation of CDs
The flux of the cleaned membrane wasmeasured through a filtration with DI water aftereach membrane cleaning step. The ratio of theflux (LMH) at room temperature of the cleanedmembrane to the new membrane flux (LMH) wasused to evaluate the flux recovery [26, 27], andthe results are shown in Fig. 14. Fig. 14 showsthat cleaning with DI water could recover themembrane flux by about 60%. The hydraulic
cleaning was found capable to clean the outmostand loose fouling layer of the fouled membranesurface.
In addition, the flux recovery for the cleanedmembrane by using 0.1 N HCl and 0.1 N NaOHsolution were about 65% and 95% respectively.Alkaline cleaning, compared to acidic cleaning,had an obvious effect on the recovery of themembrane flux. Moreover, alkaline cleaningresulted in an additional recovery of 5% of themembrane flux. As reported by other researchers,the alkaline solution was more effective inremoving the organic foulants both on the exter-ior and inner surfaces of the membrane. In thisstudy, the feed was rich in organic solutes (CDs,CGTase, maltose, glucose etc.). That is why thealkaline cleaning is more suitable in gaining theinitial flux.
4. Conclusions
Based on the results of this study, thefollowing conclusion can be made. C The higher operational TMP was found to
enhance the flux declination and help to reachthe steady state faster.
C Based on the steric condition, the reversiblefoulant was dominanted by starch and
Fig. 14. Percentage of the membrane flux recovery with different cleaning methods.

A.M. Mimi Sakinah et al. / Desalination 207 (2007) 227–242 241
CGTase, whereas the irreversible foulant werecoming from CDs and starch by-product.
C Starch, CDs and starch by-product (poly-saccharides) were found to be the majorfoulant in separation of CDs
C The major fouling mechanism in CDsseparation was the irreversible fouling, whichwas exhibiting 19% of total resistance.
C The gel/cake layer foulant contained of starchand its derivatives.
C The irreversible fouling (weak adsorption) canbe elevated by alkaline cleaning.
C The alkaline cleaning was 30% more effectivecompared to acidic cleaning.
C The maximum achievable flux recovery ofEMR for CDs separation was found to be95%.
References
[1] H.K. Sian, M. Said, O. Hassan, K. Kamaruddin, A.F.Ismail, R.A. Rahman, N.A.N. Mahmood and R.M.Illias, Purification and characterization of cyclo-dextrin glucanotransferase from alkalophilic Bacillussp. G1. Process Biochem., 40 (2005) 1101–1111.
[2] T.J. Kim, Y.D. Lee and H.S. Kim, Production ofcyclodextrins from unliquified cornstarch usingcyclodextrtin glucosyltransferase in a membranereactor. Ann. NY Acad. Sci., 672 (1992) 552–557.
[3] J. Szejtli, Introduction and general overview ofcyclodextrin chemistry. Chem Rev., 98 (1998) 1743–1753.
[4] B.N. Gawande, R.K. Singh, A.K. Chauhan, A. Goeland A.Y. Patkar, Optimisation of cyclomaltodextringlucanotransferase production from Bacillus firmus.Enzyme Microb. Technol., 22 (1998) 288–291.
[5] D.A. Volkova, S.A. Lopatin and V.P. Varlamov,One-step affinity purification of cyclodextrin glu-canotransferase from Bacillus sp. 1070. Biocatalysis-2000: Fundamentals & Applications. VestnikMoskovskogo Universiteta, Khimiya 41 (2002) 67–69.
[6] M.K. Mahat, R.M. Illias, R.A. Rahman, N.A.A.Rashid, N.A.N. Mahmood, O. Hassan, S.A. Aziz andK. Kamaruddin, Production of cyclodextrin glucano-
transferase (CGTase) from alkalophilic Bacillus sp.TS1-1: media optimization using experimentaldesign. Enzyme Microb. Technol., 35 (2004) 467–473.
[7] H.A. Ibrahim, W.A. Yusoff, A.A. Hamid, R.M.Illias, O. Hassan and O. Omar, Optimization ofmedium for the production of β-cyclodextringlucanotransferase using Central Composite Design(CCD). Process Biochem., 40 (2005) 753–758.
[8] A. Biwer, G. Antranikian and E. Heinzle, Enzymaticproduction of cyclodextrins. Appl. Microbiol. Bio-technol., 59 (2002) 609–617.
[9] J. Szejtli, Utilization of cyclodextrins in industrialproducts and processes. J. Mat. Sci., 7(4) (1997)575–587.
[10] T.J. Kim, Y.D. Lee and H.S. Kim, Enzymatic pro-duction of cyclodextrins from milled corn starch inan ultrafiltration membrane bioreactor. Biotech.Bioeng., 41 (1993) 88–94.
[11] K.H. Min, W.J. Chang and Y.M. Koo, Increasedproduction of β-cyclodextrin using an aqueous two-phase system. Biotechnol. Tech, 10 (1996) 395–400.
[12] L. Slominska, A. Szostek and A. Grzeskowiak,Studies on enzymatic continuous production ofcyclodextrins in an ultrafiltration membrane bio-reactor. Carbohydrate Polym., 50 (2002) 423–428.
[13] C. Lopez, I. Mielgo, M.T. Moreira, G. Feijoo andJ.M. Lema, Enzymatic membrane reactors for bio-degradation of recalcitrant com-pounds. Applicationto dye dedcolourisation. J. Biotechnol., 99 (2002)249–257.
[14] L. Giono and E. Drioli, Biocatalytic membranereactors: applications and perspectives. TrendsBiotechnol., 18 (2002) 339–349.
[15] D.M.F. Prazeres and J.M.S. Cabral, Enzymaticmembrane reactors. In: Cabral, J.M.S., Mota, M. andTramper, J. eds., Multiphase Bioreactor Design.Taylor & Francis, London, 2001, pp. 135–180.
[16] R.L. Ulibarri and G.M. Hall, Saccharification ofcassava flour starch in a hollow-fiber membranereactor. Enzyme Microbial Tech., 21 (1997) 398–404.
[17] A.F. Ismail and A.R. Hassan, The deduction of finestructural details of asymmetric nanofiltration mem-branes using theoretical models. J. Membr. Sci., 231(2004) 25–36.
[18] A.F. Ismail and P.Y. Lai, Development of defect-freeasymmetric polysulfone membranes for gas separa-

A.M. Mimi Sakinah et al. / Desalination 207 (2007) 227–242242
tion using response surface methodology. Sep. Purif.Technol., 40 (2004) 191–207.
[19] E. Katchalski-Katzir, Immobilized enzymes-learningfrom past successes and failures. Trends Biotechnol.,11 (1993) 471–478.
[20] A.F. Ismail, Novel studies of molecular orientation insynthetic polymeric membranes for gas separation.University of Strathclyde, Glasgow. Ph.D Thesis,1997.
[21] J. Cho, G. Amy and J. Pellegrino, Membrane filtra-tion of natural organic matter: factors and mechan-isms affecting rejection and flux decline withcharged ultrafiltration (UF) membrane. J. Membr.Sci., 164 (2000) 89–110.
[22] S. Astolfi-Filfo, E.V. Galembeck, J.B. Faria andA.C.S. Frascino, Stable yeast transformants thatsecrete functional α-amylase encoded by clonedmouse pancreatic cDNA. Biotechnology, 4 (1986)311–315.
[23] O.H. Lowry, N.J. Rosenbrough, A.L. Farr and R.J.Randall, Protein measurement with folin phenolreagent. J. Biol. Chem., 193 (1951) 265–275.
[24] E.M. Thurman, Organic Geochemistry of NaturalWaters, Martinus Nijhoff/Dr W. Junk Publishers,Boston, MA, 1995.
[25] K.J. Howe, K.P. Ishida and M.M. Clark, Use ofATR/FTIR spectrometry to study fouling of micro-filtration membranes by natural waters. Desalination,147 (2002) 251–255.
[26] L. Mo and X. Huang, Fouling characteristics andcleaning stratergies in a coagulation-microfiltrationcombination process for water purification. Desali-nation, 159 (2003) 1–9.
[27] A. Braghetta, J.G. Jacangelo, S. Chellam, M.L.Hotaling and B.A. Utne, DAF pretreatment: its effecton MF performance. J. AWWA, 89(10) (1997) 90–101.