
Construction of Chemical-Responsive Supramolecular Hydrogels from Guest-Modified Cyclodextrins
Upload
independentCategory
view
0download
0
lable at ScienceDirect
Polymer 50 (2009) 2926–2932
Contents lists avai
Polymer
journal homepage: www.elsevier .com/locate/polymer
Inclusion complexes containing poly(3-caprolactone)diol and cyclodextrins.Experimental and theoretical studies
Cesar Saldıas a, Ligia Gargallo a,*, Claudia Sandoval a, Angel Leiva a, Deodato Radic a, Julio Caballero b,Mario Saavedra b, Fernando D. Gonzalez-Nilo b
a Departamento de Quımica Fısica, Facultad de Quımica, Pontificia Universidad Catolica de Chile, Casilla 302, Correo 22, Santiago, Chileb Centro de Bioinformatica y Simulacion Molecular, Universidad de Talca, 2 Norte 685, Casilla 721, Talca, Chile
a r t i c l e i n f o
Article history:Received 9 December 2008Received in revised form31 March 2009Accepted 9 April 2009Available online 3 May 2009
Keywords:Inclusion complexesSurface pression-area isothermMolecular dynamic simulation
* Corresponding author. Tel.: þ56 2 6864748; fax:E-mail address: [email protected] (L. Gargallo).
0032-3861/$ – see front matter � 2009 Elsevier Ltd.doi:10.1016/j.polymer.2009.04.044
a b s t r a c t
Inclusion complexes (ICs) between poly(3-caprolactone)diol (PEC) with a-cyclodextrin (a-CD) (a-CD–PEC) and g-cyclodextrin (g-CD) (g-CD–PEC) were prepared and characterized by FT-IR, 1H NMR, ther-mogravimetry, surface activity and wettability measurements. The thermal stabilities of the inclusioncomplexes are very similar. The thermal stability of PEC is better than ICs and CDs. Stable monolayers ofPEC and a-CD–PEC and g-CD–PEC complexes have been obtained at the air–water interface using theLangmuir Technique. The surface pressure–area isotherms (p–A) were found to be of different types,depending on the CD utilized. From the surface free energy values of PEC and ICs it was possible toconclude that ICs are more hydrophobic than cyclodextrins. PEC is the most hydrophobic. The surfaceparameters the minimum area A0, the critical surface pressure pc, and static elasticity 30 were alsoestimated for ICs and PEC. In order to describe the experimental results, molecular dynamic simulation(MDS) was performed. In addition, the physical properties that stabilize CD–CD, CD–polymer and CD–solvent interactions were elucidated by MDS. Theoretical results have demonstrated that complexes arestabilized by hydrophobic interactions between the cavity of CDs and the –(CH2)5-units of PEC, and alsoby hydrogen-bond formation between the hydroxyl groups situated along the rim of CD moleculesthreaded onto the PEC chain. CD–CD hydrogen-bond formation is maximized in 1:2 g-CD–PEC complexand 1:1 a-CD–PEC complexes.
� 2009 Elsevier Ltd. All rights reserved.
1. Introduction
Cyclodextrins are cyclic oligosaccharides consisting of six (a-CD), seven (b-CD), eight (g-CD), and more glucose units linked by a-1,4 bonds. They form inclusion complexes (ICs) with a wide range oflow molecular weight compounds which have been prepared andcharacterized, it have been also reported ICs formation with variouspolymers [1,2], such as poly(ethylene glycol) (PEG), poly(propyleneglycol) (PPG), poly(methyl vinyl ether) (PMVE) and poly(ethyleneoxide) (PEO) [3–5]. Most of the polymers considered for thispurpose are stable and is very difficult that they were used asbiodegradable polymers. In the polymer field, biodegradablepolymers have been studied extensively thinking in their contri-bution towards the formation of the complexes involves thethreading of the CD along the polymeric chain. This process isdriven by non-covalent attractive forces, therefore allowing the CDto slide along the polymeric backbone [6]. The formation of IC is
þ56 2 6864744.
All rights reserved.
entropically unfavorable; therefore, the linear polymeric chainmust fit into several CDs units to produce the final IC. The complexis thought to be promoted by hydrophobic interactions betweenthe cavity of a-CD and the methylene units of PEC and also byhydrogen-bond formed between the hydroxyl groups situatedalong the rim of CD molecules threaded onto the PEC chain.
Inclusion complexes formation between a- and g-CD with PEC,have been widely studied by Tonelli et al. [7–9]. Studies about thecharacterization using 1H NMR and FT-IR spectroscopy, DSC andX-ray diffraction have been done [10,11]. These results have showedthat the complexes are formed and no free crystalline PEC remainsin the sample.
Because IC can be used for drug release and they can be presentat biological interfaces, it is interesting and necessary to know thesurface activity of these supramolecular systems and their surfacefree energies. The structural organization of IC should presenta different behavior at the air–water interface in comparison totheir respective precursor polymer. The determination of thesurface free energy of the complexes is also of interest in differentfields. The surface activity of the a-CD–PEC and g-CD–PEC

Fig. 1. Structures of a-cyclodextrin, 3-caprolactone and g-cyclodextrin.
C. Saldıas et al. / Polymer 50 (2009) 2926–2932 2927
complexes seems to have not been studied in comparative terms.This work is also focused on the driving force formation of ICcontaining a-CD, g-CD and PEC, using theoretical tools.
2. Experimental section
2.1. Materials
a-CD and g-CD (Sigma–Aldrich) and PEC-diol of Mw¼ 2000,were used as received. All solvents used were analytical grade.Water was purified by a Mili-Q-system.
2.2. Methods
2.2.1. Preparation of inclusion complexesICs were prepared following the procedure reported by Harada
et al. [12], 20 mg of PEC was put into tubes heated above themelting temperature and satured aqueous solution of CD (a-CD1.8� 10�4 mmol in 1,2 mL and g-CD 1.1�10�4 mmol in 0,6 mL) wasadded. The heterogeneous mixtures were ultrasonically agitated for10 min on heating and then allowed to stand overnight at roomtemperature. The mixture became turbid and the complexes wereobtained as white crystalline precipitates. They were collected bycentrifugation, dried in a vacuum oven at 373 K, washed with waterand dried under vacuum and then washed with THF and finallydried under vacuum. ICs were obtained as white powder.
The solubility of CDs and PEC in different solvents was deter-mined at room temperature.
2.3. Spectroscopic characterization
2.3.1. Fourier transform infrared measurementsInfrared spectra of ICs were recorded on a Vector 22 Bruker TM
FT-IR spectrophotometer. Samples were prepared directly in KBrpellets. The spectra were recorded with a resolution of 1 cm�1, and128 scans were accumulated. The spectra were analyzed throughthe computer system of the instrument.
2.3.2. Nuclear magnetic resonance (1H NMR)1H NMR spectra of ICs were run on a Brucker AM 400 MHz
spectrometer at room temperature in CDCl3. TMS was used asinternal standard.
2.4. Thermogravimetric and DSC measurements
Dynamic thermogravimetric measurements were performedusing a Mettler TGA/SDTA 851e thermobalance. The thermogravi-metric results were processed by the Mettler calorimetric systemusing the STARe program. Samples were heated in Al2O3 pans.Measurements were carried out between 300 K and 1000 K at20� min�1 under N2.
The calorimetric measurements DSC reported were carried outat a 20 K/min heating rate in a Mettler 821 calorimetric system,using Starte program system; the temperature scale was calibratedusing indium. The typical amount of sample used was 20 mg.
2.5. Wettability measurement (contact angle)
The contact angle (CA) was determined by means of the tech-nique of the sesil drop using a Dataphysics OCA 20. A syringe,connected to a capillary of Teflon of around 2 mm of internaldiameter, was used to provide the liquid and to deposit the drop onthe film. Measurements were done at room temperature and withliquids whose surface tensions are well known (diiodomethane andbromonaphthalene) [12,13]. This allows to determine the surface
free energy and the dispersion and polar contributions by means ofthe Owens, Wendt and Kaelble method [14,15].
2.6. Surface pressure–area isotherms (p–A)
The surface pressure–area isotherms for a-CD–PEC, g-CD–PECcomplexes and PEC were studied using the Langmuir Technique.The surface pressure–area isotherms (p–A) were performed witha surface balance of Langmuir Nima 611 at 298 K. The compressionvelocity was 10 cm2/min. The subphase was water purified bya Mili-Q-system (18 M U cm). CHCl3 and DMF were used asspreading solvents. Due to solubility reasons a binary spreadingsolvent DMF/CHCl3 was also used at different ratios (v/v).
2.7. Molecular models
The structure of PEC containing eight monomers was con-structed using Sybyl (Tripos, Inc., St. Louis, MO). The starting a-CDand g-CD structures were taken from Protein Data Bank (PDB entry1CXF for a-CD and 1D3C for g-CD). These structures were fullyminimized (CHARMM27 carbohydrate parameters were employed)and good agreement with the experimental geometry wasobtained. Parameters for poly(3-caprolactone) were adapted byanalogy from others included in the CHARMM27 force field [16].Optimized CDs and a monomer of PEC are shown in Fig. 1.
Three models were built for studying CD–polymer complexes byMDS:
PECþ 8 a-CDs (PEC–8 a-CD)PECþ 8 g-CDs (PEC–8 g-CD)2 PECþ 8 g-CDs (2 PEC–8 g-CD)
Models contain head-to-head and tail-to-tail orientation for allCDs. The ends of PEC were protected with phenyl substituents(Fig. 2A). For hydration of each model, a water box confined byperiodic boundary conditions was added to the simulation systems.The water boxes for each model were generated by adding 20 Åfrom the last atom outward in all possible directions.
Three additional models were built for studying the complexformation by steered molecular dynamics (SMD):
PECþ a-CD (PEC–a-CD)PECþ g-CD (PEC–g-CD)2 PECþ g-CD (2 PEC–g-CD)
These models are represented in Fig. 2B. The polymer wasoriented with its principal axis aligned with the z-axis. In thesemodels, water boxes ensure the whole surface of the complex to becovered along the trajectory through the z-axis.
2.8. Molecular dynamic simulations
Explicit solvent MDS were carried out for studying the structuralfeatures of the CD–PEC complexes. All MDS were carried out using

Fig. 2. Models for molecular dynamic simulations. a) MD and b) SMD.
C. Saldıas et al. / Polymer 50 (2009) 2926–29322928
the parallel MD program NAMD2 [17] and the CHARMM27 forcefield. Simulations were performed in the NPT ensemble; the non-bonded Coulomb and van der Waals interactions were calculatedwith a cut-off using a switching function starting at a distance of10 Å and reaching zero at 12 Å. The TIP3P water model wasemployed for the solvent [18]. Periodic boundary conditions wereapplied with a flexible cell. The particle mesh Ewald (PME) method[19] was employed for computation of electrostatic forces. Anintegration time step of 1 fs was assumed, permitting a multipletime-stepping algorithm [20] to be employed in which interactionsinvolving covalent bonds were updated every time step. In allsimulations, Langevin dynamics were utilized to keep a constanttemperature of 298 K; likewise, the hybrid Nose-Hoover Langevinpiston method was used to control a constant pressure of 1 atm[21].
The system was first equilibrated for 1 ns. The first and the lastoxygen atoms of the first and the eighth monomers of PECrespectively were restrained with a 0.5 kcal/mol/Å2 spring constantduring relaxation. The outputs of the equilibrated phase were usedas inputs for the main simulations. Then, simulations of 2.5 ns wereperformed without any constraints. All calculations were per-formed on a processors SGI Origin 300 server.
2.9. Steered molecular dynamics
MDS have been applied to CD–polymer complexes in severalreports [22–27]. However, SMD simulations have not been used yetfor studying these systems. Quite recently, SMD was used toinvestigate the energetic properties of formation of the inclusioncomplex between progesterone and b-CD [28]. In this report, themovement of the guest molecule through the b-CD’s interior wasadequately characterized.
To simulate the a-CD–PEC and g-CD–PEC formations, externalforces along the z-axis were applied to all atoms of CDs (modelsPEC–a-CD, PEC–g-CD, and 2 PEC–g-CD). The first and the lastoxygen atoms of the first and the eighth monomers of PECrespectively were restrained with a 0.5 kcal/mol/Å2 spring constantduring this process. In each simulation, the pulling velocity was10 Å/ns, slower than those used in some previous SMD studies inbiological systems [29–31]. During each SMD trajectory, the force
was only applied along the pulling direction. CDs were free fromconstraint in the plane perpendicular to the pulling direction. Thetrajectories were saved for every 5 ps, and steering forces wererecorded for every 0.5 ps. Each trajectory was repeated for fourtimes.
3. Results and discussion
3.1. Spectroscopic characterization
The characterization of the inclusion complexes with PEC wasdone using FT-IR and 1H NMR spectroscopy. The ICs formed for a-CD and g-CD with PEC, have been previously characterized by thesetechniques [9]. The host–guest stoichiometric ratios are 1:1 forPEC–a-CD IC and 2:1 for PEC–g-CD IC, this observation has beenreported in previous works [7–9,32]. The spectra obtained indicatethat the complexes are formed and they were in agreement withthose obtained by Tonelli and Harada [33].
3.2. Solubility
PEC and CDs are soluble in chloroform and water respectively.ICs are not soluble in chloroform neither in water but are soluble inDMF and also DMSO. PEC, a-CD–PEC and g-CD–PEC do not havea common solvent, for this reason a spreading binary solvent DMF/CHCl3 (v/v) was used to obtain a suitable spreading solvent to use inthe Langmuir technique. The spreading solvent must be immisciblewith water and volatile.
3.3. Thermal analysis
In order to know the thermal properties of the a-CD, g-CD, andICs a thermal analysis was performed. From the degradationprofiles it was determined the temperatures of initial thermaldecomposition TID and the temperature to which a 50% of lossweight is registered T50, for PEC, a-CD and the corresponding ICs.Fig. 3 shows the thermogravimetric curves for PEC, a-CD–PEC andg-CD–PEC complexes, a-CD and g-CD represented as the firstderivative of the weight loss with temperature (dm/dT). This kind ofrepresentation is a better way to enhance the thermogravimetric

200 400 600 800
-0.15
-0.10
-0.05
0.00
dm
/d
T
Temperature (°C)
IC: γ-CD-PECIC: α-CD-PECPEC α-CDγ-CD
Fig. 3. First derivative of the weight loss of the thermogravimetric profiles dm/dTagainst temperature: a-CD–PEC and g-CD–PEC complexes, PEC and a-CD and g-CD.
0 50 100 150 200 250 300
2
4
6
8
10
12
14
16
18
20
Su
rface P
ressu
re (m
N m
-1)
Area (A2 ru
-1)
(a)
(b)
(c)
Fig. 4. Surface pressure–area isotherms for a) g-CD–PEC, b) PEC and c) a-CD–PEC.
C. Saldıas et al. / Polymer 50 (2009) 2926–2932 2929
behavior to observe the degradation temperature than thediagrams of pure weight loss versus temperature. The thermalstability of ICs of a-CD–PEC or g-CD–PEC is very similar. The mainobservation on these systems is that decomposition of PEC takesplace at higher temperatures than those for the degradation of theCDs (a or g).
These thermogravimetric profiles follow a single one-stagedecomposition process for pure compounds (polymers and CDs).However, for ICs two stage decomposition profiles are found, onecorresponds to the decomposition of CDs and the other to PECdecomposition.
In order to provide some characterization of the physicalstructures of the Langmuir layers, it was estimated the crystallinitydegree of the samples of g-CD, PEC and IC (g-CD–PEC).
It was observed that the crystallinity degree of PEC decreasesfrom 10% to 1%, when this polymer is incorporated inside the g-CD.From this preliminary result it is possible to conclude that thesingle or double threaded PEC chains should be in the form ofsomewhat flexible pseudo-rotaxane without crystallinity. Furtherworks are in progress about this aspect. It is important to considerthat this behavior is in solid state in 3D. However, this situation wasextrapolated to a pseudo-solid state (2D) of the monolayer at highpression and low surface area.
3.4. Surface energy
To get information about the degree of hydrophobicity of ICs, PEC,a-CD and g-CD, the total surface free energy (SE) was estimated bymeasurement of contact angles (CAs) of bromonaphthalene and
Table 1Static contact angle (CA), total surface energy (SE), dispersion force (gD), and polarcontribution (gP) of a-CD–PEC complex, g-CD–PEC complex, a-CD, g-CD and PEC.
Systems Contact angleCA (degrees) a
Contact angleCA (degrees) b
SE (mN m�1) gD mN m�1) gP (mN m�1)
g-CD–PEC 46.1� 0.6 27.2� 0.7 40.0� 0.4 39.6� 0.4 0.4� 0.4a-CD–PEC 42.6� 0.5 32.7� 0.8 38.2� 0.7 37.6� 0.7 0.5� 0.7a-CD 48.7� 0.7 21.2� 1.1 44.5� 0.9 41.5� 0.9 3.1� 0.9g-CD 48.4� 0.7 15.7� 0.9 47.3� 0.8 42.8� 0.8 4.5� 0.8PEC 48.3� 0.4 43.4� 0.6 34.7� 0.5 33.1� 0.5 1.6� 0.5
a From diiodomethane.b From bromonaphthalene.
diiodomethane on the system surfaces. The dispersion force andpolar contributions to SE, gD and gP, respectively, were calculated byusing the Owens and Wendt and Kaelble methods [14,15]. Themeasurements of CA on a given system solid surface is one of themost practical ways to obtain surface free energies. Table 1summarizes the results obtained by wettability measurements forthe systems studied. From the SE values in Table 1 for ICs, PEC andCDs it can be concluded that the complexes present a degree ofhydrophobicity higher than PEC, a-CD and g-CD. PEC is the mosthydrophobic.
The influence of the type of CD used to form the ICs was alsostudied. The IC of g-CD–PEC is less hydrophobic than IC of a-CD–PEC for the same molecular weight of PEC. These results areconsequent because g-CD possesses more hydroxyl groups incomparison to a-CD. This situation confers it a more hydrophiliccharacter to IC of g-CD–PEC, although it is balanced by the twopolymeric chains of PEC in their cavity.
3.5. Surface pressure-area isotherms
Surface area isotherms recorded for spread IC monolayers a-CD–PEC and g-CD–PEC and PEC are presented in Fig. 4. a-CD and g-CDdo not present surface activity. The obtained isotherms are of twotypes, g-CD–PEC (a) is the expanded type [34] i.e. surface pressureincreases gradually upon monolayer compression and thecompressibility is higher than a-CD–PEC (c). The PEC isotherm is ofthe condensed type (b). Table 2 summarizes the main surfaceparameters for the ICs and PEC. In Fig. 4 the surface pressureisotherms for IC of a-CD–PEC and PEC are of the condensed type,whereas the surface pressure isotherm for IC of g-CD–PEC showsone isotherm of the expanded type. The explanation for thisparticular behavior could be the presence of two PEC chains insideof g-CD. From Table 2 it is possible to observe that the minimum
Table 2Minimum area A0 per repeating unit (ru) values and collapse pressure pc values forsurface pressure isotherms of ICs: a-CD–PEC and g-CD–PEC and PEC.
System A02 ru�1� 2 at p¼ 0 pc (mNm�1)
a-CD–PEC 50 14.4g-CD–PEC 175 15.3PEC 66 18.1
2 4 6 8 10 12 14 16 180
2
4
6
8
10
12
14
16
IC: γ-CD-PECIC: α-CD-PEC
ε 0 (m
N m
-1)
Γ (mg m-2
)
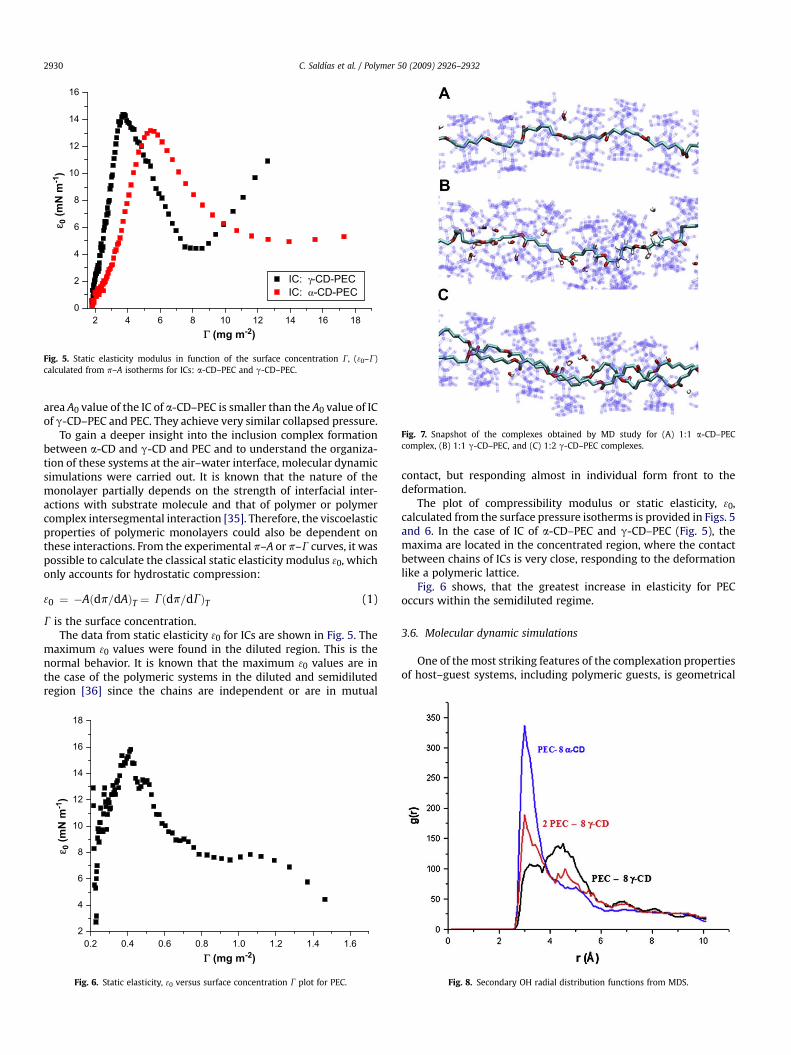
Fig. 5. Static elasticity modulus in function of the surface concentration G, (30–G)calculated from p–A isotherms for ICs: a-CD–PEC and g-CD–PEC.
Fig. 7. Snapshot of the complexes obtained by MD study for (A) 1:1 a-CD–PECcomplex, (B) 1:1 g-CD–PEC, and (C) 1:2 g-CD–PEC complexes.
C. Saldıas et al. / Polymer 50 (2009) 2926–29322930
area A0 value of the IC of a-CD–PEC is smaller than the A0 value of ICof g-CD–PEC and PEC. They achieve very similar collapsed pressure.
To gain a deeper insight into the inclusion complex formationbetween a-CD and g-CD and PEC and to understand the organiza-tion of these systems at the air–water interface, molecular dynamicsimulations were carried out. It is known that the nature of themonolayer partially depends on the strength of interfacial inter-actions with substrate molecule and that of polymer or polymercomplex intersegmental interaction [35]. Therefore, the viscoelasticproperties of polymeric monolayers could also be dependent onthese interactions. From the experimental p–A or p–G curves, it waspossible to calculate the classical static elasticity modulus 30, whichonly accounts for hydrostatic compression:
30 ¼ �Aðdp=dAÞT ¼ Gðdp=dGÞT (1)
G is the surface concentration.The data from static elasticity 30 for ICs are shown in Fig. 5. The
maximum 30 values were found in the diluted region. This is thenormal behavior. It is known that the maximum 30 values are inthe case of the polymeric systems in the diluted and semidilutedregion [36] since the chains are independent or are in mutual
0.2 0.4 0.6 0.8 1.0 1.2 1.4 1.62
4
6
8
10
12
14
16
18
ε 0 (m
N m
-1)
Γ (mg m-2
)
Fig. 6. Static elasticity, 30 versus surface concentration G plot for PEC.
contact, but responding almost in individual form front to thedeformation.
The plot of compressibility modulus or static elasticity, 30,calculated from the surface pressure isotherms is provided in Figs. 5and 6. In the case of IC of a-CD–PEC and g-CD–PEC (Fig. 5), themaxima are located in the concentrated region, where the contactbetween chains of ICs is very close, responding to the deformationlike a polymeric lattice.
Fig. 6 shows, that the greatest increase in elasticity for PECoccurs within the semidiluted regime.
3.6. Molecular dynamic simulations
One of the most striking features of the complexation propertiesof host–guest systems, including polymeric guests, is geometrical
Fig. 8. Secondary OH radial distribution functions from MDS.

Fig. 9. Force profiles in pulling CDs for (A) 1:1 a-CD–PEC complex, (B) 1:1 g-CD–PEC, and (C) 1:2 g-CD–PEC complexes.
C. Saldıas et al. / Polymer 50 (2009) 2926–2932 2931
complementarity between the diameter of the inner CD cavitiesand cross-sectional diameters of the polymer chain. In this sense,the underlying assumption in this study is that the structuralfeatures of the 1:2 g-CD–PEC complex are similar to those with 1:1a-CD–PEC. An important property of polymer–CD inclusioncomplexes is the strict regularity in the arrangement of CDs alongthe chain that favors the formation of crystalline compounds.Head-to-head and tail-to-tail arrangement of successive CDs in thecomplex favor intermolecular H-bonding between CD units.
Fig. 7 shows the most probable conformations of the inclusioncomplexes in water according to MDS. The MD trajectory of thecomplexes confirms that each CD includes one monomer and H-
bonds contribute to maintain the head-to-head and tail-to-tailarrangement. In 1:1 a-CD–PEC and 1:2 g-CD–PEC complexes(Fig. 7A and C), the accommodation of the guest inside the cavityoptimizes these H-bond interactions. However, in the 1:1 g-CD–PEC complex, CDs cannot keep the head-to-head and tail-to-tailarrangement since there is a space between the host and guest, andCDs bend down to optimize van der Waals interactions. In addition,this disarrangement causes some water molecules to fill thesespaces (Fig. 7B).
In the 1:1 g-CD–PEC complex, the accommodation of the guestinside the cavity reduces the number of H-bonds. To seek suchinformation the Radial Distribution Function (RDF) was calculated.

C. Saldıas et al. / Polymer 50 (2009) 2926–29322932
The RDF was established between secondary OH of neighbouringcyclodextrins. Fig. 8 shows the radial distribution functions derivedfrom MDS. The plot for a-CD–PEC complex shows a sharp peakcentered at 3.0 Å. This unique peak indicates that OHs are welldistributed in a head-to-head arrangement. The plot for 1:2 g-CD–PEC complex shows the same sharp peak centered at 3.0 Å, buta less intense broad peak appears above 4 Å. This broad peak occurswhen CDs bend down to optimize van der Waals interactions.Finally, the plot for the 1:1 g-CD–PEC complex shows the samepeaks, but the broad peak above 4 Å is more intense. In this sense,our MD study suggests that the head-to-head arrangement is notstable for this complex.
3.7. Steered molecular dynamics
Fig. 9 shows force profiles for pulling a-CD surrounding the PECchain (model PEC–a-CD), and g-CD surrounding one and two PECchains (models PEC–g-CD and 2 PEC–g-CD). The forces fluctuate,indicating that the thermal fluctuation of CDs is larger than theperturbation from the pulling force. The process is therefore nearequilibrium. In general, increased force appears when the polymerencounters stability due to van der Waals interactions with the CDcavity. The system must pass over an energy barrier while breakingthis interaction, but the force decreases as the guest leaves thisenergy barrier (Fig. 9A). According to this, the inclusion of PECinside the CD should occur in small steps where the guest isstabilized in each step. During the movement of the CDssurrounding the PEC chain, van der Waals interactions are estab-lished between each monomer and the hydrophobic interior of thehost, while CD’s hydroxyls interact with carbonyl groups of PECforming H-bonds. Stable conformations optimize these interac-tions; therefore, in each step CD includes a PEC’s monomer, and thetransition from the previous to the following monomer requirespassing an energy barrier. Force profiles for a-CD surrounding thePEC chain and g-CD surrounding two PEC chains reiterate a patterndue to this process (Fig. 9A and C); however, in the force profile forg-CD surrounding one PEC chain this pattern was not observed(Fig. 9B). Due to this, it can be concluded that the complex betweeng-CD and one PEC is not favored, since interactions betweena monomer and the hydrophobic cavity of g-CD are not optimal. Onthe other hand, these interactions are well established when onePEC chain is included inside of a a-CD, and a similar behavior can befound when two PEC chains are included inside of a g-CD.
4. Conclusions
The Inclusion Complexes (ICs) between poly(3-caprolactone)(PEC) and a-cyclodextrin (a-CD) and g-cyclodextrin (g-CD) wereprepared. ICs were analyzed by thermal analysis, DSC, surfaceactivity at the air–water interface and wettability measurements.Molecular Dynamic Simulation (MDS) was also performed. The PECshows a thermal stability greater than the a-CD–PEC complex,g-CD–PEC complex and a-CD and g-CD. PEC and ICs form stablemonolayers at the air–water interface. CDs do not present surfaceactivity. The surface pressure–area isotherms (p–A) are stronglyinfluenced by the nature of the cyclodextrin used. The p–A
isotherms of IC with a-CD are the condensed type and the IC withg-CD shows an expanded type isotherm. The surface free energy(SE) values and the MDS studies, show that PEC is more hydro-phobic than the respective ICs, a-CD–PEC and that g-CD–PEC. CDsare less hydrophobic than ICs and PEC. Finally, MDS providedinformation about the specific interactions that favor the formationof 1:2 g-CD–PEC and 1:1 a-CD–PEC.
Acknowledgements
Acknowledgement is made to Fondo Nacional de Ciencia yTecnologia (Fondecyt) Grants 1050956, 1080026 and 1080007 forpartial support of this research. C. Sandoval thank Fondecyt forpostdoctoral Grant 3080065. C. Saldias thank Conicyt for doctoralfellowship. J. Caballero, M. Saavedra and F. Gonzalez-Nilo thankPrograma Bicentenario de Ciencia y Tecnologıa, ACT/24.
References
[1] Saenger W. Angew Chem Int Ed Engl 1980;19:344;Schardmger F. Wien Klin Wochenschr 1904;17:207.
[2] Harada A, Kamachi M. Macromolecules 1990;23:2821.[3] Kawaguchi Y, Nishiyama T, Okada M, Karachi M, Harada A. Macromolecules
2000;33:4472.[4] Michishita T, Takashima Y, Harada A. Macromol Rapid Commun 2004;25:
1159.[5] Ceccato M, Lo Nostro P, Baglioni P. Langmuir 1997;13:2436.[6] Kawaguchi Y, Nishiyama T, Okada M, Karachi M, Harada A. Macromolecules
2000;33:4472.[7] Lu J, Mirau P, Tonelly A. Macromolecules 2001;34:3276.[8] Rusa C, Luca C, Tonelly A. Macromolecules 2001;34:1318.[9] Rusa C, Fox J, Tonelli A. Macromolecules 2003;36:2742.
[10] Huang L, Ellen E, Tonelli A. Polymer 1998;23:4857.[11] Tonelli A, Lu J, Shin L, Mirau P. Am Chem Soc 2000;82:163.[12] Ma K, Chung T, Good R. J Polym Sci B 1998;36:2327.[13] Gargallo L, Vargas D, Leiva A, Radic’ D. J Colloid Interface Sci 2006;301:607.[14] Owens DK, Wendt RC. Appl Polym Sci 1969;13:1741.[15] Kaelble DH. J Adhesion 1970;2:50.[16] Kuttel M, Brady JW, Naidoo KJ. J Comput Chem 2002;23:1236.[17] Kale L, Skeel R, Bhandarkar M, Brunner R, Gursoy A, Krawetz N, et al. J Comput
Phys 1999;151:283.[18] Jorgensen WL, Chandrasekhar J, Madura JD, Impey RW, Klein ML. J Chem Phys
1983;79:926.[19] Darden T, York D, Pedersen L. J Chem Phys 1993;98:10089.[20] Grubmuller H, Heller H, Windemuth A, Schulten K. Mol Simul 1991;6:121.[21] Izrailev S, Stepaniants S, Balsera M, Oono Y, Schulten K. Biophys J 1997;
72:1568.[22] Pozuelo J, Mendicuti F, Mattice WL. Macromolecules 1997;30:3685.[23] Pozuelo J, Mendicuti F, Mattice WL. Polym J 1998;30:479.[24] Pozuelo J, Mendicuti F, Saiz E. Polymer 2002;43:523.[25] Mayer B, Klein CT, Topchieva IN, Kohler G. J Comput Aided Mol Des 1999;
13:373.[26] Paik Y, Poliks B, Rusa CC, Tonelli AE, Schaefer J. J Polym Sci Part B Polym Phys
2007;45:1271.[27] Yu Y, Cai W, Chipot C, Sun T, Shao X. J Phys Chem B 2008;112:5268.[28] Caballero J, Zamora C, Aguayo D, Yanez C, Gonzalez-Nilo FD. J Phys Chem B
2008;112:10194.[29] Kosztin D, Izrailev S, Schulten K. Biophys J 1999;76:188.[30] Zhang D, Gullingsrud J, McCammon JA. J Am Chem Soc 2006;128:3019.[31] Dordunoo SK, Burt M. Int J Pharm 1996;133:191.[32] Rusa C, Tonelli A. Macromolecules 2000;33:5321.[33] Harada A, Kawaguchi Y, Nishiyama T, Kamachi MU. Macromol Rapid Commun
1997;18:535.[34] Crisp DJ. J Colloid Sci 1946;49:161.[35] Leiva A, Urzua M, Gargallo L, Radic’ D. J Colloid Interface Sci 2006;299:70.[36] Monroy F, Ortega F, Rubio RG. Eur Phys J 2000;B13:745.
Copyright © 2022 FDOKUMEN


![Exposure to benzo[a]pyrene of Hepatic Cytochrome P450 Reductase Null (HRN) and P450 Reductase Conditional Null (RCN) mice: Detection of benzo[a]pyrene diol epoxide-DNA adducts by immunohistochemistry](https://static.fdokumen.com/doc/165x107/63259f17c9c7f5721c022d3b/exposure-to-benzoapyrene-of-hepatic-cytochrome-p450-reductase-null-hrn-and-p450.jpg)


![Influence of C-5 substituted cytosine and related nucleoside analogs on the formation of benzo[a]pyrene diol epoxide-dG adducts at CG base pairs of DNA](https://static.fdokumen.com/doc/165x107/6324883058da543341065147/influence-of-c-5-substituted-cytosine-and-related-nucleoside-analogs-on-the-formation.jpg)
![Excited-State Diproton Transfer in [2, 2′-Bipyridyl]-3, 3′-diol: the Mechanism Is Sequential, Not Concerted](https://static.fdokumen.com/doc/165x107/6332daff5f7e75f94e094ac2/excited-state-diproton-transfer-in-2-2-bipyridyl-3-3-diol-the-mechanism.jpg)