Defining and assessing understandings of evidence with the ...

ORIGINAL RESEARCH ARTICLEpublished: 11 November 2014
doi: 10.3389/fnmol.2014.00087
Defining the nociceptor transcriptomeMatthew Thakur1*†, Megan Crow1†, Natalie Richards1†, Gareth I. J. Davey1, Emma Levine1,
Jayne H. Kelleher1, Chibeza C. Agley2, Franziska Denk1, Stephen D. R. Harridge2 and
Stephen B. McMahon1
1 Wolfson Centre for Age-Related Diseases, King’s College London, London, UK2 Centre of Human and Aerospace Physiological Sciences, King’s College London, London, UK
Edited by:
Bernard Attali, Tel Aviv University,Israel
Reviewed by:
Terrance P. Snutch, The University ofBritish Columbia, CanadaNikita Gamper, University of Leeds,UK
*Correspondence:
Matthew Thakur, Wolfson Centre forAge-Related Diseases, King’sCollege London, Guy’s Campus,London SE1 1UL, UKe-mail: [email protected]
†These authors have contributedequally to this work.
Unbiased “omics” techniques, such as next generation RNA-sequencing, can provideentirely novel insights into biological systems. However, cellular heterogeneity presentsa significant barrier to analysis and interpretation of these datasets. The neurons ofthe dorsal root ganglia (DRG) are an important model for studies of neuronal injury,regeneration and pain. The majority of investigators utilize a dissociated preparation ofwhole ganglia when studying cellular and molecular function. We demonstrate that thestandard methods for producing these preparations gives a 10%-neuronal mixture of cells,with the remainder of cells constituting satellite glia and other non-neuronal cell types.Using a novel application of magnetic purification, we consistently obtain over 95% pure,viable neurons from adult tissue, significantly enriched for small diameter nociceptorsexpressing the voltage gated ion channel Nav1.8. Using genome-wide RNA-sequencingwe compare the currently used (10% neuronal) and pure (95% nociceptor) preparationsand find 920 genes enriched. This gives an unprecedented insight into the molecularcomposition of small nociceptive neurons in the DRG, potentially altering the interpretationof previous studies performed at the tissue level, and indicating a number of novel markersof this widely-studied population of cells. We anticipate that the ease of use, affordabilityand speed of this technique will see it become widely adopted, delivering a greatlyimproved capacity to study the roles of nociceptors in health and disease.
Keywords: pain, nociceptors, nociception, somatosensation, dorsal root ganglion, RNA-sequencing, peripheral
nervous system, regeneration
INTRODUCTIONCell sorting techniques combined with transcriptional or epige-netic profiling provide a unique insight into how gene expressionis regulated across different cell types. While cell type-specificprofiling is now widely employed by researchers in the oncologyand immunology fields (Hu et al., 2005; Heng et al., 2008), mostresearchers studying the nervous system continue to assess geneexpression at the whole tissue level.
This is despite the fact that neural tissues contain a widevariety of different cell types such as epithelial cells, fibroblasts,glia and macrophages, as well as molecularly and functionallydistinctive subsets of neurons. This heterogeneity significantlylimits the usefulness of transcriptomic and epigenetic data gen-erated to date. While sorting techniques, including fluorescence-activated cell sorting (FACS), have been applied to neuraltissue, these often require transgenic animals and large amountsof cellular material in order to recover sufficient RNA, andare often better suited to neonate than adult neural tissue(Lobo et al., 2006).
In the peripheral nervous system, a commonly studied tissue isdorsal root ganglion (DRG). The peripheral nerve cell bodies con-tained in the DRG are important targets for investigators assessingsensory function, injury, regeneration and pain. Chronic pain isone of the leading causes of long term disability, estimated toaffect one in five adults (Breivik et al., 2013). More than one
in three patients suffering chronic pain report inadequate painrelief (Breivik et al., 2013)—yet many promising preclinical drugtargets have not translated into effective treatments. One reasonfor this is the relatively poor understanding of the fundamen-tal physiology and pathophysiology of pain-sensing nerve fibers(nociceptors, a subset of peripheral nerve cells) at the molecularlevel (Eijkelkamp et al., 2012).
We present a novel application of magnetic cell sorting(MACS) which generates a 95% pure nociceptor preparationfrom adult mouse DRG. This MACS preparation is enriched forsmall nociceptive neurons expressing the voltage gated sodiumchannel Nav1.8. Comparison of gene expression in mixed disso-ciated ganglion with the MACS purified nociceptor preparationreveals the transcriptional signature of nociceptors.
MATERIALS AND METHODSANIMALSAdult male C57Bl/6 mice weighing between 20 and 25 g wereused for all experiments (Harlan, Bicester, UK). Animals werehoused under standard conditions (12 h light/dark cycle, lightson between 7:00 a.m. and 7:00 p.m., free access to lab chow andwater, groups of 4–8). All care of animals was in accordance withthe United Kingdom Animals Scientific Procedures Act (1986).Nav1.8 TdTomato mice have been extensively characterizedelsewhere (Shields et al., 2012).
Frontiers in Molecular Neuroscience www.frontiersin.org November 2014 | Volume 7 | Article 87 | 1
MOLECULAR NEUROSCIENCE

Thakur et al. Defining the nociceptor transcriptome
TISSUE PREPARATIONMice were euthanized with a terminal dose of pentobarbitaland decapitated. DRG were taken from all levels as previouslydescribed (Malin et al., 2007). For experiments on intact gan-glia, DRG were snap frozen using liquid nitrogen, before beinghomogenized in Trizol (Invitrogen). For unsorted and MACS-sorted preparations, DRG were washed in F12 medium followedby incubation in dissociating enzymes (3 mg/mL dispase, 0.1%collagenase and 200 U/ml DNAse, all from Roche) for 30 min at37◦C. Dissociation enzymes were then removed and replaced withF12. Cells were triturated 5 times using a P1000 tip to disrupt thetissue. Cells in suspension were retained, and fresh F12 was addedto the remaining undisrupted material. This process was repeated5 times. Cells in suspension were filtered through a 40 μm filterand centrifuged for 5 min at 150 G. For unsorted preparations,cells were resuspended in Trizol at this point and snap frozen.
MACS-SORTING OF DISSOCIATED DORSAL ROOT GANGLIADissociated DRG neurons were washed in Dulbeccos PBS thenresuspended in 120 μl MACS buffer (Miltenyi autoMACS HBSS-based washing solution with 0.5% bovine serum albumin).30 μl of biotinylated non-neuronal antibody cocktail was added(Miltenyi MACS Neuron Isolation Kit) and cells incubated at4◦C for 5 min. After washing in MACS buffer, cells were resus-pended in 120 μl MACS buffer with 30 μl anti-biotin microbeads(Miltenyi MACS Neuron Isolation Kit) and incubated at 4◦Cfor 10 min. Cells were then run through a LD exclusion columnplaced in a QuadroMACS separator (Miltenyi Biotech), whichretained all microbead-conjugated, non-neuronal cells so thatonly neurons were eluted. For MACS-sorted preparations, elutedpure neurons were then centrifuged, resuspended in Trizol andsnap frozen.
IMMUNOCYTOCHEMISTRYFor characterization, unsorted preparations were plated onpoly-L-lysine/laminin coated coverslips. Sorted cells were platedon poly-L-lysine coverslips incubated with Matrigel (BDBiosciences) diluted 1:10 in F12. After ∼18 h in vitro, cells werefixed in 2% PFA at 37◦C for 10 min. Cells were then blockedin 10% Normal Donkey Serum in PBS with 0.2% Triton-X for30 min at room temperature, followed by a 30 min RT incuba-tion in primary antibody. Cells were washed in PBS and incu-bated in secondary antibody at room temperature for 30 min,followed by further washing and coverslipping with Vectashieldmounting medium (Vector Labs). Primary antibodies used were:mouse β-III tubulin (Promega, G712A), rabbit glutamine syn-thetase (Abcam, ab498371), mouse CGRP (Abcam, ab81887).Secondaries were all Alexa 488 or 546 (Life Technologies).Fluorescence was visualized with fixed exposure times using aZeiss Axioplan 2 microscope and analyzed using ImageJ softwareand Graphpad Prism. Positive cells were defined as cells with anintensity >30% that of the mean top 10 most intense cells in theimage being analyzed.
FLOW CYTOMETRY OF DISSOCIATED NEURONAL PREPARATIONSCells were prepared for cytometry as described above, with twovariations. Cells were prepared in cytometry buffer instead of
medium (Hank’s Buffered Saline Solution with 1 M HEPES and0.5 M EDTA). Cells were prepared from mice expressing GFPin Advillin-positive cells, i.e., all DRG neurons (Advillin-GFPmouse obtained from Gensat). The pan-nuclear marker DRAQ5(Biostatus, UK) was then added at 1:10,000. Unsorted and MACSsorted samples were analyzed using an LSR Fortessa. The num-ber of GFP-positive events were quantified as a percentage of allDRAQ5-positive events to assay the proportion of neuronal tonon-neuronal cells.
RNA EXTRACTION AND LIBRARY PREPARATION FOR SEQUENCINGRNA was extracted from intact, unsorted and MACS-sorted sam-ples using the RNeasy micro kit (Qiagen). Each sample (each n)comprised material from 1, 2 or 8 mice in the intact, unsorted andMACS-sorted groups, respectively. RNA integrity was assessed onan Agilent2100 Bioanalyzer (Agilent, Santa Clara, CA) and theRNA integrity number of each sample was >8. PolyA-selectedRNA was used for complimentary DNA library preparation usingthe NEBNext Ultra direction RNA Library Prep Kit according tomanufacturer’s instructions (NEB, Ipswich, MA). 100 bp readswere sequenced on the Illumina HiSeq2000/2500 platform inreplicate flow cells.
DATA ANALYSESQuality control, alignment and differential expression anal-yses were performed on the Galaxy server (Giardine et al.,2005; Blankenberg et al., 2010; Goecks et al., 2010). Corticalneuron fastQ files were uploaded to Galaxy directly fromthe European Nucleotide Archive (http://www.ebi.ac.uk/ena/data/view/SRP033200, sample accessions SAMN02415125,SAMN02415124). Briefly, fastQ files were uploaded, assessed forsequencing quality using fastQC (http://www.bioinformatics.babraham.ac.uk/projects/fastqc) and Picard AlignmentSummary Metrics (http://picard.sourceforge.net). Base callswere of high quality across the full-length of the reads andtrimming was not required. FastQ files were aligned to the UCSCmm10 build of the mouse genome using TopHat2 (Kim et al.,2013), with the multiple alignment parameter (-g) set to two.Aligned bam files from separate lanes were combined using theMerge Bam tool from SamTools (Li et al., 2009), then fragmentsper kilobase per million (FPKM) estimates were obtained usingCufflinks version 2.1.1 (Trapnell et al., 2012). Genes were consid-ered to be expressed if more than three samples within a grouphad an FPKM value greater than 5.
Differential expression analyses were performed using CuffDiffversion 2.1.1 (Trapnell et al., 2012). Genes were consideredto be differentially expressed if they had a q < 0.05, log2-foldchange < −0.5 or >0.5, and mean FPKM > 5 in the group withhigher expression. Following differential expression analysis ofMACS sorted samples it became clear that these were contami-nated with red blood cells (e.g., they had high levels of canonicalblood genes, such as Hbb-bs). To account for this, all genesthat were found to be both significantly upregulated in MACSsamples and had a median log2 RPKM > 3 in a recently pub-lished mouse erythrocyte transcriptome study (An et al., 2014)were removed prior to subsequent analysis (totaling 308 bloodgenes).
Frontiers in Molecular Neuroscience www.frontiersin.org November 2014 | Volume 7 | Article 87 | 2

Thakur et al. Defining the nociceptor transcriptome
Principal component analysis, density and scatter plots werecreated using the cummeRbund package in R (version 3.1.0).Hierarchical clustering and heat maps were generated usingMultiExperiment Viewer (MeV) (Saeed et al., 2003). DAVID (DaWei Huang and Lempicki, 2008; Huang et al., 2009), Panther (Miet al., 2013), and STRING (Jensen et al., 2009) were used for genefunctional annotation and network analyses.
Datasets are available via GEO accession number GSE62424.
RESULTSMACS-SORTED PURE NEURONAL PREPARATIONS ARE ENRICHED FORNOCICEPTORSWe used a novel application of magnetic cell sorting (MACS) toobtain a 95% pure peripheral nerve cell body preparation fromadult DRG. Quantification of traditionally prepared, unsorteddissociated DRG cultures stained for the neuronal marker β-IIITubulin, the satellite glial cell marker glutamine synthetase (GS)and the nuclear marker DAPI demonstrate that neuronal cellsconstitute a mean of 9% of adherent, nucleated cells presentin these preparations one day after dissociation (Figures 1A,C).In contrast, a DRG preparation subjected to MACS containsmore than 95% neuronal nuclei (Figures 1B,C). Cell size dis-tribution indicates that magnetic sorting generates a prepa-ration enriched for cells < 30 μm in diameter (nociceptors)(Figure 1D).
Flow cytometry analysis of acutely dissociated DRG prepara-tions confirms that neurons constitute 9.8% of nucleated eventsin the acute preparation (Supplementary Figure 1). This indicatesthat the relatively large proportion of non-neuronal cells detectedafter 1 day in culture do not simply reflect proliferating cells,but is an accurate reflection of the cellular makeup of the acutepreparation. Note that while we observed that neurons only con-stituted ∼10% of cells in acutely dissociated preparations of DRG,this is likely an underestimate of the total proportion of neuronsin the intact DRG as the dissociation process will cause some cells,such as larger DRG neurons, to lyse.
We next performed MACS sorting on dissociated DRGfrom transgenic animals carrying the TdTomato reporter incells expressing the voltage-gated sodium channel, Nav1.8(Figures 1E,F). This confirmed that the MACS sorting processgenerates a cell preparation enriched for nociceptors. In agree-ment with previous studies (Shields et al., 2012), Nav1.8+ cellsmake up only 76% of dissociated unsorted neurons, yet constitute95% of the MACS sorted preparation (Figure 1G).
The proportion of cells expressing the neuropeptide calci-tonin gene-related peptide (CGRP), which defined a subset ofnociceptors, is similar in unsorted (Figure 1H, 38%) and sortedpreparations (Figure 1I, 36%), indicating that the MACS sortingprocess enriches cells according to size but introduces no bias inneurochemical subtype (Figure 1J).
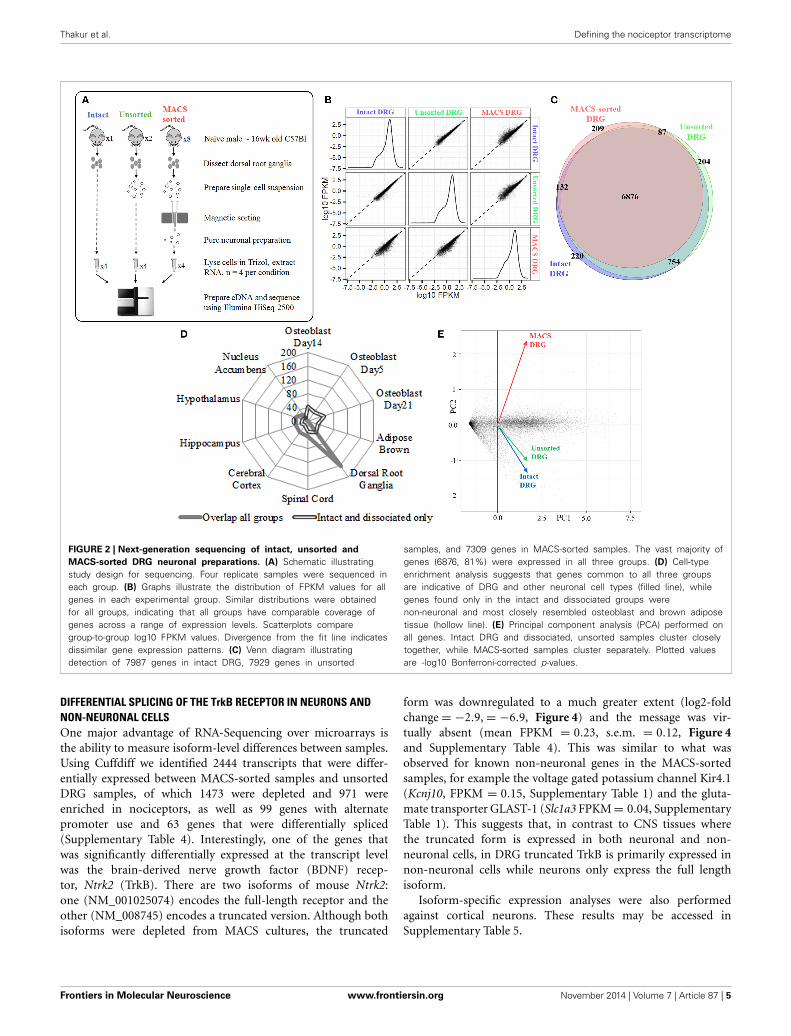
RNA-SEQUENCING OF INTACT, DISSOCIATED AND MACS-SORTEDPREPARATIONS IDENTIFIES THE NOCICEPTOR TRANSCRIPTOMEWe next extracted high-quality RNA from either whole, intactDRG, acutely dissociated, unsorted DRG or MACS-sortedDRG for use in RNA-sequencing (study design illustrated inschematic Figure 2A). The sequencing data was used to identify
unbiased gene expression profiles across the entire transcriptome.Sequencing was performed on polyA+ messenger RNA of fourbiological replicates for each condition at a depth of ∼18 millionreads per sample. Sequencing data were subject to quality con-trol analyses prior to alignment with TopHat2. A high-confidencetranscriptome was generated using Cufflinks in Galaxy, and dif-ferences in gene expression levels were analyzed using CuffDiff.Only annotated genes were analyzed.
We initially determined how many genes were expressed in allthree conditions. We detected 7987 genes in intact DRG, 7929genes in dissociated, unsorted samples and 7309 genes in MACS-sorted samples, corresponding to ∼30% of known murine genes(Figure 2B). The vast majority of these genes (6876, 81%) wereexpressed in all three groups (Figure 2C).
Cell-type enrichment analysis performed using the CTen plat-form (Shoemaker et al., 2012) accurately identified the overlap-ping genes as DRG and other neuronal cell types (Figure 2D). Incontrast, genes found only in the intact and dissociated groupswere not identified as neuronal, confirming the ability of theMACS sorting process to exclude non-neuronal cells.
Principal component analysis (PCA) was performed on allgenes. Intact DRG and dissociated, unsorted samples clusteredclosely together, while MACS-sorted samples clustered separately(Figure 2E). Pairwise comparison of replicates within each grouprevealed a high degree of correlation (r2 = 0.81–0.87), indicatingthe reproducibility of the preparation methods.
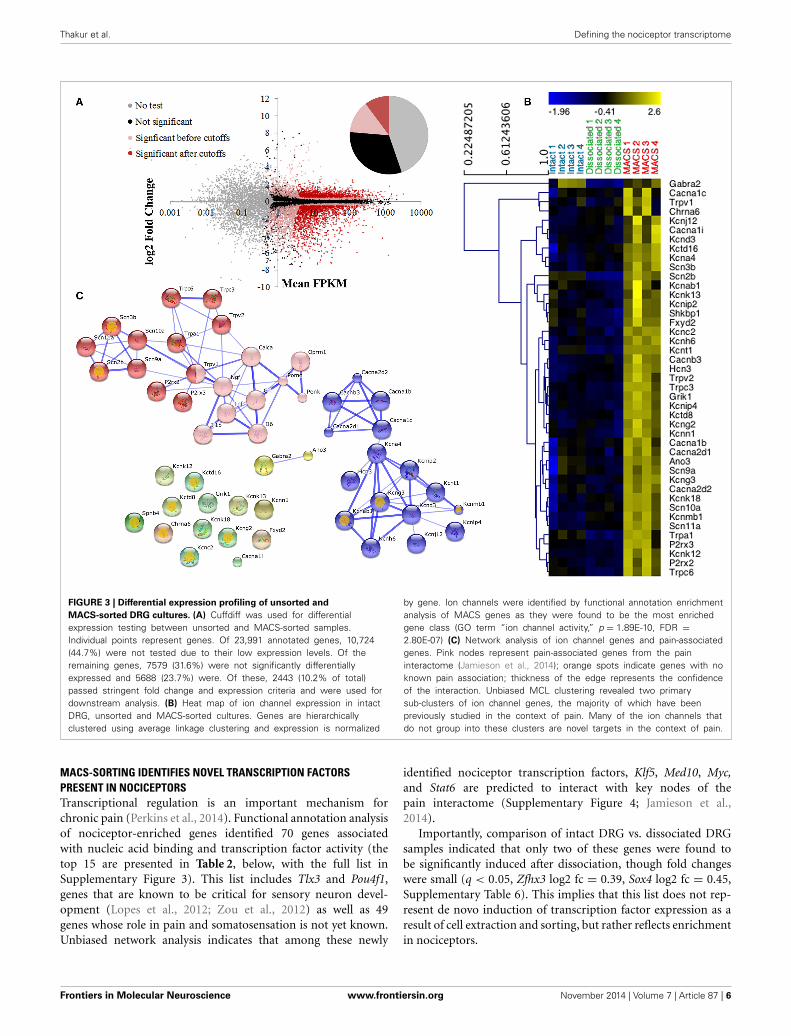
THE MACS-SORTED CELL TRANSCRIPTOME IDENTIFIES NOVELNOCICEPTOR-ENRICHED ION CHANNEL GENESNociceptor genes were identified by comparing MACS-sorted andunsorted DRG preparations using the CuffDiff algorithm. A totalof 2392 differentially expressed genes were discovered, of which920 (38.5%) were enriched in the MACS-sorted samples and 1473(61.5%) were depleted (Figure 3A).
Consistent with the in vitro characterization, genes enrichedin the MACS-sorted samples include many known small neu-ronal markers such as GDNF responsive receptor tyrosine kinase,Ret (log2-fold change = 0.79, q = 0.0002) and neurofilamentperipherin (Prph log2-fold change = 0.39, q = 0.011). Depletedgenes include the large neuronal marker parvalbumin (log2-foldchange = −3.34, q = 0.0002) and the glial cell glutamate trans-porter GLAST-1 (Slc1a3, log2-fold change = −6.99, q = 0.0044).The genes enriched in MACS-sorted neurons represent all genesexpressed more abundantly in nociceptors than in other DRGneurons and non-neuronal cells. To determine whether thesegenes may also be nociceptor-specific, we performed an in silicoanalysis of MACS transcriptional data against global gene expres-sion data from pure cortical neurons (Zhang et al., 2014). 6140genes were found to be differentially expressed between the twodatasets, of which 3190 (52%) were enriched in cortical neu-rons and 2950 (48%) were enriched in nociceptors (described inSupplementary Figure 2 and Supplementary Table 2). Of the 920genes most enriched in the MACS-sorted preparation comparedto unsorted DRG, 548 (68%) were also significantly enrichedcompared to cortical neurons. This suggests that these genes arenot only nociceptor-enriched, but may in fact be nociceptor-specific.
Frontiers in Molecular Neuroscience www.frontiersin.org November 2014 | Volume 7 | Article 87 | 3

Thakur et al. Defining the nociceptor transcriptome
FIGURE 1 | Characterisation of MACS-sorted DRG neuronal preparation.
(A,B) Immunohistochemistry visualizing neuronal (β-III tubulin), satellite glial(glutamine synthetase) or other non-neuronal (DAPI) cells in unsorted andMACS-sorted neuronal preparations. (C) Quantification of neuronal, glial andother non-neuronal cells shows that MACS-sorting generates >95% pureneuronal preparation (n = 8 per condition). (D) Cell size distribution of neuronalcells in unsorted and MACS-sorted preparations shows that the MACS-sortedpreparation is enriched for small cells <30 μm in diameter (n = 8 per
condition. ∗∗ = unpaired t-test p < 0.01). (E,F) Immunohistochemistry ofunsorted and MACS-sorted preparations generated from Nav1.8 TdTomatoreporter mice. (G) Percentage of cells positive for Nav1.8 is significantlygreater following MACS sorting (n = 4 per condition, Fisher’s exact test,∗p < 0.05). (H,I) Immunohistochemistry visualizing the neuropeptidecalcitonin gene related peptide (CGRP) in unsorted and MACS-sortedpreparations. (J) The percentage of cells expressing CGRP is unchanged inMACS-sorted preparations (n = 4, Fisher’s exact test p = 0.229).
Table 1 below shows highlighted results. All MACS vs. DRGvalues are accessible in Supplementary Table 1 and MACS vs.Cortical Neurons may be found in Supplementary Table 2.
Functional annotation clustering using DAVID indicates thatgenes enriched in MACS-sorted preparations possess GO termsrelated to ion channel activity and ion binding (false discov-ery rate corrected p-value range 6.55e-4–2.8e-7; SupplementaryTable 3), and 43 genes related to ion channel activity were identi-fied for downstream analysis (Figure 3B).
Jamieson et al. (2014) have recently described the paininteractome, a pain-specific protein-protein interaction network(Jamieson et al., 2014). Using the key nodes of the pain inter-actome alongside the 43 ion channel activity genes in an unbi-ased network analysis we discovered two major gene clusters
(Figure 3C). The largest cluster contained the known pain-related genes from the pain interactome as well as various tran-sient receptor potential channel members, purinoreceptors andvoltage-gated sodium channel subunits, the majority of whichhave known functions in somatosensation or nociception. Thesecond cluster primarily contained calcium and potassium chan-nel subunits, including the calcium channel subunit Cacna2d1(alpha-2-delta-1) which is the major target of the neuropathicpain drug, gabapentin (Bauer et al., 2009). The remaining ionchannel activity-related genes did not form clusters as they hadno known interactions with either the pain-related genes or thecalcium and potassium channel subunits, therefore represent-ing a novel subset of nociceptor-enriched ion channel genes, themajority of which have not been previously linked to pain.
Frontiers in Molecular Neuroscience www.frontiersin.org November 2014 | Volume 7 | Article 87 | 4
Thakur et al. Defining the nociceptor transcriptome
FIGURE 2 | Next-generation sequencing of intact, unsorted and
MACS-sorted DRG neuronal preparations. (A) Schematic illustratingstudy design for sequencing. Four replicate samples were sequenced ineach group. (B) Graphs illustrate the distribution of FPKM values for allgenes in each experimental group. Similar distributions were obtainedfor all groups, indicating that all groups have comparable coverage ofgenes across a range of expression levels. Scatterplots comparegroup-to-group log10 FPKM values. Divergence from the fit line indicatesdissimilar gene expression patterns. (C) Venn diagram illustratingdetection of 7987 genes in intact DRG, 7929 genes in unsorted
samples, and 7309 genes in MACS-sorted samples. The vast majority ofgenes (6876, 81%) were expressed in all three groups. (D) Cell-typeenrichment analysis suggests that genes common to all three groupsare indicative of DRG and other neuronal cell types (filled line), whilegenes found only in the intact and dissociated groups werenon-neuronal and most closely resembled osteoblast and brown adiposetissue (hollow line). (E) Principal component analysis (PCA) performed onall genes. Intact DRG and dissociated, unsorted samples cluster closelytogether, while MACS-sorted samples cluster separately. Plotted valuesare -log10 Bonferroni-corrected p-values.
DIFFERENTIAL SPLICING OF THE TrkB RECEPTOR IN NEURONS ANDNON-NEURONAL CELLSOne major advantage of RNA-Sequencing over microarrays isthe ability to measure isoform-level differences between samples.Using Cuffdiff we identified 2444 transcripts that were differ-entially expressed between MACS-sorted samples and unsortedDRG samples, of which 1473 were depleted and 971 wereenriched in nociceptors, as well as 99 genes with alternatepromoter use and 63 genes that were differentially spliced(Supplementary Table 4). Interestingly, one of the genes thatwas significantly differentially expressed at the transcript levelwas the brain-derived nerve growth factor (BDNF) recep-tor, Ntrk2 (TrkB). There are two isoforms of mouse Ntrk2:one (NM_001025074) encodes the full-length receptor and theother (NM_008745) encodes a truncated version. Although bothisoforms were depleted from MACS cultures, the truncated
form was downregulated to a much greater extent (log2-foldchange = −2.9, = −6.9, Figure 4) and the message was vir-tually absent (mean FPKM = 0.23, s.e.m. = 0.12, Figure 4and Supplementary Table 4). This was similar to what wasobserved for known non-neuronal genes in the MACS-sortedsamples, for example the voltage gated potassium channel Kir4.1(Kcnj10, FPKM = 0.15, Supplementary Table 1) and the gluta-mate transporter GLAST-1 (Slc1a3 FPKM = 0.04, SupplementaryTable 1). This suggests that, in contrast to CNS tissues wherethe truncated form is expressed in both neuronal and non-neuronal cells, in DRG truncated TrkB is primarily expressed innon-neuronal cells while neurons only express the full lengthisoform.
Isoform-specific expression analyses were also performedagainst cortical neurons. These results may be accessed inSupplementary Table 5.
Frontiers in Molecular Neuroscience www.frontiersin.org November 2014 | Volume 7 | Article 87 | 5
Thakur et al. Defining the nociceptor transcriptome
FIGURE 3 | Differential expression profiling of unsorted and
MACS-sorted DRG cultures. (A) Cuffdiff was used for differentialexpression testing between unsorted and MACS-sorted samples.Individual points represent genes. Of 23,991 annotated genes, 10,724(44.7%) were not tested due to their low expression levels. Of theremaining genes, 7579 (31.6%) were not significantly differentiallyexpressed and 5688 (23.7%) were. Of these, 2443 (10.2% of total)passed stringent fold change and expression criteria and were used fordownstream analysis. (B) Heat map of ion channel expression in intactDRG, unsorted and MACS-sorted cultures. Genes are hierarchicallyclustered using average linkage clustering and expression is normalized
by gene. Ion channels were identified by functional annotation enrichmentanalysis of MACS genes as they were found to be the most enrichedgene class (GO term “ion channel activity,” p = 1.89E-10, FDR =2.80E-07) (C) Network analysis of ion channel genes and pain-associatedgenes. Pink nodes represent pain-associated genes from the paininteractome (Jamieson et al., 2014); orange spots indicate genes with noknown pain association; thickness of the edge represents the confidenceof the interaction. Unbiased MCL clustering revealed two primarysub-clusters of ion channel genes, the majority of which have beenpreviously studied in the context of pain. Many of the ion channels thatdo not group into these clusters are novel targets in the context of pain.
MACS-SORTING IDENTIFIES NOVEL TRANSCRIPTION FACTORSPRESENT IN NOCICEPTORSTranscriptional regulation is an important mechanism forchronic pain (Perkins et al., 2014). Functional annotation analysisof nociceptor-enriched genes identified 70 genes associatedwith nucleic acid binding and transcription factor activity (thetop 15 are presented in Table 2, below, with the full list inSupplementary Figure 3). This list includes Tlx3 and Pou4f1,genes that are known to be critical for sensory neuron devel-opment (Lopes et al., 2012; Zou et al., 2012) as well as 49genes whose role in pain and somatosensation is not yet known.Unbiased network analysis indicates that among these newly
identified nociceptor transcription factors, Klf5, Med10, Myc,and Stat6 are predicted to interact with key nodes of thepain interactome (Supplementary Figure 4; Jamieson et al.,2014).
Importantly, comparison of intact DRG vs. dissociated DRGsamples indicated that only two of these genes were found tobe significantly induced after dissociation, though fold changeswere small (q < 0.05, Zfhx3 log2 fc = 0.39, Sox4 log2 fc = 0.45,Supplementary Table 6). This implies that this list does not rep-resent de novo induction of transcription factor expression as aresult of cell extraction and sorting, but rather reflects enrichmentin nociceptors.
Frontiers in Molecular Neuroscience www.frontiersin.org November 2014 | Volume 7 | Article 87 | 6

Thakur et al. Defining the nociceptor transcriptome
Table 1 | Genes with known roles in pain and somatosensation are
enriched in MACS-sorted nociceptors compared to unsorted DRG
(see also Supplementary Table 1).
Gene name Full gene description Fold change
MACS vs.
dissociated
DRG
Fold change
MACS vs.
cortical
neurons
Calcb Calcitonin-relatedpolypeptide beta
1.46 487.22
Mrgpra2b MAS-related GPR,member A2B
1.87 inf
Mrgpra3 MAS-related GPR,member A3
4.42 inf
Mrgprb4 MAS-related GPR,member B4
1.86 inf
Mrgprb5 MAS-related GPR,member B5
3.25 inf
Mrgprd MAS-related GPR,member D
2.01 inf
Mrgpre MAS-related GPR,member E
1.48 5.63
Mrgprx1 MAS-related GPR,member X1
3.19 inf
P2rx2 Purinoreceptor 2 3.36 4.95
P2rx3 Purinoreceptor 3 1.90 695.23
P2ry1 Purinergic receptorP2Y, G-proteincoupled, 1
2.51 7.37
Prph Peripherin 1.80 1189.14
Ret RET (GDNF receptor) 1.74 190.11
Scn10a Nav1.8 1.71 8010.07
Scn11a Nav1.9 2.14 3084.88
Scn9a Nav1.7 1.47 38.76
Sst Somatostatin 2.41 0.02
Tac1 Protachykinin-1(Substance Pprecursor)
1.53 24.97
Trpa1 TRPA1 1.83 176.05
Trpv1 TRPV1 1.47 50.21
Trpv2 TRPV2 1.56 5.44
Many of these genes are also enriched in MACS-sorted nociceptors compared
to cortical neurons, indicating that these genes are not only nociceptor-enriched,
but may in fact be nociceptor-specific (see also Supplementary Figure 2 and
Table 2).
DISCUSSIONWe present the first application of magnetic cell sorting (MACS)to isolate and characterize nociceptor neurons from the adultDRG using RNA-sequencing. We find that MACS increases thepurity of DRG sensory neuron cell body preparations from<10% to >95%, a purity that cannot be obtained through anyother method. These MACS preparations are enriched for noci-ceptor neurons <30 μm in size expressing the voltage gatedsodium channel, Nav1.8. Comparison of RNA-sequencing datain unsorted and nociceptor-enriched MACS-sorted preparationsenables genome-wide resolution of the nociceptor transcriptome.
We present novel biological insight into the ion channels, growthfactor receptor isoforms and transcription factors present in thesecells, and anticipate that both the novel sorting technique usedand the data generated will be of great utility to researchers study-ing nociceptors in the context of pain, injury and regeneration.
The importance of attaining cell-type specificity in the con-text of high-throughput transcriptomic technologies (most oftenmicroarray and RNA-sequencing) is becoming increasingly clear(as reviewed in Okaty et al., 2011a; Cruz et al., 2013). Datagenerated from central nervous system (CNS) or peripheral ner-vous system (PNS) tissue, given the high level of heterogeneity,is subject to a number of limitations. The first is that any tran-scriptional change occurring in small populations of cells is likelyto be underestimated if assessed in a composite tissue. Likewise,genes regulated in opposite directions in neighboring cell typeswill appear static in composite data. Similarly, transcripts whichare differentially spliced in different cell types cannot be dis-tinguished. Furthermore, following experimental manipulationssuch as injury, any change in the population of cells present inthe tissue (such as infiltration of immune cells) complicates theattribution of any observed transcriptional change.
Obtaining cell-type specificity requires a means of identifying,and a means of isolating cells of interest. A number of featuresof adult neural tissue limit the applicability of the most com-mon high throughput sorting technique, fluorescence-activatedcell sorting (FACS), in PNS. The sensitivity of adult neuronal cellbodies to physical stress, the requirement for enzymatic disrup-tion of tissue that may affect extracellular antibody epitopes, andthe relatively small number of cells available make it difficult torecover sufficient RNA for high-throughput applications whenflow sorting PNS tissue.
Another sorting technique that is suitable for transcrip-tome analysis of neural tissue is Translating Ribosome AffinityPurification (TRAP)-Seq. TRAP requires a transgenic mouse witha cell-type specific reporter allowing the labeling and isolationof ribosome-associated RNA within the cells of interest. Onestrength of the technique is that cell-type specific data can bepulled down from a composite tissue without having to separateconstituent cell types. However, data generated using this tech-nique does appear to be subject to a high degree of contaminationfrom other cell types (Okaty et al., 2011b). Furthermore, TRAP isentirely dependent on the fidelity of the cell-type reporter used,and, in contrast to RNA-sequencing of whole-cell lysate, cannotdetect non-coding RNA species.
Both FACS and TRAP require a transgenic reporter with highfidelity for the cell type of interest, and are not applicable tonon-transgenic animals. In contrast, the MACS-sorting techniquecan generate pure neuronal preparations from standard labo-ratory animals with sufficient yield to carry out genome-widesequencing.
Aside from transcriptomic studies, MACS cultures will alsobe extremely useful for in vitro study. Previously, preparing anenriched preparation of DRG neurons required extended cul-ture (> 1 week) in the presence of a mitotic inhibitor to depletecontaminating non-neuronal cells (Lerch et al., 2012). This cul-ture procedure is not widely used because of concerns aboutoff-target effects of mitotic inhibitors on neurons (Wallace and
Frontiers in Molecular Neuroscience www.frontiersin.org November 2014 | Volume 7 | Article 87 | 7

Thakur et al. Defining the nociceptor transcriptome
FIGURE 4 | RNA-Seq reveals differential expression of Ntrk2
isoforms in MACS-sorted cultures. Figure generated by theIntegrated Genome Browser using mapped reads from oneMACS-sorted (B) and one unsorted sample (A). Both Ntrk2 isoforms
are depleted from MACS-sorted cultures, though some messageremains. Interestingly, the junction between exons (16 and 17) isnot detected in the MACS-sorted cultures, implying that this isoformis not expressed in nociceptors.
Table 2 | The most highly enriched genes with nucleic acid binding functions present in nociceptors.
Gene symbol Full gene name FPKM unsorted FPKM MACS log2-fold change
Bhlha9 Basic helix-loop-helix family member a9 5.45 26.06 2.26
Klf5 Krueppel-like factor 5 14.20 43.55 1.62
Ldb2 Lim domain binding 2 47.25 119.58 1.34
Sox11 SRY-box 11 2.30 5.55 1.27
Pou4f2 POU domain class 4 transcription factor 2/Brn3b 7.57 18.23 1.27
Pdlim1 PDZ and LIM domain protein 1 6.50 15.58 1.26
Zbtb48 Zinc finger and BTB containing 48 2.24 5.28 1.23
Atf5 Activating transcription factor 5 32.35 75.84 1.23
Isl2 Islet 2 81.72 190.99 1.22
Tlx3 T-cell leukemia homeobox 3 38.59 86.16 1.16
Myt1 Myelin transcription factor 1 15.02 33.49 1.16
Grhl3 Grainyhead-like 3 3.73 8.26 1.15
Casz1 Castor zinc-finger 1 14.45 31.99 1.15
Prdm12 PR domain containing 12 64.85 142.95 1.14
Aff2 AF4/FMR2 family member 2 2.92 6.42 1.13
Genes already known to have a role in these cells are highlighted in bold.
Frontiers in Molecular Neuroscience www.frontiersin.org November 2014 | Volume 7 | Article 87 | 8

Thakur et al. Defining the nociceptor transcriptome
Johnson, 1989), the likelihood that DRG neuron phenotype fol-lowing prolonged culture will no longer resemble that of intactDRG (Buschmann et al., 1998) and the low purity of the cultureit produces [74% neuronal (Lerch et al., 2012)]. For these rea-sons, most investigators simply use mixed cultures when studyingDRG. However, for experiments focused on growth factor signal-ing, where contaminating non-neuronal cells are sensitive to andable to release growth factors, impurity of DRG culture is a sig-nificant limitation (Kalous et al., 2012). The ability to generatepure neuronal cultures will significantly simplify interpretationof in vitro experiments using dissociated DRG neurons.
Our study design allowed us to identify nociceptor-enrichedgenes by comparing global gene expression profiles of MACS-sorted small DRG neurons and dissociated whole ganglia. Furtherin silico analysis to compare nociceptor and cortical neuron tran-scriptomes revealed that the majority of nociceptor-enrichedgenes may also be PNS-specific, as these were found to be sig-nificantly upregulated compared to cortical neurons. These genesmay therefore be useful drivers for nociceptor-specific Cre lines,or for PNS-specific drug targeting. Further investigation of otherPNS neuronal subtypes, for example autonomic ganglia, wouldhelp to refine this list.
One limitation of our study is that we cannot definitivelydetermine the source of genes that are expressed at lower lev-els in nociceptors compared to the whole DRG. This is becausethese transcripts could come from either large neurons or non-neuronal cells. However, we observed that known non-neuronalgenes tend to have very low expression levels in MACS sortedcultures (FPKM < 0.5). We used this heuristic to interpret thealternate Ntrk2 isoform expression (Figure 4). Further work toisolate and transcriptionally profile all of the cell types of theDRG are required to verify the origin of depleted transcripts.However, in the absence of this information, the list of depletedgenes may still be used to inform experiments. If researchers areinterested in a particular receptor due to pharmacological effi-cacy, our differential expression data will help to identify whetherresults may be due to a direct action on nociceptors (i.e. if thereceptor is enriched), or an indirect action (if the receptor is notpresent).
Many of the ion channels we identify in nociceptors (includ-ing Kcnab1, Scn2, and Kcnc2) have not previously been describedin the PNS. Given the attractiveness of therapeutics targeting ionchannels such as the sodium channel Nav1.7 (Eijkelkamp et al.,2012; Lee et al., 2014), these channels could constitute novel tar-gets for the treatment of pain or itch. One interesting featureof the nociceptor transcriptome we observe is the relatively lowenrichment of TRPV1 (log2 FC = 0.59) in the MACS-sortedpreparation. This likely reflects the size-selection of the MACSmethod, which will exclude TRPV1+ A-fibers. This results in arelatively low enrichment for TRPV1 in the MACS-sorted prepa-ration relative to unsorted DRG, as the latter contains theseTRPV1+ A-fibers (Mitchell et al., 2010).
The nociceptor-enriched transcription factors we describeinclude a number with known roles in DRG morphogene-sis and function. These include Tlx3 and Pou4f1, which con-trol the development of subsets of nociceptors (Lopes et al.,2012; Zou et al., 2012). Disrupting expression of nociceptor
development-controlling transcription factors can be incredi-bly informative—for example, disruption of Runx1 reveals thegenes uniquely expressed in cutaneous and deep-tissue innervat-ing nociceptors (Yang et al., 2013), while Runx3 can be used todisrupt development of DRG proprioceptive neurons peripheraland central axonal projections (Inoue et al., 2002; Levanon et al.,2002).
Of the 70 genes with nucleic acid binding activity we iden-tify in nociceptors, only 21 have a known function in DRG. Ofthese 21 previously characterized genes, many control neuriteoutgrowth and axonal regeneration following injury, includingSox11, Pdlim1, Nfil3, Hivep3, and Smad1 (Jankowski et al., 2006;Wu et al., 2006; Macgillavry et al., 2009; Ohno et al., 2009; Zouet al., 2009). The remaining 49 uncharacterized genes includePou4f2 and Atf5, genes involved in the acute response to damageand axon outgrowth in the optic nerve, another popular modeltissue for regeneration (Huang et al., 2014; Yasuda et al., 2014).
The finding of differential expression of the full length (FL)and truncated (T1) isoforms of the BDNF receptor TrkB suggestsfor the first time that only TrkB FL is present in nociceptors, withTrkB T1 expressed in non-neuronal cells of the DRG (Schwanncells or satellite glia). This advances previous studies in theCNS, where TrkB T1 was found in glia, but both forms weredetected in neurons (Frisen et al., 1993; Armanini et al., 1995).The nociceptor transcriptome we present allows investigatorsto assess transcript-level differential expression for any gene ofinterest.
In summary, the DRG nociceptor preparation produced byMACS-sorting has many applications in vitro and in molecularstudies. We have demonstrated how the nociceptor transcrip-tome, generated via RNA-sequencing of MACS-sorted DRG,can be mined to gain novel biological insight. Knowledgeof the ion channels, splice isoforms and transcription factorsenriched in nociceptors will be of great utility to investiga-tors studying this tissue in the context of pain, somatosensa-tion and itch. As sequencing data in a wider array of othertissues and cellular subtypes becomes available, it will deepenour understanding of the defining features of the nociceptortranscriptome.
AUTHOR CONTRIBUTIONSData acquisition and analysis Matthew Thakur, Megan Crow,Natalie Richards, Gareth I. J. Davey, Emma Levine, Jayne H.Kelleher, Chibeza C. Agley, Stephen D. R. Harridge. Analysis ofsequencing data/Bioinformatics Megan Crow, Franziska Denk.Drafting of manuscript Matthew Thakur, Megan Crow. Editingof manuscript Matthew Thakur, Megan Crow, Franziska Denk,Stephen B. McMahon.
ACKNOWLEDGMENTSWe thank the High Throughput Genomics Group at theWellcome Trust Centre for Human Genetics (funded by WellcomeTrust grant references 090532/Z/09/Z and MRC Hub grantG0900747 91070) for the generation of sequencing data.Cytometry facilities were provided by the National Institute forHealth Research (NIHR) Biomedical Research Centre based atGuy’s and St Thomas’ NHS Foundation Trust and King’s College
Frontiers in Molecular Neuroscience www.frontiersin.org November 2014 | Volume 7 | Article 87 | 9

Thakur et al. Defining the nociceptor transcriptome
London. The views expressed are those of the author(s) and notnecessarily those of the NHS, the NIHR or the Department ofHealth. We also thank Prof John Wood at UCL for his gift ofNav1.8 TdTom mice.
SUPPLEMENTARY MATERIALThe Supplementary Material for this article can be foundonline at: http://www.frontiersin.org/journal/10.3389/fnmol.2014.00087/abstract
REFERENCESAn, X., Schulz, V. P., Li, J., Wu, K., Liu, J., Xue, F., et al. (2014). Global
transcriptome analyses of human and murine terminal erythroiddifferentiation. Blood 123, 3466–3477. doi: 10.1182/blood-2014-01-548305
Armanini, M. P., McMahon, S. B., Sutherland, J., Shelton, D. L., and Phillips, H. S.(1995). Truncated and catalytic isoforms of trkB are co-expressed in neuronsof rat and mouse CNS. Eur. J. Neurosci. 7, 1403–1409. doi: 10.1111/j.1460-9568.1995.tb01132.x
Bauer, C. S., Nieto-Rostro, M., Rahman, W., Tran-Van-Minh, A., Ferron, L.,Douglas, L., et al. (2009). The increased trafficking of the calcium channelsubunit alpha2delta-1 to presynaptic terminals in neuropathic pain is inhib-ited by the alpha2delta ligand pregabalin. J. Neurosci. 29, 4076–4088. doi:10.1523/JNEUROSCI.0356-09.2009
Blankenberg, D., Kuster, G. V., Coraor, N., Ananda, G., Lazarus, R.,Mangan, M., et al. (2010). Galaxy: a web-based genome analysis toolfor experimentalists. Curr. Protoc. Mol. Biol. 89, 19.10.1–19.10.21. doi:10.1002/0471142727.mb1910s89
Breivik, H., Eisenberg, E., O’Brien, T., and Openminds. (2013). The individual andsocietal burden of chronic pain in Europe: the case for strategic prioritisationand action to improve knowledge and availability of appropriate care. BMCPublic Health 13:1229. doi: 10.1186/1471-2458-13-1229
Buschmann, T., Martin-Villalba, A., Kocsis, J., Waxman, S., Zimmermann, M., andHerdegen, T. (1998). Expression of Jun, Fos and ATF-2 proteins in axotomizedexplanted and cultured adult rat dorsal root ganglia. Neuroscience 84, 163–176.doi: 10.1016/S0306-4522(97)00487-9
Cruz, F. C., Koya, E., Guez-Barber, D. H., Bossert, J. M., Lupica, C. R., Shaham,Y., et al. (2013). New technologies for examining the role of neuronal ensem-bles in drug addiction and fear. Nat. Rev. Neurosci. 14, 743–754. doi: 10.1038/nrn3597
Da Wei Huang, B. T. S., and Lempicki, R. A. (2008). Systematic and integrativeanalysis of large gene lists using DAVID bioinformatics resources. Nat. Protoc. 4,44–57. doi: 10.1038/nprot.2008.211
Eijkelkamp, N., Linley, J. E., Baker, M. D., Minett, M. S., Cregg, R., Werdehausen,R., et al. (2012). Neurological perspectives on voltage-gated sodium channels.Brain 135, 2585–2612. doi: 10.1093/brain/aws225
Frisen, J., Verge, V. M., Fried, K., Risling, M., Persson, H., Trotter, J., et al.(1993). Characterization of glial trkB receptors: differential response to injuryin the central and peripheral nervous systems. Proc. Natl. Acad. Sci. U.S.A. 90,4971–4975. doi: 10.1073/pnas.90.11.4971
Giardine, B., Riemer, C., Hardison, R. C., Burhans, R., Elnitski, L., Shah, P., et al.(2005). Galaxy: a platform for interactive large-scale genome analysis. GenomeRes. 15, 1451–1455. doi: 10.1101/gr.4086505
Goecks, J., Nekrutenko, A., and Taylor, J. (2010). Galaxy: a comprehensiveapproach for supporting accessible, reproducible, and transparent computa-tional research in the life sciences. Genome Biol. 11:R86. doi: 10.1186/gb-2010-11-8-r86
Heng, T. S., Painter, M. W., and Immunological Genome Project, C. (2008). TheImmunological Genome Project: networks of gene expression in immune cells.Nat. Immunol. 9, 1091–1094. doi: 10.1038/ni1008-1091
Hu, M., Yao, J., Cai, L., Bachman, K. E., Van Den Brule, F., Velculescu, V., et al.(2005). Distinct epigenetic changes in the stromal cells of breast cancers. Nat.Genet. 37, 899–905. doi: 10.1038/ng1596
Huang, D. W., Sherman, B. T., and Lempicki, R. A. (2009). Bioinformatics enrich-ment tools: paths toward the comprehensive functional analysis of large genelists. Nucleic Acids Res. 37, 1–13. doi: 10.1093/nar/gkn923
Huang, L., Hu, F., Xie, X., Harder, J., Fernandes, K., Zeng, X.-Y., et al. (2014). Pou4f1and pou4f2 are dispensable for the long-term survival of adult retinal ganglioncells in mice. PLoS ONE 9:e94173. doi: 10.1371/journal.pone.0094173
Inoue, K.-I., Ozaki, S., Shiga, T., Ito, K., Masuda, T., Okado, N., et al. (2002). Runx3controls the axonal projection of proprioceptive dorsal root ganglion neurons.Nat. Neurosci. 5, 946–954. doi: 10.1038/nn925
Jamieson, D. G., Moss, A., Kennedy, M., Jones, S., Nenadic, G., Robertson, D. L.,et al. (2014). The pain interactome: connecting pain specific protein interac-tions. Pain. doi: 10.1016/j.pain.2014.06.020. [Epub ahead of print].
Jankowski, M. P., Cornuet, P. K., McIlwrath, S., Koerber, H. R., and Albers,K. M. (2006). SRY-box containing gene 11 (Sox11) transcription factor isrequired for neuron survival and neurite growth. Neuroscience 143, 501–514.doi: 10.1016/j.neuroscience.2006.09.010
Jensen, L. J., Kuhn, M., Stark, M., Chaffron, S., Creevey, C., Muller, J., et al. (2009).STRING 8—a global view on proteins and their functional interactions in 630organisms. Nucleic Acids Res. 37, D412–D416. doi: 10.1093/nar/gkn760
Kalous, A., Nangle, M. R., Anastasia, A., Hempstead, B. L., and Keast, J. R. (2012).Neurotrophic actions initiated by proNGF in adult sensory neurons may requireperi-somatic glia to drive local cleavage to NGF. J. Neurochem. 122, 523–536.doi: 10.1111/j.1471-4159.2012.07799.x
Kim, D., Pertea, G., Trapnell, C., Pimentel, H., Kelley, R., and Salzberg, S. L.(2013). TopHat2: accurate alignment of transcriptomes in the presence of inser-tions, deletions and gene fusions. Genome Biol. 14:R36. doi: 10.1186/gb-2013-14-4-r36
Lee, J.-H., Park, C.-K., Chen, G., Han, Q., Xie, R.-G., Liu, T., et al. (2014). A mon-oclonal antibody that targets a Nav1.7 channel voltage sensor for pain and itchrelief. Cell 157, 1393–1404. doi: 10.1016/j.cell.2014.03.064
Lerch, J. K., Kuo, F., Motti, D., Morris, R., Bixby, J. L., and Lemmon, V. P.(2012). Isoform diversity and regulation in peripheral and central neuronsrevealed through RNA-Seq. PLoS ONE 7:e30417. doi: 10.1371/journal.pone.0030417
Levanon, D., Bettoun, D., Harris-Cerruti, C., Woolf, E., Negreanu, V., Eilam,R., et al. (2002). The Runx3 transcription factor regulates development andsurvival of TrkC dorsal root ganglia neurons. EMBO J. 21, 3454–3463. doi:10.1093/emboj/cdf370
Li, H., Handsaker, B., Wysoker, A., Fennell, T., Ruan, J., Homer, N., et al.(2009). The sequence alignment/map format and SAMtools. Bioinformatics 25,2078–2079. doi: 10.1093/bioinformatics/btp352
Lobo, M. K., Karsten, S. L., Gray, M., Geschwind, D. H., and Yang, X. W.(2006). FACS-array profiling of striatal projection neuron subtypes in juve-nile and adult mouse brains. Nat. Neurosci. 9, 443–452. doi: 10.1038/nn1654
Lopes, C., Liu, Z., Xu, Y., and Ma, Q. (2012). Tlx3 and Runx1 act in combina-tion to coordinate the development of a cohort of nociceptors, thermoceptors,and pruriceptors. J. Neurosci. 32, 9706–9715. doi: 10.1523/JNEUROSCI.1109-12.2012
Macgillavry, H. D., Stam, F. J., Sassen, M. M., Kegel, L., Hendriks, W. T.,Verhaagen, J., et al. (2009). NFIL3 and cAMP response element-bindingprotein form a transcriptional feedforward loop that controls neuronalregeneration-associated gene expression. J. Neurosci. 29, 15542–15550. doi:10.1523/JNEUROSCI.3938-09.2009
Malin, S. A., Davis, B. M., and Molliver, D. C. (2007). Production of disso-ciated sensory neuron cultures and considerations for their use in studyingneuronal function and plasticity. Nat. Protoc. 2, 152–160. doi: 10.1038/nprot.2006.461
Mi, H., Muruganujan, A., and Thomas, P. D. (2013). PANTHER in 2013: mod-eling the evolution of gene function, and other gene attributes, in the contextof phylogenetic trees. Nucleic Acids Res. 41, D377–D386. doi: 10.1093/nar/gks1118
Mitchell, K., Bates, B. D., Keller, J. M., Lopez, M., Scholl, L., Navarro, J., et al. (2010).Ablation of rat TRPV1-expressing Adelta/C-fibers with resiniferatoxin: analysisof withdrawal behaviors, recovery of function and molecular correlates. Mol.Pain 6, 8069–8066. doi: 10.1186/1744-8069-6-94
Ohno, K., Kato, H., Funahashi, S., Hasegawa, T., and Sato, K. (2009).Characterization of CLP36/Elfin/PDLIM1 in the nervous system. J. Neurochem.111, 790–800. doi: 10.1111/j.1471-4159.2009.06370.x
Okaty, B. W., Sugino, K., and Nelson, S. B. (2011a). Cell type-specific transcrip-tomics in the brain. J. Neurosci. 31, 6939–6943. doi: 10.1523/JNEUROSCI.0626-11.2011
Frontiers in Molecular Neuroscience www.frontiersin.org November 2014 | Volume 7 | Article 87 | 10

Thakur et al. Defining the nociceptor transcriptome
Okaty, B. W., Sugino, K., and Nelson, S. B. (2011b). A quantitative comparison ofcell-type-specific microarray gene expression profiling methods in the mousebrain. PLoS ONE 6:e16493. doi: 10.1371/journal.pone.0016493
Perkins, J. R., Antunes-Martins, A., Calvo, M., Grist, J., Rust, W., Schmid, R.,et al. (2014). A comparison of RNA-seq and exon arrays for whole genometranscription profiling of the L5 spinal nerve transection model of neuropathicpain in the rat. Mol. Pain 10:7. doi: 10.1186/1744-8069-10-7
Saeed, A., Sharov, V., White, J., Li, J., Liang, W., Bhagabati, N., et al. (2003).TM4: a free, open-source system for microarray data management and analysis.Biotechniques 34, 374–378.
Shields, S. D., Ahn, H.-S., Yang, Y., Han, C., Seal, R. P., Wood, J. N.,et al. (2012). Nav1.8 expression is not restricted to nociceptors in mouseperipheral nervous system. Pain 153, 2017–2030. doi: 10.1016/j.pain.2012.04.022
Shoemaker, J. E., Lopes, T. J., Ghosh, S., Matsuoka, Y., Kawaoka, Y., and Kitano, H.(2012). CTen: a web-based platform for identifying enriched cell types fromheterogeneous microarray data. BMC Genomics 13:460. doi: 10.1186/1471-2164-13-460
Trapnell, C., Roberts, A., Goff, L., Pertea, G., Kim, D., Kelley, D. R., et al.(2012). Differential gene and transcript expression analysis of RNA-seqexperiments with TopHat and Cufflinks. Nat. Protoc. 7, 562–578. doi:10.1038/nprot.2012.016
Wallace, T. L., and Johnson, E. M. (1989). Cytosine arabinoside kills postmitoticneurons: evidence that deoxycytidine may have a role in neuronal survival thatis independent of DNA synthesis. J. Neurosci. 9, 115–124.
Wu, L. C., Goettl, V. M., Madiai, F., Hackshaw, K. V., and Hussain, S. R. (2006).Reciprocal regulation of nuclear factor kappa B and its inhibitor ZAS3 afterperipheral nerve injury. BMC Neurosci. 7:4. doi: 10.1186/1471-2202-7-4
Yang, F.-C., Tan, T., Huang, T., Christianson, J., Samad, O. A., Liu, Y., et al.(2013). Genetic control of the segregation of pain-related sensory neuronsinnervating the cutaneous versus deep tissues. Cell Rep. 5, 1353–1364. doi:10.1016/j.celrep.2013.11.005
Yasuda, M., Tanaka, Y., Ryu, M., Tsuda, S., and Nakazawa, T. (2014). RNA sequencereveals mouse retinal transcriptome changes early after axonal injury. PLoS ONE9:e93258. doi: 10.1371/journal.pone.0093258
Zhang, Y., Chen, K., Sloan, S. A., Bennett, M. L., Scholze, A. R., O’Keeffe, S., et al.(2014). An RNA-sequencing transcriptome and splicing database of glia, neu-rons, and vascular cells of the cerebral cortex. J. Neurosci. 34, 11929–11947. doi:10.1523/JNEUROSCI.1860-14.2014
Zou, H., Ho, C., Wong, K., and Tessier-Lavigne, M. (2009). Axotomy-inducedSmad1 activation promotes axonal growth in adult sensory neurons. J. Neurosci.29, 7116–7123. doi: 10.1523/JNEUROSCI.5397-08.2009
Zou, M., Li, S., Klein, W. H., and Xiang, M. (2012). Brn3a/Pou4f1 regulatesdorsal root ganglion sensory neuron specification and axonal projectioninto the spinal cord. Dev. Biol. 364, 114–127. doi: 10.1016/j.ydbio.2012.01.021
Conflict of Interest Statement: The authors declare that the research was con-ducted in the absence of any commercial or financial relationships that could beconstrued as a potential conflict of interest.
Received: 02 September 2014; accepted: 25 October 2014; published online: 11November 2014.Citation: Thakur M, Crow M, Richards N, Davey GIJ, Levine E, Kelleher JH, AgleyCC, Denk F, Harridge SDR and McMahon SB (2014) Defining the nociceptortranscriptome. Front. Mol. Neurosci. 7:87. doi: 10.3389/fnmol.2014.00087This article was submitted to the journal Frontiers in Molecular Neuroscience.Copyright © 2014 Thakur, Crow, Richards, Davey, Levine, Kelleher, Agley, Denk,Harridge and McMahon. This is an open-access article distributed under the terms ofthe Creative Commons Attribution License (CC BY). The use, distribution or repro-duction in other forums is permitted, provided the original author(s) or licensor arecredited and that the original publication in this journal is cited, in accordance withaccepted academic practice. No use, distribution or reproduction is permitted whichdoes not comply with these terms.
Frontiers in Molecular Neuroscience www.frontiersin.org November 2014 | Volume 7 | Article 87 | 11
Copyright © 2022 FDOKUMEN