Transcriptome Profiling of Human and Murine ESCs Identifies Divergent Paths Required to Maintain the...
20
O riginal A rticle Stem Cells 2005;23:166–185 www.StemCells.com Transcriptome Profiling of Human and Murine ESCs Identifies Divergent Paths Required to Maintain the Stem Cell State Chia Lin Wei, a Takumi Miura, b Paul Robson, a,d Sai-Kiang Lim, a Xiu-Qin Xu, a Mathia Yu-Chuan Lee, a Sanjay Gupta, a Lawrence Stanton, a Yongquan Luo, b Jacqui Schmitt, f Scott Thies, g Wei Wang, e Irina Khrebtukova, e Daixing Zhou, e Edison T. Liu, a Yi Jun Ruan, a Mahendra Rao, b Bing Lim a, c ªGenome Institute of Singapore, Singapore; b National Institute of Ageing; Stem Cell, Laboratory of Neuroscience, Baltimore, Maryland, USA; c Division of Cancer Biology, Beth Israel Deaconess Medical Center, Harvard Institutes of Medicine, Boston, Massachusetts, USA; d Department of Biological Sciences, National University of Singapore, Singapore; e Lynx Therapeutics Inc., Hayward, California, USA; f Embryo Stem Cell International, Singapore; g Geron Corporation, Menlo Park, California, USA Key Words. Embryonic stem cells, murine and human • Transcriptome • Massively parallel signature sequencing (MPSS) Correspondence: Bing Lim, M.D., Ph.D., Genome Institute of Singapore, 60 Biopolis Street, Genome #02-01, Singapore 138672. Telephone: 65-6478-8000; Fax: 65-6478-9005; e-mail: [email protected]; and Mahendra Rao, M.D., Ph.D., National Institute of Ageing: Stem Cell, LNS, GRC, 333 Cassell Drive, Baltimore, MD 21224. Telephone: 410-558-8204; Fax: 410-558- 8249; e-mail: [email protected] Received July 20, 2004; accepted for publication September 15, 2004. ©AlphaMed Press 1066-5099/2005/$12.00/0 doi: 10.1634/stemcells.2004-0162 Abstract Human embryonic stem cells (hESCs) are an important source of stem cells in regenerative medicine, and much remains unknown about their molecular characteristics. To develop a detailed genomic profile of ESC lines in two different species, we compared transcriptomes of one murine and two different hESC lines by massively paral- lel signature sequencing (MPSS). Over 2 million signature tags from each line and their differentiating embryoid bodies were sequenced. Major differences and conserved similarities between species identified by MPSS were validated by reverse transcription polymerase chain reac- tion (RT-PCR) and microarray. The two hESC lines were similar overall, with differences that are attributable to alleles and propagation. Human–mouse comparisons, however, identified only a small (core) set of conserved genes that included genes known to be important in ESC biology, as well as additional novel genes. Identi- fied were major differences in leukemia inhibitory factor, transforming growth factor-beta, and Wnt and fibroblast growth factor signaling pathways, as well as the expression of genes encoding metabolic, cytoskeletal, and matrix proteins, many of which were verified by RT-PCR or by comparing them with published databases. The study reported here under- scores the importance of cross-species compari- sons and the versatility and sensitivity of MPSS as a powerful complement to current array technology. Stem Cells 2005;23:166–185 Introduction Human embryonic stem cells (hESCs) are a versatile and valu- able source of tissue-specific stem cells in regenerative medi- cine, and the ability to manipulate their growth and differentia- tion is a major challenge. Many of their molecular characteristics are still poorly understood. All stem cells share properties of pluripotency and self-renewal capacity that are progressively restricted when stem cells undergo differentiation. Progress toward the molecular understanding of these properties has been made, with detailed work on candidate genes for these devel-
-
Upload
independent -
Category
Documents
-
view
2 -
download
0
Transcript of Transcriptome Profiling of Human and Murine ESCs Identifies Divergent Paths Required to Maintain the...
Original Article
Stem Cells 2005;23:166–185 www.StemCells.com
Transcriptome Profiling of Human and Murine ESCs Identifies
Divergent Paths Required to Maintain the Stem Cell State
Chia Lin Wei,a Takumi Miura,b Paul Robson,a,d Sai-Kiang Lim,a Xiu-Qin Xu,a Mathia Yu-Chuan Lee,a Sanjay Gupta,a Lawrence Stanton,a Yongquan Luo,b
Jacqui Schmitt,f Scott Thies,g Wei Wang,e Irina Khrebtukova,e Daixing Zhou,e Edison T. Liu,a Yi Jun Ruan,a Mahendra Rao,b Bing Lima, c
ªGenome Institute of Singapore, Singapore; bNational Institute of Ageing; Stem Cell, Laboratory of
Neuroscience, Baltimore, Maryland, USA; cDivision of Cancer Biology, Beth Israel Deaconess Medical Center,
Harvard Institutes of Medicine, Boston, Massachusetts, USA; dDepartment of Biological Sciences,
National University of Singapore, Singapore; eLynx Therapeutics Inc., Hayward, California, USA; fEmbryo Stem Cell International, Singapore; gGeron Corporation, Menlo Park, California, USA
Key Words. Embryonic stem cells, murine and human • Transcriptome • Massively parallel signature sequencing (MPSS)
Correspondence: Bing Lim, M.D., Ph.D., Genome Institute of Singapore, 60 Biopolis Street, Genome #02-01, Singapore 138672. Telephone: 65-6478-8000; Fax: 65-6478-9005; e-mail: [email protected]; and Mahendra Rao, M.D., Ph.D., National Institute of Ageing: Stem Cell, LNS, GRC, 333 Cassell Drive, Baltimore, MD 21224. Telephone: 410-558-8204; Fax: 410-558-8249; e-mail: [email protected] Received July 20, 2004; accepted for publication September 15, 2004. ©AlphaMed Press 1066-5099/2005/$12.00/0 doi: 10.1634/stemcells.2004-0162
AbstractHuman embryonic stem cells (hESCs) are an important source of stem cells in regenerative medicine, and much remains unknown about their molecular characteristics. To develop a detailed genomic profile of ESC lines in two different species, we compared transcriptomes of one murine and two different hESC lines by massively paral-lel signature sequencing (MPSS). Over 2 million signature tags from each line and their differentiating embryoid bodies were sequenced. Major differences and conserved similarities between species identified by MPSS were validated by reverse transcription polymerase chain reac-tion (RT-PCR) and microarray. The two hESC lines were similar overall, with differences that are attributable to alleles and propagation. Human–mouse comparisons,
however, identified only a small (core) set of conserved genes that included genes known to be important in ESC biology, as well as additional novel genes. Identi-fied were major differences in leukemia inhibitory factor, transforming growth factor-beta, and Wnt and fibroblast growth factor signaling pathways, as well as the expression of genes encoding metabolic, cytoskeletal, and matrix proteins, many of which were verified by RT-PCR or by comparing them with published databases. The study reported here under-scores the importance of cross-species compari-sons and the versatility and sensitivity of MPSS as a powerful complement to current array technology. Stem Cells 2005;23:166–185
IntroductionHuman embryonic stem cells (hESCs) are a versatile and valu-
able source of tissue-specific stem cells in regenerative medi-
cine, and the ability to manipulate their growth and differentia-
tion is a major challenge. Many of their molecular characteristics
are still poorly understood. All stem cells share properties of
pluripotency and self-renewal capacity that are progressively
restricted when stem cells undergo differentiation. Progress
toward the molecular understanding of these properties has been
made, with detailed work on candidate genes for these devel-
Wei, Miura, Robson et al. 167
opmental decisions. An important complementary study is the
comprehensive elucidation of the genetic components and pro-
grams regulating stem cell fate decisions. To this end, several
groups have begun the analysis of the transcriptome of hESCs
using the generation of expressed sequence tags (ESTs), serial
analysis of gene expression (SAGE), microarray, and massively
parallel signature sequencing (MPSS) [1–8].
ESCs can be propagated as undifferentiated cells in
large numbers more easily than can adult stem cells. ESCs
are excellent tools for studying early events in development
as the generation of ESC-derived embryoid bodies (EBs)
recapitulates early embryo development. ESCs have been
isolated from multiple species, including murine, swine,
simian, and human blastocysts. Mouse and human ESCs are
similar in that they grow as colonies of tightly packed cells
on inactivated murine embryonic fibroblast (MEF) feeders
or in conditioned medium (CM) derived from such MEFs
[9]. Both stem cell populations have the potential to form
teratomas and to differentiate in vitro into all three germ lay-
ers—namely, ectoderm, endoderm, and mesoderm. Many
markers characteristic of undifferentiated cells, including
oct-4, nanog, sox-2, and utf-1, are expressed by both popula-
tions of cells. The expression of these markers, together with
the absence of differentiation markers, constitutes a signa-
ture profile of undifferentiated ESC cultures irrespective of
their species origin [2, 8].
Nevertheless, important differences exist in the
growth rates, culture requirements, and marker expression
of human and murine ESCs. This divergence has generally
been ascribed to fundamental differences in the pathways
that regulate self-renewal, apoptosis, and proliferation [4,
7]. Some examples include SSEA1, SSEA3, and SSEA4
expression [10]; the ability to differentiate into tropho-
blasts [11]; and the dependency on leukemia inhibitory
factor (LIF) [12, 13]. These multiple reported differences
raise the possibility that additional differences exist and
provide a compelling rationale to comprehensively map
the transcriptome of ESCs.
Human and mouse ESC transcriptomes have been indi-
vidually mapped to varying depths and breadths with regard to
their respective genomes [2, 4, 5, 8, 14–16], though no detailed
pairwise comparisons have been performed. Sato et al. [2]
compared human and murine ESCs using microarray. More
recently, Ginis and colleagues [7] compared the expression
of about 400 genes in human and murine ESCs and showed
that at least a quarter of the genes tested have significant dif-
ferences in their expression. These results suggested that the
differences represent, at best, a small fraction of the variations
that exist and that a large-scale analysis would identify more
important differences.
Comparisons reported so far have been limited by the
availability of cross-species and homologous arrays. Other
large-scale techniques, such as SAGE and the generation of
ESTs, have not been used, perhaps because of the cost and the
limitations in gene annotation. More recently, better anno-
tation of genomic data and improvements in technology,
together with development of alternative techniques such as
MPSS [17], have permitted a deeper and more complete map-
ping of transcriptomes at a significantly cheaper price than
with conventional SAGE and EST generation. The underlying
principle of MPSS, like SAGE, is that a signature sequence of
20 bases starting from the 3'-most DpnII (GATC) site is gen-
erated for each transcript. In MPSS, at least 1 million 20-base
tags are identified. Considering that an estimated 200,000–
300,000 transcripts exist in a single cell, this method theoreti-
cally allows for all transcripts in a cell to be measured without
the constraints of probe availability. It provides an unprec-
edented coverage in depth and breadth of any transcriptome
at a greatly enhanced sensitivity compared with the average
SAGE library tag generation, which is typically tens of thou-
sands of tags. MPSS analysis measures transcript levels using
a standard unit of measurement, transcripts per million (tpm),
rather than a relative unit in reference to a biological RNA
standard, thus allowing one to estimate the copy numbers of
different transcripts per cell and compare expression patterns
across homologous cells of different species. Furthermore,
MPSS has the ability to detect novel transcripts.
We have chosen MPSS to examine gene expression in
ESCs from the murine E14 line and in independently derived
hESC lines: The HES-2 line is from ES Cell International (Sin-
gapore, http://www.escellinternational.com), and the pooled
cell lines H1, H7, and H9 are from WiCell Research Institute,
Inc. (Madison, WI, http://www.wicell.org). MPSS has allowed
us to assess the complexity of ESCs and EBs and to generate a
far more exhaustive list of differences and similarities between
mouse and human ESCs than has previously been reported.
By comparing gene expression between hESC lines, we also
identified culture, developmental, and allelic differences. The
usefulness and power of developing such a comprehensive
expression database is highlighted by our ability not only to
identify putative signaling or biochemical pathways active in
ESCs but also to assess the integrity of these pathways from
receptors to signaling intermediates and then target substrates
at the transcript level.
Materials and Methods
Cell CultureFor all mouse cell work, the ESC line E14 was used. Undif-
ferentiated mouse ESCs (mESCs) were maintained on
inactivated MEFs in ESC medium consisting of Dulbecco’s
168 Human and Murine ESC Transcriptome
modified Eagle’s medium (DMEM; Gibco Life Technology,
Gaithersburg, MD, http://www.invitrogen.com) supple-
mented with 20% defined fetal bovine serum (FBS; HyClone,
Logan, UT, http://www.hyclone.com), 1% nonessential amino
acids (Gibco), 0.1 mM β-mercaptoethanol (Gibco), penicillin/
streptomycin (Gibco), and CHO-LIF-conditioned medium
(glycosylated LIF produced in Chinese hamster ovary cells
generated in the author’s B.L. laboratories, equivalent of at
least 1,000 U/ml of LIF) to maintain pluripotency. Before col-
lecting cells for RNA, fibroblasts were separated from mESCs
by trypsinization and transient adherence for 15 minutes; this
separation selectively removes the fibroblasts. Undifferenti-
ated mESCs were then grown feeder-free on gelatin-coated
plates for two more passages in the medium described above,
prior to the harvesting of RNA or for differentiation into mouse
EBs (mEBs). The mEBs were generated by trypsinization
and dissociation of undifferentiated mESCs into single-cell
suspension at a density of 4 × 10⁵ cells/ml in the above ESC
medium but without the LIF supplement. These cells were cul-
tured in nonadherent bacterial Petri dishes, and the medium
was initially replaced after 48 hours and subsequently every 24
hours. RNA was isolated on day 4 of differentiation.
The human HES-2 line [18], provided by and cultured at
ES Cell International, was used for extracting RNA by the
Genome Institute of Singapore (GIS; http://www.gis.a-star.
edu.sg) and subsequently generating the GIS hESC MPSS
dataset. These cells (referred to as hESCsESI) were grown on
inactivated MEFs in DMEM (Gibco) containing 20% defined
FBS (HyClone), 8 ng/ml of basic fibroblast growth factor
(bFGF; Gibco), 0.1 mM β-mercaptoethanol, 2 mM L-gluta-
mine, 1% nonessential amino acids, 1% insulin-transferrin-
selenium supplement (Gibco), and 0.5% penicillin/strepto-
mycin (Gibco). The hESCsESI were passaged every 7 days by
mechanical splitting under a dissecting microscope and divid-
ing the individual colonies into approximately eight pieces.
Cells were collected over a period of time, spanning passage
numbers 105–115. For RNA isolation, colonies were cut just
outside of the inner button and just inside the outer edge of
each colony, and the intervening cells were harvested.
The MPSS datasets from NIA (National Institute of
Ageing) hESCs and EBs were generated from RNAs of
the hESC lines H1, H7, and H9 [10] and are referred to as
hESCsWi and hEBsWi. These cells were maintained and pas-
saged under feeder-free conditions as described [9]. Briefly,
CM was generated from primary MEFs cultured in hESCWi
media comprised of 80% knockout DMEM (KO-DMEM;
Gibco), 20% knockout serum replacement (Gibco), 0.1
mM β-mercaptoethanol, 1 mM L-glutamine, 1% nonessen-
tial amino acids, supplemented with 4 ng/ml human bFGF
(Gibco). This medium was collected daily and used imme-
diately for feeding hESCWi cultures. MEFs for generating
CM were re-fed daily and used for a maximum of 7 days.
Before it was added to the hESCWi cultures, the MEF CM
was supplemented with an additional 4 ng/ml of human
bFGF (Gibco). The hESCWi cultures were maintained on
Matrigel in this CM and were passaged by incubation in
200 U/ml collagenase IV (Gibco) for 5–10 minutes at 37°C
and then gently dissociated into small clusters in CM. Cells
were passaged once every week. The hEBWi cultures were
formed as described previously [19]. Briefly, undifferen-
tiated hESCWi cultures were harvested by incubation with
200 U/ml collagenase at 37°C for 5–10 minutes. The cells
were gently scraped from the dish and resuspended in ultra
low attachment polystyrene plates (Corning, Acton, MA,
http://www.corning.com) in medium comprised of KO-
DMEM, 20% FBS, 1% nonessential amino acids, 1 mM
glutamate, and 0.1 mM β-mercaptoethanol. RNA was iso-
lated on day 12 of differentiation.
RNA IsolationAll RNA purifications were done using Trizol, following the
manufacturer’s protocol. For the pooled samples of hESCsWi
and hEBsWi, equal quantities of RNA from the three cell lines
were combined. All RNA samples were initially evaluated
for the presence or absence of ESC differentiation markers
by reverse transcription polymerase chain reaction (RT-
PCR). The quality of all RNA preparations was confirmed
prior to MPSS analysis by Agilent Bioanalyzer (Palo Alto,
CA, http://www.chem.agilent.com).
MPSS AnalysisPoly(A)+ RNA was isolated from total RNA samples and used
to generate cDNA, which was subsequently digested with the
restriction enzyme DpnII. Poly(A)-containing DpnII restric-
tion fragments were purified by hybridization to oligo(dT).
An adapter was added to the 5' end of the fragment that
directed a type II restriction enzyme, MmeI, to digest within
the cDNA fragment 20 base pairs (bp) from the DpnII site
(starting at G of GATC). At this point, all cDNA species (sig-
natures) were a uniform length of 20 bp. A second adapter was
added to the 3' end of each signature. These uniform-length
cDNA signatures were subsequently placed into the Mega-
clone vector, and their sequence was determined following
the previously published protocol [17, 20] of Lynx Therapeu-
tics (Hayward, CA, http://www.lynxgen.com).
The abundance for each signature was converted to
tpm for the purpose of comparison between samples [21].
Only reliable and significant signatures were considered,
this being a signature present in at least two MPSS runs
out of multiple runs and presented as at least 4 tpm in at
least one sample. The tpm shown in all datasets is the
average of four runs.
Wei, Miura, Robson et al. 169
MPSS classifications are as follows:
Class 1—forward strand, polyA signal,
polyA tail, 3'-most
Class 2—forward strand, polyA signal, 3'-most
Class 3—forward strand, polyA tail, 3'-most
Class 4—forward strand, no polyA info, 3'-most
Class 5—forward strand, no polyA info, not 3'-most
Class 22—unknown orientation, polyA signal,
last before signal
Class 23—unknown orientation, polyA tail,
last before tail
To simplify the MPSS data analysis, multiple signa-
tures mapping to the same Unigene ID (Mm build 130 and
Hs build 163) [22] for each dataset were combined into one
tpm count as follows: the sum of tpm for signatures of class
1, 2, 3, 22, and 23, if any are found; if those are not found, the
sum of class 4; and if still nothing is found, the sum of class
5 signatures. The HomoloGene database (http://www.ncbi.
nlm.nih.gov/entrez/query.fcgi?db=homologene) was used
to map human and murine orthologues.
While preparing this manuscript, we established a stem
cell database to host all the MPSS results we discuss here.
Readers can reach this site at the following GIS link: http://
www.gis.a-star.edu.sg/homepage/gistools.jsp. To organize the
data, each of the unique tags was assigned a unique ID and then
was mapped to current genome assembly (mm.5 for mouse;
hg.17 for human). Those tags that have genomic coordinates
were annotated based on the UCSC (University of California,
Santa Cruz) genome browser annotation database (http://
genome.ucsc.edu/). Readers are able to navigate and search for
genes of interest to obtain information about expression lev-
els, to compare cell types, and to link to other databases. For
detailed information, please refer to the GIS Website.
Focused-Chip Assay and RT-PCRFocused microarray chips (SuperArray, Frederick, MD,
http://www.superarray.com) were prepared and hybridized
with labeled total RNA following the manufacturer’s proto-
col. RT-PCR was performed following standard established
protocols. The RT-PCR primers used are shown in supple-
mentary online data 1.
Results
Evaluation of Transcriptome Complexity in ESCs by MPSS AnalysisTwo MPSS datasets were generated from RNAs of undiffer-
entiated feeder-free mESCs and day-4 mEBs. Three MPSS
datasets were generated from RNA of hESCs, two represent-
ing undifferentiated hESCsESI and hESCsWi and one from
12-day hEBsWi. The hESCWi RNA was from a pool of three
National Institutes of Health (NIH)–approved lines (H1,
H7, and H9) from WiCell, grown feeder-free [23], and hEBWi
RNA was derived from EBs from these three cell lines. The
hESCESI line was grown in the presence of MEF feeders.
RNA samples that passed through quality-control
checks were subjected to MPSS analysis (see Materials
and Methods). Signature sequence tags of 20 bp in length
were generated to a depth of greater than 2.2 million tags
for each sample. Tag counts of each unique signature were
expressed as tpm. From the MPSS libraries, the total number
of tags successfully sequenced from four different runs was
2,660,962; 2,367,247; 2,295,140; 2,403,315; and 2,591,008
for mESCs, mEBs, hESCsESI, hESCsWi, and hEBsW, respec-
tively. Distinct signatures present in at least two MPSS runs
and presented as at least 4 tpm per run totaled 13,824; 9,845;
20,027; 23,500; and 17,278 for mESCs, mEBs, hESCsESI,
hESCsWi, and hEBsWi, respectively.
We first evaluated the total complexity of the signa-
ture generated for each sample, expressed as total signifi-
cant signatures with the cumulative tpm (with cutoff at >10
tpm) of signature distributions for mESCs, mEBs, hESCsESI,
hESCsWi, and hEBsWi , as shown in Table 1 (for complete data,
see supplementary online data 2 for hESCs and hEBs and
supplementary online data 3 for murine equivalents). The
distributions of the number of unique signature tags and
their percentages are compiled cumulatively from the highest
abundant signatures (0.04%–0.20%) to the lowest abundant
signatures (total 55%–70%).
Despite the difference in transcriptome complexity, the
distribution of signature sequences based on abundance
was strikingly similar in human and mouse ESCs. Fewer
than 2% of the signature sequences were expressed at the
high level of greater than 1,000 tpm; more than 70% of sig-
natures were expressed at less than 50 tpm; and more than
30% of all signatures were present at a level of 10 tpm or
lower (Table 1 and supplementary online Table 1). The typi-
cal detection limit by microarray analysis and SAGE is esti-
mated at around 55 tpm [21, 24].
The unique signature sequences were then mapped to
Unigene clusters (Mm.130 and Hs.163), resulting in 6,712;
5,779; 9,093; 9,953; and 8,950 unique Unigene IDs iden-
tified in mESCs, mEBs, hESCsESI, hESCsWi, and hEBsWi,
respectively (Table 1; see supplementary online Table 1 and
accompanying text for explanation). The reduced num-
ber of Unigene signatures resulted from multiple signature
sequences mapping to the same Unigene cluster. Thus, the
complexity of ESCs is comparable to that seen in somatic cell
populations examined by MPSS [25]. Interestingly, for both
the mouse and human samples, the undifferentiated cells had
a slightly higher level of complexity than the corresponding
170 Human and Murine ESC Transcriptome
EBs had. Examination of the most abundant genes showed
that, to a large extent, the top 200 or so genes were comprised
of ribosomal, mitochondrial, and housekeeping genes, while
growth factors, transcription factors, and regulators of gene
expression were expressed in the low tpm range. The low
abundance of regulatory and biologically relevant genes
highlighted the importance of analyzing expression at high
resolution by methods such as MPSS.
MPSS Provides a Robust Assessment of the ESC StateTheoretically, MPSS at greater than 2.2 million signatures
generated per sample should provide relatively compre-
hensive coverage of gene expression in a given cell type. To
directly ascertain the quality of data, we first examined a
list of ESC-specific genes that are known to be expressed at
moderate abundance in murine and human ESCs. As shown
in Table 2, genes such as oct-4/pou5f1, sox-2, utf-1, and
tdgf-1 were well represented in MPSS-derived transcrip-
tome maps of both human and murine ES lines. Markers of
differentiation known to be upregulated in differentiating
EBs (e.g., COL4A2 [collagen type IV] and AFP [α-fetopro-
tein]) showed the expected increase in transcript frequency
as ESCs differentiated.
As a further test of general robustness, the MPSS data
were compared against a list of 283 “ES-specific” genes
derived from the intersection of three independent studies
comparing murine ESCs with various differentiated cells by
microarray analysis aimed at identifying genes preferentially
expressed in mESCs [16]. Table 3 shows a list of selected
examples of these genes and the corresponding MPSS tpm
values from mouse and human ESC and EB datasets and the
average rank of each gene in the three microarray datasets
(complete dataset in supplementary online data 4).
This initial assessment of MPSS analysis allowed us to
make several pertinent observations about the interpreta-
tions and usefulness of MPSS-generated datasets. The first
observation was that almost all the genes detected by micro-
array can be detected in mESCs by MPSS. While there was
good correlation between transcript presence or absence as
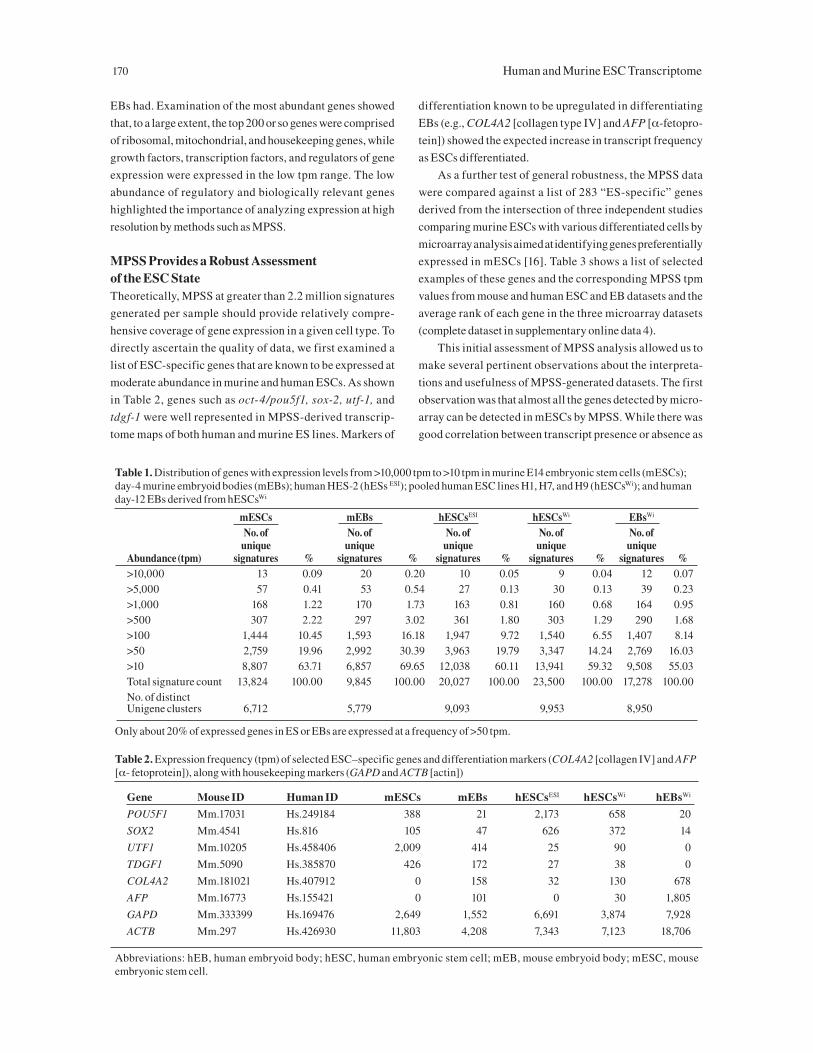
Table 1. Distribution of genes with expression levels from >10,000 tpm to >10 tpm in murine E14 embryonic stem cells (mESCs); day-4 murine embryoid bodies (mEBs); human HES-2 (hESs ESI); pooled human ESC lines H1, H7, and H9 (hESCsWi); and human day-12 EBs derived from hESCsWi
mESCs mEBs hESCsESI hESCsWi EBsWi
No. of No. of No. of No. of No. of unique unique unique unique uniqueAbundance (tpm) signatures % signatures % signatures % signatures % signatures %>10,000 13 0.09 20 0.20 10 0.05 9 0.04 12 0.07>5,000 57 0.41 53 0.54 27 0.13 30 0.13 39 0.23>1,000 168 1.22 170 1.73 163 0.81 160 0.68 164 0.95>500 307 2.22 297 3.02 361 1.80 303 1.29 290 1.68>100 1,444 10.45 1,593 16.18 1,947 9.72 1,540 6.55 1,407 8.14>50 2,759 19.96 2,992 30.39 3,963 19.79 3,347 14.24 2,769 16.03>10 8,807 63.71 6,857 69.65 12,038 60.11 13,941 59.32 9,508 55.03Total signature count 13,824 100.00 9,845 100.00 20,027 100.00 23,500 100.00 17,278 100.00No. of distinct Unigene clusters 6,712 5,779 9,093 9,953 8,950
Only about 20% of expressed genes in ES or EBs are expressed at a frequency of >50 tpm.
Table 2. Expression frequency (tpm) of selected ESC–specific genes and differentiation markers (COL4A2 [collagen IV] and AFP [α- fetoprotein]), along with housekeeping markers (GAPD and ACTB [actin])
Gene Mouse ID Human ID mESCs mEBs hESCsESI hESCsWi hEBsWi
POU5F1 Mm.17031 Hs.249184 388 21 2,173 658 20
SOX2 Mm.4541 Hs.816 105 47 626 372 14
UTF1 Mm.10205 Hs.458406 2,009 414 25 90 0
TDGF1 Mm.5090 Hs.385870 426 172 27 38 0
COL4A2 Mm.181021 Hs.407912 0 158 32 130 678
AFP Mm.16773 Hs.155421 0 101 0 30 1,805
GAPD Mm.333399 Hs.169476 2,649 1,552 6,691 3,874 7,928
ACTB Mm.297 Hs.426930 11,803 4,208 7,343 7,123 18,706
Abbreviations: hEB, human embryoid body; hESC, human embryonic stem cell; mEB, mouse embryoid body; mESC, mouse embryonic stem cell.

Wei, Miura, Robson et al. 171
Table 3. Comparison of ESC–enriched gene expression in human and murine ESCs
Avg. rank of three microaray Gene Mouse ID Human ID mESCs mEBs hESCsESI hESCsWi hEBsWi studies
Tera-pending Mm.18637 Hs.356223 14 0 52 119 0 22
TRIP13 Mm.6960 Hs.436187 149 0 57 27 0 109
Atrc3 Mm.5140 Hs.175220 72 0 258 35 13 28
Trif-pending Mm.42154 Hs.180403 37 0 108 33 2 92
EPHA2 Mm.2581 Hs.171596 103 18 191 24 61 40
MSH2 Mm.4619 Hs.440394 235 34 156 65 22 63
APEX1 Mm.203 Hs.73722 563 41 306 307 233 234
Edr1 Mm.6822 Hs.305985 334 118 144 202 14 62
Tex20 Mm.256916 Hs.189095 263 103 150 41 35 74
SFRS1 Mm.260710 Hs.68714 512 63 843 287 85 196
TUFM Mm.197829 Hs.12084 101 46 92 76 81 326
SLC2A3 Mm.7756 Hs.419240 1,150 1,344 119 100 73 76
COL18A1 Mm.4352 Hs.413175 179 126 104 111 201 72
FBXO15 Mm.28369 Hs.170668 129 21 0 0 0 6
NANOG Mm.6047 Hs.329296 112 456 Falls in repeat sequence 4
DPPA5 Mm.139314 Hs.125331 1,485 1,381 0 0 0 1
TRAP1A Mm.1297 NONE No DpnII Homologue unknown 7
DPPA4 Mm.35597 Hs.317659 8 0 321 596 23 8
ZFP42 Mm.285848 Hs.335787 245 110 Falls in repeat sequence 2
Selected list of genes common to three microarray studies [16] to identify murine genes specifically or preferentially expressed in mESCs (by comparing ESCs with non-ESCs). The MPSS tpm readings of the corresponding murine genes are shown. The aver-age rank column refers to the average ranking of the murine genes from the three microarray profiling studies: Rank 1 is the gene with the highest difference between ESCs and non-ESCs in all three microarray studies. The table shows the MPSS readings for the corresponding homologous genes in hESCs and hEBs. It illustrates examples of the failure to obtain MPSS readings due to (a) the signature having repeat sequence (human nanog and zfp42/rex 1); (b) the absence of a DpnII site (murine trap1a); (c) the absence of a homologue (trap1a).Abbreviations: hEB, human embryoid body; hESC, human embryonic stem cell; mEB, murine embryoid body; mESC, murine embryonic stem cell; MPSS, massively parallel signature sequencing.
measured by MPSS and by microarray chip analysis, there
was not a highly predictable correlation between transcript
levels estimated by these two methods. These differences
may be due to compression of signal intensities that is often
observed in microarrays.
The second observation was that some genes detected
by microarrays were not detected by MPSS. This arose from
some technical limitations of the MPSS technology that
include failure to identify cDNAs lacking a DpnII site (e.g.,
murine trap1a, Table 3), cDNAs containing a double palin-
drome within the tag (preventing sequencing by MPSS), and
cDNAs with the respective tag falling in a repeat region (e.g.,
human nanog and rex-1). For these reasons, it is important to
know the tag status of the genes of interest before conclud-
ing that it is not expressed based on the MPSS data alone.
From EST data, trap1a is known to be expressed in mESCs,
and likewise with nanog and rex-1. For all subsequent analy-
sis of genes presented in the remaining figures, we took into
consideration the technical limitations of MPSS data before
calling a tag count as zero.
A third observation was that mouse and human ESCs
appeared to differ in fundamental ways based on differing
expression levels between homologous genes identified
from our analysis. Many of the differences could be verified
by RT-PCR (see next section), suggesting that MPSS can be
used for cross-species comparisons. Thus, while MPSS was
unable to detect a small fraction of genes, this methodology
appeared sensitive and reliable. Additional expression data,
not described here, further confirmed that MPSS analy-
sis accurately and robustly described the transcriptome
of human and murine ESCs and revealed true differences
between the species.
172 Human and Murine ESC Transcriptome
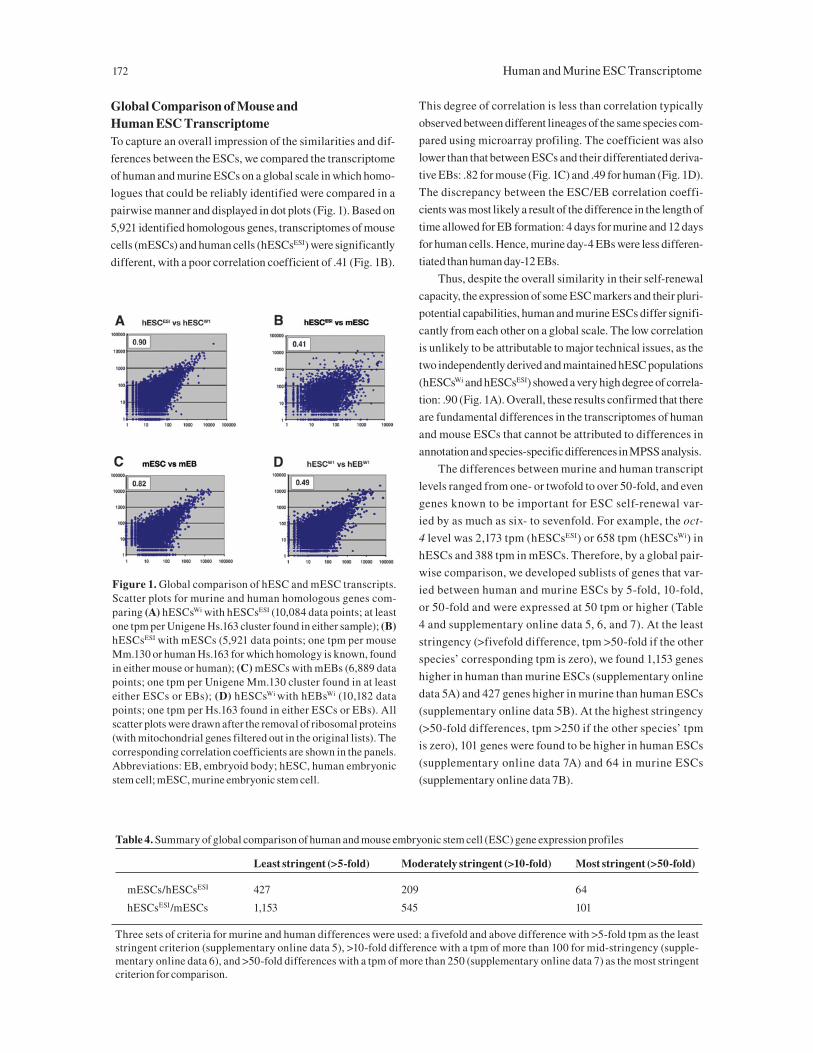
Global Comparison of Mouse and Human ESC TranscriptomeTo capture an overall impression of the similarities and dif-
ferences between the ESCs, we compared the transcriptome
of human and murine ESCs on a global scale in which homo-
logues that could be reliably identified were compared in a
pairwise manner and displayed in dot plots (Fig. 1). Based on
5,921 identified homologous genes, transcriptomes of mouse
cells (mESCs) and human cells (hESCsESI) were significantly
different, with a poor correlation coefficient of .41 (Fig. 1B).
This degree of correlation is less than correlation typically
observed between different lineages of the same species com-
pared using microarray profiling. The coefficient was also
lower than that between ESCs and their differentiated deriva-
tive EBs: .82 for mouse (Fig. 1C) and .49 for human (Fig. 1D).
The discrepancy between the ESC/EB correlation coeffi-
cients was most likely a result of the difference in the length of
time allowed for EB formation: 4 days for murine and 12 days
for human cells. Hence, murine day-4 EBs were less differen-
tiated than human day-12 EBs.
Thus, despite the overall similarity in their self-renewal
capacity, the expression of some ESC markers and their pluri-
potential capabilities, human and murine ESCs differ signifi-
cantly from each other on a global scale. The low correlation
is unlikely to be attributable to major technical issues, as the
two independently derived and maintained hESC populations
(hESCsWi and hESCsESI) showed a very high degree of correla-
tion: .90 (Fig. 1A). Overall, these results confirmed that there
are fundamental differences in the transcriptomes of human
and mouse ESCs that cannot be attributed to differences in
annotation and species-specific differences in MPSS analysis.
The differences between murine and human transcript
levels ranged from one- or twofold to over 50-fold, and even
genes known to be important for ESC self-renewal var-
ied by as much as six- to sevenfold. For example, the oct-
4 level was 2,173 tpm (hESCsESI) or 658 tpm (hESCsWi) in
hESCs and 388 tpm in mESCs. Therefore, by a global pair-
wise comparison, we developed sublists of genes that var-
ied between human and murine ESCs by 5-fold, 10-fold,
or 50-fold and were expressed at 50 tpm or higher (Table
4 and supplementary online data 5, 6, and 7). At the least
stringency (>fivefold difference, tpm >50-fold if the other
species’ corresponding tpm is zero), we found 1,153 genes
higher in human than murine ESCs (supplementary online
data 5A) and 427 genes higher in murine than human ESCs
(supplementary online data 5B). At the highest stringency
(>50-fold differences, tpm >250 if the other species’ tpm
is zero), 101 genes were found to be higher in human ESCs
(supplementary online data 7A) and 64 in murine ESCs
(supplementary online data 7B).
Figure 1. Global comparison of hESC and mESC transcripts. Scatter plots for murine and human homologous genes com-paring (A) hESCsWi with hESCsESI (10,084 data points; at least one tpm per Unigene Hs.163 cluster found in either sample); (B) hESCsESI with mESCs (5,921 data points; one tpm per mouse Mm.130 or human Hs.163 for which homology is known, found in either mouse or human); (C) mESCs with mEBs (6,889 data points; one tpm per Unigene Mm.130 cluster found in at least either ESCs or EBs); (D) hESCsWi with hEBsWi (10,182 data points; one tpm per Hs.163 found in either ESCs or EBs). All scatter plots were drawn after the removal of ribosomal proteins (with mitochondrial genes filtered out in the original lists). The corresponding correlation coefficients are shown in the panels. Abbreviations: EB, embryoid body; hESC, human embryonic stem cell; mESC, murine embryonic stem cell.
Table 4. Summary of global comparison of human and mouse embryonic stem cell (ESC) gene expression profiles
Least stringent (>5-fold) Moderately stringent (>10-fold) Most stringent (>50-fold)
mESCs/hESCsESI 427 209 64
hESCsESI/mESCs 1,153 545 101
Three sets of criteria for murine and human differences were used: a fivefold and above difference with >5-fold tpm as the least stringent criterion (supplementary online data 5), >10-fold difference with a tpm of more than 100 for mid-stringency (supple-mentary online data 6), and >50-fold differences with a tpm of more than 250 (supplementary online data 7) as the most stringent criterion for comparison.
Wei, Miura, Robson et al. 173
The differences noted between human and murine ESCs
cannot be discussed in complete detail, and readers can exam-
ine and use the supplementary online data (5, 6, and 7) for
detailed information.
Genes differentially expressed were functionally catego-
rized (by the gene ontology classification) to determine if dif-
ferences were restricted to particular classes.
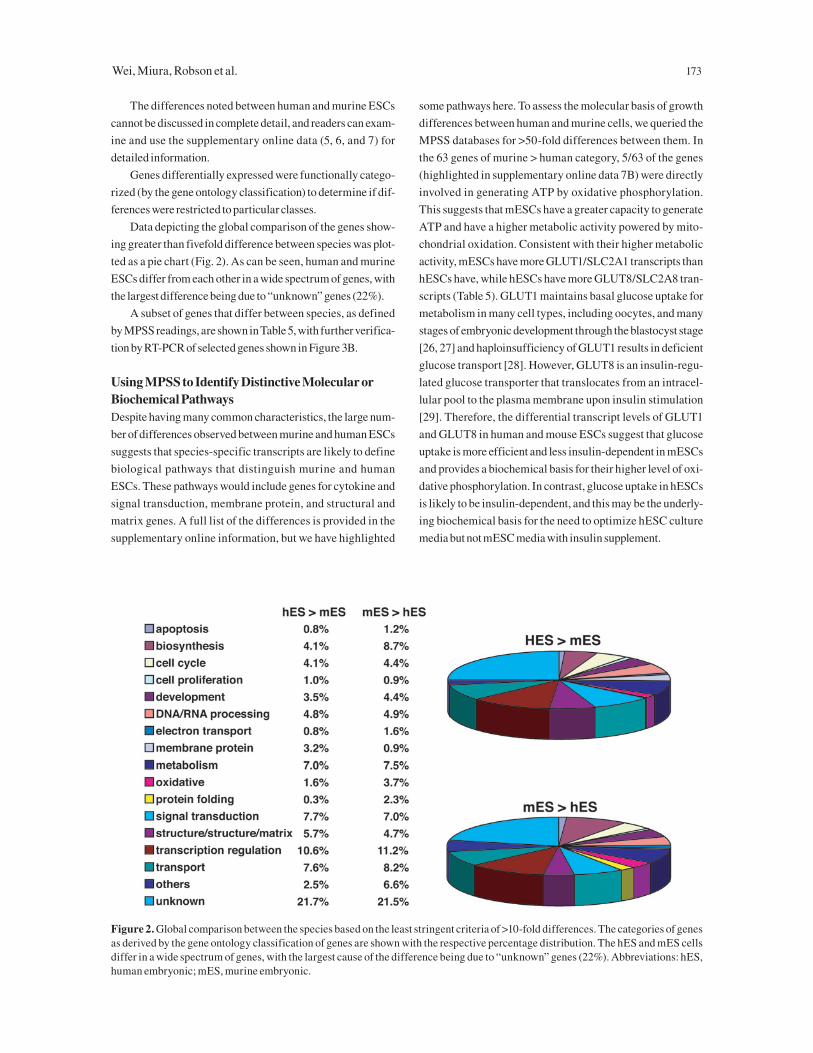
Data depicting the global comparison of the genes show-
ing greater than fivefold difference between species was plot-
ted as a pie chart (Fig. 2). As can be seen, human and murine
ESCs differ from each other in a wide spectrum of genes, with
the largest difference being due to “unknown” genes (22%).
A subset of genes that differ between species, as defined
by MPSS readings, are shown in Table 5, with further verifica-
tion by RT-PCR of selected genes shown in Figure 3B.
Using MPSS to Identify Distinctive Molecular or Biochemical PathwaysDespite having many common characteristics, the large num-
ber of differences observed between murine and human ESCs
suggests that species-specific transcripts are likely to define
biological pathways that distinguish murine and human
ESCs. These pathways would include genes for cytokine and
signal transduction, membrane protein, and structural and
matrix genes. A full list of the differences is provided in the
supplementary online information, but we have highlighted
some pathways here. To assess the molecular basis of growth
differences between human and murine cells, we queried the
MPSS databases for >50-fold differences between them. In
the 63 genes of murine > human category, 5/63 of the genes
(highlighted in supplementary online data 7B) were directly
involved in generating ATP by oxidative phosphorylation.
This suggests that mESCs have a greater capacity to generate
ATP and have a higher metabolic activity powered by mito-
chondrial oxidation. Consistent with their higher metabolic
activity, mESCs have more GLUT1/SLC2A1 transcripts than
hESCs have, while hESCs have more GLUT8/SLC2A8 tran-
scripts (Table 5). GLUT1 maintains basal glucose uptake for
metabolism in many cell types, including oocytes, and many
stages of embryonic development through the blastocyst stage
[26, 27] and haploinsufficiency of GLUT1 results in deficient
glucose transport [28]. However, GLUT8 is an insulin-regu-
lated glucose transporter that translocates from an intracel-
lular pool to the plasma membrane upon insulin stimulation
[29]. Therefore, the differential transcript levels of GLUT1
and GLUT8 in human and mouse ESCs suggest that glucose
uptake is more efficient and less insulin-dependent in mESCs
and provides a biochemical basis for their higher level of oxi-
dative phosphorylation. In contrast, glucose uptake in hESCs
is likely to be insulin-dependent, and this may be the underly-
ing biochemical basis for the need to optimize hESC culture
media but not mESC media with insulin supplement.
Figure 2. Global comparison between the species based on the least stringent criteria of >10-fold differences. The categories of genes as derived by the gene ontology classification of genes are shown with the respective percentage distribution. The hES and mES cells differ in a wide spectrum of genes, with the largest cause of the difference being due to “unknown” genes (22%). Abbreviations: hES, human embryonic; mES, murine embryonic.
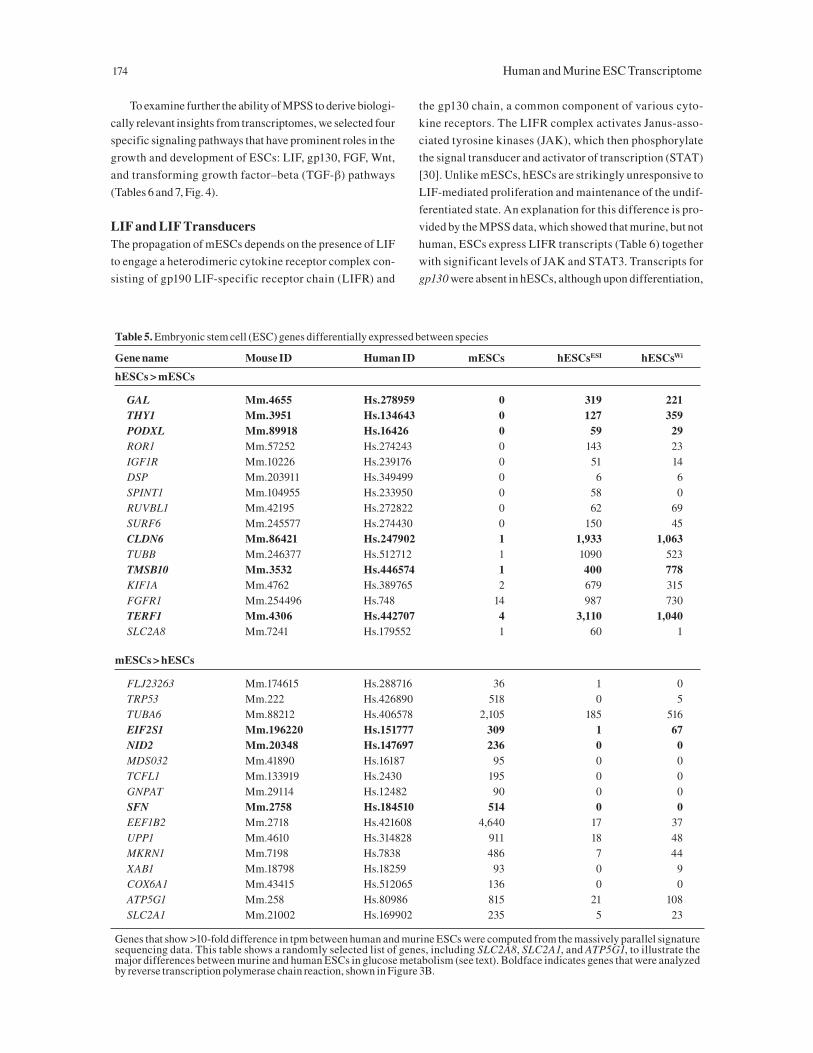
174 Human and Murine ESC Transcriptome
Table 5. Embryonic stem cell (ESC) genes differentially expressed between species
Gene name Mouse ID Human ID mESCs hESCsESI hESCsWi
hESCs > mESCs
GAL Mm.4655 Hs.278959 0 319 221THY1 Mm.3951 Hs.134643 0 127 359PODXL Mm.89918 Hs.16426 0 59 29ROR1 Mm.57252 Hs.274243 0 143 23IGF1R Mm.10226 Hs.239176 0 51 14DSP Mm.203911 Hs.349499 0 6 6SPINT1 Mm.104955 Hs.233950 0 58 0RUVBL1 Mm.42195 Hs.272822 0 62 69SURF6 Mm.245577 Hs.274430 0 150 45CLDN6 Mm.86421 Hs.247902 1 1,933 1,063TUBB Mm.246377 Hs.512712 1 1090 523TMSB10 Mm.3532 Hs.446574 1 400 778KIF1A Mm.4762 Hs.389765 2 679 315FGFR1 Mm.254496 Hs.748 14 987 730TERF1 Mm.4306 Hs.442707 4 3,110 1,040SLC2A8 Mm.7241 Hs.179552 1 60 1
mESCs > hESCs
FLJ23263 Mm.174615 Hs.288716 36 1 0TRP53 Mm.222 Hs.426890 518 0 5TUBA6 Mm.88212 Hs.406578 2,105 185 516EIF2S1 Mm.196220 Hs.151777 309 1 67NID2 Mm.20348 Hs.147697 236 0 0MDS032 Mm.41890 Hs.16187 95 0 0TCFL1 Mm.133919 Hs.2430 195 0 0GNPAT Mm.29114 Hs.12482 90 0 0SFN Mm.2758 Hs.184510 514 0 0EEF1B2 Mm.2718 Hs.421608 4,640 17 37UPP1 Mm.4610 Hs.314828 911 18 48MKRN1 Mm.7198 Hs.7838 486 7 44XAB1 Mm.18798 Hs.18259 93 0 9COX6A1 Mm.43415 Hs.512065 136 0 0ATP5G1 Mm.258 Hs.80986 815 21 108SLC2A1 Mm.21002 Hs.169902 235 5 23
Genes that show >10-fold difference in tpm between human and murine ESCs were computed from the massively parallel signature sequencing data. This table shows a randomly selected list of genes, including SLC2A8, SLC2A1, and ATP5G1, to illustrate the major differences between murine and human ESCs in glucose metabolism (see text). Boldface indicates genes that were analyzed by reverse transcription polymerase chain reaction, shown in Figure 3B.
To examine further the ability of MPSS to derive biologi-
cally relevant insights from transcriptomes, we selected four
specific signaling pathways that have prominent roles in the
growth and development of ESCs: LIF, gp130, FGF, Wnt,
and transforming growth factor–beta (TGF-β) pathways
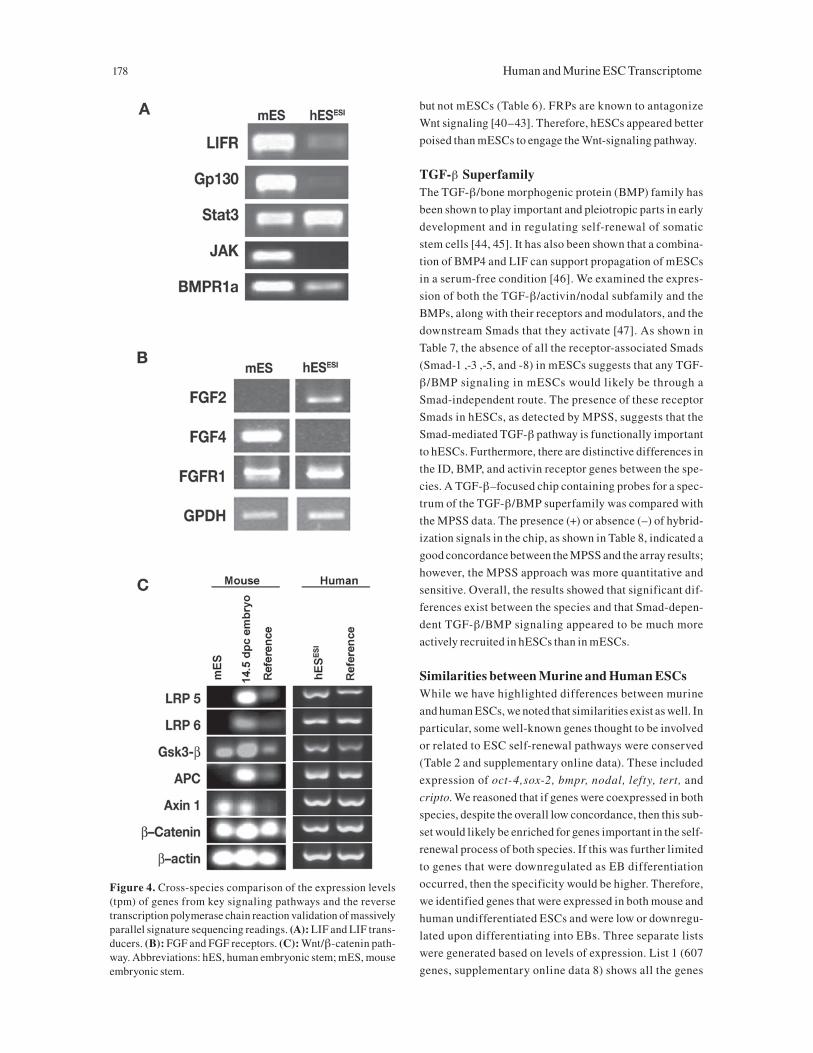
(Tables 6 and 7, Fig. 4).
LIF and LIF TransducersThe propagation of mESCs depends on the presence of LIF
to engage a heterodimeric cytokine receptor complex con-
sisting of gp190 LIF-specific receptor chain (LIFR) and
the gp130 chain, a common component of various cyto-
kine receptors. The LIFR complex activates Janus-asso-
ciated tyrosine kinases (JAK), which then phosphorylate
the signal transducer and activator of transcription (STAT)
[30]. Unlike mESCs, hESCs are strikingly unresponsive to
LIF-mediated proliferation and maintenance of the undif-
ferentiated state. An explanation for this difference is pro-
vided by the MPSS data, which showed that murine, but not
human, ESCs express LIFR transcripts (Table 6) together
with significant levels of JAK and STAT3. Transcripts for
gp130 were absent in hESCs, although upon differentiation,
Wei, Miura, Robson et al. 175
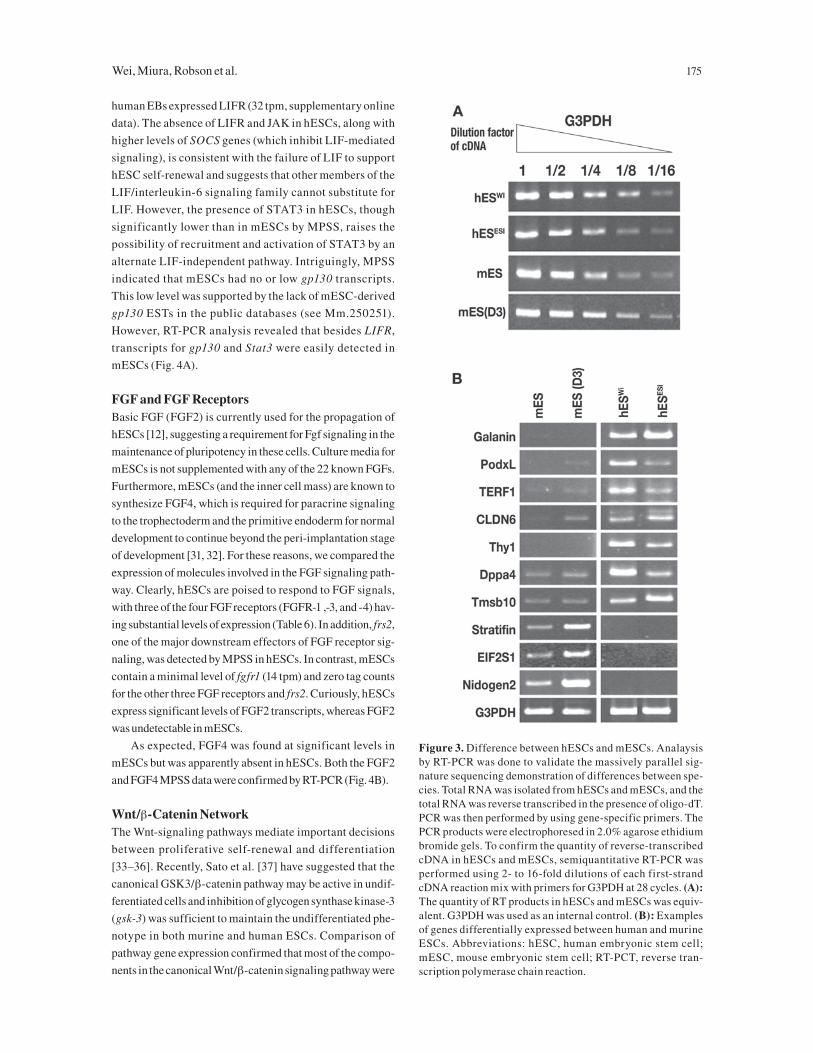
Figure 3. Difference between hESCs and mESCs. Analaysis by RT-PCR was done to validate the massively parallel sig-nature sequencing demonstration of differences between spe-cies. Total RNA was isolated from hESCs and mESCs, and the total RNA was reverse transcribed in the presence of oligo-dT. PCR was then performed by using gene-specific primers. The PCR products were electrophoresed in 2.0% agarose ethidium bromide gels. To confirm the quantity of reverse-transcribed cDNA in hESCs and mESCs, semiquantitative RT-PCR was performed using 2- to 16-fold dilutions of each first-strand cDNA reaction mix with primers for G3PDH at 28 cycles. (A): The quantity of RT products in hESCs and mESCs was equiv-alent. G3PDH was used as an internal control. (B): Examples of genes differentially expressed between human and murine ESCs. Abbreviations: hESC, human embryonic stem cell; mESC, mouse embryonic stem cell; RT-PCT, reverse tran-scription polymerase chain reaction.
human EBs expressed LIFR (32 tpm, supplementary online
data). The absence of LIFR and JAK in hESCs, along with
higher levels of SOCS genes (which inhibit LIF-mediated
signaling), is consistent with the failure of LIF to support
hESC self-renewal and suggests that other members of the
LIF/interleukin-6 signaling family cannot substitute for
LIF. However, the presence of STAT3 in hESCs, though
significantly lower than in mESCs by MPSS, raises the
possibility of recruitment and activation of STAT3 by an
alternate LIF-independent pathway. Intriguingly, MPSS
indicated that mESCs had no or low gp130 transcripts.
This low level was supported by the lack of mESC-derived
gp130 ESTs in the public databases (see Mm.250251).
However, RT-PCR analysis revealed that besides LIFR,
transcripts for gp130 and Stat3 were easily detected in
mESCs (Fig. 4A).
FGF and FGF ReceptorsBasic FGF (FGF2) is currently used for the propagation of
hESCs [12], suggesting a requirement for Fgf signaling in the
maintenance of pluripotency in these cells. Culture media for
mESCs is not supplemented with any of the 22 known FGFs.
Furthermore, mESCs (and the inner cell mass) are known to
synthesize FGF4, which is required for paracrine signaling
to the trophectoderm and the primitive endoderm for normal
development to continue beyond the peri-implantation stage
of development [31, 32]. For these reasons, we compared the
expression of molecules involved in the FGF signaling path-
way. Clearly, hESCs are poised to respond to FGF signals,
with three of the four FGF receptors (FGFR-1 ,-3, and -4) hav-
ing substantial levels of expression (Table 6). In addition, frs2,
one of the major downstream effectors of FGF receptor sig-
naling, was detected by MPSS in hESCs. In contrast, mESCs
contain a minimal level of fgfr1 (14 tpm) and zero tag counts
for the other three FGF receptors and frs2. Curiously, hESCs
express significant levels of FGF2 transcripts, whereas FGF2
was undetectable in mESCs.
As expected, FGF4 was found at significant levels in
mESCs but was apparently absent in hESCs. Both the FGF2
and FGF4 MPSS data were confirmed by RT-PCR (Fig. 4B).
Wnt/β-Catenin NetworkThe Wnt-signaling pathways mediate important decisions
between proliferative self-renewal and differentiation
[33–36]. Recently, Sato et al. [37] have suggested that the
canonical GSK3/β-catenin pathway may be active in undif-
ferentiated cells and inhibition of glycogen synthase kinase-3
(gsk-3) was sufficient to maintain the undifferentiated phe-
notype in both murine and human ESCs. Comparison of
pathway gene expression confirmed that most of the compo-
nents in the canonical Wnt/β-catenin signaling pathway were
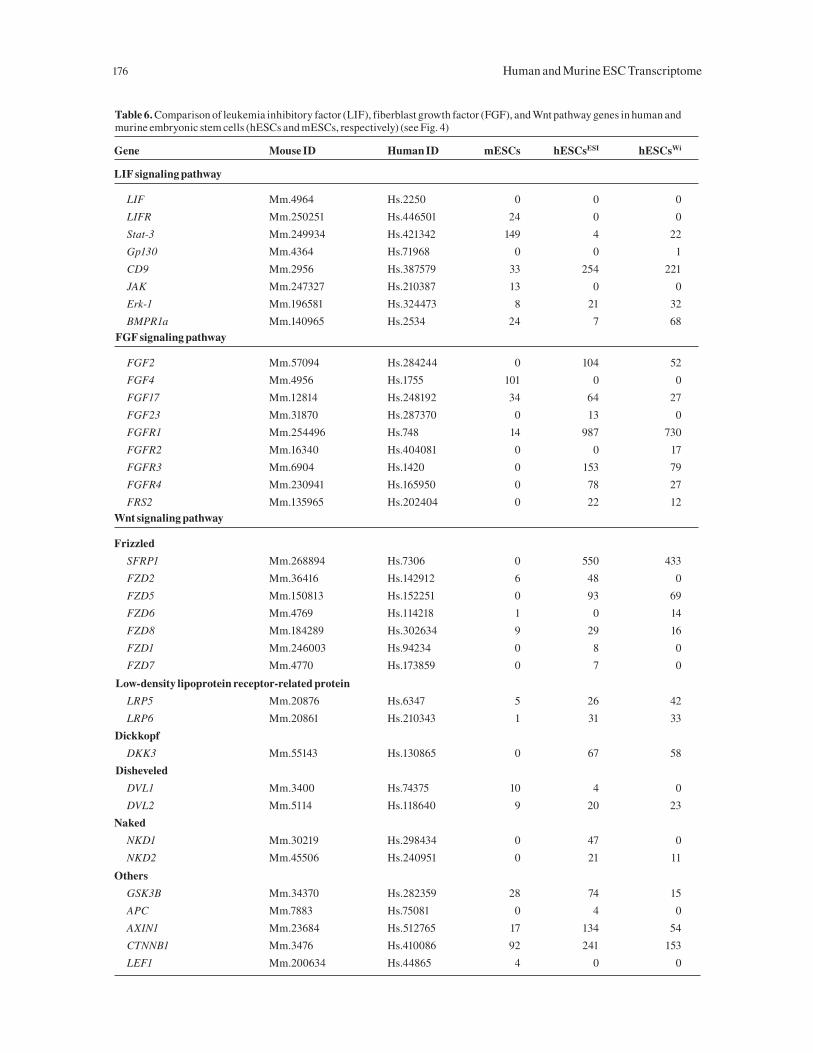
176 Human and Murine ESC Transcriptome
Table 6. Comparison of leukemia inhibitory factor (LIF), fiberblast growth factor (FGF), and Wnt pathway genes in human and murine embryonic stem cells (hESCs and mESCs, respectively) (see Fig. 4)
Gene Mouse ID Human ID mESCs hESCsESI hESCsWi
LIF signaling pathway
LIF Mm.4964 Hs.2250 0 0 0
LIFR Mm.250251 Hs.446501 24 0 0
Stat-3 Mm.249934 Hs.421342 149 4 22
Gp130 Mm.4364 Hs.71968 0 0 1
CD9 Mm.2956 Hs.387579 33 254 221
JAK Mm.247327 Hs.210387 13 0 0
Erk-1 Mm.196581 Hs.324473 8 21 32
BMPR1a Mm.140965 Hs.2534 24 7 68
FGF signaling pathway
FGF2 Mm.57094 Hs.284244 0 104 52
FGF4 Mm.4956 Hs.1755 101 0 0
FGF17 Mm.12814 Hs.248192 34 64 27
FGF23 Mm.31870 Hs.287370 0 13 0
FGFR1 Mm.254496 Hs.748 14 987 730
FGFR2 Mm.16340 Hs.404081 0 0 17
FGFR3 Mm.6904 Hs.1420 0 153 79
FGFR4 Mm.230941 Hs.165950 0 78 27
FRS2 Mm.135965 Hs.202404 0 22 12
Wnt signaling pathway
Frizzled
SFRP1 Mm.268894 Hs.7306 0 550 433
FZD2 Mm.36416 Hs.142912 6 48 0
FZD5 Mm.150813 Hs.152251 0 93 69
FZD6 Mm.4769 Hs.114218 1 0 14
FZD8 Mm.184289 Hs.302634 9 29 16
FZD1 Mm.246003 Hs.94234 0 8 0
FZD7 Mm.4770 Hs.173859 0 7 0
Low-density lipoprotein receptor-related protein
LRP5 Mm.20876 Hs.6347 5 26 42
LRP6 Mm.20861 Hs.210343 1 31 33
Dickkopf
DKK3 Mm.55143 Hs.130865 0 67 58
Disheveled
DVL1 Mm.3400 Hs.74375 10 4 0
DVL2 Mm.5114 Hs.118640 9 20 23
Naked
NKD1 Mm.30219 Hs.298434 0 47 0
NKD2 Mm.45506 Hs.240951 0 21 11
Others
GSK3B Mm.34370 Hs.282359 28 74 15
APC Mm.7883 Hs.75081 0 4 0
AXIN1 Mm.23684 Hs.512765 17 134 54
CTNNB1 Mm.3476 Hs.410086 92 241 153
LEF1 Mm.200634 Hs.44865 4 0 0
Wei, Miura, Robson et al. 177
present in both cell types (Table 6). In hESCs, RT-PCR (Fig.
4C) generally confirmed the presence of the key components,
as predicted by MPSS (Table 6). However, in mESCs, the low
level of transcripts for most of the components of the canoni-
cal Wnt/β-catenin signaling pathway—including the absence
of some key molecules— suggested that this pathway may not
be active. MPSS readings, confirmed by RT-PCR, showed
that APC [38, 39], while low in hESCs, was not detected in
mESCs. EST data also supported this finding. The low tpm
readings for lrp5 and lrp6 [36] (Table 6) were confirmed by
our negative RT-PCR result (Fig. 4C). In contrast, these com-
ponents were present in human cells both by RT-PCR/MPSS
and EST data (data not shown). The presence of an intact or
complete Wnt-signaling pathway with all the attendant posi-
tive and negative regulators was further evidenced by the
high expression of frizzled-related proteins (FRPs) in human
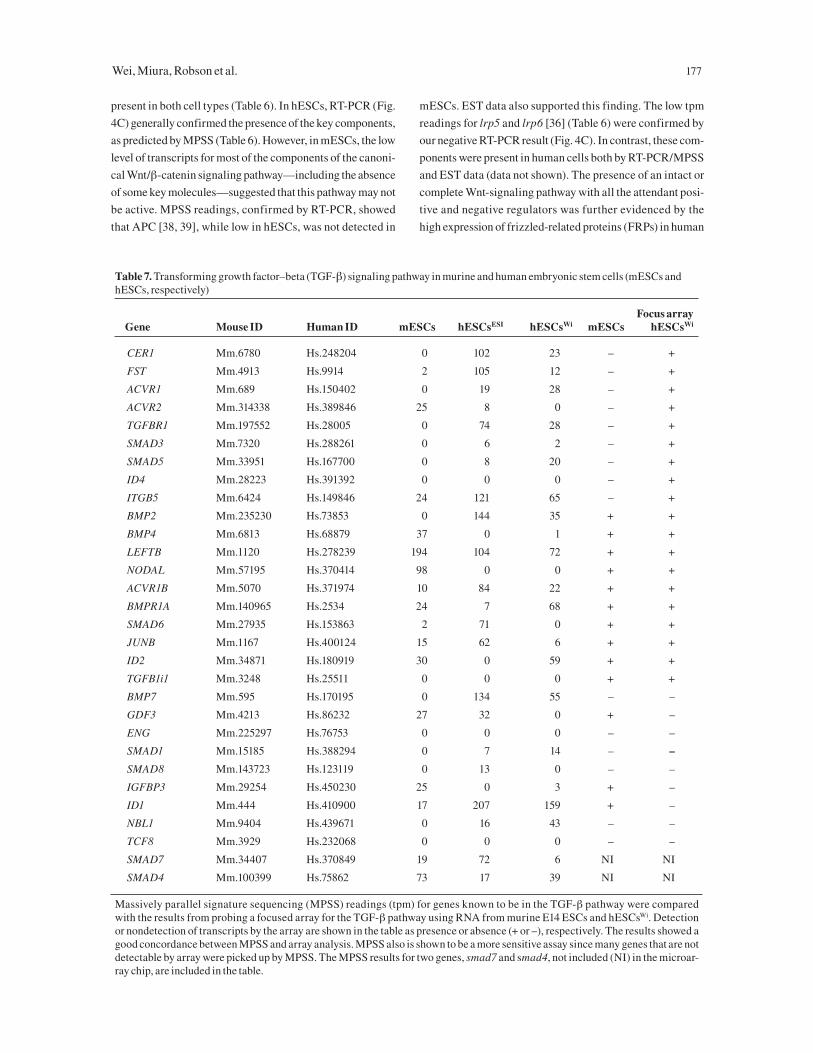
Table 7. Transforming growth factor–beta (TGF-β) signaling pathway in murine and human embryonic stem cells (mESCs and hESCs, respectively)
Focus array Gene Mouse ID Human ID mESCs hESCsESI hESCsWi mESCs hESCsWi
CER1 Mm.6780 Hs.248204 0 102 23 – +
FST Mm.4913 Hs.9914 2 105 12 – +
ACVR1 Mm.689 Hs.150402 0 19 28 – +
ACVR2 Mm.314338 Hs.389846 25 8 0 – +
TGFBR1 Mm.197552 Hs.28005 0 74 28 – +
SMAD3 Mm.7320 Hs.288261 0 6 2 – +
SMAD5 Mm.33951 Hs.167700 0 8 20 – +
ID4 Mm.28223 Hs.391392 0 0 0 – +
ITGB5 Mm.6424 Hs.149846 24 121 65 – +
BMP2 Mm.235230 Hs.73853 0 144 35 + +
BMP4 Mm.6813 Hs.68879 37 0 1 + +
LEFTB Mm.1120 Hs.278239 194 104 72 + +
NODAL Mm.57195 Hs.370414 98 0 0 + +
ACVR1B Mm.5070 Hs.371974 10 84 22 + +
BMPR1A Mm.140965 Hs.2534 24 7 68 + +
SMAD6 Mm.27935 Hs.153863 2 71 0 + +
JUNB Mm.1167 Hs.400124 15 62 6 + +
ID2 Mm.34871 Hs.180919 30 0 59 + +
TGFB1i1 Mm.3248 Hs.25511 0 0 0 + +
BMP7 Mm.595 Hs.170195 0 134 55 – –
GDF3 Mm.4213 Hs.86232 27 32 0 + –
ENG Mm.225297 Hs.76753 0 0 0 – –
SMAD1 Mm.15185 Hs.388294 0 7 14 – –
SMAD8 Mm.143723 Hs.123119 0 13 0 – –
IGFBP3 Mm.29254 Hs.450230 25 0 3 + –
ID1 Mm.444 Hs.410900 17 207 159 + –
NBL1 Mm.9404 Hs.439671 0 16 43 – –
TCF8 Mm.3929 Hs.232068 0 0 0 – –
SMAD7 Mm.34407 Hs.370849 19 72 6 NI NI
SMAD4 Mm.100399 Hs.75862 73 17 39 NI NI
Massively parallel signature sequencing (MPSS) readings (tpm) for genes known to be in the TGF-β pathway were compared with the results from probing a focused array for the TGF-β pathway using RNA from murine E14 ESCs and hESCsWi. Detection or nondetection of transcripts by the array are shown in the table as presence or absence (+ or –), respectively. The results showed a good concordance between MPSS and array analysis. MPSS also is shown to be a more sensitive assay since many genes that are not detectable by array were picked up by MPSS. The MPSS results for two genes, smad7 and smad4, not included (NI) in the microar-ray chip, are included in the table.
178 Human and Murine ESC Transcriptome
but not mESCs (Table 6). FRPs are known to antagonize
Wnt signaling [40–43]. Therefore, hESCs appeared better
poised than mESCs to engage the Wnt-signaling pathway.
TGF-β SuperfamilyThe TGF-β/bone morphogenic protein (BMP) family has
been shown to play important and pleiotropic parts in early
development and in regulating self-renewal of somatic
stem cells [44, 45]. It has also been shown that a combina-
tion of BMP4 and LIF can support propagation of mESCs
in a serum-free condition [46]. We examined the expres-
sion of both the TGF-β/activin/nodal subfamily and the
BMPs, along with their receptors and modulators, and the
downstream Smads that they activate [47]. As shown in
Table 7, the absence of all the receptor-associated Smads
(Smad-1 ,-3 ,-5, and -8) in mESCs suggests that any TGF-
β/BMP signaling in mESCs would likely be through a
Smad-independent route. The presence of these receptor
Smads in hESCs, as detected by MPSS, suggests that the
Smad-mediated TGF-β pathway is functionally important
to hESCs. Furthermore, there are distinctive differences in
the ID, BMP, and activin receptor genes between the spe-
cies. A TGF-β–focused chip containing probes for a spec-
trum of the TGF-β/BMP superfamily was compared with
the MPSS data. The presence (+) or absence (–) of hybrid-
ization signals in the chip, as shown in Table 8, indicated a
good concordance between the MPSS and the array results;
however, the MPSS approach was more quantitative and
sensitive. Overall, the results showed that significant dif-
ferences exist between the species and that Smad-depen-
dent TGF-β/BMP signaling appeared to be much more
actively recruited in hESCs than in mESCs.
Similarities between Murine and Human ESCsWhile we have highlighted differences between murine
and human ESCs, we noted that similarities exist as well. In
particular, some well-known genes thought to be involved
or related to ESC self-renewal pathways were conserved
(Table 2 and supplementary online data). These included
expression of oct-4,sox-2, bmpr, nodal, lefty, tert, and
cripto. We reasoned that if genes were coexpressed in both
species, despite the overall low concordance, then this sub-
set would likely be enriched for genes important in the self-
renewal process of both species. If this was further limited
to genes that were downregulated as EB differentiation
occurred, then the specificity would be higher. Therefore,
we identified genes that were expressed in both mouse and
human undifferentiated ESCs and were low or downregu-
lated upon differentiating into EBs. Three separate lists
were generated based on levels of expression. List 1 (607
genes, supplementary online data 8) shows all the genes
Figure 4. Cross-species comparison of the expression levels (tpm) of genes from key signaling pathways and the reverse transcription polymerase chain reaction validation of massively parallel signature sequencing readings. (A): LIF and LIF trans-ducers. (B): FGF and FGF receptors. (C): Wnt/β-catenin path-way. Abbreviations: hES, human embryonic stem; mES, mouse embryonic stem.
Wei, Miura, Robson et al. 179
with an ESC/EB ratio of two-fold or higher, and an ESC
<50 tpm in both species if EB is zero. List 2 (119 genes,
supplementary online data 9) shows all genes with an
ESC/EB ratio of five-fold or higher and an ESC <50 tpm in
both species if EB is zero. List 3 (16 genes, supplementary
online data 10) consists of genes with an ESC/EB ratio 10-
fold or higher and ES >50 tpm in both species if EB is zero.
The 16 genes in List 3 are shown in Table 8. As expected,
known genes that are ESC-specific were identified (oct-4,
leftB). Other known ESC-specific genes (see supplemen-
tary online data) fell within the 2- to 10-fold range such as
dnmt31, utf-1, sox-2 , tdgf, and dppa2. Several additional
genes not previously known to be conserved and elevated
in ESCs were identified as well. Of particular interest was
lin-28, a heterochronic gene known to be important in
regulating the appropriate timing of differentiation [48].
Another gene, mortality factor 4 (morf412), is a member of
a novel family of genes with transcription-like motifs that
induces a senescent-like phenotype in immortal cell lines
[49]. SUMO-specific protease 3 (senp3) is a member of a
novel class of regulators of Sentrin/SUMO (small-ubiqui-
tin-like modifiers) [50]. CCCTC-binding factor (ctcf ) is a
ubiquitous zinc finger (ZF) protein that is not only involved
in transcriptional silencing or activating in a context-
dependent fashion but also organizes epigenetically
controlled chromatin insulators that regulate imprinted
genes in soma [51, 52].
Comparison of hESC LinesThe high similarity between hESCWi lines grown feeder-
free and the hESCsESI grown on MEFs suggested that, over-
all, different hESC lines are similar and the differences
observed between murine and human cells must represent
fundamental species-specific differences. However, dif-
ferences between human lines likely exist. We and oth-
ers have noted some differences between ESC lines [4, 7,
23, 53], although no comprehensive comparison has been
performed. We therefore examined the MPSS dataset to
identify genes that showed a 10-fold or higher difference
between human samples. A complete list is provided in
supplementary online data 11A for hESCWi > hESCESI and
11B for hESCESI > hESCWi. Overall, even at a stringent cri-
teria of 10-fold and higher, over 1,000 genes were highly
expressed in hESCsESI and absent in hESCsWi. Several of
these genes were shared by murine and human cells but not
by the two ESC populations tested (supplementary online
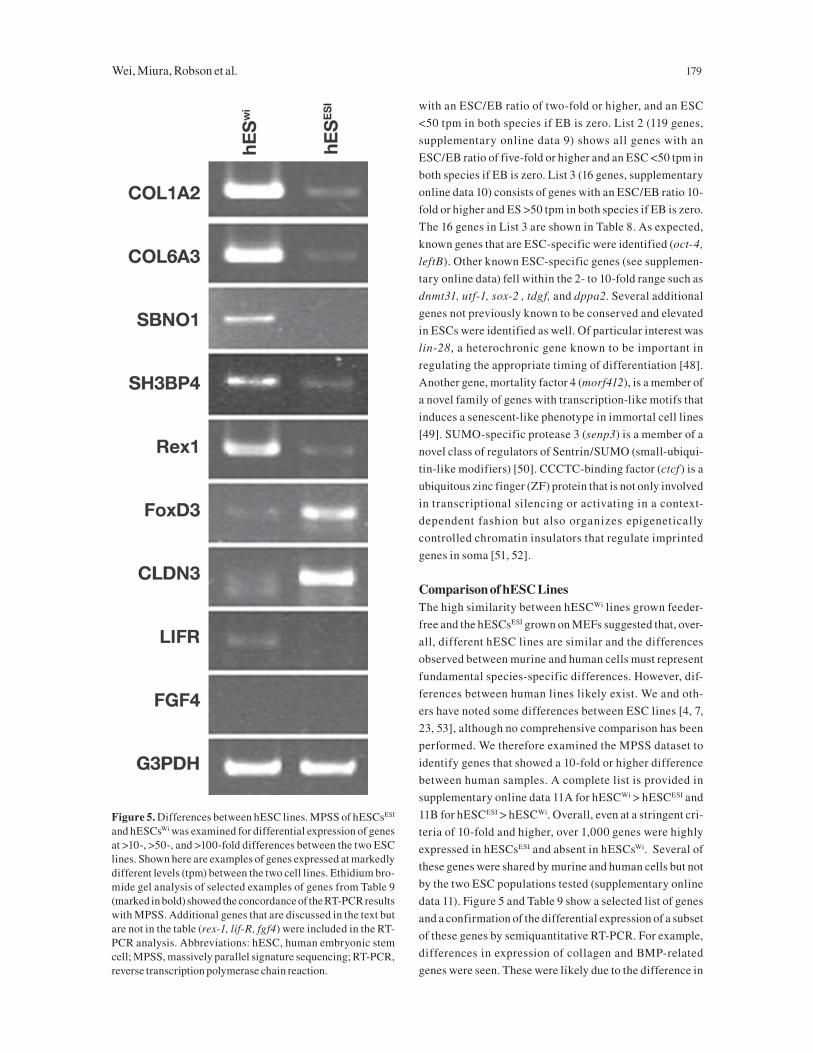
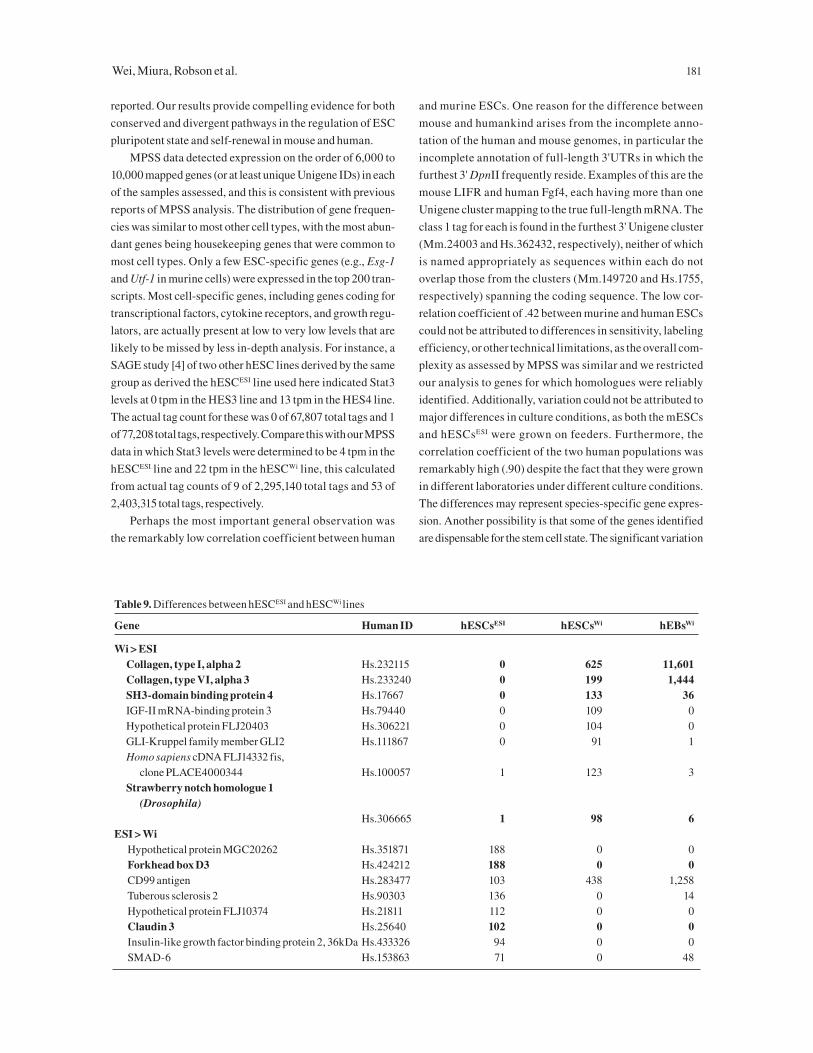
data 11). Figure 5 and Table 9 show a selected list of genes
and a confirmation of the differential expression of a subset
of these genes by semiquantitative RT-PCR. For example,
differences in expression of collagen and BMP-related
genes were seen. These were likely due to the difference in
Figure 5. Differences between hESC lines. MPSS of hESCsESI
and hESCsWi was examined for differential expression of genes at >10-, >50-, and >100-fold differences between the two ESC lines. Shown here are examples of genes expressed at markedly different levels (tpm) between the two cell lines. Ethidium bro-mide gel analysis of selected examples of genes from Table 9 (marked in bold) showed the concordance of the RT-PCR results with MPSS. Additional genes that are discussed in the text but are not in the table (rex-1, lif-R, fgf4) were included in the RT-PCR analysis. Abbreviations: hESC, human embryonic stem cell; MPSS, massively parallel signature sequencing; RT-PCR, reverse transcription polymerase chain reaction.
180 Human and Murine ESC Transcriptome
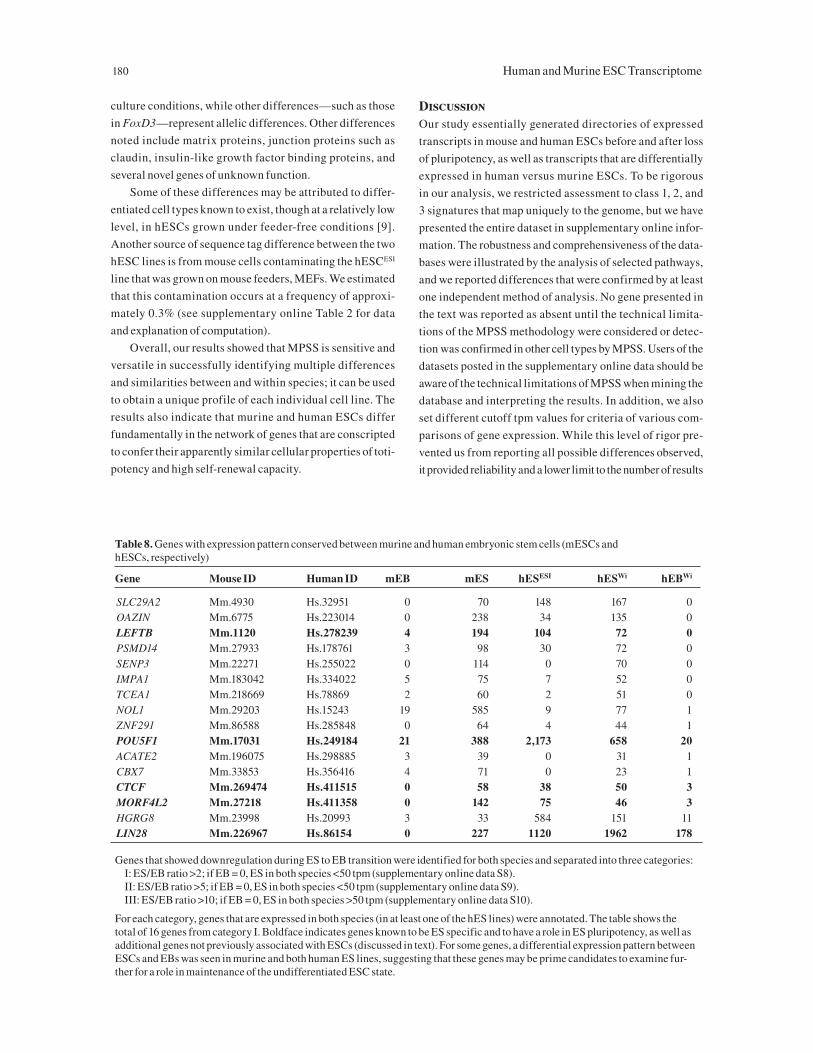
Table 8. Genes with expression pattern conserved between murine and human embryonic stem cells (mESCs and hESCs, respectively)
Gene Mouse ID Human ID mEB mES hESESI hESWi hEBWi
SLC29A2 Mm.4930 Hs.32951 0 70 148 167 0OAZIN Mm.6775 Hs.223014 0 238 34 135 0LEFTB Mm.1120 Hs.278239 4 194 104 72 0PSMD14 Mm.27933 Hs.178761 3 98 30 72 0SENP3 Mm.22271 Hs.255022 0 114 0 70 0IMPA1 Mm.183042 Hs.334022 5 75 7 52 0TCEA1 Mm.218669 Hs.78869 2 60 2 51 0NOL1 Mm.29203 Hs.15243 19 585 9 77 1ZNF291 Mm.86588 Hs.285848 0 64 4 44 1POU5F1 Mm.17031 Hs.249184 21 388 2,173 658 20ACATE2 Mm.196075 Hs.298885 3 39 0 31 1CBX7 Mm.33853 Hs.356416 4 71 0 23 1CTCF Mm.269474 Hs.411515 0 58 38 50 3MORF4L2 Mm.27218 Hs.411358 0 142 75 46 3HGRG8 Mm.23998 Hs.20993 3 33 584 151 11LIN28 Mm.226967 Hs.86154 0 227 1120 1962 178
Genes that showed downregulation during ES to EB transition were identified for both species and separated into three categories: I: ES/EB ratio >2; if EB = 0, ES in both species <50 tpm (supplementary online data S8). II: ES/EB ratio >5; if EB = 0, ES in both species <50 tpm (supplementary online data S9). III: ES/EB ratio >10; if EB = 0, ES in both species >50 tpm (supplementary online data S10).
For each category, genes that are expressed in both species (in at least one of the hES lines) were annotated. The table shows the total of 16 genes from category I. Boldface indicates genes known to be ES specific and to have a role in ES pluripotency, as well as additional genes not previously associated with ESCs (discussed in text). For some genes, a differential expression pattern between ESCs and EBs was seen in murine and both human ES lines, suggesting that these genes may be prime candidates to examine fur-ther for a role in maintenance of the undifferentiated ESC state.
culture conditions, while other differences—such as those
in FoxD3—represent allelic differences. Other differences
noted include matrix proteins, junction proteins such as
claudin, insulin-like growth factor binding proteins, and
several novel genes of unknown function.
Some of these differences may be attributed to differ-
entiated cell types known to exist, though at a relatively low
level, in hESCs grown under feeder-free conditions [9].
Another source of sequence tag difference between the two
hESC lines is from mouse cells contaminating the hESCESI
line that was grown on mouse feeders, MEFs. We estimated
that this contamination occurs at a frequency of approxi-
mately 0.3% (see supplementary online Table 2 for data
and explanation of computation).
Overall, our results showed that MPSS is sensitive and
versatile in successfully identifying multiple differences
and similarities between and within species; it can be used
to obtain a unique profile of each individual cell line. The
results also indicate that murine and human ESCs differ
fundamentally in the network of genes that are conscripted
to confer their apparently similar cellular properties of toti-
potency and high self-renewal capacity.
DiscussionOur study essentially generated directories of expressed
transcripts in mouse and human ESCs before and after loss
of pluripotency, as well as transcripts that are differentially
expressed in human versus murine ESCs. To be rigorous
in our analysis, we restricted assessment to class 1, 2, and
3 signatures that map uniquely to the genome, but we have
presented the entire dataset in supplementary online infor-
mation. The robustness and comprehensiveness of the data-
bases were illustrated by the analysis of selected pathways,
and we reported differences that were confirmed by at least
one independent method of analysis. No gene presented in
the text was reported as absent until the technical limita-
tions of the MPSS methodology were considered or detec-
tion was confirmed in other cell types by MPSS. Users of the
datasets posted in the supplementary online data should be
aware of the technical limitations of MPSS when mining the
database and interpreting the results. In addition, we also
set different cutoff tpm values for criteria of various com-
parisons of gene expression. While this level of rigor pre-
vented us from reporting all possible differences observed,
it provided reliability and a lower limit to the number of results
Wei, Miura, Robson et al. 181
reported. Our results provide compelling evidence for both
conserved and divergent pathways in the regulation of ESC
pluripotent state and self-renewal in mouse and human.
MPSS data detected expression on the order of 6,000 to
10,000 mapped genes (or at least unique Unigene IDs) in each
of the samples assessed, and this is consistent with previous
reports of MPSS analysis. The distribution of gene frequen-
cies was similar to most other cell types, with the most abun-
dant genes being housekeeping genes that were common to
most cell types. Only a few ESC-specific genes (e.g., Esg-1
and Utf-1 in murine cells) were expressed in the top 200 tran-
scripts. Most cell-specific genes, including genes coding for
transcriptional factors, cytokine receptors, and growth regu-
lators, are actually present at low to very low levels that are
likely to be missed by less in-depth analysis. For instance, a
SAGE study [4] of two other hESC lines derived by the same
group as derived the hESCESI line used here indicated Stat3
levels at 0 tpm in the HES3 line and 13 tpm in the HES4 line.
The actual tag count for these was 0 of 67,807 total tags and 1
of 77,208 total tags, respectively. Compare this with our MPSS
data in which Stat3 levels were determined to be 4 tpm in the
hESCESI line and 22 tpm in the hESCWi line, this calculated
from actual tag counts of 9 of 2,295,140 total tags and 53 of
2,403,315 total tags, respectively.
Perhaps the most important general observation was
the remarkably low correlation coefficient between human
and murine ESCs. One reason for the difference between
mouse and humankind arises from the incomplete anno-
tation of the human and mouse genomes, in particular the
incomplete annotation of full-length 3'UTRs in which the
furthest 3' DpnII frequently reside. Examples of this are the
mouse LIFR and human Fgf4, each having more than one
Unigene cluster mapping to the true full-length mRNA. The
class 1 tag for each is found in the furthest 3' Unigene cluster
(Mm.24003 and Hs.362432, respectively), neither of which
is named appropriately as sequences within each do not
overlap those from the clusters (Mm.149720 and Hs.1755,
respectively) spanning the coding sequence. The low cor-
relation coefficient of .42 between murine and human ESCs
could not be attributed to differences in sensitivity, labeling
efficiency, or other technical limitations, as the overall com-
plexity as assessed by MPSS was similar and we restricted
our analysis to genes for which homologues were reliably
identified. Additionally, variation could not be attributed to
major differences in culture conditions, as both the mESCs
and hESCsESI were grown on feeders. Furthermore, the
correlation coefficient of the two human populations was
remarkably high (.90) despite the fact that they were grown
in different laboratories under different culture conditions.
The differences may represent species-specific gene expres-
sion. Another possibility is that some of the genes identified
are dispensable for the stem cell state. The significant variation
Table 9. Differences between hESCESI and hESCWi lines
Gene Human ID hESCsESI hESCsWi hEBsWi
Wi > ESI Collagen, type I, alpha 2 Hs.232115 0 625 11,601Collagen, type VI, alpha 3 Hs.233240 0 199 1,444SH3-domain binding protein 4 Hs.17667 0 133 36IGF-II mRNA-binding protein 3 Hs.79440 0 109 0Hypothetical protein FLJ20403 Hs.306221 0 104 0GLI-Kruppel family member GLI2 Hs.111867 0 91 1Homo sapiens cDNA FLJ14332 fis, clone PLACE4000344 Hs.100057 1 123 3Strawberry notch homologue 1 (Drosophila)
Hs.306665 1 98 6ESI > Wi
Hypothetical protein MGC20262 Hs.351871 188 0 0Forkhead box D3 Hs.424212 188 0 0CD99 antigen Hs.283477 103 438 1,258Tuberous sclerosis 2 Hs.90303 136 0 14Hypothetical protein FLJ10374 Hs.21811 112 0 0Claudin 3 Hs.25640 102 0 0Insulin-like growth factor binding protein 2, 36kDa Hs.433326 94 0 0SMAD-6 Hs.153863 71 0 48
182 Human and Murine ESC Transcriptome
observed between murine and human ESCs also raises the
possibility that human and murine ESCs may represent
slightly different stages of early development or they may
use independent pathways to maintain self-renewal.
While a detailed discussion of all the observed differ-
ences is impossible, we have highlighted a few differences
that were independently verified. Our comparative analy-
sis provided a basis for the differing growth requirements
of human and mESCs. The much higher proliferation rate
of mESCs, compared to hESCs, presumably had to be sus-
tained by a higher metabolic rate. Consistent with a higher
metabolic rate, mESCs expressed higher GLUT1 tran-
script, a major glucose transporter, while insulin-dependent
GLUT8 was higher in hESCs.
Our results confirmed the lack of LIF and gp130 signal-
ing in hESCs and the activity of this pathway in mESCs.
Interestingly, levels of gp130 were low in mESCs, and
examination of the corresponding Unigene cluster revealed
no ESTs from ESCs. The low level of the gp130 transcript
raises the possibility that this is a critical, tightly regulated
step in LIF-mediated signaling.
The MPSS profile of FGFRs clearly indicates that
hESCs are molecularly positioned to respond to extracel-
lular FGF signals, whereas these same molecules are vir-
tually absent in mESCs. As MPSS was not able to identify
the known spliced isoforms of the FGF receptors and mul-
tiple FGFs work through the same receptors, further study is
required to identify the FGF molecules interacting with the
FGF receptors [1, 3, 4] expressed in hESCs. Considering that
FGF2 (bFGF) is a common supplement to hESC media, it is
surprising that both hESC lines synthesize their own FGF2.
As FGFs work predominantly through a paracrine action,
this could suggest that the apparent benefit of FGF2 supple-
mentation works indirectly through the MEF feeder layer.
Also of note is the differing expression of FGF4, a known
transcriptional target of the synergistic action between oct-
4 and sox-2 in mESCs [54] and an essential molecule in peri-
implantation during embryo development. Unlike in the
mouse, the MPSS and RT-PCR data indicate that hESCs do
not synthesize FGF4. This absence or very minimal expres-
sion of FGF4 in the human may be indicative of a develop-
mental difference between mouse and human ESCs.
It was clear that almost all the genes in Wnt/β-catenin
pathway were expressed at significantly higher levels
in human cells than in murine cells, as shown in Table 6.
This suggests that the canonical Wnt/β-catenin signaling
pathway was very likely not active in mESCs but was func-
tional in hESCs [37]. Given the reported effects of a GSK-
3β inhibitor on mESCs and the evidence for the activation
of the PI3kinase/Akt pathway, we would suggest that the
reported nuclear accumulation of β-catenin in undifferen-
tiated ESCs may be due to endogenously active PI3 K/Akt
signaling rather than active Wnt signaling.
Likewise as shown in Table 8, the absence of the recep-
tor-associated Smads-1 ,-3, -5, and -8 in mESCs but their
presence in hESCs indicated that the canonical TGF-β path-
way may be operatively important to hESCs. Indeed, recent
reports have suggested that TGF-β in combination with
FGF may be sufficient to maintain hESCs (but not mESCs)
in an undifferentiated state [55]. Furthermore, the MPSS
data suggest that the known effects of BMP4 on mESCs is
through a Smad-independent pathway.
Multiple differences were also identified in every cat-
egory of genes examined. These included structural genes,
metabolic pathways, and housekeeping genes as well. Nev-
ertheless, similarities also existed. We reasoned that if such
similarities exist despite widespread differences, then these
may represent critical core pathways that are important for
the undifferentiated state. Indeed, examining the lists gen-
erated (see Results), we identified multiple ESC-specific
genes, including oct-4, tdgf1, sox2, utf-1, dnmtl, and leftB.
The relatively large list of genes shown in supplementary
online data 5, 6, and 7 suggests that additional common
pathways required for stem cell self-renewal remain to be
identified; the possible candidates include heterochronic
genes, methylation agents, ubiquitin/SUMO genes, and
components of the DNA repair machinery.
Our comparison of hESC lines maintained in separate
laboratories revealed a high degree of similarity. We rea-
soned that most human lines were isolated from the same
stage of development. Differential expression of some of the
genes between the human lines may reflect allelic expres-
sion that is unique to each cell line. Some of the results
may be a reflection of different methods used to culture
and propagate the cells in the individual laboratories. The
high overall similarity between hESC lines suggests that a
core set of stem cell markers for all hESC lines can be gen-
erated and that cell populations can be identified by allelic
differences as well. The variable expression of genes such
as Rex, FoxD3, and LIFR seen in this comparison and in
other experiments suggests that these molecules and path-
ways are not critical for maintaining hESC lines in culture.
The expression level of certain ESC-specific genes may
provide a prediction on the growth rate and stability of dif-
ferent human lines, but this will require additional detailed
comparisons. Overall, it is clear that such a detailed analysis
provides important insights into the biology of ESCs.
While we have highlighted the power of a large-scale
analysis such as MPSS, it is important to remember that, as
with any other methodologies, there are potential problems
of which investigators need to be cognizant. For example, in
a 20-nucleotide base pair run, which was ultimately used in
Wei, Miura, Robson et al. 183
this study, the β-catenin signature was excluded because of a
sequencing error in one of the four routine sequence runs. In
reviewing the MPSS raw data, we found that in the 17-nucleo-
tide base pair sequence run, a unique signature for β-catenin
was indeed present at 92 tpm. While an extremely rare occur-
rence, this discrepancy highlights the importance of verifi-
cation. Furthermore, since the signature depends on DpnII
sites and not all cDNAs contain a DpnII site, some genes will
not be detected. A palindromic sequence within the signature
after the DpnII site will result in a hairpin loop that prevents
its sequencing, giving a false negative reading. Repetitive
sequences in the signature result in nonspecificity of the sig-
nature and thus cannot be annotated. However, these errors
and limitations occur very infrequently. In some instances
in which the MPSS result showed no tags (zero tpm), expres-
sion of the gene could be detected by other methods such as
SAGE, an EST search of the database, or RT-PCR. For most
genes, however, the absence of expression by MPSS could be
demonstrated by RT-PCR as well, confirming the validity of
the MPSS assay. While it is important to be alert to possible
sources of error in MPSS readings, the use of other methods
does not undermine the overall reliability of MPSS in tran-
scriptome analysis. It is important to emphasize, as well, that
such errors are common to most large-scale analytical pro-
cesses and suggest that comparisons across techniques and
across species may be useful.
In summary, our analysis provides, for the first time,
a direct in-depth comparison between murine and human
ESCs. Our data provide unambiguous evidence for the pres-
ence of both convergent and divergent pathways critical for
self-renewal. Our results highlight the similarities and dif-
ferences between murine and human ESCs. Although there
appears to be a core set of ESC-specific pathways that are
conserved across species, other divergent pathways are
equally critical and extreme care must be used in extrapo-
lating mESC work to hESC analysis. Our results suggest
that human cells isolated by different groups and main-
tained under different culture conditions are overall highly
similar and that the few differences observed likely repre-
sent allelic differences or variation in the propagation of
cells. The comprehensive database we have developed and
deposited for public use may be explored for more detailed
information and identification of other novel genes. This
database will provide a unique resource for additional
comparative genomic analysis and for identifying novel
candidates critical for regulating ESC growth and survival,
self-renewal, and differentiation.
AcknowledgmentsThis study was supported by A-Star (Singapore) and grants
from NIH DK47636 (B.L.) and NIH (M.R.). We thank M.
Bakre, Nicolas O. Fortunel, Huck Hui Ng, Leonard Lipov-
ich, and Janet Buhlman for reading and helpful discussions
of the manuscript.
1 Loring JF, Porter JG, Seilhammer J et al. A gene expression profile of embryonic stem cells and embryonic stem cell-derived neurons. Restor Neurol Neurosci 2001;18:81–88.
2 Sato N, Sanjuan IM, Heke M et al. Molecular signature of human embryonic stem cells and its comparison with the mouse. Dev Biol 2003;260:404–413.
3 Sperger JM, Chen X, Draper JS et al. Gene expression patterns in human embryonic stem cells and human plu-ripotent germ cell tumors. Proc Natl Acad Sci U S A 2003;100:13350–13355.
4 Richards M, Tan SP, Tan JH et al. The transcriptome pro-file of human embryonic stem cells as defined by SAGE. Stem Cells 2004;22:51–64.
5 Brandenberger R, Wei H, Zhang S et al. Transcriptome characterization elucidates signaling networks that control human ES cell growth and differentiation. Nat Biotechnol 2004;22:707–716.
6 Abeyta MJ, Clark AT, Rodriguez RT et al. Unique gene expression signatures of independently-derived human embryonic stem cell l ines. Hum Mol Genet 2004;13:601–608.
7 Ginis I, Luo Y, Miura T et al. Differences between human and mouse embryonic stem cells. Dev Biol 2004;269:360–380.
8 Bhattacharya B, Miura T, Brandenberger R et al. Gene expression in human embryonic stem cell lines: unique molecular signature. Blood 2004;103:2956–2964.
9 Xu C, Inokuma MS, Denham J et al. Feeder-free growth of undifferentiated human embryonic stem cells. Nat Bio-technol 2001;19:971–974.
10 Thomson JA, Itskovitz-Eldor J, Shapiro SS et al. Embry-onic stem cell lines derived from human blastocysts. Sci-ence 1998;282:1145–1147.
11 Xu RH, Chen X, Li DS et al. BMP4 initiates human embry-onic stem cell differentiation to trophoblast. Nat Biotech-nol 2002;20:1261–1264.
12 Thomson JA, Odorico JS. Human embryonic stem cell and embryonic germ cell lines. Trends Biotechnol 2000;18:53–57.
13 Carpenter MK, Rosler E, Rao MS. Characterization and differentiation of human embryonic stem cells. Cloning Stem Cells 2003;5:79–88.
References
184 Human and Murine ESC Transcriptome
14 Ramalho-Santos M, Yoon S, Matsuzaki Y et al. “Stem-ness”: transcriptional profiling of embryonic and adult stem cells. Science 2002;298:597–600.
15 Ivanova NB, Dimos JT, Schaniel C et al. A stem cell molec-ular signature. Science 2002;298:601–604.
16 Fortunel NO, Otu HH, Ng HH et al. Comment on “ ‘Stem-ness’: transcriptional profiling of embryonic and adult stem cells” and “A stem cell molecular signature.” Science 2003;302:393; author reply
17 Brenner S, Johnson M, Bridgham J et al. Gene expression analysis by massively parallel signature sequencing (MPSS) on microbead arrays. Nat Biotechnol 2000;18:630–634.
18 Reubinoff BE, Pera MF, Fong CY et al. Embryonic stem cell lines from human blastocysts: somatic differentiation in vitro. Nat Biotechnol 2000;18:399–404.
19 Carpenter MK, Inokuma MS, Denham J et al. Enrichment of neurons and neural precursors from human embryonic stem cells. Exp Neurol 2001;172:383–397.
20 Brenner S, Williams SR, Vermaas EH et al. In vitro clon-ing of complex mixtures of DNA on microbeads: physical separation of differentially expressed cDNAs. Proc Natl Acad Sci U S A 2000;97:1665–1670.
21 Meyers BC, Tej SS, Vu TH et al. The use of MPSS for whole-genome transcriptional analysis in Arabidopsis. Genome Res 2004;14:1641–1653.
22 Lash AE, Tolstoshev CM, Wagner L et al. SAGEmap: a public gene expression resource. Genome Res 2000;10:1051–1060.
23 Carpenter MK, Rosler ES, Fisk GJ et al. Properties of four human embryonic stem cell lines maintained in a feeder-free culture system. Dev Dyn 2004;229:243–258.
24 Lin JY, Pollack JR, Chou FL et al. Physical mapping of genes in somatic cell radiation hybrids by comparative genomic hybridization to cDNA microarrays. Genome Biol 2002;3(6):RESEARCH0026.
25 Jongeneel CV, Iseli C, Stevenson BJ et al. Comprehensive sampling of gene expression in human cell lines with mas-sively parallel signature sequencing. Proc Natl Acad Sci U S A 2003;100:4702–4705.
26 Smith D, Gridley T. Differential screening of a PCR-gener-ated mouse embryo cDNA library: glucose transporters are differentially expressed in early postimplantation mouse embryos. Development 1992;116:555–561.
27 Morita Y, Tsutsumi O, Oka Y et al. Glucose transporter GLUT1 mRNA expression in the ontogeny of glucose incorporation in mouse preimplantation embryos. Biochem Biophys Res Comm 1994;199:1525–1531.
28 Seidner G, Alvarez MG, Yeh JI et al. GLUT-1 deficiency syndrome caused by haploinsufficiency of the blood-brain barrier hexose carrier. Nat Genet 1998;18:188–191.
29 Carayannopoulos MO, Chi MM, Cui Y et al. GLUT8 is a glucose transporter responsible for insulin-stimulated glucose uptake in the blastocyst. Proc Natl Acad Sci U S A 2000;97:7313–7318.
30 Burdon T, Smith A, Savatier P. Signalling, cell cycle and
pluripotency in embryonic stem cells. Trends Cell Biol 2002;12:432–438.
31 Feldman B, Poueymirou W, Papaioannou VE et al. Require-ment of FGF-4 for postimplantation mouse development. Science 1995;267:246–249.
32 Goldin SN, Papaioannou VE. Paracrine action of FGF4 during periimplantation development maintains trophec-toderm and primitive endoderm. Genesis 2003;36:40–47.
33 Nelson WJ, Nusse R. Convergence of Wnt, beta-catenin, and cadherin pathways. Science 2004;303:1483–1487.
34 Wehrli M, Dougan ST, Caldwell K et al. Arrow encodes an LDL-receptor-related protein essential for Wingless sig-nalling. Nature 2000;407:527–530.
35 Pinson KI, Brennan J, Monkley S et al. An LDL-receptor-related protein mediates Wnt signalling in mice. Nature 2000;407:535–538.
36 Tamai K, Semenov M, Kato Y et al. LDL-receptor-related proteins in Wnt signal transduction. Nature 2000;407:530–535.
37 Sato N, Meijer L, Skaltsounis L et al. Maintenance of pluri-potency in human and mouse embryonic stem cells through activation of Wnt signaling by a pharmacological GSK-3-specific inhibitor. Nat Med 2004;10:55–63.
38 Behrens J, Jerchow BA, Wurtele M et al. Functional inter-action of an axin homolog, conductin, with beta-catenin, APC, and GSK3beta. Science 1998;280:596–599.
39 Spink KE, Polakis P, Weis WI. Structural basis of the Axin-adenomatous polyposis coli interaction. EMBO J 2000;19:2270–2279.
40 Leyns L, Bouwmeester T, Kim SH et al. Frzb-1 is a secreted antagonist of Wnt signaling expressed in the Spemann organizer. Cell 1997;88:747–756.
41 Lin K, Wang S, Julius MA et al. The cysteine-r ich frizzled domain of Frzb-1 is required and sufficient for modulation of Wnt signaling. Proc Natl Acad Sci U S A1997;94:11196–11200.
42 Wang S, Krinks M, Lin K et al. Frzb, a secreted protein expressed in the Spemann organizer, binds and inhibits Wnt-8. Cell 1997;88:757–766.
43 Rattner A, Hsieh J-C, Smallwood PM et al. A family of secreted proteins contains homology to the cysteine-rich ligand-binding domain of frizzled receptors. Proc Natl Acad Sci U S A 1997;94:2859–2863.
44 Fortunel NO, Hatzfeld JA, Monier MN et al. Control of hematopoietic stem/progenitor cell fate by transforming growth factor-beta. Oncol Res 2003;13:445–453.
45 Fortunel NO, Hatzfeld JA, Rosemary PA et al. Long-term expansion of human functional epidermal precursor cells: promotion of extensive amplification by low TGF-beta1 concentrations. J Cell Sci 2003;116:4043–4052.
46 Ying QL, Nichols J, Chambers I et al. BMP induction of Id proteins suppresses differentiation and sustains embryonic stem cell self-renewal in collaboration with STAT3. Cell 2003;115:281–292.
Wei, Miura, Robson et al. 185
47 Shi Y, Massague J. Mechanisms of TGF-beta signaling from cell membrane to the nucleus. Cell 2003;113:685–700.
48 Moss EG, Tang L. Conservat ion of the heteroch-ronic regulator Lin-28, its developmental expres-sion and microRNA complementary sites. Dev Biol 2003;258:432–442.
49 Bertram MJ, Berube NG, Hang-Swanson X et al. Iden-tification of a gene that reverses the immortal phe-notype of a subset of cells and is a member of a novel family of transcription factor-like genes. Mol Cell Biol 1999;19:1479–1485.
50 Yeh ET, Gong L, Kamitani T. Ubiquitin-like proteins: new wines in new bottles. Gene 2000;248:1–14.
51 Filippova GN, Qi CF, Ulmer JE et al. Tumor-associated zinc finger mutations in the CTCF transcription factor
selectively alter tts DNA-binding specificity. Cancer Res 2002;62:48–52.
52 Klenova EM, Morse HC 3rd, Ohlsson R et al. The novel BORIS + CTCF gene family is uniquely involved in the epigenetics of normal biology and cancer. Semin Can-cer Biol 2002;12:399–414.
53 Rosler ES, Fisk GJ, Ares X et al. Long-term culture of human embryonic stem cells in feeder-free conditions. Dev Dyn 2004;229:259–274.
54 Yuan H, Corbi N, Basilico C et al. Developmental-spe-cific activity of the FGF-4 enhancer requires the synergistic action of Sox2 and Oct-3. Genes Dev 1995;9:2635–2645.
55 Amit M SC, Margulets V, Itskovitz-Eldor J. Feeder layer-and serum-free culture of human embryonic stem cells. Biol Reprod 2004;70:837–845.