
Detection of divergent genes in microbial aCGH experiments
11
BioMed Central Page 1 of 11 (page number not for citation purposes) BMC Bioinformatics Open Access Research article Detection of divergent genes in microbial aCGH experiments Lars Snipen* 1 , Dirk Repsilber 2 , Ludvig Nyquist 3 , Andreas Ziegler 4 , Ågot Aakra 3 and Are Aastveit 1 Address: 1 Biostatistics, Department of Chemistry, Biotechnology and Food Sciences, Norwegian University of Life Sciences, N-1432 Ås, Norway, 2 Department of Biology and Biochemistry/Bioinformatics, University of Potsdam, Germany, 3 Microbial Gene Technology, Department of Chemistry, Biotechnology and Food Sciences, Norwegian University of Life Sciences, Ås, Norway and 4 Institute of Medical Biometry and Statistics, University at Lübeck, Germany Email: Lars Snipen* - [email protected]; Dirk Repsilber - [email protected]; Ludvig Nyquist - [email protected]; Andreas Ziegler - [email protected]; Ågot Aakra - [email protected]; Are Aastveit - [email protected] * Corresponding author Abstract Background: Array-based comparative genome hybridization (aCGH) is a tool for rapid comparison of genomes from different bacterial strains. The purpose of such analysis is to detect highly divergent or absent genes in a sample strain compared to an index strain. Development of methods for analyzing aCGH data has primarily focused on copy number abberations in cancer research. In microbial aCGH analyses, genes are typically ranked by log-ratios, and classification into divergent or present is done by choosing a cutoff log-ratio, either manually or by statistics calculated from the log-ratio distribution. As experimental settings vary considerably, it is not possible to develop a classical discriminant or statistical learning approach. Methods: We introduce a more efficient method for analyzing microbial aCGH data using a finite mixture model and a data rotation scheme. Using the average posterior probabilities from the model fitted to log-ratios before and after rotation, we get a score for each gene, and demonstrate its advantages for ranking and detecting divergent genes with enlarged specificity and sensitivity. Results: The procedure is tested and compared to other approaches on simulated data sets, as well as on four experimental validation data sets for aCGH analysis on fully sequenced strains of Staphylococcus aureus and Streptococcus pneumoniae. Conclusion: When tested on simulated data as well as on four different experimental validation data sets from experiments with only fully sequenced strains, our procedure out-competes the standard procedures of using a simple log-ratio cutoff for classification into present and divergent genes. Background The genetic diversity among bacteria mirrors their life- styles and physiological versatilities and evolves from adaptation to their niches and growth conditions. Many techniques have been used to obtain a picture of true microbial diversity. Microarray-based comparative genome hybridization (aCGH) is now a commonly used tool in comparative genomics. Compared to sequencing and comparing whole genomes, aCGH provides rapid genomotyping in bacteria [1,2]. Published: 30 March 2006 BMC Bioinformatics 2006, 7:181 doi:10.1186/1471-2105-7-181 Received: 12 October 2005 Accepted: 30 March 2006 This article is available from: http://www.biomedcentral.com/1471-2105/7/181 © 2006 Snipen et al; licensee BioMed Central Ltd. This is an Open Access article distributed under the terms of the Creative Commons Attribution License (http://creativecommons.org/licenses/by/2.0 ), which permits unrestricted use, distribution, and reproduction in any medium, provided the original work is properly cited.
-
Upload
independent -
Category
Documents
-
view
2 -
download
0
Transcript of Detection of divergent genes in microbial aCGH experiments
BioMed CentralBMC Bioinformatics
ss
Open AcceResearch articleDetection of divergent genes in microbial aCGH experimentsLars Snipen*1, Dirk Repsilber2, Ludvig Nyquist3, Andreas Ziegler4, Ågot Aakra3 and Are Aastveit1Address: 1Biostatistics, Department of Chemistry, Biotechnology and Food Sciences, Norwegian University of Life Sciences, N-1432 Ås, Norway, 2Department of Biology and Biochemistry/Bioinformatics, University of Potsdam, Germany, 3Microbial Gene Technology, Department of Chemistry, Biotechnology and Food Sciences, Norwegian University of Life Sciences, Ås, Norway and 4Institute of Medical Biometry and Statistics, University at Lübeck, Germany
Email: Lars Snipen* - [email protected]; Dirk Repsilber - [email protected]; Ludvig Nyquist - [email protected]; Andreas Ziegler - [email protected]; Ågot Aakra - [email protected]; Are Aastveit - [email protected]
* Corresponding author
AbstractBackground: Array-based comparative genome hybridization (aCGH) is a tool for rapidcomparison of genomes from different bacterial strains. The purpose of such analysis is to detecthighly divergent or absent genes in a sample strain compared to an index strain. Development ofmethods for analyzing aCGH data has primarily focused on copy number abberations in cancerresearch. In microbial aCGH analyses, genes are typically ranked by log-ratios, and classificationinto divergent or present is done by choosing a cutoff log-ratio, either manually or by statisticscalculated from the log-ratio distribution. As experimental settings vary considerably, it is notpossible to develop a classical discriminant or statistical learning approach.
Methods: We introduce a more efficient method for analyzing microbial aCGH data using a finitemixture model and a data rotation scheme. Using the average posterior probabilities from themodel fitted to log-ratios before and after rotation, we get a score for each gene, and demonstrateits advantages for ranking and detecting divergent genes with enlarged specificity and sensitivity.
Results: The procedure is tested and compared to other approaches on simulated data sets, aswell as on four experimental validation data sets for aCGH analysis on fully sequenced strains ofStaphylococcus aureus and Streptococcus pneumoniae.
Conclusion: When tested on simulated data as well as on four different experimental validationdata sets from experiments with only fully sequenced strains, our procedure out-competes thestandard procedures of using a simple log-ratio cutoff for classification into present and divergentgenes.
BackgroundThe genetic diversity among bacteria mirrors their life-styles and physiological versatilities and evolves fromadaptation to their niches and growth conditions. Manytechniques have been used to obtain a picture of true
microbial diversity. Microarray-based comparativegenome hybridization (aCGH) is now a commonly usedtool in comparative genomics. Compared to sequencingand comparing whole genomes, aCGH provides rapidgenomotyping in bacteria [1,2].
Published: 30 March 2006
BMC Bioinformatics 2006, 7:181 doi:10.1186/1471-2105-7-181
Received: 12 October 2005Accepted: 30 March 2006
This article is available from: http://www.biomedcentral.com/1471-2105/7/181
© 2006 Snipen et al; licensee BioMed Central Ltd.This is an Open Access article distributed under the terms of the Creative Commons Attribution License (http://creativecommons.org/licenses/by/2.0), which permits unrestricted use, distribution, and reproduction in any medium, provided the original work is properly cited.
Page 1 of 11(page number not for citation purposes)

BMC Bioinformatics 2006, 7:181 http://www.biomedcentral.com/1471-2105/7/181
The majority of applications of aCGH is in cancer-research, where copy-number abberations is the primaryfocus [3,4]. Several methods have been suggested to ana-lyze such data, e.g. [5-7].
In microbial studies of genome diversity, usually one fullysequenced strain, called index strain, is compared to a setof unsequenced strains of the same or closely related bac-terial species, called sample strains. In this setting it is ofinterest to characterize the sample strains with respect tothe genes they have in common with the index strain, andthose which are absent or highly divergent.
In theory, every given gene is either present or divergent inthe sample strain. In this respect, a perfect measurementtechnology would provide a binary output. For many rea-sons, this is not the case in aCGH. First, it is complicatedto define relationships between sequence identity andhybridization signals. Second, hybridization signals ariseboth from hybridization with similar genes, as well asfrom hybridization with homologs, paralogs, or geneswith conserved domains. Such non-specific hybridiza-tions may lead to signals even from genes that are trulydivergent. Third, gene divergence is a slow evolutionaryprocess such that based on nucleotide sequence similarityalone, in most cases a number of genes will be difficultdifficult to classify as divergent or present. Finally, theexperimental features of aCGH may complicate the inter-pretation of the hybridization patterns.
Usually, the samples for microbial aCGH are prepared asfollows: genomic DNA is extracted from the index andfrom the sample strain. The DNA is then physicallysheared or enzymatically digested, and the resulting frag-ments are labelled with different fluorescent dyes by ran-dom priming. The labelled samples are mixed and thenhybridized onto the microarray. In contrast to geneexpression experiments, the preparation of samples forhybridization by digestion or shearing, gives random frag-ments that may not match the gene targets on the array aswell as cDNA. The sheared/digested DNA varies in lengthand the longer fragments may contain pieces of severalgenes.
The common analysis of aCGH data focuses on the so-called log-ratio Mi = log2(Si/Ii) where Si is the signal inten-sity of the sample strain and Ii similar for the index strain,for gene i [2]. A small log-ratio indicates a weak samplestrain signal, and hence the gene is most likely divergent.Using a t-test statistics or a modified regularized t-test sta-tistics as for example offered by the SAM [8] is no practi-cable alternative for this kind of experiments, as inpractise there are mostly no replicate measures at all.Hence, statistical analysis is limited to finding a high qual-ity diagnostic score which can be used for a ranking of
candidate divergent genes. This is the reason for focussingon scores which can be calculated from two signal inten-sities alone, the photomultiplier intensity readouts for thelabels from index and sample strain respectively. A fixedcutoff on the log-ratio axis, separating divergent frompresent genes, is most likely sub-optimal due to the varia-tion inherent in microarray experiments. As a conse-quence, it seems mostly impossible to learn an optimalfixed cutoff as classifier from a training data set even in therare cases where such data set would be available. Discri-minant analysis approaches will therefore fail in the typi-cal case. It seems more appropriate to determine such acutoff dynamically from the data set in question for eachanalysis. To deal with this [9] introduced a method for cal-culating a dynamical cutoff from the log-ratio distribu-tion. Considering the histogram in Figure 5, it is natural toassume that the heavy left tail of the distribution is due todivergent genes. Based on this assumption [9], suggesteda calculation of the cutoff somewhere around the transi-tion between the body and the left tail of the sample dis-tribution. The data analysis tool developed from thisapproach is GACK [10].
We will in this paper extend and formalize the idea of [9],to combine it with the data rotation approach by [11].This allows us to use both the information inherent in thedistribution of the log-ratios as well as that about the V-shaped patterns in the MA-plot, as observed by [11].Finally, from estimated probabilities for each gene to beabsent or present in the sample strain, we calculate whatwe call the ROTMIX score for each gene. We use a set ofsimulated data sets as well as a set of experimental datasets from fully sequenced sample strains to validate theusefulness of the ROTMIX score for ranking and classifica-tion.
ResultsAnalyses of experimental data setsIn order to test and compare our approach to the conven-tional use of log-ratios as well as the rotation approachsuggested by [11] we performed experiments wheresequences of both sample and index genomes wereknown a priori. In a normal experiment only the sequenceof the index strain is known, but this design provides uswith data where aCGH analysis results can be validated bydirect sequence comparisons.
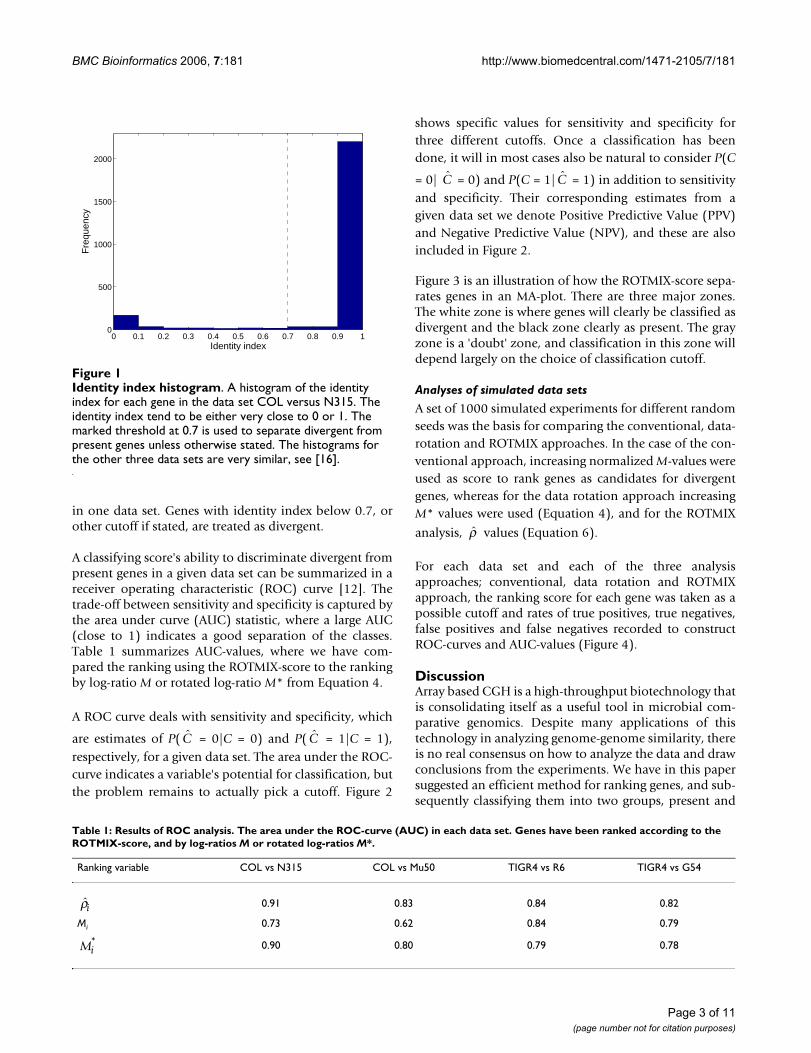
A list of truly divergent genes is essential to validate theproposed method. For experimental data sets no such listexists with absolute certainty, even for fully sequencedgenomes. However, from the sequence data it is evidentthat there exist two natural groups of genes, either aspresent or divergent in the sample strain. Figure 1 shows ahistogram of the identity indices from the BLAST searches
Page 2 of 11(page number not for citation purposes)
BMC Bioinformatics 2006, 7:181 http://www.biomedcentral.com/1471-2105/7/181
in one data set. Genes with identity index below 0.7, orother cutoff if stated, are treated as divergent.
A classifying score's ability to discriminate divergent frompresent genes in a given data set can be summarized in areceiver operating characteristic (ROC) curve [12]. Thetrade-off between sensitivity and specificity is captured bythe area under curve (AUC) statistic, where a large AUC(close to 1) indicates a good separation of the classes.Table 1 summarizes AUC-values, where we have com-pared the ranking using the ROTMIX-score to the rankingby log-ratio M or rotated log-ratio M* from Equation 4.
A ROC curve deals with sensitivity and specificity, which
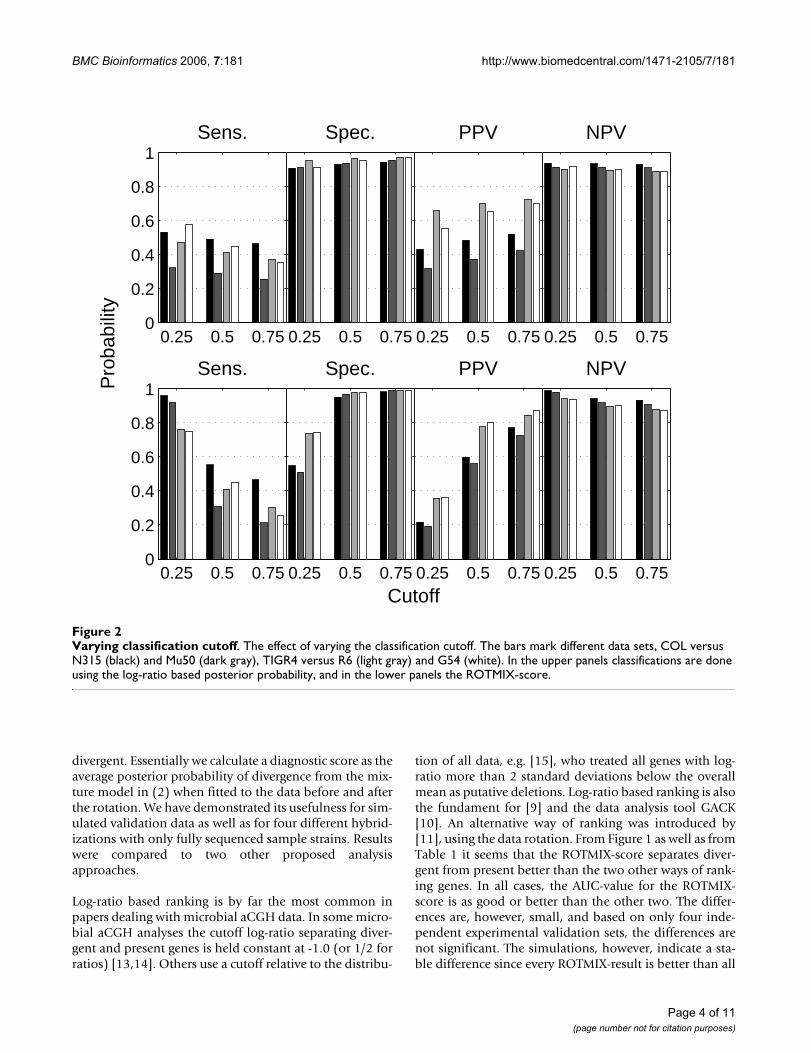
are estimates of P( = 0|C = 0) and P( = 1|C = 1),respectively, for a given data set. The area under the ROC-curve indicates a variable's potential for classification, butthe problem remains to actually pick a cutoff. Figure 2
shows specific values for sensitivity and specificity forthree different cutoffs. Once a classification has beendone, it will in most cases also be natural to consider P(C
= 0| = 0) and P(C = 1| = 1) in addition to sensitivityand specificity. Their corresponding estimates from agiven data set we denote Positive Predictive Value (PPV)and Negative Predictive Value (NPV), and these are alsoincluded in Figure 2.
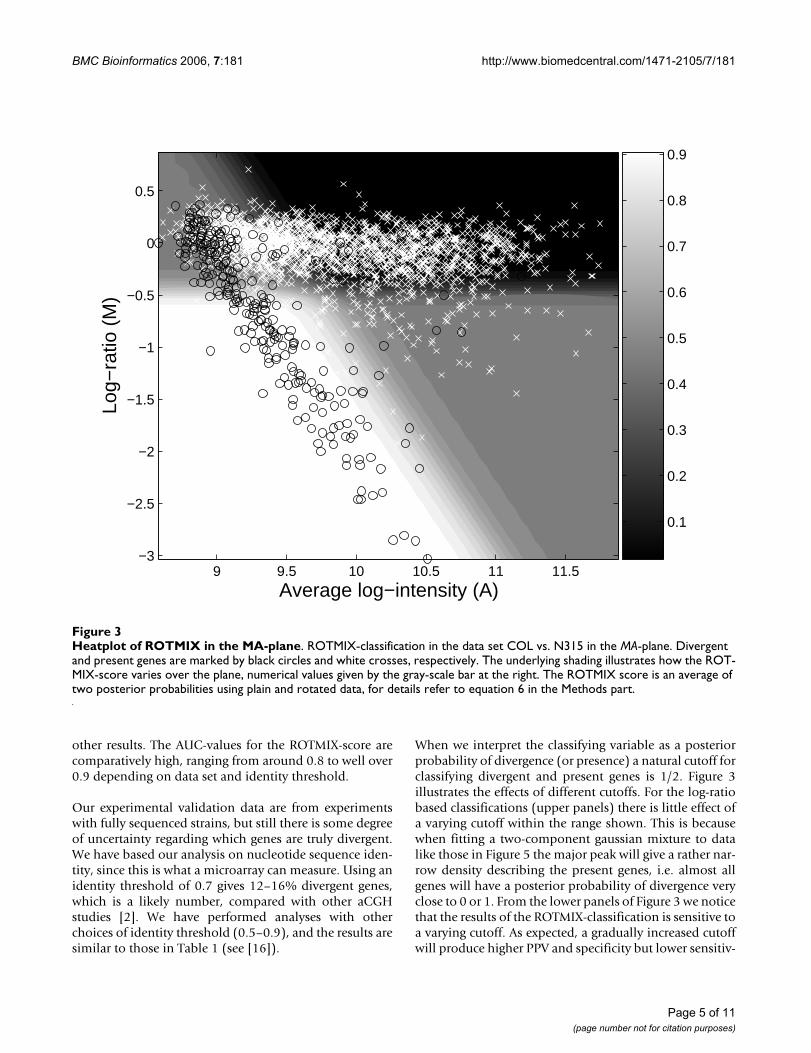
Figure 3 is an illustration of how the ROTMIX-score sepa-rates genes in an MA-plot. There are three major zones.The white zone is where genes will clearly be classified asdivergent and the black zone clearly as present. The grayzone is a 'doubt' zone, and classification in this zone willdepend largely on the choice of classification cutoff.
Analyses of simulated data sets
A set of 1000 simulated experiments for different randomseeds was the basis for comparing the conventional, data-rotation and ROTMIX approaches. In the case of the con-ventional approach, increasing normalized M-values wereused as score to rank genes as candidates for divergentgenes, whereas for the data rotation approach increasingM* values were used (Equation 4), and for the ROTMIX
analysis, values (Equation 6).
For each data set and each of the three analysisapproaches; conventional, data rotation and ROTMIXapproach, the ranking score for each gene was taken as apossible cutoff and rates of true positives, true negatives,false positives and false negatives recorded to constructROC-curves and AUC-values (Figure 4).
DiscussionArray based CGH is a high-throughput biotechnology thatis consolidating itself as a useful tool in microbial com-parative genomics. Despite many applications of thistechnology in analyzing genome-genome similarity, thereis no real consensus on how to analyze the data and drawconclusions from the experiments. We have in this papersuggested an efficient method for ranking genes, and sub-sequently classifying them into two groups, present and
C C
C C
ρ
Table 1: Results of ROC analysis. The area under the ROC-curve (AUC) in each data set. Genes have been ranked according to the ROTMIX-score, and by log-ratios M or rotated log-ratios M*.
Ranking variable COL vs N315 COL vs Mu50 TIGR4 vs R6 TIGR4 vs G54
0.91 0.83 0.84 0.82
Mi 0.73 0.62 0.84 0.79
0.90 0.80 0.79 0.78
ρi
Mi*
Identity index histogramFigure 1Identity index histogram. A histogram of the identity index for each gene in the data set COL versus N315. The identity index tend to be either very close to 0 or 1. The marked threshold at 0.7 is used to separate divergent from present genes unless otherwise stated. The histograms for the other three data sets are very similar, see [16].
0 0.1 0.2 0.3 0.4 0.5 0.6 0.7 0.8 0.9 10
500
1000
1500
2000
Identity index
Fre
quen
cy
Page 3 of 11(page number not for citation purposes)
BMC Bioinformatics 2006, 7:181 http://www.biomedcentral.com/1471-2105/7/181
divergent. Essentially we calculate a diagnostic score as theaverage posterior probability of divergence from the mix-ture model in (2) when fitted to the data before and afterthe rotation. We have demonstrated its usefulness for sim-ulated validation data as well as for four different hybrid-izations with only fully sequenced sample strains. Resultswere compared to two other proposed analysisapproaches.
Log-ratio based ranking is by far the most common inpapers dealing with microbial aCGH data. In some micro-bial aCGH analyses the cutoff log-ratio separating diver-gent and present genes is held constant at -1.0 (or 1/2 forratios) [13,14]. Others use a cutoff relative to the distribu-
tion of all data, e.g. [15], who treated all genes with log-ratio more than 2 standard deviations below the overallmean as putative deletions. Log-ratio based ranking is alsothe fundament for [9] and the data analysis tool GACK[10]. An alternative way of ranking was introduced by[11], using the data rotation. From Figure 1 as well as fromTable 1 it seems that the ROTMIX-score separates diver-gent from present better than the two other ways of rank-ing genes. In all cases, the AUC-value for the ROTMIX-score is as good or better than the other two. The differ-ences are, however, small, and based on only four inde-pendent experimental validation sets, the differences arenot significant. The simulations, however, indicate a sta-ble difference since every ROTMIX-result is better than all
Varying classification cutoffFigure 2Varying classification cutoff. The effect of varying the classification cutoff. The bars mark different data sets, COL versus N315 (black) and Mu50 (dark gray), TIGR4 versus R6 (light gray) and G54 (white). In the upper panels classifications are done using the log-ratio based posterior probability, and in the lower panels the ROTMIX-score.
0.25 0.5 0.750
0.2
0.4
0.6
0.8
1
Pro
babi
lity
Sens.
0.25 0.5 0.75
Spec.
0.25 0.5 0.75
PPV
0.25 0.5 0.75
NPV
0.25 0.5 0.750
0.2
0.4
0.6
0.8
1Sens.
0.25 0.5 0.75
Spec.
0.25 0.5 0.75Cutoff
PPV
0.25 0.5 0.75
NPV
Page 4 of 11(page number not for citation purposes)
BMC Bioinformatics 2006, 7:181 http://www.biomedcentral.com/1471-2105/7/181
other results. The AUC-values for the ROTMIX-score arecomparatively high, ranging from around 0.8 to well over0.9 depending on data set and identity threshold.
Our experimental validation data are from experimentswith fully sequenced strains, but still there is some degreeof uncertainty regarding which genes are truly divergent.We have based our analysis on nucleotide sequence iden-tity, since this is what a microarray can measure. Using anidentity threshold of 0.7 gives 12–16% divergent genes,which is a likely number, compared with other aCGHstudies [2]. We have performed analyses with otherchoices of identity threshold (0.5–0.9), and the results aresimilar to those in Table 1 (see [16]).
When we interpret the classifying variable as a posteriorprobability of divergence (or presence) a natural cutoff forclassifying divergent and present genes is 1/2. Figure 3illustrates the effects of different cutoffs. For the log-ratiobased classifications (upper panels) there is little effect ofa varying cutoff within the range shown. This is becausewhen fitting a two-component gaussian mixture to datalike those in Figure 5 the major peak will give a rather nar-row density describing the present genes, i.e. almost allgenes will have a posterior probability of divergence veryclose to 0 or 1. From the lower panels of Figure 3 we noticethat the results of the ROTMIX-classification is sensitive toa varying cutoff. As expected, a gradually increased cutoffwill produce higher PPV and specificity but lower sensitiv-
Heatplot of ROTMIX in the MA-planeFigure 3Heatplot of ROTMIX in the MA-plane. ROTMIX-classification in the data set COL vs. N315 in the MA-plane. Divergent and present genes are marked by black circles and white crosses, respectively. The underlying shading illustrates how the ROT-MIX-score varies over the plane, numerical values given by the gray-scale bar at the right. The ROTMIX score is an average of two posterior probabilities using plain and rotated data, for details refer to equation 6 in the Methods part.
Average log−intensity (A)
Log−
ratio
(M
)
9 9.5 10 10.5 11 11.5−3
−2.5
−2
−1.5
−1
−0.5
0
0.5
0.1
0.2
0.3
0.4
0.5
0.6
0.7
0.8
0.9
Page 5 of 11(page number not for citation purposes)

BMC Bioinformatics 2006, 7:181 http://www.biomedcentral.com/1471-2105/7/181
ity. This means that if a gene has a large ROTMIX-score itis also more likely to be divergent.
Fixing the cutoff at 1/2 gives a significant improvement ofPPV for the ROTMIX case compared to the log-ratio clas-sification in the upper panels (p-values below 0.05 for all
data sets in a significance test of proportions). This trans-lates to a relevant reduction in the false discovery propor-tion for the genes ranked first using the ROTMIX-score.Thus, time and costs for subsequent proving low-through-put experiments are considerably lowered. For sensitivityand NPV there is no significant difference, and for specif-icity ROTMIX gives a significant, but in practice notimportant, improvement.
Using a score-based approach rather than an establishedstatistics like for example a t-test or a regularized modifi-cation thereof (e.g. SAM, [8]) is necessary because of theusual absence of replicate measures in aCGH screenings.Moreover, a mixture model score is more robust againstnormalization problems. Any t-test like statistic, using anull hypothesis of equal signals for index and samplegenome, would classify all genes with significant devia-tion in signals as divergent. The mixture fit, however,searches for two distributions of signals, and there is noneed to assume that present genes always produce equalsignals in the sample and index strain.
MA-plots should always accompany any analysis usingthe ROTMIX-procedure. It is in this space the ROTMIX-procedure operates, as illustrated in Figure 4. It is ofcourse essential that the MA-plot graph more or less hasthe V-shaped form. If not, the ROTMIX-score may givedubious results, but of all microbial aCGH data sets wehave seen, a majority has this characteristic pattern. Asmore and more bacterial strains are sequenced, we will seemore multi-genome arrays in the future. From such arrayswe can also detect genes that are present in the sample
Typical histogram of microbial aCGH log-ratiosFigure 5Typical histogram of microbial aCGH log-ratios. A typical histogram of log2-ratios for a microbial aCGH experi-ment. The data are for Enterococcus faecalis, index strain V583 against sample strain MB143.
−5 −4 −3 −2 −1 0 1 20
100
200
300
400
500
log−ratio
Gen
es p
er in
terv
al
Simulation resultsFigure 4Simulation results. A box-plot showing the distributions of AUC values for 1000 evaluated simulated data sets with each of conventional analysis, data rotation, and ROTMIX analysis. The boxes indicate the median and upper and lower quartile. The whiskers indicate additional 1.5 interquartile range on each side, and the small circles indicate extreme results outside this range.
conv rot rotmix
0.93
0.94
0.95
0.96
0.97
0.98
0.99
1.00
Page 6 of 11(page number not for citation purposes)

BMC Bioinformatics 2006, 7:181 http://www.biomedcentral.com/1471-2105/7/181
strain but not in the index strain. Following the reasoningbehind the data rotation of [11], we expect such genes tobe found around a line of slope +2 in the MA-plot. Exper-iments on such arrays could also be analyzed by our pro-cedure, with some natural adjustments, given that suchdata show a corresponding W-shaped pattern. We haveseen some data confirming this, but more research shouldbe done before we can be conclusive.
The current validation data indicate that the most severeproblem faced is the rather low sensitivity, (between 0.4and 0.6, see Figure 3) when using a classification cutoffaround 1/2. This is not surprising, since divergent genesare in general grossly outnumbered by present. Futureefforts should, however, probably focus on this. Oneapproach could be to make better use of extra information
sources. We are actually facing a classification problem,but with no training data available. A partial training ofthe classifier could however be done using genes knownto be present, i.e. the core minimal genome genes [17].Experiments with cDNA microarrays still lacks the repeat-ability needed to transfer actual parameter estimates fromone experiment to another. To achieve this, highly special-ized arrays are required [18], at high costs and reducedversatility.
ConclusionWe have devised an efficient, sensitive and specific proce-dure for detecting divergent genes from microbial aCGHexperiments. A simple procedure based on gaussian mix-ture models and data rotation provides a score for eachgene, which is an average of two posterior probabilities of
MA-plots for different aCGH experimentsFigure 6MA-plots for different aCGH experiments. Plots of log-ratio (M) against average log-intensity (A) for four aCGH data sets from four different bacteria. The characteristic V-shaped pattern is most clearly visible in the upper left panel, but is also more or less present in the other MA-plots.
10 12 14 16−6
−4
−2
0
2Enterococcus faecalis
A
M
10 12 14 16−6
−4
−2
0
2Staphylococcus aureus
A
M
10 12 14 16−6
−4
−2
0
2Streptococcus pneumonia
A
M
10 12 14 16−6
−4
−2
0
2Campylobacter jejuni
A
M
Page 7 of 11(page number not for citation purposes)

BMC Bioinformatics 2006, 7:181 http://www.biomedcentral.com/1471-2105/7/181
divergence. When tested on simulated data as well as onfour different experimental validation data sets with onlyfully sequenced strains, this ROTMIX-score seems to be animprovement of the standard log-ratios for ranking andclassifying genes into divergent and present.
MethodsPre-processing and conventional analysisData acquisition and preprocessing is as in cDNA micro-array experiments, except for the normalization step. Mostnormalization procedures have an underlying assump-tion of (locally) symmetric distribution of log-ratios. Inexpression experiments this is usually an acceptableassumption, but as seen from Figure 5, clearly not formicrobial aCGH data. All experimental data sets we con-sider are from dye-swap experiments with multiple spots(three or four) for each gene on each array. We have there-fore implemented a normalization procedure essentiallysimilar to the 'self-hybridization' suggested by [19].
Ranking genes according to the normalized log-ratio cor-responds to the conventional approach for analyzingaCGH data.
Mixture modelClassifying genes of the index strain as present or diver-gent with respect to a sample strain is not a typical classi-fication problem, as training data in the narrow sense arenot available for every single experiment. On the otherhand, some knowledge about the log-ratios of the diver-gent genes is available, and we try to make use of this priorknowledge in our proposed analysis. We build our analy-sis upon a two-component mixture model framework.
Let Ci be the class variable for gene i, i.e.
The unconditional probability of gene i being divergent isP(Ci = 0) = π. Let Mi be the observed log-ratio, or sometransformation of it (see below), for gene i. For divergentgenes we assume this log-ratio is distributed according tothe density f0(M), and similar, f1(M) is the density forpresent genes. Thus, the joint density fC, M (C, M) isdefined, and its marginal in M is the mixture model
fM(Mi) = πf0(Mi) + (1 - π)f1(Mi) (2)
From the joint and marginal density we also get the con-ditional density fC|M (Ci|Mi = fC, M (Ci, Mi)/fM (Mi). Theposterior probability of divergence for gene
i, P(Ci = 0|Mi) = p0(Mi) is then given by this density as
Assuming fk ~ N(μk, ), k = 0,1, all parameters can be
estimated from Equation (2) without any knowledge ofCi. Either maximum likelihood estimation using the EM-
algorithm or a Bayesian approach using the Gibbs-sam-pler will do this job satisfactory [20].
Data rotationIn our novel analysis approach, we are aiming at combin-ing the conventional analysis together with the data rota-tion approach [11].
The data rotation approach is based on the presumptionthat divergent genes will tend to populate around a line ofslope -2 when their log-ratio (M) is plotted against theiraverage log-intensity (A). The observation of a V-shapedpattern in the MA-plots for microbial data sets is common(Figure 6). The lower 'arm' of this V will in general have aslope of -2, which is explained as follows:
Each of the two intensities obtained per gene can be seenas a combination of two components
Si = bi +
Ii = bi +
where bi is some baseline intensity due to non-specific
hybridization, and and are signal intensities for
sample and index strain, respectively. The baseline inten-sity is expected to be small if compared to a signal for a
gene present in the index strain. For divergent genes,
should ideally be zero, while must still be expected to
be comparatively large. Thus, for divergent genes Si ≈ bi
and Ii ≈ , and we get
Mi = log(Si/Ii) ≈ log(bi) - log( )
Ai = (log(Si) + log(Ii))/2 ≈ (log(bi) + log( ))
and hence Mi ≈ 2 log(bi) - 2Ai. This suggests that divergentgenes should, when plotting Mi versus Ai, propagatearound some line with slope -2.
Ci
ii = ( )⎧⎨⎩
0
11
if gene is divergent
if gene is present
p Mf M
f M f Mii
i i0
0
0 113( ) =
( )( ) + −( ) ( ) ( )π
π π
σk2
′Si
′Ii
′Si ′Ii
′Si
′Ii
′Ii
′Ii
12
′Ii
Page 8 of 11(page number not for citation purposes)

BMC Bioinformatics 2006, 7:181 http://www.biomedcentral.com/1471-2105/7/181
As proposed by [11], we will use a rotation of the axes (A,M) → (A*, M*) as described by the linear map
where
and where γ = arctan(-2).
Ranking genes by their M*-value rather than by their M-value gives an alternative way of separating divergent frompresent, as illustrated in Figure 7. In [11] a reduction infalse positives is reported as the main advantage of thisprocedure.
The ROTMIX-scoreTo further improve the classification, we propose a rank-ing of the genes according to a score which is the average
posterior probability of divergence from (3) when fittingthe mixture model to both M and M* values, respectively.
First, fit the two-component gaussian mixture model fromEquation (2) to the log-ratios, and let
(Mi) be the
estimated posterior probability of divergence for gene ifound from Equation (3). The density describing themajor peak of the data, f1, is very well estimated in this
case. The divergent genes are, however, most likelysmeared out over a large range of log-ratios, and f0 is prob-
ably not very well approximated. This may lead to genes
with very large log-ratios having a large (Mi) if is
very wide. To avoid this artifact we require that
where is the estimated location of f1.
Second, we perform the data rotation from Equation (4)and fit the two-component gaussian mixture to the
rotated log-ratios . The mixture estimation can be
based on all data, but as suggested by [11], we use a trun-cated data set, where only genes having log-ratio smaller
than from the first mixture model, are used. In this
truncated data set the peak of the presumably divergentgenes is more pronounced and hence easier to estimate.Nevertheless, this gives us another set of estimates
( ) for every gene. In this case f1 may be poorly esti-
mated, and hence, we make a similar requirement as wedid for the first estimates
and is the estimated location of f0.
Finally, the ROTMIX-score is the average of the two esti-mates
Classification
We classify genes based on the ROTMIX-score, using a cut-off between 0 and 1. A natural choice is 1/2, which isaccording to the Bayes rule [21], but other choices may be
M
A
M
A
*
*
⎡
⎣⎢⎢
⎤
⎦⎥⎥
=⎡
⎣⎢
⎤
⎦⎥ ( )X 4
X =( ) − ( )( ) ( )
⎡
⎣⎢⎢
⎤
⎦⎥⎥
( )sin cos
cos sin
γ γγ γ
5
Ci
ii = ( )⎧⎨⎩
0
11
if gene is divergent
if gene is present
p0 f0
ˆ min ˆ , : ˆp M p M j Mij
j j0 0 1( ) = ( ) ∀ > μ
μ1
Mi*
μ1
p0 Mi*
ˆ max ˆ , : ˆ* * *p M p M j Mij
j j0 0 0( ) = ( ) ∀ < μ
μ0
ˆ (ˆ ( ) ˆ ( ))/*ρi i ip M p M= + ( )0 0 2 6
The data rotationFigure 7The data rotation. An illustration of the data rotation. Present (dark gray) and divergent (light gray) genes are pre-sumed to group themselves into a V-shaped pattern in the MA-plot. The divergent genes populates along a line of slope -2 (broken line). After rotation the A* axis will be parallell to this line, and genes can be ranked according to their M*-value.
Page 9 of 11(page number not for citation purposes)

BMC Bioinformatics 2006, 7:181 http://www.biomedcentral.com/1471-2105/7/181
made. This means = 0 if the probability is larger than
the cutoff and = 1 otherwise. The choice of cutoff willdepend on the focus of the analysis. If we are primarilysearching for divergent genes, e.g. looking for characteris-tic divergent regions on the chromosome, it is probablywise to choose a larger cutoff to avoid too many false pos-itives (genes misclassified as divergent). On the otherhand, if the focus is on the present genes, e.g. estimatingthe minimum genome over all strains, we would naturallyavoid false negatives (genes misclassified as present), andchoose a smaller cutoff. We could also introduce a doubt-zone, i.e. only classify genes who are below a lowerthreshold or above an upper.
DataExperimental dataIn order to compare aCGH analysis approaches we con-ducted aCGH experiments with fully sequenced strains,i.e. both index and sample strains' gene contents are avail-able as gold standards. Microarrays for Staphylococcusaureus index strain COL, were used in aCGH analysesagainst strains Mu50 and N315 and similar for Streptococ-cus pneumoniae index strain TIGR4 against R6 and G54.Full genomes as well as identified gene sequences forthese strains can be downloaded from the ComprehensiveMicrobial Resource (CMR) at TIGR [22], the Streptococcusstrain G54, is available at the Spanish National CancerCentre [23].
Due to allele differences, silent mutations and possiblesequence errors in the databases we cannot expect a genefrom one strain to be found with exact similarity inanother strain even if it is truly the same gene. Highhybridization signals are based on similarity at thenucleotide sequence level. To establish a quantification ofthis similarity, each index gene was locally aligned againsta database consisting of the sample strain sequences foreach experiment.
To reduce the element of randomness in the choice ofBLAST parameters, we made several BLAST searches forevery gene, keeping the match score constant at 1 and var-ying the remaining parameters systematically aroundtheir default values. In all cases the DUST low-complexityfilter was turned off. For each search the best hit for indexgene i was recorded, and an identity index was calculatedas the number of exact matching residue-pairs divided bythe number of residues in the index gene. The medianidentity index for gene i, was used as the identity-score forthat gene.
For a chosen threshold we predicted gene i to be divergentif the corresponding identity index is below this threshold
and present otherwise. Unless otherwise stated, in thedownstream analysis we used the threshold 0.7 to estab-lish a list of divergent genes from each data set.
Simulated dataIn addition to using the experimental data sets for pur-pose of methods comparison, we also used a set of simu-lated data sets according to [24] and [11]. The underlyingmodel is
Si = αS + βSXSi · exp(ui + vSi) + ei + wSi
Ii = αI + βIXIi · exp(ui + vIi) + ei + wIi
together with the following variable explanations andparameter settings: Si and Ii denotes simulated measuredfluorescence intensity for gene i from the sample andindex strain, respectively. Each simulated experiment con-sisted of 3000 genes, where i = 1,..., ndiv were divergent. Wemodeled scenarios for different proportions of divergentgenes, 0.05 ≤ ndiv/3000 ≤ 0.5. XSi and XIi model the truevalues for the expected fluorescence signals. Intensities ofpresent and absent genes are
i.e. expected sample intensities for divergent genes aremodeled with 12.5% of the sample intensity of presentgenes.
Moreover, fixed background parameters are
αS = αI = 300
βS = βI = 0.5.
Remaining quantities are gaussian variables with zeroexpectation and variance equal to 0.25, chosen as recom-mended by [24] and resulting in simulated data with sim-ilar distributions of data points in the MA-plot as in ourlaboratory experiences. The random variables are inter-preted as in [11]: ui, vSi and vIi are multiplicative errorterms, ui models the gene-specific effects and vSi and vIi themultiplicative gene-dye-interactions, ei, wSi and wIi refer toadditive errors.
Authors' contributionsLS and DR have contributed equally to this work, by dis-cussing and polishing ideas, programming in Matlab andR, and writing the manuscript.
C
C
log ~, .
, .
log
25 0 25
8 0 25X
N i n
N i nSi( ) ( ) ≤( ) >
⎧⎨⎪
⎩⎪
when
when div
div
22 8 0 25X NIi( ) ( )~ , .
Page 10 of 11(page number not for citation purposes)
BMC Bioinformatics 2006, 7:181 http://www.biomedcentral.com/1471-2105/7/181
Publish with BioMed Central and every scientist can read your work free of charge
"BioMed Central will be the most significant development for disseminating the results of biomedical research in our lifetime."
Sir Paul Nurse, Cancer Research UK
Your research papers will be:
available free of charge to the entire biomedical community
peer reviewed and published immediately upon acceptance
cited in PubMed and archived on PubMed Central
yours — you keep the copyright
Submit your manuscript here:http://www.biomedcentral.com/info/publishing_adv.asp
BioMedcentral
LN has done the validation experiments, under supervi-sion of ÅA, who has also introduced the problem in thefirst place, and been the supplier of arrays and cultures forthe experiments.
AZ and AA have been discussion partners and supervisorsfor the statistical part.
References1. Fitzgerald JR, Sturdevant DE, Mackie SM, Gill SR, Musser JM: Evolu-
tionary genomics of Staphylococcus aureus: Insight into theorigin of methicillin-resistant strains and the toxic shock syn-drome epidemic. Proceedings of the National Academy of Science2001, 98:8821-8826.
2. Dorrell N, Champion OL, Wren BW: Application of DNA Micro-arrays for Comparative and Evolutionary Genomics. Methodsin Microbiology 2002, 33:121-136.
3. Pinkel D, Segraves R, Sudar S, Clark S, Poole I, Kowbel D, Collins C,Kuo W, Chen C, Zhai Y, Dairkee S, Ljung B, Gray JW, Albertson DG:High resolution analysis of DNA copy number variationusing comparative genomic hybridization to microarrays.Nature Genetics 1998, 20:207-211.
4. Pollack JR, Perou CM, Alizadeh AA, Eisen MB, Pergamenschikov A,Williams CF, Jeffrey SS, Botstein D, Brown PO: Genome-wideanalysis of DNA copy-number changes using cDNA microar-rays. Nature Genetics 1999, 23:41-46.
5. Fridlyand J, Snijders AM, Pinkel D, Albertson DG, Jain AN: HiddenMarkov models approach to the analysis of array CGH data.Journal of Multivariate Analysis 2004, 90:132-153.
6. Jong K, Marchiori E, Meijer G, van der Vaart A, Ylstra B: BreakpointIdentification and Smoothing of array ComparativeGenomic Hybridization data. Bioinformatics Advanced Access2004, 16:1-2.
7. Autio R, Hautaniemi S, Kauraniemi P, Yli-Harja O, Astola J, Wolf M,Kallioniemi A: CGH-Plotter: MATLAB toolbox for CGH-dataanalysis. Bioinformatics 2003, 19:1714-1715.
8. Tusher VG, Tibshirani R, Chu G: Significance analysis of micro-arrays applied to the ionizing radiation response. PNAS 2001,98(9):5116-5121.
9. Kim CV, Joyce EA, Chan K, S F: Improved analytical methods formicroarray-based genome-composition analysis. Genome Biol-ogy 2002, 3(11):research0065.1-0065.17.
10. The GACK software [http://falkow.Stanford.edu/whatwedo/software/software.html.]
11. Repsilber D, Mira A, Lindroos H, Andersson S, Ziegler A: Data rota-tion improves genomotyping efficiency. Biometrical Journal2005, 47(4):585-598.
12. Hanley JA, McNeil BJ: The meaning and use of the area under areceiver operating characteristic (ROC) curve. Radiology1982, 143:29-36.
13. Björkholm B, Lundin A, Sillén A, Guillemin K, Salama N, Rubio C,Gordon JI, Falk P, Engstrand L: Comparison of Genetic Diver-gence and Fitness between Two Subclones of Helicobacterpylori. Infection and Immunity 2001, 2001:7832-7838.
14. Dorrell N, Mangan JA, Laing KG, Hinds J, Linton D, Al-Ghusein H,Barrell BG, Parkhill J, Stoker NG, Karlyshev AV, Butcher PD, WrenBW: Whole Genome Comparison of Campylobacter jejuniHuman Isolates Using a Low-Cost Microarray RevealsExtensive Genetic Diversity. Genome Research 2001,11:1706-1715.
15. Behr MA, Wilson MA, Gill WP, Salamon H, Schoolnik GK, Rane S,Small M: Comparative Genomics of BCG Vaccines by Whole-Genome DNA Microarray. Science 1999, 284:1520-1523.
16. Supplementary material [http://arken.umb.no/~larssn/bioinformatics/ROTMIX/]
17. Gil R, Silva FJ, Peretó J, Moya A: Determination of the Core of aMinimal Bacterial Gene Set. Microbiology and Molecular BiologyReviews 2004:518-537.
18. Dunman PM, Mounts W, McAleese F, Immermann F, Macapagal D,Marsilio E, McDougal L, Tenover FC, Bradford PA, Petersen PJ, ProjanSJ, Murphy E: Uses of Staphylococcus aureus GeneChip in Gen-otyping and Genetic Composition Analysis. Journal of ClinicalMicrobiology 2004:4275-4283.
19. Yang YH, Dudoit S, Luu P, Speed T: Normalization for cDNAMicroarray Data. [http://www.stat.berkeley.edu/users/terry/zarray/Html/normspie.html].
20. McLachlan GJ, Peel D: Finite Mixture Models New York: John Wiley &Sons; 2000.
21. Ripley BD: Pattern Recognition and Neural Networks Cambridge: Cam-bridge University Press; 1996.
22. The Institute of Genomic Research [http://www.tigr.org/.]23. Spanish National Cancer Centre [http://bioinfo.cnio.es/data/
Spneumo/.]24. Cui X, Kerr MK, Churchill GA: Data transformations for cDNA
microarray data. Statistical applications in genetics and molecular biol-ogy 2003, 2:article 4.
Page 11 of 11(page number not for citation purposes)
http://www.ncbi.nlm.nih.gov/entrez/query.fcgi?cmd=Retrieve&db=PubMed&dopt=Abstract&list_uids=9771718
http://www.ncbi.nlm.nih.gov/entrez/query.fcgi?cmd=Retrieve&db=PubMed&dopt=Abstract&list_uids=9771718
http://www.ncbi.nlm.nih.gov/entrez/query.fcgi?cmd=Retrieve&db=PubMed&dopt=Abstract&list_uids=7063747