An Evaluative Study for Egyptian Primary School Textbooks ...
Developmental Trends in the Evaluative and DivergentThinking of Children R. E. Charles and M. A. RuncoDevelopmental Trends
Robyn E. CharlesCalifornia State University, Fullerton
Mark A. RuncoUniversity of Hawaii, Hilo, and California State University, Fullerton
ABSTRACT:Thepurposeof this studywas to investigatedivergent thinkingandevaluativeskillas importantpro-cesses in the development of creative thinking in ele-mentary schoolchildren. Children from the 3rd, 4th, and5th grades (N = 117) received divergent thinking tasksand measures of evaluative accuracy. The latter indi-catedhowwell they likedvarious ideas (i.e., theirprefer-ences) and the degree to which the children believedthose ideas to be original. Results indicated that the ac-curacy of their originality judgments increased signifi-cantly with age, as did the preference for appropriateideas. Unlike previous research, evaluative scores werenot related to divergent thinking test scores. Also some-whatsurprising,givenearlier research,was the lackofa“4th-grade slump.” In fact, there was a significant peak,rather thanslump, in thedivergent thinkingof4th-gradechildren,at least in therawfluencyscores.Whenfluencyratio scores were compared, there were still some inci-dents of a 4th-grade peak, but there was also a signifi-cant decline with grade in the proportions of 1 index ofhighly appropriate ideas. Although a relation was notfound between evaluative skill and divergent thinkingraw fluency scores, an increasing preference for appro-priate square ideas was found to contribute signifi-cantly to the prediction of decreases in the proportion ofhigh-quality round ideas given. Possible explanationsare given to account for this unexpected finding, includ-ing differences in interpersonal and intrapersonalevaluative skills, and the distinction between the abilityto accurately identify original or appropriate ideas andchoosing to selectively express such ideas.
Truly creative work requires a complex of skills, traits,and capacities. For this reason, Cropley (1992) referred
to the constellation of characteristics necessary for cre-ativity; Albert and Runco (1989) pointed to the creativitycomplex, and MacKinnon (1960/1983) and Mumfordand Gustafson (1988) labeled creativity a syndrome.
Such multidimensional definitions of creativity havethe advantage of being realistic, and there is some indi-cation that they make for more accurate prediction of ac-tual creative behavior (e.g., Runco, 1986a). Unfortu-nately, they also make it somewhat difficult to describethe development of creative potential. After all, it is pos-sible that the various characteristics are only coordi-nated and complementary after childhood. They mayvery we ll develop in an asynchronous fashion, with oneor more maturing earlier, and others maturing later.
When developmental trajectories are examined,they often indicate slumps and peaks, sometimesmore than one of each. This kind of curvilinear tra-jectory is consistent with general developmental theo-ries; Piaget (1980), for example, described nonlinearchanges as decalages. Evidence for a curvilinear de-velopmental trajectory is available for at least one ofthe characteristics of the creativity complex, namelydivergent thinking.
Divergent thinking is one of the most commonly rec-ognized components of the creativity complex. Diver-gent thinking is not synonomous with creative thinking,but it does reflect the ability to generate ideas and thus
Creativity Research Journal 417
Creativity Research Journal Copyright 2000–2001 by2000–2001, Vol. 13, Nos. 3 & 4, 417–437 Lawrence Erlbaum Associates, Inc.
This article was completed in partial fulfillment of the requirements forthe degree of Master of Arts in Psychology. We would like to thank themembers of the committee, Daniel W. Kee and Edward R. Stearns.
Manuscript received January 10, 1999; accepted July 1, 2000.Correspondence and requests for reprints should be sent to Mark A.
Runco, Department of Psychology, University of Hawaii, Hilo, 200 WestKawili Street, Hilo, HI 96720. E-mail: [email protected].
may play a central role. Because it does not penalizechildren for their lack of expertise or productivity, it hasan advantage over other achievement-oriented assess-ments and is especially useful with children. Althoughactual products (e.g., publications, works of art) may beuseful indexes of creativity in certain samples of adults,ideas are also more useful for studies of everyday cre-ativity (Runco & Richards, 1997).
The development of divergent thinking was recentlydescribed by Runco and Charles (1996). Although thereis some asynchrony among the various indexes of diver-gent thinking (i.e., ideational fluency, flexibility, andoriginality), by far the most common trajectory shows anearlypeak,aslumpataroundthefourthgrade,andthenanincrease (Torrance, 1968). There are of course individualdifferences: Some children do not slump; others do notrecover after the fourth grade. The fourth-grade slump is,however, apparent even outside of the United States(Raina, 1980), and it appears just when various expres-sions of conventional (i.e., conforming and unoriginal)behavior manifest themselves (Camp, 1994; Gardner,1982; Rosenblatt & Winner, 1988; Smith & Carlsson,1990; Urban, 1991). Rosenblatt and Winner even re-ferred to a conventional stage during middle childhood,when children focus more on the representational accu-racy of their art than on its aesthetic appeal.
What of the other components of creativity in thecreativity complex? Do they show curvilinear develop-ment? If so, when do they peak? Do they also show aslump or slumps, and if so, is one apparent in the 4thgrade, as is the case for divergent thinking? This inves-tigation was designed to address these questions. Its fo-cus was on the evaluative component of creative poten-tial (Runco, in press; Runco & Vega, 1990). Surely itcould have a different developmental trajectory thandivergent thinking, given that the two are only weaklyrelated (Runco & Smith, 1992) and given developmen-tal views that various skills can develop in an asyn-chronous fashion.1
The evaluative component of creative thinking isvery important. The main reason for this is easy to see:Divergent thinking is important for the generation ofnew ideas, but divergence alone will not lead to much.Purely divergent ideas can be quite bizarre. If they arebeing produced to find a solution to some problem,
they may very well be irrelevant. Using Bruner’s(1970) apt description of creative solutions, ideas thatare only divergent will be unlikely to elicit “effectivesurprise” because they will lack the appropriateness oftruly creative ideas and solutions (Bruner, 1962;Eysenck, in press; Rothenberg & Hausman, 1976;Runco & Charles, 1993).
Fortunately, some success has recently been ob-tained using a methodology to assess evaluative skills.Runco (1989; Runco & Smith, 1992; Runco & Vega,1990), for example, asked various samples of children,parents, teachers, and college students to rate ideas theythemselves gave or ideas that were taken from earliersamplesofdivergent thinking.Theywereasked toeitherrate the ideas for their originality or their popularity.(The latter was included because it seemed to be easierfor the raters to operationalize, and of course it is anti-thetical to originality.) Findings confirmed that ratingswere reliable, that there were individual differenceswithin the samples in terms of evaluative accuracy, thatratings of popularity were more accurate (and nega-tively related to originality) than ratings of originality,that evaluativeaccuracywasonlymoderatelycorrelatedwith divergent thinking, and that accuracy when ratingone’s own ideas was largely unrelated to accuracy whenrating ideas given by someone else. Runco and Smith(1992) confirmed that evaluative accuracy was unre-lated to traditional measures of critical and convergentthinking, which is why the term evaluative is used to de-scribe these particular skills. It would be misleading tolabel them convergent or critical thinking.
The primary objective of this investigation was toexamine the developmental trajectory of evaluativeskills. Because the fourth-grade slump in divergentthinking could be related to a peak in evaluative abili-ties, we chose to study third-, fourth-, and fifth-gradechildren. We also tested the possibility that declines indivergent thinking are specifically associated with anincreased preference for appropriate ideas. For this as-sessment of preferences, both qualitative and quantita-tive data were collected.
Method
Children
Children were drawn from two middle to upper mid-dle class elementary schools, one in Los Angeles
418 Creativity Research Journal
R. E. Charles and M. A. Runco
1This view is compatible with the new descriptions of cognitivedevelopment that rely on multiple overlapping waves, rather thanrigid stages (see Azar, 1995).
County (School A) and one in San Bernardino County(School B). School A followed a traditional school cal-endar and both sessions occurred during their secondmarking period. School B was on a year-round scheduleand Session 1 immediately preceded a 6-week break,whereas Session 2 occurred immediately following thebreak. Testing at both schools was completed within 1 to2 weeks of the end of their school year.
At both schools, one teacher each from the third,fourth, and fifth grades agreed to participate in thestudy at the principal’s request. Consent forms weresent out to all children in each of the six classes. A fewof the teachers included returning the consent form aspart of the weekly homework, with varying success inreturn rates. Although there were a total of 119 consentforms returned with parental approval to participate, 1child moved before the testing began; thus 118 chil-dren were interviewed during the first session, and 113children in the second session. One child was inter-viewed by mistake in Session 1 due to a mix-up withnames. All of the Session 1 data for this last child weredeleted, including the instances data, leaving 117 chil-dren in the sample for the instances lexicons. Of the 4remaining children not interviewed in the second ses-sion, 3 of them moved after Session 1, and 1 child wasabsent for an extended period of time and a suitable in-terview time could not be scheduled. The instances re-sponses for these 4 children were included in the lexi-cons to give an accurate account of unique andcommon ideas across the entire sample interviewed,but their data were not included in any further analysis.
Materials
Instances tasks. Two instances tasks from theWallach and Kogan (1965) battery were individuallyadministered to the children. In these tasks the childwas asked to name instances of round things and thingsthat make noise.2 Following standard procedure, thetasks were described as games rather than tests. This
measure was administered orally for all children, andthere was no time limit for responding. An example wasgiven during the instructions (i.e., “Name all the thingsyou can think of that move on wheels”). Both taskswere scored for total fluency, flexibility, originality,and cuing (defined later), but only the round task wasscored for appropriateness because it was not feasibleto objectively quantify things that make noise.
At times it was difficult to know precisely what thechildren meant by their instances responses. If the ex-perimenter could not understand the subject or was un-familiar with the stated object, the children were askedto explain.
Scoring of Instances Tasks
Total fluency. Initially, the instances responsesfor each task were compiled and sorted to identify com-mon and unique ideas. Some multipart answers, such as“wheels on skates, cars, Rollerblades” for round thingswere counted as three separate responses, whereas theresponse “thunder and lightning” for things that makenoise was counted as a single response because they al-ways occur together, and only the thunder makes noise.
The instances taskresponseswerescoredfor fluency,flexibility, originality, and cuing. In addition, the roundthings responses were scored for appropriateness. Eachchild received a set of instances fluency scores based onthe number of each type of idea they gave.
Cuing. Harrington, Block, and Block (1983) sug-gested that responses referring to absent objects weremore indicative of creative skill. In this study an ideawas scored as present if it was obvious to the experi-menter that the child was naming something from theimmediate environment, or if the named object wasclearly visible in the room, even if the experimenter wasnot certain the child saw it. An idea was only scored asabsent if it was clearly not present in the room (e.g., ahockey puck). An idea was also scored as absent if aspecific object that was not present was named, but amore general object was present. For example, a re-sponse of “pictures” to the question about round objectswas scored as absent because, although there were rect-angular pictures on the walls, there were no round ones.
A response would also be scored as present if theword was written on a chalkboard or another person
Creativity Research Journal 419
Developmental Trends
2The pilot study used the “square things” test from Wallach andKogan (1965), but it resulted in significantly lower fluency scores,compared to round things, and there were very few ideas that were al-ways square, which may have caused some problems in the scoring ofappropriateness. The use of a different divergent thinking test—things that make noise—was further justified by the fact that it seemsto be less restrictive and uses auditory rather than visual imaging.
said the word, or if the referent was determined to bevisible from the child’s location, even though the childmay not have looked at it. Given that various locationswere used, the coding of each child’s responses for cu-ing was based on his or her specific environment. Thus,some common responses (e.g., television) were codedas present for some children but absent for others.
Flexibility. The flexibility score reflected thenumber of categories from which a child drew his or herresponses (see Runco, 1986a). Thus multiple responsesfrom the same category did not increase this score.There were 21 categories for round things (e.g., bodyparts, food, noisemakers, school supplies, signs, tools,toys) and 17 for noise (e.g., alarms, creatures, ma-chines, musical instruments, natural phenonena, thingsbeing dropped/hit/moved, toys, vehicles).
Originality. An idea was scored as original if itwas given by only one child out of the entire group ofchildren given the instances tasks, including childrenfrom both schools (i.e., 117 children). This scoring isconsistent with the work of Runco and Albert (1985)and Wallach and Kogan (1965).
Appropriateness. Runco and Charles (1993)suggested that truly creative ideas should be both origi-nal and appropriate. In this investigation three differentcategories were used for scoring appropriateness. Ascore of 3 was given if an idea always or almost alwaysmet the given shape criterion (round or noise). Theshape criterion was fairly strict with round meaning cir-cular, not simply curved, from at least one view of theobject. Therefore, a cylinder would be appropriate if itis circular and not oval on the end. Examples of alwaysor almost always round things are “bullseye,” “steeringwheel,” and “Frisbee.” An idea was given an appropri-ateness score of 2 if the object sometimes met or couldmeet the shape criterion. Examples of sometimes roundthings are “buttons,” “clocks,” and “table.” A score of 1was given to a response that never, or almost never, metthe shape criterion. For round things the ideas “dog’sfoot,” “ears,” and “head” were some of the responsesscored as never round. Although these objects could bedrawn or imagined as being truly round, they do not nat-urally occur that way.
Three judges rated the appropriateness of each idea.An idea was only scored as always or almost alwaysround (appropriate) if all three judges gave it a score of
3. This occurred for 76 ideas of the 279 (27.2%) roundideas given. Similarly, only ideas that were given ascore of 1 by all three judges were scored as never oralmost never round (16 ideas, or 5.7%). All the remain-ing ideas were scored as sometimes round. This lastcategory included all the ideas that the judges agreedon as being sometimes round (61 ideas, or 21.9%), aswell as all the ideas that two out of three judges agreedon (116 ideas, or 41.6%), the ideas that all three judgesgave different ratings (3 ideas, or 1.1%), and 7 ideas(2.5%) that were broken out of more general groups ofresponses as being unique ideas after the ratings hadbeen completed. This scoring method was used withthe interpretation that if the three judges could not allagree on a given idea as being always (or never) round,then at least one of the judges had experienced or atleast thought of a case where the object was not round(or at least one case where the object was round), andthus sometimes round seemed a more fitting classifica-tion. Overall, the three judges agreed on 153 (54.8%)of the ideas.
There were occasional difficulties rating responsesthat were somewhat ambiguous. In some cases, al-though the child may have been thinking of a specificobject (e.g., “fire alarm”), there are instances where theobject is not round (a number of fire alarms are squareor rectangular), and thus the idea would be scored asonly sometimes appropriate. For this reason, scores ofboth always and sometimes appropriate ideas are in-cluded in the following analyses.
Demographic questionnaire. A demographicquestionnaire was given to obtain information such asage, family structure (including number and ages ofsiblings), favorite school subjects, and extracurricularactivities. The data on family size, favorite school sub-jects, and after-school activities were compiled but notanalyzed.
Vocabulary subtest. The Vocabulary subtest ofthe Wechsler Intelligence Scale for Children–III(WISC–III; Wechsler, 1991) was also administered.This was scored according to the administration man-ual. Raw scores were converted to standardized scoresbased on the ages of the children when the test was ad-ministered (i.e., the second test session).
Originality evaluation. Items for the originalityevaluation tasks were obtained from the responses
420 Creativity Research Journal
R. E. Charles and M. A. Runco

generated in Session 1 of the testing. More specifi-cally, the responses from the instances tasks werecompiled across both schools and all age groups, andnine ideas at three levels of originality (highly origi-nal, moderately original, and common) were selectedfrom each lexicon (i.e., round things and things thatmake noise). The three highly original ideas had beengiven by less than 1% of the sample; three were mod-erately original (given by greater than 4% but lessthan 7% of the sample), and three were commonideas (given by 10% or more of the sample). Eachround idea selected had to meet the additional crite-rion of being always or sometimes appropriate asagreed on by at least two of the three judges whoevaluated the lexicons.
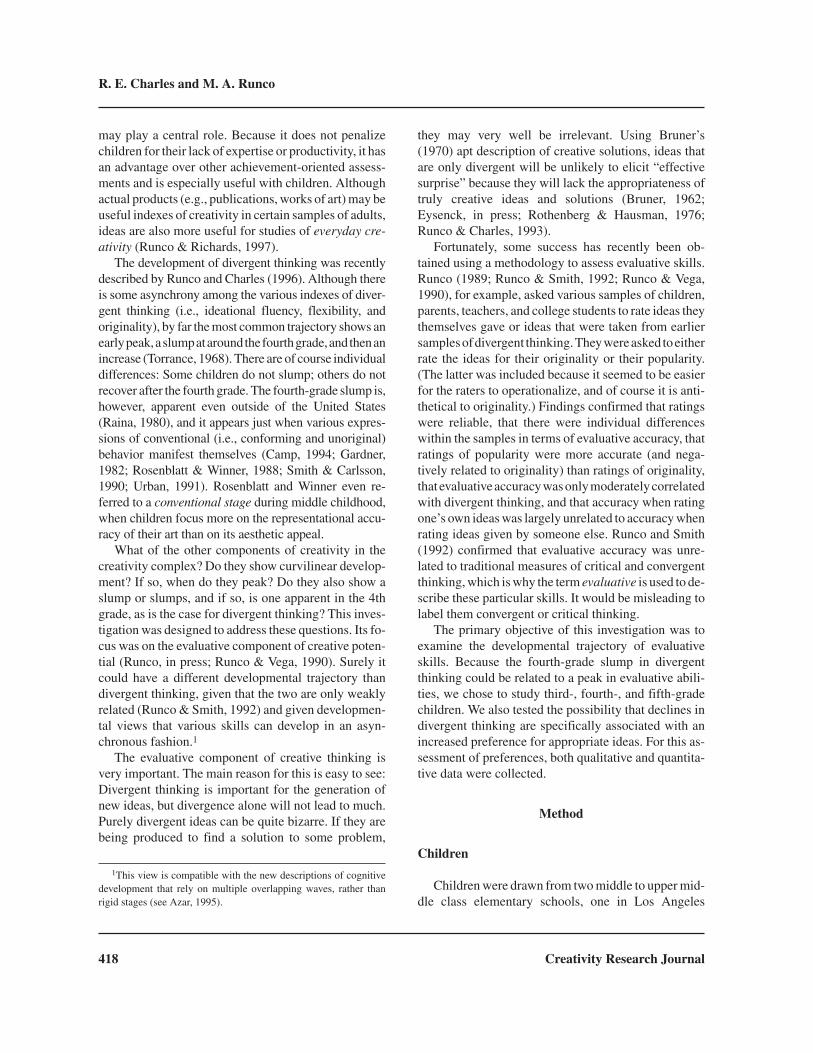
The originality evaluation tasks were administeredwith a 5-point rating scale. This was presented on acard showing rows of from one to nine human figureswith choices of one, three, five, seven, and nine figuresand with the numerical representation for each rowpresented at the beginning of the line of figures (seeFigure 1). The children were asked to respond orally orpoint to the line that represented how many children,out of 10, they thought would give a particular re-sponse. Great care was taken to explain this task (a“guessing game”) and the rating scale and to ensurecomplete understanding by the children.
Preference evaluation survey. The preferenceevaluations were conducted for round things andsquare things because objectively scoring these tasksfor appropriateness was more straightforward than the“things that make noise” task used in the originality
evaluation. Ideas for these tasks were selected based onthe results of a small-scale survey of age-appropriatechildren. The purpose of this procedure was to select agroup of ideas that children in Grades 3 through 5viewed as belonging in the three categories of appropri-ateness rather than relying on the judgments of one ortwo adult researchers.
Initially, 18 ideas were selected for each criterionwith 6 different ideas meeting each of the 3 appropri-ateness levels of always, sometimes, and never. Theseideas were drawn from multiple sources, includingRunco and Vega (1990), a pilot study (N = 30) for ideasfor the square things, and the 117 children describedearlier for the round things ideas. Ideas were selectedthat were moderate to high in originality and were notcued by objects specific to the testing environment.There was agreement among the three judges as to theappropriateness of all but one of the round things ideasincluded in the initial list of 18 ideas (there was onesometimes appropriate idea included that only two ofthe three judges agreed on). A group of 8 children weregiven the round things and square things lists and askedto rate the individual ideas as either always (a score of3), sometimes (a score of 2), or never (a score of 1)round or square, respectively. The three ideas fromeach appropriateness category that had mean ratingsthat most closely matched the proposed objective rat-ings were selected, for a total of nine ideas for each cri-terion. On items that had less than perfect agreement,ideas were selected based on mean ratings, standarddeviations, and the experimenter’s judgment to obtaina group of ideas from a variety of subject categories.For example, in the category of always appropriateround things, “Oreo cookies,” “Frisbee,” and “poolballs” all had the same mean rating and standard devia-tion. However, a Frisbee is a toy, similar to the alreadyselected idea “hula hoop” (with a mean rating of 3.00),and pool balls are similar to the idea “cannonball” (alsowith a mean rating of 3.00). For these reasons, the idea“Oreo cookies” was selected to represent food, ratherthan toys or balls.
Preference evaluation. Preference was assessedby asking the children to point to one of five faces(frown = very bad; slight frown = bad, no expression =okay, slight smile = good, smile = very good) that bestshowed what they thought of the idea. Although prefer-ence is not a matter of right or wrong, the purpose of thismeasure was to determine whether some children pre-
Creativity Research Journal 421
Developmental Trends
Figure 1. Scale shown to participants during originality evaluation.
fer objectively appropriate ideas more than others. Thescale to which the children pointed was very similar toone used by Anderson (1980) in his work on children’sreasoning.
During the preference evaluations the children werealso asked to explain why they selected the chosen rat-ing for each idea. Their responses were recorded on au-diotape, transcribed, and then coded according to thecriterion they used to explain their ratings The prefer-ence evaluations were administered for round andsquare ideas, using the ideas just described.
On occasion the children did not know what anobject was or interpreted an idea in an unexpectedway. If a child asked for a definition, a simple onewas given, and a notation was made that the word hadto be defined.
Scoring and Codingof Evaluation Tasks
Evaluations coefficients. Prior to calculating theevaluation coefficients the evaluation data were ex-plored to identify the number of requests for definitionsand times that children gave no response. This informa-tion would identify any evaluation ideas that were con-sistently misunderstood or confusing to the children.After examining the data the decision was made to re-tain all of the responses.
The evaluation coefficients were calculated, andtransformed to r' values using Fisher’s transformation(Cohen & Cohen, 1983). There were four coefficients,one each for the round and noise originality evaluations,and for the round and square preference evaluations.
For the originality coefficients, the ratings given bythe child for a specific idea were correlated with the ac-tual number of children giving that idea. Although thechildren were presented with the 5-point scale, withodd numbers ranging from 1 to 9, and they were askedhow many children (out of 10) gave each idea, somechildren gave responses that were not on the scale,such as 0, even numbers, or a range of numbers (i.e.,3–5 children). Because the coefficient calculationswere based on the actual numbers given by the chil-dren, and not the scale values, their actual responseswere recorded. In the event that a range of numberswas given, the average of the range was recorded (e.g.,a response of 3 to 5 was scored as 4, and a response of 1or 2 was scored as 1.5).
The preference evaluation coefficients were calcu-lated by correlating the children’s preference ratingswith the judged appropriateness of each idea. In casesin which a child did not respond on one or more of theitems, his or her responses were coded as missing val-ues and the coefficients were calculated based on theremaining responses.
Preference evaluation explanations. The responsesgiven by the children for why they gave a specific pref-erence rating were coded based on the criterion theyused. A score of 3 was given if the child based his or herrating on the shape of the object. For example, one childsaid “Monopoly board” was a very good idea because“all Monopoly boards are square,” whereas a number ofchildren said an “eye” was a bad or very bad idea be-cause “it’s not square.” If the child based his or her rat-ing on whether other children would think of the idea(an originality explanation), the response was given ascore of 2 (e.g., one child rated “Jack-in-the-box” as anokay idea because “I don’t think a lot of people wouldsay it”). If the rating given was based on the child’s per-sonal value for the object (e.g., one child said a choco-late bar was a very good idea because “chocolate is myfavorite thing”) then the response was given a score of 1(a value explanation). A score of 0 (an unknown expla-nation) was given if the response did not seem to followany of the patterns just described, or if no reason wasgiven for the rating (e.g., one child rated “a deflatedball” as an okay idea, stating “it depends on what kindof ball it is”).
In addition to a direct reference to the criterionshape (i.e., calling an object round or square) a re-sponse was coded as a shape explanation if mentionwas made of other shapes such as a rectangle, hexagon,circle, oval, or if the object under evaluation was com-pared to another object with an almost universally ac-cepted shape. For example, two children rated “eye” asa bad square idea because “it’s an oval shape,” and “Ithink eyes have a football shape.” Also, one child rated“cannonball” as a good round idea because “it’s shapedlike a ball or globe.” Thus all explanations that referredto the object’s shape as the reason for the rating givenwere coded as shape explanations, even if the childrenwere not entirely accurate or specific in their compari-sons. A response was coded as a value explanation ifthe child stated the intended use of the object as well ashis or her personal value for the object as the reason forthe rating. For example, two third-grade children rated
422 Creativity Research Journal
R. E. Charles and M. A. Runco
“Lego” as a good square idea because “you can buildstuff with it,” and “it’s fun to play with.” Finally, theunknown explanation category was expanded to in-clude responses of “I don’t know,” in addition to no an-swer, and unknown logic. Multiple reasons were codedas shape explanations because, in all cases, shape wasincluded as one of the reasons.
Testing location. The testing locations differedbetween schools and in some cases each class or evenpart of a class was interviewed in a different setting. Inall cases an attempt was made to locate a quiet, se-cluded setting. However, some of the interviews weremomentarily interrupted by school bells, groups ofchildren passing by, or loud music or noises outside thebuilding or in an adjacent room. These distractionswere noted during the interview and in some cases re-sulted in instances responses scored as present (cued)as noted earlier.
Testing procedure. All tasks were administeredindividually.The instances taskswereadministeredfirstin a single session with the demographic questionnairegiven between the two items. The order of the tasks wascounterbalanced across all grades, with either roundthings or things that make noise given first. The amountof time the children spent on each task was recorded bythe experimenter. The evaluation tasks were adminis-tered in a second session approximately 2 months later.The Vocabulary subtest of the WISC–III was adminis-tered between the originality and preference evalua-tions. All children evaluated 9 round ideas and 9 noiseideas for originality, as well as 9 round and 9 squareideas forpreference, fora totalof36evaluations.Theor-der of the evaluation tasks was counterbalanced by bothtype (e.g., originality or preference) and topic (e.g.,round things or things that make noise, and round thingsor square things) of evaluation, and within the two coun-terbalanced groups set up in Session 1 testing.
Results
Data Screening
Prior to analysis, the following variables were ex-amined for accuracy of data entry, missing values, andnormality of distribution: round things total fluency
(RTF), things that make noise total fluency (NTF),round things originality coefficient (r'ROrig), noiseoriginality coefficient (r'NOrig), round things prefer-ence coefficient (r'RPref), and square things rreferencecoefficient (r'SPref). The variables were examinedseparately within each grade for the 113 children inter-viewed in Session 2.
One fifth-grade child was interviewed during Ses-sion 2, but was given an incorrect instances task andthus had an incomplete data set. A fourth-grade childresponded with all 9s during the round things original-ity evaluation, thus suggesting a response set and pre-cluding the calculation of an originality coefficient.The data for these two children were excluded fromanalyses other than the instances lexicons, leaving 111children. The instances data were retained for thesechildren because including their responses in the lexi-cons gave a more accurate account of the unique andcommon ideas given by the entire sample.
Thesearch forunivariateoutlierswasconductedsep-arately for each grade. A score had to be an outlier in thedistribution for the child’s specific class as well as for allchildren in his or her grade to be counted as an outlier.Three third-grade,1fourth-grade,and3fifth-gradechil-dren met these criteria by having a score on at least oneof the variables mentioned earlier that was at least 3 SDfrom the mean (z > 3.0). All data except the instances re-sponses were deleted for these 7 children.
Two final children (1 third grader and 1 fourthgrader) had preference correlations of 1.00 (for theround things and square things preference evaluations,respectively) that could not be transformed using theFisher transformation. Although an approximatevalue, very close to 1.00, could have been substitutedfor both scores, the resulting transformed preferencecoefficients would have been outliers for both children.The data (except the instances responses) for thesechildren were also deleted, leaving a total of 102 chil-dren in the final analyses.
Analysis by School
Prior to combining the data for the two differentschools, the data for the 102 children alrady describedwere analyzed to determine whether there were signifi-cant differences between children from the two schoolsincluded in the study. The results indicated that therewere no main effects for round things or noise fluency
Creativity Research Journal 423
Developmental Trends
scores, nor a School × Grade interaction. A significantSchool × Grade interaction was found for the standard-ized WISC–III Vocabulary subtest scores. This indi-cated that the fourth-grade class in School B had thehighest mean score (M = 10.50) in their school andacross all the classes, and the fourth-grade class inSchool A had the lowest mean score in their school (M= 7.75). However, these marked differences betweenschools in the pattern of scores averaged out when thethree grades were combined, resulting in anonsignificant main effect of school. No significantdifferences were found between the schools in terms oforiginality coefficients for the round originality evalu-ation (r'ROrig), the noise originality evaluation(r'NOrig), or the preference coefficients for roundthings (r'RPref) or square things (r'SPref).
After examining the results for the analyses byschool, it was determined that the samples from thetwo schools were sufficiently similar to combine thedata for further analyses. Although the School × Gradeinteraction was significant for the standardizedWISC–III Vocabulary subtest score, this was not con-sidered to dominate the data. Further, it was not a con-cern because the WSIC–III was not a dependentvariable.
Analysis by Testing Condition
The data were next examined to verify that the chil-dren in each of the four testing conditions just de-scribed were comparable. Further, the data were ana-lyzed to look for order effects during Session 1 testing(either things that make noise or round things first forthe instances tasks), and for Session 2 testing (eitherthe preference or originality evaluation first).
Children in each of the four testing conditions(Noise, Condition A [NA]; Noise, Condition B [NB];Round things, Condition A [RA]; Round things,Condition B [RB]) were compared on their RTF andNTF scores, and their WISC–III subscores. Of the finalcount of 102 children, 20 were in condition NA, 27 incondition NB, 27 in condition RA, and 28 in conditionRB. The analysis of variance (ANOVA) results showedno significant Condition × Grade interactions or maineffects of condition.
Session 1 testing condition. The two instancestasks were administered in Session 1 with 47 of the 102
children receiving the noise task first and 55 of the chil-dren receiving the round task first. These two groups ofchildren were compared on the major instances fluencymeasures to look for order effects, in terms of signifi-cant Condition 1 × Grade interactions or significantCondition 1 main effects, caused by completing a giveninstances task first. These ANOVA results indicatedthat the only effect was a main effect of Condition 1found for the flexibility score from the instances noisequestion, with the children given the round task first us-ing more noise flexibility categories (M = 6.20) than thechildren given the noise task first (M = 5.23), F(1, 96) =4.01, p = .048.
Session 2 testing condition. The two evaluationtasks were administered in Session 2; 47 of the 102 chil-dren were given the preference evaluation first (GroupP), and 55 of the children were given the originalityevaluation first (Group O). These two groups of chil-dren were compared on their originality coefficients,for both the round and noise evaluations, and on theirpreference coefficients, for both the round and squareevaluations, to look for order effects. ANOVA resultsindicated that there were no significant Condition 2 ×Grade interactions in terms of the originality coeffi-cients for the round evaluation (r'ROrig), or the noiseevaluation (r'NOrig). The main effects of Condition 2were also nonsignificant for both r'ROrig and r'NOrig.The results were similar for the preference evaluations,with no significant Condition 2 × Grade interaction foreither the round evaluation (r'RPref), or the square eval-uation (r'SPref), and no significant main effect of Con-dition 2 for either measure. A trend was evident in thenoise originality evaluation coefficients (r'NOrig) withGroup O obtaining higher mean originality coefficientsat all grade levels. This same group obtained highermean preference coefficients at all grades for the squarepreference evaluation (r'SPref).
There were more shape than value or originality ex-planations given by all groups to both tasks, and allgroups gave more value explanations than originalityexplanations. Overall, there were very few originalityexplanations given. In most cases, Group O gaveslightly more shape explanations than Group P for bothtasks (the third-grade group in the round task is the ex-ception). These trends do not suggest a bias due the or-der of the evaluation task. In fact, no evidence wasfound to suggest a significant order effect or bias to-ward any testing condition. The children from all test-
424 Creativity Research Journal
R. E. Charles and M. A. Runco
ing conditions were thus combined within each gradefor the final analysis by grade.
Correlational Analysis
Age, grade, and gender. As expected, a signifi-cant positive correlation was found between age andgrade (r = .90, p < .001). In a pilot study (N = 30) agewas related to some instances indexes that did not showsignificant grade effects, suggesting that both should beused in subsequent analyses.
Age was related to the evaluations of round origi-nality (r = .25, p < .05) and noise originality (r = .29, p< .01), and to the preference coefficient for squarethings (r = .33, p < .001). Grade showed the same pat-tern of relations (rs = .35, .26, .42, respectively, ps <.001, .01, .001). Only r'RPref did not correlate signifi-cantly with age and grade (rs = .11). Interestingly, sig-nificant positive correlations were also found betweengrade and NFlex (r = .28, p < .01) and age and NFlex (r= .22, p < .05). These coefficients suggest that olderchildren and children in higher grades had higher origi-nality and square preference evaluation coefficients, aswell as using more noise flexibility categories. Onlyone correlation with gender was significant: Boys gavemore round, uncued, original, and appropriate re-sponses (r = .34, p < .001).
Standardized WISC–III Vocabulary subscores.WISC–III Vocabulary scores were positively related tohigher RTF (r = .21, p < .05), square things in conditionRA (RAS; r = .22, p < .05), and RFlex scores (r = .26, p< .01). They were unrelated to all other instances mea-sures, and unrelated to age (r = –.13) and grade (r =–.03). Notably, WISC–III subscores were positivelycorrelated with all four evaluation coefficients: r'ROrig(r = .36, p < .001), r'NOrig (r = .22, p < .05), r'RPref (r =.24, p < .05), and r'SPref (r = .23, p < .05). However, as aresult of the multiple analyses, the familywise error ratemay have been a factor, and in any case the shared vari-ance peaked at 12.9%.
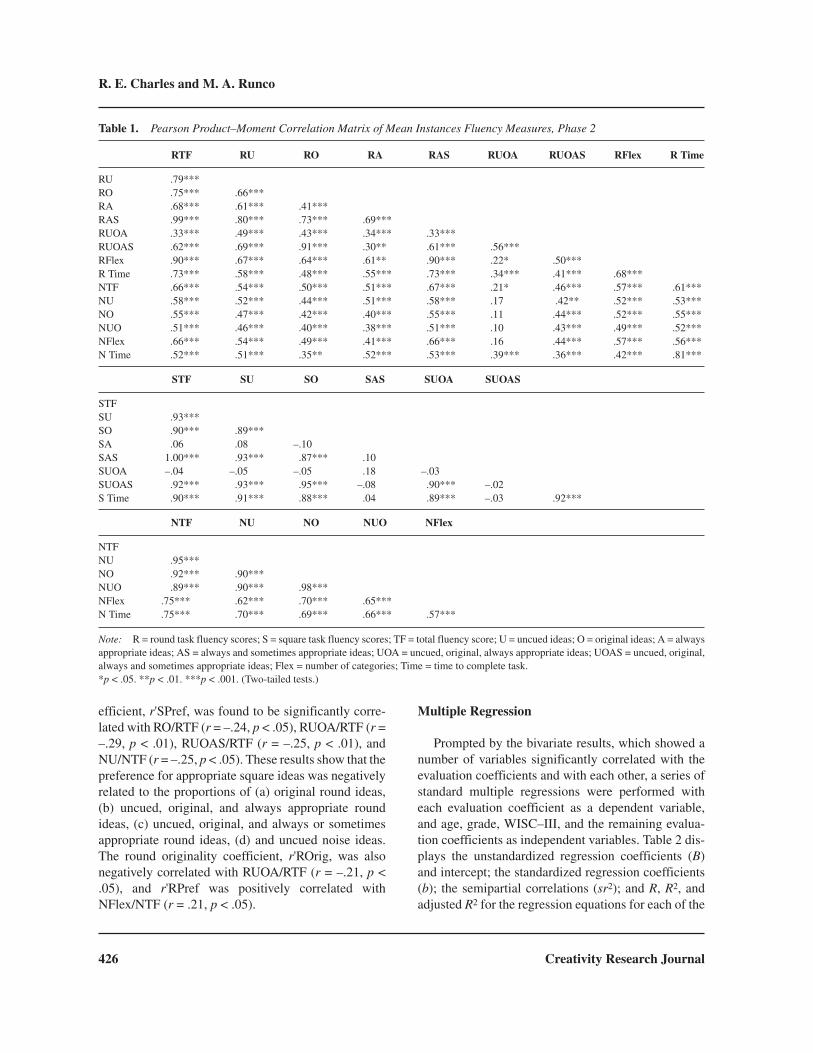
Instances measures. A correlation matrix for theinstances measures is presented in Table 1. There weresignificant positive correlations between the majorityof the round and noise instances measures, with the ex-ception of correlations between round, uncued, origi-nal, and always appropriate (RUOA) ideas; and noise,
uncued, original (NUO) ideas; and NFlex. The very lowfluency scores for RUOA may have influenced these re-sults. The positive correlations between the instancesmeasures reflect the overlap between the various sub-scores within each task, as well as the fact that childrenwho gave more round ideas also gave more noise ideas.Positive correlations were also found for the time tocomplete each instances task (R Time and N Time) andthe fluency measures for both tasks (.35 < rs < .75), in-dicating that the time taken for the instances tasks wasproportional to the number of responses given. Thefamilywise error rate again suggests caution in the in-terpretation of these comparisons, although in this caseit is less of a concern because a majority of the correla-tions were significant at the .001 level.
Originality and preference coefficients. Threeof the four evaluation coefficients were significantlyand positively correlated with each other: r'ROrig withr'NOrig and r'SPref (rs = .51 and .43, both p < .001);r'NOrig with r'RPref and r'SPref (rs = .27 and .29, bothps < .01); and r'RPref with r'SPref (r = .50, p < .001).The significant positive correlations indicated that chil-dren who were more accurate judges of originality alsopreferred appropriate ideas more. Note that the patternof correlations implies a kind of convergent anddiscriminant validity in that the highest coefficients arespecifically between two preference evaluations or twooriginality evaluations.
Somewhat surprisingly, the only significant correla-tions between the evaluation coefficients and Instancesmeasures were for r'SPref and RUOA (r = –.22, p <.05), r'SPref and NFlex (r = .25, p < .05), r'NOrig andNFlex (r = .27, p < .01), and r'NOrig and N Time (r =.25, p < .05). Correlations were also calculated be-tween fluency ratio scores.3 The square preference co-
Creativity Research Journal 425
Developmental Trends
3Admittedly ratio scores can be misleading. They tend to be bi-ased by the denominator and can be unreliable (Cohen & Cohen,1983; cf. Runco, Okuda, & Thurston, 1987). Still, they can supply in-formation that is not available without a ratio (e.g., originality peridea). In fact, the pilot study (N = 30) uncovered a significant effect ofgrade for the proportion of always appropriate round ideas: RA/RTF,F(2, 27) = 3.54, p = .043, and a post hoc Student–Newman–Keuls testidentified a significant difference (p = .050) between RA/RTF forfifth-grade children (M = 0.53, SD = 0.22) and third-grade children(M = 0.27, SD = 0.20). Although no other significant grade effectswere found, a number of the grade trends were altered by the ratioscores. Notably, higher means for the fifth-grade children on a “roundthings” task disappeared when ratio scores were used.
efficient, r'SPref, was found to be significantly corre-lated with RO/RTF (r = –.24, p < .05), RUOA/RTF (r =–.29, p < .01), RUOAS/RTF (r = –.25, p < .01), andNU/NTF (r = –.25, p < .05). These results show that thepreference for appropriate square ideas was negativelyrelated to the proportions of (a) original round ideas,(b) uncued, original, and always appropriate roundideas, (c) uncued, original, and always or sometimesappropriate round ideas, (d) and uncued noise ideas.The round originality coefficient, r'ROrig, was alsonegatively correlated with RUOA/RTF (r = –.21, p <.05), and r'RPref was positively correlated withNFlex/NTF (r = .21, p < .05).
Multiple Regression
Prompted by the bivariate results, which showed anumber of variables significantly correlated with theevaluation coefficients and with each other, a series ofstandard multiple regressions were performed witheach evaluation coefficient as a dependent variable,and age, grade, WISC–III, and the remaining evalua-tion coefficients as independent variables. Table 2 dis-plays the unstandardized regression coefficients (B)and intercept; the standardized regression coefficients(b); the semipartial correlations (sr2); and R, R2, andadjusted R2 for the regression equations for each of the
426 Creativity Research Journal
R. E. Charles and M. A. Runco
Table 1. Pearson Product–Moment Correlation Matrix of Mean Instances Fluency Measures, Phase 2
RTF RU RO RA RAS RUOA RUOAS RFlex R Time
RU .79***RO .75*** .66***RA .68*** .61*** .41***RAS .99*** .80*** .73*** .69***RUOA .33*** .49*** .43*** .34*** .33***RUOAS .62*** .69*** .91*** .30** .61*** .56***RFlex .90*** .67*** .64*** .61** .90*** .22* .50***R Time .73*** .58*** .48*** .55*** .73*** .34*** .41*** .68***NTF .66*** .54*** .50*** .51*** .67*** .21* .46*** .57*** .61***NU .58*** .52*** .44*** .51*** .58*** .17 .42** .52*** .53***NO .55*** .47*** .42*** .40*** .55*** .11 .44*** .52*** .55***NUO .51*** .46*** .40*** .38*** .51*** .10 .43*** .49*** .52***NFlex .66*** .54*** .49*** .41*** .66*** .16 .44*** .57*** .56***N Time .52*** .51*** .35** .52*** .53*** .39*** .36*** .42*** .81***
STF SU SO SAS SUOA SUOAS
STFSU .93***SO .90*** .89***SA .06 .08 –.10SAS 1.00*** .93*** .87*** .10SUOA –.04 –.05 –.05 .18 –.03SUOAS .92*** .93*** .95*** –.08 .90*** –.02S Time .90*** .91*** .88*** .04 .89*** –.03 .92***
NTF NU NO NUO NFlex
NTFNU .95***NO .92*** .90***NUO .89*** .90*** .98***NFlex .75*** .62*** .70*** .65***N Time .75*** .70*** .69*** .66*** .57***
Note: R = round task fluency scores; S = square task fluency scores; TF = total fluency score; U = uncued ideas; O = original ideas; A = alwaysappropriate ideas; AS = always and sometimes appropriate ideas; UOA = uncued, original, always appropriate ideas; UOAS = uncued, original,always and sometimes appropriate ideas; Flex = number of categories; Time = time to complete task.*p < .05. **p < .01. ***p < .001. (Two-tailed tests.)
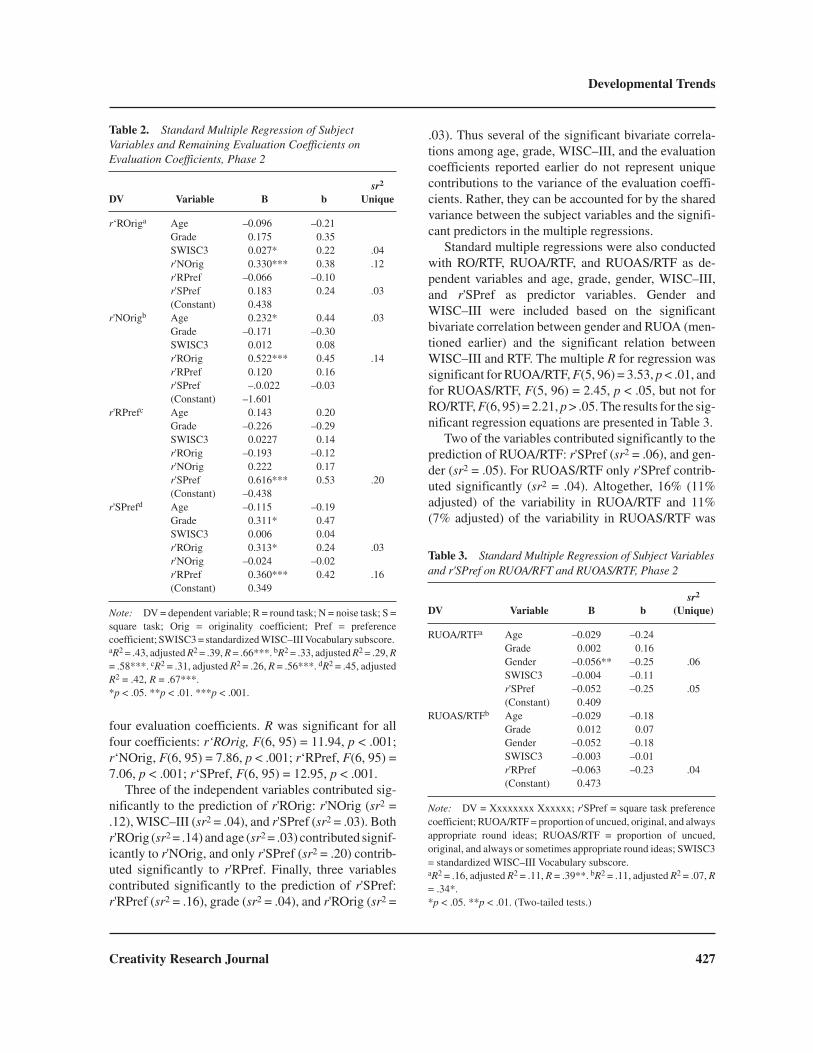
four evaluation coefficients. R was significant for allfour coefficients: r‘ROrig, F(6, 95) = 11.94, p < .001;r‘NOrig, F(6, 95) = 7.86, p < .001; r‘RPref, F(6, 95) =7.06, p < .001; r‘SPref, F(6, 95) = 12.95, p < .001.
Three of the independent variables contributed sig-nificantly to the prediction of r'ROrig: r'NOrig (sr2 =.12), WISC–III (sr2 = .04), and r'SPref (sr2 = .03). Bothr'ROrig (sr2 = .14) and age (sr2 = .03) contributed signif-icantly to r'NOrig, and only r'SPref (sr2 = .20) contrib-uted significantly to r'RPref. Finally, three variablescontributed significantly to the prediction of r'SPref:r'RPref (sr2 = .16), grade (sr2 = .04), and r'ROrig (sr2 =
.03). Thus several of the significant bivariate correla-tions among age, grade, WISC–III, and the evaluationcoefficients reported earlier do not represent uniquecontributions to the variance of the evaluation coeffi-cients. Rather, they can be accounted for by the sharedvariance between the subject variables and the signifi-cant predictors in the multiple regressions.
Standard multiple regressions were also conductedwith RO/RTF, RUOA/RTF, and RUOAS/RTF as de-pendent variables and age, grade, gender, WISC–III,and r'SPref as predictor variables. Gender andWISC–III were included based on the significantbivariate correlation between gender and RUOA (men-tioned earlier) and the significant relation betweenWISC–III and RTF. The multiple R for regression wassignificant for RUOA/RTF, F(5, 96) = 3.53, p < .01, andfor RUOAS/RTF, F(5, 96) = 2.45, p < .05, but not forRO/RTF, F(6, 95) = 2.21, p > .05. The results for the sig-nificant regression equations are presented in Table 3.
Two of the variables contributed significantly to theprediction of RUOA/RTF: r'SPref (sr2 = .06), and gen-der (sr2 = .05). For RUOAS/RTF only r'SPref contrib-uted significantly (sr2 = .04). Altogether, 16% (11%adjusted) of the variability in RUOA/RTF and 11%(7% adjusted) of the variability in RUOAS/RTF was
Creativity Research Journal 427
Developmental Trends
Table 2. Standard Multiple Regression of SubjectVariables and Remaining Evaluation Coefficients onEvaluation Coefficients, Phase 2
DV Variable B bsr2
Unique
r‘ROriga Age –0.096 –0.21Grade 0.175 0.35SWISC3 0.027* 0.22 .04r'NOrig 0.330*** 0.38 .12r'RPref –0.066 –0.10r'SPref 0.183 0.24 .03(Constant) 0.438
r'NOrigb Age 0.232* 0.44 .03Grade –0.171 –0.30SWISC3 0.012 0.08r'ROrig 0.522*** 0.45 .14r'RPref 0.120 0.16r'SPref –.0.022 –0.03(Constant) –1.601
r'RPrefc Age 0.143 0.20Grade –0.226 –0.29SWISC3 0.0227 0.14r'ROrig –0.193 –0.12r'NOrig 0.222 0.17r'SPref 0.616*** 0.53 .20(Constant) –0.438
r'SPrefd Age –0.115 –0.19Grade 0.311* 0.47SWISC3 0.006 0.04r'ROrig 0.313* 0.24 .03r'NOrig –0.024 –0.02r'RPref 0.360*** 0.42 .16(Constant) 0.349
Note: DV = dependent variable; R = round task; N = noise task; S =square task; Orig = originality coefficient; Pref = preferencecoefficient; SWISC3 = standardized WISC–III Vocabulary subscore.aR2 = .43, adjusted R2 = .39, R = .66***. bR2 = .33, adjusted R2 = .29, R= .58***. cR2 = .31, adjusted R2 = .26, R = .56***. dR2 = .45, adjustedR2 = .42, R = .67***.*p < .05. **p < .01. ***p < .001.
Table 3. Standard Multiple Regression of Subject Variablesand r'SPref on RUOA/RFT and RUOAS/RTF, Phase 2
DV Variable B bsr2
(Unique)
RUOA/RTFa Age –0.029 –0.24Grade 0.002 0.16Gender –0.056** –0.25 .06SWISC3 –0.004 –0.11r'SPref –0.052 –0.25 .05(Constant) 0.409
RUOAS/RTFb Age –0.029 –0.18Grade 0.012 0.07Gender –0.052 –0.18SWISC3 –0.003 –0.01r'RPref –0.063 –0.23 .04(Constant) 0.473
Note: DV = Xxxxxxxx Xxxxxx; r'SPref = square task preferencecoefficient; RUOA/RTF = proportion of uncued, original, and alwaysappropriate round ideas; RUOAS/RTF = proportion of uncued,original, and always or sometimes appropriate round ideas; SWISC3= standardized WISC–III Vocabulary subscore.aR2 = .16, adjusted R2 = .11, R = .39**. bR2 = .11, adjusted R2 = .07, R= .34*.*p < .05. **p < .01. (Two-tailed tests.)
predicted by the five variables. Overall, although thecontributions by r'SPref and gender were significant,they only accounted for a total of 11% of the variabilityin RUOA/RTF, and r'SPref accounted for only 4% ofthe variability in RUOAS/RTF.
ANOVA
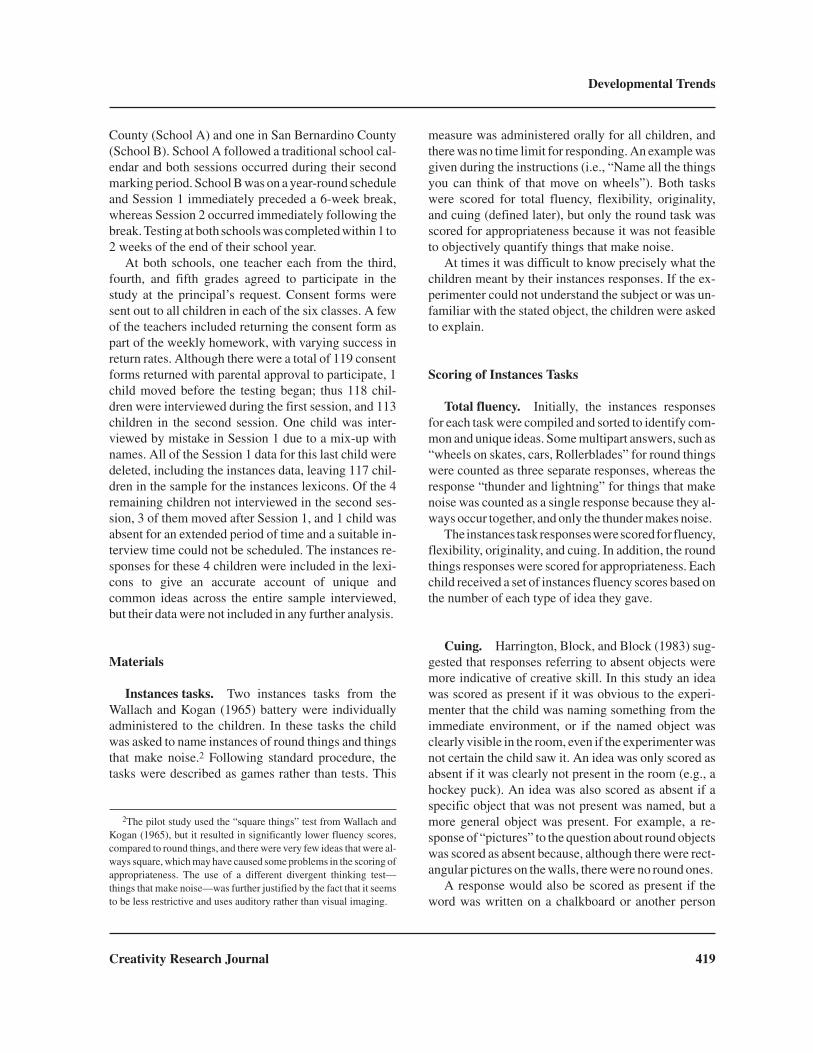
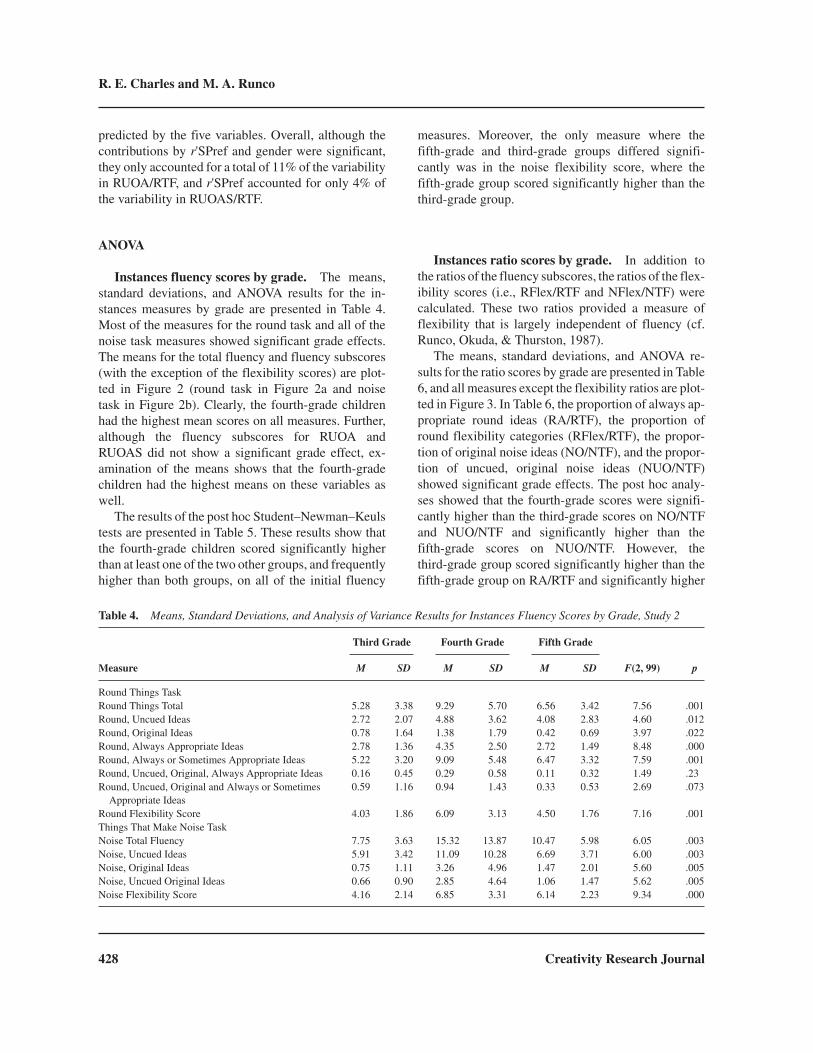
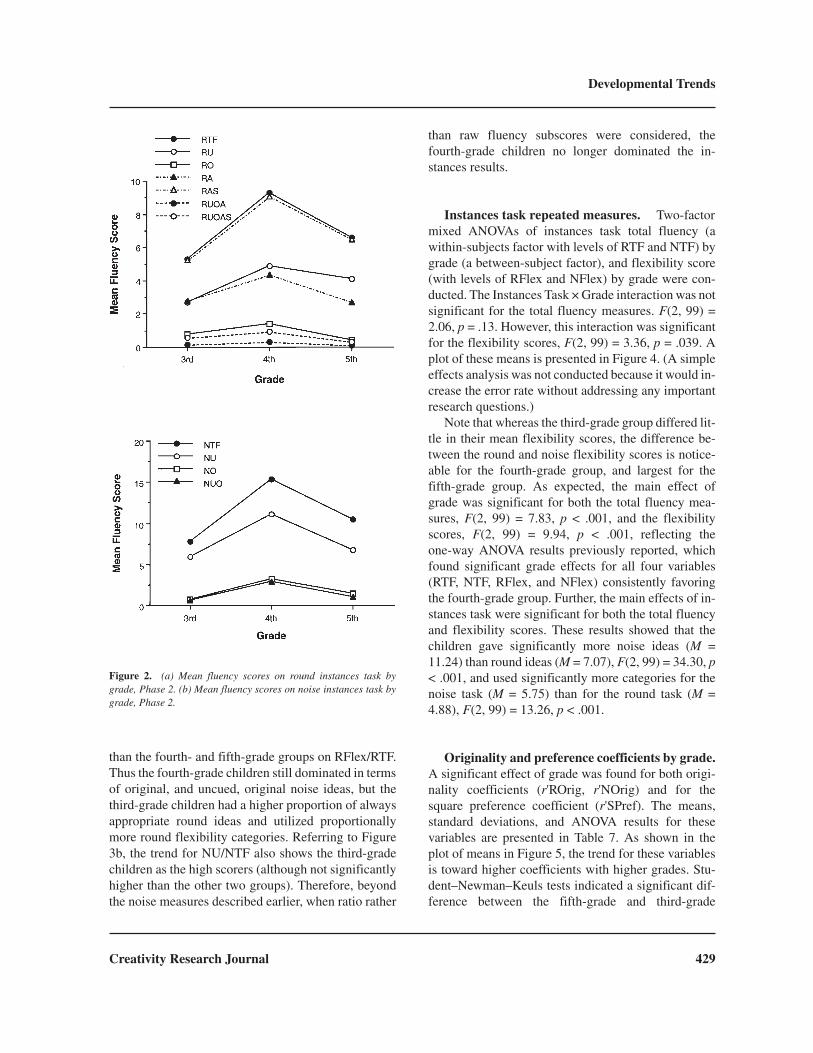
Instances fluency scores by grade. The means,standard deviations, and ANOVA results for the in-stances measures by grade are presented in Table 4.Most of the measures for the round task and all of thenoise task measures showed significant grade effects.The means for the total fluency and fluency subscores(with the exception of the flexibility scores) are plot-ted in Figure 2 (round task in Figure 2a and noisetask in Figure 2b). Clearly, the fourth-grade childrenhad the highest mean scores on all measures. Further,although the fluency subscores for RUOA andRUOAS did not show a significant grade effect, ex-amination of the means shows that the fourth-gradechildren had the highest means on these variables aswell.
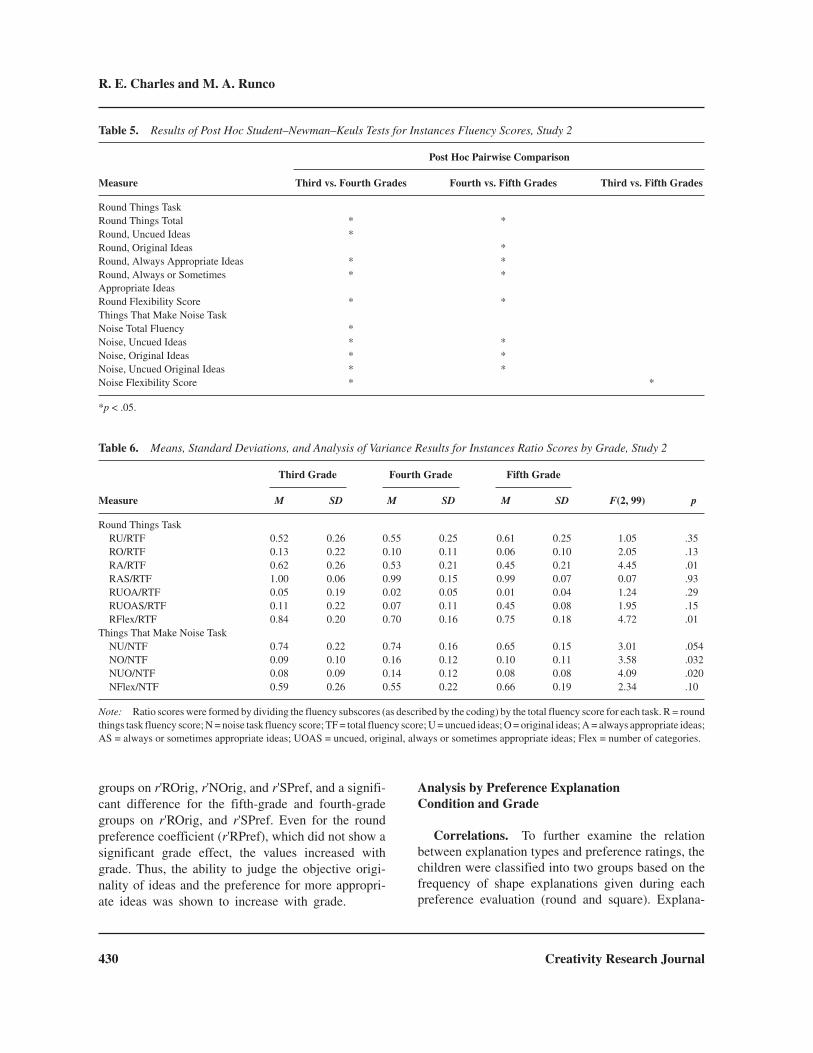
The results of the post hoc Student–Newman–Keulstests are presented in Table 5. These results show thatthe fourth-grade children scored significantly higherthan at least one of the two other groups, and frequentlyhigher than both groups, on all of the initial fluency
measures. Moreover, the only measure where thefifth-grade and third-grade groups differed signifi-cantly was in the noise flexibility score, where thefifth-grade group scored significantly higher than thethird-grade group.
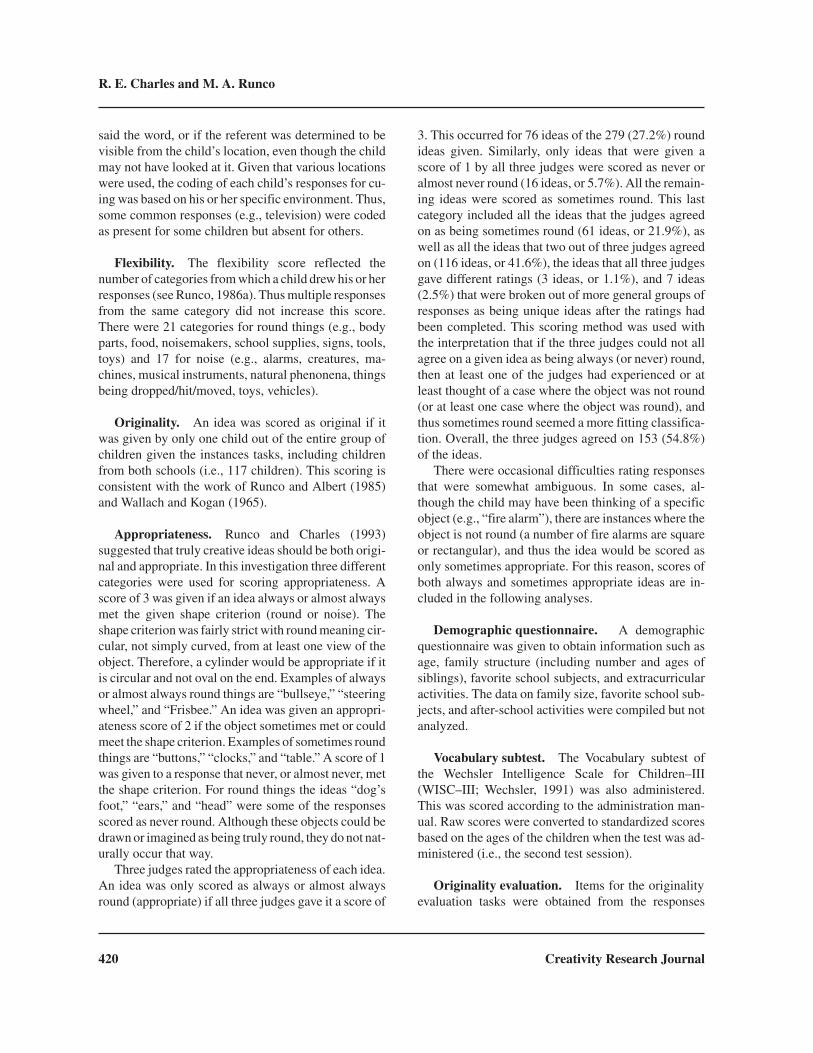
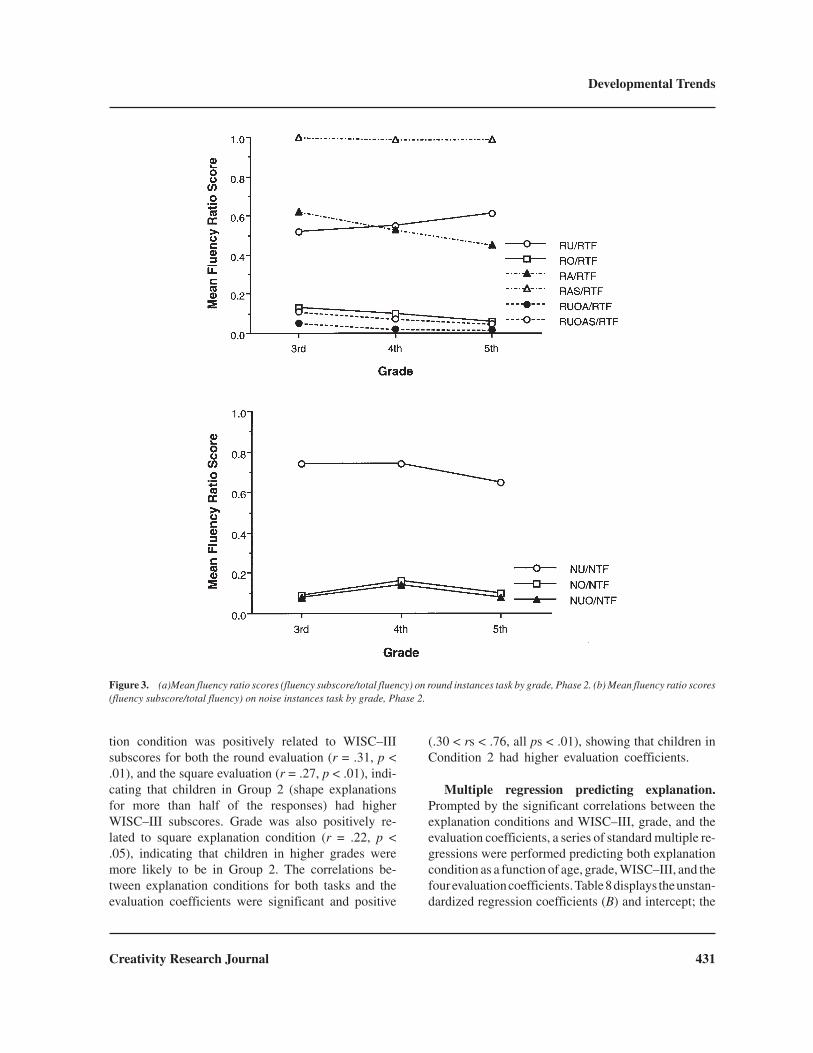
Instances ratio scores by grade. In addition tothe ratios of the fluency subscores, the ratios of the flex-ibility scores (i.e., RFlex/RTF and NFlex/NTF) werecalculated. These two ratios provided a measure offlexibility that is largely independent of fluency (cf.Runco, Okuda, & Thurston, 1987).
The means, standard deviations, and ANOVA re-sults for the ratio scores by grade are presented in Table6, and all measures except the flexibility ratios are plot-ted in Figure 3. In Table 6, the proportion of always ap-propriate round ideas (RA/RTF), the proportion ofround flexibility categories (RFlex/RTF), the propor-tion of original noise ideas (NO/NTF), and the propor-tion of uncued, original noise ideas (NUO/NTF)showed significant grade effects. The post hoc analy-ses showed that the fourth-grade scores were signifi-cantly higher than the third-grade scores on NO/NTFand NUO/NTF and significantly higher than thefifth-grade scores on NUO/NTF. However, thethird-grade group scored significantly higher than thefifth-grade group on RA/RTF and significantly higher
428 Creativity Research Journal
R. E. Charles and M. A. Runco
Table 4. Means, Standard Deviations, and Analysis of Variance Results for Instances Fluency Scores by Grade, Study 2
Third Grade Fourth Grade Fifth Grade
Measure M SD M SD M SD F(2, 99) p
Round Things TaskRound Things Total 5.28 3.38 9.29 5.70 6.56 3.42 7.56 .001Round, Uncued Ideas 2.72 2.07 4.88 3.62 4.08 2.83 4.60 .012Round, Original Ideas 0.78 1.64 1.38 1.79 0.42 0.69 3.97 .022Round, Always Appropriate Ideas 2.78 1.36 4.35 2.50 2.72 1.49 8.48 .000Round, Always or Sometimes Appropriate Ideas 5.22 3.20 9.09 5.48 6.47 3.32 7.59 .001Round, Uncued, Original, Always Appropriate Ideas 0.16 0.45 0.29 0.58 0.11 0.32 1.49 .23Round, Uncued, Original and Always or Sometimes
Appropriate Ideas0.59 1.16 0.94 1.43 0.33 0.53 2.69 .073
Round Flexibility Score 4.03 1.86 6.09 3.13 4.50 1.76 7.16 .001Things That Make Noise TaskNoise Total Fluency 7.75 3.63 15.32 13.87 10.47 5.98 6.05 .003Noise, Uncued Ideas 5.91 3.42 11.09 10.28 6.69 3.71 6.00 .003Noise, Original Ideas 0.75 1.11 3.26 4.96 1.47 2.01 5.60 .005Noise, Uncued Original Ideas 0.66 0.90 2.85 4.64 1.06 1.47 5.62 .005Noise Flexibility Score 4.16 2.14 6.85 3.31 6.14 2.23 9.34 .000
than the fourth- and fifth-grade groups on RFlex/RTF.Thus the fourth-grade children still dominated in termsof original, and uncued, original noise ideas, but thethird-grade children had a higher proportion of alwaysappropriate round ideas and utilized proportionallymore round flexibility categories. Referring to Figure3b, the trend for NU/NTF also shows the third-gradechildren as the high scorers (although not significantlyhigher than the other two groups). Therefore, beyondthe noise measures described earlier, when ratio rather
than raw fluency subscores were considered, thefourth-grade children no longer dominated the in-stances results.
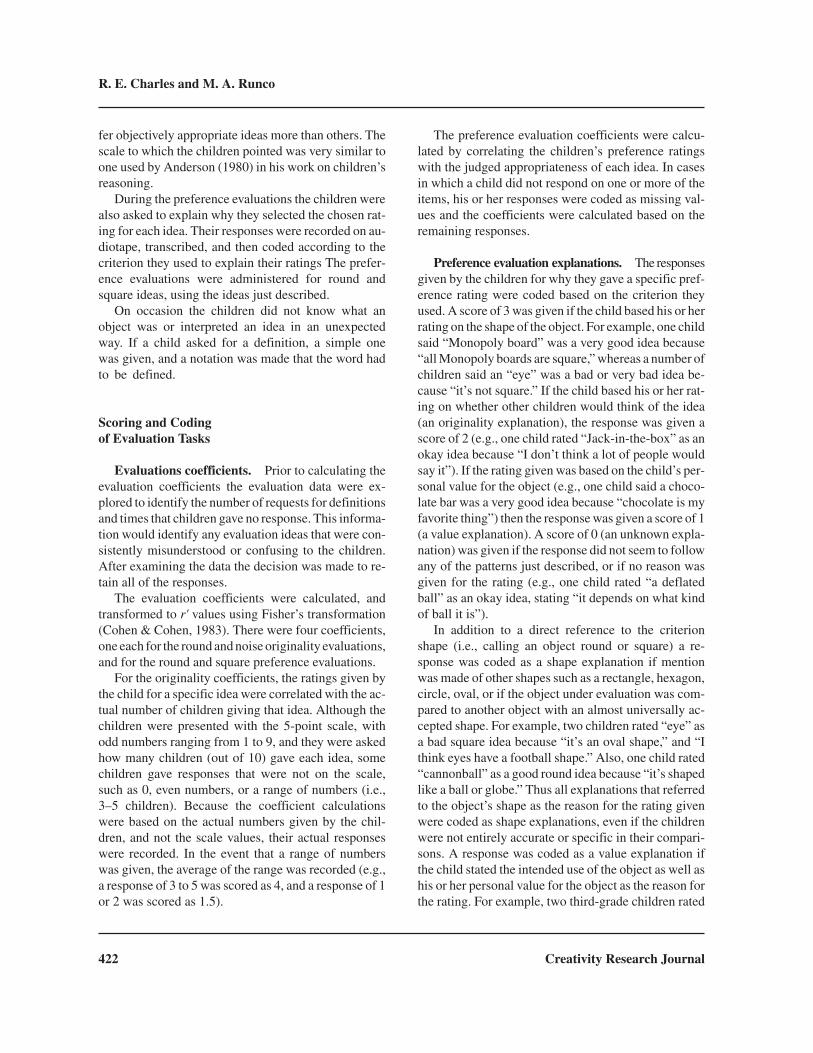
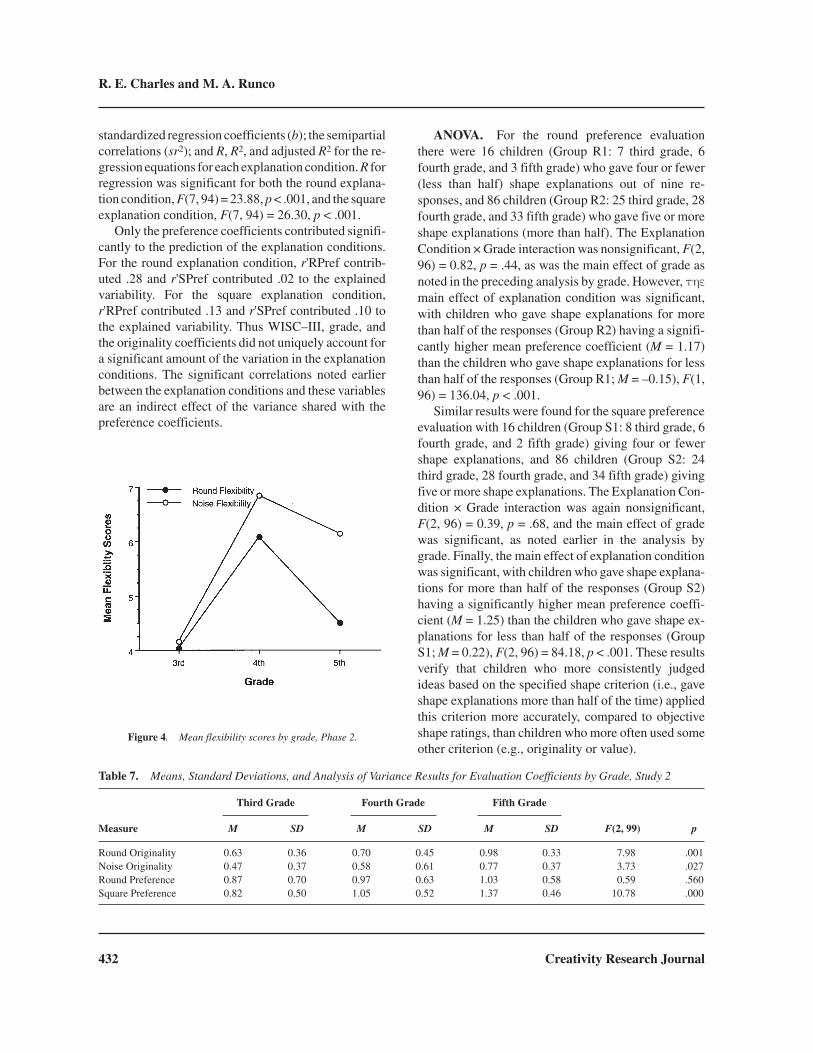
Instances task repeated measures. Two-factormixed ANOVAs of instances task total fluency (awithin-subjects factor with levels of RTF and NTF) bygrade (a between-subject factor), and flexibility score(with levels of RFlex and NFlex) by grade were con-ducted. The Instances Task × Grade interaction was notsignificant for the total fluency measures. F(2, 99) =2.06, p = .13. However, this interaction was significantfor the flexibility scores, F(2, 99) = 3.36, p = .039. Aplot of these means is presented in Figure 4. (A simpleeffects analysis was not conducted because it would in-crease the error rate without addressing any importantresearch questions.)
Note that whereas the third-grade group differed lit-tle in their mean flexibility scores, the difference be-tween the round and noise flexibility scores is notice-able for the fourth-grade group, and largest for thefifth-grade group. As expected, the main effect ofgrade was significant for both the total fluency mea-sures, F(2, 99) = 7.83, p < .001, and the flexibilityscores, F(2, 99) = 9.94, p < .001, reflecting theone-way ANOVA results previously reported, whichfound significant grade effects for all four variables(RTF, NTF, RFlex, and NFlex) consistently favoringthe fourth-grade group. Further, the main effects of in-stances task were significant for both the total fluencyand flexibility scores. These results showed that thechildren gave significantly more noise ideas (M =11.24) than round ideas (M = 7.07), F(2, 99) = 34.30, p< .001, and used significantly more categories for thenoise task (M = 5.75) than for the round task (M =4.88), F(2, 99) = 13.26, p < .001.
Originality and preference coefficients by grade.A significant effect of grade was found for both origi-nality coefficients (r'ROrig, r'NOrig) and for thesquare preference coefficient (r'SPref). The means,standard deviations, and ANOVA results for thesevariables are presented in Table 7. As shown in theplot of means in Figure 5, the trend for these variablesis toward higher coefficients with higher grades. Stu-dent–Newman–Keuls tests indicated a significant dif-ference between the fifth-grade and third-grade
Creativity Research Journal 429
Developmental Trends
Figure 2. (a) Mean fluency scores on round instances task bygrade, Phase 2. (b) Mean fluency scores on noise instances task bygrade, Phase 2.
groups on r'ROrig, r'NOrig, and r'SPref, and a signifi-cant difference for the fifth-grade and fourth-gradegroups on r'ROrig, and r'SPref. Even for the roundpreference coefficient (r'RPref), which did not show asignificant grade effect, the values increased withgrade. Thus, the ability to judge the objective origi-nality of ideas and the preference for more appropri-ate ideas was shown to increase with grade.
Analysis by Preference ExplanationCondition and Grade
Correlations. To further examine the relationbetween explanation types and preference ratings, thechildren were classified into two groups based on thefrequency of shape explanations given during eachpreference evaluation (round and square). Explana-
430 Creativity Research Journal
R. E. Charles and M. A. Runco
Table 5. Results of Post Hoc Student–Newman–Keuls Tests for Instances Fluency Scores, Study 2
Post Hoc Pairwise Comparison
Measure Third vs. Fourth Grades Fourth vs. Fifth Grades Third vs. Fifth Grades
Round Things TaskRound Things Total * *Round, Uncued Ideas *Round, Original Ideas *Round, Always Appropriate Ideas * *Round, Always or SometimesAppropriate Ideas
* *
Round Flexibility Score * *Things That Make Noise TaskNoise Total Fluency *Noise, Uncued Ideas * *Noise, Original Ideas * *Noise, Uncued Original Ideas * *Noise Flexibility Score * *
*p < .05.
Table 6. Means, Standard Deviations, and Analysis of Variance Results for Instances Ratio Scores by Grade, Study 2
Third Grade Fourth Grade Fifth Grade
Measure M SD M SD M SD F(2, 99) p
Round Things TaskRU/RTF 0.52 0.26 0.55 0.25 0.61 0.25 1.05 .35RO/RTF 0.13 0.22 0.10 0.11 0.06 0.10 2.05 .13RA/RTF 0.62 0.26 0.53 0.21 0.45 0.21 4.45 .01RAS/RTF 1.00 0.06 0.99 0.15 0.99 0.07 0.07 .93RUOA/RTF 0.05 0.19 0.02 0.05 0.01 0.04 1.24 .29RUOAS/RTF 0.11 0.22 0.07 0.11 0.45 0.08 1.95 .15RFlex/RTF 0.84 0.20 0.70 0.16 0.75 0.18 4.72 .01
Things That Make Noise TaskNU/NTF 0.74 0.22 0.74 0.16 0.65 0.15 3.01 .054NO/NTF 0.09 0.10 0.16 0.12 0.10 0.11 3.58 .032NUO/NTF 0.08 0.09 0.14 0.12 0.08 0.08 4.09 .020NFlex/NTF 0.59 0.26 0.55 0.22 0.66 0.19 2.34 .10
Note: Ratio scores were formed by dividing the fluency subscores (as described by the coding) by the total fluency score for each task. R = roundthings task fluency score; N = noise task fluency score; TF = total fluency score; U = uncued ideas; O = original ideas; A = always appropriate ideas;AS = always or sometimes appropriate ideas; UOAS = uncued, original, always or sometimes appropriate ideas; Flex = number of categories.
tion condition was positively related to WISC–IIIsubscores for both the round evaluation (r = .31, p <.01), and the square evaluation (r = .27, p < .01), indi-cating that children in Group 2 (shape explanationsfor more than half of the responses) had higherWISC–III subscores. Grade was also positively re-lated to square explanation condition (r = .22, p <.05), indicating that children in higher grades weremore likely to be in Group 2. The correlations be-tween explanation conditions for both tasks and theevaluation coefficients were significant and positive
(.30 < rs < .76, all ps < .01), showing that children inCondition 2 had higher evaluation coefficients.
Multiple regression predicting explanation.Prompted by the significant correlations between theexplanation conditions and WISC–III, grade, and theevaluation coefficients, a series of standard multiple re-gressions were performed predicting both explanationcondition as a function of age, grade, WISC–III, and thefourevaluationcoefficients.Table8displays theunstan-dardized regression coefficients (B) and intercept; the
Creativity Research Journal 431
Developmental Trends
Figure 3. (a)Mean fluency ratio scores (fluency subscore/total fluency) on round instances task by grade, Phase 2. (b) Mean fluency ratio scores(fluency subscore/total fluency) on noise instances task by grade, Phase 2.
standardized regression coefficients (b); the semipartialcorrelations (sr2); and R, R2, and adjusted R2 for the re-gression equations for each explanation condition. R forregression was significant for both the round explana-tion condition, F(7, 94) = 23.88, p < .001, and the squareexplanation condition, F(7, 94) = 26.30, p < .001.
Only the preference coefficients contributed signifi-cantly to the prediction of the explanation conditions.For the round explanation condition, r'RPref contrib-uted .28 and r'SPref contributed .02 to the explainedvariability. For the square explanation condition,r'RPref contributed .13 and r'SPref contributed .10 tothe explained variability. Thus WISC–III, grade, andthe originality coefficients did not uniquely account fora significant amount of the variation in the explanationconditions. The significant correlations noted earlierbetween the explanation conditions and these variablesare an indirect effect of the variance shared with thepreference coefficients.
ANOVA. For the round preference evaluationthere were 16 children (Group R1: 7 third grade, 6fourth grade, and 3 fifth grade) who gave four or fewer(less than half) shape explanations out of nine re-sponses, and 86 children (Group R2: 25 third grade, 28fourth grade, and 33 fifth grade) who gave five or moreshape explanations (more than half). The ExplanationCondition × Grade interaction was nonsignificant, F(2,96) = 0.82, p = .44, as was the main effect of grade asnoted in the preceding analysis by grade. However, ���main effect of explanation condition was significant,with children who gave shape explanations for morethan half of the responses (Group R2) having a signifi-cantly higher mean preference coefficient (M = 1.17)than the children who gave shape explanations for lessthan half of the responses (Group R1; M = –0.15), F(1,96) = 136.04, p < .001.
Similar results were found for the square preferenceevaluation with 16 children (Group S1: 8 third grade, 6fourth grade, and 2 fifth grade) giving four or fewershape explanations, and 86 children (Group S2: 24third grade, 28 fourth grade, and 34 fifth grade) givingfive or more shape explanations. The Explanation Con-dition × Grade interaction was again nonsignificant,F(2, 96) = 0.39, p = .68, and the main effect of gradewas significant, as noted earlier in the analysis bygrade. Finally, the main effect of explanation conditionwas significant, with children who gave shape explana-tions for more than half of the responses (Group S2)having a significantly higher mean preference coeffi-cient (M = 1.25) than the children who gave shape ex-planations for less than half of the responses (GroupS1; M = 0.22), F(2, 96) = 84.18, p < .001. These resultsverify that children who more consistently judgedideas based on the specified shape criterion (i.e., gaveshape explanations more than half of the time) appliedthis criterion more accurately, compared to objectiveshape ratings, than children who more often used someother criterion (e.g., originality or value).
432 Creativity Research Journal
R. E. Charles and M. A. Runco
Figure 4. Mean flexibility scores by grade, Phase 2.
Table 7. Means, Standard Deviations, and Analysis of Variance Results for Evaluation Coefficients by Grade, Study 2
Third Grade Fourth Grade Fifth Grade
Measure M SD M SD M SD F(2, 99) p
Round Originality 0.63 0.36 0.70 0.45 0.98 0.33 7.98 .001Noise Originality 0.47 0.37 0.58 0.61 0.77 0.37 3.73 .027Round Preference 0.87 0.70 0.97 0.63 1.03 0.58 0.59 .560Square Preference 0.82 0.50 1.05 0.52 1.37 0.46 10.78 .000

Visual analysis of preference explanations. Themean number of shape, originality, and value expla-nations given during the preference evaluations areplotted in Figure 6a (round evaluation) and Figure 6b(square evaluation) as a function of grade. Althoughstatistical analyses were not appropriate, there aredefinite between-grade trends observable in these
plots. As mentioned earlier, when examining thesedata as a function of Session 2 condition and grade,all groups gave more shape than any other type of ex-planation. Moreover, the trend is for the mean num-ber of shape explanations to increase with grade andthe mean number of value explanations to decreasewith grade. These trends suggest that children inhigher grades were more attuned to the specifiedshape criterion for the tasks and were less likely toapply their own criterion. Further, these results areconsistent with the findings for the preference coeffi-cients that showed an increasing preference for ap-propriate ideas (based on objective shape ratings)with increasing grade.
Discussion
The results of this study showed that evaluative skilland a preference for appropriateness increased signifi-cantly with grade (see Table 7 and Figure 5). This wasexpected and is consistent with Gardner’s (1982) de-scription of a literal stage and Rosenblatt and Winner’s(1988) references to middle childhood as the conven-
Creativity Research Journal 433
Developmental Trends
Figure 5. Mean evaluation coefficients by grade, Phase 2.
Table 8. Standard Multiple Regression of Participant Variables and Evaluation Coefficients on Explanation Condition,Study 2
DV Variable B b sr2 (Unique)
Round Explanation Conditiona
Age 0.014 0.03Grade –0.025 –0.06SWISC3 0.009 0.08r‘RPref 0.370 0.64 .28r‘SPref 0.119 0.18 .02r‘ROrig 0.982 0.09r‘NOrig 0.017 0.02(Constant) 1.172
Square Explanation Conditionb
Age –0.071 –0.17Grade 0.040 0.09SWISC3 –0.006 –0.01r‘RPref 0.255*** 0.44 .13r‘SPref 0.290*** 0.43 .10r‘ROrig 0.095 0.11r‘NOrig 0.061 0.08(Constant) 1.720
Note: DV = dependent variable; R = round task; N = noise task; S = square task; Orig = originality Coefficient; Pref = preference coefficient;SWISC3 = standardized WISC–III Vocabulary subscore.aR2 = .64, adjusted R2 = .61, R = .80***. bR2 = .66, adjusted R2 = .64, R = .81***.*p < .01. ***p < .001. (Two-tailed tests.)

tional years. In particular, a fairly steady increase inevaluation coefficients from the third through fifthgrade provides evidence of movement into a stagewhere the children are becoming increasingly aware ofwhich ideas other children would think of (e.g., whichideas are original, or common), and further, whichideas are appropriate.
The unexpected finding was that there was nodecline in divergent thinking fluency scores in
fourth-grade children, as predicted by Torrance (1968).Rather, when raw fluency scores were compared, chil-dren in the fourth grade actually scored higher thanthird- and fifth-grade children on total fluency andflexibility, as well as giving more uncued (absent),original, and appropriate ideas (see Table 4 and Figure2). When fluency ratio scores were compared, thefourth-grade children also gave a higher proportion ofuncued and uncued original noise ideas, but there werefew significant trends for the round instances tasks,and the fourth-grade peak was no longer apparent (seeTable 6 and Figure 3). In fact, the proportion of alwaysappropriate round ideas and the round flexibility ratiosdecreased significantly with grade, with the highestscores for third-grade children. In terms of the propor-tion of high-quality round ideas (e.g., original, eitheralways or sometimes appropriate, and absent), therewere no significant grade effects, although there was adecrease with grade.
There is support in the literature for this definitionof high-quality ideas as being the most indicative ofcreativity. For instance, recall that Harrington et al.(1983) considered ideas that were both appropriate(clearly met the task criterion) and absent as the high-est quality. Further, Runco and Charles (1993) de-scribed creativity as a combination of originality andappropriateness. Thus there is evidence of a decline increativity from third to fifth grade, but only when quan-tified by the proportions of appropriate or high-qualityideas, and not specifically as a slump in fourth, com-pared to third- and fifth-grade children.
Analysis of the explanations confirmed that chil-dren with a greater preference for appropriate ideaswere more consistent in applying the specified crite-rion (i.e., object shape) when evaluating ideas gener-ated by others (see Table 8). Decreases in divergentthinking (as measured by instances scores) were ex-pected to be associated with increases in a preferencefor appropriate ideas (as quantified by the preferenceevaluation coefficients). Some evidence was found toindicate a relation between this preference and the gen-eration of divergent thinking responses. More specifi-cally, an increasing preference for appropriate squareideas contributed significantly to predicting decreasesin the proportion of high-quality round ideas (see Table3). A similar relation might be expected for the roundpreference evaluation, but there were indications of in-consistencies with this task, such as being the onlyevaluation task where the coefficient did not signifi-
434 Creativity Research Journal
R. E. Charles and M. A. Runco
Figure 6. (a) Mean occurrence (out of nine responses) of shape,originality, and value explanations given during round preferenceevaluation by grade, Phase 2. (b) Mean occurrence (out of nine re-sponses) of shape, originality, and value explanations given duringsquare preference evaluation by grade, Phase 2.
cantly correlate with either age, grade, or verbal ability(as measured by the WISC–III Vocabulary subscores).
Although these results seem to confirm the predic-tion that declines in creativity would be accompaniedby an increase in evaluative skills, it could be mislead-ing to draw definitive conclusions from the ratioscores. The prediction was made with the expectationthat more highly developed evaluative skills wouldcause children to evaluate their own ideas more criti-cally, and thus censor their responses. If this had oc-curred, children in higher grades would probably havegiven fewer ideas overall, and a higher, not lower, pro-portion of high-quality ideas. Instead, the opposite wastrue. Comparing the raw fluency scores and the ratioscores for the round instances task (see Tables 4 and 6),the third-grade children gave fewer ideas and higherproportions of appropriate ideas, and thus appeared tobe more cautious in their responses than the fourth- andfifth-grade children. Further, looking again at the rawfluency scores, the fourth- and fifth-grade childrenwere clearly capable of thinking of, and willing to ex-press, more original, more absent, and more appropri-ate ideas, but they were also more inclined or moti-vated to give a larger number of ideas, without being asparticular as to their quality. Notably, in the raw flu-ency scores the only categories that did not show a sig-nificant grade effect favoring fourth-grade childrenwere the high-quality ideas (RUOA and RUOAS). Per-haps there are only a limited number of round ideas ac-cessible to children of these ages that meet the ratherrestrictive criteria of being uncued (absent), original,and appropriate.
It is also possible that there are different processesinvolved in the evaluation of others’ ideas and in theevaluation of one’s own ideas prior to expressingthem. This could explain why children who werebetter judges of originality did not give significantlymore original ideas in either divergent thinking task.Earlier studies (Runco & Smith, 1992; Runco &Vega, 1990) suggested that intrapersonal and inter-personal evaluative skills are distinct. One reason forthis is that because an individual remembers the pathtaken to think of a given idea, he or she will knowwhy it is appropriate. However, other individualswould have to determine the value of the idea andpossibly use different information to evaluate it thanthe individual who produced it. In a developmentalsense, it may be that the ability to accurately evaluateideas generated by others develops earlier than the
skills needed to objectively evaluate and screen one’sown ideas.
Admittedly, the present view of creativity is limitedto cognitive measurements. Yet, trends in divergentthinking measures reflect more than just the ability tocategorize or evaluate ideas. It also involves childrenchoosing to give appropriate or original responses.Thus, there is an affective (or subjective) quality to cre-ativity that is separate from abilities. It may well be thatthe children in this investigation had yet to reach thatstage where they have not only the ability, but also themotivation to be more selective when considering theirwork. Although measures of ability suggest what a per-son is capable of doing, that person’s actual behaviordepends also on the judgments and choices he or shemakes (Runco, Johnson, & Gaynor, 1999). To accu-rately predict behavior, we should look to preferences,judgments, and motivation, in addition to ability. Thecreativity complex mentioned earlier includes cogni-tive and extracognitive abilities and capacities.
In a sense, the correlations between divergent think-ing and time are relevant to the question of extra-cognitive influences. Plucker and Runco (1994) sug-gested that time on task might be used as a quantifiableand reliable index of interest and task commitment.Citing Renzulli’s (1978) theory of giftedness as re-flecting motivation, general intelligence, and creativ-ity, Plucker and Runco (1994) proposed that time beused in predictions of creative achievement, along withdivergent thinking, evaluative skill, and some index oftraditional cognitive ability. In this investigation, timeon task was associated with various indexes of diver-gent thinking. Future research could test this hypo-thesized relation between time on task and interest ormotivation. It should also examine time, divergentthinking, evaluative ability, and their interactions aspredictors of actual creative performance.
Although this study examined ability, and to somedegree preferences, there was no attempt to manipulatethe children’s choices or motivation in generating di-vergent thinking ideas. Further research should be con-ducted to determine the relation between evaluativeskills and divergent thinking in children when explicitinstructions are given. Previous work on explicit in-structions (Runco, 1986b) found large differences indivergent thinking scores when children were in-structed to give only original versus only popular ideas,showing that explicit instructions can be effective in di-recting children to given specific types of ideas. Thus a
Creativity Research Journal 435
Developmental Trends
more direct relation would be expected between an in-dividual’s ability to evaluate originality (an interper-sonal evaluation), and his or her divergent thinkingwhen asked specifically to give only original ideas (anintrapersonal evaluation). Similar relations would beexpected for explicit instructions on appropriatenessand the ability to evaluate the appropriateness of oth-ers’ ideas.
The results of this study may have been influencedto some extent by the specific schools and teacherswilling to participate. Although the fourth-grade peakwas not limited to just one class, teachers’ (as well asparents’) expectations can have a significant effect onchildren’s choices and their creative expressions(Rosenthal, 1991; Runco et al., 1999). Thus it is possi-ble that the two fourth-grade teachers who volunteeredfor this study were more actively involved in encourag-ing their children to be creative (or at least fluent), per-haps to the extent that they were able to overcomesome of the developmental trends noted earlier(Gardner, 1982; Smith & Carlsson, 1990; Torrance,1968). A longitudinal study drawing children from alarger number of schools and classes and followingchildren through a variety of teachers and classroomexperiences would be able to more fully examine thedevelopmental changes in the relation betweenevaluative skills and creativity in children.
References
Albert, R. S., & Runco, M. A. (1989). Independence and cognitiveability in gifted and exceptionally gifted boys. Journal of Youthand Adolescence, 18, 221–230.
Anderson, N. H. (1980). Information integration theory in develop-mental psychology. In F. Wilkening, J. Beden, & T. Trabasso(Eds.), Information integration by children (pp. 1–45).Hillsdale, NJ: Lawrence Erlbaum Associates, Inc.
Azar, B. (1995, June). New cognitive research makes waves. Moni-tor, p. 16.
Bruner, J. (1962). The conditions of creativity. In J. Bruner (Ed.), Onknowing: Essays for the left hand. Cambridge, MA: HarvardUniversity Press.
Camp, G. C. (1994). A longitudinal study of psychological corre-lates of creativity: Developmental trends and treatment effectsin children selected as having high creative potential. CreativityResearch Journal, 7, 125–144.
Cohen, J., & Cohen, P. (1983). Applied multiple regression/correla-tion analysis for the behavioral sciences. Hillsdale, NJ: Law-rence Erlbaum Associates, Inc.
Cropley, A. J. (1992). More ways than one: Fostering creativity.Norwood, NJ: Ablex.
Eysenck, H. (in press). Creativity, personality, and the conver-gent–divergent continuum. In M. A. Runco (Ed.), Critical cre-ative processes. Cresskill, NJ: Hampton.
Gardner, H. (1982). Art, mind, and brain. New York: Basic Books.Harrington, D. M., Block, J., & Block, J. H. (1983). Predicting cre-
ativity in preadolescence from divergent thinking in early child-hood. Journal of Personality and Social Psychology, 45,609–623.
Katz, A. N., & Giacommelli, L. (1982). The subjective nature of cre-ativity judgments. Bulletin of the Psychonomic Society, 20,17–20.
MacKinnon, D. (1983). The highly effective individual. In R. S. Al-bert (Ed.), Genius and eminence: A social psychology of cre-ativity and exceptional achievement (pp. 114–127). Oxford,England: Pergamon. (Original work published 1960)
Mumford, M. D., & Gustafson, S. B. (1988). Creativity syndrome:Integration, application, and innovation. Psychological Bulle-tin, 103, 27–43.
Piaget, J. (1980). To understand is to invent. New York: Penguin.Plucker, J., & Runco, M. A. (1994, November). Creativity, effort,
and evaluation. Paper presented at the meeting of the NationalAssociation for Gifted Children, Salt Lake City, UT.
Raina, T. N. (1980). Sex differences in creativity in India: A secondlook [Abstract]. Journal of Creative Behavior, 14, 218.
Renzulli, J. (1978). What makes giftedness? Re-examining adefintion. Phi Delta Kappan, 60, 180–184.
Rosenblatt, E., & Winner, E. (1988). The art of children’s drawings.Journal of Aesthetic Education, 22, 3–15.
Rosenthal, R. (1991). Teacher expectancy effects: A brief update 25years after the Pygmalion experiment. Journal of Research inEducation, 1, 3–12.
Rothenberg, A., & Hausman, C. (1976). The creativity question.Durham, NC: Duke University Press.
Runco, M. A. (1986a). Flexibility and originality in children’s diver-gent thinking. Journal of Psychology, 120, 345–352.
Runco, M. A. (1986b). Maximal performance on divergent thinkingtests by gifted, talented, and nongifted children. Psychology inthe Schools, 23, 308–315.
Runco, M. A. (1989). Parents’and teachers’rating of the creativity ofchildren. Journal of Social Behavior and Personality, 4, 73–83.
Runco, M. A. (in press). Implicit theories and ideational creativity. InM. A. Runco & R. S. Albert (Eds.), Theories of creativity (rev.ed., pp. 234–252). Cresskill, NJ: Hampton.
Runco, M. A., & Albert, R. S. (1985). The reliability and validity ofideational originality in the divergent thinking of gifted andnongifted children. Educational and Psychological Measure-ment, 45, 483–501.
Runco, M. A., & Charles, R. E. (1993). Judgments of originality andappropriateness as predictors of creativity. Personality and In-dividual Differences, 15, 537–546.
Runco, M. A., & Charles, R. (1996). Developmental trends in cre-ativity. In M. A. Runco (Ed.), Creativity research handbook(Vol. 1, pp. 113–150). Cresskill, NJ: Hampton.
Runco, M. A., Johnson, D., & Gaynor, J. R. (1999). The judgmentalbases of creativity and implications for the study of giftedyouth. In A. Fishkin, B. Cramond, & P. Olszewski-Kubilius(Eds.), Creativity in youth: Research and methods (pp.113–141). Cresskill, NJ: Hampton.
436 Creativity Research Journal
R. E. Charles and M. A. Runco

Runco, M. A., Okuda, S. M., & Thurston, B. J. (1987). The psycho-metric properties of four systems for scoring divergent thinkingtests. Journal of Psychoeducational Assessment, 2, 149–156.
Runco, M. A., & Richards, R. (Eds.). (1997). Eminent creativity,everyday creativity, and health. Norwood, NJ: Ablex.
Runco, M. A., & Smith, W. R. (1992). Interpersonal and intra-personal evaluations of creative ideas. Personality and Individ-ual Differences, 13, 295–302.
Runco, M. A., & Vega, L. (1990). Evaluating the creativity of chil-dren’s ideas. Journal of Social Behavior and Personality, 5,439–452.
Smith, G. J. W., & Carlsson, I. (1990). The creative process. Madi-son, CT: International Universities Press.
Torrance, E. P. (1968). A longitudinal examination of thefourth-grade slump in creativity. Gifted Child Quarterly, 12,195–199.
Urban, K. K. (1991). On the development of creativity in children.Creativity Research Journal, 4, 177–191.
Wallach, M. A., & Kogan, N. (1965). Modes of thinking in youngchildren. New York: Holt, Rinehart & Winston.
Wechsler, D. (1991). Manual for the Wechsler scale for children(3rd. ed.). New York: Psychological Corporation.
Creativity Research Journal 437
Developmental Trends
Copyright © 2022 FDOKUMEN