STATISTICAL DISTRIBUTIONS DESCRIBING MICROBIAL ...
45
STATISTICAL DISTRIBUTIONS DESCRIBING MICROBIAL QUALITY OF FRESH PRODUCE IN FOOD SERVICE FACILITIES By LEI SHAN A thesis submitted to the Graduate School - New Brunswick Rutgers, The State University of New Jersey In partial fulfillment of the requirements For the degree of Master of Science Graduate Program in Microbial Biology Written under the direction of Professor Donald W. Schaffner And approved by __________________________ __________________________ ___________________________ New Brunswick, New Jersey January 2015
-
Upload
khangminh22 -
Category
Documents
-
view
0 -
download
0
Transcript of STATISTICAL DISTRIBUTIONS DESCRIBING MICROBIAL ...

STATISTICAL DISTRIBUTIONS DESCRIBING MICROBIAL QUALITY OF
FRESH PRODUCE IN FOOD SERVICE FACILITIES
By
LEI SHAN
A thesis submitted to the
Graduate School - New Brunswick
Rutgers, The State University of New Jersey
In partial fulfillment of the requirements
For the degree of
Master of Science
Graduate Program in Microbial Biology
Written under the direction of
Professor Donald W. Schaffner
And approved by
__________________________
__________________________
___________________________
New Brunswick, New Jersey
January 2015

ii
ABSTRACT OF THE THESIS
Statistical Distributions Describing Microbial Quality of Fresh produce in Food
Service Facilities
By LEI SHAN
Thesis director:
Dr. Donald W. Schaffner
Data on the microbial food quality of fresh Ready-to-eat produces were collected in
Rutgers dining services from 2001 to 2013. Total aerobic plate count, total coliforms,
confirmed Bacillus cereus count were determined using standard methods. Statistical
analysis was performed on foods tested more than 35 times. Statistical distributions
and histograms were generated using SigmaPlot and Microsoft Excel. All data could
be described using normal distributions, once data above or below the upper or lower
limit detection were considered separately. The mean value of total aerobic plate
count of fresh produce were ranged from 3.40 to 6.45 log CFU/g. Among all the
samples, spinach, pepper and carrot had higher mean count, while apple, onion and
cauliflower had the lowest mean counts. Coliforms were most commonly found in
apple, broccoli, romaine lettuce and spinach, and least commonly found in pepper.
The average count of total coliform count (when present) ranged from 0.60 to 3.46 log
CFU/g, with carrot having highest average, while apple having the lowest average
count. Bacillus cereus were most commonly detected in onion and least detected in
tomato. B. cereus counts (when present) were highest on average in broccoli and

iii
lowest in pepper. Average B. Cereus counts for most produces were typically between
ranged from 2 and 3 log CFU/g.

iv
Acknowledgements
I would like to thank my advisor, Dr. Schaffner, for accepting me as his student when
I started my Master’s study. He always provided valuable advice and honest criticism.
With his instruction and help during the past two years, not only have I learned to use
statistical methods to analyze real world data in food microbiology research, but also I
saw my potential and interest in academia, thus I have found my future career goal.
I would like to thank my committee members, Dr. Takhistov and Dr. Zylstra, for their
precious suggestions, critique my thesis and their time.
I would like to thank my lab mates, Dane, Jenn, Gabriel, José, Wenchao, Di, Hannah,
Annie, Munira, Sidd, Jenny, Jiin, Ann, Robyn, Vahini, Zishuo, Daniele. I have really
learnt a lot from them, who helped me a lot in my research and my life, making the
two years study full of happy memories.
I would like to thank my parents and friends for their support in my Master’s study.
Finally, I would like to thank the staff at microbial biology and food sciences, Kathy,
Debbie, Irene and Dave, for their help.

v
Table of Contents
ABSTRACT OF THE THESIS...................................................................................ii
Acknowledgements......................................................................................................iv
Table of Contents..........................................................................................................v
Chapter I - Literature Review.....................................................................................1
I.1 Foodborne disease associated with fresh produce ..........................................1
I.2 Foodborne pathogens and indicator organisms...............................................3
I.2.a Salmonella spp...............................................................................................3
I.2.b Pathogenic Escherichia coli...........................................................................3
I.2.c Listeria monocytogenes..................................................................................4
I.2.d Clostridium perfingens...................................................................................4
I.2.e Staphylococcus aureus...................................................................................4
I.2.f Bacillus cereus................................................................................................5
I.3 Indicator microorganisms..................................................................................5
Chapter II - Statistical Distributions Describing Microbial Quality of Fresh
produce in Food Service Facilities..............................................................................6
II.1 Introduction...........................................................................................................6
II.2 Materials and Methods.......................................................................................10
II.3 Results..................................................................................................................13
II.4 Discussion.............................................................................................................25
Bibliography................................................................................................................33

1
Chapter I - Literature Review
I.1 Foodborne disease associated with fresh produce
Fresh produce has been playing a more and more important part in American diet, due
to their richness of vitamins and minerals, which is great promotion to people’s health.
It is reported that the consumption of fresh produce increased by over 30% during the
past few years (1). However, with the increasing consumption of fresh produce, the
proportion of produce-related outbreaks has also been increasing during the past
decades (2). That may result from the higher perishability of fresh produce compared
to processed food, and also the fact that produce are usually consumed raw, which
means less chance for reducing possible microbial contamination of the produce,
comparing with cooked food (3).
There are several source of foodborne pathogen contamination of Fresh produce.
Preharvest contamination source including the usage of untreated irrigation water,
contaminated organic fertilizers such as manure, runoff water from livestock
operations, and invasion of wildlife or domestic animal which can occur anywhere in
the farm (4, 5, 6). Postharvest contamination source including inappropriate
operations during handling, washing, processing and packaging (7).
As a good source of important vitamins, minerals, and phyto-nutrients, the
consumption of leafy green vegetables has been continuously increasing(8). However,
based on a report from USDA Economic Research Service, leafy greens have been the
category of produce that most likely to be associated with foodborne illness. In the

2
United States since 1996, it has been reported that 34% of outbreaks traced back to
vegetables and fruits, 10% of cases of illness, and 33% of deaths were associated with
leafy greens (9).
Several types of leafy green vegetables has been identified as vehicles of certain
foodborne pathogens. Iceberg lettuce has been reported to be in associated with
Shigella sonnei,Yerisinia pseudotuberculosis, and Salmonella spp. (7, 10, 11).
Romaine lettuce has been association with E. coli O157:H7 (12), and E. coli O145
(13). Spinach has been linked to E. coli O157:H7 (9).
Besides leafy green vegetables, other types of fresh produce has been identified as
vehicles of foodborne pathogens in the U.S., including apples, carrots, cucumber,
melon, mushrooms, onions, peppers, potatoes, sprouts and tomatoes. The most
commonly pathogens identified in produce-related outbreaks were Norovirus,
Salmonella spp., and pathogenic E. Coli (14).
It has been reported that apple juice and cider were associated with E.coli O157:H7
(15). Carrots has been associated with Clostridium botulinum, Shigella
sonnei,Yerisinia pseudotuberculosis (16, 17, 18). Buchholz reported that cucumber
was one of the vehicles associated with E.coli O104:H4 in the large outbreak in
German in 2011 (19). Based on a report from Center of Disease Control and
Prevention in 2008, honeydew was associated with Salmonella spp. in the outbreak in
New Jersey, 2007. Cantaloupe was reported to linked with Listeria monocytogenes
and Salmonella spp. (20, 21).

3
I.2 Foodborne pathogens and indicator organisms
Produce-related foodborne disease outbreaks are mainly associated with bacterial
pathogens. Pathogenic Escherichia coli, Salmonella spp., Listeria monocytogenes,
Clostridium perfingens, Staphylococcus aureus, and Bacillus cereus.
I.2.a Salmonella spp.
Salmonella is a genus of rod-shaped, gram-negative, motile bacteria. They are found
in worldwide cold-blood and warm-blood animals and in environment. Their optimal
growth temperature is 38℃, and can survive in raw food, soil, water, factory and
kitchen surfaces, and feces. They cause illnesses such as typhoid fever, paratyphoid
fever, and gastrointestinal foodborne illness. Salmonella has been associated with a
variety of fresh vegetables and fruits like tomatoes, alfalfa sprouts, melons and
peppers in the past outbreaks (22, 23, 24, 25, 26).
I.2.b Pathogenic Escherichia coli
Pathogenic E. coli are a group of E.coli that cause foodborne illnesses of human, they
are gram-negative, rod-shaped, facultative anaerobic bacteria. The most famous
serotype of pathogenic E. coli are E.coli O157:H7, E.coli O104:H4. The specific
produce that have been linked to pathogenic E. coli including lettuce, spinach, sprouts
and apple juice. It was reported that from 1996, 83% of leafy green-related outbreaks
were linked to E. coli O157:H7 (9).

4
I.2.c Listeria monocytogenes
Listeria monocytogenes is gram-positive, facultative anaerobic bacterium that can
cause Listeriosis, a serious infective disease with high fatality of over 20%, which
makes it one of the most virulent foodborne pathogens (27). The disease
predominantly strikes pregnant women, newborns, elderly and people with
compromised immune systems.Outbreaks were mainly linked to ready-to-eat food
including cheese, fresh celery and cantaloupe (28).
I.2.d Clostridium perfingens
Clostridium perfingens is estimated to cause one million cases of foodborne illnesses
each year, and considered to be the second common bacteria that cause foodborne
illnesses in the United States (29). Typically, C.perfingens spores germinate in raw or
poorly cooked food under anaerobic conditions, or food that is properly cooked but let
to stand to long. After ingestion, the bacteria start to form spores and produce
Clostridium perfingens enterotoxin (CPE) which cause disease (30). It is reported that
from 1998 to 2010, there were 289 confirmed C. perfingens outbreaks, 15,208 cases
of illnesses, 83 hospitalizations, and 8 death. In most of these outbreaks C. perfingens
is associated with meat and poultry (31).
I.2.e Staphylococcus aureus
One of the leading microorganisms that cause food poisoning is Staphylococcus

5
aureus. They cause gastroenteritis resulting from consumption of contaminated food
which contain the Staphylococcal enterotoxin. Staphylococcus aureus can survive and
grow in a wide range of temperature an pH, which enables them to grow in a wide
variety of foods. The food sources associated with Staphylococcus aureus are different
among countries, as different countries have different consumption habits (32). In the
United States, meat, salad, poultry, pastries, milk and seafood have been reported to
responsible for Staphylococcal food poisoning (33).
I.2.f Bacillus cereus
Bacillus cereus is responsible for minority of foodborne illness in the United States,
causing abdominal cramp, vomiting and diarrhea. Bacillus illnesses result from the
survival of Bacillus endospores during improperly cooking which primes the spores to
germinate, and subsequently improperly storage which allows vegetative growth of
the bacteria. Bacterial growth then leads to production of enterotoxin that leads to
Bacillus illness. In a report from 1998 to 2008, B. cereus is mainly linked to rice
dishes, meat and poultry (34).
I.3 Indicator microorganisms
Since it is not feasible to detect all the foodborne pathogens in every food microbial
quality test, the presence and amount of indicator microorganisms have been wildly
used to suggest the sanitary level of food, as well as the risk of the presence of
foodborne pathogens.

6
Chapter II - Statistical Distributions Describing Microbial Quality of Fresh
produce in Food Service Facilities
II.1 Introduction
The number of produce-based foodborne illness outbreaks continues to be a source of
concern. A report from Centers for Disease Control and Prevention (CDC) of the
United States showed that reported outbreaks per year associated with fresh produce
doubled between 1988 and 1992, compared to those between 1973 and 1987, and the
percentage of illnesses and outbreaks associated with produce also increased, from
1% and 0.6%, to 12% and 6%, respectively (22). Another CDC study showed that
from 1998 to 2008, nearly 46% foodborne illnesses, 38% hospitalizations and 23%
deaths were attributed to produce (35). In a Canadian survey covering data collected
between 2001 and 2009, 27 outbreaks and 1,549 cases of foodborne illness were
linked to produce (36).
Produce-related foodborne outbreaks and illnesses are predominantly associated with
bacterial pathogens. Pathogenic Escherichia coli is an important cause of foodborne
human gastrointestinal disease, which is estimated to cause about 269,000 illnesses
annually in the United States (37). Pathogenic E. coli has been linked to outbreaks
with a wide variety of food products, including meat, juice, milk and fresh produce,
which can be contaminated in the field through contaminated irrigation water,
improperly composted manure or animal intrusion. Pathogenic E. coli has been
specifically linked to lettuce, spinach, sprouts and apple juice.
7
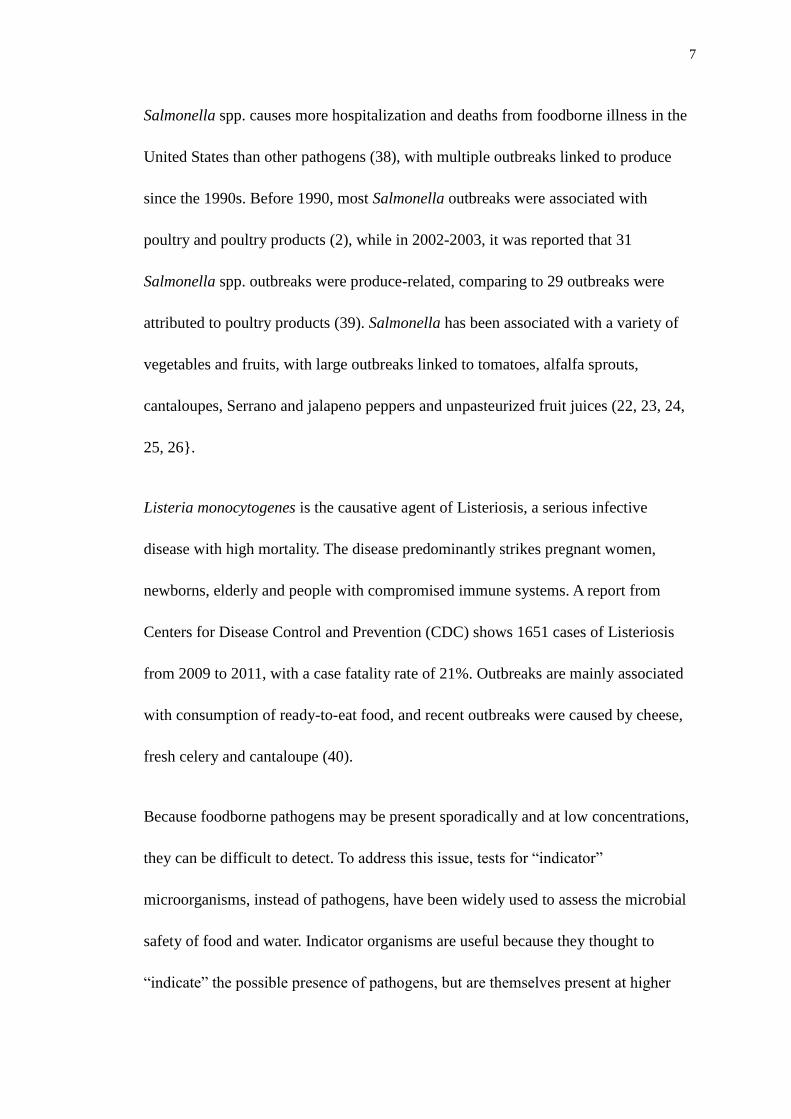
Salmonella spp. causes more hospitalization and deaths from foodborne illness in the
United States than other pathogens (38), with multiple outbreaks linked to produce
since the 1990s. Before 1990, most Salmonella outbreaks were associated with
poultry and poultry products (2), while in 2002-2003, it was reported that 31
Salmonella spp. outbreaks were produce-related, comparing to 29 outbreaks were
attributed to poultry products (39). Salmonella has been associated with a variety of
vegetables and fruits, with large outbreaks linked to tomatoes, alfalfa sprouts,
cantaloupes, Serrano and jalapeno peppers and unpasteurized fruit juices (22, 23, 24,
25, 26}.
Listeria monocytogenes is the causative agent of Listeriosis, a serious infective
disease with high mortality. The disease predominantly strikes pregnant women,
newborns, elderly and people with compromised immune systems. A report from
Centers for Disease Control and Prevention (CDC) shows 1651 cases of Listeriosis
from 2009 to 2011, with a case fatality rate of 21%. Outbreaks are mainly associated
with consumption of ready-to-eat food, and recent outbreaks were caused by cheese,
fresh celery and cantaloupe (40).
Because foodborne pathogens may be present sporadically and at low concentrations,
they can be difficult to detect. To address this issue, tests for “indicator”
microorganisms, instead of pathogens, have been widely used to assess the microbial
safety of food and water. Indicator organisms are useful because they thought to
“indicate” the possible presence of pathogens, but are themselves present at higher
8
concentrations and greater frequency that the pathogens they represent and are
therefore more easily and reliably detected. The presence and amount of indicator
microorganisms are thought to indicate the risk for the presence of foodborne
pathogens, and are often use as a measure of quality control during food processing.
Different indicators can reveal different aspect of microbial quality of food. Aerobic
plate count (APC) can indicate the time-temperature history and degree of
microbiological control level during the production and transport of fresh produce.
The total coliforms test include all aerobic and facultative anaerobic Gram-negative,
nonspore-forming bacteria that can ferment lactose with production of acid and gas at
35 °C within 48h, and includes E. coli, Citrobacter freundii, Enterobacter aerogenes,
Enterobacter cloacae, and Klebsiella pneumoniae. This classification is based on
biochemical-reaction (or metabolism) rather than any genetic relatedness. Another
widely used indicator test is for “fecal coliforms”, which include facultative anaerobic
rod-shaped, Gram-negative nonspore-forming bacteria that can grow in the presence
of bile salts, and ferment lactose to acid and gas at 44 °C within 48h. Historically
called “fecal coliforms”, the term thermotolerant coliform is more correct, as
microorganisms fitting this biochemical classification are not necessarily associated
with feces. The most prominent thermotolerant or fecal coliform, generic Escherichia
coli (also known as E. coli Biotype I) is generally considered the best indicator of
fecal contamination because it is commonly found in the intestine of humans and
warm-blooded animals. It is widely used in the assessment of the microbial quality of
food and water samples. It is also considered more specific than fecal coliforms as its

9
test does not detect non-fecal thermotolerant coliforms (41).
To assess the microbiological quality of food, especially ready-to-eat (RTE) food
including fresh produce, many microbial surveys have been conducted over the years
and around the world. In such surveys, researchers collect food sample from local
markets, grocery stores, restaurants and/or cafeterias, and subject these samples to a
variety of microbiological tests to determine the presence and/or concentration of
foodborne pathogens and indicator microorganisms. The data and information gained
in those surveys can be used subsequently to guide those facilities to improve their
practices and reduce food safety risk. The knowledge gained can also support future
food safety research and the development of food safety programs to control potential
risk.
Numerous microbiological surveys have been conducted worldwide, including ones
done in the United States, Canada, Mexico, China, and Spain (42, 43, 44, 45, 46).
Rutgers University also has a long history of weekly, year-round microbiological
quality inspection on the university dining halls for over 40 years, as part of food
safety program in response to a foodborne disease outbreak which occurred in the
1960’s (47). Random inspections are currently conducted at six large dining halls and
many smaller facilities at Rutgers. Data currently being collected and recorded
include location, date and time of sampling, temperatures of ready-to-eat foods, total
aerobic plate count, coliforms, E. coli, C. perfringens, B. cereus, L. monocytogenes, S.
aureus counts, and presence of Salmonella. Our lab has previously published analyses

10
on foods tested more than 50 times (primarily lunch meats and deli salads) and on
surfaces tested more than 500 times (36 different surfaces types, including pastry
brushes, cutting boards, and countertops) (48, 49).
With the recent interest in the microbial safety of fresh produce, the focus of Rutgers
University dining hall food testing program shifted to include more fresh produce
items. We have observed that produce items often do not meet the original testing
criteria developed for ready-to-eat foods when the program was created (47). The
object of this thesis is to characterize the microbial quality of ready-to-eat produce
items in Rutgers University dining halls using the data collected over the past thirteen
years, with an eye towards the development of new microbial quality standards for
Rutgers University ready to eat produce.
II.2 Materials and Methods
Methods
Microbial analysis. All data were obtained from samples taken from dining facilities
operated by Rutgers University from between 2001 to 2013. Facilities ranged from
large dining halls serving thousands of meals every day to small cash operations.
Temperatures of foods were obtained using a sterilized, calibrated thermometer
(Thermapen, Thermoworks, Lindon, UT) before pickup. Foods were taken from
serving lines or the kitchen and placed into sterile whirl-pack bags (Fisher Scientific,
Pittsburg, PA) using sterilized utensils, then they were transported back to the

11
laboratory in an insulated bag with ice, and stored in a lab refrigerator until testing.
Total aerobic count of foods was determined using Food and Drug Administration
standard methods. Twenty-five grams of each food was weighed into a stomacher bag
(Fisher brand, Pittsburgh, Pa.) with 225 ml of peptone water. The food was
homogenized in a stomacher (Seward, London, UK) for 1 to 2 min depending on
texture. Homogenate was serially diluted of 10-1-10-5 of original homogenate and 0.1
ml of each diluted homogenate was spread on total aerobic count agar using sterile
glass spreading rod.
Presumptive and confirmed total coliform and fecal coliform counts were determined
using the most-probable-number (MPN) method. Aliquots of homogenate and
dilutions up to 10-5 were added in triplicate to lauryl tryptose broth (Difco, BD)
containing Durham tubes and incubated at 37 °C. At 24 and 48 h, tubes were checked
for gas production, and transfers were made from positive tubes with a sterile loop to
tubes containing brilliant green broth and Escherichia coli (EC) broth (Difco, BD).
Brilliant green tubes were incubated at 37 °C and EC tubes were incubated at 45 °C.
Tubes were checked for gas production at 24 and 48 h. An MPN calculator was used
to determine number of presumptive and confirmed coliforms and presumptive E. coli
count (50). All the samples containing gas were streaked onto Eosin-Methylene Blue
(EMB) agar (Difco, BD) with a sterile loop. EMB plates were incubated at 35 °C for
24 h. Black, dark green colonies or colonies have a green sheen growing on EMB
plates were Gram stained. Each colony consisting of gram-negative short rod shaped
12
bacteria was used to inoculate in an Enterotube (Difco, BD), and incubated at 35 °C
for 24 h. An Enterotube Interpretation Guide (codebook) was used to determine
species of the inoculated bacterium.
Bacillus cereus was determined using Mannitol-Egg Yolk-Polymyxin (MYP) agar
(Difco, BD) medium. Spread plates of MYP medium were prepared in duplicate,
depositing 0.1ml of 10-1 dilution on each plate using sterile glass spreading rod. The
plates were incubated at 30 °C for 24h. Pink-red colonies with a precipitation zone
surrounding the colony were counted and further tested by Gram stain and hemolysis
reaction. Samples with strong hemolytic activity and with production of a 2-4 mm
zone of complete hemolysis surrounding the colony were counted.
Data analysis. Data were exported from the relational database in Access Data
(Microsoft, Redmond, WA) to Excel (Microsoft) for preliminary analysis, and then
from Excel to SigmaPlot (Systat Software, San Jose, CA), where histograms and box
plot were created, and correlations were determined. Similar data sets were combined
where appropriate. Distributions were created using SigmaPlot. The
Anderson-Darling test was used to determine goodness of fit. After initial analysis, the
normal distribution was selected to represent the log bacterial count on produce on the
basis of its generally high statistical ranking, visually acceptable fits, and accepted use
of describing microbial distributions in ready-to-eat produce. The normal distribution
is a two-parameter distribution with parameters μ and σ, where μ is the mean and σ2 is

13
the variance.
II.3 Results
Total Aerobic CountA
pple
Onio
n
Caulif
low
er
Cucum
ber
Tom
ato
Rom
ain
e
Bro
ccoli
Mushro
om
Lett
uce m
ixed
Iceberg
Carr
ot
Pepper
Spin
ach
Lo
g1
0 C
FU
0
2
4
6
8
10
FIGURE 1. Box plot of total aerobic counts per gram (log scale) in different RTE
produces.
The levels information of total aerobic count is shown in Figure 1 (sorted by median,
from low to high). The counts range from 1 to 9.88 log CFU/g. Apple, onion and
cauliflower had the lowest median of total aerobic counts of 2.81, 3.92, and 4.58 log
CFU/g, respectively. Spinach, pepper and carrot had the highest medians of 6.71, 6.50,
and 6.21 log CFU/g, respectively.

14
Total Coliform
Apple
Caulif
low
er
Lett
uce m
ixed
Bro
ccoli
Iceberg
Rom
ain
e
Onio
n
Tom
ato
Mushro
om
Spin
ach
Carr
ot
Cucum
ber
Pepper
Lo
g1
0 C
FU
0
1
2
3
4
5
6
FIGURE 2. Box plot of total coliform counts per gram determined by a three-tube
most-probable-number (MPN) method (log scale) in different RTE produces with
positive samples.
The levels information of coliform count is shown in Figure 2 (sorted by median from
low to high). The counts range from 0.30 to 5.04 log MPN/g. Apple, cauliflower and
mixed lettuce had the lowest median of total aerobic counts (0.48, 0.48, and 0.48 log
MPN/g, respectively), while pepper, cucumber and carrot had the highest medians
(2.96, 2.66, and 2.38 log MPN/g, respectively).

15
Confirmed B. cereus
Pepper
Iceberg
Mushro
om
Tom
ato
Caulif
low
er
Cucum
ber
Lett
uce m
ixed
Rom
ain
e
Carr
ot
Apple
Onio
n
Bro
ccoli
Spin
ach
Lo
g1
0 C
FU
1
2
3
4
5
FIGURE 3. Box plot of Bacillus cereus counts per gram determined by MYP agar
selection and hemolysis test (log scale) in different RTE products with positive
samples.
The levels information of Bacillus cereus count is shown in Figure 2 (sorted by
median from low to high). The counts range from 1.70 to 4.48 log CFU/g. Pepper,
iceberg lettuce, mushroom and tomato had the lowest median of total aerobic counts
(1.70, 2.00, 2.00, and 2.00 log CFU/g, respectively), while spinach, broccoli and
onion had the highest medians (2.78, 2.70, and 2.54 log CFU/g, respectively).

16
FIGURE 4. Normal distribution (line) fit to raw data (bars) for log total aerobic count
per gram of 30 samples of apple.
FIGURE 5. Normal distribution (line) fit to raw data (bars) for log total aerobic count
per gram of 80 samples of broccoli.

17
FIGURE 6. Normal distribution (line) fit to raw data (bars) for log total aerobic count
per gram of 81 samples of carrot.
FIGURE 7. Normal distribution (line) fit to raw data (bars) for log total aerobic count
per gram of 34 samples of cauliflower.

18
FIGURE 8. Normal distribution (line) fit to raw data (bars) for log total aerobic count
per gram of 83 samples of cucumber.
FIGURE 9. Normal distribution (line) fit to raw data (bars) for log total aerobic count
per gram of 82 samples of iceberg lettuce.

19
FIGURE 10. Normal distribution (line) fit to raw data (bars) for log total aerobic
count per gram of 75 samples of romaine lettuce.
FIGURE 11. Normal distribution (line) fit to raw data (bars) for log total aerobic
count per gram of 98 samples of mixed lettuce.

20
FIGURE 12. Normal distribution (line) fit to raw data (bars) for log total aerobic
count per gram of 56 samples of mushroom.
FIGURE 13. Normal distribution (line) fit to raw data (bars) for log total aerobic
count per gram of 64 samples of onion.

21
FIGURE 14. Normal distribution (line) fit to raw data (bars) for log total aerobic
count per gram of 62 samples of pepper.
FIGURE 15. Normal distribution (line) fit to raw data (bars) for log total aerobic
count per gram of 50 samples of spinach.

22
FIGURE 16. Normal distribution (line) fit to raw data (bars) for log total aerobic
count per gram of 137 samples of tomato.
An example of total aerobic count data fit to normal distribution is given in Figure 4
for tomato (n=137), the most frequently tested RTE produce. The parameters of the
normal distribution were μ=4.83 and σ=1.49.
TABLE 1. Statistical analysis of log total aerobic count per gram for RTE produces
picked up from Rutgers University dining facilities (2001-2013); data represent
normal distribution parameters (log CFU/g) or the percentage of samples below the
limit of detection

23
Produce Normal parameters (μ,σ2) Below limit of
detection (%)
No. of
samples
Apple (3.40, 1.78) 46.4 56
Broccoli (5.03, 1.59) 3.6 83
Carrot (6.19, 1.48) 1.2 82
Cauliflower (4.52, 1.57) 5.6 36
Cucumber (5.96, 1.26) 1.2 84
Iceberg (5.17, 1.67) 2.4 84
Romaine (4.85, 1.27) 1.3 76
Lettuce mixed (5.65, 1.46) 1.0 99
Mushroom (5.65, 1.77) 1.8 57
Onion (4.08, 1.90) 11.1 72
Pepper (6.20, 1.81) 6.1 66
Spinach (6.45, 1.11) 0.0 50
Tomato (4.77, 1.55) 2.8 141
Normal distribution parameters for all RTE produces are given in Table 1. Little
variation was seen between total aerobic count distributions for the produces (Figure.
4, 5, 6, 7, 8, 9, 10, 11, 12, 13, 14, 15, and 16). Apple had a lower mean in total aerobic
count of 3.40 log CFU/g compared with the other produces, and this difference is also
apparent from Figure. 4. Carrot, pepper and spinach had higher mean in total aerobic
counts of 6.19, 6.20 and 6.45 log CFU/g, respectively (Figure. 6, 14 and 15).
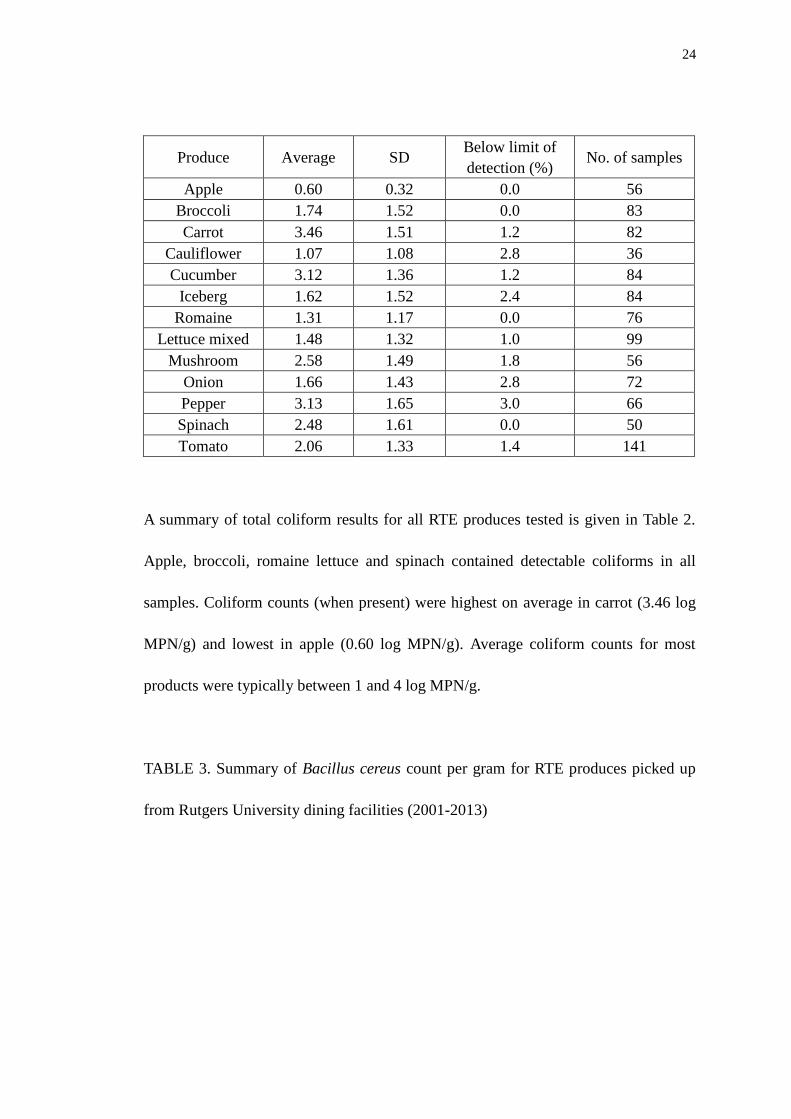
TABLE 2. Summary of total coliform most probable number per gram for RTE
produces picked up from Rutgers University dining facilities (2001-2013)
24
Produce Average SD Below limit of
detection (%) No. of samples
Apple 0.60 0.32 0.0 56
Broccoli 1.74 1.52 0.0 83
Carrot 3.46 1.51 1.2 82
Cauliflower 1.07 1.08 2.8 36
Cucumber 3.12 1.36 1.2 84
Iceberg 1.62 1.52 2.4 84
Romaine 1.31 1.17 0.0 76
Lettuce mixed 1.48 1.32 1.0 99
Mushroom 2.58 1.49 1.8 56
Onion 1.66 1.43 2.8 72
Pepper 3.13 1.65 3.0 66
Spinach 2.48 1.61 0.0 50
Tomato 2.06 1.33 1.4 141
A summary of total coliform results for all RTE produces tested is given in Table 2.
Apple, broccoli, romaine lettuce and spinach contained detectable coliforms in all
samples. Coliform counts (when present) were highest on average in carrot (3.46 log
MPN/g) and lowest in apple (0.60 log MPN/g). Average coliform counts for most
products were typically between 1 and 4 log MPN/g.
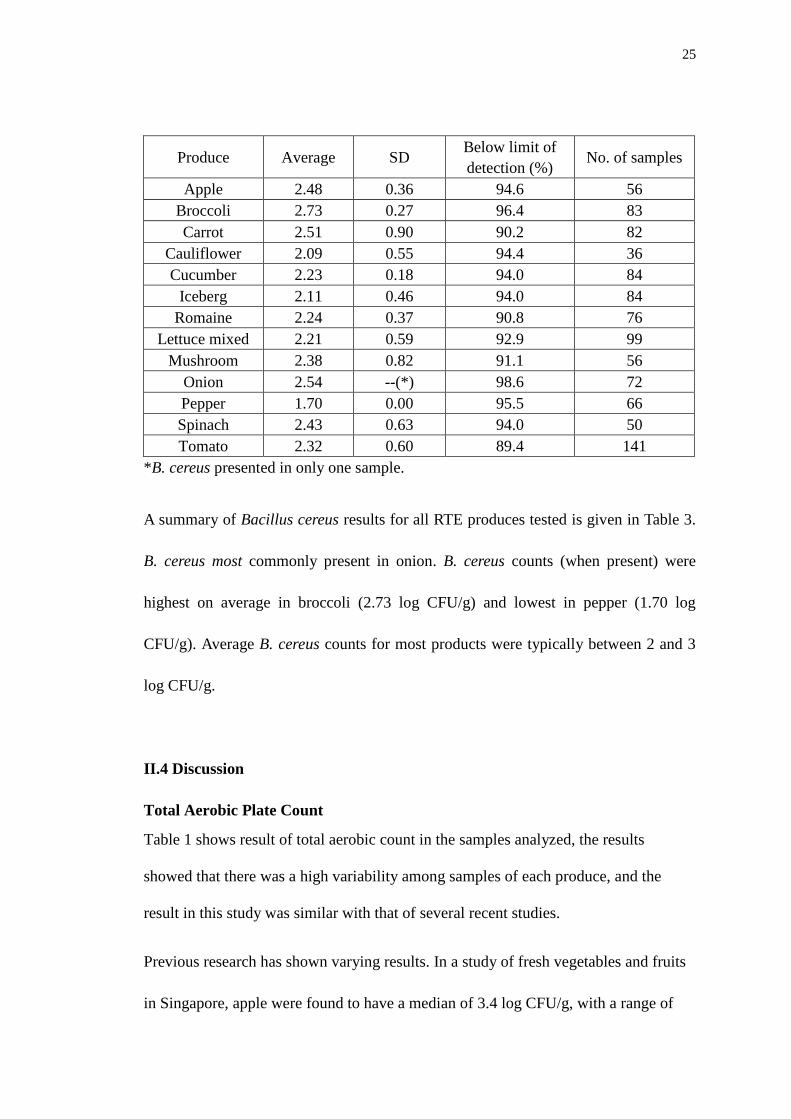
TABLE 3. Summary of Bacillus cereus count per gram for RTE produces picked up
from Rutgers University dining facilities (2001-2013)
25
Produce Average SD Below limit of
detection (%) No. of samples
Apple 2.48 0.36 94.6 56
Broccoli 2.73 0.27 96.4 83
Carrot 2.51 0.90 90.2 82
Cauliflower 2.09 0.55 94.4 36
Cucumber 2.23 0.18 94.0 84
Iceberg 2.11 0.46 94.0 84
Romaine 2.24 0.37 90.8 76
Lettuce mixed 2.21 0.59 92.9 99
Mushroom 2.38 0.82 91.1 56
Onion 2.54 --(*) 98.6 72
Pepper 1.70 0.00 95.5 66
Spinach 2.43 0.63 94.0 50
Tomato 2.32 0.60 89.4 141
*B. cereus presented in only one sample.
A summary of Bacillus cereus results for all RTE produces tested is given in Table 3.
B. cereus most commonly present in onion. B. cereus counts (when present) were
highest on average in broccoli (2.73 log CFU/g) and lowest in pepper (1.70 log
CFU/g). Average B. cereus counts for most products were typically between 2 and 3
log CFU/g.
II.4 Discussion
Total Aerobic Plate Count
Table 1 shows result of total aerobic count in the samples analyzed, the results
showed that there was a high variability among samples of each produce, and the
result in this study was similar with that of several recent studies.
Previous research has shown varying results. In a study of fresh vegetables and fruits
in Singapore, apple were found to have a median of 3.4 log CFU/g, with a range of

26
2.1 to 5.1 log CFU/g, which is consistent with the levels of contamination that we
found for apple. The Singapore study also reported carrot to have a range from 2.6 to
6.9 log CFU/g with a median of 4.8 log CFU/g (51), which is lower than the bacterial
level we found. Other studies showed similar or higher level, such as medians of 5.5
log CFU/g, 6 log CFU/, 7 log CFU/g and 7.8 log CFU/g. These results were higher
than we found in this study.
Lettuce were found to have relatively high total aerobic count level in our study.
Similarly, in a survey of Ready-to-eat lettuce in Swiss market, the lettuce were found
to have a range of 5 to 6 log CFU/g in total aerobic count (52). Another survey found
leafy lettuce to have total aerobic count ranging from 6.23 to 6.36 log CFU/g (53). In
a survey from Singapore, the total aerobic count ranged from 1.6 to 9.1 log CFU/g,
with a median of 5.8 log CFU/g for lettuce (51), which is consistent with our results.
It was also reported that lettuce mix had total aerobic count ranging from 4.5 to 8.0
log CFU/g. Similarly, a study from Spain showed that the total bacterial counts for
RTE lettuce at 16 university restaurants ranged from 3.01 to 7.81 log CFU/g (54).
In a Japanese survey of Iceberg lettuce, it was found to have a range of 5 to 6 log
CFU/g for aerobic count (55), which was similar to our result. Romaine lettuce
obtained from Brazil markets were found to have a range of 6.50 to 6.81 log CFU/g in
total aerobic count, which was higher than our results (56). In another study, it was
reported that romaine lettuce had total aerobic count ranging from 2.4 to 7.3 log
CFU/g.

27
Among all the produces, spinach had a median total aerobic count of 6.45 log CFU/g,
resulting in the highest mean count. Likewise, Kase and Borenstein found baby
spinach to have total aerobic count levels ranging from 3.9 to 8.2 log CFU/g (57).
Similarly, Valentin-Bon et al. reported that spinach had total bacterial counts of 7.2 to
7.7 log CFU/g and a broad range of <4 to 8.3 log CFU/g (42).
Our result shown that bell pepper had one of the highest total aerobic counts. Prior
study done by Cárdenas et al. found serrano and jalapeño pepper has a range of 4.4
and 4.7 log CFU/g (58), which was lower than what we found. Liao et al. reported
jalapeño pepper obtained from grocers in Pennsylvania had levels of total aerobic
count ranging from 4.7 to 6.3 log CFU/g with a median of 5.6 log CFU/g. Another
study in Mexico found 7.2 and 6.4 log CFU/g for serrano and jalapeño pepper (59).
The median of total aerobic count of tomato was 4.77 log CFU/g. This was also
consistent with the results from a Singapore survey, in which tomato was reported to
have total aerobic count ranging from 2.4 to 5.5 log CFU/g with a median of 4.2 log
CFU/g (51). In contrast, it was reported bola and saladette tomatoes have total aerobic
count of 3.2 and 3.6 log CFU/g, respectively (60).
Coliforms
In this study, the produces had mean coliform counts ranging from 0.60 to 3.46 log
MPN/g (Table 2). The highest mean coliform counts were obtained in the carrot,
pepper and cucumber with 3.46, 3.13 and 3.12 log MPN/g, respectively. Recent

28
studies also have varying results in total coliforms. In Singapore study, it was reported
to have coliform levels of 0.1 log CFU/g in apple, 2.7 log CFU/g in carrot (51), which
were much lower than we found.
Romaine lettuce obtained from Brazil markets was found to have a range of 3.23 to
3.50 log MPN/g in coliforms (61). In another survey, spinach and lettuce mix had
coliforms ranging from <0.47 to >4.0 log MPN/g, similar to the range of <0.47 to
3.38 log MPN/g reported for RTE lettuce in a Spain survey (62), which was a little
higher than our results. Iceberg lettuce was found to have coliform ranging from 1 to
4 log MPN/g (55), which was much higher than our results.
Cárdenas et al. found 3.3 and 3.7 log CFU/g in pepper with a range from <1 to 3 log
CFU/g (60), which is consistent with our results, and much lower than those reported
for 3.0 to 8.1log CFU per sample from popular markets in Hidalgo, Mexico (63).
The concentrations of coliforms on spinach from the US ranged from undetectable to
4.0 log CFU/g (64). Likewise, Valentin-Bon et al. found that spinach have a range
from <0.47 to ≥4.0 log MPN/g. Both of them had a lower coliform level than our
result (42).
In the Singapore survey, tomato was reported to have a median of 2.1 log CFU/g (51),
which is very similar to our results. Tomato is also reported to have coliform
contamination of 2.6 log CFU/g with a range from <2 to 5 log CFU/g (60), which is
higher than what we found in this study.

29
Other pathogenic indicators
These surveys showed that the microbial flora of RTE produce is highly variable and
complex. Among all the 955 samples, No Clostridium perfringens was isolated.
Staphylococcus aureus was isolated in 2.53% of all the samples, while Escherichia
coli was isolated from 1.36% of all the samples, and E. coli O157:H7 was isolated
only once from spinach in the past ten years. Salmonella spp. was isolated from
0.73% of all the samples, Listeria monocytogenes was isolated from 0.31% of all the
samples, and Bacillus cereus was isolated from 6.81% of all the samples.
The microbial level of those pathogenic indicators was lower than other studies. In an
survey in Canada, E. coli was isolated from 8.2% of RTE produces including lettuce,
spinach, carrots, and green onions (43). Another survey in Swiss showed E.coli was
isolated from 3.52% of RTE lettuce and fruits samples, and non-O157 STEC was
isolated once in an lettuce sample (52), which also reported a higher level (3.52%) of
L.monocytogenes compared to our results. A study in Ontario collected from retail
distribution centers and farmers’ markets found 5.3% positive for E.coli of the fresh
produces samples positive for E. coli, and 0.17% to be positive for Salmonella (65). In
the USDA Microbiological Data Program a total of 7,646 produce samples from
terminal markets and wholesale distribution centers were tested, and a positive rate of
20.8% for E.coli was reported with an enzyme-based detection method, which was
higher than our result. Salmonella was isolated from 0.04% of the samples, which was
lower than Salmonella isolated in our study. Other researches have reported positive
30
rates for E. coli higher than that reported here (46, 66). Among those studies, none of
the samples was positive for E. coli O157:H7. The bacteria counts varied largely
among studies, which could due to different testing methodologies, produce type, and
geographic positions. Overall, the levels of E. coli found in this study are lower than
those reported by several other researchers. Besides, no Salmonella or E. coli
O157:H7 were detected in fresh produce from Spain (46), Norway (67), Ireland (68),
or the United Kingdom (69). Several studies have been conducted in recent years in
the United States to evaluate the microbiological quality of fresh produce, and no or
very low levels of pathogenic bacteria have been reported (66,70).
Cho et al. found positive rates for S. aureus and B. cereus of 1.72% and 2.18% in
RTE foods, respectively, both of which were lower higher than we found in this study
(71). According to the study of Chung et al., the detection rates of B. cereus,
Salmonella spp, L. monocytogenes, and S. aureus in RTE foods in Korea were less
than 4%, which was similar to our results. A survey in Mexico found that 1.25% of
RTE tomato and peppers were positive for Salmonella (60), which was higher than
our results. In another study conducted in Portugal, the positive rate for Salmonella, L.
monocytogenes and B. cereus were 1.99%, 0.66%, and 22.7%, respectively (72). In
another study in Japan, Hara-kudo et al. reported a positive rate of Salmonella of
0.1-0.2% isolated from cucumber, lettuce, sprout and tomatoes (73), which was lower
than our results. Although the microbial load of most of the indicator bacteria were
lower in this study compared to other studies, demonstrates that there is room for
improvement throughout the produce processing and storage.

31
There are a few possible explanations for the relatively high total aerobic counts in
lettuces, spinach, pepper and carrot. First, lettuces and spinach are leafy greens with
large surface areas and folds. This makes them more susceptible to bacterial
contamination and adhesion; and when untreated manure is utilized as soil fertilizers
in the farm, it is also easy for their open leaves to contact with soil and irrigation
water, thus result in microorganisms transfer on to their leaves (74). Second, the
reason for high aerobic count in pepper could result from the cross-contamination
between pepper stems and pepper flesh when they are prepared for serving, as pepper
stems accounted for a greater contamination level of aerobic bacteria; in additional,
the stem is the contact area of pepper used to pluck it from the plant during harvest,
which could also cause cross-contamination (60). Last, for carrot, since it is a
subterranean crop and in direct contact with soil, those bacteria in irrigation water,
manure and fertilizers could easily attach to it (46).
We were unable to compare our results of the microbial load on cauliflower and
broccoli with those of other studies, for there are very few papers reporting microbial
load on those produces, that may due to few outbreaks they caused as they are usually
consumed cooked.
Furthermore, the high aerobic microbial load could also result from processing,
storage and handling. Microbial surveys can demonstrate that products handled under
good sanitary conditions generally evidence microbial counts significantly lower than
those of products produced in plants operating under poor sanitary conditions (75).
32
The result in this study showed that mean total aerobic count for the broccoli, carrot,
cucumber, iceberg lettuce, lettuce mixed, mushroom, pepper and spinach examined
exceeded 5 log CFU/g (Table 1), indicating that those produces were in unsatisfactory
condition to consumption, because the “acceptable” level of aerobic bacterial count
for ready-to-eat food is not more than 5 log CFU/g at Rutgers Dinning halls (48).
Therefore, these results suggest that effective control measures should be
implemented in production facilities and subsequent processes to enhance the
microbiological quality of fresh produce provided in Rutgers dining facilities.
33
Bibliography
1. Dobhal, S., Zhang, G., Royer, T., Damicone, J., & Ma, L. M. (2014). Survival
and growth of foodborne pathogens in pesticide solutions routinely used in
leafy green vegetables and tomato production. Journal of the science of food
and agriculture
2. Tauxe, R. V. (1997). Emerging foodborne diseases: an evolving public health
challenge. Emerging infectious diseases, 3(4), 425.
3. Buzby, J. C. (2003). International trade and food safety: economic theory and
case studies. Washington, DC: US Department of Agriculture, Economic
Research Service.
4. Steele, M., & Odumeru, J. (2004). Irrigation water as source of foodborne
pathogens on fruit and vegetables. Journal of Food Protection®, 67(12),
2839-2849.
5. Beuchat, L. R. (2006). Vectors and conditions for preharvest contamination of
fruits and vegetables with pathogens capable of causing enteric
diseases.British Food Journal, 108(1), 38-53.
6. Delaquis, P., Bach, S., & Dinu, L. D. (2007). Behavior of Escherichia coli
O157: H7 in leafy vegetables. Journal of Food Protection®, 70(8),
1966-1974.
7. Mercanoglu Taban, B., & Halkman, A. K. (2011). Do leafy green vegetables
and their ready-to-eat [RTE] salads carry a risk of foodborne
pathogens?. Anaerobe,17(6), 286-287.
8. Beuchat, L. R. (2002). Ecological factors influencing survival and growth of
human pathogens on raw fruits and vegetables. Microbes and infection, 4(4),
413-423.
9. Calvin, L. (2007). Outbreak linked to spinach forces reassessment of food
safety practices. Risk, 157, H7.
10. Kapperud, G., Rørvik, L. M., Hasseltvedt, V., Høiby, E. A., Iversen, B. G.,
Staveland, K., ... & Andersson, Y. (1995). Outbreak of Shigella sonnei
infection traced to imported iceberg lettuce. Journal of clinical
microbiology, 33(3), 609-614.
11. Nuorti, J. P., Niskanen, T., Hallanvuo, S., Mikkola, J., Kela, E., Hatakka, M., ...
& Ruutu, P. (2004). A widespread outbreak of Yersinia pseudotuberculosis O:
3 infection from iceberg lettuce. Journal of Infectious Diseases, 189(5),

34
766-774.
12. Ackers, M. L., Mahon, B. E., Leahy, E., Goode, B., Damrow, T., Hayes, P.
S., ... & Slutsker, L. (1998). An outbreak of Escherichia coli O157: H7
infections associated with leaf lettuce consumption. Journal of Infectious
Diseases,177(6), 1588-1593.
13. Taylor, E. V., Nguyen, T. A., Machesky, K. D., Koch, E., Sotir, M. J., Bohm, S.
R., ... & Williams, I. (2013). Multistate outbreak of Escherichia coli O145
infections associated with romaine lettuce consumption, 2010. Journal of
Food Protection®, 76(6), 939-944.
14. Doyle, M. P., & Erickson, M. C. (2008). Summer meeting 2007–the problems
with fresh produce: an overview. Journal of Applied Microbiology, 105(2),
317-330.
15. Friedman, M., Henika, P. R., Levin, C. E., & Mandrell, R. E. (2004).
Antibacterial activities of plant essential oils and their components against
Escherichia coli O157: H7 and Salmonella enterica in apple juice. Journal of
agricultural and food chemistry, 52(19), 6042-6048.
16. Sheth, A. N., Wiersma, P., Atrubin, D., Dubey, V., Zink, D., Skinner, G., ... &
Sobel, J. (2008). International outbreak of severe botulism with prolonged
toxemia caused by commercial carrot juice. Clinical infectious diseases,47(10),
1245-1251.
17. Rimhanen-Finne, R., Niskanen, T., Hallanvuo, S., Makary, P., Haukka, K.,
Pajunen, S., ... & Kuusi, M. (2009). Yersinia pseudotuberculosis causing a
large outbreak associated with carrots in Finland, 2006. Epidemiology and
infection, 137(03), 342-347.
18. Gaynor, K., Park, S. Y., Kanenaka, R., Colindres, R., Mintz, E., Ram, P. K., ...
& Effler, P. V. (2009). International foodborne outbreak of Shigella sonnei
infection in airline passengers. Epidemiology and infection, 137(03), 335-341.
19. Buchholz, U., Bernard, H., Werber, D., Böhmer, M. M., Remschmidt, C.,
Wilking, H., ... & Kühne, M. (2011). German outbreak of Escherichia coli
O104: H4 associated with sprouts. New England Journal of Medicine, 365(19),
1763-1770.
20. Laksanalamai, P., Joseph, L. A., Silk, B. J., Burall, L. S., Tarr, C. L.,
Gerner-Smidt, P., & Datta, A. R. (2012). Genomic characterization of Listeria
monocytogenes strains involved in a multistate listeriosis outbreak associated
with cantaloupe in US. PloS one, 7(7), e42448.
35
21. Munnoch, S. A., Ward, K., Sheridan, S., Fitzsimmons, G. J., Shadbolt, C. T.,
Piispanen, J. P., ... & Durrheim, D. N. (2009). A multi-state outbreak of
Salmonella Saintpaul in Australia associated with cantaloupe
consumption.Epidemiology and infection, 137(03), 367-374.
22. Sivapalasingam, S., Friedman, C. R., Cohen, L., & Tauxe, R. V. (2004). Fresh
produce: a growing cause of outbreaks of foodborne illness in the United
States, 1973 through 1997. Journal of Food Protection®, 67(10), 2342-2353.
23. Hedberg, C. (1999). Food-related illness and death in the United
States.Emerging infectious diseases, 5(6), 840.
24. Greene, S. K., Daly, E. R., Talbot, E. A., Demma, L. J., Holzbauer, S., Patel, N.
J., ... & Painter, J. A. (2008). Recurrent multistate outbreak of Salmonella
Newport associated with tomatoes from contaminated fields,
2005.Epidemiology and infection, 136(02), 157-165.
25. Mahon, B. E., Pönkä, A., Hall, W. N., Komatsu, K., Dietrich, S. E., Siitonen,
A., ... & Slutsker, L. (1997). An international outbreak of Salmonella
infections caused by alfalfa sprouts grown from contaminated seeds. Journal
of Infectious Diseases, 175(4), 876-882.
26. Barton Behravesh, C., Mody, R. K., Jungk, J., Gaul, L., Redd, J. T., Chen, S., ...
& Williams, I. T. (2011). 2008 outbreak of Salmonella Saintpaul infections
associated with raw produce. New England Journal of Medicine, 364(10),
918-927.
27. Ramaswamy, V., Cresence, V. M., Rejitha, J. S., Lekshmi, M. U., Dharsana, K.
S., Prasad, S. P., & Vijila, H. M. (2007). Listeria-review of epidemiology and
pathogenesis. Journal of Microbiology Immunology and Infection, 40(1), 4.
28. Centers for Disease Control and Prevention (CDC. (2013). Vital signs: Listeria
illnesses, deaths, and outbreaks--United States, 2009-2011. MMWR. Morbidity
and mortality weekly report, 62(22), 448.
29. Scallan, E., Hoekstra, R. M., Angulo, F. J., Tauxe, R. V., Widdowson, M. A.,
Roy, S. L., ... & Griffin, P. M. (2011). Foodborne illness acquired in the United
States—major pathogens. Emerg Infect Dis, 17(1).
30. Juneja, V. K., Marks, H., Huang, L., & Thippareddi, H. (2011). Predictive
model for growth of Clostridium perfringens during cooling of cooked
uncured meat and poultry. Food microbiology, 28(4), 791-795.
36
31. Grass, J. E., Gould, L. H., & Mahon, B. E. (2013). Epidemiology of foodborne
disease outbreaks caused by Clostridium perfringens, United States,
1998–2010. Foodborne pathogens and disease, 10(2), 131-136.
32. Le Loir, Y., Baron, F., & Gautier, M. (2003). Staphylococcus aureus and food
poisoning. Genet Mol Res, 2(1), 63-76.
33. Genigeorgis, C. A. (1989). Present state of knowledge on staphylococcal
intoxication. International Journal of Food Microbiology, 9(4), 327-360.
34. Bennett, S. D., Walsh, K. A., & Gould, L. H. (2013). Foodborne disease
outbreaks caused by Bacillus cereus, Clostridium perfringens, and
Staphylococcus aureus—United States, 1998–2008. Clinical infectious
diseases, 57(3), 425-433.
35. Painter, J. A., Hoekstra, R. M., Ayers, T., Tauxe, R. V., Braden, C. R., Angulo,
F. J., & Griffin, P. M. (2013). Attribution of foodborne illnesses,
hospitalizations, and deaths to food commodities by using outbreak data,
United States, 1998–2008. Emerging infectious diseases, 19(3), 407.
36. Kozak-Muiznieks, N. A., Lucas, C. E., Brown, E., Pondo, T., Taylor, T. H.,
Frace, M., ... & Winchell, J. M. (2014). Prevalence of sequence types among
clinical and environmental isolates of Legionella pneumophila serogroup 1 in
the United States from 1982 to 2012. Journal of clinical microbiology, 52(1),
201-211.
37. Mead, P. S., Slutsker, L., Dietz, V., McCaig, L. F., Bresee, J. S., Shapiro, C., ...
& Tauxe, R. V. (1999). Food-related illness and death in the United
States.Emerging infectious diseases, 5(5), 607.
38. Scallan, E., Hoekstra, R. M., Angulo, F. J., Tauxe, R. V., Widdowson, M. A.,
Roy, S. L., ... & Griffin, P. M. (2011). Foodborne illness acquired in the United
States—major pathogens. Emerg Infect Dis, 17(1).
39. Fatica, M. K., & Schneider, K. R. (2011). Salmonella and produce: Survival in
the plant environment and implications in food safety. Virulence, 2(6),
573-579.
40. Centers for Disease Control and Prevention (CDC. (2013). Vital signs: Listeria
illnesses, deaths, and outbreaks--United States, 2009-2011. MMWR. Morbidity
and mortality weekly report, 62(22), 448.
41. Odonkor, S. T., & Ampofo, J. K. (2013). Escherichia coli as an indicator of
bacteriological quality of water: an overview. Microbiology Research, 4(1), e2.

37
42. Valentin-Bon, I., Jacobson, A., Monday, S. R., & Feng, P. C. (2008).
Microbiological quality of bagged cut spinach and lettuce mixes. Applied and
environmental microbiology, 74(4), 1240-1242.
43. Bohaychuk, V. M., Bradbury, R. W., Dimock, R., Fehr, M., Gensler, G. E.,
King, R. K., ... & Barrios, P. R. (2009). A microbiological survey of selected
Alberta-grown fresh produce from farmers' markets in Alberta, Canada.
Journal of Food Protection®, 72(2), 415-420.
44. Cárdenas, C., Molina, K., Heredia, N., & García, S. (2013). Evaluation of
Microbial Contamination of Tomatoes and Peppers at Retail Markets in
Monterrey, Mexico. Journal of Food Protection®, 76(8), 1475-1479.
45. 王燕梅, 乔昕, 袁宝君, 戴月, 符晓梅, & 沈赟. (2010). 2006-2009 年江苏
省食品中食源性致病菌的监测分析. 中国食品卫生杂志, (5), 431-434.
46. Abadias, M., Usall, J., Anguera, M., Solsona, C., & Viñas, I. (2008).
Microbiological quality of fresh, minimally-processed fruit and vegetables,
and sprouts from retail establishments. International Journal of Food
Microbiology,123(1), 121-129.
47. Solberg, M., Buckalew, J. J., Chen, C. M., Schaffner, D. W., O'Neill, K.,
McDowell, J., ... & Boderck, M. (1990). Microbiological safety assurance
system for foodservice facilities. Food Technology, 44(12), 68-70.
48. Buchalew, J. J., Schaffner, D. W., & Solberg, M. (1996). Surface sanitation
and microbiological food quality of a university foodservice
operation.Foodservice Research International, 9(1), 25-39.
49. Montville, R., & Schaffner, D. W. (2004). Statistical distributions describing
microbial quality of surfaces and foods in food service operations. Journal of
Food Protection®, 67(1), 162-167.
50. Curiale, M. (2004). MPN calculator (VB6 version) for food, feed, and water
microbiologist.
51. Seow, J., Ágoston, R., Phua, L., & Yuk, H. G. (2012). Microbiological quality
of fresh vegetables and fruits sold in Singapore. Food Control, 25(1), 39-44.
52. Althaus, D., Hofer, E., Corti, S., Julmi, A., & Stephan, R. (2012).
Bacteriological survey of ready-to-eat lettuce, fresh-cut fruit, and sprouts
collected from the Swiss market. Journal of Food Protection®, 75(7),
1338-1341.

38
53. Rossman, R., Giraud, D., & Albrecht, J. A. (2012). Misting Effects of the
Microbial Quality of Retail Leaf Lettuce. RURALS: Review of Undergraduate
Research in Agricultural and Life Sciences, 7(1), 1.
54. Blesa, J., Soriano, J. M., Molto, J. C., & Manes, J. (2004). Limited survey for
the presence of aflatoxins in foods from local markets and supermarkets in
Valencia, Spain. Food additives and contaminants, 21(2), 165-171.
55. Koseki, S., Mizuno, Y., Kawasaki, S., & Yamamoto, K. (2011). A survey of
iceberg lettuce for the presence of Salmonella, Escherichia coli O157: H7, and
Listeria monocytogenes in Japan. Journal of Food Protection®, 74(9),
1543-1546.
56. Maffei, D. F., Silveira, N. F. D. A., & Catanozi, M. D. P. L. M. (2013).
Microbiological quality of organic and conventional vegetables sold in
Brazil.Food Control, 29(1), 226-230.
57. Kase, J. A., Borenstein, S., Blodgett, R. J., & Feng, P. C. (2012). Microbial
quality of bagged baby spinach and romaine lettuce: effects of top versus
bottom sampling. Journal of Food Protection®, 75(1), 132-136.
58. Castro-Rosas, J., Gómez-Aldapa, C. A., Acevedo-Sandoval, O. A., González
Ramírez, C. A., Villagomez-Ibarra, J. R., Hernández, N. C., ... & Torres-Vitela,
M. D. (2011). Frequency and behavior of Salmonella and Escherichia coli on
whole and sliced jalapeno and serrano peppers. Journal of Food
Protection®,74(6), 874-881.
59. Cerna-Cortes, J. F., Gómez-Aldapa, C. A., Rangel-Vargas, E., Torres-Vitela,
M., Villarruel-López, A., & Castro-Rosas, J. (2012). Presence of some
indicator bacteria and diarrheagenic E. coli pathotypes on jalapeño and serrano
peppers from popular markets in Pachuca City, Mexico. Food
microbiology,32(2), 444-447.
60. Cardenas-Conejo, Y., Arguello-Astorga, G., Poghosyan, A.,
Hernandez-Gonzalez, J., Lebsky, V., Holguin-Peña, J., ... & Vega-Peña, S.
(2013). First report of Tomato yellow leaf curl virus co-infecting pepper with
Tomato chino La Paz virus in Baja California Sur,
México. Phytoparasitica, 41(3), 271-276.
61. Maffei, D. F., Silveira, N. F. D. A., & Catanozi, M. D. P. L. M. (2013).
Microbiological quality of organic and conventional vegetables sold in
Brazil.Food Control, 29(1), 226-230.

39
62. Soriano, J. M., Rico, H., Moltó, J. C., & Manes, J. (2000). Assessment of the
microbiological quality and wash treatments of lettuce served in University
restaurants. International journal of food microbiology, 58(1), 123-128.
63. Castro-Rosas, J., Cerna-Cortés, J. F., Méndez-Reyes, E., Lopez-Hernandez, D.,
Gómez-Aldapa, C. A., & Estrada-Garcia, T. (2012). Presence of faecal
coliforms,< i> Escherichia coli and diarrheagenic E. coli pathotypes in
ready-to-eat salads, from an area where crops are irrigated with untreated
sewage water. International journal of food microbiology, 156(2), 176-180.
64. Allen, K. J., Kovacevic, J., Cancarevic, A., Wood, J., Xu, J., Gill, B., ... &
Mesak, L. R. (2013). Microbiological survey of imported produce available at
retail across Canada. International journal of food microbiology, 162(2),
135-142.
65. Arthur, L., Jones, S., Fabri, M., & Odumeru, J. (2007). Microbial survey of
selected Ontario-grown fresh fruits and vegetables. Journal of Food
Protection®, 70(12), 2864-2867.
66. Mukherjee, A., Speh, D., Dyck, E., & Diez-Gonzalez, F. (2004). Preharvest
evaluation of coliforms, Escherichia coli, Salmonella, and Escherichia coli
O157: H7 in organic and conventional produce grown by Minnesota
farmers.Journal of Food Protection®, 67(5), 894-900.
67. Johannessen, G. S., Loncarevic, S., & Kruse, H. (2002). Bacteriological
analysis of fresh produce in Norway. International Journal of Food
Microbiology,77(3), 199-204.
68. McMahon, M. A. S., & Wilson, I. G. (2001). The occurrence of enteric
pathogens and Aeromonas species in organic vegetables. International Journal
of Food Microbiology, 70(1), 155-162.
69. Sagoo, S. K., Little, C. L., Ward, L., Gillespie, I. A., & Mitchell, R. T. (2003).
Microbiological study of ready-to-eat salad vegetables from retail
establishments uncovers a national outbreak of salmonellosis. Journal of Food
Protection®, 66(3), 403-409.
70. Johnston, L. M., Jaykus, L. A., Moll, D., Martinez, M. C., Anciso, J., Mora, B.,
& Moe, C. L. (2005). A field study of the microbiological quality of fresh
produce. Journal of Food Protection®, 68(9), 1840-1847.
71. Gurung, M., Moon, D. C., Choi, C. W., Lee, J. H., Bae, Y. C., Kim, J., ... &
Lee, J. C. (2011). Staphylococcus aureus produces membrane-derived vesicles
that induce host cell death. PloS one, 6(11), e27958.

40
72. Santos, M. I., Cavaco, A., Gouveia, J., Novais, M. R., Nogueira, P. J., Pedroso,
L., & Ferreira, M. A. S. S. (2012). Evaluation of minimally processed salads
commercialized in Portugal. Food Control, 23(1), 275-281.
73. Hara-Kudo, Y., Konuma, H., Kamata, Y., Miyahara, M., Takatori, K., Onoue,
Y., ... & Ohnishi, T. (2013). Prevalence of the main food-borne pathogens in
retail food under the national food surveillance system in Japan. Food
Additives & Contaminants: Part A, 30(8), 1450-1458.
74. Aycicek, H., Oguz, U., & Karci, K. (2006). Determination of total aerobic and
indicator bacteria on some raw eaten vegetables from wholesalers in Ankara,
Turkey. International journal of hygiene and environmental health, 209(2),
197-201.
75. Banwart, G. J. (1989). Basic food microbiology (No. Ed. 2). Van Nostrand
Reinhold.