Numerical Simulation of a Convergent Divergent Supersonic Nozzle ...

Conserved and Divergent Patterns of DNA Methylation
in Higher Vertebrates
Ning Jiang12 Lin Wang1 Jing Chen2 Luwen Wang1 Lindsey Leach2 and Zewei Luo121Department of Biostatistics amp Computational Biology SKLG School of Life Sciences Fudan University Shanghai China2School of Biosciences The University of Birmingham Birmingham B15 2TT United Kingdom
Corresponding author E-mail zwluofudaneducn ljleachbhamacuk
Accepted October 20 2014
Abstract
DNA methylation in the genome plays a fundamental role in the regulation of gene expression and is widespread in the genome of
eukaryotic species Forexample inhighervertebrates there is aldquoglobalrdquo methylationpattern involvingcompletemethylationofCpG
sitesgenome-wideexcept inpromoter regions thatare typicallyenriched forCpGdinucleotidesor socalledldquoCpG islandsrdquo Herewe
comprehensively examined and compared the distribution of CpG sites within ten model eukaryotic species and linked the observed
patterns to theroleofDNAmethylation incontrollinggenetranscriptionTheanalysis revealedtwodistinctbutconservedmethylation
patterns for gene promoters in human and mouse genomes involving genes with distinct distributions of promoter CpGs and gene
expression patterns Comparative analysis with four other higher vertebrates revealed that the primary regulatory role of the DNA
methylation system is highly conserved in higher vertebrates
Key words genome-wide CpG site distribution CpG sites within promoters conservation and divergence in DNA
methylation eukaryotes comparative phylogenetic analysis
Introduction
DNA methylation involves the postreplicative addition of a
methyl group to the 5-position of particular cytosines in the
DNA sequence and constitutes an important and widely rec-
ognized epigenetic mark (Holliday and Pugh 1975 Riggs
1975 Day and Sweatt 2010 Parle-McDermott and Harrison
2011 Zhu and Reinberg 2011) It is highly conserved among
eukaryotic species including protists fungi plants and ani-
mals and plays a fundamental role in modulating biological
processes particularly the regulation of transcription (Jaenisch
and Bird 2003 Patra et al 2008 Chen and Riggs 2011 He
et al 2011) Two mechanisms by which DNA methylation
regulates gene expression levels have been identified
(Attwood et al 2002 Fahrner et al 2002 Geiman and
Robertson 2002 Li 2002 Herman and Baylin 2003 Goll
and Bestor 2005) First methylated cytosines can physically
disrupt the binding of RNA polymerases and transcription fac-
tors to the appropriate regions of target genes Second meth-
ylated DNA may be targeted by multiple proteins including
methyl-CpG-binding domain proteins histone deacetylases
and chromatin remodeling proteins to form complex struc-
tures which can inactivate the chromatin and silence gene
transcription
DNA methylation occurs in three sequence contexts Most
frequently it occurs at ldquoCpGrdquo dinucleotides in plants and an-
imals though it also occurs in both ldquoCpHpGrdquo and ldquoCpHpHrdquo
contexts in plants The level and distribution pattern of DNA
methylation can vary dramatically among species Some eu-
karyotic organisms including Saccharomyces cerevisiae (bud-
ding yeast) and Caenorhabditis elegans (nematode worm) do
not encode any DNA methyltransferase family genes and so
their DNA is not methylated (Bird 2002 Suzuki and Bird
2008) Other species have a ldquomosaicrdquo methylation pattern
characterized by moderately high methylation levels in many
DNA sequence domains separated by completely unmethy-
lated domains These species include the fungus Neurospora
crassa plants (eg Arabidopsis corn rice and poplar)
(Montero 1992 Palmer 2003 Chan et al 2005 Gehring
and Henikoff 2007 Henderson and Jacobsen 2007
Zilberman et al 2007) and invertebrates (eg sea squirt
Drosophila) (Gowher et al 2000 Salzberg et al 2004 He
et al 2011) Methylation of these genomes is mainly targeted
to gene bodies or to transposable regions where it represents
a crucial transcriptional silencing mechanism involving small
interfering RNAs (Mette et al 2000 Chan 2004 Suzuki and
Bird 2008) In contrast vertebrate species particularly
GBE
The Author(s) 2014 Published by Oxford University Press on behalf of the Society for Molecular Biology and Evolution
This is an Open Access article distributed under the terms of the Creative Commons Attribution Non-Commercial License (httpcreativecommonsorglicensesby-nc40) which permits
non-commercial re-use distribution and reproduction in any medium provided the original work is properly cited For commercial re-use please contact journalspermissionsoupcom
2998 Genome Biol Evol 2998ndash3014 doi101093gbeevu238 Advance Access publication October 28 2014
at Library of M
edical Center of Fudan U
niversity on Novem
ber 5 2014httpgbeoxfordjournalsorg
Dow
nloaded from
mammals typically exhibit ldquoglobalrdquo DNA methylation pat-
terns (Robertson 2005 Rollins 2006 Chen and Riggs 2011)
where candidate methylation sites across the entire genome
are completely methylated except for those in promoter
regions where the methylation level varies highly among
different tissues cells growth conditions and developmental
stages The methylation status and local density of CpG dinu-
cleotides within promoter regions is associated with the reg-
ulation of gene transcription in vertebrates (Boyes and Bird
1992 Hsieh 1999 Weber 2007) though the same has not
been observed in invertebrates The functional implications of
this relationship have not yet been thoroughly explored on a
genome-wide basis in vertebrates
Here we report a comprehensive investigation of the DNA
methylation system in eukaryotes through examining the fully
sequenced genomes of ten model eukaryotic species includ-
ing six higher vertebrates (amniotes) 1) Homo sapiens
(human) 2) Mus musculus (mouse) 3) Rattus norvegicus
(rat) 4) Bos taurus (cow) 5) Canis familiaris (dog) and 6)
Gallus gallus (chicken) one lower vertebrate (Danio rerio zeb-
rafish) two invertebrates (Drosophila melanogaster [fruitfly]
and C elegans [nematode worm]) and the plant Arabidopsis
thaliana (Arabidopsis) We focused on the distribution and
roles of CpG dinucleotides and discovered patterns that are
highly conserved among the six higher vertebrate species and
can be used to accurately assemble the evolutionary relation-
ships among these species Using extensive data sets of DNA
methylation and gene expression from human and mouse tis-
sues we linked the observed patterns to the regulatory and
(most likely) highly conserved role of DNA methylation in mod-
ulating gene transcription in higher vertebrate genomes
Materials and Methods
Whole-Genome Sequences and Genomic FeatureAnnotation Information
Whole-genome sequence data for each of ten eukaryotic
model organisms were downloaded from the University of
CaliforniandashSanta Cruz (UCSC) genome bioinformatics data-
base (httphgdownloadcseucscedudownloadshtml last
accessed November 1 2014) and the Arabidopsis Information
Resource (httpwwwarabidopsisorgdownloadindexjsp
last accessed November 1 2014) and the corresponding ge-
nomic annotation was obtained from the genome annotation
database of the UCSC Genome Browser (httpgenome-ar-
chivecseucscedudownloads last accessed November 1
2014) the ExonndashIntron Database (httpbpgutoledoedu
~afedorovlabeidhtml last accessed November 1 2014) and
the Mammalian Promoter Database (httpmpromdbwistar
upennedu last accessed November 1 2014) The direct links
to different types of data sets for each of ten eukaryotic model
organisms used in our analysis were listed in supplementary
table S1 Supplementary Material online
Analysis of CpG Dinucleotide Distribution in Promoters
A FORTRAN program was developed to parse the sequence
data and identify the locations of CpG dinucleotides and the
fraction of GC content for various genomic features The
Poisson distribution was used to test whether the distribution
of CpG dinucleotides in promoter regions follows a random
pattern The mean of the distribution = 51 was equal to the
average number of CpG sites per 1000 bases in promoters of
the human genome Hence we calculated the expected
probability of promoters with the number of CpG sites in a
1000-bp region k falling within a number of ranges includ-
ing ldquo0ndash25rdquo ldquo26ndash40rdquo ldquo41ndash50rdquo ldquo51ndash60rdquo ldquo61ndash75rdquo and
ldquogt75rdquo Here we could estimate the expected probability of
promoters with 0ndash25 CpG sites in 1000 bp length as
Prethk frac14 0 25 frac14 51THORN frac14X25
kfrac140
k
ke
frac14X25
kfrac140
51k
ke51
frac14 000004
eth1THORN
where e was the base of the natural logarithm (e = 2718) k
was the number of occurrences of CpGs in 1000-bp se-
quence and was the average number of CpGs in
1000 bp In the same way we also calculated the expected
Poisson probabilities of promoters with 26ndash40 41ndash50 51ndash60
61ndash75 and gt75 CpG sites in 1000 bp length We then
identified the observed proportions of promoters with 0ndash25
26ndash40 41ndash50 51ndash60 61ndash75 andgt75 CpG sites in 1000 bp
length Variation in the length of individual promoters was
accounted for by normalizing for a fixed 1000 bp length
Note that the criterion for grouping the promoters was
entirely for convenience of statistical analysis and did not
affect the conclusions drawn from the analysis The
Pearsonrsquos chi-square test was implemented to test for the
goodness of fit between observed and expected frequency
distributions with degrees of freedom equal to 4
Pearson0s 2 frac14X6
ifrac141
ethOi EiTHORN2=Ei eth2THORN
where Oi is the observed proportion of promoters in the ith
category and Ei is the expected proportion of promoters in the
ith category
Identification of High and Low CpG Density Promoters
The ratio of observedexpected (OE) CpGs in the pro-
moter region of each annotated gene was calculated as
follows
ratio of Obs=Exp frac14number of CpG
number of C number of GN
eth3THORN
DNA Methylation Conservation and Divergence GBE
Genome Biol Evol 2998ndash3014 doi101093gbeevu238 Advance Access publication October 28 2014 2999
at Library of M
edical Center of Fudan U
niversity on Novem
ber 5 2014httpgbeoxfordjournalsorg
Dow
nloaded from
where N is the length of the promoter (Karlin and Mrazek 1997)
Two classes of promoter were defined according to Saxonov
et al (2006) and Weber (2007) as follows First high CpG
density promoters (HCP) with CpG OE ratio gt65 and GC
fraction gt55 second low CpG density promoters (LCP)
with CpG OE ratiolt65 and GC fractionlt45 the remain-
ing promoters were classified as intermediate CpG density
Promoters (ICP)
Identification of Homologous Genes and InterspeciesConservation Analysis
The homologous genes across six higher vertebrate species
were downloaded from the National Center for
Biotechnology Information (NCBI)-HomoloGene Database (re-
lease 65 ftpftpncbinihgovpubHomoloGenebuild65
homologenedata) which is built upon both DNA sequence
and protein sequence data for homologous gene families
as described at httpwwwncbinlmnihgovhomologene
build-procedure (last accessed November 1 2014) Among
the genes homologous between two vertebrate species we
inferred a conserved status where the promoters of both
genes were classified into the same group (HCP or LCP) By
analyzing all annotated protein-coding genes from the NCBI-
HomoloGene Database we could identify the conservation
level of the promoter status of homologous genes among
six higher vertebrates over evolutionary time Furthermore
for each pair of homologous genes between two vertebrates
with conserved promoter status we measured their evolution-
ary conservation at the sequence level We used two substi-
tution rate statistics to estimate and compare the evolutionary
maintenance of homologous genes with either HCP or LCP
conserved status 1) The ratio of nonsynonymous to synony-
mous substitution rate for sequences in protein-coding re-
gions (KaKs) and 2) the rate of nucleotide substitution for
sequences in promoter regions Kimura80 model (K80)
(Kimura 1980) The nonsynonymous (Ka) and synonymous
(Ks) substitution rates for each pair of homologous genes
were calculated using the ldquocodemlrdquo maximum-likelihood
method in PAML4 (Yang 2007) K80 was calculated using
the ldquoKimura80rdquo nucleotide substitution model (Kimura
1980) Only genes with a unique promoter were used in this
analysis
Reconstruction and Comparison of PhylogeneticRelationships among Six Higher Vertebrates
The information of phylogenetic relationships and times of
divergence among six higher vertebrates was obtained from
published data (Hedges 2002) which used both genome-
wide DNA and protein sequences to estimate the phyloge-
netic tree that minimizes the number of sequence changes
As described in the above section we inferred the level of
conserved status (LCP or HCP) of the promoters of homolo-
gous genes between each pair of six higher vertebrates We
directly used these conservation levels as the measurement of
divergence distance to build the distance matrix for all six
higher vertebrates Then we input this distance matrix to
Minitab software and used the cluster analysis module ldquoclus-
ter variablesrdquo to calculate the similarity () among six higher
vertebrates and to reconstruct the phylogenetic tree Default
parameter values were used (average linkage method and
correlation distance measure) For comparison a phylogenetic
tree was reconstructed in the same way based on the times of
divergence among six higher vertebrates calculated according
to Hedges (2002)
DNA Methylation and Gene Expression Data Sets
The genome-wide DNA methylation patterns for 28 different
human tissues (or cell lines) were assayed using the Infinium
HumanMethylation27 DNA analysis BeadChip platform The
raw data from the BeadChip assay were downloaded from the
NCBI Gene Expression Omnibus (GEO) database under acces-
sion numbers GSE17769 GSE20872 GSE24087 GSE28356
and GSE26133 (httpwwwncbinlmnihgovgeo last
accessed November 1 2014) The data consisted of 27578
probe units representing 27578 CpG sites across the pro-
moter regions of gt14000 genes The quantitative estimate
of methylation level () for each specific CpG site was calcu-
lated from the signals of the methylated bead (M) and the
unmethylated bead (U) as follows
Methylation level ethTHORN frac14M
M thorn U thorn 100 eth4THORN
This was implemented by the methylation module in the
Illumina Genome BeadStudio Software The methylation levels
ranged from 0 (completely unmethylated) to 1 (completely
methylated)
Gene expression raw data were obtained from 107 differ-
ent human tissues (or cell lines) from the NCBI GEO database
under accession numbers GSE7127 GSE17768 GSE24089
and GSE11582 The data were generated using the
Affymetrix U133 human expression microarray GeneChip
containing over 45000 probe sets representing approximately
33000 well-annotated human genes We analyzed the raw
signal intensities of probe sets using the standard Affymetrix
strategy MAS50 and normalization by the global median scal-
ing method
The 17 different mouse tissues whose methylation data
and expression data were analyzed here came from the
C57Bl6 strain which has been widely used for genetic re-
search The whole-genome DNA methylation data for 17
mouse tissues were obtained using whole-genome bisulfite
sequencing (bisulfite-seq) using the Illumina Hiseq2000 plat-
form The raw data were accessed under accession number
GSE42836 from the NCBI GEO database (httpwwwncbi
nlmnihgovgeo last accessed November 1 2014) The raw
Jiang et al GBE
3000 Genome Biol Evol 2998ndash3014 doi101093gbeevu238 Advance Access publication October 28 2014
at Library of M
edical Center of Fudan U
niversity on Novem
ber 5 2014httpgbeoxfordjournalsorg
Dow
nloaded from
short-read data were preprocessed and mapped with Bowtie
to the computationally bisulfite-converted mm9 genome as
described previously (Hon et al 2013) Methylation level of the
cytosine in each CpG site was estimated as the ratio of meth-
ylated read-coverage to total read-coverage across the CpG
site Based on bisulfite-seq data we could identify methylation
levels at over 16000000 CpG sites across the whole mouse
genome Here we only focused on the DNA methylation
levels in annotated promoter regions of the mouse genome
The genome-wide gene expression of the corresponding 17
mouse tissues was profiled using the Affymetrix mouse
genome 430 20 GeneChip consisting of 45037 probe sets
for 21078 genes The raw data for mouse gene expression
were downloaded from the NCBI GEO database and the ac-
cession number for the gene expression data of each mouse
tissue was summarized in supplementary table S2
Supplementary Material online The mouse gene expression
data were processed in exactly the same way as described for
the human gene expression data
GO Annotation Data Sets and OverrepresentationAnalysis
Gene ontology annotation (GO terms) for each of the six
higher vertebrates was downloaded from the Gene
Ontology database (httpwwwgeneontologyorgGOdown
loadsannotationsshtml last accessed November 1 2014)
To identify GO terms overrepresented either in HCP or in
LCP groups the binomial test was employed for each GO
term by comparing the number of ORFs in each of the
groups associated with a given GO term with the number
of genome-wide ORFs associated with the given GO term
For each GO term a Z statistic was computed as follows
Z frac14ethFd FGTHORNffiffiffiffiffiffiffiffiffiffiffiffiffiffi
FGeth1FGTHORN
Nd
q eth5THORN
where Fd is the fraction of HCP (or LCP) promoter genes
annotated with the given GO term FG is the fraction of all
annotated genes with the given term and Nd is the total
number of genes with HCP (or LCP) A GO term was
determined to be significantly overrepresented in a particular
group when Zgt475 (Plt 106 after Bonferroni correction)
The analyses were performed with custom programs
scripts in either Fortran-90 or R languages and are available
upon request from the corresponding author
Results
Genome-Wide Distribution of CpG Sites and GC Content
We first explored the full genome sequences of the ten model
eukaryotic species and compared the distribution of the GC
content and of CpG dinucleotides across the whole genome
and in different genome features (table 1) Among the six
higher vertebrate species the whole genomes and intron re-
gions had the lowest GC content fraction (~3795ndash4246)
followed by the exon regions (~4888ndash5157) The
promoter regions had distinctly higher GC content (~5221ndash
5729) agreeing with the observation that conserved
functional sequences have higher GC content compared
with the entire genome or intronic regions of the human
genome (Pozzoli et al 2008) The pattern observed for the
lower vertebrate (zebrafish) invertebrates and the plant was
clearly different Although the exon regions had higher GC
content compared with the entire genome or introns the
promoter regions did not show enriched GC content but in-
stead showed a similar GC content to the entire genome or
introns
Next we calculated the expected proportions of CpG sites
based on the random union of C and G nucleotides and com-
pared the expectations with the observed proportions We
found that CpG dinucleotides were consistently and signifi-
cantly enriched (observed gt expected) in promoter regions in
the six higher vertebrate genomes (P = 0013 MannndashWhitney
U test) (fig 1 and table 1) consistent with the higher level of
promoter GC content in these species Meanwhile the
genome-wide CpG content was significantly lower than that
expected in the higher vertebrate genomes (Plt 0005
MannndashWhitney U test) However the lower vertebrate inver-
tebrate and plant species showed a different pattern in
which the observed proportion of CpGs consistently but not
Table 1
GC Content and Distribution of CpG Sites in Vertebrate Invertebrate and Plant Genome Features
Higher Vertebrates (Mammals Birds)a Lower Vertebrate Invertebrates and Plantb
GC Expected CpG c Observed CpG GC Expected CpG c Observed CpG
Genome-wide 3795ndash4239 361ndash449 095ndash208 3544ndash4124 314ndash425 348ndash811
Intron 4037ndash4246 407ndash450 175ndash221 3214ndash3991 258ndash398 265ndash735
Exon 4888ndash5157 597ndash665 535ndash678 4242ndash5000 450ndash625 589ndash1169
Transcripts 4847ndash5172 587ndash669 494ndash682 4259ndash5010 454ndash627 593ndash1171
Promoter 5221ndash5729 681ndash821 766ndash1198 3242ndash4155 263ndash432 419ndash908
aRange among six mammalian higher vertebrate species (human mouse rat cow dog and chicken)bRange among four lower vertebrate invertebrate or plant species (zebrafish Drosophila Arabidopsis Caenorhabditis elegans)cExpected CpG percentage calculated based on the observed GC percentage
DNA Methylation Conservation and Divergence GBE
Genome Biol Evol 2998ndash3014 doi101093gbeevu238 Advance Access publication October 28 2014 3001
at Library of M
edical Center of Fudan U
niversity on Novem
ber 5 2014httpgbeoxfordjournalsorg
Dow
nloaded from
significantly exceeded the expected in both the promoter re-
gions and the entire genome (P = 0061 MannndashWhitney U
test) (fig 1)
Distributional Divergence of CpG Sites in PromoterRegions across Species
To test whether the CpG sites were randomly distributed in
the promoter regions we examined the distribution of the
number of CpGs occurring per 1000 bp of promoter se-
quence and grouped the promoters into six categories accord-
ing to the number of CpG sites (0ndash25 26ndash40 41ndash50 51ndash60
61ndash75 and gt75) We modeled the occurrence of CpGs as
independent random events that follow a Poisson distribution
with parameter (ie the mean of the distribution) in a fixed
promoter length (here 1000 bp) Pearsonrsquos chi-square test
was employed to test for significance of concordance be-
tween the observed CpGs and the expected CpGs under
the Poisson model For example the average number of
CpG sites per 1000 bases in promoters of the human
genome was equal to 51 Thus we calculated the observed
proportion of promoters and expected Poisson probability of
promoters in each of six categories for the human genome
(table 2) Overall the analysis showed that P values of the test
were less than 1015 across all six higher vertebrates The
highly significant deviation of CpG sites in the promoters
from the Poisson expectation strongly supports their
nonrandom distribution In sharp contrast CpG sites in the
promoters of the four lower vertebrate invertebrate and
plant species perfectly follow the Poisson distribution and scat-
ter randomly over the promoters (Pgt 005)
To further characterize the nonrandom distribution of
CpGs in higher vertebrate promoters we looked at the occur-
rence of ldquoCpG islandsrdquo which are recognized as small dis-
persed regions of DNA sequence that contain highly dense
clusters of CpG dinucleotides relative to the whole genome
The widely accepted definition of a CpG island is a genomic
region at least 200 bp in length with GC content fraction
gt50 and an observedexpected CpG percentage ratio of
gt60 (Gardiner-Gardner and Frommer 1987) Among the
34257 annotated promoters of the human genome we
found 21890 (639) promoters containing CpG islands
whereas the other 12367 (361) have only few CpG dinu-
cleotides For the other five higher vertebrate species CpG
islands were detected in over half of their annotated pro-
moters The density of CpG sites in the promoters of all six
higher vertebrates showed a bimodal distribution (fig 2)
which was reported previously only in the human genome
(Saxonov et al 2006 Glass 2007) In contrast no CpG islands
were found in the four lower vertebrate invertebrate or plant
genomes and a unimodal distribution of CpG sites was
FIG 1mdashObserved and expected proportions of CpGs across the entire genome or in gene promoters of ten model species
Jiang et al GBE
3002 Genome Biol Evol 2998ndash3014 doi101093gbeevu238 Advance Access publication October 28 2014
at Library of M
edical Center of Fudan U
niversity on Novem
ber 5 2014httpgbeoxfordjournalsorg
Dow
nloaded from
observed (fig 2) This difference cannot be attributed to the
difference in the GC content distribution between the
two groups because the distribution does not clearly
differ between the two groups (supplementary fig S1
Supplementary Material online) We proceeded to explore
the functional roles of DNA methylation in regulating gene
expression and attempted to explain the bimodal distribution
pattern of CpGs in the promoters of higher vertebrates
We classified gene promoters of the higher vertebrate spe-
cies into two main groups as previously defined for all human
genes according to the GC fraction and observed to expected
ratio of CpG sites (OE) as in Weber (2007) First is the HCP
with GC fraction 55 and CpG OE 65 second is the
LCP with GC fraction lt45 and CpG OE lt65 The re-
maining genes were not assigned into either HCP or LCP
group and were grouped as the ICP as in previous work
(Saxonov et al 2006 Weber 2007) For each of the six
higher vertebrates promoters were classified as HCP (~50
of promoters) LCP (~25) or ICP (~25) We investigated
the extent to which the annotated CpG islands overlapped
with each of the three types of promoter in the six higher
vertebrate genomes using the CpG islands data set down-
loaded from the UCSC annotation database A promoter
was recognized to contain a CpG island if the CpG island
covered more than 25 of the promoter region Between
50 and 63 of all promoters in the higher vertebrate ge-
nomes contain CpG islands as shown in supplementary table
S3 Supplementary Material online CpG islands are signifi-
cantly overrepresented in the HCP (Plt0005 Mannndash
Whitney U test) over 80 of which contained CpG islands
In contrast CpG islands are significantly underrepresented in
the LCP (Plt0004 MannndashWhitney U test) and there are only
a few (lt6) LCP containing CpG islands Additionally the
distribution of CpG islands in ICP does not differ from the
distribution of CpG islands in all promoters (P = 0471
MannndashWhitney U test) In the following analyses we focused
on the two most divergent classes (HCP and LCP)
A striking difference was apparent between HCP and LCP
both for the GC content fraction and the occurrence of CpG
sites in relation to the transcription start site (TSS) (fig 3 and
supplementary fig S3 Supplementary Material online) For
the HCP in the higher vertebrates both the proportion of
CpG sites and the GC content fraction peaked consistently
in the vicinity of the TSS and declined with increasing distance
from the TSS On the other hand the proportions of CpG sites
in LCP were approximately zero despite a mild peak for the
GC content fraction occurring immediately downstream of
the TSS These results indicate a high level of conservation
of CpG site distribution among higher vertebrate species sug-
gestive of an important biological function For zebrafish the
patterns of GC content fraction and CpG site density at all
promoters were similar to those of the HCP of the higher
vertebrates The pattern was noticeably different for the in-
vertebrate species with the GC content fraction and CpG
density exhibiting a sharp peak immediately downstream of
the TSS but either a flat curve (Arabidopsis and C elegans) or
surprisingly a valley (D melanogaster) upstream of the TSS
(fig 3)
Evolutionary Conservation of Promoter HCP or LCPStatus in Higher Vertebrates
To further explore the level of conservation of promoter status
in the six higher vertebrates we grouped homologous genes
between each pair of the six higher vertebrate species into a
conserved pair if the genes were classified into the same cat-
egory of either HCP or LCP (table 3) The number of genes in
each category for each of the six higher vertebrate species is
given on the diagonal whereas the off-diagonal elements
show the proportion of conserved homologous genes be-
tween the corresponding species pair For example 937
of genes with HCP in human also had HCP in mouse whereas
976 of genes with HCP in mouse also had HCP in human It
can be seen from table 3 that the HCP or LCP status of pro-
moters is highly conserved among homologous genes in
mammals Between 779 and 976 of homologous
genes among the five mammals are conserved in either HCP
or LCP categories A similar level of conservation is observed
between the five mammals and the bird (chicken) for genes
with HCP Although the level of conservation is reduced to a
range of 33ndash56 between the mammals and chicken for
genes with LCP it is still significantly higher than the
Table 2
Observed Proportion and Expected Poisson Probability of Promoters Classified into Each of the Six CpG Density Categories in the Human Genome
Number of CpG Sites per 1000 Bases of Promoter Sequence Total
0ndash25 26ndash40 41ndash50 51ndash60 61ndash75 gt75
Observed number of promoters 10028 3306 2205 2674 4888 11056 34157
Observed proportion of promoters ()a 2936 968 646 783 1441 3237 100
Expected number of promoters 5 2272 14155 14493 3187 38 34157
Expected proportion of promoters () 001 665 4144 4243 933 011 100
Pearsonrsquos chi-square statistic 86142 001 030 028 003 9461 95665
aExpected proportion is calculated based on a Poisson distribution with mean parameter equal to 51
DNA Methylation Conservation and Divergence GBE
Genome Biol Evol 2998ndash3014 doi101093gbeevu238 Advance Access publication October 28 2014 3003
at Library of M
edical Center of Fudan U
niversity on Novem
ber 5 2014httpgbeoxfordjournalsorg
Dow
nloaded from
FIG 2mdashProportion of CpG sites in gene promoters across ten model species The horizontal axis represents the proportion of CpG sites in gene
promoters whereas the vertical axis represents the number of promoters for each model species Color is used to distinguish HCP (black) LCP (green) and
ICP (red)
Jiang et al GBE
3004 Genome Biol Evol 2998ndash3014 doi101093gbeevu238 Advance Access publication October 28 2014
at Library of M
edical Center of Fudan U
niversity on Novem
ber 5 2014httpgbeoxfordjournalsorg
Dow
nloaded from
FIG 3mdashDistribution of CpGs with respect to the TSS The horizontal axis represents the distance from the TSS whereas the vertical axis represents the
CpG fraction
DNA Methylation Conservation and Divergence GBE
Genome Biol Evol 2998ndash3014 doi101093gbeevu238 Advance Access publication October 28 2014 3005
at Library of M
edical Center of Fudan U
niversity on Novem
ber 5 2014httpgbeoxfordjournalsorg
Dow
nloaded from
conservation of LCP status in the promoters of
nonhomologous (randomly paired) genes (P = 0022 Mannndash
Whitney U test)
To compare the conservation level of HCP or LCP status of
the promoter among homologous genes between any pair of
the six higher vertebrates we explored the difference be-
tween the corresponding rates of conservation We found
that HCP were considerably more conserved between species
compared with LCP (P = 0006 MannndashWhitney U test)
(table 3) Thus HCP have been more conserved over evolu-
tionary time than LCP among six higher vertebrates We next
investigated whether the differential conservation of HCP
versus LCP status was associated with differential conservation
at the sequence level Table 4 summarized two substitution
rate statistics to compare the sequence level evolution of ho-
mologous genes with either HCP or LCP conserved status K80
is the rate of nucleotide substitution in promoter regions
under the Kimura 80 of promoter sequence evolution
whereas KaKs is the ratio of nonsynonymous and synony-
mous substitution rate which measures protein evolution
and is a possible indicator of selection pressure The results
clearly showed that both K80 and KaKs values varied signif-
icantly between HCP and LCP conserved homologous gene
groups (Plt 0001 in all cases studentrsquos t-test) Both of these
measurements suggested that homologous genes with con-
served HCP status were more highly conserved at the se-
quence level than those with LCP status
Divergence in the conservation level of promoter status
reflected evolutionary divergence between the species We
therefore reconstructed the phylogeny among these species
using the conservation level of promoter status and compared
it with the phylogeny constructed from DNAprotein sequence
data of each species (Hedges 2002) Figure 4 shows that the
two phylogenetic trees are remarkably similar The main dis-
crepancy between the two trees occurs at the point where the
dog links into the phylogenies In our tree based on promoter
status conservation level the dog species diverged prior to all
of the other mammals (fig 4B) whereas in the tree based on
DNA and protein sequence data (fig 4A) the dog and cow
diverged from the other three mammals around 92 Ma
before the two separated around 83 Ma (Hedges 2002)
This discrepancy can most likely be attributed to the poor
quality of sequence annotation for the dog genome In fact
promoters have been identified for only 11 (148113410)
of all dog genes
Distinct Methylation Patterns between HCP and LCP
We analyzed genome-wide DNA methylation profiles from 28
different human tissues (or cell lines) which were assayed by
the Illumina Human Methylation27 BeadChip platform
(Bonazzi et al 2011 Chari et al 2011 Loudin et al 2011)
This BeadChip assessed 27578 CpG sites located within the
promoter regions of 14475 genes Multiple sites (on average
two CpGs) were interrogated per promoter region We con-
firmed that CpG sites have much lower methylation levels in
promoter regions when compared with the genome-wide av-
erage as previously shown (Lister et al 2009) Figure 5A
shows a slightly bimodal distribution The majority (727)
of CpG sites in all promoter regions across 28 tissues were
unmethylated (methylation level 01) whereas 185 were
semimethylated (methylation level between 01 and 07) and
88 were considered methylated (methylation level 07)
according to the criteria established in Bell et al (2011) The
distribution of methylation levels showed two distinct patterns
for HCP compared with LCP (fig 5B) The HCP showed a
unimodal distribution with 771 unmethylated 166
semimethylated and 63 methylated CpG sites whereas
the CpG sites in LCP tended to be more highly methylated
with corresponding proportions of 258 379 and
363 Both HCP and LCP showed a similar distribution of
methylation levels with respect to distance from the TSS (fig
5C) The lowest methylation levels are found in the vicinity of
the TSS whereas the methylation level increases with increas-
ing distance from the TSS However CpG sites in the LCP
showed consistently higher methylation levels than those in
the HCP throughout the promoter region Within an individual
promoter the methylation levels of adjacent CpG pairs were
positively correlated and the correlation tends to be weak-
ened when the CpG pairs are distantly separated (fig 5D)
Moreover the CpG pairs within LCP exhibited a higher
Table 3
Conservation of Two Classes of Promoter in Higher Vertebrates
Proportion of Conserved HCP () Proportion of Conserved LCP ()
Human Mouse Rat Cow Dog Chicken Human Mouse Rat Cow Dog Chicken
Human 7139 976 974 969 888 857 2895 867 873 795 898 421
Mouse 937 8097 967 937 858 847 851 4365 899 832 874 482
Rat 919 926 5634 904 834 897 850 946 2596 869 779 563
Cow 936 941 952 1536 845 843 906 960 793 577 889 548
Dog 822 805 849 863 435 806 811 906 872 971 187 400
Chicken 896 870 897 844 825 913 473 536 516 537 333 251
NOTEmdashThe diagonal cells show the number of genes with HCP or LCP in each species The upper and lower triangles show the percentage of genes in the columnspecies also given the same classification for the row species
Jiang et al GBE
3006 Genome Biol Evol 2998ndash3014 doi101093gbeevu238 Advance Access publication October 28 2014
at Library of M
edical Center of Fudan U
niversity on Novem
ber 5 2014httpgbeoxfordjournalsorg
Dow
nloaded from
correlation in methylation levels compared with HCP across all
distances
The corresponding results based on the mouse promoter
methylation information were obtained from bisulfite-seq
data and are summarized in supplementary figure S3AndashD
Supplementary Material online Bisulfite-seq can more pre-
cisely detect the methylation level of CpG sites than the
Methylation BeadChip platform based on hybridization tech-
nology Moreover the bisulfite-seq data could simultaneously
measure the methylation level for over 1 million CpG sites in
mouse promoter regions whereas the Human Methylation
BeadChip can detect the methylation level for only approxi-
mately 27000 CpG sites in human promoter regions Despite
these differences the results from mouse bisulfite-seq data
were similar to those obtained from the human Methylation
BeadChip data The overall methylation pattern of CpG sites in
promoters also showed a bimodal distribution (supplementary
fig S3A Supplementary Material online) Furthermore the
CpG sites in LCP exhibited higher methylation levels than
the CpG sites in HCP (supplementary fig S3B
Supplementary Material online) The methylation pattern
with respect to distance from the TSS (supplementary fig
S3C Supplementary Material online) and distance between
adjacent CpG pairs (supplementary fig S3D Supplementary
Material online) in mouse HCP and LCP was consistent with
the pattern identified in human promoters (fig 5) Overall the
distinct methylation patterns between HCP and LCP genes are
consistent between the two species indicating a remarkable
level of conservation between HCP and LCP over evolutionary
time
Distinct Expression Patterns between HCP and LCP across107 Human Tissues and 17 Mouse Tissues
We next investigated the relationship between promoter DNA
methylation and gene expression levels in human and mouse
tissues The human promoter methylation data were collected
from the 28 tissues as analyzed above and gene expression
was measured across 107 human tissues (including the same
28 tissues) using Affymetrix U133 human expression
microarrays (Johansson et al 2007 Bell et al 2011 Chari
et al 2011) The mouse promoter methylation and gene ex-
pression data were measured across a set of 17 tissues of
C57Bl6 mice using whole-genome bisulfite-seq on the
Illumina Hiseq2000 platform and the Affymetrix mouse
genome 430 20 GeneChip respectively First we observed
a clear negative correlation (from 005 to 018) between
the gene expression level and methylation level of each pro-
filed CpG site across the 28 human tissues (fig 5E) This cor-
relation was confined to CpGs located in the core and
proximal promoter regions (0ndash250 bp upstream of the TSS)
with the average correlation coefficient equal to 010 and
012 in HCP and LCP respectively For the CpG sites located
further upstream (gt250 bp) from the TSS the strength of
correlation decreased and no obvious relationship with gene
expression level was apparent No differences in the correla-
tion were observed between LCP and HCP The corresponding
results based on the mouse data were shown in supplemen-
tary figure S3E Supplementary Material online There is a sim-
ilar negative correlation pattern between gene expression
level and methylation level of CpG sites located in the core
and proximal promoter regions with the average correlation
coefficient equal to 004 and 016 in HCP and LCP re-
spectively Therefore methylation of CpG sites in the core and
proximal promoter regions must play a crucial role in regulat-
ing gene expression levels in both human and mouse
Next we compared the number of tissues from which each
gene was detectably expressed from a total of 107 human
tissues (fig 5F) The difference between LCP and HCP genes
was striking Genes with LCP tended to be expressed in only a
small number of tissues compared with genes with HCP More
than 35 of genes with LCP were expressed in no more than
eight tissues whereas only less than 5 were expressed in
99ndash107 tissues On the other hand genes with HCP showed a
reasonably uniform distribution (from 0 to 107) for the
number of tissues in which they were expressed and approx-
imately 15 of genes were expressed in 99ndash107 tissues The
corresponding gene expression results from 17 mouse tissues
were shown in supplementary figure S3F Supplementary
Table 4
Means and Standard Errors for Two Substitution Rate Statistics of Homologous Genes with Conserved Promoter Status
Homologous Genes with Conserved HCP Homologous Genes with Conserved LCP
Human Mouse Rat Cow Dog Chicken Human Mouse Rat Cow Dog Chicken
Human 063 0005 062 0006 063 0011 054 0019 076 0008 074 0012 071 0016 072 0029 063 0063 089 0028
Mouse 010 0001 021 0004 071 0008 063 0040 091 0010 022 0005 034 0007 077 0013 077 0040 105 0013
Rat 010 0001 009 0001 070 0009 067 0080 090 0010 020 0007 024 0005 079 0009 083 0041 103 0018
Cow 013 0004 010 0003 011 0003 045 0046 083 0025 029 0015 022 0007 019 0008 062 0015 101 0033
Dog 008 0007 005 0004 006 0005 007 0013 078 0049 016 0031 015 0018 016 0019 020 0044 099 0025
Chicken 009 0003 009 0003 008 0003 011 0009 007 0009 018 0020 015 0011 015 0011 019 0023 013 0040
NOTEmdashThe upper triangles show the rates of nucleotide substitution under the K80 in promoter regions for paired homologous genes with conserved promoter status (mean standard error) The lower triangles show the ratio of nonsynonymous and synonymous substitution rates (KaKs) in protein-coding regions for paired homologous genes with conservedpromoter status (mean standard error)
DNA Methylation Conservation and Divergence GBE
Genome Biol Evol 2998ndash3014 doi101093gbeevu238 Advance Access publication October 28 2014 3007
at Library of M
edical Center of Fudan U
niversity on Novem
ber 5 2014httpgbeoxfordjournalsorg
Dow
nloaded from
Material online A similar expression pattern was found in
mouse data that the genes with LCP tended to be expressed
in fewer tissues compared with genes with HCP More than
32 of genes with LCP were expressed in no more than one
tissue whereas only 6 were expressed in all 17 tissues The
genes with LCP were therefore more likely to be ldquotissue-
specificrdquo a finding consistent with our earlier observation of
increased divergence between mammals and chicken for
genes in the LCP group (table 3) Meanwhile genes with
HCP were more likely to be ldquohousekeepingrdquo genes expressed
in many different tissues or all tissues to maintain cellular func-
tions In fact among 885 housekeeping genes identified in
the human genome (Zhu et al 2008) that were also present in
the gene expression data set only 59 had LCP whereas
941 had HCP We further investigated the expression pat-
terns of these 885 annotated housekeeping genes in 107 dif-
ferent human tissues In figure 5F the number labeled above
each bar represented the corresponding number of expressed
housekeeping genes in different expression categories
It indicated that the annotated housekeeping genes tend to
be expressed in a broad range of human tissues For instance
376 (424) of these annotated housekeeping genes have
HCP and were expressed in almost all (99ndash107) human tissues
Troukhan et al (2009) reported that the expression of
genes with TATA-boxes tends to be tissue specific whereas
genes without TATA-boxes tend to be expressed more
broadly We investigated the distribution of TATA-boxes in
different classes (categories) of promoters for each of the six
higher vertebrate species and the analysis was summarized in
supplementary table S4 Supplementary Material online It
shows that only a small proportion of promoters contained
the canonical TATA-box in higher vertebrates For instance
only about 138 of promoters contained a TATA-box in the
human genome consistent with a previous report showing a
minority of mammalian promoters having the TATA-box ar-
chitecture and about 10 of promoters having TATA-boxes
in the human genome (Yang et al 2007) Furthermore we
observed a marked difference in the TATA-box structure
Table 5
Conserved and Overrepresented GO Terms for Genes with HCP and LCP in Six Higher Vertebrates
GO ID Conservationa Subontology GO Term Description
Overrepresented among genes with HCP
0000122 4 BP Regulation of transcription from RNA polymerase promoter
0003676 4 MF Nucleic acid binding
0003677 4 MF DNA binding
0003723 4 MF RNA binding
0004672 4 MF Protein kinase activity
0004930 4 MF G-protein coupled receptor activity
0005634 4 CC Nucleus
0005730 4 CC Nucleolus
0006915 4 BP Apoptotic process
0016021 4 CC Integral to membrane
0016301 4 MF Kinase activity
0043234 4 CC Protein complex
0043565 5 MF Sequence-specific DNA binding
0044212 4 MF Transcription regulatory region DNA binding
0045892 4 BP Negative regulation of transcription DNA-dependent
0045893 4 BP Positive regulation of transcription DNA-dependent
Overrepresented among genes with LCP
0004869 4 MF Cysteine-type endopeptidase inhibitor activity
0004984 4 MF Olfactory receptor activity
0006955 4 BP Immune response
0006958 5 BP Complement activation classical pathway
0006974 4 BP Response to DNA damage stimulus
0007596 4 BP Blood coagulation
0007601 4 BP Visual perception
0008009 4 MF Chemokine activity
0008270 4 MF Zinc ion binding
0009897 4 CC External side of plasma membrane
0015711 4 BP Organic anion transport
0032729 4 BP Positive regulation of interferon-gamma production
NOTEmdashCC cellular component BP biological process MF molecular functionaThe number of higher vertebrate species for which the corresponding GO term is overrepresented
Jiang et al GBE
3008 Genome Biol Evol 2998ndash3014 doi101093gbeevu238 Advance Access publication October 28 2014
at Library of M
edical Center of Fudan U
niversity on Novem
ber 5 2014httpgbeoxfordjournalsorg
Dow
nloaded from
between HCP and LCP In the genomes of the six higher ver-
tebrates the TATA-box was significantly enriched in LCP in
comparison to HCP (Plt0001 one-tailed paired studentrsquos
t-test)
Distinct and Conserved Functions of Genes with HCPor LCP
Functional annotation of the human genome into GO terms
led to the discovery that promoters with CpG islands are more
likely to be associated with genes performing basic cellular
functions whereas promoters without CpG islands are asso-
ciated with genes delivering tissue-specific functions (Larsen
et al 1992 Ponger et al 2001 Saxonov et al 2006) We
carried out a binomial test to identify overrepresentation of
GO classes for genes with HCP versus LCP From the six higher
vertebrates we found approximately 100 GO terms signifi-
cantly overrepresented in either HCP or LCP groups Genes
with LCP were particularly enriched for functions (GO terms)
characteristic of differentiated or highly regulated cells for
example immunological functions whereas those with HCP
were enriched for more basic cellular processes such as reg-
ulation of transcription and cell cycle activity Comparison of
significant GO terms among the six higher vertebrate species
allowed us to identify GO terms shared by at least four species
as ldquoconservedrdquo terms Accordingly 16 and 12 GO terms were
identified as conserved in HCP and LCP gene groups respec-
tively (table 5) As expected these conserved GO terms were
enriched in tissue-specific functions for the LCP group and
enriched in housekeeping functions for the HCP genes
We also explored the association of genes with either HCP
or LCP with annotated tumor suppressor genes So far there
are 861 annotated tumor suppressor genes for over 54 differ-
ent human tumors in the most up-to-date TSGene database
(Tumor Suppressor Gene database httpbioinfomcvander-
bilteduTSGene last accessed November 1 2014) Of the
861 suppressors 365 can be mapped uniquely to one class
in our annotated promoter data set (supplementary table S5
Supplementary Material online) Among tumor suppressor
genes 912 contained CpG islands with 70 23 and
7 of the 365 suppressors in the HCP ICP or LCP groups
respectively showing a significant association of tumor sup-
pressor genes with HCP (Plt0001 Pearsonrsquos chi-square test)
Additionally we investigated the methylation level in pro-
moters of the 365 tumor suppressor genes across 28
human tissues or cell lines of which 18 were tumor tissues
or tumor cell lines We found that the pattern of methylation
level in the promoter regions of the tumor suppressors was
comparable to that of other nonsuppressor genes In addition
the LCP had a much higher level of methylation than the HCP
in the tumor suppressor genes particularly in the region sur-
rounding the TSS The CpG sites in tumor suppressor gene
HCP trend to have markedly higher methylation levels in the
tumor samples compared with nontumor samples (supple-
mentary fig S4 Supplementary Material online) which is con-
sistent with widely observed methylation of tumor suppressor
gene promoters occurring in human cancers (Esteller 2002)
Discussion
DNA methylation has an essential role in the modulation of
gene transcription in eukaryotic species particularly verte-
brates (Antequera and Bird 1993 Bennetzen et al 1994
Attwood et al 2002 Zilberman and Henikoff 2007 Suzuki
and Bird 2008) Although several studies have explored the
relationship between regulation of gene transcription by DNA
methylation and the CpG content of gene promoters (Boyes
and Bird 1992 Hsieh 1999 Robinson et al 2004 Robertson
2005 Weber 2007) studies in the current literature have been
either based on limited data sets or focused only on analysis of
the human genome Our study presents the first comprehen-
sive and comparative investigation of the DNA methylation
system and its impact on gene transcription between ten
model eukaryotic species including higher vertebrates a
lower vertebrate invertebrates and a plant
FIG 4mdashPhylogenies of six higher vertebrate species reconstructed either from DNA and protein sequence data (A) or from conservation level of HCP or
LCP status in gene promoters (B)
DNA Methylation Conservation and Divergence GBE
Genome Biol Evol 2998ndash3014 doi101093gbeevu238 Advance Access publication October 28 2014 3009
at Library of M
edical Center of Fudan U
niversity on Novem
ber 5 2014httpgbeoxfordjournalsorg
Dow
nloaded from
Our analysis revealed that the genome-wide distribution
patterns of GC content and CpG dinucleotides vary dramati-
cally for higher vertebrates compared with lower vertebrate
invertebrate and plant species In higher vertebrates both the
GC content and CpG dinucleotides were consistently enriched
in functional regions of the genome particularly in promoter
FIG 5mdashMethylation and gene expression patterns across 28 human tissues Methylation levels of CpG sites in all promoters (A) and in HCP and LCP (B)
across 28 different human tissues The average methylation levels with respect to the TSS with each point representing the average methylation level in an
interval of 10 bp (C) The correlation of methylation levels between all pairwise CpGs sites in the same promoter with each point showing the average
correlation in 10-bp intervals according to the distance between CpG sites (D) The correlation coefficient between methylation and gene expression level
with increasing distance from the TSS (E) Distribution of the number of tissues in which HCP and LCP genes are expressed Each bar is labeled with the
corresponding number of expressed housekeeping genes as identified in Zhu et al (2008) (F)
Jiang et al GBE
3010 Genome Biol Evol 2998ndash3014 doi101093gbeevu238 Advance Access publication October 28 2014
at Library of M
edical Center of Fudan U
niversity on Novem
ber 5 2014httpgbeoxfordjournalsorg
Dow
nloaded from
regions compared with putative ldquononfunctionalrdquo regions in-
cluding introns and intergenic sequences This pattern may be
explained by the following two observations First methylated
cytosines have a higher probability than unmethylated
cytosines to be converted to thymine over evolutionary time
(Ehrlich et al 1982 Kerry Lee 2001) Second nearly all CpG
sites from nonfunctional sequences are completely
methylated in higher vertebrate species Functional constraints
within genic regions would limit the frequency of such
mutations However we did not detect this pattern for
lower vertebrate invertebrate or plant species instead
CpG dinucleotides were enriched across all regions
of the genome meaning that we could not detect
evidence of higher levels of functional constraint in
putative ldquofunctionalrdquo compared with putative nonfunctional
regions of these genomes though the reasons for this are
unclear
Focusing next on gene promoters we discovered that far
from being randomly distributed within the promoter se-
quence CpG dinucleotides consistently showed a bimodal
distribution pattern in each of the six higher vertebrate species
(human mouse rat cow dog and chicken) The previously
defined ldquoCpG richrdquo promoters (HCP) and ldquoCpG poorrdquo pro-
moters (LCP) could be observed in all six higher vertebrate
species but not in the lower vertebrate invertebrate or
plant species For both groups of genes CpGs were concen-
trated in the core and proximal promoter regions
Furthermore the classification of genes into HCP or LCP
groups was highly conserved among the homologous genes
of the six higher vertebrate species Indeed the level of con-
servation of promoter sequences between species could be
used to accurately reconstruct the evolutionary relationships
between these species Remarkably we found that genes
with HCP have significantly higher levels of conservation
among vertebrates in both promoter and protein-coding se-
quences compared with genes with LCP This indicates that
among vertebrates genes with HCP are likely to be under
stronger purifying selection pressure than genes with LCP
All of these observations led us to conclude that the DNA
methylation system is highly conserved among higher verte-
brate species and to further explore a functional role for the
distribution of the CpG dinucleotides within promoter
sequences
DNA methylation of CpGs within both HCP and LCP of the
human and mouse genome is nonrandom the level of meth-
ylation across the length of the promoter shows a u-shaped
distribution with the lowest levels corresponding with the
core promoter regions This distribution is likely to facilitate
transcription initiation whereas the increased methylation
level in the proximal and distal promoter regions could mod-
ulate transcription by modulating the binding of transcription
factors Methylation specifically in the core and proximal pro-
moter regions negatively regulated the gene expression level
across multiple human and mouse tissues and human cell
lines This could be explained by the physical distribution of
protein-binding sites in promoter regions the binding sites for
RNA polymerase and most essential transcription factors are
located in the core and proximal promoter regions (Koudritsky
and Domany 2008) whereas only few additional transcription
factor-binding sites are located in the distal promoter region
(gt250 bp upstream of the TSS)
Moreover we discovered distinct characteristics of HCP
and LCP that ultimately relate to their underlying biological
functions The level of CpG methylation was consistently
higher within LCP compared with HCP Methylation levels of
CpGs within the same promoter were highly correlated
among different cell types or tissues particularly for two
CpGs located in close proximity These differences in the pat-
tern of DNA methylation between the two classes of promoter
were reflected in different patterns of gene expression Genes
with HCP were expressed in a broader range of tissues and
were associated using GO analysis with housekeeping
functions whereas genes in the LCP group were enriched in
tissue-specific functions We further discovered that 94 of
annotated housekeeping genes contained HCP confirming
previous reports of HCP being more frequently associated
with housekeeping genes expressed in a large number of tis-
sues whereas LCP are associated with tissue-specific genes
(Larsen et al 1992 Ponger et al 2001 Saxonov et al 2006
Weber 2007) Moreover we observed a higher level of con-
servation in both coding and promoter sequences in the HCP
genes than in the LCP genes among six higher vertebrates
This agrees with the observation that housekeeping genes in
mice and human evolve more slowly than tissue-specific genes
(Zhang and Li 2004) which can also be associated with the
increased breadth of expression of such genes compared with
tissue-specific genes (Park and Choi 2010) In addition tissue-
specific genes tend to locate in late replicating regions of the
human genome (Cui et al 2012) which may also contribute
to a higher mutation rate compared with housekeeping
genes In conclusion for genes with HCP the DNA methyla-
tion system regulates the expression level in a wide spectrum
of tissues whereas for genes with LCP the DNA methylation
system provides a functional ldquoonndashoffrdquo switch to determine
whether the gene is expressed or not Most importantly we
have shown here that this relationship is conserved among all
six model higher vertebrate species
VanderKraats et al (2013) performed a comprehensive
analysis of the relationship between methylation around the
TSS region and gene expression using high-resolution RNA
sequencing and DNA methylation sequencing data in several
human tumor and normal tissues They observed that hyper-
or hypomethylation spanning the TSS may negatively correlate
with gene expression changes in tumor and normal tissues
This study confirms this observation on a larger scale covering
six vertebrate genomes and further reveals evolutionary con-
servation of the methylation pattern surrounding the TSS be-
tween the two distinct promoter groups VanderKraats et al
DNA Methylation Conservation and Divergence GBE
Genome Biol Evol 2998ndash3014 doi101093gbeevu238 Advance Access publication October 28 2014 3011
at Library of M
edical Center of Fudan U
niversity on Novem
ber 5 2014httpgbeoxfordjournalsorg
Dow
nloaded from
observed that gene expression could be negatively regulated
by methylation downstream of the TSS (mainly within 3 kb of
the TSS) though this methylation pattern was only seen in a
small group of genes (37 genes) In this study we did not
observe this phenomenon This long distance negative regu-
lation of gene expression may not be directly due to methyl-
ation but to a repressive chromatin environment in the
promoters of these genes (Hon et al 2012)
This study has focused on methylation in promoter regions
and its impact on repression of gene expression It has been
reported that gene body methylation is not associated with
repression of gene expression in vertebrates (Jones 2012) In
support of this our analysis showed that the average methyl-
ation level downstream of the TSS in human and mouse ge-
nomes could become very high (even in genes with HCP) but
it did not in turn repress gene transcription (fig 5C and sup-
plementary fig S3C Supplementary Material online)
Recently many studies have reported a positive relationship
between gene-body methylation and gene expression levels in
nonvertebrate species including Arabidopsis (Cokus et al
2008) silkworm (Xiang et al 2010) honeybee (Foret et al
2012) and several eukaryotic species (Zemach et al 2010) For
vertebrates a positive relationship between alternative splicing
and gene body methylation has been reported in both human
(Anastasiadou et al 2011 Shukla et al 2011) and mouse
(Wan et al 2013) genomes Therefore gene body methylation
may have a significant role in the repression of gene expres-
sion in nonvertebrate genomes and in the regulation of alter-
native splicing in vertebrate genomes We also investigated
whether there is a relationship between genic GC3 and pro-
moter methylation in the species under study here For each
gene with an annotated promoter the GC3 content in the
coding region was calculated as GC3 = (C3 + G3)(L3) where
C3 and G3 were counts of cytosine and guanine in the third
position of codons and L was the length of the coding region
(Tatarinova et al 2013) Across the six higher vertebrates the
Pearsonrsquos correlation coefficient between genic GC3 content
and the promoter CpG density was only weak and varied from
005 to 010 In contrast it is reported that GC3-rich genes
are usually tissue specific whereas GC3-poor genes are usu-
ally housekeeping in rice bee and Arabidopsis genomes
(Tatarinova et al 2013)
Supplementary Material
Supplementary figures S1ndashS4 and tables S1ndashS5 are available
at Genome Biology and Evolution online (httpwwwgbe
oxfordjournalsorg)
Acknowledgments
The authors are grateful to two anonymous reviewers for their
constructive criticisms which have helped improve both con-
text and presentation of an earlier version of the article
This work was supported by research grants from the
National Basic Research Program of China (grant number
2012CB316505) the National Natural Science Foundation
of China (grant numbers 81172006 91231114 and
31401126) China Postdoctoral Science Foundation (grant
number 2014M561406) and the Leverhulme Trust and
BBSRC United Kingdom to ZWL
Literature CitedAnastasiadou C Malousi A Maglaveras N Kouidou S 2011 Human
epigenome data reveal increased CpG methylation in alternativelys-
pliced sites and putative exonic splicing enhancers DNA Cell Biol
30(5)267ndash275
Antequera A Bird A 1993 DNA methylation molecular biology and bi-
ological significance Basel (Birkhauser) Nature Publishing Group
Attwood JT Yung RL Richardson BC 2002 DNA methylation and the
regulation of gene transcription Cell Mol Life Sci 59241ndash257
Bell J et al 2011 DNA methylation patterns associate with genetic and
gene expression variation in HapMap cell lines Genome Biol 12R10
Bennetzen JL Schrick K Springer PS Brown WE SanMiguel P 1994
Active maize genes are unmodified and flanked by diverse classes of
modified highly repetitive DNA Genome 37565ndash576
Bird A 2002 DNA methylation patterns and epigenetic memory Genes
Dev 166ndash21
Bonazzi VF et al 2011 Cross-platform array screening identifies COL1A2
THBS1 TNFRSF10D and UCHL1 as genes frequently silenced by meth-
ylation in melanoma PLoS One 6e26121
Boyes J Bird A 1992 Repression of genes by DNA methylation depends
on CpG density and promoter strength evidence for involvement of a
methyl-CpG binding protein EMBO J 11327ndash333
Chan SW 2004 RNA silencing genes control de novo DNA methylation
Science 3031336
Chan SW Henderson IR Jacobsen SE 2005 Gardening the genome DNA
methylation in Arabidopsis thaliana Nat Rev Genet 6351ndash360
Chari R Coe B Vucic E Lockwood W Lam W 2011 An integrative multi-
dimensional genetic and epigenetic strategy to identify aberrant genes
and pathways in cancer BMC Syst Biol 467
Chen Z-X Riggs AD 2011 DNA methylation and demethylation in mam-
mals J Biol Chem 28618347ndash18353
Cokus SJ et al 2008 Shotgun bisulphite sequencing of the Arabidopsis
genome reveals DNA methylation patterning Nature 452215ndash219
Cui P et al 2012 Distinct contributions of replication and transcription to
mutation rate variation of human genomes Genomics Proteomics
Bioinformatics 10(1)4ndash10
Day JJ Sweatt JD 2010 DNA methylation and memory formation Nat
Neurosci 131319ndash1323
Ehrlich M et al 1982 Amount and distribution of 5-methylcytosine in
human DNA from different types of tissues or cells Nucl Acids Res 10
2709ndash2721
Esteller M 2002 CpG island hypermethylation and tumor suppressor
genes a booming present a brighter future Oncogene 21
5427ndash5440
Fahrner JA Eguchi S Herman JG Baylin SB 2002 Dependence of histone
modifications and gene expression on DNA hypermethylation in
cancer Cancer Res 627213ndash7218
Foret S et al 2012 DNA methylation dynamics metabolic fluxes genes-
plicing and alternative phenotypes in honey bees Proc Natl Acad Sci U
S A 1094968ndash4973
Gardiner-Gardner M Frommer M 1987 CpG islands in vertebrate ge-
nomes J Mol Biol 196261ndash282
Gehring M Henikoff S 2007 DNA methylation dynamics in plant ge-
nomes Biochim Biophys Acta 1769276ndash286
Jiang et al GBE
3012 Genome Biol Evol 2998ndash3014 doi101093gbeevu238 Advance Access publication October 28 2014
at Library of M
edical Center of Fudan U
niversity on Novem
ber 5 2014httpgbeoxfordjournalsorg
Dow
nloaded from
Geiman TM Robertson KD 2002 Chromatin remodeling histone mod-
ifications and DNA methylationmdashhow does it all fit together J Cell
Biochem 87117ndash125
Glass JL 2007 CG dinucleotide clustering is a species-specific property of
the genome Nucl Acids Res 356798ndash6807
Goll MG Bestor TH 2005 Eukaryotic cytosine methyltransferases Annu
Rev Biochem 74481ndash514
Gowher H Leismann O Jeltsch A 2000 DNA of Drosophila melanogaster
contains 5-methylcytosine EMBO J 196918ndash6923
He X-J Chen T Zhu J-K 2011 Regulation and function of DNA methyl-
ation in plants and animals Cell Res 21442ndash465
Hedges SB 2002 The origin and evolution of model organisms Nat Rev
Genet 3838ndash849
Henderson IR Jacobsen SE 2007 Epigenetic inheritance in plants Nature
447418ndash424
Herman JG Baylin SB 2003 Mechanisms of disease gene silencing in
cancer in association with promoter hypermethylation N Engl J Med
3492042ndash2054
Holliday R Pugh JE 1975 DNA modification mechanisms and gene ac-
tivity during development Science 187226ndash232
Hon GC et al 2012 Global DNA hypomethylation coupled to repressive
chromatin domain formation and gene silencing in breast cancer
Genome Res 22246ndash258
Hon GC et al 2013 Epigenetic memory at embryonic enhancers identi-
fied in DNA methylation maps from adult mouse tissues Nat Genet
45(10)1198ndash1206
Hsieh CL 1999 Evidence that protein binding specifies sites of DNA de-
methylation Mol Cell Biol 1946ndash56
Jaenisch R Bird A 2003 Epigenetic regulation of gene expression how
the genome integrates intrinsic and environmental signals Nat Genet
33245ndash254
Johansson P Pavey S Hayward N 2007 Confirmation of a BRAF muta-
tion-associated gene expression signature in melanoma Pigment Cell
Res 20216ndash221
Jones PA 2012 Functions of DNA methylation islands start sites gene
bodies and beyond Nat Rev Genet 13484ndash492
Karlin S Mrazek J 1997 Compositional differences within and be-
tween eukaryotic genomes Proc Natl Acad Sci U S A 94
10227ndash10232
Kerry Lee T 2001 Methylated cytosine and the brain a new base for
neuroscience Neuron 30649ndash652
Kimura M 1980 A simple method for estimating evolutionary rate of base
substitution through comparative studies of nucleotide sequences
J Mol Evol 16111ndash120
Koudritsky M Domany E 2008 Positional distribution of human transcrip-
tion factor binding sites Nucl Acids Res 366795ndash6805
Larsen F Gundersen G Lopez R Prydz H 1992 CpG islands as gene
markers in the human genome Genomics 131095ndash1107
Li E 2002 Chromatin modification and epigenetic reprogramming in
mammalian development Nat Rev Genet 3662ndash673
Lister R et al 2009 Human DNA methylomes at base res-
olution show widespread epigenomic differences Nature 462
315ndash322
Loudin MG et al 2011 Genomic profiling in Down syndrome
acute lymphoblastic leukemia identifies histone gene dele-
tions associated with altered methylation profiles Leukemia 25
1555ndash1563
Mette MF Aufsatz W van der Winden J Matzke MA Matzke AJ 2000
Transcriptional silencing and promoter methylation triggered by
double-stranded RNA EMBO J 195194ndash5201
Montero LM 1992 The distribution of 5-methylcytosine in the nuclear
genome of plants Nucl Acids Res 203207ndash3210
Palmer LE 2003 Maize genome sequencing by methylation filtration
Science 3022115ndash2117
Park SG Choi SS 2010 Expression breadth and expression abundance
behave differently in correlations with evolutionary rates BMC Evol
Biol 10241
Parle-McDermott A Harrison A 2011 DNA methylation a timeline of
methods and applications Front Genet
Patra S Patra A Rizzi F Ghosh T Bettuzzi S 2008 Demethylation of
(Cytosine-5-C-methyl) DNA and regulation of transcription in the epi-
genetic pathways of cancer development Cancer Metastasis Rev 27
315ndash334
Ponger L Duret L Mouchiroud D 2001 Determinants of CpG Islands
expression in early embryo and isochore structure Genome Res 11
1854ndash1860
Pozzoli U et al 2008 Both selective and neutral processes
drive GC content evolution in the human genome BMC Evol Biol
899
Riggs AD 1975 X-inactivation differentiation and DNA methylation
Cytogenet Cell Genet 149ndash25
Robertson KD 2005 DNA methylation and human disease Nat Rev
Genet 6597ndash610
Robinson PN Bohme U Lopez R Mundlos S Nurnberg P 2004 Gene-
Ontology analysis reveals association of tissue-specific 50CpG-island
genes with development and embryogenesis Hum Mol Genet 13
1969ndash1978
Rollins RA 2006 Large-scale structure of genomic methylation patterns
Genome Res 16157ndash163
Salzberg A Fisher O Siman-Tov R Ankri S 2004 Identification of meth-
ylated sequences in genomic DNA of adult Drosophila melanogaster
Biochem Biophys Res Commun 322465ndash469
Saxonov S Berg P Brutlag DL 2006 A genome-wide analysis of
CpG dinucleotides in the human genome distinguishes two
distinct classes of promoters Proc Natl Acad Sci U S A 103
1412ndash1417
Shukla SE et al 2011 CTCF-promoted RNA polymerase II pausing links
DNA methylation to splicing Nature 47974ndash79
Suzuki MM Bird A 2008 DNA methylation landscapes provocative in-
sights from epigenomics Nat Rev Genet 9465ndash476
Tatarinova T Elhaik E Pellegrini M 2013 Cross-species analysis of genic
GC3 content and DNA methylation patterns Genome Biol Evol 5
1443ndash1456
Troukhan M Tatarinova T Bouck J Flavell RB Alexandrov NN 2009
Genome-wide discovery of cis-elements in promoter sequences
using gene expression OMICS 13139ndash151
VanderKraats ND Hiken JF Decker KF Edwards JR 2013 Discovering
high-resolution patterns of differential DNA methylation that corre-
late with gene expression changes Nucleic Acids Res 41(14)
6816ndash6827
Wan J et al 2013 Integrative analysis of tissue-specific methylation and
alternative splicing identifies conserved transcription factor binding
motifs Nucleic Acids Res 41(18)8503ndash8514
Weber M 2007 Distribution silencing potential and evolutionary impact
of promoter DNA methylation in the human genome Nat Genet 39
457ndash466
Xiang H et al 2010 Single base-resolution methylome of the
silkwormreveals a sparse epigenomic map Nat Biotechnol 28
516ndash520
Yang ZH 2007 PAML4 phylogenetic analysis by maximum likelihood
Mol Biol Evol 4551ndash556
Yang C Bolotin E Jiang T Sladek FM Martinez E 2007 Prevalence of the
initiator over the TATA box in human and yeast genes and identifica-
tion of DNA motifs enriched in human TATA-less core promoters
Gene 389(1)52ndash65
Zemach A McDaniel I Silva P Zilberman D 2010 Genome-wide evolu-
tionary analysis of eukaryotic DNA methylation Science 328(5980)
916ndash919
DNA Methylation Conservation and Divergence GBE
Genome Biol Evol 2998ndash3014 doi101093gbeevu238 Advance Access publication October 28 2014 3013
at Library of M
edical Center of Fudan U
niversity on Novem
ber 5 2014httpgbeoxfordjournalsorg
Dow
nloaded from
Zhang L Li W-S 2004 Mammalian housekeeping genes
evolve more slowly than tissue-specific genes Mol Biol Evol 21(2)
236ndash239
Zhu B Reinberg D 2011 Epigenetic inheritance Uncontested Cell Res
21435ndash441
Zhu J He F Song S Wang J Yu J 2008 How many human genes can be
defined as housekeeping with current expression data BMC
Genomics 9172
Zilberman D Gehring M Tran RK Ballinger T Henikoff S 2007 Genome-
wide analysis of Arabidopsis thaliana DNA methylation uncovers an
interdependence between methylation and transcription Nat Genet
3961ndash69
Zilberman D Henikoff S 2007 Genome-wide analysis of DNA methylation
patterns Development 1343959ndash3965
Associate editor Tal Dagan
Jiang et al GBE
3014 Genome Biol Evol 2998ndash3014 doi101093gbeevu238 Advance Access publication October 28 2014
at Library of M
edical Center of Fudan U
niversity on Novem
ber 5 2014httpgbeoxfordjournalsorg
Dow
nloaded from
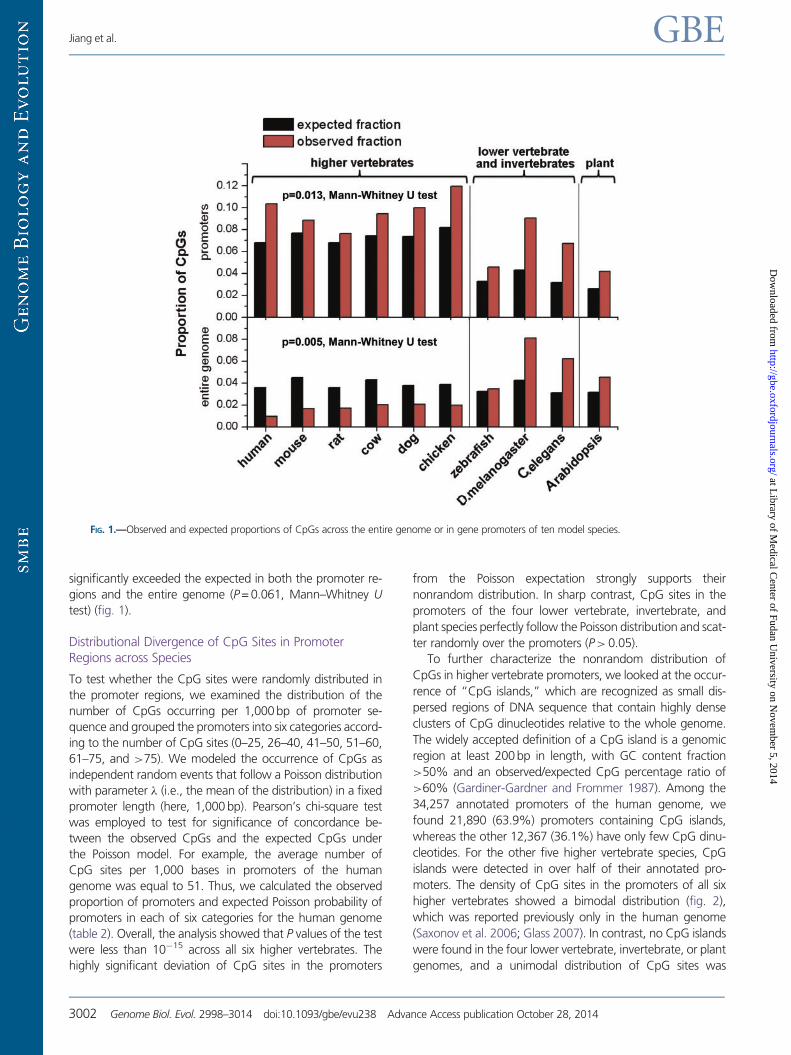
Copyright © 2022 FDOKUMEN