Elements of episodic-like memory in free-living hummingbirds, energetic consequences
Upload
independentCategory
view
0download
0
Insights into the iron and sulfur energetic metabolism ofAcidithiobacillus ferrooxidans by microarray transcriptome profiling
Raquel Quatrini a1 Corinne Appia-Ayme b1 Yann Denis b Jeanine Ratouchniak bFelipe Veloso a Jorge Valdes a Claudia Lefimil e Simon Silver c
Frank Roberto d Omar Orellana e Franccedilois Denizot b Eugenia Jedlicki eDavid Holmes a Violaine Bonnefoy b
a Andreacutes Bello University and Millennium Institute for Fundamental and Applied Biology Santiago Chileb Laboratoire de Chimie Bacteacuterienne IBSM CNRS Marseille France
c University of Illinois Chicago USAd Idaho National Engineering and Environmental Laboratory Idaho Falls USA
e ICBM Faculty of Medicine University of Chile Santiago Chile
Abstract
Acidithiobacillus ferrooxidans is a well known acidophilic chemolithoautotrophic Gram negative bacterium involved inbioleaching and acid mine drainage In aerobic conditions it gains energy mainly from the oxidation of ferrous iron andor reducedsulfur compounds present in ores After initial oxidation of the substrate electrons from ferrous iron or sulfur enter respiratorychains and are transported through several redox proteins to oxygen However the oxidation of ferrous iron and reduced sulfurcompounds has also to provide electrons for the reduction of NAD(P) that is subsequently required for many metabolic processesincluding CO2 fixation To help unravel the enzymatic pathways and the electron transfer chains involved in these processes agenome-wide microarray transcript profiling analysis was carried out Oligonucleotides corresponding to approximately 3000genes of the A ferrooxidans type strain ATCC23270 were spotted onto glass-slides and hybridized with cDNA retrotranscribedfrom RNA extracted from ferrous iron and sulfur grown cells The genes which are preferentially transcribed in ferrous ironconditions and those preferentially transcribed in sulfur conditions were analyzed The expression of a substantial number of thesegenes has been validated by real-time PCR Northern blot hybridization andor immunodetection analysis
Our results support and extend certain models of iron and sulfur oxidation and highlight previous observations regarding thepossible presence of alternate electron pathways Our findings also suggest ways in which iron and sulfur oxidation may be co-ordinately regulated An accompanying paper (Appia-Ayme et al) describes results pertaining to other metabolic functions
Keywords Iron oxidation Sulfur oxidation Microarray analysis Extremophile Electron transport Bioinformatics
Corresponding authorE-mail addresses rquatriniyahoocomar (R Quatrini)
cappiaaymeyahoofr (C Appia-Ayme) ejedlickmeduchilecl(E Jedlicki) dsholmes2000yahoocom (D Holmes)bonnefoyibsmcnrs-mrsfr (V Bonnefoy)1 These authors contributed equally to the work
1 Introduction
Acidithiobacillus ferrooxidans is one of the moststudied microorganism commonly found in acid minedrainage (see references in [12]) One can wonder at howlife is possible in such extreme environments (high proton
R Quatrini et al
and metal concentration) In fact A ferrooxidans takesadvantage of these conditions and gains energy requiredfor growth from the aerobic oxidation of ferrous iron(FeII) and reduced sulfur compounds to ferric iron (FeIII)and sulfuric acid respectively The oxidation productsthen attack chemically the metal sulfides [3] leading tometal solubilization and ore desulfurization Thereforeelucidating the unusual energetic metabolism of A ferro-oxidans is of central importance to understanding itsbioleaching and bioremediation properties Consequentlyunderstanding the respiration of iron and reduced sulfurcompounds is of wide interest not only scientifically butalso from an economic and environmental point of view
Iron-based energetic metabolism has been studied forseveral years leading to the proposal of a number ofrespiratory chain models [4ndash9] The currently acceptedmodel [9] is based on genetic [910] and biochemicalevidence [1112] and is further supported by thesubcellular localization of the proposed redox partners[1314] On the other hand the study of the energeticmetabolism of reduced sulfur compounds is morecomplicated than for iron because (i) it involves severalenzymatic reactions (ii) only some of them are coupledto the respiratory chain(s) and (iii) these couplings occurat different points of the respiratory chain(s) Whileseveral enzymes proposed to be involved in sulfur dissi-milation have been known for a long time [15ndash21] it isonly recently that some results were reported on thesulfur respiratory chains [2223] To add to the comple-xity of A ferrooxidans energetic metabolism the oxida-tion of ferrous iron and of reduced sulfur compounds hasto provide electrons for the reduction of NAD(P) that issubsequently required for many metabolic processessuch as carbon and nitrogen fixation It is now clear thatA ferrooxidans respiratory chains to oxygen areredundant and branched [22] Furthermore from the Aferrooxidans genome sequence analysis the existence ofseveral electron transfer proteins has been inferred[132224] but the respiratory chain to which theybelong was not known for most of them
Despite considerable effort A ferrooxidans remainslargely recalcitrant to standard genetic techniques for itsmanipulation although promising progress has beenmade for developing a conjugation system for geneticexchange with Escherichia coli [2526] Such deficiencyseriously impedes the direct experimental investigationof the metabolism ofA ferrooxidans and gene knockoutsare still difficult to obtain Nevertheless the study andcomparison of gene expression profiles is an alternativethat can circumvent this limitation Recently the Aferrooxidans genome sequence has been made availableby The Institute for Genomic Research As part of the
growing effort to understand A ferrooxidans physiologyits genome has been annotated and curated (Holmes etal 2005 manuscript in preparation) making feasiblegenome-wide comprehensive studies through the con-struction and use of microarray technology
To gain further insight into the physiological role of theknown redox proteins and to help identify yet unknown ormissing components involved in iron and sulfur respira-tory chains to oxygen we have undertaken a globaltranscriptomic approach In the present work we havecompared the expression profiles of the A ferrooxidanscells grown on iron with those grown on sulfur focusingour interpretations on the energy metabolism functions
2 Materials and methods
21 Strain and culture conditions
A ferrooxidans ATCC 23270 was obtained from theAmerican Type Culture Collection A ferrooxidans wasgrown at 30degC under oxic conditions (200rpm) in (i)FeII-medium consisting of 62mM FeSO4ndash7H2O in 9Kbasal salts solution ((NH4)2SO4 04gl K2HPO4 04glMgSO4ndash7H2O 04gl adjusted to pH 16 with H2SO4(ii) S0-medium consisting of 1 (wv) elemental sulfurin 9K basal salts solution ((NH4)2SO4 04gl K2HPO404gl MgSO4ndash7H2O adjusted to pH 35 with H2SO4
22 Materials
The TRIZOLreg reagent was from Invitrogen The HighPure RNA isolation kit was from Roche Applied Bio-system The 50-mer oligonucleotides were synthesizedand HPCRreg (High Purity Salt Free) purified by MWGBiotech The size of randomly chosen oligonucleotideswas controled by MALDI-TOF mass spectroscopy byMWG Biotech The slides (UltraGAPS) the spottingbuffer (Prontotrade Universal Printing Kit) the labellingand clean-up reagents (ChipShottrade Labelling Clean-UpSystem) and the pre-hybridization and hybridization rea-gents (ProntotradeMicroarray Reagent System) were fromPromega-Corning (Prontotrade Plus System) Cyreg3 andCyreg5-labeled nucleotides were from Amersham Bios-ciences LightCycler Fast Start DNAmaster (plus) SYBRGreen I PCR kit was from Roche Applied Biosystems
23 Oligonucleotide design
For each of the 3037 putative ORFs predicted in thegenomic sequence of A ferrooxidans ATCC 23270(TIGR release September 2003 298Mb) an internal 50-mer oligonucleotide was designed using the Oligoarray
R Quatrini et al
software (Version 10) Oligonucleotide design consid-erations include narrow melting temperature (92plusmn7degC)and avoidance of self-annealing structures To excluderedundant oligonucleotides and minimize cross-hybrid-ization a Blast search (using eminus10 as cutoff) was carriedout A special set of control oligonucleotides (negativepositive tiled and antisense sequences) was included toevaluate probe specificity and adjust the hybridizationconditions 50-mer oligonucleotides corresponding tothe CDS of the gfp gene from Aequorea sp the rad9gene form Saccharomyces cereviciae and the idi2 genefrom human were used as negative controls
Unmodified 50-mer oligonucleotides have beenshown to enable high signal intensity and high speci-ficity [27] Therefore unmodified oligonucleotidessynthesized by MWG Biotech at a 10nm scale and at100μM were used
24 Oligonucleotides spotting
The unmodified 50-mer oligonucleotides were dilut-ed to 50μM in Corning Prontotrade Universal SpottingSolution for spotting purposes They were spotted induplicate on Corning UltraGAPS slides coated withGamma Amino Propyl Silane with an 8 pin Affimetrix427 Arrayer at the Marseille-Nice Genopole (France)They were subsequently immobilized by UV cross-linking with the UV Stratalinker 2400 (Stratagene) andstored in a dessicator cabinet until use
25 RNA preparation
A ferrooxidansmid logarithmic cultures grown in thepresence of FeII (62mM FeSO4) or S0 (05 S0) asenergy source (30degC 200rpm) were harvested by cen-trifugation at 4degC and immediately processed for RNAextraction Cells were washed in 9K buffer (pH adjusted)to remove iron traces or sulfur particles before furthertreatment Total RNA was extracted using a modifiedacidndashphenol extraction method [28] including a pre-liminary TRIZOLreg reagent (Invitrogen) extraction stepThis RNA was used directly for cDNA synthesis andlabelling For real-time PCR RNAs were additionallypurified with the High Pure RNA isolation kit (RocheApplied Biosystem) and treated twice with DNAse I(Roche Applied Biosystem) The lack of DNA contam-ination was checked by PCR on each RNA sample
26 Labelled cDNA synthesis and hybridization
The ChipShottrade Labelling Clean-Up System (Pro-mega-Corning) was used to generate fluorescently
labeled cDNA via direct incorporation of Cyreg3 andCyreg5-labeled nucleotides from Amersham BiosciencesThe reverse transcription reaction was performed in thepresence of 5μg total RNA and random hexamers(Protocols wwwpromegacom) Two independentcDNA preparations were labeled once with each dye(reverse dye labeling) to account for sampling differ-ences biases in dye coupling or emission efficiency ofCyreg-dyes Labelled cDNA was purified from contam-inating fluorescent dNTPs and degraded RNA using theChipShot Labelling Clean-Up System (Promega-Corn-ing) Dye incorporation efficiency was determined byabsorbance readings at 260 550 and 650nm and thefrequency of incorporation (FOI pmol of dye incorpo-rated per ng of cDNA) was calculated according toPromegas instructions Optimally labelled sampleswere combined vacuum-dried and resuspended to afinal volume of 40ndash50μL in Corning Pronto UniversalHybridization Buffer
The Pronto trade Universal Hybridization kit was usedaccording to Promegas instructions Briefly thecombined denatured target cDNA samples (95degC for5min) were hybridized to the spotted slides for 14h at42degC in the Corning hybridization chamber Followinghybridization slides were washed in serial dilutions ofCorning Wash Buffers as recommended by the manu-facturer and dried by centrifugation at 1200timesg for 2min
27 Image acquisition and data analysis
Microarrays were scanned for the Cyreg3 and Cyreg5fluorescent signals using the ScanArray 4000 Micro-array Analysis System (PerkinElmer Life Sciences Inc)at a resolution of 10μm per pixel Scanning parameters(laser power 85ndash95 and photomultiplier voltage 90ndash95) were adjusted so that overall intensities in bothfluorescent channels were balanced and few spots weresaturated (to maximize the dynamic range) Scans storedas 16-bit TIFF (Tagged Information File Format) imagefiles and then analyzed with the image quantificationsoftware package GenePix Pro 40 (Axon InstrumentsInc) Addressing information raw signal intensityreadings and quality parameters for each spot wererecorded Low-quality spots (spots smaller than 60μmor bigger than 160μm in diameter sub-circular in shapeandor exhibiting uneven fluorescence distribution)were flagged and filtered out Genes with median signalintensities less than two standard deviations abovebackground in both channels were considered as notdetected and array elements that approached themaximum value (65535per pixel for a 16-bit scanner)were considered as saturated and excluded from further
R Quatrini et al
statistical analysis Local background was subtractedfrom the recorded spot intensities (median values)Negative values (ie local background intensities higherthan spot signal) were considered as no data Medianspot intensities were Log transformed (Log2) andnormalized to account for any difference in totalintensity between the scanned images due to pin effects(Pin group location normalization) dye and slide effects(Scale normalization) and intensity-dependent effects(Lowees normalization) using the R package (Version181 URL httpwwwR-projectorg) The processedFeII and S0 signal intensities for each spot were used forcalculating the expression ratio FeIIS0 Eight ratiovalues per gene resulting from direct and reverselabelling and replicate experiments were used forfurther statistical analysis of the data The statisticalsignificance of differential expression in FeII or S0
grown cells was assessed using R package applying tothe data set the Student t-test [28]
28 Real-time PCR
The relative abundances of a set of differentiallyexpressed genes and a set of invariant genes accordingto the microarray results obtained were determined inFeII- and S0-grown cells by real-time PCR Specificprimers for the genes of interest amplifying averageproducts of 300bp with about 50GC and about 55degCTm were designed Equal amounts of A ferrooxidansDNAseI-treated total RNA were retro-transcribed fromthese primers with the Superscript IItrade RNase Hminus
Fig 1 Differentially expressed genes in A ferrooxidans microarrays (A) OFeIIS0)] (B) Fold-change cut-off determination by hybridization of identica
(InVitro Life Technologies) at 42degC for 50min and thentreated at 70degC for 15min to inactivate the enzyme Thereal-time PCR quantifications were realized at thetranscriptome platform of the IBSM (MarseilleFrance) on the total cDNA obtained using the Light-Cycler instrument and the LightCycler Fast Start DNAmaster (plus) SYBR Green I PCR kit (Roche AppliedBiosystems) with external standards as described inRoche Molecular Biochemicals technical note no LC112000 The real-time PCR experiments were per-formed twice with both independent total RNA andcDNA preparations by the comparative threshold cyclemethod The calculated threshold cycle (Ct) for eachgene was normalized to Ct of the rrs gene coding for the16S rRNAwhich expression is invariant under FeII- andS0-growth conditions [10]
3 Results and discussion
31 A ferrooxidans microarrays analysis
The genomic expression profiles of A ferrooxidansATCC 23270 growing on FeII or S0 media weredetermined and compared with one another To identifythe genes differentially affected by the energy sourcethe following statistical criteria were employed (i)genes with P values gt001 were considered as notregulated regardless of their differential expressionlevel (ii) genes with a P value of lt001 were consideredto have significant differential expression and thusregarded as up-regulated either in FeII or in S0
dds of being differentially expressed [B-statistic versus M (Log2 ratiol cDNA samples labelled with Cyreg3 and Cyreg5
R Quatrini et al
conditions (Fig 1A) The fold-change cut-off to beused for the identification of the genes exhibitingdifferential expression between treatments wasassessed by hybridization of identical cDNA samples(total RNA extracted from FeII-grown cells) labeledwith Cyreg3 or Cyreg5 dyes The pattern of hybridizationrevealed a linear correlation of the data and a foldchange in gene expression level (M Log2 ratio FeIIS0) no larger that 15 (Fig 1B) Similar cut-off valueshave been reported as being biologically significantelsewhere Therefore genes with a positive Log2 FeIIS0 ratio (M) were considered to be more expressed inFeII- than in S0 and vice-versa while the genes with aLog2 FeIIS0 ratio (M) close to zero were considered tobe similarly expressed in both conditions
On the basis of the criteria described above theexpression level of more than 200 genes of Aferrooxidans was affected by the presence of eitherFeII or S0 as energy source in the growth media (Fig 2)The comparison of the transcriptional profiles of FeII-grown cells versus S0-grown cell indicated that about120 genes were induced (Max=up to 38 fold) in FeIIconditions and about 90 were specifically induced(Max=up to 10 fold) in S0 conditions
32 Energy source (FeII or S0) expression profile
The genes expressed differentially according to theenergy source can be divided into seven functionalcategories energy metabolism central intermediarymetabolism regulatory functions protein translationamino acid biosynthesis cell wall and envelopeconstituents and miscellaneous (unknown function) Inthis paper we will analyze the genes encoding proteinsinvolved in the energetic metabolism while resultspertaining to the other metabolic functions and more
Fig 2 Upregulated genes in A ferrooxidans cells grown in FeII or S0 StatiBayes B-statistic In the left panel circles induced in FeII triangles induce
particularly to the carbon metabolism are described inthe accompanying paper (Appia-Ayme et al)
Table 1 summarizes the data obtained on genesencoding electron transfer proteins we have previouslysuggested to be involved in FeII or S0 energeticmetabolism ([9223031] Bruscella Appia-AymeLevican Ratouchniak Holmes Jedlicki and Bonnefoymanuscript in preparation)
321 Characterization of FeII-induced genes encodingelectron transporters
In FeII conditions the petI operon encoding one ofthe bc1 complexes ([243031] Bruscella Appia-AymeLevican Ratouchniak Holmes Jedlicki and Bonnefoymanuscript in preparation) was highly expressed (Table1 and Fig 3) in agreement with Northern hybridizationand real time PCR experiments ([31] Bruscella Appia-Ayme Levican Ratouchniak Holmes Jedlicki andBonnefoy manuscript in preparation)
The rus operon encoding electron transfer proteinsinvolved in the respiratory chain between FeII andoxygen [9] was shown by a number of approaches tobe more expressed in FeII than in S0 conditions inthe strains ATCC 33020 [10133233] ATCC 19859[2234] or Torma [35] except in NASF-1 strainwhere the transcriptional level of coxB was similar inboth conditions [23] The spots corresponding to thegenes of this operon were saturated in iron so ex-pression ratios could not be determined Howeverdifferential expression in iron is in agreement withprevious results Optimized image acquisition anddata analysis conditions will have to be found for thiscase
Surprisingly while higher sulfide quinone reductaseactivity was observed in S0 than in FeII conditions [22]two out of the three putative operons encoding sulfide
stical significance was assessed by either t-test probability value P ord in S0
Table 1Microarray expression ratios between FeII and S0 grown cells
Genename
Gene function M value Pvalue
Expression
rus operoncyc2 Outer membrane
cytochrome c precursorSaturated
cyc1 Cytochrome c552diheme precursor
Saturated
coxB aa3 Cytochrome coxidase II
Saturated
coxA aa3 Cytochrome coxidase I
Saturated
coxC aa3 Cytochrome coxidase III
Saturated
rus Rusticyanin Saturatedrus Rusticyanin Saturatedrus Rusticyanin Saturated
cydAB encoding bd ubiquinol oxidasecydA Cytochrome d ubiquinol
oxidase I (bd)minus075 0128 ND
cydB Cytochrome d ubiquinoloxidase II (bd)
minus122 0065 ND
cyoBACD encoding bo3 ubiquinol oxidasecyoB Cytochrome o ubiquinol
oxidase subunit IIminus197 0008 NL
cyoA Cytochrome o ubiquinoloxidase subunit I
minus269 0008 NL
cyoC Cytochrome o ubiquinoloxidase subunit III
minus249 0020 ND
cyoD Cytochrome o ubiquinoloxidase subunit IV
minus145 0113 ND
doxI operon encoding thiosulfate quinol reductasedoxDA1 thiosulfate quinol
oxido-reductase149 0056 ND
doxII operon encoding thiosulfate quinol reductasedoxDA2 thiosulfate quinol
oxido-reductaseminus141 0029 ND
rod Rhodanese-relatedsulfurtransferase
minus095 0061 ND
petI operoncycA1 Cytochrome c4 precursor
(c-552)361 0000 DF
petA1 Ubiquinol-cytochrome creductase Rieske protein
347 0000 DF
petB1 Ubiquinol-cytochrome creductase cytochrome b
525 0001 DF
petC1 Ubiquinol-cytochrome creductase cytochrome c1
341 0000 DF
petII operoncycA2 Cytochrome c4 precursor
(c-552)minus040 0192 ND
petA2 Ubiquinol-cytochrome creductase Rieske protein
minus135 0012 NL
Table 1 (continued)
Genename
Gene function M value Pvalue
Expression
petII operonpetB2 Ubiquinol-cytochrome c
reductase cytochrome bminus142 0013 NL
petC2 Ubiquinol-cytochrome creductase cytochrome c1
009 0780 ND
hip High redox potentialironndashsulfur protein(HiPIP)
minus104 0031 ND
sqrI operon encoding sulfide quinone reductasesqrI Sulfide quinone reductase 216 0000 DF
sqrII operon encoding sulfide quinone reductasesqrII Sulfide quinone reductase 247 0000 DF
sqr3 gene encoding sulfide quinone reductasesqr3 Sulfide quinone reductase 059 0491 ND
ND not differential (Pgt001) NL near cut-off limit (are significantaccording to one of the test criteria eg Ple001 therefore indefinite)In bold Ple001 DF Differential FeII up (Plt001 and Mgt0)
R Quatrini et al
quinone reductase (sqrI and II) showed a 5 fold higherexpression (M=217plusmn063) in FeII- than in S0-growncells (Table 1) However these two operons areconstituted of paralogue genes sqr and three othergenes encoding hypothetical proteins Likely theidentity level of these genes prevented the differentia-tion of their expression levels by microarrays using 50-mers oligonucleotides The third sqr gene (sqr3)included in a different gene context does not seem tobe differentially expressed in either conditions contraryto what was observed in A ferrooxidansNASF-1 wherethe transcriptional level of sqr3 was found to be threefold higher in S0 than in FeII-grown cells [23] Furtherexperiments are therefore required to explain thesediscrepancies
322 Characterization of S0-induced genes encodingelectron transporters
Several genes of the cyd cyo doxII and petIIoperons presented differences in expression that werevery near the statistic significance cut-off limitestablished in the present analysis (Table 1) and werethus considered as differentially expressed Thereforethese operons seem to be more expressed in S0 than inFeII conditions in agreement with previous results Wehave indeed shown by Northern hybridization and realtime PCR that the petII operon is slightly expressed inS0 than in FeII conditions in the ATCC 33020 strain([31] Bruscella Appia-Ayme Levican RatouchniakHolmes Jedlicki and Bonnefoy manuscript in
R Quatrini et al
preparation) The same holds true for the rod geneencoding a rhodanese-like proteins [20] and belongingto the putative doxII operon Furthermore higheramounts of quinol oxidases and higher activities ofquinol oxidases and thiosulfate quinol reductase havebeen observed in ATCC 19859 cells grown in S0
compared to those grown in FeII [22] However in theNASF-1 strain the transcription of the cydA geneencoding subunit I of the alternate bd quinol oxidasewas similar in both conditions [23]
Table 2Comparison of raw fold changes in gene expression between FeII- andS0-grown cells (midlog) obtained by microarray analysis and real timePCR () in this work
Gene expression ratios
Microarray
Fold ()
46c
116c
84c
96c
ndash44c
58c
130203120276116
02081820
ndash1152
720626
09
Fold
12
03
Upregulated inFe or in S0
cyc2cyc1orfcoxBcoxAcoxCruscycA1sdrA1petA1petB1petC1cycA2sdrA2petA2petB2petC2hip (iro)Gene downstream
from sqr2cyoAcydAGene upstream
from doxDA2rod (downstream
from doxDA2)
Not differentiallyexpressed
Gene downstreamfrom sqr1
sqr3Gene upstream
from doxDA102
Real-time PCR
Fold change () Fold change
49a
235a
885a
175a
946a
568a
245a
474b
225 558b
14512b
6577b
6067b
465b
088b
277b
373b
148b
805b
48 1053
6 124517 4433 674
239
Fold Fold
21 197
15 10114 117
Underlined higher expression in FeII dotted underlined higher expressionin S0 Real-time PCR data from a [103233] b ([31] Bruscella Appia-Ayme Levican Ratouchniak Holmes Jedlicki and Bonnefoy manuscriptin preparation) c [data obtained from unsaturated spots]
33 Validation of microarrays results using real-timePCR
To confirm the expression patterns observed with themicroarrays some genes were selected for furtheranalysis by real-time PCR The rrs gene coding forthe 16S rRNA has been shown to be expressed at thesame (constitutive) level under both conditions ofgrowth (FeII- and S0-medium) [10] and was used asthe reference standard Raw fold changes in expressionare shown in Table 2 The expression ratios obtained byreal-time-PCR of most of these genes correlated wellwith those obtained with microarrays (Table 2)However as described previously in other cases thetranscript levels values obtained by real-time PCR werehigher than with the microarrays in accordance with thehigher sensitivity of the former technique Despite ofthese (minor) quantitative differences the resultsobtained by real-time PCR were in good agreementwith those obtained from microarrays and support thegeneral consistency between the two methods formeasuring relative expression levels
To differentiate the expression of the two identicalsqrI and sqrII operons 20-mers oligonucleotides weredesigned in the very beginning or very end of the geneclusters where the sequences differ Real-time PCR withthese oligonucleotides indicated that sqrII is 1053 foldmore expressed in FeII than in S0 conditions while sqrIis almost evenly expressed in both conditions (Table 2)Thus differential regulation of paralogue genes whichsequences are highly similar could be distinguished byreal-time PCR with adequate designed oligonucleotides
For the genes of the petII cyd cyo and doxII operonswhere B andor P values were near the cut-off limit real-time PCR experiments clearly showed higher expressionin S0 than in FeII conditions (Table 2)
In the case of the rus operon which correspondingspots were saturated on microarrays higher expressionin FeII- than in S0-grown cells was obtained by real-timePCR [103236] (Table 2)
4 Conclusion
Global changes in transcript abundance reflectingthe primary response of A ferrooxidans to energysource changes are in agreement with previous findingsfor most genes The differential expression of the ruspetI petII cyd cyo doxII operons encoding electrontransfer proteins is consistent with existing data([910202231ndash3336] Bruscella Appia-Ayme Levi-can Ratouchniak Holmes Jedlicki and Bonnefoymanuscript in preparation) Combined microarrays and
R Quatrini et al
real-time PCR data supported the FeII and S0 respiratorychain model we have proposed (Fig 3) ([9222329ndash3133] Bruscella Appia-Ayme Levican RatouchniakHolmes Jedlicki and Bonnefoy manuscript in prepara-tion) In this model the outer membrane cytochrome cCyc2 transfers electrons from FeII to the periplasmicrusticyanin which passes them to the membrane-boundcytochrome c4 Cyc1 and from there to the cyto-chrome oxidase CoxBACD where oxygen is reducedto water All these redox proteins are encoded by the
Fe(II)
OMOM
Periplasm
IMIM
Cytoplasm O O22 HH22OO
pH 16-3
Rusticy
Cyc
Cyc 1(c4)
Cytochromeoxidase
FeII gtgt S0
coxC
cyc2cyc1 coxB
coxArus
Operonrus
orf coxD
ORF
Fig 3 Model proposed for iron and sulfur energetic metabolism of A ferrooxipresented in the same color TQR thiosulfate quinol reductase SQR sulfid
rus operon [9] FeII oxidation and NAD(P) reductionhas been proposed to be coupled to explain the balanceof the electron flow from FeII between two pathwaysthe exergonic one through the aa3 type oxidasetowards oxygen encoded by the rus operon and theendergonic one through a bc1 complex toward NAD(P) [2437] In the reverse electron (endergonic)pathway the bc1 complex receives electrons from acytochrome c and transfers them to the quinol poolWe have proposed that this bc1 complex and this
Fe(III)
anin
2
UQUQ
CycA1(c4)
bc1complex(PetABC1)
NAD(P) NAD(P)HNAD(P) NAD(P)H
NNAADDHHII
FeII gtgt S0
OperonpetI
cycA1 petA1petB1
petC1sdrA1
dans The transcriptional units and the corresponding redox proteins aree quinone reductase Hip High Potential Ironndashsulfur protein
R Quatrini et al
cytochrome c are encoded by the petI operon ([3031]Bruscella Appia-Ayme Levican Ratouchniak HolmesJedlicki and Bonnefoy manuscript in preparation) andthat the rusticyanin can give electrons to two differentcytochromes c4 CycA1 encoded by the petI operon orCyc1 encoded by the rus operon ([31] Bruscella Appia-Ayme Levican Ratouchniak Holmes Jedlicki andBonnefoy manuscript in preparation) In the formercase electrons are transferred to the endergonic pathwayto oxygen while in the later case they are transferred tothe exergonic pathway to NAD(P) In A ferrooxidansthe cytochrome bc1 complex has been shown to functionin reverse in FeII grown cells even in the presence ofthiosulfate while it functions in the forward direction inS0 grown cells [2224] According to our model the bc1complex encoded by petI is the one functioning inreverse and transfers the electrons from ferrous iron toNAD(P) while the bc1 complex encoded by petII is theone functioning in the forward direction and transferselectrons from sulfur to oxygen ([31] Bruscella Appia-Ayme Levican Ratouchniak Holmes Jedlicki andBonnefoy manuscript in preparation)When functioningin the forward direction the bc1 complex receiveselectrons from the quinol pool and transfers them eitherto a membrane-bound cytochrome c andor to a solubleredox protein such a cytochrome c or a high potentialironndashsulfur protein (HiPIP) which then gives the electronto the terminal oxidase where oxygen reduction takesplace [38ndash40] Since a membrane-bound cytochrome c(CycA2) and a soluble HiPIP are encoded by the petIIoperon we have suggested that these two redox proteinstransfer electrons between the two integral membranecomplexes the bc1 and the terminal oxidase ([31]Bruscella Appia-Ayme Levican Ratouchniak HolmesJedlicki and Bonnefoy manuscript in preparation)
We propose to continue our microarray investiga-tions not only providing a deeper analysis of theexisting comparison between transcription in FeIIversus S0 grown cells but also extending the work toinvestigate transcription in cells grown in differentconcentrations of FeII and at different pHs Pertinentaspects of our working models derived from thecombination of bioinformatic and microarray analysiswill be subjected to confirmation by real-time PCR andwhere feasible by mutant construction and analysisgenetic complementation and biochemical experiments
Acknowledgements
Work supported in part by Fondecyt 1010623 and1050063 ConicytCNRS ldquoGeomexrdquo and ldquoPuces agraveADNrdquo from the Centre National de la Recherche
Scientifique and NSF RQ was the recipient of anAmerican Society for Microbiology Antorcha Fellowshipand was supported by scholarships from the DAAD andfrom the Fundacioacuten Ciencia para la Vida Chile CAAwassupported by a CNRS post-doctoral fellowship We thankthe Institute vfor Genome Research (TIGR) for the use oftheir genome sequence of A ferrooxidans
References
[1] Baker BJ Banfield JF FEMS Microbiol Ecol 44 (2003)139ndash152
[2] Johnson DB Hallberg KB Res Microbiol 154 (2003)466ndash473
[3] Schippers A Sand W Appl Environ Microbiol 65 (1999)319ndash321
[4] Yamanaka T et al in Mukohata Y (Ed) New Era ofBioenergetics Academic Press Tokyo 1991 pp 223ndash246
[5] Bruschi M Cavazza C Giudici-Orticoni MT Deacutechets 4(1996) 27ndash30
[6] Blake RC Shute EA Biochemistry 33 (1994) 9220ndash9228[7] Ingledew WJ Cox JC Halling PJ FEMSMicrobiol Lett 2
(1977) 193ndash197[8] Giudici-Orticoni MT et al Biochemistry 39 (2002)
7205ndash7211[9] Appia-Ayme C et al Appl Environ Microbiol 65 (1999)
4781ndash4787[10] Yarzabal A et al Microbiology 150 (2004) 2113ndash2123[11] Appia-Ayme C et al FEMS Microbiol Lett 167 (1998)
171ndash177[12] Giudici-Orticoni MT et al J Biol Chem 274 (1999)
30365ndash30369[13] Yarzabal A Brasseur G Bonnefoy V FEMSMicrobiol Lett
209 (2002) 189ndash195[14] Yarzabal A et al J Bacteriol 184 (2002) 313ndash317[15] Tabita R Silver M Lundgren DG Can J Biochem 47
(1969) 1141ndash1145[16] Sugio T et al Appl Environ Microbiol 54 (1988) 153ndash157[17] Sugio T et al J Bacteriol 169 (1987) 4916ndash4922[18] Silver M Lundgren DG Can J Biochem 46 (1968)
1215ndash1220[19] Silver M Lundgren DG Can J Biochem 46 (1968)
457ndash461[20] Ramirez P et al Appl Environ Microbiol 68 (2002)
1837ndash1845[21] Kuenen JG et al in Torma AE Apel ML Brierley CL
(Eds) Biohydrometallurgical Technologies vol 2 TMSWarrendale PA 1993 pp 487ndash494
[22] Brasseur G et al Biochim Biophys Acta 1656 (2004)114ndash126
[23] Wakai S Kikumoto M Kanao T Kamimura K BiosciBiotechnol Biochem 68 (2004) 2519ndash2528
[24] Brasseur G et al Biochim Biophys Acta 1555 (2002) 37ndash43[25] Liu Z et al J Bacteriol 182 (2000) 2269ndash2276[26] Liu Z Borne F Ratouchniak J Bonnefoy V Hydrometal-
lurgy 59 (2001) 339ndash345[27] Kane MD Jatkoe TA Stumpf CR Lu J Thomas JD
Madore SJ Nucleic Acids Res 28 (2000) 4552ndash4557[28] Aiba H Adhya S de Crombrugghe B J Biol Chem 256
(1981) 11905ndash11910
R Quatrini et al
[29] Smyth GH Stat Appl Genet Mol Biol 3 (2004) 3[30] Levican G et al J Bacteriol 184 (2002) 1498ndash1501[31] Bruscella P Etude des opeacuterons petI et petII codant pour deux
complexes bc1 chez la bacteacuterie acidophile chimioautotrophestricte Acidithiobacillus ferrooxidans PhD Thesis Universiteacute dela Meacutediterraneacutee Aix-Marseille II 2004
[32] Yarzabal A Duquesne K Bonnefoy V in Ciminelli VSTet Garcia Jr O (Eds) Biohydrometallurgy FundamentalsTechnology and Sustainable Development Elsevier Amsterdam2001 pp 253ndash261
[33] Yarzabal A Etude de lopeacuteron rus codant pour sept proteacuteinestransporteurs deacutelectrons chez la bacteacuterie acidophile chimioau-totrophe obligatoire Acidithiobacillus ferrooxidans PhD ThesisUniversiteacute de la Meacutediterraneacutee Aix-Marseille II 2003
[34] Pulgar V et al in Torma AE Apel ML Brierley CL(Eds) Biohydrometallurgical Technologies The Mineralsvol 2 Metals and Material Society Warrendale PA 1993pp 541ndash548
[35] Jedlicki E et al Biotechnol Appl Biochem 8 (1986)342ndash350
[36] Yarzabal A Duquesne K Bonnefoy V Hydrometallurgy 71(2003) 107ndash114
[37] Elbehti A Brasseur G Lemesle-Meunier D J Bacteriol 182(2000) 3602ndash3606
[38] Trumpower BL Microbiol Rev 54 (1990) 101ndash109[39] Bonora P et al Biochim Biophys Acta 1410 (1999) 51ndash60[40] Pereira MM Carita JN Teixeira M Biochemistry 38
(1999) 1268ndash1275
R Quatrini et al
software (Version 10) Oligonucleotide design consid-erations include narrow melting temperature (92plusmn7degC)and avoidance of self-annealing structures To excluderedundant oligonucleotides and minimize cross-hybrid-ization a Blast search (using eminus10 as cutoff) was carriedout A special set of control oligonucleotides (negativepositive tiled and antisense sequences) was included toevaluate probe specificity and adjust the hybridizationconditions 50-mer oligonucleotides corresponding tothe CDS of the gfp gene from Aequorea sp the rad9gene form Saccharomyces cereviciae and the idi2 genefrom human were used as negative controls
Unmodified 50-mer oligonucleotides have beenshown to enable high signal intensity and high speci-ficity [27] Therefore unmodified oligonucleotidessynthesized by MWG Biotech at a 10nm scale and at100μM were used
24 Oligonucleotides spotting
The unmodified 50-mer oligonucleotides were dilut-ed to 50μM in Corning Prontotrade Universal SpottingSolution for spotting purposes They were spotted induplicate on Corning UltraGAPS slides coated withGamma Amino Propyl Silane with an 8 pin Affimetrix427 Arrayer at the Marseille-Nice Genopole (France)They were subsequently immobilized by UV cross-linking with the UV Stratalinker 2400 (Stratagene) andstored in a dessicator cabinet until use
25 RNA preparation
A ferrooxidansmid logarithmic cultures grown in thepresence of FeII (62mM FeSO4) or S0 (05 S0) asenergy source (30degC 200rpm) were harvested by cen-trifugation at 4degC and immediately processed for RNAextraction Cells were washed in 9K buffer (pH adjusted)to remove iron traces or sulfur particles before furthertreatment Total RNA was extracted using a modifiedacidndashphenol extraction method [28] including a pre-liminary TRIZOLreg reagent (Invitrogen) extraction stepThis RNA was used directly for cDNA synthesis andlabelling For real-time PCR RNAs were additionallypurified with the High Pure RNA isolation kit (RocheApplied Biosystem) and treated twice with DNAse I(Roche Applied Biosystem) The lack of DNA contam-ination was checked by PCR on each RNA sample
26 Labelled cDNA synthesis and hybridization
The ChipShottrade Labelling Clean-Up System (Pro-mega-Corning) was used to generate fluorescently
labeled cDNA via direct incorporation of Cyreg3 andCyreg5-labeled nucleotides from Amersham BiosciencesThe reverse transcription reaction was performed in thepresence of 5μg total RNA and random hexamers(Protocols wwwpromegacom) Two independentcDNA preparations were labeled once with each dye(reverse dye labeling) to account for sampling differ-ences biases in dye coupling or emission efficiency ofCyreg-dyes Labelled cDNA was purified from contam-inating fluorescent dNTPs and degraded RNA using theChipShot Labelling Clean-Up System (Promega-Corn-ing) Dye incorporation efficiency was determined byabsorbance readings at 260 550 and 650nm and thefrequency of incorporation (FOI pmol of dye incorpo-rated per ng of cDNA) was calculated according toPromegas instructions Optimally labelled sampleswere combined vacuum-dried and resuspended to afinal volume of 40ndash50μL in Corning Pronto UniversalHybridization Buffer
The Pronto trade Universal Hybridization kit was usedaccording to Promegas instructions Briefly thecombined denatured target cDNA samples (95degC for5min) were hybridized to the spotted slides for 14h at42degC in the Corning hybridization chamber Followinghybridization slides were washed in serial dilutions ofCorning Wash Buffers as recommended by the manu-facturer and dried by centrifugation at 1200timesg for 2min
27 Image acquisition and data analysis
Microarrays were scanned for the Cyreg3 and Cyreg5fluorescent signals using the ScanArray 4000 Micro-array Analysis System (PerkinElmer Life Sciences Inc)at a resolution of 10μm per pixel Scanning parameters(laser power 85ndash95 and photomultiplier voltage 90ndash95) were adjusted so that overall intensities in bothfluorescent channels were balanced and few spots weresaturated (to maximize the dynamic range) Scans storedas 16-bit TIFF (Tagged Information File Format) imagefiles and then analyzed with the image quantificationsoftware package GenePix Pro 40 (Axon InstrumentsInc) Addressing information raw signal intensityreadings and quality parameters for each spot wererecorded Low-quality spots (spots smaller than 60μmor bigger than 160μm in diameter sub-circular in shapeandor exhibiting uneven fluorescence distribution)were flagged and filtered out Genes with median signalintensities less than two standard deviations abovebackground in both channels were considered as notdetected and array elements that approached themaximum value (65535per pixel for a 16-bit scanner)were considered as saturated and excluded from further
R Quatrini et al
statistical analysis Local background was subtractedfrom the recorded spot intensities (median values)Negative values (ie local background intensities higherthan spot signal) were considered as no data Medianspot intensities were Log transformed (Log2) andnormalized to account for any difference in totalintensity between the scanned images due to pin effects(Pin group location normalization) dye and slide effects(Scale normalization) and intensity-dependent effects(Lowees normalization) using the R package (Version181 URL httpwwwR-projectorg) The processedFeII and S0 signal intensities for each spot were used forcalculating the expression ratio FeIIS0 Eight ratiovalues per gene resulting from direct and reverselabelling and replicate experiments were used forfurther statistical analysis of the data The statisticalsignificance of differential expression in FeII or S0
grown cells was assessed using R package applying tothe data set the Student t-test [28]
28 Real-time PCR
The relative abundances of a set of differentiallyexpressed genes and a set of invariant genes accordingto the microarray results obtained were determined inFeII- and S0-grown cells by real-time PCR Specificprimers for the genes of interest amplifying averageproducts of 300bp with about 50GC and about 55degCTm were designed Equal amounts of A ferrooxidansDNAseI-treated total RNA were retro-transcribed fromthese primers with the Superscript IItrade RNase Hminus
Fig 1 Differentially expressed genes in A ferrooxidans microarrays (A) OFeIIS0)] (B) Fold-change cut-off determination by hybridization of identica
(InVitro Life Technologies) at 42degC for 50min and thentreated at 70degC for 15min to inactivate the enzyme Thereal-time PCR quantifications were realized at thetranscriptome platform of the IBSM (MarseilleFrance) on the total cDNA obtained using the Light-Cycler instrument and the LightCycler Fast Start DNAmaster (plus) SYBR Green I PCR kit (Roche AppliedBiosystems) with external standards as described inRoche Molecular Biochemicals technical note no LC112000 The real-time PCR experiments were per-formed twice with both independent total RNA andcDNA preparations by the comparative threshold cyclemethod The calculated threshold cycle (Ct) for eachgene was normalized to Ct of the rrs gene coding for the16S rRNAwhich expression is invariant under FeII- andS0-growth conditions [10]
3 Results and discussion
31 A ferrooxidans microarrays analysis
The genomic expression profiles of A ferrooxidansATCC 23270 growing on FeII or S0 media weredetermined and compared with one another To identifythe genes differentially affected by the energy sourcethe following statistical criteria were employed (i)genes with P values gt001 were considered as notregulated regardless of their differential expressionlevel (ii) genes with a P value of lt001 were consideredto have significant differential expression and thusregarded as up-regulated either in FeII or in S0
dds of being differentially expressed [B-statistic versus M (Log2 ratiol cDNA samples labelled with Cyreg3 and Cyreg5
R Quatrini et al
conditions (Fig 1A) The fold-change cut-off to beused for the identification of the genes exhibitingdifferential expression between treatments wasassessed by hybridization of identical cDNA samples(total RNA extracted from FeII-grown cells) labeledwith Cyreg3 or Cyreg5 dyes The pattern of hybridizationrevealed a linear correlation of the data and a foldchange in gene expression level (M Log2 ratio FeIIS0) no larger that 15 (Fig 1B) Similar cut-off valueshave been reported as being biologically significantelsewhere Therefore genes with a positive Log2 FeIIS0 ratio (M) were considered to be more expressed inFeII- than in S0 and vice-versa while the genes with aLog2 FeIIS0 ratio (M) close to zero were considered tobe similarly expressed in both conditions
On the basis of the criteria described above theexpression level of more than 200 genes of Aferrooxidans was affected by the presence of eitherFeII or S0 as energy source in the growth media (Fig 2)The comparison of the transcriptional profiles of FeII-grown cells versus S0-grown cell indicated that about120 genes were induced (Max=up to 38 fold) in FeIIconditions and about 90 were specifically induced(Max=up to 10 fold) in S0 conditions
32 Energy source (FeII or S0) expression profile
The genes expressed differentially according to theenergy source can be divided into seven functionalcategories energy metabolism central intermediarymetabolism regulatory functions protein translationamino acid biosynthesis cell wall and envelopeconstituents and miscellaneous (unknown function) Inthis paper we will analyze the genes encoding proteinsinvolved in the energetic metabolism while resultspertaining to the other metabolic functions and more
Fig 2 Upregulated genes in A ferrooxidans cells grown in FeII or S0 StatiBayes B-statistic In the left panel circles induced in FeII triangles induce
particularly to the carbon metabolism are described inthe accompanying paper (Appia-Ayme et al)
Table 1 summarizes the data obtained on genesencoding electron transfer proteins we have previouslysuggested to be involved in FeII or S0 energeticmetabolism ([9223031] Bruscella Appia-AymeLevican Ratouchniak Holmes Jedlicki and Bonnefoymanuscript in preparation)
321 Characterization of FeII-induced genes encodingelectron transporters
In FeII conditions the petI operon encoding one ofthe bc1 complexes ([243031] Bruscella Appia-AymeLevican Ratouchniak Holmes Jedlicki and Bonnefoymanuscript in preparation) was highly expressed (Table1 and Fig 3) in agreement with Northern hybridizationand real time PCR experiments ([31] Bruscella Appia-Ayme Levican Ratouchniak Holmes Jedlicki andBonnefoy manuscript in preparation)
The rus operon encoding electron transfer proteinsinvolved in the respiratory chain between FeII andoxygen [9] was shown by a number of approaches tobe more expressed in FeII than in S0 conditions inthe strains ATCC 33020 [10133233] ATCC 19859[2234] or Torma [35] except in NASF-1 strainwhere the transcriptional level of coxB was similar inboth conditions [23] The spots corresponding to thegenes of this operon were saturated in iron so ex-pression ratios could not be determined Howeverdifferential expression in iron is in agreement withprevious results Optimized image acquisition anddata analysis conditions will have to be found for thiscase
Surprisingly while higher sulfide quinone reductaseactivity was observed in S0 than in FeII conditions [22]two out of the three putative operons encoding sulfide
stical significance was assessed by either t-test probability value P ord in S0
Table 1Microarray expression ratios between FeII and S0 grown cells
Genename
Gene function M value Pvalue
Expression
rus operoncyc2 Outer membrane
cytochrome c precursorSaturated
cyc1 Cytochrome c552diheme precursor
Saturated
coxB aa3 Cytochrome coxidase II
Saturated
coxA aa3 Cytochrome coxidase I
Saturated
coxC aa3 Cytochrome coxidase III
Saturated
rus Rusticyanin Saturatedrus Rusticyanin Saturatedrus Rusticyanin Saturated
cydAB encoding bd ubiquinol oxidasecydA Cytochrome d ubiquinol
oxidase I (bd)minus075 0128 ND
cydB Cytochrome d ubiquinoloxidase II (bd)
minus122 0065 ND
cyoBACD encoding bo3 ubiquinol oxidasecyoB Cytochrome o ubiquinol
oxidase subunit IIminus197 0008 NL
cyoA Cytochrome o ubiquinoloxidase subunit I
minus269 0008 NL
cyoC Cytochrome o ubiquinoloxidase subunit III
minus249 0020 ND
cyoD Cytochrome o ubiquinoloxidase subunit IV
minus145 0113 ND
doxI operon encoding thiosulfate quinol reductasedoxDA1 thiosulfate quinol
oxido-reductase149 0056 ND
doxII operon encoding thiosulfate quinol reductasedoxDA2 thiosulfate quinol
oxido-reductaseminus141 0029 ND
rod Rhodanese-relatedsulfurtransferase
minus095 0061 ND
petI operoncycA1 Cytochrome c4 precursor
(c-552)361 0000 DF
petA1 Ubiquinol-cytochrome creductase Rieske protein
347 0000 DF
petB1 Ubiquinol-cytochrome creductase cytochrome b
525 0001 DF
petC1 Ubiquinol-cytochrome creductase cytochrome c1
341 0000 DF
petII operoncycA2 Cytochrome c4 precursor
(c-552)minus040 0192 ND
petA2 Ubiquinol-cytochrome creductase Rieske protein
minus135 0012 NL
Table 1 (continued)
Genename
Gene function M value Pvalue
Expression
petII operonpetB2 Ubiquinol-cytochrome c
reductase cytochrome bminus142 0013 NL
petC2 Ubiquinol-cytochrome creductase cytochrome c1
009 0780 ND
hip High redox potentialironndashsulfur protein(HiPIP)
minus104 0031 ND
sqrI operon encoding sulfide quinone reductasesqrI Sulfide quinone reductase 216 0000 DF
sqrII operon encoding sulfide quinone reductasesqrII Sulfide quinone reductase 247 0000 DF
sqr3 gene encoding sulfide quinone reductasesqr3 Sulfide quinone reductase 059 0491 ND
ND not differential (Pgt001) NL near cut-off limit (are significantaccording to one of the test criteria eg Ple001 therefore indefinite)In bold Ple001 DF Differential FeII up (Plt001 and Mgt0)
R Quatrini et al
quinone reductase (sqrI and II) showed a 5 fold higherexpression (M=217plusmn063) in FeII- than in S0-growncells (Table 1) However these two operons areconstituted of paralogue genes sqr and three othergenes encoding hypothetical proteins Likely theidentity level of these genes prevented the differentia-tion of their expression levels by microarrays using 50-mers oligonucleotides The third sqr gene (sqr3)included in a different gene context does not seem tobe differentially expressed in either conditions contraryto what was observed in A ferrooxidansNASF-1 wherethe transcriptional level of sqr3 was found to be threefold higher in S0 than in FeII-grown cells [23] Furtherexperiments are therefore required to explain thesediscrepancies
322 Characterization of S0-induced genes encodingelectron transporters
Several genes of the cyd cyo doxII and petIIoperons presented differences in expression that werevery near the statistic significance cut-off limitestablished in the present analysis (Table 1) and werethus considered as differentially expressed Thereforethese operons seem to be more expressed in S0 than inFeII conditions in agreement with previous results Wehave indeed shown by Northern hybridization and realtime PCR that the petII operon is slightly expressed inS0 than in FeII conditions in the ATCC 33020 strain([31] Bruscella Appia-Ayme Levican RatouchniakHolmes Jedlicki and Bonnefoy manuscript in
R Quatrini et al
preparation) The same holds true for the rod geneencoding a rhodanese-like proteins [20] and belongingto the putative doxII operon Furthermore higheramounts of quinol oxidases and higher activities ofquinol oxidases and thiosulfate quinol reductase havebeen observed in ATCC 19859 cells grown in S0
compared to those grown in FeII [22] However in theNASF-1 strain the transcription of the cydA geneencoding subunit I of the alternate bd quinol oxidasewas similar in both conditions [23]
Table 2Comparison of raw fold changes in gene expression between FeII- andS0-grown cells (midlog) obtained by microarray analysis and real timePCR () in this work
Gene expression ratios
Microarray
Fold ()
46c
116c
84c
96c
ndash44c
58c
130203120276116
02081820
ndash1152
720626
09
Fold
12
03
Upregulated inFe or in S0
cyc2cyc1orfcoxBcoxAcoxCruscycA1sdrA1petA1petB1petC1cycA2sdrA2petA2petB2petC2hip (iro)Gene downstream
from sqr2cyoAcydAGene upstream
from doxDA2rod (downstream
from doxDA2)
Not differentiallyexpressed
Gene downstreamfrom sqr1
sqr3Gene upstream
from doxDA102
Real-time PCR
Fold change () Fold change
49a
235a
885a
175a
946a
568a
245a
474b
225 558b
14512b
6577b
6067b
465b
088b
277b
373b
148b
805b
48 1053
6 124517 4433 674
239
Fold Fold
21 197
15 10114 117
Underlined higher expression in FeII dotted underlined higher expressionin S0 Real-time PCR data from a [103233] b ([31] Bruscella Appia-Ayme Levican Ratouchniak Holmes Jedlicki and Bonnefoy manuscriptin preparation) c [data obtained from unsaturated spots]
33 Validation of microarrays results using real-timePCR
To confirm the expression patterns observed with themicroarrays some genes were selected for furtheranalysis by real-time PCR The rrs gene coding forthe 16S rRNA has been shown to be expressed at thesame (constitutive) level under both conditions ofgrowth (FeII- and S0-medium) [10] and was used asthe reference standard Raw fold changes in expressionare shown in Table 2 The expression ratios obtained byreal-time-PCR of most of these genes correlated wellwith those obtained with microarrays (Table 2)However as described previously in other cases thetranscript levels values obtained by real-time PCR werehigher than with the microarrays in accordance with thehigher sensitivity of the former technique Despite ofthese (minor) quantitative differences the resultsobtained by real-time PCR were in good agreementwith those obtained from microarrays and support thegeneral consistency between the two methods formeasuring relative expression levels
To differentiate the expression of the two identicalsqrI and sqrII operons 20-mers oligonucleotides weredesigned in the very beginning or very end of the geneclusters where the sequences differ Real-time PCR withthese oligonucleotides indicated that sqrII is 1053 foldmore expressed in FeII than in S0 conditions while sqrIis almost evenly expressed in both conditions (Table 2)Thus differential regulation of paralogue genes whichsequences are highly similar could be distinguished byreal-time PCR with adequate designed oligonucleotides
For the genes of the petII cyd cyo and doxII operonswhere B andor P values were near the cut-off limit real-time PCR experiments clearly showed higher expressionin S0 than in FeII conditions (Table 2)
In the case of the rus operon which correspondingspots were saturated on microarrays higher expressionin FeII- than in S0-grown cells was obtained by real-timePCR [103236] (Table 2)
4 Conclusion
Global changes in transcript abundance reflectingthe primary response of A ferrooxidans to energysource changes are in agreement with previous findingsfor most genes The differential expression of the ruspetI petII cyd cyo doxII operons encoding electrontransfer proteins is consistent with existing data([910202231ndash3336] Bruscella Appia-Ayme Levi-can Ratouchniak Holmes Jedlicki and Bonnefoymanuscript in preparation) Combined microarrays and
R Quatrini et al
real-time PCR data supported the FeII and S0 respiratorychain model we have proposed (Fig 3) ([9222329ndash3133] Bruscella Appia-Ayme Levican RatouchniakHolmes Jedlicki and Bonnefoy manuscript in prepara-tion) In this model the outer membrane cytochrome cCyc2 transfers electrons from FeII to the periplasmicrusticyanin which passes them to the membrane-boundcytochrome c4 Cyc1 and from there to the cyto-chrome oxidase CoxBACD where oxygen is reducedto water All these redox proteins are encoded by the
Fe(II)
OMOM
Periplasm
IMIM
Cytoplasm O O22 HH22OO
pH 16-3
Rusticy
Cyc
Cyc 1(c4)
Cytochromeoxidase
FeII gtgt S0
coxC
cyc2cyc1 coxB
coxArus
Operonrus
orf coxD
ORF
Fig 3 Model proposed for iron and sulfur energetic metabolism of A ferrooxipresented in the same color TQR thiosulfate quinol reductase SQR sulfid
rus operon [9] FeII oxidation and NAD(P) reductionhas been proposed to be coupled to explain the balanceof the electron flow from FeII between two pathwaysthe exergonic one through the aa3 type oxidasetowards oxygen encoded by the rus operon and theendergonic one through a bc1 complex toward NAD(P) [2437] In the reverse electron (endergonic)pathway the bc1 complex receives electrons from acytochrome c and transfers them to the quinol poolWe have proposed that this bc1 complex and this
Fe(III)
anin
2
UQUQ
CycA1(c4)
bc1complex(PetABC1)
NAD(P) NAD(P)HNAD(P) NAD(P)H
NNAADDHHII
FeII gtgt S0
OperonpetI
cycA1 petA1petB1
petC1sdrA1
dans The transcriptional units and the corresponding redox proteins aree quinone reductase Hip High Potential Ironndashsulfur protein
R Quatrini et al
cytochrome c are encoded by the petI operon ([3031]Bruscella Appia-Ayme Levican Ratouchniak HolmesJedlicki and Bonnefoy manuscript in preparation) andthat the rusticyanin can give electrons to two differentcytochromes c4 CycA1 encoded by the petI operon orCyc1 encoded by the rus operon ([31] Bruscella Appia-Ayme Levican Ratouchniak Holmes Jedlicki andBonnefoy manuscript in preparation) In the formercase electrons are transferred to the endergonic pathwayto oxygen while in the later case they are transferred tothe exergonic pathway to NAD(P) In A ferrooxidansthe cytochrome bc1 complex has been shown to functionin reverse in FeII grown cells even in the presence ofthiosulfate while it functions in the forward direction inS0 grown cells [2224] According to our model the bc1complex encoded by petI is the one functioning inreverse and transfers the electrons from ferrous iron toNAD(P) while the bc1 complex encoded by petII is theone functioning in the forward direction and transferselectrons from sulfur to oxygen ([31] Bruscella Appia-Ayme Levican Ratouchniak Holmes Jedlicki andBonnefoy manuscript in preparation)When functioningin the forward direction the bc1 complex receiveselectrons from the quinol pool and transfers them eitherto a membrane-bound cytochrome c andor to a solubleredox protein such a cytochrome c or a high potentialironndashsulfur protein (HiPIP) which then gives the electronto the terminal oxidase where oxygen reduction takesplace [38ndash40] Since a membrane-bound cytochrome c(CycA2) and a soluble HiPIP are encoded by the petIIoperon we have suggested that these two redox proteinstransfer electrons between the two integral membranecomplexes the bc1 and the terminal oxidase ([31]Bruscella Appia-Ayme Levican Ratouchniak HolmesJedlicki and Bonnefoy manuscript in preparation)
We propose to continue our microarray investiga-tions not only providing a deeper analysis of theexisting comparison between transcription in FeIIversus S0 grown cells but also extending the work toinvestigate transcription in cells grown in differentconcentrations of FeII and at different pHs Pertinentaspects of our working models derived from thecombination of bioinformatic and microarray analysiswill be subjected to confirmation by real-time PCR andwhere feasible by mutant construction and analysisgenetic complementation and biochemical experiments
Acknowledgements
Work supported in part by Fondecyt 1010623 and1050063 ConicytCNRS ldquoGeomexrdquo and ldquoPuces agraveADNrdquo from the Centre National de la Recherche
Scientifique and NSF RQ was the recipient of anAmerican Society for Microbiology Antorcha Fellowshipand was supported by scholarships from the DAAD andfrom the Fundacioacuten Ciencia para la Vida Chile CAAwassupported by a CNRS post-doctoral fellowship We thankthe Institute vfor Genome Research (TIGR) for the use oftheir genome sequence of A ferrooxidans
References
[1] Baker BJ Banfield JF FEMS Microbiol Ecol 44 (2003)139ndash152
[2] Johnson DB Hallberg KB Res Microbiol 154 (2003)466ndash473
[3] Schippers A Sand W Appl Environ Microbiol 65 (1999)319ndash321
[4] Yamanaka T et al in Mukohata Y (Ed) New Era ofBioenergetics Academic Press Tokyo 1991 pp 223ndash246
[5] Bruschi M Cavazza C Giudici-Orticoni MT Deacutechets 4(1996) 27ndash30
[6] Blake RC Shute EA Biochemistry 33 (1994) 9220ndash9228[7] Ingledew WJ Cox JC Halling PJ FEMSMicrobiol Lett 2
(1977) 193ndash197[8] Giudici-Orticoni MT et al Biochemistry 39 (2002)
7205ndash7211[9] Appia-Ayme C et al Appl Environ Microbiol 65 (1999)
4781ndash4787[10] Yarzabal A et al Microbiology 150 (2004) 2113ndash2123[11] Appia-Ayme C et al FEMS Microbiol Lett 167 (1998)
171ndash177[12] Giudici-Orticoni MT et al J Biol Chem 274 (1999)
30365ndash30369[13] Yarzabal A Brasseur G Bonnefoy V FEMSMicrobiol Lett
209 (2002) 189ndash195[14] Yarzabal A et al J Bacteriol 184 (2002) 313ndash317[15] Tabita R Silver M Lundgren DG Can J Biochem 47
(1969) 1141ndash1145[16] Sugio T et al Appl Environ Microbiol 54 (1988) 153ndash157[17] Sugio T et al J Bacteriol 169 (1987) 4916ndash4922[18] Silver M Lundgren DG Can J Biochem 46 (1968)
1215ndash1220[19] Silver M Lundgren DG Can J Biochem 46 (1968)
457ndash461[20] Ramirez P et al Appl Environ Microbiol 68 (2002)
1837ndash1845[21] Kuenen JG et al in Torma AE Apel ML Brierley CL
(Eds) Biohydrometallurgical Technologies vol 2 TMSWarrendale PA 1993 pp 487ndash494
[22] Brasseur G et al Biochim Biophys Acta 1656 (2004)114ndash126
[23] Wakai S Kikumoto M Kanao T Kamimura K BiosciBiotechnol Biochem 68 (2004) 2519ndash2528
[24] Brasseur G et al Biochim Biophys Acta 1555 (2002) 37ndash43[25] Liu Z et al J Bacteriol 182 (2000) 2269ndash2276[26] Liu Z Borne F Ratouchniak J Bonnefoy V Hydrometal-
lurgy 59 (2001) 339ndash345[27] Kane MD Jatkoe TA Stumpf CR Lu J Thomas JD
Madore SJ Nucleic Acids Res 28 (2000) 4552ndash4557[28] Aiba H Adhya S de Crombrugghe B J Biol Chem 256
(1981) 11905ndash11910
R Quatrini et al
[29] Smyth GH Stat Appl Genet Mol Biol 3 (2004) 3[30] Levican G et al J Bacteriol 184 (2002) 1498ndash1501[31] Bruscella P Etude des opeacuterons petI et petII codant pour deux
complexes bc1 chez la bacteacuterie acidophile chimioautotrophestricte Acidithiobacillus ferrooxidans PhD Thesis Universiteacute dela Meacutediterraneacutee Aix-Marseille II 2004
[32] Yarzabal A Duquesne K Bonnefoy V in Ciminelli VSTet Garcia Jr O (Eds) Biohydrometallurgy FundamentalsTechnology and Sustainable Development Elsevier Amsterdam2001 pp 253ndash261
[33] Yarzabal A Etude de lopeacuteron rus codant pour sept proteacuteinestransporteurs deacutelectrons chez la bacteacuterie acidophile chimioau-totrophe obligatoire Acidithiobacillus ferrooxidans PhD ThesisUniversiteacute de la Meacutediterraneacutee Aix-Marseille II 2003
[34] Pulgar V et al in Torma AE Apel ML Brierley CL(Eds) Biohydrometallurgical Technologies The Mineralsvol 2 Metals and Material Society Warrendale PA 1993pp 541ndash548
[35] Jedlicki E et al Biotechnol Appl Biochem 8 (1986)342ndash350
[36] Yarzabal A Duquesne K Bonnefoy V Hydrometallurgy 71(2003) 107ndash114
[37] Elbehti A Brasseur G Lemesle-Meunier D J Bacteriol 182(2000) 3602ndash3606
[38] Trumpower BL Microbiol Rev 54 (1990) 101ndash109[39] Bonora P et al Biochim Biophys Acta 1410 (1999) 51ndash60[40] Pereira MM Carita JN Teixeira M Biochemistry 38
(1999) 1268ndash1275
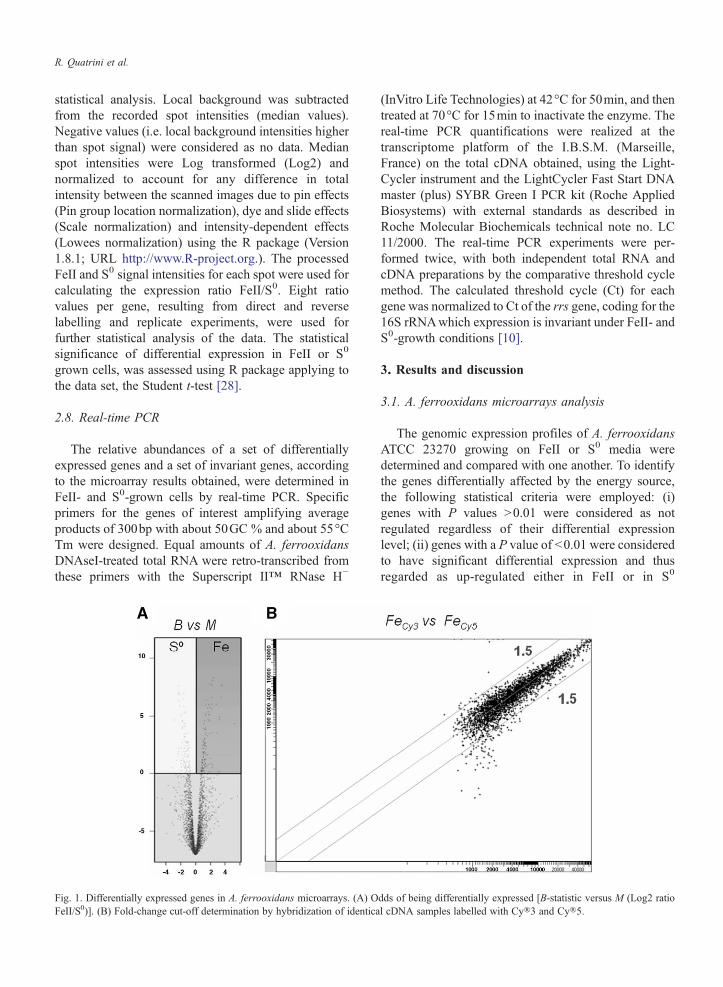
R Quatrini et al
statistical analysis Local background was subtractedfrom the recorded spot intensities (median values)Negative values (ie local background intensities higherthan spot signal) were considered as no data Medianspot intensities were Log transformed (Log2) andnormalized to account for any difference in totalintensity between the scanned images due to pin effects(Pin group location normalization) dye and slide effects(Scale normalization) and intensity-dependent effects(Lowees normalization) using the R package (Version181 URL httpwwwR-projectorg) The processedFeII and S0 signal intensities for each spot were used forcalculating the expression ratio FeIIS0 Eight ratiovalues per gene resulting from direct and reverselabelling and replicate experiments were used forfurther statistical analysis of the data The statisticalsignificance of differential expression in FeII or S0
grown cells was assessed using R package applying tothe data set the Student t-test [28]
28 Real-time PCR
The relative abundances of a set of differentiallyexpressed genes and a set of invariant genes accordingto the microarray results obtained were determined inFeII- and S0-grown cells by real-time PCR Specificprimers for the genes of interest amplifying averageproducts of 300bp with about 50GC and about 55degCTm were designed Equal amounts of A ferrooxidansDNAseI-treated total RNA were retro-transcribed fromthese primers with the Superscript IItrade RNase Hminus
Fig 1 Differentially expressed genes in A ferrooxidans microarrays (A) OFeIIS0)] (B) Fold-change cut-off determination by hybridization of identica
(InVitro Life Technologies) at 42degC for 50min and thentreated at 70degC for 15min to inactivate the enzyme Thereal-time PCR quantifications were realized at thetranscriptome platform of the IBSM (MarseilleFrance) on the total cDNA obtained using the Light-Cycler instrument and the LightCycler Fast Start DNAmaster (plus) SYBR Green I PCR kit (Roche AppliedBiosystems) with external standards as described inRoche Molecular Biochemicals technical note no LC112000 The real-time PCR experiments were per-formed twice with both independent total RNA andcDNA preparations by the comparative threshold cyclemethod The calculated threshold cycle (Ct) for eachgene was normalized to Ct of the rrs gene coding for the16S rRNAwhich expression is invariant under FeII- andS0-growth conditions [10]
3 Results and discussion
31 A ferrooxidans microarrays analysis
The genomic expression profiles of A ferrooxidansATCC 23270 growing on FeII or S0 media weredetermined and compared with one another To identifythe genes differentially affected by the energy sourcethe following statistical criteria were employed (i)genes with P values gt001 were considered as notregulated regardless of their differential expressionlevel (ii) genes with a P value of lt001 were consideredto have significant differential expression and thusregarded as up-regulated either in FeII or in S0
dds of being differentially expressed [B-statistic versus M (Log2 ratiol cDNA samples labelled with Cyreg3 and Cyreg5
R Quatrini et al
conditions (Fig 1A) The fold-change cut-off to beused for the identification of the genes exhibitingdifferential expression between treatments wasassessed by hybridization of identical cDNA samples(total RNA extracted from FeII-grown cells) labeledwith Cyreg3 or Cyreg5 dyes The pattern of hybridizationrevealed a linear correlation of the data and a foldchange in gene expression level (M Log2 ratio FeIIS0) no larger that 15 (Fig 1B) Similar cut-off valueshave been reported as being biologically significantelsewhere Therefore genes with a positive Log2 FeIIS0 ratio (M) were considered to be more expressed inFeII- than in S0 and vice-versa while the genes with aLog2 FeIIS0 ratio (M) close to zero were considered tobe similarly expressed in both conditions
On the basis of the criteria described above theexpression level of more than 200 genes of Aferrooxidans was affected by the presence of eitherFeII or S0 as energy source in the growth media (Fig 2)The comparison of the transcriptional profiles of FeII-grown cells versus S0-grown cell indicated that about120 genes were induced (Max=up to 38 fold) in FeIIconditions and about 90 were specifically induced(Max=up to 10 fold) in S0 conditions
32 Energy source (FeII or S0) expression profile
The genes expressed differentially according to theenergy source can be divided into seven functionalcategories energy metabolism central intermediarymetabolism regulatory functions protein translationamino acid biosynthesis cell wall and envelopeconstituents and miscellaneous (unknown function) Inthis paper we will analyze the genes encoding proteinsinvolved in the energetic metabolism while resultspertaining to the other metabolic functions and more
Fig 2 Upregulated genes in A ferrooxidans cells grown in FeII or S0 StatiBayes B-statistic In the left panel circles induced in FeII triangles induce
particularly to the carbon metabolism are described inthe accompanying paper (Appia-Ayme et al)
Table 1 summarizes the data obtained on genesencoding electron transfer proteins we have previouslysuggested to be involved in FeII or S0 energeticmetabolism ([9223031] Bruscella Appia-AymeLevican Ratouchniak Holmes Jedlicki and Bonnefoymanuscript in preparation)
321 Characterization of FeII-induced genes encodingelectron transporters
In FeII conditions the petI operon encoding one ofthe bc1 complexes ([243031] Bruscella Appia-AymeLevican Ratouchniak Holmes Jedlicki and Bonnefoymanuscript in preparation) was highly expressed (Table1 and Fig 3) in agreement with Northern hybridizationand real time PCR experiments ([31] Bruscella Appia-Ayme Levican Ratouchniak Holmes Jedlicki andBonnefoy manuscript in preparation)
The rus operon encoding electron transfer proteinsinvolved in the respiratory chain between FeII andoxygen [9] was shown by a number of approaches tobe more expressed in FeII than in S0 conditions inthe strains ATCC 33020 [10133233] ATCC 19859[2234] or Torma [35] except in NASF-1 strainwhere the transcriptional level of coxB was similar inboth conditions [23] The spots corresponding to thegenes of this operon were saturated in iron so ex-pression ratios could not be determined Howeverdifferential expression in iron is in agreement withprevious results Optimized image acquisition anddata analysis conditions will have to be found for thiscase
Surprisingly while higher sulfide quinone reductaseactivity was observed in S0 than in FeII conditions [22]two out of the three putative operons encoding sulfide
stical significance was assessed by either t-test probability value P ord in S0
Table 1Microarray expression ratios between FeII and S0 grown cells
Genename
Gene function M value Pvalue
Expression
rus operoncyc2 Outer membrane
cytochrome c precursorSaturated
cyc1 Cytochrome c552diheme precursor
Saturated
coxB aa3 Cytochrome coxidase II
Saturated
coxA aa3 Cytochrome coxidase I
Saturated
coxC aa3 Cytochrome coxidase III
Saturated
rus Rusticyanin Saturatedrus Rusticyanin Saturatedrus Rusticyanin Saturated
cydAB encoding bd ubiquinol oxidasecydA Cytochrome d ubiquinol
oxidase I (bd)minus075 0128 ND
cydB Cytochrome d ubiquinoloxidase II (bd)
minus122 0065 ND
cyoBACD encoding bo3 ubiquinol oxidasecyoB Cytochrome o ubiquinol
oxidase subunit IIminus197 0008 NL
cyoA Cytochrome o ubiquinoloxidase subunit I
minus269 0008 NL
cyoC Cytochrome o ubiquinoloxidase subunit III
minus249 0020 ND
cyoD Cytochrome o ubiquinoloxidase subunit IV
minus145 0113 ND
doxI operon encoding thiosulfate quinol reductasedoxDA1 thiosulfate quinol
oxido-reductase149 0056 ND
doxII operon encoding thiosulfate quinol reductasedoxDA2 thiosulfate quinol
oxido-reductaseminus141 0029 ND
rod Rhodanese-relatedsulfurtransferase
minus095 0061 ND
petI operoncycA1 Cytochrome c4 precursor
(c-552)361 0000 DF
petA1 Ubiquinol-cytochrome creductase Rieske protein
347 0000 DF
petB1 Ubiquinol-cytochrome creductase cytochrome b
525 0001 DF
petC1 Ubiquinol-cytochrome creductase cytochrome c1
341 0000 DF
petII operoncycA2 Cytochrome c4 precursor
(c-552)minus040 0192 ND
petA2 Ubiquinol-cytochrome creductase Rieske protein
minus135 0012 NL
Table 1 (continued)
Genename
Gene function M value Pvalue
Expression
petII operonpetB2 Ubiquinol-cytochrome c
reductase cytochrome bminus142 0013 NL
petC2 Ubiquinol-cytochrome creductase cytochrome c1
009 0780 ND
hip High redox potentialironndashsulfur protein(HiPIP)
minus104 0031 ND
sqrI operon encoding sulfide quinone reductasesqrI Sulfide quinone reductase 216 0000 DF
sqrII operon encoding sulfide quinone reductasesqrII Sulfide quinone reductase 247 0000 DF
sqr3 gene encoding sulfide quinone reductasesqr3 Sulfide quinone reductase 059 0491 ND
ND not differential (Pgt001) NL near cut-off limit (are significantaccording to one of the test criteria eg Ple001 therefore indefinite)In bold Ple001 DF Differential FeII up (Plt001 and Mgt0)
R Quatrini et al
quinone reductase (sqrI and II) showed a 5 fold higherexpression (M=217plusmn063) in FeII- than in S0-growncells (Table 1) However these two operons areconstituted of paralogue genes sqr and three othergenes encoding hypothetical proteins Likely theidentity level of these genes prevented the differentia-tion of their expression levels by microarrays using 50-mers oligonucleotides The third sqr gene (sqr3)included in a different gene context does not seem tobe differentially expressed in either conditions contraryto what was observed in A ferrooxidansNASF-1 wherethe transcriptional level of sqr3 was found to be threefold higher in S0 than in FeII-grown cells [23] Furtherexperiments are therefore required to explain thesediscrepancies
322 Characterization of S0-induced genes encodingelectron transporters
Several genes of the cyd cyo doxII and petIIoperons presented differences in expression that werevery near the statistic significance cut-off limitestablished in the present analysis (Table 1) and werethus considered as differentially expressed Thereforethese operons seem to be more expressed in S0 than inFeII conditions in agreement with previous results Wehave indeed shown by Northern hybridization and realtime PCR that the petII operon is slightly expressed inS0 than in FeII conditions in the ATCC 33020 strain([31] Bruscella Appia-Ayme Levican RatouchniakHolmes Jedlicki and Bonnefoy manuscript in
R Quatrini et al
preparation) The same holds true for the rod geneencoding a rhodanese-like proteins [20] and belongingto the putative doxII operon Furthermore higheramounts of quinol oxidases and higher activities ofquinol oxidases and thiosulfate quinol reductase havebeen observed in ATCC 19859 cells grown in S0
compared to those grown in FeII [22] However in theNASF-1 strain the transcription of the cydA geneencoding subunit I of the alternate bd quinol oxidasewas similar in both conditions [23]
Table 2Comparison of raw fold changes in gene expression between FeII- andS0-grown cells (midlog) obtained by microarray analysis and real timePCR () in this work
Gene expression ratios
Microarray
Fold ()
46c
116c
84c
96c
ndash44c
58c
130203120276116
02081820
ndash1152
720626
09
Fold
12
03
Upregulated inFe or in S0
cyc2cyc1orfcoxBcoxAcoxCruscycA1sdrA1petA1petB1petC1cycA2sdrA2petA2petB2petC2hip (iro)Gene downstream
from sqr2cyoAcydAGene upstream
from doxDA2rod (downstream
from doxDA2)
Not differentiallyexpressed
Gene downstreamfrom sqr1
sqr3Gene upstream
from doxDA102
Real-time PCR
Fold change () Fold change
49a
235a
885a
175a
946a
568a
245a
474b
225 558b
14512b
6577b
6067b
465b
088b
277b
373b
148b
805b
48 1053
6 124517 4433 674
239
Fold Fold
21 197
15 10114 117
Underlined higher expression in FeII dotted underlined higher expressionin S0 Real-time PCR data from a [103233] b ([31] Bruscella Appia-Ayme Levican Ratouchniak Holmes Jedlicki and Bonnefoy manuscriptin preparation) c [data obtained from unsaturated spots]
33 Validation of microarrays results using real-timePCR
To confirm the expression patterns observed with themicroarrays some genes were selected for furtheranalysis by real-time PCR The rrs gene coding forthe 16S rRNA has been shown to be expressed at thesame (constitutive) level under both conditions ofgrowth (FeII- and S0-medium) [10] and was used asthe reference standard Raw fold changes in expressionare shown in Table 2 The expression ratios obtained byreal-time-PCR of most of these genes correlated wellwith those obtained with microarrays (Table 2)However as described previously in other cases thetranscript levels values obtained by real-time PCR werehigher than with the microarrays in accordance with thehigher sensitivity of the former technique Despite ofthese (minor) quantitative differences the resultsobtained by real-time PCR were in good agreementwith those obtained from microarrays and support thegeneral consistency between the two methods formeasuring relative expression levels
To differentiate the expression of the two identicalsqrI and sqrII operons 20-mers oligonucleotides weredesigned in the very beginning or very end of the geneclusters where the sequences differ Real-time PCR withthese oligonucleotides indicated that sqrII is 1053 foldmore expressed in FeII than in S0 conditions while sqrIis almost evenly expressed in both conditions (Table 2)Thus differential regulation of paralogue genes whichsequences are highly similar could be distinguished byreal-time PCR with adequate designed oligonucleotides
For the genes of the petII cyd cyo and doxII operonswhere B andor P values were near the cut-off limit real-time PCR experiments clearly showed higher expressionin S0 than in FeII conditions (Table 2)
In the case of the rus operon which correspondingspots were saturated on microarrays higher expressionin FeII- than in S0-grown cells was obtained by real-timePCR [103236] (Table 2)
4 Conclusion
Global changes in transcript abundance reflectingthe primary response of A ferrooxidans to energysource changes are in agreement with previous findingsfor most genes The differential expression of the ruspetI petII cyd cyo doxII operons encoding electrontransfer proteins is consistent with existing data([910202231ndash3336] Bruscella Appia-Ayme Levi-can Ratouchniak Holmes Jedlicki and Bonnefoymanuscript in preparation) Combined microarrays and
R Quatrini et al
real-time PCR data supported the FeII and S0 respiratorychain model we have proposed (Fig 3) ([9222329ndash3133] Bruscella Appia-Ayme Levican RatouchniakHolmes Jedlicki and Bonnefoy manuscript in prepara-tion) In this model the outer membrane cytochrome cCyc2 transfers electrons from FeII to the periplasmicrusticyanin which passes them to the membrane-boundcytochrome c4 Cyc1 and from there to the cyto-chrome oxidase CoxBACD where oxygen is reducedto water All these redox proteins are encoded by the
Fe(II)
OMOM
Periplasm
IMIM
Cytoplasm O O22 HH22OO
pH 16-3
Rusticy
Cyc
Cyc 1(c4)
Cytochromeoxidase
FeII gtgt S0
coxC
cyc2cyc1 coxB
coxArus
Operonrus
orf coxD
ORF
Fig 3 Model proposed for iron and sulfur energetic metabolism of A ferrooxipresented in the same color TQR thiosulfate quinol reductase SQR sulfid
rus operon [9] FeII oxidation and NAD(P) reductionhas been proposed to be coupled to explain the balanceof the electron flow from FeII between two pathwaysthe exergonic one through the aa3 type oxidasetowards oxygen encoded by the rus operon and theendergonic one through a bc1 complex toward NAD(P) [2437] In the reverse electron (endergonic)pathway the bc1 complex receives electrons from acytochrome c and transfers them to the quinol poolWe have proposed that this bc1 complex and this
Fe(III)
anin
2
UQUQ
CycA1(c4)
bc1complex(PetABC1)
NAD(P) NAD(P)HNAD(P) NAD(P)H
NNAADDHHII
FeII gtgt S0
OperonpetI
cycA1 petA1petB1
petC1sdrA1
dans The transcriptional units and the corresponding redox proteins aree quinone reductase Hip High Potential Ironndashsulfur protein
R Quatrini et al
cytochrome c are encoded by the petI operon ([3031]Bruscella Appia-Ayme Levican Ratouchniak HolmesJedlicki and Bonnefoy manuscript in preparation) andthat the rusticyanin can give electrons to two differentcytochromes c4 CycA1 encoded by the petI operon orCyc1 encoded by the rus operon ([31] Bruscella Appia-Ayme Levican Ratouchniak Holmes Jedlicki andBonnefoy manuscript in preparation) In the formercase electrons are transferred to the endergonic pathwayto oxygen while in the later case they are transferred tothe exergonic pathway to NAD(P) In A ferrooxidansthe cytochrome bc1 complex has been shown to functionin reverse in FeII grown cells even in the presence ofthiosulfate while it functions in the forward direction inS0 grown cells [2224] According to our model the bc1complex encoded by petI is the one functioning inreverse and transfers the electrons from ferrous iron toNAD(P) while the bc1 complex encoded by petII is theone functioning in the forward direction and transferselectrons from sulfur to oxygen ([31] Bruscella Appia-Ayme Levican Ratouchniak Holmes Jedlicki andBonnefoy manuscript in preparation)When functioningin the forward direction the bc1 complex receiveselectrons from the quinol pool and transfers them eitherto a membrane-bound cytochrome c andor to a solubleredox protein such a cytochrome c or a high potentialironndashsulfur protein (HiPIP) which then gives the electronto the terminal oxidase where oxygen reduction takesplace [38ndash40] Since a membrane-bound cytochrome c(CycA2) and a soluble HiPIP are encoded by the petIIoperon we have suggested that these two redox proteinstransfer electrons between the two integral membranecomplexes the bc1 and the terminal oxidase ([31]Bruscella Appia-Ayme Levican Ratouchniak HolmesJedlicki and Bonnefoy manuscript in preparation)
We propose to continue our microarray investiga-tions not only providing a deeper analysis of theexisting comparison between transcription in FeIIversus S0 grown cells but also extending the work toinvestigate transcription in cells grown in differentconcentrations of FeII and at different pHs Pertinentaspects of our working models derived from thecombination of bioinformatic and microarray analysiswill be subjected to confirmation by real-time PCR andwhere feasible by mutant construction and analysisgenetic complementation and biochemical experiments
Acknowledgements
Work supported in part by Fondecyt 1010623 and1050063 ConicytCNRS ldquoGeomexrdquo and ldquoPuces agraveADNrdquo from the Centre National de la Recherche
Scientifique and NSF RQ was the recipient of anAmerican Society for Microbiology Antorcha Fellowshipand was supported by scholarships from the DAAD andfrom the Fundacioacuten Ciencia para la Vida Chile CAAwassupported by a CNRS post-doctoral fellowship We thankthe Institute vfor Genome Research (TIGR) for the use oftheir genome sequence of A ferrooxidans
References
[1] Baker BJ Banfield JF FEMS Microbiol Ecol 44 (2003)139ndash152
[2] Johnson DB Hallberg KB Res Microbiol 154 (2003)466ndash473
[3] Schippers A Sand W Appl Environ Microbiol 65 (1999)319ndash321
[4] Yamanaka T et al in Mukohata Y (Ed) New Era ofBioenergetics Academic Press Tokyo 1991 pp 223ndash246
[5] Bruschi M Cavazza C Giudici-Orticoni MT Deacutechets 4(1996) 27ndash30
[6] Blake RC Shute EA Biochemistry 33 (1994) 9220ndash9228[7] Ingledew WJ Cox JC Halling PJ FEMSMicrobiol Lett 2
(1977) 193ndash197[8] Giudici-Orticoni MT et al Biochemistry 39 (2002)
7205ndash7211[9] Appia-Ayme C et al Appl Environ Microbiol 65 (1999)
4781ndash4787[10] Yarzabal A et al Microbiology 150 (2004) 2113ndash2123[11] Appia-Ayme C et al FEMS Microbiol Lett 167 (1998)
171ndash177[12] Giudici-Orticoni MT et al J Biol Chem 274 (1999)
30365ndash30369[13] Yarzabal A Brasseur G Bonnefoy V FEMSMicrobiol Lett
209 (2002) 189ndash195[14] Yarzabal A et al J Bacteriol 184 (2002) 313ndash317[15] Tabita R Silver M Lundgren DG Can J Biochem 47
(1969) 1141ndash1145[16] Sugio T et al Appl Environ Microbiol 54 (1988) 153ndash157[17] Sugio T et al J Bacteriol 169 (1987) 4916ndash4922[18] Silver M Lundgren DG Can J Biochem 46 (1968)
1215ndash1220[19] Silver M Lundgren DG Can J Biochem 46 (1968)
457ndash461[20] Ramirez P et al Appl Environ Microbiol 68 (2002)
1837ndash1845[21] Kuenen JG et al in Torma AE Apel ML Brierley CL
(Eds) Biohydrometallurgical Technologies vol 2 TMSWarrendale PA 1993 pp 487ndash494
[22] Brasseur G et al Biochim Biophys Acta 1656 (2004)114ndash126
[23] Wakai S Kikumoto M Kanao T Kamimura K BiosciBiotechnol Biochem 68 (2004) 2519ndash2528
[24] Brasseur G et al Biochim Biophys Acta 1555 (2002) 37ndash43[25] Liu Z et al J Bacteriol 182 (2000) 2269ndash2276[26] Liu Z Borne F Ratouchniak J Bonnefoy V Hydrometal-
lurgy 59 (2001) 339ndash345[27] Kane MD Jatkoe TA Stumpf CR Lu J Thomas JD
Madore SJ Nucleic Acids Res 28 (2000) 4552ndash4557[28] Aiba H Adhya S de Crombrugghe B J Biol Chem 256
(1981) 11905ndash11910
R Quatrini et al
[29] Smyth GH Stat Appl Genet Mol Biol 3 (2004) 3[30] Levican G et al J Bacteriol 184 (2002) 1498ndash1501[31] Bruscella P Etude des opeacuterons petI et petII codant pour deux
complexes bc1 chez la bacteacuterie acidophile chimioautotrophestricte Acidithiobacillus ferrooxidans PhD Thesis Universiteacute dela Meacutediterraneacutee Aix-Marseille II 2004
[32] Yarzabal A Duquesne K Bonnefoy V in Ciminelli VSTet Garcia Jr O (Eds) Biohydrometallurgy FundamentalsTechnology and Sustainable Development Elsevier Amsterdam2001 pp 253ndash261
[33] Yarzabal A Etude de lopeacuteron rus codant pour sept proteacuteinestransporteurs deacutelectrons chez la bacteacuterie acidophile chimioau-totrophe obligatoire Acidithiobacillus ferrooxidans PhD ThesisUniversiteacute de la Meacutediterraneacutee Aix-Marseille II 2003
[34] Pulgar V et al in Torma AE Apel ML Brierley CL(Eds) Biohydrometallurgical Technologies The Mineralsvol 2 Metals and Material Society Warrendale PA 1993pp 541ndash548
[35] Jedlicki E et al Biotechnol Appl Biochem 8 (1986)342ndash350
[36] Yarzabal A Duquesne K Bonnefoy V Hydrometallurgy 71(2003) 107ndash114
[37] Elbehti A Brasseur G Lemesle-Meunier D J Bacteriol 182(2000) 3602ndash3606
[38] Trumpower BL Microbiol Rev 54 (1990) 101ndash109[39] Bonora P et al Biochim Biophys Acta 1410 (1999) 51ndash60[40] Pereira MM Carita JN Teixeira M Biochemistry 38
(1999) 1268ndash1275
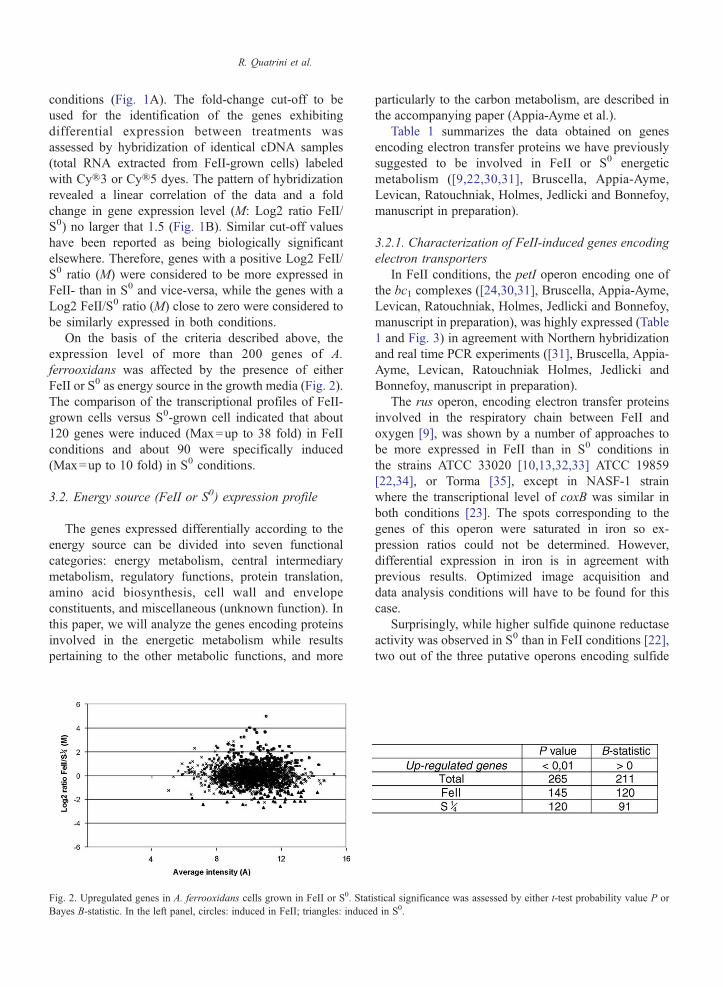
R Quatrini et al
conditions (Fig 1A) The fold-change cut-off to beused for the identification of the genes exhibitingdifferential expression between treatments wasassessed by hybridization of identical cDNA samples(total RNA extracted from FeII-grown cells) labeledwith Cyreg3 or Cyreg5 dyes The pattern of hybridizationrevealed a linear correlation of the data and a foldchange in gene expression level (M Log2 ratio FeIIS0) no larger that 15 (Fig 1B) Similar cut-off valueshave been reported as being biologically significantelsewhere Therefore genes with a positive Log2 FeIIS0 ratio (M) were considered to be more expressed inFeII- than in S0 and vice-versa while the genes with aLog2 FeIIS0 ratio (M) close to zero were considered tobe similarly expressed in both conditions
On the basis of the criteria described above theexpression level of more than 200 genes of Aferrooxidans was affected by the presence of eitherFeII or S0 as energy source in the growth media (Fig 2)The comparison of the transcriptional profiles of FeII-grown cells versus S0-grown cell indicated that about120 genes were induced (Max=up to 38 fold) in FeIIconditions and about 90 were specifically induced(Max=up to 10 fold) in S0 conditions
32 Energy source (FeII or S0) expression profile
The genes expressed differentially according to theenergy source can be divided into seven functionalcategories energy metabolism central intermediarymetabolism regulatory functions protein translationamino acid biosynthesis cell wall and envelopeconstituents and miscellaneous (unknown function) Inthis paper we will analyze the genes encoding proteinsinvolved in the energetic metabolism while resultspertaining to the other metabolic functions and more
Fig 2 Upregulated genes in A ferrooxidans cells grown in FeII or S0 StatiBayes B-statistic In the left panel circles induced in FeII triangles induce
particularly to the carbon metabolism are described inthe accompanying paper (Appia-Ayme et al)
Table 1 summarizes the data obtained on genesencoding electron transfer proteins we have previouslysuggested to be involved in FeII or S0 energeticmetabolism ([9223031] Bruscella Appia-AymeLevican Ratouchniak Holmes Jedlicki and Bonnefoymanuscript in preparation)
321 Characterization of FeII-induced genes encodingelectron transporters
In FeII conditions the petI operon encoding one ofthe bc1 complexes ([243031] Bruscella Appia-AymeLevican Ratouchniak Holmes Jedlicki and Bonnefoymanuscript in preparation) was highly expressed (Table1 and Fig 3) in agreement with Northern hybridizationand real time PCR experiments ([31] Bruscella Appia-Ayme Levican Ratouchniak Holmes Jedlicki andBonnefoy manuscript in preparation)
The rus operon encoding electron transfer proteinsinvolved in the respiratory chain between FeII andoxygen [9] was shown by a number of approaches tobe more expressed in FeII than in S0 conditions inthe strains ATCC 33020 [10133233] ATCC 19859[2234] or Torma [35] except in NASF-1 strainwhere the transcriptional level of coxB was similar inboth conditions [23] The spots corresponding to thegenes of this operon were saturated in iron so ex-pression ratios could not be determined Howeverdifferential expression in iron is in agreement withprevious results Optimized image acquisition anddata analysis conditions will have to be found for thiscase
Surprisingly while higher sulfide quinone reductaseactivity was observed in S0 than in FeII conditions [22]two out of the three putative operons encoding sulfide
stical significance was assessed by either t-test probability value P ord in S0
Table 1Microarray expression ratios between FeII and S0 grown cells
Genename
Gene function M value Pvalue
Expression
rus operoncyc2 Outer membrane
cytochrome c precursorSaturated
cyc1 Cytochrome c552diheme precursor
Saturated
coxB aa3 Cytochrome coxidase II
Saturated
coxA aa3 Cytochrome coxidase I
Saturated
coxC aa3 Cytochrome coxidase III
Saturated
rus Rusticyanin Saturatedrus Rusticyanin Saturatedrus Rusticyanin Saturated
cydAB encoding bd ubiquinol oxidasecydA Cytochrome d ubiquinol
oxidase I (bd)minus075 0128 ND
cydB Cytochrome d ubiquinoloxidase II (bd)
minus122 0065 ND
cyoBACD encoding bo3 ubiquinol oxidasecyoB Cytochrome o ubiquinol
oxidase subunit IIminus197 0008 NL
cyoA Cytochrome o ubiquinoloxidase subunit I
minus269 0008 NL
cyoC Cytochrome o ubiquinoloxidase subunit III
minus249 0020 ND
cyoD Cytochrome o ubiquinoloxidase subunit IV
minus145 0113 ND
doxI operon encoding thiosulfate quinol reductasedoxDA1 thiosulfate quinol
oxido-reductase149 0056 ND
doxII operon encoding thiosulfate quinol reductasedoxDA2 thiosulfate quinol
oxido-reductaseminus141 0029 ND
rod Rhodanese-relatedsulfurtransferase
minus095 0061 ND
petI operoncycA1 Cytochrome c4 precursor
(c-552)361 0000 DF
petA1 Ubiquinol-cytochrome creductase Rieske protein
347 0000 DF
petB1 Ubiquinol-cytochrome creductase cytochrome b
525 0001 DF
petC1 Ubiquinol-cytochrome creductase cytochrome c1
341 0000 DF
petII operoncycA2 Cytochrome c4 precursor
(c-552)minus040 0192 ND
petA2 Ubiquinol-cytochrome creductase Rieske protein
minus135 0012 NL
Table 1 (continued)
Genename
Gene function M value Pvalue
Expression
petII operonpetB2 Ubiquinol-cytochrome c
reductase cytochrome bminus142 0013 NL
petC2 Ubiquinol-cytochrome creductase cytochrome c1
009 0780 ND
hip High redox potentialironndashsulfur protein(HiPIP)
minus104 0031 ND
sqrI operon encoding sulfide quinone reductasesqrI Sulfide quinone reductase 216 0000 DF
sqrII operon encoding sulfide quinone reductasesqrII Sulfide quinone reductase 247 0000 DF
sqr3 gene encoding sulfide quinone reductasesqr3 Sulfide quinone reductase 059 0491 ND
ND not differential (Pgt001) NL near cut-off limit (are significantaccording to one of the test criteria eg Ple001 therefore indefinite)In bold Ple001 DF Differential FeII up (Plt001 and Mgt0)
R Quatrini et al
quinone reductase (sqrI and II) showed a 5 fold higherexpression (M=217plusmn063) in FeII- than in S0-growncells (Table 1) However these two operons areconstituted of paralogue genes sqr and three othergenes encoding hypothetical proteins Likely theidentity level of these genes prevented the differentia-tion of their expression levels by microarrays using 50-mers oligonucleotides The third sqr gene (sqr3)included in a different gene context does not seem tobe differentially expressed in either conditions contraryto what was observed in A ferrooxidansNASF-1 wherethe transcriptional level of sqr3 was found to be threefold higher in S0 than in FeII-grown cells [23] Furtherexperiments are therefore required to explain thesediscrepancies
322 Characterization of S0-induced genes encodingelectron transporters
Several genes of the cyd cyo doxII and petIIoperons presented differences in expression that werevery near the statistic significance cut-off limitestablished in the present analysis (Table 1) and werethus considered as differentially expressed Thereforethese operons seem to be more expressed in S0 than inFeII conditions in agreement with previous results Wehave indeed shown by Northern hybridization and realtime PCR that the petII operon is slightly expressed inS0 than in FeII conditions in the ATCC 33020 strain([31] Bruscella Appia-Ayme Levican RatouchniakHolmes Jedlicki and Bonnefoy manuscript in
R Quatrini et al
preparation) The same holds true for the rod geneencoding a rhodanese-like proteins [20] and belongingto the putative doxII operon Furthermore higheramounts of quinol oxidases and higher activities ofquinol oxidases and thiosulfate quinol reductase havebeen observed in ATCC 19859 cells grown in S0
compared to those grown in FeII [22] However in theNASF-1 strain the transcription of the cydA geneencoding subunit I of the alternate bd quinol oxidasewas similar in both conditions [23]
Table 2Comparison of raw fold changes in gene expression between FeII- andS0-grown cells (midlog) obtained by microarray analysis and real timePCR () in this work
Gene expression ratios
Microarray
Fold ()
46c
116c
84c
96c
ndash44c
58c
130203120276116
02081820
ndash1152
720626
09
Fold
12
03
Upregulated inFe or in S0
cyc2cyc1orfcoxBcoxAcoxCruscycA1sdrA1petA1petB1petC1cycA2sdrA2petA2petB2petC2hip (iro)Gene downstream
from sqr2cyoAcydAGene upstream
from doxDA2rod (downstream
from doxDA2)
Not differentiallyexpressed
Gene downstreamfrom sqr1
sqr3Gene upstream
from doxDA102
Real-time PCR
Fold change () Fold change
49a
235a
885a
175a
946a
568a
245a
474b
225 558b
14512b
6577b
6067b
465b
088b
277b
373b
148b
805b
48 1053
6 124517 4433 674
239
Fold Fold
21 197
15 10114 117
Underlined higher expression in FeII dotted underlined higher expressionin S0 Real-time PCR data from a [103233] b ([31] Bruscella Appia-Ayme Levican Ratouchniak Holmes Jedlicki and Bonnefoy manuscriptin preparation) c [data obtained from unsaturated spots]
33 Validation of microarrays results using real-timePCR
To confirm the expression patterns observed with themicroarrays some genes were selected for furtheranalysis by real-time PCR The rrs gene coding forthe 16S rRNA has been shown to be expressed at thesame (constitutive) level under both conditions ofgrowth (FeII- and S0-medium) [10] and was used asthe reference standard Raw fold changes in expressionare shown in Table 2 The expression ratios obtained byreal-time-PCR of most of these genes correlated wellwith those obtained with microarrays (Table 2)However as described previously in other cases thetranscript levels values obtained by real-time PCR werehigher than with the microarrays in accordance with thehigher sensitivity of the former technique Despite ofthese (minor) quantitative differences the resultsobtained by real-time PCR were in good agreementwith those obtained from microarrays and support thegeneral consistency between the two methods formeasuring relative expression levels
To differentiate the expression of the two identicalsqrI and sqrII operons 20-mers oligonucleotides weredesigned in the very beginning or very end of the geneclusters where the sequences differ Real-time PCR withthese oligonucleotides indicated that sqrII is 1053 foldmore expressed in FeII than in S0 conditions while sqrIis almost evenly expressed in both conditions (Table 2)Thus differential regulation of paralogue genes whichsequences are highly similar could be distinguished byreal-time PCR with adequate designed oligonucleotides
For the genes of the petII cyd cyo and doxII operonswhere B andor P values were near the cut-off limit real-time PCR experiments clearly showed higher expressionin S0 than in FeII conditions (Table 2)
In the case of the rus operon which correspondingspots were saturated on microarrays higher expressionin FeII- than in S0-grown cells was obtained by real-timePCR [103236] (Table 2)
4 Conclusion
Global changes in transcript abundance reflectingthe primary response of A ferrooxidans to energysource changes are in agreement with previous findingsfor most genes The differential expression of the ruspetI petII cyd cyo doxII operons encoding electrontransfer proteins is consistent with existing data([910202231ndash3336] Bruscella Appia-Ayme Levi-can Ratouchniak Holmes Jedlicki and Bonnefoymanuscript in preparation) Combined microarrays and
R Quatrini et al
real-time PCR data supported the FeII and S0 respiratorychain model we have proposed (Fig 3) ([9222329ndash3133] Bruscella Appia-Ayme Levican RatouchniakHolmes Jedlicki and Bonnefoy manuscript in prepara-tion) In this model the outer membrane cytochrome cCyc2 transfers electrons from FeII to the periplasmicrusticyanin which passes them to the membrane-boundcytochrome c4 Cyc1 and from there to the cyto-chrome oxidase CoxBACD where oxygen is reducedto water All these redox proteins are encoded by the
Fe(II)
OMOM
Periplasm
IMIM
Cytoplasm O O22 HH22OO
pH 16-3
Rusticy
Cyc
Cyc 1(c4)
Cytochromeoxidase
FeII gtgt S0
coxC
cyc2cyc1 coxB
coxArus
Operonrus
orf coxD
ORF
Fig 3 Model proposed for iron and sulfur energetic metabolism of A ferrooxipresented in the same color TQR thiosulfate quinol reductase SQR sulfid
rus operon [9] FeII oxidation and NAD(P) reductionhas been proposed to be coupled to explain the balanceof the electron flow from FeII between two pathwaysthe exergonic one through the aa3 type oxidasetowards oxygen encoded by the rus operon and theendergonic one through a bc1 complex toward NAD(P) [2437] In the reverse electron (endergonic)pathway the bc1 complex receives electrons from acytochrome c and transfers them to the quinol poolWe have proposed that this bc1 complex and this
Fe(III)
anin
2
UQUQ
CycA1(c4)
bc1complex(PetABC1)
NAD(P) NAD(P)HNAD(P) NAD(P)H
NNAADDHHII
FeII gtgt S0
OperonpetI
cycA1 petA1petB1
petC1sdrA1
dans The transcriptional units and the corresponding redox proteins aree quinone reductase Hip High Potential Ironndashsulfur protein
R Quatrini et al
cytochrome c are encoded by the petI operon ([3031]Bruscella Appia-Ayme Levican Ratouchniak HolmesJedlicki and Bonnefoy manuscript in preparation) andthat the rusticyanin can give electrons to two differentcytochromes c4 CycA1 encoded by the petI operon orCyc1 encoded by the rus operon ([31] Bruscella Appia-Ayme Levican Ratouchniak Holmes Jedlicki andBonnefoy manuscript in preparation) In the formercase electrons are transferred to the endergonic pathwayto oxygen while in the later case they are transferred tothe exergonic pathway to NAD(P) In A ferrooxidansthe cytochrome bc1 complex has been shown to functionin reverse in FeII grown cells even in the presence ofthiosulfate while it functions in the forward direction inS0 grown cells [2224] According to our model the bc1complex encoded by petI is the one functioning inreverse and transfers the electrons from ferrous iron toNAD(P) while the bc1 complex encoded by petII is theone functioning in the forward direction and transferselectrons from sulfur to oxygen ([31] Bruscella Appia-Ayme Levican Ratouchniak Holmes Jedlicki andBonnefoy manuscript in preparation)When functioningin the forward direction the bc1 complex receiveselectrons from the quinol pool and transfers them eitherto a membrane-bound cytochrome c andor to a solubleredox protein such a cytochrome c or a high potentialironndashsulfur protein (HiPIP) which then gives the electronto the terminal oxidase where oxygen reduction takesplace [38ndash40] Since a membrane-bound cytochrome c(CycA2) and a soluble HiPIP are encoded by the petIIoperon we have suggested that these two redox proteinstransfer electrons between the two integral membranecomplexes the bc1 and the terminal oxidase ([31]Bruscella Appia-Ayme Levican Ratouchniak HolmesJedlicki and Bonnefoy manuscript in preparation)
We propose to continue our microarray investiga-tions not only providing a deeper analysis of theexisting comparison between transcription in FeIIversus S0 grown cells but also extending the work toinvestigate transcription in cells grown in differentconcentrations of FeII and at different pHs Pertinentaspects of our working models derived from thecombination of bioinformatic and microarray analysiswill be subjected to confirmation by real-time PCR andwhere feasible by mutant construction and analysisgenetic complementation and biochemical experiments
Acknowledgements
Work supported in part by Fondecyt 1010623 and1050063 ConicytCNRS ldquoGeomexrdquo and ldquoPuces agraveADNrdquo from the Centre National de la Recherche
Scientifique and NSF RQ was the recipient of anAmerican Society for Microbiology Antorcha Fellowshipand was supported by scholarships from the DAAD andfrom the Fundacioacuten Ciencia para la Vida Chile CAAwassupported by a CNRS post-doctoral fellowship We thankthe Institute vfor Genome Research (TIGR) for the use oftheir genome sequence of A ferrooxidans
References
[1] Baker BJ Banfield JF FEMS Microbiol Ecol 44 (2003)139ndash152
[2] Johnson DB Hallberg KB Res Microbiol 154 (2003)466ndash473
[3] Schippers A Sand W Appl Environ Microbiol 65 (1999)319ndash321
[4] Yamanaka T et al in Mukohata Y (Ed) New Era ofBioenergetics Academic Press Tokyo 1991 pp 223ndash246
[5] Bruschi M Cavazza C Giudici-Orticoni MT Deacutechets 4(1996) 27ndash30
[6] Blake RC Shute EA Biochemistry 33 (1994) 9220ndash9228[7] Ingledew WJ Cox JC Halling PJ FEMSMicrobiol Lett 2
(1977) 193ndash197[8] Giudici-Orticoni MT et al Biochemistry 39 (2002)
7205ndash7211[9] Appia-Ayme C et al Appl Environ Microbiol 65 (1999)
4781ndash4787[10] Yarzabal A et al Microbiology 150 (2004) 2113ndash2123[11] Appia-Ayme C et al FEMS Microbiol Lett 167 (1998)
171ndash177[12] Giudici-Orticoni MT et al J Biol Chem 274 (1999)
30365ndash30369[13] Yarzabal A Brasseur G Bonnefoy V FEMSMicrobiol Lett
209 (2002) 189ndash195[14] Yarzabal A et al J Bacteriol 184 (2002) 313ndash317[15] Tabita R Silver M Lundgren DG Can J Biochem 47
(1969) 1141ndash1145[16] Sugio T et al Appl Environ Microbiol 54 (1988) 153ndash157[17] Sugio T et al J Bacteriol 169 (1987) 4916ndash4922[18] Silver M Lundgren DG Can J Biochem 46 (1968)
1215ndash1220[19] Silver M Lundgren DG Can J Biochem 46 (1968)
457ndash461[20] Ramirez P et al Appl Environ Microbiol 68 (2002)
1837ndash1845[21] Kuenen JG et al in Torma AE Apel ML Brierley CL
(Eds) Biohydrometallurgical Technologies vol 2 TMSWarrendale PA 1993 pp 487ndash494
[22] Brasseur G et al Biochim Biophys Acta 1656 (2004)114ndash126
[23] Wakai S Kikumoto M Kanao T Kamimura K BiosciBiotechnol Biochem 68 (2004) 2519ndash2528
[24] Brasseur G et al Biochim Biophys Acta 1555 (2002) 37ndash43[25] Liu Z et al J Bacteriol 182 (2000) 2269ndash2276[26] Liu Z Borne F Ratouchniak J Bonnefoy V Hydrometal-
lurgy 59 (2001) 339ndash345[27] Kane MD Jatkoe TA Stumpf CR Lu J Thomas JD
Madore SJ Nucleic Acids Res 28 (2000) 4552ndash4557[28] Aiba H Adhya S de Crombrugghe B J Biol Chem 256
(1981) 11905ndash11910
R Quatrini et al
[29] Smyth GH Stat Appl Genet Mol Biol 3 (2004) 3[30] Levican G et al J Bacteriol 184 (2002) 1498ndash1501[31] Bruscella P Etude des opeacuterons petI et petII codant pour deux
complexes bc1 chez la bacteacuterie acidophile chimioautotrophestricte Acidithiobacillus ferrooxidans PhD Thesis Universiteacute dela Meacutediterraneacutee Aix-Marseille II 2004
[32] Yarzabal A Duquesne K Bonnefoy V in Ciminelli VSTet Garcia Jr O (Eds) Biohydrometallurgy FundamentalsTechnology and Sustainable Development Elsevier Amsterdam2001 pp 253ndash261
[33] Yarzabal A Etude de lopeacuteron rus codant pour sept proteacuteinestransporteurs deacutelectrons chez la bacteacuterie acidophile chimioau-totrophe obligatoire Acidithiobacillus ferrooxidans PhD ThesisUniversiteacute de la Meacutediterraneacutee Aix-Marseille II 2003
[34] Pulgar V et al in Torma AE Apel ML Brierley CL(Eds) Biohydrometallurgical Technologies The Mineralsvol 2 Metals and Material Society Warrendale PA 1993pp 541ndash548
[35] Jedlicki E et al Biotechnol Appl Biochem 8 (1986)342ndash350
[36] Yarzabal A Duquesne K Bonnefoy V Hydrometallurgy 71(2003) 107ndash114
[37] Elbehti A Brasseur G Lemesle-Meunier D J Bacteriol 182(2000) 3602ndash3606
[38] Trumpower BL Microbiol Rev 54 (1990) 101ndash109[39] Bonora P et al Biochim Biophys Acta 1410 (1999) 51ndash60[40] Pereira MM Carita JN Teixeira M Biochemistry 38
(1999) 1268ndash1275
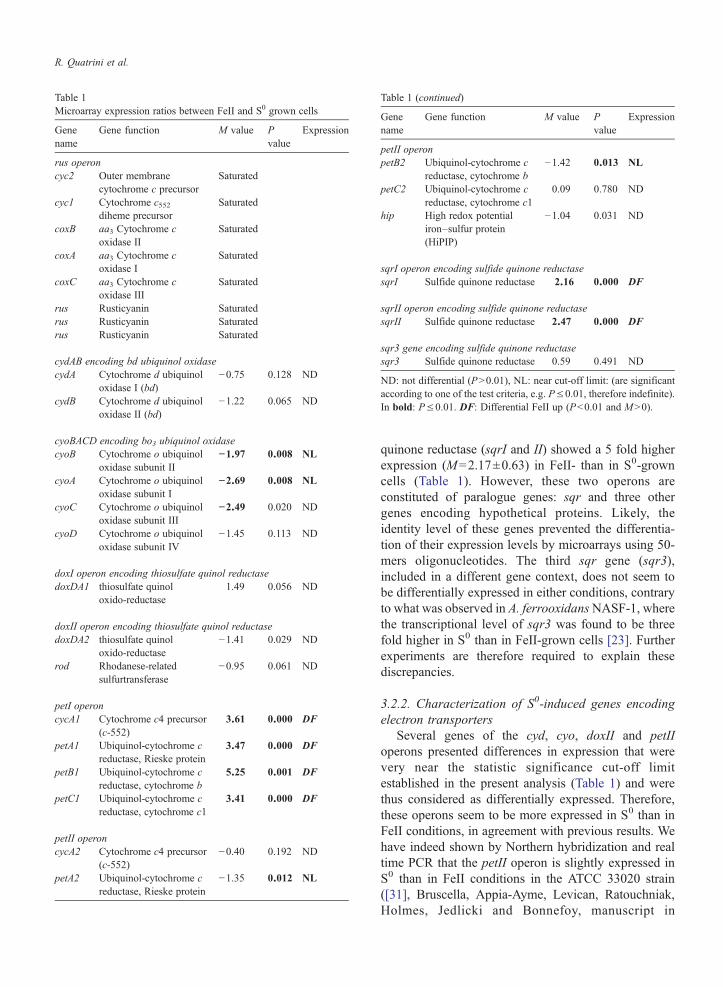
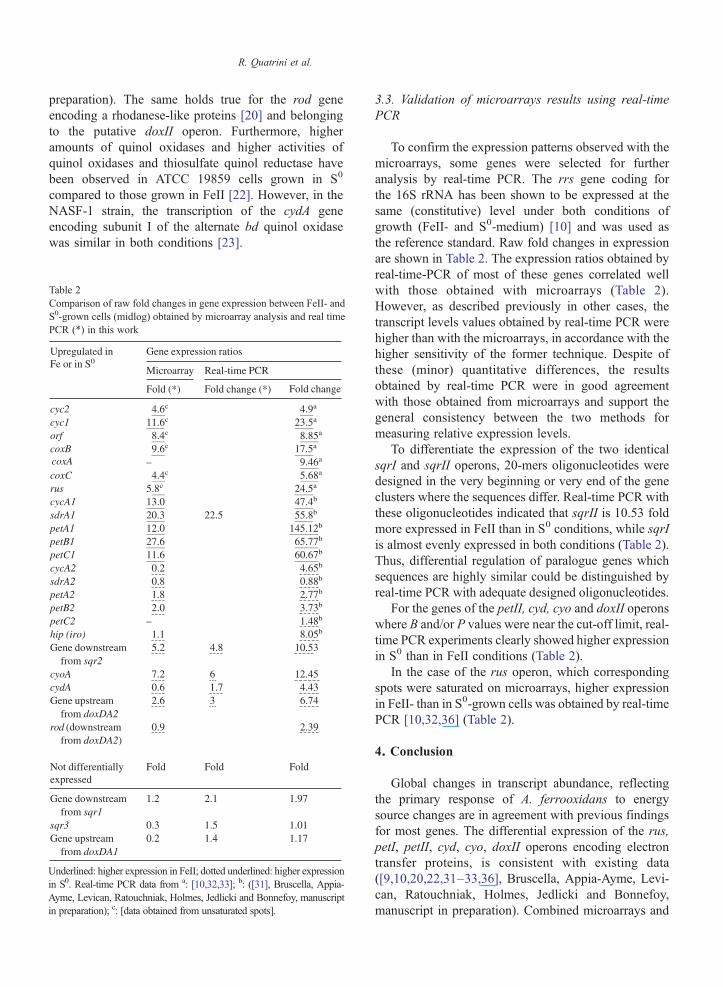
R Quatrini et al
real-time PCR data supported the FeII and S0 respiratorychain model we have proposed (Fig 3) ([9222329ndash3133] Bruscella Appia-Ayme Levican RatouchniakHolmes Jedlicki and Bonnefoy manuscript in prepara-tion) In this model the outer membrane cytochrome cCyc2 transfers electrons from FeII to the periplasmicrusticyanin which passes them to the membrane-boundcytochrome c4 Cyc1 and from there to the cyto-chrome oxidase CoxBACD where oxygen is reducedto water All these redox proteins are encoded by the
Fe(II)
OMOM
Periplasm
IMIM
Cytoplasm O O22 HH22OO
pH 16-3
Rusticy
Cyc
Cyc 1(c4)
Cytochromeoxidase
FeII gtgt S0
coxC
cyc2cyc1 coxB
coxArus
Operonrus
orf coxD
ORF
Fig 3 Model proposed for iron and sulfur energetic metabolism of A ferrooxipresented in the same color TQR thiosulfate quinol reductase SQR sulfid
rus operon [9] FeII oxidation and NAD(P) reductionhas been proposed to be coupled to explain the balanceof the electron flow from FeII between two pathwaysthe exergonic one through the aa3 type oxidasetowards oxygen encoded by the rus operon and theendergonic one through a bc1 complex toward NAD(P) [2437] In the reverse electron (endergonic)pathway the bc1 complex receives electrons from acytochrome c and transfers them to the quinol poolWe have proposed that this bc1 complex and this
Fe(III)
anin
2
UQUQ
CycA1(c4)
bc1complex(PetABC1)
NAD(P) NAD(P)HNAD(P) NAD(P)H
NNAADDHHII
FeII gtgt S0
OperonpetI
cycA1 petA1petB1
petC1sdrA1
dans The transcriptional units and the corresponding redox proteins aree quinone reductase Hip High Potential Ironndashsulfur protein
R Quatrini et al
cytochrome c are encoded by the petI operon ([3031]Bruscella Appia-Ayme Levican Ratouchniak HolmesJedlicki and Bonnefoy manuscript in preparation) andthat the rusticyanin can give electrons to two differentcytochromes c4 CycA1 encoded by the petI operon orCyc1 encoded by the rus operon ([31] Bruscella Appia-Ayme Levican Ratouchniak Holmes Jedlicki andBonnefoy manuscript in preparation) In the formercase electrons are transferred to the endergonic pathwayto oxygen while in the later case they are transferred tothe exergonic pathway to NAD(P) In A ferrooxidansthe cytochrome bc1 complex has been shown to functionin reverse in FeII grown cells even in the presence ofthiosulfate while it functions in the forward direction inS0 grown cells [2224] According to our model the bc1complex encoded by petI is the one functioning inreverse and transfers the electrons from ferrous iron toNAD(P) while the bc1 complex encoded by petII is theone functioning in the forward direction and transferselectrons from sulfur to oxygen ([31] Bruscella Appia-Ayme Levican Ratouchniak Holmes Jedlicki andBonnefoy manuscript in preparation)When functioningin the forward direction the bc1 complex receiveselectrons from the quinol pool and transfers them eitherto a membrane-bound cytochrome c andor to a solubleredox protein such a cytochrome c or a high potentialironndashsulfur protein (HiPIP) which then gives the electronto the terminal oxidase where oxygen reduction takesplace [38ndash40] Since a membrane-bound cytochrome c(CycA2) and a soluble HiPIP are encoded by the petIIoperon we have suggested that these two redox proteinstransfer electrons between the two integral membranecomplexes the bc1 and the terminal oxidase ([31]Bruscella Appia-Ayme Levican Ratouchniak HolmesJedlicki and Bonnefoy manuscript in preparation)
We propose to continue our microarray investiga-tions not only providing a deeper analysis of theexisting comparison between transcription in FeIIversus S0 grown cells but also extending the work toinvestigate transcription in cells grown in differentconcentrations of FeII and at different pHs Pertinentaspects of our working models derived from thecombination of bioinformatic and microarray analysiswill be subjected to confirmation by real-time PCR andwhere feasible by mutant construction and analysisgenetic complementation and biochemical experiments
Acknowledgements
Work supported in part by Fondecyt 1010623 and1050063 ConicytCNRS ldquoGeomexrdquo and ldquoPuces agraveADNrdquo from the Centre National de la Recherche
Scientifique and NSF RQ was the recipient of anAmerican Society for Microbiology Antorcha Fellowshipand was supported by scholarships from the DAAD andfrom the Fundacioacuten Ciencia para la Vida Chile CAAwassupported by a CNRS post-doctoral fellowship We thankthe Institute vfor Genome Research (TIGR) for the use oftheir genome sequence of A ferrooxidans
References
[1] Baker BJ Banfield JF FEMS Microbiol Ecol 44 (2003)139ndash152
[2] Johnson DB Hallberg KB Res Microbiol 154 (2003)466ndash473
[3] Schippers A Sand W Appl Environ Microbiol 65 (1999)319ndash321
[4] Yamanaka T et al in Mukohata Y (Ed) New Era ofBioenergetics Academic Press Tokyo 1991 pp 223ndash246
[5] Bruschi M Cavazza C Giudici-Orticoni MT Deacutechets 4(1996) 27ndash30
[6] Blake RC Shute EA Biochemistry 33 (1994) 9220ndash9228[7] Ingledew WJ Cox JC Halling PJ FEMSMicrobiol Lett 2
(1977) 193ndash197[8] Giudici-Orticoni MT et al Biochemistry 39 (2002)
7205ndash7211[9] Appia-Ayme C et al Appl Environ Microbiol 65 (1999)
4781ndash4787[10] Yarzabal A et al Microbiology 150 (2004) 2113ndash2123[11] Appia-Ayme C et al FEMS Microbiol Lett 167 (1998)
171ndash177[12] Giudici-Orticoni MT et al J Biol Chem 274 (1999)
30365ndash30369[13] Yarzabal A Brasseur G Bonnefoy V FEMSMicrobiol Lett
209 (2002) 189ndash195[14] Yarzabal A et al J Bacteriol 184 (2002) 313ndash317[15] Tabita R Silver M Lundgren DG Can J Biochem 47
(1969) 1141ndash1145[16] Sugio T et al Appl Environ Microbiol 54 (1988) 153ndash157[17] Sugio T et al J Bacteriol 169 (1987) 4916ndash4922[18] Silver M Lundgren DG Can J Biochem 46 (1968)
1215ndash1220[19] Silver M Lundgren DG Can J Biochem 46 (1968)
457ndash461[20] Ramirez P et al Appl Environ Microbiol 68 (2002)
1837ndash1845[21] Kuenen JG et al in Torma AE Apel ML Brierley CL
(Eds) Biohydrometallurgical Technologies vol 2 TMSWarrendale PA 1993 pp 487ndash494
[22] Brasseur G et al Biochim Biophys Acta 1656 (2004)114ndash126
[23] Wakai S Kikumoto M Kanao T Kamimura K BiosciBiotechnol Biochem 68 (2004) 2519ndash2528
[24] Brasseur G et al Biochim Biophys Acta 1555 (2002) 37ndash43[25] Liu Z et al J Bacteriol 182 (2000) 2269ndash2276[26] Liu Z Borne F Ratouchniak J Bonnefoy V Hydrometal-
lurgy 59 (2001) 339ndash345[27] Kane MD Jatkoe TA Stumpf CR Lu J Thomas JD
Madore SJ Nucleic Acids Res 28 (2000) 4552ndash4557[28] Aiba H Adhya S de Crombrugghe B J Biol Chem 256
(1981) 11905ndash11910
R Quatrini et al
[29] Smyth GH Stat Appl Genet Mol Biol 3 (2004) 3[30] Levican G et al J Bacteriol 184 (2002) 1498ndash1501[31] Bruscella P Etude des opeacuterons petI et petII codant pour deux
complexes bc1 chez la bacteacuterie acidophile chimioautotrophestricte Acidithiobacillus ferrooxidans PhD Thesis Universiteacute dela Meacutediterraneacutee Aix-Marseille II 2004
[32] Yarzabal A Duquesne K Bonnefoy V in Ciminelli VSTet Garcia Jr O (Eds) Biohydrometallurgy FundamentalsTechnology and Sustainable Development Elsevier Amsterdam2001 pp 253ndash261
[33] Yarzabal A Etude de lopeacuteron rus codant pour sept proteacuteinestransporteurs deacutelectrons chez la bacteacuterie acidophile chimioau-totrophe obligatoire Acidithiobacillus ferrooxidans PhD ThesisUniversiteacute de la Meacutediterraneacutee Aix-Marseille II 2003
[34] Pulgar V et al in Torma AE Apel ML Brierley CL(Eds) Biohydrometallurgical Technologies The Mineralsvol 2 Metals and Material Society Warrendale PA 1993pp 541ndash548
[35] Jedlicki E et al Biotechnol Appl Biochem 8 (1986)342ndash350
[36] Yarzabal A Duquesne K Bonnefoy V Hydrometallurgy 71(2003) 107ndash114
[37] Elbehti A Brasseur G Lemesle-Meunier D J Bacteriol 182(2000) 3602ndash3606
[38] Trumpower BL Microbiol Rev 54 (1990) 101ndash109[39] Bonora P et al Biochim Biophys Acta 1410 (1999) 51ndash60[40] Pereira MM Carita JN Teixeira M Biochemistry 38
(1999) 1268ndash1275
R Quatrini et al
[29] Smyth GH Stat Appl Genet Mol Biol 3 (2004) 3[30] Levican G et al J Bacteriol 184 (2002) 1498ndash1501[31] Bruscella P Etude des opeacuterons petI et petII codant pour deux
complexes bc1 chez la bacteacuterie acidophile chimioautotrophestricte Acidithiobacillus ferrooxidans PhD Thesis Universiteacute dela Meacutediterraneacutee Aix-Marseille II 2004
[32] Yarzabal A Duquesne K Bonnefoy V in Ciminelli VSTet Garcia Jr O (Eds) Biohydrometallurgy FundamentalsTechnology and Sustainable Development Elsevier Amsterdam2001 pp 253ndash261
[33] Yarzabal A Etude de lopeacuteron rus codant pour sept proteacuteinestransporteurs deacutelectrons chez la bacteacuterie acidophile chimioau-totrophe obligatoire Acidithiobacillus ferrooxidans PhD ThesisUniversiteacute de la Meacutediterraneacutee Aix-Marseille II 2003
[34] Pulgar V et al in Torma AE Apel ML Brierley CL(Eds) Biohydrometallurgical Technologies The Mineralsvol 2 Metals and Material Society Warrendale PA 1993pp 541ndash548
[35] Jedlicki E et al Biotechnol Appl Biochem 8 (1986)342ndash350
[36] Yarzabal A Duquesne K Bonnefoy V Hydrometallurgy 71(2003) 107ndash114
[37] Elbehti A Brasseur G Lemesle-Meunier D J Bacteriol 182(2000) 3602ndash3606
[38] Trumpower BL Microbiol Rev 54 (1990) 101ndash109[39] Bonora P et al Biochim Biophys Acta 1410 (1999) 51ndash60[40] Pereira MM Carita JN Teixeira M Biochemistry 38
(1999) 1268ndash1275
Copyright © 2022 FDOKUMEN