Improved pinning regime by energetic ions using reduction of pinning potential
15
Improved pinning regime by energetic ions using reduction of pinning potential Roy Weinstein a,b, * , Alberto Gandini a,b , Ravi-Persad Sawh a,b , Drew Parks a,b , Bill Mayes a a Beam Particle Dynamics Laboratory, Department of Physics, University of Houston, 632 Science and Research Bldg. I, Houston, TX 77204-5005, USA b Texas Center for Superconductivity and Advanced Materials, 202 Houston Science Center, University of Houston, Houston, TX 77204-5002, USA Received 26 September 2002; received in revised form 25 November 2002; accepted 27 November 2002 Abstract When ion damage is used to create pinning centers, full columnar pinning centers provide the largest pinning po- tential, U pin , but not the greatest J c or pinned field, B pin . Some of the characteristics of columnar defects which limit J c and B pin are discussed, including reduction of percolation path, and the need for a larger number of columns of damage, for pinning, than are usually estimated. It is concluded that columnar pinning centers are limited to B pin < 4 T, and also severely reduce J c . Evidence is reviewed that aligned damage, or broken-columnar pinning centers, described herein, can provide orders of magnitude higher J c , and higher pinned field, despite providing lower U pin . A pinning center mor- phology is discussed which utilizes multiple-in-line-damage (MILD). For, e.g., present day large grain HTS J c , ob- tainable by MILD pinning, is estimated to be of the order of 10 6 A/cm 2 at 77 K, even when crystal plane alignment and weak links are not improved. Pinned field is increased by over an order of magnitude. An experiment is proposed to confirm these observations, and to directly compare MILD to columnar pinning centers. It will also determine the optimum MILD structure. Other measurements of interest, made possible by the same data set, are described. Ó 2002 Elsevier Science B.V. All rights reserved. PACS: 74.60.Ge; 74.60.Jg; 75.50.y; 81.40.Rs Keywords: Critical current density; Pinning potential; Columnar pinning; Percolation current; Ionic irradiation 1. Background The critical current density, J c , of a supercon- ductor is a very important characteristic, second only to the critical temperature, T c . When both J c and an applied field, B A , are present in Type II superconductor a Lorentz force results, which causes motion of the fluxoids, u o , of the field. This in turn creates a dissipative electric field, which reduces J c . The reduction of J c can be prevented by pinning centers which hold the fluxoids in place. Pinning centers are regions of low (or no) su- perconductivity in which a fluxoid, u o , is in a lower energy state by an amount proportional to the * Corresponding author. Address: Beam Particle Dynamics Laboratory, Department of Physics, University of Houston, 632 Science and Research Bldg. I, Houston, TX 77204-5005, USA. 0921-4534/02/$ - see front matter Ó 2002 Elsevier Science B.V. All rights reserved. doi:10.1016/S0921-4534(02)02361-4 Physica C 387 (2003) 391–405 www.elsevier.com/locate/physc
Transcript of Improved pinning regime by energetic ions using reduction of pinning potential

Improved pinning regime by energetic ionsusing reduction of pinning potential
Roy Weinstein a,b,*, Alberto Gandini a,b, Ravi-Persad Sawh a,b,Drew Parks a,b, Bill Mayes a
a Beam Particle Dynamics Laboratory, Department of Physics, University of Houston, 632 Science and Research Bldg. I,
Houston, TX 77204-5005, USAb Texas Center for Superconductivity and Advanced Materials, 202 Houston Science Center, University of Houston,
Houston, TX 77204-5002, USA
Received 26 September 2002; received in revised form 25 November 2002; accepted 27 November 2002
Abstract
When ion damage is used to create pinning centers, full columnar pinning centers provide the largest pinning po-
tential, Upin, but not the greatest Jc or pinned field, Bpin. Some of the characteristics of columnar defects which limit Jcand Bpin are discussed, including reduction of percolation path, and the need for a larger number of columns of damage,for pinning, than are usually estimated. It is concluded that columnar pinning centers are limited to Bpin < 4 T, and alsoseverely reduce Jc. Evidence is reviewed that aligned damage, or broken-columnar pinning centers, described herein, canprovide orders of magnitude higher Jc, and higher pinned field, despite providing lower Upin. A pinning center mor-phology is discussed which utilizes multiple-in-line-damage (MILD). For, e.g., present day large grain HTS Jc, ob-tainable by MILD pinning, is estimated to be of the order of 106 A/cm2 at 77 K, even when crystal plane alignment and
weak links are not improved. Pinned field is increased by over an order of magnitude. An experiment is proposed to
confirm these observations, and to directly compare MILD to columnar pinning centers. It will also determine the
optimum MILD structure. Other measurements of interest, made possible by the same data set, are described.
� 2002 Elsevier Science B.V. All rights reserved.
PACS: 74.60.Ge; 74.60.Jg; 75.50.y; 81.40.Rs
Keywords: Critical current density; Pinning potential; Columnar pinning; Percolation current; Ionic irradiation
1. Background
The critical current density, Jc, of a supercon-ductor is a very important characteristic, second
only to the critical temperature, Tc. When both Jcand an applied field, BA, are present in Type IIsuperconductor a Lorentz force results, which
causes motion of the fluxoids, uo, of the field. Thisin turn creates a dissipative electric field, which
reduces Jc. The reduction of Jc can be prevented bypinning centers which hold the fluxoids in place.
Pinning centers are regions of low (or no) su-
perconductivity in which a fluxoid, uo, is in a lowerenergy state by an amount proportional to the
*Corresponding author. Address: Beam Particle Dynamics
Laboratory, Department of Physics, University of Houston,
632 Science and Research Bldg. I, Houston, TX 77204-5005,
USA.
0921-4534/02/$ - see front matter � 2002 Elsevier Science B.V. All rights reserved.
doi:10.1016/S0921-4534(02)02361-4
Physica C 387 (2003) 391–405
www.elsevier.com/locate/physc
condensation energy. Generally, pinning centers
have been considered best if the pinning potential,
Upin, they provide is largest. Thus columnar pin-ning centers have been considered excellent since if
the fluxoid, uo, is parallel to the axis of the col-umn, the pinning potential, Upin, is maximized. It isgenerally assumed that maximizing the pinning
potential, Upin, maximizes Jc. We argue here thatthis is seriously misleading. The argument is given
in some detail because the assumption that maxi-
mum Upin results in maximum Jc is very broadlyheld. We argue that assumption has resulted in the
most promising pinning center morphology re-
maining largely unexplored.It is easily seen that the highest Upin need not
lead to the highest current. Upin increases with thelength of fluxoid pinned, L. It has also been shown[1] that the pinning potential of a columnar pin-
ning center increases with the diameter of the de-
fect, dd
Upin � ðH 2c =8pÞ2pn2L ln 1
�þ ½dd=2
ffiffiffi2
pn�2
�ð1Þ
where Hc is the critical field, and n is the coherencelength. Thus, the strongest pinning potential re-
sults from pinning centers with the largest diame-
ter, dd, due to the ln term. This has experimentallybeen confirmed [2].
However, it is easily seen that the strategy of
using columnar defects with large diameter in or-
der to achieve high Jc can result in zero currentcapability. For reducto ad absurdum consider
that, from Eq. (1), a single column with damage
diameter almost equal in size to the diameter of
the HTS, dd � dHTS, provides strongest pinning.However, such a pinning center, although it has
maximum Upin, consumes the entire area of theHTS available for current percolation, and results
in zero current. This strategy for pinning also failsfor large applied field, BA. If a pinning center ofvery large size pins only one fluxoid, uo, it is use-less at higher BA. In order to pin higher fields, onemust trade the strongest pinning potential for a
larger number of pinning centers. The conclusions
drawn in the remainder of this note are not quite
as simplistic as this, but the conclusions drawn are
similar, i.e., that the best strategy to obtain high Jc,and high pinned field, Bpin, requires trading re-
duced pinning potential for improved percolation
path.
Since, in order to obtain high Jc at high BA, wewill not take advantage of the logarithmic increase
of U for large dd, we consider pinning centers ofdiameter circa dd � 2
ffiffiffi2
pn. Then
Upin � ðH 2c =8pÞ2pn2L ð2Þ
The pinning potential is proportional to the
length L of the portion of the fluxoid pinned.Consider a pinning center which is a cylindrical
column of non-superconducting or poorly super-conducting material, with its axis parallel to a
fluxoid. The entire length of the fluxoid can
be bound when the fluxoid is parallel to the col-
umn. In this case the pinning potential is maxi-
mized.
Energetic ions of high nuclear charge, Z, havebeen shown to produce damage of columnar shape
and of approximately the diameter required forpinning centers [3]. If columnar pinning centers are
produced by energetic ions, it has been assumed [4]
that the number of ions striking the HTS should be
equal to the number of pinning centers created.
We argue below that this apparently obvious ob-
servation is not correct. However, assume initially
that it is correct. If one ion creates one column of
damage, and each column pins one fluxoid, uo �2 107 G cm2, the number of fluxoids pinned perunit area would be equal to the number of ions per
unit area, called the fluence of ions, Fi. The fieldpinned would then be [4]
Bu ¼ Fiuo ð3ÞIn the literature, Bu is referred to as the
‘‘equivalent field.’’ The equivalent field, Bu, is an
alternate way to express a fluence, Fi.Many studies of Jc vs. the number of columnar
defects per unit area, Fi, have been done (e.g. [5–7]). These have certain common features. Fig. 1
shows as an example the trapped magnetic field
enhancement, RM, in a sample of melt-texturedYBa2Cu3O7d superconductor (Y123) vs. the flu-ence of 7.86 GeV Xe ions used to create pinning
centers. Trapped field, and hence Jc, initially in-creases as the number of pinning centers increases,
because flux quanta are pinned. After this initial
increase, the value of Jc levels out as ion fluence, Fi,
392 R. Weinstein et al. / Physica C 387 (2003) 391–405
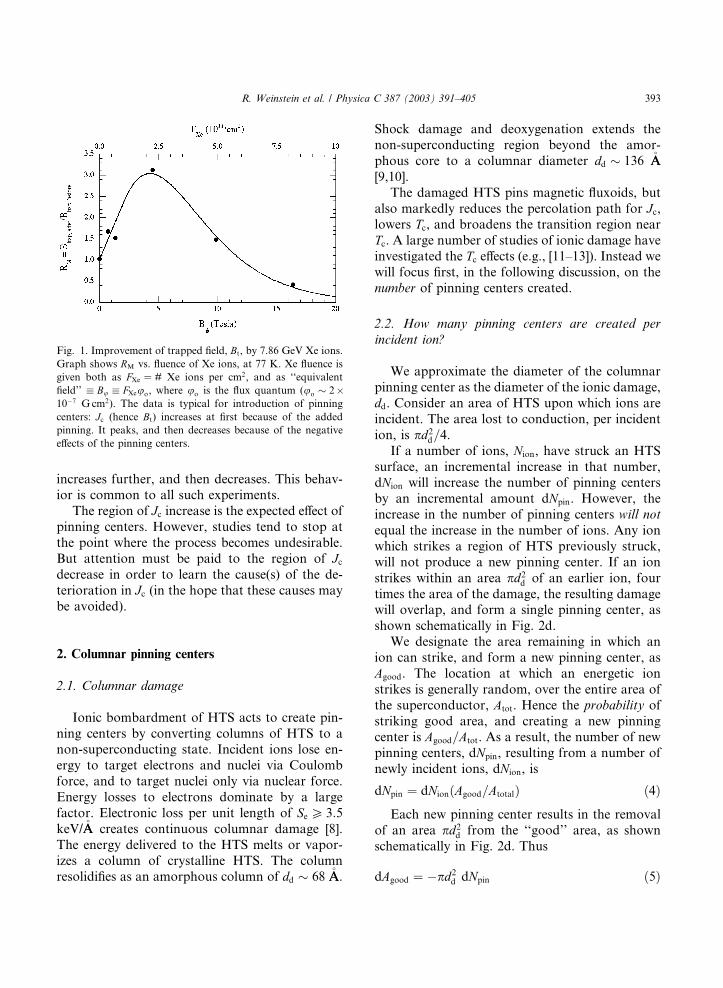
increases further, and then decreases. This behav-ior is common to all such experiments.
The region of Jc increase is the expected effect ofpinning centers. However, studies tend to stop at
the point where the process becomes undesirable.
But attention must be paid to the region of Jcdecrease in order to learn the cause(s) of the de-
terioration in Jc (in the hope that these causes maybe avoided).
2. Columnar pinning centers
2.1. Columnar damage
Ionic bombardment of HTS acts to create pin-
ning centers by converting columns of HTS to anon-superconducting state. Incident ions lose en-
ergy to target electrons and nuclei via Coulomb
force, and to target nuclei only via nuclear force.
Energy losses to electrons dominate by a large
factor. Electronic loss per unit length of SeP 3:5keV/�AA creates continuous columnar damage [8].
The energy delivered to the HTS melts or vapor-
izes a column of crystalline HTS. The columnresolidifies as an amorphous column of dd � 68 �AA.
Shock damage and deoxygenation extends the
non-superconducting region beyond the amor-
phous core to a columnar diameter dd � 136 �AA[9,10].
The damaged HTS pins magnetic fluxoids, but
also markedly reduces the percolation path for Jc,lowers Tc, and broadens the transition region nearTc. A large number of studies of ionic damage haveinvestigated the Tc effects (e.g., [11–13]). Instead wewill focus first, in the following discussion, on the
number of pinning centers created.
2.2. How many pinning centers are created per
incident ion?
We approximate the diameter of the columnar
pinning center as the diameter of the ionic damage,
dd. Consider an area of HTS upon which ions areincident. The area lost to conduction, per incident
ion, is pd2d=4.If a number of ions, Nion, have struck an HTS
surface, an incremental increase in that number,dNion will increase the number of pinning centersby an incremental amount dNpin. However, theincrease in the number of pinning centers will not
equal the increase in the number of ions. Any ion
which strikes a region of HTS previously struck,
will not produce a new pinning center. If an ion
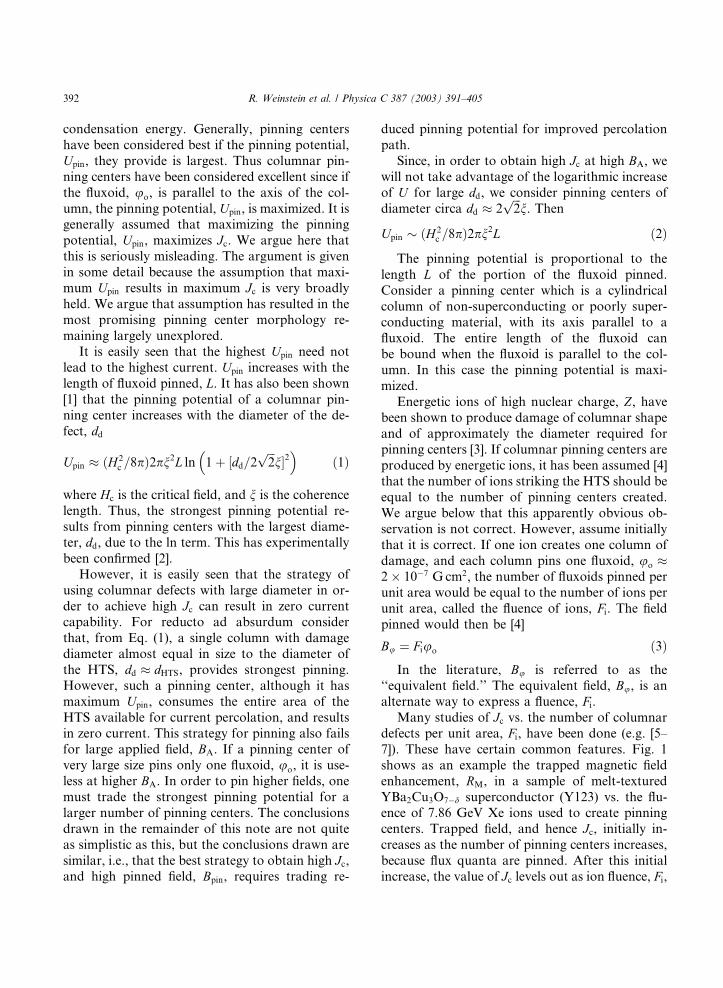
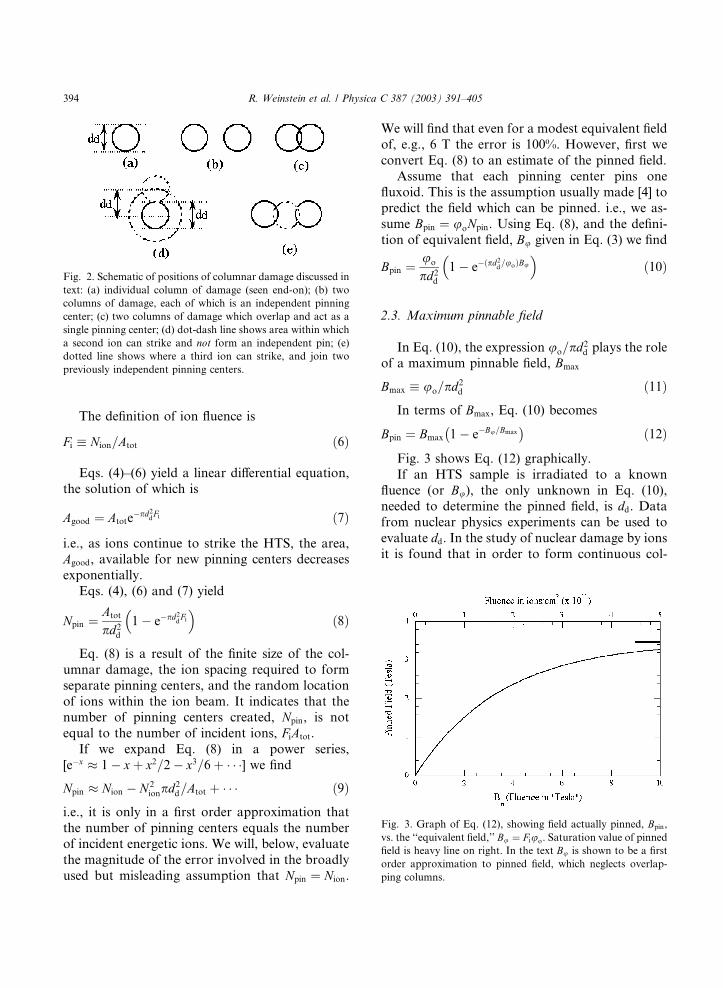
strikes within an area pd2d of an earlier ion, fourtimes the area of the damage, the resulting damagewill overlap, and form a single pinning center, as
shown schematically in Fig. 2d.
We designate the area remaining in which an
ion can strike, and form a new pinning center, as
Agood. The location at which an energetic ionstrikes is generally random, over the entire area of
the superconductor, Atot. Hence the probability ofstriking good area, and creating a new pinningcenter is Agood=Atot. As a result, the number of newpinning centers, dNpin, resulting from a number ofnewly incident ions, dNion, is
dNpin ¼ dNionðAgood=AtotalÞ ð4ÞEach new pinning center results in the removal
of an area pd2d from the ‘‘good’’ area, as shown
schematically in Fig. 2d. Thus
dAgood ¼ pd2d dNpin ð5Þ
Fig. 1. Improvement of trapped field, Bt, by 7.86 GeV Xe ions.Graph shows RM vs. fluence of Xe ions, at 77 K. Xe fluence isgiven both as FXe ¼ # Xe ions per cm2, and as ‘‘equivalentfield’’ � Bu � FXeuo, where uo is the flux quantum (uo � 2107 G cm2). The data is typical for introduction of pinning
centers: Jc (hence Bt) increases at first because of the addedpinning. It peaks, and then decreases because of the negative
effects of the pinning centers.
R. Weinstein et al. / Physica C 387 (2003) 391–405 393
The definition of ion fluence is
Fi � Nion=Atot ð6Þ
Eqs. (4)–(6) yield a linear differential equation,
the solution of which is
Agood ¼ Atotepd2dFi ð7Þ
i.e., as ions continue to strike the HTS, the area,Agood, available for new pinning centers decreasesexponentially.
Eqs. (4), (6) and (7) yield
Npin ¼Atotpd2d
1�
epd2dFi�
ð8Þ
Eq. (8) is a result of the finite size of the col-
umnar damage, the ion spacing required to form
separate pinning centers, and the random location
of ions within the ion beam. It indicates that thenumber of pinning centers created, Npin, is notequal to the number of incident ions, FiAtot.If we expand Eq. (8) in a power series,
[ex � 1 xþ x2=2 x3=6þ ] we findNpin � Nion N 2ionpd
2d=Atot þ ð9Þ
i.e., it is only in a first order approximation that
the number of pinning centers equals the number
of incident energetic ions. We will, below, evaluate
the magnitude of the error involved in the broadly
used but misleading assumption that Npin ¼ Nion.
We will find that even for a modest equivalent field
of, e.g., 6 T the error is 100%. However, first we
convert Eq. (8) to an estimate of the pinned field.
Assume that each pinning center pins one
fluxoid. This is the assumption usually made [4] topredict the field which can be pinned. i.e., we as-
sume Bpin ¼ uoNpin. Using Eq. (8), and the defini-tion of equivalent field, Bu given in Eq. (3) we find
Bpin ¼uopd2d
1�
eðpd2d=uoÞBu
�ð10Þ
2.3. Maximum pinnable field
In Eq. (10), the expression uo=pd2d plays the role
of a maximum pinnable field, Bmax
Bmax � uo=pd2d ð11Þ
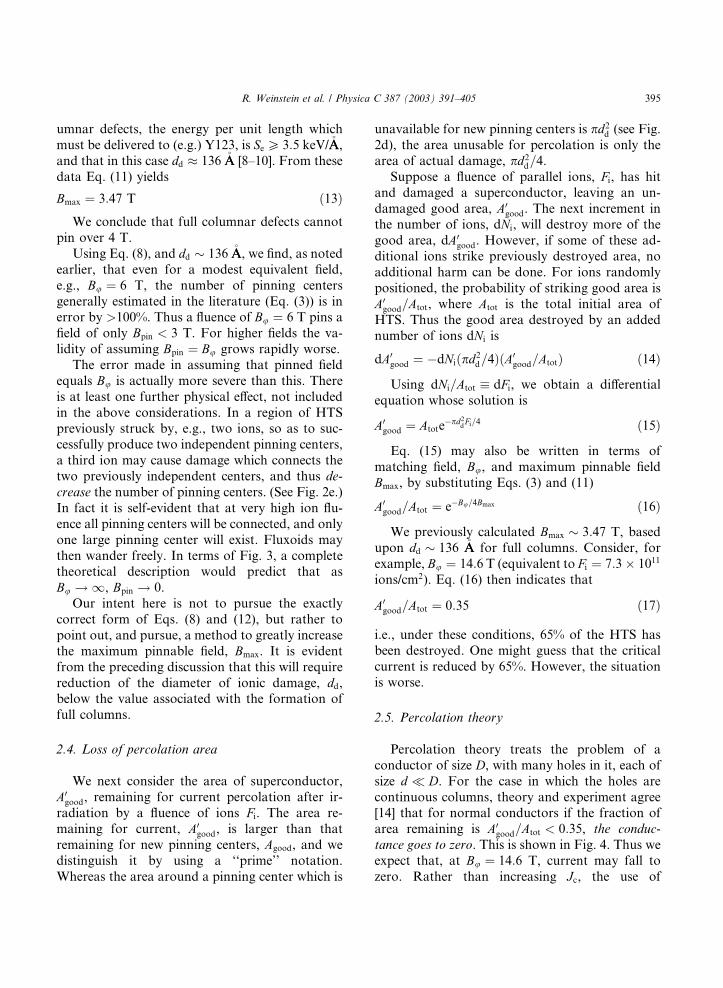
In terms of Bmax, Eq. (10) becomes
Bpin ¼ Bmax 1�
eBu=Bmax�
ð12Þ
Fig. 3 shows Eq. (12) graphically.
If an HTS sample is irradiated to a known
fluence (or Bu), the only unknown in Eq. (10),needed to determine the pinned field, is dd. Datafrom nuclear physics experiments can be used to
evaluate dd. In the study of nuclear damage by ionsit is found that in order to form continuous col-
Fig. 2. Schematic of positions of columnar damage discussed in
text: (a) individual column of damage (seen end-on); (b) two
columns of damage, each of which is an independent pinning
center; (c) two columns of damage which overlap and act as a
single pinning center; (d) dot-dash line shows area within which
a second ion can strike and not form an independent pin; (e)
dotted line shows where a third ion can strike, and join two
previously independent pinning centers.
Fig. 3. Graph of Eq. (12), showing field actually pinned, Bpin,vs. the ‘‘equivalent field,’’ Bu ¼ Fiuo. Saturation value of pinnedfield is heavy line on right. In the text Bu is shown to be a first
order approximation to pinned field, which neglects overlap-
ping columns.
394 R. Weinstein et al. / Physica C 387 (2003) 391–405
umnar defects, the energy per unit length which
must be delivered to (e.g.) Y123, is SeP 3:5 keV/�AA,and that in this case dd � 136 �AA [8–10]. From thesedata Eq. (11) yields
Bmax ¼ 3:47 T ð13ÞWe conclude that full columnar defects cannot
pin over 4 T.
Using Eq. (8), and dd � 136 �AA, we find, as notedearlier, that even for a modest equivalent field,
e.g., Bu ¼ 6 T, the number of pinning centersgenerally estimated in the literature (Eq. (3)) is inerror by >100%. Thus a fluence of Bu ¼ 6 T pins afield of only Bpin < 3 T. For higher fields the va-lidity of assuming Bpin ¼ Bu grows rapidly worse.
The error made in assuming that pinned field
equals Bu is actually more severe than this. There
is at least one further physical effect, not included
in the above considerations. In a region of HTS
previously struck by, e.g., two ions, so as to suc-cessfully produce two independent pinning centers,
a third ion may cause damage which connects the
two previously independent centers, and thus de-
crease the number of pinning centers. (See Fig. 2e.)
In fact it is self-evident that at very high ion flu-
ence all pinning centers will be connected, and only
one large pinning center will exist. Fluxoids may
then wander freely. In terms of Fig. 3, a completetheoretical description would predict that as
Bu ! 1, Bpin ! 0.
Our intent here is not to pursue the exactly
correct form of Eqs. (8) and (12), but rather to
point out, and pursue, a method to greatly increase
the maximum pinnable field, Bmax. It is evidentfrom the preceding discussion that this will require
reduction of the diameter of ionic damage, dd,below the value associated with the formation of
full columns.
2.4. Loss of percolation area
We next consider the area of superconductor,
A0good, remaining for current percolation after ir-
radiation by a fluence of ions Fi. The area re-maining for current, A0
good, is larger than that
remaining for new pinning centers, Agood, and wedistinguish it by using a ‘‘prime’’ notation.
Whereas the area around a pinning center which is
unavailable for new pinning centers is pd2d (see Fig.2d), the area unusable for percolation is only the
area of actual damage, pd2d=4.Suppose a fluence of parallel ions, Fi, has hit
and damaged a superconductor, leaving an un-
damaged good area, A0good. The next increment in
the number of ions, dNi, will destroy more of thegood area, dA0
good. However, if some of these ad-
ditional ions strike previously destroyed area, no
additional harm can be done. For ions randomly
positioned, the probability of striking good area is
A0good=Atot, where Atot is the total initial area ofHTS. Thus the good area destroyed by an added
number of ions dNi is
dA0good ¼ dNiðpd2d=4ÞðA0
good=AtotÞ ð14Þ
Using dNi=Atot � dFi, we obtain a differentialequation whose solution is
A0good ¼ Atotepd2
dFi=4 ð15Þ
Eq. (15) may also be written in terms of
matching field, Bu, and maximum pinnable field
Bmax, by substituting Eqs. (3) and (11)
A0good=Atot ¼ eBu=4Bmax ð16Þ
We previously calculated Bmax � 3:47 T, basedupon dd � 136 �AA for full columns. Consider, forexample, Bu ¼ 14:6 T (equivalent to Fi ¼ 7:3 1011ions/cm2). Eq. (16) then indicates that
A0good=Atot ¼ 0:35 ð17Þ
i.e., under these conditions, 65% of the HTS has
been destroyed. One might guess that the critical
current is reduced by 65%. However, the situationis worse.
2.5. Percolation theory
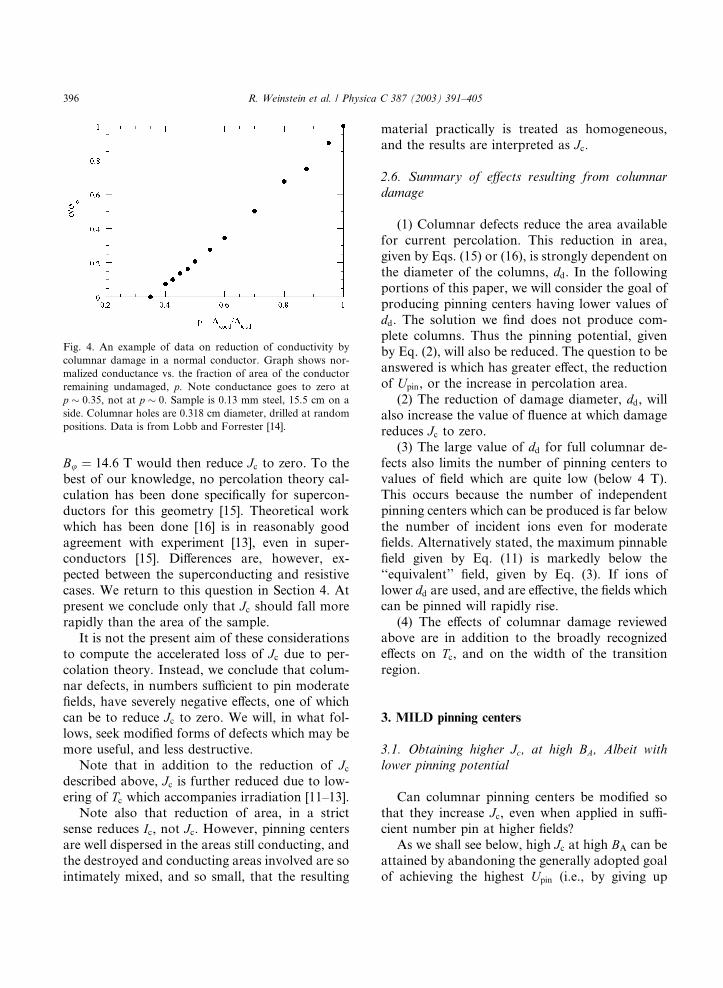
Percolation theory treats the problem of a
conductor of size D, with many holes in it, each ofsize d � D. For the case in which the holes arecontinuous columns, theory and experiment agree[14] that for normal conductors if the fraction of
area remaining is A0good=Atot < 0:35, the conduc-
tance goes to zero. This is shown in Fig. 4. Thus we
expect that, at Bu ¼ 14:6 T, current may fall tozero. Rather than increasing Jc, the use of
R. Weinstein et al. / Physica C 387 (2003) 391–405 395
Bu ¼ 14:6 T would then reduce Jc to zero. To thebest of our knowledge, no percolation theory cal-
culation has been done specifically for supercon-
ductors for this geometry [15]. Theoretical work
which has been done [16] is in reasonably good
agreement with experiment [13], even in super-conductors [15]. Differences are, however, ex-
pected between the superconducting and resistive
cases. We return to this question in Section 4. At
present we conclude only that Jc should fall morerapidly than the area of the sample.
It is not the present aim of these considerations
to compute the accelerated loss of Jc due to per-colation theory. Instead, we conclude that colum-nar defects, in numbers sufficient to pin moderate
fields, have severely negative effects, one of which
can be to reduce Jc to zero. We will, in what fol-lows, seek modified forms of defects which may be
more useful, and less destructive.
Note that in addition to the reduction of Jcdescribed above, Jc is further reduced due to low-ering of Tc which accompanies irradiation [11–13].Note also that reduction of area, in a strict
sense reduces Ic, not Jc. However, pinning centersare well dispersed in the areas still conducting, and
the destroyed and conducting areas involved are so
intimately mixed, and so small, that the resulting
material practically is treated as homogeneous,
and the results are interpreted as Jc.
2.6. Summary of effects resulting from columnar
damage
(1) Columnar defects reduce the area available
for current percolation. This reduction in area,
given by Eqs. (15) or (16), is strongly dependent on
the diameter of the columns, dd. In the followingportions of this paper, we will consider the goal of
producing pinning centers having lower values of
dd. The solution we find does not produce com-plete columns. Thus the pinning potential, givenby Eq. (2), will also be reduced. The question to be
answered is which has greater effect, the reduction
of Upin, or the increase in percolation area.(2) The reduction of damage diameter, dd, will
also increase the value of fluence at which damage
reduces Jc to zero.(3) The large value of dd for full columnar de-
fects also limits the number of pinning centers tovalues of field which are quite low (below 4 T).
This occurs because the number of independent
pinning centers which can be produced is far below
the number of incident ions even for moderate
fields. Alternatively stated, the maximum pinnable
field given by Eq. (11) is markedly below the
‘‘equivalent’’ field, given by Eq. (3). If ions of
lower dd are used, and are effective, the fields whichcan be pinned will rapidly rise.
(4) The effects of columnar damage reviewed
above are in addition to the broadly recognized
effects on Tc, and on the width of the transitionregion.
3. MILD pinning centers
3.1. Obtaining higher Jc, at high BA, Albeit with
lower pinning potential
Can columnar pinning centers be modified so
that they increase Jc, even when applied in suffi-cient number pin at higher fields?
As we shall see below, high Jc at high BA can beattained by abandoning the generally adopted goal
of achieving the highest Upin (i.e., by giving up
Fig. 4. An example of data on reduction of conductivity by
columnar damage in a normal conductor. Graph shows nor-
malized conductance vs. the fraction of area of the conductor
remaining undamaged, p. Note conductance goes to zero atp � 0:35, not at p � 0. Sample is 0.13 mm steel, 15.5 cm on aside. Columnar holes are 0.318 cm diameter, drilled at random
positions. Data is from Lobb and Forrester [14].
396 R. Weinstein et al. / Physica C 387 (2003) 391–405

some pinning potential in exchange for reduced
damage). In this section we consider experimental
evidence that this strategy works. We then con-
sider a broad class of ionic damage, only sparsely
studied to date, which can be expected to dra-
matically increase Jc at higher BA. Finally we willdiscuss a method to experimentally test the ex-
pected results and also to experimentally deter-
mine the optimum structure of ionic damage for
maximizing Jc at high BA.
3.2. Experiments using fission fragments
The highest Jc (�300 kA/cm2 at 77 K) in bulkgrains of HTS has been obtained in Y123 by use of
fission fragments [17,18]. The highest Jc in bulkNd123 (�270 kA/cm2 at 77 K) has been obtainedin the same way [19].
Fission fragments are ions, of energy of �100MeV. This energy, and the average fragment
charge (Z ¼ 46), result in ionization energy lossper unit distance of typically Se6 1:7 keV/�AA [18].This rate of energy loss per unit distance does not
provide the rate of energy loss, Se ¼ 3:5 keV/�AA,needed to create full columnar defects [8]. An ex-
ample of Se for fission ions is given in Fig. 5.Specific energy loss of Se < 3:5 keV/�AA can,
however, create incomplete columns. Excitations or
ionizations can occur for one or several electrons
in the target atoms. Only the probability of these
various excitations is predictable, and hence Sevaries, statistically, along the ion track, around an
average value. As the ion traverses the target ma-
terial, upward statistical fluctuations in Se at somepoints along the ion track result in the formationof segments of columns. Thus, the tracks of fission
ions (Se6 1:7 keV/�AA) contain broken columns.The gaps between columnar segments have two
effects. One is to reduce damage. The other is to
reduce the pinning potential. Assume that along
the track of the ion, there are gaps of average gap
length hgi. Assume that there are columnar seg-ments of average column length hci. Relative tocontinuous columns, the total length of damaged
superconductor is reduced by a factor fL, where
fL ¼ hci=ðhgi þ hciÞ ð18Þ
The pinning potential of a fluxoid which is
parallel to the ion track is, in Eq. (2), reduced by
the factor fL.For Se P 3:5 keV/�AA, fL ¼ 1. As Se is reduced
below 3.5 keV/�AA, fL is reduced below 1. The valueof fL is not a well-measured parameter, althoughsome measurements exist [9,20]. For example, in
an experiment done with gold and silver ions, the
gold ions (Se � 3:48) were measured to have
fL � 1, as expected for full columns. The silverions (Se � 2:38) were measured to have fL � 0:5.Thus, fission ions will have fL < 0:5.The values of dd (Se) are experimentally fairly
well determined at the present time. At Se � 3:5keV/�AA, dd � 136 �AA. As Se drops below Se � 3:5keV/�AA, and columns become discontinuous, ddalso decreases. As Se decreases further, the damageresembles a string-of-beads, and dd is further re-duced. Both dd and fL decrease as Se decreases.Fig. 6 shows the microstructure of fission frag-
ment damage. The damage is made up of multiple
in-line defects (MILD). MILD pinning centershave proven successful in Y123 [17,18], Nd123 [19]
and BiSCCO [21–23]. In all three HTS systems
remarkable increases in Jc have been observedusing ions resulting from nuclear fission. In Y123
and Nd123, increases by one to two orders of
magnitude in Jc were observed in bulk HTS
grains. Without the need to improve crystal plane
alignment or improve weak links, Jc in Y123
Fig. 5. Examples of specific ionization, Se, vs. range, x. Forfission ion, the product fragment chosen is 116Pd (85 MeV). Also
shown are 580 MeV 116Sn, used by Civale et al. [4], and 3.5 keV/�AA, needed to produce continuous columns.
R. Weinstein et al. / Physica C 387 (2003) 391–405 397

increased from typical values of 20 kA/cm2 at 77 K
and low BA, to 270 kA/cm2 [18]. Experiments doneon Y123 at 50 K showed a factor of 15 improve-
ment in Jc, to �106 A/cm2, and the increase in Jcremained over a factor of 10 (at values of over 100
kA/cm2) at fields of 14 T [18]. This is to be con-
trasted to the �4 T limit posed by full columnardefects. In Nd123 under similar conditions, Jc in-creased from typical values of 30–274 kA/cm2 at
77 K, low field [19]. Pinning centers produced by
fission ions also resulted in increases of Ic in Ag–BiSCCO tape, by factors of up to 100, and in-
creased the irreversibility field, Hirr, by factors ex-ceeding two [20–22].
We attribute the large increases in Jc at fieldsexceeding 10 T to the reduced damage involved inMILD pinning centers. This improvement occurs
despite significant decreases in Upin.
3.3. Limiting value of low Se for the creation of
effective MILD pinning
In an effort to learn how low Se can be, and stillresult in large increases in Jc, an experiment wasperformed using a 6.88 GeV beam of Kr ions, in-
cident on 1 mm thick melt-textured grains of Y123
[24]. 6.88 GeV Kr ions barely penetrate 1.0 mm of
YBCO. Se vs. penetration distance, for such ions,is shown in Fig. 7.
Following bombardment of the Y123 by vari-
ous fluences of Kr ions, up to Bu ¼ 40 T, criticaltrapped fields, Bt, of the Y123 targets were mea-sured at the entrance and exit surfaces of the Kr
ions. Bt was found to be higher at the exit, where Seis high, showing that Jc is higher on the exit side ofthe sample, where Se is high.One of the Y123 targets, initially �1 mm thick,
was gradually thinned by polishing on the exit
side. As the target was thinned, trapped field was
repeatedly measured at the front and rear of theY123 target. Fig. 8 shows the results. The region of
the target containing the higher Jc was all con-tained in the last �0.1 mm of Kr ion track.
Analysis of these results indicates that high Jc isrestricted to the region of the sample where
SeP 0:8� 0:1 keV/�AA. The remaining 90% of the
Y123 target shows negligible increases in Jc com-pared to those seen for SeP 0:8� 0:1 keV/�AA.
Fig. 6. Example of quasi-columnar damage caused by fission
ions in melt-textured Y123. Scale bar is 200 nm. Large deposits
are (U0:6Pt0:4)YBa2O6. Thermal neutron irradiation has been
used to fission a small fraction of the 235U. Visible fission track
damage is estimated to be <26 �AA in diameter, and is the core of
the total damage to the HTS, which is estimated to be <52 �AA in
diameter. Columns, broken columns and string-of-bead dam-
age are observable.
Fig. 7. Graph of specific ionization, Se, vs. range of 6.88 GeVKr ions in melt-textured Y123, used by Weinstein et al. [24] to
measure Se;min.
398 R. Weinstein et al. / Physica C 387 (2003) 391–405
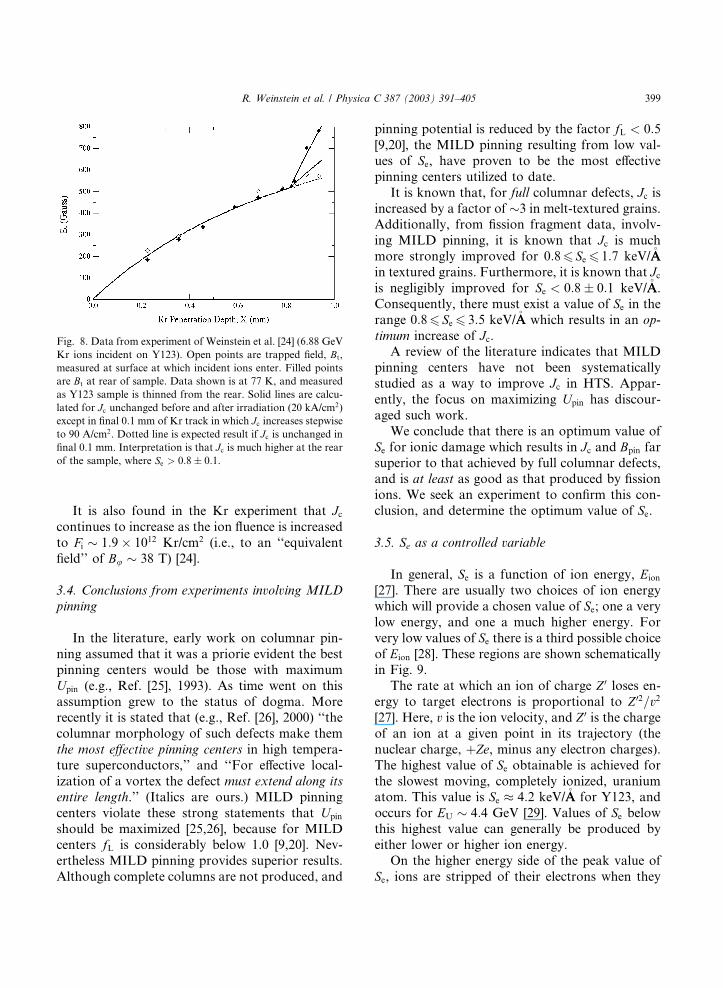
It is also found in the Kr experiment that Jccontinues to increase as the ion fluence is increased
to Fi � 1:9 1012 Kr/cm2 (i.e., to an ‘‘equivalentfield’’ of Bu � 38 T) [24].
3.4. Conclusions from experiments involving MILD
pinning
In the literature, early work on columnar pin-
ning assumed that it was a priorie evident the best
pinning centers would be those with maximum
Upin (e.g., Ref. [25], 1993). As time went on thisassumption grew to the status of dogma. Morerecently it is stated that (e.g., Ref. [26], 2000) ‘‘the
columnar morphology of such defects make them
the most effective pinning centers in high tempera-
ture superconductors,’’ and ‘‘For effective local-
ization of a vortex the defect must extend along its
entire length.’’ (Italics are ours.) MILD pinning
centers violate these strong statements that Upinshould be maximized [25,26], because for MILDcenters fL is considerably below 1.0 [9,20]. Nev-ertheless MILD pinning provides superior results.
Although complete columns are not produced, and
pinning potential is reduced by the factor fL < 0:5[9,20], the MILD pinning resulting from low val-
ues of Se, have proven to be the most effectivepinning centers utilized to date.
It is known that, for full columnar defects, Jc isincreased by a factor of �3 in melt-textured grains.Additionally, from fission fragment data, involv-
ing MILD pinning, it is known that Jc is muchmore strongly improved for 0:86 Se6 1:7 keV/�AAin textured grains. Furthermore, it is known that Jcis negligibly improved for Se < 0:8� 0:1 keV/�AA.Consequently, there must exist a value of Se in therange 0:86 Se6 3:5 keV/�AA which results in an op-
timum increase of Jc.A review of the literature indicates that MILD
pinning centers have not been systematically
studied as a way to improve Jc in HTS. Appar-ently, the focus on maximizing Upin has discour-aged such work.
We conclude that there is an optimum value of
Se for ionic damage which results in Jc and Bpin farsuperior to that achieved by full columnar defects,and is at least as good as that produced by fission
ions. We seek an experiment to confirm this con-
clusion, and determine the optimum value of Se.
3.5. Se as a controlled variable
In general, Se is a function of ion energy, Eion[27]. There are usually two choices of ion energy
which will provide a chosen value of Se; one a verylow energy, and one a much higher energy. For
very low values of Se there is a third possible choiceof Eion [28]. These regions are shown schematicallyin Fig. 9.
The rate at which an ion of charge Z 0 loses en-
ergy to target electrons is proportional to Z 02=v2
[27]. Here, v is the ion velocity, and Z 0 is the charge
of an ion at a given point in its trajectory (the
nuclear charge, þZe, minus any electron charges).The highest value of Se obtainable is achieved forthe slowest moving, completely ionized, uraniumatom. This value is Se � 4:2 keV/�AA for Y123, andoccurs for EU � 4:4 GeV [29]. Values of Se belowthis highest value can generally be produced by
either lower or higher ion energy.
On the higher energy side of the peak value of
Se, ions are stripped of their electrons when they
Fig. 8. Data from experiment of Weinstein et al. [24] (6.88 GeV
Kr ions incident on Y123). Open points are trapped field, Bt,measured at surface at which incident ions enter. Filled points
are Bt at rear of sample. Data shown is at 77 K, and measuredas Y123 sample is thinned from the rear. Solid lines are calcu-
lated for Jc unchanged before and after irradiation (20 kA/cm2)except in final 0.1 mm of Kr track in which Jc increases stepwiseto 90 A/cm2. Dotted line is expected result if Jc is unchanged infinal 0.1 mm. Interpretation is that Jc is much higher at the rearof the sample, where Se > 0:8� 0:1.
R. Weinstein et al. / Physica C 387 (2003) 391–405 399

penetrate matter. Thus, U of Ei P 4:4 GeV be-
comes fully ionized in Y123. The ionic charge is
constant and, until energies are so high that rela-
tivistic effects occur (i.e., until Ei � Mionc2), Se be-haves as Se / Zion=v2, where Z is the nuclearcharge.
The behavior on the lower energy side of the
peak of Se is not so simple. In that region, in ad-dition to statistical fluctuations in the ionization
and excitation of the target atoms, there is pick up
and loss of electrons by the incident ion. When the
ion finally stops, it is neutral. It has picked up Znegatively charged electrons which neutralize itsnuclear charge of þZe. Generally as the ion slowsto a velocity v comparable to the orbital velocity ofsome electron in the target atoms, it has the
highest probability of picking up that electron to
neutralize a portion of the positive ionic charge.
As a result, ionic charge is a function of velocity.
As an ion slows down, the decrease in ionic charge
due to electron pick up dominates over the de-crease in velocity, and Se / Z 02=v2 decreases to-ward zero.
Another drawback to using low ionic energy is
that there is more Coulomb scattering at low Eion,and consequently less certainty about the direction
of the ion in the sample. At higher energies,
Coulomb scattering is, on average, negligible [28].
For these reasons we prefer to consider tests of the
ideas proposed herein at higher energies (region B
in Fig. 9).
3.6. Damage diameter, dd , vs. Se for MILD pinning
centers
The column of damage produced by an ion has
a core which is the result of melting (or vaporiza-
tion) of the crystalline material and resolidifying in
an amorphous form [8]. Around this core is an
area damaged by shock wave and reduced oxy-
genation [9,10]. Extensive literature exists on the
core portion of dd (e.g., [3,8–10,30–37]). The corediameter depends primarily on Se, but may alsodepend on Eion, and on the direction of the ionrelative to the HTS axes [10]. For given values of
Eion, Se, and direction relative to the HTS crystalaxes, the diameter of the core is relatively well
determined in the literature. The increase in radius
due to shock and deoxygenation is less well de-
termined. The relatively well determined values ofthe radius of the core, and the more speculative
shock/deoxygenation radii are both shown in Fig.
10, which summarizes dd vs. Se, at high energy, forions in Y123. Features of Fig. 10 have been used
earlier in this discussion. For example, dd � 136 �AA,for full columnar defects produced by ions with
SeP 3:5 keV/�AA, was used to estimate Bmax.
Fig. 9. Schematic of energy loss, Se, vs. ion energy, Eion for atypical ion. In region A, incident atom is only partially ionized.
In region B atom is fully ionized and non-relativistic. In region
D, relativistic effects cause increase of electric field transverse to
v*. Region C is referred to as the region of minimum Se. Inregions A and B, Se / Z2ion=v
2ion.
Fig. 10. Radius of damage to Y123 by incident ion having
specific energy loss, Se. Solid line shows radius of amorphouscore of damage. Dashed line shows approximate damage radius
including region of shock wave and deoxygenation.
400 R. Weinstein et al. / Physica C 387 (2003) 391–405
Note that dd decreases as Se decreases. For ex-ample, at the highest values of Se involved in theuse of fission fragment ions (Se < 1:7 keV/�AA),dd6 52 �AA. Thus, the damage area resulting fromfission ions is, at its largest, only ð52=136Þ2 ¼14:6% of the damage area resulting from completecolumns. This upper limit for the value of dd forfission ions may be used in Eq. (11) to find Bmax.The result is that, using fission ions, pinning cen-
ters sufficiently numerous to trap at least 23.7 T
can be produced. This has been experimentally
tested and confirmed up to 14 T [38]. For these
values of Se, fL � 0:5. Therefore, damage de-creases due to fL also. Fission fragments utilize0:86 Se6 1:7 keV/�AA, and hence 06 dd6 52 �AA, in-dicating that Bmax may be much higher.Note in Fig. 10 that dd ! 0 at �0.7� 1 keV/�AA.
Recall that the point at which the enhancement of
Jc was lost in the Kr data [24] was 0:8� 0:1 keV/�AA.This indicates that it is the string-of-beads and
broken-column morphology of multiple-in-line-
damage which is associated with large increases inJc, and that large Jc enhancement does not resultfrom nuclear collisions. This view is reinforced by
the observation that the diameter of the ionic
damage is a good match to the diameter expected
theoretically for pinning centers when the log
factor of Eq. (1) is not utilized.
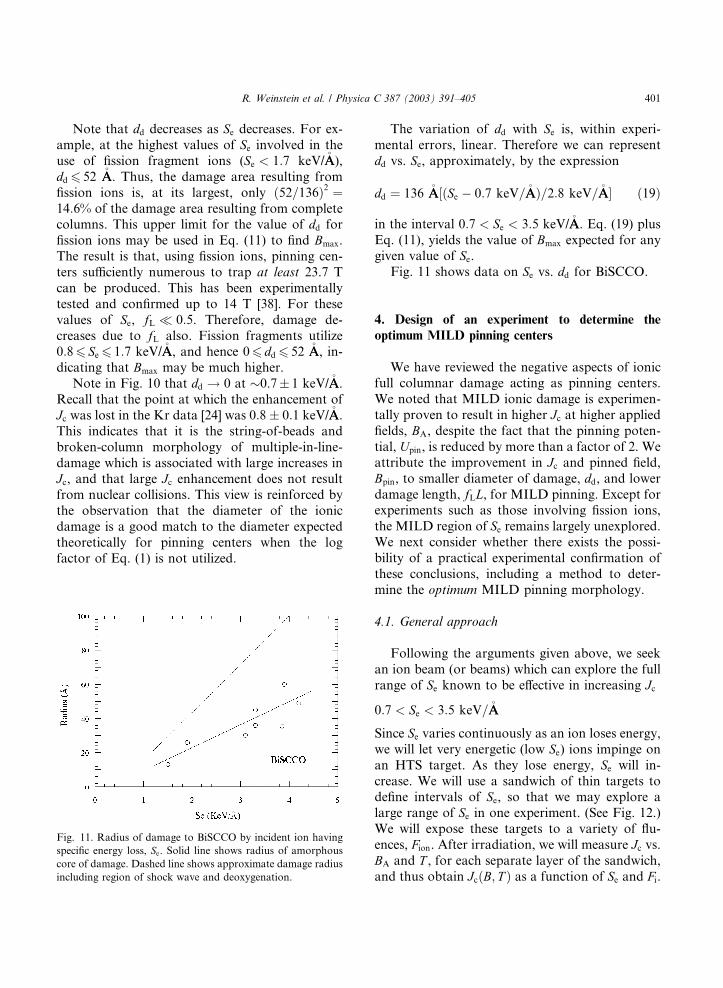
The variation of dd with Se is, within experi-mental errors, linear. Therefore we can represent
dd vs. Se, approximately, by the expression
dd ¼ 136 �AA½ðSe 0:7 keV=�AAÞ=2:8 keV=�AA� ð19Þ
in the interval 0:7 < Se < 3:5 keV/�AA. Eq. (19) plusEq. (11), yields the value of Bmax expected for anygiven value of Se.Fig. 11 shows data on Se vs. dd for BiSCCO.
4. Design of an experiment to determine the
optimum MILD pinning centers
We have reviewed the negative aspects of ionicfull columnar damage acting as pinning centers.
We noted that MILD ionic damage is experimen-
tally proven to result in higher Jc at higher appliedfields, BA, despite the fact that the pinning poten-tial, Upin, is reduced by more than a factor of 2. Weattribute the improvement in Jc and pinned field,Bpin, to smaller diameter of damage, dd, and lowerdamage length, fLL, for MILD pinning. Except forexperiments such as those involving fission ions,
the MILD region of Se remains largely unexplored.We next consider whether there exists the possi-
bility of a practical experimental confirmation of
these conclusions, including a method to deter-
mine the optimum MILD pinning morphology.
4.1. General approach
Following the arguments given above, we seek
an ion beam (or beams) which can explore the full
range of Se known to be effective in increasing Jc
0:7 < Se < 3:5 keV=�AA
Since Se varies continuously as an ion loses energy,we will let very energetic (low Se) ions impinge onan HTS target. As they lose energy, Se will in-crease. We will use a sandwich of thin targets todefine intervals of Se, so that we may explore alarge range of Se in one experiment. (See Fig. 12.)We will expose these targets to a variety of flu-
ences, Fion. After irradiation, we will measure Jc vs.BA and T , for each separate layer of the sandwich,and thus obtain JcðB; T Þ as a function of Se and Fi.
Fig. 11. Radius of damage to BiSCCO by incident ion having
specific energy loss, Se. Solid line shows radius of amorphouscore of damage. Dashed line shows approximate damage radius
including region of shock wave and deoxygenation.
R. Weinstein et al. / Physica C 387 (2003) 391–405 401

We will also measure other characteristics of the
superconductors which vary with Se and Fi (e.g.,Hirr, Tc, creep, etc.). Other questions of interest, asoutlined in the next section, can also be explored in
the same data sample.
4.2. Other questions of interest
In the proposed work, we can additionally
measure parameters of ion damage which are not
presently well known. We will determine the
fraction, fL, of the track length which pins, andhence the fraction of Upin which is utilized. We willalso determine average column length hci and gaphgi as Se varies.We expect the optimum value of Se for ‘‘stiff’’
fluxoids (e.g., in Y123) to differ from that of flex-
ible fluxoids (e.g., in BiSCCO) because the pinning
gap hgi varies with Se; i.e., we expect that largergaps in the pinning center will be better tolerated
in HTS with stiff fluxoids, such as Y123.
To the best of our knowledge there have been
no tests of percolation theory involving the effects
of broken-columnar damage on percolation inHTS. (In percolation theory this is related to the
‘‘Swiss cheese model’’ [39].) The sample set will
provide a test of percolation effects for broken
columns in HTS, in which comparison to full
columns is particularly straight forward, since full
columnar samples are generated in the same data
set as broken columns.The data set generated by the proposed exper-
iments will also permit measurement of the effect
of pinning center diameter. Consider, as an ex-
ample, Y123 for which dd vs. Se is shown in Fig.10. Note that 0 < dd < 136 �AA. At 77 K, the valueof the coherence lengths n in Y123 are [40]: nc � 7�AA and nab � na ¼ nb ¼ 20 �AA. Thus, for MILD de-fects in which a fluxoid parallel to the c-axis ispinned, dd will vary from 0 to �7nab, at 77 K. i.e.,
the proposed experiment will permit a meaningful
study of Jc vs. the variable dd=n. Such data allowsinterpretation in terms of pinning force vs. dd=nab
[46]. Eq. (2) indicates a quasi-saturation of pinning
potential at a value of dd � 2ffiffiffi2
pnab � 57 �AA, at 77
K. The data set will permit study of Jc at values ofdd as high as 2.4 times this expected saturationvalue, and as low as zero, at 77 K.
4.3. Details of a proposed experiment
The design of the experiment is discussed for
the HTS Y123, although any HTS may be used
(e.g., Nd123, Sm123, BiSCCO, or MgB2).
We desire to use targets thick enough to be self-
supporting. For example, for textured Y123, made
in our laboratories, this requires a thickness
DX P 0:2 mm.In each slice of sample (Fig. 12), we aim to re-
strict Se to an interval of about �10% or less, inorder to meaningfully determine, e.g., Jc ¼ JcðSeÞ.We find that the region 0:76 Se6 3:5 keV/�AA can
be spanned by two ion beams, and meet the above
constraints, if 56 GeV 238U92, and 110 GeV 197Au79
are used, for example. These beams are scheduled
at the GSI Accelerator, Darmstadt. Figs. 13 and
14 show Se vs. penetration distance for these twoion beams, each incident on Y123 [29].
The study of Se vs. range for 56 GeV 238U shows
that the interval of Se available is about 1:22 <Se < 4:2 keV/�AA. We do not use the very end ofrange of the Uion, where the ion velocity is very low,for reasons discussed earlier. Se ¼ 3:7 keV/�AA is
Fig. 12. Schematic of HTS targets. Energetic ions are incident
from left. It is planned to irradiate entire sandwich at one time,
thereby spanning the range of Se noted in Figs. 13 and 14.Sandwich layers then will be separated for analysis.
402 R. Weinstein et al. / Physica C 387 (2003) 391–405

the highest value used in the proposed 238U ex-
periment. Thus the 238U measurement covers the
range 1:226 Se6 3:7 keV/�AA.For the 110 GeV 197Au ions, we plan to utilize a
range of 0:646 Se6 2:6 keV/�AA. As a result, there isa significant interval of Se (1:226 Se6 2:6 keV/�AA)which is tested by both beams, and provides an
overlap region in which to test consistency of in-
terpretation.
Figs. 13 and 14 also indicate target thicknesses
of Y123 which can be used to define Se to 6�10%.
4.4. Direction of beam relative to HTS axes, and
splay
The proposed experiment utilizes ions moving
parallel to the c crystal axis of Y123. As notedpreviously, the damage diameter, dd, depends inpart on the angle of v
*ion with respect to the crystal
axes [10]. Also, variation of angle in a single target
(splay) leads to fluxoid entanglement [41] which
merits study. Initially, parallel MILD pinning
centers can be studied, leading to a predominance
of individually pinned fluxoids. In later studies
angle of ion incidence can be changed to investi-gate, e.g., dependence on crystal axis orientation,
or can be varied in a given target, in order to test
the effects of splay, and consequent fluxoid en-
tanglement.
4.5. Estimate of radioactivity of the resulting
material
Radiation methods for introducing pinning
centers generally result in the highest Jc. Thehighest values of Jc in textured materials are thoseproduced by fission products. These are created by
the inclusion of 235U within the HTS, followed by
thermal neutron irradiation (called the U/n pro-
cess) [17–21]. This process also produces very low
residual radioactivity. Comparable Jc can also beproduced by high energy proton bombardment of
a fissile nucleus such as 209Bi [23], albeit with in-
creased radioactivity. Nevertheless, the application
of materials produced by the U/n process is limited
because they are radioactive. It is therefore of in-
terest to estimate the radioactivity of HTS material
containing MILD pinning centers.
We first note that the energetic ions used toproduce the MILD pinning traverse the HTS ma-
terial; they do not stop in it. In particular, the
energetic 238U exits the HTS, which then contains
no residual uranium.
We next consider induced radioactivity, caused
by the energetic ions. Using the liquid drop model
of the nucleus [42], and normalizing to earlier data
on proton irradiation [43], we calculated the ap-proximate gamma ray radioactivity for Y123 with
MILD pinning suitable for pinning BA ¼ 10 T,and compared it to other irradiated HTS. We find
Fig. 13. Se vs. penetration distance for 56 GeV 238U ions inci-
dent on melt-textured YBCO superconductor. Thickness of
regions a–e are designed to define Se to about �10%. Thicknessof regions a, b are thinnest practical, self-supporting targets of
textured YBCO made in our laboratory.
Fig. 14. As in Fig. 13, but using beam of 110 GeV 197Au ions.
Combination of U and Au beams cover region 0:6 < Se < 3:7keV/�AA. Overlap occurs for 1:26 Se6 2:6 keV/�AA.
R. Weinstein et al. / Physica C 387 (2003) 391–405 403
A 2 cm diameter, 1 cm thick, trapped fieldmagnet (TFM) with MILD pinning, capable of
trapping over 2 T at 77 K, will have a radioactivity
of �94 nCi. At a distance of 3 cm, this source givesa dose about equal to the ever-present cosmic ray
background. The radioactivity of this sample does
not require registration and is so low it can be
shipped through the mail. Comparison of the level
of radioactivity of a TFM with MILD pinningcenters to radioactivity of objects encountered in
everyday life may be more intuitively meaningful.
As an example of this, consider that the gamma
radioactivity ingested with milk averages 1.4 nCi
per quart [44]. Thus, a child drinking 1 quart of
milk per day ingests over 500 nCi of gamma ra-
dioactivity per year. This exceeds the amount of
radioactivity in five TFMs, each 2 cm diameter 1cm thick, containing MILD pinning centers.
4.6. Expected Jc
Fig. 1 shows the results of an experiment in
which melt-textured Y123 was irradiated with ions
for which 1:2 < Se < 2:5 keV/�AA, with a fluence ofFi � 2:5 1011 (Bu ¼ 5 T). This resulted in an in-crease in Jc by a factor of 3.5. Also, fission frag-ments, using 0 < Se < 1:7 keV/�AA (which is
effectively 0:76 Se < 1:7 keV/�AA) result in an in-crease in Jc by a factor of P 10 [17–19,38,45].Additionally, Gandini et al., in an analysis of Jc inU/n-BiSCCO, [21,22] concluded that Jc could beincreased by an additional factor of 2–3 if ion
damage, still remaining in the U/n process, could
be reduced by a factor of 2. Similar conclusions
may be drawn concerning removal of the de-
structive effects of ion bombardment from U/n
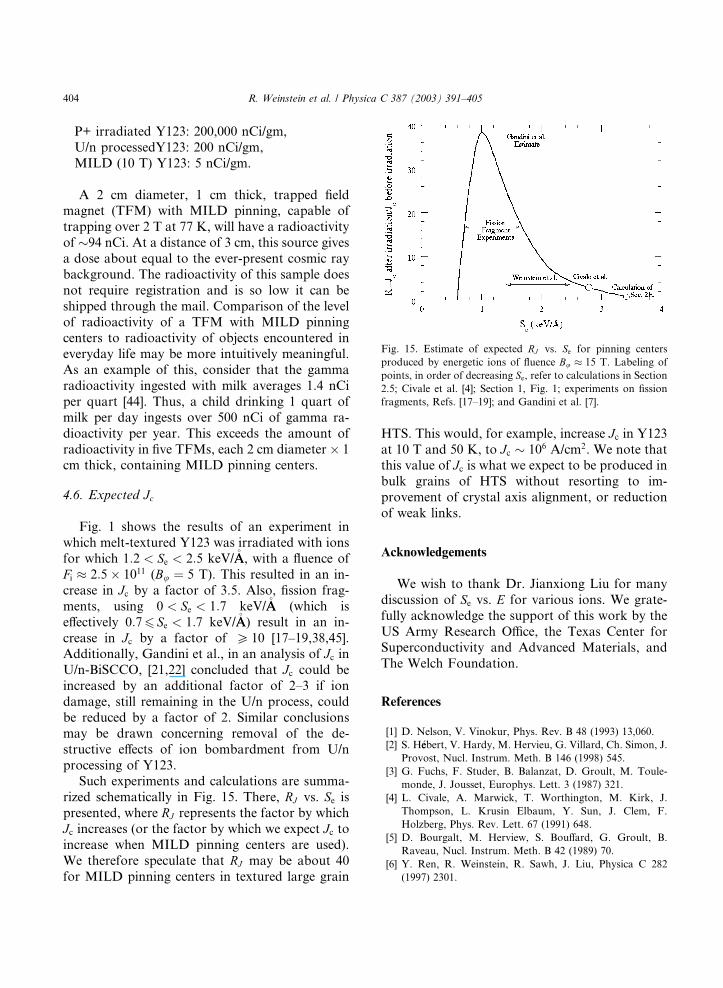
processing of Y123.Such experiments and calculations are summa-
rized schematically in Fig. 15. There, RJ vs. Se ispresented, where RJ represents the factor by which
Jc increases (or the factor by which we expect Jc toincrease when MILD pinning centers are used).
We therefore speculate that RJ may be about 40
for MILD pinning centers in textured large grain
HTS. This would, for example, increase Jc in Y123at 10 T and 50 K, to Jc � 106 A/cm2. We note thatthis value of Jc is what we expect to be produced inbulk grains of HTS without resorting to im-
provement of crystal axis alignment, or reduction
of weak links.
Acknowledgements
We wish to thank Dr. Jianxiong Liu for many
discussion of Se vs. E for various ions. We grate-fully acknowledge the support of this work by the
US Army Research Office, the Texas Center for
Superconductivity and Advanced Materials, and
The Welch Foundation.
References
[1] D. Nelson, V. Vinokur, Phys. Rev. B 48 (1993) 13,060.
[2] S. H�eebert, V. Hardy, M. Hervieu, G. Villard, Ch. Simon, J.
Provost, Nucl. Instrum. Meth. B 146 (1998) 545.
[3] G. Fuchs, F. Studer, B. Balanzat, D. Groult, M. Toule-
monde, J. Jousset, Europhys. Lett. 3 (1987) 321.
[4] L. Civale, A. Marwick, T. Worthington, M. Kirk, J.
Thompson, L. Krusin Elbaum, Y. Sun, J. Clem, F.
Holzberg, Phys. Rev. Lett. 67 (1991) 648.
[5] D. Bourgalt, M. Herview, S. Bouffard, G. Groult, B.
Raveau, Nucl. Instrum. Meth. B 42 (1989) 70.
[6] Y. Ren, R. Weinstein, R. Sawh, J. Liu, Physica C 282
(1997) 2301.
Fig. 15. Estimate of expected RJ vs. Se for pinning centersproduced by energetic ions of fluence Bu � 15 T. Labeling ofpoints, in order of decreasing Se, refer to calculations in Section2.5; Civale et al. [4]; Section 1, Fig. 1; experiments on fission
fragments, Refs. [17–19]; and Gandini et al. [7].
P+ irradiated Y123: 200,000 nCi/gm,
U/n processedY123: 200 nCi/gm,
MILD (10 T) Y123: 5 nCi/gm.
404 R. Weinstein et al. / Physica C 387 (2003) 391–405

[7] A. Gandini, R. Weinstein, D. Parks, R. Sawh, S.X. Dou,
Presented at Applied Superconductivity Conf., August
2002, IEEE Trans. Appl. Supercond., in press.
[8] M. Toulemonde, S. Bouffard, F. Studer, Nucl. Instrum.
Meth. B 91 (1994) 108.
[9] Y. Zhu, Z.X. Cai, R. Budhavi, M. Suenaga, D.O. Welch,
Phys. Rev. B 48 (1993) 6436.
[10] Y. Zhu, R. Budhavi, Z. Cai, D. Welch, M. Suenaga, R.
Yoshizaki, H. Ikeda, Philos. Mag. Lett. 67 (1993) 125.
[11] V. Hardy, D. Groult, J. Provost, M. Hervieu, B. Raveau,
S. Bouffard, Physica C 198 (1991) 225.
[12] R. Hensel, B. Roas, S. Henke, R. Hopfengartner, M.
Lippert, J. Strobel, M. Vildic, G.S. Ischenko, Phys. Rev. B
42 (1990) 4135.
[13] D. Bourgault, D. Groult, S. Bouffard, M. Hervieu, J.
Provost, F. Studer, B. Reveau, Radiat. Eff. Def. Solids 110
(1989) 211.
[14] C.J. Lobb, M.G. Forrester, Phys. Rev. B 35 (1987) 1899.
[15] M. Costantini, F. Brisard, A.M. Meftah, F. Studer, M.
Toulemonde, Radiat. Eff. Def. Solids 126 (1993) 233;
See also B. Roas, B. Hensel, S. Henke, S. Klaum€uunzer, B.
Kabius, W. Watanabe, G.S. Ischenko, L. Schultz, K.
Urban, Europhys. Lett. 11 (1990) 669.
[16] E.S. Gorbac, M.F. Thorpe, M.S. DeVries, A.R. Day, Phys.
Rev. A 43 (1991) 6473.
[17] R. Weinstein, Y. Ren, J. Liu, I. Chen, R. Sawh, V. Obot,
C. Foster, in: Advances in Superconductivity VI, Springer-
Verlag, Tokyo, 1994, p. 855.
[18] R. Weinstein, R. Sawh, Y. Ren, D. Parks, J. Mater. Sci.
Eng. B 53 (1998) 38.
[19] R. Weinstein, R. Sawh, D. Parks, M. Murakami, T.
Mochida, N. Chikumoto, G. Krabbes, W. Bieger, Physica
C 383 (2002) 214.
[20] E. Dartyge, P. Sigmund, Phys. Rev. B 32 (1985) 5429.
[21] A. Gandini, R. Weinstein, Y.R. Ren, R.P. Sawh, D. Parks,
Y.C. Guo, B. Zeimetz, S.X. Dou, S. T€oonies, C. Klein,H.W. Weber, Physica C 341 (2000) 1453.
[22] A. Gandini, Improvement of critical current, irreversibility
field, and anisotropy in BiSCCO tape by the U/n method.
Thesis submitted in partial fulfillment of the requirements
for the Ph.D., University of Houston, August 2001.
[23] H. Safar, J. Cho, S. Flashler, M. Maley, J.O. Willis, Y.
Coulter, J. Ullmann, P. Lisowski, G. Riley, M. Rupich,
J.R. Thompson, L. Krusin-Elbaum, Appl. Phys. Lett. 67
(1995) 130.
[24] R. Weinstein, R.-P. Sawh, J. Liu, D. Parks, Y. Ren, V.
Obot, C. Foster, Physica C 357 (2001) 743.
[25] R. Wheeler, M. Kirk, A.D. Marwick, L. Civale, F.
Holtzberg, Appl. Phys. Lett. 63 (1993) 1573.
[26] Chapter on columnar defects, by R.C. Budhani, in: A.
Narlikar (Ed.), Studies of High Temperature Supercon-
ductors, Nova Science Publishers, Huntington, NY, 2000,
p. 116.
[27] R. Weinstein, Interactions of Radiation and Matter,
McGraw-Hill, NY, 1964, p. 30.
[28] Particle Physics Booklet, Subset of Review of Particle
Physics, Eur. Phys. J. C 3 (1998) 181.
[29] J.F. Ziegler, J.P. Biersack, V. Littmork, in: The Stopping
and Range of Ions in Solids, vol. 1, Pergamon Press,
Oxford, 1985;
See also J.F. Ziegler, www.SRIM.org.
[30] D. Bourgault, M. Hervieu, S. Bouffard, D. Groult, B.
Raveau, Nucl. Instrum. Meth. B 42 (1989) 61.
[31] M. Toulemonde, N. Enault, J. Yun Fan, F. Studer, J.
Appl. Phys. 68 (1990) 1545.
[32] M. Konczykowski, F. Rullier-Albenque, E.R. Yacoby, A.
Shaulov, Y. Yeshurun, P. Lejay, ORB 44 (1991) 7167.
[33] V. Hardy, J. Provost, D. Groult, M. Hervieu, B. Raveau,
S. Durcok, E. Pollert, J.C. Frison, J.P. Chaminade, M.
Pouchard, Physica C 191 (1992) 85–96.
[34] L. Civale, L. Krusin-Elbaum, J.R. Thompson, R. Wheeler,
A.D. Marwick, M.A. Kirk, Y.R. Sun, F. Holtzberg, C.
Feidl, Phys. Rev. B 50 (1994) 4102.
[35] S. H�eebert, V. Hardy, G. Villard, M. Hervieu, Ch. Simon, J.Provost, Physica C 259 (1998).
[36] D.X. Huang, Y. Sasaki, Y. Ikuhara, Phys. Rev. B 59 (1999)
3862.
[37] N. Kuroda, N. Ishikawa, Y. Chimi, A. Iwase, H. Ikeda, R.
Yoshizaki, T. Kambara, Phys. Rev. B 63 (2001) 2245.
[38] R. Weinstein, R. Sawh, Y. Ren, M. Eisterer, H. Weber,
Supercond. Sci. Technol. 11 (1998) 959.
[39] R. Zallen, The Physics of Amorphous Solids, John Wiley
and Sons, NY, 1983.
[40] P. Poole, Handbook of Superconductivity, Academic
Press, 2000.
[41] T. Hua, P. Le Doussal, D. Nelson, V. Vinokur, Phys. Rev.
Lett. 71 (1993) 3545.
[42] R. Weinstein, Nuclear Physics, McGraw-Hill Book Co,
NY, 1964, p. 82.
[43] R. Weinstein, I. Chen, J. Liu, J. Xu, V. Obot, C. Foster, J.
Appl. Phys. 73 (1993) 10.
[44] Human Health Fact Sheet, Argonne National Lab, Octo-
ber 2001.
[45] R. Weinstein, Y. Ren, R. Sawh, A. Gandini, W. Hennig,
M. Murakami, T. Mochida, N. Chikumoto, N. Sakai, G.
Krabbes, W. Bieger, D. Milliken, S.X. Dou, S. T€oonies, M.
Eisterer, H.W. Weber, Physica C 341 (2000) 1415.
[46] D. Dew-Hughes, Philos. Mag. 30 (1997) 293.
R. Weinstein et al. / Physica C 387 (2003) 391–405 405