Energetic Bottlenecks and Other Design Constraints in Avian ...
Upload
khangminh22Category
view
3download
0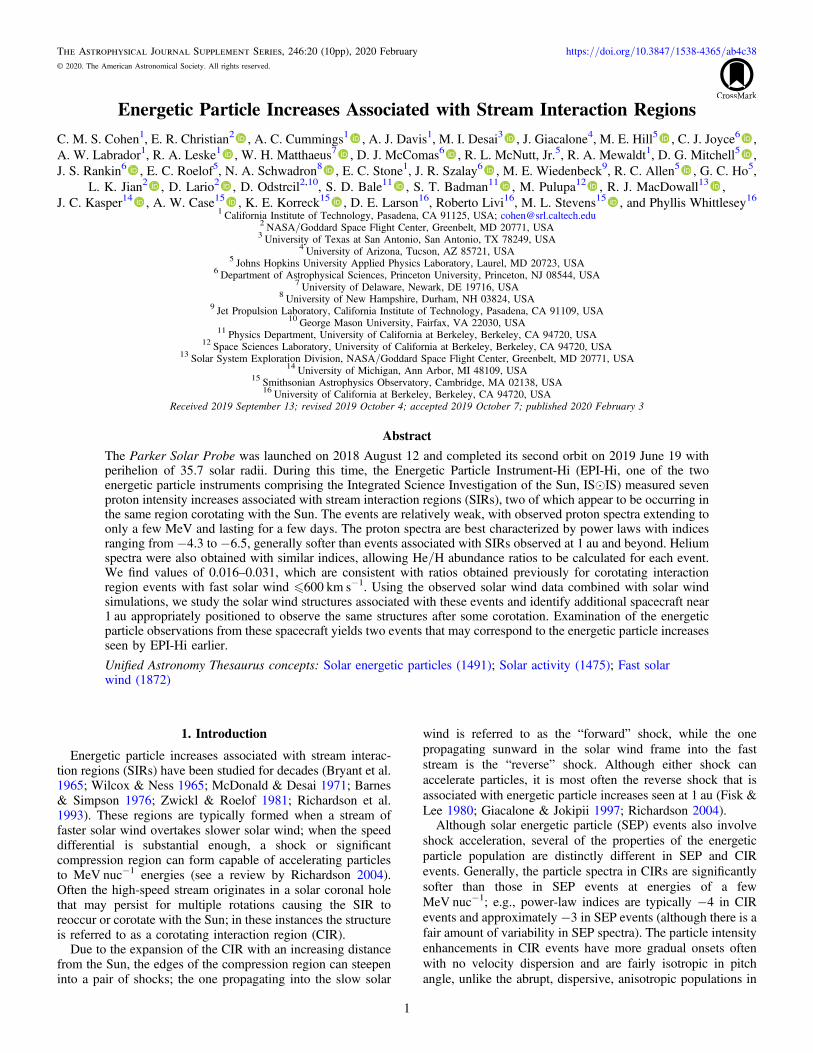
Energetic Particle Increases Associated with Stream Interaction Regions
C. M. S. Cohen1, E. R. Christian2 , A. C. Cummings1 , A. J. Davis1, M. I. Desai3 , J. Giacalone4, M. E. Hill5 , C. J. Joyce6 ,A. W. Labrador1, R. A. Leske1 , W. H. Matthaeus7 , D. J. McComas6 , R. L. McNutt, Jr.5, R. A. Mewaldt1, D. G. Mitchell5 ,J. S. Rankin6 , E. C. Roelof5, N. A. Schwadron8 , E. C. Stone1, J. R. Szalay6 , M. E. Wiedenbeck9, R. C. Allen5 , G. C. Ho5,
L. K. Jian2 , D. Lario2 , D. Odstrcil2,10, S. D. Bale11 , S. T. Badman11 , M. Pulupa12 , R. J. MacDowall13 ,J. C. Kasper14 , A. W. Case15 , K. E. Korreck15 , D. E. Larson16, Roberto Livi16, M. L. Stevens15 , and Phyllis Whittlesey16
1 California Institute of Technology, Pasadena, CA 91125, USA; [email protected] NASA/Goddard Space Flight Center, Greenbelt, MD 20771, USA3 University of Texas at San Antonio, San Antonio, TX 78249, USA
4 University of Arizona, Tucson, AZ 85721, USA5 Johns Hopkins University Applied Physics Laboratory, Laurel, MD 20723, USA
6 Department of Astrophysical Sciences, Princeton University, Princeton, NJ 08544, USA7 University of Delaware, Newark, DE 19716, USA
8 University of New Hampshire, Durham, NH 03824, USA9 Jet Propulsion Laboratory, California Institute of Technology, Pasadena, CA 91109, USA
10 George Mason University, Fairfax, VA 22030, USA11 Physics Department, University of California at Berkeley, Berkeley, CA 94720, USA
12 Space Sciences Laboratory, University of California at Berkeley, Berkeley, CA 94720, USA13 Solar System Exploration Division, NASA/Goddard Space Flight Center, Greenbelt, MD 20771, USA
14 University of Michigan, Ann Arbor, MI 48109, USA15 Smithsonian Astrophysics Observatory, Cambridge, MA 02138, USA
16 University of California at Berkeley, Berkeley, CA 94720, USAReceived 2019 September 13; revised 2019 October 4; accepted 2019 October 7; published 2020 February 3
Abstract
The Parker Solar Probe was launched on 2018 August 12 and completed its second orbit on 2019 June 19 withperihelion of 35.7 solar radii. During this time, the Energetic Particle Instrument-Hi (EPI-Hi, one of the twoenergetic particle instruments comprising the Integrated Science Investigation of the Sun, ISeIS) measured sevenproton intensity increases associated with stream interaction regions (SIRs), two of which appear to be occurring inthe same region corotating with the Sun. The events are relatively weak, with observed proton spectra extending toonly a few MeV and lasting for a few days. The proton spectra are best characterized by power laws with indicesranging from −4.3 to −6.5, generally softer than events associated with SIRs observed at 1 au and beyond. Heliumspectra were also obtained with similar indices, allowing He/H abundance ratios to be calculated for each event.We find values of 0.016–0.031, which are consistent with ratios obtained previously for corotating interactionregion events with fast solar wind �600 km s−1. Using the observed solar wind data combined with solar windsimulations, we study the solar wind structures associated with these events and identify additional spacecraft near1 au appropriately positioned to observe the same structures after some corotation. Examination of the energeticparticle observations from these spacecraft yields two events that may correspond to the energetic particle increasesseen by EPI-Hi earlier.
Unified Astronomy Thesaurus concepts: Solar energetic particles (1491); Solar activity (1475); Fast solarwind (1872)
1. Introduction
Energetic particle increases associated with stream interac-tion regions (SIRs) have been studied for decades (Bryant et al.1965; Wilcox & Ness 1965; McDonald & Desai 1971; Barnes& Simpson 1976; Zwickl & Roelof 1981; Richardson et al.1993). These regions are typically formed when a stream offaster solar wind overtakes slower solar wind; when the speeddifferential is substantial enough, a shock or significantcompression region can form capable of accelerating particlesto MeV nuc−1 energies (see a review by Richardson 2004).Often the high-speed stream originates in a solar coronal holethat may persist for multiple rotations causing the SIR toreoccur or corotate with the Sun; in these instances the structureis referred to as a corotating interaction region (CIR).
Due to the expansion of the CIR with an increasing distancefrom the Sun, the edges of the compression region can steepeninto a pair of shocks; the one propagating into the slow solar
wind is referred to as the “forward” shock, while the onepropagating sunward in the solar wind frame into the faststream is the “reverse” shock. Although either shock canaccelerate particles, it is most often the reverse shock that isassociated with energetic particle increases seen at 1 au (Fisk &Lee 1980; Giacalone & Jokipii 1997; Richardson 2004).Although solar energetic particle (SEP) events also involve
shock acceleration, several of the properties of the energeticparticle population are distinctly different in SEP and CIRevents. Generally, the particle spectra in CIRs are significantlysofter than those in SEP events at energies of a fewMeV nuc−1; e.g., power-law indices are typically −4 in CIRevents and approximately −3 in SEP events (although there is afair amount of variability in SEP spectra). The particle intensityenhancements in CIR events have more gradual onsets oftenwith no velocity dispersion and are fairly isotropic in pitchangle, unlike the abrupt, dispersive, anisotropic populations in
The Astrophysical Journal Supplement Series, 246:20 (10pp), 2020 February https://doi.org/10.3847/1538-4365/ab4c38© 2020. The American Astronomical Society. All rights reserved.
1
SEP events. Finally, the elemental composition is different inthe two populations, particularly for He/H, which is typically afactor of ∼3 lower in SEP events (Richardson 2004 andreferences therein).
Most of our knowledge of CIR events is from observationsnear 1 au and beyond. However, the Helios spacecraft observedseveral CIR events, including five inside 0.6 au (Van Hollebekeet al. 1978). The recently launched Parker Solar Probe (PSP)provides another opportunity to study such events well inside1 au and to compare the energetic particle population character-istics to those observed at larger distances. The first two orbits ofPSP yielded seven periods of enhanced intensities of energeticparticles that are likely related to SIRs/CIRs (McComas et al.2019). Here we present more detailed analyses of these events toreveal some characteristics of protons and helium at energies of afew MeV nuc−1.
2. Instrumentation
PSP (Fox et al. 2016) was launched on 2018 August 12 andplaced into an orbit that, with the help of seven Venus flybys,will carry the spacecraft to within 10 solar radii (RS) of the Sunby the end of 2024. Even in the first orbit (with perihelion of35.7 RS), PSP explored regions closer to the Sun than anyspacecraft has before. The spacecraft carries four sciencepackages, designed to measure the solar wind plasma andelectromagnetic fields, and energetic particles, and to image thesolar corona and inner heliosphere: the Solar Wind ElectronsAlphas and Protons Investigation (SWEAP; Kasper et al.2016), the Electromagnetic Fields Investigation (FIELDS; Baleet al. 2016), the Integrated Science Investigation of the Sun(ISeIS; McComas et al. 2016), and the Wide Field Imager forSolar Probe Plus (WISPR; Vourlidas et al. 2016).
Two energetic particle instruments comprise ISeIS, includ-ing one measuring the lower energies (the Energetic ParticleInstrument-Lo, EPI-Lo) and one focusing on the higherenergies (EPI-Hi); a complete description of these instrumentsis given in McComas et al. (2016), Hill et al. (2017), andWiedenbeck et al. (2017). Once EPI-Lo and EPI-Hi are fullyintercalibrated (see Joyce et al. 2020), it will be possible tocombine the measurements to provide energy spectra spanningnearly four orders of magnitude. However, this has yet to be
achieved, particularly for protons where the EPI-Lo instrumentresponse is complicated. Thus, for this study, we have limitedthe analysis to EPI-Hi observations, and here we detail only theEPI-Hi capabilities.The EPI-Hi instrument consists of two double-ended and
one single-ended “telescopes” that are each formed of a stackof silicon detectors allowing particle identification via thestandard dE/dx versus energy technique. Ions with energiesabove ∼10 MeV nuc−1 are measured by the high-energytelescope (HETA and HETB for the sunward and anti-sunwarddirected ends, respectively); energies below ∼20 MeV nuc−1
are covered by the low-energy telescopes, LET1 being thedouble-ended sensor and LET2 being the single-ended sensor.We refer to the two ends of LET1 as LETA (sunward facing)and LETB (anti-sunward) and the single aperture of LET2 asLETC. The center of the field of view of LETC is orthogonal tothose of LETA and LETB, allowing the full range of particlepitch angles to be observed.The events presented here were too weak to be measurable
by HET, thus our analysis is further focused on LETobservations. Each LET aperture has a geometry factor thatranges from 0.25 cm2 sr at ∼1 MeV nuc−1 to 0.63 cm2 sr at∼10 MeV nuc−1. Both ends of LET1 have ∼12 μm detectors atthe top of the stack, allowing particles with energies as low as 1MeV nuc−1 to be measured. In contrast, LETC has a thickerwindow protecting the entrance, which results in minimumenergies of ∼2 MeV nuc−1.
3. Observations
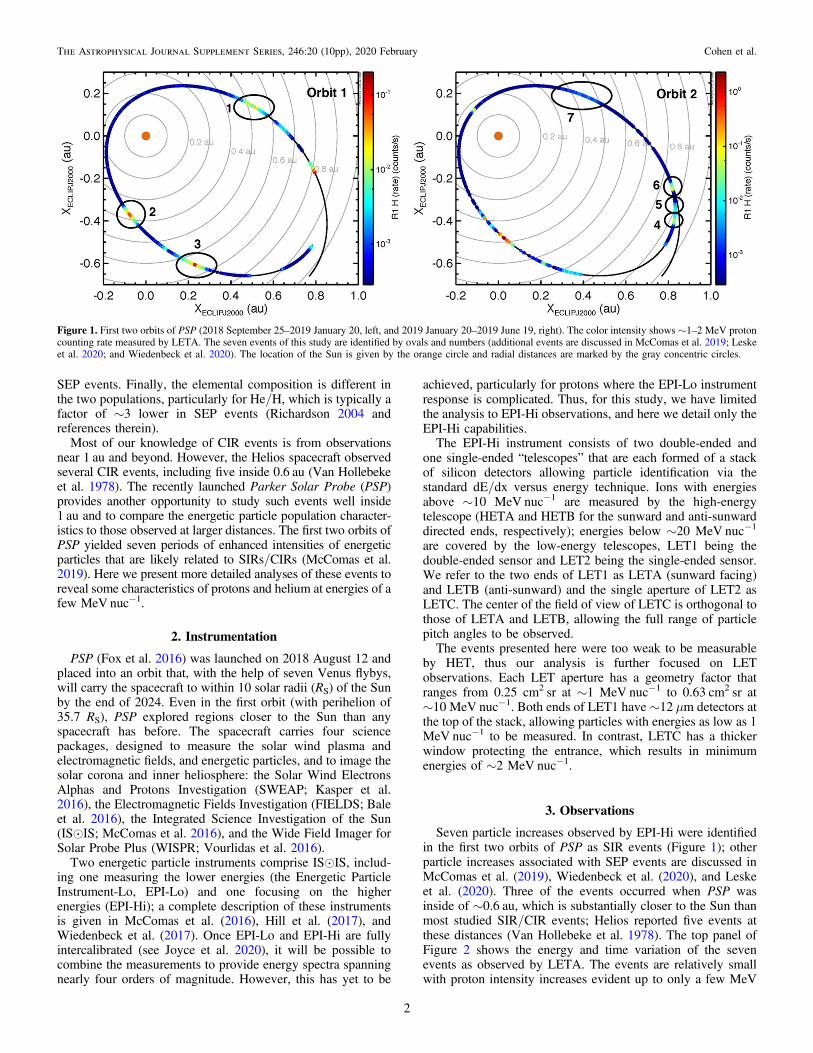
Seven particle increases observed by EPI-Hi were identifiedin the first two orbits of PSP as SIR events (Figure 1); otherparticle increases associated with SEP events are discussed inMcComas et al. (2019), Wiedenbeck et al. (2020), and Leskeet al. (2020). Three of the events occurred when PSP wasinside of ∼0.6 au, which is substantially closer to the Sun thanmost studied SIR/CIR events; Helios reported five events atthese distances (Van Hollebeke et al. 1978). The top panel ofFigure 2 shows the energy and time variation of the sevenevents as observed by LETA. The events are relatively smallwith proton intensity increases evident up to only a few MeV
Figure 1. First two orbits of PSP (2018 September 25–2019 January 20, left, and 2019 January 20–2019 June 19, right). The color intensity shows ∼1–2 MeV protoncounting rate measured by LETA. The seven events of this study are identified by ovals and numbers (additional events are discussed in McComas et al. 2019; Leskeet al. 2020; and Wiedenbeck et al. 2020). The location of the Sun is given by the orange circle and radial distances are marked by the gray concentric circles.
2
The Astrophysical Journal Supplement Series, 246:20 (10pp), 2020 February Cohen et al.
but that last for several days (the specific time periods selectedare given in Table 1).
The magnetic footpoint of the spacecraft was determined bycalculating the Parker spiral connecting the Sun and PSP,assuming a solar wind speed of 400kms−1. The heliocentricdistance of the spacecraft is plotted versus the calculatedfootpoint in Figure 2. The color intensity of the pointscorresponds to the ∼1–2MeV LETA proton counting rate (incounts-sec−1). Events 1 and 3 (2018 October 14 and 2018November 28, respectively) are shown to have occurred atapproximately the same solar footpoint longitude, suggestingthese are corotating (i.e., CIR events; McComas et al. 2019).Event 7, observed 3.5 months later (2019 March 17), alsooccurs at the same solar longitude, yet there are nocorresponding particle increases when PSP passed by the samelongitude three times in the intervening interval. Thus, weconsider this event unrelated to the previous two.
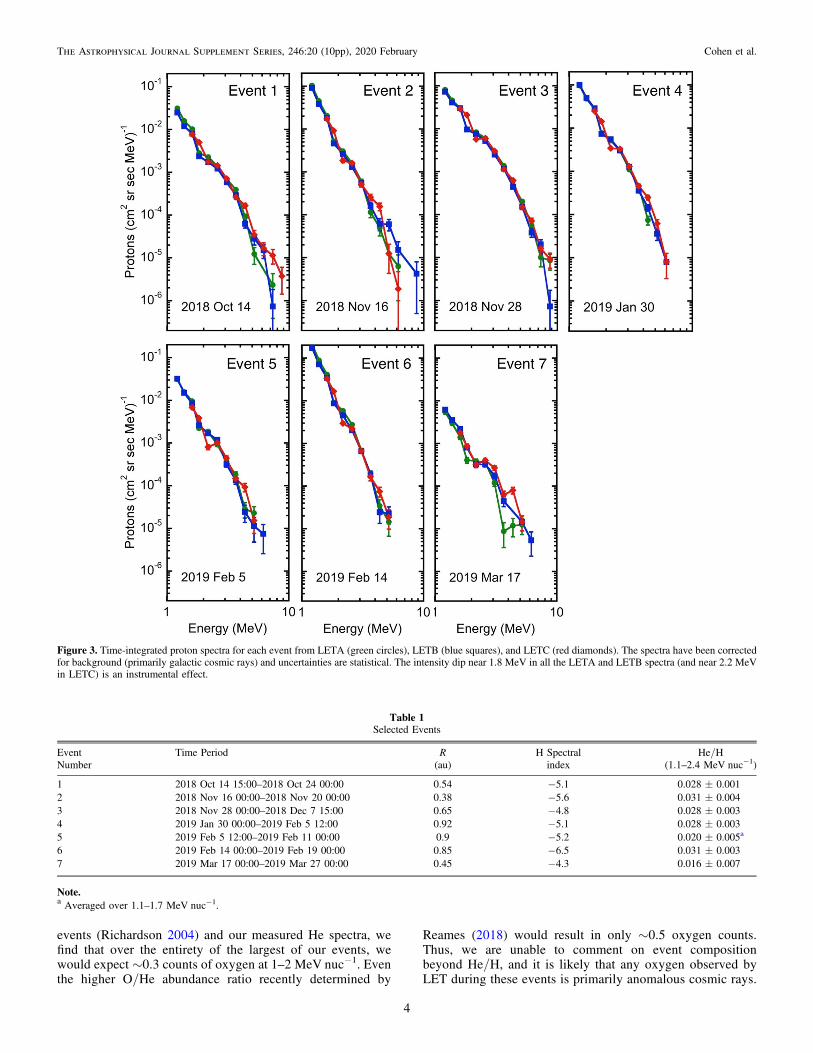
For each event, the proton intensities were integrated overthe time periods given in Table 1 and corrected for background.The background spectrum was determined by integrating overmany quiet days (as described in Leske et al. 2020) and ismostly due to galactic cosmic rays (and anomalous cosmic raysfor He). The resulting spectra from the three EPI-Hi LETapertures are given in Figure 3 for each event. It should benoted that LETC has a thicker window at the entrance of thetelescope than LETA and LETB, resulting in the LETC spectrastarting at a higher energy than the LETA and LETB spectra.Although there are some variations, particularly at the higherenergies, generally, the three spectra show good agreement
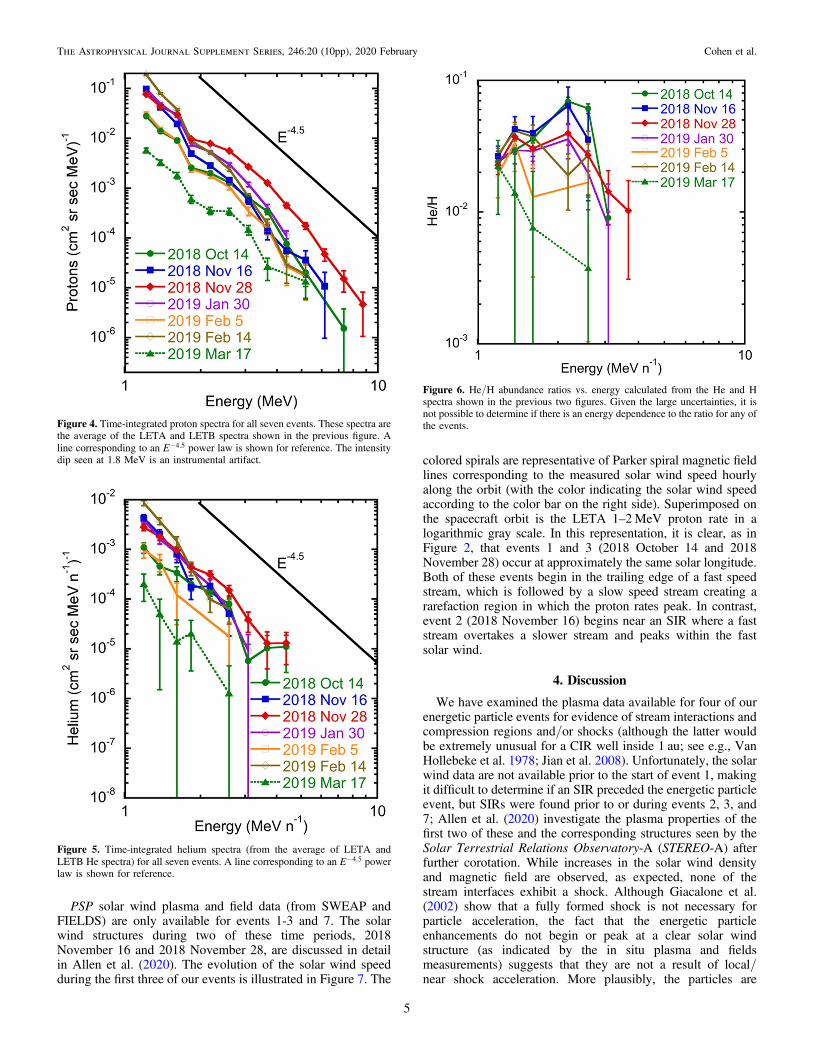
indicating a fairly isotropic particle distribution. For furtheranalyses, we have averaged the LETA and LETB spectra foreach event.Figure 4 compares the proton spectra of the seven events; a
power law corresponding to -E 4.5 is also shown for reference.Most of the events are seen to be fairly well described by apower law with indices similar to −4.5. It should be noted thatthe dip in the spectra near 1.8MeV is an instrumental effect; wehave ignored this data point when fitting the spectra. Thepower-law indices resulting from fitting the spectra are given inTable 1 and range from −4.3 to −6.5.Although the statistics are significantly poorer, He spectra
were also obtained during each event. The LETA–LETBaverage spectra are shown in Figure 5. Generally, the heliumspectra have similar spectral indices to the proton spectra. Fromthese spectra, the He/H abundance ratio as a function of energycan be calculated and is shown in Figure 6. Due to the largeuncertainties (primarily due to the poor He statistics), it is notpossible to identify any energy dependence of the ratio in anyof the events. The weighted mean of the He/H ratios inthe lowest four energy bins (1.1–2.4 MeV nuc−1) is given inTable 1 for each event.Although EPI-Hi is capable of measuring ions heavier
than He (see, e.g., observations during a small SEP eventpresented in Leske et al. 2020 and during a 3He-rich SEPevent detailed in Wiedenbeck et al. 2020), sufficient fluxeshave not been observed to date to properly calibrate the heavyion response in the LET and HET telescopes. Regardless,based on nominal O/He abundance ratios observed in CIR
Figure 2. (Top panel) Proton intensity spectrogram from LETA showing the seven events (as numbered along the top of the panel) as a function of time and energy.Gray regions are data gaps. (Bottom panel) Counting rate of 1–2 MeV protons from LETA (the color bar) as a function of the distance from the Sun and the longitudeof the spacecraftʼs magnetic footpoint (assuming a Parker spiral corresponding to 400kms−1). Increases corresponding to the seven events are labeled by number;time increases with the decreasing footpoint longitude along each trajectory segment.
3
The Astrophysical Journal Supplement Series, 246:20 (10pp), 2020 February Cohen et al.
events (Richardson 2004) and our measured He spectra, wefind that over the entirety of the largest of our events, wewould expect ∼0.3 counts of oxygen at 1–2 MeV nuc−1. Eventhe higher O/He abundance ratio recently determined by
Reames (2018) would result in only ∼0.5 oxygen counts.Thus, we are unable to comment on event compositionbeyond He/H, and it is likely that any oxygen observed byLET during these events is primarily anomalous cosmic rays.
Figure 3. Time-integrated proton spectra for each event from LETA (green circles), LETB (blue squares), and LETC (red diamonds). The spectra have been correctedfor background (primarily galactic cosmic rays) and uncertainties are statistical. The intensity dip near 1.8 MeV in all the LETA and LETB spectra (and near 2.2 MeVin LETC) is an instrumental effect.
Table 1Selected Events
Event Time Period R H Spectral He/HNumber (au) index (1.1–2.4 MeV nuc−1)
1 2018 Oct 14 15:00–2018 Oct 24 00:00 0.54 −5.1 0.028±0.0012 2018 Nov 16 00:00–2018 Nov 20 00:00 0.38 −5.6 0.031±0.0043 2018 Nov 28 00:00–2018 Dec 7 15:00 0.65 −4.8 0.028±0.0034 2019 Jan 30 00:00–2019 Feb 5 12:00 0.92 −5.1 0.028±0.0035 2019 Feb 5 12:00–2019 Feb 11 00:00 0.9 −5.2 0.020±0.005a
6 2019 Feb 14 00:00–2019 Feb 19 00:00 0.85 −6.5 0.031±0.0037 2019 Mar 17 00:00–2019 Mar 27 00:00 0.45 −4.3 0.016±0.007
Note.a Averaged over 1.1–1.7 MeV nuc−1.
4
The Astrophysical Journal Supplement Series, 246:20 (10pp), 2020 February Cohen et al.
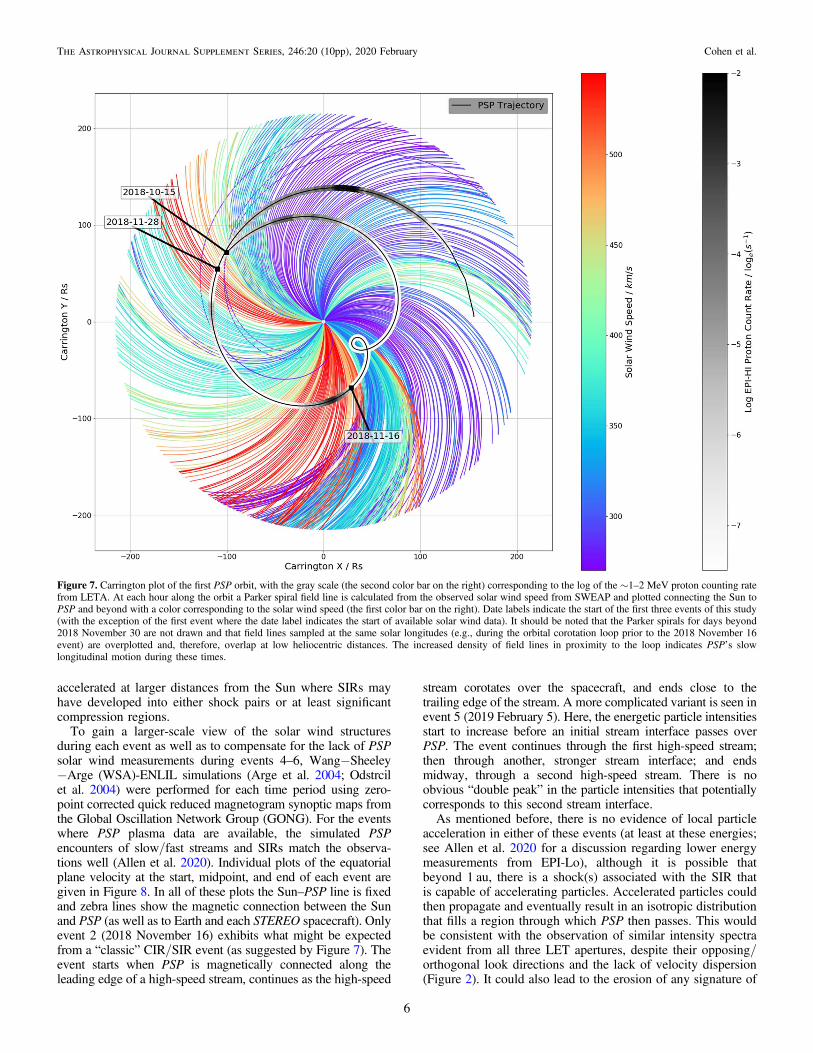
PSP solar wind plasma and field data (from SWEAP andFIELDS) are only available for events 1-3 and 7. The solarwind structures during two of these time periods, 2018November 16 and 2018 November 28, are discussed in detailin Allen et al. (2020). The evolution of the solar wind speedduring the first three of our events is illustrated in Figure 7. The
colored spirals are representative of Parker spiral magnetic fieldlines corresponding to the measured solar wind speed hourlyalong the orbit (with the color indicating the solar wind speedaccording to the color bar on the right side). Superimposed onthe spacecraft orbit is the LETA 1–2MeV proton rate in alogarithmic gray scale. In this representation, it is clear, as inFigure 2, that events 1 and 3 (2018 October 14 and 2018November 28) occur at approximately the same solar longitude.Both of these events begin in the trailing edge of a fast speedstream, which is followed by a slow speed stream creating ararefaction region in which the proton rates peak. In contrast,event 2 (2018 November 16) begins near an SIR where a faststream overtakes a slower stream and peaks within the fastsolar wind.
4. Discussion
We have examined the plasma data available for four of ourenergetic particle events for evidence of stream interactions andcompression regions and/or shocks (although the latter wouldbe extremely unusual for a CIR well inside 1 au; see e.g., VanHollebeke et al. 1978; Jian et al. 2008). Unfortunately, the solarwind data are not available prior to the start of event 1, makingit difficult to determine if an SIR preceded the energetic particleevent, but SIRs were found prior to or during events 2, 3, and7; Allen et al. (2020) investigate the plasma properties of thefirst two of these and the corresponding structures seen by theSolar Terrestrial Relations Observatory-A (STEREO-A) afterfurther corotation. While increases in the solar wind densityand magnetic field are observed, as expected, none of thestream interfaces exhibit a shock. Although Giacalone et al.(2002) show that a fully formed shock is not necessary forparticle acceleration, the fact that the energetic particleenhancements do not begin or peak at a clear solar windstructure (as indicated by the in situ plasma and fieldsmeasurements) suggests that they are not a result of local/near shock acceleration. More plausibly, the particles are
Figure 4. Time-integrated proton spectra for all seven events. These spectra arethe average of the LETA and LETB spectra shown in the previous figure. Aline corresponding to an -E 4.5 power law is shown for reference. The intensitydip seen at 1.8 MeV is an instrumental artifact.
Figure 5. Time-integrated helium spectra (from the average of LETA andLETB He spectra) for all seven events. A line corresponding to an -E 4.5 powerlaw is shown for reference.
Figure 6. He/H abundance ratios vs. energy calculated from the He and Hspectra shown in the previous two figures. Given the large uncertainties, it isnot possible to determine if there is an energy dependence to the ratio for any ofthe events.
5
The Astrophysical Journal Supplement Series, 246:20 (10pp), 2020 February Cohen et al.
accelerated at larger distances from the Sun where SIRs mayhave developed into either shock pairs or at least significantcompression regions.
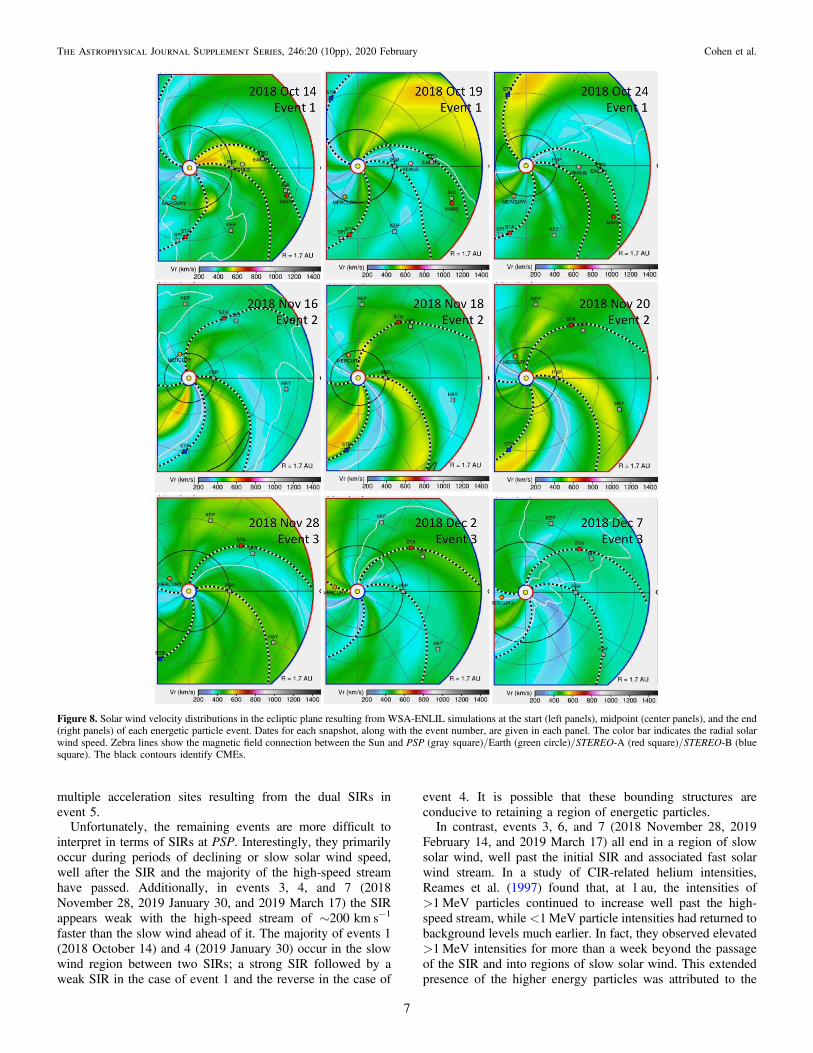
To gain a larger-scale view of the solar wind structuresduring each event as well as to compensate for the lack of PSPsolar wind measurements during events 4–6, Wang−Sheeley−Arge (WSA)-ENLIL simulations (Arge et al. 2004; Odstrcilet al. 2004) were performed for each time period using zero-point corrected quick reduced magnetogram synoptic maps fromthe Global Oscillation Network Group (GONG). For the eventswhere PSP plasma data are available, the simulated PSPencounters of slow/fast streams and SIRs match the observa-tions well (Allen et al. 2020). Individual plots of the equatorialplane velocity at the start, midpoint, and end of each event aregiven in Figure 8. In all of these plots the Sun–PSP line is fixedand zebra lines show the magnetic connection between the Sunand PSP (as well as to Earth and each STEREO spacecraft). Onlyevent 2 (2018 November 16) exhibits what might be expectedfrom a “classic” CIR/SIR event (as suggested by Figure 7). Theevent starts when PSP is magnetically connected along theleading edge of a high-speed stream, continues as the high-speed
stream corotates over the spacecraft, and ends close to thetrailing edge of the stream. A more complicated variant is seen inevent 5 (2019 February 5). Here, the energetic particle intensitiesstart to increase before an initial stream interface passes overPSP. The event continues through the first high-speed stream;then through another, stronger stream interface; and endsmidway, through a second high-speed stream. There is noobvious “double peak” in the particle intensities that potentiallycorresponds to this second stream interface.As mentioned before, there is no evidence of local particle
acceleration in either of these events (at least at these energies;see Allen et al. 2020 for a discussion regarding lower energymeasurements from EPI-Lo), although it is possible thatbeyond 1 au, there is a shock(s) associated with the SIR thatis capable of accelerating particles. Accelerated particles couldthen propagate and eventually result in an isotropic distributionthat fills a region through which PSP then passes. This wouldbe consistent with the observation of similar intensity spectraevident from all three LET apertures, despite their opposing/orthogonal look directions and the lack of velocity dispersion(Figure 2). It could also lead to the erosion of any signature of
Figure 7. Carrington plot of the first PSP orbit, with the gray scale (the second color bar on the right) corresponding to the log of the ∼1–2 MeV proton counting ratefrom LETA. At each hour along the orbit a Parker spiral field line is calculated from the observed solar wind speed from SWEAP and plotted connecting the Sun toPSP and beyond with a color corresponding to the solar wind speed (the first color bar on the right). Date labels indicate the start of the first three events of this study(with the exception of the first event where the date label indicates the start of available solar wind data). It should be noted that the Parker spirals for days beyond2018 November 30 are not drawn and that field lines sampled at the same solar longitudes (e.g., during the orbital corotation loop prior to the 2018 November 16event) are overplotted and, therefore, overlap at low heliocentric distances. The increased density of field lines in proximity to the loop indicates PSPʼs slowlongitudinal motion during these times.
6
The Astrophysical Journal Supplement Series, 246:20 (10pp), 2020 February Cohen et al.
multiple acceleration sites resulting from the dual SIRs inevent 5.
Unfortunately, the remaining events are more difficult tointerpret in terms of SIRs at PSP. Interestingly, they primarilyoccur during periods of declining or slow solar wind speed,well after the SIR and the majority of the high-speed streamhave passed. Additionally, in events 3, 4, and 7 (2018November 28, 2019 January 30, and 2019 March 17) the SIRappears weak with the high-speed stream of ∼200km s−1
faster than the slow wind ahead of it. The majority of events 1(2018 October 14) and 4 (2019 January 30) occur in the slowwind region between two SIRs; a strong SIR followed by aweak SIR in the case of event 1 and the reverse in the case of
event 4. It is possible that these bounding structures areconducive to retaining a region of energetic particles.In contrast, events 3, 6, and 7 (2018 November 28, 2019
February 14, and 2019 March 17) all end in a region of slowsolar wind, well past the initial SIR and associated fast solarwind stream. In a study of CIR-related helium intensities,Reames et al. (1997) found that, at 1 au, the intensities of>1MeV particles continued to increase well past the high-speed stream, while <1MeV particle intensities had returned tobackground levels much earlier. In fact, they observed elevated>1MeV intensities for more than a week beyond the passageof the SIR and into regions of slow solar wind. This extendedpresence of the higher energy particles was attributed to the
Figure 8. Solar wind velocity distributions in the ecliptic plane resulting from WSA-ENLIL simulations at the start (left panels), midpoint (center panels), and the end(right panels) of each energetic particle event. Dates for each snapshot, along with the event number, are given in each panel. The color bar indicates the radial solarwind speed. Zebra lines show the magnetic field connection between the Sun and PSP (gray square)/Earth (green circle)/STEREO-A (red square)/STEREO-B (bluesquare). The black contours identify CMEs.
7
The Astrophysical Journal Supplement Series, 246:20 (10pp), 2020 February Cohen et al.
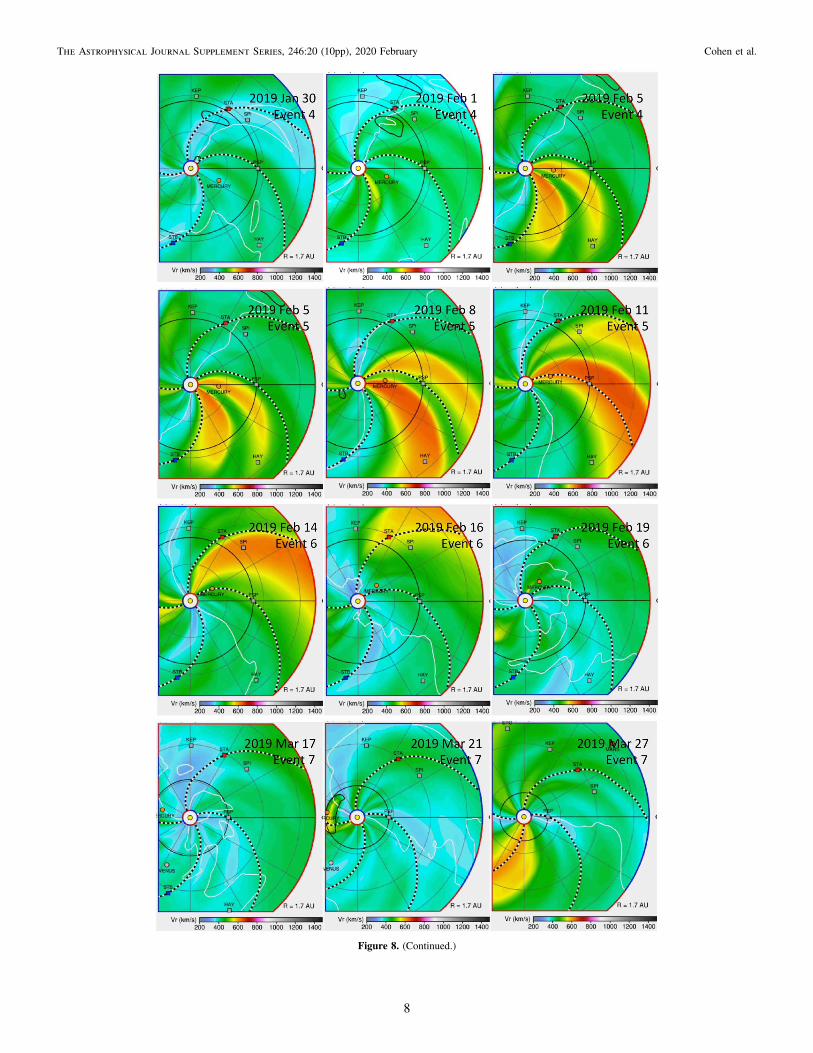
Figure 8. (Continued.)
8
The Astrophysical Journal Supplement Series, 246:20 (10pp), 2020 February Cohen et al.
CIR shock strengthening at larger radial distances where it wascapable of accelerating particles to higher energies. Because oftheir higher rigidities, only the higher energy particles werecapable of returning to 1 au in sufficient numbers to register aselevated intensities. It is possible that an analogous situation isresponsible for our events that occur in regions of slow solarwind, suggesting acceleration sources at larger radial distancesthan those of the other events.
All of the events studied here, with perhaps the exception ofevent 7 (2018 March 17), have softer spectra than the E−4, whichis typical for CIR events observed at 1 au (Richardson 2004).Whether this is related to the acceleration conditions or thetransport conditions is unknown. If the former, then the softspectra imply weaker shocks than is typical for CIR eventsobserved at 1 au. A transport explanation would suggest lessdiffusion of the lower energies, relative to the higher, out of thepopulated region. There does not appear to be any correlationbetween the spectral index of our events and the solar windstructure in which they occur (per available PSP observations andthe WSA-ENLIL simulations).
The average He/H abundance ratio quoted by Richardson(2004) for CIR events is 0.058, which is substantially higherthan those obtained for any of the events studied here.However, Richardson et al. (1993) found that the He/Habundance varies with the speed of the fast solar wind stream.They obtained an He/H ratio of 0.023 for solar wind streamswith a velocity �600km s−1 and 0.053 for streams with highervelocities. As nearly all the fast solar wind streams in ourevents have velocities �600km s−1, the derived abundanceratio values of 0.016–0.031 seem reasonable. It is also possiblethat the lower He/H abundance is a result of a radialdependence (e.g., Franz et al. 1999); however, our limitedsample does not reflect this, consistent with previous studiesinside 2.2 au (Christon & Simpson 1979).
Using the WSA-ENLIL simulations as a guide, we havesurveyed the energetic particle data available near 1 au in aneffort to identify events that are associated with the corotatedsolar wind structures previously seen on PSP in connectionwith our selected events. For event 1, the Earth is located closeto the Sun–PSP line, with its magnetic field line close tothe leading edge of the high-speed stream that passed PSPbefore the start of the event. Allen et al. (2020) identify acorresponding SIR seen in Advanced Composition Explorer(ACE) plasma data; however, there is nothing seen in the datafrom the Ultra Low Energy Isotope Spectrometer (ULEIS;Mason et al. 1998) on ACE that can be clearly identified as aCIR particle event during this time. For the remaining events,STEREO-A is the most well-positioned spacecraft for compar-ison. Events 5-7 do not have any particle increases in either theSuprathermal Ion Telescope (SIT; Mason et al. 2008) or theLow Energy Telescope (LET; Mewaldt et al. 2008) that can beconvincingly related to our events (there is a particle event seenby both SIT and LET on 2019 February 21; however, this islater than would be expected to correspond to our event 6).
As mentioned previously, Allen et al. (2020) havedetermined that the stream interfaces of events 2 and 3 arriveat STEREO-A on 2018 November 22 and 2018 December 1,respectively. There is an increase of 190 keV nuc−1 Heintensities observed by SIT on 2018 November 22 lasting for∼2.5 days, suggesting an event corresponding to our event 2(2018 November 16). At higher energies, there is no evidenceof an increase in the few MeV nuc−1 ions observed by LET,
probably an indication of a very soft event. In contrast, SITdoes not register any particle increases on 2018 December 1,while LET does; however the particle intensity is alreadyelevated due to an onset on 2018 November 29. Whether theadditional slight increase on 2018 December 1 is a separateevent or merely a temporal variation in the ongoing previousevent is unclear, making it difficult to uniquely match theSTEREO-A event with event 3 (2018 November 28) on PSP.Similarly, SIT does not see any particle intensity increase thatcan be related to event 4 (2019 January 30), while LETregisters an increase in the �1MeV proton intensities startingaround 2019 February 2, with an additional increase on 2019February 4.It should be noted that we are currently relying on the WSA-
ENLIL simulations for these PSP/STEREO-A correspondencesand, in some cases, the modeled solar wind time profiles do notmatch those of STEREO-A very well (see Allen et al. 2020). Astudy that utilizes the measured 1 au solar wind more directly todetermine the arrival of the SIRs might provide alternateinterpretations regarding our events and their potentiallycorresponding events on STEREO-A. The further addition ofEPI-Lo observations could provide a more complete pictureof the energetic particle spectra and, in combination withSTEREO-A/SIT+LET spectra, could yield interesting infor-mation regarding the radial and/or longitudinal gradient ofCIR-related energetic particles. For events 2 and 3, PSP waswell inside 1 au (Table 1), while it was near 1 au during events4 and 5 but is separated from STEREO-A by ∼60° in the solarlongitude. Such a study is beyond the scope of this work but isa possible future investigation.
5. Summary
We have detailed the first observations made by PSP ofenergetic particle events associated with SIRs during the firsttwo orbits. Several of these events occurred at locations inside0.65 au (with two inside 0.5 au), adding to the limited catalogof these events observed well inside Earth’s orbit, having beenpreviously only measured by Helios. Two of these eventsappear to be verified CIR events in that PSP observed them onsequential passes of the same solar longitude. All the events arerelatively small with measurable proton intensities extending toonly a few MeV and have spectra corresponding to power lawswith indices ranging from −4.3 to −6.5. This is softer than istypical for CIR events observed near 1 au, but it is not possibleto determine whether this is related to the accelerationconditions or to transport effects.The helium spectra are similarly soft, and we obtain He/H
abundance ratios near 1 MeV nuc−1, varying somewhat fromevent to event, with values between 0.016±0.007 and0.031±0.003. These ratios are lower than the average He/Habundance of CIR events at 1 au. However, they are consistentwith the ratio obtained by Richardson et al. (1993) for CIRevents in which the speed of the fast solar wind stream was�600km s−1. Nearly all the fast solar wind periods observedduring our events are also below or close to 600km s−1.None of the events occurred near a clear solar wind shock/
compression region (either in the data or simulations) and allexhibited particle isotropy and a lack of clear velocitydispersion. Thus, we find it likely that these events are not aresult of local acceleration but rather correspond to regionspreviously filled with energetic particles sweeping over thespacecraft. In some cases, it appears that a similar particle
9
The Astrophysical Journal Supplement Series, 246:20 (10pp), 2020 February Cohen et al.
population later passes over the STEREO-A spacecraft near1 au, although a detailed study comparing the properties ofthese populations has yet to be done. Given the currently quietsolar conditions, it is likely that there will be additional eventsobserved during upcoming PSP orbits, potentially allowing amore direct and in depth comparison of 1 au observations andthose of PSP/ISeIS.
This work was supported by NASA’s Parker Solar ProbeMission, contract NNN06AA01C. We thank all the scientistsand engineers who have worked hard to make PSP a successfulmission. In particular, we thank B. Kecman and W.R. Cook,without whom the EPI-Hi instrument would not be possible.S.D.B. acknowledges support of the Leverhulme Trust VisitingProfessorship program. We gratefully acknowledge the test andcalibration support provided by Michigan State University’sNational Superconducting Cyclotron Laboratory, Texas A&MUniversity’s Cyclotron Institute, and the Lawrence BerkeleyNational Laboratory’s 88-inch Cyclotron Laboratory.
ORCID iDs
E. R. Christian https://orcid.org/0000-0003-2134-3937A. C. Cummings https://orcid.org/0000-0002-3840-7696M. I. Desai https://orcid.org/0000-0002-7318-6008M. E. Hill https://orcid.org/0000-0002-5674-4936C. J. Joyce https://orcid.org/0000-0002-3841-5020R. A. Leske https://orcid.org/0000-0002-0156-2414W. H. Matthaeus https://orcid.org/0000-0001-7224-6024D. J. McComas https://orcid.org/0000-0001-6160-1158D. G. Mitchell https://orcid.org/0000-0003-1960-2119J. S. Rankin https://orcid.org/0000-0002-8111-1444N. A. Schwadron https://orcid.org/0000-0002-3737-9283J. R. Szalay https://orcid.org/0000-0003-2685-9801R. C. Allen https://orcid.org/0000-0003-2079-5683L. K. Jian https://orcid.org/0000-0002-6849-5527D. Lario https://orcid.org/0000-0002-3176-8704S. D. Bale https://orcid.org/0000-0002-1989-3596S. T. Badman https://orcid.org/0000-0002-6145-436XM. Pulupa https://orcid.org/0000-0002-1573-7457R. J. MacDowall https://orcid.org/0000-0003-3112-4201J. C. Kasper https://orcid.org/0000-0002-7077-930X
A. W. Case https://orcid.org/0000-0002-3520-4041K. E. Korreck https://orcid.org/0000-0001-6095-2490M. L. Stevens https://orcid.org/0000-0002-7728-0085
References
Allen, R., Lario, D., Odstrcil, D., et al. 2020, ApJS, doi:10.3847/1538-4365/ab578f
Arge, C. N., Luhmann, J. G., Odstrcil, D., Schrijver, C. J., & Li, Y. 2004,JASTP, 66, 1295
Bale, S. D., Goetz, K., Harvey, P. R., et al. 2016, SSRv, 204, 49Barnes, C. W., & Simpson, J. A. 1976, ApJL, 210, L91Bryant, D. A., Cline, T. L., Desai, U. D., & McDonald, F. B. 1965, PhRvL,
14, 481Christon, S. P., & Simpson, J. A. 1979, ApJL, 227, L49Fisk, L. A., & Lee, M. A. 1980, ApJ, 237, 620Fox, N. J., Velli, M. C., Bale, S. D., et al. 2016, SSRv, 204, 7Franz, M., Keppler, E., Lauth, U., et al. 1999, GeoRL, 26, 17Giacalone, J., & Jokipii, J. R. 1997, GeoRL, 24, 1723Giacalone, J., Jokipii, J. R., & Kóta, J. 2002, ApJ, 573, 845Hill, M. E., Mitchell, D. G., Andrews, G. B., et al. 2017, JGR, 122, 1513Jian, L. K., Russell, C. T., Luhmann, J. G., Skoug, R. M., & Steinberg, J. T.
2008, SoPh, 249, 85Joyce, C. J., McComas, D. J., Christian, E. R., et al. 2020, ApJS, doi:10.3847/
1538-4365/ab5948Kasper, J. C., Abiad, R., Austin, G., et al. 2016, SSRv, 204, 131Leske, R. A., Christian, E. R., Cohen, C. M. S., et al. 2020, ApJS, doi:10.3847/
1538-4365/ab5712Mason, G. M., Gold, R. E., Krimigis, S. M., et al. 1998, SSRv, 86, 409Mason, G. M., Korth, A., Walpole, P. H., et al. 2008, SSRv, 136, 257McComas, D. J., Alexander, N., Angold, N., et al. 2016, SSRv, 204, 187McComas, D. J., Christian, E. R., Cohen, C. M. S., et al. 2019, Natur, 576, 223McDonald, F. B., & Desai, U. D. 1971, JGR, 76, 808Mewaldt, R. A., Cohen, C. M. S., Cook, W. R., et al. 2008, SSRv, 136, 285Odstrcil, D., Riley, P., & Zhao, X. P. , 2004, JGR, 109, A02116Reames, D. V. 2018, SoPh, 293, 144Reames, D. V., Ng, C. K., Mason, G. M., et al. 1997, GeoRL, 24, 2917Richardson, I. G. 2004, SSRv, 111, 267Richardson, I. G., Barbier, L. M., Reames, D. V., & Rosenvinge von, T. T.
1993, JGR, 98, 13Van Hollebeke, M. A. I., McDonald, F. B., Trainor, J. H., & Rosenvinge von, T. T.
1978, JGR, 83, 4723Vourlidas, A., Howard, R. A., Plunkett, S. P., et al. 2016, SSRv, 204, 83Wiedenbeck, M. E., Angold, N. G., Birdwell, B., et al. 2017, Proc. ICRC, 35, 16Wiedenbeck, M. E., Bucik, R., Mason, G. M., et al. 2020, ApJS, doi:10.3847/
1538-4365/ab5963Wilcox, J. M., & Ness, N. F. 1965, JGR, 70, 5793Zwickl, R. D., & Roelof, E. C. 1981, JGR, 86, 5449
10
The Astrophysical Journal Supplement Series, 246:20 (10pp), 2020 February Cohen et al.
Copyright © 2022 FDOKUMEN