2007 Chevrolet Tahoe, Suburban Owner Manual M - Dealer E ...

THE SUBURBAN STREAM SYNDROME: EVALUATING LAND USE AND STREAM IMPAIRMENTS IN THE SUBURBS
Mary Ann CunninghamDepartment of Earth Science and Geography
Vassar College, 124 Raymond Ave., Poughkeepsie, New York 12604
Catherine M. O’ReillyBiology Program
Bard College, PO Box 5000, Annandale-on-Hudson, New York 12504
Kirsten M. Menking and David P. GillikinDepartment of Earth Science and Geography
Vassar College, 124 Raymond Ave., Poughkeepsie, New York 12604
Kelsey C. Smith, Catherine M. Foley, Stuart L. Belli, A. Marshall Pregnall, Mark A. Schlessman, and Pinar Batur
Environmental Studies ProgramVassar College, 124 Raymond Ave., Poughkeepsie, New York 12604
Abstract: Development is known to impair stream water quality at moderate to highlevels of urbanization, but the effects of low-density urban expansion, the kind occurringon the outskirts of many cities, remain unclear. We examined five suburban headwaterstreams in Duchess County, New York whose watersheds contained between 4.7% and34% impervious surface cover. We measured Cl– and nitrate-N (NO3-N) concentrations inwater samples taken at four to six sites on each stream in winter and summer. Even at lowlevels of population and impervious cover, concentrations of both Cl– and NO3-Nexceeded reference levels found in cleaner streams in the region. Chloride levels wereelevated in upper reaches and remained elevated or continued to increase downstream,with a linear response to impervious cover. Nitrate-N increased downstream in all water-sheds, indicating that NO3-N inputs exceeded natural denitrification and uptake in bothwinter and summer. Nitrate-N responded logarithmically to impervious surface cover,with steep increases at low levels of imperviousness. Per-capita inputs were also high inrural areas. Agricultural inputs were not sufficient to explain observed trends in NO3-N;we interpret inputs to result chiefly from low-density exurban expansion. Widespread res-idential expansion has significant impacts on water quality that have not previously beenacknowledged. [Key words: chloride, nitrate, impervious surface cover, urban watersheds,water quality.]
INTRODUCTION
Land use policies on the periphery of American cities have often allowed orencouraged the expansion of low-density suburbs (USEPA, 2004; Richards, 2006).These conditions lead to changes in the percentage of impervious surface cover
269
Physical Geography, 2009, 30, 3, pp. 269–284.Copyright © 2009 by Bellwether Publishing, Ltd. All rights reserved. DOI: 10.2747/0272-3646.30.3.269

270 CUNNINGHAM ET AL.
(ISC) in a watershed, a factor that has the potential to impair water quality in urbanstreams. In cities and inner suburbs, increasing ISC contributes to higher salinityand nutrient loading compared to forested environments (Groffman et al., 2004;Walsh et al., 2005; Shields et al., 2008). Studies of ISC effects have tended to focuson contrasts between highly developed and undeveloped (e.g., forested) water-sheds. In recent decades, however, low-density suburban expansion into exurbanareas (beyond both the relatively densely developed urban core and inner suburbs)has been a prominent aspect of land use change in the United States. What are theeffects of these low-density developments on surface water quality?
A variety of factors can encourage low-density development. Among these fac-tors are zoning laws that enforce large lot sizes, transportation systems that focus onimproving rural highway networks, and road-salting policies that maintain snow-free winter road conditions in snow-belt states, thus facilitating residential expan-sion outside the urban core. Low-density zoning is supported in part by codes thatlimit septic density (USEPA, 2004; Richards, 2006). Residential septic systems relyon ecological services such as bacterial decomposition and aeration in soil todecontaminate and take up nutrients from human waste. Low-density codes aredesigned in part to safeguard health and water quality by maintaining adequate dis-tances between these systems. The rapid expansion of outlying suburbs makes itimportant to evaluate whether these rules are effective in protecting surface waters.
Impervious surface cover in a watershed has been a useful proxy for multipleaspects of urbanization, such as increasing density of road networks, parking lots,and buildings. These land uses both contribute contaminants to streams and accel-erate the movement of contaminants to surface waterways (Doyle et al., 2000; Pauland Meyer, 2001; Feminella and Walsh, 2005). Chloride (Cl–) levels in streams arestrongly associated with percentage ISC, especially where anti-icing road salt isused in winter (Godwin et al., 2003; Jackson and Jobbágy, 2005; Kaushal et al.,2005; Cunningham et al., 2008; Kelly et al., 2008). Elevated levels of nutrients,including nitrate (NO3
–) are also associated with ISC (Paul and Meyer, 2001;Groffman et al., 2004; Walsh et al., 2005). Because of its contribution to eutrophi-cation in estuaries, NO3
– is a particular concern in the Hudson River Estuary (Burns,2006). Watersheds show impairment at 10% impervious surface cover or less(Wang et al., 2001; Kaushal et al., 2005; Wollheim et al., 2005). Recent studieshave found effects on biotic health at levels of impervious cover as low as 4–5%(Schiff and Benoit, 2007; Walsh et al., 2007), levels that approximate those of manyoutlying suburbs. If stream contaminants increase at very low levels of ISC, thenlow-density residential areas have the potential for disproportionately high per-person impacts on stream health and on the environmental services associated withstream ecosystems. As urban and regional planners consider development andresidential expansion in a region, it becomes important to understand whether per-person effects in rural locations are similar to, less than, or greater than per-personeffects in urban areas.
To examine the effects of spatially expansive exurban development on streamwater quality, we examined water quality and impervious cover in five headwaterstreams draining directly into the Hudson River in Dutchess County, New York (Fig.1), an area on the margin of the New York City region. In recent decades, over a

SUBURBAN STREAM SYNDROME 271
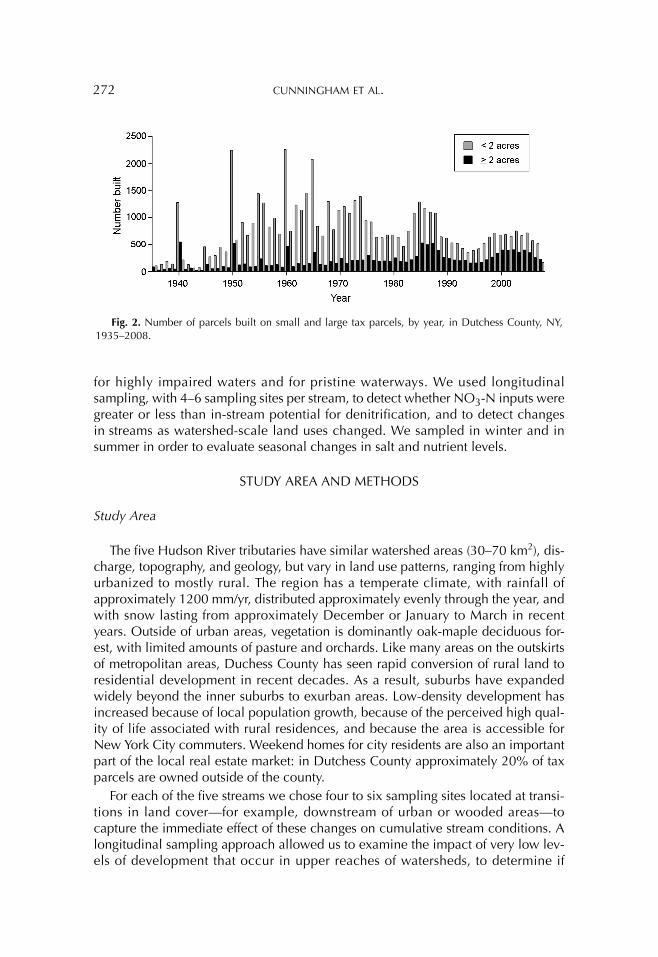
third of new buildings in the county have been erected on suburban lots larger than0.8 hectares (2 acres, Fig. 2). Like many exurban areas of the United States, muchof the county is zoned for residential development at densities of 0.8–2.0 hectares(2–5 acres) or more per residence, so the trend of expansive suburban developmentseems likely to continue. We evaluated the effects of two explanatory factors—basin-scale percentage ISC and settlement concentrations (number of residents in awatershed)—on concentrations of Cl– and nitrate-N (NO3-N) in the five streams.We also examined the effect of the farming operations that remain in the water-sheds and of wastewater treatment plants (WWTPs) to evaluate whether nutrientlevels were more related to ISC or to these other possible sources. To assess severityof impacts, we compared observed levels of Cl– and NO3-N to standard levels both
Fig. 1. Sample points on five streams, with farms and wastewater treatment plants (WWTP) alsoshown. Shaded areas represent watersheds.
272 CUNNINGHAM ET AL.
for highly impaired waters and for pristine waterways. We used longitudinalsampling, with 4–6 sampling sites per stream, to detect whether NO3-N inputs weregreater or less than in-stream potential for denitrification, and to detect changesin streams as watershed-scale land uses changed. We sampled in winter and insummer in order to evaluate seasonal changes in salt and nutrient levels.
STUDY AREA AND METHODS
Study Area
The five Hudson River tributaries have similar watershed areas (30–70 km2), dis-charge, topography, and geology, but vary in land use patterns, ranging from highlyurbanized to mostly rural. The region has a temperate climate, with rainfall ofapproximately 1200 mm/yr, distributed approximately evenly through the year, andwith snow lasting from approximately December or January to March in recentyears. Outside of urban areas, vegetation is dominantly oak-maple deciduous for-est, with limited amounts of pasture and orchards. Like many areas on the outskirtsof metropolitan areas, Duchess County has seen rapid conversion of rural land toresidential development in recent decades. As a result, suburbs have expandedwidely beyond the inner suburbs to exurban areas. Low-density development hasincreased because of local population growth, because of the perceived high qual-ity of life associated with rural residences, and because the area is accessible forNew York City commuters. Weekend homes for city residents are also an importantpart of the local real estate market: in Dutchess County approximately 20% of taxparcels are owned outside of the county.
For each of the five streams we chose four to six sampling sites located at transi-tions in land cover—for example, downstream of urban or wooded areas—tocapture the immediate effect of these changes on cumulative stream conditions. Alongitudinal sampling approach allowed us to examine the impact of very low lev-els of development that occur in upper reaches of watersheds, to determine if
Fig. 2. Number of parcels built on small and large tax parcels, by year, in Dutchess County, NY,1935–2008.

SUBURBAN STREAM SYNDROME 273
threshold effects were detectable, and to evaluate the ability of instream processeseither to dilute or to take up nutrients and salts present in the stream.
Land Cover and Population Size
We defined watershed areas upstream of each sample site using the Soil andWater Assessment Tool (SWAT) utility for ArcMap 9.2. This utility delineated water-sheds from 1 arc-second digital elevation data taken from the National ElevationDataset (DiLuzio, 2002; USGS, 2008a). The SWAT utility also delineated streamcourses. We used these stream lengths to designate each sample point’s distancedownstream from the beginning of the stream as designated by SWAT.
We characterized watershed land cover patterns using percentage ISC and thenumber of farms in the sub-basin upstream of each sampling point. For each sub-basin, we calculated the amount of impervious cover from 30 m land cover dataacquired from the New York Hudson River Estuary Program and the New YorkDepartment of Environmental Conservation Gap Analysis Project (Hudson RiverEstuary Program, 2005). All GIS analysis was done using ArcGIS 9.2, with percent-age impervious calculated using FragstatsBatch for ArcGIS (McGarigal et al., 2002;Mitchell, 2007). We acquired agricultural land use data from county records.County data identified classes of agricultural land use but not intensity of use (e.g.,number of livestock). To examine possible impacts of these operations, we calcu-lated the number of agricultural parcels in each sub-watershed recorded as havingeither livestock (including horses, sheep, poultry, dairy, and other) or crops (rowcrops, orchards, berry farms, truck farms).
Wastewater treatment plants can also be an important point source of nutrientsand possibly salt inputs. We identified wastewater treatment plants (WWTPs) fromthe New York state listing of the National Pollution Discharge Elimination Systems(NPDES) compliance records (USEPA, 2008). Three WWTPs occurred in our water-sheds. To identify sampling points downstream of these plants we geocoded eachWWTP according to its latitude/longitude coordinates and mapped these points onwatershed maps. Accurate records of the number of households on sewage vs.septic systems were not available in the study area.
To evaluate per capita inputs to streams, we approximated the cumulative popu-lation near streams in each watershed area. We selected U.S. Census blocks thatintersected a 500 m buffer of stream channels and took the sum of the number ofpeople in those blocks to represent the population within the watershed upstreamof a sample point. Because the watersheds were small, the 500 m buffer approxi-mated the lateral extent of the watershed. The cumulative population in all water-sheds upstream of a sample point thus represented the cumulative influence ofsettlement.
Water Sampling and Analysis
Replicate water samples were taken at each site on three separate days withintwo-week periods in winter (February–March) and summer (mid-June). Sampleswere taken at close to base flow conditions, based on weather observations and on

274 CUNNINGHAM ET AL.
USGS streamflow records in an adjacent watershed (Wappinger Creek; USGS,2008b). Samples were syringe-filtered (Whatman GF/F) in the field into clean 2 mLion chromatography sample vials. Samples were stored at 4° C and analyzed withintwo days on a Dionex ICS-3000 Dual RFIC System ion chromatograph for Cl– andNO3-N.
Statistical Analysis
Because multiple samples were taken on each stream, we tested for indepen-dence among sample sites on any individual stream by including distance fromheadwaters, nested by stream, in preliminary multiple regression analysis. For bothCl– and NO3-N, this nested variable was significant (p < 0.001), indicating that dif-ferences among sampling sites contributed explanation in addition to other factorsand that adjacent sites were statistically independent. We then used multivariateregression to evaluate response of Cl– and NO3-N to explanatory factors. Theseincluded ISC, number of farms, distance from headwaters (to reflect the effect ofdownstream changes), season, and stream (to assess differences among streams).Dummy variables were used for the categorical variables stream and season. Con-tinuous variables were log-transformed as necessary to obtain normal distributions.Population was strongly correlated with percentage ISC (Spearman’s rho = 0.88,p < 0.001), so we excluded population from multivariate analysis. We used step-wise regression, entering terms in order of largest to smallest F statistic, to determinethe proportion of variation explained by each of the effects. To examine seasonaldifferences in levels of Cl– and NO3-N, we used ANOVA.
Although population values were excluded from multiple regression because oftheir correlation with ISC, we were interested in examining the independent effectsof population. We therefore calculated per capita inputs of Cl– and NO3-N, usingpopulation values in the watersheds upstream of each sampling site. We calculatedthese per capita inputs as:
Cl– /population = [(mg Cl–/L) ÷ (watershed population)] * 100, (1)
NO3-N /population = [(mg NO3-N /L) ÷ (watershed population)] * 10,000. (2)
We then plotted Cl–/population and NO3-N/population against percentage imper-vious cover. We used ANOVA to compare per capita inputs for sub-basins with< 5% ISC and those with ≥ 5% ISC. Statistical analysis was done using SAS JMP 7.0.
RESULTS
For the five whole watersheds, ISC ranged from 4.7% (Saw Kill) to 34%(Casperkill; Table 1); sub-watersheds ranged from 0.7 to 39.4% ISC. Mean Cl– levels(mean of all samples for a stream) ranged from 30 to 145 mg Cl–/L in winter andfrom 24 to 91 mg Cl–/L in summer (Table 1). Mean NO3-N levels ranged from 0.29to 0.82 mg/L in winter and 0.29 to 0.64 mg/L in summer. Farms were most abun-dant in the northern watersheds, especially that of the Saw Kill (Fig. 1). Wastewater

SUBURBAN STREAM SYNDROME 275
treatment plants were located in the lower reaches of three of the watersheds. Lev-els of ISC, population, Cl–, and NO3-N increased from upper to lower reaches ofmost streams, with the most dramatic increases occurring in the Casperkill, oursouthernmost and most developed watershed (Fig. 3).
Chloride concentrations were explained primarily by ISC (Table 2, Fig. 4). Thecategorical variable stream was significant in regression, indicating that the fivestreams had different patterns of Cl– accumulation and response to explanatoryvariables. Number of farms was not a significant contributor to Cl–. Chloride levelsincreased linearly with ISC (p < 0.0001), and increases were evident even at lowlevels of ISC (< 5%; Fig. 4). The linear relationship between ISC and Cl– explains theunusually high Cl– levels in the Casperkill (Fig. 3), which had about 35% ISC for thethree lowest sampling points. Chloride levels increased significantly with distancedownstream (p < 0.01) for three streams in summer (Casperkill, Fallkill, Lands-mankill) and for all streams except the Saw Kill in winter. In a seasonal comparison,Cl– levels were significantly higher in all streams during the winter (F = 280,p < 0.0001), with the most significant differences for Crum Elbow, Fallkill, andLandsmankill (p < 0.005) and the least for Saw Kill (p < 0.03) and Casperkill(p < 0.04).
Nitrate increases were explained primarily by ISC and distance downstream(Table 2). Farms provided little explanation for NO3-N and were not significant (p =0.52). For all streams taken together, NO3-N concentrations increased significantlyand logarithmically downstream (p < 0.001). When streams were analyzed sepa-rately, NO3-N levels also increased significantly with distance downstream (p <0.01) for all streams in both winter and summer. High NO3-N levels occurredwhere wastewater treatment plants were present, but rapid increases occurredupstream of WWTPs, as well (Fig. 3). Seasonally, NO3-N did not differ whenstreams were analyzed together (F = 43, p = 0.21) or when analyzed individually.
Table 1. Mean Levels of Impervious Surface Cover (ISC), Cl–, and NO3-N(plus or minus standard error)
Stream
Cl– NO3-N
Na ISCbWinter mean
c (± se)Summer meanc
(± se)Winter meanc
(± se)Summer meanc
(± se)
Saw Kill 5 4.7 30.24 (2.22) 23.90 (2.10) 0.59 (0.10) 0.56 (0.14)
Landsmankill 4 5.4 44.47 (4.75) 30.56 (4.55) 0.46 (0.08) 0.55 (0.19)
Crum Elbow 6 6.0 36.92 (3.37) 26.35 (2.96) 0.29 (0.07) 0.29 (0.06)
Fallkill 5 15.0 54.20 (7.94) 44.47 (9.58) 0.40 (0.08) 0.30 (0.09)
Casperkill 5 34.0 145.79 (39.11) 90.60 (22.18) 0.82 (0.19) 0.64 (0.14)
aNumber of sites sampled. bPercentage impervious surface cover in whole watershed.cmg/L Cl– or N, means from three seasonal sampling dates.

276 CUNNINGHAM ET AL.
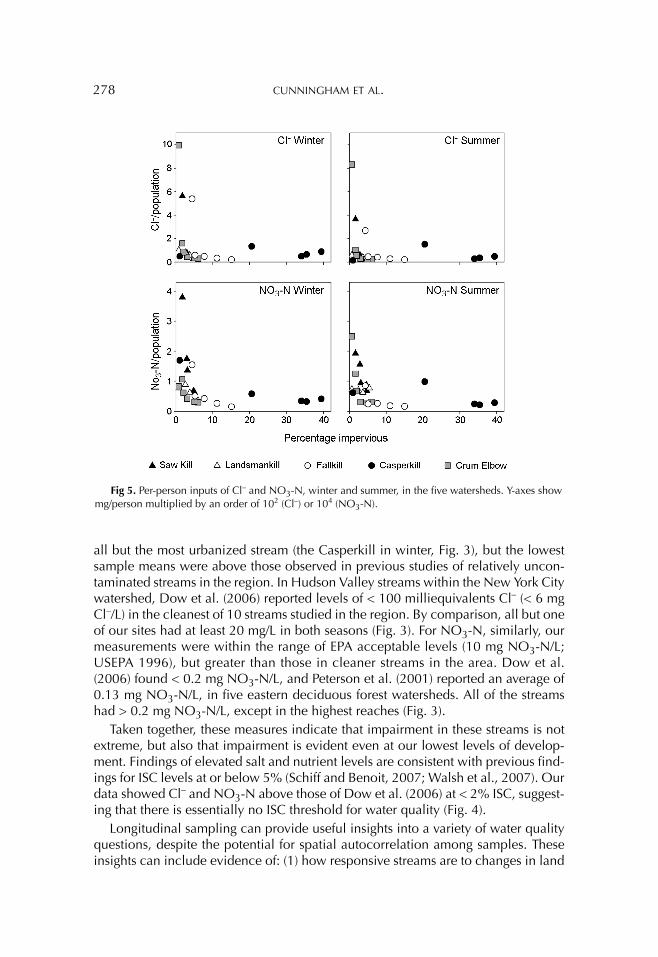
When examined in terms of inputs/person, concentrations of Cl–/person weresignificantly higher in areas with < 5% ISC than in areas with higher ISC (ANOVA F =11.7, p < 0.001; Fig. 5). Nitrate inputs/person were also significantly higher in areaswith < 5% ISC than in areas with higher ISC (F = 41.6, p < 0.0001).
Fig 3. Changes in variables over the length of five streams. Winter and summer graphs show meanvalues at a site for three sampling days; range bars show maximum and minimum values. Horizontaldashed lines show reference levels of Cl– and NO3-N found in clean streams in the region by Dow etal. (2006). Open circles around data points indicate sites directly downstream of wastewater treatmentplants.

SUBURBAN STREAM SYNDROME 277
DISCUSSION
Low-density development had a clear impact on stream water quality. Even withISC levels as low as 1 to 3%, we observed impacts on Cl– and NO3-N concentra-tions. Chloride levels were below the EPA limit for drinking water (250 mg/L Cl–) in
Fig 4. Relationship of Cl– and NO3-N to percentage impervious surface cover. Dots show means oftriplicate samples from three sampling dates in each season; regression models are shown for seasonalmeans of all sampling points. Open circles around data points indicate sites directly downstream ofwastewater treatment plants.
Table 2. Effect of Explanatory Variables on Cl– and on NO3-N
Explanatory variableCl– Fratio p
Pct. variation explained
NO3-N F ratio p
Pct. variation explained
Log ISC 377 <0.0001 68.3 38 <0.0001 43.5
Season 48 <0.0001 5.0 5 0.02 0.8
Stream 28 <0.0001 8.1 39 <0.0001 24.8
Distance downstream 12 0.0007 3.2 21 <0.0001 9.1
Log farms 0.3 0.58 <<1 0.4 0.52 <0.1
Overall model 101 <0.0001 84.4 69 <0.0001 80.0
278 CUNNINGHAM ET AL.
all but the most urbanized stream (the Casperkill in winter, Fig. 3), but the lowestsample means were above those observed in previous studies of relatively uncon-taminated streams in the region. In Hudson Valley streams within the New York Citywatershed, Dow et al. (2006) reported levels of < 100 milliequivalents Cl– (< 6 mgCl–/L) in the cleanest of 10 streams studied in the region. By comparison, all but oneof our sites had at least 20 mg/L in both seasons (Fig. 3). For NO3-N, similarly, ourmeasurements were within the range of EPA acceptable levels (10 mg NO3-N/L;USEPA 1996), but greater than those in cleaner streams in the area. Dow et al.(2006) found < 0.2 mg NO3-N/L, and Peterson et al. (2001) reported an average of0.13 mg NO3-N/L, in five eastern deciduous forest watersheds. All of the streamshad > 0.2 mg NO3-N/L, except in the highest reaches (Fig. 3).
Taken together, these measures indicate that impairment in these streams is notextreme, but also that impairment is evident even at our lowest levels of develop-ment. Findings of elevated salt and nutrient levels are consistent with previous find-ings for ISC levels at or below 5% (Schiff and Benoit, 2007; Walsh et al., 2007). Ourdata showed Cl– and NO3-N above those of Dow et al. (2006) at < 2% ISC, suggest-ing that there is essentially no ISC threshold for water quality (Fig. 4).
Longitudinal sampling can provide useful insights into a variety of water qualityquestions, despite the potential for spatial autocorrelation among samples. Theseinsights can include evidence of: (1) how responsive streams are to changes in land
Fig 5. Per-person inputs of Cl– and NO3-N, winter and summer, in the five watersheds. Y-axes showmg/person multiplied by an order of 102 (Cl–) or 104 (NO3-N).

SUBURBAN STREAM SYNDROME 279
use; (2) rates of accumulation of contaminants; and (3) possibility of recovery, eitherby instream processing (N) or dilution (N or Cl–). In our case, recovery was not evi-dent for either Cl– or NO3-N, but accumulation rates differed in important ways,and impairment began very early in the stream courses. These findings would nothave been evident if we had sampled the streams only once near their outlets.
Chloride Trends and Sources
Chloride increases occurred in these streams, but in general Cl– increases wereless steep than NO3-N increases (Fig. 3). For all streams except the Casperkill, ourmost urban stream, Cl– increased downstream by a factor of 2, on average (maxi-mum value/minimum value), in both seasons, whereas NO3-N rose by a factor of 8,on average. The smaller increases in Cl– apparently results from the extensive roadnetworks that are required in low-density residential areas as well as in high-densityareas. Most Cl– in surface waters in this area has been attributed to road anti-icingsalt (Peters and Turk, 1981; Jackson and Jobagy, 2005; Kaushal et al., 2005; Kelly etal., 2008). Higher winter levels of Cl– also point to road salt as the principal sourceof Cl– in these streams. Road salt is a difficult factor to reduce, as drivers from bothurban and rural areas have come to expect clear and safe roads in all seasons. Thepresence of rural-dwelling urban workers seems likely to increase the importanceof keeping roads dry in winter, because commuting requires daily travel on arestricted time schedule. Residential development in this region in the past half cen-tury has emphasized widely spaced housing without public transportation, whileurban areas have been subject to policies of neglect that encouraged out-migration.Consequently, many of the most desirable residential neighborhoods are in remoteareas, and families looking for “good” neighborhoods may feel that they have fewchoices other than suburban living and long commutes on rural roads. Reducingroad salt impacts on watersheds may require attention to attitudes about planningpolicies more than changes in salt use per se.
Residential water softeners may be a secondary source of salt in these water-sheds, but Kelly et al. (2008) calculated a salt budget for a watershed adjacent toour study area and concluded that less than 3% of salt could be attributed to watersofteners. Even if a significant amount of salinity in our streams came from residen-tial water softeners in our watersheds, that would still be consistent with our overallfindings that distributed, low-density residential development affects water qualityin these streams.
Although we observed higher levels of Cl– in winter, levels were elevated in sum-mer as well, and concentrations rose with distance downstream in both seasons.These results show that salinity is not just a winter problem. High summer Cl– levelsapparently reflect gradual transport of salt through soil water to streams (Burns,2006; Kelly et al., 2008). Even our most rural streams (the Saw Kill, Landsmankill,and Crum Elbow; Fig. 3) saw year-round persistence of these high salt levels. Thisfinding underscores the extended temporal, as well as spatial, impacts that roadnetworks can have beyond the urban periphery.

280 CUNNINGHAM ET AL.
Nitrate Trends and Sources
The non-linear responses of NO3-N to ISC indicate that NO3-N was more sensi-tive to changes in impervious cover in exurban watersheds than in urban water-sheds. This difference could represent a shift from septic-dominated systems, whichare common with low-density development, to sewer-dominated systems moreprevalent in more highly urbanized environments.
The strong correlation between NO3-N and impervious cover and population(Figs. 4 and 5) suggests that N inputs are mainly anthropogenic. If sources such asatmospheric deposition were chiefly responsible, then more samples should havelow levels comparable to those found by Dow et al. (2006) or Peterson et al. (2001).Septic systems are a likely source of NO3-N in these streams: household septicsystems are widely distributed, and many are decades old, if their ages are similarto those of the houses in the study area (Fig. 2). In the urbanized parts of our water-sheds, in contrast, city sewer infrastructure removes much of the nutrient load fromthe watershed by sending it to a wastewater treatment facility (Fig. 4). Lawn fertiliz-ers are another potential source of nutrients, and fertilizer use is another way inwhich dispersed suburban settlement can input nutrients into the stream system(Robbins et al., 2001; Groffman et al., 2004; Law et al., 2004). A lack of seasonaldifferences in NO3-N concentrations also points to septic sources, because septicsystems are more likely to be in use year-round. Both septic systems and lawnfertilizers are inputs that can accompany suburban development.
Regardless of whether septic systems or fertilizers are the main inputs to thesestreams, it is notable that N concentrations rose steadily in the course of all but themost urban stream (Fig 3). Small streams generally have high denitrification potential(Peterson et al., 2001; Triska et al., 2007), but in all the studied streams, in summeras well as in winter, even in areas with low-density development, the current septicdensity (or other residential sources) apparently contributed NO3-N to streams at arate faster than denitrification and nutrient uptake in soils and in-stream biota couldremove it from the system. Levels were somewhat lower in summer, probably reflect-ing more rapid uptake and denitrification than in winter months, but even in sum-mer, NO3-N levels increased, rather than decreased, in the course of all five streams.
Although farms were present in some of the watersheds, they did not contributesufficient inputs of nutrients or salts to cause stream impairments commensuratewith those from ISC. The lack of effect from farms in these watersheds may reflectthe fact that most farms in the study area are small operations, apparently withoutlarge numbers of livestock or crop fertilizers. This pattern of small operations maynot be unusual on urban peripheries, where recreational and residential land own-ership elevate land values, and alternative economic opportunities make large-scale farming less viable than in more concentrated farming areas.
Per Capita Effects
Populations in exurban areas had a disproportionately large per person NO3-Nor Cl– effect on stream quality compared to more developed areas (Fig. 5). In expan-sive, low-density development, economic costs of water, sewer, and other
SUBURBAN STREAM SYNDROME 281
infrastructure requirements for each household are widely recognized. Our findingsfurther suggest that the per capita environmental impacts on aquatic systems arealso higher in exurban areas. Planning policies that promote in-fill, for examplewhere sewer infrastructure already exists, could reduce these effects. Extensive roadnetworks are needed in lightly populated areas, but exurban residential develop-ment further accelerates demands for subdivision roads, for pavement, and for saferwinter driving conditions. In terms of watershed impacts, infill in urban and inner-suburban areas is better than further expansion of outlying suburbs.
It is important to note that the watershed scale is not the only scale at which ISCinfluences stream conditions. Also important (and in some studies more important)are riparian-zone vegetation and soil flora, which can take up NO3-N and othernutrients (Triska et al., 2007; Walsh et al., 2007). The impacts of ISC can thus beameliorated by land management approaches, including protection of vegetatedstream buffers, maintaining green space along stream courses. Low-impact devel-opment strategies, including disconnected storm drainage and on-site infiltration,clustered housing, or bioretention in swales and filter strips (Hood et al., 2007;Dietz and Clausen, 2008), can also be beneficial. In our study area, however, sub-urban development often follows stream networks, either because stream valleysare relatively level and offer surfaces on which it is easy to build, because road net-works follow streams, or because of the aesthetic amenity of streams in the land-scape. Thus exurban development often occurs in the zone that is most sensitive foraquatic systems.
There are many arguments in favor of promoting development in already-urban-ized areas, including opportunities for walkable communities, lower tax burdens,energy efficiency, community, and conservation of terrestrial and wetland habitat.Our results suggest that additional water quality parameters are likely to benefitfrom less expansive development patterns. Even the modest levels of rural develop-ment, such as those established with 0.8- to 2.0-hectare (2- to 5-acre) zoning,appear to introduce impairments to streams.
Acknowledgments: We thank our field crew, L. Robins, E. Vail, J. London, andP. Fitzgerald, for their assistance. This work was funded by the Collins Fund forEnvironmental Research, Vassar College; the Vassar Undergraduate Research Sum-mer Institute; the Mellon Foundation; and the NSF (MRI- 0722813). We greatlyappreciate the support of M. Calef and the helpful comments of three anonymousreviewers.
REFERENCES
Burns, D. J. (2006) Assessment of In-stream Water Quality of Hudson River Tribu-taries in the Rural to Urban Landscapes of Dutchess County, NY. UnpublishedM.A. thesis, State University of New York at New Paltz, New Paltz, New York.
Cunningham, M. A., Snyder, E., Yonkin, D., Ross, M., and Elsen, T. (2008) Accumu-lation of deicing salts in soils in an urban environment. Urban Ecosystems, Vol.11, 17–31.

282 CUNNINGHAM ET AL.
Dietz, M. E. and Clausen, J. C. (2008). Stormwater runoff and export changes withdevelopment in a traditional and low impact subdivision. Journal of Environmen-tal Management, Vol. 87, 560–566.
DiLuzio, M., Srinivasan, R., and Arnold, J. G. (2002) Integration of watershed toolsand SWAT model into BASINS. Journal of the American Water Resources Associ-ation, Vol. 38, 1127–1141.
Dow, C. L., Arscott, D. B., and Newbold, J. D. (2006) Relating major ions and nutri-ents to watershed conditions across a mixed-use, water-supply watershed. Jour-nal of the North American Benthological Society, Vol. 25, 887–911.
Doyle, M. W., Harbor, J. M., Rich, C. F., and Spacie, A. (2000) Examining the effectsof urbanization on streams using indicators of geomorphic stability. PhysicalGeography, Vol. 21, 155–181.
Feminella, J. W., and Walsh, C. J. (2005) Urbanization and stream ecology: Anintroduction to the series. Journal of the North American Benthological Society,Vol. 24, 585–587.
Godwin, K. S., Hafner, S. D., and Buff., M. F. (2003) Long-term trends in sodium andchloride in the Mohawk River, New York: The effect of fifty years of road-saltapplication. Environmental Pollution, Vol. 124, 273–281.
Groffman, P. M., Law, N. L., Belt, K. T., Band, L. E., and Fisher, G. T. (2004) Nitrogenfluxes and retention in urban watershed ecosystems. Ecosystems, Vol. 7, 393–403.
Hood, M. J., Clausen, J. C., and Warner, G. C. (2007) Comparison of stormwater lagtimes for low impact and traditional residential development. Journal of theAmerican Water Resources Association, Vol. 43, 1036–1046.
Hudson River Estuary Program (HREP). (2005) Hudson River Valley Gap Analysis30m Land Cover (raster digital data). Retrieved from http://cugir.mannlib.cornell.edu/, June 9, 2009.
Jackson, R. B. and Jobbágy, E. G. (2005) From icy roads to salty streams. Proceed-ings of the National Academy of Sciences of the United States of America, Vol.102, 14,487–14,488.
Kaushal, S. S., Groffman, P. M., Likens, G. E., Belt, K. T., Stack, W. P., Kelly, V. R.,Band, L. E., and Fisher, G. T. (2005) Increased salinization of fresh water in theNortheastern United States. Proceedings of the National Academy of Sciences ofthe United States of America, Vol. 102, 13,517–13,520.
Kelly, V. R., Lovett, G. M., Weathers, K. C., Findlay, S. G., Strayer, D. L., Burns, D. J.,and Likens, G. E. (2008) Long-term sodium chloride retention in a rural water-shed: Legacy effects of road salt on stream water concentration. EnvironmentalScience and Technology, Vol. 42, 410–415.
Law, N. L., Band, L. E., and Grove, J. M. (2004) Nitrogen input from residential lawncare practices in suburban watersheds in Baltimore County, MD. Journal of Envi-ronmental Planning and Management, Vol. 47, 737–755.
McGarigal, K., Cushman, S. A., Neel, M. C., and Ene, E. (2002) FRAGSTATS: SpatialPattern Analysis Program for Categorical Maps (computer software program).Available at: www.umass.edu/landeco/research/fragstats/fragstats.html
Mitchell, B. (2007) FragStatsBatch for ArcGIS 9 (software). Retrieved January 2008from http://arcscripts.esri.com/

SUBURBAN STREAM SYNDROME 283
Paul, M. J., and Meyer, J. L. (2001) Streams in the urban landscape. Annual Reviewof Ecology and Systematics, Vol. 32, 333–365.
Peters, N. E. and Turk, J. T. (1981) Increases in sodium and chloride in the MohawkRiver, New York, from the 1950s to the 1970s attributed to road salt. Journal ofthe American Water Resources Association, Vol. 17, 586–598.
Peterson, B. J., Wollheim, W. M., Mulholland, P. J., Webster, J. R., Meyer, J. L., Tank,J. L., Marti, E., Bowden, W. B., Valett, H. M., Hershey, A. E., McDowell, W. H.,Dodds, W. K., Hamilton, S. K., Gregory, S., and Morrall, D. D. (2001) Control ofnitrogen export from watersheds by headwater streams. Science, Vol. 292, 86–90.
Richards, L. (2006) Protecting Water Resources with Higher-density Development.Washington, DC: U.S. Environmental Protection Agency, EPA Report 231-R-06-001.
Robbins, P., Polderman, A., and Birkenholtz, T. (2001) Lawns and toxins: An ecol-ogy of the city. Cities: The International Journal of Urban Policy and Planning,Vol. 18, 369–380.
Schiff, R. and Benoit, G. (2007) Effects of impervious cover at multiple spatial scaleson coastal watershed streams. Journal of the American Water Resources Associ-ation, Vol. 43, 712–730.
Shields, C. A., Band, L. E., Law, N., Groffman, P. M., Kaushal, S. S., Savvas, K.,Fisher, G. T., and Belt, K. T. (2008) Streamflow distribution of non–point sourcenitrogen export from urban-rural catchments in the Chesapeake Bay watershed.Water Resources Research, Vol. 44, W09416, doi:10.1029/2007WR006360.
Triska, F. J., Duff, J. H., Sheibley, R. W., Jackman, A., P., and Avanzion, R. J. (2007)DIN retention–transport through four hydrologically connected zones in a head-water catchment of the upper Mississippi River. Journal of the American WaterResources Association, Vol. 43, 60–71.
United States Environmental Protection Agency (USEPA). (1996) EnvironmentalIndicators of Water Quality in the United States. Washington, DC: U.S. Environ-mental Protection Agency, EPA report # 841-F-96-001.
United States Environmental Protection Agency (USEPA). (2004) Protecting WaterResources with Smart Growth. Washington, DC: U.S. Environmental ProtectionAgency, EPA Report 231-R-04-002.
United States Environmental Protection Agency (USEPA). (2008) Water dischargepermits (PCS). Retrieved December 2008 from http://www.epa.gov/enviro/html/pcs/index.html
United States Geological Survey (USGS) (2008a). National Elevation Dataset(NED). Sioux Falls, SD: EROS Data Center. Accessed March 2008 from http://seamless.usgs.gov/index.php
United States Geological Survey (USGS) (2008b). USGS Water Data for USA,Wappinger Creek, NY. Retrieved from http://waterdata.usgs.gov/nwis, June 9,2009.
Walsh, C. J., Roy, A. H., Feminella, J. W., Cottingham, P. D., Groffman, P. M., andMorgan, II, R. P. (2005) The urban stream syndrome: Current knowledge and thesearch for a cure. Journal of the North American Benthological Society, Vol. 24,706–723.

284 CUNNINGHAM ET AL.
Walsh, C. J., Waller, K. A., Gehling, J., and MacNally, R. (2007) Riverine inverte-brate assemblages are degraded more by catchment urbanization than by ripar-ian deforestation. Freshwater Biology, Vol. 52, 574–587.
Wang, L., Lyons, J., Kanehl, P., and Bannerman, R. (2001) Impacts of urbanizationon stream habitat and fish across multiple spatial scales. Environmental Manage-ment, Vol. 28, 255–266.
Wollheim, W. M., Pellerin, B. A., Vörösmarty, C. J., and Hopkinson, C. S. (2005)N retention in urbanizing headwater catchments. Ecosystems, Vol. 8, 871–884.
Copyright © 2022 FDOKUMEN