Minority ions acceleration by ICRH: a tool for investigating burning plasma physics
Upload
khangminh22Category
view
0download
0
USD 173
AUTHOR 'Turlock ruce d And OthersTITLE i Solar Energy,P-roject,-. Activiti7 s arch Science.INSTITUTION Dppartment 4of bitergy, *Washingtpt',, Co ; New York
Eclue4tioyL.;1 State univ. NMI York, Albany.Atmospheric ,Sci nce.tlesearch Center.D0 E--CS-0063Jan 7988p.; For related,ilccuments, see SE 028 1406413Super.in't indent of Documents, ri.S..Gover tnmen Printing
,Office ishington, D.C: -20402 (Stock dumber061-00 0232-.4'; $2.75),
4 Plus Pbstage.cience; *Energy ;. Enviro me-ntal Education;Plans; Meteorology; Science Curriaulury;
rice, Education; *Secondary BduCat_don; *Solarion; Tchnological Advancement; Technology
rgy,Educafiorb; *Solar EnergyABSTRACT
a
-T-his guide d'.6 ntains iass©n S and outlinesscience% ac ivities which present concepts o olar energy in the.context of:earth science. experiments. Each u presents an. -i,ntrOduction,;.'objectives; skills and-kndwledgeljneeded; materials.;method; guetions; recommendations for turtle? study; and a teacherinformation sheet. The teacher informa.tion, Sheet includes suggestedgrade level; additional subject' areas involved; 'backgroundinformation;. hints OR 'gathering materials; suggested time allotmsuggested approach; typical results; predautions; modifications;evalutions; and refA9nceis. (SE)
**f**Repradtrc
* * * * *
***i*** *4ions suppid by
from the* ******** **
****-*** ***********4 ** *****MRS the best 'hat can b maoriginal locumnt.******** *****************

DO CS.
DEPARTMENT OF HEALTH.A-WELFARE
NATIONAL INSTITUTE OFEDUCATION
THIS DOCUMENT HAS BEEN 4EPRD-Duc Eo ERECTLY AS RECEIVED FROPTHE PERSON OR OROANIZATION ORIOSNh,TING IT POINTS OF VIEW OR ORINION.,STATED DO NM NECESSARILY. REFRE--SE IILT O ICIAL NATIONAL INSTI-TOIE OF-ECUCATION POSITION OR POLiC.,
anua 1
.S ...Departinent of Eneristant Secretary for Conservation
and SolarApplicptionsMarket Development and Training Program
Washington, D.C. 20545

INTRODUCTION
\'As we ell know, the sun warms ourni and provides the
-=lighe-by. which we See.. The h i O Aeat t S off h sdireet-effeets bn-anyface-it strikes: But are the eff,ects---the same on all surfaces? Do
4 effects vary with the depth you go into the object-On:which the sun- /'shining? This4xperiment will ask:you_to_construct_an_apparatutto ____
iftV6itigate-thensweri-0 ihese questions. From this date you ca*.provid6answers to many question a thst architects, heating contractors, landscapers'and
sShd-environmentallits-mst-ask-before-building-Are Pik U0

CRLHEICTOM
At the coMplqtion of -erirent_construct heat transfer _ys:
ladetermine b _mebsurethent of temaswa funetio of depth todeterminedetermine m pureof different .su sta--
determine the.of sunlight..
bhalm e; the heating
unction 'Of duration
SKILLS AND KNpWLEDGE YOU NEED
4 HoTi to measure .-:Celstua temperatUre-on a.. thermeMeter.;._Tenth -et-Ca- ruler ; tithe on a .cloet7, *.atchor Stopwatch 'masson a balance--; and velUme graduated qyfinder.
How to,plot and interpret graphs of data
App>=ox mately One dozen (12) tyro' a -ups. (,
Celsius the zimometers (one is adequate t 3-6
One cardboard box froul the mimio roombpaPer supply CThe 1ream box Is approximately 20xm x 20cm x 40cm and works verywel )
4
X-Acte or other shargikniffasteners.
king tape hea4
uty paper
eating samples (may include loose topsol Iltclayfine sand,coarse sand, fine gr vel, coarse gravel, water, Styrofoam blocks,or any permeable mAt als). ti
Timing device.
Rul er- other Meas
_Graduated-cylin-
ialance.
determination.

1
6 EVENLY-SPA HOLESCUT TO FIT SNUGLY
ML. STYROFOAM CUPS-USE SOLID SIDE; OR COVER OF BOX_
DEPTI GAUGEFOR AEASURING HEATIN 11 CM. INCREMiNTS.-
VENTILATION HOLES_LOWALL FOWL
1. . Cut into the box on .a single solid side six evenly spaced.holes, Make em 'large enough to snugly contain the styrofoamCups.
etting the six-hole' face be the top, cut ventilation' holes inhe four sides. Make them as large as possible without,,weakeningthe frame too much. The holes should not extend so high thatsunlight will strike the sides of the cups.
tz,Fi the styrofoam cups to the level of the rim bulge of eachcu Use various substarres uto gather data All samples shouldbe equal and uniform temperatures throAghout whenqthe timingstar s. Measure the mass of each cup and thetup plus contents.By subtraction determine mass o the contents - Describe the.contents' as precisely as possible for your data
Place the framework in direct sunlight , tilting it to r as;',vertical as possible illumination of the cups. This cannot i
obe' done if, you choose to use liquids and you should comment onherw-lailure to do it Will-affect your data.

easure the air _emperature wlth a shielded thermometer. After,. Ordthe svrapfeLA
tares eac-_ 1211;re7_y care u y p ac rig= the tip of theerp meter into-it., In the same-fashien either .barefully:dig-
the, thermometer.deeper i tSi-trial-to get four ofhdle,using a nail or4owel rotherMometer and then Placenot to sturb the miterItAh
each sample, approlFimately I.25cmmperature readings, or drill aof the same size as thefihermometer into the sa4le. Trythe 'thermometer is put into-iis available the data may beervatibn even from sunrise"
Constant-and,exanded to sever dl hours of oto4iinset. ;If the full- day .-.data Is..taken-the ail temperaturemay be measured -hourly as,.well. stanpe temperaturei andit iga146 reboMmended that theibbx surface he left horizontal'for dll rladings.
;After .taming dada of temperature, time and-depth,plotas followsi e-
Surface temperature vs. tTMe for each substance.On the same axes-plbt air temperature-vs. time
\,"each stibbtahce arid- depth prepare another:graph
temperature vs. time.
After -the data are gathered-, add,a, measured amount of water to
Froth, the water volume and cup size determi e the riahepeentageeach cup until. it-is full: or full absorption.Stir .to.11ow ;
e.
air space in, each cup and the densities of loch substance"!03 4 Mass/Volume).
.`
LOOM:A AOC_
.You.have investigated the-relative absorptioh of-the sun' s energy=by various Substances. It should be possible to conclude,from:yo r -data'which subStances absorh,best as compared to'the other substanc4s yo a used.
QUESTIONS
V
1. Does they nature of the'sutstance seen to I fiber' the raie.ofheating at its surface? From Aur data s ecifica ly gnote the--rate of te-mperature.change and,comment'on characteristics of thesubstinne that segt influence this rate. - (NOTE: You have a tafor the particle sne, deppity of thowsubstance, 14rcentage oair space In *ample, deScriNlye properties as we s'thtemperature vs. time evidence:--Try to 41t all into-Of aieculatinna.)
2 6 At all does dpth influence heating? Comment ,on teraturech e rate as compared to increased 4Fiqi in-a
I
4

samples behave _h Does densi_
ear ,.to influence heat nsfer
If iyoir used.a fluid 'for' one salpl h-ow eaR youkIddtaltgaVe?
' .
Why were,the instructions so specific abodt the entlationhole their size and placementZYWhat4affect would twocup masses instead" of one have On' the date.?
For the full day, trial does the -time of day influenee the.temperature change of the substance as-, well as air temperatuii?Why?_ po.the times of peak' air temperature correspend to thetimes-of peak substance. temperature? :How-do these temperatures.correspond to local Solar-noon?
GOING FURTHER-
How may one improve the-4apparatusthat money' is -noobjebt_
of the experiment? AsSume
s lf the bottom of the bOx'Were cut out and th6 bpx then plac'edover grass, hard -paced dirt, concrete paving, asphalt pavement
-,and a pan of water each in turn.to gather data ea inthe original procedure, whet would be expected to nappen? Why?
- Try the experiment in a place near a highly reflective we,
.-,
surface - - --,-.
_
,By use 2,thernaal-energy equations, calculate the heat gain byeach sa. e add speeulatelon the reasons for.any _differences.,,(Heatgain-=-maas of samPle x change in Operature x specificheat 'off substance)" Ask you teacher for datafon specificheat values.
Try thelab pFoeeldures'with.substances such as canning wax(melting point iequite low), 10(bhol (evaporates 'rapidly),wood samples With holes-trine - nto the "blocks at, depthintervals (tr.AbOth-soft and hard wpods),-,fonm samples, metapellets .0r ,anything thdt seeMa.promising. BE SURE TO CHECKITA-Y0 TEACHERP-BEFORE TRYING-SUBSTANCES-THAT-HAVE-ANYOSSIBIL TY OF BEING DANGEROUS WHEN HEATED.-
Why doWhy is
the said on the beach change temperature` with depth?he moisture in it also influenced by depth?
Why n the .acct* s there ice belciw swamps, even in midsummer?
7

Why is erspiration .less ev
Why 'does 'perspiration coalon iced drinks in hot place
.+6
0
ested Grade Level and Disci line
9-14, Science
Earth ScientePhysics
Bacicground, Information_
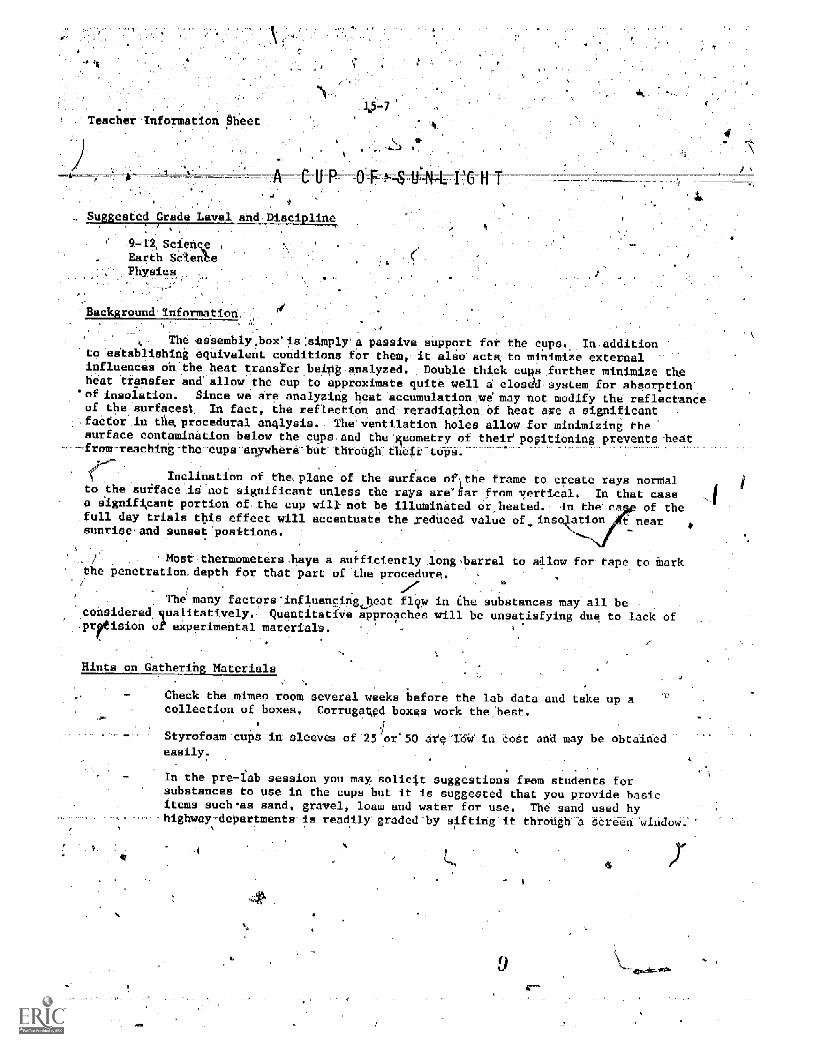
The essemblybox'is:aimplya passive support for the cups., In additiontp 'establishing equivalent conditions for them, it also acts; to Minimize externalinfluences on the heat transerbeipg:analyzed. Double thick culls further minimize theheat transfer and allow the cup to approximate quite well a closed system for absorptionof inriolation. Since we are analyzing heat accumulation.we may not modify the reflectanceof the surfacesl, In fact, the reflection and reradiatlon of heat are a significantfactor'. in the procedural Analysis.. The' ventilation holes allow for minimizing thesurface contamination below the cups-and the:geometry of their' positioning prevents heat
°-from-reaching-the -cups-anywhere-but- -through their tops.
inclination of the, plane of the surface of the frame to create rays normalto the surface. S not significant unless the rays arefar,from vertical. In that casea significant portion of the cup will not be illuminated orheated.. In the a of theJun day trials this effect will accentuate the seduced, value of ins: ation nearsunrise and sunset' positions.
theMost thermemeters.haye a sufficiently longlparrel to allow for tape to mark
penetration=depth for that part of the procedure.
The many factors-influencing heat flow in the substances may all beconsidered -ualitatively.- Quantitative approaches will be unsatisfying due to lackp ision of experimental materials.
Hints on Gathering Materials
Check the mlmee room several weeks b efore the lab data and take up acollection of boxes. Cerrugatked boxes work the,:best.
jStyrofoam cups in sleeves of-25 er'90 are o-IeW in cost and may be obtainedeasily.
In the pre -lab session you may solicit suggestions from students forsubstances to use in the cups but it is suggested that you provide basicitems such-as sand, gravel, loam and water for use. The sand used by
-highway-departments-is readily graded-by 'sifting it through a screen window.
L
9

13-8
Thermocouples can be used by sone students if.they are available
---- Rememb'er-that-saturating the contents renders -thst-cup---u-saless fortrial until it la .again evaporated :ary. have enough materials to cover'-:=that contingency.
, e ..
X-Acto knives must be used with care and- it is suggested that you.. do the cutting yourself from a master template.
,
Su ested --enttm
One -period to construct the frame and explain the purpose and procedureof the lab.
One to three days to gather data.4
-
. Susp Sted Approach
Establish the qualitative perspec ve and open-ended philosophy pf theprocedure -and hypotheses'.
Try'ro get at least twosets Of all data' to check for correpp:ndence butstrive. for a variety pf setups As ontlineciih thg procedures.
Note the dependence of your data on unifarm atmospheec 'conditions andbe prepared with alternative lessons if the heavens do not smile on you.
Emphasis on the, GOING FURTHER 'section will give valuable information toincrease the relevance of-the procedure and data. '
cal Result:
Precautions
Differences in temi,eratureof diffe Alt materials at the surface as:Wellas different depths to kcm will be on the order of '5°C over a 30 minuteobservation session in good sun.
Conduefioe effects will be quite good for the denser substances but thosewith high'potosityp_rcentages will not work too well nor will convectionin fluids give signs :ant depth variation.
Metal meat thermometer type thermometers may be substituted for mercury.bulb Ones but in any case care-in their use and penetration of samplesAmust be emphasised.- -
l0

Further It:beyond procedure is advocadesired.
. .
This, is an exercise in inference and .awsuch_should be treated as an,opportunity to licit student opinions bailed on data they gather, Defebseof.a thesis is 1..significant skill and eqtablishment of an appropriate oneis just es' relevant A:skill. Encourage the, students. to speculate byeextrapolation from the data
Col).ection of data and graphs. plus a brief written explanation ofconclusions before and afterAuist-lab
discussions,will%be!of value.Quality of.procedure And reasoning from it can be determined by this as-well as in class_ discussion_perfcirmance,
of Physics with A
I
Jeer' Welke Wiley 1277

INTR9DUCTION .r ., 1
gaVe you ever. noticed that car tires often seem flatter in'.rcoolerweather, than in warmer weather? Why might.this be so? Heat or lack ofheat affects air in.Many:ways One of these will be investigated-inthis activity
Temperature can be measured by 'using air that is heated or Cooled.A solar thermometer can be used to measure air temperature.
,,7, . - A,-.:: : - : , - . , ,
This activity deals with severa SundSmental,scientific principles.You shbuld have a clearer unders ing of.thed after completing theactivity on the solar theirnoi
16-1
2

16-2
OBJECTIVE
At the bompletion-of this activity, You will have
cons ucted a Spri4r'thermom ter.
r. calibrated Y_ lr solar ,Xbermometer,
observed the vffects ©f. the sun on L. 1,011thermometer.
SKILLS AND KNOWLEDGE YOU NEED
You must be able to ead a thermomcLeL.
You must be able
You must know what calibrate meen,
bend glasS tubing,
MATERIALSTIS4 _ _n (ditto fluid
2 hie stopper.
3 pieces-4MM glass tubing (2 pieL es 43cm,.91cm).
2 rubber hoax
1 lah aL0 y LliekitiuMeL,zr
m A oi-
1 hoa.rd 2 2,,m A 13.-_;M A JU-0,
Swall qualiti4y va.jaL... ok.
Strip of .graph papci LoL
#8
Mask
1 tun

Thermorn
Two-holeRubber Steppe
Gallon Can
METHOD
16-3
Glass Tubing
Taps
TemperatureCalibration Paper
RubberConnecter
Manometerwith Salad Oil
Board(back)
1. Nail.the'long (back) board to the short (footy,boalo.(See diagram.)
2 Bend the glass tubing into 2 - L shapes and I(See diagram.)
Connect the glass tubing with the hose counecioks.
snap=
4. Moisten and insert the thermometer into the stopper , -and insert one en&-of glass tubing into the stopAr. Wr-p thethermometer and glass tubipg in a cloth when inserti4.9 into thestopper to prevent cutting yourself if they break.
Place the U shaped tubing against the back board and Lavefirmly into place by putting the tape completely around Ow. i-Gtk4(See diagrarej
6. Slide the vegetable oil down the opena funnel to do this.
7. Insert the rubber steppe, into
U uhupo_
8. Tape or tack a paper strip to the balk board alony-4.4,tube. (See diagram.)

16-4
Cut a small vertical slot -in. -the end of the cardboard shieldthe pOint that the glass tube rests on the slot with both canand foot board resting ontLtable surface.
BI- Place the whole thermameterunit in the
a. Vithmanlights only the tin can but with the,thermometer unit shielded, until the veg table oil levelstabilizes, put a mark an the paper strip at top of theoil level and record the temperature truncated bli themcmeter.tn the tin can.
b. Now, nave the cardboard shield so that the t can is now inthe shade, with the thenmaeter unit. Repeat part (a.) and againrecord the temperature indicated by the the ter in the tin can.
11. Repeat this Procedure varying the amount of sunlight ztrthe can, recording at least five temperatur headings on thepaper strip.
12. Use the thermometer you have made to measurithe air temperaturein several places such as your classroom, i ide a closet,inside a refrigerator etc Compare the temperatures youmeasured with ydur air thermoMeter with the temperaturesmeasured with a laboratory thermometer.
LOOKING BACK
In the course of this activity you have constructed a simplethermometer that is activated by the expansion and contraction of a 1in the tin can. In this case the sun's light has provided the energynecessary for the expansion and contraction proceas. You haVeyour thermom er and collected data.
QUESTIONS
1. What happens to the air 11, Inc can AL A.sunlight?
Why was it necessary totube before you inserted
t A.
ide the vegetable oil. u
_ahe rubber stopper into cant
How do you think the recorded temperatures wek ielalclthe amount of solar energy received by the tin .an?
4. Thermometers have always been used as 1.ndicatola orenergy. From your experience in this activity, villa( othform of energy could be measured by this therm3.etei

GOING FURTHER
Use different cola
Extend the activitysuch as cloud cover
5
s and textures of paints up the
one week, introducing variablesbarometric pressure and time of day
'Do indoors, using different energy soutL,0* (r0,ultraviolet li lt, it-LI-tared, and white 116ht.)
Piot data collected on graphs.
70.0138 0 - 77, - 7

,Teacher information' Sheet
16-6
LHE OtAli 'THERM ETER
Suggested,Grade_Level and Discipline
7-9 ScienceEarth Science
Back round'Informarion
,fThesolar thermom rer in babla41Y 1n4numete L ,_onn acted to an air expansiontank (gallon can).. As the air in the,expansion tank is heated by the surf, the air willexpand and move through the connacttnetube to force the salad oil in the manometeetochange level. By calibrating thalevsl.of the salad oil with a conventional mercury oralcohol, thermometer the apparatus can be used-to measure air temperatures. Conversely_ ,the cooling of the air in the can should produce a reverse reaction.
The outside color of the can (expansion tank) may have an effect on the Limees achieve a. given temperature and the maximum temperature that can be attained.
It is possible to have salad oil forced out the open end of the tape.
The-solar thermometer is riot parti,.ulerly pia,riLai as a mess...A..6 device.It is cumbersome and not very accurate.- It does, however, pr de h way to examine somebasic scientific principles. Expansion and ContraeLfon. air p _snr, and ihe effe,t'ofdark surface on heat absorption are three a.eas that cah be exp cared using this devite.
ts.,,ttlitAtt- P1.010tift12
ati s
kict oalpty Uitt,
Uao rapes , 0, -t,taps. all the waA, s.ound bard
A...Jtmeh
Uu
Ufas= tia5 p.&10,1 t, ti,.
,ins.ructi ns, M re Awe Way be k 14
extended,
One ro.

Suggeated -prodach
1 §e1
'Disctraj heat and itsffects on matter.
7
works.- 'Review how a therm
Discuss the diagram and method of c0utier
Construct the solar thermometer.
.41
Diseues the pro- Ore for calibration. Define t,term calibfationusing example cusevith student how they are going to use thethermometer.
Provide students with actual hands-en use of-the solar thermometerand collection of data. The best results occur if done outside.
2 A.7
Ana'ysis aid in pr6 t on of data collected should follow heact vity415
kcal Reaults4
Temperature readings will be h gher wheh Aire can Ao An directsunlight rather than in the ahade.
The greater the amount of i.,01,ALI,It.temperature.
AL-
Depending Oh att.t....L.4
gq.das,
Le ogre/
towel toglycacin or
Modi
tub/dig .ALd 4ut
plasti. k,t. .6,or the glass tubing Ln
Evaluation
.- Check studeut. .AppaA-."L 1
- Check students' answer
4 .4
I8
I LI.
dB,
na hi,q4

DoR A f ACTIVM
BUILDING A `SOLAR
INTRODUCTION
-Water, water to everywhere atlii it >wt.' tAiAjust dig a hole in the ground and make yourself o still
in many parts or the world water is an abundant and valuablural resource. Its presence in streams, lakes, rivers, oceans, polo.caps, the atmosphere, and the ground, means that water is everywherearth.
Despite all of the water around us wg still hear warnings andcomplaints about water shortages. Such shortages can become severeenough to caUse crop failures during droughts and death to inexperi n6cdtravelers in. an arid region% If you were ever faced with the crisis ofthirst in a,desert region, you might use simple steps to sur=vive.
I
In t_ s activity you will construct a still which usebrergy for its p ration.
17-1
19

OBJECTIVE
At the-completion of= .=this 4ct1v
build and'use a sample solar still,.
suggest possible 'practical applications for
understand the frinciple of distillation.
r-o test for the presence of water.
SKILLS AND KNOWL GE YOU NEED
How to follow direction
How to read a,thermoter.
How to graph da
How to interpret data.
MATERIALS
StLOLA6, tiXiblee.g.. plastic,worm window o.veriLg.
Several fist size rucks.
,Calibrated co ne i4 ,.11. . , . tt., .. ,. ,
Shovel.
Two thermomete ( LLJ
Tithing devices 1
Piece of car-dLoard Lu _v-L uf Ltt
Graph paper.
.Graduated cylinder.
Cobalt chloride test papa.water.
Protractor
a solar s i 11.
k.eb

id-coverall
heftnemetet
17-3
thermometer snould
be covered
by sheeting
METHOD
_
Apig ad hold abou 1" .AA.l A. . A A
he soil t. one .ide. C nter'rhe collecti_g ve_sel tt,
atom of the hole.
2 Placd the piece of plasfiL LLB ao.norone -edge with small'rocs.
Place-one *wail rock lu the lh, L.. AA.
over the collecting vessel, and allow the plastic to st.etcfto at least a 34 angle from the hori.ont-1
Seal the edge ut the plastic wiOr a011 arid aa,,,11 i,er
Insert thermometer under the plastic s _ -eL WILL, LL. .11
exten g into the air chamber, and positioned so tLat he acan b read.
1). Place the othel LLQiwom tcL ueat. Lh,a aura,. t1 reitt. AL, L"Alcovered by cardboard (as shown i.. th6 diag.am and p-sitAonedso that the scale can. be read.
Simultaneously record th6 tcayakat-A-A t-iLthe outside Xhermometers at two-minute in,ervale, Constra d ?ta table to record your results.
17-4
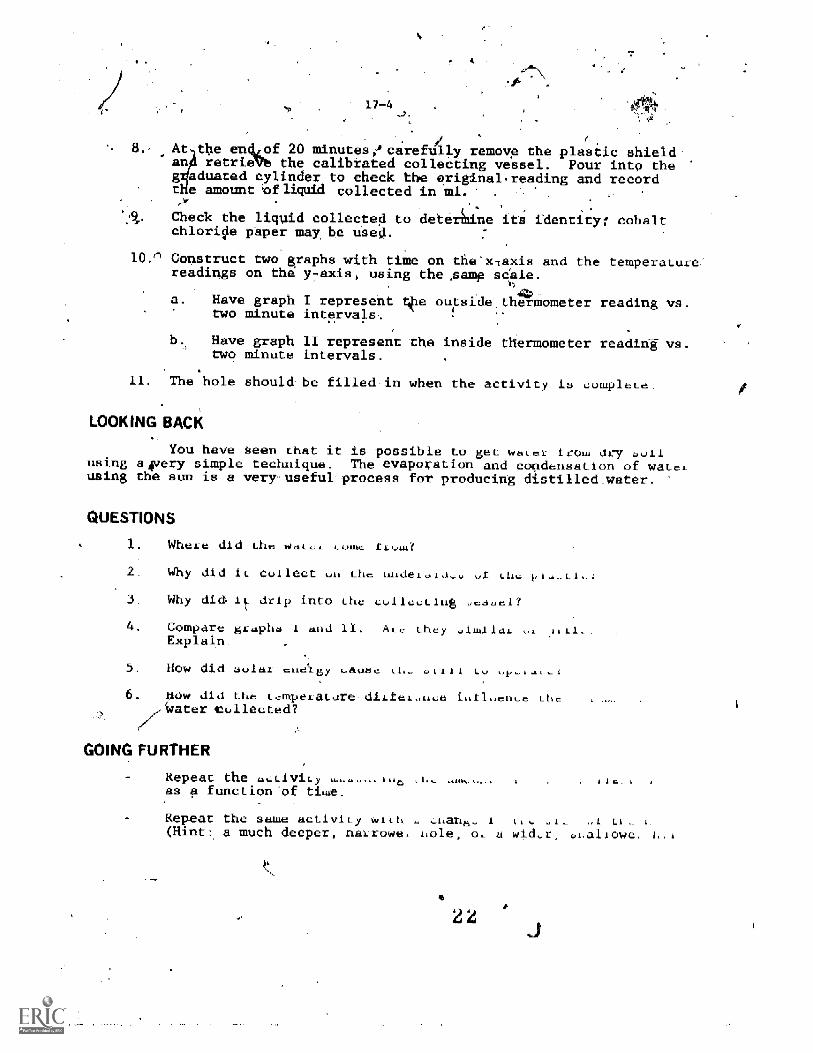
A the eraidof 20 minutesecarefUlly remove the plastic shieldan retriab the calibrated collecting vessel. Pour into theg_aduated cylinder to check the original .reading and recordt e amount of liquid collected in ml.
Check the liquid collected to deterhine its identity; cobaltchlori e paper may be used.
10.n Construct two graphs with time on the'x7axis and the temperaturereadings on the y-axis, using the Aisne scale.
outside thermometer reading vs.Have graph I representtwo minute intervals-.
Have graph II represent the inside thermometer reading vs.two minute intervals.
11. The hole should be filled-in when the activity is oomplete.
LOOKING BACK
You have seen that it is possible to get water true, dry soilusing a4very simple technique. The evaporation and condensation of ware,using the am is a very* useful process for producing distilled. water.
QUESTIONS
1. Where did the L. Y
2 Why did IL collect oa the __Jidet.,.. ot the
3 Why did IE drip into the colleoting
4. Compare gr pho and 11. AL. Lh.y .IwIloL Li,Explain
5. How did solar eaelgy o ekill
6. Uow did the Lemperatare dirteL iiirl"euee (AleWater collected?
GOING FURTHER
Repeat the sotiVityas a function of tiwe.
Repeat the same activity w 1 Li 4.(Hint: a much deeper, narrowe, i,ole, 0. sLalAowe. L.A

Discuss some practical
Check forthe-purity
Check for bacteria'.
17-5
uses for solar stills.
the water obtained.

Teacher Infot-
17-6
on Sheet
-BUILDING, A SOLAR STILL0
ed Grade Level an Discipline
'7-9 ScienceEarth ScienceOutdoor EducationDescriptive Chemistry
Background Information
Stills are upecl Lc. purity liquid. fuL v..ivu. v..of evaporating and condensing liquids, non-volatile impurities can separated fromthe liquids to make them usable,for desired activities.
Soil always cunLairla some ruolstura although IL 1, ,,ILdAi ,
By digging a hole in the ground and covering the hole with a transparent msiai,temperature in the hole will go up dramatically and the moisture from the soil wilvaporize.. As the water touChes the cooler undersurrace of the eidetic, it win con_and run down the plastic to drip into the cdtitainer. This 10 a gaud dotv1v01 tc,holgoeto know as well as a demonstration of bruilic
niuLa pal
A ...lib& _dA
eliminates the need Lu pour ti.e titer rt. a thea graduated cylinde.
ng V4,,
Oa. ,iaaa 1,,k 5kaph1ik5 o
gated AiJprua la
try on oat,
Divide the clast I t I

it 7
Each student should help with an aspect of construction of the still.Divide the lager- so that the construction takes a minimal amount oftime
In order to compare results, each still must be SiIlart0 the otherStills in cqnstruction and-orientation.
Compile the data from all the stills and discuss the trends thatevident. A discussion of the'confrol of variables should be partthis lesson.
Typical. Results
Sunny days close to the s.fitr solstice Will ptoduce moat dramatic Results.
Precautions
Fill in the
Hake
If ...it
difications
Evaluation
the e.4pe4mrtt is ,:,,,i(lE,G.6c,Lb
the slope of the plastic cover towards center is _
no.t, water-to,LL not .gip into the colLeating,veasel.
If desired, this abtivlty co. be u,., alai o to.6.of the hole. In this setup the coil must to moistened,
Anothet vatiatio.. might be Lb. ..dattton or f,od ..ototto,and/or salt to tho pan of water'. Your students could th,..observe the collection of fresh water from contaminated war..
Have students nrkcpat,. i.poik in,AAJA.6 JUL]responses to question..
Use a performance evalostioo tascd -o uaLd"oL.AA.m ,neoperation of a solar still.
References
An.ergy, i jL,

ALliviiy 18
'CLOUD COVERING :AND ITS EFFECT ON .AVAILA
INCIDENT SOLAR RADIATION
INTROOUCT ION
nib 4.,
arts t. (hat etoud etin has 4" 14ilevel, You will observe cloud co,di itak .,1 raaaingthe daL0 et-lot a graph aid d twine he L S of tti,. inf:)Lmobtained

18-2
OBJECTIVES
At the completion of this activitT,4 you should be able to
opera_ e a so er.
.construot a graph frbm the da.
draw inferences from the
demonstrate an understandineof the effect of cloudcovering on, the available inci4ent so r; radiation.
'SKILLS AND kNitIWLEDGE YOU NEED
Be able to Accurately read a meter.
Observe.and-estimate cloud
Keep decimate and neat notes.
e able to calculate percentages,
MATERIALS
Solarimater
graph paper d pencil.
1. In order to have valid results you' ust take accurate data andnotes. Prepare a data sheet to include the following:observer'arname, the location, date, general cloud hovering,the time each meter reading is taken, the meter readings, andthe cloud cover between the sun.and the meter at the'momentthe reading is made.
Data from one class period will be sufficient if the clouds arespaced so that both direct and overcast (indirect) sunlight areobserved. Additional readings can be made over a longer periodfor even better results.- The solarimeter should be locatedaway from shadows and bright objects. It may be best to havethe meter at or close to eye level. The solar cell must behorizontal. The observer should not interfere with the light.
27

18-3
Usin the meter readin s on the vertical scale and the. time, on.the horizontal scale plot the data of graph paper. Determinethe'relationship.between the cloud' cover and the meter reading.
LOOKING BACK
Using the data collected, you uld be able,to find arelationship between the incident radiation measured and the cloud cover.
QUESTIONS
1. What is the.maximum reading recorded?
Whit was the abud cover at the time of reading?
What, was the lowest eading recorded?-
What was the cloud cover at the time of the, lowest reading?
It heavy clouds c front of the sun,...why_didn!_t_.(wouldn!the reading go to zero?
.Calculate the percentage of time the sun was clear of clouds.
.. Calculate one half 50) of the maximum teading.
8. Calculate the percenthge of time the readings were below the50%.1evel.
In general, what is the `relationship between cloud coverthe amount of solar radiation striking your meter?
'10. Do you feel that. there is enough available sunlight in yourarea for solar use? (Do you have, enough data to make a goodestimate ?)
11. Was this type of day typijcal for your lotation?
GOING FURTHER
Data may be collected ofull day, week or more
Keep.a record of just the amount of cloud covering fo? a longperiod of time _to help, determine the availability of sunli ht.
a lunge* period time - like a
Information may be Available for your-area n the amount ofcloud covering for the year.- Wtite your state capital or. the
ftedftates-Weather-Bureau-fer-suchinformatto
Readings can hetaken earlier in the morning and through.the'afternoon to see. if theposition-of the sun has,an effect_5)21 the radiation
Data may also be .6btained'fot different times of th0 year tosee cif the. values change with the-seasons.
29-

LOUT -C-OVERING AN-D- ITS EFFECTAVAILABLE INCIDENT SOLAR RADIATION
Suggested Gtade Level and Discipline.
7-9 Science,Earth Science
Background Informati
The pf,'solar energy as a dependable energy source assumes that the sundirect n gyAS available for a-large percentage of the daylight hours over a periodof years, Many f cto affect the amount of-direct sunlight that reaches the tarth'ssurface, one of w ich is the extent.and duration of cloud cover.
activity will investigate the effect cloud cover,has on incident,solar energy. , A solar cell will be used to perform the solar energimeasurements.
-Cloud types and, the extent of cloud' cover. defined in several weather bureaupublidations,' Ihe_longer.thp.timeperiod for data colleskion themore.accurate willbe theAnferences that ceallp made about the effect-of clods on incident solar radiation.
A set,of Sampladata ncluded. should the weather 9onditions not alloitthe student to obtain good
late.
Hints on Gathe terials-
A plan for a simple solarimeter is givenin the hardware section of thisdocument. A photographic light .meter could also used.
ugassteCTime Allotment
One-Claes period to collect data
One clans period to graph data and:dis use the results.
Suggested' Approach
Divide thd class into groups of two orthree students.
Have each student prepare a data. sheet prior to starting this activity.
The activity-should be done outdoors away from obstructions:

A8-6
1f-the day is completely overcei 40.points will besufficient. The activity'should Vie. continued loranottier class period,howevek, when the sun is ahining directly and the clouds are" intermittent,-
ch stud-aphs
uld collecLthedataandprensrthe-g aphsand-then-usethe-Lp answer the queetions.
t + -or light meters srAwe. groups can-collect the data
Time
10:00 a10:0510:1010:1510:2010:2510:3010:3510:4010:45
Meter Beadier Remarks
60 Clear60- Clear41 edge ever sun25 clend_over son31) loud ovhr.sun28 cloud over son52
f o over sun62
62 Clea45_, -Thin ud:over-sun
TIM

-ecautiena;
Warn d* y a
difications
1
Ligh may beanbatituted for sole meters. Be sure t ey .a
seale'tbat will read direct sunlight.
rDuring' this lessen many questions can be asked by the teacher. .In addition,enough time is :available to observe- and question the atudents during 7the,t2speriMent-and graph work .Accuracy and neatness of the data along withthe plotting Of the graph and the Calculations may also be used toevaluate the stbdenta.-

INTRODUCTION
Solar energy is energy radiated from the-aUn. This energy travelsthroug space in all directions. The earth xeceivesonly a small portion
this energy, mostly in the form of light,.
How can we detect the presence of solar energy?We, know that our skin and clothes feel warm when we stand in light.We also know that our houses tend to be warmer on sunny days. u the keyto detecting solar energy'is remembering that energy 'is defined as theability to do work. One instrument that allows us to "see" wthe work done,
iby solar energy is called 'a radiometer. By using a r diGmeter Similar tothe one pictured above,. wean detect the presence of absence of solarenergy, and we can determine when we have different amounts- of it
19-1

131.ECTIVESi-
H. At the- c- this activity-you should be able to:
he appearance of anmddle type radiometer.
of_theradiometer'
SKILLS AND K
Ho
distinguieh be en the presence and the absence qf sun-light by means of the radiometer. --
distinguish between high and low levels of sunlight byuse, of the 'radiometer.
''.demonstrate that radiation fromithe sun can
devise a definition of solar energy.
QINLEDGkr YOU NEED
o follow directions,
MATERIALS
' Paddle_ type radiometer.
Squar pieces of cardboard (or black construction papercm on a side.
A can.large enough to fit over. he radiorete
METHOD
1. Examine the radiometer carefully to see how itespecially the paddles.
Place the radiometer on a table in sunlight. _._ Observe whathappens, and record your observations.
is constructed
3 4
Use. the cardboard pieced.td partly shade thetradiometer Iromthe sunlight. Observe what- happens and your Observations.
.4. Use the'cardboard pieces to,completely shade the radiometer.bserve4hathappenaT-land-reeor&yo1ir
observations.
PlaCe the coffee can over the radiometer in the sunlight.Leave-the can over it for a few_minutes,..then remove it quickly.-Observe the paddies the instant you r4Move the can Recordyour observations.
LOOKING BACK
The radiometer is just one simple instrument which can detectthe presence of dolar energy. By the rate at which its paddles turn, itcan give you some idea of the amount of solar energy present. The radio-.
A meter can show that s light is energy.
QUESTIONS
1. Describe the apPearance of the. radiometer
2. Alt are the 'differences in the- two sides of each paddle inthe radiometer?
Talet. haroPetled'a)when the radi meter was Placed in the lib) When it was partly shaded? ) when was completelyshaded? d), when it was- just-removed .f under the,Can?
in which direction does he peddle wheel spin, dark sidesfacing forward or light sides facing forward?
Under what fight condition did the radiometer paddles spin thefastest? the slowestInot at all?
Row does the radiometer detect solar energy?
How does the radiometer show that sunlight is energy that cando work? (Ridt: What is work?)
Based on what you have learned_indefinitithfor solar energy.
GOING FURTHER
this activity, write a
We have demonstrated that the radiometes can do work. But wehave no idea how this work Is done. By recalling the differencesin the two sides of each paddle, can you explain what causes thepaddle tetlikn ire the-anitliht?
=Haw do -you think= =the radiometer would work= if the inside wasa perfect vacuum?

Backgrdand Information,
The radiometer is a simple instrument which illustrates clearly that sunlightis a.form of.energy. It can also be used.to. compare rbughly various intensities- oflightby the rateof rotation .of its paddles.
The atmosphere inside the radiometer is a partialyacuum,'so the air molecules'left inside the radiometer are able to move abour_much more4freely...than those outside...EaCh'paddie hae:a light7colored side and'adark colored side... -The light colored Sidedoes not absotbas much solar energy and it is clearly the Cooler side, and the dark side,is the warmer side. When the air molecules strike ,the dark .side, they take on a gkeat,deal'of..energyiand boUnce away atlahigh"speed. The result is'that the paddle wheelbeginsto move as the fastek moledules."kitk away" from the dark sides of the paddle
---whes1.-. . "
The greater the light intensity, the more energy there is to be absorbedeby the dark coloresides to "heat" them up. Thus, the air molecules bounce Away fasteras the light 'intensity increases, making the radiometer paddles turn faster.
The dark aides of the paddles are fictually absorbing infwed rad_ation,causing the surface molecules to store heat by their increased kinetic energy. Thisincreased kinetic energy ii transferred to the air molecules.when they'.strike the dark
^aides of, the paddles and causes the 'kicking away" effect.
Mints on Gathering Materials
Havecardboard squares pre-cut.
Studentscan bring in coffee C-
Suggested me Allo
depanding-ba whether r-queations are answered, in orout of class, and depending upon the amount of class discussion:
Suggested Approach
be-`done as a'lab "activity` -with a pair of-Fitudents Working aradiometer.

:19-5.
If rsclipmete ,are in shortliiipply, this.cdUldbe done, an.an a teacherdemonstration withistudent0 answering questions.
This activity- erves as a good elementary introduction to ,solar energy,an it effectiVely demonstrates Sunlight as a form' of-energy..
cal Results
ecautions
I-
tn!The radiometer will rotate fastest with highest intensity of sunlight,sloWest with the least.' When the coffee can' is .just removed, the'meter:.should not be rotating at all..
Modificat _ns
eor tit
a delicate instrument Which should not be dropped, tipped,'se misused. Sines the radiometer is a sacuum-padked
is recommended that students,wear safety glasSes when usingeler were 0 =be accidentally broken, this would eliminateeyes'of. f4ing glasS.
If it impractical to do this activity in sunlight, a 200-watt incandescenlamp cith-reflectoradn'be7adbatituted4 although the,effectiveness ofthe activity' with young students may be reduced when they do-not actuallyuse solar energy-as:their source of light.
ollect student answers to questions. Have they been answered°factory manner?
the student' tried'GOING-FURTiER? Is hiS ,explanatiot reasonable?
Obsfrve the student's ability to follow written directions. And the manner,is which he handles the radiometer. Is he folloWing safali preCautions?
References:'I
27te Radiometer I What Makes it Work? (Windsor ElectronicsPO Box 662, Wheaton, Illinois, 601874
37

As odi/sA4PigY Cif 00ail fuels decreases aed*rP. nergy has .becomemore and morepOpular.as,- aiternatate energy source. e use of solar.
6 sun s energy and converti4 it into usefulenergy involves .colleer
. -
fiheat. This 'cOnVeraind:-o energyiii being done constant1N by the materials ,.,(AM eartU as well-:asioUrf-Jatmosphere. You can feel this effect while getting-'Into a \closed .car on a acinnY_day. But while we have so much of the sun' sshyenergy reaching the earth, we must ask ourselves if solar energy_ can be _concentrated'renbugh:te'beceme ca practical alternative, yen a portionof the alternative to , as s il fuels.
This activity will help to answer this question, by comparing tic.temperature ges and heat added to air and water under differentconditions
20-1
ompletion of this activity. you should be _able to:
plot interpret a temperature. va'. time graph..
calculate the amount of heat getriedin calories
udge if solar energy can be- as Tali-alternative to-faSsil.. fuels . _
.
SKILLS AND NOWLEDGE YOU
How to read a timing device'.
Ho vii to read- a thermometer.
- -How to record t data;
How to-. graph data
AID ERIALS
Solar .,collector.
4 stand td laboratly theData tab es. (see sample).Graph- paper.
'Timing e
1000 ral
om ters,.

0
0METER.
COLLECTOR
CONTROL STORAGE used to mor4tor Mount of heatenergy-nol,lected t a in e r of water in thesuit. The bontainer has a transparent top.
COCLECTOR_STORAGE used to store the :heat energycollected, by.;,.:the solar collector
COLLECTOR -, owed to collect energytransfer this energy into-useful h
Place. the collector so it faces' -the sun at all- times,:. Placetithe beaker. of water in the sun with the thermometir
2 qn the data---table'prov-ided record, the time. "actual time"
Check- the thermbmeterk aii4:trecord the. temperature of the firstthree variables,- "outside -Six-rertperature' "c lector air:tsmperature" and . outside,.rater tempetatu e-",
Run- the drill pump for .seconds to trans r the water fromthe collector to the pump. Take the the °meter reacking inthe collector storage,and recolad ,the fo th variable under"col lectbr water temperature"
-Leave the last two columns blank for' co' g "calories'This will be done bY the entire class`.
Repeat this proceeure every 5 minutes.
40

20-4
7 Plot on the'same graph, the temperature of the fourfluids at 15 minute intervals.
8. Using. the formula: Heat.in -calories = tempgrature change massof water find the calories of heat added to the collector waterand to the outside control water at 15 minute intervals.
9 Using another sheet of graph paper, plot on the same graph,the heat added to the two masses of water.
LOOKING BACK
We know our-slapply oenergy source must be found.alternatives available today.4400natrated to be practical.to decide for yourself whetherto fossil fuels.
QUESTIONS
q5"
fossil fuels is limited and anhe use of solar energy is one of severalSolar energy will be used only if it isThe data you have collected will allow yousolar energy can'be used as an alternative
1. Which of the four variables had the greatest change intemperature?
2. Which_ variable` had the least change in temerature?
Which liquid gained the most heat?114
4. Wyhat time did we receive maximum amounL of enAigy?
Does the. celsius temperature of the collgctor watera temperature which we could use in the home fOr heating orathing?
GOING FURTHER
Would the slant of the collectorTif the-year?
-erent dui iag t1,er ti
What suggestions do you have for Imp,,,vin Lt.., .. .
the collector (design changes)?
- Could we have collected more energy by u,01 ...16 0 ditre........ ...,Now would we calculate the heat added using a Liquid oth,,kthan water? (Hint: Look up specific heat in the library
i
What are some things that uuld cau0ecollector water storage temp erasure t- be differ,ent:
41

20-5
.Teacher Information Shut
OLAR ENERGY-HOW WELL DOES IT WORK ?'
Suggestea Grade LevelandDisci line
8 -9 Science
Earth Science
rgaltrond Information
4 The Solar'eollector is,a, simple device which allows solar radiation to penetratethe glazing material (transparent surface) and strike the absoyber (auto heater core).This energy heats the absorber and:the heat from the absorber is transferred to thefluid (water). The fluid is then transferred to the area of desired heating. In additionto allowing the .solar radiation to penetrate, the glazing traps most of the long waveinfrared radiation, keeping it inside the collector to be transferred by the fluid.The glazing is usually thermopane for better insulation against conducted heat lost.q
The common tollectors 4re either flat plate collectors using water or .flatplate collectors using air as the collecting and transferring fluids. The collector.diagrammed in this unit is more of a concentrating flat plate collector using water asthe fluid. .*!:The object of -a concentrating collector is to collect the solar radiationa large surface and focus4r,oto a smaller-surface
Though solar en gy is much talked about, there is still some skepticismabout it serving as a via to alternative to ourpresent-day energy sources.
This activity is designed to give the a Okustudent_ aL 1%,. 6,- points and its shortcomings. It should also make the student more aware of litovatare
concerning solar energy and aid him in interpreting the literature in a critical way.
=
nhthe
The materials needed include: aoL0 heatet .44""4"plywood, aluminum flashing, glazing material (plastic, glass,or plexaglass),2 auto heaters or washer hoses, 3 small styrofoam picnic containers, variablespeed drill, variable:speed drill pump, 4 standard laboratory thermometers.
e
The materials Mould be collected over a long petto.1 ot Limeand teacher.
ie absorb& (beater e iel bu Vux.i.uu.a flew an atyt.relatively low price
other materials caw be poL,hueea t...-the school or home
A styrofoam container used to k±,At+A,k. .
collector construction.,
j.

20-6
assg ted T e'Allotment
One day to collect data.
`Three to four days for doing heat problems, graphing, and discussion ofresults.
Suggested _Approach
The construction of the collector pictured in, this unitfollowing manner:
was done in the
a. Plywood was placed around a styrofoam container for stronger construction.The styrofoam was used as insulation.
sr(ROFOAM
PLYWOOD
reflector for Loncentrotioub. Aluminum was folded in a manner to serve as aof the ,sun's energy.
ALUMINUM
The heater core was placed(Le- on LOF suth
absorber.
tiEATtli COR
d. The entire inside was painted flat blo,k e.ceeLsurface. (Cover with newspaper during painting )
e. Double pane glazing was placed on top.
set up a schedule Of your wort sciva.oLed wort Ailt,.&t.At A
class to monitor the collection during the day.
sure equal amounts of water and add Lu thecollector storage before class
C
_0 minutes before the end LA... ,..AtAud
and the collector with all compon..nts o tside .0 begi.. the
43
IAAA.ALA.o

20-7
Explain the operation to the entire ciswork.
and allow the monitors to begin
Your school day can proceed as usual With the last 10 or 15 minutes beingset aside to take the class outside to view the collection and to gaininformation abotit its operation.
The data collected by the monitoring students should be copied and distributedto all students for graphing and discussion.
A possible follow-up to this activity could be a field trip to some agencyusing solar energy for heating, or bringing in resource persons to discusssolar energy as an alternative energy source.
p cal Resul
Students should quickly realize that the temperature of the water and airinside t collector increases more rapidly than the water and air not inthe cone tor.
The collector air temperature should be higher than the water temperature.
The outside air temperature may be higher than the outside water temperature.
The datd table and graphs shown below dive actual student results forthis activity.
40 -
36-
32-
HEAT CNA_ .GiS
1 kilocalorie (kCal)=1000colories
Collector Water
12-
8-
4-
0
4
Outside %fate,
'10- 4
11100 11,30 NOON 12,30 1,00 1,30 2:00 2,30
TIME
44-

a
I50=
40-
20
10
0
H
20-8
TEMPERATURE CHANGES
Collector Air Temperature
Collector Temperature
Outside Water Temperature
Outside Air Ternmeronire
9!30 10,00 400 11[00 11.30 NOON 1130 1100
A4TUAL TIME
Any 4line an eleocrioat device
Be sure proper grounding ins truethe experiment in drrrp areas.
glass is used for g tazin9 a sa
Modifications
. ,113.0 3,00 2, JO
w"vowed an,l avoid set,
LrJ may 0..,cst.
The collector can be Wad with traveKu "fez -
aluminum plate serving as the absorber, any .ther voriati-n which .01p.the aame'principle.
Various materials c..1 be used for i ine nd 1a__ _LIIn.lati.,41. AbaA.,they must have the basic characteristics for the tunction,they sa.ve:
It may be of interest to conduct the experiment on partly cloudy days aCiwell as aunny days.

20-9
DATA TABLE
Minutentervals
Actuatime
Outsideair temp.
aC
Collectorair temp,.
°C
OutsideH 0 temp.2o
C
700 ittl. H 0
CollectorH 0 temp.2o
C
700 ml. H 02
Caloriesadded
outsideH2O
5
1015
9309:359:40
99
9
394143
242323
242526
20 9:45 9 44 23 2725 9:50 9 45 23 2930 9:55 9 47 23 30
35 10:00 46 23 3140 10:05 9 46 23 3145 10:10 9 47 23
50 10:15 48 235 10:20 49 2360 10:25 50 24
65 10:30 10 50 25 3470 10:35 10 50 23 3575 10:40 10 50 '24 34
80 10:45 10 49 24 3585 10:50 10 48 25 3490 10:55 10 48 25 35
95 11:00 10 49100 11:05 10 49 25105 11:10 52 25
110 1.1:1b 10 51 35115
1201:20:25
10
10
5252 25
35
35
125 11:30.
11 53 Lo130 11:35 11 51 26135 11 40 11 51 25 31
140 11:46 II 51 10 JO145 11:50 11 52 25 37150 11:55 11 53 26 37
L55 12 :00 55160 12:05 56 26165 12:10 55 26
Caloriesadded
collector0
2

20-10
170.175180,'
12:1512;2012:25
121212
545354
262327
383839
18.5,;190195
12-:-.50
12:3512:40
131313
555554
272726 ,
38--3838
200 12:45 L3 54 26 , 382t5 12:50 13 53 27 36210 12:55 13 53 27 36
215 iv 00 13 53 26 36,
220 1:05 13 53 28 362257 ,1:10 13 52 27 39
...._
230 1:15 13 52 27 39235 1:20' 13 52 28 40240 1:25 13 52 27 39
245 :50 14 50 27,. 39250 1:35 14 53 -.27 , 39265 1:40 14 53 ,28."-1-260 2:40 14 54 x2 40265 1:50 14 54
._40
270 1:55 14 51 39
.-,--
275 2:00 14 44 38280 2:05 14 46, 37285 2:10 14 49' 37
--.
*
..-..-,-..-vri
290 2-16 14 1 51 37295 2:20 14 d 51, 37300 2:25 14 .-' -'1, ' 37
_,
31305 2:30 15 r- ,4`310 2:35 15 5,2 28 38315 2:40 15 37
;
320 2:45 15 29 37325 2:50330 3:00
-- -..-. f-

DRAFT Ac viTY 21
THE EARTH'S ENERGY BUDGET
CPONa amount of insolation in a particular area has a direct
temperature of the'earth in that same area In thisyou will set up a model of the pattern of insolation twld-latitudes over,a period of time From this model, a
may be inferred concerning insolation patterns and temperot,,kc
21 1
48

21-2
OBJECTIVES
At the completion of this activity, you should be able to:
describe similarities and differences between the earthand the model.
constructmonth.
o constructmonth.
a graph showing the maximum insole on per
a graph showing the maxims temperature per
show the relationship between the two graphs.
o identify patterns of annual maximw d minimum temperatures.
o relate maximum and minimum temperatures to maximum andminimum duration of insolation.
SKILLS AND KNOWLEDGE YOU NEED
Be able to read a metric ruler or meter
able to measure volumes in moles.
Be able to time.
MATERIALS
Ring aL.And and clempk,,,
Catch basins.
12-1000 ml. beakers
Crayou.
Funnel.
Time piece wl,t1
Rubber hose.
Adjustable ciaLp
Graduated
Water.
SCich

21-3
METHOD
1. Read through entire dire ions first Let re yk,kl .t I 4I4activity.
2, Set up the plastic column, ri_n6 sLaild cair411in the diagram above.
3. Measure up_15cm from the bottom of t_ he column and ma,k aring around the tube at this level with a crayon.
4. Adjust the clamp on the rubbetillose so that the rate or riia about 600m1/min. or so the level of the water falls rromthe tdp of the column to the ring in 50 to 60 seconds.
5. Into each of 12 beakers (labeled 1-12) place an amount ofwater proportional to the amount of insolation for thatA possible scheme appears below.
6. Pinch thehose and fill the plastic I I
the ring: As you release the hose, add th,, water from ,ea,and begin timing the experiment.

MONTkI
JANUARY 22
FEBRUARY 23
MARCH 23
APRIL 23
MAY 23
JUNE 23
JULY 23
AUGUST 22
SEPTEMBER 22 9
OCTOBER 22
NOVEMBER 22
DECEMBER 22
BEAKERNO
.7
8
10
11
12
(APPROX. HRS.)DIAM11.0.111111Q.LAILM
9 1/2
10 1/2
.12
13
14 1/2
15
14 1/2.
13
12
10 1/2
9 1/2
8 1/2
AMOUNT OF
NOTE THE ABOVE VALUES FOR THE LOME OF WATERWERE OBTAINED BY MULTIPLYING BY
ONAPPROXIMATE
NUMBER OF HOURS OF DAYLIGHT AT 4 ON LATITUDE FORTHE.GIVEN DATES.
Using the crayon, quickly mark off thewater reaches in the plastic column andnumber.
475
52.
600
650
725
750
725
650
600
525
475
425
maximum level theindicate the beak
8. At the end of one minute, add the water trom beakek &againmarking off maximum water level and beaker number_
Proceed as above for allminute.
akers, adding a new beahL,L v.&1
10. Measure (in ml) the vultm.e. of the maxims,. WaLQXplastic column for each beaker and record ,,r1 data table
On the same graph, graph t_ he maximum wateL level vamonth and the volume of water in the beake. vs, the .on_l
LOOKING BACK
In Ulla model the awk,ka.L Lthe amount of insolation eresent for thewater in the column is rpresentativ, ofmonth. From this activity you should bethe amount of insulation and the maximum
month.. The -aximum heikLiLempera.ure fo. t.a relationship LcLk4tfor a paLLien11 1214,
the ma... mumabl to seetemp.rature

-BEAKER .NUMBER
3
4
5
6
7
8
9 .
-11
DATA TABLE
MONTHREPRESENTED
JANUARY
FEBRUARY
MARCH
APR I L
MAY
JUNE
JuLy..,-AUGUST
SEPTEMBER
OCTOBER
NOVEMBER
DECEMBER
rk
VOLUME OFWATER. I BEAkER
475525600650725
750
72560600
525
475425
L)
MAXU4UM LEVEL OF.WATER N COLUMN
L
.

QUESTIONS .
21-6
1. What' effectdoes _an,-increase in the duration of insolationhaVe.:Upoirthe temperature? 0
2. At .what' time of the year is thea maximum; at a minimum?
duration .o- insolation at
How does the time of maximum surfacewith the tithe'bf:aximum duration of
temperature compareinsolation for the w
How is the duration of insolation related to .the variousseasons?
What dries the one minuti,model?
waiting i3e iod represent for, your
,
For your model,- what does 'the water flowing out of the bottomof thy. -tube represent?
7. 'Describe the ways in which the model iearth and the ways it which it is not
WING FURTHER,
Jiow,wou14.t i duLALionaffected by an increase
The teaCher may wish theseveral years.
analogous Lk) t-LAe
4Q14Lion dur ing tht.,latitude?
studeuL

Teacher In _ Sheet
EARTH
ade I.L -el. and D ne
Earth SciencePhysics
Information
21-7
ENERGY BUDGE-T
Insolation is the amount of energy received from the sun at a given placein ai given time. This energy is transferred into heat energy which we see astemperature changes as the amount of insolation changes. Where you live and the timeof year it is, will determine -the temperatures for the northern middle latitudes.Insolation is at i maximum in June and minimum in December. The maximum temperatureshowever, are reach sometime after the maximum insolation. The minimum temperaturesare reached sometime after mtniMum insolation.
Hints on _her n later]
dials Should be available in most e.4th uLlence ,laaatvoms_
Suggested Eille A1lotmnt
Sug
, One period to du a,riVity and record data
_e period to make graph. and discuss rebut,-
sted Approach
' Have bawls.
01%.014e otedgeLA 1i LU .mall L.
EXplein tu Sledeeta Lltal LLe amount t waLaL leused to represent Me am..unt of ina-la,ion f..r that ...onth.
hApluin to students Lhsll the maltaum height ot 46te4 lerepresentative of:the maximum temperature
Typical Results
Student. ant.ald aaallya minimum iu December:
.Students 0hould easilytime after maximum ins.,lat.on ® d thasopietime atter minimum irtaAaLion
1111k.: _
n.1

Precation-$
Be -e e to check aZi equi imren .to make eure
Be aura to check the rate'af%flow.
Modification*
Evaluation
rences
ionirtg ,pr p
it may be difficult to adjust the late of flow Co 600m1 min. Anothermethod is tb time. the water, level from full, o the ring (15cm.above thebottom..) When(the 'flow-is' adjusted correctlY, the `level takes about50-60 -seConds,to'fall- from the top to the,Ang .
e teacher w1 tro experiment and develop his own time table anrate of flow.
Minimum levelaeolthe column may also be-taken so as to give atemperature range throughout the year. .
Check student_ data.sheets:
.Check students! answers to. questions..
Check students' graphs.
Thvestigating the-Earth; (Earth Sciehee Curriculum Pt -HoughtonMifflin, Boston),..,1968,,PP. 158 161.
5 5

INTRODUCTION
iPL#mounts of gunlight pass through the atmosphere and hit ..the earth's urfice every day. This light is absorbed by the earth'ssurface-and turned into heat waves which re longer wavelengths .1' Theseheat waves are called infrared rays. The longer wavelength- infrared rays
cannot easiXy pass hack through the .attiosphere into space because certain.substances like carbon, dioxide and water in the atmosphere absorb them.When` this heat energy is prevented from escaping back into space, .11e-"greenhouse effectli occurs.
In thisP l be investigating the ' g eetihouseeffect",
22-I

22-2
OBJECTIVES.,_
At the completion of this activity you should be able -to:
'-constructa simple -apparatus to shoW the greenhouse effect,.
Peke some comparisons between;Your apparatus and theearth.
collect data from thermometer readings and record them ina table.
represent yo results in the form of a lin graph. .
SkILLS'ANDKNOWLEDGE YOU NEED
How to read.a thermometer.
HoW to graph data. using a: simple line graph.
Know what is meant by wavelengths as used in the
NUMERAM, A
--1-st andard laboratory thermometer (-10°C io 110°C'
.1 clear plastic shoe box with cover.
Outdoor ref ectorflood lamp, and mounting stand.
oil -and-water
Cardboard'sUppr ca-which to leab the theotet .
NTRODUCTION.

..Plaoe about 2cm of soil in the bottom of the elea_Thoroughly moisten the-soil with water..
Cut out h piece of cardboard so that when inserted in the boxit will divi ethe box in half. The cardboard should not quitereach the of the box.
P VIEW
An the thermometerbill-
CLEAR PLASTIC BOX
CARDBOARD SUPPORT
against the cardboard _Support with
:Put the box and ,lamp in a part of the room where the effectsof direct-sunlight,heating and cooling:systems, and dkAftswill be reduced.
Put the lamp directly over the thermometer bulb at a distanceof about 25om. Put the lid on the box.
SIDE VIEWLID
CLEAR PLASTIC BOX
CARDBOARD SUPPORT
Record the thermometer readingfor_the_covered_box
7. Turn on the light.
for
BUCB: OF THERMOMETER
THERMOMETER
MOISTENED DIRT0 minutes on the data table
8. Record in your data''ta le the temperature every minute for atotal of 15 mihutes.

At the endof:15,minUtes ff the light, remove -the lidallow the thermometer to return to room temperature
Repeat the procedure with,aiaAincoyared box andtemperatures in the data table.- ,
Plot the data from the 7col:4red and'.uncovered box, an th a sgraph. Use different colors to represent aadh one Compareyour resUlts.
record all your
Tt is possible to trap incoming ligit end ehane it to heat.The-trapping of this heat energy under a covering referred to as the"greenhouse- effect" Clri earth the greenhoUanel act is created - betweenthe at sphere. which =Tact as -Alblanket-to,keairthe heat in,.and theearth's surface. Consider in this actiVittthat the box with no. lid on
QUESTIONS''
1. In which box did the temperature rise the most
2. Explain. this activity showa the greenhouse effect.
3. How does this activity relate'to the greenhouse effect onthe planet earth itself. a) What part of the box representsthe earth's surface? b) What part of the box represents theearth's atmosphere?
GOING FURTHER
How. could air pollutant,d disturb the greenhouse effect?
Describe experiment-that you could do to see how diffarentcoverings ld affect the.tempersture change.
COuld the greenhouse effect ever be harmful?
Use a book on solar energy to find out the parts of a solarpanel. HoW is the greenhouse effect related to the panel'sconstruction?
In wit ways is this Vetiv ty different from the greenhouseeffect on th th 7
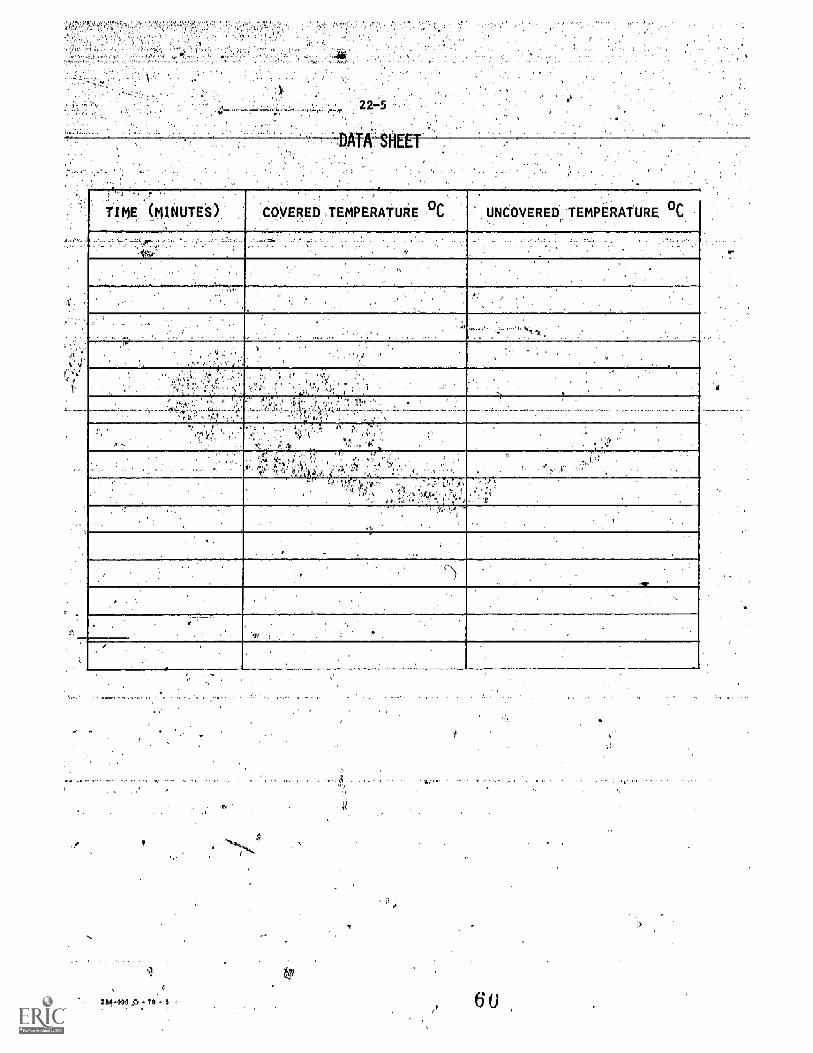
TIME ME MINUTES COVERED TEMPERATURE UNCOVERED TEMPERATURE UC

Teacher format on' Shea
Middle School:ScienceEarth'ScienCe.Grade 9 - General Science
Back round Information .
The earth receivers energy, Q varying .wiliO,pngths from; he sup. These wavesmake up part of the electromagnetie; speciOna: xis' spectrum includes v ible light whichranges from red light with long wayOerigihs to violet,', light with shorte engths.Ultraviolet rays. re invisible rays .1§Wbeyortl 4.1.6let light in the sped and these`ultravidlet rays' have even shorter Vavleniths.-' :Thebe rays can give you 'a suntan. Havinglonger wavelengths than the visible:.ed. light, re ihe infrared rays. Thede are the _rayswhich make sunlight feel warm to yo-u' :. - :' !
When sunlight passea throughr:the atmosphere wome..of.it may -be'abs rbedparticles of dust and.trioleculea of-gas bef_Are it hit, the 'earth.: The reili4iiin -sunlight::may be abserbed byr -substances on __the' eqrth' a. surface,_ such as4Ocita, r; aud. plants.These objects then, radiate :thin energy,,aa:16nger wavelength infrared rays Mr -into': theatmosphere. These _rays can.be trapped ill ,the--atmoaphereaS heat._ This is .te::greefifnuseeffeet..
_e only haa.to compare_a_ clear winter night whnight' which is,m d rr i u t ilc e t of --autos
the ,Iand. -surface: .-, , .
.global average.,the'-gieenhousc- effect causes temperatures to
m -19 st thetop of the atpidsphere. to .0 at the surface of tile earth.-. "
g;reenhouse effect is:otrliously based on the similar falight passee.through the glass of,ra (greenhouse-the shorter visible waveler4ths areabsort3dd..by_jsuchthings as plaAts+'and,-sail7:in'the.interior. This light- then changelighc, of ,ltInger wa.5felenghts, infared'.; liTifia heat' energy is then trapped-because the,
. ..-longerwaVelermths cannot pass' back nut:- .The- temperature inside the greenhOnsesriset
$ome practical knowledge=_of this effect can be extended to ,everyday.For e automobiles heat up when the sun shines through the windows-etirtainsopened- in Winter let sunlight into houses ; floral,. greenhouses retain heat:, rid solar.collectors heat domestic hot water..
..Hint's on Gatherin teriala
The -clean = plastic shoe boxes with- lids work well'. A small fish talk With -asuss cover -also work well..
An outdoor" reflector leap- put in a socket and then attached to a r.Ing standahould work well. A. lamp that throws a lot of heat is necessary for goodresults.. '
61
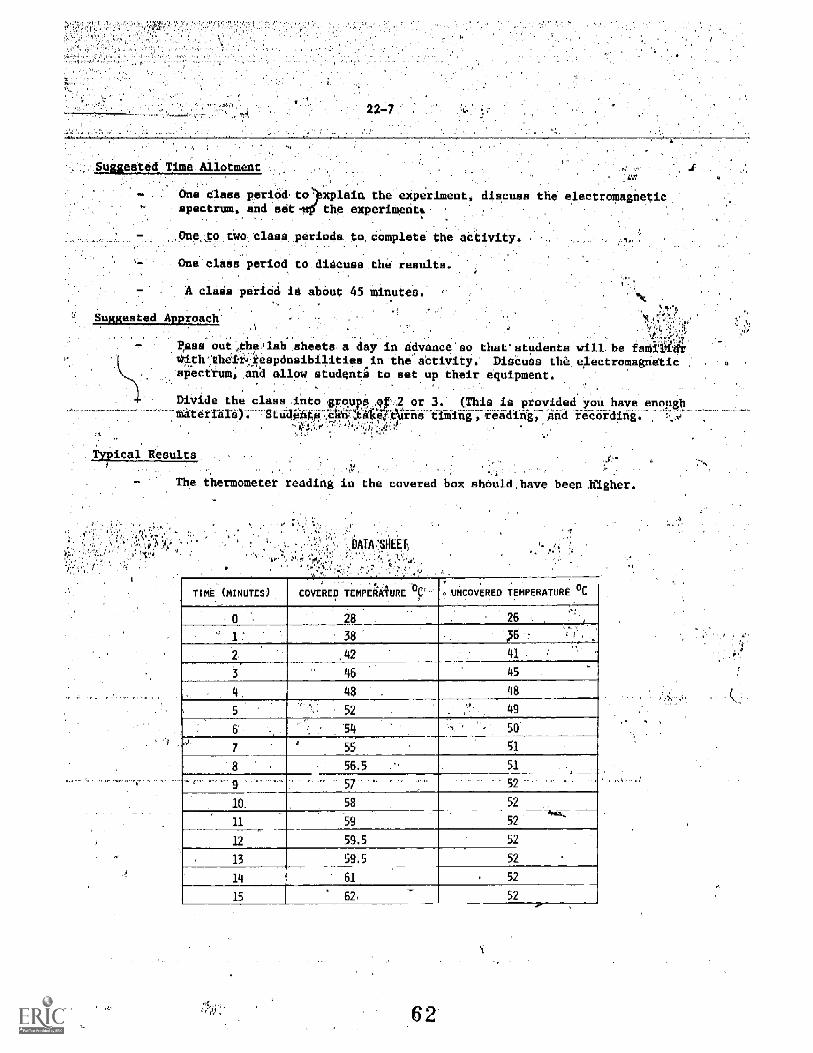
uggestedTime Allotment
one class, period to lain the experimentspectrum, and set the experiment*
One, to.two class period_ complet
he electromagnetic
One clads period to didcuss.the results.
A cladsperiod, id about 45 minutes.
11162ES-24AREP2Eft.
Pass out,the)lab Aheet a day_ in 'advance' so that' students will. be fatil41.th'theliresponsibilities_in-the'aCtivity.: Discuss the electromagnetic .
Octrtim,and allow students to set up their equipment.
Divide the class into 2 or 3. (This is provided you have enough-Material-4); -StUdOnts urns timing, reading, And reCording. ,..'.-
apical Results
The thermometer reading in the covered box should, have been,h1gher.
rDATA!S8EET3
TIME (MINUTES) COVERED TEMPERATURE MNCOvERED TEMPERATURE °C
28
38
142
26
46
48
52
54
55
56.5
57'
58
59
59.5
59.5
61
62
10
11
12
13
14
41
45
48
49
5
51
52
52
52
52
52
52
52
62

6 7 8.
6umnts
Precautions
cation
rf.:yon do not have enou ime, havetaomeexperiment without the lid and some do itresUlts.
Students .may wish to -try other' kinds of covering. eudh -as white cloth orwax paper.
groups oif`,ntudents dowith the cover. Then
thecompare the
Try outside with the sun as the heat
..Eyalua ti.on.
References
Solar Energy, William . Eaton, (Washington: Department of Energy), 1976.pp. 48.
ource.
Check the students data table and graphs to de ermine how, well they Can_ _
read a thermometer and how well they can represent it on a graph.
Check the answers to the questions.
63

INTRODUCTION
They sun's position in the.ski changes. Where is the sun foundin the early-,-morning? At noon? -LI the afternoon? Does the Positionchange with the seasons as well as the time of day?
This activity will give you a chance to measure the sun'sposition and obtain data which is useful in solar energy design. If weare going to use solar energy to heat our homes, then'we need to knowsomething-about the 'sun's position-'throughout the whole year
-You will construct a very simple = device that will help youthe angle that the sun's rays make with the ground. You will
compare your data with data other members of the class have collected atdifferent times during the year You will also compare your data with`published solar position data.
23-1
64

BJECTIVE
At. the completion of this activity, you should beaaure the angle that the'-sun's *aye' m
ground at any till* of day:.v,
use published' solar position tabletaltitude and azimuth at any given time
.SKILLS-ANDANDWI,EDGEIDLI NEED. .
How to:-measure angles with a protractor... .
Howryto level a board tt-inga.bubble level..' -
How to read and use a magnetic compass._ How graph `dale
MATERIALS
A small:peg board..
3/8 inch wood dowels.
gnetic compass.
A bubble level.
A block ©r watch.
Paper, pencil, straig
rindand
. -
edge, and a -protractor.
t the
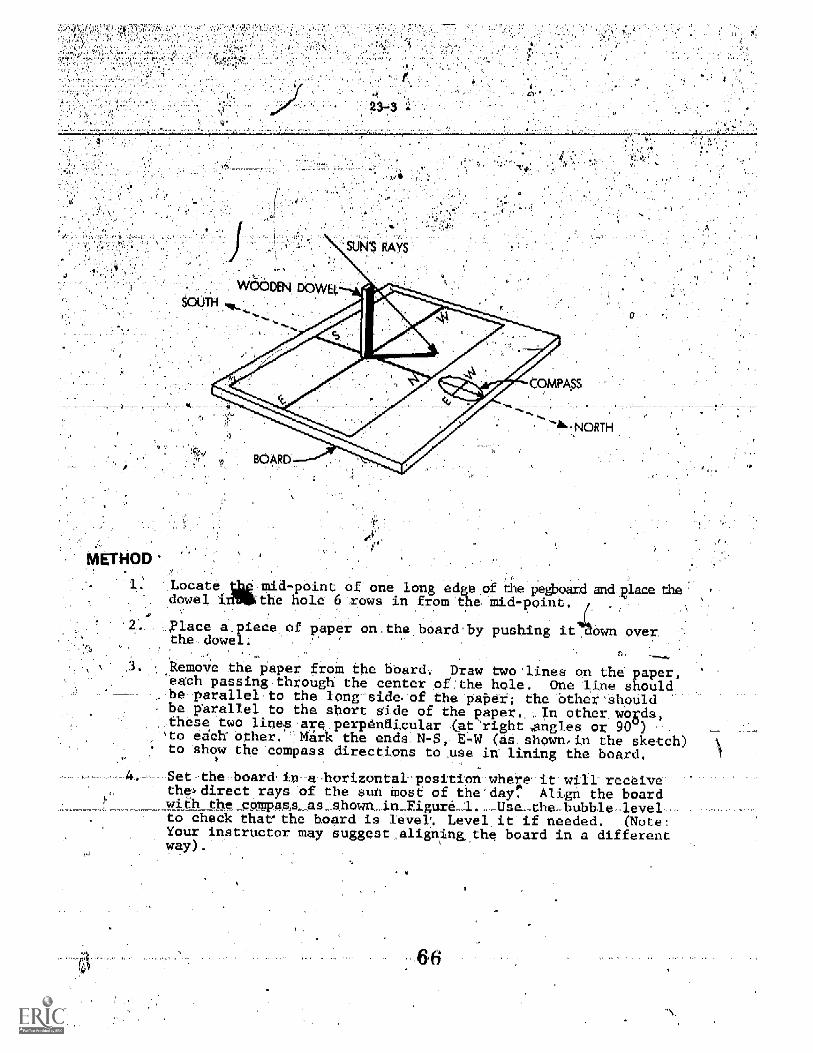
Lecatedowel i
mid-point of one long edge of the pethe hole 6 rows in from the mid-point
place a piece of paper on the board by pushing I own overthe dowel.
RemoVe the paper from the board Draw two lines on the paper,each passing through the center of the hole. One line shouldbe parallel to the long side of the paper; the other 'should
- be parallel to the short side of the paper..,, In other words,these two lines ark. perpendicular (at 'right ,angles or 90)to each other. Mark the ends N-S, E-W (as shown, in the sketch)to show the compass directions to use it lining the board.
Set the board in--a- horizontal-position whete it will receivethe direct rays of the sun most of the day. Align the boardwith the compass_ as_ shown_ in_ Figure 1. . _Use _the bubble levelto check that the board is level:. Level it if needed. (Note:Your instructor may suggest alignngthe board in a differentway).

Measure and "record .the =height of the dowel abovy thesurface of the board.
.
.Each 15 minutes draw a line on the paper.ahowing the positionof'the shadaw. Be_ careful to mark-the-end of the shadow
---Aecurately.: Since the pesitions of the ahadaws,ere neededthroughout the day, students in all classes wIll have to makeae.of each other's data -Record the time and ate for eachshadow,drawn.
For each position ofangles:
The first is the angle between the shadow(s) can the ;paperand the slanting side (11) of ;the triangle as shown in thesketch below. This angle-is called the altitudeof,thedun. _
SUNS RAYS
LENGTH OFSHADOW(S)
,a separate sheet of paper draw a right angle. trianglesuch that the vertical side is equal to the dowel Heightand the horizontal side is equal to the shadma lengthsDraw-line.(H) and measure angle 1. Record: date, time,and altitude of the sun in degrees on the diagram,
The second-angle tells us how much east orwest of the.'_1.-1S line the sun is. . This angle is eelled,the.azimuth.
6.7

Meaaure angle 2, and recora it directly on the apparatus .
If the actual position of the sun, ks .west the N-S line(in,- other words, the .shadow- falls to the eart of Ola N-gline) then the azimuth angle is recorded as 6o many7degreeswest If the sun is east of theN-S line then the
many,,
is recorded as a certain number of egrees -east.In the sketch onothe previous page he azimuth might bd.-approxidately 30 W
Prepare a data table for the sfollowing' informati8n:
osition.' Include th
e.
un_!s_Aititude=in degrees.
Sun!s imuthin degrees
Since- the solar ,energy. designer needs this kind of informationfor the-whole year, tables have .been carefully prepare byscientists. Compare your 'data with that in published tablesavailable from the weather ureau. 1./hy are the tables arrangedby latitude? -What is .the- approximate. latitude where you live?-
'LOOKING BACK
The position of the sun indesign This can:b!e:determined'withprepared- ao that the positthn can-be
the sky is important in Solar energyaim le -equipmen-t : Tables can',prediCt-edgl for any time 9r place .t

QUE STION
V
23-6
1.4whatt_eoiday_is.he sun's shadow at' Whatthis mean? :71,4
Are the sun's shadows longer in suet or w
3. It usually seems Alder early frc the morning titan au noon,it is colder in. whiter than in summer. How are se factsrelated to what you have just learned?
GOING FURTHER5,
if you want - the wo.k _
would you position a solar collector? Wuuthe same in winter a. summ r,
L._
Since alv4L at. 1 .4140(
position would you suggest ihey be se at? .hould _ e, facN S E or W?-----anAle with the ground .1, you think wouldbe best? (Hint. Whin are you likely tosned the most heat?
How euuld YUU ,ES.. Lhewindows in your home so youenergy?
What effect u-o, Lt., .1, L
on the energy re. eiv d by ti.e
kh, .uu th-Lt,e 111..151 renfit of the su
ou. home?
in land aplog,z'our Lo.,, !-o ...,,,I., tree. L, dseo ,
to help keep yoU- house .-:ohle. in smmei L. war mr.L. An kiiiALL!c
What kind of tre would you 1.,..e iE1 what pos 1 tion7
Using data oo sola, pus Ai make , ..1.,11 1, ..,,Iii
of a house with windows showing ho ,he sun s ray, d en.at different Limes of LI. year Sh"w how c,.soges windowt,roof overhang, etc would Affe,li thaoamount of di, 1. sunlight energy received,
CAYou might an L0 --e.p.1.1, ....db -.o 1...i. of _ 1
to show the efree, of window sic position and 10cati .10
well as root overhang the a _ of ener re,eived uilhithe interior (inside the house.
0

Teacher Informst OE Sheet
46
Suggested Grade; Level and Disci lit
74 ScienceEarth Science
Eackground Informitit nn
0ei
a
POS4iT I Olt IN THE S'KYf.w
G' Perhaps the most rundam- tal Intowmatioe needed by Lhe 001a. ,k-,L6),e
experimenter is soltar position, and ntensity data. The appurent,poditio,, of the 644.Echanges throughoutAthe day asta result of tbe earth's rotation about its axis. the .,,-
appears to rise each day in a generally eastern direction and sets in 'a kfneraify weste.,direction Ae=4e earth reVolves about the sun during the course of thle -ear, the exactpckthat the suriapptihrs, to take' changesJ.' ?mss is a reedit of the tact thitc the earth'.
* the earth'smorb ha bout thec Oun. Only twice a Yeat4ihan, around March 21 (the' vrnaleirrotational ax : titled 231/2° with _respect to a line drawn perpendicular to the plane of
equinox)-and Se-ftembet 21 (the autumnal equinox), abet; the sun appear to rind 'directlyat the east point pad set directkoppt the west point, The sun reache© the lowest peinL(at noon) in the'southern sky Decembet 22 (winter sol0(4ce) anu'the hi p pointulti lonepL u -1_
(summer solatce).It71t.1
L..,1,
Cquit.. s mitar to the ,E...6-sy.
on vs _h, makes use of the "celestial sphere" with .sear pos ti a...4._ ed n 1.,,
"right ascension" al eclination. '-Generally, haweyee, the more 0404 _ ski b II_systems simile; to that used by navigators r surVayors., is used by 'Eh -)king la tn.solar energy field. The position of thAl _ l sctlbeu 4k, Let 0 of is 1L1Lude ( ugt.
and its azimuth, (angle). -
the -.L.'-tnier'elline of sight to Che sun an., t e,torth.ti ,the
The azimuth measuremdm by4w1..r eoergy worker. is slightiby surveyors. The azimuth is the angle measured :6et,eau the N-S line and sheof the line of sight onto the horizontal plane. The angle ake,s11,:ei be&k.fee.) Lhe S
horizon point and the projection nn the horizont..1 plane of the 1i of aight to ae
The azimuth will therefore be a measurement in degrees 1. .(1,t t_Le mot,Iti,g) t deg.ete0(in the afternoon). (lrr the surveyor's system all meauutewent.., ut as,11,h *to *N
made by measuring the angle clockw se from the _ horizon point ,en.i have he v.1,-.from 00 to 360°). ! ,1
t, .-,A, b,.w01 the t
iferen. 'Loan hat' _

Azimuth
23-8
lestial Sphere
In this discussion, the directions referred to are the geographical LaLL61than the magnetic compass directions. Since the north magnetic pole does no crrespo,..1with,t17te true or geographical, pole, correctiOs to compass readings must be made toofrect for the magnetic declination at any,given locality. The magnetic declination ishp angle between the 'direction the compass needle points and true north; values formagnetit declination can he lound on local topographical maps or in tables in mostphysics reference books.
At 12 o'clock noon, sun Llme, the sun would to lu, ated .1-imaginary line that passes through the N-S points and yout zerOth-. However, 12 o'. loctsun time does not correspond to 12 p'clock standard time. For this reason, she son'sshadow does-not fall exactly along a line running north and south 4, 12:00 noontime). Correction can be made for local time as toliowe:
There are 24 time zones extending arutiod ,ht aa,th,extend over 3600. Each time zone covers appLoximat_ly 15Of longitude (360° .24). This means thot 1° of longitudecorrespirds,oto a time difference of 4 minutes.
OU1 hr. 60 .inutco theLero.t. mio.tes =
15,L1
Longitude is lasursd, vegtworg f-roll Luc_ metidlan .1k ,JrenWiCh, t
Ther _ longitudes of 00, 150, 30 ©, 450, 60 ®, 75' etc. correspi.ad to the 'cenLel:leach
0time zqpnel, The center of the eastern time hone is tt.e meridian ,ith a longitud
Hof 75 . Ada OT sOtract 4 minutes to the time for every,,degree of 1.,ogitode that youeagt or west of the center of your time zone.
Example: Your clock reed. Iv LI K A Is_,0is 800. This is D westor the 75th m.ri.ldan whe,e it is actually 10 S,_5 degrees x 4 minutes/degree 40 minutes. IL is 9.40 sµ',. ti. time at your l Delisun will not, be on your meridan until 10t2v a.m. (clock time). Foi'krem, pLecire`measurements an additional correction can be applied to correct for the fact tha,sun is sometimes ahead of clock time by a few minutes and other tim.s behind clot_ ti
This correction, known as the "equation of time ", can amount to a.. much as 16 ...huts.. at cerkain timeSpof year. Graphs or correclion tables can be found in theist colleAastronomy textbooks under "Equation of Time". This variation is caused by theof the earth's orbit and the obliquity of the ecliptic, the annual path the oon' in Lksky.

23-9
In this activity, the board must be oriented in somethe students sppear,to be able to handle magnetic north-to-truereadily than those involving solar time-clock time. Perhaps theto have students merely align'tha boards in a magnetic north -soulot descriptions and building orientations are likely to be donercompass bearings; but be prepared to tackle the inevitable questshadow lie north-south at 12 o'clock noon?" Most solar positionof solar time and igu1ar measurements from true south; studentpublished data unless these references are used.
Hints on Gathering Materials
All materials necessary arL A- 4t .e dll
reg board sr3/8" dowels
direction. In general,north corrections moreSiMplierat procedure is
d' direction. After all,in terms of magnetiion, "Why doesn't thetables are given in rems
data will not agree with
are common Au flIsuy ,A .
e not critical) Have extra d,wela on had
Solar Insolation data are availaule ft.m your nearei-tWeather Bureau brfice.
TW., days.
a u,), ,
ti Day Two; ii,tLia, dat, CC, pL... 1.
,-r1 ,o11-,tio ,1 ...1.114. ..al ,444.
I
LAU U ddMA WAIL. y bamiaof the ,rAect
LLia add1L1 us! da A 7,10 ,
Ot I. 4,he Is .1,
time dud tr,e A. S rlentatl-o
AnAdegL4e:,
the bus d Iult!slA se
1.1A
ull ,u - IL At
the .4 1
I

-Precau ons
23-10
The aymm try of morning and afternoon readings will become apparent.
Student data will agree closely enough with published data to make thismeaningful to the students.
AT NO Tr SHOULD THE STUDENTS LOOK DIHECTLY AT THE SUN. This couldserious injury to their eyes.
Mod f icat ions
valuation
Some students pay wish to examine sundial theory and Lcuatructiun aoffshoot of this work.
If this activity were carried out with students poseesalog a knowled6, Ltrigonometry, then the-solutions of angles using trigonometric functionsinstead of measurement by protractor would be appropriate.
Lan h L46 api.akal..0 4..,k.
s is his data orgaul.ed iu am.b a way that IL aaadthe classes?
Gait Lite stua.uta to .t, aLL.l ...,
Reterenc
erinoip4,.0 df ,,ant L,
=
rgy bxp.,rcog
pp. 129-

D R ACTIVITY 2L
VARIATION Of :THE S-11111INTENSITY
INTRODUCTION
The chief sourv; or 1 the esiki .Li,e
we know the s emin'energy a_a ndarly constL !ace.energy that .'Tikes the earth .is-known as the solar n-intensity olarradiationfalling on Any portion of the eiLth's .J.ial
-
however, is n codstanp. . In ';his ativipy,;you Will be invesOigatng thatrelationship ihesuri's ntenwit to"atspositdon in the sky.,
AbTole qUanti.y
Lan't The
74
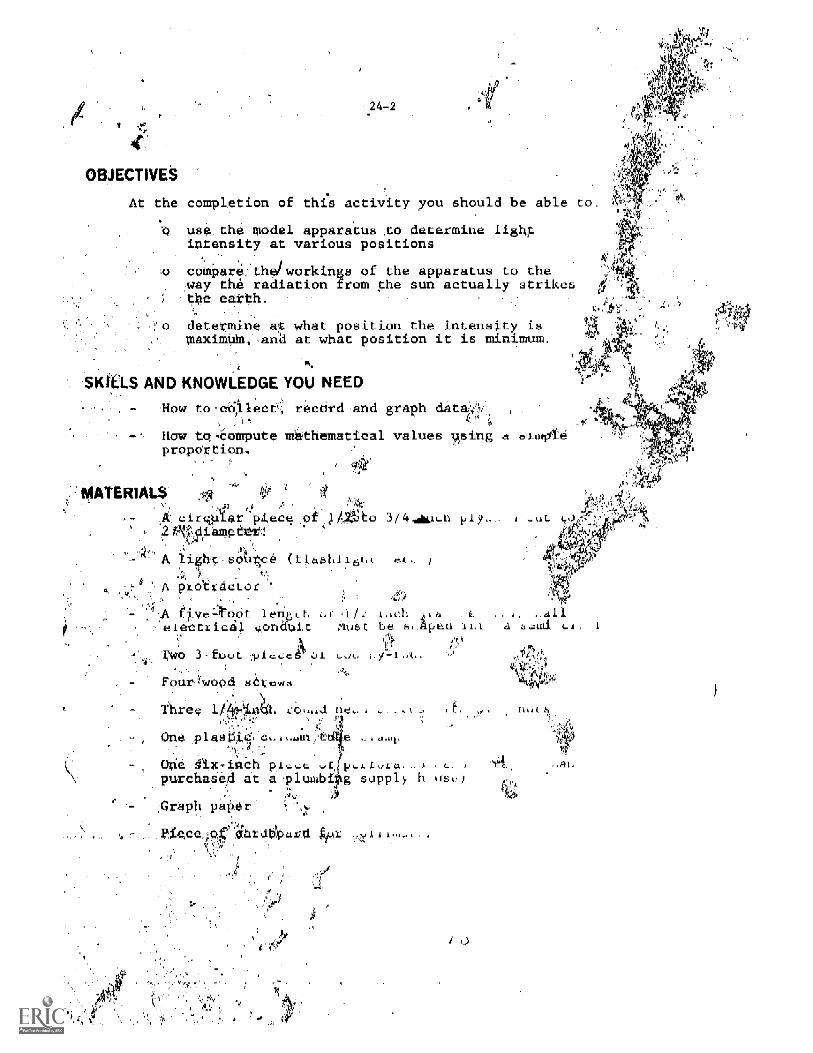
OBJECTIVES
-24 -2
At the completion o this activity you should be able to:
-0 use the model apparatus to determine lightintensity at various positions
o coMpare:thetworkings of the apparatus to theway the radiation from the sun actually strikestke earth.
determine at what position the intensity isMaxiM4WHan'd at what position it is minimum.
SKILLS AND KNOWLEDGE YOU NEED
How to-o0:11ect record and graph data
How to,compute mathematical values ?singproportion.
MATERIALS
circimiar piece27-Nr i;sangba-r4-
e.t
Two 3-frJut
MU6t tie 6
Fou ood s
One 4x-inch pr.,purchased at a plumbf g supply t
Graph paper
,
a ,d11ea lnt a z.dmi-L1
3.
1.%11. 4

Stove Bolt with Wing Nat
Perforated S
24-3
Wing Nuts with 1*"Stove Bolt
Graph Paper
METHOD
1. Obtain the apparatus ircum your teacher.
2. Using the graph paper supplied to you byapf the graph paper to fit the configuration of theciterle as shown in the diagram above.
Set the elevation of the glide bat ,4t441 L.,light source at position I marked _ the tar, Be surto tighten the wing nuts and attach the collik..ato, tothe light source.
Mk
With the bar at 90' and the light at p0o.U. a. I L t+Alight on. Count and record the nunibdr of sq-at,sthe nearest whole square) the light cover at positioi,Record in the data sheet.
Protractor
Angle Iron Corner Braces
Keeping the bar at 90° and ckia light at &the light on Count and record the number of squaresthe light covers at the other positions marked on the LaBe. surer to, orient the light_so that it strikes the centerof the circle.
6. Change the elevation of the bar to 429 and repeat theprocedures #4 and #5.
7. Change the elevation of the bar and repeat p. 0,-J-.#4 and #5,

24-4
8. Using the following relationship compute-the intensity of thelight for each light setting marked on 'the har.
NTEfts Ty s 11,15ELDEJLERECZERELLALLEQUILLtiWEER OR SQUARES COVERED AT THE OTHER POSITIONS
Graph the following relationships:
a. Light position vs. number of squareb. Light position vs. intensity.
LOOKING BACK.
The altitude and the seasonal path ot the sun are Lwo imp,,LLbtafactors that determine the amount of insulation striking the earda at agiven point. Other factors such as number of cloudy days, duration ofinsolation, and atmospheric pollution also affect the total amount ofinsolation received by the earth at a given point.
/'
QUESTIONS
1. At what light setting wbs LL iaLehaity Lb,
2. At what light betting Vie.L,G LLIC gL Ca 1.1111 er ..t ,..1,8areL,
covered? Why?
At what bar el vatic., weke Ll,e 5L6 1411.. t,t4 1
covered by the light? Why?
Using your glaph ,.1,,t1ba 11. tt,la,t.- hi L
position ot the light and lote.,sity.
Using your graph, deb,ribe the relati,.,unieelevation of the bar and the light's intens.ty,
What eompaLibenb you wake batw,..b t1110real world?
GOING FURTHER
Would ,Alculg,n6 Ln,. , ..6n. . i .intensity striking a given l.oi. CI lry i,
If the beam of light were closer the boa.a ,,I4A. tii,A
any effect on intensity? Try using collimato of d fferklengths.
[It
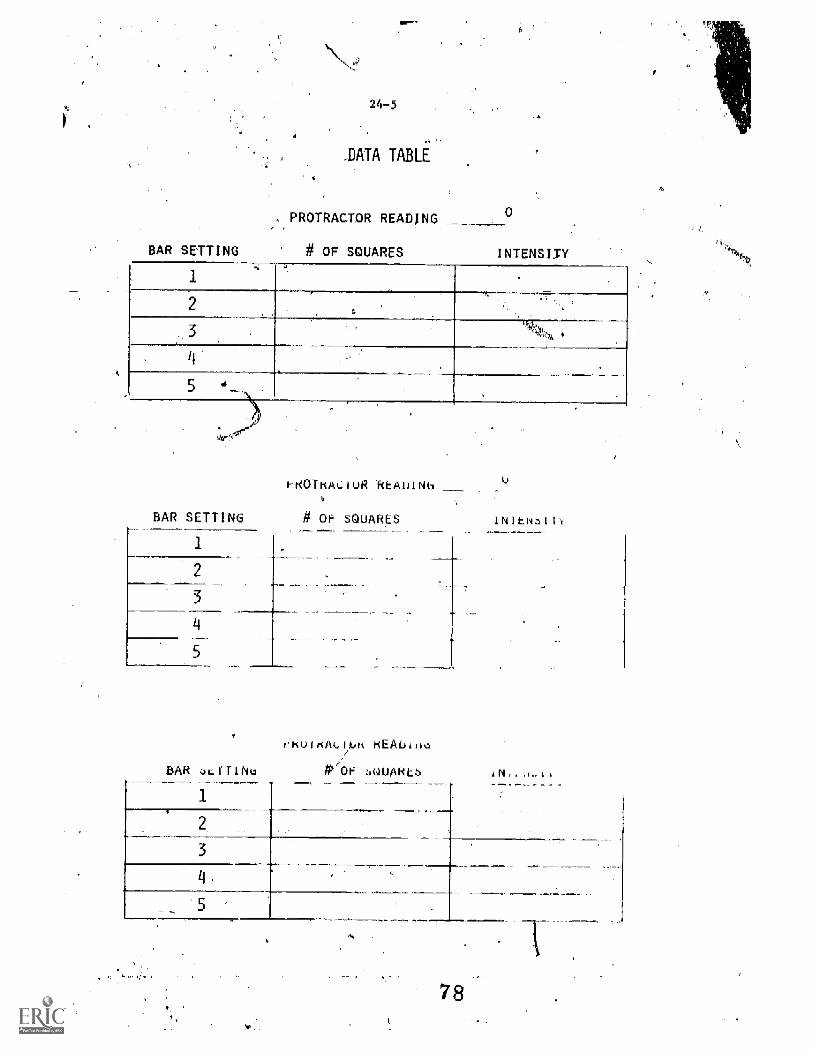
BAR SETTING
1
2
24-5
DATA TABLE
PROTRACTOR READING
# OF SQUARES
0
INTENSIFY
4
BAR SETTING
PKOTRAOUR rIADINb4
# OF SQUARES
BA
riluIKALI KEAI kilo
(0'0 bQUAKLs
U
78

24-6Teacher Information Sheet
VARIATION OF THE SUN'S INTENSITY
Sugsted Grade Level and Discipline
7-9 SdienceEarth ScienceSolar Science
Background Information
The ea h is warmed by the insolation it receives. Even enough the au..emits a constant am writ of energy (2 calories/centimeter square/minute or 429 BTU/ssquare footOour), the intensity of the solar radiation falling on any portion of theearth's surface is' not constant.
There are two reasons why the radiAtion falling on a hOrizontal surfaceVaries with he eleVation'ef the sun. Firet, when the"Sun is low on the horizon, itsradiation passe4 through a thicker layer of the atmosphere than when the sun is overhead.Secondly, when the sun is low in the sky, its radiant energy is spread over . larger area.of the earth's surface than when it is high, so that the radiation per unit area is tests.
The average Insolation per unit area falling on the earth's surface each yeais greatest at the equator and smallest at the poles. This is due to the ankle at which tamsun strikes the earth. As a result of4thia distribution of Insolation, the average annualtemperature of the earth's surface and the air near the ground decrease* from the equatorto the poles.
This activity should wive 00 th0 1,:ad activity teltiu,to solar energy. A basic understanding of the factc,rs,,that affect the intensity of thesun at a given point on the earth's surface wakes it possib collect and mak..efficient use of the sun's energy.
Hints athering Material.
Several weeks I. ILlyity iv pt0or, put,t,...seek help frow the industrial arts teacher in putting LIle appars.ustogether.
Build seveb....1
Suggests41 Time
Two to fou
79
de,

24-7'
,Suggested Aproach
Have several models built in advance. See the diSgr model dpeelfica ons.
Divide the class into seveehl groups. Have each group experiment withdifferent bar elevations to simulate intensity at different latitudes.
various career opportunities in the field of solar energy could beored by:
1. Researching,li erature pertaining to solar energy.7. Guest speakers brought into. the classroom.3. Obtaining handout material from the Department of Emdrisy ai
your State Energy Office.
Once the data has been collected, recorded, sod graphed, the Lollrelationships should be in evidence;
As the altitude of the 11610. 144L4.alilo t4P arealight decreases.As the area covered in, teased the intenbit), de,As latitude increases intensity decreases.
j
tiara, op t 2r4 the to-rd.
A A "
atm spheriL nditlo.,s .re nut condo iv,e t 1, SI L &.a
will,serve the same
elect
L;hccic a 3L., len s-
_ 4,
;0.4, t1,,ns
Detei.11,e Li.. ability ut at.oduca to L.real world,
U
Alg
1 L . IL

References
244
h, Ehergy Anawetoj Tom Dean, Modern, andcraft, Keuana City.Missouri, September-October 19/' ; pp. 30,60-61.
Intel Fnedl ate Minimum Property Stundards for Solar fleattng ana tvinotL,Hot Water System, Volume 5, United States Department of Rousingand Urban DeVelopment, Washington, D.C. 1977, pp. C-§, C-9.

WHAT SOILWENERGY?
t
INTRODUCTIt, N
The growth of green plants, the heatihg,u Lueindeed; life,On'earth would not be;-poabible without energyl from the sun.Today we heat more and More about harnessing solar energy so )_c can 4used direqtl: by Man to produce electricity, to ,run Machines and` to heat,and-cOol- ia becoming more and,MaIdiMportant.tostand energy.
a! iht.r_
ant,energtivity you will learn about sow,of the charaeterlot

TI
At the 'ccog
SKILLS A
ipn of-th s activity, you ,should be ite0
,
isC he types of radiant 'energy in the electromagnetic:'spectrum from Shortest wavelengths to the lodgest.
, .,,,,
-,explain how radiant e ergy in the electromagnetic spectrumis usectby mad or hew- t affects man.
my=
list the types 'solarolar Alant energy that reach the'"surface Hof the earth.
construct'a graph that shows the distribution of incoLintsolar radiation,
.1
D.KNOWLEDGE- YOU NEED-
Hoyto use science referencebooks to locate infor tion onsolar energy topics.
How to use a pried, ctroscope, xadicimeter and laboratorythermomet dr.
How to construct and interpret a line graph.
Mesourc ttiodoks on solar energy.
1 the meter- with the bulb pa nted black.
1 prism.
1 spectroscope._
I light socket with a 300:--wart,a 300 watt' infrared 44lb. ,
1 fluoracent light sobrce ".
4
standard incandescen&bulb and
1 j ar f ter ach; group must~ have a jar the same s

Diredt sunlight through a prism Into -a .sheet of Papera labeled-diagram to. des Abe what you observe.
NextUse reference book to reed aboUtYkthe visible .spec urn. tto your .first di+ make another, labeled diagrata to showthe visible `spectrum shown in your reference book.
labeled dia. _am Of what yolk obserye . NEVER LOOK DIRECTLYPoint your ectroscope to
yolk--Aid:. of the sun and draw a
. AT THE SUN EVEN.THROUGH-A SPECTROSCOPE. Point your spectroscopetoward a fluorescent light and araw.a labeled diagram of What.you
xr Fobserve. . . . .
a.' Place -a black -bulb thermometer on,the.lab- counter andhold a 30watt incandescent lamp .5m &tirectly abovethe lack bulb for 5 minutes. Record the temperature.
E 4.
. it*Allow: the t rmemeter to return. to roomtempetature
.
ano . _.._
then repeat e Same procedure using a 300 watt infrared.A
,'01,1 '.1b: ROcqrd the temperature at the end of 5 minutes. -. .. J, .
Use reference books to locate a graph showing the iintensityand type of-solar radiation that reaches the earth 4ndrecord, the information in your note ook. Flees a copy of-graph your not hook.
LOOKINGeBACK
The story of solar energy begins when the nuclei of 4 h5-rdrogenatoms lain. to for& a helium atom within. the core of the sun. The enormous
onnt of energy_ released by the nucilear fusion reaction heata-elements6-the surface of-the sun: These elements give off the different formsoCradiant energy found in the electromagnetic spectrum.
Some of the harmful solar radiation is absorbed by the earthsatmosphere before reaching the earth '0 surface. Ultraviolet, visible.light and infrared radiation eventually reach the earth's surface.
-_
The next chapter it' the solar energ%_story .concerns itself with.--t-let thappena to .the so19,r energy once it'Teaches the earth.
QUESTIONS
1411-1at evidence have you seen that suggests ,sunlight containsdifferet-tYpea of radiant energy?
Deearl,be wayetbey be about .the e . , 0
Compare the ,color pattern of sunlight an tthe fluorescentlight. How are they different? -Do all light sources giveoff the same type of fadiant 'energy?
ich= our two -diagrams are alike. --Should

Refer to yout graph -,The distrilution of the sun's energyreaching the earth is about 5% in the . region,40% in the region And 554-in theregion.
are
too find Out how the-sun produces its eneigy.. ..
.being conducted to use here on earth the:same energr,process, fusion, that takes place on the, sun. .What
latest developments in-fusion-research?

WHAT I SOLAR, ENERGY
Suggested Grade` Level and ° Lisciline`.
7-9 ScienceEarth SciencePhYsical Scien e,
ound Information
.Some background informatsun-is appropriate.
Theaun is made dp of every large amount, of different gas U. Relium makesup25 percentof.the sun's mass; hydrogen gas makee.up74,peregatvondpereen4 is MadeUp of small amounts of all theother-known chemical elements. %Ihe weight-of all thematter in the suit creates a great pressure wfithin tlid sun e:eore. This ppessuge is
17-ifeatIY-en -biirion''fiiiea the air pressure eart4:s.surface.
Such high pressure and temperatureicause four -,Wrogen nuclei to jobform d'helium nucleus. This process of small nuclei joining to farm single 1helium nucleus is called fuslon. ANt-Js*this.processpf hydrogen fusion that :startsthe formation of solar energy. a
dM
The helium thatais prOdUcedahas a little less messnuclei had-together-. The:small amount of:the missinchanged into a large amount of'enSkRY.
n theofour hydrogen'hydrogen .mass seems to be
0,.
Thi- change cif Amass tb ene y takes place-deep Aside the sun. The energyproduced inmide the sun makes itvway to.thespurface. At, the surface, gases absorbthe energy and become hot and give of radiant en y: Radiant energy travels awayftem the sun at a speed et 186,000 p176 per secu d. This Means that radiant energy:travels from the sun to the earth in about 8 min es.
AThe sun' sends out Adiant enerjt; of all kinds. Most the energy eaving
the sun is-in the lormlof visible tight and.infrared-rays. .Together they account formore than 90 percent:of the energy producbd by the sun. Most of the remaining 10percent is,accounted for 4.ultraviolet says x- ays, and glaMma ;o5TP. Not on of thesun's radiant energy,readhes the earth's -surface. The earWs !atmosphere absorbsharmful x-rays, gamma rays.and most of the ultraviolet rays. The solar energy. thatdoes reach the surface of the earth is Visttleliglit for the: most part. A small amountis in the form of_ infrared' and ultraviolet rays.
--. A- -wall chart-of-the electromagneticapectcharge from General Electric-Lamp Divisi
'be ordered fru of/ark, Clev6land,
VETHDD step 1 and 2.
One period to complet0 METHOD step 3 and 4.-. -
One period to complete METHOD- step
HUgg- roach
Relevancy. Letture pescribe ways in which a knuledimportaneto studentstway of life.
Overexposure - skin cancer, sunburnEnergy source for natural systems - weatherLimiting factor for h n activity - availal
harnessed by ma has implications for echange.oflife. tyla or_neW_waya_for
,, Students name each:type of energy in the electromause by or effect _sin' n. (cosmic rays, x-rays, ultlight, infrared, anz.radio waves
AT' eAfter METHOD step 5, an overhdistribution of indoMin radiatio
o ar energy iv
and itvia bl
4eParcuom the ion:
Have students plan in-experiment 1 a,nit water, cetc,
sfiowing,pek.
BaElVlab
group will be provided'. with a rhe-- ndescedt bulband elar of water. The object will b es which gin.47ban raise thewater-temperature the mostnsingieniy7"r bulb es-e hource-ener&y, They maydo research and bring in other materiek Have stildentakeep a V* es,7
record of their plan. On a sunny dSif-,tne-sun'se,er!trgY may be dubs tiltedA
for the electric light bulb.
With good techniquetthe activresults toidentifyerrors
Warn students about elictr,-,
Do. not .loedirectly at the

Modifitstions
_ resource textbooks are not aVailable,- lecture o -keippresentations could be used,.
Lab activities could be performed as_ ea4Ier
_ -433.7a t
Obaarve 010: grade students working e
inktructions and With :Other- cia
.
Collect-4nd grade anaWera.to questionsr.
.
_ mintater.a.rus.,St lasdd,orr the performance objectives:.
P
----am-CeihOopes'old-ChaT eves, Vol";-3, d VCebco, New VorkY, 1973. w
,
Earth Sdieiw?4,bragOlcA'_lbitstantine Constant and S.L. GdffnerSchool PAblIcstitinsNew-lork) , 197,2;York
;
m
raring Ear eh Seinnde, Walter Thurber ;.and E :Hilburn; (#1iyi;Bacon, Ind;,Boston).
t'Earth'Sciance, Sanford M. Eislve, M. Stock -an(Cambridgd Book cempany. New Ye0c). 1973.
A
can
Copyright © 2022 FDOKUMEN