Effect of co-ions and counter-ions on mAb capture with weak ...
232
Effect of co-ions and counter-ions on mAb capture with weak cation exchange membranes by Huayu Niu A thesis presented to the University of Waterloo in fulfillment of the thesis requirement for the degree of Doctor of Philosophy in Chemical Engineering Waterloo, Ontario, Canada, 2020 ©Huayu Niu 2020
-
Upload
khangminh22 -
Category
Documents
-
view
0 -
download
0
Transcript of Effect of co-ions and counter-ions on mAb capture with weak ...

Effect of co-ions and counter-ions on mAb capture with weak cation exchange
membranes
by
Huayu Niu
A thesis
presented to the University of Waterloo
in fulfillment of the
thesis requirement for the degree of
Doctor of Philosophy
in
Chemical Engineering
Waterloo, Ontario, Canada, 2020
©Huayu Niu 2020

ii
Examining committee membership The following served on the Examining Committee for this thesis. The decision of the Examining Committee is by majority vote. External Examiner Dr. Raja Ghosh
Professor (McMaster University)
Supervisor(s) Dr. Christine Moresoli
Professor (Chemical Engineering)
Internal Member Dr. Marc Aucoin
Associate Professor (Chemical Engineering)
Dr. Xianshe Feng
Professor (Chemical Engineering)
Internal-external Member Dr. Maud Gorbet
Associate Professor (System Designs Engineering)

iii
AUTHOR'S DECLARATION
I hereby declare that I am the sole author of this thesis. This is a true copy of the thesis, including any required final revisions, as accepted by my examiners. I understand that my thesis may be made electronically available to the public.
iv
Abstract
Cation exchange chromatography (CEX) has risen as a promising alternative to Protein-A affinity
chromatography for the capture of monoclonal antibody (mAb). mAb capture with CEX works on the
basis of electrostatic interactions and is sensitive to buffer conditions, especially for weak CEX
materials that present variable ionization according to buffer pH. While mAb capture with CEX is
primarily based on strong CEX resins, CEX membranes are advantageous as they do not cause high
pressure drop that is associated with resins. It is critical to investigate the role of buffer conditions on
the performance of IgG/mAb binding with weak CEX membranes.
The main objective of this PhD work was to investigate the role of buffer on IgG/mAb binding with
weak CEX membranes and on IgG/mAb unfolding, based on which the design space was developed
for mAb capture with CEX to assure process productivity and product quality. Buffer effects were
investigated in terms of buffer pH, concentration of buffer cations (or counter-ions in CEX),
concentation of buffer anions (or co-ions in CEX) and type of buffer anions. Two commonly used
buffers in CEX, phosphate citrate buffer (contain multi-valent co-ions) and acetate buffer (contain
monovalent co-ions), were employed. The model proteins include IgG for its cheap cost and availability
in large quantity, as well as a humanized mAb, Bevacizumab and a chimeric mAb, Rituximab. The
weak CEX membrane employed is Natrix C weak CEX membrane, as it possesses a high binding
capacity at optimized buffer conditions. Methodologies employed in this work include, swelling
experiment, Environmental Scanning Electron Microscopy (ESEM), static and dynamic protein
binding, high-throughput intrinsic fluorescence measurement, size-exclusion liquid chromatography
(SE-HPLC) and Design of Experiment (DoE), response surface model (RSM), two adsorption models,
the Langmuir model and the steric-mass action (SMA) model.
The first section of this work focuses on investigating the buffer effects on IgG/mAb binding with
weak CEX membranes, which will facilitate the subsequent design space development for improved
process productivity. The structure of the weak CEX hydrogel membrane employed in this work is
sensitive to buffer conditions. The role of buffer pH, counter-ions, and co-ions on the membrane
swelling behavior and its surface morphology was investigated through swelling experiment and
ESEM. Buffer pH and counter-ions had a significant influence on membrane swelling and membrane
pore size, while the effect of co-ion type was negligible. The role of buffer conditions, especially the
co-ion type on static IgG/mAb binding with Natrix C weak CEX membrane was then quantified with

v
two adsorption models, the Langmuir model and the steric mass-action (SMA) model. The estimated
model parameters of both adsorption models revealed the significant effect of co-ions on IgG binding.
It was proposed that multi-valent co-ions may promote the binding affinity compared to monovalent
co-ions by creating more binding patches on the IgG surface [1]. Co-ions may also affect the structure
of IgG molecules thus changing the IgG binding capacity. When investigating the effect of co-ion type
on static Bevacizumab binding with Natrix C weak CEX membrane, it was found that the co-ion effect
was only significant at relatively high concentration.
The second section of this work focuses on developing an efficient tool for investigating the structure
of IgG/mAb and then applying the tool for investigations on buffer effects on IgG/mAb structure. A
high-throughput intrinsic fluorescence microplate method was developed for fast detection of IgG/mAb
structural changes. Comparison of the emission spectra of thermally stressed IgG samples collected
from a cuvette spectrofluorometer and a fluorescence microplate reader demonstrated that the intrinsic
fluorescence microplate method was as efficient in detecting IgG structural changes as its counterpart.
The method was also shown to be effective in detecting structural changes of thermally stressed
Bevacizumab and the effect of buffer conditions, especially the counter-ion concentration (Cs) and co-
ion type. Both Cs and co-ion type had significant effect on the structural changes of mechanically
stressed IgG, where higher Cs induced protein unfolding, and co-ion type affected structural changes.
The effect of co-ion type on the unfolding of Bevacizumab after binding with a weak CEX membranes
was significant at a relatively high initial concentration (≥ 7 mg/mL). The structural changes of mAb
were also related to the monomer percentage detected by SE-HPLC.
Finally, a framework for design space development for mAb capture with weak CEX membranes
was established. The first step was the identification of critical process parameters through risk
assessment, where four critical parameters were identified as buffer pH, buffer molarity, Cs (Na+
concentration) and mAb concentration based on the literature. The second step was to study the
characterization range of buffer pH, molarity and Cs (Na+ concentration) through static binding, to
identify the range of conditions for high Rituximab binding capacity and low Rituximab structual
changes. The third step was developing the design space with a response surface model (RSM). The
construction of the RSM was based on a DoE study of the four critical parameters at three levels for
static Rituximab binding with Natrix C weak CEX membrane. The fourth step was to examine the
RSM through performing static Rituximab binding and dynamic Rituximab binding with Natrix C weak
CEX membrane at the optimal buffer conditions estimated with the RSM.

vi
In conclusion, this study shows that co-ions have significant effect on the structural changes and the
binding of IgG, Bevacizumab, and Rituximab with Natrix C weak CEX membranes, and should not be
overlooked in optimizing the buffer conditions during mAb capture with CEX membranes. The intrinsic
fluorescence microplate method was demonstrated to be an efficient tool in analyzing the structural
changes of IgG/mAb. The SMA adsoprtion model could be used to investigate buffer effects on
IgG/mAb binding and as an supplementary tool to investigate buffer effects on the structural changes
of IgG/mAb. The framework for design space development established in this work can help
significantly improve the efficiency of process development for mAb capture with weak CEX
membranes.
vii
Acknowledgements
First of all, I would like to express my sincere gratitude to my supervisor, Prof. Christine Moresoli. It
has been a great honor to be her student. Throughout the years, her dedication in work has constantly
inspired me to keep passionate about what I do; her guidance has tremendously helped me to search for
new ideas and overcome obstacles. I am thankful that she cultivated a strong group with brilliant
students, Dr. Katharina Hassel, Priscilla Lai, Dr. Rasool Nasseri, Joseph Khouri, Nickole Lyn, Holly
Huang, with whom I enjoyed warm friendship and fruitful discussions. Special thanks to Dr. Katharina
Hassel for her training on static protein binding, and to Rasool for his advices on modelling with
MATLAB.
I am grateful to a number of people who have kindly granted me access to the equipment in their lab.
I thank Prof. Marc Aucoin for access to the ÄKTA Prime and centrifuge, and Prof. Raymond Legge
for access to the Synergy 4 plate reader. I thank John Zhang for access to the ÄKTA Avant and his
training on the equipment. I thank Ralph Dickhout for access to Waters separation and his training on
the equipment and data analysis.
I would like to thank the numerous co-op students who made contributions in my work. I very much
appreciated Ao Zeng and Disha’s experimental work in high-through protein binding, and especially
Ao Zeng’s work on mAb dialysis and modelling improvement with MATLAB. I appreciated the work
of David La on intrinsic fluorescence measurement and the work of Dilip on the improvement of
modelling with R. I would also like to thank Shivani and David for their experimental work in dynamic
protein binding.
I would like to thank my committee members, Dr. Raja Ghosh, Dr. Marc Aucoin, Dr. Xianshe Feng
and Dr. Maud Gorbet, for their precious time and insightful feedback.
Lastly, I would like to thank my family for their love and support. I am deeply grateful to have my
parents who have supported me emotionally and financially through my PhD years. I am fortunate to
meet my partner, Adam Westbrook, when I just started my PhD and he has made the most significant
influence in my life. His professional achievement inspired me to pursue higher goals, while his endless
love nurtured me to be a better person.

viii
Table of Contents
Chapter 1 Introduction ....................................................................................................... 1 1.1 Research motivation ............................................................................................................ 1 1.2 Research objectives and hypotheses .................................................................................... 3 1.3 Thesis structure .................................................................................................................... 5
Chapter 2 Literature review ................................................................................................ 9 2.1 IgG/mAb structure and characteristics ................................................................................. 9 2.2 IgG/mAb capture ............................................................................................................... 13
2.2.1 Traditional affinity chromatography .................................................................................. 13 2.2.2 Enhanced Affinity chromatography ................................................................................... 15 2.2.3 Non-affinity chromatography............................................................................................. 16
2.3 Ion exchange chromatography ........................................................................................... 18 2.3.1 IEX materials ....................................................................................................................... 18
2.4 IgG/mAb capture with CEX ................................................................................................. 24 2.4.1 Principles and application .................................................................................................. 24 2.4.2 Buffer effect on IgG/mAb binding with CEX ....................................................................... 25
2.5 IgG/mAb unfolding and buffer effects ................................................................................ 28 2.5.1 IgG/mAb unfolding ............................................................................................................. 28 2.5.2 Buffer effect on IgG/mAb unfolding ................................................................................... 29
2.6 Quality by Design principles ............................................................................................... 30 2.6.1 Risk assessment .................................................................................................................. 35 2.6.2 Design of Experiment (DoE) ............................................................................................... 37 2.6.3 High-throughput processing .............................................................................................. 38
Chapter 3 Effect of buffer on the structure of weak CEX membranes ............................... 40 3.1 Introduction ....................................................................................................................... 40 3.2 Materials and methods ...................................................................................................... 41
3.2.1 Buffers ................................................................................................................................ 41 3.2.2 Membranes ........................................................................................................................ 41 3.2.3 Membrane swelling ............................................................................................................ 42 3.2.4 Environmental scanning electron microscopy (ESEM) ....................................................... 42 3.2.5 Statistical analysis ............................................................................................................... 44 3.2.6 Summary of experimental conditions ................................................................................ 44
3.3 Results and discussion ........................................................................................................ 46 3.3.1 Effect of buffer conditions on membrane swelling ............................................................ 46 3.3.2 Effects of buffer conditions on membrane surface pore size ............................................ 48
3.4 Conclusion ......................................................................................................................... 52
Chapter 4 Effect of co-ion and counter-ion on IgG/mAb binding with Natrix C weak CEX membranes ...................................................................................................................... 54
4.1 Introduction ....................................................................................................................... 54 4.2 Materials and methods ...................................................................................................... 55
4.2.1 Buffers and chemicals ........................................................................................................ 55 4.2.2 Proteins .............................................................................................................................. 56

ix
4.2.3 Membranes ......................................................................................................................... 57 4.2.4 Bevacizumab dialysis and Polysorbate 20 quantification ................................................... 57 4.2.5 Milliliter-scale static protein binding with Natrix C weak CEX membranes ....................... 59 4.2.6 High-throughput static protein binding with Natrix C weak CEX membranes with microplates .................................................................................................................................. 59 4.2.7 Protein Quantification ........................................................................................................ 60 4.2.8 Determination of static protein binding capacity ............................................................... 61 4.2.9 Statistical analysis ............................................................................................................... 62 4.2.10 Summary of experimental conditions .............................................................................. 62
4.3 Theory ............................................................................................................................... 63 4.3.1 Protein adsorption model ................................................................................................... 63 4.3.2 Model parameter estimation and parameter sensitivity analysis ...................................... 64
4.4 Results and discussion........................................................................................................ 64 4.4.1 Effect of buffer conditions on static protein binding for lysozyme and IgG ....................... 64 4.4.2 Validation of high-throughput IgG binding with CEX membrane ....................................... 67 4.4.3 Effect of buffer type and sodium content on IgG binding capacity and mechanism ......... 72 4.4.4 Effect of buffer type on Bevacizumab binding capacity ..................................................... 82
4.5 Conclusion ......................................................................................................................... 86
Chapter 5 Developing a high-throughput intrinsic fluorescence microplate method for the detection of IgG/mAb unfolding ...................................................................................... 88
5.1 Introduction ....................................................................................................................... 88 5.2 Materials and methods ...................................................................................................... 92
5.2.1 Buffers ................................................................................................................................. 92 5.2.2 IgG and Bevacizumab .......................................................................................................... 93 5.2.3 IgG and Bevacizumab thermal stress .................................................................................. 93 5.2.4 Intrinsic fluorescence measurement with a spectrofluorometer ...................................... 93 5.2.5 High-throughput intrinsic fluorescence microplate method .............................................. 93 5.2.6 Size-exclusion high performance liquid chromatography (SE-HPLC) ................................. 94 5.2.7 Summary of experimental conditions ................................................................................ 95
5.3 Results and discussion........................................................................................................ 95 5.3.1 Development of intrinsic fluorescence microplate method vs. spectrofluorometer method for thermally stressed IgG ........................................................................................................... 95 5.3.2 Detection of thermally induced Bevacizumab unfolding and aggregation with high-throughput intrinsic fluorescence microplate method and SE-HPLC ........................................ 104
5.4 Conclusion ....................................................................................................................... 112
Chapter 6 Effect of buffer on IgG/mAb unfolding ........................................................... 114 6.1 Introduction ..................................................................................................................... 114 6.2 Materials and methods .................................................................................................... 116
6.2.1 Buffers ............................................................................................................................... 116 6.2.2 Proteins ............................................................................................................................. 116 6.2.3 Membranes ....................................................................................................................... 117 6.2.4 IgG subjected to shaking as mechanical stress ................................................................. 117 6.2.5 High-throughput Bevacizumab static binding .................................................................. 117 6.2.6 High-throughput intrinsic fluorescence microplate measurement .................................. 118

x
6.2.7 Size-exclusion high performance liquid chromatography (SE-HPLC) ............................... 118 6.2.8 Response surface model (RSM) ........................................................................................ 119 6.2.9 SMA model ....................................................................................................................... 119 6.2.10 Summary of experimental conditions ............................................................................ 119
6.3 Results and discussion ...................................................................................................... 121 6.3.1 Effect of buffer on the maximum fluorescence intensity of IgG ...................................... 121 6.3.2 Effect of buffer on Bevacizumab unfolding ...................................................................... 125
6.4 Conclusion ....................................................................................................................... 129
Chapter 7 Developing design space for mAb capture with weak CEX membranes ..... 131 7.1 Introduction ..................................................................................................................... 131 7.2 Materials and methods .................................................................................................... 132
7.2.1 Buffers .............................................................................................................................. 132 7.2.2 Rituximab ......................................................................................................................... 133 7.2.3 Membranes ...................................................................................................................... 133 7.2.4 High-throughput static Rituximab binding and elution with microplate ......................... 133 7.2.5 Dynamic Rituximab binding and elution .......................................................................... 134 7.2.6 High-throughput intrinsic fluorescence measurement .................................................... 135 7.2.7 Response surface model (RSM) ........................................................................................ 135 7.2.8 Summary of experimental conditions .............................................................................. 137
7.3 Results and discussion ...................................................................................................... 138 7.3.1 Risk assessment ................................................................................................................ 138 7.3.2 Characterization range ..................................................................................................... 142 7.3.3 Response surface model development ............................................................................ 148 7.3.4 RSM application in Rituximab binding and elution .......................................................... 159
7.4 Conclusion ....................................................................................................................... 165
Chapter 8 Conclusions and recommendations ................................................................ 166 8.1 Conclusions ...................................................................................................................... 166 8.2 Recommendations ........................................................................................................... 168
8.2.1 Characterization of non-uniform hydrogel membranes .................................................. 168 8.2.2 Characterization of IgG/mAb aggregates with asymmetric flow field-flow fractionation (AF4) .......................................................................................................................................... 169 8.2.3 Design space development with dynamic protein binding and cell culture supernatant 169 8.2.4 Multi-modal chromatography for mAb capture .............................................................. 170
Bibliography ................................................................................................................... 171
Appendices ..................................................................................................................... 183

xi
List of Figures Figure 1 Flowchart of conventional antibody purification process. ....................................................... 2 Figure 2 Illustration of thesis structure for Chapter 3 to Chapter 7. ....................................................... 6
Figure 3 Schematic representation of IgG structure. .............................................................................. 9
Figure 4 Illustration of murine, chimeric and humanized mAbs. The murine sequences are shown in
white and the human sequences are shown in gray. Copyright (2004), with permission from Springer
[48]. ...................................................................................................................................................... 11 Figure 5 Structure of Bevacizumab, consisting of six murine specificity sequences (green dots)
grafted onto a backbone of disulfide linked heavy and light chains containing variable and constant
regions [55]. .......................................................................................................................................... 12
Figure 6 Structure of Rituximab. Reprinted from Critical Reviews in Oncology/Hematology, 37/1, S.
Sacchi et al., Treatment of B-cell non-Hodgkin's lymphoma with anti CD 20 monoclonal antibody
Rituximab, 13-15, Copyright (2001), with permission from Elsevier [62]. ......................................... 13
Figure 7 Molecular structures of antibody-binding domains of Protein-A. Ig-binding domain of
Protein A (yellow) bound to the CH2−CH3 domain interface. Reprinted with permission from N.
Kruljec, T. Bratkovic, Alternative Affinity Ligands for Immunoglobulins, Bioconjug Chem, 28
(2017) 2009-2030. Copyright (2017) American Chemical Society. .................................................... 14 Figure 8 Comparison of mass transport in (a) IEX resin and (b) IEX membrane. ............................... 20 Figure 9 Illustration of the 3-dimensional hydrogel porous structure of Natrix C weak CEX
membrane [101]. .................................................................................................................................. 23 Figure 10 Quality by Design (QbD) roadmap [144]. ........................................................................... 32 Figure 11 Illustration of the swelling experiment. ............................................................................... 42 Figure 12 (A) Original SEM image of Natrix C weak CEX membrane and (B) Pores defined by the
Pore Image Processor over the original SEM image [38]. ................................................................... 44
Figure 13 Swelling factor of Natrix C weak CEX membrane in (A) phosphate citrate buffer and (B)
acetate buffer at various pH and KCl concentration. Error bars represent standard error (n=3). ......... 46
Figure 14 (A) Original ESEM image of Natrix C weak CEX membrane after equilibrating in 150 mM
phosphate citrate buffer with a Na+ concentration of 206 mM and (B) ESEM images processed with
the Pore Image Processor. Images were taken at a magnification of 5000 x. ...................................... 50
Figure 15 (A) Original ESEM image of Natrix C weak CEX membrane after equilibrating in 37.5
mM phosphate citrate buffer with a Na+ concentration of 50 mM and (B) ESEM images processed
with the Pore Image Processor. Images were taken at a magnification of 5000 x. 50
xii
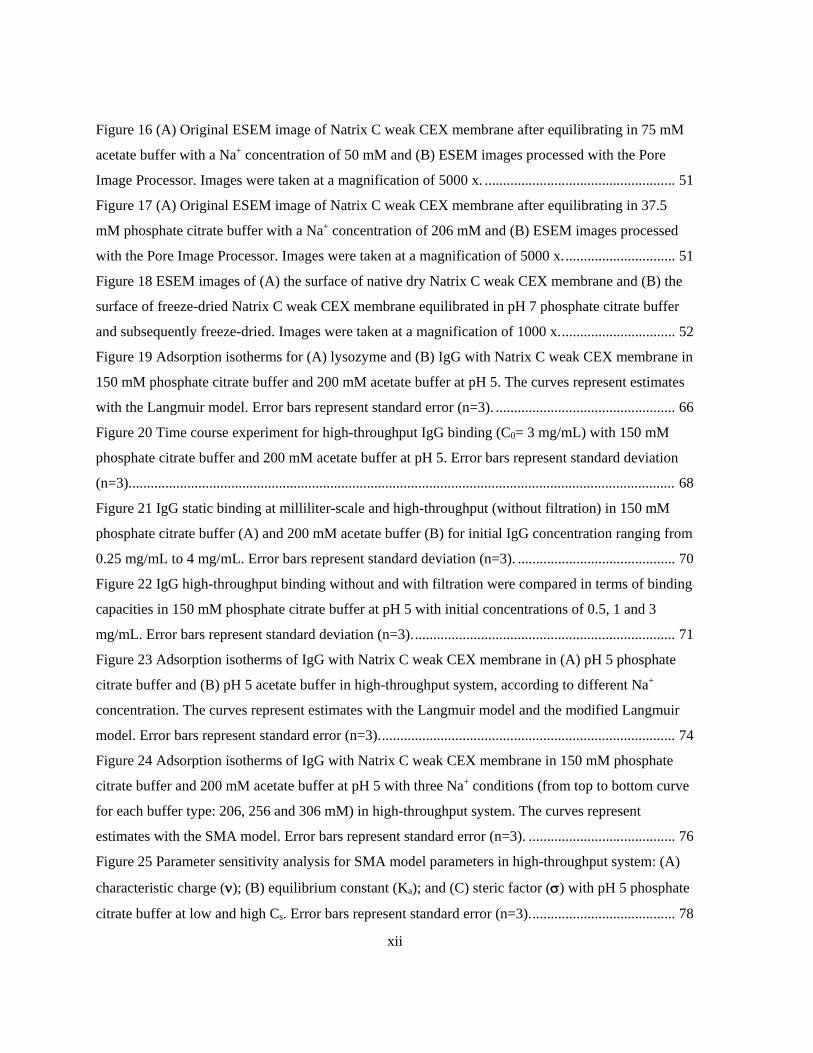
Figure 16 (A) Original ESEM image of Natrix C weak CEX membrane after equilibrating in 75 mM
acetate buffer with a Na+ concentration of 50 mM and (B) ESEM images processed with the Pore
Image Processor. Images were taken at a magnification of 5000 x. .................................................... 51 Figure 17 (A) Original ESEM image of Natrix C weak CEX membrane after equilibrating in 37.5
mM phosphate citrate buffer with a Na+ concentration of 206 mM and (B) ESEM images processed
with the Pore Image Processor. Images were taken at a magnification of 5000 x. .............................. 51
Figure 18 ESEM images of (A) the surface of native dry Natrix C weak CEX membrane and (B) the
surface of freeze-dried Natrix C weak CEX membrane equilibrated in pH 7 phosphate citrate buffer
and subsequently freeze-dried. Images were taken at a magnification of 1000 x. ............................... 52 Figure 19 Adsorption isotherms for (A) lysozyme and (B) IgG with Natrix C weak CEX membrane in
150 mM phosphate citrate buffer and 200 mM acetate buffer at pH 5. The curves represent estimates
with the Langmuir model. Error bars represent standard error (n=3). ................................................. 66
Figure 20 Time course experiment for high-throughput IgG binding (C0= 3 mg/mL) with 150 mM
phosphate citrate buffer and 200 mM acetate buffer at pH 5. Error bars represent standard deviation
(n=3). .................................................................................................................................................... 68
Figure 21 IgG static binding at milliliter-scale and high-throughput (without filtration) in 150 mM
phosphate citrate buffer (A) and 200 mM acetate buffer (B) for initial IgG concentration ranging from
0.25 mg/mL to 4 mg/mL. Error bars represent standard deviation (n=3). ........................................... 70 Figure 22 IgG high-throughput binding without and with filtration were compared in terms of binding
capacities in 150 mM phosphate citrate buffer at pH 5 with initial concentrations of 0.5, 1 and 3
mg/mL. Error bars represent standard deviation (n=3). ....................................................................... 71 Figure 23 Adsorption isotherms of IgG with Natrix C weak CEX membrane in (A) pH 5 phosphate
citrate buffer and (B) pH 5 acetate buffer in high-throughput system, according to different Na+
concentration. The curves represent estimates with the Langmuir model and the modified Langmuir
model. Error bars represent standard error (n=3). ................................................................................ 74
Figure 24 Adsorption isotherms of IgG with Natrix C weak CEX membrane in 150 mM phosphate
citrate buffer and 200 mM acetate buffer at pH 5 with three Na+ conditions (from top to bottom curve
for each buffer type: 206, 256 and 306 mM) in high-throughput system. The curves represent
estimates with the SMA model. Error bars represent standard error (n=3). ........................................ 76
Figure 25 Parameter sensitivity analysis for SMA model parameters in high-throughput system: (A)
characteristic charge (ν); (B) equilibrium constant (Ka); and (C) steric factor (σ) with pH 5 phosphate
citrate buffer at low and high Cs. Error bars represent standard error (n=3). ....................................... 78

xiii
Figure 26 Illustration of the IgG binding mechanism with weak cation exchange membranes in the
context of counter-ion effect. ............................................................................................................... 80
Figure 27 Illustration of the IgG binding mechanism with weak cation exchange membranes in the
context of co-ion effect. ........................................................................................................................ 81
Figure 28 Time course experiment for high-throughput Bevacizumab binding (C0= 0.5 and 3 mg/mL)
with 100 mM phosphate citrate buffer and 200mM acetate buffer, both at pH 5 and Cs 140 mM. Error
bars represent standard deviation (n=3). .............................................................................................. 83
Figure 29 Static binding capacity of Bevacizumab with Natrix C weak CEX membrane in 100 mM
phosphate citrate buffer and 200mM acetate buffer, both at pH 5 and with a Cs of 140 mM, in high-
throughput system. Error bars represent standard deviation (n=3)....................................................... 85
Figure 30 Maximum fluorescence intensity vs. incubation time at 60 °C for 0.5 mg/mL IgG samples
in 10 mM PBS at pH 7. Excitation wavelength at 280 nm and emission wavelength from 300 nm to
450 nm with 1 nm increments. Comparison between Ohadi et al.’s work [189] and results from this
work. Average values of triplicates for results in this work. ................................................................ 97
Figure 31 Maximum fluorescence intensity vs. incubation time for 0.5 mg/mL IgG samples in 10 mM
PBS at pH 7 stressed at 60 °C. Excitation wavelength was 280 nm and emission wavelength was from
300 nm to 450 nm with a step size of 1 nm. The maximum fluorescence intensity for the cuvette
spectrofluorometer is given by the left y-axis and is given by the right y-axis for the microplate
reader. Average values of triplicates. ................................................................................................... 99
Figure 32 Fluorescence emission spectra of 0.5 mg/mL IgG samples in 100 mM phosphate citrate
buffer at pH 5. Samples according to incubation time at 60 °C. The excitation wavelength was 280
nm and the sensitivity was set at 93. Average values of triplicates. ................................................... 102
Figure 33 Fluorescence emission spectra of 0.5 mg/mL Bevacizumab samples in 100 mM phosphate
citrate buffer at pH 5, according to incubation time at 60 °C. The excitation wavelength was 280 nm
and the sensitivity was set at 93. Average values of triplicates. ......................................................... 105
Figure 34 Maximum fluorescence intensity according to incubation time at 60 °C for 0.5 mg/mL IgG
and Bevacizumab samples in 100 mM phosphate citrate buffer at pH 5. Average values of triplicates.
............................................................................................................................................................ 107
Figure 35 SE-HPLC chromatogram of 0.5 mg/mL Bevacizumab samples in 100 mM phosphate
citrate buffer at pH 5, after incubating at 60 °C for 20 min. ............................................................... 109
Figure 36 SE-HPLC chromatogram of 0.5 mg/mL Bevacizumab samples in 100 mM phosphate
citrate buffer at pH 5, with 0 min, 20 min, 40 min and 60 min incubation in 60 °C water bath. ....... 110
xiv
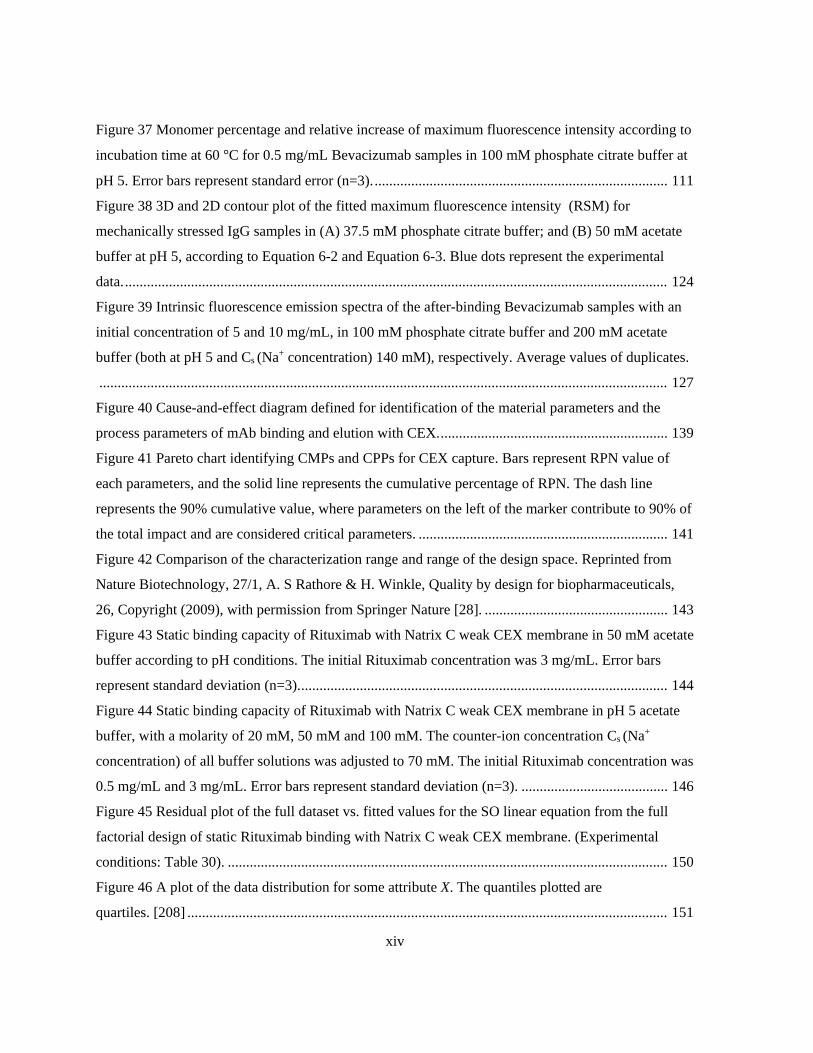
Figure 37 Monomer percentage and relative increase of maximum fluorescence intensity according to
incubation time at 60 °C for 0.5 mg/mL Bevacizumab samples in 100 mM phosphate citrate buffer at
pH 5. Error bars represent standard error (n=3). ................................................................................ 111
Figure 38 3D and 2D contour plot of the fitted maximum fluorescence intensity (RSM) for
mechanically stressed IgG samples in (A) 37.5 mM phosphate citrate buffer; and (B) 50 mM acetate
buffer at pH 5, according to Equation 6-2 and Equation 6-3. Blue dots represent the experimental
data. .................................................................................................................................................... 124 Figure 39 Intrinsic fluorescence emission spectra of the after-binding Bevacizumab samples with an
initial concentration of 5 and 10 mg/mL, in 100 mM phosphate citrate buffer and 200 mM acetate
buffer (both at pH 5 and Cs (Na+ concentration) 140 mM), respectively. Average values of duplicates.
........................................................................................................................................................... 127
Figure 40 Cause-and-effect diagram defined for identification of the material parameters and the
process parameters of mAb binding and elution with CEX. .............................................................. 139 Figure 41 Pareto chart identifying CMPs and CPPs for CEX capture. Bars represent RPN value of
each parameters, and the solid line represents the cumulative percentage of RPN. The dash line
represents the 90% cumulative value, where parameters on the left of the marker contribute to 90% of
the total impact and are considered critical parameters. .................................................................... 141
Figure 42 Comparison of the characterization range and range of the design space. Reprinted from
Nature Biotechnology, 27/1, A. S Rathore & H. Winkle, Quality by design for biopharmaceuticals,
26, Copyright (2009), with permission from Springer Nature [28]. .................................................. 143 Figure 43 Static binding capacity of Rituximab with Natrix C weak CEX membrane in 50 mM acetate
buffer according to pH conditions. The initial Rituximab concentration was 3 mg/mL. Error bars
represent standard deviation (n=3). .................................................................................................... 144
Figure 44 Static binding capacity of Rituximab with Natrix C weak CEX membrane in pH 5 acetate
buffer, with a molarity of 20 mM, 50 mM and 100 mM. The counter-ion concentration Cs (Na+
concentration) of all buffer solutions was adjusted to 70 mM. The initial Rituximab concentration was
0.5 mg/mL and 3 mg/mL. Error bars represent standard deviation (n=3). ........................................ 146 Figure 45 Residual plot of the full dataset vs. fitted values for the SO linear equation from the full
factorial design of static Rituximab binding with Natrix C weak CEX membrane. (Experimental
conditions: Table 30). ........................................................................................................................ 150
Figure 46 A plot of the data distribution for some attribute X. The quantiles plotted are
quartiles. [208] ................................................................................................................................... 151

xv
Figure 47 Normal QQ plot where the quantiles of the residuals of the responses were plotted against
the quantiles from a standard normal distribution for the full dataset for the SO linear equation
developed from the full factorial design experiment of static Rituximab binding with Natrix C weak
CEX membrane. The solid red line represents the reference line and the dotted red line marked the
boundaries. (Experimental conditions: Table 30. Number of Runs = 213). ....................................... 152
Figure 48 Normal QQ plot where the quantiles of the residuals of the responses were plotted against
the quantiles from a standard normal distribution for modified SO linear equation with the smaller
dataset. The solid red line represents the reference line and the dotted red line marked the boundaries.
(Experimental conditions: Table 30. Number of Runs = 192). .......................................................... 154 Figure 49 Contour plot (A) and response surface (B) of static binding capacities of Natrix C weak
CEX membrane with Rituximab at pH 4.8......................................................................................... 156
Figure 50 Contour plot (A) and response surface (B) of static binding capacities of Natrix C weak
CEX membrane with Rituximab at Cs (Na+ concentration) 75 mM. .................................................. 157 Figure 51 Contour plot (A) and response surface (B) of static binding capacities of Natrix C weak
CEX membrane with Rituximab at buffer molarity 50 mM............................................................... 158
Figure 52 Breakthrough curve of Rituximab with Natrix C weak CEX membrane in pH 4.8, acetate
buffer (50 mM) with Cs (Na+ concentration) of 75 mM. Dynamic mode with a flowrate of 1 mL/min.
............................................................................................................................................................ 161 Figure 53 Chromatogram of Rituximab with Natrix C weak CEX membrane, eluted by 20 mM
phosphate citrate buffer at pH 7.2 and pH 7.6. Dynamic mode with a flowrate of 1 mL/min. .......... 163
Figure 54 Chromatogram of Rituximab with Natrix C weak CEX membrane, eluted by 20 mM and
150 mM phosphate citrate buffer at pH 7.2. Dynamic mode with a flowrate of 1 mL/min. .............. 164
Figure 55 Calibration curves of Polysorbate 20 (0.01 mg/mL to 0.08 mg/mL) spiked with Nile Red.
............................................................................................................................................................ 185
Figure 56 Calibration curves of Polysorbate 20 (0.1 mg/mL to 1 mg/mL) spiked with Nile Red. .... 186
Figure 57 Calibration curves of Polysorbate 80 (0.01 mg/mL to 0.08 mg/mL) spiked with Nile Red.
............................................................................................................................................................ 187
Figure 58 Calibration curves of Polysorbate 80 (0.1 mg/mL to 1 mg/mL) spiked with Nile Red. .... 188
Figure 59 Calibration curve for Bevacizumab in 200 mM acetate buffer at pH 5. ............................ 209
Figure 60 Schematic flow diagram of the ÄKTA Avant system. ...................................................... 210
xvi
List of Tables Table 1 Name system for humanized and chimeric mAbs. ................................................................. 10 Table 2 MMC materials for mAb capture [89]. ................................................................................... 17
Table 3 Selected ligands for ion exchange materials. .......................................................................... 18
Table 4 Properties of a selection of commercial IEX membranes. ...................................................... 22
Table 5 Properties of the counter-ions used in the work of Almodovar et al. [108]. ........................... 27
Table 6 Literature review of design space development for mAb downstream processes. ................. 34 Table 7 Example of a five-point Severity scale suggested by Stamatis’s reference book on FMEA
[155]. .................................................................................................................................................... 36
Table 8 Buffer solutions at pH 5 for the Environmental scanning electron microscopy (ESEM)
experiment............................................................................................................................................ 43 Table 9 Buffer conditions and experimental conditions for Chapter 3. ............................................... 45 Table 10 Estimated pore diameter of freeze-dried Natrix C weak CEX membrane according to
equilibration buffer conditions. ............................................................................................................ 48
Table 11 Major ionic species in 150 mM sodium phosphate citrate buffer and 200mM sodium acetate
buffer at pH 5. ...................................................................................................................................... 56
Table 12 Properties of lysozyme, IgG and Bevacizumab. ................................................................... 57 Table 13 Buffer conditions, model proteins and experimental conditions for static protein binding at
pH 5 with Natrix C weak CEX membranes presented in Chapter 4. ................................................... 62
Table 14 Fitted Langmuir model parameters for lysozyme and IgG with Natrix C weak CEX
membrane. ............................................................................................................................................ 65 Table 15 Fitted Langmuir model parameters for IgG binding with Natrix C weak CEX membrane in
150 mM phosphate citrate buffer and 200 mM acetate buffer at pH 5 with same Cs (206 mM). ........ 72
Table 16 Fitted SMA model parameters for IgG and Natrix C weak CEX membrane in 150 mM
phosphate citrate buffer and 0.2M acetate buffer at pH 5 with matching Na+. Confidence interval of
estimated parameters in the bracket. .................................................................................................... 77
Table 17 Published studies for the detection of IgG/mAb unfolding using intrinsic fluorescence
spectroscopy. ........................................................................................................................................ 91
Table 18 Buffer conditions, model proteins and experimental conditions for Chapter 5. ................... 95
Table 19 Maximum fluorescence intensity and maximum emission wavelength of emission spectra of
0.5 mg/mL IgG samples in 10 mM PBS at pH 7 after incubating at 60 °C for 0, 20, 40, and 60
xvii
minutes, measured by the plate reader. The excitation wavelength was 280 nm and the sensitivity was
set at 98. Average values of triplicates. .............................................................................................. 100
Table 20 Maximum fluorescence intensity and maximum emission wavelength of emission spectra of
0.5 mg/mL IgG samples in 100 mM phosphate citrate buffer at pH 5 after incubating at 60 °C for 0,
20, 40, and 60 minutes, measured with microplate reader. The excitation wavelength was 280 nm and
the sensitivity was set at 93. Average values of triplicates. ............................................................... 103
Table 21 Maximum fluorescence intensity and maximum emission wavelength of emission spectra of
0.5 mg/mL Bevacizumab samples in 100 mM phosphate citrate buffer at pH 5 after incubating at 60
°C for 0, 20, 40, and 60 minutes, measured with microplate reader. The excitation wavelength was
280 nm and the sensitivity was set at 93. Average values of triplicates. ............................................ 106
Table 22 Peak characteristics and percentage calculated by Empower 3 software for 0.5 mg/mL
Bevacizumab samples in 100 mM phosphate citrate buffer at pH 5, with 20 min incubation in 60 °C
water bath. The % Area is calculated from the area of a given peak versus the area of all peaks. .... 109 Table 23 DoE for investigating IgG unfolding for 37.5 mM phosphate citrate and 75 mM acetate
buffer, at pH 5. ................................................................................................................................... 117
Table 24 Buffer conditions, model proteins and experimental conditions for Chapter 6. .................. 120 Table 25 Maximum fluorescence intensity of IgG in 37.5 mM phosphate citrate buffer at pH 5 after
mechanical stress, measured with microplate reader. The excitation wavelength was 280 nm and the
sensitivity was set at 80. Average values of triplicates. ..................................................................... 121
Table 26 Maximum fluorescence intensity of IgG in 50 mM acetate buffer at pH 5 after mechanical
stress, measured with microplate reader. The excitation wavelength was 280 nm and the sensitivity
was set at 80. Average values of triplicates. ....................................................................................... 121 Table 27 Fitted SMA model parameters for Bevacizumab and Natrix C weak CEX membrane in 25
mM phosphate citrate buffer and 50 mM acetate buffer at pH 5 with 50mM, 100 mM and 200 mM Cs
(Na+ concentration). ........................................................................................................................... 129 Table 28 Experimental conditions of dynamic Rituximab binding with the ÄKTA system. ............. 134
Table 29 Factors and levels of the buffer conditions for high-throughput static Rituximab binding
DoE (Step 3) ....................................................................................................................................... 136
Table 30 Buffer conditions, model proteins and experimental conditions for Chapter 6. .................. 137
Table 31 Failure Mode and Effects Analysis (FMEA) for mAb capture with CEX. ......................... 139
xviii
Table 32 Maximum fluorescence intensity and maximum emission wavelength of emission spectra of
Rituximab with an initial concentration of 3 mg/mL after binding with 50 mM acetate buffer at pH 4
and 6 and Cs (Na+ concentration) adjusted to 150 mM. Average values of triplicates. ...................... 145 Table 33 Maximum fluorescence intensity and maximum emission wavelength of emission spectra of
Rituximab with an initial concentration of 3 mg/mL after binding with 80 mM, pH 5.5 acetate buffer
with Cs (Na+ concentration) ranging from 75 mM to 225 mM. Average values of triplicates. .......... 148
Table 34 Reference table for preparing 100 mL 150 mM phosphate citrate buffer. .......................... 183
Table 35 Reference table for preparing 100 mL 200 mM acetate buffer. .......................................... 184
Table 36 Reference table for preparing 100 mL 10 mM PBS. .......................................................... 185 Table 37 Fluorescence intensity for each round of filtrate with corresponding Polysorbate 20
concentrations. ................................................................................................................................... 186
Table 38 Fluorescence intensity for each round of filtrate with corresponding Polysorbate 80
concentrations. ................................................................................................................................... 188

xix
List of Abbreviations
Λ Ion exchange capacity
AF4 Asymmetric flow field-flow fractionation
ANOVA Analysis of variance
Arg Arginine
C Carboxyl
CEX Cation exchange chromatography
CLSM Confocal laser scanning microscopy
DEAE Diethylaminoethyl
DSC Differential scanning calorimetry
ESEM Environmental Scanning Electron Microscopy
Fc Fragment-crystallizable
FDA Food and Drug Administration
FEG-ESEM Field Emission Gun Environmental Scanning
Electron Microscopy
FESEM Field Emission Scanning Electron Microscopy
HCP Host cell protein
HIC Hydrophobic interaction chromatography
IEX Ion exchange chromatography
IgG Immunoglobulin G (polyclonal if not specified)
IVIG Intravenous immunoglobulin
mAb Monoclonal antibody
MMC Multi-modal chromatography
MWCO Molecular weight cutoff

xx
PBS Phosphate buffered saline
PES Polyethersulfone
pI Isoelectric point
PP Polypropylene
PVDF Polyvinylidene fluoride
Q Quaternary ammonium
QbD Quality by design
R2 Coefficient of determination
R2adj Adjusted coefficient of determination
RC Regenerated Cellulose
RPN Risk priority number
RSM Response surface model
S Sulpho
SEC Size exclusion chromatography
SE-HPLC Size-exclusion high performance liquid
chromatography
SMA Steric mass-action model
TBAH Tetra-n-butylammonium

xxi
List of Parameters
C0 (Static binding; mg/mL) Initial protein concentration
Ce (Langmuir; mg/mL) Equilibrium protein concentration (used in the
Langmuir model)
Ce (SMA; mM) Equilibrium protein concentration (used in the
SMA model)
Cp (dynamic binding; mg/mL) Feed protein concentration
Cs (mM) Counter-ion (cation) concentration
DBC Dynamic binding capacity
DBC10% Dynamic binding capacity at 10% breakthrough
K (Langmuir; mL/mg) Equilibrium constant
Ka (SMA) Equilibrium constant
Ka 0(SMA) Value of the estimated equilibrium constant for
IgG binding with Natrix C weak CEX membrane
in phosphate citrate buffer
qmax (mg/mL) Maximum binding capacity
t (hr) Time
Vmembrane (mL) Total volume of membrane
Vpermeate (mL) Total volume of permeate
Vsolution (mL) Total volume of binding buffer
ν Characteristic charge
ν0 Estimated characteristic charge for IgG binding
with Natrix C weak CEX membrane in phosphate
citrate buffer
σ Steric factor

xxii
σ0 Estimated steric factor for IgG binding with
Natrix C weak CEX membrane in phosphate
citrate buffer

1
Chapter 1 Introduction
1.1 Research motivation
Monoclonal antibodies (mAbs) are antibodies produced by clones of a unique B cell that target one
specific epitope for one antigen [2], which enable effective applications in cancer treatment,
autoimmune disease treatment and Alzheimer's disease treatment. After the approval of the first
therapeutic chimeric and humanized mAb in the late 1990s, there has been a constant increase in
demand for mAb products, with a growing market estimated to be 70 mAb products associated with
sales of £125 billion by 2020 [3]. Recent advances in cell culture technology have prompted cell lines
with high-growth characteristics and led to high antibody titers up to 10 g/L [4, 5]. The improved
productivity of mammalian cell culture processes has shifted the bottleneck of antibody production to
the downstream section where downstream processes are estimated to take up to 50% ~ 80% of total
manufacturing costs in 2011 [6].
The production of IgG/mAbs commonly takes place in mammalian cells, especially CHO cells [7].
After harvesting the cells, cell debris is removed by centrifugation or precipitation and cell culture
supernatant is collected for the following downstream process. A conventional downstream process
(Figure 1) starts with a capture step and several polishing steps to remove product contaminate, i.e. host
cell proteins (HCPs), DNA, viruses, and high molecular weight aggregates [8]. Most of the capture step
for commercial mAbs is realized with Protein-A affinity chromatography. The products recovered from
Protein-A resins then go through several polishing steps including anion exchange chromatography
(AEX), cation exchange chromatography (CEX), and hydrophobic interaction chromatography (HIC)
to further remove HCP, DNA and aggregates. After a viral clearance step, the formulation step uses
ultrafiltration/diafiltration (UF/DF) buffer exchange and product concentrating.
2
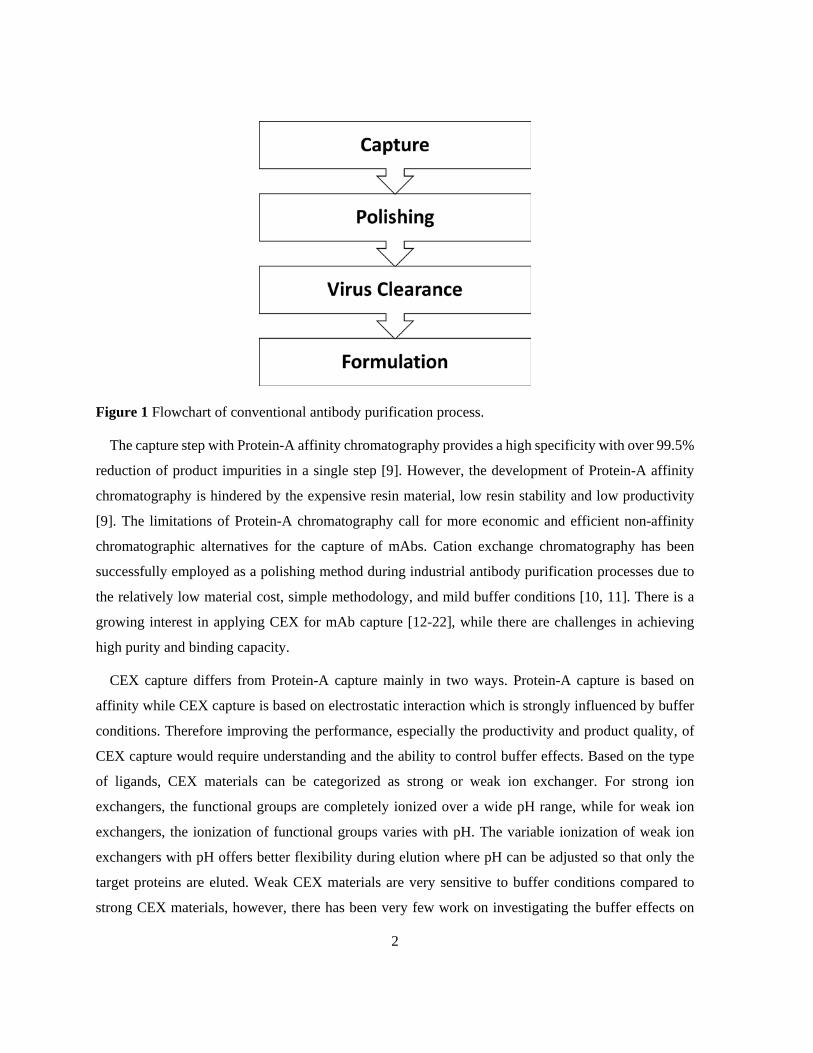
Figure 1 Flowchart of conventional antibody purification process.
The capture step with Protein-A affinity chromatography provides a high specificity with over 99.5%
reduction of product impurities in a single step [9]. However, the development of Protein-A affinity
chromatography is hindered by the expensive resin material, low resin stability and low productivity
[9]. The limitations of Protein-A chromatography call for more economic and efficient non-affinity
chromatographic alternatives for the capture of mAbs. Cation exchange chromatography has been
successfully employed as a polishing method during industrial antibody purification processes due to
the relatively low material cost, simple methodology, and mild buffer conditions [10, 11]. There is a
growing interest in applying CEX for mAb capture [12-22], while there are challenges in achieving
high purity and binding capacity.
CEX capture differs from Protein-A capture mainly in two ways. Protein-A capture is based on
affinity while CEX capture is based on electrostatic interaction which is strongly influenced by buffer
conditions. Therefore improving the performance, especially the productivity and product quality, of
CEX capture would require understanding and the ability to control buffer effects. Based on the type
of ligands, CEX materials can be categorized as strong or weak ion exchanger. For strong ion
exchangers, the functional groups are completely ionized over a wide pH range, while for weak ion
exchangers, the ionization of functional groups varies with pH. The variable ionization of weak ion
exchangers with pH offers better flexibility during elution where pH can be adjusted so that only the
target proteins are eluted. Weak CEX materials are very sensitive to buffer conditions compared to
strong CEX materials, however, there has been very few work on investigating the buffer effects on

3
mAb capture with weak CEX materials. Protein-A ligands binds to the constant regions of mAbs [23]
while several research groups have suggested that CEX ligands bind to the variable regions of mAbs
that vary among different types of mAbs [24-26]. Differences in binding regions indicated process
development for CEX capture requires more detailed mAb-specific information compared to Protein-
A capture, thus process development for CEX capture can be time-consuming. Therefore it is critical
to establish a framework for high-throughput design space development for CEX capture. According
to Quality by Design (QbD) principles [27], design space development is essential for process
improvement by quantifying the effect of material and process parameters on the performance of the
process [28, 29]. There have been several studies on design space development for mAb polishing with
IEX resins [11, 30-32], while no work has been done on design space development for mAb capture
with CEX materials. Design space development for mAb capture requires different parameters and
goals from that for mAb polishing.
In addition to the challenges listed above, the current CEX capture process is plagued by its reliance
on column chromatography, where mass transport is dominated by pore diffusion and lowers the
column efficiency. Membrane chromatography has risen as a promising alternative for column
chromatography in CEX capture [33, 34]. The mass transport with CEX membrane is dominated by the
convective transport of proteins, which allows for higher productivity and lower operational cost [35-
37]. However for membranes with non-uniform pore size distribution and uneven thickness, the inlet
flow distribution may be distorted and lead to low utilization of binding sites on the membrane [36].Yet
there has been very few work on mAb capture with CEX membranes [22, 38].
1.2 Research objectives and hypotheses
The main objective of this PhD work was to investigate the effect of buffer co-ions on IgG/mAb binding
with weak CEX membranes. The model proteins include IgG for its cheap cost and availability in large
quantity, as well as a humanized mAb, Bevacizumab and a chimeric mAb, Rituximab. The weak CEX
membrane employed is Natrix C weak CEX membrane, as it contains a high density of carboxylic acid
binding groups and possesses a high binding capacity at optimized buffer conditions. The selected
buffer solutions are two commonly used buffer type in CEX, phosphate citrate buffer and acetate buffer,
that possess distinct ion characteristics.

4
Four specific objectives were pursued to build knowledge and develop tools for achieving the main
objective. The first specific objective was to investigate the effect of pH, counter-ions and co-ions on
the swelling behavior and pore structure of Natrix C weak CEX membranes. The pore structure
visualization of the membrane was achieved with ESEM. The hypothesis and experimental approach
for this section are listed below.
Hypothesis: buffer pH, counter-ions and co-ions affect membrane properties, namely the membrane
swelling behavior and its surface morphology of weak CEX membranes
Experimental approach: membrane swelling experiment and Environmental Scanning Electron
Microscopy (ESEM) analysis for Natrix C weak CEX membranes treated with two buffers with various
pH, counter-ions and co-ions.
The second specific objective was to examine the effect of buffer conditions, with an emphasis on
co-ion type, on IgG/mAb binding with Natrix C weak CEX membranes, using two adsorption models.
Proteins investigated were lysozyme, IgG and a humanized mAb, Bevacizumab. The hypothesis and
experimental approach for this section are listed below.
Hypothesis: Buffer co-ions affect the binding capacity of IgG/mAb with weak CEX membranes
Experimental approach: Static binding of lysozyme, IgG and Bevacizumab with the Natrix C weak
CEX membrane in phosphate citrate buffer and acetate buffer. The binding results were analyzed with
the Langmuir and SMA adsorption models.
The third specific objective was to investigate the buffer effects on IgG/ mAb structure, especially
the effect of counter-ion concentration (Na+ concentration) and co-ion type (valence and chemistry),
with a microplate intrinsic fluorescence method. Proteins of interest were mechanically stressed IgG
and Bevacizumab after binding with Natrix C weak CEX membranes. The hypothesis and experimental
approach for this section are listed below.
Hypothesis: Buffer counter-ion concentration and co-ion type affect the structure of IgG/mAb.
Experimental approach: IgG and Bevacizumab were mechanically stressed in phosphate citrate
buffer and acetate buffer. The structure of the mechanically stressed IgG/mAb samples was observed
with intrinsic fluorescence microplate method and analyzed with a response surface model and SMA
adsorption model.
5
The fourth objective was to establish a framework for design space development for mAb capture
with weak CEX membranes employing the experimental observations and tools developed in this work.
Experimental approach: Rituximab, a chimeric mAb, was selected for binding and elution in static
and dynamic conditions with Natrix C weak CEX membranes. The structure of Rituximab was analyzed
with the intrinsic fluorescence microplate method. A response surface model (RSM) model with four
critical process parameters at three levels (identified from risk assessment) was constructed to describe
the relationships of the parameters and Rituximab binding capacity.
1.3 Thesis structure
This thesis consists of the literature review (Chapter 2), results and discussion (Chapter 3 to7), and
conclusions and recommendations (Chapter 8) (Figure 2). Chapter 3 to Chapter 7 address one of the
specific objectives formulated in the previous section.

6
Figure 2 Illustration of thesis structure for Chapter 3 to Chapter 7.

7
Chapter 2
This chapter summarizes the scientific literature and fundamental principles relevant to the
development of this thesis: (1) IgG and mAb structure and characteristics; (2) IgG and mAb capture;
(3) Ion exchange chromatography; (4) IgG and mAb capture with cation exchange chromatography;
(5) IgG/mAb unfolding and buffer effects; (6) Quality by Design principles.
Chapter 3
This chapter investigates the effect of pH, counter-ions and co-ions on membrane swelling behavior
and membrane surface pore structure of Natrix C weak CEX membrane. The pore structure
visualization of the membrane was achieved with ESEM.
Chapter 4
This chapter investigates buffer effects on static IgG and Bevacizumab binding with a weak CEX
membrane, Natrix C weak CEX membrane, where the effect of co-ion types is studied with phosphate
citrate buffer and acetate buffer. The Langmuir model and SMA model were employed to gain a better
understanding of buffer effects at a molecular level, and knowledge gained from which contributes to
risk assessment and analysis of productivity in Chapter 7.
Chapter 5
A high-throughput intrinsic fluorescence method using microplates for the detection of IgG/ mAb
unfolding is developed in this chapter through examining emission spectra collected from thermally
stressed IgG in PBS buffer and phosphate citrate buffer with spectrofluorometers and plate readers, as
well as emission spectra of thermally stressed Bevacizumab in phosphate citrate buffer and monomer
analysis with SE-HPLC.
Chapter 6
The high-throughput method developed in Chapter 5 was applied to probe the buffer effects on
IgG/mAb unfolding in this chapter, especially the effect of counter-ion concentration (Cs) and co-ion
type, results from which shed light to buffer selection for maintaining product quality during design
space development in Chapter 7.

8
Chapter 7
This chapter presents the framework for high-throughput design space development for mAb capture
with CEX membranes, where parameter effects on productivity and product quality are monitored by
binding capacity and protein unfolding. Design space is developed for Rituximab capture with Natrix
C weak CEX membrane in four steps: (1) identify key parameters with risk assessment; (2) study the
characterization range; (3) establish design space with a RSM; (4) test optimal buffer conditions in
static binding mode and dynamic binding mode.
Chapter 8
This chapter provides a summary of the results achieved from this thesis and recommendations for
future work.

9
Chapter 2 Literature review
2.1 IgG/mAb structure and characteristics
Human immunoglobulins are glycoproteins produced by plasma cells functioning as antibodies. Their
general functions are antigen binding and effector binding. Immunoglobulins are divided into five
classes, IgA, IgD, IgE, IgM, and IgG. Type G immunoglobulin (IgG) is the most abundant antibody,
about 13.5 g/L in terms of serum concentration.
IgGs are “Y” shaped tetramers with two heavy chains (H) of type γ and two light chains (L) of type
κ or λ (Figure 3). IgGs can be cleaved into two Fab fragments and one Fc fragment by the proteinase
papain, with the Fab fragment being the antigen-binding part while the Fc fragment binds to cell surfaces
for interaction. IgG consists of variable regions (V) and constant regions (C), as shown in Figure 3. The
Fc fragment consists of two constant regions, CH2 and CH3 for each heavy chain. The oligosaccharides
are linked to the amide group of an asparagine residue in the Fc fragment through a N-glycosidic link.
Disulfide bonds stabilize IgGs by linking the two heavy chains together and linking the heavy chains
to the light chains, and also exist within the domains to stabilize the tertiary structure. IgGs are greatly
mobile in the hinge region. The molecular weight of an IgG is approximately 150 kDa [39].
Figure 3 Schematic representation of IgG structure.

10
Depending on the differences in function and structure, antibodies can be divided into polyclonal
antibodies and monoclonal antibodies. The difference between polyclonal antibodies and monoclonal
antibodies is that polyclonal antibodies are produced by different B cells and can bind to different
epitopes of one antigen, which means polyclonal antibodies contain antibodies with various variable
regions. While monoclonal antibodies are clones of one unique B cell and bind with only one specific
epitope for one antigen [2], they contain only one type of variable region.
Polyclonal human IgG is the main component of intravenous immunoglobulin (IVIG) which is a
blood product for treating patients with antibody deficiencies and was licensed in the USA in 1981 [40,
41]. The isoelectric point (pI) of polyclonal human IgG ranges from 6.5 to 10 [42]. When pH is below
the pI value of a protein, the surface basic residues will be ionized thus the protein molecule is positively
charged.
mAbs only target one specific epitope for one antigen [2] therefore enable their effective applications
in cancer treatment, autoimmune disease treatment and Alzheimer's disease treatment [43]. To date
there are over 80 FDA approved mAb drugs [44-46], and are named according to the sub-stems
developed by the International Nonproprietary Names (INN) system in 1997 [47] (Table 1). mAbs can
be categorized based on their origin. Humanized mAb and chimeric mAb are the two categories of
interest in this work.
Table 1 Name system for humanized and chimeric mAbs.
Antibody Origin INN Sub-stem Examples
Humanized -zu- Bevacizumab,Palivizumab,
Trastuzumab, Natalizumab
Chimeric -xi- Rituximab,Cetuximab,
Abciximab, Infliximab
According to the 2014 WHO’s definition of humanized mAb, it is “one for which both chain types
are humanized as a result of antibody engineering. A humanized chain is typically a chain in which the
complementarity determining regions (CDR) of the variable domains are foreign (originating from one
species other than human, or synthetic) whereas the remainder of the chain is of human origin” [47].
The 2014 WHO’s definition of chimeric mAb is “one of which both chain types are chimeric as a result
11
of antibody engineering. A chimeric chain is a chain that contains a foreign variable domain (originating
from one species other than human, or synthetic) linked to a constant region of human origin” [47]. The
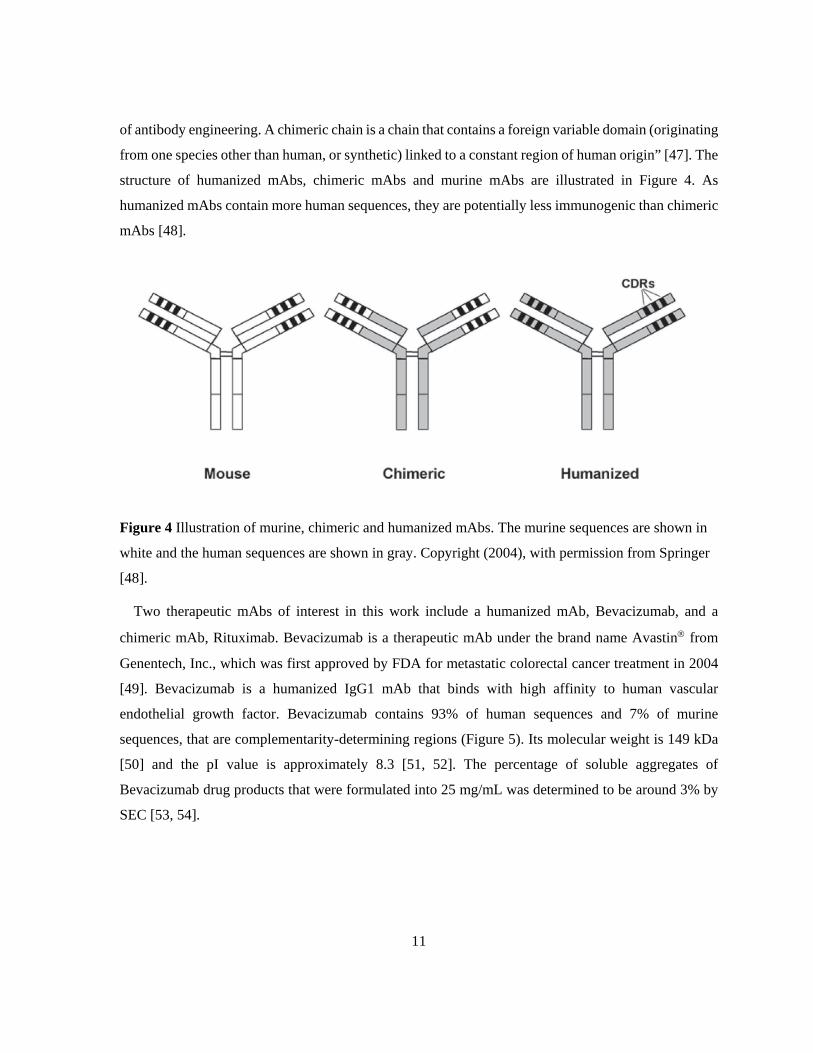
structure of humanized mAbs, chimeric mAbs and murine mAbs are illustrated in Figure 4. As
humanized mAbs contain more human sequences, they are potentially less immunogenic than chimeric
mAbs [48].
Figure 4 Illustration of murine, chimeric and humanized mAbs. The murine sequences are shown in
white and the human sequences are shown in gray. Copyright (2004), with permission from Springer
[48].
Two therapeutic mAbs of interest in this work include a humanized mAb, Bevacizumab, and a
chimeric mAb, Rituximab. Bevacizumab is a therapeutic mAb under the brand name Avastin from
Genentech, Inc., which was first approved by FDA for metastatic colorectal cancer treatment in 2004
[49]. Bevacizumab is a humanized IgG1 mAb that binds with high affinity to human vascular
endothelial growth factor. Bevacizumab contains 93% of human sequences and 7% of murine
sequences, that are complementarity-determining regions (Figure 5). Its molecular weight is 149 kDa
[50] and the pI value is approximately 8.3 [51, 52]. The percentage of soluble aggregates of
Bevacizumab drug products that were formulated into 25 mg/mL was determined to be around 3% by
SEC [53, 54].

12
Figure 5 Structure of Bevacizumab, consisting of six murine specificity sequences (green dots)
grafted onto a backbone of disulfide linked heavy and light chains containing variable and constant
regions [55].
Rituximab is a therapeutic mAb under the brand name Rituxan from Genentech, Inc., which was
first approved by FDA for rheumatoid arthritis treatment in 2006 [56]. Rituximab is a chimeric
murine/human mAb directed against the CD20 antigen found on the surface of normal and malignant
B lymphocytes [57-59]. It is an IgG1 κ immunoglobulin containing murine light- and heavy-chain
variable region sequences and human constant region sequences [60] (Figure 6). The molecular weight
of Rituximab is approximately 144 kDa [61] and the isoelectric point is 8.68 [60]. The percentage of
soluble aggregates of Rituximab drug products that were formulated into 10 mg/mL was determined to
be around 1% by SEC [53].

13
Figure 6 Structure of Rituximab. Reprinted from Critical Reviews in Oncology/Hematology, 37/1, S.
Sacchi et al., Treatment of B-cell non-Hodgkin's lymphoma with anti CD 20 monoclonal antibody
Rituximab, 13-15, Copyright (2001), with permission from Elsevier [62].
2.2 IgG/mAb capture
2.2.1 Traditional affinity chromatography
The capture step is usually accomplished with Protein-A affinity chromatography. Affinity
chromatography separates proteins on the basis of reversible noncovalent interactions between the
target protein and immunoglobulin-binding ligands immobilized on chromatography resins. Protein-A
is a natural immunoglobulin-binding protein derived from a strain of Staphylococcus aureus, and was
the first identified immunoglobulin-binding protein. The intact native Protein-A molecule is anchored
to the cell wall of Staphylococcus aureus and consists of three regions (1) the signal sequence that is
cleaved off during secretion; (2) five highly homologous Ig-binding domains (designated E, D, A, B,
and C) and (3) the C-terminal cell wall binding domain (designated X). Domain X is usually engineered
to be deleted for Protein-As for IgG/mAb capture purpose. After the truncation, the molecular weight
of Protein-A is reduced to 42 kDa [63]. Each of the Ig-binding domains can bind to the Fc part of
human IgG1, IgG2, and IgG4 [64] and crystallographic studies indicated that it binds at the junction
between the CH2 and CH3 domains of the Fc region of IgG [65] (Figure 7). The biospecific binding of
Ig-binding domains results in a high specificity with over 99.5% reduction of product impurities in a
single step [9, 24]. The unbound impurities from the mixture are washed off, and target proteins are
eluted later by lowering pH or increasing ionic strength.

14
Figure 7 Molecular structures of antibody-binding domains of Protein-A. Ig-binding domain of
Protein A (yellow) bound to the CH2−CH3 domain interface. Reprinted with permission from N.
Kruljec, T. Bratkovic, Alternative Affinity Ligands for Immunoglobulins, Bioconjug Chem, 28
(2017) 2009-2030. Copyright (2017) American Chemical Society.
The development of Protein-A affinity chromatography is hindered by the expensive resin material,
low resin stability and low productivity. The cost of Protein-A resins per liter (US$9,000–14,000) was
almost 5 times more expensive than ion exchange resins (US$2,000–3,000) in 2014 [18, 66]. While the
patent expiry of Protein-A in recent years has prompted new Protein-A vendors offering new Protein-
A resins at US$6,000–7,000, the price is still not as competitive as that of ion exchange resins [67].
Protein-A ligands may suffer from denature from the harsh sanitization solution of sodium hydroxide
and may leach from the resin matrix. Ligand leaching contaminates the product and have to be removed
from the final product as they may cause immunogenic responses in human body [68]. The product
quality can also be compromised by the elution conditions of Protein-A chromatography, where the
typical elution pH is between 3 and 4. Antibodies subject to such a low pH may go through
conformational changes and form aggregates [23]. Traditional Protein-A resins generally have a
dynamic binding capacity (DBC) less than 40 g/L which limits the productivity of the process [21].

15
Considering the limitations of Protein-A affinity chromatography, there are mainly two ways to
improve the IgG/mAb capture step. One is to enhance the stability and capacity of affinity
chromatography, the other is to explore more economic, reliable and efficient non-affinity
chromatographic alternatives.
2.2.2 Enhanced Affinity chromatography
The limitations of natural immunoglobulin-binding proteins, such as Protein-A, prompted development
of enhanced affinity ligands with increased thermal stability or milder elution conditions. Natural
immunoglobulin-binding proteins are generally sensitive to extreme pH conditions, while low pH is
required for elution during the capture step and high pH is required for the removal of contaminants
from chromatographic columns [69]. Therefore new affinity ligands have been engineered based on the
structures of the natural counterparts, with some engineered ligands outperforming the natural
counterparts in terms of chemical stability or binding specificity.
Nilsson et al. [70] engineered a Protein-A variant by mutating two amino acids in the B domain (one
of the Ig-binding domain listed above) that are key to protein stability, and renamed it as the Z domain.
The engineered variant can not only endure protease degradation but also has greater alkaline stability,
which enables harsh elution or cleaning conditions. Linhult et al. [71] also worked on mutagenesis
studies of Z domain and designed Protein-A variants with increased tolerance to alkaline conditions.
Other groups [72-74] worked on designing ligands that enable milder elution conditions during protein
capture. Pabst et al. [72] engineered a single-mutation Protein-A ligand ( Z(H18S)4) and a double-
mutation Protein-A ligand (Z(H18S, N28A)4) that supported elution pH at 0.5 unit higher than usual
pH, and achieved comparable dynamic binding capacity and selectivity.
However, the application of engineered affinity ligands in protein capture is plagued by its high
production costs and unstable structure, which prompted the development of affinity ligands based on
alternative scaffolds that are smaller and simpler than immunoglobulins. One of the commonly used
alternative scaffolds is the Z domain [75]. A short peptide ligand is another affordable alternative with
relatively high stability and moderate affinity to proteins, which enables mild elution conditions [76-
78]. Moreover, there have also been attempts on synthetizing small functional mimetics of natural Ig-
binding proteins [79].

16
2.2.3 Non-affinity chromatography
The limitations of Protein-A chromatography may also be addressed by non-affinity chromatographic
alternatives, where ion exchange chromatography (IEX) and multi-modal chromatography (MMC)
have gained a lot of interest. The potential of IEX in mAb capture will be discussed in detail in the next
section (2.3).
MMC is a chromatographic method combining multiple types of interaction between the stationary
phase and the mobile phase, where multimodal ligands comprising ion exchange, hydrogen bonding
and hydrophobic interaction groups are commonly used [80]. The complex composition of multimodal
ligands enables great flexibility in designing MMC material with high selectivity for protein capture.
One family of multimodal ligands is the hydrocarbyl amine family, which consists of the hexyl amine
(HEA HyperCel™), the propyl amine (PPA HyperCel™) and the 2-aminomethylpyridine sorbents that
offer electrostatic and hydrophobic interactions [81, 82]. Protein binding with this type of ligands
happens at physiological conditions through a combination of electrostatic interactions and
hydrophobic interactions, while elution happens when the electrostatic interactions are disturbed [83].
The other family of multimodal ligands is the Capto™ family, where the N-benzyl-N-methyl
ethanolamine (Capto™ adhere) and the 2-benzamido-4-mercaptobutanoic acid (Capto™ MMC) are
most studied. These ligands were developed based on the finding that introducing hydrogen bonding
groups near the charged groups led to high breakthrough capacities at high salt concentrations [84].
Commercial MMC materials have gained great attention for their potential in mAb capture (Table
2), with MEP Hypercel™ sorbent being the most extensively studied. MEP Hypercel™ offers similar
binding capacities as Protein-A materials at only 25% of the cost and with better stability [85].
However, protein elution with MEP Hypercel™ requires a low pH condition at around 4. HEA
Hypercel™ and PPA Hypercel™ offer milder elution conditions for similar binding capacity [86].
Capto™ MMC is a weak cation exchanger with a phenyl group as hydrophobic moiety, an amide group
for hydrogen bonding, and a thioether group for thiophilic interaction, which has been patented for
mAb capture in 2011 and 2012 [87]. Joucla et al. [88] compared the performance of mAb capture
between Capto™ MMC and a strong cation exchanger, Capto™ S at optimal binding and elution
conditions. When increasing the buffer conductivity, no significant change in mAb retention was
observed with Capto™ MMC while the retention was reduced for Capto™ S [88].

17
Table 2 MMC materials for mAb capture [89].
Product name
Ligand name Ligand pKa
Ligand structure
MEP Hypercel™
4-mercaptoethylpyridine
4.85
HEA Hypercel™
Hexylamine 10
PPA Hypercel™
Phenylpropylamine 6~7
MBI HyperCel™
2-mercapto-5-benzimidazole sulfonic acid
-
Capto™ MMC
2-benzamido-4-mercaptobutanoic acid
3.3

18
2.3 Ion exchange chromatography
2.3.1 IEX materials
IEX materials bind with proteins according to their distinct charge characteristics. This technique works
on the basis of the reversible electrostatic interactions between the charged functional groups on the
stationary phase and the protein molecules in the mobile phase with opposite charges [90]. Depending
on the format of the stationary phase, IEX materials exist as IEX resin and IEX membrane. For both
IEX resin and IEX membrane, their functionality comes from their ligands. Based on the type of ligands
and the ionizing strength, IEX materials can be categorized as either a strong or weak ion exchanger.
For a strong ion exchanger, the functional groups are completely ionized over a wide pH range, holding
a high ion exchange capacity. Common strong ion exchange ligands (Table 3) are sulfo (S) group for
strong cation exchanger and quaternary ammonium (Q) group for strong anion exchanger. For weak
ion exchangers, the ionization of functional groups varies with pH, offering better flexibility. Common
weak ion exchange ligands are carboxyl (C) group and for weak cation exchanger and
diethylaminoethyl (DEAE) group for weak anion exchanger. The ligand type and density are critical to
the performance of both IEX resin and membrane.
Table 3 Selected ligands for ion exchange materials.
Ligand type Ligand name Class Ligand structure
Cation exchanger Sulpho (S) Strong -SO3
Sulfopropyl (SP) Strong -CH2CH2CH2SO3
Carboxymethyl (CM) Weak -CH2COO-
Anion exchanger Quaternary
ammonium (Q)
Strong -N+(CH3)3
Quaternary
aminoethyl (QAE)
Strong -N+(C2H5)2CH2CHOHCH3
Diethylaminoethyl
(DEAE)
Weak -CH2CH2N+ (C2H5)2
Dimethylaminoethyl
(DMAE)
Weak -CH2CH2N+ (CH3)2

19
2.3.1.1 IEX resin
IEX resins are the most commonly used IEX materials for protein purification, where porous resin
beads are loaded in a glass or steel column. Other properties of the ligand, including the matrix material,
particle size, pore size and porosity are crucial to the performance of IEX resin in protein purification.
An inert matrix material with high physical stability and chemical stability eliminates non-specific
interactions and ensures reproducibility of the process. The matrix of IEX resin is usually based on
inorganic materials, synthetic resins or polysaccharides. The mean particle size of commercial IEX
resins lies between 3 μm (MiniBeadsTM) to 200 μm (Sepharose Big Beads) [91]. The pore size of
functionalized, hydrated IEX resins is approximately 1 to 2 nm, while macroporous resins have
macropores with a size of about 20 to 100 nm [92]. Hart et al. [93] suggested that an intermediate
apparent pore size is optimal for resin capacity for a mAb, with 17% increase of maximum dynamic
binding capacity compared to resins with small pores or large pores. High porosity of IEX resins
provides a large surface area, which usually lead to higher binding capacity.
The use of IEX resins for protein purification suffers from a few problems. The mass transport in
IEX resins is dominated by pore diffusion which prolongs the processing time and lowers the separation
efficiency. The high pressure drop across the column limits the flow rate and can also result in resin
deformation [94]. Channeling may occur with cracked resin beads and lead to poor bed utilization [95].
2.3.1.2 IEX membrane
The recent development of IEX membranes has prompted membrane chromatography to be a promising
alternative to column chromatography in protein purification [33, 34, 37, 96]. For IEX membranes, the
pore size is significantly larger than that of IEX resins, thus the mass transport of protein molecules to
ligands on the IEX membrane is dominated by bulk convection (Figure 8). With minimized pore
diffusion, higher flow rates improve productivity. Considerable buffer consumption may also be
reduced with shortened overall process time [35]. Compared to resins, IEX membranes also stand out
for the operational and economic advantages. The flow-independent property enables the system to be
easily scaled up. The lower pressure drop reduces expenses on pressure-resistant equipment. In
addition, cheap IEX membranes are disposable, which eliminate the expenses on cleaning, regeneration
and sanitization [36].

20
Figure 8 Comparison of mass transport in (a) IEX resin and (b) IEX membrane.
Despite the advantages of IEX membranes over resins, there remain several limitations to be
addressed. For membranes with non-uniform pore size distribution and uneven thickness, the inlet flow
distribution may be distorted since the feed flow will preferably go through larger pores or thinner
areas. This leads to low utilization of binding sites on the membrane [36]. The conventional membrane
modules with inlet and outlet at the center are problematic due to the high radial to axial aspect ratios.
The large variability in flow path lengths and solute residence time distribution within the membrane
will lead to broad elution peaks and early breakthrough of bound solutes. Madadkar et al. [97] proposed
implementing a flow directing layer (FDL) within the membrane module and observed improved
separation efficiency for the FDL module housing strong cation exchange membranes. Most IEX
membranes have lower surface-to-bed volume ratio than IEX resins, which will result in lower binding
capacity, therefore limiting its applications in the bind/elute mode where protein of interest is bound
onto the membrane and impurities are eluted. In order to improve the binding capacity of IEX
membranes, considerable work has been done on coating pores with porous polymer to create a three-
dimensional structure thus increasing the binding surface [95].

21
Similar to IEX resins, the performance of IEX membranes in protein purification is largely dependent
on the membrane properties, including matrix material, pore size and pore size distribution. Table 4
lists a selection of commercial IEX membranes with their properties. The most extensively used matrix
material for IEX membrane is regenerated cellulose (RC) for its low cost, while the short lifetime
remains a problem. Compared to natural polymers, synthetic organic polymer supports have better
chemical and physical stability that will increase their reusability. A variety of synthetic polymer
materials are used for commercial IEX membranes, e.g. polyethersulfone (PES), polypropylene (PP),
and polyvinylidene fluoride (PVDF). Some inorganic materials, e.g. alumina, glass fiber, and carbon
nanofiber have also been investigated for their high uniformity [98].

22
Table 4 Properties of a selection of commercial IEX membranes.
Ligand type
Product Matrix material
Pore size Binding capacity
Manufacturer
AEX ChromasorbTM PP n/a ≥50 mg/ml (BSA)
EMD Millipore
Natrix Q Hydrogel 0.45μm >200mg/ml (BSA)
Natrix Separations
(now part of Merck KGaA)
Mustang Q Modified PES
0.8μm 10mg/Acrodisc Unit (negatively charged proteins)
Pall Corporation
Mustang E Modified PES
0.2μm n/a Pall Corporation
Sartobind Q RC > 3μm > 29mg/ml (Albumine)
Sartorius
Sartobind D RC > 3μm > 29mg/ml (Albumine)
Sartorius
CEX Natrix S (Discontinued)
Hydrogel 0.45μm n/a Natrix Separations
(now part of Merck KGaA)
Natrix C weak CEX
(Discontinued)
Hydrogel 0.45μm 100 mg/ml
(IgG)
Natrix Separations
(now part of Merck KGaA)
Mustang S Modified PES
0.8μm 10mg
(positively-charged proteins)
Pall Corporation
Sartobind S RC > 3μm >25 mg/ml (Lysozyme)
Sartorius
Sartobind C
(Discontinued)
RC > 3μm >22 mg/ml
(BSA/Lysozyme)
Sartorius

23
The IEX membrane of interest in this work is the weak CEX membrane, Natrix C weak CEX. Natrix
C weak CEX membrane consists of a functionalized hydrogel with three-dimensional porous structure,
physically supported by a polyolefin backbone (Figure 9) [99]. Containing a high density of carboxylic
acid binding groups, Natrix C weak CEX membranes possess a high binding capacity at optimized
buffer conditions. A couple of groups have assessed its potential application in mAb capture [38, 99,
100]. Kuczewski et al. [100] designed a single-use mAb purification process with Natrix C weak CEX
membrane in a bind/elute mode for capture, followed with Chromasorb (AEX membrane) and
Sartobind Phenyl (HIC membrane) at flow-through mode for polishing. The group reported an overall
yield of 63%, with aggregate level < 0.5 % and HCP less than 50 ppm for a mAb produced in a PER.C6
human cell line. Hou and the group [99] reported a higher yield of 90% with Natrix C weak CEX
membrane, with binding capacities >60 mg/mL, HCP removal > 85% and DNA reduction >99% at an
optimized bind/elute mAb capture process. The potential of applying Natrix C weak CEX membrane
for mAb capture had been explored by Hassel and Moresoli [38], where membrane structure was
characterized through swelling and Field Emission Scanning Electron Microscopy (FESEM) at various
pH conditions. They reported that the membrane average pore size was lower at pH below 5.5,
reflecting the nearly zero surface charge of the membrane material. Maximum IgG binding capacity
was observed at pH 4.8 and 0 M KCl, whereas highest IgG elution was obtained at pH 7 and 0 M KCl.
Figure 9 Illustration of the 3-dimensional hydrogel porous structure of Natrix C weak CEX
membrane [101].

24
2.4 IgG/mAb capture with CEX
2.4.1 Principles and application
IEX has been successfully employed as a polishing step in industrial antibody purification processes
due to the relatively low material cost, simple methodology, and mild operating conditions, while its
application in the capture step has been limited [10, 11]. Recent development of CEX materials with
improved ligand density and pore structure leads to better selectivity and enhanced binding capacity of
over 100 mg/mL, which enables it to be a promising alternative to Protein-A chromatography for mAb
capture [20, 21].
mAb capture with CEX works on the basis of reversible electrostatic interactions. In the bind/elute
mode, positively charged mAb molecules will be absorbed to negatively charged CEX material at
selected pH of binding buffer. As the pI of HCP are generally lower than antibodies, Ng et al. [102]
separated HCP from IgG1 in the Protein-A effluent using pH-induced chromatography with a CEX
resin. It has been reported that mAb capture with CEX can achieve an overall yield of 76% to 88%,
which is comparable to the overall yield of 85% with Protein-A chromatography [88].
Application of CEX for mAb capture was reported as early as 1998 where a CEX resin with high
charge density, CM-HyperD, demonstrated sufficient yield and resolution in capturing a mAb at an
ionic strength equivalent to cell culture supernatant [12]. mAb capture with CEX has since gained great
attention in the industry and numerous studies have worked on improving the HCP removal and yield
for mAb capture with CEX. Follman and Fahrner [13] from Genentech evaluated a three-step
chromatographic purification process with CEX capture for a mAb using SP-Sepharose Fast Flow resin,
where the order of the process steps was found to have a significant effect on the HCP removal. HCP
removal is critical to the purity of mAb products. Effective HCP removal (<2 ng/mg mAb) was
achieved with processes in the sequence of CEX–AEX–hydrophobic interaction chromatography,
CEX–AEX–mixed CEX, and CEX–mixed CEX–AEX. Arunakumari and colleagues in Medarex (now
part of Bristol-Myers Squibb) proposed a two-step purification schemes potentially for large-scale
mAbs manufacturing, with a capture step by a CEX resin of high dynamic binding capacity (100 g/L)
and a polishing step with an AEX membrane with an equivalent loading of 2100 g/L [14, 15]. Ng and
Snyder from Bio-Rad laboratories demonstrated the effectiveness of NuviaTM S in a capture step of a
three-column process, with more than 99% HCP reduction and 95% ~ 99.4% DNA clearance [16]. A
50-cycle study showed consistent chromatography performance of NuviaTM S. Recent researches
25
reported enhanced performance of CEX capture for IgG with advance chromatin extraction, where the
dynamic binding capacity increased to 173 g/L [17]. CEX for mAb capture has been realized with a
series of commercialized monoclonal antibodies: Simulect (basiliximab) from Novartis, Synagis
(palivizumab) from Medimmune, Soliris (eculizumab) from Alexion Pharmaceuticals, Inc. and
Humira® (adalimumab) from Abbott Laboratory [18, 19].
2.4.2 Buffer effect on IgG/mAb binding with CEX
mAbs bind to CEX materials based on electrostatic interactions, therefore the performance is strongly
influenced by buffer conditions. For IgG/mAb binding with CEX, buffer conditions include buffer pH,
type and concentration of buffer cation (counter-ion), and type and concentration of buffer anion (co-
ion), among which counter-ion concentration (Cs) is the most investigated factor [42, 103-105]. Ionic
strength is defined as a measure of the concentration of charges in a solution [106], which has a linear
relationship with conductivity. In most studies, changes in ionic strength or conductivity of a buffer are
manipulated by adding salt to the buffer and thus changing the Cs. The concentration of co-ions is
usually manipulated by changing the buffer molarity.
Numerous groups investigated buffer effects on IgG/mAb binding with CEX resins [42, 103-105],
while only a few investigated with CEX membranes [22]. Since CEX resins and CEX membranes
possess the same ligand group, previous work with resins can still provide valuable information for
understanding buffer effects with membranes.
As opposed to strong CEX materials, weak CEX materials contain functional groups that present
variable ionization according to buffer pH. The performance of weak CEX materials is more susceptible
to buffer effects compared to strong cation exchangers. Yet buffer effects on IgG/mAb binding with
weak CEX resins and membranes have rarely been studied.
Buffer pH
Buffer pH is a critical factor during IgG/mAb binding with CEX. mAb capture with CEX works on the
basis of reversible electrostatic interactions. During the binding step, positively charged mAb molecules
will be absorbed to negatively charged CEX material at selected buffer pH. While during the elution
buffer, the electrostatic interactions can be disrupted by changing the buffer pH and the bounded mAb
molecules can be eluted out. The investigation of pH effect was often correlated with the effect of buffer

26
ions. Faude et al. [107] reported a correlation between buffer pH and the maximum dynamic binding
capacity of strong CEX resins with a human mAb. With increasing buffer molarity, maximum mAb
dynamic binding capacity was observed at a lower pH. Gillespie [103] observed correlating effect of
pH and counter-ions on the maximum mAb dynamic binding capacity of strong CEX resins with a
mAb. At low pH, the maximum mAb dynamic binding capacity was insensitive to Cs, while at higher
pH, an optimal Cs for the maximum mAb dynamic binding capacity was observed.
Counter-ion
The driving force for protein binding to CEX materials is the displacement of counter-ions by the target
protein. Therefore, the type and concentration of counter-ions is critical to the binding performance of
CEX materials.
Sodium ion (Na+) is the most commonly used counter-ion in CEX for mAb capture. It was proposed
that the smaller size of Na+ compared to K+ facilitates the water displacement process and thus a weaker
competitor for protein binding [107]. Almodovar et al. [108] proposed that the effect of counter-ions is
dependent on their molecular size, aqueous diffusivity, and charge. In a comprehensive investigation
on the effect of the type of counter-ion on static mAb binding for three strong CEX resins of different
structure, NuviaTM S, UNOsphereTM S and CaptoTM S, Almodovar et al. selected four counter-ions with
distinct molecular size, aqueous diffusivity, and charge, including Na+, tetra-n-butylammonium
(TBAH), arginine (Arg), and calcium (Ca2+). The rate of protein adsorption was observed to increase
dramatically with the type of counter-ions (Ca2+ > Arg+ > Na+ > TBAH+).

27
Table 5 Properties of the counter-ions used in the work of Almodovar et al. [108].
Type Structure Charge
at pH 5
Aqueous
diffusivity
at 25 °C
(cm2/s)
[109]
Molecular
radius (nm)
[109]
Sodium Na+ +1 1.3 × 10 -5
0.17
Calcium Ca2+ +2 0.79 × 10 -5 0.28
Arginine
+1 0.60 × 10 -5 0.36
TBAH
+1 0.42 × 10 -5 0.52
28
A negative effect of Cs on the binding capacity due to competitive binding has been widely reported
[104, 110-112]. Forrer et al. [110] reported a linear decrease of polyclonal IgG binding capacity with
increasing ionic strength (70 to 170 mM) with a strong CEX resin, Fractogel EMD SE HiCap (M).
Stone et al. [104] observed 50% decrease of the maximum binding capacity of a mAb when the ionic
strength increased from 20 mM to 70 mM, with four agarose-based strong CEX resins. Bhambure et
al. [112] also observed higher static binding capacity of a mAb in buffer solution with an ionic strength
of 20 mM than that of 100 mM for two tentacular strong CEX resins.
Co-ion
During the process of IgG/mAb binding with CEX, co-ions are the ions that carry negative charges,
and will be attracted to the surface of the positively charged IgG/mAb molecules. Therefore the type
and concentration of co-ions also affect the movement of IgG/mAb molecules. The effect of co-ions on
IgG/mAb binding with CEX has been probed by a few groups. Wrzosek et al. [113] reported a 50%
decrease of mAb binding capacity for SP Sepharose Fast Flow, when switching buffer type from
phosphate buffer to phosphate citrate buffer. At the same buffer molarity, phosphate citrate buffer
contains more multi-valent anions than does phosphate buffer. It was proposed that multi-valent anions
may compensate the global positive charges of the mAb, thus weakening the electrostatic interaction
with cation exchangers [107]. However, the effect of co-ions on local protein charge characteristics was
not addressed.
2.5 IgG/mAb unfolding and buffer effects
2.5.1 IgG/mAb unfolding
Usually native proteins in solution are in equilibrium with a small number of unfolded intermediates.
When exposed to thermal stress, mechanical stress or changes in the buffer composition, the
equilibrium will be disturbed and lead to increased number of unfolded intermediates. These
intermediates expose more hydrophobic patches and are more flexible compared to the folded state,
which may lead to the formation of protein aggregates [114]. The unfolding of IgG/mAb can be detected
with differential scanning calorimetry [115-119], circular dichroism spectroscopy [117, 120, 121],
dynamic light scattering [122, 123] and fluorescence spectroscopy [124-130], among which intrinsic
fluorescence spectroscopy has gained interest as a fast and non-invasive analytical method.

29
When a protein molecule partially or completely unfolds, the hydrophobic patches buried inside the
molecule will be exposed thus increasing the hydrophobicity of the local environment [131]. IgG/mAb
contains amino acids with intrinsic fluorescence, including tryptophan and tyrosine, that are very
sensitive to changes in hydrophobicity and will exhibit an increase in the fluorescence intensity or
maximum emission wavelength when excited at a certain wavelength. Maximum emission wavelength
is the emission wavelength at which the maximum fluorescence intensity is observed. At an excitation
wavelength of 280 nm, both tryptophan and tyrosine will be excited and show an increase in the
fluorescence intensity when the degree of protein unfolding increases, while there may be an increase
in the maximum emission wavelength for tryptophan depending on the type of the solvent used [132-
134]. Emission wavelength for tryptophan and tyrosine is usually set between 280 nm to 450nm
(through the filter setting). When applying intrinsic fluorescence spectroscopy for the detection of
protein unfolding, one can only detect the degree of unfolding through changes in hydrophobicity of
the protein molecules, but cannot distinguish between partially unfolded proteins and completely
unfolded proteins.
2.5.2 Buffer effect on IgG/mAb unfolding
During the IgG/mAb capture process, factors such as pH, ion type and ion concentration of buffer,
especially counter-ion concentration (Cs) and co-ion type may have great impact on the structure of
IgG/mAbs.
pH and counter-ion
Buffer pH is the most critical factor among all buffer factors, that may induce partial/complete protein
unfolding and alters colloidal stability [114]. Buffer pH affects IgG/mAb structure by changing the
charge distribution on the protein surface, thus changing the electrostatic interactions within and
between protein molecules [135, 136]. One of the drawbacks of IgG/mAb capture with Protein-A
chromatography is that low pH (around 3) is required to elute target IgG/mAbs off the chromatographic
media, while the low pH disturbs the structure of IgG/mAbs, and induces unfolding and aggregation
[137].
Investigations of pH effect on IgG/mAb unfolding were often correlated with the counter-ion
concentration (Cs). Bickel et al. [115] investigated the effect of pH and NaCl concentration on the
unfolding of a mAb, where the investigated pH ranged from 2 to 7 and NaCl concentration ranges from

30
0 M to 1.5 M. It was concluded that the degree of unfolding was highest at low pH (pH 3.5) and high
ionic strength (1.5 M). Herdberg et al. [138] mapped the degree of unfolding of mAb across pH from
4 to 9 and NaCl concentration from 0 M to 1.0 M. After stressing the samples at 40 °C for 4 weeks, a
higher degree of unfolding was found at pH < pH 5 for all NaCl concentration. A higher degree of
unfolding was also found at pH 5 to pH 9 when NaCl concentration was less than 0.2 M. Sahin et al.
[117] investigated the degree of unfolding of four types of human IgG1 under the effect of buffer pH
and Cs, while the relatively small range of Cs investigated (54 mM and 100 mM) did not show any
differences in unfolding when studied at the same pH. Increasing protein unfolding was observed when
decreasing pH from 6.5 to 3.5 for both Cs conditions. These studies revealed the complexity of the
effect of pH and Cs on mAb unfolding, and both indicated that low pH (2~3.5) and high Cs (1.5 M) may
enhance protein unfolding.
Co-ion
The effect of buffer co-ion on IgG/mAb unfolding has been correlated with the Hofmeister effects.
Hofmeister proposed that salts have different effects on the solubility of proteins and the stability of
their secondary and tertiary structure [139]. The salt-out effects of anions were listed as citrate ion >
phosphate ion > acetate ion > chloride ion. Most studies on IgG/mAb unfolding showed good agreement
with the Hofmeister series. Rubin et al. [140] investigated the unfolding of a monoclonal human IgG1
induced by various buffer type, including acetate, sulfate and formate. Acetate was found to be the most
stabilizing anion, where no unfolding was observed at moderate concentration and slow unfolding at
low concentration. Singla et al. [141] studied the unfolding of an IgG1-based mAb in buffer type
commonly used in CEX, citrate, acetate and phosphate buffer, where citrate buffer was the only type
that induced unfolding even without salt addition. Barnett et al. [142] explored the ion effect of acetate
and citrate on an anti-streptavidin IgG1 and observed that citrate tended to accumulate around the
surface of the anti-streptavidin IgG1 compared to acetate. The accumulation of citrate resulted in
conformational changes, weaker electrostatic repulsion between proteins and thus increased unfolding
rates.
2.6 Quality by Design principles
The US FDA and other health authorities have been actively promoting Quality by Design (QbD) for
the manufacturing and development of pharmaceuticals since 2002 [27].The main objective of QbD is

31
to ensure product quality throughout the manufacturing process, which renders more flexibility towards
changes in process conditions. The key elements include the quality target product profile (QTPP),
critical quality attributes (CQAs), critical material parameters (CMPs), critical process parameters
(CPPs), risk assessments, design space, control strategy and product life cycle management [143]. The
QbD roadmap illustrates how all of the elements of QbD are linked to each other (Figure 10).

32
Figure 10 Quality by Design (QbD) roadmap [144].

33
During the production of pharmaceutical products, variations within and between batches are very
common and difficult to eliminate, while these variations can be minimized through the design space
development. The International Council for Harmonisation of Technical Requirements for
Pharmaceuticals for Human Use (ICH) has described design space in the ICH Q8 guidance [145] as,
“the multidimensional combination and interaction of input variables that have been demonstrated to
provide assurance of quality within an acceptable range”. The anticipation of issues and achievement
of a better process control is possible when the design space is defined. It renders the manufacturing
process flexibility, as stated by the guidance “working within the design space is not considered a
change” [145]. The design space development has been achieved with small molecule pharmaceuticals
[146-148], while there is also growing work in downstream processes of mAb manufacturing [30, 149-
152] (Table 6).

34
Table 6 Literature review of design space development for mAb downstream processes.
Sample Application Results Ref
Fc fusion
protein sample
hydrophobic interaction
chromatography (HIC)
for purification
• identified key operating parameters to be, protein
loading, resin hydrophobicity, load conductivity,
chase conductivity, and load sialic acid (SA level)
• determined the design space that enabled a high step
yield (≥ 40%) and high-molecular weight aggregate
(HMW) clearance (HMW ≤ 2.5%)
Jiang
et al.
[151]
harvested cell culture fluid (HCCF) containing viruses
Protein-A
chromatography for viral
clearance
• established a multivariate approach used to evaluate
process parameter impacts on viral clearance, based
on the levels of retrovirus-like particles (RVLP)
present among process characterization study
samples
Zhang
et al.
[153]
stock mAb intermediate protein A samples
anion exchange
chromatography (AEX)
for viral clearance (model
virus: X-MuLV, SV40,
and
MMV)
• identified key parameters as, conductivity, load
density, pH and flow rate
• determined the design space that enabled a high
virus reduction level, expressed in LRV, 5.6 to 6.1
for X-MuLV, 4.9 to 5.9 for SV40, and 5.3 to 6.0 for
MMV
Strauss
et al.
[30]
mAb1 expressed in CHO cells and purified by protein A chromatography
cation exchange
chromatography (CEX)
for removal of aggregates
• identified equilibration buffer as the key parameter.
Its operating range is set at 40 ± 5 mM acetate, pH
5.0 ± 0.1
• identified elution buffer, load mass, and gradient
elution volume are non-key parameters; their
operating ranges are set at 250 ± 10 mM acetate, pH
6.0±0.2, 45±10 g/L resin, and 10±20% CV
respectively
• purity of the sample was 99.8% or above and the
step yield was above 92%,
Xu et
al. [31]
The development of design space is important in quantifying the effect of material and process
parameters on the performance of mAb manufacturing process, in terms of productivity and product

35
quality [28, 29]. During design space development, it is critical to first identify CMPs and CPPs through
risk assessment. Design space development can be significantly expedited with tools such as Design of
Experiment (DoE) and high-throughput process, which will be discussed in the next sections.
2.6.1 Risk assessment
A risk assessment of the process parameters is required to identify the CMPs and CPPs that have
significant impact on CQAs and productivity. The assessment serves as a basis for minimizing the
number of parameters required for the design space development. Failure mode and effects analysis
(FMEA) is a numerical tool used to assess the criticality of process parameters [30, 151, 154]. Xu et al.
applied the FMEA approach by creating a cause-and-effect diagram for all process parameters and then
generating a Pareto plot to identify the parameters with greatest potential impact on the removal of
aggregates with strong CEX resins [31].
Using FMEA, each parameter is assessed based on scientific experience and knowledge on
equipment and process control capability and then ranked by the risk priority number (RPN) scores
which is calculated by the severity (S), occurrence (O), and detection (D) of the risks (RPN=S×O×D).
Severity means the severity of the potential effect of the failure. Occurrence is the likelihood that the
failure will occur. Detection rates the likelihood that the problem will be detected before it reaches the
end-user. Rating scales usually range from 1 to 5 or from 1 to 10, with the higher number representing
the higher seriousness or risk. For example, on a ten-point scale, Severity of 1 means low risk to the
end user, and a score of 10 means high risk to the end user; Occurrence of 1 means low probability of
the risk happening, and a 10 means a very high probability of the risk happening; Detection of 1 means
a process that will likely detect a failure, and a 10 means the process will likely not detect a failure. The
specific rating descriptions and criteria is defined by the analysis team to fit processes being analyzed.
An example of a five-point severity scale suggested by Stamatis’s reference book on FMEA [155] is
given in Table 7.
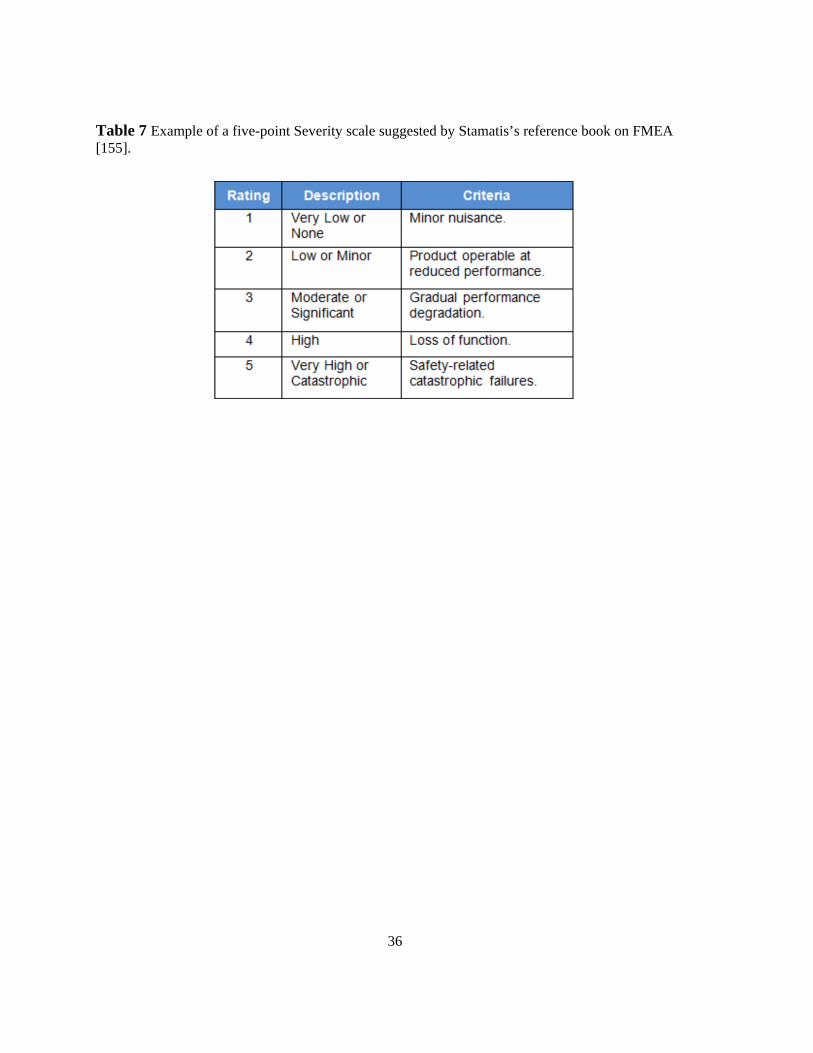
36
Table 7 Example of a five-point Severity scale suggested by Stamatis’s reference book on FMEA [155].
37
2.6.2 Design of Experiment (DoE)
One-factor-at-a-time approach consumes significant amount of time and raw materials, and neglects
interactions between process parameters. Therefore, the more advanced characterization approach such
as DoE has drawn great attention. DoE maximizes the information of experimental data with statistical
analysis [156]. DoE also enables investigations on parameter interactions and classification of
parameters according to their influence on product quality and productivity, which is fundamental to
design space development [151].
Lain et al. [18] designed the operating window with DoE for the capture of IgG1 (pI=8.1) from
clarified harvest with GigaCap S-650M. The group examined the loading conditions and elution
conditions separately to eliminate the complicity of the experimental design. For the loading DoE,
loading pH at three levels (4.9, 5.2, and 5.5) and conductivity at two levels (4.0 and 5.0 mS/cm) were
evaluated. For the elution DoE, pH (4.8, 5.3 and 5.8) and conductivity (90, 120 and 150 mS/cm) were
evaluated at three levels. Interaction plot and contour plot for yield and HCP were constructed. The
optimal loading conditions were found at pH 5.2 ± 0.2 and conductivity of 4.5 ± 0.5 mS/cm and optimal
elution conditions were pH 5.3 ± 0.2 and NaCl concentration of 110 ± 15 mM, where >98% recovery,
>98% purity, and >95% HCP removal were achieved. The robustness of the conditions was then
confirmed at intermediate and large scale, where the intermediate scale-up used a 2.6×14.5 cm (77 mL)
column, and large scale-up chromatography used a 5.05×14.3 cm (286 mL) column.
Comparable operating space of loading buffer was reported by Miesegaes et al. [157], where load
pH between 5.3 to 5.7 and conductivity < 5.0 mS/cm was defined as the optimal conditions to achieve
highest yield and purity for IgG4 mAb capture with strong CEX resins. The group started by
establishing an initial operating space, based on prior industry knowledge, information with other mAbs
and observation from own database. Scouting studies with five commercial CEX resins for IgG4 mAb
(pI = 7.5) determined an appropriate center-point condition of pH 5.3 and 5.0 mS/cm conductivity,
based on which a five-point DoE was conducted to determine the optimal combination of loading pH
and conductivity. Nevertheless, the group proposed that designs space development for mAb capture
with CEX should be treated on a case-by-case basis.
Tao et al. [66] looked into the process optimization for CEX capture with two mAbs (mAb A: pI=6.5
and mAb B: pI= 8.7). Loading conditions were optimized by testing the effect of pH (4.5, 5 and 5.5)
and conductivity (5, 11 and 17 mS/cm) on DBC and HCP removal. The approach was similar to that of
Lain et al. [12], while the operating space of conductivity was much higher, because the conductivity
38
of harvested cell culture supernatant ranged from 12 mS/cm to15 mS/cm. Adding a dilution or UF step
prior to CEX capture is not favorable for large-scale manufacturing, therefore performance
optimization of CEX depends more on pH adjustment. No correlation was observed between HCP
removal and pH or conductivity, while decreasing DBC with increasing loading pH was reported,
especially for the more acidic mAb A. The operating space was determined to be loading pH 4.6±0.05
for mAb A and 4.8± 0.2 for mAb B, with fixed conductivity at 14 mS/cm. Optimization of elution
conditions was realized by a central composite face-centered design (CCFD) which consists of 13
experimental points. Elution buffer pH and sodium ion concentration ([Na+]) were examined at two
levels for their effect on yield, HCP reduction and elution volume. Contour plots showed elution pH to
be the most influential factor on HCP removal. The statistical model predicted the optimal elution
conditions for the two mAbs, which was pH 5/ pH5.1 with [Na+] of 210 mM with Fractogel SO3 /Poros
XS for mAb A; pH5.5 with [Na+] of 300 mM/275 mM for Fractogel SO3 /Poros XS for mAb B.
2.6.3 High-throughput processing
High-throughput processi stands out as an efficient and economic approach for better process and
product understanding during process development. It is the integration of miniaturization, automation
and parallelization [158-161]. The workflow of high-throughput includes “planning an experimental
setup using a systematic approach, carrying out experiments by testing various experimental conditions
in a parallel manner, analyzing data using high-throughput analysis, and evaluating data and analyzing
the results” [162, 163]. The implementation of high-throughput reduces the time frame of screening
process from weeks to hours, with less sample consumption and larger experimental window.
A couple of groups have worked on high-throughput mAb purification with IEX resins [20, 162,
164-166]. Stein and Kiesewetter [20] conducted pH screening for optimal mAb binding and HCP
removal with Fractogel® EMD SO3− (M) and Fractogel® EMD SE Hicap (M). Results of batch
screening were comparable between the 100 mL scale and 200 µL scale with the 96-well plate format
(manual liquid handling). Coffman et al. [164] evaluated the application of a 96-well filter plate (50/100
µL) format for optimizing mAb purification conditions with IEX resins, incorporated with a robotic
liquid-handling system, Tecan Genesis 150. The miniaturized batch-binding format reported the same
trend of purity and recovery with process parameters as that with the regular column, which provided
valuable information for process development. Grönberg [162] presented a case study of a high-

39
throughput process combined with DoE to optimize mAb purification with 96-well filter plates and
mini-columns assisted by TECAN Freedom Evo 150 robot.
There has not been any high-throughput work with IEX membranes for mAb purification. Yoshimoto
et al. [167] investigated the dynamic binding of BSA with IEX membranes in 96-well microplates. The
dynamic BSA binding capacities obtained from the high-throughput process with IEX membrane (disks
with 7 mm diameter and 2 mm thickness) was in good agreement with those from the regular sized IEX
disk column (disks with 12 mm diameter and 3 mm thickness in a disk holder).
40
Chapter 3 Effect of buffer on the structure of weak CEX membranes
3.1 Introduction
Prior to probing buffer effects on the interaction of IgG/mAb and weak CEX membranes, it was critical
to investigate the effect of buffer on the membrane structure, especially for the Natrix C weak CEX
membrane employed in this work. The Natrix C weak CEX membrane presented a unique three-
dimensional macroporous hydrogel structure, and when interacting with a buffer solution, the
membrane material swelled in response to the environment, namely pH and ionic strength. The swelling
behavior of the membrane altered the pore size, which in turn affected the protein binding capacity and
the protein transport within the pores.
Ionic strength is a measure of the concentration of charges of all ions in a solution [106], which is
influenced by both the concentration of counter-ions (buffer cations in the case of CEX) and co-ions
(buffer anions in the case of CEX). The concentration of counter-ions is denoted as, Cs, and is often
manipulated by adding NaCl or KCl to the buffer. The concentration of co-ions could be represented
by buffer molarity.
Hassel and Moresoli [38] investigated the swelling behavior of Natrix C weak CEX membrane
equilibrated in phosphate citrate buffer with pH ranging from 4.5 to 7, and KCl additions ranging from
0M to 1M. It was reported that the swelling factor of Natrix C weak CEX membrane was dependent on
both pH and ionic strength of buffer. Hassel and Moresoli [38] also characterized the pore size of Natrix
C weak CEX membrane equilibrated in phosphate citrate buffer with pH ranging from 4.5 to 7, and
KCl additions of 0M and 1M, with Field Emission Scanning Electron Microscopy (FE-SEM). However,
visualizations with SEM require the membrane samples to be coated with a layer of gold particles and
then operating in high vacuum mode, which may damage the fragile structure of the hydrogel material.
Therefore it was proposed to use the Field Emission Gun Environmental Scanning Electron Microscopy
(FEG-ESEM) for the visualization of hydrogel membrane surface pore structure. ESEM offers high
resolution secondary electron imaging in a gaseous environment, which eliminates the need for
conductive coating and can operate at low vacuum mode, which helps protect the structure of fragile
samples.
It was hypothesized that buffer pH, counter-ions, and buffer type (represented by buffer co-ions)
could affect membrane properties, namely the membrane swelling behavior and membrane surface pore
structure of weak CEX membranes. The hypothesis was tested with Natrix C weak CEX membrane,

41
employing two most common buffer types for CEX, the phosphate citrate buffer and the acetate buffer.
Buffer pH and ionic strength were selected based on Hassel and Moresoli [38]’s work and adjusted
accordingly to meet the specific objectives in this work. Buffer effects on membrane swelling behavior
were investigated with membrane swelling experiments, while buffer effects on membrane surface pore
structure were investigated with Environmental Scanning Electron Microscopy (ESEM).
3.2 Materials and methods
3.2.1 Buffers
All buffers and solutions were prepared with ultra-purified water. Stock sodium phosphate citrate buffer
was prepared by mixing 100 mM citric acid (EMD Chemicals Inc., Gibbstown, USA) solution and 200
mM sodium phosphate dibasic (Fisher Scientific, Fair Lawn, USA) solution. Stock sodium acetate
buffer was prepared by mixing 200 mM acetic acid (EMD Chemicals Inc., Gibbstown, USA) solution
and 200 mM sodium acetate (EMD Chemicals Inc., Gibbstown, USA) solution. All buffers were
adjusted to the desired pH by adding approximately 1 drop of 0.1 M HCl or 0.1 M NaOH solution. This
amount was considered negligible and was not accounted in the buffer composition.
For the swelling experiment, stock sodium phosphate citrate buffer at pH 4.5 to 7 and stock sodium
acetate buffer at pH 4.5 to 6 were used. Potassium chloride (EMD Chemicals Inc., Gibbstown, USA)
was added into the stock phosphate citrate buffer and stock acetate buffer to achieve a KCl
concentration of 0.1M, 0.3M, and 1M.
For the microscopy experiment, the stock sodium phosphate citrate and acetate buffer at pH 5 were
diluted to various concentrations and sodium concentration was adjusted with sodium chloride (BDH
Inc., Toronto, Canada). See Appendix A for details of buffer preparation.
3.2.2 Membranes
Weak CEX membranes, Natrix C weak CEX membranes (disc diameter: 25 mm) were kindly provided
by Natrix Separations Inc. (Burlington, Ontario, Canada).

42
3.2.3 Membrane swelling
Each membrane disc (25 mm diameter) was cut into eight pieces and the dry weight of each piece was
measured. Each membrane piece was immersed in 20 mL buffer with distinct pH and KCl concentration
in a vial and then incubated on a shaker (Thermo Scientific 2309 lab rotator, Canada) for 4 hours. After
the incubation, the membrane pieces were removed and hung for 10 min before the wet weight was
measured. The procedure is illustrated in Figure 11.
Figure 11 Illustration of the swelling experiment.
The swelling factor qms was calculated as the ratio of the mass of swollen membrane (g) to the mass
of dry membrane (g), as in Equation 3-1.
qms = mswollenmdry
Equation 3-1
where mswollen is the mass of the wet membrane (g) and mdry is the mass of the dry membrane (g).
3.2.4 Environmental scanning electron microscopy (ESEM)
Membrane samples (5 mm × 5 mm) were equilibrated for 24 h in buffer solution with various molarity,
and cation concentration at pH 5 to examine the effect of ion type and concentration (
Table 8). The stock 150 mM sodium phosphate citrate buffer has a sodium concentration of 206 mM
(1), and was diluted four times to achieve a lower sodium concentration of 50 mM and buffer molarity
of 37.5 mM (2). The sodium content of the 37.5 mM sodium phosphate citrate buffer (2) was adjusted
by adding NaCl to achieve a sodium concentration of 206 mM (3), keeping the buffer molarity the same
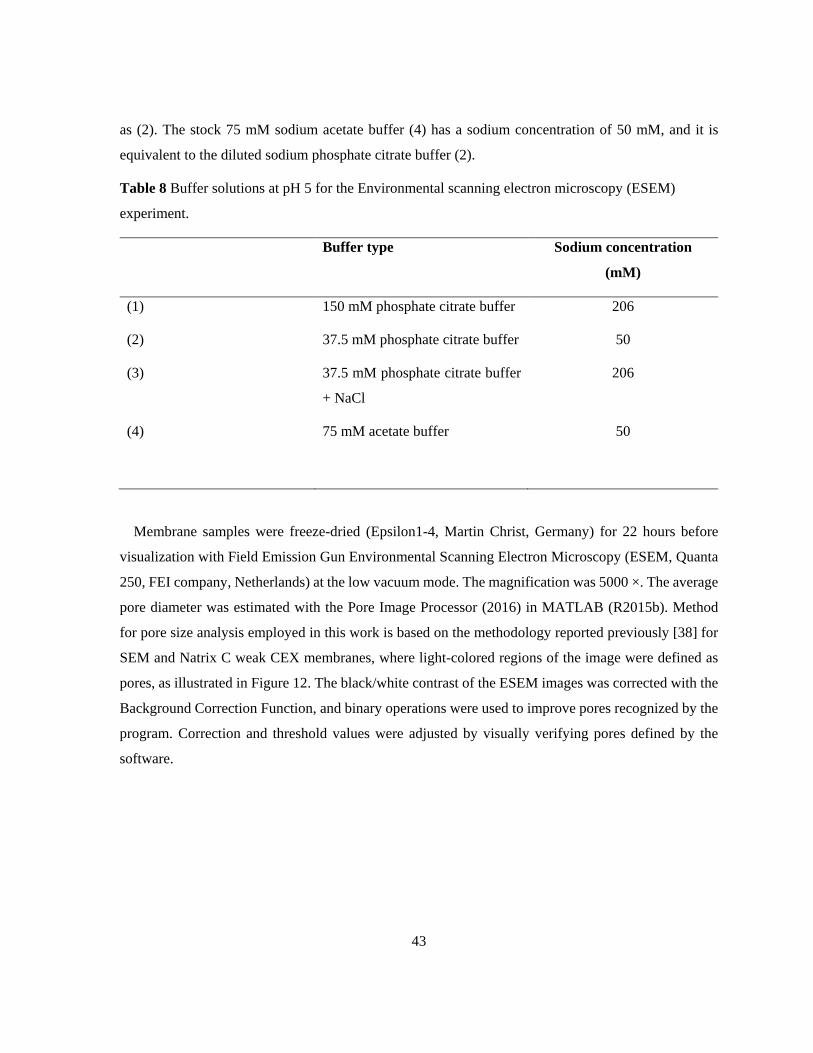
43
as (2). The stock 75 mM sodium acetate buffer (4) has a sodium concentration of 50 mM, and it is
equivalent to the diluted sodium phosphate citrate buffer (2).
Table 8 Buffer solutions at pH 5 for the Environmental scanning electron microscopy (ESEM)
experiment.
Buffer type Sodium concentration
(mM)
(1) 150 mM phosphate citrate buffer 206
(2) 37.5 mM phosphate citrate buffer 50
(3) 37.5 mM phosphate citrate buffer
+ NaCl
206
(4) 75 mM acetate buffer 50
Membrane samples were freeze-dried (Epsilon1-4, Martin Christ, Germany) for 22 hours before
visualization with Field Emission Gun Environmental Scanning Electron Microscopy (ESEM, Quanta
250, FEI company, Netherlands) at the low vacuum mode. The magnification was 5000 ×. The average
pore diameter was estimated with the Pore Image Processor (2016) in MATLAB (R2015b). Method
for pore size analysis employed in this work is based on the methodology reported previously [38] for
SEM and Natrix C weak CEX membranes, where light-colored regions of the image were defined as
pores, as illustrated in Figure 12. The black/white contrast of the ESEM images was corrected with the
Background Correction Function, and binary operations were used to improve pores recognized by the
program. Correction and threshold values were adjusted by visually verifying pores defined by the
software.

44
Figure 12 (A) Original SEM image of Natrix C weak CEX membrane and (B) Pores defined by the
Pore Image Processor over the original SEM image [38].
3.2.5 Statistical analysis
Analysis of variance (ANOVA) and paired sample t-test were employed for statistical analysis at a
confidence interval of 95%.
3.2.6 Summary of experimental conditions
The effect of pH, counter-ions and co-ions on membrane swelling behavior and membrane surface pore
structure of Natrix C weak CEX membrane was investigated in this chapter (Table 9).

45
Table 9 Buffer conditions and experimental conditions for Chapter 3.
Section
Buffer Experimental
conditions Type Molarity (mM)
Na+ concentration
(mM)
K+ concentration
(mM) pH
3.3.1 phosphate citrate
150 206 0 4.5, 5, 5.5, 6, 7
Swelling
phosphate citrate
150 206 100 4.5, 5, 5.5, 6, 7
phosphate citrate
150 206 300 4.5, 5, 5.5, 6, 7
phosphate citrate
150 206 1000 4.5, 5, 5.5, 6, 7
acetate 200 140 0 4.5, 5, 5.5, 6
acetate 200 140 100 4.5, 5, 5.5, 6
acetate 200 140 300 4.5, 5, 5.5, 6
acetate 200 140 1000 4.5, 5, 5.5, 6
3.3.2 phosphate citrate
150 206 \ 5 ESEM
phosphate citrate
37.5 50 \ 5
acetate 75 50 \ 5
phosphate citrate
37.5 206 \ 5

46
3.3 Results and discussion
3.3.1 Effect of buffer conditions on membrane swelling
The swelling behavior of Natrix C weak CEX membrane was investigated in phosphate citrate buffer
with a pH range of 4.5 to 7 and KCl concentrations ranging from 0 M to 1 M, and in acetate buffer with
a pH range of 4.5 to 6 and KCl concentrations ranging from 0 M to 1 M (Figure 13).
Figure 13 Swelling factor of Natrix C weak CEX membrane in (A) phosphate citrate buffer and (B)
acetate buffer at various pH and KCl concentration. Error bars represent standard error (n=3).
47
The membrane swelling in phosphate citrate buffer was affected by pH, and the pH effect was
statistically significant (ANOVA, 95% confidence). At a given KCl concentration, the swelling factor
initially increased significantly with pH, and then leveled off at pH 6.0. When pH was increased from
4.5 to 7, the swelling factor increased significantly by 104% at 0 M KCl and increased significantly by
43% at 1M KCl (Paired t-test; 95%). The swelling behavior reflects the composition of the membrane,
which contains porous polyacrylate hydrogel with pendant carboxylic acid ligands that exhibit variable
ionization according to pH condition. The effect of pH on membrane swelling could result from
electrostatic repulsion. With a pKa of 5.3 [38], the carboxylic acid ligands of the membrane will be
ionized and negatively charged at pH>5.3. The increasing negative surface charge of the material with
pH will lead to strong repulsion within the polymer network, thus the polymer chain tends to uncoil
and allows more water molecules to be attracted to the hydrophilic carboxylic group [38]. While at pH
6.0, it is proposed that the pores of hydrogel almost reached their maximum size, thus further pH
increase did not influence the swelling factor.
The membrane swelling in phosphate citrate buffer was affected by KCl concentration, and the KCl
concentration effect was statistically significant (ANOVA, 95% confidence). In general, the swelling
factor decreased with KCl concentration at a given pH. The most pronounced effect of KCl
concentration on swelling factor was observed at pH 5, with a reduction of 25%. However, significant
decrease of swelling factor with increasing KCl concentration was not observed (Paired t-test; 95%),
and indicated that this method was not capable of distinguishing the KCl concentration effect on
swelling factor.
The membrane swelling in phosphate citrate buffer confirmed that both the pH and the KCl
concentration of buffer have a significant influence on membrane swelling (ANOVA, 95% confidence).
The swelling factor was found to increase with pH significantly. The swelling factor qms in phosphate
citrate buffer ranged from 1.9 ± 0.1 (pH 4.5; 0 M) to 3.8 ± 0.1 (pH 7; 0 M), smaller than values reported
previously by Hassel and Moresoli [38] for the same Natrix C weak CEX membrane in phosphate
citrate buffer where qms was 3.4 (pH 4.5; 0 M) and 4.53 ± 0.03 (pH 7; 0 M). The ratio of qms (pH 7) /
qms (pH 4.5) in this work was 2.0 and the ratio was 1.3 in Hassel and Moresoli’s work. The difference
in results may come from differences in humidity and temperature at the time of experiment. The
standard error in this work was higher than that from Hassel’s work, which suggested that the
methodology is difficult to control, such as small sample size and material heterogeneity. Membrane
swelling may not be the best method to assess small contributions of pH.

48
The membrane swelling in acetate buffer was affected by pH and KCl concentration, and the two
effects were statistically significant (ANOVA, 95% confidence), as same for the phosphate citrate
buffer. Paired t-test (95% confidence, P = .35) were performed and concluded that there was no
significant difference of swelling factors between the two types of buffer.
3.3.2 Effects of buffer conditions on membrane surface pore size
The effect of buffer type, molarity and counter-ion concentration on the membrane morphology was
explored by conducting microscopy imaging. Environmental scanning electron microscopy (ESEM)
offers high resolution secondary electron imaging in a gaseous environment, which eliminates the need
for a conductive coating and can preserve the fragile structure of hydrogel membrane. The average pore
diameter of Natrix C weak CEX membrane freeze-dried after equilibration in different buffer
conditions (Table 10) revealed the effects of counter-ion/co-ion concentration and co-ion type on pore
structure.
Table 10 Estimated pore diameter of freeze-dried Natrix C weak CEX membrane according to
equilibration buffer conditions.
Type Molarity (mM) Sodium
concentration
(mM)
Pore Diameter
(average ± SD,
n=3, µm)
Phosphate citrate buffer 150 206 0.62±0.05
Phosphate citrate buffer 37.5 50 0.65±0.05
Acetate buffer 75 50 0.64±0.05
Phosphate citrate buffer + NaCl 37.5 206 0.54±0.04
No equilibration 0.64±0.07
The ESEM images of Natrix C weak CEX membrane equilibrated in phosphate citrate buffer and
acetate buffer with different Na+ concentration was collected and analyzed (Figure 14, Figure 15, Figure
16 and Figure 17). The effect of ion type on the pore diameter of Natrix C weak CEX membrane was
found to be insignificant (Paired t-test; 95%), as the average pore diameters of membranes equilibrated

49
in phosphate citrate buffer and acetate buffer with the same sodium concentration were similar. The
observation corresponded with the similar membrane swelling factors between the two buffer types. At
equivalent sodium concentration, buffer molarity had an effect on the pore diameter, where the pore
diameter of Natrix C weak CEX membrane equilibrated in 150 mM phosphate citrate buffer was larger
than that in 37.5 mM phosphate citrate buffer with the same Na+ concentration. However, the effect of
buffer molarity on the pore diameter was insignificant (Paired t-test; 95%). Na+ concentration also had
an effect on the pore diameter of Natrix C weak CEX membrane, as the pore diameter of membrane
equilibrated in 37.5 mM phosphate citrate buffer with increased Cs was smaller than that equilibrated
in 37.5 mM phosphate citrate buffer. However, the effect of Na+ concentration on the pore diameter
was also insignificant (Paired t-test; 95%). It was suggested that ESEM was not sufficient in revealing
the effect of buffer molarity and Na+ concentration on the pore diameter of membranes.

50
Figure 14 (A) Original ESEM image of Natrix C weak CEX membrane after equilibrating in 150
mM phosphate citrate buffer with a Na+ concentration of 206 mM and (B) ESEM images processed
with the Pore Image Processor. Images were taken at a magnification of 5000 x.
Figure 15 (A) Original ESEM image of Natrix C weak CEX membrane after equilibrating in 37.5
mM phosphate citrate buffer with a Na+ concentration of 50 mM and (B) ESEM images processed
with the Pore Image Processor. Images were taken at a magnification of 5000 x.

51
Figure 16 (A) Original ESEM image of Natrix C weak CEX membrane after equilibrating in 75 mM
acetate buffer with a Na+ concentration of 50 mM and (B) ESEM images processed with the Pore
Image Processor. Images were taken at a magnification of 5000 x.
Figure 17 (A) Original ESEM image of Natrix C weak CEX membrane after equilibrating in 37.5
mM phosphate citrate buffer with a Na+ concentration of 206 mM and (B) ESEM images processed
with the Pore Image Processor. Images were taken at a magnification of 5000 x.

52
The applicability of ESEM for quantitatively characterizing the pore size of Natrix C weak CEX
membrane remains limited because of the heterogeneity of the membrane material. This heterogeneity
is visible in the ESEM image of both the native membrane and the freeze-dried membrane previously
equilibrated in buffer where irregular porous hydrogel, physically supported by interlaced thin fibers
was observed (Figure 18).
Figure 18 ESEM images of (A) the surface of native dry Natrix C weak CEX membrane and (B) the
surface of freeze-dried Natrix C weak CEX membrane equilibrated in pH 7 phosphate citrate buffer
and subsequently freeze-dried. Images were taken at a magnification of 1000 x.
3.4 Conclusion
In this chapter, the role of buffer pH, counter-ion concentration, and buffer type on membrane
properties, namely the membrane swelling behavior with K+ as counter-ion and its surface morphology
with Na+ as counter-ion, were investigated through the swelling experiment and ESEM, for the weak
cation exchange hydrogel membrane, Natrix C weak CEX membrane.
The swelling factors of Natrix C weak CEX membrane in both phosphate citrate buffer and acetate
buffer indicated that both the pH and the K+ concentration of buffer had a significant influence on
membrane swelling (ANOVA, 95%). The swelling factor increased with increasing pH significantly

53
(Paired t-test; 95%). However, there were no significant difference of swelling factors between the two
types of buffer for all pH and K+ concentration investigated in this study (Paired t-test, 95% confidence,
P = .35). The reliability of the methodology for assessing swelling should be further investigated.
Surface pore size of Natrix C weak CEX membrane freeze-dried after equilibration in different buffer
conditions was visualized by ESEM. It was proposed that both sodium concentration and buffer
molarity had an effect on the pore diameter of Natrix C weak CEX membrane, but the effect were
insignificant (Paired t-test; 95%). The effect of buffer type on the pore diameter of Natrix C weak CEX
membrane was found to be insignificant (Paired t-test; 95%), which corresponded with the similar
membrane swelling factors between the two buffer types. However, as observed in ESEM image of
both the native membrane and the freeze-dried membrane previously equilibrated in buffer, the
applicability of ESEM for quantitatively characterizing the pore size of Natrix C weak CEX membrane
remains limited due to the heterogeneity of the material.

54
Chapter 4 Effect of co-ion and counter-ion on IgG/mAb binding with Natrix C weak CEX membranes
4.1 Introduction
IgG/mAb binding with CEX is based on the electrostatic interactions between positively charged
proteins and the negatively charged porous chromatography absorbent. The binding capacity of proteins
with CEX not only depends on the characteristics of the protein and the membrane, but also largely on
the buffer conditions.
Numerous studies have investigated the IgG/mAb binding with strong CEX resins [1, 104, 107, 108,
110-113, 168], while limited studies were conducted with weak CEX resins. As opposed to strong CEX
materials, weak CEX materials contain functional groups that present absorbent variable ionization
according to buffer pH, which makes weak CEX materials more susceptible to buffer conditions.
Nonetheless, the buffer conditions in IgG/mAb binding with weak CEX materials has not been
thoroughly investigated. In terms of the format of the chromatography, resins are the most commonly
used stationary phase for IgG/mAb binding, while membranes have risen as a cheaper and more
efficient alternative to resin [33, 34, 37]. However, buffer effects on strong or weak CEX membranes
for IgG/mAb binding have rarely been studied [22, 38].
Buffer conditions of importance in the binding of IgG/mAb with CEX materials comes from its pH,
cation (counter-ion), and anion (co-ion) content. The effect of buffer ions has been confounded with
the effect of pH in the literature [107, 168]. Given their confounding effect, in this chapter buffer pH
was kept constant to focus on the effect of the ion content of the buffer. During binding with CEX
materials, counter-ions compete with positively charged protein molecules for the negatively charged
binding sites on the material surface, while co-ions will form a layer around the positively charged
protein molecules and shield the protein surface. The concentration of counter-ion (Cs) is the most
critical factors in IgG/mAb binding with CEX, as protein molecules displace counter-ions on the CEX
material during the binding process. A negative effect of Cs on the binding capacity due to competitive
binding has been widely reported [104, 110-112]. The effect of co-ions on IgG/mAb binding with CEX
has been probed by a few groups [107, 113], however, its effect on local protein characteristics was not
addressed. Wrzosek et al. [113] reported a 50% decrease of mAb binding capacity for SP Sepharose
Fast Flow, when switching buffer type from phosphate buffer to phosphate citrate buffer. At the same
buffer molarity, sodium phosphate citrate buffer contains more multi-valent anions than sodium

55
phosphate buffer. It was proposed that multi-valent anions may compensate the global positive charges
of the mAb, thus weakening the electrostatic interaction with cation exchangers [107].
In this chapter, it was hypothesized that buffer co-ions will affect the binding capacity of proteins
with weak CEX membranes. Co-ions are buffer anions in the context of CEX. The hypothesis was
tested with Natrix C weak CEX membrane, employing two most common buffers with different co-ion
type, valence and chemistry, where phosphate citrate buffer contains multi-valent co-ions and acetate
buffer contains monovalent co-ions. Counter-ion concentration was also investigated with NaCl
addition, since in chapter 3 membrane swelling was impacted by NaCl addition.
The selection of co-ion and counter-ion concentration was based on Hassel’s work [38] for IgG
binding with Natrix C weak CEX membrane. Natrix C weak CEX membrane was reported to show
high salt tolerance at pH 5 [22] for mAb binding, thus pH of all buffers was fixed at 5 in this chapter.
Three proteins with different size and pI were selected, lysozyme with its relatively small molecular
size and relatively high pI, IgG with its relatively large size and low pI, and Bevacizumab as a
humanized mAb for investigating co-ion effect on mAb binding. Static protein binding was analyzed
from the equilibrium isotherms and with the Langmuir model and the SMA model to better understand
the role of ions at a molecular level. A 96-well plate platform was developed for protein binding with
membranes to facilitate the investigation to be performed in an efficient and cost-effective manner.
Throughout this document, high-throughput binding refers to binding taking place in 96-well
microplates.
4.2 Materials and methods
4.2.1 Buffers and chemicals
All buffers and solutions were prepared with ultra-purified water (with Resistivity ≥ 16 MΩ • cm).
Sodium phosphate citrate buffer was prepared by mixing citric acid (EMD Chemicals Inc., Gibbstown,
USA) solution and sodium phosphate dibasic (Fisher Scientific, Fair Lawn, USA) solution. Sodium
acetate buffer was prepared by mixing acetic acid (EMD Chemicals Inc., Gibbstown, USA) solution
and sodium acetate (EMD Chemicals Inc., Gibbstown, USA) solution. All buffers were adjusted to the
desired pH by adding approximately 1 drop of 0.1 M HCl or 0.1 M NaOH solution. This amount was
considered negligible and was not accounted in the buffer composition. Desired counter-ion
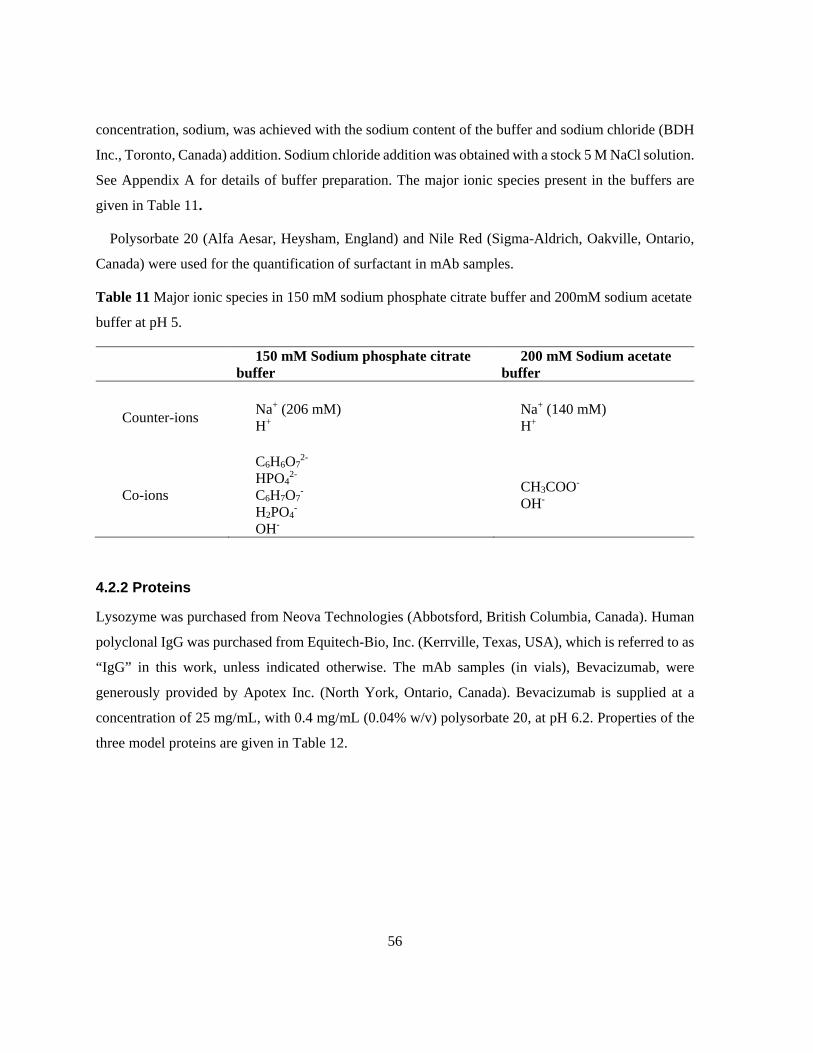
56
concentration, sodium, was achieved with the sodium content of the buffer and sodium chloride (BDH
Inc., Toronto, Canada) addition. Sodium chloride addition was obtained with a stock 5 M NaCl solution.
See Appendix A for details of buffer preparation. The major ionic species present in the buffers are
given in Table 11.
Polysorbate 20 (Alfa Aesar, Heysham, England) and Nile Red (Sigma-Aldrich, Oakville, Ontario,
Canada) were used for the quantification of surfactant in mAb samples.
Table 11 Major ionic species in 150 mM sodium phosphate citrate buffer and 200mM sodium acetate
buffer at pH 5.
150 mM Sodium phosphate citrate buffer
200 mM Sodium acetate buffer
Counter-ions Na+ (206 mM) H+
Na+ (140 mM) H+
Co-ions
C6H6O72-
HPO42-
C6H7O7-
H2PO4-
OH-
CH3COO- OH-
4.2.2 Proteins
Lysozyme was purchased from Neova Technologies (Abbotsford, British Columbia, Canada). Human
polyclonal IgG was purchased from Equitech-Bio, Inc. (Kerrville, Texas, USA), which is referred to as
“IgG” in this work, unless indicated otherwise. The mAb samples (in vials), Bevacizumab, were
generously provided by Apotex Inc. (North York, Ontario, Canada). Bevacizumab is supplied at a
concentration of 25 mg/mL, with 0.4 mg/mL (0.04% w/v) polysorbate 20, at pH 6.2. Properties of the
three model proteins are given in Table 12.

57
Table 12 Properties of lysozyme, IgG and Bevacizumab.
Properties Lysozyme [169] IgG [170] Bevacizumab [51, 52]
Molecular weight
(Mw; kDa) Around 14 Around 150 Around 149
Isoelectric point (pI) 11
Range from 4 to 9,
with a median of 6 8.3
Amino
Acid
Residues
Arginine
(pKa=12) 11 16 16
Lysine
(pKa=10.5) 6 45 45
Histidine
(pKa=6) 1 14 14
4.2.3 Membranes
Weak CEX membrane, Natrix C weak CEX membranes (disc diameter: 47 mm) were kindly provided
by Natrix Separations Inc. (Burlington, Ontario, Canada).
4.2.4 Bevacizumab dialysis and Polysorbate 20 quantification
Bevacizumab dialysis served two purposes in this work: (1) formulate Bevacizumab sample to the pH,
conductivity, and Bevacizumab concentration of the binding solution; (2) remove the surfactant
Polysorbate 20 to avoid potential interferences with the binding. The following procedure for mAb
dialysis was developed from the work of Torres et al. [171], where conductivity was used to identify
when the binding solution had reached the target conditions. The procedure for Polysorbate 20
quantification was developed from the work of Arora et al. [172].
The dialysis was done with the a 10 kDa molecular weight cutoff (MWCO) membrane with a
diameter of 25 mm, Ultracel regenerated cellulose membrane (EMD Millipore Corporation,
Massachusetts, USA), to ensure the retention of Bevacizumab. The dialysis was performed with a 10

58
mL Amicon stirred cell (EMD Millipore, Darmstadt, Germany), where nitrogen gas was used for
pressurizing the cell at 45 psi. A volume of 8 mL of Bevacizumab samples was filled in the stirred cell
and concentrated to 4 mL at first, and 4 mL of the binding buffer (phosphate citrate buffer or acetate
buffer at pH 5 and conductivity) was then added to the stirred cell. The mixture was then concentrated
to 4 mL and a second volume of binding buffer (4 mL) was added. This procedure was repeated for 3
times.
To confirm that the Bevacizumab samples were formulated to pH 5 and conductivity of the target
binding solution, pH and conductivity were measured with SevenMulti™ pH meter (METTLER
TOLEDO, Ontario, Canada). To verify that the Bevacizumab samples were retained, the UV
absorbance of Bevacizumab samples was measured before and after dialysis with the Synergy 4 multi-
detection microplate reader (BioTek Instruments, Winooski VT, US) for UV at 280 nm. mAb loss was
less than 1%.
The effectiveness of polysorbate 20 removal by dialysis was evaluated by quantifying the polysorbate
content with Nile Red through fluorescence intensity (Sigma-Aldrich, Oakville, Ontario, Canada). First
step was to generate the calibration curve of Polysorbate 20 solution (without Nile Red) in binding
buffer with a Polysorbate 20 concentration of 0.01, 0.02, 0.03, 0.04, 0.05, 0.08, 0.1, 0.2, 0.5, 0.8 and
1mg/ml. A volume of 4.1 µL Nile Red stock solution (100 µM in ethanol) was then added to 200µl
Polysorbate 20 solution in a 96-well non-binding black microplate (Greiner Bio-One, North Carolina,
USA). After equilibrating for 30 minutes on a shaker at 125 rpm, the fluorescence spectra (Excitation:
550 nm/Emission: 570 to 700 nm) for each Polysorbate 20 concentration were collected with the
Synergy 4 microplate reader, at sensitivity of 95 and emission step of 1 nm. The calibration curve
indicated that the maximum fluorescence intensity was linearly proportional to Polysorbate 20
concentration, with an R2 of 0.99. The next step was to add Nile Red to the Bevacizumab sample after
dialysis and fluorescence spectra was collected at the same conditions (Excitation: 550 nm/Emission:
570 to 700 nm) with the Synergy 4 microplate reader. The Polysorbate 20 concentration was then
calculated from the maximum fluorescence intensity using the calibration curve, which showed that
91% of Polysorbate 20 was removed. See Appendix A for calibration curves and concentration
calculation of Polysorbate 20.

59
4.2.5 Milliliter-scale static protein binding with Natrix C weak CEX membranes
Milliliter-scale static protein binding was conducted in 10 mL vials at room temperature, adapted from
Hassel and Moresoli [38] for two types of protein, lysozyme and IgG. Buffer conditions are summarized
in Table 13. The membrane sample was prepared by cutting one-eighth of a circular membrane piece
(Diameter: 47 mm), with a membrane volume of 0.06 ± 0.002 mL. The membrane volume was
calculated from the total mass of the membrane (measured in duplicates) and membrane density
(0.42275g/ml). The total sample mass was measured with a Mettler AE 100 balance (readability 0.1
mg). The membrane density was calculated by measuring the mass of the 47 mm circular membranes
(measurements in triplicate; 0.17g) piece with a known volume of 0.399 mL[38].
Experiments for each protein concentration were conducted in triplicate. The membrane sample was
first incubated in 5 mL of the desired binding buffer on a shaker (Thermo Scientific 2309 lab rotator,
Canada) at 120 rpm for 2 h. The equilibrated membrane samples were then transferred to 10 mL protein
solutions in the binding buffer, with initial concentration ranging from 0.1 mg/mL to 4 mg/mL.
Incubation time was 72 h for lysozyme and 24 h for IgG to achieve equilibrium adsorption.
Equilibration time was chosen from the work of Hassel and Moresoli [38]. At the end of the incubation,
the solution was recovered and filtered through a 0.45 μm PES syringe filter (Thermo Scientific,
Ottawa, Canada) before further analysis.
4.2.6 High-throughput static protein binding with Natrix C weak CEX membranes with microplates
The high-throughput static protein binding was performed in 96-well microplates at room temperature
for two types of proteins, IgG and Bevacizumab. Buffer conditions are presented in Table 13.
There were two considerations when investigating the membrane volume and the solution volume,
(1) the ratio of Vsolution /Vmembrane (Equation 4-1) between the milliliter-scale (ratio = 167) and the high-
throughput binding should be kept relatively constant, and (2) the solution volume should be within the
maximum working volume of 96-well microplates. Under these constraints, the appropriate membrane
volume was determined to be 0.0013 mL, while the solution volume was 0.25 mL for high-throughput
binding in this work.
Circular membrane samples (Diameter: 2.6 mm) were prepared from full size membranes (Diameter:
47 mm) and with a cork borer. The membrane volume was calculated from the total sample mass

60
(measured in duplicates with Mettler AE 100 balance, readability 0.1 mg) and membrane density
(0.42275g/ml), which was 0.0013 mL. Initial IgG concentration ranging 0.1 mg/mL to 4 mg/mL, or
initial Bevacizumab concentration ranging from 0.5 mg/mL to 10 mg/mL were prepared through
dilution from the stock IgG solution (4 mg/mL) or stock Bevacizumab solution (10 mg/mL). Binding
experiments for each protein concentration were conducted in triplicate.
High-throughput binding was performed with 96-well non-binding clear microplates (Greiner Bio-
One, North Carolina, USA) on the shaker at 200 rpm. The equilibration time of membrane in buffer
without protein was 1 h and the binding time was determined from time course experiments. Time
course experiment for high-throughput binding was performed with IgG (C0= 3 mg/mL) in 150 mM
phosphate citrate buffer and 200 mM acetate buffer at pH 5, in triplicates.
A different set of high-throughput binding experiments was performed to evaluate if filtration was
required in order to remove potential protein aggregates formed during the binding experiment.
MultiScreen HTS 96-well filter plates with 0.45 μm PVDF membranes (EMD Millipore Corporation,
Massachusetts, USA) were used. In this set of experiment, after equilibration with the buffer for 1h,
Natrix C weak CEX membrane samples were recovered from the buffer by centrifugation 60 g for 2
minutes, with Eppendorf centrifuge 5804R (Hamburg, Germany). A volume of 200 μL IgG solutions
with various concentration were then added to each well with equilibrated membrane pieces. After
binding, IgG solutions were filtered out at 60 g for 2 minutes and the filtrates were collected for further
analysis.
4.2.7 Protein Quantification
Quantification of lysozyme, IgG and Bevacizumab was obtained by UV absorbance at 280 nm.
Calibration curve for each protein was constructed for protein concentrations ranging from 0.1 mg/mL
to 2 mg/mL. For lysozyme and IgG, the calibration curve was linear for concentration up to 1 mg/mL.
For Bevacizumab samples, the calibration curve was linear for concentration up to 2 mg/mL.
Calibration curves were prepared for each set of experiments for each protein.
For milliliter-scale binding, the absorbance at 280 nm was determined with a UV-vis
spectrophotometer (Spectronic GENESYS 5, Thermo Scientific, Waltham, USA). At the end of a
binding experiment, a 2 mL volume of the solution was transferred to quartz cuvettes (Fisher Scientific,

61
Fair Lawn, USA), and the UV absorbance was measured at 280 nm. Protein concentration was
calculated based on the calibration curve.
For high-throughput binding, the protein concentration was determined with a Synergy 4 multi-
detection microplate reader (BioTek Instruments, Winooski VT, US). A volume of 150 µL of the
binding solution was transferred to 96-well UV transparent plates (EMD Millipore, Darmstadt,
Germany) and the UV absorbance was measured at 280 nm. Protein concentration was calculated based
on the calibration curve.
4.2.8 Determination of static protein binding capacity
The static protein binding capacity was calculated from Equation 4-1,
qe = (C0 − Ce) (Vsolution
Vmembrane) Equation 4-1
where qe is the static protein binding capacity at equilibrium (mg/mL); C0 is the initial protein
concentration (mg/mL); Ce is the equilibrium protein concentration (mg/mL); Vsolution is the total volume
of binding buffer (mL); and Vmembrane is the volume of the membrane piece (mL). See Appendix F for
calculation example.
Note that the membrane volume used for calculating protein binding capacity in this work is the dry
membrane volume, same as other work using the same membrane material [22, 173]. Protein binding
capacity is largely dependent on the ion exchange capacity of the membrane, which is the number of
active binding sites on the ion exchanger and was determined to be 204 mM for Natrix C weak CEX
membrane based on the dry membrane volume [173]. Static binding capacity is the maximum amount
of protein bound to the ion exchanger at given buffer conditions and protein concentration conditions,
where protein is overloaded and should be able to bind to the surface of the ion exchanger as well as
the inner pores.

62
4.2.9 Statistical analysis
Analysis of variance (ANOVA) was employed for statistical analysis at a confidence interval of 95%.
Paired two-sample t-test was employed for statistical analysis at a confidence interval of 95%.
4.2.10 Summary of experimental conditions
Table 13 Buffer conditions, model proteins and experimental conditions for static protein binding at
pH 5 with Natrix C weak CEX membranes presented in Chapter 4.
Section
Buffer Model
Protein Experimental conditions Type Molarity
(mM)
Sodium concentration
(mM) 4.4.1 phosphate
citrate 150 206 Langmuir IgG,
lysozyme Milliliter-scale
acetate 200 140 Langmuir 4.4.2 phosphate
citrate 150 206 N/A IgG Milliliter-scale
and high-throughput acetate 200 140
4.4.3 phosphate citrate
150 206, 256*, 306*
Langmuir, modified Langmuir and SMA
IgG High-throughput
acetate 200 206*, 256*, 306*
SMA
acetate 200 140, 190*, 240*
Modified Langmuir
4.4.4 phosphate citrate
100 140 N/A Bevacizumab High-throughput
acetate 200 140
* with NaCl addition
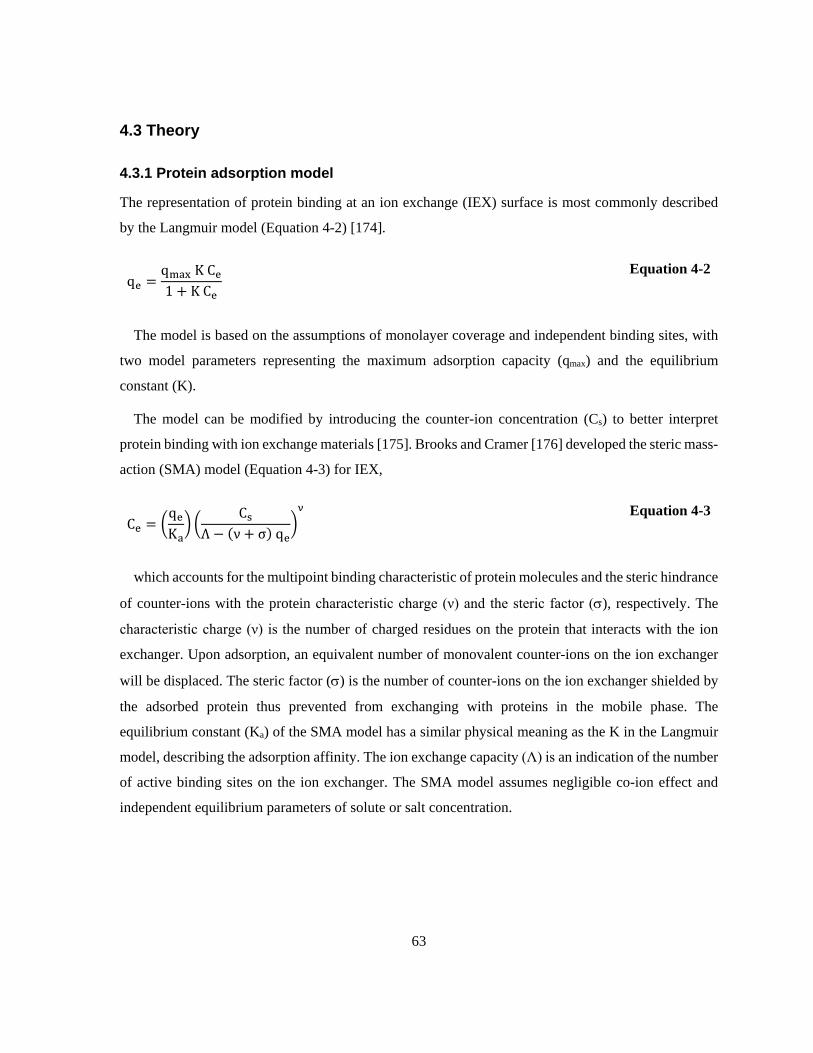
63
4.3 Theory
4.3.1 Protein adsorption model
The representation of protein binding at an ion exchange (IEX) surface is most commonly described
by the Langmuir model (Equation 4-2) [174].
qe =qmax K Ce1 + K Ce
Equation 4-2
The model is based on the assumptions of monolayer coverage and independent binding sites, with
two model parameters representing the maximum adsorption capacity (qmax) and the equilibrium
constant (K).
The model can be modified by introducing the counter-ion concentration (Cs) to better interpret
protein binding with ion exchange materials [175]. Brooks and Cramer [176] developed the steric mass-
action (SMA) model (Equation 4-3) for IEX,
Ce = qeKa
CsΛ − (ν + σ) qe
ν
Equation 4-3
which accounts for the multipoint binding characteristic of protein molecules and the steric hindrance
of counter-ions with the protein characteristic charge (ν) and the steric factor (σ), respectively. The
characteristic charge (ν) is the number of charged residues on the protein that interacts with the ion
exchanger. Upon adsorption, an equivalent number of monovalent counter-ions on the ion exchanger
will be displaced. The steric factor (σ) is the number of counter-ions on the ion exchanger shielded by
the adsorbed protein thus prevented from exchanging with proteins in the mobile phase. The
equilibrium constant (Ka) of the SMA model has a similar physical meaning as the K in the Langmuir
model, describing the adsorption affinity. The ion exchange capacity (Λ) is an indication of the number
of active binding sites on the ion exchanger. The SMA model assumes negligible co-ion effect and
independent equilibrium parameters of solute or salt concentration.

64
4.3.2 Model parameter estimation and parameter sensitivity analysis
Experimental static protein adsorption data (High-throughput binding) were fitted with two adsorption
models, the Langmuir model (Equation 4-2) and the SMA model (Equation 4-3).
The Langmuir model parameters, the maximum adsorption capacity (qmax) and the equilibrium constant
(K), were estimated with the least squares approach (MATLAB, R2016b).
The SMA model parameters, protein characteristic charge (ν), steric factor (σ), and equilibrium
constant (Ka) were estimated with fzero and nlinfit (MATLAB, R2016b) (See Appendix C). The ion
exchange capacity (Λ) was determined to be 204 mM [38, 173] for Natrix C weak CEX membrane.
The coefficient of determination R2 was used as an indication of goodness of fit of the model. Parameter
sensitivity analysis for the SMA model was conducted for IgG adsorption with Natrix C weak CEX
membrane in phosphate citrate buffer at low Na+ concentration (206 mM) and high Na+ concentration
(306 mM). The protein binding capacity at equilibrium (qe) was estimated by varying each parameter
(ν, Ka or σ) by ±20% based on the estimated value, while keeping other parameters constant.
4.4 Results and discussion
The effect of buffer co-ions obtaiend by selecting two different buffers and counter-ions obtained by
sodium concentration was evaluated for IgG/mAb binding with Natrix C weak CEX membrane.
Binding experiments were performed according to the experimental conditions presented in Table 13.
The effect of protein size and pI and buffer conditions on adsorption with Natrix C weak CEX
membrane will be first investigated with IgG and lysozyme. After validating the high-throughput
format for IgG binding with CEX membrane, investigations on the effect of buffer on IgG binding will
be performed with the assistance of the Langmuir model and SMA model and a binding mechanism
will be proposed. Lastly, the effect of buffer type (co-ion) on the binding capacity of Bevacizumab with
Natrix C weak CEX membrane will be investigated and compared with IgG.
4.4.1 Effect of buffer conditions on static protein binding for lysozyme and IgG
The first step was to investigate the effect of protein size and pI and buffer conditions on adsorption
with Natrix C weak CEX membrane. Lysozyme is selected as a model protein for its relatively small
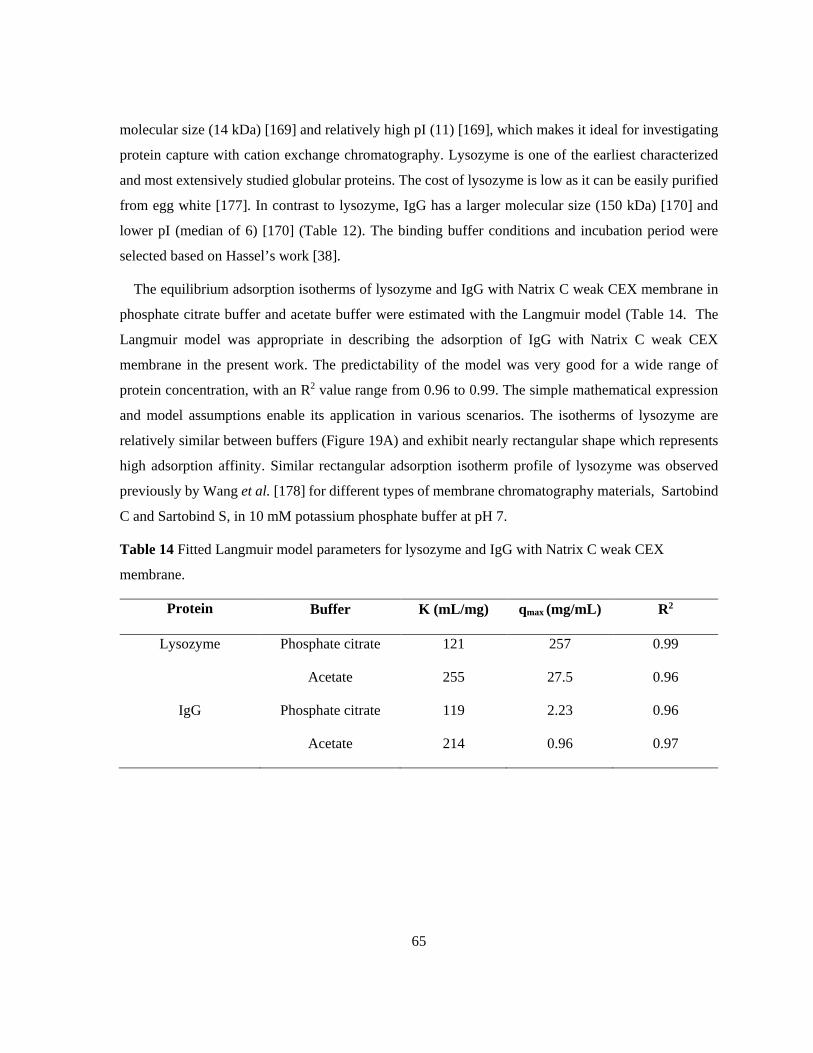
65
molecular size (14 kDa) [169] and relatively high pI (11) [169], which makes it ideal for investigating
protein capture with cation exchange chromatography. Lysozyme is one of the earliest characterized
and most extensively studied globular proteins. The cost of lysozyme is low as it can be easily purified
from egg white [177]. In contrast to lysozyme, IgG has a larger molecular size (150 kDa) [170] and
lower pI (median of 6) [170] (Table 12). The binding buffer conditions and incubation period were
selected based on Hassel’s work [38].
The equilibrium adsorption isotherms of lysozyme and IgG with Natrix C weak CEX membrane in
phosphate citrate buffer and acetate buffer were estimated with the Langmuir model (Table 14. The
Langmuir model was appropriate in describing the adsorption of IgG with Natrix C weak CEX
membrane in the present work. The predictability of the model was very good for a wide range of
protein concentration, with an R2 value range from 0.96 to 0.99. The simple mathematical expression
and model assumptions enable its application in various scenarios. The isotherms of lysozyme are
relatively similar between buffers (Figure 19A) and exhibit nearly rectangular shape which represents
high adsorption affinity. Similar rectangular adsorption isotherm profile of lysozyme was observed
previously by Wang et al. [178] for different types of membrane chromatography materials, Sartobind
C and Sartobind S, in 10 mM potassium phosphate buffer at pH 7.
Table 14 Fitted Langmuir model parameters for lysozyme and IgG with Natrix C weak CEX
membrane.
Protein Buffer K (mL/mg) qmax (mg/mL) R2
Lysozyme Phosphate citrate 121 257 0.99
Acetate 255 27.5 0.96
IgG Phosphate citrate 119 2.23 0.96
Acetate 214 0.96 0.97

66
Figure 19 Adsorption isotherms for (A) lysozyme and (B) IgG with Natrix C weak CEX membrane
in 150 mM phosphate citrate buffer and 200 mM acetate buffer at pH 5. The curves represent
estimates with the Langmuir model. Error bars represent standard error (n=3).

67
The profile of the adsorption isotherms for IgG with Natrix C weak CEX membrane in 150 mM
phosphate citrate buffer and 200 mM acetate buffer at pH 5 (Figure 19B) are distinct from that of
lysozyme, with lower saturation level and smaller slope, demonstrated by the lower estimated qmax and
K value. The lower saturation level of IgG is due to its large size which induce stronger steric hindrance
effect [179] during binding. Small proteins such as lysozyme also have a higher accessibility of active
binding sites on the membrane [180]. The smaller slope reflects lower adsorption affinity, which may
come from their differences in pI and amino acid composition (Table 12). Lysozyme has a higher pI
(pI=11) therefore it is more positively charged than IgG (pI: 4~9) at pH 5. The higher content of arginine
residues in lysozyme may also contribute to the strong affinity, since arginine is the major contributor
for binding with cation exchangers [181].
The nature of the buffer did not translate in differences of the adsorption process for lysozyme,
possibly due to its strong binding affinity, where significant differences were observed for adsorption
curves for IgG. Lysozyme is not ideal for investigating co-ion effect, which is present when
investigating IgG binding. Further investigation of the buffer effects of protein adsorption with Natrix
C weak CEX membranes was pursued only for IgG as it is a better representation of mAb than
lysozyme. A high-throughput platform for IgG binding with membranes was developed to ensure the
investigation performed in an efficient and cost effective manner and will be discussed in the next
section.
4.4.2 Validation of high-throughput IgG binding with CEX membrane
Down-scaling the IgG binding process from milliliter-scale to microscale will enable the rapid
investigation of buffer effects but should not compromise the quality of the experimentation. The
equilibrium binding time, the membrane volume, the solution volume and filtration methods were
investigated.
The equilibrium binding time for the microscale format was determined with phosphate citrate buffer
(150 mM) and acetate buffer (200 mM) at pH 5. The equilibrium binding time determined from a time
course experiment was 6 h for high-throughput IgG binding in both buffer types (Figure 20), compared
to 24 h for milliliter-scale IgG binding [38].

68
Figure 20 Time course experiment for high-throughput IgG binding (C0= 3 mg/mL) with 150 mM
phosphate citrate buffer and 200 mM acetate buffer at pH 5. Error bars represent standard deviation
(n=3).
69
High-throughput IgG binding was validated by comparing the IgG static binding capacity for the
high-throughput system (without filtration) to the milliliter-scale system in both buffer types (Figure
21). The trend of IgG binding capacities changing with equilibrium IgG concentrations in high-
throughput system appears to match that in milliliter-scale system in both buffer types, which indicated
that high-throughput system was appropriate in investigating IgG binding with Natrix C weak CEX
membrane [164, 182].

70
Figure 21 IgG static binding at milliliter-scale and high-throughput (without filtration) in 150 mM
phosphate citrate buffer (A) and 200 mM acetate buffer (B) for initial IgG concentration ranging from
0.25 mg/mL to 4 mg/mL. Error bars represent standard deviation (n=3).
IgG static binding capacity was compared for high-throughput IgG binding without filtration and
with filtration in 150 mM phosphate citrate buffer at pH 5, the trend of IgG binding capacities changing
with equilibrium IgG concentrations for IgG binding without filtration appears to match that for IgG
binding with filtration, with less than 20% difference on average. Therefore high-throughput binding
without filtration was adopted for the following work in this chapter as a high-throughput method for
buffer investigation.

71
Figure 22 IgG high-throughput binding without and with filtration were compared in terms of
binding capacities in 150 mM phosphate citrate buffer at pH 5 with initial concentrations of 0.5, 1 and
3 mg/mL. Error bars represent standard deviation (n=3).
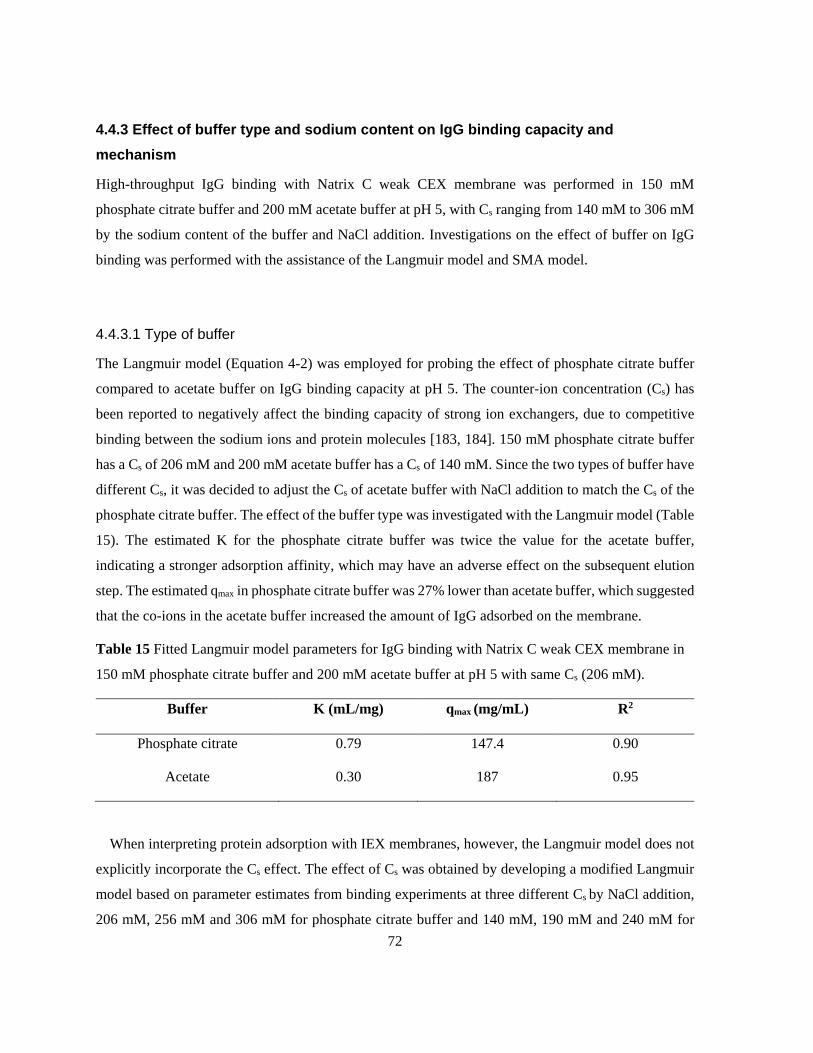
72
4.4.3 Effect of buffer type and sodium content on IgG binding capacity and mechanism
High-throughput IgG binding with Natrix C weak CEX membrane was performed in 150 mM
phosphate citrate buffer and 200 mM acetate buffer at pH 5, with Cs ranging from 140 mM to 306 mM
by the sodium content of the buffer and NaCl addition. Investigations on the effect of buffer on IgG
binding was performed with the assistance of the Langmuir model and SMA model.
4.4.3.1 Type of buffer
The Langmuir model (Equation 4-2) was employed for probing the effect of phosphate citrate buffer
compared to acetate buffer on IgG binding capacity at pH 5. The counter-ion concentration (Cs) has
been reported to negatively affect the binding capacity of strong ion exchangers, due to competitive
binding between the sodium ions and protein molecules [183, 184]. 150 mM phosphate citrate buffer
has a Cs of 206 mM and 200 mM acetate buffer has a Cs of 140 mM. Since the two types of buffer have
different Cs, it was decided to adjust the Cs of acetate buffer with NaCl addition to match the Cs of the
phosphate citrate buffer. The effect of the buffer type was investigated with the Langmuir model (Table
15). The estimated K for the phosphate citrate buffer was twice the value for the acetate buffer,
indicating a stronger adsorption affinity, which may have an adverse effect on the subsequent elution
step. The estimated qmax in phosphate citrate buffer was 27% lower than acetate buffer, which suggested
that the co-ions in the acetate buffer increased the amount of IgG adsorbed on the membrane.
Table 15 Fitted Langmuir model parameters for IgG binding with Natrix C weak CEX membrane in
150 mM phosphate citrate buffer and 200 mM acetate buffer at pH 5 with same Cs (206 mM).
Buffer K (mL/mg) qmax (mg/mL) R2
Phosphate citrate 0.79 147.4 0.90
Acetate 0.30 187 0.95
When interpreting protein adsorption with IEX membranes, however, the Langmuir model does not
explicitly incorporate the Cs effect. The effect of Cs was obtained by developing a modified Langmuir
model based on parameter estimates from binding experiments at three different Cs by NaCl addition,
206 mM, 256 mM and 306 mM for phosphate citrate buffer and 140 mM, 190 mM and 240 mM for

73
acetate buffer. We have adopted the approach developed by Shekhawat et.al [185], where the Langmuir
kinetic model was modified by representing the adsorption rate constant as a non-linear function of Cs.
Their modified model gave a better prediction of mAbs adsorption with IEX membranes than the SMA
model. In the current work, a linear relationship was found between model parameters and Cs for a
given buffer type, phosphate citrate buffer (Equation 4-4) and acetate buffer (Equation 4-5).
Phosphate citrate buffer 𝑞𝑞𝑚𝑚𝑚𝑚𝑚𝑚 = −0.87 𝐶𝐶𝑠𝑠 + 305.4 (𝑅𝑅2 = 0.98)
𝐾𝐾 = −0.012 𝐶𝐶𝑠𝑠 + 4.272 (𝑅𝑅2 = 1)
Equation
4-4
Acetate buffer 𝑞𝑞𝑚𝑚𝑚𝑚𝑚𝑚 = −1.55 𝐶𝐶𝑠𝑠 + 474.5 (𝑅𝑅2 = 0.99)
𝐾𝐾 = 0.0096 𝐶𝐶𝑠𝑠 − 0.824 (𝑅𝑅2 = 0.99)
Equation
4-5
For both buffers, the estimated qmax decreased linearly with Cs, which agreed with the role of the
counter-ions as competitive binding and causing membrane pore shrinkage for CEX materials. The
estimated K decreased with Cs (206 mM to 306 mM) for phosphate citrate buffer, while increased with
Cs (140 mM to 240 mM) for the acetate buffer, which indicated that moderate Cs may improve protein
transport by compressing the electrical double layer of Natrix C weak CEX membrane [186].
Substituting Equation 4-4 and Equation 4-5 into the original Langmuir model gives the modified
Langmuir model for phosphate citrate buffer and acetate buffer, respectively. The estimated adsorption
isotherms of IgG and Natrix C weak CEX membrane from the modified model and the original
Langmuir model was illustrated in Figure 23. Deviation at high Cs in phosphate citrate buffer implied
the limitation of the modified Langmuir model at high Cs condition.

74
Figure 23 Adsorption isotherms of IgG with Natrix C weak CEX membrane in (A) pH 5 phosphate
citrate buffer and (B) pH 5 acetate buffer in high-throughput system, according to different Na+
concentration. The curves represent estimates with the Langmuir model and the modified Langmuir
model. Error bars represent standard error (n=3).
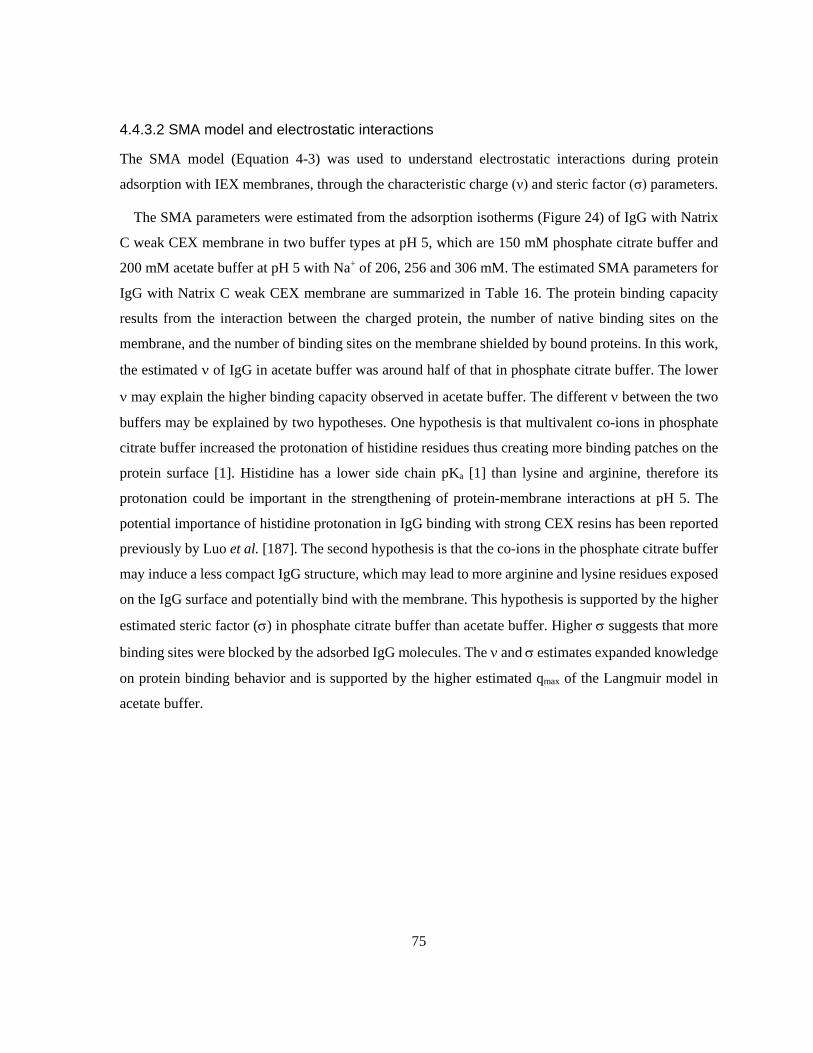
75
4.4.3.2 SMA model and electrostatic interactions
The SMA model (Equation 4-3) was used to understand electrostatic interactions during protein
adsorption with IEX membranes, through the characteristic charge (ν) and steric factor (σ) parameters.
The SMA parameters were estimated from the adsorption isotherms (Figure 24) of IgG with Natrix
C weak CEX membrane in two buffer types at pH 5, which are 150 mM phosphate citrate buffer and
200 mM acetate buffer at pH 5 with Na+ of 206, 256 and 306 mM. The estimated SMA parameters for
IgG with Natrix C weak CEX membrane are summarized in Table 16. The protein binding capacity
results from the interaction between the charged protein, the number of native binding sites on the
membrane, and the number of binding sites on the membrane shielded by bound proteins. In this work,
the estimated ν of IgG in acetate buffer was around half of that in phosphate citrate buffer. The lower
ν may explain the higher binding capacity observed in acetate buffer. The different ν between the two
buffers may be explained by two hypotheses. One hypothesis is that multivalent co-ions in phosphate
citrate buffer increased the protonation of histidine residues thus creating more binding patches on the
protein surface [1]. Histidine has a lower side chain pKa [1] than lysine and arginine, therefore its
protonation could be important in the strengthening of protein-membrane interactions at pH 5. The
potential importance of histidine protonation in IgG binding with strong CEX resins has been reported
previously by Luo et al. [187]. The second hypothesis is that the co-ions in the phosphate citrate buffer
may induce a less compact IgG structure, which may lead to more arginine and lysine residues exposed
on the IgG surface and potentially bind with the membrane. This hypothesis is supported by the higher
estimated steric factor (σ) in phosphate citrate buffer than acetate buffer. Higher σ suggests that more
binding sites were blocked by the adsorbed IgG molecules. The ν and σ estimates expanded knowledge
on protein binding behavior and is supported by the higher estimated qmax of the Langmuir model in
acetate buffer.

76
Figure 24 Adsorption isotherms of IgG with Natrix C weak CEX membrane in 150 mM phosphate
citrate buffer and 200 mM acetate buffer at pH 5 with three Na+ conditions (from top to bottom curve
for each buffer type: 206, 256 and 306 mM) in high-throughput system. The curves represent estimates
with the SMA model. Error bars represent standard error (n=3).
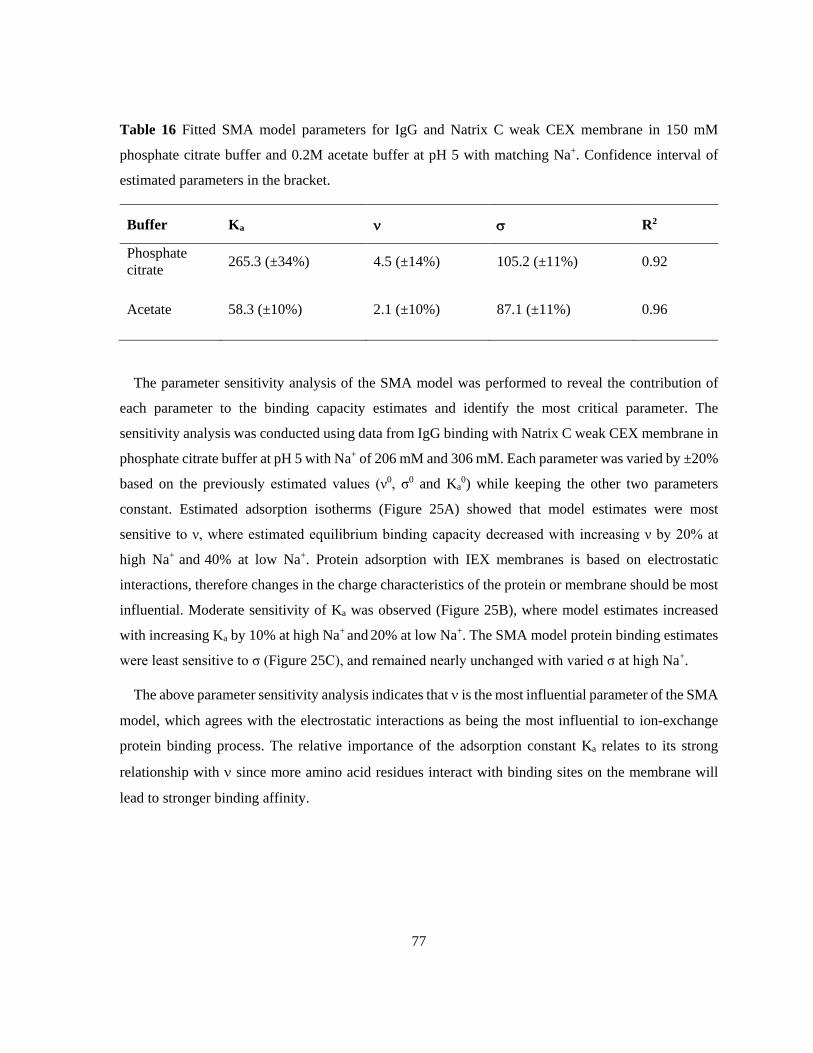
77
Table 16 Fitted SMA model parameters for IgG and Natrix C weak CEX membrane in 150 mM
phosphate citrate buffer and 0.2M acetate buffer at pH 5 with matching Na+. Confidence interval of
estimated parameters in the bracket.
Buffer Ka ν σ R2
Phosphate citrate 265.3 (±34%) 4.5 (±14%) 105.2 (±11%) 0.92
Acetate 58.3 (±10%) 2.1 (±10%) 87.1 (±11%) 0.96
The parameter sensitivity analysis of the SMA model was performed to reveal the contribution of
each parameter to the binding capacity estimates and identify the most critical parameter. The
sensitivity analysis was conducted using data from IgG binding with Natrix C weak CEX membrane in
phosphate citrate buffer at pH 5 with Na+ of 206 mM and 306 mM. Each parameter was varied by ±20%
based on the previously estimated values (ν0, σ0 and Ka0) while keeping the other two parameters
constant. Estimated adsorption isotherms (Figure 25A) showed that model estimates were most
sensitive to ν, where estimated equilibrium binding capacity decreased with increasing ν by 20% at
high Na+ and 40% at low Na+. Protein adsorption with IEX membranes is based on electrostatic
interactions, therefore changes in the charge characteristics of the protein or membrane should be most
influential. Moderate sensitivity of Ka was observed (Figure 25B), where model estimates increased
with increasing Ka by 10% at high Na+ and 20% at low Na+. The SMA model protein binding estimates
were least sensitive to σ (Figure 25C), and remained nearly unchanged with varied σ at high Na+.
The above parameter sensitivity analysis indicates that ν is the most influential parameter of the SMA
model, which agrees with the electrostatic interactions as being the most influential to ion-exchange
protein binding process. The relative importance of the adsorption constant Ka relates to its strong
relationship with ν since more amino acid residues interact with binding sites on the membrane will
lead to stronger binding affinity.

78
Figure 25 Parameter sensitivity analysis for SMA model parameters in high-throughput system: (A)
characteristic charge (ν); (B) equilibrium constant (Ka); and (C) steric factor (σ) with pH 5 phosphate
citrate buffer at low and high Cs. Error bars represent standard error (n=3).

79
4.4.3.3 Binding mechanism of IgG binding
Based on the analysis of IgG binding with Natrix C weak CEX membrane at pH 5 and two different
buffers, phoshphate citrate buffer with multi-valent co-ions and acetate buffer with monovalent co-ions,
a schematic diagram of binding mechanism is proposed to represent the effect of counter-ions (Figure
26) and the effect of co-ions and (Figure 27). It was proposed that buffer counter-ions compete with
the protein molecules for the available sites on the membrane surface, which may result in decreased
binding capacity, which was supported by estimated parameters of the Langmuir model and the SMA
model (Figure 26). It was hypothesized that multivalent co-ions of the buffer may facilitate the binding
process by strengthening the electrostatic interactions between the protein and the membrane (Figure
27), compared to monovalent co-ions. In this work, it was proposed that buffer ions could potentially
affect the number of charged residues on variable regions of IgG and the conformation of bounded IgG
when interacting with CEX membranes, based on the estimated parameters of the SMA model (Figure
27). In the diagram we are representing the binding take place between the variable region of IgG and
the membrane surface, as proposed by a few groups [25, 26, 188]. Through peptide mapping, a few
groups have predicted that IgG/mAb binds to CEX materials through the variable regions [25, 26, 188].

80
Figure 26 Illustration of the IgG binding mechanism with weak cation exchange membranes in the
context of counter-ion effect.
81
Figure 27 Illustration of the IgG binding mechanism with weak cation exchange membranes in the
context of co-ion effect.

82
4.4.4 Effect of buffer type on Bevacizumab binding capacity
The humanized mAb, Bevacizumab, is a therapeutic mAb for metastatic colorectal cancer treatment
[49]. Investigations on buffer effects on Bevacizumab binding with Natrix C weak CEX membrane will
help with buffer selections for improved binding capacity. Recent advances in cell culture technology
have prompted cell lines with high-growth characteristics, high cell specific productivity and high cell
stability. which leads to high antibody titers up to 10 mg/mL [4, 5]. In this work, preliminary work was
conducted with 0.5 mg/mL to 3 mg/mL and subsequent work was conducted with Bevacizumab with
initial concentration between 0.5 mg/mL to 10 mg/mL.
High-throughput Bevacizumab static binding with Natrix C weak CEX membrane was performed
with 96-well microplates to investigate differences in binding capacity between the phosphate citrate
and acetate buffer. The binding buffer conditions employed were 100 mM phosphate citrate buffer and
200mM acetate buffer at pH 5. The Na+ concentration of the two buffer solutions was adjusted to 140
mM through NaCl addition. The equilibrium binding time for Bevacizumab with Natrix C weak CEX
membrane was determined from a time course experiment in high-throughput format, where
Bevacizumab samples with an initial concentration of 0.5 mg/mL and 3 mg/mL (Figure 28). For
Bevacizumab samples with an initial concentration of 0.5 mg/mL, the equilibrium binding capacity did
not change with time for both buffer types, which showed that the equilibrium binding time for
Bevacizumab samples with very low concentration is 1 hour. For samples with an initial concentration
of 3 mg/mL, the binding capacity started to level off after 6 hours in both buffer types, which showed
that the equilibrium binding time for Bevacizumab samples with higher concentration is 6 hours. In the
following sections, binding time of 6 hours were employed for Bevacizumab binding with Natrix C
weak CEX membrane, which was the same time for high-throughput IgG binding with Natrix C weak
CEX membrane.

83
Figure 28 Time course experiment for high-throughput Bevacizumab binding (C0= 0.5 and 3 mg/mL)
with 100 mM phosphate citrate buffer and 200mM acetate buffer, both at pH 5 and Cs 140 mM. Error
bars represent standard deviation (n=3).

84
The binding of Natrix C weak CEX membrane and Bevacizumab with initial concentration between
0.5 mg/mL to 10 mg/mL was investigated (Figure 29). The equilibrium binding capacity of
Bevacizumab were comparable for the two buffer types when the initial Bevacizumab concentration
was no higher than 7 mg/mL (t-test, 95%, P = .18). At initial Bevacizumab concentration of 7 mg/mL,
the equilibrium binding capacity of Bevacizumab in phosphate citrate buffer was 156 mg/mL, and 151
mg/mL in acetate buffer. When the initial Bevacizumab concentration was higher than 7 mg/mL,
however, the equilibrium binding capacity was significantly higher in acetate buffer compared to the
phosphate citrate buffer (t-test, 95%, P = .01). At initial Bevacizumab concentration of 10 mg/mL, the
equilibrium binding capacity of Bevacizumab in phosphate citrate buffer was 253 mg/mL, and 340
mg/mL in acetate buffer.
The equilibrium binding capacity of Bevacizumab in 200 mM acetate buffer at pH 5 were
significantly lower than IgG (t-test, 95%, P = .01). The differences in binding capacity may come from
their differences in structure. Polyclonal antibodies contain antibodies with various variable regions
while mAbs contain only one type of variable region. Several research groups have suggested that CEX
material binds with the basic amino acid residues on the variable region of heavy chain (VH) of
IgG/mAb [25, 26]. It may be speculated that the higher binding capacity of IgG than Bevacizumab may
result from the larger number of basic amino acid residues on the various variable regions of IgG.
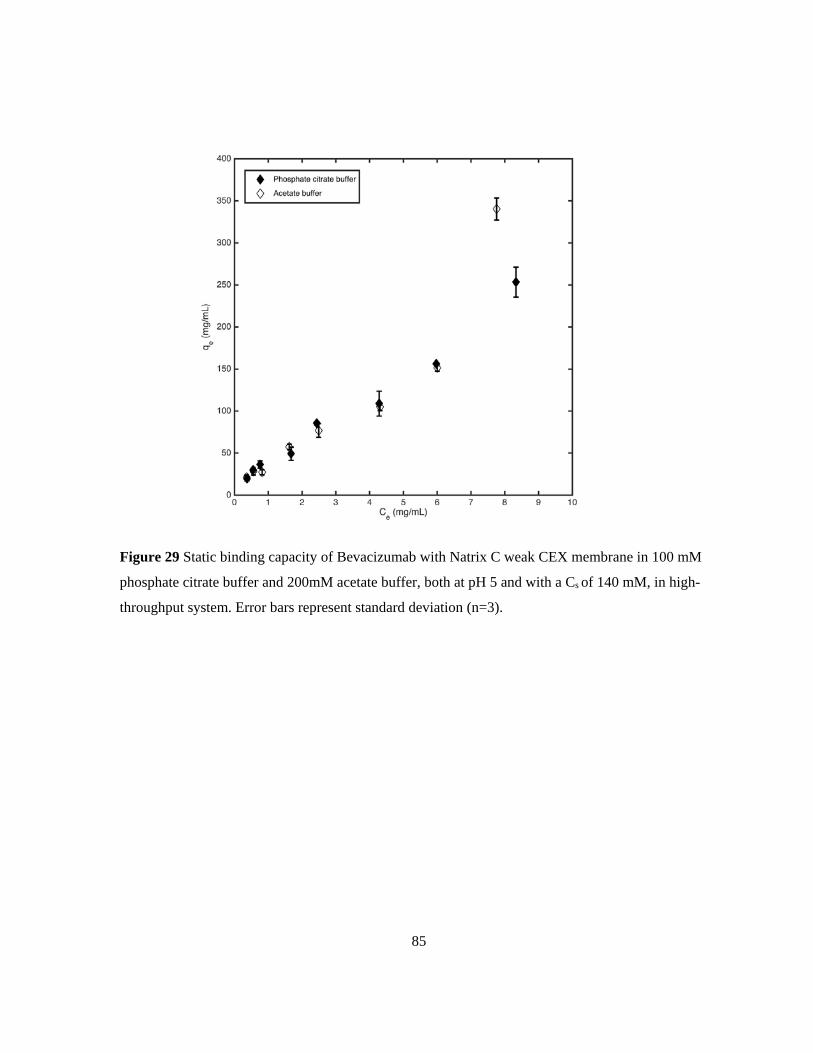
85
Figure 29 Static binding capacity of Bevacizumab with Natrix C weak CEX membrane in 100 mM
phosphate citrate buffer and 200mM acetate buffer, both at pH 5 and with a Cs of 140 mM, in high-
throughput system. Error bars represent standard deviation (n=3).

86
4.5 Conclusion
In this chapter, CEX membranes were employed as an alternative to Protein-A for mAb capture.
Furthermore, weak cation exchange membranes were selected for their ability to display different
charges to different buffer pH and ion conditions. Specifically, the role of buffer co-ion (chemistry and
valence) on the static binding of IgG and Bevacizumab with a weak CEX membrane, Natrix C weak
CEX membrane was probed in a high-throughput system. In contrast to Protein-A materials, protein
binding with CEX materials is proposed to take place on the variable regions of antibodies [25, 26]
through electrostatic interactions, therefore it was critical to investigate buffer effects on CEX binding
with IgG/mAb. IgG was employed as the model protein for its cheap cost and availability in large
quantity, and Bevacizumab was employed because it’s an humanized mAb with only one type of
variable region. The two buffers of interest were phosphate citrate buffer and acetate buffer, that were
commonly used in CEX for the polishing step of mAb purification in the industry, as well as for mAb
capture in the literature [12, 13, 16, 18]. The Natrix C weak CEX membrane was reported to show high
salt tolerance at pH 5 [22], thus pH of all buffer solutions was fixed at 5 in this chapter. Phosphate
citrate buffer contains various multivalent co-ions, including C6H6O72- and HPO4
2-, whereas acetate
buffer contains only monovalent co-ions.
The equilibrium adsorption isotherms estimated with the Langmuir model for IgG with Natrix C
weak CEX membrane in phosphate citrate buffer and acetate buffer showed a significant effect of buffer
type on the adsorption behaviors for IgG with Natrix C weak CEX membranes. In order to carry on
extensive investigations on buffer effects in an efficient and economical way, a high-throughput
microscale platform using 96 well microplates for IgG binding with membranes was developed. The
high-throughput format was successfully validated against the milliliter-scale format.
Two adsorption models, the Langmuir model and the SMA model, were employed for probing the
buffer effects on the binding capacity of IgG with Natrix C weak CEX. The Langmuir model indicated
higher binding capacity in acetate buffer, while stronger adsorption affinity in phosphate citrate buffer.
To incorporate the effect of salt for protein adsorption with ion exchange membranes, a modified
Langmuir model was developed by correlating model parameters with salt concentrations. The SMA
model was employed to help understand the protein adsorption with ion exchange membranes at a
molecular level. The estimated ν of IgG in acetate buffer was around half of that in phosphate citrate
buffer, which indicated higher binding capacity in acetate buffer. It was proposed that the higher ν in
phosphate citrate buffer was a result of improved protonation of histidine residues, due to the higher

87
valence of co-ions in phosphate citrate buffer. It was also proposed that co-ions in phosphate citrate
buffer induced less compact IgG structure, as the higher σ in phosphate citrate buffer would mean more
hindered binding sites of the membrane.
The investigation of buffer type was then conducted with the Bevacizumab. The equilibrium binding
capacities were comparable between the two buffer types when the initial Bevacizumab concentration
was below 7 mg/mL, while it was significantly higher in acetate buffer when the initial concentration
was above 7 mg/mL.
In conclusion, to achieve a higher binding capacity of polyclonal IgG or humanized mAb with weak
cation exchange membranes, acetate buffer is preferred over phosphate citrate buffer, especially for
samples with high concentration.

88
Chapter 5 Developing a high-throughput intrinsic fluorescence microplate method for the detection of IgG/mAb unfolding
5.1 Introduction
The effect of buffer on the static binding of IgG and Bevacizumab with a weak CEX membrane was
examined in the previous chapter. In this chapter we have pursued the investigation of the effect of
buffer on IgG/mAb, where our attention focused on the thermal treatment and the associated potential
unfolding. We have used the experimental conditions, IgG in 10 mM PBS buffer, pH7, and the
corresponding intrinsic fluorescence observations reported by Ohadi et al. [125] for a cuvette
spectrofluorometer. These experimental conditions were used to develop a microplate reader method
to monitor the unfolding of IgG and Bevacizumab when heated at 60°C in 100 mM phosphate citrate
buffer, pH 5, representing a common buffer in weak CEX chromatography. Size-exclusion liquid
chromatography (SE-HPLC) was also used as it is the standard method for characterizing protein
aggregates, which allows the separation and quantification of protein dimers, trimers and oligomers.
One of the major pathways of protein aggregation is through partial unfolding proteins whose
interactions lead to the formation of protein aggregates, therefore characterizing the degree of protein
unfolding can be indicative of the degree of protein aggregation [114]. Intrinsic fluorescence
spectroscopy has gained interest as a fast and non-invasive analytical method for the detection of
IgG/mAb unfolding [115, 124-128].
Different laboratory fluorescence systems exist that differ primarily according to the type of light
source and the path of the light source in addition to the volume of the sample required for analysis.
These characteristics will be summarized in the following sections followed by a discussion on these
systems for the detection of IgG/mAb unfolding. Two fluorescence systems will be discussed, the
cuvette fluorescence spectrometer which offers high sensitivity and accuracy, but is more time-
consuming and material-consuming and the fluorescence microplate reader. The equipment used in this
work, Cary Eclipse spectrofluorometer and Synergy 4 multi-mode microplate reader, were used as
examples for comparison here.
(1) Light source and position
The light source of the Cary Eclipse cuvette spectrofluorometer is a xenon lamp, while the Synergy
4 multi-mode fluorescence microplate reader offers the options of a xenon lamp and a tungsten lamp
[189, 190]. The tungsten lamp is a less sensitive but cheaper alternative for the xenon lamp. For a Cary
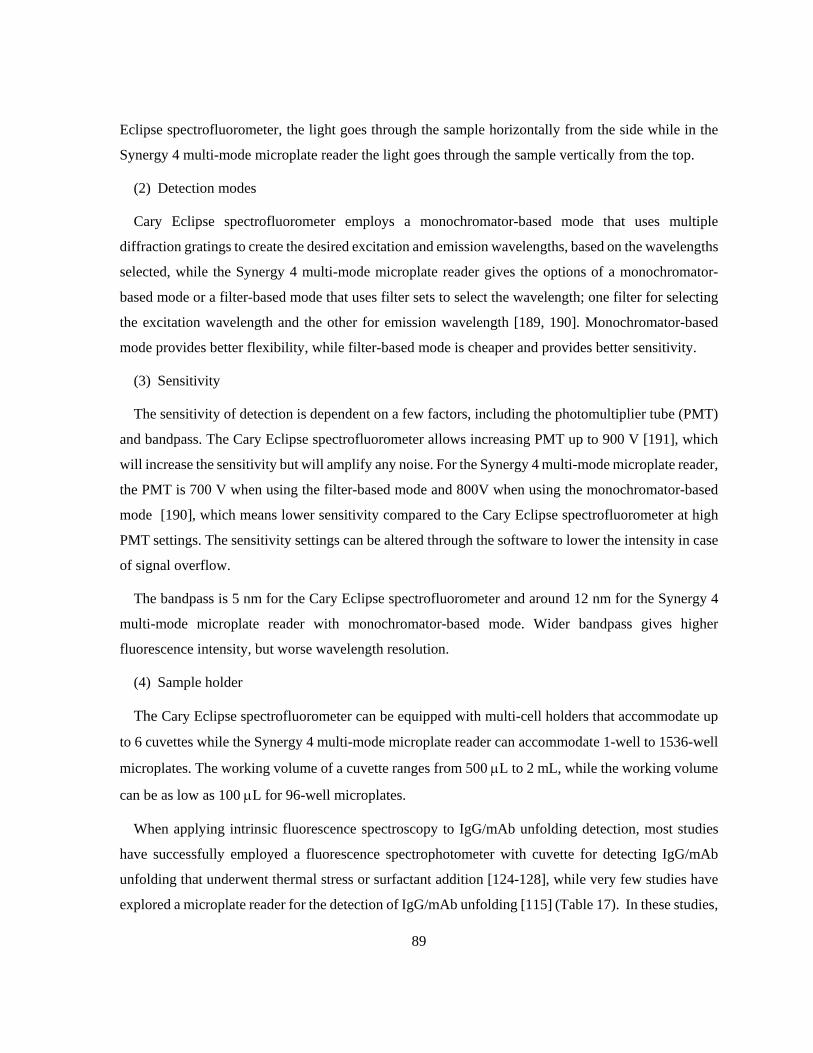
89
Eclipse spectrofluorometer, the light goes through the sample horizontally from the side while in the
Synergy 4 multi-mode microplate reader the light goes through the sample vertically from the top.
(2) Detection modes
Cary Eclipse spectrofluorometer employs a monochromator-based mode that uses multiple
diffraction gratings to create the desired excitation and emission wavelengths, based on the wavelengths
selected, while the Synergy 4 multi-mode microplate reader gives the options of a monochromator-
based mode or a filter-based mode that uses filter sets to select the wavelength; one filter for selecting
the excitation wavelength and the other for emission wavelength [189, 190]. Monochromator-based
mode provides better flexibility, while filter-based mode is cheaper and provides better sensitivity.
(3) Sensitivity
The sensitivity of detection is dependent on a few factors, including the photomultiplier tube (PMT)
and bandpass. The Cary Eclipse spectrofluorometer allows increasing PMT up to 900 V [191], which
will increase the sensitivity but will amplify any noise. For the Synergy 4 multi-mode microplate reader,
the PMT is 700 V when using the filter-based mode and 800V when using the monochromator-based
mode [190], which means lower sensitivity compared to the Cary Eclipse spectrofluorometer at high
PMT settings. The sensitivity settings can be altered through the software to lower the intensity in case
of signal overflow.
The bandpass is 5 nm for the Cary Eclipse spectrofluorometer and around 12 nm for the Synergy 4
multi-mode microplate reader with monochromator-based mode. Wider bandpass gives higher
fluorescence intensity, but worse wavelength resolution.
(4) Sample holder
The Cary Eclipse spectrofluorometer can be equipped with multi-cell holders that accommodate up
to 6 cuvettes while the Synergy 4 multi-mode microplate reader can accommodate 1-well to 1536-well
microplates. The working volume of a cuvette ranges from 500 µL to 2 mL, while the working volume
can be as low as 100 µL for 96-well microplates.
When applying intrinsic fluorescence spectroscopy to IgG/mAb unfolding detection, most studies
have successfully employed a fluorescence spectrophotometer with cuvette for detecting IgG/mAb
unfolding that underwent thermal stress or surfactant addition [124-128], while very few studies have
explored a microplate reader for the detection of IgG/mAb unfolding [115] (Table 17). In these studies,

90
all fluorescence spectra of the stressed samples were analyzed for potential changes in intrinsic
fluorescence intensity and the corresponding maximum emission wavelength. In terms of experimental
conditions for work with fluorescence spectrophotometers, all published studies reported in Table 17
used stressed IgG/mAb samples with concentrations ranging from 0.05 mg/mL to 0.5 mg/mL and used
quartz cuvettes with path length of 10 mm except for Zhang et al. [128]. Excitation wavelength was set
at either 280 nm [115, 124] or 295 nm [126-128], except for Ohadi et al. [125] where excitation
wavelengths ranging from 260 nm to 350 nm were investigated to establish an excitation emission
matrix for partial least squares regression analysis. Emission wavelength investigated in the literature
ranged from 280 nm to 450 nm, except for Wang et al. [126] where a much wider range (250~820 nm)
was examined.
The only reported work with the fluorescence microplate reader, Bickel et al. [115] used a
SpectraMax microplate reader for the detection of NaCl-induced unfolding of a humanized mAb.
Excitation wavelength was set at 280 nm and emission wavelength was 300 ~ 450 nm for 0.1 mg/mL
mAb samples. Bickel et al. observed a slight red-shift for samples with increasing pH (from 2 to 6) at
1.5 M NaCl addition, which showed that the fluorescence microplate reader was capable of capturing
the unfolding of mAb samples.

91
Table 17 Published studies for the detection of IgG/mAb unfolding using intrinsic fluorescence
spectroscopy.
Equipment Sample holder
Excitation/Emission wavelength (nm)
Bandpass (nm)
Protein type/ concentration
Buffer conditions
Stress conditions
Results Ref
LS 55 Fluo-rescence Spectro-meter
Quartz cuvette (path length of 10 mm)
280/300~ 450
2.5 IgG1/0.05 mg/mL
pH 7.5 formulation buffer
Incubation at 60 °C for 72 h
Increase in the intrinsic fluorescence intensity and a red-shift of the spectra were observed
[124]
Cary Eclipse Spectrofluo-rometer
Quartz cuvette (path length of 10 mm)
260~350/280~450
5 Mono-clonal human IgG/0.5 mg/mL
0.01M phosphate buffer saline (PBS), pH 3~9
Incubation at 40°C, 50°C, 60°C, 70°C, 80 °C for 20, 40, 60min
Increase in the intrinsic fluorescence intensity and a red-shift of the spectra were observed
[125]
Horiba Jobin Yvon FluoroMax-3 spectrofluo-rometer
Quartz cuvette (path length of 5 mm)
295/300~ 450
/ Bevaci-zumab/ 0.1 mg/mL
0.02 M citric buffer
Incubation at 70°C for 10 min
Increase in the intrinsic fluorescence intensity and a red-shift of the spectra were observed
[128]
Dual-FLTM spectropho-tometer
Quartz cuvette (path length of 10 mm)
295/250~ 820
/ IgG1/0.1 mg/mL
20 mM Histidine-HCl buffer at pH 6.0
Shaking at a rate of 200 rpm for 48/72 h and incubated in various surfactants in different concentrations
A small increase in fluorescence intensity was observed
[126]
Cary Eclipse Spectrofluo-rometer
Quartz cuvette (path length of 10 mm)
295/300~ 400
5 Camel IgG2/2.1 µM (≈ 0.3 mg/mL)
20mM sodium acetate buffer at pH 3.5
Incubated overnight in 0~ 10 mM SDS
An increase in fluorescence intensity and a blue-shift of maximum emission wavelength were observed
[127]
SpectraMax microplate reader
96-well microplate
280/300~ 450
/ Humani-zed mAb/0.1 mg/mL
Citrate-phosphate buffer at pH between 2 and 7.5
Incubated in 0.25 M to 1.5 M NaCl
A slight red-shift was observed
[115]

92
The main objective of this chapter was to develop a high-throughput intrinsic fluorescence method
using microplates for detection of IgG and Bevacizumab unfolding, which will be used for the fast and
low-cost investigations of buffer effects on unfolding, as well as design space development for
IgG/mAb. In this work, high-throughput intrinsic fluorescence microplate method refers to method
employing a plate reader and microplates for measuring the intrinsic fluorescence of stressed samples.
Thermal stress was employed for inducing IgG/mAb unfolding, and the stress conditions were the same
as Ohadi et al.’s work [125]. IgG and a humanized mAb, Bevacizumab, were examined at a
concentration of 0.5 mg/mL, same as that in Ohadi et al.’s work [125]. Two types of buffer were
examined through the method development, 10 mM PBS at pH 7, the buffer used previously with
spectrofluorometer [125] and with microplate reader [115], and 100 mM phosphate citrate buffer at pH
5 selected to reflect fluorescence observations to IgG/mAb binding with Natrix C weak CEX (Chapter
4). The degree of Bevacizumab unfolding was obtained from the fluorescence measurements and the
relative monomer content obtained with size-exclusion high performance liquid chromatography (SE-
HPLC).
5.2 Materials and methods
5.2.1 Buffers
All buffers and solutions were prepared with ultra-purified water. Phosphate buffered saline (PBS), pH
7, 10 mM, was prepared by mixing potassium phosphate monobasic (EMD Chemicals Inc., New Jersey,
USA), sodium phosphate dibasic heptahydrate (VWR International, Ohio, USA), sodium chloride and
potassium chloride (Fisher Scientific, Fair Lawn, USA). Phosphate citrate buffer, pH 5, 100 mM, was
prepared by mixing citric acid (EMD Chemicals Inc., Gibbstown, USA) solution and sodium phosphate
dibasic (Fisher Scientific, Fair Lawn, USA) solution.
The running buffer for HPLC, 100 mM sodium phosphate buffer at pH 7 was prepared by mixing
sodium phosphate dibasic heptahydrate (VWR International, Ohio, USA) and sodium phosphate
monobasic (VWR International, Ohio, USA). See Appendix A for details of buffer preparation.

93
5.2.2 IgG and Bevacizumab
IgG was purchased from Equitech-Bio, Inc. (Kerrville, Texas, USA). The mAb samples (in vials),
Bevacizumab, were generously provided by Apotex Inc. (North York, Ontario, Canada). Bevacizumab
is supplied at a concentration of 25mg/ml, with 0.4mg/ml (0.04%) polysorbate 20 at pH 6.2. All
Bevacizumab samples were dialyzed as described previously in 4.2.4.
5.2.3 IgG and Bevacizumab thermal stress
A 10mL IgG or Bevacizumab sample was placed in centrifuge tubes were thermally stressed at 60 °C
in a water bath (VWR® General Purpose Water Baths, Ohio, US) for 20, 40 and 60 min. The thermal-
treated samples were cooled on a lab bench to room temperature and then centrifuged with Eppendorf
5804R (Hamburg, Germany) at 400g for 5 min to remove large insoluble aggregates. The supernatant
was used for intrinsic fluorescence measurements and SE-HPLC analysis.
5.2.4 Intrinsic fluorescence measurement with a spectrofluorometer
The intrinsic fluorescence of IgG and Bevacizumab samples was measured with a Cary Eclipse
spectrofluorometer (Palo Alto, CA) equipped with a Peltier multi-cell holder with quartz cuvettes with
path length of 10 mm (Mandel Scientific, ON). Sample or buffer, 3 mL, were placed into each quartz
cuvette. Each sample was measured in triplicates. Emission spectra were collected at an excitation
wavelength of 280 nm and emission wavelength from 300 nm to 450 nm with 1 nm increments. The
PMT voltage was set at 600 V and bandpass at 5 nm, and the scanning rate was 600 nm/min. The
fluorescence intensity of samples were calculated by subtracting the fluorescence intensity of buffers.
The experimental conditions were selected based on previous studies that employed a fluorescence
spectrophotometer with cuvette for detecting unfolding of IgG and Bevacizumab samples that
underwent thermal stress [124, 125, 128].
5.2.5 High-throughput intrinsic fluorescence microplate method
The intrinsic fluorescence of IgG and Bevacizumab samples was measured with Synergy 4 microplate
reader, where samples and blank buffers were prepared on 96-well non-binding black microplates

94
(Greiner Bio-One, North Carolina, USA). A volume of 200 µL sample or buffer were placed into each
well and all samples were measured in triplicate.
Sensitivity for each sample set was investigated first to avoid measurement overflowing (signal
saturation) for that given set which represented either IgG or Bevacizumab in a given buffer for the
three incubation times at 60 °C. The highest sensitivity, 100, was assigned to the longest incubation
time. If measurement overflowing occurred, a lower sensitivity would be selected and the measurement
would be repeated until no measurement overflowing would occur. Sensitivity was set to 98 for IgG
samples in PBS, while 93 for IgG and Bevacizumab samples in pH 5, 100 mM phosphate citrate buffer.
Emission spectra were collected at an excitation wavelength of 280 nm and emission wavelength
from 300 nm to 450 nm with a step size of 1 nm, which corresponded with the conditions used for the
spectrofluorometer. The fluorescence intensity of samples were calculated by subtracting the
fluorescence intensity of buffers. The average of the maximum fluorescence intensity and maximum
emission wavelength of emission spectra were calculated with Excel from the triplicates. The standard
deviation was less than 1% and will not be reported. The maximum emission wavelength represents
the emission wavelength at which the maximum fluorescence intensity was observed.
5.2.6 Size-exclusion high performance liquid chromatography (SE-HPLC)
SE-HPLC was performed on Waters 2690 separations module (Waters, MA, USA) with the Sepax
Zenix-C SEC-300 (Sepax Technologies, Newark, DE) column. Prior to SE-HPLC tests, all samples
were filtered with a 0.45 μm PES syringe filter (Thermo Scientific, Ontario, Canada). A volume of 100
µL of sample was loaded onto the SEC column. The flow rate of the mobile phase was increased from
0 mL/min to 1 mL/min within 1 min, and the duration of elution was set to 20 min. The mobile phase
consisted of 100 mM sodium phosphate buffer at pH 7. A calibration curve was prepared with various
concentrations of Bevacizumab ranging from 0.0625 to 1 mg/mL, and UV absorbance was collected at
280 nm to detect protein content. The monomer content was estimated from the area under the curve
of the peak corresponding to the monomeric form of Bevacizumab. The relative monomer content was
calculated as the ratio of the area of the monomer peak of a given thermal stress to the area of the
monomer peak with no thermal treatment, by the Empower 3 software (See Appendix E). All
measurements were carried out in duplicates.

95
5.2.7 Summary of experimental conditions
Table 18 lists buffer conditions, model proteins and experimental conditions used in this chapter.
Table 18 Buffer conditions, model proteins and experimental conditions for Chapter 5.
Section
Buffer
Protein Experimental conditions Molarity
(mM) Type Na+
concentration (mM)
pH
5.3.1 10 PBS / 7 IgG thermal stress – intrinsic fluorescence measurement
100 phosphate citrate
140 5
5.3.2 100 phosphate citrate
140 5 Bevacizumab thermal stress – intrinsic fluorescence measurement
100 sodium phosphate
/ 7 SE-HPLC
5.3 Results and discussion
5.3.1 Development of intrinsic fluorescence microplate method vs. spectrofluorometer method for thermally stressed IgG
In this section, the high-throughput intrinsic fluorescence microplate method was developed by
comparing to results from a spectrofluorometer. The next step was to apply the high-throughput
intrinsic fluorescence microplate method to investigate thermally stressed IgG samples formulated in
two buffer types, phosphate buffered saline (10 mM PBS at pH 7) and 100 mM phosphate citrate buffer
at pH 5.
5.3.1.1 Preliminary results with a cuvette spectrofluorometer
The emission spectra of 0.5 mg/mL IgG samples in 10 mM PBS at pH 7 stressed at 60 °C for 20 min,
40 min and 60 min were collected with a spectrofluorometer, using the same buffer conditions, IgG
concentration, thermal treatment and measurement parameters as that in Ohadi et al.’s work [125]. The
maximum fluorescence intensity of the stressed samples against incubation time were compared

96
between this work and the literature (Figure 30). Note that the maximum fluorescence intensities of
Ohadi et al. [125] were visually extracted from their emission spectra at excitation wavelength of 280.
The results obtained in this work showed a similar linear increase of the maximum fluorescence
intensity with increasing incubation time, with a R2 of 0.97 and 0.98 for the published values. However,
the magnitude of the fluorescence intensity was approximately 50% higher in this study compared to
those reported by Ohadi et al. [125]. The only differences between the two studies are the source of
IgG and their sensitivity settings that were not specified. The variable of the maximum fluorescence
intensity with incubation time was similar in both studies, the spectrofluorometer cuvette methodology
was considered reliable.

97
Figure 30 Maximum fluorescence intensity vs. incubation time at 60 °C for 0.5 mg/mL IgG samples
in 10 mM PBS at pH 7. Excitation wavelength at 280 nm and emission wavelength from 300 nm to
450 nm with 1 nm increments. Comparison between Ohadi et al.’s work [189] and results from this
work. Average values of triplicates for results in this work.

98
5.3.1.2 Detecting IgG unfolding in PBS by intrinsic fluorescence method with a fluorescence
microplate reader
The next step was to develop the fluorescence microplate reader method for the analysis of IgG
unfolding in 10 mM PBS at pH 7 by collecting the emission spectra of 0.5 mg/mL IgG samples stressed
at 60 °C for 20 min, 40 min and 60 min. The maximum fluorescence intensity of the stressed samples
against incubation time at 60 °C were compared between results from the spectrofluorometer and the
plate reader (Figure 31).
99
Figure 31 Maximum fluorescence intensity vs. incubation time for 0.5 mg/mL IgG samples in 10
mM PBS at pH 7 stressed at 60 °C. Excitation wavelength was 280 nm and emission wavelength was
from 300 nm to 450 nm with a step size of 1 nm. The maximum fluorescence intensity for the cuvette
spectrofluorometer is given by the left y-axis and is given by the right y-axis for the microplate
reader. Average values of triplicates.

100
The maximum fluorescence intensity obtained with the cuvette spectrofluorometer and the
microplate reader exhibited a linear increase with incubation time at 60 °C between 20 min to 60 min,
with R2 of 0.97 for the cuvette spectrofluorometer and 0.99 for the microplate reader. The similar results
suggest that microplate reader can be used as a potential alternative to cuvette spectrofluorometer, even
though the value of the maximum fluorescence intensity was significantly different. The linear increase
suggests increasing degree of protein unfolding.
The maximum fluorescence intensity and the maximum emission wavelength of stressed and native
IgG samples measured by the plate reader are summarized in Table 19. Maximum emission wavelength
is the emission wavelength at which the maximum fluorescence intensity was observed. For all
thermally stressed IgG samples, the maximum fluorescence intensity was significantly higher than that
of the native IgG sample which suggested increased degree of unfolding, while no shift in maximum
emission wavelength was observed.
Table 19 Maximum fluorescence intensity and maximum emission wavelength of emission spectra of
0.5 mg/mL IgG samples in 10 mM PBS at pH 7 after incubating at 60 °C for 0, 20, 40, and 60
minutes, measured by the plate reader. The excitation wavelength was 280 nm and the sensitivity was
set at 98. Average values of triplicates.
Time (min) Maximum fluorescence
intensity (RFU)
Maximum emission
wavelength (nm)
0 10148 314
20 20148 314
40 21463 314
60 22368 314
5.3.1.3 Detecting IgG unfolding in phosphate citrate buffer with high-throughput intrinsic
fluorescence method
As buffer conditions may affect the intrinsic fluorescence of tryptophan, the high-throughput intrinsic
fluorescence of 0.5 mg/mL IgG samples was assessed in a different buffer, 100 mM phosphate citrate
101
buffer at pH 5. The IgG samples were stressed at 60 °C for 20 min, 40 min and 60 min. The fluorescence
emission spectra of stressed IgG samples obtained with the plate reader were compared to the spectra
of native IgG (0 min) (Figure 32). The degree of unfolding of IgG samples was suggested by the
maximum fluorescence intensity and the maximum emission wavelength, summarized in Table 20.

102
Figure 32 Fluorescence emission spectra of 0.5 mg/mL IgG samples in 100 mM phosphate citrate
buffer at pH 5. Samples according to incubation time at 60 °C. The excitation wavelength was 280
nm and the sensitivity was set at 93. Average values of triplicates.

103
Table 20 Maximum fluorescence intensity and maximum emission wavelength of emission spectra of
0.5 mg/mL IgG samples in 100 mM phosphate citrate buffer at pH 5 after incubating at 60 °C for 0,
20, 40, and 60 minutes, measured with microplate reader. The excitation wavelength was 280 nm and
the sensitivity was set at 93. Average values of triplicates.
Time (min) Maximum fluorescence
intensity (RFU)
Maximum emission
wavelength (nm)
0 8750 314
20 11728 314
40 16400 318
60 18141 320
The maximum fluorescence intensity increased with incubation time for thermally stressed IgG
samples and was significantly higher than the native IgG sample, which may indicate conformational
changes in all stressed samples. The maximum fluorescence intensity of IgG samples incubated for 20
min was 34% higher than that of the native sample. The maximum fluorescence intensity of IgG
samples incubated for 60 min was 11% higher than that of the samples incubated for 40 min, while it
was 55% higher than the samples incubated for 20 min. The increase of the maximum fluorescence
intensity of IgG samples according to incubation time was higher in the 100 mM phosphate citrate
buffer at pH 5 than that in 10 mM PBS buffer at pH 7. It suggests that the increase in the degree of
unfolding of IgG samples according to stress time was more pronounced in the phosphate citrate buffer
than in the PBS buffer. Note that the sensitivity setting was different and set at 98 for IgG samples in
PBS buffer, while the sensitivity was 93 for all samples formulated in phosphate citrate buffer to avoid
signal overflow at higher sensitivity.
A red-shift in the maximum emission wavelength was observed for IgG samples in phosphate citrate
buffer, when stressed for at least 40 min. Maximum emission wavelength increased from 314 nm for
native IgG samples to 320 nm for IgG samples stressed for 60 min, which suggested higher degree of
unfolding with increased incubation time. No shift in maximum emission wavelength was observed for
stressed IgG samples in PBS, which may reflect differences in the response of tryptophan to the buffer
conditions. The citrate ions in phosphate citrate buffer have been reported to be more chaotropic than

104
phosphate ions in PBS [192, 193], which may relate to the response of tryptophan to hydrophobic
environment. Further discussion of the effect of buffer type on IgG/mAb unfolding will be presented
in the next chapter.
5.3.2 Detection of thermally induced Bevacizumab unfolding and aggregation with high-throughput intrinsic fluorescence microplate method and SE-HPLC
In the previous section, the intrinsic fluorescence microplate method was developed with thermally
stressed IgG samples formulated in two buffer types. The increase in the maximum fluorescence
intensity and red-shift in the maximum emission wavelength were observed which could reflect an
increasing degree of IgG unfolding. As the structure of IgG is representative of mAb, the results
obtained from IgG in the previous section were used to set the experimental conditions for the analysis
for the Bevacizumab, which will be presented in this section. As the degree of protein unfolding may
be indicative of the degree of protein aggregation, SE-HPLC will be applied for characterizing the
degree of aggregation for Bevacizumab. In this section, we have limited the investigation to one buffer,
100 mM phosphate citrate buffer at pH 5 which is representative of CEX binding conditions.
5.3.2.1 Detection of Bevacizumab unfolding with high-throughput intrinsic fluorescence
method
The emission spectra of 0.5 mg/mL Bevacizumab samples in 100 mM phosphate citrate buffer at pH 5
stressed at 60 °C for 20 min, 40 min and 60 min were collected with a plate reader and compared to
those of native Bevacizumab (Figure 33). The maximum fluorescence intensity and the maximum
emission wavelength are summarized in Table 21.

105
Figure 33 Fluorescence emission spectra of 0.5 mg/mL Bevacizumab samples in 100 mM phosphate
citrate buffer at pH 5, according to incubation time at 60 °C. The excitation wavelength was 280 nm
and the sensitivity was set at 93. Average values of triplicates.

106
Table 21 Maximum fluorescence intensity and maximum emission wavelength of emission spectra of
0.5 mg/mL Bevacizumab samples in 100 mM phosphate citrate buffer at pH 5 after incubating at 60
°C for 0, 20, 40, and 60 minutes, measured with microplate reader. The excitation wavelength was
280 nm and the sensitivity was set at 93. Average values of triplicates.
Time (min) Maximum fluorescence
intensity (RFU)
Maximum emission
wavelength (nm)
0 12487 314
20 13276 314
40 16182 320
60 22258 320
For all thermally stressed Bevacizumab samples, the maximum fluorescence intensity was
significantly higher than the native Bevacizumab sample, which may reflect conformational changes
in all stressed samples. The maximum fluorescence intensity of stressed Bevacizumab samples
increased with increasing incubation time. The maximum fluorescence intensity of Bevacizumab
samples incubated for 20 min was 6% higher than that of the native sample. The maximum fluorescence
intensity of Bevacizumab samples incubated for 60 min was 38 % higher than that of the samples
incubated for 40 min, and it was 68% higher than that of the samples incubated for 20 min. The increase
of the maximum fluorescence intensity of Bevacizumab samples stressed for 20 min was lower than
that of stressed IgG samples in the same phosphate citrate buffer (34%), which may suggest that
Bevacizumab was more stable than IgG when thermally stressed for a relatively short time. The increase
of the maximum fluorescence intensity of Bevacizumab samples with different incubation time was
higher than IgG samples in the same buffer, which may indicate that the degree of unfolding of
Bevacizumab increased more than IgG samples throughout the thermal incubation (Figure 34).

107
Figure 34 Maximum fluorescence intensity according to incubation time at 60 °C for 0.5 mg/mL IgG
and Bevacizumab samples in 100 mM phosphate citrate buffer at pH 5. Average values of triplicates.

108
A red-shift in the maximum emission wavelength was observed for Bevacizumab samples incubated
for at least 40 min, and was also observed for IgG (Table 20). When incubated for 40 min, the maximum
emission wavelength increased from 314 nm to 318 nm for native IgG samples while it increased from
314 nm to 320 nm for Bevacizumab samples. The red-shift suggested greater exposure of tryptophan
residues in Bevacizumab samples, thus higher degree of unfolding with increased incubation time.
Increase in the unfolding of 0.1 mg/mL Bevacizumab in 20 mM citrate buffer after incubating at 70
°C for 10 min was also reported by Zhang et al. [128], where a significant increase in fluorescence
intensity and a red-shift of the maximum emission wavelength were observed.
5.3.2.2 Detection of Bevacizumab aggregation with SE-HPLC
The degree of protein unfolding detected by intrinsic fluorescence spectroscopy could be indicative of
the degree of protein aggregation, while protein aggregation can also be measured directly with SE-
HPLC. The thermally stressed Bevacizumab samples were analyzed with SE-HPLC for monomer
percentage (See Appendix E for chromatograms of Bevacizumab samples). Monomer amount was
calculated based on the area under the curve pertinent to the peak of the monomeric form of
Bevacizumab (Figure 35) according to the calibration curve, and the percentage of monomer was
calculated by the Empower 3 software (
Table 22). Note that the peaks appeared after the main peak could be fragment peaks.

109
Figure 35 SE-HPLC chromatogram of 0.5 mg/mL Bevacizumab samples in 100 mM phosphate
citrate buffer at pH 5, after incubating at 60 °C for 20 min.
Table 22 Peak characteristics and percentage calculated by Empower 3 software for 0.5 mg/mL
Bevacizumab samples in 100 mM phosphate citrate buffer at pH 5, with 20 min incubation in 60 °C
water bath. The % Area is calculated from the area of a given peak versus the area of all peaks.
Peak Retention Time (min) Area (AU*sec) %Area Amount (mg/L)
1 10.985 30979 0.62 -
2-BEVA 12.585 4763186 95.38 456.411
3 14.760 18506 0.37 -
4 17.206 134957 2.70 -
5 17.646 46466 0.93 -

110
SE-HPLC chromatogram of 0.5 mg/mL Bevacizumab samples in 100 mM phosphate citrate buffer
at pH 5, with 0 min, 20 min, 40 min and 60 min incubation in 60 °C water bath are presented as below.
Figure 36 SE-HPLC chromatogram of 0.5 mg/mL Bevacizumab samples in 100 mM phosphate
citrate buffer at pH 5, with 0 min, 20 min, 40 min and 60 min incubation in 60 °C water bath.
Monomer percentage was plotted versus the relative increase of maximum fluorescence intensity of
stressed Bevacizumab compared to the native one (Figure 37). A decrease in monomer percentage may
indicate an increase in aggregate formation.

111
Figure 37 Monomer percentage and relative increase of maximum fluorescence intensity according
to incubation time at 60 °C for 0.5 mg/mL Bevacizumab samples in 100 mM phosphate citrate buffer
at pH 5. Error bars represent standard error (n=3).

112
For Bevacizumab samples incubated for 20 min and 40 min, the monomer percentage decreased from
95.4% to 91.3%, while the increase of maximum fluorescence intensity increased from 6% to 30%. For
Bevacizumab samples incubated for 60 min, the monomer percentage slightly increased to 92%
(insignificant increase based on paired t-test) while the relative increase of maximum fluorescence
intensity further increased to 78%. It suggested that increasing incubation time from 40 min to 60 min
may induce more unfolding of the monomers, but did not induce more aggregates formation. It
indicated that the intrinsic fluorescence microplate method could be a measure of the monomer
percentage, while require further investigation, such as buffer type and pH values.
5.4 Conclusion
The application of intrinsic fluorescence spectroscopy for IgG/mAb unfolding has relied heavily on the
use of cuvette spectrofluorometers in the literature, while the potential of fluorescence plate readers has
been overlooked. In this chapter, a high-throughput intrinsic fluorescence microplate method for the
detection of IgG and Bevacizumab unfolding was developed with thermally stressed IgG and
Bevacizumab for two different buffer conditions, 10 mM PBS at pH 7 and 100 mM phosphate citrate
at pH 5.
By comparing the intrinsic fluorescence emission spectra of thermally stressed IgG in PBS obtained
with a cuvette spectrofluorometer and a fluorescence plate reader, a linear increase of the degree of
protein unfolding with incubation time was observed for both systems, demonstrated by the linear
increase of maximum fluorescence intensity with increasing incubation time. It indicated that the
intrinsic fluorescence microplate method could be applied for detecting unfolding of stressed IgG
samples in PBS.
As phosphate citrate buffer is the buffer type used for IgG and Bevacizumab binding with Natrix C
weak CEX membrane in this work, it was essential to examine protein unfolding of IgG and
Bevacizumab samples in the phosphate citrate buffer at pH 5. The intrinsic fluorescence emission
spectra of thermally stressed IgG samples in phosphate citrate buffer analyzed with the microplate
method showed increasing maximum intrinsic fluorescence intensity with incubation time as observed
in the PBS buffer. In addition, a red-shift of maximum emission wavelength was observed for the
stressed IgG in phosphate citrate buffer.

113
The intrinsic fluorescence microplate method was applied to detect the unfolding of thermally
stressed Bevacizumab samples in 100 mM phosphate citrate buffer at pH 5. Increasing maximum
intrinsic fluorescence emission intensity with incubation time was observed as with IgG. When
incubated for 20 min, the increase of the maximum fluorescence intensity of Bevacizumab samples was
lower than that of IgG samples in the same phosphate citrate buffer, potentially indicating that
Bevacizumab is more stable than IgG in this stress condition. While the increase of the maximum
fluorescence intensity of Bevacizumab samples with different incubation time was higher than IgG
samples in the same buffer, which could suggest that the degree of unfolding of Bevacizumab was
higher than for IgG samples throughout the thermal incubation. The thermally stressed Bevacizumab
samples were analyzed with SE-HPLC. It indicated that the unfolding of Bevacizumab detected by the
intrinsic fluorescence microplate method could be related to the monomer percentage detected by SE-
HPLC.
In summary, the high-throughput intrinsic fluorescence microplate method developed in this work
could be applied for the detection of IgG/ mAb unfolding in an economic and efficient way.
114
Chapter 6 Effect of buffer on IgG/mAb unfolding
6.1 Introduction
During IgG/mAb separation with weak CEX chromatography, solution factors such as pH, type and
concentration of buffer, especially counter-ion concentration (Cs) and co-ion type are critical to the
productivity of the process and quality of the product, as they can affect the binding capacity and protein
unfolding.
The pH of the buffer may vary from 4 to 6 during the binding process of IgG/mAb with weak CEX
materials, which affects binding and unfolding of the protein by changing the charge distribution on
the protein surface [114, 135, 136]. For CEX chromatography, counter-ions will be buffer cations,
usually sodium ions, where Cs is manipulated by NaCl addition, with typical concentration ranging
from 20 mM to 150 mM. The driving force of protein binding to CEX materials will be the displacement
of counter-ions on the CEX material by the target protein, and Cs may also affect protein unfolding.
The effect of buffer pH on mAb unfolding is generally investigated together with the counter-ion
concentration (Cs) [115, 117]. Bickel et al. [115] investigated the effect of pH and NaCl concentration
on the non-specified mAb unfolding for mAb samples in buffer solutions with pH ranging 2 to 7 and
NaCl concentration ranging from 0 mM to 150 mM. mAb unfolding was measured with Differential
Scanning Fluorimetry (DSF), intrinsic and extrinsic fluorescence spectroscopy. Higher degree of
unfolding was observed for mAb solutions in buffer contained 150 mM NaCl compared to 0 mM NaCl
at pH 5, however, lower degree of unfolding was observed for mAb solutions in buffer containing 150
mM NaCl compared to 0 mM NaCl when pH dropped to 2. Sahin et al. [117] reported on the degree of
unfolding of four types of human IgG1 according to buffer pH and Cs. Unfolding was characterized by
differential scanning calorimetry. The relatively small range of Cs investigated (54 mM and 100 mM)
did not result in any differences of unfolding when studied at the same pH. Increasing protein unfolding
was observed for pH 6.5 compared to 3.5 for both Cs conditions. These studies reveal the complexity
of the effect of pH and Cs on mAb unfolding. Both studies indicate that low pH (2~3.5) and high Cs
(1.5 M) may increase protein unfolding. Thus it is expected that choosing buffer with higher pH and
lower Cs will minimize unfolding during the separation of mAb with weak CEX materials.
Phosphate, citrate and acetate ions are among the most common co-ion type used in CEX
chromatography, and their contribution to protein unfolding has been related to the Hofmeister series.
Namely, according to the Hofmeister series, anions were ranked as sulphate > citrate > phosphate >

115
formate >acetate, where higher rank indicates a stronger ability of the anion to change tertiary structure
of proteins [139, 194]. Note that the Hofmeister series may not be applicable when the ion concentration
is low. Published studies show good agreement with the Hofmeister series [140-142, 195], where mAb
prepared in buffer solutions containing anions of higher rank in the Hofmeister series demonstrated a
higher degree of protein unfolding. Rubin et al. [140] investigated the unfolding of a IgG1-based mAb
induced by co-ions, including acetate, sulfate and formate, where lowest protein unfolding was
observed for protein sample with 25 mM acetate buffer, which is the lowest ranked anion in the
Hofmeister series. Singla et al. [141] studied the effect of citrate (20 mM and 100 mM), acetate (25
mM and 100 mM) and phosphate ions (15 mM) on the unfolding of a IgG1-based mAb and observed
higher unfolding for protein samples with citrate ions, which was ranked higher than acetate and
phosphate ions in the Hofmeister series. Barnett et al. [142] reported increased unfolding of an anti-
streptavidin IgG1 in 5 mM citrate buffer compared to 10 mM acetate buffer, explained by the
accumulation of citrate ions around the surface of the anti-streptavidin IgG1. Based on the above
studies, the Hofmeister series can serve as a reliable guidance for the selection of the co-ion type that
minimize unfolding thus improving the quality of mAb during separation process with weak CEX
materials.
Buffer effects on binding capacity was discussed in Chapter 4, and their effects on protein unfolding
would be investigated in detail in this chapter. It was hypothesized that buffer counter-ion concentration
(Cs) and co-ion type (chemistry and valence) have an impact on IgG/mAb unfolding. A high-throughput
intrinsic fluorescence microplate method developed in Chapter 5 is suitable for the detection of IgG/
mAb unfolding in an economic and efficient way and will be employed in this chapter. The hypothesis
was tested with polyclonal human IgG, which is cheap and can be representative of the structure of
mAb, and Bevacizumab, a humanized mAb. IgG and Bevacizumab samples were formulated with
buffers at pH 5, with various Na+ concentration and co-ion type prior to mechanical stress (Table 24).
Mechanical stress was used in this study to represent the shaking taking place during static binding,
while the stress conditions were amplified for IgG to reveal the buffer effects. IgG samples were
stressed by shaking for 24 hours while Bevacizumab samples were stressed by shaking for 1 hour
without a membrane and then for 6 hours with a membrane (namely static binding). After being
mechanically stressed, the IgG samples and Bevacizumab samples were analyzed with the intrinsic
fluorescence microplate method developed in the previous chapter. Response surface model (RSM)
used for analyzing the collected fluorescence intensities of IgG samples for buffer effects.

116
Through analyzing the buffer effects on IgG/mAb binding in chapter 4, the steric factor of IgG
binding with Natrix C weak CEX membrane in phosphate citrate buffer was estimated to be 105 from
the SMA model, which was 21% larger than the steric factor in acetate buffer. The steric factor
represents the number of ion sites on the IEX material hindered by one bounded protein molecule,
which could be an indicator of the size and conformational structure of protein molecules. Therefore
the larger steric factor estimated for the phosphate citrate buffer may suggest that the IgG structure is
less compact than that in acetate buffer which could result from the effect of buffer co-ions. In this
chapter, the SMA model was used to understand the structure of Bevacizumab samples during binding
with Natrix C weak CEX membranes.
6.2 Materials and methods
6.2.1 Buffers
All buffers and solutions were prepared with ultra-purified water. Phosphate citrate buffer was prepared
by mixing citric acid (EMD Chemicals Inc., Gibbstown, USA) solution and sodium phosphate dibasic
(Fisher Scientific, Fair Lawn, USA) solution. Sodium acetate buffer was prepared by mixing acetic acid
(EMD Chemicals Inc., Gibbstown, USA) solution and sodium acetate (EMD Chemicals Inc.,
Gibbstown, USA) solution. See appendix A for details. Na+ concentration was adjusted with sodium
chloride (BDH Inc., Toronto, Canada). See Appendix A for details of buffer preparation.
6.2.2 Proteins
IgG was purchased from Equitech-Bio, Inc. (Kerrville, Texas, USA). Bevacizumab samples (in vials)
were generously provided by Apotex Inc. (North York, Ontario, Canada). Bevacizumab is supplied at
a concentration of 25mg/ml, with 0.4mg/ml (0.04%) polysorbate 20, at pH 6.2. All Bevacizumab
samples used in this chapter were dialyzed with the targeting buffer following the same procedures as
in 4.2.4.

117
6.2.3 Membranes
Weak CEX membrane, Natrix C weak CEX membranes (disc diameter: 47 mm) were kindly provided
by Natrix Separations Inc. (Burlington, Ontario, Canada). Circular Natrix C weak CEX membrane
samples (Diameter: 2.6 mm) were prepared with a cork borer for use in the static binding experiments.
6.2.4 IgG subjected to shaking as mechanical stress
IgG unfolding was investigated by Design of Experiment (DoE) involving 3 factors (Table 23). 37.5
mM phosphate citrate buffer and 75 mM acetate buffer at pH 5 were used and the Na+ concentration of
the buffer was adjusted accordingly with NaCl. The stress condition was identified by preliminary
experiments and adapted from the literature work [196-198] , such that changes in intrinsic fluorescence
intensity can be captured. In one study, Telikepalli et al. [196] stressed a IgG1 mAb sample at 300 rpm
for 1 to 3 days for structural analysis, and in another study the group [197] investigated the physical
stability of the lyophilized IgG1 mAb sample under shipping-like stress where samples were shaken
from 5 min to 24 h at 3200 rpm. Uchino et al. [198] generate protein aggregates through stressing
diluted commercialized mAb formulation at 250 rpm for 5min. In this work, samples were stressed by
shaking at 200 rpm on a shaker (Thermo Scientific 2309 lab rotator, Canada) for 24 hours before the
intrinsic fluorescence analysis.
Table 23 DoE for investigating IgG unfolding for 37.5 mM phosphate citrate and 75 mM acetate
buffer, at pH 5.
Factor Level
Na+ concentration (mM) 50 100 150 200 250
IgG concentration (mg/mL) 0.5 1 2 3 4
6.2.5 High-throughput Bevacizumab static binding
The high-throughput static protein binding was performed in 96-well non-binding clear microplates
(Greiner Bio-One, North Carolina, USA) at room temperature placed on a shaker at 200 rpm. Circular
Natrix C weak CEX membrane samples (Diameter: 2.6 mm) were prepared with a cork borer. The
membrane volume was calculated as indicated in 4.2.6. Bevacizumab samples with initial concentration

118
of 5 and 10 mg/mL in pH 5 100 mM phosphate citrate buffer or 200 mM acetate buffer were used. The
equilibration time was 1 h and binding time was 6 h. Four replicates were performed for each
concentration. The buffer conditions selected aligned with that used in chapter 4.
For the analysis of the SMA model, static binding experiments of Bevacizumab with Natrix C weak
CEX membrane were performed in 25 mM phosphate citrate buffer and 50 mM acetate buffer at pH 5
with three different Na+ concentration, 50mM, 100 mM and 200 mM.
6.2.6 High-throughput intrinsic fluorescence microplate measurement
In order to minimized the disruption of the protein structure, mechanically stressed IgG samples and
Bevacizumab samples were not centrifuged or filtered prior to intrinsic fluorescence measurements.
After mechanically stressed, the stressed IgG samples or Bevacizumab samples (referred to as the after-
binding solution) were transferred to 96-well non-binding black microplates (Greiner Bio-One, North
Carolina, USA). The emission spectra were collected with the Synergy 4 microplate reader, excitation
at 280 nm and emission collected for 300~450 nm, at sensitivity of 80 and emission step of 1 nm in
duplicates. Sensitivity was selected by testing the sample potentially with the highest fluorescence
intensity until no signal overflowing was observed. The maximum fluorescence intensity was extracted
from the emission spectra for each experimental condition. The degree of unfolding was determined as
the maximum fluorescence intensity.
6.2.7 Size-exclusion high performance liquid chromatography (SE-HPLC)
SE-HPLC was performed on Waters 2690 separations module (Waters, MA, USA) with the Sepax
Zenix-C SEC-300 (Sepax Technologies, Newark, DE) column. Prior to SE-HPLC tests, all samples
were filtered with a 0.45 μm PES syringe filter (Thermo Scientific, Ontario, Canada). A volume of 100
µL of sample was loaded onto the SEC column. The flow rate of the mobile phase was increased from
0 mL/min to 1 mL/min within 1 min, and the duration of elution was set to 20 min. The mobile phase
consisted of 100 mM sodium phosphate buffer at pH 7. A calibration curve was prepared with various
concentrations of Bevacizumab ranging from 0.125 to 2 mg/mL, and UV absorbance was collected at
280 nm to detect protein content. The monomer content was estimated from the area under the curve
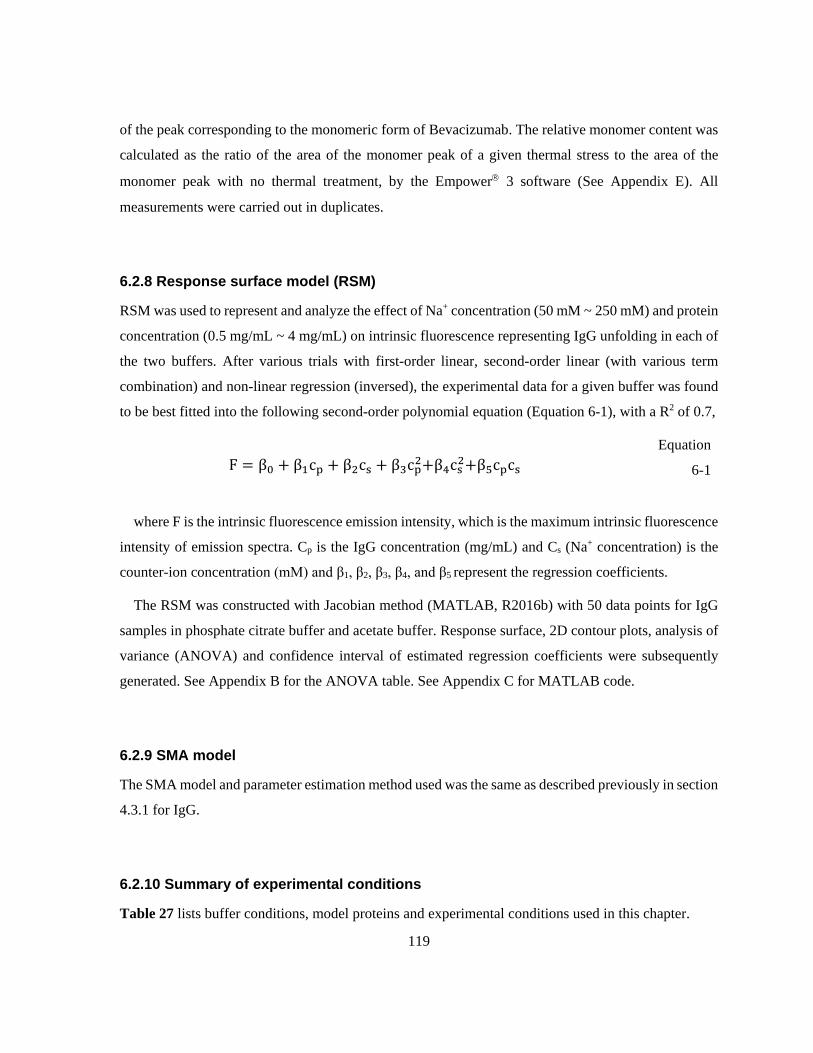
119
of the peak corresponding to the monomeric form of Bevacizumab. The relative monomer content was
calculated as the ratio of the area of the monomer peak of a given thermal stress to the area of the
monomer peak with no thermal treatment, by the Empower 3 software (See Appendix E). All
measurements were carried out in duplicates.
6.2.8 Response surface model (RSM)
RSM was used to represent and analyze the effect of Na+ concentration (50 mM ~ 250 mM) and protein
concentration (0.5 mg/mL ~ 4 mg/mL) on intrinsic fluorescence representing IgG unfolding in each of
the two buffers. After various trials with first-order linear, second-order linear (with various term
combination) and non-linear regression (inversed), the experimental data for a given buffer was found
to be best fitted into the following second-order polynomial equation (Equation 6-1), with a R2 of 0.7,
F = β0 + β1cp + β2cs + β3cp2+β4cs2+β5cpcs Equation
6-1
where F is the intrinsic fluorescence emission intensity, which is the maximum intrinsic fluorescence
intensity of emission spectra. Cp is the IgG concentration (mg/mL) and Cs (Na+ concentration) is the
counter-ion concentration (mM) and β1, β2, β3, β4, and β5 represent the regression coefficients.
The RSM was constructed with Jacobian method (MATLAB, R2016b) with 50 data points for IgG
samples in phosphate citrate buffer and acetate buffer. Response surface, 2D contour plots, analysis of
variance (ANOVA) and confidence interval of estimated regression coefficients were subsequently
generated. See Appendix B for the ANOVA table. See Appendix C for MATLAB code.
6.2.9 SMA model
The SMA model and parameter estimation method used was the same as described previously in section
4.3.1 for IgG.
6.2.10 Summary of experimental conditions
Table 27 lists buffer conditions, model proteins and experimental conditions used in this chapter.

120
Table 24 Buffer conditions, model proteins and experimental conditions for Chapter 6.
Section
Buffer
Protein Experimental conditions Molarity
(mM) Type Na+
concentration (mM)
pH
6.3.1 37.5 phosphate citrate
50, 100, 150, 200, 250
5 IgG Mechanical stress (shaking) – intrinsic fluorescence measurement
75 acetate 50, 100, 150, 200, 250
5
6.3.2 100 phosphate citrate
140 5 Bevacizumab Mechanical stress (high-throughput static Bevacizumab binding) – intrinsic fluorescence measurement and SE-HPLC
200 acetate 140 5
25 phosphate citrate
50, 100, 200 5 Bevacizumab High-throughput static Bevacizumab binding – for SMA analysis
50 acetate 50, 100, 200 5
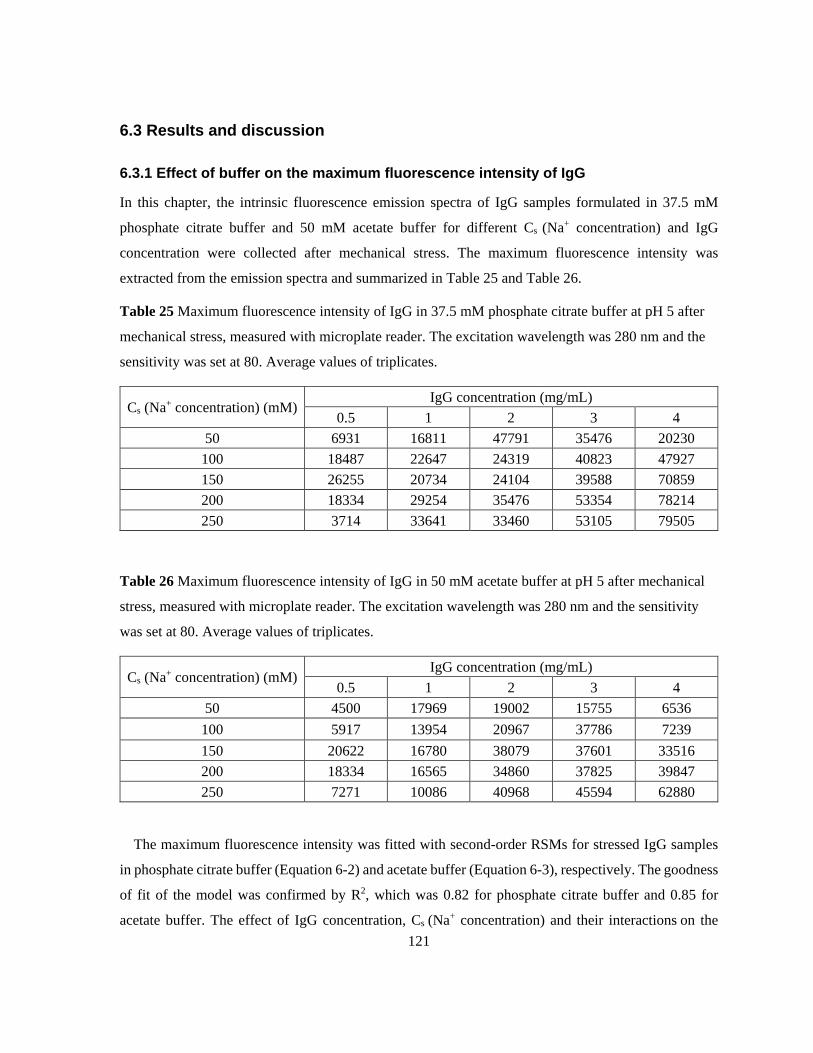
121
6.3 Results and discussion
6.3.1 Effect of buffer on the maximum fluorescence intensity of IgG
In this chapter, the intrinsic fluorescence emission spectra of IgG samples formulated in 37.5 mM
phosphate citrate buffer and 50 mM acetate buffer for different Cs (Na+ concentration) and IgG
concentration were collected after mechanical stress. The maximum fluorescence intensity was
extracted from the emission spectra and summarized in Table 25 and Table 26.
Table 25 Maximum fluorescence intensity of IgG in 37.5 mM phosphate citrate buffer at pH 5 after
mechanical stress, measured with microplate reader. The excitation wavelength was 280 nm and the
sensitivity was set at 80. Average values of triplicates.
Cs (Na+ concentration) (mM) IgG concentration (mg/mL)
0.5 1 2 3 4 50 6931 16811 47791 35476 20230
100 18487 22647 24319 40823 47927 150 26255 20734 24104 39588 70859 200 18334 29254 35476 53354 78214 250 3714 33641 33460 53105 79505
Table 26 Maximum fluorescence intensity of IgG in 50 mM acetate buffer at pH 5 after mechanical
stress, measured with microplate reader. The excitation wavelength was 280 nm and the sensitivity
was set at 80. Average values of triplicates.
Cs (Na+ concentration) (mM) IgG concentration (mg/mL)
0.5 1 2 3 4 50 4500 17969 19002 15755 6536
100 5917 13954 20967 37786 7239 150 20622 16780 38079 37601 33516 200 18334 16565 34860 37825 39847 250 7271 10086 40968 45594 62880
The maximum fluorescence intensity was fitted with second-order RSMs for stressed IgG samples
in phosphate citrate buffer (Equation 6-2) and acetate buffer (Equation 6-3), respectively. The goodness
of fit of the model was confirmed by R2, which was 0.82 for phosphate citrate buffer and 0.85 for
acetate buffer. The effect of IgG concentration, Cs (Na+ concentration) and their interactions on the

122
degree of IgG unfolding were statistically significant for both buffer types, confirmed by analysis of
variance (ANOVA) at 95% confidence level. As suggested in the following equations, the coefficients
of first-order and second-order terms of protein concentration (Cp) were larger than that of Cs (Na+
concentration), indicating that Cp had a stronger influence on the fluorescence intensity of stressed IgG
than Cs (Na+ concentration) in both buffer types.
F = 2 × 10⁴ + (−378) ∗ cp + (−30) ∗ cs + 771 ∗ cp2 + (−0.097) ∗ cs2 + 58 ∗
cpcs
Equation
6-2
F = (−70) + (1 × 10⁴) ∗ cp + 60 ∗ cs + (−3828) ∗ cp2 + (−0.4) ∗ cs2 + 76 ∗ cpcs Equation
6-3
Contour plots developed from Equation 6-2 and Equation 6-3 are presented in Figure 38. The
mechanically stressed IgG samples in phosphate citrate buffer show no significant change in the
maximum fluorescence intensity for Cs (Na+ concentration) ranging from 50 mM to 250 mM, which
demonstrated negligible effect of Cs (Na+ concentration) on IgG unfolding. At higher IgG concentration
(4 mg/mL) the maximum fluorescence intensity doubled when Cs (Na+ concentration) increased from
50 mM to 250 mM, which demonstrated more significant effect of Cs (Na+ concentration) on IgG
unfolding. The mechanically stressed IgG samples at 4 mg/mL in acetate buffer showed lower
maximum fluorescence intensities than in phosphate citrate buffer at all Cs (Na+ concentration)
conditions and was 26% lower at Cs (Na+ concentration) 250 mM, which may indicate lower degree of
IgG unfolding in acetate buffer compared to phosphate citrate buffer.
The effect of counter-ion concentration (Cs, Na+ concentration) and co-ion type (chemistry and
valence) on the maximum fluorescence intensity of IgG observed in this study is in good agreement
with the literature work with mAbs. Bickel et al. [115] observed higher degree of non-specified mAb
unfolding for phosphate citrate buffer at Cs (Na+ concentration) 150 mM compared to Cs (Na+
concentration) 0 mM at pH 5 and proposed that higher salt concentration enhanced hydrophobic
interactions of protein molecules and induced non-native conformation. Unfolding was measured with
Differential Scanning Fluorimetry (DSF), intrinsic and extrinsic fluorescence spectroscopy. The lower
degree of IgG/mAb unfolding in acetate buffer compared to phosphate citrate buffer observed in this
study was also was observed by other groups [140-142]. Thus, proteins in solutions containing acetate
ions should be more stable than those in solutions containing phosphate ions and citrate ions.

123
Formaneck et al. [199] investigated the effect of Na+ concentration on the structural stability of a
non-mAb simpler protein, the human Lymphotactin, using extensive molecular dynamics (MD)
simulations and reported that the structure of Lymphotactin with higher surface charge is more sensitive
to the ionic environment compared to proteins with lower surface charge. Thus it is proposed that IgGs
in phosphate citrate buffer potentially exhibiting higher surface charge may be more sensitive to Cs
(Na+ concentration) compared to IgGs in acetate buffer in this study. This may explain the higher
fluorescence intensity of IgGs in phosphate citrate buffer at high Cs (Na+ concentration) compared to
IgGs in acetate buffer. The acetate buffer is recommended over phosphate citrate buffer for IgG to
maintain a low degree of unfolding in various Cs (Na+ concentration) and protein concentration
conditions (Figure 38).
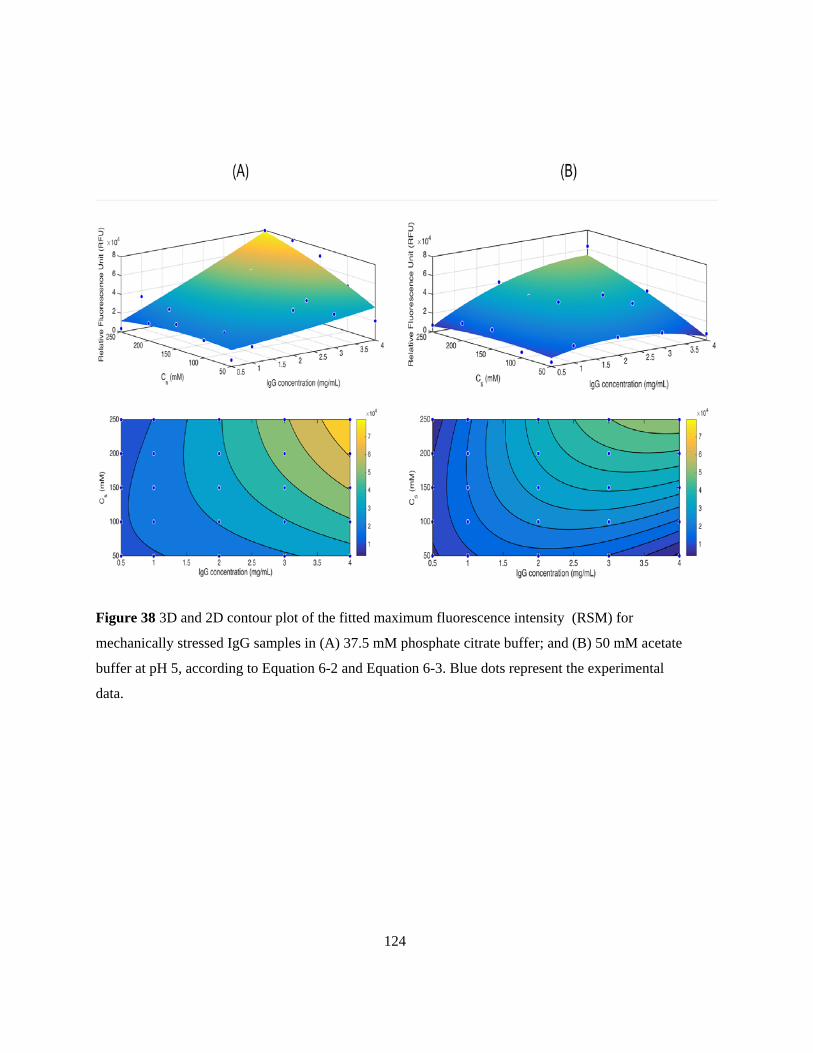
124
Figure 38 3D and 2D contour plot of the fitted maximum fluorescence intensity (RSM) for
mechanically stressed IgG samples in (A) 37.5 mM phosphate citrate buffer; and (B) 50 mM acetate
buffer at pH 5, according to Equation 6-2 and Equation 6-3. Blue dots represent the experimental
data.

125
6.3.2 Effect of buffer on Bevacizumab unfolding
Investigations of the effect of Cs (Na+ concentration) and co-ion type on IgG maximum fluorescence
intensity in the previous section was used to define the conditions for the investigation of buffer
conditions with Bevacizumab. In this section, the effect of co-ion type (chemistry and valence) on
Bevacizumab maximum fluorescence intensity will be discussed by comparing the intrinsic
fluorescence emission spectra of Bevacizumab samples in 100 mM phosphate citrate buffer and 200
mM acetate buffer at pH 5 and with the same Cs (Na+ concentration) after binding with weak CEX
membranes. As protein unfolding could be indicative of protein aggregation, SE-HPLC will be applied
for the analysis of the monomer content as an indication of potential aggregation. The Bevacizumab
binding with weak CEX membranes was also analyzed with the SMA model to examine the effect of
co-ion type on potential Bevacizumab unfolding.
Since the static protein binding experiment with Natrix C weak CEX membrane was performed by
shaking protein samples with the membranes, the binding process was viewed as a mechanical
treatment. Phosphate citrate buffer, 100 mM, and acetate buffer, 200mM, both at pH 5 and Cs (Na+
concentration) 140 mM, were selected in accordance with the buffer conditions used in the previous
binding experiment (section 4.4.4). The pH and Cs (Na+ concentration) of the two buffer types were
kept the same so that the investigation can focus on the effect of co-ion type on mAb unfolding.
6.3.2.1 Intrinsic fluorescence of Bevacizumab solutions under mechanical stress
The effects of co-ion type (chemistry and valence) on the static binding capacity of Bevacizumab with
Natrix C weak CEX membrane presented previously in section 4.4.4 showed comparable equilibrium
binding capacities for the two buffer types when the initial Bevacizumab concentration was lower than
10 mg/mL. The equilibrium Bevacizumab binding capacity in 200 mM acetate buffer was significantly
(Paired t-test, 95%) higher than in 100 mM phosphate citrate buffer when the initial Bevacizumab
concentration reached 10 mg/mL. It indicated that the effect of co-ion type on binding capacity was
only prominent at high Bevacizumab concentration. In this section, the effect of co-ion type (chemistry
and valence) on Bevacizumab maximum fluorescence intensity was investigated for initial
concentrations of 5 and 10 mg/mL, representing low and high concentration conditions.
The intrinsic fluorescence emission spectra of after-binding Bevacizumab samples in 100 mM
phosphate citrate buffer and 200 mM acetate buffer, were collected and compared (Figure 39). The

126
intrinsic fluorescence intensity of the after-binding Bevacizumab samples appears to be comparable
between the 100 mM phosphate citrate buffer and 200 mM acetate buffer when the initial Bevacizumab
concentration was 5 mg/mL. In contrast, when the initial Bevacizumab concentration was 10 mg/mL,
the intrinsic fluorescence intensity of Bevacizumab samples in 100 mM phosphate citrate buffer were
significantly higher than that in 200 mM acetate buffer, which could suggest a higher degree of
Bevacizumab unfolding. The observation corresponded to the ones in section 4.4.4 that the effect of
co-ion type on Bevacizumab binding capacity tend to be more evident at higher Bevacizumab
concentration.
The equilibrium binding capacity of Bevacizumab were comparable for the two buffer types when
the initial Bevacizumab concentration was less than or equal to 7 mg/mL. However, the equilibrium
binding capacity was significantly higher in acetate buffer compared to the phosphate citrate buffer
when the initial Bevacizumab concentration was 10 mg/mL. Based on these observations, the acetate
buffer is recommended over phosphate citrate buffer for Bevacizumab binding with Natrix C weak
CEX membrane at high concentrations, in order to minimize the degree of unfolding.

127
Figure 39 Intrinsic fluorescence emission spectra of the after-binding Bevacizumab samples with an
initial concentration of 5 and 10 mg/mL, in 100 mM phosphate citrate buffer and 200 mM acetate
buffer (both at pH 5 and Cs (Na+ concentration) 140 mM), respectively. Average values of duplicates.
6.3.2.2 SE-HPLC analysis of Bevacizumab solutions after high-throughput binding
Based on the previous section, it is proposed that 100 mM phosphate citrate buffer, pH 5 could result
in higher degree of unfolding for after-binding Bevacizumab samples with an initial concentration of
10 mg/mL compared to acetate buffer. As the degree of protein unfolding could be indicative of protein
aggregation, SE-HPLC analysis was performed for the after-binding Bevacizumab samples in 100 mM
phosphate citrate buffer and 200 mM acetate buffer (both at pH 5 and Cs (Na+ concentration) 140 mM),
with an initial concentration of 10 mg/mL. The monomer percentage of the before-binding and after-
binding Bevacizumab samples in each buffer was 96%, which indicates negligible aggregation. The
SE-HPLC analysis showed that the co-ion type did not have significant effect on the aggregation of
Bevacizumab under mechanical stress (binding).

128
6.3.2.3 SMA model of Bevacizumab binding with Natrix C weak CEX
The static binding experiments for IgG analyzed with the SMA model in the previous section (4.4.3.2)
indicates that the steric factor parameter could potentially be used to probe the effect of buffer on IgG
unfolding. The steric factor of IgG binding with Natrix C weak CEX membrane in 150 mM phosphate
citrate buffer was estimated to be 21% larger than in 200 mM acetate buffer, which suggest that the
IgG structure was less compact in phosphate citrate buffer than in acetate buffer. The hypothesis of the
structural change of IgG was confirmed by comparing the intrinsic fluorescence emission spectra of
mechanically stressed IgG samples in phosphate citrate buffer and in acetate buffer (6.3.1). The higher
maximum intrinsic fluorescence intensity was observed in phosphate citrate buffer compared to acetate
buffer, which indicates that the distinct co-ion type in phosphate citrate buffer promoted unfolding of
IgGs. Since similar intrinsic fluorescence differences were also observed with Bevacizumab samples
after binding with Natrix C weak CEX membrane (section 6.3.2.1), the steric factor parameter of the
SMA model will be discussed in this section for the binding of Bevacizumab with Natrix C weak CEX
membrane.
In this section, the results of the static binding experiments of Bevacizumab with Natrix C weak CEX
membrane performed in 25 mM phosphate citrate buffer and 50 mM acetate buffer at pH 5 with three
different counter-ion conditions, Cs (Na+ concentration) 50mM, 100 mM and 200 mM, were fitted into
the SMA model for parameter estimation. The estimated steric factor (σ) in phosphate citrate buffer
was 68% larger than in acetate buffer (Table 27), which indicates higher number of binding sites
blocked by the adsorbed Bevacizumab molecules. This may be associated with potential structural
changes undergone by Bevacizumab in phosphate citrate buffer, such as unfolding. Thus, the higher
estimated σ in phosphate citrate buffer agrees with the observations of higher Bevacizumab unfolding
in phosphate citrate buffer than acetate buffer during mechanical stress.
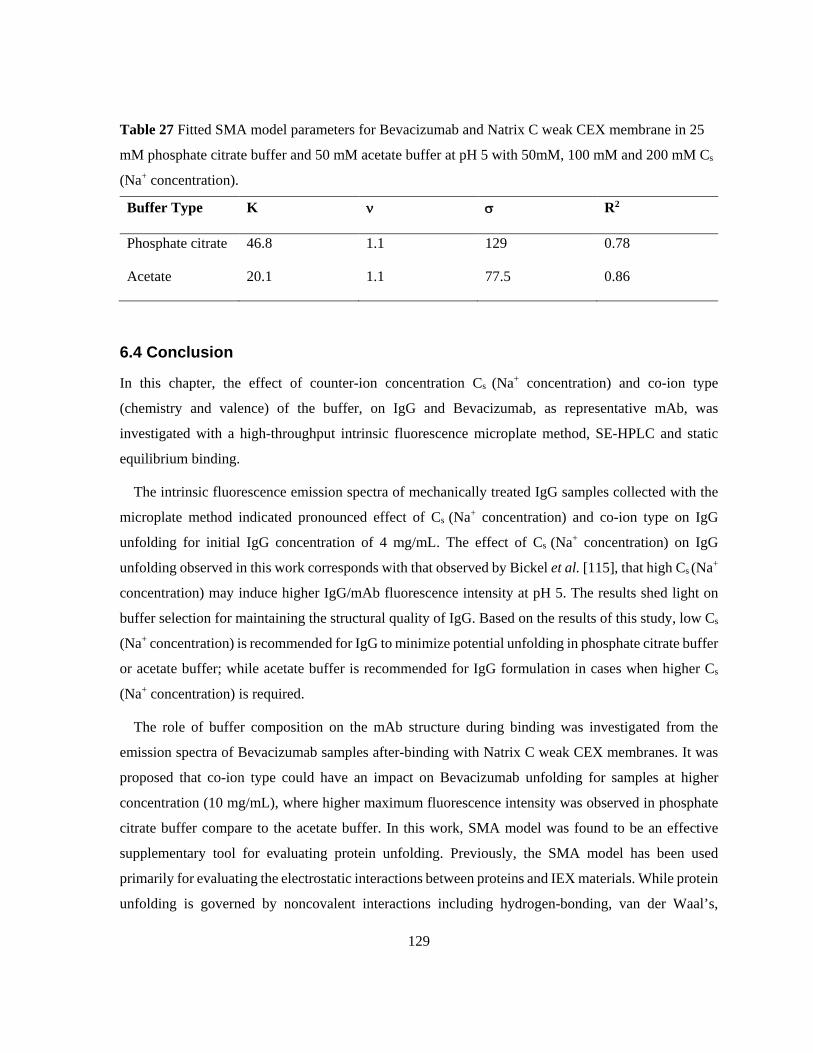
129
Table 27 Fitted SMA model parameters for Bevacizumab and Natrix C weak CEX membrane in 25
mM phosphate citrate buffer and 50 mM acetate buffer at pH 5 with 50mM, 100 mM and 200 mM Cs
(Na+ concentration).
Buffer Type K ν σ R2
Phosphate citrate 46.8 1.1 129 0.78
Acetate 20.1 1.1 77.5 0.86
6.4 Conclusion
In this chapter, the effect of counter-ion concentration Cs (Na+ concentration) and co-ion type
(chemistry and valence) of the buffer, on IgG and Bevacizumab, as representative mAb, was
investigated with a high-throughput intrinsic fluorescence microplate method, SE-HPLC and static
equilibrium binding.
The intrinsic fluorescence emission spectra of mechanically treated IgG samples collected with the
microplate method indicated pronounced effect of Cs (Na+ concentration) and co-ion type on IgG
unfolding for initial IgG concentration of 4 mg/mL. The effect of Cs (Na+ concentration) on IgG
unfolding observed in this work corresponds with that observed by Bickel et al. [115], that high Cs (Na+
concentration) may induce higher IgG/mAb fluorescence intensity at pH 5. The results shed light on
buffer selection for maintaining the structural quality of IgG. Based on the results of this study, low Cs
(Na+ concentration) is recommended for IgG to minimize potential unfolding in phosphate citrate buffer
or acetate buffer; while acetate buffer is recommended for IgG formulation in cases when higher Cs
(Na+ concentration) is required.
The role of buffer composition on the mAb structure during binding was investigated from the
emission spectra of Bevacizumab samples after-binding with Natrix C weak CEX membranes. It was
proposed that co-ion type could have an impact on Bevacizumab unfolding for samples at higher
concentration (10 mg/mL), where higher maximum fluorescence intensity was observed in phosphate
citrate buffer compare to the acetate buffer. In this work, SMA model was found to be an effective
supplementary tool for evaluating protein unfolding. Previously, the SMA model has been used
primarily for evaluating the electrostatic interactions between proteins and IEX materials. While protein
unfolding is governed by noncovalent interactions including hydrogen-bonding, van der Waal’s,

130
hydrophobic interactions, and electrostatic interactions [200], weak CEX materials exhibiting variable
ionization according to pH may influence protein structure through electrostatic interactions. The
higher maximum fluorescence intensity of Bevacizumab in phosphate citrate buffer was supported by
the higher estimated steric factor of the SMA model.
In conclusion, the intrinsic fluorescence microplate method could be employed as an efficient and
economical way to investigate buffer effects on protein unfolding for IgG/mAbs, which helped with
buffer selection for IgG/mAbs during the formulation process and the binding process. The steric factor
parameter of the SMA model can also be used to probe the effect of buffer on IgG unfolding. Therefore
acetate buffer is recommended for Bevacizumab binding with Natrix C weak CEX membrane to
minimize unfolding and obtain high binding capacity as shown in the previous section (4.4.4) where
the binding capacity of Bevacizumab with Natrix C weak CEX membrane was higher in acetate buffer
than that in phosphate citrate buffer when the initial concentration was 10 mg/mL. The findings agree
with that in literature where higher degree of IgG/mAb unfolding was observed for buffers contain
citrate ions and phosphate ions compare to buffers with acetate ions [140-142, 195].
131
Chapter 7 Developing design space for mAb capture with weak CEX
membranes
7.1 Introduction
The concept of Quality by Design (QbD) is a systematic approach that aims to ensure product quality
throughout the manufacturing process. This approach offers flexibility for changes in process
conditions within the design space [201]. The key elements of QbD include the quality target product
profile (QTPP), critical quality attributes (CQAs), critical material parameters (CMPs), critical process
parameters (CPPs), risk assessments, design space development, control strategy and product life cycle
management [143]. During the production of pharmaceutical products, variations within and between
batches are very common and difficult to eliminate, while these variations can be minimized with
through the design space development. The definition of design space was “the multidimensional
combination and interaction of input variables that have been demonstrated to provide assurance of
quality within an acceptable range”, according to the ICH Q8 guidance [145]. The design space
development is important to quantify the effect of material and process parameters on the performance
of biopharmaceutical manufacturing process, in terms of productivity and product quality [28, 29].
The principles of QbD require inspection and regulation of raw materials and process parameters for
control of the variability and the product quality during the downstream process, which consist of mAb
capture (binding and elution) and polishing steps. Considering the vast number of parameters involved
in the capture of mAb compared to small-molecule drugs, it is important to identify critical material
parameters (CMPs) and critical process parameters (CPPs) by risk assessment. CMPs and CPPs present
a significant impact on the critical quality attributes (CQAs) of mAb products and productivity, and
should be monitored and controlled to ensure that the process produces the desired quality. According
to the ICH Q8 guidance [145], CQAs are “A property or characteristic that when controlled within a
defined limit, range, or distribution ensures the desired product quality”.
There is growing work in design space development for downstream processes of mAb
manufacturing with ion exchange chromatography (IEX) for the polishing step of mAb purification,
viral clearance or aggregate removal. Strauss et al. [30] defined the design space for viral clearance
with AEX chromatography, with four process parameters, namely, pH, conductivity, mAb load density
and flow rate. Connell-Crowley et al. [11] investigated the retrovirus clearance with CEX, and defined
the design space with two parameters, pH and ionic strength. In terms of design space development for

132
aggregate removal with CEX, Xu et al. [31] defined the design space of the aggregate content with
mAb load and equilibration buffer. Khalaf et al. [32] developed a model for design space estimation,
where the elution behavior of the protein with CEX was first predicted with a thermodynamic model
and then the model was refined with experimentations to help define design space.
There has been no study on the design space development of the mAb capture step with CEX
membrane chromatography. Design space development can help explore the potentials of CEX
membranes for mAb capture through investigating the process performance, namely process
productivity and product quality in an efficient way.
The main objective of the work presented in this chapter was to establish a framework for high-
throughput design space development of the binding step of mAb capture with Natrix C weak CEX
membranes. A different mAb, Rituximab, which is a chimeric mAb, was selected because of its
different characteristics from Bevacizumab, with size of approximately 144 kDa [61] and the isoelectric
point is 8.68 [60]. Acetate buffer was selected as the binding buffer because it demonstrated higher
binding capacity (4.4.4) and lower unfolding (6.3.2) for Bevacizumab with weak CEX membranes.
Step 1, the critical parameters were identified with risk assessment, based on knowledge acquired from
the literuature and the work presented in the previous chapters. Step 2, the characterization range was
studied to help define the range of the critical parameters. Step 3, response surface model (RSM) was
created to define the design spaces, where the impact of parameters on productivity and product quality
was assessed from the binding capacity and the degree of protein unfolding. The RSM was established
by fitting into experimental data generated with a full factorial design of four factors and three levels.
Protein unfolding was detected with the high-throughput intrinsic fluorescence method developed in
Chapter 5. Step 4, optimal conditions defined by the design space was applied to Rixtuximab binding
with Natrix C weak CEX membrane, at static mode and dynamic mode which is the actual operating
mode.
7.2 Materials and methods
7.2.1 Buffers
All buffers and solutions were prepared with ultra-purified water. Sodium acetate buffer was prepared
by mixing acetic acid (EMD Chemicals Inc., Gibbstown, USA) and sodium acetate (EMD Chemicals
Inc., Gibbstown, USA). Phosphate citrate buffer was prepared by mixing citric acid (EMD Chemicals
133
Inc., Gibbstown, USA) solution and sodium phosphate dibasic (Fisher Scientific, Fair Lawn, USA)
solution. Sodium concentration was adjusted with sodium chloride (BDH Inc., Toronto, Canada). See
Appendix A for details of buffer preparation.
7.2.2 Rituximab
Chimeric mAb sample, Rituximab, was generously provided by Apotex Inc. (North York, Ontario,
Canada). All Rituximab samples used in this chapter were dialyzed with the targeting buffer following
the same procedures as in section 4.2.4.
7.2.3 Membranes
Weak CEX membrane, Natrix C weak CEX membranes (disc diameter: 47 mm (high-throughput static
binding, section 7.2.4) and 25 mm (dynamic binding, section 7.2.5)) were kindly provided by Natrix
Separations Inc. (Burlington, Ontario, Canada).
7.2.4 High-throughput static Rituximab binding and elution with microplate
The high-throughput static Rituximab binding was performed with 96-well microplates at room
temperature, with the same procedures as described in section 6.2.5. Circular Natrix C weak CEX
membrane samples (Diameter: 2.6 mm) were prepared with a cork borer. The membrane volume was
calculated from total sample mass and membrane density (0.42275g/ml). Rituximab samples with
initial concentration of 1, 2 and 3 mg/mL were selected. Acetate buffer with different pH, molarity and
counter-ion concentration Cs (Na+ concentration) was used as the binding buffer. Static binding was
performed with 96-well non-binding clear microplates (Greiner Bio-One, North Carolina, USA) on the
shaker at 200 rpm. The equilibration time was 1 h and the binding time was 6 h, as per Bevacizumab.
Triplicates were performed for each Rituximab concentration. The static binding capacity was
calculated as described in 4.2.8 from the after-binding solution.
For Rituximab elution, each membrane was removed from the binding solution and transferred to a
volume of 250 µL elution buffer of 20 mM phosphate citrate buffer at pH 7.2, with Cs (Na+
concentration) 75 mM, contained in 96-well microplates. After incubating for 4 hours on the shaker at

134
200 rpm, the membranes were taken out and the remaining after-elution solution was collected. The
amount of Rituximab eluted out was estimated from the UV absorbance at 280 nm with the Synergy 4
multi-detection microplate reader (BioTek Instruments, Winooski VT, US). The recovery was
calculated as follows,
Recovery (%) = ProeluPro𝑏𝑏𝑏𝑏𝑏𝑏𝑏𝑏
× 100% Equation 7-1
where Proelu is the amount of Rituximab eluted from the membrane and Pro𝑏𝑏𝑏𝑏𝑏𝑏𝑏𝑏 is the amount of
Rituximab bound to the membrane. Pro𝑏𝑏𝑏𝑏𝑏𝑏𝑏𝑏 is calculated from the initial concentration and the
concentration of the after-binding solution.
7.2.5 Dynamic Rituximab binding and elution
Dynamic Rituximab binding and elution was performed with ÄKTA Avant (GE Healthcare, Uppsala,
Sweden), and the experimental conditions are listed in
Table 28.
Table 28 Experimental conditions of dynamic Rituximab binding with the ÄKTA system.
Phase Volume (mL) Flow rate (mL/min)
Equilibration 10 1
Binding 50 1
Washing 5 1
Elution 35 1
A 25 mm Natrix C weak CEX membrane was placed in a membrane holder before the start of
equilibration phase. A new membrane sample was used for each run. The Rituximab load was adjusted
to 3 mg/mL during the dialysis the equilibration/binding buffer. Acetate buffer was used as
equilibration buffer, and buffer conditions was determined by the response surface model, which was
50 mM acetate buffer at pH 4.8, with Cs (Na+ concentration) 75 mM. Phosphate citrate buffer was used
as the elution buffer at various buffer conditions, including 20 mM phosphate citrate buffer at pH 7.2

135
and 7.6, and 150 mM phosphate citrate buffer at pH 7.2. Flowrate was 1 mL/min for all experiments.
The UV detector was set at 280 nm for UV absorbance measurement. Dynamic binding capacity (DBC)
(Equation 7-2) at 10% breakthrough (DBC10%) was calculated with MATLAB (R2016b). See Appendix
C. The recovery was calculated based on Equation 7-1.
DBC10% =Cp Vpermeate10%
V𝑚𝑚𝑚𝑚𝑚𝑚𝑏𝑏𝑚𝑚𝑚𝑚𝑏𝑏𝑚𝑚
Equation 7-2
where Cp is the Rituximab concentration (mg/mL), Vpermeate10% is the volume of permeate collected
at 10% breakthrough (mL) and Vmembrane is the calculated volume of the membrane (mL).
7.2.6 High-throughput intrinsic fluorescence measurement
The intrinsic fluorescence emission spectra of Rituximab was collected as per 6.2.6.
7.2.7 Response surface model (RSM)
RSM was constructed with the results from the high-throughput static Rituximab binding in acetate
buffer with Natrix C weak CEX membrane. A full factorial design of experiments (DoE) with four
factors at three levels for each factor was used to identify their contribution on Rituximab binding
capacity, and randomization and replication were implemented with a total of 213 runs (Table 29). The
range of the levels of each factor were identify in 7.3.2. A full second-order RSM was fitted to the
experimental data with R (version 3.4.0), using the rsm package [202, 203] (See Appendix D). All
factors were coded to ensure equal contribution to the model. Contour plots and response surfaces were
plotted with the plotly package. The coefficient of determination R2 and adjusted R2 was used as an
indication of goodness of fit of the model. The adjusted R2 is a modified version of R2 that is adjusted
for the number of predictors in the model and it increases only if the new term improves the model.

136
Table 29 Factors and levels of the buffer conditions for high-throughput static Rituximab binding
DoE (Step 3)
Factor Level
Low Medium High
pH 4 5 5.5
Cs (Na+ concentration) (mM) 75 100 150 buffer molarity (mM) 20 50 80
mAb (Rituximab) concentration (mg/mL) 1 2 3

137
7.2.8 Summary of experimental conditions
Table 30 lists buffer conditions, model proteins and experimental conditions used in this chapter.
Table 30 Buffer conditions, model proteins and experimental conditions for Chapter 6.
Section
Buffer Rituximab concentration
(mg/mL)
Experimental conditions Molarity
(mM) Type Cs (Na+
concentration) (mM)
pH
7.4.2 20, 50, 100 acetate Around 50 mM to 100 mM
5 Rituximab high-throughput static Rituximab binding Step 2: study characterization range
50 acetate Around 50 mM to 100 mM
4, 4.6, 5, 5.4, 6
50 acetate 50, 100, 200 5
7.4.3 20, 50, 80 acetate 75, 100, 150 4, 5, 5.5
Rituximab high-throughput static Rituximab binding - for RSM analysis Step 3: RSM development
7.4.4 50 acetate 75 4.8 Rituximab high-throughput static Rituximab binding Step 4: model application
20 phosphate citrate
75 7.2 high-throughput static Rituximab elution
50 acetate 75 4.8 Rituximab dynamic Rituximab binding Step 4: model application
20 phosphate citrate
/ 7.2, 7.6
dynamic Rituximab elution
20, 150 phosphate citrate
/ 7.2
138
7.3 Results and discussion
7.3.1 Risk assessment
The risk assessment analysis consists of two steps. The first step of the risk assessment was to identify
the relevant parameters to mAb binding and elution with CEX and create a cause-and-effect diagram.
A cause-and-effect diagram for capture by CEX was created based on knowledge from the literature
(Figure 40). The second step was to select and apply a risk assessment tool for the evaluation of the
parameters for mAb capture by CEX. Failure mode effects analysis (FMEA) was selected as the most
commonly used risk assessment tool for protein downstream processing [30, 151, 154]. According to
FMEA, each parameter is ranked by the risk priority number (RPN). The RPN score is determined by
the severity (S), occurrence (O), and detection (D) of the given parameter and is calculated as
RPN=S×O×D. In this work, the FMEA was performed for mAb capture with CEX materials, consist
of the severity, occurrence, and detection of relevant CEX material and process parameters, which were
ranked on a ten-point scale [204]. The scale of 1 means the lowest and the scale of 10 means the highest.
The score was given to each factor based on literature work on IgG/mAb purification (both capture and
polishing) with CEX, as well as knowledge of buffer effects on IgG/mAb binding with CEX acquired
in the previous section (Chapter 4). After assigning scores to severity, occurrence, and detection of all
parameters relating to mAb capture by CEX, the risk priority numbers were calculated accordingly
(Table 31).

139
Figure 40 Cause-and-effect diagram defined for identification of the material parameters and the
process parameters of mAb binding and elution with CEX.
Table 31 Failure Mode and Effects Analysis (FMEA) for mAb capture with CEX.
Parameters S O D RPN
CEX material 5 3 2 30
Filter 1 3 1 3
Chemical 1 1 1 1
pH 9 5 1 45
Conductivity 9 5 1 45
Counter-ion 7 1 1 7
flowrate 5 1 1 5
Residence time 3 3 1 9
Load
concentration 7 3 1 21
Load mode 7 1 1 7
Elution mode 7 1 1 7

140
The classification and identification of the parameters of greatest potential impact on mAb unfolding
and productivity of CEX capture was done with a Pareto chart(Figure 41) ,and was adapted from the
work of Xu et al. [31]. A Pareto chart is a graphical representation summarizing the relative importance
of each parameter and highlight the most important ones. The chart contains bars, representing
individual values are arranged in decreasing order of the RPN, and a line, representing the cumulative
value of the RPN. The cumulative percentage was calculated by dividing the RPN value of a given
parameter by the sum of the RPN value for all parameters. The parameters with high RPN and a
cumulative impact above 90% were considered as high risk and identified as critical parameters. As
shown in Figure 41, six of the ten parameters were identified as CMPs and CPPs. These parameters are
pH, conductivity, CEX material, mAb load concentration, residence time and load mode. The results
are in good agreement with the literature, where the above parameters are often investigated as critical
factors in mAb capture with CEX materials [14, 15, 17].

141
Figure 41 Pareto chart identifying CMPs and CPPs for CEX capture. Bars represent RPN value of
each parameters, and the solid line represents the cumulative percentage of RPN. The dash line
represents the 90% cumulative value, where parameters on the left of the marker contribute to 90% of
the total impact and are considered critical parameters.

142
The risk assessment analysis developed above for mAb capture with CEX material, will be applied
to Natrix C weak CEX membranes and the mAb, Rituximab, which will be discussed in the remaining
sections of this chapter with the following simplifications. Since the Natrix C weak CEX membrane
was selected as the CEX material for its high binding capacity, thus the CEX material parameter was
eliminated. The binding of Rituximab with Natrix C weak CEX membrane was performed in static
mode in the following work, thus residence time and load mode are not relevant. Therefore, three
critical process parameters, conductivity, pH of equilibration/load buffer, and Rituximab concentration,
will be examined in the following section. Findings from previous sections showing the significant
effect of the co-ions on mAb binding (4.4.4) and structural changes (6.3.2) was used to express. the
conductivity as two parameters, buffer molarity and Cs (Na+ concentration). It is the first time that buffer
molarity is investigated as the critical process parameter during design space development.
7.3.2 Characterization range
After identifying the critical parameters, the next step was to define the experimental characterization
range of the four critical parameters for design space development. Note that the design space is located
within the characterization range (Figure 42) [28, 205]. In this work one-factor-at-a-time (OFAT) was
employed as a simple approach to investigate the effect of each of the four critical parameters on the
Rituximab binding capacity and structural changes during binding with Natrix C weak CEX membrane.
The range of each factor was based on literature information and will be detailed for each parameter in
the next section.

143
Figure 42 Comparison of the characterization range and range of the design space. Reprinted from
Nature Biotechnology, 27/1, A. S Rathore & H. Winkle, Quality by design for biopharmaceuticals, 26,
Copyright (2009), with permission from Springer Nature [28].
7.3.2.1 pH of the binding buffer
The pH of the buffer is the most critical factor among all buffer factors for protein binding with CEX
materials, especially for weak CEX materials. mAb binding with CEX is based on electrostatic
interactions. Buffer pH can change the charge distribution on the protein surface and ionization of weak
CEX materials, which affects the electrostatic interactions between protein molecules and weak CEX
materials, as well as the electrostatic interactions within protein molecules [114, 135, 136]. For the
Natrix C weak CEX membrane, pH affect the swelling behavior of the membrane (Section 3.3.1) and
thus affect the availability of the binding sites on the membrane.
The effect of the pH of buffer on the binding capacity of Rituximab with Natrix C weak CEX
membrane was examined by comparing the static binding capacity of Rituximab with Natrix C weak
CEX membrane in 50 mM acetate buffer according to pH conditions (Figure 43). Acetate buffer was
selected as the binding buffer because it demonstrated higher binding capacity (4.4.4) and lower
unfolding (6.3.2) for Bevacizumab with weak CEX membranes. The initial Rituximab concentration
was set at 3 mg/mL. The binding capacity significantly increased with increasing pH until pH 5.4
(paired t-test, 95%), and then decreased at pH 6. The results are comparable to the literature, where
Hou et al. [22] investigated the dynamic binding capacity (DBC) of a mAb with Natrix C weak CEX
membrane with 50 mM acetate buffer with pH ranging from 4.4 to 5.2, and reported maximum DBC
at pH 5.2 (conductivity 8 mS/cm).

144
Figure 43 Static binding capacity of Rituximab with Natrix C weak CEX membrane in 50 mM
acetate buffer according to pH conditions. The initial Rituximab concentration was 3 mg/mL. Error
bars represent standard deviation (n=3).
The effect of pH on mAb unfolding was obtained from the intrinsic fluorescence, emission spectra
of Rituximab samples after binding with Natrix C weak CEX membrane in 50 mM acetate buffer at pH
4 and 6 and Cs (Na+ concentration) adjusted to 150 mM to avoid interference of the Cs (Na+
concentration) effect on mAb structure. The maximum fluorescence intensity of after-binding
Rituximab samples in acetate buffer at pH 6 was around twice as much as that of after-binding
Rituximab samples in acetate buffer at pH 4 (Table 32). A red-shift in maximum emission wavelength
was observed when the buffer pH increased from pH 4 to pH 6, which indicates increased unfolding.
Based on these results, the range of the pH of the buffer of Rituximab binding with Natrix C weak CEX
membrane was set to pH 4 to pH 5.5 for the next steps in the development of the design space.

145
Table 32 Maximum fluorescence intensity and maximum emission wavelength of emission spectra of
Rituximab with an initial concentration of 3 mg/mL after binding with 50 mM acetate buffer at pH 4
and 6 and Cs (Na+ concentration) adjusted to 150 mM. Average values of triplicates.
pH Maximum fluorescence
intensity (RFU)
Maximum emission
wavelength (nm)
4 1672 314
6 3593 325
7.3.2.2 Molarity of the binding buffer and Rituximab concentration
The buffer molarity has not been investigated as standalone parameter for design space development
of mAb capture by CEX. To examine the effect of buffer molarity, static Rituximab binding with Natrix
C weak CEX membrane was performed in pH 5 acetate buffer with a buffer molarity of 20 mM, 50
mM, and 100 mM (Figure 44). The molarity of buffer used for mAb binding with CEX materials has
been reported to range from 20 mM to 50 mM [16, 206, 207]. Guélat et al. [206] used 20 mM sodium
acetate buffer for the capture of Bevacizumab and Trastuzumab with strong cation exchange resins. Ng
et al. [16] used 40 mM sodium acetate buffer to purify a humanized mAb with a strong cation resin.
Tugcu et al. [207] considered 50 mM sodium acetate buffer for the purification of mAb with strong
cation resins. In order to explore a wider range of buffer molarity, buffer molarity up to 100 mM was
investigated in this work. The counter-ion concentration Cs (Na+ concentration) of all buffer solutions
was adjusted to 70 mM to avoid interference of Cs (Na+ concentration) effect.
Two initial Rituximab concentrations, 0.5 mg/mL and 3 mg/mL were examined. The results indicated
that the buffer molarity did not affect the binding capacity of Rituximab at low initial Rituximab
concentration (0.5 mg/mL), while its binding capacity was affected at moderate initial Rituximab
concentration (3 mg/mL). The effect of buffer molarity was statistically significant (t-test, a confidence
level of 95%, P = .01). When the buffer molarity was increased from 20 mM to 50 mM, the static
Rituximab binding capacity increased by 25%. The binding capacity decreased by 12% when the buffer
molarity was increased to 100 mM. The results indicated that medium buffer molarity (50 mM) is
preferred for achieving higher binding capacity of Rituximab with Natrix C weak CEX membrane.
High-throughput fluorescence measurement indicated that no unfolding occurred within the buffer

146
molarity range. The range of buffer molarity for design space development was then set to 20 mM to
100 mM.
Figure 44 Static binding capacity of Rituximab with Natrix C weak CEX membrane in pH 5 acetate
buffer, with a molarity of 20 mM, 50 mM and 100 mM. The counter-ion concentration Cs (Na+
concentration) of all buffer solutions was adjusted to 70 mM. The initial Rituximab concentration was
0.5 mg/mL and 3 mg/mL. Error bars represent standard deviation (n=3).

147
7.3.2.3 Counter-ion concentration (Na+ concentration) of the binding buffer
The effect of the counter-ion concentration Cs (Na+ concentration) on binding capacity has been
extensively investigated. The lowering of the binding capacity with increasing Cs (Na+ concentration)
has been reported for polyclonal IgG and monoclonal IgG with CEX resins due to competitive binding
between the counter-ions and protein molecules for the binding sites of the resins [183, 184]. The
negative effect of Cs (Na+ concentration) on binding capacity was also confirmed in the previous section
(6.3.2.3), where static binding capacities of Bevacizumab with Natrix C weak CEX membrane
decreased with increasing Cs (Na+ concentration) (50 mM, 100 mM and 200 mM) in pH 5 and 50 mM
acetate buffer.
In this section, the effect of the Cs (Na+ concentration) on static Rituximab binding with Natrix C
weak CEX membrane was investigated with 80 mM, pH 5.5 acetate buffer with Cs (Na+ concentration)
ranging from 75 mM to 225 mM to help locate the range of design space of Cs (Na+ concentration). The
initial Rituximab concentration was set at 3 mg/mL. The Rituximab binding capacity was summarized
in Table 33. The decreasing binding capacity of Rituximab with Natrix C weak CEX membrane
decreased with increasing Cs (Na+ concentration). The effect of Cs (Na+ concentration) on the Rituximab
structure of after-binding Rituximab samples was obtained from its intrinsic fluorescence emission
spectra. The maximum fluorescence intensity of after-binding Rituximab samples in acetate buffer with
Cs (Na+ concentration) of 225 mM was 27% higher than that of after-binding Rituximab samples in
acetate buffer with Cs (Na+ concentration) of 150 mM (Table 33. A slight red-shift (324nm to 325 nm)
in maximum emission wavelength was observed when the Cs (Na+ concentration) increased from 150
mM to 225 mM. Based on these results, the range of Cs (Na+ concentration) for the acetate buffer for
the design space development of Rituximab binding with Natrix C weak CEX membrane was set to 75
mM to 150 mM for next steps.
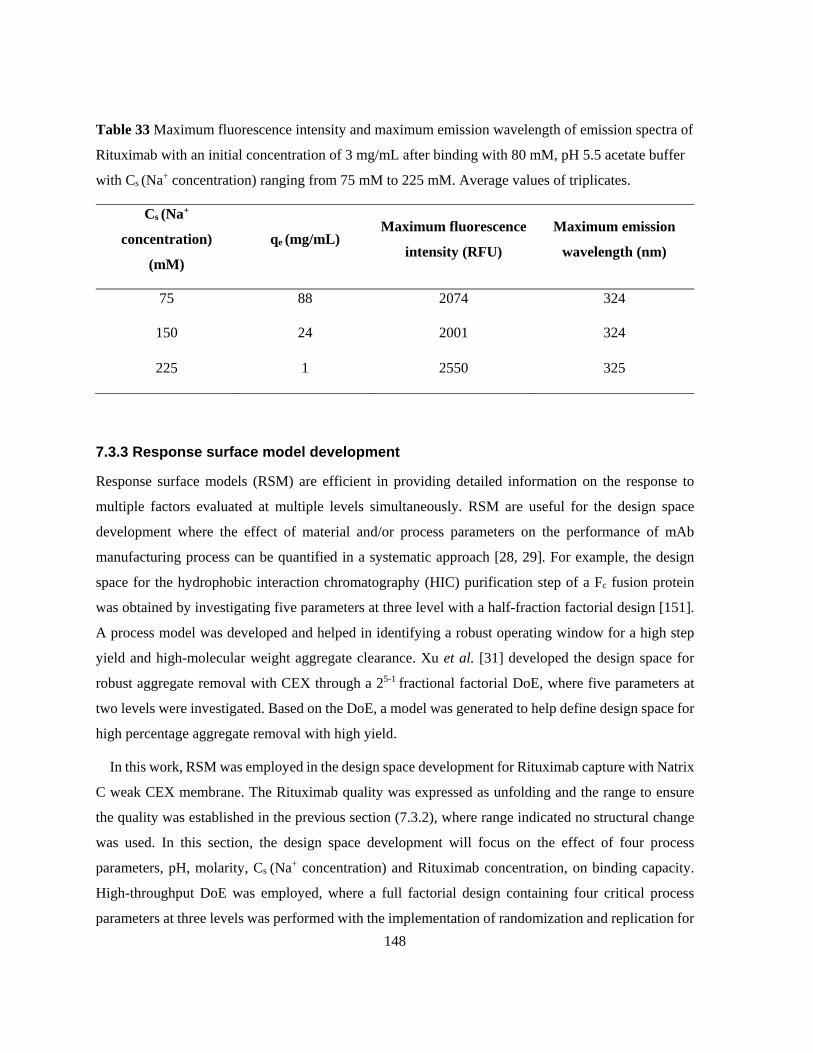
148
Table 33 Maximum fluorescence intensity and maximum emission wavelength of emission spectra of
Rituximab with an initial concentration of 3 mg/mL after binding with 80 mM, pH 5.5 acetate buffer
with Cs (Na+ concentration) ranging from 75 mM to 225 mM. Average values of triplicates.
Cs (Na+
concentration)
(mM)
qe (mg/mL) Maximum fluorescence
intensity (RFU)
Maximum emission
wavelength (nm)
75 88 2074 324
150 24 2001 324
225 1 2550 325
7.3.3 Response surface model development
Response surface models (RSM) are efficient in providing detailed information on the response to
multiple factors evaluated at multiple levels simultaneously. RSM are useful for the design space
development where the effect of material and/or process parameters on the performance of mAb
manufacturing process can be quantified in a systematic approach [28, 29]. For example, the design
space for the hydrophobic interaction chromatography (HIC) purification step of a Fc fusion protein
was obtained by investigating five parameters at three level with a half-fraction factorial design [151].
A process model was developed and helped in identifying a robust operating window for a high step
yield and high-molecular weight aggregate clearance. Xu et al. [31] developed the design space for
robust aggregate removal with CEX through a 25-1 fractional factorial DoE, where five parameters at
two levels were investigated. Based on the DoE, a model was generated to help define design space for
high percentage aggregate removal with high yield.
In this work, RSM was employed in the design space development for Rituximab capture with Natrix
C weak CEX membrane. The Rituximab quality was expressed as unfolding and the range to ensure
the quality was established in the previous section (7.3.2), where range indicated no structural change
was used. In this section, the design space development will focus on the effect of four process
parameters, pH, molarity, Cs (Na+ concentration) and Rituximab concentration, on binding capacity.
High-throughput DoE was employed, where a full factorial design containing four critical process
parameters at three levels was performed with the implementation of randomization and replication for

149
static binding experiment in acetate buffer. The static binding capacity (q) of Rituximab with Natrix C
weak CEX membrane was collected as the response.
The full dataset (see Appendix D) was coded and fitted into a first order (FO) linear equation using
the rsm function, while the R2 of the FO regression was found to be 0.2762, indicating a weak model
fit to the data. As FO regression is generally suitable when the response surface covers a relatively
small region of the independent variable space with very little curvature, the full dataset was then fitted
with a full second order (SO) model (including quadric terms of all parameters) to account for the larger
curvature. The R2 of the SO linear equation was estimated to be 0.4786, while the adjusted R2 was
0.4417, which indicated a moderately good fit to the data. Efforts were made to improve the model fit
by modifying the SO regression equation, while adding in cubic terms, and nonlinear terms
(log/exponential terms) which did not improve the fit. A residual plot of the SO model (Figure 45) was
employed to examine the residuals vs. fitted response and the residual points were found to be randomly
dispersed around the horizontal dotted axis, indicating that a linear regression model is appropriate for
the data.

150
Figure 45 Residual plot of the full dataset vs. fitted values for the SO linear equation from the full
factorial design of static Rituximab binding with Natrix C weak CEX membrane. (Experimental
conditions: Table 30).

151
The normal distribution of the residuals of the SO regression was then examined by a normal
quantile-quantile (QQ) plot, using the qqplot function. A normal QQ plot is a scatterplot created by
plotting the quantiles of the one data set against the quantiles of another data set. Quantiles are the cut
points dividing data points of a sample, or range of a normal distribution into continuous intervals with
equal probabilities (Figure 46). A 45-degree reference line is used to evaluate if the two datasets come
from a population with the same distribution, where the points should fall approximately along this
reference line. If the two datasets don’t come from populations with the same distributions, the data
points will deviate from the 45-degree reference line. A normal QQ plot was generated by plotting the
quantiles of the residuals of the responses, which are the differences between the observed response
values (binding capacity) and the predicted values by the SO linear equation, against the quantiles from
a standard normal distribution (Figure 47).
Figure 46 A plot of the data distribution for some attribute X. The quantiles plotted are
quartiles. [208]

152
Figure 47 Normal QQ plot where the quantiles of the residuals of the responses were plotted against
the quantiles from a standard normal distribution for the full dataset for the SO linear equation
developed from the full factorial design experiment of static Rituximab binding with Natrix C weak
CEX membrane. The solid red line represents the reference line and the dotted red line marked the
boundaries. (Experimental conditions: Table 30; Number of Runs = 213).

153
The QQ plot demonstrated that the points did not fall along the reference line, and exhibited a “heavy
tail” that deviated from the reference line in the right corner. It meant that the residuals of the responses
were not from populations with normal distributions, or in another word, meant that the residuals of the
responses were not normally distributed. The non-normality indicated that the residuals of the responses
have more extreme values than would be expected if they truly came from a normal distribution.
Therefore data points related to the residuals that fell into the right corner were further examined. Data
points that led to residuals over 10 (see Appendix D) were deemed as outliers and eliminated from the
dataset, which reduced the sample size from 213 data points to 192 data points. The new dataset was
fitted into the SO model and R2 of the fitted model was found to be 0.7, and the adjusted R2 was 0.67.
The R2 value was considered satisfactory as it was comparable to the R2 acquired during design space
development in the literature [31]. Xu et al. [31] achieved a R2 of 0.83 and adjusted R2 of 0.76 while
modeling a DoE study consisting five parameters at two levels, including the molarity and pH of the
equilibration buffer, the molarity and pH of the elution buffer and load amount when developing the
design space of aggregates removal using CEX resin. The normal distribution of the residuals of the
responses of the new SO model was confirmed by the normal QQ plot (Figure 48), where nearly all
points were located along the reference line between the boundaries.
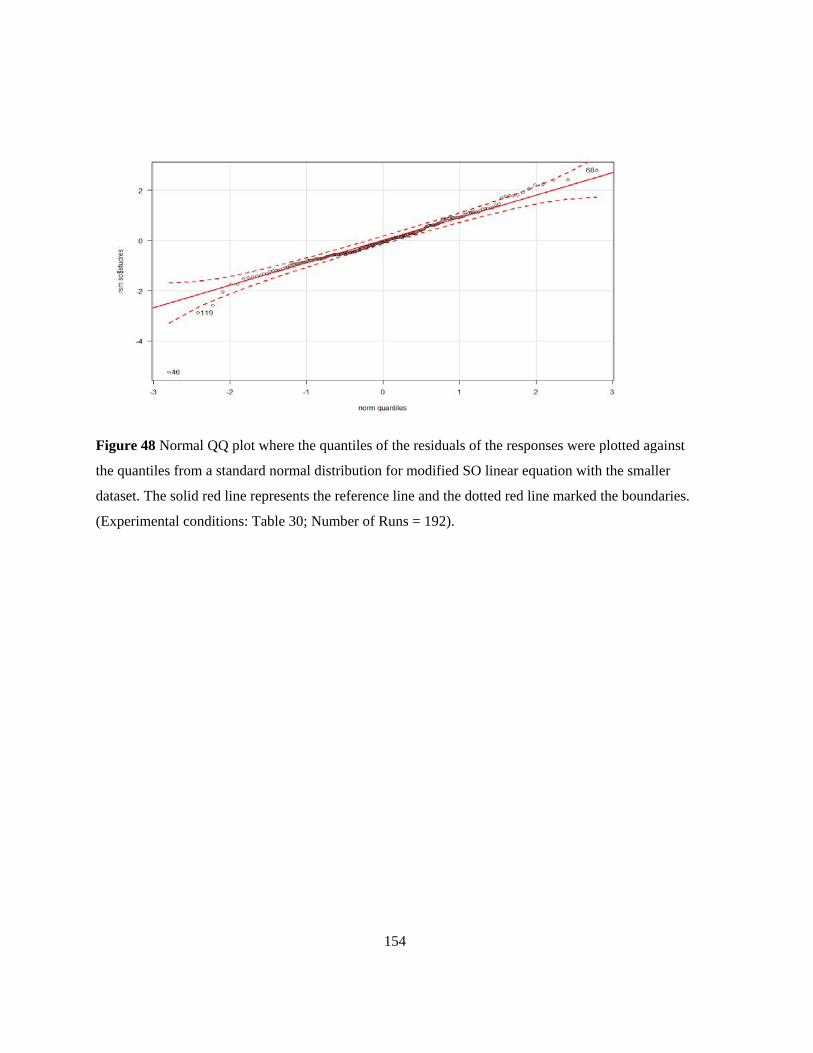
154
Figure 48 Normal QQ plot where the quantiles of the residuals of the responses were plotted against
the quantiles from a standard normal distribution for modified SO linear equation with the smaller
dataset. The solid red line represents the reference line and the dotted red line marked the boundaries.
(Experimental conditions: Table 30; Number of Runs = 192).

155
The R2 value and QQ plot confirmed the goodness of fit of the modified SO model generated from
the reduced dataset. Therefore the modified SO model was employed as the RSM for describing the
relationship between the four critical process parameters, pH, Cs, buffer molarity, mAb load, and static
binding capacity (q). Note that the main purpose of design space development is to understand the
relationship between the parameters and Rituximab binding capacity, and to assist with the selection of
the parameters within the range for better binding capacity and acceptable product quality. In this case,
the established RSM served as a sufficient tool to describe the relationship, but one should not rely on
the RSM for generating accurate estimations of the binding capacity as the R2 was 0.7. An analysis of
variance (ANOVA) was performed and confirmed that the four process parameters and their two-way
interactions are critical to the response, at a 95% confidence level (See Appendix B for details).
Considering the development in cell culture technology that leads to higher titer [4, 5], it is essential
to investigate design space for mAb capture at higher mAb load, therefore the mAb load was fixed at
3 mg/mL in the following analysis. The range of design space for Rituximab capture with Natrix C
weak CEX membrane was defined through analyzing the characterization range in section 7.3.2, where
the product quality (low unfolding indicated by low intrinsic fluorescence intensity) was maintained.
The buffer conditions for the highest static binding capacity based on the RSM, was acetate buffer
at pH 4.75, 53 mM buffer molarity and Cs (Na+ concentration) 75 mM for 3 mg/mL Rituximab
concentration. Considering the feasibility of parameter control in industrial processing, the optimal
buffer condition was rounded off to pH 4.8, 50 mM buffer molarity and Cs (Na+ concentration) 75 mM
for the following analysis, where the static binding capacity of Rituximab was estimated to be 69
mg/mL by the RSM. To visualize the design space, 2D contour plots and 3D response surfaces were
used to demonstrate the relationship between the static binding capacity of Rituximab with Natrix C
weak CEX membrane, and two process parameters, keeping the third one constant. At constant pH 4.8
(Figure 49), Rituximab binding capacity (q) decreased with increasing buffer molarity (BM) conditions,
especially at low Cs (Na+ concentration) conditions. At constant Cs (Na+ concentration), 75 mM (Figure
50), maximum Rituximab binding capacity appeared around medium pH (~5) and medium buffer
molarity (~ 50 mM). At constant buffer molarity at 50 mM (Figure 51), the Rituximab binding capacity
decreased with increasing pH and the maximum appeared around medium Cs (Na+ concentration) (~110
mM).

156
Figure 49 Contour plot (A) and response surface (B) of static binding capacities of Natrix C weak
CEX membrane with Rituximab at pH 4.8.
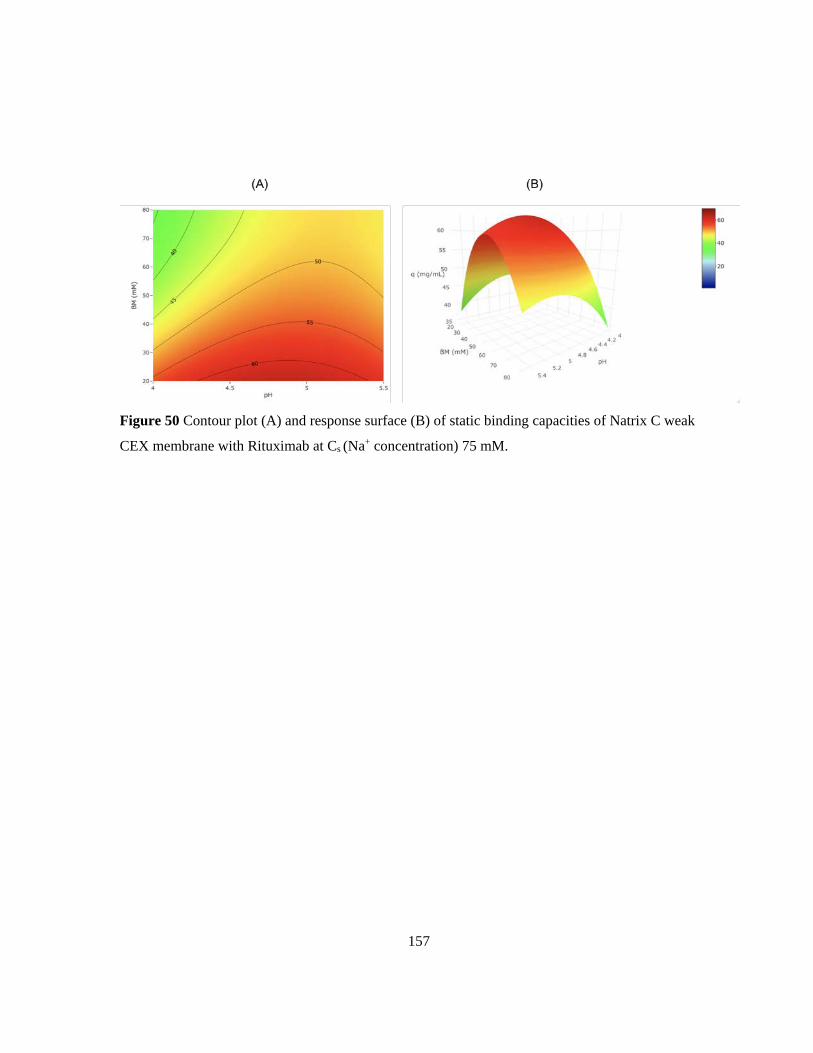
157
Figure 50 Contour plot (A) and response surface (B) of static binding capacities of Natrix C weak
CEX membrane with Rituximab at Cs (Na+ concentration) 75 mM.

158
Figure 51 Contour plot (A) and response surface (B) of static binding capacities of Natrix C weak
CEX membrane with Rituximab at buffer molarity 50 mM.

159
7.3.4 RSM application in Rituximab binding and elution
Static binding capacity is often obtained under overloading conditions therefore it’s the maximum
amount of protein bound onto the chromatography material at given buffer conditions, while it can be
predictive of the dynamic binding capacity. Dynamic binding capacity, or the amount of protein that
bound onto the material under given buffer and flow conditions before a significant breakthrough, is
obtained under the dynamic mode. Dynamic mode is the actual operating mode employed in mAb
manufacturing, therefore the optimal buffer conditions obtained from the RSM was then investigated
in dynamic Rituximab binding and elution. Each method will be discussed separately.
7.3.4.1 RSM application in Rituximab static binding and elution mode
The RSM established in the previous section will be first examined in the static mode, where Rituximab
binding was performed with Natrix C weak CEX membrane in an equilibration/load buffer with optimal
conditions estimated by the RSM and then eluted with an elution buffer with conditions that align with
the subsequent polishing step.
The static binding capacity of Rituximab with Natrix C weak CEX membrane obtained was 45 ± 5
mg/mL, which was 35% lower than the value estimated by the RSM model. The difference can be
explained by the limitation of the RSM in accurately estimating responses, and the variability in sample
materials, especially the Natrix C weak CEX membranes that are heterogeneous.
The bound Rituximab was then eluted with an elution buffer of 20 mM phosphate citrate buffer at
pH 7.2, with Cs (Na+ concentration) 75 mM. The condition of the elution buffer was selected such that
it would fall within the design space of a subsequent AEX polishing step, which is the conventional
subsequent step after capture such as to avoid the need for additional buffer exchange. The Rituximab
recovery was 78 ±10%.
To verify the quality of the mAb after the binding and elution step, the after-binding and after-elution
solution was examined with high-throughput intrinsic fluorescence method and no degree of unfolding
was detected, which indicated that Rituximab quality was maintained throughout the process.

160
7.3.4.2 RSM application in dynamic Rituximab binding and elution mode
The DBC10% of Rituximab with Natrix C weak CEX membrane in pH 4.8, 50 mM acetate buffer with
Cs (Na+ concentration) of 75 mM was 44.3 ± 0.4 mg/mL. The breakthrough curve (Figure 52) showed
almost a rectangular shape, which indicated little mass transport limitations [209]. The pore size of
Natrix C weak CEX membrane is around 300 nm, and is significantly larger than that of CEX resins
(20 to 100 nm for macroporous resins [92]). The mass transport for Natrix C weak CEX membrane is
dominated by bulk convection, which can improve productivity of mAb capture. The pores of Natrix
C weak CEX membrane are not clearly defined compared to resins.

161
Figure 52 Breakthrough curve of Rituximab with Natrix C weak CEX membrane in pH 4.8, acetate
buffer (50 mM) with Cs (Na+ concentration) of 75 mM. Dynamic mode with a flowrate of 1 mL/min.

162
The effect of elution buffer type and pH on Rituximab recovery was investigated. First, Rituximab
was eluted with phosphate citrate buffer at different pH conditions. The recovery of Rituximab eluted
with 20 mM phosphate citrate buffer at two different pH conditions, pH 7.2 and 7.6, was 61.4% and
56.6% respectively (Figure 53). Contrary to the common knowledge that an increase in elution pH will
enhance the recovery of protein with CEX, the recovery decreased 4.8% in this case. A slightly earlier
elution was observed at pH 7.6. Second, Rituximab was eluted with phosphate citrate buffer at pH 7.2
and two different buffer molarity conditions. The recovery of Rituximab eluted with 20 mM and 150
mM phosphate citrate buffer at pH 7.2 was 61.4% and 53.4%, respectively (Figure 54). Contrary to the
common knowledge that an increase in elution ionic strength will enhance the recovery of protein, the
recovery decreased 8% in this case. A much earlier elution was observed with 150 mM phosphate
citrate buffer. The lower recovery was observed with increasing pH and buffer molarity was suspected
to be a result of aggregation.

163
Figure 53 Chromatogram of Rituximab with Natrix C weak CEX membrane, eluted by 20 mM
phosphate citrate buffer at pH 7.2 and pH 7.6. Dynamic mode with a flowrate of 1 mL/min.

164
Figure 54 Chromatogram of Rituximab with Natrix C weak CEX membrane, eluted by 20 mM and
150 mM phosphate citrate buffer at pH 7.2. Dynamic mode with a flowrate of 1 mL/min.

165
7.4 Conclusion
In this chapter, a framework for high-throughput design space development for mAb capture with
Natrix C weak CEX membrane was established.
Rituximab and Natrix C weak CEX membrane were used for the design space development. The first
step of defining design space was to identify material/process parameters that have significant impact
on the product quality and productivity through risk assessment, where pH, counter-ion concentration
(Cs, Na+ concentration), buffer molarity and mAb load were determined to be critical parameters in this
work. The buffer molarity was investigated as a critical parameter during design space development for
mAb capture for the first time. The second step of design space development for mAb capture with
CEX was to study the characterization range to help define the range of critical parameters for the
design space. Rituximab binding with Natrix C weak CEX membrane with acetate buffer at different
levels of pH, buffer molarity and counter-ion concentration (Cs) were investigated. The range of the
parameters were defined by static Rituximab binding capacity and Rituximab unfolding measured with
intrinsic fluorescence. The third step was to establish a response surface model (RSM) for representing
the design space for Rituximab capture with Natrix C weak CEX membrane. The construction of the
RSM was based on a DoE study of the four critical parameters at three levels. The RSM was effective
in describing the relationship of the parameters and Rituximab binding capacity. The fourth step was
to conduct Rituximab binding with Natrix C weak CEX membrane using the optimal buffer conditions
estimated with the RSM for two different configurations, static mode and dynamic mode. This
framework can help significantly improve the efficiency of process development for mAb capture with
weak CEX membranes.

166
Chapter 8 Conclusions and recommendations
8.1 Conclusions
This PhD work focused on investigating the role of buffer effects, especially the buffer co-ions on
IgG/mAb binding with weak CEX membranes and on IgG/mAb structural change. For strong CEX
materials, the functional groups are completely ionized over a wide pH range, while for weak CEX
materials, the ionization of functional groups varies with pH. The variable ionization of weak ion
exchangers with pH offers better flexibility during elution where pH can be adjusted so that only the
target proteins are eluted. The effect of co-ions on IgG/mAb binding with strong CEX resins has been
probed by a few groups [107, 113], however there has not been any work with weak CEX membranes.
The work focused on Natrix C weak CEX membrane that has the ability to swell according to pH and
ion conditions. IgG and two different mAbs, Bevacizumab and Rituximab, were investigated with two
commonly used buffers for mAb binding, phosphate citrate buffer (contain multi-valent co-ions) and
acetate buffer (contain monovalent co-ions).
The first specific objective was to investigate the role of buffer pH, counter-ions, and co-ions on
membrane properties, namely the swelling behavior and surface morphology by ESEM for Natrix C
weak CEX membrane (Chapter 3). Both the pH and the counter-ions of phosphate citrate buffer and
acetate buffer had a significant influence on membrane swelling and membrane pore size, while the
buffer type (co-ion type) did not have significant effect. However, the applicability of ESEM for
quantitatively characterizing the pore size of Natrix C weak CEX membrane remains limited due to the
heterogeneity of the material.
The second specific objective was to examine the effect of the buffer conditions on IgG/mAb binding
with a weak CEX membrane, with an emphasis on the effect of co-ion type (Chapter 4). This work
helped expand the knowledge of the effect of co-ions on static IgG binding with the Natrix C weak
CEX membrane, employing the Langmuir model and the SMA model for assessing binding capacity.
The estimated model parameters indicated that co-ions may affect IgG binding in two ways. On one
hand, multi-valent co-ions (phosphate citrate buffer) may promote more protonation of histidine
residues on IgG surface compared to monovalent co-ions (acetate buffer), as observed by the estimated
characteristic charge of the SMA model. On the other hand, the co-ion valence may affect the structure
of IgG molecules thus changing the binding capacity, as observed by the estimated steric factor of the
SMA model. In the context of static binding of a humanized mAb, Bevacizumab, with Natrix C weak

167
CEX membrane, differences in the binding capacity according to the co-ion type was observed at
relatively high Bevacizumab concentration.
The third specific objective was to examine the effect of co-ion type (valence and chemistry) and
counter-ion concentration (Cs, Na+ concentration) on IgG/mAb structure (Chapter 5/Chapter 6). In order
to investigate buffer effects on IgG/mAb structure, an intrinsic fluorescence microplate method was
developed in Chapter 5 for thermally stressed samples and compared to published results. This method
was used to investigate the effects of co-ion type and Cs (Na+ concentration) on mechanically stressed
IgG employing a response surface model (Chapter 6). Higher Cs (Na+ concentration) and co-ion type
induced IgG structural change were observed, and are in good agreement with literature results. In the
context of Bevacizumab binding with weak CEX membranes, differences in Bevacizumab structure
were observed with the intrinsic fluorescence microplate method and the SMA model, where a higher
degree of Bevacizumab unfolding was observed in phosphate citrate buffer compared to acetate buffer
at a relatively high initial concentration (≥ 7 mg/mL). These observations were supported by the
estimated SMA parameters which further demonstrated that SMA model can serve as a supplementary
tool for evaluating protein structural changes, and are in agreement with the results obtained in chapter
3, where differences in binding capacity was observed at a relatively high initial concentration (≥ 7
mg/mL).
The fourth specific objective was to establish a framework for design space development for mAb
capture with weak CEX membranes (Chapter 7). This framework was developed with the experimental
observations and tools discussed in Chapter 3 to Chapter 6, using this time a chimeric mAb, Rituximab,
static and dynamic binding conditions. Four critical process parameters were identified, investigated,
and used to construct a response surface model (RSM) model. The RSM was effective in describing
the relationship of the parameters and Rituximab binding capacity.
Since mAb capture with CEX materials potentially occurs by binding with the variable regions of
mAb/IgG [25, 26], the framework established in this study could be employed in developing CEX
capture for other specific mAbs, which could help improve the efficiency of process development and
speed up studies in moving forward with mAb capture alternative systems to Protein-A affinity
chromatography.
168
8.2 Recommendations
8.2.1 Characterization of non-uniform hydrogel membranes
Pore structure
The pore structure of hydrogel IEX membranes plays an important role in mAb capture, however it is
difficult to quantify due to the fragile and heterogeneous properties.
In this work, the three-dimensional macroporous hydrogel structure of a weak CEX membrane,
Natrix C weak CEX membrane, was probed by swelling and ESEM. Both methods were satisfactory
in demonstrating that the hydrogel IEX membrane was sensitive to buffer conditions, while accurate
quantification of the pore size cannot be achieved with ESEM. There are two limitations, (1) the
hydrated membrane samples in the chamber suffered from dehydration throughout the visualization
process, which meant images could only be captured for the first few minutes after positioning the
sample in the chamber. The dehydration problem was also observed by Wang et al. [178] when imaging
Sartobind S and C using ESEM; (2) the acquired ESEM images revealed the non-uniform
characteristics of the pore structure of the membrane investigated, which meant a couple of images
captured within the first few minutes visualization process cannot be representative of the pore structure
of the whole sample. To address these problems, it is recommended to apply a combination of
characterization methods to accurately capture the pore size of the hydrogel IEX membrane treated by
various buffers, including confocal laser scanning microscopy (CLSM), differential scanning
calorimetry (DSC), mercury intrusion and nitrogen sorption porosimetry, and permeability
measurement. [210]. As each technique has its own limitations in detection size, pressure and
resolution, combining results obtained from all the techniques will generate a more comprehensive
picture of the pore structure of the hydrogel membrane and help better design the mAb capture process.
pH within the membrane
The pH of buffer is one of the most decisive factors in IgG/mAb capture with CEX membranes,
especially for weak CEX membranes that present variable ionization according to pH. However the pH
within the CEX membrane, or the pH microenvironment, may differ from the pH of buffer.
pH microelectrode has been used on various biological systems for monitoring the pH
microenvironment [211, 212], but the spatial resolution is limited by the tip size and insertion of the
microelectrode may perturb the local surroundings. Fluorescence microscopic methods, especially
CLSM, stands out for its accuracy and relative simplicity for monitoring pH microenvironment.
169
Therefore, it is recommended to employ CLSM combining with various pH-sensitive dyes for
monitoring the pH microenvironment of weak CEX membranes and help optimizing IgG/mAb capture.
8.2.2 Characterization of IgG/mAb aggregates with asymmetric flow field-flow fractionation (AF4)
Characterization of IgG/mAb aggregates is one of the most important elements for quality control
during IgG/mAb manufacturing. While the high-throughput intrinsic fluorescence method in this work
is applicable for fast in-line control, the quantitative characterization of IgG/mAb aggregates was
limited.
Asymmetric flow field-flow fractionation (AF4) is a promising alternative to SEC for more accurate
protein structure characterization [213-215], which can also address the limitations of intrinsic
fluorescence method. AF4 is the most applicable field-flow fractionation technique, where the
separation field of force is established by a second stream of carrier liquid, pumped in vertical direction
to the axial flow stream. AF4 technique is superior to size exclusion chromatography (SEC) with
improved reproducibility [214], higher flexibility for mobile phase selection [213], lower material loss
and most importantly wider size range, from [216, 217]. The lower limit is determined by the molecular
weight cut-off of the ultrafiltration membrane, whereas the upper limit is related to the channel height.
When coupled to a multi-angle light scattering detector and a refractive index or spectrophotometric
detector, the molar mass and root mean-square radius and their distributions can be determined for the
components fractionated by AF4 [218]. Therefore, it is recommended to employ AF4 for quantifying
the number and size of IgG/mAb aggregates.
8.2.3 Design space development with dynamic protein binding and cell culture supernatant
In this work, design space has been developed with static Rituximab binding experiments, while its
application is limited in terms of helping to reduce residence time. Therefore, it is recommended to
develop design space for mAb capture with weak CEX membranes employing dynamic protein binding
experiments that simulate the process conditions.
170
The focus of the design space development in this work was to improve the binding capacity and
eliminate mAb unfolding, thus purified Rituximab was employed. It is also critical to evaluate the
separation efficiency of weak cation exchange membranes. Hou et al. investigated the capability of
Natrix C weak CEX membranes for capturing mAbs from cell culture supernatant, and achieved over
85% of HCP removal and over 90% yield with selected buffer conditions (Binding: pH 5.2,
Conductivity 12 mS/cm, 50 mM acetate buffer; Elution: pH 6.5, 100 mM phosphate buffer). Therefore
it is recommended to develop design space to help improved impurity removal employing cell culture
supernatant for future work. HCP can be quantified using enzyme-linked immunosorbent assay
(ELISA) and mAb content can be quantified using Protein-A HPLC.
8.2.4 Multi-modal chromatography for mAb capture
The potential of weak CEX chromatography for mAb capture explored in this work has shown
limitations of CEX by its relatively low salt tolerance compared to other chromatographic methods.
There has been a growing interest in multi-modal chromatography (MMC) for mAb capture, which is
a chromatographic method combining multiple types of interaction between the stationary phase and
the mobile phase, where multimodal ligands comprising ion exchange, hydrogen bonding and
hydrophobic interaction groups are used [80]. MMC may be a superior capture method than CEX in
that it addresses the problem with salt tolerance through hydrophobic interactions. The complex
composition of multimodal ligands would offer greater flexibility in designing MMC material with
high selectivity for protein capture. Therefore it was recommended to explore the potential of MMC
membranes as non-affinity chromatography for mAb capture.
171
Bibliography
[1] K. Wrzosek, M. Polakovič, Effect of pH on protein adsorption capacity of strong cation exchangers with grafted layer, Journal of Chromatography A, 1218 (2011) 6987-6994. [2] N.S. Lipman, L.R. Jackson, L.J. Trudel, F. Weis-Garcia, Monoclonal versus polyclonal antibodies: distinguishing characteristics, applications, and information resources, ILAR journal, 46 (2005) 258-268. [3] D.M. Ecker, S.D. Jones, H.L. Levine, The therapeutic monoclonal antibody market, in: MAbs, Taylor & Francis, 2015, pp. 9-14. [4] J.R. Birch, A.J. Racher, Antibody production, Advanced Drug Delivery Reviews, 58 (2006) 671-685. [5] M. Butler, A. Meneses-Acosta, Recent advances in technology supporting biopharmaceutical production from mammalian cells, Applied Microbiology and Biotechnology, 96 (2012) 885-894. [6] G. Guiochon, L.A. Beaver, Separation science is the key to successful biopharmaceuticals, Journal of Chromatography A, 1218 (2011) 8836-8858. [7] E. Jain, A. Kumar, Upstream processes in antibody production: evaluation of critical parameters, Biotechnology Advances, 26 (2008) 46-72. [8] W. Marek, R. Muca, S. Woś, W. Piatkowski, D. Antos, Isolation of monoclonal antibody from a Chinese hamster ovary supernatant. I: Assessment of different separation concepts, Journal of Chromatography A, 1305 (2013) 55-63. [9] P. Marichal‐Gallardo, M. Alvarez, State‐of‐the‐art in downstream processing of monoclonal antibodies: Process trends in design and validation, Biotechnology Progress, 28 (2012) 899-916. [10] P. Gagnon, 17 Polishing Methods for Monoclonal IgG Purification, Process Scale Bioseparations for the Biopharmaceutical Industry, (2007) 491. [11] L. Connell‐Crowley, T. Nguyen, J. Bach, S. Chinniah, H. Bashiri, R. Gillespie, J. Moscariello, P. Hinckley, H. Dehghani, S. Vunnum, Cation exchange chromatography provides effective retrovirus clearance for antibody purification processes, Biotechnology and Bioengineering, 109 (2012) 157-165. [12] R. Necina, K. Amatschek, A. Jungbauer, Capture of human monoclonal antibodies from cell culture supernatant by ion exchange media exhibiting high charge density, Biotechnology and Bioengineering, 60 (1998) 689-698. [13] D.K. Follman, R.L. Fahrner, Factorial screening of antibody purification processes using three chromatography steps without protein A, Journal of Chromatography A, 1024 (2004) 79-85. [14] A. Arunakumari, J. Wang, G. Ferreira, Improved downstream process design for human monoclonal antibody production, BioPharm International, (2007) 36-40. [15] G. Ferreira, J. Dembecki, K. Patel, A. Arunakumari, A two-column process to purify antibodies without Protein A, Biopharm International, 20 (2007). [16] P.K. Ng, M.A. Snyder, pH-based cation exchange chromatography in the capture and elution of monoclonal antibodies, Journal of Separation Science, 35 (2012) 29-35. [17] R. Nian, P. Gagnon, Advance chromatin extraction enhances performance and productivity of cation exchange chromatography-based capture of Immunoglobulin G monoclonal antibodies, Journal of Chromatography A, 1453 (2016) 54-61. [18] B. Lain, M.A. Cacciuttolo, G. Zarbis-Papastoitsis, Development of a high-capacity Mab capture step based on cation-exchange chromatography, BioProcess International, 7 (2009) 26-34. [19] U. Gottschalk, Process scale purification of antibodies, John Wiley & Sons, 2011.

172
[20] A. Stein, A. Kiesewetter, Cation exchange chromatography in antibody purification: pH screening for optimised binding and HCP removal, Journal of Chromatography B: Analytical Technologies in the Biomedical and Life Sciences, 848 (2007) 151-158. [21] M. Urmann, H. Graalfs, M. Joehnck, L.R. Jacob, C. Frech, Cation-exchange chromatography of monoclonal antibodies: Characterisation of a novel stationary phase designed for production-scale purification, in: MAbs, Taylor & Francis, 2010, pp. 395-404. [22] Y. Hou, M. Brower, D. Pollard, D. Kanani, R. Jacquemart, B. Kachuik, J. Stout, Advective hydrogel membrane chromatography for monoclonal antibody purification in bioprocessing, Biotechnology Progress, 31 (2015) 974-982. [23] T. Arakawa, K. Tsumoto, D. Ejima, Alternative downstream processes for production of antibodies and antibody fragments, Biochimica et Biophysica Acta (BBA) - Proteins and Proteomics, 1844 (2014) 2032-2040. [24] J. Deisenhofer, Crystallographic refinement and atomic models of a human Fc fragment and its complex with fragment B of protein A from Staphylococcus aureus at 2.9-and 2.8-. ANG. resolution, Biochemistry, 20 (1981) 2361-2370. [25] T. Ishihara, T. Kadoya, H. Yoshida, T. Tamada, S. Yamamoto, Rational methods for predicting human monoclonal antibodies retention in protein A affinity chromatography and cation exchange chromatography: Structure-based chromatography design for monoclonal antibodies, Journal of Chromatography A, 1093 (2005) 126-138. [26] L. Zhang, W. Lilyestrom, C. Li, T. Scherer, R. van Reis, B. Zhang, Revealing a positive charge patch on a recombinant monoclonal antibody by chemical labeling and mass spectrometry, Analytical Chemistry, 83 (2011) 8501-8508. [27] U. Food, Drug Administration CDAR, Guidance for Industry Patient-Reported Outcome Measures: Use in Medical Product Development to Support Labeling Claims, in, 2006. [28] S.F. Abu-Absi, L. Yang, P. Thompson, C. Jiang, S. Kandula, B. Schilling, A.A. Shukla, Defining process design space for monoclonal antibody cell culture, Biotechnol Bioeng, 106 (2010) 894-905. [29] A.S. Rathore, M. Pathak, A. Godara, Process development in the QbD paradigm: Role of process integration in process optimization for production of biotherapeutics, Biotechnology Progress, 32 (2016) 355-362. [30] D.M. Strauss, T. Cano, N. Cai, H. Delucchi, M. Plancarte, D. Coleman, G.S. Blank, Q. Chen, B. Yang, Strategies for developing design spaces for viral clearance by anion exchange chromatography during monoclonal antibody production, Biotechnology Progress, 26 (2010) 750-755. [31] Z. Xu, J. Li, J.X. Zhou, Process development for robust removal of aggregates using cation exchange chromatography in monoclonal antibody purification with implementation of quality by design, Preparative Biochemistry and Biotechnology, 42 (2012) 183-202. [32] R. Khalaf, J. Heymann, X. LeSaout, F. Monard, M. Costioli, M. Morbidelli, Model-based high-throughput design of ion exchange protein chromatography, J Chromatogr A, 1459 (2016) 67-77. [33] P. Gagnon, Technology trends in antibody purification, Journal of chromatography A, 1221 (2012) 57-70. [34] R. van Reis, A. Zydney, Bioprocess membrane technology, Journal of Membrane Science, 297 (2007) 16-50. [35] C. Boi, Membrane adsorbers as purification tools for monoclonal antibody purification, Journal of Chromatography B, 848 (2007) 19-27. [36] V. Orr, L. Zhong, M. Moo-Young, C.P. Chou, Recent advances in bioprocessing application of membrane chromatography, Biotechnology Advances, 31 (2013) 450-465. [37] J. Thömmes, M. Etzel, Alternatives to chromatographic separations, Biotechnology Progress, 23 (2007) 42-45.

173
[38] K.J. Hassel, C. Moresoli, Role of pH and Ionic strength on weak cation exchange macroporous Hydrogel membranes and IgG capture, Journal of Membrane Science, 498 (2016) 158-166. [39] K.D. Elgert, Immunology: Understanding the Immune System, John Wiley & Sons, Inc. , 1998. [40] S. Jolles, W. Sewell, S. Misbah, Clinical uses of intravenous immunoglobulin, Clinical & Experimental Immunology, 142 (2005) 1-11. [41] A. Etzioni, H.D. Ochs, Primary Immunodeficiency Disorders: A Historic and Scientific Perspective, Academic Press, 2014. [42] N. Forrer, A. Butté, M. Morbidelli, Chromatographic behavior of a polyclonal antibody mixture on a strong cation exchanger column. Part I: Adsorption characterization, Journal of Chromatography A, 1214 (2008) 59-70. [43] P. Fontoura, Monoclonal antibody therapy in multiple sclerosis: paradigm shifts and emerging challenges, in: MAbs, Taylor & Francis, 2010, pp. 670-681. [44] C. Biolabs, New Monoclonal Antibody Drug Approvals Hit Record Levels in 2017, in, 2018. [45] AntibodySociety, First approval for cemiplimab-rwlc, in: https://www.antibodysociety.org/first-approval-for-cemiplimab-rwlc/ (Ed.), 2018. [46] NCI Dictionary of Cancer Terms, in: N.C. Institute (Ed.). [47] P.J. Carter, Antibody Drug Nomenclature : WHO Has Been Changing Them?, in: Antibody Engineering & Therapeutics 2015, San Diego, CA, 2015. [48] S.M. Kipriyanov, F. Le Gall, Generation and production of engineered antibodies, Molecular biotechnology, 26 (2004) 39-60. [49] Drugs.com, Avastin Approval History, in: https://www.drugs.com/history/avastin.html (Ed.). [50] Drugbank, Bevacizumab, in: https://www.drugbank.ca/drugs/DB00112 (Ed.). [51] S. Kaja, J.D. Hilgenberg, E. Everett, S.E. Olitsky, J. Gossage, P. Koulen, Effects of dilution and prolonged storage with preservative in a polyethylene container on Bevacizumab (Avastin™) for topical delivery as a nasal spray in anti-hereditary hemorrhagic telangiectasia and related therapies, Human antibodies, 20 (2011) 95-101. [52] M. Vlčková, F. Kalman, M.A. Schwarz, Pharmaceutical applications of isoelectric focusing on microchip with imaged UV detection, Journal of Chromatography A, 1181 (2008) 145-152. [53] T. scientific, A universal chromatography method for aggregate analysis of monoclonal antibodies, in: https://www.separatedbyexperience.com/documents/AN-21601-LC-SEC-mAbs-AN21601-EN.pdf (Ed.), 2016. [54] M.A. Sugimoto, V.d.P.C.P. Toledo, M.R.R. Cunha, V.M. Carregal, R. Jorge, P. Leão, S.L. Fialho, A. Silva-Cunha, Quality of bevacizumab (Avastin®) repacked in single-use glass vials for intravitreal administration, Arquivos brasileiros de oftalmologia, 80 (2017) 108-113. [55] H.B. Newton, Bevacizumab: Review of Development, Pharmacology, and Application to Brain Tumors, Clinical Medicine Insights. Therapeutics, 1 (2009) 1577. [56] Genentech, FDA Approves Rituxan - The First Targeted B-Cell Therapy for Treatment of Moderate-to-Severe Rheumatoid Arthritis, in: https://www.gene.com/media/press-releases/9407/2006-02-28/fda-approves-rituxan-the-first-targeted (Ed.), 2006. [57] G. Motta, M. Cea, E. Moran, F. Carbone, V. Augusti, F. Patrone, A. Nencioni, Monoclonal antibodies for non-Hodgkin's lymphoma: state of the art and perspectives, Clinical and Developmental Immunology, 2010 (2011). [58] J.P. Overington, B. Al-Lazikani, A.L. Hopkins, How many drug targets are there?, Nature Reviews Drug Discovery, 5 (2006) 993. [59] P. Imming, C. Sinning, A. Meyer, Drugs, their targets and the nature and number of drug targets, Nature Reviews Drug Discovery, 5 (2006) 821. [60] E.M. Agency, Mabthera: Scientific Discussion, (2005).

174
[61] Drugbank, Rituximab, in: https://www.drugbank.ca/drugs/DB00073 (Ed.). [62] S. Sacchi, M. Federico, G. Dastoli, C. Fiorani, G. Vinci, V. Clò, B. Casolari, Treatment of B-cell non-Hodgkin's lymphoma with anti CD 20 monoclonal antibody Rituximab, Critical reviews in oncology/hematology, 37 (2001) 13-25. [63] N. Kruljec, T. Bratkovic, Alternative Affinity Ligands for Immunoglobulins, Bioconjugate Chemistry, 28 (2017) 2009-2030. [64] L. Jendeberg, P. Nilsson, A. Larsson, P. Denker, M. Uhlen, B. Nilsson, P.-Å. Nygren, Engineering of Fc1 and Fc3 from human immunoglobulin G to analyse subclass specificity for staphylococcal protein A1, Journal of Immunological Methods, 201 (1997) 25-34. [65] N.T. Vijesh Kumar, Ranga Godavarti, Anurag S. Rathore, Evolution of the Monoclonal Antibody Purification Platform, BioPharm International, 26 (2013). [66] Y. Tao, A. Ibraheem, L. Conley, D. Cecchini, S. Ghose, Evaluation of high-capacity cation exchange chromatography for direct capture of monoclonal antibodies from high-titer cell culture processes, Biotechnology and Bioengineering, 111 (2014) 1354-1364. [67] N. Singh, S. Herzer, Downstream Processing Technologies/Capturing and Final Purification, in: New Bioprocessing Strategies: Development and Manufacturing of Recombinant Antibodies and Proteins 2017, pp. 115-178. [68] A.A. Shukla, B. Hubbard, T. Tressel, S. Guhan, D. Low, Downstream processing of monoclonal antibodies—application of platform approaches, Journal of Chromatography B, 848 (2007) 28-39. [69] L. Wang, J. Dembecki, N.E. Jaffe, B.W. O’Mara, H. Cai, C.N. Sparks, J. Zhang, S.G. Laino, R.J. Russell, M. Wang, A safe, effective, and facility compatible cleaning in place procedure for affinity resin in large-scale monoclonal antibody purification, Journal of Chromatography A, 1308 (2013) 86-95. [70] B. Nilsson, T. Moks, B. Jansson, L. Abrahmsen, A. Elmblad, E. Holmgren, C. Henrichson, T.A. Jones, M. Uhlen, A synthetic IgG-binding domain based on staphylococcal protein A, Protein Engineering, Design and Selection, 1 (1987) 107-113. [71] M. Linhult, S. Gülich, T. Gräslund, A. Simon, M. Karlsson, A. Sjöberg, K. Nord, S. Hober, Improving the tolerance of a protein a analogue to repeated alkaline exposures using a bypass mutagenesis approach, Proteins: Structure, Function, and Bioinformatics, 55 (2004) 407-416. [72] T.M. Pabst, R. Palmgren, A. Forss, J. Vasic, M. Fonseca, C. Thompson, W.K. Wang, X. Wang, A.K. Hunter, Engineering of novel Staphylococcal protein A ligands to enable milder elution pH and high dynamic binding capacity, Journal of Chromatography A, 1362 (2014) 180-185. [73] H. Watanabe, H. Matsumaru, A. Ooishi, Y. Feng, T. Odahara, K. Suto, S. Honda, Optimizing pH response of affinity between protein G and IgG Fc how electrostatic modulations affect protein-protein interactions, Journal of Biological Chemistry, 284 (2009) 12373-12383. [74] H. Watanabe, H. Matsumaru, A. Ooishi, S. Honda, Structure-based histidine substitution for optimizing pH-sensitive Staphylococcus protein A, Journal of Chromatography B, 929 (2013) 155-160. [75] J. Löfblom, J. Feldwisch, V. Tolmachev, J. Carlsson, S. Ståhl, F.Y. Frejd, Affibody molecules: engineered proteins for therapeutic, diagnostic and biotechnological applications, FEBS letters, 584 (2010) 2670-2680. [76] J.V. Olsen, S.-E. Ong, M. Mann, Trypsin cleaves exclusively C-terminal to arginine and lysine residues, Molecular & Cellular Proteomics, 3 (2004) 608-614. [77] A. Verdoliva, F. Pannone, M. Rossi, S. Catello, V. Manfredi, Affinity purification of polyclonal antibodies using a new all-D synthetic peptide ligand: comparison with protein A and protein G, Journal of Immunological Methods, 271 (2002) 77-88. [78] B. D'Agostino, P. Bellofiore, T. De Martino, C. Punzo, V. Rivieccio, A. Verdoliva, Affinity purification of IgG monoclonal antibodies using the D-PAM synthetic ligand: chromatographic

175
comparison with protein A and thermodynamic investigation of the D-PAM/IgG interaction, Journal of Immunological Methods, 333 (2008) 126-138. [79] Y.D. Clonis, Affinity chromatography matures as bioinformatic and combinatorial tools develop, Journal of Chromatography A, 1101 (2006) 1-24. [80] P. Gagnon, Purification of monoclonal antibodies by mixed-mode chromatography, Process Scale Purification of Antibodies, (2009) 125-143. [81] V.B. Brochier, A. Schapman, P. Santambien, L. Britsch, Fast purification process optimization using mixed-mode chromatography sorbents in pre-packed mini-columns, Journal of Chromatography A, 1177 (2008) 226-233. [82] J. Pezzini, C. Cabanne, J.-W. Dupuy, R. Gantier, X. Santarelli, A study on the nature of interactions of mixed-mode ligands HEA and PPA HyperCel using phenylglyoxal modified lysozyme, Journal of Chromatography B, 960 (2014) 209-213. [83] S. Burton, D. Harding, Hydrophobic charge induction chromatography: salt independent protein adsorption and facile elution with aqueous buffers, Journal of Chromatography A, 814 (1998) 71-81. [84] B.-L. Johansson, M. Belew, S. Eriksson, G. Glad, O. Lind, J.-L. Maloisel, N. Norrman, Preparation and characterization of prototypes for multi-modal separation media aimed for capture of negatively charged biomolecules at high salt conditions, Journal of Chromatography A, 1016 (2003) 21-33. [85] W. Schwartz, D. Judd, M. Wysocki, L. Guerrier, E. Birck-Wilson, E. Boschetti, Comparison of hydrophobic charge induction chromatography with affinity chromatography on protein A for harvest and purification of antibodies, Journal of Chromatography A, 908 (2001) 251-263. [86] S.S. Ranjini, D. Bimal, A. Dhivya, M. Vijayalakshmi, Study of the mechanism of interaction of antibody (IgG) on two mixed mode sorbents, Journal of Chromatography B, 878 (2010) 1031-1037. [87] I.F. Pinto, R.R. Soares, S.A. Rosa, M.R. Aires-Barros, V. Chu, J.P. Conde, A.M. Azevedo, High-Throughput Nanoliter-Scale Analysis and Optimization of Multimodal Chromatography for the Capture of Monoclonal Antibodies, Analytical Chemistry, 88 (2016) 7959-7967. [88] G. Joucla, C. Le Sénéchal, M. Bégorre, B. Garbay, X. Santarelli, C. Cabanne, Cation exchange versus multimodal cation exchange resins for antibody capture from CHO supernatants: Identification of contaminating Host Cell Proteins by mass spectrometry, Journal of Chromatography B: Analytical Technologies in the Biomedical and Life Sciences, 942-943 (2013) 126-133. [89] I.F. Pinto, M.R. Aires-Barros, A.M. Azevedo, Multimodal chromatography: debottlenecking the downstream processing of monoclonal antibodies, Pharmaceutical Bioprocessing, 3 (2015) 263-279. [90] R. Boyer, Modern Experimental Biochemistry, Addison Wesley Longman, 2000. [91] G. Healthcare, Ion Exchange Chromatography & Chromatofocusing: Principles and Methods, Edition AA, Amersham Biosciences, (2010) 7. [92] L. Zhong, J. Scharer, M. Moo-Young, D. Fenner, L. Crossley, C.H. Honeyman, S.-Y. Suen, C.P. Chou, Potential application of hydrogel-based strong anion-exchange membrane for plasmid DNA purification, Journal of Chromatography B, 879 (2011) 564-572. [93] D.S. Hart, C. Harinarayan, G. Malmquist, A. Axén, M. Sharma, R. van Reis, Surface extenders and an optimal pore size promote high dynamic binding capacities of antibodies on cation exchange resins, Journal of Chromatography A, 1216 (2009) 4372-4376. [94] U. Gottschalk, Bioseparation in Antibody Manufacturing: The Good, The Bad and The Ugly, Biotechnology Progress, 24 (2008) 496-503. [95] R. Ghosh, Protein separation using membrane chromatography: opportunities and challenges, Journal of Chromatography A, 952 (2002) 13-27. [96] R. Sadavarte, P. Madadkar, C.D. Filipe, R. Ghosh, Rapid preparative separation of monoclonal antibody charge variants using laterally-fed membrane chromatography, Journal of Chromatography B, 1073 (2018) 27-33.

176
[97] P. Madadkar, R. Mahansaria, J. Mukherjee, R. Ghosh, Enhancing the efficiency of disc membrane chromatography modules by using a flow directing layer, Journal of Membrane Science, (2019). [98] C.-S. Chang, S.-Y. Suen, Modification of porous alumina membranes with n-alkanoic acids and their application in protein adsorption, Journal of Membrane Science, 275 (2006) 70-81. [99] Y. Hou, M. Brower, D. Kanani, R. Jacquemart, B. Kachuik, D. Pollard, J. Stout, Advective Hydrogel Membrane Chromatography for Monoclonal Antibody Purification in Bioprocessing, Biotechnology Progress, (2015). [100] M. Kuczewski, E. Schirmer, B. Lain, G. Zarbis-Papastoitsis, A single-use purification process for the production of a monoclonal antibody produced in a PER.C6 human cell line, Biotechnology Journal, 6 (2011) 56-65. [101] N.S. Inc., Natrix Data File, in, pp. 18. [102] P.K. Ng, J. He, M.A. Snyder, Separation of protein mixtures using pH-gradient cation-exchange chromatography, Journal of Chromatography A, 1216 (2009) 1372-1376. [103] C. Gillespie, Utilizing mAb Adsorption Isotherms To Direct Process Development of a Strong Cation-Exchange Chromatography Step, in: Developments in Biotechnology and Bioprocessing, ACS Publications, 2013, pp. 51-65. [104] M.C. Stone, Y. Tao, G. Carta, Protein adsorption and transport in agarose and dextran-grafted agarose media for ion exchange chromatography: Effect of ionic strength and protein characteristics, Journal of Chromatography A, 1216 (2009) 4465-4474. [105] C. Harinarayan, J. Mueller, A. Ljunglof, R. Fahrner, J. Van Alstine, R. van Reis, An exclusion mechanism in ion exchange chromatography, Biotechnology and Bioengineering, 95 (2006) 775-787. [106] H.-M. Eun, Enzymology primer for recombinant DNA technology, Elsevier, 1996. [107] A. Faude, D. Zacher, E. Müller, H. Böttinger, Fast determination of conditions for maximum dynamic capacity in cation-exchange chromatography of human monoclonal antibodies, Journal of Chromatography A, 1161 (2007) 29-35. [108] E.X. Perez Almodovar, B. Glatz, G. Carta, Counterion effects on protein adsorption equilibrium and kinetics in polymer-grafted cation exchangers, Journal of Chromatography A, 1253 (2012) 83-93. [109] E. Cussler, Diffusion: Mass Transfer in Fluid Systems.(2nd edn) Cambridge, S 226ff, (1997). [110] N. Forrer, A. Butte, M. Morbidelli, Chromatographic behavior of a polyclonal antibody mixture on a strong cation exchanger column. Part I: Adsorption characterization, Journal of Chromatography A, 1214 (2008) 59-70. [111] C. Harinarayan, J. Mueller, A. Ljunglöf, R. Fahrner, J. Van Alstine, R. Van Reis, An exclusion mechanism in ion exchange chromatography, Biotechnology and bioengineering, 95 (2006) 775-787. [112] R. Bhambure, J.M. Angelo, C.M. Gillespie, M. Phillips, H. Graalfs, A.M. Lenhoff, Ionic strength-dependent changes in tentacular ion exchangers with variable ligand density. II. Functional properties, Journal of Chromatography A, 1506 (2017) 55-64. [113] K. Wrzosek, M. Gramblička, D. Tóthová, M. Antošová, M. Polakovič, Impact of ionic strength on adsorption capacity of chromatographic particles employed in separation of monoclonal antibodies, Chemical Papers, 64 (2010). [114] W. Wang, S. Nema, D. Teagarden, Protein aggregation--pathways and influencing factors, International Journal of Pharmaceutics, 390 (2010) 89-99. [115] F. Bickel, E.M. Herold, A. Signes, S. Romeijn, W. Jiskoot, H. Kiefer, Reversible NaCl-induced aggregation of a monoclonal antibody at low pH: characterization of aggregates and factors affecting aggregation, European Journal of Pharmaceutics and Biopharmaceutics, 107 (2016) 310-320. [116] M.L. Brader, T. Estey, S. Bai, R.W. Alston, K.K. Lucas, S. Lantz, P. Landsman, K.M. Maloney, Examination of thermal unfolding and aggregation profiles of a series of developable therapeutic monoclonal antibodies, Molecular pharmaceutics, 12 (2015) 1005-1017.

177
[117] E. Sahin, A.O. Grillo, M.D. Perkins, C.J. Roberts, Comparative effects of pH and ionic strength on protein–protein interactions, unfolding, and aggregation for IgG1 antibodies, Journal of pharmaceutical sciences, 99 (2010) 4830-4848. [118] S.B. Hari, H. Lau, V.I. Razinkov, S. Chen, R.F. Latypov, Acid-induced aggregation of human monoclonal IgG1 and IgG2: molecular mechanism and the effect of solution composition, Biochemistry, 49 (2010) 9328-9338. [119] M.L. Brader, T. Estey, S. Bai, R.W. Alston, K.K. Lucas, S. Lantz, P. Landsman, K.M. Maloney, Examination of thermal unfolding and aggregation profiles of a series of developable therapeutic monoclonal antibodies, Molecular Pharmaceutics, 12 (2015) 1005-1017. [120] V. Joshi, T. Shivach, N. Yadav, A.S. Rathore, Circular dichroism spectroscopy as a tool for monitoring aggregation in monoclonal antibody therapeutics, Anal Chem, 86 (2014) 11606-11613. [121] P. Arosio, G. Barolo, T. Muller-Spath, H. Wu, M. Morbidelli, Aggregation stability of a monoclonal antibody during downstream processing, Pharmaceutical Research 28 (2011) 1884-1894. [122] B. Lorber, F. Fischer, M. Bailly, H. Roy, D. Kern, Protein analysis by dynamic light scattering: methods and techniques for students, Biochemistry and Molecular Biology Education, 40 (2012) 372-382. [123] D.B. Temel, P. Landsman, M.L. Brader, Orthogonal Methods for Characterizing the Unfolding of Therapeutic Monoclonal Antibodies: Differential Scanning Calorimetry, Isothermal Chemical Denaturation, and Intrinsic Fluorescence with Concomitant Static Light Scattering, Methods Enzymology, 567 (2016) 359-389. [124] A. Fincke, J. Winter, T. Bunte, C. Olbrich, Thermally induced degradation pathways of three different antibody-based drug development candidates, Eur J Pharm Sci, 62 (2014) 148-160. [125] K. Ohadi, R.L. Legge, H.M. Budman, Intrinsic fluorescence-based at situ soft sensor for monitoring monoclonal antibody aggregation, Biotechnology Progress, 31 (2015) 1423-1432. [126] S. Wang, G. Wu, X. Zhang, Z. Tian, N. Zhang, T. Hu, W. Dai, F. Qian, Stabilizing two IgG1 monoclonal antibodies by surfactants: Balance between aggregation prevention and structure perturbation, European Journal of Pharmaceutics and Biopharmaceutics, 114 (2017) 263-277. [127] M.A. Ismael, J.M. Khan, A. Malik, M.A. Alsenaidy, S. Hidayathulla, R.H. Khan, P. Sen, M. Irfan, A.M. Alsenaidy, Unraveling the molecular mechanism of the effects of sodium dodecyl sulfate, salts, and sugars on amyloid fibril formation in camel IgG, Colloids and Surfaces B: Biointerfaces, (2018). [128] A. Zhang, S.K. Singh, M.R. Shirts, S. Kumar, E.J. Fernandez, Distinct aggregation mechanisms of monoclonal antibody under thermal and freeze-thaw stresses revealed by hydrogen exchange, Pharmaceutical Research, 29 (2012) 236-250. [129] J.K. Grzeskowiak, A. Tscheliessnig, P.C. Toh, J. Chusainow, Y.Y. Lee, N. Wong, A. Jungbauer, Two-dimensional fluorescence difference gel electrophoresis for comparison of affinity and non-affinity based downstream processing of recombinant monoclonal antibody, Journal of Chromatography A, 1216 (2009) 4902-4912. [130] F. He, D.H. Phan, S. Hogan, R. Bailey, G.W. Becker, L.O. Narhi, V.I. Razinkov, Detection of IgG aggregation by a high throughput method based on extrinsic fluorescence, Journal of Pharmaceutical Sciences, 99 (2010) 2598-2608. [131] C.J. Roberts, T.K. Das, E. Sahin, Predicting solution aggregation rates for therapeutic proteins: approaches and challenges, International Journal of Pharmaceutics, 418 (2011) 318-333. [132] A. Ghisaidoobe, S. Chung, Intrinsic tryptophan fluorescence in the detection and analysis of proteins: a focus on Förster resonance energy transfer techniques, International Journal of Molecular Sciences, 15 (2014) 22518-22538. [133] R. Pain, Current protocols in protein science, Coligan, JE, (2004) 7.6.
178
[134] X. Zhuang, T. Ha, H.D. Kim, T. Centner, S. Labeit, S. Chu, Fluorescence quenching: A tool for single-molecule protein-folding study, Proceedings of the National Academy of Sciences, 97 (2000) 14241-14244. [135] E.Y. Chi, S. Krishnan, T.W. Randolph, J.F. Carpenter, Physical stability of proteins in aqueous solution: mechanism and driving forces in nonnative protein aggregation, Pharmaceutical Research, 20 (2003) 1325-1336. [136] S. Idicula-Thomas, P.V. Balaji, Correlation between the structural stability and aggregation propensity of proteins, In Silico Biology, 7 (2007) 225-237. [137] S. Hober, K. Nord, M. Linhult, Protein A chromatography for antibody purification, Journal of Chromatography B, 848 (2007) 40-47. [138] S.H.M. Hedberg, D. Lee, Y. Mishra, J.M. Haigh, D.R. Williams, Mapping the mAb Aggregation Propensity Using Self-Interaction Chromatography as a Screening Tool, Analytical Chemistry 90 (2018) 3878-3885. [139] R.L. Baldwin, How Hofmeister ion interactions affect protein stability, Biophysical Journal, 71 (1996) 2056. [140] J. Rubin, L. Linden, W.M. Coco, A.S. Bommarius, S.H. Behrens, Salt-induced aggregation of a monoclonal human immunoglobulin G1, Journal of Pharmaceutical Sciences 102 (2013) 377-386. [141] A. Singla, R. Bansal, V. Joshi, A.S. Rathore, Aggregation Kinetics for IgG1-Based Monoclonal Antibody Therapeutics, AAPS J, 18 (2016) 689-702. [142] G.V. Barnett, V.I. Razinkov, B.A. Kerwin, A. Hillsley, C.J. Roberts, Acetate- and Citrate-Specific Ion Effects on Unfolding and Temperature-Dependent Aggregation Rates of Anti-Streptavidin IgG1, Journal of Pharmaceutical Sciences, 105 (2016) 1066-1073. [143] J.F.H.S.K.M.M.-M. S, Quality by design for biopharmaceutical drug product development, New York : Springer, 2015. [144] R. Taticek, J. Liu, Definitions and Scope of Key Elements of QbD, 18 (2015) 31-46. [145] I.H.T. Guideline, Pharmaceutical Development Q8 (R2), Current step, 4 (2009). [146] S.L. Nail, J.A. Searles, Elements of quality by design in development and scale-up of freeze-dried parenterals, Biopharm International, 21 (2008). [147] T. Lipsanen, O. Antikainen, H. Räikkönen, S. Airaksinen, J. Yliruusi, Novel description of a design space for fluidised bed granulation, International Journal of Pharmaceutics, 345 (2007) 101-107. [148] D. Getaz, A. Butte, M. Morbidelli, Model-based design space determination of peptide chromatographic purification processes, Journal of Chromatography A, 1284 (2013) 80-87. [149] Y. Lam, R. Haverstock, M. Westoby, A design space approach towards the development of the viral filtration and tangential flow ultrafiltration unit operations for the commercial purification process of a monoclonal antibody, in: AIChE Annual Meeting, Conference Proceedings, 2008. [150] A. Banerjee, Designing in quality: Approaches to defining the design space for a monoclonal antibody process, BioPharm International, 23 (2010) 26-40. [151] C. Jiang, L. Flansburg, S. Ghose, P. Jorjorian, A.A. Shukla, Defining process design space for a hydrophobic interaction chromatography (HIC) purification step: Application of quality by design (QbD) principles, Biotechnology and Bioengineering, 107 (2010) 985-997. [152] R. Bhambure, A. Rathore, Chromatography process development in the quality by design paradigm I: Establishing a high‐throughput process development platform as a tool for estimating “characterization space” for an ion exchange chromatography step, Biotechnology Progress, 29 (2013) 403-414. [153] M. Zhang, G.R. Miesegaes, M. Lee, D. Coleman, B. Yang, M. Trexler-Schmidt, L. Norling, P. Lester, K.A. Brorson, Q. Chen, Quality by design approach for viral clearance by protein a chromatography, Biotechnology and Bioengineering, 111 (2014) 95-103.

179
[154] M. Looby, N. Ibarra, J.J. Pierce, K. Buckley, E. O'Donovan, M. Heenan, E. Moran, S.S. Farid, F. Baganz, Application of quality by design principles to the development and technology transfer of a major process improvement for the manufacture of a recombinant protein, Biotechnology Progress, 27 (2011) 1718-1729. [155] D.H. Stamatis, Failure mode and effect analysis: FMEA from theory to execution, ASQ Quality Press, 2003. [156] I.J. Del Val, C. Kontoravdi, J.M. Nagy, Towards the implementation of quality by design to the production of therapeutic monoclonal antibodies with desired glycosylation patterns, Biotechnology Progress, 26 (2010) 1505-1527. [157] G.R. Miesegaes, S. Lute, D.M. Strauss, E.K. Read, A. Venkiteshwaran, A. Kreuzman, R. Shah, P. Shamlou, D. Chen, K. Brorson, Monoclonal antibody capture and viral clearance by cation exchange chromatography, Biotechnology and Bioengineering, 109 (2012) 2048-2058. [158] C.R. Gardner, O. Almarsson, H. Chen, S. Morissette, M. Peterson, Z. Zhang, S. Wang, A. Lemmo, J. Gonzalez-Zugasti, J. Monagle, Application of high throughput technologies to drug substance and drug product development, Computers & chemical engineering, 28 (2004) 943-953. [159] S. Chhatre, N.J. Titchener-Hooker, Review: Microscale methods for high-throughput chromatography development in the pharmaceutical industry, Journal of Chemical Technology & Biotechnology, 84 (2009) 927-940. [160] K.M. Lącki, High‐throughput process development of chromatography steps: Advantages and limitations of different formats used, Biotechnology Journal, 7 (2012) 1192-1202. [161] R. Bhambure, A.S. Rathore, Chromatography process development in the quality by design paradigm I: Establishing a high-throughput process development platform as a tool for estimating "characterization space" for an ion exchange chromatography step, Biotechnology Progress, 29 (2013) 403-414. [162] A. Grönberg, Optimizing Cation-exchange chromatography with high-throughput process development for mAb purification: Optimization of each phase in a chromatographic cycle has a positive impact on productivity, BioPharm International, 28 (2015) 44-47. [163] R.P. Hertzberg, A.J. Pope, High-throughput screening: new technology for the 21st century, Current Opinion in Chemical Biology, 4 (2000) 445-451. [164] J.L. Coffman, J.F. Kramarczyk, B.D. Kelley, High-throughput screening of chromatographic separations: I. Method development and column modeling, Biotechnology and Bioengineering, 100 (2008) 605-618. [165] A. Mehay, T. Gu, A general rate model of ion-exchange chromatography for investigating ion-exchange behavior and scale-up, Journal of Microbial & Biochemical Technology 6(2014) 216-222. [166] A.M. Lenhoff, Ion-exchange chromatography of proteins: the inside story, Materials Today: Proceedings, 3 (2016) 3559-3567. [167] N. Yoshimoto, K. Minakuchi, D. Itoh, Y. Isakari, S. Yamamoto, High-throughput process development methods for chromatography and precipitation of proteins: Advantages and precautions, Engineering in Life Sciences, 13 (2013) 446-455. [168] C. Gillespie, Utilizing mAb adsorption isotherms to direct process development of a strong-cation exchange chromatography step, in: ABSTRACTS OF PAPERS OF THE AMERICAN CHEMICAL SOCIETY, AMER CHEMICAL SOC 1155 16TH ST, NW, WASHINGTON, DC 20036 USA, 2011. [169] F. Dismer, M. Petzold, J. Hubbuch, Effects of ionic strength and mobile phase pH on the binding orientation of lysozyme on different ion-exchange adsorbents, Journal of Chromatography A, 1194 (2008) 11-21. [170] P.R. Baum, E.S. Espling, P. Tan, P.A. Thompson, Binding proteins comprising immunoglobulin hinge and fc regions having altered fc effector functions, in, Google Patents, 2007.
180
[171] O.B. Torres, J.F. Antoline, F. Li, R. Jalah, A.E. Jacobson, K.C. Rice, C.R. Alving, G.R. Matyas, A simple nonradioactive method for the determination of the binding affinities of antibodies induced by hapten bioconjugates for drugs of abuse, Analytical and Bioanalytical Chemistry, 408 (2016) 1191-1204. [172] P. Arora, S. Paratkar, R. Gandhi, High Throughput Fluorescence Assay to Detect Aggregation During Biologics Formulation Development, Journal of Pharmaceutical Innovation, 10 (2015) 109-117. [173] A. Hassel, Josefine, Protein Capture by Cation Exchange Membranes, in, UWSpace, 2015. [174] I. Tatárová, P. Dreveňák, A. Kosior, M. Polakovič, Equilibrium and kinetics of protein binding on ion-exchange cellulose membranes with grafted polymer layer, Chemical Papers, 67 (2013) 1527-1536. [175] Q. Lan, A.S. Bassi, J.-X.J. Zhu, A. Margaritis, A modified Langmuir model for the prediction of the effects of ionic strength on the equilibrium characteristics of protein adsorption onto ion exchange/affinity adsorbents, Chemical Engineering Journal, 81 (2001) 179-186. [176] C.A. Brooks, S.M. Cramer, Steric mass-action ion exchange: Displacement profiles and induced salt gradients, AIChE Journal, 38 (1992) 1969-1978. [177] K. Liburdi, I. Benucci, M. Esti, Lysozyme in Wine: An Overview of Current and Future Applications, Comprehensive Reviews in Food Science and Food Safety, 13 (2014) 1062-1073. [178] J. Wang, F. Dismer, J. Hubbuch, M. Ulbricht, Detailed analysis of membrane adsorber pore structure and protein binding by advanced microscopy, Journal of Membrane Science, 320 (2008) 456-467. [179] M. Urmann, M. Hafner, C. Frech, Influence of protein and stationary phase properties on protein–matrix-interaction in cation exchange chromatography, Journal of Chromatography A, 1218 (2011) 5136-5145. [180] S. Wickramasinghe, J. Carlson, C. Teske, J. Hubbuch, M. Ulbricht, Characterizing solute binding to macroporous ion exchange membrane adsorbers using confocal laser scanning microscopy, Journal of membrane science, 281 (2006) 609-618. [181] K.M.H. Lang, J. Kittelmann, C. Dürr, A. Osberghaus, J. Hubbuch, A comprehensive molecular dynamics approach to protein retention modeling in ion exchange chromatography, Journal of Chromatography A, 1381 (2015) 184-193. [182] P.R. Levison, M. Streater, J.W. Dennis, A scale‐down study into the chromatography of a peptide using the cation‐exchange cellulose, Express‐Ion C, Journal of Chemical Technology and Biotechnology, 74 (1999) 204-207. [183] K. Wrzosek, P. Ačai, M. Gramblička, M. Polakovič, Modeling of equilibrium and kinetics of human polyclonal immunoglobulin G adsorption on a tentacle cation exchanger, Chem. Pap., 67 (2013) 1537-1547. [184] M.M. Rohani, A. Mehta, A.L. Zydney, Development of high performance charged ligands to control protein transport through charge-modified ultrafiltration membranes, Journal of Membrane Science, 362 (2010) 434-443. [185] L.K. Shekhawat, A.P. Manvar, A.S. Rathore, Enablers for QbD implementation: Mechanistic modeling for ion-exchange membrane chromatography, Journal of Membrane Science, 500 (2016) 86-98. [186] S. Zhang, Y. Sun, Study on protein adsorption kinetics to a dye–ligand adsorbent by the pore diffusion model, Journal of Chromatography A, 964 (2002) 35-46. [187] H. Luo, M. Cao, K. Newell, C. Afdahl, J. Wang, W.K. Wang, Y. Li, Double-peak elution profile of a monoclonal antibody in cation exchange chromatography is caused by histidine-protonation-based charge variants, J Chromatogr A, 1424 (2015) 92-101.

181
[188] J. Kittelmann, K.M.H. Lang, M. Ottens, J. Hubbuch, Orientation of monoclonal antibodies in ion-exchange chromatography: A predictive quantitative structure-activity relationship modeling approach, J Chromatogr A, 1510 (2017) 33-39. [189] I. Agilent Technologies, Cary Eclipse Fluorescence Spectrophotometer User’s Guide, (2016). [190] I. BioTek Instruments, Synergy 4 multi-mode microplate reader operator's manual, (2010). [191] W.D. Selector, Agilent Technologies, Inc. - Cary Eclipse Fluorescence Spectrophotometer, in. [192] Y. Zhang, P.S. Cremer, Interactions between macromolecules and ions: the Hofmeister series, Current opinion in chemical biology, 10 (2006) 658-663. [193] M. Cacace, E. Landau, J. Ramsden, The Hofmeister series: salt and solvent effects on interfacial phenomena, Quarterly reviews of biophysics, 30 (1997) 241-277. [194] C.A. Cassou, E.R. Williams, Anions in electrothermal supercharging of proteins with electrospray ionization follow a reverse Hofmeister series, Analytical Chemistry, 86 (2014) 1640-1647. [195] D. Kameoka, E. Masuzaki, T. Ueda, T. Imoto, Effect of Buffer Species on the Unfolding and the Aggregation of Humanized IgG, Journal of Biochemistry, 142 (2007) 383-391. [196] S.N. Telikepalli, O.S. Kumru, C. Kalonia, R. Esfandiary, S.B. Joshi, C.R. Middaugh, D.B. Volkin, Structural characterization of IgG1 mAb aggregates and particles generated under various stress conditions, Journal of pharmaceutical sciences, 103 (2014) 796-809. [197] S. Telikepalli, O.S. Kumru, J.H. Kim, S.B. Joshi, K.B. O'berry, A.W. Blake-Haskins, M.D. Perkins, C.R. Middaugh, D.B. Volkin, Characterization of the physical stability of a lyophilized IgG1 mAb after accelerated shipping-like stress, Journal of pharmaceutical sciences, 104 (2015) 495-507. [198] T. Uchino, Y. Miyazaki, T. Yamazaki, Y. Kagawa, Immunogenicity of protein aggregates of a monoclonal antibody generated by forced shaking stress with siliconized and nonsiliconized syringes in BALB/c mice, Journal of Pharmacy and Pharmacology, 69 (2017) 1341-1351. [199] M.S. Formaneck, L. Ma, Q. Cui, Effects of temperature and salt concentration on the structural stability of human lymphotactin: Insights from molecular simulations, Journal of the American Chemical Society, 128 (2006) 9506-9517. [200] W.F.X. Stina Lindman, Olga Szczepankiewicz, Mikael C. Bauer, Hanna Nilsson, Sara Linse, Salting the Charged Surface: pH and Salt Dependence of Protein G B1 Stability, Biophysical Journal, 90 (2006) 2911-2921. [201] X.Y. Lawrence, G. Amidon, M.A. Khan, S.W. Hoag, J. Polli, G. Raju, J. Woodcock, Understanding pharmaceutical quality by design, The AAPS journal, 16 (2014) 771-783. [202] R.V. Lenth, Response-Surface Methods in R, using rsm, Journal of Statistical Software, 32 (2009) 1-17. [203] C. Sievert, C. Parmer, T. Hocking, S. Chamberlain, K. Ram, M. Corvellec, P. Despouy, plotly: Create Interactive Web Graphics via ‘plotly. js’. R package version 4.7. 1, in, 2017. [204] P.F. Mode, Effects Analysis (FMEA), Reference Manual, 2 (2008). [205] A.S. Rathore, H. Winkle, Quality by design for biopharmaceuticals, Nature biotechnology, 27 (2009) 26. [206] B. Guelat, L. Delegrange, P. Valax, M. Morbidelli, Model-based prediction of monoclonal antibody retention in ion-exchange chromatography, J Chromatogr A, 1298 (2013) 17-25. [207] N. Tugcu, D.J. Roush, K.E. Goklen, Maximizing productivity of chromatography steps for purification of monoclonal antibodies, Biotechnology and Bioengineering, 99 (2008) 599-613. [208] J. Han, J. Pei, M. Kamber, Data mining: concepts and techniques, Elsevier, 2011. [209] L.E. Weaver Jr, G. Carta, Protein adsorption on cation exchangers: comparison of macroporous and gel‐composite media, Biotechnology progress, 12 (1996) 342-355.

182
[210] I. Tatárová, R. Fáber, R. Denoyel, M. Polakovič, Characterization of pore structure of a strong anion-exchange membrane adsorbent under different buffer and salt concentration conditions, Journal of Chromatography A, 1216 (2009) 941-947. [211] M. Kühl, Optical microsensors for analysis of microbial communities, Methods in enzymology, 397 (2005) 166-199. [212] P. Stief, G. Eller, The gut microenvironment of sediment-dwelling Chironomus plumosus larvae as characterised with O2, pH, and redox microsensors, Journal of Comparative Physiology B, 176 (2006) 673-683. [213] W. Fraunhofer, G. Winter, The use of asymmetrical flow field-flow fractionation in pharmaceutics and biopharmaceutics, European Journal of Pharmaceutics and Biopharmaceutics 58 (2004) 369-383. [214] A. Hawe, S. Romeijn, V. Filipe, W. Jiskoot, Asymmetrical flow field-flow fractionation method for the analysis of submicron protein aggregates, J Pharm Sci, 101 (2012) 4129-4139. [215] A. Hawe, W. Friess, M. Sutter, W. Jiskoot, Online fluorescent dye detection method for the characterization of immunoglobulin G aggregation by size exclusion chromatography and asymmetrical flow field flow fractionation, Analytical Biochemistry, 378 (2008) 115-122. [216] J.P. Gabrielson, M.L. Brader, A.H. Pekar, K.B. Mathis, G. Winter, J.F. Carpenter, T.W. Randolph, Quantitation of aggregate levels in a recombinant humanized monoclonal antibody formulation by size-exclusion chromatography, asymmetrical flow field flow fractionation, and sedimentation velocity, Journal of Pharmaceutical Sciences, 96 (2007) 268-279. [217] P.J. Dycus, K.D. Healy, G.K. Stearman, M.J. Wells, Diffusion coefficients and molecular weight distributions of humic and fulvic acids determined by flow field-flow fractionation, Separation Science and Technology, 30 (1995) 1435-1453. [218] K.G. Wahlund, Flow field-flow fractionation: critical overview, Journal of Chromatography A, 1287 (2013) 97-112.

183
Appendices
Appendix A Buffer preparation and surfactant calculation
Phosphate citrate buffer
A stock buffer solution of 150 mM phosphate citrate buffer was first prepared by mixing 100 mM citric
acid (EMD Chemicals Inc., Gibbstown, USA) solution and 200 mM sodium phosphate dibasic (Fisher
Scientific, Fair Lawn, USA) solution. 100 mL stock buffer at various pH were made according to Table
34. Stock buffer was refrigerated after preparation and taken out the night before usage.
Phosphate citrate buffer with lower buffer molarity was diluted from the stock buffer by mixing it
with ultra-purified water. Phosphate citrate buffer with higher counter-ion concentration was prepared
by adding sodium chloride (BDH Inc., Toronto, Canada) to the stock buffer.
Table 34 Reference table for preparing 100 mL 150 mM phosphate citrate buffer.
pH 100 mM citric acid (mL) 200 mM sodium phosphate dibasic (mL)
4.0 61.45 38.55 4.2 58.60 41.40 4.4 55.90 44.10 4.6 53.25 46.75 4.8 50.70 49.30 5.0 48.50 51.50 5.2 46.40 53.60 5.4 44.25 55.75 5.6 42.00 58.00 5.8 39.55 60.45 6.0 36.85 63.15 6.2 33.90 66.10 6.4 30.75 69.25 6.6 27.25 72.75 6.8 22.75 77.25 7.0 17.65 82.35 7.2 13.05 86.95 7.4 9.15 90.85 7.6 6.35 93.65

184
Acetate buffer
A stock buffer solution of 200 mM sodium acetate buffer was prepared by mixing 200 mM acetic acid
(EMD Chemicals Inc., Gibbstown, USA) and 200 mM sodium acetate (EMD Chemicals Inc.,
Gibbstown, USA) solution. 100 mL stock buffer at various pH were made according to Table 35. Stock
buffer was refrigerated after preparation and taken out the night before usage.
Acetate buffer with lower buffer molarity was diluted from the stock buffer by mixing it with ultra-
purified water. Acetate buffer with higher counter-ion concentration was prepared by adding sodium
chloride (BDH Inc., Toronto, Canada) to the stock buffer.
Table 35 Reference table for preparing 100 mL 200 mM acetate buffer.
pH 200 mM sodium acetate (mL) 200 mM acetic acid (mL) 4.0 18.0 82.0 4.2 26.5 73.5 4.4 37.0 63.0 4.6 49.0 51.0 4.8 59.0 41.0 5.0 70.0 30.0 5.2 79.0 21.0 5.4 86.0 14.0 5.6 91.0 9.0 6 94.8 5.2
Phosphate buffered saline (PBS)
100 mL 10 mM PBS at pH 7 was prepared by preparing 80 mL of ultra-purified water in a proper
container, and then add potassium phosphate monobasic (EMD Chemicals Inc., New Jersey, USA),
sodium phosphate dibasic heptahydrate (VWR International, Ohio, USA), sodium chloride and
potassium chloride (Fisher Scientific, Fair Lawn, USA) according to Table 36. The solution was
adjusted to pH 7 and then add more ultra-purified water until volume is 100mL.

185
Table 36 Reference table for preparing 100 mL 10 mM PBS.
Chemical Mass Molarity NaCl (mw: 58.4 g/mol) 800 mg 0.137 M KCl (mw: 74.551 g/mol) 20 mg 0.0027 M Na2HPO4 (mw: 141.96 g/mol) 144 mg 0.01 M KH2PO4 (mw: 136.086 g/mol) 24 mg 0.0018 M
Polysorbate 20 calibration curve and concentration calculation
Figure 55 Calibration curves of Polysorbate 20 (0.01 mg/mL to 0.08 mg/mL) spiked with Nile Red.
y = 11194x + 12.013R² = 0.99176
0
200
400
600
800
1000
1200
0 0.02 0.04 0.06 0.08 0.1
Fluo
resc
ence
Inte
nsity
Polysorbate 20 Concentration (mg/mL)

186
Figure 56 Calibration curves of Polysorbate 20 (0.1 mg/mL to 1 mg/mL) spiked with Nile Red.
Table 37 Fluorescence intensity for each round of filtrate with corresponding Polysorbate 20
concentrations.
Average Fluorescence Intensity
Concentration (mg/mL)
Cumulative Percentage Removal
1st Filtrate 468 0.041 31% 2nd Filtrate 476 0.124 41% 3rd Filtrate 177 0.133 74% 4th Filtrate 34 0.053 87%
5th Filtrate 14 0.014 91%
y = 21119x - 1018.1R² = 0.99684
0
5000
10000
15000
20000
25000
0 0.2 0.4 0.6 0.8 1 1.2
Fluo
resc
ence
Inte
nsity
Polysorbate 20 Concentration (mg/mL)

187
Polysorbate 80 calibration curve and concentration calculation
Figure 57 Calibration curves of Polysorbate 80 (0.01 mg/mL to 0.08 mg/mL) spiked with Nile Red.

188
Figure 58 Calibration curves of Polysorbate 80 (0.1 mg/mL to 1 mg/mL) spiked with Nile Red.
Table 38 Fluorescence intensity for each round of filtrate with corresponding Polysorbate 80
concentrations.
Average Fluorescence Intensity Concentration (mg/mL)
Cumulative Percentage Removal
Filtrate 1 5635 0.232 33% Filtrate 2 1238 0.232 66% Filtrate 3 134 0.103 81% Filtrate 4 14 0.118 98% Filtrate 5 0 0 98%

189
Appendix B ANOVA tables
1 ANOVA table for 6.3.1
For stressed IgG samples in phosphate citrate buffer:
SS DF MS F0 Fc
Cp 19107414960 4 4776853740 1082.215655 F 0.05, 4, 50=2.56
Cs 3168306907 4 792076726.8 179.448206 interaction 8225439685 16 514089980.3 116.4691772 error 220697867.2 50 4413957.345 total 30721859420 74 415160262.4
For stressed IgG samples in acetate buffer:
SS DF MS F0 Fc
Cp 6607085373 4 1651771343 149.3547662 F 0.05, 4, 50= 2.56
Cs 4773356815 4 1193339204 107.9028877 interaction 5547692213 16 346730763.3 31.35173176 error 552969076.7 50 11059381.53 total 17481103478 74 236231128.1

190
2 ANOVA table for 6.4.3
SS DF F0 Pr(>F) Significance
(Intercept) 234993 1 1694.3019 < 2.2e-16 ***
pH 11865 2 42.7728 3.963e-16 ***
Cs 4597 2 16.5711 2.256e-07 ***
Buffer molarity (BM) 2748 2 9.9072 7.983e-05 ***
PC 12970 2 46.7572 < 2.2e-16 ***
pH:Cs 8518 4 15.3534 6.211e-11 ***
pH:BM 6672 4 12.0270 9.340e-09 ***
Cs:BM 2303 4 4.1503 0.003002 **
Residuals 27046 195
Significance codes: 0 ‘***’ 0.001 ‘**’ 0.01 ‘*’ 0.05 ‘.’ 0.1

191
Appendix C MATLAB code
1 MATLAB code for SMA analysis

192
2 MATLAB code for RSM of IgG in phosphate citrate buffer
General model:
fitresult(x,y) = A+B.*x.^2+C.*y.^2+D.*x.*y+E.*x+F.*y
Coefficients (with 95% confidence bounds):

193
A = 2.013e+04 (-1.392e+04, 5.418e+04)
B = 770.5 (-3324, 4865)
C = -0.09687 (-1.311, 1.117)
D = 58.37 (2.29, 114.4)
E = -378.2 (-2.088e+04, 2.013e+04)
F = -29.84 (-419.2, 359.6)
gof (goodness of fit):
sse: 2.7959e+09
rsquare: 0.7133
dfe: 19
adjrsquare: 0.6379
rmse: 1.2131e+04

194
3 MATLAB code for RSM of IgG in acetate buffer
General model:
fitresult(x,y) = A+B.*x.^2+C.*y.^2+D.*x.*y+E.*x+F.*y
Coefficients (with 95% confidence bounds):
A = -69.67 (-1.886e+04, 1.872e+04)

195
B = -3828 (-6087, -1568)
C = -0.3736 (-1.043, 0.2962)
D = 75.55 (44.61, 106.5)
E = 1.193e+04 (613.3, 2.324e+04)
F = 60.46 (-154.4, 275.3)
gof (goodness of fit):
sse: 8.5127e+08
rsquare: 0.8491
dfe: 19
adjrsquare: 0.8094
rmse: 6.6936e+03

196
4 MATLAB code for dynamic binding
197

198
Appendix D Dataset and R scripts for response surface model
1 Full dataset
pH Cs (mM) Buffer molarity (mM) mAb (Rituximab) load (mg/mL) q (mg/mL) 4 75 20 1 23.27 4 75 20 1 30.01 4 75 20 1 37.87 4 75 20 2 41.76 4 75 20 2 42.88 4 75 20 2 32.78 4 75 20 3 36.26 4 75 20 3 39.06 4 75 20 3 33.45 4 100 20 2 39.74 4 100 20 2 38.64 4 100 20 2 44.69 4 100 20 3 44.74 4 100 20 3 39.38 4 100 20 3 39.38 4 150 20 1 21.69 4 150 20 1 26.64 4 150 20 1 21.40 4 150 20 2 29.25 4 150 20 2 42.63 4 150 20 2 41.47 4 150 20 3 42.14 4 150 20 3 33.85 4 150 20 3 34.72 4 75 50 1 23.71 4 75 50 1 25.60 4 75 50 1 29.38 4 75 50 2 34.03 4 75 50 2 49.53 4 75 50 2 48.02 4 75 50 3 40.27 4 75 50 3 35.17 4 75 50 3 40.84

199
pH Cs (mM) Buffer molarity (mM) mAb (Rituximab) load (mg/mL) q (mg/mL) 4 100 50 2 35.66 4 100 50 2 34.87 4 100 50 2 37.75 4 100 50 3 57.02 4 100 50 3 48.78 4 100 50 3 37.79 4 150 50 1 33.52 4 150 50 1 26.63 4 150 50 1 27.09 4 150 50 2 30.77 4 150 50 2 33.98 4 150 50 2 33.52 4 150 50 3 0.00 4 150 50 3 28.24 4 150 50 3 44.08 4 75 80 1 23.13 4 75 80 1 17.50 4 75 80 1 19.49 4 75 80 2 42.02 4 75 80 2 30.44 4 75 80 2 33.41 4 75 80 3 30.27 4 75 80 3 38.21 4 75 80 3 33.25 4 100 80 2 34.44 4 100 80 2 35.92 4 100 80 2 39.13 4 100 80 3 33.87 4 100 80 3 27.20 4 100 80 3 26.83 4 150 80 1 23.08 4 150 80 1 20.72 4 150 80 1 18.75 4 150 80 2 48.67 4 150 80 2 55.74 4 150 80 2 33.73 4 150 80 3 80.66

200
pH Cs (mM) Buffer molarity (mM) mAb (Rituximab) load (mg/mL) q (mg/mL) 4 150 80 3 64.74 4 150 80 3 70.05 5 75 20 1 33.40 5 75 20 1 23.09 5 75 20 1 31.34 5 75 20 2 41.38 5 75 20 2 37.25 5 75 20 2 47.56 5 75 20 3 71.34 5 75 20 3 57.94 5 75 20 3 67.73 5 100 20 2 64.30 5 100 20 2 63.31 5 100 20 2 68.76 5 100 20 3 83.06 5 100 20 3 78.22 5 100 20 3 78.22 5 150 20 1 26.50 5 150 20 1 27.83 5 150 20 1 20.26 5 150 20 2 21.95 5 150 20 2 28.63 5 150 20 2 31.31 5 150 20 3 11.56 5 150 20 3 37.61 5 150 20 3 18.24 5 75 50 1 40.89 5 75 50 1 36.23 5 75 50 1 34.68 5 75 50 2 56.00 5 75 50 2 62.21 5 75 50 2 52.11 5 75 50 3 76.42 5 75 50 3 72.35 5 75 50 3 65.36 5 100 50 2 45.13 5 100 50 2 44.38

201
pH Cs (mM) Buffer molarity (mM) mAb (Rituximab) load (mg/mL) q (mg/mL) 5 100 50 2 47.12 5 100 50 3 71.06 5 100 50 3 63.20 5 100 50 3 52.72 5 150 50 1 19.03 5 150 50 1 22.98 5 150 50 1 24.63 5 150 50 2 33.25 5 150 50 2 31.94 5 150 50 2 34.57 5 150 50 3 56.80 5 150 50 3 59.27 5 150 50 3 49.88 5 75 80 1 43.09 5 75 80 1 33.49 5 75 80 1 40.29 5 75 80 2 43.56 5 75 80 2 42.77 5 75 80 2 39.57 5 75 80 3 56.35 5 75 80 3 34.17 5 75 80 3 47.96 5 100 80 2 46.30 5 100 80 2 47.69 5 100 80 2 50.70 5 100 80 3 52.77 5 100 80 3 46.52 5 100 80 3 46.17 5 150 80 1 22.69 5 150 80 1 22.69 5 150 80 1 21.10 5 150 80 2 32.64 5 150 80 2 41.59 5 150 80 2 25.60 5 150 80 3 44.64 5 150 80 3 41.76 5 150 80 3 53.27

202
pH Cs (mM) Buffer molarity (mM) mAb (Rituximab) load (mg/mL) q (mg/mL) 5.5 75 20 1 18.08 5.5 75 20 1 27.23 5.5 75 20 1 18.84 5.5 75 20 2 40.92 5.5 75 20 2 26.05 5.5 75 20 2 30.24 5.5 75 20 3 36.78 5.5 75 20 3 33.92 5.5 75 20 3 31.63 5.5 100 20 2 7.09 5.5 100 20 2 8.46 5.5 100 20 2 4.61 5.5 100 20 3 10.22 5.5 100 20 3 9.39 5.5 100 20 3 0.00 5.5 150 20 1 0.00 5.5 150 20 1 0.00 5.5 150 20 1 0.00 5.5 150 20 2 0.00 5.5 150 20 2 0.00 5.5 150 20 2 0.00 5.5 75 50 1 32.03 5.5 75 50 1 45.74 5.5 75 50 1 39.76 5.5 75 50 2 40.40 5.5 75 50 2 36.18 5.5 75 50 2 35.83 5.5 75 50 3 40.55 5.5 75 50 3 55.85 5.5 75 50 3 65.87 5.5 100 50 2 18.20 5.5 100 50 2 18.82 5.5 100 50 2 19.44 5.5 100 50 3 30.08 5.5 100 50 3 19.40 5.5 100 50 3 38.90 5.5 150 50 1 20.77

203
pH Cs (mM) Buffer molarity (mM) mAb (Rituximab) load (mg/mL) q (mg/mL) 5.5 150 50 1 35.83 5.5 150 50 1 21.58 5.5 150 50 2 41.00 5.5 150 50 2 41.81 5.5 150 50 2 34.08 5.5 150 50 3 86.53 5.5 150 50 3 86.53 5.5 150 50 3 59.67 5.5 75 80 1 22.74 5.5 75 80 1 17.45 5.5 75 80 1 16.70 5.5 75 80 2 34.41 5.5 75 80 2 38.56 5.5 75 80 2 23.08 5.5 75 80 3 96.91 5.5 75 80 3 90.68 5.5 75 80 3 75.17 5.5 100 80 2 19.90 5.5 100 80 2 28.35 5.5 100 80 2 23.28 5.5 100 80 3 42.52 5.5 100 80 3 40.41 5.5 100 80 3 44.63 5.5 150 80 1 9.61 5.5 150 80 1 11.60 5.5 150 80 1 11.27 5.5 150 80 2 18.66 5.5 150 80 2 14.69 5.5 150 80 2 16.67 5.5 150 80 3 20.04 5.5 150 80 3 22.03 5.5 150 80 3 29.49
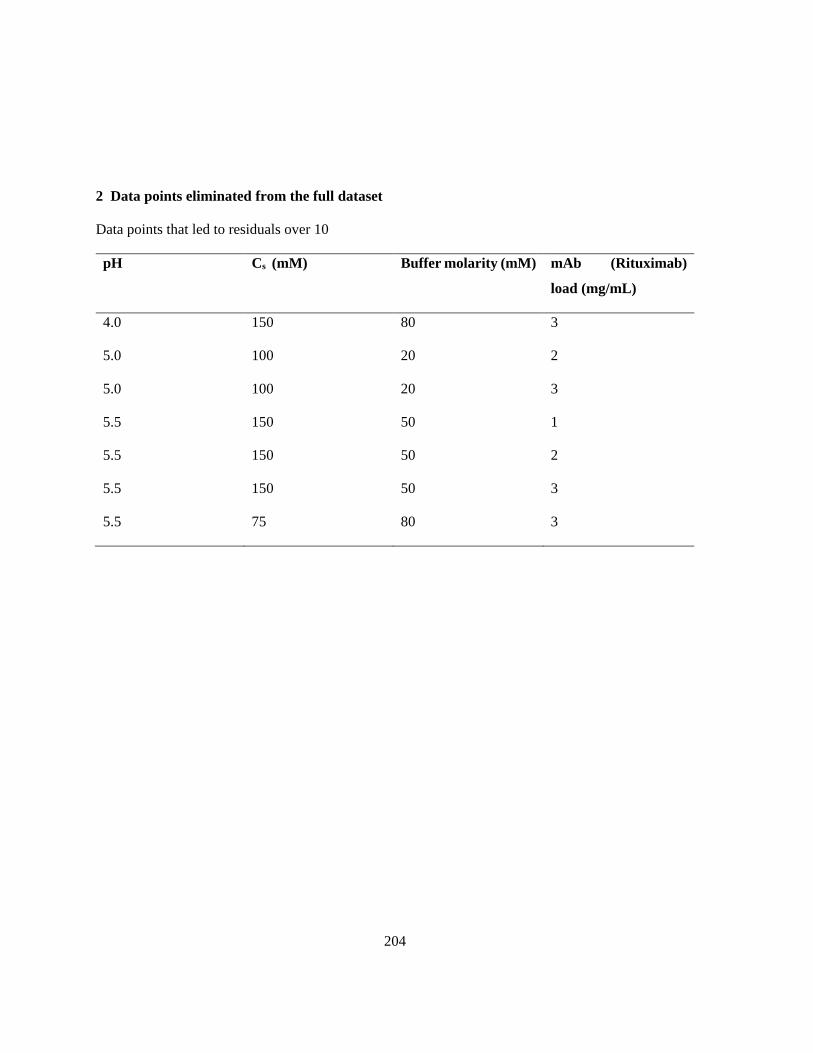
204
2 Data points eliminated from the full dataset
Data points that led to residuals over 10
pH Cs (mM) Buffer molarity (mM) mAb (Rituximab)
load (mg/mL)
4.0 150 80 3
5.0 100 20 2
5.0 100 20 3
5.5 150 50 1
5.5 150 50 2
5.5 150 50 3
5.5 75 80 3

205
3 R script for constructing the response surface model and plot the QQ plot:

206
4 R script for plotting the response surface and contour plot:

207

208
Appendix E Calculation example for static protein binding capacity
Static protein binding capacity of Natrix C weak CEX membrane was calculated according to the
equation below in this work,
qe = (C0 − Ce) (Vsolution
Vmembrane)
where qe is the static protein binding capacity at equilibrium (mg/mL); C0 is the initial protein
concentration (mg/mL); Ce is the equilibrium protein concentration (mg/mL); Vsolution is the total volume
of binding buffer (mL); and Vmembrane is the volume of the membrane piece (mL).
For example, for binding of Bevacizumab in 200 mM acetate buffer at pH 5, with an initial
concentration of 0.5 mg/mL. C0 = 0.5 mg/mL. For high-throughput binding, Vsolution = 0.2 mL, dry
membrane pieces used for multiple wells were measured together where a total mass was obtained. In
this example, a total of 48 membrane pieces were consumed for the experiment set, with a total mass
of 0.0267 g, thus the mass of one membrane piece used for one well is 0.000556g. The density of the
membrane piece is 0.42275 g/mL, thus the volume of one membrane piece Vmembrane = 0.001316 mL.
After binding, the equilibrium protein concentration Ce was calculated from the UV absorbance based
on the calibration curve (Figure 59). The UV absorbance was measured as 0.214, thus Ce = 0.301049
mg/mL and qe = 30.2405 mg/mL.

209
Figure 59 Calibration curve for Bevacizumab in 200 mM acetate buffer at pH 5.
y = 0.7052x + 0.0017R² = 0.9997
0
0.2
0.4
0.6
0.8
1
1.2
1.4
1.6
0 0.5 1 1.5 2 2.5
Abso
rban
ce (2
80nm
)
Concentration (mg/mL)
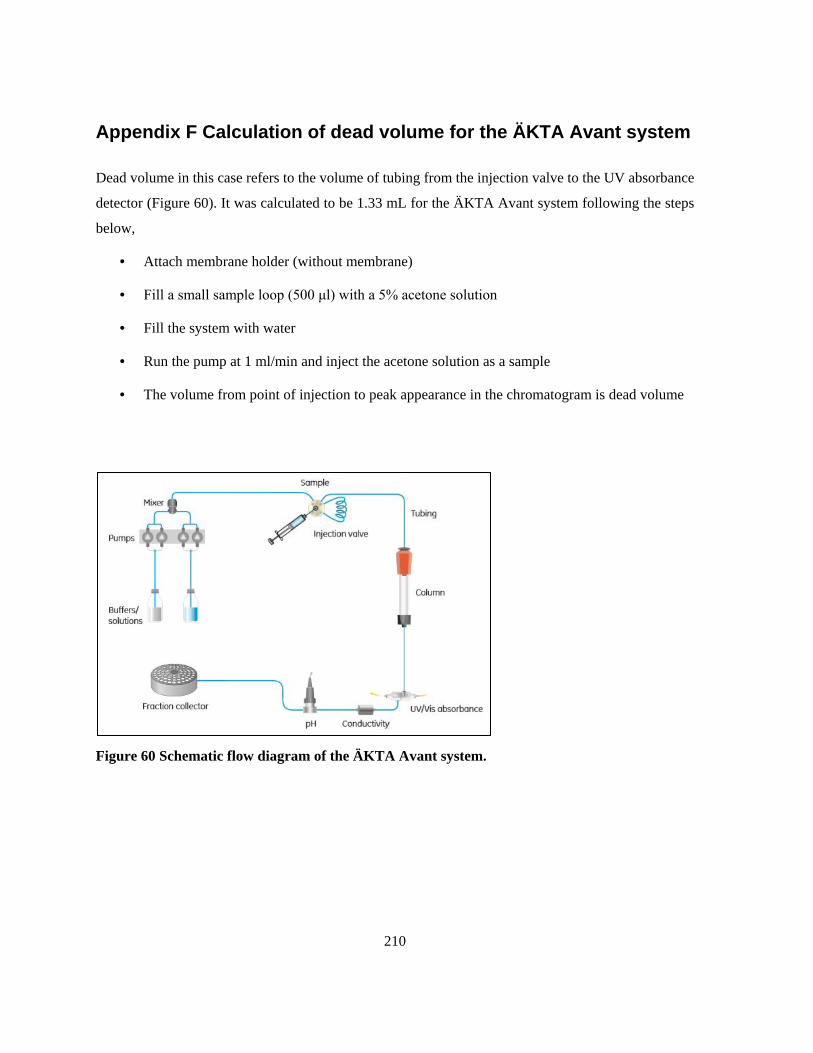
210
Appendix F Calculation of dead volume for the ÄKTA Avant system
Dead volume in this case refers to the volume of tubing from the injection valve to the UV absorbance
detector (Figure 60). It was calculated to be 1.33 mL for the ÄKTA Avant system following the steps
below,
• Attach membrane holder (without membrane)
• Fill a small sample loop (500 μl) with a 5% acetone solution
• Fill the system with water
• Run the pump at 1 ml/min and inject the acetone solution as a sample
• The volume from point of injection to peak appearance in the chromatogram is dead volume
Figure 60 Schematic flow diagram of the ÄKTA Avant system.