Accuracy of performance counter measurements
10
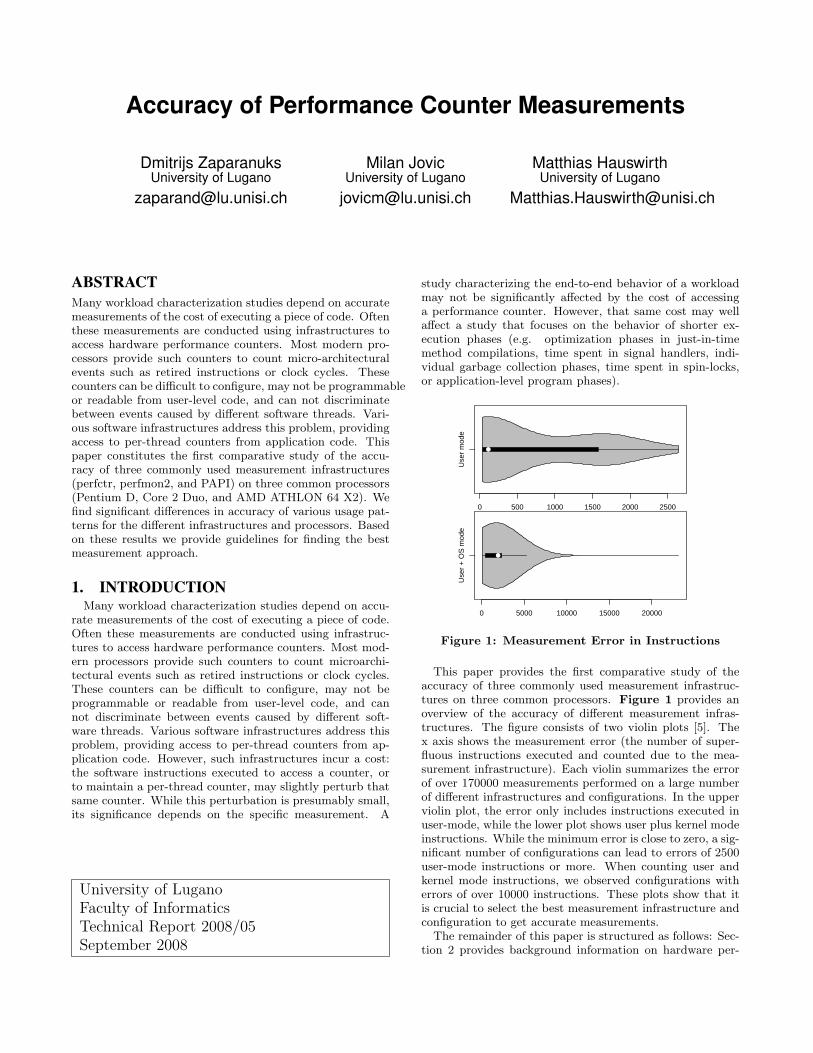
Accuracy of Performance Counter Measurements Dmitrijs Zaparanuks University of Lugano [email protected] Milan Jovic University of Lugano [email protected] Matthias Hauswirth University of Lugano [email protected] ABSTRACT Many workload characterization studies depend on accurate measurements of the cost of executing a piece of code. Often these measurements are conducted using infrastructures to access hardware performance counters. Most modern pro- cessors provide such counters to count micro-architectural events such as retired instructions or clock cycles. These counters can be difficult to configure, may not be programmable or readable from user-level code, and can not discriminate between events caused by different software threads. Vari- ous software infrastructures address this problem, providing access to per-thread counters from application code. This paper constitutes the first comparative study of the accu- racy of three commonly used measurement infrastructures (perfctr, perfmon2, and PAPI) on three common processors (Pentium D, Core 2 Duo, and AMD ATHLON 64 X2). We find significant differences in accuracy of various usage pat- terns for the different infrastructures and processors. Based on these results we provide guidelines for finding the best measurement approach. 1. INTRODUCTION Many workload characterization studies depend on accu- rate measurements of the cost of executing a piece of code. Often these measurements are conducted using infrastruc- tures to access hardware performance counters. Most mod- ern processors provide such counters to count microarchi- tectural events such as retired instructions or clock cycles. These counters can be difficult to configure, may not be programmable or readable from user-level code, and can not discriminate between events caused by different soft- ware threads. Various software infrastructures address this problem, providing access to per-thread counters from ap- plication code. However, such infrastructures incur a cost: the software instructions executed to access a counter, or to maintain a per-thread counter, may slightly perturb that same counter. While this perturbation is presumably small, its significance depends on the specific measurement. A University of Lugano Faculty of Informatics Technical Report 2008/05 September 2008 study characterizing the end-to-end behavior of a workload may not be significantly affected by the cost of accessing a performance counter. However, that same cost may well affect a study that focuses on the behavior of shorter ex- ecution phases (e.g. optimization phases in just-in-time method compilations, time spent in signal handlers, indi- vidual garbage collection phases, time spent in spin-locks, or application-level program phases). 0 500 1000 1500 2000 2500 User mode ● 0 5000 10000 15000 20000 User + OS mode ● Figure 1: Measurement Error in Instructions This paper provides the first comparative study of the accuracy of three commonly used measurement infrastruc- tures on three common processors. Figure 1 provides an overview of the accuracy of different measurement infras- tructures. The figure consists of two violin plots [5]. The x axis shows the measurement error (the number of super- fluous instructions executed and counted due to the mea- surement infrastructure). Each violin summarizes the error of over 170000 measurements performed on a large number of different infrastructures and configurations. In the upper violin plot, the error only includes instructions executed in user-mode, while the lower plot shows user plus kernel mode instructions. While the minimum error is close to zero, a sig- nificant number of configurations can lead to errors of 2500 user-mode instructions or more. When counting user and kernel mode instructions, we observed configurations with errors of over 10000 instructions. These plots show that it is crucial to select the best measurement infrastructure and configuration to get accurate measurements. The remainder of this paper is structured as follows: Sec- tion 2 provides background information on hardware per-
Transcript of Accuracy of performance counter measurements
Accuracy of Performance Counter Measurements
Dmitrijs ZaparanuksUniversity of Lugano
Milan JovicUniversity of Lugano
Matthias HauswirthUniversity of Lugano
ABSTRACTMany workload characterization studies depend on accuratemeasurements of the cost of executing a piece of code. Oftenthese measurements are conducted using infrastructures toaccess hardware performance counters. Most modern pro-cessors provide such counters to count micro-architecturalevents such as retired instructions or clock cycles. Thesecounters can be difficult to configure, may not be programmableor readable from user-level code, and can not discriminatebetween events caused by different software threads. Vari-ous software infrastructures address this problem, providingaccess to per-thread counters from application code. Thispaper constitutes the first comparative study of the accu-racy of three commonly used measurement infrastructures(perfctr, perfmon2, and PAPI) on three common processors(Pentium D, Core 2 Duo, and AMD ATHLON 64 X2). Wefind significant differences in accuracy of various usage pat-terns for the different infrastructures and processors. Basedon these results we provide guidelines for finding the bestmeasurement approach.
1. INTRODUCTIONMany workload characterization studies depend on accu-
rate measurements of the cost of executing a piece of code.Often these measurements are conducted using infrastruc-tures to access hardware performance counters. Most mod-ern processors provide such counters to count microarchi-tectural events such as retired instructions or clock cycles.These counters can be difficult to configure, may not beprogrammable or readable from user-level code, and cannot discriminate between events caused by different soft-ware threads. Various software infrastructures address thisproblem, providing access to per-thread counters from ap-plication code. However, such infrastructures incur a cost:the software instructions executed to access a counter, orto maintain a per-thread counter, may slightly perturb thatsame counter. While this perturbation is presumably small,its significance depends on the specific measurement. A
University of LuganoFaculty of InformaticsTechnical Report 2008/05September 2008
study characterizing the end-to-end behavior of a workloadmay not be significantly affected by the cost of accessinga performance counter. However, that same cost may wellaffect a study that focuses on the behavior of shorter ex-ecution phases (e.g. optimization phases in just-in-timemethod compilations, time spent in signal handlers, indi-vidual garbage collection phases, time spent in spin-locks,or application-level program phases).
0 500 1000 1500 2000 2500
Use
r m
ode
●
0 5000 10000 15000 20000
Use
r +
OS
mod
e
●
Figure 1: Measurement Error in Instructions
This paper provides the first comparative study of theaccuracy of three commonly used measurement infrastruc-tures on three common processors. Figure 1 provides anoverview of the accuracy of different measurement infras-tructures. The figure consists of two violin plots [5]. Thex axis shows the measurement error (the number of super-fluous instructions executed and counted due to the mea-surement infrastructure). Each violin summarizes the errorof over 170000 measurements performed on a large numberof different infrastructures and configurations. In the upperviolin plot, the error only includes instructions executed inuser-mode, while the lower plot shows user plus kernel modeinstructions. While the minimum error is close to zero, a sig-nificant number of configurations can lead to errors of 2500user-mode instructions or more. When counting user andkernel mode instructions, we observed configurations witherrors of over 10000 instructions. These plots show that itis crucial to select the best measurement infrastructure andconfiguration to get accurate measurements.
The remainder of this paper is structured as follows: Sec-tion 2 provides background information on hardware per-

formance counters and on infrastructures that access them.Section 3 describes our evaluation methodology. The follow-ing three sections present our results. Section 4 evaluatesthe measurement error due to counter accesses. Section 5studies how the error depends on measurement duration.Section 6 demonstrates the problem of evaluating the accu-racy of cycle counts. Section 7 discusses the limitations andthreats to the validity of our study. Section 8 presents guide-lines for improving the accuracy of hardware performancecounter measurements. Section 9 compares this study torelated work, and Section 10 concludes.
2. BACKGROUNDThis section introduces the relevant background on hard-
ware performance counters and the software used to config-ure and use them.
2.1 Hardware Performance CountersMost modern processors contain hardware performance
counters [13], special-purpose registers that can count theoccurrence of micro-architectural events. Often these coun-ters are programmable: They can be enabled or disabled,they can be configured to cause an interrupt at overflow,and they can be configured to count different types of events.Commonly supported events include the number of commit-ted instructions, clock cycles, cache misses, or branch mis-predictions. As processors differ in their micro-architectures,they necessarily differ in the type of countable events. Thenumber of counter registers also differs greatly between dif-ferent micro-architectures. In addition to programmablecounters, some processors also support fixed-function coun-ters which provide limited programmability (i.e. they alwayscount the same event, or they cannot be disabled).
2.2 Configuring & Accessing CountersProcessors provide special registers to configure the hard-
ware performance counters (e.g. to enable or disable a counter,or to determine which event to count). They also providespecial instructions to access the counter and the counterconfiguration registers. For example, on processors sup-porting the IA32 instruction set architecture, the RDPMC in-struction reads the value of a performance counter into gen-eral purpose registers, RDTSC reads the value of the timestamp counter (a special kind of fixed-function performancecounter), and RDMSR/WRMSR read/write the value of any model-specific register (such the time stamp counter, a performancecounter, or the registers used to configure the counters).
All the above mentioned IA32 instructions can be exe-cuted when in kernel mode. RDMSR and WRMSR are unavail-able in user mode. Whether RDPMC and RDTSC work in usermode is configurable by software and depends on the oper-ating system.
2.3 Per-Thread CountersHardware performance counters count events happening
on a given processor1. The counter register does not distin-guish between different software threads that run on its pro-cessor2. Performance analysts often need to know the num-ber of events incurred by specific threads. To support this1On multi-core processors each core usually contains its ownset of counters.2On cores supporting hyper-threading, some counters canbe configured to count events of specific hardware threads.
per-thread counting, the operating system’s context switchcode has to be extended to save and restore the counterregisters in addition to the general purpose registers.
2.4 Software Support for Hardware CountersThe fact that some of the counter configuration or access
instructions require kernel mode privileges, and the need toprovide per-thread counts, have lead to the development ofkernel extensions that provide user mode applications accessto the counters. For Linux, the two frequently used kernelextensions are perfctr [12] and perfmon2 [4].
These kernel extensions are specific to an operating sys-tem. Thus, measurement code using these extensions be-comes platform dependent. Moreover, even when using thesame kernel extension, configuring counters for different pro-cessors requires processor-specific code. For this reason,many performance analysts use PAPI [2], a higher level APIto access performance counters. PAPI provides a platform(OS and processor) independent programming interface. Itachieves OS-independence by providing a layer of abstrac-tion over the interface provided by kernel extensions thatprovide access to counters. It achieves processor-independenceby providing a set of high level events that are mapped tothe corresponding low-level events available on specific pro-cessors. PAPI also provides access to the machine-specificlow-level events. To allow an even simpler programmingmodel, PAPI provides a high level API that requires almostno configuration.
2.5 User and Kernel Mode CountingMany processors support conditional event counting: they
only increment a counter while the processor is running ata specific priviledge level (e.g. user mode, kernel mode, oreither of the two). Whether a specific counter counts eventsthat occur during user mode, kernel mode, or user+kernelmode, can be specified as part of that counter’s configura-tion. Thus, if a counter is configured to count user modeevents, as soon as the processor switches to kernel mode(e.g. due to a system call or an interrupt), it immediatelystops counting.
In this paper we study the accuracy of event counts cap-tured during user mode and of event counts captured dur-ing user+kernel mode. Depending on the type of perfor-mance analysis, analysts may be interested in only user-levelcounts, or they may want to include kernel-level counts. Wedo not study kernel-only event counts. Performance analystswho exclusively focus on kernel performance do not have touse the user level counter access infrastructures we evaluatein this paper.
3. EXPERIMENTAL METHODOLOGYIn this section we present the methodology we use for our
study.
3.1 HardwareWe use three state-of-the-art processors that all imple-
ment the IA32 instruction set architecture (ISA). They havesignificantly different micro-architectures and different per-formance counter support. Table 1 shows the three proces-sors, their micro-architectures, and the number of fixed andprogrammable counters they provide. The number of fixedcounters includes the time stamp counter (TSC), which is

CountersProcessor GHz µArch fixed prg.
PD Pentium D 925 3.0 NetBurst 0+1 18CD Core2 Duo E6600 2.4 Core2 3+1 2K8 Athlon 64 X2 4200+ 2.2 K8 0+1 4
Table 1: Processors used in this Study
Figure 2: Counter Access Infrastructure
specified in the IA32 ISA and is available on any IA32 pro-cessor.
3.2 Operating SystemWe run kubuntu Linux with kernel version 2.6.22. At the
time of this writing, this kernel is the most recent kernelsupported by both kernel extensions we study (perfmon2and perfctr).
To prevent the processor clock frequency from changingduring our measurements, we disable frequency scaling bysetting the Linux scaling governor to “performance”. Thiscauses the processors to continuously run at its highest fre-quency (the frequencies are shown in Table 1).
3.3 Counter Access InterfacesFigure 2 presents the infrastructures we analyzed in this
study. We created two patched versions of the Linux 2.6.22kernel: one with the perfmon2 2.6.22-070725 kernel patch,and the other with the perfctr 2.6.29 patch.
While these patched kernels allow user-level access to per-thread hardware counters, the protocol to interact with thesekernel extensions is cumbersome. For this reason, bothkernel extensions come with a matching user-space librarythat provides a clean API. The library supporting perfmon,libpfm, is available as a separate package. We use libpfmversion 3.2-070725. The library supporting perfctr, libper-fctr, is included in the perfctr package.
We use two builds of PAPI, one on top of perfctr, the otheron top of perfmon. At the time of this writing, the releasedversion 3.5.0 of PAPI does not build on all our configura-tions, and thus we use the most recent version of PAPI fromCVS (from “16 Oct 2007 0:00:00 UTC”). We build PAPIon top of libperfctr 2.6.29 and also on top of our version oflibpfm 3.2-070725. PAPI provides two APIs for accessingcounters. The low-level API is richer and more complex,while the high-level API is simpler.
Based on this infrastructure, we evaluate the accuracyof the six possible ways for accessing performance countersshown in Figure 2: directly through libpfm (pm), directlythrough libperfctr (pc), through the PAPI low-level API on
asm v o l a t i l e (” movl $0 , %%eax\n”” . loop :\n\ t ”” addl $1 , %%eax\n\ t ””cmpl $” MAX ” , %%eax\n\ t ”” jne . loop ”::: ” eax ” ) ;
Figure 3: Loop Micro-Benchmark
top of libpfm (PLpm) or libperfctr (PLpc), or through thePAPI high-level API on top of libpfm (PHpm) or libperfctr(PHpc).
3.4 BenchmarksIn this paper we assess the accuracy of performance counter
measurement approaches. To do this, we compare the mea-sured counter values to the true event counts. How can weknow the true counts? We could use accurate simulators ofthe respective processors, but no such simulators are gen-erally available. For this reason we use micro-benchmarks,short pieces of code for which we can statically determinethe exact event counts.
We want to measure two kinds of cost that affect measure-ment accuracy: the fixed cost of accessing the counters atthe beginning and at the end of the measurement, and thevariable cost of maintaining per-thread counts throughoutthe measurement. We expect the variable cost to changedepending on the duration of the measurement.
To measure the fixed cost, we use a null benchmark, anempty block of code consisting of zero instructions. We knowthat this code should generate no events, thus any eventcount different from zero constitutes inaccuracy.
We measure the variable cost using the loop benchmarkshown in Figure 3. We wrote this loop in gcc inline assem-bly language, so it is not affected by the C compiler usedto generate the benchmark harness (the measurement codecontaining the loop). This code clobbers the EAX register,which it uses to maintain the loop count. The number ofiterations is defined by the MAX macro at compile time andgets embedded in the code as an immediate operand. Theloop takes 1 + 3 MAX instructions to execute.
3.5 Counter Access PatternsEach interface in Figure 2 provides a subset of the fol-
lowing functions: read a counter, start a counter, stop acounter, and reset a counter. To read a counter, the infras-tructure ultimately needs to use the RDPMC instruction. Tostart or stop a counter, the infrastructure enables or disablescounting using WRMSR. Finally, the infrastructure can reseta counter by setting its value to 0 with WRMSR. Note thatsome of these instructions can only be used in kernel mode,and thus some functions incur the cost of a system call.Moreover, since the infrastructures we study support “vir-tualized” (per-thread) counters, the above functions requiremore work than just accessing or configuring a hardwareregister. We expect these differences to affect measurementaccuracy.
The above functions allow us to use four different mea-surement patterns. We define these patterns in Table 2.All patterns capture the counter value in a variable (c0) be-fore starting the benchmark, then run the benchmark and
capture the counter’s value after the benchmark finishes invariable c1. Thus, c∆ = c1 − c0 provides the number ofevents that occurred during the benchmark run.
Pattern Definitionar start-read c0=0, reset, start . . . c1=readao start-stop c0=0, reset, start . . . stop, c1=readrr read-read start, c0=read . . . c1=readro read-stop start, c0=read . . . stop, c1=read
Table 2: Counter Access Patterns
Not every interface supports all four patterns. In particu-lar, the PAPI high-level API does not support the read-readand read-stop patterns, since its read function implicitly re-sets the counters after reading.
3.6 Compiler Optimization LevelTo run our measurements, we embed the given bench-
mark code in a measurement harness (that is, we surroundit with the library calls required by the given counter accesspattern). We use gcc version 4.1.2 with the default options(except for the optimization level, which we explicitly spec-ify) to compile the resulting C file. Because the benchmarkcode is written in gcc’s inline assembly language, gcc doesnot optimize that code. However, gcc can optimize the sur-rounding measurement code. To determine the impact ofthe different compiler optimization levels on the measure-ment error, we compile the C file using each of the fouroptimization levels provided by gcc (O0 to O3).
4. MEASUREMENT ERRORFigure 1 gave a high-level picture of the error caused by
hardware counter accesses. Most notable is the significantvariability of that error – the inter-quartile range amountsto about 1500 user-level instructions. In this section westudy the factors that affect this error by measuring eventcounts for the null benchmark. We expect these counts tobe zero (as there are no instructions in this benchmark),and we assume that every deviation from zero constitutes ameasurement error.
4.1 Fewer Counters = Smaller Error?Modern processors provide multiple performance counter
registers (see Table 1 for the number of counters available onthe three processors we use). This section explores whetherthe measurement error depends on the number of countersmeasured.Use of Time Stamp Counter. Besides the micro-archi-tecture-specific number of hardware performance counters,the IA32 architecture also prescribes the existence of a timestamp counter register (TSC). Perfctr provides access tothat register, and allows us to enable or disable its use. Wewanted to determine by how much we could reduce the errorby disabling these additional TSC readouts.
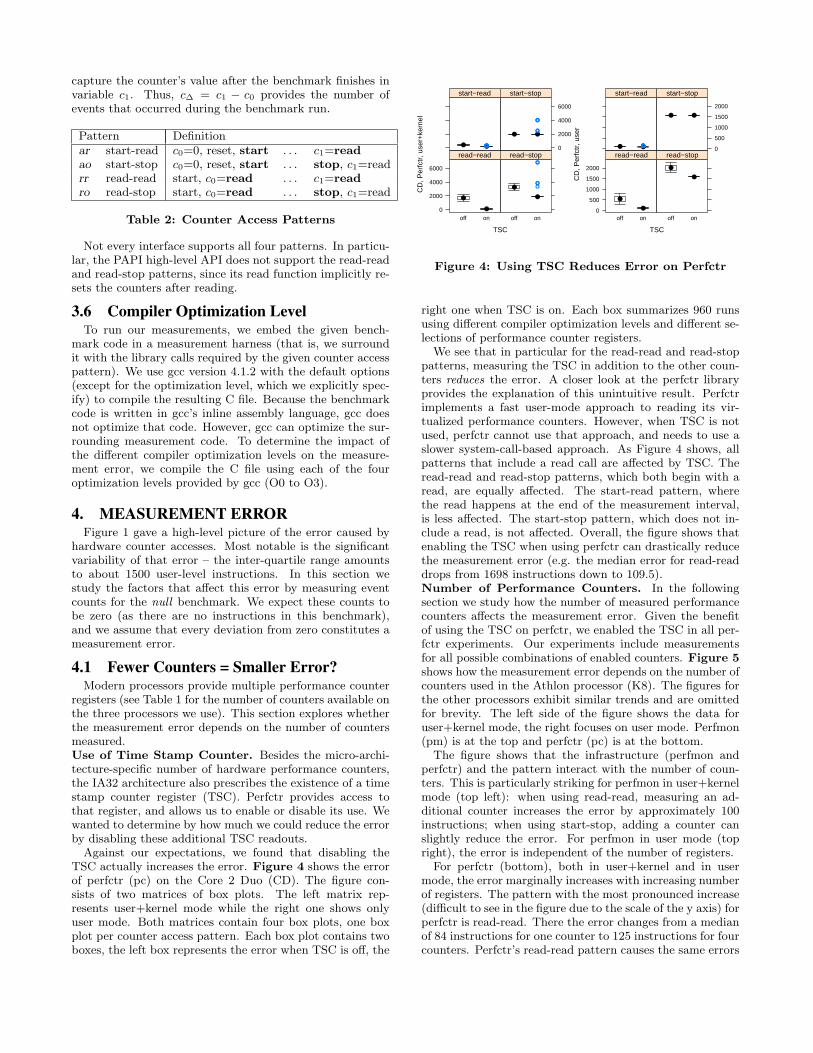
Against our expectations, we found that disabling theTSC actually increases the error. Figure 4 shows the errorof perfctr (pc) on the Core 2 Duo (CD). The figure con-sists of two matrices of box plots. The left matrix rep-resents user+kernel mode while the right one shows onlyuser mode. Both matrices contain four box plots, one boxplot per counter access pattern. Each box plot contains twoboxes, the left box represents the error when TSC is off, the
TSC
CD
, Per
fctr
, use
r+ke
rnel
0
2000
4000
6000
off on
●
●
read−read
off on
●
●
●●●
●●
read−stop
● ●●●●●●●●●●●●●●●●●●●●●
start−read
0
2000
4000
6000
● ●
●●●
●●
start−stop
TSC
CD
, Per
fctr
, use
r
0
500
1000
1500
2000
off on
●
●
read−read
off on
●
●
read−stop● ●●●●●●●●●●●●●●●●●●●●●
start−read
0
500
1000
1500
2000
● ●
start−stop
Figure 4: Using TSC Reduces Error on Perfctr
right one when TSC is on. Each box summarizes 960 runsusing different compiler optimization levels and different se-lections of performance counter registers.
We see that in particular for the read-read and read-stoppatterns, measuring the TSC in addition to the other coun-ters reduces the error. A closer look at the perfctr libraryprovides the explanation of this unintuitive result. Perfctrimplements a fast user-mode approach to reading its vir-tualized performance counters. However, when TSC is notused, perfctr cannot use that approach, and needs to use aslower system-call-based approach. As Figure 4 shows, allpatterns that include a read call are affected by TSC. Theread-read and read-stop patterns, which both begin with aread, are equally affected. The start-read pattern, wherethe read happens at the end of the measurement interval,is less affected. The start-stop pattern, which does not in-clude a read, is not affected. Overall, the figure shows thatenabling the TSC when using perfctr can drastically reducethe measurement error (e.g. the median error for read-readdrops from 1698 instructions down to 109.5).Number of Performance Counters. In the followingsection we study how the number of measured performancecounters affects the measurement error. Given the benefitof using the TSC on perfctr, we enabled the TSC in all per-fctr experiments. Our experiments include measurementsfor all possible combinations of enabled counters. Figure 5shows how the measurement error depends on the number ofcounters used in the Athlon processor (K8). The figures forthe other processors exhibit similar trends and are omittedfor brevity. The left side of the figure shows the data foruser+kernel mode, the right focuses on user mode. Perfmon(pm) is at the top and perfctr (pc) is at the bottom.
The figure shows that the infrastructure (perfmon andperfctr) and the pattern interact with the number of coun-ters. This is particularly striking for perfmon in user+kernelmode (top left): when using read-read, measuring an ad-ditional counter increases the error by approximately 100instructions; when using start-stop, adding a counter canslightly reduce the error. For perfmon in user mode (topright), the error is independent of the number of registers.
For perfctr (bottom), both in user+kernel and in usermode, the error marginally increases with increasing numberof registers. The pattern with the most pronounced increase(difficult to see in the figure due to the scale of the y axis) forperfctr is read-read. There the error changes from a medianof 84 instructions for one counter to 125 instructions for fourcounters. Perfctr’s read-read pattern causes the same errors

# of registers
K8,
pm
, use
r+ke
rnel
500
600
700
800
900
1 2 3 4
●
●
●
●
read−read
1 2 3 4
●
●
●
●
read−stop
●●
●●
start−read
500
600
700
800
900
● ● ● ●
start−stop
# of registersK
8, p
m, u
ser
35
40
45
1 2 3 4
● ● ● ●
read−read
1 2 3 4
● ● ● ●
read−stop
● ● ● ●
start−read
35
40
45
● ● ● ●
start−stop
# of registers
K8,
pc,
use
r+ke
rnel
0
500
1000
1500
2000
1 2 3 4
● ● ● ●●●●●●●●●●●●●●●●●●●●● ● ●●●●●●●●●●●●●●●●●●●●●●●
read−read
1 2 3 4
● ● ● ●
read−stop
● ● ● ●
start−read
0
500
1000
1500
2000● ● ● ●
start−stop
# of registers
K8,
pc,
use
r
0
500
1000
1500
1 2 3 4
● ● ● ●●●●●●●●●●●●●●●●●●●●●●●●●●●●●●●●●●●●●●●●●●●●●●●●●●●●●●●●●●●●●●●●●●●●●●●●●●●●●●●●●●●●●●●●●●●●●●●●●●● ●● ●●●●●●●●●●●●●●●●●●●●●●●●●●
read−read
1 2 3 4
● ● ● ●
read−stop● ● ● ●
start−read
0
500
1000
1500● ● ● ●
start−stop
Figure 5: Error Depends on Number of Counters
in user+kernel mode as it does in user mode, because withthe enabled TSC, read-read never enters kernel mode.
Overall, the number of measured performance counter reg-isters can significantly affect the measurement error (e.g. themedian error for read-read for user+kernel mode on perf-mon increases from 573 instructions for one register to 909instructions for four registers). Thus, depending on the mea-surement infrastructure and the pattern used, reducing thenumber of concurrently measured hardware events can be agood way to improve measurement accuracy.
4.2 Dependency on InfrastructureWe expect different measurement infrastructures to cause
different measurement errors. In this section we quantifythese differences and answer two questions: (1) What impactdoes the use of a high level API have on the error? (2) Howdoes the error differ between perfmon and perfctr?
Mode Tool Best Pattern Median Min
user+kernel pm read-read 726 572user+kernel PLpm start-read 742 653user+kernel PHpm start-read 844 755user+kernel pc start-read 163 74user+kernel PLpc start-read 251 249user+kernel PHpc start-read 339 333user pm read-read 37 36user PLpm start-read 134 134user PHpm start-read 236 236user pc start-read 67 56user PLpc start-read 152 144user PHpc start-read 236 230
Table 3: Error Depends on Infrastructure
user
+ke
rnel
, # o
f ins
truc
tions
1000
2000
3000
4000
PHpm PHpc PLpm PLpc pm pc
●
●
●
●
●
●●●●
user
, # o
f ins
truc
tions
50
100
150
200
PHpm PHpc PLpm PLpc pm pc
● ●
●
●
●
●
●●●●●●●●
●●●●●●●●●●●●●●●●●●●●●●●●●●●●●●●●●●
Figure 6: Error Depends on Infrastructure
Figure 6 and Table 3 provide the basis for answeringthese questions. Figure 6 consists of two box plots. Thetop box plot shows the error for user+kernel mode, the bot-tom one focuses on user mode. Each box plot consists ofsix boxes, three for perfmon (*pm) and three for perfctr(*pc). The left-most two boxes represent the PAPI highlevel API, the next two boxes the PAPI low level API, andthe two boxes on the right represent the direct use of theperfmon and perfctr libraries. We use the best readout pat-tern for each specific infrastructure. Moreover, for perfctr,we enable the TSC to enable the benefit of user-mode read-out. We only use one counter register to avoid bias due tothe different numbers of registers in the different platforms.Each box represents multiple measurements for all hardwareplatforms and compiler optimization levels. Table 3 showsthe patterns used for the boxes in Figure 6 as well as themedian and minimum of each box.
Lower Level API = Smaller Error? One would ex-pect to reduce the measurement error by directly using thelow-level infrastructures (i.e. perfctr or perfmon) insteadof going through PAPI. Figure 6 shows that this indeed isthe case. The reduction in measurement error when us-ing lower level infrastructures is significant. The use of lowlevel PAPI, instead of high level PAPI, reduces the error be-

tween 12% (from 844 down to 742 instructions for perfmonin user+kernel mode) and 43% (from 236 down to 134 in-structions for perfmon in user mode). When using perfmonor perfctr directly, instead of the PAPI low level API, theerror is reduced between 2% (from 752 down to 744 instruc-tions for perfmon in user+kernel mode) and 72% (from 134down to 37 instructions for perfmon in user mode).Perfctr or Perfmon? A performance analyst using hard-ware performance counters has to decide whether to use per-fctr or perfmon. Here we provide guidance for this decision.As Figure 6 and Table 3 show, neither perfmon nor perfctris the clear winner. However, if the performance analystknows whether she needs to measure user+kernel mode orjust user mode instructions, the decision is clear. This deci-sion does not depend on whether the analyst intends to usePAPI or not. For user mode measurements, using perfmoninstead of perfctr reduces the median error by 45% (pm),22% (PLpm), or by 0% (PHpm). For user+kernel modemeasurements, using perfctr instead of perfmon reduces themedian error by 77% (pc), 66% (PLpc), or by 59% (PHpc).
4.3 Factors Affecting AccuracyThe prior subsections show how specific factors, such as
the number of measured registers, affect accuracy. To verifywhether this effect is statistically significant, we have per-formed an n-way analysis of variance (ANOVA [6]). We usedthe processor, measurement infrastructure, access pattern,compiler optimization level, and the number of used counterregisters as factors and the instruction count as the responsevariable. We have found that all factors but the optimiza-tion level are statistically significant (Pr(> F ) < 2 · 10−16).The fact that the compiler optimization level is not affect-ing the measurement error is not surprising, as the codethat is actually optimizable is restricted to the small num-ber of instructions constituting the calls to the measurementmethods.
5. ERROR DEPENDS ON DURATIONIn the prior section we studied the error due to the over-
head of accessing the counters at the beginning and the endof the measurement. That information was particularly rel-evant for measuring short sections of code. In this sectionwe evaluate whether the measurement error depends on theduration of the benchmark. For this purpose we use our loopmicrobenchmark with a varying number of iterations. Weexpect the measured data to fit the model ie = 1+3l (whereie is the number of instructions, and l is the number of loopiterations). We consider any deviation from that model ameasurement error.
The figures in this section show data for up to 1 millionloop iterations. We verified that longer loops (we performedup to 1 billion iterations) do not affect our conclusions.
We expect the error for user+kernel measurements to de-pend on the benchmark duration because of interrupts (suchas the timer interrupt or i/o interrupts). The interrupt han-dlers are executing in kernel mode, and the events that occurduring their execution may be attributed to the kernel eventcounts of the currently running thread. Thus, the longer theduration of a measurement, the more interrupt-related in-structions it will include. We expect that the error in usermode instructions does not depend on the benchmark dura-tion.
In our first experiment we studied the user+kernel mode
0.002
0.003PDCDK8
0
0.001
pm PLpm PHpm pc PLpc PHpcp p p p p p
Figure 7: User+Kernel Mode Errors
instruction error. We computed the error i∆ by subtract-ing the expected instruction count ie (based on our model)from the measured count im. To determine how the errori∆ changes with increasing loop iterations l, we determinedthe regression line through all points (l, i∆), and computedits slope (i∆/l). Figure 7 shows the results. The x-axisshows six groups of bars, one group for each measurementinfrastructure. Each group consists of three bars, one barfor each micro-architecture. The y-axis shows the numberof extra instructions per loop iteration (i∆/l), which corre-sponds to the slope of the regression line. The figure showsthat the slopes of all the regression lines are positive. Thisdemonstrates that the error depends on the duration of thebenchmark; the more loop iterations, the bigger the error.For example, for perfmon on the Athlon processor (K8) wemeasure 0.001 additional instructions for every loop itera-tion executed by the benchmark. As Figure 7 shows, theerror does not depend on whether we use the high level orlow level infrastructure. This makes sense, as the fact thatwe use PAPI to read, start, or stop counting does not affectwhat happens in the kernel during the bulk of the measure-ment.
-0.000004
-0.000003
-0.000002
-0.000001
0.000000
0.000001
0.000002
pm PLpm PHpm pc PLpc PHpc
PD
CD
K8
Figure 8: User Mode Errors

In our second experiment we computed the same regres-sion lines for the user instruction counts. Figure 8 showsthat the error is several orders of magnitude smaller. Forexample, for perfmon on the Athlon processor (K8) we mea-sure only 0.0000004 additional instructions per loop itera-tion. In general, the slopes of the regression lines are closeto zero; some are negative while others are positive.
●●
●●
● ●●
●
●●●
●●
●
●
●●
●●●
●●
●
●●
●
●●
●●
●●
●●
●
●
●●
●●
●
●●●
●●
●●
●
●
●
●●●
●●
●●
●
●
●●
●●●
●
●●
●●●
●● ●
●●
●●
●●
●
●●
●●
●●●●
●●
●●●
●●
●●●●●●●●
●●
●●
●
●●
●●
●●●●●●
●●
●●●
●●
●●
●●●
●●●●
●
●
●
●●●
●●●●●●●●●
●●●
●●●●●
●
●●●
●●●
●●●
●●●●
●●
●●
●●
●●●
●●●
●●
●●●●●●
●●●
●●●
●●●
●●●
●
●●
●●
●●
●●●
●●●
●
●●
●
●●
●
●
●
●
●
●●●
●●
●●●●●●●
●
●●
●
●●●●
●
●
●
●
●
●●●●●
●●
●
●●
●●
●●●
●
●●●
●●
●●
●●●●●
●
●
●●●●●
●●●
●
●●
●
●●
●●
●
●●
●●
●●●●●
●
●●
●
●●●●
●●
●●
●●
●●
●●
●
●
●●
●
●●
●
●
●●●●
●
●
●●
●●
●●●
●●
●
●
●
●
●●
●●
●●●
●●●
●●
●●
●
●●●
●●
●●●
●●
●
●●●
●
●●●
●●
●
●●
●●●
●
●●●●●●
●●
●
●●
●●●●●●●●
●
●●●
●●●●
●●
●●●●●●●
●
●●
●
●●
●●●
●●
●●●
●●●●●●●●
●
●
●
●●●●●
●●●●
●●●●●
●
●●●●●
●●
●●●
●
●●●●●●●
●●●
●●
●
●●
●●●●
●
●●●
●●●
●
●●●
●●●
●●●●●
●●●
●●
●●
●●●●
●
●●●
●●●
●●●
●●
●●●
●●
●●●●●
●●
●●
●●
●●
●●
●●●
●
●
●
●
●●
●●
●●●
●●●
●●●
●
●●
●●
●●●
●●
●●●
●
●
●●
●●
●
●●●
●●
●●●●●●
●
●●●
●●
●●
●●●●●
●●●●●
●●●●
●●●
●
●
●●
●●●
●
●●
●
●●
●
●●●●●
●●●
●●●
●●●●●
●●
●●
●●
●●
●
●●
●●
●●●
●
●●
●●●
●
●
●●●●
●
●●
●●●●●
●●
●
●●●●●●●●●●
●●
●
●
●●
●●
●
●●
●
●●●
●●●●●●
●●●●●
●
●●●
●●●●
●●●●●●●
●●●●●●●
●●●
●●●●●●●
●●
●●●●●●●
●
●
●
●●●
●●●
●●●●●
●
●
●●
●●
●
●●
●●
●
●●●●●
●●
●●
●●●●
●●●
●●●
●●●●
●●
●●●●
●●
●●
●●
●●
●●
●●
●●●
●
●●
●●
●
●●
●●●
●
●●●
●
●●●
●●●
●●●
●●●●●
●●
●●●
●●
●●●●●●●
●
●●●
●●●
●●
●●●●
●●●●
●
●●●
●●●●●●●●
●●●
1
2500
0
5000
0
7500
0
1000
00
2500
00
5000
00
7500
00
1000
000
0
1000
2000
3000
4000
Loop size
CD
, OS
mod
e, in
str
Figure 9: Kernel Mode Instructions by Loop Size(pc on CD)
To crosscheck the above results, we conducted an exper-iment in which we only measured the kernel-mode instruc-tion count. Because the benchmark code does not directlycause any kernel activity, the entire number of measuredkernel instructions can be attributed to measurement error.Figure 9 presents the resulting measurements for a Core 2Duo processor using perfctr. Each box represents the dis-tribution of instruction count errors i∆ (y-axis) for a givenloop size l (x-axis). Note that the boxes are equally spacedalong the x-axis, but the loop sizes are not (a linear growthin error will not lead to a straight line in the figure). Asmall square within each box indicates the average error forthat loop size. Because interrupts (the prospective causeof this measurement error) are relatively infrequent events,and thus the probability of a short loop being perturbed byan interrupt is small, we use a large number of runs (severalthousand) for each loop size.
Figure 9 shows that we measure an average of approxi-mately 1500 kernel instructions for a loop with 500000 iter-ations, and approximately 2500 kernel instructions for a loopwith 1 million iterations. This leads to a slope of 0.002 ker-nel instructions per iteration. The regression line throughall the data underlying Figure 9 confirms this. It has a slopeof 0.00204 kernel instructions per loop iteration, the exactnumber we report in Figure 7 for Core 2 Duo using perfctr.
We conclude that there is a small but significant inac-curacy in long-running measurements of user+kernel modeinstruction counts using current performance counter infras-
tructures.
6. ACCURACY OF CYCLE COUNTSIn the prior sections we have studied the accuracy of in-
struction count measurements. In particular, we measuredthe number of non-speculative instructions. This count iseasy to model analytically: it is independent of the micro-architecture and only depends on the instruction set ar-chitecture. Every execution of a deterministic benchmarkshould lead to the exact same count. Moreover, our loopbenchmark provides us with the “ground truth”: it allowsus to create a straightforward analytical model of instructioncount based on the number of loop iterations.
Besides instructions, hardware performance counters cancount many other types of events. The one event that mostsuccinctly summarizes system performance is the numberof cycles needed to execute a benchmark. All other eventsdirectly or indirectly affect this cycle count. We thus focuson investigating the accuracy of the measured cycle counts.
Figure 10: Cycles by Loop Size
Figure 10 shows the cycle measurements for loops of upto 1 million iterations. It consists of a matrix of six scatterplots. It includes plots for all three processors (rows “K8”,“PD”, and “CD”) for perfctr (column “pc”) and perfmon(column “pm”). The x-axis of each plot represents the loopsize, and the y-axis represents the measured user+kernel cy-cle count. We can see that for a given loop size the measure-ments vary greatly. For example, on Pentium D, we measureanywhere between 1.5 and 4 million cycles for a loop with 1million iterations. Is this variation all attributable to mea-surement error? Is the measurement instrumentation indeedaffecting the cycle count by that much for such a long loop?
To answer this question, Figure 11 focuses on the datafor perfmon on the Athlon processor (the “K8” “pm” plot atthe top right of Figure 10). It shows that the measurementsare split into two groups. We include two lines in the figureto show two possible models for this cycle count: c = 2i and
●●●●●●●●●●●●●●●●●●●●●●●●●●●●●●●●●●●●●●●●●●●●●●●●●●●●●●●●●●●●●●●●●●●●●●●●●●●●●●●●●●●●●●●●●●●●●●●●●●●●●●●●●●●●●●●●●●●●●●●●●●●●●●●●●●●●●●●●●●●●●●●●●●●●●●●●●●●●●●●●●●●●●●●●●●●●●●●●●●●●●●●●●●●●●●●●●●●●●●●●●●●●●●●●●●●●●●●●●●●●●●●●●●●●●●●●●●●●●●●●●●●●●●●●●●●●●●●●●●●●●●●●●●●●●●●●●●●●●●●●●●●●●●●●●●●●●●●●●●●●●●●●●●●●●●●●●●●●●●●●●●●●●●●●●●●●●●●●●●●●●●●●●●●●●●●●●●●●●●●●●●●●●●●●●●●●●●●●●●●●●●●●●●●●●●●●●●●●●●●●●●●●●●●●●●●●●●●●●●●●●●●●●●●●●●●●●●●●●●●●●●●●●●●●●●●●●●●●●●●●●●●●●●●●●●●●●●●●●●●●●●●●●●●●●●●●●●●●●●●●●●●●●●●●●●●●●●●●●●●●●●●●●●●●●●●●●●●●●●●●●●●●●●●●●●●●●●●●●●●●●●●●●●●●●●●●●●●●●●●●●●●●●●●●●●●●●●●●●●●●●●●●●●●●●●●●●●●●●●●●●●●●●●●●●●●●●●●●●●●●●●●●●●●●●●●●●●●●●●●●●●●●●●●●●●●●●●●●●●●●●●●●●●●●●●●●●●●●●●●●●●●●●●●●●●●●●●●●●●●●●●●●●●●●●●●●●●●●●●●●●●●●●●●●●●●●●●●●●●●●●●●●●●●●●●●●●●●●●●●●●●●●●●●●●●●●●●●●●●●●●●●●●●●●●●●●●●●●●●●●●●●●●●●●●●●●●●●●●●●●●●●●●●●●●●●●●●●●●●●●●●●●●●●●●●●●●●●●●●●●●●●●●●●●●●●●●●●●●●●●●●●●●●●●●●●●●●●●●●●●●●●●●●●●●●●●●●●●●●●●●●●●●●●●●●●●●●●●●●●●●●●●●●●●●●●●●●●●●●●●●●●●●●●●●●●●●●●●●●●●●●●●●●●●●●●●●●●●●●●●●●●●
●●●●●●●●●●●●●●●●●●●●●●●●●●●●●●●●●●●●●●●●●●●●●●●●●●●●●●●●●●●●●●●●●●●●●●●●●●●●●●●●●●●●●●●●●●●●●●●●●●●●●●●●●●●●●●●●●●●●●●●●●●●●●●●●●●●●●●●●●●●●●●●●●●●●●●●●●●●●●●●●●●●●●●●●●●●●●●●●●●●●●●●●●●●●●●●●●●●●●●●●●●●●●●●●●●●●●●●●●●●●●●●●●●●●●●●●●●●●●●●●●●●●●●●●●●●●●●●●●●●●●●●●●●●●●●●●●●●●●●●●●●●●●●●●●●●●●●●●●●●●●●●●●●●●●●●●●●●●●●●●●●●●●●●●●●●●●●●●●●●●●●●●●●●●●●●●●●●●●●●●●●●●●●●●●●●●●●●●●●●●●●●●●●●●●●●●●●●●●●●●●●●●●●●●●●●●●●●●●●●●●●●●●●●●●●●●●●●●●●●●●●●●●●●●●●●●●●●●●●●●●●●●●●●●●●●●●●●●●●●●●●●●●●●●●●●●●●●●●●●●●●●●●●●●●●●●
●●●●●●●●●●●●●●●●●●●●●●●●●●●●●●●●●●●●●●●●●●●●●●●●●●●●●●●●●●●●●●●●●●●●●●●●●●●●●●●●●●●●●●●●●●●●●●●●●●●●●●●●●●●●●●●●●●●●●●●●●●●●●●●●●●●●●●●●●●●●●●●●●●●●●●●●●●●●●●●●●●●●●●●●●●●●●●●●●●●●●●●●●●●●●●●●●●●●●●●●●●●●●●●●●●●●●●●●●●●●●●●●●●●●●●●●●●●●●●●●●●●●●●●●●●●●●●●●●●●●●●●●●●●●●●●●●●●●●●●●●●●●●●●●●●●●●●●●●●●●●●●●●●●●●●●●●●●●●●●●●●●●●●●●●●●●●●●●●●●●●●●●●●●●●●●●●●●●●●●●●●●●●●●●●●●●●●●●●●●●●●●●●●●●●●●●●●●●●●●●●●●●●●●●●●●●●●●●●●●●●●●●●●●●●●●●●●●●●●●●●●●●●●●●●●●●●●●●●●●●●●●●●●●●●●●●●●●●●●●●●●●●●●●●●●●●●●●●●●●●●●●●●●●●●●●●
●●●●●●●●●●●●●●●●●●●●●●●●●●●●●●●●●●●●●●●●●●●●●●●●●●●●●●●●●●●●●●●●●●●●●●●●●●●●●●●●●●●●●●●●●●●●●●●●●●●●●●●●●●●●●●●●●●●●●●●●●●●●●●●●
●●●●●●●●●●●●●●●●●●●●●●●●●●●●●●●●●●●●●●●●●●●●●●●●●●●●●●●●●●●●●●●●●●●●●●●●●●●●●●●●●●●●●●●●●●●●●●●●●●●●●●●●●●●●●●●●●●●●●●●●●●●●●●●●●●●●●●●●●●●●●●●●●●●●●●●●●●●●●●●●●●●●●●●●●●●●●●●●●●●●●●●●●●●●●●●●●●●●●●●●●●●●●●●●●●●●●●●●●●●●●●●●●●●●●●●●●●●●●●●●●●●●●●●●●●●●●●●●●●●●●●●●●●●●●●●●●●●●●●●●●●●●●●●●●●●●●●●●●●●●●●●●●●●●●●●●●●●●●●●●●●●●●●●●●●●●●●●●●●●●●●●●●●●●●●●●●●●●●●●●●●●●●●●●●●●●●●●●●●●●●●●●
●●●●●●●●●●●●●●●●●●●●●●●●●●●●●●●●
●●●●●●●●●●●●●●●●●●●●●●●●●●●●●●●●
●●●●●●●●●●●●●●●●●●●●●●●●●●●●●●●●
●●●●●●●●●●●●●●●●●●●●●●●●●●●●●●●●
●●●●●●●●●●●●●●●●●●●●●●●●●●●●●●●●●●●●●●●●●●●●●●●●●●●●●●●●●●●●●●●●●●●●●●●●●●●●●●●●●●●●●●●●●●●●●●●●
●●●●●●●●●●●●●●●●●●●●●●●●●●●●●●●●
●●●●●●●●●●●●●●●●●●●●●●●●●●●●●●●●
●●●●●●●●●●●●●●●●●●●●●●●●●●●●●●●●
●●●●●●●●●●●●●●●●●●●●●●●●●●●●●●●●
●●●●●●●●●●●●●●●●●●●●●●●●●●●●●●●●●●●●●●●●●●●●●●●●●●●●●●●●●●●●●●●●
●●●●●●●●●●●●●●●●●●●●●●●●●●●●●●●●
●●●●●●●●●●●●●●●●●●●●●●●●●●●●●●●●
●●●●●●●●●●●●●●●●●●●●●●●●●●●●●●●●
●●●●●●●●●●●●●●●●●●●●●●●●●●●●●●●●
●●●●●●●●●●●●●●●●●●●●●●●●●●●●●●●●
●●●●●●●●●●●●●●●●●●●●●●●●●●●●●●●●
●●●●●●●●●●●●●●●●●●●●●●●●●●●●●●●●
●●●●●●●●●●●●●●●●●●●●●●●●●●●●●●●●●●●●●●●●●●●●●●●●●●●●●●●●●●●●●●●●●●●●●●●●●●●●●●●●●●●●●●●●●●●●●●●●
●●●●●●●●●●●●●●●●●●●●●●●●●●●●●●●●
●●●●●●●
●●
●●●●●●●●●●●●●●●●●●●●●●●
●●●●●●●●●●●●●●●●●●●●●●●●●●●●●●●●
●●●●●●●●●●●●●●●●●●●●●●●●●●●●●●●●
●●●●●●●●●●●●●●●●●●●●●●●●●●●●●●●●●●●●●●●●●●●●●●●●●●●●●●●●●●●●●●●●
●●●●●●●●●●●●●●●●●●●●●●●●●●●●●●●●
●●●●●●●●●●●●●●●●●●●●●●●●●●●●●●●●
●●●●●●●●●●●●●●●●●●●●●●●●●●●●●●●●
●●●●●●●●●●●●●●●●●●●●●●●●●●●●●●●●
●●●●●●●●●●●●●●●●●●●●●●●●●●●●●●●●
●●●●●●●●●●●●●●●●●●●●●●●●●●●●●●●●
●●●●●●●●●●●●●●●●●●●●●●●●●●●●●●●●
●●●●●●●●●●●●●●●●●●●●●●●●●●●●●●●●●●●●●●●●●●●●●●●●●●●●●●●●●●●●●●●●●●●●●●●●●●●●●●●●●●●●●●●●●●●●●●●●
●●●●●●●●●●●●●●●●●●●●●●●●●●●●●●●●
●●●●●●●●●●●●●●●●●●●●●●●●●●●●●●●●
●●●●●●●●●●●●
●
●●●●●●●●●●●●●●●●●●●
●●●●●●●●●●●●●●●●●●●●●●●●●●●●●●●●
●●●●●●●●●●●●
●
●●●●●●●●●●●●●●●●●●●●●●●●●●●●●●●●●●●●●●●●●●●●●●●●●●●
●●●●●●●●●●●●●●●●●●●●●●●●●●●●●●●●
●●●●●●●●●●●●●●●●●●●●●●●●●●●●●●●●
●●●●●●●●●●●●●●●●●●●●●●●●●●●●●●●●
●●●●●●●●●●●●●●●●●●●●●●●●●●●●●●●●●●●●●●●●●●●●●●●●●●●●●●●●●●●●●●●●●●●●●●●●●●●●●●●●●●●●●●●●●●●●●●●●●●●●●●●●●●●●●●●●●●●●●●●●●●●●●●●●●●●●●●●●●●●●●●●●●●●●●●●●●●●●●●●●●●●●●●●●●●●●●●●●●●●●●●●●●●●●●●●●●●●●●●●●●●●●●●●●●●●●●●●●●●●●●●●●●●●●●●●●●●●●●●●●●●●●●●●●●●●●●●●●●●●●●●●●●●●●●●●●●●●●●●●●●●●●●●●●●●●●●●●●●●●●●●●●●●●●●●●●●●●●●●●●●●●●●●●●●●●●●●●●●●●●●●●●●●●●●●●●●●●●●●●●●●●●●●●●●●●●●●●●●●●●●●●●●●●●●●●●●●●●●●●●●●●●●●●●●●●●●●●●●●●●●●●●●●●●●●●●●●●●●●●●●●●●●●●●●●●●●●●●●●●●●●●●●●●●●●●●●●●●●●●●●●●●●●●●●●●●●●●●●●●●●●●●●●●●●●●●●●●●●●●●●●●●●●●●●●●●●●●●●●●●●●●●●●●●●●●●●●●●●●●●●●●●●●●●●●●●●●●●●●●●●●●●●●●●●●●●●●●●●●●●●●●●●●●●●●●●●●●●●●●●●●●●●●●●●●●●●●●●●●●●●●●●●●●●●●●●●●●●●●●●●●●●●●●●●●●●●●●●●●●●●●●●●●●●●●●●●●●●●●●●●●●●●●●●●●●●●●●●●●●●●●●●●●●●●●●●●●●●●●●●●●●●●●●●●●●●●●●●●●●●●●●●●●●●●●●●●●●●●●●●●●●●●●●●●●●●●●●●●●●●●●●●●●●●●●●●●●●●●●●●●●●●●●●●●●●●●●●●●●●●●●●●●●●●●●●●●●●●●●●●●●●●●●●●●●●●●●●●●●●●●●●●●●●●●●●●●●●●●●●●●●●●●●●●●●●●●●●●●●●●●●●●●●●●●●●●●●●●●●●●●●●●●●●●●●●●●●●●●●●●●●●●●●●●●●●●●●●●●●●●●●●●●●●●●●●●●●●●●●●●●●●●●●●●●●●●●●●●●●●●●●●●
●●●●●●●●●●●●●●●●●●●●●●●●●●●●●●●●●●●●●●●●●●●●●●●●●●●●●●●●●●●●●●●●●●●●●●●●●●●●●●●●●●●●●●●●●●●●●●●●●●●●●●●●●●●●●●●●●●●●●●●●●●●●●●●●●●●●●●●●●●●●●●●●●●●●●●●●●●●●●●●●●●●●●●●●●●●●●●●●●●●●●●●●●●●●●●●●●●●●●●●●●●●●●●●●●●●●●●●●●●●●●●●●●●●●●●●●●●●●●●●●●●●●●●●●●●●●●●●●●●●●●●●●●●●●●●●●●●●●●●●●●●●●●●●●●●●●●●●●●●●●●●●●●●●●●●●●●●●●●●●●●●●●●●●●●●●●●●●●●●●●●●●●●●●●●●●●●●●●●●●●●●●●●●●●●●●●●●●●●●●●●●●●●●●●●●●●●●●●●●●●●●●●●●●●●●●●●●●●●●●●●●●●●●●●●●●●●●●●●●●●●●●●●●●●●●●●●●●●●●●●●●●●●●●●●●●●●●●●●●●●●●●●●●●●●●●●●●●●●●●●●●●●●●●●●●●●
●●●●●●●●●●●●●●●●●●●●●●●●●●●●●●●●●●●●●●●●●●●●●●●●●●●●●●●●●●●●●●●●●●●●●●●●●●●●●●●●●●●●●●●●●●●●●●●●●●●●●●●●●●●●●●●●●●●●●●●●●●●●●●●●●●●●●●●●●●●●●●●●●●●●●●●●●●●●●●●●●●●●●●●●●●●●●●●●●●●●●●●●●●●●●●●●●●●●●●●●●●●●●●●●●●●●●●●●●●●●●●●●●●●●●●●●●●●●●●●●●●●●●●●●●●●●●●●●●●●●●●●●●●●●●●●●●●●●●●●●●●●●●●●●●●●●●●●●●●●●●●●●●●●●●●●●●●●●●●●●●●●●●●●●●●●●●●●●●●●●●●●●●●●●●●●●●●●●●●●●●●●●●●●●●●●●●●●●●●●●●●●●●●●●●●●●●●●●●●●●●●●●●●●●●●●●●●●●●●●●●●●●●●●●●●●●●●●●●●●●●●●●●●●●●●●●●●●●●●●●●●●●●●●●●●●●●●●●●●●●●●●●●●●●●●●●●●●●●●●●●●●●●●●●●●●●
●●●●●●●●●●●●●●●●●●●●●●●●●●●●●●●●●●●●●●●●●●●●●●●●●●●●●●●●●●●●●●●●●●●●●●●●●●●●●●●●●●●●●●●●●●●●●●●●●●●●●●●●●●●●●●●●●●●●●●●●●●●●●●●●●●●●●●●●●●●●●●●●●●●●●●●●●●●●●●●●●●●●●●●●●●●●●●●●●●●●●●●●●●●●●●●●●●●●●●●●●●●●●●●●●●●●●●●●●●●●●●●●●●●●●●●●●●●●●●●●●●●●●●●●●●●●●●●●
●●●●●●●●●●●●●●●●●●●●●●●●●●●●●●●●●●●●●●●●●●●●●●●●●●●●●●●●●●●●●●●●
●●●●●●●●●●●●●●●●●●●●●●●●●●●●●●●●●●●●●●●●●●●●●●●●●●●●●●●●●●●●●●●●●●●●●●●●●●●●●●●●●●●●●●●●●●●●●●●●●●●●●●●●●●●●●●●●●●●●●●●●●●●●●●●●●●●●●●●●●●●●●●●●●●●●●●●●●●●●●●●●●●●●●●●●●●●●●●●●●●●●●●●●●●●●●●●●
●●●●●●●●●●●●●●●●●●●●●●●●●●●●●●●●
●●●●●●●●●●●●●●●●●●●●●●●●●●●●●●●●
●●●●●●●●●●●●●●●●●●●●●●●●●●●●●●●●
●●●●●●●●●●●●●●●●●●●●●●●●●●●●●●●●
●●●●●●●●●●●●●●●●●●●●●●●●●●●●●●●●●●●●●●●●●●●●●●●●●●●●●●●●●●●●●●●●●●●●●●●●●●●●●●●●●●●●●●●●●●●●●●●●
●●●●●●●●●●●●●●●●●●●●●●●●●●●●●●●●
●●●●●●●●●●●●●●●●●●●●●●●●●●●●●●●●
●●●●●●●●●●●●●●●●●●●●●●●●●●●●●●●●
●●●●●●●●●●●●●●●●●●●●●●●●●●●●●●●●
●●●●●●●●●●●●●●●●●●●●●●●●●●●●●●●●●●●●●●●●●●●●●●●●●●●●●●●●●●●●●●●●
●●●●●●●●●●●●●●●●●●●●●●●●●●●●●●●●
●●●●●●●●●●●●●●●●●●●●●●●●●●●●●●●●
●●●●●●●●●●●●●●●●●●●●●●●●●●●●●●●●
●●●●●●●●●●●●●●●●●●●●●●●●●●●●●●●●
●●●●●●●●●●●●●●●●●●●●●●●●●●●●●●●●
●●●●●●●●●●●●●●●●●●●●●●●●●●●●●●●●
●●●●●●●●●●●●●●●●●●●●●●●●●●●●●●●●
●●●●●●●●●●●●●●●●●●●●●●●●●●●●●●●●●●●●●●●●●●●●●●●●●●●●●●●●●●●●●●●●●●●●●●●●●●●●●●●●●●●●●●●●●●●●●●●●
●●●●●●●●●●●●●●●●●●●●●●●●●●●●●●●●
●●●●●●●●●●●●●●●●●●●●●●●●●●●●●●●●
●●●●●●●●●●●●●●●●●●●●●●●●●●●●●●●●
●●●●●●●●●●●●●●●●●●●●●●●●●●●●●●●●
●●●●●●●●●●●●●●●●●●●●●●●●●●●●●●●●●●●●●●●●●●●●●●●●●●●●●●●●●●●●●●●●
●●●●●●●●●●●●●●●●●●●●●●●●●●●●●●●●
●●●●●●●●●●●●●●●●●●●●●●●●●●●●●●●●
●●●●●●●
●●
●●●●●●●●●●●●●●●●●●●●●●●
●●●●●●●●●●●●●●●●●●●●●●●●●●●●●●●●
●●●●●●●●●●●●●●●●●●●●●●●●●●●●●●●●
●●●●●●●●●●●●●●●●●●●●●●●●●●●●●●●●
●●●●●●●●●●●●●●●●●●●●●●●●●●●●●●●●
●●●●●●●●●
●●●
●●●●●●●●●●●●●●●●●●●●●●●●●●●●●●●●●●●●●●●●●●●●●●●●●●●●●●●●●●●●●●●●●●●●●●●●●●●●●●●●●●●●
●●●●●●●●●●●●●●●●●●●●●●●●●●●●●●●●
●●●●●●●●●●●●●●●●●●●●●●●●●●●●●●●●
●●●●●●●●●●●●●●●●●●●●●●●●●●●●●●●●
●●●●●●●●●●●●●●●●●●●●●●●●●●●●●●●●
●●●●●●●●●●●●●●●●●●●●●●●●●●●●●●●●●●●●●●●●●●●●●●●●●●●●●●●●●●●●●●●●
●●●●●●●●●●●●●●●●●●●●●●●●●●●●●●●●
●●●●●●●●●●●●●●●●●●●●●●●●●●●●●●●●
●●●●●●●●●●●●●●●●●●●●●●●●●●●●●●●●
●●●●●
●●
●●●●●●●●●●●●●●●●●●●●●●●●●
●●●●●●●●●●●●●●●●●●●●●●●●●●●●●●●●
●●●●●●●●●●●●●●●●●●●●●●●●●●●●●●●●
●●●●●●●●●●●●●●●●●●●●●●●●●●●●●●●●
●●●●●●●●●●●●●●●●●●●●●●●●●●●●●●●●●●●●●●●●●●●●●●●●●●●●●●●●●●●●
●●●●●●●●●●●●●
●●●
●●●●●●●●●●●●●●●●●●●●
●●●●●●●●●●●●●●●●●●●●●●●●●●●●●●●●
●●●●●●●●●●●●●●●●●●●●●●●●●●●●●●●●
●●●●●●●●●●●●●●●●●●●●●●●●●●●●●●●●
●●●●●●●●●●●●●●●●●●●●●●●●●●●●●●●●
●●●●●●●●●●●●●●●●●●●●●●●●●●●●●●●●●●●●●●●●●●●●●●●●●●●●●●●●●●●●●●●●
●●●●●●●●●●●●●●●●●●●●●●●●●●●●●●●●
●●●●●●●●●●●●●●●●●●●●●●●●●●●●●●●●
●●●●●●●●●●●●●●●●●●●●●●●●●●●●●●●●
●●●●●●●●●●●●●●●●●●●●●●●●●●●●●●●●●●●●●●●●●●●●●●●●●●●●●●●●●●●●●●●●●●●●●●●●●●●●●●●●●●●●●●●●●●●●●●●●●●●●●●●●●●●●●●●●●●●●●●●●●●●●●●●●●●●●●●●●●●●●●●●●●●●●●●●●●●●●●●●●●●●●●●●●●●●●●●●●●●●●●●●●●●●●●●●●●●●●●●●●●●●●●●●●●●●●●●●●●●●●●●●●●●●●●●●●●●●●●●●●●●●●●●●●●●●●●●●●●●●●●●●●●●●●●●●●●●●●●●●●●●●●●●●●●●●●●●●●●●●●●●●●●●●●●●●●●●●●●●●●●●●●●●●●●●●●●●●●●●●●●●●●●●●●●●●●●●●●●●●●●●●●●●●●●●●●●●●●●●●●●●●●●●●●●●●●●●●●●●●●●●●●●●●●●●●●●●●●●●●●●●●●●●●●●●●●●●●●●●●●●●●●●●●●●●●●●●●●●●●●●●●●●●●●●●●●●●●●●●●●●●●●●●●●●●●●●●●●●●●●●●●●●●●●●●●●●●●●●●●●●●●●●●●●●●●●●●●●●●●●●●●●●●●●●●●●●●●●●●●●●●●●●●●●●●●●●●●●●●●●●●●●●●●●●●●●●●●●●●●●●●●●●●●●●●●●●●●●●●●●●●●●●●●●●●●●●●●●●●●●●●●●●●●●●●●●●●●●●●●●●●●●●●●●●●●●●●●●●●●●●●●●●●●●●●●●●●●●●●●●●●●●●●●●●●●●●●●●●●●●●●●●●●●●●●●●●●●●●●●●●●●●●●●●●●●●●●●●●●●●●●●●●●●●●●●●●●●●●●●●●●●●●●●●●●●●●●●●●●●●●●●●●●●●●●●●●●●●●●●●●●●●●●●●●●●●●●●●●●●●●●●●●●●●●●●●●●●●●●●●●●●●●●●●●●●●●●●●●●●●●●●●●●●●●●●●●●●●●●●●●●●●●●●●●●●●●●●●●●●●●●●●●●●●●●●●●●●●●●●●●●●●●●●●●●●●●●●●●●●●●●●●●●●●●●●●●●●●●●●●●●●●●●●●●●●●●●●●●●●●●●●●●●●●●●●●●●●●●●●●●●●●
●●●●●●●●●●●●●●●●●●●●●●●●●●●●●●●●●●●●●●●●●●●●●●●●●●●●●●●●●●●●●●●●●●●●●●●●●●●●●●●●●●●●●●●●●●●●●●●●●●●●●●●●●●●●●●●●●●●●●●●●●●●●●●●●●●●●●●●●●●●●●●●●●●●●●●●●●●●●●●●●●●●●●●●●●●●●●●●●●●●●●●●●●●●●●●●●●●●●●●●●●●●●●●●●●●●●●●●●●●●●●●●●●●●●●●●●●●●●●●●●●●●●●●●●●●●●●●●●●●●●●●●●●●●●●●●●●●●●●●●●●●●●●●●●●●●●●●●●●●●●●●●●●●●●●●●●●●●●●●●●●●●●●●●●●●●●●●●●●●●●●●●●●●●●●●●●●●●●●●●●●●●●●●●●●●●●●●●●●●●●●●●●●●●●●●●●●●●●●●●●●●●●●●●●●●●●●●●●●●●●●●●●●●●●●●●●●●●●●●●●●●●●●●●●●●●●●●●●●●●●●●●●●●●●●●●●●●●●●●●●●●●●●●●●●●●●●●●●●●●●●●●●●●●●●●●●
●●●●●●●●●●●●●●●●●●●●●●●●●●●●●●●●●●●●●●●●●●●●●●●●●●●●●●●●●●●●●●●●●●●●●●●●●●●●●●●●●●●●●●●●●●●●●●●●●●●●●●●●●●●●●●●●●●●●●●●●●●●●●●●●●●●●●●●●●●●●●●●●●●●●●●●●●●●●●●●●●●●●●●●●●●●●●●●●●●●●●●●●●●●●●●●●●●●●●●●●●●●●●●●●●●●●●●●●●●●●●●●●●●●●●●●●●●●●●●●●●●●●●●●●●●●●●●●●●●●●●●●●●●●●●●●●●●●●●●●●●●●●●●●●●●●●●●●●●●●●●●●●●●●●●●●●●●●●●●●●●●●●●●●●●●●●●●●●●●●●●●●●●●●●●●●●●●●●●●●●●●●●●●●●●●●●●●●●●●●●●●●●●●●●●●●●●●●●●●●●●●●●●●●●●●●●●●●●●●●●●●●●●●●●●●●●●●●●●●●●●●●●●●●●●●●●●●●●●●●●●●●●●●●●●●●●●●●●●●●●●●●●●●●●●●●●●●●●●●●●●●●●●●●●●●●●
●●●●●●●●●●●●●●●●●●●●●●●●●●●●●●●●●●●●●●●●●●●●●●●●●●●●●●●●●●●●●●●●●●●●●●●●●●●●●●●●●●●●●●●●●●●●●●●●●●●●●●●●●●●●●●●●●●●●●●●●●●●●●●●●●●●●●●●●●●●●●●●●●●●●●●●●●●●●●●●●●●●●●●●●●●●●●●●●●●●●●●●●●●●●●●●●●●●●●●●●●●●●●●●●●●●●●●●●●●●●●●●●●●●●●●●●●●●●●●●●●●●●●●●●●●●●●●●●●●●●●●●●●●●●●●●●●●●●●●●●●●●●●●●●●●●●●●●●●●●●●●●●●●●●●●●●●●●●●●●●●●●●●●●●●●●●●●●●●●●●●●●●●●●●●●●●●●●●●●●●●●●●●●●●●●●●●●●●●●●●●●●●●●●●●●●●●●●●●●●●●●●●●●●●●●●●●●●●●●●●●●●●●●●●●●●●●●●●●●●●●●●●●●●●●●●●●●●●●●●●●●●●●●●●●●●●●●●●●●●●●●●●●●●●●●●●●●●●●●●●●●●●●●●●●●●●
●●●●●●●●●●●●●●●●●●●●●●●●●●●●●●●●
●●●●●●●●●●●●●●●●●●●●●●●●●●●●●●●●
●●●●●●●●●●●●●●●●●●●●●●●●●●●●●●●●
●●●●●●●●●●●●●●●●●●●●●●●●●●●●●●●●
●●●●●●●●●●●●●●●●●●●●●●●●●●●●●●●●●●●●●●●●●●●●●●●●●●●●●●●●●●●●●●●●●●●●●●●●●●●●●●●●●●●●●●●●●●●●●●●●
●●●●●●●●●●●●●●●●●●●●●●●●●●●●●●●●
●●●●●●●●●●●●●●●●●●●●●●●●●●●●●●●●
●●●●●●●●●●●●●●●●●●●●●●●●●●●●●●●●
●●●●●●●●●●●●●●●●●●●●●●●●●●●●●●●●
●●●●●●●●●●●●●●●●●●●●●●●●●●●●●●●●●●●●●●●●●●●●●●●●●●●●●●●●●●●●●●●●
●●●●●●●●●●●●●●●●●●●●●●●●●●●●●●●●
●●●●●●●●●●●●●●●●●●●●●●●●●●●●●●●●
●●●●●●●●●●●●●●●●●●●●●●●●●●●●●●●●
●●●●●●●●●●●●●●●●●●●●●●●●●●●●●●●●
●●●●●●●●●●●●●●●●●●●●●●●●●●●●●●●●
●●●●●●●●●●●●●●●●●●●●●●●●●●●●●●●●
●●●●●●●●●●●●●●●●●●●●●●●●●●●●●●●●
●●●●●●●●●●●●●●●●●●●●●●●●●●●●●●●●●●●●●●●●●●●●●●●●●●●●●●●●●●●●●●●●●●●●●●●●●●●●●●●●●●●●●●●●●●●●●●●●
●●●●●●●●●●●●●●●●●●●●●●●●●●●●●●●●
●●●●●●●●●●●●●●●●●●●●●●●●●●●●●●●●
●●●●●●●●●●●●●●●●●●●●●●●●●●●●●●●●
●●●●●●●●●●●●●●●●●●●●●●●●●●●●●●●●
●●●●●●●●●●●●●●●●●●●●●●●●●●●●●●●●●●●●●●●●●●●●●●●●●●●●●●●●●●●●●●●●
●●●●●●●●●●●●●●●●●●●●●●●●●●●●●●●●
●●●●●●●●●●●●●●●●●●●●●●●●●●●●●●●●
●●●●●●●●●●●●●●●●●●●●●●●●●●●●●●●●
0e+00 2e+05 4e+05 6e+05 8e+05 1e+06
050
0000
1500
000
2500
000
Size of Loop
K8,
pm
, Cyc
les
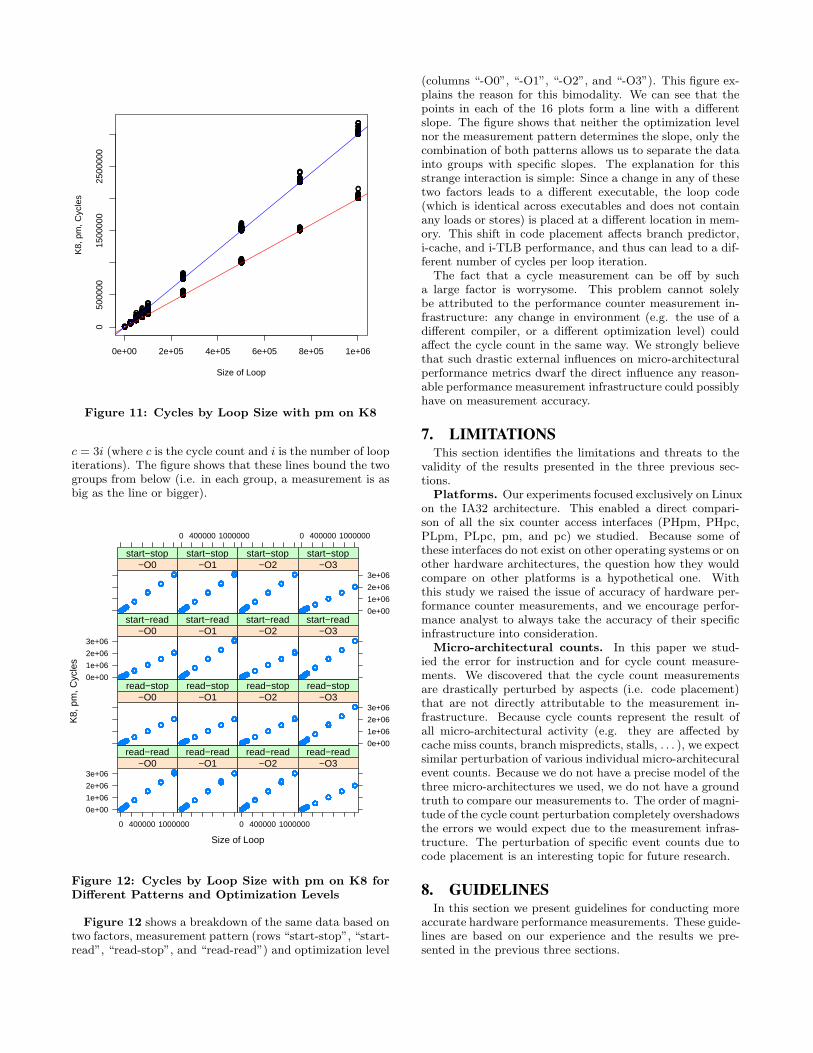
Figure 11: Cycles by Loop Size with pm on K8
c = 3i (where c is the cycle count and i is the number of loopiterations). The figure shows that these lines bound the twogroups from below (i.e. in each group, a measurement is asbig as the line or bigger).
Size of Loop
K8,
pm
, Cyc
les
0e+00
1e+06
2e+06
3e+06
0 400000 1000000
●●●●●●●●●●●●●●●●●●●●●●●●●●●●●●●●●●●●●●●●●●●●●●●●●●●●●●●●●●●●●●●●●●●●●●●●●●●●●●●●●●●●●●●●●●●●●●●●●●●●●●●●●●●●●●●●●●●●●●●●●●●●●●●●●●●●●●●●●●●●●●●●●●●●●●●●●●●●●●●●
●●●●●●●●●●●●●●●●●●●●●●●●●●●●●●●●
●●●●●●●●●●●●●●●●●●●●●●●●●●●●●●●●
●●●●●●●●●●●●●●●●●●●●●●●●●●●●●●●●
●●●●●●●●●●●●●●●●●●●●●●●●●●●●●●●●
●●●●●●●●●●●●●●●●●●●●●●●●●●●●●●●●●●●●●●●●●●●●●●●●●●●●●●●●●●●●●●●●●●●●●●●●●●●●●●●●●●●●●●●●●●●●●●●●●●●●●●●●●●●●●●●●●●●●●●●●●●●●●●●●●●●●●●●●●●●●●●●●●●●●●●●●●●●●●●●●
●●●●●●●●●●●●●●●●●●●●●●●●●●●●●●●●
●●●●●●●●●●●●●●●●●●●●●●●●●●●●●●●●
●●●●●●●●●●●●●●●●●●●●●●●●●●●●●●●●
●●●●●●●●●●●●●●●●●●●●●●●●●●●●●●●●
●●●●●●●●●●●●●●●●●●●●●●●●●●●●●●●●●●●●●●●●●●●●●●●●●●●●●●●●●●●●●●●●●●●●●●●●●●●●●●●●●●●●●●●●●●●●●●●●●●●●●●●●●●●●●●●●●●●●●●●●●●●●●●●●●●●●●●●●●●●●●●●●●●●●●●●●●●●●●●●●
●●●●●●●●●●●●●●●●●●●●●●●●●●●●●●●●
●●●●●●●●●●●●●●●●●●●●●●●●●●●●●●●●
●●●●●●●●●●●●●●●●●●●●●●●●●●●●●●●●
●●●●●●●●●●●●●●●●●●●●●●●●●●●●●●●●
−O0read−read
●●●●●●●●●●●●●●●●●●●●●●●●●●●●●●●●●●●●●●●●●●●●●●●●●●●●●●●●●●●●●●●●●●●●●●●●●●●●●●●●●●●●●●●●●●●●●●●●●●●●●●●●●●●●●●●●●●●●●●●●●●●●●●●●●●●●●●●●●●●●●●●●●●●●●●●●●●●●●●●●
●●●●●●●●●●●●●●●●●●●●●●●●●●●●●●●●
●●●●●●●●●●●●●●●●●●●●●●●●●●●●●●●●
●●●●●●●●●●●●●●●●●●●●●●●●●●●●●●●●
●●●●●●●●●●●●●●●●●●●●●●●●●●●●●●●●
●●●●●●●●●●●●●●●●●●●●●●●●●●●●●●●●●●●●●●●●●●●●●●●●●●●●●●●●●●●●●●●●●●●●●●●●●●●●●●●●●●●●●●●●●●●●●●●●●●●●●●●●●●●●●●●●●●●●●●●●●●●●●●●●●●●●●●●●●●●●●●●●●●●●●●●●●●●●●●●●
●●●●●●●●●●●●●●●●●●●●●●●●●●●●●●●●
●●●●●●●●●●●●●●●●●●●●●●●●●●●●●●●●
●●●●●●●●●●●●●●●●●●●●●●●●●●●●●●●●
●●●●●●●●●●●●●●●●●●●●●●●●●●●●●●●●
●●●●●●●●●●●●●●●●●●●●●●●●●●●●●●●●●●●●●●●●●●●●●●●●●●●●●●●●●●●●●●●●●●●●●●●●●●●●●●●●●●●●●●●●●●●●●●●●●●●●●●●●●●●●●●●●●●●●●●●●●●●●●●●●●●●●●●●●●●●●●●●●●●●●●●●●●●●●●●●●
●●●●●●●●●●●●●●●●●●●●●●●●●●●●●●●●
●●●●●●●●●●●●●●●●●●●●●●●●●●●●●●●●
●●●●●●●●●●●●●●●●●●●●●●●●●●●●●●●●
●●●●●●●●●●●●●●●●●●●●●●●●●●●●●●●●
−O1read−read
0 400000 1000000
●●●●●●●●●●●●●●●●●●●●●●●●●●●●●●●●●●●●●●●●●●●●●●●●●●●●●●●●●●●●●●●●●●●●●●●●●●●●●●●●●●●●●●●●●●●●●●●●●●●●●●●●●●●●●●●●●●●●●●●●●●●●●●●●●●●●●●●●●●●●●●●●●●●●●●●●●●●●●●●●
●●●●●●●●●●●●●●●●●●●●●●●●●●●●●●●●
●●●●●●●●●●●●●●●●●●●●●●●●●●●●●●●●
●●●●●●●●●●●●●●●●●●●●●●●●●●●●●●●●
●●●●●●●●●●●●●●●●●●●●●●●●●●●●●●●●
●●●●●●●●●●●●●●●●●●●●●●●●●●●●●●●●●●●●●●●●●●●●●●●●●●●●●●●●●●●●●●●●●●●●●●●●●●●●●●●●●●●●●●●●●●●●●●●●●●●●●●●●●●●●●●●●●●●●●●●●●●●●●●●●●●●●●●●●●●●●●●●●●●●●●●●●●●●●●●●●
●●●●●●●●●●●●●●●●●●●●●●●●●●●●●●●●
●●●●●●●●●●●●●●●●●●●●●●●●●●●●●●●●
●●●●●●●●●●●●●●●●●●●●●●●●●●●●●●●●
●●●●●●●●●●●●●●●●●●●●●●●●●●●●●●●●
●●●●●●●●●●●●●●●●●●●●●●●●●●●●●●●●●●●●●●●●●●●●●●●●●●●●●●●●●●●●●●●●●●●●●●●●●●●●●●●●●●●●●●●●●●●●●●●●●●●●●●●●●●●●●●●●●●●●●●●●●●●●●●●●●●●●●●●●●●●●●●●●●●●●●●●●●●●●●●●●
●●●●●●●●●●●●●●●●●●●●●●●●●●●●●●●●
●●●●●●●●●●●●●●●●●●●●●●●●●●●●●●●●
●●●●●●●●●●●●●●●●●●●●●●●●●●●●●●●●
●●●●●●●●●●●●●●●●●●●●●●●●●●●●●●●●
−O2read−read
●●●●●●●●●●●●●●●●●●●●●●●●●●●●●●●●●●●●●●●●●●●●●●●●●●●●●●●●●●●●●●●●●●●●●●●●●●●●●●●●●●●●●●●●●●●●●●●●●●●●●●●●●●●●●●●●●●●●●●●●●●●●●●●●●●●●●●●●●●●●●●●●●●●●●●●●●●●●●●●●●●●●●●●●●●●●●●●●●●●●●●●●●●●●●●●●
●●●●●●●●●●●●●●●●●●●●●●●●●●●●●●●●●●●●●●●●●●●●●●●●●●●●●●●●●●●●●●●●
●●●●●●●●●●●●●●●●●●●●●●●●●●●●●●●●
●●●●●●●●●●●●●●●●●●●●●●●●●●●●●●●●●●●●●●●●●●●●●●●●●●●●●●●●●●●●●●●●●●●●●●●●●●●●●●●●●●●●●●●●●●●●●●●●●●●●●●●●●●●●●●●●●●●●●●●●●●●●●●●●●●●●●●●●●●●●●●●●●●●●●●●●●●●●●●●●●●●●●●●●●●●●●●●●●●●●●●●●●●●●●●●●
●●●●●●●●●●●●●●●●●●●●●●●●●●●●●●●●●●●●●●●●●●●●●●●●●●●●●●●●●●●●●●●●
●●●●●●●●●●●●●●●●●●●●●●●●●●●●●●●●
●●●●●●●●●●●●●●●●●●●●●●●●●●●●●●●●●●●●●●●●●●●●●●●●●●●●●●●●●●●●●●●●●●●●●●●●●●●●●●●●●●●●●●●●●●●●●●●●●●●●●●●●●●●●●●●●●●●●●●●●●●●●●●●●●●●●●●●●●●●●●●●●●●●●●●●●●●●●●●●●●●●●●●●●●●●●●●●●●●●●●●●●●●●●●●●●
●●●●●●●●●●●●●●●●●●●●●●●●●●●●●●●●●●●●●●●●●●●●●●●●●●●●●●●●●●●●●●●●
●●●●●●●●●●●●●●●●●●●●●●●●●●●●●●●●
−O3read−read
●●●●●●●●●●●●●●●●●●●●●●●●●●●●●●●●●●●●●●●●●●●●●●●●●●●●●●●●●●●●●●●●●●●●●●●●●●●●●●●●●●●●●●●●●●●●●●●●●●●●●●●●●●●●●●●●●●●●●●●●●●●●●●●●●●●●●●●●●●●●●●●●●●●●●●●●●●●●●●●●
●●●●●●●●●●●●●●●●●●●●●●●●●●●●●●●●●●●●●●●●●●●●●●●●●●●●●●●●●●●●●●●●
●●●●●●●●●●●●●●●●●●●●●●●●●●●●●●●●●●●●●●●●●●●●●●●●●●●●●●●●●●●●●●●●
●●●●●●●●●●●●●●●●●●●●●●●●●●●●●●●●●●●●●●●●●●●●●●●●●●●●●●●●●●●●●●●●●●●●●●●●●●●●●●●●●●●●●●●●●●●●●●●●●●●●●●●●●●●●●●●●●●●●●●●●●●●●●●●●●●●●●●●●●●●●●●●●●●●●●●●●●●●●●●●●●●●●●●●●●●●●●●●●●●●●●●●●●●●●●●●●
●●●●●●●●●●●●●●●●●●●●●●●●●●●●●●●●●●●●●●●●●●●●●●●●●●●●●●●●●●●●●●●●
●●●●●●●●●●●●●●●●●●●●●●●●●●●●●●●●
●●●●●●●●●●●●●●●●●●●●●●●●●●●●●●●●●●●●●●●●●●●●●●●●●●●●●●●●●●●●●●●●●●●●●●●●●●●●●●●●●●●●●●●●●●●●●●●●●●●●●●●●●●●●●●●●●●●●●●●●●●●●●●●●●●●●●●●●●●●●●●●●●●●●●●●●●●●●●●●●
●●●●●●●●●●●●●●●●●●●●●●●●●●●●●●●●●●●●●●●●●●●●●●●●●●●●●●●●●●●●●●●●
●●●●●●●●●●●●●●●●●●●●●●●●●●●●●●●●●●●●●●●●●●●●●●●●●●●●●●●●●●●●●●●●
−O0read−stop
●●●●●●●●●●●●●●●●●●●●●●●●●●●●●●●●●●●●●●●●●●●●●●●●●●●●●●●●●●●●●●●●●●●●●●●●●●●●●●●●●●●●●●●●●●●●●●●●●●●●●●●●●●●●●●●●●●●●●●●●●●●●●●●●●●●●●●●●●●●●●●●●●●●●●●●●●●●●●●●●●●●●●●●●●●●●●●●●●●●●●●●●●●●●●●●●
●●●●●●●●●●●●●●●●●●●●●●●●●●●●●●●●●●●●●●●●●●●●●●●●●●●●●●●●●●●●●●●●
●●●●●●●●●●●●●●●●●●●●●●●●●●●●●●●●
●●●●●●●●●●●●●●●●●●●●●●●●●●●●●●●●●●●●●●●●●●●●●●●●●●●●●●●●●●●●●●●●●●●●●●●●●●●●●●●●●●●●●●●●●●●●●●●●●●●●●●●●●●●●●●●●●●●●●●●●●●●●●●●●●●●●●●●●●●●●●●●●●●●●●●●●●●●●●●●●
●●●●●●●●●●●●●●●●●●●●●●●●●●●●●●●●●●●●●●●●●●●●●●●●●●●●●●●●●●●●●●●●
●●●●●●●●●●●●●●●●●●●●●●●●●●●●●●●●●●●●●●●●●●●●●●●●●●●●●●●●●●●●●●●●
●●●●●●●●●●●●●●●●●●●●●●●●●●●●●●●●●●●●●●●●●●●●●●●●●●●●●●●●●●●●●●●●●●●●●●●●●●●●●●●●●●●●●●●●●●●●●●●●●●●●●●●●●●●●●●●●●●●●●●●●●●●●●●●●●●●●●●●●●●●●●●●●●●●●●●●●●●●●●●●●●●●●●●●●●●●●●●●●●●●●●●●●●●●●●●●●
●●●●●●●●●●●●●●●●●●●●●●●●●●●●●●●●●●●●●●●●●●●●●●●●●●●●●●●●●●●●●●●●
●●●●●●●●●●●●●●●●●●●●●●●●●●●●●●●●
−O1read−stop
●●●●●●●●●●●●●●●●●●●●●●●●●●●●●●●●●●●●●●●●●●●●●●●●●●●●●●●●●●●●●●●●●●●●●●●●●●●●●●●●●●●●●●●●●●●●●●●●●●●●●●●●●●●●●●●●●●●●●●●●●●●●●●●●●●●●●●●●●●●●●●●●●●●●●●●●●●●●●●●●●●●●●●●●●●●●●●●●●●●●●●●●●●●●●●●●
●●●●●●●●●●●●●●●●●●●●●●●●●●●●●●●●●●●●●●●●●●●●●●●●●●●●●●●●●●●●●●●●
●●●●●●●●●●●●●●●●●●●●●●●●●●●●●●●●
●●●●●●●●●●●●●●●●●●●●●●●●●●●●●●●●●●●●●●●●●●●●●●●●●●●●●●●●●●●●●●●●●●●●●●●●●●●●●●●●●●●●●●●●●●●●●●●●●●●●●●●●●●●●●●●●●●●●●●●●●●●●●●●●●●●●●●●●●●●●●●●●●●●●●●●●●●●●●●●●●●●●●●●●●●●●●●●●●●●●●●●●●●●●●●●●
●●●●●●●●●●●●●●●●●●●●●●●●●●●●●●●●●●●●●●●●●●●●●●●●●●●●●●●●●●●●●●●●
●●●●●●●●●●●●●●●●●●●●●●●●●●●●●●●●
●●●●●●●●●●●●●●●●●●●●●●●●●●●●●●●●●●●●●●●●●●●●●●●●●●●●●●●●●●●●●●●●●●●●●●●●●●●●●●●●●●●●●●●●●●●●●●●●●●●●●●●●●●●●●●●●●●●●●●●●●●●●●●●●●●●●●●●●●●●●●●●●●●●●●●●●●●●●●●●●●●●●●●●●●●●●●●●●●●●●●●●●●●●●●●●●
●●●●●●●●●●●●●●●●●●●●●●●●●●●●●●●●●●●●●●●●●●●●●●●●●●●●●●●●●●●●●●●●
●●●●●●●●●●●●●●●●●●●●●●●●●●●●●●●●
−O2read−stop
0e+00
1e+06
2e+06
3e+06
●●●●●●●●●●●●●●●●●●●●●●●●●●●●●●●●●●●●●●●●●●●●●●●●●●●●●●●●●●●●●●●●●●●●●●●●●●●●●●●●●●●●●●●●●●●●●●●●●●●●●●●●●●●●●●●●●●●●●●●●●●●●●●●●●●●●●●●●●●●●●●●●●●●●●●●●●●●●●●●●
●●●●●●●●●●●●●●●●●●●●●●●●●●●●●●●●
●●●●●●●●●●●●●●●●●●●●●●●●●●●●●●●●
●●●●●●●●●●●●●●●●●●●●●●●●●●●●●●●●
●●●●●●●●●●●●●●●●●●●●●●●●●●●●●●●●
●●●●●●●●●●●●●●●●●●●●●●●●●●●●●●●●●●●●●●●●●●●●●●●●●●●●●●●●●●●●●●●●●●●●●●●●●●●●●●●●●●●●●●●●●●●●●●●●●●●●●●●●●●●●●●●●●●●●●●●●●●●●●●●●●●●●●●●●●●●●●●●●●●●●●●●●●●●●●●●●
●●●●●●●●●●●●●●●●●●●●●●●●●●●●●●●●
●●●●●●●●●●●●●●●●●●●●●●●●●●●●●●●●
●●●●●●●●●●●●●●●●●●●●●●●●●●●●●●●●
●●●●●●●●●●●●●●●●●●●●●●●●●●●●●●●●
●●●●●●●●●●●●●●●●●●●●●●●●●●●●●●●●●●●●●●●●●●●●●●●●●●●●●●●●●●●●●●●●●●●●●●●●●●●●●●●●●●●●●●●●●●●●●●●●●●●●●●●●●●●●●●●●●●●●●●●●●●●●●●●●●●●●●●●●●●●●●●●●●●●●●●●●●●●●●●●●
●●●●●●●●●●●●●●●●●●●●●●●●●●●●●●●●
●●●●●●●●●●●●●●●●●●●●●●●●●●●●●●●●
●●●●●●●●●●●●●●●●●●●●●●●●●●●●●●●●
●●●●●●●●●●●●●●●●●●●●●●●●●●●●●●●●
−O3read−stop
0e+00
1e+06
2e+06
3e+06
●●●●●●●●●●●●●●●●●●●●●●●●●●●●●●●●●●●●●●●●●●●●●●●●●●●●●●●●●●●●●●●●●●●●●●●●●●●●●●●●●●●●●●●●●●●●●●●●●●●●●●●●●●●●●●●●●●●●●●●●●●●●●●●●●●●●●●●●●●●●●●●●●●●●●●●●●●●●●●●●
●●●●●●●●●●●●●●●●●●●●●●●●●●●●●●●●●●●●●●●●●●●●●●●●●●●●●●●●●●●●●●●●
●●●●●●●●●●●●●●●●●●●●●●●●●●●●●●●●●●●●●●●●●●●●●●●●●●●●●●●●●●●●●●●●
●●●●●●●●●●●●●●●●●●●●●●●●●●●●●●●●●●●●●●●●●●●●●●●●●●●●●●●●●●●●●●●●●●●●●●●●●●●●●●●●●●●●●●●●●●●●●●●●●●●●●●●●●●●●●●●●●●●●●●●●●●●●●●●●●●●●●●●●●●●●●●●●●●●●●●●●●●●●●●●●
●●●●●●●●●●●●●●●●●●●●●●●●●●●●●●●●●●●●●●●●●●●●●●●●●●●●●●●●●●●●●●●●
●●●●●●●●●●●●●●●●●●●●●●●●●●●●●●●●●●●●●●●●●●●●●●●●●●●●●●●●●●●●●●●●
●●●●●●●●●●●●●●●●●●●●●●●●●●●●●●●●●●●●●●●●●●●●●●●●●●●●●●●●●●●●●●●●●●●●●●●●●●●●●●●●●●●●●●●●●●●●●●●●●●●●●●●●●●●●●●●●●●●●●●●●●●●●●●●●●●●●●●●●●●●●●●●●●●●●●●●●●●●●●●●●
●●●●●●●●●●●●●●●●●●●●●●●●●●●●●●●●●●●●●●●●●●●●●●●●●●●●●●●●●●●●●●●●
●●●●●●●●●●●●●●●●●●●●●●●●●●●●●●●●●●●●●●●●●●●●●●●●●●●●●●●●●●●●●●●●
−O0start−read
●●●●●●●●●●●●●●●●●●●●●●●●●●●●●●●●●●●●●●●●●●●●●●●●●●●●●●●●●●●●●●●●●●●●●●●●●●●●●●●●●●●●●●●●●●●●●●●●●●●●●●●●●●●●●●●●●●●●●●●●●●●●●●●●●●●●●●●●●●●●●●●●●●●●●●●●●●●●●●●●
●●●●●●●●●●●●●●●●●●●●●●●●●●●●●●●●
●●●●●●●●●●●●●●●●●●●●●●●●●●●●●●●●
●●●●●●●●●●●●●●●●●●●●●●●●●●●●●●●●
●●●●●●●●●●●●●●●●●●●●●●●●●●●●●●●●
●●●●●●●●●●●●●●●●●●●●●●●●●●●●●●●●●●●●●●●●●●●●●●●●●●●●●●●●●●●●●●●●●●●●●●●●●●●●●●●●●●●●●●●●●●●●●●●●●●●●●●●●●●●●●●●●●●●●●●●●●●●●●●●●●●●●●●●●●●●●●●●●●●●●●●●●●●●●●●●●
●●●●●●●●●●●●●●●●●●●●●●●●●●●●●●●●
●●●●●●●●●●●●●●●●●●●●●●●●●●●●●●●●
●●●●●●●●●●●●●●●●●●●●●●●●●●●●●●●●
●●●●●●●●●●●●●●●●●●●●●●●●●●●●●●●●
●●●●●●●●●●●●●●●●●●●●●●●●●●●●●●●●●●●●●●●●●●●●●●●●●●●●●●●●●●●●●●●●●●●●●●●●●●●●●●●●●●●●●●●●●●●●●●●●●●●●●●●●●●●●●●●●●●●●●●●●●●●●●●●●●●●●●●●●●●●●●●●●●●●●●●●●●●●●●●●●
●●●●●●●●●●●●●●●●●●●●●●●●●●●●●●●●
●●●●●●●●●●●●●●●●●●●●●●●●●●●●●●●●
●●●●●●●●●●●●●●●●●●●●●●●●●●●●●●●●
●●●●●●●●●●●●●●●●●●●●●●●●●●●●●●●●
−O1start−read
●●●●●●●●●●●●●●●●●●●●●●●●●●●●●●●●●●●●●●●●●●●●●●●●●●●●●●●●●●●●●●●●●●●●●●●●●●●●●●●●●●●●●●●●●●●●●●●●●●●●●●●●●●●●●●●●●●●●●●●●●●●●●●●●●●●●●●●●●●●●●●●●●●●●●●●●●●●●●●●●
●●●●●●●●●●●●●●●●●●●●●●●●●●●●●●●●●●●●●●●●●●●●●●●●●●●●●●●●●●●●●●●●
●●●●●●●●●●●●●●●●●●●●●●●●●●●●●●●●●●●●●●●●●●●●●●●●●●●●●●●●●●●●●●●●
●●●●●●●●●●●●●●●●●●●●●●●●●●●●●●●●●●●●●●●●●●●●●●●●●●●●●●●●●●●●●●●●●●●●●●●●●●●●●●●●●●●●●●●●●●●●●●●●●●●●●●●●●●●●●●●●●●●●●●●●●●●●●●●●●●●●●●●●●●●●●●●●●●●●●●●●●●●●●●●●●●●●●●●●●●●●●●●●●●●●●●●●●●●●●●●●
●●●●●●●●●●●●●●●●●●●●●●●●●●●●●●●●●●●●●●●●●●●●●●●●●●●●●●●●●●●●●●●●
●●●●●●●●●●●●●●●●●●●●●●●●●●●●●●●●
●●●●●●●●●●●●●●●●●●●●●●●●●●●●●●●●●●●●●●●●●●●●●●●●●●●●●●●●●●●●●●●●●●●●●●●●●●●●●●●●●●●●●●●●●●●●●●●●●●●●●●●●●●●●●●●●●●●●●●●●●●●●●●●●●●●●●●●●●●●●●●●●●●●●●●●●●●●●●●●●●●●●●●●●●●●●●●●●●●●●●●●●●●●●●●●●
●●●●●●●●●●●●●●●●●●●●●●●●●●●●●●●●●●●●●●●●●●●●●●●●●●●●●●●●●●●●●●●●
●●●●●●●●●●●●●●●●●●●●●●●●●●●●●●●●
−O2start−read
●●●●●●●●●●●●●●●●●●●●●●●●●●●●●●●●●●●●●●●●●●●●●●●●●●●●●●●●●●●●●●●●●●●●●●●●●●●●●●●●●●●●●●●●●●●●●●●●●●●●●●●●●●●●●●●●●●●●●●●●●●●●●●●●●●●●●●●●●●●●●●●●●●●●●●●●●●●●●●●●
●●●●●●●●●●●●●●●●●●●●●●●●●●●●●●●●
●●●●●●●●●●●●●●●●●●●●●●●●●●●●●●●●
●●●●●●●●●●●●●●●●●●●●●●●●●●●●●●●●
●●●●●●●●●●●●●●●●●●●●●●●●●●●●●●●●
●●●●●●●●●●●●●●●●●●●●●●●●●●●●●●●●●●●●●●●●●●●●●●●●●●●●●●●●●●●●●●●●●●●●●●●●●●●●●●●●●●●●●●●●●●●●●●●●●●●●●●●●●●●●●●●●●●●●●●●●●●●●●●●●●●●●●●●●●●●●●●●●●●●●●●●●●●●●●●●●
●●●●●●●●●●●●●●●●●●●●●●●●●●●●●●●●
●●●●●●●●●●●●●●●●●●●●●●●●●●●●●●●●
●●●●●●●●●●●●●●●●●●●●●●●●●●●●●●●●
●●●●●●●●●●●●●●●●●●●●●●●●●●●●●●●●
●●●●●●●●●●●●●●●●●●●●●●●●●●●●●●●●●●●●●●●●●●●●●●●●●●●●●●●●●●●●●●●●●●●●●●●●●●●●●●●●●●●●●●●●●●●●●●●●●●●●●●●●●●●●●●●●●●●●●●●●●●●●●●●●●●●●●●●●●●●●●●●●●●●●●●●●●●●●●●●●
●●●●●●●●●●●●●●●●●●●●●●●●●●●●●●●●
●●●●●●●●●●●●●●●●●●●●●●●●●●●●●●●●
●●●●●●●●●●●●●●●●●●●●●●●●●●●●●●●●
●●●●●●●●●●●●●●●●●●●●●●●●●●●●●●●●
−O3start−read
●●●●●●●●●●●●●●●●●●●●●●●●●●●●●●●●●●●●●●●●●●●●●●●●●●●●●●●●●●●●●●●●●●●●●●●●●●●●●●●●●●●●●●●●●●●●●●●●●●●●●●●●●●●●●●●●●●●●●●●●●●●●●●●●●●●●●●●●●●●●●●●●●●●●●●●●●●●●●●●●
●●●●●●●●●●●●●●●●●●●●●●●●●●●●●●●●
●●●●●●●●●●●●●●●●●●●●●●●●●●●●●●●●
●●●●●●●●●●●●●●●●●●●●●●●●●●●●●●●●
●●●●●●●●●●●●●●●●●●●●●●●●●●●●●●●●
●●●●●●●●●●●●●●●●●●●●●●●●●●●●●●●●●●●●●●●●●●●●●●●●●●●●●●●●●●●●●●●●●●●●●●●●●●●●●●●●●●●●●●●●●●●●●●●●●●●●●●●●●●●●●●●●●●●●●●●●●●●●●●●●●●●●●●●●●●●●●●●●●●●●●●●●●●●●●●●●
●●●●●●●●●●●●●●●●●●●●●●●●●●●●●●●●
●●●●●●●●●●●●●●●●●●●●●●●●●●●●●●●●
●●●●●●●●●●●●●●●●●●●●●●●●●●●●●●●●
●●●●●●●●●●●●●●●●●●●●●●●●●●●●●●●●
●●●●●●●●●●●●●●●●●●●●●●●●●●●●●●●●●●●●●●●●●●●●●●●●●●●●●●●●●●●●●●●●●●●●●●●●●●●●●●●●●●●●●●●●●●●●●●●●●●●●●●●●●●●●●●●●●●●●●●●●●●●●●●●●●●●●●●●●●●●●●●●●●●●●●●●●●●●●●●●●
●●●●●●●●●●●●●●●●●●●●●●●●●●●●●●●●
●●●●●●●●●●●●●●●●●●●●●●●●●●●●●●●●
●●●●●●●●●●●●●●●●●●●●●●●●●●●●●●●●
●●●●●●●●●●●●●●●●●●●●●●●●●●●●●●●●
−O0start−stop
0 400000 1000000
●●●●●●●●●●●●●●●●●●●●●●●●●●●●●●●●●●●●●●●●●●●●●●●●●●●●●●●●●●●●●●●●●●●●●●●●●●●●●●●●●●●●●●●●●●●●●●●●●●●●●●●●●●●●●●●●●●●●●●●●●●●●●●●●●●●●●●●●●●●●●●●●●●●●●●●●●●●●●●●●
●●●●●●●●●●●●●●●●●●●●●●●●●●●●●●●●
●●●●●●●●●●●●●●●●●●●●●●●●●●●●●●●●
●●●●●●●●●●●●●●●●●●●●●●●●●●●●●●●●
●●●●●●●●●●●●●●●●●●●●●●●●●●●●●●●●
●●●●●●●●●●●●●●●●●●●●●●●●●●●●●●●●●●●●●●●●●●●●●●●●●●●●●●●●●●●●●●●●●●●●●●●●●●●●●●●●●●●●●●●●●●●●●●●●●●●●●●●●●●●●●●●●●●●●●●●●●●●●●●●●●●●●●●●●●●●●●●●●●●●●●●●●●●●●●●●●
●●●●●●●●●●●●●●●●●●●●●●●●●●●●●●●●
●●●●●●●●●●●●●●●●●●●●●●●●●●●●●●●●
●●●●●●●●●●●●●●●●●●●●●●●●●●●●●●●●
●●●●●●●●●●●●●●●●●●●●●●●●●●●●●●●●
●●●●●●●●●●●●●●●●●●●●●●●●●●●●●●●●●●●●●●●●●●●●●●●●●●●●●●●●●●●●●●●●●●●●●●●●●●●●●●●●●●●●●●●●●●●●●●●●●●●●●●●●●●●●●●●●●●●●●●●●●●●●●●●●●●●●●●●●●●●●●●●●●●●●●●●●●●●●●●●●
●●●●●●●●●●●●●●●●●●●●●●●●●●●●●●●●
●●●●●●●●●●●●●●●●●●●●●●●●●●●●●●●●
●●●●●●●●●●●●●●●●●●●●●●●●●●●●●●●●
●●●●●●●●●●●●●●●●●●●●●●●●●●●●●●●●
−O1start−stop
●●●●●●●●●●●●●●●●●●●●●●●●●●●●●●●●●●●●●●●●●●●●●●●●●●●●●●●●●●●●●●●●●●●●●●●●●●●●●●●●●●●●●●●●●●●●●●●●●●●●●●●●●●●●●●●●●●●●●●●●●●●●●●●●●●●●●●●●●●●●●●●●●●●●●●●●●●●●●●●●
●●●●●●●●●●●●●●●●●●●●●●●●●●●●●●●●
●●●●●●●●●●●●●●●●●●●●●●●●●●●●●●●●
●●●●●●●●●●●●●●●●●●●●●●●●●●●●●●●●
●●●●●●●●●●●●●●●●●●●●●●●●●●●●●●●●
●●●●●●●●●●●●●●●●●●●●●●●●●●●●●●●●●●●●●●●●●●●●●●●●●●●●●●●●●●●●●●●●●●●●●●●●●●●●●●●●●●●●●●●●●●●●●●●●●●●●●●●●●●●●●●●●●●●●●●●●●●●●●●●●●●●●●●●●●●●●●●●●●●●●●●●●●●●●●●●●
●●●●●●●●●●●●●●●●●●●●●●●●●●●●●●●●
●●●●●●●●●●●●●●●●●●●●●●●●●●●●●●●●
●●●●●●●●●●●●●●●●●●●●●●●●●●●●●●●●
●●●●●●●●●●●●●●●●●●●●●●●●●●●●●●●●
●●●●●●●●●●●●●●●●●●●●●●●●●●●●●●●●●●●●●●●●●●●●●●●●●●●●●●●●●●●●●●●●●●●●●●●●●●●●●●●●●●●●●●●●●●●●●●●●●●●●●●●●●●●●●●●●●●●●●●●●●●●●●●●●●●●●●●●●●●●●●●●●●●●●●●●●●●●●●●●●
●●●●●●●●●●●●●●●●●●●●●●●●●●●●●●●●
●●●●●●●●●●●●●●●●●●●●●●●●●●●●●●●●
●●●●●●●●●●●●●●●●●●●●●●●●●●●●●●●●
●●●●●●●●●●●●●●●●●●●●●●●●●●●●●●●●
−O2start−stop
0 400000 1000000
0e+00
1e+06
2e+06
3e+06
●●●●●●●●●●●●●●●●●●●●●●●●●●●●●●●●●●●●●●●●●●●●●●●●●●●●●●●●●●●●●●●●●●●●●●●●●●●●●●●●●●●●●●●●●●●●●●●●●●●●●●●●●●●●●●●●●●●●●●●●●●●●●●●●●●●●●●●●●●●●●●●●●●●●●●●●●●●●●●●●
●●●●●●●●●●●●●●●●●●●●●●●●●●●●●●●●●●●●●●●●●●●●●●●●●●●●●●●●●●●●●●●●
●●●●●●●●●●●●●●●●●●●●●●●●●●●●●●●●●●●●●●●●●●●●●●●●●●●●●●●●●●●●●●●●
●●●●●●●●●●●●●●●●●●●●●●●●●●●●●●●●●●●●●●●●●●●●●●●●●●●●●●●●●●●●●●●●●●●●●●●●●●●●●●●●●●●●●●●●●●●●●●●●●●●●●●●●●●●●●●●●●●●●●●●●●●●●●●●●●●●●●●●●●●●●●●●●●●●●●●●●●●●●●●●●●●●●●●●●●●●●●●●●●●●●●●●●●●●●●●●●
●●●●●●●●●●●●●●●●●●●●●●●●●●●●●●●●●●●●●●●●●●●●●●●●●●●●●●●●●●●●●●●●
●●●●●●●●●●●●●●●●●●●●●●●●●●●●●●●●
●●●●●●●●●●●●●●●●●●●●●●●●●●●●●●●●●●●●●●●●●●●●●●●●●●●●●●●●●●●●●●●●●●●●●●●●●●●●●●●●●●●●●●●●●●●●●●●●●●●●●●●●●●●●●●●●●●●●●●●●●●●●●●●●●●●●●●●●●●●●●●●●●●●●●●●●●●●●●●●●
●●●●●●●●●●●●●●●●●●●●●●●●●●●●●●●●●●●●●●●●●●●●●●●●●●●●●●●●●●●●●●●●
●●●●●●●●●●●●●●●●●●●●●●●●●●●●●●●●●●●●●●●●●●●●●●●●●●●●●●●●●●●●●●●●
−O3start−stop
Figure 12: Cycles by Loop Size with pm on K8 forDifferent Patterns and Optimization Levels
Figure 12 shows a breakdown of the same data based ontwo factors, measurement pattern (rows “start-stop”, “start-read”, “read-stop”, and “read-read”) and optimization level
(columns “-O0”, “-O1”, “-O2”, and “-O3”). This figure ex-plains the reason for this bimodality. We can see that thepoints in each of the 16 plots form a line with a differentslope. The figure shows that neither the optimization levelnor the measurement pattern determines the slope, only thecombination of both patterns allows us to separate the datainto groups with specific slopes. The explanation for thisstrange interaction is simple: Since a change in any of thesetwo factors leads to a different executable, the loop code(which is identical across executables and does not containany loads or stores) is placed at a different location in mem-ory. This shift in code placement affects branch predictor,i-cache, and i-TLB performance, and thus can lead to a dif-ferent number of cycles per loop iteration.
The fact that a cycle measurement can be off by sucha large factor is worrysome. This problem cannot solelybe attributed to the performance counter measurement in-frastructure: any change in environment (e.g. the use of adifferent compiler, or a different optimization level) couldaffect the cycle count in the same way. We strongly believethat such drastic external influences on micro-architecturalperformance metrics dwarf the direct influence any reason-able performance measurement infrastructure could possiblyhave on measurement accuracy.
7. LIMITATIONSThis section identifies the limitations and threats to the
validity of the results presented in the three previous sec-tions.
Platforms. Our experiments focused exclusively on Linuxon the IA32 architecture. This enabled a direct compari-son of all the six counter access interfaces (PHpm, PHpc,PLpm, PLpc, pm, and pc) we studied. Because some ofthese interfaces do not exist on other operating systems or onother hardware architectures, the question how they wouldcompare on other platforms is a hypothetical one. Withthis study we raised the issue of accuracy of hardware per-formance counter measurements, and we encourage perfor-mance analyst to always take the accuracy of their specificinfrastructure into consideration.
Micro-architectural counts. In this paper we stud-ied the error for instruction and for cycle count measure-ments. We discovered that the cycle count measurementsare drastically perturbed by aspects (i.e. code placement)that are not directly attributable to the measurement in-frastructure. Because cycle counts represent the result ofall micro-architectural activity (e.g. they are affected bycache miss counts, branch mispredicts, stalls, . . . ), we expectsimilar perturbation of various individual micro-architecuralevent counts. Because we do not have a precise model of thethree micro-architectures we used, we do not have a groundtruth to compare our measurements to. The order of magni-tude of the cycle count perturbation completely overshadowsthe errors we would expect due to the measurement infras-tructure. The perturbation of specific event counts due tocode placement is an interesting topic for future research.
8. GUIDELINESIn this section we present guidelines for conducting more
accurate hardware performance measurements. These guide-lines are based on our experience and the results we pre-sented in the previous three sections.

Frequency scaling. Rarely do studies that include aperformance evaluation report whether frequency scaling wasenabled or disabled on the processor. In gathering the datafor this paper, we originally did not control this factor. Thisresulted in significant variability in our results, caused by thepower daemon dynamically changing the processor’s clockfrequency. Depending on the power management configu-ration and the workload characteristics of the benchmarks,the clock frequency may rarely change, it may change onlyafter running a number of experiments, or it may changeseveral times during a single measurement. Each of thesecases will introduce different types of error into performancemeasurements. Since the frequency setting of the processordoes not affect the bus frequency, changing the CPU fre-quency can affect the memory access latency (as measuredin CPU cycles), and thus ultimately the measured CPU cy-cle count. We recommend setting the processor frequency(of all cores) to a fixed value. In Linux, this is done bychosing the “performance” governor (for the highest possi-ble frequency), or the “powersave” governor (for the lowestpossible frequency).
Use of low level APIs. Performance analysts may as-sume that using a lower level measurement infrastructureautomatically leads to more accurate measurements. Thisis only the case if the low level infrastructure is used in ex-actly the right way. For example, turning off the time stampcounter when measuring with perfctr, while seemingly re-ducing the amount of work required by the infrastructure(one less counter to read), will lead to a degradation of ac-curacy (since it prevents the use of fast user-mode reads).Moreover, in our results we show which measurement pat-terns lead to the smallest error. We encourage performanceanalysts to ensure that they are using the best performingpattern, no matter whether they use low-level or high-levelAPIs.
Micro-architectural event counts. We have shownthat cycle counts, unlike the counts of retired instructions,are easily affected by conditions such as the placement ofthe measured code in memory. This effect dwarfs any ex-pected error due to measurement overhead, and it lead tosignificant errors even in long-running benchmarks. We cau-tion performance analysts to be suspicious of cycle counts,and any micro-architectural event counts (cycles are but aresult of all other micro-architectural events), gathered withperformance counters.
Error depends on duration. We have found a smallbut significant inaccuracy in long-running measurements us-ing current performance counter infrastructures. However,this variable error, which occurs in addition to the fixed er-ror due to the calls to the measurement infrastructure at thestart and end of the measurement, only manifests itself whenincluding kernel mode instructions in the measurements.
9. RELATED WORKResearchers in the PAPI group have previously published
work including discussions of the accuracy of their infras-tructure. Moore [9] distinguishes between the accuracy oftwo distinct performance counter usage models: countingand sampling. The section on counting accuracy presentsthe cost for start/stop and for read as the number of cycleson five different platforms: Linux/x86, Linux/IA-64, CrayT3E, IBM POWER3, and MIPS R12K. On Linux/x86, shereports 3524 cycles for start/stop and 1299 for read, num-
bers which lie in the range of our results. However, as weshow in this paper, cycle counts can drastically vary, evenwhen measuring the exact same block of code (e.g. justdue to the fact that the code is located at a different mem-ory address). Moore’s work does not mention the specificprocessor or operating system used, does not report the ex-act measurement configuration (PAPI high level or low levelAPI, compiler optimization level, how many registers used),and it does not mention the number of runs executed to de-termine that value. It just reports one single number. Alsoin the context of PAPI, Dongarra et al. [3] mention poten-tial sources of inaccuracy in counter measurements. Theypoint out issues such as the extra instructions and systemcalls required to access counters, and indirect effects like thepollution of caches due to instrumentation code, but they donot present any experimental data.
Korn et al. [7] study the accuracy of the MIPS R12000performance counters using micro-benchmarks. They com-pare the measured event counts to analytical results (theexpected event counts of their micro-benchmarks) and to re-sults from simulating their micro-benchmarks on SimpleScalar’ssim-outorder micro-architectural simulator. They use threemicro-benchmarks: a linear sequence of instructions (to es-timate L1 cache misses), a loop (they vary the number ofiterations, like we do), and a loop accessing a large arrayin memory (to estimate d-cache and TLB misses). Theyuse a single infrastructure (libperfex on SGI’s IRIX oper-ating system) to access the counters, and they do not ex-plore the space of possible measurement configurations. Weshow the accuracy of instruction count measurements of thethree prevalent measurement infrastructures on Linux onthree state-of-the-art processors. We study a large parame-ter space, varying factors from the compiler optimizationlevel, over the measurement pattern, to the exact set ofperformance counters used for a measurement. Our resultsshow that varying these factors can drastically affect mea-surement accuracy.
Besides using the libperfex library, Korn et al. [7] also eval-uate the accuracy of the perfex command line tool based onthat library. To no surprise, this leads to a huge inaccuracy(over 60000% error in some cases), since the perfex programstarts the micro-benchmark as a separate process, and thusincludes process startup (e.g. loading and dynamic link-ing) and shutdown cost in its measurement. We have alsoconducted measurements using the standalone measurementtools available for our infrastructures (perfex included withperfctr, pfmon of perfmon2, papiex available for PAPI), andfound errors of similar magnitude. Since our study focuseson fine-grained measurements we do not include these num-bers.
Maxwell et al. [8] broaden Kron et al.’s work by includingthree more platforms: IBM POWER3, Linux/IA-64, andLinux/Pentium3. They do not study how the factors a per-formance analyst could control (such as the measurementpattern) would affect accuracy. They report on performancemetrics such as cycles and cache misses. We show in Sec-tion 6 that such information is very sensitive to initial con-ditions, such as the placement of the loop code, and thusmay drastically change in a slightly different context.
Based on Maxwell et al.’s work, Araiza et al. [1] propose to
3They do not specify which version of the Pentium proces-sor they studied (different Pentium processors are based onentirely different micro-architectures).

develop a suite of platform-independent micro-benchmarksto allow the comparison of measured performance countsand analytically determined counts. In a related effort witha different goal, Yotov et al. [14] have developed micro-benchmarks to explore the size of micro-architectural struc-tures. In this paper we use two trivial micro-benchmarks,the empty null benchmark for which we expect an eventcount of 0, and the loop benchmark for which we can an-alytically determine the expected number of instructions.We believe that the refinement of such benchmarks to al-low the analytical determination of counts for any micro-architectural event requires special consideration of the sen-sitivity of modern processors to initial conditions such as thememory layout.
Najafzadeh et al. [11] discuss a methodology to validatefine-grained performance counter measurements and to com-pensate the measurement error. They propose to measurethe cost of reading out counters by injecting null-probes atthe beginning of the code section to be measured. Theyindicate that this placement would lead to a more realis-tic context for measuring the cost of reading. They do notinclude a quantitative evaluation of their idea.
Mytkowicz et al. [10] also study the accuracy of perfor-mance counter-based measurements. However, their focusis on the accuracy of measurements when the number ofevents to measure is greater than the number of the availableperformance counter registers. They compare two “time in-terpolation” approaches, multiplexing and trace alignment,and evaluate their accuracy. Their work does not addressthe measurement error caused by any software infrastruc-ture that reads out and virtualizes counter values.
10. CONCLUSIONSThis paper constitutes the first comparative study of the
accuracy of performance counter measurement infrastruc-tures. We evaluate three commonly used infrastructures,PAPI, perfctr, and perfmon2, on three different modern pro-cessors, Athlon 64 X2, Pentium D, and Core 2 Duo. Our re-sults show significant inaccuracies even in instruction counts(up to thousands of instructions). We study the factors withthe biggest impact on measurement accuracy, and we pro-vide guidelines that help performance analysts improve theaccuracy of their performance counter measurements.
11. REFERENCES[1] Roberto Araiza, Maria Gabriela Aguilera, Thientam Pham,
and Patricia J. Teller. Towards a cross-platformmicrobenchmark suite for evaluating hardware performancecounter data. In Proceedings of the 2005 conference onDiversity in computing (TAPIA’05), pages 36–39, NewYork, NY, USA, 2005. ACM.
[2] S. Browne, J. Dongarra, N. Garner, K. London, andP. Mucci. A scalable cross-platform infrastructure forapplication performance tuning using hardware counters. InProceedings of the 2000 ACM/IEEE Conference onSupercomputing (SC’00), Dallas, Texas, November 2000.
[3] Jack Dongarra, Kevin London, Shirley Moore, PhilipMucci, Daniel Terpstra, Haihang You, and Min Zhou.Experiences and lessons learned with a portable interface tohardware performance counters. In Proceedings of the 17thInternational Symposium on Parallel and DistributedProcessing (IPDPS’03), page 289.2, Washington, DC, USA,2003. IEEE Computer Society.
[4] Stephane Eranian. perfmon2: A flexible performancemonitoring interface for linux. In Proceedings of the LinuxSymposium, pages 269–288, July 2006.
[5] J.L. Hintze and R.D. Nelson. Violin plots: A boxplot-density trace synergism. The American Statistician,52(2):181–184, May 1998.
[6] Richard A. Johnson and Dean W. Wichern. AppliedMultivariate Statistical Analysis. Pearson EducationInternational, fifth edition, 2002.
[7] W. Korn, P. J. Teller, and G. Castillo. Just how accurateare performance counters? In Proceedings of the IEEEInternational Conference on Performance, Computing, andCommunications (IPCCC’01), pages 303–310, 2001.
[8] M. Maxwell, P. Teller, L. Salayandia, and S. Moore.Accuracy of performance monitoring hardware. InProceedings of the Los Alamos Computer Science InstituteSymposium (LACSI’02), October 2002.
[9] Shirley V. Moore. A comparison of counting and samplingmodes of using performance monitoring hardware. InProceedings of the International Conference onComputational Science-Part II (ICCS’02), pages 904–912,London, UK, 2002. Springer-Verlag.
[10] Todd Mytkowicz, Peter F. Sweeney, Matthias Hauswirth,and Amer Diwan. Time interpolation: So many metrics, sofew registers. In Proceedings of the InternationalSymposium on Microarchitecture (MICRO’07), 2007.
[11] Haleh Najafzadeh and Seth Chaiken. Validated observationand reporting of microscopic performance using pentium iicounter facilities. In Proceedings of the 4th internationalworkshop on Software and performance (WOSP’04), pages161–165, New York, NY, USA, 2004. ACM.
[12] Mikael Pettersson. perfctr.http://user.it.uu.se/˜mikpe/linux/perfctr/.
[13] Brinkley Sprunt. The basics of performance monitoringhardware. IEEE Micro, 22(4):64–71, 2002.
[14] Kamen Yotov, Keshav Pingali, and Paul Stodghill.Automatic measurement of memory hierarchy parameters.In Proceedings of the 2005 ACM SIGMETRICSinternational conference on Measurement and modeling ofcomputer systems (SIGMETRICS’05), pages 181–192, NewYork, NY, USA, 2005. ACM.