163/164 - MultiFunction Counter - Pendulum Instruments
204
163/164 MultiFunction Counter Users Manual 4031 600 64001, rev. 03 July 2003 This manual, in whole or in part, may not be copied without permission. 1998-2003 Pendulum Instruments AB. All rights reserved. Printed in Sweden. All product names are trademarks of their respective companies.
-
Upload
khangminh22 -
Category
Documents
-
view
0 -
download
0
Transcript of 163/164 - MultiFunction Counter - Pendulum Instruments

163/164 MultiFunction Counter
Users Manual
4031 600 64001, rev. 03 July 2003 This manual, in whole or in part, may not be copied without permission. 1998-2003 Pendulum Instruments AB. All rights reserved. Printed in Sweden. All product names are trademarks of their respective companies.

ii

iii
Table of Contents
Chapter Title Page
1 Introduction............................................................................. 1-1 2 Using the Controls ................................................................. 2-1 3 Tutorial .................................................................................... 3-1 4 Measure Functions................................................................. 4-1 5 Input Trigger ........................................................................... 5-1 6 User Options ........................................................................... 6-1 7 Waveform ................................................................................ 7-1 8 Values...................................................................................... 8-1 9 Statistics.................................................................................. 9-1 10 Understanding your MultiFunction Counter ...................... 10-1 11 Specifications ....................................................................... 11-1 12 User Maintenance................................................................. 12-1 13 Appendices ........................................................................... 13-1
14 Index ...................................................................................... 14-1

iv
GUARANTEE STATEMENT This guarantee is in addition to all rights, which the Buyer may have against his supplier under the sales agreement between the Buyer and the supplier and according to local legislation. Pendulum Instruments AB guarantees this product to be free from defects in material and workmanship under normal use and service for a period of eighteen (18) months from the date of shipment. This guarantee does not cover possible required re-calibration and/or standard maintenance actions. This guarantee extends only to the original end purchaser and does not apply to fuses, batteries, power adapters, or to any product or part thereof that has been misused, altered, or has been subjected to abnormal conditions of operation and handling. Pendulum Instruments’ obligation under this guarantee is limited to repair or replacement of a product that is returned to the factory within the guarantee period, provided that Pendulum Instruments determines that the product is defective and that the failure has not been caused by misuse, alteration or abnormal operation. If a failure occurs, send the product, transportation prepaid, to Pendulum’s delivery address: Pendulum Instruments AB Adolfsbergsvägen 2 P.O. Box 20020 SE-61 02 Bromma, Sweden Attach a description of the malfunction. At Pendulum Instruments’ option, repairs will be made or the product replaced. Pendulum Instruments shall return the repaired or replaced product to the Buyer, transportation prepaid. However, the Buyer shall pay all shipping charges, duties and taxes for products returned to Pendulum Instruments from another country. Pendulum Instruments assumes no risk for damage in transit.
Disclaimer The foregoing guarantee is exclusive and is in lieu of all other guarantees, expressed or implied, including but not limited to any implied guarantee of merchantability, fitness, or adequacy for any particular purpose or use. We shall not be liable for any direct, indirect, special, incidental, or consequential damages, whether based on contract, tort, or otherwise.

v
EC DECLARATION OF CONFORMITY Number: 4031 100 58901A041 The undersigned, representing the following manufacturer: Manufacturer: Pendulum Instruments AB Karlsbodavägen 39, Box 20020 SE-161 02 Bromma, Sweden Representative: Kali Rahman Function: Quality Manager herewith declare that the product: Product Identification Product: MultiFunction Counter Brand: Pendulum Model: 164 Version: All models Additional information: is in conformance with the EC Directive 89/336/EEC based on test results using harmonized standards in accordance with Article 10(1) of the directive and the directive LVD-73/23/EEC. Harmonized standards used: Safety: EN 61010-1 Cat. II (1993), UL1210 EMC: EN 50081-1 (1993)/EN 55011 (1991) Group1, ClassA EN 50082-2 (1995) /EN 61000-4-2: 4 kV CD, 8 kV AD /ENV 50140: 10 V/m, AM 80% (1kHz) 80-1000 MHz /EN 61000-4-4: 2 kV AC (mains), 1kV (signal lines) ENV 50141: 10 V7m, AM 80% (1 kHz) 0.15-80 MHz Other references or information required by the applicable EC directives: SEMCO: TCF certificate 9918100T TCF 981214 Signature of representative of manufacturer: Kali Rahman Place: Bromma Date: 2003-05-05 This Conformity is indicated by the symbol , i.e. “Conformité européenne”.

vi

i
SAFETY PRECAUTIONS To ensure the correct and safe operation of this instrument, it is essential that you follow generally accepted safety procedures in addition to the safety precautions specified in this manual.
Caution and Warning Statements Caution
Shows where incorrect procedures can cause damage to, or destruction of equipment or other property.
Warning Shows a potential danger that requires correct procedures or practices to prevent personal injury.
Symbols < Indicates that the operator should consult the manual.
One such symbol is printed on the TM-164/164H, near the input connectors, and one on the AC/DC Power Adapter. This symbol on the instrument should encourage the user to use the correct procedure for common instrument ground and maximum input voltages as described below.
The symbol on the AC/DC Power Adapter indicates that only the Option 51 AC/DC Power Adapter is allowed for the TM-164 and the TM-164H.
> This symbol is printed on the MultiFunction Counters. It indicates that the
signal ground of the connectors is internally connected to the other connectors with the same symbol, and to parts that are easily accessible for the user. The accessible parts are the BNC-connectors.
Warning The metallic BNC-connector housings will all carry the same common voltage. Applying signals with a common potential of more than 30Vrms (42Vpk or 60Vdc) above ground potential will make the instrument dangerous.

ii
Connections The TM-164 and TM-164H are double-insulated and battery operated. The instrument is therefore floating with respect to ground potential. Before connecting probes to the instrument you must be aware of that the grounds of all BNC-connectors on the instrument are interconnected inside the instrument. This means that connecting the signal ground of one probe or test lead to 42VDC (30Vrms) or more above ground potential will make the signal ground of other probes and measuring leads dangerous.
Warning To avoid electrical shock, remove any test leads that are not currently in use. Use safety designed probes without exposed metal connectors. Use probes and test leads within ratings and inspect before use.
Caution Never apply signals with higher amplitude than 30Vrms to Input A or Input B, or 12Vrms to the other inputs for safety reasons.
If In Doubt About Safety Whenever you suspect that it is unsafe to use the instrument, you must make it inoperative by doing the following:
• Disconnecting the line cord • Clearly marking the instrument to prevent its further operation • Informing Pendulum Instruments’ Service Center.
For example, the instrument is likely to be unsafe if it is visibly damaged.

Chapter 1
Introduction
Contents Page
About this manual ............................................................................. 1-2
Product features and use.................................................................... 1-3

164 Users Manual
1-2
ABOUT THIS MANUAL This manual contains the information required to use the TM-164 and TM-164H MultiFunction Counters from Pendulum Instruments AB. It also contains a training guide for MultiFunction Counter users.
The intended audience for this Users Manual is the installer and the Operator/User. It provides operating instructions, application information, specifications, and user maintenance instructions.
The MultiFunction Counter Users Manual contains fourteen chapters:
1 Introduction
2 Using the Controls
3 Tutorial
4 Measure Function
5 Input Trigger
6 User Options
7 WAVEFORM mode
8 VALUES mode
9 STATISTICS mode
10 Understanding your MultiFunction Counter
11 Specifications
12 User Maintenance
13 Appendices
14 Index

Introduction Product Features and Use
1
1-3
PRODUCT FEATURES AND USE The MultiFunction Counter is more than just a high accuracy top-performance counter, it adds a wideband DVM and displays waveform information like an oscilloscope.
Three different presentation modes let you VIEW, MEASURE and ANALYZE your signal. These presentation modes supply measuring data, as seen from different perspectives, giving more insight and confidence.
• In the WAVEFORM mode, the bright LCD display shows the input signal and trigger level, so you can view what you are measuring is correct. At the same time you can read off the measurement, which is displayed at up to 10 digits resolution.
• The VALUES mode displays up to 10 different signal parameters simultaneously, giving a wealth of information from just a single measurement.
• The STATISTICS mode gives statistical data over any number of readings up to 1 000 000 and reveals trends, jitter, drift, etc. It reduces random errors by statistical averaging, so enhancing accuracy.
Best of all is the ease-of-operation of this new instrument. Simple menu selection and an intelligent AUTOSET makes everyone an expert user and takes all the hard work out of getting results. With just a few keystrokes, the MultiFunction Counter helps you measure more with better results, faster and with less effort.
Now you can VIEW, MEASURE and ANALYZE confidently parameters like: Frequency, Period, Vmax, Vmin, Vpeak-peak, Pulse Width, Rise-/Fall Time, Duty Cycle, Time Interval, Phase, Burst Frequency, Vdc, true RMS Vac, Jitter and Totalize of Counts.
The MultiFunction Counter delivers high-resolution, high-accuracy readings of up to 10 digits. The high-stability oven controlled oscillator in the TM-164H model enhances accuracy even further. This is the ideal instrument for verification, alignment, calibration and analysis when you need accurate results. It is easier to use than a traditional counter, and it is more accurate than an oscilloscope for timing and frequency measurements.

164 Users Manual
1-4
• Total signal characterization, with up to 10 parameters displayed simultaneously.
• 160 MHz / 2.7 GHz frequency counting.
• Up to 10-digits resolution.
• 700 ps single-shot time resolution.
• 0.01° phase resolution.
• See signals up to 50 MHz and read voltages, including true-RMS.
• Confident triggering through visual waveform verification.
• High-stability optional ovenized crystal oscillator.
• Easy to learn, easy to use, easy to get results.
• AUTO SET for foolproof results.
• Handheld, rugged, battery operation: Ideal for field use.
• 3 years warranty, 40 000 hours MTBF.
• RS-232 interface for programmability and downloading of data.

Introduction Product Features and Use
1
1-5
Using a MultiFunction Counter From a Computer If you intend to use your 164 with the optical serial interface, use the Programming Instructions provided on the diskette that is delivered with the optional serial interface cable. This interface cable is available under product number Option 23/80.

164 Users Manual
1-6
Unpacking and first installation
UNPACKING AND INCOMING INSPECTION
Check that the shipment is complete and that no damage has occurred during transportation. If the contents are incomplete or damaged, file a claim with the carrier immediately. Also notify your local sales representative or Pendulum Instruments AB directly, in case repair or replacement may be required.
Contents of Box
The shipment should contain the following:
1. One 164 MultiFunction Counter (including rechargeable battery)
2. One Protective Holster (if ordered)
3. One AC/DC Power Adapter
4. One Certificate of Calibration
5. This Users Manual

Introduction Product Features and Use
1
1-7
IDENTIFICATION
The name strip on top of the display indicates what options are included in your instrument.
1. “164” indicates the basic model with a frequency measurement capability of 160 MHz (A- and B-inputs) and a separate 2.7 GHz HF-input.
2. “164H” indicates that you have also a High-stability Oven Controlled Crystal Oscillator, i. e. a time base with an aging of 1x10⁻⁷ per year.

164 Users Manual
1-8
USING THE HOLSTER AND TILT STAND
The MultiFunction Counter is cradled in an optional gray holster (option 23/01) that provides shock protection during rough handling. All keys and connections are accessible with the holster in place. You will need to remove the holster only to replace batteries. (See chapter 12 for battery replacement instructions.)
The MultiFunction Counter is also equipped with a multipurpose tilt stand, allowing viewing from different angles. The stand can also be used to hang the MultiFunction Counter at a convenient viewing position. Simply push up the quick release and tilt the stand. The tilt stand/bracket is fully usable with the gray holster in place. Typical positions are shown in Figure 1.
Figure 1 Multiposition Stand.
Quick release

Introduction Product Features and Use
1
1-9
POWERING THE INSTRUMENT
The MultiFunction Counter can be powered from any of the following sources:
• Internal Battery Pack (Option 23/86). A rechargeable Ni-Cd Battery pack comes installed in the 163/164 MultiFunction Counter.
• C Cell Batteries. You can use alkaline batteries in place of the Ni-Cd battery pack. (The charger is defeated when standard C Cells are installed. )
• AC/DC Power Adapter (Option 51). The AC/DC Power Adapter/Battery Charger powers the MultiFunction Counter from a standard ac outlet. The MultiFunction Counter can be used during battery charging. Verify that your local line voltage is appropriate before using the AC/DC Power Adapter/Battery Charger.
• Connect the Adapter/Charger to the MultiFunction Counter before connecting it to the ac outlet.
Note When measuring small signals where noise may be a problem, use the MultiFunction Counter on battery power only
Figure 2 You can insert alkaline C-size batteries in the 163/164.

164 Users Manual
1-10
Charging the Batteries
Warning To avoid electrical shock, use only an AC/DC Power Adapter/Battery Charger that is authorized for use with the MultiFunction Counter
Charge the batteries if the MultiFunction Counter does not start, or if a battery charge warning is shown.
To charge the batteries:
1. Connect the charger to the MultiFunction Counter.
2. Connect the charger to the ac outlet.
3. Charging starts directly when you plug in the charger to the MultiFunction Counter and to the ac outlet.
4. If the MultiFunction Counter is turned off, the batteries will quick-charge in 3 hours.
5. If you use the MultiFunction Counter as a line powered instrument during charge, 30 hours is needed for Full Charge.
Note To keep your batteries functional as long as possible, read about battery care in the User Maintenance chapter, page 12-3.

Chapter 2
Using the Controls
Contents Page
Introduction ....................................................................................... 2-1
Front panel keys ................................................................................ 2-3
What’s on the display ....................................................................... 2-5
On-screen controls............................................................................. 2-9
Conventions..................................................................................... 2-13
Convenience keys............................................................................ 2-15
Measurement control keys............................................................... 2-18

164 Users Manual
2-2
INTRODUCTION This chapter describes the various controls and related functions of the MultiFunction Counter.
The chapter is divided into four sections:
• Front Panel Keys
• What’s on the Display
• On-screen controls
• Conventions
• Convenience keys
After reading this chapter you will be able to maneuver your MultiFunction Counter through most measuring situations.
If you don’t like reading manuals With only a few keystrokes you can make most measurements:
OR
Select what to measure with MEASURE FUNCTION
Press AUTO SET twice (double-click) after changing function to get optimal working settings for the selected function. A single press will only affect voltage range, trigger level and waveform time-base settings
Select WAVEFORM mode with WAVEFORM, to see the signal like on an oscilloscope.
Press VALUES to see the results as numerical values.
Press INFO to get context sensitive help on the subject currently pointed out by the cursor.

Using the Controls Front Panel Keys
2
2-3
FRONT PANEL KEYS Turning On
Switch on by pressing the
ON/OFF key in the lower left
corner. The MultiFunction
Counter starts with the setup it
had when turned off.
If you want default setup
instead:
1. Press c
2. Press [_Recall_Default_Setuo_]
Presentation Mode Keys 1 Shows the waveform
of the signal.
2 Shows measurement
results as numerical values.
3 Shows the variation of
the signal over a set number of samples by presenting the maximum, minimum, maximum minus minimum, mean and standard deviation.
PRES EN TATI O N M O D E
SE TUP M EN U S
WAVEFORM
1.234
VALUESMAXMIN
STATISTICS
MEASUREFUNCTION
INPUTTRIGGER
USEROPTIONS
UNDOAUTOSET
SAVERECALLRESTART
HOLDRUN
SELECTEXIT
164H MULTIFUNCTION COUNTER

164 Users Manual
2-4
Setup Menu Keys Q Selects what parameter to measure (Single Function), or what
signal type to characterize (Signal Characterization).
W Selects input settings and measurement trigger conditions.
E Selects parameters that affect the MultiFunction Counter, not the
measurement.
Cursor Control Keys VHUN Used to move a cursor on the screen
9 Used to select items on the screen and to enter menus.
0 Used to exit menus on the screen.
Convenience Keys A Returns to the previous setting.
S Sets up the instrument to measure properly on the connected
signal.
D Gives help information on the topic that the cursor points at.
Measurement Control Keys z Freezes the measurement results or waveform on screen.
x Resets the measurement results and initiates a new
measurement/waveformcapture.
Additional Keys O Turns the MultiFunction Counter on or off.
C Saves and recalls instrument setup and screen data in nonvolatile
memory inside the MultiFunction Counter.
B Steps the intensity of the display backlight between high, medium
or low. Low intensity means longer battery life.

Using the Controls What’s on the Display
2
2-5
WHAT’S ON THE DISPLAY
WAVEFORM mode Figure 3 shows the waveform mode screen and explains its elements.
Figure 3 A typical WAVEFORM mode screen.
Note The black field on Chan: is the cursor. You can move it to the
function you want to change with the cursor control m.
Time/division
Automatically or manually set
Measurement FunctionIn the top area of the display you see what parameter is measured. If signal characterization is selected, the signal type is also shown.
Trigger level
Horizontal line for time measurements, and grayed hysteresis band field for Frequency and Period measurements
Voltage/division (Automatically set)
Measuring Channel
Here you see what input channel you measure on.
Pretrigger area
The two left divisions show what happens before the trigger point (Signal must be above 2 kHz).
Indicators for Vp-p, Clipped, and No Trig
Waveform trigger Indicator ( )
Waveform trigger setting
Info Banner

164 Users Manual
2-6
VALUES mode Figure 4 shows the different elements of the values screen. If a single measurement function is selected, only the large result and the voltage readings are shown.
Figure 4 A typical VALUES mode screen.
Select Primary measurement parameter
By selecting the appropriate radio button, the primary parameter is enlarged and put at the top of the screen.
Primary parameter value
Volt Readings
Here you see signal amplitude. Positive and negative peak voltages, as well as Vp-p are shown.
Input & Trigger Settings
Here you can see input and trigger settings, etc. on screen. (You can also change the settings here)
Status Indicators
These give you information about the current status of the instrument:
The result is scaled by mathematics.
The display value is frozen.
The MultiFunction Counter is remotely controlled by a computer

Using the Controls What’s on the Display
2
2-7
STATISTICS mode Figure 5 shows the different elements of the statistics screen.
Figure 5 The STATISTICS screen.
IndicationStatistics mode is indicated by the MAX/MIN icon.
Measuring FunctionHere you see what parameter the statistics is based on.
Statistical Functionperformed on the measured value.
Sample SizeHere you can see and set how many samples are taken before the results on the screen are updated.
Sample CounterHere you see how many samples are taken until now. This number is updated continuously when measurements are in progress.
Measured ValueShows measured value once per second. If measuring time is longer than one second, the measured value is updated once per measurement.

164 Users Manual
2-8
Quick Input & Trigger settings The bottom part of the display shows status information. These parameters are
found in the w menu.
The most commonly used input settings can be changed directly in the display by moving the dark cursor to the parameter to be changed.
With the interactive controls you don’t need to go via menus when you want to adjust Trigger level or Scope trace trigger, do it directly on the screen while watching the measurement results.
Above the horizontal line are Scope settings: trace trigger slope, trace trig level, and time/division. Below the horizontal line are the Counter settings: trigger level, trigger slope, voltage range, AC/DC settings, etc. At the very bottom you will find channel selection and measurement trigger information such as Hold Off and Arming.
Figure 6 Interactive controls.
Alert area, shows:
Remote if the MultiFunction Counter is controlled via the optical interface
Hold if z is in HOLD state, or
Meas if the MultiFunction Counter is currently measuring
Waveform trigger settings
Input-A settings
Input-B settings
Measurement channel, hold off and arming settings

Using the Controls On-screen controls
2
2-9
ON-SCREEN CONTROLS Apart from the keys on the front panel, the screen contains controls of four different kinds:
1. On screen buttons
2. List boxes
3. Numerical entries
4. Radio buttons (mutually exclusive buttons)
Moving the Cursor To use the cursor, proceed as follows:
1. Press the arrow keys unvh to move the black cursor from one on
screen control to another. Unavailable selections are grayed, but you can still
put the cursor on them and press d to get an explanation of the control.
2. Press 9 to select the parameter the cursor points at.
3. When your selection is made, leave by pressing the 0 key.
Buttons These controls look like buttons and you press them by positioning the cursor on
them and then pressing 9. In this manual, the buttons will look like this:
[_Frequency_]

164 Users Manual
2-10
List Boxes A list box is an on-screen text that ends with a colon and a setting, for example Voltage Range:±5.0 V.
To make a selection in a list box, proceed as follows:
1. Put the cursor on the text.
2. Press 9 or h. A list with the available selections appears1.
3. Press un to select the item you want from the list.
4. Press 0, v or h to exit the list box.
1 In horizontally oriented menus, the list appears directly when you put the cursor on the text.

Using the Controls On-screen controls
2
2-11
Numerical Entries A numerical entry is almost like the list box, with the exception that a numerical value follows the colon.
To set a numerical value, proceed as follows:
1. Put the cursor on the text.
2. Press 9 or h. An up/down arrow symbol appears to the right of the
value.
3. Press u to increase or n to decrease the value in steps.
4. Press 0 v or h to exit the numerical entry.
5. If you press 9 directly after step 2, a keypad appears where you can fine-
tune numbers. Clr Clears the number
←←←← Removes last digit Exp. Sets exponent V, mV sets suffix Enter, leaves keypad
(Pressing 0will also leave the
keypad)

164 Users Manual
2-12
Radio Buttons Radio buttons are arranged like a table of text with a button to the left of each entry. Only one selection can be made.
To make a selection with radio buttons, proceed as follows:
1 Put the cursor on the text you want to select.
2 Press 9.
The button you select is depressed and any other previously selected button in the table is released.

Using the Controls Conventions
2
2-13
CONVENTIONS The following shortcuts are used in the procedure descriptions in this manual:
Press w This means that you should press and release the INPUT TRIGGER-key on the MultiFunction Counter.
Press [_Input_A_]
This is a soft button in the display. For example “Press Input A” means that you should put the cursor on the soft button labeled “Input A” and press and release
9
Select Timebase Reference: External
This means that you should put the cursor on the text “Timebase Reference:”,
press 9 , put the cursor on External in the list that appears, and press 9 again. An alternative method is to put the cursor on “Timebase Reference" and press right arrow key, press up/down arrow keys until the cursor is on External, then press left arrow. Try this method; it is a very swift way of operating the list-boxes.
Set Trigger Level: 2.5V
This means that you should position the cursor on the text “Trigger Level", press
9 and use up/down arrow-keys to increase/decrease the trigger level. You
can also press 9 twice when the cursor is on Trigger Level, and you will get
a calculator style keypad where you can enter the value of your choice.

164 Users Manual
2-14
Select as Primary Parameter
This means that you should make a parameter display in large digits with full resolution at the top of the values screen display.
This is done in the values screen by positioning the cursor on the parameter that
you want as primary, and pressing 9. This is explained in detail later.
Figure 7 Selecting Primary Parameter.
Primary Parameter
The enlarged result shows in full resolution, i. e. all measured digits are shown here.
List of Secondary Parameters
Primary Parameter Selection Buttons
After you select the appropriate radio button, the parameter is enlarged and put at the top of the screen.

Using the Controls Convenience Keys
2
2-15
CONVENIENCE KEYS
Figure 8 Position of the Convenience keys.
AUTO SET key Make it a rule to press the green s once after changing measuring function or
changing input signal.
• One press on s gives working settings for the measurements you are
currently making.
• Double click s (press twice quickly), will give a more extensive auto set
by first presetting the MultiFunction Counter before the AUTO SET. The Preset performed turns on Auto trigger (see below), sets ideal Coupling, etc. It turns off all auxiliary functions like filter, arming and hold off. See Table 4 on page 10-12 for the complete list.
When AUTO SET has determined the ideal settings, The MultiFunction Counter returns to measuring, and you can freely modify the setting.
UNDO key
AUTO SET key INFO key

164 Users Manual
2-16
TWO TYPES OF ”AUTO”
s key
Determines ideal settings for the current measurement once, then goes inactive until the next time the key is pressed.
Auto Triggering and Auto Scaling
When Auto Triggering is ON (as is the preset state), Auto Trig continuously checks the signal and sets correct trigger levels and hysteresis, before each measurement.
When Auto Time Scale is ON (as is the preset state), The Time/Division is set automatically so that the graph displays one to two cycles of the signal. (Volt/Division is always controlled automatically).
UNDO key This key will undo the last selection made, that is, you change back to the previous setting. Pressing undo once more will return to the first setting again.
INFO key
Press the d key whenever you need information about an on
screen control. Information is given about the control that the cursor
currently points at. To remove the
Info window press d again or
press 0. Note
“MORE ? ” in the lower right corner shows that more Info pages are available and can be read
by pressing h.
Figure 9 A typical Info Screen.

Using the Controls Convenience Keys
2
2-17
TUTORIAL
If you have questions about the MultiFunction Counter but don’t have this manual available:
1. Press d
2. Press u to put the cursor on
[_Tutorial_]
3. Press 9
4. Select a topic from the list.
Figure 10 These topics are covered by the tutorial.

164 Users Manual
2-18
MEASUREMENT CONTROL KEYS
HOLD/RUN and RESTART keys
Figure 11 Measurement Control Keys.
z and x are used to control the measurement progress of the
MultiFunction Counter. When preset, the MultiFunction Counter measures continuously, that is, when one data acquisition is ready, a new data acquisition is automatically started, and the display is updated.
To use HOLD/RUN and RESTART, proceed as follows:
1. Press z to freeze the display.
2. The measurement result stays on the display until you start new captures by
pressing z.
3. Pressing x when the MultiFunction Counter is in hold will start one
capture and then return to hold.
4. Pressing x when the MultiFunction Counter is running will reset the
results and start a new capture.
5. In STATISTICS mode, x will start a new data capture of the set
sample size.
HOLD RUN key
RESTART key

Using the Controls Measurement Control Keys
2
2-19
Save/Recall key C will call up a menu where you
can save 10 complete instrument setups and one screen copy.
SAVING A SETUP
1. Set up the MultiFunction Counter for the measurement you want to make.
2. Press c.
3. Press [_Save_Setup/Screen_].
4. Put the cursor on a free memory location. You can see which locations are free in the Contents column of the Save Setup screen.
5. Press 9.
Now the setup is saved in battery backed-up memory.
RECALLING A SAVED SETUP
1. Press c.
2. Press [_Recall_Setup/Screen_].
3. Put the cursor on the memory location you want to recall. The Contents column shows the measurement function made by the saved setup.
4. Press 9.
Now the MultiFunction Counter is set up according to the saved setup.
Figure 12 The SAVE/RECALL screen.

164 Users Manual
2-20
CLEARING A MEMORY
1. Press c.
2. Press [_Clear_Setup/Screen_].
3. Put the cursor on the memory you want to erase.
4. Press 9
Now that memory is cleared.
Note You can save a new setup over an existing setup without first clearing the memory location.
PROTECTING MEMORY 6 TO 10
Memory locations 6 to 10 can be write protected like files on a diskette.
To activate memory protection:
1. Press c.
2. Select : Write Protect Memory 6 to 10: Yes
To deactivate memory protection:
1. Press c.
2. Select : Write Protect Memory 6 to 10: No
SAVING A SCREEN COPY
You can save the Waveform, Values or Statistics result screen.
1 Press c.
2 Press [_Save_Setup/Screen_].
3 Put the cursor on [_Screen_].
4 Press 9 and the screen is saved

Using the Controls Measurement Control Keys
2
2-21
RECALLING THE SCREEN COPY
1 Press c.
2 Press [_Recall_Setup/Screen_].
3 Put the cursor on [_Screen_].
4 Press 9.
Now the saved screen is shown, see Figure 13.
Pressing any key will return the MultiFunction Counter to measuring.
RECALL DEFAULT SETUP
This selection gives the MultiFunction Counter default setup as specified in Table 4 on page 10-12. The difference from a Preset is that the measuring channels are set to Input A as Primary Channel and Input B as secondary Channel, the measurement function is set to Sine-type Signal Characterization, and the Presentation Mode is set to Waveform.
RECALL LAST POWER OFF SETTINGS
Recalls the settings the MultiFunction Counter had when turned on.
Figure 13 The bottom of the screen shows that this waveform is recalled from memory.

164 Users Manual
2-22

Chapter 3
Tutorial
Contents Page
Introduction ....................................................................................... 3-2
Characterizing a sinewave signal....................................................... 3.4
Characterizing pulses......................................................................... 3-8
Selecting a single function measurement......................................... 3-10
Measure relation between two signals ............................................. 3-11
Time interval between two channels ............................................... 3-14
Time interval on one channel .......................................................... 3-15
Measuring single shot events........................................................... 3-16

164 Users Manual
3-2
INTRODUCTION This part of the manual describes how you perform some common measurement tasks. These are not actual application notes, but more general solutions.
The topics are:
• Characterizing a signal
• Characterizing pulses
• Selecting a single function measurement
• Measure relations between two signals
• Time Interval between two channels
• Time Interval on one Channel
• Capturing single shot events
You will get the most out of these exercises if you have signals of your own to measure. If not, use signals generated on the MultiFunction Counter output.
In the exercises that follow, remember the following:
• Use q to select either a specific measuring function (single function)
or a signal type for signal characterization.
• Select 1 or 2 to choose waveform or values presentation mode.
• Press s after change of function or change of signal.2
• Press d whenever in doubt.
2 Note: One press (single-click) auto-sets trigger level, voltage range and waveform time/div. Settings.
Two presses (double-click) PRESETS the MultiFunction Counter to optimal pre-defined input and trigger
settings. A preset will turn off settings like filter, arming, hold-off and mathematics.

Tutorial Introduction
3
3-3
Exercise Setup You’ll need a MultiFunction Counter (any configuration), a T-Piece and two BNC cables. One cable should be long, a 2 m cable is suggested. If you use a different cable length, you can still do these exercises, but your measurement results for two channel measurements will differ from the results in the VIEW RESULT figures.
1. Put the T-piece on Input A of the MultiFunction Counter.
2. Connect the short cable between the T-Piece and the output.
3. Connect the long cable between the T-Piece and Input B.
START WITH DEFAULT SETTINGS
1. Turn on the MultiFunction Counter.
2. Press c
3. Put the cursor on [_Recall_Default_Setup_].
4. Press 9.
GENERATING A PULSE SIGNAL AT THE OUTPUT
Normally no signal is present on the output, so you must turn it on.
Then follow the SETUP instructions below.
New instructions appear in the text whenever you need to change the signal.
1. Press: e [_Output_]. 2. Select: Output: On.
3. Select: Output Signal: 2kHz, Probe Adjust.
4. Press 00 (or press e again to exit User Options menu).
Figure 14 Exercise Setup. Connections for using the built-in generator for the exercises that require a pulse signal.

164 Users Manual
3-4
CHARACTERIZING A SINEWAVE SIGNAL The first task is to find out the basic parameters for an unknown signal. This is a simple task with the MultiFunction Counter.
Connect the signal Normally you connect the signal to Input A. (For exercise, use a 3 Vp-p, 2 kHz signal from a Sinewave generator. )
Figure 15 Connect the signal to Input A.

Tutorial Characterizing a Sinewave Signal
3
3-5
View Values list 1. Press: q[_Sine_]9
Note that the presentation mode is automatically changed to “VALUES”, so you don’t have to
press 2
2. Press ss (double-click) to
set a wide hysteresis band for maximum noise rejection.
The Sine-group fits all continuous signals. A typical Sine Group Screen is shown in Figure 16.
You get Frequency, Period, Vmax, Vmin, and Vp-p in one and the same screen, and all measured values are updated regularly.
Figure 16 Signal Characterization. “Sine” gives a list with two values plus three voltage readings.

164 Users Manual
3-6
View waveform 1. Press: 1.
After a few seconds you see the signal waveform on the screen as in Figure 17.
2. If necessary, press s to
optimize the graph settings for the connected signal.
If the signal displays properly no other adjustments need to be done. Pressing Auto Set also selects an automatic time/division setting that displays the signal properly.
Figure 17 Results screen in WAVEFORM mode.

Tutorial Characterizing a Sinewave Signal
3
3-7
Additional selections 1. Press 2 to go to Values Screen.
2. Select primary parameter by positioning the cursor on Period
Average A and pressing 9.
This way you will get Period instead of Frequency as “Primary Parameter" in full resolution at the top of the screen. See Figure 18.
Note The peak voltage parameters are always shown in full resolution, and cannot be selected as primary parameter in this screen. You can, however, select them as measurement function from the MEASURE FUNCTION menu.
Figure 18 Period in full resolution.

164 Users Manual
3-8
CHARACTERIZING PULSES Connect the pulse signal to Input A. (For exercise, use setup in Figure 14 which gives a 2 kHz square wave.)
Select Pulse Signal Type 1 Press q.
2 Press [_Pulse_].
3 Press 1.
4 Press ss(double-click).
Now you see the signal waveform on the screen. ”AUTO SET with PRESET” optimizes the settings for the connected signal. For Pulse signals this means minimum hysteresis width and DC coupling for accurate time measurements.
If the signal displays properly, no other adjustments need to be done. If not, see “Input Trigger Settings” in this manual.
Figure 19 Connect the signal to Input A.
Figure 20 Results screen in WAVEFORM mode.

Tutorial Characterizing Pulses
3
3-9
View Results 1. Press 2.
In a Pulse Group Screen (see Figure 21) you can see a list with the most common pulse parameters on screen at the same time.
Additional selections You can select another “Primary Parameter" to display, in the same way as described under “Characterizing a Sine-wave Signal" previously in this exercise.
Figure 21 The VALUES screen for Pulse Signal type.
Figure 22 Primary Parameter. Positive Pulse Width selected as Primary Parameter.

164 Users Manual
3-10
SELECTING A SINGLE FUNCTION MEASUREMENT Sometimes it is confusing to have many parameters on the screen at the same time, and at other times you want to make adjustments and need the fastest screen update possible. Then you select a single function from the left column in the Measure Function menu. In this example we select RPM, revolutions per minute:
1 Press q.
2 Select [_More_Functions_].
3 Select [_RPM_].
Now the result is shown as RPM. (The 2 000 Hz from the test signal equals 120 000 RPM.)
In a real life situation the RPM transducer may produce several pulses/rev. If so, the transducer scaling factor can be set to obtain a correct RPM reading. Try it yourself!
1 Press q.
2 Select [_More_Functions_].
3 Set Pulses/Rev: 500
4 Select [_RPM_].
The display now shows 240 rpm.
1. Press 2 to see only the result
of the single measurement.
2. Press 1 to see the result of the
measurement as well as the waveform on the same screen.
Figure 23 Measure Functions. The left column, FUNCTIONS, contain 26 different measuring functions in submenus.
Figure 24 Select RPM from the more functions menu.

Tutorial Measure Relation Between two Signals
3
3-11
MEASURE RELATION BETWEEN TWO SIGNALS The MultiFunction Counter can measure time interval, phase angle and frequency ratio between a signal on one input and another signal on the other input. It can also measure time between two events on the same input.
Connect the two signals Connect the measuring signal to the primary channel (normally Input A) and the reference to the secondary channel (normally Input B).
Phase measurements are almost always made on sinewave signals. But sinewave generators seldom have dual outputs with selectable phase delay. So for this exercise, use the setup in Figure 14 but also put 50Ω terminators on Input A and Input B to get a clean signal without reflections.
1. Press e.
2. Select [_Output_].
3. Select Output signal: 1 MHz, Square and press 9.
This setup gives 10 ns (3.6°) between Input A and Input B.
Select Phase Group 1. Press q.
2. Select. [_Phase_].
3. Select [_Phase_Group_].
4. Press ss(double-click).
Figure 25 Connections for two- channel measurements.
Connect reference signal to input B
Connect measuring signal to input A

164 Users Manual
3-12
View Results Now you will see both phase, frequency of the reference signal, and frequency-ratio at the same time, See Figure 26.
The phase will be shown in respect to the secondary channel, so if the pulse in the primary channel comes before the pulse on the secondary input, the phase will be positive, and vice versa.
Note Ratio must be 1.000, otherwise the phase measurement makes no sense.
Figure 26 The Phase Group. Shows both Phase, Frequency and Ratio.

Tutorial Measure Relation Between two Signals
3
3-13
View signal Press: 1s. Now you see both signal waveforms on the screen. AUTO SET optimizes the graph settings for the connected signals. If the signals display properly no other adjustments need to be done. If not, see ”
Input Trigger” Chapter.
In Figure 27 the phase delay is hardly visible, so we need to zoom in on the signals:
1. Put the cursor on 200 ns/div.
2. Press n until 20 ns/div.
Now you see the phase delay clearly, see Figure 28.
Figure 27 Both channels are shown in waveform mode.
Figure 28 Zoom in on phase delay.

164 Users Manual
3-14
TIME INTERVAL BETWEEN TWO CHANNELS Another two channel measurement in the MultiFunction Counter is Time Interval. We use the 10 MHz output signal.
1. Press e.
2. Select [_Output_].
3. Select Output signal: 10 MHz,
Reference and press 9.
Put 50Ω terminations on Input A and Input B to get a clean signal without reflections.
Select Time Interval 1. Press q.
2. Select [_Period_&_Time_(s)_].
3. Select [_Time_Interval_].
4. Press w.
5. Press [Measure_Channels].
6. Select [A,_B]
7. Press ss.
View Waveform Screen The time between a trigger on the primary channel and a trigger on the secondary channel is measured. Normally, the primary channel is Input A and the Secondary channel is Input B, which makes the MultiFunction Counter measure Time Interval A to B.
Note that the trigger levels for both signals are visible on screen (horizontal lines).
Figure 29 Connect like this for two-channel measurements.
Figure 30 The time between the pulse on Input A and the pulse on Input B is about 10ns.
Connect secondary signal to input B
Connect primary signal to input A

Tutorial Time Interval on one Channel
3
3-15
TIME INTERVAL ON ONE CHANNEL By setting also the Secondary Channel to Input A, the MultiFunction Counter will measure Time Interval A to A. In this case the trigger level and trigger slope for Input B are used to set the stop trigger point on Input A.
Connect the signal Use the setup from the previous exercise.
Select Input A for both channels 1. Press w.
2. Select [_Measure_Channel(s)_].
3. Select [_A,_A_] (Common). Note that this selection is only available when a two channel measurement like Time Interval is currently selected.
Set the Trigger Levels Turn off Auto Trig for both channels. Select the time you want to measure by positioning Cursor A on the start point with Input A trigger level setting.
Position Cursor B on the stop point using the trigger level setting for Input B. Select start and stop trigger slope with the Input A and Input B slope settings.
Figure 31 Select Input A as secondary as well as primary channel.
Figure 32 The time between the start trigger cursor (A) and the stop trigger cursor (B) is 42.1 ns.
Trigger level selection
This time is measured
Slope selection

164 Users Manual
3-16
MEASURING SINGLE SHOT EVENTS The MultiFunction Counter can measure single pulse widths and periods. However, there exist limitations:
• The MultiFunction Counter cannot adjust itself to the measuring signal since there is no signal present to adjust to, so AUTO TRIG will not work.
• The MultiFunction Counter can only measure one parameter. The help parameters Vmax, Vmin and Vp-p will not be measured since they require a continuous signal.
• Signal characterization does not work for single shot events.
• The MultiFunction Counter cannot show the waveform of a single shot event.
Connect the signal Connect the signal to Input A (For exercise, use a pulse generator with Repetition Time set to Single Shot and Duration to 10 ms).
Turn off Auto Trigger and set Trigger Level Manually 1. Press w.
2. Select [_Input_A_].
3. Select Auto Trigger: OFF.
4. Set Trigger Level to the desired level, in this example we use 0 V.
5. Select Trigger Level: 0 mV.
6. Press 2.
Figure 33 Single Shot. Only the Pulse Width reading is shown, no voltage readings are possible for single shot events.
Hold indicates that the result is frozen

Tutorial Measuring Single Shot Events
3
3-17
Select Pulse Width Measurements 1. Press Q.
2. Select [_Period_&_Time_(s)_].
3. Press [_Positive_Pulse_Width_].
Capture the Single Event 1. Press Z so that the MultiFunction Counter is in hold state (HOLD is
shown in the display above the horizontal line separating the results screen from the input settings field, see Figure 33).
2. Press x and the MultiFunction Counter is armed and will capture the
next pulse that appears on the input, and then return to hold state.
3. Generate one pulse from the pulse generator.
Read Results Now you will read the Pulse Width of the single event on the screen.

164 Users Manual
3-18

Chapter 4
Measure Functions
Contents Page
Introduction ....................................................................................... 4-2
Selecting functions ............................................................................ 4-3
Frequency (Hz).................................................................................. 4-5
Period & time (s) ............................................................................... 4-7
Phase (°) ............................................................................................ 4-9
Voltage (V)...................................................................................... 4-11
Totalize (counts).............................................................................. 4-13
More functions ................................................................................ 4-15

164 Users Manual
4-2
INTRODUCTION This part of the manual describes how you select the parameter( s) to measure.
Each measurement function is described along with what it measures and what settings affect the measurement.
The chapter is divided into the following parts:
• Selecting Functions
• Frequency (Hz)
• Period & Time (s)
• Phase (°)
• Voltage (V)
• Totalize (Counts)
• More functions
The order of descriptions is the same as the order in the menu that appears when
you press the q -key.
After reading this chapter you will know what the MultiFunction Counter can measure and how to select the functions.

Measure Functions Selecting Functions
4
4-3
SELECTING FUNCTIONS Select what to measure by pressing the q key. A screen appears with two
columns with the headlines: Functions and Signal Characterization.
Single Functions Select the type of function you want by positioning the cursor on Hz, s, °, V etc., for example press
[_Period_&_Time_(s)_] and 9.
Make your final function selection by putting the cursor on for instance
[_Rise_Time_], and pressing 9.
Figure 34 The left column contains Function types.
Figure 35 Making Final Function Selections.

164 Users Manual
4-4
Signal Characterization Signal characterization gives all necessary data to describe a signal.
The number of parameters required to describe a signal varies with the signal shape. A sine signal is easily described by giving frequency and amplitude, while a pulse signal also needs rise/fall times and duty cycle to be accurately described.
The results from signal characterization are only shown in VALUES mode (when
2 has been pressed). Select a signal type and the MultiFunction Counter
shows you all the relevant parameters on the screen simultaneously.
[_Sine_] gives you Frequency, Period, and positive and negative peak voltage of any continuous signal.
[_Pulse_] gives you Period, Pulse Width, Duty Factor, Rise/Fall-time, and positive and negative peak voltage.
[_Burst_] gives you Burst Frequency, Burst Repetition Rate and positive and negative peak voltage.
1. Position the cursor on the signal type you want.
2. Press 9 to select the signal
type and start measuring.
One parameter is always the primary parameter that is enlarged at the top of the display. You can select primary parameter by putting the cursor on it
and pressing 9 The radio button in
front of the parameter will be depressed and its result enlarged at the top. The primary parameter is measured with higher resolution and this parameter
will be analyzed if you press 3 and
shown if you press 1.
Figure 36 The right column of the Measure Function menu contains Signal types.

Measure Functions Frequency (Hz)
4
4-5
FREQUENCY (Hz) Frequency Frequency is the number of cycles/second in a repetitive signal. The MultiFunction Counter measures the period time of the signal and calculates the frequency as:
FrequencyPeriod
= 1.
Resolution is set via measuring time
under w.
Auto Trig selects 50% trigger level and 33% hysteresis for Frequency.
Frequency Ratio Frequency ratio shows the relation between two frequencies:
RatioChannel frequency
Secondary Channel frequency= Primary
.
In the MultiFunction Counter both frequencies are measured simultaneously in real time, so the result is always correct. You can use this to verify that logic dividers and rotary encoders work correctly, for example.
Always connect the lowest frequency to the secondary channel.
t
Frequency=t1
Figure 37 Frequency definition
Figure 38 The FREQUENCY menu.

164 Users Manual
4-6
Frequency in Burst
Figure 39 These parameters are measured in a burst.
This is the frequency within the actual burst.
Note that correct results require correctly set burst timing parameters in the
w menu. Pressing swill set these correctly in most cases.
Burst Repetition Rate This is the frequency at which the bursts repeat themselves.
Table 1 Signal requirements for successful burst measurements.
Input A and B Input C
Min. no. of cycles
Min. Burst Duration
Min. no. of cycles
Min. Burst Duration
Internal Sync. ssss
6 0.5 µs 192 50 µs
Internal Sync. Man
4 0.5 µs 128 50 µs
External Sync.
2 - 128 -
Burst Repetition Rate
Frequency in Burst

Measure Functions Period & Time (s)
4
4-7
PERIOD & TIME (S) Period (Single) That is the time for one cycle of the waveform. Single means that one single period is measured and the result is displayed.
Auto Trig selects 50% trigger level and minimum hysteresis for Period Single.
Period (Average) Here the period of many cycles are measured and the average period is calculated and displayed. Period average increases the resolution of the period measurement. The number of periods that are used in the averaging process is set by the measuring time. Longer time gives more cycles which gives more digits.
You find the measuring time in the Input Trigger menu.
Auto Trig selects 50% trigger level and 33% hysteresis for Period Average.
Period=T
Figure 40 Period, Single.
Figure 41 The PERIOD & TIME menu.
T
1 2 3
PeriodAverage=T/3
Figure 42 Period Average shows the average of several periods

164 Users Manual
4-8
RiseTime
Fall Time
90%
10%
Positive Pulse Width This is the time from when a positive pulse passes the trigger level, until it returns to the trigger level again. Auto Set sets the trigger level to 50% of the amplitude.
Negative Pulse Width This is the time from when a negative pulse passes the trigger level, until it returns to the trigger level again.
Rise Time This is the time from when a rising (positive going) edge passes 10% of the amplitude, until it reaches 90% of the amplitude.
Fall Time
This is the time from when a falling (negative going) edge passes 90% of the amplitude, until it reaches 10% of the amplitude.
Note Rise/Fall time as single function has both auto and manual trigger levels.
As part of the Pulse Group, Rise/Fall time only uses automatic trigger levels.
PositivePulseWidth
NegativePulseWidth
Figure 43 Definition of pulse width.
Figure 44 Definition of Rise and Fall-time.

Measure Functions Phase ( )
4
4-9
Time Interval This is the time between an event on the primary channel to an event on the secondary channel. By selecting for instance Input A for both primary and secondary channel you can measure between any two events on a signal.
PHASE (°) Phase is the time between a signal on the primary channel, and a signal of equal frequency on the secondary channel, expressed in degrees of the period.
The phase will be shown with respect to the secondary channel, so if the pulse on the primary channel comes before the pulse on the secondary channel, the phase will be positive, and vice versa.
Note AC-coupling (Preset) is ideal for phase measurements on sine and other symmetrical signals. Use DC-coupling and manual trigger levels for pulse signals.
Figure 45 Time Interval.
Reference
90 °
360 °
A
B
Figure 46 Phase.
TimeInterval

164 Users Manual
4-10
Phase Phase gives only phase on the display.
Phase Group Phase Group will give Phase plus a number of help parameters that are useful when measuring Phase. These Parameters are as follows:
FREQUENCY
Shows the frequency of the signal you measure phase on.
RATIO
Ratio shows you if both signals have equal frequency. Only at a ratio of 1 you successfully measure phase.
VOLTAGE
Amplitude for both Input A and Input B signals are shown. This is ideal for filter measurements: You can read both phase and attenuation in one and the same measurement.
Figure 47 The Phase Menu.
Figure 48 The Phase Group Screen.

Measure Functions Voltage (V)
4
4-11
VOLTAGE (V) Voltages can be measured on Input A and B, not on Input C.
Always use a filter on all signals up to 1 kHz in voltage measurements.
VRMS AC
Shows the rms value of the ac component of the signal. The MultiFunction Counter samples the waveform of the signal and calculates the Vrms from the waveform data. This gives accurate rms values for any waveform that is correctly displayed.
Note Use VALUES mode for Vrms. If you select WAVEFORM mode with Vrms selected, the MultiFunction Counter will sample the signal once to update the graph, and once again to calculate Vrms, which doubles the update time.
VRMS AC+ DC
Shows the rms value of the ac and dc components of the signal. The measure-ment is made in the same way as Vrms AC.
VDC
Shows the dc value of the signal. Vdc is done on sampled waveform data, as Vrms.
VP-P
Shows the peak-to-peak voltage of the signal. This measurement is made by the auto trigger circuitry of the MultiFunction Counter and is the same voltage presented as a help parameter in the lower part of the values display in all measurement functions, and appears in the right corner of the waveform graphs.
Figure 49 The Voltage Menu.

164 Users Manual
4-12
VMAX
Shows the maximum (positive peak) voltage of the signal. The measurement is done in the same way as Vp-p.
VMIN
Shows the minimum (negative peak) voltage of the signal. The measurement is made in the same way as Vp-p.

Measure Functions Totalize (Counts)
4
4-13
TOTALIZE (COUNTS) Counts positive or negative edges on the primary channel. You select which edges to count by selecting trigger slope on the primary channel.
The totalizing screen shows counts on A and Counts on B, as well as the difference and sum of these parameters simultaneously on screen in Manual Hold/Run and gated by time modes.
When the MultiFunction Counter is in hold, you can see each result in full resolution by selecting it as primary parameter.
Note Statistics is not available for Totalize.
Manual Hold/Run 1. Here you start the totalizing by
pressing z.
2. The MultiFunction Counter counts
each pulse until you press z again.
3. If you repeat the steps above, the new counts will be added to the previous ones.
4. Pressing x resets the value
to 0.
Figure 50 The TOTALIZE menu.
1 2 3
Figure 51 Totalize manually.
164 Users Manual
4-14
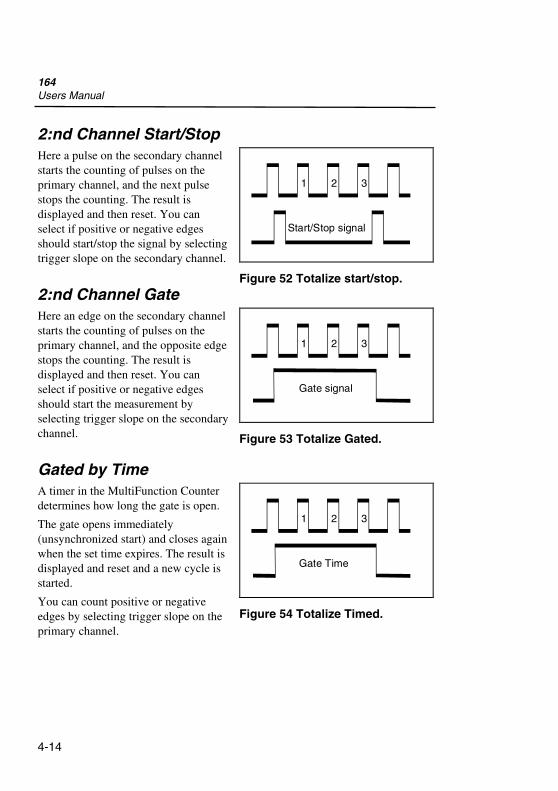
2:nd Channel Start/Stop Here a pulse on the secondary channel starts the counting of pulses on the primary channel, and the next pulse stops the counting. The result is displayed and then reset. You can select if positive or negative edges should start/stop the signal by selecting trigger slope on the secondary channel.
2:nd Channel Gate Here an edge on the secondary channel starts the counting of pulses on the primary channel, and the opposite edge stops the counting. The result is displayed and then reset. You can select if positive or negative edges should start the measurement by selecting trigger slope on the secondary channel.
Gated by Time A timer in the MultiFunction Counter determines how long the gate is open.
The gate opens immediately (unsynchronized start) and closes again when the set time expires. The result is displayed and reset and a new cycle is started.
You can count positive or negative edges by selecting trigger slope on the primary channel.
1 2 3
Start/Stop signal
Figure 52 Totalize start/stop.
1 2 3
Gate signal
Figure 53 Totalize Gated.
1 2 3
Gate Time
Figure 54 Totalize Timed.

Measure Functions More Functions
4
4-15
MORE FUNCTIONS These are functions that do not give results in Hz, s, degrees, or volt.
Positive Duty Cycle Shows the percentage of a cycle that is “High”.
Negative Duty Cycle Shows the percentage of a cycle that is “Low”.
RPM Shows Revolutions per minute. Here you can enter the number of pulses that the transducer gives for each revolution to get a correct RPM readout.
For example, when measuring the RPM on a normal car engine, 2 pulses/rev. gives correct RPM for 4-cylinder engines, while 3 pulses/rev. gives correct RPM for 6-cylinder engines, and 4 pulses/rev. gives correct RPM for 8-cylinder engines, provided the ignition pulses are used as the indirect signal source.
Figure 55 The MORE FUNCTIONS menu.

164 Users Manual
4-16

Chapter 5
Input Trigger
Contents Page
Introduction ....................................................................................... 5-2
Selecting measuring channel ............................................................. 5-3
Input A and Input B........................................................................... 5-5
Arming ............................................................................................ 5-17
Hold off ........................................................................................... 5-22
Burst ................................................................................................ 5-23
Scope ............................................................................................... 5-23
Measuring time................................................................................ 5-24

164 Users Manual
5-2
INTRODUCTION This chapter is divided into two sections:
1. The INPUT section describes the basic concept of trigger levels and hysteresis, and how to use the input trigger settings to obtain the best timer/counter measurements.
2. The TRIGGER section describes measurement trigger. It starts with simple measurement control via the
z and x keys; then it
advances to arming, hold-off and burst synchronization.
The “Scope” settings that you access
through the w key are
thoroughly described in Chapter 7.
Figure 56 The INPUT TRIGGER Menu.

Input Trigger Selecting Measuring Channel
5
5-3
SELECTING MEASURING CHANNEL With default settings3, the MultiFunction Counter measures on Input A (primary channel) and uses Input B as secondary channel in two channel measurements.
On units with prescaler, Input C will be available for Frequency, Period or Ratio measurements.
1. Press w and select
[_Measure_Channel(s)_] to change channel.
Quick Selection In the quick menu at the bottom of the display you can change channel without entering any menu.
3 To get Default Settings, press ? and select [_Recall_Default_Setup_].
Figure 57 Channel selection in the Input Trigger menu.
Figure 58 Select input with Chan:

164 Users Manual
5-4
Two-Channel Measurements If a two-channel measurement function like Time Interval, Phase or Ratio is selected, the Measure Channel Menu changes to include two-channel selections.
The indication ”Measurement will be:” shows how the inputs are used with the current Measure Function selection.
Common means that one input connector will be used for both measuring channels. That is A,A means that the Input A BNC connector is internally connected to both the Primary and the Secondary Channel. Input A settings are used for the Primary Channel and Input B settings are used for the Secondary Channel.
Figure 59 Two channel measurement gives Common selections.
Figure 60 Channel selection in the quick menu. The left position is Primary Channel and the right position is Secondary Channel.

Input Trigger Input A and Input B
5
5-5
INPUT A AND INPUT B Trigger Level & Hysteresis All measurements in the MultiFunction Counter are based on the assumption that you can set a trigger level that gives a unique trigger point for the part of the signal that you want to measure. For example, this means that a Period or Pulse Width measurement starts when the signal passes the trigger level, and stops again when the trigger level is passed again.
The trigger level is surrounded by a “dead zone” called the hysteresis band. The signal needs to cross the 20 mV4
hysteresis band, before triggering occurs. Other names for trigger hysteresis are ‘trigger sensitivity’ or ‘noise immunity’, which explain the various characteristics of the hysteresis.
4 The hysteresis band is 200 mV in the ±50 V range. A wider hysteresis band is used for frequency, period
average and RPM measurements when Auto Trigger is ON.
Figure 61 Signal with unique trigger point.
Figure 62 This signal has no unique trigger point.
Min.20mV
Figure 63 Hysteresis band ensures correct triggering.

164 Users Manual
5-6
Input Amplifier The input amplifiers are used to adapt measuring signals to the measuring logic of the MultiFunction Counter. These amplifiers have many controls and it is essential to understand how these controls work together and how they affect the signal. The block diagram below shows the order in which the different controls are connected.
Figure 64 Input Amplifier Block Diagram. This is not a complete technical diagram. It is only intended to help you understand the controls in the description that follows.

Input Trigger Input A and Input B
5
5-7
Impedance The input impedance of Input A and Input B is fixed at 1M Ω, and for Input C it is 50 Ω. Should you need 50 Ω also for Input A and Input B, use a 50 Ω termination on the BNC connector, e.g. PM9581 from Pendulum.
WARNING Never connect the MultiFunction Counter to signals above 30Vrms above ground, not even when using safety designed BNC connectors, feed-through terminations, coaxial attenuators (PADs) etc.
Figure 65 Select the input impedance you want by putting terminations on the BNC connectors.
50 Ω BNC-Termination e.g. PM9581

164 Users Manual
5-8
Voltage Range The voltage range setting (±0.5 V, ±5V or ±50 V) determines the range and resolution of the trigger level setting, and the sensitivity.
Select voltage range as follows:
w Voltage Range: 5 V
Pressing s selects a voltage range
based on the amplitude of the input signal.
You can read and change the voltage range in the quick menu in the lower part of the screen.
ATTENUATOR
If you are used to traditional Timer/Counters, which have X1/X10 attenuators, the 0.5 V and 5 V ranges equals attenuation X1, and the 50 V range equals attenuation X10.
WARNING Never connect a MultiFunction Counter to signals more than 30Vrms above ground; not even with Safety-Designed probes.
Using a probe may be erroneously interpreted as though you can measure on 10x as high voltages. Lethal voltages may appear on the unshielded BNC connector of the MultiFunction Counter if measuring on high voltages.
Figure 66 Voltage Range setup. Note that Auto Trigger only operates within the selected Voltage Range. To change Voltage
Range, you must press ssss, or set range manually.

Input Trigger Input A and Input B
5
5-9
Auto Trigger With Auto Trigger on, the MultiFunction Counter automatically measures the peak-to-peak levels of the input signal and sets the trigger level to 50% of that value.
Turn on Auto trigger as follows:
w[_Input_A_]Auto Trigger: ON
You turn on Auto Trigger separately for Input A and Input B.
Auto Trigger works within the selected Voltage Range. So if your signal levels
change you may have to press s to
change voltage range, or select voltage range manually.
If the Rise & Fall time function is selected, Auto Trigger sets the trigger levels to 10% and 90% of the amplitude.
FREQUENCY LIMIT
Auto Trigger works on all signals from 20 Hz and up. To measure on signals below 20 Hz, turn off Auto Trigger and select trigger level manually.
STATISTICS
MultiFunction Counters measure amplitude and calculate trigger levels rapidly, but if you want to measure at top speed, for example when gathering statistical samples, turn off Auto Trigger.
Figure 67 Auto Trigger. Auto Trigger follows any signal changes so the MultiFunction Counter shows numerical results on the available signal. The waveform display is not affected by Auto Trig.

164 Users Manual
5-10
Trigger Level Turn off Auto Trigger as follows:
W[_Input_A_]Auto Trigger: OFF
When Auto Trigger is off, you can enter trigger levels manually, as follows:
W[_Input_A_]
Trigger Level: 100mV
You can use un, or press 9 to enter the “keypad” to set the value, see “Numerical Entries" on page 2-11.
FREEZE AUTO TRIGGER LEVELS
Press s and the MultiFunction
Counter will set the trigger levels to trigger correctly on the connected signal.
AUTO SET
Double clicking s turns on Auto Trigger.
HYSTERESIS
The hysteresis (sensitivity) of the MultiFunction Counter is normally fixed at approximately 20 mVp–p. In frequency and period measurements, the Auto Trigger of the MultiFunction Counter can vary the width of the hysteresis band so that it is always 1/3 of Vp-p.
Note Variable hysteresis is used only in Frequency and Period Average measurements.
TRIGGER INDICATORS
When the signal does not trigger the input, the measurement result is replaced by — — — — —.
In WAVEFORM mode, a NO TRIG annunciator appears on the screen when the scope trigger level is set so that the trace does not trigger.
Figure 68 Manual Trigger Level. Complex signals like this one need manual trigger level (black line) to measure correctly. Auto Trigger would set trigger level at 50% (gray line). This results in frequency read-outs of 1/3 of the actual frequency.

Input Trigger Input A and Input B
5
5-11
Slope The input amplifier can be set to trigger on positive (increasing voltages passing the trigger level) or negative slopes.
Slope settings are essential to time interval measurements, but unimportant5 for frequency and period measurements.
This selection is grayed for measurement functions that have a predefined slope. For instance Rise Time and Positive Pulse Width trigger on positive slope, while Fall Time and Negative Pulse Width trigger on negative slope.
Note Do not confuse Counter Trigger Slope with Waveform Trigger Slope!
Changing Input A or Input B Trigger Slope does not affect the waveform presentation, only the numerical measurements.
To trigger the waveform graph on negative slope instead of positive, change Scope
Trigger Slope in the w [_Scope_] menu.
5 Slope control is removed for measuring functions which do not benefit from slope selection.
Figure 69 Trigger Slope. Change Trigger Slope in Time Interval measurements to select the interval to measure.
Figure 70
View and Select Trigger Slope for both Input-A and Input-B in
the quick menu, or via w.

164 Users Manual
5-12
DC/AC Coupling w Coupling: DC
Changes coupling from AC to DC or from DC to AC. Check the annunciator in the lower part of the display to see selected coupling.
Use the AC coupling feature to eliminate unwanted DC signal components. Always use AC coupling when the AC signal is superimposed on a DC voltage that is greater than can be offset with the MultiFunction Counter’s trigger level setting.
We recommend AC coupling in many other measurements because when you measure symmetrical signals, such as sine and square waves or triangles, AC coupling filters out all DC components. This means that a 0 V trigger level is always centered around the middle of the signal where triggering is most stable.
Signals with changing duty cycle (or with a very low or high duty cycle) do require DC coupling when manually set trigger level is used. Figure 72 shows how pulses can be missed, while Figure 73 shows that triggering does not occur at all because the signal amplitude and hysteresis band are not centered.
AC-coupling limits the lowest repetition rate to 20 Hz. Double-clicking s selects appropriate coupling for the selected measurement.
Figure 71 AC-coupling a sym-metrical signal. (The capacitor in the figure removes DC.)
Figure 72 Missing trigger events due to AC coupling.
Figure 73 AC coupling a signal with very low duty cycle. (without Auto Trigger).

Input Trigger Input A and Input B
5
5-13
Rule of Thumb for Coupling
• DC: All time measurements, totalizing, duty cycle, Vmax, Vmin, Vp-p, Vdc + Frequency and period below 20 Hz.
• AC: Frequency, Period, Ratio, Phase, RPM, Vac.
Figure 74 AC-coupling distortion. AC coupling (right side) distorts the waveform of low frequency signals. Note that the amplitude (Vp-p) read-out increases when AC coupling is used.

164 Users Manual
5-14
Filter
ANALOG OR DIGITAL FILTER
Both the Analog Low-pass Filter and the Digital Filter can be used to reduce the influence of noise superimposed on the measuring signal. The effects on noise reduction are similar, however with the following differences:
• The analog low-pass filter is more efficient in suppressing frequency components above 100 kHz. It can even suppress HF-interference with a higher amplitude than the signal itself.
• The digital filter has a variable cut-off frequency (1 Hz to 3 MHz) compared to the fixed 100 kHz limit for the analog filter.
• The analog filter is hardware controlled and always available for all measurement functions and on both input channels (A and B). The digital filter is software controlled and only available on one input channel at a time and only in some selected measurement functions.
The Analog Low-pass Filter is the preferred filter for frequency measurements of signals up to 100 kHz.
ANALOG LOW-PASS FILTER, INPUT A AND B
If you cannot obtain a stable reading, the signal-to-noise ratio may be too low. (It could also be a non-repetitive waveform, for example.)
If the signal is too noisy, you should try using the filter.
Accurate frequency measurements of noisy LF signals (up to 200 kHz) can be made, when the noise components have significantly higher frequencies than the fundamental signal.
Always use a filter on all input signals up to 1 kHz in voltage measurements.
Figure 75 LP Filter. Input A and Input B each have an analog LP filter with cutoff frequency of approximately 100 kHz, and a signal rejection of 20 dB at 1 MHz.

Input Trigger Input A and Input B
5
5-15
DIGITAL FILTER, INPUT A AND INPUT B
With the Digital Filter it is possible to insert a mask time in the input trigger circuit. This means that the input of the MultiFunction Counter ignores all hysteresis-band crossings made by the input signal during a preset time.
For all types of fundamental input signals, e.g. sinewave as in Figure 76, the signal crosses the hysteresis band twice every period, e.g. at t n T= + ×0 ,
t T n T= + ×2
(T = period time of input signal). Once per period, the hysteresis band is crossed with a positive signal slope, and once per period the band is crossed with a negative signal slope. Heavy noise on the signal may instead cause multiple crossings of the hysteresis band at the "t=0"-point and the "t=T/2"-point. This would lead to erroneous input cycle counts without the use of a filter.
The purpose of the Digital Filter is to generate exactly one count per inut signal cycle, irrespective of noise triggering. The filter generates a "mask time" starting at the first triggering at the "t=0"-point. During this mask time, further input triggering is inhibited at the"t=0"-point as well as at the "t=T/2"-point. The mask time is derived from the set Filter Frequency value, so that the mask time ends at the "t=3T/4"-point, between the two "critical" "t=0"- and "t=T/2"-points. After that, the counter is ready to accept a new input trigger at the next "t=0"-point. In this way it is ensured that the MFC receives exactly one input count per input signal cycle. See Figure 76.
To use the digital filter effectively you must have a rough idea of the frequency to be measured; otherwise, setting the filter frequency is not easy.
The actual signal frequency must be in the range 50% to 200% of the Filter Frequency for correct results.
A too low filter frequency setting may give a perfectly stable reading, but at a frequency that is too low. In such a case, triggering occurs only on every 2nd ,3rd , or 4th cycle.
With too high filter frequency, more than twice the actual frequency may also lead to a stable reading, e.g., when exactly one noise pulse is counted for each half-cycle.
Figure 76 Digital Filter. The digital filter operates in the instrument's measuring logic, not in the analog input signal path.

164 Users Manual
5-16
USING ATTENUATION AS FILTER
An alternative way to reduce noise is to attenuate the signal so that the noise is too small to trigger the input. For instance if you have a signal of 1 V with 100 mV of noise, you normally use the ±5V range. This range has an input sensitivity of 20 mV and will trigger perfectly on the noise, ruining the measurement. However, if you select the 50 V range, the sensitivity decreases to 200 mV, canceling out the noise totally.
When measuring Frequency, Period Average and RPM using auto trigger, the hysteresis band is automatically set to 33% of the signal amplitude. This gives excellent noise reduction, and using an attenuator under these circumstances will give no further improvement.

Input Trigger Arming
5
5-17
ARMING Arming or actually Measurement Arming, is the process to enable the start and stop of measurements. The MultiFunction Counter has four arming modes.
1. Free Run (normal) or ARMING OFF
2. Manual Arming or HOLD/RESTART
3. External Arming or ARMING ON
4. Burst Arming (described on page 5-23).
The MultiFunction Counters always synchronize the start and stop of the actual measuring period to the input signal trigger events (because of the reciprocal counting technique).
The description “ARMING” used in the instrument refers to the External Arming mode.
Figure 77 Measurement Trigger. A reciprocal counter synchronizes with the signal as shown in this figure.
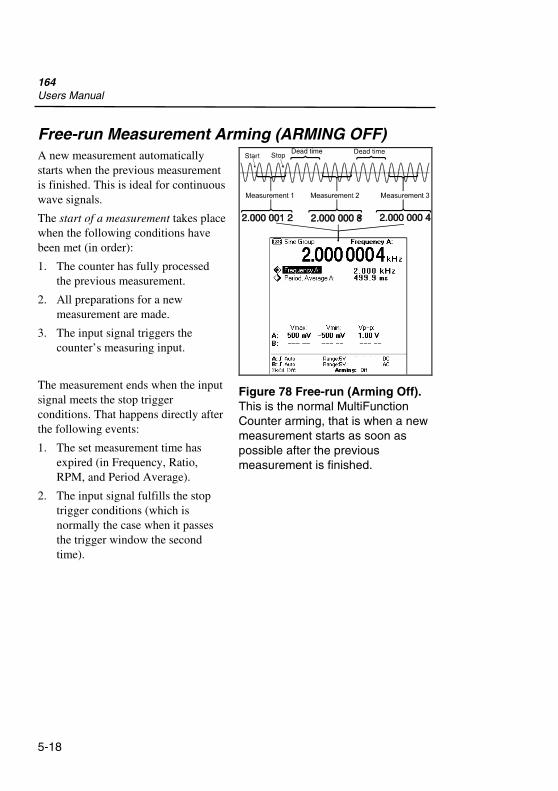
164 Users Manual
5-18
Free-run Measurement Arming (ARMING OFF) A new measurement automatically starts when the previous measurement is finished. This is ideal for continuous wave signals.
The start of a measurement takes place when the following conditions have been met (in order):
1. The counter has fully processed the previous measurement.
2. All preparations for a new measurement are made.
3. The input signal triggers the counter’s measuring input.
The measurement ends when the input signal meets the stop trigger conditions. That happens directly after the following events:
1. The set measurement time has expired (in Frequency, Ratio, RPM, and Period Average).
2. The input signal fulfills the stop trigger conditions (which is normally the case when it passes the trigger window the second time).
Figure 78 Free-run (Arming Off). This is the normal MultiFunction Counter arming, that is when a new measurement starts as soon as possible after the previous measurement is finished.

Input Trigger Arming
5
5-19
Manual Measurement Arming (HOLD/RUN)
HOLD/RUN
Pressing z freezes the result
on the display.
RESTART
x triggers a new
measurement. Use this manual arming mode to measure single-shot phenomena, which are either triggered manually or occur at long intervals. Another reason for using this manual arming could simply be to allow sufficient time to write down individual results.
Z has a special meaning in
controlling manual totalizing, see Figure 79.
Figure 79 One press on HOLD/RUN starts, and the next press stops counting (this example is for Totalize Manual).
5 pulses counted

164 Users Manual
5-20
External Arming (Arming on) The external arming (called ARMING in the MultiFunction Counter) is a pre-trigger condition (“ qualifier”), like an external trigger on an oscilloscope, that must be fulfilled before the counter allows a measurement to start. When you use external arming, you disable the normal free-run mode, and all individual measurements must be preceded by a valid External Arming signal transition.
WHEN DO I USE EXTERNAL ARMING
External Arming can be used for Frequency, Period, Pulse Width, RPM, and Duty Cycle measurements. It is useful for measurements in signals, such as the following:
1. Single-shot events or non cyclic signals.
2. Pulse signals where pulse width or pulse positions can vary.
3. Burst signals.
4. A selected part of a complex waveform signal.
Signal sources that generate complex wave forms, like pulsed RF, pulse bursts, TV line signals, or sweep signals, usually also produce a sync signal that coincides with the start of a sweep, length of an RF burst, or the start of a TV line. These sync signals can be used to arm the counter. See Figure 80.
Figure 80 External Arming. An external synchronization signal starts the measurement (positive pulse width in this example) when external arming is used.

Input Trigger Arming
5
5-21
WHEN DO I USE ARMING WITH DELAY
In a complex signal you may want to select a certain part to measure. For this purpose there is an arming delay function, which delays the actual start of measurement with respect to the arming pulse, similar to a ‘’delayed time base’’ in an oscilloscope.
You can delay the start arming point with respect to the external arming signal. Use this function when the external arming signal does not coincide with the part of the signal that you are interested in. The range for time delay is 200 ns to 1.6 seconds with a setting resolution of 100 ns.
ACTIVATE EXTERNAL ARMING AS FOLLOWS:
1. Press w.
2. Press [_Arming_&_Hold_Off_].
3. Select External Arming: On Input B. (You can also select On Input A)
4. Select Arming Start Delay: ON
5. Select Start Delay Time: and enter the delay you want between 200 ns and 1.6s in 100 ns increments.
Note You can also turn on and off arming, and select arming channel in the quick menu at the bottom of the display.
Figure 81 Arm Start Delay. Use Arm Start Delay to select a part of the signal that does not coincide with the sync signal.

164 Users Manual
5-22
HOLD OFF Hold off inhibits re-triggering and stop-triggering for the set hold off time. This means that after a measurement has started, nothing can disturb the measurement process during the hold off time. Hold off can be used to effectively ignore contact bounces and distortion.
The start of the measurement also starts the hold off timer, disabling any further triggering.
When the set time elapses, the MultiFunction Counter accepts measurement stop and measurement start triggering again, see Figure 82.
Turning on Hold Off 1. Press w.
2. Press [_Arming_&_Hold_Off_]. 3. Select Trigger Hold Off: On.
4. Set Hold Off Time: It must exceed the bounce time and expire before the next period starts. The range is 200 ns to 1.6 s, the resolution is 100 ns, and preset value is: 10 µs.
Note The actual Hold Off time varies between the set time and 100 ns below.
Figure 82 Hold Off. Hold Off disables measurement stop and restart during contact bounce.

Input Trigger Burst
5
5-23
BURST Here you manually set the sync. parameters for burst measurements.
After pressing s you can read the
auto set burst timing parameters selected by entering this menu.
SYNC. DELAY
This delay should be longer than the duration of the burst, but shorter than the burst repetition period. The manual setting range is 200 ns to 5s. Pressing
s will increase Sync. Delay in steps
until synchronization is obtained.
IGNORE START FOR:
Bursts often start slowly and require a certain time before they are stable. Adding this delay from the start of the burst until the actual measurement starts gives a more accurate burst frequency. The manual setting range is 800 ns to 5s. Pressing
s will set Ignore Start to 5% of the sync. delay.
BURST MEASURING TIME
The Burst Measuring time starts when the ignore start delay has elapsed and must end before the burst ends. The manual setting range is 200 ns to 5s. Pressing
s will set the burst measuring time to 40% of the sync. delay.
For s to set these burst timing parameters correctly, a burst on Input A or
Input B must have:
• less than 50% duty cycle
• at least six cycles
• more than 50 µs burst duration
See also Table 1 Signal requirements for successful burst measurements. on page 4-6.
Figure 83 Burst Timing parameters.

164 Users Manual
5-24
SCOPE The scope settings are explained in the Waveform chapter.
MEASURING TIME The measuring time affects the resolution in Frequency, Ratio, RPM, and Period Average measurements, and in Sine Signal Characterization. To get higher resolution the MultiFunction Counter can average the counted periods in a longer time. The measuring time is preset to 100 ms. This gives 8 digits on the display, and 1 to 2 measurements each second. Increasing the measuring time gives more digits, but fewer measurements per second.
To Change the Measurement Time: 1. Press w.
2. Select Measuring Time: 100 ms.
Set Measuring Time to the desired time in 1/2/5 steps, using the arrow keys, or continuously variable using the keyboard.
The range is 0.2 µs to 15 s, and preset measurement time is 100 ms.
Table 2 Resolution versus measuring time.
Measuring Time Resolution
200 ns 5 digits 1 µs 6 digits
10 µs 7 digits 100 µs 8 digits
1s 9 digits 10 s 10 digits
Figure 84 Measuring time setting in the INPUT TRIGGER menu.

Chapter 6
User Options
Contents Page
Introduction ....................................................................................... 6-2
Display contrast ................................................................................. 6-3
Time base reference........................................................................... 6-4
Display .............................................................................................. 6-5
Output................................................................................................ 6-6
Math (scaling & offset) ..................................................................... 6-7
Interface............................................................................................. 6-8
Test and adjustment........................................................................... 6-9
About............................................................................................... 6-10

164 Users Manual
6-2
INTRODUCTION User options make settings that do not influence the measurement.
If you press e.you will get a
screen where you can do the following:
• Set Display Contrast
• Select between Internal or External Time base
• Select Digit Blanking
• Select dotted or full Scope Grid
• Select Dot or Line Scope Trace
• Select signal for the Output
• Set up Mathematical expressions to scale or offset the measurement result
• Set up the Serial Interface
• Perform self tests and adjustments
• Read what program version and installed options the MultiFunction Counter has, and when it was last adjusted.
Figure 85 User Options menu. This menu contains measurement independent settings.

User Options Display Contrast
6
6-3
DISPLAY CONTRAST The display contrast can be changed from almost totally black (100%) to almost white (0%). The factory default value is 45%.
1. Press e.
2. Position the cursor on Display Contrast.
3. Press H or 9.
4. Press u to increase, or n to
decrease the contrast.
5. Press 90 when you have found
the best setting.
Figure 86 Display Contrast. The display contrast can be varied between 100% (top) and 0% (bottom).

164 Users Manual
6-4
TIME BASE REFERENCE Selects if the internal time base or an external time base reference is to be used. The MultiFunction Counter uses the internal time base by default, but if you make measurements with extreme demands on accuracy and traceability you can use an external reference.
1. Connect a 10 MHz reference signal with an amplitude between 0.5 Vrms and 12 Vrms, to the REF INPUT on the MultiFunction Counter.
2. Press e.
3. Select Timebase Reference:External.
4. Press 9 to return to
measuring.
An annunciator in the quick menu indicates that external reference is used.
Figure 87 Reference Signal. A 10 MHz reference signal can be connected to REF INPUT. The amplitude can be between 0.5Vrms and 12Vrms.
Figure 88 Timebase Reference. External/Internal is selected in USER OPTIONS Menu.
10 MHz reference signal

User Options Display
6
6-5
DISPLAY Digit Blanking The MultiFunction Counter can truncate the measuring result by blanking irrelevant digits. This is useful, for example, when using the MultiFunction Counter for frequency alignment. Here you don’t want to see more digits than you should adjust.
TURNING ON DIGIT BLANKING:
1. Press e.
2. Select Digit Blanking: On.
3. Position the cursor on Blank Digits.
Use u and n to select the number
of digits you want to blank out.
1. Press 9 to return to measuring.
Now the selected number of digits is replaced by _.
TURN OFF DIGIT BLANKING
Select Digit Blanking: Off when you want to see all measured digits.
Scope Grid Here you can select between the dot grid (Default) and Full grid. See also ”Grid (graticule) Display” on page 7-11.
Scope Trace Here you select Line (Default) or Dot Trace. See also ”Trace Display” on page 7-10.
Figure 89 Blanking Setup. You can select to blank out (remove) between 0 and 9 digits.
Figure 90 Three Blanked Digits. Blanked digits are replaced by an underline character.

164 Users Manual
6-6
OUTPUT Here you enable/disable the signal on the OUTPUT connector, and select what to output on the connector. The selections are 11 different pulse signals, and a gate open signal. The pulse signals can be used for probe adjustment, to excite the device under test, or as a reference signal for other instruments.
Note For maximum battery life; turn off the output when not in use.
Figure 91 Output Signal menu. There are many signals to choose from.
Figure 92 Output. The signals are available at the OUTPUT BNC connector.

User Options Math (Scaling & Offset)
6
6-7
MATH (SCALING & OFFSET) The MultiFunction Counter can mathematically scale and offset the primary measuring result before displaying it.
Use mathematics to display, for example, the temperature when you have a probe that outputs 2kHz/° C, or subtract the 10.7 MHz intermediate frequency from a frequency measurement of the local oscillator in a radio (heterodyne receiver) when calibrating analog tuning scales.
The mathematical operation remains if you change presentation mode; if you for instance scale Period in VALUES mode, you will scale Period in Waveform and STATISTICS mode too.
Mathematics is automatically disabled when the measurement function or primary parameter is changed.
The scaling factors are not affected by the automatic disabling. They remain set until you change them manually.
Hint Math simplifies adjust-ments. It is much simpler to turn the trimmer until the display shows 0, than turning until it shows 4.1954304MHz".
Figure 93 Math setup. The constant K scales the result, while the constant L offsets the result.
Figure 94 Math example. In this example math is used to subtract the correct result, 4.194304 MHz, from the measured result., 4.195....MHz.
Note Both the scaled (upper arrow), and
original (lower arrow) result is shown
Math is an Indicator that shows when the result is scaled or offset

164 Users Manual
6-8
INTERFACE Here you can select baud-rate for the communication on the optical serial interface. The character length is fixed at 8-bits with even parity bit and one stop bit.
Connecting to a PC Use the optional Optically Isolated RS-232 Adapter/Cable (Option 23/80) to connect a PC to the MultiFunction Counter. See Figure 96.
The Option 23/80 comes with instructions on how to use the MultiFunction Counter via the optical interface.
The possibilities are:
• Screen dump: Output the screen as a bitmap.
• Values output: Get numerical measurement data.
• Fetch/Send: Get, store and load data to repeat an exact setup of a previous measurement.
• Program update: If you receive/buy another MultiFunction Counter software release, the optical interface is used to load the program into the instrument.
Figure 95 Baud rate Setup. Set both the MultiFunction Counter and the PC COM-port to the same interface settings.
Figure 96 Option 23/80 Hookup.

User Options Test and Adjustment
6
6-9
TEST AND ADJUSTMENT Here you can test the MultiFunction Counter if you suspect an error in the instrument
See the User Maintenance Chapter.
The qualified service technician can also adjust the time base and the voltage reference of the MultiFunction Counter in this menu. These functions are password protected to avoid destruction of the instrument adjustment. The procedure can be obtained from Pendulum Instruments representative on request.
You can check when adjustment was made in the About menu under
e.
Figure 97 The Self Tests in the TEST & ADJUSTMENT menu.

164 Users Manual
6-10
ABOUT Here you will see information about this MultiFunction Counter:
• Instrument Type (164 or 164H)
• Program Version (Version number and date)
• Input-C ( 2.7 GHz)
• Timebase Adjusted: (Calibration date)
• Voltage Adjusted: (Calibration date)
Figure 98 A typical “About This Instrument” screen.

Chapter 7
Waveform
Contents Page
Introduction ....................................................................................... 7-1
Using waveform mode ...................................................................... 7-3
The waveform screen......................................................................... 7-4
Waveform trigger .............................................................................. 7-5
Scope trigger settings ........................................................................ 7-7
Selecting measurement functions .................................................... 7-12

164 Users Manual
7-2
INTRODUCTION This chapter describes the waveform display function of the MultiFunction Counter.
The chapter is divided into four sections:
• Using WAVEFORM mode
• The Waveform screen
• Waveform Trigger
• Scope Trigger Settings
After reading this chapter you will be able to use the waveform screen to view various signals and to make input trigger settings for the timer/counter functions of the MultiFunction Counter.
Note The Waveform function displays signals from 1Hz to 50 MHz on Input A and Input B. It can show one or two traces on the screen.
Signals between 1Hz and 20 Hz may require manual selection of LF sampling mode, DC coupling, Trigger Level, Time/Division etc. If the waveform is shown together with the No Trig annunciator, the trace is not synchronized with the input signal.
No waveform is shown for the signal on the 2.7 GHz prescaler, nor for Totalize manual

Waveform Using WAVEFORM mode
7
7-3
USING WAVEFORM mode It is often convenient to see that your input signal looks the way you expect. So make it a rule to start a measurement in Waveform mode.
1. Press 1 to turn on
WAVEFORM mode.
Note WAVEFORM mode shows the signal amplitude versus time like an oscilloscope, but the method of obtaining the graph is quite different from both analog and digital oscilloscopes. Read more about the way a MultiFunction Counter measures waveforms in ”Understanding your MultiFunction Counter” on page 10-1.
Figure 99 One-trace display. Select a one-channel measurement to show one trace.
Waveform Mode is shown in the upper left corner of the display

164 Users Manual
7-4
THE WAVEFORM SCREEN The values area shows the measurement result from the selected measurement function. See ”Selecting Functions” on page 4-3.
The graph area shows Volt versus time traces:
• One trace if the MultiFunction Counter makes one-channel measurements like Period
• Two traces if it makes two-channel measurements like Phase A to B, and if arming is enabled.
The settings area is the same as in values presentation mode, see page 2-8.
Dual Waveform Display To get a two-channel display, press q and select a measurement function
that uses two channels, that is Ratio, Phase, or Time Interval. Arming (in the lower right corner of the settings area) will also turn on the second channel.
Single Waveform Display To get a one-channel display, press q and select any one-channel
measurement function.
Settings The scope menu line in the graph area (above the line) shows the scope trig slope, scope trigger level, and time/div.
The quick menu below the line contains the settings of the input( s) in use, and the measurement trigger settings (Hold Off and Arming).
• Above the line: Scope trigger and time-scale settings • Below the line: Input & measurement trigger settings
Figure 100 Dual trace display. Select a two channel measurement to show two traces.
Values area
Graph area
Settings area

Waveform Waveform Trigger
7
7-5
WAVEFORM TRIGGER
Figure 101 When you select a single channel measurement, only one trace is shown.
The trace starts at the vertical ”0-line” (separating the pre- and post-trigger areas), at the Scope Trigger Level. The trace normally starts upwards, on the positive slope like in Figure 101. For frequencies above 2kHz (HF sampling) pre-trigger information is shown, for lower frequencies this area will be empty.
Trigger channel is automatically selected in two-channel measurements, and positioned as the top trace. The selection is based on measurement function. To change slope and/or scope trigger level:
1. Position the cursor on Scope:
2. Press h to move the cursor to the scope slope list box.
3. Put the cursor on the slope you want with un.
4. Press h to move the cursor to the scope trigger level field.
5. Change the scope trigger level with un. Note that the scope trigger level
indicator ( ) moves up/down.
Y-scale Voltage /division
Waveform trigger level
indicator ( )
Waveform trigger level
and slope setting
X-scale Time /division
Trigger level
Horizontal line for time mea-surements, and grayed hystere-sis band field for Frequency and Period measurements
Zero voltage indication line
Line separating pre-trigger and post-trigger area

164 Users Manual
7-6
6. Press h to move the cursor to the time/division field. Time/division is
normally scaled automatically, as indicated by Auto in Figure 101.
7. Change the time/div with un. Note that the Auto indicator is changed to
Man. Change back to Auto when you want Auto scaling again.
8. Press 0 to leave the waveform trig level control.

Waveform Scope Trigger Settings
7
7-7
SCOPE TRIGGER SETTINGS To change scope trigger, time-scale and sampling mode with w:
1. Press w, then
2. Select [_Scope_]
Sampling Mode You can select AUTO, LF, or HF sampling.
LF-sampling is like an ordinary oscilloscope and works up to approximately 5 kHz.
HF is the unique transitional sampling technique used by the MultiFunction Counters. It works on repetitive signals from 500 Hz to 50 MHz. Read more about the different principles for sampling in Chapter 0.
AUTO means that the MultiFunction Counter itself selects appropriate sampling mode based on the pulse width of the input signal.
On LF signals with much noise, the MultiFunction Counter may detect short pulse widths and wrongfully select HF-mode. This may result in distorted traces and excessive sampling times. Select LF sampling in such cases.
The preset selection is AUTO.
Figure 102 The Scope Trigger Setup Menu.

164 Users Manual
7-8
Time/Division (X-Scale) The time base is automatically set to display two to five cycles of the signal, using Auto Time Scale. When the input frequency changes significantly, so will the time/division setting.
You can also manually set a time/div. when you for instance want to see more cycles than normal, or zoom in on an edge.
1. Press w.
2. Press [_Scope_]..
3. Set Time/Div: 10. 0 ms.
If s is pressed in WAVEFORM
mode, Auto Time Scale is turned on.
PRE-TRIGGER
Note that the zero point of the time scale is positioned two divisions from the left side of the grid. The first two divisions show pre-trigger information, that is, what happened before the trigger point. This pre-trigger information is only available in HF-sampling.
Figure 103 Manually set time/div. affects screen appearance.
“Normal” Time/div.
Shorter time/div. gives more detail.
Longer time/div. gives more cycles on screen.

Waveform Scope Trigger Settings
7
7-9
Amplitude (Y-Scale) The Y-scale is always set automatically. The graph is scaled so that you see the Vmax and Vmin of the signal, and the trigger level cursors. If the amplitude on the screen is distorted or clipped, the Voltage range setting is wrong.
1. Press s to let the MultiFunction
Counter select a new voltage range, or change range manually
You can set Voltage Range and other common input settings directly in the waveform screen. This way you can see the effect directly in the graph. See Figure 105.
Figure 104 Voltage Range.
Figure 105 Quick Menu.
“Correct” Voltage range
Too low voltage range clips the trace
Too high voltage range makes the trace distorted due to too low volt resolution.

164 Users Manual
7-10
Trace Display You can set the trace to Line or Dot.
1. Press e.
2. Press [_Display_].
3. Select Trace Display: Line (or Dot).
The MultiFunction Counter samples the input signal. This means that you get a series of “dots” in the X-Y diagram on the screen. The MultiFunction Counter does not know what happens in between these dots. So showing only these dots on the display is the correct way of presenting the measurement results.
Normally, however, you want to see the trace on the screen as a continuous line. This makes it easy to follow the signal with the eye. To do this, the MultiFunction Counter interconnects the samples with a straight line. This is the default setting.
For some measurements on noisy, modulated or complex signals it can be very difficult for the MultiFunction Counter to know what samples to interconnect on the screen. In such cases it is much easier to get information out of the graph by just seeing the individual samples as dots.
Note “Line” is suitable for most signals like sine, square and triangle, while “Dot” is suitable for signals with much distortion and noise.
Figure 106 Trace Display.
Figure 107 Dot Shape. A close-up of the “Dots” shows that
Line trace is easy to read
Dot trace is always correct

Waveform Scope Trigger Settings
7
7-11
Grid (graticule) Display You can set the grid to Full or Dotted.
1. Press e.
2. Select [_Display_].
3. Set Scope Grid: to Dotted or Full.
Figure 108 Example of Scope Grids.
Dotted Full

164 Users Manual
7-12
SELECTING MEASUREMENT FUNCTIONS Select what to measure by pressing the
q key.
In WAVEFORM mode only one measurement function is measured at a time. So select function from the left column in the functions menu.
1. To select the function, position the
cursor on it and press 9.
If you select a signal type for signal characterization while in WAVEFORM mode, the MultiFunction Counter automatically switches to VALUES mode. Switching from Values to Waveform means measuring and displaying the Primary Parameter from the selected group.
Figure 109 The left column contains Functions.

Chapter 8
Values
Contents Page
Introduction ....................................................................................... 8-2
Selecting values mode ....................................................................... 8-3
The single values screen .................................................................... 8-4
The multiple values screen ................................................................ 8-5

164 Users Manual
8-2
INTRODUCTION This chapter describes the Values Presentation Mode of the MultiFunction Counter.
The chapter is divided into four sections:
• Selecting VALUES mode
• The Single Values Screen
• The Multiple Values Screen
After reading this chapter you will be able to use the elements of a values screen.

Values Selecting VALUES MODE
8
8-3
SELECTING VALUES MODE Viewing the signal is great when you need to verify its shape, but to characterize a signal you often need several parameters measured with high precision.
1. Press 2 to switch to
VALUES mode
Note VALUES mode will be selected automatically when you select Signal Characterization ([_SINE_], [_PULSE_], [_BURST_], Phase Group or Totalize Manual).

164 Users Manual
8-4
THE SINGLE VALUES SCREEN This screen numerically displays one (this page), or several (next page) measurement results.
Figure 110 The Values Screen for a single measurement function.
In the upper right corner you see what input channel you measure on.
The main measurement function is shown.
Here you see signal level.
The current input settings are shown below the line. You can move the cursor into this field and change the settings here, instead of going via the
w menu.

Values The Multiple Values Screen
8
8-5
THE MULTIPLE VALUES SCREEN Signal characterization on the VALUES screen
Figure 111 The Values Screen with several results. This is the kind of screen you get when you select Signal Characterization.
By selecting the appropriate radio button, the selected parameter is enlarged and put at the top of the screen in full resolution.
If a signal type for signal characterization is selected, the group name is shown here.
The main measurement function is shown here and by the depressed radio button in the parameter list.
Here you see signal level.
All shown parameters are measured and updated regularly.
In the upper right corner you see what input channel you measure on.

164 Users Manual
8-6

Chapter 9
Statistics
Contents Page
Introduction ....................................................................................... 9-2
The statistics screen ........................................................................... 9-3
Why statistics ................................................................................... 9-4
Increasing the resolution.................................................................... 9-5
Jitter................................................................................................... 9-5
FM measurements ............................................................................. 9-6

164 Users Manual
9-2
INTRODUCTION This chapter describes the statistical functions of the MultiFunction Counter. The chapter is divided into five sections:
• The Statistics Screen
• Why Statistics
• Increasing the Resolution
• Jitter
• FM Measurements
After reading this chapter you will be able to understand the benefits of using the statistical functions of your MultiFunction Counter.
Note Statistics is not available for totalize functions. For Frequency, Ratio, RPM and Period Average, the measuring time sets the sampling speed — short measuring time means fast sampling.

Statistics The Statistics Screen
9
9-3
THE STATISTICS SCREEN To enter STATISTICS mode proceed as follows:
1. Press 3.
Figure 112 The statistics screen.
IndicationStatistics mode is indicated by the MAX/MIN icon.
Measurement FunctionHere you see what parameter the statistics is based on.
Statistical Functionperformed on the measured value.
Sample SizeHere you can see and set how many samples are taken before the results on the screen are updated.
Sample CounterHere you see how many samples are taken until now. This number is updated continuously when measurements are in progress.
Measured ValueShows measured value once per second. If measuring time is longer than one second, the measured value is updated once per measurement.

164 Users Manual
9-4
WHY STATISTICS A parameter that fluctuates (jitters) shows as a wider trace in WAVEFORM mode, and as unstable digits in VALUES mode. The statistics presentation is used to quantify such variations.
1. Press 3 and you will see:
• Mean • Maximum • Minimum • ∆ Max. minus Min. • Standard Deviation (Jitter) • Measured Value
With Default settings, the MultiFunction Counter takes 100 samples, then calculates the statistical parameters and shows the result.
SAMPLES A sample is one measurement in a set of identically performed measurements.
You can change the number of samples taken by moving the cursor to the Sample Size field and changing the numerical values. Range is 2 to 1 000 000 samples.
Table 3 Example, statistics.
A 10 sample statistical gathering, and how the results are calculated. Measurement No. (Sample No. ) Result (X) Statistical function
1 250. 0123 2 250. 0231 3 250. 0067 Minimum 4 250. 0472 5 250. 0871 6 250. 1034 Maximum 7 250. 0248 8 250. 0309 9 250. 0195
10 +250. 0463 Sum 2500. 4013
Sum divided by No. of samples (n) 250. 0401 Mean Sample 6 minus sample 3 0. 0967 Maximum minus
Minimum
( ( ) )1
1
12 2
nx
nxi i−
− ∑∑0. 0320 Standard Deviation

Statistics Increasing the Resolution
9
9-5
INCREASING THE RESOLUTION Statistical Mean gives more digits in the result than the normal VALUES mode result. Calculating Mean on 50 samples justifies one more digit in the result while 5000 samples gives two more digits etc. The resolution is increased
with a factor of n , where n is the number of samples. You can use this on all measuring functions. The drawback is that the time to make the measurement will of course increase with a factor of 50, 5000 etc.
JITTER To measure period jitter of, for example, a data communications clock:
1. Press q.
2. Press [_Period_&_Time_].
Press [_Period_(Single)_].
3. Select a suitable sample size, for example ≥1000.
4. Select Standard Deviation as primary parameter.
Read the result. Standard deviation equals Jitter RMS, and ∆Maximum-Minimum equals Jitter peak-to-peak.
Figure 113 More samples give more digits.
t
Period Jitter
Figure 114 Jitter. Jitter is the fast variation of a signal that is supposed to be stable.
No statistics
50 samples
5000 samples

164 Users Manual
9-6
FM MEASUREMENTS Statistical mode can be used to characterize an FM-modulated signal having a center frequency fc, a modulation frequency fmod, causing a deviation of the carrier of ±fdev.
1. Select Frequency, and a measuring time that is ≈10% of one modulation cycle ( )Measuring time f s= 01. ( )mod
2. Set the number of samples to more than 1000.
3. Turn off auto trigger to speed up the sampling.
4. Read the results as follows:
Mean = f c (Carrier frequency)
0.5x( ∆Maximum-Minimum) = fdev (frequency deviation)
The modulation frequency cannot be measured using statistics.

Chapter 10
Understanding your MultiFunction Counter
Contents Page
Introduction ..................................................................................... 10-1
LF-(time sequential) and HF-(transitional) sampling ...................... 10-3
Why are Vrms and Vdc and waveform the same kind of measurement .................................................................................. 10-4
Time interval measurements............................................................ 10-5
Period measurements....................................................................... 10-8
Voltage peak measurements ............................................................ 10-9
Combined measurements............................................................... 10-10
Auto set, auto set with preset and default setup............................. 10-12

164 Users Manual
10-2
INTRODUCTION This part of the manual is dedicated to you who want more information on the MultiFunction Counter. This chapter explains how the MultiFunction Counter makes a specific measurement, and what types of measurement errors are involved in the measurement. From the MultiFunction Counter’s point of view, some measurements are made in roughly the same way.
The following descriptions relate to these groups:
WAVEFORM SAMPLING BASED MEASUREMENTS Waveform Volt RMS Volt DC
TIME INTERVAL BASED MEASUREMENTS Time interval Pulse Width Rise Time Fall Time
PERIOD BASED MEASUREMENTS Frequency Period RPM Burst Frequency PRF
VOLTAGE PEAK MEASUREMENTS Auto trigger Volt p-p Volt max. Volt min.
COMBINED MEASUREMENTS Phase Duty Factor Ratio
PULSE COUNTING Totalize Manual Totalize Start/Stop Totalize Gated Totalize Timed

Understanding your MultiFunction Counter LF-(Time Sequential) and HF-(Transitional) sampling
10
10-3
LF-(TIME SEQUENTIAL) AND HF-(TRANSITIONAL) SAMPLING The waveform visualization in the MultiFunction Counter is based on two sampling principles called Transitional and Time Sequential Sampling.
Normal DSO’s have Time Sequential Sampling. This means that they measure the amplitude at a fixed sampling rate, and store the results in memory. When triggering is in progress, the results are shown at fixed intervals along the horizontal axis. This is the principle used by the MultiFunction Counter for low frequency input signals (LF-sampling up to a few kHz). In this mode the time is incremented and the
voltage is sampled.
The MultiFunction Counter also has Transitional Sampling. From the start trigger point, many time intervals are measured at different trigger levels, scanned over the entire waveform. This technique concentrates sample data on transitions, where high time resolution is most needed. Vertical resolution is defined by the 8-bit trigger level DAC s, supplying 256 vertical steps.
Pros and cons By comparing Figure 115 and Figure 116 you immediately see one of the benefits of Transitional Sampling: When the signal changes amplitude, many samples are taken, and when the level is constant, few samples are taken. This means that when an edge appears, no matter how fast it is, it will be
Figure 115 Time Sequential Sampling. Only a few samples are taken on transitions, creating the risk that very narrow pulses be missed. This sampling is traditionally used in DSOs.
Figure 116 Transitional Sampling. Concentrates sample data on transitions, obtaining a high time resolution of <1ns in all time base positions (>1 GSa/s effective sample rate).

164 Users Manual
10-4
represented by many samples with high accuracy. The MultiFunction Counter will reveal short spikes that normal DSO’s never will detect.
If you look at the two figures you also see a drawback with the technique: Signals with much activity will result in very many samples and will therefore take longer time to process compared to Time Sequential Sampling.
Transitional Sampling also results in high resolution along the very important time axis. Each measurement is made with 700 ps resolution.
Transitional sampling requires repetitive signals and it is slower than LF-sampling (Time Sequential Sampling). So, for low frequencies, the MultiFunction Counter uses LF-sampling.
WHY ARE VRMS AND VDC AND WAVEFORM THE SAME KIND OF MEASUREMENT These voltages are not measured with specific circuits, nor obtained by any coarse approximation, but are calculated from the actual waveform samples. This gives accurate measurements of DC and true rms voltages up to high frequencies and for complex waveforms.
LF (Time Sequential) sampling LF sampling is used for signals up to approximately 2 kHz. Here values of Vrms and Vdc are always available.
Vrms and Vdc measurements have only guaranteed specifications up to 2 kHz. HF sampling is used between 2 kHz and 50 MHz.
Vdc Vdc is calculated over 200 ms as the average of the voltage samples. Only LF sampling is used.
Vac Vac is calculated over N periods as the Root Mean Square of the voltage samples. LF or HF sampling is used depending on the input signal.

Understanding your MultiFunction Counter Time Interval Measurements
10
10-5
TIME INTERVAL MEASUREMENTS Time interval is the measured time from a start event to a stop event. The start event is the crossing of a trigger level and the stop event is the crossing of the same or another trigger level in the same or another signal.
The accuracy in time measurements is affected by the trigger level setting, especially on signals with low slew rate.
The MultiFunction Counter addresses this problem by adding hysteresis compensation to the auto trigger function.
Basic time interval measurements are made also in pulse width, rise time, and fall time measurements.
Positive Pulse Width To make a Pulse Width measurement on Input A, the MultiFunction Counter selects:
• Primary and Secondary Channels are set to Input A.
• Start (Input A) trigger level 50% of signal amplitude (Auto Set).
• Start Slope Positive (Input A slope).
• Stop (Input B) trigger level 50% of signal amplitude (Auto Set).
• Stop Slope Negative (Input B slope).
Figure 117 The hysteresis band is asymmetrical to increase time accuracy.

164 Users Manual
10-6
Negative pulse width Same as positive pulse width but start slope is negative and stop slope is positive.
Note Hysteresis compensation is only active in Time Interval, Rise/Fall Time and Phase measurements. Not in Pulse width and Duty Cycle. To make a very accurate Pulse Width measurement, where trigger accuracy is essential, use one-channel Time Interval, with manual start/stop trigger settings.
Rise Time To make a rise time measurement on Input A, the MultiFunction Counter selects:
• Primary and Secondary Channels are set to Input A.
• Start Slope Positive (Input A slope)
• Stop Slope Positive (Input B slope)
With auto trigger on, start (Input A) trigger level is set to 10%, and stop (Input B) trigger level to 90% of signal amplitude.
Note To measure on single shot phenomena, or for instance rise time between 20% and 80%, use manual trigger levels
Figure 118 Rise Time. Rise time is a time Interval measurement between the start trigger level on 10% of the amplitude, and the stop trigger level on 90% of the amplitude.

Understanding your MultiFunction Counter Time Interval Measurements
10
10-7
Fall Time Same as rise time but start level is 90%, stop level 10% and both slopes are negative.
.
Note Auto Set Trigger levels are set at 10% and 90% of Vp-p including over and undershoot. On distorted pulses this may lead to incorrect trigger settings which can be visually observed in WAVEFORM mode. If so, identify the pulse roof and pulse floor in the graph and use manually set trigger levels to 10% and 90% thereof.
Figure 119 Rise/Fall time, from pulse floor to pulse roof. Use manual trigger levels if the signal has over-
and undershoots.

164 Users Manual
10-8
PERIOD MEASUREMENTS The MultiFunction Counter has two methods for period based measurements: Single and Average.
• Period (Single) means that you measure the period of one single period and display the result.
• Period (Average) means that you measure the number of complete periods that occur in a preset time and then calculate the average period time as: Elapsed time (Number of clock cycles)
Number of counted cycles .
The Period average method is used for Frequency, Ratio, RPM, Period (average), and Sine-type Signal-Characterization.
Frequency, Period, RPM, Burst Frequency or PRF is calculated from the measured period.
Frequency
FrequencyPeriod
= 1
RPM
RPMFrequency
Pulses / Revolution 60
Frequency in Burst Here the MultiFunction Counter makes an ordinary frequency measurement, but the special burst arming ensures that the measurement start synchronizes with the start of the burst. Read more about burst trigger settings in Chapter 0.
Burst Repetition Rate Here the MultiFunction Counter makes an ordinary frequency measurement, but the special burst arming ensures that the period measured is from the start of one burst to the start of the next burst.

Understanding your MultiFunction Counter Voltage Peak Measurements
10
10-9
VOLTAGE PEAK MEASUREMENTS Maximum voltage, minimum voltage and peak-to-peak voltage are measured with the auto trigger function of the MultiFunction Counter. The method is successive approximation of the trigger level setting and means that the MultiFunction Counter starts by setting the trigger level to one level and checks if the input triggers. If it does, the trigger level is incremented, and the MultiFunction Counter again checks if the input triggers. If not, the MultiFunction Counter sets a trigger level between (at 50%) the one that triggers, and the one that does not trigger, and checks for triggering. This procedure is continued until the difference in trigger levels between trigger and no trigger is as small as possible. Now the MultiFunction Counter knows the maximum voltage of the signal.
The procedure to obtain minimum voltage is similar.
Voltage peak-to-peak is calculated as the difference between maximum and minimum.
The trigger level method for measuring peak voltages is fast, has the same resolution as the trigger level setting, and works very well over a wide frequency range. In fact, it works from 20 Hz to 50 MHz with specified accuracy, and up to 100 MHz with reduced accuracy.
Figure 120 Sampling the Vmax value. The gray field indicates the band where the real Vmax may be. This field decreases quickly after just a few samples.

164 Users Manual
10-10
COMBINED MEASUREMENTS Combined measurements are measurements where several parameters are measured, and the result is calculated from these measurements. Phase, Duty Cycle, and Ratio are such measurements.
Phase Phase is the time difference between the zero crossings of two signals with equal frequency expressed as an angle. The MultiFunction Counter measures phase as three consecutive measurements:
• A period measurement
• A time interval A to B measurement
• A time interval B to A measurement
Phase is then calculated as
180360
2
( )Time Interval 1 Time Interval 2
Period The signal must be stable and continuous during the measurement.
The basic source of error for sine wave phase measurements is the zero crossing time error (phase error). The MultiFunction Counter has hysteresis compensation which reduces the offset level.
Duty Cycle Duty cycle is the high/low relationship of a signal. If a signal with a period of 100 ms is high for 30 ms and low for 70 ms, the Duty cycle is 30%.
Figure 121 Combined Measurement. Two Time Interval measurements and one Period measurement equals phase.

Understanding your MultiFunction Counter Combined Measurements
10
10-11
DUTY FACTOR
The names Duty Cycle and Duty Factor are both used for expressing this high/low relationship. Duty cycle is expressed in percent, while duty factor is a ratio.
Consequently, for the 30 ms High and 70 ms low signal, the Duty Cycle is 30% and the Duty Factor is 0. 3.
POSITIVE DUTY CYCLE
The MultiFunction Counter measures the Period of the signal, then the Positive Pulse Width and then it calculates the result as:
Positive duty cyclePos Pulse Width
Period .
100%
NEGATIVE DUTY CYCLE
The MultiFunction Counter measures the Period of the signal, then the Negative Pulse Width and then it calculates the result as:
Negative duty cycleNeg Pulse Width
Period .
100%
Frequency Ratio Frequency Ratio is one frequency divided by another frequency.
The MultiFunction Counter, however, never measures the frequencies. Instead it simultaneously counts the number of triggerings on Input A, and Input B. After the set measuring time, the result is calculated as:
RatioNo of counts on Input A
No of counts on Input B .
.

164 Users Manual
10-12
AUTO SET, AUTO SET WITH PRESET AND DEFAULT SETUP This table is a help to the user to understand what the difference between the auto-set, preset, and default setups means. The intention with automatic setup is that the measurements should be as good as possible without manual fine tuning.
Note The table was created using version 1.0 of the MultiFunction Counter program and may be altered in future program versions.
Table 4 Settings after Autoset, Preset and Default Setup
Function
S
SS(Double-click)
C
[Recall_Default_Setup]
Menu
Button
Trigger Level Set to 50%
of Vp-p
Not applic-
able (Set con-
tinuously by
Auto trigger)
Not applicable
(Set continuously
by Auto trigger)
w [_Input_A_]
Voltage Range Selected to
match input
signal
Selected to
match input
signal
5V w [_Input_A_]
Coupling Checks If
AC coup-
ling allows
for lower
voltage
range. If it
does, AC is
selected
Selects DC
for time
measure-
ments and
AC for fre-
quency, per-
iod average
and phase
AC w [_Input_A_]
Auto Time Scale On On On w [_Scope_]
Auto Volt Scale Always On Always On Always On w [_Scope_]
Measuring Time - 100 ms 100 ms w
Auto trigger - On On w [_Input_A_]
100 kHz LP
Filter
- Off Off w [_Input_A_]

Understanding your MultiFunction Counter Auto set, Auto set with Preset and Default Setup
10
10-13
Function
S
SS (Double-click)
C
[Recall_Default_Setup]
Menu
Button
Digital Filter - Off Off w [_Input_A_]
External
Arming
- Off Off w [Arming_&_Hold_Off]
Trigger Hold
Off
- Off Off w [Arming_&_Hold_Off]
Sync Delay - Set to 75% of
burst period
50 µs w [_Burst_]
Ignore Start for - Set to 5% of
Sync Delay
0.0 µs w [_Burst_]
Burst Meas-
uring Time
- Set to 40% of
Sync Delay
10 µs w [_Burst_]
Sampling Mode - Auto Auto w [_Scope_]
Measure
Function
- - Frequency A q [Measure_Function]
Totalize Gate
Time
- - 100ms q [Measure_Function]
RPM Pulses/Rev. - - 1 q [Measure_Function]
Select Input - - A, B w [Measure_Channels]
Common - - Off w [Measure_Channels]
Trigger Slope - - Positive w [_Input_A_]
Filter Frequency - - 1 kHz w [_Input_A_]
Arm Start Delay - - Off w [Arming_&_Hold_Off]
Start Delay Time - - 0.1 µs w [Arming_&_Hold_Off]
Hold Off Time - - 0.1 µs w [Arming_&_Hold_Off]
Trigger Slope - - Positive w [_Scope_]
Trigger Level - - 0 mV w [_Scope_]

164 Users Manual
10-14
Function
S
SS(Double-click)
C
[Recall_Default_Setup]
Menu
Button
Timebase
Reference
- - Internal e
Digit Blanking - - Off e [_Display_]
Blank Digits - - 0 e [_Display_]
Scope Grid - - Dotted e [_Display_]
Scope Trace - - Line e [_Display_]
Output - - Off e [_Output_]
Output Signal - - 2 kHz Probe
Adjust e [_Output_]
Math - - Off e [_Math_]
K: - - 1 e [_Math_]
L: - - 0 e [_Math_]
Baud-rate - - 9600 e [_Interface_]
Select Self Tests - - All Self Tests e [Test_&_Adjustments]
Display Contrast - - - e

Chapter 11
Specifications
Contents Page
Presentation modes.......................................................................... 11-2
Timer / counter functions ................................................................ 11-2
Measuring time and synchronization............................................... 11-6
Voltage functions ............................................................................ 11-7
Multiple parameter display.............................................................. 11-8
Waveform display function ............................................................. 11-9
Input A & B................................................................................... 11-11
Input C (models 164H / 164T only) .............................................. 11-12
Ext. reference input ....................................................................... 11-12
Test signals output......................................................................... 11-13
RS232 data in/output (not on model 163) ..................................... 11-13
Auxiliary functions........................................................................ 11-14
General .......................................................................................... 11-15
Timer/counter measurement uncertainty ....................................... 11-17
Uncertainty calculation formulas:.................................................. 11-20
Ordering information..................................................................... 11-24

164 Users Manual
11-2
Note Specifications apply after 30 minutes warm-up time For timer / counter functions, the minimal frequency specified is valid with manual trigger setting. When using AUTO TRIGGER or AC-coupled inputs, the minimal frequency is 20 Hz.
PRESENTATION MODES
Waveform: Displays recurrent signals and trigger settings. Eliminates the need for a separate oscilloscope to verify the input signal and correct triggering. Displays additionally one selected timer/counter read-out with up to 10 digits resolution plus the input signal’s Vp-p value.
Values: Up to 10 simultaneous readings of frequency, time and voltages like a Counter, DVM and Phasemeter.
Statistics : Mean, Maximum, Minimum plus Peak-to-Peak and Standard Deviation of a selected number of samples;
sample size: 2 to 106.
TIMER / COUNTER FUNCTIONS
Frequency
Range:
Input A & B: 1µHz to 160 MHz
Input C: 140 MHz to 2.7 GHz
Resolution: 9 digits/s measuring time, max. 10 digits resolution
Burst Frequency, Burst Repetition Rate
Synchronization timing:
Manual: Manually set timing parameter
Automatic: AUTO SET sets suitable timing parameters for bursts with a duration of 50 µs to 100 ms, min. 3 cycles on Input A or B and min. 192 cycles on Input C.
Burst duration:

Specifications Timer / Counter Functions
11
11-3
Input A & B: 0.5 µs to 1.5 s, min. 2 cycles in burst
Input C: 50 µs to 1.5 s, min. 128 cycles in burst. Burst ON/OFF ratio: < 1:1
Burst Frequency Range:
Input A & B: 3 Hz to 140 MHz
Input C: 140 MHz to 2.7 GHz
Resolution: 9 digits/s burst measuring time, max. 10 digits resolution
Burst repetition rate:
Input A & B: Up to 1 MHz
Input C: Up to 20 kHz
Resolution: 9 digits/s measuring time, max. 10 digits resolution
Note If an external control signal (burst synchronization) is available, Input C Burst frequency can be measured in bursts with a duration from 0.5 µs and min. 128 cycles using normal Frequency measurement with External Arming.
Period
Range:
Input A & B: 6 ns to 106s (averaged, to 160 MHz) 20 ns to 107s (single, to 50 MHz)
Input C: 370 ps to 7 ns (140 MHz to 2.7 GHz)
Modes: Single cycle (Input A, B) or Multiple cycles averaged (Input A, B, C)
Resolution:
Single: 700 ps
Averaged: 9 digits/s measuring time, max. 10 digits resolution

164 Users Manual
11-4
Frequency Ratio f1/f2
Range: 10-9 to 109
Frequency Range:
Input A & B: 1 µHz to 160 MHz
Input C: 140 MHz to 2.7 GHz
Measurement Modes: fA / fB, fB / fA, fC / fA and fC / fB
RPM
Range (Input A or B): 10-5 RPM to 109 RPM (with 1 pulse/revolution)
Transducer scaling factor: 1 to 106 pulses/revolution
Time Interval
Range: 0 ns to 107 s
Measurement Modes: Input A to B, Input B to A, (separate) Input A to A, Input B to B (common)
Frequency Range: up to 50 MHz
Pulse Width: ≥6 ns at set trigger level
Resolution: 700 ps
Positive/Negative Pulse Width
Range (Input A or B): 6 ns to 107 s
Frequency Range: up to 50 MHz
Resolution: 700 ps
Rise/Fall Time
Range (Input A or B): 6 ns to 107 s
Frequency Range: up to 50 MHz
Pulse Width: ≥ 6 ns at set trigger level
Resolution: 700 ps

Specifications Timer / Counter Functions
11
11-5
Duty Cycle
Range: 0.000 1 to 99.999 9%
Frequency Range: 10 mHz to 50 MHz
Pulse Width: ≥ 6 ns at set trigger level
Resolution: 0.000 1% or Frequency GHz/ %1 100 whichever
is greatest
Phase Range: -180.00° to +360.00°
Measurement Modes: Input A to B or Input B to A
Frequency Range: 10 mHz to 50 MHz
Resolution: 0.01° or Frequency GHz/ 1 360 whichever is
greatest
Totalize with manual control and / or set measuring time Range: 0 to 1014 counts
Measurement modes: Manual: Counts simultaneously pulses on inputs A and B and displays A, B, A-B and A+B Timed: Counts on one input, A or B
Start/Stop: - With Run/Hold key
- Totalize during the set time 200 ns to 15 s
Frequency Range: 0 Hz to 100 MHz
Pulse Width: ≥ 5 ns at set trigger level
Totalize with external control signal
Range: 0 to 1014 counts
Measurement modes: Counts pulses on Input A (or B), starts and stops counting via external control signal on input B (or A)
Start/Stop: - By two consecutive pulses - Totalize during presence of gating signal
Frequency Range: 0 Hz to 100 MHz
Pulse Width: ≥ 5 ns at set trigger level

164 Users Manual
11-6
MEASURING TIME AND SYNCHRONIZATION
Measuring Time
Multiple cycles: 200 ns to 15 s with 100 ns resolution. Used for averaging of Frequency, Burst Frequency, Burst Repetition Rate, RPM, Period and Ratio measurements.
Single cycle: Equal to the time duration to be measured. Used for Single Period A & B, Time Interval, Pulse Width and Rise-/Fall times.
Display time: Measuring time or 200 ms whichever is greater.
HOLD / RUN: HOLD freezes last result. RESTART starts new measurement.
Additional Trigger Control Normally, measurements are immediately started/stopped by the first input event, that meets the trigger conditions. Arming, Arming Delay and Hold-Off are additional trigger control features that enable the counter to measure on a specific point in a stream of pulses on input A (or B), by ignoring triggering during a set delay time and/or as long as an additional trigger condition on input B (or A) has not been fulfilled.
Arming ON: Start triggering on input A is enabled directly after an external arming signal has triggered the arming input B. Applies to Frequency, Period or Pulse Width measurements.
Start Arming Delay: After arming, an additional delay is inserted before the instrument can be start-triggered for a new measurement. Range: 200 ns to 5s Resolution: 100 ns
Trigger Hold-Off: Stop triggering is inhibited during the set trigger Hold-Off time. Applies to Time Interval, Pulse Width, and Rise/Fall Time measurements. Range: 200 ns to 5s Resolution: 100 ns

Specifications Voltage Functions
11
11-7
VOLTAGE FUNCTIONS
Inputs: A or B
Voltage range selection: Manually in three steps or automatically via Auto Set key.
Over-ranging indicator: Screen indicator “Clipped” indicates over-ranging.
Uncertainty: Uncertainties specified apply from 10% to 100% of full range - and from 18 °C to 28 °C, after 30 minutes warm-up time. Add (specified uncertainty) x 0.1/ °C at < 18 °C or > 28 °C. Confidence level corresponds to 2σ for a normal Gaussian distribution (>95%).
Peak Voltage (V max, V min, V p-p)
Voltage Range: 500 mV, 5.00 V, 50.0 V
Frequency Range: 20 Hz to 50 MHz
Resolution 1, 10, 100 mV
Uncertainty:
20 Hz to 2 kHz: 2% + 0.2% of range
2 kHz to 5 MHz 4% + 0.2% of range
5 MHz to 20 MHz 10% + 1% of range
20 MHz to 50 MHz 25% + 1% of range
DC Voltage ( DC or DC-component from AC-signal)
Range: 500 mV, 5.00 V, 50.0 V
Resolution: 1, 10, 100 mV
Uncertainty: 2% + 0.2% of range
AC or AC+DC True-RMS Voltage
Range: 300 mV, 3.00 V, 30.0 V
Peak voltage limits: ±500 mV, ±5 V, ±50 V
Resolution 1 mV, 10 mV, 100 mV
Uncertainty (sinewaves):
20 Hz to 50 Hz: 2% + 0.2% of range (DC +AC), 4% + 0.2% of range (AC)

164 Users Manual
11-8
50 Hz to 2 kHz: 2% + 0.2% of range
2 kHz to 5 MHz: 4% + 0.2% of range (4% + 2% of range in 300 mV range)
5 MHz to 10 MHz: 10% + 1% of range (10% + 2% of range in 300 mV range)
RMS-principle: The rms-value is calculated from input signal volt-vs-time samples. Specified uncertainty applies only when triggering is correct, resulting in a correctly displayed waveform.
Crest Factor: Any crest factor tolerated for signals within Vp limits. The instrument is calibrated to the rms value of a sinewave input. For non-sinusoidal input signals, with crest factors up to 3.0, add 2% + 2% of range (typically).
MULTIPLE PARAMETER DISPLAY Automatic waveform characterization with simultaneous display of all parameters, relevant for selected signal type:
Signal type Parameters displayed simultaneously
SINE and similarcontinuous symm. signals:
Frequency, Period, Vmax, Vmin, Vp-p
PULSE and similar cont. asymm. signals:
Frequency, Period, Positive Pulse Width, Negative Pulse Width, Rise Time, Fall Time, Duty Cycle, Vmax, Vmin, Vp-p.
BURST and similar Burst Frequency, Burst Repetition Rate, Vmax, Vmin, Vp-p.

Specifications Waveform Display Function
11
11-9
WAVEFORM DISPLAY FUNCTION Displays the waveform of recurrent input signals. Eliminates for most signals the need for a separate oscilloscope to verify the input signal and correct triggering. Uses the same inputs A & B as for Timer/Counter and Voltage measure functions. For viewing complex signal patterns, dynamically changing signals or low amplitude signals, a fully featured oscilloscope can be expected to give a better signal representation..
Vertical Sampling(Voltage sequential): Suitable for recurrent signals of 200 Hz to 50 MHz. The waveform is captured by measuring Time vs. Voltage samples. Measured time intervals start at one unique start trigger point and stop at consecutive stop trigger points at different trigger levels, scanned over the entire signal.
Bandwidth / rise time: 50 MHz / 3.5ns. Note. Vertical sampling technique causes a different relationship between bandwidth and rise-time, compared to traditional oscilloscopes. The -3dB loss in amplitude is like on a 50 MHz oscilloscope, while the pulse response is 3.5 ns rise time i.e. like a 100 MHz oscilloscope.
Effective sampling rate: 3 Gsa/s, ≤ 20 ns/div. 1 GSa/s, > 20 ns/div.
Glitch detect: ≥6 ns repetitive pulses. Always active and independent of time-base setting.
Horizontal Sampling: Suitable for recurrent signals of 1 Hz to 2 kHz. (Time sequential)
Frequency Range: 1 Hz to 2 kHz
Sampling Rate: Up to 40 kS/s
AUTO Sampling: Automatic selection between Vertical- and Horizontal Sampling. Selection is based on detected input signal frequency and pulse width.

164 Users Manual
11-10
Vertical deflection
Display Modes: One input (A or B), or two input (A and B). Fixed selection depending on selected measurement function.
Frequency response: 1 Hz to 50 MHz (-3dB in Vp-p display)
AC coupled: 20 Hz to 50 MHz (-3dB in Vp-p display)
Coupling: AC/DC
Rise time: 3.5 ns (vertical sampling mode)
Display Voltage Range: 100 mV to 50 V
Sensitivity: 20 mV/div. to 10V/div. AUTO and manual scaling
Accuracy: 2% + 25 mV
Number of divisions: 8
Pixels/division: 21
Horizontal deflection
Time Coefficients: 5 ns/div. to 0.2 s/div. in a 1-2-5-sequence, auto-scaling (2 cycles of signal) or manually set
Accuracy: 700 ps + 1 pixel (vertical sampling) 25 µs + 1 pixel (horizontal sampling)
Number of divisions: 8 divisions with post trigger data 2 divisions with pre trigger data (vertical sampling mode only)
Pixels/division: 21
Max. display length: 5 input signal cycles
Waveform (Scope) Triggering
Sources: Input A or B, AUTO selected, depending on set measurement function
Trigger sensitivity: 60 mVp-p to 10 MHz 90 mVp-p to 50 MHz 120 mVp-p to 75 MHz
Trigger Point: AUTO SET or manually set trigger level and slope
Pre-trigger: 2 divisions, max. 1 cycle (vertical sampling mode only)

Specifications Input A & B
11
11-11
Display
Trace: Dot or dot-joined line
Grid graticule: Dotted or full line
INPUT A & B
Coupling: DC or AC
Frequency Range: 0 Hz to 160 MHz (DC-coupled) 20 Hz to 160 MHz (AC-coupled) Frequency limits for MEASURE FUNCTIONS and WAVEFORM display are separately specified (see Timer/Counter, Voltage and Waveform Functions).
Trigger Level Range: ± 500 mV, ± 5.00 V or ±50.0 V
Resolution: 1, 10 or 100 mV
Uncertainty: ± 1% + resolution
Setting: AUTO, Manual
Read-out: Digital read-out, or with trigger lines on WAVEFORM display.
Trigger sensitivity, manual trigger setting:
± 0.5 V / ± 5 V range: 20 mVrms sine (up to 50 MHz)
40 mVrms sine (50 MHz to 160 MHz)
± 50 V range: 200 mVrms sine (up to 50 MHz)
400 mVrms sine (50 MHz to 160 MHz)
AUTO Trigger:
Level: Automatically set at 50% of input signal’s Vp-p value, or at 10% and 90% of Vp-p for Rise/Fall Time measurements
Trigger hysteresis: In Frequency and Period Average modes, hysteresis is automatically set to approx. 33% of input signal’s Vp-p value to provide optimal noise immunity. For all other functions, the hysteresis is equal to the specified trigger sensitivity (manual setting) up to 120 MHz. Above 120 MHz the trigger hysteresis increases to 100 mV (0.5V/5V range), and to 1V (50V range) at 160 MHz.

164 Users Manual
11-12
Min. Frequency: 20 Hz.
Impedance: 1 MΩ//15 pF
Low Pass Filter: ≤ 100 kHz
Digital Low-Pass Filter: ≤ 1 Hz to 3 MHz
Maximum input voltage:
No instrument damage: 240 Vrms up to 1 kHz, decreasing linearly to 6 Vrms at 10 MHz.
Safe for user: 30 Vrms.
INPUT C
Frequency Range: 140 MHz to 2.7 GHz
Prescaler Factor: 64
Operating Input Voltage:
140 MHz to 300 MHz: 20 mVrms to 5 Vrms
0.3 to 2.1 GHz: 10 mVrms to 5 Vrms
2.1 to 2.4 GHz: 20 mVrms to 5 Vrms
2.4 (*2) to 2.7 GHz: 70 mVrms to 5 Vrms
Impedance: 50 Ω nominal, AC-coupled, VSWR <2:1
Maximum Voltage Without Damage: 12 Vrms during 60s, PIN-diode protected
EXT. REFERENCE INPUT
Frequency: 10 MHz
Voltage Range: 500 mVrms to 12 Vrms
Impedance: Approx. 500 Ω, AC coupled

Specifications Test signals output
11
11-13
TEST SIGNALS OUTPUT
Reference frequency: 10 MHz square-wave
Probe Compensation: 2 kHz square-wave
Gate Monitor: Gate open: low, gate closed: high
Test Signal Source: Square-waves, selectable: 1 Hz, 50 Hz, 100 Hz, 1 kHz, 10 kHz, 100 kHz, 1 MHz and 5 MHz Low- and high-duty cycle pulses: 1 kHz/0.2 µs and 1 kHz / 999.8 µs.
Output levels: Fixed TTL: low ≤0.4 V, high ≥1.8 V into 50 Ω:
RS232 Data in/output
Connector: Isolated optical connector, for use with optional optical-to-RS232 adapter Option 23/80
Input: Full programmability via LEARN data strings and RECALL of up to 10 complete instrument settings. Full description available on Option 23/80 software diskette.
Output: Measurement data, bitmap screen dump etc.

164 Users Manual
11-14
AUXILIARY FUNCTIONS
Statistics
Statistical functions: Maximum-, Minimum- Mean- values, plus Standard Deviation and Peak-Peak Deviation (= Max-Min). Not available in Totalize functions.
Error reduction: Random uncertainties for instance from noise and jitter can normally be reduced by √N, by averaging a number of measurement readings.
N (Sample Size): 2 to 1 000 000
Mathematics
Mathematics: Displayed value = K x measurement + L, where K and L are selectable constants
Constants K and L range: 0 and ±(10-20 to 1020), 12 digits resolution
INFO
A built in context sensitive help function gives guidance for all manual settings.
Tutorial
A built in tutorial description of the MultiFunction Counter
SAVE / RECALL
No. of instrument set-ups: 10
No. of screen images: 1 (WAVEFORM, VALUES or STATISTICS).

Specifications General
11
11-15
GENERAL Quality and maintenance
Quality assurance: ISO 9001 Quality System
Warranty: 3 years parts and labor
MTBF 40 000 hours
Calibration: Closed Case Calibration, recommended interval: 12 months
Display Type: Super Twisted Liquid Crystal
Size: 84 x 84 mm, 4.7" diagonal
Resolution: 240x240 pixels
Backlight: Cold Cathode Fluorescent (CCFL) tube.
Brightness: 3 user selectable levels: max. 50 cd/m2
Contrast ratio: User adjustable, max. 1:15 (typical at 20°C)
Environmental Data Temperature:
Operating: 0°C to 50°C
Storage: -20°C to 70°C
Humidity:
Operating: <90% RH non-condensing, 20°C to 30°C, <70% RH non-condensing, 30°C to 50°C,
Storage: <95% RH
Altitude:
Operating: 3000 m (10 000 ft)
Storage: 12000 m (40 000 ft)
Vibration: Up to 3G at 55 Hz, per MIL-T-28800E, Class 3
Shock: Half-sine shock pulse 30G, per MIL-T-28800E, Class 3
Safety: EN 61010-1:1993, Cat. II
EMC: Emission: EN 55011 ISM Group 1, Class A.
Susceptibility: EN 50082-2

164 Users Manual
11-16
Safety
Safe Operation: 30 Vrms
Compliance: EN 61010-1:1993, Cat. II CE
CSA CAN / CSA - C22.2 No.1010.1 - 92
AC/DC adapter: UL: UL1310 Class 2
C22.2 No. 223
Power Supply
Line voltage: Via Option 51 AC/DC adapter: 90 to 130 Vrms or 190 to 255 Vrms, 45 Hz to 440 Hz, 18 VA
Internal Ni-Cd Battery: Type Option 23/86, 4.8 V
Battery Operating Time: Pulse output and external reference input switched off, lowest backlight brightness level and full battery capacity
Model 164: typical 2¼ hours
Model 164H: typical 1½ hours
Battery Charging Time: 3 h typical (instrument switched OFF) 30 h typical (instrument switched ON)
Alternate Battery: 4 alkaline C cells (not included)
External DC Supply: 10 V to 20 V DC, 10 W typical
Current at 12 Vdc: 0.8 A (operating) 0.5 A (non operating, charging only)
Input Connector: 5 mm power jack, DIN 45323
Mechanical Data
Height x Width x Length: 60 x 130 x 260 mm / 2.4 x 5.1 x 10.2 in., excl. holster 65 x 140 x 275 mm / 2.5 x 5.5 x 10.8 in., incl. holster
Weight: 1.5 kg /3.3 lb., excl. holster, 1.8 kg/4.0 lb., incl.holster
Transport weight: 3.4 kg / 7.5 lb.

Specifications Timer/Counter Measurement Uncertainty
11
11-17
TIMER/COUNTER MEASUREMENT UNCERTAINTY
Uncertainty examples Uncertainty examples below are a simplified way to quickly obtain the magnitude of accuracy for commonly made measurements. The figures are overall figures, taking into account all instrument error contributors, such as quantization error, trigger errors, timebase oscillator aging, temperature drift and one year calibration interval.
Exact calculations of the measurement’s uncertainties are described in the following section ”Uncertainty Calculation Formulas” (random, systematic and total values), taking into account specific manual settings, ambient temperature and input signal characteristics as slew-rate and noise.

164 Users Manual
11-18
FREQUENCY MEASUREMENTS ON SINEWAVE SIGNALS
Table 1 shows the uncertainty for measurements on undistorted 1Vrms sinewave input signals, with instrument settings obtained through AUTO-SET and making use of the internal timebase reference at room temperature.
Table 5 Uncertainty for measurements on sinewave input signals
Model 164 164H Mode and input signal Absolute uncertainty Absolute uncertainty
Frequency & Period Average: (Period =1 ÷ Frequency) ≤ 100 Hz
1 mHz
1 mHz
1 kHz 5 mHz 1 mHz 10 kHz 50 mHz 1 mHz
100 kHz…2.7 GHz 5x10⁻⁶ x Frequency 1x10⁻⁷ x Frequency Phase: f: ≤100 kHz
0.1°
0.1°
1 MHz 0.5° 0.5° 10 MHz 5° 5° Frequency Ratio f1 / f2: f2: 100 Hz
0.1
0.1
10 kHz 0.001 0.001 1 MHz 0.00001 0.00001 100 MHz 0.0000001 0.0000001 Conditions that lead to a better accuracy (reduced uncertainty) are: steeper trigger transitions (for instance through higher input amplitude and higher input frequency), use of STATISTICS to average the result of a number of readings, the use of a more accurate external timebase reference and a shorter calibration interval than 12 months. In LF Frequency measurements, the internal trigger uncertainty is the dominating error contributor, whereas for HF Frequency measurements the internal timebase uncertainty dominates.

Specifications Timer/Counter Measurement Uncertainty
11
11-19
FREQUENCY MEASUREMENTS ON PULSE SIGNALS
Table 2 shows the uncertainty for measurements on undistorted 1Vp-p pulse signals with 10 ns rise/fall times (except where otherwise noted for rise/fall-time measurements), with instrument settings obtained through AUTO-SET and making use of the internal timebase at room temperature.
Table 6 Uncertainty for measurements on pulse input signals
Model 164 164H Mode and input signal Absolute uncertainty Absolute uncertainty
Frequency & Period Average:(Period =1 ÷ Frequency) 20 Hz to 2.7 GHz
5x10⁻⁶ x Frequency
1x10⁻⁷ x Frequency
Period Single: ≤ 1 µs
700 ps
700 ps
1 ms 5 ns 1 ns 1 s 5 µs 100 ns Time Interval, Pulse width: ≤ 1 µs
1.5 ns
1.5 ns
1 ms 5 ns 1.5 ns 1 s 5 µs 100 ns Rise/Fall time (@ 100 kHz): ≤ 10 ns
2 ns
2 ns
100 ns 5 ns 5 ns 1 µs 50 ns 50 ns Duty Cycle: ≤ 100 Hz
0.0001 %
0.0001 %
10 kHz 0.0015 % 0.0015 % 1 MHz 0.15 % 0.15 % Conditions that lead to a better accuracy (reduced uncertainty) are: steeper trigger transitions (for instance through shorter rise-/fall time and higher input amplitude), use of STATISTICS to average the result of a number of readings, the use of a more accurate external timebase reference and a shorter calibration interval than 12 months. For short duration Time measurements, the 700 ps resolution is the dominating error contributor, whereas for long duration Time measurements, the internal timebase uncertainty dominates.
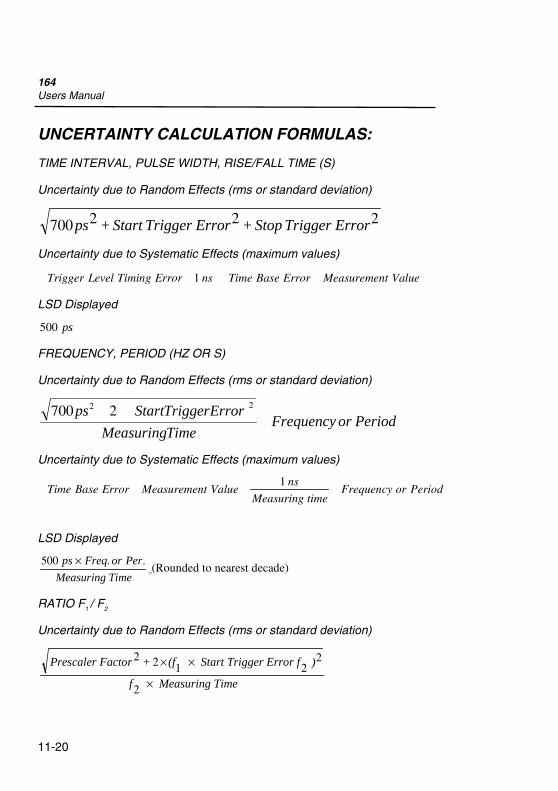
164 Users Manual
11-20
UNCERTAINTY CALCULATION FORMULAS:
TIME INTERVAL, PULSE WIDTH, RISE/FALL TIME (S)
Uncertainty due to Random Effects (rms or standard deviation)
222700 ErrorTriggerStop+ErrorTriggerStart+ps
Uncertainty due to Systematic Effects (maximum values)
Trigger Level Timing Error ns Time Base Error Measurement Value1
LSD Displayed
500 ps
FREQUENCY, PERIOD (HZ OR S)
Uncertainty due to Random Effects (rms or standard deviation)
PeriodorFrequency
TimeMeasuring
ErrorTriggerStartps
22 2700
Uncertainty due to Systematic Effects (maximum values)
Time Base Error Measurement Valuens
Measuring timeFrequency or Period
1
LSD Displayed
500 ps Freq or Per
Measuring Time
× . . (Rounded to nearest decade)
RATIO F1 / F2
Uncertainty due to Random Effects (rms or standard deviation)
Prescaler Factor + (f Start Trigger Error f )
f Measuring Time
2 2 1 22
2
× ×
×

Specifications Uncertainty calculation formulas:
11
11-21
LSD Displayed
Prescaler Factor
Measuring Time f× 2
(Rounded to nearest decade)
PHASE (DEGREES)
Uncertainty due to Random Effects (rms or standard deviation)
360)222700( FrequencyErrorTriggerStop+ErrorTriggerStart+ps
Uncertainty due to Systematic Effects (maximum values)
Trigger Level Timing Error Freq ns Frequency. 360 1 360
LSD Displayed
0 01. °
DUTY CYCLE (%)
Uncertainty due to Random Effects (rms or standard deviation)
%100)222700( FrequencyErrorTriggerStop+ErrorTriggerStart+ps
Uncertainty due to Systematic Effects (maximum values)
Trigger Level Timing Error Freq ns Frequency. 100% 1 100%
LSD Displayed
0 0001%.

164 Users Manual
11-22
Internal Timebase Stability Table 7 Timebase Stability.
Type Standard High Stability Oven
Model 164 164H
Aging Rate per:
24h <1.5 x 10⁻⁹ (first year)
Month <5 x 10⁻⁷ <3 x 10⁻⁸
Year <5 x 10⁻⁶ <1 x 10⁻⁷ (after first year)
Temperature 0° to 50° <5 x 10⁻⁶ <2 x 10⁻⁷
Stability: 10° to 40° <1 x 10⁻⁷ (after 15 min.)
(referenced to +23°C)
18° to 28° <2 x 10⁻⁶
(after 15 min.) <5 x 10⁻⁸ (after 15 min)
Factory adjustment uncertainty (+23°C):
10 MHz ± 50 Hz
10 MHz ± 1 Hz
Start/Stop Trigger Error due to Random Effects
Trigger error, caused by external and internal noise, results in too early or too late start- and stop- triggering. The rms trigger errors associated with each trigger point is:
Start / Stop Trigger Error = (Vnoise - input ) + (Vnoise - signal )
Signal slew rate (V s) at trigger point
2 2
Vnoise-input: 0.5 mVrms noise of the input amplifier
Vnoise-signal: rms noise of the input signal over a 160 MHz bandwidth
Trigger Level Timing Error due to Systematic Effects
Trigger level timing error is the sum of two error sources: 1. The trigger level setting error due to deviation of the actual trigger point from
the set (indicated) trigger level and

Specifications Uncertainty calculation formulas:
11
11-23
2. The width of the input amplifier hysteresis band (only in Pulse Width & Duty Cycle measurements)
The magnitude of both errors depends on the input signal slew rate:
Trigger Level Setting Errortrig lev resol + % of start trigger level
Slew rate ( ) at start trigger point
+trig lev resol + % of stop trigger level
Slew rate ( ) at stop trigger point
Vs
Vs
=×
×
2 1
2 1
. . .
. . .
Input Amplifier Hysteresis Error.
Slew rate ( ) at start trigger point
-.
Slew rate ( ) at stop trigger point
Vs
Vs
= 0 01
0 01
Calculation of Measurement Uncertainty (2 σσσσ)
The total uncertainty of a measurement is calculated as twice the combined standard uncertainty (two standard deviations or 2 σ) using the following formula:
Total Combined Standard Uncertainty = x s +S ia
2 22
3
where:
s = uncertainty due to random effects, calculated from the formula, specified for each measuring function.
ai = uncertainty due to systematic effects, calculated for each contributing error, specified for each measurement function.

164 Users Manual
11-24
ORDERING INFORMATION
Selection guide Table 8 Features.
Models 164 164H
160 MHz Frequency Counter 50 MHz Time and Vp-p meter 100 MHz PulseTotalizer V dc and 10 MHz true-RMS V ac meter
•••• ••••
50 MHz Waveform presentation mode •••• •••• Frequency in Burst and Burst Repetition Rate •••• •••• 2.7 GHz Frequency and Period •••• •••• Timebase stability / Accuracy 5 x 10
-65 x 10
-7
Statistics, including Jitter measurements •••• •••• Mathematics •••• •••• Trigger Hold-Off, Arming and Arming Delay •••• •••• Optional PC-support: RS232 adapter •••• ••••
164 50MHz / 2.7 GHz MultiFunction Counter with Standard Timebase
164H 50 MHz / 2.7 GHz MultiFunction Counter with High Stability Oven Timebase

Specifications Ordering Information
11
11-25
Included Accessories
9446 601 64001 Users Manual, English
Calibration Certificate
Ni-Cd Battery Pack
Option 51/00X Line Voltage Adapter/Battery Charger X = 1 for Europe (190V-255V) X = 3 for USA and Japan (90V-130V) X = 4 for UK (190V-255V) X = 8 for universal (90V-130V or 190V-255V)
Optional Accessories
Option 23/01 Grey Protective holster
Option 23/80 RS-232C Optically isolated interface adapter
Option 23/86 Spare Ni-Cd Battery Pack
Option 25/164 PendulumView SW for TM-164/164H
PM9585/01 50Ω Feedthrough Termination, 1W
PM9588/01 50Ω BNC-BNC cable set (5x0.2 m – 1ns, 4x0.4 m – 2ns, 3x0.6 m – 3ns , 3x2 m –10ns ).

164 Users Manual
11-26

Chapter 12
User Maintenance
Contents Page
Battery care...................................................................................... 12-3
Calibration intervals ........................................................................ 12-4
Cleaning .......................................................................................... 12-6
How to get service & repair............................................................. 12-6

164 Users Manual
12-2
REPLACING THE BATTERIES
Note This instrument contains a Nickel-Cadmium battery. Do not dispose of this battery with other solid waste. Used batteries should be disposed of by a qualified recycler or hazardous materials handler.
1. Disconnect the MultiFunction Counter from the charger.
2. Remove the holster.
3. Unscrew the two screws holding the battery cover.
4. Remove the old batteries.
5. If installing a Ni-Cd battery pack, make sure the charging tab on the pack springs out about 30° from the battery pack.
6. Insert new batteries or battery pack according to Figure 122.
7. Fasten the battery cover with the two screws. Do not overtighten!
Figure 122 Replacing Batteries. Follow the procedure in this figure to replace batteries. Note that you can insert Non-rechargeable Alkaline C-Cells also.
Charging tab

User Maintenance Battery Care
12
12-3
BATTERY CARE
For All Batteries • Remove batteries if the MultiFunction Counter is to be stored for 6 months or
more.
• Do not expose the MultiFunction Counter to high temperatures; for example, never leave it in the sun.
For Alkaline Batteries • Turn off the MultiFunction Counter when not in use.
• Do not leave batteries in the MultiFunction Counter during storage.
For Ni-Cd Batteries • Charge batteries fully as often as possible.
• Fully discharge the batteries occasionally by leaving the MultiFunction Counter turned on. It will turn itself off when the batteries are sufficiently discharged. Then recharge the batteries.
• When you replace old batteries, remember to recycle them.

164 Users Manual
12-4
CALIBRATION INTERVALS To maintain the performance of the MultiFunction Counter we recommend that you calibrate the timebase of your instrument every year, or more often if you require greater time base accuracy. Calibration should be performed with traceable references and instruments at a certified calibration laboratory. To know the present status of your instrument, test your counter from time to time. The test can be made according to the information in “Appendix 1, Acceptance Test.”
Voltage Reference The built-in voltage reference is the main factor that influences voltage measurement accuracy. The voltage reference should be calibrated once a year. The adjustment procedure is a ”closed case” procedure described in the service manual.
Oscillator The frequency of the reference crystal oscillator is the main parameter that influences time, frequency and phase accuracy of a MultiFunction Counter. External conditions, such as ambient temperature and supply voltage, affect the frequency, but aging is also a factor. When calibrating and adjusting, you compensate the reference crystal oscillator only for deviation in frequency due to aging.
SOME IMPORTANT POINTS:
The high-stability oscillators have been built into an oven to keep the oscillator temperature as stable as possible.
The stability shown for the oscillators is valid within a temperature range of 0 to 50° C, with a reference temperature of 23° C. If the counter is used in a room temperature of 18 to 28 °C, the temperature stability of a standard oscillator or Oven Oscillator will be improved by a factor of 3 typically.
The stability for standard oscillators is mainly dependent on the ambient temperature. During the first 30 minutes after power-on there is always a temperature increase inside the counter that will influence the oscillator.
Timebase Uncertainty (room temperature) What time base uncertainty can you expect when operating in room temperature (18º-28ºC) and calibrate once per month, once per year, once per two years, and once per three years

User Maintenance Cleaning
12
12-5
Table 9 Timebase uncertainty at room temperature.
Month Year 2 Years 3 Years
164 2.4x10⁻⁶ 6.2x10⁻⁶ 1.2x10⁻⁵ 1.7x10⁻⁵ 164H
First year 7.8x10⁻⁸ 6.3x10⁻⁷ 7.4x10⁻⁷ 8.6x10⁻⁷
164H Following year
6.7x10⁻⁸ 1.3x10⁻⁷ 2.4x10⁻⁷ 3.1x10⁻⁷
Timebase Uncertainty (full temperature range) What time base uncertainty can you expect when operating in the temperature range 0º-50ºC and calibrate once per month, once per year, once per two years, and once per three years
Table 10 Timebase uncertainty, full temperature range.
Month Year 2 Years 3 Years
164 5.8x10⁻⁶ 8.2x10⁻⁶ 1.3x10⁻⁵ 1.8x10⁻⁵ 164H
First year 2.4x10⁻⁷ 6.6x10⁻⁷ 7.7x10⁻⁷ 8.9x10⁻⁷
164H Following year
2.3x10⁻⁷ 2.6x10⁻⁷ 3.3x10⁻⁷ 4.2x10⁻⁷
When calibrating, keep in mind that the reference crystal oscillator will be compensated only for frequency deviation caused by aging.
For other calibration intervals the ”internal Timebase Stability” table in the technical specifications will give all necessary information.
CLEANING Keep your MultiFunction Counter clean by wiping it off with a cloth and a mild detergent. Never use alcohol or other chemicals.

164 Users Manual
12-6
HOW TO GET SERVICE & REPAIR To get service and repair, contact your local sales representative or Pendulum Instruments’ Service center at the address below:
Pendulum Instruments AB Karlsbodavägen 39 Box 20020 SE-161 02 Bromma Sweden Phone: +46 8 5985 1000 Fax: +46 8 5985 1040 e-mail: [email protected]
.

Chapter 13
Appendices
Contents Page
Appendix 1, acceptance test ............................................................ 13-2

164 Users Manual
13-2
APPENDIX 1, ACCEPTANCE TEST
General Information The MultiFunction Counter should be calibrated and in operating condition when you receive it.
WARNING: Before turning on the instrument, ensure that it has been installed in accordance with the installation instructions outlined in chapter 1 of the Users Manual.
This procedure is intended to:
• be used for incoming inspection to determine the acceptability of newly purchased instruments and recently calibrated instruments.
• check the necessity of calibration adjustment after the specified recalibration intervals.
Note The procedure does not check every aspect of the instrument’s calibration; rather, it is concerned primarily with those parts of the instrument which are essential to the function of the instrument.
It is not necessary to remove the cover of the instrument to perform this procedure.
If the instrument fails any of the tests, calibration adjustments and/or repair is necessary.
Extensive Performance Verification The MultiFunction Counter Service Manual contains a Complete Performance Verification Procedure intended to verify the specifications listed in chapter “Specifications” on page 11-1. If the instrument passes the tests, it is considered to be calibrated and can carry a calibration sticker.

Appendices Appendix 1, Acceptance Test
13
13-3
Required Test Equipment
Table 11 Recommended Test Equipment.
Equipment Type Required Characteristics
Recommended Model
50Ω Power Splitter PM 9584/02
50Ω Feedthrough Termination (2 pcs)
PM 9585
50Ω Coaxial Cable (3 pcs)
BNC to BNC, 2 pcs of equal
length

164 Users Manual
13-4
Operational Verification The operational verification is a quick way to check that the instrument operates properly without performing the complete performance verification. Because of the highly integrated design of the MultiFunction Counter, it is not always necessary to check all features separately.
Note Power up the MultiFunction Counter and the test equipment at least 30 minutes before testing to let them reach normal operating temperature. Failure to do so may result in certain test steps not meeting the specifications.
SELF TEST
Procedure
1. Press o to turn on the MultiFunction Counter.
2. Select Default Settings by: Pressing c and choosing [_Recall_Default_Setup_]
and then pressing 9.
3. Press e.
4. Position the black cursor on [_Test&Adjust_] and press 9.
5. Check that Select Self Test: All Self Tests is displayed.
6. Position the black cursor on [_Run_Self_Tests_] and press 9.
7. Check that all tests are passed. If the test is not applicable, dashes (----) will show instead of ”Passed”.
8. End the self test by pressing any key.

Appendices Appendix 1, Acceptance Test
13
13-5
PRESENTATION MODE
These tests verify the operation of the PRESENTATION MODE.
Test setup
Figure 123 Test setup.
WAVEFORM Test Procedure
1. Select Default Settings by: Pressing c and choosing [_Recall_Default_Setup_]
and then pressing 9.
2. Press e, then choose [_Output_], then press 9.
3. Set OUTPUT as follows: Output: OnOutput Signal: 1 MHz, Square
4. Press 1, then verify that the 1 MHz, 0.9 Vp-p square wave is displayed.
5. Press q and choose [_Frequency_(Hz)_], press 9, select [_Frequency_Ratio_]
and press 9.
6. Verify that the two 1 MHz, 0.9 Vp-p square wave traces are displayed.
7. Press a to return to the one trace screen.
VALUES Test Procedure
1. Press 2.
50Pow erSplitter
Ω
50Term inations
Ω

164 Users Manual
13-6
2. Verify the following measured values: Frequency A: 1.000 MHz Period Average A: 1.000 µs Vmax: approx. 0.45V Vmin: approx. 0.45V Vp-p: approx. 0.90V
STATISTICS Test Procedure
1. Press 3.
2. Verify the following measured values: Mean: 1.000 MHz Standard Deviation: <5 mHz Maximum: 1.000 MHz Minimum: 1.000 MHz Max-Min: < 30 mHz
MEASURE FUNCTION
These tests verify the operation of MEASURE FUNCTION.
Test setup
As test setup in Figure 123.
Time Interval A to B Test Procedure
1. Select Default Settings by: Pressing c and choosing [_Recall_Default_Setup_]
and then pressing 9.
2. Press e, then choose Output, then press 9.
3. Set Output as follows: Output: OnOutput Signal: 1 kHz, Square
4. Press q, then choose [_Period&Time_], then press 9.
5. Choose [_Time_Interval_], then press 9.
6. Press w, choose [_Input_A_], then press 9.

Appendices Appendix 1, Acceptance Test
13
13-7
7. Set Input A conditions to: Trigger Slope: PositiveAuto Trigger: OnVoltage Range: ±5.0VCoupling: DC100 kHz LP Filter: Off
8. Press 0 to exit Input A settings.
9. Choose Input B, then press 9.
10. Set input B conditions to: Trigger Slope: NegativeAuto Trigger: OnVoltage Range: ±5.0VCoupling: DC100 kHz LP Filter: Off
11. Press 0 to exit input B settings.
12. Choose [_Arming&Hold_Off_], then press 9.
13. Set Hold Off conditions to Trigger Hold Off: OnHold Off Time: 2.00 ms
14. Press 2.
15. Verify the following approximate measured values:
Time Interval A to B: 2.5 ms
16. Verify the following approximate voltage readings Vmax Vmin Vp-p 0.90V 0.00V 0.90V 0.90V 0.00V 0.90V

164 Users Manual
13-8
Totalize, Gated by Time Test Procedure
1. Press q, then choose [_Totalize_(Counts)_], then press 9.
2. Choose [_Gated_by_Time_], then press 9.
3. Use the INFORMATION MENU at the bottom of the display and set A
trigger to MAN, then press s.
4. Verify the following measured value: Totalize A Timed: 100 ±1
Pulse Group Test Procedure
1. Press q, then choose [_Pulse_], then press 9.
2. Use the INFORMATION MENU and set Hold-Off to Off.
3. Verify the following approximate measured values:
Period A: 1.000 ms
Frequency A: 1.000 kHz
Positive Pulse Width A: 500.0 µs
Negative Pulse Width A: 500.0 µs
Positive Duty Cycle A: 50.00%
Rise Time A: 15 ns
Fall Time A: 10 ns

Appendices Appendix 1, Acceptance Test
13
13-9
10 MHz REFERENCE INPUT
This test verifies the operation of the External Timebase Reference Input.
Test setup
As test setup in Figure 123. Also connect the Frequency Standard to the MultiFunction Counter’s REF INPUT.
Test Procedure
1. Select Default Settings by: Pressing c and choosing [_Recall_Default_Setup_]
and then pressing 9.
2. Press e, then choose Timebase Reference: External.
3. Choose [_Output_], then press 9.
4. Set OUTPUT as follows: Output: OnOutput Signal: 10 MHz, Reference.
5. Press 2.
Verify that the display reads approximately 10.000 000 XX MHz and the Ext Ref on the INFORMATION MENU is lit.

164 Users Manual
13-10

Chapter 14
Index
1.3 GHz Warning, 5-8
2:nd Channel Gate
Totalize, 4-14
2:nd Channel Start/Stop
Totalize, 4-14
About this Manual, 1-2
AC Coupling
When to Use, 5-13
AC/DC Coupling, 5-12
AC/DC Power Adapter, 1-9; i
Activate External Arming, 5-21
Adjust Access Code. See Service Manual
Adjustments
With MultiFunction Counter, 6-7
Aging, 1-7; 12-4; 12-5
Alkaline C-size Batteries, 1-9
Amplitude, 7-9
Analog Low-pass, Filter, 5-14
Aperture. See Measuring Time
Arming, 2-8; 5-20; 11-6
Arming Delay, 11-6
Arming off, 5-17
Arming with Delay, 5-21
Arming, Manual
Manual Hold/Run, 4-13
Attenuator, 5-8

164 Users Manual
14-2
AUTO Sampling, 11-9
Auto Scaling, 2-16
Auto Set, 5-10
Key, 2-4; 2-15
with Preset, 2-15
Auto Trigger, 5-5; 5-9; 11-11
Frequency Limit, 5-9
Statistics, 5-9
Auto Triggering, 2-16
Average, 5-24
Average Period, 4-7; 10-8
Backlight key, 2-4
Battery Care, 12-3
Battery Charger, 1-9
Battery Pack, 1-9
BNC cables, 3-3
Burst arming, 5-17
Burst duration:, 11-3
Burst Frequency, 11-2
Burst Frequency Range, 11-3
Burst Repetition Rate, 10-8; 11-3
Burst Repetition Rate , 11-2; 11-6
Burst Repetition Rate , 4-6
Burst-signal characterization, 4-4
Buttons on screen, 2-9
C Cell Batteries, 1-9
Calibration Date, 6-10
Calibration intervals, 12-4
Carrier Frequency, 9-6
Caution, i
Center Frequency, 9-6
Chan:, 2-5

Index
14
14-3
Channel
Selecting Measuring, 5-3
Characterizing a Sinewave Signal, 3-4
Characterizing Pulses, 3-8
Charge
Quick, 1-10
Charging the Batteries, 1-10
Clearing a Memory, 2-20
Coaxial attenuators, 5-7
Combined Measurements, 10-10
Common, 5-4
Computer
Using MultiFunction Counter from, 1-5
Connecting to a PC, 6-8
Connections, ii
Constants, 6-7
Contents of Box, 1-6
Continuous measurements, 2-18
Convenience Keys, 2-4; 2-15
Conventions, 2-13
Counter Settings, 2-8
Counts, 4-3
Coupling, 5-12; 11-11
Cursor, 2-5
Moving, 2-9
Cursor Control Keys, 2-4
Cursor Measurements, 3-15
DC Coupling
When to Use, 5-13
DC Voltage, 11-7
DC/AC Coupling, 5-12
Default Settings, 3-3

164 Users Manual
14-4
Default Setup, 2-3
Recall, 2-21
Delayed Arming, 5-21
Digit Blanking, 6-2
Digital Filter, 5-15
Digits
Entering, 2-11
Large, 2-14
Diskette, 1-5
Display, 11-11; 11-15
Display Backlight, 2-4
Display dual waveforms, 7-4
Display in Large Digits, 2-14
Distorted Waveform, 5-13
Dots
Indicate Slope, 7-10
Double click, 2-15
Dual waveform display, 7-4
Duty Cycle, 4-15; 10-10; 11-5
Duty Factor, 10-10
Enter Menus. See Select Key
Environmental Data, 11-15
Exercise Setup, 3-3
Exit
Key, 2-4
Exit key, 2-9
Ext trigger, 5-20
Ext. Reference Input, 11-12
External arming, 5-17; 5-20
External Time base, 6-4
Fall Time, 4-8; 10-7
Filter, 5-14

Index
14
14-5
Filter characterization, 4-10
Filter Frequency, 5-15
Fixed Hysteresis, 5-10
FM measurements, 9-6
Free Run, 2-18; 5-17
Freeze Auto Trigger Levels, 5-10
Freeze Result, 2-4
Freeze the Display, 2-18
Frequency, 10-8; 11-2
Frequency (Hz), 4-5
Frequency Deviation, 9-6
Frequency in Burst, 10-8
Frequency in Burst ,
Frequency Limit
Auto Trigger, 5-9
Frequency Ratio, 4-5; 10-11; 11-4
Front Panel Keys, 2-3
full charge, 1-10
Gate Open Signal, 6-6
Gate Time. See Measuring Time
Gated by Time
Totalize, 4-14
Generating a Pulse Signal on Output, 3-3
Graph Scale, 7-9
Graticule. See Grid
Grid, 6-5
Guarantee Statement, iv
Help. See Info
HF input, 1-7
HF sampling, 7-7; 10-3
High-Pass Filter, 5-12
Hint, 6-7

164 Users Manual
14-6
Hold Off, 2-8; 5-22
Time, 5-22
Hold/Run, 2-18; 4-13; 5-19
Key, 2-4
Hold-Off, 11-6
Holster, 1-8
Horizontal deflection, 11-10
Horizontal Sampling, 10-3; 11-9
Horizontally Oriented Menus, 2-10
Hysteresis, 5-5; 5-10
Hysteresis Band, 2-5
Hz, 4-3
,
, 1-4
Identification, 1-7
If In Doubt About Safety, ii
Impedance, 5-7; 11-12
Incoming Inspection, 1-6
Increase the Resolution, 4-7
INFO, 11-14
Info, 2-4
Info Banner, 2-5
Info key, 2-16
Initiate New Measurement/Waveform, 2-4
Input Amplifier, 5-6
Input Impedance, 5-7
Input Trigger, 5-1
Key, 2-4
Input voltage, maximum, 11-12
Input-A, 5-3; 5-5; 11-11
Trigger Slope, 5-11
Input-B, 5-3; 5-5; 11-11

Index
14
14-7
Trigger Slope, 5-11
Input-C, 11-12
Waveform, 7-2
Installation, 1-6
Intensity of Backlight, 2-4
Interactive level control, 2-8
Interface
Optical Serial, 1-5
Interface Cable. See Option 23/80
Interface ,
Internal Battery Pack, 1-9
Internal or External Time base, 6-4
Introduction, 1-1
Jitter, 9-2; 9-4; 9-5
K Constant, 6-7
Keypad, 2-11
L Constant, 6-7
Large Digits, 2-14
Lethal voltages, 5-8
LF sampling, 7-7; 10-3
List Boxes, 2-10
Low Pass Filter, 11-12
Low-pass, Filter, 5-14
Manual Arming, 5-17; 5-19
Manual Hold/Run, 4-13
Manual Hold/Run, 4-13
Manual Measurement Trigger, 5-19
Manual trigger setting, 11-11
Math, 6-7
Math (Scaling & Offset) , 6-7
Mathematical expressions, 6-2
Mathematics, 11-14

164 Users Manual
14-8
Max/Min, 2-3; 9-4
Maximum input voltage, 11-12
Mean, 2-3; 9-5
Measure Function, 4-1; 7-12
Key, 2-4
Measurement Trigger, 2-4; 2-8; 5-17
Measurement Uncertainty (2 σ), 11-23
Measuring Channel Selection, 5-3
Measuring Time, 4-7; 5-24; 11-6
Mechanical Data, 11-16
Memory
Clearing, 2-20
Protecting, 2-20
Recalling, 2-19
Saving, 2-19
Modulation Frequency, 9-6
MORE ?, 2-16
More Functions, 4-15
Moving the Cursor, 2-9
Multiple Parameter Display, 11-8
Mutually exclusive muttons
Radio Buttons. Se
Name Strip, 1-7
Negative Duty Cycle, 4-15; 10-11
Negative Pulse Width, 4-8
Ni-Cd Battery, 1-9
NO TRIG, 5-10
Noise
Avoiding, 1-9
Note, 1-9; 1-10; 2-5; 2-20; 3-7; 4-9; 4-11; 5-10; 5-11; 5-21; 5-22; 7-2; 7-10; 8-3; 12-2
Numerical Display, 8-4
Numerical Entries, 2-11

Index
14
14-9
Numerical Values. See Values
Offset, 6-7
On Screen Controls, 2-9
ON/OFF key, 2-3; 2-4
Optical Serial Interface, 1-5
Options Included, 1-7
Ordering Information, 11-24
Oscillator, calibration, 12-4
Oscilloscope, 7-1
Output, 3-3; 6-2; 6-6; 11-13
Oven, 1-7; 12-4
Oven Controlled X-tal Oscillator, 1-7
PADs, 5-7
Password. See Adjust Access Code
PC
Connecting to, 6-8
Peak Voltage, 11-7
Peak-to-Peak Jitter, 9-5
Peak-to-Peak Voltage. See Vp-p
Period, 10-8; 11-3
Period & Time (s), 4-7
Period (Average), 4-7
Period (Single), 4-7
Period Average, 10-8
Phase, 10-10; 11-5
Phase (°), 4-9
Phase Group, 3-11; 4-10
Option 23/80, 6-8
Option 23/86, 1-9
Positive Duty Cycle, 4-15; 10-11
Positive Pulse Width, 4-8; 10-5
Post-trigger area, 7-5

164 Users Manual
14-10
Power Adapter, 1-7; 1-9
Power Connections., 1-9
Power On, 2-3
Power Supply, 11-16
Powering the Instrument, 1-9
Presentation Mode Keys, 2-3
Presentation Modes, 11-2
Preset, 2-15
Pretrigger, 2-5
Pre-trigger area, 7-5
Primary Channel, 5-3
Primary Parameter, 2-14; 3-7; 3-9; 4-4
Probe Adjustment Signal, 6-6
Product Features and Use, 1-3
Program Version, 6-2; 6-10
Programming Instructions, 1-5
Protecting Memory 6 to 10, 2-20
Pulse Width, 3-17; 4-8; 10-5; 11-4
Pulses/Revolution, 4-15
Pulse-signal characterization, 4-4
Quality and maintenance, 11-15
Quick Charge, 1-10
Quick menu, 2-8
Quick Start, 2-2
Radio Buttons, 2-12
Range
Voltage, 5-8
Ratio, 4-10
Recall Default Setup, 2-21
Recall Instrument Setup, 2-4
Recall Last Power Off Settings, 2-21
Recalling a Saved Setup, 2-19

Index
14
14-11
RECALLING A SCREEN COPY, 2-21
Rechargeable Battery, 1-9
Reciprocal, 5-17
Reciprocal Counting, 5-17
Relationship Between two Signals, 3-11
Replacing the Batteries, 12-2
Reset the Measurement Results, 2-4
Resolution, 4-4; 5-24; 11-11
Increasing, 9-5
Trigger Level, 5-8
Restart, 2-18; 5-19
Restart, 2-4
Return to previous setting, 2-4
Revolutions per Minute, 4-15
Rise & Fall
Trigger Levels, 5-9
Rise Time, 4-8; 10-6
Rise/Fall Time, 11-4
RMS Jitter, 9-5
RPM, 3-10; 4-15; 10-8; 11-4
RS232, 11-13
RS-232. See Optical Serial Interface
Run. See Hold/Run
s, 4-3
Safety, 11-16
Safety Precautions, i
Sample Size, 9-4
Sampling Mode, 7-7
SAVE / RECALL, 11-14
Save Instrument Setup, 2-4
Save/Recall, 2-19
Key, 2-4

164 Users Manual
14-12
SAVING A SCREEN COPY, 2-20
Saving a Setup, 2-19
Scaling, 6-7
Scope, 7-1
Scope Display Settings, 7-7
Scope Grid, 6-5
Scope Settings, 2-8
Scope Trace, 6-2; 6-5
Screen Copy
Save, 2-19
Secondary Channel, 5-3
Select, 2-9
Key, 2-4
Select as Primary Parameter, 2-14
Select Parameter( s) to Measure, 4-2
Selecting Functions, 4-3
Selecting Measuring Channel, 5-3
Self Tests, 6-2
Sensitivity. See Hysteresis
Serial Interface, 1-5; 6-2
Set Up the Instrument Automatically. See Auto Set
Settings
At Power On, 2-3
Setup Menu Keys, 2-4
Signal Characterization, 2-4; 8-5
Signal Type, 4-4
Sine group. Se
Sine-signal characterization, 4-4
Sinewave Signal Characterization, 3-4
Single Function, 2-4
Single Function Measurement, 3-10
Single Functions, 4-3

Index
14
14-13
Single Period, 4-7; 10-8
Single Shot, 3-16
Single waveform display, 7-4
Single-Shot, 5-19
Slope, 5-11
Specifications, 11-1
Standard Deviation, 2-3; 9-5
Start and Stop Measurements, 5-17
Start Conditions, 5-18
Start with Default Settings, 3-3
Start/Stop Trigger Error, 11-22
Statistics, 2-3; 9-1; 11-14
Statistics
Auto Trigger, 5-9
STATISTICS mode
Screen, 2-7
Status Information, 2-8
Stop Conditions, 5-18
Switch On, 2-3
Symbols, i
Synchronize
Measurement, 5-17
Table of Contents, iii
Termination, 5-7
Test and Adjustment, 6-9
Test signals output, 11-13
The Statistics Screen, 9-3
The Values Screen, 8-4
The Waveform Screen, 7-4
Tilt Stand, 1-8

164 Users Manual
14-14
Time Base, 1-7
Adjustment, 6-9
Internal/External, 6-4
Time Base Stability, 11-22
Time Interval, 3-14; 4-9; 11-4
Time Interval Measurements, 10-5
Time/Division, 2-8; 7-6; 7-8
Timer / Counter Functions, 11-2
TIMER/COUNTER MEASUREMENT UNCERTAINTY, 11-17
Totalize (Counts), 4-13
Totalize with external control, 11-5
Totalize with manual control, 11-5
T-Piece, 3-3
Trace, 7-5
Trace Trigger, 2-8
Transducer Factor
RPM, 4-15
Transition Time. See Rise/Fall Time
Transitional sampling
Vertical sampling. See
Trigger
Measurement, 5-17
Trigger Control, 11-6
Trigger hysteresis, 11-11
Trigger Indicators, 5-10
Trigger Level, 3-15; 5-5
Manual, 5-10
Trigger Level & Hysteresis, 5-5
Trigger Level Timing Error, 11-22
Trigger Manually, 5-19
Trigger Slope, 5-11
Trimming

Index
14
14-15
With MultiFunction Counter, 6-7
True-RMS Voltage, 11-7
Turning On, 2-3
Tutorial, 2-17; 3-1
Two Channel Measurements, 5-3
Uncertainty calculation formulas, 11-20
Uncertainty examples, 11-17
Understanding your MultiFunction Counter, 10-1
Undo, 2-4
Undo key, 2-16
Unpacking and first installation, 1-6
Unpacking and Incoming Inspection, 1-6
User Options, 6-1
Key, 2-4
Using the Controls, 2-1
V, 4-3
Values
Presentation Mode, 2-3; 2-6; 2-14; 3-5; 4-11; 9-4
VALUES mode, 3-2
Screen, 2-6
Values Presentation Mode, 8-2
Values Screen, 3-7
Warning, 1-10; 5-7; 5-8; 13-2; i; ii
Waveform, 2-3; 2-5; 2-8; 2-21; 3-2; 3-6; 3-8; 3-10; 3-13; 4-7; 4-11; 5-9; 5-11; 5-13; 5-14; 5-20; 7-1; 7-2; 7-3; 7-5; 7-8; 7-9; 10-3; 10-4
1 to 20 Hz, 7-2
Waveform (Scope) Triggering, 11-10
Waveform Display Function, 11-9
WAVEFORM mode screen, 2-5
Waveform Trigger:, 2-5
Vdc, 4-11; 10-4
Vertical deflection, 11-10
Vertical Sampling, 10-3; 11-9

164 Users Manual
14-16
Why Statistics, 9-4
Vmax, 4-12
Vmin, 4-12
Voltage
Adjusting Reference, 6-9
Voltage (V), 4-11
Voltage Functions, 11-7
Voltage Peak Measurements, 10-9
Voltage Range, 5-8; 7-9
Voltage Reference calibration, 12-4
Voltage sequential sampling, 11-9
Vp-p, 4-11
Write Protect Memory, 2-20
Vrms, 10-4
Vrms ac, 4-11
Vrms ac+ dc, 4-11
X scale, 2-5
X1/X10 Attenuator, 5-8
X-Scale, 7-8
Y scale, 2-5
Y-Scale, 7-9