A comparison of nearest neighbours, discriminant and logit models for auditing decisions

1410 IEEE TRANSACTIONS ON BIOMEDICAL ENGINEERING, VOL. 57, NO. 6, JUNE 2010
Orthogonal Fuzzy Neighborhood DiscriminantAnalysis for Multifunction Myoelectric
Hand ControlRami N. Khushaba∗, Ahmed Al-Ani, and Adel Al-Jumaily, Member, IEEE
Abstract—Developing accurate and powerful electromyogram(EMG) driven prostheses controllers that can provide the amputeeswith effective control on their artificial limbs, has been the focusof a great deal of research in the past few years. One of the majorchallenges in such research is extracting an informative subset offeatures that can best discriminate between the different forearmmovements. In this paper, a new dimensionality reduction method,referred to as orthogonal fuzzy neighborhood discriminant analy-sis (OFNDA), is proposed as a response to such a challenge. Unlikeexisting attempts in fuzzy linear discriminant analysis, the objec-tive of the proposed OFNDA is to minimize the distance betweensamples that belong to the same class and maximize the distance be-tween the centers of different classes, while taking into account thecontribution of the samples to the different classes. The proposedOFNDA is validated on EMG datasets collected from seven sub-jects performing a range of 5 to 10 classes of forearm movements.Practical results indicate the significance of OFNDA in comparisonto many other feature projection methods (including locality pre-serving and uncorrelated variants of discriminant analysis) withaccuracies ranging from 97.66% to 87.84% for 5 to 10 classes ofmovements, respectively, using only two EMG electrodes.
Index Terms—Feature extraction, fuzzy discriminant analysis(FDA), myoelectric control, pattern recognition.
I. INTRODUCTION
ONE of the approaches for restoring the missing function-ality of the amputated limbs involves the utilization of the
electromyogram (EMG) signal collected from the human mus-cles as an input for the controller of a multifunction poweredprosthetic device. In such an approach, the EMG signal is ac-quired from the muscles remnant at the amputation site and fedto the controller of the prosthesis, after being processed with theappropriate methods. This approach forms an advanced humanmachine interaction (HMI) scheme in which the human inten-tions of control, embedded in the EMG signal, are utilized toprovide the amputees with intuitive control over their prostheticlimbs. Advances in EMG studies revealed that there are distinctdifferences in the temporal structure associated with differentkinds of the arm movements [1]. Thus, a pattern recognition
Manuscript received August 1, 2009; revised October 15, 2009, November21, 2009, and December 2, 2009; accepted December 11, 2009. Date of publica-tion February 17, 2010; date of current version May 14, 2010. Asterisk indicatescorresponding author.
∗R. N. Khushaba is with the Faculty of Engineering and Information Tech-nology, University of Technology Sydney, N.S.W. 2007, Australia (e-mail:[email protected]).
A. Al-Ani and A. Al-Jumaily are with the Faculty of Engineering and Infor-mation Technology, University of Technology Sydney, N.S.W. 2007, Australia(e-mail: [email protected]; [email protected]).
Digital Object Identifier 10.1109/TBME.2009.2039480
approach has been utilized in the literature to discriminate be-tween the different arm movements.
One of the most important factors that may limit the clini-cal availability of the EMG pattern-recognition-based prostheticdevices, is the inadequate controllability that is perceived by theuser, i.e., the lack of intuitive and dexterous control [2]. Sincethe remaining muscles after amputation under the recordingsites are physiologically appropriate or relevant to the intendedclasses of movement, then the challenge here will be to accu-rately and rapidly process the EMG signals (acquired from thesemuscles) to decipher, which motion is being performed basedon the current pattern of EMG signals. Parker et al. [2] reportedthat the current knowledge representation methods lack the ro-bustness in processing of the input (the EMG signal) to extractthe most important information required to specify the output(joint-space kinematics). In the pattern recognition framework,knowledge representation refers to feature extraction and/or di-mensionality reduction. Feature extraction is defined as the pro-cess of converting patterns to a compact and informative setof features [3]. Despite the fact that a wide variety of featureextraction techniques was utilized in the literature within themyoelectric control problem [4], recent studies have found thata combination of Hudgin’s time domain (TD) features and theautoregressive (AR) features can achieve good classification ac-curacies while being computationally efficient [5], [6].
Due to the fact that a multichannel approach is usually uti-lized to capture motor information from different muscles, theextracted feature vector size can become very large. Hence, adimensionality reduction method is needed to identify an in-formative, yet small size feature set that can best discriminatebetween the different classes of the problem. Additionally, theuse of a dimensionality reduction method can also help in reduc-ing the total time of classification, especially, in problems withlarge number of channels (and thus large number of features).Feature set dimensionality can be reduced using either featureselection (FS) or feature projection (FP) methods. An impor-tant factor that limits the applicability of FS methods to EMGclassification problems is caused by the large variance of theEMG signal [7]. In situations, when the information is liberallydispersed among the original feature set, FS algorithms cannotprovide powerful performance. On the other hand, projection-based methods can consolidate this information more effectivelythan selection-based methods [8].
Englehart revealed that a combination of wavelet-packet-transform-based features and principal component analysis(PCA), a well-known FP method, could give good results [9]. A
0018-9294/$26.00 © 2010 IEEE

KHUSHABA et al.: ORTHOGONAL FUZZY NEIGHBORHOOD DISCRIMINANT ANALYSIS 1411
combination of PCA and a self-organizing feature map (SOFM)is another FP method applied to myoelectric control that wasreported to produce better performance that PCA alone [10](although being of much higher computational cost). Lineardiscriminant analysis (LDA) based FP and its variants like theuncorrelated LDA (ULDA) also proved to produce very encour-aging results in myoelectric control [7], [11]. However, each oneof these methods has its own limitations, as will be described inthe next section.
In order to address the limitations of existing LDA-based FPmethods, this paper presents a new fuzzy LDA (FLDA) method,which we referred to as orthogonal fuzzy neighborhood dis-criminant analysis (OFNDA). The proposed method introducesthe concept of neighborhood preserving into fuzzy discriminantanalysis (FDA) through a theoretically justified approach. Theproposed method will be used to generate a small subset of fea-tures that maximally extract the information embedded withinthe EMG signal, thus enhancing the performance of an EMGdriven prosthesis controller.
The structure of this paper is as follows. Section II presentsa description of discriminant-analysis-based FP methods.Section III presents the proposed technique. Section IV presentsthe experimental results, and finally a conclusion is given inSection V.
II. DISCRIMINANT ANALYSIS BASED PROJECTION METHODS
Feature set dimensionality reduction via discriminant analysisis one of the most sought after approaches in many applications.In its simplest implementation, classical LDA aims to maximizethe ratio of the determinant of the between-class scatter matrix ofthe projected samples to the determinant of the within-class scat-ter matrix of the projected samples [12]. A variation of Fisher’sclassical LDA is the FLDA that emerged as a classification tool,proving to present better performance than LDA in certain prob-lems [13]. The goal of FLDA is to determine the linear discrim-inant function that provides the maximum separation of fuzzygroups in a real space. Although the initial work on FLDA datesback to 1986 [13], there were only few attempts in the literatureto propose variations to the original FLDA. Chen et al. [14] pro-posed an approach that utilizes the k-nearest neighbor (kNN)rule to estimate the memberships required in FLDA and appliedit to chemical datasets. The authors mentioned explicitly thatseveral runs should be made in order to decide the best value ofk and the other membership parameter utilized in their approach.A different approach in estimating the FLDA memberships us-ing the kNN rule was proposed by Kwak and Pedrycz [15].The main difference between the two FLDA versions describedin [14] and [15] is that a preprocessing step employing PCAis utilized by the latter. This in turn forms a fuzzy variation toclassical subspace LDA [16]. It is generally known, from the lit-erature, that the limitation of this approach is that the applicationof PCA may lead to losing useful information as the PCA + LDAapproach keeps only a certain number of principal componentsin the PCA step to make the within-class scatter matrix (SW )nonsingular. In another attempt and inspired by fuzzy supportvector machine principles, the memberships of FLDA were first
estimated, then a kernel technique was introduced to performthe nonlinear mapping [17]. The experimental results by Wuand Zhou [17] proved that the kernel-based FDA (KFDA) canachieve better performance than FLDA, but it required highercomputational cost due to the use of the kernel matrices.
A limitation to both classical LDA and FLDA is that they donot pay attention to the decorrelation of data. Hence, they maynot always give the best results, especially, when the datasetscontain a large degree of information redundancy. If there isa high degree of redundancy among features, then SW willbe singular, and thus, both LDA and FLDA will fail. In or-der to overcome this limitations, Ye et al. [18] proposed theULDA. ULDA employs the generalized singular value decom-position (GSVD) method to handle undersampled data and thefeatures that it produces in the transformed space are uncorre-lated. Ye further generalized the ULDA to an orthogonal LDA(OLDA) [19]. The features in the reduced space of ULDA areuncorrelated, while the discriminant vectors of OLDA are or-thogonal to each other. Although the performance of many ofthese algorithm is very acceptable, but it was reported by Caiet al. [20] that all of the above algorithms involves the SVDof the data matrix, which is computationally expensive in bothtime and memory when computing the projection matrix forhigh-dimensional large scale datasets in the training phase. TheSVD is considered as an extension of eigenvalue decompositionfor nonsquare matrices, and is mostly used to avoid the singu-larity problem that LDA and FLDA face with the undersampledproblems. The undersampled problem refers to the situation inwhich the number of samples (l) is always smaller than the num-ber of dimensions (n), a problem that is unlikely to occur withEMG control. Due to the fact that for a centered data matrix(one in which each dimension has been adjusted to have a zeromean), the application of both PCA and SVD can give similarresults, thus we opt to use PCA as an alternative to SVD. Thisis justified because PCA is reported in the literature as beingcomputationally less expensive than SVD [20], [21]. Thus, theapplication of PCA, in EMG control can save computationalcost in the training phase, while for the testing phase the newdata is only multiplied by the precomputed projection matrix(this is in turn valid for both PCA and SVD).
The next section presents our proposed FLDA-based methodthat in addition to using the memberships of samples in thedifferent classes, it also focuses on minimizing the distancebetween the samples of the same class while increasing thedistance between centers of different classes.
III. ORTHOGONAL FUZZY NEIGHBORHOOD
DISCRIMINANT ANALYSIS
In the first step of the proposed method, the data is prepro-cessed by applying PCA. The goal here is to remove any possi-ble redundancy that can make SW singular, before starting thediscriminant analysis. In such a step, we simply keep all the prin-cipal components to avoid any information loss. In comparisonwith the known PCA + LDA approach from the literature, thePCA + LDA removes certain principal components, and thus,loses information [22]. In the PCA stage, the transformation

1412 IEEE TRANSACTIONS ON BIOMEDICAL ENGINEERING, VOL. 57, NO. 6, JUNE 2010
matrix related to PCA denoted as GPCA is simply obtained byapplying the eigen decomposition on the covariance matrix ofthe input. For the FNDA stage, the first task will be to computethe membership values of the samples in all of the classes.
Given the universal set X = {x1 ,x2 , . . . ,xl}, where xk isa feature vector, k = 1, 2, . . . , l is the number of samples. Forsimplicity, it will be useful to describe the membership degreethat the kth data point has in the ith class with the followingnotation:
µik = µi(xk ) ∈ [0, 1]. (1)
In order to estimate the required fuzzy memberships, there aremany methods in the literature that can be utilized. Examplesinclude the kNN approach for membership estimation employedin [14] and the well-known fuzzy C-means (FCM) algorithmfrom the literature [23]. Due to the fact that the kNN approachrequires more computational cost than the FCM algorithm, thena typical choice would be to use FCM. Despite of its wideapplication and simplicity, the FCM algorithm suffers from thesingularity problem when the sample value equals the clustercenter value. Thus, a more robust measure for estimating thefuzzy memberships is proposed first, which in addition to itscapability of overcoming the singularity problem, includes aregularization step to identify outliers and reduce their effecton memberships’ estimation. Then, the proposed regularizedobjective function to determine the fuzzy partition matrix U forgrouping a collection of l data points into c classes is given asfollows:
Jm (U, v) =l∑
k=1
c∑i=1
µmik exp
(|xk − vi |
ηi/3
)2
− λ
c∑i=1
l∑k=1
(µik − 1) (2)
where µik is the membership grade of the kth sample in the ithclass, |.| is the Euclidean distance, λ is the Lagrange multiplier,m is the fuzzification parameter, vi is the mean of the input databelonging to class i, that is vi =
∑k∈Ai
xk/Ni , Ai is the setof indexes of the training patterns belonging to class i, Ni isthe number of training patterns that belong to class i, and ηi arechosen as the radius of each class, these are given as follows:
ηi = max |xk − vi | , k = 1, 2, 3, . . . , l. (3)
The minimum of Jm (U, v) is obtained by taking the derivativewith respect to µik and equating it with 0, thus, we obtain
∂ (Jm (U, v))∂µik
= mµm−1ik exp
(|xk − vi |
ηi/3
)2
− λ = 0 (4)
hence
µik =(
λ
m
)1/(m−1) 1
exp (|xk − vi |/(ηi/3))2/(m−1) . (5)
Taking into account the identity constraint∑c
j=1 µjk = 1,we have(
λ
m
)1/(m−1) c∑j=1
1
exp (|xk − vj |(ηj/3))2/(m−1) = 1. (6)
Thus, we can determine the Lagrange multiplier λ to be
(λ
m
)1/(m−1)
=1∑c
j=1 1/(exp (|xk − vj |/(ηj/3)))2/(m−1) .
(7)Next, by inserting the aforementioned expression into (5)
yields (8), as shown at the bottom of this page.Equation (8) is employed to compute the membership grade
of each sample in all classes. Then for each sample xk , thememberships in all of the classes are normalized by makingthem sum up to 1. The computation of the proposed FNDA isexplained next.
A. Fuzzy Neighborhood Discriminant Analysis
In this section, a new dimensionality reduction method is de-scribed that is considered as a novel variation to FLDA. FLDAis a well-known data-analytic tool for studying the class rela-tionship between data points, but a major disadvantage of FLDAis that it fails to discover the local geometrical structure of thedata points. It has been shown in the literature that in manycases the local structure is generally more important than globalstructure for discriminant analysis [24]–[26]. Also preservingthe local structure maximizes the margin between data pointsfrom different classes at each local area. Specifically, a new FPmethod is proposed in which the data points are mapped intoa subspace in which the nearby points with the same label areclose to each other, while the nearby points with different labelsare far apart.
The description of the proposed FNDA proceeds with thefuzzy within-class scatter matrix given as follows:
SW =c∑
i=1
li∑k=1
µik (xk − vi) (xk − vi)T (9)
where µik is the membership of pattern k in class i, xk is thekth sample, and vi is the mean of the patterns that belong toclass i
vi =∑li
k=1 µikxk∑lik=1 µik
. (10)
We proceed with the modification of the within-class scattermatrix starting from (9) as follows:
SW =c∑
i=1
li∑k=1
µik
(xkxT
k − vixTk − xkvT
i + vivTi
)(11)
µik =1∑c
j=1 (exp (|xk − vi |/(ηi/3))/(exp (|xk − vj |/(ηj/3))))2/m−1 (8)

KHUSHABA et al.: ORTHOGONAL FUZZY NEIGHBORHOOD DISCRIMINANT ANALYSIS 1413
SW =c∑
i=1
[li∑
k=1
µikxkxTk − vi
li∑k=1
µikxTk
− vTi
li∑k=1
µikxk + vivTi
li∑k=1
µik
]. (12)
Using (10), we replace∑li
k=1 µikxTk with vT
i
∑lik=1 µik , and∑li
k=1 µikxk with vi
∑lik=1 µik . Thus, (12) can be rewritten as
follows:
SW =c∑
i=1
[li∑
k=1
µikxkxTk − vivT
i
li∑k=1
µik
]. (13)
Using (10) again, we replace both vi and vTi with their equiv-
alent, thus the aforementioned equation turns into
SW =c∑
i=1
[li∑
k=1
µikxkxTk − 1∑li
j=1 µij
(li∑
k=1
µikxk
)
(li∑
j=1
µijxTj
)]. (14)
Then if we get 1/∑li
j=1 µij out as a common factor, we get
SW =c∑
i=1
1∑lij=1 µij
[li∑
j=1
µij
li∑k=1
µikxkxTk
−li∑
k=1
µikxk
li∑j=1
µijxTj − 1
2
li∑j=1
µij
li∑k=1
µikxkxTk
+12
li∑k=1
µik
li∑j=1
µijxjxTj
]. (15)
Then by using some of the mathematical series identities, theaforementioned equation simplifies to
SW =c∑
i=1
1
2∑li
j=1 µij
[li∑
j=1
µij
li∑k=1
µikxkxTk − 2
li∑k=1
µikxk
li∑j=1
µijxTj +
li∑k=1
µik
li∑j=1
µijxjxTj
]. (16)
Then by organizing the aforementioned equation, we get
SW
=c∑
i=1
1
2∑li
j=1 µij
li∑k=1
li∑j=1
µikµij
[xkxT
k − 2xkxTj + xjxT
j
].
(17)
The aforementioned within-class scatter matrix can be ex-pressed as follows:
SW =c∑
i=1
1
2∑li
j=1 µij
li∑k=1
li∑j=1
µikµij (xk − xj ) (xk − xj )T .
(18)
Thus, (18) indicates that the objective of the new SW is tominimize the distance between samples of the same class whenprojecting them, thus preserving the neighborhood. Addition-ally, in a similar manner to FLDA, the proposed new SW alsoincorporates the membership values, thus considering the sam-ples contribution in the class when preserving their distances.
According to He et al. [27], based on the strong law of largenumbers the aforementioned equation can be further simplifiedinto one that employs matrices multiplications rather than usingsummations.
In order to simplify the aforementioned equation and thesubsequent equations, we provide the following two definitions.
Definition 1: Bi is the fuzzy amount of elements in fuzzy classci , this is equal to the summation of the membership values ofthe samples that belong to class ci in the same class, and is givenby
Bi =li∑
k=1
µik . (19)
Definition 2: N is the fuzzy amount of elements in all fuzzyclasses, and this is given by
N =c∑
i=1
Bi. (20)
If we replace µikµij in (18) by Ukj and given that we alreadyhave the exterior sum in terms of i, then
SW =c∑
i=1
12Bi
li∑k=1
li∑j=1
(xk − xj ) (xk − xj )T Ukj (21)
SW =c∑
i=1
12Bi
li∑k,j
(xk − xj ) (xk − xj )T Ukj (22)
SW =c∑
i=1
12Bi
(li∑
k,j
xkxTk Ukj +
li∑k,j
xjxTj Ukj
−li∑
k,j
xkxTj Ukj −
li∑k,j
xjxTk Ukj
)(23)
SW =c∑
i=1
22Bi
(li∑k
xkxTk Dkk −
li∑k,j
xkxTj Ukj
)(24)
SW =c∑
i=1
1Bi
(XiDXT
i − XiUXTi
)(25)
SW =c∑
i=1
1Bi
(XiL1XT
i
)(26)
where L1 = D − U is derived in the same manner as theLaplacian matrix in [27]. D is a diagonal matrix; its entriesare column sums of U (or row sums, since U is symmetric),Dkk =
∑k Ukj . Xi is a matrix that contains the samples of the
ith class, where the kth column of matrix Xi is xk .Now in a similar approach to the derivation of SW , we derive
the between-class scatter matrix starting with the fuzzy version
1414 IEEE TRANSACTIONS ON BIOMEDICAL ENGINEERING, VOL. 57, NO. 6, JUNE 2010
of SB
SB =c∑
i=1
li∑k=1
µik (vi − x) (vi − x)T (27)
where x is the mean of the training samples, this is in turn givenas follows:
x =∑c
i=1∑li
k=1 µikxk∑ci=1
∑lik=1 µik
. (28)
The between-class scatter matrix represented by (27) can beexpressed as follows:
SB =1
2N
c∑i=1
c∑j=1
BiBj (vi − vj ) (vi − vj )T . (29)
The aforementioned equation can be also written in termsof matrices multiplications using the same approach employedwith SW . If we simply replace BiBj with Bij , then
SB =1
2N
c∑i=1
c∑j=1
Bij (vi − vj )(vi − vj )T (30)
SB
=1
2N
(c∑
i,j=1
BijvivTi − 2
c∑i,j=1
vivjBij +c∑
i,j=1
vjvTj Bij
)T
(31)
SB =2
2N
(c∑
i,j=1
BijvivTi −
c∑i,j=1
vivjBij
)(32)
SB =1N
(c∑
i=1
vivTi Eii −
c∑i,j=1
vivjBij
)(33)
SB =1N
(VEVT − VBVT ) (34)
SB =1N
VL2VT (35)
where L2 = E − B and E is a diagonal matrix; its entriesare column (or row, since B is symmetric) sums of B, Eii =∑
i Bij . The ith column of matrix V is Vi .Using the new representation of the scatter matrices given by
(26) and (35), we can simply employ to find the transformationmatrix GFNDA related to FNDA as follows:
GFNDA = arg maxG
trace
(GT SB GGT SW G
). (36)
In order to get the complete transformation matrix G, wesimply multiply GFNDA by the transformation matrix from thePCA stage GPCA . Then a QR-decomposition is applied on theresultant matrix to acquire a new transformation matrix Q, thatis G = QR. In such an equation, R is an upper triangular matrix
and Q is an orthogonal matrix, i.e., one satisfying QT Q = I,where QT is the transpose of Q and I is the identity matrix.Finally, the resultant transformation matrix for the proposedtwo stages algorithm is GOFNDA = Q.
The proposed OFNDA provides many interesting features thata good FP method should exhibit. First, it provides an orthogo-nal projection matrix without the use of SVD, unlike OLDA [18]that is based on SVD. This is due to the fact that an eigen de-composition is employed in both stages of the proposed method.Secondly, the proposed OFNDA is also capable of preservingthe local structure of the within-class samples, thus sharinga similar property with the neighborhood preserving embed-ding (NPE) [24] and locality preserving projection (LPP) [25].Thirdly, like NPE and LPP methods, the proposed OFNDA canbase its calculations on computing the distance between eachof the samples and its kNNs, thus reducing the computationalcost required to compute the distance between each sample andall other samples. In addition to this, the method also takes therelation between the samples and the classes into considerationby introducing the memberships of the samples in the classeswithin the new scatter matrices, thus sharing a similar propertywith FLDA [13]. Additionally, the locality preserving characterof the proposed OFNDA makes it relatively insensitive to out-liers and noise, and as a result the proposed method implicitlyemphasizes the natural clusters in the data. Finally, the pro-posed method is different from PCA, which aims at preservingthe global Euclidean structure, where this global nature mightlead PCA to miss the local clusters structures. In comparison,the proposed OFNDA can find a subspace, which well preservesthe local clusters structures in the data, and thus, it can also beused to perform dimensionality reduction for clustering in fewerdimensions.
IV. EXPERIMENTS AND PRACTICAL RESULTS
The EMG dataset utilized in this paper was collected bythe authors for the purpose of this research. The dataset wasrecorded using two EMG channels and processed by the My-oTrac Infinity encoder from Thought Technology Ltd. with asampling rate of 2048 samples/s. Two bipolar electrodes wereplaced on the human forearm, where the type of the electrodeswas the T3404 single strip electrodes that are separated beforeuse. These are provided with the encoder and used with anextender cable after attaching two DIN-to-Snap adaptors. Theposition of these electrodes are shown in Fig. 1. There are tenclasses of the forearm movement in this dataset. These are sum-marized here as: wrist flexion (WF), wrist extension (WE), handclose (HC), hand open (HO), forearm pronation (FP), forearmsupination (FS), key grip (KG), chuck grip (CG), radial devi-ation (RD), and finally ulnar deviation (UD). Seven subjectsparticipated in the data collection process, none of these sub-jects had any training on such a device before the time of theexperiment. When collecting the data, the subjects were askedto produce each of the ten specific movements with a mod-erate constant force, and hold that movement for a period of25 s in each trial. There were six trials or repetitions of each

KHUSHABA et al.: ORTHOGONAL FUZZY NEIGHBORHOOD DISCRIMINANT ANALYSIS 1415
Fig. 1. Bipolar electrodes placement on the right forearm. (a) Position of firstelectrode pair. (b) Position of second electrode pair.
movement, thus generating a good amount of data to test thesystem generalization capability.
In order to present a fair evaluation of the proposed OFNDA,some of the well-known LDA variants are included in the ex-periments. Details of the experiments carried out are listed asfollows.
1) Comparison with other methods: The proposed OFNDAwill be compared against two groups of other techniques:the first group includes methods that have already beenapplied into myoelectric control like ULDA and PCA.The second group include techniques that were not usedwithin the myoelectric control systems, like FDA (referredto in this section as FLDA) [17]. We also included in thecomparison the NPE [24] and LPP [27], since both NPEand LPP proved to be powerful, neighborhood preserving,and FP techniques in comparison to LDA and its variants.
2) Type of classifier employed: Two classifiers are used to testthe performance of the proposed OFNDA, namely a linearversion of SVM, referred to as the LIBLINEAR clas-sifier, acquired from http://www.csie.ntu.edu.tw/∼cjlin/liblinear/ and a multilayer perceptron (MLP) trained withbackpropagation.
3) Testing method employed: The general testing scheme em-ployed is a three way data split. Although such a testingscheme is not required with classifiers like LIBLINEAR,but this testing scheme is necessary when using MLP toavoid any possible overfitting. Thus, the testing schemeis fixed across all classifiers. In such a scheme, each ofdatasets utilized is first randomized, and then, dividedinto three sets: training, validation, and testing sets. Aprojection matrix is calculated based on the training set,
Fig. 2. EMG pattern recognition system.
and then, all the data segments (training, validation, andtesting) are multiplied by this projection matrix to achievedimensionality reduction. The classifier then is trained andvalidated (for MLP) to optimize the weights of the hiddenlayers. Finally, a completely unseen testing set is utilizedto measure the generalization capability of the proposedsystem.
The proposed EMG pattern recognition system is shown inFig. 2. The EMG data were collected using only two EMG elec-trodes or channels, this was done in order to reduce the computa-tional requirements for designing a real-time EMG recognitionsystem. A continuous windowing scheme was utilized in whichan analysis window of size 384 samples (384/2048 = 187.5 ms)was incremented by 64 samples (64/2048 = 31.3 ms). Thus,the system would generate an output class decision in less thanthe 300 ms threshold defined in the literature. The total of 300ms delay was avoided in this experiment, as there exists de-bate in the literature about this value [5]. Thus, it was decidedto make the analysis window length as small as possible, i.e.,187.5 ms (smaller values caused a degradation in performance)to prove the accuracy and speed of information processing ofthe proposed system.
Features were extracted from each analysis window by meansof a combination of the first six AR coefficients (six features),the root mean square value (one feature), waveform length (onefeature), mean absolute value (one feature), the sample skewnessof the windowed data (one feature), the slope sign change fea-ture (one feature), number of zero crossings (one feature), andthe integral absolute value (one feature). This in turns forms afeatures set that consist of 13 features per channel, thus for twochannels problem, the total number of features = number ofchannels (2) × number of features/channel (13) = 26 features.This feature set was referred to as TDAR, i.e., the combinationof time-domain (TD) and autoregressive (AR) feature sets.
As a dimensionality reduction step, the performance of theproposed OFNDA was compared with all of the LLP, PCA,ULDA, OLDA, and FLDA. In the final portion of the EMGrecognition system, two classifiers are proposed as possiblecandidates, these are: LIBLINEAR and MLP mentioned ear-lier. Since there were six trials or repetitions of each movement,then one trial was used for training, one other trial for validation,and the remaining four trials were utilized for testing.
The first part of this experiment involves the utilization ofan MLP artificial neural network with 15 hidden layer nodes,which was trained using the backpropagation algorithm and theLIBLINEAR classifiers. This is done in order to check the sig-nificance of utilizing a classifier that is capable of nonlinearlyseparating the different classes, i.e., the MLP in comparison toLIBLINEAR, which as its name implies a linear classifier. The

1416 IEEE TRANSACTIONS ON BIOMEDICAL ENGINEERING, VOL. 57, NO. 6, JUNE 2010
TABLE IDIFFERENT CLASSES OF MOVEMENTS CONSIDERED IN THE EXPERIMENTS
Fig. 3. Classification accuracy with different classifiers.
classification accuracy results were computed using OFNDAand MLP for different problem classes, i.e., 5, 6, 7, 8, 9, and 10.The different classes of movements considered when workingwith less than the total number of classes are shown in Table I.These were selected based on a sequential manner, i.e., remov-ing one class at a time (different classes selection can also bemade here). The plot given in Fig. 3 shows the classificationaccuracy of both LIBLINEAR and MLP, both with featuresprojected with OFNDA. Additionally, no postprocessing stepswere implemented, thus the given results are the actual hit ratesachieved by the classifier.
In order to check the significance of using MLP and testthe hypothesis that the groups of the classification accuracyresults for features projected with OFNDA and classified withtwo different classifiers as not two different from each other, atwo-way analysis of variance (ANOVA) test was utilized withthe significance level being 0.05. The ρ-value was found to beρ = 0.7069, this in turn provides a strong indication that therewas no difference in the accuracies achieved by both classifiers.Thus, both of the linear model provided by LIBLINEAR and thenonlinear model provided by MLP achieved the same results.One advantage for LIBLINEAR over MLP is that it does notrequires any iterative process, thus avoiding the possibility ofoverfitting.
In the next part of this experiment, the classifier type was fixedto LIBLINEAR, as this classifier is much faster than MLP, and itis also implemented in C++ and linked to MATLAB as mex fileimplementation. The performance of all of FP techniques weretested on the extracted TDAR feature set with the LIBLINEARclassifier. In order to give the reader an idea about the capa-bility of a two channel system in separating different forearm
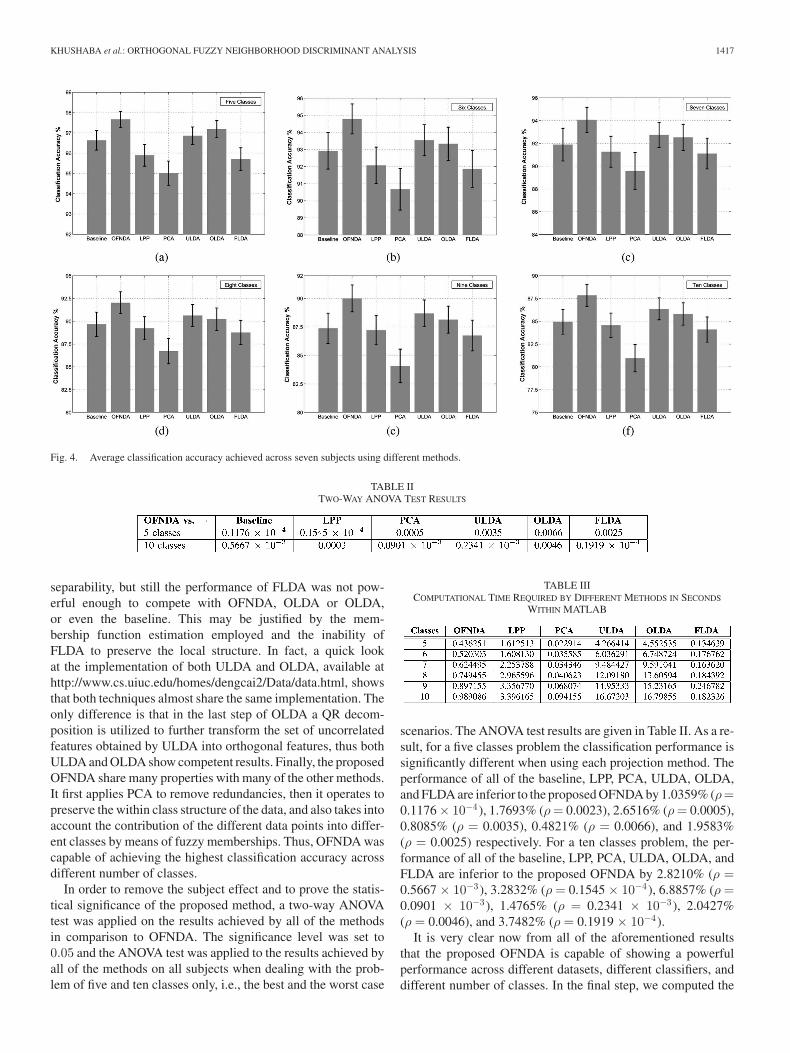
movements, it was decided to again test the system performanceon different number of classes or movements. In simple words,the classification accuracy results (together with the estimatedstandard error) reported in Fig. 4 show the system performancewith the different FP techniques on 5, 6, 7, 8, and 9 separatelyfrom the total ten classes. The number of projected feature wasset to c – 1 for LPP and PCA, while this is the default for allof the OFNDA, OLDA, ULDA, and FLDA. This was done inorder to first provide a fair comparison between the methods,and secondly to check if the generalization of the classifier isachieved by dimensionality reduction or better projection thatleads to good clustering or a mixture of both.
According to the classification accuracy results given inFig. 4, one can clearly categorize the performance of the differ-ent FP techniques into four groups. The first is occupied withOFNDA offering the best performance in terms of the classifi-cation accuracy across different number of classes. The secondgroup is occupied by both ULDA and OLDA, since their perfor-mance is very close to each other, while achieving slightly loweraccuracy than OFNDA (that avoids the use of SVD). The thirdcategory includes both of the LLP and FLDA, both achieve closeresults to each other while showing lower performance than thatof both ULDA and OLDA. The last group includes the PCAthat offered the worse performance across the different numberof classes. The performance of PCA is justified by the fact thatit projects the data along the directions of maximal varianceonly, i.e., it does not take the class label into considerations. Onthe other hand, LPP should be seen as an alternative to PCA.LPP aims at preserving the local neighborhood structure of thehigh-dimensional data that lies on a low-dimensional manifoldembedded in the ambient space, while PCA aims at preservingthe global Euclidean structure [25]. Also LPP shares many of thedata representation properties of nonlinear techniques, such asLaplacian eigenmaps or locally linear embedding, thus offeringbetter performance than PCA.
It is important to mention that the classification results ob-tained using the features projected by LPP and PCA are shownto be worse than that of the baseline (using the total feature setwithout projection). The justification for this behavior is thatboth methods project the original feature set into a new domainor representation with the same number of features as the origi-nal feature set. Thus, the use of smaller number of features, i.e.,c − 1 features does not necessitate providing good classificationaccuracies, as the information in the transformed domain maybe dispersed along some of the remaining dimensions. This inturn results in losing certain information required for classifica-tion, as it is hard to decide the optimal number of features. Onthe other hand, OFNDA, OLDA, and ULDA project the origi-nal feature set into a new domain with only c − 1 dimensions(features), thus dimensionality reduction is embedded in theprojection process. At the same time, the reduced feature setsproduced by these methods proved to present better classifica-tion results than LPP and PCA. In other words, OFNDA, OLDA,and ULDA have the potential to produce better clustering of datawhen using the reduced feature sets.
FLDA on the other hand, projects the fuzzy representa-tions of the data along directions, which maximizes the class
KHUSHABA et al.: ORTHOGONAL FUZZY NEIGHBORHOOD DISCRIMINANT ANALYSIS 1417
Fig. 4. Average classification accuracy achieved across seven subjects using different methods.
TABLE IITWO-WAY ANOVA TEST RESULTS
separability, but still the performance of FLDA was not pow-erful enough to compete with OFNDA, OLDA or OLDA,or even the baseline. This may be justified by the mem-bership function estimation employed and the inability ofFLDA to preserve the local structure. In fact, a quick lookat the implementation of both ULDA and OLDA, available athttp://www.cs.uiuc.edu/homes/dengcai2/Data/data.html, showsthat both techniques almost share the same implementation. Theonly difference is that in the last step of OLDA a QR decom-position is utilized to further transform the set of uncorrelatedfeatures obtained by ULDA into orthogonal features, thus bothULDA and OLDA show competent results. Finally, the proposedOFNDA share many properties with many of the other methods.It first applies PCA to remove redundancies, then it operates topreserve the within class structure of the data, and also takes intoaccount the contribution of the different data points into differ-ent classes by means of fuzzy memberships. Thus, OFNDA wascapable of achieving the highest classification accuracy acrossdifferent number of classes.
In order to remove the subject effect and to prove the statis-tical significance of the proposed method, a two-way ANOVAtest was applied on the results achieved by all of the methodsin comparison to OFNDA. The significance level was set to0.05 and the ANOVA test was applied to the results achieved byall of the methods on all subjects when dealing with the prob-lem of five and ten classes only, i.e., the best and the worst case
TABLE IIICOMPUTATIONAL TIME REQUIRED BY DIFFERENT METHODS IN SECONDS
WITHIN MATLAB
scenarios. The ANOVA test results are given in Table II. As a re-sult, for a five classes problem the classification performance issignificantly different when using each projection method. Theperformance of all of the baseline, LPP, PCA, ULDA, OLDA,and FLDA are inferior to the proposed OFNDA by 1.0359% (ρ=0.1176 × 10⁻⁴), 1.7693% (ρ = 0.0023), 2.6516% (ρ = 0.0005),0.8085% (ρ = 0.0035), 0.4821% (ρ = 0.0066), and 1.9583%(ρ = 0.0025) respectively. For a ten classes problem, the per-formance of all of the baseline, LPP, PCA, ULDA, OLDA, andFLDA are inferior to the proposed OFNDA by 2.8210% (ρ =0.5667 × 10⁻³), 3.2832% (ρ = 0.1545 × 10⁻⁴), 6.8857% (ρ =0.0901 × 10⁻³), 1.4765% (ρ = 0.2341 × 10⁻³), 2.0427%(ρ = 0.0046), and 3.7482% (ρ = 0.1919 × 10⁻⁴).
It is very clear now from all of the aforementioned resultsthat the proposed OFNDA is capable of showing a powerfulperformance across different datasets, different classifiers, anddifferent number of classes. In the final step, we computed the

1418 IEEE TRANSACTIONS ON BIOMEDICAL ENGINEERING, VOL. 57, NO. 6, JUNE 2010
TABLE IVCLASSIFIER COMPUTATIONAL TIME WITH AND WITHOUT DIMENSIONALITY REDUCTION IN SECONDS
computational time required for all of the aforementioned meth-ods to compute the projection matrix based on the total trainingset (with different number of classes and number of samplesbeing >8000 sample). This was done in MATLAB computingenvironment on a Pentium-4 computer with 3 GB of memorywith an Intel Dual Core Processor of 2.5 GHz speed. The timerequirements for all of the methods is given in Table III laterfor different number of classes. These results can also be cate-gorized into three groups. The first group included both of PCAand FLDA, which required the smallest computational time, butachieved the lowest classification accuracy. The second groupincluded both LPP and the proposed OFNDA requiring modestcomputational cost. The performance of OFNDA was proved tobe the best across different experiments and even better than thatof LPP while achieving slightly lower computational cost. Thefinal group included both of ULDA and OLDA requiring thehighest computational cost while achieving classification accu-racies that are lower than that of OFNDA. Faster implementationof the proposed algorithm can be achieved by implementing itin C/C++ instead of MATLAB. On the other hand, the execu-tion time during the feedforward testing phase for all methodsis almost equal, as the input only needs to be multiplied by theprecomputed projection matrix.
Finally, we present here the effect of dimensionality reductionon the classifier’s computational time. In order to provide a uni-fied platform under which the computational time is estimated,all the files (MATLAB m files and the imported files from C++)were converted into executable files. It is important to divide theoverall classification time into: 1) time required for training (of-fline time); and 2) time required for testing (online time). Inorder to give as estimation for these values, we computed thetime to train the classifier with the training set (>8000 sample)and the average time required to process each new frame of thetesting data (that is needed to make a control decision). Eachof these classifier computational time values was computed firstwithout dimensionality reduction, and later with dimensionalityreduction. The computational time for both cases is reported inTable IV later in which the feature extraction time (being 2.4ms per one frame or window of EMG data) was removed forsimplicity as it applies on both the offline and online phases.
The aforementioned table indicates that the offline train-ing time of classification with dimensionality reduction (being0.9880 + 0.1951 = 1.1831 s) is clearly higher than that with-out dimensionality reduction (0.4182 s). Given that the trainingtime is irrelevant for clinical applications, as it has no bearing onperformance, then the extra offline computational time can beconsidered as an expense incurred for accuracy improvement.On the other hand, in order to prove that the use of OFNDAcan provide computational time saving during the online testingphase, one can simply add the time taken to project the new
testing sample (the time to multiply it by the precomputed pro-jection matrix during offline training, being 8.6603 × 10⁻⁶ s) tothe time taken by the classifier to test the class label of the newsample with reduced dimensionality, being 6.6735 × 10⁻⁵ s.Since the result of this addition (7.5395× 10⁻⁵ s) is smaller thanthe time for classifying one sample without OFNDA (1.0269 ×10⁻⁴ s), then there is an actual saving in computational costper each sample. Hence, for online applications, dimensionalityreduction can in fact reduce the time needed to classify unseenpatterns, and this becomes more apparent in problems with largenumber of channels (i.e., large number of extracted features).
As can be noticed from all of the aforementioned that in addi-tion to the statistically significant classification results achievedby OFNDA, there was also some enhancement in the systemcomputational cost.
V. CONCLUSION
The main focus of this paper was on developing a noveldimensionality reduction method based on the well-known con-cept of discriminant analysis. Specifically, the proposed methodwas based on an analytical solution to the FP problem and it wasreferred to as OFNDA. The step-by-step mathematical deriva-tions for the proposed OFNDA were all given. The proposedmethod was tested of different datasets, including EMG datasetscollected from seven subjects implementing 5 to 10 classes ofmovements using only two electrodes. Accurate results werereported that proved the effectiveness of the proposed OFNDAin comparison to the available FP techniques from the literature(with accuracies ranging from 97.66% to 87.84% for 5 to 10classes of movements, respectively).
REFERENCES
[1] B. Hudgins, P. Parker, and R. N. Scott, “A new strategy for multifunctionmyoelectric control,” IEEE Trans. Biomed. Eng., vol. 40, no. 1, pp. 82–94,Jan. 1993.
[2] P. A. Parker, K. B. Englehart, and B. S. Hudgins, “Control of poweredupper limb prostheses,” in Electromyography Physiology, Engineering,and Noninvasive Applications. R. Merletti and P. Parker, Eds. NewYork: Wiley, 2004.
[3] I. Guyon, S. Gunn, M. Nikravesh, and L. A. Zadeh, Feature Extraction:Foundations and Applications. Berlin, Heidelberg: Springer-Verlag,2006.
[4] M. A. Oskoei and H. Hu, “Myoelectric control systems—A survey,”Biomed. Signal Process. Control, vol. 2, no. 4, pp. 275–294, 2007.
[5] T. R. Farrell, “Multifunction prosthesis control: The effect of targetingsurface vs. intramuscular electrodes on classification accuracy and theeffect of controller delay on prosthesis performance,” Ph.D. dissertation,Biomed. Eng., Northwestern Univ., Chicago, IL, 2007.
[6] L. Hargrove, K. Englehart, and B. Hudgins, “A comparison of surface andintramuscular myoelectric signal classification,” IEEE Trans. Biomed.Eng., vol. 54, no. 5, pp. 847–853, May 2007.
[7] J. U. Chu, I. Moon, and M. S. Mun, “A supervised feature projection forreal-time multifunction myoelectric hand control,” in Proc. 28th IEEEEMBS Annu. Int. Conf., New York, 2006, pp. 2417–2420.

KHUSHABA et al.: ORTHOGONAL FUZZY NEIGHBORHOOD DISCRIMINANT ANALYSIS 1419
[8] K. Englehart, “Signal representation for classification of the transientmyoelectric signal,” Ph.D. dissertation, Dept. Electr. Comput. Eng., Univ.New Brunswick, New Brunswick, Canada, 1998.
[9] K. Englehart, B. Hudgins, P. Parker, and M. Stevenson, “Time-frequencyrepresentation for classification of the transient myoelectric signal,” inProc. 20th IEEE EMBS Annu. Int. Conf., Hong Kong, China, 1998,pp. 2627–2630.
[10] J. U. Chu, I. Moon, and M. S. Mun, “A real-time EMG pattern recognitionsystem based on linear-nonlinear feature projection for a multifunctionmyoelectric hand,” IEEE Trans. Biomed. Eng., vol. 53, no. 11, pp. 2232–2239, Nov. 2006.
[11] A. D. C. Chan and G. C. Green, “Myoelectric control development tool-box,” presented at the 30th Conf. Can. Med. Biol. Eng. Soc., Toronto,Canada, 2007, M0100.
[12] S. Theodoridis and K. Koutroumbas, Pattern Recognition, 3rd ed. SanDiego, CA: Academic, 2006.
[13] J. Watada, H. Tanaka, and K. Asai, “Fuzzy discriminant analysis in fuzzygroups,” Fuzzy Sets Syst., vol. 19, no. 3, pp. 261–271, 1986.
[14] Z. P. Chen, J. H. Jiang, Y. Li, Y. Z. Liang, and R. Q. Yu, “Fuzzy lineardiscriminant analysis for chemical data sets,” Chemometrics Intell. Lab.Syst., vol. 45, no. 1–2, pp. 295–302, 1999.
[15] K. C. Kwak and W. Pedrycz, “Face recognition using a fuzzy fisherfaceclassifier,” Pattern Recognit., vol. 38, no. 10, pp. 1717–1732, 2005.
[16] D. L. Swets and J. Weng, “Using discriminant eigenfeatures for imageretrieval,” IEEE Trans. Pattern Anal. Mach. Intell., vol. 18, no. 8, pp. 831–836, Aug. 1996.
[17] X. H. Wu and J. J. Zhou, “Fuzzy discriminant analysis with kernel meth-ods,” Pattern Recognit., vol. 39, no. 11, pp. 2236–2239, 2006.
[18] J. Ye, T. Li, T. Xiong, and R. Janardan, “Using uncorrelated discriminantanalysis for tissue classification with gene expression data,” IEEE/ACMTrans. Comput. Biol. Bioinformatics, vol. 1, no. 4, pp. 181–190, Oct./Dec.2004.
[19] J. Ye, “Characterization of a family of algorithms for generalized discrim-inant analysis on undersampled problems,” J. Mach. Learn. Res., vol. 6,pp. 483–502, 2005.
[20] D. Cai, X. He, and J. Han, “SRDA: An efficient algorithm for large scalediscriminant analysis,” IEEE Trans. Knowl. Data Eng., vol. 20, no. 1,pp. 1–12, Jan. 2008.
[21] H. Park and L. Elden, “Matrix rank reduction for data analysis andfeature extraction,” in Handbook of Parallel Computing and Statistics, E.J. Kontoghiorghes, Ed. New York: Taylor & Francis Group, LLC, 2006.
[22] P. N. Belhumeur, J. P. Hepanha, and D. J. Kriegman, “Eigenfaces vsFisherfaces: Recognition using class specific linear projection,” IEEETrans. Pattern Anal. Mach. Intell., vol. 19, no. 7, pp. 711–720, Jul. 1997.
[23] H. M. Lee, C. M. Chen, J. M. Chen, and Y. L. Jou, “Low-level segmentationof aerial images with fuzzy clustering,” IEEE Trans. Syst. Man Cybern.,vol. SMC-16, no. 4, pp. 589–598, Jul. 1986.
[24] H. Xiaofei, C. Deng, Y. Shuicheng, and H. J. Zhang, “Neighborhood pre-serving embedding,” in Proc. 10th IEEE Int. Conf. Comput. Vis., Beijing,China, 2005, pp. 1208–1213.
[25] X. He and P. Niyogi, “Locality preserving projections,” presented at theAdv. Neural Inf. Process. Syst. 16 (NIPS), Vancouver, BC, Canada, 2003.
[26] D. Cai, X. He, K. Zhou, J. Han, and H. Bao, “Locality sensitive discrimi-nant analysis,” in Proc. Int. Joint Conf. Artif. Intell., Hyderabad, AndhraPradesh, India, 2007, pp. 708–713.
[27] X. He, S. Yan, Y. Hu, P. Niyogi, and H. J. Zhang, “Face recognition usinglaplacianfaces,” IEEE Trans. Pattern Anal. Mach. Intell., vol. 27, no. 3,pp. 328–340, Mar. 2005.
Rami N. Khushaba was born in Baghdad, Iraq. Hereceived the B.Sc. degree in computers engineeringand the M.Sc. degree in electronics engineering bothfrom the University of Technology, Baghdad, Iraq,and the Ph.D. degree from the University of Technol-ogy Sydney (UTS), N.S.W., Australia.
He was first appointed as a Research Assistantwith the UTS and later as a Casual Lecturer, whilecurrently working as a Research Associate in the Fac-ulty of Engineering and Information Technology atUTS. His research interests include biomechatronics,
evolutionary algorithms, statistical learning, and signal processing.
Ahmed Al-Ani received the Ph.D. degree fromQueensland University of Technology, Brisbane,Australia, in 2003.
He was a Research Associate with the Universityof Western Australia, Perth, W.A., Australia. He iscurrently a Lecturer with the University of Technol-ogy Sydney, N.S.W., Australia. He has authored orcoauthored several journal and conference papers onpattern classification and machine learning.
Adel Al-Jumaily (M’00) received the Ph.D. degree inelectrical engineering (AI) from Universiti TeknologiMalaysia, Skudai. Johor, Malaysia.
He is a Senior Lecturer in Engineering andInformation Technology, University of Technology,Sydney (UTS), Australia. His research interests in-clude fields of artificial intelligent systems, health-care, and biomedical engineering.
Copyright © 2022 FDOKUMEN