Factors Determining Customer Satisfaction with Counter ...
33
Page 1/33 Factors Determining User Satisfaction with Counter Services of Local Government Oces: On-Site Survey at Higashihiroshima City Hall, Japan Yasutoshi Moteki ( [email protected] ) Hiroshima University https://orcid.org/0000-0001-7763-670X Research Article Keywords: Counter Service, Principal Component Analysis, Local Governments, Direct Experiences Posted Date: April 25th, 2022 DOI: https://doi.org/10.21203/rs.3.rs-1118972/v3 License: This work is licensed under a Creative Commons Attribution 4.0 International License. Read Full License
-
Upload
khangminh22 -
Category
Documents
-
view
2 -
download
0
Transcript of Factors Determining Customer Satisfaction with Counter ...

Page 1/33
Factors Determining User Satisfaction with CounterServices of Local Government O�ces: On-SiteSurvey at Higashihiroshima City Hall, JapanYasutoshi Moteki ( [email protected] )
Hiroshima University https://orcid.org/0000-0001-7763-670X
Research Article
Keywords: Counter Service, Principal Component Analysis, Local Governments, Direct Experiences
Posted Date: April 25th, 2022
DOI: https://doi.org/10.21203/rs.3.rs-1118972/v3
License: This work is licensed under a Creative Commons Attribution 4.0 International License. Read Full License

Page 2/33
AbstractThis study empirically investigated the major factors determining customer satisfaction with counterservices in local government o�ces in Japan, comparing them with the results of similar surveysconducted in 2020. It considers visitors’ direct experience of counter services through an on-site surveyconducted at a municipal government building, including (1) customer satisfaction research in variouscountries, especially the expectancy discon�rmation model; (2) the SERVQUAL model; and (3)subsequent methods emphasising customer’s direct experience. SERVQUAL is a �ve-group scale forevaluating service quality with respect to customer satisfaction. However, in actual organisationalsettings, �ve groups of questions may be burdensome to respondents and may reduce the collection rate.This research involves conducting on-site surveys on customer satisfaction or service quality of the localgovernment o�ce using an original three-group questionnaire scale and tailoring the question items to ascale for Japanese local administration settings. A total of 1,000 questionnaires were distributed overfour weekdays at the City Hall. As of September 27, 2021, there were 537 respondents (response rate:53.7%). Regression analysis indicated that the independent variables of group C (service delivery) weremost in�uential, followed by those of groups B (human-related factors) and A (o�ce hardware) (adjustedR2 value: .58). This is consistent with the results of a previous survey of users of Osaka CityGovernment’s ward o�ces. Focusing on the second principal component of the service delivery category(C), promptness and short waiting times do not necessarily affect customer satisfaction positively. Theauthor's scale, which is a 3-group scale, is less than SERVQUAL's 5-group scale. The validation of a simplethree-group scale for public facility user satisfaction provides useful insights for local governmentpractitioners seeking to conduct similar satisfaction surveys and offers methodological suggestions forresearchers examining service satisfaction in public and private service organizations.
IntroductionThe study and practice of customer satisfaction in the private sector have progressed over severaldecades, with a focus on service quality. This shift is related to goods provided by private companiesshifting from tangible to intangible goods or service goods. In the �eld of public administration, researchon the relationship between service quality and other variables is ongoing. Recently, Ziller andAndreß (2021) examined the relationship between quality, e�ciency, and fairness of local public serviceprovision and social trust in European cities using cross-sectional survey data over time. As the LiteratureReview discusses in detail, the background theory of research on customer satisfaction began with Oliverand Winer’s (1987) expectancy discon�rmation model, which led to the development of the SERVQUALmodel by Parasuraman, Zeithaml, and Berry (1988) and an increasing number of empirical studies invarious sectors based on it. The University of Michigan’s Johnson and Gustafsson (2000) put forward amodel diagram concerning customer satisfaction with convenience stores on p. 65 of their Chapter 4,showing that multiple factors comprising multiple questions that affect customer satisfaction lead toenhanced reputation and customer loyalty; in Chapter 5, they summarise the method computing eachquestion group of factors into synthetic variables using principal component analysis, and demonstrate

Page 3/33
how the most in�uential factors by multiple regression analysis using these compound variables areexamined. SERVQUAL, as the name suggests, is a �ve-group scale for evaluating service quality withrespect to customer satisfaction. However, in actual organisational settings, �ve groups of questions maybe burdensome to respondents and reduce the collection rate. The author’s research involves conductingon-site surveys on customer satisfaction or service quality of a local government o�ce using an originalthree-group questionnaire scale referring to the similar simpli�ed framework of three groups of questionitems applied in Malaysia by Mansor and Razali (2010) and tailoring the question items to a scale forJapanese local administration settings. Furthermore, Talib and Shukor (2016) conducted a factoranalysis for each question and found that it was appropriate to divide the questionnaire into threegroups. The use of fewer question groups, and consequently, fewer total questions, is expected to reducerespondents’ burden and increase the response rate. The development of a simple method withequivalent measurement capabilities has methodological signi�cance for customer satisfaction research,and has practical advantages in terms of practical application. Using Principal Component Analysisregression for quantitative research on the determinants of customer satisfaction was introduced byJohnson and Gustafsson (2000) at the University of Michigan, the most prominent example and theirbook has been translated and published in Japan and is widely referenced worldwide.
The study of customer or citizen satisfaction in public administration in Japan was derived anddeveloped from the research and practice of policy evaluations and government evaluations with anawareness of the issues of local government reform. Mie Prefecture, in central Japan, implemented agovernment evaluation system during the 1990s. Local governments across the country followed suit,implementing government evaluation systems. This movement in�uenced the central government toenact a law mandating all ministries to carry out three types of policy evaluations—performanceassessment, programme evaluation for constructing infrastructure, and general evaluation with severalperspectives—in 2002. Several studies using surveys have indicated that large municipalities, such ascities, are more assertive in incorporating policy evaluations into local governments’ operationalactivities than small ones, such as towns and villages (Moteki 2015; Tabuchi 2010). Evaluation activitiesthat can be applied to individual concrete situations are now required, and these can be developedthrough the improvement of more speci�c operations and introduction of more speci�c methods ofevaluation practice (for the current status of government evaluations in Japan, see Moteki 2020). Thesecircumstances necessitate that Japanese municipalities apply evaluation activities to speci�c conditionsthrough the improvement of more speci�c operations and the introduction of new methods. Morediversi�ed methods are required for speci�c organisational needs, such as programme satisfactionsurveys targeting citizens and the use of logic models. Shisaku Manzoku-do Chosa, that is, theProgramme Satisfaction Survey—also known as the ‘citizen satisfaction survey’—focuses on the level ofimportance of and satisfaction with all programmes and analyses them in four quadrants.
Many municipalities, including the city of Higashihiroshima, survey citizen satisfaction with programmesand focus on the level of importance of and satisfaction with each programme. As the survey targetsmunicipal residents, their perceptions and behaviours related to a wide range of local governmentprogrammes can be collected by mail. Based on the answers, each programme is placed in one of the

Page 4/33
four quadrants decided by the two elements of importance and performance. Contrastingly, a fewmunicipalities in Hiroshima Prefecture, such as Kumano Town, survey visitors to the o�ce, focusing oncustomer satisfaction with counter services. Subsequently, more speci�c surveys of customersatisfaction emerged in the form of on-site counter-service satisfaction surveys to improve theoperations of government o�ces. For example, Kumano Town in Hiroshima Prefecture has focused oncustomer satisfaction with counter services. They implemented an on-site survey in 2009 (Kumano Town2009) and continued conducting similar surveys regularly. Moreover, the city of Ogaki, in ShigaPrefecture, performed a questionnaire survey of 2,000 residents by mail to help consider the rebuilding ofa City Hall (Ogaki City Government 2014). The response rate was 47.7%. The residents were questionedabout their experience during a previous visit, the purpose of that visit, the means of transportation used,and their experiences with the counter service.
In Japan, according to the CiNii Database, an o�cial article database, the earliest reference to customersatisfaction was in the title of the 1984 paper, ‘Customer Satisfaction Survey at Sekisui Heim’, publishedin the Journal of the Japanese Society for Quality Control. This is the result of a search in Japanese forKokyaku Manzokudo [customer satisfaction] in the database. Sekisui Heim is the housing brand of theSekisui Chemical Group, a house builder focusing on detached houses. This was four years after Oliver(1980) published his discussion of satisfaction based on expectancy discon�rmation theory, and sincethen, in Japan, the term ‘customer satisfaction’ has been used, and practice and research have developedmainly in the private sector. Quality Control (QC) is a production control method developed in Japan byNikkagiren [Union of Japanese Scientists and Engineers], a foundation operated in cooperation with theJapanese business community, academia, and government, to improve and streamline productionmanagement, mainly in private companies, using scienti�c methods including statistics, for industrialdevelopment. QC is characterized by discussions and improvement proposals for productionimprovement in small groups in the workplace. The improvement movement in these small groups isknown as QC Circle, and during the period when the Japanese economy was booming, it attractedattention from large foreign companies and was adopted into practice by some companies. It was usedboth to mean Quality Control and Quality Circle, an abbreviation of QC Cercle. The practice of this methodat Toyota Motor Corporation, Kaizen, has become world-renowned both for its practice in the corporatemanagement �eld and the research undertaken since. The method was often referred to as Total QualityControl; however, since then, it became part of the name of the academic journal overseas (The TQMJournal), and is now called Total Quality Management (TQM) around the world—in Japan, Nikkagirenbegan calling it TQM in 1996. The term customer satisfaction is used in case studies of TQM in Japan,such as the case study of the kaizen movement at Shiseido, a cosmetics company in Japan.
Research on policy evaluation and administrative evaluation in Japan has focused mainly on theintroduction of overseas evaluation theories and the examination of advanced examples of domesticpractice, such as the evaluation system for administrative projects. However, research from theperspective of speci�c methods to improve actual evaluation practices based on overseas evaluationtheories, i.e. evaluation research based on logic model methods and service quality assessment usingSERVQUAL methods, has not progressed much. This study enables us to grasp the factors that determine
Page 5/33
the level of satisfaction with counter services and examine the constituent items of each group tounderstand those aspects that lead to the improvement of customer satisfaction with government o�cecounter services scienti�cally and academically.
This study is unique because it provides suggestions for practical use through on-site research atHigashihiroshima City Hall. Therefore, it applied the method adopted by research in the business �eldinvestigating private corporations. Noda (2013, 2014, 2019) already focuses on the citizen satisfactionconcept when dealing with residents of local governments in Japan by conducting survey studies.
A search of Google Scholar, an extensive database of articles using the keyword ‘customersatisfaction’ reveals many research papers from private companies and government agencies inMalaysia. Similar to this study, Mansor and Razali (2010), using a three-group Customer Satisfactionsurvey scale, is one such Malaysian study. The rise of public-private research focusing on customersatisfaction in Malaysia is probably due to the Look East policy of President Mahathir, who served aspresident of the country from 1981 to 2003. The Look East policy, as its name suggests, sought toemulate the post-war economic recovery of Japan, located east of Malaysia, in its socio-economicinstitutions and methods of corporate management that had led to the country’s economic recovery.
The term Customer Satisfaction is not as often used regarding public organizations, such as thegovernment, as it is used in research within the private sector. The concept of citizen satisfaction is oftenused to describe satisfaction in the public administration �eld, as Zhang et al. (2022) used it in the title oftheir paper, wherein they conducted a meta-analysis of studies based on The Expectancy-Discon�rmationModel. However, for the author’s research on satisfaction in the �eld of public administration published in2021 and 2022, the author included ‘customer satisfaction’, and not ‘citizen satisfaction’, in the titles ofthe papers. The reasons for this are (1) in the �eld of local government, which is the subject of theauthor’s research, the customers of local governments include registered Japanese citizens andforeigners, and (2) the term ‘citizen satisfaction’ is usually used at an abstract level in relation to multiplepolicies of local governments in general. Additionally, those levels of analysis differ from that ofsatisfaction surveys conducted at speci�c, concrete administrative facilities, as in the author's study.Using the concept of customer satisfaction is also disadvantageous as the private-sector corporateimage of the concept may impede the understanding of the research collaborators and may bemisunderstood by other researchers as a sign of normative awareness that ‘private-sector managementmethods should be applied to public organizations’.
Instead, the author uses the term ‘user satisfaction’ in this study to clarify that the focus of the survey ison the level of satisfaction with the counter service provided by public facilities. In empirical studies onpublic administration, Alemán, et al. (2018), Lauritzen, et al. (2021), and others use the concept of usersatisfaction for services provided by administrative agencies and facilities. In the health careadministration �eld, the neighbourhood of public administration, patient satisfaction research hasevolved and is moving toward the study of patient experience (PX). The author will examine the factorscontributing to satisfaction by focusing on the series of experiences of each surveyed user when they
Page 6/33
enter a public facility, complete their errands, and leave the building. Some surveys under the premise ofcitizen satisfaction are based on expectancy discon�rmation theory, but on long-term memories or surveycitizens’ evaluations of policies and services that they have not actually experienced. One such exampleis the policy satisfaction surveys conducted by local governments in Japan, many of which use thepostal mail method and are opinion surveys on consumer expectations (importance) and evaluations(perceived outcomes) of a wide range of service measures provided by the local government. Theauthor’s study is premised on expectancy discon�rmation theory as an explanation of the mechanismthat causes satisfaction; however, the purpose of the study is not to verify the validity of the theory itself,but rather to focus on user satisfaction, or the actual experience of users at public facilities, andempirically examine factors that improve it.
The SERVQUAL �ve-group question scale, a tool for speci�c research on Satisfaction, was initially used inthe private sector and is now also used by public institutions and a wide range of public sectors,including museums and art galleries. Studies using SERVQUAL use the concept of service quality in thetitle of the paper. Quality control has been focused in discussions only since the 1980s. Later, thediscussion of quality control shifted from industrial products to mass consumer goods, such ascosmetics, and then, to the provision of intangible goods as the economy became more service-oriented,or as the tertiary industry became the center of the economy, and in this respect, the focus on satisfactionand service quality has arisen simultaneously. However, the two concepts have some things in commonin certain areas and do not overlap in other areas. Based on a survey of �rms in three service areas, Lee,et al.'s (2000) analysis showed that perceived service quality is a predecessor variable of satisfaction andnot its opposite. Likewise the author believes that service quality is one factor that determinessatisfaction. Although the subjective perception of service quality overlaps signi�cantly with that ofsatisfaction, the author will focus on the term satisfaction and use service quality as a subordinateconcept, considering the accumulation of past research and practice in which customer satisfaction wasalso emphasized in mass consumer goods, such as cosmetics.
The SERVQUAL scale is characterized by the calculation of the value of the difference betweenexpectations and the actual situation for each item, based on expectancy discon�rmation theory. Basedon the results of a survey in Italy, Giannoccaro et al. (2008) showed that using the values of performanceas perceived by respondents is superior to using difference values in terms of reliability and validity; italso saves time in the calculation. The fact that the difference between expectations and perceivedperformance largely dictates satisfaction is supported by several studies in the �eld of publicadministration (Zhang et al. 2022), but with an eye toward application to practice, it is important toexamine the factors governing satisfaction that are relatively important within the control of the serviceprovider. This study mainly aims to determine whether user satisfaction can be adequately explained byprincipal component regression analysis by placing respondents’ perceived accomplishments at thecenter of the questionnaire, although this study acknowledges that expectancy discon�rmation theory ispremised as an explanatory theory of the satisfaction mechanism. Furthermore, to reduce the researcher’sburden of analysis and the respondent’s burden of �lling the form, and to survey only perceived
Page 7/33
performance without using difference values, we propose a unique three-group scale, fewer than the �vegroups in SERVQUAL, and test its usefulness through principal component regression analysis.
This study used an academic approach to examine the determinants of satisfaction with counterservices. In other words, the focus is on the counter service among the services provided by localgovernments. This study involved a multi-group questionnaire survey of residents, and statisticallyexamined factors affecting the overall customer satisfaction level with counter service using selectivemulti-group principal component regression analysis (Takahashi and Kawasaki 2019), which combinesprincipal component analysis and multiple regression analysis. Everitt (2005) mentions that in themethod of applying principal component analysis, multiple question items can be grouped into severalcategories before the combined principal component scores of explanatory variables are used in themultiple regression analysis. Thus, the use of the principal component score can weaken themulticollinearity problem between each question item used in the regression analysis. In addition, thisstudy compares the results of the survey conducted by the authors at Higashihiroshima City Hall withthose implemented at the Kurose branch o�ce in 2020 and the Internet survey of other cities. Based onMansor and Razali (2010), the questionnaire includes three groups of factors: hardware, includingphysical aspects such as buildings and access; software, including staff response, among others; andservice delivery. Hardware, which was relatively unimportant in relation to the cost explanatory variablesin the regression analysis of the Kurose branch survey results, is examined in more detail in this survey.
This study compares the results of the 2020 and 2021 surveys conducted at the Kurose branch o�ce andHigashihiroshima City Hall, respectively. The current municipal territory of Higashihiroshima city wasformed by the municipal merger of the old Higashihiroshima city and the �ve towns of Kurose, Fukutomi,Toyosaka, Kochi, and Akitsu in February 2005. Its population was 189,196 as of July 31, 2021(Higashihiroshima City Government 2021), and it ranks fourth in terms of population in HiroshimaPrefecture. The new city established branch o�ces in the �ve towns consolidated in 2005. These brancho�ces perform most of the counter service functions executed by the old towns before the municipalmerger, except for affairs related to city-wide policy decision-making such as urban planning. Citizens cancarry out many administrative procedures at nearby branch o�ces even after the merger. Accordingly, asurvey was conducted in the Kurose branch o�ce in August 2020, and another was performed atHigashihiroshima City Hall in August 2021 as a part of the present study. The results of the survey at theKurose branch showed that human factors were most important for overall satisfaction, similar to thestudy by Mansor and Razali (2010). Author (2021) presents the results of an Internet survey of wardo�ces in Osaka city; in a survey of those o�ces, the regression analysis found that the compositevariable of the service delivery quality factor was the most important, unlike the results for the Kurosebranch o�ce. After con�rming that the factors governing customer satisfaction differed depending onurban/suburban areas and the accuracy of administrative facilities, the main objective of this study wasto empirically examine the factors governing customer satisfaction in the main o�ce building of the cityhall of a regional city with a population of less than 200,000 and to obtain clues for making practicalimprovements to administrative services. This study also aims to verify the usefulness of the author'sscale by utilising the three groups of customer satisfaction survey scales proposed by the author and
Page 8/33
examining the coe�cient of determination of the regression analysis under different circumstances, CityHall of a local city in Japan.
This study seeks to identify the primal factors that in�uence the level of satisfaction with counterservices, in a way similar to the research methodology presented by Johnson and Gustafsson (2000) atthe University of Michigan. Using a similar set of questions as SERVQUAL, Talib and Shukor (2016)conducted a factor analysis for each question and found it appropriate to divide the questionnaire intothree groups. Fewer question groups, and consequently, fewer total questions, are expected to reduce therespondents’’ burden and increase the response rate. The development of a simple method withequivalent measurement capabilities has methodological signi�cance for customer satisfaction researchand has advantages in terms of practical application. To explore the determinants of customersatisfaction and to compare it with the survey already conducted in 2020 at the Kurose branch o�ce,Higashihiroshima, the current study was performed at Higashihiroshima City Hall, located at Saijo Sakae-Machi, in the Saijo area. This study assumes three groups of factors composed of multiple questions: (A)hardware, (B) software, and (C) service delivery at the City Hall, referring to Mansor and Razali (2010),who apply three similar groups of question items.
Literature ReviewResearch publications that are closely related to the �ndings at the City Hall reported in this study, includeMoteki (2020) and Moteki (2021). This section �rst discusses these outlines and how they relate to theresults and implementations of the current study. Thereafter, it presents an overview of the customersatisfaction research in the public sector.
After distinguishing the differences in the administrative evaluation concept between Japan and theUnited States, Moteki (2020) analysed the results of a questionnaire survey of towns and villages inJapan that has been widely administered by Japanese local governments since the 1990s. The resultsindicated that there is a large difference in the implementation status between the larger citygovernments and the small municipalities, which face the challenge of a lack of resources, such asexpertise and personnel because of �scal constraints.
Moteki (2021) summarised the results of an online survey of visitors to the ward o�ces of Osaka, whichwas conducted to investigate the determinants of citizens’ satisfaction with the o�ces of localgovernments. This study compares its results with a similar survey conducted in the Kurose branch o�ce,Higashihiroshima, in August 2020. Unlike the survey in Kurose, which emphasised the importance ofhuman factors, such as the response of staff, in Osaka, the service delivery factor had the strongesteffect on the visitors’ overall satisfaction with the counter service.
Customer satisfaction research in the public sector has referred to the accumulation of research onmarketing by private corporations. Oliver and Winer’s (1987) prominent study pioneered this research,focusing on the discrepancy between expectations and perceptions of performance afterwards asdetermining factors of customer satisfaction. Using their view as the foundation of analysis, Zeithaml

Page 9/33
(1988) treated the intrinsic and extrinsic attributes as in�uential factors of perceived service quality (4). Inthis study, ‘hardware’ corresponds with Zeithaml’s extrinsic attributes.
Later, in 2010, Oliver published his theories and perspectives on customer satisfaction in a book entitledSatisfaction, and Oliver (2015) updated the book’s content in its second edition. Following Oliver’sexpectancy discon�rmation theory, many public administration studies considering citizens as customershave been published in academic journals (Van Ryzin 2004, 2006; Van Ryzin and Immerwahr 2007; VanRyzin et al. 2004). Morgeson and Petrescu (2011) analysed citizen data on six federal governmentagencies and found that the factors that contribute to satisfaction and trust in government includeperception of quality of service, information provided by the government, demographic factors, citizenexpectations, and e-government adoption. Further, an empirical study by Morgeson (2012) addedrespondents’ political ideology, party identi�cation, and overall trust in the federal government as otherfactors determining citizen satisfaction. Kelly (2003) examined the relationship between overall customersatisfaction and �re and police services’ performance in local public administration. Kelly and Swindell(2002) also examined the relationship between the indicators of actual programme performance and theoverall customer satisfaction of local governments statistically.
The SERVQUAL model explained by Parasuraman, Zeithaml, and Berry (1988), following Oliver’s theory,focuses on the exceptional gap between expectations and actual performance. This model had a strongin�uence on subsequent research on measures of service quality and customer satisfaction. Shortly afterthis study on SERVQUAL, other research was conducted on SERVQUAL, including Carman (1990),Reidenbach and Sandifer-Smallwood (1990), and Finn and Lamb (1991). Since then, many studies havecontinued to examine the �ve elements of factors in�uencing service quality. The identi�ed componentsof SERVQUAL are tangibles, reliability, responsiveness, assurance, and empathy. Each element comprisesmultiple items. The ‘tangibles’ category of the model is equivalent to the hardware category in the currentstudy. Assurance, empathy, and responsiveness—the multiple human factor-related elements—of theSERVQUAL scale are equivalent to the software category in this study. Wilson et al. (2021, 89–91)detailed the SERVQUAL model in the latest edition of Services Marketing: Integrating Customer FocusAcross the Firm, a prominent textbook in the service marketing �eld. Among the studies on publicadministration, Wisniewski (2001) showed broad usage of the SERVQUAL-based model by ScottishCouncil services in the United Kingdom.
Customer satisfaction studies in the public sector after 2010 shifted toward examining the direct serviceexperience. Studies on patient experience derived from patient satisfaction are an example in the medical�eld (Manary et al. 2013; Wolf et al. 2014). The Patient Experience Journal, specialising in this �eld, waslaunched in 2014. Further, the Japan Patient Experience Research Association developed a standardisedquestionnaire index on patient experience in the Japanese language, tailored for medical practice inJapanese hospitals. As for the private sector, one study discussed positive experiences and customersatisfaction in the Lithuanian hotel industry and applied the value co-creation-dialogue, access, riskassessment, transparency (DART) model in marketing research (Solakis et al. 2021). Solakis, Peña-Vinces, and Lopéz-Bonilla (2017) focused on the four aspects of DART in consumer behaviour in the
Page 10/33
Greek hotel industry, which is the basis for the aforementioned study. Referring to these recent studies oncustomer experience in the public sector, including the medical �eld, the current study recognises thatcustomers’ direct experiences in�uence their overall satisfaction with counter services and thatexpectations are an important factor of customer satisfaction. A series of studies by the author intends toexamine whether there are differences in the primal factors of customer satisfaction with governmentcounter services in different environmental conditions using a simpli�ed three-factor model.
In the public sector context, Wagenheim and Reurink’s (1991) Figure 1 presents a conceptual diagram onthe relationships among various elements from a customer service perspective in public administration.Speci�cally, the four elements involved in the government’s efforts and perceptions related to customersatisfaction lead to satisfaction with internal and external customer service needs (customer service),which in turn creates organisational e�ciency and effectiveness. Many studies following this modelexamined customer or citizen satisfaction in the public sector worldwide. Similar to the aforementionedprivate and healthcare sectors, research on satisfaction in the government sector, since 2010, hasincreasingly focused on the direct experience of users, including on-site surveys. This study applies thesimpli�ed framework of Mansor and Razali (2010), who conducted research in Malaysia using threequestion-item categories related to the determinative factors of customer satisfaction with the municipalgovernment’s counter service. To evaluate user satisfaction of public facilities, this study uses a three-group scale that is simpler than SERVQUAL’s �ve-group scale. Agus, Barker, and Kandampully (2007)utilised a similar study concept in the Malaysian public sector. They conducted two different surveystargeting customers and managers in government branches and present the co-relationships amongservice quality dimensions, service performance, and customer satisfaction. Table 1 summarizes recentstudies on user satisfaction with public facilities and services, focusing on user experience. Similarstudies have been conducted in neighbouring countries in Southeast Asia. In Indonesia, Surapto (2014)conducted a survey targeting 200 residents from urban villages in South Tangerang. McMahon (2004)carried out a study on citizens’ customer satisfaction with three local governments in Australia,implementing a mail-based survey among 1,500 residents in the city of Perth. Hsiao and Lin (2008) inTaiwan and Huque and Hayllar (1999) in Hong Kong conducted other prominent studies on customersatisfaction with government services in Asia. Akinboade, Kinfack, and Mokwena (2012) conducted asimilar study in South Africa. As explained above, research on customer satisfaction in the �eld of publicadministration—sometimes referred to as citizen satisfaction—began in Europe and the United States andhas spread to Asia and Africa.
[Table 1 here]
[Figure 1 here]

Page 11/33
Considering the related studies conducted to date, this study draws implications for research on customersatisfaction by considering visitors’ direct experience through an on-site survey held at a governmentbuilding. Statistical examination of the survey results can reveal the possible determinants for counterservices provided at branch o�ces of the municipal government.
Research MethodsAfter research at the Kurose branch o�ce and an Internet survey on the Osaka City Government in 2020, aself-administered on-site questionnaire survey was conducted in August 2021 at Higashihiroshima CityHall for citizens who visited and completed their business at this government facility.
Kurose Branch O�ce, August 2020
For the questionnaire survey conducted at the Kurose branch o�ce of Higashihiroshima in August 2020,Moteki (2022) provided a detailed description of the survey methodology. Customers of the Kurosebranch o�ce who completed their business received a four-page-long self-administered questionnaire.Researchers were waiting at the desks on the opposite side of the o�ce counter. A total of 240participants completed the questionnaires on the spot. The survey lasted for six business days (August24–31, 2020). Based on the number of distributed �yers, the survey participation rate was approximately60%. The questionnaire included items based on three concept groups, A–C, and a group of questionsrelated to the dependent variable Y. This framework of the research design is similar to the design of thestudy at the City Hall presented in this article.
Survey at Higashihiroshima City Hall, August 2021
A four-page self-administered questionnaire survey was conducted at Higashihiroshima City Hall forvisitors who had completed their business. A4 size envelopes containing four pages long questionnairewere distributed to the city hall users, who �lled them after leaving the city hall and returned them to theresearcher in the enclosed stamped envelope. The survey took over four weekdays after we �nisheddistributing the 1,000 copies we had prepared. Questionnaires were distributed at two places at the CityHall: the main entrance hall and the area around the side of the service entrance. The researcher andresearch assistants (third- and fourth-year students of the Public Administration seminar, Faculty of Lawand one PhD student) waited in the o�ce and guided visitors from the counter. There were six researchassistants in total, with a maximum of three working simultaneously. The researcher and two researchassistants were present at two places—the entrance hall and the area around the service entrance—at theCity Hall and asked visitors to cooperate with the questionnaire survey of Deleted for anonymity, offeringthem a ballpoint pen, as a gift, pre-packaged in the A4 envelope containing the questionnaire. The serviceentrance, conveniently located to move toward the parking lot after running errands, is used by many
Page 12/33
visitors to return home. The booths at the service entrance were operated during lunch breaks or when thesurvey collaborators took turns and had fewer personnel. At the two entrances to City Hall building, allusers who have completed their errands were invited to participate in the survey, and those who agreewere handed the questionnaires. All the prepared questionnaires were distributed by the afternoon of thefourth day.
The authors handed out (1) a letter requesting survey participation, explaining the cooperation agreementbetween the Higashihiroshima City Government and Deleted for anonymity, which were working togetherto create an international research centre in Higashihiroshima; (2) a questionnaire; (3) an envelope forreturning the questionnaire; and (4) a ballpoint pen in a paper box, all sealed in an A4-sized paperenvelope. Visitors who accepted the questionnaire �lled out the form after returning home and mailed itto Deleted for anonymity with a pre-stamped envelope. The survey was conducted over four weekdaysfrom Monday to Thursday, and 1,000 envelope sets were distributed to citizens visiting the o�ce. A list ofthe questions is presented in Table 2. Figure 1 illustrates an analytical model with the question items forthe explanatory variables classi�ed into three groups. Table 3 presents the total number of copiesdistributed by day of the week, and Table 4 presents the total number of copies distributed by time slot ina day (excluding Thursday). The original research plan was to distribute the survey over �ve days fromMonday to Friday, but distribution went smoothly, and the distribution of 1,000 copies �nished a littleafter 1:00 p.m. on Thursday, August 26. During the period, Higashihiroshima was a target area for prioritymeasures to prevent the spread of COVID-19 based on the Act on Special Measures concerning In�uenzaPandemic (Novel In�uenza or Re-Emerging In�uenza). From Friday, the day after the actual survey period,Hiroshima Prefecture became an area subject to the declaration of a state of emergency as stipulated bythe Act on Special Measures against In�uenza Pandemic. As described below, the questionnaire alsoincludes questions on measures to prevent the transmission of COVID-19 in the City Hall.
[Table 2 here]
[Table 3 here]
[Table 4 here]
The letter requesting survey participation included in the envelope detailed the scope and signi�cance ofthe survey. The enclosed request letter included an explanation of the signi�cance of the research and theagreement between Higashihiroshima city and Deleted for anonymity on the formation of an internationalresearch centre in Higashihiroshima. The letter also included the telephone number and e-mail address ofthe author as the principal investigator, so that the visitors could inquire about any points that they mighthave been unclear about.
To compare the results of the survey at the Kurose branch o�ce and the survey of users at the wardo�ce in Osaka, both in 2020, with the results of this survey, the part of the questionnaire regarding the
Page 13/33
satisfaction level was left unchanged. Moreover, in the survey considered in this article, the three questionitems for the overall satisfaction of the dependent variable were convenience of the service, satisfactionwith the experience, and others’ recommendation of the service, based on similar surveys in the privatesector. The �rst change made was to add a question on countermeasures against COVID-19 infections inthe hardware of the government building (Group B) in response to a request from the City Hall. Next, inrelation to the previous point, questions about lighting in the building and the non-smoking/smokingenvironment from the hardware group were removed. In addition, the question about ‘time (shortness) to�nish errands’, which was included in group B in the previous survey, was moved to one of the questionitems of group C about service delivery (CQ2). CQ5, on the smoothness of service delivery, was alsoadded in this survey. The other three questions in Group C are the same as those in the previous twosurveys. In addition to the three groups of questions related to causal factors of customer satisfaction aswell as question items corresponding to components of overall customer satisfaction, which are commonto the 2020 survey at the Kurose branch o�ce and the Internet survey for Osaka and have been surveyedcontinuously, questions on visitors’ attributes, errands to be done at the o�ce, and transportation accessto the o�ce were also included. In particular, questions about the sogo madoguchi (general counter),which has become a keyword for improving administrative counter services in Japan, were added. InJapanese public administration, the issue of taraimawashii, or the need to visit multiple counters insteadof just one to complete errands, has often been pointed out as a major problem in bureaucratic work(oyakusyo shigoto). Saga City and Matsuyama City are experimenting with a general counter system thatallows people to complete all procedures from the birth of a child to moving to a local government bysimply visiting one counter. The reason that question 10 asked about the use of the general informationdesk (reception desk) and question 4 asked about the number of counters used before running errands isto examine the necessity of introducing the general counter approach mentioned above.
Figure 1 indicates the relationships assumed between customer satisfaction with the counter services atmunicipal o�ces based on the abovementioned questionnaire categories (A–C), the explanatoryvariables, and the items in group Y. Using the principal component analysis based on each category,scores of the �rst and second principal components of each group were circulated for the followingregression analysis.
ResultsA total of 1,000 sets of questionnaires were distributed during the four-day survey period. Table 3 showsthat the fewest questionnaires were distributed on Thursday, August 26, 2021, whereas the most weredistributed on Monday, August 23. The distribution of the scheduled number of questionnaires wascompleted after 1:00 p.m. on August 26, a day earlier than planned. By September 27, 2021, 537 surveyshad been collected, with a response rate of 53.7%. One of the questionnaires was largely incomplete andcontained only attribute data. The rest of the questionnaires contained valid answers to many of thequestions.

Page 14/33
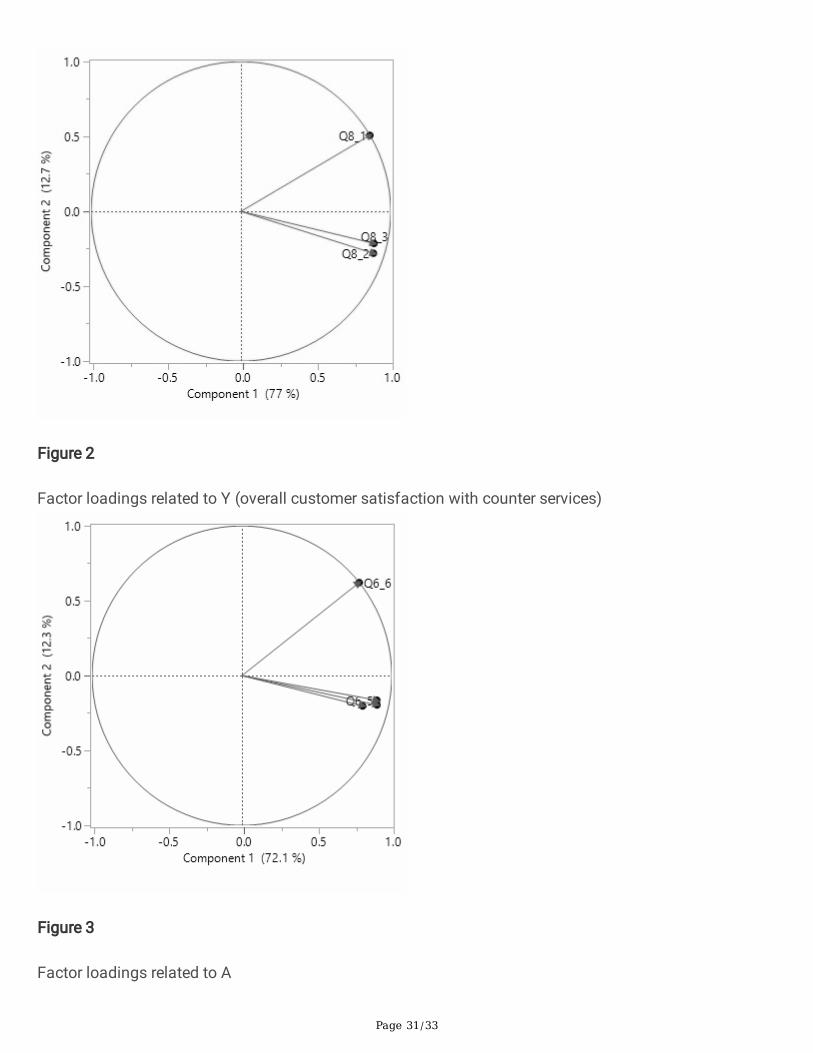
To avoid multicollinearity in the regression analysis, the author �rst summarised the explanatoryvariables into composite variables using principal component analysis for each group. The recent studyby Davino et al. (2022) describes how to avoid multicollinearity in regression analysis using principalcomponent analysis. Figure 2 depicts the results of the principal component analysis for questions incategory Y. As a new column, the principal component scores for the �rst and second components wereappended to the dataset as variables ZY1 and ZY2. Figure 2 also shows that YQ1 (Q8_1), which isdepicted at the top of the �gure, had considerable effects on the second principal component—‘convenience and recommendation to others’—whereas the �rst component was interpreted as‘experience satisfaction’.
Table 5 presents the correlation coe�cients between the question items in groups A to C and ZY1 of Ycategory. Question items with correlation e�ciencies higher than .40 were selected for use in the principalcomponent analysis for each category. Figure 3 presents the principal component analysis results for thequestion items in category A. After this analysis, the dataset included the column of principal componentscores for the �rst and second components of variables ZA1 and ZA2. We found that AQ6 (Q6_6), relatedto COVID-19 infection prevention in the building, had signi�cant effects on the second principalcomponent. Regarding the �rst principal component, each question item shows the same directionalcharacteristics. When checking details of the �gure for AQ4 (Q6_4) and AQ5 (Q6_5), the clarity of thelayout of the buildings on the site and locations of divisions inside the buildings are to the extreme right,strongly indicating the characteristics of the �rst principal component. Considering the relevant questionitems, we interpreted component 1 as ‘ease of �nding building locations and understanding the divisions’layout in the building’. We can then interpret component 2 as the ‘COVID-19 infection preventionmeasures in the building’.
[Table 5 here]
[Figure 2 here]
[Figure 3 here]
Similarly, principal component analysis was conducted for group B (Figure 4). Variables ZB1 and ZB2calculated from the principal component analysis as the �rst and second components scores wereincluded in this study. Figure 4 shows that BQ1 (Q6_7) to BQ2 (Q6_8) had greater effects on component 2(ZB1). Further, BQ3 (Q6_9) and BQ4 (Q6_10) are related to ease of understanding explanations given bythe o�cers. Component 1 was thus interpreted as ‘courteousness and responsiveness of the staff incharge’. Component 2 (ZB2) was interpreted as ‘ease of understanding explanations given by the o�cers’if we focus on the contents of BQ3 (Q3_9) and BQ4 (Q3_10).

Page 15/33
[Figure 4 here]
Similarly, Figure 5 presents the principal component analysis results for the question items in category C.New columns were created for variables ZC1 and ZC2 from the principal component scores for the �rstand second components. For the second principal component, CQ2 (Q7_2) and CQ4 (Q7_4) showedopposing characteristics. Further, CQ2 (Q7_2) and CQ5 (Q7_5), related to waiting time and processingtime, were in the same direction. For the �rst principal component, CQ3 (Q7_3), a question item aboutproblem solving, is the most to the right. Component 1 is interpreted as ‘solving the customer’s problemsand concerns’. Component 2 could be interpreted as ‘waiting and processing time in the building’ byfocusing on the meaning of CQ3 (Q7_3).
[Figure 5 here]
Using these variables, multiple regression analysis was conducted using the variable increase/decreasemethod in a stepwise approach, with ZY1 as the explained variable (Table 6). The synthetic variablesused were ZA1, ZA2, ZB1, ZB2, ZC1, and ZC2, which were generated from the categories of explanatoryquestion groups A–C. Table 6 indicates that the standardised partial regression coe�cient in ZC1 wasthe highest at .40, signi�cant at the 1% level. ZC1 was de�ned as ‘solving customers’ problems andconcerns’ and was the most important variable for explained variable ZY1. Following this variable,signi�cant at the 1% level, ZB1 and ZA1 had positive effects on the objective variable, in that order. ZC2was signi�cant at the 5% level and had a negative coe�cient. Focusing on the second principalcomponent of the service delivery category, it was found that promptness of service delivery and shortwaiting time do not necessarily affect customer satisfaction positively. As each variance in�ationfactor was under 2.00, independence among the explanatory variables in the model was maintained.
[Table 6 here]
DiscussionThis study conducted at Higashihiroshima City Hall aimed to identify the determinants of customersatisfaction with counter service in the context of municipalities in Japan. Additionally, to reduce theresearcher’s burden of analysis and the respondents’ burden of �lling the form, we proposed a uniquethree-group scale, fewer than the �ve groups in SERVQUAL, and tested its usefulness through principalcomponent regression analysis. Few studies have investigated user satisfaction and its determinativefactors based on on-site survey focusing on users’ direct experiences in public facilities. Although many

Page 16/33
studies have made signi�cant progress on satisfaction using expectancy discon�rmation theory, some ofthe SERVQUAL-based citizen satisfaction studies in the administrative �eld have merely been opinionsurveys on policy areas in which respondents have no experience, and randomly selected residents aresurveyed by postal mail method. The survey was conducted on four business days (23–26 August 2021),resulting in a total of 528 responses, with a response rate of 52.8%. The question items related to theregression analysis were categorised into three groups of explanatory questionnaire variables and onegroup of the explained variable of counter-service satisfaction at the City Hall. The three question itemsfor overall satisfaction with the dependent variable are convenience of the service, satisfaction with theexperience, and others’ recommendation of the service, based on similar surveys in the private sector.There was also an open-ended question about opinions on general improvement in government services.The questionnaire included question items in four categories (A, B, C, and Y), constituting a simpli�edmodel compared with SERVQUAL’s �ve-group categories for determinative factors. A two-stage analysis,the selective principal component regression analysis, was applied to the survey dataset. The regressionanalysis showed that the composite variable ZC1 of service delivery was the most important for thedependent variable ZY1, followed by groups B and A with an adjusted R2 value of .58. The β of ZC1 was.58. These results support the �ndings of a previous study conducted on Osaka city residents visitingward o�ces (Moteki 2021).
There were differences among the results of the surveys conducted at the Kurose branch o�ce, wardo�ces of Osaka, and Higashihiroshima City Hall. The latter two surveys’ results indicated that servicedelivery of ZC1 was more important than that of ZB1 based on the principal component scores of counterstaff responses or human-related factors. The differences between the results of the three studies may bedue to differences in the services provided by the three types of government o�ces of these ordinance-designated cities: branch o�ce, ward o�ce, and the City Hall. Further, the differences between thesegovernment o�ces are linked to each visitor’s attributes and characteristics. The coe�cient ofdetermination for the regression analysis on the scale of the three groups in this study is .58, which isconsidered appropriate in the social sciences. As in the 2020 questionnaire survey at the Kurose branch,at least one synthetic variable produced from each of the A-C question groups was statisticallysigni�cant in the regression equation, and the results of this series of surveys con�rm the usefulness ofthe author’s proposed three-group user satisfaction survey scale. The author’s 3-group scale is less thanSERVQUAL's 5-group scale, examines only the value of perceived performance without using the value ofthe difference between expected and perceived performance. It also eases the respondent's burden inresponding and reduces the data processing burden for analysts, including practitioners. This study’svalidation of a simple 3-group survey scale for public facility user satisfaction provides useful insightsfor local government practitioners seeking to conduct similar satisfaction surveys, and offersmethodological suggestions for researchers examining service satisfaction in public and private serviceorganizations.
Conclusion

Page 17/33
This study has examined citizens’ direct experience of counter services through an on-site survey heldwith visitors of a municipal government building. The regression analysis revealed that service delivery,human factors, and hardware aspects are important, in that order, concerning customer satisfaction withthe services of the City Hall. The service-delivery-related component, ZC1, was more important than thehardware of the building (tangibles in SERVQUAL) and human-related factors. Regarding the secondprincipal component of service delivery, the results showed that promptness of service delivery and shortwaiting time do not necessarily affect customer satisfaction positively. Among studies in the healthcare�eld, which is close to the �eld of government, some show that waiting time in hospitals has an effect,especially a negative effect, on patient satisfaction (Alrasheedi et al. 2019). By contrast, previous studieshave shown that it is not the waiting time itself—or ‘objective waiting time’—that affects patientsatisfaction but the way the patient waits or their ‘waiting environment’ (Pruyn and Smidts 1998). Pruynand Smidts (1998) also examined the in�uence of the waiting room’s attractiveness and presence oftelevision. The �rst �oor of Higashihiroshima City Hall, the government o�ce examined in this study, hasLCDs in front of the waiting chairs. This type of waiting environment is a subject for future research bythe author.
The authors would like to explore models and questionnaires that can better grasp customer satisfactionat government o�ces by conducting a follow-up survey in the same Kurose branch o�ce in the future.The results of these three surveys up to 2021 could be compared with those of future research toexamine the effect of different characteristics of government organisations on the determinants ofcustomer satisfaction. Further research can not only help examine the order of importance among thethree groups of questionnaire items, which is an academic analysis, but also identify the items ofimportance within each question group. The results can provide feedback to the local governments thatcooperated in the implementation of the survey studies with suggestions that will lead to improvement ofspeci�c administrative tasks.
DeclarationsBiographical note
Yasutoshi Moteki (PhD) is an associate professor of public administration at Hiroshima University’sFaculty of Law and the School of Humanities and Social Sciences. His current research interest lies inpublic management, budgetary process, and policy evaluations. He has also been conducting empiricalresearch on customer or citizen satisfaction in the �eld of public administration. He received his Bachelorof Law, Master of Laws, and PhD degree from Kyushu University. His work has appeared in prominentscholarly journals both in Japan and abroad. He served on the Board of Directors of the Nippon UrbanManagement and Local Government Research Association from 2015 to 2018.
Declaration of con�icting interests
Page 18/33
The author declares no potential con�icts of interest with respect to the research, authorship, and/orpublication of this article.
Acknowledgments
The town and gown relation o�ce of an a�liated institution assisted us in conducting this research.More speci�cally, the o�ce coordinated the research plan as conducted at the Higashihiroshima City Hall.The city government also provided extensive assistance in securing survey responses from residents ofthe city.
Funding
This study was supported by the Regional Economic Research Cooperation Council. An earlier draft ofthis work was presented at the Southeastern Conference for Public Administration in 2021. It wassupported by a subsidy for English editing services for international conference presentations provided bythe a�liated academic association in Japan. For revisions after receipt of the initial peer review results ofthe submission to this journal, a subsidy for English editing was received from the a�liated university.
Data availability statement
The datasets generated and/or analyzed during the current study are not publicly available due to thedata anonymity guarantee given to the City Hall. The aggregated statistics of each question items areavailable from the corresponding author on reasonable request.
Ethical approval
This study is not biomedical research directly covered by the Declaration of Helsinki and has notundergone ethical review at our institution. The survey is within the scope of a normal social survey, andthe question items in the questionnaire are not invasive. However, referring to the three principles outlinedin the Declaration, we prepared a survey implementation plan and questionnaire which were con�rmed bythe divisions in charge at the City Hall, who did so from the perspective of the citizens (the studysubjects). In addition, before preparing the research plan, the detailed research design was reviewed bythe council's review committee for funding, which included government practitioners, to evaluate theappropriateness of the overall design.
Page 19/33
Informed consent
For the on-site survey, the name of the survey and the entity conducting the survey were displayed onposters at two locations in the booth, and questionnaires were distributed to willing City Hall users. Inaddition, the enclosed request letter clearly states (1) the purpose of the survey, (2) that the responses arevoluntary and aggregate results will be used only for academic purposes, (3) the name of theorganisation conducting the survey, person in charge, address, contact telephone number, and e-mailaddress, and (4) the procedures to be followed if participants wished to receive the survey results.Moreover, the abovementioned points (1) and (2) are clearly stated again at the beginning of thequestionnaire, along with the name of the organisation conducting the survey. It also explains that theresults of individual responses will not be shared with the City Hall and participants will not beinconvenienced because of the content of their responses. No independent written consent forms wereprovided and questionnaires were distributed only at the survey booth. The responses were �lled outaway from City Hall and mailed using the enclosed stamped return envelopes. The abovementionedmeasures ensured that participation was voluntary.
ReferencesAgus A, Barker S, Kandampully J (2007) An exploratory study of service quality in the Malaysian publicservice sector. Int J Qual Rel Manag 24(2):177–190. https://doi.org/10.1108/02656710710722284
Alemán R, Gutiérrez-Sánchez R, Liébana-Cabanillas F (2018) Determinant factors of satisfaction withpublic services in Spain. Australian Journal of Public Administration 77:102-113. https://doi.org/10.1111/1467-8500.12252
Atkinson P (1989) TQM Fact Finding Mission to Japan. The TQM Magazine 1(2):120-124. https://doi.org/10.1108/EUM0000000003001
Agus A, Barker S, Kandampully J (2007) An exploratory study of service quality in the Malaysian publicservice sector. Int J Qual Rel Manag 24(2):177–190.
Akinboade OA, Kinfack EC, Mokwena MP (2012) An analysis of citizen satisfaction with public servicedelivery in the Sedibeng district municipality of South Africa. Int J Soc Econ 39(3):182–199. https://doi.org/10.1108/03068291211199350
Alrasheedi KF, Al-Mohaithef M, Edrees HH, Chandramohan S (2019) The association between wait timesand patient satisfaction: Findings From primary health centers in the Kingdom of Saudi Arabia. HealthServices Research and Managerial Epidemiology. Health Serv Res Mang Epidemiol6. https://doi.org/10.1177/2333392819861246
Page 20/33
Moteki, Y. (2015) Gyosei hyoka bumu-go no jichitai ni okeru seisaku hyoka seido no henka to kadai: Hyokafuan′ ga ∈ enotegakarinishitazenkokuchōsanimo → dzukuhyoka dsukare' no kento(Changes and challenges after the evaluation boom years in Japanese local governments: Anexamination of evaluation exhaustion based on the data from a nationwide survey focusing on theconcept of evaluation anxiety), Chihoujichi Kenkyu (Journal of Urban Management and LocalGovernment Research), 30(2), 1–17.
Moteki, Y. (2020). Government Evaluations in Japan's Municipalities Based on Nationwide Survey Data.Journal of Japanese Management. http://www.jfmra.org/doc/jjm/jjm_5-1_03.pdf
Moteki, Y. (2021). Customer satisfaction with services at the ward o�ces of Osaka City Government.Journal of Urban Management and Local Government Research, 36(1), 91–103.
Moteki, Y. (2022). Customer Satisfaction with Branch O�ce Services in Higashihiroshima, HiroshimaPrefecture. Public Organiz Rev. https://doi.org/10.1007/s11115-021-00574-w
Carman JM (1990) Consumer perceptions of service quality: An assessment of the SERVQUALdimensions. J Retail 66(1):33–55.
Davino C, Romano R, Vistocco D (2022) Handling multicollinearity in quantile regression through the useof principal component regression. METRON (2022). https://doi.org/10.1007/s40300-022-00230-3
Everitt BS (2005) An R and S-PLUS companion to multivariate analysis. Springer Science & BusinessMedia, London.
Finn DW, Lamb CW Jr (1991) An evaluation of the SERVQUAL scales in a retailing setting. Adv ConsumRes 18:483–90. https://www.acrwebsite.org/volumes/7137/
Giannoccaro R, Costantino N, Ludovico AD, Pietroforte R (2008) Measuring citizen satisfaction withaspects of public services from a local authority and determining their importance: A case study. PublicOrganiz Rev 8:1–15. https://doi.org/10.1007/s11115-007-0044-1
Higashihiroshima City Government (2021) 2021 (Reiwa 3) nendo owaza betsu jinko oyobi nenrei betsujinko-to [Population by area and age in2021]. https://www.city.higashihiroshima.lg.jp/shisei/tokeijoho/1/28273.html. Accessed 11 Aug 2021
Hsiao CT, Lin J (2008) A study of service quality in public sector. International Journal of Electron BusManag 6(1):29–37. https://citeseerx.ist.psu.edu/viewdoc/download?doi=10.1.1.470.6991&rep=rep1&type=pdf
Huque AS, Hayylar MR. (1999) The limits of customer satisfaction: The case of the Companies RegistryTrading Fund in Hong Kong. Asian Rev Public Admin 6(2):100–113.
Page 21/33
Johnson M, Gustafsson A (2000) Improving customer satisfaction, loyalty and pro�t: An integratedmeasurement and management system. John Wiley & Sons, San Francisco.
Johnson M, Gustafsson A (2000) Improving customer satisfaction, loyalty and pro�t: An integratedmeasurement and management system. John Wiley & Sons, Hoboken.
Józsa T (2017) The antecedents of market orientation and its effect on customer satisfaction and servicequality: The case of Hungarian municipal public service provisions. Int Rev Public Nonpro�t Mark14:391–407. https://doi.org/10.1007/s12208-017-0179-x
Kelly JM (2003) Citizen satisfaction and administrative performance measures: Is there really a link?. UrbAff Rev 38(6):855–866. https://doi.org/10.1177%2F1078087403038006005
Kelly JM, Swindell D (2002) A multiple–indicator approach to municipal service evaluation: Correlatingperformance measurement and citizen satisfaction across jurisdictions. Public Admin Rev 62(5):610–621. https://doi.org/10.1111/1540-6210.00241
Kumano Town (2009) Madoguchi sabisu anketo chosa kekka [Results of questionnaire on counterservice]. https://www.town.kumano.hiroshima.jp/www/contents/1248846633875/index.html. Accessed25 March 2022
Lauritzen HH, Grøn, CH, Kjeldsen AM (2021) Leadership matters, but so do co-workers: A study of therelative importance of transformational leadership and team relations for employee outcomes and usersatisfaction. Review of Public Personnel Administration,0734371X211011618. https://doi.org/10.1177%2F0734371X211011618
Lee H, Lee Y, Yoo D (2000) The determinants of perceived service quality and its relationship withsatisfaction. Journal of services marketing 14(3):217-231. https://doi.org/10.1108/08876040010327220
Manary MP, Boulding W, Staelin R, Glickman SW (2013) The patient experience and health outcomes. NEngl J Med 368(3):201–203. https://doi.org/10.1056/NEJMp1211775
Mansor N, Razali CHCM (2010) Customers’ satisfaction towards counter service of local authority inTerengganu, Malaysia. Asian Soc Sci 6(8):197. https://doi.org/10.5539/ass.v6n8p197
Morgeson FV (2012) Expectations, discon�rmation, and citizen satisfaction with the US federalgovernment: Testing and expanding the model. J Public Admin Res Theor 23(2):289–305. https://doi.org/10.1093/jopart/mus012
Morgeson FV, Petrescu C (2011) Do they all perform alike? An examination of perceived performance,citizen satisfaction and trust with US federal agencies. Int Rev Admin Sci 77(3):451–479. https://doi.org/10.1177/0020852311407278

Page 22/33
Noda Y (2013) Shimin manzoku-do no kenkyu [Research on citizen satisfaction]. Nippon Hyoronsha,Tokyo.
Noda Y (2014) Nonlinear effects on citizen satisfaction and different levels of governments in Japan.Asian Rev Public Admin 25(1):74–91. https://journals.sfu.ca/arpa/index.php/arpa/article/view/50
Noda Y (2019) Citizen expectations and satisfaction of service performance: Lessons from subnationalgovernments in Japan. Asia Pacif J Public Admin 41(3):142–156. https://doi.org/10.1080/23276665.2019.1658361
Ogaki City Government (2014) Shin chosha kensetsu shimin anketo chosa hokoku-sho [Citizenquestionnaire survey report for considering new government buildingconstruction]. https://www.city.ogaki.lg.jp/cms�les/contents/0000017/17968/anketoshuukei. Accessed8 Apr 2021
Oliver RL (2015) Satisfaction: A behavioral perspective on the consumer, 2nd ed. Routledge, London andNew York.
Oliver RL, Winer RS (1987) A framework for the formation and structure of consumer expectations:Review and propositions. J Econ Psychol 8(4):469–499. https://doi.org/10.1016/0167-4870(87)90037-7
Oliver RL (1980) A cognitive model of the antecedents and consequences of satisfaction decisions.Journal of marketing research 17(4):460-469. https://doi.org/10.1177/002224378001700405
Parasuraman A, Zeithaml VA, Berry LL (1988) SERVQUAL: A multiple-item scale for measuring consumerperceptions of service quality. J Retail 64(1):12–40.
Pruyn A, Smidts A (1998) Effects of waiting on the satisfaction with the service: Beyond objective timemeasures. Int J Res Mark 15(4):321–34. https://doi.org/10.1016/S0167-8116(98)00008-1
Reidenbach RE, Sandifer-Smallwood B (1990) Exploring perceptions of hospital operations by a modi�edSERVQUAL approach. J Health Care Mark 10(4):47–55. https://pubmed.ncbi.nlm.nih.gov/10108701/
Romano G, Masserini L (2020) Factors affecting customers’ satisfaction with tap water quality: Doesprivatisation matter in Italy?. Journal of Cleaner Production 258,120593. https://doi.org/10.1016/j.jclepro.2020.120593
Solakis K, Peña-Vinces JC, Lopéz-Bonilla JM (2017) DART model from a customer’s perspective: Anexploratory study in the hospitality industry of Greece. Probl Perspect Manag 15(2):536–548. http://dx.doi.org/10.21511/ppm.15(si).2017.07
Solakis K, Peña-Vinces JC, Lopez-Bonilla JM, Aguado LF (2021) From value co-creation to positiveexperiences and customer satisfaction: A customer perspective in the hotel industry. Technol Econ DevEcon 27(4):948–969. https://doi.org/10.3846/tede.2021.14995
Page 23/33
Surapto D (2014) The in�uence of people satisfaction on services organization public performance ofvillage district in south of Tangerang. J Manag Bus 13(2):169–176.
Tabuchi Y (2010) Chihou jichitai ni okeru gyosei hyoka 12 nen no ayumi to kongo no kadai [Progress ofpublic sector evaluation in local government in 12 years and future prospects]. Mitsubishi Sogo KenkyujoHou [Mitsubishi research institute report] 53:30–53.
Takahashi T, Kawasaki S (2019) Anketo ni yoru chosa to kaso jikken: Kokyaku manzoku-do no haaku tokojo [Survey and virtual experiments by questionnaire: Understanding and improving customersatisfaction]. Nikkagiren, Tokyo.
Talib MA, Shukor NJA (2016) Quality measurement of public payment counter service: A statisticalapproach. In: M. A. Abdullah, W. K. Yahya, M. Ramli, S. R. Mohamed, & B. E. Ahmad (Eds.) RegionalConference on Science, Technology and Social Sciences (RCSTSS 2014). Springer, Singapore, p 1053–1062.
Van Ryzin GG (2004) Expectations, performance, and citizen satisfaction with urban services. J PolicyAnal Manag 23(3):433–448. https://www.jstor.org/stable/3326260
Van Ryzin GG (2006) Testing the expectancy discon�rmation model of citizen satisfaction with localgovernment. J Public Admin Res Theor 16(4):599–611. https://doi.org/10.1093/jopart/mui058
Van Ryzin GG, Immerwahr S (2007) Importance–performance analysis of citizen satisfaction surveys.Public Admin 89(1):215–226. https://doi.org/10.1111/j.1467-9299.2007.00641.x
Van Ryzin GG, Muzzio D, Immerwahr S, Gulick L, Martinez E (2004) Drivers and consequences of citizensatisfaction: An application of the American Customer Satisfaction Index Model to New York City. PublicAdmin Rev 64(3):331–441. https://doi.org/10.1111/j.1540-6210.2004.00377.x
Wagenheim GW, Reurink JH (1991) Customer service in public administration. Public Admin Rev 51:263–269. https://doi.org/10.2307/976950
Wilson A, Zeithaml VA, Bitner MJ, Gremler DD (2021) Services marketing: Integrating customer focusacross the �rm, 4th European ed. McGraw Hill, Maidenhead.
Wisniewski M (2001) Assessing customer satisfaction with local authority services using SERVQUAL.Total Qual Manag 12(7–8):995–1002. https://doi.org/10.1080/09544120100000026
Wolf JA, Niederhauser V, Marshburn D, LaVela, SL (2014) De�ning patient experience. Patient Exp J1(1):7–19. https://pxjournal.org/journal/vol1/iss1/3/
Zeithaml VA (1988) Consumer perceptions of price, quality, and value: A means-end model and synthesisof evidence. J Mark 52(3):2–22. https://doi.org/10.2307/1251446
Page 24/33
Zhang J, Chen W, Petrovsky N, Walker RM (2022) The expectancy‐discon�rmation model and citizensatisfaction with public services: A meta‐analysis and an agenda for best practice. Public AdministrationReview 82(1): 147-159. https://doi.org/10.1111/puar.13368
Ziller C, Andreß H (2021) Quality of local government and social trust in European cities. UrbStud. https://doi.org/10.1177/00420980211019613.
Tables
Table 1. Recent studies on user satisfaction with public facilities or public services

Page 25/33
Author(s)
(Year of
Publication)
Type of
facility,
region/country
Details
1 Agus,
Barker, and
Kandampully
(2007)
86 branches of
Ministries,
Malaysia
They conducted two different surveys targeting
customers and managers in government branches.
2 Hsiao and
Lin (2008)
A local
government
Revenue
Service Office
(GRSO),
Taiwan
The authors used their own scale for administrative
agencies called the COSES model (customer-oriented
service-enhancement system). It is a five-group scale
for measuring the staff’s customer orientation of
organizations.
3 Mansor and
Razali
(2010)
Malaysia They conducted research in Malaysia using three
question-item categories related to the determinative
factors of customer satisfaction with the municipal
government’s counter service. To evaluate user
satisfaction of public facilities, this study uses a three-
group scale that is simpler than SERVQUAL’s five-
group scale.
4 Akinboade,
Kinfack, and
Mokwena
(2012)
The Sedibeng
district
municipality,
South Africa.
Structured sample of 1,000 residents of Lesedi,
Emfuleni and Midvaal municipalities were analysed.
Their study revealed differences in satisfaction and
dissatisfaction in each policy area.
5 Surapto
(2014)
South
Tangerang,
Indonesia
The researcher conducted a survey targeting 200
residents from urban villages.
6
Józsa (2017). Hungary The research used 60 question items on a 5-point
Likert scale concerning market orientation in
municipal services and that market orientation plays
Page 26/33
an important role because of positively influencing
customer satisfaction. A total of 1580 municipal
service providers were surveyed.
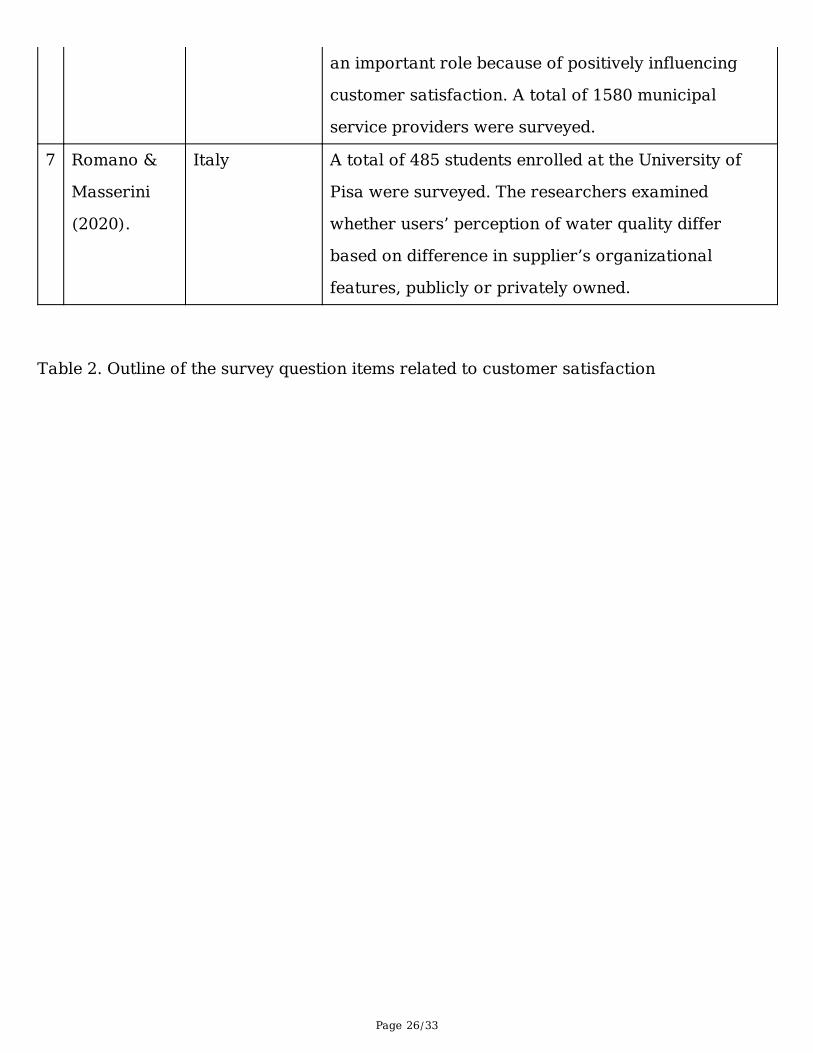
7
Romano &
Masserini
(2020).
Italy A total of 485 students enrolled at the University of
Pisa were surveyed. The researchers examined
whether users’ perception of water quality differ
based on difference in supplier’s organizational
features, publicly or privately owned.
Table 2. Outline of the survey question items related to customer satisfaction

Page 27/33
Concept Groups Question Items
A) Office hardware (buildings,
tables, chairs, lighting, and
others)
AQ1 (Q6_1) Location (access from home)
AQ2 (Q6_2) Tables and chairs in the building
AQ3 (Q6_3) Indoor atmosphere
AQ4 (Q6_4) Ease of understanding the layout of the
floors and offices inside the building
AQ5 (Q6_5) Ease of understanding the buildings’
locations and entrances at the site of the City Hall
AQ6 (Q6_6) Countermeasures against COVID-19
infection in buildings (partitions, sanitisers at
entrances, etc.)
B) Software (staff responses) BQ1 (Q6_7) Courteousness of the staff in charge
BQ2 (Q6_8) Ease of consultation and asking the staff
in charge questions
BQ3 (Q6_9) Ease of understanding oral explanations
from the officer in charge (speed)
BQ4 (Q6_10) Clarity of explanation given by the
officer in charge (content)
C) Service delivery CQ1 (Q7_1) Planned business in the City Hall was
completed after this visit
CQ2 (Q7_2) Length of time to complete customer
requests is short
CQ3 (Q7_3) The problem was solved after this visit
to the City Hall
CQ4 (Q7_4) The worries and concerns of customers
were alleviated after this visit to the City Hall
CQ5 (Q7_5) This time, I was able to run my errands
at the City Hall more smoothly than expected
Y) Degree of customer YQ1 (Q8_1) Satisfaction with the experience at the

Page 28/33
satisfaction with counter services
at the City Hall
City Hall this time
YQ2 (Q8_2) I want to tell people about this
experience at the City Hall and how good it was
YQ3 (Q8_3) The administrative services provided by
the City Hall are convenient
Table 3. Number of questionnaires distributed (August 2021)
Day of the Month Weekday Count Ratio
23 Monday 382 38.2%
24 Tuesday 229 22.9%
25 Wednesday 277 27.7%
26 Thursday 101 10.1%
Distribution date unknown 11 1.1%
Total 1,000 100.0%
Note: Thursday’s distribution ended at about 1:05 p.m.
Table 4. Number of questionnaires distributed in each time slot (August 2021)8 a.m. 9 a.m. 10 a.m. 11 a.m. 12 p.m. 13 p.m. 14 p.m. 15 p.m. 16 p.m. 17 p.m. Monday
throughWednesday
25 67 129 131 106 102 160 118 44 6 8882.8% 7.5% 14.5% 14.8% 11.9% 11.5% 18.0% 13.3% 5.0% 0.7% 100.0%
Table 5. Co-relationship between component ZY1 and the question items

Page 29/33
Question Items r
AQ1 (Q6_1) 0.234**
AQ2 (Q6_2) 0.375**
AQ3 (Q6_3) * 0.494**
AQ4 (Q6_4) * 0.463**
AQ5 (Q6_5) * 0.453**
AQ6 (Q6_6) * 0.455**
BQ1 (Q6_7) * 0.615**
BQ2 (Q6_8) * 0.602**
BQ3 (Q6_9) * 0.613**
BQ4 (Q6_10) * 0.609**
CQ1 (Q7_1) * 0.458**
CQ2 (Q7_2) * 0.419**
CQ3 (Q7_3) * 0.502**
CQ4 (Q7_4) * 0.628**
CQ5 (Q7_5) * 0.589**
Note: Questionnaire items with correlation coefficients of 0.4 or higher have a single
asterisk. These questions were used in the principal component analysis for each category.
** p < .01
Table 6. Multiple regression predicting the overall customer satisfaction (component ZY1)
Zero Order r β p VIF
ZA1 .540** 0.24** < .0001 1.49
ZB1 .650** 0.28** < .0001 1.96
ZC1 .641** 0.40** < .0001 1.50
ZC2 -.073 -0.06* .0383 1.00
Note: R2 = .58; Adjusted R2 = .58; VIF = variance inflation factor.
** p < .01 * p < .05

Page 30/33
Figures
Figure 1
Research analysis model
Page 31/33
Figure 2
Factor loadings related to Y (overall customer satisfaction with counter services)
Figure 3
Factor loadings related to A

Page 32/33
Figure 4
Factor loadings related to B
Figure 5

Page 33/33
Factor loadings related to C