Factors Determining UK Album Success
37
FACTORS DETERMINING UK ALBUM SUCCESS Caroline Elliott 1 & Rob Simmons Department of Economics Lancaster University Management School Lancaster University Lancaster LA1 4YX Tel. +44 (0) 1524 594225 Fax +44 (0) 1524 594244 [email protected] ABSTRACT This paper uses a recently compiled dataset on UK album sales to determine which factors contribute to bestselling album sales success. We control for factors including length of time since release, nationality of artist, artist type and album type, 1 Author for correspondence 1
Transcript of Factors Determining UK Album Success
FACTORS DETERMINING UK ALBUM SUCCESS
Caroline Elliott1 & Rob Simmons
Department of Economics
Lancaster University Management School
Lancaster University
Lancaster LA1 4YX
Tel. +44 (0) 1524 594225
Fax +44 (0) 1524 594244
ABSTRACT
This paper uses a recently compiled dataset on UK
album sales to determine which factors contribute to
bestselling album sales success. We control for
factors including length of time since release,
nationality of artist, artist type and album type,1 Author for correspondence
1

testing the increasing returns to information
hypothesis. Information on general public online
review scores for the albums in the data set allows a
strong test of the accuracy of online reviews in
predicting music sales, as online reviews are a
relatively recent phenomenon while the release of many
of the albums predates the widespread use of the
Internet.
KEYWORDS:
Music Returns to Information Reviews
Sales
JEL CLASSIFACTION NUMBERS:
D12 D83 L15 L25 L82
1. INTRODUCTION
Despite challenges faced by the music industry in
recent years, the industry remains important to the UK
economy, with total UK recorded music income reaching
£928.8million in 2009 according to the British
Phonographic Industry.2 Music albums, along with other2 www.bpi.co.uk
2

entertainment goods such as films, can broadly be
considered to be experience goods, which have to be
‘consumed’ for consumers to discover whether the
product matches their preferences, although some
characteristics of the product can be ascertained, via
search, prior to purchasing (Nelson, 1970; Shapiro and
Varian, 1999). Individual music tracks can be heard on
television music channels, online or on the radio, but
full information on the album may be difficult to
obtain prior to purchase. This paper uses a recently
compiled dataset on UK bestselling album sales over
the past fifty years to determine which factors
contribute to album sales success. While there is an
established literature examining the factors
contributing to sales of films, for example Elberse
and Eliashberg (2003), Moul (2007) and Elliott and
Simmons (2008), the literature on the factors
contributing to music sales is more limited. See Fox
and Kochanowski (2007), Connolly and Krueger (2006)
and Strobl and Tucker (2000) for recent detailed
summaries of developments in the music industry, as
3
well as discussion of the limited existing literature
that explores the determinants of album success.
In the statistical analysis we test whether factors
such as length of time since release, nationality of
artist, type of artist and type of album impact on
bestselling album success. We are also able to test
the increasing returns to information hypothesis,
which suggests that past success of an album gives
rise to a greater amount of album information in the
public domain, contributing to further album success
and sales. Increasing returns to information have
previously been identified for a number of experience
goods in the entertainment industry, including the US
hit singles market in popular music, Giles (2007);
films, (Walls (1997) for the US and Hand (2001) for
the UK)); and Broadway theatre productions, Maddison
(2004). This paper extends this literature by
confirming the increasing returns to information
result for UK music album sales. The result is
particularly strong as it is not only identified for
4
the UK bestselling albums, but replicated using a
second dataset of recently released albums.
Potential consumers have an increasing number of
sources of information available to them when
considering the purchase of experience goods such as
music, films and books. Online reviews are
increasingly common, and those provided by the general
public are an alternative to expert reviews that
continue to be published in newspapers and magazines,
as well as online. Hence, data were collected on
general public online review scores. This allows a
strong test of the accuracy of online reviews in
predicting music sales, as online reviews are a
relatively recent phenomenon while the release of many
of the albums in the dataset predates the widespread
use of the Internet. There is a growing empirical
literature investigating the impact of third-party
reviews in diverse settings such as Broadway shows,
Reddy et al. (1998); cinema, Eliashberg and Shugan
(1997), Holbrook (2005), Reinstein and Snyder (2005),
5
Elliott and Simmons (2008); books, Chevalier and
Mayzlin (2006). Consequently, reviews, whether offered
by ‘experts’ or increasingly online by members of the
public, may be influential in determining sales.
However, we are unaware of any other research into the
impact of online reviews in the music industry to
date.
The structure of the remainder of the paper is as
follows: in the following section the methodology and
dataset adopted are discussed. Results are reported in
Section 3, with conclusions suggested in Section 4.
2. METHODOLOGY AND DATA
2.1 EMPIRICAL METHODOLOGY
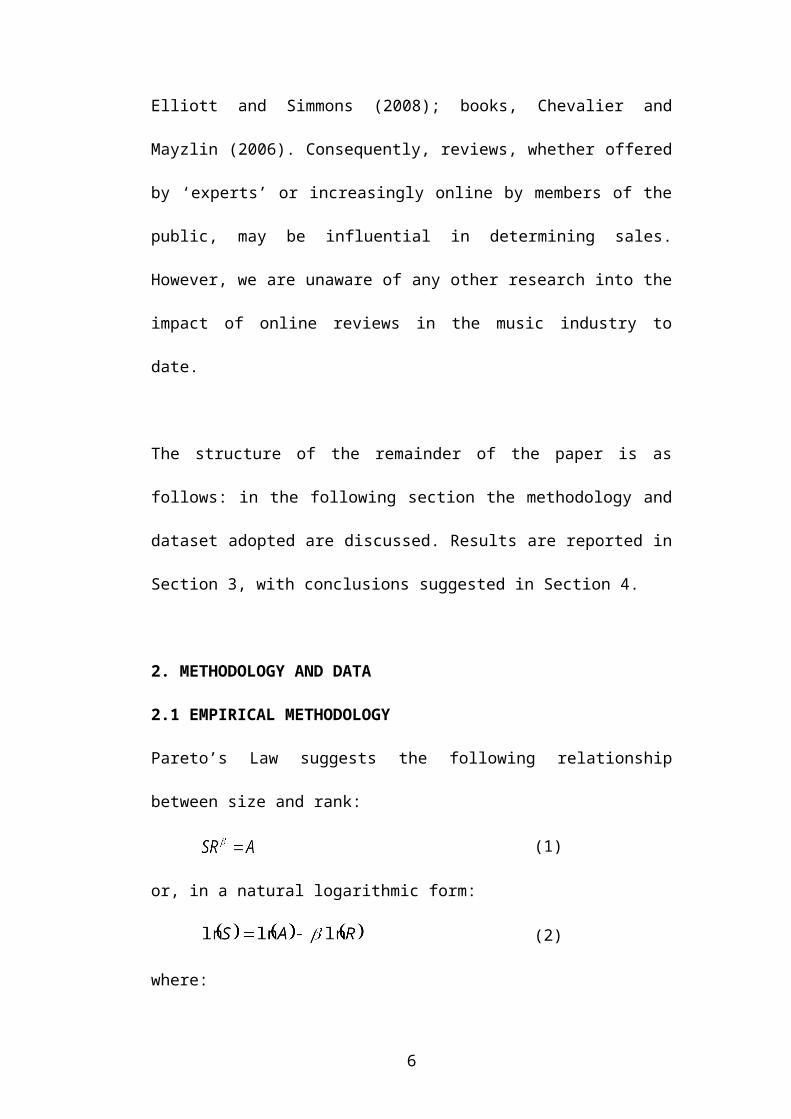
Pareto’s Law suggests the following relationship
between size and rank:
(1)
or, in a natural logarithmic form:
(2)
where:
6
S = size
R = rank
A, = coefficients
The relationship has been applied in a number of
settings, including investigations into the
relationship between firm size and rank, see for
example Steindl (1965). However, it has been argued
that (sales) growth of a firm, album, film etc. may
reflect its recent growth, such that ‘success breeds
success’, as discussed in De Vany and Walls (1996).
For example, this may be due to the greater propensity
for word of mouth recommendations, which may be
particularly valuable for experience good purchases.
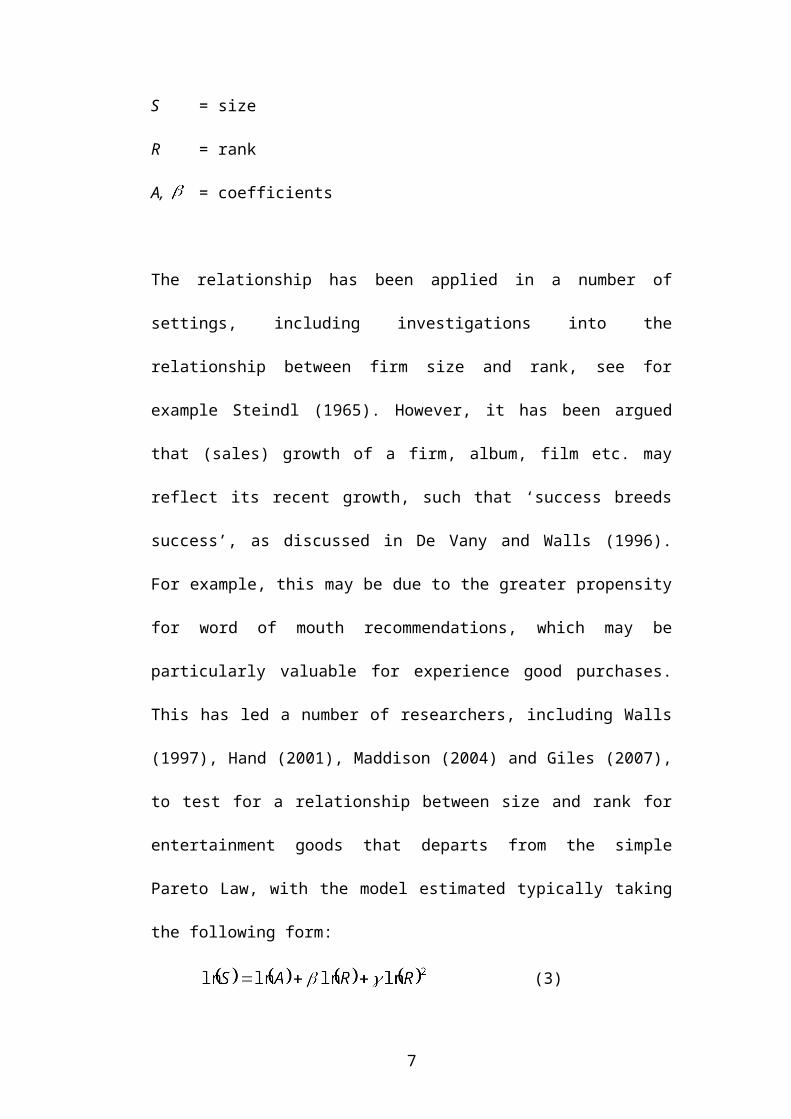
This has led a number of researchers, including Walls
(1997), Hand (2001), Maddison (2004) and Giles (2007),
to test for a relationship between size and rank for
entertainment goods that departs from the simple
Pareto Law, with the model estimated typically taking
the following form:
(3)
7
Of crucial importance is the sign associated with the
coefficient on the squared rank variable. A negative,
significantly different from zero coefficient
indicates a departure from Pareto’s Law, with
autocorrelated growth and increasing returns to
information.
Initial OLS regression results suffered from
heteroscedasticity. Hence, Huber’s Robust Regression
Method was adopted in our sales regressions. Robust
regression is an estimator designed to eliminate gross
outliers. The procedure is to perform an initial
screening of the data based on Cook’s distance > 1.
Once any gross outliers are removed iterations are
performed, using Huber weights and biweights
sequentially, until convergence is achieved. The
resulting standard errors are then robust to
heteroscedasticity. This procedure can be applied
where a distribution exhibits excess kurtosis due to
the presence of outliers, for example for film
revenues where a big blockbuster massively outperforms
8
ordinary films. In our case, there are a few albums
with extremely high sales that may appear as outliers.
2.2 DATA COLLECTION
In November 2006 the UK Chart Company published total
sales of the one hundred best selling albums in the UK
for the first time, with data collated from the 1950s
onwards. The data includes vinyl as well as cd sales,
and includes greatest hits, live albums and
soundtracks. This allows researchers the opportunity
to estimate the factors impacting on album success for
the most popular albums. The analysis below focuses on
number of albums sold (sales) as a measure of size,
with Maddison (2004) similarly using a count of number
of Broadway performances. However, note that revenue
has been used in Walls (1997) and Hand (2001), while
Giles uses number of weeks in the top position in the
US singles chart. The rank and squared rank variables,
the rank and rank2 variables respectively, refer to the
position of the albums in the list of the 100 best
9
selling albums in the UK as released by the UK Chart
Company. See Appendix 1 for a list of variables used.
Further explanatory variables considered include dummy
variables that identify albums by bands, male and
female solo artists, artists of UK origin, greatest
hits and soundtrack albums (typically to films or
musicals). Information on release date and so number
of months since release, number of albums previously
released by the artist(s), number of weeks in the UK
album chart, and number of weeks spent at number one
in the UK album chart were obtained from Betts (2005).
Note that only the number of albums previously
released by a band or artist in their current
recording guise is counted. Hence, for example, Robbie
Williams’s or George Michael’s album releases when
members of the bands Take That and Wham respectively,
are not counted as albums previously released by them.
It was felt that participation in previous bands may
increase artist recognition when they move on and, for
example, embark on solo careers, but this may help or
10
hinder the later album sales, particularly if an
artist’s style or genre of music changes. Some
correlation between UK and US album sales may be
expected, and so a dummy variable was created taking
the value unity when an album had obtained sales of at
least one million in the US.
As highlighted in the Introduction a number of papers
have investigated the impact of online reviews on
sales in a variety of industries. It is maybe
surprisingly difficult to find online reviews of a
broad range of albums in the UK, particularly if
reviews are required of albums that were released more
than a few years previously. The only suitable UK site
was found to be www.amazon.co.uk, to which members of
the public are able to submit online reviews,
including a score between 0 and 5 (5 being the maximum
score available). However, we were initially concerned
about the representativeness of the average online
scores awarded as some albums had only received a
11
small number of reviews and associated scores.3
Consequently, the online reviews on the US Amazon site
www.amazon.com were also collected. As shown in Table
1 below, the standard deviation of scores awarded both
on the UK and US websites was very low, and it is
hypothesised that respondents typically only give
reviews and scores to albums that they have
appreciated. If this is true, then the number of
reviews submitted may also be indicative of the
general public’s views of albums. Hence, data were
collected on the number of individuals reviewing
albums and submitting online scores, on both the UK
and US Amazon sites. Finally, data were collected from
the UK Amazon site on the ranking (as of January 3rd
2007) of albums according to Amazon sales
(UKamazonrank). A further explanatory variable was
then created, using the squared UK Amazon sales
rankings (UKamazonrank2).
3 In fact one album, Robson and Jerome by Robson and Jerome, had
not received any online review or rating score. Consequently,
this album was deleted from the analysis that follows.
12

Table 1 about here
Typically, natural logarithms of continuous variables
were taken, with the missing values resulting from
taking the log of a zero value recoded as zeros.
There is unavoidable sample selection bias in the
dataset as a result of collecting data for only the
hundred greatest selling albums in the UK. However,
The UK Chart Company were unable to provide sales data
for a greater number of albums. Sample selection bias
seems to be an unfortunate feature of many papers that
examine the factors determining sales success for a
number of entertainment products. Reflecting this, the
current analysis is only able to indicate factors that
contribute to sales success of highly successful
albums, rather than albums in the UK market more
generally.
3. RESULTS
13

3.1 INCREASING RETURNS TO INFORMATION
Results in Table 2 below are reported using the log of
the number of album sales as the dependent variable,
estimated using Huber’s Robust Regression Method. A
general to specific methodology was used to select the
explanatory variables in the reported regressions,
with the final iterations reported. The final column
of Table 2 reports the regression results with only
the rank and squared rank explanatory variables to aid
comparison with the previous papers published. We
recognise that as in all of the literature on
increasing returns to information there is a problem
that the explanatory rank variables will be
endogenously determined. Unfortunately this is an
unavoidable weakness facing all studies of this
nature, including those of Walls (1997), Hand (2001),
Maddison (2004) and Giles (2007). Further, as
identified by Hand (2001), using rank and squared rank
variables as explanatory variables may be problematic
as they will be closely related.
14
Nevertheless, the results reported confirm the result
found in previous analyses, including that of Giles
(2007) for the US music industry, namely that
increasing returns to information exist, as shown by
the highly significant negative coefficient always
associated with the squared logged sales rank
variable. This result has also been identified in the
film industry by Walls (1997) and Hand (2001), and for
Broadway productions by Maddison (2004).
Table 2 about here
The finding of increasing returns to information in
Giles (2007) comes from hit (number one) singles in
the US popular music market. It is worth considering
just how general this result is. We can also show
evidence from a sample of 315 recent albums released
in the UK that appeared in the top 40 over the period
2002 to 2004. This is a broader category as it is not
restricted to number one albums and albums themselves
tend often to occupy niche markets and enjoy less mass
15
popularity than the hit singles analysed by Giles. For
this second sample we do not know the sales figures,
just the number of weeks in the UK top 40 album chart.
We construct a rank measure based on weeks of
appearance over the sample period. Where number of
weeks of appearance is the same for more than one
album, we base the rank measure on highest chart
position obtained.
Using Huber’s Robust Regression estimates to
facilitate comparison with the results reported above
and again adopting a double-log functional form our
estimates are:
LOG WEEKS = 3.366 + 1.191LOG RANK – 0.287 (LOG RANK)2
= 0.96 (4)
where both coefficients have p values of 0.00. Hence,
the results of Giles for US hit singles, and our own
findings for UK most popular albums are supported by
this additional data set that comprises some less
popular albums. Broadening the music category away
16
from the most popular singles or albums seems not to
damage the increasing returns result.
Similar Huber’s Robust regressions using the 100 best
selling albums data set were then estimated, with
either the number of weeks in the chart (to ensure
comparability with the previous regression) or the
number of weeks at number one in the albums chart (to
aid comparability with Giles (2007)) as the dependent
variable, with the rank variables similarly
constructed according to either weeks in the chart or
the number of weeks at the top chart position. Results
are reported in Table 3 below.
Table 3 about here
Yet again, the results support the hypothesis of
increasing returns to information. Consequently, this
result appears particularly robust. Both Giles (2007)
and this paper use datasets spanning approximately
fifty years, and so the relationship between measures
17
of success and rank may have been predicted to be
weaker as numerous factors may influence single or
album sales over such a long period of time. This
prediction is not borne out. A comparable increasing
returns result emerges for albums and singles, and the
same result is identified in the additional albums
dataset reported in this paper even though the data
period is much shorter and some of the albums appeal
to more niche audiences.
3.2 DETERMINANTS OF ALBUM SALES
Determining the factors that influence (logged) sales
is complicated by the strength of the relationships
between the dependent variable and the logged rank and
squared rank variables, -0.9767 and -0.9785
respectively. The regression results in Table 2
indicate that the only other coefficients
significantly different from zero are those associated
with UK Amazon sales rankings. This is maybe not
surprising given the diversity of albums that appear
in the list of the 100 best selling albums in the UK.
18
However, it was expected that stronger relationships
between album sales and the length of time since the
album’s release and the weeks in the UK album chart
may have been identified. Following Giles (2007), an
interaction variable was created, by multiplying the
log of sales rank by the number of months since
release. Yet, unlike the results discussed in Section
3.1 above, our results differ from those of Giles
(2007) as the coefficient on this variable was not
found to be significantly different from zero.
Considering the impact of online reviews, in
regressions including the logged average UK or US
online review score, the coefficient on these
variables was consistently found to be insignificantly
different from zero, although this was not unexpected
given the very low standard deviations associated with
these data, reported in Table 1. It is hypothesised
that typically it is individuals who have enjoyed an
album who make the effort to submit a review score for
the album online. Hence, not only was the standard
19
deviation of scores low, but Table 1 reports the high
simple arithmetic means of scores submitted to both
the UK and US Amazon sites.4 More surprisingly, when
the log of the number of scores recorded in either the
UK or US was included, again the coefficient on these
variables was found to be insignificantly different
from zero.
An inspection of the data suggested that the majority
of online reviews relate to albums released relatively
recently. A dummy variable taking the value of unity
for albums released in the UK since January 1st 2000
was created, with this variable multiplied by the log
of the number of UK online scores recorded, to create
an interaction variable 2000interact. The choice of
4 To confirm that the high average scores and low standard
deviation of scores is not just a feature of the albums in the
dataset, the mean and standard deviation of UK Amazon scores for
a second sample of albums were calculated. Using the top thirty
albums sold in the UK in the week commencing November 5th 2006
(just before the 100 best selling UK albums sales figures were
published) and the Amazon scores from December 2007, the mean
score was 4.18, with a standard deviation of 0.56.
20
January 1st 2000 was not arbitrary. Rather, Gopal et
al. (2004) suggest that during the 1990s, and
particularly in the late 1990s, the music industry
changed due to the availability of downloadable music
online.5 Nevertheless, when this variable was
included, the coefficient associated with it was again
found to be insignificantly different from zero.
This suggests that online reviews do not have an
impact on sales, even though online sales are related
to album sales more generally, as evidenced by the
coefficients on the UK Amazon rank variables. We can
only speculate as to whether this result will continue
to hold in the future as consumers continue to post
reviews online for an increasing number of products.
Again a nonlinear relationship was identified between
album sales and UK Amazon sales rankings, as shown by
the negative coefficient on lUKamazonrank, and a
5 Nevertheless the analysis was repeated with January 1st 2002 the
date from which the dummy variable took the value unity. Very
similar results were obtained although the explanatory power of
the model was lower. Results available upon request.
21
positive coefficient on lUKamazonrank2, both of these
coefficients being significantly different from zero
at least at the five percent level. Note that the
analysis benefits from the consistency to be gained
from using sales rank and sales rank squared
explanatory variables, and similarly Amazon sales
rankings and squared Amazon sales rankings.
It should be noted that the coefficients on the dummy
variables representing type of album, artist (other
than UK based artists) and US sales in excess of one
million were never found to be significantly different
from zero, at at least the 10% significance level.
These findings contrast with those reported by Fox and
Kochanowski (2007) who found, amongst other results,
that solo artists and male artists achieved more gold
albums in the US market. A dummy explanatory variable
was also created, taking the value unity when a
leading member of a group or solo artist is deceased.6
However, the coefficient on this explanatory variable
6 The dummy variable takes the value unity in the dataset for
albums recorded by The Beatles, Bob Marley, Nirvana and Queen.
22
was never found to be significantly different from
zero, indicating that album sales do not increase
significantly after the death of a band member.
Similarly, the coefficient on the logged number of
albums previously released was never significantly
different from zero, so this variable was omitted in
the final reported regressions.7
4. CONCLUSIONS
This paper contributes to a limited literature
exploring the factors determining music album success.
Results support strongly the hypothesis of increasing
returns to information found previously to hold in the
music industry and more generally for a number of
entertainment products. However, the research also
explored whether other factors could be identified as
contributing to bestselling album sales success,
7 A zero value was inserted in place of a missing value when the
number of albums previously released was zero. Otherwise, when
this variable was logged, 35 missing values would have reduced
the size of the dataset considerably.
23
concluding that it is difficult to identify such
factors.
The paper offers a further original contribution to
the existing literature investigating album success as
it tests whether online reviews can predict music
success. Online reviews are a relatively recent
phenomenon while the release of many of the albums in
the dataset predates the widespread use of the
Internet. Results suggest that online reviews do not
predict album sales neither generally, nor just for
albums released relatively recently (since 2000).
Interestingly, there was a very limited distribution
of scores given to albums, both in the UK and the US,
suggesting that individuals typically were only likely
to submit online reviews and scores for albums that
they had enjoyed. Yet even when the number of
individuals submitting an online score for an album in
the UK was adopted as an explanatory variable rather
than the mean of the scores submitted the same result
emerges.
24

Ultimately it appears that success really does breed
further success to the exclusion of other factors in
the UK album industry. Nevertheless, a drawback of the
analysis arises from the data limitations. Data were
only available for the hundred bestselling albums in
the UK, and so the analysis can only offer insights
into the factors influencing sales of bestselling
albums. In addition, as online reviews continue to be
posted, the richness of online review data available
is expected to increase. Further research is still
required into factors influencing album sales more
generally, but this future research will benefit from
the availability of greater online review data.
ACKNOWLEDGEMENTS
Many thanks to Owen Rodwell for excellent research
assistance, to two anonymous referees, as well as
participants of the 2007 Scottish Economic Society and
Western Economic Association Conferences for very
25
helpful comments. All errors of course remain the
responsibility of the authors.
REFERENCES
Betts, G. (2005) Complete UK Hit Albums 1956-2005, Collins,
London.
British Phonographic Industry
http://www.bpi.co.uk/press-area/news-amp3b-press-
release/article/recorded-music-sales-revenue-
stabilise-in-2009.aspx, accessed May 5th 2010.
Chevalier, J. & Mayzlin, D. (2006) The Effect of Word
of Mouth on Sales: Online Book Reviews, Journal of
Marketing Research, 43, 345-354.
Connolly, M. & Krueger, A. B. (2006) Rockonomics: The
Economics of Popular Music, Handbook of the Economics of Art
and Culture, ed. Ginsburgh, V. and Throsby, D.,
Elsevier, Amsterdam.
26

De Vany, A. & Walls, W. D. (1996) Bose-Einstein
Dynamics and Adaptive Contracting in the Motion
Picture Industry, Economic Journal, 106, 1493-1514.
Elberse, A. & Eliashberg, J. (2003) Demand and Supply
Dynamics for Sequentially Released Products in
International Markets: The Case of Motion Pictures,
Marketing Science, 22, 329-354.
Eliashberg, J. & Shugan, S. (1997) Film Critics:
Influencers or Predictors?, Journal of Marketing, 61, 68-
78.
Elliott, C. & Simmons, R. (2008) Determinants of UK
Box Office Success: The Impact of Quality Signals,
Review of Industrial Organization, 33, 93-111.
Fox, M. & Kochanowski, P. (2007) Multi-Stage Markets
in the Recording Industry, Popular Music and Society, 30,
173-195.
27

Giles, D. (2007) Increasing Returns to Information in
the US Popular Music Industry, Applied Economic Letters, 14,
327-331.
Gopal, R., Sanders, G., Bhattacharjee, S., Agrawal, M.
& Wagner, S. (2004) A Behavioral Model of Digital
Music Piracy, Journal of Organizational Computing and Electronic
Commerce, 46, 107-111.
Hand, C. (2001) Increasing Returns to Information:
Further Evidence from the UK Film Market’, Applied
Economic Letters, 8, 419-421.
Holbrook, M. (2005) The Role of Ordinary Evaluations
in the Market for Popular Culture: Do Consumers Have
“Good Taste”?, Marketing Letters, 16, 75-86.
Maddison, D. (2004) Increasing Returns to Information
and the Survival of Broadway Theatre Productions,
Applied Economics Letters, 11, 639-643.
28
Moul, C. (2007) Measuring Word of Mouth’s Impact on
Theatrical Movie Admissions, Journal of Economics and
Management Strategy, 16, 859-892.
Nelson, P. (1970) Information and Consumer Behavior,
Journal of Political Economy, 78, 311-329.
Reddy, S., Swaminathan, V. & Motley, C. (1998)
Exploring the Determinants of Broadway Show Success,
Journal of Marketing Research, 35, 370-383.
Reinstein, D. & Snyder, C. (2005) The Influence of
Expert Reviews on Consumer Demand for Experience
Goods: A Case Study of Movie Critics, Journal of Industrial
Economics, 53, 27-52.
Shapiro, C. & Varian, H. (1999) Information Rules: A Strategic
Guide to the Network Economy, Harvard Business School
Press, Boston.
29

Steindl, J. (1965) Random Process and the Growth of Firm: A
Study of the Pareto Law, Hafneer, New York.
Strobl, E. A. & Tucker, C. (2000) The Dynamics of
Chart Success in the UK Pre-Recorded Popular Music
Industry, Journal of Cultural Economics, 24, 113-134.
Walls, W. D. (1997) Increasing Returns to Information:
Evidence from the Hong Kong Movie Market, Applied
Economics Letters, 4, 287-290.
30

TABLE 1: ONLINE REVIEW DESCRIPTIVE STATISTICS
Variable N Mean Std.
Dev.
Minimu
m
Maximu
m
UKamazonscor
e
10
0
4.48 0.61 0 5
UKamazoncou
nt
10
0
66.66 81.48 0 437
USamazonscor
e
10
0
4.44 0.31 3.5 5
USamazoncou
nt
10
0
327.34 445.52 1 2056
UKamazonran
k
10
0
11,090
.88
30,266
.46
38 208,83
7
Notes:
Amazonscore variables record the mean online scores
received by albums. UK data are correct as of the 21st
December 2006, and the US data are correct as of the
22nd December 2006. Amazoncount variables record the
number of online scores submitted for an album,
collected at the same time as the mean Amazon scores.
There was only one album that had not received any
online reviews on the UK Amazon website; this was
31

‘Robson and Jerome’ by Robson and Jerome, and so this
album was excluded from the regression modelling.
32

TABLE 2: ROBUST REGRESSION RESULTS
Variable Regressi
on 1
Regressi
on 2
Regressi
on 3lrank -0.0334
(0.00)
-0.0409
(0.00)
-0.0381
(0.00)lrank2 -0.0396
(0.00)
-0.0388
(0.00)
-0.0393
(0.00)months*lrank -2.47e-6
(0.27)UK -0.0036
(0.30)lmonths 0.0016
(0.83)lwksinukchart 0.0018
(0.62)lwks@1inukcha
rt
0.0006
(0.72)2000interact -0.0008
(0.53)lUKamazonran
k
-0.0164
(0.03)
-0.0120
(0.05)lUKamazonran
k2
0.0010
(0.03)
0.0008
(0.05)Constant 15.3794
(0.00)
15.3870
(0.00)
15.3387
(0.00)N 99 99 99F 2838.29 7116.68 13,750.3
9
33
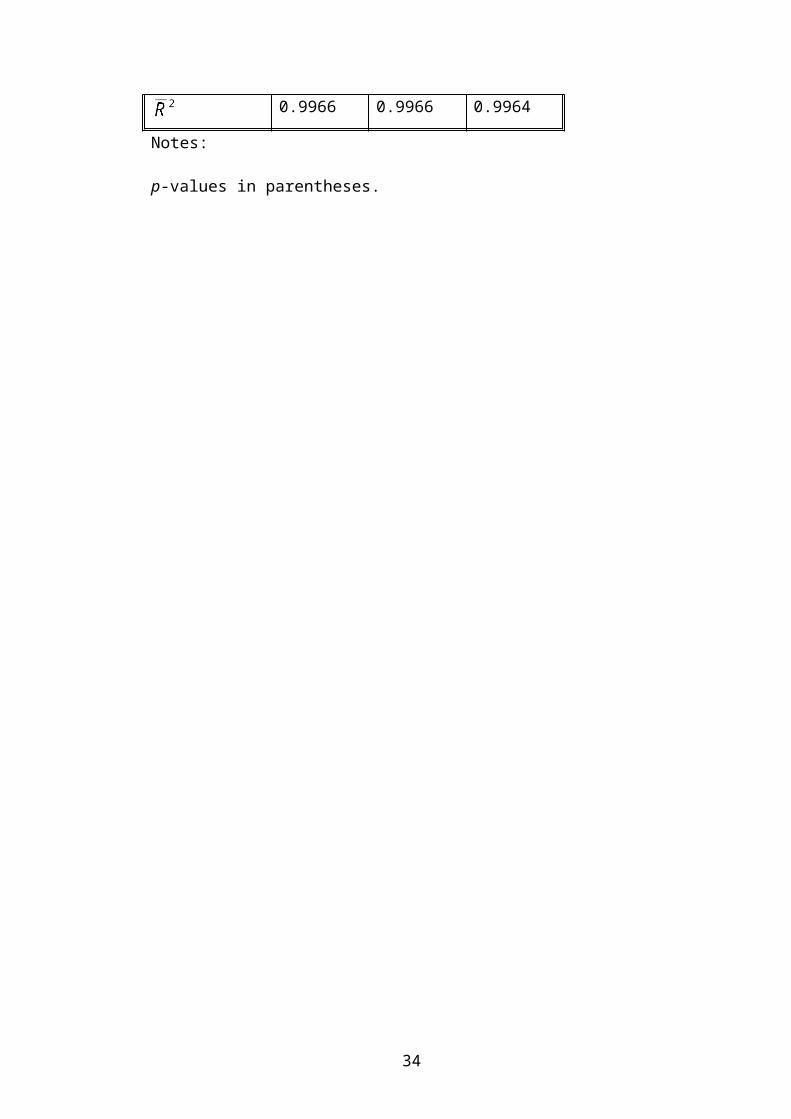
0.9966 0.9966 0.9964
Notes:
p-values in parentheses.
34

TABLE 3: ADDITIONAL INCREASING RETURNS REGRESSION
RESULTS
Variable Regression 1
Dependent
Variable
lwksinukchart
Regression 2
Dependent
variable
lwks@1inukchart
lrank -0.0203
(0.40)
2.6213
(0.00)
lrank2 -0.1006
(0.00)
-0.5459
(0.00)
Constant 6.1904
(0.00)
-0.5369
(0.01)
N 99 99
F 6994.89 898.81
0.9930 0.9487
Notes:
p-values in parentheses.
35
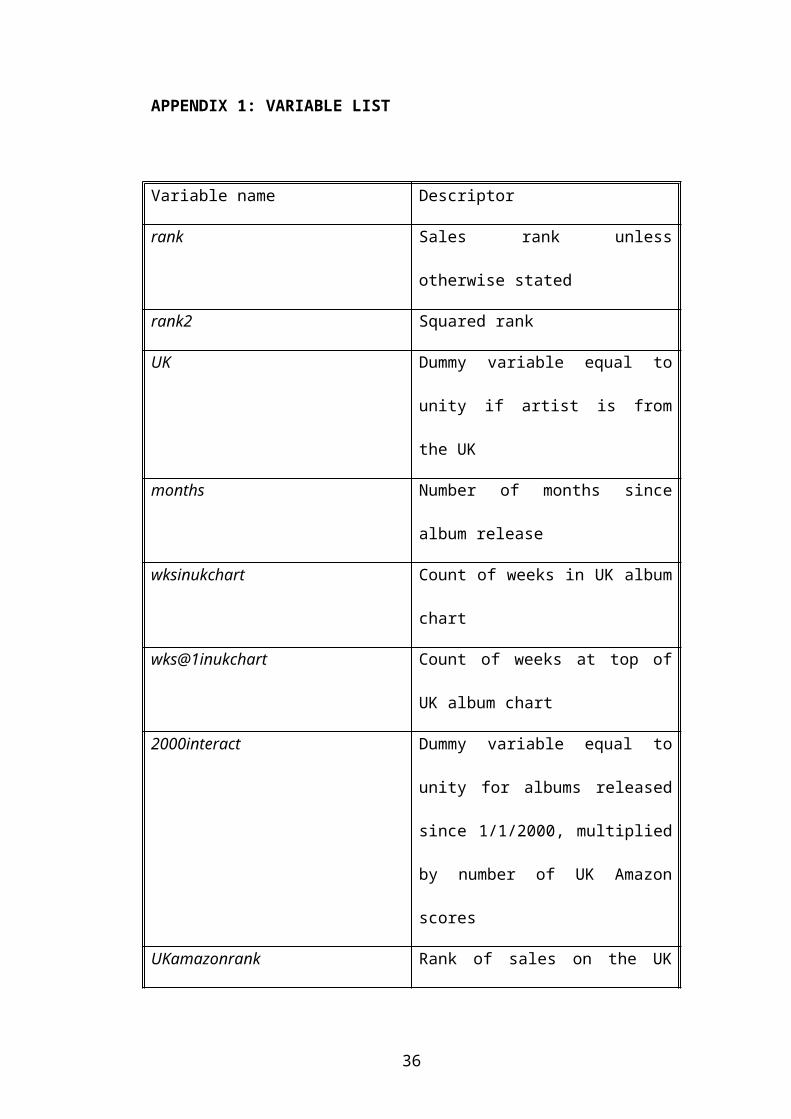
APPENDIX 1: VARIABLE LIST
Variable name Descriptor
rank Sales rank unless
otherwise stated
rank2 Squared rank
UK Dummy variable equal to
unity if artist is from
the UK
months Number of months since
album release
wksinukchart Count of weeks in UK album
chart
wks@1inukchart Count of weeks at top of
UK album chart
2000interact Dummy variable equal to
unity for albums released
since 1/1/2000, multiplied
by number of UK Amazon
scores
UKamazonrank Rank of sales on the UK
36

Amazon site
UKamazonrank2 Squared rank of UK Amazon
sales
l This denotes a (natural)
logged variable
37