Improved pinning regime by energetic ions using reduction of pinning potential
Receptacle Model of Salting-In by Tetramethylammonium Ions
Barbara Hribar-Lee,*,† Ken A. Dill,‡ and Vojko Vlachy†
Faculty of Chemistry and Chemical Technology, UniVersity of Ljubljana, AskerceVa c. 5, SI-1000 Ljubljana,SloVenia, and Department of Pharmaceutical Chemistry, UniVersity of California, San Francisco,California 94143-2240, United States
ReceiVed: August 25, 2010; ReVised Manuscript ReceiVed: October 8, 2010
Water is a poor solvent for nonpolar solutes. Water containing ions is an even poorer solvent. According tostandard terminology, the tendency of salts to precipitate oils from water is called salting-out. However,interestingly, some salt ions, such as tetramethylammonium (TMA), cause instead the salting-in of hydrophobicsolutes. Even more puzzling, there is a systematic dependence on solute size. TMA causes the salting-out ofsmall hydrophobes and the salting-in of larger nonpolar solutes. We study these effects using NPT MonteCarlo simulations of the Mercedes-Benz (MB) + dipole model of water, which was previously shown toaccount for hydrophobic effects and ion solubilities in water. The present model gives a structural interpretationfor the thermodynamics of salting-in. The TMA structure allows deep penetration by a first shell of waters,the dipoles of which interact electrostatically with the ion. This first water shell sets up a second water shellthat is shaped to act as a receptacle that binds the nonpolar solute. In this way, a nonpolar solute can actuallybind more tightly to the TMA ion than to another hydrophobe, leading to the increased solubility and salting-in. Such structuring may also explain why molecular ions do not follow the same charge density series asatomic ions do.
1. Introduction
Hydrophobic molecules are poorly soluble in water and aretypically even less soluble in aqueous solutions that contain saltions.1-3 Such multicomponent solutions of water, nonpolarsolutes, and salt ions are important throughout many areas ofchemistry, including in separations and analytical chemistry;for many types of biomolecules, including proteins, nucleicacids, and lipid bilayers; in formulations of pharmaceuticals;in solutions of micelles and surfactants; and in environmentalchemistry.
The first studies of aqueous solutions of salts and nonpolarsolutes date back to Franz Hofmeister, who studied how differentsalts affect the solubilities of proteins in water.4,5 Salting-in andsalting-out are now commonly used techniques in proteinseparation technology. The reduction in solubilities of hydro-phobic solutes in water due to the presence of salts is describedby the empirical Setschenov equation6
where ci and ci(0) are the molar solubilities of the hydrophobein a salt solution and in water, respectively; cS is the molarconcentration of the salt; and kS is the salt’s Setschenov salting-out coefficient. The value of kS depends on the type of salt andthe nature of the nonelectrolyte.2,7-9 The “Hofmeister series”is a rank-ordering of ion types based on the values of theirSetschenov coefficients.10-12
Interestingly, while most monatomic inorganic ions have apositive value of kSssalts usually drive hydrophobes to pre-
cipitate in watersa few molecular ions have kS < 0.13 Forexample, tetraalkylammonium salts2,8,9,14-16 tend to favor dis-solving hydrophobes in water. This is called salting-in. A similareffect has been observed for certain alcohols.9,17-19
Several mechanisms have been proposed to explain the effectof electrolytes on the properties of hydrophobes in aqueoussolutions.3,20-22 The first explanation proposed by Hofmeister4
suggests that ions get strongly hydrated removing the watermolecules from the hydration shell of the hydrophobes, leadingto salting-out. Other models related the salting-out effect withthe contraction of the volume upon dissolving most of theelectrolytes in water. These theories are based on the fact thatthe Setschenov coefficient of a salt correlates with how thatsalt changes the volume of the solution, VS - VjS
0, where VjS0 is
the partial molar volume of the salt at infinite dilution and VS
is the molar volume of the salt as in the molten state.3 Salting-in occurs if VS - VjS
0 is negative.3,7,16 It is also known that salteffects on nonpolar solubilities depend on the charge densitiesof the salt ions. Ions having high charge densities (they are smallin size or have high charge) tend to reduce the hydrophobicsolubilities in water (salting-out effect, positive kS), whereasions having low charge densities (large ions or small charge)tend to increase the solubilities of hydrophobes (salting-in effect,negative kS). While these approaches can predict the relativeefficiency of ions as salting-out agents, they fail to explain thesalt-induced increase of the hydrophobe solubility, as well asdifferent effects of a particular salt on different hydrophobicmolecules.
Computer simulations have been performed to seek a moremicroscopic and structural interpretation of ion-hydrophobeinteractions in water7,20,23-27 to resolve these questions. It hasbeen shown that the salting-in and salting-out effects can becorrelated to the hydrophobe hydration in electrolyte solutionsversus the hydration in pure water. Ions of high charge density,classified as kosmotropes, are strongly hydrated and cannot
* Corresponding author. E-mail: [email protected].† University of Ljubljana.‡ University of California.
lnci
ci(0)) -kScS (1)
J. Phys. Chem. B 2010, 114, 15085–15091 15085
10.1021/jp108052r 2010 American Chemical SocietyPublished on Web 10/28/2010
come into direct contact with the hydrophobe, leading to thesalting-out effect. The opposite is true for the chaotropic ionsthat exhibit hydrophobe-like character.24,28 They are weaklyhydrated and can come into direct contact with hydrophobe,leading to salting-in. This association requires an opening of asolute-size cavity in the first hydration shell of the ion. Thisprocess is being opposed by the entropic cost in the case ofkosmotropes but is entropy driven in the case of chaotropes.28
In addition, the salting-in process is reinforced by a favorablesolute-solvent energy change. Along these lines, the importanceof the hydrophobe geometrical properties can be understood.
The specific value of kS for a certain salt depends on the sizeand shape of the hydrophobe2,8,9,29 and is correlated with themolecular volume of the latter.3,30 In some cases, the same saltwill salt-out small hydrophobes (positive kS) but will salt-in largehydrophobes.8
Recent molecular dynamics and Monte Carlo simulationsindicate that the salting-out effect caused by small ions is dueto the exclusion of the hydrophobe from the ion’s first watershell.23,24,27,31 The hydrophobe, depending on its size, insertseither into the first water shell around the ion or into the secondwater shell. Small ions bind water tightly, so the hydrophobeis excluded from their first solvation shell, driving salting-outof the hydrophobes.27 The effect is more pronounced for largehydrophobes. This finding is consistent with the experimentalstudies of solubility of hydrophobic solutes.32 Zhang andCremer32 found that the Hofmeister effect is caused by thechange in the hydration water structure due to the presence ofthe salt. These findings were confirmed also by recent computersimulations.33,34
What remains largely unexplored, however, is the mechanismof salting-in. This is the purpose of the present study. We usehere the Mercedes-Benz (MB) model of water.35,36 Despite itssimplicity, this two-dimensional (2D) model correctly repro-duces many properties of water and aqueous solutions. Interest-ingly, the two-dimensional and three-dimensional version37 ofthe model provide the same insights into the water properties.Because the 2D MB model has previously been shown tocorrectly explain the qualitative behavior of the Setschenovsalting-out coefficients for simple hydrophobes of different sizesin the presence of different simple salts,27,31 it provides a goodbasis for our present exploration of salting-in. Review ofexperimental data for kS values7 shows that tetramethylammo-nium bromide in water salts-in most of the hydrophobes andhas a negative value of VS - VjS
0 (-16 mL/mol), so it is a usefulparadigmatic salt for the present study.
2. Model Description and the Simulation
In the two-dimensional MB + dipole model, each watermolecule is represented as a disk that interacts with othermolecules through a Lennard-Jones (LJ) interaction and throughan orientational-dependent hydrogen-bonding (HB) interac-tion.25,27,35,36 The name arises because there are three hydrogen-bonding arms, arranged as in the Mercedes-Benz logo (cf. Figure1a).
In the MB model, the energy of interaction between twowaters is35
The notation is the same as in previous papers:25,27,35,36 Xi
denotes a vector representing both the coordinates and theorientation of the ith water molecule, and rij is the distance
between the molecular centers of the molecules i and j. TheLennard-Jones term is
where εLJ and σLJ are the well-depth and contact parameters,respectively. In addition, neighboring water molecules can forman explicit hydrogen bond when an arm of one molecule alignswith an arm of another water molecule, with an energy functionthat is a Gaussian function of separation and angle
where G(x) is an unnormalized Gaussian function
The unit vector ik represents the kth arm on the ith particle(k ) 1, 2, 3), and uij is the vector joining the center of moleculei to the center of molecule j (Figure 1a). H-bonding arms arenot distinguished as donors and acceptors. The strength of thehydrogen bond is only determined by the degree of the arm’salignment.35
The model parameters are defined as previously.25,27,35,36 Theparameters εHB ) 1 and rHB ) 1 define the optimal hydrogenbond energy and bond length, respectively. The same widthparameter σ ) 0.085 is used for both the distance and the angledeviation of a hydrogen bond. The interaction energy in theLennard-Jones potential function, εLJ ) 0.1εHB, and the LJdistance, σLJ, is 0.7 of that of rHB. The MB model was modifiedto include an electrostatic dipole.27 A single negative charge isput at the center of each water molecule, and a single positivecharge is put onto one of the H-bonding arms, at a distance0.165 rHB from the center (Figure 1b). An ion interacts withthe charges on a water molecule through a screened potential
Here, rij is the distance between the ion center and a chargeon a water dipole, and the valencies zi(zj) are +1 and -1. Allthe distances are in the units of rHB. The parameter κ is, as
Uww(Xi, Xj) ) ULJ(rij) + UHB(Xi, Xj) (2)
Figure 1. MB-dipole model: the water-water and water-tetrameth-ylammonium ion interaction.
ULJ(rij) ) 4εLJ[(σLJ
rij)12
- (σLJ
rij)6] (3)
UHB(Xi, Xj) ) εHBG(rij - rHB) ∑k,l)1
3
G(ik · uij - 1) ×
G(jl · uij + 1) (4)
G(x) ) exp[-x2/2σ2] (5)
Ucharge ) zizj|εHB|Rexp(-κrij)
rij(6)
15086 J. Phys. Chem. B, Vol. 114, No. 46, 2010 Hribar-Lee et al.
previously established,27 0.1, and R ) 2.27. The ion-waterpotential is
We modeled different hydrophobic solutes as disks ofdifferent diameters (σhyd).31 The tetramethylammonium ion ismodeled as shown in Figure 1b. The nitrogen atom is a centraldisk having the same diameter as water (σLJ ) 0.7), with apositive charge at its center. The three methyl groups are disksof the same size intercepting the central sphere at a distance0.5 from the center (Figure 1b). Only the central disk has acharge, but all the disks interact with waters and with thehydrophobe molecule through a Lennard-Jones potential. Thewell-depth for the Lennard-Jones potential, εLJ, is, as before,27
taken to be the same for all the molecules, εLJ ) 0.1εHB.The Monte Carlo simulations were performed at constant
pressure (P* ) PrHB2 /|εHB| ) 0.19) in the NPT ensemble. Monte
Carlo steps were displacements and rotations of the watermolecules. The simulations were performed using 60 watermolecules and a single TMA ion fixed in the center of thesimulation box. The first 108 steps were used to equilibrate thesystem, and the statistics were collected over the following 5× 10⁸ steps. After the system was equilibrated, the free energy,enthalpy, and entropy of transferring a hydrophobe into asolution were calculated using the Widom test-particle method38
and using related fluctuation formulas.35 The potential of meanforce between the ion and a nonpolar solute was calculated usingthe Widom method.27,38
3. Results and Discussion
To validate our model, we first show that it correctly predictssalting-in for the TMA ion, while predicting salting-out for othersimpler ions. The free energy of transfer of simple hydrophobicsolutes of different sizes was calculated using the Widommethod.27,38 We compare experiments, which are given in termsof kS, with the underlying corresponding quantity27,31 from ourmodel, ∆∆G, the difference in free energy between transfer intosolution vs pure water. The comparison is shown in Table 1and Figure 2. The upper panel of Figure 2 shows experimentalkS for hydrocarbon gases (dashed line9) and 2-ketones (solidlines8,39) in aqueous solutions of different salts. The lower panelshows the results for the ∆∆G of hydrophobes of different sizesin the presence of a sodium ion31 and a TMA ion (this work).Note that while the experimental values for kS are given forsalts the calculated values are given for single ions. It has beenestablished previously that the cation and anion effects on thehydrophobe solubility are independent and additive.18,40
While there is a slight tendency for small hydrophobes(σLJ ) 0.7) to be salted out (small positive value for ∆∆G)
regardless of the salt, the TMA model ion increases the solubilityof larger hydrophobes, roughly beyond the size of benzene (e.g.,σLJ ) 1.5 in our model). This is in qualitative agreement withthe experimental value of kS ) -0.24 for the salting-in of thebenzene in aqueous solution of TMA-bromide.2 The ∆∆Gvalue slightly decreases with the hydrophobe size as shownexperimentally for kS, for example, for hydrocarbon gases9 or2-ketones8 in aqueous TMA salt solutions (Figure 2). The modelcorrectly captures the trends of kS with the size of the nonpolarsolute for both salting-in and salting-out salts.
It is worth mentioning here that even certain salts consistingof two large simple ions, such as CsI, salt-in hydrophobes ofconsiderable size, such as benzene. kS for benzene in watersolutions of CsI is reported to be a small negative value, -0.0063
(note that we also get a small negative value for ∆∆G (-0.02)of benzene-size hydrophobes in the presence of a model Cs ion).However, due to a limited amount of experimental data oncesium salts, we decided to use TMA as a reference ion in ourstudy.
A more stringent test of our model is the temperaturedependence of kS. Figure 3 shows our predictions vs experimentsfor gaseous methane and ethane in TMABr water,9 which wemodel using two different hydrophobe sizes, σhyd ) 1.2 andσhyd ) 1.5. Our model correctly captures the three mainproperties: (1) that kS decreases with temperature, (2) that thiscan cause a crossover from salting-out to salting-in, and (3)that kS is more negative for the larger solute.
Now, we explore the microscopic basis for these results.Figure 4 shows the structure of water around the tetramethy-
TABLE 1: Free Energy of Insertion, ∆Gins, of Hydrophobesof Different Sizes into Pure Water and into the Water with aSingle TMA Ion, as Obtained from Our Monte CarloSimulation
σLJ,hyd
∆Gins/kBT(pure water)
∆Gins/kBT(water + TMA) ∆∆G/kBT
0.7 1.26 ( 0.01 1.30 ( 0.01 +0.041.2 2.76 ( 0.01 2.76 ( 0.01 0.001.5 3.86 ( 0.02 3.82 ( 0.02 -0.041.8 4.90 ( 0.02 4.84 ( 0.03 -0.062.0 5.58 ( 0.04 5.50 ( 0.04 -0.08
Uiw(Xi, Xj) ) ULJ(rij) + ∑+,-
Ucharge(Xi, Xj) (7)
Figure 2. Experimental Setchenov coefficients, kS, in mol/kg fordifferent salts as a function of a hydrophobe size (upper panel) and∆∆G/kBT as obtained with the MB + dipole TMA model (lower panel).The experimental data for hydrocarbon gases (from ref 9) are shownby a dashed line, and the data for 2-ketones (from refs 8, 39) are shownby solid lines. n denotes the number of carbon atoms in a molecule.
Receptacle Model of Salting-In by TMA Ions J. Phys. Chem. B, Vol. 114, No. 46, 2010 15087

lammonium ion in our model. Figure 4, left panel, shows theangle-averaged TMA-water pair distribution function, andFigure 4, right panel, shows the relative water density aroundthe TMA ion. The first notable feature is very high density ofwater molecules that wedge in between the methyl groups ofthe TMA ion (yellow areas in the lower panel of Figure 4).There is also a high probability of finding a water molecule inthe vicinity of the methyl groups (at an approximate distance1.2 from the center of the TMA ion). This is in qualitativeagreement with the results obtained by molecular dynamicsstudy of more realistic all-atom models,41-43 as well as withthe experimental data.44,45 In these previous studies, it was alsofound that water molecules prefer to occupy the space betweenthe methyl groups as well as that waters form traditional
hydrophobic cagelike structures around the methyl groups. Tomaximize water-water hydrogen bonding, the TMA model ioncauses a structuring of the water orientations in the first twohydration shells, much like hydrophobic solutes do.24,41-44,46 Thisis consistent with the experimental observations.43,44
Figure 5, upper panel, shows the angular distributions of first-shell water molecules around the TMA ion. The angle shownis calculated between the center of the TMA model ion and thewater hydrogen bonding arm. This distribution arises fromelectrostatic water ordering. The water molecules are pointingthe positive ends of their dipoles away from the positive chargeon the TMA ion (corresponding to the angle 180° in Figure 5).Even though the TMA ion is large, and therefore would have
Figure 3. Experimental Setchenov coefficients, kS, in mol/kg, forgaseous methane and ethane in water TMABr solution as a functionof temperature (from ref 9) (upper panel) and ∆∆G/kBT as obtainedwith the MB + dipole TMA model for two different hydrophobe sizes(lower panel).
Figure 4. Average (left panel) and orientation-dependent (right panel) water-tetramethylammonium ion pair distribution function as obtainedfrom MC simulation for MB + dipole.
Figure 5. First two shells water-tetramethylammonium ion angledistribution function (upper panel) and a snapshot of the first two shells(indicated by thin broken lines) waters (lower panel) around thetetramethylammonium ion as obtained from MC simulation for the MB+ dipole model.
15088 J. Phys. Chem. B, Vol. 114, No. 46, 2010 Hribar-Lee et al.
low charge density on the outside, the first-shell water moleculesare wedged and can approach much closer to the nitrogen, sofrom the perspective of the first-shell water molecules, the ionacts as if it had a high charge density.
For a clearer presentation, a snapshot of the TMA ion andits surrounding water molecules in the first two shells indicatedby a thin broken line are shown in Figure 5, lower panel. First-shell waters have little or no hydrogen bonding because of thesteric and electrostatic restrictions. If we calculate the liberationfree energy, ∆Glib, of these first-shell waters around the TMAion using a procedure described previously,24,47 we get+0.51kBT. This indicates that first-shell waters are stronglyordered (kosmotropic), similar to high-charge-density ions (∆Glib
for lithium ion, for example, is +0.48kBT, while for sodium itis only +0.093kBT and for cesium -0.42kBT).27 This isconsistent with the experimental values for Jones-Dole viscosityB-coefficients: +0.146 for lithium, +0.085 for sodium, -0.047for cesium, and +0.123 for TMA ion.48 Note that positive Jones-Dole B values are indicative for kosmotropes, while negativevalues are typical for chaotropic ions.27 In the second shellaround the TMA ion, however, there is a considerable cagelikestructure, resulting from the influence of the first-shell watersand the hydrophobic effect arising from the methyl groups onthe TMA ion.
To investigate the mechanism of salting-in, we looked at thepotential of mean force between the model TMA ion and thehydrophobe (see Figures 6 and 7). The red areas in Figure 6show an increased probability of finding the hydrophobe in thecavities after the second hydration shell. The TMA ion namelyhelps to orient the water molecules into cagelike structures,
forming cavities outside the second shell (Figure 5) where alarge hydrophobe molecules can insert. In short, the strongelectrostatic ordering of first-shell waters forces an arrangementof second-shell waters much like that of a “catcher’s mitt” or a“receptacle” of prestructured waters that can bind tightly to thehydrophobe. Nevertheless, the hydrophobe prefers to sit justoutside the first hydration shell of water (blue areas in Figure7, left panel), yet close to the TMA ion. The most favorableinsertion sites for large hydrophobes are denoted as circles ofthick green dashed lines in Figure 7, right panel. Theseobservations are in agreement with previous findings:24,28 salting-in occurs where the hydrophobic molecule loses some of itshydration water which is replaced by an ion. Between the firstand second hydration shell, the microscopic water structurearound the TMA ion enables a cavity to be readily formed(Figure 7).
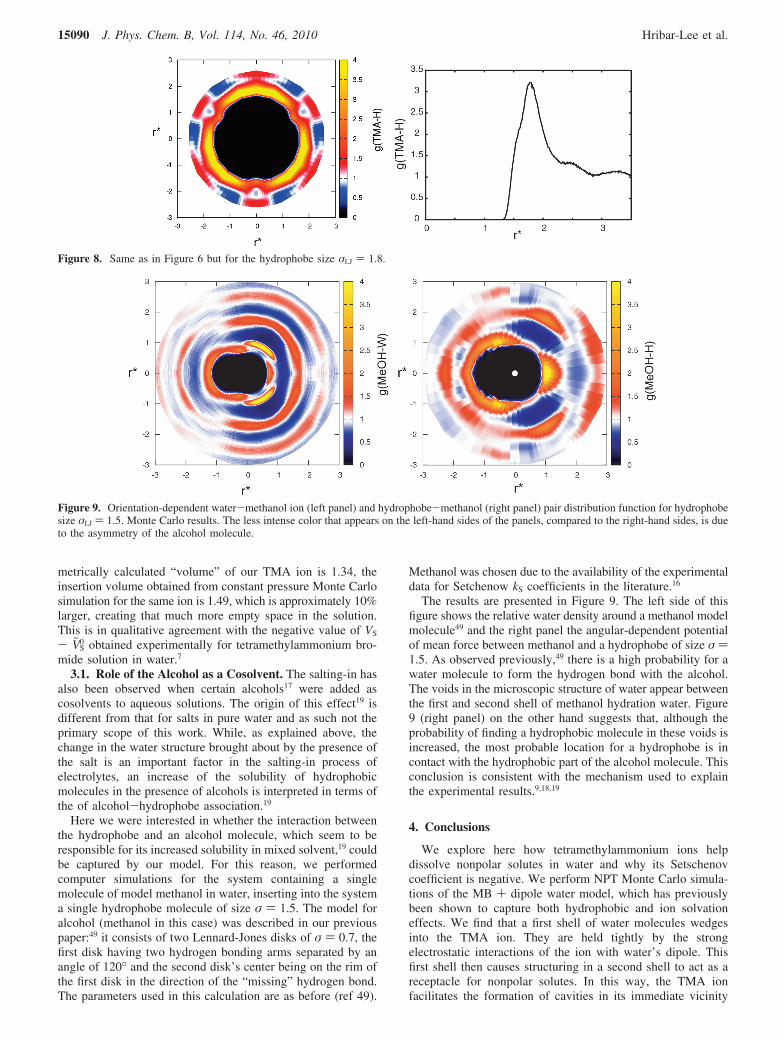
Why are larger hydrophobes more salted-in by the TMA ionthan smaller hydrophobes? Figure 8 shows the PMF for a largerhydrophobe than in Figure 6. Again, the hydrophobe prefers tosit just outside the first water shell of the TMA ion. Table 1gives the computed free energies of insertion of the hydrophobesof different sizes into water, compared to the same quantitiesfor TMA in pure water. Increasing the size of the hydrophobereduces its ∆∆Gins. The TMA ion helps solvate the largerhydrophobes slightly more than smaller ones. A possibleexplanation is that due to its larger surface the probability of alarger hydrophobe to come into contact with the ion is higher.The TMA ion enables this contact by creating space in thesolution. This can be seen if comparing the insertion volumeof the TMA-model ion with its actual size. While the geo-
Figure 6. Monte Carlo simulation results for average (right panel) and orientation-dependent (left panel) hydrophobe-tetramethylammonium ionpair distribution function for hydrophobe of size σLJ ) 1.5. Monte Carlo simulation results.
Figure 7. Orientation-dependent pair distribution function for water-tetramethylammonium ion (left panel) and hydrophobe-tetramethylammoniumion (right panel) for hydrophobe size σLJ ) 1.5. Green circles denote the most probable location of water (left) and hydrophobe (right) molecules.Monte Carlo results.
Receptacle Model of Salting-In by TMA Ions J. Phys. Chem. B, Vol. 114, No. 46, 2010 15089
metrically calculated “volume” of our TMA ion is 1.34, theinsertion volume obtained from constant pressure Monte Carlosimulation for the same ion is 1.49, which is approximately 10%larger, creating that much more empty space in the solution.This is in qualitative agreement with the negative value of VS
- VjS0 obtained experimentally for tetramethylammonium bro-
mide solution in water.7
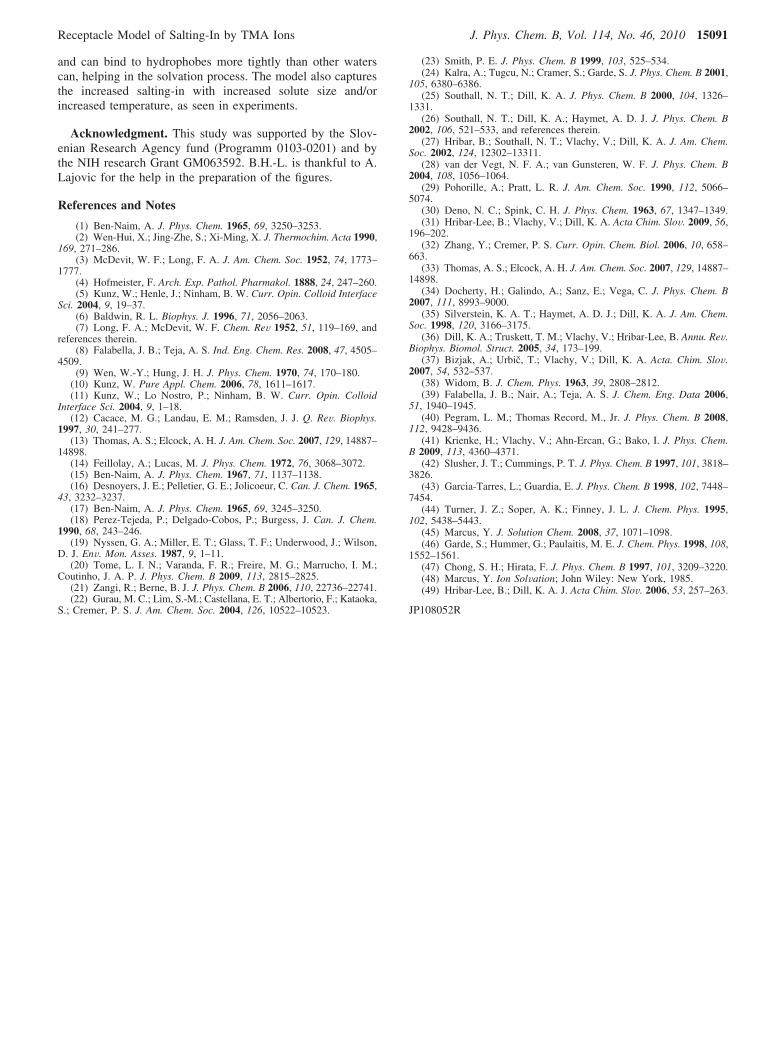
3.1. Role of the Alcohol as a Cosolvent. The salting-in hasalso been observed when certain alcohols17 were added ascosolvents to aqueous solutions. The origin of this effect19 isdifferent from that for salts in pure water and as such not theprimary scope of this work. While, as explained above, thechange in the water structure brought about by the presence ofthe salt is an important factor in the salting-in process ofelectrolytes, an increase of the solubility of hydrophobicmolecules in the presence of alcohols is interpreted in terms ofthe of alcohol-hydrophobe association.19
Here we were interested in whether the interaction betweenthe hydrophobe and an alcohol molecule, which seem to beresponsible for its increased solubility in mixed solvent,19 couldbe captured by our model. For this reason, we performedcomputer simulations for the system containing a singlemolecule of model methanol in water, inserting into the systema single hydrophobe molecule of size σ ) 1.5. The model foralcohol (methanol in this case) was described in our previouspaper:49 it consists of two Lennard-Jones disks of σ ) 0.7, thefirst disk having two hydrogen bonding arms separated by anangle of 120° and the second disk’s center being on the rim ofthe first disk in the direction of the “missing” hydrogen bond.The parameters used in this calculation are as before (ref 49).
Methanol was chosen due to the availability of the experimentaldata for Setchenow kS coefficients in the literature.16
The results are presented in Figure 9. The left side of thisfigure shows the relative water density around a methanol modelmolecule49 and the right panel the angular-dependent potentialof mean force between methanol and a hydrophobe of size σ )1.5. As observed previously,49 there is a high probability for awater molecule to form the hydrogen bond with the alcohol.The voids in the microscopic structure of water appear betweenthe first and second shell of methanol hydration water. Figure9 (right panel) on the other hand suggests that, although theprobability of finding a hydrophobic molecule in these voids isincreased, the most probable location for a hydrophobe is incontact with the hydrophobic part of the alcohol molecule. Thisconclusion is consistent with the mechanism used to explainthe experimental results.9,18,19
4. Conclusions
We explore here how tetramethylammonium ions helpdissolve nonpolar solutes in water and why its Setschenovcoefficient is negative. We perform NPT Monte Carlo simula-tions of the MB + dipole water model, which has previouslybeen shown to capture both hydrophobic and ion solvationeffects. We find that a first shell of water molecules wedgesinto the TMA ion. They are held tightly by the strongelectrostatic interactions of the ion with water’s dipole. Thisfirst shell then causes structuring in a second shell to act as areceptacle for nonpolar solutes. In this way, the TMA ionfacilitates the formation of cavities in its immediate vicinity
Figure 8. Same as in Figure 6 but for the hydrophobe size σLJ ) 1.8.
Figure 9. Orientation-dependent water-methanol ion (left panel) and hydrophobe-methanol (right panel) pair distribution function for hydrophobesize σLJ ) 1.5. Monte Carlo results. The less intense color that appears on the left-hand sides of the panels, compared to the right-hand sides, is dueto the asymmetry of the alcohol molecule.
15090 J. Phys. Chem. B, Vol. 114, No. 46, 2010 Hribar-Lee et al.
and can bind to hydrophobes more tightly than other waterscan, helping in the solvation process. The model also capturesthe increased salting-in with increased solute size and/orincreased temperature, as seen in experiments.
Acknowledgment. This study was supported by the Slov-enian Research Agency fund (Programm 0103-0201) and bythe NIH research Grant GM063592. B.H.-L. is thankful to A.Lajovic for the help in the preparation of the figures.
References and Notes
(1) Ben-Naim, A. J. Phys. Chem. 1965, 69, 3250–3253.(2) Wen-Hui, X.; Jing-Zhe, S.; Xi-Ming, X. J. Thermochim. Acta 1990,
169, 271–286.(3) McDevit, W. F.; Long, F. A. J. Am. Chem. Soc. 1952, 74, 1773–
1777.(4) Hofmeister, F. Arch. Exp. Pathol. Pharmakol. 1888, 24, 247–260.(5) Kunz, W.; Henle, J.; Ninham, B. W. Curr. Opin. Colloid Interface
Sci. 2004, 9, 19–37.(6) Baldwin, R. L. Biophys. J. 1996, 71, 2056–2063.(7) Long, F. A.; McDevit, W. F. Chem. ReV 1952, 51, 119–169, and
references therein.(8) Falabella, J. B.; Teja, A. S. Ind. Eng. Chem. Res. 2008, 47, 4505–
4509.(9) Wen, W.-Y.; Hung, J. H. J. Phys. Chem. 1970, 74, 170–180.
(10) Kunz, W. Pure Appl. Chem. 2006, 78, 1611–1617.(11) Kunz, W.; Lo Nostro, P.; Ninham, B. W. Curr. Opin. Colloid
Interface Sci. 2004, 9, 1–18.(12) Cacace, M. G.; Landau, E. M.; Ramsden, J. J. Q. ReV. Biophys.
1997, 30, 241–277.(13) Thomas, A. S.; Elcock, A. H. J. Am. Chem. Soc. 2007, 129, 14887–
14898.(14) Feillolay, A.; Lucas, M. J. Phys. Chem. 1972, 76, 3068–3072.(15) Ben-Naim, A. J. Phys. Chem. 1967, 71, 1137–1138.(16) Desnoyers, J. E.; Pelletier, G. E.; Jolicoeur, C. Can. J. Chem. 1965,
43, 3232–3237.(17) Ben-Naim, A. J. Phys. Chem. 1965, 69, 3245–3250.(18) Perez-Tejeda, P.; Delgado-Cobos, P.; Burgess, J. Can. J. Chem.
1990, 68, 243–246.(19) Nyssen, G. A.; Miller, E. T.; Glass, T. F.; Underwood, J.; Wilson,
D. J. EnV. Mon. Asses. 1987, 9, 1–11.(20) Tome, L. I. N.; Varanda, F. R.; Freire, M. G.; Marrucho, I. M.;
Coutinho, J. A. P. J. Phys. Chem. B 2009, 113, 2815–2825.(21) Zangi, R.; Berne, B. J. J. Phys. Chem. B 2006, 110, 22736–22741.(22) Gurau, M. C.; Lim, S.-M.; Castellana, E. T.; Albertorio, F.; Kataoka,
S.; Cremer, P. S. J. Am. Chem. Soc. 2004, 126, 10522–10523.
(23) Smith, P. E. J. Phys. Chem. B 1999, 103, 525–534.(24) Kalra, A.; Tugcu, N.; Cramer, S.; Garde, S. J. Phys. Chem. B 2001,
105, 6380–6386.(25) Southall, N. T.; Dill, K. A. J. Phys. Chem. B 2000, 104, 1326–
1331.(26) Southall, N. T.; Dill, K. A.; Haymet, A. D. J. J. Phys. Chem. B
2002, 106, 521–533, and references therein.(27) Hribar, B.; Southall, N. T.; Vlachy, V.; Dill, K. A. J. Am. Chem.
Soc. 2002, 124, 12302–13311.(28) van der Vegt, N. F. A.; van Gunsteren, W. F. J. Phys. Chem. B
2004, 108, 1056–1064.(29) Pohorille, A.; Pratt, L. R. J. Am. Chem. Soc. 1990, 112, 5066–
5074.(30) Deno, N. C.; Spink, C. H. J. Phys. Chem. 1963, 67, 1347–1349.(31) Hribar-Lee, B.; Vlachy, V.; Dill, K. A. Acta Chim. SloV. 2009, 56,
196–202.(32) Zhang, Y.; Cremer, P. S. Curr. Opin. Chem. Biol. 2006, 10, 658–
663.(33) Thomas, A. S.; Elcock, A. H. J. Am. Chem. Soc. 2007, 129, 14887–
14898.(34) Docherty, H.; Galindo, A.; Sanz, E.; Vega, C. J. Phys. Chem. B
2007, 111, 8993–9000.(35) Silverstein, K. A. T.; Haymet, A. D. J.; Dill, K. A. J. Am. Chem.
Soc. 1998, 120, 3166–3175.(36) Dill, K. A.; Truskett, T. M.; Vlachy, V.; Hribar-Lee, B. Annu. ReV.
Biophys. Biomol. Struct. 2005, 34, 173–199.(37) Bizjak, A.; Urbic, T.; Vlachy, V.; Dill, K. A. Acta. Chim. SloV.
2007, 54, 532–537.(38) Widom, B. J. Chem. Phys. 1963, 39, 2808–2812.(39) Falabella, J. B.; Nair, A.; Teja, A. S. J. Chem. Eng. Data 2006,
51, 1940–1945.(40) Pegram, L. M.; Thomas Record, M., Jr. J. Phys. Chem. B 2008,
112, 9428–9436.(41) Krienke, H.; Vlachy, V.; Ahn-Ercan, G.; Bako, I. J. Phys. Chem.
B 2009, 113, 4360–4371.(42) Slusher, J. T.; Cummings, P. T. J. Phys. Chem. B 1997, 101, 3818–
3826.(43) Garcia-Tarres, L.; Guardia, E. J. Phys. Chem. B 1998, 102, 7448–
7454.(44) Turner, J. Z.; Soper, A. K.; Finney, J. L. J. Chem. Phys. 1995,
102, 5438–5443.(45) Marcus, Y. J. Solution Chem. 2008, 37, 1071–1098.(46) Garde, S.; Hummer, G.; Paulaitis, M. E. J. Chem. Phys. 1998, 108,
1552–1561.(47) Chong, S. H.; Hirata, F. J. Phys. Chem. B 1997, 101, 3209–3220.(48) Marcus, Y. Ion SolVation; John Wiley: New York, 1985.(49) Hribar-Lee, B.; Dill, K. A. J. Acta Chim. SloV. 2006, 53, 257–263.
JP108052R
Receptacle Model of Salting-In by TMA Ions J. Phys. Chem. B, Vol. 114, No. 46, 2010 15091
Copyright © 2022 FDOKUMEN