Consistency of genome-wide associations across major ancestral groups
15
Hum Genet (2012) 131:1057–1071 DOI 10.1007/s00439-011-1124-4 123 ORIGINAL INVESTIGATION Consistency of genome-wide associations across major ancestral groups Evangelia E. Ntzani · George Liberopoulos · Teri A. Manolio · John P. A. Ioannidis Received: 18 June 2011 / Accepted: 29 November 2011 / Published online: 20 December 2011 © Springer-Verlag 2011 Abstract It is not well known whether genetic markers identiWed through genome-wide association studies (GWAS) confer similar or diVerent risks across people of diVerent ancestry. We screened a regularly updated catalog of all published GWAS curated at the NHGRI website for GWAS-identiWed associations that had reached genome- wide signiWcance (p · 5 £ 10 ¡8 ) in at least one major ancestry group (European, Asian, African) and for which replication data were available for comparison in at least two diVerent major ancestry groups. These groups were compared for the correlation between and diVerences in risk allele frequencies and genetic eVects’ estimates. Data on 108 eligible GWAS-identiWed associations with a total of 900 datasets (European, n = 624; Asian, n = 217; Afri- can, n = 60) were analyzed. Risk-allele frequencies were modestly correlated between ancestry groups, with >10% absolute diVerences in 75–89% of the three pairwise com- parisons of ancestry groups. Genetic eVect (odds ratio) point estimates between ancestry groups correlated mod- estly (pairwise comparisons’ correlation coeYcients: 0.20–0.33) and point estimates of risks were opposite in direction or diVered more than twofold in 57%, 79%, and 89% of the European versus Asian, European versus African, and Asian versus African comparisons, respec- tively. The modest correlations, diVering risk estimates, and considerable between-association heterogeneity suggest that diVerential ancestral eVects can be anticipated and genomic risk markers may need separate further evaluation in diVerent ancestry groups. Abbreviations CEU Utah residents with Northern and Western European ancestry from the CEPH collection CHB Han Chinese in Beijing CI ConWdence interval GWAS Genome-wide association study GWS Genome-wide signiWcance IQR Inter-quartile range JPT Japanese in Tokyo LD Linkage disequilibrium NCBI National Centre for Biotechnology Information NHGRI National Human Genome Research Institute OR Odds ratio PMID PubMed identiWcation number ROR Relative odds ratio SMD Standardized mean diVerence SNP Single nucleotide polymorphism YRI Yoruba in Ibadan Electronic supplementary material The online version of this article (doi:10.1007/s00439-011-1124-4) contains supplementary material, which is available to authorized users. E. E. Ntzani · G. Liberopoulos · J. P. A. Ioannidis Clinical and Molecular Epidemiology Unit, Department of Hygiene and Epidemiology, University of Ioannina School of Medicine, 45110 Ioannina, Greece T. A. Manolio OYce of Population Genomics, National Human Genome Research Institute, Bethesda, MD 20892-2152, USA J. P. A. Ioannidis (&) Department of Medicine, Stanford Prevention Research Center, Stanford University School of Medicine, Stanford, CA 94305-5411, USA e-mail: [email protected] J. P. A. Ioannidis Department of Health Research and Policy, Stanford University School of Medicine, Stanford, CA 94305-5411, USA
Transcript of Consistency of genome-wide associations across major ancestral groups

Hum Genet (2012) 131:1057–1071
DOI 10.1007/s00439-011-1124-4ORIGINAL INVESTIGATION
Consistency of genome-wide associations across major ancestral groups
Evangelia E. Ntzani · George Liberopoulos · Teri A. Manolio · John P. A. Ioannidis
Received: 18 June 2011 / Accepted: 29 November 2011 / Published online: 20 December 2011© Springer-Verlag 2011
Abstract It is not well known whether genetic markersidentiWed through genome-wide association studies(GWAS) confer similar or diVerent risks across people ofdiVerent ancestry. We screened a regularly updated catalogof all published GWAS curated at the NHGRI website forGWAS-identiWed associations that had reached genome-wide signiWcance (p · 5 £ 10¡8) in at least one majorancestry group (European, Asian, African) and for whichreplication data were available for comparison in at leasttwo diVerent major ancestry groups. These groups werecompared for the correlation between and diVerences inrisk allele frequencies and genetic eVects’ estimates. Dataon 108 eligible GWAS-identiWed associations with a total
of 900 datasets (European, n = 624; Asian, n = 217; Afri-can, n = 60) were analyzed. Risk-allele frequencies weremodestly correlated between ancestry groups, with >10%absolute diVerences in 75–89% of the three pairwise com-parisons of ancestry groups. Genetic eVect (odds ratio)point estimates between ancestry groups correlated mod-estly (pairwise comparisons’ correlation coeYcients:0.20–0.33) and point estimates of risks were opposite indirection or diVered more than twofold in 57%, 79%, and89% of the European versus Asian, European versusAfrican, and Asian versus African comparisons, respec-tively. The modest correlations, diVering risk estimates, andconsiderable between-association heterogeneity suggestthat diVerential ancestral eVects can be anticipated andgenomic risk markers may need separate further evaluationin diVerent ancestry groups.
AbbreviationsCEU Utah residents with Northern and Western
European ancestry from the CEPH collectionCHB Han Chinese in BeijingCI ConWdence intervalGWAS Genome-wide association studyGWS Genome-wide signiWcanceIQR Inter-quartile rangeJPT Japanese in TokyoLD Linkage disequilibriumNCBI National Centre for Biotechnology InformationNHGRI National Human Genome Research InstituteOR Odds ratioPMID PubMed identiWcation numberROR Relative odds ratioSMD Standardized mean diVerenceSNP Single nucleotide polymorphismYRI Yoruba in Ibadan
Electronic supplementary material The online version of this article (doi:10.1007/s00439-011-1124-4) contains supplementary material, which is available to authorized users.
E. E. Ntzani · G. Liberopoulos · J. P. A. IoannidisClinical and Molecular Epidemiology Unit, Department of Hygiene and Epidemiology, University of Ioannina School of Medicine, 45110 Ioannina, Greece
T. A. ManolioOYce of Population Genomics, National Human Genome Research Institute, Bethesda, MD 20892-2152, USA
J. P. A. Ioannidis (&)Department of Medicine, Stanford Prevention Research Center, Stanford University School of Medicine, Stanford, CA 94305-5411, USAe-mail: [email protected]
J. P. A. IoannidisDepartment of Health Research and Policy, Stanford University School of Medicine, Stanford, CA 94305-5411, USA
123

1058 Hum Genet (2012) 131:1057–1071
Introduction
Technological advances have greatly increased the availabil-ity and reduced the cost of genetic information (Ashleyet al.2010; Janssens et al. 2008). Genome-wide association stud-ies (GWAS) addressing a variety of common human diseaseshave found many hundreds of associations with robust statis-tical support heightening the expectations for a substantialcontribution of genomics to personalized medicine (HindorVet al. 2009, 2011; McCarthy et al. 2008). Most GWAS havebeen performed on European descent populations, butincreasing numbers of such investigations are now performedon other ancestral groups. In the currently available GWASliterature, there are occasions where the observed geneticeVects seem to exhibit eVect consistency across ancestralgroups, either in terms of eVect direction or comparability ofthe magnitude of the eVect (Waters et al. 2010). On the otherhand, there are other occasions where GWAS-derived sig-nals point to a pattern of diVerential ancestral eVects (Rosen-berg et al. 2010).
Identifying patterns of observed genetic eVect variabilityor consistency across populations of diVering ancestry (Ioan-nidis et al. 2004) can support our understanding of thegenetic architecture of complex diseases. The risk conferredby GWAS-identiWed markers may vary in people of diVerentancestry (Rosenberg et al. 2010; Helgason et al. 2007) due tovariability in allelic frequencies and to diVerences in linkagedisequilibrium (LD) between the identiWed variants and thetrue functional variants that underlie disease risk. Alterna-tively, if common variant associations are consistent acrossmajor ethnic groups, the causal variants they presumably tagare also likely to be common, arguing against the syntheticassociation model in those instances (Waters et al. 2010). Itis also possible that the true functional variants may not bethe same in diVerent ancestry groups (Ioannidis et al. 2004;Manica et al. 2005; Tang 2006). An unequal distribution ofdisease-associated alleles between diVerent ancestry popula-tions has been described for several recessive mendelian dis-orders, e.g., hemochromatosis, and for some complexdisorders (e.g., inXammatory bowel disease or cardiomyopa-thies) (Burchard et al. 2003; Dhandapany et al. 2009). Typi-cal reasons for this are population-speciWc mutations,diVerent LD patterns and recombination events, or evendiVering selective pressures in the areas of origin or residenceof these groups. Furthermore, individuals of European andAfrican ancestry diVer signiWcantly in the expression ofmany genes which could contribute to some of the observeddiVerences in susceptibility to common diseases (Spielmanet al. 2007; Zhang et al. 2008). Finally, diVerences in risk-allele frequencies may aVect the power to detect genome-wide signiWcant associations across populations of varyingancestral origin (Moonesinghe et al. 2008), and may alsoaVect the transferability of disease-risk prediction across
major populations. Such diVerences might require consider-ation of ancestral origin to control for unmeasured allele fre-quency diVerences as well as measured allele frequencies andLD diVerences in developing personalized prediction models.
Empirical assessment of consistency of genetic eVectsfor GWAS-identiWed markers in populations of variableancestral origin can thus shed light on the genetic architec-ture of common diseases as well as potential for generaliz-ability of Wndings across population groups. Here, weevaluated whether frequencies of the genetic markers ofinterest and the genetic eVects that they confer are diVerentacross populations of diVerent ancestral origin for 108GWAS-discovered markers with robust statistical support.
Methods
Eligible associations
We evaluated GWAS-discovered associations for any phe-notype or trait that (a) have had robust statistical support inat least one major ancestral group and (b) had been Wnallyreplicated in at least two of the three diVerent major ances-tral groups (see below for ancestral origin and Wnal replica-tion deWnitions).
Ancestral origin
We used the following categorization of self-reported ances-tral origin that is in accordance with a previous empiricalevaluation of ancestry diVerences for candidate gene associa-tions (Ioannidis et al. 2004). ‘European ancestry’ wasassigned to native populations of Europe and to people ofEuropean origin living in Oceania, North America and SouthAmerica, excluding Hispanics (Spanish speaking people liv-ing in the Americas). As ‘African ancestry’, we consideredpopulations native to or with origin in sub-Saharan Africa,and self-identiWed African Americans. ‘Asian ancestry’ wasassigned to native populations of China, Japan, Korea, andTaiwan, excluding India, Indochina, and Philippines. In Hap-Map terms, CEU, YRI, and CHB + JPT panels would belongto our European, African, and Asian groups, respectively(The International HapMap Project 2003). We excludedupfront populations not included in the groups above.
Robust statistical support
Robust statistical support was deWned as having p · 5 £ 10¡8
(genome-wide signiWcance, GWS) in a meta-analysis combin-ing with Wxed eVects all available datasets from a speciWcancestry group in at least one genome-wide association studypublication. We included both agnostic discovery and replica-tion data in the calculations for attaining GWS.
123

Hum Genet (2012) 131:1057–1071 1059
Screened GWAS publications and selection of associations and datasets
We screened a regularly updated list of all GWAS publica-tions curated at the NHGRI website (HindorV et al. 2011)through January 19, 2010 when 2,659 associations atp values ·10–5 had been entered in the database. TheNHGRI database includes GWAS that have attempted togenotype 100,000 SNPs or more. Full-text articles wereobtained and further scrutinized, including all the supple-ments of each publication.
We considered GWAS that evaluated more than one ofthe previously deWned ancestry groups at a Wnal replicationstage in the same publication; or compared their dataagainst previously published data from one or more GWASthat had investigated the same phenotype in populations ofdiVerent ancestry (see Supplementary Methods). DiVerentassociations were deWned by diVerences in gene variant,phenotype, or both, but not just by diVerent genetic modelsof inheritance (e.g., allele-based vs. genotype-based);whenever highly linked markers were detected (r2 > 0.8),we kept the one with the lowest p value. Further details onselection of associations appear in Supplementary Methods.Most GWAS use data from diverse pre-existing studies inthe discovery and/or replication phase. We a prioriendorsed the deWnition of distinct population datasets asreported in the original papers. To avoid the inXation ofeVect sizes due to the winner’s curse (Ioannidis 2007; Zoll-ner and Pritchard 2007), we only selected datasets that per-tained to the Wnal replication stage.
Statistical analysis
Risk-allele frequencies
For each eligible association, we recorded the frequencies ofthe risk allele in the European (CEU), African (YRI), andAsian (CHB + JPT) descent populations in HapMap phase 2data release 27, February 2009 (The International HapMap2003), on NCBI B36 assembly, dbSNP b126. We estimatedthe Pearson correlation coeYcient between the risk-allele fre-quencies in the CEU population and the respective frequen-cies in the CHB + JPT or YRI populations. We used aninverse-variance weighted summary estimate for the com-bined Asian datasets (CHB + JPT) after an arcsin transfor-mation. Less than a third of the GWAS provided genotypecounts in each dataset and group to allow using the risk-allelefrequency information from these studies, but data reportedwere generally compatible with their respective HapMapestimates. To evaluate population diVerentiation, we alsoextracted information on Fst estimates for all assessed geneticvariants as provided at HapPlotter (Voight et al. 2006).
Genetic eVect sizes
We used the odds ratio (OR) for binary outcomes and thestandardized mean diVerence (SMD) for continuous out-comes. For consistency in the analyses, genetic eVect esti-mates were always presented so as to have OR > 1 orSMD > 0 in the ancestry group reaching overall GWS. Wesynthesized eVect sizes (OR or SMD) for datasets in eachassociation separately for each ancestry group (Supplemen-tary Methods). Many GWAS did not provide eVect sizeinformation per dataset, and had already combined dataunder Wxed eVects models. Therefore, for consistency wealso combined all remaining data with Wxed eVects models(Mantel and Haensel 1959; Cooper and Hedges 1994, Der-Simonian and Laird 1986). Fixed eVects models have betterpower for discovery, but random eVects are more appropri-ate for estimating the typical eVects and their expected vari-ability across diVerent populations (Pereira et al. 2009).
We evaluated how often eVect sizes diVered more than two-fold between the compared ancestry groups. This includescases where eVect estimates were in the opposite direction(e.g., OR 1.20 in Europeans and 0.90 in Asians), and caseswhere eVect estimates were in the same direction, but the OR-1 was more than double in one ancestry group than the other(e.g., OR 1.20 in Europeans and <1.10 in Asians). We alsoevaluated whether the eVect sizes diVered beyond chance inpopulations of diVerent ancestry, using the Z score as describedpreviously (Cappelleri et al. 1996; Ioannidis et al. 2001). Sincepoint estimates alone do not account for the uncertainty sur-rounding them and testing eVect sizes for signiWcant diVer-ences depends on whether there is limited (underpowered) orextensive (overpowered) evidence for the compared ancestrygroups, these analyses oVer complementary information. Wealso estimated the Pearson correlation coeYcient between theeVect sizes for a speciWc association in European ancestry pop-ulations and the respective eVect sizes in Asian or Africanancestry populations. This was done separately for ORs(n = 68) and for SMDs (n = 40). Combined analyses translatedSMDs to OR equivalent using the conversion factor 1.81, aspreviously proposed (Chinn 2000). The conversion (1.81 = �/q3) works well for normally distributed eVects (as assumed inOR and SMD calculations in general). We also sought toexplore whether very small eVect sizes could dilute theobserved correlation estimates due to simple stochastic varia-tion or whether associations involving uncommon and rarevariants could exhibit a diVerent pattern of correlation due totheir diVering evolutionary characteristics. We thus performeda sensitivity analysis limited to associations where the eVectsize in the ancestry group that reached GWS corresponded toan OR > 1.2 and another sensitivity analysis limited to associa-tions where the assessed variants were rare (maf · 0.01) oruncommon (maf · 0.05) in at least one of the comparedancestral groups as estimated in the HapMap phase 2 data.
123

1060 Hum Genet (2012) 131:1057–1071
Additionally, for each association we calculated the pair-wise relative odds ratio (ROR) for every pair of ancestrygroups, by dividing the summary ORs or the OR-translatedSMDs of the corresponding ancestry groups. For example, anassociation with a European–Asian ROR > 1 means that thegenetic eVect estimate observed in the combined Europeandatasets was larger compared to the eVect estimate observedin datasets of Asian ancestry. We then calculated the sum-mary ROR (sROR) across all associations combining the nat-ural logarithms of all individual RORs for each ancestralbetween-group comparison, using a random eVects model toallow for the large heterogeneity in ROR estimates and thenre-exponentiating the derived summary log ROR. Heteroge-neity in the ROR estimates was estimated with the Q test(considered signiWcant for p < 0.10) and the I2 metric and its95% CI (Higgins et al. 2003; Ioannidis et al. 2007).
Adjacent hotspots
Since the observed diVerences in the genetic risk estimatesacross ancestral groups could be explained by diVerences inlinkage disequilibrium (LD) between the identiWed variantsand the true functional variants that underlie disease risk, welooked for the presence of recombination hotspots in vicinityto the GWAS-discovered genetic markers. For everyassessed SNP, the current mapping position was retrievedthrough the 1000 Genomes browser (1000 Genomes 2011).We then identiWed 1000 Genomes hotspots within a 200-kbdistance around the SNP under study and captured the num-ber of nearby hotspots as well as the distance from the SNPunder study to the closest end of the most adjacent hotspot.Univariate logistic regression analyses were further per-formed to evaluate whether the numbers of adjacent hotspotsor the distance to the nearest hotspot could predict theobserved ROR estimates or the occurrence of risk estimatediVerences (statistically signiWcantly diVerent ancestral esti-mates, opposite direction genetic ancestral eVects or morethan twofold diVerences across ancestries). For the risk esti-mate diVerences’ logistic regression analyses, separate analy-ses were performed to predict the occurrence of diVerences inall pairwise comparisons and the occurrence of any kind ofrisk estimate diVerence across all ancestral groups for everyassessed association.
Analyses were performed in Stata SE 10.0 (College Sta-tion, TX, USA). All p values are two tailed.
Results
Characteristics of the eligible associations
We screened 365 GWAS reports published through January19, 2010. Of those, we considered eligible for our analysis,
all the GWAS literature on associations that had beenassessed in at least two of the three major ancestry groups(Europeans, Asians, Africans) with GWS in at least oneancestry group. Forty-one publications qualiWed for inclusionin our study and they assessed 151 potentially eligible associ-ations. Eighteen associations pertaining to 13 publicationswere further excluded due to lack of available data for analy-sis (eVect size estimates and standard errors or p values) and4 associations were also excluded because meta-analysis perancestry group did not reach GWS in any ancestry group.Finally, 21 associations were excluded due to the presence ofanother highly linked marker with a lower p value.
The 108 eligible associations of 105 SNPs with variousoutcomes were published in 33 papers [Table 1, Appendix A(Supplementary Methods)]. Binary disease outcomes wereassessed in 68 (63%) associations and 40 associationsassessed continuous traits (mostly height [n = 29], but alsobody mass index, eosinophil count, and uric acid). Afterexcluding discovery and trimming down datasets (see Sup-plementary Methods for deWnitions), there were 900 eligibleWnal replication datasets. These datasets, where variants sur-viving the previous stage(s) were assessed without other sub-sequent validation, would be least likely to be aVected by the“winner’s curse” phenomenon (Campbell et al. 2005; Yanget al. 2008; Tang et al. 2005) that tends to inXate the esti-mates of newly discovered associations passing a given dis-covery threshold of signiWcance. The median number ofanalyzed Wnal replication datasets per association tested was6 (range 2–27) and the median number of participants perassociation in these datasets was 23,321 (IQR 4,400–52,886)for all three ancestry groups combined.
Non-European populations were under-represented amongthe populations assessed in the 108 GWS associations. All eli-gible associations had been evaluated in populations of Euro-pean ancestry (including 68 associations evaluated in a non-European study and contrasted with a previously publishedEuropean genome-wide association study). A total of 97 asso-ciations were evaluated in both European and Asian popula-tions; 24 in both European and African populations; and 13 inboth Asian and African populations (these 13 associations hadbeen evaluated in all three groups). Likewise, most Wnal repli-cation datasets included individuals of European ethnic origin(n = 624), while populations of Asian or African ethnic originwere represented by only 217 and 60 datasets, respectively.Log-additive models were reported in 35 (32%) associations,while in the rest 73 (72%) associations the eVect size was cal-culated under an additive model assumption.
Risk-allele frequencies
As shown in Figure and Supplementary Table 1, risk-allelefrequencies had a modest correlation between diVerent ances-
123

Hum Genet (2012) 131:1057–1071 1061
Table 1 Characteristics of the 108 robustly replicated associations
Outcome Chr. region Gene locus SNP N participants (N datasets)
Total European Asian African
Asthma 1q31.3 DENND1B, CRB1 rs2786098 6,175 2,463 (3) 0 3,712 (2)
Asthma 1q31.3 DENND1B, CRB1 rs1891497 6,175 2,463 (3) 0 3,712 (2)
Asthma 2q13 IL1RL1 rs1420101 52,886 51,177 (8) 1,709 (1) 0
Atrial Wbrillation 4q25 Intergenic rs2200733 20,979 17,810 (3) 3,169 (1) 0
Atrial Wbrillation 4q25 PITX2,ENPEP rs10033464 20,979 17,810 (3) 3,169 (1) 0
BMI 16q12.2 FTO rs9939609 28,266 19,424 (7) 8,842 (1) 0
BMI 18q21.32 MC4R rs17782313 69,194 60,352 (21) 8,842 (1) 0
Breast cancer 16 TNRC9/LOC643714 rs12443621 43,246 37,318 (19) 5,928 (3) 0
Breast cancer 16 TNRC9/LOC643714 rs8051542 34,374 32,668 (16) 1,706 (2) 0
Breast cancer 10q26.13 FGFR2 rs2981582 45,246 37,318 (19) 7,928 (4) 0
Breast cancer 11p15.5 LSP1 rs3817198 39,024 37,318 (19) 1,706 (2) 0
Breast cancer 16q12.1 TNRC9 rs3803662 34,479 28,551 (15) 5,928 (3) 0
Breast cancer 2q35 Intergenic rs13387042 2,227 1,101 (1) 1,126 (1) 0
Breast cancer 5q11.2 MAP3K1 rs889312 43,246 37,318 (19) 5,928 (3) 0
Breast cancer 8q24.21 Intergenic rs13281615 34,479 28,551 (15) 5,928 (3) 0
Colorectal cancer 11q23.1 LOC120376 rs3802842 23,321 15,747 (6) 7,574 (1) 0
Colorectal cancer 18q21.1 SMAD7 rs4939827 23,839 16,270 (6) 7,569 (1) 0
Colorectal cancer 8q24.21 POU5F1P1/DQ515897 rs7014346 23,790 16,216 (6) 7,574 (1) 0
Eosinophil count 3 GATA2 rs7635061 9,618 7,660 (6) 1,958 (1) 0
Eosinophil count 5 IL5 rs2079103 9,618 7,660 (6) 1,958 (1) 0
Eosinophil count 2q12.1 IL1RL1 rs1420101 12,872 7,660 (6) 5,212 (2) 0
Eosinophil count 2q34 IKZF2 rs12619285 12,872 7,660 (6) 5,212 (2) 0
Eosinophil count 3q21.3 GATA2 rs4857855 12,872 7,660 (6) 5,212 (2) 0
Eosinophil count 5q31.1 IL5 rs4143832 12,872 7,660 (6) 5,212 (2) 0
Gout 4p16.1 SLC2A9 rs16890979 26,714 22,871 (1) 0 3,843 (1)
Gout 4q22.1 ABCG2 rs2231142 26,714 22,871 (1) 0 3,843 (1)
Height 12q14.3 HMGA2 rs1042725 23,064 13,604 (4) 9,460 (3) 0
Height 12q22 SOCS2 rs11107116 25,942 16,482 (4) 9,460 (3) 0
Height 13q14.3 DLEU7 rs3116602 25,942 16,482 (4) 9,460 (3) 0
Height 15q25.2 ADAMTSL3 rs10906982 25,942 16,482 (4) 9,460 (3) 0
Height 19p13.3 DOT1L rs12986413 14,222 13,604 618 (1) 0
Height 1p12 SPAG17 rs12735613 25,942 16,482 (4) 9,460 (3) 0
Height 1p34.2 SCMH1 rs6686842 25,942 16,482 (4) 9,460 (3) 0
Height 1q42.13 ZNF678 rs1390401 25,942 16,482 (4) 9,460 (3) 0
Height 20p12.3 BMP2 rs967417 6,135 5,517 (1) 618 (1) 0
Height 20q11.22 GDF5–BFZB rs6060369 48,209 34,889 (10) 9,460 (2) 3,860 (1)
Height 2p16.1 EFEMP1 rs3791675 38,626 30,147 (10) 8,479 (2) 0
Height 2q35 IHH rs6724465 25,942 16,482 (4) 9,460 (3) 0
Height 3q23 ZBTB38 rs6440003 38,626 30,147 (10) 8,479 (2) 0
Height 4p15.32 LCORL rs16896068 25,942 16,482 (4) 9,460 (3) 0
Height 4q31 HHIP rs1812175 6,135 5,517 (1) 618 (1) 0
Height 4q31.22 HHIP rs6854783 25,324 16,482 (4) 8,842 (2) 0
Height 6p21.31 HMGA1 rs6918981 43,198 35,337 (5) 7,861 (1) 0
Height 6p21.31 C6orf106 rs2814993 25,324 16,482 (4) 8,842 (3) 0
Height 6p22.1 HIST1H1D rs10946808 25,832 25,214 618 (1) 0
Height 6p24 BMP6 rs12198986 6,135 5,517 (1) 618 (1) 0
Height 6q16.3 LIN28B rs314277 14,222 13,604 618 (1) 0
123

1062 Hum Genet (2012) 131:1057–1071
Table 1 continued
Outcome Chr. region Gene locus SNP N participants (N datasets)
Total European Asian African
Height 6q22.32 LOC387103 rs4549631 25,942 16,482 (4) 9,460 (3) 0
Height 6q24.1 GPR126 rs3748069 6,135 5,517 (1) 618 (1) 0
Height 6q24.3 GPR126 rs4896582 14,908 14,290 618 (1) 0
Height 7p22 GNA12 rs798544 6,135 5,517 (1) 618 (1) 0
Height 7q21.2 CDK6 rs2282978 25,324 16,482 (4) 8,842 (2) 0
Height 8q12.1 PLAG1 rs13273123 44,346 35,337 (4) 7,861 (1) 1,148 (1)
Height 9q22.32 PTCH1 rs10512248 25,942 16,482 (4) 9,460 (3) 0
Height 4p15.32 NCAPG, LCORL rs2011603 14,359 5,517 (4) 8,842 (2) 0
PD 4 BST1 rs11931532 30,311 13,625 (5) 16,686 (1) 0
PD 4 BST1 rs12645693 30,311 13,625 (5) 16,686 (1) 0
PD 17 IMP5 rs17690703 28,600 8,208 (3) 20,392 (3) 0
PD 17 NSF rs183211 28,600 8,208 (3) 20,392 (3) 0
PD 1q32.1 PARK1/NUCKS1 rs823128 30,311 13,625 (5) 16,686 (1) 0
PD 1q32.1 PARK1/NUCKS1 rs708730 30,311 13,625 (5) 16,686 (1) 0
PD 1q32.1 PARK1/SLC41A1 rs823156 30,311 13,625 (5) 16,686 (1) 0
PD 1q32.1 PARK1/SLC41A1 rs947211 30,311 13,625 (5) 16,686 (1) 0
PD 4p15.32 BST1 rs4538475 30,311 13,625 (5) 16,686 (1) 0
Prostate cancera 11p15.5 IGF2, IGF2AS, INS, TH rs7127900
Prostate cancera 22q13.2 rs5759167
Prostate cancera 2q31.1 ITGA rs12621278
Prostate cancera 4q22.3 PDLIM5 rs17021918
Prostate cancera 4q22.3 PDLIM5 rs12500426
Prostate cancera 4q24 TET2 rs7679673
Prostate cancera 8p21.2 NKX3.1 rs1512268
Prostate cancera 8q24 Intergenic rs1447295 4,400 3,655 (3) 0 745 (1)
Prostate cancera 8q24 Intergenic rs16901979 4,400 3,655 (3) 0 745 (1)
Schizophrenia 2q32.1 ZNF804A rs1344706 9,100 5,453 (2) 3,647 (2) 0
SLE 11p15.5 KIAA1542 Rs4963128 16,125 3,671 (2) 12,454 (3) 0
SLE 16p11.2 ITGAM rs9888739 16,125 3,671 (2) 12,454 (3) 0
SLE 16p11.2 ITGAM rs1143678 16,125 3,671 (2) 12,454 (3) 0
SLE 16p11.2 ITGAM rs4548893 16,125 3,671 (2) 12,454 (3) 0
SLE 2q32.3 STAT4 rs3821236 13,194 740 (1) 12,454 (3) 0
SLE 2q32.3 STAT4 rs7574865 16,503 6,301 (5) 10,202 (2) 0
SLE 3q14.3 PXK rs6445975 16,125 3,671 (2) 12,454 (3) 0
SLE 4q24 BANK1 rs10516487 15,390 2,936 (4) 12,454 (2) 0
SLE 5q33.3 rs2431697 16,125 3,671 (2) 12,454 (3) 0
SLE 6p21.33 MSH5 rs3131379 16,125 3,671 (2) 12,454 (3) 0
SLE 6q21 PRDM1-ATG5 rs6568431 16,125 3,671 (2) 12,454 (3) 0
SLE 6q23.3 TNFAIP3 rs2230926 16,115 5,913 (4) 10,202 (2) 0
SLE 7q32.1 IRF5/TNPO3 rs729302 16,125 3,671 (2) 12,454 (3) 0
SLE 7q32.1 IRF5/TNPO3 rs12537284 16,125 3,671 (2) 12,454 (3) 0
SLE 7q32.1 TNPO3 rs10239340 16,125 3,671 (2) 12,454 (3) 0
SLE 7q32.1 IRF5/TNPO3 rs10279821 16,216 3,671 (2) 12,545 (3) 0
SLE 8p23.1 BLK rs13277113 14,104 1,650 (1) 12,454 (3) 0
SLE 8p23.1 BLK rs2248932 16,930 6,728 (4) 10,202 (2) 0
123

Hum Genet (2012) 131:1057–1071 1063
try groups. CHB and JPT minor allele frequencies were highlycorrelated, as expected (correlation coeYcient = 0.98,p < 0.001), and therefore merged into a combined CHB + JPTgroup. The Pearson correlation coeYcient was 0.63(p < 0.001) for frequencies in the CEU versus CHB + JPT,0.53 (p < 0.001) for CEU versus YRI, and 0.31 (p = 0.01) forCHB + JPT versus YRI ancestry. DiVerences in the minorallele frequencies of >10% in absolute frequency were com-mon and occurred in 77 (72%), 75 (69%), and 89 (83%) of theCEU versus CHB + JPT, CEU versus YRI and CHB + JPTversus YRI comparisons. Most of the variants were common inat least one ancestral group (minor allele frequency >5%).According to HapMap data, 7, 20, and 15 genetic variantswere uncommon in CEU, CHB + JPT and YRI samples,respectively, while 2, 9 and 8 rare variants were observed inthe aforementioned ancestral groups, respectively. The riskallele was the minor allele in 49, 60, and 54 of the assessedassociations in CEU, CHB + JPT, and YRI samples, respec-tively. Of the assessed genetic variants, 8 and 8 had Fst > 0.25for the CEU populations compared to the CHB + JPT and YRIsamples, respectively. These were variants associated withbreast cancer, schizophrenia, height, uric acid, systemic lupuserythematosus, Parkinson’s disease (Supplementary Table 2).
Genetic eVect sizes
As shown in Table 2 eVect sizes showed notable variabilityacross diVerent ancestry groups, particularly for compari-
sons with African ancestry groups. Among the Europeanand Asian ancestry genetic eVect size estimates, 17 (18%)had estimates in the opposite direction and another 31(39%) were in the same direction, but diVered from morethan twofold; eVect size estimates diVered beyond chancein 21 of the 97 (22%) comparisons. The frequency of dis-crepancies between European and African eVect size esti-mates was 5 (21%), 11 (58%) and 10 (42%), respectively.The frequency of discrepancies between Asian and AfricaneVect size estimates was 5 (39%), 4 (50%) and 3 (23%),respectively.
Regarding the potential eVect of the underlying LD onthe observed eVect concordance patterns, there were 7SNPs with no recombination hotspot nearby. Overall, amedian of 2 (range 0–6) hotspots were found in vicinity tothe assessed SNPs and the median distance to the closesthotspot was 23.8 kb; neither the number of identiWed hot-spots nor the distance to the closest hotspot seem to be astatistically signiWcant predictor of Wnding risk estimatediVerences in any of the three aspects studied (statisticallysigniWcant diVerences; opposite direction of eVects; oppo-site direction of eVects or same direction but with morethan twofold diVerence). In a pairwise fashion, the numberof nearby hotspots had a nominally statistically signiWcantinverse weak relationship with the occurrence of more thantwofold genetic risk diVerences (OR 0.70; 95% CI 0.51–0.97; p = 0.031) for the European–Asian comparison, butthis should be interpreted cautiously given the number ofanalyses (Table 3).
Table 1 continued
BMI body mass index, PD Parkinson’s disease, SLE systematic lupus erythematosus, T2D type 2 diabetesa Exact sample size not provided
Outcome Chr. region Gene locus SNP N participants (N datasets)
Total European Asian African
SLE 8p23.1 XKR6 rs6985109 16,125 3,671 (2) 12,454 (3) 0
SLE 8p23.1 XKR6 rs4240671 16,125 3,671 (2) 12,454 (3) 0
SLE 8p23.1 XKR6 rs11783247 16,125 3,671 (2) 12,454 (3) 0
SLE 8p23.1 XKR6 rs6984496 16,125 3,671 (2) 12,454 (3) 0
SLE 8p23.1 C8orf12 rs7836059 16,125 3,671 (2) 12,454 (3) 0
SLE 8q12.1 LYN rs7829816 16,125 3,671 (2) 12,454 (3) 0
Stroke 12p13.33 NINJ2 rs12425791 42,253 37,702 (1) 0 4,551 (1)
Systemic sclerosis 6 HLA–DPB1 and DPB2 rs3128930 3,998 3,838 (1) 0 160 (1)
T2D 11p15.5 KCNQ1 rs2237892 38,760 16,698 (4) 22,062 (5) 0
T2D 2p21 THADA rs7578597 73,373 60,832 (16) 12,541 (3) 0
T2D 6p22.3 CDKAL1 rs4712523 51,193 32,554 (7) 18,639 (3) 0
T2D 9p21.3 CDKN2A/B rs2383208 53,848 32,554 (7) 21,294 (4) 0
T2D 12p15.5 KCNQ1 rs2074196 19,743 6,570 (1) 13,173 (4) 0
Uric acid 4p16.1 SLC2A9 rs16890979 26,714 22,871 (1) 0 3,843 (1)
Uric acid 4q22.1 ABCG2 rs2231142 26,714 22,871 (1) 0 3,843 (1)
Uric acid 6p22.2 SLC17A3 rs1165205 26,714 22,871 (1) 0 3,843 (1)
123

1064 Hum Genet (2012) 131:1057–1071
Table 2 Observed discrepancies for ancestral eVect sizes and adjacent hotspots
SNP Locus Outcome Z score Same direction Two fold differences
euas euafr asafr euas euafr asafr euas euafr asafr N
rs1420101 IL1RL1 Asthma 0 1 0 3
rs2786098 DENND1B, CRB1 Asthma 1 0 1 1
rs1891497 DENND1B, CRB1 Asthma 1 0 1 0
rs2200733 Intergenic Atrial fibrillation 0 1 0 3
rs10033464 PITX2,ENPEP Atrial fibrillation 0 1 1 4
rs9939609 FTO BMI 0 1 0 3
rs17782313 MC4R BMI 0 1 0 1
rs13387042 Intergenic Breast cancer 0 0 0 1 1 1 1 1 0 3
rs2981582 FGFR2 Breast cancer 0 1 0 3
rs12443621 TNRC9/LOC643714 Breast cancer 1 1 1 2
rs8051542 TNRC9/LOC643714 Breast cancer 0 0 1 3
rs889312 MAP3K1 Breast cancer 0 1 0 3
rs3817198 LSP1 Breast cancer 0 1 1 1
rs13281615 Intergenic Breast cancer 0 1 1 4
rs3803662 TNRC9 Breast cancer 0 1 1 1 0 0 0 1 1 4
rs7014346 POU5F1P1/DQ515897 Colorectal cancer 1 0 1 3
rs3802842 Colorectal cancer 1 1 1 2
rs4939827 SMAD7 Colorectal cancer 1 0 1 4
rs1420101 IL1RL1 Eosinophil count 0 1 0 3
rs12619285 IKZF2 Eosinophil count 0 1 0 2
rs4857855 GATA2 Eosinophil count 0 1 0 4
rs4143832 IL5 Eosinophil count 1 1 1 2
rs7635061 GATA2 Eosinophil count 0 1 0 4
rs2079103 IL5 Eosinophil count 0 0 1 2
rs16890979 SLC2A9 Gout 1 1 1 1
rs2231142 ABCG2 Gout 0 1 0 3
rs6060369 GDF5 – BFZB Height 0 0 0 1 1 1 0 0 1 1
rs6918981 HMGA1 Height 0 0 0 1 1 1 1 0 1 3
rs6440003 ZBTB38 Height 0 1 0 2
rs13273123 PLAG1 Height 1 0 1 0 1 0 1 0 1 1
rs3791675 EFEMP1 Height 0 1 0 3
rs1042725 HMGA2 Height 0 1 0 3
rs16896068 LCORL Height 0 1 0 1
rs10512248 PTCH1 Height 0 1 0 1
rs12735613 SPAG17 Height 0 1 0 1
rs11107116 SOCS2 Height 0 1 0 6
rs6854783 HHIP Height 0 1 0 1
123

Hum Genet (2012) 131:1057–1071 1065
Table 2 continued
SNP Locus Outcome Z score Same direction Two fold differences
euas euafr asafr euas euafr asafr euas euafr asafr N
rs1390401 ZNF678 Height 0 1 1 0
rs2011603 NCAPG, LCORL Height 1 0 1 0 1 0 1 1 1 1
rs2282978 CDK6 Height 0 1 1 0
rs4549631 LOC387103 Height 0 1 0 0
rs2814993 C6orf106 Height 0 1 0 1
rs3116602 DLEU7 Height 0 1 0 2
rs6686842 SCMH1 Height 1 0 1 1
rs10906982 ADAMTSL3 Height 0 1 0 2
rs6724465 IHH Height 0 1 1 1
rs12198986 BMP6 Height 0 1 1 4
rs10946808 HIST1H1D Height 0 1 1 2
rs798544 GNA12 Height 0 1 0 2
rs1812175 HHIP Height 0 1 0 1
rs12986413 DOT1L Height 0 0 1 2
rs967417 BMP2 Height 0 1 0 4
rs3748069 GPR126 Height 0 1 1 1
rs314277 LIN28B Height 0 0 1 3
rs4896582 GPR126 Height 0 1 1 2
rs17690703 IMP5 PD 1 1 1 2
rs183211 NSF PD 1 1 1 1
rs823128 PARK1/NUCKS1 PD 0 1 0 3
rs708730 PARK1/ NUCKS1 PD 1 1 1 1
rs823156 PARK1/SLC41A1 PD 1 1 1 1
rs947211 PARK1/SLC41A1 PD 1 1 1 1
rs4698412 BST1 PD 0 1 1 1
rs11931532 BST1 PD 0 1 1 1
rs4538475 BST1 PD 1 1 1 1
rs12621278 ITGA Prostate cancer 0 1 0 1 1 1 0 1 1 3
rs17021918 PDLIM5 Prostate cancer 0 0 0 0 1 0 1 0 1 3
rs12500426 PDLIM5 Prostate cancer 0 1 0 0 0 1 1 1 0 3
rs7679673 TET2 Prostate cancer 0 1 0 1 0 0 0 1 1 1
rs1512268 NKX3.1 Prostate cancer 0 0 0 1 1 1 0 0 0 5
rs7127900 IGF2, IGF2AS, INS, TH Prostate cancer 0 1 0 1 1 1 0 1 1 3
rs5759167 Prostate cancer 0 0 0 1 1 1 1 1 0 3
rs1447295 Intergenic Prostate cancer 1 1 1 5
rs16901979 Intergenic Prostate cancer 0 1 1 1
rs1344706 ZNF804A Schizophrenia 0 1 0 0
rs3821236 STAT4 SLE 0 1 0 1
123

1066 Hum Genet (2012) 131:1057–1071
Table 2 continued
BMI body mass index, distance distance to the closest hotspot end, N number of adjacent hotspots (200 kb window), PD Parkinson’s disease, SLEsystematic lupus erythematosus, T2D type 2 diabetes
SNP Locus Outcome Z score Same direction Two fold differences
euas euafr asafr euas euafr asafr euas euafr asafr N
rs7574865 STAT4 SLE 0 1 0 4
rs2431697 SLE 0 1 0 5
rs6568431 PRDM1-ATG5 SLE 0 1 0 3
rs2230926 TNFAIP3 SLE 0 1 0 5
rs729302 IRF5/TNPO3 SLE 0 1 0 3
rs13277113 BLK SLE 0 1 0 3
rs2248932 BLK SLE 0 1 0 2
rs3131379 MSH5 SLE 0 0 1 1
rs12537284 IRF5/TNPO3 SLE 0 1 1 3
rs6985109 XKR6 SLE 0 0 1 2
rs4240671 XKR6 SLE 0 0 1 2
rs11783247 XKR6 SLE 0 1 0 2
rs6984496 XKR6 SLE 0 1 1 2
rs7829816 LYN SLE 0 1 1 2
rs9888739 ITGAM SLE 0 1 1 2
rs1143678 ITGAM SLE 0 1 1 2
rs4548893 ITGAM SLE 0 1 0 2
rs7836059 C8orf12 SLE 1 0 1 3
rs4963128 KIAA1542 SLE 0 1 1 1
rs6445975 PXK SLE 1 1 1 1
rs10516487 BANK1 SLE 0 1 0 2
rs10239340 TNPO3 SLE 1 0 1 2
rs10279821 IRF5/TNPO3 SLE 1 0 1 3
rs12425791 NINJ2 Stroke 0 1 1 3
rs3128930 HLA–DPB1 and DPB2 Systemic sclerosis 0 1 1 4
rs2074196 KCNQ1 T2D 0 1 0 5
rs2237892 KCNQ1 T2D 1 1 0 6
rs4712523 CDKAL1 T2D 1 1 0 1
rs2383208 CDKN2A/B T2D 1 1 0 3
rs7578597 THADA T2D 0 1 0 0
rs16890979 SLC2A9 Uric acid 1 1 0 2
rs2231142 ABCG2 Uric acid 0 1 0 3
rs1165205 SLC17A3 Uric acid 0 1 1 0
123
Hum Genet (2012) 131:1057–1071 1067
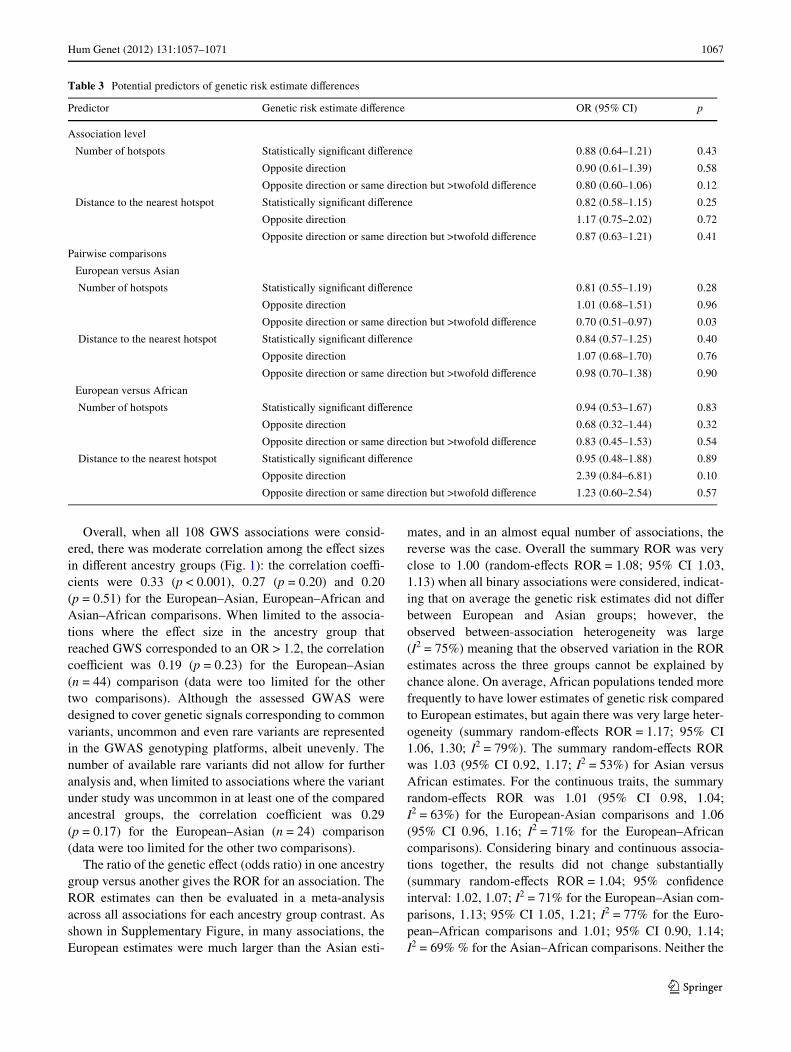
Overall, when all 108 GWS associations were consid-ered, there was moderate correlation among the eVect sizesin diVerent ancestry groups (Fig. 1): the correlation coeY-cients were 0.33 (p < 0.001), 0.27 (p = 0.20) and 0.20(p = 0.51) for the European–Asian, European–African andAsian–African comparisons. When limited to the associa-tions where the eVect size in the ancestry group thatreached GWS corresponded to an OR > 1.2, the correlationcoeYcient was 0.19 (p = 0.23) for the European–Asian(n = 44) comparison (data were too limited for the othertwo comparisons). Although the assessed GWAS weredesigned to cover genetic signals corresponding to commonvariants, uncommon and even rare variants are representedin the GWAS genotyping platforms, albeit unevenly. Thenumber of available rare variants did not allow for furtheranalysis and, when limited to associations where the variantunder study was uncommon in at least one of the comparedancestral groups, the correlation coeYcient was 0.29(p = 0.17) for the European–Asian (n = 24) comparison(data were too limited for the other two comparisons).
The ratio of the genetic eVect (odds ratio) in one ancestrygroup versus another gives the ROR for an association. TheROR estimates can then be evaluated in a meta-analysisacross all associations for each ancestry group contrast. Asshown in Supplementary Figure, in many associations, theEuropean estimates were much larger than the Asian esti-
mates, and in an almost equal number of associations, thereverse was the case. Overall the summary ROR was veryclose to 1.00 (random-eVects ROR = 1.08; 95% CI 1.03,1.13) when all binary associations were considered, indicat-ing that on average the genetic risk estimates did not diVerbetween European and Asian groups; however, theobserved between-association heterogeneity was large(I2 = 75%) meaning that the observed variation in the RORestimates across the three groups cannot be explained bychance alone. On average, African populations tended morefrequently to have lower estimates of genetic risk comparedto European estimates, but again there was very large heter-ogeneity (summary random-eVects ROR = 1.17; 95% CI1.06, 1.30; I2 = 79%). The summary random-eVects RORwas 1.03 (95% CI 0.92, 1.17; I2 = 53%) for Asian versusAfrican estimates. For the continuous traits, the summaryrandom-eVects ROR was 1.01 (95% CI 0.98, 1.04;I2 = 63%) for the European-Asian comparisons and 1.06(95% CI 0.96, 1.16; I2 = 71% for the European–Africancomparisons). Considering binary and continuous associa-tions together, the results did not change substantially(summary random-eVects ROR = 1.04; 95% conWdenceinterval: 1.02, 1.07; I2 = 71% for the European–Asian com-parisons, 1.13; 95% CI 1.05, 1.21; I2 = 77% for the Euro-pean–African comparisons and 1.01; 95% CI 0.90, 1.14;I2 = 69% % for the Asian–African comparisons. Neither the
Table 3 Potential predictors of genetic risk estimate diVerences
Predictor Genetic risk estimate diVerence OR (95% CI) p
Association level
Number of hotspots Statistically signiWcant diVerence 0.88 (0.64–1.21) 0.43
Opposite direction 0.90 (0.61–1.39) 0.58
Opposite direction or same direction but >twofold diVerence 0.80 (0.60–1.06) 0.12
Distance to the nearest hotspot Statistically signiWcant diVerence 0.82 (0.58–1.15) 0.25
Opposite direction 1.17 (0.75–2.02) 0.72
Opposite direction or same direction but >twofold diVerence 0.87 (0.63–1.21) 0.41
Pairwise comparisons
European versus Asian
Number of hotspots Statistically signiWcant diVerence 0.81 (0.55–1.19) 0.28
Opposite direction 1.01 (0.68–1.51) 0.96
Opposite direction or same direction but >twofold diVerence 0.70 (0.51–0.97) 0.03
Distance to the nearest hotspot Statistically signiWcant diVerence 0.84 (0.57–1.25) 0.40
Opposite direction 1.07 (0.68–1.70) 0.76
Opposite direction or same direction but >twofold diVerence 0.98 (0.70–1.38) 0.90
European versus African
Number of hotspots Statistically signiWcant diVerence 0.94 (0.53–1.67) 0.83
Opposite direction 0.68 (0.32–1.44) 0.32
Opposite direction or same direction but >twofold diVerence 0.83 (0.45–1.53) 0.54
Distance to the nearest hotspot Statistically signiWcant diVerence 0.95 (0.48–1.88) 0.89
Opposite direction 2.39 (0.84–6.81) 0.10
Opposite direction or same direction but >twofold diVerence 1.23 (0.60–2.54) 0.57
123

1068 Hum Genet (2012) 131:1057–1071
number of nearby hotspots nor the distance to the closesthotspot was statistically signiWcant associated with theobserved ROR estimates for the assessed associations con-sidering either pairwise or overall comparisons.
We next sought to explore whether the synthesis of dataacross all available ancestral groups would lead to enhance-
ment of statistical signiWcance of the replicated associa-tions. Data synthesis under a Wxed-eVect model assumptionacross the assessed ancestral groups is shown in Supple-mentary Table 3. In 76 cases, the combined ancestry datayield a more promising (i.e., lower) p value while in 32cases they yield a worse (i.e., higher) p value that is
Fig. 1 Pairwise correlations between risk-allele frequencies and thegenetic-risk estimates (binary phenotypes as blue dots and continuousoutcomes as red dots) across three major ancestral groups, for the
European–Asian (a), European–African (b) and Asian–African(c) comparisons, respectively
123

Hum Genet (2012) 131:1057–1071 1069
achieved by a single-ancestry analysis. Finally, among the47 associations with available detailed information to esti-mate measures of between- and within-ancestry heteroge-neity (�2), the available data suggest more commonly largervariance compared to between-ancestry groups than within-ancestry groups, but these estimates have large uncertaintyand for the majority of these associations there is notenough detailed information to calculate them (Supplemen-tary Table 4).
Discussion
The current evaluation of 108 GWS associations with agnos-tically discovered genetic markers shows varying consis-tency in genetic eVect sizes across major ancestral groups,and notable diVerences are encountered in a sizable propor-tion. Although the eVect sizes seen in one population havemodest correlation with the eVect sizes in populations ofanother ancestry and it is not possible to reliably predict theeVect in diVerent ancestry groups for an association that hasreached GWS in one ancestry group, eVects diVering beyondchance are less common. Combination of data from diverseancestry groups may thus be more likely to lead to lowerp values for association than ancestry-speciWc analyses.
A previous evaluation (Ioannidis et al. 2004) of 43 vali-dated candidate gene associations had shown large diVer-ences in the allele frequencies, but quite good agreementwith the eVect sizes. While candidate gene associationstackled mostly variants that were thought to be the func-tional, causative variants, agnostic GWAS have capturedcommon markers that are likely to be only in linkage dis-equilibrium with the culprits, and rarely the functional,causative variants themselves. The GWAS approach is farmore eYcient and has dramatically increased the yield ofmarkers with robust support for association. Linkage dis-equilibrium of the discovered tagging markers with func-tional, causative variants may vary a lot across diVerentancestry groups (Bodmer and Bonilla 2008) aVecting thecorrelations among observed cross-ancestry genetic-riskestimates. A previous study of population diVerentiation ofGWAS-discovered SNPs for 26 conditions across diVerentHapMap populations (Adeyemo and Rotimi 2010) foundsubstantial diVerences in allele frequencies, but populationdiVerentiation (expressed by Fst) varied across diVerentconditions. No previous study has examined diVerences inthe genetic eVects of GWAS-discovered variants across alarge number of conditions. Several studies have tested anumber of GWAS-discovered SNPs for one condition indiVerent ancestry groups (Grant et al. 2008; Ioannidis2009a, b; Ioannidis et al. 2009; Li et al. 2008; Ng et al.2008; Yamada et al. 2009). Most have documented somemodest or large diVerences in the genetic eVects, but infer-
ences are diYcult to generalize from single studies andtraits.
Some limitations should be discussed. First, althoughunder adequate quality control procedures, genotyping isgenerally considered accurate (Chanock et al. 2007; Well-come Trust Case Control Consortium 2007) in the GWASera, other sources of errors, e.g., phenotype misclassiW-cation, or suboptimal characterization of ancestry groupscould cause diVerences in diVerent studies. Second, thenotion that common ancestry is an eYcient way to ensurepopulation homogeneity has been extensively debated andancestry deWnitions range from self-reported ancestry toreported grandparental birthplace to genome-deWned(through hierarchical clustering methodology) ancestry; allapproaches have limitations (Campbell et al. 2005; Yanget al. 2008; Tang et al. 2005; Royal et al. 2010). In all,genome-wide data are an accurate and cost-eVective way toascertain stratiWcation within study populations, includingstratiWcation due to Wner grained population historieslargely unknown to individuals (Need and Goldstein 2006;Tian et al. 2008; TishkoV et al. 2009). Conversely, genome-based clustering is not commonly used in replication data-sets where ancestry is often assigned by self-report withoutgenomic data conWrmation. Third, comparison of geneticeVects across ancestry groups may be inXuenced by thewinner’s curse. We followed a strict protocol in selectingonly Wnal replication datasets (rather than initial discoverystudies) that are least likely to be aVected by the winner’scurse. Finally, we took extra care in assuring that theobserved diVerences were observed in situations wherethere was strong evidence for the presence of an overallgenetic association. We thus speciWcally focused onrobustly replicated GWAS-derived associations, since wewanted to exclude the possibility of including null underly-ing associations where either the detection of any cross-ancestry diVerence would be due to chance alone or anobserved pattern of consistency would reXect the null eVectvariation. Toward the same end and aiming to include asso-ciations less prone to selection and reporting biases, weexcluded candidate gene studies and fully endorsed theagnostic, genome-wide association study framework.
On average the genetic eVects were substantially smallerin African populations, probably because these 108 associa-tions were generally not initially discovered in African pop-ulations. Of note, the majority of the assessed Africanpopulations were African–American groups where the pro-portion of European ancestry is considerable (as high as20%) with very large variation among individuals (Brycet al. 2010). Thus, the diVerences between European andAfrican populations, other than African Americans, mightbe even more prominent.
The notion that the underlying recombination back-ground could create between-ancestry and within-ancestry
123

1070 Hum Genet (2012) 131:1057–1071
eVect diVerences was not supported by our evaluation ofrecombination hotspots using 1000 Genomes data. Never-theless, we should acknowledge that this analysis is notconclusive and it is limited due to the paucity of non-Euro-pean population data in GWAS. Moreover, linkage disequi-librium patterns may diVer enough to cause diVerences inassociations between ancestral groups even when recombi-nation hotspots are not identiWed in the 1000 Genomes data(Myers et al. 2005). Finally, as mentioned before for manyassociations, the amount of data from non-European popu-lations was limited. Therefore, the proportion of the associ-ations where there is a diVerence beyond chance in eVectsize across ancestry groups is probably underestimated.
The variable consistency in associations of commonvariants across major ancestry groups has important impli-cations for understanding the genetic architecture of com-plex diseases. These diVerences may also reXect diVerencesin the causal variants and/or their frequency across diVerentpopulations. Inclusion of populations of diVering ancestryin ongoing eVorts should be further encouraged. The powerto detect some markers may be diVerent in one ancestrygroup than another, because of diVerences in allele frequen-cies, genetic eVects, and potential environmental modiWers.Given that many loci may be pertinent to more than oneancestry group, one can obtain complementary lists ofinteresting loci with GWS signals by examining diVerentancestry groups, while an appropriately adjusted combinedanalysis will often increase power and contribute furtherdiscoveries. Finally, results of risk models involving manySNPs are more likely to be population-speciWc due todiVerences in LD patterns and allele frequencies character-istic of each composite SNP (RansohoV and Khoury 2010;Yang et al. 2009), and should have separate validation inother populations. This has implications for the transla-tional potential and development of genetic-risk predictiontests (Gulcher and Stefansson 2010; Ioannidis 2009a, b).
ConXict of interest The authors declare no conXict of interest relat-ed to this manuscript.
References
deyemo A, Rotimi C (2010) Genetic variants associated with complexhuman diseases show wide variation across multiple populations.Public Health Genomics 13:72–79
Ashley EA, Butte AJ, Wheeler MT, Chen R, Klein TE, Dewey FE,Dudley JT, Ormond KE, Pavlovic A, Morgan AA et al (2010)Clinical assessment incorporating a personal genome. Lancet375:1525–1535
Bodmer W, Bonilla C (2008) Common and rare variants in multifacto-rial susceptibility to common diseases. Nat Genet 40:695–701
Bryc K, Auton A, Nelson MR, Oksenberg JR, Hauser SL, Williams S,Froment A, Bodo JM, Wambebe C, TishkoV SA et al (2010) Ge-nome-wide patterns of population structure and admixture in
West Africans and African Americans. Proc Natl Acad Sci USA107:786–791
Burchard EG, Ziv E, Coyle N, Gomez SL, Tang H, Karter AJ, Moun-tain JL, Pérez-Stable EJ, Sheppard D, Risch N (2003) The impor-tance of race and ethnic background in biomedical research andclinical practice. N Engl J Med 348:1170–1175
Campbell CD, Ogburn EL, Lunetta KL, Lyon HN, Freedman ML,Groop LC, Altshuler D, Ardlie KG, Hirschhorn JN (2005) Dem-onstrating stratiWcation in a European American population. NatGenet 37:868–872
Cappelleri JC, Ioannidis JP, Schmid CH, de Ferranti SD, Aubert M,Chalmers TC, Lau J (1996) Large trials vs meta-analysis of small-er trials: how do their results compare? JAMA 276:1332–1338
Chinn S (2000) A simple method for converting an odds ratio to eVectsize for use in meta-analysis. Stat Med 19:3127–3131
Cooper H, Hedges LV (eds) (1994) The handbook of research synthe-sis (Russell Sage 58. Foundation, New York)
DerSimonian R, Laird N (1986) Meta-analysis in clinical trials. Con-trol Clin Tr 7:177–188
Dhandapany PS, Sadayappan S, Xue Y, Powell GT, Rani DS, NallariP, Rai TS, Khullar M, Soares P, Bahl A et al (2009) A commonMYBPC3 (cardiac myosin binding protein C) variant associatedwith cardiomyopathies in South Asia. Nat Genet 41:187–191
1000 Genomes (2011) A deep catalog of human genetic variation. ht-tp://www.1000genomes.org/
Grant SF, Li M, BradWeld JP, Kim CE, Annaiah K, Santa E, GlessnerJT, Casalunovo T, Frackelton EC, Otieno FG et al (2008) Associ-ation analysis of the FTO gene with obesity in children of Cauca-sian and African ancestry reveals a common tagging SNP. PLoSOne 3:e1746
Gulcher J, Stefansson K (2010) Genetic risk information for commondiseases may indeed be already useful for prevention and earlydetection. Eur J Clin Invest 40:56–63
Helgason A, Pálsson S, Thorleifsson G, Grant SF, Emilsson V, Gun-narsdottir S, Adeyemo A, Chen Y, Chen G, Reynisdottir I et al(2007) ReWning the impact of TCF7L2 gene variants on type 2diabetes and adaptive evolution. Nat Genet 39:218–225
Higgins JP, Thompson SG, Deeks JJ, Altman DG (2003) Measuringinconsistency in meta-analyses. BMJ 327:557–560
HindorV LA, Sethupathy P, Junkins HA, Ramos EM, Mehta JP, Col-lins FS, Manolio TA (2009) Potential etiologic and functionalimplications of genome-wide association loci for human diseasesand traits. Proc Natl Acad Sci USA 106:9362–9367
HindorV LA, Junkins HA, Hall PN, Mehta JP, Manolio TA (2011) Acatalog of published genome-wide association studies. (Availableat: http://www.genome.gov/gwastudies)
Ioannidis JP (2007) Non-replication and inconsistency in the genome-wide association setting. Hum Hered 64:203–213
Ioannidis JP (2009a) Population-wide generalizability of genome-widediscovered associations. J Natl Cancer Inst 101:1297–1299
Ioannidis JP (2009b) Personalized genetic prediction: too limited, tooexpensive, or too soon? Ann. Intern Med 150:139–141
Ioannidis JP, Ntzani EE, Trikalinos TA, Contopoulos-Ioannidis DG(2001) Replication validity of genetic association studies. NatGenet 29:306–309
Ioannidis JP, Ntzani EE, Trikalinos TA (2004) ‘Racial’ diVerences ingenetic eVects for complex diseases. Nat Genet 36:1312–1318
Ioannidis JP, Patsopoulos NA, Evangelou E (2007) Uncertainty in het-erogeneity estimates in meta-analyses. BMJ 335:914–916
Ioannidis JP, Thomas G, Daly MJ (2009) Validating, augmenting andreWning genome-wide association signals. Nat Rev Genet10:318–329
Janssens AC, van Duijn CM (2008) Genome-based prediction of com-mon diseases: advances and prospects. Hum Mol Genet 17:R166–R173
123

Hum Genet (2012) 131:1057–1071 1071
Li H, Wu Y, Loos RJ, Hu FB, Liu Y, Wang J, Yu Z, Lin X (2008) Vari-ants in the fat mass- and obesity-associated (FTO) gene are notassociated with obesity in a Chinese Han population. Diabetes57:264–268
Manica A, Prugnolle F, Balloux F (2005) Geography is a better deter-minant of human genetic diVerentiation than ethnicity. Hum Gen-et 118:366–371
Mantel N, Haenszel W (1959) Statistical aspects of the analysis of datafrom retrospective studies of disease. J Natl Cancer Inst 22:719–748
McCarthy MI, Abecasis GR, Cardon LR, Goldstein DB, Little J, Ioan-nidis JP, Hirschhorn JN (2008) Genome-wide association studiesfor complex traits: consensus, uncertainty and challenges. NatRev Genet 9:356–369
Moonesinghe R, Khoury MJ, Liu T, Ioannidis JP (2008) Required sam-ple size and nonreplicability thresholds for heterogeneous geneticassociations. Proc Natl Acad Sci USA 105:617–622
Myers S, Bottolo L, Freeman C, McVean G, Donnelly P (2005) A Wne-scale map of recombination rates and hotspots across the humangenome. Science 310:321–324
NCI-NHGRI Working Group on Replication in Association Studies,Chanock SJ, Manolio T, Boehnke M, Boerwinkle E, Hunter DJ,Thomas G, Hirschhorn JN, Abecasis G, Altshuler D et al (2007)Replicating genotype-phenotype associations. Nature 447:655–660
Need AC, Goldstein DB (2006) Genome-wide tagging for everyone.Nat Genet 38:1227–1228
Ng MC, Park KS, Oh B, Tam CH, Cho YM, Shin HD, Lam VK, MaRC, So WY, Cho YS et al (2008) Implication of genetic variantsnear TCF7L2, SLC30A8, HHEX, CDKAL1, CDKN2A/B,IGF2BP2, and FTO in type 2 diabetes and obesity in 6, 719Asians. Diabetes 57:2226–2233
Pereira TV, Patsopoulos NA, Salanti G, Ioannidis JP (2009) Discoveryproperties of genome-wide association signals from cumulativelycombined data sets. Am J Epidemiol 170:1197–1206
RansohoV DF, Khoury MJ (2010) Personal genomics: information canbe harmful. Eur J Clin Invest 40:64–68
Rosenberg NA, Huang L, Jewett EM, Szpiech ZA, Jankovic I, Bo-ehnke M (2010) Genome-wide association studies in diverse pop-ulations. Nat Rev Genet 11:356–366
Royal CD, Novembre J, Fullerton SM, Goldstein DB, Long JC, Bam-shad MJ, Clark AG (2010) Inferring genetic ancestry: opportuni-ties, challenges, and implications. Am J Hum Genet 86:661–673
Spielman RS, Bastone LA, Burdick JT, Morley M, Ewens WJ, CheungVG (2007) Common genetic variants account for diVerences ingene expression among ethnic groups. Nat Genet 39:226–231
Tang H (2006) Confronting ethnicity-speciWc disease risk. Nat Genet38:13–15
Tang H, Quertermous T, Rodriguez B, Kardia SL, Zhu X, Brown A,Pankow JS, Province MA, Hunt SC, Boerwinkle E et al (2005)Genetic structure, self-identiWed race/ethnicity, and confoundingin case-control association studies. Am J Hum Genet 76:268–275
The International HapMap Project (2003) Nature 426:789–796Tian C, Gregersen PK, Seldin MF (2008) Accounting for ancestry:
population substructure and genome-wide association studies.Hum Mol Genet 17:R143–R150
TishkoV SA, Reed FA, Friedlaender FR, Ehret C, Ranciaro A, FromentA, Hirbo JB, Awomoyi AA, Bodo JM, Doumbo O et al (2009)The genetic structure and history of Africans and African Ameri-cans. Science 324:1035–1044
Voight BF, Kudaravalli S, Wen X, Pritchard JK (2006) A map of re-cent positive selection in the human genome. PLoS Biol 4:e72
Waters KM, Stram DO, Hassanein MT, Le Marchand L, Wilkens LR,Maskarinec G, Monroe KR, Kolonel LN, Altshuler D, HendersonBE et al (2010) Consistent association of type 2 diabetes risk vari-ants found in Europeans in diverse racial and ethnic groups. PLoSGenet 6:e1001078
Wellcome Trust Case Control Consortium (2007) Genome-wide asso-ciation study of 14,000 cases of seven common diseases and3,000 shared controls. Nature 447:661–678
Yamada H, Penney KL, Takahashi H, Katoh T, Yamano Y, YamakadoM, Kimura T, Kuruma H, Kamata Y, Egawa S et al (2009) Repli-cation of prostate cancer risk loci in a Japanese case-control asso-ciation study. J Natl Cancer Inst 101:1330–1336
Yang JJ, Burchard EG, Choudhry S, Johnson CC, Ownby DR, FavroD, Chen J, Akana M, Ha C, Kwok PY et al (2008) DiVerences inallergic sensitization by self-reported race and genetic ancestry.J Allergy Clin Immunol 122:820–827
Yang Q, Flanders WD, Moonesinghe R, Ioannidis JP, Guessous I,Khoury MJ (2009) Using lifetime risk estimates in personal geno-mic proWles: estimation of uncertainty. Am J Hum Genet 85:786–800
Zhang W, Duan S, Kistner EO, Bleibel WK, Huang RS, Clark TA,Chen TX, Schweitzer AC, Blume JE, Cox NJ et al (2008) Evalu-ation of genetic variation contributing to diVerences in geneexpression between populations. Am J Hum Genet 82:631–640
Zollner S, Pritchard JK (2007) Overcoming the winner’s curse: esti-mating penetrance parameters from case–control data. Am J HumGenet 80:605–615
123