DIET AND IDENTITY AMONG THE ANCESTRAL OHLONE
572
DIET AND IDENTITY AMONG THE ANCESTRAL OHLONE: INTEGRATING STABLE ISOTOPE ANALYSIS AND MORTUARY CONTEXT AT THE YUKISMA MOUND (CA-SCL-38) ____________ A Thesis Presented to the Faculty of California State University, Chico ____________ In Partial Fulfillment of the Requirements for the Degree Master of Arts in Anthropology ____________ by Karen Smith Gardner Spring 2013
-
Upload
khangminh22 -
Category
Documents
-
view
0 -
download
0
Transcript of DIET AND IDENTITY AMONG THE ANCESTRAL OHLONE
DIET AND IDENTITY AMONG THE ANCESTRAL OHLONE:
INTEGRATING STABLE ISOTOPE ANALYSIS AND
MORTUARY CONTEXT AT THE YUKISMA
MOUND (CA-SCL-38)
____________
A Thesis
Presented
to the Faculty of
California State University, Chico
____________
In Partial Fulfillment
of the Requirements for the Degree
Master of Arts
in
Anthropology
____________
by
Karen Smith Gardner
Spring 2013
DIET AND IDENTITY AMONG THE ANCESTRAL OHLONE:
INTEGRATING STABLE ISOTOPE ANALYSIS AND
MORTUARY CONTEXT AT THE YUKISMA
MOUND (CA-SCL-38)
A Thesis
by
Karen Smith Gardner
Spring 2013
APPROVED BY THE DEAN OF GRADUATE STUDIES AND VICE PROVOST FOR RESEARCH:
_________________________________ Eun K. Park, Ph.D.
APPROVED BY THE GRADUATE ADVISORY COMMITTEE:
______________________________ _________________________________ Guy Q. King, Ph.D. Eric Bartelink, Ph.D., Chair Graduate Coordinator
_________________________________ Antoinette M. Martinez, Ph.D.
iii
ACKNOWLEDGMENTS
The process of completing this degree and writing this thesis has been a
homecoming for me, returning me to the ideas and complexities of anthropology and to
the rolling hills and valleys of Central California, where I grew up. First and foremost, I
would like to thank Rosemary Cambra and the Muwekma Ohlone Tribe for your interest
and support of this project. I am humbled by your trust in giving me this access to your
past. It has been my honor to glimpse the lives of your ancestors.
My thesis committee has been tremendously supportive. To Dr. Eric Bartelink
and Dr. Antoinette Martinez, thank you for your patience and encouragement. Between
you, you have provided me with a wonderful breadth of knowledge. Eric, as a pioneer of
stable isotope analysis in Central California you have introduced new potential to the
interpretation of the prehistoric past here, and passed this enthusiasm along to your
students. I’ll never forget the day when you gave me this project; it was a generous
gesture and the best luck of my academic career. Nette, your ability to balance theory,
archaeological interpretation, historical context, and ethnohistory to peel back layers of
perspective about the lived experience of people in the past has inspired me to do the
same. Thank you for being a voice of calm encouragement throughout this process. To
both of you, your insights are clearly inscribed between the lines of these pages.
Thanks are also due to my professors at California State University, Chico,
who gave me the tools to approach anthropological questions from a four-field
iv
perspective. I have had the privilege of studying forensic anthropology with Dr. Turhon
Murad, learning the art of teaching from Dr. Beth Shook, squinting over faunal remains
with Dr. Frank Bayham, and learning about linguistics from Dr. Sarah Trechter. I studied
medical anthropology with Dr. David Eaton, who brings such careful concern to each
topic and every student. Dr. Bill Loker challenged me to question my theoretical footing,
and I am the better for it. To Dr. P. Willey, I will never be able to thank you enough for
our grand Peruvian adventure and the weeks of osteological survey in the Chachapoyan
cave. To Drs. Georgia Fox, Stacy Schaefer, Brian Brazeal, Colleen Milligan, and Jesse
Dizzard, thank you for the inspired conversations. It has been a wonderful experience to
be a part of such a diverse and thoughtful department.
The completion of this thesis research required assistance from many people
and many laboratories. At CSU Chico, thanks are due to Melanie Beasley for training me
in stable isotope methods in the Stable Isotope Preparation Laboratory and for spending
long and odd hours in the lab with me getting this project done. Melanie also showed me
the art of pressing pellets for FT-IR analysis in the CSU Chico chemistry laboratory.
Thank you to Dr. Randy Miller for allowing us to use his lab’s materials and equipment
for this research. I also appreciate the help of graduate students Amy MacKinnon and
Stefanie Kline, who prepared additional samples from CA-SCL-38 to supplement my
research. Shannon Clinkinbeard manages the CSU Chico Human Identification
Laboratory, and I want to thank her for a million conversations while I was overtired,
overstressed, and working in the lab.
v
Stable isotope analysis of bone collagen was completed under the supervision
of Dr. David Harris at the UC Davis Stable Isotope Facility in the Department of Plant
Sciences. The bone apatite analysis was completed by Dr. David Winter and Dr. Howie
Spero at the UC Davis Stable Isotope Laboratory in the Department of Geology. Analysis
of sulfur isotopes was provided by Dr. Olaf Nehlich in the Department of Human
Evolution at the Max Planck Institute for Evolutionary Anthropology in Leipzig,
Germany. Much gratitude is due to these men and their assistants who provided the data
for this analysis. Fourteen new radiocarbon dates were run at the Center for Accelerator
Mass Spectrometry at the Lawrence Livermore National Laboratory. I am grateful for the
friendship and guidance of Paula Zermeño and the support of Tom Guilderson.
I have had the benefit of advice from many experts in their fields. Thank you
to Alan Leventhal at San Jose State University for access to the CA-SCL-38 collections,
for all of the helpful and informative information about regional archaeology, and for
your enthusiastic support throughout this process. Dwight Simons has given me
wonderful advice about the early environment and available resources on the menu for
the ancestral Ohlone. Ben Fuller provided access to unpublished comparative sulfur
isotope data and answered questions about radiocarbon dating methods. Conversations
with Mark Hylkema provided great insight about artifact significance and ritual practices.
Bev Ortiz gave me a special tour of the mounds at Coyote Hills, so I could get a sense of
what mounded space in prehistoric California would have been like. Forensic
odontologist, Leon Pappanastos, met with me to review photographs of dentition from

vi
CA-SCL-38 for refinement of age classifications. Kevin Dalton created the wonderful
regional map, used in Chapter II.
The excavation of the Yukisma Mound was completed in 1993 and 1994. As
such, my access to the information from this site is framed through the eyes of earlier
interpreters. Thanks are due to Ohlone Families Consulting Services, particularly
Rosemary Cambra, Alan Leventhal, and Laura Jones, for documentation of the
excavation and for granting me access to this information. Robert Jurmain and Susan
Morley’s analyses of the osteological material provided the demographic basis and data
for bioarchaeological interpretation. Viviana Bellifemine documented the mortuary
context and provided me with advice, access to unpublished data, and encouragement
along the way. Tammy Buonasera shared her insights about groundstone form and
function. Cara Monroe helped me with sample selection at the beginning of this project
and shared insights about the Yukisma Mound population from her DNA research.
The study of diet and identity of the ancestral Ohlone was actually not the first
thesis project I began at CSU Chico. Before embarking on this journey, I had planned to
do a research project about diet, trade, and mobility patterns of individuals from the
Tiwanaku polity, buried between 800 and 1000 AD in the Chen Chen Cementario in
Moquegua, Peru. I traveled to Bolivia and Peru during the summer of 2008 and
completed sample collection with all appropriate local permissions, but was unable to
export the samples to complete the analysis. Nonetheless, I would like to take this
opportunity to acknowledge the help of Dr. Bruce Owen in connecting me with this
project and the wonderful people at Museo Contesuyo in Moquegua, Peru, including Paty

vii
Palacios Filinich and Yamilex Tejada. I hope to one day finish what I started – perhaps
completion of this master’s degree will help.
I was tremendously lucky to have been part of an amazing cohort at CSU
Chico, including Brenna Blanchard, Lance Blanchard, Carrie Brown, Melinda Button,
Kristin Chelotti, Deanna Commons, Leanna Flaherty, Kate Kolpan, Nicole Ramirez, and
Amanda van Woert. I have loved sharing this journey with you! Thank you for the
laughs and the friendship. Thanks and acknowledgements are also due to Arran Bell, Lisa
Bright, James Brill, Maija Glasier, Kristina Crawford, Stephanie Meyers, Maura
Schapper, and Nikki Willits. Kristina and Lisa, thank you for being my home away from
home and for the late night conversations about archaeology and bourbon and bones.
Thank you to Lauren Hasten, my friend and mentor, for showing me the
power of anthropology education, inspiring me to return to school, and giving me a job
when I was done with classes. I also want to acknowledge Dr. Margaret Richards and Dr.
Mike Ansell, my chemistry professors, and Kathleen Azevedo, my Physiology and
Anatomy professor at Las Positas College in Livermore, California. Together they made
me believe that I could succeed in science. My students over the last three years at Las
Positas College have watched me balance teaching and research, and I appreciate their
support and encouragement as well.
In the summer of 2012, I began work with Karin Beck and Annamarie
Guerrero of URS and Diane DiGuiseppe and Dave Grant of D&D Osteology. I would
like to thank them for the opportunities they have given me, and also for being so flexible
and supportive about time off to finish writing. My co-workers on the VMC project have
viii
listened to me ramble about Santa Clara archaeology and have provided a valued
sounding board for many ideas.
Much gratitude is due to my friends and family who have watched me slog
through years of research, mounds of paper, and all the joys and stresses of graduate
school. To my friends, thank you for being patient while I’ve been holed up working on
my thesis. To my parents, Chuck and Ann Smith, you have always supported my dreams.
Thank you for your faith in me. To Sheryl, Danny, Nicole, Megan, Cami, Steve, Sharon,
Robert, and David, thank you for your encouragement all these years. Now I can finally
make it to family gatherings! To my husband, Steven Gardner, we’ve known each other
all our lives, but just reconnected at the beginning of this grad school journey. You knew
what I was in for, and you joined me anyway. Thank you for your love and
understanding.
My network of friendship, support, and academic inspiration has been a
blessing to me. I am grateful to you all, and to those of you who weren’t named but have
been along this path as well. Finally, gratitude is due to the people who were buried at the
Yukisma Mound, who have disrupted their sleep to tell us their stories.
ix
TABLE OF CONTENTS
PAGE
Acknowledgments ...................................................................................................... iii List of Tables.............................................................................................................. xii List of Figures............................................................................................................. xvi Abstract....................................................................................................................... xx
CHAPTER I. Approaching Diet and Identity at the Yukisma Mound
Site (CA-SCL-38)..................................................................................... 1 Introduction .................................................................................. 1 The Ohlone: Introduction and Terminology................................. 3 Geographic and Archaeological Terminology ............................. 5 Organization of this Thesis........................................................... 5
II. Perspectives on the Archaeology of Central California ........................... 11
Introduction .................................................................................. 11 Shellmounds, Chronologies, and the Development of
Central California Archaeology............................................ 12 South San Francisco Bay Region Archaeology............................ 34 Recent Perspectives on South Bay Archaeology and
Shellmound Analysis ............................................................ 64
III. The Yukisma Mound Site (CA-SCL-38) ................................................. 70
Introduction .................................................................................. 70 Historic Impacts and Early Archaeological Interpretations ......... 71 Demographic Data from CA-SCL-38 .......................................... 84 Mortuary Context at CA-SCL-38................................................. 88 Dating the Site .............................................................................. 136 Conclusion: The Yukisma Mound (CA-SCL-38) ........................ 152

x
CHAPTER PAGE
IV. Food and Identity in Prehistory: Theoretical and Practical Approaches ............................................................................................... 154
Introduction .................................................................................. 154 Theoretical Considerations........................................................... 154 Identity.......................................................................................... 158 Identity and Archaeology ............................................................. 160 Identity and Food.......................................................................... 177 Identity and Social Bioarchaeology at CA-SCL-38 ..................... 182
V. Approaches to Paleodietary Reconstruction: Indirect Evidence .............. 186
Introduction .................................................................................. 186 A Brief History of Paleodietary Analysis..................................... 187 Evidence of Food Resources near CA-SCL-38: Indirect Sources 190 Discussion: What Was On the Menu?.......................................... 257
VI. Approaches to Paleodietary Reconstruction: Direct Evidence................. 260
Introduction .................................................................................. 260 Bioarchaeological Evidence ......................................................... 262 Stable Isotope Analysis ................................................................ 269 Discussion: Refining Paleodietary Analysis in the
Santa Clara Valley Using Direct Evidence ........................... 300 Conclusions: Potential Contributions of Stable Isotope
Analysis to Paleodietary Reconstruction at CA-SCL-38...... 301
VII. Materials and Methods ............................................................................. 304
Introduction .................................................................................. 304 Sample Selection .......................................................................... 305 Stable Isotope Analysis Methods ................................................. 314 Tests of Sample Quality ............................................................... 324 Summary of Materials and Methods ............................................ 334
VIII. Results of Stable Isotope Analysis ........................................................... 336
Introduction .................................................................................. 336 Population Dietary Patterns.......................................................... 337 Dietary Patterns by Temporal Period ........................................... 344 Dietary Patterns by Age Category................................................ 348

xi
CHAPTER PAGE
Dietary Patterns by Biological Sex............................................... 353 Dietary Patterns by Mortuary Context ......................................... 354 Dietary Patterns by Artifact Associations .................................... 363 Dietary Patterns by Artifact Abundance....................................... 374 Dietary Patterns by Artifact Diversity .......................................... 377 Results of Sulfur Isotope Testing ................................................. 378 Conclusion.................................................................................... 380
IX. Discussion: Diet and Identity at the Yukisma Mound (CA-SCL-38) ...... 385
Introduction .................................................................................. 385 Social Identities and Diet at SCL-38 ............................................ 386 Summary: Social Identity and Diet .............................................. 419
X. Conclusion: Foodways of the Ancestral Ohlone at CA-SCL-38.............. 421
Introduction .................................................................................. 421 Nutrition, Menu, Diet, and Cuisine .............................................. 422 Final Comments............................................................................ 436
References Cited......................................................................................................... 437
Appendices A. Determination of Unique Individuals and Reconciliation of
Demographic Information ........................................................................ 484 B. Mortuary Practice and Burial-Associated Artifacts at CA-SCL-38 ......... 512 C. New Radiocarbon Date Calibration and Calculation of Dietary
Percent Marine.......................................................................................... 535

xii
LIST OF TABLES
TABLE PAGE 1. Central California County Trinomial Codes Used for
Archaeological Site Identification..................................................... 6 2. Characteristics of the Delta Sequence, the First Chronology
for Central California, Based on Lower Sacramento Valley Sites........................................................................................ 23
3. Characteristics of Patterns in Central California Archaeology................. 29 4. Demographic Summary of Unique Individuals from CA-SCL-38........... 86 5. Age Classification by Sex for Adults from CA-SCL-38 .......................... 87 6. Interment Type Frequencies at CA-SCL-38............................................. 89 7. Associated Burials at CA-SCL-38............................................................ 90 8. Burial Posture at CA-SCL-38 ................................................................... 91 9. Burial Position at CA-SCL-38.................................................................. 93 10. Burial Orientation at CA-SCL-38............................................................. 94 11. Special Mortuary Preparation Frequencies by Type at
CA-SCL-38 ....................................................................................... 96 12. Spatial Cluster Membership at CA-SCL-38 ............................................. 100 13. Burial-Associated Unworked Organic Materials at CA-SCL-38 ............. 103 14. Number of Artifact Types with Burials at CA-SCL-38............................ 105 15. Unique Individuals with Burial-Associated Technomic
Artifacts at CA-SCL-38..................................................................... 107
xiii
TABLE PAGE 16. Presence of Burial-Associated Sociotechnic Artifacts
at CA-SCL-38.................................................................................... 118 17. Burial-Associated Shell Beads by Bead Quantity at CA-SCL-38............ 119 18. Presence of Burial-Associated Ideotechnic Artifacts at
CA-SCL-38 ....................................................................................... 126
19. Radiocarbon Dates for CA-SCL-38 Listed by Burial or Feature Number ................................................................................. 139
20. Radiocarbon Dates for CA-SCL-38 Listed by Temporal Period.............. 142 21. Obsidian Hydration Rim Measurements by Sample ID ........................... 145 22. Obsidian Hydration Dates for CA-SCL-38 Listed by
Temporal Period ................................................................................ 146 23. Estimated Historical Habitat Acreages in the Coyote Creek
Watershed, Circa 1800 AD ............................................................... 196 24. Important Economic Plant Resources in Southern Santa
Clara Valley Habitats ........................................................................ 200 25. Important Economic Faunal Resources in Southern Santa
Clara Valley Habitats ........................................................................ 202 26. Botanical Resources Identified at CA-SCL-38 and Nearby Sites ............ 212 27. Relative Abundance of Vertebrate Faunal Species Identified
at CA-SCL-38.................................................................................... 220 28. Identified Faunal Remains from Archaeological Sites in the
Coyote Creek Catchment (Presence/Absence).................................. 223 29. Identified Invertebrate Remains from Archaeological Sites
in the Coyote Creek Catchment......................................................... 228 30. Mean Carbon and Nitrogen Stable Isotope Values for
Archaeological Human Bone Reported in Central California........... 297
xiv
TABLE PAGE 31. Age and Sex Distribution Within Stable Isotope Analysis Sample.......... 307 32. Interment Type Frequencies for Study Sample Individuals ..................... 309 33. Associated Burials for Study Sample Individuals .................................... 309 34. Burial Posture for Study Sample Individuals ........................................... 310 35. Burial Position for Study Sample Individuals ........................................ 310 36. Burial Orientation for Study Sample Individuals ..................................... 311 37. Special Mortuary Preparation Frequencies for Study Sample
Individuals ......................................................................................... 312 38. Spatial Cluster Membership for Study Sample Individuals...................... 313 39. Temporal Context for Study Sample Individuals ..................................... 314 40. Number of Artifact Types Associated with Study Sample
Individuals ......................................................................................... 315 41. Burial-Associated Technomic Bone Artifacts with Study
Sample Individuals ............................................................................ 316 42. Burial-Associated Technomic Stone Artifacts with Study
Sample Individuals ............................................................................ 317 43. Burial-Associated Sociotechnic Artifacts with Study Sample
Individuals ......................................................................................... 318 44. Burial-Associated Ideotechnic Artifacts with Study Sample
Individuals ......................................................................................... 319 45. Burial-Associated Shell Quantities for Study Sample Individuals........... 320 46. Sample Quality and Stable Isotope Results .............................................. 325 47. Sample Quality and Stable Isotope Results – Faunal Samples................. 328
xv
TABLE PAGE 48. Comparison of Stable Isotope Values from Collagen
Between CA-SCL-38 and Mean Regional Values for Central California .............................................................................. 344
49. Stable Isotope Results by Temporal Period.............................................. 346 50. Stable Isotope Results by Age Group for Individuals
from CA-SCL-38............................................................................... 348 51. Stable Isotope Results by Sex for Adults from CA-SCL-38 .................... 354 52. Stable Isotope Values by Mortuary Context Variable .............................. 356 53. Stable Isotope Values by Burial Association with
Technomic Artifacts .......................................................................... 364 54. Stable Isotope Values by Burial Association with
Sociotechnic Artifacts ....................................................................... 367 55. Stable Isotope Values by Burial Association with
Ideotechnic Artifacts ......................................................................... 371 56. Stable Isotope Results by Shell Bead Class.............................................. 375 57. Stable Isotope Results by Artifact Diversity............................................. 378 58. Artifact Associations by Disability Type.................................................. 397 59. Stable Isotope Values for Individuals with Large Caches
of Bird Bone Tubes and Whistles...................................................... 400

xvi
LIST OF FIGURES
FIGURE PAGE 1. Map of California Indian Language Groups............................................. 4 2. Comparative Taxonomies for Central California Archaeology................ 27 3. Comparative Chronologies of Central California ..................................... 32 4. San Francisco Bay Area Population Growth by County .......................... 35 5. Regional Map Featuring Significant Archaeological Sites
Mentioned in Text ............................................................................. 39 6. Chronology of Selected South Bay Region Sites, Based
on Available Radiocarbon Dates....................................................... 40 7. Map Detail of Milpitas Settlements in 1876............................................. 73 8. The O’Toole Mansion, Converted to the Santa Clara County
Alms House in 1894 .......................................................................... 74 9. Auger Testing During The OFCS Archaeological Test
Excavation Program at CA-SCL-38 in 1993..................................... 80 10. The 1993-1994 OFCS Excavation at CA-SCL-38.................................... 81 11. Repatriation of CA-SCL-38 Skeletal Material and Artifacts,
October 1996 ..................................................................................... 82 12. Repatriated Materials from CA-SCL-38, October 1996........................... 83 13. Spatial Cluster Distribution ...................................................................... 99 14. Technomic Bone Implements from CA-SCL-38...................................... 108 15. Bone Strigil Found with B93, CA-SCL-38 .............................................. 109

xvii
FIGURE PAGE 16. Bullroarer Found with B227 ..................................................................... 112 17. Bowl Mortar Associated with B45 and Pestle from B28,
CA-SCL-38 ....................................................................................... 115 18. Show Mortar with Shell Appliqué on Rim, Associated
with B240, CA-SCL-38..................................................................... 115
19. Olivella Shell Beads from CA-SCL-38 .................................................... 120 20. Magnesite Stone Beads from CA-SCL-38 with B53................................ 121 21. Haliotis and Margaritafera Shell Pendants from CA-SCL-38 .................. 122 22. Elk Bone Pendants from CA-SCL-38....................................................... 125 23. Bird Bone Tubes and Whistles from CA-SCL-38 .................................... 127 24. Ideotechnic Stone Artifacts: Stone Pipes Made of Serpentinite,
Found with Burials 53 and 97 ........................................................... 130 25. Charmstones from CA-SCL-38 ................................................................ 131 26. Summary of Temporal Information for CA-SCL-38................................ 150 27. Monthly Average Temperatures and Precipitation in
Milpitas, California (Modern) ........................................................... 193 28. Map of Tectonic Faults in the San Francisco Bay Area ........................... 194 29. Typical δ13C Values for Terrestrial and Marine Plants ............................ 276 30. Mean isotopic Values of Economically Important Plant
and Animal Resources in Central California..................................... 295 31. Plot of Relationship Between the Infrared Splitting Factor
(IR-SF) and Apatite δ13C Values for CA-SCL-38 Samples (Fit Line Excludes Fauna) ................................................................. 332
32. Plot of Relationship Between C/P Ration and Apatite δ13C
Values for CA-SCL-38 Samples (Fit Line Excludes Fauna) ............ 333

xviii
FIGURE PAGE 33. Stable carbon and Nitrogen Isotope Values of Human Bone
Collagen from CA-SCL-38 ............................................................... 338 34. Stable Carbon Isotope Values of Human Bone Collagen
and Bone Apatite from CA-SCL-38.................................................. 339 35. Apatite-collagen Spacing Values for Estimation of Marine
Protein Contributions to Diet at CA-SCL-38.................................... 339 36. Model for Terrestrial and Marine Protein Consumption
Based on Froehle, Kellner, and Schoeninger method (2010)............ 340 37. Stable Carbon and Nitrogen Isotope Values of Bone Collagen
from CA-SCL-38 Compared to a Theoretical Isotopic Food Web for Central California................................................................ 341
38. Comparison of Stable Isotope Values of Bone Collagen with
Other Central California Sites ........................................................... 345 39. Box Plots of Mean Isotopic Values by Temporal Period ......................... 347 40. Stable Carbon and Nitrogen Isotope Values from Bone
Collagen by Age Group..................................................................... 349 41. Stable Carbon Isotope Values from Bone Collagen and
Apatite by Age Group ....................................................................... 350 42. Standardized Residual Values Showing the Difference
Between Predicted and Observed δ15N Based on δ13C Values of Bone Collagen, by Estimated Age .................................... 351
43. Standardized Residual Values Showing the Difference
Between Predicted and Observed δ15N Based on δ13C V alues of Bone Collagen, for Subadults under 10 Years..................... 352
44. Stable Carbon and Nitrogen Isotope Values from Bone
Collagen by Sex................................................................................. 355 45. Stable Carbon and Nitrogen Isotope Values from Bone
Collagen by Burial Posture................................................................ 358
xix
FIGURE PAGE 46. Stable Carbon and Nitrogen Isotope Values from Bone
Collagen by Special Mortuary Treatment ......................................... 359 47. Stable Carbon and Nitrogen Isotope Values from Bone
Collagen by Spatial Cluster............................................................... 361 48. Stable Carbon and Nitrogen Isotope Values from Bone
Collagen for Individuals with Burial-Associated Technomic Artifacts ............................................................................................. 365
49. Stable Carbon and Nitrogen Isotope Values from Bone
Collagen for Individuals with Burial-Associated Sociotechnic Artifacts ............................................................................................. 368
50. Detail of Stable Carbon and Nitrogen Isotope Values from
Bone Collagen for Individuals with Burial-Associated Shell Beads and Haliotis Pendants ............................................................. 368
51. Detail of Stable Carbon Isotope Values from Bone Collagen
and Apatite for Individuals with Burial-Associated Haliotis Pendants............................................................................................. 369
52. Stable Carbon and Nitrogen Isotope Values from Bone
Collagen for Individuals with Burial-Associated Ideotechnic Artifacts, with Detail for Associations with Bird Bone Tubes and Whistles, Charmstones, Cinnabar, and Ideotechnic Faunal Remains ............................................................. 372
53. Box Plots of Mean Isotopic Values by Shell Bead Class ......................... 376 54. Stable Sulfur Isotope Values for Humans and Fauna from
CA-SCL-38 ....................................................................................... 379 55. Stable Isotope Values of Individuals with Disabilities............................. 395 56. Relationship Between Technomic Artifact Presence and
Bead Lot Size .................................................................................... 410 57. Excavation Photo of B141, B142, B143, and B144 from
CA-SCL-38 ....................................................................................... 416

xx
ABSTRACT
DIET AND IDENTITY AMONG THE ANCESTRAL OHLONE:
INTEGRATING STABLE ISOTOPE ANALYSIS AND
MORTUARY CONTEXT AT THE YUKISMA
MOUND (CA-SCL-38)
by
Karen Smith Gardner
Master of Arts in Anthropology
California State University, Chico
Spring 2013
This thesis explores the relationship between dietary patterns and indicators
of social identity among individuals buried at the Yukisma Mound (CA-SCL-38) during
the Middle-Late Transition and Late Period (940-230 BP). The remains of 248
individuals and associated artifacts were recovered during excavations in 1993 and
1994 by Ohlone Families Consulting Services. This study begins by situating the
Yukisma Mound within the context of California archaeology. Variables of mortuary
context and artifact associations are reconciled and correlated with demographic
categories.
Prehistoric foodways are addressed through discussions of nutrition, menu,
diet, and cuisine. Bioarchaeological evidence suggests that diets were nutritionally

xxi
complete. The menu of food resources from the prehistoric Santa Clara Valley is
reconstructed using paleoenvironmental data, faunal and botanical remains from
archaeological contexts, artifactual evidence, and ethnohistoric reports.
Stable isotope δ13C and δ15N values from bone collagen (n = 127) and δ13C
from bone apatite (n = 122) indicate a diet of terrestrial resources with some freshwater
fish, waterfowl, and bay shellfish, and few marine resources. The pattern at CA-SCL-38
is distinct from all other measured populations in the Bay Area, and is intermediate to
populations in the East and South Bay Regions.
To interpret cuisine at the Yukisma Mound site, dietary patterns are
compared to mortuary context, artifact associations, and indicators of social identity
including social age, sex and gender, disabilities, specializations, status, and population
affinity. The assemblage from CA-SCL-38 supports an interpretation of ranked social
organization, inherited wealth, and flexible identity construction, but few correlations
are found with diet.

1
CHAPTER I
APPROACHING DIET AND IDENTITY
AT THE YUKISMA MOUND SITE
(CA-SCL-38)
Introduction
The prehistory of Central California has been revealed slowly, through lenses
of the remembered past of descendent populations, the trowels of archaeologists, and the
interpretations and imaginations of historians, anthropologists, and other storytellers.
Each of these contributors has shaped perception of the past, introducing their own values
and priorities within the presentation of knowledge. The result is a changing field of
opinion about the Central California past, and about the lifeways of the people who lived
here. The past has been minimized, stigmatized, and romanticized, sometimes
simultaneously.
The stories of the people who lived in the San Francisco Bay area prior to
European contact are particularly difficult to parse due to the combined effects of the
California Mission system, the early pueblos and presidios of San Jose, Santa Clara and
San Francisco, the growing populations that followed, and the rapid and continual
transformation of the local landscape to accommodate all of these newcomers. The
landscape around San Francisco Bay was once enhanced by over 425 shellmounds. These
earthworks were cemeteries, ritual spaces, and some may have been habitation sites as
2
well. When first documented at the beginning of the 20th century (Nelson 1909), most
had already been impacted to satisfy the demands of development and agriculture. The
scarcity of mound sites on the modern landscape makes the records of previous
excavations all the more valuable.
The Yukisma Mound site (CA-SCL-38), located in Santa Clara County,
California, was excavated as a salvage project between 1993 and 1994 by Ohlone
Families Consulting Services, the CRM arm of the Muwekma Ohlone Tribe. The
excavators identified 243 discrete graves while clearing the path of development for
construction of new barracks on the grounds of a prison in Milpitas, California. Most of
the human remains and some of the artifacts have since been reburied. However, the
records which were kept during excavation, the analysis of skeletal remains (Jurmain
2000) and the work of previous scholars (Bellifemine 1997; Morley 1997; Wu 1999) as
well as consultation with members of the original analytical team have informed the
present work.
This thesis project was completed with the hope of situating the individuals
buried at the Yukisma Mound within a cultural and physical landscape. My approach
uses the theories and techniques of social bioarchaeology to go beyond population based
studies, and examine patterns of individuality and identity within this community. Results
from stable isotope analysis of human bone will be integrated with a review of
archaeological documentation from the Yukisma Mound.
Food choices are cultural expressions of values, esteem, danger, and
belonging. The consumption and distribution of food resources is deeply symbolic and
patterned, reflecting the social organization and expression of recognized difference
3
within and between groups of people. Dietary patterns observed through stable isotope
analysis will be compared with contextual evidence of social identities from the Yukisma
Mound assemblage to better understand social organization of the ancestral Ohlone.
The Ohlone: Introduction and Terminology
The native people who lived in the San Francisco Bay Area and the Central
Coast through Monterey were called Costaños (coastal people) by the Spanish. This term
was later translated to English as Costanoans. The Costanoans spoke dialects of the Utian
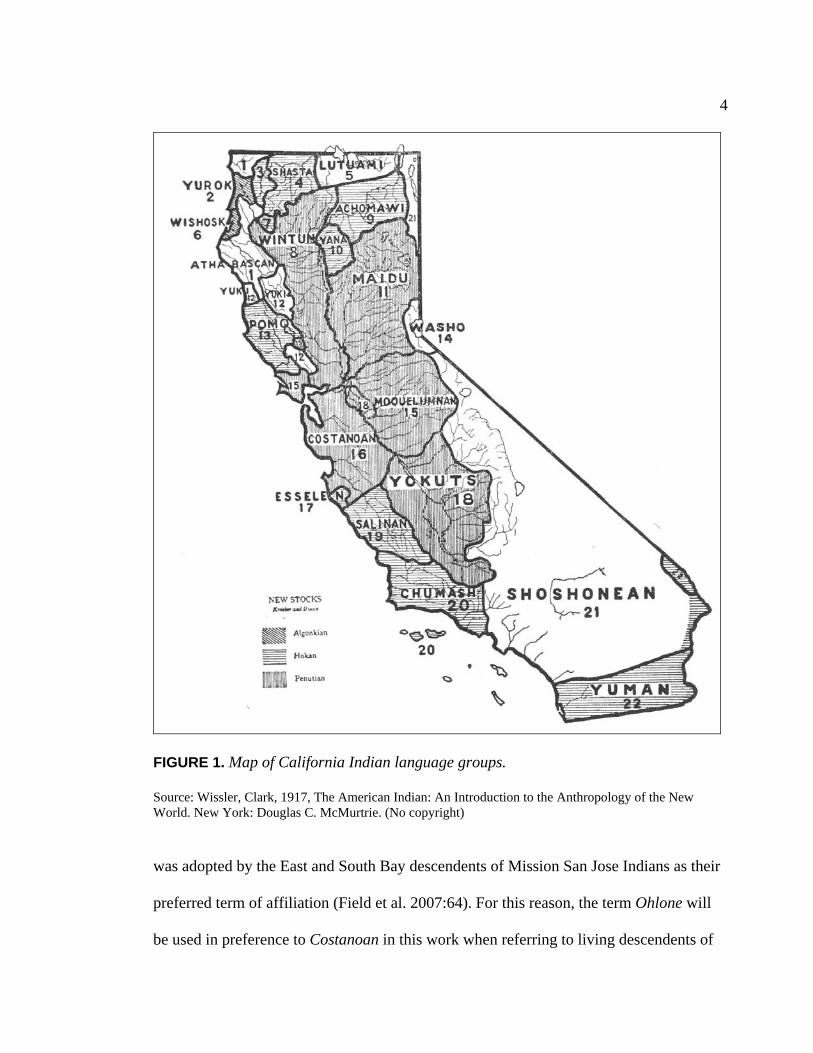
language, part of the Penutian language family (see Figure 1). Eight distinct Costanoan
languages were identified by Levy (1978), coinciding with the seven California Mission
sites in their territory, plus one for the people who lived to the northeast (the Karkin).
These linguistic designations would have been based on the native translators who were
available at each Mission site, and are unlikely to represent the intricate diversity of
languages or dialects spoken.
It is not clear where the name Ohlone came from, although it may have been
borrowed from a native community called Oljon that lived due west of San Jose, near the
modern town of San Gregorio. The earliest use of the word found in the literature comes
from Frederick William Beechey’s journals from 1826 (Beechey 1832). In his account
Beechey spelled the name Olchone, and used it to refer to the coastal population between
San Francisco and Monterey (who may have actually been the Oljon) (Beechey 1832:78).
Forty years later, the name Ohlone (with the expected spelling) appears to have been in
common use, and was used to refer to the indigenous people of the Santa Clara Valley in
an early History of San Jose (Hall 1871:41). By the early 20th century, the name Ohlone
4
FIGURE 1. Map of California Indian language groups. Source: Wissler, Clark, 1917, The American Indian: An Introduction to the Anthropology of the New World. New York: Douglas C. McMurtrie. (No copyright) was adopted by the East and South Bay descendents of Mission San Jose Indians as their
preferred term of affiliation (Field et al. 2007:64). For this reason, the term Ohlone will
be used in preference to Costanoan in this work when referring to living descendents of
5
Bay Area Indians. The term Costanoan is occasionally used when referring to existing
literature about prehistoric populations; however, these people will otherwise be called
ancestral Ohlone in this work. Prehistoric in this case simply refers to events which
occurred prior to documentation in written form. Most dates in the text are described in
years BP (before present), where “present” is set at 1950 AD.
Geographic and Archaeological Terminology
This thesis will include frequent mention of geographic areas within Central
California and identified archaeological sites of the region. Following the Smithsonian
Trinomial system, archaeological sites in California are identified by a three-letter
abbreviation for the county and a number for the site, such that CA-SCL-38 is the 38th
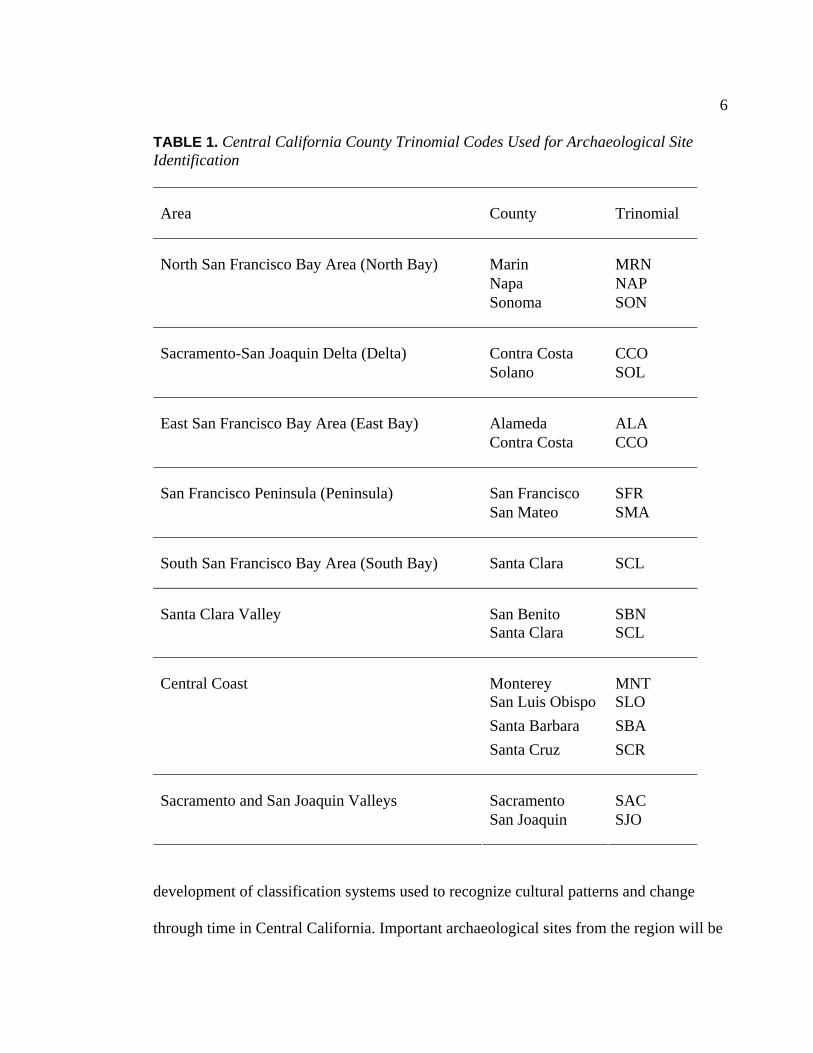
site registered in Santa Clara County, California. Table 1 lists geographic areas within the
Central California region and the associated county trinomials. In the text, the prefix CA-
may be omitted after each site is introduced (e.g., SCL-38). Likewise, the shortened
versions of regional area names (e.g., South Bay) may be used to mean South San
Francisco Bay Area. The word Bay will always refer to the San Francisco Bay unless
otherwise specified. The Bay Area includes the San Francisco Peninsula as well as the
North, East, and South Bay regions.
Organization of this Thesis
This topics covered in this thesis are organized into ten chapters, with three
appendices. Following the introductory chapter, Chapter II presents an overview of
California archaeology, focusing on the personalities and perspectives that have shaped
opinion about Bay Area prehistory. This chapter also includes a review of the
6
TABLE 1. Central California County Trinomial Codes Used for Archaeological Site Identification
Area County Trinomial
Marin MRN North San Francisco Bay Area (North Bay) Napa NAP
Sonoma SON
Contra Costa CCO Sacramento-San Joaquin Delta (Delta) Solano SOL
Alameda ALA East San Francisco Bay Area (East Bay) Contra Costa CCO
San Francisco SFR San Francisco Peninsula (Peninsula) San Mateo SMA
South San Francisco Bay Area (South Bay) Santa Clara SCL
Santa Clara Valley San Benito SBN Santa Clara SCL
Central Coast Monterey MNT San Luis Obispo SLO
Santa Barbara SBA
Santa Cruz SCR
Sacramento SAC Sacramento and San Joaquin Valleys San Joaquin SJO
development of classification systems used to recognize cultural patterns and change
through time in Central California. Important archaeological sites from the region will be
7
used to illustrate diachronic assemblage patterns. The chapter concludes with a review of
current perspectives on Bay Area shellmounds.
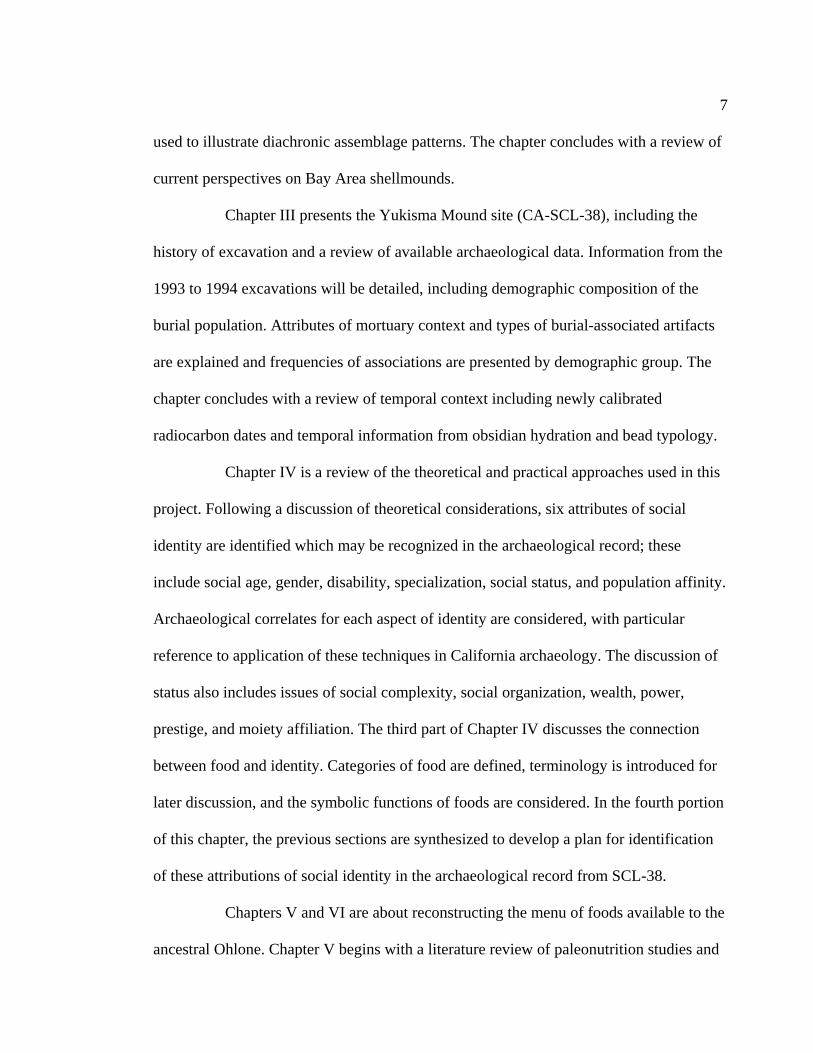
Chapter III presents the Yukisma Mound site (CA-SCL-38), including the
history of excavation and a review of available archaeological data. Information from the
1993 to 1994 excavations will be detailed, including demographic composition of the
burial population. Attributes of mortuary context and types of burial-associated artifacts
are explained and frequencies of associations are presented by demographic group. The
chapter concludes with a review of temporal context including newly calibrated
radiocarbon dates and temporal information from obsidian hydration and bead typology.
Chapter IV is a review of the theoretical and practical approaches used in this
project. Following a discussion of theoretical considerations, six attributes of social
identity are identified which may be recognized in the archaeological record; these
include social age, gender, disability, specialization, social status, and population affinity.
Archaeological correlates for each aspect of identity are considered, with particular
reference to application of these techniques in California archaeology. The discussion of
status also includes issues of social complexity, social organization, wealth, power,
prestige, and moiety affiliation. The third part of Chapter IV discusses the connection
between food and identity. Categories of food are defined, terminology is introduced for
later discussion, and the symbolic functions of foods are considered. In the fourth portion
of this chapter, the previous sections are synthesized to develop a plan for identification
of these attributions of social identity in the archaeological record from SCL-38.
Chapters V and VI are about reconstructing the menu of foods available to the
ancestral Ohlone. Chapter V begins with a literature review of paleonutrition studies and
8
paleodietary analysis. The balance of the chapter is an exploration of indirect sources of
information about paleodiet in the prehistoric Santa Clara Valley, including data from
paleoenvironmental reconstruction, faunal and botanical remains from SCL-38 and other
nearby archaeological sites, and clues from artifactual evidence including groundstone
and chipped stone forms. Ethnohistoric accounts are presented, including an overview of
accounts from European explorers, missionaries, and historians, focusing particularly on
their comments about food and environment. Chapter V concludes with a review of what
was on the menu.
Chapter VI continues the discussion of paleodietary reconstruction, focusing
on direct sources of information. The first section discusses nutritional implications of
bioarchaeological indicators of stress and nutritional deficiencies observed in the SCL-38
population, as well as dental wear patterns and dental pathologies. The second section is a
literature review of stable isotope analysis as a tool for visualizing patterns in past diets.
Principles of stable isotopes are discussed, as well as the clues provided by analysis of
bone protein (collagen) and mineral (apatite). Studies highlighting the application of this
technique in archaeological interpretation are reviewed, focusing on identifying
differential consumption of marine foods, detection of breastfeeding and weaning
patterns, and investigation of identity and social status. Studies from Central California
are presented, including reference values for important food resources and mean values
from other nearby archaeological sites. This chapter concludes by identifying eight
research questions to be addressed through the integration of stable isotope data from
SCL-38 with other sources of paleodietary information, details of archaeological and
mortuary context, and artifactual associations.
9
Chapter VII reviews materials and methods. The strategy for sample selection
is discussed, and frequencies of associations for attributes of mortuary context and burial-
associated artifacts are presented for available samples and individuals included in the
study. Of the 202 samples available, 128 humans were included in the study.
Additionally, bone collagen from eight faunal samples was prepared for stable isotope
analysis, and bone apatite was analyzed for three faunal samples. Sulfur isotope data
results were obtained for 11 humans and two faunal samples. Detail of stable isotope
values are presented along with results of sample quality tests.
Chapter VIII presents the population level information about dietary patterns
at SCL-38 including temporal patterns. Next, the individual results of stable isotope
analysis are correlated with attributes of mortuary context and artifact associations
presented in Chapter III. The eight research questions developed in Chapter VI are
answered in the conclusion of this chapter.
Chapter IX correlates the data from Chapter VIII with attributes of social
identity identified in Chapter IV. Archaeological evidence for differentiation based on
social age, gender, disability, specialization, status, and population affinity at SCL-38 are
identified. Implications of the dietary patterns associated with these social attributes are
discussed. Social organization is tested based on archaeological precedents, and measures
of wealth, prestige, moiety affiliation, and power are analyzed. The chapter concludes
with a review of social identity and diet.
Chapter X returns to the larger questions of food use by the ancestral Ohlone.
The data presented in previous chapters is summarized in terms of nutrition, menu, diet,
and cuisine. The discussion of cuisine addresses questions of low and high prestige foods,
10
food preparation methods, and food distribution within the community. The chapter
concludes with final thoughts about future avenues for study.
Three appendices complete the project. The first presents a detailed
reconciliation of demographic data from the site. The second presents mortuary context
and burial associations for each individual from SCL-38. The last presents new
radiocarbon dates obtained for this study, including a review of materials and methods, a
new linear mixing model for determining percent marine in Central California, and
calibration of radiocarbon dates.
11
CHAPTER II
PERSPECTIVES ON THE ARCHAEOLOGY
OF CENTRAL CALIFORNIA
Introduction
The archaeological records of the Yukisma Mound site (CA-SCL-38) are
situated within a body of literature about the prehistoric past of Central California, which
is inevitably a product of the personalities, priorities, and perspectives of California
archaeologists of the past century. The biases of analysis have influenced perceptions
about the lived experience of pre-contact Native Californians, including the interpretation
of social and political organization, past relationships with the land and food resources,
the nature of site construction and village life, and the potential for regional and temporal
variation in all of these practices.
In this chapter, I will provide a brief history of the interpretation of
shellmound sites in Central California, and an introduction to some of the personalities
who influenced both academic and popular perceptions of the local Native populations.
The discussion will then be expanded to examine the recognition of change in the
archaeological record and the taxonomic systems used to record temporal and regional
variation within and between sites. Next will be a review of archaeology in the Santa
Clara Valley, featuring descriptions of a few sites which will be used for comparative
purposes in upcoming chapters. The chapter will conclude with a review of the changing

12
perceptions of the South San Francisco Bay Region, the trends in settlement patterns and
wealth distribution through time, and a discussion of recent interpretations of shell- and
earth-mound sites in the San Francisco Bay area.
Shellmounds, Chronologies, and the Development of Central California
Archaeology
Our understanding of Central California archaeology has been shaped by the
ideas and personalities of the twentieth century. Early interpretations of shellmound sites
such as Emeryville (CA-ALA-309) (Nelson 1996; Uhle 1907) and Ellis Landing (CA-
CCO-295) (Nelson 1910) established the precedent for future perceptions of social
organization and social history in the region. As more sites were revealed and excavated
in subsequent decades, improved perspective eventually led to the recognition of greater
local and regional diversity. The result was an expansion in theory and interpretation, and
the development of more complex systems of classification to track and compare the
chronology of these diverse groups across time and space. All existing chronologies for
Central California were produced through a culture-historical perspective, and are
consequently particularistic, based on artifact typology, locally specific, and difficult to
integrate or compare with one another. The challenge in situating CA-SCL-38 within this
matrix of time, space, and interpretation is significant.
Formative Years: (1901-1938)
The most striking archaeological features in the San Francisco Bay region of
California are the shellmounds, large accumulations of shell, soil, sand, ash, charcoal,
rock, and faunal remains (Gifford 1916), located along the perimeter of bay waters, and

13
ranging in size from 30 to 600 feet (9 to 183 meters) in diameter, with heights from a few
inches thick to 30 feet tall (up to 9 meters) (Luby et al. 2006; Moratto 1984; Nelson
1909:325). The first survey of San Francisco Bay Area shellmounds was completed in
1906 by Nels C. Nelson, and published three years later (Nelson 1909). Along the
borders of San Francisco Bay, San Pablo Bay, and Suisun Bay, he identified 425
shellmound sites (sometimes called shell heaps) (Nelson 1909:310). He noted that
shellmounds along Sonoma Creek and the Napa River to the north and along Guadalupe
River to the south contained relatively more earth and ash than shell, and that the relative
composition of mounds generally shifted to more earth content and “artificial”
construction with greater distance from the coast (Nelson 1909:322). Mounds located
along inland tributary streams were classified as earth mounds, rather than shellmounds,
and were thought to be “of relatively recent origin and possibly representative of distinct
cultures” (Nelson 1909:310). The Yukisma Mound was not recorded by Nelson on this
survey, but other earth-rich shellmounds (CA-SCL-6 and CA-SCL-300) which lay on the
western shore of the Guadalupe River just three miles to the west were recorded (Nelson
1909:Map 1). Based on early site records (Meighan 1952), the Yukisma Mound would
likely have been classified as an earth mound due to its location and composition (see
Chapter III for a detailed description of the Yukisma Mound).
The first interpretations of Central Californian shellmounds were framed by
comparison to constructed earthworks and archaeological sites containing shell refuse in
other parts of the world, particularly those in Denmark, the Eastern United States, the
Aleutian Islands, the Pacific Northwest, Brazil, and Peru (Nelson 1996, 1909, 1910,
1996; Uhle 1907). Based, on these analogies, Nelson says of Bay Area shellmounds,

14
They are kitchen middens, of the type found in Denmark, and have their counterpart in certain shell heaps in the Gulf and Atlantic Coast states, and in their general nature quite agree with the refuse heaps in the vicinity of Puget Sound on the northwest coast. [Nelson 1909:335]
The global scope of archaeological interpretation limited the possibilities for recognition
of local variation in site use and construction. All San Francisco Bay area shellmounds
contain human burials, however the Danish kitchen middens do not (Nelson 1909:343),
making them a poor analogy in retrospect. Nevertheless, a global normative approach
was applied to site interpretation in Central California, and shellmounds were subsumed
into the existing literature about earthworks, where they were classified as refuse heaps,
habitation sites, and incidentally, also burial sites. Max Uhle explained it this way:
Shellmounds originate on the accumulated refuse deposited by people who have lived in the place when the heap has formed, and the mounds may therefore be regarded as sites for dwelling places, or abodes for the living, and not as mounds set aside as burial grounds by people living elsewhere in the vicinity. Whenever these mounds were used for burials it was not done in spite of their being dwelling places, but rather because they were such. [Uhle 1907:21]
Uhle elaborates that California populations buried their dead in residential shellmounds
to protect the graves from disturbance, and so that the living might be protected by the
spirits of the deceased, stating “wherever graves are found in shellmounds, in all parts of
the world, their presence is generally to be explained in this way” (Uhle 1907:21). Nelson
added the practical observation that digging in midden soil is much easier than in
California clay, and local populations may have taken advantage of the loose fill in the
shellmounds as an expedient mode of burying their dead (Nelson 1909:343).
Even within the scope of interpretation possible within a global normative
approach, Uhle recognized change through time in his stratigraphic analysis of the
Emeryville Shellmound (CA-ALA-309) (Uhle 1907). His partial excavation of the
15
western (bay-side) portion of the mound was conducted in the spring of 1902, under the
supervision of Professor Merriam of the University of California at Berkeley. In his
report, Uhle recognized several distinct stratigraphic layers within the mound, different
construction methods for the lower and upper portions of the mound structure, different
artifact types and frequencies through time, and a change in mortuary practices in the
later centuries of site use (Uhle 1907). He noted that, “this change in the manner of
forming the mound signifies a change in the character of its occupants” (Uhle 1907:16).
Uhle found evidence of at least three distinct groups of inhabitants at Emeryville, with
variation within each of these divisions (Uhle 1907: 40-41). In the following excerpt, he
rejects even the possibility of cultural stasis:
It is impossible that the cultural state of one and the same place should have remained stationary for many centuries and, even judging by the mass alone, the [Emeryville] mound could not have reached such a height in less than a considerable number of centuries. [Uhle 1907:37]
While still hindered by unfavorable comparison to civilizations of Mesoamerica and the
Andes, Uhle nevertheless recognized that California populations living in close proximity
for an extended period of time would lead to some degree of social organization and
complexity, and that change through time was inevitable (Uhle 1907:31).
Alfred Kroeber was the first anthropology professor at the University of
California, Berkeley, and directed the department from 1901 until 1946 (University of
California, Berkeley, Department of Anthropology Website). In 1909, he published a
paper entitled, “An Archaeology of California,” in which he clearly stated his position
regarding interpretation of the Californian past:
The civilization revealed by [California Archaeology] is in essentials the same as that found in the same region by the more recent explorer and settler. The material

16
dealt with by archaeology and ethnology is therefore the same, and the two branches of investigation move closely linked toward the same goal, differing only in their methods. [Kroeber 1909:3]
Kroeber subscribed to the “direct historical approach,” a method of archaeological
interpretation which relies on assumed direct continuity between the archaeology of
antecedent cultures and the practices and beliefs of living people (Earle 2008:195). This
position was not at all uncommon among archaeologists of the time (Trigger 1989).
However, Kroeber’s stance would have serious implications for the interpretation of
California prehistory.
Kroeber went on in his 1909 paper to present the state of archaeological
research in each region of California. Without mentioning him by name, Kroeber sharply
criticized Uhle’s analysis of the Emeryville mound.
The one published account of a systematic though partial exploration of a shell-heap on San Francisco bay, upholds the view of a distinct progression and development of civilization having taken place during the growth of the deposit. An independent examination of the material on which this opinion is reared, tends to negative rather than to confirm it. [Kroeber 1909:15]
After reviewing Uhle’s notes, Kroeber found the differences between artifact types and
forms through the strata in the Emeryville mound were not significant enough to signify
substantive cultural change (Rowe 1962:399). Ironically, the basis for this bias may well
have been Uhle’s own prior work in Peru; the impressive collections that Uhle
contributed to the Hearst collection in Berkeley in 1902 predisposed Kroeber to expect
major changes of technology and subsistence as the only meaningful indicators of culture
change. Kroeber’s focus on the ethnographic present and bias against the surviving
Native Californians of the Central region led him to completely dismiss the possibility of
significant local change.

17
Particularly where the recent civilization is still so simple as in central California, it is difficult to believe that a few thousand years would comprise a notable development . . . because a radically simpler culture than the recent one in central California must have been so extremely rude as to make its existence a short time ago seem more than questionable to anyone impressed with the evident historical antiquity of a fairly well developed civilization elsewhere in America. [Kroeber 1909:16]
Kroeber’s strong opinions regarding the Central Californian past and his influential
position as head of the UC Berkeley Anthropology Department constrained any nuanced
interpretation of Central California archaeology for decades. Not a single doctoral
dissertation addressed patterns of archaeological change during the time that Kroeber led
the UC Berkeley Anthropology Department. “Kroeber simply refused to permit his
students to work on such subjects, although a number of them would have been glad to
do so” (Rowe 1962:409).
In 1906, three years prior to Kroeber’s publication, Nels C. Nelson, a graduate
student in anthropology at UC Berkeley, excavated a six foot square shaft on the east side
of the Emeryville Mound (Broughton 1996). Nelson found eleven distinct strata marked
by variation in soil color and matrix composition, and a temporal shift in structural
technique consistent with Uhle’s findings on the west side of the mound (Nelson 1996:6,
10). Nelson’s detail regarding content of each stratum was excellent and showed clear
contrasts in composition and artifact type and form found in each layer. However, his
interpretation of these contrasts was inconsistent. Towards the middle of the report, he
suggested that no significant change in artifact type or form was observed, stating
“though the types of artifacts extracted from the shaft differ in some respects, the
difference is not absolute; and the quality of the workmanship is not so widely different
as might reasonably be expected, considering the great period of time involved” (Nelson
18
1996:11). Rather than refuting Uhle, he suggests that conditions found on the west side of
the mound may have been different from those on the east side (Nelson 1996:11).
However, in the final pages of the report, he compares his results to Uhle’s and concludes
that,
On some specific minor points there has been shown to be discrepancies, but in reference to all the broader and really significant facts there is all the agreement that might reasonably be expected (in so unscientific a structure as a shellmound.) (Not one absolute contradiction is apparent). [Nelson 1996:18, emphasis added]
Nelson’s report remained unpublished for ninety years, surfacing only in 1996
(Broughton 1996).
Nelson earned his Master’s of Letters degree in 1908, based on his analysis of
another shellmound at Ellis Landing (CA-CCO-295), the results of which were published
two years later (Nelson 1910). Regarding the Ellis Landing site, Nelson only briefly
reported on the internal structure of the mound, and stated that there were no clearly
defined strata (Nelson 1910:374). He did, however, find a clear distinction in
construction between the upper and lower levels of the mound, a difference in shellfish
and faunal composition based on depth, uneven distribution of human burials, and uneven
demographic representation of human burials (Nelson 1910). Additionally, he noted
evidence of long-distance trade, of the use of boats, and of fine craftsmanship and
“artistic instinct” (Nelson 1910:376, 397, 402). In his conclusions, however, the voices of
both student and professor are apparent.
It may be well to point out that the same general types of implements prevail from the bottom of the refuse heap to the top. Certain notable additions were made in later times, and the progress towards perfection of manufacture is generally marked; but aside from these normal changes there are no important breaks in the culture represented. [Nelson 1910:402]
19
Nelson excavated other Bay Area sites over the next few years, including the Fernandez
Site (CA-CCO-259) and the Bayshore Site (SFR-7, also known as the Crocker Mound)
but no reports were published (Moratto 1984). After leaving Berkeley in 1912, Nelson
went on to pioneer stratigraphic analysis in the American Southwest, establishing proof
of chronology through stratigraphic excavations at several New Mexico sites (Willey and
Sabloff 1980:87-89).
The demands of a rapidly growing population in the San Francisco Bay region
during the twentieth century have led to the destruction of all but a few of the
shellmounds recorded in Nelson’s 1906 survey. Shellmound and earth mound sites are
located on prime real estate along the bayshore and river banks, and are composed of a
rich matrix of soil and organic matter which was already being repurposed as agricultural
soil, fertilizer, or fill more than a century ago (Nelson 1909). With increasing frequency,
archaeological reports of shellmound sites have been based on salvage efforts during the
destruction of the mounds.
In the following decades, two important reports were published regarding
salvage efforts of San Francisco Bay area shellmounds. The first was a limited excavation
and recovery of materials from the Stege Mounds at Richmond, which were leveled in (or
prior to) 1915 to make way for a housing tract (Loud 1924). The largest mound (CA-
ALA-300) was estimated to have been 475 feet long by 350 feet wide (145 by 107
meters) and 9 feet (3 meters) deep. A smaller mound (CA-ALA-298) had an estimated
size of 240 by 160 feet (73 by 49 meters) and a depth of seven to eight feet (2 to 2.5
meters) (Loud 1924:357-358). Loud and an assistant spent sixteen days following behind
two men and a team of horses as the mounds were dismantled (Loud 1924:356). Loud did
20
not explicitly mention the stratigraphy of the mounds, but did note differences in shell
content by depth both within and between mound sites (Loud 1924:358). Although the
two mounds were located only 300 feet (less than 100 meters) apart and both bordered
the bayshore, the contents of the mounds were notably different (Loud 1924). Loud
rejected the possibility that the differences were due to environment, suggested instead
that the mounds were occupied by people living at different times, and implied that
diachronic change in the Bay Area influenced mode of subsistence and material culture
(Loud 1924:369).
The second notable publication of the 1920s is W. Egbert Schenck’s (1926)
“Final Report” regarding the Emeryville Mound (CA-ALA-309). This colossal
shellmound was leveled in 1924 to make way for a paint factory, and Schenck reported
on the contents revealed. Schenck worked closely with Kroeber, and joined him as a field
assistant in Peru two years later, in 1926 (Rowe 1962:404). In his analysis of the
Emeryville Mound, Schenck claimed there was a lack of evidence for stratification,
refuted previous estimates of site age, and criticized the idea of development through
time, commenting instead on the “evenness of the culture” (Schenck 1926:270).
Schenck’s report has since been sharply criticized by Gerow (with Force 1968) and
termed “ultraconservative” by Moratto (1984:229).
Meanwhile, in the Central Valley of California, archaeologists and students
had been excavating earth mound sites and noticing patterns of change. J. A. Barr, the
superintendent of schools in Stockton and an avocational archaeologist, excavated at least
twelve mounds near Stockton between 1883 and 1901 (Jones 1923; Moratto 1984:177).
He trained Elmer J. Dawson, who systematically explored multiple sites near Lodi
21
between 1912 and 1930, keeping careful records of stratigraphy, artifact forms, and site
locations (Moratto 1984:178). Dawson recognized significant diachronic change at these
sites and made his data and collections available to faculty at the University of California,
Berkeley, to supplement their research (Moratto 1984:178). Unfortunately, W. Egbert
Schenck was selected to evaluate Dawson’s results. Schenck disregarded the cultural
sequence proposed by Dawson, suggested that only 1,500 years of time depth were
represented by the data, and asserted that the culture revealed at these sites was no
different from that of Native Californians in the eighteenth century (Moratto 1984:178;
Schenck and Dawson 1929:410). Schenck’s insistence on the direct historical approach,
the essentially static nature of Native Californian culture, and the shallow time depth of
archaeological sites led to the delay of formal recognition of change by the
archaeological community for another ten years.
Classification and Chronology: (1939-1974)
Excavations in the Central Valley region continued through the 1930s,
particularly by individuals affiliated with Sacramento Junior College (Moratto 1984). In
1939, the college president, Jeremiah B. Lillard, along with students, Robert F. Heizer
and Franklin Fenenga, published the first chronology for succession of culture patterns in
Central California. Within the strata of the Windmiller Mound (CA-SAC-107), the
Augustine Site (CA-SAC-127), the Booth Site (CA-SAC-126), and other sites of the
lower Sacramento Valley and Delta regions, three distinct cultural horizons were
recognized: an Early Period, a Transitional Period, and a Late Period (Heizer and
Fenenga 1939; Lillard et al. 1939). Periods were defined based on the observed sequence
of mortuary practices and artifact types, with particular attention to burial position and

22
orientation, projectile point form and materials, the form and frequency of ground stone
artifacts (e.g., millingstones, mortars, pestles, and charmstones), and types of Olivella and
Haliotis shell ornaments and beads (see Table 2) (Heizer and Fenenga 1939; Lillard et al.
1939). While the time depth for each period remained uncertain, Lillard, Heizer, and
Fenenga clearly documented evidence of change and cultural succession in Central
Californian archaeological patterns and provided the groundwork for all future
chronologies for the region. In a subsequent article by Heizer and Fenenga (1939), they
made their position clear. “Until quite recently, California culture has been widely cited
as endowed with an unique uniformity and unchangeableness, persisting in its simple,
specific form for thousands of years. We now know this to be incorrect” (Heizer and
Fenenga 1939:378).
Heizer worked with Richard K. Beardsley in archaeological surveys of the
Marin coast during 1940 and 1941 and the two published an article together about baked-
clay figurines from the northern Bay Area two years later (Heizer and Beardsley 1943).
When Beardsley returned to Berkeley to complete his dissertation, he reconsidered
previous analyses of San Francisco Bay region sites, likely influenced by Heizer’s
perspectives on Central California chronology (Beardsley 1947). Beardsley submitted his
dissertation at the University of California just one year after Kroeber had retired from
the department (Rowe 1962). Beardsley also summarized his conclusions in a 1948
article, and published his dissertation results in 1954.
In these publications, Beardsley expertly parsed the subtext of interpretation
of change in the San Francisco area, and pointed out that lack of evidence for major
changes in mode of production and economy (“evolutionary change”) had been broadly

23
TABLE 2. Characteristics of the Delta Sequence, the First Chronology for Central California, Based on Lower Sacramento Valley Sites
Early Period Transitional Period Late Period
Type Sites Windmiller (SAC-107)
Morse (SAC-66)
Augustine (SAC-127)
Burials Extended, face down, westerly orientation; buried away from villages.
First cremations; cobblestone burial platforms; unworked faunal bone inclusions.
Cremations and flexed burials; whole abalone shells with infant burials.
Projectile points
Leaf-shaped, concave-base, or stemmed and shouldered; green chert or slate.
Large chipped with stemmed or concave-base and diagonal flaking; more obsidian points; less chert.
Small, laterally notched, square-serrated; “Stockton type” and “Stockton curves;” some larger spear points or knife blades.
Ground stone artifacts
Millingstones (metates); perforated charmstones, phallic form common; slate “pencils”; conically drilled, thick-walled stone pipes.
Fewer millingstones (metates); increasing mortars; fish-tail charmstones.
Mortars: flat rimmed, flat bottomed; pestles; stone pipes: biconically drilled with bone stem; no charmstones; perforated stone “discoidals.”
Bone and antler artifacts
Mammal bone tubes, undecorated; bone pins; turtle carapace ornaments; single piece bone fishhook, modified human bone artifacts.
Bone or antler strigils; bone tubes with cut ends; bone whistles of thick mammal bone; bone bodkins; gaming dice; needles; antler projectile points.
Incised bird bone tubes; bird bone whistles in pairs; undecorated mammal bone tubes; barbed antler fish spears; antler shaft straighteners.
Olivella beads
Large, rectangular; some items with bead appliqué w/asphaltum.
Small, flat, circular; some items with bead appliqué w/asphaltum.
Saucer shaped; minute circular beads.
Haliotis ornaments
Rectangular or circular, one or two central perforations.
Abalone disc beads; circular ornaments with dentate edge and single, large perforations.
Ovoid and “banjo” types; drilled-pit decoration on periphery; single perforation near edge.
Other diagnostic artifacts
Quartz crystals. Quartz crystals; rare stone beads; ground hematite chunks.
Red ochre in molded cakes; clam-shell disc beads; stone beads; baked clay objects.
Source: Data for table from Heizer, Robert F., and F. Fenenga, 1939, Archaeological Horizons in Central California. American Anthropologist 41:378-399; Lillard, Jeremiah B., R. F. Heizer, and Franklin Fenenga, 1939, An Introduction to the Archeology of Central California. Sacramento Junior College Department of Anthropology Bulletin 2. Sacramento, CA: The Board of Education of the Sacramento City Unified School District.
24
distorted as evidence “that all cultural change was lacking” (Beardsley 1948:1, original
emphasis). Through fieldwork in the North Bay area, review of earlier reports on sites
around San Francisco Bay, and a close reading of Lillard, Heizer, and Fenenga’s reports
about the lower and middle Sacramento Valley (e.g., Heizer and Fenenga 1939; Lillard et
al. 1939), Beardsley recognized that the distinct stages of development seen in the
Central Valley were also present in the San Francisco Bay area (Beardsley 1948).
In his interpretation, he combined Lillard, Heizer, and Fenenga’s
chronological sequence with aspects of the Midwestern Taxonomic System (McKern
1939), forging a new taxonomic approach for classification of Central Californian
archaeological materials. Beardsley used the term horizon in place of Lillard and
colleagues’ period, and formally recognized the distinctive characteristics of their
Transitional Period by renaming it the Middle Horizon (Beardsley 1948). From the
Midwestern Taxonomic System, he borrowed the concepts of component and focus, but
renamed the latter facies and slightly modified the meaning. He also introduced the
concept of province, which combined temporal, geographic, and cultural classifications
to recognize regions with common cultural practices within a temporal horizon. The
resulting system recognized distinct cultural phases throughout Central California,
incorporating aspects of cultural practices, material forms, geographic space, and time,
and has persisted as a standard classificatory system to the present day (Milliken et al.
2007). In 1968, Gerow gave this system a name, the Central California Taxonomic
System (CCTS) (Gerow with Force 1968; Hughes 1994; Moratto 1984).
Connecting measures of cultural change with temporal and spatial divisions
was problematic, however. In the 1960s and 1970s, James Bennyhoff, David Fredrickson,
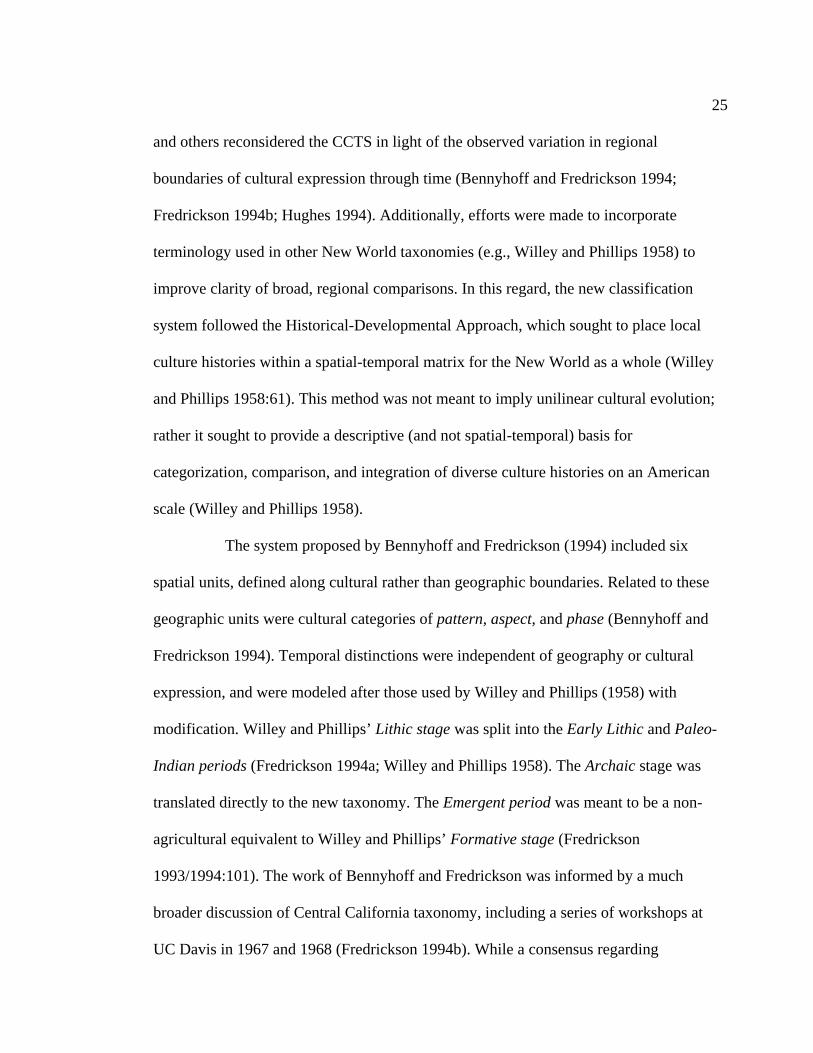
25
and others reconsidered the CCTS in light of the observed variation in regional
boundaries of cultural expression through time (Bennyhoff and Fredrickson 1994;
Fredrickson 1994b; Hughes 1994). Additionally, efforts were made to incorporate
terminology used in other New World taxonomies (e.g., Willey and Phillips 1958) to
improve clarity of broad, regional comparisons. In this regard, the new classification
system followed the Historical-Developmental Approach, which sought to place local
culture histories within a spatial-temporal matrix for the New World as a whole (Willey
and Phillips 1958:61). This method was not meant to imply unilinear cultural evolution;
rather it sought to provide a descriptive (and not spatial-temporal) basis for
categorization, comparison, and integration of diverse culture histories on an American
scale (Willey and Phillips 1958).
The system proposed by Bennyhoff and Fredrickson (1994) included six
spatial units, defined along cultural rather than geographic boundaries. Related to these
geographic units were cultural categories of pattern, aspect, and phase (Bennyhoff and
Fredrickson 1994). Temporal distinctions were independent of geography or cultural
expression, and were modeled after those used by Willey and Phillips (1958) with
modification. Willey and Phillips’ Lithic stage was split into the Early Lithic and Paleo-
Indian periods (Fredrickson 1994a; Willey and Phillips 1958). The Archaic stage was
translated directly to the new taxonomy. The Emergent period was meant to be a non-
agricultural equivalent to Willey and Phillips’ Formative stage (Fredrickson
1993/1994:101). The work of Bennyhoff and Fredrickson was informed by a much
broader discussion of Central California taxonomy, including a series of workshops at
UC Davis in 1967 and 1968 (Fredrickson 1994b). While a consensus regarding
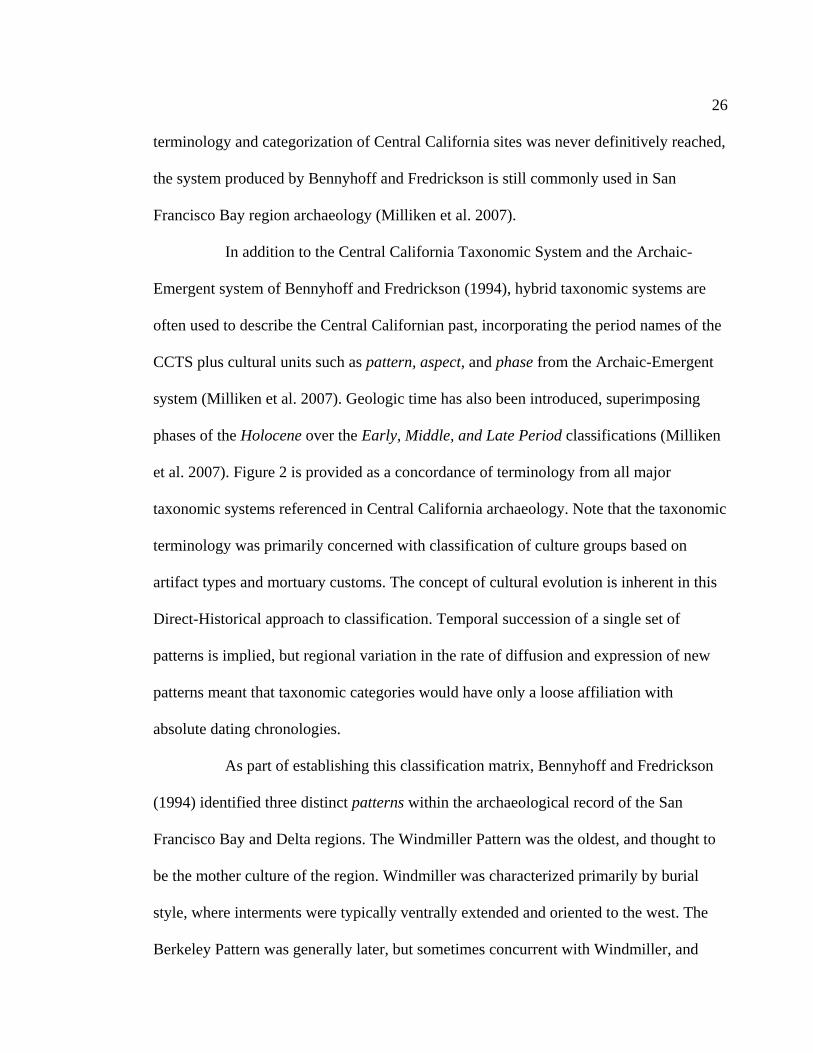
26
terminology and categorization of Central California sites was never definitively reached,
the system produced by Bennyhoff and Fredrickson is still commonly used in San
Francisco Bay region archaeology (Milliken et al. 2007).
In addition to the Central California Taxonomic System and the Archaic-
Emergent system of Bennyhoff and Fredrickson (1994), hybrid taxonomic systems are
often used to describe the Central Californian past, incorporating the period names of the
CCTS plus cultural units such as pattern, aspect, and phase from the Archaic-Emergent
system (Milliken et al. 2007). Geologic time has also been introduced, superimposing
phases of the Holocene over the Early, Middle, and Late Period classifications (Milliken
et al. 2007). Figure 2 is provided as a concordance of terminology from all major
taxonomic systems referenced in Central California archaeology. Note that the taxonomic
terminology was primarily concerned with classification of culture groups based on
artifact types and mortuary customs. The concept of cultural evolution is inherent in this
Direct-Historical approach to classification. Temporal succession of a single set of
patterns is implied, but regional variation in the rate of diffusion and expression of new
patterns meant that taxonomic categories would have only a loose affiliation with
absolute dating chronologies.
As part of establishing this classification matrix, Bennyhoff and Fredrickson
(1994) identified three distinct patterns within the archaeological record of the San
Francisco Bay and Delta regions. The Windmiller Pattern was the oldest, and thought to
be the mother culture of the region. Windmiller was characterized primarily by burial
style, where interments were typically ventrally extended and oriented to the west. The
Berkeley Pattern was generally later, but sometimes concurrent with Windmiller, and
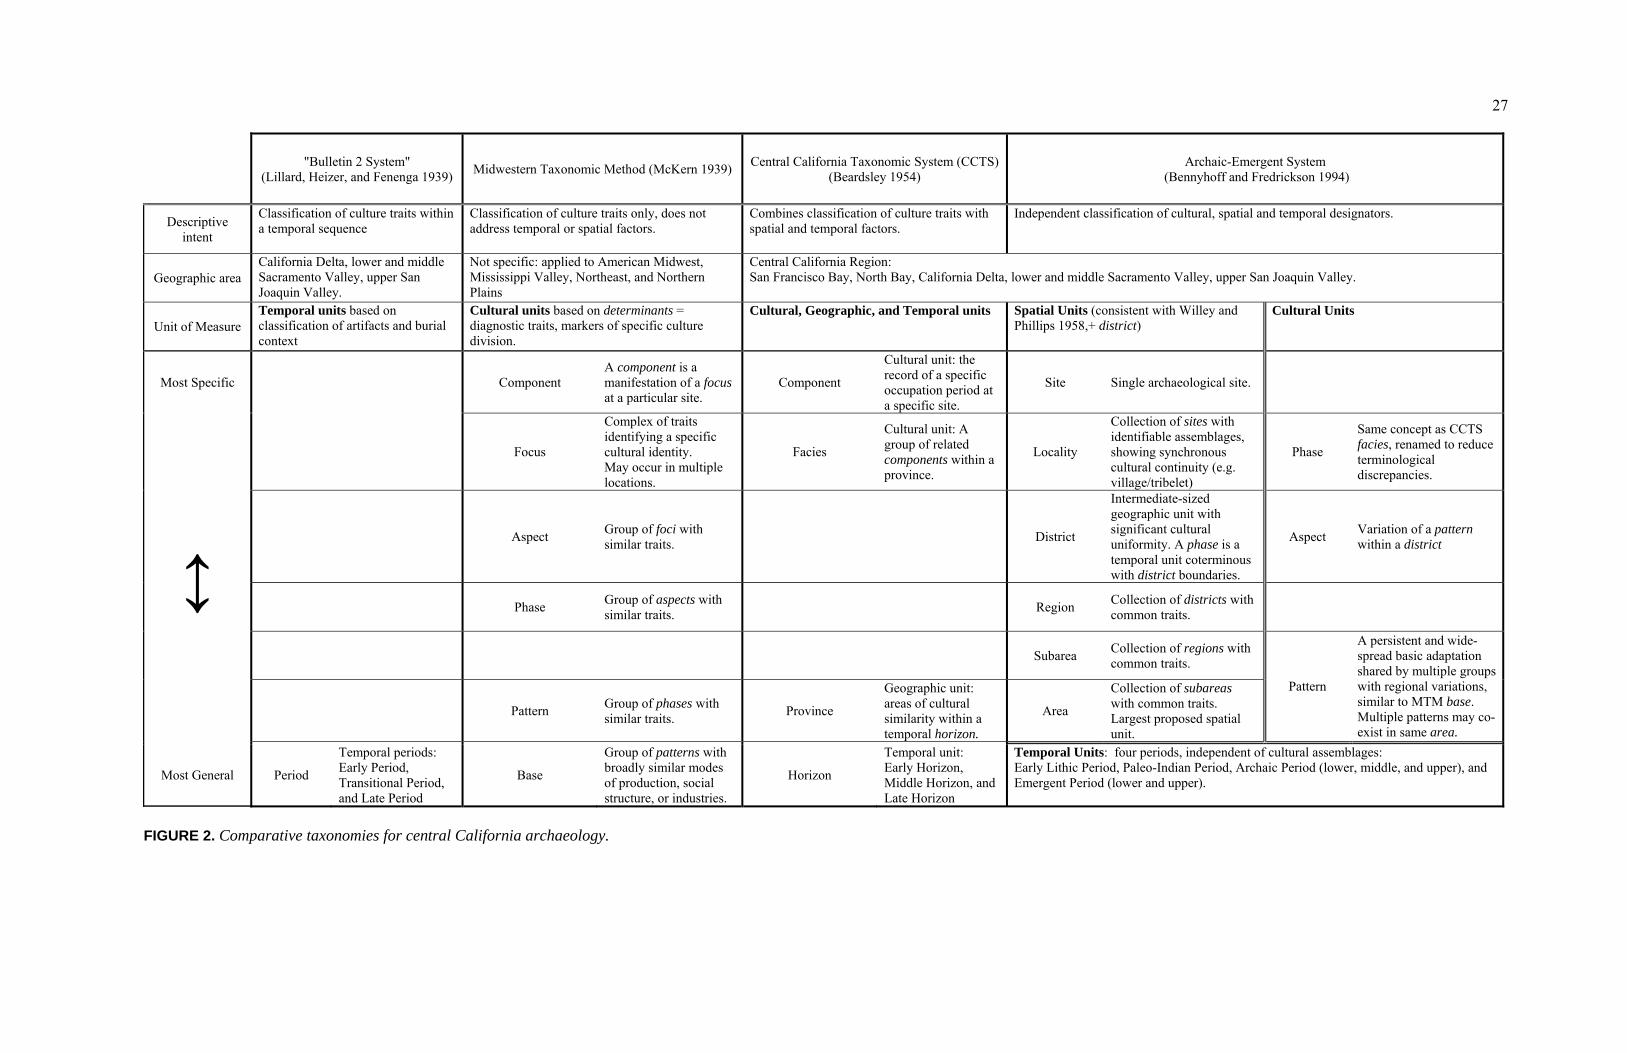
27
"Bulletin 2 System"
(Lillard, Heizer, and Fenenga 1939) Midwestern Taxonomic Method (McKern 1939)
Central California Taxonomic System (CCTS) (Beardsley 1954)
Archaic-Emergent System (Bennyhoff and Fredrickson 1994)
Descriptive intent
Classification of culture traits within a temporal sequence
Classification of culture traits only, does not address temporal or spatial factors.
Combines classification of culture traits with spatial and temporal factors.
Independent classification of cultural, spatial and temporal designators.
Geographic area California Delta, lower and middle Sacramento Valley, upper San Joaquin Valley.
Not specific: applied to American Midwest, Mississippi Valley, Northeast, and Northern Plains
Central California Region: San Francisco Bay, North Bay, California Delta, lower and middle Sacramento Valley, upper San Joaquin Valley.
Unit of Measure Temporal units based on classification of artifacts and burial context
Cultural units based on determinants = diagnostic traits, markers of specific culture division.
Cultural, Geographic, and Temporal units Spatial Units (consistent with Willey and Phillips 1958,+ district)
Cultural Units
Most Specific Component A component is a manifestation of a focus at a particular site.
Component
Cultural unit: the record of a specific occupation period at a specific site.
Site Single archaeological site.
Focus
Complex of traits identifying a specific cultural identity. May occur in multiple locations.
Facies
Cultural unit: A group of related components within a province.
Locality
Collection of sites with identifiable assemblages, showing synchronous cultural continuity (e.g. village/tribelet)
Phase
Same concept as CCTS facies, renamed to reduce terminological discrepancies.
Aspect Group of foci with similar traits.
District
Intermediate-sized geographic unit with significant cultural uniformity. A phase is a temporal unit coterminous with district boundaries.
Aspect Variation of a pattern within a district
Phase Group of aspects with similar traits.
Region Collection of districts with common traits.
Subarea Collection of regions with common traits.
↕
Pattern Group of phases with similar traits.
Province
Geographic unit: areas of cultural similarity within a temporal horizon.
Area
Collection of subareas with common traits. Largest proposed spatial unit.
Pattern
A persistent and wide-spread basic adaptation shared by multiple groups with regional variations, similar to MTM base. Multiple patterns may co-exist in same area.
Most General Period
Temporal periods: Early Period, Transitional Period, and Late Period
Base
Group of patterns with broadly similar modes of production, social structure, or industries.
Horizon
Temporal unit: Early Horizon, Middle Horizon, and Late Horizon
Temporal Units: four periods, independent of cultural assemblages: Early Lithic Period, Paleo-Indian Period, Archaic Period (lower, middle, and upper), and Emergent Period (lower and upper).
FIGURE 2. Comparative taxonomies for central California archaeology.
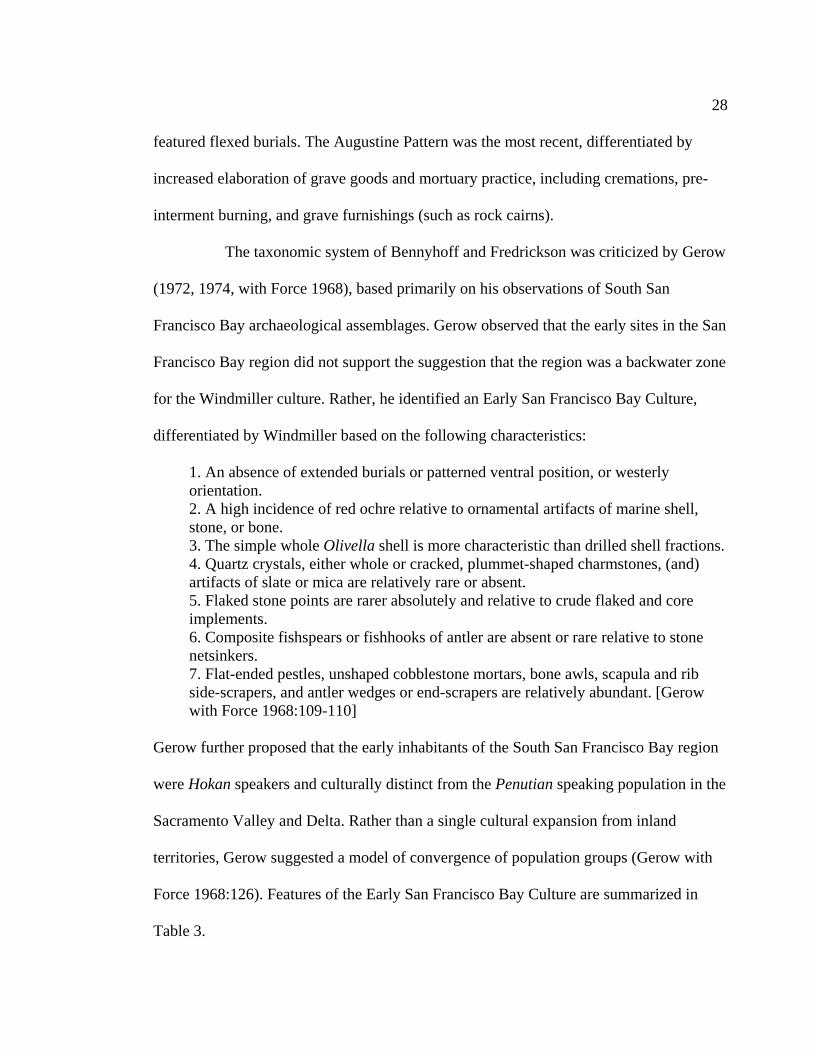
28
featured flexed burials. The Augustine Pattern was the most recent, differentiated by
increased elaboration of grave goods and mortuary practice, including cremations, pre-
interment burning, and grave furnishings (such as rock cairns).
The taxonomic system of Bennyhoff and Fredrickson was criticized by Gerow
(1972, 1974, with Force 1968), based primarily on his observations of South San
Francisco Bay archaeological assemblages. Gerow observed that the early sites in the San
Francisco Bay region did not support the suggestion that the region was a backwater zone
for the Windmiller culture. Rather, he identified an Early San Francisco Bay Culture,
differentiated by Windmiller based on the following characteristics:
1. An absence of extended burials or patterned ventral position, or westerly orientation. 2. A high incidence of red ochre relative to ornamental artifacts of marine shell, stone, or bone. 3. The simple whole Olivella shell is more characteristic than drilled shell fractions. 4. Quartz crystals, either whole or cracked, plummet-shaped charmstones, (and) artifacts of slate or mica are relatively rare or absent. 5. Flaked stone points are rarer absolutely and relative to crude flaked and core implements. 6. Composite fishspears or fishhooks of antler are absent or rare relative to stone netsinkers. 7. Flat-ended pestles, unshaped cobblestone mortars, bone awls, scapula and rib side-scrapers, and antler wedges or end-scrapers are relatively abundant. [Gerow with Force 1968:109-110]
Gerow further proposed that the early inhabitants of the South San Francisco Bay region
were Hokan speakers and culturally distinct from the Penutian speaking population in the
Sacramento Valley and Delta. Rather than a single cultural expansion from inland
territories, Gerow suggested a model of convergence of population groups (Gerow with
Force 1968:126). Features of the Early San Francisco Bay Culture are summarized in
Table 3.
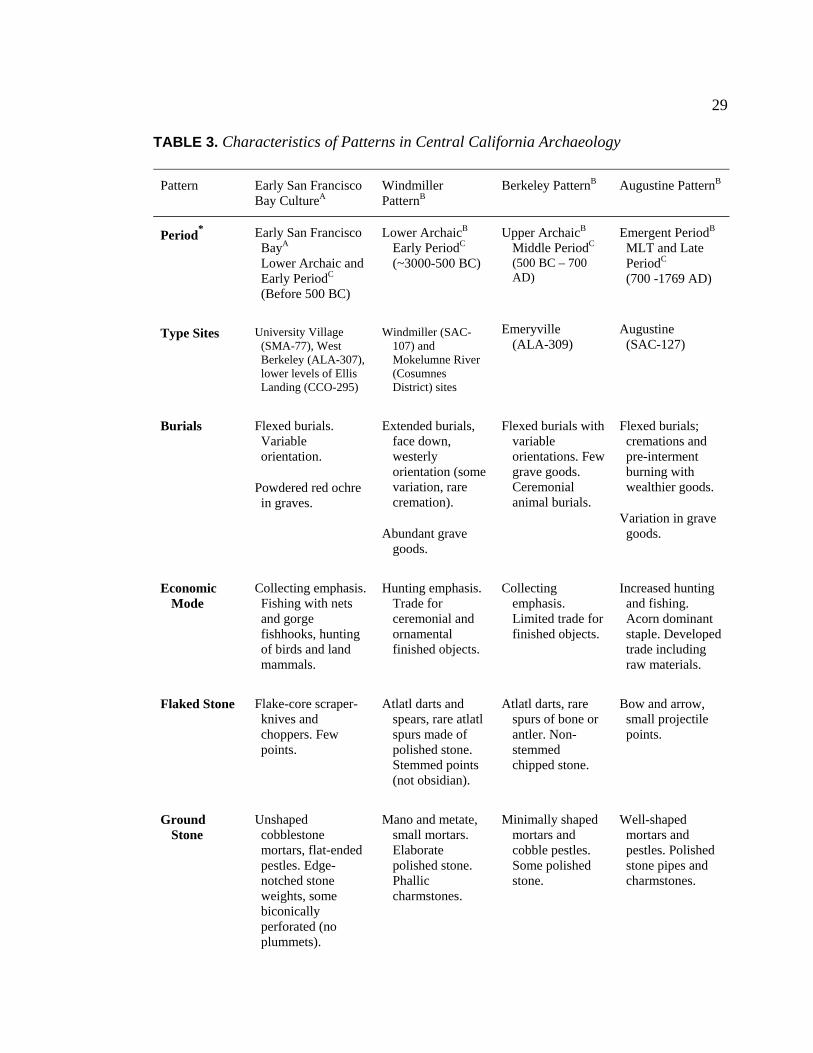
29
TABLE 3. Characteristics of Patterns in Central California Archaeology
Pattern Early San Francisco Bay CultureA
Windmiller PatternB
Berkeley PatternB Augustine PatternB
Period* Early San Francisco BayA Lower Archaic and Early PeriodC (Before 500 BC)
Lower ArchaicB
Early PeriodC (~3000-500 BC)
Upper ArchaicB
Middle PeriodC
(500 BC – 700 AD)
Emergent PeriodB
MLT and Late PeriodC (700 -1769 AD)
Type Sites University Village (SMA-77), West Berkeley (ALA-307), lower levels of Ellis Landing (CCO-295)
Windmiller (SAC-107) and Mokelumne River (Cosumnes District) sites
Emeryville (ALA-309)
Augustine (SAC-127)
Burials Flexed burials. Variable orientation.
Powdered red ochre in graves.
Extended burials, face down, westerly orientation (some variation, rare cremation).
Abundant grave goods.
Flexed burials with variable orientations. Few grave goods. Ceremonial animal burials.
Flexed burials; cremations and pre-interment burning with wealthier goods.
Variation in grave goods.
Economic Mode
Collecting emphasis. Fishing with nets and gorge fishhooks, hunting of birds and land mammals.
Hunting emphasis. Trade for ceremonial and ornamental finished objects.
Collecting emphasis. Limited trade for finished objects.
Increased hunting and fishing. Acorn dominant staple. Developed trade including raw materials.
Flaked Stone Flake-core scraper-knives and choppers. Few points.
Atlatl darts and spears, rare atlatl spurs made of polished stone. Stemmed points (not obsidian).
Atlatl darts, rare spurs of bone or antler. Non-stemmed chipped stone.
Bow and arrow, small projectile points.
Ground Stone
Unshaped cobblestone mortars, flat-ended pestles. Edge-notched stone weights, some biconically perforated (no plummets).
Mano and metate, small mortars. Elaborate polished stone. Phallic charmstones.
Minimally shaped mortars and cobble pestles. Some polished stone.
Well-shaped mortars and pestles. Polished stone pipes and charmstones.
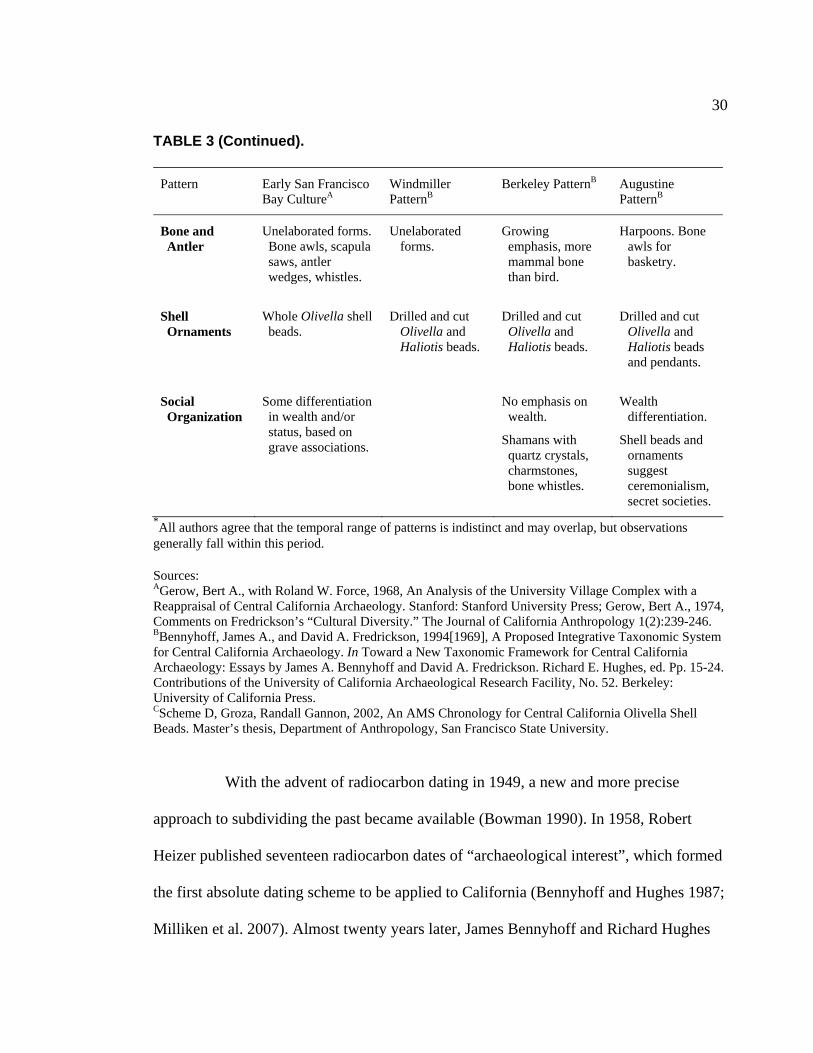
30
TABLE 3 (Continued).
Pattern Early San Francisco Bay CultureA
Windmiller PatternB
Berkeley PatternB Augustine PatternB
Bone and Antler
Unelaborated forms. Bone awls, scapula saws, antler wedges, whistles.
Unelaborated forms.
Growing emphasis, more mammal bone than bird.
Harpoons. Bone awls for basketry.
Shell Ornaments
Whole Olivella shell beads.
Drilled and cut Olivella and Haliotis beads.
Drilled and cut Olivella and Haliotis beads.
Drilled and cut Olivella and Haliotis beads and pendants.
Social Organization
Some differentiation in wealth and/or status, based on grave associations.
No emphasis on wealth.
Shamans with quartz crystals, charmstones, bone whistles.
Wealth differentiation.
Shell beads and ornaments suggest ceremonialism, secret societies.
*All authors agree that the temporal range of patterns is indistinct and may overlap, but observations generally fall within this period. Sources: AGerow, Bert A., with Roland W. Force, 1968, An Analysis of the University Village Complex with a Reappraisal of Central California Archaeology. Stanford: Stanford University Press; Gerow, Bert A., 1974, Comments on Fredrickson’s “Cultural Diversity.” The Journal of California Anthropology 1(2):239-246. BBennyhoff, James A., and David A. Fredrickson, 1994[1969], A Proposed Integrative Taxonomic System for Central California Archaeology. In Toward a New Taxonomic Framework for Central California Archaeology: Essays by James A. Bennyhoff and David A. Fredrickson. Richard E. Hughes, ed. Pp. 15-24. Contributions of the University of California Archaeological Research Facility, No. 52. Berkeley: University of California Press. CScheme D, Groza, Randall Gannon, 2002, An AMS Chronology for Central California Olivella Shell Beads. Master’s thesis, Department of Anthropology, San Francisco State University.
With the advent of radiocarbon dating in 1949, a new and more precise
approach to subdividing the past became available (Bowman 1990). In 1958, Robert
Heizer published seventeen radiocarbon dates of “archaeological interest”, which formed
the first absolute dating scheme to be applied to California (Bennyhoff and Hughes 1987;
Milliken et al. 2007). Almost twenty years later, James Bennyhoff and Richard Hughes

31
released a detailed analysis of shell bead forms found in California and the western Great
Basin, and incorporated stratigraphic analysis and one hundred eighty additional
radiocarbon dates to produce four new dating schemas.
Scheme A1 was based upon the dates published by Heizer in 1958.
Modifications were added to incorporate San Joaquin county dates published by Ragir
(1972) in Scheme A2 (Bennyhoff and Hughes 1987:147). Bennyhoff and Hughes
proposed Schemes B1 and B2 based on one hundred eighty additional uncorrected
radiocarbon dates. These schema are correlated with local bead type sequences, where B2
has shortened Late Period phases in comparison with B1 (Bennyhoff and Hughes
1987:147, 149). In 2002, Randy Groza revisited the earlier chronologies, obtained 104
new AMS radiocarbon dates on shell beads with temporal significance in Central
California, and recalibrated the sequence, producing Scheme D (Groza 2002). Temporal
context for the current study will be reported in terms of Scheme D, with additional
reference to the contextual taxonomies previously described. Figure 3 provides a
concordance of chronologies for cross-reference.
In 1993, Terry Jones published a revised culture sequence for the Central
California Coast, based on radiocarbon dates and obsidian hydration measurements from
excavations in Monterey and San Luis Obispo counties. This region spans the area
between the San Francisco Bay populations and the Santa Barbara Coast, and includes
the southern territory of the Ohlone (see Figure 1). Jones and other researchers have
found evidence of continuous occupation in the region between 4400 BC and AD 1830
(6350 to 120 years BP). Suggested cultural-temporal phases are marked by the
introduction of new artifact types, generally without replacement of existing technologies
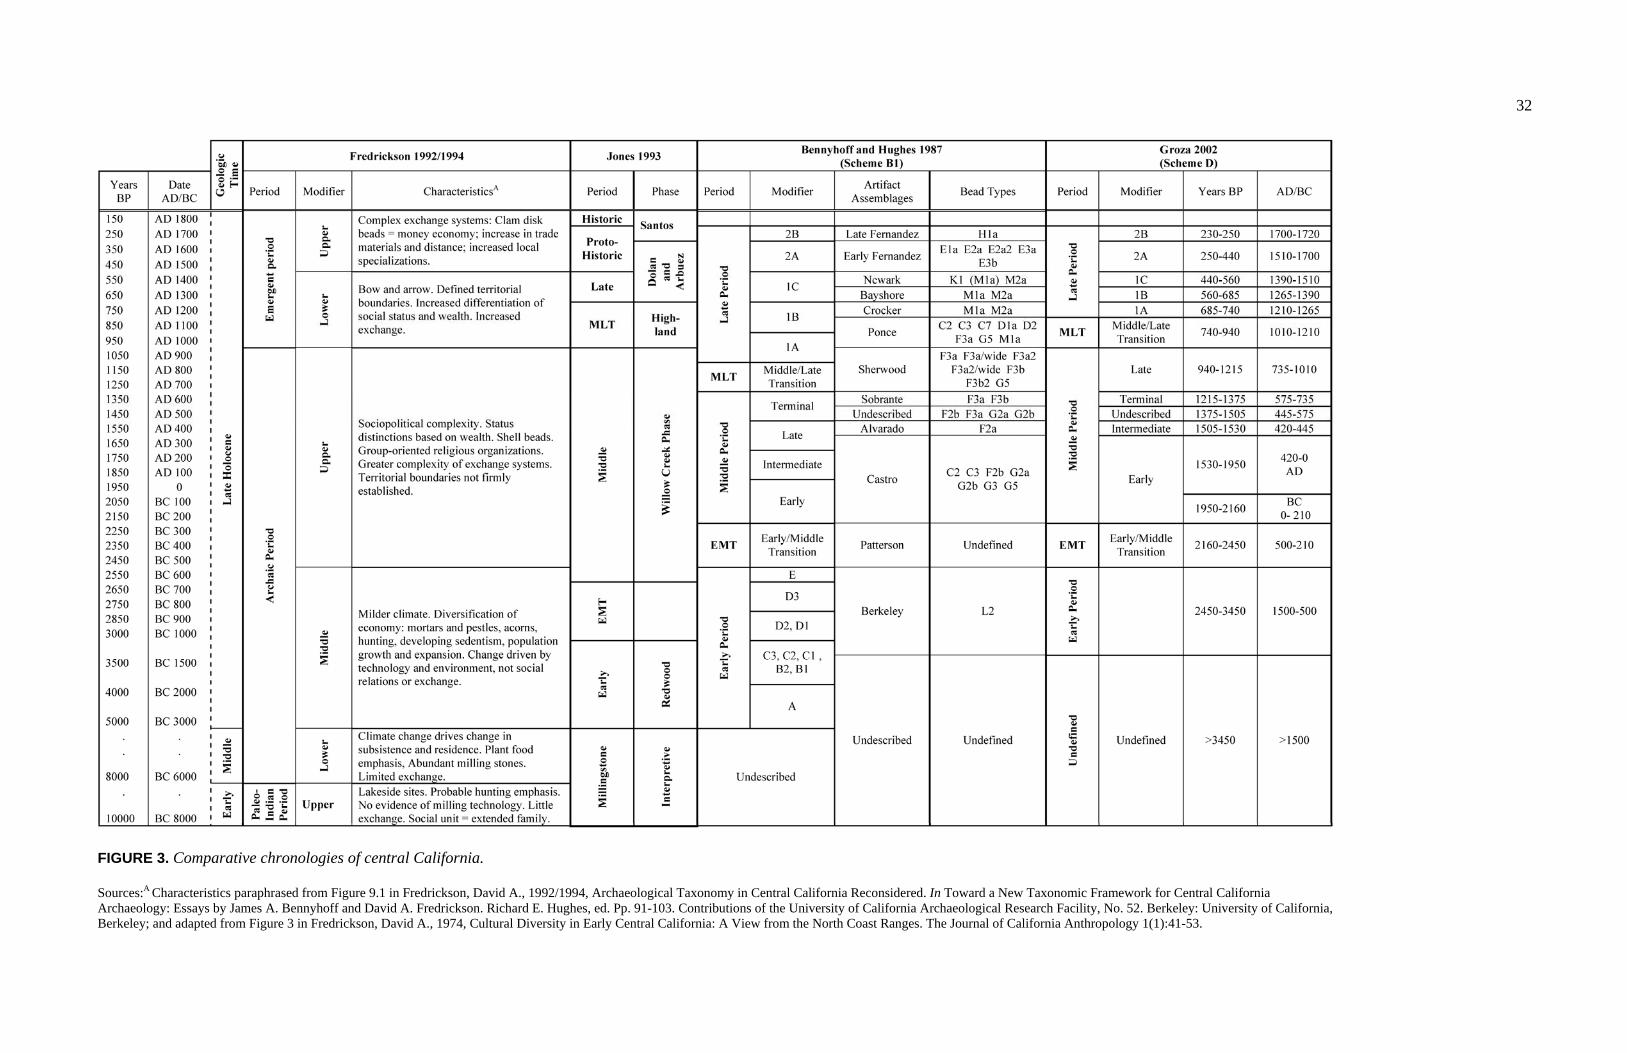
32
FIGURE 3. Comparative chronologies of central California.
Sources:A Characteristics paraphrased from Figure 9.1 in Fredrickson, David A., 1992/1994, Archaeological Taxonomy in Central California Reconsidered. In Toward a New Taxonomic Framework for Central California Archaeology: Essays by James A. Bennyhoff and David A. Fredrickson. Richard E. Hughes, ed. Pp. 91-103. Contributions of the University of California Archaeological Research Facility, No. 52. Berkeley: University of California, Berkeley; and adapted from Figure 3 in Fredrickson, David A., 1974, Cultural Diversity in Early Central California: A View from the North Coast Ranges. The Journal of California Anthropology 1(1):41-53.
33
(Jones 1993:23). The Interpretive Phase (so named for type-site at the Interpretive Trail
in Big Sur), was the earliest phase, lasting from 4400 until 3500 BC (6350 to 5450 BP).
Interpretive assemblages include handstones, millingslabs, lanceolate projectile points
and barrel Olivella beads, but no mortars or pestles. The Redwood Phase spanned the
years between 3500 and 600 BC (5450 to 2550 BP), and featured the introduction of the
mortar and pestle as well as new projectile point and bead forms. The Willow Creek
Phase, from 600 BC to AD 1000 (2550 to 950 BP), included the introduction of the shell
fishhook, but otherwise a similar assemblage as the earlier Redwood Phase. Beads and
other artifact forms were also similar to other Middle Period sites in the Bay and Delta
regions. The Highland Phase, from 1000-1250 AD (950-700 BP), saw the introduction of
the hopper mortar and flanged pestle in the region. The three phases of the Late Period
were the Dolan Phase and the Arbuez Phase, contemporaneous patterns both dating
between 1250 and 1650 AD (700 to 300 BP), and the Santos Phase, from 1650 to 1300
AD (300 to 150 BP). The Dolan Phase was characterized by a change in projectile point
form and a new suite of bead types. The Arbuez Phase represented a continuation of the
earlier Highland Phase, without adoption of the new styles seen at Dolan sites. The
Santos Phase included elements from both Arbuez and Santos Phase sites, and the
addition of historic period artifacts (e.g., glass beads). The regional continuity of artifact
styles and the additive nature of innovations through time suggest a degree of regional
stability on the Central Coast lasting more than six thousand years. This chronology of
southern Ohlone sites is also included in Figure 3.

34
South San Francisco Bay Region Archaeology
The publication of Beardsley’s dissertation in 1947 marked the beginning of a
new era in Central California Archaeology. In 1948, the University of California
Archaeological Survey was founded, renewing the effort to initiate University-led
archaeological investigations. The handful of reports released in the following two
decades focused on prominent shellmound sites on the Bay margin or coast, for example
Davis and Treganza’s report (1959) about the Patterson Mound (CA-ALA-328), and
archaeological discoveries encountered during construction projects, such as Gerow’s
report (with Force 1968) reviewing the 1951-1952 excavations at the University Village
Complex (CA-SMA-77). But nothing awakened South Bay archaeological efforts like the
rapid population expansion in Santa Clara County since the 1950s and the frequent
encounters with the buried past that came with provisioning and accommodating the
growing population (see Figure 4). Between 1950 and 1960, over 350 thousand new
residents settled in Santa Clara County, more than doubling the local population.
Between 1960 and 1970, over 400 thousand new residents arrived, and each of the next
two decades brought more than 200 thousand additional people to the valley (Bay Area
Census). Although the rate of growth has slowed since 1990, the population of Santa
Clara County continues to build.
South Bay Archaeology Since 1974
A series of new laws was passed between 1966 and 1974 to ensure that the
archaeological record was not completely disregarded as the urban sprawl consumed the
Valley. The first of these was Section 106 of the National Historic Preservation Act

35
0
200,
000
400,
000
600,
000
800,
000
1,00
0,00
0
1,20
0,00
0
1,40
0,00
0
1,60
0,00
0
1,80
0,00
0
Population by County Reported in California Census A
lam
eda
8927
2423
762
976
9386
413
0197
2461
3134
4177
4748
8351
3011
7403
1590
8209
1073
184
1105
379
1279
182
1443
741
1510
271
Con
tra C
osta
5328
8461
1252
513
515
1804
631
674
5388
978
608
1004
5029
8984
4090
3055
8389
6563
8080
3732
9488
1610
4902
5
Mar
in33
3469
0311
324
1307
215
702
2511
427
342
4164
852
907
8561
914
6820
2060
3822
2568
2300
9624
7289
2524
09
Nap
a55
2171
6313
235
1641
116
451
1980
020
678
2289
728
503
4660
365
890
7914
099
199
1107
6512
4279
1364
84
San
Fra
ncis
co56
802
1494
7323
3959
2989
9734
2782
4169
1250
6676
6343
9463
4536
7753
5774
0316
7156
7467
8974
7239
5977
6733
8052
35
San
Mat
eo32
1466
3586
6910
087
1209
426
585
3678
177
405
1117
8223
5659
4443
8755
6234
5893
2964
9623
7071
6171
8451
San
ta C
lara
1191
226
246
3503
948
005
6021
683
539
1006
7614
5118
1749
4929
0547
6423
1510
6471
412
9507
114
9757
716
8258
517
8164
2
Sol
ano
7169
1687
118
475
2094
624
143
2755
940
602
4083
449
118
1048
3313
4597
1699
4123
5203
3404
2139
4542
4133
44
Son
oma
1186
719
819
2592
632
721
3848
048
394
5209
062
222
6905
210
3405
1473
7520
4885
2996
8138
8222
4586
1448
3878
1860
1870
1880
1890
1900
1910
1920
1930
1940
1950
1960
1970
1980
1990
2000
2010
FIG
UR
E 4
. San
Fra
ncis
co B
ay a
rea
popu
latio
n gr
owth
by
coun
ty.
Sou
rce:
Dat
a fr
om B
ay A
rea
Cen
sus,
n.d
., S
elec
ted
Cen
sus
data
fro
m th
e S
an F
ranc
isco
Bay
Are
a—P
rovi
ded
by th
e M
etro
polit
an T
rans
port
atio
n C
omm
issi
on a
nd th
e A
ssoc
iatio
n of
Bay
Are
a G
over
nmen
ts. F
eatu
ring
Cen
sus
data
fro
m 1
860-
2010
, http
://w
ww
.bay
area
cens
us.c
a.go
v , a
cces
sed
Aug
ust,
2011
.
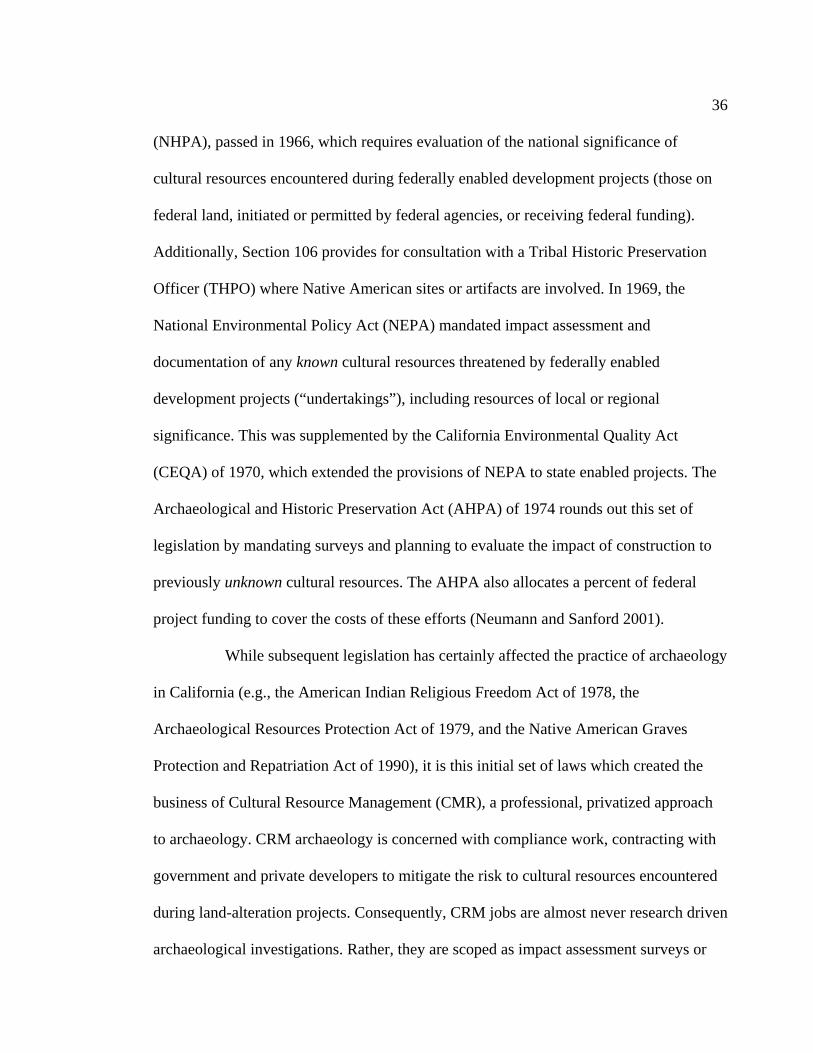
36
(NHPA), passed in 1966, which requires evaluation of the national significance of
cultural resources encountered during federally enabled development projects (those on
federal land, initiated or permitted by federal agencies, or receiving federal funding).
Additionally, Section 106 provides for consultation with a Tribal Historic Preservation
Officer (THPO) where Native American sites or artifacts are involved. In 1969, the
National Environmental Policy Act (NEPA) mandated impact assessment and
documentation of any known cultural resources threatened by federally enabled
development projects (“undertakings”), including resources of local or regional
significance. This was supplemented by the California Environmental Quality Act
(CEQA) of 1970, which extended the provisions of NEPA to state enabled projects. The
Archaeological and Historic Preservation Act (AHPA) of 1974 rounds out this set of
legislation by mandating surveys and planning to evaluate the impact of construction to
previously unknown cultural resources. The AHPA also allocates a percent of federal
project funding to cover the costs of these efforts (Neumann and Sanford 2001).
While subsequent legislation has certainly affected the practice of archaeology
in California (e.g., the American Indian Religious Freedom Act of 1978, the
Archaeological Resources Protection Act of 1979, and the Native American Graves
Protection and Repatriation Act of 1990), it is this initial set of laws which created the
business of Cultural Resource Management (CMR), a professional, privatized approach
to archaeology. CRM archaeology is concerned with compliance work, contracting with
government and private developers to mitigate the risk to cultural resources encountered
during land-alteration projects. Consequently, CRM jobs are almost never research driven
archaeological investigations. Rather, they are scoped as impact assessment surveys or
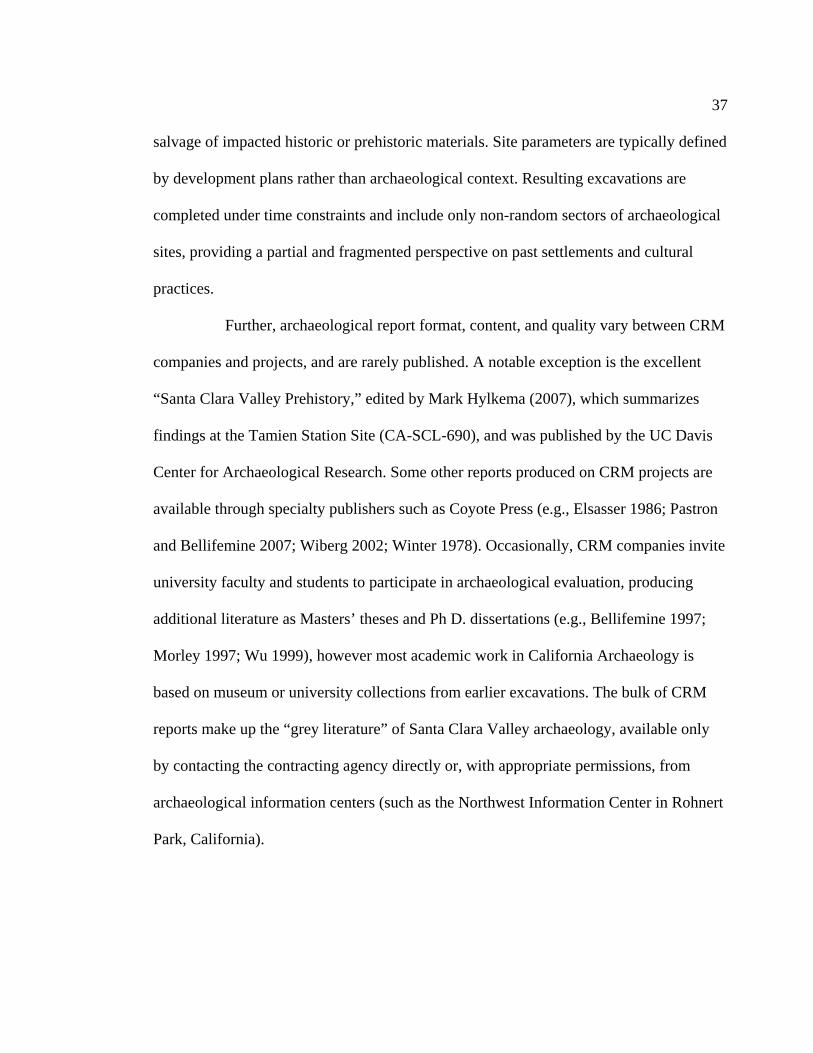
37
salvage of impacted historic or prehistoric materials. Site parameters are typically defined
by development plans rather than archaeological context. Resulting excavations are
completed under time constraints and include only non-random sectors of archaeological
sites, providing a partial and fragmented perspective on past settlements and cultural
practices.
Further, archaeological report format, content, and quality vary between CRM
companies and projects, and are rarely published. A notable exception is the excellent
“Santa Clara Valley Prehistory,” edited by Mark Hylkema (2007), which summarizes
findings at the Tamien Station Site (CA-SCL-690), and was published by the UC Davis
Center for Archaeological Research. Some other reports produced on CRM projects are
available through specialty publishers such as Coyote Press (e.g., Elsasser 1986; Pastron
and Bellifemine 2007; Wiberg 2002; Winter 1978). Occasionally, CRM companies invite
university faculty and students to participate in archaeological evaluation, producing
additional literature as Masters’ theses and Ph D. dissertations (e.g., Bellifemine 1997;
Morley 1997; Wu 1999), however most academic work in California Archaeology is
based on museum or university collections from earlier excavations. The bulk of CRM
reports make up the “grey literature” of Santa Clara Valley archaeology, available only
by contacting the contracting agency directly or, with appropriate permissions, from
archaeological information centers (such as the Northwest Information Center in Rohnert
Park, California).
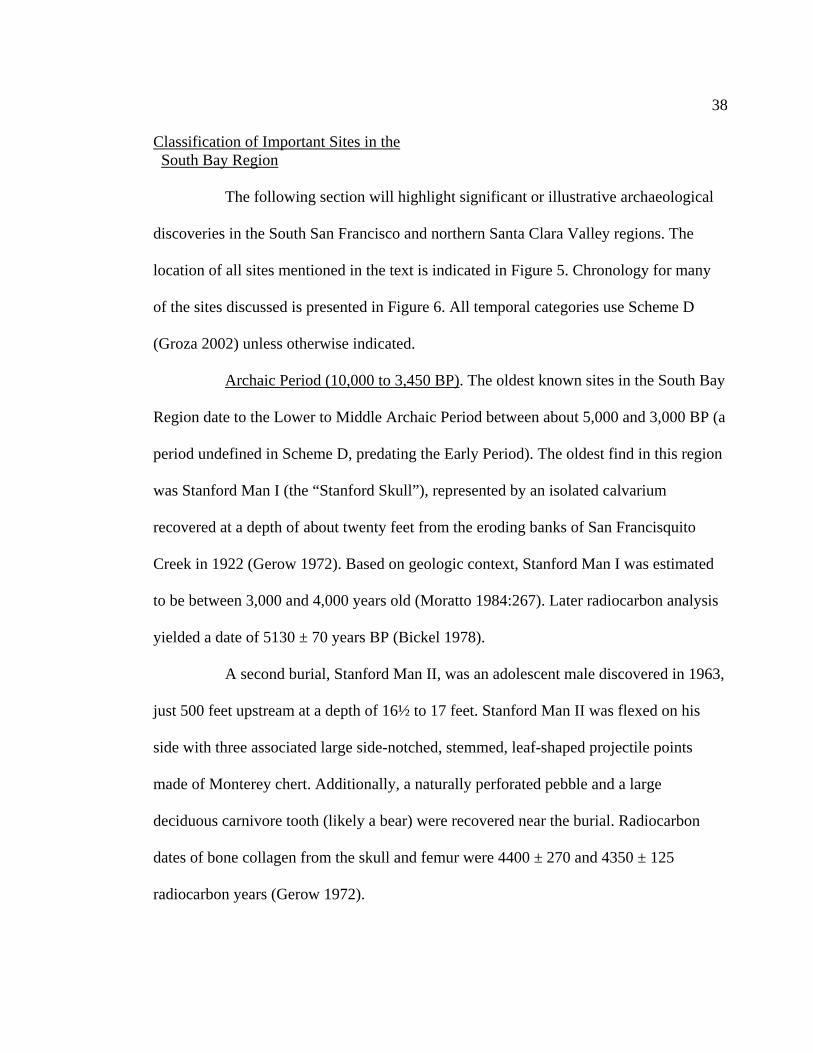
38
Classification of Important Sites in the South Bay Region
The following section will highlight significant or illustrative archaeological
discoveries in the South San Francisco and northern Santa Clara Valley regions. The
location of all sites mentioned in the text is indicated in Figure 5. Chronology for many
of the sites discussed is presented in Figure 6. All temporal categories use Scheme D
(Groza 2002) unless otherwise indicated.
Archaic Period (10,000 to 3,450 BP). The oldest known sites in the South Bay
Region date to the Lower to Middle Archaic Period between about 5,000 and 3,000 BP (a
period undefined in Scheme D, predating the Early Period). The oldest find in this region
was Stanford Man I (the “Stanford Skull”), represented by an isolated calvarium
recovered at a depth of about twenty feet from the eroding banks of San Francisquito
Creek in 1922 (Gerow 1972). Based on geologic context, Stanford Man I was estimated
to be between 3,000 and 4,000 years old (Moratto 1984:267). Later radiocarbon analysis
yielded a date of 5130 ± 70 years BP (Bickel 1978).
A second burial, Stanford Man II, was an adolescent male discovered in 1963,
just 500 feet upstream at a depth of 16½ to 17 feet. Stanford Man II was flexed on his
side with three associated large side-notched, stemmed, leaf-shaped projectile points
made of Monterey chert. Additionally, a naturally perforated pebble and a large
deciduous carnivore tooth (likely a bear) were recovered near the burial. Radiocarbon
dates of bone collagen from the skull and femur were 4400 ± 270 and 4350 ± 125
radiocarbon years (Gerow 1972).

39
FIGURE 5. Regional map featuring significant archaeological sites mentioned in text. (Courtesy of Kevin Dalton) In 1969, during construction of the San Francisco Civic Center Bay Area Rapid Transit
(BART) station, a fragmentary human skeleton with no associated artifacts was
discovered about 75 feet below the ground surface and 26 feet below sea level. The bones
were initially described as a female, age 24 to 26 (Henn et al. 1972), but the sex was later
judged to be male (Moratto 1984:266). Botanical remains adhering to the bones
suggested that this individual died in an estuarine environment. Radiocarbon dates based
on the botanical remains placed this burial at 4900 ± 250 years BP (Henn et al. 1972).
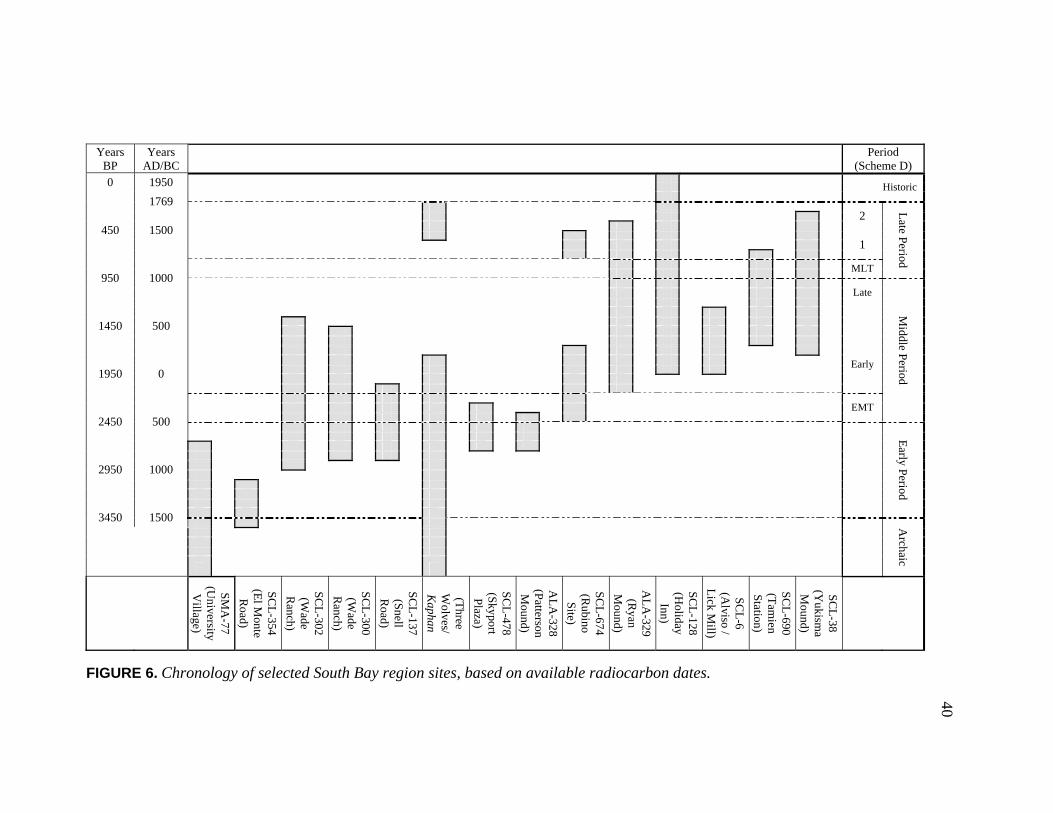
40
Years BP
Years AD/BC
Period (Scheme D)
0 1950 Historic
1769 2
450 1500 1
MLT
Late P
eriod
950 1000 Late
1450 500
1950 0 Early
EMT
Middle P
eriod
2450 500
2950 1000
Early P
eriod
3450 1500
Archaic
SM
A-77
(University
Village)
SC
L-354
(El M
onte R
oad)
SC
L-302
(Wade
Ranch)
SC
L-300
(Wade
Ranch)
SC
L-137
(Snell
Road)
(Three
Wolves/
Kaphan
SC
L-478
(Skyport
Plaza)
AL
A-328
(Patterson
Mound)
SC
L-674
(Rubino
Site)
AL
A-329
(Ryan
Mound)
SC
L-128
(Holiday Inn)
SCL
-6 (A
lviso / L
ick Mill)
SC
L-690
(Tam
ien S
tation)
SC
L-38
(Yukism
a M
ound)
FIGURE 6. Chronology of selected South Bay region sites, based on available radiocarbon dates.

41
The fourth Archaic Period burial was discovered in Sunnyvale, approximately
three meters (ten feet) below the ground surface. The fragmentary remains were
estimated to be from a female, and had no associated artifacts. Radiocarbon dates were
not obtained based on the bone because collagen preservation was insufficient. However,
a charcoal deposit in the same stratum about 500 meters away yielded a date of 4460 ± 95
radiocarbon years (Bickel 1978). Amino acid racemization, an alternative approach to
dating, was performed on an antler wedge associated with the dated charcoal deposit, and
also on a sample of the human bone. This procedure suggested an incredibly old age for
the Sunnyvale Woman of 70,000 years (Bada and Helfman 1975); however, this estimate
has been dismissed by most scholars (e.g., Bickel 1978; Moratto 1984).
All of these early burials were isolated, single interments, found in flexed
positions (when articulated). Only Stanford Man II had directly associated artifacts, and
those were limited to three projectile points, a perforated pebble, and a carnivore tooth.
No suggestion is found in these early burials of differences in social status, wealth
accumulation, or dietary patterns.
All of these individuals were discovered at great depths, with no surface
indications that burials would be found beneath. The changing landscape of the San
Francisco Bay region has likely left all signs of early occupation buried beneath several
feet of alluvium or submerged beneath the Bay or Pacific waters (cf. Bickel 1978) (see
Chapter V for a discussion of the developing environment). The only Central California
sites found pre-dating these discoveries were significantly inland, such as the Los
Vaqueros site in the East Bay (CA-CCO-637), with a burial dating to 8526 ± 60 cal. BP
(Meyer and Rosenthal 1998), and the Metcalf Road site (CA-SCL-178) in the southern
42
Santa Clara Valley, with radiocarbon dates as old as 8050 ± 30 to 9960 ± 500 years BP
(Moratto 1984).
Early Period (3450 to 2450 BP). South Bay sites representing the Early Period
provide better information about social organization and cultural practices of local
populations. Two significant sites will be discussed here. The first is the University
Village Complex (CA-SMA-77), located on the south shore of the Bay next to San
Francisquito Creek, about 13 kilometers (8 miles) from the Yukisma Mound site. The
second is the El Monte Road site (CA-SCL-354, also called Adobe Creek), located in the
foothills of the Coastal Mountain range, about 8 kilometers (5 miles) west of the
Bayshore and about 15 kilometers (9 miles) west of the Yukisma Mound.
The University Village Complex was excavated between 1951 and 1953 by
Bert Gerow and his students. This site appears to have been a cemetery, as over fifty
graves and several small lenses of shell deposit were identified, but no large midden was
found (Gerow with Force 1968:27). However, the presence of cooking stones, possible
hearth areas, and a “possible semi-subterranean structure” suggest ceremonial use of the
property (Gerow with Force 1968:37). The environmental context of University Village
suggests that it could have been a mound site, but it is not described as such by Nels
Nelson (1909) or Gerow (with Force 1968).
Burial position was flexed or semi-flexed in all cases, orientation varied
widely, and evidence of cremation or pre-interment burning was common. Almost 80
percent of burials included some grave goods. Males were more likely to have the most
grave associations, and were the only individuals with “chipped stone tools, notched
stones, bone awls, polished elk ribs, crescentic stones, charmstones . . . (or) unworked
43
animal bones and teeth” (Gerow with Force 1968:43). Only females were found with
pestles or polished deer scapulae. However all individuals, including subadults, were
likely to be buried with red ochre (cinnabar), shell beads and pendants. The burial with
the most associations was a male, found with 1,182 shell beads or ornaments, 15 chipped
stone implements, 22 notched stones, 2 quartz crystals, as well as several unworked
animal bones, red ochre and other implements (Gerow with Force 1968:44). Gerow
interprets the grave associations as suggesting “a well-developed sense of personal
property and the wealth concept,” rather than reflecting ceremonialism (Gerow with
Force 1968:43).
The discoveries at the University Village site led Gerow to redefine the
character of the Early San Francisco Bay populations. He noted that the assemblage at
CA-SMA-77 was similar to that found at West Berkeley (CA-ALA-307) and in the lower
levels of Ellis Landing (CA-CCO-295), and was distinct from the somewhat
contemporaneous Windmiller Pattern of the North Bay and Delta Regions. His “Early
San Francisco Bay Culture” pattern is described in Figure 2, and all observations are
consistent with findings from University Village.
A similar assemblage was discovered at the El Monte Road site (CA-SCL-
354), including flexed burials, whole Olivella beads, similar groundstone and lithic
forms, perforate charmstones including phallic forms, quartz crystals, red pigment, and
animal burials. This site also dates to the Early Period, with corrected radiocarbon dates
of 3470 ± 170 BP and 3090 ± 170 BP (Hylkema 2007:402), based on samples of shell
and faunal bone. Distinctive artifact types found at SCL-354 include polished stone
wedges, large Olivella G3b ring beads, and perforated grizzly bear fibula pendants
44
(Hylkema 2007:404). Artifact assemblages varied between graves at this site, which
Hylkema interprets as markers of distinctive social roles (shamans, headmen, etc.) rather
than signifiers of accrued wealth (Hylkema 2007:407).
The EMT (2450 to 2160 BP) and the Middle Period (2160 to 940 BP). During
the fifteen-hundred years to follow, a shift in settlement patterns, assemblages, and the
quantity and nature of grave associations was noted in the south San Francisco Bay
region. The end of the Early Period and the Early to Middle Period Transition (EMT) saw
the earliest known mound sites in the South Bay, including sites along the lower
Guadalupe corridor (e.g., CA-SCL-137, CA-SCL-300, CA-SCL-302, CA-SCL-418, and
CA-SCL-478), approximately 6 kilometers (3.5 miles) to the west of Yukisma. These
sites were not described as mounds in the review of Guadalupe Corridor archaeology
produced for the Santa Clara County Archaeological Society in 1993 (Cartier et al. 1993),
however three mounds in this region were documented by Nels Nelson in his regional
survey of shellmound sites (Nelson 1909). Based on Nelson’s sketched map, it is difficult
to determine exactly which mounds he identified, although the positions are consistent
with SCL-6, SCL-418, and SCL-300/SCL-302. A few other sites along the Guadalupe
River feature prominently in the prehistory of the region, including the Rubino Site
(SCL-674), used during the EMT and Early Middle Period and again during Phase 1 of
the Late Period, the Lick Mill Site (CA-SCL-6), used during the Middle Period, and the
Holiday Inn site (CA-SCL-128), established during the Middle Period with evidence of
use through the Historic Period.
The Patterson Mound (CA-ALA-328), located in the Coyote Hills, just 13
kilometers (8 miles) northwest of the Yukisma site along the bayshore, was also
45
established during the EMT (Bickel 1981). The Ryan Mound (CA-ALA-329), adjacent to
the Patterson Mound, was established during the Middle Period and used through Late
Period 1. Both of these sites are earth mounds identified on Nelson’s survey in 1906
(Nelson 1909), and remain standing today. Two additional smaller mound sites are
located in the same complex, ALA-12 and ALA-13, although these were not noted by
Nelson (Nelson 1909).
Important inland sites were established during the Middle Period as well,
including Three Wolves/Kaphan Umux (CA-SCL-732), Tamien Station (CA-SCL-690),
and Skyport Plaza (CA-SCL-478), all within 14 kilometers (8.5 miles) generally south of
the Yukisma Mound. SCL-732 will serve as an example of a late Early Period to Middle
Period assemblage from the Santa Clara Valley. Tamien Station will be explored during
the discussion of Augustine pattern assemblages. The Skyport Plaza site provides an
example of a new pattern to enter the region during the Middle Period, the Meganos
Aspect.
The significance of several Guadalupe Corridor sites was established in a
1993 regional review, produced by Robert Cartier and colleagues. In this study, the
authors noted that the sites of the late Early Period, Early-to-Middle-Transition, and
Middle Period in this region shared similar mortuary customs. Each site included
primarily flexed burials found in central clusters (Cartier et al. 1993:65). Isolated graves
were extremely rare (SCL-288, located near SCL-302, is the only example) (Anastasio
1988). Mortuary practice and artifact assemblages were consistent with the Berkeley
Pattern (Hylkema 2007). Significant variation in grave furnishings was observed both
within and between sites, and interpreted as variation in wealth by Cartier and colleagues

46
(1993). Indicators of status for this comparison included exotic materials, such as
obsidian artifacts and Haliotis shell pendants, and artifacts displaying a significant
investment of time and craftsmanship, such as beads and large bowl mortars. A point-
based ranking system was developed to compare relative wealth between and within the
Guadalupe Corridor sites (Cartier et al. 1993:70).
The concentrations of these prestigious artifact types varied by site, but were
all significantly lower than the high frequency of grave goods seen at University Village.
Among the Guadalupe Corridor sites, presence of Olivella beads varied from zero percent
of burials at SCL-300 to 76.2 percent of burials at SCL-690. Haliotis ornaments were
included in no graves at SCL-300, and 26.1 percent of graves at SCL-302. Imported
obsidian implements were found in 7 percent of graves at SCL-137 and 20 percent at
SCL-300 (Cartier et al. 1993:68). Of the two sites at Wade Ranch, CA-SCL-302 appeared
to have a concentration of “wealthy” graves and CA-SCL-300 was one of the “poorest”
sites, but proximity suggests that these were segregated cemeteries separating the same
population by status (Anastasio 1988:399).
Some of the relatively “poorer” sites still included a few graves with a notable
quantity of grave goods, including the Snell Site (SCL-137), and Lick Mill (SCL-6). This
variation is interpreted as indicative of social differentiation within the community
(Cartier et al. 1993; Winter 1978). Conversely, at the Rubino Site (SCL-674), the Middle
Period is characterized as having sparse grave goods and little social differentiation,
although some imported obsidian, bone awls and whistles, and a few shell beads (less
than ten per grave) were recovered from EMT and Middle Period burials (Pastron and
Bellifemine 2007).

47
Located in the Coyote Hills of the East Bay shore, the Patterson Mound
(ALA-328) had significantly less historic disturbance than the sites near the Guadalupe
River. Patterson is a large earth mound site, estimated to have been 13 feet thick (4
meters), 350 feet (107 meters) long and 250 feet (76 meters) wide (Davis and Treganza
1959:1). Excavations in 1935 by Waldo Wedel and between 1949 and 1968 by Adán E.
Treganza and his students at San Francisco State College (later San Francisco State
University) exposed perhaps half of the burials contained within the mound, an
astonishing 517 individuals (Bickel 1981). Of burials with known posture, 98 percent
were in flexed positions of variable orientation, although the earlier burials were most
commonly oriented with crania towards the northwest (Bickel 1981:282). Primary
inhumations were the most common form of burial, although six percent of burials at
ALA-328 included cremation or burning; these individuals occur throughout the time
depth of the site (Bickel 1981:288). Approximately one-third of the burials had
associated artifacts, twice that if red pigment is included as an artifact type (Bickel
1981:300). The Patterson Mound contained a greater quantity and variety of artifacts than
is seen in many contemporaneous sites in the South Bay region, although less than at the
University Village site (SMA-77). Localized cemeteries within the mound area showed
variation in artifact density and mortuary preparation. Artifacts recovered include 4,810
whole and 2,332 cut shell beads plus over 87 shell ornaments, bone artifacts (e.g., tubes,
serrated tools, whistles, awls and antler wedges), ground stone (mortars, pestles,
hammerstones and charmstones), and relatively few obsidian blades and debitage (Bickel
1981:320), again consistent with Berkeley Pattern assemblages (Table 3).

48
Further south, the site of Kaphan Umux, or Three Wolves (SCL-732), dates to
as early as 6460 ± 150 BP, making this one of the oldest sites in the region. Based on
radiocarbon dates of charcoal and faunal bone associated with burials, the cemetery
component at this site appears to have been established at the end of the Early Period
(2720 ± 180 BP) and used through the EMT into the Intermediate Phase of the Middle
Period (1770 ± 90 BP). The site was abandoned until about 410 BP, after which only
residential and ceremonial assemblages were found (Leventhal and Jones 1996). Burials
were typically flexed, with some variability, and orientation varied widely. However, a
few clusters of individuals showed trends in burial orientation, including all but one of
the semi-extended or extended burials (n = 5) which were oriented due east, and a central
cluster of flexed burials oriented due west (L. Jones 1996:11.2). Approximately one
hundred graves were identified in this cemetery, of which only 11 percent contained
associated artifacts and only nine percent contained Olivella beads. Interestingly, beads
occurred almost exclusively in graves of subadults (612 beads in three graves, an average
of 204 per burial) and females (386 beads in four graves, an average of 96.5 per burial),
while only one male was found with beads (n = 34). One additional adult of
indeterminate sex had a single bead. Other artifacts (mortars, Haliotis pendants, one
pestle, a whistle, and cinnabar/red ochre) occurred in the same graves as the beads, plus a
double burial of an indeterminate adult and an adolescent subadult containing more than
forty Haliotis pendant fragments and cinnabar (L. Jones 1996:11.5). Based on the sparse
artifact assemblage and variable mortuary traditions, this cemetery is typical of the Early
San Francisco Bay Pattern, with bead types more typical of the Berkeley Pattern.
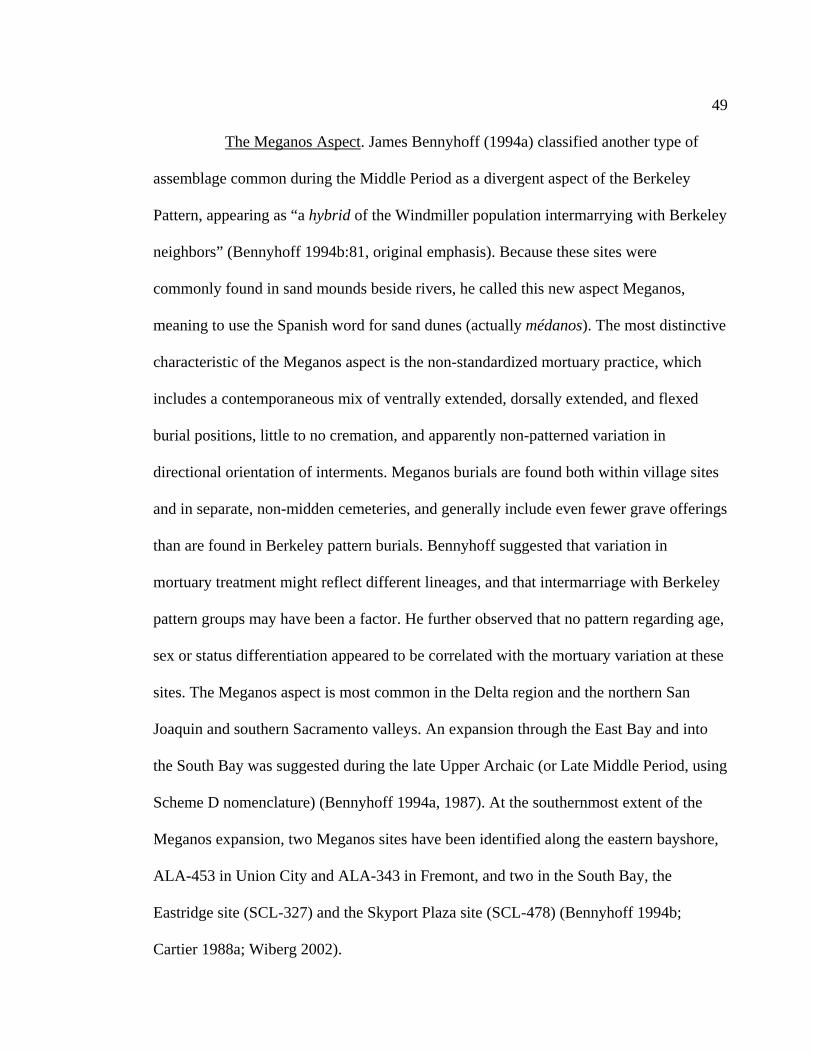
49
The Meganos Aspect. James Bennyhoff (1994a) classified another type of
assemblage common during the Middle Period as a divergent aspect of the Berkeley
Pattern, appearing as “a hybrid of the Windmiller population intermarrying with Berkeley
neighbors” (Bennyhoff 1994b:81, original emphasis). Because these sites were
commonly found in sand mounds beside rivers, he called this new aspect Meganos,
meaning to use the Spanish word for sand dunes (actually médanos). The most distinctive
characteristic of the Meganos aspect is the non-standardized mortuary practice, which
includes a contemporaneous mix of ventrally extended, dorsally extended, and flexed
burial positions, little to no cremation, and apparently non-patterned variation in
directional orientation of interments. Meganos burials are found both within village sites
and in separate, non-midden cemeteries, and generally include even fewer grave offerings
than are found in Berkeley pattern burials. Bennyhoff suggested that variation in
mortuary treatment might reflect different lineages, and that intermarriage with Berkeley
pattern groups may have been a factor. He further observed that no pattern regarding age,
sex or status differentiation appeared to be correlated with the mortuary variation at these
sites. The Meganos aspect is most common in the Delta region and the northern San
Joaquin and southern Sacramento valleys. An expansion through the East Bay and into
the South Bay was suggested during the late Upper Archaic (or Late Middle Period, using
Scheme D nomenclature) (Bennyhoff 1994a, 1987). At the southernmost extent of the
Meganos expansion, two Meganos sites have been identified along the eastern bayshore,
ALA-453 in Union City and ALA-343 in Fremont, and two in the South Bay, the
Eastridge site (SCL-327) and the Skyport Plaza site (SCL-478) (Bennyhoff 1994b;
Cartier 1988a; Wiberg 2002).

50
The most significant East Bay site identified as part of the Meganos aspect is
the Santa Rita Village Mortuary Complex (CA-ALA-413). During salvage excavations in
1978 and 1979, 64 burials were exposed (Wiberg 2002). Of the 41 where the original
burial position could be determined, 30 (71%) were ventrally extended, 5 (12%) were
dorsally extended, and 6 (15%) were flexed in various positions, although flexed burials
were recorded only in the lower component at the site. Axial orientation varied, but was
most commonly toward the north, northeast, or northwest (79.5%), with a few burials
oriented in all other compass directions except due east (Wiberg 2002:15). No cremations
were observed, but there was one instance of a pre-interment fire (Burial 18).
This cemetery included an uncommon quantity of grave offerings, including
the richest burial ever identified in California. Found in association with Burial 25,
identified as a 30 to 35 year old male, were a cache of over 28,000 Olivella beads,
numerous Haliotis ornaments, bone implements (needles, wands, and spatulate objects),
quartz crystals and phallic charmstones, as well as unworked faunal remains (Wiberg
2002:23). Due to disturbance at the site and only partial excavation of some burials, a
precise estimate of the frequency of artifact association with burials was not possible, but
Wiberg suggested that the figure could be as high as 60 to 70 percent (Wiberg 2002:24).
The “wealthiest” graves were those of five adult males (all at least 27 years of age) and
one adult female (age 30 to 35), suggesting that differential wealth was accumulated
through a lifetime, and available to select social groups; all of these were extended
burials (four ventral and two dorsal).
Radiocarbon dates from this site range from 2010 ± 280 to 1640 ± 190 BP (60
BC to 310 AD) (Wiberg 1988:8). Burial patterns and bead styles suggest site occupation
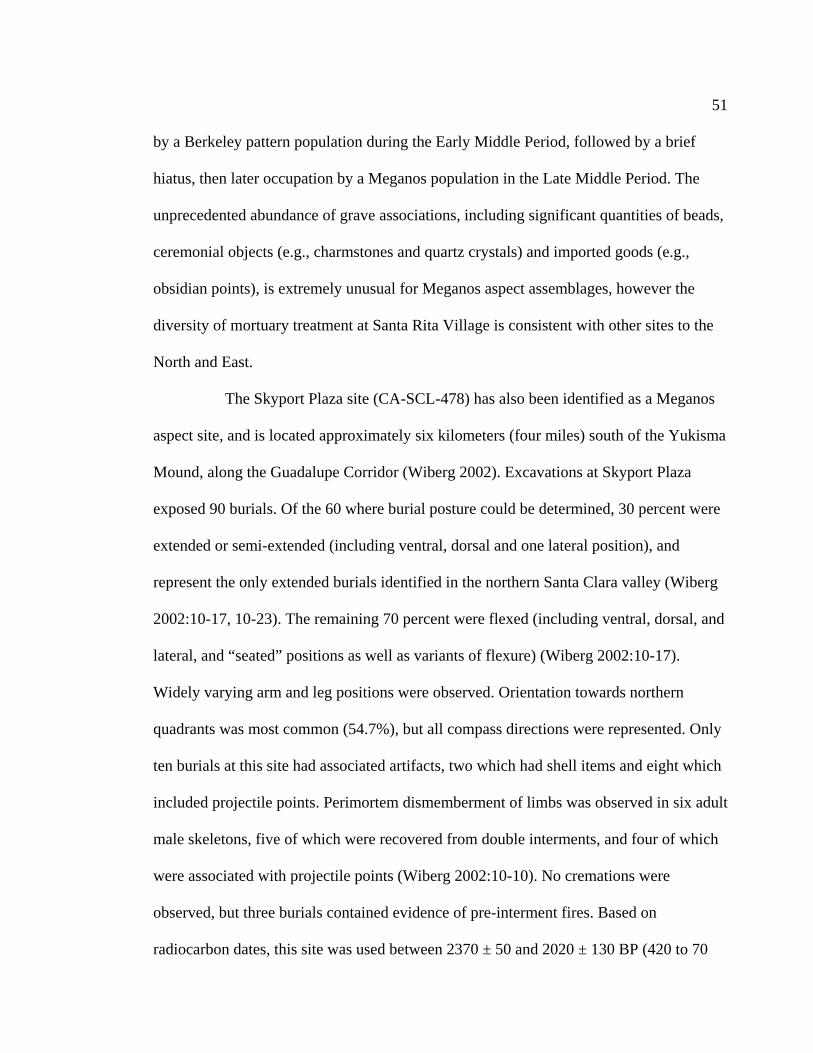
51
by a Berkeley pattern population during the Early Middle Period, followed by a brief
hiatus, then later occupation by a Meganos population in the Late Middle Period. The
unprecedented abundance of grave associations, including significant quantities of beads,
ceremonial objects (e.g., charmstones and quartz crystals) and imported goods (e.g.,
obsidian points), is extremely unusual for Meganos aspect assemblages, however the
diversity of mortuary treatment at Santa Rita Village is consistent with other sites to the
North and East.
The Skyport Plaza site (CA-SCL-478) has also been identified as a Meganos
aspect site, and is located approximately six kilometers (four miles) south of the Yukisma
Mound, along the Guadalupe Corridor (Wiberg 2002). Excavations at Skyport Plaza
exposed 90 burials. Of the 60 where burial posture could be determined, 30 percent were
extended or semi-extended (including ventral, dorsal and one lateral position), and
represent the only extended burials identified in the northern Santa Clara valley (Wiberg
2002:10-17, 10-23). The remaining 70 percent were flexed (including ventral, dorsal, and
lateral, and “seated” positions as well as variants of flexure) (Wiberg 2002:10-17).
Widely varying arm and leg positions were observed. Orientation towards northern
quadrants was most common (54.7%), but all compass directions were represented. Only
ten burials at this site had associated artifacts, two which had shell items and eight which
included projectile points. Perimortem dismemberment of limbs was observed in six adult
male skeletons, five of which were recovered from double interments, and four of which
were associated with projectile points (Wiberg 2002:10-10). No cremations were
observed, but three burials contained evidence of pre-interment fires. Based on
radiocarbon dates, this site was used between 2370 ± 50 and 2020 ± 130 BP (420 to 70
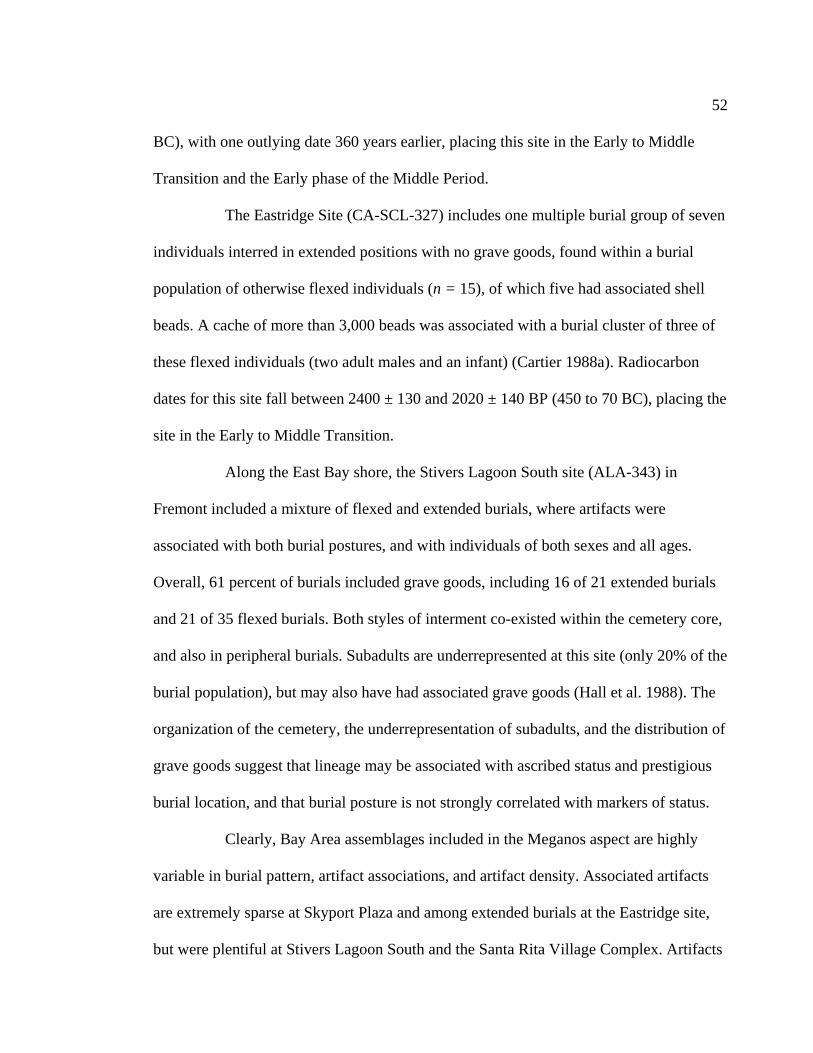
52
BC), with one outlying date 360 years earlier, placing this site in the Early to Middle
Transition and the Early phase of the Middle Period.
The Eastridge Site (CA-SCL-327) includes one multiple burial group of seven
individuals interred in extended positions with no grave goods, found within a burial
population of otherwise flexed individuals (n = 15), of which five had associated shell
beads. A cache of more than 3,000 beads was associated with a burial cluster of three of
these flexed individuals (two adult males and an infant) (Cartier 1988a). Radiocarbon
dates for this site fall between 2400 ± 130 and 2020 ± 140 BP (450 to 70 BC), placing the
site in the Early to Middle Transition.
Along the East Bay shore, the Stivers Lagoon South site (ALA-343) in
Fremont included a mixture of flexed and extended burials, where artifacts were
associated with both burial postures, and with individuals of both sexes and all ages.
Overall, 61 percent of burials included grave goods, including 16 of 21 extended burials
and 21 of 35 flexed burials. Both styles of interment co-existed within the cemetery core,
and also in peripheral burials. Subadults are underrepresented at this site (only 20% of the
burial population), but may also have had associated grave goods (Hall et al. 1988). The
organization of the cemetery, the underrepresentation of subadults, and the distribution of
grave goods suggest that lineage may be associated with ascribed status and prestigious
burial location, and that burial posture is not strongly correlated with markers of status.
Clearly, Bay Area assemblages included in the Meganos aspect are highly
variable in burial pattern, artifact associations, and artifact density. Associated artifacts
are extremely sparse at Skyport Plaza and among extended burials at the Eastridge site,
but were plentiful at Stivers Lagoon South and the Santa Rita Village Complex. Artifacts
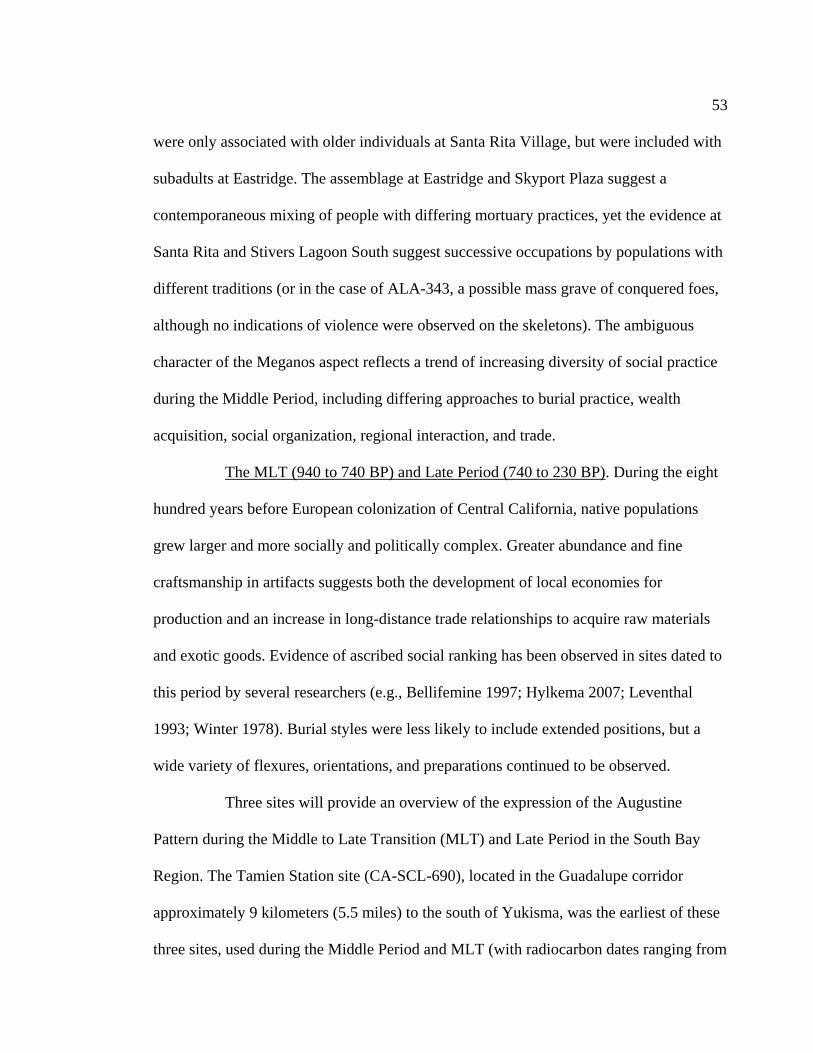
53
were only associated with older individuals at Santa Rita Village, but were included with
subadults at Eastridge. The assemblage at Eastridge and Skyport Plaza suggest a
contemporaneous mixing of people with differing mortuary practices, yet the evidence at
Santa Rita and Stivers Lagoon South suggest successive occupations by populations with
different traditions (or in the case of ALA-343, a possible mass grave of conquered foes,
although no indications of violence were observed on the skeletons). The ambiguous
character of the Meganos aspect reflects a trend of increasing diversity of social practice
during the Middle Period, including differing approaches to burial practice, wealth
acquisition, social organization, regional interaction, and trade.
The MLT (940 to 740 BP) and Late Period (740 to 230 BP). During the eight
hundred years before European colonization of Central California, native populations
grew larger and more socially and politically complex. Greater abundance and fine
craftsmanship in artifacts suggests both the development of local economies for
production and an increase in long-distance trade relationships to acquire raw materials
and exotic goods. Evidence of ascribed social ranking has been observed in sites dated to
this period by several researchers (e.g., Bellifemine 1997; Hylkema 2007; Leventhal
1993; Winter 1978). Burial styles were less likely to include extended positions, but a
wide variety of flexures, orientations, and preparations continued to be observed.
Three sites will provide an overview of the expression of the Augustine
Pattern during the Middle to Late Transition (MLT) and Late Period in the South Bay
Region. The Tamien Station site (CA-SCL-690), located in the Guadalupe corridor
approximately 9 kilometers (5.5 miles) to the south of Yukisma, was the earliest of these
three sites, used during the Middle Period and MLT (with radiocarbon dates ranging from
54
1640 ± 70 to 695 ± 50 corrected years BP) (Hylkema 2007:402). The Ryan Mound (CA-
ALA-329) is located in the Coyote Hills Complex about 14 kilometers (8.5 miles) to the
north of the Yukisma site, near the Patterson Mound (CA-ALA-328). Radiocarbon dates
from the Ryan Mound ranged from the Middle Period (as early as 2080 ± 90 BP) through
Late Period 2 (as late as 250 ± 50 BP) (Leventhal 1993). The third site to be discussed in
this overview is the Holiday Inn site (CA-SCL-128), located in the Guadalupe corridor,
just north of SCL-690. Salvage efforts at this site were able to record the context of only
a few burials, but evidence supports site use from the early Middle Period through the
Historic Period (with uncorrected radiocarbon dates ranging from 1700 ± 110 to 250 ± 90
years BP and shell bead types supporting occupation from the Terminal Late Period
through Historic times) (Winter 1978). The assemblages found at these three sites
provide an excellent overview of conditions and changes in the South Bay region during
the MLT and Late Period, the same span of time that the Yukisma Mound site was used.
The excavation of Tamien Station (CA-SCL-690) in 1990 was led by Mark
Hylkema, with assistance from Robert Jurmain of San Jose State University, support of
the Muwekma Ohlone Tribe, and monitoring by Ohlone Families Consulting Services,
Inc. (OFCS, the CRM arm of the Muwekma Ohlone Tribe). Following excavation, the
investigators produced and published an excellent collaborative report of the site
contents, context, and regional implications, including an ethnography written by Tribal
members (Hylkema 2007).
Within the organized cemetery at Tamien Station, 125 articulated skeletons
were recovered, of which 68 were single burials and 53 were found in association with
the bones of at least one other individual. After analysis of comingled remains, a likely
55
number of individuals was calculated at 142, including 28 males, 25 females, 66 adults of
indeterminate sex, and 23 subadults (Bethard with Jurmain 2007). Where burial position
could be determined (n = 91), all individuals were in flexed positions. Most were on their
sides, with just one ventrally flexed and 14 dorsally flexed individuals. Of those burials
where directional orientation could be determined (n = 85), 45 percent were oriented
towards the north, northwest, or northeast, but all compass directions were represented.
Twenty-three graves included evidence of pre-interment burning, but no correlation was
noted with type or quantity of associated grave goods. No cremations were found
(Bethard 2007).
All but 20 burials had some associated grave goods, an incidence of at least 84
percent, but the type and quantity of associations varied widely. Grave goods included
groundstone items (mortars, pestles, manos and millingstones), chipped stone tools
(cores, projectiles points, and bifaces), bone implements (awls, serrated tools, and antler
wedges), ritual items (smoking pipes, bird bone whistles, charmstones, quartz crystals,
and cinnabar), and shell beads and pendants. One hundred twenty three individuals had
associated beads, and 36 of them had more than 100, a far greater quantity and frequency
than was seen in Central California sites during the Middle Period. Bethard interpreted
the distribution of grave goods at this site as suggesting that wealth was accumulating
horizontally (by region or village) rather than vertically (through individual
aggrandizement or achievement), and that social stratification was not yet rigidly
institutionalized (Bethard 2007:223).
However, a few burials contained notably more signs of wealth than others,
suggesting some degree of social differentiation within this community. Of the six burials
56
with more than 1,500 associated beads, there were three adult males, two adult females,
and one infant, one to two years old. Symbols of wealth and status, such as beads and
pendants, were found in approximately equal frequency with males and females, and
accompanied infants and juveniles as well, suggesting that wealth was ascribed at birth.
Conversely, ritual objects such as charmstones, crystals, smoking pipes, and bird bone
whistles, were found only with adults, a pattern interpreted as the achievement of
specialized shamanic roles with adulthood (even if rights to the role were inherited)
(Bethard 2007:219).
To the northeast, along the eastern Bay Shore, the Ryan Mound (CA-ALA-
329) is part of the Coyote Hills Complex, and was investigated by several research
groups between 1935 and 1993, representing the University of California, Stanford
University, and San Jose State College/San Jose State University, and California State
University, Hayward (now CSU East Bay) (Leventhal 1993; Wilson 1993). The
opportunity for academic, research-based investigation at this site (rather than salvage as
at most South Bay sites) provided a rich and all-too-unique opportunity for evaluation of
site use and context. Early excavations yielded twelve burials excavated by Wedel in
1935, curated at UC Berkeley, 38 burials removed by Smith in 1948, curated at CSU East
Bay, and 139 skeletons excavated by Gerow, which were curated at Stanford University
and then repatriated in 1989. The remains of an estimated 298 individuals from 283
designated gravelots remain at San Jose State University (Jurmain 1990a:83), supporting
research for many graduate students and other scholars (e.g., Gillett 1987; Gross 1991;
Jurmain 1990a, 1990b, 1991; Jurmain et al. 2009; Musladin et al. 1986; Nechayev 2007;
Pierce 1982; Weiss 2006, 2009a, 2009b).

57
The Ryan Mound is a large earth mound, up to 16 feet (5 meters) thick, 450
feet (137 meters) long, and 300 feet (91 meters) wide (Leventhal 1993:31). Of the
estimated 20,900 cubic yards of culturally deposited material in this mound, only 2,600
cubic yards have been excavated. Based on burial frequency in the excavated portions, as
many as 3,100 additional burials may still be present within the mound (Wilson 1993).
Radiocarbon dates range from 2080 ± 90 to 250 ± 50 years BP, or the Early Middle
Period through Late Period Phase 2 (Leventhal 1993:76-79).
The deep temporal context and relatively undisturbed nature of this site allow
observations of changes in mortuary practice and grave associations through time. Of the
283 grave lots assigned during San Jose State University (SJSU) excavations, 53 were
determined to be from the Middle Period, 141 from Late Period Phase 1, and 89 from
Late Period Phase 2, based on burial depths, associated bead types, obsidian hydration
dates, and radiocarbon dates (Leventhal 1993). Where discernable and indicated, all
burials were in flexed postures except for one extended subadult from the MP component
(Burial 107, part of a double burial with a flexed adult female, in a “running” position)
(Leventhal 1993: Appendix A). Wilson (1993:10) reported four extended burials, but did
not specify which burials were included in this category. He also reports that 22 of the
flexed interments were in “seated” positions (Wilson 1993:10). Burials were oriented
towards all compass directions in each temporal period, but were slightly more likely to
be oriented towards the west during the Middle Period (36% of MP burials). During both
phases of the Late Period, burial orientation appeared to have no preferred pattern
(Leventhal 1993:89). Mortuary preparation changed slightly through time. During the
58
Middle Period, no cremations were noted, but both primary and secondary (redeposited)
cremations are seen in the Late Period, with increasing frequency through time.
Associated grave goods were found with 213 (75%) of the SJSU excavated
burials, including 75 percent of adult males, 83 percent of adult females, 62 percent of
adults of indeterminate sex, and 71 percent of subadults (Leventhal 1993). This site
appears to have enjoyed a great share of wealth throughout time, with a prevalence of
burial associations in the Middle Period comparable to that seen at the Stivers Lagoon
South site (CA-ALA-343, 61%) and Santa Rita Village (CA-ALA-413, up to 70%), and
considerably more than at Skyport Plaza (CA-SCL-478, about 11 percent including
projectile points), or Eastridge (CA-SCL-327, 23%). The frequency of associated
artifacts is also considerably greater than in the nearby Patterson Mound (ALA-328),
where approximately one-third of Early Period burials had associated artifacts (Bickel
1981).
When considered by temporal period, there were progressively larger portions
of the population buried with grave goods through time at ALA-329, although prevalence
in the first and second phase of the Late Period was quite similar (78 and 80 percent,
respectively). In all periods, a higher percentage of females had associated grave goods
than did males, and prevalence among adults was greater than with children, although
more than two thirds of subadults had associated goods in all temporal periods.
Artifacts found in association with Ryan Mound burials included groundstone
(mortars, pestles, and one mano), polished stone (pipes and charmstones), chipped stone
(points and tools), bone tools (antler wedges, harpoons, awls, saws, and whistles) and
over 43,000 shell beads and ornaments. Elevated or wealthy social status was attributed
59
to individuals found with an abundance of artifact types, as well as those with quantities
of beads (Leventhal 1993). Burials containing more than 1,000 beads occurred in all
temporal periods at the site, but were most common in Phase 1 of the Late Period. One
third of burials with more than 500 beads were subadults (n = 8, 33%), of which five
were estimated to have been younger than three years. Adult males were more likely to
have large caches of shell beads (n = 8, 33%), but females were also represented (n = 5,
21%). One burial with more than 500 beads was of indeterminate sex (n = 1, 4%).
Another important marker of identity within the Ryan Mound assemblage was
N series Haliotis pendants, called effigy pendants because of their anthropoid shape,
including a large circular “head,” a descending straight-sided “body” and sometimes
laterally extending “limbs.” The term banjo is also used for this form, referring to the
shape of tuning pegs for a banjo or other stringed instrument (Gifford 1947). Thirty-eight
of these shell ornaments were found with 13 individuals at CA-ALA-329, including six
adult males, three adult females, one adult of indeterminate sex, and three subadults, each
less than two years of age. Burials containing N series pendants were dated to both
phases of the Late Period. These ornaments are associated with the Kuksu cult, a pan-
regional religious tradition observed throughout Central California, including the Yuki,
Pomo, Wintun, Maidu, Miwok, Costanoan, Esselen, and Salinan Tribes (Kroeber
1925:371). The shape is similar to that of a Kuksu dancer’s “big-head” regalia,
ethnographically known to include a headpiece made of tule from which multiple sticks
project two to three feet with feathers adorning the tips (Gifford 1947:21).
Dancers participating in Kuksu rituals embodied mythical beings, a potentially
dangerous process involving secret knowledge and power, which was obtained either
60
through inheritance of the role or by appointment by the shaman (Kroeber 1925, 1971).
Involvement in Kuksu was prestigious, and graves including items related to this tradition
are often quite wealthy. Unfortunately, most traditional regalia for Kuksu rituals was
perishable (e.g., feathered headpieces, dance skirts or capes and wooden drums), and has
not survived in the archaeological record (Bates 1982; Kroeber 1925). Although
ethnohistoric literature stresses that these organizations were secret societies restricted to
initiated men (Chartkoff and Chartkoff 1984; Jones 1971; Kroeber 1925, 1971; Moratto
1984), suggestions of Kuksu membership, such as the banjo pendants (e.g., Bennyhoff
1977), have been found in the archaeological record with the remains of infants, children,
and women as well, suggesting regional or temporal variation in practice. The spread of
secret societies and related indicators of wealth and prestige during the Late Period
indicates significant interaction across regions and language groups, and a new
opportunity for social differentiation.
The Augustine pattern is also seen at the last site to be considered in this
review, the Holiday Inn site (CA-SCL-128). Based on radiocarbon dates and artifact
types, this site was used from at least 1700 ± 110 years BP through the Historic Period to
the present day (Winter 1978). Excavation at CA-SCL-128 consisted of two salvage
projects during 1973 and 1977, each completed under suboptimal circumstances for
archaeological recovery of the site. Before construction was halted, significant damage
had been done and many burials and artifacts were lost or severely disturbed. In spite of
these many impediments, Joseph Winter and colleagues produced a tremendous site
report (Winter 1978), including analysis of recovered skeletal remains, prehistoric
artifacts (shell beads, chipped stone, projectile points, and ground stone), botanical and

61
faunal remains, and historical material (glass trade beads, historic ceramics, glass bottles,
and other items).
In 1977, most burials were removed by earthmoving equipment before the
archaeological team could begin work, but nine were recovered from the sidewalls of the
trench. All were damaged, and some were crushed by the heavy machinery, but much of
the context was still assessed and recorded (unfortunately burial posture and orientation
are not included in the report). Within this small sample, shell beads and Haliotis
pendants were found with adult males, adult females, adults of indeterminate sex, and
subadults, consistent with the trend of ascribed status seen at the Ryan Mound. Haliotis
pendants and pendant fragments recovered from both the spoils and burials included the
banjo/Kuksu style, further indication that this tradition extended into the South Bay. One
of the nine intact burials, a female estimated to be around 15 years of age (Burial 9) had
three associated N series Haliotis pendants. Nineteen additional banjo pendant fragments
were recovered from the backdirt pile (Winter 1978:98).
Overview of South San Francisco Bay Region Archaeology. Excavation at
these and several other sites in the South San Francisco Bay region has revealed
considerable change through time in burial style and the types and quantities of burial
associations. From the earliest sites in the region, little is known regarding social
organization. Isolated burials at Stanford (Stanford Man I and II), the San Francisco Civic
Center BART station, and Sunnyvale (Sunnyvale Woman) include only a few grave
goods, and little evidence to indicate differentiated wealth or status.
Organized cemetery and ritual spaces have been identified from Early Period
sites (used between 3450 and 2450 BP), which include a frequency of associated grave
62
goods with burials as high as 80 percent. Goods are found with males, females, and
subadults, but caches are rarely large (the largest being 1,182 shell beads with one male
at University Village). Burials were flexed, and no preferred compass orientation was
noted. Assemblages seen during this period are consistent with the Early San Francisco
Bay Pattern, as described by Gerow (with Force 1968), and include chipped stone tools
made of chert, bone tools, Olivella shell beads, and frequent use of red ochre (cinnabar).
Some differentiation in social roles or status is suggested, based on variation in associated
grave goods.
During the EMT and Middle Period (2450-940 BP), mound sites first
appeared along the South and East bayshore. Sites following the Early San Francisco Bay
Pattern or Berkeley Pattern have few burial associations, with prevalence as low as 11
percent at SCL-732 or 33 percent at ALA-328. Cemetery organization is apparent, and
patterned variation in mortuary context and associated goods appears within sites. The
few indicators of wealth are found with subadults and females, sometimes more
frequently than with males. Most burials at these sites are still flexed, with variable
orientation, although a preference for easterly orientation is noted for extended burials at
SCL-732.
The Middle Period was a dynamic time, including greater movement of
people and the contemporaneous expression of distinct ethnic identities. The Meganos
Aspect reflects the intermixing of Windmiller-like traditions and Berkeley/Early SF Bay
traditions within sites, and is seen in scattered locations along the East and South Bay.
These sites are characterized by a mix of burial styles, including both extended and
flexed postures, and less concern about directional orientation than is seen at earlier
63
Windmiller pattern sites. Grave goods are associated with up to 60 to 70 percent of
burials at Santa Rita Village (CA-ALA-413), including the wealthiest burial found in
California, and with as few as 11 percent of burials at Skyport Plaza (CA-SCL-478).
Goods are found with males, females, and subadults, and inherited social prestige is
suggested.
During the MLT and Late Period (940-230 BP), a greater variety of burial
contexts are seen, but fewer individuals are buried in extended positions. Observations in
sites of the South and East Bay regions are consistent with the Augustine Pattern, and
include primary and secondary cremations as well as primary and secondary burials,
oriented with no clear preference to compass direction. Caches of grave goods are larger
than they were in earlier periods, and include finely finished groundstone objects and
abundant Olivella beads and Haliotis ornaments. These objects are associated with males,
females, and subadults, although the assemblage at Tamien Station (CA-SCL-690)
suggests that ritual objects associated with shamanism are included with only adult
burials. The introduction of the Kuksu cult is associated with secret societies and a new
social and ritual complexity in Central California.
The cumulative work of these many researchers describes a different
chronology in the San Francisco Bay region than was anticipated by earlier academics
such as Alfred Kroeber. Change is evident in cemetery organization, burial preparation,
mortuary ritual, artifact assemblages, and the frequency and types of burial associations.
These changes reflect developments in sociopolitical organization and individual identity
though time.

64
Recent Perspectives on South Bay Archaeology and Shellmound
Analysis
Discovery of new sites and reconsideration of known datasets have only
recently begun to inspire new ideas about the use of mounded space in California’s
prehistoric past. Following early shellmound interpretations by Nelson (1909, 1910,
1996), Uhle (1907), Loud (1924), Schenck (1926), and Kroeber (1909, 1925), mounds
are still commonly described as villages and kitchen middens, built from long term
incidental accretion of refuse. A classic example is seen below in an excerpt from The
Archaeology of California, published in 1984:
The shell mound was built up over 3,000 years as the debris from food, fire hearths, and toolmaking accumulated around the village. An artificial mound, or kitchen midden, nearly 20 feet deep (6 meters) developed over the centuries, preserving evidence of the development of prehistoric life along the bay’s shore. San Francisco was ringed by over five hundred of these mounds; only a handful survive. [Chartkoff and Chartkoff 1984:230, describing CA-MRN-10 in Marin County]
The earliest critique of Central California mounds as village sites was not
published until 1987, when Clement Meighan questioned the interpretation of Early
Period (Windmiller) earth mounds in the Sacramento Valley (Meighan 1987).
Considering his own experience excavating at the Blossom Mound, (CA-SJO-68),
Meighan reexamined previous descriptions of the site. He found that the “physical nature
of the site deposit, arrangement and disposition of burials, the scarcity of domestic
artifacts in the site, the scarcity of food refuse in the site, and the occurrence of
unquestionable midden sites elsewhere,” did not support the original site interpretation
(Meighan 1987:29). Rather, evidence from the Blossom Mound suggested use as a
dedicated mortuary and ceremonial place, and not a place of habitation. Meighan
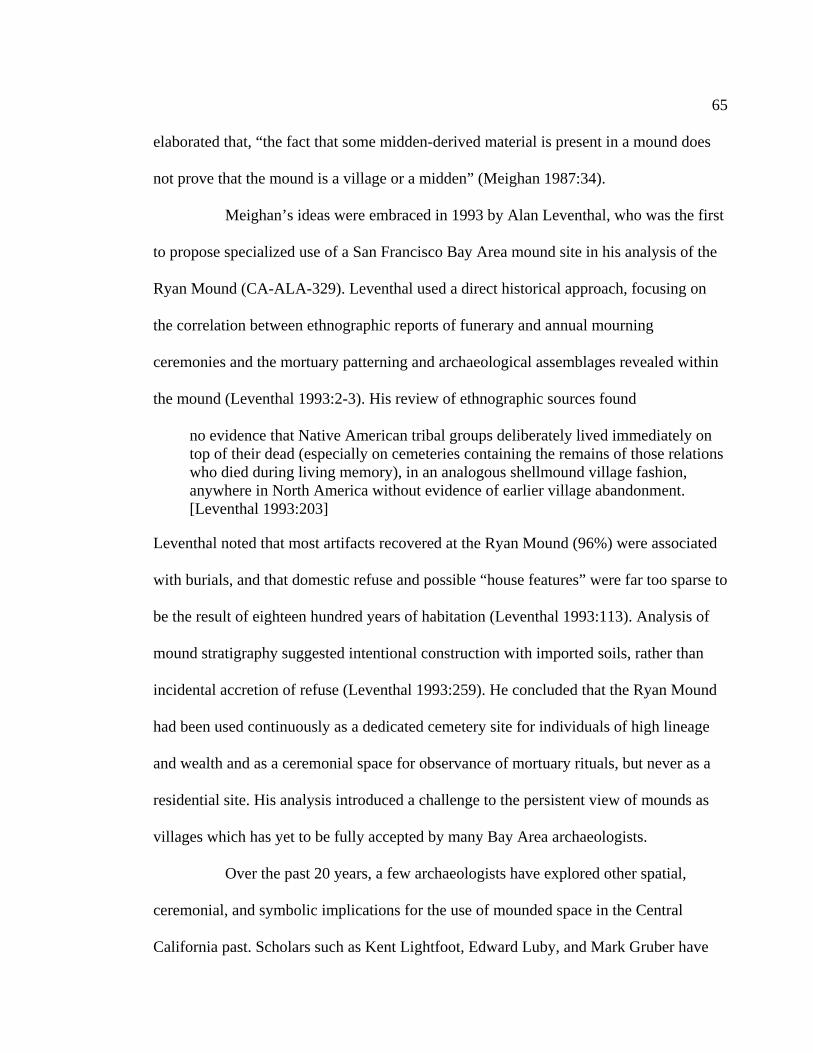
65
elaborated that, “the fact that some midden-derived material is present in a mound does
not prove that the mound is a village or a midden” (Meighan 1987:34).
Meighan’s ideas were embraced in 1993 by Alan Leventhal, who was the first
to propose specialized use of a San Francisco Bay Area mound site in his analysis of the
Ryan Mound (CA-ALA-329). Leventhal used a direct historical approach, focusing on
the correlation between ethnographic reports of funerary and annual mourning
ceremonies and the mortuary patterning and archaeological assemblages revealed within
the mound (Leventhal 1993:2-3). His review of ethnographic sources found
no evidence that Native American tribal groups deliberately lived immediately on top of their dead (especially on cemeteries containing the remains of those relations who died during living memory), in an analogous shellmound village fashion, anywhere in North America without evidence of earlier village abandonment. [Leventhal 1993:203]
Leventhal noted that most artifacts recovered at the Ryan Mound (96%) were associated
with burials, and that domestic refuse and possible “house features” were far too sparse to
be the result of eighteen hundred years of habitation (Leventhal 1993:113). Analysis of
mound stratigraphy suggested intentional construction with imported soils, rather than
incidental accretion of refuse (Leventhal 1993:259). He concluded that the Ryan Mound
had been used continuously as a dedicated cemetery site for individuals of high lineage
and wealth and as a ceremonial space for observance of mortuary rituals, but never as a
residential site. His analysis introduced a challenge to the persistent view of mounds as
villages which has yet to be fully accepted by many Bay Area archaeologists.
Over the past 20 years, a few archaeologists have explored other spatial,
ceremonial, and symbolic implications for the use of mounded space in the Central
California past. Scholars such as Kent Lightfoot, Edward Luby, and Mark Gruber have

66
proposed that most Bay Area mounds were used as both residential and ceremonial
places, and that site use varied temporally and from mound to mound (Lightfoot 1997;
Luby and Gruber 1999; Lightfoot and Luby 2002; Luby et al. 2006). Upon considering
the nature of mounded space, burial placement, concentration of domestic refuse,
occupation history, and regional settlement patterns, these authors have incorporated the
potential symbolic and ceremonial functions of shell mounds into a discussion of
evolving social complexity in the region. Additionally, efforts were made to understand
and consolidate historical classification of mound sites, including variation in
nomenclature, mound composition, and site construction (Luby et al. 2006).
All authors in this group agree that Bay Area mounds were at least partially
built through accretion as a result of continuous occupation as village sites over many
hundreds or thousands of years. They suggest that mounds were used as habitation sites
during the Early and Middle Periods, then abandoned between 700 and 1100 AD, and
later repurposed during the Late Period as dedicated mortuary and ceremonial sites
(Lightfoot and Luby 2002). The oldest and largest mound in each region may have served
as a political and ceremonial center and as a mortuary site for local elites, while
surrounding smaller mounds were either permanent or seasonal village sites (Lightfoot
1997). Lightfoot and Luby (2002) correlated changes in social organization, population
density, and political complexity in the region during the MLT to the abandonment and
repurposing of mound sites, noting changes in grave wealth distribution and the
introduction of cremations in mound site burials during the Late Period.
As residential spaces, the raised terrain would have served additional purposes
such as elevating villages above the nearby floodplain or tidal waters and providing

67
convenient access to estuarine resources (Lightfoot 1997). Additionally, the elevated
space would form territorial markers visible across the valley, especially important as the
local population density and competition for resources increased. To enhance these
qualities, Lightfoot (1997) suggested that the mounds were at least partially constructed
through intentional deposition of materials, including the dumping of “rocks, sands, and
clay onto sites” (Lightfoot 1997:139).
The ceremonial significance of mounded space was central to the
interpretations of Luby and Gruber (1999), particularly the potential for large social
gatherings, feasting, and aggrandizement of local elites. These authors viewed shell
mounds as “intentional cultural features rather than accidental aggregates of shell refuge
that happen to contain artefacts” (Luby and Gruber 1999:195). They focused on the
cosmological and symbolic significance of these earthworks, and noted meaningful
connections between the remains of foods in the matrix, the human remains interred
within this matrix, the living community that would gather and feast above, and the ritual
and sociopolitical power that would be generated by this convergence.
While early interpretations of shellmounds use were perhaps limited by global
comparison, a recent return to cross-regional comparisons now has the potential to
enhance understanding of California mound structures (Luby and Gruber 1999; Luby et
al. 2006; Sassaman 2004). By situating California shellmounds within the context of
prehistoric earth works from other regions, new investigations of planned monumental
construction and spatial patterning are available. This approach allows other regions with
perhaps better site preservation or less disrupted ethnohistoric narratives to provide
proxies for potential interpretation of California sites, an important consideration because
68
of the challenges of missionization, historic landscape modification, and the relative lack
of research driven excavation in Central California. Sassaman (2004) provides an
example, noting the “uncanny similarities . . . between the shell mounds of San Francisco
Bay and those of northeast Florida” (Sassaman 2004:249). In both regions, Sassaman
notes that mounds may have been used as symbolic space for ceremonial feasting,
including redistribution of wealth and mitigation of inequality. This interpretation
supports his thesis that social and political transformation occurred in the American
Southeast without significant change in subsistence economies, and by extension, that
mounds in Central California may have served similar purposes.
At present, there remains a lack of agreement as to the use and history of
mounded space in Central California, although the discussion has expanded to include
probable variation in site use and construction across space and through time. Mounds are
no longer viewed as evidence of a simple and static culture which lived on top of their
accumulating garbage for hundreds of years. The re-imagining of mounds as intentionally
constructed earthworks and symbolic centers has transformed discussion and introduced
social complexity into the interpretive milieu. The fact that all Central California mound
sites were also repositories for the dead enhances their symbolic value, but confuses
interpretation about use as residential sites.
While there is little potential for discovery of an undisturbed Central
California mound site for future research-based excavation, information from past
excavations and ongoing CRM work will continue to inform these discussions. Cross-
regional comparisons may also introduce new interpretive possibilities for the past. The
most significant transformations in the interpretation of San Francisco Bay Area
69
prehistory since the early 20th century are the acknowledgement of cultural change
through time, of social complexity and transformation, and of regional continuity as well
as variation in site use, socio-political organization and ceremonialism. These factors are
all considered in the present interpretation of the Yukisma Mound (CA-SCL-38), as
individual dietary composition and mortuary contexts are evaluated as evidence for social
differentiation.
70
CHAPTER III
THE YUKISMA MOUND SITE
(CA-SCL-38)
Introduction
The Yukisma Mound (CA-SCL-38, also known as the Alms House Mound
and the Elmwood Mound) is an archaeological site in the Santa Clara Valley, first
recorded in 1952 (Meighan 1952), surveyed and further defined in the 1980s (Cartier
1981, 1985, 1987, 1988c) and principally excavated between 1993 and 1994 (Bellifemine
1997). Aspects of these excavations have been reported in three master’s theses
(Bellifemine 1997; Morley 1997; Wu 1999), and one published article (Jurmain 2001).
All other records are in the grey literature (e.g., Cartier 1985, 1987, 1988c; Jurmain
2000). Funding for the archaeological analysis of CA-SCL-38 was unfortunately cut prior
to completion of the site report; therefore, no complete analysis of these findings has
been published. To support the current project, it was necessary to review the original
excavation documents in detail and to synthesize multiple accounts of the site contents
and associations.
The Yukisma Mound site (CA-SCL-38) is located on the bank of Lower
Penetencia Creek, two miles southeast of the San Francisco Bay. This location falls
within the USGS Milpitas 7.5’ quadrangle. Although originally located on the eastern
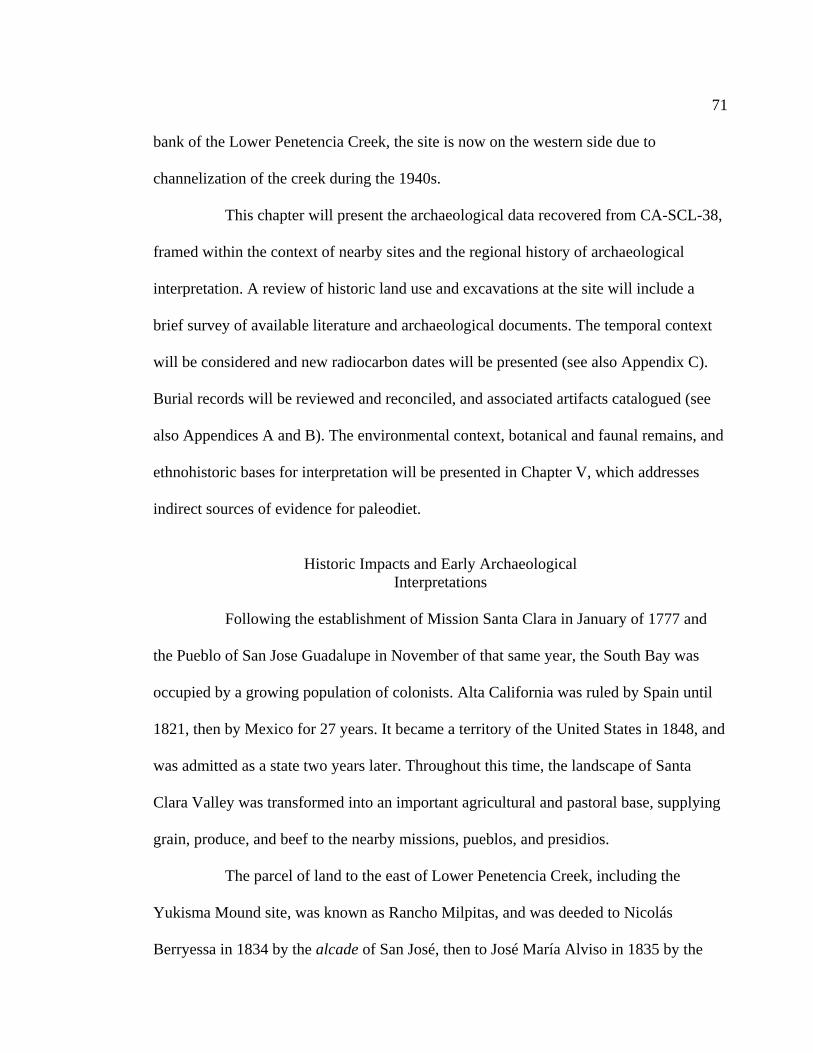
71
bank of the Lower Penetencia Creek, the site is now on the western side due to
channelization of the creek during the 1940s.
This chapter will present the archaeological data recovered from CA-SCL-38,
framed within the context of nearby sites and the regional history of archaeological
interpretation. A review of historic land use and excavations at the site will include a
brief survey of available literature and archaeological documents. The temporal context
will be considered and new radiocarbon dates will be presented (see also Appendix C).
Burial records will be reviewed and reconciled, and associated artifacts catalogued (see
also Appendices A and B). The environmental context, botanical and faunal remains, and
ethnohistoric bases for interpretation will be presented in Chapter V, which addresses
indirect sources of evidence for paleodiet.
Historic Impacts and Early Archaeological
Interpretations
Following the establishment of Mission Santa Clara in January of 1777 and
the Pueblo of San Jose Guadalupe in November of that same year, the South Bay was
occupied by a growing population of colonists. Alta California was ruled by Spain until
1821, then by Mexico for 27 years. It became a territory of the United States in 1848, and
was admitted as a state two years later. Throughout this time, the landscape of Santa
Clara Valley was transformed into an important agricultural and pastoral base, supplying
grain, produce, and beef to the nearby missions, pueblos, and presidios.
The parcel of land to the east of Lower Penetencia Creek, including the
Yukisma Mound site, was known as Rancho Milpitas, and was deeded to Nicolás
Berryessa in 1834 by the alcade of San José, then to José María Alviso in 1835 by the

72
governor of Alta California (Munzel 2000). Despite challenges from Berryessa and his
heirs, the Berryessa family never regained rights to the property (U.S. 337 – Alviso v.
United States, 1869). The land near the creek was used for cattle ranching, and may have
also supported small garden plots from local settlers and squatters (Munzel 2000). The
first commercial property in Milpitas was built in 1855, just half a mile north of the
Yukisma Mound site, and development in the historic downtown continued over the next
150 years (Munro-Fraser 1881). By 1870, settlers Joseph and Kate Kelley built a home
and established a garden adjacent to the mound site (U.S. Census 1870, Thompson and
West 1876). Crops typically grown in lowland areas of the Milpitas Rancho included
berries (strawberries, blackberries and raspberries), many varieties of tree fruit, and
vegetables (San Jose Mercury News 1975). By 1876, railroad tracks were installed
between San Jose and Alviso, passing within half a kilometer of the Yukisma Site
(Munro-Fraser 1881:439; Thompson and West 1876; see Figure 7).
The land to the west of Lower Penetencia Creek was part of Rancho Rincón
de los Esteros, deeded to Ignacio Alviso in 1838. The property was split into three parcels
in 1852, with the easternmost portion, including the land between Lower Penetencia
Creek and Coyote Creek, granted to the family of Charles White. After Charles’ death in
the explosion of the steamboat “Jenny Lind” the following year, his widow Ellen
continued running the ranch, and was granted official title to the property in 1862 (BLM
document PLC 139). Like Rancho Milpitas, this land was also primarily used for cattle
grazing.
The property later passed to another Irish immigrant, John O’Toole, who built
an elaborate twenty-room Victorian mansion (Figure 8), raised thoroughbred horses,
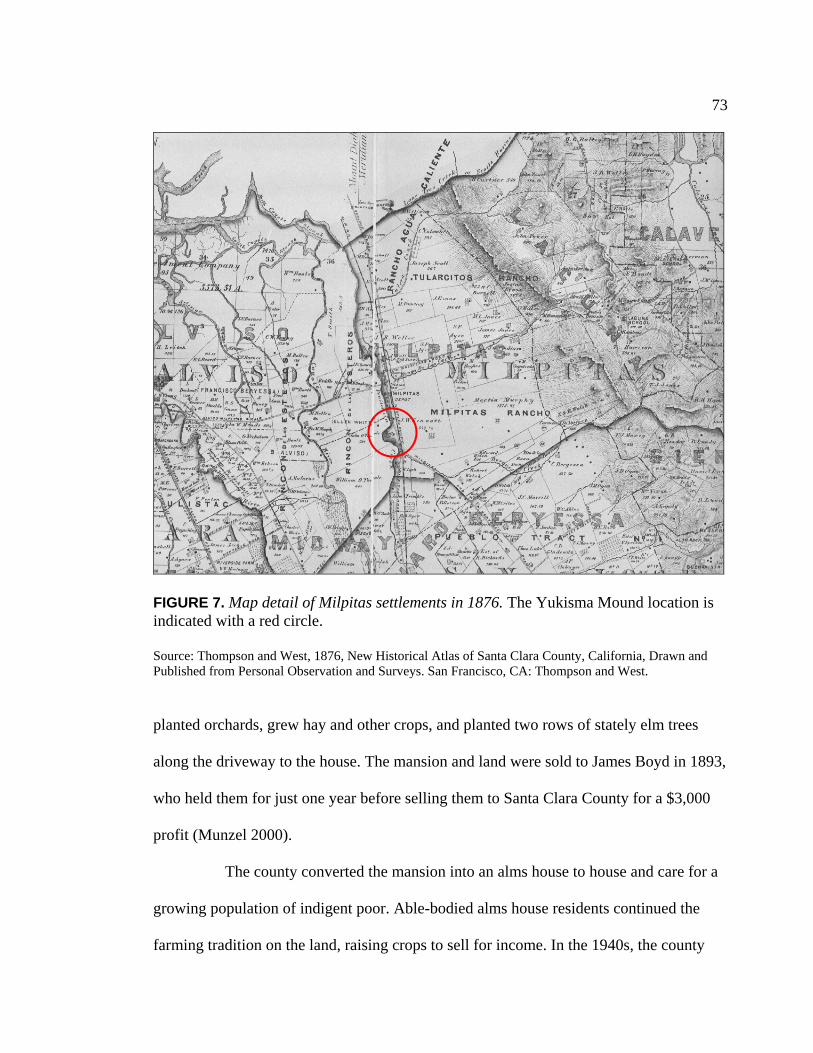
73
FIGURE 7. Map detail of Milpitas settlements in 1876. The Yukisma Mound location is indicated with a red circle. Source: Thompson and West, 1876, New Historical Atlas of Santa Clara County, California, Drawn and Published from Personal Observation and Surveys. San Francisco, CA: Thompson and West.
planted orchards, grew hay and other crops, and planted two rows of stately elm trees
along the driveway to the house. The mansion and land were sold to James Boyd in 1893,
who held them for just one year before selling them to Santa Clara County for a $3,000
profit (Munzel 2000).
The county converted the mansion into an alms house to house and care for a
growing population of indigent poor. Able-bodied alms house residents continued the
farming tradition on the land, raising crops to sell for income. In the 1940s, the county
74
FIGURE 8. The O’Toole Mansion, converted to the Santa Clara County Alms House in 1894. Source: Photo circa 1900, courtesy of History San José, San Jose, California. Assession # 1997-300. Reprinted with permission.
began housing low-security prisoners at the alms house. During the next decade, many of
the old buildings were torn down, new buildings and barracks erected, and the creek
channelized along the eastern border of the property. The meander of the creek that
encircled the Yukisma Mound was eliminated in favor of a straight channel, effectively
moving the Yukisma Mound site to the western shore and bringing it within the property
of the alms house.
75
The Yukisma Mound (CA-SCL-38) was first recorded by Clement Meighan in
1952, at which time it was called the Alms House Mound. In the Archaeological Site
Survey Record, Meighan described SCL-38 as “an extensive habitation site marked by a
low, almost not discernable mound,” approximately 300 feet (91 meters) in diameter and
four feet (1.2 meters) deep. The identification as a habitation site was based on midden
deposits and scattered artifacts (e.g., bone whistles and charmstones), but no house floors
were found, nor any other features directly associated with habitation. Meighan noted that
a hay crop was currently growing on the mound, and that the area was subject to annual
plowing. Inmates and staff at the alms house reported that human bone was often found
when plowing and landscaping and was scattered on the surface in the orchard area on
the eastern perimeter of the property. Additionally, it was reported that burials found
during construction had been “excavated and re-interred by a local Ohlone group a few
years ago” (Meighan 1952). The site survey record from 1952 mentions a small
excavation by San Jose State College in 1950, in which deer bone, shell, vitreous clay,
charmstones, and bird bone whistles were recovered, but this project is otherwise
undocumented.
While surveying SCL-38 in 1952, Meighan along with colleagues Ellison,
Curren, and Treganza, excavated six burials and one feature. All burials were recovered
from within the “midden mass.” The burials were all primary interments, each including
one individual, aligned in various compass orientations. All burials were flexed or tightly
flexed. One was positioned on the left side, one on the right side, one in a seated position,
two dorsally, and one was disturbed before it could be documented. No pathology was
noted in any of the individuals. The group included one adult male, three adult females,
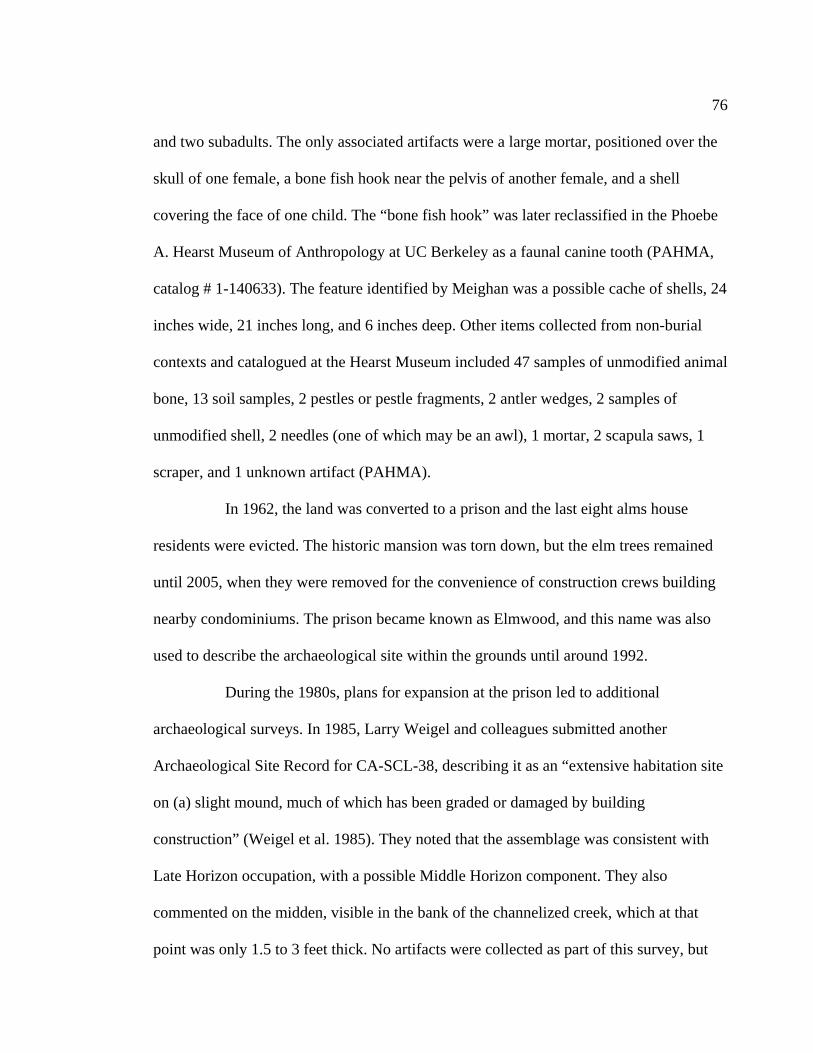
76
and two subadults. The only associated artifacts were a large mortar, positioned over the
skull of one female, a bone fish hook near the pelvis of another female, and a shell
covering the face of one child. The “bone fish hook” was later reclassified in the Phoebe
A. Hearst Museum of Anthropology at UC Berkeley as a faunal canine tooth (PAHMA,
catalog # 1-140633). The feature identified by Meighan was a possible cache of shells, 24
inches wide, 21 inches long, and 6 inches deep. Other items collected from non-burial
contexts and catalogued at the Hearst Museum included 47 samples of unmodified animal
bone, 13 soil samples, 2 pestles or pestle fragments, 2 antler wedges, 2 samples of
unmodified shell, 2 needles (one of which may be an awl), 1 mortar, 2 scapula saws, 1
scraper, and 1 unknown artifact (PAHMA).
In 1962, the land was converted to a prison and the last eight alms house
residents were evicted. The historic mansion was torn down, but the elm trees remained
until 2005, when they were removed for the convenience of construction crews building
nearby condominiums. The prison became known as Elmwood, and this name was also
used to describe the archaeological site within the grounds until around 1992.
During the 1980s, plans for expansion at the prison led to additional
archaeological surveys. In 1985, Larry Weigel and colleagues submitted another
Archaeological Site Record for CA-SCL-38, describing it as an “extensive habitation site
on (a) slight mound, much of which has been graded or damaged by building
construction” (Weigel et al. 1985). They noted that the assemblage was consistent with
Late Horizon occupation, with a possible Middle Horizon component. They also
commented on the midden, visible in the bank of the channelized creek, which at that
point was only 1.5 to 3 feet thick. No artifacts were collected as part of this survey, but

77
obsidian projectile points (c.f. Stockton serrated), a heat-treated chert flake, groundstone
fragments (including pestles, a shallow bowl mortar or metate and charmstones) and shell
(Haliotis, Cerithidea, and Ostrea) were noted in the midden. Ongoing collection of
artifacts was reported among staff and inmates, and the midden concentration appeared
reduced from observations made by Cartier in 1981 (Weigel et al. 1985).
Several reports were prepared by Archaeological Resource Management
during the 1980s, evaluating the scope and nature of the site (Cartier 1981, 1985, 1987,
1988c). As before, the site was described as “a large habitation site with human burials
and a midden rich in artifacts” (Cartier 1985:3). Surface surveys revealed prehistoric
midden with fire-altered rock, chipped lithics, groundstone fragments, shell and bone
fragments. In 1988, two small (1x1 meter) units and 28 auger samples (4 inches wide and
up to 1.2 meters deep) were examined to evaluate the extent and nature of the
archaeological deposit. Of the shell recovered, 79 percent was California hornsnail
(Cerithidea californicus) and 21 percent was California oyster (Ostrea lurida). Only 13
grams of faunal bone were recovered, too fragmented to be identified to species. Stone
artifacts included three chipped stone debitage flakes, one intact handstone with
significant use-wear, and several undescribed groundstone fragments. Fire-altered rock
and vitrified earth were interpreted as cooking debris. One radiocarbon date was
obtained, based on a sample of Cerithidea shell from the midden, yielding an uncorrected
date of 500 ± 60 years BP (Beta-24408). The 1988 study concluded that the site was a
Late Period village with a cemetery component, and that the “location of Native
American graves at the Elmwood deposit is in the same area as the prehistoric habitation
site” (Cartier 1988c:14).
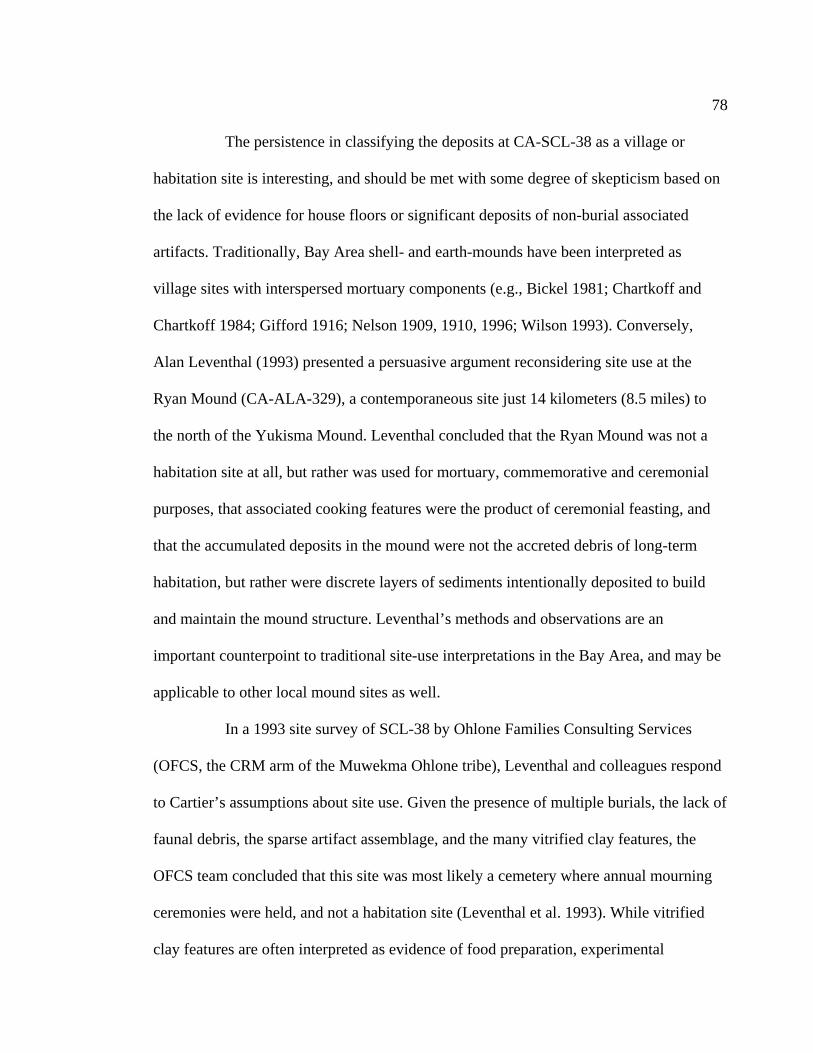
78
The persistence in classifying the deposits at CA-SCL-38 as a village or
habitation site is interesting, and should be met with some degree of skepticism based on
the lack of evidence for house floors or significant deposits of non-burial associated
artifacts. Traditionally, Bay Area shell- and earth-mounds have been interpreted as
village sites with interspersed mortuary components (e.g., Bickel 1981; Chartkoff and
Chartkoff 1984; Gifford 1916; Nelson 1909, 1910, 1996; Wilson 1993). Conversely,
Alan Leventhal (1993) presented a persuasive argument reconsidering site use at the
Ryan Mound (CA-ALA-329), a contemporaneous site just 14 kilometers (8.5 miles) to
the north of the Yukisma Mound. Leventhal concluded that the Ryan Mound was not a
habitation site at all, but rather was used for mortuary, commemorative and ceremonial
purposes, that associated cooking features were the product of ceremonial feasting, and
that the accumulated deposits in the mound were not the accreted debris of long-term
habitation, but rather were discrete layers of sediments intentionally deposited to build
and maintain the mound structure. Leventhal’s methods and observations are an
important counterpoint to traditional site-use interpretations in the Bay Area, and may be
applicable to other local mound sites as well.
In a 1993 site survey of SCL-38 by Ohlone Families Consulting Services
(OFCS, the CRM arm of the Muwekma Ohlone tribe), Leventhal and colleagues respond
to Cartier’s assumptions about site use. Given the presence of multiple burials, the lack of
faunal debris, the sparse artifact assemblage, and the many vitrified clay features, the
OFCS team concluded that this site was most likely a cemetery where annual mourning
ceremonies were held, and not a habitation site (Leventhal et al. 1993). While vitrified
clay features are often interpreted as evidence of food preparation, experimental

79
archaeology has demonstrated that the minimum temperature required to vitrify local
Santa Clara Valley clays (melting them and converting the silica inclusions to glass)
would be 1,200ºC, a temperature consistent with cremation practices and impractical for
food preparation (Parsons and Leventhal 1981). Although determining the prehistoric
function(s) of the Yukisma Mound is outside the scope of the present study, it should be
said that there is no clear evidence available to this author for use as a permanent or
seasonal habitation site, and such classification seems more likely to be a product of
habitual modes of thinking about the California past than of objective observation.
Excavations of 1993-1994
In 1993, a renovation was proposed at the Elmwood Correctional Facility,
which was to include demolition of existing structures and construction of a new large
barracks building in the southeastern corner of the prison. Before the project began, an
archaeological survey was requested to comply with CEQA regulations. Ohlone Families
Consulting Services (OFCS) completed a test excavation program in April of 1993 to
assess significance and scope of the archaeological site, including eight one-by-one-meter
hand-excavated test units and 16 auger bore holes across the proposed construction area
(Leventhal et al. 1993) (Figure 9). OFCS found at least some cultural material in all test
units, and recovered one burial within test unit 5 (Burial Feature 1). Isolated human bones
found in two other test units suggested that human activities during the historic period
caused significant disturbance to the site. The team concluded that CA-SCL-38 was
culturally and historically significant and that it “should be preserved, or (if preservation
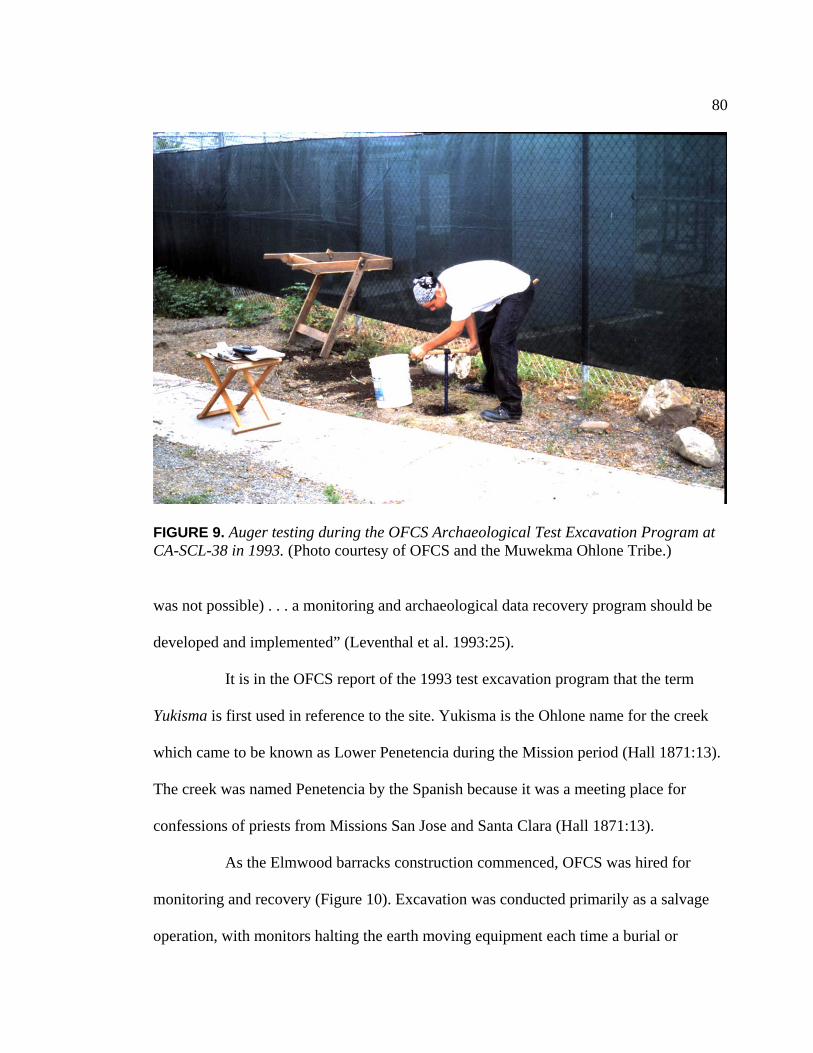
80
FIGURE 9. Auger testing during the OFCS Archaeological Test Excavation Program at CA-SCL-38 in 1993. (Photo courtesy of OFCS and the Muwekma Ohlone Tribe.) was not possible) . . . a monitoring and archaeological data recovery program should be
developed and implemented” (Leventhal et al. 1993:25).
It is in the OFCS report of the 1993 test excavation program that the term
Yukisma is first used in reference to the site. Yukisma is the Ohlone name for the creek
which came to be known as Lower Penetencia during the Mission period (Hall 1871:13).
The creek was named Penetencia by the Spanish because it was a meeting place for
confessions of priests from Missions San Jose and Santa Clara (Hall 1871:13).
As the Elmwood barracks construction commenced, OFCS was hired for
monitoring and recovery (Figure 10). Excavation was conducted primarily as a salvage
operation, with monitors halting the earth moving equipment each time a burial or
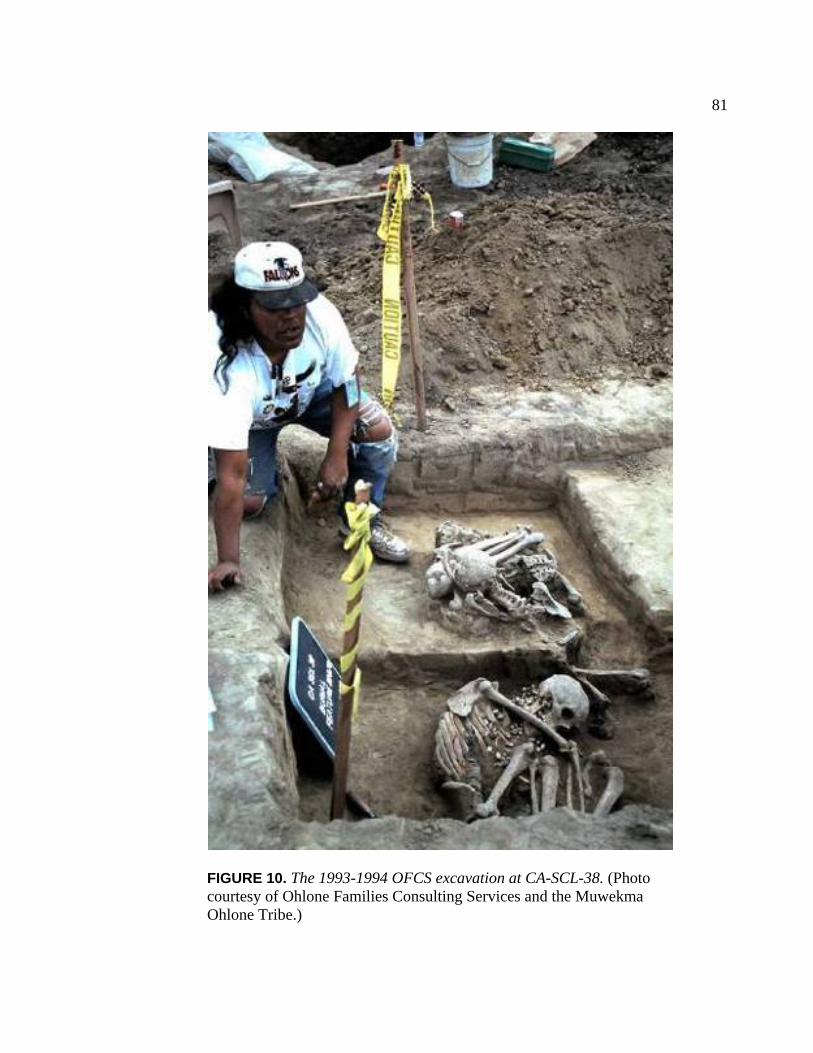
81
FIGURE 10. The 1993-1994 OFCS excavation at CA-SCL-38. (Photo courtesy of Ohlone Families Consulting Services and the Muwekma Ohlone Tribe.)

82
sensitive feature was encountered. Between August of 1993 and October of 1994, 243
discrete burial features were identified. All archaeological materials encountered at the
site were recorded, boxed and transported to San Jose State University (SJSU) for further
analysis.
The human remains from CA-SCL-38 were studied over a period of seven
months in the SJSU Physical Anthropology and Archaeology Laboratory by a team led
by Robert Jurmain, and including several SJSU students and staff as well as Suzanne
Rodriquez, a member of the Muwekma Ohlone Tribe. In October of 1996, the remains
were repatriated, along with many of the artifacts from the site (Figures 11 and 12).
FIGURE 11. Repatriation of CA-SCL-38 skeletal material and artifacts, October 1996. (Photo courtesy of Ohlone Families Consulting Services and the Muwekma Ohlone Tribe.)

83
FIGURE 12. Repatriated materials from CA-SCL-38, October 1996. (Photo courtesy of Ohlone Families Consulting Services and the Muwekma Ohlone Tribe.)
Selected artifacts were retained for tribal education and display purposes, as
well as future analysis. These artifacts are curated by San Jose State University the
Muwekma Ohlone Tribe. In addition, the tribe agreed to retain a single rib or other small
bone from each viable individual for future analysis. As a result, bone samples from 202
discrete individuals are available for ongoing studies, including stable isotope analysis,
DNA studies, radiocarbon dating, and other research techniques, even after the rest of the
remains have been repatriated. This innovative compromise is an excellent model for
empowering living Native California populations to both protect their heritage and to take
advantage of modern techniques to learn more about their past.

84
Previous Studies about CA-SCL-38
Unfortunately, funding for the OFCS analysis of the CA-SCL-38 assemblage
was cut before a formal report was completed. Although there is no site report, six topical
reports have been published. The technical report of osteological and dental analysis was
released in 2000 by Robert Jurmain. Jurmain also published a study of traumatic injuries
the following year (Jurmain 2001). Three masters’ theses include Susan Morley’s
paleodemographic reconstruction of the SCL-38 mortuary community (Morley 1997),
Viviana Bellifemine’s analysis of mortuary patterning and cemetery organization
(Bellifemine 1997), and Victoria Wu’s study of pathological lesions in the vertebrae of
six individuals from the site (Wu 1999). Most recently, a study of breastfeeding and
weaning patterns, using stable isotope data from the present study, was published by the
author and colleagues (Gardner et al. 2011). Data from all of these sources, as well as the
original 1993-1994 field notes, burial records, photographs, artifact catalog, and site
maps, will be synthesized in the present study to reconstruct burial context for the
individuals interred in the Yukisma Mound.
Demographic Data from CA-SCL-38
Although previous studies have included estimations of the number of unique
individuals recovered at CA-SCL-38 as well as their biological sex and ages at death,
there are significant discrepancies between the demographic details presented in each
source. The interpretation of skeletal material from this recovery is complicated by
taphonomic, cultural, and historic impacts to the site. Of the 243 gravelots identified by
OHFS, four contained no human bone (Burials 2, 22, 199, and 200). Of the remaining
85
239 gravelots, 86 (34%) contained elements from more than one individual. Observed
commingling may indicate the in situ burial of more than one individual, but might also
be the product of disturbance caused during the excavation, or earlier digging or soil
repurposing by ranchers, farmers, developers and inmates, or even prehistoric reuse of
cemetery soils for new burials. Ambiguity is also a product of researchers’ goals in
evaluating the data. Jurmain (2000) sought to estimate the most likely minimum number
of individuals represented. Morley (1997) was interested in a maximum number for her
demographic analysis. Bellifemine incorporated aspects of both studies in her study of
mortuary context, and focused on individuals for whom the burial location was noted
(1997). For the present study, I reviewed the osteological notes and logic of these
researchers and reconciled them with the original burial records. The details of
reconciliation are presented in Appendix A.
My reconciliation found that an estimated 248 unique individuals were
recovered from the CA-SCL-38 site during the 1993 to 1994 OFCS excavations. Of the
204 adults, 63 were female, 99 were male, and 42 were of indeterminate sex. Among the
43 identified subadults, 15 were infants, 10 were young children (3-5 years old), 12 were
children between 6 and 10 years of age, and 5 were adolescents (see Tables 4 and 5). Age
could not be estimated for the last subadult. The age categories used in this study are
defined in Appendix A, Table A.2
Because the 1993-1994 excavation at the Yukisma Mound was a salvage
effort, the scope of which was determined by construction plans, it is certain that this is
only a portion of the burial population from the site, and these individuals may not be
fully representative of the entire burial population. Nonetheless, some interesting patterns

86
TABLE 4. Demographic Summary of Unique Individuals from CA-SCL-38
Age Class (Years) Male Female Indeterminate Sex Total
Subadults
Infants (0-2) 15 15
Young Children (3-5) 10 10
Children (6-10) 12 12
Adolescents (11-15) 5 5
Subadult Unknown 1 1
Total Subadults 43 43
Adults
Adults (16-40) 78 28 40 156
Elders (Over 41) 21 35 2 58
Total Adults 99 63 42 204
Unknown 1 1
Total 99 63 86 248
are apparent. The underrepresentation of subadults in this collection suggests that some
individuals may have been interred in other locations (Morley 1997:136). With a male-to-
female sex ratio of 1.6:1, it is surprising that 58 percent of all elders recovered at the site
were female (35 of 60). Female survivorship appears to exceed that of males, with 56
percent of represented adult females surviving beyond the age of 41, whereas only 21

87
TABLE 5. Age Classification by Sex for Adults from CA-SCL-38
Age Range Females Males Indeterminate Sex Total
Over 16 0 1 10 11
16-20 5 10 12 27
16-30 2 3 0 5
21-30 9 21 4 34
20+ 3 2 13 18
21-40 2 12 1 15
31-40 6 29 0 35
30+ 1 0 0 1
31-50 6 9 0 15
Over 41 5 0 0 5
41-50 19 12 2 33
Over 51 5 0 0 5
Total 63 99 42 204
percent of represented males lived past their 30s. Morley suggests that low female
mortality during childbearing years may indicate that women were well cared for during
pregnancy and childbirth, or alternatively, that women who did not survive might be
buried elsewhere (Morley 1997:137). She also suggests that high mortality of adult males
may be due to interpersonal aggression or regional conflict (Morley 1997:137). Jurmain
(2001) analyzed patterns of trauma at CA-SCL-38, and also concluded that violence and
88
interpersonal aggression were quite common. The disparity of representation in the
cemetery led Morley to suggest that CA-SCL-38 may have been a “special purpose
cemetery where members of a specific status were interred, specifically males and older
females.” She further states that, “if this is true, the distribution of burial associated
artifacts may eventually support this theory as ongoing research unfolds” (Morley
1997:138). The intention of the current study is to follow up on this suggestion by
correlating mortuary patterns suggesting differential social status or social roles with
dietary patterns to better understand social organization of these early inhabitants of the
Santa Clara Valley.
Mortuary Context at CA-SCL-38
Several aspects of mortuary context are considered here, including funerary
methods, cemetery organization, and burial associations. The first section below will
review funerary methods observed at the Yukisma Mound site, including variation in
interment types (primary or secondary), associated burials, burial posture, burial position,
burial orientation, and special burial preparation (including pre- or post-interment
burning, cremation, and grave furnishings such as rock cairns). The second section will
address cemetery organization, including the spatial clusters identified by Bellifemine
(1997). The third section will present frequencies of burial associations, including
unworked organic materials and artifacts made of bone, stone, and shell. Unfortunately,
no artifacts made of perishable materials (e.g., wood, feathers, fur, reeds or fibers) were
preserved, although these surely would have been present at the time of burial. This
chapter will present tables indicating the frequencies of artifact presence by type, but not
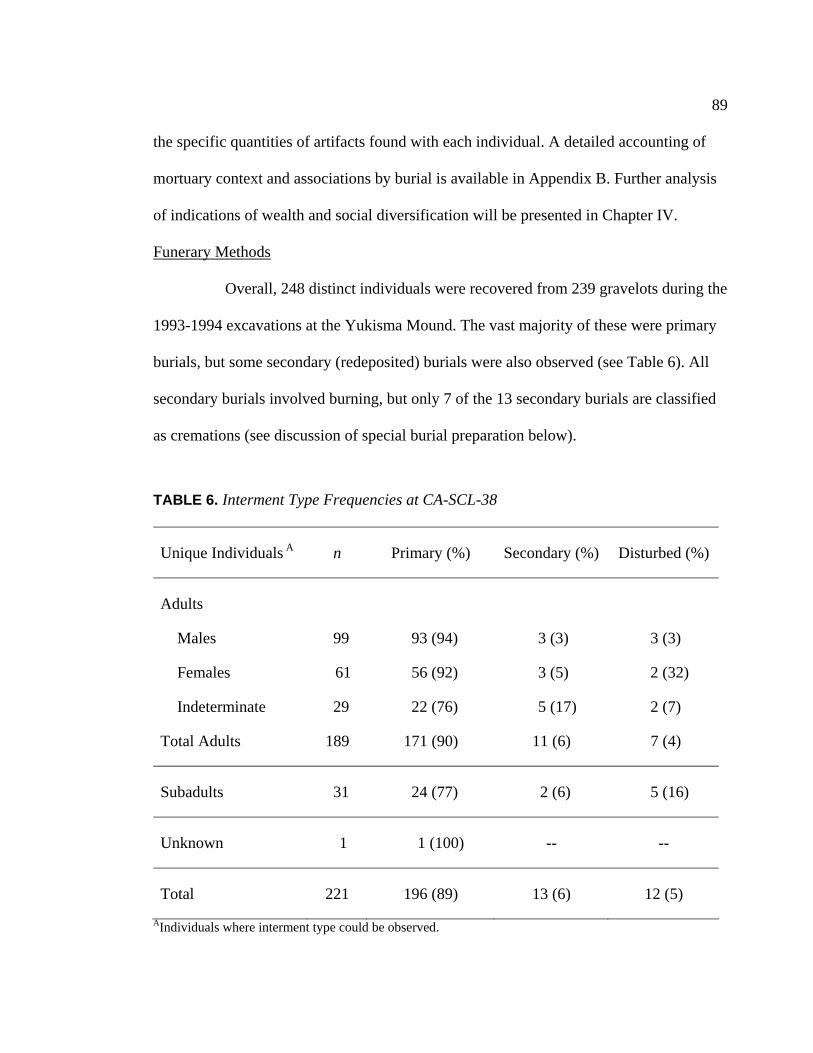
89
the specific quantities of artifacts found with each individual. A detailed accounting of
mortuary context and associations by burial is available in Appendix B. Further analysis
of indications of wealth and social diversification will be presented in Chapter IV.
Funerary Methods
Overall, 248 distinct individuals were recovered from 239 gravelots during the
1993-1994 excavations at the Yukisma Mound. The vast majority of these were primary
burials, but some secondary (redeposited) burials were also observed (see Table 6). All
secondary burials involved burning, but only 7 of the 13 secondary burials are classified
as cremations (see discussion of special burial preparation below).
TABLE 6. Interment Type Frequencies at CA-SCL-38
Unique Individuals A n Primary (%) Secondary (%) Disturbed (%)
Adults
Males 99 93 (94) 3 (3) 3 (3)
Females 61 56 (92) 3 (5) 2 (32)
Indeterminate 29 22 (76) 5 (17) 2 (7)
Total Adults 189 171 (90) 11 (6) 7 (4)
Subadults 31 24 (77) 2 (6) 5 (16)
Unknown 1 1 (100) -- --
Total 221 196 (89) 13 (6) 12 (5)
AIndividuals where interment type could be observed.
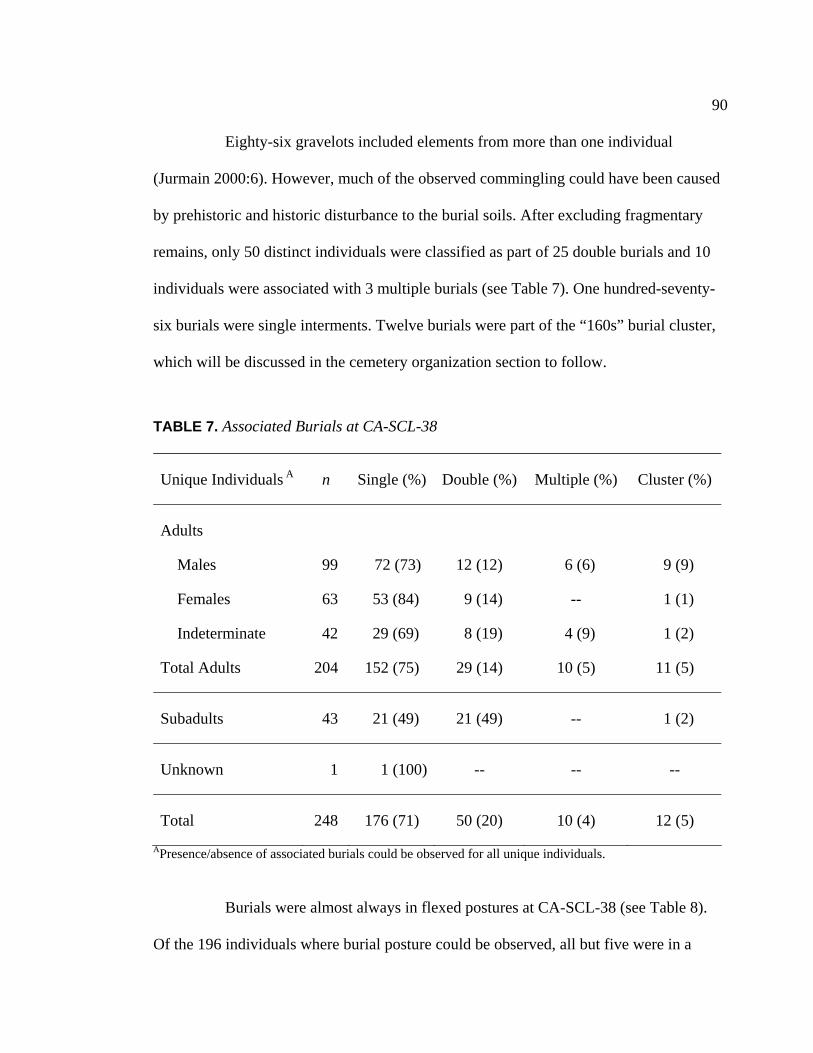
90
Eighty-six gravelots included elements from more than one individual
(Jurmain 2000:6). However, much of the observed commingling could have been caused
by prehistoric and historic disturbance to the burial soils. After excluding fragmentary
remains, only 50 distinct individuals were classified as part of 25 double burials and 10
individuals were associated with 3 multiple burials (see Table 7). One hundred-seventy-
six burials were single interments. Twelve burials were part of the “160s” burial cluster,
which will be discussed in the cemetery organization section to follow.
TABLE 7. Associated Burials at CA-SCL-38
Unique Individuals A n Single (%) Double (%) Multiple (%) Cluster (%)
Adults
Males 99 72 (73) 12 (12) 6 (6) 9 (9)
Females 63 53 (84) 9 (14) -- 1 (1)
Indeterminate 42 29 (69) 8 (19) 4 (9) 1 (2)
Total Adults 204 152 (75) 29 (14) 10 (5) 11 (5)
Subadults 43 21 (49) 21 (49) -- 1 (2)
Unknown 1 1 (100) -- -- --
Total 248 176 (71) 50 (20) 10 (4) 12 (5)
APresence/absence of associated burials could be observed for all unique individuals.
Burials were almost always in flexed postures at CA-SCL-38 (see Table 8).
Of the 196 individuals where burial posture could be observed, all but five were in a

91
TABLE 8. Burial Posture at CA-SCL-38
Unique Individuals A
n Tightly Flexed (%)
Flexed (%)
Semi-Flexed (%)
Extended (%)
Disorganized (%)
Adults
Males 92 80 (87) 3 (3) 6 (7) 2 (2) 1 (1)
Females 59 52 (88) 2 (3) 4 (7) -- 1 (2)
Indeterminate 23 18 (78) 4 (17) -- 1 (4) --
Total Adults 174 150 (86) 9 (5) 10 (6) 3 (2) 2 (1)
Subadults 22 20 (91) 1 (5) 1 (5) -- --
Unknown 0 -- -- -- -- --
Total 196 170 (87) 10 (5) 11 (6) 3 (2) 2 (1)
AIndividuals where burial posture could be observed. flexed position. The most common observation was that burials were tightly flexed, with
the angle between the torso and thighs less than 45 degrees; this included 87 percent of
all individuals, approximately the same percentage for adult males and females, and an
even greater frequency among subadults (20 of 22 observed, or 91%). Only three
individuals were in extended positions, including two adult males and one adult of
indeterminate sex (Burials 52, 142, and 143). None of these burials followed the
patterning of a Windmiller or Meganos style interment. For Burial 52, no lower limbs
were recovered, so the observation of an extended position is uncertain. Burials 142 and
143 were included in a multiple burial at the site (along with 141 and 144), which has
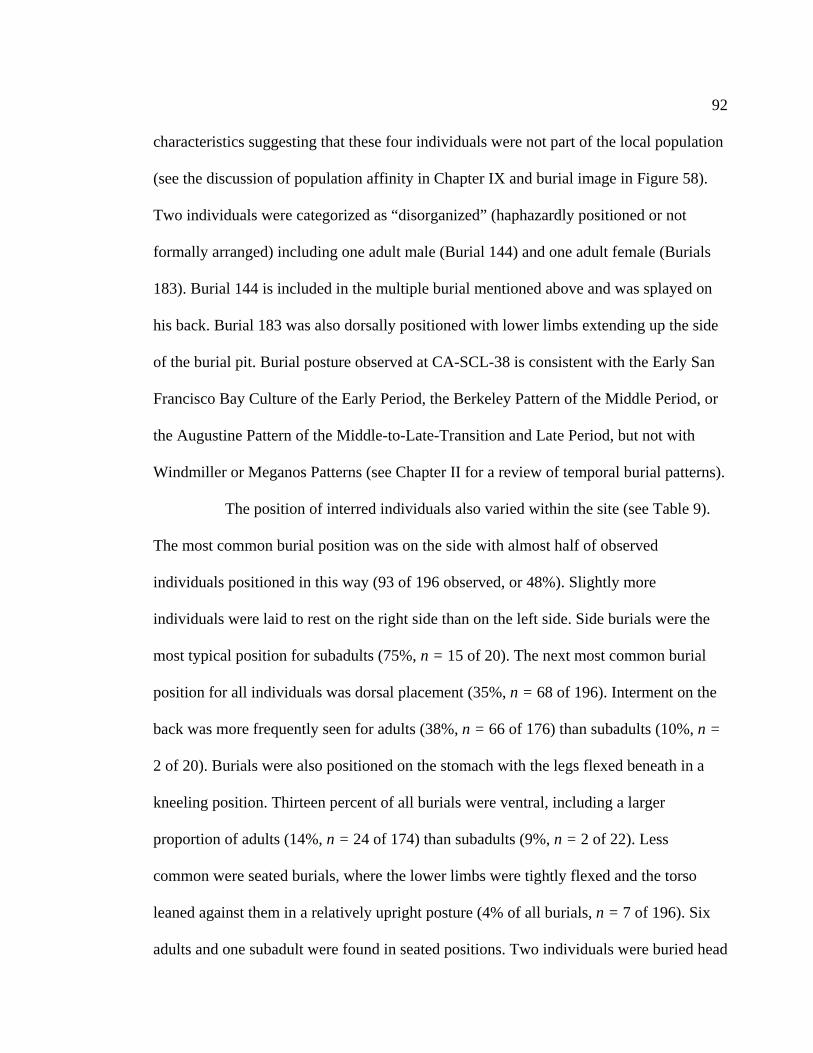
92
characteristics suggesting that these four individuals were not part of the local population
(see the discussion of population affinity in Chapter IX and burial image in Figure 58).
Two individuals were categorized as “disorganized” (haphazardly positioned or not
formally arranged) including one adult male (Burial 144) and one adult female (Burials
183). Burial 144 is included in the multiple burial mentioned above and was splayed on
his back. Burial 183 was also dorsally positioned with lower limbs extending up the side
of the burial pit. Burial posture observed at CA-SCL-38 is consistent with the Early San
Francisco Bay Culture of the Early Period, the Berkeley Pattern of the Middle Period, or
the Augustine Pattern of the Middle-to-Late-Transition and Late Period, but not with
Windmiller or Meganos Patterns (see Chapter II for a review of temporal burial patterns).
The position of interred individuals also varied within the site (see Table 9).
The most common burial position was on the side with almost half of observed
individuals positioned in this way (93 of 196 observed, or 48%). Slightly more
individuals were laid to rest on the right side than on the left side. Side burials were the
most typical position for subadults (75%, n = 15 of 20). The next most common burial
position for all individuals was dorsal placement (35%, n = 68 of 196). Interment on the
back was more frequently seen for adults (38%, n = 66 of 176) than subadults (10%, n =
2 of 20). Burials were also positioned on the stomach with the legs flexed beneath in a
kneeling position. Thirteen percent of all burials were ventral, including a larger
proportion of adults (14%, n = 24 of 174) than subadults (9%, n = 2 of 22). Less
common were seated burials, where the lower limbs were tightly flexed and the torso
leaned against them in a relatively upright posture (4% of all burials, n = 7 of 196). Six
adults and one subadult were found in seated positions. Two individuals were buried head
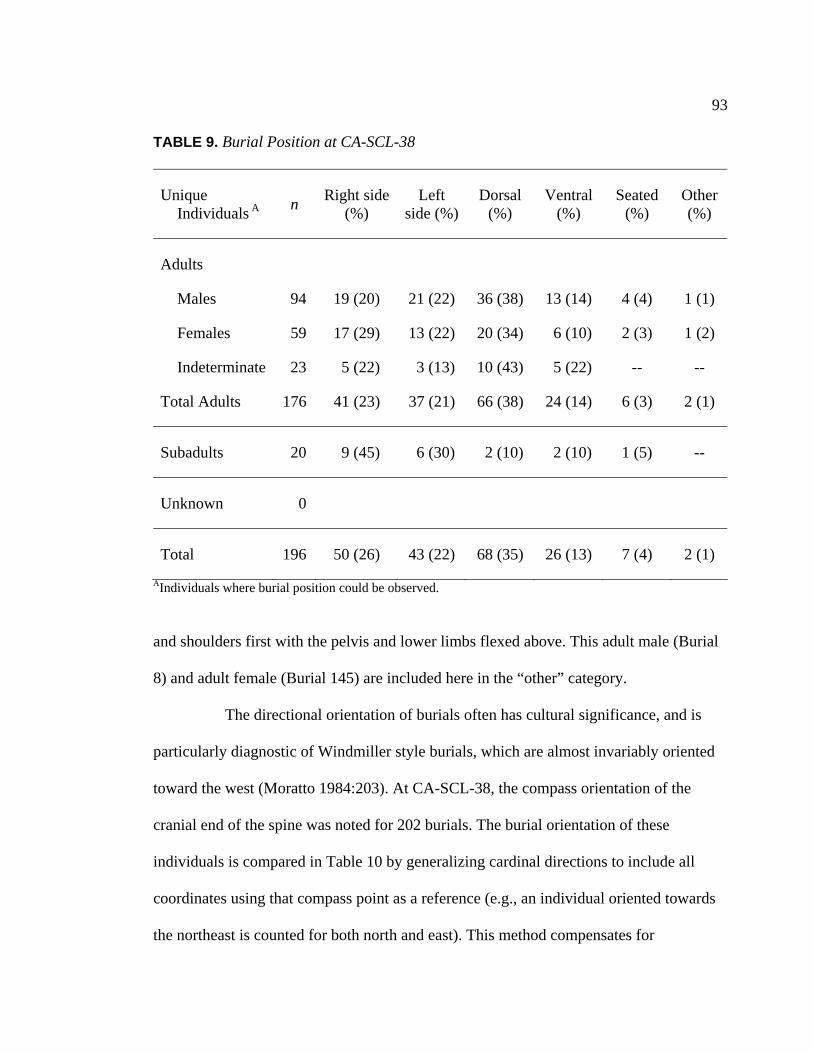
93
TABLE 9. Burial Position at CA-SCL-38
Unique Individuals A
n Right side (%)
Left side (%)
Dorsal (%)
Ventral (%)
Seated (%)
Other (%)
Adults
Males 94 19 (20) 21 (22) 36 (38) 13 (14) 4 (4) 1 (1)
Females 59 17 (29) 13 (22) 20 (34) 6 (10) 2 (3) 1 (2)
Indeterminate 23 5 (22) 3 (13) 10 (43) 5 (22) -- --
Total Adults 176 41 (23) 37 (21) 66 (38) 24 (14) 6 (3) 2 (1)
Subadults 20 9 (45) 6 (30) 2 (10) 2 (10) 1 (5) --
Unknown 0
Total 196 50 (26) 43 (22) 68 (35) 26 (13) 7 (4) 2 (1)
AIndividuals where burial position could be observed. and shoulders first with the pelvis and lower limbs flexed above. This adult male (Burial
8) and adult female (Burial 145) are included here in the “other” category.
The directional orientation of burials often has cultural significance, and is
particularly diagnostic of Windmiller style burials, which are almost invariably oriented
toward the west (Moratto 1984:203). At CA-SCL-38, the compass orientation of the
cranial end of the spine was noted for 202 burials. The burial orientation of these
individuals is compared in Table 10 by generalizing cardinal directions to include all
coordinates using that compass point as a reference (e.g., an individual oriented towards
the northeast is counted for both north and east). This method compensates for

94
TABLE 10. Burial Orientation at CA-SCL-38 A
Unique IndividualsB
n North
NW-N-NE (%)
East NE-E-SE
(%)
South SE-S-SW
(%)
West SW-W-NW
(%)
Adults
Males 93 38 (41) 50 (54) 38 (41) 39 (42)
Females 58 24 (41) 25 (43) 24 (41) 24 (41)
Indeterminate 26 11 (42) 11 (42) 13 (50) 14 (54)
Total Adults 177 73 (41) 86 (49) 75 (42) 77 (44)
Subadults 25 17 (68) 9 (36) 6 (24) 15 (60
Unknown 0 -- -- -- --
Total 202 90 (45) 95 (47) 81 (40) 92 (45)
AIndividuals are tallied by cardinal direction of the cranial end of the spine. When burial position lies between cardinal directions (e.g., northeast), both directions are tallied (e.g., both north and east). BIndividuals where burial orientation could be observed. inconsistencies in directional notation in the excavation records, and highlights trends of
orientation. However, some individuals are tallied twice as a consequence.
In general, no clear patterns in directional preference are seen among the
Yukisma Mound burials. A possible exception is the orientation of subadults, which are
most commonly oriented towards the north or west, although there is considerable
variation. Of the 17 subadults oriented towards the north, 8 are toward the northeast, 1 is
due north, and 8 are northwest. Of the 15 subadults oriented towards the west, 7 are to the
95
northwest, 1 is due west, and 7 are to the southwest. It is not clear whether the trend of
northerly or westerly oriented subadult burials is significant.
All interments at CA-SCL-38 were found in unlined pit graves with indistinct
sidewalls. While many special mortuary preparation techniques may have been practiced,
few are visible in the archaeological record. For example, bodies may have been wrapped
in a blanket of furs, laid to rest on reed mats, or even wrapped within basketry bundles,
but if so, none of these materials have survived. Special preparation that is visible in the
archaeological record includes evidence of burning and the construction of rock cairns.
Fire was a common component of mortuary practice, and included pre- or
post-interment fires as well as cremations. Pre-interment fires were apparent when a layer
of charcoal was found beneath the skeleton, but without evidence of burning on the
human remains. Post-interment fires were noted in the archaeological record when a layer
of soil separated the remains from a layer of charcoal, sometimes including charring of
the remains as well. Localized burning was also noted when a small area of the grave
included charcoal or a small portion of the skeleton exhibited signs of burning. Several
burials which included evidence of burning also included charred faunal materials,
suggesting that offerings of food or goods may have been burned in the grave as part of
the mortuary process. For comparison in the present study, all of these types of burning
have been combined into one category. Cremations and partial cremations are included in
the burning category, and also considered separately. In Table 11, the frequencies of
burning, cremation, and rock cairns at CA-SCL-38 are considered for the 242 burials
where context was recorded.
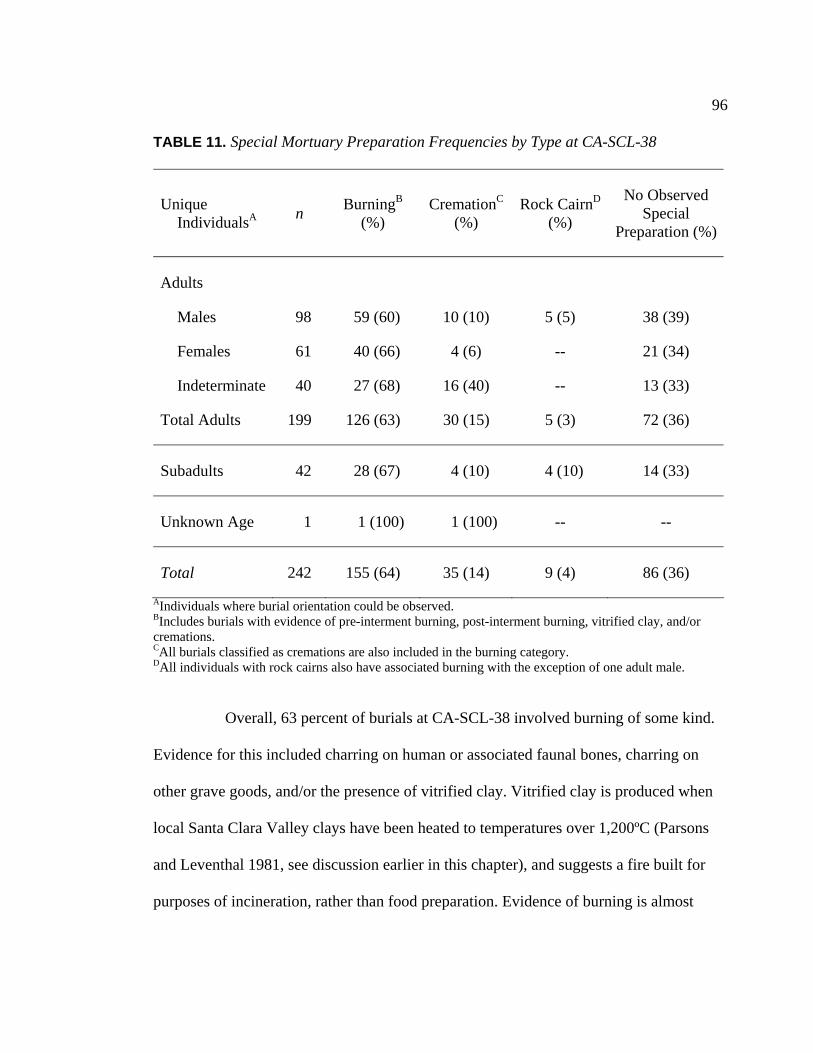
96
TABLE 11. Special Mortuary Preparation Frequencies by Type at CA-SCL-38
Unique IndividualsA
n BurningB
(%) CremationC
(%) Rock CairnD
(%)
No Observed Special
Preparation (%)
Adults
Males 98 59 (60) 10 (10) 5 (5) 38 (39)
Females 61 40 (66) 4 (6) -- 21 (34)
Indeterminate 40 27 (68) 16 (40) -- 13 (33)
Total Adults 199 126 (63) 30 (15) 5 (3) 72 (36)
Subadults 42 28 (67) 4 (10) 4 (10) 14 (33)
Unknown Age 1 1 (100) 1 (100) -- --
Total 242 155 (64) 35 (14) 9 (4) 86 (36)
AIndividuals where burial orientation could be observed. BIncludes burials with evidence of pre-interment burning, post-interment burning, vitrified clay, and/or cremations. CAll burials classified as cremations are also included in the burning category. DAll individuals with rock cairns also have associated burning with the exception of one adult male.
Overall, 63 percent of burials at CA-SCL-38 involved burning of some kind.
Evidence for this included charring on human or associated faunal bones, charring on
other grave goods, and/or the presence of vitrified clay. Vitrified clay is produced when
local Santa Clara Valley clays have been heated to temperatures over 1,200ºC (Parsons
and Leventhal 1981, see discussion earlier in this chapter), and suggests a fire built for
purposes of incineration, rather than food preparation. Evidence of burning is almost
97
equally common for adults (62%, n = 126 of 202) and subadults (67%, n = 28 of 42), and
almost equal between males (60%, n = 59 of 99) and females (63%, n = 40 of 63).
Of the 155 individuals where burning was noted, 35 were classified as
cremations. Cremation was slightly more common for adults (15%, n = 30 of 202) than
for subadults (10%, n = 4 of 42). Due to the transformational effects of cremation on
bone, no meaningful observations can be made regarding frequency of cremation for
males and females. More than half of cremated adults could not be identified by sex.
However, of those identified, there are more males (10%, n = 10 of 99) than females
(6%, n = 4 of 63).
Rock cairns were unusual at the site, and were noted for only nine burials
(4%, n = 9 of 242) when a quantity of rocks, cobbles, or chunks of vitrified clay was
found above, below, or around the human remains. Notably, burials with rock cairns were
exclusively those of adult males (5%, n = 5 of 99) or of subadults (10%, n = 4 of 42). No
adult females or adults of indeterminate sex had associated rock cairns. Of the nine
individuals with rock cairns, all but one (Burial 202, an adult male) also had associated
burning. Two adult males with rock cairns were cremations (Burials 25 and 204). Rock
cairns were not exclusively constructed for primary burials. Two of the interments with
associated rock cairns were secondary (redeposited) burials, including an adult male
(Burial 188) and a subadult between seven and ten years of age (Burial 203).
Mortuary customs, in any place and time, are a richly symbolic reflection of
belief systems about life and death. Observed variation in the placement, positioning,
orientation, or preparation of the dead is a product of the relationship between the social
identity of the deceased and the traditions of the people who buried them, possibly
98
influenced by extenuating factors as well (e.g., weather, location and/or season of death).
Change in mortuary customs through time is certainly a possibility too, but cannot yet be
properly examined with this data set (see discussion of temporal context to follow). A
more complete discussion of the potential social significance of mortuary context will be
presented in Chapter IV (see also Bellifemine 1997 for a thorough investigation of
mortuary variability at CA-SCL-38).
Cemetery Organization
While the scope of excavation at CA-SCL-38 was driven by the parameters of
construction rather that site dimensions, analysis of mortuary patterning in the excavated
portion did reveal spatial organization and statistically significant clustering by
demographic variables and artifact density (Bellifemine 1997). In particular, there was an
overrepresentation of all artifact types in Spatial Cluster 5, the central ring. This cluster
included almost half of the individuals for which coordinates were available (47%, n =
115 of 245). Figure 13 presents the boundaries of Bellifemine’s spatial clusters.
Membership and description of the clusters is summarized in Table 12.
In addition to the spatial clusters identified by Bellifemine, one group of
burials was so closely associated that it was noted as a cluster during excavation (see
Table 7. This cluster was called the “160s” cluster in the field, and included Burials 161
through 169 plus Burials 148 and 184 (all within Spatial Cluster 5). This group was
primarily composed of adult males (75% of individuals in the cluster, n = 9 of 12), but
also included an adult female, an adult of indeterminate sex, and one subadult (Burial
169, a child between 3.5 and 5.5 years of age). The “160s” cluster included no rock
cairns, one partial cremation (Burial 163, an adult male), and six other burials with

99
FIGURE 13. Spatial cluster distribution. Source: Viviana Bellifemine, 1997, Mortuary Variability in Prehistoric Central California: A Statistical Study of the Yukisma Site, CA-SCl-38. Masters thesis, Department of Anthropology, San Jose State University. Used with permission.
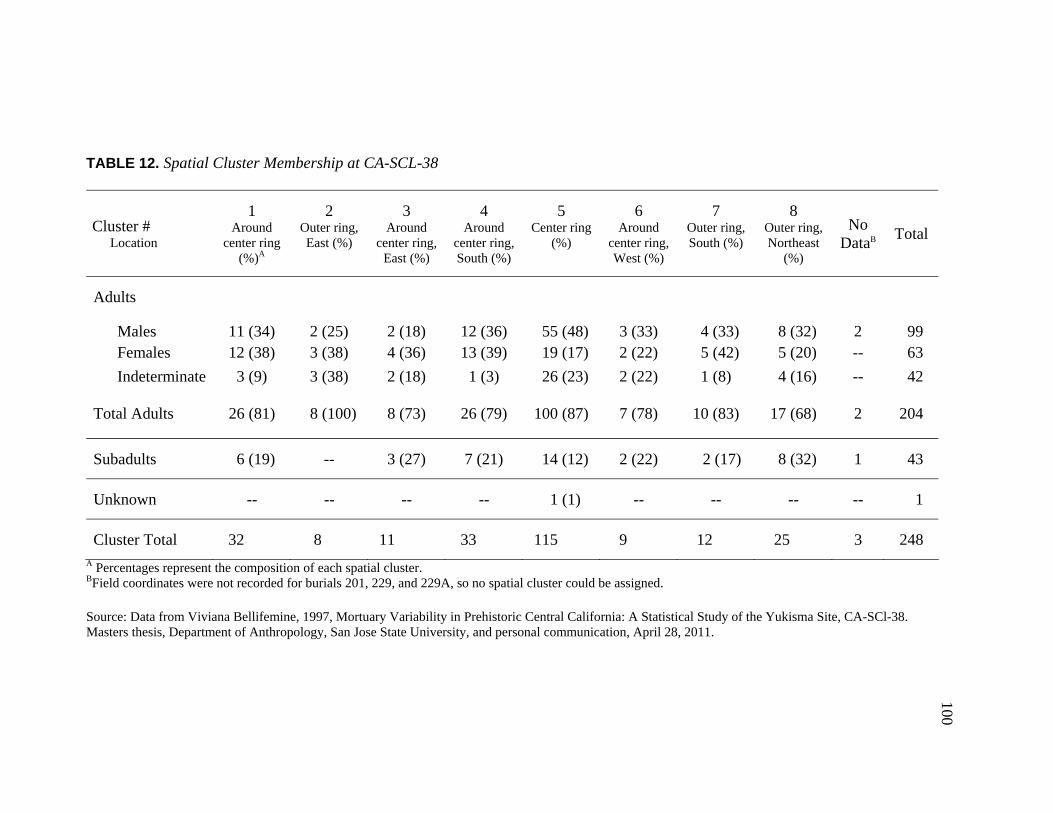
100
TABLE 12. Spatial Cluster Membership at CA-SCL-38
Cluster #
Location
1 Around
center ring (%)A
2 Outer ring, East (%)
3 Around
center ring, East (%)
4 Around
center ring, South (%)
5 Center ring
(%)
6 Around
center ring, West (%)
7 Outer ring, South (%)
8 Outer ring, Northeast
(%)
No DataB Total
Adults
Males 11 (34) 2 (25) 2 (18) 12 (36) 55 (48) 3 (33) 4 (33) 8 (32) 2 99 Females 12 (38) 3 (38) 4 (36) 13 (39) 19 (17) 2 (22) 5 (42) 5 (20) -- 63
Indeterminate 3 (9) 3 (38) 2 (18) 1 (3) 26 (23) 2 (22) 1 (8) 4 (16) -- 42
Total Adults 26 (81) 8 (100) 8 (73) 26 (79) 100 (87) 7 (78) 10 (83) 17 (68) 2 204
Subadults 6 (19) -- 3 (27) 7 (21) 14 (12) 2 (22) 2 (17) 8 (32) 1 43
Unknown -- -- -- -- 1 (1) -- -- -- -- 1
Cluster Total 32 8 11 33 115 9 12 25 3 248 A Percentages represent the composition of each spatial cluster. BField coordinates were not recorded for burials 201, 229, and 229A, so no spatial cluster could be assigned. Source: Data from Viviana Bellifemine, 1997, Mortuary Variability in Prehistoric Central California: A Statistical Study of the Yukisma Site, CA-SCl-38. Masters thesis, Department of Anthropology, San Jose State University, and personal communication, April 28, 2011.

101
evidence of burning (Burials 161, 164, 166, 167, and 168, all adult males, plus one adult
of indeterminate sex, Burial 167A). This cluster within Spatial Cluster 5 may suggest
additional levels of spatial organization within the Yukisma Mound cemetery.
Burial-Associated Artifacts
The objects placed within the grave of an individual may have been personal
possessions, or could be offerings made by the living. Regardless, the nature and quantity
of items associated with the deceased is related to their social role during life. Items
associated with burials from the Yukisma Mound are here divided into unworked organic
remains and artifacts. For the purposes of this paper, artifacts are defined as items in
which labor has been invested to produce a useful object, or items which are associated
with burials but have no obvious utilitarian value, such as distinctive minerals or crystals.
Quantity of artifacts and association with burials were compiled based on the Artifact
Catalog from Ohlone Families Consulting Services and the detailed descriptions and
tables in Bellifemine (1997). Where discrepancies were present between sources, Burial
Record Forms and photos from the excavation were consulted. When these did not
resolve the conflict, the information from Bellifemine was privileged as she had the
opportunity to directly examine many of the artifacts. The artifact collection from SCL-
38 is jointly curated between San Jose State University and the Muwekma Ohlone Tribe.
Additionally, many artifacts were reinterred when the human remains were repatriated in
1996 (see Figure 12). All artifact descriptions to follow rely heavily on the work of
Bellifemine (1997), as well as direct observations when possible.
At the Yukisma Mound, unworked organic materials were associated with the
majority of burials (81%, n = 202 of 248). These materials include shell, faunal bone, and
102
botanical remains, and may have been funerary offerings or remnants of a funerary feast.
Additionally, they may have been midden components, inadvertently associated with
burials as part of grave fill soils or as a result of bioturbation or other soil disturbance.
Without a way to clearly differentiate between intentional offerings and inadvertent
inclusions, all burial-associated organic materials which are not described as culturally
modified in some way are included in Table 13.
Shellfish remains were by far the most commonly associated material, and
were found in 75 percent of graves (n = 186 of 248). Associated shellfish included the
California horn snail (Cerithidea sp.), the California oyster (Ostrea lurida), both bentnose
(Macoma nasuta) and boring clams (not described by species in the artifact log), mussels
(Mytilus sp.), and abalone (Haliotis sp.). Of these species, the horn snails were the most
common, appearing in 66 percent of burials (n = 164 of 248). Mussels, whole abalone,
crab, fish remains, and turtle shell were found infrequently. Unworked faunal bone was
associated with more than half of the burials (57%, n = 142 of 248). Thirteen burials
(5%) had some type of associated botanical remains, including bulbs and seeds
(sometimes charred), wood fragments, and fibers. Bird bone was called out independently
from faunal bone in 31 cases (13%), and is included here if no indication was made in the
artifact log that the bone was a tube or whistle.
Overall, adults were more likely to have unworked organic burial-associated
materials than subadults. Thirty percent of subadults had no associated unworked organic
materials at all (n = 13 of 43), compared to only 16 percent of adults (n = 33 of 204).
While subadults are represented in most categories, the frequency of associations is
always less than that for adult burials. Males and females were almost equally likely to be
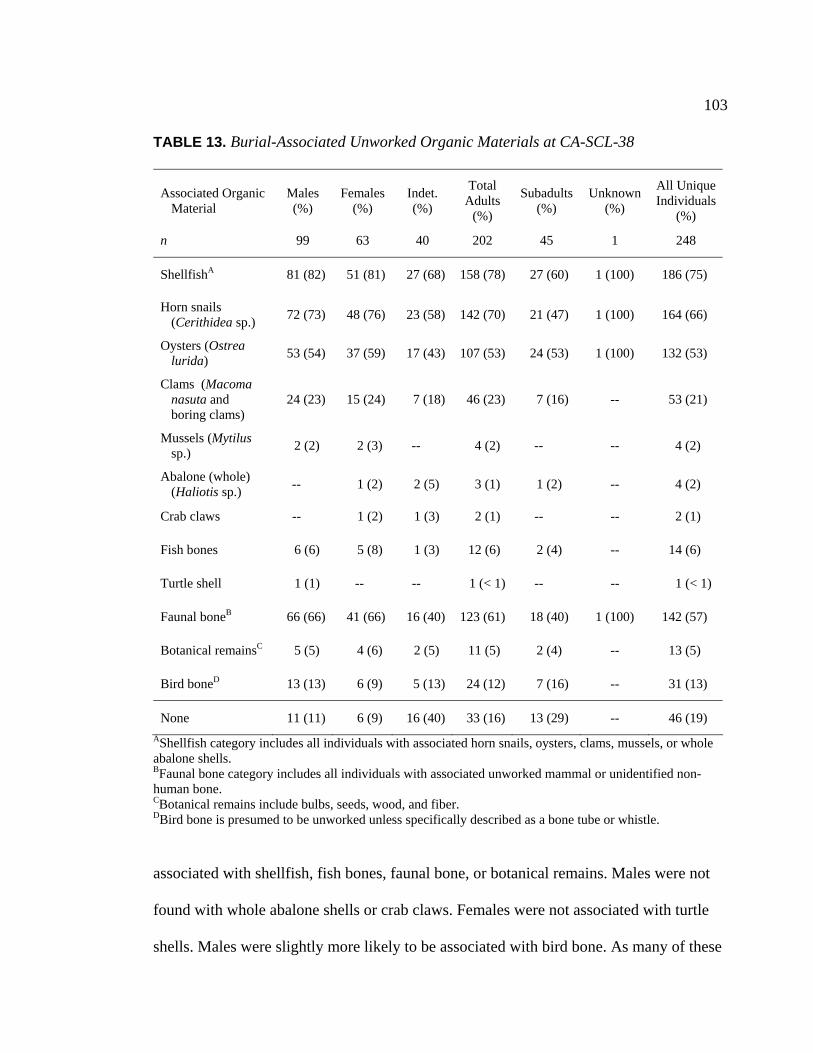
103
TABLE 13. Burial-Associated Unworked Organic Materials at CA-SCL-38
Associated Organic Material
Males (%)
Females (%)
Indet. (%)
Total Adults
(%)
Subadults (%)
Unknown (%)
All Unique Individuals
(%)
n 99 63 40 202 45 1 248
ShellfishA 81 (82) 51 (81) 27 (68) 158 (78) 27 (60) 1 (100) 186 (75)
Horn snails (Cerithidea sp.)
72 (73) 48 (76) 23 (58) 142 (70) 21 (47) 1 (100) 164 (66)
Oysters (Ostrea lurida)
53 (54) 37 (59) 17 (43) 107 (53) 24 (53) 1 (100) 132 (53)
Clams (Macoma nasuta and boring clams)
24 (23) 15 (24) 7 (18) 46 (23) 7 (16) -- 53 (21)
Mussels (Mytilus sp.)
2 (2) 2 (3) -- 4 (2) -- -- 4 (2)
Abalone (whole) (Haliotis sp.)
-- 1 (2) 2 (5) 3 (1) 1 (2) -- 4 (2)
Crab claws -- 1 (2) 1 (3) 2 (1) -- -- 2 (1)
Fish bones 6 (6) 5 (8) 1 (3) 12 (6) 2 (4) -- 14 (6)
Turtle shell 1 (1) -- -- 1 (< 1) -- -- 1 (< 1)
Faunal boneB 66 (66) 41 (66) 16 (40) 123 (61) 18 (40) 1 (100) 142 (57)
Botanical remainsC 5 (5) 4 (6) 2 (5) 11 (5) 2 (4) -- 13 (5)
Bird boneD 13 (13) 6 (9) 5 (13) 24 (12) 7 (16) -- 31 (13)
None 11 (11) 6 (9) 16 (40) 33 (16) 13 (29) -- 46 (19)
AShellfish category includes all individuals with associated horn snails, oysters, clams, mussels, or whole abalone shells. BFaunal bone category includes all individuals with associated unworked mammal or unidentified non-human bone. CBotanical remains include bulbs, seeds, wood, and fiber. DBird bone is presumed to be unworked unless specifically described as a bone tube or whistle.
associated with shellfish, fish bones, faunal bone, or botanical remains. Males were not
found with whole abalone shells or crab claws. Females were not associated with turtle
shells. Males were slightly more likely to be associated with bird bone. As many of these
104
materials are only rarely encountered at this site, it is unclear whether the subtle
differences of distribution between sexes are significant.
Several types of artifacts were associated with burials at CA-SCL-38
including items made from worked bone, chipped stone, ground stone, polished stone,
and worked shell. These items were found with 61 percent of burials (n = 151 of 248);
the remaining individuals had no burial associated artifacts (n = 97 of 248), although
some of these individuals were associated with unworked organic materials. Both the
quantity and variety of artifacts varied significantly between individuals.
Table 14 reports the diversity of artifact types found with unique individuals
at CA-SCL-38. This table does not reflect the quantity of associated artifacts, but rather
counts how many types of artifacts are associated with each burial. Types include scapula
saws, bone strigils (sweat scrapers), bone awls, bone needles, antler wedges, other bone
implements, projectile points, other chipped stone artifacts (excluding debitage), mortars,
pestles, manos, abraders, stone beads, Haliotis pendants, clam shell pendants, bone
pendants, shell beads, bone tubes or whistles, stone pipes, stone spoons, charmstones,
magic stones, cinnabar, stingray points, antler, and claws or non-human teeth. Projectile
points are counted only if they are not directly associated with traumatic injury
(imbedded or otherwise very suggestive of traumatic association). Descriptions of each
artifact type are included in the detailed review of artifact presence later in this chapter.
All but 14 individuals (6%) had four artifact types or fewer. Of the 14 most
diverse artifact caches, 7 were associated with males, 4 with females, 2 with adults of
indeterminate sex, and only 1 with a subadult (Burial 178, a child between two and four
years of age). The significance of variation in artifact type distribution will be explored

105
TABLE 14. Number of Artifact Types with Burials at CA-SCL-38
Associated Artifact TypesA
Males (%)
Females (%)
Indet. Adults
(%)
Total Adults
(%)
Subadults (%)
Unknown Age (%)
All Unique Individuals
(%)
0 29 (30) 21 (33) 17 (40) 67 (33) 30 (70) -- 97 (39)
1 21 (21) 18 (29) 15 (36) 54 (26) 6 (14) -- 60 (24)
2 16 (16) 13 (21) 3 (7) 32 (16) 4 (9) -- 36 (15)
3 15 (15) 4 (6) 5 (12) 24 (12) -- -- 24 (10)
4 11 (11) 3 (5) -- 14 (7) 2 (5) 1 (100) 17 (7)
5 3 (3) 1 (2) -- 4 (2) 1 (2) -- 5 (2)
6 3 (3) 1 (2) 1 (2) 5 (2) -- -- 5 (2)
7 1 (1) 1 (2) -- 2 (1) -- -- 2 (1)
8 -- -- -- -- -- -- --
9 -- -- 1 (2) 1 (< 1) -- 1 (< 1)
10 -- 1 (2) -- 1 (< 1) -- -- 1 (< 1)
Totals 99 63 42 204 43 1 248 AArtifact types include scapula saws, bone strigils, bone awls, bone needles, antler wedges, other bone implements, projectile points not directly associated with traumatic injury, other chipped stone artifacts (excluding debitage), mortars, pestles, manos, abraders, stone beads, Olivella shell beads, Haliotis pendants, clam shell pendants, bone pendants, bone tubes or whistles, stone pipes, stone spoons, charmstones, magic stones, cinnabar, stingray points, antler, and claws or non-human teeth. Unworked faunal and botanical materials are not included in this metric. Each type listed here is counted as 1 toward the total artifact type regardless of how many of these items were associated with the burial. Specific descriptions of each artifact type are presented elsewhere in this text.
further in Chapter IV when considering indicators for social differentiation. Variation in
quantity of associations will also be discussed in Chapter IV.
As a first step towards thinking about the many types of artifacts present at
CA-SCL-38, I have divided them according to the categories proposed by Binford
(1962). The first category is technomic artifacts, which includes functional, practical
objects associated with meeting the basic needs of life (e.g., procurement of food and
shelter, protection). The second category is sociotechnic artifacts, which are symbols of
106
social status, functioning “as the extra-somatic means of articulating individuals one with
another into cohesive groups capable of efficiently maintaining themselves and of
manipulating the technology” (Binford 1962:219). The third category is ideotechnic
artifacts, which are ritual objects whose “primary functional context (is) in the
ideological component of the social system” (Binford 1962:219). When categorizing
artifact types, I have chosen the more conservative interpretation of artifact function
when more than one option is possible.
Technomic Artifacts. Among the artifact types classified here as technomic
are bone implements (scapula saws, awls, needles, antler wedges, and other bone),
chipped stone artifacts (projectile points not associated with trauma, and other chipped
stone), and groundstone artifacts (mortars, pestles, manos and abraders). The frequency
for each artifact type is presented in Table 15.
Technomic Bone Artifacts. The following is an overview of burial-associated
artifacts from SCL-38 made of worked bone or antler.
1. Scapula saws. These objects are created from faunal scapulae, with serrations
along the axillary or coricoid borders, intact glenoid fossae, and often use-wear polish
along the edges. Their significance is uncertain, but the most promising interpretation
comes from Bennyhoff (1953:269), who proposed that these implements were used in the
Bay Area to cut grass (tule). Other interpretations include use as fleshers (Gifford 1940;
Schenck 1926) or bark shredders (Harrington 1933). At SCL-38 they are found only with
adults, and as commonly with males as with females. An example is provided in Figure
14.

107
TABLE 15. Unique Individuals with Burial-Associated Technomic Artifacts at CA-SCL-38
Burial-Associated Technomic Artifacts
Males (%)
Females (%)
Indet. (%)
Total Adults
(%)
Subadults (%)
Unknown (%)
All Unique Individuals
(%)
n 99 63 42 204 43 1 248
Bone Artifacts
Scapula saws 5 (5) 4 (6) -- 9 (4) -- -- 9 (4)
Bone strigils -- 3 (5) 1 (2) 4 (2) -- -- 4 (2)
Bone awls 8 (8) 2 (3) 1 (2) 11 (5) -- -- 11 (4)
Bone needles 2 (2) 1 (2) -- 3 (1) -- -- 3 (1)
Antler wedges 2 (2) 1 (2) 1 (2) 4 (2) -- -- 4 (2)
Other bone 3 (3) -- 1 (2) 4 (2) -- -- 4 (2)
Any technomic bone
18 (18) 8 (13) 4 (10) 30 (15) -- -- 30 (12)
Chipped stone artifacts
Projectile pointsC 9 (9) 3 (5) 5 (12) 17 (8) -- -- 17 (7)
Other chipped stoneD 16 (16) 7 (11) 5 (12) 28 (14) 3 (7) -- 31 (13)
Any chipped stoneE 23 (23) 10 (16) 9 (21) 42 (21) 3 (7) -- 45 (18)
Groundstone artifacts
Mortars 9 (9) 8 (13) 2 (5) 19 (9) 1 (2) 1 (100) 21 (8)
Pestles 12 (12) 11 (17) -- 23 (11) 4 (9) 1 (100) 28 (11)
Manos -- 2 (3) 1 (2) 3 (1) -- -- 3 (1)
Abraders 1 (1) -- 1 (2) 2 (1) -- -- 2 (1)
Any groundstoneF 18 (18) 15 (24) 1 (2) 34 (17) 3 (7) 1 (100) 38 (15)
No technomic artifacts
56 (57) 39 (62) 31 (74) 126 (62) 37 (86) -- 163 (67)
ADefinition of technomic from Binford 1962. BAny technomic bone category includes scapula saws, bone awls, bone needles, antler wedges, other bone. CProjectile point count excludes points embedded in bone or very likely involved in traumatic injury. DOther Chipped Stone includes flakes, cores, and cobbles. Materials include chert, obsidian, rhyolite, and basalt. EAny Chipped Stone totals all individuals with projectile points and/or other chipped stone. FAny Groundstone includes mortars, pestles, manos and abraders.

108
FIGURE 14. Technomic bone implements from CA-SCL-38. (Top): Scapula saw, isolate. (Bottom left): Bone awls associated with B93 and B132. (Bottom right): Needles associated with B179. Photos by author.
2. Strigils. A strigil is a serrated side-bladed scraper made from a mammal rib,
with one end worked “to a rounded point” (Gifford 1940). At SCL-38, all strigils were
serrated ribs from large mammals, but species could not be determined (see Figure 15).
Gifford describes these tools as sweat removers. In 1775, Fages noted of the Rumsen
(southern Ohlone) that these tools were “always carr(ied) for the purpose of scraping off
their perspiration while in the bath and during the fatigue of their marches” (Fages
1937:65-67, as cited in Milliken 1987:24). Fages also observed that these “spatulas of
bone” were used for conflict resolution in ritualized battles, where quarrels were ended
with the first drawing of blood, whereupon the combatants “become reconciled as

109
FIGURE 15. Bone strigil found with B93, CA-SCL-38. (Illustration by Glen Wilson) Source: Viviana Bellifemine, 1997, Mortuary Variability in Prehistoric Central California: A Statistical Study of the Yukisma Site, CA-SCl-38. Masters thesis, Department of Anthropology, San Jose State University. Used with permission. friends, even when redress of the greatest injury is sought” (Fages 1937:65-67, as cited in
Milliken 1987:24). In the assemblage at SCL-38, a total of four strigils were found with
burials, associated with three adult females (burials 63, 67, and 93) and one young adult
of indeterminate sex (burial 225).
3. Bone awls. Awls are single-pointed bone implements without eyes or grooves
for cord attachment (Figure 14), thought to be used for making coiled basketry or
weaving nets or fish traps, and possibly perforating of hides (Gifford 1940:168; Stimpson
2007:168). At SCL-38, bone awls were found only with adults and more frequently with
males than females.
4. Bone needles. Bone needles are smaller than awls and are perforated (Figure
14). They may have been used to pass cord through basketry or to suspend the tool
around the neck or from another object (Gifford 1940). Needles were found with three
adults at SCL-38, one female and one male with one needle each, and one male with two
needles.
110
5. Antler wedges. Antler wedges are sharpened at the distal end, and may have
been used to split planks or lumber (Gifford 1940:182). Locally, they are most commonly
associated with Middle Period sites and are typically found with males (Hylkema
2007:310). At SCL-38, a wedge was found with two males, one female, and one adult of
indeterminate sex. Again, no subadults were buried with antler wedges.
6. Other bone implements. Of the three other bone objects with adult males, one
was a bipointed tool (with B97), one a bone pin with groove (with B182, probably a
needle of a different form), and the last was described only as “worked bone” (with B69).
The bipointed tool and bone pin were likely used for basketry, weaving of nets or fish
traps, or hide preparation. The other bone object with an adult female (B122) was also
only described as “worked bone.” The object with the indeterminate adult was identified
as a bullroarer in the artifact catalog, and this item merits further discussion.
The young adult buried with the possible bullroarer (B227) was found to be of
indeterminate sex and between 15 and 19 years of age at the time of death by Jurmain
(2000:130), although identified by Morley (1997) as female. This individual had a severe
cleft palate, described as follows:
Very deformed palate, deep and narrow, open at midline (at max. separation = 5 mm). Also appears open on facial view; anterior dentition is crowded; nose also deformed; nasal aperture remodeled superiorly with hypertrophic bone on right superior margin. [Jurmain 2000:146]
A congenital defect such as this would have affected appearance and the ability to speak.
Without tissue closure at the roof of the mouth, problems with articulation of consonants
as well as control of air pressure for speech would make normal diction impossible, and
compensation with grunts or growling sounds is common in children with unrepaired

111
palates (Cleft Palate Foundation 2001). Additionally, ear infections are common in
children with cleft palates, which can further impair language acquisition.
A bullroarer is a worked piece of bone or wood suspended at the end of a cord,
which is spun rapidly to produce sound that carries across great distances. This particular
object was 21 centimeters long, made of bone (possibly sea mammal), hollowed and
flanged (Bellifemine 1997:167) (see Figure 16). The use of bullroarers by northern
Costanoan groups was noted by Harrington (1942) based on interviews with tribal
members in the early twentieth century. Harrington classifies these items as musical
instruments and amusements (Harrington 1942:28).
The classification as a technomic object in this case is my interpretation of the
object’s probable use in this context. I believe this item may have been an innovative
adaptation, providing an alternative voice for this individual. There may have been ritual
or spiritual implications as well, however no other worked artifacts or ideo-technic
objects were found with this individual, making a utilitarian interpretation more
parsimonious.
Technomic Chipped Stone Artifacts. The following is an overview of burial-
associated non-imbedded projectile points and other chipped stone tools. A discussion of
tool form and function is included in Chapter V. Burial associations are presented in
Appendix B. See Bellifemine (1997:133, Table 4-17) for details of projectile point and
biface attributes.
1. Projectile points. Sixteen obsidian projectile points and four obsidian biface
tool fragments were included with burials at SCL-38. Two of these were found lodged
between vertebrae (B140 and B171), and so are excluded from this artifact count due to

112
FIGURE 16. Bullroarer found with B227. (Illustration by Glen Wilson) Source: Viviana Bellifemine, 1997, Mortuary Variability in Prehistoric Central California: A Statistical Study of the Yukisma Site, CA-SCl-38. Masters thesis, Department of Anthropology, San Jose State University. Used with permission.
the high probability that they were introduced by traumatic injury rather than included as
grave offerings. Four additional point fragments were imbedded in bone (Burials 91, 142,
143, and 161) and are also excluded from the present count. The remaining eighteen
points or bifaces were found within or near human remains, but cannot unambiguously be
considered as evidence of interpersonal violence. At the same time, in no case does the
burial context rule out violence or clearly suggest that the implements were grave

113
offerings. Projectile points were associated only with adults, and more frequently with
males than females, although five points (31%) were associated with adults of
indeterminate sex. Individuals found with projectile points and no other chipped stone
included seven adult males, three adult females, and four adults of indeterminate sex. One
adult male (Burial 81) had two associated non-traumatic points.
2. Other chipped stone. Chipped stone tools found with burials at SCL-38
included 24 cores, 4 assayed cobbles, 12 utilized flakes, and 5 modified flakes. A
hammerstone is used to break flaked tools off of a stone core. Cores which are no longer
useful are assayed cobbles (Hylkema and Leventhal 2007). Utilized flakes are the
primary stone tools generated while knapping and possess one or more sharp edges,
useful for cutting, shaving, whittling, or scraping. Modified flakes have been retouched to
produce specialized edges or contours (Hylkema and Leventhal 2007:332). Additional
discussion of chipped stone functions and reconciliation with Bellifemine (1997) are
presented in Chapter V.
Chipped stone tools were primarily found in association with adults, and males
were slightly more likely than females to be interred with these items, although
Bellifemine found no statistical correlation between chipped stone tools and either age or
sex (Bellifemine 1997:129). Three subadults were associated with chipped stone tools,
including an infant (B155) and an adolescent (B75), each buried with a utilized flake, and
a young child (B177) buried with an assayed cobble (Bellifemine 1997:127).
Technomic Groundstone Artifacts. Ground stone tools are those shaped by
pecking or grinding to create a smooth, sculpted surface. A more thorough analysis of

114
SCL-38 groundstone is presented in Chapter V, as artifactual evidence of subsistence
(also see Bellifemine 1997; Buonasera 2012).
1. Mortars. Mortars are concave ground stone forms used as receptacles for
grinding, crushing, or pounding of foods (e.g., acorns, nuts, grass seeds, or small
mammals) or other materials (e.g., pigments, minerals, or medicines) (Mikkelsen 1985).
Twenty-two mortars were recovered at SCL-38, associated with 21 graves (for
reconciliation with Bellifemine (1997) and details of non-burial-associated mortars,
please see discussion of mortars in Chapter V). Mortars at SCL-38 were predominately
made of greywacke sandstone, but materials also included softer sandstone (the small
mortar found with B21) and red andesite (the large show mortar found with B240).
Mortar types used in identification follow the classification system of Buonasera (2012),
with the quantity of burial-associated mortars from SCL-38 noted after the definitions:
A. Small cobble mortars which can be held in one hand (n = 1).
B. Dished mortars with a gently sloping concavity (consistent with
“hopper” forms, but avoiding the specific use-associations of that term) (n = 7).
C. Conical mortars with concavities which are cone-shaped or parabolic
(n = 3).
D. Bowl mortars with concavities which are U-shaped (n = 3, see Figure
17).
E. Flower-pot mortars, which are formally shaped both inside and out, with
straight sides or a slight-waist, a formal rim with a beveled interior, straight interior
walls, and a flat or parabolic well base (n = 5, see Figure 18).

115
FIGURE 17. Bowl mortar associated with B45 and pestle from B28, CA-SCL-38. (Photo by author)
FIGURE 18. Show mortar with shell appliqué on rim, associated with B240, CA-SCL-38. (Photo by author)

116
F. Other mortars which do not fit in the previous categories (n = 1,
unfinished).
The frequency of mortar association with adult males and females is essentially the
same, and a mortar was associated with one subadult (B137, age three to four years).
Additionally, one mortar placed over the remains of an adult female (B120) held the
bones of an infant (B119). Flower-pot mortars may be symbols of status, and were
associated with two adult males (B13 and B240), one adult female (B72), one child of
three to four years (B137), and an individual of indeterminate age and sex (B40). The
small cobble mortar may have been a ritual object, and was associated with an adult of
indeterminate sex (B21).
2. Pestles. Pestles are elongated groundstone forms, round or ovate in cross-
section, used in conjunction with mortars to grind or pound materials. At SCL-38, 41
pestles and pestle fragments were associated with 28 human burials. All of these were
made from greywacke sandstone. (Again, please see Chapter V for reconciliation of
pestle quantity and further detail about form and function). Of the burial-associated
pestles which could be measured, thirteen were of “medium length,” between 11 and 35
centimeters, and 24 were “long,” measuring as much as 64 centimeters. Medium length
pestles were likely used to grind or pound foods in mortars, although one found with a
child (artifact B178-10) had pigment residue on one end (Bellifemine 1997:142). Long
pestles are more likely to have been associated with preparing large quantities of foods
for feasts, or may have served symbolic purposes as mortuary goods (see Figure 17 for an
example). Pestles were more frequently found with adults than subadults, including both
males and females, and there was no clear correlation between pestle length and sex.

117
3. Manos. Manos or handstones are rounded cobbles, shaped to fit comfortably in
the hand, used for grinding foods or other materials. Three burial-associated manos were
found at SCL-38, all made from greywacke sandstone beach cobbles. All were associated
with adults, including two females and one adult of indeterminate sex.
4. Abraders. Abraders are unmodified sandstone cobbles, used for crushing or
grinding. Of the two abraders found with burials, one is a small sandstone pebble (with
B21, an adult of indeterminate sex) and the other was a rhyolite cobble (with B121, an
adult male) (Bellifemine 1997:148).
Sociotechnic Artifacts. The artifact types classified here as sociotechnic are
those which seem to be unambiguously associated with social identity, social status, or
wealth, including beads made of shell or stone and pendants made of shell or bone. These
classifications are based on both ethnohistoric accounts and the consensus of
archaeologists who have worked in this region (e.g., Bellifemine 1997; Cartier et al.
1993; Hylkema 2007; Leventhal 1993). Because these objects served symbolic functions,
their forms may have been heavily influenced by cultural trends and agents of power.
Additionally, most of the materials and the beads and pendants themselves were imported
(Eerkens 2009), and so are subject to fluctuations in trade networks and the preferences
of distant polities. Consequently, bead and pendant forms appear to have changed over
time, and are used as a proxy for dating in California archaeology (this will be explored
later in Chapter III). The presence of each sociotechnic artifact type is noted in Table 16.
The variation in quantity of beads and pendants found with individuals is introduced in
Table 17 and will be discussed further in Chapter IV.

118
TABLE 16. Presence of Burial-Associated Sociotechnic Artifacts at CA-SCL-38
Burial-Associated SociotechnicA Artifacts
Males (%)
Females (%)
Indet. (%)
Total Adults
(%)
Subadults (%)
Unknown (%)
All Unique Individuals
(%)
n 99 63 42 204 43 1 248
Beads
Shell (Olivella) 45 (45) 23 (37) 14 (35) 82 (41) 10 (22) 1 (100) 93 (38)
Stone beads 2 (2) -- 1 (2) 3 (1) -- -- 3 (1)
Any beadsB 45 (45) 23 (37) 14 (35) 82 (41) 10 (22) 1 (100) 93 (38)
Pendants or Ornaments
Abalone (Haliotis) 29 (29) 14 (22) 9 (23) 52 (26) 5 (11) 1 (100) 58 (23)
Mussel or clam shellC 3 (3) -- -- 3 (1) -- -- 3 (1)
Bone pendants -- 2 (3) 1 (3) 3 (1) -- -- 3 (1)
Any Pendants or OrnamentsD 30 (30) 14 (22) 10 (25) 54 (27 5 (11) 1 (100) 60 (24)
No sociotechnic artifacts 47 (47) 33 (52) 22 (55) 102 (50) 35 (78) -- 137 (55) ADefinition of sociotechnic from Binford 1962. BAny Bead category includes all individuals with Olivella shell beads or stone beads. All individuals with associated stone beads at CA-SCL-38 also have Olivella shell beads. CPendants are described as clam shell in the Artifact Catalog and Bellifemine (1997), but the example viewed by the author was a freshwater pearl mussel (Margaritafera margaritafera), see Figure 21. DAny Pendants or Ornaments category includes all individuals with Haliotis, clam shell or bone ornaments or pendants.
At SCL-38, 38 percent of individuals were buried with beads, and 23 percent
with pendants or other ornaments. Slightly more than half of all individuals (55%) were
buried with no beads or ornaments whatsoever. The presence of both beads and
ornaments is more common in adult burials (40% and 26% respectively), but was also
noted with subadults (23% and 12% respectively).
1. Shell and stone beads. Bead types were classified by Bellifemine (1997:70-
74), following Bennyhoff and Hughes (1987) with minor practical modifications (see
Figure 19). Four classes of Olivella shell beads were identified, including spire-lopped

119
TABLE 17. Burial-Associated Shell Beads by Bead Quantity at CA-SCL-38
Burial-Associated SociotechnicA Artifacts
Males (%)
Females (%)
Indet. (%)
Total Adults
(%)
Subadults (%)
Unknown (%)
All Unique
Individuals (%)
n 99 63 42 204 43 1 248
# Shell Beads
None 54 (55) 40 (63) 27 (64) 121 (59) 34 (79) -- 155 (63)
1-10 10 (10) 12 (19) 7 (17) 29 (14) 4 (9) 1 (100) 34 (14)
11-50 3 (3) 1 (2) 2 (5) 6 (3) 1 (2) -- 7 (3)
51-100 3 (3) 1 (2) 3 (7) 7 (3) 1 (2) -- 8 (3)
101-500 11 (11) 7 (11) 3 (7) 21 (10) 3 (7) -- 24 (10)
501-1000 9 (9) 2 (3) -- 11 (5) -- -- 11 (4)
Over 1000 9 (9) -- -- 9 (4) -- -- 9 (4)
(Class A), callus or bushing (Class K), thick rectangle (Class L), and thin rectangle (Class
M).
Description and further discussion of bead types is included in the temporal
analysis, later in this chapter (see also Bellifemine 1997). Details of bead association
quantities by individual are presented in Appendix B, Table B.2.
Quantities of beads found with individuals varied by sex and age (see Table 17). Of
the 33,081 total shell beads found at the site, more than 28,000 (67%) were associated
with males. The seventeen individuals with the largest caches of shell beads were all
male, and together possessed 20,602 beads (7% of total unique individuals with 62% of
all beads found at the site). Ten subadults (22%) were found with associated beads. Half
of these subadults had less than ten beads, but a few had more than 100. Burial 41, a child
about ten years of age, had 109 shell beads, but no other artifact types. Burials 137 and
178, both young children under five years of age, had larger bead lots (381 and 299,
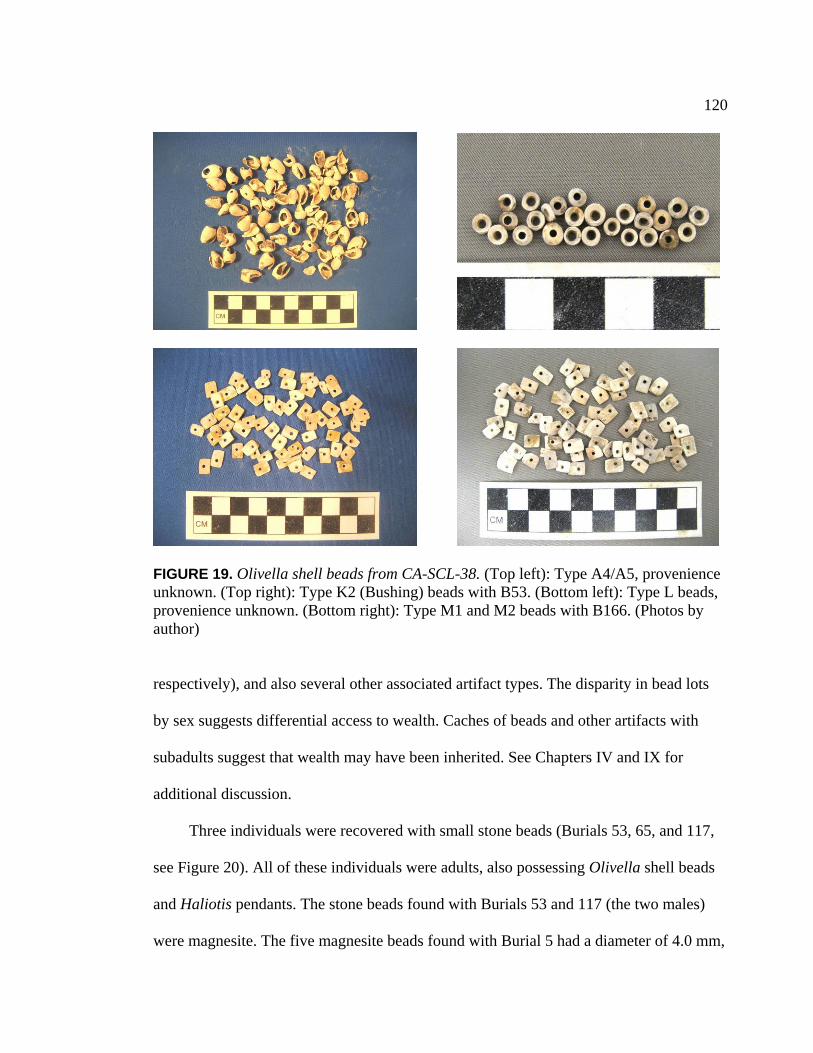
120
FIGURE 19. Olivella shell beads from CA-SCL-38. (Top left): Type A4/A5, provenience unknown. (Top right): Type K2 (Bushing) beads with B53. (Bottom left): Type L beads, provenience unknown. (Bottom right): Type M1 and M2 beads with B166. (Photos by author) respectively), and also several other associated artifact types. The disparity in bead lots
by sex suggests differential access to wealth. Caches of beads and other artifacts with
subadults suggest that wealth may have been inherited. See Chapters IV and IX for
additional discussion.
Three individuals were recovered with small stone beads (Burials 53, 65, and 117,
see Figure 20). All of these individuals were adults, also possessing Olivella shell beads
and Haliotis pendants. The stone beads found with Burials 53 and 117 (the two males)
were magnesite. The five magnesite beads found with Burial 5 had a diameter of 4.0 mm,
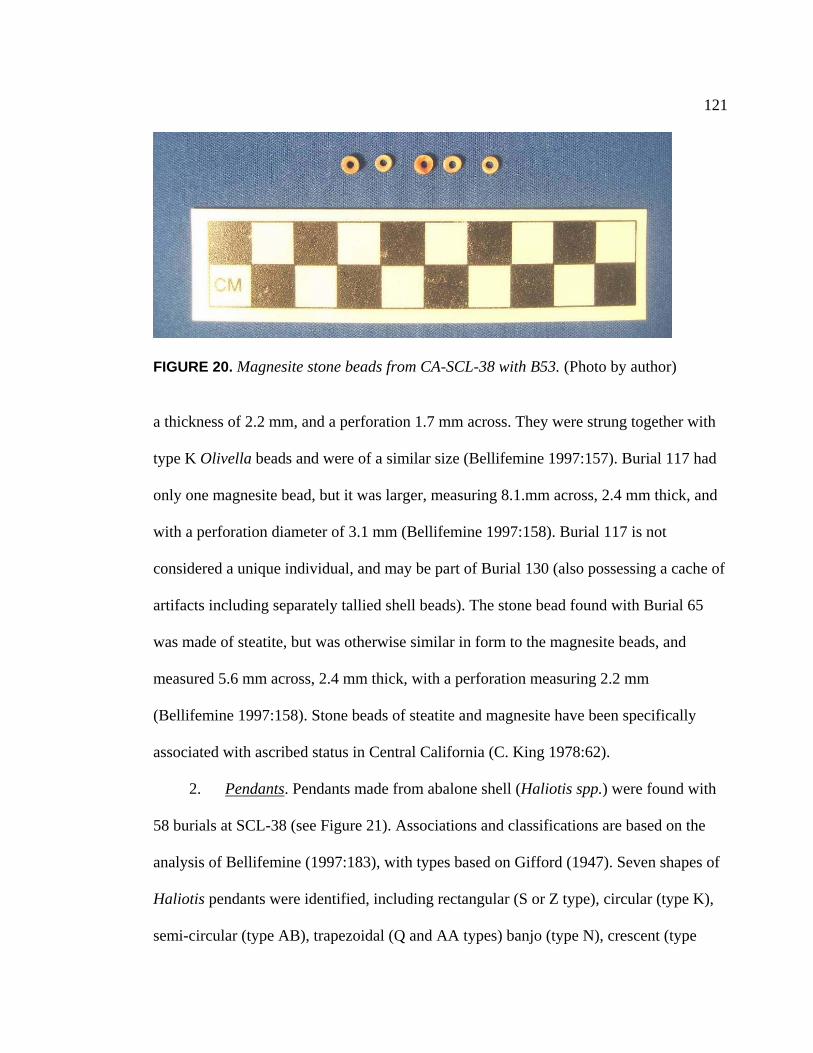
121
FIGURE 20. Magnesite stone beads from CA-SCL-38 with B53. (Photo by author) a thickness of 2.2 mm, and a perforation 1.7 mm across. They were strung together with
type K Olivella beads and were of a similar size (Bellifemine 1997:157). Burial 117 had
only one magnesite bead, but it was larger, measuring 8.1.mm across, 2.4 mm thick, and
with a perforation diameter of 3.1 mm (Bellifemine 1997:158). Burial 117 is not
considered a unique individual, and may be part of Burial 130 (also possessing a cache of
artifacts including separately tallied shell beads). The stone bead found with Burial 65
was made of steatite, but was otherwise similar in form to the magnesite beads, and
measured 5.6 mm across, 2.4 mm thick, with a perforation measuring 2.2 mm
(Bellifemine 1997:158). Stone beads of steatite and magnesite have been specifically
associated with ascribed status in Central California (C. King 1978:62).
2. Pendants. Pendants made from abalone shell (Haliotis spp.) were found with
58 burials at SCL-38 (see Figure 21). Associations and classifications are based on the
analysis of Bellifemine (1997:183), with types based on Gifford (1947). Seven shapes of
Haliotis pendants were identified, including rectangular (S or Z type), circular (type K),
semi-circular (type AB), trapezoidal (Q and AA types) banjo (type N), crescent (type
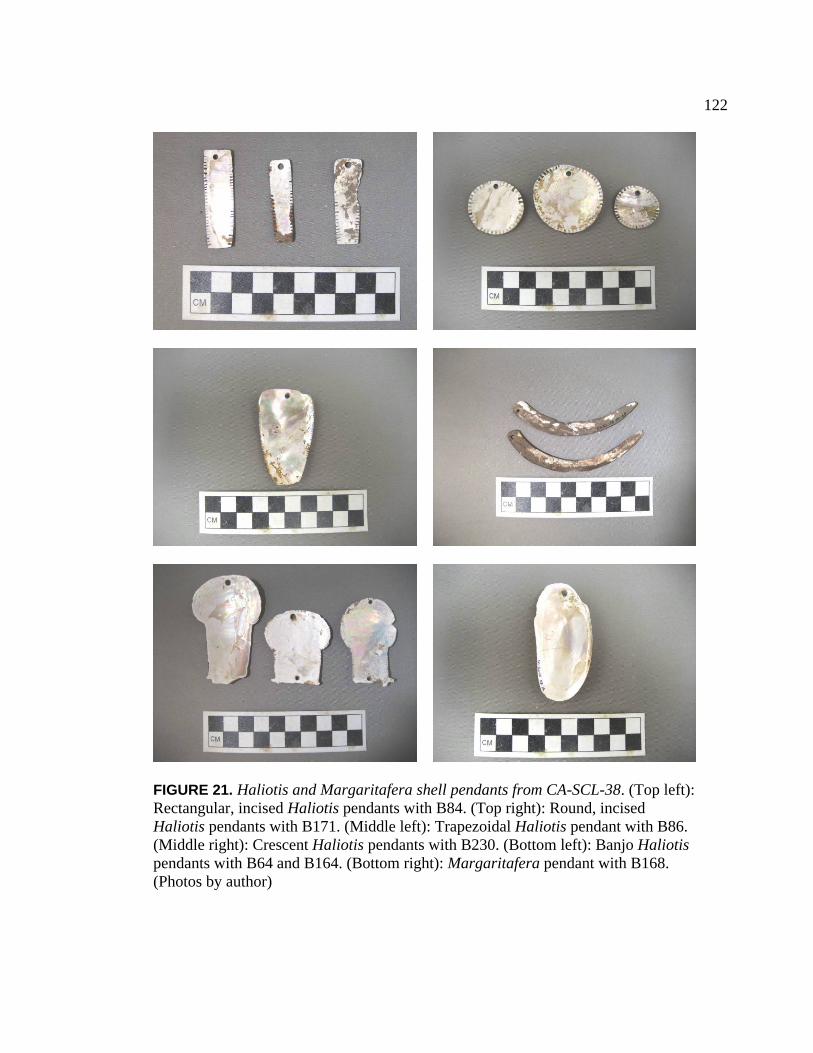
122
FIGURE 21. Haliotis and Margaritafera shell pendants from CA-SCL-38. (Top left): Rectangular, incised Haliotis pendants with B84. (Top right): Round, incised Haliotis pendants with B171. (Middle left): Trapezoidal Haliotis pendant with B86. (Middle right): Crescent Haliotis pendants with B230. (Bottom left): Banjo Haliotis pendants with B64 and B164. (Bottom right): Margaritafera pendant with B168. (Photos by author)
123
AP), and triangular (type U) forms. Each will be discussed briefly below (see Bellifemine
1997 for additional detail). A record of Haliotis pendant associations by burial is
presented in Appendix B, including reconciliation with previous publications.
The most common shape of Haliotis pendants found at SCL-38 was rectangular
(Gifford S or Z type, n = 345), and these were associated with 76 percent of the burials
with Haliotis pendants (44 burials). Rectangular pendants measured between 1.5 and 6.5
cm long and 0.3 to 4.5 cm wide. Two-thirds of the rectangular pendants included incising
around the edges. Most had a single perforation near a narrow edge, but some were
perforated at both narrow edges. One had two perforations at the same end (artifact 95-9).
Three adult males had more than 25 rectangular pendants each (Burials 53, 58, and 71),
and another adult male (Burial 84) had 83 pendants of this type. Interestingly, three of
these four males were young adults, in their late teens; the fourth (Burial 53) was in his
thirties.
Circular pendants were the next most common form (Gifford type K, n = 100), and
were associated with 11 burials (19%). These pendants were typically incised around the
edges (87% of circular pendants), and had diameters ranging from 2.5 to 8.0 centimeters.
One or two perforations were located near the edges of each, either near each other or on
opposing sides. Large caches of circular pendants (more than thirty) were found with
Burial 171, an adult male in his thirties, and Burial 175, an adult male in his twenties.
Ninety-three trapezoidal pendants (Gifford types Q and AA) were associated with 8
burials (14%), including seven adult males and one infant (Burial 156). Again, most
trapezoidal pendants have incised edges and one or two perforations. Size and shape of
these pendants varied.
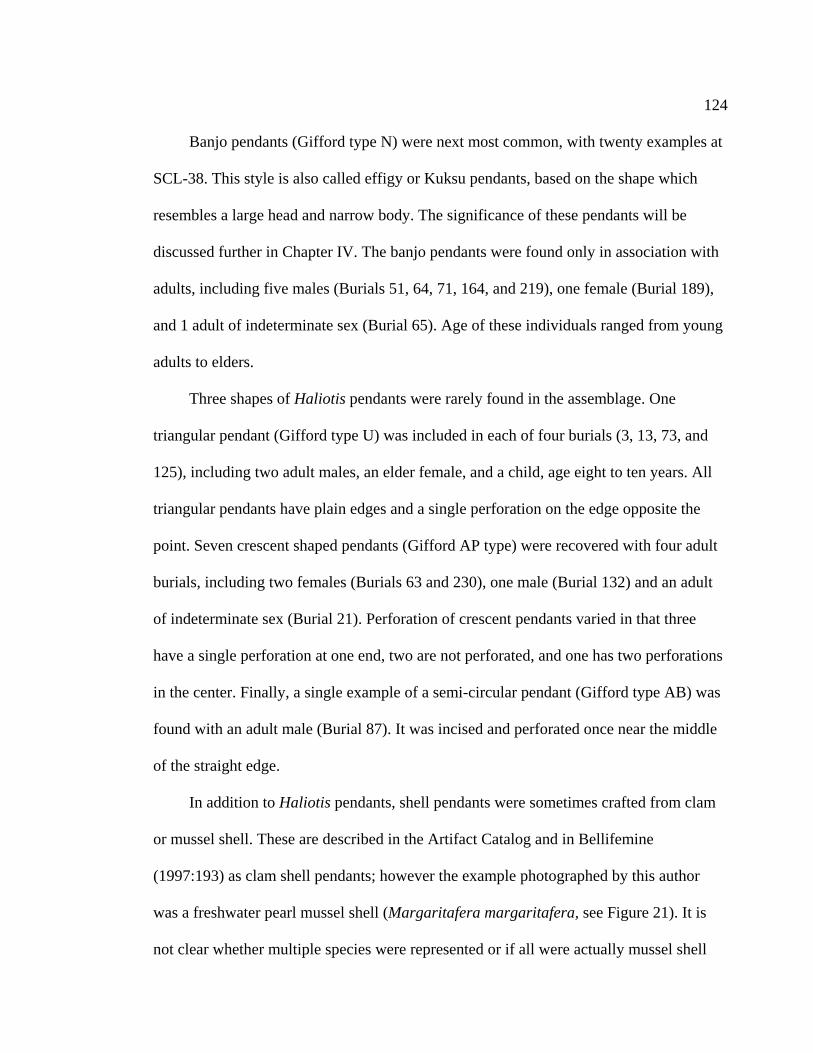
124
Banjo pendants (Gifford type N) were next most common, with twenty examples at
SCL-38. This style is also called effigy or Kuksu pendants, based on the shape which
resembles a large head and narrow body. The significance of these pendants will be
discussed further in Chapter IV. The banjo pendants were found only in association with
adults, including five males (Burials 51, 64, 71, 164, and 219), one female (Burial 189),
and 1 adult of indeterminate sex (Burial 65). Age of these individuals ranged from young
adults to elders.
Three shapes of Haliotis pendants were rarely found in the assemblage. One
triangular pendant (Gifford type U) was included in each of four burials (3, 13, 73, and
125), including two adult males, an elder female, and a child, age eight to ten years. All
triangular pendants have plain edges and a single perforation on the edge opposite the
point. Seven crescent shaped pendants (Gifford AP type) were recovered with four adult
burials, including two females (Burials 63 and 230), one male (Burial 132) and an adult
of indeterminate sex (Burial 21). Perforation of crescent pendants varied in that three
have a single perforation at one end, two are not perforated, and one has two perforations
in the center. Finally, a single example of a semi-circular pendant (Gifford type AB) was
found with an adult male (Burial 87). It was incised and perforated once near the middle
of the straight edge.
In addition to Haliotis pendants, shell pendants were sometimes crafted from clam
or mussel shell. These are described in the Artifact Catalog and in Bellifemine
(1997:193) as clam shell pendants; however the example photographed by this author
was a freshwater pearl mussel shell (Margaritafera margaritafera, see Figure 21). It is
not clear whether multiple species were represented or if all were actually mussel shell

125
pendants. Regardless, twenty of these items were found in association with the burials of
three adult males (Burials 163, 168, and 224). All were singly perforated at one end and
polished but otherwise unmodified. The 18 mussel and/or clam pendants found with
B168 were arranged near his feet.
The last type of pendant identified at the Yukisma Mound site was made of
polished elk bone (see Figure 22). Sixteen elk rib pendants were found in association
FIGURE 22. Elk bone pendants from CA-SCL-38. (Left): Two pendants from B63. (Right): Pendant from B230. (Photos by author) with two adult females, Burial 63 with nine pendants and Burial 230 with six pendants.
Additionally one pendant was found with Burial 185, and adult of indeterminate sex.
These pendants measure between 20 and 35 centimeters long and are biconically drilled
or grooved at one end. Those associated with Burial 230 are darker in color, and may
have been treated with heat.
Ideotechnic Artifacts. The artifact types classified here as ideotechnic are
those which are associated with ritual or symbolic functions, including bird bone tubes or
whistles, stone pipes, stone spoons, charmstones, “magic” stones, cinnabar (also called

126
ochre), stingray points, antler, or faunal teeth or claws. Each of these will be briefly
described below. Ideotechnic artifacts were relatively rare in the SCL-38 assemblage,
found with only 18 percent of burials (see Table 18). Individuals found with these artifact
types included 23 adult males, 9 adult females, 6 adults of indeterminate sex and 3
subadults. All adult age categories were represented for both males and females but 22
percent of the males were elders over 40 years of age (n = 5 of 23), whereas twice the
percentage of females with these objects were elders (n = 4 of 9, 44%).
TABLE 18. Presence of Burial-Associated Ideotechnic Artifacts at CA-SCL-38
Burial-Associated Ideotechnic A Artifacts
Males (%)
Females (%)
Indet. (%)
Total Adults
(%)
Subadults (%)
Unknown (%)
All Unique Individuals
(%)
n 99 63 42 204 43 1 248
Bone Artifacts
Bird bone tubes or whistles
13 (13) 6 (10) 3 (8) 22 (11) 1 (2) -- 23 (9)
Stone Artifacts
Stone pipes 5 (5) -- 1 (3) 6 (3) -- -- 6 (2)
Stone spoons -- 1 (2) -- 1 (< 1) -- -- 1 (< 1)
Charmstones 9 (9) 1 (2) 2 (5) 12 (6) 1 (2) -- 13 (5)
“Magic” stones 2 (2) -- 1 (3) 3 (1) -- -- 3 (1)
Minerals
Cinnabar (“ochre”)
3 (3) 1 (2) -- 4 (2) 2 (4) -- 6 (2)
Faunal Remains
Stingray points -- -- 1 (3) 1 (< 1) -- -- 1 (< 1)
Antler 1 (1) 2 (3) -- 3 (1) 1 (2) -- 4 (2)
Faunal teeth or claws 3 (3) 2 (3) -- 5 (2) -- -- 5 (2)
No ideotechnic artifacts
73 (74) 54 (86) 36 (86) 163 (80) 40 (93) 1 (100) 204 (82)
ADefinition of ideotechnic from Binford 1962.
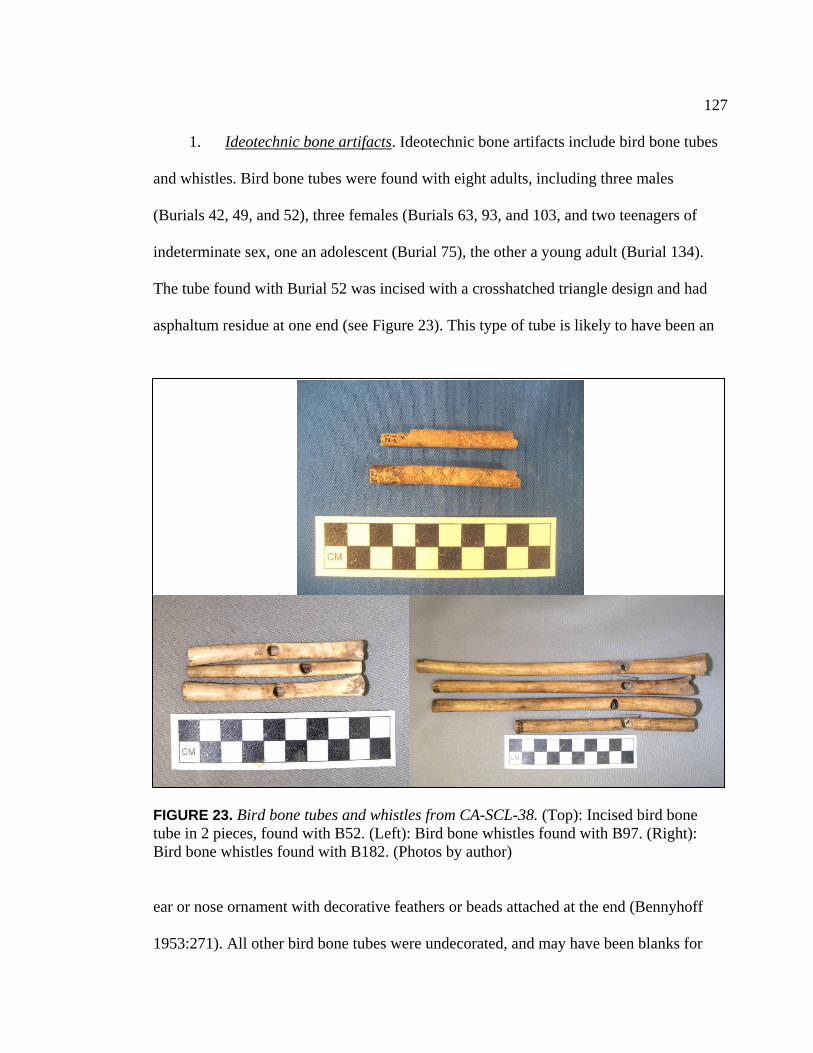
127
1. Ideotechnic bone artifacts. Ideotechnic bone artifacts include bird bone tubes
and whistles. Bird bone tubes were found with eight adults, including three males
(Burials 42, 49, and 52), three females (Burials 63, 93, and 103, and two teenagers of
indeterminate sex, one an adolescent (Burial 75), the other a young adult (Burial 134).
The tube found with Burial 52 was incised with a crosshatched triangle design and had
asphaltum residue at one end (see Figure 23). This type of tube is likely to have been an
FIGURE 23. Bird bone tubes and whistles from CA-SCL-38. (Top): Incised bird bone tube in 2 pieces, found with B52. (Left): Bird bone whistles found with B97. (Right): Bird bone whistles found with B182. (Photos by author) ear or nose ornament with decorative feathers or beads attached at the end (Bennyhoff
1953:271). All other bird bone tubes were undecorated, and may have been blanks for
128
whistles (Bellifemine 1997:168), unadorned ear or nose tubes (Bennyhoff 1953:271),
sucking tubes used by shamans in healing ceremonies (Bates 1992:99), or storage tubes
for cinnabar or other precious substances (Stimpson 2007:173). These undecorated tubes
were made from the tibiae, ulnae, or radii of cranes (Grus sp.), swans (Cygnus sp.) or
geese (Chen sp.) (Bellifemine 1997:168).
Approximately 150 bird bone whistles were found with 17 burials. Individuals with
whistles included ten adult males (Burials 33, 62, 94, 97, 105, 162, 164, 166, 182, and
224), four adult females (Burials 63, 37, 90, and 93), and three adults of indeterminate
sex (Burials 100, 134, and 225). Adults in all age groups were represented, but no
subadults were found with bird bone whistles. Whistles from SCL-38 are typical of those
found in Central California; they had a single hole placed about one third the length from
the proximal end or in the middle of the shaft and measured between 8 and 23
centimeters long (Bellifemine 1997:171). Also most retained the usual asphaltum stops at
the distal end and plugs near the orifice (Bellifemine 1997:172; Bennyhoff
1953:271). All were made from ulnae of birds. Of the 88 whistles where species could be
identified, the majority were swan (Cygnus sp., 61%), but crane (Grus sp., 22%), pelican
(Pelicanus sp., 11%), and great blue heron (Ardea herodius, 5%) were also present.
Most bone whistles were unadorned, but eleven had evidence of decoration. Four
whistles found with Burial 90 and two found with Burial 105 were decorated with shell
beads, affixed with asphaltum. Asphaltum is also present on one whistle from Burial 93,
two from Burial 164 and two from Burial 166; the latter two sets also retained
impressions of cordage in the asphaltum (Bellifemine 1997:172). Bird bone whistles are
129
most commonly associated with music and dance accompaniment, but were also a part of
healing ceremonies in many parts of California (Bennyhoff 1953:271).
2. Ideotechnic stone artifacts. Stone artifacts used for ritual purposes fall into
two main categories: stone that has been ground and polished into a new form for specific
use (e.g., pipes, spoons, and charmstones) and exotic stone that is unmodified (e.g.,
crystals or other “magic” stones). With the exception of one charmstone tip found with
Burial 178, a child between two and four years of age, ideotechnic stone artifacts were
found only with adults. Males were far more likely to possess artifacts in this category (n
= 14, 70% of individuals with ideotechnic stone), however two adult females, Burial 63
in her thirties and Burial 93, an elder, also possessed stone ritual objects. Four adults of
indeterminate sex are also included in this group.
a. Stone pipes. Seven stone pipes were found with seven individuals,
including five adult males (Burials 33, 82, 97, 167, and 170), one adult female
(Burial 93) and one adult of indeterminate sex (Burial 19). The objects were made
of either sandstone (with Burials 33 and 170) or serpentinite (all others, see Figure
24). They were tubular in form and drilled from both ends with lengths between 6.5
and 27 centimeters. Five of the pipes had flanged necks; exceptions were the pipe
with Burial 167, which had a contracting neck, and that with Burial 93, which had a
barrel shape. Those with Burials 19, 33, and 167 were “killed” (broken) as part of
the mortuary process; the others were found intact (Bellifemine 1997:156-157).
Stone pipes of this sort have been observed at many other nearby contemporaneous
sites (e.g., CA-ALA-329, CA-SCL-674, and CA-SCL-690), are thought to have
been used for smoking wild tobacco (Hylkema and Fitzgerald 2007; Leventhal
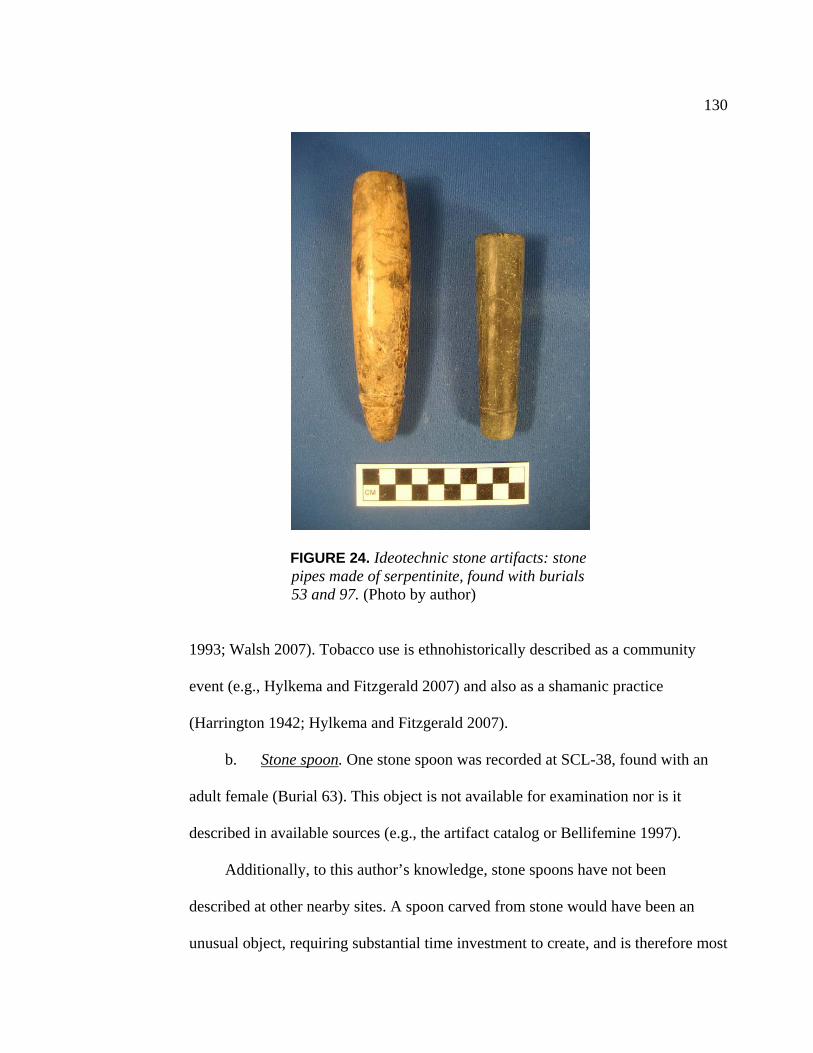
130
FIGURE 24. Ideotechnic stone artifacts: stone pipes made of serpentinite, found with burials 53 and 97. (Photo by author)
1993; Walsh 2007). Tobacco use is ethnohistorically described as a community
event (e.g., Hylkema and Fitzgerald 2007) and also as a shamanic practice
(Harrington 1942; Hylkema and Fitzgerald 2007).
b. Stone spoon. One stone spoon was recorded at SCL-38, found with an
adult female (Burial 63). This object is not available for examination nor is it
described in available sources (e.g., the artifact catalog or Bellifemine 1997).
Additionally, to this author’s knowledge, stone spoons have not been
described at other nearby sites. A spoon carved from stone would have been an
unusual object, requiring substantial time investment to create, and is therefore most
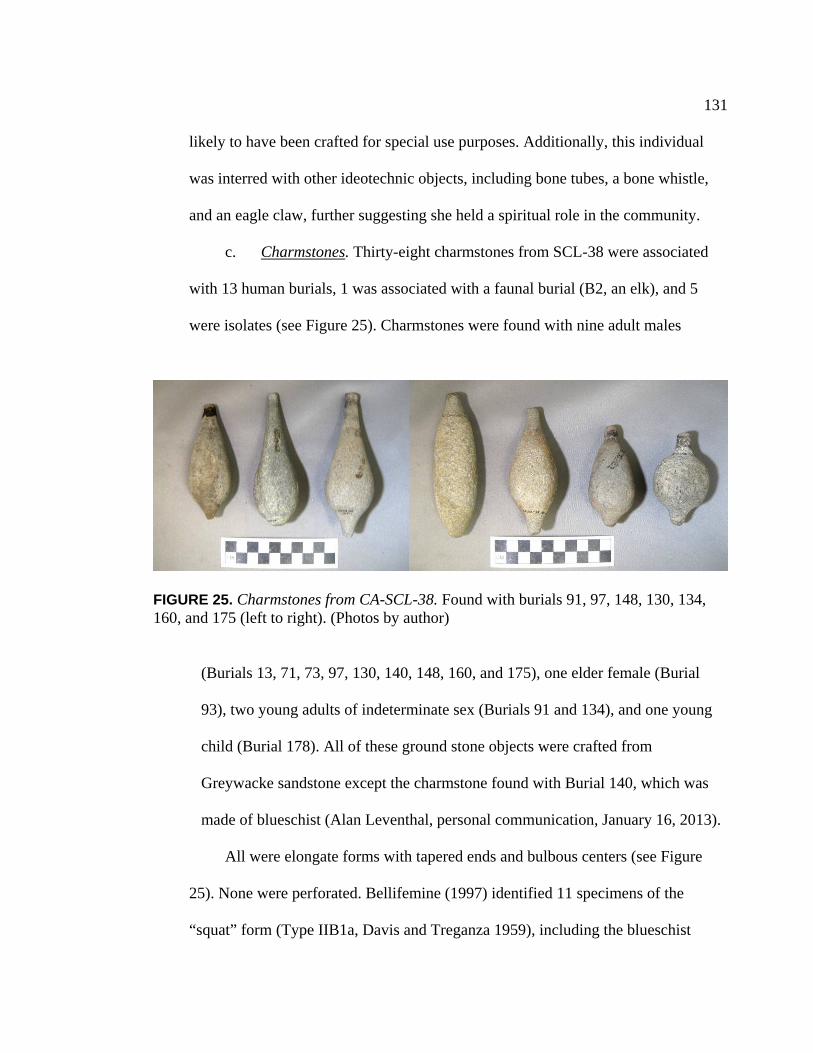
131
likely to have been crafted for special use purposes. Additionally, this individual
was interred with other ideotechnic objects, including bone tubes, a bone whistle,
and an eagle claw, further suggesting she held a spiritual role in the community.
c. Charmstones. Thirty-eight charmstones from SCL-38 were associated
with 13 human burials, 1 was associated with a faunal burial (B2, an elk), and 5
were isolates (see Figure 25). Charmstones were found with nine adult males
FIGURE 25. Charmstones from CA-SCL-38. Found with burials 91, 97, 148, 130, 134, 160, and 175 (left to right). (Photos by author)
(Burials 13, 71, 73, 97, 130, 140, 148, 160, and 175), one elder female (Burial
93), two young adults of indeterminate sex (Burials 91 and 134), and one young
child (Burial 178). All of these ground stone objects were crafted from
Greywacke sandstone except the charmstone found with Burial 140, which was
made of blueschist (Alan Leventhal, personal communication, January 16, 2013).
All were elongate forms with tapered ends and bulbous centers (see Figure
25). None were perforated. Bellifemine (1997) identified 11 specimens of the
“squat” form (Type IIB1a, Davis and Treganza 1959), including the blueschist
132
charmstone. Thirty-one charmstones and fragments were identified as “piled
plummets” (no type identified). This group includes an isolate which had a unique
bi-lobed body (artifact 44-4). Finally, two specimens were identified as “piled”
(Type IIB1b, Davis and Treganza 1959).
The significance of charmstones is not clear, and has been the subject of
considerable debate. It has been proposed that these finely crafted stones were used
as sling stones, as personal ornaments, as levels, as game pieces, as weights for
weaving, as sinkers for fishing tackle, and as sacred implements (Elsasser and
Rhode 1996, Foster 1887, Henderson 1872, Yates 1889). Ethnographic sources
suggest that these objects held power which could be harnessed to control weather,
influence hunting or fishing outcomes, and heal the sick (Sharp 2000). In Northern
California, they were also reported to “control social phenomena such as love,
gambling, and war” (Sharp 2000:235). An extensive survey of ethnographic
literature by John Sharp (2000) overwhelmingly associated these objects with
shamanism.
d. Magic stones. “Magic” stones were found with three individuals at SCL-
38, two adult males with one stone each (Burials 175 and 188) and one adult of
indeterminate sex with a magic stone broken into two pieces (Burial 21). The stone
with Burial 175 is identified as an agate in the artifact catalog. The stone with
Burial 188 identified in the catalog as scoria, a dark igneous rock with large air
bubbles. The stone fragments with Burial 21 are green schist (Bellifemine
1997:137). These exotic rocks may have been power objects, used in shamanic
practice (Bean 1992).

133
Cinnabar. Nuggets of cinnabar (a red pigment, also called ochre in the
archaeological record) were associated with the burials of three adult males (Burials
61, 73, and 132), one elder female (Burial 93), and two subadults (Burial 135, a
child between eight and ten years old, and Burial 178, a child between two and four
years old). Of these, Burials 61, 93, and 135 had a single nugget of cinnabar, Burial
73 had three nuggets, and Burial 132 had a large cache of 48 nuggets. The cinnabar
associated with the young subadult was residue on a pestle. Cinnabar residue was
also found on the distal end of a small pestle buried with the remains of an elk
(Burial 2).
Cinnabar was an extremely important ceremonial element in Central
California, commonly found in burials in the Early Period (Gerow with Force
1968:109) and persisting at least through the nineteenth century (Hall 1871:44).
This pigment was likely sourced from the New Almaden mine (Heizer and
Treganza 1972), located about 20 kilometers (12.4 miles) south of the Yukisma
Mound site.
3. Faunal remains (ideotechnic). A few distinctive faunal elements were found
with burials, and are likely to have had symbolic significance. At SCL-38, these items
include stingray points, elk or deer antlers, faunal teeth, and claws from mammals or
birds. Antlers, claws and teeth of mammals and bird of prey are likely to be totemic
symbols, especially when not associated with other bones of these animals that might
suggest alimentary use. Elements of esteemed animals may have been retained by
individuals as a form of contagious magic, with the hope that the essence of the animal or
associated spirit would be imparted to the person who wore them. Alternatively, they

134
could have been symbols of identity, associated with moieties or lineages (and therefore
should be sociotechnic instead). Each type of symbolic faunal artifact will be discussed
individually.
At SCL-38, one individual was buried with seven stingray points (Burial 21, and
adult of indeterminate sex and age). Stingray points are not well documented in Central
California, but are strongly associated with ritual practice in Mesoamerica, where they
were used by the Maya as lancets for bloodletting (Schele and Miller 1986:175). This
individual was also buried with the small cobble mortar and a “magic” stone, supporting
the interpretation of the stingray points as ritual items.
Four burials were associated with antlers. Burial 33, an adult male, and 217, a
subadult between five and six years of age, each had an antler or antler fragment in their
burial assemblage. Burial 101, an elder female, had a full antler rack buried above her.
Burial 99, an adult female, was interred immediately above the antler feature. In the case
of Burials 33 and 217, these antlers may have been possessions or grave offerings. For
the two females, the antler feature was clearly an offering. Deer and elk were important
food resources, but the burial of the antlers alone suggests ritual significance, and may be
related to moiety (clan) affiliation. This possibility will be explored further in Chapters
IV and IV.
One adult male (Burial 182) and one elder female (Burial 184) were buried with
animal teeth (n = 4 with B182, n = 2 with B184). The teeth are not otherwise described
in the artifact catalog or burial record. One adult male (Burial 80) had four animal claws
with him. No further description of these items is available either. Two individuals, an
adult male (Burial 224) and an adult female (Burial 63) were buried with one eagle talon

135
each. These individuals all had other grave goods, but only the two individuals with eagle
talons both had other ideotechnic artifacts (bird bone whistles and a stone spoon,
respectively). The male with animal claws had no other ideotechnic items, but did have a
large cache of shell beads (n = 427, bead class 3). The two individuals with animal teeth
had different associations; the male had bird bone whistles (ideotechnic) and a large
cache of shell beads (n = 1135, bead class 4) as well as a bone tool; the only other items
with the female were two shell beads. The mixed associations complicate the
interpretation of this group of artifacts.
Artifact Presence Summary. The division of burial associations into unworked
organic materials, technomic artifacts, sociotechnic artifacts, and ideotechnic artifacts is
based upon this author’s interpretation of the probable significance of these items. This
interpretation will be used in Chapter IV to determine possible indicators of social roles,
which will then be used as a basis for dietary comparison in Chapters VII and IX. Both
the quantity and diversity of burial associated artifacts, as well as the presence of some
specific artifact types, may contribute to the interpretation of social roles. The intention
of this section is delineate which artifact types are present and provide some general
context for their interpretation as possible markers of social identity. For a more detailed
exploration of artifact types found at SCL-38, the reader is again directed to the analysis
of Bellifemine (1997). Additional detail regarding ground stone artifacts from this and
other Bay Area sites can be found in Buonasera (2012).
136
Dating the Site
Several sources will be considered when estimating the temporal context of
the Yukisma Mound site. Radiocarbon dates are available from earlier studies and new
ones were run in 2010 and 2012 to support this research. Obsidian hydration estimates
were produced in 1995 by Glen Wilson. Finally, Olivella bead types and Haliotis pendant
styles with temporal significance will be considered. These sources are listed here in
descending order of dating precision. Burials with direct temporal context are included as
well as those associated with dated burials (e.g., from double or multiple interments).
Radiocarbon (14C) Dating
Prior to the current study, 27 radiocarbon dates were available for CA-SCL-
38. The first was a single radiocarbon date obtained in 1988 by Robert Cartier, in support
of archaeological research commissioned by the County of Santa Clara (Cartier 1988c).
The sample submitted was 227 grams of mixed Cerithidea shell, obtained from Unit #2 at
a depth of 10 to 20 centimeters. A comparison of maps suggests that Unit #2 from the
1987 survey was approximately 75 meters north of the 1993-1994 excavation. This date
was processed by Beta Analytic (BETA-24408). Unfortunately, the result is problematic.
Although the uncorrected date is 500 years before present (± 60 years), shell dates are
subject to correction for the marine reservoir effect, which causes marine-based foods
(and those who consume them) to date several hundred years older than they really are
(see Appendix C for a discussion of the marine reservoir effect). When corrected, this
date is actually too recent to be calibrated.
Twenty-four additional 14C dates were processed in 1996 at the Washington
State University (WSU) Radiocarbon Dating Laboratory, submitted by Alan Leventhal of

137
San Jose State University (SJSU) on behalf of Ohlone Families Consulting Services
(OFCS). Three samples were associated with non-burial features, one with a faunal burial
(B22) and twenty with human burials. The material used for dating this group was
primarily charcoal, although a bone sample was submitted for the faunal burial (B22).
Results of the 1996 radiocarbon dates run at WSU were published as uncorrected dates in
Bellifemine (1997:209) and as corrected dates in Hylkema (2007:401), with the exception
of the result for B50, which was not published in either, and the results for B4 and B166,
which were excluded from Hylkema because contamination was suspected. The result for
B4 was far too recent, suggesting a modern time period; the date for B166 was 4230 ±
200 uncorrected years BP, far older than the others obtained for this site. Both B4 and
B166 were tested again in the new batch of radiocarbon dates run in 2010, reported
below.
Additionally, two shell beads from SCL-38 were included in Randy Groza’s
(2002) recalibration of California chronology using Olivella shell bead forms. These
dates were both processed in 2001 at the Lawrence Livermore National Laboratory
(LLNL) in the Center for Accelerator Mass Spectrometry (CAMS). In both cases, the
beads came from burials which have been radiocarbon dated through other means (one in
the 1996 WSU batch, the other in the 2010 LLNL CAMS batch).
In support of the present study, fourteen new radiocarbon dates were
processed at the LLNL CAMS laboratory. The sample material for these dates was
human bone collagen, already purified for the stable isotope analysis portion of the
research project. All samples were prepared for radiocarbon dating by the author in the
LLNL CAMS laboratory in 2010. A linear mixing model with regionally specific end
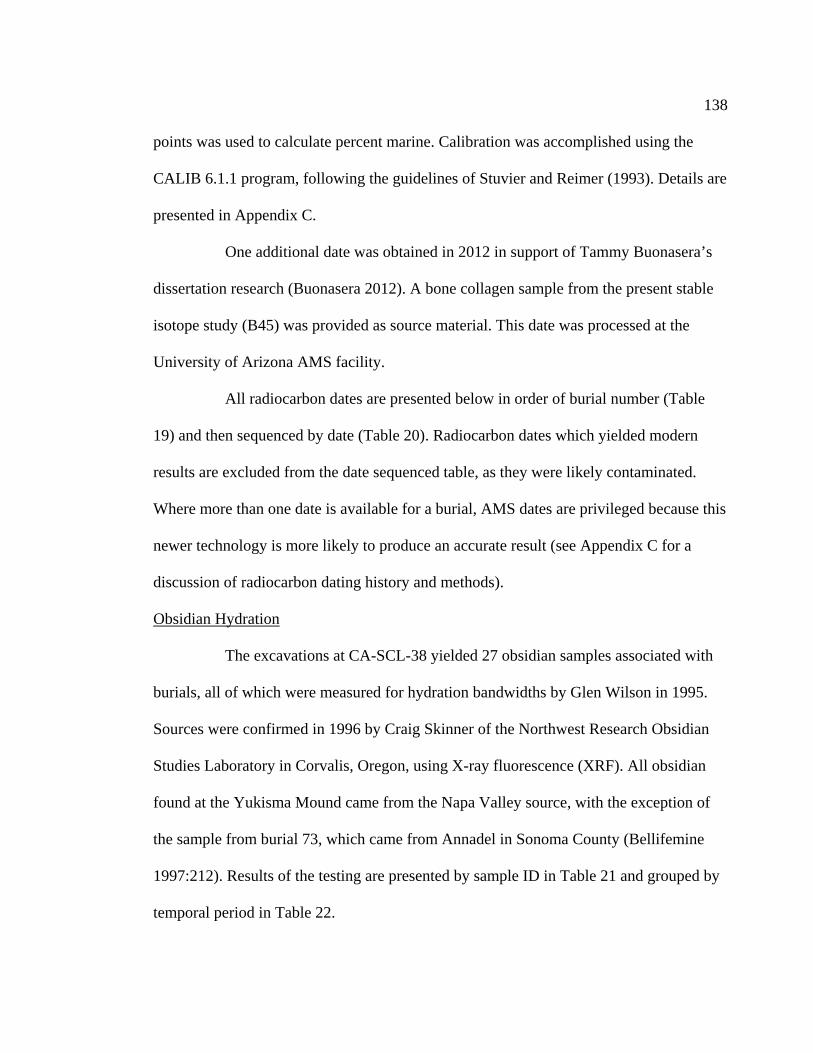
138
points was used to calculate percent marine. Calibration was accomplished using the
CALIB 6.1.1 program, following the guidelines of Stuvier and Reimer (1993). Details are
presented in Appendix C.
One additional date was obtained in 2012 in support of Tammy Buonasera’s
dissertation research (Buonasera 2012). A bone collagen sample from the present stable
isotope study (B45) was provided as source material. This date was processed at the
University of Arizona AMS facility.
All radiocarbon dates are presented below in order of burial number (Table
19) and then sequenced by date (Table 20). Radiocarbon dates which yielded modern
results are excluded from the date sequenced table, as they were likely contaminated.
Where more than one date is available for a burial, AMS dates are privileged because this
newer technology is more likely to produce an accurate result (see Appendix C for a
discussion of radiocarbon dating history and methods).
Obsidian Hydration
The excavations at CA-SCL-38 yielded 27 obsidian samples associated with
burials, all of which were measured for hydration bandwidths by Glen Wilson in 1995.
Sources were confirmed in 1996 by Craig Skinner of the Northwest Research Obsidian
Studies Laboratory in Corvalis, Oregon, using X-ray fluorescence (XRF). All obsidian
found at the Yukisma Mound came from the Napa Valley source, with the exception of
the sample from burial 73, which came from Annadel in Sonoma County (Bellifemine
1997:212). Results of the testing are presented by sample ID in Table 21 and grouped by
temporal period in Table 22.
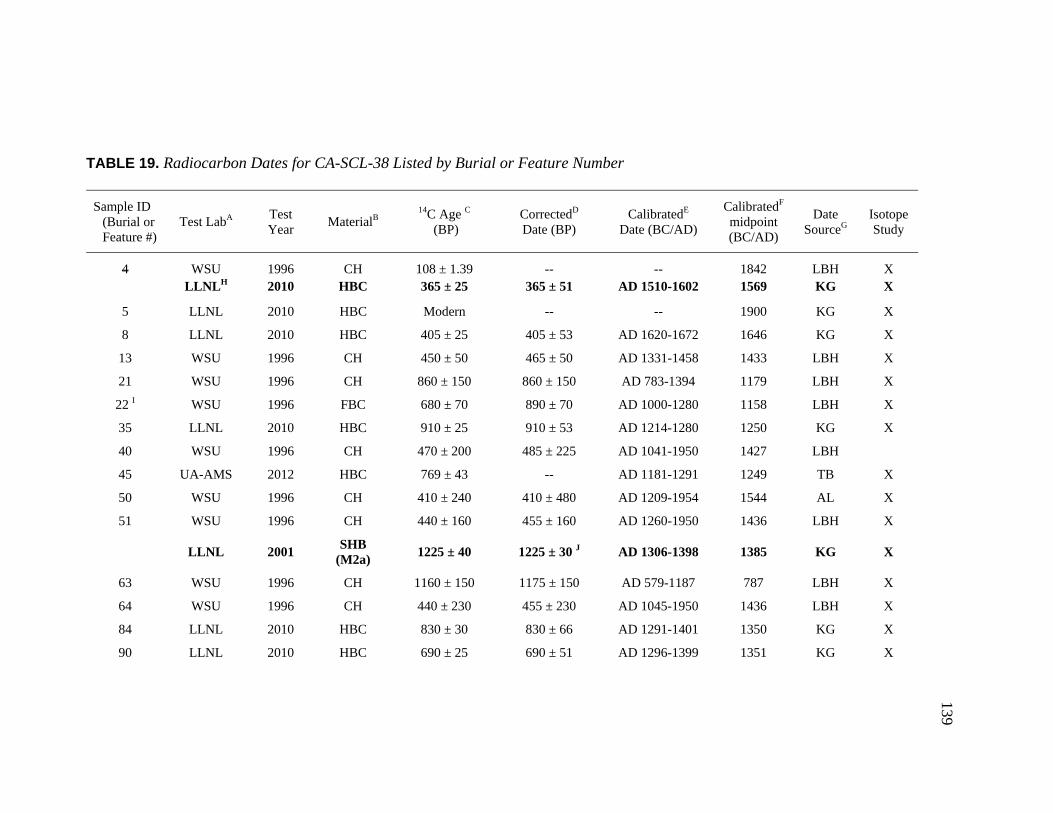
139
TABLE 19. Radiocarbon Dates for CA-SCL-38 Listed by Burial or Feature Number
Sample ID (Burial or Feature #)
Test LabA Test Year
MaterialB 14C Age C
(BP) CorrectedD
Date (BP) CalibratedE
Date (BC/AD)
CalibratedF
midpoint (BC/AD)
Date SourceG
Isotope Study
WSU 1996 CH 108 ± 1.39 -- -- 1842 LBH X 4 LLNLH 2010 HBC 365 ± 25 365 ± 51 AD 1510-1602 1569 KG X
5 LLNL 2010 HBC Modern -- -- 1900 KG X
8 LLNL 2010 HBC 405 ± 25 405 ± 53 AD 1620-1672 1646 KG X
13 WSU 1996 CH 450 ± 50 465 ± 50 AD 1331-1458 1433 LBH X
21 WSU 1996 CH 860 ± 150 860 ± 150 AD 783-1394 1179 LBH X
22 I WSU 1996 FBC 680 ± 70 890 ± 70 AD 1000-1280 1158 LBH X
35 LLNL 2010 HBC 910 ± 25 910 ± 53 AD 1214-1280 1250 KG X
40 WSU 1996 CH 470 ± 200 485 ± 225 AD 1041-1950 1427 LBH
45 UA-AMS 2012 HBC 769 ± 43 -- AD 1181-1291 1249 TB X
50 WSU 1996 CH 410 ± 240 410 ± 480 AD 1209-1954 1544 AL X
WSU 1996 CH 440 ± 160 455 ± 160 AD 1260-1950 1436 LBH X 51
LLNL 2001 SHB
(M2a) 1225 ± 40 1225 ± 30 J AD 1306-1398 1385 KG X
63 WSU 1996 CH 1160 ± 150 1175 ± 150 AD 579-1187 787 LBH X
64 WSU 1996 CH 440 ± 230 455 ± 230 AD 1045-1950 1436 LBH X
84 LLNL 2010 HBC 830 ± 30 830 ± 66 AD 1291-1401 1350 KG X
90 LLNL 2010 HBC 690 ± 25 690 ± 51 AD 1296-1399 1351 KG X

140
TABLE 19 (Continued)
Sample ID (Burial or Feature #)
Test LabA Test Year
MaterialB 14C Age C
(BP) CorrectedD
Date (BP) CalibratedE
Date (BC/AD)
CalibratedF
midpoint (BC/AD)
Date SourceG
Isotope Study
91 WSU 1996 CH 690 ± 220 705 ± 220 AD 890-1650 1280 LBH X
93 WSU 1996 CH 620 ± 60 635 ± 60 AD 1260-1420 1372 LBH
97 LLNL 2010 HBC 815 ± 25 815 ± 54 AD 1275-1323 1306 KG X
107 WSU 1996 CH 735 ± 85 750 ± 85 AD 1042-1393 1268 LBH X
117 WSU 1996 CH 1540 ± 180 1555 ± 180 AD 70-860 473 LBH X
120 LLNL 2010 HBC 670 ± 25 670 ± 52 AD 1308-1366 1353 KG X
132 LLNL 2010 HBC 790 ± 25 790 ± 51 AD 1263-1307 1286 KG X
144 WSU 1996 CH 230 ± 50 245 ± 50 AD 1512-1950 1652 LBH X
WSU 1996 CH 4230 ± 200 2280 BC LBH X
LLNL 2001 SHB (M1a) 1390 ± 25 1390 ± 25 J AD 1215-1288 1256 RG X
166
LLNL 2010 HBC 840 ± 35 840 ± 75 AD 1286-1401 1348 KG X
167 WSU 1996 CH 1130 ± 170 1145 ± 170 AD 560-1255 891 LBH X
171 WSU 1996 CH 340 ± 300 355 ± 30 AD 1442-1641 1492 LBH X
178 WSU 1996 CH 880 ± 280 895 ± 280 AD 601-1620 1157 LBH
179 WSU 1996 CH 1710 ± 200 1725 ± 200 172 BC-AD 670 293 LBH X
182 LLNL 2010 HBC 805 ± 25 805 ± 53 AD 1277-1325 1312 KG X
209 LLNL 2010 HBC 370 ± 40 370 ± 81 AD 1611-1686 1650 KG X
210 LLNL 2010 HBC 295 ± 35 295 ± 70 AD 1628-1687 1669 KG X

141
TABLE 19 (Continued)
Sample ID (Burial or Feature #)
Test LabA Test Year
MaterialB 14C Age C
(BP) CorrectedD
Date (BP) CalibratedE
Date (BC/AD)
CalibratedF
midpoint (BC/AD)
Date SourceG
Isotope Study
227 LLNL 2010 HBC 520 ± 25 520 ± 51 AD 1420-1472 1444 KG X
230 WSU 1996 CH 1210 ± 120 1225 120 AD 600-1021 794 LBH X
240 WSU 1996 CH 1790 ± 180 2205 ± 170 790 BC-AD 130 218 BC LBH
814-1K WSU 1996 CH 1250 ± 130 1265 130 AD 540-1018 725 LBH X
814-2K WSU 1996 CH 830 ± 70 845 ± 70 AD 1020-1280 1210 LBH X
850 K WSU 1996 CH 1790 ± 180 1805 ± 180 346 BC-AD 637 190 LBH X ATest laboratories: LLNL = Lawrence Livermore National Laboratory Center for Accelerator Mass Spectrometry; WSU = Washington State University, Department of Geology, Radiocarbon Dating Laboratory; UA-AMS = University of Arizona AMS Laboratory; BA = Beta Analytic, Inc. BMaterial: CH = charcoal; FBC = faunal bone collagen; HBC = human bone collagen; SH = shell; SHB = shell bead (with bead type in parentheses). C14C Age: Radiocarbon age is the uncalibrated result reported from the laboratory in years before present (BP). Following convention, present is 1950 AD. DCorrected Date: produced by the calibration program, the corrected date is reported in years before present (BP). All ranges are 2-sigma except for dates from Groza 2002, reported in 1-sigma. For previously published dates, reported values are as published. The WSU date for B50 and the Beta-Analytic date for Unit 2 were not previously calibrated. Calibration for all dates not previously calibrated, including new dates, was done by KG using CALIB 6.1.1. See Appendix C for details. ECalibrated Date: produced by the calibration program, the calibrated date is reported in years BC/AD. All ranges are 2-sigma except for dates from Groza 2002, reported in 1-sigma. FCalibrated midpoints are all AD except where noted otherwise. GDate Source: AL = CA-SCL-38 site documentation curated by Alan Leventhal, San Jose State University. KG = newly reported dates in this thesis; LBH = CA-SCL-38 site documentation curated by Alan Leventhal, San Jose State University, 14C Age reported in Bellifemine (1997), calibrated dates in Hylkema (2007); RC = Cartier et al. (1988); RG = Groza (2002); TB = Buonasera (2012). HBolded dates: Where more than one date exists for a burial, the most reliable date is bolded. IB22 is a faunal burial, a grizzly bear (Ursus arctos californicus). JCorrected and calibrated dates from Groza 2002 are presented in 1-sigma ranges, following the original publication. KNon-burial-associated features or midden samples from CA-SCL-38.
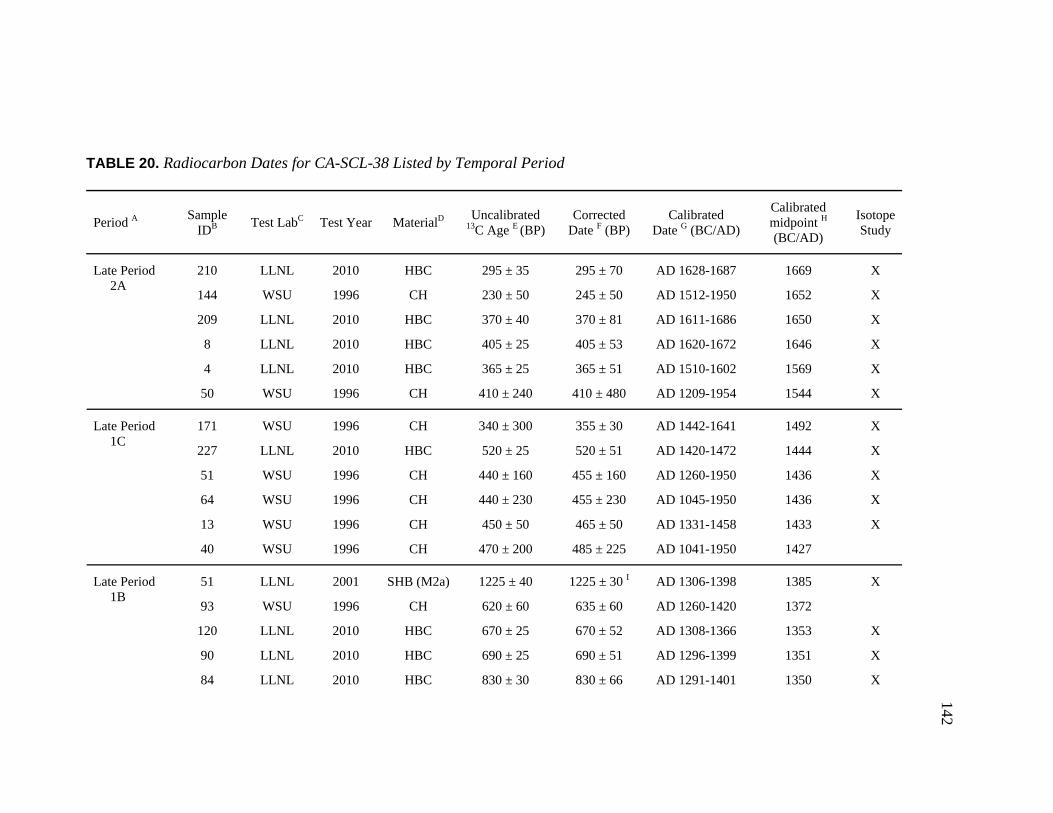
142
TABLE 20. Radiocarbon Dates for CA-SCL-38 Listed by Temporal Period
Period A Sample IDB Test LabC Test Year MaterialD Uncalibrated
13C Age E (BP) Corrected
Date F (BP) Calibrated
Date G (BC/AD)
Calibrated midpoint H (BC/AD)
Isotope Study
210 LLNL 2010 HBC 295 ± 35 295 ± 70 AD 1628-1687 1669 X
144 WSU 1996 CH 230 ± 50 245 ± 50 AD 1512-1950 1652 X
209 LLNL 2010 HBC 370 ± 40 370 ± 81 AD 1611-1686 1650 X
8 LLNL 2010 HBC 405 ± 25 405 ± 53 AD 1620-1672 1646 X
4 LLNL 2010 HBC 365 ± 25 365 ± 51 AD 1510-1602 1569 X
Late Period 2A
50 WSU 1996 CH 410 ± 240 410 ± 480 AD 1209-1954 1544 X
171 WSU 1996 CH 340 ± 300 355 ± 30 AD 1442-1641 1492 X
227 LLNL 2010 HBC 520 ± 25 520 ± 51 AD 1420-1472 1444 X
51 WSU 1996 CH 440 ± 160 455 ± 160 AD 1260-1950 1436 X
64 WSU 1996 CH 440 ± 230 455 ± 230 AD 1045-1950 1436 X
13 WSU 1996 CH 450 ± 50 465 ± 50 AD 1331-1458 1433 X
Late Period 1C
40 WSU 1996 CH 470 ± 200 485 ± 225 AD 1041-1950 1427
51 LLNL 2001 SHB (M2a) 1225 ± 40 1225 ± 30 I AD 1306-1398 1385 X
93 WSU 1996 CH 620 ± 60 635 ± 60 AD 1260-1420 1372
120 LLNL 2010 HBC 670 ± 25 670 ± 52 AD 1308-1366 1353 X
90 LLNL 2010 HBC 690 ± 25 690 ± 51 AD 1296-1399 1351 X
Late Period 1B
84 LLNL 2010 HBC 830 ± 30 830 ± 66 AD 1291-1401 1350 X

143
TABLE 20 (Continued)
Period A Sample IDB Test LabC Test Year MaterialD Uncalibrated
13C Age E (BP) Corrected
Date F (BP) Calibrated
Date G (BC/AD)
Calibrated midpoint H (BC/AD)
Isotope Study
166 LLNL 2010 HBC 840 ± 35 840 ± 75 AD 1286-1401 1348 X
182 LLNL 2010 HBC 805 ± 25 805 ± 53 AD 1277-1325 1312 X
97 LLNL 2010 HBC 815 ± 25 815 ± 54 AD 1275-1323 1306 X
132 LLNL 2010 HBC 790 ± 25 790 ± 51 AD 1263-1307 1286 X
91 WSU 1996 CH 690 ± 220 705 ± 220 AD 890-1650 1280 X
Late Period 1B (cont.)
107 WSU 1996 CH 735 ± 85 750 ± 85 AD 1042-1393 1268 X
166 LLNL 2001 SHB (M1a) 1390 ± 25 1390 ± 25 I AD 1215-1288 1256 X Late Period 1A
35 LLNL 2010 HBC 910 ± 25 910 ± 53 AD 1214-1280 1250 X
45 UA-AMS 2012 HBC 769 ± 43 AD 1181-1291 1249 X Late Period 1A
814-2J WSU 1996 CH 830 ± 70 845 ± 70 AD 1020-1280 1210 X
21 WSU 1996 CH 860 ± 150 860 ± 150 AD 783-1394 1179 X
22 K WSU 1996 FBC 680 ± 70 890 ± 70 AD 1000-1280 1158 X
MLT
178 WSU 1996 CH 880 ± 280 895 ± 280 AD 601-1620 1157
167 WSU 1996 CH 1130 ± 170 1145 ± 170 AD 560-1255 891 X
230 WSU 1996 CH 1210 ± 120 1225 120 AD 600-1021 794 X
Late Middle Period
63 WSU 1996 CH 1160 ± 150 1175 ± 150 AD 579-1187 787 X
144
TABLE 20 (Continued)
Period A Sample IDB Test LabC Test Year MaterialD Uncalibrated
13C Age E (BP) Corrected
Date F (BP) Calibrated
Date G (BC/AD)
Calibrated midpoint H (BC/AD)
Isotope Study
Terminal Middle Period
814-1J WSU 1996 CH 1250 ± 130 1265 130 AD 540-1018 725 X
Intermediate Middle Period
117 WSU 1996 CH 1540 ± 180 1555 ± 180 AD 70-860 473 X
179 WSU 1996 CH 1710 ± 200 1725 ± 200 172 BC-AD 670 293 X Early Middle Period
850J WSU 1996 CH 1790 ± 180 1805 ± 180 346 BC-AD 637 190 X
EMT 240 WSU 1996 CH 1790 ± 180 2205 ± 170 790 BC-AD 130 218 BC AScheme D (Groza 2002). BSample IDs listed exclude dates with modern results (likely contaminated) and those where retesting has produced a more reliable result. CTest laboratories: LLNL = Lawrence Livermore National Laboratory Center for Accelerator Mass Spectrometry; WSU = Washington State University, Department of Geology, Radiocarbon Dating Laboratory; UA-AMS = University of Arizona AMS Laboratory; BA = Beta Analytic, Inc. DMaterial: CH = charcoal; FBC = faunal bone collagen; HBC = human bone collagen; SH = shell; SHB = shell bead (with bead type in parentheses). E14C Age: Radiocarbon age is the uncalibrated result reported from the laboratory in years before present (BP). Following convention, present is 1950 AD. FCorrected Date: produced by the calibration program, the corrected date is reported in years before present (BP). All ranges are 2-sigma except for dates from Groza 2002, reported in 1-sigma. For previously published dates, reported values are as published. The WSU date for B50 and the Beta-Analytic date for Unit 2 were not previously calibrated. Calibration for all dates not previously calibrated, including new dates, was done by KG using CALIB 6.1.1. See Appendix C for details. GCalibrated Date: produced by the calibration program, the calibrated date is reported in years BC/AD. All ranges are 2-sigma except for dates from Groza 2002, reported in 1-sigma. HCalibrated midpoints are all AD except where noted otherwise. ICorrected and calibrated dates from Groza 2002 are presented in 1-sigma ranges, following the original publication. JNon-burial-associated features or midden samples from CA-SCL-38. KB22 is a faunal burial, a grizzly bear (Ursus arctos californicus).
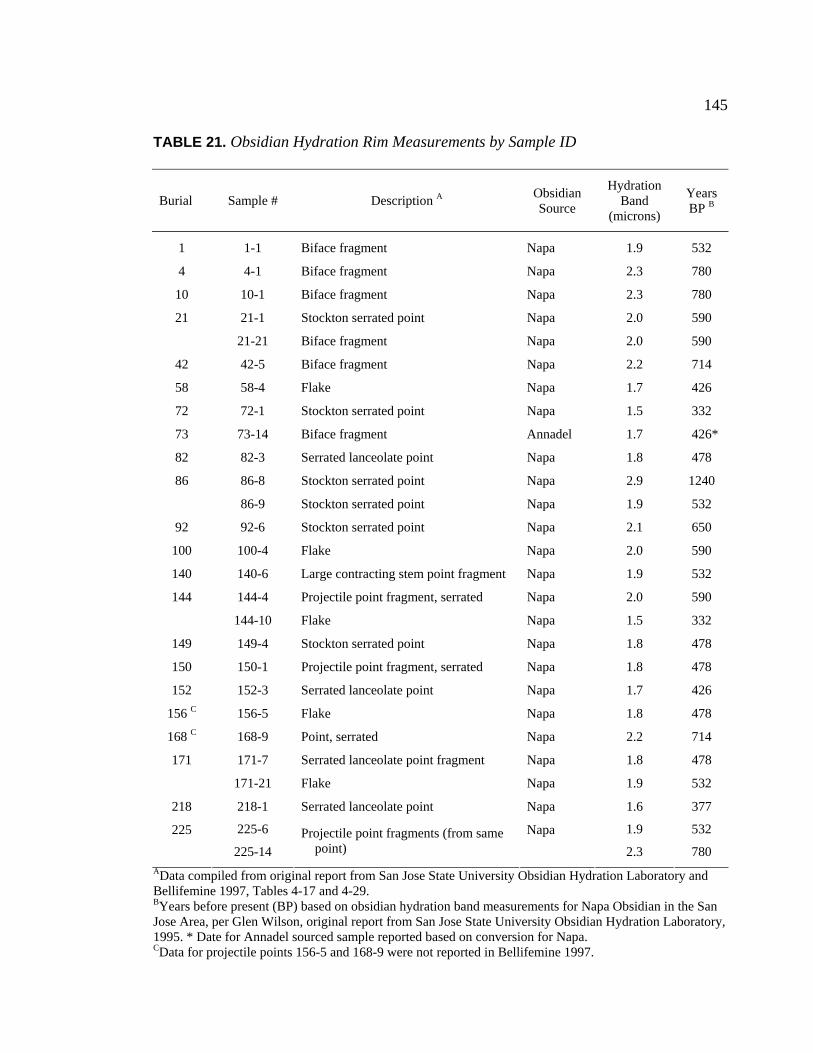
145
TABLE 21. Obsidian Hydration Rim Measurements by Sample ID
Burial Sample # Description A Obsidian Source
Hydration Band
(microns)
Years BP B
1 1-1 Biface fragment Napa 1.9 532
4 4-1 Biface fragment Napa 2.3 780
10 10-1 Biface fragment Napa 2.3 780
21-1 Stockton serrated point Napa 2.0 590 21
21-21 Biface fragment Napa 2.0 590
42 42-5 Biface fragment Napa 2.2 714
58 58-4 Flake Napa 1.7 426
72 72-1 Stockton serrated point Napa 1.5 332
73 73-14 Biface fragment Annadel 1.7 426*
82 82-3 Serrated lanceolate point Napa 1.8 478
86-8 Stockton serrated point Napa 2.9 1240 86
86-9 Stockton serrated point Napa 1.9 532
92 92-6 Stockton serrated point Napa 2.1 650
100 100-4 Flake Napa 2.0 590
140 140-6 Large contracting stem point fragment Napa 1.9 532
144-4 Projectile point fragment, serrated Napa 2.0 590 144
144-10 Flake Napa 1.5 332
149 149-4 Stockton serrated point Napa 1.8 478
150 150-1 Projectile point fragment, serrated Napa 1.8 478
152 152-3 Serrated lanceolate point Napa 1.7 426
156 C 156-5 Flake Napa 1.8 478
168 C 168-9 Point, serrated Napa 2.2 714
171-7 Serrated lanceolate point fragment Napa 1.8 478 171
171-21 Flake Napa 1.9 532
218 218-1 Serrated lanceolate point Napa 1.6 377
225-6 1.9 532 225
225-14
Projectile point fragments (from same point)
Napa
2.3 780 AData compiled from original report from San Jose State University Obsidian Hydration Laboratory and Bellifemine 1997, Tables 4-17 and 4-29. BYears before present (BP) based on obsidian hydration band measurements for Napa Obsidian in the San Jose Area, per Glen Wilson, original report from San Jose State University Obsidian Hydration Laboratory, 1995. * Date for Annadel sourced sample reported based on conversion for Napa. CData for projectile points 156-5 and 168-9 were not reported in Bellifemine 1997.

146
TABLE 22. Obsidian Hydration Dates for CA-SCL-38 Listed by Temporal Period
Period (Scheme D) Burial Sample # Description
Obsidian Source
Hydration Band
(microns)
Years BP A
58 58-4 Flake Napa 1.7 426
72 72-1 Stockton serrated point Napa 1.5 332
73 73-14 Biface fragment Annadel 1.7 426
144-10 Flake Napa 1.5 332
144 144-4
Projectile point fragment, serrated
Napa 2 (590)
152 152-3 Serrated lanceolate point Napa 1.7 426
Late Period 2A
218 218-1 Serrated lanceolate point Napa 1.6 377
1 1-1 Biface fragment Napa 1.9 532
86-9 Stockton serrated point Napa 1.9 532 86
86-8 Stockton serrated point Napa 2.9 (1240)
149 149-4 Stockton serrated point Napa 1.8 478
150 150-1 Projectile point fragment,
serrated Napa 1.8 478
156 156-5 Flake Napa 1.8 478
171-7 Serrated lanceolate point
fragment Napa 1.8 478
171
171-21 Flake Napa 1.9 532
225-6 Napa 1.9 532
Late Period 1C
225 225-14
Projectile point fragments (from same point) Napa 2.3 (780)
21-1 Stockton serrated point Napa 2 590 21
21-21 Biface fragment Napa 2 590
92 92-6 Stockton serrated point Napa 2.1 650
Late Period 1B
100 100-4 Flake Napa 2 590
42 42-5 Biface fragment Napa 2.2 714 Late Period 1A
168 168-9 Point, serrated Napa 2.2 714
4 4-1 Biface fragment Napa 2.3 780 MLT
10 10-1 Biface fragment Napa 2.3 780 AWhere there was more than one result from a single burial, the more recent value (smallest hydration band) is used because older obsidian flakes may have been found objects, heirlooms, or introduced through disturbance of burial soils. Bold indicates date used; parentheses indicate older date for same burial.
147
Bead and Pendant Temporal Significance. Regional surveys have confirmed
that styles of Olivella shell beads and Haliotis pendants changed through time. The work
of Bennyhoff and Hughes (1987), calibrated by Groza (2002), provides another important
tool for evaluating temporal context in Central California archaeological sites.
Olivella shell beads were found in association with 93 of the 248 burials
(38%) at the Yukisma Mound. Of these, four bead classes were identified by Bellifemine
(1997) including Class A (spire-lopped), Class K (callus or bushing beads), Class L
(thick rectangles) and Class M (thin rectangles). All shell bead classifications and
temporal associations follow the typology defined in Bennyhoff and Hughes (1987).
Haliotis pendants were found with 56 (23%) of burials at SCL-38, including seven
burials with the distinctive and temporally significant “banjo” style. These were also
classified by Bellifemine (1997:215), following the typology of Gibson and Fenenga
(1978:148).
Among the Class A spire-lopped Olivella beads associated with Yukisma site
burials, the following three types were identified: type A1, “simple spire-lopped,” type
A4, “punched spire-lopped,” and type A5, “appliqué spire-lopped.” The type A1 beads
were further divided by size, where A1a were small beads (3.0-6.5 mm), A1b were
medium beads (6.51-9.5 mm), and A1c were large beads (9.51-14.0 mm) (Bellifemine
1997:71). Of the Class A beads, only type A5 have temporal significance, suggesting the
Protohistoric to Historic period in the San Joaquin Valley and Delta regions (Bennyhoff
and Hughes 1987:119). Timing for these is not clear for the Santa Clara Valley, but a
relatively recent incidence seems probable. Type A5 beads were found in association
with Burials 162, 163, 164, and 176.

148
Class K callus beads found with burials at SCL-38 included two types: K1,
which are cupped, and K2 which are bushing beads. The cupped type are markers for
Phase 1 of the Late Period in Central California (Bennyhoff and Hughes 1987:137). This
type of beads was found with Burials 13, 50, 52, 53, 65, 80, and 167. Bushing beads (K2)
are tiny cylindrical beads used like a washer against another surface with threads or fibers
passing through them, and may also simply be strung as beads. Type K2 beads are
considered a marker for Phase 2 of the Late Period (Bennyhoff and Hughes 1987:137),
and occur at Yukisma with Burials 13, 50, 53, 65, 80, and 167.
Three types of rectangular beads were found at SCL-38. Type L2 are small,
thick rectangles, recovered with Burials 166, 178, and 179. Unfortunately, the Type L2
beads are not specifically associated with any single period in Central California
(Bennyhoff and Hughes 1987:139). Type M beads are thinner rectangles, also called
sequin beads. M1 beads are “normal” sequins, perforated in the center. Type M2 beads
are ‘pendant” beads, perforated near one end and often sewn in overlapping rows to a
garment (Bennyhoff and Hughes 1977:141). Both types M1 and M2 are diagnostic of
Phase 1 of the Late Period in Central California, where M1 appears during early and
middle Phase 1, the two occur together during middle Phase 1, and M2 persists into late
Phase 1, and occasionally into Phase 2 of the Late Period (Bennyhoff and Hughes
1987:141). Two class M beads were included in Groza’s (2002) radiocarbon study of
bead dates: a type M1 bead from Burial 166 which dated to Late Period Phase 1A/1B
(AD 1215-1288, calibrated, 1-sigma), and a type M2 bead from Burial 51 which dated to
Late Period Phase 1B/1C (AD 1218-1418, calibrated, 1-sigma). These results support the
temporal expectations of Bennyhoff and Hughes. Eleven burials from SCL-38 had
149
associated type M1 beads, but no M2 beads (Burials 63, 68, 71, 93, 97, 106, 163, 164,
167, 169, and 184). Seven burials included both M1 and M2 types (Burials 13, 50, 69, 88,
94, 105, and 168). Two burials included type M2, but not M1 (Burials 51 and 87).
Haliotis “banjo” pendants (so named because their shape resembles the tuning
pegs of a banjo, with a rounded “head” and narrow body) were found with seven burials
at the Yukisma Mound (Burials 51, 64, 65, 71, 164, 189, and 219). Based on the stylistic
analysis of Bellifemine (1997:215), variants of types N1a, N1b, N2a, N4a, N6a, and N6b
were present. All of these types are typical of the Late Period Phase 1B or 1C.
Summary of Temporal Information for SCL-38
Figure 26 summarizes the results from calibrated radiocarbon dates, obsidian
hydration dates, and temporally significant bead and pendant associations. Burials dated
using more than one method are listed once as directly dated (in the column of the date
deemed most reliable), and then as either “Repeated (same)” if another method produced
the same result, or “Repeated (different)” if another method suggested a different
temporal period. For burials dated with multiple methods, radiocarbon dates are generally
prioritized first, followed by obsidian hydration results, then bead typology. Burials
associated with dated burials (e.g., double or multiple interments) are listed below those
directly dated in each temporal period.
Overall, the vast majority of dates from all three methods fall into the Late
Period, particularly Phase 1 (46 of 80 dates, or 57.5%). Phase 2 of the Late Period
includes twenty-four dated burials (30%). The Middle-Late Transition includes three
burials (4%), dated with both radiocarbon and obsidian hydration results. Seven burials

150
Temporal Period
(Scheme D)
Burial AssociationA
Burials Dated with Radiocarbon
Burials Dated with Obsidian Hydration
Burials Dated with Beads & Pendants
Burials per
periodB
Directly dated 4, 8, 144, 209, 210 58, 72, 73, 152, 218 13, 50, 53, 65, 80, 162, 163, 164, 176
Associated 141, 142, 143 (w/144)
13A & 83 (w/13 & 50); 52 (w/53)
Repeated (same)
50 144, 210
LATE PERIOD 2 440-230 BP AD 1510-
1720 Repeated (different)
167
25
Directly dated
35, 40, 45, 51, 64, 84, 90, 91, 93, 97, 107, 120, 132, 166, 171, 182, 227
1, 42, 82, 86, 92, 100, 140, 149, 150, 156, 168, 225
68, 69, 71, 87, 88, 94, 105, 106, 169, 184, 189, 219
Associated 90A (w/90); 119 (w/120); 226 (w/227)
151 (w/149 & 150); 155 (w/156)
105A (w/105); 220 (w/219)
Repeated (same)
171 51, 64, 93, 97, 168
LATE PERIOD 1 740-440 BP AD 1210-
1510
Repeated (different)
13 21 13, 50, 52, 53, 63,
65, 80, 163, 164, 167
48
Directly dated 21*, 178 10
MLT 940-740 BP AD 1010-
1210 Repeated (different)
4 3
Directly dated 63*, 117, 167*, 179, 230
MIDDLE PERIOD 2160-940
BP 210 BC- AD 1010
Associated 130 (w/117); 167A (w/167); 230A (w/230)
8
EMT 2450-2160
BP 500-210 BC
Directly dated 240* 1
Total by MethodC 39 20 26 85
ABurial Association: Directly dated = burials referenced for date; Associated = burials associated with dated burials (e.g., double or multiple interments); Repeated (same) = burial directly dated using another method with the same result; Repeated (different) = burial directly dated using another method which yielded a different result, explained in text. BBurials per period is the total of directly dated and associated burials in each temporal period and excludes all repeated burials. CTotal by method is the total of burials directly dated using each method as well as their associated burials, but excludes all repeated burials. *Burial date assigned based on radiocarbon results, but problematic due to artifact assemblage, explained in text.
FIGURE 26. Summary of temporal information for CA-SCL-38.
151
were placed before the MLT, all from radiocarbon dates from the 1996 batch. The lack of
other temporal verification of these earlier dates is concerning, and several of these early
14C results actually conflict with other dating methods which suggest a later temporal
assignment.
Thirteen burials presented dilemmas for temporal classification (Burials 4, 13,
21, 50, 52, 53, 63, 65, 80, 163, 164, 167, and 240). Burial 4 was dated with both
radiocarbon (in 2010) and obsidian hydration, but the obsidian date is much older.
Because AMS dates are considered to be very reliable and obsidian associations may be
heirlooms or retouched flakes, the more recent radiocarbon date is used.
Burials 13 and 50 are part of a multiple interment and so are expected to have
the same date. However, the 1996 14C results placed these burials in different phases of
the Late Period (burial 13 in Phase 1C and burial 50 in Phase 2A). Additionally, both
burials had associated bead types consistent with both LP1 and LP2. Burial 13 had five
associated magnesite stone beads, which appear in the archaeological record during Phase
2 of the Late Period (C. King 1978:62). Accordingly, in this case, the bead chronology
will resolve the dilemma presented by the radiocarbon dates, placing both burials in LP2
along with their associated burials (13A and 83).
Burials 21, 63, 167, and 240 were all part of the 1996 14C dating batch, which
yielded very early dates, but each has other indicators suggesting a later temporal
assignment. Burial 21 contains obsidian dated to LP1, but the 14C date suggests MLT.
Burials 63 and 167 both have 14C dates placing them in the Middle Period, but contain
bead types consistent with the Late Period. Burial 240 yielded the earliest 14C date from
the site, yet included the red andesite show mortar with bead appliqué, clearly produced
152
during the Late Period (Tammy Buonasera, personal communication, June 3, 2011).
These burials are provisionally classified according to their 14C dates, but are marked
with an asterisk to note that the dates are suspicious.
The last group of problematic classifications includes burials which contain
beads diagnostic of both Phase 1 and Phase 2 of the Late Period (Burials 65, 80, 163, and
164). In each case, it was determined that older beads could be retained in more recent
burials, so each of these was assigned to LP2.
In summary, the temporal information available for SCL-38 is substantive, but
still insufficient to accurately classify the use of this site through time. Radiocarbon dates
from the 1996 batch indicated that the site was used for more than 2000 years (c.f.
Bellifemine 1997; Morley 1997). However, no other dating source has confirmed site use
earlier than 780 years BP (during the MLT). Data from obsidian hydration, artifact
typology, and new radiocarbon dates suggest that the Yukisma Mound may have been
used as a cemetery site for less than 600 years, from the end of the MLT through Late
Period Phases 1 and 2.
Conclusion: The Yukisma Mound
(CA-SCL-38)
The low earth mound mortuary site which has come to be known as the
Yukisma Mound has a long story of traditional use and historical impacts. The site was
primarily used as a cemetery during the Middle-Late Transition and Late Periods
(roughly AD 1010 through 1720), but may have been used during earlier periods as well.
Additional temporal studies would be helpful to better understand the depth of this site.
153
During the excavations of 1993 and 1994, approximately 248 unique
individuals were removed from the path of construction. There was little differentiation
in their mortuary traditions, but significant differentiation in the accompanying grave
goods. More than 60 percent of these individuals were buried without artifacts of any
kind. However, a few individuals had large and diverse caches of useful, socially
significant, and/or ritual goods. The interpretation of this diversity or richness will be the
subject of Chapter IV.

154
CHAPTER IV
FOOD AND IDENTITY IN PREHISTORY:
THEORETICAL AND PRACTICAL
APPROACHES
Introduction
At its core, this work attempts to reconstruct the lived identities of individuals
buried at the Yukisma Mound (CA-SCL-38) based on the evidence they left behind.
Material culture (artifacts), mortuary context (mode of interment) and
bioarchaeology (skeletal morphology and chemical composition) all reflect aspects of
social identity. Yet, no combination of archaeological evidence can fully represent the
personalities, aspirations, challenges, or interpersonal connections between these
individuals. The discussion of identity in archaeological terms is necessarily limited by
issues of preservation and representation, and shaped by our own concepts of
individuality and personhood (Fowler 2004). This chapter explores the aspects of identity
available in the archaeological record and the theoretical framework shaping their
interpretation in this work.
Theoretical Considerations
This project, like most in biological anthropology, was grounded in the
pragmatic, hypothesis-driven, observation- and experiment-based theory of processual

155
archaeology (Binford 1962). Correlation between observed mortuary context, artifact
associations, bioarchaeological evidence, and stable isotope evidence was tested to
evaluate hypotheses about dietary patterns in the past. Clarity of method and
reproducibility of results were prioritized. However, when addressing issues of identity
and social organization in the past, explanatory models beyond those in available in the
processual toolkit were necessary.
Both middle-range theory (sensu Binford 2001), which uses ethnographic
analogy to interpret archaeological evidence, and the culture-historical approach, which
projects ethnohistoric information into prehistoric contexts, rely on risky premises. In the
first case, there is an assumption of universalism and progressive cultural evolution, in
the second, of cultural stasis through time. Both approaches can produce useful
suggestions about possibility in the archaeological record, but should not be used as
limiting factors for interpretation. Ethnographic analogy was used sparingly in the present
work, with the intention of illustrating diverse possibilities, rather than diagnosing
particular outcomes based on archaeological context. The culture-historical approach has
been particularly common in the interpretation of California prehistory (see discussion in
Chapter II). While consideration of ethnohistoric accounts is a part of the interpretation of
social organization (later in this chapter) and dietary patterns (Chapter V), this evidence
is regarded as a snapshot of experience, particular to a specific time, place, informant,
and recorder, and not necessarily reflective of the lifeways of those buried at the Yukisma
Mound.
A degree of flexibility in interpretation is necessary to visualize the nuances of
changing cultural expression and individual variation from archaeological evidence. To
156
this end, theoretical components of post-processual and interpretive archaeology were
also included. The pursuit of identity in the archaeological record is enriched by the
concept of individual agency, clarified by reflexivity, and strengthened by the expanded
perspectives of feminist anthropology and queer theory.
Because processual archaeology draws from ecosystem theory, there is an
emphasis on the effects of systems (environmental, cultural, evolutionary) on
populations. In this way, innovation is muted, the agency of individuals is obscured, and
the dynamics between sub-populations (e.g., gender, class, and factions) are often missed
(Brumfiel 1992). Post-processual archaeology shifts the focus from whole populations
and adaptive systems to the agency of individuals and the negotiation of power between
sub-populations (Watson 2008). The fields of feminist archaeology and queer theory
draw from many theoretical bases to advocate awareness of gender in interpretations of
the past, including the perspectives and priorities of women as well as those of genders
which do not align with binary sex designations (Hegmon 2003). Additionally, post-
processual archaeology highlights the power of the archaeologist in shaping interpretation
and advocates reflexive clarity, making the reader aware of the interpretive frame of
reference. These are all important refinements to archaeological interpretation, and will
be included in this work.
A final aspect of post-processual archaeology to be highlighted in this review
is multi-vocality—the awareness that many interpretations of the past are possible and
that none has absolute claim on truth. In response to this aspect, I call upon interpretive
archaeology, which limits possible interpretations and negotiates between stakeholders as
follows:

157
Archaeologists need to retain the authority to be able to say that a particular interpretation does not fit the data, but they also need to be open to dialogue and conflicts with vested interests other than their own and to understand the social implications of the knowledge they construct. [Hodder 1991:16]
I agree that an awareness of other voices is an important component of interpretation,
particularly the voices of descendant populations. For this reason, I am extraordinarily
grateful for the ongoing involvement of the Muwekma Ohlone Tribe in this research, and
look forward to a continuing dialogue about these interpretations for a long time to come.
The relatively new field of social bioarchaeology infuses traditional
bioarchaeological research with social theory, enabling broader interpretations of social
dynamics and individual life experience (Agarwal and Glencross 2011). Social
bioarchaeology treats human remains as a cultural artifact, one which has been shaped by
the activities of life and built of the foods consumed. Through both intentional and
unintentional actions, the form and composition of bones are modified throughout life.
Each human skeleton is a unique product of an individual’s life path, a synthetic result of
genetic, nutritional, and activity patterns, and thereby inscribed with evidence of the
stresses, triumphs, and everyday patterns of life. The body, thereby, “can be regarded as a
form of material culture” (Sofaer 2006:xv). Social bioarchaeology seeks to integrate
empirical interpretation of the skeleton (features such as biological sex, age, and
pathological conditions) with an awareness of the body as a social construction. Using
this integrative suite of evidence, deeper questions of social identity can be addressed and
the imprints of power and social organization can be visualized, even at the level of
individuals and sub-populations (Agarwal and Glencross 2011; Tung 2012). “The body is
the locus through which agendas are constructed and contested, and as bioarchaeologists,
158
we have privileged access to those narratives” (Tung 2012:17-18). The theoretical toolkit
used in this project is ultimately a synthesis of all of these points of view, including the
pragmatic science of processualism, the interpretive awareness and inclusiveness of post-
processualism, the refinement of interpretive archeology, and the practical applications of
social bioarchaeology. The views expressed in this work are ultimately those of the
author, with hopes of incorporating the multi-vocal perspectives of descendent
populations and other collaborators in future publications.
Identity
Social identity is an amalgam of an individual’s characteristics framing his or
her place within the community. The process of identity formation is culturally specific
and may be primarily self-actualized (manifested from a sense of individual awareness
and achievement) or relationship-based (reliant on interactions and interdependencies
with others) (Fowler 2004). Likewise, the characteristics which are prioritized in identity
formation are culturally mediated and may vary through time.
The term “social identity” is used here following the definition established by
Saxe (1970), which was based on Goodenough (1965), with modifications. Goodenough
proposed that social identity was “any aspect of self that makes a difference in how one’s
rights and duties distribute to specific others” (Goodenough 1965:3). Saxe used the term
more generally to refer to “a category of persons or what has been called a social position
or status” (Saxe 1970:4). Any individual may hold multiple social identities
simultaneously. For example, a woman, born to a high status family, who is an elder and
a specialist in basketry, can also be a mother and grandmother and wife and advisor to

159
the chief. Goodenough frames social identities in terms of rights and duties, best applied
in ethnographic contexts, while Saxe expands his classifications to mortuary analysis
(Goodenough 1965; Saxe 1970). Goodenough and Saxe both use the term “social
persona” to refer to the “composite of social identities selected as appropriate to a given
interaction” (Goodenough 1965:7; Saxe 1970:7). Binford applied the concept to the
archaeological record, stating that the social persona of the deceased is “the composite of
the social identities maintained in life and recognized as appropriate for consideration at
death” (Binford (1971:17). The primary dimensions of the social persona affecting
mortuary treatment, as recognized by Binford, were age, sex, rank, and affiliation with
“membership segments of the broader social unit” (Binford 1971:17). Additionally, he
points out that the circumstances of death may affect mortuary practices and obscure the
social persona of the deceased. For example, burial practice may be different for
individuals killed in battle, or individuals who died far from home.
In discussing social identities in the past, archaeologists must be pragmatic
about identifying characteristics of identity in the archaeological record, and then test
these against other criteria to interpret social relevance. Identification is contingent upon
available evidence – many signifiers of social roles or relationships may be unavailable in
mortuary contexts or may not have survived in the archaeological record. Building upon
the categories recognized by Binford, aspects of social identity to be considered in this
project include social age, sex and gender, disabilities, specializations, status, and
population affinity.

160
Identity and Archaeology
Social Age
For the purpose of understanding social identity, age is more than a matter of
seasons of life on the planet; the social categories of age must be considered as well.
Three meanings of age, described by Ginn and Arber (1995) are relevant to
archaeological interpretation (Sofaer 2006:119). The first two, chronological age and
biological age, are closely associated in osteological interpretation. Chronological age
refers to the years since birth; biological age refers to the apparent years since birth
manifested in bodily tissues. Biological age may differ from chronological age, based on
stress, trauma, nutrition, and variation. However, in absence of other documentary
evidence, biological age serves as a proxy for chronological age in archaeological
contexts. Social age is the socially-constructed expectation for behavior and
responsibilities, based on flexible cultural categories of childhood and adulthood.
Estimations of biological age (and chronological age) are based upon
osteological analysis, focusing on observations of developmental stages for subadults
(dental eruption and epiphyseal fusion), and of deterioration for adults (morphology of
the pubic symphyses, auricular surfaces or sternal rib ends, evidence of osteoarthritis,
fusion of cranial sutures). Archaeological interpretation also requires an awareness of
social age. Variation in associated artifact types or quantities may provide clues as to the
age at which a subadult transitions to the social role of an adult and clarify transitioning
roles of post-reproductive or elder individuals within the community.
161
Sex and Gender
Like age, the aspects of biological sex and social gender are more complex
than can be addressed with only bioarchaeological data. Osteological analysis provides
evidence of biological sex, based on morphology of the pelvis, cranium, and dimensions
of long bones. However, gender roles are socially constructed guidelines to behavior and
interaction which may include multiple and flexible options beyond binary biological sex
designations. “Gender is a process that changes over the life course in a socially
recognized manner; people are constrained by society’s view of who they are but are able
to negotiate and alter their perception in relation to pre-existing configurations” (Sofaer
2006:98). Because reproduction is an important facet of identity, correlation between
biological sex and gender identity options may be stronger during reproductive years,
particularly for females, although this too may be influenced by cultural variation and
individual agency. In the literature of social bioarchaeology, as in the present project, the
terms male and female are used to describe biological sex, whereas word such as man,
woman, third-gender, two-spirit, or berdache are used to describe gender roles.
One of the primary bases for differentiation of masculine and feminine roles
in California archaeology is the division of labor in food and craft production. Hunting
and fishing are thought to have been primarily the work of men, although women were
involved in hunting of small game and in communal drives in many parts of California
(Willoughby 1963). Collection of plant foods (e.g., acorns, tubers, greens, seeds) was
primarily the responsibility of women (Jackson 2004) and of children of both sexes, but
men assisted during seasonal harvests (Jacknis 2004; Willoughby 1963). Usually women
collected insect foods (grubs, insects, and larvae), but men-only collection trips for
162
specific species were reported by the Pomo (Willoughby 1963). Processing of meat and
hides was done by men in most areas of California, and processing of vegetable foods
done by women, but many exceptions are noted. Cooking was primarily done by women,
but men sometimes were responsible for roasting tubers or cooking meat (Willoughby
1963). Overall, considerable variation in the delegation of subsistence tasks seems to
have been present among Native California populations and few tasks were exclusively
the responsibility of a single gender. Social age was also a factor, as children and older
men often shared the food collection and preparation responsibilities with women
(Willoughby 1963).
Responsibilities for craft production may also have been divided between
gender roles. Willoughby reports that among the Costanoans, men were responsible for
stone working, woodworking, canoe building, and dressing of hides, whereas women
were responsible for basketry, and both men and women made cordage (Willoughby
1963:49). Elsewhere in California, men were primarily responsible for weaving nets,
building traps, weirs, and snares, building weapons, and crafting horn or bone
implements. Women were primarily responsible for weaving mats. Both men and women
were involved in construction of houses, and in production of mortars and pestles
(Willoughby 1962:49). From the archaeological record, occupational specializations can
be discerned based on burial-associated artifacts and bioarchaeological evidence of
activity patterns.
Sandra Hollimon has done extensive research on gender roles in prehistoric
California, and has found evidence of third gender (two-spirits) individuals among the
Chumash, Yokuts, Mono, and Tubatulabal (Hollimon 2005). These populations live in

163
Southern and Central California; the Northern Valley Yokuts are just east of Ohlone
territory, in the San Joaquin Valley. Ethnohistoric accounts from these tribes depict two-
spirits individuals (previously called berdaches) as mortuary specialists, usually men
dressed in women’s attire, responsible for digging graves, depositing the dead, and
watching over mortuary ceremonies (Hollimon 2005). Reports of two-spirits were
recorded in the ethnohistoric literature of thirty-four of forty-four California tribes in
Willoughby’s (1963) survey, including the Costanoans. Two-spirits were designated as
exclusively of male sex in eighteen tribes (including Costanoan), as primarily male but
sometimes female in four tribes, and as individuals of both male and female sex in twelve
tribes. Willoughby notes that “instances where the trait was denied are probably a
reflection of recent attitudes” rather than confirmation that this practice was regionally
absent (Willoughby 1963:57). Two-spirits were reported to do the work of women, but
sometimes also participated in hunting, a masculine task (Willoughby 1963).
Bioarchaeological evidence for third gender individuals has been noted in
patterns of osteoarthritis and traumatic injury. Two biological males from a Chumash
population displayed vertebral osteoarthritis typical of female patterns in the region, and
likely related to activities of digging. These individuals were also the only males at the
site buried with digging stick weights (Hollimon 2005). Additionally, “manly-hearted
women” with evidence of traumatic injuries consistent with violent combat are noted in
the archaeological record of North America (Joyce 2008:61-62). Calling them “women
warriors,” Joyce suggests that this is evidence of fluidity in gender classifications or non-
binary gender role options. Hollimon suggests the following archaeological tests for
identifying two-spirit burials: individuals buried with artifacts typically associated with
164
the other sex, individuals buried in a section of the cemetery associated with the other
sex, individuals buried with clothing and/or ornaments associated with the other sex or
with a third gender identity, or individuals buried with tools associated with a third-
gender identity activity (e.g., digging sticks and digging baskets) (Hollimon 2005:187).
Disabilities
Individuals with disabilities experience limitations to sensory, physical,
cognitive, or social skills, which may be congenital or developed through life due to
disease or injury (Centers for Disease Control and Prevention 2010). Any barrier to
normal participation in life activities would inevitably be a component of an individual’s
social identity, further negotiated based on community response and mitigated by
individual agency. Many types of disability would be invisible in the archaeological
record, but some may be observable based on pathologies of the skeleton. Further,
archaeological associations may provide evidence about social adaptations and
accommodations for individuals with disabilities.
Specialization
Specialization of social roles is an aspect of complex social organizations
where select individuals expand on areas of personal expertise and often are relieved of
some subsistence responsibilities. Two types that are detectable in the archaeological
record of California are craft specialization and ritual specialization. Craft specialization
is defined as “the production of substantial quantities of goods or services well beyond
local or personal needs, and whose production is generally organized, standardized, and
carried out by persons freed in part from subsistence pursuits” (Arnold and Munns
1994:475). Of all California Indian populations, the greatest reputation for craft
165
specialization belongs to the Chumash of the Santa Barbara Channel region. Evidence of
specialized production of shell beads, plank-canoes, and microdrills has been observed in
the archaeological record, based on large accumulations of production debris displaying
standardization of form (Arnold 1987). This evidence has been used as a proxy for
complex social and political organization among the Chumash.
Ritual specialization, or shamanism, has always been an important component
of California Indian social organization (Bean 1992a; Heizer 1978; Kroeber 1925).
Within shamanic practice, sub-specializations have been reported in the ethnographic
literature, including sucking doctors, soul-recovering shamans, weather controlling
shamans, rattlesnake shamans, bear shamans, herbalists, and midwives (Bean 1992a;
Levy 1978; Willoughby 1963). Shamanic roles among the Ohlone were most typically
held by men, but sometimes by women (Harrington 1942). An exception was made for
midwives, who were reportedly always female (Willoughby 1963). Ritual specialists may
have obtained their roles by being called to service, but often these positions ran in
families, particularly families which already had influence and power in the tribe (Bean
and Vane 1992). Shamans had to follow strict food taboos (Jacknis 2004:103). These
dietary limitations may be evident in the stable isotope values of their bones.
Archaeological associations with ritual specialists would likely include objects
for the symbolic capture and control of power, such as quartz crystals, charmstones,
totem objects like eagle claws or bear bones, or transformed trophy objects (e.g.,
modified human bones). They would also likely possess objects used in healing practices,
such as sucking tubes or medicinal herbs. A third category of objects would be associated
with their roles in ceremonies, including pigments and other regalia. Finally, they are

166
expected to have objects reflecting their esteemed status in the group (see discussion of
status below).
Status
Social status is an important component of social identity in ranked or
complex social organizations. Status is defined here as a difference in prestige or power
relative to other members of a group (cf. Ames 2008:488). An individual’s status may be
associated with prestige, wealth, or power, each of which may have distinct
archaeological correlates. Social status is a factor of social complexity, and a product of
social organization. This review will focus on the types of social status which are viewed
archaeologically, including prestige, wealth, and power, and the evidence for these
aspects in the archaeological record of Central California.
A complex social system is one which is composed of many interrelated parts
(cf. Price and Brown 1985:7). Social complexity further implies a condition of permanent
social inequality between those parts (Ames 2008:490). Permanent social or institutional
inequality exists when differences between individuals, whether based on lineage, ability,
or physical traits (beyond age or sex), are invested with social meaning causing some
individuals to be denied access to opportunities, prestige, or social roles. Using this
definition, any ranked or hierarchical social organization is complex. A ranked society is
one in which there is differential access to status and prestige, but equal access to the
means of production. Stratified societies have differential access to status and prestige,
and also to means of production. Because of the distinction between ranked and stratified
societies, the definition of complexity developed by Jeanne Arnold, based on her study of
the Chumash of southern California, will not be used in this study. In that definition,
167
social complexity “first and foremost means institutionalized control by some
individual(s) over nonkin labor” (Arnold 1996:93). The control of labor is pertinent to
stratified societies (like the Chumash), but not to ranked societies.
Although the early literature in California archaeology favored interpretation
of California Indian social organization as egalitarian, this was largely an artifact of
colonial biases (see Chapter II) and a long-standing supposition that complexity required
the presence of agriculture (cf. T. King 1978). Egalitarian social organization is
frequently observed in ethnographic studies of small foraging (“hunter-gatherer”) groups
such as the Ache, the Dobe Ju/’Hoansi, and the Hadza (Hill and Hurtado 1996; Howell
2000; Lee 1979; Marlowe 2010). In an egalitarian social organization, all individuals do
not necessarily have the same amount of goods, food, prestige, or authority, however
there is “equal access to food, to the technology needed to acquire resources, and to the
paths leading to prestige” (Kelly 2007:296, emphasis added). The prevalence of
egalitarian organization among modern foragers was long used as evidence that all
foragers in the past would have the same organization.
However, a few ethnographic studies of foraging populations have
demonstrated that more complex models of social organization are possible now, and
would have been in the past as well. Ranked and/or hierarchical societies have been
observed among the Tlingit and Haida of the Pacific Northwest, the Ainu of Japan, and
the Chumash of southern California (Kelly 2007). The potential for social complexity, the
markers of complexity, and the forces contributing to social diversification within
foraging communities have been the subject of substantial discussion, but these topics are
beyond the scope of the present project (but see Bellifemine 1997 for a literature review).
168
Scholars who have spent more years than this author thinking about such
things seem to agree that the Native People of Central California lived in complex,
ranked societies (Bean 1976; King 1970, 1978; Lightfoot et al. 2013; Wiberg 1988). For
the purposes of this paper, ranked societies, chiefdoms, trans-egalitarian organizations,
and middle-range societies will be considered synonymous, although subtle differences
may be found in the literature. In all of these scenarios, differential access to rank and
prestige are present, and these will be the attributes of focus in this project.
Status, or differential access to social privilege, may be a factor of prestige,
wealth, or power. Prestige is freely given, based on respect. “Someone with prestige is
listened to, their opinions are heavily weighed (not obeyed) because the person enjoys
credit, estimation, or standing in general opinion” (Henrich and Gil-White 2001:168).
Prestige may be earned based on wise counsel or demonstrated skill, or inherited based
on lineage or moiety affiliation.
Moieties were clan-like divisions within settlements, documented among the
Miwok, Mono, Central Yokuts, Salinan, Kitanemuk, Serrano, Cahuilla, Cupeño and
Luiseño (Bean 1976; Kroeber 1925). Often membership was based on patrilineal descent,
as with the Miwok (Kroeber 1925), but in some populations moiety affiliation was
chosen, as with the “pseudo-moieties” of the Pomo (Bean 1976). The moiety concept
divided ritual responsibilities, animal totems, habitation areas in villages, and burial areas
within cemeteries. Marriage patterns were usually exogamous, as marriage within the
moiety was prohibited for five generations (Bean 1976). Cross-moiety marriages served
to maintain a wide network of affiliations between villages, which also strengthened
regional economic and political relationships. The totemic animals most commonly
169
associated with moieties in Central California are the bear and the deer. Ethnohistoric
records support the existence of “bear” and “deer” moieties among the Costanoan
(Harrington 1942; Levy 1978), but details are sparse.
In the economy of prehistoric California, a monetized system of shell beads
was used for trade, for compensation for healing or other ritual services, and as tribute.
Individuals with influence on any of these aspects of life accumulated wealth.
Additionally, access to certain groves or harvesting areas was controlled by lineages and
passed to descendents through inheritance. Wealth is thought to have been very closely
aligned with lineage (Bean 1976).
The exercise of power in Central California prehistory is somewhat unclear.
Ethnohistoric documents indicate that leaders had considerable influence and
commanded respect (Beebe and Senkewicz 2011; Brown 2011; Crespí 1999, 2001;
Stanger and Brown 1969). Osteological evidence of interpersonal violence suggests that
political disagreements sometimes led to warfare, requiring tactical organization. Four
modalities of power, defined by Eric Wolf (1999:5), provide a useful vocabulary for
discussion. The first mode is personal power (to compel or physically overpower). The
second is social power (to influence through social interactions). The third is tactical or
organizational power (to influence based on the authority of position, rather than personal
attributes). The fourth is structural power (to direct resources, energy and labor).
According to this model, all individuals in a ranked society would have access to the
personal power, and to some degree, to social power. Where authority is institutionalized,
there is a potential for tactical power. In the case of prehistoric Central California, it is
not clear whether a village chief would have power regardless of his or her personal
170
attributes. Exercise of the structural power depends on local institutions (e.g.,
redistribution of resources), which may have been in place.
The political organization of the ancestral Ohlone appears to have been an
expansive network of settlements, forming a loose federation. Smaller settlements (often
called “tribelets”) were affiliated with larger, central villages, and may have housed
individuals of different lineages, social statuses, or served as bases for specialized
subsistence pursuits. Each settlement had one or more leaders (chiefs), and may also have
had an orator, one or more shamans, and individuals in various other social positions of
authority or prestige. Some sites were hosts for feasting and ritual gatherings that
included people from distant settlements, serving as nodes for intense socio-political
interaction (Bean 1976). It is thought that most specialized roles (e.g., ritual, trade) and
roles of power or prestige were inherited. Local ranked organizations may have also
involved individuals of a middle status, such as chief’s assistants, messengers, managers,
or callers. These positions were also likely inherited, but may have been achieved (Bean
1976).
When investigating social complexity in the archaeological record of
California, archaeologists have focused on patterns of mortuary treatment and associated
grave goods. Models developed by Binford (1962, 1971) have proven useful in
differentiating egalitarian and ranked social organization based on mortuary contexts. In
evaluating mortuary context, Binford focused on three variables: (1) treatment of the
body, including preparation, processing, and disposition, (2) preparation of the mortuary
facility (grave), including form, orientation, and location relative to other interments, and
(3) grave furniture, including the types, quantities, and assemblages of burial-associated
171
artifacts (Binford 1971:21). Binford proposed that mortuary assemblages in egalitarian
societies would have the following characteristics:
Technomic artifacts would serve as status indicators, where refined form and
exotic materials may symbolize greater achievement in technological activities during
life.
Sociotechnic artifacts would be associated with many individuals, with
qualitative and quantitative differentiation based on demographic categories (age and sex)
and no formal exclusions.
An individual’s possessions symbolizing status would be destroyed at death
through interment with the deceased or outright destruction (Binford 1962:222).
Archaeological assemblages from societies with greater social complexity
would reflect a greater degree of differentiation in mortuary treatment of persons with
different status positions (Binford 1971:18). Archaeological indicators of ranked social
organization include the following:
Fewer technomic artifacts would be associated with individuals of higher status.
Symbols of social status would be more esoteric than in egalitarian assemblages.
There would be more complexity and variation in sociotechnic artifact
distribution, with some forms restricted to individuals of certain status positions.
An increase in differential treatment at death would be apparent, with variation
in grave goods, orientation, and spatial distribution cross-cutting sex and age categories.
Status symbols would be more frequently inherited at death (not buried with the
decedent) (Binford 1962:222-223).

172
The first two studies in California to directly consider social status were Gary
Stickel’s (1968) report from Rincon (CA-SBA-1), and Linda King’s report (1969) from
Medea Creek Village (CA-LAN-243), both Chumash sites. Stickel examined mortuary
context, demographic variables, and artifact associations using nearest neighbor analysis
and applying Binford’s (1962) criteria for interpretation of social organization. He noted
differential distribution of grave good types and quantities, heterogeneous interment
procedures, and spatial organization at the cemetery by demographic groups (Stickel
1968:222). Although he reported status differentiation based on quantity of artifact
associations and presence of exotic materials, he concluded that the assemblage at Rincon
was consistent with an egalitarian social organization. His reasons were (1) the lack of
esoteric artifact forms (all appeared to be useful), (2) the lack of distinct types of grave
good associations by burial type, (3) status association with age and possibly sex, (4)
destruction of grave goods indicating achieved status based on individual merit, and (5)
lack of evidence for high status with infant burials (Stickel 1968:227).
Linda King came to a different conclusion about the Medea Creek cemetery,
finding evidence of spatial organization consistent with family plots of differential rank,
and of ascribed wealth based on grave goods associated with subadults (L. King 1969).
Cemetery organization included differences in grave depth, burial orientation, and artifact
associations by sector. Artifacts considered in estimation of wealth were large lithics
(including mortars and groundstone bowls), large bead lots (> 50 beads), and caches of
more than four types of artifacts (a measure of diversity) (L. King 1969).
Gamble and colleagues (2001) reported similar organization at another
Chumash cemetery in Malibu, identifying wealthy burials by grave depth, bead lot size
173
and inclusion of prestige items (ornaments and parts of plank canoes). Genetic research
confirmed lineage-based organization of wealth ascription and cemetery organization
(Gamble et al. 2001).
Just north of the San Francisco Bay, the prehistoric cemetery at Tiburon (CA-
MRN-27) was the site of another important analysis of social rank and status. Tom King
used Binford’s model to parse the mortuary data from this site, further refining the
criteria for rank and egalitarian archaeological contexts. The organization of the cemetery
at Tiburon was found to be highly structured, with a central ring including high status
cremations and large quantities of sociotechnic artifacts, surrounded by a ring of male
burials with no artifacts, and then an outer circle of individuals of both sexes and
subadults with few artifacts. Further, artifacts were more commonly associated with
females, a pattern King interpreted to imply patrilineal inheritance of wealth (T. King
1970).
A few years later, Tom King elaborated on his approach to analysis of social
structure in his study of the mortuary contexts at Buchanan Reservoir (CA-MAD-106,
MAD-117, and MAD-159), located in Madeira County on the eastern edge of the San
Joaquin Valley. Drawing from both Binford (1971) and Saxe (1970), King established
five test implications for ranked societies, summarized below:
A. Differentiation in mortuary treatment should crosscut age and sex
classifications.
B. Clusters of burials will include both adults and subadults. Distinction in
mortuary context and artifact associations will exist between clusters, but be minimized
174
within clusters. Clusters will be organized by rank, and may be associated with
membership in a lineage or class.
C. Mortuary context of individuals of high rank will exhibit a greater degree of
standardization in position, orientation, location, and associations than that of low
ranking individuals.
D. A key structure diagram of mortuary customs should be highly redundant,
meaning that evidence for social organization follows a predictable hierarchy. (The key
structure diagram for King’s study was produced following the technique of Saxe (1970)
and Tainter (1975), using an early program called CLUSTAN 1A for multivariate binary
regression).
E. Burials with markers of high status should be clustered together in a definable
space (T. King 1978).
Using these criteria, King found that the cemetery organization at Buchanan
Reservoir was patterned, with concentrated areas of burials with quantities of beads and
ornaments, as well as patterning of interment style (T. King 1978).
At Santa Rita Village (CA-ALA-413), Randy Wiberg reported mixed
evidence for social organization (Wiberg 1988). At this site, many sociotechnic and
ideotechnic artifacts were recovered with relatively few individuals, suggesting a ranked
organization. However, all burials with these objects were adults and most were older
males, consistent with egalitarian patterns of achieved social roles. Mortuary treatment
was also positively correlated with age. Disturbance of contexts during excavation and
small sample size further complicate interpretation of this site.

175
In the Santa Clara Valley, Cartier and colleagues interpreted differential social
status within and between six archaeological sites along the Guadalupe River corridor
(Cartier et al. 1993). Burial-associated artifact quantity and type were proxies for status.
Objects requiring great investment of time for manufacture and those made of exotic,
imported materials were given greater value. A point system of grave associations was
created to compare sites statistically, giving a value to each artifact type and totaling
points for each burial. Obsidian tools, ground stone mortars, large caches of Olivella
beads, and any number of Haliotis pendants were given higher points. Faunal remains,
chert, and other groundstone were given fewer points. The result of the comparison found
patterning both within and between cemeteries, where some, such as SCL-690 (Tamien
Station), appeared to be elite cemeteries for wealthy individuals, and others, such as SCL-
128 (the Holiday Inn site), were poorer cemeteries with lower grave association scores.
Most relevant to the current work is Viviana Bellifemine’s 1997 study of
mortuary context at the Yukisma Mound (SCL-38). Bellifemine calculated frequencies of
presence and absence of artifact types by age and sex, including chi-square calculations
where sample size was large enough. She also used cluster analysis to reveal patterning in
spatial organization, mode of interment, artifact presence, and artifact diversity, and
examined each cluster pattern for significance with respect to age and sex classifications.
Her results will be integrated with the discussion of dietary patterns in Chapter IX.
Population Affinity
A final aspect of social identity commonly addressed in archaeological
literature is population affinity, including both ethnic identity of sub-populations within a
larger society and the identification of immigrants. Typically, the techniques used to

176
evaluate population affinity are osteological markers of identity, such as epigenetic traits
(Hauser and DeStefano 1989; Sutter 2005) and cultural modifications to the shape of
crania or teeth (Blakey and Rankin-Hill 2004; Blom 2005; Torres-Rouff 2009). Stable
isotope analysis is also commonly used, especially focusing on strontium isotopes in
tooth enamel (Beard and Johnson 2000; Knudson et al. 2005; Price et al. 2006; Wright
2005). In California, Jorgensen and colleagues (2009) used this technique to understand
migration and post-marital residence patterns for individuals buried at the Marsh Creek
site (CA-CCO-548) between three- and four-thousand years ago.
Recently, isotopes of sulfur have also been used to associate individuals from
archaeological contexts with their homelands (Nehlich 2010; Richards et al. 2001, 2003).
The abundance and isotopic ratios of sulfur present in soils varies with local geology.
Sulfur is incorporated into plants growing in the region, and then passed along to
consumers of those plants. Through local food webs, humans ingest trace amounts of
sulfur, which are then retained in bodily tissues. Feeding studies have demonstrated that
the ratio of sulfur isotopes within bone, teeth, hair, or nails is approximately equal to that
in the local environment for individuals consuming sufficient dietary protein (Richards et
al. 2003).
Finally, the range of stable carbon and nitrogen isotope values retained in the
bones or teeth of a population will vary along a range of possibilities, based on local
menu options. In California, analysis of stable carbon and nitrogen isotopes from bone
collagen of individuals who lived near San Francisco Bay, near Tomales Bay (to the
north), and in the Sacramento Valley (inland and to the east) yielded distinctive isotopic
ranges of values for each population (Bartelink 2006). Based on this evidence,
177
individuals with stable carbon and/or nitrogen isotope values that are more than two
standard deviations from the local population mean are likely to be from another region.
Identity and Food
The connection between food and social identity has been recognized in
anthropological and sociological literature since the nineteenth century, but has received
particular attention over the past thirty years. Familiar statements such as, “tell me what
kind of food you eat and I will tell you what kind of man you are” (Brillat-Savarin
2009:14), highlight the intuitive connection between consumption choices and social
identity. Through the process of socialization, children learn which foods are appropriate
for consumption, guidelines that include matters of food safety as well as implicit
symbolic meanings of certain foods (cf. Beardsworth and Keil 1997). Mary Douglas
explains, “If food is treated as a code, the messages it encodes will be found in the pattern
of social relations being expressed. The message is about different degrees of hierarchy,
inclusion and exclusion, boundaries and transactions across the boundaries” (Douglas
1972:61).
As social organization is observed, it is internalized and embodied, guiding
food choices either consciously or unconsciously. Pierre Bourdieu refers to the
unconscious manifestation of social structure as doxa (Bourdieu 1984:470). The concept
of embodiment is used here in the sense of physical incorporation of psychological,
social, or emotional experience. This is similar to somatization in the literature of medical
anthropology, which is “the expression of personal and social distress in an idiom of
bodily complaints” (Kleinman and Kleinman 2007), and is differentiated from the use of

178
the term embodiment in phenomenology, which refers to the ways in which perception, as
mediated by the bodily senses, reflexively shapes experience (e.g., Csordas 1994).
The categories of food learned and internalized during the socialization
process can be divided into five classifications, described by Jelliffe (1967). These
classes provide a useful vocabulary for discussing food distinctions.
1. Cultural superfoods: the dominant staple and the focus of the greatest
investment of labor for procurement and preparation.
2. Prestige foods: foods reserved for important occasions or high status
individuals. These are usually proteins and foods which are exotic or rare.
3. Body-image foods: those which are associated with the physiological
workings of the body, important for maintaining health and balance (such as tridosha
foods in India, or hot and cold foods in Chinese medicine).
4. Sympathetic magic foods: believed to transmit attributes of the consumed
plant or animal to the consumer.
5. Physiologic group foods: foods reserved for or forbidden to groups of
individuals based on categories such as gender or age (Jelliffe 1967).
Of interest in the present discussion are those classifications most closely tied
to social identity, particularly prestige foods and physiologic group foods. Cultural
superfoods would have been consumed by all individuals, and thus provide a baseline for
the general dietary pattern of the population. Evidence for body-image foods and
sympathetic magic foods is likely to be elusive in the archaeological record, but may
present itself in association with other indicators of specialized social role or chronic
disability.
179
The terms nutrition, menus, diet, and cuisine are used in this work following
the definitions of Reitz and Wing (2008). Nutrition is a measure of whether the foods
consumed provide the nourishment necessary for growth, healing, and reproduction. This
aspect of diet is most clearly viewed in the archaeological record through
bioarchaeological evidence of growth disruption or pathologies associated with vitamin
deficiency (see discussion in Chapter VI). The menu is the full range of food items
available to a population, regardless of whether they are eaten. Archaeological
approaches to understanding prehistoric menus include paleoenvironmental
reconstruction and analysis of archaeological botanical and faunal data. Diet is the range
of foods actually consumed. To estimate actual diets from the prehistoric past,
archaeologists use the contexts of botanical and faunal remains (e.g., archaeological
associations, butchering patterns, charring, refuse disposal patterns) in conjunction with
analysis of the implements used for food procurement and processing (including residues
of foods on these tools). Additionally, direct evidence from coprolite analysis or stable
isotope ratios in body tissues may illuminate the diet of individuals. Finally, cuisine
describes the manner of preparation, style of cooking, and social rules about distribution
of foods (Reitz and Wing 2008:251). Examination of cooking features and pollen
analysis may provide some insight as to preparation methods and styles of cooking.
Ethnohistoric sources are also useful for guiding interpretation, but the source’s context
must be considered as well. Finally, analyses such as this one may reveal patterns of food
distribution within society.
In describing the social function of foods, Mintz and DuBois observe that
“food serves both to solidify group membership and to set groups apart” (Mintz and

180
DuBois 2002:109). The power of food in defining and negotiating social roles and
relationships is a common theme in anthropological literature (e.g., E. Anderson 2005;
Counihan 1999; Danforth 1999; Farb and Armelagos 1980; Fischler 1988; Gumerman
1997; Lupton 1996; Weissner and Schiefenhövel 1996). Distinctions at the level of diet
and cuisine can be observed at the level of groups within populations or in individual
dietary variation.
In any given society, we might expect to observe a degree of menu differentiation, that is, different categories of individuals within the population (defined in terms of gender, age, class, caste, etc.) would be expected or compelled to make characteristically different choices from the aliments made available within a given menu. [Beardsworth and Keil 1997:68]
The connection between food and identity was as real for the ancestral Ohlone
as it is today. In his review of the use and significance of foods in California Indian
culture, Ira Jacknis observed,
To a great extent, the identity of a Native Californian was defined by what, how, and with whom she or he ate. Beyond the social act of consuming a meal lies a broader arena of food as an emblem of social status and relations: gender (men or women), age (newborns or the elderly), life crises (birth, puberty, marriage, death), rank and wealth, social role (hunters, doctors, or chiefs), and ethnicity. People of differing categories may have to follow certain rules of consumption, eating differently, at least some of the time. [Jacknis 2004:92]
While a general understanding of the cultural superfoods of the ancestral Ohlone has
been reached (e.g., acorns, seeds, tubers, deer, rabbits, elk, shellfish, see Chapter V), the
allocation of other food classifications is not entirely clear.
Ethnohistoric sources describe situational food taboos observed during liminal
or ceremonial periods. For example, women were to avoid certain foods during their
menstrual periods, during pregnancies, and for a few weeks following birth (Harrington
1942; Jacknis 2004; Levy 1978). Forbidden foods may have included meat, fish, salt, and

181
grease, but reports vary regionally in California about the taboos and extent of avoidance
(Harrington 1942). Men observed similar restrictions following childbirth, but for a
shorter duration (Jacknis 2004:94). Food avoidances of meat, fish, and grease may have
been observed during mourning periods, lasting several days (Jacknis 2004:102).
Shamans are one of the few groups reported to have long-term food prohibitions,
although the particular list of tabooed foods varied regionally (Jacknis 2004:103). No
clear record of food taboos or regional cuisine is available for the ancestral Ohlone, but
ethnographic reports from other California native populations may serve as guides to
possible dietary patterns. Regarding distinctions by status, Jacknis says, “beyond gender
and age, social status rarely correlated with food” (Jacknis 2004:102); however, in the
same passage he also negates any social ranking within California Indian groups, due to
the “prevailing egalitarianism throughout the region.”
An excellent example of a deeper investigation into the association between
dietary practices, gender roles, social status, and biases of ethnohistoric accounts is
Madonna Moss’ (1993) study of shellfish consumption patterns of the Tlingit of
Southwest Alaska. In this, she looks past preconceptions that shellfish is universally
viewed as a low-priority resource, and examines the functional and identity-associative
basis for the differential use of shellfish by the Tlingit. She found that while
ethnographers reported that shellfish gathering was women’s work, men not only assisted
but sometimes went on exclusively male collecting expeditions. Ethnographic reports
reflected an association of shellfish with poverty, low prestige, and laziness, which may
be related to the relative ease of obtaining this resource. Sympathetic magic associations
of the clam’s siphon and limpet shells with male and female sex organs, respectively,

182
added an association with ritual impurity to this abundant food resource. Avoidance of
shellfish by high-status individuals was important to preserve moral purity and maintain
social superiority (Moss 1993:642). Additionally, the risk of shellfish toxicity, a
potentially fatal consequence of consuming contaminated shellfish, would have
influenced the social consequences of this dietary option. Moss determined that social
rank was a more significant predictor of shellfish consumption than gender, although
both types of social identity figured into the cuisine designations of this important food
resource, and practical exceptions to these guidelines were permitted (for example when
there was not enough time to hunt).
Examinations of foodways in prehistoric Central California have focused
primarily on population-based studies rather than investigations of cuisine or identity-
based food choices. Archaeologists have deciphered the menu (e.g., Jacknis 2004;
Lightfoot and Parrish 2009), and modeled intensification (e.g., Broughton 1994). Some
have explored differential access to foods by gender, based on division of labor (Jackson
2004). The present work seeks to expand the discussion of prehistoric foodways to
include the social context of diet selection beyond categories of age and gender.
Identity and Social Bioarchaeology
at CA-SCL-38
In the subsequent chapters of this thesis, I will use the available evidence from
previous publications and my own research to identify patterns of dietary doxa in the
archaeological record at SCL-38. This process will begin with an exploration of the
available menu options in the Santa Clara Valley (Chapters V and VI). I will then present
research methods and results of the stable isotope analysis used to identify dietary

183
patterns (Chapters VII and VIII). In Chapter IX, I will discuss the dietary evidence in
terms of social identity with the following considerations for each identified category.
Social Age
The translation of biological age to social age is based on artifactual evidence
and continuity with previous work at this site. All studies of the population from SCL-38
have placed the transition from subadult to adult at 16 years of age, and considered any
individuals over 40 years at time of death to be elders (Bellifemine 1997; Jurmain 2000;
Morley 1997). The absence of utilitarian (technomic) bone artifacts with individuals
under 16 years old at SCL-38 supports the hypothesis that this is was approximately the
time of transition to a social identity as an adult. Consequently, this study will compare
dietary patterns between individuals who were 15 years of age or younger to those of
adults 16 to 40, and also to elders over 41 years of age. Additionally, dietary patterns of
infants less than two years of age will be investigated to discern weaning patterns.
Sex and Gender
If grave goods represent the possessions of the deceased, and if division of
labor by gender was present among the ancestral Ohlone, some differences in the
patterning of burial-associated artifacts should be apparent. However, few significant
differences in the distribution of technomic (utilitarian) artifact types are seen at SCL-38
(see Chapter III). Males are slightly more likely to have associated bone tools (17% of
male burials versus 14% of female burials). Males are twice as likely to have associated
chipped stone (21% of male burials versus 11% of females). Females are only slightly
more likely to have associated ground stone (20% of female burials versus 17% of male
burials). In all cases where an object appears in the mortuary contexts more than three
184
times, it was found with both males and females and also with individuals of
indeterminate sex, who might skew the ratio if sex were known.
The association of technomic artifact types with individuals of both biological
sexes suggests that either the division of labor for food and craft production tasks was
very flexible at this site, or that grave goods may have been donated by mourners. The
pattern of artifact association at SCL-38 provides little basis for identification of
masculine and feminine gender roles or identification of two-spirits within the
population. Unfortunately, for lack of clear markers of gender identity, the analysis of
gender in this study will be limited to correlation with biological sex.
Disabilities
Evidence for physical or cognitive challenges likely to have influenced normal
participation in daily activities will be gleaned from the osteological report produced by
Jurmain (2000). A few individuals from SCL-38 were observed to have distinctive
congenital or pathological lesions which suggest that their activities and social
interactions would have been affected.
Specializations
Limited evidence for craft specialization was found in the archaeological
documentation from SCL-38. Larger caches of bird bone tubes or whistles than those
likely needed for individual use were found with 11 individuals at the site. Caches of
worked Olivella shells, identified as type A4 beads, may have been bead blanks (Alan
Leventhal, personal communication, April 11, 2012). If local bead production was taking
place, individuals associated with these blanks would likely have had a special status
within the population.

185
The presence of ideotechnic artifacts with some individuals suggests that they
had ritual responsibilities and may have been shamans. Dietary patterns will be examined
among individuals with any burial-associated ideotechnic artifacts, as well as those with
specific types (bone whistles and tubes, charmstones, cinnabar, and totemic faunal
artifacts).
Status
Social status at SCL-38 will be inferred based on the presence and abundance
of sociotechnic artifact types (beads and ornaments). Additionally, overall diversity of
artifact associations will be considered. Further, mortuary context will be examined to see
if dietary patterns, age classes, or sex designations correlate with interment type,
association burials, burial posture, burial position, burial orientation, special mortuary
preparation (e.g., burning), or spatial cluster affiliation (based on Bellifemine 1997).
Affiliation with moieties or lineages may be inferred from spatial organization of the
cemetery as well as association with ornaments.
Population Affinity
Finally, individuals with dietary patterns which are significantly different than
the majority of the population are likely to have been eating from a different menu. Stable
isotope values of carbon and nitrogen will be used to determine whether all individuals
buried at the Yukisma Mound were likely to have been part of the local population.
Additional data from stable isotopes of sulfur will enhance this discussion by associating
the mineral content of bones with geological variation in the landscape.
186
CHAPTER V
APPROACHES TO PALEODIETARY
RECONSTRUCTION: INDIRECT
EVIDENCE
Introduction
Reconstruction of past foodways is a complicated endeavor, requiring
multiple sources of information. To know what might have been eaten, it is important to
first know which resources were available and how local resource availability might have
varied through time. Dietary choices are based on maximizing caloric and nutritional
return and minimizing energy required for procurement and processing (Bayham 1979;
Broughton 1994). When preferred foods are harder to procure (due to climate change,
territory infringement, or over-exploitation), a broader range of foods must be considered.
Other factors enter into dietary decisions as well. Understanding what humans
find “good” to eat is more complex than simply knowing which foods are available.
Cultural concepts influence choices about which species are appropriate for everyday
consumption, and which foods are preferred for prestigious or ceremonial purposes.
Some potential food resources may be avoided due to preferences, taboos, traditions, or
territorial access. Other species may be useful for non-culinary purposes, such as plants
used for basketry or animals kept for work or companionship. The most effective dietary
187
reconstruction will consider cultural evidence (e.g., ethnohistorical accounts) in addition
to environmental reconstruction and physical evidence of foods consumed.
This chapter will present a brief history of approaches to paleodietary
analysis, the study of foodways of prehistoric peoples. Sources of dietary information are
categorized as indirect (implying presence of a resource) or direct (definitive evidence of
resource consumption). Available data from CA-SCL-38 and nearby sites will be
presented for each indirect source of paleodietary information, including environmental
reconstruction, botanical and faunal remains, and artifactual evidence for subsistence
practices. Available information from ethnographic and historic sources will also be
discussed. The chapter will conclude with a summary of what was likely to have been on
the menu for the early inhabitants of the Santa Clara Valley. Direct sources of evidence
about the diet of the ancestral Ohlone evidence will be presented in Chapter VI.
A Brief History of Paleodietary Analysis
Plant and animal remains at archaeological sites have been studied for
centuries (e.g., Dall 1877; Heer 1866; Kunth 1826; Wyman 1868a, 1868b, 1875) but
integrated approaches to paleonutritional analysis are relatively new (Sutton et al. 2010).
A symposium held in St. Louis in 1976, entitled, “Paleonutrition: The Reconstruction of
Diet from Archaeological Evidence,” inspired the first major book on integrative
paleodietary analysis, written by Wing and Brown (1977). In this volume, the authors
presented several approaches to understanding the diet of past populations, including
analysis of botanical, faunal, bioarchaeological, and artifactual remains. They were the
first to advocate a “coordinated reconstruction rather than isolated and unrelated
188
information” (Wing and Brown 1977:1). Eight years later, Gilbert and Mielke (1985)
edited another volume, in which multiple authors addressed specific techniques of
paleodietary analysis. Their work included important perspectives on approaches to
paleonutrition, but lacked the integrative focus of Wing and Brown (1977).
The publication of Sobolik’s edited volume on paleonutritional analysis in
1994 was a major contribution and set the tone for future paleodietary studies. Sobolik
and colleagues advocated an integrative approach and divided analytical techniques into
two categories: indirect sources and direct sources. Analytical approaches which
demonstrate presence of resources, but not necessarily their use as food, were categorized
as indirect sources of dietary information. These included botanical evidence, faunal
evidence, and tools used for food procurement, processing, and storage. Direct sources
unambiguously demonstrate consumption by individual humans, and come directly from
the human body in the form of paleofecal evidence (gut contents and coprolites) and
bioarchaeological evidence (diet-related pathologies, trace elements in bones and teeth
and stable isotope analysis of skeletal materials) (Sutton 1994:98). In the concluding
chapter of this volume, Wing advocates a finer grained consideration of food dynamics
within communities, including the identification of differential access to resources based
on issues of gender, status and age (Wing 1994:315).
Later publications addressing paleonutrition (Sutton et al. 2010) as well as
some handbooks on specific techniques (e.g., Pearsall 2008) have adopted the structure of
direct and indirect approaches to paleodietary reconstruction and expanded the list of
techniques in each category. From these sources, and for the purposes of my analysis to
follow, the following approaches are recognized as indirect sources of information about
189
paleodiet at the household or community level: (1) remains of foods and residues
including botanical evidence, faunal remains, and residue analysis from cooking tools,
and (2) implements of food procurement and preparation, including groundstone and
tools for hunting, fishing and gathering (Pearsall 2008:499). Additionally, other indirect
sources provide evidence of diet at the extra-community or regional level, such as
paleoenvironmental reconstruction, resource proximity to habitation sites, evidence of
landscape modification, and food processing or kill sites outside the habitation zone
(Pearsall 2008:500). Ethnohistoric records regarding food resource use are not addressed
in the above sources, but will be included in my discussion below as a valuable indirect
source of insight about food preferences and traditions, particularly those of more recent
generations.
The list of direct sources of dietary information has not changed significantly
in recent decades, and still includes studies of paleofecal and bioarchaeological evidence,
including pathologies, trace elements in bone and teeth, and stable isotope analysis of
human tissues. Sutton et al. (2010) introduced two changes to the list of direct sources.
The first is the addition of DNA studies, particularly for identification of gut contents,
identification of species from residues on processing tools, and identification of
domesticated species (Sutton et al 2010:49). The second change is the recategorization of
stable isotope analysis to the list of indirect sources of dietary information (Sutton et al.
2010:86). The reason given for this change is that non-dietary, environmental factors may
influence stable isotope values in human tissues. While this is true for some stable
isotopes, the authors in this chapter have conflated their discussion of dietary isotope
evidence (from carbon and nitrogen values) with environmental isotope evidence (from

190
oxygen and hydrogen values in water, or strontium and sulfur values in soil). All of these
elements are incorporated into the body through dietary consumption, but of these, only
carbon and nitrogen (and more recently, sulfur, e.g., Craig et al. 2006; Krouse and
Herbert 1988; Nehlich et al. 2011, 2012) are typically used to understand dietary
composition. By discussing all of these factors together, the relative value of specific
isotopes for dietary reconstruction is missed. Additionally, while it is recognized that
environment can affect the value of nitrogen isotopes within food webs, particularly in
very dry, hot conditions (Ambrose 1991), this would not have been a significant factor
within the environment of California’s Santa Clara Valley (see discussion of
paleoenvironment below). For the purposes of this study, stable carbon and nitrogen
isotope values of human bone will be categorized as a direct source of paleodietary
evidence, because these values have been shown to directly relate to the composition of
an individual’s diet (see discussion of stable isotope analysis in Chapter VI). The next
section of this chapter will review available indirect evidence about paleodiet in the
southern San Francisco Bay Area and northern Santa Clara Valley. Direct evidence will
be addressed in Chapter VI.
Evidence of Food Resources near
CA-SCL-38: Indirect Sources
The following paleoenvironmental reconstruction will feature evidence
particular to the northern Santa Clara Valley environment, including environmental data
from local studies, archaeological information from CA-SCL-38 and other nearby sites,
and historical and ethnographic data particularly related to the Ohlone Indians of the
northern Valley and East Bay Area. While several surveys of California Indian foodways

191
have been written, these works generalize about traditions across the Central Coast region
(Lightfoot and Parrish 2009), based on “ecological type” (Heizer and Elsasser 1980), or
broadly over the entire state (e.g., M. K. Anderson 2005; Kroeber 1925; Jacknis 2004).
Generalization can be problematic, as Milliken mentioned in his “Ethnohistory of the
Ohlone People,”
Since Santa Clara Valley people spoke a Costanoan language, there has been a tendency to accept any information about any Costanoan groups as if it were pertinent to all places where Costanoan was spoken. In this review we do not automatically assume information about other Costanoan-ethnolinguistic groups describes contact period Santa Clara Valley people. There was a tremendous cultural diversity within the aboriginal Costanoan language area, and diversity renders suspect extrapolations from neighboring groups to the Santa Clara Valley groups. [Milliken 2007:48]
Following Milliken’s lead, my paleodietary reconstruction for the ancestral Ohlone in the
Yukisma area will rely on locally derived evidence, rather than assuming the that
foodways there were the same as those practiced in other regions of California.
Additionally, with the help of direct evidence, I will examine the effects of adaptive or
preferential variation through time. Rather than accepting generalized truisms about diet
for this specific group, this study will present an evidence-based reconstruction of local
foodways.
Paleoenvironmental Reconstruction
The Yukisma Mound Site (CA-SCL-38) is located within the modern city of
Milpitas, in Santa Clara Valley, California. The site lies within the Coyote Creek
watershed system, on the historical shoreline of Lower Penetencia Creek. The Valley is
framed by the Santa Cruz Mountains to the west and the Coastal Range to the east (also
called the Diablo Range or Mt. Hamilton Range). The Pacific Ocean is just beyond the

192
Santa Cruz Mountains, about 25 kilometers (16 miles) away. The San Francisco Estuary,
including the Bay and Baylands, extends to within two miles of the Yukisma Mound Site.
Historic Climate and Landforms. Central California has a Mediterranean
climate, with mild, wet winters and warm, dry summers (Gilliam 2002). The surrounding
mountains and estuary contribute to the particularly temperate microclimate in the
northern Santa Clara Valley. Rainfall in the northern Valley averages only 16 inches per
year, because it lies in the rain shadow of the Santa Cruz Mountains. By comparison,
annual rainfall in Ben Lomond, in the Santa Cruz mountains, averages 42 inches per year
(Gilliam 2002).
The Santa Clara Valley is also shielded from summertime coastal fogs.
However, during the winter, radiation fog (known locally as “tule fog”) forms over
marshy inland areas in the early morning hours and blankets the valley floor for periods
lasting up to a few days at a time. Modern average temperatures in Milpitas range
between 50 and 70 degrees Fahrenheit (approximately 10-20°C), with summertime highs
occasionally reaching the low 100 degrees Fahrenheit (38-42°C) and winter lows only
rarely dipping below freezing (see Figure 27). The climate experienced in the Santa Clara
Valley today is more stable and temperate than at any time during the past ten thousand
years (Grossinger et al. 2008). Climate fluctuation during the Middle and Late Holocene
would certainly have affected the local environment for people living in the Santa Clara
Valley. Evidence for prehistoric climate will be explored later in this chapter.
Another major component of the Central California landscape is the shifting
ground itself. Three major tectonic faults run through the region, bracketing the Bay. The
Hayward and Calaveras faults lie to the east of the Yukisma Mound, at distances as close

193
0102030405060708090
100110
Te
mp
era
ture
(I
n d
eg
ree
s F
ah
ren
he
it)
Record High 79 81 87 95 101 109 108 105 104 101 85 79Average High 58 62 66 69 74 79 82 82 80 74 64 58Mean 50 54 57 59 63 68 70 70 69 64 55 50Average Low 42 45 47 49 52 56 58 58 57 53 46 42Record Low 24 26 30 35 37 42 47 47 42 36 21 19Average Precipitation(inches)
3.07 3.22 2.54 1.18 0.51 0.10 0.02 0.02 0.18 0.80 1.68 2.61
Jan Feb Mar Apr May Jun Jul Aug Sep Oct Nov Dec
FIGURE 27. Monthly average temperatures and precipitation in Milpitas, California (modern). Source: Weather Channel, n.d., Monthly Averages for Milpitas, CA. http://www.weather.com, accessed May 15, 2012. as 4 and 11 kilometers (2.5 and 7 miles), respectively. The San Andreas Fault lies to the
west, and passes within 24 kilometers (15 miles) of the site (See Figure 28).
Earthquakes along these fault lines would have caused surface ruptures, as
demonstrated by geologic evidence in Sunol (12 km/7.5 miles northeast), and subsidence
and groundwater changes, observed in southern Santa Clara Valley (Rosenthal and Meyer
2004:41). Offsets in stream paths caused by earthquakes can still be seen along San
Ysidro Creek, about 60 kilometers (37 miles) southeast of the Yukisma Mound (Baldwin
et al. 2002:18). Although there is no way to know exactly what the ancestral Ohlone
thought about these unpredictable interruptions to the stability of the earth’s surface,

194
FIGURE 28. Map of tectonic faults in the San Francisco Bay area. The approximate location of CA-SCL-38 is shown as a red dot. Source: Adapted from File: 122-38 Hayward Fault, 2004, https://en.wikipedia.org/wiki/File:122-38HaywardFault.jpg, accessed May 15, 2012. earthquakes would have the potential to cause both immediate damage to built structures
(e.g., homes, dance houses, acorn granaries) and long-term change to landforms and
drainage systems.
The Yukisma Mound site is located on the shore of Lower Penetencia Creek,
and is surrounded by a landscape of diverse micro-environments. Historical
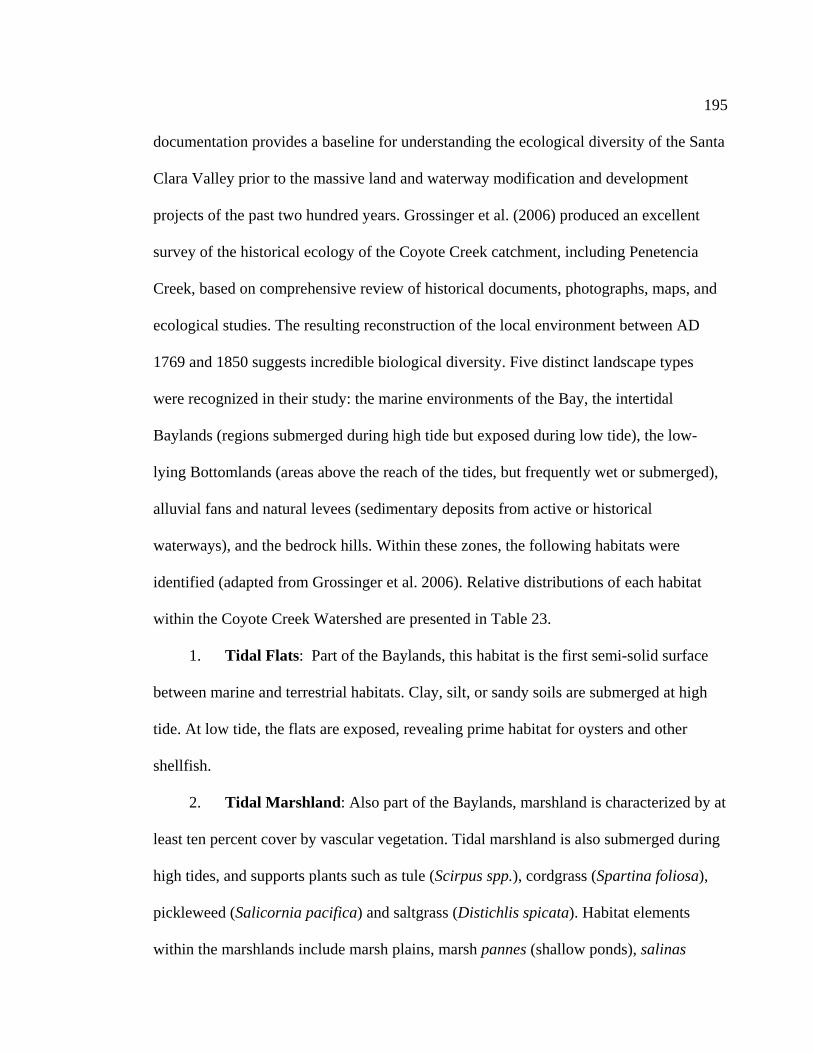
195
documentation provides a baseline for understanding the ecological diversity of the Santa
Clara Valley prior to the massive land and waterway modification and development
projects of the past two hundred years. Grossinger et al. (2006) produced an excellent
survey of the historical ecology of the Coyote Creek catchment, including Penetencia
Creek, based on comprehensive review of historical documents, photographs, maps, and
ecological studies. The resulting reconstruction of the local environment between AD
1769 and 1850 suggests incredible biological diversity. Five distinct landscape types
were recognized in their study: the marine environments of the Bay, the intertidal
Baylands (regions submerged during high tide but exposed during low tide), the low-
lying Bottomlands (areas above the reach of the tides, but frequently wet or submerged),
alluvial fans and natural levees (sedimentary deposits from active or historical
waterways), and the bedrock hills. Within these zones, the following habitats were
identified (adapted from Grossinger et al. 2006). Relative distributions of each habitat
within the Coyote Creek Watershed are presented in Table 23.
1. Tidal Flats: Part of the Baylands, this habitat is the first semi-solid surface
between marine and terrestrial habitats. Clay, silt, or sandy soils are submerged at high
tide. At low tide, the flats are exposed, revealing prime habitat for oysters and other
shellfish.
2. Tidal Marshland: Also part of the Baylands, marshland is characterized by at
least ten percent cover by vascular vegetation. Tidal marshland is also submerged during
high tides, and supports plants such as tule (Scirpus spp.), cordgrass (Spartina foliosa),
pickleweed (Salicornia pacifica) and saltgrass (Distichlis spicata). Habitat elements
within the marshlands include marsh plains, marsh pannes (shallow ponds), salinas
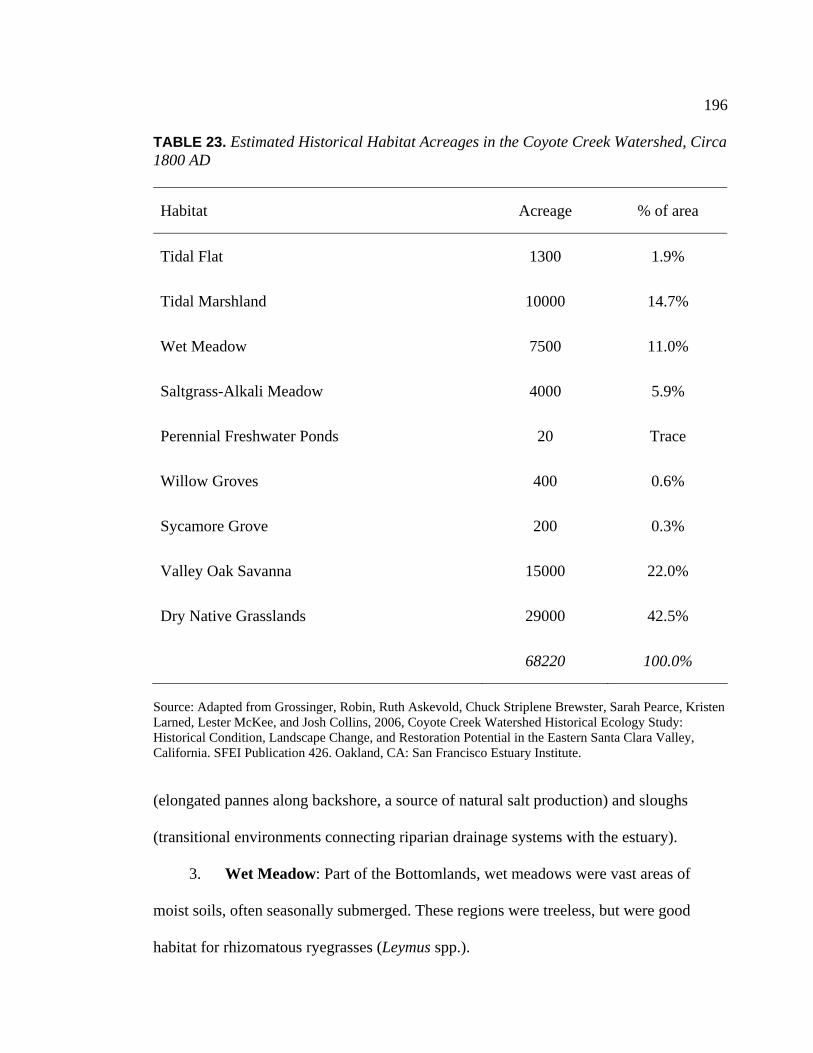
196
TABLE 23. Estimated Historical Habitat Acreages in the Coyote Creek Watershed, Circa 1800 AD
Habitat Acreage % of area
Tidal Flat 1300 1.9%
Tidal Marshland 10000 14.7%
Wet Meadow 7500 11.0%
Saltgrass-Alkali Meadow 4000 5.9%
Perennial Freshwater Ponds 20 Trace
Willow Groves 400 0.6%
Sycamore Grove 200 0.3%
Valley Oak Savanna 15000 22.0%
Dry Native Grasslands 29000 42.5%
68220 100.0%
Source: Adapted from Grossinger, Robin, Ruth Askevold, Chuck Striplene Brewster, Sarah Pearce, Kristen Larned, Lester McKee, and Josh Collins, 2006, Coyote Creek Watershed Historical Ecology Study: Historical Condition, Landscape Change, and Restoration Potential in the Eastern Santa Clara Valley, California. SFEI Publication 426. Oakland, CA: San Francisco Estuary Institute.
(elongated pannes along backshore, a source of natural salt production) and sloughs
(transitional environments connecting riparian drainage systems with the estuary).
3. Wet Meadow: Part of the Bottomlands, wet meadows were vast areas of
moist soils, often seasonally submerged. These regions were treeless, but were good
habitat for rhizomatous ryegrasses (Leymus spp.).
197
4. Saltgrass-Alkali Meadow: A subdivision of wet meadows, the saltgrass-
alkali meadow (salitroso) habitat featured high concentrations of salt in the soils, and
distinctive flora.
5. Perennial Freshwater Ponds: Very few freshwater ponds (lagunas) were
identified in the Coyote Creek watershed region. The closest to the Yukisma Site would
have been Penitencia Pond, a small body of probably somewhat brackish water two miles
downstream from the site. Tulares are smaller freshwater emergent wetland zones,
predominately vegetated with tule (Scirpus spp.)
6. Willow Groves: Willow groves (sausals) were found in the bottomlands near
seeps or springs, at the ends of distributary creeks, or in sinks beside creeks. In addition
to willows (Salix lasiolepis), historical accounts describe blackberries and wild roses in
this habitat.
7. Sycamore Groves: Found along natural levees, California sycamores
(Platanus racemosa) were the most common trees along gravelly creek beds in the
Coyote Creek watershed.
8. Valley Oak Savanna: The signature habitat of the alluvial fans in the Santa
Clara Valley was Valley Oak Savanna (roblares). Valley oak (Quercus lobata) was the
most common species, but live oaks (Q. agrifolia) were also present. Trees were widely
spaced, and often of remarkable age and size.
9. Dry Native Grasslands: The final terrestrial habitat identified was the
grasslands, which grew on well-drained alluvial fans. Flora included rhizomatous grasses
and perennial bunch grasses. Frequent, low intensity burning was critical to the
198
maintenance of this habitat, which would have otherwise converted to brushland or
woodland.
Positioning the Yukisma Mound within this environment, SCL-38 was located
on alluvial deposits just at the southern edge of the Bottomlands. The site would have
been on the northern reach of a sycamore grove, which continued south along the shores
of the creek. The Sycamore Grove habitat was bordered by saltgrass-alkali meadows,
which transitioned to less alkaline wet meadows to the north and east. Willow groves
grew to the east and southeast. Vast Valley Oak Savannas covered the alluvial plains to
the south of the site, surrounded by extensive dry grasslands. To the north, the Baylands
extended to within two miles of the site. In summary, at the beginning of the 19th century,
marine and estuarine environments and all nine terrestrial ecozones described above
would have been found within a two-mile radius of the Yukisma Mound site. The precise
range and composition of the local ecozones would have shifted in prior centuries, but the
overall composition and biodiversity are likely to have been similar in California’s past.
In addition to these marine, estuarine, and terrestrial habitats, the creeks would
have been important resources for Native Americans. Lower Penitencia Creek is thought
to have been a steady perennial stream, and may have been the dominant outlet for the
Coyote Creek system during the Holocene (Grossinger et al. 2006:III-17). The Lower
Penetencia was characterized by an unusually wide slough and relatively wide riparian
forest. In the tidal reaches of Lower Penitencia Creek and Coyote Creek, many fish
species were probably available, including white sturgeon, thicktail chub, Sacramento
blackfish, Sacramento splittail, Sacramento sucker, longfin smelt, threespine stickleback,
prickly sculpin, Pacific staghorn sculpin, Sacramento perch, tule perch, shiner perch,
199
longjaw mudsucker, and starry flounder (Grossinger et al. 2006:Table IV-51). Further
upstream, in the “shallow, sinuous, well-wooded perennial lowland stream reaches” of
the Lower Coyote Creek and Lower Penitencia Creek, additional species such as Pacific
lamprey, western brook lamprey, Sacramento blackfish, hitch, Sacramento pike-minnow,
three-spine stickleback, prickly sculpin, tule perch, and possibly Chinook salmon would
have been available (Grossinger et al. 2006:Table IV-51.). Steelhead could have entered
the valley from Penitencia Creek and Berryessa creek, developing into resident rainbow
trout in years when rainfall was insufficient for return to the sea (Grossinger et al.
2006:IV-53).
Habitat reconstructions from Hildebrandt and Swenson (1983) describe
important economic species by habitat type in the Southern Santa Clara Valley during the
Contact Period. Because their focus was on the southern portion of the valley, the
Bayland and Bottomland environments described by Grossinger et al. (2006) are not
included. However, Hildebrandt and Swenson (1983) do provide species lists for the Tule
Marsh (similar to Willow Grove), Riparian Forest (similar to Sycamore Grove),
California Prairie (similar to Dry Native Grasslands), and Valley Oak Savanna (same
name used). Additionally, plant and animal communities are described for the Chaparral
environment of the foothills and the Mixed Hardwood Forest of the Coastal Mountain
Range. Economically important plant resources which are likely to have been present in
each community are summarized in Table 24. Important faunal resources for each
community are presented in Table 25.
Reconstructions of the historical landscape of Santa Clara Valley, between
1769 when the Portolá expedition first documented the local terrain, and 1850, when
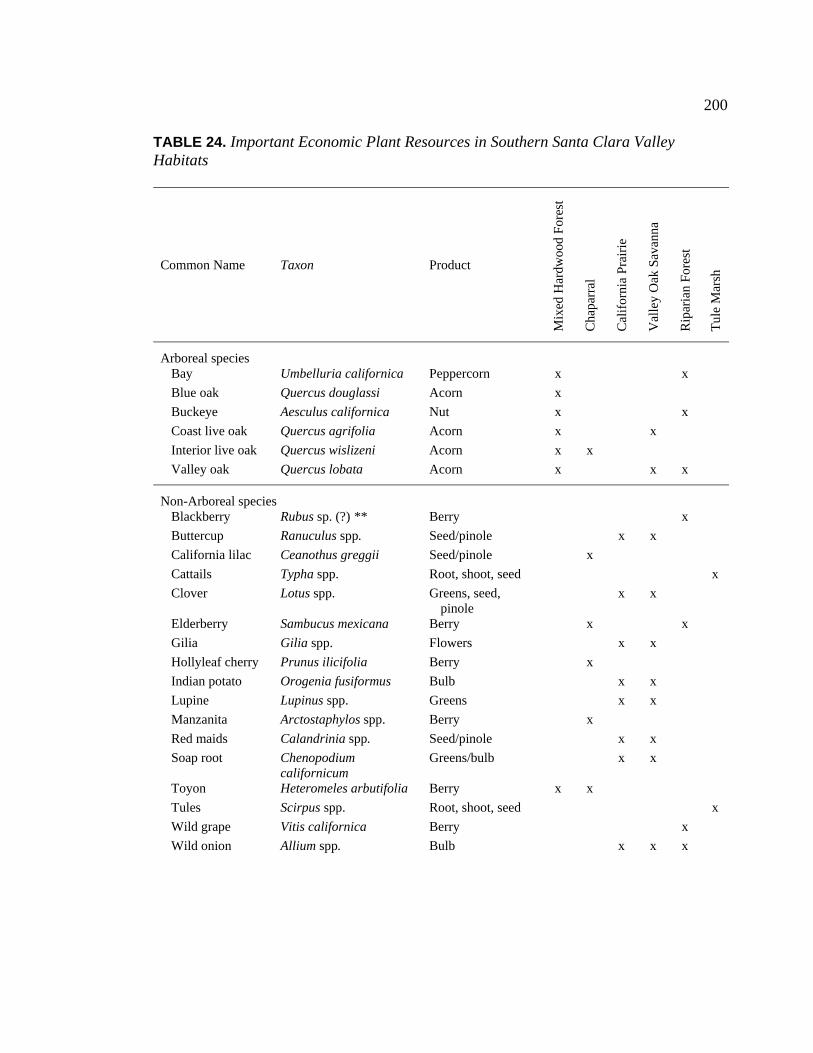
200
TABLE 24. Important Economic Plant Resources in Southern Santa Clara Valley Habitats
Common Name Taxon Product
M
ixed
Har
dwoo
d Fo
rest
C
hapa
rral
C
alif
orni
a P
rair
ie
V
alle
y O
ak S
avan
na
R
ipar
ian
For
est
T
ule
Mar
sh
Arboreal species Bay Umbelluria californica Peppercorn x x
Blue oak Quercus douglassi Acorn x
Buckeye Aesculus californica Nut x x
Coast live oak Quercus agrifolia Acorn x x
Interior live oak Quercus wislizeni Acorn x x
Valley oak Quercus lobata Acorn x x x
Non-Arboreal species Blackberry Rubus sp. (?) ** Berry x
Buttercup Ranuculus spp. Seed/pinole x x
California lilac Ceanothus greggii Seed/pinole x
Cattails Typha spp. Root, shoot, seed x
Clover Lotus spp. Greens, seed, pinole
x x
Elderberry Sambucus mexicana Berry x x
Gilia Gilia spp. Flowers x x
Hollyleaf cherry Prunus ilicifolia Berry x
Indian potato Orogenia fusiformus Bulb x x
Lupine Lupinus spp. Greens x x
Manzanita Arctostaphylos spp. Berry x
Red maids Calandrinia spp. Seed/pinole x x
Soap root Chenopodium californicum
Greens/bulb x x
Toyon Heteromeles arbutifolia Berry x x
Tules Scirpus spp. Root, shoot, seed x
Wild grape Vitis californica Berry x
Wild onion Allium spp. Bulb x x x
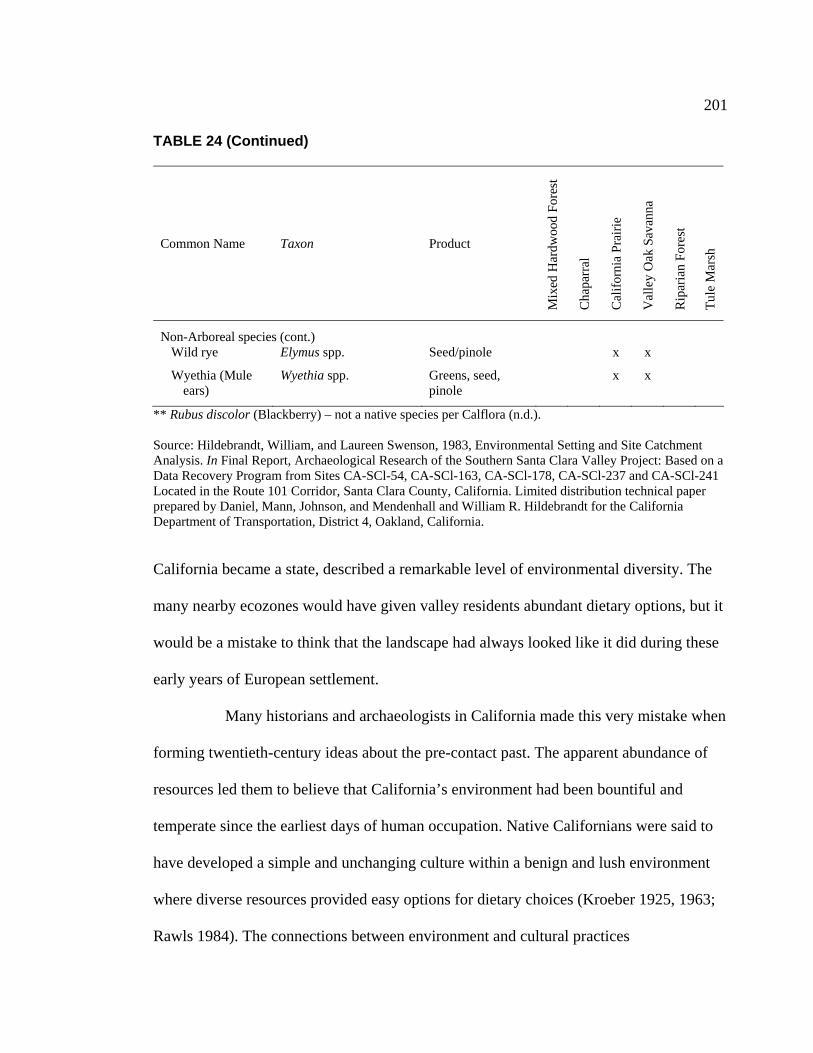
201
TABLE 24 (Continued)
Common Name Taxon Product
M
ixed
Har
dwoo
d Fo
rest
C
hapa
rral
C
alif
orni
a P
rair
ie
V
alle
y O
ak S
avan
na
R
ipar
ian
For
est
T
ule
Mar
sh
Non-Arboreal species (cont.) Wild rye Elymus spp. Seed/pinole x x
Wyethia (Mule ears)
Wyethia spp. Greens, seed, pinole
x x
** Rubus discolor (Blackberry) – not a native species per Calflora (n.d.).
Source: Hildebrandt, William, and Laureen Swenson, 1983, Environmental Setting and Site Catchment Analysis. In Final Report, Archaeological Research of the Southern Santa Clara Valley Project: Based on a Data Recovery Program from Sites CA-SCl-54, CA-SCl-163, CA-SCl-178, CA-SCl-237 and CA-SCl-241 Located in the Route 101 Corridor, Santa Clara County, California. Limited distribution technical paper prepared by Daniel, Mann, Johnson, and Mendenhall and William R. Hildebrandt for the California Department of Transportation, District 4, Oakland, California. California became a state, described a remarkable level of environmental diversity. The
many nearby ecozones would have given valley residents abundant dietary options, but it
would be a mistake to think that the landscape had always looked like it did during these
early years of European settlement.
Many historians and archaeologists in California made this very mistake when
forming twentieth-century ideas about the pre-contact past. The apparent abundance of
resources led them to believe that California’s environment had been bountiful and
temperate since the earliest days of human occupation. Native Californians were said to
have developed a simple and unchanging culture within a benign and lush environment
where diverse resources provided easy options for dietary choices (Kroeber 1925, 1963;
Rawls 1984). The connections between environment and cultural practices
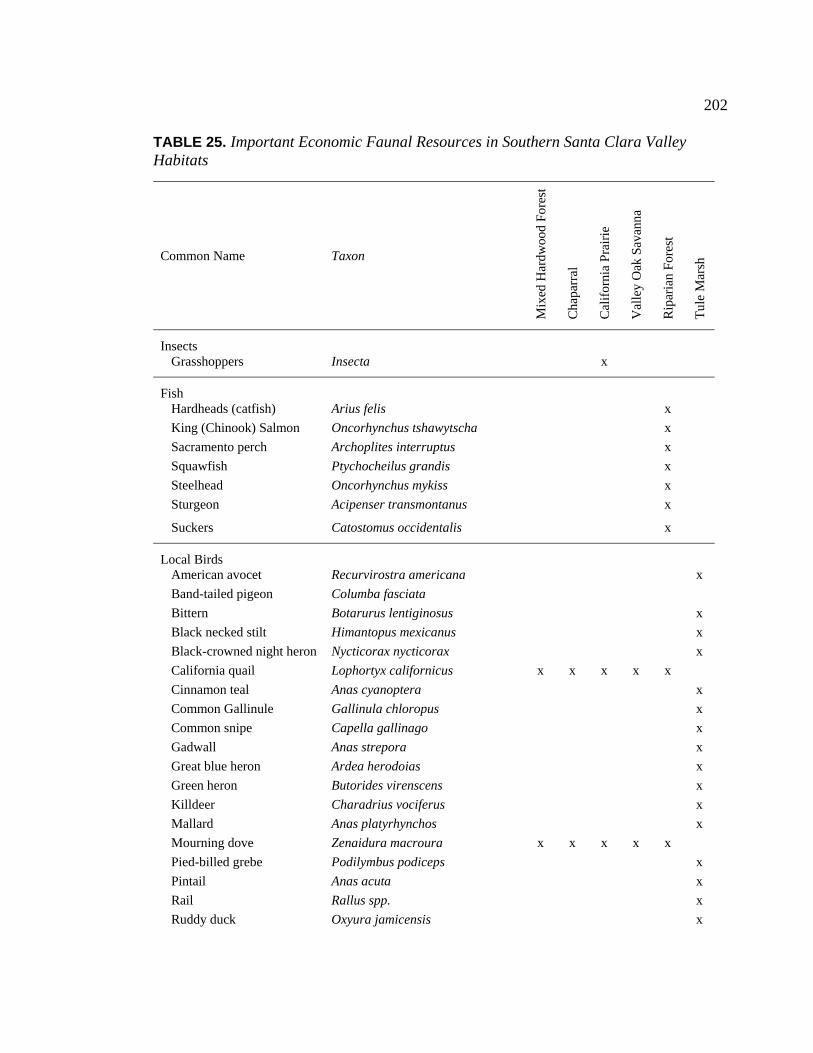
202
TABLE 25. Important Economic Faunal Resources in Southern Santa Clara Valley Habitats
Common Name Taxon
M
ixed
Har
dwoo
d Fo
rest
C
hapa
rral
C
alif
orni
a P
rair
ie
V
alle
y O
ak S
avan
na
R
ipar
ian
For
est
T
ule
Mar
sh
Insects Grasshoppers Insecta x
Fish Hardheads (catfish) Arius felis x
King (Chinook) Salmon Oncorhynchus tshawytscha x
Sacramento perch Archoplites interruptus x
Squawfish Ptychocheilus grandis x
Steelhead Oncorhynchus mykiss x
Sturgeon Acipenser transmontanus x
Suckers Catostomus occidentalis x
Local Birds American avocet Recurvirostra americana x
Band-tailed pigeon Columba fasciata
Bittern Botarurus lentiginosus x
Black necked stilt Himantopus mexicanus x
Black-crowned night heron Nycticorax nycticorax x
California quail Lophortyx californicus x x x x x
Cinnamon teal Anas cyanoptera x
Common Gallinule Gallinula chloropus x
Common snipe Capella gallinago x
Gadwall Anas strepora x
Great blue heron Ardea herodoias x
Green heron Butorides virenscens x
Killdeer Charadrius vociferus x
Mallard Anas platyrhynchos x
Mourning dove Zenaidura macroura x x x x x
Pied-billed grebe Podilymbus podiceps x
Pintail Anas acuta x
Rail Rallus spp. x
Ruddy duck Oxyura jamicensis x
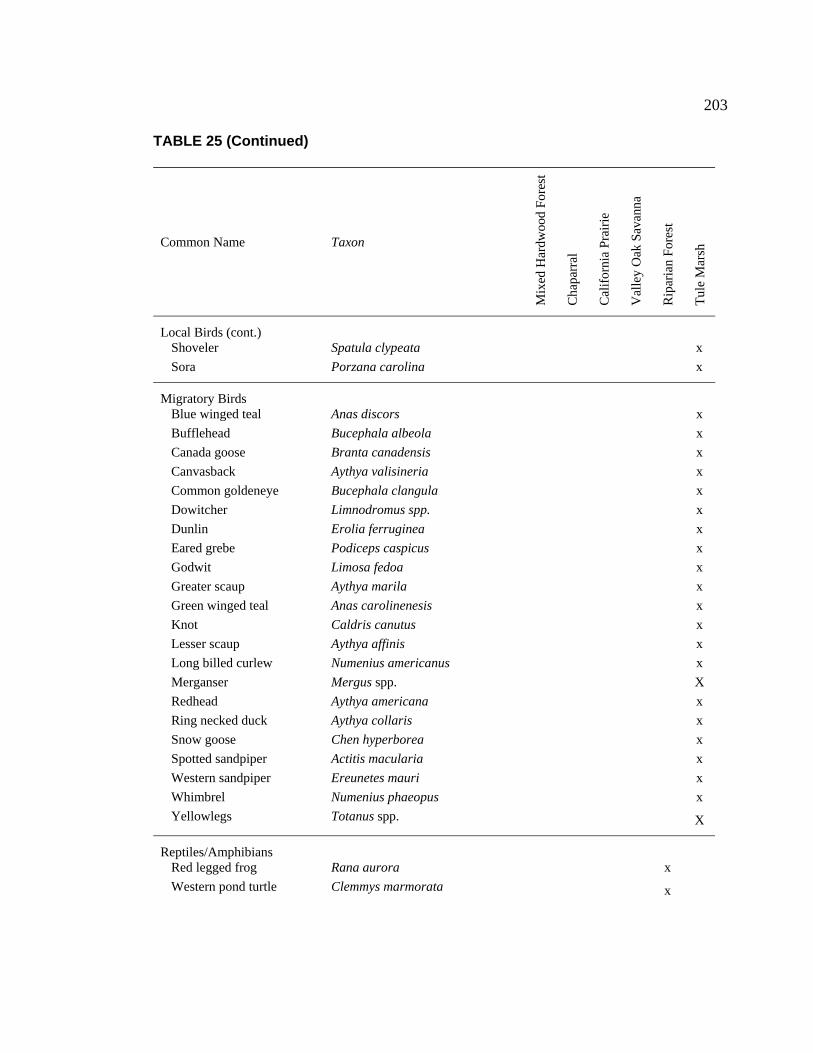
203
TABLE 25 (Continued)
Common Name Taxon
M
ixed
Har
dwoo
d Fo
rest
C
hapa
rral
C
alif
orni
a P
rair
ie
V
alle
y O
ak S
avan
na
R
ipar
ian
For
est
T
ule
Mar
sh
Local Birds (cont.) Shoveler Spatula clypeata x
Sora Porzana carolina x
Migratory Birds Blue winged teal Anas discors x
Bufflehead Bucephala albeola x
Canada goose Branta canadensis x
Canvasback Aythya valisineria x
Common goldeneye Bucephala clangula x
Dowitcher Limnodromus spp. x
Dunlin Erolia ferruginea x
Eared grebe Podiceps caspicus x
Godwit Limosa fedoa x
Greater scaup Aythya marila x
Green winged teal Anas carolinenesis x
Knot Caldris canutus x
Lesser scaup Aythya affinis x
Long billed curlew Numenius americanus x
Merganser Mergus spp. X
Redhead Aythya americana x
Ring necked duck Aythya collaris x
Snow goose Chen hyperborea x
Spotted sandpiper Actitis macularia x
Western sandpiper Ereunetes mauri x
Whimbrel Numenius phaeopus x
Yellowlegs Totanus spp. X
Reptiles/Amphibians Red legged frog Rana aurora x
Western pond turtle Clemmys marmorata x

204
TABLE 25 (Continued)
Common Name Taxon
M
ixed
Har
dwoo
d Fo
rest
C
hapa
rral
C
alif
orni
a P
rair
ie
V
alle
y O
ak S
avan
na
R
ipar
ian
For
est
T
ule
Mar
sh
Mammals Badger Taxidea taxus x x x
Black-tail deer Odocoileus hemionus columbianus x x x
Bobcat Lynx rufus x
Brush rabbit Sylvilagus hachmanii x Coyote Canis ochropus x Grey squirrel Scirius griseus x
Ground squirrel Otospermophilus beecheyi x x x
Jack rabbit Lepus californicus x x x x
Kangaroo rat Dipodomys spp. x x
Meadow mouse Microtus californicus x x
Mink Neovison vison x
Mountain lion Felis concolor x
Pocket gopher Thomomys spp. x x x x
Pronghorn antelope Antilocapra americana x x
Raccoon Procyon lotor x x
Striped skunk Mephitis mephitis x
Tule elk Cervus elaphus nannodes x x x
Vagrant shrew Sorex vagrans x
Wood rat Neotoma fuscipes x x
Source: Hildebrandt, William, and Laureen Swenson, 1983, Environmental Setting and Site Catchment Analysis. In Final Report, Archaeological Research of the Southern Santa Clara Valley Project: Based on a Data Recovery Program from Sites CA-SCl-54, CA-SCl-163, CA-SCl-178, CA-SCl-237 and CA-SCl-241 Located in the Route 101 Corridor, Santa Clara County, California. Limited distribution technical paper prepared by Daniel, Mann, Johnson, and Mendenhall and William R. Hildebrandt for the California Department of Transportation, District 4, Oakland, California. were considered to be so definitive in California prehistory that cultural behavior was
described based on “ecological type” (Heizer and Elsasser 1980). Only in recent decades
have archaeologists incorporated empirical ecological data to understand the true nature
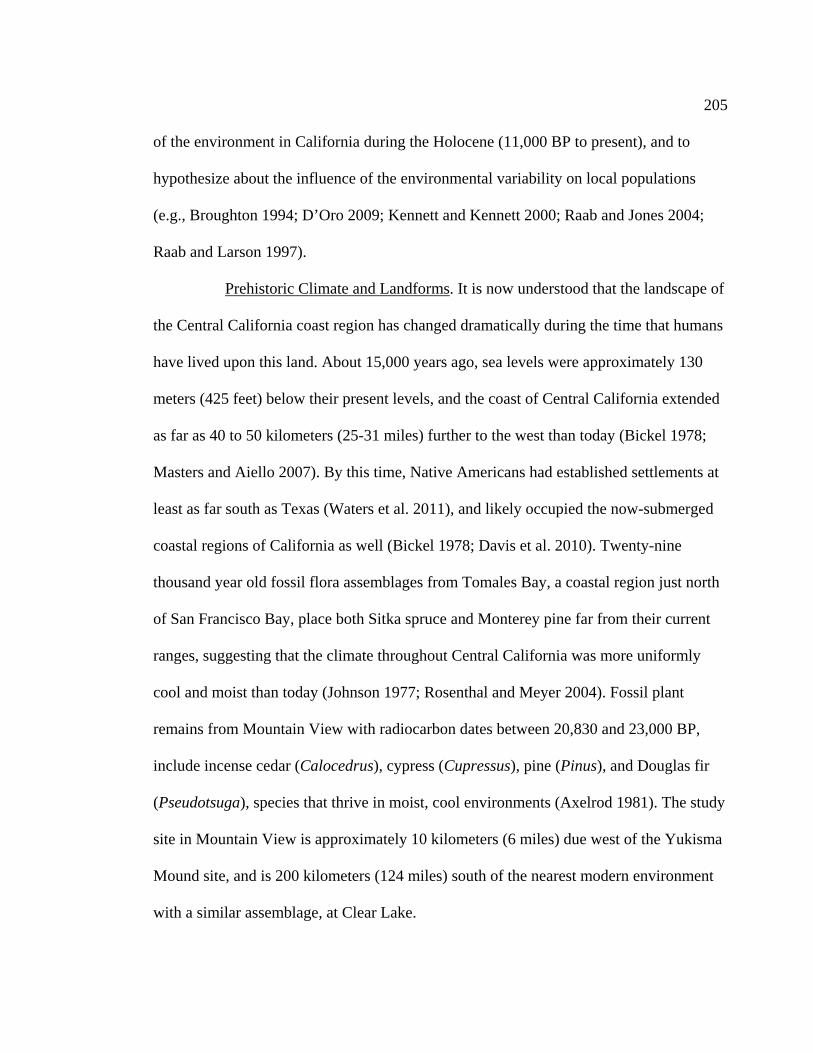
205
of the environment in California during the Holocene (11,000 BP to present), and to
hypothesize about the influence of the environmental variability on local populations
(e.g., Broughton 1994; D’Oro 2009; Kennett and Kennett 2000; Raab and Jones 2004;
Raab and Larson 1997).
Prehistoric Climate and Landforms. It is now understood that the landscape of
the Central California coast region has changed dramatically during the time that humans
have lived upon this land. About 15,000 years ago, sea levels were approximately 130
meters (425 feet) below their present levels, and the coast of Central California extended
as far as 40 to 50 kilometers (25-31 miles) further to the west than today (Bickel 1978;
Masters and Aiello 2007). By this time, Native Americans had established settlements at
least as far south as Texas (Waters et al. 2011), and likely occupied the now-submerged
coastal regions of California as well (Bickel 1978; Davis et al. 2010). Twenty-nine
thousand year old fossil flora assemblages from Tomales Bay, a coastal region just north
of San Francisco Bay, place both Sitka spruce and Monterey pine far from their current
ranges, suggesting that the climate throughout Central California was more uniformly
cool and moist than today (Johnson 1977; Rosenthal and Meyer 2004). Fossil plant
remains from Mountain View with radiocarbon dates between 20,830 and 23,000 BP,
include incense cedar (Calocedrus), cypress (Cupressus), pine (Pinus), and Douglas fir
(Pseudotsuga), species that thrive in moist, cool environments (Axelrod 1981). The study
site in Mountain View is approximately 10 kilometers (6 miles) due west of the Yukisma
Mound site, and is 200 kilometers (124 miles) south of the nearest modern environment
with a similar assemblage, at Clear Lake.
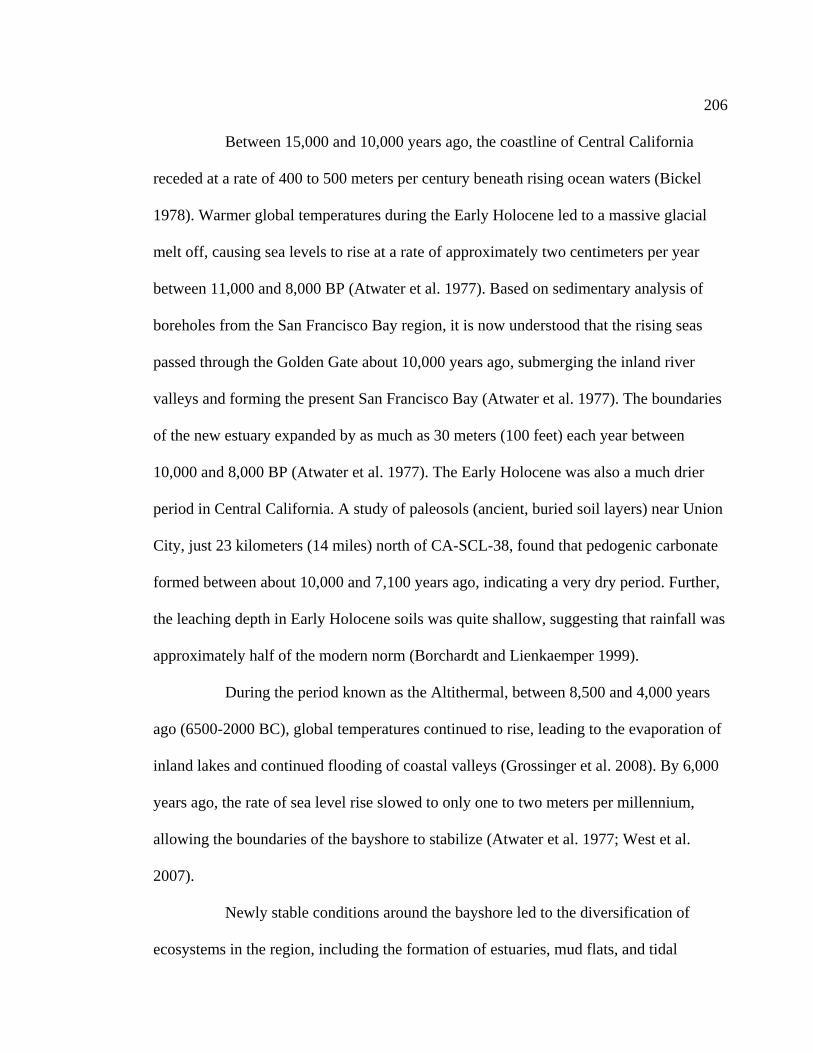
206
Between 15,000 and 10,000 years ago, the coastline of Central California
receded at a rate of 400 to 500 meters per century beneath rising ocean waters (Bickel
1978). Warmer global temperatures during the Early Holocene led to a massive glacial
melt off, causing sea levels to rise at a rate of approximately two centimeters per year
between 11,000 and 8,000 BP (Atwater et al. 1977). Based on sedimentary analysis of
boreholes from the San Francisco Bay region, it is now understood that the rising seas
passed through the Golden Gate about 10,000 years ago, submerging the inland river
valleys and forming the present San Francisco Bay (Atwater et al. 1977). The boundaries
of the new estuary expanded by as much as 30 meters (100 feet) each year between
10,000 and 8,000 BP (Atwater et al. 1977). The Early Holocene was also a much drier
period in Central California. A study of paleosols (ancient, buried soil layers) near Union
City, just 23 kilometers (14 miles) north of CA-SCL-38, found that pedogenic carbonate
formed between about 10,000 and 7,100 years ago, indicating a very dry period. Further,
the leaching depth in Early Holocene soils was quite shallow, suggesting that rainfall was
approximately half of the modern norm (Borchardt and Lienkaemper 1999).
During the period known as the Altithermal, between 8,500 and 4,000 years
ago (6500-2000 BC), global temperatures continued to rise, leading to the evaporation of
inland lakes and continued flooding of coastal valleys (Grossinger et al. 2008). By 6,000
years ago, the rate of sea level rise slowed to only one to two meters per millennium,
allowing the boundaries of the bayshore to stabilize (Atwater et al. 1977; West et al.
2007).
Newly stable conditions around the bayshore led to the diversification of
ecosystems in the region, including the formation of estuaries, mud flats, and tidal
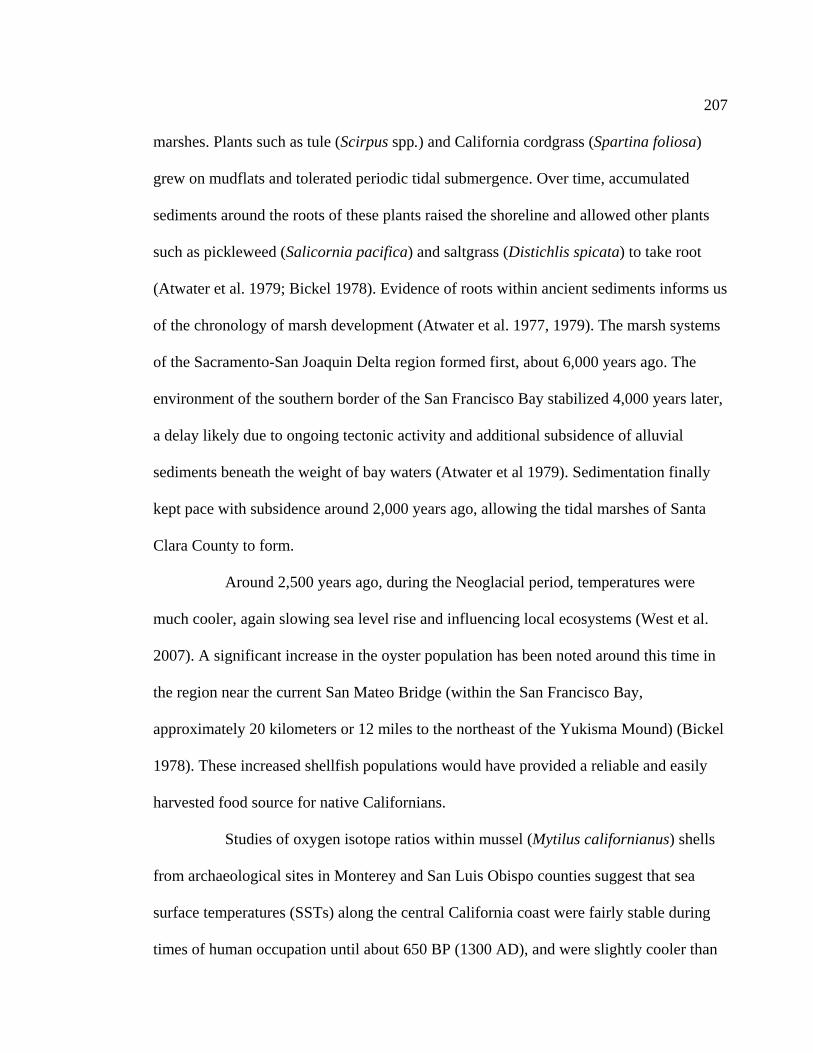
207
marshes. Plants such as tule (Scirpus spp.) and California cordgrass (Spartina foliosa)
grew on mudflats and tolerated periodic tidal submergence. Over time, accumulated
sediments around the roots of these plants raised the shoreline and allowed other plants
such as pickleweed (Salicornia pacifica) and saltgrass (Distichlis spicata) to take root
(Atwater et al. 1979; Bickel 1978). Evidence of roots within ancient sediments informs us
of the chronology of marsh development (Atwater et al. 1977, 1979). The marsh systems
of the Sacramento-San Joaquin Delta region formed first, about 6,000 years ago. The
environment of the southern border of the San Francisco Bay stabilized 4,000 years later,
a delay likely due to ongoing tectonic activity and additional subsidence of alluvial
sediments beneath the weight of bay waters (Atwater et al 1979). Sedimentation finally
kept pace with subsidence around 2,000 years ago, allowing the tidal marshes of Santa
Clara County to form.
Around 2,500 years ago, during the Neoglacial period, temperatures were
much cooler, again slowing sea level rise and influencing local ecosystems (West et al.
2007). A significant increase in the oyster population has been noted around this time in
the region near the current San Mateo Bridge (within the San Francisco Bay,
approximately 20 kilometers or 12 miles to the northeast of the Yukisma Mound) (Bickel
1978). These increased shellfish populations would have provided a reliable and easily
harvested food source for native Californians.
Studies of oxygen isotope ratios within mussel (Mytilus californianus) shells
from archaeological sites in Monterey and San Luis Obispo counties suggest that sea
surface temperatures (SSTs) along the central California coast were fairly stable during
times of human occupation until about 650 BP (1300 AD), and were slightly cooler than

208
at present (Jones and Kennett 1999). After this time, extreme fluctuations in SSTs
occurred, yet climate change on land is apparent several centuries earlier.
Temperatures in terrestrial environments have been inferred from tree ring
growth around the Bay Area (Stahle et al. 2001) and in the Sierra Nevada (Stine 1994).
Extremely severe drought conditions were observed between 1100 and 850 BP and
between 750 and 600 BP with a wet interval between (Stine 1994). These droughts fall
within the period known as the Medieval Climatic Anomaly (MCA), a span between
approximately 1150 and 650 BP (800-1400 AD) during which conditions around the
world were particularly dry, but also highly variable (Jones and Kennett 1999; West et al.
2007).
As a response to recurring periods of drought and deluge, intense alluvial
deposition also changed the landscape of Santa Clara Valley during the Medieval
Climatic Anomaly, building deep, rich soils on the valley floor (Grossinger et al. 2008).
Alluvial deposits would have accumulated alongside creek beds, at the mouths of
streams, and within the inner circumference of meanders in streams (Press and Siever
1986:195). As a bend in a stream increases, a point bar is formed along the inner bank
where the current is the weakest. Alluvial sands and soils are deposited, forming deep,
soft, mounds. Nels Nelson observed that landforms such as these were preferred sites for
earth mound construction (Nelson 1909). The Yukisma Mound site lies within a historic
meander of the Lower Penitencia Creek, and 93 percent of radiocarbon dates from the
site are within the past 1200 years, suggesting that site use began during the early part of
the Medieval Climatic Anomaly.
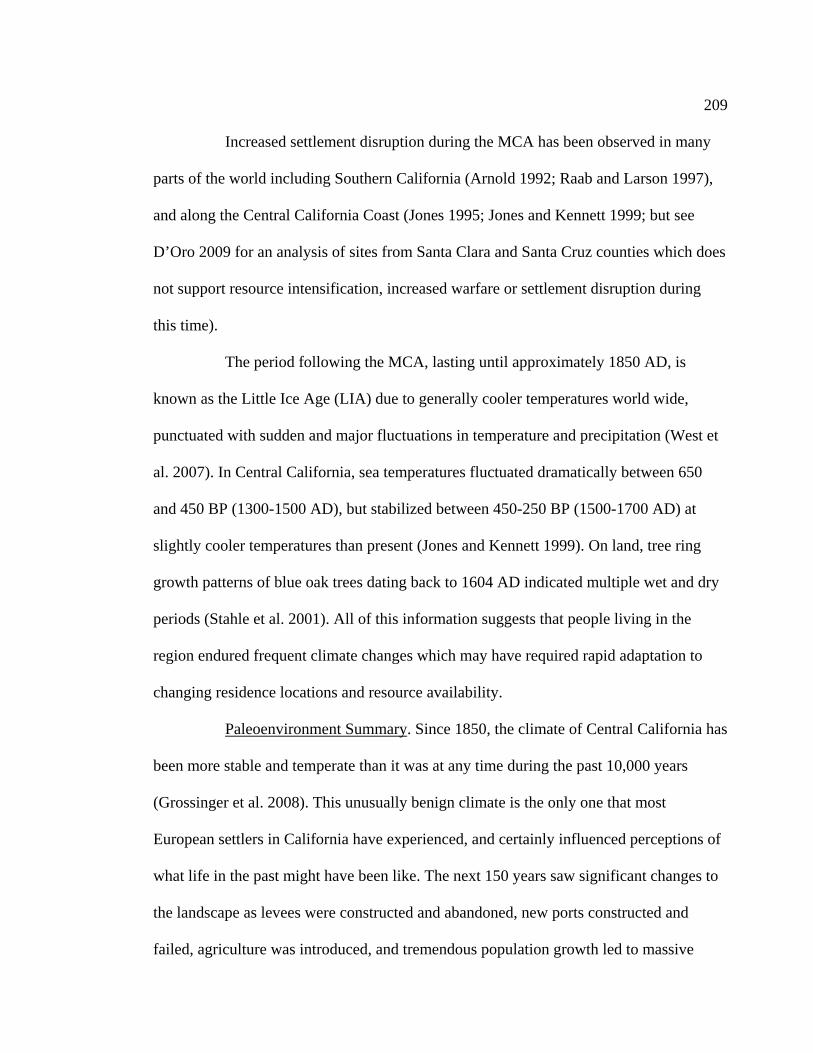
209
Increased settlement disruption during the MCA has been observed in many
parts of the world including Southern California (Arnold 1992; Raab and Larson 1997),
and along the Central California Coast (Jones 1995; Jones and Kennett 1999; but see
D’Oro 2009 for an analysis of sites from Santa Clara and Santa Cruz counties which does
not support resource intensification, increased warfare or settlement disruption during
this time).
The period following the MCA, lasting until approximately 1850 AD, is
known as the Little Ice Age (LIA) due to generally cooler temperatures world wide,
punctuated with sudden and major fluctuations in temperature and precipitation (West et
al. 2007). In Central California, sea temperatures fluctuated dramatically between 650
and 450 BP (1300-1500 AD), but stabilized between 450-250 BP (1500-1700 AD) at
slightly cooler temperatures than present (Jones and Kennett 1999). On land, tree ring
growth patterns of blue oak trees dating back to 1604 AD indicated multiple wet and dry
periods (Stahle et al. 2001). All of this information suggests that people living in the
region endured frequent climate changes which may have required rapid adaptation to
changing residence locations and resource availability.
Paleoenvironment Summary. Since 1850, the climate of Central California has
been more stable and temperate than it was at any time during the past 10,000 years
(Grossinger et al. 2008). This unusually benign climate is the only one that most
European settlers in California have experienced, and certainly influenced perceptions of
what life in the past might have been like. The next 150 years saw significant changes to
the landscape as levees were constructed and abandoned, new ports constructed and
failed, agriculture was introduced, and tremendous population growth led to massive

210
construction and development (Grossinger and Askevold 2005) (also see Figure 6 for
population growth in the Santa Clara Valley). Only 5 to 17 percent of the original
marshland remains today; the balance has been filled or diked for use as salt ponds
(Atwater et al 1979; Grossinger and Askevold 2005).
The evidence above suggests that the Native people in Central California have
witnessed massive changes to the landscape, the drowning of coasts and flooding of river
valleys, the formation of new ecosystems along the bayshore, temperature extremes both
cooler and warmer than today, periods of drought and periods of heavy rains. Although
sea surface temperatures have varied through the past 2,000 years, there is no indication
in the Monterey area of temperatures high enough to disrupt kelp forest environments or
of other resource depression of marine food sources (Jones and Kennett 1999). The most
significant effects of the changing climate would have been noticed in terrestrial,
estuarine and riparian food webs. During times of environmental stress, the ranges of
animal prey species would have shifted continually to follow resource availability. The
changing ecosystems in the area invited new resources as well, such as shellfish and
migratory shore birds. Periods of drought would adversely affect availability of seeds,
acorns, greens, nuts, and root foods, perhaps inspiring additional mobility of populations
and greater competition for resources.
Botanical Studies
One of the best indirect indicators of past diets is the botanical remains found
within archaeological sites. These seeds, roots, pollen grains, and other botanical remains
are strong evidence for the plants that existed nearby at the time, and were likely utilized
in some way by the local people. Botanical information from CA-SCL-38 is limited to

211
preliminary pollen analysis from residue on two mortars (associated with Burials 13 and
45) and three pipes (associated with Burials 33, 167, and 93) (Smith 1996). The
preliminary findings highlight several economic families including sage/mint, cattail,
mustard, nightshade, rose, grass, composite (sunflower) and umbel (e.g., wild celery)
(Smith 1996). The nightshade found in this study was in the residue of a pipe, and is
consistent with tobacco. To supplement this information, botanical data from other
nearby sites which were used during similar timeframes (between 1725 ± 200 to 245 ± 50
calibrated years BP, or about AD 225-1700) will also be considered (see Table 26).
The Rubino Site (CA-SCL-674) is located on an alluvial plain between the
Guadalupe River and Canoas Creek, about 15 kilometers (9 miles) south of the Yukisma
Mound site (Pastron and Bellifemine 2007). This was a mortuary site with a midden
component, used during two distinct periods of time, between 2500 and1700 BP (550
BC-AD 250) and again between 700 and 400 BP (AD 1250-1550). These dates place use
of the Rubino Site during the Early Middle Period and Phase I of the Late Period.
Macrobotanical analysis was done by Wohlgemuth (2007) and pollen residue analysis
was completed by Cummings and Moutoux (2007).
Botanical analysis is also available from CA-SCL-690, the Tamien Station
Site, also located along the Guadalupe River, about 3 kilometers (2 miles) north of the
Rubino Site (Hylkema 2007). The cemetery at SCL-690 was used between approximately
1150 and 650 BP (800-1300 AD), with the greatest concentration of dates between 1050
and 850 BP (900-1100 AD) (Hylkema 2007). These dates place the Tamien Station site
use from the Late Middle Period to the early phases of the Late Period, with declining use
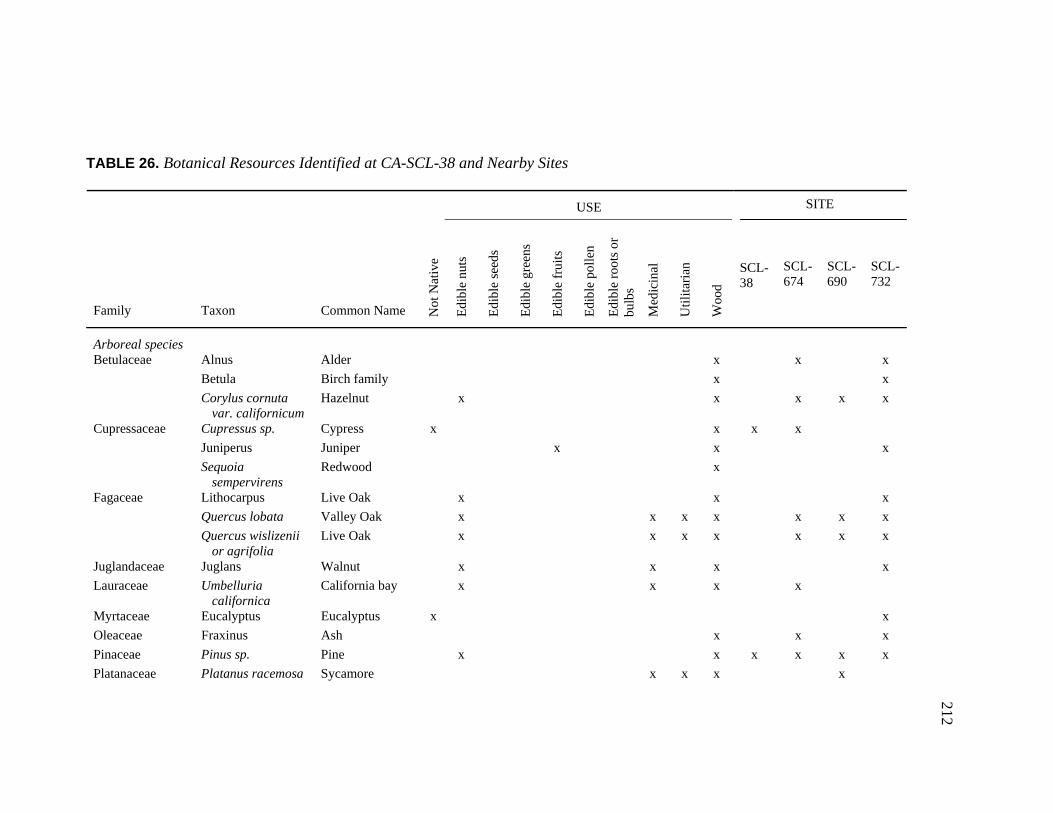
212
TABLE 26. Botanical Resources Identified at CA-SCL-38 and Nearby Sites
USE SITE
Family Taxon Common Name
N
ot N
ativ
e
E
dibl
e nu
ts
E
dibl
e se
eds
E
dibl
e gr
eens
E
dibl
e fr
uits
E
dibl
e po
llen
E
dibl
e ro
ots
or
bu
lbs
M
edic
inal
U
tili
tari
an
W
ood
SCL-38
SCL-674
SCL-690
SCL-732
Arboreal species
Alnus Alder x x x
Betula Birch family x x
Betulaceae
Corylus cornuta var. californicum
Hazelnut x x x x x
Cupressus sp. Cypress x x x x
Juniperus Juniper x x x
Cupressaceae
Sequoia sempervirens
Redwood x
Lithocarpus Live Oak x x x
Quercus lobata Valley Oak x x x x x x x
Fagaceae
Quercus wislizenii or agrifolia
Live Oak x x x x x x x
Juglandaceae Juglans Walnut x x x x
Lauraceae Umbelluria californica
California bay x x x x
Myrtaceae Eucalyptus Eucalyptus x x
Oleaceae Fraxinus Ash x x x
Pinaceae Pinus sp. Pine x x x x x x
Platanaceae Platanus racemosa Sycamore x x x x
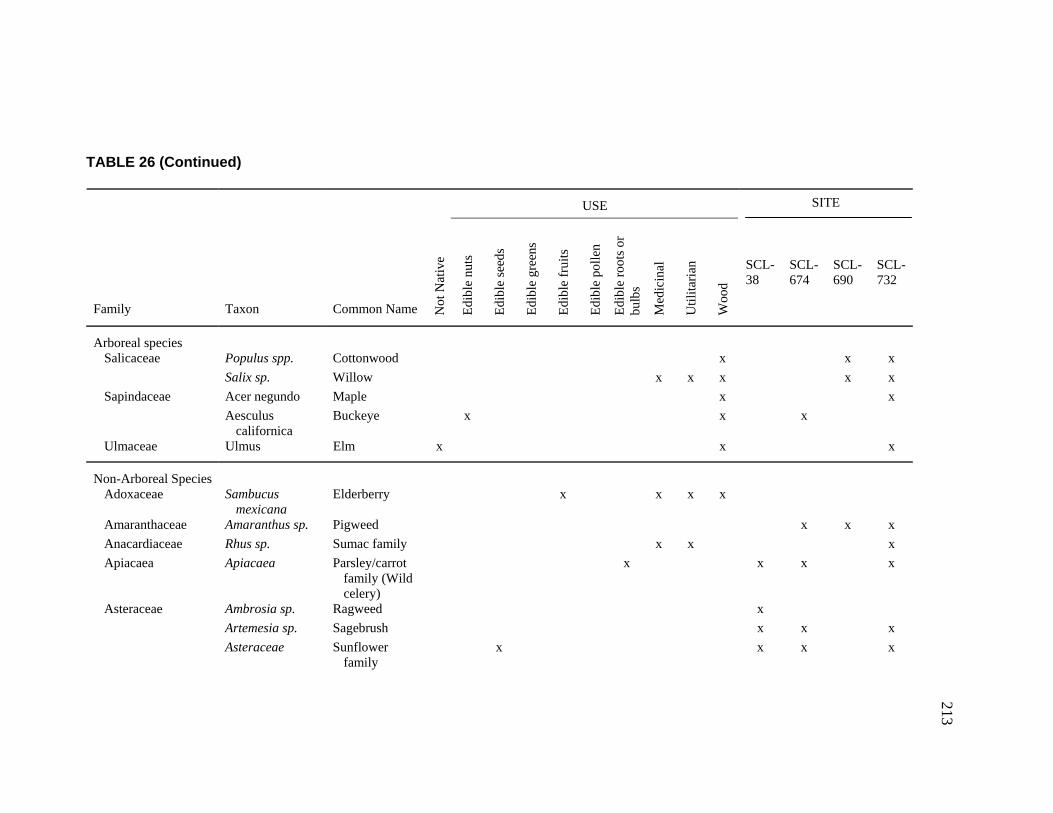
213
TABLE 26 (Continued)
USE SITE
Family Taxon Common Name
N
ot N
ativ
e
E
dibl
e nu
ts
E
dibl
e se
eds
E
dibl
e gr
eens
E
dibl
e fr
uits
E
dibl
e po
llen
E
dibl
e ro
ots
or
bu
lbs
M
edic
inal
U
tili
tari
an
W
ood
SCL-38
SCL-674
SCL-690
SCL-732
Arboreal species
Populus spp. Cottonwood x x x Salicaceae
Salix sp. Willow x x x x x
Acer negundo Maple x x Sapindaceae
Aesculus californica
Buckeye x x x
Ulmaceae Ulmus Elm x x x
Non-Arboreal Species Adoxaceae Sambucus
mexicana Elderberry x x x x
Amaranthaceae Amaranthus sp. Pigweed x x x
Anacardiaceae Rhus sp. Sumac family x x x
Apiacaea Apiacaea Parsley/carrot family (Wild celery)
x x x x
Ambrosia sp. Ragweed x
Artemesia sp. Sagebrush x x x
Asteraceae
Asteraceae Sunflower family
x x x x

214
TABLE 26 (Continued)
USE SITE
Family Taxon Common Name
N
ot N
ativ
e
E
dibl
e nu
ts
E
dibl
e se
eds
E
dibl
e gr
eens
E
dibl
e fr
uits
E
dibl
e po
llen
E
dibl
e ro
ots
or
bu
lbs
M
edic
inal
U
tili
tari
an
W
ood
SCL-38
SCL-674
SCL-690
SCL-732
Non-Arboreal Species (cont.) Baccharis
pilularis var. consanguinea
Coyote brush x x
Cirsium sp. Thistle x x
Hemizonia sp. Tarweed x x
Asteraceae (cont.)
Madia or Hemizonia
Tarweed x x x x x
Amsinckia-Cryptantha-Plagiobothrys
Borage, Fiddleneck
x x Boraginaceae
Phacelia sp. Wild heliotrope x
Brassicaceae Mustard family x x x x Brassicaceae
Lepidium sp. Peppergrass x x x
Cactaceae Cactaceae Cactus family x
Atriplex Saltbush x x x x x Chenopodiaceae
Chenopodium sp. Goosefoot x x x x x x
Cucurbitaceae Marah sp. Wild cucumber x x x
Cyperaceae Cyperaceae Sedge family x
Dodonaea Dodonaea Soapberry family
x x

215
TABLE 26 (Continued)
USE SITE
Family Taxon Common Name
N
ot N
ativ
e
E
dibl
e nu
ts
E
dibl
e se
eds
E
dibl
e gr
eens
E
dibl
e fr
uits
E
dibl
e po
llen
E
dibl
e ro
ots
or
bu
lbs
M
edic
inal
U
tili
tari
an
W
ood
SCL-38
SCL-674
SCL-690
SCL-732
Non-Arboreal Species (cont.) Ericaceae Arctostaphylos
sp. Manzanita x x x x
Euphorbiaceae Euphorbia Spurge x
Fabaceae Lotus, bean x
Lotus cf. Pushianus
Spanish clover x x
Lotus sp. Deer vetch x x x
Fabaceae
Lupinus sp. Lupine x x x
Fabaceae Trifolium sp. Clover x x x
Erodium spp. Filaree x x x x Geraniaceae
Geranium sp. Wild geranium x
Lamiacae sp. (Labiatae sp.)
Mint family x x Lamiaceae
Salvia spp. Chia x x x
Calandrinia sp. Red Maids x x
Claytonia perfoliata
Miner’s lettuce x x x
Montiaceae
Montia perfoliata
Miner’s lettuce x x

216
TABLE 26 (Continued)
USE SITE
Family Taxon Common Name
N
ot N
ativ
e
E
dibl
e nu
ts
E
dibl
e se
eds
E
dibl
e gr
eens
E
dibl
e fr
uits
E
dibl
e po
llen
E
dibl
e ro
ots
or
bu
lbs
M
edic
inal
U
tili
tari
an
W
ood
SCL-38
SCL-674
SCL-690
SCL-732
Non-Arboreal Species (cont.) Clarkia sp. Farewell-to-
spring x x x Onagraceae
Onagraceae Evening primrose family
x x
Plantaginaceae cf. Plantago sp. Plaintain x
Agrostis or Muhlenbergia sp.
Bentgrass-type x x x
Bromus sp. Brome grass x x x x
Calamagrostis sp.
Reedgrass-type x x x
Poaceae
Deschampsia sp. Hairgrass x x x x
Elymus sp. Ryegrass x x x
Eragrostis sp. Lovegrass x x
Festuca or Vulpia sp.
Fescue grass x x x
Hordeum sp. Wild barley x x
Panicum sp. Panic Grass x

217
TABLE 26 (Continued)
USE SITE
Family Taxon Common Name
N
ot N
ativ
e
E
dibl
e nu
ts
E
dibl
e se
eds
E
dibl
e gr
eens
E
dibl
e fr
uits
E
dibl
e po
llen
E
dibl
e ro
ots
or
bu
lbs
M
edic
inal
U
tili
tari
an
W
ood
SCL-38
SCL-674
SCL-690
SCL-732
Non-Arboreal Species (cont.) Phalaris sp. Maygrass x x x x
Poa sp. Bluegrass x x x
Poaceae Grass family x x x
Poaceae (cont.)
Stipa sp. Needlegrass x
Gilia sp. Gilia x Polemoniaceae
Polemoniaceae Phlox family x
Eriogonum sp. Wild buckwheat
x x x x x Polygonaceae
Rumex sp. Dock x x
Portulacaceae Portulaca sp. Purslane x x
Potamogetonaceae Potamogeton sp. Pondweed x
Ranunculaceae Clematis Clematis x
Ranuculus sp. Buttercup x x
Rhamnaceae Ceanothus or Rhamnus
Buckthorn family
x x
Rosaceae Heteromeles arbutifolia and Adenostoma
Toyon and Chamise
x x x x x
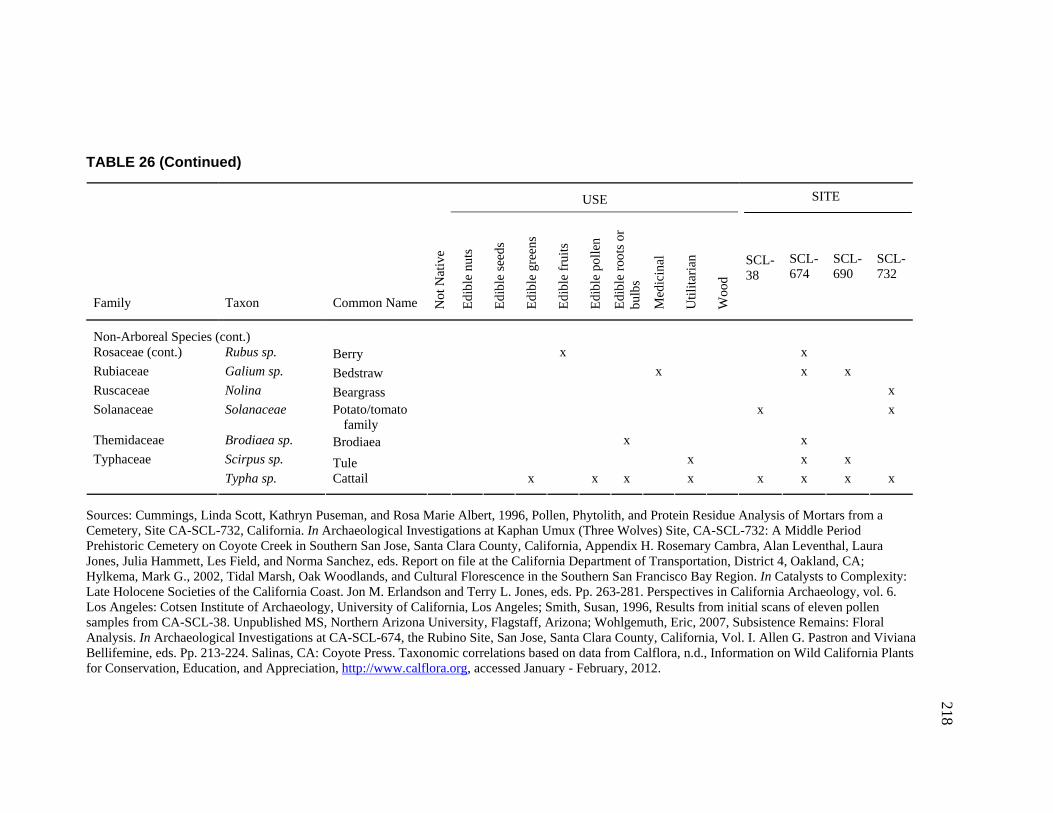
218
TABLE 26 (Continued)
USE SITE
Family Taxon Common Name
N
ot N
ativ
e
E
dibl
e nu
ts
E
dibl
e se
eds
E
dibl
e gr
eens
E
dibl
e fr
uits
E
dibl
e po
llen
E
dibl
e ro
ots
or
bu
lbs
M
edic
inal
U
tili
tari
an
W
ood
SCL-38
SCL-674
SCL-690
SCL-732
Non-Arboreal Species (cont.) Rosaceae (cont.) Rubus sp. Berry x x
Rubiaceae Galium sp. Bedstraw x x x
Ruscaceae Nolina Beargrass x
Solanaceae Solanaceae Potato/tomato family
x x
Themidaceae Brodiaea sp. Brodiaea x x
Scirpus sp. Tule x x x Typhaceae
Typha sp. Cattail x x x x x x x x
Sources: Cummings, Linda Scott, Kathryn Puseman, and Rosa Marie Albert, 1996, Pollen, Phytolith, and Protein Residue Analysis of Mortars from a Cemetery, Site CA-SCL-732, California. In Archaeological Investigations at Kaphan Umux (Three Wolves) Site, CA-SCL-732: A Middle Period Prehistoric Cemetery on Coyote Creek in Southern San Jose, Santa Clara County, California, Appendix H. Rosemary Cambra, Alan Leventhal, Laura Jones, Julia Hammett, Les Field, and Norma Sanchez, eds. Report on file at the California Department of Transportation, District 4, Oakland, CA; Hylkema, Mark G., 2002, Tidal Marsh, Oak Woodlands, and Cultural Florescence in the Southern San Francisco Bay Region. In Catalysts to Complexity: Late Holocene Societies of the California Coast. Jon M. Erlandson and Terry L. Jones, eds. Pp. 263-281. Perspectives in California Archaeology, vol. 6. Los Angeles: Cotsen Institute of Archaeology, University of California, Los Angeles; Smith, Susan, 1996, Results from initial scans of eleven pollen samples from CA-SCL-38. Unpublished MS, Northern Arizona University, Flagstaff, Arizona; Wohlgemuth, Eric, 2007, Subsistence Remains: Floral Analysis. In Archaeological Investigations at CA-SCL-674, the Rubino Site, San Jose, Santa Clara County, California, Vol. I. Allen G. Pastron and Viviana Bellifemine, eds. Pp. 213-224. Salinas, CA: Coyote Press. Taxonomic correlations based on data from Calflora, n.d., Information on Wild California Plants for Conservation, Education, and Appreciation, http://www.calflora.org, accessed January - February, 2012.
219
during the Middle to Late Period Transition (just at the beginning of the Medieval
Climatic Anomaly).
Botanical analyses of CA-SCL-732, Kaphan Umux, or the Three Wolves Site,
have been published by Miksicek (1993) and Hammett (1996a) and summarized in
Hylkema (2002). This site lies along the banks of Coyote Creek, approximately 8 miles to
the south/southeast of the Yukisma Mound. SCL-732 is a multicomponent site, with at
least three discrete periods of concentrated use as a cemetery and ritual space. Site use
there began in the Early Period, before the Yukisma Site was established, but subsequent
use periods (uncalibrated radiocarbon dates of 2720 ± 180 to 1770 ± 90 BP, during the
Early Middle Period, and 410 ± 80 to 150 ± 80 BP, during Phase 2 of the Late Period)
bracket and slightly overlap those found at the Yukisma Mound.
An overview of the botanical information recovered from these four sites
suggests that the ancestral Ohlone made good use of a wide variety of local plants.
Information from nearby sites suggests that many varieties of grass seeds, nuts (including
acorns), greens, geophytes (roots, bulbs, tubers, and corms) and fruits were consumed.
Faunal Studies
A preliminary analysis of faunal remains from the Yukisma Mound site was
included in Bellifemine 1997, and further developed in Hylkema 2002. Table 27 presents
relative abundance of identified vertebrate taxa at SCL-38. These species include
artiodactyls (tule elk, black-tailed deer, and pronghorns), lagomorphs (cottontails and
jack rabbits), other land mammals which may have been consumed (dogs, wolves,
coyotes, grey foxes, grizzly and black bears, raccoons, skunks, a bobcat, and a mountain
lion), sea mammals (sea otters and one California sea lion), waterfowl (geese, cranes,
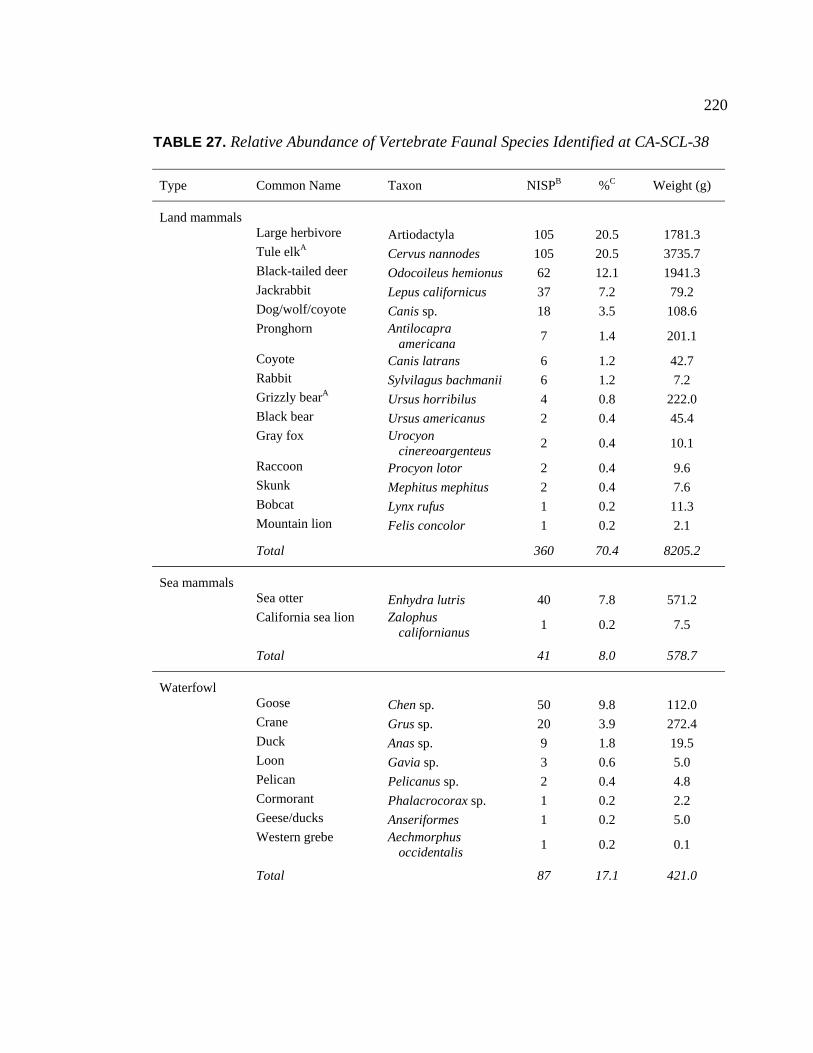
220
TABLE 27. Relative Abundance of Vertebrate Faunal Species Identified at CA-SCL-38
Type Common Name Taxon NISPB %C Weight (g)
Land mammals Large herbivore Artiodactyla 105 20.5 1781.3
Tule elkA Cervus nannodes 105 20.5 3735.7
Black-tailed deer Odocoileus hemionus 62 12.1 1941.3
Jackrabbit Lepus californicus 37 7.2 79.2
Dog/wolf/coyote Canis sp. 18 3.5 108.6
Pronghorn Antilocapra
americana 7 1.4 201.1
Coyote Canis latrans 6 1.2 42.7
Rabbit Sylvilagus bachmanii 6 1.2 7.2
Grizzly bearA Ursus horribilus 4 0.8 222.0
Black bear Ursus americanus 2 0.4 45.4
Gray fox Urocyon
cinereoargenteus 2 0.4 10.1
Raccoon Procyon lotor 2 0.4 9.6
Skunk Mephitus mephitus 2 0.4 7.6
Bobcat Lynx rufus 1 0.2 11.3
Mountain lion Felis concolor 1 0.2 2.1
Total 360 70.4 8205.2
Sea mammals Sea otter Enhydra lutris 40 7.8 571.2
California sea lion Zalophus
californianus 1 0.2 7.5
Total 41 8.0 578.7
Waterfowl Goose Chen sp. 50 9.8 112.0
Crane Grus sp. 20 3.9 272.4
Duck Anas sp. 9 1.8 19.5
Loon Gavia sp. 3 0.6 5.0
Pelican Pelicanus sp. 2 0.4 4.8
Cormorant Phalacrocorax sp. 1 0.2 2.2
Geese/ducks Anseriformes 1 0.2 5.0
Western grebe Aechmorphus
occidentalis 1 0.2 0.1
Total 87 17.1 421.0
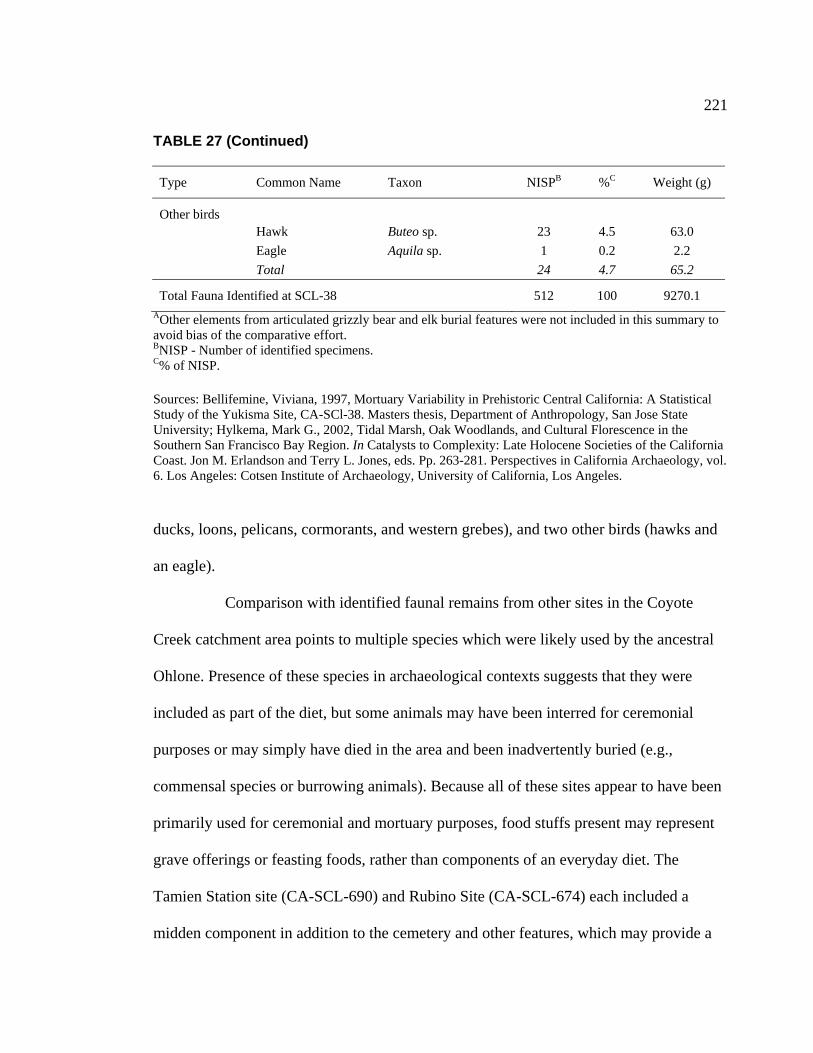
221
TABLE 27 (Continued)
Type Common Name Taxon NISPB %C Weight (g)
Other birds Hawk Buteo sp. 23 4.5 63.0
Eagle Aquila sp. 1 0.2 2.2
Total 24 4.7 65.2
Total Fauna Identified at SCL-38 512 100 9270.1 AOther elements from articulated grizzly bear and elk burial features were not included in this summary to avoid bias of the comparative effort. BNISP - Number of identified specimens. C% of NISP. Sources: Bellifemine, Viviana, 1997, Mortuary Variability in Prehistoric Central California: A Statistical Study of the Yukisma Site, CA-SCl-38. Masters thesis, Department of Anthropology, San Jose State University; Hylkema, Mark G., 2002, Tidal Marsh, Oak Woodlands, and Cultural Florescence in the Southern San Francisco Bay Region. In Catalysts to Complexity: Late Holocene Societies of the California Coast. Jon M. Erlandson and Terry L. Jones, eds. Pp. 263-281. Perspectives in California Archaeology, vol. 6. Los Angeles: Cotsen Institute of Archaeology, University of California, Los Angeles.
ducks, loons, pelicans, cormorants, and western grebes), and two other birds (hawks and
an eagle).
Comparison with identified faunal remains from other sites in the Coyote
Creek catchment area points to multiple species which were likely used by the ancestral
Ohlone. Presence of these species in archaeological contexts suggests that they were
included as part of the diet, but some animals may have been interred for ceremonial
purposes or may simply have died in the area and been inadvertently buried (e.g.,
commensal species or burrowing animals). Because all of these sites appear to have been
primarily used for ceremonial and mortuary purposes, food stuffs present may represent
grave offerings or feasting foods, rather than components of an everyday diet. The
Tamien Station site (CA-SCL-690) and Rubino Site (CA-SCL-674) each included a
midden component in addition to the cemetery and other features, which may provide a

222
better indication of the species involved in diet. Both Bellifemine’s (2007) analysis at the
Rubino Site and Simons’ (2007) analysis of the Tamien Station material provide
contextual detail, separating elements found in middens from those in features or burial
inclusions. A summary of vertebrate species identified at each of the four sites is
presented in Table 28.
Of the sites compared in Table 28, CA-SCL-38 is nearest to marine resources
and is only site to include bones from marine mammals (sea lions and sea otters). A few
fish vertebrae were recovered from SCL-38, but these have not been identified by taxon.
Some species identified in the table are introduced species, and would not have been
present during prehistoric times, including the cattle, pig, sheep, chicken, and black rat
(Simons 2007). Simons (2007) indicated that all fish and amphibians listed in Table 28
would have been economically significant species for the ancestral Ohlone, in addition to
all birds listed except the passeriforms, and all mammals excluding the burrowing
insectivores (mole) and rodents (ground squirrel, gopher, kangaroo rat, wood rat, and
meadow mouse). This last exclusion is an important distinction compared to many other
resources, which mention rodents as typical foods of Native Californians (e.g.,
Harrington 1942:6; Kroeber 1925). Simons observed that the rodent remains from
Tamien Station did not show evidence of cultural modification associated with cooking
or consumption, such as breakage or burning, and were likely invasive rather than part of
the cultural assemblage (Dwight Simons, personal communication, March 1, 2012).
Shellfish would have also been an important dietary component. The most
complete analysis of marine invertebrates by taxa for archaeological sites in the Coyote
Creek Catchment region was completed by Robichaud (2007), analyzing material from

223
TABLE 28. Identified Faunal Remains from Archaeological Sites in the Coyote Creek Catchment (Presence/Absence)
Family Common Name Taxonomic Name SCL-38 SCL-674 SCL-690 SCL-732 Intrusive Not native
Fish Catostomidae Sacramento Sucker Catostomus
occidentalis X1
Pacific Herring Clupea harengus X1 Clupeidae Pacific Sardine Sardinops sagax X
Hitch Lavinia exilicauda X1
Minnow Cyprinidae X1
Cyprinidae
Splittail Pogonichthys macrolepidotus
X1
Salmonidae Steelhead Oncorhynchus mykiss X
Sebastidae Rockfish Sebastes sp. X
Triakadae Shark Triakis/Mustelus/Galeorhinus sp.
X
Unidentified X X
Reptiles/Amphibians Anura Frog Rana sp. X1
Chelonia Pacific Pond Turtle Clemmys marmorata X1 X1
Garter snake Thamnophis sp. X X? Colubridae Snake Unidentified X X?
Leptotyphlopidae Snake Leptotyphlopidae X X?
Birds Eagle Aquila sp. X Accipitridae
Hawk Buteo sp. X X1

224
TABLE 28 (Continued)
Family Common Name Taxonomic Name SCL-38 SCL-674 SCL-690 SCL-732 Intrusive Not native
Birds Hawk Circus sp. X Accipitridae
(cont.) Hawk/Eagle/Falcon Falconiformes X
Duck Anas/Aythya/Bucephala/Oxyura sp.
X X1 Anatidae
Goose Anser/Branta/Chen sp. X X1 X
Ardeidae Heron/Egret Ardeidae X
Columbidae Band-Tailed Pigeon Columba fasciata X1
Corvidae American Crow Corvus brachyrhynchos
X1
Gaviidae Loon Gavia sp. X
Gruidae Crane Grus sp. X
Odontiforidae California Quail Callipepla californica X1
Passeriformes Perching Bird Passeriformes X1
Pelecanidae Pelican Pelicanus sp. X
Phalacrocoracidae Cormorant Phalacrocorax sp. X
Phasianidae Chicken Gallus gallus X X
Picidae Northern Flicker Colaptes auratus X1
Podicipedidae Western Grebe Aechmorphus occidentalis
X
Scolopacidae Shorebird Scolopacidae X1
Tytonidae Barn Owl Tyto alba X1
Aves Unidentified X1

225
TABLE 28 (Continued)
Family Common Name Taxonomic Name SCL-38 SCL-674 SCL-690 SCL-732 Intrusive Not native
Mammals Black-Tailed Deer, Mule Deer Odocoileus hemionus X X1 X1 X
Domestic goat Capra hircus X1 X
Domestic Sheep Ovis aries X1 X
Medium Artiodactyl Odocoileus/Ovis/Antilocapra sp.
X X1
Pronghorn Antilocapra americana
X X1
Artiodactyla
Tule Elk Cervus elaphus X X1 X1 X
Bovidae Domestic Cattle Bos taurus X1 X
Coyote Canis latrans X X
Dog/Coyote Canis sp. X X1 X1 X
Gray Fox Urocyon cinereoargentus
X X1 X
Red Fox Vulpes fulva X
Canidae
Wolf Canis lupis X1 X
Bobcat Lynx rufus X X1 X1 X Felidae
Mountain Lion Felis concolor X X
Geomyidae Pocket Gopher Thomomys bottae X1 X?
Black-Tailed Hare, Jackrabbit Lepus californicus X X1 X1 Lagomorpha Cottontail Rabbit Sylvilagus sp. X X1 X1
Badger Taxidea taxus X X1 X
Long-Tailed Weasel Mustela frenata X
Mustelidae
Sea Otter Enhydra lutris X
Spotted Skunk Silogale putorius X1 X

226
TABLE 28 (Continued)
Family Common Name Taxonomic Name SCL-38 SCL-674 SCL-690 SCL-732 Intrusive Not native
Mammals (cont.) Mustelidae (cont.) Striped Skunk Mephitis mephitis X X1 X1
Pinnipedia California Sea Lion Zalophus californianus
X
Procyonidae Raccoon Procyon lotor X X1 Black Rat Rattus rattus X1 X Kangaroo Rat Dipodomys sp. X1 X Meadow Mouse Microtus californicus X1 X
Rodentia
Wood Rat Neotoma sp. X1 X California Ground Squirrel Spermophilus beecheyi X1 X? Sciuridae
Grey Squirrel Sciurus griseus X Talpidae Broad-Handed Mole Scapanus latimanus X1 X?
Black Bear Ursus americanus X X Ursidae
Grizzly Bear Ursus arctos X X1 X1 X X1 Identified specimens in midden contexts.
Sources: Data compiled from CA-SCL-38 field notes; Bellifemine, Viviana, 1997, Mortuary Variability in Prehistoric Central California: A Statistical Study of the Yukisma Site, CA-SCl-38. Masters thesis, Department of Anthropology, San Jose State University; Hammett, Julia E., 1996b, Paleolandscape Ecology of Coyote Creek. In Archaeological Investigations at Kaphan Umux (Three Wolves) Site, CA-SCL-732: A Middle Period Prehistoric Cemetery on Coyote Creek in Southern San Jose, Santa Clara County, California. Rosemary Cambra, Alan Leventhal, Laura Jones, Julia Hammett, Les Field, and Norma Sanchez, eds. Pp. 9.1-9.9. Report on file at the California Department of Transportation, District 4, Oakland, CA; Hylkema, Mark G., 2002, Tidal Marsh, Oak Woodlands, and Cultural Florescence in the Southern San Francisco Bay Region. In Catalysts to Complexity: Late Holocene Societies of the California Coast. Jon M. Erlandson and Terry L. Jones, eds. Pp. 263-281. Perspectives in California Archaeology, vol. 6. Los Angeles: Cotsen Institute of Archaeology, University of California, Los Angeles; Simons, Dwight D., 2007, Vertebrate Faunal Remains. In Santa Clara Valley Prehistory: Archaeological Investigations at CA-SCL-690, the Tamien Station Site, San Jose, California. Mark G. Hylkema, ed. Pp. 353-388. California Department of Transportation, District 4, Oakland, CA; Wilson, Glen, 1996, Faunal Data Sheets. In Archaeological Investigations at Kaphan Umux (Three Wolves) Site, CA-SCL-732: A Middle Period Prehistoric Cemetery on Coyote Creek in Southern San Jose, Santa Clara County, California, Appendix G. Rosemary Cambra, Alan Leventhal, Laura Jones, Julia Hammett, Les Field, and Norma Sanchez, eds. Pp. G1-G14. Report on file at the California Department of Transportation, District 4, Oakland, CA.
227
the Rubino Site (CA-SCL-732). Interestingly, most unmodified shellfish species in
midden contexts at the Rubino Site were not from local resources (Pastron and
Bellifemine 2007). A taxonomic list of shellfish species found at CA-SCL-732 is
provided by Hammett (1996b), who reported that unmodified shellfish remains at this site
were only found in burial contexts. Species present at Tamien Station (CA-SCL-690) are
reported by Hylkema (2007). Shellfish species present at the Yukisma Mound have not
been formally analyzed, but are reported here based on a review of the artifact catalog
from the 1993 to 1994 excavations. The compiled list of species present at these four sites
is presented in Table 29.
Residue Analysis
Residue analysis is a powerful technique used to differentiate pollen grains,
starch grains, proteins, fatty acids, and other residues related to food procurement and
preparation from those which are present in the environment but not utilized in this way.
Residue analysis for two mortars and three pipes from CA-SCL-38 was completed by
Susan Smith (1996), and Julia Hammett but only preliminary results are available. Pollen
recovered from multiple washes of the mortars included evidence from oak, rose, and
Rhus families. These data are included in Table 26.
Four mortars from CA-SCL-674 yielded pollen, phytoliths, and starch
granules, as reported by Cummings and Moutoux (2007). Pollen data are included in
Table 26, and represent members of the mustard, goosefoot, mint, grass, cattail, and
Phacelia (greens) families. Additionally, a starch grain of the Hordeum type was
discovered, consistent with wild barley or little barley grass (Cummings and Moutoux
2007:425). Two types of spores recovered reveal the presence of ferns (Monolete) and
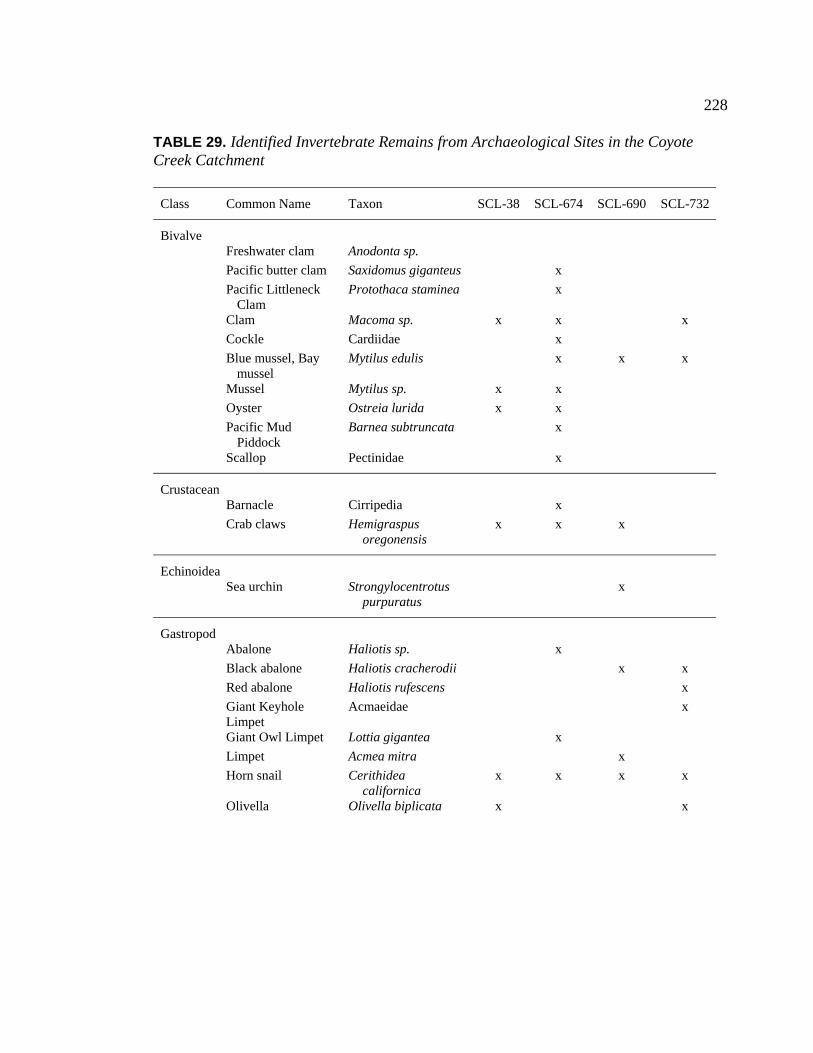
228
TABLE 29. Identified Invertebrate Remains from Archaeological Sites in the Coyote Creek Catchment
Class Common Name Taxon SCL-38 SCL-674 SCL-690 SCL-732
Bivalve Freshwater clam Anodonta sp.
Pacific butter clam Saxidomus giganteus x
Pacific Littleneck Clam
Protothaca staminea x
Clam Macoma sp. x x x
Cockle Cardiidae x
Blue mussel, Bay mussel
Mytilus edulis x x x
Mussel Mytilus sp. x x
Oyster Ostreia lurida x x
Pacific Mud Piddock
Barnea subtruncata x
Scallop Pectinidae x
Crustacean Barnacle Cirripedia x
Crab claws Hemigraspus oregonensis
x x x
Echinoidea Sea urchin Strongylocentrotus
purpuratus x
Gastropod Abalone Haliotis sp. x
Black abalone Haliotis cracherodii x x
Red abalone Haliotis rufescens x
Giant Keyhole Limpet
Acmaeidae x
Giant Owl Limpet Lottia gigantea x
Limpet Acmea mitra x
Horn snail Cerithidea californica
x x x x
Olivella Olivella biplicata x x

229
TABLE 29 (Continued)
Class Common Name Taxon SCL-38 SCL-674 SCL-690 SCL-732
Gastropod (cont.)
Cone shell Conidae x Snail Gastropod x
Sources: Data compiled from CA-SCL-38 field notes; Bellifemine, Viviana, 2007, Subsistence Remains: Faunal Analysis. In Archaeological Investigations at CA-SCL-674, the Rubino Site, San Jose, Santa Clara County, California, vol. I. Allen G. Pastron and Viviana Bellifemine, eds. Pp. 181-202. Salinas, CA: Coyote Press; Hammett, Julia E., 1996b, Paleolandscape Ecology of Coyote Creek. In Archaeological Investigations at Kaphan Umux (Three Wolves) Site, CA-SCL-732: A Middle Period Prehistoric Cemetery on Coyote Creek in Southern San Jose, Santa Clara County, California. Rosemary Cambra, Alan Leventhal, Laura Jones, Julia Hammett, Les Field, and Norma Sanchez, eds. Pp. 9.1-9.9. Report on file at the California Department of Transportation, District 4, Oakland, CA; Hylkema, Mark G., 2007, Santa Clara Valley Prehistory: Archaeological Investigations at CA-SCL-690, the Tamien Station Site, San Jose, California. California Department of Transportation, District 4, Oakland, CA. dung fungus (Sporormiella). The latter may indicate intrusive presence of grazing
animals during historic times, or could suggest that live deer or rabbits were in the
vicinity in prehistoric times (Cummings and Moutoux 2007:425). Phytoliths were
recovered from a bone tube, typical of festucoid grasses, plus one phytolith from an
unidentified, non-grass plant (Cummings and Moutoux 2007:426).
Analysis of five mortars from the Three Wolves/Kaphan Umux site yielded
information about pollen, phytoliths, starches, and protein residues (Cummings et al.
1996). Identified pollen types included several species of trees, and members of the
sumac, parsley/carrot, sunflower, sagebrush, amaranth/pigweed, mustard, buckwheat,
rose, and grass families (Cummings et al. 1996); these species are included in Table 26.
Phytoliths recovered from mortar washings came from several species of grasses,
however most were of the type found in blades of grass rather than seeds, suggesting that
their presence in the mortars may have been due to decomposing vegetal matter in the
soil rather than residue from food preparation (Cummings et al. 1996:4). Starch granules

230
from grass seeds were also recovered, which may have been deposited by seeds ground in
the mortars, or could be from decomposing seeds in the soil (Cummings et al. 1996).
Residues from the mortars were also tested with anti-sera to identify animal
proteins. Positive results for rabbit (Leporidae) were obtained from three mortars, two
tested positive for mouse protein (Cricetidae, the New World rats and mice family), and
two tested positive for human proteins (Cummings et al. 1996:17). Ethnohistoric reports
and previous protein residue studies from southern California suggest that mortars were
sometimes used to grind the meat and bones of animals, particularly deer and rabbits
(Kroeber 1925:652; Yohe et al. 1991). The rabbit and mouse residues found in mortars
from SCL-732 may have been the result of this sort of processing; however, the
possibility that these residues came from unassociated animal feces deposited in the soil
nearby cannot be ruled out.
Artifactual Evidence of Subsistence
Artifacts used for collecting, processing, or preparing foods can also provide
valuable indirect information about the types of foods consumed. At SCL-38, items
possibly relating to food preparation include groundstone (mortars, pestles, manos and
abraders), formal flaked stone implements (bifaces and projectile points) and informal
flaked stone implements (utilized flakes and modified flakes). Descriptions and
frequencies of these objects were provided in Chapter III of this thesis. Many other
implements used for food procurement would not have been preserved in this wet
environment, such as basketry, netting, or wooden tools. Serrated bone tools made from
animal scapulae (“scapula saws”) were found with the burials of nine adults, and may
have been used to harvest grasses and cut tule. Although fishing equipment, such as

231
hooks, net weights or barbed spear heads, was often made of materials which would have
preserved (e.g., bone, shell, or stone), no tools related to fishing were found (note: one
bone fishhook identified by Meighan in 1952 was later reclassified as a canine faunal
tooth at the Phoebe Hearst Museum of Anthropology in Berkeley).
Ground Stone Artifacts. Ground stone artifacts have held very specific
associations in California archaeology, where millingstones have commonly been linked
to the processing of grass seeds and mortars and pestles were associated with pounding
acorns (e.g., Basgall 2004; Baumhoff 1963; Fredrickson 1994a; Gifford 1936; Kroeber
1925). Pat Mikkelsen reevaluated the potential functions of milling tools in California in
1985, incorporating a global ethnographic and archaeological review of groundstone
form and function, use-wear analysis through experimental archaeology, and a review of
millingtools from four sites in Lake and Mendocino Counties in Northern California (a
region approximately 200 kilometers/125 miles north-northwest of the Yukisma Mound
site). She reports that “there is a significant amount of overlap in tool-resource
correlations,” and that “numerous ethnographies report the use of grindingslabs and
mortars for processing both acorns and seeds” (Mikkelsen 1985:190).
Millingstones are more commonly associated with grinding of tough, dry
seeds, but can also be used for pounding or crushing, and are more versatile overall
because the contour of the stone does not interfere with range of motion of the crushing
or grinding implement (Mikkelson 1985:70). In California, milling stones are most
commonly found in sites dating to the lower Archaic Period, between 6,000 and 3,000
years ago (Fredrickson 1994a). No millingstones were found in the excavations at SCL-
38.
232
Mortars are more frequently associated with acorn processing economies in
both California and Japan, are better suited to crushing or pounding, and are more often
found in regions with wetter environments (Mikkelsen 1985:30-34, 70, 192). Besides
foodstuffs, mortars are commonly used to crush pigments, minerals, and medicines
(Mikkelsen 1985). Mortars and pestles became more common in California
archaeological sites after 3,000 BP (Fredrickson 1994a). Three general types of mortars
are recognized: (1) bedrock mortars, which are depressions formed in large immobile
boulders or rocky outcrops, (2) bowl mortars, which are portable and have deep
concavities, and (3) hopper mortars, which are portable, have shallow concavities, and
are used in conjunction with a “hopper,” a basket which is affixed to the mortar to
contain material (usually acorns) during processing (Mikkelson 1985).
These categories have been further refined by Tammy Buonasera, who has
recently reviewed groundstone forms in the San Francisco Bay Area (Buonasera 2012).
Buonasera made distinctions based on mortar size, shape of the mortar well,
presence/absence of a beveled rim, and exterior shaping. Six types were recognized:
1. Small cobble mortars which can be held in one hand.
2. Dished mortars with a gently sloping concavity (consistent with “hopper”
forms, but avoiding the specific use-associations of that term).
3. Conical mortars, with concavities which are cone-shaped or parabolic.
4. Bowl mortars, with concavities which are U-shaped.
5. Flower-pot mortars, which are formally shaped both inside and out, with
straight sides or a slight-waist, a formal rim with a beveled interior, straight interior
walls, and a flat or parabolic well base.
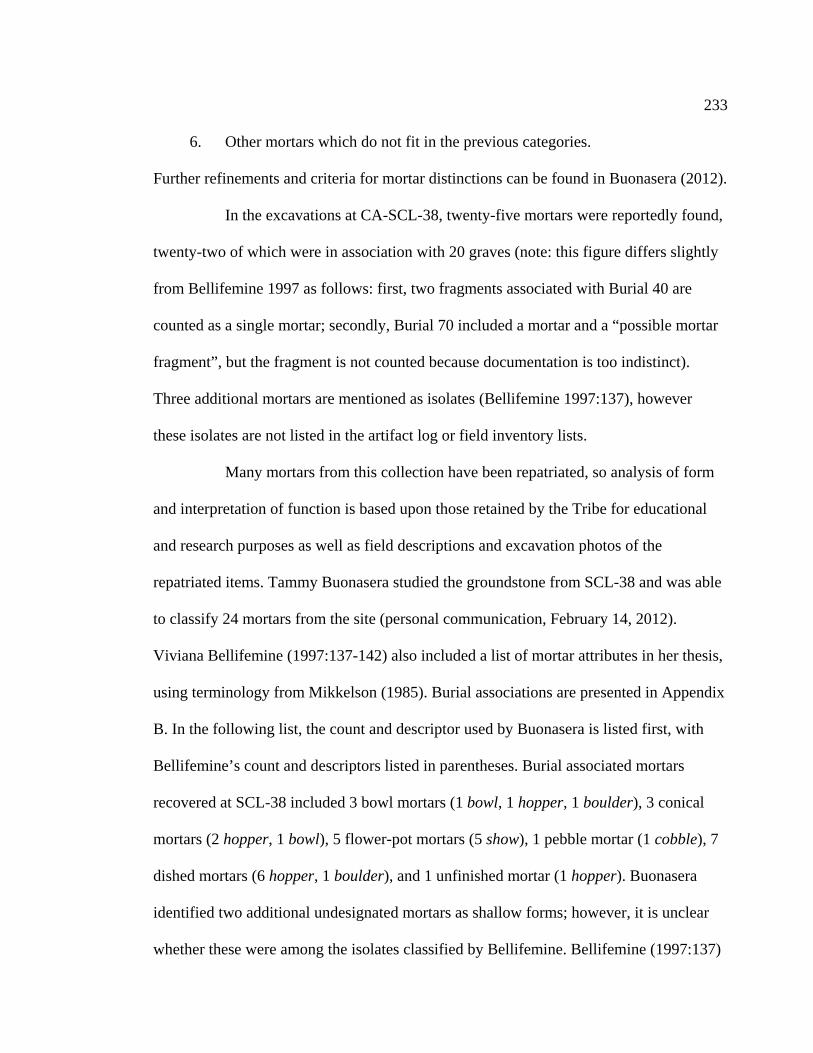
233
6. Other mortars which do not fit in the previous categories.
Further refinements and criteria for mortar distinctions can be found in Buonasera (2012).
In the excavations at CA-SCL-38, twenty-five mortars were reportedly found,
twenty-two of which were in association with 20 graves (note: this figure differs slightly
from Bellifemine 1997 as follows: first, two fragments associated with Burial 40 are
counted as a single mortar; secondly, Burial 70 included a mortar and a “possible mortar
fragment”, but the fragment is not counted because documentation is too indistinct).
Three additional mortars are mentioned as isolates (Bellifemine 1997:137), however
these isolates are not listed in the artifact log or field inventory lists.
Many mortars from this collection have been repatriated, so analysis of form
and interpretation of function is based upon those retained by the Tribe for educational
and research purposes as well as field descriptions and excavation photos of the
repatriated items. Tammy Buonasera studied the groundstone from SCL-38 and was able
to classify 24 mortars from the site (personal communication, February 14, 2012).
Viviana Bellifemine (1997:137-142) also included a list of mortar attributes in her thesis,
using terminology from Mikkelson (1985). Burial associations are presented in Appendix
B. In the following list, the count and descriptor used by Buonasera is listed first, with
Bellifemine’s count and descriptors listed in parentheses. Burial associated mortars
recovered at SCL-38 included 3 bowl mortars (1 bowl, 1 hopper, 1 boulder), 3 conical
mortars (2 hopper, 1 bowl), 5 flower-pot mortars (5 show), 1 pebble mortar (1 cobble), 7
dished mortars (6 hopper, 1 boulder), and 1 unfinished mortar (1 hopper). Buonasera
identified two additional undesignated mortars as shallow forms; however, it is unclear
whether these were among the isolates classified by Bellifemine. Bellifemine (1997:137)
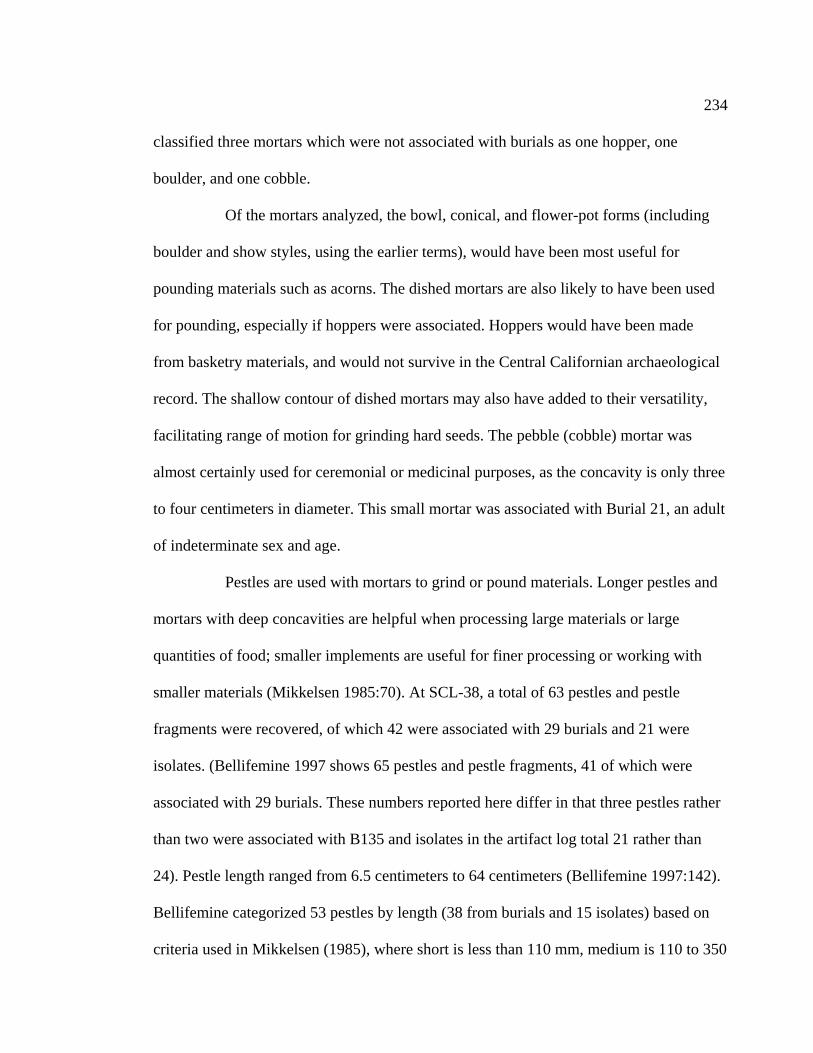
234
classified three mortars which were not associated with burials as one hopper, one
boulder, and one cobble.
Of the mortars analyzed, the bowl, conical, and flower-pot forms (including
boulder and show styles, using the earlier terms), would have been most useful for
pounding materials such as acorns. The dished mortars are also likely to have been used
for pounding, especially if hoppers were associated. Hoppers would have been made
from basketry materials, and would not survive in the Central Californian archaeological
record. The shallow contour of dished mortars may also have added to their versatility,
facilitating range of motion for grinding hard seeds. The pebble (cobble) mortar was
almost certainly used for ceremonial or medicinal purposes, as the concavity is only three
to four centimeters in diameter. This small mortar was associated with Burial 21, an adult
of indeterminate sex and age.
Pestles are used with mortars to grind or pound materials. Longer pestles and
mortars with deep concavities are helpful when processing large materials or large
quantities of food; smaller implements are useful for finer processing or working with
smaller materials (Mikkelsen 1985:70). At SCL-38, a total of 63 pestles and pestle
fragments were recovered, of which 42 were associated with 29 burials and 21 were
isolates. (Bellifemine 1997 shows 65 pestles and pestle fragments, 41 of which were
associated with 29 burials. These numbers reported here differ in that three pestles rather
than two were associated with B135 and isolates in the artifact log total 21 rather than
24). Pestle length ranged from 6.5 centimeters to 64 centimeters (Bellifemine 1997:142).
Bellifemine categorized 53 pestles by length (38 from burials and 15 isolates) based on
criteria used in Mikkelsen (1985), where short is less than 110 mm, medium is 110 to 350
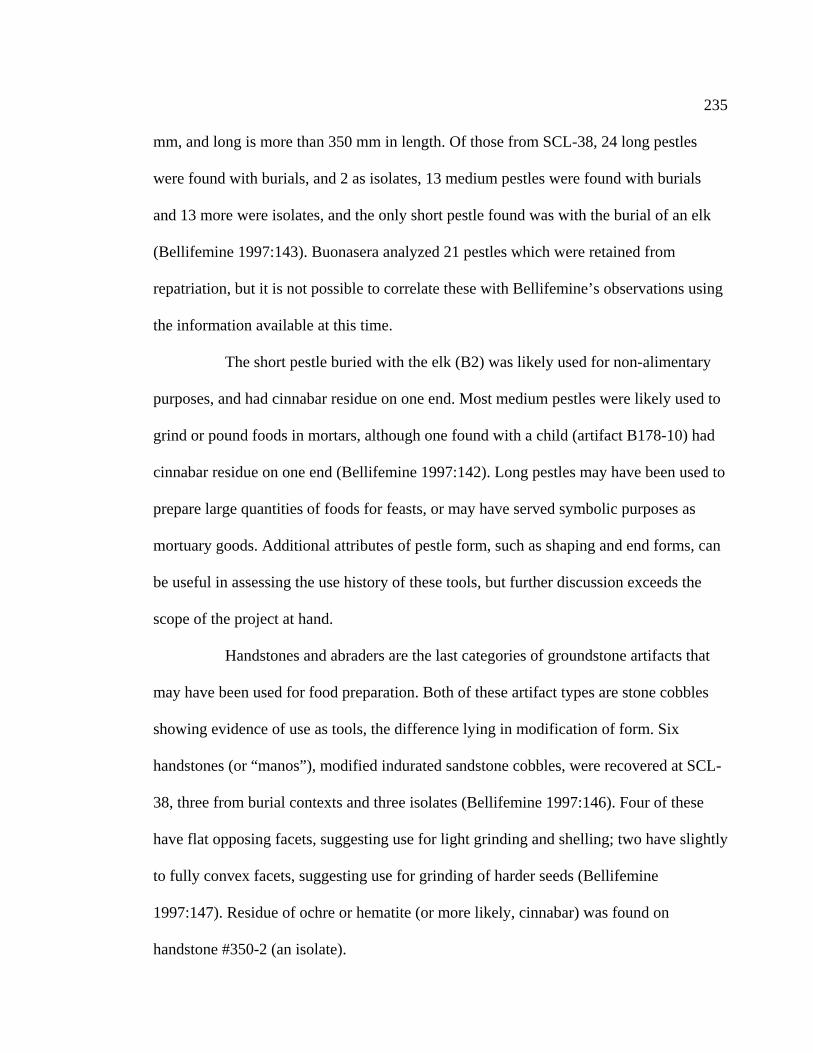
235
mm, and long is more than 350 mm in length. Of those from SCL-38, 24 long pestles
were found with burials, and 2 as isolates, 13 medium pestles were found with burials
and 13 more were isolates, and the only short pestle found was with the burial of an elk
(Bellifemine 1997:143). Buonasera analyzed 21 pestles which were retained from
repatriation, but it is not possible to correlate these with Bellifemine’s observations using
the information available at this time.
The short pestle buried with the elk (B2) was likely used for non-alimentary
purposes, and had cinnabar residue on one end. Most medium pestles were likely used to
grind or pound foods in mortars, although one found with a child (artifact B178-10) had
cinnabar residue on one end (Bellifemine 1997:142). Long pestles may have been used to
prepare large quantities of foods for feasts, or may have served symbolic purposes as
mortuary goods. Additional attributes of pestle form, such as shaping and end forms, can
be useful in assessing the use history of these tools, but further discussion exceeds the
scope of the project at hand.
Handstones and abraders are the last categories of groundstone artifacts that
may have been used for food preparation. Both of these artifact types are stone cobbles
showing evidence of use as tools, the difference lying in modification of form. Six
handstones (or “manos”), modified indurated sandstone cobbles, were recovered at SCL-
38, three from burial contexts and three isolates (Bellifemine 1997:146). Four of these
have flat opposing facets, suggesting use for light grinding and shelling; two have slightly
to fully convex facets, suggesting use for grinding of harder seeds (Bellifemine
1997:147). Residue of ochre or hematite (or more likely, cinnabar) was found on
handstone #350-2 (an isolate).

236
Abraders are unmodified cobbles with use wear. Three abraders were found at
SCL-38, two with burials and one isolate (see Appendix B for burial association details).
Cinnabar residue was found on the isolate (Bellifemine 1997:148).
Flaked Stone Artifacts. Flaked stone artifacts pertaining to subsistence include
projectile points and modified chipped stone tools. At SCL-38, 130 flaked stone
implements were recovered, including 20 obsidian bifaces or projectile points, and 110
informal flaked stone tools (Bellifemine 1997:124). Details of flaked stone artifact
associations can be found in Appendix B.
Twenty obsidian biface tools were catalogued at SCL-38, including sixteen
obsidian projectile points and fragments. All were associated with burials. Four
additional point fragments which were found imbedded in bone (in Burials 91, 142, 143,
and 161) were not catalogued with separate artifact numbers. Two catalogued points were
found lodged between vertebrae, but not imbedded (Burials 140 and 171). The remaining
eighteen points or bifaces were found within or near human remains, but cannot
unambiguously be considered as evidence of interpersonal violence. At the same time, in
no case does the burial context rule out violence or clearly suggest that the implements
were grave offerings.
Of the projectile points which were identified by type, six were Stockton
serrated points, four were serrated lanceolate points, and one was a large contracting stem
point. The remaining points were either fragmentary or embedded, preventing
identification by type. Previous studies of projectile point metrics suggest that function
correlates with point weight, where projectile points weighing less than 3.5 grams are
likely to have been used as arrowheads, and those weighing more than 4.5 grams are
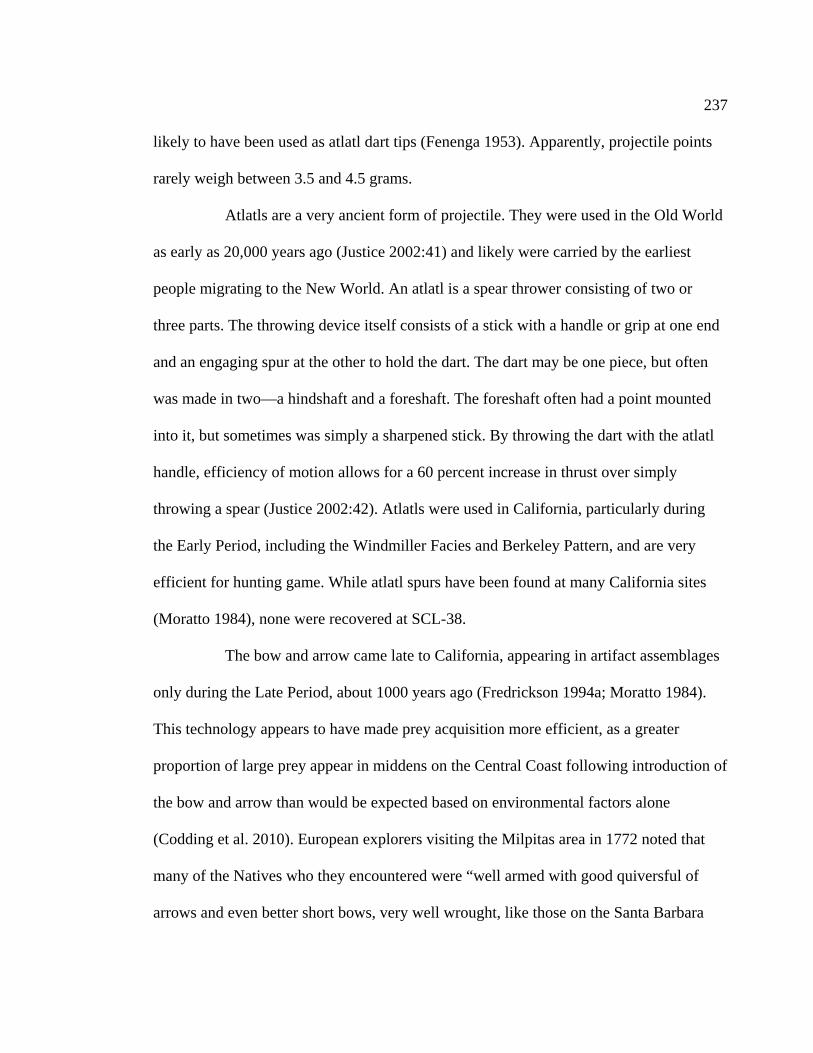
237
likely to have been used as atlatl dart tips (Fenenga 1953). Apparently, projectile points
rarely weigh between 3.5 and 4.5 grams.
Atlatls are a very ancient form of projectile. They were used in the Old World
as early as 20,000 years ago (Justice 2002:41) and likely were carried by the earliest
people migrating to the New World. An atlatl is a spear thrower consisting of two or
three parts. The throwing device itself consists of a stick with a handle or grip at one end
and an engaging spur at the other to hold the dart. The dart may be one piece, but often
was made in two—a hindshaft and a foreshaft. The foreshaft often had a point mounted
into it, but sometimes was simply a sharpened stick. By throwing the dart with the atlatl
handle, efficiency of motion allows for a 60 percent increase in thrust over simply
throwing a spear (Justice 2002:42). Atlatls were used in California, particularly during
the Early Period, including the Windmiller Facies and Berkeley Pattern, and are very
efficient for hunting game. While atlatl spurs have been found at many California sites
(Moratto 1984), none were recovered at SCL-38.
The bow and arrow came late to California, appearing in artifact assemblages
only during the Late Period, about 1000 years ago (Fredrickson 1994a; Moratto 1984).
This technology appears to have made prey acquisition more efficient, as a greater
proportion of large prey appear in middens on the Central Coast following introduction of
the bow and arrow than would be expected based on environmental factors alone
(Codding et al. 2010). European explorers visiting the Milpitas area in 1772 noted that
many of the Natives who they encountered were “well armed with good quiversful of
arrows and even better short bows, very well wrought, like those on the Santa Barbara
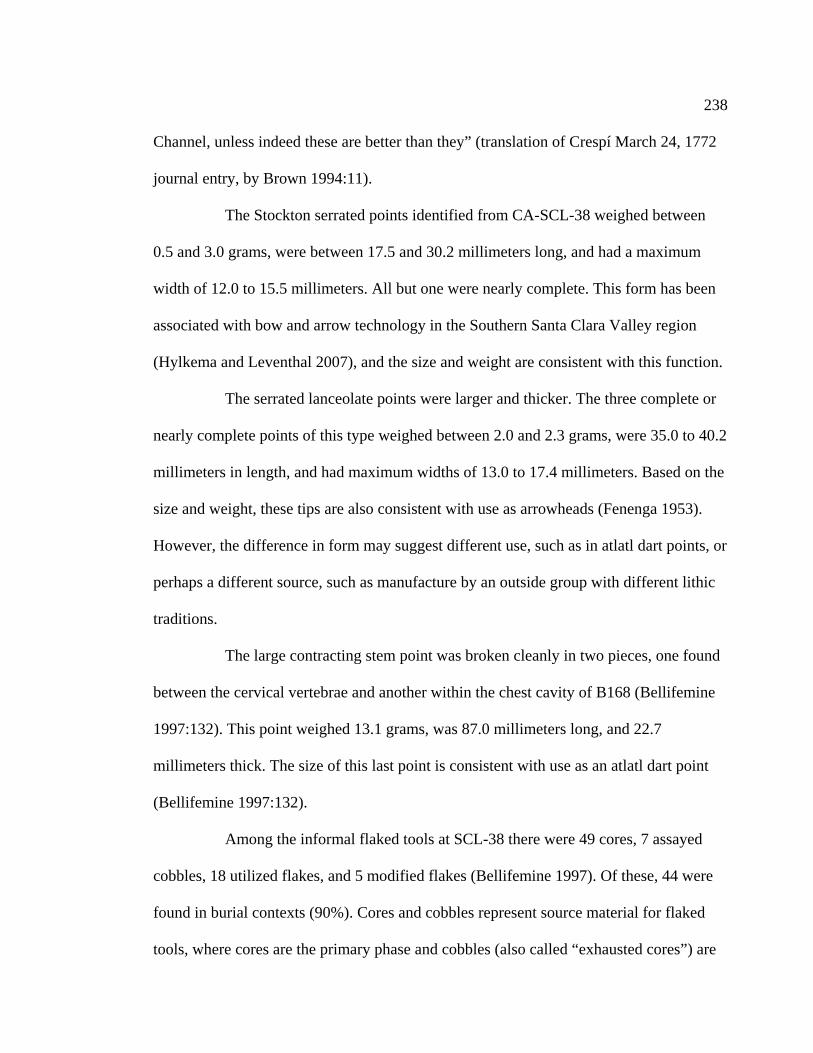
238
Channel, unless indeed these are better than they” (translation of Crespí March 24, 1772
journal entry, by Brown 1994:11).
The Stockton serrated points identified from CA-SCL-38 weighed between
0.5 and 3.0 grams, were between 17.5 and 30.2 millimeters long, and had a maximum
width of 12.0 to 15.5 millimeters. All but one were nearly complete. This form has been
associated with bow and arrow technology in the Southern Santa Clara Valley region
(Hylkema and Leventhal 2007), and the size and weight are consistent with this function.
The serrated lanceolate points were larger and thicker. The three complete or
nearly complete points of this type weighed between 2.0 and 2.3 grams, were 35.0 to 40.2
millimeters in length, and had maximum widths of 13.0 to 17.4 millimeters. Based on the
size and weight, these tips are also consistent with use as arrowheads (Fenenga 1953).
However, the difference in form may suggest different use, such as in atlatl dart points, or
perhaps a different source, such as manufacture by an outside group with different lithic
traditions.
The large contracting stem point was broken cleanly in two pieces, one found
between the cervical vertebrae and another within the chest cavity of B168 (Bellifemine
1997:132). This point weighed 13.1 grams, was 87.0 millimeters long, and 22.7
millimeters thick. The size of this last point is consistent with use as an atlatl dart point
(Bellifemine 1997:132).
Among the informal flaked tools at SCL-38 there were 49 cores, 7 assayed
cobbles, 18 utilized flakes, and 5 modified flakes (Bellifemine 1997). Of these, 44 were
found in burial contexts (90%). Cores and cobbles represent source material for flaked
tools, where cores are the primary phase and cobbles (also called “exhausted cores”) are

239
the utilized phase (Hylkema and Leventhal 2007). (The number of cores reported above
differs from that used by Bellifemine (1997:127) in that cinnabar pebbles are excluded in
the present count). Utilized flakes are tools produced from cores, with one or more sharp
edges used for cutting, shaving, whittling, or scraping (Hylkema and Leventhal
2007:331). Modified flakes are further refined with soft hammer percussion and/or
pressure flaking to produce specialized edges or angles for cutting and scraping activities
(Hylkema and Leventhal 2007:332).
Based on the flaked tool assemblage at SCL-38, the ancestral Ohlone had
projectile points consistent with bow and arrow technology, which would have been
useful in hunting both large and small game. A single large contracting stem point may
indicate that atlatls were also used in the region. Informal flaked tools provided cutting
implements which would have been useful for processing meat, as well as modifying
other animal resources such as bone or hides.
Ethnohistoric Accounts
The best way to know what people are eating is, of course, to meet with them,
talk to them, and observe and document their practices and preferences. Documentation
of the lifeways of California Indians, however, has been problematic for many reasons.
No ethnographer has ever interviewed anyone from the region who participated in pre-
contact hunting and collecting traditions (Milliken 2007:48). The native peoples of
California themselves did not have a written language prior to contact with Europeans,
and no record has survived of any documentation created by Santa Clara Valley Natives
during Mission times. The Mission system and later relocation to rancherias brought
people from diverse communities together and likely led to the sharing and blending of
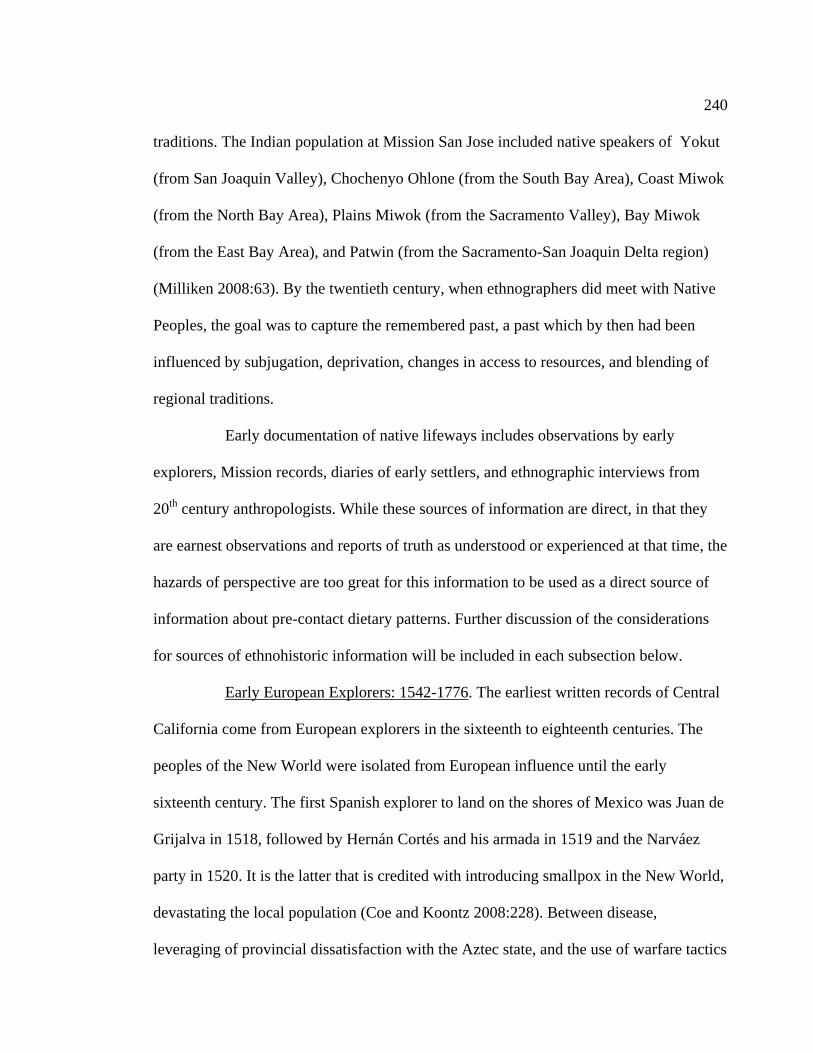
240
traditions. The Indian population at Mission San Jose included native speakers of Yokut
(from San Joaquin Valley), Chochenyo Ohlone (from the South Bay Area), Coast Miwok
(from the North Bay Area), Plains Miwok (from the Sacramento Valley), Bay Miwok
(from the East Bay Area), and Patwin (from the Sacramento-San Joaquin Delta region)
(Milliken 2008:63). By the twentieth century, when ethnographers did meet with Native
Peoples, the goal was to capture the remembered past, a past which by then had been
influenced by subjugation, deprivation, changes in access to resources, and blending of
regional traditions.
Early documentation of native lifeways includes observations by early
explorers, Mission records, diaries of early settlers, and ethnographic interviews from
20th century anthropologists. While these sources of information are direct, in that they
are earnest observations and reports of truth as understood or experienced at that time, the
hazards of perspective are too great for this information to be used as a direct source of
information about pre-contact dietary patterns. Further discussion of the considerations
for sources of ethnohistoric information will be included in each subsection below.
Early European Explorers: 1542-1776. The earliest written records of Central
California come from European explorers in the sixteenth to eighteenth centuries. The
peoples of the New World were isolated from European influence until the early
sixteenth century. The first Spanish explorer to land on the shores of Mexico was Juan de
Grijalva in 1518, followed by Hernán Cortés and his armada in 1519 and the Narváez
party in 1520. It is the latter that is credited with introducing smallpox in the New World,
devastating the local population (Coe and Koontz 2008:228). Between disease,
leveraging of provincial dissatisfaction with the Aztec state, and the use of warfare tactics

241
unknown in the Precolumbian world, the Spanish conquered the Aztecs in 1521 and
claimed their territory as New Spain (Coe and Koontz 2008). Repressive policies and
disease devastated the local people, reducing the aboriginal population to 13.6 percent of
the pre-Conquest totals by the year 1650 (Coe and Koontz 2008:230). Explorers,
ambitions, and disease all spread across the continent in the century to follow.
The first European ship to explore the coast of Alta California was captained
by Juan Rodriguez Cabrillo in 1542. His party sailed as far north as Point Reyes, but their
only records of contact with Native populations are in Southern California, in San Diego,
Santa Catalina Island and the Santa Barbara Channel (Wagner 1928). Along the
California shores, they witnessed several fires which may have been intentionally set by
the Indians to manage landscape resources (Beebe and Senkewicz 2001). Of the people
near Santa Barbara, it was said, “They wear skins of many different kinds of animals, eat
acorns and a white seed the size of maize, which is used to make tamales. They live well.
They say that inland there is much maize and men like us go about there” (translation of
the original account of Cabrillo’s voyage from the Archivo de Indias, provided by
Wagner 1928:49). Other mentions are made of clothed and bearded men living inland, as
well as abundant maize and herds of cattle, none of which were to arrive in California
until more than two hundred years later (Wagner 1928:48). However, the clues provided
in these accounts do let us know that fishing, hunting, and eating acorns and pinole (seed
cakes) were commonly practiced in the sixteenth century, at least in Southern California.
From their territories in New Spain, the Spanish expanded their trade routes to
Asia, regularly sailing between Acapulco on the Pacific Coast and Manila, in the
Philippines. In 1579, the English explorer and pirate, Sir Frances Drake, attacked Spanish
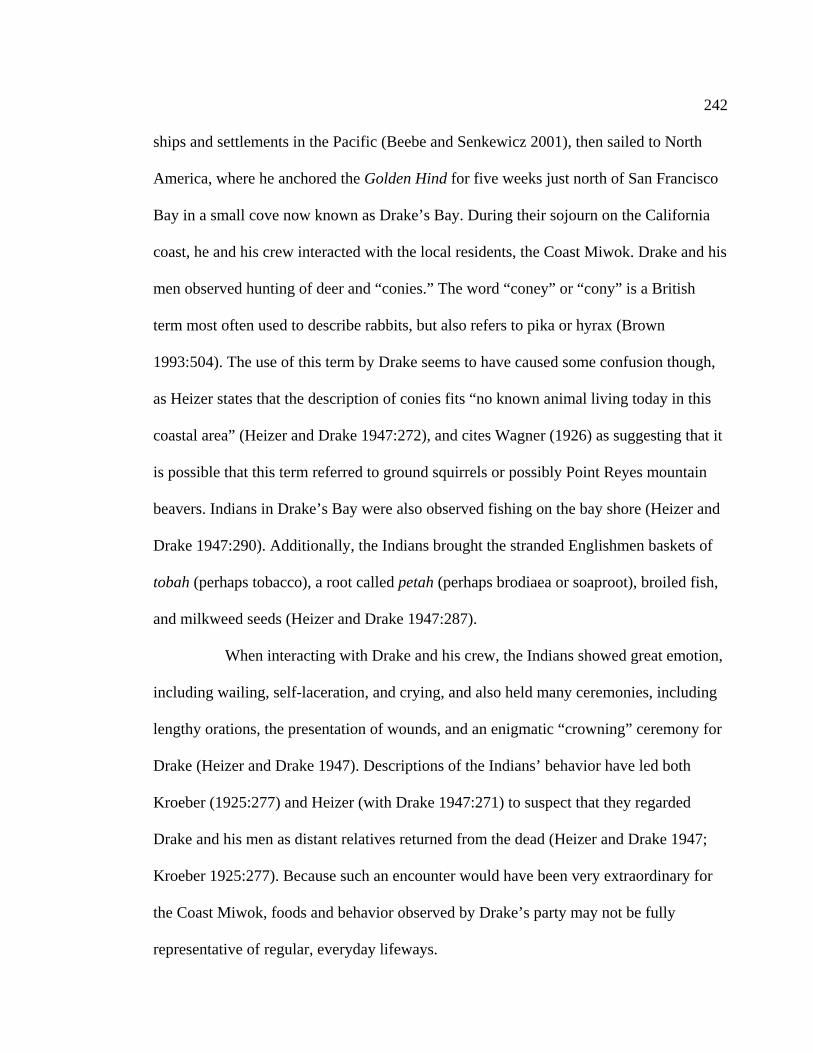
242
ships and settlements in the Pacific (Beebe and Senkewicz 2001), then sailed to North
America, where he anchored the Golden Hind for five weeks just north of San Francisco
Bay in a small cove now known as Drake’s Bay. During their sojourn on the California
coast, he and his crew interacted with the local residents, the Coast Miwok. Drake and his
men observed hunting of deer and “conies.” The word “coney” or “cony” is a British
term most often used to describe rabbits, but also refers to pika or hyrax (Brown
1993:504). The use of this term by Drake seems to have caused some confusion though,
as Heizer states that the description of conies fits “no known animal living today in this
coastal area” (Heizer and Drake 1947:272), and cites Wagner (1926) as suggesting that it
is possible that this term referred to ground squirrels or possibly Point Reyes mountain
beavers. Indians in Drake’s Bay were also observed fishing on the bay shore (Heizer and
Drake 1947:290). Additionally, the Indians brought the stranded Englishmen baskets of
tobah (perhaps tobacco), a root called petah (perhaps brodiaea or soaproot), broiled fish,
and milkweed seeds (Heizer and Drake 1947:287).
When interacting with Drake and his crew, the Indians showed great emotion,
including wailing, self-laceration, and crying, and also held many ceremonies, including
lengthy orations, the presentation of wounds, and an enigmatic “crowning” ceremony for
Drake (Heizer and Drake 1947). Descriptions of the Indians’ behavior have led both
Kroeber (1925:277) and Heizer (with Drake 1947:271) to suspect that they regarded
Drake and his men as distant relatives returned from the dead (Heizer and Drake 1947;
Kroeber 1925:277). Because such an encounter would have been very extraordinary for
the Coast Miwok, foods and behavior observed by Drake’s party may not be fully
representative of regular, everyday lifeways.

243
Drake’s interference with trans-Pacific trade and subsequent attacks by the
English pirate Thomas Cavendish along the coast of Baja California led the viceroy of
New Spain, Luis de Velasco, to ask Sebastián Rodríguez Cermeño to scout the Alta
California coast for safe ports on his return from Manila in 1594. Cermeño and his crew
anchored in a bay they named “San Francisco” (actually Drake’s Bay again) and
encountered the Coast Miwok there, but their interaction lacked the fearful and
reverential tone relayed in the Drake accounts (Beebe and Senkewicz 2001). Near the
local village, Cermeño observed trees bearing acorns, hazelnuts, “other fruits,” madrones,
thistles, and “fragrant herbs like those in Castile,” as well as “a quantity of crabs and wild
birds and deer, with which the people maintain their existence” (Cermeño’s account, as
translated by Wagner 1924:13-14). The Declaration submitted on Cermeño’s return to
Chacala in 1595 also includes a detail about edible seeds, “the size of an anise seed only a
little thinner, and which had the same taste as sesame, of which they made bread,” and
mention of very large deer (likely elk) (translated by Wagner 1924:14, n. 19). On leaving
the bay, Cermeño’s galleon was wrecked by a storm just off shore and all cargo was lost.
The surviving crew limped to shore in a launch, then returned slowly down the coast,
where native people near San Luis Obispo provided them with food, including bitter
acorns and acorn mush, served in “dishes made of straw like large chocolate bowls”
(Cermeño’s account, as translated by Wagner 1924:13-16). The Indians in this
community were also observed fishing from tule boats.
Eight years later, in 1602, Sebastian Vizcaíno was dispatched to survey the
coast, again hoping to find a good location for a port where ships sailing between New
Spain and the Philippines could rest and be provisioned. They sailed as far as Cape
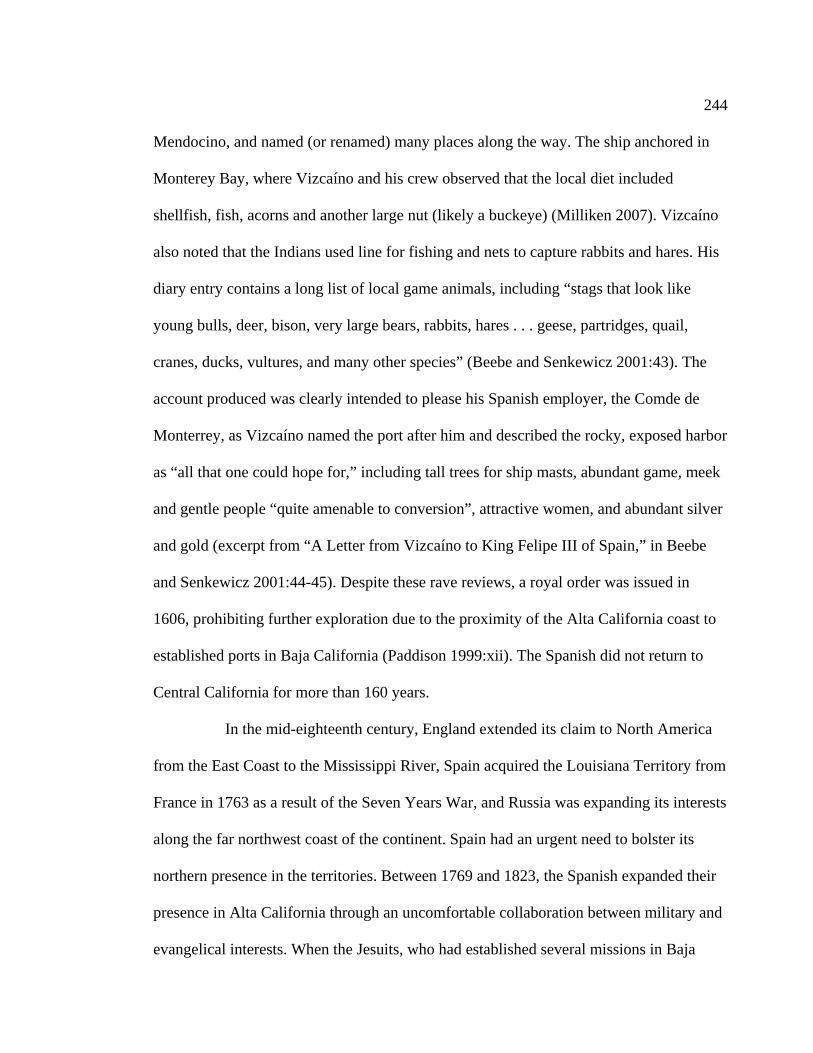
244
Mendocino, and named (or renamed) many places along the way. The ship anchored in
Monterey Bay, where Vizcaíno and his crew observed that the local diet included
shellfish, fish, acorns and another large nut (likely a buckeye) (Milliken 2007). Vizcaíno
also noted that the Indians used line for fishing and nets to capture rabbits and hares. His
diary entry contains a long list of local game animals, including “stags that look like
young bulls, deer, bison, very large bears, rabbits, hares . . . geese, partridges, quail,
cranes, ducks, vultures, and many other species” (Beebe and Senkewicz 2001:43). The
account produced was clearly intended to please his Spanish employer, the Comde de
Monterrey, as Vizcaíno named the port after him and described the rocky, exposed harbor
as “all that one could hope for,” including tall trees for ship masts, abundant game, meek
and gentle people “quite amenable to conversion”, attractive women, and abundant silver
and gold (excerpt from “A Letter from Vizcaíno to King Felipe III of Spain,” in Beebe
and Senkewicz 2001:44-45). Despite these rave reviews, a royal order was issued in
1606, prohibiting further exploration due to the proximity of the Alta California coast to
established ports in Baja California (Paddison 1999:xii). The Spanish did not return to
Central California for more than 160 years.
In the mid-eighteenth century, England extended its claim to North America
from the East Coast to the Mississippi River, Spain acquired the Louisiana Territory from
France in 1763 as a result of the Seven Years War, and Russia was expanding its interests
along the far northwest coast of the continent. Spain had an urgent need to bolster its
northern presence in the territories. Between 1769 and 1823, the Spanish expanded their
presence in Alta California through an uncomfortable collaboration between military and
evangelical interests. When the Jesuits, who had established several missions in Baja
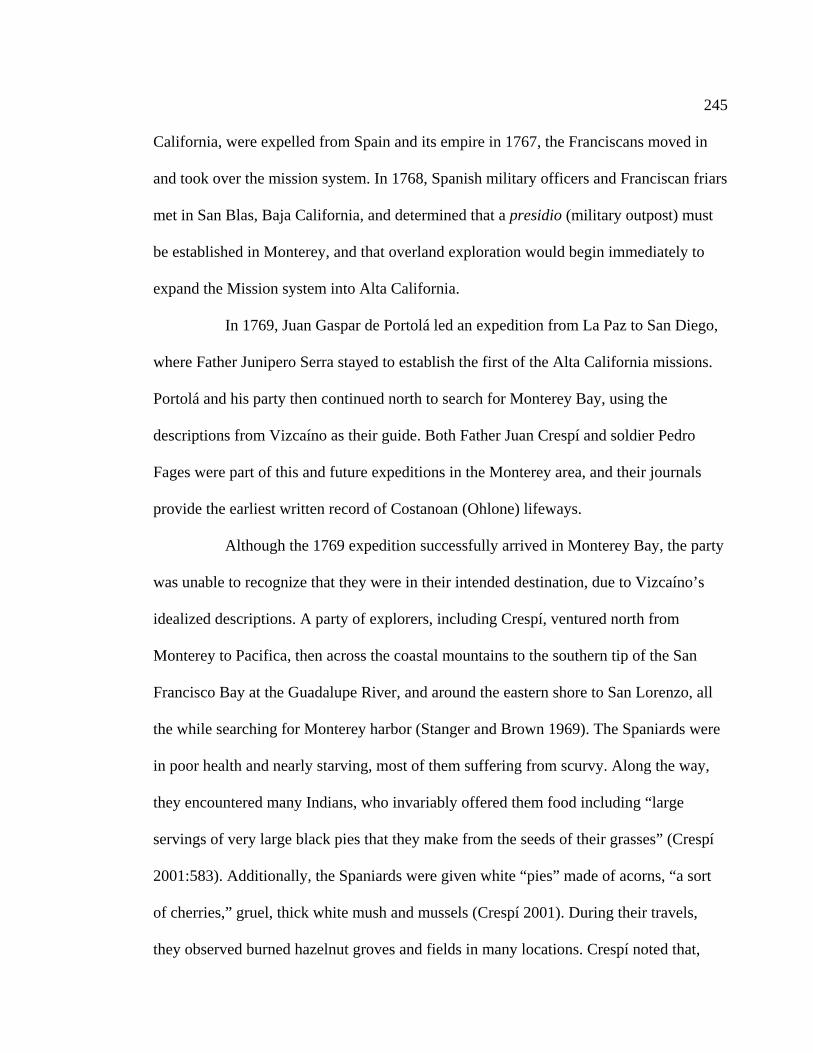
245
California, were expelled from Spain and its empire in 1767, the Franciscans moved in
and took over the mission system. In 1768, Spanish military officers and Franciscan friars
met in San Blas, Baja California, and determined that a presidio (military outpost) must
be established in Monterey, and that overland exploration would begin immediately to
expand the Mission system into Alta California.
In 1769, Juan Gaspar de Portolá led an expedition from La Paz to San Diego,
where Father Junipero Serra stayed to establish the first of the Alta California missions.
Portolá and his party then continued north to search for Monterey Bay, using the
descriptions from Vizcaíno as their guide. Both Father Juan Crespí and soldier Pedro
Fages were part of this and future expeditions in the Monterey area, and their journals
provide the earliest written record of Costanoan (Ohlone) lifeways.
Although the 1769 expedition successfully arrived in Monterey Bay, the party
was unable to recognize that they were in their intended destination, due to Vizcaíno’s
idealized descriptions. A party of explorers, including Crespí, ventured north from
Monterey to Pacifica, then across the coastal mountains to the southern tip of the San
Francisco Bay at the Guadalupe River, and around the eastern shore to San Lorenzo, all
the while searching for Monterey harbor (Stanger and Brown 1969). The Spaniards were
in poor health and nearly starving, most of them suffering from scurvy. Along the way,
they encountered many Indians, who invariably offered them food including “large
servings of very large black pies that they make from the seeds of their grasses” (Crespí
2001:583). Additionally, the Spaniards were given white “pies” made of acorns, “a sort
of cherries,” gruel, thick white mush and mussels (Crespí 2001). During their travels,
they observed burned hazelnut groves and fields in many locations. Crespí noted that,

246
“close to the shore, there ran on some tablelands and rolling knolls with very good soil
and very good grass, though the latter all burnt, since the heathens burn it all off in order
for a better yield of the grass seeds that they eat.” (Crespí 2001:587). Fages observed
duck hunting from tule rafts in a large pool, likely one of the marsh pannes or a
freshwater laguna (Fages 1911:149). The endpoint of this journey would mark the first
time Europeans had travelled directly past the Yukisma Mound site. The following
description is translated from Crespí’s journal, dated November 6th to 9th, 1770, written at
their camp at the mouth of the Guadalupe River, and is the first written description of this
territory:
This is the farthest limit reached by this Expedition in search of MonteRey harbor, up to nearly the end of this large inlet here, which all or most of us hold to be the harbor of San Francisco – a grand spot, this, for a very large plenteous mission with vast amounts of good soil, vast quantities of heathen folk, the finest and best-mannered that have been met with in the entire journey; and this spot, here, one of the most excellent ones for a very large mission. The soldiers report a great number of lakes and small inlets appearing next to the large inlet, with countless fowl, ducks, geese, cranes, and other kinds; while the miriness of the aforesaid lakes and small inlets makes getting past them very toilsome. At once on our reaching here several very well-behaved heathens, most of them bearded, came to the camp, who gave us to understand they belonged to three different villages, and I have no doubt there must be many of these, because of the great many smokes visible in different directions. Some very large bears have been seen; while I myself at this spot where camp was made saw two fresh heaps of these beasts’ droppings, full of acorns, which they must get plenty of to eat from the vast amounts of large ones that are yielded by the white oaks here; so many lay fallen beneath some of these white oaks that the ground could not be seen. Very large acorns they were, and the soldiers and our Indians gathered many of them [Crespí 2001:605]
From this camp, scouts travelled across the Guadalupe River and Lower Penetencia
Creek, then north along the bayshore. The Indians encountered on the East Bay shore
were of different character than all those they had met until then, being “wild” and
disinclined to trade (Crespí 2001:609). After these encounters, the explorers conceded

247
that they had been unable to locate Monterey Bay, and returned to the encampment at
Point Pinos (which was actually on the shore of Monterey Bay), then retreated to San
Diego.
The following year, another expedition was mounted to Monterey, including
both a land and sea approach. This time, the sailors were able to confirm that they were in
Monterey Bay. The Monterey Presidio and Mission San Carlos Borromeo de Carmelo
were founded there in 1770. Monterey served as the northern boundary of the Spanish
occupation in Alta California for the next six years.
During this period, exploratory teams made three major trips to the north,
scouting for resources and good locations for expansion of the mission system. The first
trip, in 1772, was led by Captain Pedro Fages, and included Fr. Juan Crespí, both of
whom kept journals. This expedition travelled along the eastern shore of the San
Francisco Bay, again passing through the region of the Yukisma site. Near Coyote Creek,
Fages wrote “about twenty heathens met us and some of the women commenced a dance
for our entertainment, with many gestures of joy; one of the women harangued us at no
little length; we gave them beads and they responded with feathers” (Stanger and Brown
1969:120). The second trip, in 1774, was led by Captain Fernando Rivera and Father
Francisco Palóu, who explored the San Francisco Peninsula and western shore of the
Bay, and identified preferred sites for the presidio in San Francisco and the Mission San
Francisco de Asís (also called Mission Dolores), which were established in 1776. The
third expedition approached from the sea on the ship San Carlos in 1775, and was the
first to identify the San Francisco Bay inlet at the Golden Gate. Father Vincente Santa
María documented the many peaceful interactions between the crew and the local

248
villagers. Each of these three expeditions encountered Native Americans who ate and
offered cakes (pinole) made of seeds or acorns, as well as acorn mush, shellfish, and
game including deer, elk, and waterfowl (Beebe and Senkewicz 2001; Crespí 1999; Santa
María 1999; Stanger and Brown 1969).
In 1776, Juan Bautista de Anza and Pedro Font led 240 colonists from the
presidio at Tubac, just south of Tucson, to Monterey, and then journeyed onward to the
Santa Clara Valley to scout locations for northern missions, pueblos, and presidios. At the
Guadalupe River, Font saw fish weirs and traps in the river and piles of mussel shells in a
nearby village (Brown 2011:290) On the eastern shore of the Bay, near what is now
Fremont, Font comments that “the Indians that we saw hereabouts are entirely different
from the earlier ones in their speech, rather bearded, mild-mannered and very poor, but
the same as all the others in their color” and that “their speech seems to be a different
language from those we have heard up until here” (Brown 2011:291, 292). He also noted
that Indians in this area ate grasses, herbs, and “some roots like medium-sized onions,
which they called amole,” which were likely soaproot (Chlorogalum pomeridianum)
(Beebe and Senkewicz 2001:199). Additionally, Font noticed birds stuffed with grass,
used as hunting decoys. Further north, between Oakland and Carquinez, he noted the
popularity of root foods, including amole, which he describes as “their most normal
food…most plentiful, since the fields hereabouts are full of it,” rather like a long onion,
and tasting like mescal, and cacomites, “a root that they eat which is a small, flattish,
nearly round plant head, of the size and shape of a half-flattened musket ball” (Brown
2011:297), which may have been brodiaea bulbs (Beebe and Senkewicz 2001:202); both
roots were served roasted on strings. Another large root, called chuchupate, was likely a
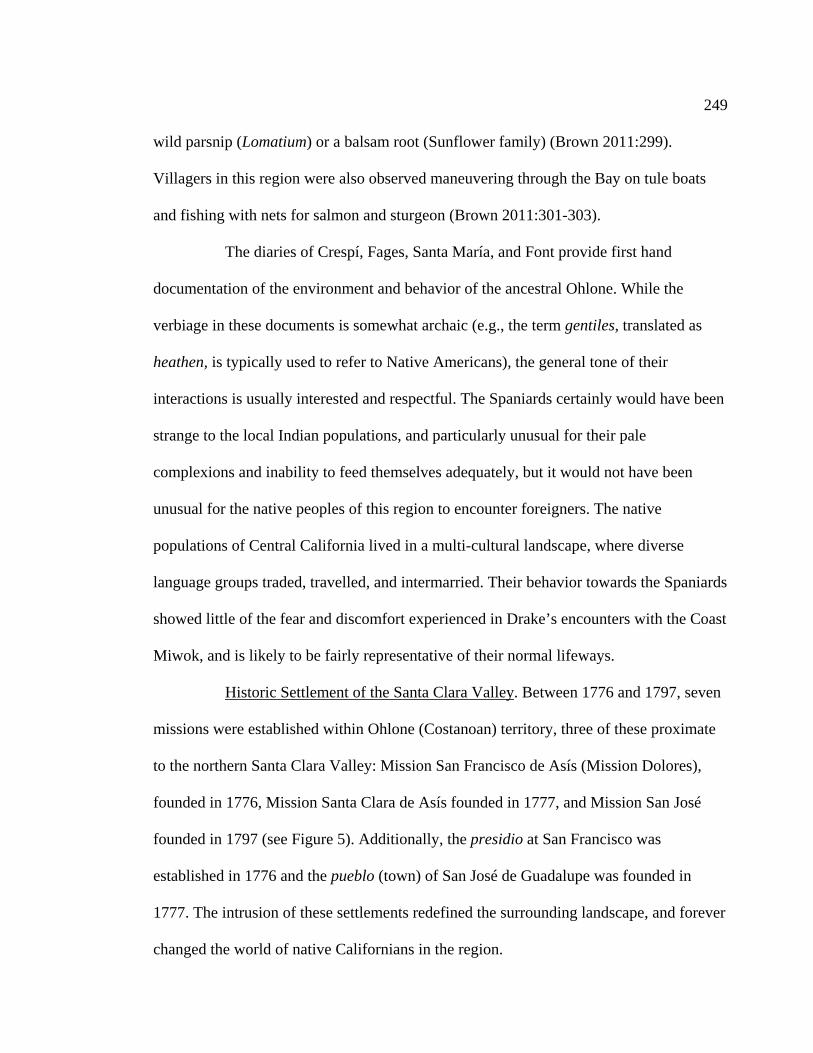
249
wild parsnip (Lomatium) or a balsam root (Sunflower family) (Brown 2011:299).
Villagers in this region were also observed maneuvering through the Bay on tule boats
and fishing with nets for salmon and sturgeon (Brown 2011:301-303).
The diaries of Crespí, Fages, Santa María, and Font provide first hand
documentation of the environment and behavior of the ancestral Ohlone. While the
verbiage in these documents is somewhat archaic (e.g., the term gentiles, translated as
heathen, is typically used to refer to Native Americans), the general tone of their
interactions is usually interested and respectful. The Spaniards certainly would have been
strange to the local Indian populations, and particularly unusual for their pale
complexions and inability to feed themselves adequately, but it would not have been
unusual for the native peoples of this region to encounter foreigners. The native
populations of Central California lived in a multi-cultural landscape, where diverse
language groups traded, travelled, and intermarried. Their behavior towards the Spaniards
showed little of the fear and discomfort experienced in Drake’s encounters with the Coast
Miwok, and is likely to be fairly representative of their normal lifeways.
Historic Settlement of the Santa Clara Valley. Between 1776 and 1797, seven
missions were established within Ohlone (Costanoan) territory, three of these proximate
to the northern Santa Clara Valley: Mission San Francisco de Asís (Mission Dolores),
founded in 1776, Mission Santa Clara de Asís founded in 1777, and Mission San José
founded in 1797 (see Figure 5). Additionally, the presidio at San Francisco was
established in 1776 and the pueblo (town) of San José de Guadalupe was founded in
1777. The intrusion of these settlements redefined the surrounding landscape, and forever
changed the world of native Californians in the region.

250
Mission San Francisco de Asís primarily recruited neophytes from
surrounding villages on the San Francisco Peninsula, but also ventured across the Bay to
recruit from tribes living near Oakland and Richmond (Milliken 2008:30). The biggest
impact to the lives of individuals near the Yukisma Mound was the establishment of the
pueblo of San José de Guadalupe the following year on the east bank of the Guadalupe
River, and Mission Santa Clara de Asís, twelve miles to the south. The threefold purpose
of the pueblo settlement was defined by the Governor of the Californias, Felipe de Neve,
in Title Fourteen of his Regulations for Government of the Californias of 1779 as firstly
“to advance the reducción” (the process of relocating the Indians to the Missions),
secondly “to make this country as useful as possible to the State,” and thirdly to “promote
the planting and cultivation of crops, stock raising, and in succession the other branches
of industry, so that in the course of a few years their produce may suffice to supply the
presidio garrisons with provisions and horses” (Beebe and Senkewicz 2001:211). As
incentive, each settler was provided with “two mares, two cows with one calf, two ewes,
and two she-goats, all pregnant, one yoke of oxen or bullocks, one ploughshare or tip,
one hoe, one spade, one ax and one sickle, one field knife, one lance, one shotgun and
one shield, two horses, and one pack mule,” as well as four lots of land (from the
Regulations for Government of the Californias of 1797, Title Fourteen, translated in
Beebe and Senkewicz 2001:213).
Consequently, massive changes to the landscape ensued. In 1778, the settlers
dammed the Guadalupe River; and when the dam washed away, it was rebuilt, only to be
lost again later that year (Beebe and Senkewicz 2001:277). New foods were introduced to
the Santa Clara menu, including crops such as maize (corn), beans, lentils, garbanzos,
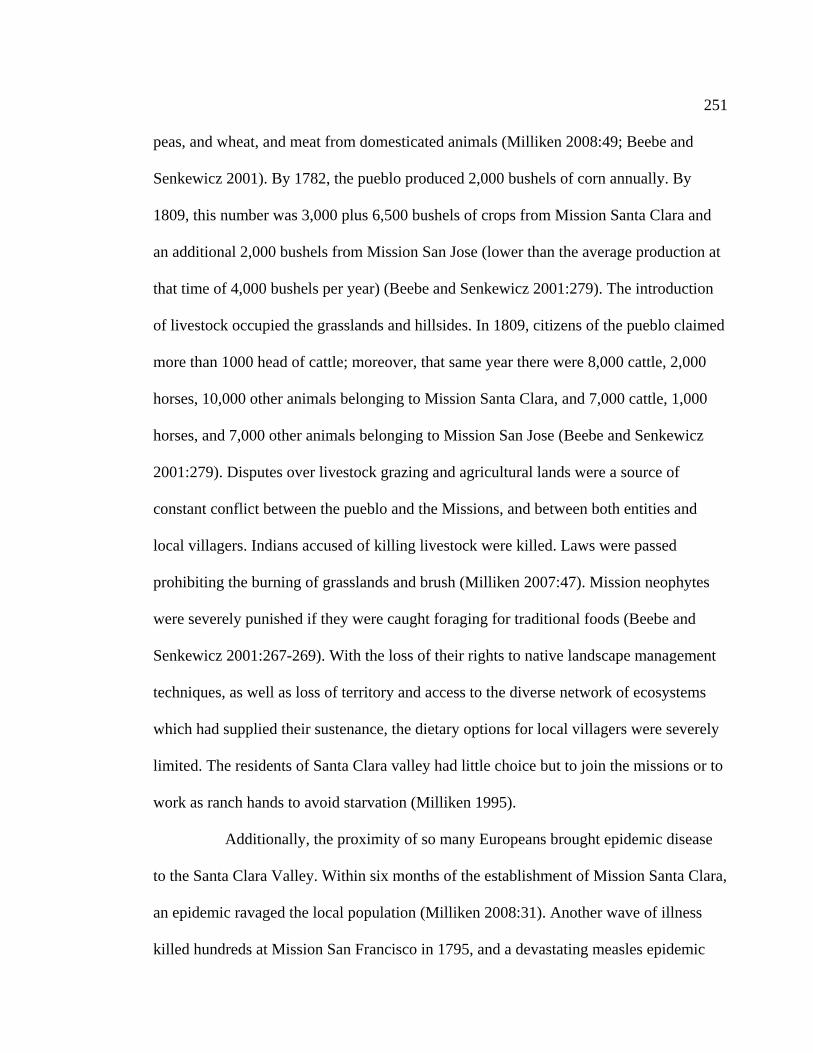
251
peas, and wheat, and meat from domesticated animals (Milliken 2008:49; Beebe and
Senkewicz 2001). By 1782, the pueblo produced 2,000 bushels of corn annually. By
1809, this number was 3,000 plus 6,500 bushels of crops from Mission Santa Clara and
an additional 2,000 bushels from Mission San Jose (lower than the average production at
that time of 4,000 bushels per year) (Beebe and Senkewicz 2001:279). The introduction
of livestock occupied the grasslands and hillsides. In 1809, citizens of the pueblo claimed
more than 1000 head of cattle; moreover, that same year there were 8,000 cattle, 2,000
horses, 10,000 other animals belonging to Mission Santa Clara, and 7,000 cattle, 1,000
horses, and 7,000 other animals belonging to Mission San Jose (Beebe and Senkewicz
2001:279). Disputes over livestock grazing and agricultural lands were a source of
constant conflict between the pueblo and the Missions, and between both entities and
local villagers. Indians accused of killing livestock were killed. Laws were passed
prohibiting the burning of grasslands and brush (Milliken 2007:47). Mission neophytes
were severely punished if they were caught foraging for traditional foods (Beebe and
Senkewicz 2001:267-269). With the loss of their rights to native landscape management
techniques, as well as loss of territory and access to the diverse network of ecosystems
which had supplied their sustenance, the dietary options for local villagers were severely
limited. The residents of Santa Clara valley had little choice but to join the missions or to
work as ranch hands to avoid starvation (Milliken 1995).
Additionally, the proximity of so many Europeans brought epidemic disease
to the Santa Clara Valley. Within six months of the establishment of Mission Santa Clara,
an epidemic ravaged the local population (Milliken 2008:31). Another wave of illness
killed hundreds at Mission San Francisco in 1795, and a devastating measles epidemic

252
swept through the Mission system, starting in Baja California in 1805 and reaching
Mission San Jose in February of 1806, and Missions Santa Clara and San Francisco two
months later. Sixteen percent of the neophyte population at Mission San Jose perished
within six weeks (Milliken 2008:45).
In 1797, an estimated 4,000 Indians still lived in rancherias (villages) near
San Jose (Hall 1871). By 1807, just ten years later, a labor crisis developed in the pueblo
of San Jose because no local native population remained outside the missions (Milliken
2008:47). The remaining Ohlone had either affiliated themselves with Mission Santa
Clara or Mission San Jose, relocated to the Calaveras region to the north, retreated into
the Central Valley, or perished from disease, hunger, or persecution from the settlers or
missionaries.
During the following period of secularization and Mexican independence,
between 1824 and 1849, Mission populations were dispersed. Rapid settlement and
landscape modification in the Santa Clara Valley precluded re-establishment of local
villages. Mission lands were divided between Mexican families, who took on several of
the native Californians as ranch hands or house servants. Other native families returned to
their homelands in the Central Valley or moved to rancherias such as Alisal in the
Caleveras hills, particularly after the 1860s (Milliken 2008). The advent of statehood in
1850 reduced the subsistence options for Native Californians further. Native land claims
near Mission San Jose were rejected, and ranch positions were preferentially given to
American colonists.
Ethnographic Records. With the establishment of an anthropology department
at the University of California, Berkeley, just 51 years after statehood, there existed for
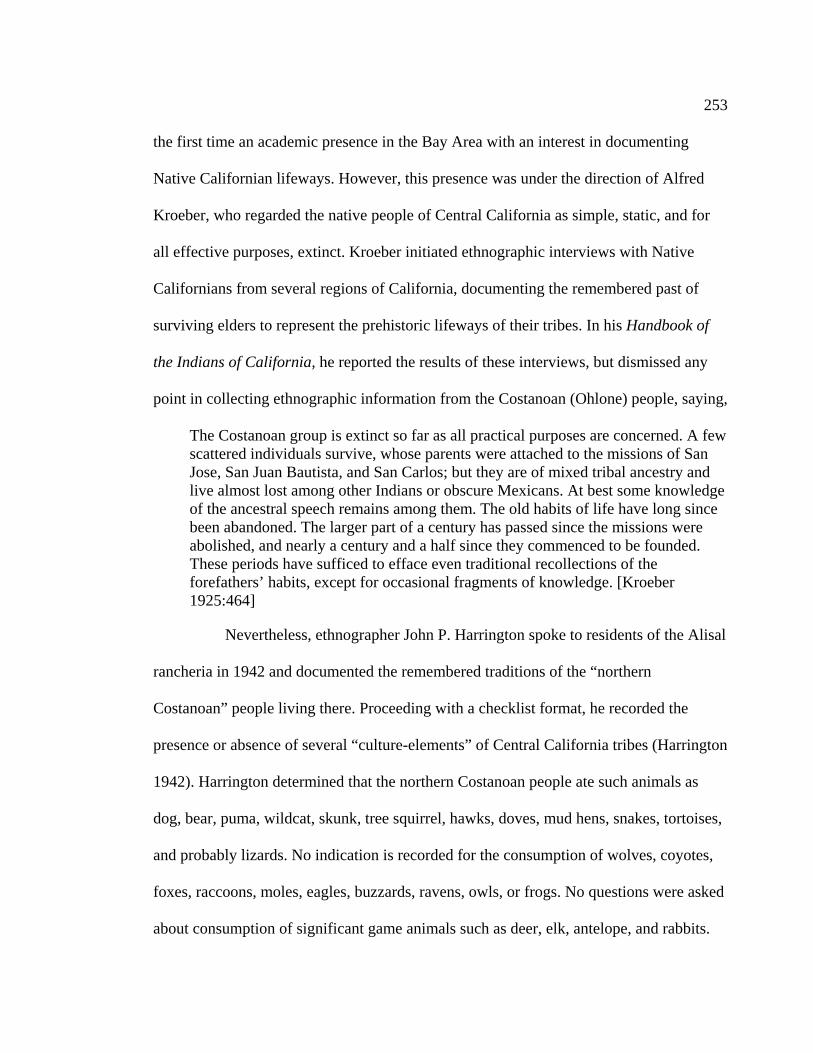
253
the first time an academic presence in the Bay Area with an interest in documenting
Native Californian lifeways. However, this presence was under the direction of Alfred
Kroeber, who regarded the native people of Central California as simple, static, and for
all effective purposes, extinct. Kroeber initiated ethnographic interviews with Native
Californians from several regions of California, documenting the remembered past of
surviving elders to represent the prehistoric lifeways of their tribes. In his Handbook of
the Indians of California, he reported the results of these interviews, but dismissed any
point in collecting ethnographic information from the Costanoan (Ohlone) people, saying,
The Costanoan group is extinct so far as all practical purposes are concerned. A few scattered individuals survive, whose parents were attached to the missions of San Jose, San Juan Bautista, and San Carlos; but they are of mixed tribal ancestry and live almost lost among other Indians or obscure Mexicans. At best some knowledge of the ancestral speech remains among them. The old habits of life have long since been abandoned. The larger part of a century has passed since the missions were abolished, and nearly a century and a half since they commenced to be founded. These periods have sufficed to efface even traditional recollections of the forefathers’ habits, except for occasional fragments of knowledge. [Kroeber 1925:464]
Nevertheless, ethnographer John P. Harrington spoke to residents of the Alisal
rancheria in 1942 and documented the remembered traditions of the “northern
Costanoan” people living there. Proceeding with a checklist format, he recorded the
presence or absence of several “culture-elements” of Central California tribes (Harrington
1942). Harrington determined that the northern Costanoan people ate such animals as
dog, bear, puma, wildcat, skunk, tree squirrel, hawks, doves, mud hens, snakes, tortoises,
and probably lizards. No indication is recorded for the consumption of wolves, coyotes,
foxes, raccoons, moles, eagles, buzzards, ravens, owls, or frogs. No questions were asked
about consumption of significant game animals such as deer, elk, antelope, and rabbits.

254
Small game animals were hunted with deadfalls and cage traps. Rodents were gathered
by blowing smoke into burrows or burning rat nests. Toxins extracted from soaproot were
used to kill fish. Gathered foods included buckeye nuts and wild-plum-seed meal.
Digging sticks were used to gather roots. Mesquite, yucca, and agave were not eaten (nor
are they native to this region). Again, no questions were posed regarding consumption of
common resources such as acorns, grass seed, hazelnuts, pine nuts, or geophytes (roots,
bulbs, tubers, or corms). Informants confirmed that insects were an important food
source, including grasshoppers, yellow-jacket larvae, and honeydew from aphids. Salt
was gathered from the ocean (or likely, the Bayshore). Food preparation techniques
included marrow extraction with a little stick, parching with coals on a basket, drying in
the sun, and smoking. No questions were posed regarding the pulverizing of small
mammals or other foods in mortars, stone boiling in baskets, storage technologies for
surplus harvests, or burning as a landscape management technology (Harrington 1942).
The collection of these data is an important contribution to the reconstruction
of paleodiet in the Santa Clara Valley. In particular, it is helpful to have confirmation of
food resources which would not have preserved in the archaeological record, such as the
consumption of insects, and of hunting technologies, such as deadfalls and cage traps.
The information collected by Harrington reflects remembered traditions from the past,
which may include a mix of preferred prehistoric traditions and survival techniques
adopted during settlement times when choices were significantly limited. A poem,
written by survivors of the Aztec defeat to the Spaniards in 1512, highlights the impact of
an overpowering external culture on traditional diets, concluding, “We have chewed dry
twigs and salt grasses;/we have filled our mouths with dust and bits of adobe;/we have
255
eaten lizards, rats, and worms . . .” (Beebe and Senkewicz 2001:25). Given the
tremendous disruptions to traditional lifeways suffered due to displacement and
landscape modification, the remembered traditions reported to Harrington may better
represent transitional times than pre-contact lifeways.
Landscape Management Practices. Before leaving the discussion of evidence
for food resources, the landscape management practices which facilitated this harvest
should be considered. Although there is no evidence for formalized agriculture in
prehistoric traditions of Central California, there is evidence that the landscape was
managed with controlled burns to maximize harvests, to control species prosperity, and to
attract beneficial species to the region. Accounts from the explorers mention fires, from
Cabrillo’s observations of fires on the shores of Southern California in 1542 to the burnt
hazelnut groves and grasslands observed by Fages and Crespí in Ohlone territory in 1769.
Burning was banned by the Spanish provincial government shortly after the pueblo of
San José de Guadalupe was founded, indicating that the practice persisted. Kat Anderson
(2005) has done considerable work in reconstructing native land management practices in
California, with special attention to the importance of regular, controlled burns for
maintaining grasslands and ensuring optimal harvests. Likewise, Lightfoot and Parrish
(2009) call California Indians “pyrodiversity collectors,” placing the role of burning as
central to their landscape management strategy and mode of production. Regular burning
served many purposes for Native resource management, including the following
examples from Lightfoot and Parrish (2009:21):
1. Augmented the growth and diversity of many economic plants, including
roots, tubers, fruits, greens, nuts, and seeds.

256
2. Provided forage that attracts both small and large birds and mammals.
3. Controlled insects and pests.
4. Removed detritus from the ground surface.
5. Opened up pathways in forests and woodlands.
6. Fertilized the soil with nutrients.
7. Encouraged young, straight sprouts and other useable raw materials that can
be incorporated into the production of cordage, baskets, and other household materials.
8. Facilitated the collection of resources such as acorns and mesquite beans, by
burning off the underbrush.
The use of burning techniques transformed the valley environment to a “park-
like” setting by maintaining open grasslands, cultivating old oak trees, and providing
inviting micro-environments for desired prey animals. In 1791, Captain George
Vancouver travelled through the Santa Clara valley, commenting,
For almost twenty miles it could be compared to a park which had originally been planted with the true old English oak; the underwood, that had probably attained its early growth, had the appearance of having been cleared away and had left the stately lords of the forest in complete possession of the soil, which was covered with luxuriant herbage and beautifully diversified with pleasing eminences and valleys, which, with the lofty range of mountains that bounded the prospect, required only to be adorned with neat habitations of an industrious people to produce a scene not inferior to the most studied effect of taste in the disposal of grounds. [Hall 1871:38]
Although the agriculture and livestock associated with the pueblo of San José de
Guadalupe and Mission Santa Clara de Asís were already impacting the landscape by this
time, the cultivated effect produced by native landscape management practices was
clearly still in evidence.
257
Discussion: What Was On the Menu?
A synthesis of these many sources of paleodietary information yields a broad
and nuanced overview of the resources which may have been on the ancestral Ohlone
menu. The residents of the Yukisma Mound region would have lived in a dynamic
environment, where multiple micro-climates merged to produce a wide variety of
subsistence choices. Harvesting from terrestrial, marine, estuarine, lacustrine, and
riparian environments would have provided a diverse menu and enabled the local people
to respond to temporary fluctuations in the availability of specific resources due to
changes in climate, territorial access, or resource depletion.
The menu in the northern Santa Clara Valley certainly included a wide variety
of terrestrial plant foods. Paleobotanical evidence demonstrates that many species of
grasses, greens, herbs, fruits, nuts, and geophytes were present at SCL-38 and
neighboring sites. Residues from groundstone artifacts indicate the presence of greens
(Phacelia), herbs (such as sage, mint, and mustard), seeds (including grasses, goosefoot,
sunflower, amaranth and wild barley), and roots (e.g., wild celery, and parsley/carrot).
Groundstone forms support the preparation of vegetal foods by pounding methods,
consistent with traditional preparation techniques for acorns, and potentially useful for
grinding of seeds. Accounts from early explorers consistently mention the consumption
of cakes made of grass seeds (pinole), acorns prepared roasted or as mush or gruel, and
roasted geophytes, including amole (soaproot), cacomites (brodiaea), and chuchupate
(likely a wild parsnip or balsam root), as well as a variety of greens, herbs, hazelnuts,
buckeye nuts, and fruits. The fact that some of these traditions are not well documented
258
in the ethnographic record should not negate the substantial indirect evidence of resource
use provided by the archaeological and historic record.
Terrestrial proteins would also have been widely available to the early
residents of the Santa Clara Valley. The faunal record from SCL-38 demonstrates the
presence of tule elk, black-tailed deer, pronghorns, cottontail rabbits, jack rabbits, dogs,
wolves, coyotes, grizzly and black bears, raccoons, skunks, grey foxes, and large cats as
well as several species of waterfowl and other birds. Mortar residues tested positive for
rabbit and mouse proteins, which may have been a result of pulverizing these small
animals prior to cooking. The flaked stone assemblage at SCL-38 includes projectile
points which would have been appropriate for arrowheads, and also a large point
appropriate for an atlatl dart, all indicating that hunting of large game was certainly
possible during this time. Explorer accounts remark on the presence of deer, elk, and
bears. Drake also comments on the “conies,” which may have been rabbits or ground
squirrels. Crespí and Fages both observed East Bay villagers hunting ducks from tule
boats. Harrington recorded techniques for hunting of small game in his 1942 survey.
Resources from marine, estuarine, lacustrine, and riparian environments are
somewhat more elusive in the archaeological record. However, faunal remains from
SCL-38 include the bones of several sea otters and one California sea lion, as well as
substantial quantities of shell from mussels, oysters, abalone, clams, and horn snails. The
few fish vertebrae recovered from SCL-38 are not identified to species, but do indicate
that fish were part of the local menu. All accounts from early explorers include comments
about fishing on the coast or in the Bay, sometimes with nets, others with lines. Pedro
Font noted the use of fish weirs and traps in the Guadalupe River in 1776, and piles of
259
mussel shells in a local village. Harrington identified the remembered use of soaproot as
a fish toxin.
Given the many resources available during the Late Holocene in the Santa
Clara Valley, a multitude of combinations could have made up the diet of residents of the
Milpitas area. Further, the dietary choices made by the group would have likely varied
through time, as environmental pressures, territorial competition, and cultural food
associations changed and developed. As social organization changed, so too might food
distribution between individuals. Distinct social roles might have particular taboos or
guidelines as to which foods were appropriate. Given indirect evidence, it is possible to
imagine the choices, but not possible to see dietary variation between individuals. To
gain perspective on this important nuance of food choice, it is necessary to consult direct
sources of paleodietary information, such as bioarchaeological evidence and stable
isotope analysis of human tissues.

260
CHAPTER VI
APPROACHES TO PALEODIETARY
RECONSTRUCTION: DIRECT
EVIDENCE
Introduction
Paleodietary reconstruction is most likely to accurately represent past diets
when an integrated approach is used, incorporating multiple lines of evidence. Indirect
sources of information, such as paleoenvironmental reconstruction, analysis of
archaeological materials (botanical and faunal remains and artifacts associated with
subsistence), and integration of ethnohistoric data, are excellent resources for determining
which materials may have been available at a community level. However, none of these
lines of evidence can indicate which foods were consumed by individuals at the site.
Direct lines of evidence, including paleofecal analysis, bioarchaeological
indicators of diet, and bone chemistry (trace elements and stable isotope analysis), can
inform about the actual dietary practices of individuals within a community, allowing for
a more personal scale of analysis. However, with the exception of paleofecal analysis, the
dietary information gleaned from these approaches is much less specific than data from
indirect sources. By integrating information from both direct and indirect dietary
indicators, a more nuanced and complete interpretation of past diets is possible.
261
A review of approaches to paleodietary reconstruction and indirect sources of
information about the diet of the ancestral Ohlone was presented in Chapter V. The
present chapter will continue the paleodietary reconstruction for this population by
considering evidence from direct sources.
In the Santa Clara Valley, two sources of direct information are available:
bioarchaeological studies and stable isotope analysis. The moist climate of Central
California makes the recovery of paleofeces unlikely; no examples of human coprolites
have been recovered in this region. Also, no archaeological studies from the Santa Clara
Valley have published trace element data. Therefore, these potential direct lines of
evidence will not be discussed further in this chapter.
Bioarchaeological studies can reveal indications of dietary deficiencies in
bones and teeth. The technical report on analysis of human skeletal remains from CA-
SCL-38, produced by Jurmain (2000), provides the basis for the first section of this
chapter. The second section of the chapter pertains to stable isotope analysis. This
technique uses bone chemistry to understand general aspects of dietary composition,
including the proportion of marine foods in the diet and nuances of protein consumption.
Because this is the technique which is used in the present study, this chapter will include
a detailed discussion of the history of stable isotope analysis as a direct source of
evidence for paleodietary reconstruction. The results of stable isotope analysis for
individuals from CA-SCL-38 will not be presented in this chapter, but are included in
Chapter VIII (Results), along with comparisons of these data with other nearby sites. The
present chapter will conclude with an overview of how direct evidence from
262
bioarchaeological studies and stable isotope analysis can refine what is known about diets
of the ancestral Ohlone people who were buried at the Yukisma Mound.
Bioarchaeological Evidence
The human skeleton is arguably the most personal thing left behind after
death. Bones are built from nutrients derived from the foods a person consumes, shaped
by metabolic processes, and marked by activities, disease, and past traumas. The
integration of dietary components into body tissues and the relationship between nutrition
and bone metabolism make human remains a direct source of evidence for reconstructing
paleodiet.
Non-specific Indicators of Stress
Stressors encountered during development can cause growth to temporarily
cease and then resume. In bones, a pause in growth may create a Harris Line, visible only
by x-ray as a radio-opaque transverse line, parallel to the growth plate. In teeth, stressors
lasting weeks to months can cause linear enamel hypoplasias, which are transverse
grooves in enamel, formed when enamel growth pauses and then resumes. In addition to
stress, linear enamel hypoplasias may be caused by hereditary anomalies or localized
traumas, although these etiologies are less common (Larson 1997). Shorter interruptions
of tooth development result in microdefects called Wilson bands, seen through a
microscope as narrow bands of abnormal enamel. Each of these traits is considered a
non-specific indicator of stress, and may result from any circumstance that disrupts a
child’s metabolism, including dietary insufficiencies, illness, trauma, or even emotional
stress (Larson 1997).
263
More than 350 radiographs were taken during the analysis of skeletal remains
from the Yukisma Mound, including all complete or mostly complete right humeri, radii,
femora, and tibiae, with the left side substituted when the right was unavailable (Jurmain
2000:3). However, no information regarding the frequency of Harris lines is included in
the osteological report.
Detailed macroanalysis of the teeth from these individuals found very low
incidence of linear enamel hypoplasias, with only 2.6 percent of observed teeth affected
(n = 128 of 4,837). All linear enamel hypoplasias observed in this population were on
anterior teeth. When molars are excluded the prevalence is still quite low, at 4.3 percent
(n = 128 of 3,001). The lowest frequencies of these enamel defects were on mandibular
premolars (0.6 to 1.3%, n = 157 to 161); the highest frequency was seen in mandibular
canines, with 14.5 percent (n = 157) in the lower right canine, and 15.3 percent (n = 157)
in the lower left canine (Jurmain 2000:61). The enamel on mandibular canines forms
between approximately the ages of birth to six years (Hillson 2003). Maxillary
involvement included only the incisors and canines. Overall, the frequency of linear
enamel hypoplasias observed in maxillary teeth was 1.8 percent (n = 2,392), and in
mandibular teeth was 3.4 percent (n = 2,445) (Jurmain 2000:61). While the presence of
these enamel defects suggests that some degree of stress was encountered by ancestral
Ohlone children, the frequency and distribution of linear enamel hypoplasias was
considered to be unremarkable and highly typical of other contemporaneous groups
(Jurmain 2000:24). By comparison, a recent study of linear enamel hypoplasias in
Alaskan Inuit foragers found a prevalence rate of 28.8 percent on anterior teeth (Guatelli-
Steinberg et al. 2004).
264
Nutritional Deficiencies
Some dietary insufficiencies leave more specific markers on bone. In
particular, anemia in developing children may cause cribra orbitalia or porotic
hyperostosis, both easily recognizable conditions on the bones of the cranium. In each
case, expansion of the diploë, the porous layer between the inner and outer layers of
dense cortical bone in the cranium, expands to accommodate additional hematopoietic
bone marrow for increased red blood cell production. As the diploic region remodels and
expands, the outer table thins, producing lesions with a pitted or spiky, “hair-on-end”
appearance. Cribra orbitalia refers to lesions of this sort within the upper eye orbits.
Porotic hyperostosis refers to these lesions if found on the frontal, parietal or occipital
bones of the cranial vault. In the New World, these conditions have long been associated
with iron-deficiency anemia, which may be caused by dietary deficiencies or
malabsorption due to intestinal parasites (Blom et al. 2005; Holland and O’Brien 1997;
Stuart-Macadam 1985; White and Folkens 2005).
However, persuasive work by Walker et al. (2009) suggests that these
conditions could not be the result of iron-deficiency anemia, as iron is required for
marrow hypertrophy and red blood cell production in the first place. Rather, it is
suggested that these lesions are most likely to be a result of a vitamin B12 deficiency
(Walker et al. 2009). Severe deficiencies of vitamin B12 (cobalamin) or vitamin B9 (folic
acid) are the most common causes of megaloblastic anemia, which destroys existing red
blood cells without hindering hematogenesis. Deficiencies of vitamin B12 are most
commonly seen in individuals with extremely low consumption of animal products, in
breastfeeding infants whose mothers have a vitamin B12 deficiency, or in individuals with
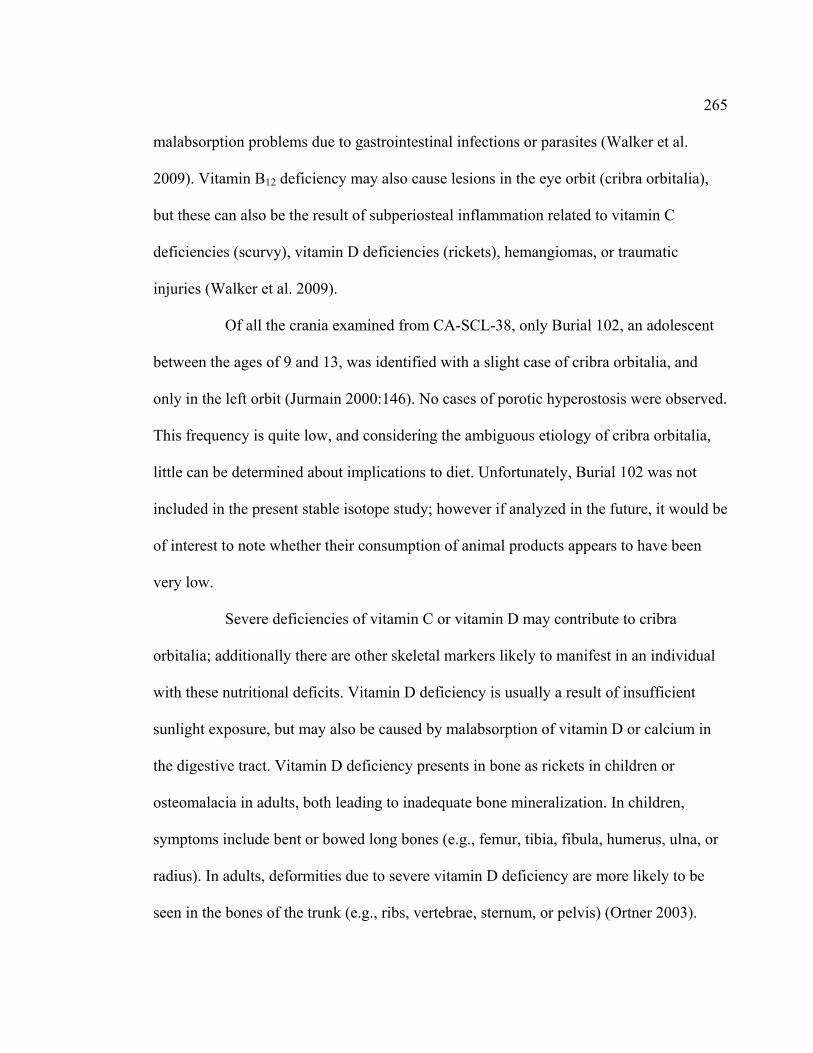
265
malabsorption problems due to gastrointestinal infections or parasites (Walker et al.
2009). Vitamin B12 deficiency may also cause lesions in the eye orbit (cribra orbitalia),
but these can also be the result of subperiosteal inflammation related to vitamin C
deficiencies (scurvy), vitamin D deficiencies (rickets), hemangiomas, or traumatic
injuries (Walker et al. 2009).
Of all the crania examined from CA-SCL-38, only Burial 102, an adolescent
between the ages of 9 and 13, was identified with a slight case of cribra orbitalia, and
only in the left orbit (Jurmain 2000:146). No cases of porotic hyperostosis were observed.
This frequency is quite low, and considering the ambiguous etiology of cribra orbitalia,
little can be determined about implications to diet. Unfortunately, Burial 102 was not
included in the present stable isotope study; however if analyzed in the future, it would be
of interest to note whether their consumption of animal products appears to have been
very low.
Severe deficiencies of vitamin C or vitamin D may contribute to cribra
orbitalia; additionally there are other skeletal markers likely to manifest in an individual
with these nutritional deficits. Vitamin D deficiency is usually a result of insufficient
sunlight exposure, but may also be caused by malabsorption of vitamin D or calcium in
the digestive tract. Vitamin D deficiency presents in bone as rickets in children or
osteomalacia in adults, both leading to inadequate bone mineralization. In children,
symptoms include bent or bowed long bones (e.g., femur, tibia, fibula, humerus, ulna, or
radius). In adults, deformities due to severe vitamin D deficiency are more likely to be
seen in the bones of the trunk (e.g., ribs, vertebrae, sternum, or pelvis) (Ortner 2003).
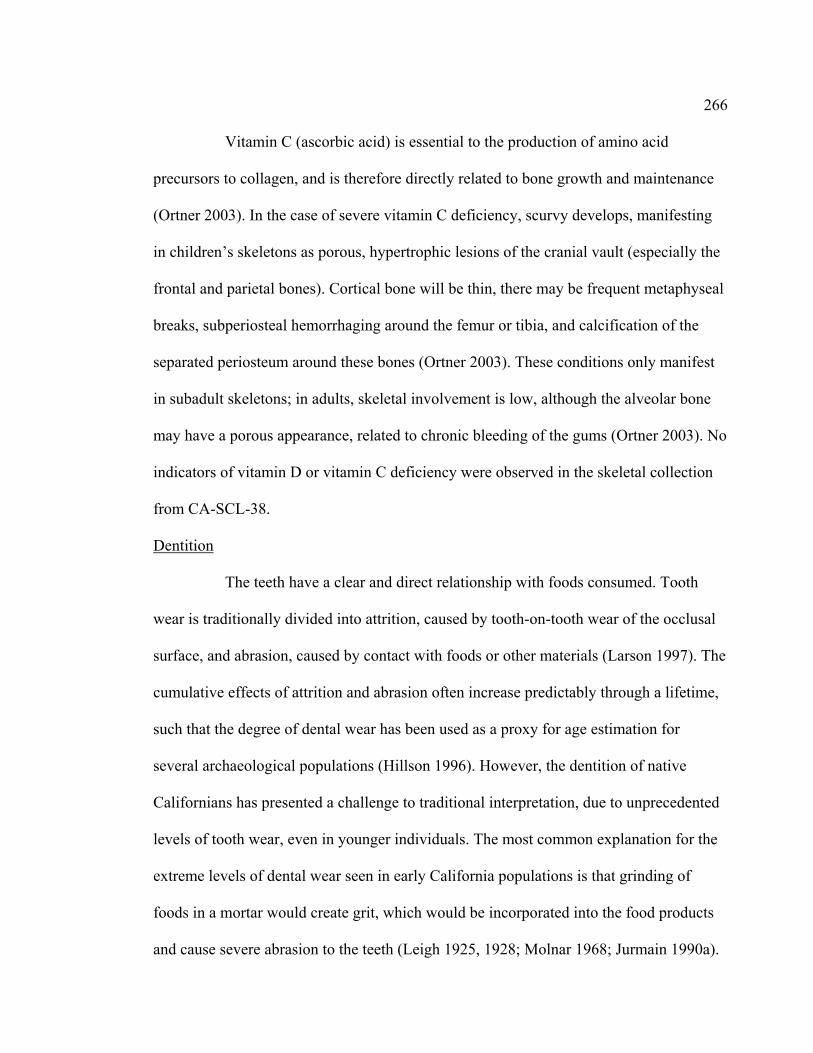
266
Vitamin C (ascorbic acid) is essential to the production of amino acid
precursors to collagen, and is therefore directly related to bone growth and maintenance
(Ortner 2003). In the case of severe vitamin C deficiency, scurvy develops, manifesting
in children’s skeletons as porous, hypertrophic lesions of the cranial vault (especially the
frontal and parietal bones). Cortical bone will be thin, there may be frequent metaphyseal
breaks, subperiosteal hemorrhaging around the femur or tibia, and calcification of the
separated periosteum around these bones (Ortner 2003). These conditions only manifest
in subadult skeletons; in adults, skeletal involvement is low, although the alveolar bone
may have a porous appearance, related to chronic bleeding of the gums (Ortner 2003). No
indicators of vitamin D or vitamin C deficiency were observed in the skeletal collection
from CA-SCL-38.
Dentition
The teeth have a clear and direct relationship with foods consumed. Tooth
wear is traditionally divided into attrition, caused by tooth-on-tooth wear of the occlusal
surface, and abrasion, caused by contact with foods or other materials (Larson 1997). The
cumulative effects of attrition and abrasion often increase predictably through a lifetime,
such that the degree of dental wear has been used as a proxy for age estimation for
several archaeological populations (Hillson 1996). However, the dentition of native
Californians has presented a challenge to traditional interpretation, due to unprecedented
levels of tooth wear, even in younger individuals. The most common explanation for the
extreme levels of dental wear seen in early California populations is that grinding of
foods in a mortar would create grit, which would be incorporated into the food products
and cause severe abrasion to the teeth (Leigh 1925, 1928; Molnar 1968; Jurmain 1990a).
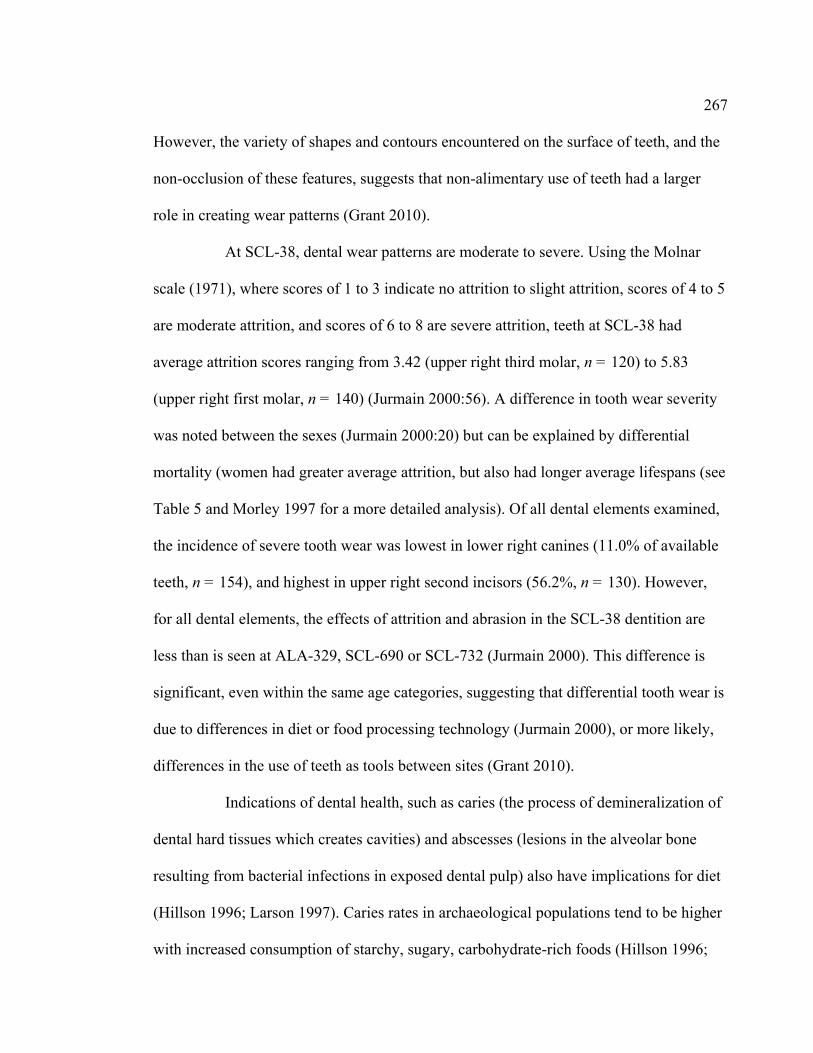
267
However, the variety of shapes and contours encountered on the surface of teeth, and the
non-occlusion of these features, suggests that non-alimentary use of teeth had a larger
role in creating wear patterns (Grant 2010).
At SCL-38, dental wear patterns are moderate to severe. Using the Molnar
scale (1971), where scores of 1 to 3 indicate no attrition to slight attrition, scores of 4 to 5
are moderate attrition, and scores of 6 to 8 are severe attrition, teeth at SCL-38 had
average attrition scores ranging from 3.42 (upper right third molar, n = 120) to 5.83
(upper right first molar, n = 140) (Jurmain 2000:56). A difference in tooth wear severity
was noted between the sexes (Jurmain 2000:20) but can be explained by differential
mortality (women had greater average attrition, but also had longer average lifespans (see
Table 5 and Morley 1997 for a more detailed analysis). Of all dental elements examined,
the incidence of severe tooth wear was lowest in lower right canines (11.0% of available
teeth, n = 154), and highest in upper right second incisors (56.2%, n = 130). However,
for all dental elements, the effects of attrition and abrasion in the SCL-38 dentition are
less than is seen at ALA-329, SCL-690 or SCL-732 (Jurmain 2000). This difference is
significant, even within the same age categories, suggesting that differential tooth wear is
due to differences in diet or food processing technology (Jurmain 2000), or more likely,
differences in the use of teeth as tools between sites (Grant 2010).
Indications of dental health, such as caries (the process of demineralization of
dental hard tissues which creates cavities) and abscesses (lesions in the alveolar bone
resulting from bacterial infections in exposed dental pulp) also have implications for diet
(Hillson 1996; Larson 1997). Caries rates in archaeological populations tend to be higher
with increased consumption of starchy, sugary, carbohydrate-rich foods (Hillson 1996;

268
Kolpan 2010), and slightly lower with consumption of marine foods, which inhibit the
caries process by raising pH within the mouth (Delgado-Darias et al. 2005; Littleton and
Frohlich 1992). Inflammation of the periodontal tissues may occur when bacteria or their
toxins enter exposed dental pulp through carious lesions or fractured teeth, ultimately
resulting in acute periapical abscesses (Hillson 1996). Thus, frequency of abscesses has a
similar relationship to diet as frequency of caries.
At SCL-38, caries rates were relatively low, with an overall incidence rate of
only 1.2 percent when both upper and lower teeth are considered (Jurmain 2000:25). This
figure is comparable to the rate seen at ALA-329, slightly less than at SCL-690 (2.3%)
and slightly higher than SCL-732 (0.9%) (Jurmain 2000:25). Rates of abscesses observed
at SCL-38 were higher, with a maxillary frequency of 9.1 percent and mandibular
frequency of 4.2 percent (Jurmain 2000:22). Overall presence of abscesses at SCL-38
was similar to ALA-329 for individuals under 30 years of age, but was higher for older
individuals, a result that Jurmain suspects to be interobserver error rather than a
meaningful difference in dental health (Jurmain 2000:24). Based on these data, it can be
surmised that the diet of individuals from SCL-38 was typical of sites in the region. A
more detailed review of dental traits at SCL-38 might be illuminating, considering
differences in sex, age, and change through time, however this exceeds the scope of the
current study.
Summary: Bioarchaeology
Overall, bioarchaeological data from CA-SCL-38 suggest that individuals
interred there consumed a healthy and diverse diet. Only one individual was observed
with evidence of a possible dietary deficiency (B102 with slight, unilateral cribra
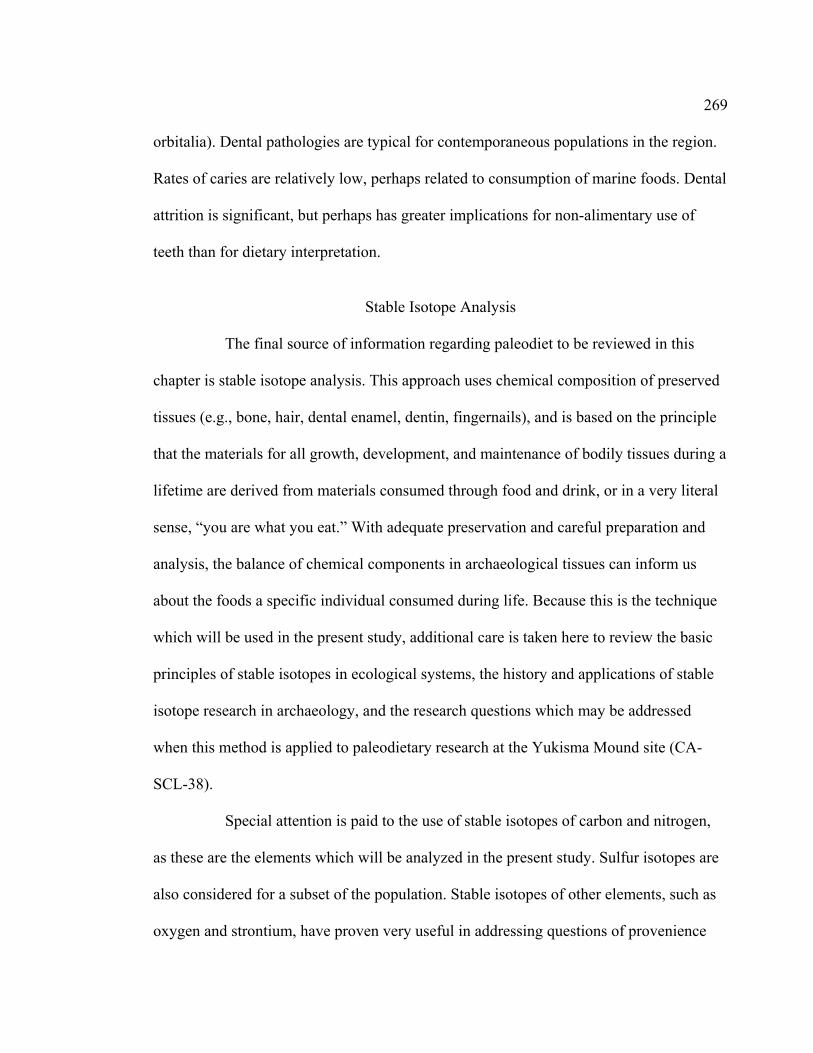
269
orbitalia). Dental pathologies are typical for contemporaneous populations in the region.
Rates of caries are relatively low, perhaps related to consumption of marine foods. Dental
attrition is significant, but perhaps has greater implications for non-alimentary use of
teeth than for dietary interpretation.
Stable Isotope Analysis
The final source of information regarding paleodiet to be reviewed in this
chapter is stable isotope analysis. This approach uses chemical composition of preserved
tissues (e.g., bone, hair, dental enamel, dentin, fingernails), and is based on the principle
that the materials for all growth, development, and maintenance of bodily tissues during a
lifetime are derived from materials consumed through food and drink, or in a very literal
sense, “you are what you eat.” With adequate preservation and careful preparation and
analysis, the balance of chemical components in archaeological tissues can inform us
about the foods a specific individual consumed during life. Because this is the technique
which will be used in the present study, additional care is taken here to review the basic
principles of stable isotopes in ecological systems, the history and applications of stable
isotope research in archaeology, and the research questions which may be addressed
when this method is applied to paleodietary research at the Yukisma Mound site (CA-
SCL-38).
Special attention is paid to the use of stable isotopes of carbon and nitrogen,
as these are the elements which will be analyzed in the present study. Sulfur isotopes are
also considered for a subset of the population. Stable isotopes of other elements, such as
oxygen and strontium, have proven very useful in addressing questions of provenience

270
and migration (e.g., Jorgenson et al 2009; Knudson and Price 2007), but will not be
considered in this thesis. Sulfur isotopes also tie people to places and can also be used for
paleodietary interpretation, particularly when freshwater or marine resources are included
in the diet and where previous sulfur isotope studies have provided a baseline for
comparison (e.g., Nehlich et al. 2010, 2011, 2012; Richards et al. 2001, 2003). Because
this baseline is not yet available for Central California, sulfur will be used here to
establish provenience rather than diet. The literature supporting sulfur isotope analysis is
presented in Materials and Methods, Chapter VII. Strontium analysis is not possible for
this population, as this isotope is most reliably sourced from teeth and all dentition from
SCL-38 individuals was repatriated and is no longer available for research.
Basic Principles of Stable Isotopes
All matter is made up of atoms, tiny conglomerates of even smaller particles
with distinct characteristics. In the center of each atom is the nucleus, composed of
protons and neutrons. The number of protons defines an element: for example, all carbon
atoms have six protons, all nitrogen atoms have seven, and all oxygen atoms have eight.
The number of neutrons in the nucleus can vary, however. It is this variation that results
in isotopes. Orbiting the nucleus are electrons, negatively charged particles which
balance the positive charge of the protons. If the number of electrons does not equal the
number of protons, the particle behaves as an ion, affecting reactions with other
materials.
The two elements which will be considered in the present dietary study are
carbon and nitrogen. Most carbon on earth (98.93%) has six neutrons and six protons in
the nucleus (Lide 2003). Adding the protons and neutrons, the name of this isotope is
271
carbon-12 (12C). Two other naturally occurring isotopes of carbon are present in all
things, but in lesser abundance. Carbon-13 (13C) has one additional neutron and
comprises 1.07 percent of carbon atoms on earth. Carbon-14 (14C) has two additional
neutrons and comprises less than 0.01 percent of all carbon on earth (only one part in 1012
relative to 12C) (Bowman 1990:34). Of these, 14C is unstable, is classified as a
radioisotope, and slowly decays to a stable state, becoming 14N at the rate of half the 14C
particles in any sample every 5,730 years (Bowman 1990). In contrast, 13C is a stable
isotope and does not decay. Nitrogen has two stable isotopes, 14N, the most common
form (99.632%), and 15N (0.368%), which is less abundant but still ubiquitous (Lide
2003).
All isotopes of carbon and nitrogen are present in biological systems, forming
the building blocks of plant and animal tissues. Heavier isotopes behave similarly to
lighter isotopes, however the additional neutrons give these atoms a slightly greater mass,
which increases the strength of their chemical bonds and slows the rates of chemical
reactions, relative to lighter isotopes. Consequently, heavier isotopes may be retained in
plant or animal tissues in different proportions than those originally ingested, a
phenomenon known as fractionation (Katzenberg 2008).
While global proportions of these stable isotopes are known, proportions
within living things are variable, depending on isotopic composition of materials
consumed, fractionation effects, photosynthetic pathways of plants in the food web,
trophic level of foods consumed, and other factors. Proportions of heavy to light isotopes
in a sample are reported by comparing the observed ratio to that in a known international
standard, and then multiplying the result by 1,000. The result is written as a delta value
272
(δ), and reported in permil (‰). In the following example, R represents the ratio of the
heavier isotope to the lighter isotope (e.g., 13C/12C or 15N/14N).
δ = [(RSample / RStandard) – 1] * 1000
In the case of carbon, the National Bureau of Standards and the International
Atomic Energy Agency in Vienna provide an international reference standard of Peedee
Belemnite (PDB). This standard uses the ratio of 13C/12C found in a Cretaceous belemnite
fossil formation off the coast of South Carolina, which was significantly enriched in 13C.
The standard, by definition, has a delta value of zero (δ13C = 0.0‰). Consequently, most
measured values from ecological systems are more depleted and yield negative values
(e.g., a δ13C value of -20.0 ‰ would indicate that the heavy isotope of carbon in the test
sample is depleted by 20 permil relative to the standard). The original source of PDB has
been entirely used for research purposes, and is now replicated as Vienna PDB (VPDB),
with the same δ13C value.
The international standard for stable isotopes of nitrogen is the ratio of
15N/14N present in atmospheric nitrogen gas (N2), officially known as AIR (the Ambient
Inhalable Reservoir). This standard also has a delta value set at 0.0‰, by definition, but
nitrogen gas in air is depleted in the heavy isotope relative to most biological systems.
Therefore, most measured values will be positive (e.g., a sample with a δ15N value of
8.4‰ is enriched in the heavy isotope by 8.4 permil, relative to the standard).
Stable Carbon Isotopes in Biological Systems
Carbon is the central element in biological systems, and is present in all living
things. In terrestrial systems, plants obtain carbon from carbon dioxide gas (CO2)
273
ingested during photosynthesis. In marine systems, phytoplankton obtain most of their
carbon from dissolved CO2 gas in seawater, while other marine plants obtain carbon
primarily from dissolved carbonates (compounds including the HCO3⎯ ion), sourced from
decomposed biological hard tissues (e.g., from mollusk or crustacean shells and fish
bones), as well as geological sources (e.g., weathered carbonate rocks, such as limestone)
(Fry 2006; Sharp 2007). Additionally, carbon from decomposed terrestrial plant material
is introduced to the marine environment at river deltas (Tan 1989). The metabolic
pathways involved in plant photosynthesis introduce various fractionation factors,
influencing the isotopic ratio of carbon that will be retained in the plant tissues.
During photosynthesis, CO2 passes through stomata (pores) in the epidermis
of the plant, and then dissolves into the cellular fluid. Plants also require water for this
process, and produce oxygen and sugar. The simplified chemical equation for
photosynthesis is presented below:
6 CO2 + 12 H2O C6H12O6 + 6 H2O + 6 O2
For ninety percent of plants, the next step is for the dissolved CO2 molecules
to diffuse into the chloroplasts (organelles within plant cells) where carboxylation occurs,
a process which reduces (adds an H+ to) each CO2 molecule and bonds it with a 5-carbon
sugar called ribulose biphosphate (RuBP), briefly forming a 6-carbon molecule which
splits to become two 3-carbon phosphoglyceric acid (PGA) molecules. These are then
reduced to phosphoglyceraldehyde (PGAL). Some PGAL molecules later form 6-carbon
sugars, becoming carbohydrate energy for the plant and its consumers (O’Leary 1981,
1988; Sharp 2007; Smith 1986). This photosynthetic process is called the Calvin-Benson
pathway, and plants which use it exclusively are known as C3 plants because of the 3-

274
carbon PGAL molecule produced following carboxylation. For these plants,
carboxylation is the limiting step, resulting in the greatest discrimination against the
heavier carbon isotope. Plants using the C3 pathway are depleted 13C and tend to have
very negative δ13C values, typically between -29.0 permil and -25.0 permil (O’Leary
1981, 1988).
Some important food plants, including corn (maize), sorghum, millet, and
sugar cane, incorporate an additional step in their photosynthetic pathway to optimize
energy production and minimize dehydration in hot climates. The Hatch-Slack, or C4
pathway, fixes carbon from CO2 rapidly by combining it with phosphoenolpyruvate
(PEP), to form the 4-carbon compounds malate and aspartate (Smith 1986). These
compounds later donate their carbon to RuBP, and follow the same path to create sugars
as was seen in C3 plants. However, the preliminary step of forming 4-carbon compounds
fixes carbon so efficiently that there is less discrimination against 13C and less need for
plants to leave their stomata open to collect CO2, which reduces the risk of dehydration.
Plants which use a C4 pathway have less negative δ13C values than C3
plants, typically
between -16.0 permil and -12.0 permil (O’Leary 1981, 1988). C4 plants include only
about 0.4 percent of angiosperms (seed bearing, flowering plants), but make up 18
percent of plant global productivity (Sharp 2007).
Cacti and other succulent plants use the crassulacean acid metabolism (CAM)
photosynthetic pathway, which combines features of both the C3 and C4
pathways. In
conditions where water is scarce, CAM plants open their stomata to collect CO2 only at
night, fix the carbon in a preliminary step as malate (a 4-carbon compound), and later
donate their carbon to RuBP to produce PGA, and eventually sugar (Smith 1986). If

275
water rationing is not necessary, CAM plants also have the ability to follow a more
energy efficient C3-type pathway, fixing carbon directly from CO2 without the
preliminary 4-carbon molecule step. Because of the flexibility of the crassulacean acid
metabolism, CAM plants may have δ13C values ranging from -10.0 permil in very arid
conditions to -20.0 permil when conditions are more temperate (O’Leary 1981, 1988).
Although most aquatic plants use a metabolism similar to C3 plants, the
diffusion rate of CO2 in water is much slower than that in air, making diffusion the
limiting step, and reducing discrimination against 13C (O’Leary 1988). Additionally,
stable carbon isotope ratios in dissolved CO2 in seawater are enriched by about 9.0 permil
over those in atmospheric CO2, due to enrichment from marine bicarbonates and
chemical fractionation effects as atmospheric CO2 is exchanged with the ocean’s surface
(Fry 2006). Typical δ13C values of marine plants vary by type and are influenced by
water temperature. Values for algae range from -22.0 permil to -10.0 permil, plankton
from -31.0 permil to -18.0 permil, and kelp from -20.0 permil to -10.0 permil, with an
overall average for marine plants of -20.0 permil (Sharp 2007). In riparian systems, the
rate of water flow also influences fractionation rates. In fast flowing streams, a greater
availability of dissolved CO2 leads to less fractionation and less negative δ13C values.
Slower streams hold less dissolved CO2, leading to more fractionation and more negative
δ13C values (O’Leary 1988). A summary of typical δ13C values in terrestrial and marine
plants is presented in Figure 29.
The isotopic ratio of carbon in plant tissues is passed along through an
ecosystem from consumer to consumer, as animals eat plants and are then subsequently
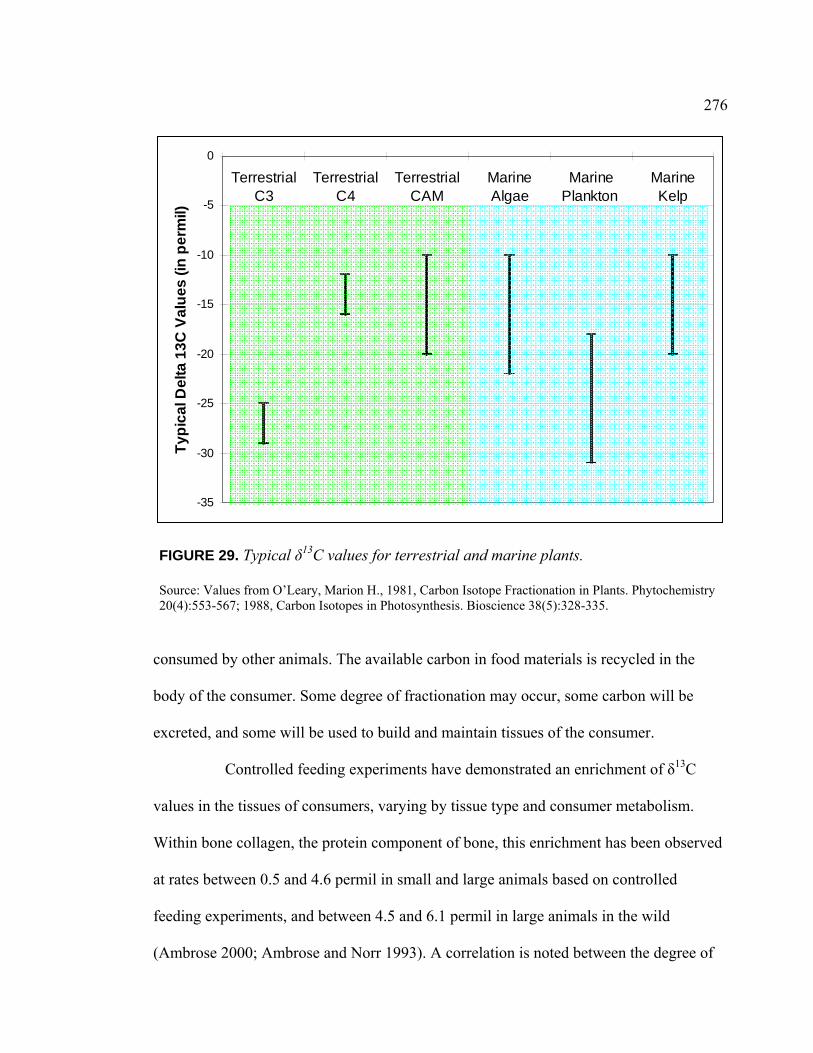
276
-35
-30
-25
-20
-15
-10
-5
0
TerrestrialC3
TerrestrialC4
TerrestrialCAM
MarineAlgae
MarinePlankton
MarineKelp
Ty
pic
al D
elt
a 1
3C
Va
lue
s (i
n p
erm
il)
FIGURE 29. Typical δ13C values for terrestrial and marine plants. Source: Values from O’Leary, Marion H., 1981, Carbon Isotope Fractionation in Plants. Phytochemistry 20(4):553-567; 1988, Carbon Isotopes in Photosynthesis. Bioscience 38(5):328-335.
consumed by other animals. The available carbon in food materials is recycled in the
body of the consumer. Some degree of fractionation may occur, some carbon will be
excreted, and some will be used to build and maintain tissues of the consumer.
Controlled feeding experiments have demonstrated an enrichment of δ13C
values in the tissues of consumers, varying by tissue type and consumer metabolism.
Within bone collagen, the protein component of bone, this enrichment has been observed
at rates between 0.5 and 4.6 permil in small and large animals based on controlled
feeding experiments, and between 4.5 and 6.1 permil in large animals in the wild
(Ambrose 2000; Ambrose and Norr 1993). A correlation is noted between the degree of

277
enrichment and body size of the consumer (Ambrose and Norr 1993). However, little to
no enrichment is seen between animal trophic levels (e.g., in carnivores eating the flesh
of herbivores) (Ambrose and Norr 1993). In humans, δ13C values in bone collagen are
enriched by an average of approximately 5.0 permil over diet (Ambrose and Norr 1993;
Tieszen and Fagre 1993; van der Merwe and Vogel 1978).
Carbon in Different Fractions of Bone
Based on the results of controlled feeding experiments with animals, it has
been determined that essential amino acids in dietary protein are preferentially routed to
build new proteins, such as bone collagen (Ambrose 2000; Ambrose and Norr 1993;
DeNiro and Epstein 1978; Lee-Thorp et al. 1989; Tieszen and Fagre 1993). Accordingly,
the carbon found in bone collagen has been found to correlate most closely with the
protein component of the diet (Ambrose and Norr 1993; Hedges 2003; Tieszen and Fagre
1993).
The mineral component of bone is hydroxyapatite (also called apatite or
bioapatite), made up of a crystalline lattice of calcium phosphate, Ca10(PO4)6(OH)2.
Although no carbon is apparent, carbon is incorporated into bioapatite when dissolved
carbonate ions (CO3-2) in blood substitute for phosphate ions (PO4
-3). This carbonate may
be derived from any component of diet (protein, carbohydrates, or lipids), making carbon
in apatite a more complete indicator of whole diet (Ambrose and Norr 1993; Hedges
2003; Tieszen and Fagre 1993). The ratio of carbon isotopes found in human bone apatite
is enriched by approximately 9.4 permil over carbon in the complete diet (Ambrose and
Norr 1993; Tieszen and Fagre 1993).
278
The difference in nutritional source material for carbon in bone collagen and
bone apatite has been shown to be an important tool in interpreting dietary composition, a
metric known as apatite-collagen spacing (Ambrose and Norr 1993; Tieszen and Fagre
1993). If both protein and whole diet foods come from terrestrial environments where no
C4 plants are available, it would be expected that the difference in δ13C values between
bone apatite and bone collagen would be approximately 4.4 permil, as shown below:
When: δ13CComplete diet = δ13CDietary protein,
(δ13CComplete diet + 9.4‰Apatite offset) - (δ13CDietary protein + 5.0‰Collagen offset) = 4.4‰
If protein, however, comes from a source that is relatively enriched in 13C,
such as marine foods, the spacing between apatite and collagen will be less than 4.4
permil. If complete diet were very high in C3 carbohydrates and depleted in proteins, the
spacing between apatite and collagen values would be greater than 4.4 permil. Influence
of C4 plants in the complete diet or consumption of C4 plants by protein resources can
also affect the apatite-collagen spacing if C4 contributions are disproportionate between
nutritional sources.
Additional models to evaluate dietary composition using carbon isotope
values of bone collagen and apatite have been proposed by Kellner and Schoeninger
(2007), later joined by Froehle (Froehle et al. 2010, 2012). The primary goal of these
models is to differentiate terrestrial C3 diets from those including terrestrial C4 foods or
marine foods, with progressively complex approaches focused on discriminating between
similar marine and C4 signatures. Because C4 foods are not a factor in pre-contact
Californian diets, a modified version of the 2010 model will be used in the present study,
along with the traditional collagen-apatite spacing approach (see Results in Chapter VIII).
279
In summary, carbon isotope ratios in human bone collagen and apatite will
vary based on food source environment (marine/terrestrial), plant metabolism,
fractionation within the body, and tissues analyzed. Within the ecosystems of pre-contact
California, no important C4 plant resources have been identified, so carbon isotope values
primarily inform about the relative dietary contributions of terrestrial and marine foods.
Stable Nitrogen Isotopes in Biological Systems
Nitrogen is a key component of amino acids, which are the building blocks of
proteins, and like carbon, is passed from plants to consumers within a food web. Seventy-
nine percent of the earth’s atmosphere is composed of nitrogen gas (N2), however this
source of nitrogen is biologically unavailable to most organisms (Smith 1986). Those
plants which use symbiotic relationships with bacteria or fungi to fix nitrogen from
atmospheric N2 (e.g., legumes and lichens), or from dissolved N2 in sea or fresh water
(e.g., blue-green algae), have δ15N values close to 0.0 permil, similar to air. All other
plants obtain nitrogen through their roots as dissolved byproducts of decomposition, such
as compounds containing ammonium (NH4+) or nitrate (NO3
-) ions (Sharp 2007).
Nitrogen obtained through these indirect pathways is slightly enriched in the heavier
isotope; therefore, terrestrial plants generally have δ15N values greater than 0.0 permil
(Pate 1994).
As nitrogen passes through trophic levels of an ecosystem, fractionation
causes enrichment of the heavy isotope within the tissues of consumers. Bada and
colleagues (1989) explained that the digestion of consumed proteins involves peptide
bond hydrolysis, which would preferentially leave more of the heavy isotope of nitrogen
280
to be incorporated into tissues, but would not discriminate significantly between carbon
isotopes. Controlled feeding tests on small animals confirmed a step-wise enrichment of
approximately 3 permil between dietary δ15N values and δ15N values in bone collagen of
consumers (DeNiro and Epstein 1981; DeNiro and Schoeniger 1983). In herbivores, δ15N
values in bone collagen are approximately three permil greater than in the plant resources
they consume, and collagen in carnivores is enriched by an additional three permil over
their food resources (Minagawa and Wada 1984; Schoeninger and DeNiro 1984). A
review of over 100 studies of mammalian and avian δ15N values by Jeffrey Kelly (2000)
supported the expected pattern of 15N enrichment by trophic level, regardless of other
sources of variation in isotope values (e.g., body size, habitat, climate, or geographical
location). This step-wise trophic level enrichment is particularly evident in marine
ecosystems, where a longer food chain produces even greater δ15N values in top
consumers (Schoeninger and DeNiro 1984; Schoeninger et al. 1983). Freshwater
resources are somewhat more variable, and values similar to terrestrial carnivores have
been observed in carnivorous freshwater fish (Schoeninger and DeNiro 1984). Studies of
lacustrine resources have demonstrated that considerable variability in δ15N values of the
tissues of lake fish may exist, even for fish of the same species from nearby lakes
(Dufour et al. 1999).
Environment also affects both δ15N values in soils and fractionation within the
tissues of consumers. Saline soils in desert and coastal environments are enriched in 15N,
and higher δ15N values are absorbed by non-nitrogen-fixing plants in these regions
(Ambrose 1991; Heaton 1987). In xeric environments, higher temperatures may lead to
volatilization of ammonia in soils, and due to their lighter atomic weights, compounds
281
containing 14N are more likely to be vaporized than those containing the heavier isotope
(Schwarcz et al. 1999). Plants growing in soils which are enriched in 15N incorporate
these higher δ15N values into their tissues and pass them along to their consumers, where
additional fractionation occurs. While the mechanism is not clearly understood, animals
living in conditions of water and heat stress have been observed to excrete urea (in urine)
which is significantly depleted in 15N relative to diet, leaving a greater-than-usual
proportion of the heavy isotope behind to be incorporated into their tissues (Ambrose
1991). Use of animal fertilizers for crops can further increase soil δ15N values by adding
nitrogen to the soil. Although depleted in the heavier isotope relative to the values
retained in animal tissues, the additional urea in fertilized soil is converted to ammonia,
which is then subject to volatilization, with the end result of increased soil δ15N values
(Schwarcz et al. 1999). Isotopic studies of archaeological populations from the coast of
southern Peru have found average δ15N values in human bone collagen as high as 20.94
permil, due to combined factors of dry environments, consumption of marine foods, and
the use of guano fertilizer (Tomczak 2003). Because so many variables may affect δ15N
values in the food chain, and ultimately in human bone collagen, it is essential to
compare measured values in any study to others from similar geological, geographical,
and temporal contexts (c.f. Ambrose 1991; Katzenberg 2008; Wada et al. 1991).
Stable Carbon and Nitrogen Isotope Research in Archaeology
Stable isotopes were discovered in 1919 by Francis W. Aston, who received
the Nobel Prize in Chemistry in 1922 for his pioneering work (Fry 2006). However, it
wasn’t until about fifty years later that the nuances of isotopic flow through ecosystems

282
were explored (e.g., Fry et al. 1978). As the isotopic relationships between consumers
and foods were revealed, the utility of stable isotopes for paleodietary analysis was
recognized by biologist Johannes Vogel and archaeologist Nikolaas J. van der Merwe in
two pioneering publications (Vogel and van der Merwe 1977; van der Merwe and Vogel
1978). In these, they examined the δ13C values of human bone collagen from four
archaeological sites in New York State, and ten sites in Illinois, Ohio, and West Virginia,
successfully identifying the introduction of maize (a C4 plant) into the diet, based on
relatively enriched δ13C values.
The use of bioapatite in archaeological isotope research was initially
controversial, due to questions about whether diagenetic contamination or processing
methods threatened the integrity of isotopic results (Schoeninger and DeNiro 1982, 1983;
Sullivan and Krueger 1981, 1983). Chemical changes or contamination may occur within
a bone after deposition, altering the isotopic values which would have been present
during life. Additionally, processing methods in the laboratory can introduce new sources
of carbon or nitrogen, potentially changing the structure and composition of samples.
However, with the establishment of preparation methods to remove diagenetic
contamination (Garvie-Lok et al. 2004; Hedges and Millard 1995; Koch et al. 1997;
Nielsen-Marsh and Hedges 2000a, 2000b; Wang and Cerling 1994), the introduction of
reliable tests of sample integrity (Beasley 2008; Garvie-Lok et al. 2004; Shemesh 1990;
Surovell and Stiner 2001; Termine and Posner 1966; Wright and Schwarcz 1996), and
additional feeding studies to understand the relationships between dietary composition
and the δ13C values of bone collagen and apatite (Ambrose and Norr 1993), the analysis
of bone apatite is now an accepted source of paleodietary information. One of the earliest
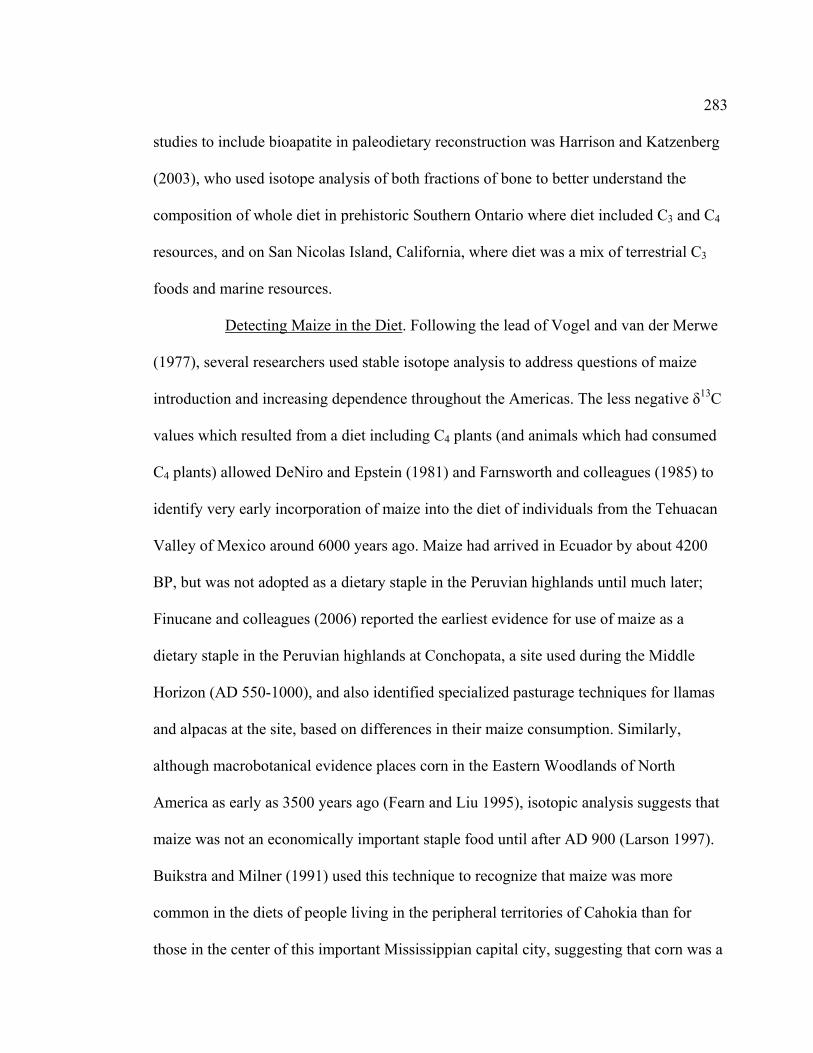
283
studies to include bioapatite in paleodietary reconstruction was Harrison and Katzenberg
(2003), who used isotope analysis of both fractions of bone to better understand the
composition of whole diet in prehistoric Southern Ontario where diet included C3 and C4
resources, and on San Nicolas Island, California, where diet was a mix of terrestrial C3
foods and marine resources.
Detecting Maize in the Diet. Following the lead of Vogel and van der Merwe
(1977), several researchers used stable isotope analysis to address questions of maize
introduction and increasing dependence throughout the Americas. The less negative δ13C
values which resulted from a diet including C4 plants (and animals which had consumed
C4 plants) allowed DeNiro and Epstein (1981) and Farnsworth and colleagues (1985) to
identify very early incorporation of maize into the diet of individuals from the Tehuacan
Valley of Mexico around 6000 years ago. Maize had arrived in Ecuador by about 4200
BP, but was not adopted as a dietary staple in the Peruvian highlands until much later;
Finucane and colleagues (2006) reported the earliest evidence for use of maize as a
dietary staple in the Peruvian highlands at Conchopata, a site used during the Middle
Horizon (AD 550-1000), and also identified specialized pasturage techniques for llamas
and alpacas at the site, based on differences in their maize consumption. Similarly,
although macrobotanical evidence places corn in the Eastern Woodlands of North
America as early as 3500 years ago (Fearn and Liu 1995), isotopic analysis suggests that
maize was not an economically important staple food until after AD 900 (Larson 1997).
Buikstra and Milner (1991) used this technique to recognize that maize was more
common in the diets of people living in the peripheral territories of Cahokia than for
those in the center of this important Mississippian capital city, suggesting that corn was a
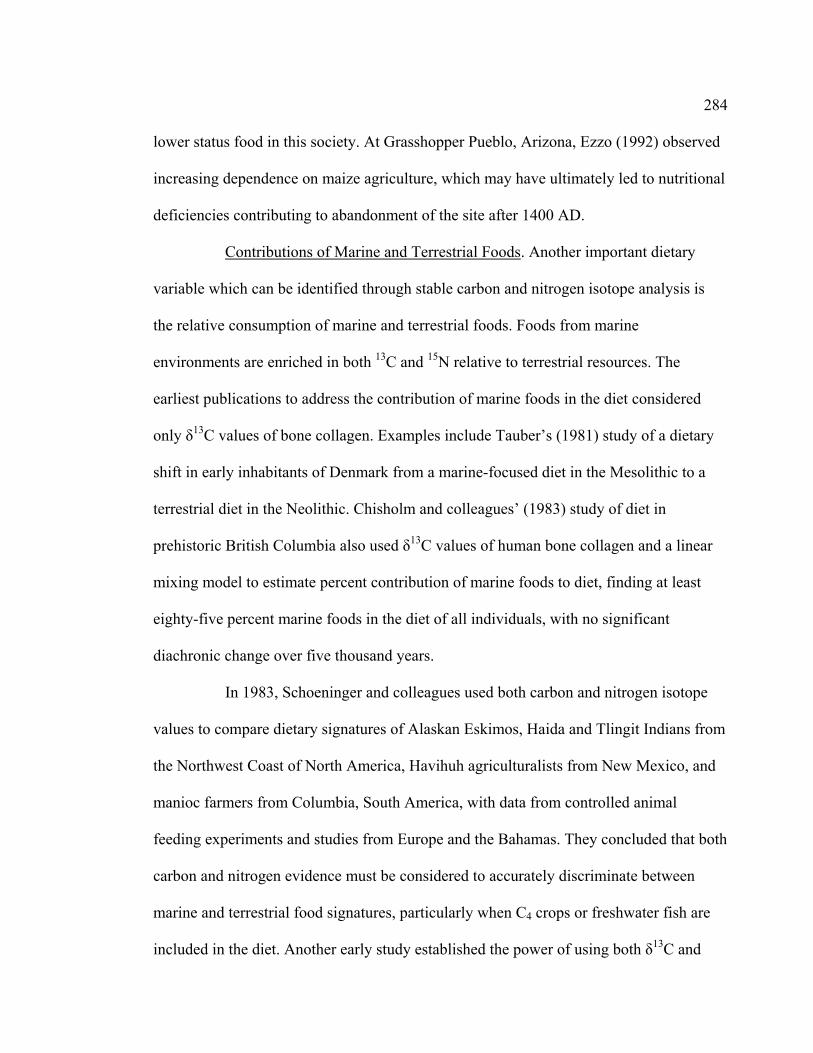
284
lower status food in this society. At Grasshopper Pueblo, Arizona, Ezzo (1992) observed
increasing dependence on maize agriculture, which may have ultimately led to nutritional
deficiencies contributing to abandonment of the site after 1400 AD.
Contributions of Marine and Terrestrial Foods. Another important dietary
variable which can be identified through stable carbon and nitrogen isotope analysis is
the relative consumption of marine and terrestrial foods. Foods from marine
environments are enriched in both 13C and 15N relative to terrestrial resources. The
earliest publications to address the contribution of marine foods in the diet considered
only δ13C values of bone collagen. Examples include Tauber’s (1981) study of a dietary
shift in early inhabitants of Denmark from a marine-focused diet in the Mesolithic to a
terrestrial diet in the Neolithic. Chisholm and colleagues’ (1983) study of diet in
prehistoric British Columbia also used δ13C values of human bone collagen and a linear
mixing model to estimate percent contribution of marine foods to diet, finding at least
eighty-five percent marine foods in the diet of all individuals, with no significant
diachronic change over five thousand years.
In 1983, Schoeninger and colleagues used both carbon and nitrogen isotope
values to compare dietary signatures of Alaskan Eskimos, Haida and Tlingit Indians from
the Northwest Coast of North America, Havihuh agriculturalists from New Mexico, and
manioc farmers from Columbia, South America, with data from controlled animal
feeding experiments and studies from Europe and the Bahamas. They concluded that both
carbon and nitrogen evidence must be considered to accurately discriminate between
marine and terrestrial food signatures, particularly when C4 crops or freshwater fish are
included in the diet. Another early study established the power of using both δ13C and

285
δ15N values in bone collagen to visualize the nuances of dietary change in the Georgia
Bight of North America, noting the simultaneous reduction of marine foods and increase
in maize agriculture after AD 1150, then a reduction in maize reliance after AD 1300,
and an additional increase in maize consumption during the Mission Period in the
seventeenth century (Larsen et al. 1992).
Several researchers expanded on Tauber’s (1981) study to examine the
nuances of dietary change between the Mesolithic and Neolithic periods in coastal
Europe (e.g., Lubell et al. 1994; Richards and Hedges 1999; Richards et al. 2003),
sparking lively and productive debate about the interpretation of isotopic results (Hedges
2004; Milner et al. 2004). The new stable isotope data, in combination with refined
radiocarbon date calibrations, pointed to a rapid abandonment of marine resources during
the Early Neolithic period in coastal Denmark, England, Portugal, and France, which did
not match the expected pattern based on other archaeological evidence (e.g., Neolithic
period coastal habitation and workshop sites in Denmark). Because of the conflict in
interpretation between isotopic and archaeological data, Milner and colleagues (2004)
challenged the conclusions, questioning the degree of sensitivity to marine contributions
recorded in bone collagen and whether small sample sizes could support population-level
generalizations (Milner et al. 2004). These debates highlight the value of stable isotope
analysis, in that this direct source of evidence can detect nuances of dietary behavior
masked by archaeological interpretations and provide evidence on an individual scale,
which may or may not represent the diet of the local population.
Applying the distinction between marine and terrestrial dietary signatures,
investigators have been able to address such issues as distinguishing regional cultural

286
practices (e.g., Neolithic Baltic seal hunters who did not adopt the agricultural practices
of their neighbors, documented by Eriksson in 2004), or challenging ethnohistorical
suggestions about dietary composition (e.g., coastal populations of Australian Aborigines
who obtained significantly less dietary protein from marine foods than expected,
identified by Hobson and Collier, 1984). Other challenges have included understanding
paleodiet on islands, where consumption of marine resources is sometimes deceptively
low. Ambrose et al. (1997) examined prehistoric diet on three islands in Micronesia,
Rota, Guam, and Saipan, using both bone collagen and apatite. In all cases, average
marine contribution to diet was less than 50 percent, and on Saipan, less than 20 percent.
However, high δ13C values and low δ15N values suggested that either a C4 plant (sugar
cane) or seaweed (a low trophic level marine food) were major components of the diet. In
an earlier study in the Bahamas, Keegan and DeNiro (1988) observed that seagrass and
coral reef environments produce foods enriched in 13C and depleted in 15N, relative to
marine foods from the open ocean.
In southern California, Walker and DeNiro (1986) and Goldberg (1993)
studied diet among the Chumash Indians of the Channel Islands and Santa Barbara
region. Walker and DeNiro (1986) found that Indians living on the islands consumed a
significant amount of marine foods, those living on the coast an intermediate amount, and
those living inland subsisted on primarily terrestrial resources. Considering the
significance of trade among the Chumash and the complex social organization of this
group, the regional specificity of diets is especially interesting. Adding to the regional
distinctions, Goldberg (1993) found that consumption of marine animals increased
through time in the northern Channel Islands, but decreased through time for populations

287
of the southern islands. Similarly, in Baja California, Jerome King (1997) found that diet
in prehistoric coastal and inland populations was composed almost entirely of local
foods, with little contribution from traded goods or seasonal excursions to other
environments.
Detection of Breastfeeding and Weaning Practices. The trophic level
enrichment of δ15N values in the tissues of consumers can also be used to examine
childrearing practices in prehistory, particularly the duration of breastfeeding and age at
weaning. When babies are born, their isotopic body composition is equal to that of their
mothers. With the consumption of breastmilk, babies are functionally a trophic level
above their mothers, and δ15N values in the tissues of breastfeeding infants show
progressive enrichment over the first few months of life. With the introduction of
weaning foods, these levels begin to fall, reaching values comparable to the community
within six months after the complete cessation of breastfeeding (Fuller et al. 2006;
Katzenberg et al. 1996:188).
The earliest isotopic study to address questions of infant weaning was
completed by Fogel and colleagues (1989), who confirmed a 3 permil trophic level
enrichment between modern mothers and their breastfeeding infants through analysis of
fingernail clippings, then applied this method to the analysis of bone collagen in two
prehistoric North American populations. In both archaeological cases, a progressive
enrichment in δ15N values was clear during the first months of life, followed by a drop to
values similar to those at birth around three years of age. Analysis of stable nitrogen
isotopes in human bone has since been used to understand breastfeeding and weaning
practices among archaeological populations from places including Ancient Egypt and
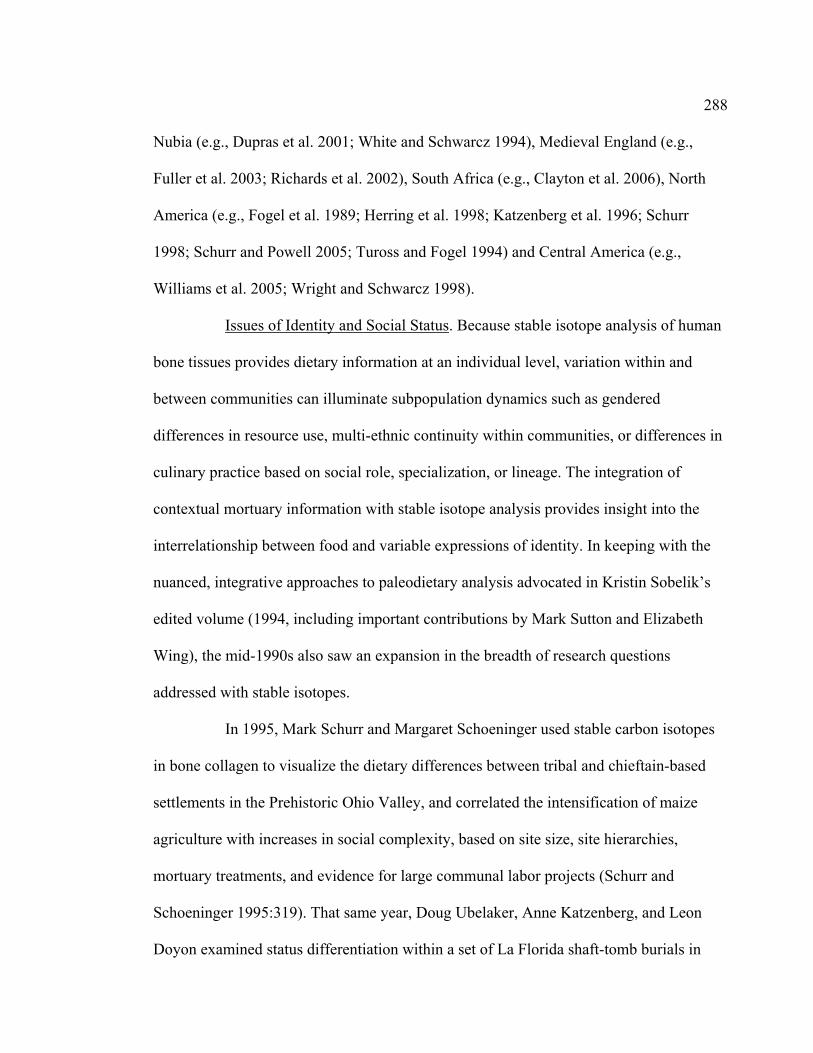
288
Nubia (e.g., Dupras et al. 2001; White and Schwarcz 1994), Medieval England (e.g.,
Fuller et al. 2003; Richards et al. 2002), South Africa (e.g., Clayton et al. 2006), North
America (e.g., Fogel et al. 1989; Herring et al. 1998; Katzenberg et al. 1996; Schurr
1998; Schurr and Powell 2005; Tuross and Fogel 1994) and Central America (e.g.,
Williams et al. 2005; Wright and Schwarcz 1998).
Issues of Identity and Social Status. Because stable isotope analysis of human
bone tissues provides dietary information at an individual level, variation within and
between communities can illuminate subpopulation dynamics such as gendered
differences in resource use, multi-ethnic continuity within communities, or differences in
culinary practice based on social role, specialization, or lineage. The integration of
contextual mortuary information with stable isotope analysis provides insight into the
interrelationship between food and variable expressions of identity. In keeping with the
nuanced, integrative approaches to paleodietary analysis advocated in Kristin Sobelik’s
edited volume (1994, including important contributions by Mark Sutton and Elizabeth
Wing), the mid-1990s also saw an expansion in the breadth of research questions
addressed with stable isotopes.
In 1995, Mark Schurr and Margaret Schoeninger used stable carbon isotopes
in bone collagen to visualize the dietary differences between tribal and chieftain-based
settlements in the Prehistoric Ohio Valley, and correlated the intensification of maize
agriculture with increases in social complexity, based on site size, site hierarchies,
mortuary treatments, and evidence for large communal labor projects (Schurr and
Schoeninger 1995:319). That same year, Doug Ubelaker, Anne Katzenberg, and Leon
Doyon examined status differentiation within a set of La Florida shaft-tomb burials in
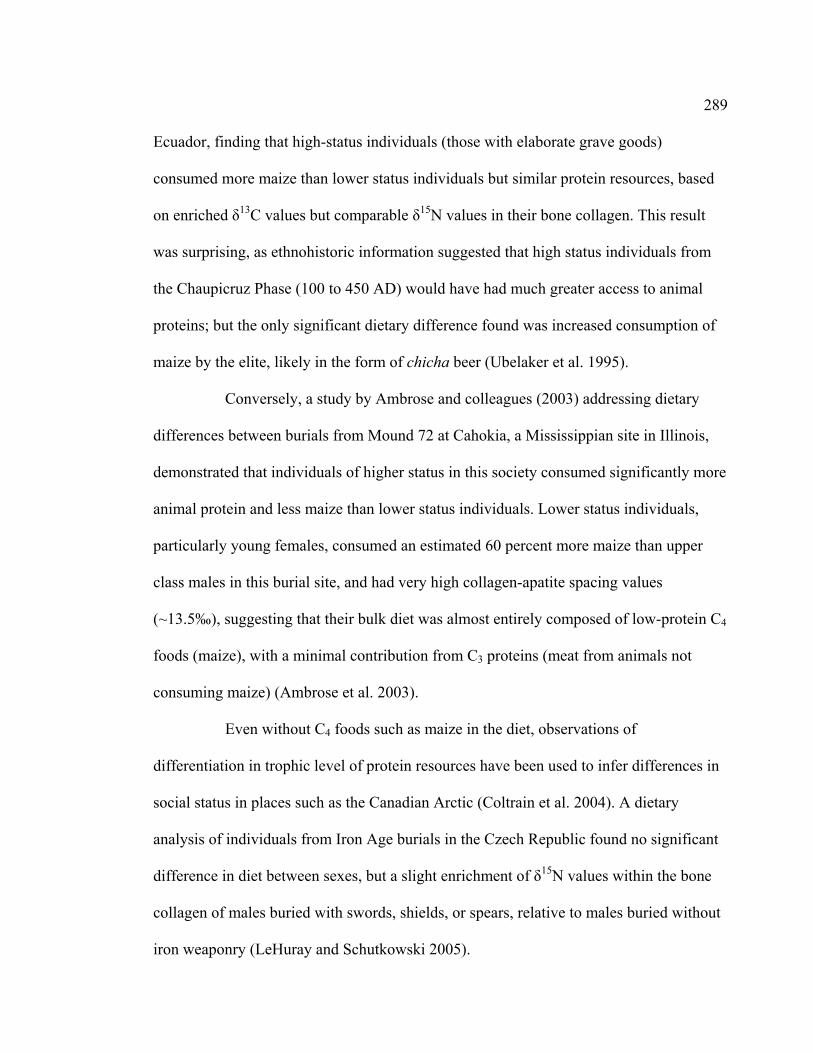
289
Ecuador, finding that high-status individuals (those with elaborate grave goods)
consumed more maize than lower status individuals but similar protein resources, based
on enriched δ13C values but comparable δ15N values in their bone collagen. This result
was surprising, as ethnohistoric information suggested that high status individuals from
the Chaupicruz Phase (100 to 450 AD) would have had much greater access to animal
proteins; but the only significant dietary difference found was increased consumption of
maize by the elite, likely in the form of chicha beer (Ubelaker et al. 1995).
Conversely, a study by Ambrose and colleagues (2003) addressing dietary
differences between burials from Mound 72 at Cahokia, a Mississippian site in Illinois,
demonstrated that individuals of higher status in this society consumed significantly more
animal protein and less maize than lower status individuals. Lower status individuals,
particularly young females, consumed an estimated 60 percent more maize than upper
class males in this burial site, and had very high collagen-apatite spacing values
(~13.5‰), suggesting that their bulk diet was almost entirely composed of low-protein C4
foods (maize), with a minimal contribution from C3 proteins (meat from animals not
consuming maize) (Ambrose et al. 2003).
Even without C4 foods such as maize in the diet, observations of
differentiation in trophic level of protein resources have been used to infer differences in
social status in places such as the Canadian Arctic (Coltrain et al. 2004). A dietary
analysis of individuals from Iron Age burials in the Czech Republic found no significant
difference in diet between sexes, but a slight enrichment of δ15N values within the bone
collagen of males buried with swords, shields, or spears, relative to males buried without
iron weaponry (LeHuray and Schutkowski 2005).
290
In a particularly nuanced analysis, Paula Tomczak (2003) examined stable
isotopes in both bone collagen and apatite to compare dietary patterns of individuals from
four Chiribaya communities from southern Peru. The observed patterns from within and
between communities were then used to evaluate two trans-regional models of economic
resource utilization commonly cited to explain Pre-Columbian trade networks in the
Andes, the horizontal model of Rostworowski de Diez Canseco (1970) and the verticality
model of Murra (1972). Specialized local economies were identified, supporting the
horizontal model of coastal independence from highland resources, and resource
supplementation through coastal trade networks. While differences were noted between
communities, no significant difference in diet was found between males and females at
any of the sites. Diversity of diet within the cemetery at Chiribaya Alta correlated with
differences in mortuary assemblages and styles of cranial modification, suggesting
sustained multi-ethnic traditions within this community.
With the recent focus on cultural embodiment in social bioarchaeology (see
Chapter IV), a few studies have emerged integrating stable isotopes with
bioarchaeological and contextual data to reconstruct social identities of individuals from
prehistory. An excellent example is the study by Christine White and colleagues (2009),
investigating the identities of the “Lovers from Lamanai,” two adults and an infant from
the Maya Late Postclassic period (AD 1450-1500), buried together at the site of Lamanai,
Belize. The stated goals of this study were as follows:
to reconstruct the biological and social identities of the Lamanai lovers within their cultural context and . . . to promote the movement from traditional osteobiography to social biography for the purpose of better understanding social identity. [White et al. 2009:155]

291
The three individuals were positioned in a unique manner, with the male seated against a
wall, the woman seated next to him with her arm around his shoulders, and the infant
lying in the bend of her right knee, a configuration not seen in any other Mayan burial
(White et al. 2009:155). Through careful bioarchaeological analysis, stable isotope
analysis of bones and teeth, and the integration of archaeological insights regarding
material culture and context, the authors reconstructed individual identities for each of
the three individuals, determining that the adults were originally from West Mexico, but
had lived many years near Lamanai and had consumed a diet similar to other local
residents. Material markers of status and bioarchaeological evidence of repetitive actions
suggested that the male was of relatively high status in West Mexico, and had retained his
identity and status in the Maya region, possibly due to his specialized skills as a weaver
of mats. The isotopic conclusions, when integrated with the bioarchaeological evidence,
further indicated that the male had lived in the Maya region for many years before the
arrival of the female, suggesting a long-term relationship between these distant lands.
The use of stable isotope analysis to answer archeological questions has
developed over the past thirty years to include broader and more nuanced evaluations.
Earlier studies focused primarily on the investigation of community level dietary change,
such as the integration of maize into diet, intensification of maize agriculture, dietary
shifts through time, effects of missionization on diets, consumption of marine foods, and
evaluation of ethnohistoric accounts of past behaviors. As the pursuit of paleodietary
knowledge has progressed, more integrated studies have emerged which focus on
individual dietary variation. These studies allow investigators to address questions of
individual identity including gender- or status-based differences in resource access,

292
dietary protocol of cultural specialists, identification of migrants, and multi-ethnic
traditions within communities. Further synthesis of multiple lines of evidence produces a
new archaeology of identity, permitting an unprecedented knowledge of the lived
experience of persons from the prehistoric past.
One clear point of caution emerges from this collection of studies however,
that each region and time must be addressed independently. Isotope values within
ecosystems vary by local environment. Climate, latitude, and geology all contribute to
variation in the δ13C and δ15N values available in local foods. Dietary components also
have held variable significance with regards to prestige and identity in different places
and times. Before proceeding with stable isotope analysis of the individuals from SCL-
38, it is important to first investigate what is known about the local environment and
dietary variation in prehistoric Central California.
Stable Isotopes in Central California Archaeology
Baseline Isotopic Values for the Prehistoric Californian Menu. Based on
evidence from indirect sources, such as environmental reconstruction, botanical and
faunal analysis from archaeological sites, and ethnohistoric accounts (see Chapter V), the
menu in prehistoric California included a variety of terrestrial plant and animal foods but
no important plants with C4 photosynthetic pathways. Maize was not a part of California
diets until the late eighteenth century, when it was introduced by Spanish missionaries.
While other California Native groups likely consumed CAM plants such as agave and
prickly-pear (Opuntia sp.) fruits (Jacknis 2004; Kroeber 1925; Lightfoot and Parrish
2009), these foods were not readily available to inhabitants of Santa Clara County.

293
Therefore, the only important terrestrial plant resources on the ancestral Ohlone menu
were C3 plants.
Aquatic foods from marine, brackish, and freshwater environments were also
readily available to the early inhabitants of the Santa Clara Valley. Marine resources
would have included seaweed, fish, mollusks, and marine mammals. Freshwater
resources would include both lacustrine and riverine fish, and possibly anadromous
species as well. Estuarine environments include habitat for species specialized to endure
brackish waters, such as certain plants, fish, and horn snails (Cerethidea californica).
A few studies have compiled isotopic information from these Central
Californian environments. Virginia and Delwiche (1982) analyzed δ15N values in plants
from several Californian environments north of San Francisco Bay. In Mix Canyon, a
region with a woodland-chaparral vegetation type near Vacaville, California (70 miles
north of CA-SCL-38 and 95 miles inland), the average δ15N value for leguminous plants
was 0.3 permil, with a measured range of -0.1 to 0.6 permil. For non-fixing species in
this environment, the average δ15N value was 0.7 permil , with a range of -0.4 to 2.2
permil. The same study examined values at Point Reyes, a coastal site about seventy
miles northwest of the Yukisma Mound, and found the highest plant δ15N values in non-
leguminous species living in beach-dune vegetation communities (up to 5.2 permil),
whereas values for leguminous plants in coastal environments remained low, between 0.0
and 1.0 permil.
Newsome and colleagues (2004) compiled isotopic values for important food
resources in the coastal region between Santa Cruz and Monterey (between 35 and 60
miles south/southwest of the Yukisma Mound site), using both archaeological samples

294
and modern samples. Delta carbon isotope values from modern samples were adjusted to
account for the Suess effect, the global reduction in δ13C values since the industrial
revolution caused by burning of fossil fuels.
In his 2006 dissertation, Eric Bartelink produced a survey of Californian
archaeological δ13C and δ15N isotopic values, including some from his own research,
those produced by Newsome et al. (2004), and data from other studies from Northern and
Southern California (Bartelink 2006:139-155). His detailed review of δ13C and δ15N
values for significant food resources in the Bay Area is summarized here in Figure 30.
To supplement the known isotopic values for the food web near the Yukisma
Mound, bone samples from eight animals recovered from midden and burial contexts at
CA-SCL-38 were also prepared for isotopic analysis. The results of isotopic faunal
studies from this site will be presented in Chapter VIII, Results.
Seaweeds, including kelp, were a regular food source for many California
Indian tribes, including the Salinan, Coast Miwok, Wappo, Kashaya Pomo, Yuki, and
Coast Yuki, but were reportedly more of a salty condiment for the Costanoan (Lightfoot
and Parrish 2009:216). A study of isotope values of kelp (Macrocystus pyrifera) from the
Big Sur Coast found that both δ13C and δ15N values varied significantly with seasonal
upwelling (Foley and Koch 2010). Values of δ13C in kelp leaves ranged between -25 and
-13 permil (modern value), while δ15N ranged from 2 to 10 permil over a two year time
span. Previously published values from the Santa Barbara channel showed less
variability, with δ13C ranging only from -13.8 to -12.2 permil and δ15N values ranging
between 8.5 and 9.7 permil (Page et al. 2008). With the availability of salinas (natural
evaporation ponds) along the backshore of the Bay, there would be no need to travel to
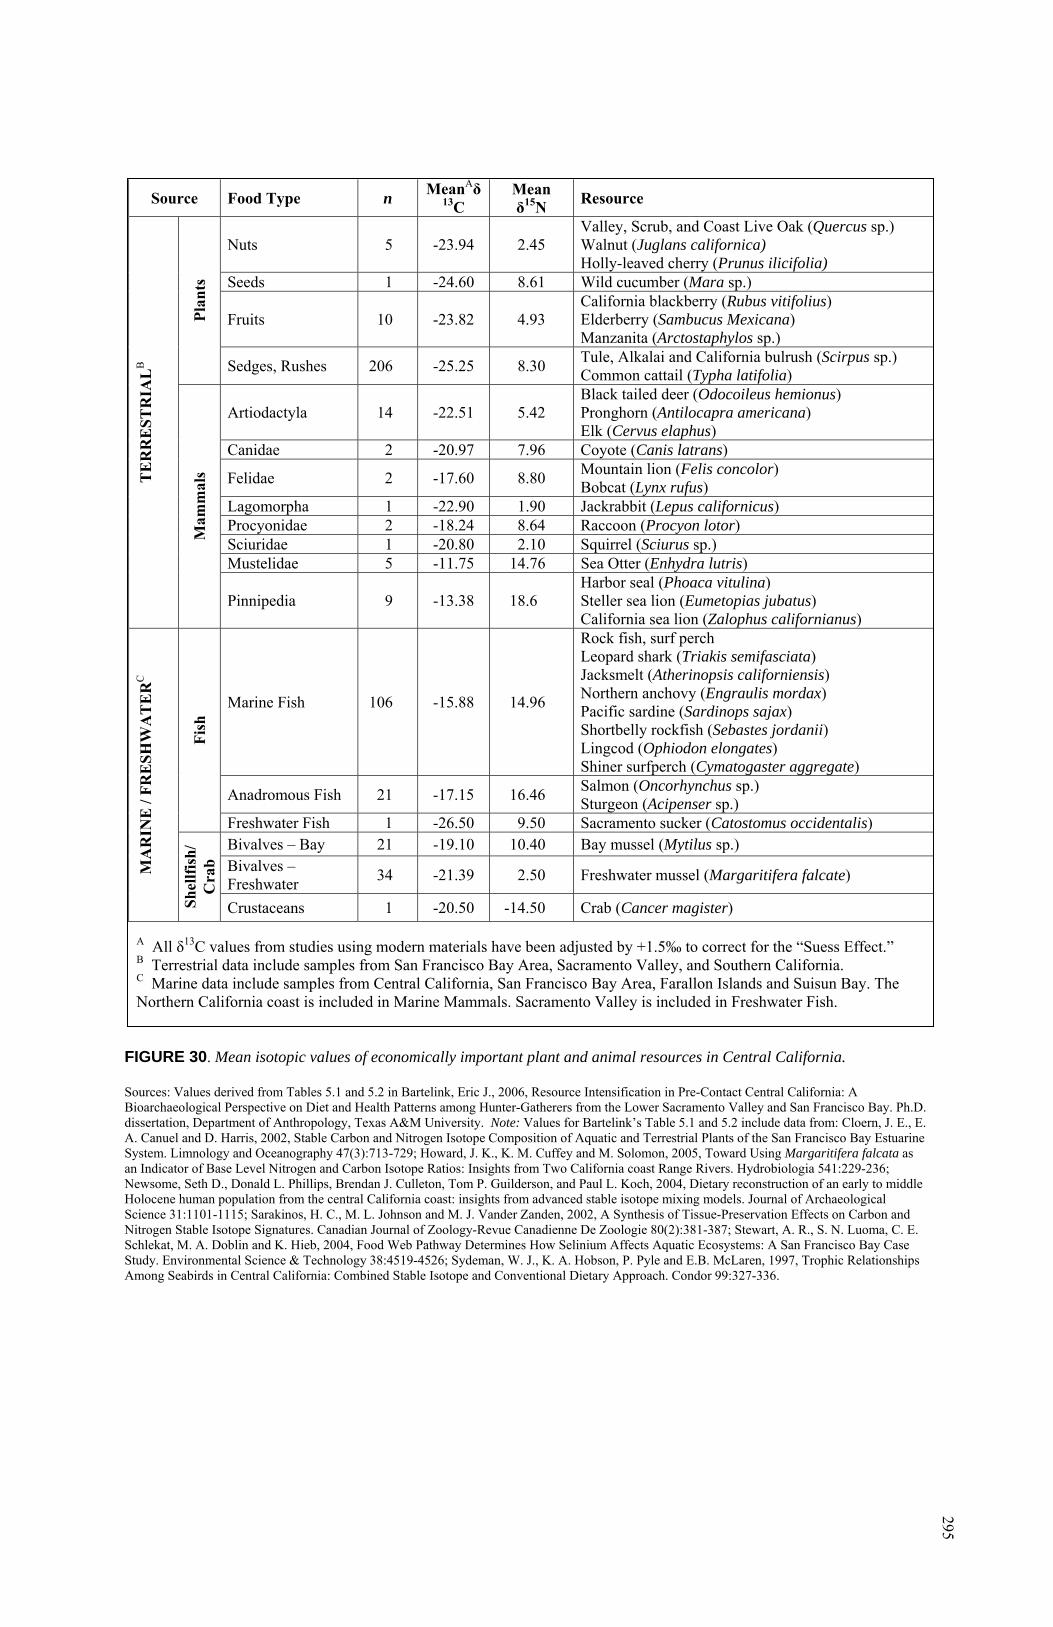
295
Source Food Type n MeanAδ13C
Mean δ15N
Resource
Nuts 5 -23.94 2.45 Valley, Scrub, and Coast Live Oak (Quercus sp.) Walnut (Juglans californica) Holly-leaved cherry (Prunus ilicifolia)
Seeds 1 -24.60 8.61 Wild cucumber (Mara sp.)
Fruits 10 -23.82 4.93 California blackberry (Rubus vitifolius) Elderberry (Sambucus Mexicana) Manzanita (Arctostaphylos sp.)
Pla
nts
Sedges, Rushes 206 -25.25 8.30 Tule, Alkalai and California bulrush (Scirpus sp.) Common cattail (Typha latifolia)
Artiodactyla 14 -22.51 5.42 Black tailed deer (Odocoileus hemionus) Pronghorn (Antilocapra americana) Elk (Cervus elaphus)
Canidae 2 -20.97 7.96 Coyote (Canis latrans)
Felidae 2 -17.60 8.80 Mountain lion (Felis concolor) Bobcat (Lynx rufus)
Lagomorpha 1 -22.90 1.90 Jackrabbit (Lepus californicus) Procyonidae 2 -18.24 8.64 Raccoon (Procyon lotor) Sciuridae 1 -20.80 2.10 Squirrel (Sciurus sp.) Mustelidae 5 -11.75 14.76 Sea Otter (Enhydra lutris)
TE
RR
ES
TR
IAL
B
Mam
mal
s
Pinnipedia 9 -13.38 18.6 Harbor seal (Phoaca vitulina) Steller sea lion (Eumetopias jubatus) California sea lion (Zalophus californianus)
Marine Fish 106 -15.88 14.96
Rock fish, surf perch Leopard shark (Triakis semifasciata) Jacksmelt (Atherinopsis californiensis) Northern anchovy (Engraulis mordax) Pacific sardine (Sardinops sajax) Shortbelly rockfish (Sebastes jordanii) Lingcod (Ophiodon elongates) Shiner surfperch (Cymatogaster aggregate)
Anadromous Fish 21 -17.15 16.46 Salmon (Oncorhynchus sp.) Sturgeon (Acipenser sp.)
Fis
h
Freshwater Fish 1 -26.50 9.50 Sacramento sucker (Catostomus occidentalis) Bivalves – Bay 21 -19.10 10.40 Bay mussel (Mytilus sp.) Bivalves – Freshwater
34 -21.39 2.50 Freshwater mussel (Margaritifera falcate) MA
RIN
E /
FR
ES
HW
AT
ER
C
Sh
ellf
ish
/ C
rab
Crustaceans 1 -20.50 -14.50 Crab (Cancer magister)
A All δ13C values from studies using modern materials have been adjusted by +1.5‰ to correct for the “Suess Effect.” B Terrestrial data include samples from San Francisco Bay Area, Sacramento Valley, and Southern California. C Marine data include samples from Central California, San Francisco Bay Area, Farallon Islands and Suisun Bay. The Northern California coast is included in Marine Mammals. Sacramento Valley is included in Freshwater Fish.
FIGURE 30. Mean isotopic values of economically important plant and animal resources in Central California. Sources: Values derived from Tables 5.1 and 5.2 in Bartelink, Eric J., 2006, Resource Intensification in Pre-Contact Central California: A Bioarchaeological Perspective on Diet and Health Patterns among Hunter-Gatherers from the Lower Sacramento Valley and San Francisco Bay. Ph.D. dissertation, Department of Anthropology, Texas A&M University. Note: Values for Bartelink’s Table 5.1 and 5.2 include data from: Cloern, J. E., E. A. Canuel and D. Harris, 2002, Stable Carbon and Nitrogen Isotope Composition of Aquatic and Terrestrial Plants of the San Francisco Bay Estuarine System. Limnology and Oceanography 47(3):713-729; Howard, J. K., K. M. Cuffey and M. Solomon, 2005, Toward Using Margaritifera falcata as an Indicator of Base Level Nitrogen and Carbon Isotope Ratios: Insights from Two California coast Range Rivers. Hydrobiologia 541:229-236; Newsome, Seth D., Donald L. Phillips, Brendan J. Culleton, Tom P. Guilderson, and Paul L. Koch, 2004, Dietary reconstruction of an early to middle Holocene human population from the central California coast: insights from advanced stable isotope mixing models. Journal of Archaeological Science 31:1101-1115; Sarakinos, H. C., M. L. Johnson and M. J. Vander Zanden, 2002, A Synthesis of Tissue-Preservation Effects on Carbon and Nitrogen Stable Isotope Signatures. Canadian Journal of Zoology-Revue Canadienne De Zoologie 80(2):381-387; Stewart, A. R., S. N. Luoma, C. E. Schlekat, M. A. Doblin and K. Hieb, 2004, Food Web Pathway Determines How Selinium Affects Aquatic Ecosystems: A San Francisco Bay Case Study. Environmental Science & Technology 38:4519-4526; Sydeman, W. J., K. A. Hobson, P. Pyle and E.B. McLaren, 1997, Trophic Relationships Among Seabirds in Central California: Combined Stable Isotope and Conventional Dietary Approach. Condor 99:327-336.

296
the coast for salt. However, it is certainly possible that the ancestral Ohlone enjoyed this
popular food source.
Roasted insects may also have been a common food in Central California.
Ethnohistoric reports indicate that grasshoppers, army worms (Noctuidae moth larvae),
caterpillars, and yellow-jacket larvae may all have been on the local menu (Lightfoot and
Parrish 2009). A literature review found no Central California studies on the stable
isotope values of these insects, but a study by Fry and colleagues (1978) demonstrated
that grasshoppers in Texas had δ13C values similar to their food sources. A study of
several arthropod taxa in Rhode Island supported this finding, and further showed that
δ15N values of insects were enriched by trophic level, such that omnivores (such as
grasshoppers or yellow-jacket larvae) were enriched over herbivores (Donlan 2011).
Controlled feeding studies by Peters and colleagues (2012) found a δ15N trophic level
enrichment for (herbivorous) caterpillars of only 1 permil, and also a second non-trophic
level enrichment of approximately 1.5 permil during metamorphosis. Applying these data
to the Central California foodweb, insects should have δ13C values similar to local plants
(-24 to -25 permil). Caterpillars and army worms would have δ15N values similar to
terrestrial herbivores; grasshoppers and yellow-jacket larvae would have slightly enriched
δ15N values.
Paleodietary Reconstruction in Central California Using Stable Isotope
Analysis. Only a handful of paleodietary studies have been published in Central
California using stable isotope analysis. Mean carbon and nitrogen isotope values of
human bone published in these sources are presented in Table 30.
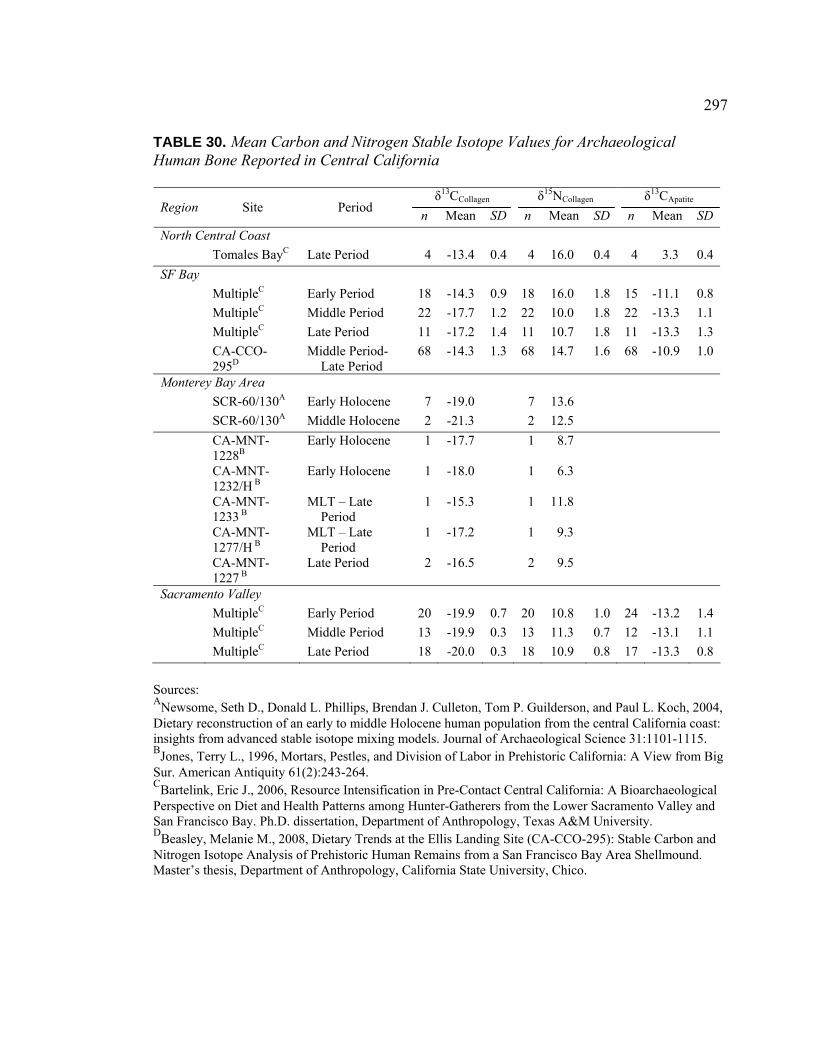
297
TABLE 30. Mean Carbon and Nitrogen Stable Isotope Values for Archaeological Human Bone Reported in Central California
δ13CCollagen δ15NCollagen δ13CApatite Region Site Period
n Mean SD n Mean SD n Mean SD
North Central Coast
Tomales BayC Late Period 4 -13.4 0.4 4 16.0 0.4 4 3.3 0.4
SF Bay
MultipleC Early Period 18 -14.3 0.9 18 16.0 1.8 15 -11.1 0.8
MultipleC Middle Period 22 -17.7 1.2 22 10.0 1.8 22 -13.3 1.1
MultipleC Late Period 11 -17.2 1.4 11 10.7 1.8 11 -13.3 1.3
CA-CCO-295D
Middle Period-Late Period
68 -14.3 1.3 68 14.7 1.6 68 -10.9 1.0
Monterey Bay Area
SCR-60/130A Early Holocene 7 -19.0 7 13.6
SCR-60/130A Middle Holocene 2 -21.3 2 12.5
CA-MNT-1228B
Early Holocene 1 -17.7 1 8.7
CA-MNT-1232/H B
Early Holocene 1 -18.0 1 6.3
CA-MNT-1233 B
MLT – Late Period
1 -15.3 1 11.8
CA-MNT-1277/H B
MLT – Late Period
1 -17.2 1 9.3
CA-MNT-1227 B
Late Period 2 -16.5 2 9.5
Sacramento Valley
MultipleC Early Period 20 -19.9 0.7 20 10.8 1.0 24 -13.2 1.4
MultipleC Middle Period 13 -19.9 0.3 13 11.3 0.7 12 -13.1 1.1
MultipleC Late Period 18 -20.0 0.3 18 10.9 0.8 17 -13.3 0.8
Sources: ANewsome, Seth D., Donald L. Phillips, Brendan J. Culleton, Tom P. Guilderson, and Paul L. Koch, 2004, Dietary reconstruction of an early to middle Holocene human population from the central California coast: insights from advanced stable isotope mixing models. Journal of Archaeological Science 31:1101-1115. BJones, Terry L., 1996, Mortars, Pestles, and Division of Labor in Prehistoric California: A View from Big Sur. American Antiquity 61(2):243-264. CBartelink, Eric J., 2006, Resource Intensification in Pre-Contact Central California: A Bioarchaeological Perspective on Diet and Health Patterns among Hunter-Gatherers from the Lower Sacramento Valley and San Francisco Bay. Ph.D. dissertation, Department of Anthropology, Texas A&M University. DBeasley, Melanie M., 2008, Dietary Trends at the Ellis Landing Site (CA-CCO-295): Stable Carbon and Nitrogen Isotope Analysis of Prehistoric Human Remains from a San Francisco Bay Area Shellmound. Master’s thesis, Department of Anthropology, California State University, Chico.
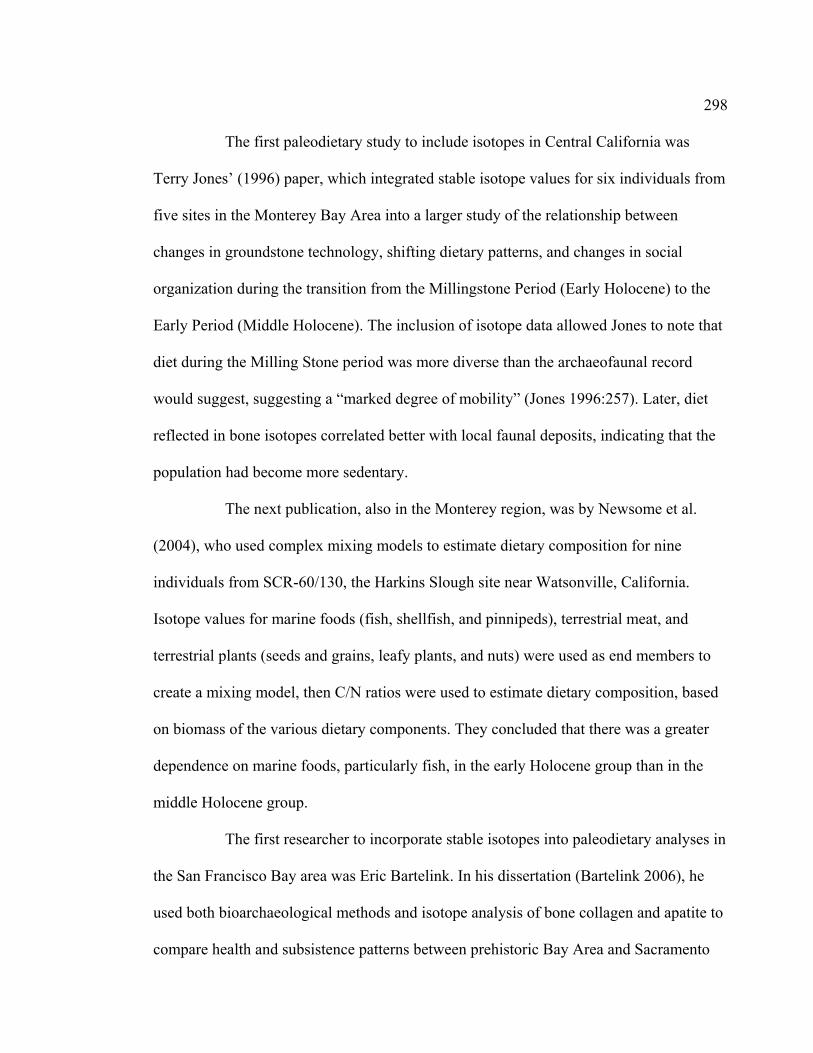
298
The first paleodietary study to include isotopes in Central California was
Terry Jones’ (1996) paper, which integrated stable isotope values for six individuals from
five sites in the Monterey Bay Area into a larger study of the relationship between
changes in groundstone technology, shifting dietary patterns, and changes in social
organization during the transition from the Millingstone Period (Early Holocene) to the
Early Period (Middle Holocene). The inclusion of isotope data allowed Jones to note that
diet during the Milling Stone period was more diverse than the archaeofaunal record
would suggest, suggesting a “marked degree of mobility” (Jones 1996:257). Later, diet
reflected in bone isotopes correlated better with local faunal deposits, indicating that the
population had become more sedentary.
The next publication, also in the Monterey region, was by Newsome et al.
(2004), who used complex mixing models to estimate dietary composition for nine
individuals from SCR-60/130, the Harkins Slough site near Watsonville, California.
Isotope values for marine foods (fish, shellfish, and pinnipeds), terrestrial meat, and
terrestrial plants (seeds and grains, leafy plants, and nuts) were used as end members to
create a mixing model, then C/N ratios were used to estimate dietary composition, based
on biomass of the various dietary components. They concluded that there was a greater
dependence on marine foods, particularly fish, in the early Holocene group than in the
middle Holocene group.
The first researcher to incorporate stable isotopes into paleodietary analyses in
the San Francisco Bay area was Eric Bartelink. In his dissertation (Bartelink 2006), he
used both bioarchaeological methods and isotope analysis of bone collagen and apatite to
compare health and subsistence patterns between prehistoric Bay Area and Sacramento

299
Valley populations. Results indicated that there was a decrease in consumption of marine
foods in the San Francisco Bay group between the Early and Middle Periods, but similar
consumption between the Middle and Late Periods. Conversely, diet in the Sacramento
Valley groups showed no significant temporal change. This work is also referenced and
expanded in two additional publications, Bartelink and Yoder (2008) and Bartelink
(2009).
The next researcher to publish a paleodietary analysis of prehistoric Central
California populations was Melanie Beasley (2008), who studied dietary trends at the
Ellis Landing site (CA-CCO-295) on the Berkeley shore of the San Francisco Bay. She
found similar dietary composition through time, but a high degree of variability between
individuals, particularly during the Middle Period. There was also a small, but
statistically significant difference in the diet of males and females at the site, with males
having slightly enriched average δ15N values in bone collagen.
Three isotopic studies of breastfeeding and weaning practices have been
published with regard to prehistoric California populations. Eerkens and colleagues
published a study in 2011, using serial micro-samples of dentin collagen to estimate
weaning behaviors for six individuals from CA-CCO-548, an Early Period site in Contra
Costa County. The second study, also published in 2011, used a subsample of data from
the present dietary analysis from CA-SCL-38 to visualize weaning practices among the
ancestral Ohlone from Santa Clara County (Gardner et al. 2011). The third study is a
follow up to the first, focusing on differences in weaning practices based on sex (Eerkens
and Bartelink in press).
300
Summary: Stable Isotope Analysis
Food and drink consumed during life provide the building blocks for growth,
development, and maintenance of body tissues. The chemical signatures of dietary
components are retained in the tissues even after death, and provide a direct line of
evidence for the dietary practice of individuals within a community. This extraordinary
access into the lived experience of specific individuals from the past enables researchers
to reconstruct not only dietary practices, but also the manifestation of social and political
praxis within the bodies of these individuals. In each case highlighted in the preceding
literature review, the correlation of social roles, social identities and diet during life can
be accessed and understood in archaeological contexts using stable isotope analysis.
Discussion: Refining Paleodietary Analysis
in the Santa Clara Valley using Direct Evidence
In the previous chapter, indirect sources of evidence about paleodiet in the
Santa Clara Valley were reviewed. Paleoenvironmental reconstruction suggests that the
Yukisma Mound site was situated within a mosaic of micro-environments, including tidal
flats, marshlands, wet meadows, riparian woodlands, willow groves, oak savannah, open
grasslands, and freshwater ponds. Additionally, resources from marine environments and
mixed pine forests were available by trade or by short foraging excursions.
Paleobotanical records from CA-SCL-38 and nearby sites reveal the presence of a wide
variety of local plants, including leafy greens, seeds, geophytes (roots, tubers, bulbs, and
corms), and nuts (including acorns). The paleofaunal record likewise reveals an
abundance of resources, including terrestrial mammals, resident and migratory birds,
301
marine mammals (especially sea otters), amphibians (frogs), reptiles (turtles, possibly
snakes), marine and riverine fish, and mollusks. The ethnohistoric record supports the
diverse diet represented by the bioartifacts at these sites, and also suggests that some
foods which would not have preserved, such as insects (grasshoppers, larvae) and honey,
would have been important sources of nutrition. Each of these sources provides valuable
evidence about the resources which would have been available to the community, but
only direct evidence can reflect the resources actually consumed by individuals at the
site.
The first direct source of evidence regarding paleodiet was bioarchaeological
data from the skeleton and teeth. Within the assemblage at CA-SCL-38, few indications
were noted of nutritional stress. Frequency of linear enamel hypoplasias was remarkably
low, and the only suggestion of nutritional stress was a single example of healed cribra
orbitalia in Burial 102. With only a single case of cribra orbitalia noted, and no other
bioarchaeological markers of nutritional deficiencies, it is unlikely that the population
suffered from malnutrition. Overall, the bioarchaeolgical evidence suggests that this
population made good use of the wide variety of resources available to them, and enjoyed
a diverse and nutritionally complete diet.
Conclusions: Potential Contributions of Stable
Isotope Analysis to Paleodietary Reconstruction at CA-SCL-38
The addition of stable isotope analysis will allow further refinement of
paleodietary analysis for this population. Examination of δ13C and δ15N values in bone
collagen will provide direct evidence for the balance of terrestrial and marine protein

302
resources consumed by each individual. The addition of δ13C data from bone apatite will
provide further insight as to total diet breadth, including sources of carbohydrates and
fats. Beyond community level paleodietary reconstruction, stable isotope data from SCL-
38 may be used to better understand variation within the community. Differences in
dietary patterns between individuals of different sexes, different age categories, or
different burial contexts will illuminate nuances of embodied social practice
differentiating subpopulations within the ancestral Ohlone population.
The integration of stable isotope values with data from other sources of
paleodietary evidence, details of archaeological and mortuary context, and artifactual
associations will inform the following research questions in the present study:
1. What general dietary pattern is observed for the population at CA-SCL-38?
2. How does this local pattern compare to available data from other Central
California sites?
3. Do dietary patterns change through time?
4. Is there evidence that access to different foods is acquired through a lifetime,
or is appropriate to certain age groups?
5. Is there evidence for gendered identities which affect dietary choices?
6. Is there evidence for status-based food access, based on mortuary treatment
(body position, body orientation, associated burning)?
7. Do dietary patterns differ for individuals buried in different spatial clusters
within the cemetery at CA-SCL-38?
8. Are there artifacts that are associated with distinct dietary patterns?
303
9. Do dietary patterns differ for individuals with greater quantities of associated
grave goods?
The answers to these questions will be presented in Chapter VIII, Results.
These data can then inform larger biosocial inquiries regarding the cultural identifiers of
social difference, and the embodiment of social roles through dietary privilege or
limitations, which will be addressed in Chapter IX.

304
CHAPTER VII
MATERIALS AND METHODS
Introduction
The materials used for the stable isotope analysis in this study were small
portions of human rib bone from the population recovered during the excavations at the
Yukisma Mound (CA-SCl-38) in 1993 and 1994. Prior to repatriation of the human
remains from this project in 1996, the Muwekma Ohlone Tribe elected to reserve one rib
from each individual (where preservation allowed) for use in future research. The
generosity and foresight of this decision has enabled researchers to uncover new
information about the Ohlone past. To date, the reserved ribs have been used in such
studies as the ancient DNA research conducted by Cara Monroe at Washington State
University (ongoing), this stable isotope study, and the acquisition of additional
radiocarbon dates at the Lawrence Livermore National Laboratory in 2010 and 2012.
Remaining portions of these precious samples are currently curated in the CSU Chico
Stable Isotope Lab and at Washington State University, and, with tribal permission, may
be used for additional research as new techniques become available.
The first 65 bone samples provided for use in this study were randomly
selected from the available ribs at Washington State University, and sent by courier to the
Stable Isotope Preparation Laboratory in Chico in February, 2009. All of these
individuals were included in my research. In July 2009, I traveled to Washington State

305
University, and with the assistance of Cara Monroe, collected a portion of each remaining
bone sample in the CA-SCL-38 collection (137 additional samples, N = 202. Samples
from Burials 91 and 105a turned out to be femoral fragments rather than ribs). From these
additional samples, 61 individuals were non-randomly selected to complete the
population for this stable isotope study. Two additional individuals were added to the
study in 2012 because of their burial associations, for an overall sample of 128
individuals.
Sample Selection
The sample population for this study was selected with the intention of
maximizing demographic and contextual representation, while staying within budgetary
constraints for analysis. Considerations were made to ensure that subpopulations within
the sample group were large enough to be compared with statistical significance
whenever possible (n ≥ 30). Criteria of sex, age, burial context, temporal context, and
associated mortuary regalia were all considered. Selected samples were visually
inspected and appeared to be in good condition. No charring or other thermal effects were
apparent, even when burning or cremation was indicated in the mortuary context.
Sex and Age Distribution
The study sample included 104 adults over the age of 16 years. Of these, 37
were female (29% of sample, 66% of available females), 57 were male (44% of sample,
61% of available males), and 10 were of indeterminate sex (8% of sample, 37% of
available adults of indeterminate sex). Eighteen of the adults in the study group were over
40 years of age and are classified as elders (6 males and 12 females). Twenty-four
306
subadults were included (19% of the sample, 92% of available subadults). The two
subadults which were available but not included were Burials 102 and 104, both
adolescents recovered from disturbed and fragmentary burial contexts. The number of
individuals in each age category, the individuals available for study, and those included
in the present research are presented in Table 31. Please see Appendix A for a detailed
discussion of age and sex determination and of the categories used for this study.
Burial Context
Individuals were selected to represent a variety of burial contexts. The sample
includes individuals who were interred alone, in double burials, and one multiple burial
of four. Some were interred in a flexed position, some tightly flexed, others extended,
splayed, or in unusual positions. Some burials included pre- or post-interment burning;
some were cremated. Some had rock cairns built within the grave. The number of
individuals within each grave varied, as did the directional orientation of interments.
Further, the quantity and type of burial associations varied between individuals. Each of
these factors was considered in an attempt to represent each contextual factor in the
sample group. Description of burial context attributes is presented in Chapter III; contexts
attributed to each individual are presented in Appendix B. The burial context of
individuals available to be studied and those included in the present research are
presented in Tables 32, 33, 34, 35, 36, and 37.
Spatial organization of the cemetery at Yukisma was analyzed by Bellifemine
(1997). Eight spatial clusters were noted, with the greatest concentration of burials in the
center of the site, in Spatial Cluster 5. Table 38 presents the number of available and
sampled individuals from each spatial cluster.
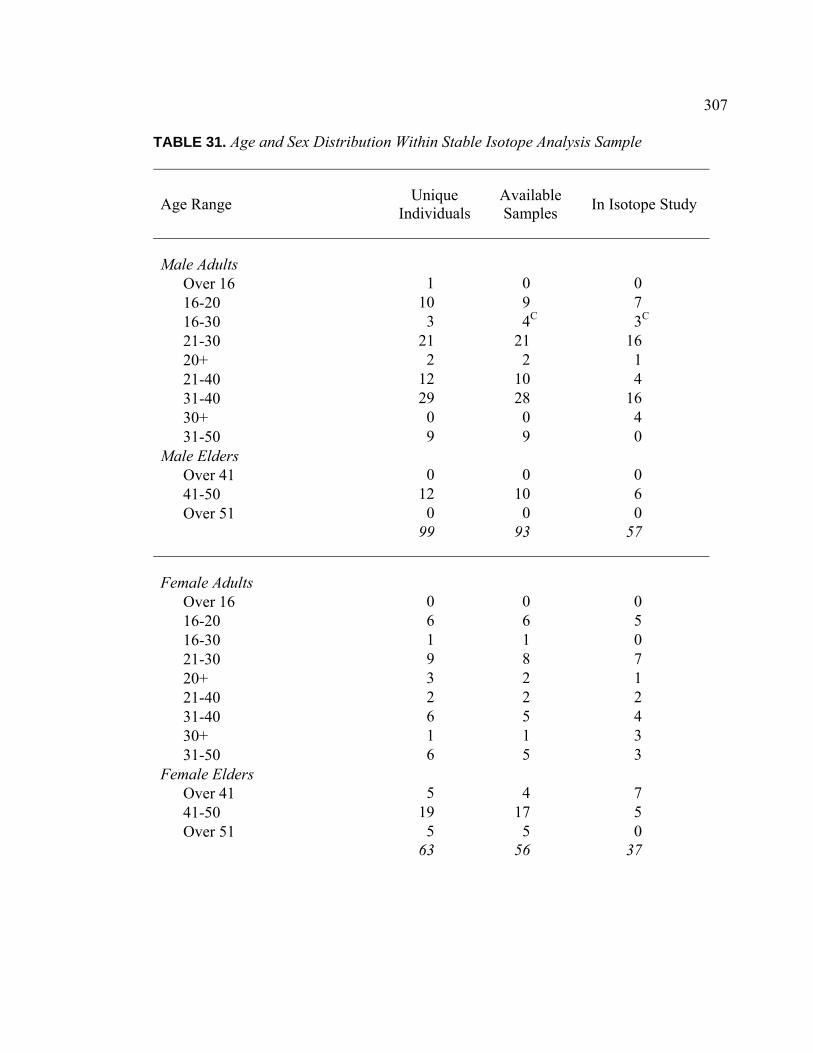
307
TABLE 31. Age and Sex Distribution Within Stable Isotope Analysis Sample
Age Range Unique
Individuals Available Samples
In Isotope Study
Male Adults Over 16 1 0 0 16-20 10 9 7 16-30 3 4C 3C 21-30 21 21 16 20+ 2 2 1 21-40 12 10 4 31-40 29 28 16 30+ 0 0 4 31-50 9 9 0
Male Elders Over 41 0 0 0 41-50 12 10 6 Over 51 0 0 0
99 93 57
Female Adults Over 16 0 0 0 16-20 6 6 5 16-30 1 1 0 21-30 9 8 7 20+ 3 2 1 21-40 2 2 2 31-40 6 5 4 30+ 1 1 3 31-50 6 5 3
Female Elders Over 41 5 4 7 41-50 19 17 5 Over 51 5 5 0
63 56 37

308
TABLE 31 (Continued).
Age Range Unique
Individuals Available Samples
In Isotope Study
Adults of Indeterminate Sex Over 16 10 6D 2 16-20 12 8 7 16-30 0 0 0 21-30 4 2 0 20+ 13 9 1 21-40 1 1 0 31-40 0 0 0 30+ 0 0 0 31-50 0 0 0
Elders of Indeterminate Sex Over 41 0 0 0 41-50 2 1 0 Over 51 0 0 0
42 27 10
Total Adults 204 176 104
Subadults Infant (0-2) 15 8 8 Young Child (3-5) 10 6 6 Child (6-10) 12 8 8 Adolescent (11-15) 5 4E 2 Subadult (Unknown) 1 0 0
43 26 24
Individuals of Unknown Age 1 0 0
Total Individuals 248 202 128
AUnique Individuals as defined in Appendix A. B Bone samples retained for research purposes after repatriation of remains. CIncludes B117, combined with B130 in unique individual list. DIncludes B114, excluded from unique individual list due to fragmentary nature. EIncludes B104 and B102, combined in unique individual list. This pair was excluded from the isotope study.

309
TABLE 32. Interment Type Frequencies for Study Sample Individuals
Primary Secondary Disturbed Unclear
Available Samples Males 89 2 2 0
Females 51 2 2 1
Indeterminate 19 4 0 4
Total Adults 159 8 4 5
Subadults 18 1 4 3 Total Available 177 9 8 8
In Isotope Study Males 54 1 2 0
Females 34 2 1 0
Indeterminate 9 0 0 1
Total Adults 97 3 3 1
Subadults 17 1 3 3 Total In Study 114 4 6 4
TABLE 33. Associated Burials for Study Sample Individuals
Single Double Multiple Cluster
Available Samples Males 69 12 5 7
Females 48 7 0 1
Indeterminate 24 3 0 0
Total Adults 141 22 5 8
Subadults 17 8 0 1 Total Available 158 30 5 9
In Isotope Study Males 39 7 5 6
Females 32 4 0 1
Indeterminate 7 3 0 0
Total Adults 78 14 5 7
Subadults 15 8 0 1 Total In Study 93 22 5 8
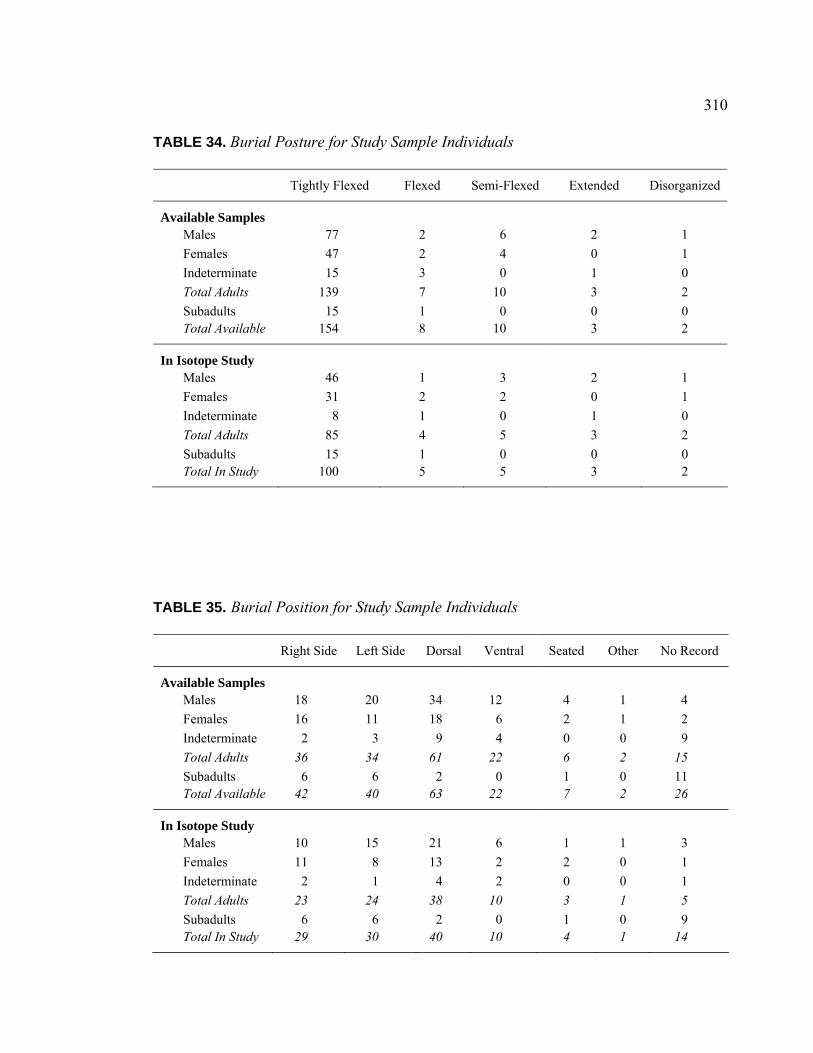
310
TABLE 34. Burial Posture for Study Sample Individuals
Tightly Flexed Flexed Semi-Flexed Extended Disorganized
Available Samples Males 77 2 6 2 1
Females 47 2 4 0 1
Indeterminate 15 3 0 1 0
Total Adults 139 7 10 3 2
Subadults 15 1 0 0 0 Total Available 154 8 10 3 2
In Isotope Study Males 46 1 3 2 1
Females 31 2 2 0 1
Indeterminate 8 1 0 1 0
Total Adults 85 4 5 3 2
Subadults 15 1 0 0 0 Total In Study 100 5 5 3 2
TABLE 35. Burial Position for Study Sample Individuals
Right Side Left Side Dorsal Ventral Seated Other No Record
Available Samples Males 18 20 34 12 4 1 4
Females 16 11 18 6 2 1 2
Indeterminate 2 3 9 4 0 0 9
Total Adults 36 34 61 22 6 2 15
Subadults 6 6 2 0 1 0 11 Total Available 42 40 63 22 7 2 26
In Isotope Study Males 10 15 21 6 1 1 3
Females 11 8 13 2 2 0 1
Indeterminate 2 1 4 2 0 0 1
Total Adults 23 24 38 10 3 1 5
Subadults 6 6 2 0 1 0 9 Total In Study 29 30 40 10 4 1 14

311
TABLE 36. Burial Orientation for Study Sample IndividualsA
North
(NW-N-NE) East
(NE-E-SE) South
(SE-S-SW) West
(SW-W-NW)
Available Samples Males 35 47 37 36
Females 22 23 21 22
Indeterminate 9 8 7 10
Total Adults 66 78 65 68
Subadults 13 8 4 10 Total Available 79 86 69 78
In Isotope Study Males 18 31 23 19
Females 14 19 14 12
Indeterminate 6 4 3 5
Total Adults 38 54 40 36
Subadults 13 8 4 10 Total In Study 51 62 44 46
A Individuals are tallied by cardinal direction of the cranial end of the spine. When burial position lies between cardinal directions (e.g., northeast), both directions are tallied (e.g., both north and east). Temporal Context
Of the 80 individuals for which temporal context was available (see Chapter
III, Figure 26), only 68 were available for further study. Of these, all but three were
included in this project (see Table 39). The samples which were available but not
included were from adults of indeterminate age, all dated to the Late Period based on
bead type (burial 100, dated to LP1, and burials 83 and 163, dated to LP2).
Unfortunately, samples are no longer available for four individuals with radiocarbon
dates from the 1996 WSU batch. This includes burial 240, the individual with the earliest
14C date from the site (falling during the Early-Middle Transition) but with ground stone
typical of the Late Period. Burial 178, the individual with the 14C date in the Middle-Late
Transition and obsidian dating to LP1, was also unfortunately unavailable.
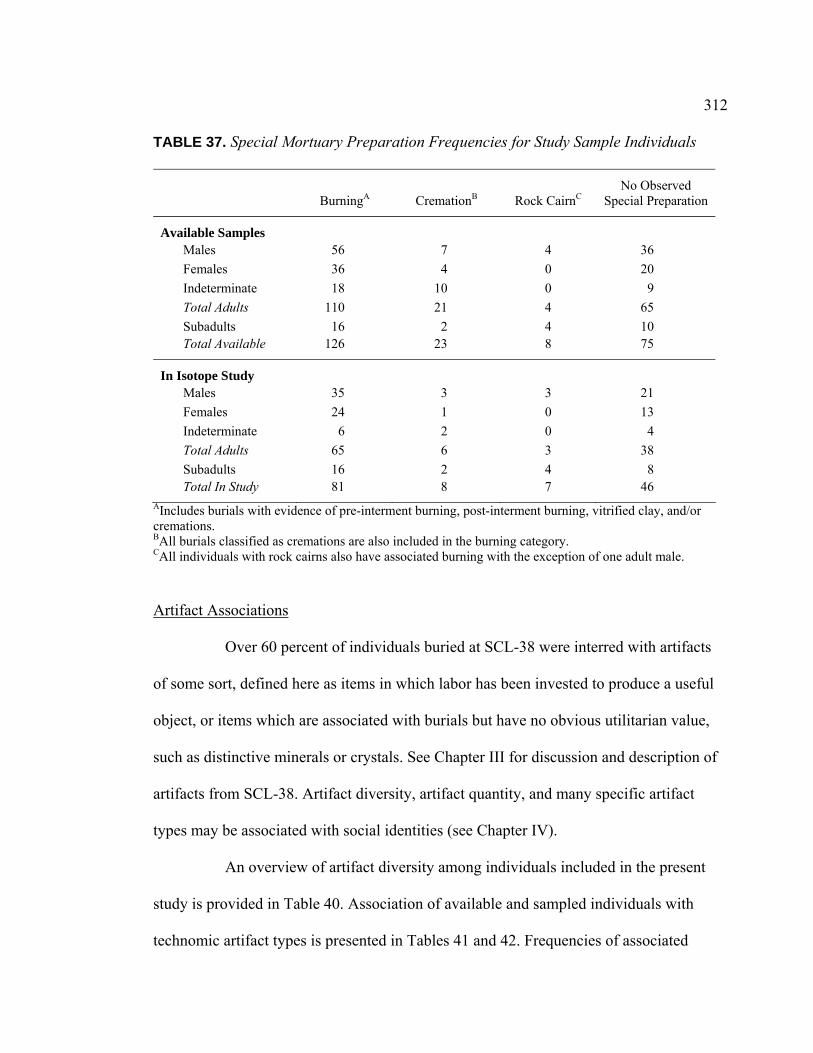
312
TABLE 37. Special Mortuary Preparation Frequencies for Study Sample Individuals
BurningA CremationB Rock CairnC
No Observed Special Preparation
Available Samples Males 56 7 4 36
Females 36 4 0 20
Indeterminate 18 10 0 9
Total Adults 110 21 4 65
Subadults 16 2 4 10 Total Available 126 23 8 75
In Isotope Study Males 35 3 3 21
Females 24 1 0 13
Indeterminate 6 2 0 4
Total Adults 65 6 3 38
Subadults 16 2 4 8 Total In Study 81 8 7 46
AIncludes burials with evidence of pre-interment burning, post-interment burning, vitrified clay, and/or cremations. BAll burials classified as cremations are also included in the burning category. CAll individuals with rock cairns also have associated burning with the exception of one adult male. Artifact Associations
Over 60 percent of individuals buried at SCL-38 were interred with artifacts
of some sort, defined here as items in which labor has been invested to produce a useful
object, or items which are associated with burials but have no obvious utilitarian value,
such as distinctive minerals or crystals. See Chapter III for discussion and description of
artifacts from SCL-38. Artifact diversity, artifact quantity, and many specific artifact
types may be associated with social identities (see Chapter IV).
An overview of artifact diversity among individuals included in the present
study is provided in Table 40. Association of available and sampled individuals with
technomic artifact types is presented in Tables 41 and 42. Frequencies of associated
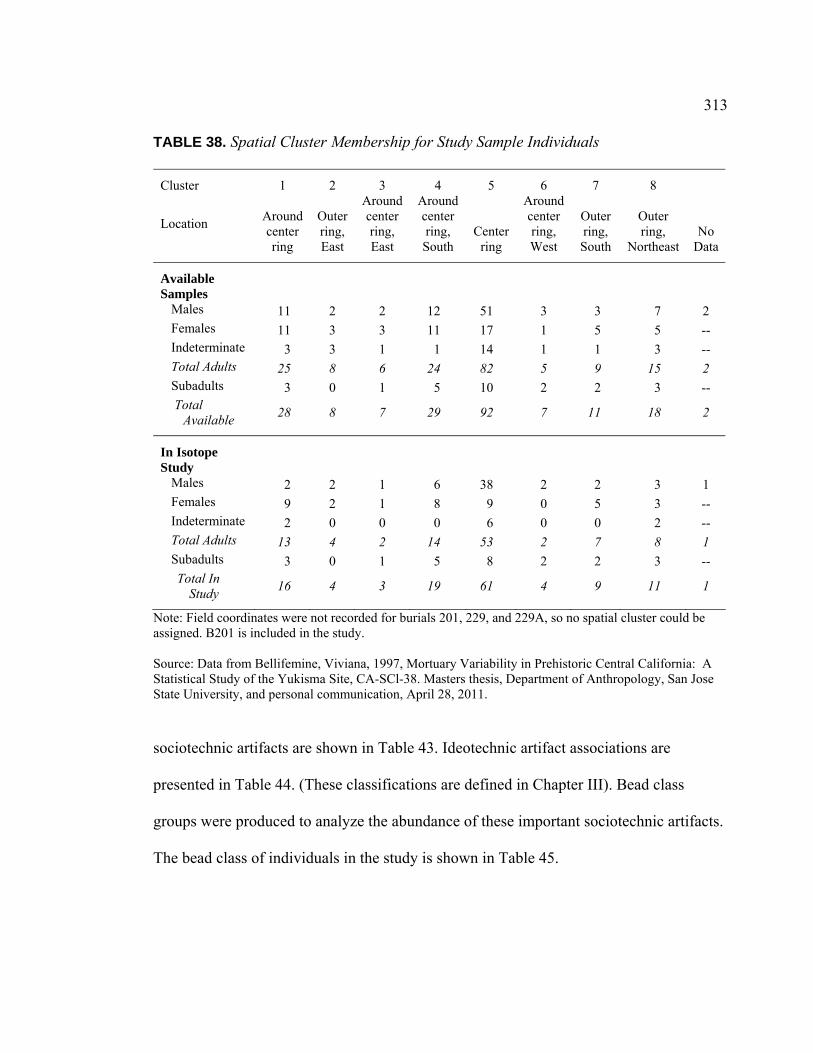
313
TABLE 38. Spatial Cluster Membership for Study Sample Individuals
Cluster 1 2 3 4 5 6 7 8
Location Around center ring
Outer ring, East
Around center ring, East
Around center ring, South
Center ring
Around center ring, West
Outer ring, South
Outer ring,
Northeast No
Data
Available Samples
Males 11 2 2 12 51 3 3 7 2 Females 11 3 3 11 17 1 5 5 -- Indeterminate 3 3 1 1 14 1 1 3 -- Total Adults 25 8 6 24 82 5 9 15 2 Subadults 3 0 1 5 10 2 2 3 -- Total
Available 28 8 7 29 92 7 11 18 2
In Isotope Study
Males 2 2 1 6 38 2 2 3 1 Females 9 2 1 8 9 0 5 3 -- Indeterminate 2 0 0 0 6 0 0 2 -- Total Adults 13 4 2 14 53 2 7 8 1 Subadults 3 0 1 5 8 2 2 3 -- Total In
Study 16 4 3 19 61 4 9 11 1
Note: Field coordinates were not recorded for burials 201, 229, and 229A, so no spatial cluster could be assigned. B201 is included in the study.
Source: Data from Bellifemine, Viviana, 1997, Mortuary Variability in Prehistoric Central California: A Statistical Study of the Yukisma Site, CA-SCl-38. Masters thesis, Department of Anthropology, San Jose State University, and personal communication, April 28, 2011. sociotechnic artifacts are shown in Table 43. Ideotechnic artifact associations are
presented in Table 44. (These classifications are defined in Chapter III). Bead class
groups were produced to analyze the abundance of these important sociotechnic artifacts.
The bead class of individuals in the study is shown in Table 45.
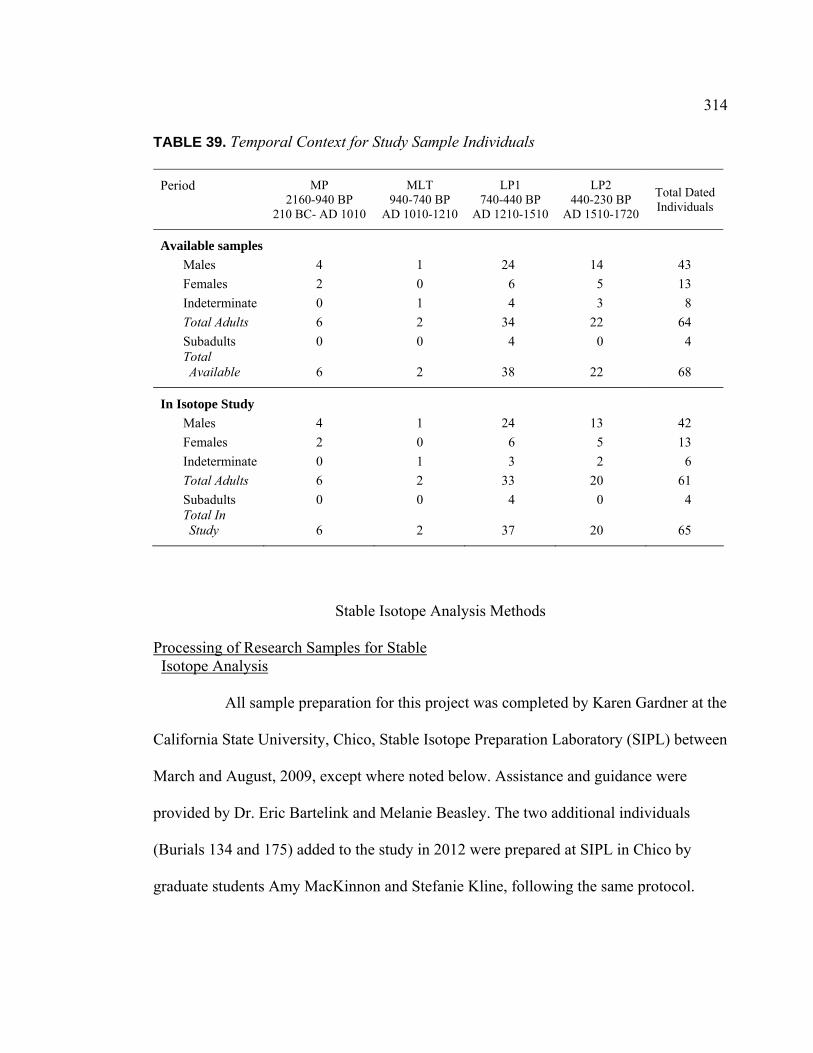
314
TABLE 39. Temporal Context for Study Sample Individuals
Period
MP 2160-940 BP
210 BC- AD 1010
MLT 940-740 BP
AD 1010-1210
LP1 740-440 BP
AD 1210-1510
LP2 440-230 BP
AD 1510-1720
Total Dated Individuals
Available samples
Males 4 1 24 14 43
Females 2 0 6 5 13
Indeterminate 0 1 4 3 8
Total Adults 6 2 34 22 64
Subadults 0 0 4 0 4 Total Available 6 2 38 22 68
In Isotope Study
Males 4 1 24 13 42
Females 2 0 6 5 13
Indeterminate 0 1 3 2 6
Total Adults 6 2 33 20 61
Subadults 0 0 4 0 4 Total In Study 6 2 37 20 65
Stable Isotope Analysis Methods
Processing of Research Samples for Stable Isotope Analysis
All sample preparation for this project was completed by Karen Gardner at the
California State University, Chico, Stable Isotope Preparation Laboratory (SIPL) between
March and August, 2009, except where noted below. Assistance and guidance were
provided by Dr. Eric Bartelink and Melanie Beasley. The two additional individuals
(Burials 134 and 175) added to the study in 2012 were prepared at SIPL in Chico by
graduate students Amy MacKinnon and Stefanie Kline, following the same protocol.

315
TABLE 40. Number of Artifact TypesA Associated with Study Sample Individuals
0 1 2 3 4 5 6 7 8 9 10
Available samples Males 27 20 15 15 9 3 3 1 -- -- -- Females 19 16 12 3 3 1 1 1 -- -- -- Indeterminate 9 9 2 5 -- -- 1 -- -- 1 -- Total Adults 55 45 29 23 12 4 5 2 -- 1 -- Subadults 17 5 3 -- 1 -- -- -- -- -- -- Total Available 72 50 32 23 13 4 5 2 -- 1 --
In Isotope Study Males 12 8 12 11 9 2 2 1 -- -- -- Females 12 9 8 2 3 1 1 1 -- -- -- Indeterminate 1 3 1 3 -- -- 1 -- -- 1 -- Total Adults 25 20 21 16 12 3 4 2 -- 1 -- Subadults 15 5 3 -- 1 -- -- -- -- -- -- Total In Study 40 25 24 16 13 3 4 2 -- 1 --
AArtifact types include scapula saws, bone awls, bone needles, antler wedges, other bone implements, projectile points not directly associated with traumatic injury, other chipped stone artifacts (excluding debitage), mortars, pestles, manos, abraders, stone beads, Haliotis pendants, clam shell pendants, bone pendants, shell beads, bone tubes or whistles, bone strigils, stone pipes, stone spoons, charmstones, magic stones, cinnabar, stingray points, antler, and claws or non-human teeth. Unworked faunal and botanical materials are not included in this metric. Each type listed here is counted as 1 toward the total artifact type regardless of how many of these items were associated with the burial. Specific descriptions of each artifact type are presented elsewhere in this text.
Prior to any processing, all bone samples were catalogued and weighed. Photo
records of all unprocessed samples were kept to document the size, condition, and
specific portion of bone used in the study. Portions of bone needed for collagen and
apatite preparations for the current project were separated for processing; the remaining
sample portions are curated in the SIPL for future research.
To prepare the bone samples for isotopic analysis they were first thoroughly
cleaned. Small portions of the rib samples (less than 2 grams each) were mechanically
cleaned using a Dremel tool with a diamond-studded bit (#7144), removing adhering soil
and any other surface contaminants. Because trabecular (spongy) bone has a different

316
TABLE 41. Burial-Associated TechnomicA Bone Artifacts with Study Sample Individuals
Bone Artifacts (Technomic)
No
Technomic Artifacts
Scapula saws
Bone strigils
Bone awls
Bone needles
Antler wedges
Other bone
Any BoneB
Available Samples Males 53 4 0 8 2 1 3 16
Females 36 3 2 1 0 0 0 6
Indet 18 0 1 1 0 1 1 4 Total Adults
107 7 3 10 2 2 4 26
Subadults 23 0 0 0 0 0 0 0 Total
Available 130 7 3 10 2 2 4 26
In Isotope Study Males 31 1 0 7 2 1 3 13
Females 23 2 2 1 0 0 0 5
Indet. 6 0 1 1 0 0 1 3 Total Adults
60 3 3 9 2 1 4 21
Subadults 21 0 0 0 0 0 0 0 Total In
Study 81 3 3 9 2 1 4 21
ADefinition of technomic from Binford 1962. BAny Technomic Bone category includes scapula saws, bone awls, bone needles, antler wedges, and other bone. turnover rate and is more susceptible to diagenesis and contamination than compact bone,
it was also important to remove all trabecular bone with the Dremel tool. The samples
were rinsed in deionized water (dH2O) to remove adhering dust. Each sample was then
washed ultrasonically using the Fisher Scientific Ultrasonic Cleaner FS220 (“sonicator”)
in successive rinses of dH2O, 95 percent ethanol, 100 percent ethanol, and finally
acetone.
The clean samples were dried in a 60° C oven until all moisture was removed,
then divided and weighed for separate collagen and apatite preparation. Ideally, 1.0 to 1.5
grams of clean bone were reserved for collagen preparation, and 0.5 to 1.0 gram was
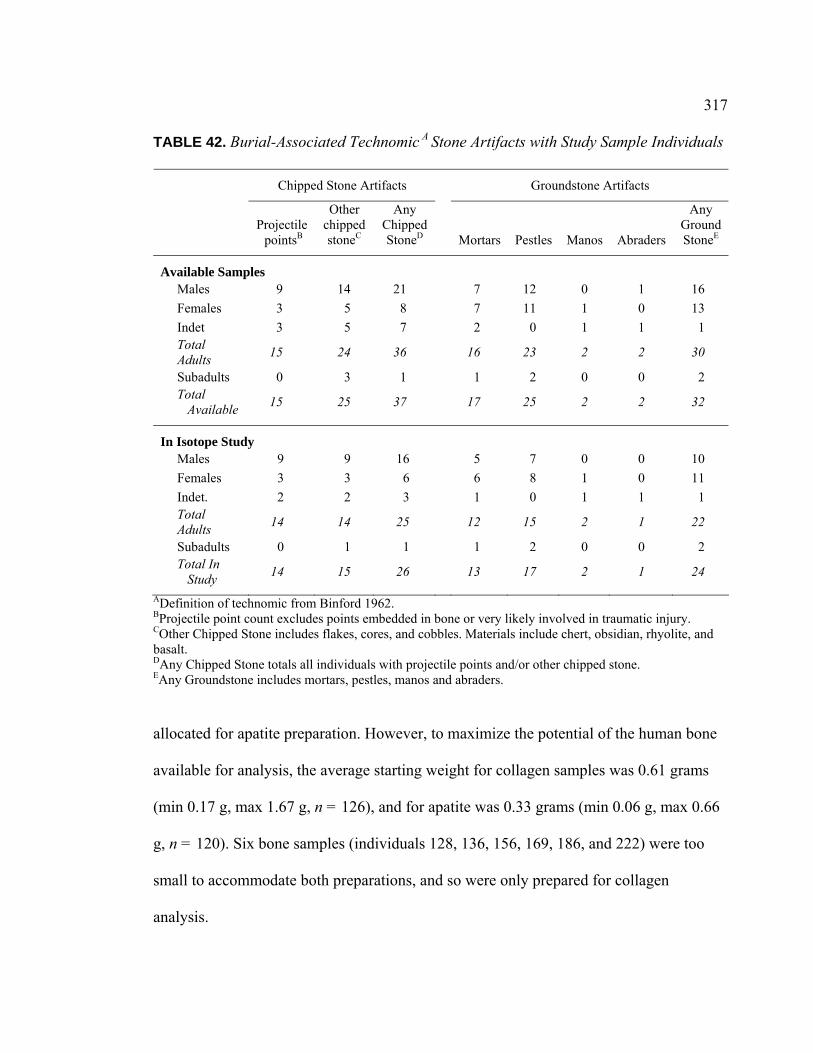
317
TABLE 42. Burial-Associated Technomic A Stone Artifacts with Study Sample Individuals
Chipped Stone Artifacts Groundstone Artifacts
Projectile pointsB
Other chipped stoneC
Any Chipped StoneD Mortars Pestles Manos Abraders
Any GroundStoneE
Available Samples Males 9 14 21 7 12 0 1 16
Females 3 5 8 7 11 1 0 13
Indet 3 5 7 2 0 1 1 1 Total Adults
15 24 36 16 23 2 2 30
Subadults 0 3 1 1 2 0 0 2 Total
Available 15 25 37 17 25 2 2 32
In Isotope Study Males 9 9 16 5 7 0 0 10
Females 3 3 6 6 8 1 0 11
Indet. 2 2 3 1 0 1 1 1 Total Adults
14 14 25 12 15 2 1 22
Subadults 0 1 1 1 2 0 0 2 Total In
Study 14 15 26 13 17 2 1 24
ADefinition of technomic from Binford 1962. BProjectile point count excludes points embedded in bone or very likely involved in traumatic injury. COther Chipped Stone includes flakes, cores, and cobbles. Materials include chert, obsidian, rhyolite, and basalt. DAny Chipped Stone totals all individuals with projectile points and/or other chipped stone. EAny Groundstone includes mortars, pestles, manos and abraders. allocated for apatite preparation. However, to maximize the potential of the human bone
available for analysis, the average starting weight for collagen samples was 0.61 grams
(min 0.17 g, max 1.67 g, n = 126), and for apatite was 0.33 grams (min 0.06 g, max 0.66
g, n = 120). Six bone samples (individuals 128, 136, 156, 169, 186, and 222) were too
small to accommodate both preparations, and so were only prepared for collagen
analysis.
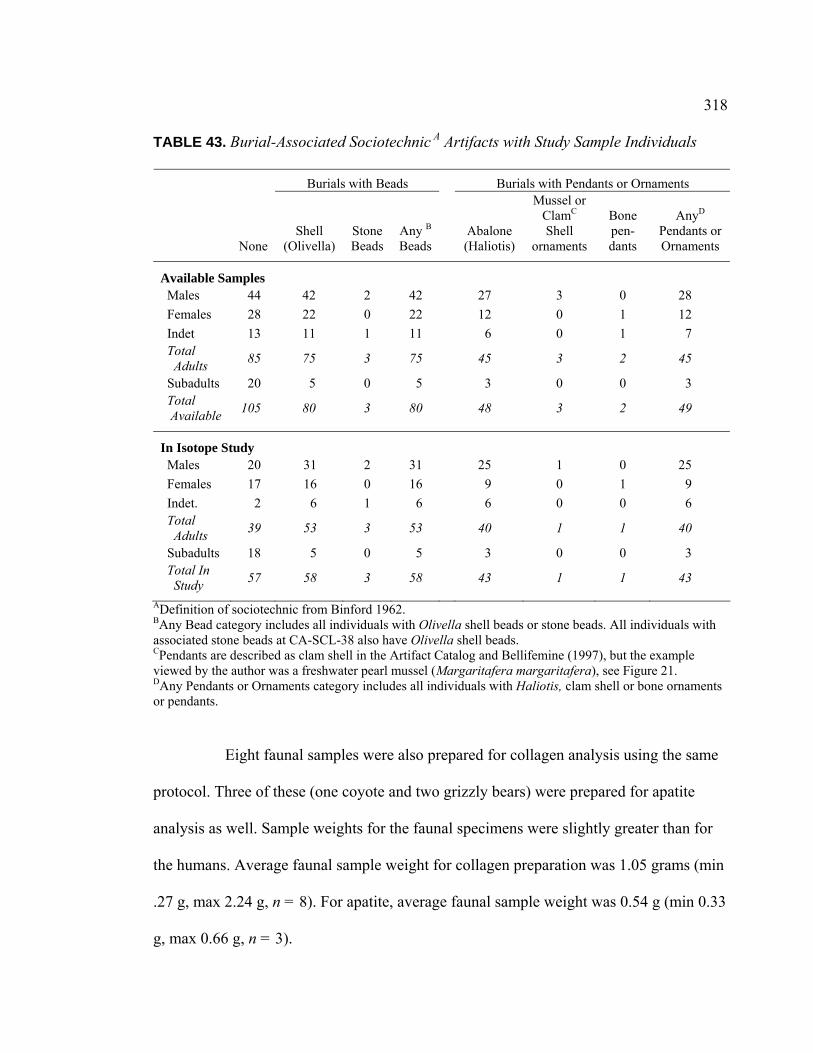
318
TABLE 43. Burial-Associated Sociotechnic A Artifacts with Study Sample Individuals
Burials with Beads Burials with Pendants or Ornaments
None Shell
(Olivella) Stone Beads
Any B Beads
Abalone (Haliotis)
Mussel or ClamC Shell
ornaments
Bone pen-dants
AnyD Pendants or Ornaments
Available Samples Males 44 42 2 42 27 3 0 28
Females 28 22 0 22 12 0 1 12
Indet 13 11 1 11 6 0 1 7 Total Adults
85 75 3 75 45 3 2 45
Subadults 20 5 0 5 3 0 0 3 Total Available
105 80 3 80 48 3 2 49
In Isotope Study Males 20 31 2 31 25 1 0 25
Females 17 16 0 16 9 0 1 9
Indet. 2 6 1 6 6 0 0 6 Total Adults
39 53 3 53 40 1 1 40
Subadults 18 5 0 5 3 0 0 3 Total In Study
57 58 3 58 43 1 1 43
ADefinition of sociotechnic from Binford 1962. BAny Bead category includes all individuals with Olivella shell beads or stone beads. All individuals with associated stone beads at CA-SCL-38 also have Olivella shell beads. CPendants are described as clam shell in the Artifact Catalog and Bellifemine (1997), but the example viewed by the author was a freshwater pearl mussel (Margaritafera margaritafera), see Figure 21. DAny Pendants or Ornaments category includes all individuals with Haliotis, clam shell or bone ornaments or pendants.
Eight faunal samples were also prepared for collagen analysis using the same
protocol. Three of these (one coyote and two grizzly bears) were prepared for apatite
analysis as well. Sample weights for the faunal specimens were slightly greater than for
the humans. Average faunal sample weight for collagen preparation was 1.05 grams (min
.27 g, max 2.24 g, n = 8). For apatite, average faunal sample weight was 0.54 g (min 0.33
g, max 0.66 g, n = 3).
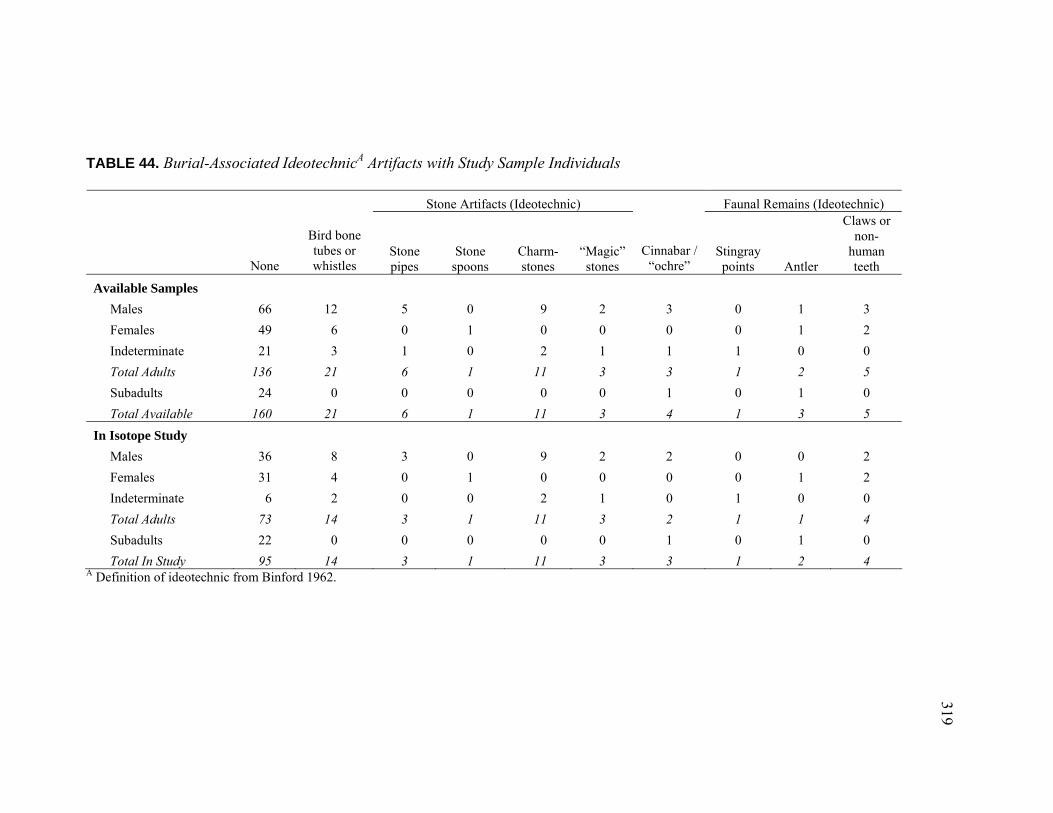
319
TABLE 44. Burial-Associated IdeotechnicA Artifacts with Study Sample Individuals
Stone Artifacts (Ideotechnic) Faunal Remains (Ideotechnic)
None
Bird bone tubes or whistles
Stone pipes
Stone spoons
Charm-stones
“Magic” stones
Cinnabar / “ochre”
Stingray points Antler
Claws or non-
human teeth
Available Samples
Males 66 12 5 0 9 2 3 0 1 3
Females 49 6 0 1 0 0 0 0 1 2
Indeterminate 21 3 1 0 2 1 1 1 0 0
Total Adults 136 21 6 1 11 3 3 1 2 5
Subadults 24 0 0 0 0 0 1 0 1 0
Total Available 160 21 6 1 11 3 4 1 3 5
In Isotope Study
Males 36 8 3 0 9 2 2 0 0 2
Females 31 4 0 1 0 0 0 0 1 2
Indeterminate 6 2 0 0 2 1 0 1 0 0
Total Adults 73 14 3 1 11 3 2 1 1 4
Subadults 22 0 0 0 0 0 1 0 1 0
Total In Study 95 14 3 1 11 3 3 1 2 4 A Definition of ideotechnic from Binford 1962.
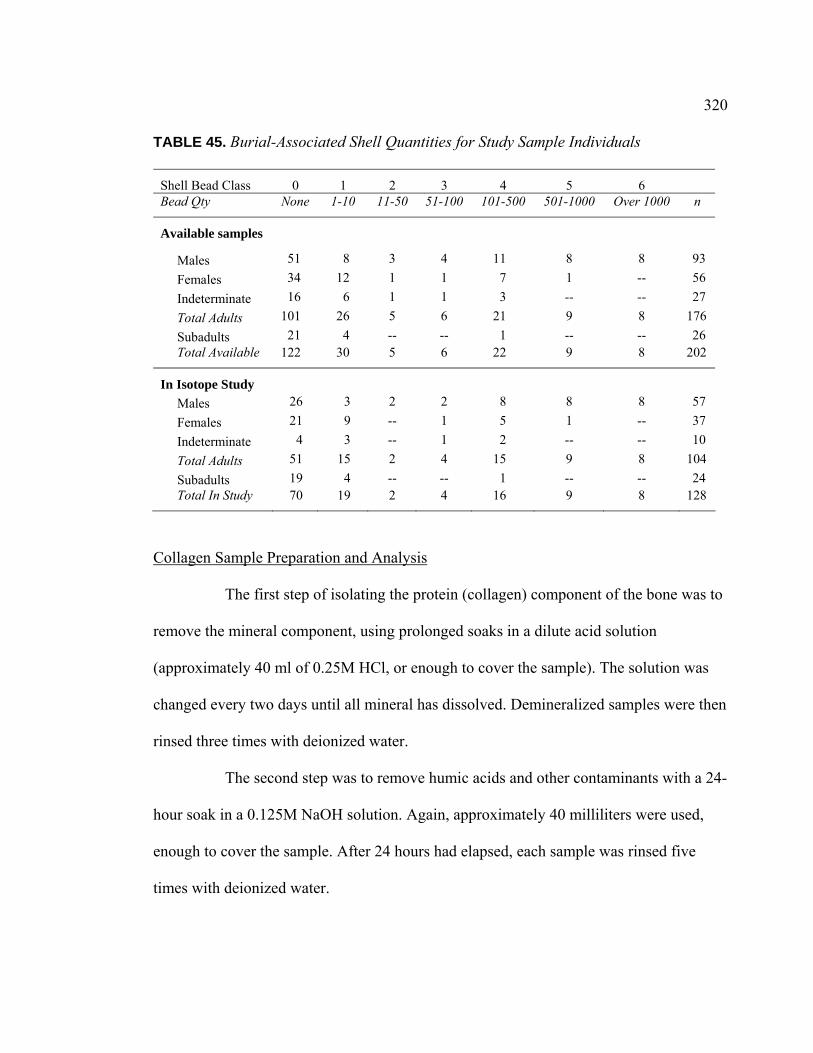
320
TABLE 45. Burial-Associated Shell Quantities for Study Sample Individuals
Shell Bead Class 0 1 2 3 4 5 6 Bead Qty None 1-10 11-50 51-100 101-500 501-1000 Over 1000 n
Available samples
Males 51 8 3 4 11 8 8 93
Females 34 12 1 1 7 1 -- 56
Indeterminate 16 6 1 1 3 -- -- 27
Total Adults 101 26 5 6 21 9 8 176
Subadults 21 4 -- -- 1 -- -- 26 Total Available 122 30 5 6 22 9 8 202
In Isotope Study
Males 26 3 2 2 8 8 8 57
Females 21 9 -- 1 5 1 -- 37
Indeterminate 4 3 -- 1 2 -- -- 10
Total Adults 51 15 2 4 15 9 8 104
Subadults 19 4 -- -- 1 -- -- 24 Total In Study 70 19 2 4 16 9 8 128
Collagen Sample Preparation and Analysis
The first step of isolating the protein (collagen) component of the bone was to
remove the mineral component, using prolonged soaks in a dilute acid solution
(approximately 40 ml of 0.25M HCl, or enough to cover the sample). The solution was
changed every two days until all mineral has dissolved. Demineralized samples were then
rinsed three times with deionized water.
The second step was to remove humic acids and other contaminants with a 24-
hour soak in a 0.125M NaOH solution. Again, approximately 40 milliliters were used,
enough to cover the sample. After 24 hours had elapsed, each sample was rinsed five
times with deionized water.
321
Next, each sample was solubilized (gelatinized), by adding approximately 15
milliliters of very weak HCl solution (pH 3), sealing tightly, and incubating in an oven at
70 to 90°C. After 24 hours, the sample was centrifuged, the solubilized collagen was
poured off into a clean Teflon cup, and another 15 milliliters of pH3 solution was added
to the remaining sample. This process was repeated three times or until all visible
collagen had solubilized. The Teflon cups were stored in the 70 to 90°C oven to
evaporate all liquid. When solubilizing was complete, a few milliliters of pH3 solution
were added to the Teflon cup to liquefy the collagen, and the sample was poured into a
clean, labeled, pre-weighed, glass scintillation vial.
The final step of preparation in the CSU Chico Stable Isotope Preparation Lab
was to lyophilize (freeze-dry) the samples. After solubilizing, the sample vials were
frozen. Frozen samples were placed into a lyophilizer overnight. The next day the vials
were removed, tightly sealed, and weighed to determine collagen yield (used for quality
assessment).
The prepared samples were transported to the Stable Isotope Facility (SIF) in
the Department of Plant Sciences at UC Davis. Small portions of freeze-dried collagen
(1.5 to 2.0 mg) were measured into tin capsules, and then submitted to SIF lab personnel
for analysis, under the supervision of Dr. David Harris. Values for δ13C and δ15N were
obtained using a PDZ Europa ANCA-GSL elemental analyzer, which was interfaced to a
PDX Europa 20-20 isotope ratio mass spectrometer (reported precision ± 0.2‰ for δ13C
and ± 0.3‰ for δ15N). Several replicates of two previously calibrated reference samples
were interspersed with the project samples during the analysis to ensure consistency and
to calibrate the results.
322
After analysis of carbon and nitrogen isotope values, remaining portions of
purified, lyophilized collagen from twenty individuals and five fauna were sent to Dr.
Olaf Nehlich at the Max Planck Institute for Evolutionary Anthropology, Department of
Human Evolution, in Leipzig, Germany, for analysis of sulfur isotope composition.
Sulfur isotope values (δ34S) in bone collagen reflect the local geology of food resources
(Nehlich 2010; Richards et al. 2001, 2003). The individuals selected for this additional
process included nineteen adult males, one infant, two bears, one coyote, and two rabbits.
Faunal samples were included with the expectation that these animals had been eating
local resources and could provide a value for sulfur isotopes in the Santa Clara Valley.
The adults include four males found in an unusual mortuary context Burials 141, 142,
143, and 144), who were suspected of being outsiders. Other males are included in the
hopes of differentiating humans eating a local diet from those who had been living and
dining elsewhere. The infant (Burial 220) was part of a double burial with an adult male,
also included in this study (Burial 219), and is likely to have been eating a locally derived
diet.
Apatite Sample Preparation and Analysis
To test the isotopic composition of the apatite (mineral) fraction of bone from
CA-SCL-38, the clean, dry, and weighed bone samples were each mechanically ground
to a fine powder by crushing them with a steel mortar and pestle until all bone powder
passed through a micro-sieve fitted with a size 60 mesh screen. The powdered bone was
weighed at this stage, and then poured into a centrifuge tube.
For the second step of preparation, a measured portion of dilute bleach
solution was added to each sample to remove the organic component of the bone (1.5%

323
sodium hypochlorite (NaOCl) at the ratio of 0.04 ml of solution for every mg of bone
powder). The bone powder was soaked in the bleach solution for 24 hours, and swirled
periodically to expose all powder to the solution. After 24 hours, the sample was
centrifuged, the old bleach solution poured off, and a new measure of bleach solution was
added. Following the second 24 hour soak, the samples were again centrifuged, the
solution poured off, and the samples were rinsed three times with deionized water,
centrifuging between each rinse.
The final step of apatite preparation was to soak the samples for two 12-hour
periods in a buffered acetic acid solution (1M CH3COOH buffered with NaOH to pH 4.5)
to remove the diagenetic contaminants. The same proportion of solution to sample is used
to control the reaction. After each 12-hour period, the samples were centrifuged and then
the old solution poured off. After the final soak, the samples were rinsed three times with
deionized water, and then dried overnight in a 70°C oven.
Prepared apatite samples were delivered to the UC Davis Stable Isotope
Laboratory in the Department of Geology. Initial analytical tests were completed by Dr.
David Winter using the GVI Optima Stable Isotope Ratio Mass Spectrometer (SIRMS),
which loads samples via a 44-sample carbonate carousel and uses a shared acid bath for
sample combustion. Results from this first sample run were problematic. Review of
reference sample values included in the run showed a progressive accumulation of some
isotopic values (especially heavy oxygen isotopes), which skewed the results. To avoid
this “memory effect” problem, the samples were run a second time under the direction of
Dr. Howard Spero, using the GVI Isoprime Mass Spectrometer, which combusts each

324
sample individually (avoiding the shared acid bath). Results from this second run
produced unambiguous δ13C values, and will be the ones used in this study.
Tests of Sample Quality
Buried bone is subject to changes in composition due to diagenesis, the
breakdown and contamination of material after deposition. Diagenetic processes may
alter bone structure and chemical integrity. Exposure to minerals carried in groundwater,
associated soil components, microbial and bacterial contaminants, and modern pollutants
can all affect bone chemistry. To ensure that stable isotope analysis yields results that
pertain to the bone and not to environmental contaminants, it is essential to test for
sample quality. Three methods were used in this study to assess the integrity of collagen
samples; these are collagen yield, C/N ratio, and collagen appearance. Two methods were
used to test the integrity of the apatite samples: infrared splitting factor (IR-SF) and
CO3/PO4 (C/P) ratio. Explanations of these methods and discussion of test results will
follow.
Assessment of Collagen Sample Quality
Collagen yield is determined by subtracting the final collagen sample weight
from the clean bone sample weight recorded before processing and is expressed as a
percentage of the original bone weight. Yields over 3.5 percent suggest good preservation
(Ambrose 2000). A study by van Klinken (1999) placed the threshold lower, but advised
that additional quality measures should be used for samples with yields between 2 and
0.5 percent. Most samples included in this project had a collagen yield over 3.5 percent (n
= 127 of 136, see Tables 46 and 47). Three samples in this study had relatively low
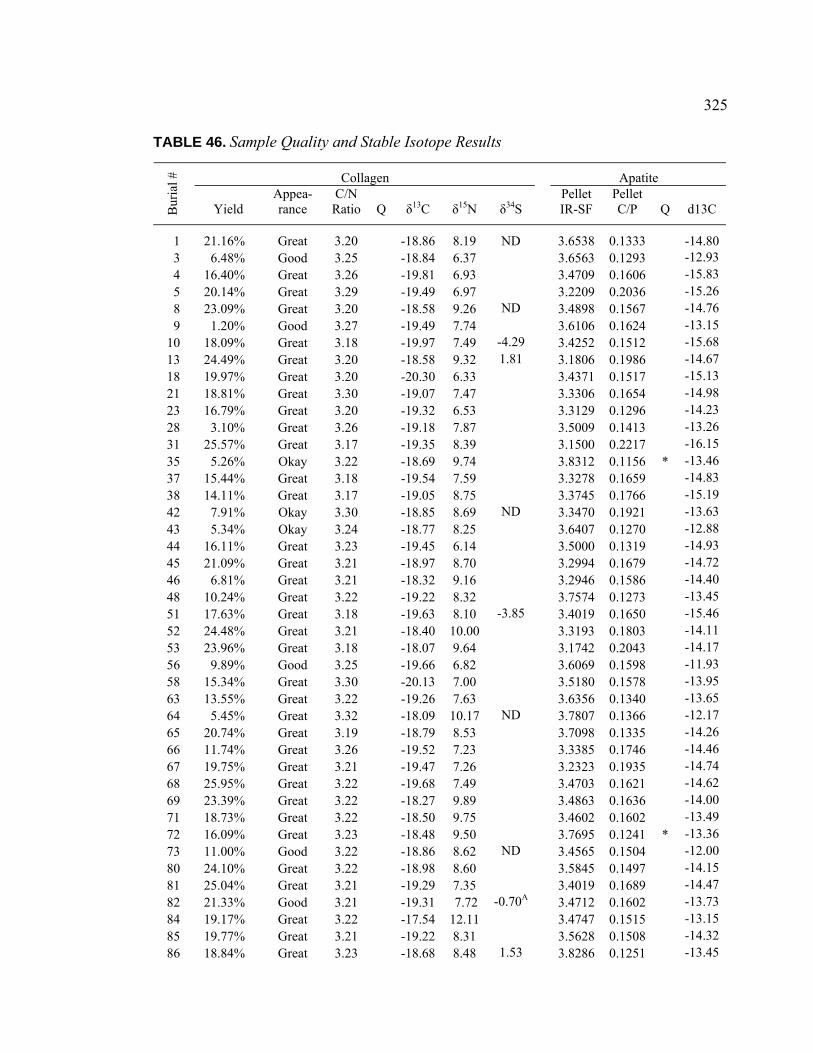
325
TABLE 46. Sample Quality and Stable Isotope Results
Collagen Apatite B
uria
l #
Yield Appea-rance
C/N Ratio Q δ13C δ15N δ34S
Pellet IR-SF
Pellet C/P Q d13C
1 21.16% Great 3.20 -18.86 8.19 ND 3.6538 0.1333 -14.80 3 6.48% Good 3.25 -18.84 6.37 3.6563 0.1293 -12.93 4 16.40% Great 3.26 -19.81 6.93 3.4709 0.1606 -15.83 5 20.14% Great 3.29 -19.49 6.97 3.2209 0.2036 -15.26 8 23.09% Great 3.20 -18.58 9.26 ND 3.4898 0.1567 -14.76 9 1.20% Good 3.27 -19.49 7.74 3.6106 0.1624 -13.15
10 18.09% Great 3.18 -19.97 7.49 -4.29 3.4252 0.1512 -15.68 13 24.49% Great 3.20 -18.58 9.32 1.81 3.1806 0.1986 -14.67 18 19.97% Great 3.20 -20.30 6.33 3.4371 0.1517 -15.13 21 18.81% Great 3.30 -19.07 7.47 3.3306 0.1654 -14.98 23 16.79% Great 3.20 -19.32 6.53 3.3129 0.1296 -14.23 28 3.10% Great 3.26 -19.18 7.87 3.5009 0.1413 -13.26 31 25.57% Great 3.17 -19.35 8.39 3.1500 0.2217 -16.15 35 5.26% Okay 3.22 -18.69 9.74 3.8312 0.1156 * -13.46 37 15.44% Great 3.18 -19.54 7.59 3.3278 0.1659 -14.83 38 14.11% Great 3.17 -19.05 8.75 3.3745 0.1766 -15.19 42 7.91% Okay 3.30 -18.85 8.69 ND 3.3470 0.1921 -13.63 43 5.34% Okay 3.24 -18.77 8.25 3.6407 0.1270 -12.88 44 16.11% Great 3.23 -19.45 6.14 3.5000 0.1319 -14.93 45 21.09% Great 3.21 -18.97 8.70 3.2994 0.1679 -14.72 46 6.81% Great 3.21 -18.32 9.16 3.2946 0.1586 -14.40 48 10.24% Great 3.22 -19.22 8.32 3.7574 0.1273 -13.45 51 17.63% Great 3.18 -19.63 8.10 -3.85 3.4019 0.1650 -15.46 52 24.48% Great 3.21 -18.40 10.00 3.3193 0.1803 -14.11 53 23.96% Great 3.18 -18.07 9.64 3.1742 0.2043 -14.17 56 9.89% Good 3.25 -19.66 6.82 3.6069 0.1598 -11.93 58 15.34% Great 3.30 -20.13 7.00 3.5180 0.1578 -13.95 63 13.55% Great 3.22 -19.26 7.63 3.6356 0.1340 -13.65 64 5.45% Great 3.32 -18.09 10.17 ND 3.7807 0.1366 -12.17 65 20.74% Great 3.19 -18.79 8.53 3.7098 0.1335 -14.26 66 11.74% Great 3.26 -19.52 7.23 3.3385 0.1746 -14.46 67 19.75% Great 3.21 -19.47 7.26 3.2323 0.1935 -14.74 68 25.95% Great 3.22 -19.68 7.49 3.4703 0.1621 -14.62 69 23.39% Great 3.22 -18.27 9.89 3.4863 0.1636 -14.00 71 18.73% Great 3.22 -18.50 9.75 3.4602 0.1602 -13.49 72 16.09% Great 3.23 -18.48 9.50 3.7695 0.1241 * -13.36 73 11.00% Good 3.22 -18.86 8.62 ND 3.4565 0.1504 -12.00 80 24.10% Great 3.22 -18.98 8.60 3.5845 0.1497 -14.15 81 25.04% Great 3.21 -19.29 7.35 3.4019 0.1689 -14.47 82 21.33% Good 3.21 -19.31 7.72 -0.70A 3.4712 0.1602 -13.73 84 19.17% Great 3.22 -17.54 12.11 3.4747 0.1515 -13.15 85 19.77% Great 3.21 -19.22 8.31 3.5628 0.1508 -14.32 86 18.84% Great 3.23 -18.68 8.48 1.53 3.8286 0.1251 -13.45

326
TABLE 46 (Continued).
Collagen Apatite B
uria
l #
Yield Appea-rance
C/N Ratio Q δ13C δ15N δ34S
Pellet IR-SF
Pellet C/P Q d13C
87 19.20% Great 3.22 -19.38 7.61 3.3431 0.1692 -14.71 88 14.74% Great 3.22 -18.50 9.49 3.4154 0.1719 -13.32 90 20.13% Great 3.29 -19.73 7.07 3.5163 0.1606 -14.84 91 15.71% Great 3.30 -18.31 9.27 3.5903 0.1202 * -14.26 92 21.74% Good 3.24 -18.68 8.85 0.99 3.5794 0.1563 -13.50 94 -0.83% Great 3.25 -18.27 9.89 3.5794 0.1561 -12.39 95 11.68% Great 3.21 -18.36 9.64 3.7761 0.1339 -12.71 97 17.81% Good 3.24 -18.52 9.13 3.4123 0.1730 -12.69 99 11.51% Good 3.26 -19.25 8.44 3.4424 0.1810 -13.32
105 16.80% Great 3.30 -18.88 7.35 3.4747 0.1395 -13.53 107 19.41% Great 3.30 -18.57 8.29 3.3655 0.1597 -14.74 108 14.61% Good 3.24 -19.86 6.79 3.1923 0.2010 -15.79 115 5.81% Great 3.27 -19.38 6.96 3.4059 0.1614 -14.64 116 19.84% Great 3.31 -19.38 7.06 3.3407 0.1603 -15.14 117 15.01% Great 3.22 -18.43 9.57 3.7485 0.1366 -13.75 119 20.28% Great 3.23 -19.25 11.62 3.5424 0.1349 -15.26 120 20.76% Great 3.24 -19.34 8.75 3.6035 0.1432 -14.37 125 25.25% Great 3.23 -19.99 6.76 3.6047 0.1424 -14.97 127 18.48% Good 3.25 -18.52 10.25 3.5688 0.1316 -14.89 128 20.25% Great 3.23 -19.76 8.92 129 24.96% Great 3.24 -19.17 7.91 3.3562 0.1767 -14.51 130 17.97% Great 3.22 -18.65 9.41 3.7699 0.1311 -13.42 132 21.90% Great 3.30 -19.50 7.60 3.3429 0.1739 -14.62
134 3.48% N/R 2.82 * -19.64 8.17 -13.96
135 16.59% Great 3.24 -19.21 8.22 3.6952 0.1255 -13.80 136 4.67% Okay 3.36 -20.09 10.61 137 5.13% Great 3.29 -19.27 7.98 3.5341 0.1481 -13.55 140 20.24% Good 3.22 -18.86 9.96 0.91 3.5854 0.1502 -14.20 141 19.15% Great 3.23 -18.51 6.48 3.03 3.4188 0.1651 -13.97 142 12.79% Great 3.23 -18.51 6.10 ND 3.4154 0.1588 -13.32 143 14.61% Great 3.24 -18.28 6.74 3.93 3.4409 0.1579 -14.00 144 15.09% Great 3.25 -18.46 6.39 ND 3.4420 0.1548 -13.65 146 15.02% Great 3.26 -19.71 7.69 3.6154 0.1730 -14.69 148 19.38% Great 3.24 -18.73 9.53 3.5086 0.1551 -14.26 152 21.16% Great 3.27 -19.88 7.94 -2.85 3.5824 0.1357 -15.10 156 12.94% Good 3.27 -17.60 12.77 159 -6.06% Great 3.25 -19.31 8.04 3.5944 0.1354 -13.71 160 23.02% N/R 3.21 -18.74 9.15 3.6457 0.1474 -14.15 161 5.30% Great 3.24 -18.54 9.46 3.5201 0.1754 -12.84 164 12.43% Great 3.23 -19.10 7.58 3.6830 0.1466 -13.62 166 20.82% Great 3.20 -17.49 11.68 3.4756 0.1616 -13.18 167 19.45% Great 3.22 -18.58 8.74 3.6347 0.1396 -14.00 168 18.33% Great 3.28 -19.42 8.11 3.3853 0.1529 -14.07
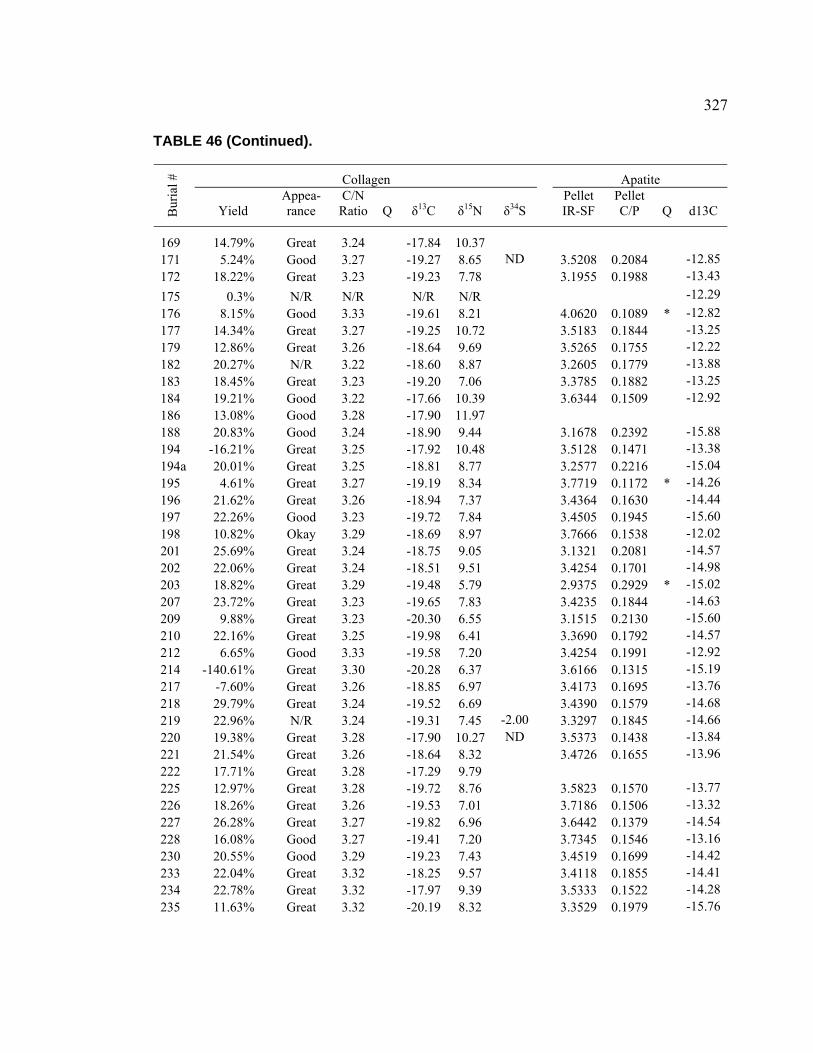
327
TABLE 46 (Continued).
Collagen Apatite B
uria
l #
Yield Appea-rance
C/N Ratio Q δ13C δ15N δ34S
Pellet IR-SF
Pellet C/P Q d13C
169 14.79% Great 3.24 -17.84 10.37 171 5.24% Good 3.27 -19.27 8.65 ND 3.5208 0.2084 -12.85 172 18.22% Great 3.23 -19.23 7.78 3.1955 0.1988 -13.43
175 0.3% N/R N/R N/R N/R -12.29
176 8.15% Good 3.33 -19.61 8.21 4.0620 0.1089 * -12.82 177 14.34% Great 3.27 -19.25 10.72 3.5183 0.1844 -13.25 179 12.86% Great 3.26 -18.64 9.69 3.5265 0.1755 -12.22 182 20.27% N/R 3.22 -18.60 8.87 3.2605 0.1779 -13.88 183 18.45% Great 3.23 -19.20 7.06 3.3785 0.1882 -13.25 184 19.21% Good 3.22 -17.66 10.39 3.6344 0.1509 -12.92 186 13.08% Good 3.28 -17.90 11.97 188 20.83% Good 3.24 -18.90 9.44 3.1678 0.2392 -15.88 194 -16.21% Great 3.25 -17.92 10.48 3.5128 0.1471 -13.38 194a 20.01% Great 3.25 -18.81 8.77 3.2577 0.2216 -15.04 195 4.61% Great 3.27 -19.19 8.34 3.7719 0.1172 * -14.26 196 21.62% Great 3.26 -18.94 7.37 3.4364 0.1630 -14.44 197 22.26% Good 3.23 -19.72 7.84 3.4505 0.1945 -15.60 198 10.82% Okay 3.29 -18.69 8.97 3.7666 0.1538 -12.02 201 25.69% Great 3.24 -18.75 9.05 3.1321 0.2081 -14.57 202 22.06% Great 3.24 -18.51 9.51 3.4254 0.1701 -14.98 203 18.82% Great 3.29 -19.48 5.79 2.9375 0.2929 * -15.02 207 23.72% Great 3.23 -19.65 7.83 3.4235 0.1844 -14.63 209 9.88% Great 3.23 -20.30 6.55 3.1515 0.2130 -15.60 210 22.16% Great 3.25 -19.98 6.41 3.3690 0.1792 -14.57 212 6.65% Good 3.33 -19.58 7.20 3.4254 0.1991 -12.92 214 -140.61% Great 3.30 -20.28 6.37 3.6166 0.1315 -15.19 217 -7.60% Great 3.26 -18.85 6.97 3.4173 0.1695 -13.76 218 29.79% Great 3.24 -19.52 6.69 3.4390 0.1579 -14.68 219 22.96% N/R 3.24 -19.31 7.45 -2.00 3.3297 0.1845 -14.66 220 19.38% Great 3.28 -17.90 10.27 ND 3.5373 0.1438 -13.84 221 21.54% Great 3.26 -18.64 8.32 3.4726 0.1655 -13.96 222 17.71% Great 3.28 -17.29 9.79 225 12.97% Great 3.28 -19.72 8.76 3.5823 0.1570 -13.77 226 18.26% Great 3.26 -19.53 7.01 3.7186 0.1506 -13.32 227 26.28% Great 3.27 -19.82 6.96 3.6442 0.1379 -14.54 228 16.08% Good 3.27 -19.41 7.20 3.7345 0.1546 -13.16 230 20.55% Good 3.29 -19.23 7.43 3.4519 0.1699 -14.42 233 22.04% Great 3.32 -18.25 9.57 3.4118 0.1855 -14.41 234 22.78% Great 3.32 -17.97 9.39 3.5333 0.1522 -14.28 235 11.63% Great 3.32 -20.19 8.32 3.3529 0.1979 -15.76

328
TABLE 46 (Continued).
Collagen Apatite B
uria
l #
Yield Appea-rance
C/N Ratio Q δ13C δ15N δ34S
Pellet IR-SF
Pellet C/P Q d13C
236 5.58% Good 3.33 -18.52 8.82 3.8194 0.1432 -12.19 237 15.15% N/R 3.33 -19.14 8.00 3.4977 0.1560 -13.45
QC = Quality control, * = values raise concerns about sample quality (discussed in text). ND = No data, awaiting result from Max Planck Institute. AValue equals mean of two test results (-1.03 and -0.36). TABLE 47. Sample Quality and Stable Isotope Results – Faunal Samples
Collagen
Apatite
Burial # Faunal
Specimen Yield C/N
Ratio d13C d15N d34S
Pellet IR-SF
IR-SF Result
Pellet C/P d13C
22 Bear 1 19% 3.24 -19.67 4.25 1.38 3.2634 Good 0.1913 -14.50 250-173 Sylvilagus 1 14% 3.27 -20.85 4.57 -5.35 250-186 Sylvilagus 2 12% 3.24 -22.19 7.20 ND 250-74-1 Goose 20% 3.25 -20.91 5.73 250-74-2 Duck 10% 3.28 -26.73 7.78 300-17 Bear 2 13% 3.26 -20.55 2.87 ND 3.1895 Good 0.2137 -15.91 NP1F Coyote 18% 3.23 -19.33 8.24 ND 3.0714 Good 0.2465 -14.55 NP2F Goose 15% 3.24 -20.86 4.00
ND = No data, awaiting result from Max Planck Institute. yields (Burial 9 at 1.20%, Burial 28 at 3.10%, and Burial 134 at 3.48%). The sample from
Burial 175 yielded too little collagen to run (0.3%). Unfortunately, calculated yields were
below zero for the remaining five samples. The latter result, where processed sample
weight is less than starting sample weight, is the result of weighing errors. Fortunately,
two additional methods were used to evaluate sample integrity.

329
After the collagen samples were lyophilized, they were visually inspected for
quality. Well-preserved, good quality collagen should be pale in color and solid or foamy
in texture. Collagen of marginal quality is dark amber in color, and clusters in small
beads. Poor quality collagen is very dark in color, forming a crust at the bottom of the
vial. Visual inspection of the samples in this study found two examples where collagen
quality appeared to be poor (Burials 28 and 237), and eleven examples where collagen
appeared to be of marginal quality (Burials 42, 88, 94, 136, 168, 176, 179, 198, 222, 228,
and 236).
The final test of collagen quality is the atomic carbon to nitrogen (C/N) ratio.
For each sample run through the PDZ Europa ANCA-GSL elemental analyzer at the UC
Davis Stable Isotope Facility, the weights of carbon and nitrogen present in the sample
were measured. Calculating the ratio of carbon to nitrogen particles in the sample
provides a good estimate of bone quality, as proteins have a predictable structure and
composition. If the measured quantity of carbon or nitrogen is outside the expected range,
components of the bone have either been lost or new particles (contaminants) have been
deposited. The expected C/N ratio for modern bone ranges between 2.9 and 3.6 (DeNiro
1985).
All but one of the samples in this study fell within the acceptable C/N range.
The C/N ratio for Burial 134 was slightly below, at 2.82. The collagen yield for this
individual was also low (3.48%), making quality of this sample marginal. However, the
δ13C and δ15N values for this individual fell within one standard deviation of the
population mean, which suggests that the isotopic results may still be reliable. Based on
the results of collagen sample quality testing, all human and faunal samples will be
330
included where results were available (n = 127 humans and 8 fauna, Burial 175 is
excluded).
Assessment of Apatite Sample Quality
To assess sample integrity of the bone mineral (apatite) samples from this
study, all original samples were analyzed using Fourier transform infrared spectroscopy
(FTIR) (n = 123, including 120 humans and 3 fauna). Samples were prepared and tested
in the Department of Chemistry at CSU Chico, with permission of Dr. Randy Miller, and
under the guidance of Melanie Beasley. For each sample, 2.0 milligrams of prepared
bone apatite was ground in an agate mortar with 200 milligrams of potassium bromide
(KBr). A pellet was created by pressing the mixture into a paper disk using a hydraulic
press at 10,000 psi of pressure for two minutes. The chemical bonds within each pelleted
sample were evaluated using a Nicolet Magna 500 FTIR analyzer, which directs infrared
light through the pellet. Absorbance levels were measured for wavelengths between 4000
and 400 cm-1 using 100 scans at a resolution of 8 cm-1. Each type of molecule within the
sample absorbed light at specific wavelengths, based on the natural vibrational
frequencies of its chemical bonds (Pavia et al 1999:A15). The proportions of absorbed
infrared wavelengths were graphically captured as a spectrum of wavelength amplitudes
for each sample. Specific peaks from the spectra produced by FTIR analysis were
measured using OMNIC 7.0 software.
The first index of sample quality measured using the FTIR spectra is the ratio
of carbonate to phosphate, the CO3/PO4, or C/P, ratio. During life, carbonate groups (CO3)
naturally substitute for phosphate groups (PO4) in the formation of apatite molecules
(Ca10(PO4)6(OH)2. After death, diagenetic processes introduce additional carbonates
331
which continue to replace phosphates, altering the biogenic ratio of carbonates to
phosphates (Wright and Schwarcz 1996). Measuring the ratio of carbonate to phosphate
in the sample therefore is an excellent assessment of the degree of diagenesis. Unaltered
modern bone has a C/P ratio of 0.25; any additional carbonate acquired through
diagenetic processes would produce a higher C/P ratio (Wright and Schwarcz 1996). A
low C/P ratio indicates a depletion of carbonate in the sample; samples below 0.125 are
excluded from Wright and Schwarcz’s study. C/P ratio is determined by establishing a
baseline on the spectrum and then dividing the measured amplitude of the carbonate peak
at 1415 cm-1 by that of the phosphate peak at 1035 cm-1.
The second measure of sample quality is the infrared splitting factor (IR-SF),
also called the crystallinity index (CI). This ratio divides the combined amplitudes of
phosphate peaks at 605 and 560 cm-1 by that of the trough between them at 590 cm-1.
Modern bone shows an IR-SF value of 3.1, ranging to 3.5 with acetic acid treatment
(Wright and Schwarcz 1996). Higher values indicate that size within the apatite lattice
structure has increased (due to either new crystal growth or dissolution of smaller
crystals). Crystallinity is a concern because exogenous materials can become
incorporated in the matrix, affecting the isotopic composition of bone.
The results show a weak, positive correlation between δ13C and the IR-SF (r
=.551, p < .01, n = 123, see Figure 31). When the faunal samples are removed, the
correlation is still significant (r =.515, p < .01, n = 120), suggesting that diagenesis may
have altered composition of the apatite in these samples. This relationship implies that
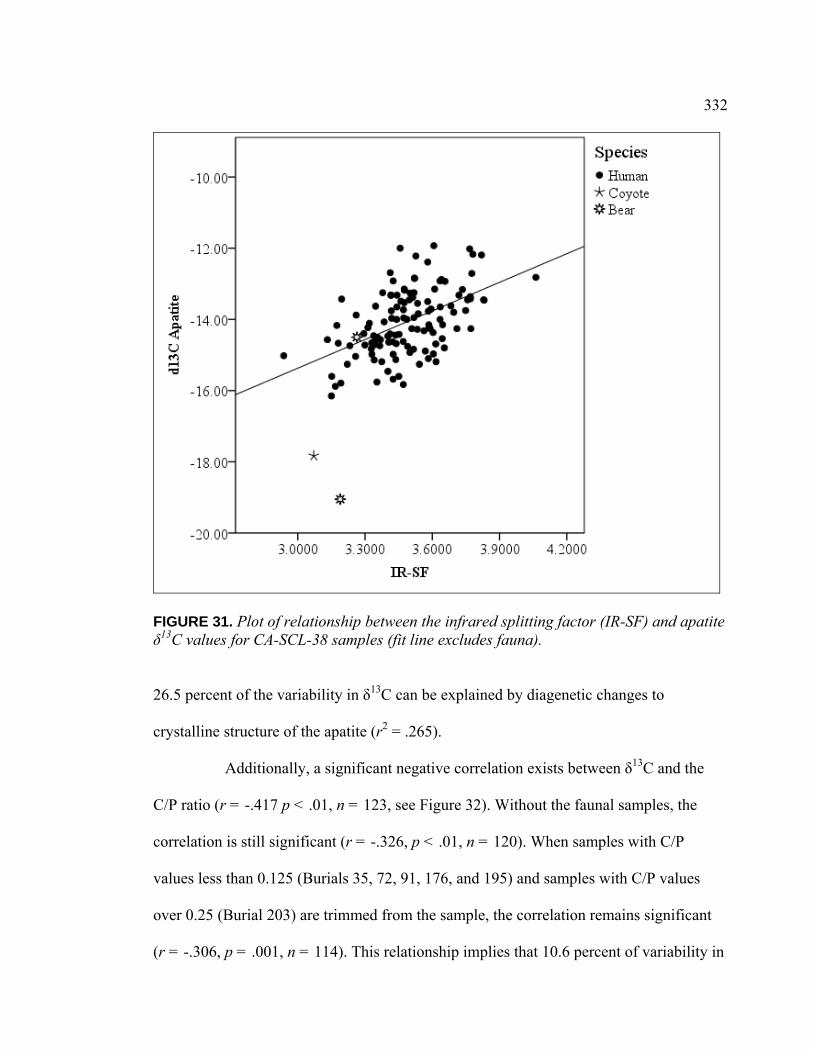
332
FIGURE 31. Plot of relationship between the infrared splitting factor (IR-SF) and apatite δ13C values for CA-SCL-38 samples (fit line excludes fauna). 26.5 percent of the variability in δ13C can be explained by diagenetic changes to
crystalline structure of the apatite (r2 = .265).
Additionally, a significant negative correlation exists between δ13C and the
C/P ratio (r = -.417 p < .01, n = 123, see Figure 32). Without the faunal samples, the
correlation is still significant (r = -.326, p < .01, n = 120). When samples with C/P
values less than 0.125 (Burials 35, 72, 91, 176, and 195) and samples with C/P values
over 0.25 (Burial 203) are trimmed from the sample, the correlation remains significant
(r = -.306, p = .001, n = 114). This relationship implies that 10.6 percent of variability in
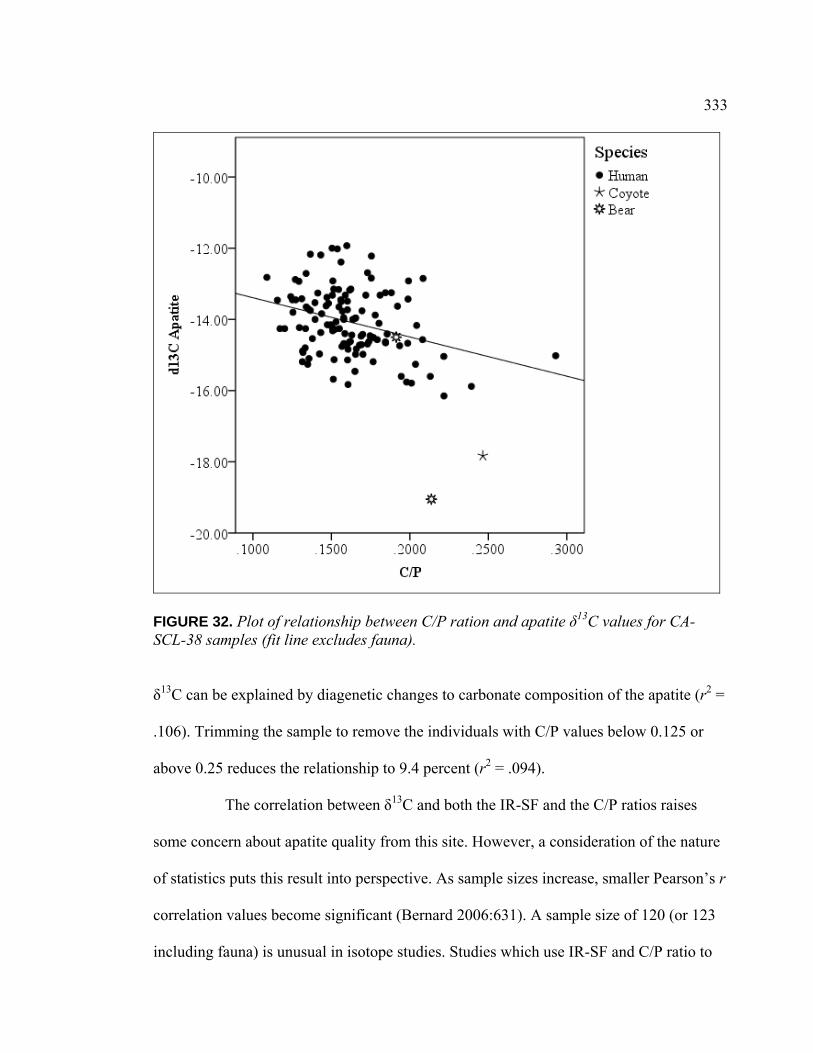
333
FIGURE 32. Plot of relationship between C/P ration and apatite δ13C values for CA-SCL-38 samples (fit line excludes fauna). δ13C can be explained by diagenetic changes to carbonate composition of the apatite (r2 =
.106). Trimming the sample to remove the individuals with C/P values below 0.125 or
above 0.25 reduces the relationship to 9.4 percent (r2 = .094).
The correlation between δ13C and both the IR-SF and the C/P ratios raises
some concern about apatite quality from this site. However, a consideration of the nature
of statistics puts this result into perspective. As sample sizes increase, smaller Pearson’s r
correlation values become significant (Bernard 2006:631). A sample size of 120 (or 123
including fauna) is unusual in isotope studies. Studies which use IR-SF and C/P ratio to
334
establish metrics for evaluation of sample quality have typically used smaller sample
groups (e.g., n = 25 in Nielsen-Marsh and Hedges 2000b; n = 41 in Wright and Schwarcz
1996). Further, when plotting samples which have been damaged by diagenetic
processes, a clear linear relationship is visible between the IR-SF or C/P ratios and the
δ13C values (Nielsen-Marsh and Hedges 2000b; Wright and Schwarcz 1996). The breadth
of the scatter of points seen in Figures 31and 32 provides some level of assurance that
considerable biogenetic variation is still present in the observed values of these samples,
and that the influence of diagenetic factors is minor. Finally, the δ13CApatite results are
congruous with those from collagen, and are consistent with expectations for a population
with a diet based primarily on terrestrial foods with some marine contributions (see
Chapter VIII). Based on these considerations, the δ13C values from all one hundred
twenty three apatite samples are included in stable isotope results and discussion, with
minor qualifications.
Summary of Materials and Methods
The human bone samples selected for this stable isotope research project
represent a diverse group of individuals from the population recovered from the Yukisma
Mound (CA-SCL-38). These individuals were associated with a variety of burial contexts
and artifacts, and so should represent a meaningful cross-section of social roles and
statuses for dietary correlation. Collagen samples, which are the most meaningful
indicators of dietary protein, proved to be of good quality. Apatite samples, used to assess
whole diet variation, may have been subject to some degree of diagenetic change in
crystalline structure and carbonate composition. However, a contextual consideration of

335
the apatite results suggests that the δ13CApatite values are likely to be consistent with the
original biogenetic values. Correlation between collagen and apatite δ13C values will be
presented in Chapter VIII, the Results chapter.
336
CHAPTER VIII
RESULTS OF STABLE ISOTOPE
ANALYSIS
Introduction
This chapter presents the results of stable isotope analysis of bone collagen
and apatite for 128 individuals whose remains were excavated from the Yukisma Mound
(CA-SCL-38) in Santa Clara County, California, between 1993 and 1994. Of the 128
individuals initially selected to be part of this study, collagen results were obtained for all
but one (Burial 175). Apatite data was obtained for 122 individuals, which includes all
samples submitted. Apatite samples were not prepared for six subadults (Burials 128,
136, 156, 169, 186, and 222) because the available sample material was insufficient for
both preparations. Additionally collagen results were obtained for eight faunal samples
(two bears, two rabbits, one coyote, two geese, and one duck). Three faunal samples (two
bears and one coyote) were also submitted for apatite analysis and yielded results.
From the samples of purified collagen, stable isotope values of carbon (δ13C)
and nitrogen (δ15N) were recorded. From the bone apatite samples, only carbon values
(δ13C) are reported in this study. At the time of this writing, data from eleven of the 25
collagen samples submitted for sulfur isotope analysis (δ34S) have been received.
The presentation of results will begin by examining the general dietary
patterns of the population. Stable isotope results are plotted against a theorized foodweb
337
to estimate dietary choices from the available menu. Temporal variation in diet will be
reviewed based on radiocarbon, obsidian hydration, and shell bead dates. An examination
of dietary variation between demographic groups will compare diet of males and females
and of individuals of different age classes. Statistical comparison of isotope values will
conclude by correlating dietary patterns with mortuary context and artifactual
associations. Statistics were calculated using IBM SPSS Statistics 21. The research
questions posed at the end of Chapter VI (Direct Evidence for Paleodietary
Reconstruction) will be answered in this chapter’s conclusion, based on the results of
dietary analysis.
Population Dietary Patterns
The δ13C and δ15N values of the collagen samples from SCL-38 have a
significant linear relationship (r = .672, r2 = .452 p < .01, n = 127), suggesting that most
members of this population were choosing their diets from the same menu of local food
options (see Figure 33). The positive linear relationship suggests that these foods came
from two isotopically distinct sources. Based on the available menu in prehistoric Central
California, the diet would have been a mix of terrestrial and marine foods.
A technique for estimating marine contribution to diet is to examine the
difference between δ13C values from apatite and from collagen. The apatite fraction is
composed of carbon from the whole diet (including protein, carbohydrates, and lipids).
Fractionation within the body causes apatite δ13C values to be enriched by approximately
9.4 permil over diet (Ambrose and Norr 1993; Tieszen and Fagre 1993). The collagen
fraction is built primarily from the protein component of diet, and fractionation causes an
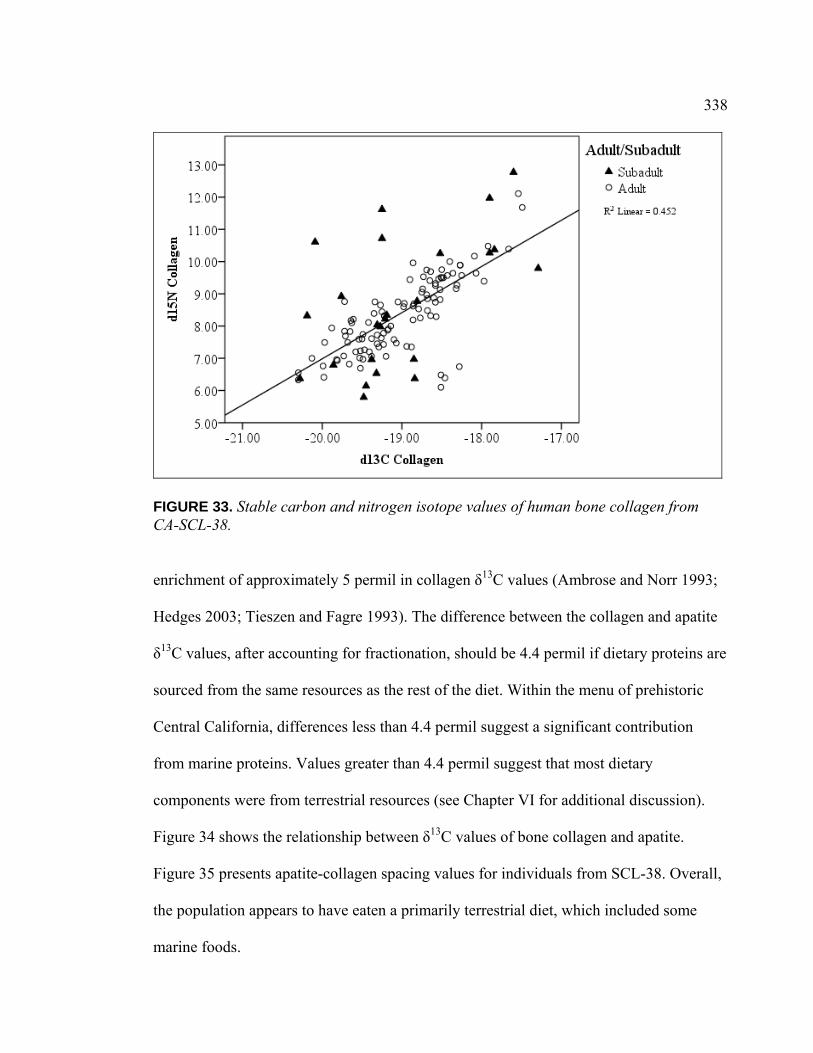
338
FIGURE 33. Stable carbon and nitrogen isotope values of human bone collagen from CA-SCL-38. enrichment of approximately 5 permil in collagen δ13C values (Ambrose and Norr 1993;
Hedges 2003; Tieszen and Fagre 1993). The difference between the collagen and apatite
δ13C values, after accounting for fractionation, should be 4.4 permil if dietary proteins are
sourced from the same resources as the rest of the diet. Within the menu of prehistoric
Central California, differences less than 4.4 permil suggest a significant contribution
from marine proteins. Values greater than 4.4 permil suggest that most dietary
components were from terrestrial resources (see Chapter VI for additional discussion).
Figure 34 shows the relationship between δ13C values of bone collagen and apatite.
Figure 35 presents apatite-collagen spacing values for individuals from SCL-38. Overall,
the population appears to have eaten a primarily terrestrial diet, which included some
marine foods.
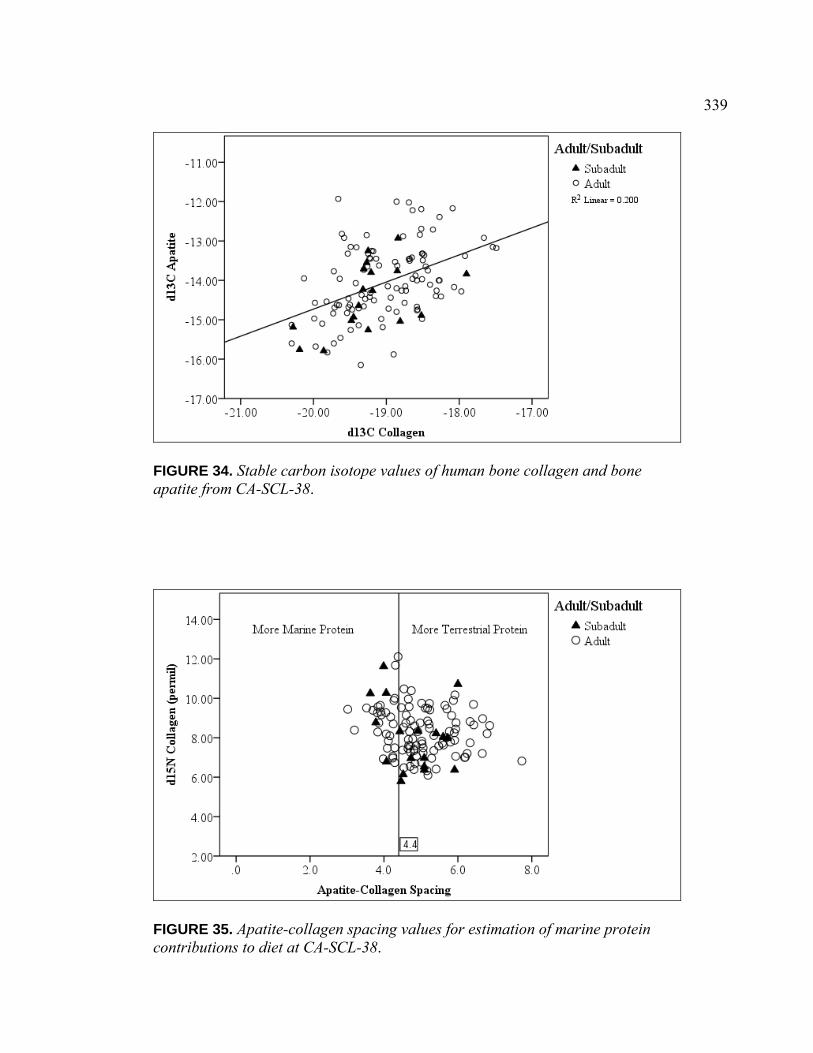
339
FIGURE 34. Stable carbon isotope values of human bone collagen and bone apatite from CA-SCL-38.
FIGURE 35. Apatite-collagen spacing values for estimation of marine protein contributions to diet at CA-SCL-38.

340
A new tool for differentiating contributions between protein resources from
terrestrial and marine ecosystems was developed by Froehle and colleagues (2010).
When δ13CApatite and δ13CCollagen are plotted against calculated regression lines
representing dietary signatures, the proximity to these lines represents relative
contribution of each dietary resource. For the SCL-38 population, the
data again suggest that proteins were mostly terrestrial, with some variable amount of
marine contribution (see Figure 36).
FIGURE 36. Model for terrestrial and marine protein consumption based on Froehle, Kellner, and Schoeninger method (2010).

341
To further evaluate the composition of diets at SCL-38, isotope values from
this population were plotted against dietary signatures of economically important food
resources (Figure 37). This theoretical isotopic food web was developed by Bartelink
FIGURE 37. Stable carbon and nitrogen isotope values of bone collagen from CA-SCL-38 compared to a theoretical isotopic food web for Central California. Source: Adapted from Bartelink, Eric J., 2006, Resource Intensification in Pre-Contact Central California: A Bioarchaeological Perspective on Diet and Health Patterns among Hunter-Gatherers from the Lower Sacramento Valley and San Francisco Bay. Ph.D. dissertation, Department of Anthropology, Texas A&M University. (2006) based on measured isotopic values of food resources from California. Dietary
signatures include offset for fractionation within the tissues of the consumer (see Chapter
Marine Mammals
Marine Fish
Terrestrial Carnivores
C3, Terrestrial and Marsh Plants
Freshwater Fish
Bay Shellfish
Freshwater Mussels
Terrestrial Herbivores

342
VI). Accordingly, the measured δ13C values of foods were increased by 5 permil and δ15N
values were increased by 3 permil to produce the dietary signature box values for each
resource. These adjustments were not performed on the faunal data from SCL-38, so
these animals are plotted within the diet that they likely consumed, rather than the
signature they would produce in humans if eaten.
The isotopic values of human bone are a composite average of dietary
resources from the last ten years of life for an adult (fewer years in children). Because of
this, stable isotope values of bone do not indicate specific food resources consumed, but
rather are bulk averages of general dietary patterns (Pate 1994). The isotopic values from
this study are consistent with a diet based on terrestrial and marsh plants, terrestrial
herbivores, freshwater fish, and bay shellfish, enriched with some marine fish. Marine
mammals are unlikely to have been a component of the everyday diet, but may have been
consumed on rare occasions. Consumption of terrestrial carnivores is consistent with
observed isotopic values, but because the values of these animals overlap other important
resources, their inclusion in diet cannot be verified isotopically. Freshwater mussels may
have contributed to the diet, but do not appear to have been a primary source of protein.
Insects such as caterpillars or moth larvae (herbivorous species) and grasshoppers and
yellow jacket larvae (omnivorous species), were also likely to have been part of the local
diet (Lightfoot and Parrish 2009). These species would have δ13C values similar to their
food sources (Fry et al. 1978) and δ15N values reflecting trophic levels (Donlan 2011), as
do mammals.
Although the correlation of δ13C and δ15N values suggests a common menu of
dietary components for these individuals, there is also a degree of variation within the

343
population, indicating differential use of menu items. Collagen values, which are
indicators of protein composition in the bulk diet, range more than 3 permil for δ13C
(min. -20.30‰, max. -17.29, mean -19.01, SD 0.64, n = 127). δ15N values from collagen,
which reflect the trophic levels of dietary proteins, have a range of almost 7 permil (min.
5.79, max. 12.77, mean 8.40, SD 1.38, n = 127). Finally, δ13C values from apatite, which
sources carbon from dietary lipids, carbohydrates, and proteins, have a range of over 4
permil (min. -16.15, max. -11.93, mean -14.05, SD 0.93, n = 122). The correlation of
dietary patterns within the community, plus the variation of dietary composition within
that dietary range, suggest a degree of differential access to resources.
When compared to mean stable isotope values from other Central California
sites, the values from CA-SCL-38 are statistically different than those from the coast, the
Sacramento-San Joaquin Delta, and the northern and eastern communities of the San
Francisco Bay Area, (determined by ANOVA and Bonferonni post-hoc test, p <.01).
Differences between mean isotope values from CA-SCL-38 and other South Bay sites are
not statistically significant; however, the mean δ15N value at the Yukisma site is enriched
by 0.42 permil relative to other nearby sites, suggesting that freshwater fish or bay
shellfish may have been more important sources of protein than at other South Bay sites.
A comparison of regional means is presented in Table 48. Mean values with standard
error bars for each comparative site are presented in Figure 38 (values from Bartelink
2006, Beasley 2008; Eric Bartelink, personal communication, March 27, 2011; Melanie
Beasley, personal communication, March 28, 2011).
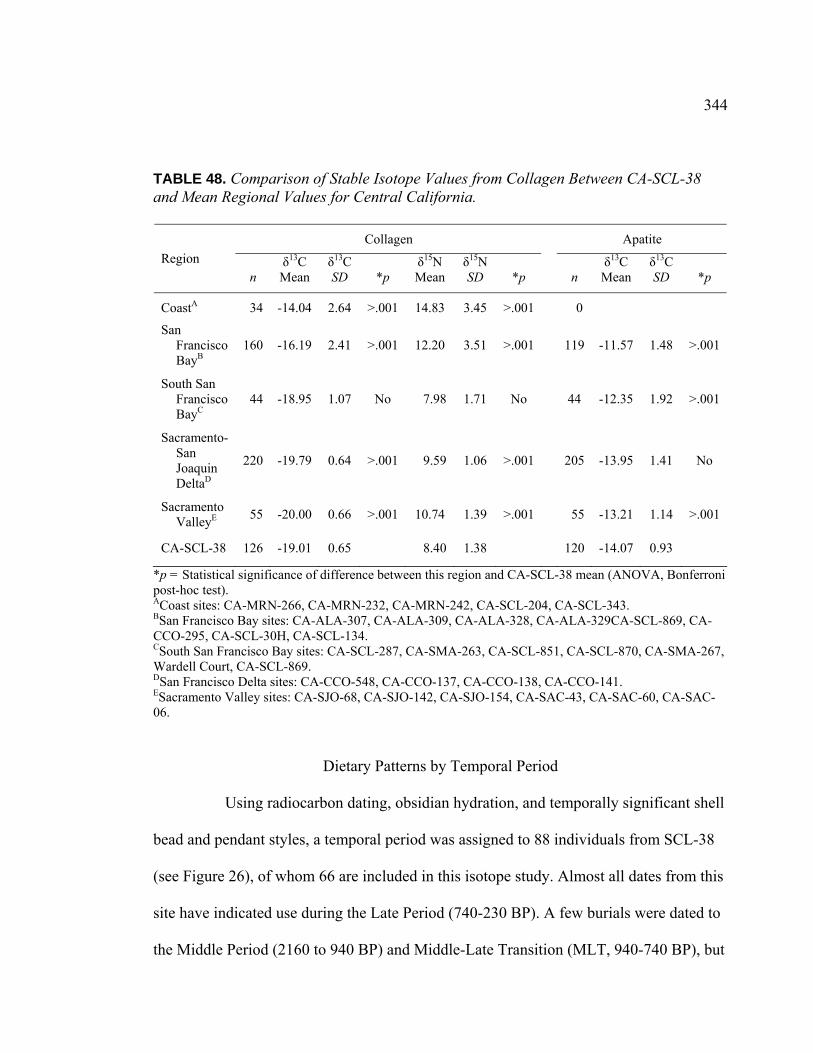
344
TABLE 48. Comparison of Stable Isotope Values from Collagen Between CA-SCL-38 and Mean Regional Values for Central California.
Collagen Apatite
Region
n δ13C Mean
δ13C SD *p
δ15N Mean
δ15N SD *p n
δ13C Mean
δ13C SD *p
CoastA 34 -14.04 2.64 >.001 14.83 3.45 >.001 0
San Francisco BayB
160 -16.19 2.41 >.001 12.20 3.51 >.001 119 -11.57 1.48 >.001
South San Francisco BayC
44 -18.95 1.07 No 7.98 1.71 No 44 -12.35 1.92 >.001
Sacramento-San Joaquin DeltaD
220 -19.79 0.64 >.001 9.59 1.06 >.001 205 -13.95 1.41 No
Sacramento ValleyE 55 -20.00 0.66 >.001 10.74 1.39 >.001 55 -13.21 1.14 >.001
CA-SCL-38 126 -19.01 0.65 8.40 1.38 120 -14.07 0.93
*p = Statistical significance of difference between this region and CA-SCL-38 mean (ANOVA, Bonferroni post-hoc test). ACoast sites: CA-MRN-266, CA-MRN-232, CA-MRN-242, CA-SCL-204, CA-SCL-343. BSan Francisco Bay sites: CA-ALA-307, CA-ALA-309, CA-ALA-328, CA-ALA-329CA-SCL-869, CA-CCO-295, CA-SCL-30H, CA-SCL-134. CSouth San Francisco Bay sites: CA-SCL-287, CA-SMA-263, CA-SCL-851, CA-SCL-870, CA-SMA-267, Wardell Court, CA-SCL-869. DSan Francisco Delta sites: CA-CCO-548, CA-CCO-137, CA-CCO-138, CA-CCO-141. ESacramento Valley sites: CA-SJO-68, CA-SJO-142, CA-SJO-154, CA-SAC-43, CA-SAC-60, CA-SAC-06.
Dietary Patterns by Temporal Period
Using radiocarbon dating, obsidian hydration, and temporally significant shell
bead and pendant styles, a temporal period was assigned to 88 individuals from SCL-38
(see Figure 26), of whom 66 are included in this isotope study. Almost all dates from this
site have indicated use during the Late Period (740-230 BP). A few burials were dated to
the Middle Period (2160 to 940 BP) and Middle-Late Transition (MLT, 940-740 BP), but

345
0
2
4
6
8
10
12
14
16
18
20
-24 -22 -20 -18 -16 -14 -12 -10
d13C of Bone Collagen
d15
N o
f B
on
e C
oll
agen
CA-ALA-307
CA-ALA-309
CA-ALA-328
CA-ALA-329
CA-CCO-137
CA-CCO-138
CA-CCO-141
CA-CCO-295
CA-CCO-548
CA-MRN-232
CA-MRN-242
CA-MRN-266
CA-SAC-06
CA-SAC-43
CA-SAC-60
CA-SCL-134
CA-SCL-287
CA-SCL-204
CA-SCL-851
CA-SCL-869
CA-SJO-142
CA-SJO-68
CA-SCL-38
FIGURE 38. Comparison of stable isotope values of bone collagen with other Central California sites.
Source: Comparative data courtesy of Eric Bartelink, personal communication, March 27, 2011, and Melanie Beasley, personal communication, March 28, 2011.

346
some of these dates are suspicious based on artifact associations (see discussion in
Chapter III). Nonetheless, mean isotope values for all temporal periods represented by the
available data are presented in Table 49. Variation in isotope values through time is also
graphically depicted in Figure 39.
TABLE 49. Stable Isotope Results by Temporal Period
Collagen Apatite
Temporal PeriodA
Years BP BC/AD n
δ13C Mean
‰ δ13CSD
δ15N Mean ‰
δ15N SD n
δ13C Mean
‰ δ13CSD
Middle Period
2160-940 BP (210 BC-AD 1010)
6 -18.80 0.35 8.75 1.00 6 -13.58 0.75
MLT 940-740 BP (AD 1010-1210)
2 -19.52 0.64 7.48 0.01 2 -15.33 0.49
Late Period 1
740-440 BP (AD 1210-1510)
37 -18.78 0.68 9.06 1.46 35 -13.89 0.81
Late Period 2
440-230 BP (AD 1510-1720)
20 -19.04 0.70 7.82 1.29 20 -14.13 0.90
AScheme D (Groza 2002)
Sample sizes from the Middle Period and MLT are too small for statistical
analysis. There is a statistically significant difference between δ15N values of individuals
from LP1 compared to those in LP2 (t = 3.171, df = 55, p < .01), but not in carbon values
from collagen or apatite (δ13CCollagen: t = 1.351, df = 55, p = .18; δ13CApatite: t = 1.020, df
= 53, p = .31). Between the first and second phases of the Late Period, δ15N values drop
1.23 permil on average, indicating a significant change in protein availability or trophic
level emphasis through time.

347
FIGURE 39. Box plots of mean isotopic values by temporal period.

348
Dietary Patterns by Age Category
For statistical comparison, the sample population from SCL-38 was divided
into four age groups: infants (birth to 2 years), subadults (3 to 15 years), adults (16 to 40
years), and elders (over 41 years). Results are summarized in Table 50 and presented in
detail in Figure 40 and Figure 41. No significant difference was found in isotope values
between the adult and elder age groups (δ13CCollagen: t = 1.483, df = 101, p = .141;
δ15NCollagen : t = 1.115, df = 101, p = .268; δ13CApatite : t = 0.819, df = 102, p = .415),
suggesting that there was no patterned change in diet with advancing age. Sample sizes in
the subadult and infant categories were not large enough for statistical comparison, but
enriched δ15N values are seen in infants and depleted δ15N are seen in children (Table
50).
TABLE 50. Stable Isotope Results by Age Group for Individuals from CA-SCL-38
Collagen Apatite Age Group
Age range
(years) n
δ13C Mean
‰
δ13C SD
δ15N Mean
‰
δ15N SD
n δ13C Mean
‰
δ13C SD
Infants Birth -2 8 -18.90 1.05 10.59 1.51 4 -14.94 0.81
Subadults 3-15 16 -19.10 0.71 7.76 1.54 14 -14.29 0.83
Adults 16-40 75 -18.95 0.61 8.41 1.25 76 -13.94 0.86
Elders Over 41 28 -19.15 0.58 8.12 0.97 28 -14.11 1.12
The most likely explanation for elevated δ15N values in infants is the effects of
breastfeeding (see discussion in Chapter VI). Newborn infants have similar δ15N values
to those of their mothers, but with breastfeeding the δ15N values of the infant’s bone
collagen become progressively enriched due to the trophic level effect, until the values
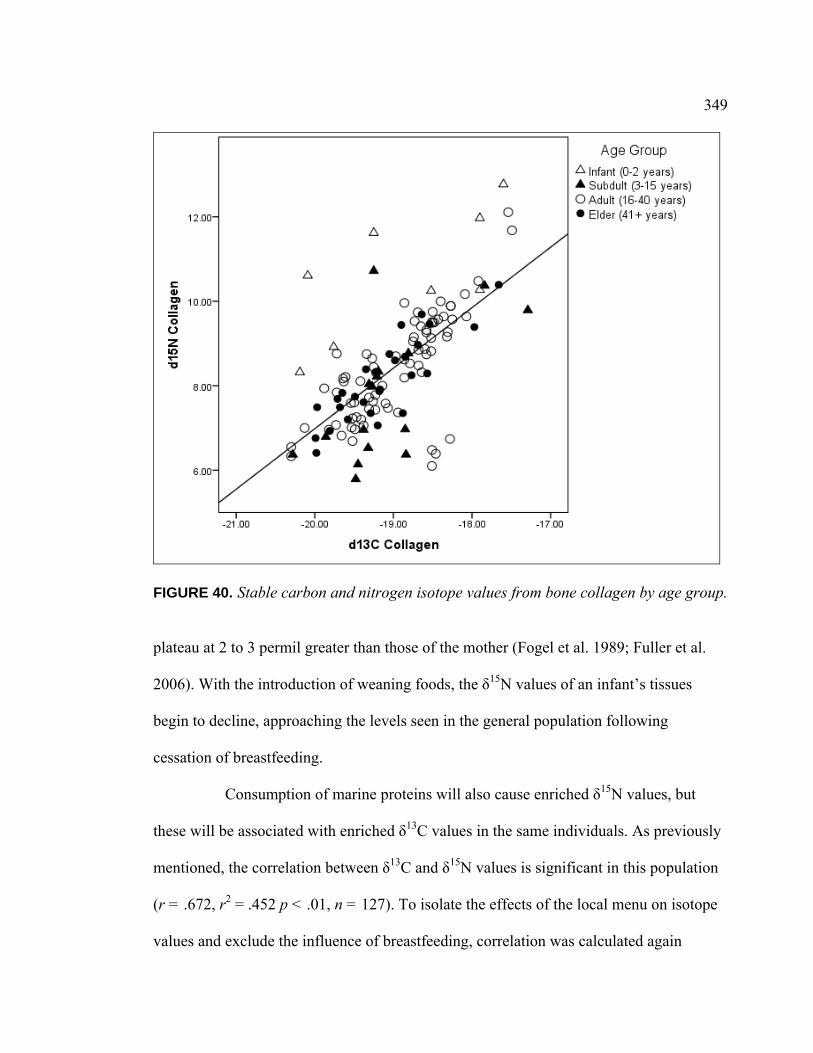
349
FIGURE 40. Stable carbon and nitrogen isotope values from bone collagen by age group. plateau at 2 to 3 permil greater than those of the mother (Fogel et al. 1989; Fuller et al.
2006). With the introduction of weaning foods, the δ15N values of an infant’s tissues
begin to decline, approaching the levels seen in the general population following
cessation of breastfeeding.
Consumption of marine proteins will also cause enriched δ15N values, but
these will be associated with enriched δ13C values in the same individuals. As previously
mentioned, the correlation between δ13C and δ15N values is significant in this population
(r = .672, r2 = .452 p < .01, n = 127). To isolate the effects of the local menu on isotope
values and exclude the influence of breastfeeding, correlation was calculated again
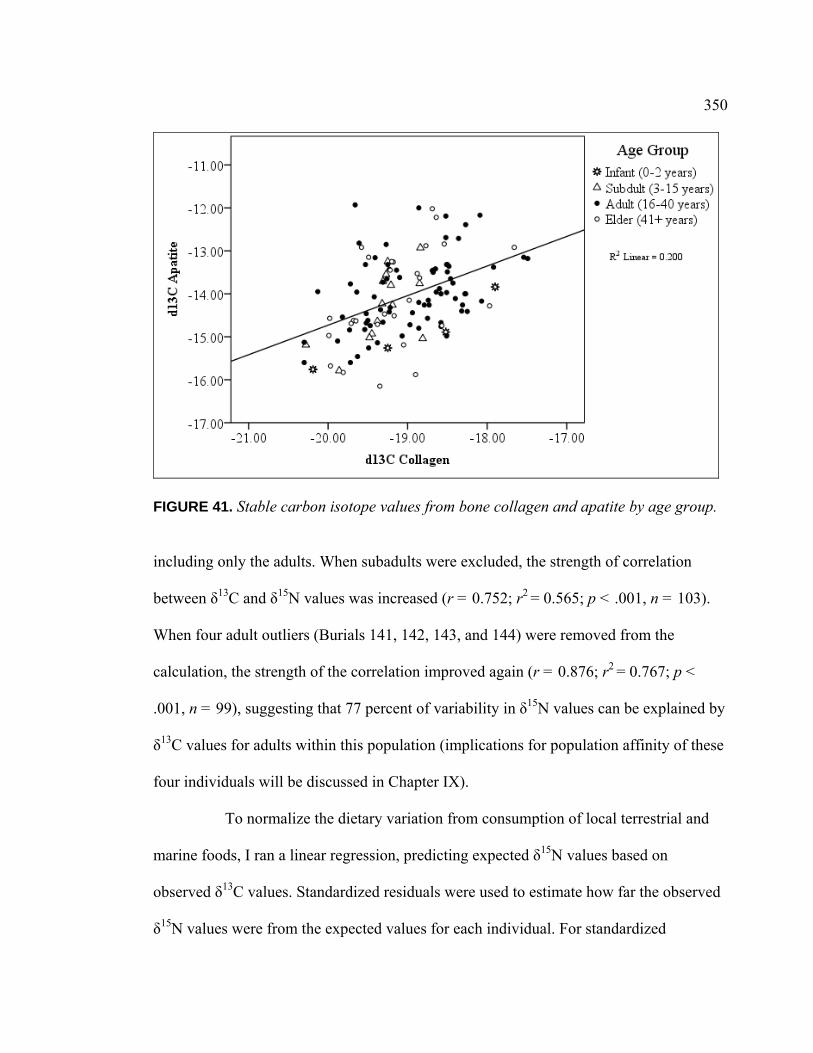
350
FIGURE 41. Stable carbon isotope values from bone collagen and apatite by age group. including only the adults. When subadults were excluded, the strength of correlation
between δ13C and δ15N values was increased (r = 0.752; r2 = 0.565; p < .001, n = 103).
When four adult outliers (Burials 141, 142, 143, and 144) were removed from the
calculation, the strength of the correlation improved again (r = 0.876; r2 = 0.767; p <
.001, n = 99), suggesting that 77 percent of variability in δ15N values can be explained by
δ13C values for adults within this population (implications for population affinity of these
four individuals will be discussed in Chapter IX).
To normalize the dietary variation from consumption of local terrestrial and
marine foods, I ran a linear regression, predicting expected δ15N values based on
observed δ13C values. Standardized residuals were used to estimate how far the observed
δ15N values were from the expected values for each individual. For standardized
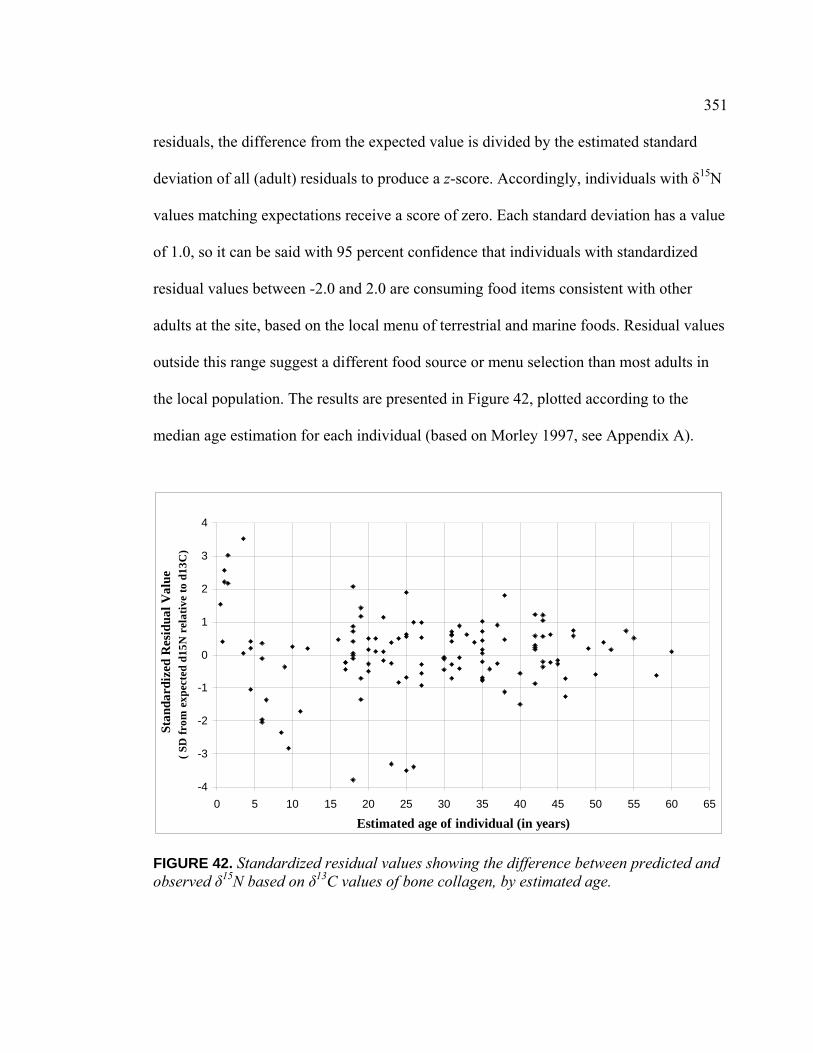
351
residuals, the difference from the expected value is divided by the estimated standard
deviation of all (adult) residuals to produce a z-score. Accordingly, individuals with δ15N
values matching expectations receive a score of zero. Each standard deviation has a value
of 1.0, so it can be said with 95 percent confidence that individuals with standardized
residual values between -2.0 and 2.0 are consuming food items consistent with other
adults at the site, based on the local menu of terrestrial and marine foods. Residual values
outside this range suggest a different food source or menu selection than most adults in
the local population. The results are presented in Figure 42, plotted according to the
median age estimation for each individual (based on Morley 1997, see Appendix A).
-4
-3
-2
-1
0
1
2
3
4
0 5 10 15 20 25 30 35 40 45 50 55 60 65
Estimated age of individual (in years)
Stan
dard
ized
Res
idua
l Val
ue
( SD
fro
m e
xpec
ted
d15
N r
elat
ive
to d
13C
)
FIGURE 42. Standardized residual values showing the difference between predicted and observed δ15N based on δ13C values of bone collagen, by estimated age.

352
Focusing on the subadults, significant variation from expected δ15N values is
seen in infants and children less than ten years old. An expanded graph highlights this
variation (Figure 43). The addition of a trend line illustrates a pattern of gradual
-4
-3
-2
-1
0
1
2
3
4
0 1 2 3 4 5 6 7 8 9 10
Estimated age of individual (in years)
Sta
nd
ard
ized
Res
idu
al V
alu
e (S
D f
rom
exp
ecte
d d1
5N r
elat
ive
to d
13C
)
FIGURE 43. Standardized residual values showing the difference between predicted and observed δ15N based on δ13C values of bone collagen, for subadults under 10 years. enrichment of δ15N values up to age two, then a decline to values consistent with the diet
of the adult population by age three-and-a-half to four years. This trend is consistent with
a pattern of exclusive breastfeeding until approximately age two, then the addition of
weaning foods to the diet, and cessation of breastfeeding by age three or four (see
Gardner et al. 2011 for a more detailed discussion).
The three-and-a-half year old with very elevated δ15N values may have been
breastfed longer than average or may have had a diet supplemented with some other high
353
δ15N valued food item. An important consideration when dealing with stable isotope
analysis of bone is that estimated age of these individuals is age at death, and people who
had been sickly for long periods prior to death may have received different care (and
consumed different diets) than healthy individuals. One way to avoid this analytical
dilemma is to use permanent molars for isotope analysis, which are formed progressively
from birth through age 20 and do not remodel (see Eerkens et al. 2011, and Eerkens and
Bartelink, in press); unfortunately, teeth were not available from the SCL-38 population.
The residual values for children between five and ten years of age dip below
expected δ15N values. While not outside the 99 percent confidence range for the local
menu, this dip suggests that children in this age group may have been consuming less
protein than adults, or obtaining protein from lower trophic level foods. This same pattern
of childhood depletion in δ15N values has been observed in other isotopic studies of
prehistoric weaning practices in Central California, including a study from the Marsh
Creek site (CA-CCO-548), located about 30 miles (48 km) northeast of the Yukisma
Mound, and occupied between 4,000 and 3,000 years ago (Eerkens et al. 2011), and at
CA-ALA-554, a site located about 16 miles (26 km) north of the Yukisma Mound
(Greenwald and Eerkens 2013).
Dietary Patterns by Biological Sex
Significant differences in diet were observed between males and females for
δ13C values from bone collagen (t = 4.13, df = 91, p < .001), with a mean difference of
0.48 permil between the sexes. Difference between males and females in δ15N values was
also significant (t = 3.93, df = 91, p < .001), with a mean difference of 0.93 permil. In

354
bone apatite, differences in δ13C values were observed, but failed the test of significance
(t = 1.75, df = 91, p = .083), with a mean difference of only 0.35 permil. Results are
presented in Table 51 and graphed in Figure 44. Subadults are excluded because
TABLE 51. Stable Isotope Results by Sex for Adults from CA-SCL-38
Collagen
Apatite Biological Sex
(Adults) n δ13C
Mean ‰ δ13C SD
δ15N Mean ‰
δ15N SD n
δ13C Mean ‰
δ13C SD
Males 56 -18.80 0.53 8.71 1.21 57 -13.83 0.94
Females 37 -19.28 0.57 7.78 0.96 37 -14.19 0.98
Indeterminate 10 -19.17 0.69 8.22 1.00 10 -14.13 0.61
All Adults 103 -19.00 0.60 8.33 1.18 104 -13.99 0.94
biological sex from subadult skeletons cannot be reliably determined. These results
suggest that males had a slightly greater proportion of higher trophic level proteins in
their diets on average than did females.
Dietary Patterns by Mortuary Context
Several variables of mortuary context were potentially relevant to social
identity, and therefore are considered here to test for dietary correlation (see Table 52).
Sample sizes for secondary burials are not sufficient for a meaningful statistical
comparison with primary burials, however the observed isotope values for these two
modes of interment were almost identical.
Some variation was observed between individuals buried in single interments
and those in double, multiple, or cluster burials. Although δ15N values of individuals in
double interments appear somewhat enriched relative to those buried alone, no significant
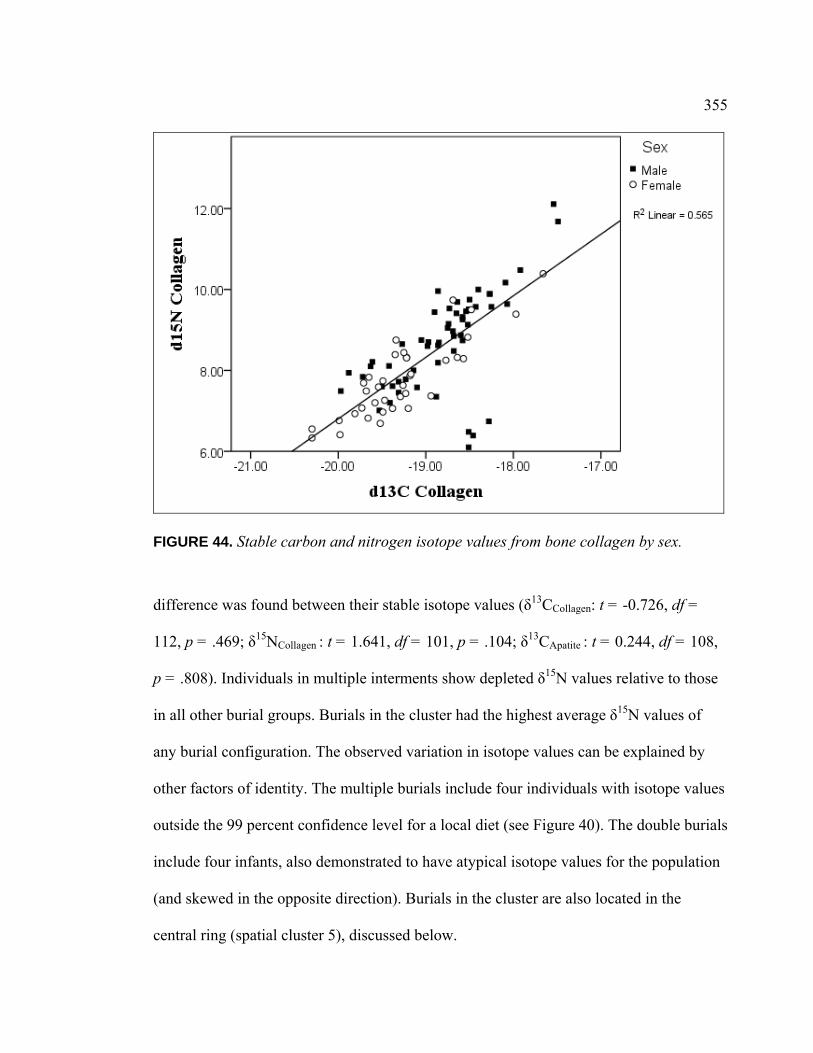
355
FIGURE 44. Stable carbon and nitrogen isotope values from bone collagen by sex.
difference was found between their stable isotope values (δ13CCollagen: t = -0.726, df =
112, p = .469; δ15NCollagen : t = 1.641, df = 101, p = .104; δ13CApatite : t = 0.244, df = 108,
p = .808). Individuals in multiple interments show depleted δ15N values relative to those
in all other burial groups. Burials in the cluster had the highest average δ15N values of
any burial configuration. The observed variation in isotope values can be explained by
other factors of identity. The multiple burials include four individuals with isotope values
outside the 99 percent confidence level for a local diet (see Figure 40). The double burials
include four infants, also demonstrated to have atypical isotope values for the population
(and skewed in the opposite direction). Burials in the cluster are also located in the
central ring (spatial cluster 5), discussed below.
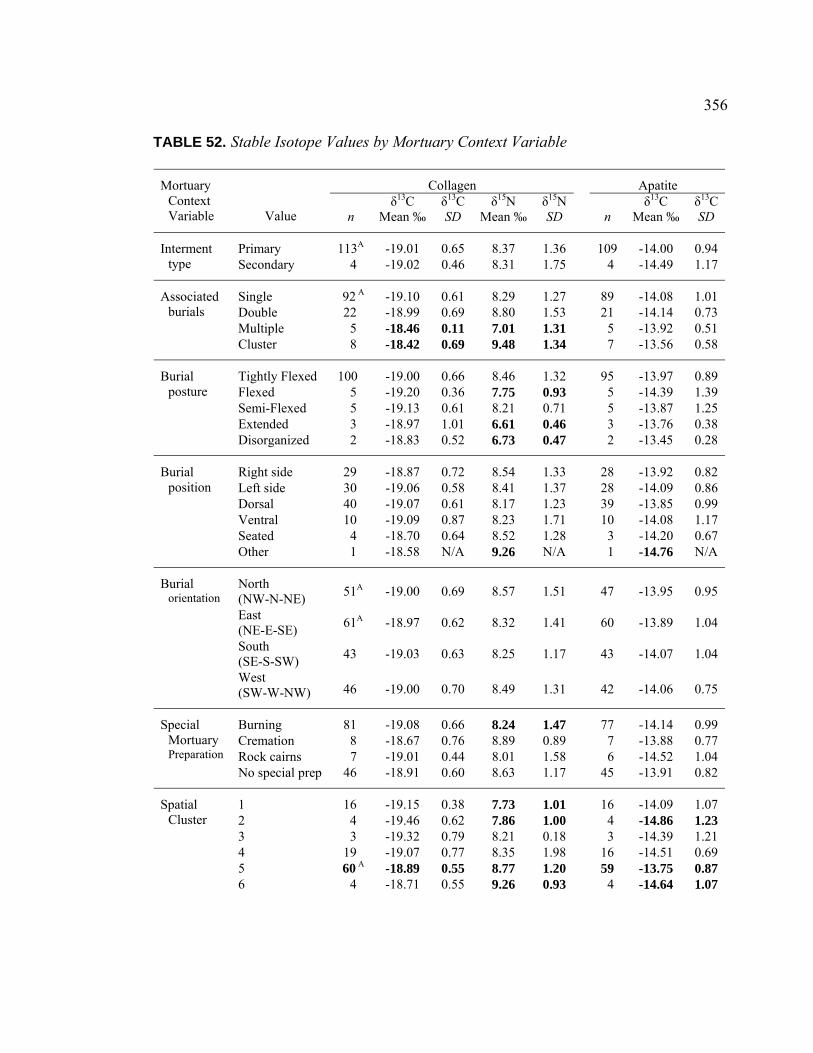
356
TABLE 52. Stable Isotope Values by Mortuary Context Variable
Collagen Apatite Mortuary Context Variable Value n
δ13C Mean ‰
δ13CSD
δ15N Mean ‰
δ15NSD
n
δ13C Mean ‰
δ13CSD
Primary 113A -19.01 0.65 8.37 1.36 109 -14.00 0.94 Interment type Secondary 4 -19.02 0.46 8.31 1.75 4 -14.49 1.17
Single 92 A -19.10 0.61 8.29 1.27 89 -14.08 1.01 Double 22 -18.99 0.69 8.80 1.53 21 -14.14 0.73 Multiple 5 -18.46 0.11 7.01 1.31 5 -13.92 0.51
Associated burials
Cluster 8 -18.42 0.69 9.48 1.34 7 -13.56 0.58
Tightly Flexed 100 -19.00 0.66 8.46 1.32 95 -13.97 0.89 Flexed 5 -19.20 0.36 7.75 0.93 5 -14.39 1.39 Semi-Flexed 5 -19.13 0.61 8.21 0.71 5 -13.87 1.25 Extended 3 -18.97 1.01 6.61 0.46 3 -13.76 0.38
Burial posture
Disorganized 2 -18.83 0.52 6.73 0.47 2 -13.45 0.28
Right side 29 -18.87 0.72 8.54 1.33 28 -13.92 0.82 Left side 30 -19.06 0.58 8.41 1.37 28 -14.09 0.86 Dorsal 40 -19.07 0.61 8.17 1.23 39 -13.85 0.99 Ventral 10 -19.09 0.87 8.23 1.71 10 -14.08 1.17 Seated 4 -18.70 0.64 8.52 1.28 3 -14.20 0.67
Burial position
Other 1 -18.58 N/A 9.26 N/A 1 -14.76 N/A
North (NW-N-NE)
51A -19.00 0.69 8.57 1.51 47 -13.95 0.95
East (NE-E-SE)
61A -18.97 0.62 8.32 1.41 60 -13.89 1.04
South (SE-S-SW)
43 -19.03 0.63 8.25 1.17 43 -14.07 1.04
Burial orientation
West (SW-W-NW) 46 -19.00 0.70 8.49 1.31 42 -14.06 0.75
Burning 81 -19.08 0.66 8.24 1.47 77 -14.14 0.99 Cremation 8 -18.67 0.76 8.89 0.89 7 -13.88 0.77 Rock cairns 7 -19.01 0.44 8.01 1.58 6 -14.52 1.04
Special Mortuary Preparation
No special prep 46 -18.91 0.60 8.63 1.17 45 -13.91 0.82
1 16 -19.15 0.38 7.73 1.01 16 -14.09 1.07 2 4 -19.46 0.62 7.86 1.00 4 -14.86 1.23 3 3 -19.32 0.79 8.21 0.18 3 -14.39 1.21 4 19 -19.07 0.77 8.35 1.98 16 -14.51 0.69 5 60 A -18.89 0.55 8.77 1.20 59 -13.75 0.87
Spatial Cluster
6 4 -18.71 0.55 9.26 0.93 4 -14.64 1.07
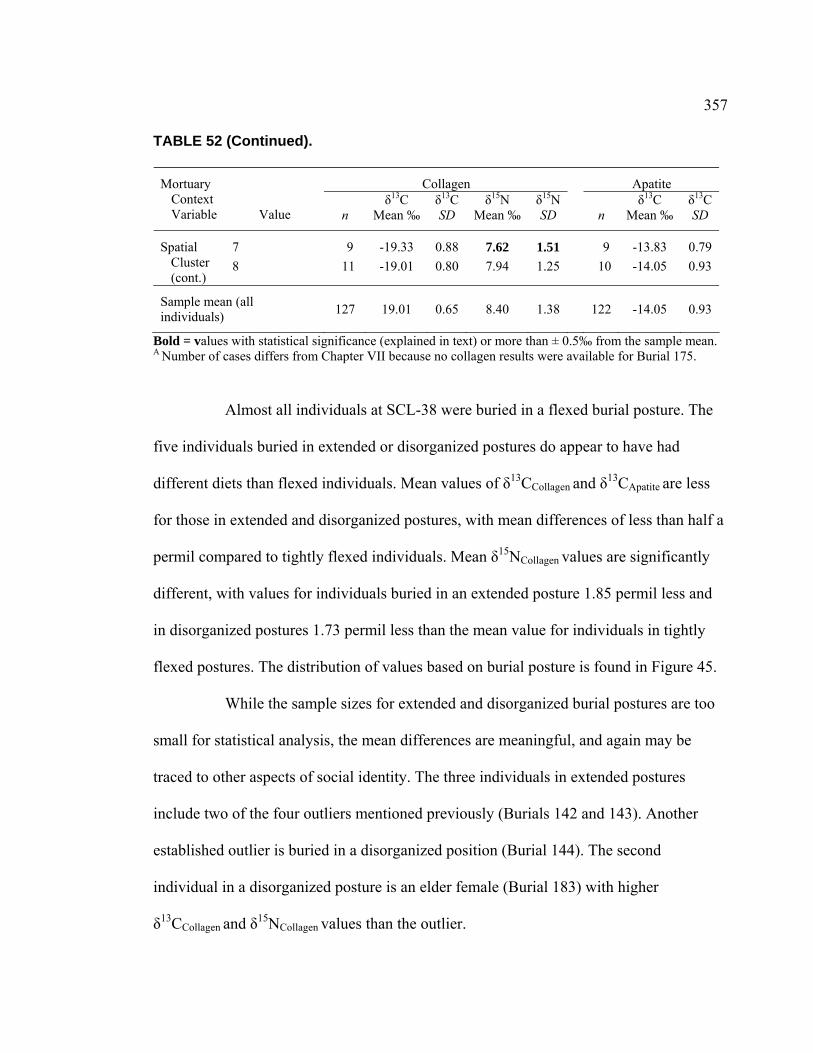
357
TABLE 52 (Continued).
Collagen Apatite Mortuary Context Variable Value n
δ13C Mean ‰
δ13CSD
δ15N Mean ‰
δ15NSD
n
δ13C Mean ‰
δ13CSD
7 9 -19.33 0.88 7.62 1.51 9 -13.83 0.79 Spatial Cluster (cont.)
8 11 -19.01 0.80 7.94 1.25 10 -14.05 0.93
Sample mean (all individuals)
127 19.01 0.65 8.40 1.38 122 -14.05 0.93
Bold = values with statistical significance (explained in text) or more than ± 0.5‰ from the sample mean. A Number of cases differs from Chapter VII because no collagen results were available for Burial 175.
Almost all individuals at SCL-38 were buried in a flexed burial posture. The
five individuals buried in extended or disorganized postures do appear to have had
different diets than flexed individuals. Mean values of δ13CCollagen and δ13CApatite are less
for those in extended and disorganized postures, with mean differences of less than half a
permil compared to tightly flexed individuals. Mean δ15NCollagen values are significantly
different, with values for individuals buried in an extended posture 1.85 permil less and
in disorganized postures 1.73 permil less than the mean value for individuals in tightly
flexed postures. The distribution of values based on burial posture is found in Figure 45.
While the sample sizes for extended and disorganized burial postures are too
small for statistical analysis, the mean differences are meaningful, and again may be
traced to other aspects of social identity. The three individuals in extended postures
include two of the four outliers mentioned previously (Burials 142 and 143). Another
established outlier is buried in a disorganized position (Burial 144). The second
individual in a disorganized posture is an elder female (Burial 183) with higher
δ13CCollagen and δ15NCollagen values than the outlier.
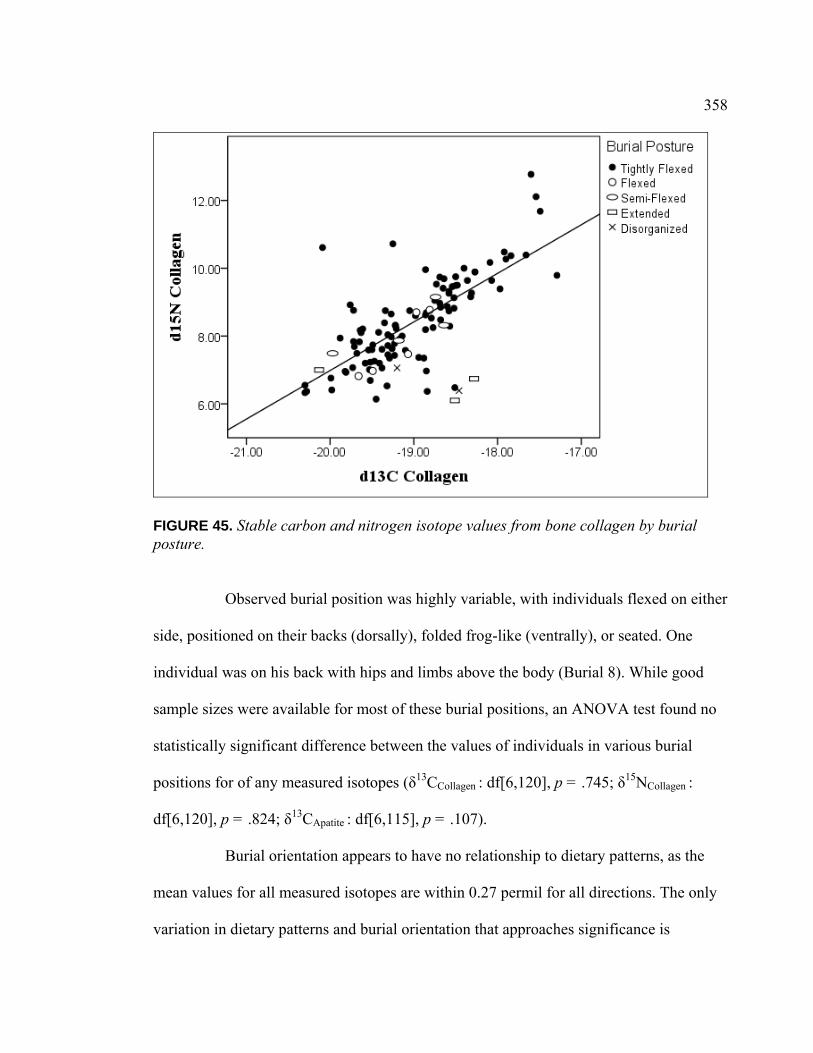
358
FIGURE 45. Stable carbon and nitrogen isotope values from bone collagen by burial posture.
Observed burial position was highly variable, with individuals flexed on either
side, positioned on their backs (dorsally), folded frog-like (ventrally), or seated. One
individual was on his back with hips and limbs above the body (Burial 8). While good
sample sizes were available for most of these burial positions, an ANOVA test found no
statistically significant difference between the values of individuals in various burial
positions for of any measured isotopes (δ13CCollagen : df[6,120], p = .745; δ15NCollagen :
df[6,120], p = .824; δ13CApatite : df[6,115], p = .107).
Burial orientation appears to have no relationship to dietary patterns, as the
mean values for all measured isotopes are within 0.27 permil for all directions. The only
variation in dietary patterns and burial orientation that approaches significance is
359
δ13CApatite values of individuals oriented towards the east, versus those oriented in any
other direction (t = -1.889, df = 120, p = .06). The mean difference between easterly
oriented burials and those in other directions is only -0.32 permil, and is not likely to
indicate a meaningful difference in dietary patterns.
Although special mortuary preparation is commonly associated with specific
social identities and elite social status, few differences were observed between the isotope
values of individuals with burning, cremation, or rock cairns and those without any
special mortuary preparation (see Figure 46). There difference between the δ15NCollagen
FIGURE 46. Stable carbon and nitrogen isotope values from bone collagen by special mortuary treatment. values of individuals with associated burning (including cremation, pre- or post-interment
fires, and associated charring or vitrified clay) and those without burning just barely fails
360
the test of significance (t = 1.929, df = 123, p = 0.056). If infants (with enriched
δ15NCollagen values due to breastfeeding) are excluded, the relationship is significant (t =
2.089, df = 115, p = .04). The mean value of those with burning is almost half a permil
lower than for those without associated burning.
Exposure to high temperatures can alter the isotopic ratios within bone,
particularly δ15N values. Experimental data demonstrated that both δ13C and δ15N values
remain stable with heat exposure up to approximately 200°C, but that exposure to
temperatures over 300°C may result in an increase in δ15N values of as much as 5 permil
(Schurr et al. 2008). Additionally, changes are observed in the carbon to nitrogen (C/N)
ratio of burned bone as nitrogen is lost and the bone is carbonized (Schurr et al. 2008).
External appearance is considered a good proxy for the degree of thermal
modification to bone (Devlin and Herrman 2008). The color of bone changes predictably
with elevated temperature, turning first pale yellow or pale brown at temperatures below
285°C, then progressing to black and then grey tones at higher temperatures (Shipman et
al. 1984). In prehistoric cremations, it is common for some elements to be more heat-
affected than others. For those at SCL-38, the available sample portions of bone showed
no color change and tested within acceptable carbon to nitrogen (C/N) ratios (see Chapter
VII). Therefore, the isotopic values of these samples are unlikely to have been
significantly affected by heating. Additionally, Schurr and colleagues (2008) observed
enriched δ15N values with exposure to high temperatures, and the mean δ15N values for
those with associated burning at SCL-38 was actually slightly lower than for those
without burning. These results suggest that the difference between mean δ15N values of
those with and without burning at SCL-38 is real and not a product of thermal alteration.

361
The last aspect of mortuary context considered here is association with spatial
clusters. Bellifemine (1997) identified eight spatial clusters at SCL-38 with associated
variation in artifact density and artifact diversity. Isotope values by spatial cluster are
presented in Figure 47. Because a disproportionate number of individuals are associated
FIGURE 47. Stable carbon and nitrogen isotope values from bone collagen by spatial cluster. with Cluster 5 (the center ring), statistical comparison was made between those within the
central cluster (n = 60), and those outside the central cluster (n = 66). Mean values for all
three measured isotopes were enriched for those in the central cluster, and all differences
proved to be statistically significant. The δ13CCollagen values of those in Cluster 5 were
enriched by an average of 0.24 permil over the others (t = -2.133, df = 124, p < .05).
362
Values of δ15NCollagen of Cluster 5 individuals were 0.72 permil greater on average than
those in other clusters (t = -3.022, df = 124, p < .01). Differences in δ13CApatite values
were also significant (t = -3.561, df = 119, p = .001), with a mean difference of 0.58
permil. While statistically significant, these differences are not large, and can be
explained by the composition of this cluster (to be discussed in the section of Chapter IX
dealing with status).
The sample size in other clusters is too small for statistical comparison;
however a few results are worth noticing. The enriched isotope values found in Cluster 6
individuals are noteworthy, with δ15NCollagen values averaging even higher than those in
Cluster 5. Cluster 4 contains a disproportionate number of outliers, with four adults with
very low isotope values and five infants with enriched δ15NCollagen values, producing a
standard deviation of almost 2 permil for nitrogen isotope values in this group.
Statistically, the extreme values in Cluster 4 effectively neutralize each other, but the
diversity of values in this cluster will be discussed further in Chapter IX. Overall, these
dietary data support Bellifemine’s interpretation (1997) that cemetery organization at
SCL-38 reflected differential status within the community.
In conclusion, not all mortuary context variables were found to have
meaningful correlation with dietary patterns. Significant differences in isotope values
were noted in associated burials, with those in the cluster having higher carbon and
nitrogen values from collagen than single burials, and cluster burials having higher
nitrogen values than double burials, which were higher than multiple burials. Burial
posture was also telling, where those buried in un-flexed positions had lower nitrogen
values than those with any degree of burial flexion. Burial position and orientation did

363
not have significant correlation with dietary markers. Individuals with associated burning
had statistically lower δ15NCollagen values than those without, a surprising result. Finally,
the spatial organization of the cemetery appears to be the attribute of mortuary context
with the most significant correlation to dietary patterns.
Dietary Patterns by Artifact Associations
Technomic Artifacts
Technomic artifacts are the functional tools used for meeting the basic needs
of life (Binford 1968, see Chapter 3). These utilitarian objects were associated with 46
burials in the test group (36% of the sample). Mean isotope values for each artifact type
are presented in Table 53; individual values are displayed in Figure 48.
Unfortunately, no significant difference in any measured isotope value was
noted between individuals with technomic artifacts and those without (δ13CCollagen: t = -
.029, df = 125, p = 0.98; δ15NCollagen: t = -.669, df = 125, p = .51; δ13CApatite: t = -1.095, df
= 120, p = .28). Further, there was no significant difference found between individuals
with or without bone artifacts (δ13CCollagen: t = -.011, df = 125, p = 0.99; δ15NCollagen: t = -
.613, df = 125, p = .54; δ13CApatite: t = -1.114, df = 120, p = .27). Presence of chipped
stone also had no significant association with diet (δ13CCollagen: t = -.059, df = 125, p =
0.87; δ15NCollagen: t = -.239, df = 125, p = .81; δ13CApatite: t = -1.091, df = 120, p = .28).
Groundstone also failed the test of correlation with isotope results (δ13CCollagen: t = -.694,
df = 125, p = 0.49; δ15NCollagen: t = -.529, df = 125, p = .60; δ13CApatite: t = -.857, df =
120, p = .39).

364
TABLE 53. Stable Isotope Values by Burial Association with Technomic Artifacts
Collagen Apatite Technomic Artifact Group
Artifact Type n δ13C Mean
‰
δ13C SD
δ15N Mean
‰
δ15N SD
n δ13C Mean
‰
δ13C SD
Bone Artifacts
Scapula saws 3 -19.01 0.08 7.48 0.65 3 -14.27 1.29 Bone strigils 3 -19.48 0.23 7.88 0.78 3 -14.05 0.60 Bone awls 8 A -18.95 0.66 8.96 1.46 9 -13.83 0.81 Bone needles 1A -18.64 N/A 9.36 N/A 2 -12.26 0.50 Antler wedges 1 -18.07 N/A 9.64 N/A 1 -14.17 N/A Other bone 4 -18.80 0.69 8.71 1.25 4 -13.78 0.78 Any bone (total) 20A -19.01 0.61 8.58 1.26 21 -13.85 0.84
Chipped Stone
Projectile points (non-traumatic)
14 -19.18 0.47 8.15 0.80 14 -14.02 1.07
Other chipped stone
14 A -18.82 0.61 8.72 1.68 15 -13.62 1.02
Any chipped stone (total)
25A -18.99 0.59 8.46 1.38 26 -13.88 0.99
Ground Stone
Mortars 13 -19.01 0.37 8.29 0.86 13 -14.02 0.87 Pestles 16 A -18.92 0.55 8.69 0.97 17 -13.73 0.82 Manos 2 -18.82 0.35 7.89 0.58 2 -14.86 0.17 Abraders 1 -19.07 N/A 7.47 N/A 1 -14.05 N/A
Any ground stone (total)
23 A -18.92 0.49 8.40 0.93 24 -13.91 0.91
Any technomic artifacts 46 -19.01 0.55 8.51 1.13 47 -13.94 0.91
No technomic artifacts 81 -19.01 0.70 8.34 1.50 75 -14.13 0.95
Sample mean (all individuals) 127 -19.01 0.65 8.40 1.38 122 -14.05 0.93
Bold = values more than ± 0.5‰ from population mean.
At the level of individual artifact types, a few mean values were found to vary
from the population mean by more than half a permil. Individuals with scapula saws (two
adult females and one adult male) or bone strigils (two adult females and an adult of
indeterminate sex) had depleted δ15N values relative to the population mean, suggesting
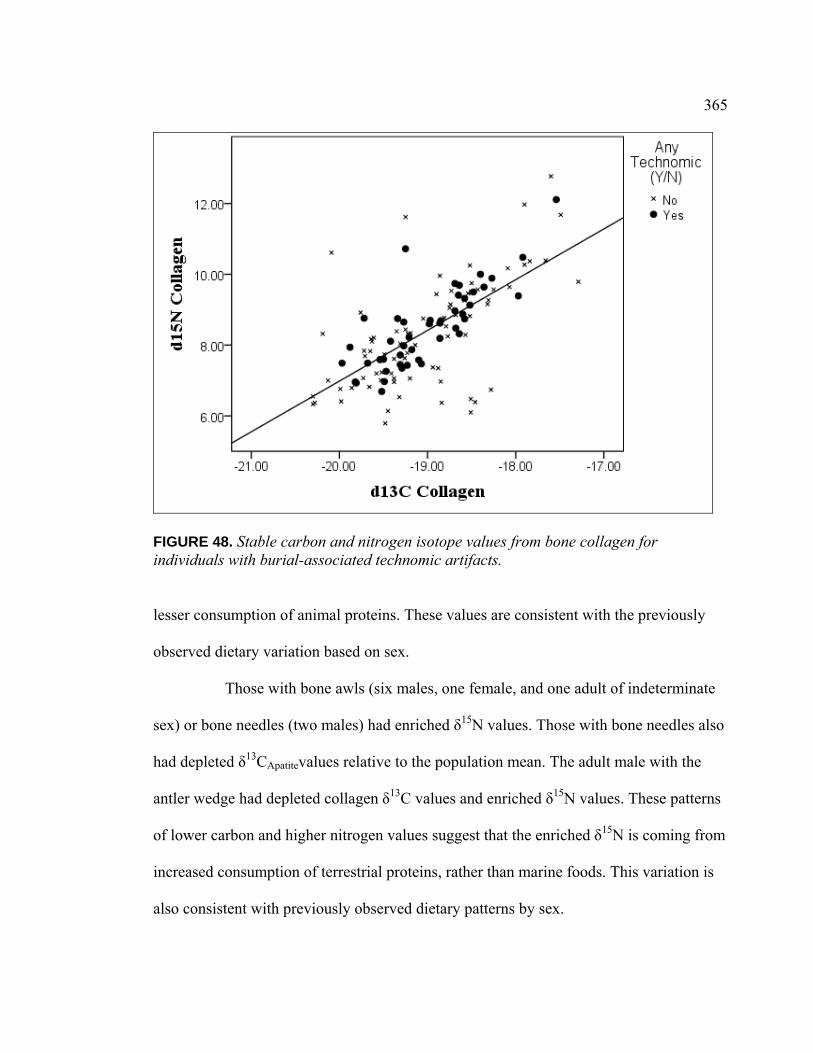
365
FIGURE 48. Stable carbon and nitrogen isotope values from bone collagen for individuals with burial-associated technomic artifacts. lesser consumption of animal proteins. These values are consistent with the previously
observed dietary variation based on sex.
Those with bone awls (six males, one female, and one adult of indeterminate
sex) or bone needles (two males) had enriched δ15N values. Those with bone needles also
had depleted δ13CApatitevalues relative to the population mean. The adult male with the
antler wedge had depleted collagen δ13C values and enriched δ15N values. These patterns
of lower carbon and higher nitrogen values suggest that the enriched δ15N is coming from
increased consumption of terrestrial proteins, rather than marine foods. This variation is
also consistent with previously observed dietary patterns by sex.
366
The only other notable variation within the technomic artifact category is in
groundstone. One individual with a mano (an adult of indeterminate sex) has a depleted
δ15N value, while the other (an adult female) has a δ15N value close to the population
mean. Both have elevated δ13CApatitevalues. This pattern could be caused by consumption
of non-protein marine foods such as seaweed.
Sociotechnic Artifacts
Sociotechnic artifacts are those with established associations with social
identity, status and wealth. In support of the hypothesis that wealthy individuals and/or
people of higher social status would have different access to resources than lower status
or poorer individuals, significant differences were observed between those with
sociotechnic artifacts and those without for all three measured isotopes (δ13CCollagen: t = -
2.159, df = 125, p < .05; δ15NCollagen: t = -2.921, df = 125, p < .01; δ13CApatite: t = -3.134,
df = 120, p < .01). The mean values for all isotopes were higher (more positive) for
individuals with associated sociotechnic items than for those without (δ13CCollagen: +.25‰;
δ15NCollagen: +.70‰; δ13CApatite: +.52‰). The slightly higher mean values of both carbon
and nitrogen isotopes suggest that higher trophic level foods, such as marine proteins,
may have been the preferred foods for wealthy individuals or people of higher social
status.
However, of the 71 individuals with sociotechnic artifacts in the isotope study,
37 are male and two are infants. Both of these groups have already been shown to have
enriched isotope values compared to females and children, and the demographic
composition of this group may be enough to explain the small differences in mean
isotope values. The mean isotope values for individuals with each type of sociotechnic
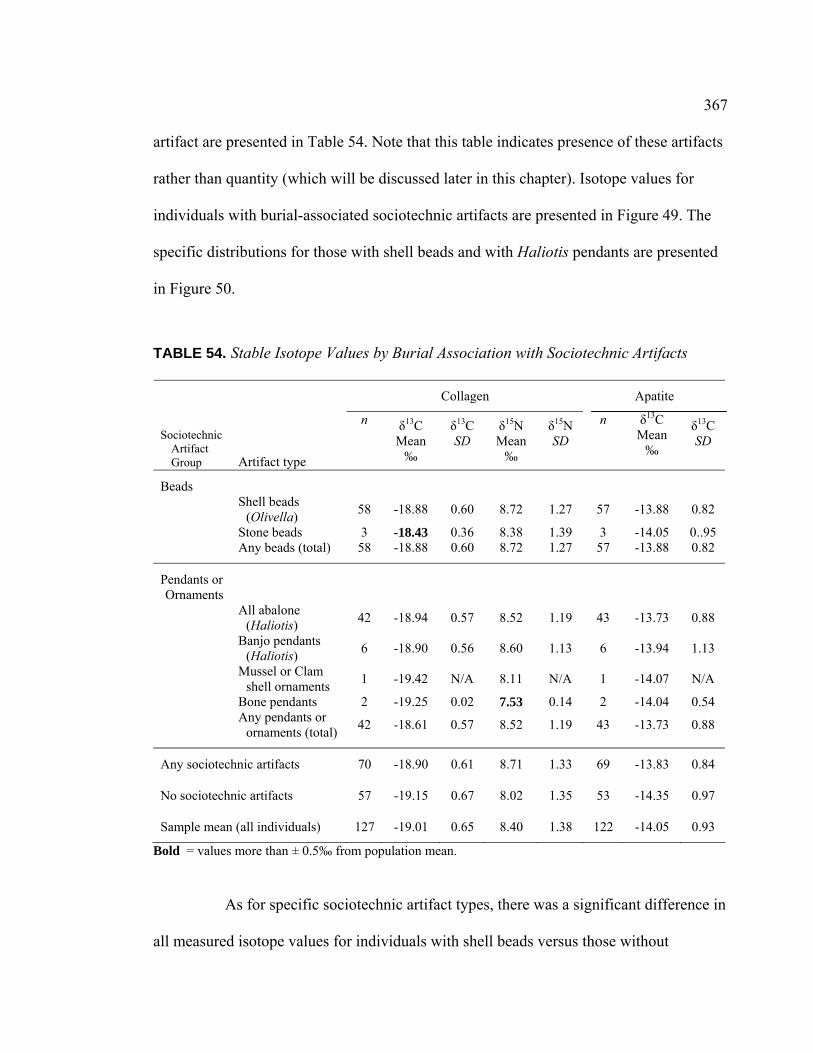
367
artifact are presented in Table 54. Note that this table indicates presence of these artifacts
rather than quantity (which will be discussed later in this chapter). Isotope values for
individuals with burial-associated sociotechnic artifacts are presented in Figure 49. The
specific distributions for those with shell beads and with Haliotis pendants are presented
in Figure 50.
TABLE 54. Stable Isotope Values by Burial Association with Sociotechnic Artifacts
Collagen Apatite
Sociotechnic Artifact Group Artifact type
n δ13C Mean
‰
δ13C SD
δ15N Mean
‰
δ15N SD
n δ13C Mean
‰
δ13C SD
Beads
Shell beads
(Olivella) 58 -18.88 0.60 8.72 1.27 57 -13.88 0.82
Stone beads 3 -18.43 0.36 8.38 1.39 3 -14.05 0..95 Any beads (total) 58 -18.88 0.60 8.72 1.27 57 -13.88 0.82
Pendants or Ornaments
All abalone
(Haliotis) 42 -18.94 0.57 8.52 1.19 43 -13.73 0.88
Banjo pendants
(Haliotis) 6 -18.90 0.56 8.60 1.13 6 -13.94 1.13
Mussel or Clam
shell ornaments 1 -19.42 N/A 8.11 N/A 1 -14.07 N/A
Bone pendants 2 -19.25 0.02 7.53 0.14 2 -14.04 0.54
Any pendants or
ornaments (total) 42 -18.61 0.57 8.52 1.19 43 -13.73 0.88
Any sociotechnic artifacts 70 -18.90 0.61 8.71 1.33 69 -13.83 0.84
No sociotechnic artifacts 57 -19.15 0.67 8.02 1.35 53 -14.35 0.97
Sample mean (all individuals) 127 -19.01 0.65 8.40 1.38 122 -14.05 0.93
Bold = values more than ± 0.5‰ from population mean.
As for specific sociotechnic artifact types, there was a significant difference in
all measured isotope values for individuals with shell beads versus those without
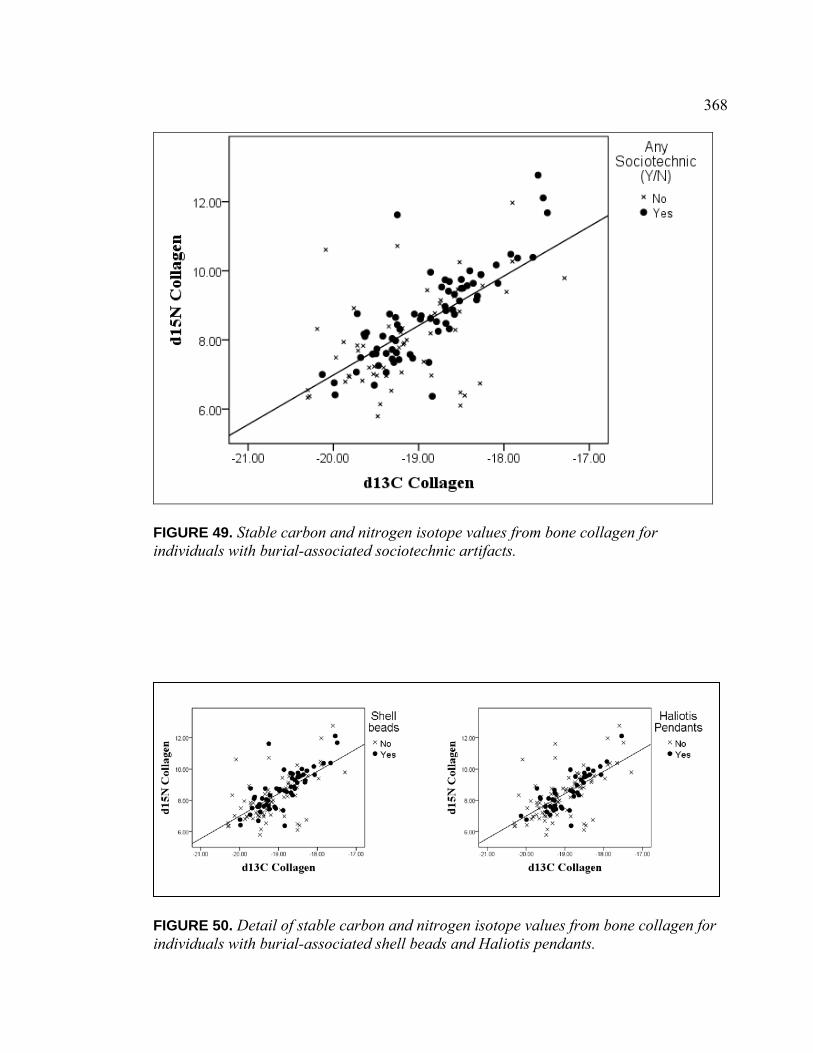
368
FIGURE 49. Stable carbon and nitrogen isotope values from bone collagen for individuals with burial-associated sociotechnic artifacts.
FIGURE 50. Detail of stable carbon and nitrogen isotope values from bone collagen for individuals with burial-associated shell beads and Haliotis pendants.

369
(δ13CCollagen: t = -2.113, df = 125, p < .05; δ15NCollagen: t = -2.454, df = 125, p < .05;
δ13CApatite: t = -1.968, df = 120, p = .05). Individuals with stone beads (two males and
one adult of indeterminate sex) had δ15NCollagen and δ13CApatite values near the population
mean, and were only enriched in δ13CCollagen, although the large standard deviations and
small sample size indicate more variability than the mean might suggest.
Interestingly, isotopic values from bone collagen were not statistically
different for individuals with Haliotis pendants than for those without (δ13CCollagen: t = -
.845, df = 125, p = .40; δ15NCollagen: t = -.706, df = 125, p = .48), but were significant for
apatite (δ13CApatite: t = -2.910, df = 120, p < .01) with a mean difference of .50 permil
(see Figure 51). Enriched apatite values without enriched collagen suggest variation in
FIGURE 51. Detail of stable carbon isotope values from bone collagen and apatite for individuals with burial-associated Haliotis pendants.
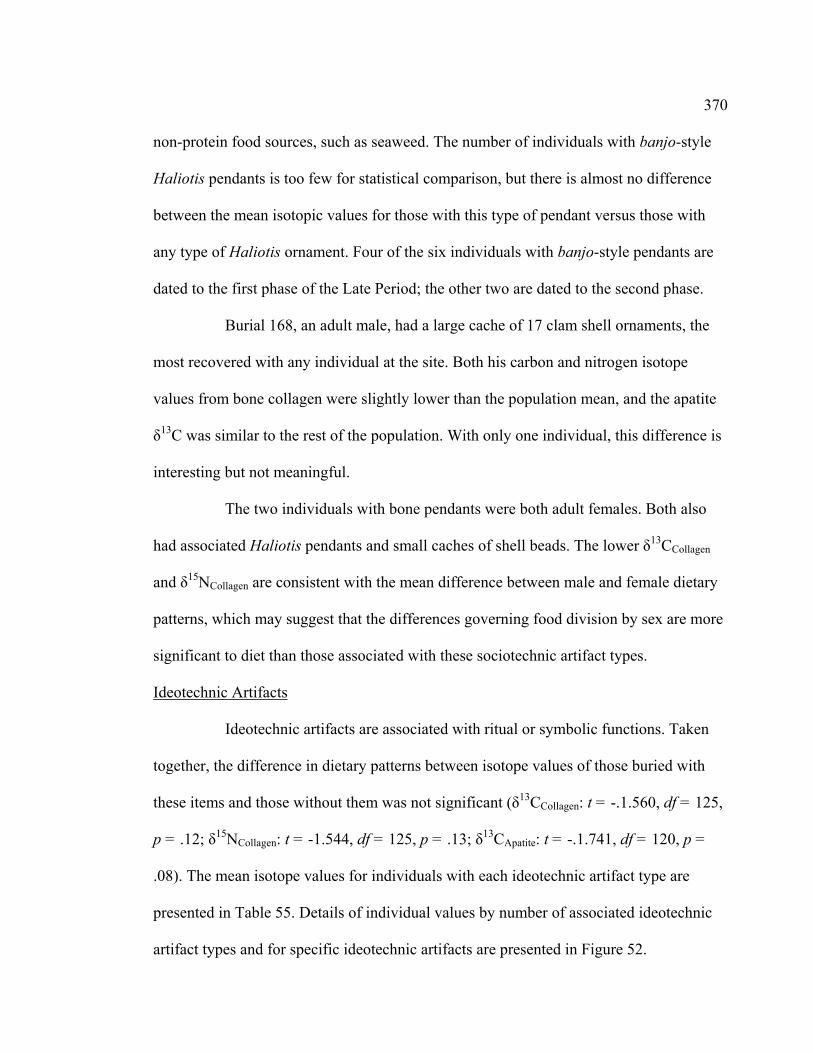
370
non-protein food sources, such as seaweed. The number of individuals with banjo-style
Haliotis pendants is too few for statistical comparison, but there is almost no difference
between the mean isotopic values for those with this type of pendant versus those with
any type of Haliotis ornament. Four of the six individuals with banjo-style pendants are
dated to the first phase of the Late Period; the other two are dated to the second phase.
Burial 168, an adult male, had a large cache of 17 clam shell ornaments, the
most recovered with any individual at the site. Both his carbon and nitrogen isotope
values from bone collagen were slightly lower than the population mean, and the apatite
δ13C was similar to the rest of the population. With only one individual, this difference is
interesting but not meaningful.
The two individuals with bone pendants were both adult females. Both also
had associated Haliotis pendants and small caches of shell beads. The lower δ13CCollagen
and δ15NCollagen are consistent with the mean difference between male and female dietary
patterns, which may suggest that the differences governing food division by sex are more
significant to diet than those associated with these sociotechnic artifact types.
Ideotechnic Artifacts
Ideotechnic artifacts are associated with ritual or symbolic functions. Taken
together, the difference in dietary patterns between isotope values of those buried with
these items and those without them was not significant (δ13CCollagen: t = -.1.560, df = 125,
p = .12; δ15NCollagen: t = -1.544, df = 125, p = .13; δ13CApatite: t = -.1.741, df = 120, p =
.08). The mean isotope values for individuals with each ideotechnic artifact type are
presented in Table 55. Details of individual values by number of associated ideotechnic
artifact types and for specific ideotechnic artifacts are presented in Figure 52.

371
TABLE 55. Stable Isotope Values by Burial Association with Ideotechnic Artifacts
Collagen Apatite
Ideotechnic Artifact Group Artifact Type n
δ13C Mean
‰ δ13CSD
δ15N Mean
‰ δ15N SD n
δ13C Mean
‰ δ13CSD
Bone Artifacts Bird bone tubes
and whistles 14 -18.94 0.64 8.54 1.32 14 -13.74 0.69
Stone Artifacts Stone pipes 3 -18.80 0.44 8.53 0.73 3 -13.47 0.69 Stone spoons 1 -19.26 N/A 7.63 N/A 1 -13.65 N/A Charmstones 10A -18.74 0.36 9.23 0.52 11 -13.58 0.89
“Magic” stones 2 -18.99 0.12 8.46 1.39 3 -14.38 1.87
Cinnabar
Cinnabar/
“ochre” 3 -19.19 0.32 8.15 0.51 3 -13.47 1.34
Faunal remains Stingray points 1 -19.07 N/A 7.47 N/A 1 -14.98 N/A Antler 2 -19.05 0.28 7.71 1.04 2 -13.54 0.31
Claws or non-
human teeth 4 -18.63 0.70 8.87 1.14 4 -13.65 0.53
Any ideotechnic artifacts 31 -18.85 0.53 8.73 1.10 32 -13.81 0.82
No ideotechnic artifacts 96 -19.06 0.68 8.29 1.44 90 -14.14 0.96
Sample mean (all individuals) 127 -19.01 0.65 8.40 1.38 122 -14.05 0.93
Bold = values more than ± 0.5‰ from the sample mean. A Number of cases differs from Chapter VII because no collagen results were available for Burial 175.
Measured stable isotope values for individuals with more than one type of
ideotechnic artifact have a smaller range of variation than those with just one type (see
Figure 52). All seven individuals in this study who had more than one type of ideotechnic
artifact were buried in the central cluster (Cluster 5), already noted to have enriched δ15N
values relative to other sectors of the cemetery. Individuals buried with multiple types of
ideotechnic artifacts at SCL-38 who were not part of this study include one other
individual from Cluster 5 and one each from Clusters 1, 4, and 8.
372
FIGURE 52. Stable carbon and nitrogen isotope values from bone collagen for individuals with burial-associated ideotechnic artifacts, with detail for associations with bird bone tubes and whistles, charmstones, cinnabar, and ideotechnic faunal remains.

373
Bird bone tubes were likely ear or nose ornaments or whistle blanks, but may
also have been used in healing practices. Bone whistles were used in rituals and as dance
accompaniment. Because it is not possible to clearly differentiate tubes and whistle
blanks based on the archaeological records, tubes and whistles are grouped together for
this analysis. The isotope values of those buried with tubes and whistles are not
significantly different than for those without these items (δ13CCollagen: t = -.431, df = 125,
p = .67; δ15NCollagen: t = -.388, df = 125, p = .70; δ13CApatite: t = -.1.325, df = 120, p =
.19). If bird bone tubes and whistles were markers of identity, no specific dietary patterns
were associated with these social roles.
Charmstones do appear to have a relationship to dietary patterns. A significant
difference is observed in δ15N values (t = -2.088, df = 125, p < .05), with a mean
difference of 0.45 permil. If the one outlier case is excluded (Burial 134, a sample of
questionable quality—see Chapter VII), the relationship is strengthened, and the mean
difference more than doubles to 1.02 permil. The differences between those with
charmstones and those without are not significant, although the apatite carbon value
difference approaches significance (δ13CCollagen: t = -1.388, df = 125, p = .17; δ13CApatite: t
= -.1.776, df = 120, p = .08). The small range of variation in isotope values for those
with charmstones supports the hypothesis that these were tools of shamans who would
have observed strict dietary guidelines, particularly if the value from Burial 134 is
excluded (see Figure 52).
Cinnabar was associated with six humans at SCL-38, three of whom were
included in this study. This group is too small for statistical comparison, but the data are
presented here for consideration. All three individuals were buried in Cluster 5 (two of
374
the three individuals with cinnabar who were not included in this study were also in
Cluster 5). Individuals buried with cinnabar have higher (less negative) δ13CApatite values
on average than the population mean. However, the large standard deviation indicates
quite a bit of variation in this value.
Totemic faunal remains, including stingray points, antler and animal claws or
teeth, were also inadequately represented in burial assemblages from SCL-38 for
statistical comparison. However, the individual values from bone collagen are presented
in Figure 52 for consideration. The adult of indeterminate sex with stingray spines had
lower δ15N and δ13CApatite values than the population mean. The female and adult of
indeterminate sex who were buried with associated antlers had dissimilar isotope values.
Likewise, no pattern was apparent between the two adult males and two adult females
with animal claws or teeth, although it is interesting to note that individual with the most
enriched values in this group was an elder female (Burial 184).
Overall, the association of these ideotechnic artifact types with dietary
patterns is weak. Only charmstones emerge as a meaningful proxy for specific dietary
practices. Variation observed in this category may be associated with the dietary patterns
already noted between biological sexes and between spatial clusters in the cemetery.
Dietary Patterns by Artifact Abundance
Three measures of artifact abundance will tested for correlation to isotope
values. These include shell bead quantity, overall artifact quantity, and artifact quantity
without shell beads. Shell bead quantities have been divided into shell bead classes for
ease of statistical comparison. A Spearman’s rank correlation test found a significant
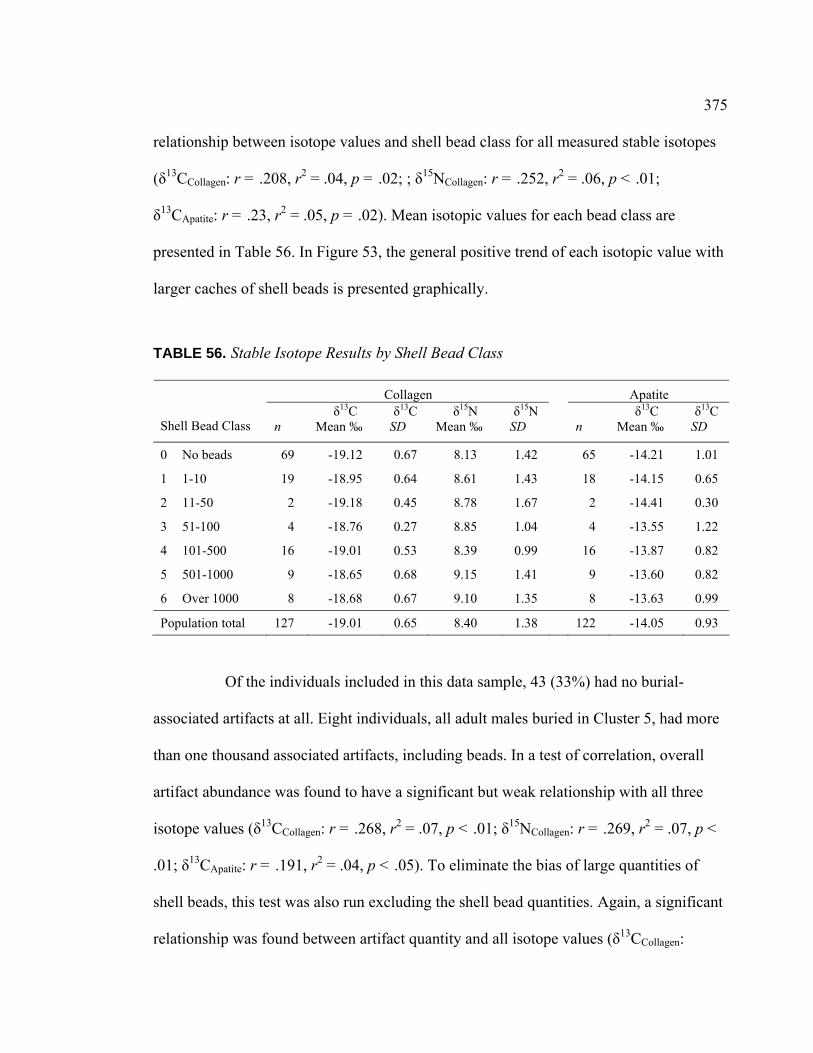
375
relationship between isotope values and shell bead class for all measured stable isotopes
(δ13CCollagen: r = .208, r2 = .04, p = .02; ; δ15NCollagen: r = .252, r2 = .06, p < .01;
δ13CApatite: r = .23, r2 = .05, p = .02). Mean isotopic values for each bead class are
presented in Table 56. In Figure 53, the general positive trend of each isotopic value with
larger caches of shell beads is presented graphically.
TABLE 56. Stable Isotope Results by Shell Bead Class
Collagen Apatite
Shell Bead Class n δ13C
Mean ‰ δ13C
SD δ15N
Mean ‰ δ15N
SD
n δ13C
Mean ‰ δ13C
SD
0 No beads 69 -19.12 0.67 8.13 1.42 65 -14.21 1.01
1 1-10 19 -18.95 0.64 8.61 1.43 18 -14.15 0.65
2 11-50 2 -19.18 0.45 8.78 1.67 2 -14.41 0.30
3 51-100 4 -18.76 0.27 8.85 1.04 4 -13.55 1.22
4 101-500 16 -19.01 0.53 8.39 0.99 16 -13.87 0.82
5 501-1000 9 -18.65 0.68 9.15 1.41 9 -13.60 0.82
6 Over 1000 8 -18.68 0.67 9.10 1.35 8 -13.63 0.99
Population total 127 -19.01 0.65 8.40 1.38 122 -14.05 0.93
Of the individuals included in this data sample, 43 (33%) had no burial-
associated artifacts at all. Eight individuals, all adult males buried in Cluster 5, had more
than one thousand associated artifacts, including beads. In a test of correlation, overall
artifact abundance was found to have a significant but weak relationship with all three
isotope values (δ13CCollagen: r = .268, r2 = .07, p < .01; δ15NCollagen: r = .269, r2 = .07, p <
.01; δ13CApatite: r = .191, r2 = .04, p < .05). To eliminate the bias of large quantities of
shell beads, this test was also run excluding the shell bead quantities. Again, a significant
relationship was found between artifact quantity and all isotope values (δ13CCollagen:

376
FIGURE 53. Box plots of mean isotopic values by shell bead class.

377
r = .182, r2 = .03, p < .05; δ15NCollagen: r = .227, r2 = .05, p = .01; δ13CApatite: r = .259, r2
= .07, p < .01). However, with or without beads, artifact abundance explains less than 10
percent of variation in all isotope values.
Dietary Patterns by Artifact Diversity
Another metric for social status is association with a diverse cache of artifact
types (see Chapter IV). Individuals in this study had up to nine types of associated
artifacts. Types include scapula saws, bone strigils, bone awls, bone needles, antler
wedges, other bone implements, projectile points not directly associated with traumatic
injury, other chipped stone artifacts (excluding debitage), mortars, pestles, manos,
abraders, stone beads, Olivella shell beads, Haliotis pendants, clam shell pendants, bone
pendants, bone tubes or whistles, stone pipes, stone spoons, charmstones, magic stones,
cinnabar, stingray points, antler, and claws or non-human teeth. Mean isotope values by
number of burial-associated artifact types are presented in Table 57.
A test of correlation found a significant relationship only between artifact
diversity and δ13C of apatite (r = .260, r2 = .07, p < .01). While the relationship is
significant, artifact diversity explains only 7 percent of variation in apatite δ13C values.
No correlation was found between collagen stable isotope values and artifact diversity
(δ13CCollagen: r = .135, r2 = .02, p = .13; δ15NCollagen: r = .141, r2 = .02, p = .11). As with
artifact abundance, the weakness of association between dietary patterns and artifact
diversity suggests that individuals with these markers of wealth did not have dietary
patterns that changed predictably with accumulation of goods.
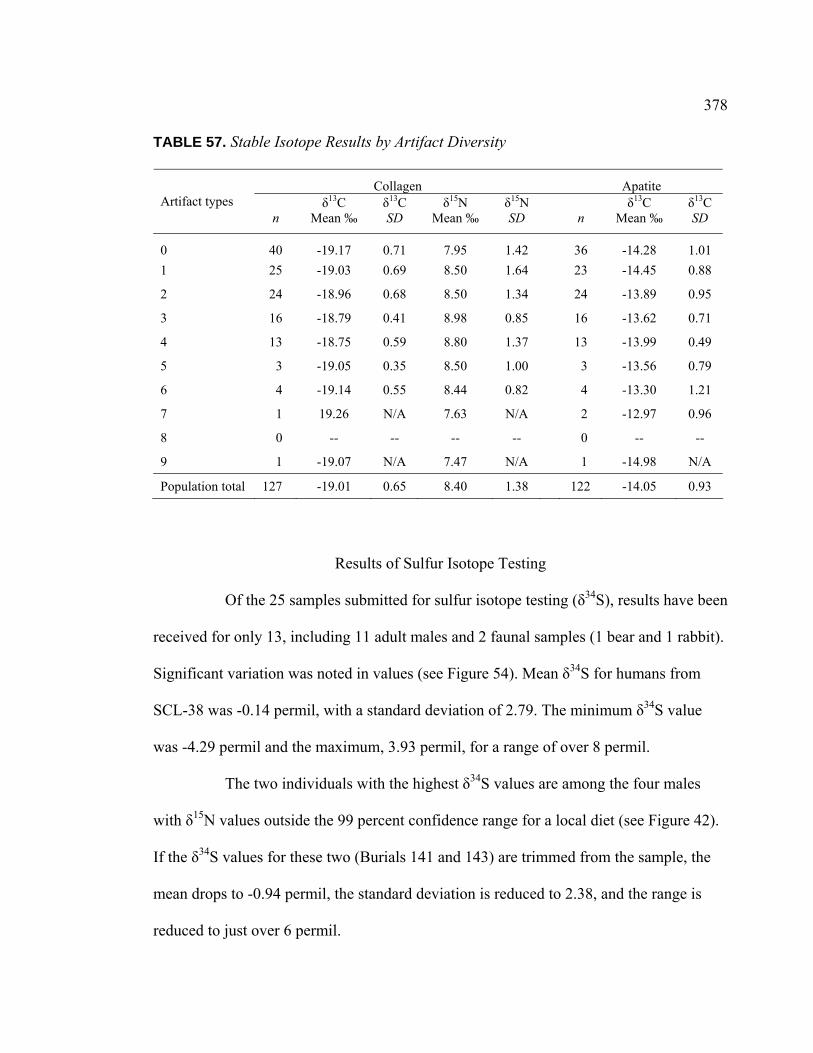
378
TABLE 57. Stable Isotope Results by Artifact Diversity
Collagen Apatite Artifact types
n δ13C
Mean ‰ δ13C SD
δ15N Mean ‰
δ15N SD
n
δ13C Mean ‰
δ13C SD
0 40 -19.17 0.71 7.95 1.42 36 -14.28 1.01
1 25 -19.03 0.69 8.50 1.64 23 -14.45 0.88
2 24 -18.96 0.68 8.50 1.34 24 -13.89 0.95
3 16 -18.79 0.41 8.98 0.85 16 -13.62 0.71
4 13 -18.75 0.59 8.80 1.37 13 -13.99 0.49
5 3 -19.05 0.35 8.50 1.00 3 -13.56 0.79
6 4 -19.14 0.55 8.44 0.82 4 -13.30 1.21
7 1 19.26 N/A 7.63 N/A 2 -12.97 0.96
8 0 -- -- -- -- 0 -- --
9 1 -19.07 N/A 7.47 N/A 1 -14.98 N/A
Population total 127 -19.01 0.65 8.40 1.38 122 -14.05 0.93
Results of Sulfur Isotope Testing
Of the 25 samples submitted for sulfur isotope testing (δ34S), results have been
received for only 13, including 11 adult males and 2 faunal samples (1 bear and 1 rabbit).
Significant variation was noted in values (see Figure 54). Mean δ34S for humans from
SCL-38 was -0.14 permil, with a standard deviation of 2.79. The minimum δ34S value
was -4.29 permil and the maximum, 3.93 permil, for a range of over 8 permil.
The two individuals with the highest δ34S values are among the four males
with δ15N values outside the 99 percent confidence range for a local diet (see Figure 42).
If the δ34S values for these two (Burials 141 and 143) are trimmed from the sample, the
mean drops to -0.94 permil, the standard deviation is reduced to 2.38, and the range is
reduced to just over 6 permil.
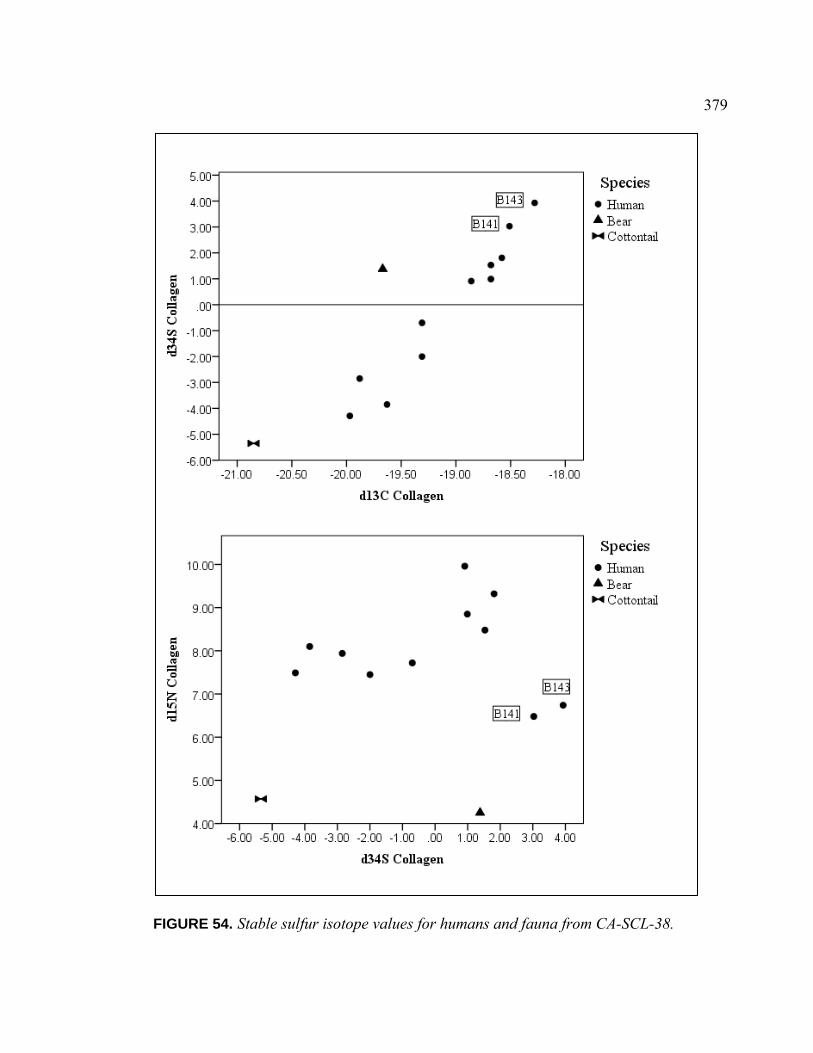
379
FIGURE 54. Stable sulfur isotope values for humans and fauna from CA-SCL-38.
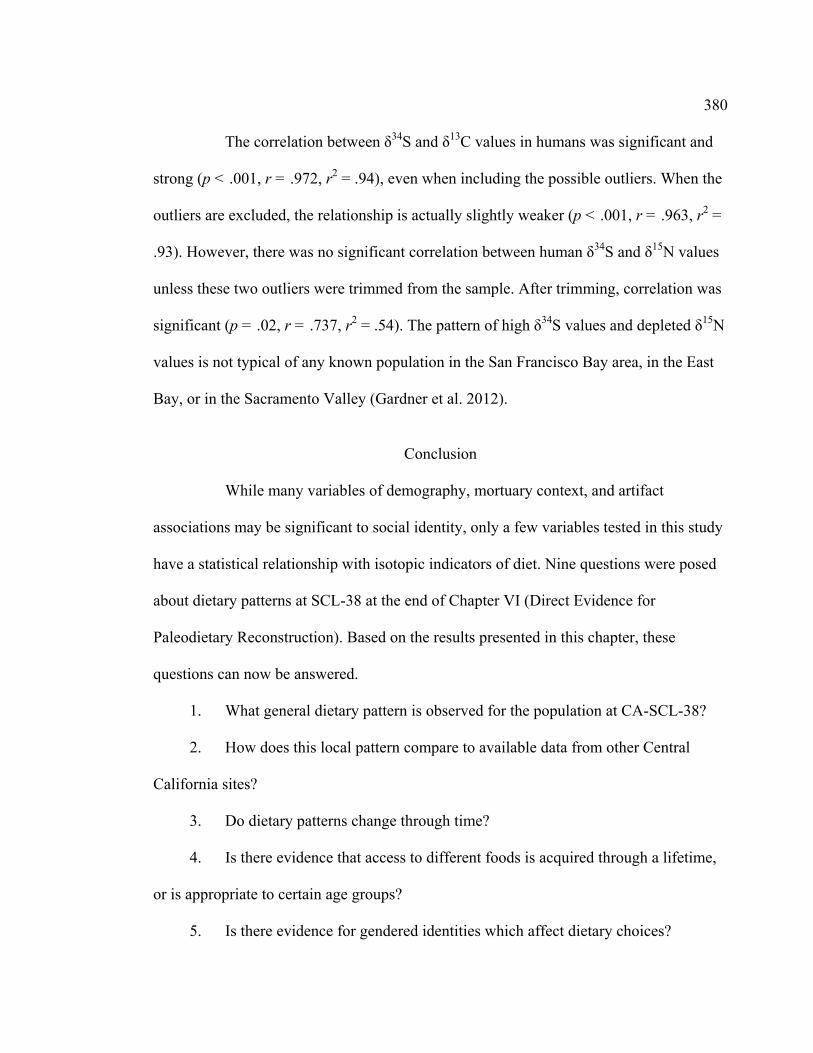
380
The correlation between δ34S and δ13C values in humans was significant and
strong (p < .001, r = .972, r2 = .94), even when including the possible outliers. When the
outliers are excluded, the relationship is actually slightly weaker (p < .001, r = .963, r2 =
.93). However, there was no significant correlation between human δ34S and δ15N values
unless these two outliers were trimmed from the sample. After trimming, correlation was
significant (p = .02, r = .737, r2 = .54). The pattern of high δ34S values and depleted δ15N
values is not typical of any known population in the San Francisco Bay area, in the East
Bay, or in the Sacramento Valley (Gardner et al. 2012).
Conclusion
While many variables of demography, mortuary context, and artifact
associations may be significant to social identity, only a few variables tested in this study
have a statistical relationship with isotopic indicators of diet. Nine questions were posed
about dietary patterns at SCL-38 at the end of Chapter VI (Direct Evidence for
Paleodietary Reconstruction). Based on the results presented in this chapter, these
questions can now be answered.
1. What general dietary pattern is observed for the population at CA-SCL-38?
2. How does this local pattern compare to available data from other Central
California sites?
3. Do dietary patterns change through time?
4. Is there evidence that access to different foods is acquired through a lifetime,
or is appropriate to certain age groups?
5. Is there evidence for gendered identities which affect dietary choices?

381
6. Is there evidence for status-based food access, based on mortuary treatment
(body position, body orientation, associated burning)?
7. Do dietary patterns differ for individuals buried in different spatial clusters
within the cemetery at CA-SCL-38?
8. Are there artifacts that are associated with distinct dietary patterns?
9. Do dietary patterns differ for individuals with greater quantities of associated
grave goods?
Firstly, the general dietary pattern at SCL-38 includes primarily terrestrial
resources with some marine contributions and is generally homogeneous with some
individual variation. From the many available foods on the menu, stable isotope values
are consistent with diets including terrestrial and marsh plant foods (e.g., seeds, nuts,
acorns, greens, roots, and tubers), terrestrial mammals (e.g., elk, deer, and rabbits),
insects (grasshoppers, yellow-jacket larvae, caterpillars or moth larvae), freshwater fish,
and bay shellfish. Marine fish would have played a minor part in the diet. Marine
mammals are unlikely to have been a major component of the diet, but may have been
consumed on rare occasions. Isotopic data are inconclusive for the consumption of
terrestrial carnivores and freshwater mussels.
The dietary pattern at SCL-38 is not statistically different from other South
San Francisco Bay Area sites, but does show slightly higher δ15N values, suggesting
increased reliance on bay shellfish or marine fish at SCL-38 compared to other nearby
sites. However, all available δ13C and δ15N isotope values are significantly lower at SCL-
38 than at coastal sites or sites on the east or north shores of San Francisco Bay,
suggesting that those regions included more marine foods in their diets. Delta sites have

382
statistically significant differences in both collagen isotope values, with lower δ13C, but
higher δ15N values, perhaps indicating greater reliance on freshwater fish.
Only a few burials from SCL-38 have been dated prior to the Late Period
(before 740 BP), and the associations with these early burials cast some doubt as to the
accuracy of the temporal assignments. Statistical comparison was possible between the
first and second phase of the Late Period, however, and a statistically significant
difference was noted in declining δ15N values through time. This observation is consistent
with interpretations of resource depression in the Late Holocene (e.g., Broughton 1994).
Alternatively, it could suggest reduced reliance on bay shellfish or other marine
resources.
The only significant dietary difference associated with age groups was
explained by the breastfeeding of infants. A dip in δ15N relative to δ13C values in children
between 5 and 10 years of age suggests a greater reliance on plant foods during this
period, with less input from animal proteins. No statistically significant difference was
observed between the diets of adults (age 16-40) and elders (over 41 years old), although
mean values for elders were slightly lower for all isotopes.
There was evidence for gendered identities affecting dietary choices at SCL-
38. Based on biological sex assessment, males were shown on average to have higher
δ13C and δ15N values from bone collagen than females. Higher δ13C values from apatite
were also observed, but were not statistically significant. This suite of enriched isotopes
suggests that males consumed foods of slightly higher trophic levels than females,
perhaps including increased quantities of animal proteins.

383
Of the variables considered for mortuary context, there was no dietary pattern
noted with interment type (primary or secondary), burial position (right side, left side,
ventral, dorsal, etc.), or burial orientation. Variation seen between single, double,
multiple and cluster variables was explained by other factors of identity, as were the
values of individuals buried in non-flexed postures. Individuals with associated burning
had slightly lower δ15N values on average than those without. Based on the premise that
individuals of higher status would be buried with more complex mortuary rituals, it
follows that if these individuals consumed higher status foods, these were not the highest
isotopic value foods on the menu. Terrestrial resources may have been more valued than
marine fish, freshwater fish, or bay shellfish. This will be discussed further in Chapter IX.
Spatial organization of the cemetery does appear to have a meaningful
association with dietary patterns, particularly for those in the central cluster (Cluster 5)
versus those in other sectors. Values for all three measured isotopes were significantly
higher for those interred in the central cluster, with mean values 0.24 to 0.72 permil
greater than those in other sectors of the cemetery. While individuals in Cluster 5 have
diverse isotope values, the general enrichment in this sector supports Bellifemine’s
(1997) early observation of spatial organization at the cemetery.
Evaluation of burial-associated artifact types showed no relationship between
the presence of technomic artifacts and dietary patterns. Individuals with shell beads and
Haliotis ornaments did have enriched values for all observed stable isotopes, although
when Haliotis ornaments where considered separately, the only significant difference was
in δ13C values of bone apatite. Of all ideotechnic artifacts considered, the only significant
association with dietary patterns was with charmstones.
384
Measures of artifact abundance held significant but extremely weak
relationships with dietary patterns. Artifact diversity was not related to isotope values in
any significant way. These results are somewhat surprising, and suggest that indicators of
wealth and prestige may not have been associated dietary privileges or isotopically
significant variation in cuisine. These results will be considered in light of indicators of
social identity in Chapter IX.
385
CHAPTER IX
DISCUSSION: DIET AND IDENTITY AT
THE YUKISMA MOUND (CA-SCL-38)
Introduction
With the diverse menu available to the prehistoric residents of the Santa Clara
Valley, many foods would have been potentially good to eat. But not all food resources
with nutritional potential would have been consumed, and those that were may have been
used selectively. Appropriate food choices are shaped by cultural preferences, infused
with symbolic associations, and limited by taboos and restrictions. Beyond the dominant
staples (“cultural superfoods”), some options will be associated with prestige, some with
magic, some with masculinity or femininity, and some with danger. The negotiation of
socially ascribed meanings of foods shapes dietary choices based on self-actualized or
relationship-based social identities.
This chapter examines the relationship of dietary patterns at CA-SCL-38 with
attributes of social personae visible in the archaeological record. The results of stable
isotope analysis presented in Chapter VIII are integrated with the aspects of social
identity discussed in Chapter IV. This information is further informed by the mortuary
context and artifact associations discussed in Chapter III, to produce an overview of
context and dietary correlations by social category, including social age, gender,
disability, specialization, status, and population affinity.

386
Social Identities and Diet at SCL-38
Social Age
Social age refers to the socially designated age categories which separate
childhood from adulthood, and possibly differentiate adults from elders. Because
responsibilities and expectations for individuals may change with age, contextual
evidence from artifact associations will provide clues to translate biological age observed
by osteologists to social age categories used by the ancestral Ohlone. The individuals
included in this study included all subadults where bone samples were available (n = 24),
as well as 75 adults between the ages of 16 and 40 years and 28 elders over 41 years of
age. The transition from subadult to adult at 16 years of (biological) age and the transition
from adult to elder after the 40th year are consistent with previous studies (Bellifemine
1997; Jurmain 2000; Morley 1997). In the following discussion, childhood and elder
patterns will be distinguished from adult patterns.
Childhood. Children are less likely to have responsibilities for production of
material goods, and therefore are less likely to be associated with technomic (utilitarian)
artifacts. Only six subadults (14%) had associated technomic artifacts, while 78 adults
(38%) were buried with these useful items, a statistically significant difference (Χ2 =
11.22, df = 2, p < .01, V = .21). Within the sample group, the same relationship is
observed and the association of technomic artifacts with adults is slightly stronger (Χ2 =
7.46, df = 1, p < .01, V = .24).
Examination of specific types of technomic artifacts reveals that not all types
had the same significance for childhood. Technomic bone artifacts (scapula saws, bone
strigils, bone awls, bone needles, antler wedges, and other bone artifacts) were found

387
with 30 of 204 adults (15%), but with none of the 43 subadults at the site. Technomic
chipped stone was associated with 3 subadults (7%), and 42 adults (21%). Technomic
groundstone objects (mortars, pestles, manos, or abraders) were associated with 4
subadults (9%) and 34 adults (17%). The absence of bone tools with individuals under 16
years of age supports the transition to the social category of adulthood around this time.
Chipped stone with subadults (an infant, a young child, and an adolescent) included
flaked chert, but never projectile points. Groundstone with subadults included pestles
with four non-infant children and a mortar with one young child (B135). Another infant,
(B119) was also placed within a mortar, immediately above the remains of an adult
female. These mortars likely served a symbolic purpose in the mortuary preparation of
these subadults, rather than representing utilitarian possessions of the decedents. The
significance of pestles likewise may be more symbolic than functional.
Children were sometimes associated with sociotechnic artifacts (beads and
pendants). Three infants, four children under five years old, two children between six and
ten years old, and one adolescent had associated beads or pendants. Of these, all had shell
beads except one infant. Haliotis pendants were associated with that infant, plus three
children under five, and one child between six and ten. These valuable items will be
considered in the discussion of status below. However, it is fair to suppose that children
under the age of ten would have these items due to ascribed status, rather than life
achievements.
Ideotechnic artifacts were associated with one child under five years old, two
between six and ten years old, and one adolescent. The young child (B178) had a
charmstone tip and cinnabar on the surface of a small pestle. The older children had
388
associated cinnabar (B135) and a piece of elk antler (B217). The adolescent (B75) had a
bird bone tube. The association of subadults with these ritually significant artifact types
suggests that their social identities afforded them ceremonial recognition as part of the
group. This is an important distinction, as the overall underrepresentation of infants at
SCL-38 suggests that not all young children were interred in the cemetery site.
Specialized mortuary treatment of children also included double burials and
associated burning. Of the 15 infants recovered at SCL-38, 11 (73%) were buried with
another individual. Thirty-six percent of subadults (n = 10 of 28) were interred in double
burials. Only 14 percent of adults and elders were interred with another individual (n =
29 of 204). Additionally, burning was common in funerary practices for infants, with a
prevalence of 60 percent (n = 9 of 15), compared to 43 percent for children (n = 12 of
28) and 46 percent of adults and elders (n = 94 of 204).
Because of the small sample size for subadults, the diet of children could not
be statistically differentiated from that of adults, although infants displayed evidence of
breastfeeding and weaning (discussed in Chapter VIII). The pattern of δ15N enrichment
indicated that infants were exclusively breastfed for approximately two years. Weaning
foods were introduced around age two, and most children were completely weaned by
age three to four years, although children who were sickly may have received different
care. Stable isotope values of children between five and ten years old had lower δ15N
values than expected for the population (see Chapter VIII), which suggests that they may
have consumed less animal protein or lower trophic level foods than older children and
adults.
389
The artifactual and dietary evidence of childhood at SCL-38 suggests that
children were not responsible for production of material goods, but may have participated
in some subsistence practices (based on association with chipped stone tools). Further,
some children were born to higher social status than others, and some had more elaborate
mortuary rituals.
Adulthood and Elders. Once past the childhood years, each individual
negotiated the roles and responsibilities associated with adulthood. Of the 204 adults
excavated from SCL-38, 59 (29%) were over the age of 41, beyond childbearing years,
and may have had different social roles as elders in the community. Comparison of
mortuary contexts, artifact presence, artifact abundance, and dietary patterns between
adults and elders in this burial population revealed evidence of only a few changes in
social roles or recognition with advancing age.
No statistically significant differences were noted in mortuary treatment of
elders compared to other adults, except that elders were almost twice as likely to be
oriented towards the north (52% of elders, or 31 of 59, compared to 29% of adults, or 42
of 145). The relationship between northerly interment and age class is statistically
significant, but the association is weak (Χ2 = 0.14, df = 1, p < .01, V = .22). No
significant patterns were noted between adults and elders with other directional
orientations or in burial type, burial position, burial posture, or special mortuary
preparation (burning, cremation, or rock cairns). Based on these observations, there was
no evident change in mortuary ritual for the elders of the community compared to adults
who died earlier in life.
390
Additionally, differences in presence, quantity, or diversity of artifact
associations between adults and elders were insignificant or very weak. Elders over 40
years were almost equally likely to have associated technomic artifacts as adults (36%
compared to 38%), and slightly less likely to have sociotechnic artifacts (41% of elders,
54% of adults). Elders also had a lower frequency of ideotechnic objects (14% compared
to 23%). However, none of these differences is statistically significant. Both adults and
elders had caches of more than one thousand beads (5% of adults, 3% of elders), but there
is no statistically significant relationship between age class and bead quantity class. There
is a statistically significant relationship between artifact quantity and elder versus adult
age class (r = -0.156, F[1, 204], p = .03), but the relationship is so weak that it is
essentially meaningless (r2 = .02). A significant but weak relationship also exists between
age class and artifact diversity (χ2 = 20.225, df = 9, p = .02, V = .32). Generally, adults
were more likely to be associated with diverse assemblages, however the individual with
the most diverse assemblage at SCL-38 with ten artifact types was an elder female (B93).
Other than that individual, no elders had more than three associated artifact types.
No significant differences were found between isotope values of adults and
those of elders (δ13CCollagen: t = 1.483, df = 101, p = .14; δ15NCollagen: t = 1.115, df = 101,
p = .27; δ13CApatite: t = 0.819, df = 102, p = .42). These findings, in association with the
lack of differentiation in mortuary practice or artifact associations, suggest that if elder
status was recognized by this group, there was no associated change in social status,
social roles, or patterned modification of diet with advancing age.
391
Sex and Gender
In this text, the words male and female refer to biological sex, while man/men,
woman/women, or two-spirits refer to gender identities. For an informed discussion of
gender roles in the prehistoric past, evidence of distinction must be observed in classes of
artifacts, mortuary preparations, spatial organization in the cemetery, or skeletal
indicators of activity patterns (e.g., musculoskeletal markers or patterns of osteoarthritis).
With the assumption that the gender identities of most individuals will align with
biological sex classifications, material evidence which is primarily associated with one
biological sex can be extended to a discussion of individuals who do not match binary
categories and may represent third gender (males in altern roles) or fourth gender
(females in altern roles) classifications.
For the purposes of this discussion, it is unfortunate that no distinct patterns of
artifact distribution by sex were apparent at SCL-38. While a few unique objects were
found with males or with females, any object which occurred more than three times at the
site was associated with individuals of both sexes. While males were overrepresented in
the central cluster of the cemetery (Cluster 5) and females were overrepresented in other
areas (Clusters 1, 3, 4, and 7), all clusters included multiple individuals of both sexes
(Bellifemine 1997). Patterns of osteoarthritis are reported in Jurmain’s (2000) analysis of
the skeletal remains; however frequencies are low and patterns by sex are not included in
the report. Ultimately, no archaeological markers of gender designations could be
observed in this dataset; therefore, discussion of gender is limited to binary sex
classifications. Third gender individuals were undoubtedly part of the social milieu as
392
well, (Harrington 1942; Holliman 2005; Willoughby 1963) but cannot be distinguished
based on the available evidence from SCL-38.
There were some notable differences in artifact diversity and abundance by
sex. Males had larger caches of artifacts, including statistically significant differences in
quantity of sociotechnic artifacts (t = 2.835, df = 161, p < .01) and in overall quantity of
grave goods, both with and without shell beads (with beads: t = 2.843, df = 161, p < .01;
without beads: t = 2.547, df = 161, p = .01). However, differences in quantities of
technomic artifacts were not significant (t = 1.058, df = 161, p = .29), nor were
differences in quantities of ideotechnic items (t = 0.879, df = 161, p = .38). Of the three
classes of artifacts, males were only more likely to have associated ideotechnic objects,
and this relationship was very weak (χ2 = 5.259, df = 1, p = .02, V = .18).
Quantities of shell beads in burials were also significantly but weakly related
to sex (χ2 = 32.797, df = 18, p = .02, V = .25). Men were twice as likely to have large
caches of over one hundred shell beads (29% of males compared to 14% of females).
Only males had shell bead caches of over one thousand beads (n = 9). Accumulation of
beads or goods was not associated with advancing age for either sex.
Dietary difference between males and females was significant (see Chapter
VIII) with males showing higher mean values for all measured isotopes. These
differences suggest that males consumed a slightly greater proportion of higher trophic
level proteins than did females. These differences are also reflected in dental health,
particularly in the presence of abscesses. Females had significantly more abscesses than
males (χ2 = 23.2, p < .001; Jurmain 2000:23). The pattern of relatively poor dental health
in females is consistent with Kolpan’s (2009) observations of Early Period Windmiller

393
populations from the Sacramento Valley and Delta regions and with Bartelink’s (2006)
observations of Sacramento Valley and San Francisco Bay populations, particularly
during the Middle Period, but also in the Early and Late Periods. Differences in dental
health are likely due to dietary variation and possibly related to labor activities, as women
may have had more contact with carbohydrates (preparing of acorn mush, seed cakes,
gathering of fruits) and been more prone to snacking on these higher-sugar foods (Kolpan
2009).
The observed differences in type and quantity of artifacts have implications
for gender identity at SCL-38. The presence of technomic artifacts (utilitarian bone tools,
chipped stone, and groundstone) in burials of both sexes implies that labor
responsibilities were flexible, or that the items in these burials were donated by mourners
rather than reflecting activities of the deceased. Men were not statistically more likely to
have associated markers of wealth and prestige, but did have a greater abundance of these
items than women. The association of ritual objects with males is significant, but some
females also possessed these objects including the elder female with the greatest artifact
diversity at the site (Burial 93).
The difference in dietary patterns and dental health between males and
females does support ethnohistoric reports of a division of labor, where men were more
responsible for hunting game and women were more responsible for gathering plant
foods and preparing meals. However, the diversity seen in this assemblage suggests that
these gender roles were flexible, and may have been multiple. Both men and women used
(or were given) utilitarian tools without clear sexual divisions by tool type. Both men and
women also had associated objects signifying wealth and prestige, but men were entitled

394
to greater quantities of these items. Men were also more likely to have objects associated
with the spiritual or ritual realm, but some women also occupied these roles. The absence
of burial associated artifacts may also suggest that these objects were inherited rather
than buried with the deceased (cf. Binford 1962). If so, the relative lack of goods with
females may suggest matrilineal inheritance of wealth objects.
Disabilities
The osteological analysis of the remains from SCL-38 yielded insights into
the challenges that some of these individuals faced during life. Of the 248 unique
individuals, 24 (10%) exhibited some sort of condition that would have significantly
influenced their ability to participate in the same activities as able-bodied members of
society. Of these, eight were congenital or developmental conditions, nine were traumatic
injuries that resulted in prolonged infections or compromised limb function, six were
vertebral lesions suggesting long battles with disease (Wu 1999), and one suffered a
perforating cranial injury two years prior to death which probably would have produced
severe neurological and behavioral symptoms (according to consultation with Dr. Bruce
Ragsdale, per Jurmain 2000:33). The stable isotope values from the bone collagen of the
individuals with disabilities are highlighted in Figure 55.
Dietary patterns of individuals with congenital or developmental conditions
were very consistent with the fit line for the whole population, suggesting that these
individuals ate the same sorts of foods as everybody else. Burial 227 (the individual with
the most negative stable isotope values in this group) was a young adult of indeterminate
sex, but possibly female (Morley 1997), with a severe cleft palate. As discussed in
Chapter III, this person was buried with a bullroarer, which may have served as an
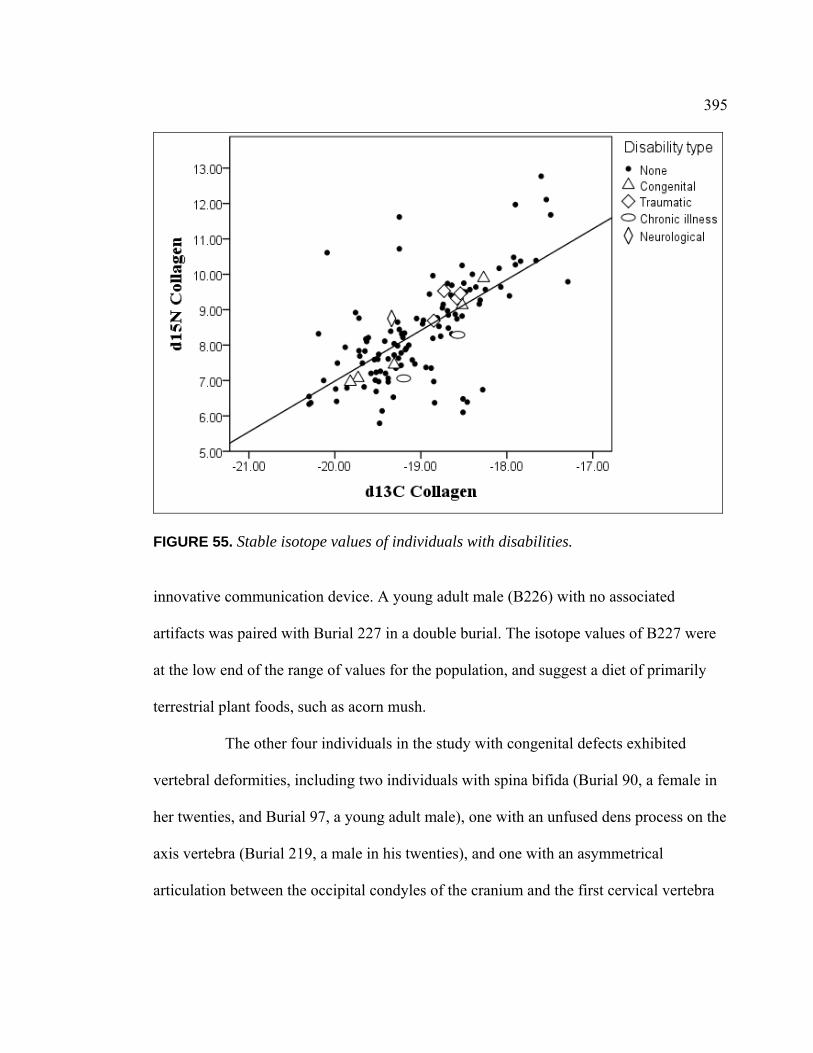
395
FIGURE 55. Stable isotope values of individuals with disabilities. innovative communication device. A young adult male (B226) with no associated
artifacts was paired with Burial 227 in a double burial. The isotope values of B227 were
at the low end of the range of values for the population, and suggest a diet of primarily
terrestrial plant foods, such as acorn mush.
The other four individuals in the study with congenital defects exhibited
vertebral deformities, including two individuals with spina bifida (Burial 90, a female in
her twenties, and Burial 97, a young adult male), one with an unfused dens process on the
axis vertebra (Burial 219, a male in his twenties), and one with an asymmetrical
articulation between the occipital condyles of the cranium and the first cervical vertebra

396
(Burial 69, a male in his thirties). Of this group, the female has the most negative isotope
values, just slightly higher than the individual with the cleft palate.
Three adult males with congenital disabilities were not included in the isotope
study. Burial 27 had developmental asymmetry of the left arm. Burial 29 had deformity
of the sternum and clavicles. Burial 157 had an occluded external auditory meatus (a
developmental defect per Jurmain 2000). Artifact associations with these individuals
varied widely (see Table 58). Two individuals in this group had more than one thousand
associated shell beads (Burials 97 and 69) and one had more than four hundred beads
(Burial 90). The other five had no beads at all.
All individuals from SCL-38 with traumatic injuries which would have caused
disability in life were adults in their thirties or forties. Four males from this group were
included in the isotope study. Burials 13 and 151 both experienced projectile point
injuries which healed with complications, one resulting in a severe infection
(osteomyelitis) in the right femur, the other involving perforation of the 5th lumbar
vertebra with reaction in the inter-vertebral disc space. Burial 148 had a poorly healed
fracture of the right tibia, resulting in shortening of the limb. Burial 42 experienced a
crushing injury to the left elbow. Radiocarbon and obsidian hydration dates place Burials
13 and 42 in the first phase of the Late Period (740-440 BP). The diet of these males was
absolutely typical of males at the site, with no alteration observed due to their mobility
challenges. Three males not included in the study exhibited leg fractures causing
deformity or severe infection (Burials 16, 24, and 76). Two elder females are also
included in this group, one with a crushing injury to the right humerus and scapula

397
TABLE 58. Artifact Associations by Disability Type
Disability Type
Burial # Sex
Age Group Technomic Artifacts Sociotechnic Artifacts Ideotechnic Artifacts
# Artifact Types Bead qty class
Total artifacts
Congenital 27 M A 0 0 0 39 M A Mortar 1 0 1 69 M A Worked bone tool Olivella shell beads 2 Over 1000 3575 90 F A Olivella shell beads Bone tubes/whistles 2 100-500 461 97 M A Bipointed bone tool Olivella shell beads & Haliotis
pendants Bone tubes/whistles, stone pipe, charmstone
6 Over 1000 1530
157 M A Pestle 1 0 1 219 M A Bone awl Haliotis pendants 2 0 2 227 I A Bullroarer 1 0 1
Traumatic 13 M A Mortar Olivella shell beads & Haliotis
pendants Charmstone 4 501-1000 944
16 M E 0 0 0 24 M E Olivella shell beads 1 1-10 6 42 M E Bone awl & projectile
point Bone tubes/whistles 3 0 23
54 F E Scapula saw Olivella shell beads 2 100-500 168 55 F E Mortar 1 0 1 76 M E Haliotis pendants 1 0 18 148 M A Haliotis pendants Charmstone 2 0 2 161 M E 0 0 0
Chronic illness 6 I A 0 0 0 33 M A Bone tubes/whistles, stone pipe, antler 3 0 28 62 M A Olivella shell beads Bone tubes/whistles 2 1-10 15 107 F E Mano 1 0 2 109 M A 0 0 1 183 F E 0 0 0
Neurological 120 F A Mortar & pestle Olivella shell beads 3 1-10 5

398
(Burial 54), and another with an un-united but healed fracture (synchondrosis) of the left
ulna.
Six individuals from SCL-38 (Burials 6, 33, 62, 107, 109, and 183) had lytic
lesions on vertebral elements suggesting that they suffered from tuberculosis (either M.
bovis or M. tuberculosis) or a fungal infection called coccidiodomycosis (“Valley Fever”)
(Wu 1999). In either case, the formation of vertebral lesions suggests that these
individuals had been ill for a long period prior to their deaths. Two females in their
thirties or forties are included in the isotope study. One of them, Burial 107, was
radiocarbon dated to the first phase of the Late Period. Stable isotope values suggest that
these women had been consuming a mix of terrestrial foods and shellfish, but that their
diets were low in animal proteins.
The individual identified with a neurological disorder was a female about 19
years old at the time of her death. She had sustained a perforating cranial injury
approximately two years prior to her death which would have resulted in severe
behavioral and neurological symptoms. The lesion perforated both the inner and outer
tables of the left parietal near lambda. It measured approximately 18.3 millimeters in
diameter and had well rounded edges (Jurmain 2000). She was buried with a mortar
above her, on which were laid the remains of an infant, approximately 1½ years old.
Given the healing of the wound and the age of the infant, it is likely that conception and
the injury occurred at the same time or within just a few months. This woman appears to
have been well nourished, with δ15N values one permil higher than the mean for females
in the population. The infant had been breastfed with no evidence yet for the introduction
of weaning foods. The woman also had a pestle and three Olivella beads. The infant had
399
one Olivella bead and an associated chert cortical flake. This pair was dated to 1308-1388
AD (calibrated radiocarbon date).
Overall, individuals with disabilities were slightly more likely to be have
associated technomic artifacts (46%, n = 11 of 24) than adults without disabilities (36%,
n = 67 of 186). They were almost equally likely to have associated sociotechnic items
(46% of individuals with disabilities, 49% without), and somewhat more likely to have
associated ideotechnic artifacts (29% of individuals with disabilities, 19% of those
without). None of the differences in artifact distribution are statistically significant,
however. Dietary patterns mirror those of the rest of the community, with most variation
explained by sex. None of these individuals fall outside the 95 percent confidence level
for consumption of the same local diet as their peers. The patterns of artifact associations
and isotope values suggest that these people were well regarded and well cared for, but
that they did not receive special recognition or status because of their conditions.
Specialization
Specialists emerge in complex social organizations as individuals with
achieved skills or inherited prestige entitling them to roles of specialized production of
goods or to ritual positions such as dancers, drummers, or shamans. In ranked and
particularly hierarchical societies, these roles may exempt individuals from some or all
subsistence responsibilities and thereby affect the pattern of dietary provisioning within
the group. Additionally, dietary taboos would have been observed by ritual specialists
(Harrington 1942; Jacknis 2004), and may be apparent in stable isotope values. Evidence
for craft specialization and ritual specialization at SCL-38 will be considered below, in
the context of observed dietary variation.
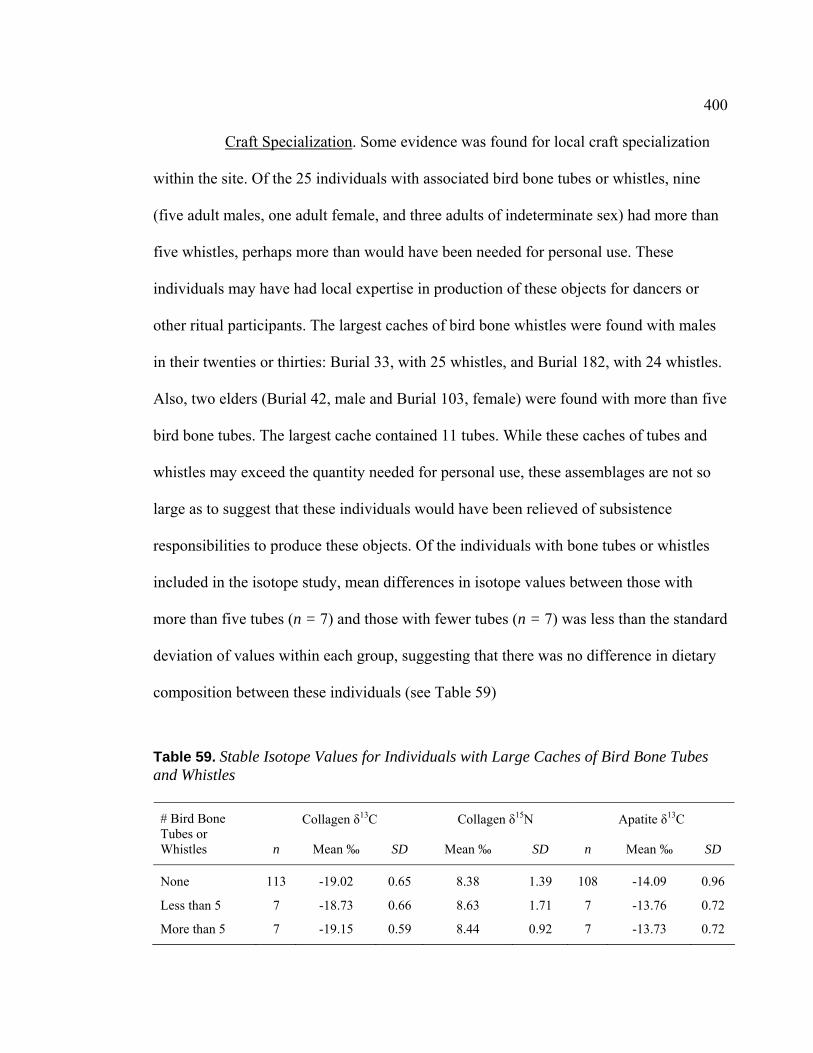
400
Craft Specialization. Some evidence was found for local craft specialization
within the site. Of the 25 individuals with associated bird bone tubes or whistles, nine
(five adult males, one adult female, and three adults of indeterminate sex) had more than
five whistles, perhaps more than would have been needed for personal use. These
individuals may have had local expertise in production of these objects for dancers or
other ritual participants. The largest caches of bird bone whistles were found with males
in their twenties or thirties: Burial 33, with 25 whistles, and Burial 182, with 24 whistles.
Also, two elders (Burial 42, male and Burial 103, female) were found with more than five
bird bone tubes. The largest cache contained 11 tubes. While these caches of tubes and
whistles may exceed the quantity needed for personal use, these assemblages are not so
large as to suggest that these individuals would have been relieved of subsistence
responsibilities to produce these objects. Of the individuals with bone tubes or whistles
included in the isotope study, mean differences in isotope values between those with
more than five tubes (n = 7) and those with fewer tubes (n = 7) was less than the standard
deviation of values within each group, suggesting that there was no difference in dietary
composition between these individuals (see Table 59)
Table 59. Stable Isotope Values for Individuals with Large Caches of Bird Bone Tubes and Whistles
Collagen δ13C Collagen δ15N Apatite δ13C # Bird Bone Tubes or Whistles n Mean ‰ SD Mean ‰ SD n Mean ‰ SD
None 113 -19.02 0.65 8.38 1.39 108 -14.09 0.96
Less than 5 7 -18.73 0.66 8.63 1.71 7 -13.76 0.72
More than 5 7 -19.15 0.59 8.44 0.92 7 -13.73 0.72

401
Some caches of burial-associated worked Olivella shells were identified as
type A4 beads, but may have been bead blanks (Alan Leventhal, personal
communication, March 13, 2013). Unfortunately, there is insufficient data available at
this time to analyze the implications of possible bead blanks at SCL-38 as no beads were
identified as blanks in the artifact catalog. Because shell beads served as currency, if bead
production was occurring on site, individuals with these items would have held high
status. If bead blanks can be identified from the artifact collection curated at San Jose
State University, future tests of stable oxygen isotopes might be able to identify whether
these shells were gathered locally, which would support the hypothesis of local
production.
Ritual Specialization. Ritual specialists filled traditional roles as dancers,
musicians, and shamans. Dance regalia may have included capes, skirts or aprons made
of furs, feathers, or grasses, headpieces adorned with feathers, and body paint including
cinnabar (Bates 1982; Harrington 1942). Abalone (Haliotis) pendants, particularly those
of banjo shape, may have been associated with specific ritual and dance roles of the
Kuksu cult (Bennyhoff 1977). Musicians would have accompanied the dancers, playing
bird bone whistles, bone or wooden flutes, rattles (made from cocoons, split sticks, deer
hooves, turtle shells, or rattlesnakes), and wooden drums.
If these items were buried with individuals from SCL-38, few preserved. No
clothing, featherwork, or furs were recovered. Cinnabar may be the only clue as to the
identity of dancers, but this pigment was used for other ritual purposes as well (e.g.,
Munro-Fraser 1881:53). The dietary associations with Haliotis pendants will be discussed
in the status section, below. The only musical instruments found were bird bone whistles,
402
associated with 17 burials at the site. Isotope values of individuals with whistles are not
significantly different than for those without. The one bullroarer found may have been
used as an instrument, but contextually appears to have been a signaling device (see
discussion in the disability section, above). No drums or rattles were identified in the
archaeological record. Overall, these possible associations with dancing and music do not
appear to have a correlation with distinct food choices.
Ritual specialists who served in shamanic roles were tremendously important
members of society in prehistoric Central California. Ethnohistoric accounts suggest that
shamans were most commonly male, but sometimes were female (Harrington 1942).
Shamans used objects and ritual knowledge to manage and balance power in the world.
They served as ambassadors between the realm of the living and the realms above and
below. They also served as ambassadors between tribal groups, and often travelled for
diplomatic purposes (Bean and Vane 1992:16). The risk involved with wielding this
specialized knowledge would have granted these individuals prestige within the group,
and was likely associated with accumulation of wealth (Bean 1992b:31). Shamanic social
roles were obtained by being called to service, but often ran in families, particularly
families who already had influence and power in the tribe (Bean and Vane 1992). As
such, they would have had access to high quality foods, but also were required to observe
strict dietary guidelines and taboos (Jacknis 2004:103).
At SCL-38, ideotechnic artifact types (bird bone tubes or whistles, stone
pipes, stone spoons, charmstones, “magic” stones, cinnabar, or totemic faunal remains)
were associated with only 18 percent of burials. Individuals with these objects were
predominately male (n = 26, 26% of males), but nine females (14%), six adults of
403
indeterminate sex (14%), and three subadults (7%) also had these ritually significant
items. Of the various ideotechnic artifacts identified at SCL-38, the only objects with
distinct dietary associations were charmstones (see Chapter VIII).
Charmstones were power objects, used to control weather, influence hunting
or fishing outcomes, and heal the sick (Sharp 2000). Ethnographic reports from the Napa
region indicate that they were suspended over streams or
laid upon ledges of rocks on high peaks, with the belief that, owing to their peculiar form and some occult power which they possessed, they traveled in the night through the water to drive the fish up the creeks to favorite fishing places, or through the air to drive the land game up towards certain peaks and favorite hunting grounds. [Yates 1889:304]
The association with fishing provides an interesting suggestion about dietary patterns,
which is supported by the isotope evidence for individuals buried with charmstones. A
statistically significant difference in δ15N values exists between those with charmstones
and those without, with a mean difference of more than one permil when one sample of
dubious quality (Burial 134) is trimmed from the group. Based on isotope signatures of
foods on the local menu, the enriched δ15N values could well be due to greater
consumption of freshwater fish. Additionally, variation of both δ13C and δ15N values in
bone collagen is very small for individuals with charmstones (δ13C: mean =18.64, SD =
0.18, δ15N: mean = 9.35, SD = 0.39, trimmed sample), suggesting that these individuals
observed the same dietary restrictions.
Status
Along with demographic categories such as social age and gender, status is
one of the most commonly examined attributes of social identity in the archaeological
record. Special or time-intensive mortuary treatment, abundance of artifact associations,

404
association with costly artifacts (items requiring significant time investment to
manufacture or made from rare or exotic materials) or with culturally significant wealth
items (such as shell beads) all suggest that some individuals held higher status than others
without these associations. At SCL-38, attributes of burial context, artifact associations,
and artifact abundance all indicate differential treatment of some individuals during their
funerary preparations, which suggests that these individuals held different statuses during
life.
Wealth. Measures of wealth, such as presence of sociotechnic artifacts (shell
beads or pendants), quantity of shell beads, quantity of artifacts, or artifact diversity all
show that wealth was unevenly distributed within this population. These measures of
wealth were not correlated with advancing age, indicating that wealth was inherited.
While it might be expected that greater wealth granted access to prestige foods, the
correlation between shell bead class and all measured isotope values in this study showed
that accumulating shell beads explained only 4 to 6 percent of variation in stable isotope
values (r2 values from .04 to .06, see Chapter VIII). Likewise, artifact abundance was
correlated with isotope values, but predicted only 4 to 7 percent of variation when shell
beads were included in abundance calculations. Without shell beads, the relationship was
still very weak (r2 values from .03 to .07).
Artifact diversity is another proxy for wealth in the archaeological record. But
the only relationship between artifact diversity and diet was with δ13C values of apatite,
and again the relationship was very week (r2 = .07). Wealth at SCL-38 is present and
unevenly distributed, but stable isotope analysis does not detect any difference in diet
based on these markers of status.

405
Prestige. Of the many attributes of mortuary context examined in this study,
only burning and spatial organization of the cemetery were correlated with dietary
patterns. Mortuary practices involving fire were common at SCL-38, involving 60
percent of all burials where context was recorded (n = 155 of 242). Fire was incorporated
into the mortuary ceremony in many ways, including burning of an individual’s
possessions or mortuary offerings in the grave prior to interment, burning of these items
above the interred body, or burning of the body itself. Thirty-five individuals with
associated burning were classified as cremations. Mortuary practices involving burning
suggest more elaborate and costly ceremonies, and are expected to be associated with
prestigious individuals.
There was no correlation between burning or cremation and the presence of
technomic artifacts (burning: χ2 = 3.222, df = 2, p = .20; cremation: χ2 = 2.604, df = 2, p
= .27), or sociotechnic artifacts (burning: χ2 = 0.458, df = 2, p = .80; cremation: χ2 =
3.834, df = 2, p = .15), or ideotechnic artifacts (burning: χ2 = 0.018, df = 2, p = .99;
cremation: χ2 = 1.005, df = 2, p = .61). Nor was there any significant relationship
between burning or cremation and artifact abundance (burning: t = -0.29, df -= 240, p =
.77; cremation: t = 1.396, df -= 240, p = .16), shell bead class (burning: rs = -0.007, p =
.91; cremation: rs = -0.020, p = .76), or artifact diversity (burning: rs = -0.092, p = .15;
cremation: rs = -0.088, p = .17). The use of fire in mortuary practices therefore appears to
have been independent of wealth, as measured by these variables, and is predicated on
some other aspect of social status. Measured values of stable isotopes are lower on
average for individuals with burning than for those without, with a significant difference
in δ15N values. This pattern suggests that individuals with associated burning ate lower

406
trophic level foods than those without, concentrating on a diet of terrestrial foods with
fewer freshwater fish, shellfish, or other marine resources.
Spatial organization at the cemetery was also significant. Greater
concentrations of artifacts, greater incidence of burning, and a greater concentration of
adult males were found in the cemetery center (Cluster 5) than in surrounding areas of the
site (Bellifemine 1997). As artifact abundance has a neutral relationship with dietary
patterns, burning is associated with slightly lower values for all measured isotopes, and
males are associated with enriched isotope values, the net effect of these factors is likely
to be slightly higher values for all measured isotopes, which is exactly the result of the
analysis. While isotope values were significantly more enriched for individuals in Cluster
5, the differences were small, and may be explained by the overrepresentation of males in
this cluster.
Moiety Affiliation. One interesting pattern having to do with status and
identity is associated with artifacts which might be tied to moiety affiliation. Moieties
were clan-like societies within and between communities, which divided ritual
responsibilities, animal totems, habitation areas within the villages, and burial areas
within cemeteries (Bean 1976). Based on the symbolic systems of the Miwok, moieties
divided the world into land and water sides (Kroeber 1925:455). The land side moiety
was associated with the bear, the water side with the deer. Other animals associated with
the land side include the puma, wildcat, dog, fox, raccoon, tree squirrel, badger,
jackrabbit, and birds of prey. On the water side appear antelope, coyote, beaver, otter,
waterfowl, fish, and many insect species. Interestingly, Haliotis shell pendants and bead
money were attributes of the water side.
407
While working with the Yokuts in the 1930s, Anna Gayton found that
affiliated totem animals were protected. “The totemic animal was venerated. Under no
circumstances did an individual kill his animal, and in the case of its being edible—as
bear, dove, or fish, its flesh was never eaten. A person who unwittingly ate of such food
would always be nauseated by it” (Gayton 1930:367). From an isotopic point of view, if
moiety affiliation shaped food choices, the difference between the high trophic level
terrestrial animals affiliated with the land side and eaten by water side people, and the
low trophic level terrestrial animals plus fish affiliated with the water side and eaten by
land-side people, would be detectable. However, as Levi-Strauss pointed out, “natural
species are chosen [as totems] not because they are 'good to eat' but because they are
‘good to think’ ” (Levi-Strauss 1971:89). The relationship between the ancestral Ohlone
and totem species is not known, and any culture-historic projection into the past and
across territories should be done cautiously and with qualifications.
At SCL-38, individuals with Haliotis pendants did have distinct isotope values
from those without these items. The difference was in δ13C values of apatite, which was
enriched by an average of .50 permil for those with these items (n = 43 with pendants, 79
without). The interesting aspect of the enriched apatite value is that collagen isotope
values are not significantly different between those with and without Haliotis pendants.
Enrichment of only the δ13C values of apatite is also seen in individuals with cinnabar
(n = 3) and with stone pipes (n = 3). Bone pendants and totemic faunal remains (stingray
points, antler, claws, or non-human teeth) may have been associated with moiety
affiliation, but individuals with these items do not display the same isotopic pattern.

408
However, both δ15N and δ13CApatite values were enriched in individuals with associated
antlers.
Enrichment of carbon values in apatite would be caused by a non-protein
dietary source. One likely resource is seaweed. Kelps and seaweeds were popular snack
foods among northern California groups, such as the Pomo (Dubin and Tolley 2008;
Lightfoot and Parrish 2009). Dried seaweed is lightweight, easy to transport, and can be
stored for over a year (Dubin and Tolley 2008:29). While kelp may not be a good source
of dietary fiber or protein, it contains carbohydrates, many vitamins and minerals, and
may even provide some degree of protection against heavy metal poisoning.
Polysaccharides in alginates bind metal ions (MacArtain et al. 2007), which would have
been important if mercury from the nearby cinnabar mine at New Almaden leached into
the Guadalupe River or other nearby groundwater or drainage systems.
There is some question as to whether the bioavailability of kelp would allow
incorporation of marine carbon enough to affect δ13C values in human bone apatite.
Ambrose and colleagues (1997) observed enriched δ13CApatite without elevation of
collagen values in a prehistoric population from the Marianas Islands, which they
interpreted to be an indication of the consumption of seaweed or sugar cane;
unfortunately, it was not possible to differentiate between those resources. Another study
of dietary patterns of Scottish sheep demonstrated a measurable difference in δ13C values
of tooth enamel in sheep which had been consuming seaweed, with values more than 6
permil higher than when the same sheep were eating terrestrial resources (Balasse et al.
2006). Further, the association with Haliotis pendants, a species found only in the ocean,
409
suggests that these individuals travelled to the ocean, or were connected by traders, and
would have had access to seaweed and kelp.
Social Organization and Power. Reflecting on Binford’s (1971) indications of
egalitarian and ranked social organization, the archaeological data from SCL-38 can be
applied to interpret social organization at this site. Binford suggested that in egalitarian
societies, technomic artifacts would be present with most individuals, and refined forms
would reflect achieved status and therefore be associated with older individuals. In
ranked societies, fewer technomic artifacts would be associated with individuals of higher
status and esoteric forms of these artifacts would be present. At SCL-38, technomic
artifacts were present with only one-third of individuals (n = 85, 33%). Refined forms
were present, particularly in the groundstone assemblage, but some of these objects were
associated with children who would have been unlikely to achieve such status so early in
life (e.g., Burial 137, a two- to three-year-old child with a flower-pot mortar). At SCL-38,
individuals with large bead caches often had technomic artifacts as well (see Figure 56);
however, individuals with more than 1,000 beads had no more than two technomic
artifacts, while those with fewer beads had up to 12. The technomic artifact evidence
supports an interpretation of ranked status at SCL-38.
Regarding sociotechnic artifacts, Binford (1971) predicted that distribution of
these prestigious symbols in egalitarian societies would vary with age and demographic
categories, and in ranked societies variation would be more complex with some forms
limited to individuals of certain status positions. At SCL-38, beads were found with
individuals of all age classes. However children never had more than 400 beads, whereas
adults had up to 4,091 (Burial 166, an adult male). The distribution of wealth items
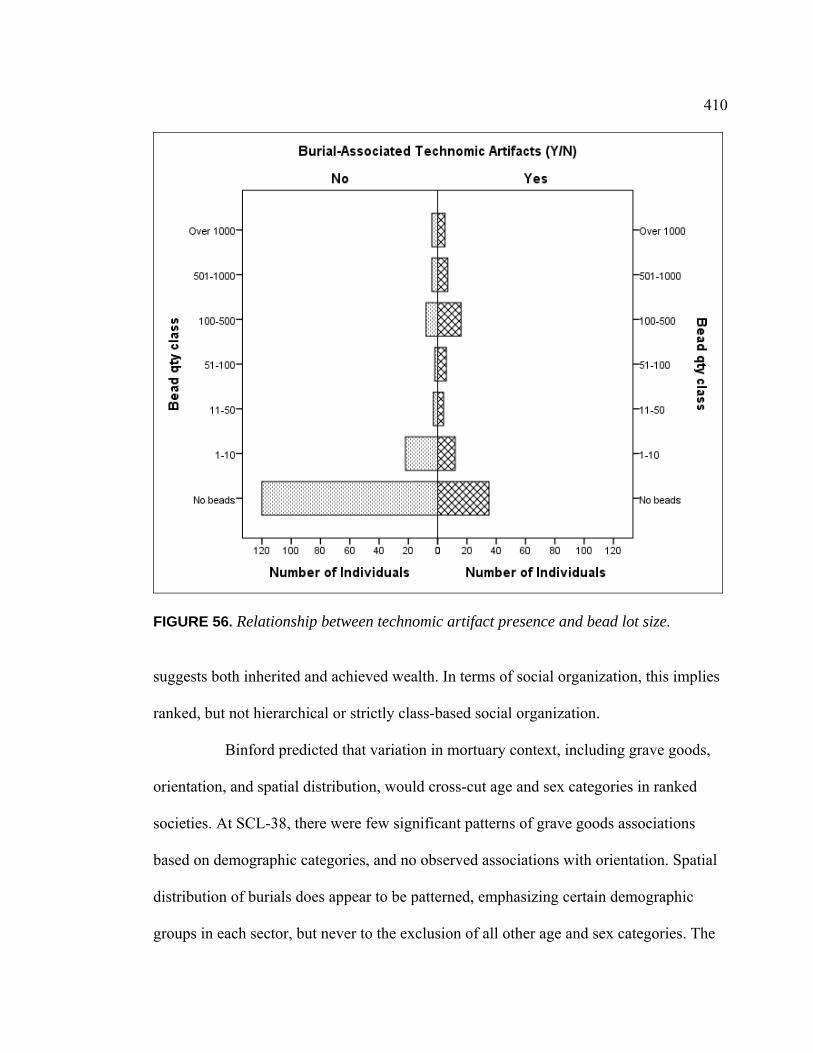
410
FIGURE 56. Relationship between technomic artifact presence and bead lot size. suggests both inherited and achieved wealth. In terms of social organization, this implies
ranked, but not hierarchical or strictly class-based social organization.
Binford predicted that variation in mortuary context, including grave goods,
orientation, and spatial distribution, would cross-cut age and sex categories in ranked
societies. At SCL-38, there were few significant patterns of grave goods associations
based on demographic categories, and no observed associations with orientation. Spatial
distribution of burials does appear to be patterned, emphasizing certain demographic
groups in each sector, but never to the exclusion of all other age and sex categories. The

411
concentration of artifacts and associated burning in mortuary practices for individuals in
the central cluster supports Binford’s measure for ranked society in this regard.
Finally, Binford predicts that in egalitarian societies an individual’s
possessions symbolizing status will be destroyed at death or buried with the decedent, but
in ranked societies these objects will be inherited. At SCL-38, there were several
instances of “killed” mortars, pestles, or charmstones, which would support Binford’s
prediction for egalitarian societies, but it is impossible to know which objects were
inherited instead of being buried or destroyed. For this estimation, it cannot be known
whether absence of evidence is evidence of absence. Further, according to Binford’s
logic, the presence of “killed” artifacts would suggest egalitarian social organization, but
this practice has been associated with prestige in several hierarchical or ranked societies,
such as the Wari of Peru (Tung 2012).
The framework provided by Eric Wolf (1999) outlines four modalities of
power which were each exercised in the social organization of prehistoric Central
California in some way. Personal power of individuals to compel or physically
overpower others is always an attribute of human populations, based on physical and
cognitive variation. The use of social power may be inferred by the presence of moiety
groups, social organizations which balanced ritual, spiritual, and subsistence
responsibilities. The networks formed by exogamous marriage across moieties created
and maintained relationships across distance which could be leveraged for trade or
political negotiations. Central California moieties appear to have been similar to the
numayma of the Kwakiutl of British Columbia, which were internally stratified multi-
house social units including extended families built from exogamous marriages (Wolf
412
1999). Variation in wealth within spatial units at the SCL-38 cemetery supports the
internal stratification of social units within the community.
Those with positions of authority would have been able to rely on cross-
regional networks of influence in the exercise of tactical and organizational power.
Organizational power may be apparent with evidence of feasting ceremonies, particularly
if they involve redistribution of accumulated resources. At SCL-38, the midden deposit
and lack of other evidence of habitation (e.g., house floors, cooking features), may
suggest that feasting took place at this site. Annual mortuary feasts are recorded for the
northern Costanoan in Harrington (1942). A similar interpretation of site use was made
for the Ryan Mound (ALA-329), a nearby contemporaneous site (Leventhal 1993).
Further, the presence of individuals with embedded projectile points suggests that battles
took place, which would imply the exercise of tactical power.
The chiefdom system of the Kwakiutl is described as, “an arrangement that
could sustain an order of social stratification, not through decisive force concentrated in
the institutions of a superordinate state but through a mix of material, organizational, and
ideational features and sanctions” (Wolf 1999:123-124). The same could be said for the
organizational system of the ancestral Ohlone, and in this regard, a moderate degree of
structural power is present there as well. Structural power refers to the control of
resources, energy and labor. There is no evidence of stratification involving control of
labor classes in Central California, as there is for the Chumash of the Santa Barbara
Channel (Arnold 1987, 1992) or the tribes of the Northwest Coast (Matson and Coupland
2009). The political organization of Central California does not appear to have been
hierarchical, but chiefs nevertheless exercised power over local resources. Some evidence
413
of this can be found in limited access to some resources based on territorial
circumscription, to be addressed in the population affinity discussion, below.
In conclusion, the assemblage at SCL-38 includes most of Binford’s (1971)
indicators for ranked social organization. The uneven distribution of artifact types and
quantities, cross-cutting demographic categories of age and sex, suggests inherited wealth
as well as opportunity for achievement later in life. Dietary patterns do not correlate well
with markers of wealth in this society, but do correlate with other status markers such as
Haliotis pendants, possibly a symbol of moiety affiliation. Prestige is not necessarily
related to wealth, as elaborate mortuary treatments are observed for individuals with
wide-ranging artifact associations. Power was certainly exercised, but archaeological
correlates are vague.
Population Affinity
The last aspect of social identity to be addressed in this study is population
affinity—the observable differences between members of the local population and
individuals who were buried at the Yukisma Mound but lived their lives elsewhere.
Differences in population affinity may be observed in the archaeological record as
distinct features of skeletal biology, non-traditional mortuary practice, unusual grave
goods, or differences in dietary patterns. Since the present study focuses on dietary
patterns, these will be considered first.
The mosaic landscape of Central California provided a very diverse menu of
food choices, but also made access to specific resources easier from some sites than from
others. Regional differences in stable isotope values of human bone tissues were closely
correlated to local environments, such that populations on the coast or bayshore generally
414
consumed more marine resources than those in the valleys. Additionally, population
pressure and competition for resources may have led to territorial circumscription, further
limiting access to more distant resources. The result was a diverse pattern of food
consumption within the San Francisco Bay Area (see Figure 38), in which the distinct
dietary pattern of individuals from each site manifested as different stable isotope mean
values and ranges of variation.
Individuals buried at the Yukisma Mound consumed few marine resources,
and showed a modest range of variation in stable isotope values (δ13CCollagen: mean= -
19.01‰, SD 0.64, n = 127; δ15Ncollagen: mean= 8.40‰, SD 1.38, n = 127; δ13Capatite:
mean= -14.05‰, SD 0.93, n = 122). The collagen δ13C and δ15N values of adults from
SCL-38 were found to co-vary, such that δ13C values explained 57 percent of variability
in δ15N values for adults (r = 0.752; r2 = 0.565; p < .001, n = 103), and graphed results
were patterned along a fit line (see Figure 40). When stable isotope results from this site
were plotted, the values for four adult males (Burials 141, 142, 143, and 144) were
anomalous, with slightly enriched δ13C values and depleted δ15N values relative to the fit
line for the population. When these four individuals were trimmed from the adult
population, the strength of correlation between δ13C values and δ15N values improved to
77 percent (r = 0.876; r2 = 0.767; p < .001, n = 99). The four males had stable isotope
values very similar to one another, but distinct from the rest of the local population.
Additional dietary evidence for population affinity was observed when a
regression was run to predict δ15N values for SCL-38 adults, based on observed δ13C
values (see Figure 42). Residual values, measuring the difference between predicted and
observed δ15N values, were standardized by dividing them by the standard error.
415
Standardized residual scores for these four individuals fell more than three units below
the rest of the population (values ranging from -3.272 for B141 to -3.746 for B142),
placing them outside of the 99 percent confidence range for a locally derived diet. The
difference in the diet of these four men is strong evidence that they had not been eating
from the same menu as others from the site over the past ten years or so, and were
unlikely to have been part of the local population.
Stable isotope values of sulfur distinguish geological differences in soils,
which are passed along through plants to consumers without fractionation (Nehlich 2010;
Richards et al. 2001, 2003). From SCL-38, δ34S values have been obtained for 11 adult
males, one rabbit and one bear. Two of the males with unusual dietary signatures were
included in this sample. Values for B141 (δ34S = 3.03‰) and B143 (δ34S = 3.93‰) are
the highest seen at SCL-38 (see Figure 54). A strong linear relationship between δ13C
values and δ34S values is observed, and is actually stronger when including these
individuals (p < .001, r = .972, r2 = .94) than when they are excluded (p < .001, r = .963,
r2 = .93). However, there is no relationship between δ15N and δ34S values unless they are
trimmed (with: p = .96; without: p = .02, r = .737, r2 = .54). Similar δ34S values have
been observed for two individuals at the Ryan Mound, CA-ALA-329 on the eastern
Bayshore, and one individual from the Blossom Mound, CA-SJO-68 in the Sacramento
Valley (unpublished data courtesy of Eric Bartelink and Benjamin Fuller). However, the
combination of δ13C, δ15N, and δ34S values is unprecedented in Central California isotope
research. These individuals were either from a different (untested) region or were eating a
radically different diet than others at the Yukisma Mound.
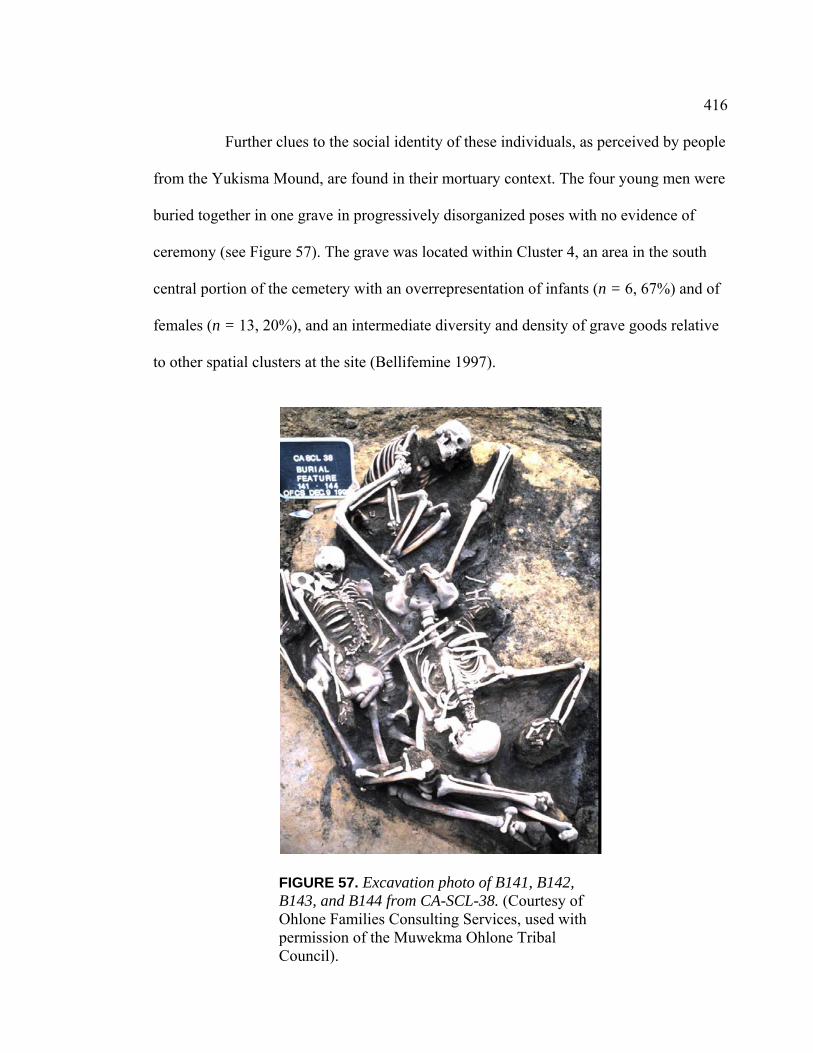
416
Further clues to the social identity of these individuals, as perceived by people
from the Yukisma Mound, are found in their mortuary context. The four young men were
buried together in one grave in progressively disorganized poses with no evidence of
ceremony (see Figure 57). The grave was located within Cluster 4, an area in the south
central portion of the cemetery with an overrepresentation of infants (n = 6, 67%) and of
females (n = 13, 20%), and an intermediate diversity and density of grave goods relative
to other spatial clusters at the site (Bellifemine 1997).
FIGURE 57. Excavation photo of B141, B142, B143, and B144 from CA-SCL-38. (Courtesy of Ohlone Families Consulting Services, used with permission of the Muwekma Ohlone Tribal Council).
417
Burial 141 was the first in the grave, placed on his side in the traditional
flexed position. He was between 21 and 30 years old and had two small pieces of faunal
bone and six Cerithidea (horn snail) shells, but no other grave goods. Potential evidence
of healed trauma included exostoses on the lateral aspect of the distal left femur and
dorso-medial aspect of the proximal right femur, consistent with myositis ossificans
(possible muscle pulls, Jurmain 2000:140).
Burial 142 was the third in the grave, extended ventrally on top of Burial 143.
He was between 15 and 18 years old and had 36 pieces of faunal bone and 60 associated
Cerithidea shells, but no other grave goods. He had a small lytic lesion (7.0 x 4.1 mm) at
the distal end of his right femur and an embedded projectile point fragment (7.9 x 4.8
mm) in the lateral margin of his distal left femur with no evidence of remodeling
(Jurmain 2000:138, 146).
Burial 143 was the second in the grave, extended dorsally. He was between 21
and 30 years old and had no grave goods. A small obsidian fragment was embedded in
his rib (left side, rib 8, 9, or 10), with no evidence of remodeling (Jurmain 2000:138).
Burial 144 was the last in the grave, splayed dorsally. He was between 18 and
27 years old and had three bird bone tubes, an obsidian flake, and an associated obsidian
projectile point. Radiocarbon dating of charcoal associated with Burial 144 yielded a
corrected date of 245 +/- 50 cal. B.P. (WSU-4878), the most recent date obtained for the
CA-SCL-38 assemblage. A note in the osteological report states, “R. elbow, distal
humerus and proximal ulna, medial aspect, narrow indentations; possible cut marks?”
(Jurmain 2000:138). However, following close examination, Jurmain determined that the

418
indentations were more likely caused by post-mortem damage (Robert Jurmain, personal
communication, April 4, 2012).
Still, this observation is intriguing, as similar burial contexts at other Central
California sites have involved trophy taking. Trophy victims in this region were most
likely to have missing or displaced forearm bones and cutmarks on the distal humerus.
They are more likely to be interred in multiple burials, to be positioned ventrally and/or
haphazardly, to be young adult males, and to display evidence of other peri-mortem
trauma (Andrushko et al. 2005, 2010; Bellifemine 2007; Musladin et al. 1996). In Central
California, trophy taking is most commonly seen at South Bay sites, with decreasing
frequency after 700 A.D. (Bartelink et al. in press).
A final addition to the mystery of identity of these four males comes from
DNA research of Cara Monroe (Monroe et al. 2013). As part of her genetic studies of the
SCL-38 population, she found that the mtDNA haplogroups for these four individuals
were consistent with those found in local populations. Burials 141 and 143 were
haplogroup A, a rare but not uncommon type in Central California. Burial 142 was
haplogroup D, a common type throughout the region. But Burial 144 was found to be a
rather unique variant of haplogroup C, found only in the San Francisco Bay Area.
Because mitochondrial DNA is maternally inherited, these results suggest that the
mothers of these men were from the San Francisco Bay Area, and perhaps married
exogamously into other regions. The men may have been returning to visit cousins, to
fight a common enemy, or for trade negotiations. “Moiety exogamy was associated with
ritual reciprocity, and consequently moieties served to define potential marriage alliances
as well as religious, economic, and sometimes military alliances” (Bean 1976:105).

419
Summary: Social Identity and Diet
As a result of this investigation, archaeological indicators of social identity
were identified for social age, gender, disability, specialization, status, and population
affinity. However, dietary differences were only noted in a few of these categories.
Infants and children had fewer artifact associations than adults, especially
technomic items. However, even infants had sociotechnic objects, suggesting ascribed
status. Evidence of breastfeeding and weaning was observed in infant diets. Children also
appear to have had slightly different diets than adults. Infants and children were more
likely than adults to be interred in double burials and to have funerary rituals including
fire. No changes in mortuary context, artifact associations, or dietary patterns were
observed for elder adults.
Few distinctions could be made based on evidence of gender or disability.
Males had slightly different diets than females. The slight enrichment of all stable isotope
values in males is consistent with a division of labor, although no artifact types at this site
are exclusively associated with either sex. Although 24 adults from the SCL-38
assemblage were observed to have congenital or pathological conditions which would
have impaired their ability to participate in subsistence and other life activities, there was
no observed difference in mortuary context, artifact associations, or dietary patterns in
these individuals compared to others at the site.
Possible evidence of craft specialization at a local scale was noted, but there
were no dietary implications. Ritual specialists buried with charmstones appeared to
follow a particular dietary regime, supporting ethnohistoric reports of dietary taboos for
shamans.

420
There were many indications of wealth at the site, including differences in
shell bead cache size, artifact abundance, and artifact diversity. These differences cross-
cut demographic categories of age and sex, but did not have identifiable correlations with
mortuary contexts or dietary patterns. Mortuary preparations involving burning were not
correlated with markers of wealth although the use of fire indicates a more costly
funerary ritual and was likely a sign of prestige. Dietary patterns of those with associated
mortuary burning included slightly lower δ15N values than others at the site, suggesting
lesser consumption of marine foods or other high trophic-level proteins. Individuals with
Haliotis pendants, which may be associated with moiety affiliations, appear to have had a
different balance of non-protein resources in their diets than others at the site which
might be explained by consumption of seaweed and kelp. Overall, the indicators of social
status at SCL-38 supported Binford’s (1971) criteria for ranked social organization.
The dietary pattern at SCL-38 was distinct from those observed through stable
isotope analysis at other sites around the San Francisco Bay, the Sacramento-San Joaquin
Delta, the Sacramento Valley, and the Central California coast. Dietary variation seen at
the site is patterned such that individuals who had not been eating from the local menu
had isotope values which fell outside the expected range for the population. Population
affinity can be inferred from similarity of mortuary context and dietary patterns with
others at the site. The stable δ13C, δ15N, and δ34S values of four adult males interred
together in an unusual burial context mark them as outsiders. Their burial within the
cemetery is mysterious.

421
CHAPTER X
CONCLUSION: FOODWAYS OF THE
ANCESTRAL OHLONE AT
CA-SCL-38
Introduction
A review of archaeological records, reconstruction of the early environment of
the Santa Clara Valley, examination of faunal, botanical, and artifactual evidence, a
bioarchaeological review, and new data from stable isotope analysis from the Yukisma
Mound have supported the hypothesis that the social environment of the ancestral Ohlone
was diverse, ranked, and included room for individual variation in identity construction.
The synthesis of this information reveals new evidence about how effectively these
people met their nutritional requirements, about which foods would have been on the
menu in the prehistoric past, and about the diets they constructed from the available
menu. Each of these aspects of paleodiet, based on definitions from Reitz and Wing
(2008:251), will be considered in this concluding chapter. The discussion will also
address the matter of cuisine, including the preparation, style of cooking, and social rules
about distribution of foods apparent from the available data. Dietary patterns associated
with social roles will be reviewed, concluding with a new exploration of prestige foods.

422
Nutrition, Menu, Diet, and Cuisine
Nutrition
All humans require a balance of proteins, carbohydrates, fats, vitamins and
minerals to maintain body tissues and stay healthy and active. The additional
requirements of growth, development and reproduction increase the body’s demand for
nutrients, and intensify the consequences of nutritional deficiency. As broad-spectrum
omnivores, humans are faced with the challenge of sourcing foods which fill these
requirements. Indeed, Kroeber commented that California Indians “are perhaps the most
omnivorous group of tribes on the continent” (Kroeber 1925:523). Humans live with the
“omnivore’s paradox” (Fischler 1988; Rozin 1976; later dubbed the “omnivore’s
dilemma” by Pollan 2006), because we have a physiological system that gives us the
flexibility to eat a wide variety of foods but at the same time requires multiple resources
to meet nutritional needs. Our freedom to choose from a plethora of food products is also
our danger. Culinary innovation in a changing environment may result in discovery of
new cuisine, or may have dire consequences. “Omnivores, such as…humans, faced with
an enormous number of potential foods, must choose wisely. (Nutritional balance)…must
by necessity come from incorporation of appropriate nutrients in the environment and,
hence, behavior” (Rozin 1976:23). With the support of our social and economic
networks, humans develop local cuisines to meet nutritional requirements.
Measures of nutrition for the present study come from the review of
bioarchaeological data (Jurmain 2000), discussed in Chapter VI. Among the 248 unique
individuals from SCL-38, only one was noted to have osteological evidence of a
nutritional deficiency. This individual (Burial 102), an adolescent between the ages of 9
423
and 13, had healed lesions in one eye orbit, characteristic of cribra orbitalia. This
condition was most likely caused by megaloblastic anemia in very early childhood due to
vitamin B12 deficiency (Walker et al. 2009). The most common cause of vitamin B12
deficiency is low consumption of animal products including meat, shellfish, fish, or eggs.
However this condition can also be related to traumatic injury or caused by subperiosteal
inflammation due to deficiencies of vitamin C or vitamin D. This individual,
unfortunately, was not included in the present stable isotope analysis.
Other than B102, all individuals at SCL-38 appear to have had a nutritionally
complete diet. With such low incidence of skeletal markers for dietary stress, it appears
that the ancestral Ohlone were experts in choosing foods to satisfy their nutritional
requirements. The value of their experience is highlighted by the plight of Spanish
explorers, who suffered dreadfully from scurvy and malnutrition while traveling through
this land in the 18th century (Stanger and Brown 1969). Their successors brought
domesticated crops and animal species along when establishing the California Missions,
presidios and pueblos, to buffer their unfamiliarity with the local resources.
The Menu
The ancestral Ohlone lived in a diverse environment, amidst the tidal flats and
marshlands of the Baylands, the wet meadows of the Bottomlands, riparian corridors
dotted with groves of willow and sycamore, and expanses of valley oak savanna and dry
grasslands. These habitats were bordered by the Bay to the north, the foothill chaparral of
the bedrock hills to the east, and the mixed hardwood forest of the coastal mountains to
the west. Together, these habitats were a rich source of food options.
424
Botanical studies at four Santa Clara Valley archaeological sites (including
SCL-38) have identified remains of least 65 species of native plants and 16 species of
native trees (see Table 26). Eight of these trees produced edible nuts (hazelnuts, three
types of acorns, walnuts, pine nuts, buckeye nuts, and nuts from the California bay).
Junipers produced edible berries. Of the identified plant species, 24 produced edible
seeds, including sunflowers, wild mustard, goosefoot, wild cucumber, several species of
grasses, and wild buckwheat. Twelve identified native species produced edible greens,
including tarweed, peppergrass, saltbush, goosefoot, clover, Miner’s lettuce, and dock.
Native elderberries, manzanita berries, toyon berries and blackberries provided tasty
fruits. Edible pollen was available from cattails. Identified remains of edible geophytes
included wild celery root, brodiaea bulbs, and cattail roots. The use of additional plant
species is suggested by ethnohistoric accounts, which report local consumption of amole,
which was likely soaproot, and chuchupate, which was likely wild parsnip or balsam root
(Brown 2011).
At the same four Santa Clara valley sites, diverse faunal assemblages have
been studied. Identified taxa include 9 species of fish, 5 species of reptiles or amphibians,
19 species of birds, and 31 species of mammals (see Table 28). Of these, 14 land
mammals, 2 sea mammals, 8 types of waterfowl, and 2 other birds were identified in the
SCL-38 assemblage (see Table 27). The menu of terrestrial fauna included artiodactyls
(Tule elk, black-tailed deer, and pronghorn), lagomorphs (jackrabbits and cottontails),
canids (dogs, wolves, and coyotes), bears (grizzly and black bears), rodents (gophers,
rats, mice, squirrels, and moles), other terrestrial mammals (foxes, raccoons, skunks, and
weasels), and wild cats (bobcats and mountain lions). Marine fauna were rare in Santa

425
Clara Valley assemblages, but remains of sea otters and one California sea lion were
identified at SCL-38. A few fish bones were present at SCL-38 but have not been
identified to species. Fish identified at nearby sites include Sacramento suckers, Pacific
herring, Pacific sardines, hitches, minnows, splittails, steelheads, rockfish, and sharks.
Local assemblages have also revealed remains of frogs, Pacific pond turtles, and snakes
which may have been part of the menu. Santa Clara Valley bird remains included land
birds, such as quail, waterfowl (such as ducks, geese, cranes, herons, egrets, loons,
pelicans and cormorants), and birds which may have had ceremonial significance (hawks,
eagles, northern flickers, crows, and owls). Finally, several species of shellfish have
been identified at these four sites, including 10 bivalves (clams, cockles, mussels, oysters,
and scallops), 2 crustaceans (barnacles and crabs), sea urchins, and 10 species of
gastropods (including abalones, limpets, and snail species). Of these, six species were
identified at SCL-38 (see Table 29).
A few other important resources would have been available, but are not
preserved in the archaeological record. Insects such as grasshoppers, army worms
(Noctuidae moth larvae), and caterpillars would have been seasonally abundant.
Ethnohistoric reports suggest that these protein-packed resources were roasted and eaten
by California Indians, and Harrington (1942) confirmed that grasshoppers were eaten by
the northern Costanoan. Additionally, yellow-jacket larvae were a considered a delicacy
(Harrington 1942; Lightfoot and Parrish 2009). Another resource that was exploited by
many Native Californian groups is seaweed. Seaweed could be dried and stored, and
provided a good source of salt, micronutrients, fiber, and carbohydrates.
426
The diversity of the Santa Clara Valley menu would have provided many
options for foods, but not all choices were pursued in equal measure. Factors of resource
availability due to seasonality, possible resource depression, or territorial circumscription
would limit options. Additionally, social and symbolic significance of food classifications
would influence which food choices were considered to be safe and contextually
appropriate. Dietary patterns were shaped by the choices of foods consumed from the
available menu.
Diet
Dietary patterns at SCL-38 are revealed through stable isotope analysis of
human bone tissues as well as indirect sources of evidence such as faunal and botanical
identification (see Chapter V). While stable isotope analysis is an excellent tool for
detecting general dietary patterns of populations and dietary variation at an individual
level, this method does not identify specific food resources on the Central Californian
menu. The isotopic signature of terrestrial plants is fairly distinct from other resource
types, having the lowest δ13C and δ15N values on the menu. However, within the broad
assortment of nuts, grass seeds, geophytes, greens, and fruits on the local menu, there is
no meaningful difference in isotopic values passed along to consumers.
The dietary signatures of terrestrial mammals and insects will all produce
similar δ13C values in the tissues of consumers, but δ15N values will vary based on
trophic level. Accordingly, the artiodactyls (elk, deer, and pronghorns) and the rabbits
will be isotopically indistinguishable as terrestrial herbivores, with δ15N values
approximately three permil higher than terrestrial plant foods. Canids, bears, foxes,
raccoons, and skunks would have δ15N values enriched approximately three permil over
427
the herbivores. The carnivorous wild cats would have the highest δ15N values of this
group. Sea mammals would have enriched δ13C values and very high δ15N dietary
signatures relative to terrestrial mammals. Caterpillars and army worms would have δ15N
values similar to terrestrial herbivores; grasshoppers and yellow-jacket larvae would have
slightly enriched δ15N values, similar to other omnivores.
Waterfowl remains at the site suggest that they were part of the local diet
Results of stable isotope analysis of two geese and one duck from SCL-38 indicated that
waterfowl would produce a dietary signature with δ13C values ranging from -20.73 to
-15.86 permil (values adjusted by +5‰ for fractionation), and δ15N values ranging from
7.00 to 10.78 permil (values adjusted by +3‰ for fractionation), similar to the dietary
signatures of freshwater fish or bay shellfish, but lower than the signature for marine fish
(see Figure 37). These dietary signatures are very consistent with the range of values seen
in the human population from SCL-38.
As for aquatic species, marine fish would have enriched δ13C values and δ15N
values. Anadromous fish, such as salmon, would have the same dietary signatures as
marine species. Freshwater fish have variable dietary signatures, depending on local
geology and nitrogenous waste accumulation in lakes; however, the general expectation
is for relatively terrestrial low δ13C values and somewhat enriched δ15N values. The
isotopic signature of shellfish vary based on the source environment (marine, bay, or
freshwater), but δ13C and δ15N values would typically be higher than terrestrial resources
(see Figure 30). Generally, consumption of shellfish on the San Francisco Bayshore
produced an intermediate signature between terrestrial and marine resources (see Figure
37). Seaweed could potentially produce a distinct isotopic signature, as it is a source of
428
dietary carbohydrates with enriched (marine) δ13C values which could affect δ13C in bone
apatite of consumers, with little available protein to enrich δ13C values in bone collagen.
A recent study of giant kelp off the Big Sur coast found that modern δ13C values varied
seasonally between -25 and -13 permil (Foley and Koch 2010).
The individuals buried at SCL-38 clearly had a diverse menu of foods to
choose from, and likely consumed all of these resources in some combination during their
lives. The composition of bone in adult humans is built from nutrients consumed during
the most recent ten years of life or so, and would reflect a bulk average of isotopic
signatures of each person’s diet. Growing children have a faster turnover of bone tissue,
and their isotope values would reflect diet over a shorter period of time.
With population mean stable isotope δ13C values of -19.01, δ15N values of
8.40 permil, and δ13CApatite values of -14.07 permil, the diet of individuals from SCL-38
generally focused on terrestrial plants and animals with some enrichment of δ15N values
due to consumption of shellfish, freshwater fish, and waterfowl. The dietary pattern for
the population is also very consistent with consumption of insects. Marine mammals
were not a major part of the diet, but may have been consumed on occasion. Remains of
marine mammals found at SCL-38 may have been rare foods or perhaps present for non-
alimentary reasons, such as harvesting of sea otter pelts, or as souvenir or ritual objects
(only a small portion of sea lion bone was identified weighing 7.5 grams). People buried
at the Yukisma Mound consumed less marine fish than populations who lived along the
eastern and northern shores of San Francisco Bay, and significantly less than populations
on the coast (see Table 48).

429
Dietary patterns of individuals at the Yukisma Mound also shifted through
time, with slightly lower δ15N values in the second phase of the Late Period (560-230 BP)
than in the first phase (740-440 BP). No significant shift in δ13C values from either
collagen or apatite was observed between these periods. Together, these data suggest that
there was no significant change in reliance on marine foods between periods, but there
was a reduction in use of freshwater fish, waterfowl, or higher trophic level terrestrial
mammals during later years.
Cuisine
Food traditions and social practices transform dietary resources into cuisine.
Modes of food preparation, presentation, and distribution are all mediated by socially
constructed guidelines. At SCL-38, few distinctions in food distribution were apparent.
Diet of infants reflected an enriched source of δ15N which would have been supplied by
breastfeeding. Children between the ages of 5 and 10 years old had somewhat depleted
δ15N values suggesting that they consumed lower trophic level foods or less animal
protein than adults. Males had slightly enriched values for all measured isotopes,
compared to females.
Correlation of dietary patterns with demographic categories suggests that food
was distributed along egalitarian lines. However, differentiation in wealth and mortuary
context at SCL-38 was consistent with ranked social organization. The bridge between
these apparently conflicting lines of evidence lies in the nature of prestige foods in the
prehistoric past of Central California.
Prestige Foods. Prestige foods are an expected category in any cuisine (Jelliffe
1967). These foods are reserved for high status individuals and served on important

430
occasions. Yet, stable isotope analysis did not reveal distinct dietary trends for
individuals at SCL-38 with markers of wealth, as measured in presence of shell beads or
pendants, quantity of shell beads, total artifact quantity or overall artifact diversity. Either
everyone at SCL-38 had access to the same foods, with some minor distinction by sex
and age, or the prestige foods consumed are invisible based on the methods of this study.
Certainly, there are nuances of cuisine which cannot be parsed using stable isotope
analysis.
Faunal analysis provides some clues about food priorities in the past. Theory
from human behavioral ecology suggests that larger animals (such as elk or deer) are
always preferred when available, even when smaller animals (such as rabbits) are locally
abundant (Bayham 1979; Broughton 1994). These species would be isotopically the
same, but may have had very different social significance as part of cuisine. Deer were an
important symbolic entity for Central California Indians, as expressed in the totems of
moieties (Kroeber 1925). Also, prohibitions against sex before deer hunts were reported
to Harrington (1942), suggesting that a degree of personal sacrifice and purification were
required to obtain this esteemed prey.
Analysis of butchering patterns and element representation of faunal remains
also provides clues about consumption patterns. Much of the faunal collection from SCL-
38 was identified to species, but further analysis about use patterns has yet to be done.
However, work by Simons at with the Tamien Station (SCL-690) faunal collection
provides insight about consumption of rodent species. Simons suggests that rodents found
in the midden were invasive, and not part of cuisine, because no cutmarks or other
indications of food processing (e.g., crushing, charring) were identified on their bones
431
(Dwight Simons, personal communication, March 1, 2012). This is a useful distinction,
as Harrington (1942) reported that the northern Costanoan burned wood rat nests and
smoked out ground squirrel holes to hunt these resources. This may have been a case of
local variation in practice, or may represent the difference between traditional cuisine in
prehistoric times, and the cuisine of oppression after the arrival of the Spanish. Times of
desperation would call for use of less desirable, lower-prestige foods, which may be
among those reported in remembered accounts of traditional food use.
Another clue to prestige foods may come in the form of short-term food
avoidances observed by the ancestral Ohlone. Austerity diets which are adopted in times
of spiritual risk or as sacrifice to obtain a desired goal require avoidance of valued foods.
Austerities “are thought to work either directly by increasing one’s spiritual and physical
power or indirectly by impressing the gods and almost obliging them to grant their
favours” (Eichinger Ferro-Luzzi 1975:405). Harrington (1942) reported that northern
Costanoan girls had to avoid fresh meat, fish, and fat during puberty, all meat and fish
during menses, and all meat and salt for one month after giving birth. Jacknis (2004)
drew upon several ethnohistoric accounts in his review of California Indian food
avoidances. He found nearly ubiquitous taboos against consumption of meat, fat, salt, and
sometimes fish, associated with “liminal moments, passage between one social state and
another, when a person was thought to be especially powerful and especially at risk to
themselves and others” (Jacknis 2004:92). These avoidances were most commonly
observed by women during puberty, menstruation, pregnancy, nursing, or mourning, but
men often had to observe the same prohibitions as their wives to ensure successful hunts.
432
Sympathetic magic was often invoked as an emic explanatory device; for
example, a Pomo account reported that if a pregnant woman ate fish, the fish would drink
up all the liquid inside of her (Loeb 1926:249). However, the larger social value of foods
must have influenced austerity avoidances during liminal times. Regarding avoidance of
salt during mourning periods in India, the following observation was made:
Abstention from salt in its quality of a desirable item means a sacrifice, appropriate during periods of penitence like mourning. On such occasions, salt may be forbidden together with other good things of life such as abundant food, delicacies, alcohol, and sex. A dietary sacrifice would also be appropriate prior to or during important enterprises like war or the vision quest. [Eichinger Ferro-Luzzi 1978:413]
If sacrifice is associated with desirable items, periodic avoidance of fresh meat, fish, salt,
and fat or grease is an indication that these foods were considered luxurious.
Generally, short-term food avoidances would have no apparent effect on
stable isotope values in bone tissues, as the dietary signature of all foods consumed
during bone formation would be represented as a bulk average. However, if menstrual
food avoidances lasted ten days per month, as was reported for the Yurok and Tolowa
(Jacknis 2004), it seems possible that the bulk average isotope values from protein
consumption might be depleted. This is a facet of variation between male and female
dietary patterns that merits further investigation.
Given the information obtained from faunal studies and inferred from food
avoidances, high prestige foods included meats, particularly large animals such as elk or
deer. Luxury items included salt and animal fat or grease. Fish may have also been a
highly valued food, although the stable isotope values of individuals from wealthy and/or
prestigious burials did not reveal increased consumption of fish. Rodents, such as wood
rats or ground squirrels, may have been considered low-ranked food items, consumed

433
only when territorial infringement and environmental change were introduced by
immigrants from Spain, Mexico, and the Eastern United States.
Food Preparation. Past techniques for transforming food resources into tasty
cuisine are best observed through ethnohistoric and artifactual clues. The accounts of
early European explorers described prepared foods eaten and shared by Indian groups in
Central California. During the 1769 expedition, Juan Crespí and his men were offered
cakes made from black seeds, acorns, and fruits as well as acorn mush and mussels
(Crespí 2001). Similar foods were offered to a group led by Captain Pedro Fages in 1772
(Stanger and Brown 1969) and to the crew of the ship San Carlos in 1775, the latter also
commenting on gifts of game including deer, elk and waterfowl (Santa María 1999).
Another overland expedition in 1776, chronicled by Pedro Font, noted the popularity of
geophytes, including amole, cacomites, and chuchupate (likely soaproot, brodiaea bulbs,
and wild parsnip roots) each roasted on some sort of string (Brown 2011).
Artifacts associated with food preparation at SCL-38 include groundstone
mortars and pestles. These items, discussed in Chapter V, would be useful for pounding
acorns or other nuts, grinding seeds, crushing herbs, or tenderizing small animals. No
cooking features were identified at SCL-38, with the exception of vitrified clay. As
temperatures of at least 1,200°C are required to transform Santa Clara Valley clay to this
state, these features are much more likely to be related to mortuary practices than to food
preparation (Parsons and Leventhal 1981). The absence of hearths or earth ovens at SCL-
38 may indicate that food for mortuary rituals held there was prepared off site, that these
features existed in unexcavated areas of the site, or that the features were destroyed by
historic activities near the site, prior to the 1993 to 1994 excavations. Information from

434
other sites as well as ethnohistoric data suggest that food preparation techniques included
roasting and baking in earth ovens, boiling or stewing in baskets with heated rocks or
clay balls, and sun drying or smoking of meats, fish and seaweeds (Jacknis 2004).
Distribution of Foods. Finally, there is the question of differential distribution
of food resources. Stable isotope analysis detected variation in dietary patterns associated
with age, with sex, with ritual specialization, with moiety affiliation, and with prestigious
mortuary rituals. Food distribution within family units appears to have been patterned,
with men receiving higher trophic level foods and/or more meat that women. Children
were also served less meat or lower trophic level foods. These patterns equalize by
adolescence such that the most significant differences in dietary patterns of adults and
elders are based only on gender roles.
Ritual specialists, identified by association with charmstones, appear to have
consumed foods following very specific dietary guidelines. The low variation in their
isotopic values suggests that these individuals ate diets very similar to one another. Their
dietary signatures are consistent with consumption of large quantities of freshwater fish
or bay shellfish, but may be explained through other combinations of foods (such as a
mix of terrestrial and marine resources).
Individuals buried with abalone (Haliotis) pendants had slightly enriched δ13C
values of bone apatite, without statistically higher values of either δ13C or δ15N from bone
collagen. This pattern suggests additional consumption of a non-protein food with higher
δ13C values, such as seaweed.
Abundant evidence for wealth differentiation was observed in the
archaeological record from SCL-38, with artifact abundance, shell bead quantity, and

435
artifact diversity measures all showing no clear pattern by sex or age. However, no
significant dietary difference was observed between individuals with relatively wealthy
mortuary associations and those with few or no associations. If there was differentiation
in food provisioning based on wealth, it was based on foods which are not sensitive to
isotope analysis, such as large versus small game, freshwater fish versus shellfish, or
insects versus mammals.
Additionally no differentiation was noted between individuals with observed
evidence of disabilities and those who were apparently able bodied. Of the 24 individuals
at SCL-38 with osteological evidence for developmental defects, traumatic injury
associated with long-term impairment to limb function or serious infection, chronic
illness, or probable neurological disorders, the distribution of artifact types and quantities,
mortuary contexts, and dietary patterns were no different than for other individuals at the
site. The lack of social distinction towards these individuals suggests that their social
identities were not defined by their physical participation in life activities.
Individuals with evidence of mortuary ceremonies involving fire (pre- or post-
interment fires or cremation) did have statistically different dietary patterns. The bone
collagen of these individuals was depleted in δ15N by an average of approximately 0.5
permil (n = 81 of 127) relative to those buried without associated burning. Mortuary
ceremonies involving more elaborate preparations suggest that these individuals held
prestigious positions during life. Interestingly, the use of fire in mortuary practice was not
associated with measures of wealth.
436
Final Comments
The breadth of this thesis project was designed to maximize understanding of
the connection between social identity and dietary patterns of the ancestral Ohlone buried
at the Yukisma Mound (CA-SCL-38), based on available resources. Even so, additional
information would be helpful to understand the relationships between these individuals
and the cuisine they prepared together. Ongoing studies of DNA from this population by
Cara Monroe will provide fascinating insights into the internal structure and relationships
within this population. Future analyses of faunal remains may yield further information
about use of various species at the site and the procurement and processing of animal
proteins. Stable isotope analysis in this project was somewhat limited by time and
funding; analysis of bone collagen and apatite for the remaining 74 available individuals
from this site may provide an even better understanding of dietary patterns. Likewise,
additional sulfur isotope analysis could provide insight into exogamous marriage
patterns, geographic sourcing of foods and differentiation in sulfur values within the food
web of the San Francisco Bay Area. Finally, additional radiocarbon dates from this and
other nearby sites would be a wonderful tool to track changes in dietary patterns and
social phenomena through time.
As a study of patterns of identity in the archaeological record of Central
California, it is my hope that this project will inspire further discussion about these
important aspects of personhood. Through the lenses of artifact associations, mortuary
practice, bioarchaeological indicators of health, disease and disability, and the common
language of food choices, we can recognize the social personae and agency of individuals
as well as the dynamic complexities of social and political life in the past.

REFERENCES CITED
438
REFERENCES CITED Agarwal, Sabrina C., and Bonnie A. Glencross, eds.
2011 Social Bioarchaeology. West Sussex, UK: Wiley-Blackwell. Ambrose, Stanley H.
1991 Effects of Diet, Climate and Physiology on Nitrogen Isotope Abundances in Terrestrial Foodwebs. Journal of Archaeological Science 18(3):293-317
2000 Controlled Diet and Climate Experiments on Nitrogen Isotope Ratios of Rats. In Biogeochemical Approaches to Paleodietary Analysis. S. H. Ambrose and M. A. Katzenberg, eds. Pp. 243-259. New York: Kluwer Academic/Plenum.
Ambrose, Stanley H., Jane Buikstra, and Harold W. Krueger
1993 Status and Gender Differences in Diet at Mound 72, Cahokia, Revealed by Isotopic Analysis of Bone. Journal of Anthropological Archaeology 22:217-226.
Ambrose, Stanley H., Brian M. Butler, Douglas B. Hanson, Rosalind L. Hunter-Anderson, and Harold W. Krueger
1997 Stable Isotopic Analysis of Human Diet in the Marianas Archipelago, Western Pacific. American Journal of Physical Anthropology 104:343-361.
Ambrose, Stanley H., and M. Anne Katzenberg, eds.
2000 Biogeochemical Approaches to Paleodietary Analysis. New York: Kluwer Academic/Plenum Publishers.
Ambrose, Stanley H., and Lynette Norr
1993 Experimental Evidence for the Relationship of the Carbon Isotope Ratios of Whole Diet and Dietary Protein to Those of Bone Collagen and Carbonate. In Prehistoric Human Bone: Archaeology at the Molecular Level. J. B. Lambert and G. Grupe, eds. Pp.1-37. New York: Springer-Verlag.
Ames, Kenneth M.
2008 The Archaeology of Rank. In Handbook of Archaeological Theories. R. Alexander Bentley, Herbert D. G. Maschener, and Christopher Chippindale, eds. Pp. 487-513. New York: Altamira Press.
Anastasio, Rebecca Loveland
1988 Middle Horizon Sites in North San Jose. Proceedings of the Society for California Archaeology 1:393-410.
439
Anderson, E. N. 2005 Everyone Eats: Understanding Food and Culture. New York: New York
University Press.
Anderson, M. Kat 2005 Tending the Wild: Native American Knowledge and the Management of
California’s Natural Resources. Berkeley: University of California Press. Andrushko, Valerie A., Kate A. S. Latham, Diane L. Grady, Allen G. Pastron, and Phillip L. Walker
2005 Bioarchaeological Evidence for Trophy-Taking in Prehistoric Central California. American Journal of Physical Anthropology 127(4):375-384.
Andrushko, Valerie A., Al W. Schwitalla, and Phillip L. Walker
2010 Trophy-Taking and Dismemberment as Warfare Strategies in Prehistoric Central California. American Journal of Physical Anthropology 141:83-96.
Arnold, Jeanne E.
1987 Craft Specialization in the Prehistoric Channel Islands, California. Berkeley: University of California Press.
1992 Complex Hunter-Gatherer-Fishers of Prehistoric California: Chiefs, Specialists, and Maritime Adaptations of the Channel Islands. American Antiquity 57(1):60-84
1996 The Archaeology of Complex Hunter-Gatherers. Journal of Archaeological Method and Theory 3(2):77-126.
Arnold, Jeanne E., and Ann Munns
1994 Independent or Attached Specialization: The Organization of Shell Bead Production in California. Journal of Field Archaeology 21(4):473-489.
Atwater, B. F., S. G. Conard, J. N. Dowden, C. W. Hedel, R. L. MacDonald, and W. Savage
1979 History, Landforms, and Vegetation of the Estuary’s Tidal Marshes. In San Francisco Bay: The Urbanized Estuary: Investigations into the Natural History of San Francisco Bay and Delta with Reference to the Influence of Man. T. John Conomos, Alan E. Leviton, and Margaret Berson, eds. Pp. 347-386. Lawrence, KS: Allen Press.
Atwater, Brian F., Charles W. Hedel, and Edward J. Helley
1977 Late Quaternary Depositional History, Holocene Sea-Level Changes, and Vertical Crustal Movement, Southern San Francisco Bay, California. Geological Survey Professional Paper 1014. Washington DC: United States Government Printing Office.

440
Axelrod, Daniel I. 1981 Holocene Climatic Changes in Relation to Vegetation Disjunction and
Speciation. The American Naturalist 117(6):847-870. Bada, Jeffrey L., and Patricia Masters Helfman
1975 Amino Acid Racemization Dating of Fossil Bones. World Archaeology 7(2):160-173.
Bada, Jeffrey L., Margaret J. Schoeninger, and Arndt Schimmelmann
1989 Isotopic Fractionation During Peptide Bond Hydrolysis. Geochimica et Cosmochimica Acta 53:3337-3341.
Balasse, M., A. Tresset, and S. H. Ambrose
2006 Stable Isotope Evidence (δ13C, δ18O) for Winter Feeding on Seaweed by Neolithic Sheep of Scotland. Journal of Zoology 270:170-176.
Baldwin, John N., Keith I. Kelson, Robert C. Witter, Richard D. Koehler, John G. Helms, and Andrew D. Barron
2002 Preliminary Report on the Late Holocene Slip Rate Along the Central Calaveras Fault, Southern San Francisco Bay Area, Gilroy, California, Final Technical Report. Prepared for the US Geological Survey, National Earthquake Hazards Reduction Program. Walnut Creek, CA: William Lettis & Associates.
Bartelink, Eric J.
2006 Resource Intensification in Pre-Contact Central California: A Bioarchaeological Perspective on Diet and Health Patterns among Hunter-Gatherers from the Lower Sacramento Valley and San Francisco Bay. Ph.D. dissertation, Department of Anthropology, Texas A&M University.
2009 Late Holocene Dietary Change in the San Francisco Bay Area: Stable Isotope Evidence for an Expansion in Diet Breadth. California Archaeology 1(2):227-251.
2011 Paleo-Dietary Reconstruction at CA-SCL-869: Stable Carbon and Nitrogen Isotope Analysis of Four Human Burials. In Final Report on the Burial and Archaeological Data Recovery Program Conducted on a Portion of a Middle Period Ohlone Indian Cemetery, Katwáš Ketneyma Waréeptak (The Four Matriarchs Site) CA-SCL-869. Alan Leventhal, with Diane DiGiuseppe, Melynda Atwood, David Grant, Rosemary Cambra, Charlene Nijmeh, Monica V. Arellano, Susanne Rodriguez, Sheila Guzman-Schmidt, Gloria E. Gomez, Norma Sanchez, and Stella D’Oro, eds. Pp. 9.1-9.6. Report prepared for the Department of Public Works, City of San Jose, California.

441
Bartelink, Eric J., Valerie A. Andrushko, Viviana I. Bellifemine, Irina Nechayev, and Robert Jurmain
In press Violence and Warfare in the Prehistoric San Francisco Bay Area, California: Regional and Temporal Variations in Conflict. In The Bioarchaeology of Human Conflict: Osteology and ‘Traumatized Bodies’ from Early Prehistory to the Present. Christopher Knüsel and Martin Smith, eds. Oxford: Routledge Press.
Bartelink, Eric J., and Cassady Yoder
2008 A Bioarchaeological Examination of Health and diet in Mainland and Coastal Central California. Newsletter of the Society for Archaeological Sciences 31(3):9-12.
Basgall, Mark E.
2004 Resource Intensification among Hunter-Gatherers: Acorn Economies in Prehistoric California. In Prehistoric California: Archaeology and the Myth of Paradise. L. Mark Raab and Terry L. Jones, eds. Pp. 86-98. Salt Lake City: University of Utah Press.
Bass, William M.
1991 Human Osteology: A Laboratory and Field Manual. Columbia, MO: Archaeological Society.
Bates, Craig D.
1982 Feathered Regalia of Central California: Wealth and Power. Occasional Papers of the Redding Museum, No. 2. Redding, CA: Redding Museum and Art Center.
Baumhoff, Martin A.
1963 Ecological Determinants of Aboriginal California Populations. University of California Publications in American Archaeology and Ethnology 49(2):155-236.
Bay Area Census
N.d. Selected Census data from the San Francisco Bay Area—Provided by the Metropolitan Transportation Commission and the Association of Bay Area Governments. Featuring Census data from 1860-2010. http://www.bayareacensus.ca.gov, accessed August 12, 2011.
Bayham, Frank E.
1979 Factors Influencing the Archaic Pattern of Animal Exploitation. Kiva 44:2219-235.
Bean, Lowell John
1976 Social Organization in Native California. In Native Californians: A Theoretical Retrospective. Lowell John Bean and Thomas C. Blackburn, eds. Pp. 99-123. Menlo Park, CA: Ballena Press.
1992a California Indian Shamanism. Menlo Park, CA: Ballena Press.
442
1992b Power and Its Applications in Native California. In California Indian Shamanism. Lowell John Bean, ed. Pp. 21-32. Menlo Park, CA: Ballena Press.
Bean, Lowell John, and Sylvia Brakke Vane
1992 The Shamanic Experience. In California Indian Shamanism. Lowell John Bean, ed. Pp. 7-20. Menlo Park, CA: Ballena Press.
Beard, Brian L., and Clark M. Johnson
2000 Strontium Isotope Composition of Skeletal Material Can Determine the Birth Place and Geographic Mobility of Humans and Animals. Journal of Forensic Science 45:1049-1061.
Beardsley, Richard K.
1947 Temporal and Areal Relationships in Central California Archaeology. Ph.D. dissertation, Department of Anthropology, University of California, Berkeley.
1948 Culture Sequences in Central California Archaeology. American Antiquity 14(1):1-28.
1954 Temporal and Areal Relationships in Central California Archaeology, Parts One and Two. Berkeley: University of California Archaeological Survey.
Beardsworth, Alan, and Teresa Keil
1997 Sociology on the Menu: An Invitation to the Study of Food and Society. New York: Routledge.
Beasley, Melanie M.
2008 Dietary Trends at the Ellis Landing Site (CA-CCO-295): Stable Carbon and Nitrogen Isotope Analysis of Prehistoric Human Remains from a San Francisco Bay Area Shellmound. Master’s thesis, Department of Anthropology, California State University, Chico.
Beebe, Rose Marie, and Robert M. Senkewicz
2001 Lands of Promise and Despair: Chronicles of Early California, 1535-1846. Berkeley: Heydey Books.
Beechey, Frederick William
1832 Narrative of a Voyage to the Pacific and Beering’s Strait, to Co-operate with the Polar Expeditions: Performed in His Majesty’s Ship Blossom, Under the Command of Captain F. W. Beechey, R. N. in the Years 1825, 26, 27, 28. Philadelphia: Carey & Lea.
Bellifemine, Viviana
1997 Mortuary Variability in Prehistoric Central California: A Statistical Study of the Yukisma Site, CA-SCl-38. Masters thesis, Department of Anthropology, San Jose State University, California.

443
2007 Subsistence Remains: Faunal Analysis. In Archaeological Investigations at CA-SCL-674, the Rubino Site, San Jose, Santa Clara County, California, vol. I. Allen G. Pastron and Viviana Bellifemine, eds. Pp. 181-202. Salinas, CA: Coyote Press.
Bennyhoff, James A.
1953 Bone, Antler, and Claws. In The Archaeology of the Napa Region. Robert F. Heizer, ed. Pp. 265-272. University of California Anthropological Records 12(6). Berkeley: University of California Press.
1977 Ethnogeography of the Plains Miwok. Publication 5. Davis: University of California, Center for Archaeological Research.
1994a[1968] A Delta Intrusion to the Bay in the Late Middle Period in Central California. In Toward a New Taxonomic Framework for Central California Archaeology. Richard E. Hughes, ed. Pp. 7-13. Contributions of the University of California Archaeological Research Facility, No. 52. Berkeley: University of California Press.
1994b[1987] Variation Within the Meganos Culture. In Toward a New Taxonomic Framework for Central California Archaeology: Essays by James A. Bennyhoff and David A. Fredrickson. Richard E. Hughes, ed. Pp. 81-89. Contributions of the University of California Archaeological Research Facility, No. 52. Berkeley: University of California Press.
Bennyhoff, James A., and David A. Fredrickson
1994[1969] A Proposed Integrative Taxonomic System for Central California Archaeology. In Toward a New Taxonomic Framework for Central California Archaeology: Essays by James A. Bennyhoff and David A. Fredrickson. Richard E. Hughes, ed. Pp. 15-24. Contributions of the University of California Archaeological Research Facility, No. 52. Berkeley: University of California Press.
Bennyhoff, James A., and Richard E. Hughes
1987 Shell Bead and Ornament Exchange Networks Between California and the Western Great Basin. Anthropological Papers of the American Museum of Natural History 64(2):79-175.
Bernard, H. Russell
2006 Research Methods in Anthropology: Qualitative and Quantitative Approaches. 4th edition. New York: Altamira Press.
Bethard, Kenneth R.
2007 The Mortuary Complex. In Santa Clara Valley Prehistory: Archaeological Investigations at CA-SCL-690, the Tamien Station Site, San Jose, California. Publication No. 15. Mark G. Hylkema, ed. Pp. 101-225. Davis: University of California, Center for Archaeological Research.

444
Bethard, Kenneth R., with Robert Jurmain 2007 Physical Anthropology of CA-SCL-690. In Santa Clara Valley Prehistory:
Archaeological Investigations at CA-SCL-690, the Tamien Station Site, San Jose, California. Publication No. 15. Mark G. Hylkema, ed. Pp. 185-206. Davis: University of California, Center for Archaeological Research.
Bickel, Polly McW.
1978 Changing Sea Levels along the California Coast: Anthropological Implications. The Journal of California Anthropology 5(1):6-20.
1981 San Francisco Bay Archaeology: Sites ALA-328, ALA-13 and ALA-12. Contributions of the University of California Archaeological Research Facility, No. 43. Berkeley: University of California.
Binford, Lewis R.
1962 Archaeology as Anthropology. American Antiquity 28(2):217-225. 1971 Mortuary Practices: Their Study and Their Potential. Memoirs of the Society
for American Archaeology 25:6-29. 2001 Constructing Frames of Reference: An Analytical Method for Archaeological
Theory Building Using Ethnographic and Environmental Data Sets. Berkeley: University of California Press.
Blakey, Michael L., and L. M. Rankin-Hill, eds.
2004 Skeletal Biology Final Report: The New York African Burial Ground, vols. 1 and 2. Washington, DC: The African Burial Ground Project, Howard University for the United States General Services Administration, Northeastern and Caribbean Region.
Blom, Deborah E.
2005 A Bioarchaeological Approach to Tiwanaku Group Dynamics. In Us and Them: Archaeology and Ethnicity in the Andes. Richard Martin Reycraft, ed. Pp. 153-182. Los Angeles: Cotsen Institute of Archaeology, University of California, Los Angeles.
Blom, Deborah E., Jane E. Buikstra, Linda Keng, Paula D. Tomczak, Elenor Shoreman, and Debbie Stevens-Tuttle.
2005 Anemia and Childhood Mortality: Pre-Columbian Latitudinal Patterns Along the Coast of Peru. American Journal of Physical Anthropology 126:152-169.
Borchardt, Glenn, and James J. Lienkaemper
1999 Pedogenic Calcite as Evidence for an Early Holocene Dry Period in the San Francisco Bay Area, California. Geological Society of America Bulletin 111(6):906-918.
Bourdieu, Pierre
445
1984 Distinction: A Social Critique of the Judgement of Taste. Richard Nice, trans. Cambridge: Harvard University Press.
Bowman, Sheridan
1990 Radiocarbon Dating. Berkeley: University of California Press.
Brillat-Savarin, Jean Anthelme 2009[1825] The Physiology of Taste; or Transcendental Gastronomy. M. F. K.
Fisher, trans. New York: Alfred A. Knopf. Broughton, Jack M.
1994 Declines in Mammalian Foraging Efficiency During the Late Holocene, San Francisco Bay, California. Journal of Anthropological Archaeology 13:371-401.
1996 Preface. In Excavation of the Emeryville Shellmound, 1906: Nels C. Nelson’s Final Report. Jack M. Broughton, ed. Pp. v-viii. Contributions of the University of California Archaeological Research Facility, No. 54. Berkeley: University of California Press.
Brown, Alan K.
1994 The European Contact of 1772 and Some Later Documentation. In The Ohlone Past and Present: Native Americans of the San Francisco Bay Region. Lowell John Bean, ed. Pp. 1-42. Menlo Park, CA: Ballena Press.
2011 With Anza to California 1775-1776: The Journal of Pedro Font, OFM. Alan K. Brown, trans. and ed. Norman, OK: University of Oklahoma Press.
Brown, Lesley, ed.
1993 The New Shorter Oxford English Dictionary. New York: Oxford University Press.
Brown, T. A., D. E. Nelson, J. S. Vogel, and J. R. Southon
1988 Improved Collagen Extraction by Modified Longin Method. Radiocarbon 30(2):171-177.
Brumfiel, Elizabeth M.
1992 Distinguished Lecture in Archaeology: Breaking and Entering the Ecosystem – Gender, Class and Faction Steal the Show. American Anthropologist 94(3):551-568.
Buikstra, Jane E., and George R. Milner
1991 Isotopic and Archaeological Interpretations of Diet in the Central Mississippi Valley. Journal of Archaeological Science 18(3):319-329.

446
Buonasera, Tammy Y. 2012 Expanding Archaeological Approaches to Ground Stone: Modeling
Manufacturing Costs, Analyzing Absorbed Organic Residues, and Exploring Social Dimensions of Milling Tools. Ph.D. dissertation, School of Anthropology, University of Arizona.
Calflora
N.d. Information on Wild California Plants for Conservation, Education, and Appreciation. http://www.calflora.org, accessed January - February, 2012.
Cartier, Robert
1981 Cultural Resource Evaluation for the Elmwood Addition Project in the County of Santa Clara. Report on file at the Northwest Information Center, Rohnert Park, CA.
1985 Cultural Resource Evaluation for the Elmwood Detention Facility Master Plan in the City of Milpitas, County of Santa Clara. Report on file at the Northwest Information Center, Rohnert Park, CA.
1986 The Good, the Bad, and the CRM of the Elsasser Review. In Part II: Comments on Elsasser’s “Prehistory of the Santa Clara Valley Region.” Pp. 79-81. Salinas, CA: Coyote Press.
1987 Cultural Resource Evaluation for the Elmwood Detention Facility Master Plan in the city of Milpitas, County of Santa Clara. Report on file at the Northwest Information Center, Rohnert Park, CA.
1988a The Eastridge Site, CA-SCL-327. Proceedings of the Society for California Archaeology 1:355-366.
1988b The Middle Period in the Southern San Francisco Bay Area. Proceedings of the Society for California Archaeology 1:273-282.
1988c Archaeological Study of the Elmwood Detention Facility. Report on file at the Northwest Information Center, Rohnert Park, CA.
Cartier, Robert, Jason Bass, and Scott Ortman
1993 The Archaeology of the Guadalupe Corridor. Santa Clara, CA: Santa Clara County Archaeological Society.
Centers for Disease Control and Prevention
2010 Types of Disabilities. http://www.cdc.gov, accessed February 10, 2013. Cleft Palate Foundation
2001 Speech Development. www.Cleftline.org, accessed December 29, 2012. Chartkoff, Joseph L., and Kerry Kona Chartkoff
1984 The Archaeology of California. Stanford, CA: Stanford University Press.
447
Chisholm, Brian S., D. Erle Nelson, and Henry P. Schwarcz 1983 Marine and Terrestrial Protein in Prehistoric Diets on the British Columbia
Coast. Current Anthropology 24(3):396-398.
Clayton, F., J. Sealy, and S. Pfeiffer 2006 Weaning Age Among Foragers at Matjes River Rock Shelter, South Africa,
from Stable Nitrogen and Carbon Isotope Analyses. American Journal of Physical Anthropology 120:311-317.
Cloern, J. E., E. A. Canuel and D. Harris
2002, Stable Carbon and Nitrogen Isotope Composition of Aquatic and Terrestrial Plants of the San Francisco Bay Estuarine System. Limnology and Oceanography 47(3):713-729.
Codding, Brian F., Judith F. Porcasi and Terry L. Jones
2010 Explaining Prehistoric Variation in the Abundance of Large Prey: A Zooarchaeological Analysis of Deer and Rabbit Hunting Along the Pecho Coast of Central California. Journal of Anthropological Archaeology 29:47-61.
Coe, Michael D., and Rex Koontz
2008 Mexico: From the Olmecs to the Aztecs. 6th edition. London: Thames & Hudson.
Coltrain, Joan Brenner, M. Geoffrey Hayes, and Dennis H. O’Rourke
2004 Sealing, Whaling and Caribou: The Skeletal Isotope Chemistry of Eastern Arctic Foragers. Journal of Archaeological Science 31:39-57.
Counihan, Carole M.
1999 The Anthropology of Food and Body: Gender, Meaning, and Power. New York: Routledge.
Craig, O. E., R. Ross, Søren H. Andersen, N. Milner, and G. N. Bailey
2006 Focus: Sulphur Isotope Variation in Archaeological Marine Fauna from Northern Europe. Journal of Archaeological Science 33:1642-4646.
Crespí, Juan
1999[1769] Account of the “Sacred Expedition.” In A World Transformed: Firsthand Accounts of California Before the Gold Rush. Joshua Paddison, ed. Pp. 7-20. Berkeley: Heydey Books.
2001[1769-1770] A Description of Distant Roads: Original Journals of the First Expedition into California, 1769-1770. Alan K. Brown, trans. and ed. San Diego: San Diego State University Press.
Csordas, Thomas J., ed.
448
1994 Embodiment and Experience: The Existential Ground of Culture and Self. New York: Cambridge University Press.
Cummings, Linda Scott, and Thomas E. Moutoux
2007 Pollen Analysis of Mortars and Pollen/Phytolith/Starch Analysis of a Bone Tube from CA-SCL-674, Santa Clara County, California. In Archaeological Investigations at CA-SCL-674, the Rubino Site, San Jose, Santa Clara County, California, vol. I. Allen G. Pastron and Viviana Bellifemine, eds. Pp. 421-427. Salinas, CA: Coyote Press.
Cummings, Linda Scott, Kathryn Puseman, and Rosa Marie Albert
1996 Pollen, Phytolith, and Protein Residue Analysis of Mortars from a Cemetery, Site CA-SCL-732, California. In Archaeological Investigations at Kaphan Umux (Three Wolves) Site, CA-SCL-732: A Middle Period Prehistoric Cemetery on Coyote Creek in Southern San Jose, Santa Clara County, California, Appendix H. Rosemary Cambra, Alan Leventhal, Laura Jones, Julia Hammett, Les Field, and Norma Sanchez, eds. Pp. H1-H24. Report on file at the California Department of Transportation, District 4, Oakland, CA.
D’Oro, Stella
2009 Native Californian Prehistory and Climate in the San Francisco Bay Area. Master’s thesis, Department of Anthropology, San Jose State University, California.
Dall, W. H.
1877 On Succession in the Shell-Heaps of the Aleutian Islands. Contributions to North American Ethnology 1(2):41-91. Washington DC: U.S. Geological and Geographic Service.
Danforth, Marie Elaine
1999 Nutrition and Politics in Prehistory. Annual Review of Anthropology 28:1-25.
Davis, Troy W., Jon M. Erlandson, Gerrit L. Fenenga, and Keith Hamm 2010 Chipped Stone Crescents and the Antiquity of Maritime Settlement on San
Nicolas Island, Alta California. California Archaeology 2(2):185-202. Davis, James T., and A. E. Treganza
1959 The Patterson Mound: A Comparative Analysis of the Archaeology of Site ALA-328. Reports of the University of California Archaeological Survey, No. 47. Berkeley: University of California Archaeological Survey.
Delgado-Darias, T., J. Velasco-Vázquez, M. Arnay-de-la-Rosa, E. Martín-Rodríguez, and E. González-Reimers.
2005 Dental Caries among the Prehispanic Population from Gran Canaria. American Journal of Physical Anthropology 128(3):560-568.

449
DeNiro, Michael J. 1985 Postmortem Preservation and Alteration of in vivo Bone-Collagen Isotope
Ratios in Relation to Paleodietary Reconstruction. Nature 317(6040):806-809. DeNiro, Michael J., and Samuel Epstein
1978 Influence of Diet on the Distribution of Carbon Isotopes in Animals. Geochimica et Cosmochimica Acta 42:495-506.
1981 Influence of Diet on the Distribution of Nitrogen Isotopes in Animals. Geochimica et Cosmochimica Acta 45:341-351.
DeNiro, Michael J., and Margaret J. Schoeniger
1983 Stable Carbon and Nitrogen Isotope Ratios of Bone Collagen: Variations Within Individuals, Between Sexes, and Within Populations Raised on Monotonous Diets. Journal of Archaeological Science 10:199-203.
Devlin, Joanne B., and Nicholas P. Herrmann
2008 Bone Color as an Interpretive Tool of the Depositional History of Archaeological Cremains. In The Analysis of Burned Human Remains. Christopher W. Schmidt and Steven A. Symes, eds. Pp. 109-128. San Francisco: Academic Press.
Dittrick, Jean and Judy Myers Suchey
1986 Sex Determination of Prehistoric Central California Skeletal Remains Using Discriminant Analysis of the Femur and Humerus. American Journal of Physical Anthropology 70:3-9.
Donlan, Sarah E.
2011 Carbon and Nitrogen Stable Isotopes in Fruits and Arthropods that are Eaten by Songbirds During Migration. Senior Honors Projects, Paper 245. University of Rhode Island.
Douglas, Mary
1972 Deciphering a Meal. Daedalus 101(1):61-81. Dubin, Margaret, and Sara-Larus Tolley, eds.
2008 Seaweed, Salmon, and Manzanita Cider: A California Indian Feast. Berkeley: Heyday Books.
Dufour, Elise, Hervé Bocherens, and André Mariotti
1999 Palaeodietary Implications of Isotopic Variability in Eurasian Lacustrine Fish. Journal of Archaeological Science 26:617-627.
Dupras, Tosha L., Henry P. Schwarcz, and Scott I. Fairgrieve
2001 Infant Feeding and Weaning Practices in Roman Egypt. American Journal of Physical Anthropology 115:204-212.
450
Earle, Timothy 2008 Cultural Anthropology and Archaeology: Theoretical Dialogues. In Handbook
of Archaeological Theories. R. Alexander Bentley, Herbert D. G. Maschner, and Christopher Chippindale, eds. Pp. 187-202. New York: AltaMira Press.
Eerkens, Jelmer W., and Eric J. Bartelink
In press Sex-based weaning and early childhood diet among Middle Holocene hunter-gaterers in Central California. American Journal of Physical Anthropology.
Eerkens, Jelmer W., Ada G. Berget, and Eric J. Bartelink
2011 Estimating weaning and early childhood diet from serial micro-samples of dentin collagen. Journal of Archaeological Science 38(11):3101-3111.
Eerkens, Jelmer W., Jeffrey S. Rosenthal, Howard J. Spero, Nathan E. Stevens, Richard Fitzgerald, and Laura Brink
2009 The Source of Early Horizon Olivella Beads: Isotopic Evidence from CCO-548. Proceedings of the Society for California Archaeology 23:1-11.
Eichinger Ferro-Luzzi, Gabriella
1975 Food Avoidances of Indian Tribes. Anthropos 70 (3/4):385-427. 1978 More on Salt Taboos. Current Anthropology 19(2):412-413.
Elsasser, Albert B.
1986 Part I: Review of the Prehistory of the Santa Clara Valley Region, California. Salinas, CA: Coyote Press.
Elsasser, Albert B., and Peter T. Rhode
1996 Further Notes on California Charmstones. Salinas, CA: Coyote Press. Eriksson, Gunilla
2004 Part-time Farmers or Hard-core Sealers? Västerbjers Studied by Means of Stable Isotope Analysis. Journal of Anthropological Archaeology 23:135-162.
Ezzo, Joseph A.
1992 Dietary Change and Variability at Grasshopper Pueblo, Arizona. Journal of Anthropological Archaeology 11:219-289.
Fages, Pedro
1911[1770] Expedition to San Francisco Bay in 1770, Diary of Pedro Fages. Herbert Eugene Bolton, ed. Berkeley: University of California Press.
1935 A Historical, Political, and Natural Description of California by Pedro Fages, Written for the Viceroy in 1775. Herbert L. Priestley, trans. Berkeley, CA: University of California Press.

451
Farb, Peter, and George Armelagos 1980 Consuming Passions: The Anthropology of Eating. Boston: Houghton Mifflin.
Farnsworth, Paul, James E. Brady, Michael J. DeNiro, and Richard S. MacNeish
1985 A Re-Evaluation of the Isotopic and Archaeological Reconstructions of Diet in the Tehuacan Valley. American Antiquity 50(1):102-116.
Fearn, Miriam L, and Kam Biu Liu
1995 Maize Pollen of 3500 B.P. from Southern Alabama. American Antiquity 60(1): 109-117.
Fenenga, Franklin F.
1953 The Weights of Chipped Stone Points: A Clue to their Function. Southwestern Journal of Anthropology 9:309-323.
File: 122-38 Hayward Fault
2004 File: 122-38 Hayward Fault. https://en.wikipedia.org/wiki/File:122-38HaywardFault.jpg, accessed May 15, 2012.
Finucane, Brian, Patricia Maita Agurto, and William H. Isbell
2006 Human and Animal Diet at Conchapata, Peru: Stable Isotope Evidence for Maize Agriculture and Animal Management Practices During the Middle Horizon. Journal of Archaeological Science 33(12):1766-1776.
Fischler, Claude
1988 Food, Self and Identity. Social Science Information 27(2):275-292. Foley, Melissa M., and Paul L. Koch
2010 Correlation Between Allochthonous Subsidy Input and Isotopic Variability in the Giant Kelp Macrocystis pyrifera in Central California, USA. Marine Ecology Progress Series 409:41-50.
Fredrickson, David A.
1974 Cultural Diversity in Early Central California: A View from the North Coast Ranges. The Journal of California Anthropology 1(1):41-53.
1994a[1973] Spatial and Cultural Units in Central California Archaeology. In Toward a New Taxonomic Framework for Central California Archaeology: Essays by James A. Bennyhoff and David A. Fredrickson. Richard E. Hughes, ed. Pp. 25-47. Contributions of the University of California Archaeological Research Facility, No. 52. Berkeley: University of California Press.
1994b[1992] Archaeological Taxonomy in Central California Reconsidered. In Toward a New Taxonomic Framework for Central California Archaeology: Essays by James A. Bennyhoff and David A. Fredrickson. Richard E. Hughes, ed. Pp. 91-103. Contributions of the University of California Archaeological Research Facility, No. 52. Berkeley: University of California Press.
452
Fogel, M., N. Tuross, and D. W. Owsley 1989 Nitrogen Isotope Tracers of Human Lactation in Modern and Archaeological
Populations. In Annual Report of the Director of the Geophysical Laboratory, Carnegie Instn. Washington, 1988-1989. Pp. 111-117. Washington, DC: Geophysical Laboratory.
Foster, John Wells
1887 Prehistoric Races of the United States of America. Chicago: S. C. Griggs. Fowler, Chris
2004 The Archaeology of Personhood: An Anthropological Approach. New York: Routledge.
Froehle, A. W., C. M. Kellner, and M. J. Schoeninger
2010 FOCUS: Effect of Diet and Protein Source on Carbon Stable Isotope Ratios in Collagen: Follow up to Warinner and Tuross (2009). Journal of Archaeological Science 37:2662-2670.
2012 Multivariate Carbon and Nitrogen Stable Isotope Model for the Reconstruction of Prehistoric Human Diet. American Journal of Physical Anthropology 147:352-369.
Fry, Brian
2006 Stable Isotope Ecology. New York: Springer.
Fry, Brian, Anthony Joern, and P. L. Parker 1978 Grasshopper Food Web Analysis: Use of Carbon Isotope Ratios to Examine
Feeding Relationships Among Terrestrial Herbivores. Ecology 59:498-506.
Fuller, B. T., M. P. Richards, and S. A. Mays 2003 Stable Carbon and Nitrogen Isotope Variations in Tooth Dentine Serial
Sections from Wharram Percy. Journal of Archaeological Science 30:1673-1684. Fuller, B. T., J. L. Fuller, D. A. Harris, and R. E. M. Hedges
2006 Detection of Breastfeeding and Weaning in Modern Human Infants with Carbon and Nitrogen Stable Isotope Ratios. American Journal of Physical Anthropology 129:279-293.
Gamble, Lynn H., Phillip L. Walker, and Glenn S. Russell
2001 An Integrative Approach to Mortuary Analysis: Social and Symbolic Dimensions of Chumash Burial Practices. American Antiquity 66(2):185-212.
453
Gardner, Karen S., Alan Leventhal, Rosemary Cambra, Eric J. Bartelink, and Antoinette Martinez
2011 Mothers and Infants in the Prehistoric Santa Clara Valley: What Stable Isotopes Tell Us About Ancestral Ohlone Weaning Practices. Proceedings of the Society for California Archaeology 25:1-14.
2012 Strangers among them: using stable C, N, and S isotope analysis of human bone to interpret four unusual burials at the Yukisma Mound (CA-SCL-38), in Santa Clara County, California. Poster presented at the 81st Annual Meeting of the American Association of Physical Anthropologists, Portland, Oregon, April 11-14.
Garvie-Lok, S. J., T. L. Varney, and M. A. Katzenberg
2004 Preparation of Bone Carbonate for Stable Isotope Analysis: The Effects of Treatment Time and Acid Concentration. Journal of Archaeological Science 31(6):763-776.
Gayton, Anna H.
1930 Yokuts-Mono Chiefs and Shamans. University of California Publications in American Archaeology and Ethnology 24(8):361-420. Berkeley, CA: University of California Press.
Gerow, Bert A.
1972 Stanford Man II, an Early Grave from the San Francisco Bay Region. Paper presented at the Meeting of the Southwestern Anthropological Association and the Society for California Archaeology, Long Beach, March 29-April1.
1974 Comments on Fredrickson’s “Cultural Diversity.” The Journal of California Anthropology 1(2):239-246.
Gerow, Bert A., with Roland W. Force
1968 An Analysis of the University Village Complex with a Reappraisal of Central California Archaeology. Stanford: Stanford University Press.
Gibson, Robert O., and Gerrit Fenega
1978 A Preliminary Analysis of the Shell Beads and Ornaments from CA-SCL-128. In Archaeological Investigations at CA-SCL-128, the Holiday Inn Site. Joseph C. Winter, ed. Pp. 95-148. Salinas, CA: Coyote Press.
Gifford, Edward Winslow
1916 Composition of California Shellmounds. University of California Publications in American Archaeology and Ethnology 12(1):1-29. Berkeley, CA: University of California Press.
1936 California Indian Balanophagy. In Essays in Anthropology Presented to Alfred L. Kroeber. Robert H. Lowie, ed. Pp. 87-98. Berkeley: University of California Press.
1940 California Bone Artifacts. Anthropological Records 3(2). Berkeley, CA: University of California Press.
454
1947 California Shell Artifacts. Anthropological Records 9(1). Berkeley, CA: University of California Press.
Gilbert, Jr., Robert I., and James H. Mielke, eds.
1985 The Analysis of Prehistoric Diets. New York: Academic Press. Gillett, Rhonda M.
1987 Comparative Aging Techniques as Applies to the Paleodemography of CA-ALA-329. Master’s thesis, Department of Social Sciences, San Jose State University, California.
Gilliam, Harold
2002 Weather of the San Francisco Bay Region. 2nd edition. Berkeley: University of California Press.
Ginn, J., and S. Arber
1995 “Only Connect”: Gender Relations and Ageing. In Connecting Gender and Ageing: A Sociological Approach. S. Arber and J. Ginn, eds. Pp. 1-14. Buckingham: Open University Press.
Goldberg, Carol Frances
1993 The Application of Stable Carbon and Nitrogen Isotope Analysis to Human Dietary Reconstruction in Prehistoric Southern California. Ph.D. dissertation, University of California, Los Angeles.
Goodenough, Ward H.
1965 Rethinking ‘Status’ and ‘Role’: Toward a General Model of the Cultural Organization of Social Relationships. In The Relevance of Models for Social Anthropology. Michael Banton, ed. Pp. 1-24. London: Tavistock Publications.
Grant, Dave
2010 Native Americans in the San Francisco Bay Area: Patterns in Ancient Teeth, Palimpsests of Behavior. Masters thesis, Department of Environmental Studies, San Jose State University, California.
Greenwald, Alexandra, and Jelmer Eerkens
2013 Parental Investment Strategies during the Middle-Late Transition in Central California: Stable Isotope Estimates of Weaning and Early Childhood Diet. Paper presented at the 47th Annual Meeting of the Society for California Archaeology, Berkeley, California, March 7-10.
Gross, Charlene S.
1991 A New Method of Skeletal Aging Using Stages of Sacral Fusion as Seen in the CA-ALA-329 Burial Population. Master’s thesis, Department of Social Sciences, San Jose State University, California.

455
Grossinger, Robin, and Ruth Askevold 2005 Baylands & Creeks of South San Francisco Bay. San Francisco Estuary
Institute. Oakland: Oakland Museum of California. Grossinger, Robin, Ruth Askevold, Chuck Striplene Brewster, Sarah Pearce, Kristen Larned, Lester McKee, and Josh Collins
2006 Coyote Creek Watershed Historical Ecology Study: Historical Condition, Landscape Change, and Restoration Potential in the Eastern Santa Clara Valley, California. SFEI Publication 426. Oakland, CA: San Francisco Estuary Institute.
Grossinger, R. M., E. E. Beller, M. N. Salomon, A. A. Whipple, R. A. Askevold, C. J. Striplen, E. Brewster, and R. A. Leidy
2008 South Santa Clara Valley Historical Ecology Study, Including Soap Lake, the Upper Pajaro River, and Llagas, Uvas-Carnadero, and Pacheco Creeks. A Report of SFEI’s Historical Ecology Program, SFEI Publication #558. Oakland: San Francisco Estuary Institute.
Groza, Randall Gannon
2002 An AMS Chronology for Central California Olivella Shell Beads. Master’s thesis, Department of Anthropology, San Francisco State University.
Guatelli-Stenberg D., C. S. Larsen, and D. L. Hutchinson
2004 Prevalence and the Duration of Linear Enamel Hypoplasia: A Comparative Study of Neanderthals and Inuit Foragers. Journal of Human Evolution 47(1-2):65-84.
Gumerman IV, George
1997 Food and Complex Societies. Journal of Archaeological Method and Theory 4(2):105-139.
Hall, Frederic
1871 The History of San José and Surroundings: with Biographical Sketches of Early Settlers. San Francisco: A. L. Bancroft and Company.
Hall, Jeffrey T., Robert Jurmain, and James S. Nelson
1988 Preliminary Description of Cemetery Complex at CA-ALA-343. Proceedings of the Society for California Archaeology 1:321-333.
Hammett, Julia E.
1996a Paleoethnobotany of Site CA-SCL-732. In Archaeological Investigations at Kaphan Umux (Three Wolves) Site, CA-SCL-732: A Middle Period Prehistoric Cemetery on Coyote Creek in Southern San Jose, Santa Clara County, California. Rosemary Cambra, Alan Leventhal, Laura Jones, Julia Hammett, Les Field, and Norma Sanchez, eds. Pp. 8.1-8.15. Report on file at the California Department of Transportation, District 4, Oakland, CA.

456
1996b Paleolandscape Ecology of Coyote Creek. In Archaeological Investigations at Kaphan Umux (Three Wolves) Site, CA-SCL-732: A Middle Period Prehistoric Cemetery on Coyote Creek in Southern San Jose, Santa Clara County, California. Rosemary Cambra, Alan Leventhal, Laura Jones, Julia Hammett, Les Field, and Norma Sanchez, eds. Pp. 9.1-9.9. Report on file at the California Department of Transportation, District 4, Oakland, CA.
Harrington, John P.
1942 Culture Element Distributions: XIX, Central California Coast. Berkeley: University of California Press.
Harrington, M. R.
1933 Gypsum Cave, Nevada. Southwest Museum Papers 8. Los Angeles: Southwest Museum.
Harrison, Roman G., and M. Anne Katzenberg
2003 Paleodiet Studies Using Stable Carbon Isotopes from Bone Apatite and Collagen: Examples from Southern Ontario and San Nicolas Island, California. Journal of Anthropological Archaeology 22(3):227-244.
Hauser, G., and G. F. DeStefano
1989 Epigenetic Variants of the Human Skull. Stuttgart, Germany: E. Schweizerbart’sche Verlagsbuchhandlung (Nägele u. Obermiller).
Heaton, T. H. E.
1987 The 15N/14N Ratios of Plants in South Africa and Namibia: Relationship to Climate and Coastal/Saline Environments. Oecologia 74:236-246.
Hedges, R. E. M.
2003 On Bone Collagen-Apatite-Carbonate Isotopic Relationships. International Journal of Osteoarchaeology 13:66-79.
2004 Isotopes and Red Herrings: Comments on Milner et al. and Lidén et al. Antiquity 78(299):34-37.
Hedges, R. E. M., and Andrew R. Millard
1995 Bones and Groundwater: Towards the Modelling of Diagenetic Processes. Journal of Archaeological Science 22:155-164.
Heer, O.
1866 Treatise on the Plants of the Lake Dwellings. In The Lake Dwellings of Switzerland and Other Parts of Europe. Ferdinand Keller, ed. and John E. Lee, trans. p. 336-354. London: Longmans, Green, and Co.
457
Hegmon, Michelle 2003 Setting Theoretical Egos Aside: Issues and Theory in North American
Archaeology. American Antiquity 68(2):213-243. Heizer, Robert F.
1958 Radiocarbon Dates from California of Archaeological Interest. University of California Archaeological Survey Reports 44(1):1-16.
Heizer, Robert F., ed.
1978 California. Handbook of North American Indians, vol. 8. Washington DC: Smithsonian Institution Press.
Heizer, Robert F., and Richard K. Beardsley
1943 Fired Clay Human Figurines in Central and Northern California. American Antiquity 9(2):199-207.
Heizer, Robert F., and Francis Drake
1947 Francis Drake and the California Indians, 1579. Berkeley: University of California Press.
Heizer, Robert F., and Albert B. Elsasser
1980 The Natural World of the California Indians. Berkeley: University of California Press.
Heizer, Robert F., and F. Fenenga
1939 Archaeological Horizons in Central California. American Anthropologist 41:378-399.
Heizer, Robert F., and Adan E. Treganza
1972 Mines and Quarries of the Indians of California. Ramona, CA: Ballena Press. Henderson, John G.
1872 Notes on Aboriginal Relics Known as “Plummets.” The American Naturalist 6(11):641-650.
Henn, Winfield, Tom Jackson, and Julius Schlocker
1972 Buried Human Bones at the “BART” Site, San Francisco. California Geology 25:208-209.
Henrich, Joseph, and Francisco J. Gil-White
2001 The Evolution of Prestige: Freely Conferred Deference As a Mechanism for Enhancing the Benefits of Cultural Transmission. Evolution and Human Behavior 22:165-196.
458
Herring, D. Ann, S. R. Saunders, and M. A. Katzenberg 1998 Investigating the Weaning Process in Past Populations. American Journal of
Physical Anthropology 105:425-439.
Hill, Kim, and A. Magdalena Hurtado 1996 Ache Life History: The Ecology and Demography of a Foraging People. New
York: Aldine de Gruyter.
Hillson, Simon 1996 Dental Anthropology. New York: Cambridge University Press.
Hodder, Ian 1991 Interpretive Archaeology and Its Role. American Antiquity 56(1):7-18.
Holland, Thomas D., and Michael J. O’Brien
1997 Parasites, Porotic Hyperostosis, and the Implications of Changing Perspectives. American Antiquity 62(2):183-193.
Howell, Nancy
2000 Demography of the Dobe !Kung. 2nd edition. New York: Aldine de Gruyter. Hildebrandt, William, and Laureen Swenson
1983 Environmental Setting and Site Catchment Analysis. In Final Report, Archaeological Research of the Southern Santa Clara Valley Project: Based on a Data Recovery Program from Sites CA-SCl-54, CA-SCl-163, CA-SCl-178, CA-SCl-237 and CA-SCl-241 Located in the Route 101 Corridor, Santa Clara County, California. Limited distribution technical paper prepared by Daniel, Mann, Johnson, and Mendenhall and William R. Hildebrandt for the California Department of Transportation, District 4, Oakland, California.
Hillson, Simon
1996 Dental Anthropology. Cambridge: Cambridge University Press. Hitchcock, Christopher S., and Edward J. Helley
2003 Characterization of Subsurface Sediments, Southern San Francisco Bay Area, Final Technical Report. Walnut Creek, CA: William Lettis & Associates.
Hobson, Keith A., and Stephen Collier
1984 Marine and Terrestrial Protein in Australian Aboriginal Diets. Current Anthropology 25(2):238-240.
459
Hollimon, Sandra E. 2005 The Third Gender in Native California: Two-Sprit Undertakers Among the
Chumash and Their Neighbors. In The Archaeology of Plural and Changing Identities: Beyond Identification. Eleanor Conlin Casella and Chris Fowler, eds. Pp. 173-188. New York: Kluwer Academic/Plenum.
Howard, J. K., K. M. Cuffey and M. Solomon
2005, Toward Using Margaritifera falcata as an Indicator of Base Level Nitrogen and Carbon Isotope Ratios: Insights from Two California coast Range Rivers. Hydrobiologia 541:229-236.
Hughes, Richard E.
1994 Editor’s Introduction. In Toward a New Taxonomic Framework for Central California Archaeology, essays by James A. Bennyhoff and David A. Fredrickson. Richard E. Hughes, ed. Pp. 1-5. Contributions of the University of California Archaeological Research Facility, Berkeley, No. 52. Berkeley: University of California Press.
Hylkema, Mark G.
2002 Tidal Marsh, Oak Woodlands, and Cultural Florescence in the Southern San Francisco Bay Region. In Catalysts to Complexity: Late Holocene Societies of the California Coast. Jon M. Erlandson and Terry L. Jones, eds. Pp. 263-281. Perspectives in California Archaeology 6. Los Angeles: Cotsen Institute of Archaeology, University of California, Los Angeles.
2007 Santa Clara Valley Prehistory: Archaeological Investigations at CA-SCL-690, the Tamien Station Site, San Jose, California. Publication No. 15. Davis: University of California, Center for Archaeological Research.
Hylkema, Mark, and Richard Fitzgerald
2007 Cobble Artifacts. In Santa Clara Valley Prehistory: Archaeological Investigations at CA-SCL-690, the Tamien Station Site, San Jose, California. Publication No. 15. Mark Hylkema, ed. Pp. 287-307. Davis: University of California, Center for Archaeological Research.
Hylkema, Mark, and Alan Leventhal
2007 Flaked Stone Assemblage. In Santa Clara Valley Prehistory: Archaeological Investigations at CA-SCL-690, the Tamien Station Site, San Jose, California. Publication No. 15. Mark Hylkema, ed. Pp. 321-348. Davis: University of California, Center for Archaeological Research.
Jacknis, Ira, ed.
2004 Food in California Indian Culture. Berkeley: University of California, Phoebe Hearst Museum of Anthropology.

460
Jackson, Thomas L. 2004 Pounding Acorn: Women’s Production as Social and Economic Focus. In
Prehistoric California: Archaeology and the Myth of Paradise. L. Mark Raab and Terry L. Jones, eds. Pp 172-181. Salt Lake City: The University of Utah Press.
Jelliffe, Derrick B.
1967 Parallel Food Classifications in Developing and Industrialized Countries. The American Journal of Clinical Nutrition 20(3):279-281.
Johnson, Donald Lee
1977 The Late Quaternary Climate of Coastal California: Evidence for an Ice Age Refugium. Quaternary Research 8: 154-179.
Jones, Laura
1996 Mortuary Treatment. In Archaeological Investigations at Kaphan Umux (Three Wolves) Site, CA-SCL-732: A Middle Period Prehistoric Cemetery on Coyote Creek in Southern San Jose, Santa Clara County, California. Rosemary Cambra, Alan Leventhal, Laura Jones, Julia Hammett, Les Field, and Norma Sanchez, eds. Pp. 11.1-11.7. Report on file at the California Department of Transportation, District 4, Oakland, CA.
Jones, Philip Mills
1923 Mound Excavations Near Stockton. Publications in American Ethnology and Archaeology 20:113-122. Berkeley: University of California Press.
Jones, S. J.
1971[1951] Some Regional Aspects of Native California. In The California Indians, a Source Book. 2nd ed. R. F. Heizer and M. A. Whipple, eds. Pp. 84-96. Berkeley: University of California Press.
Jones, Terry L.
1993 Big Sur: A Keystone in Central California Culture History. Pacific Coast Archaeological Society Quarterly 29(1):1-78.
1995 Transitions in Prehistoric Diet, Mobility, Exchange, and Social Organization along California’s Big Sur Coast. Ph.D. dissertation, Department of Anthropology, University of California, Davis.
1996 Mortars, Pestles, and Division of Labor in Prehistoric California: A View from Big Sur. American Antiquity 61(2):243-264.
Jones, Terry L., and Douglas J. Kennett
1999 Late Holocene Sea Temperatures along the Central California Coast. Quaternary Research 51:74-82.
Jorgenson, Gina A., Jelmer W. Eerkens, Gry H. Barfod, and Eric J. Bartelink
461
2009 Migration Patterns in the Prehistoric California Delta: Analysis of Strontium Isotopes. Proceedings of the Society for California Archaeology 23:1-7.
Joyce, Rosemary A.
2008 Ancient Bodies, Ancient Lives: Sex, Gender, and Archaeology. New York: Thames and Hudson.
Jurmain, Robert
1990a Paleoepidemiology of a Central California Prehistoric Population from CA-ALA-329: Dental Disease. American Journal of Physical Anthropology 81:333-342.
1990b Paleoepidemiology of a Central California Prehistoric Population from CA-ALA-329:II, Degenerative Disease. American Journal of Physical Anthropology 83:83-94.
1991 Paleoepidemiology of Trauma in a Prehistoric Central California Population. In Human Paleopathology: Current Synthesis and Future Options. Donald J. Ortner and Arthur C. Aufderheide, eds. Pp. 241-248. Washington DC: Smithsonian Institution Press.
2000 Analysis of the Human Skeletal Remains from CA-SCL-038: Technical Report. Manuscript on file at the Department of Anthropology, San Jose State University, San Jose, California.
2001 Paleoepidemiological Patterns of Trauma in a Prehistoric Population from Central California. American Journal of Physical Anthropology 115:13-23.
Jurmain, Robert, Eric J. Bartelink, and Alan Leventhal
2009 Paleoepidemiological Patterns of Interpersonal Aggression in a Prehistoric Central California Population from CA-ALA-329. American Journal of Physical Anthropology 139(4):462-473.
Justice, Noel D.
2002 Stone Age Spear and Arrow Points of California and the Great Basin. Bloomington, IN: Indiana University Press.
Katzenberg, M. Anne
2008 Stable Isotope Analysis: A Tool for Studying Past Diet, Demography, and Life History. In Biological Anthropology of the Human Skeleton. 2nd edition. M. Anne Katzenberg and Shelley R. Saunders, eds. Pp. 413-441. Hoboken, NJ: John Wiley and Sons.
Katzenberg, M. Anne, Ann D. Harring, and Shelley R. Saunders
1996 Weaning and Infant Mortality: Evaluating the Skeletal Evidence. Yearbook of Physical Anthropology 38:177-199.

462
Keegan, William F., and Michael J. DeNiro 1988 Stable Carbon- and Nitrogen-Isotope Ratios of Bone Collagen Used to Study6
Coral-Reef and Terrestrial Components of Prehistoric Bahamian Diet. American Antiquity 53(2):320-336.
Kellner, C. M., and M. J. Schoeninger
2007 A Simple Carbon-Isotope Model for Reconstructing Prehistoric Human Diet. American Journal of Physical Anthropology 133:1112-1127.
Kelly, Jeffrey F.
2000 Stable Isotopes of Carbon and Nitrogen in the Study of Avian and Mammalian Trophic Ecology. Canadian Journal of Zoology 78:1-27.
Kelly, Robert L.
2007 The Foraging Spectrum: Diversity in Hunter-Gatherer Lifeways. Clinton Corners, NY: Percheron Press.
Kennett, Douglas J., and James P. Kennett
2000 Competitive and Cooperative Responses to Climatic Instability in Coastal Southern California. American Antiquity 65(2):379-395.
King, Chester
1978 Protohistoric and Historic Archaeology. In California. Handbook of North American Indians, vol. 8. Robert F. Heizer, ed. Pp. 58-68. Washington DC: Smithsonian Institution Press.
King, Jerome Hardy
1991 Prehistoric Diet in Central Baja California, Mexico. Masters thesis, Department of Archaeology, Simon Fraser University, Brunaby, British Columbia.
King, Linda
1969 The Medea Creek Cemetery (LAn-243): An Investigation of Social Organization from Mortuary Practices. Archaeological Survey Annual Report, vol. 11, University of California, Los Angeles. Salinas, CA: Coyote Press.
King, Thomas F.
1970 The Dead at Tiburon: Mortuary Customs and Social Organization on Northern San Francisco Bay. Northwestern California Archaeological Society, Occasional Paper Number 2. Salinas, CA: Coyote Press.
1978 Don’t that Beat the Band? Nonegalitarian Political Organization in Prehistoric Central California. In Social Archaeology: Beyond Subsistence and Dating. C. L. Redman, M. Bennan, E. Curtin, W. Langhome, Jr., N. Versaggi, and J. Wanser, eds. Pp. 225-248. San Diego, CA: Academic Press.
463
Kleinman, Arthur, and Joan Kleinman 2007 Somatization: the Interconnections in Chinese Society among Culture,
Depressive Experiences, and the Meanings of Pain. In Beyond the Body Proper: Reading the Anthropology of Material Life. Margaret Lock and Judith Farquhar, eds. Pp. 468-474. Durham, NC: Duke University Press.
Koch, P. L., N. Tuross, and M. L. Fogel
1997 The Effects of Sample Treatment and diagenesis on the Isotopic Integrity of carbonate in Biogenic Hydroxylapatite. Journal of Archaeological Science 24(5):417-429.
Kolpan, Katharine E.
2009 Dental Pathology Distribution and Sex Ratios in Windmiller Populations from Central California. Masters thesis, Department of Anthropology, California State University, Chico.
Knudson, Kelly J., and T. Douglas Price
2007 Utility of Multiple Chemical Techniques in Archaeological Residential Mobility Studies: Case Studies from Tiwanaku- and Chiribaya-Affiliated Sites in the Andes. American Journal of Physical Anthropology 132:25-39.
Knudson, Kelly J., Tiffiny A. Tung, Kenneth C. Nystrom, T. Douglas Price, Paul D. Fullagar
2005 The Origin of the Juch’uypampa Cave Mummies: Strontium Isotope Analysis of Archaeological Human Remains from Bolivia. Journal of Archaeological Science 32:903-913.
Kroeber, Alfred L.
1909 The Archaeology of California. In Putnam Anniversary Volume: Anthropological Essays. Franz Boaz, Roland B. Dixon, F. W. Hodge, Alfred L. Krober, and Harlan I. Smith, eds. Pp. 1-42. New York: G.E. Stechert.
1925 Handbook of the Indians of California. New York: Dover Publications. 1963[1948] Anthropology: Culture Patterns and Processes. New York: Harcourt,
Brace & World. 1971[1922] Elements of Culture in Native California. University of California
Publications in American Archaeology and Ethnology 13:260-328. In The California Indians, A Source Book, 2nd Edition. R. F. Heizer and M. A. Whipplem eds. Pp. 3-65. Berkeley, CA: University of California Press.
Krouse, H. R., and M. K. Herbert
1988 Sulphur and Carbon Isotope Studies of Food Webs. In Diet and Subsistence: Current Archaeological Perspectives. B. V. Kennedy and G. M. LeMoine, eds. Pp. 315-325. Calgary: University of Calgary Archaeological Association.
464
Kunth, C. 1826 Examen Botanique des Fruits et des Fruits et des Plantes en la Collection
Égyptienne de M. Passalacqua. In Catalogue Raisonné et Historique de Antiquités Découvertes en Egypte. J. Passalacqua, ed. Pp. 227-229. Paris: Galerie d’Antiquités Égyptiennes.
Larson, Clark Spencer
1997 Bioarchaeology: Interpreting Behavior from the Human Skeleton. Cambridge: Cambridge University Press.
Larsen, Clark Spencer, Margaret J. Schoeninger, Nikolaas J. van der Merwe, Katherine M. Moore, and Julia A. Lee-Thorp
1992 Carbon and Nitrogen Stable Isotopic Signatures of Human Dietary Change in the Georgia Bight. American Journal of Physical Anthropology 89:197-214.
Lee, Richard B.
1979 The Dobe !Kung. San Francisco: Holt, Rinehart, and Winston. Lee-Thorp, J. A., J. C. Sealy and N. J. van der Merwe
1989 Stable Carbon Isotope Ratio Differences Between Bone Collagen and Bone Apatite, and Their Relationship to Diet. Journal of Archaeological Science 16:585-599.
LeHuray, Jonathan D., and Holger Schutkowski
2005 Diet and social status during the La Tène period in Bohemia: Carbon and nitrogen stable isotope analysis of bone collagen from Kutná Hora-Karlov and Radovesice. Journal of Anthropological Archaeology 24:135-147.
Leigh, Rufus Wood
1925 Dental Pathology of the Eskimo. Dental Cosmos 67:884-898. 1928 Dental Pathology of Aboriginal California. University of California
Publications in American Archaeology and Ethnology 23(10):399-440. Leventhal, Alan
1993 A Reinterpretation of Some Bay Area Shellmound Sites: A View from the Mortuary Complex from CA-ALA-329, the Ryan Mound. Master’s thesis, Department of Social Science, San Jose State University, California.
Leventhal, Alan, and Laura Jones
1996 Chronology. In Archaeological Investigations at Kaphan Umux (Three Wolves) Site, CA-SCL-732: A Middle Period Prehistoric Cemetery on Coyote Creek in Southern San Jose, Santa Clara County, California. Rosemary Cambra, Alan Leventhal, Laura Jones, Julia Hammett, Les Field, and Norma Sanchez, eds. Pp. 10.1-10.14. Report on file at the California Department of Transportation, District 4, Oakland, CA.
465
Leventhal, Alan, Laura Jones, Rosemary Cambra, and Norma Sanchez 1993 Results from a Presence/Absence Subsurface Archaeological Test Excavation
Program on a Portion of Prehistoric Site: CA-SCL-38 (Alms House Mound) for the Proposed Construction of Housing Unit Barracks M8 Located within the Elmwood Correctional Facility City of Milpitas, Santa Clara County, California. Report Prepared by Ohlone Families Consulting Services for the County of Santa Clara.
Levi-Strauss, Claude
1971 Totemism. Rodney Needham, trans. Boston: Beacon Press. Levy, Richard
1978 Costanoan. In California. Handbook of North American Indians, vol. 8. Robert F. Heizer, ed. Pp. 485-495. Washington DC: Smithsonian Institution Press.
Lide, David R., ed.
2003 CRC Handbook of Chemistry and Physics. 84th edition. New York: CRC Press.
Lightfoot, Kent G.
1997 Cultural Construction of Coastal Landscapes: A Middle Holocene Perspective from San Francisco Bay. In Archaeology of the California Coast During the Middle Holocene. J. M. Erlandson and M. Glassow, eds. Pp.129-141. Perspectives in Archaeology 4. Los Angeles: Cotsen Institute of Archaeology, University of California, Los Angeles.
Lightfoot, Kent G., and Edward M. Luby
2002 Late Holocene in the San Francisco Bay Area: Temporal Trends in the Use and Abandonment of Shell Mounds in the East Bay. In Catalysts to Complexity: Late Holocene Societies of the California Coast. Jon M. Erlandson and Terry L. Jones, eds. Pp. 263-281. Perspectives in California Archaeology 6. Los Angeles: Cotsen Institute of Archaeology, University of California, Los Angeles.
Lightfoot, Kent G., Lee M. Panich, Tsim D. Schneider, Sara L. Gonzalez, Mattew A. Russell, Darren Modzelewski, Theresa Molino, and Elliot H. Blair.
2013 The Study of Indigenous Political Economies and Colonialism in Native California: Implications for Contemporary Tribal Groups and Federal Recognition. American Antiquity 78(1):89-103.
Lightfoot, Kent G., and Otis Parrish
2009 California Indians and Their Environment: An Introduction. Berkeley: University of California Press.
466
Lillard, Jeremiah B., R. F. Heizer, and Franklin Fenenga 1939 An Introduction to the Archeology of Central California. Sacramento Junior
College Department of Anthropology Bulletin 2. Sacramento: The Board of Education of the Sacramento City Unified School District.
Littleton J, and B. Frohlich
1992 Fish-Eaters and Farmers: Dental Pathology in the Arabian Gulf. American Journal of Physical Anthropology 92:427-447.
Loeb, Edwin M.
1926 Pomo Folkways. University of California Publications in American Archaeology and Ethnology, 19(2):149-405.
Loth, S.R.
1995 Age Assessment of the Spitalfields Cemetery Population by Rib Phase Analysis. American Journal of Human Biology 7:465-471.
Loud, Llewellyn L.
1924 The Stege Mounds at Richmond, California. University of California Publications in American Archaeology and Ethnology 17(6):355-372.
Lovejoy, C. O., R. S. Meindl, T. R. Preyzbeck, and R. P. Mensforth
1985 Chronological Metamorphosis of the Auricular Surface of the Ilium: A New Method for the Determination of Adult Skeletal Age at Death. American Journal of Physical Anthropology 99:473-485.
Lubell, David, Mary Jackes, Henry Schwarcz, Martin Knyf, and Christopher Meiklejohn
1994 The Mesolithic-Neolithic Transition in Portugal: Isotopic and Dental Evidence of Diet. Journal of Archaeological Science 21:201-216.
Luby, Edward M., Clayton D. Drescher, and Kent G. Lightfoot
2006 Shell Mounds and Mounded Landscapes in the San Francisco Bay Area: An Integrated Approach. Journal of Island & Coastal Archaeology 1:191-214.
Luby, Edward M., and Mark F. Gruber
1999 The Dead Must be Fed: Symbolic Meanings of the Shellmounds of the San Francisco Bay Area. Cambridge Archaeological Journal 9(1):95-108.
Lupton, Deborah
1996 Food, the Body and the Self. Thousand Oaks, CA: SAGE. MacArtain, Paul, Christopher I. R. Gill, Mariel Brooks, Ross Campbell, and Ian R. Rowland
2007 Nutritional Value of Edible Seaweeds. Nutrition Reviews 65(12):535-543
467
Marlowe, Frank W. 2010 The Hadza: Hunter-Gatherers of Tanzania. Berkeley: University of California
Press. Masters, Patricia M., and Ivano W. Aiello
2007 Postglacial Evolution of Coastal Environments. In California Prehistory: Colonization, Culture and Complexity. Terry L. Jones and Kathryn A. Klar, eds. Pp. 35-51. New York: Altamira Press.
Matson, R. G., and Gary Coupland
2009 The Prehistory of the Northwest Coast. Walnut Creek, CA: Left Coast Press. McKern, W. C.
1939 The Midwestern Taxonomic Method as an Aid to Archaeological Culture Study. American Antiquity 4(4):301-313.
Meighan, Clement W.
1952 Archaeological Site Survey Record, Site SCL-38. University of California Archaeological Survey. Report on file at the Northwest Information Center, Rohnert Park, CA.
1987 Reexamination of the Early Central California Culture. American Antiquity 52(1):28-36.
Meyer, Jack, and Jeffrey S. Rosenthal
1998 An Archaeological Investigation of Artifacts and Human Remains from CA-CCO-673, Los Vaqueros Project Area, Contra Costa County, California. Rohnert Park, CA: Anthropological Studies Center, Sonoma State University Academic Foundation.
Mikkelsen, Pat
1985 A Study of Millingtool Form and Function Applied to the North Coast Ranges, California. Masters thesis, Department of Cultural Resource Management, California State University, Sonoma.
Miksicek, C. M.
1993 Paleobotanical Remains. In Results of Midden Testing, CA-SCL-732/H, Santa Clara County, California. S. Baker, ed. Pp. 48-56. MS on file at the Northwest Archaeological Information Center, Sonoma State University, Rohnert Park.
Milliken, Randall T.
1987 Ethnohistory of the Rumsen. Papers in Northern California Anthropology 2. Northern California Anthropological Group, Berkeley, California. Salinas, CA: Coyote Press.
1995 A Time of Little Choice: the disintegration of tribal culture in the San Francisco Bay Area, 1769-1810. Menlo Park, CA: Malki-Ballena Press.

468
2007 Ethnohistory of the Ohlone People, Part 1: The Ohlone People of the Santa Clara Valley in the 1770s. In Santa Clara Valley Prehistory: Archaeological Investigations at CA-SCL-690, the Tamien Station Site, San Jose, California. Publication No. 15. Mark G. Hylkema, ed. Pp. 47-60. Davis: University of California, Center for Archaeological Research.
2008 Native Americans at Mission San Jose. Banning, CA: Malki-Ballena Press. Milliken, Randall, Richard T. Fitzgerald, Mark G. Hylkema, Randy Groza, Tom Origer, David G. Bieling, Alan Leventhal, Randy S. Wiberg, Andrew Gottsfield, Donna Gillette, Viviana Bellifemine, Eric Strother, Robert Cartier, and David A. Fredrickson
2007 Punctuated Culture Change in the San Francisco Bay Area. In California Prehistory: Colonization, Culture, and Complexity. Terry L. Jones and Kathryn A. Klar, eds. Pp. 99-123. New York: Altamira Press.
Milner, N., O. E. Craig, G. N. Bailey, K. Pedersen, and S. H. Andersen
2004 Something Fishy in the Neolithic? A Re-Evaluation of Stable Isotope Analysis of Mesolithic and Neolithic Coastal Populations. Antiquity 78(299):9-22.
Minagawa, Masao, and Eitaro Wada
1984 Stepwise Enrichment of 15N Along Food Chains: Further Evidence and the Relation Between δ15N and Animal Age. Geochimica et Cosmochimica Acta 48:1135-1140.
Mintz, Sidney W., and Christine M. DuBois
2002 The Anthropology of Food and Eating. Annual Review of Anthropology 31:99-119.
Molnar, Stephen
1968 Human Tooth Wear, Tooth Function and Cultural Variability. American Journal of Physical Anthropology 34:175-190.
1971 Sex, Age and Tooth Position As Factors in the Production of Tooth Wear. American Antiquity 36(2): 182-188.
Monroe, Cara, Karen S. Gardner, Eric L. Lenci, Alan Leventhal, Rosemary Cambra, Eric J. Bartelink, and Brian M. Kemp
2013 Mystery Men of Yukisma: Ancient DNA and Stable Isotope Data Used to Deduce the Origin and Relationship of an Unusual Group Burial at CA-SCL-38. Paper presented at the 47th Annual Meeting of the Society for California Archaeology, Berkeley, California, March 7-10.
Moratto, Michael J.
1984 California Archaeology. San Francisco: Academic Press.

469
Morley, Susan 1997 The Paleodemography of the Yukisma Site, CA-SCl-38: A Prehistoric
Cemetery of the South San Francisco Bay. Masters thesis, Department of Social Science, San Jose State University, California.
Moss, Madonna L.
1993 Shellfish, Gender, and Status on the Northwest Coast: Reconciling Archaeological, Ethnographic, and Ethnohistorical Records of the Tlingit. American Anthropologist 95(3):631-652.
Munro-Fraser, J. P.
1881 History of Santa Clara County, California. San Francisco: Alley, Bowen & Co. Munzel, Steve
2000 Milpitas History Homepage. http://www.milpitashistory.org/home/, accessed May 15, 2012.
Murra, J. V.
1972 El Control Vertical de un Máximo de Pisos Ecológicos en las Economía de las Sociedades Andinas. In Visita de la Provincia de León de Huánaco en 1562. Iñigo Ortiz de Zuñiga, ed. Pp. 429-476. Huánaco, Perú: Universidad Nacional Hermilo Valdizán.
Musladin, Anton C., Robert Jurmain, and Alan Leventhal
1986 Osteological Evidence of Projectile Trauma in the CA-ALA-329: The Ryan Mound Population. Paper presented at the Annual Meeting of the Society for California Archaeology, Santa Rosa, California, March 27-29.
Nechayev, Irina
2007 A Bioarchaeological Study of Health in the Prehistoric Population from CA-ALA-329. Master’s thesis, Department of Interdisciplinary Studies, San Jose State University, California.
Nehlich, Olaf, Dušan Boríc, Sofija Stefanovíc, and Michael P. Richards
2010 Sulphur Isotope Evidence for Freshwater Fish Consumption: A Case Study from the Danube Gorges, SE Europe. Journal of Archaeological Science 37:1131-1139.
Nehlich, Olaf, Benjamin T. Fuller, Nicholas Márquez-Grant, and Michael P. Richards
2012 Investigation of Diachronic Dietary Patterns on the Islands of Ibiza and Formentera, Spain: evidence from Sulfur Stable Isotope Ratio Analysis. American Journal of Physical Anthropology 149: 115-124.

470
Nehlich, Olaf, Benjamin T. Fuller, Mandy Jay, Alice Mora, Rebecca A. Nicholson, Colin I. Smith, and Michael P. Richards
2011 Application of Sulphur Isotope Ratios to Examine Weaning Patterns and Freshwater Fish Consumption in Roman Oxfordshire, UK. Geochimica et Cosmochimica Acta 75:4963-4977.
Nelson, Nels C.
1909 Shellmounds of the San Francisco Bay Region. University of California Publications in American Archaeology and Ethnology 7(4):309-348.
1910 The Ellis Landing Shellmound. University of California Publications in American Archaeology and Ethnology 7(5):357-426.
1996[1906] Excavation of the Emeryville Shellmound, Being a Partial Report of Exploration for the Dep’t. of Anthrop. during the year 1906. In Excavation of the Emeryville Shellmound, 1906: Nels C. Nelson’s Final Report. Jack M. Broughton, ed. Pp.1-18. Contributions of the University of California, Number 54. Berkeley: Archaeological Research Facility.
Neumann, Thomas W., and Robert M. Sanford
2001 Cultural Resources Archaeology. Walnut Creek, CA: Altamira Press.
Newsome, Seth D., Donald L. Phillips, Brendan J. Culleton, Tom P. Guilderson, and Paul L. Koch
2004 Dietary Reconstruction of an Early to Middle Holocene Human Population from the Central California Coast: Insights from Advanced Stable Isotope Mixing Models. Journal of Archaeological Science 31:1101-1115.
Nielsen-Marsh, Christina M., and Robert E. M. Hedges
2000a Patterns of Diagenesis in Bone I: The Effects of Site Environments. Journal of Archaeological Science 27:1139-1150.
2000b Patterns of Diagenesis in Bone II: Effects of Acetic Acid Treatment and the Removal of Diagenetic CO2
3-. Journal of Archaeological Science 27:1151-1159. O’Leary, Marion H.
1981 Carbon Isotope Fractionation in Plants. Phytochemistry 20(4):553-567. 1988 Carbon Isotopes in Photosynthesis. Bioscience 38(5):328-335.
Ortner, Donald J.
2003 Identification of Pathological Conditions in Human Skeletal Remains. 2nd edition. San Francisco: Academic Press.
Paddison, Joshua, ed.
1999 A World Transformed: Firsthand Accounts of California Before the Gold Rush. Berkeley: Heydey Books.
471
Page, Henry M., Daniel C. Reed, Mark A. Brzezinski, John M. Melack, Jenifer E. Dugan 2008 Assessing the Importance of Land and Marine Sources of Organic Matter to
Kelp Forest Food Webs. Marine Ecology Progress Series 360: 47-62. Parsons, Gary, and Alan Leventhal
1981 Endothermic Reaction of Clay from the Holiday Inn Site, CA-SCL-128. Paper presented at the Society for California Archaeology Annual Meeting. Bakersfield, California, April 9-11.
Pastron, Allen G., and Viviana Bellifemine
2007 Archaeological Investigations at CA-SCL-674, the Rubino Site, San Jose, Santa Clara County, California, vol. I. Salinas, CA: Coyote Press.
Pate, F. Donald
1994 Bone Chemistry and Paleodiet. Journal of Archaeological Method and Theory 1(2):161-209.
Pavia, Donald L., Gary M. Lampman, George S. Kriz, and Randall G. Engel
1999 Introduction to Organic Laboratory Techniques: A Microscale Approach. 3rd edition. San Diego: Saunders College Publishing.
Peters, Jacob M., Nathan Wolf, Craig A.Stricker, Timothy R. Collier, and Carlos Martinez del Rio
2012 Effects of Trophic Level and Metamorphosis on Discrimiation of Hydrogen Isotopes in a Plant-Herbivore System. PLoS ONE 7(3): e32744.
Pearsall, Deborah M.
2008 Paleoethnobotany: A Handbook of Procedures. 2nd edition. Bingley, England: Emerald Group Publishing.
Pierce, Lorna K. C.
1982 The Incidence of Periosteal Reaction Among a Native Californian Skeletal Collection. Master’s thesis, San Jose State University, California.
Pollan, Michael
2006 The Omnivore’s Dilemma: A Natural History of Four Meals. New York: Penguin Books.
Press, Frank, and Raymond Siever
1986 Earth. 4th edition. New York: W. H. Freeman. Price, T. Douglas, and James A. Brown
1985 Aspects of Hunter-Gatherer Complexity. In Prehistoric Hunter-Gatherers: The Emergence of Cultural Complexity. T. Douglas Price and James A. Brown, eds. Pp. 3-20. San Diego: Academic Press.

472
Price, T. Douglas, Vera Tiesler, and James H. Burton 2006 Early African Diaspora in Colonial Campeche, Mexico: Strontium Isotopic
Evidence. American Journal of Physical Anthropology 130(4):485-490. Raab, L. M., and T. L. Jones
2004 The Future of California Prehistory. In Prehistoric California: Archaeology and the Myth of Paradise. L. M. Raab and T. L. Jones, eds. Pp. 204-211. Salt Lake City: University of Utah Press.
Raab, L. Mark, and Daniel O. Larson
1997 Medieval Climatic Anomaly and Punctuated Cultural Evolution in Coastal Southern California. American Antiquity 62(2):319-336.
Rawls, J. J.
1984 Indians of California. Norman: University of Oklahoma Press. Ragir, Sonia R.
1972 The Early Horizon in Central California Prehistory. Contributions of the University of California Archaeological Research Facility, No. 15. Berkeley: University of California Press.
Ramsey, Christopher Bronk, Thomas Higham, Angela Bowles, and Robert Hedges
2004 Improvements to the Pretreatment of Bone at Oxford. Radiocarbon 46(2):155-163.
Reitz, Elizabeth J., and Elizabeth S. Wing
2008 Zooarchaeology. 2nd edition. New York: Cambridge University Press. Richards, Michael P., Benjamin T. Fuller, and R. E. M. Hedges
2001 Sulphur Isotopic Variation in Ancient Bone Collagen from Europe: Implications for Human Palaeodiet, Residence Mobility, and Modern Pollutant Studies. Earth and Planetary Science Letters 191:185-190.
Richards, M. P., B. T. Fuller, M. Sponheimer, T. Robinson, and L. Ayliffe
2003 Sulphur Isotopes in Palaeodietary Studies: A Review and Results from a Controlled Feeding Experiment. International Journal of Osteoarchaeology 13:37-45.
Richards, Michael P., and R. E. M. Hedges
1999 Stable Isotope Evidence for Similarities in the Types of Marine Foods Used by Late Mesolithic Humans at Sites along the Atlantic Coast of Europe. Journal of Archaeological Science 26:717-722.
473
Richards, Michael P., Simon Mays, and Benjamin T. Fuller 2002 Stable Carbon and Nitrogen Isotope Values of Bone and Teeth Reflect
Weaning Age at the Medieval Wharram Percy Site, Yorkshire, UK. American Journal of Physical Anthropology 119:205-210.
Richards, Michael P., T. Douglas Price, and Eva Koch
2003 Mesolithic and Neolithic Subsistence in Denmark: New Stable Isotope Data. Current Anthropology 44(2):288-295.
Robichaud, Rhonda K.
2007 Subsistence Remains: Unmodified Shell Analysis. In Archaeological Investigations at CA-SCL-674, the Rubino Site, San Jose, Santa Clara County, California, vol. I. Allen G. Pastron and Viviana Bellifemine, eds. Pp. 203-212. Salinas, CA: Coyote Press.
Rosenthal, Jeffrey, and Jack Meyer
2004 Landscape Evolution and the Archaeological Record: A Geoarchaeological Study of the Southern Santa Clara Valley and Surrounding Region. Publication Number 14. Davis: University of California, Center for Archaeological Research.
Rostworowski de Diez Canseco, M.
1970 Mercadores del Valle de Chincha en la Epoca Prehispánica: Un Documento y Unos Comentarios. Revista Española de Antropología Americana 5:135-177.
Rozin, Paul
1976 The Selection of Foods by Rats, Humans and Other Animals. In Advances in the Study of Behavior, vol. 6. J. S. Rosenblatt, ed. Pp. 21-76. London: Academic Press.
Rowe, John Howland
1962 Alfred Louis Kroeber 1876-1960. American Antiquity 27(3):395-415.
San Jose Mercury News 1975[1896] Sunshine, Fruit and Flowers: Santa Clara County and its Resources, A
Souvenir of the San Jose Mercury. Reprinted in 1975 by the San Jose Historical Museum Association.
Santa María, Vincente
1999[1775] Journal of the First Ship to Enter San Francisco Bay. In A World Transformed: Firsthand Accounts of California before the Gold Rush. Joshua Paddison, ed. Pp. 27-46. Berkeley: Heydey Books.
Sarakinos, H. C., M. L. Johnson, and M. J. Vander Zanden
474
2002, A Synthesis of Tissue-Preservation Effects on Carbon and Nitrogen Stable Isotope Signatures. Canadian Journal of Zoology-Revue Canadienne De Zoologie 80(2):381-387.
Sassaman, Kenneth E.
2004 Complex Hunter-Gatherers in Evolution and History: A North American Perspective. Journal of Archaeological Research 12(3):227-280.
Saxe, A. A.
1970 Social Dimensions of Mortuary Practices. Ph.D. dissertation, University of Michigan, Ann Arbor.
Schele, Linda, and Mary Ellen Miller
1986 The Blood of Kings: Dynasty and Ritual in Maya Art. New York: George Braziller.
Schenck, W. Egbert
1926 The Emeryville Shellmound: Final Report. University of California Publications in American Archaeology and Ethnology 23(3):147-282.
Schenck, W. Egbert, and Elmer J. Dawson
1929 Archaeology of the Northern San Joaquin Valley. University of California Publications in American Archaeology and Ethnology 25(4):289-413.
Schoeninger, Margaret J., and Michael J. DeNiro
1982 Carbon Isotope Ratios of Apatite from Fossil Bone Cannot Be Used to Reconstruct Diets of Animals. Nature 297(5867):577-578.
1983 Carbon Isotope Ratios of Bone Apatite and Animal Diet Reconstruction – Reply. Nature 301(5896):178-178.
1984 Nitrogen and Carbon Isotopic Composition of Bone Collagen from Marine and Terrestrial Animals. Geochimica et Cosmochimica Acta 48:625-639.
Schoeninger, Margaret J., Michael J. DeNiro, and Henrik Tauber
1983 Stable Nitrogen Isotope Ratios of Bone Collagen Reflect Marine and Terrestrial Components of Prehistoric Human Diet. Science 220(4604):1381-1383.
Schurr, Mark R.
1998 Using Stable Nitrogen-Isotopes to Study Weaning Behavior in past Populations. World Archaeology 30(2):327-342.
Schurr, Mark R., Robert G. Hayes, and Della C. Cook
2008 Thermally Induced Changes in the Stable Carbon and Nitrogen Isotope Ratios of Charred Bones. In The Analysis of Burned Human Remains. Christopher W. Schmidt and Steven Symes, eds. Pp. 95-108. San Diego: Academic Press.

475
Schurr, Mark R., and Mary Lucas Powell 2005 The Role of Changing Childhood Diets in the Prehistoric Evolution of Food
Production: An Isotopic Assessment. American Journal of Physical Anthropology 126:278–294
Schurr, Mark R., and Margaret J. Schoeninger
1995 Associations Between Agricultural Intensification and Social Complexity: An Example from the Prehistoric Ohio Valley. Journal of Anthropological Archaeology 14:315-339.
Schwarcz, H. P., T. L. Dupras and S. I Fairgrieve
1999 15N Enrichment in the Sahara: In Search of a Global Relationship. Journal of Archaeological Science 26(6):629-636.
Sharp, John
2000 Charmstones: A Summary of the Ethnographic Record. Proceedings of the Society for California Archaeology 13:233-243.
Sharp, Zachary
2007 Principles of Stable Isotope Geochemistry. Upper Saddle River, NJ: Pearson, Prentice Hall.
Shemesh, A.
1990 Crystallinity and diagenesis of Sedimentary Apatites. Geochimica et Cosmochimica Acta 54(9):2433-2438.
Shipman, Pat, Giraud Foster, and Margaret Schoeninger
1984 Burnt Bone and Teeth: An Experimental Study of Color, Morphology, Crystal Structure and Shrinkage. Journal of Archaeological Science 11(4):307-325.
Simons, Dwight D.
2007 Vertebrate Faunal Remains. In Santa Clara Valley Prehistory: Archaeological Investigations at CA-SCL-690, the Tamien Station Site, San Jose, California. Publication No. 15. Mark G. Hylkema, ed. Pp. 353-388. Davis: University of California, Center for Archaeological Research.
Smith, Robert Leo
1986 Elements of Ecology. 2nd edition. San Francisco: Harper & Row. Smith, Susan
1996 Results from Initial Scans of Eleven Pollen Samples from CA-SCL-38. Unpublished MS, Northern Arizona University, Flagstaff, Arizona.
476
Sobolik, Kristin D., ed. 1994 Paleonutrition: The Diet and Health of Prehistoric Americans. Occasional
Paper No. 22. Carbondale, IL: Southern Illinois University Center for Archaeological Investigations.
Sofaer, Joanna R.
2006 The Body as Material Culture: A Theoretical Osteoarchaeology. New York: Cambridge University Press.
Stahl, David W., Matthew D. Therrell, and Malcolm K. Cleaveland
2001 Ancient Blue Oaks Reveal Human Impact on San Francisco Bay Salinity. Eos 82(12):141-145.
Stanger, Frank M., and Alan K. Brown
1969 Who Discovered the Golden Gate? The Explorers’ Own Accounts: How They Discovered a Hidden Harbor and at Last Found Its Entrance. San Mateo, CA: San Mateo County Historical Association.
Stewart, A. R., S. N. Luoma, C. E. Schlekat, M. A. Doblin and K. Hieb
2004, Food Web Pathway Determines How Selinium Affects Aquatic Ecosystems: A San Francisco Bay Case Study. Environmental Science & Technology 38:4519-4526.
Stickel, E. Gary
1968 Status Differentiation at the Rincon Site. Archaeological Survey Annual Report 10:209-261. University of California, Los Angeles.
Stimpson, Cara
2007 Artifact Assemblage Analysis: Modified Bone. In Archaeological Investigations at CA-SCL-674, the Rubino Site, San Jose, Santa Clara County, California. Allen G. Pastron and Viviana Bellifemine, eds. Pp. 167-179. Salinas, CA: Coyote Press.
Stine, Scott
1994 Extreme and persistent drought in California and Patagonia during mediaeval time. Nature 369:546-549.
Stuart-Macadam, Patty
1985 Porotic Hyperostosis: Representative of a Childhood Condition. American Journal of Physical Anthropology 66:391-398.
Stuvier, Minze, and Paula Reimer
1993 Extended 14C Database and Revised CALIB Radiocarbon Calibration Program. Radiocarbon 35:215-230.
477
Stuiver, M., and T. F. Braziunas 1993 Modeling atmospheric 14C influences and 14C ages of marine samples to 10000
BC. Radiocarbon 35(1):137-91. Sullivan, C. H., and H. W. Krueger
1981 Carbon Isotope Analysis of Separate Chemical Phases in Modern and Fossil Bone. Nature 292(5821):333-335.
1983 Carbon Isotope Ratios of Bone Apatite and Animal Diet Reconstruction. Nature 301(5896):177.
Surovell, Todd A., and Mary C. Stiner
2001 Standardizing Infra-Red Measures of Bone Mineral Crystallinity: An Experimental Approach. Journal of Archaeological Science 28(6):633-642.
Sutter, Richard C.
2005 A Bioarchaeological Assessment of Prehistoric Ethnicity Among Early Late Intermediate Period Populations of the Azapa Valley, Chile. In Us and Them: Archaeology and Ethnicity in the Andes. Richard Martin Reycraft, ed. Pp. 183-205. Los Angeles: Cotsen Institute of Archaeology, University of California, Los Angeles.
Sutton, Mark Q.
1994 Indirect Evidence in Paleonutrition Studies. In Paleonutrition: The Diet and Health of Prehistoric Americans. Kristin D. Sobolik, ed. Pp. 98-111. Occasional Paper No. 22. Carbondale, IL: Southern Illinois University Center for Archaeological Investigations.
Sutton, Mark Q., Kristin D. Sobolik, and Jill K. Gardner
2010 Paleonutrition. Tucson: The University of Arizona Press. Sydeman, W. J., K. A. Hobson, P. Pyle, and E.B. McLaren
1997, Trophic Relationships Among Seabirds in Central California: Combined Stable Isotope and Conventional Dietary Approach. Condor 99:327-336.
Tainter, Joseph
1975 The Archaeological Study of Social Change: Woodland Systems in West-Central Illinois. Ph.D. dissertation, Northwestern University.
Tan, F. C.
1989 Stable Carbon Isotopes in Dissolved Inorganic Carbon in Marine and Estuarine Environments. In Handbook of Environmental Isotope Geochemistry, vol. 3: The Marine Environment. P. Fritz and J. Fontes, eds. Pp. 171-190. Amsterdam: Elsevier.
478
Tauber, Henrik 1981 13C Evidence for Dietary Habits of Prehistoric Man in Denmark. Nature
292:332-333.
Termine, J. D., and A. S. Posner 1966 Infrared Analysis of Rat Bone: Age Dependency of Amorphous and
Crystalline Mineral Fractions. Science 153(743):1523-1525. Tieszen, Larry L., and Tim Fagre
1993 Effect of Diet Quality and Composition on the Isotopic Composition of Respiratory CO2, Bone Collagen, Bioapatite, and Soft Tissues. In Prehistoric Human Bone: Archaeology at the Molecular Level. J. B. Lambert and G. Grupe, eds. Pp. 121-144. New York: Springer-Verlag.
Thompson and West
1876 New Historical Atlas of Santa Clara County, California, Drawn and Published from Personal Observation and Surveys. San Francisco, CA: Thompson and West.
Tomczak, Paula D.
2003 Prehistoric diet and socioeconomic relationships within the Osmore Valley of southern Peru. Journal of Anthropological Archaeology 22:262-278.
Torres-Rouff, Christina
2009 The Bodily Expression of Ethnic Identity: Head Shaping in the Chilean Atacama. In Bioarchaeology and Identity in the Americas. Kelly J. Knudson and Christopher M. Stojanowski, eds. Pp. 212-227. Gainesville: University Press of Florida.
Trigger, Bruce G.
1989 A History of Archaeological Thought. New York: Cambridge University Press. Tung, Tiffiny A.
2012 Violence, Ritual, and the Wari Empire: A Social Bioarchaeology of Imperialism in the Ancient Andes. Gainesville: University Press of Florida.
Tuross, N., and M. L. Fogel
1994 Stable isotope analysis and subsistence patterns at the Sully site. In Skeletal Biology in the Great Plains: Migration, Warfare, Health, and Subsistence. Douglas W. Owsley and Richard L. Jantz, eds. Pp. 238-289. Washington DC: Smithsonian Institution Press.
Ubelaker, Douglas H.
1989 Human Skeletal Remains: Excavation, Analysis, Interpretation. 2nd edition. Washington, DC: Taraxacum.
479
Ubelaker, D. H., M. A. Katzenberg, and L. G. Doyon 1995 Status and Diet in Precontact Highland Ecuador. American Journal of Physical
Anthropology 97:403-411. Uhle, Max
1907 The Emeryville Shellmound. University of California Publications in American Archaeology and Ethnology 7(1):1-106.
University of California, Berkeley, Department of Anthropology
N.d. History. http://anthropology.berkeley.edu/history.php, accessed on July 25, 2011.
van Klinken, G. J.
1999 Bone Collagen Quality Indicators for Palaeodietary and Radiocarbon Measurements. Journal of Archaeological Science 26: 687-695.
van der Merwe, Nikolaas J., and J. C. Vogel
1978 13C Content of Human Collagen As a Measure of Prehistoric Diet in Woodland North America. Nature 276:815-816.
Vogel, J. C., and Nikolaas J. van der Merwe
1977 Isotopic Evidence for Early Maize Cultivation in New York State. American Antiquity 42(2):238-242.
Virginia, Ross A., and C. C. Delwiche
1982 Natural 15N Abundance of Presumed N2-Fixing and Non-N2-Fixing Plants from Selected Ecosystems. Oecologia 54(3):317-325.
Wada, E., H. Mizutani, and M. Minagawa
1991 The Use of Stable Isotopes for Food Web Analysis. Critical Reviews in Food Science and Nutrition 30(3):361-371.
Wagner, Henry R.
1924 The Voyage to California of Sebastian Rodriguez Cermeño in 1595. California Historical Society Quarterly 3(1):3-24.
1926 Sir Francis Drake’s Voyage around the World. Berkeley: J. J. Cillick. 1928 Spanish Voyages to the Northwest Coast in the Sixteenth Century. Chapter IV:
The Voyage of Juan Rodriguez Cabrillo. California Historical Society Quarterly, 7(1):20-77.
480
Walker, Phillip L., Rhonda R. Bathurst, Rebecca Richman, Thor Gjerdrum, and Valerie A. Andrushko
2009 Perspectives: The Causes of Porotic Hyperostosis and Cribra Orbitalia: A Reappraisal of the Iron-Deficiency-Anemia Hypothesis. American Journal of Physical Anthropology 139(2):109-125.
Walker, Phillip L., and Michael J. DeNiro
1986 Stable Nitrogen and Carbon Isotope Ratios in Bone Collagen as Indices of Prehistoric Dietary Dependence on Marine and Terrestrial Resources in Southern California. American Journal of Physical Anthropology 71:51-61.
Walsh, Michael R.
2007 Artifact Assemblage Analysis: Ground and Polished Stone. In Archaeological Investigations at CA-SCL-674, the Rubino Site, San Jose, Santa Clara County, California. Allen G. Pastron and Viviana Bellifemine, eds. Pp. 139-153. Salinas, CA: Coyote Press.
Wang, Y., and T. E. Cerling
1994 A Model of Fossil Tooth and Bone Diagenesis – Implications for Paleodiet Reconstruction from Stable Isotopes. Palaeogeography Palaeoclimatology Palaeoecology 107(3-4):291-289.
Waters, Michael R., Steven L. Forman, Thomas A. Jennings, Lee C. Nordt, Steven G.
Driese, Joshua M. Feinberg, Joshua L. Keene, Jessi Halligan, Anna Lindquist, James Pierson, Charles T. Hallmark, Michael B. Collins, and James E. Wiederhold 2011 The Buttermilk Creek Complex and the Origins of Clovis at the Debra L.
Friedkin Site, Texas. Science 331:1599-1603. Watson, Patty Jo
2008 Processualism and After. In Handbook of Archaeological Theories. R. Alexander Bentley, Herbert D. G. Maschener, and Christopher Chippindale, eds. Pp. 29-38. New York: Altamira Press.
Weather Channel
N.d. Monthly Averages for Milpitas, CA. http://www.weather.com, accessed May 15, 2012.
Weigel, L., and R. Gross, M. Steiner
1985 Archaeological Site Record, CA-SCL-38. The Anthropology Laboratory, Sonoma State College. Report on file at the Northwest Information Center, Rohnert Park, CA.
Weissner, Polly, and Wulf Schiefenhövel, eds.
1996 Food and the Status Quest: An Interdisciplinary Perspective. Providence, RI: Berghahn Books.
481
Weiss, Elizabeth 2006 Osteoarthritis and Body Mass. Journal of Archaeological Science 33(5):690-
695. 2009a Sex Differences in Humeral Bilateral Asymmetry in Two Hunter-Gatherer
Populations: California Amerinds and British Columbian Amerinds. American Journal of Physical Anthropology 140(1):19-24).
2009b Spondylolysis in a Pre-Contact San Francisco Bay Population: Behavioral and Anatomical Sex Differences. International Journal of Osteoarchaeology 19(3):375-385.
West, G. James, Wallace Woolfenden, James A. Wanket, and R. Scott Anderson
2007 Late Pleistocene and Holocene Environments. In California Prehistory: Colonization, Culture and Complexity. Terry L. Jones and Kathryn A. Klar, eds. Pp. 11-34. New York: Altamira Press.
White, Christine D., Fred J. Longstaffe, David M. Pendergast, and Jay Maxwell
2009 Cultural Embodiment and the Enigmatic Identity of the Lovers from Lamanai. In Bioarchaeology and Identity in the Americas. Kelly J. Knudson and Christopher M. Stojanowski, eds. Pp. 155-176. Gainesville: University Press of Florida.
White, Christine D., and Henry P. Schwarcz
1994 Temporal Trends in Stable Isotopes for Nubian Mummy Tissues. American Journal of Physical Anthropology 93:165-187.
White, Tim D., and Pieter A. Folkens
2005 The Human Bone Manual. San Francisco: Elsevier Academic Press. Wiberg, Randy S.
1988 The Santa Rita Village Mortuary Complex (CA-ALA-413): Evidence and Implications of a Meganos Intrusion. Salinas, CA: Coyote Press.
2002 Archaeological Investigations: Skyport Plaza Phase I (CA-SCL-478), San Jose, Santa Clara County, California. Salinas, CA: Coyote Press.
Willey, Gordon R., and Philip Phillips
1958 Method and Theory in American Archaeology. Tuscaloosa: The University of Alabama Press.
Willey, Gordon R., and Jeremy A. Sabloff
1980 A History of American Archaeology. 2nd edition. New York: W. H. Freeman and Company.
Williams, Jocelyn S., Christine D. White, and Fred J. Longstaffe
2005 Trophic Level and Macronutrient Shift Effects Associated with the Weaning Process in the Postclassic Maya. American Journal of Physical Anthropology 128:781-790.

482
Willoughby, Nona Christenen 1963 Division of Labor Among the Indians of California. Reports of the University
of California Archaeological Research Facility, 60:1-80. Berkeley: University of California Press.
Wilson, Glen
1993 The Archaeological Collection from CA-ALA-329, the Ryan Mound, Alameda County, California. Salinas, CA: Coyote Press.
1996 Faunal Data Sheets. In Archaeological Investigations at Kaphan Umux (Three Wolves) Site, CA-SCL-732: A Middle Period Prehistoric Cemetery on Coyote Creek in Southern San Jose, Santa Clara County, California, Appendix G. Rosemary Cambra, Alan Leventhal, Laura Jones, Julia Hammett, Les Field, and Norma Sanchez, eds. Pp. G1-G14. Report on file at the California Department of Transportation, District 4, Oakland, CA.
Wing, Elizabeth S.
1994 The Past, Present, and Future of Paleonutritional Research. In Paleonutrition: The Diet and Health of Prehistoric Americans. Kristin D. Sobolik, ed. Pp. 309-317. Occasional Paper No. 22. Carbondale, IL: Southern Illinois University Center for Archaeological Investigations.
Wing, Elizabeth S., and Antoinette B. Brown
1979 Paleonutrition: Method and Theory in Prehistoric Foodways. San Francisco: Academic Press.
Winter, Joseph C., ed.
1978 Archaeological Investigations at CA-SCL-128, the Holiday Inn Site. Salinas, CA: Coyote Press.
Wissler, Clark
1917 The American Indian: An Introduction to the Anthropology of the New World. New York: Douglas C. McMurtrie.
Wohlgemuth, Eric
2007 Subsistence Remains: Floral Analysis. In Archaeological Investigations at CA-SCL-674, the Rubino Site, San Jose, Santa Clara County, California, vol. I. Allen G. Pastron and Viviana Bellifemine, eds. Pp. 213-224. Salinas, CA: Coyote Press.
Wolf, Eric R.
1999 Envisioning Power: Ideologies of Dominance and Crises. Berkeley: University of California Press.

483
Wright, Lori E. 2005 Identifying Immigrants to Tikal, Guatemala: Defining Local Variability in
Strontium Isotope Ratios of Human Tooth Enamel. Journal of Archaeological Science 32:555-556.
Wright, Lori E., and Henry P. Schwarcz
1996 Infrared and Isotopic Evidence for Diagenesis of Bone Apatite at Dos Pilas, Guatemala: Palaeodietary Implications. Journal of Archaeological Science 23(6):933-944.
1998 Stable Carbon and Oxygen Isotopes in Human Tooth Enamel: Identifying Breastfeeding and Weaning in Prehistory. American Journal of Physical Anthropology 106:1-18.
Wu, Victoria M.
1999 Differential Diagnosis of Vertebral Lytic Lesions from an Ohlone Cemetery Site: CA-SCL-038. Master’s thesis, Department of Social Science, San Jose State University, California.
Wyman, J.
1868a An Account of Some Kjoekkenmoeddings, or Shell-Heaps, in Maine and Massachusetts. American Naturalist 1(11):561-584.
1868b On the Fresh-Water Shell-heaps of the St. Johns River, East Florida. American Naturalist 2(8):393-403.
1875 Fresh-Water Shell Mounds of the St. Johns River, Florida. Memoirs of the Peabody Academy of Science 4:3-94.
Yates, Lorenzo G.
1889 Charm Stones: Notes on the So-called “Plummets” or Sinkers. In Annual Report of the Board of Regents of the Smithsonian Institution for the Year Ending June 30, 1886. Part I. Pp. 296-305. Washington, DC: Government Printing Office.
Yohe, Robert M., II, Margaret E. Newman, and Joan S. Schneider
1991 Immunological Identification of Small-Mammal Proteins on Aboriginal Milling Equipment. American Antiquity 56(4):659-666.

APPENDIX A
485
DETERMINATION OF UNIQUE INDIVIDUALS
AND RECONCILIATION OF DEMOGRAPHIC
INFORMATION
Introduction
Because no formal site report has been produced for CA-SCL-38 and subtle
discrepancies exist between the various sources of demographic data (unpublished field
notes, Bellifemine 1997, Morley 1997, and Jurmain 2000), it was necessary to develop
logic for the determination of unique individuals from the site, as well as reconciliation of
age and sex classifications. Appendix A will describe the process of reconciliation of
demographic data from the 1993 to 1994 excavations at SCL-38 and present the
supporting data for classifications used in the present study.
Determination of Unique Individuals
Although determining the number of individuals represented by the skeletal
remains from SCL-38 might seem to be a relatively straightforward task, the combined
effects of long-term site use by the ancestral Ohlone, commingled burials, taphonomic
effects and differential decomposition, historic disturbance to the site by ranchers,
farmers, developers and inmates, and the very nature of salvage archaeology, make this a
very complicated project (see Figure A.1). For the present study, I reviewed the
osteological notes and logic of previous researchers (Bellifemine 2007; Jurmain 2000;
and Morley 2007) and reconciled these with the original burial records. Each of these
sources identified a slightly different number of unique individuals.
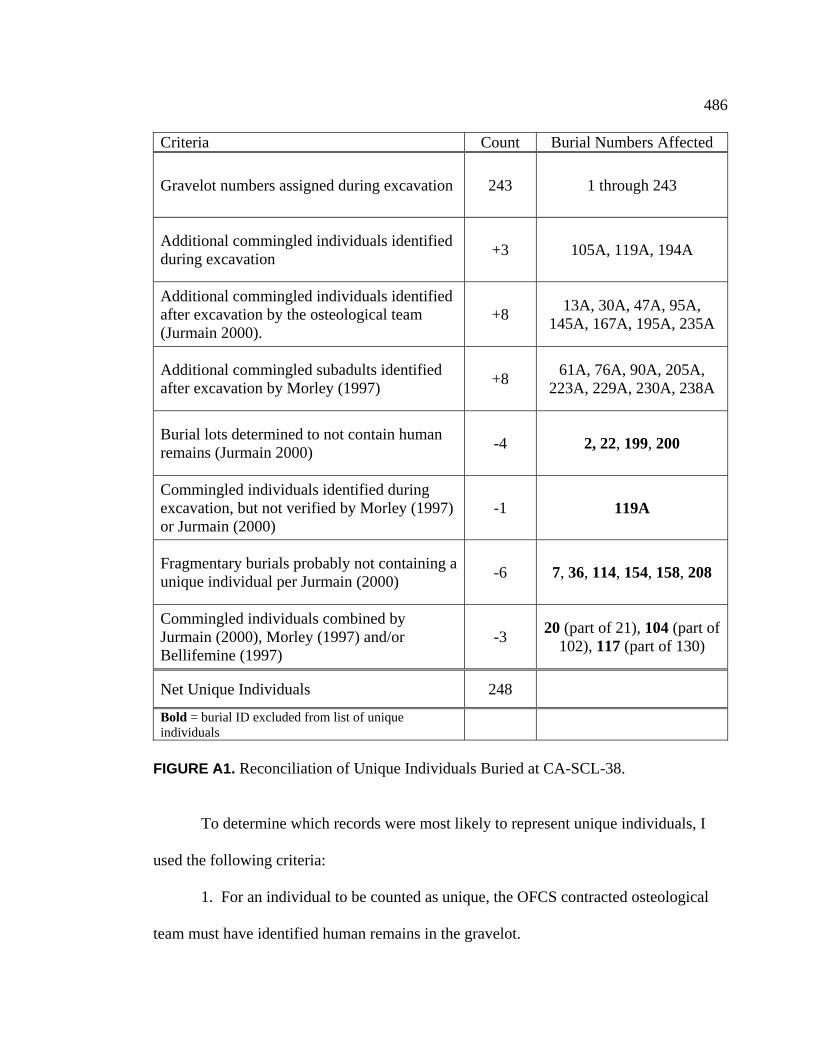
486
Criteria Count Burial Numbers Affected
Gravelot numbers assigned during excavation 243 1 through 243
Additional commingled individuals identified during excavation
+3 105A, 119A, 194A
Additional commingled individuals identified after excavation by the osteological team (Jurmain 2000).
+8 13A, 30A, 47A, 95A,
145A, 167A, 195A, 235A
Additional commingled subadults identified after excavation by Morley (1997)
+8 61A, 76A, 90A, 205A,
223A, 229A, 230A, 238A
Burial lots determined to not contain human remains (Jurmain 2000)
-4 2, 22, 199, 200
Commingled individuals identified during excavation, but not verified by Morley (1997) or Jurmain (2000)
-1 119A
Fragmentary burials probably not containing a unique individual per Jurmain (2000)
-6 7, 36, 114, 154, 158, 208
Commingled individuals combined by Jurmain (2000), Morley (1997) and/or Bellifemine (1997)
-3 20 (part of 21), 104 (part of
102), 117 (part of 130)
Net Unique Individuals 248
Bold = burial ID excluded from list of unique individuals
FIGURE A1. Reconciliation of Unique Individuals Buried at CA-SCL-38. To determine which records were most likely to represent unique individuals, I
used the following criteria:
1. For an individual to be counted as unique, the OFCS contracted osteological
team must have identified human remains in the gravelot.

487
2. When resources differ, preference is generally given to individuals identified
as unique in Dr. Robert Jurmain’s (2000) report, because he is the most experienced
osteologist to have been involved in analysis of the remains. However, two logical
exceptions are made. Susan Morley (1997) identified eight individual subadults, not
included in Jurmain (2000), but included in my count (see below for detail). Additionally,
I will include eight individuals identified in Burial Records as cremations or secondary
burials (Burials 77, 96, 149, 150, 151, 181, 147, and 174) which were excluded by
Jurmain (2000) because of their fragmentary nature.
During the 1993-1994 excavations, Ohlone Families Consulting Services
completed 248 Burial Record Forms, which included 243 discrete grave lots, 3
commingled individuals, and 2 features. When the original 243 gravelots were analyzed
by the osteological team, an additional eight commingled individuals were identified
(Burials 13A, 30A, 47A, 95A, 145A, 167A, 195A, and 235A), and are included in the
present count (Jurmain 2000). Additionally, Susan Morley (1997:62) identified eight
cases of subadult remains interred with primary burials, which she counted as discrete
individuals when no other subadult burials were found within a 5 meter radius (Burials
61A, 76A, 90A, 205A, 223A, 229A, 230A, and 238A). Although not included in Jurmain
(2000), the logical basis for including these subadults is sound, and they will therefore be
part of my estimate. The osteological team determined that four of the original gravelots
did not contain human bone, excluding burial lots 2 and 22, which were faunal burials (an
elk and a grizzly bear, respectively), and burial lots 99 and 100, which contained no
human remains. One individual catalogued during the excavation (Burial 119A) was not
identified by Jurmain’s team (Jurmain 2000) or by Morley (1997), and so is excluded

488
from the present reconciliation. Six gravelots, which were not cremations or secondary
burials, were excluded by Jurmain due to their very fragmentary nature (Burials 7, 36,
114, 154, 158, and 208). These are excluded here as well because of the likelihood that
disturbances prior to or during excavation cause intermixing of elements between
gravelots. Finally, the researchers combined three pairs of gravelots, determining that
they likely represented the same individual. Burial 20 is excluded as part of 21, Burial
104 is excluded as part of 102, and Burial 117 is excluded as part of 130. After
reconciling these available resources, I find that the most likely number of unique
individuals represented by the remains excavated by OFCS between 1993 and 1994 is
248. Please see Table A1 for complete detail of the data used to arrive at the list of
distinct individuals for this thesis.
The conclusion of my reconciliation is slightly different than that of previous
researchers. Jurmain (2000) produced an estimate of 228 distinct individuals. This
estimate began with the 243 gravelots identified in the field, and then deducts the four
lots without human bone (2, 22, 199, and 200). The number is further reduced by
excluding all eleven “very fragmentary” gravelots (20, 36, 77, 96, 149, 150, 151, 154,
158, 181, and 208) and 50 percent of the six “quite fragmentary” gravelots (7, 106, 114,
117, 147, and 174). Three individuals from significantly commingled gravelots were
added back in to the count (30A, 47A, and 145A). The osteology team came to the
conclusion that remains likely represented 228 distinct individuals (Jurmain 2000:7). This
total did not include the incomplete remains of seven individuals identified later in the
report (13A, 95A, 105A, 167A, 194A, 195A, and 235A).
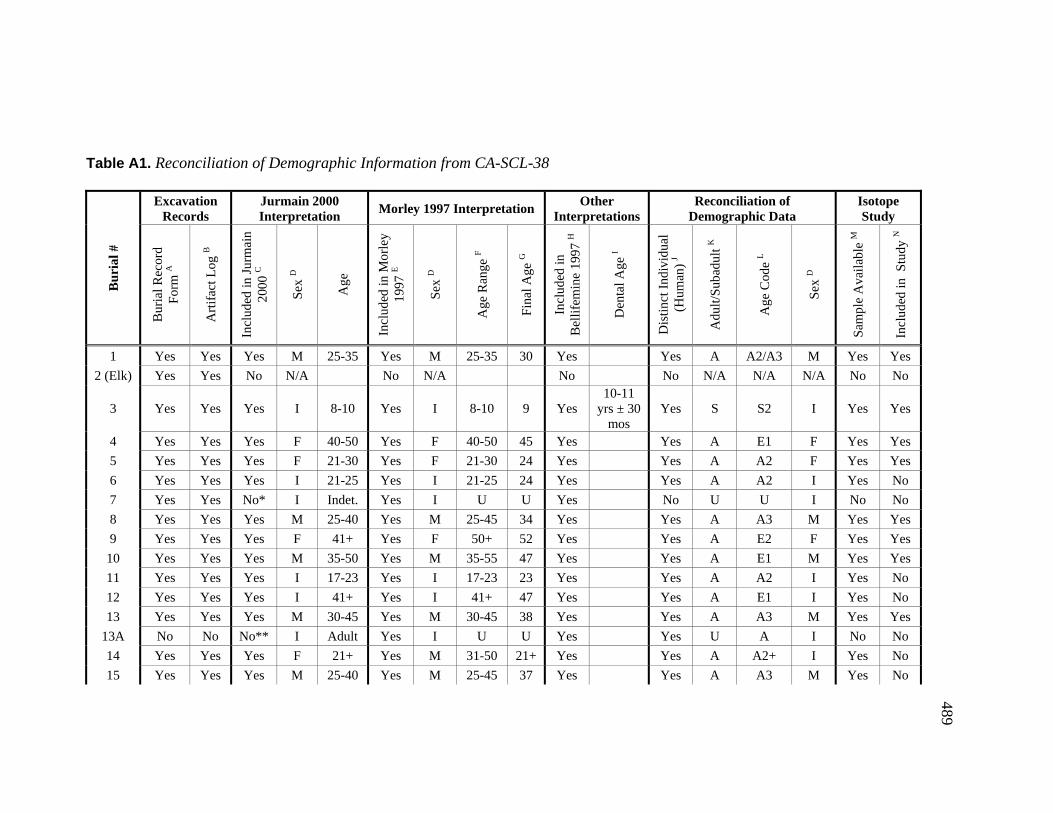
489
Table A1. Reconciliation of Demographic Information from CA-SCL-38
Excavation Records
Jurmain 2000 Interpretation
Morley 1997 Interpretation Other
Interpretations Reconciliation of
Demographic Data Isotope Study
Bu
rial
#
Bur
ial R
ecor
d
For
m A
Art
ifac
t Log
B
Incl
uded
in J
urm
ain
2000
C
Sex
D
Age
Incl
uded
in M
orle
y 19
97 E
Sex
D
Age
Ran
ge F
Fin
al A
ge G
Incl
uded
in
Bel
lifem
ine
1997
H
Den
tal A
ge I
Dis
tinct
Ind
ivid
ual
(Hum
an)
J
Adu
lt/S
ubad
ult K
Age
Cod
e L
Sex
D
Sam
ple
Ava
ilabl
e M
Incl
uded
in S
tudy
N
1 Yes Yes Yes M 25-35 Yes M 25-35 30 Yes Yes A A2/A3 M Yes Yes
2 (Elk) Yes Yes No N/A No N/A No No N/A N/A N/A No No
3 Yes Yes Yes I 8-10 Yes I 8-10 9 Yes 10-11
yrs ± 30 mos
Yes S S2 I Yes Yes
4 Yes Yes Yes F 40-50 Yes F 40-50 45 Yes Yes A E1 F Yes Yes
5 Yes Yes Yes F 21-30 Yes F 21-30 24 Yes Yes A A2 F Yes Yes
6 Yes Yes Yes I 21-25 Yes I 21-25 24 Yes Yes A A2 I Yes No
7 Yes Yes No* I Indet. Yes I U U Yes No U U I No No
8 Yes Yes Yes M 25-40 Yes M 25-45 34 Yes Yes A A3 M Yes Yes
9 Yes Yes Yes F 41+ Yes F 50+ 52 Yes Yes A E2 F Yes Yes
10 Yes Yes Yes M 35-50 Yes M 35-55 47 Yes Yes A E1 M Yes Yes
11 Yes Yes Yes I 17-23 Yes I 17-23 23 Yes Yes A A2 I Yes No
12 Yes Yes Yes I 41+ Yes I 41+ 47 Yes Yes A E1 I Yes No
13 Yes Yes Yes M 30-45 Yes M 30-45 38 Yes Yes A A3 M Yes Yes
13A No No No** I Adult Yes I U U Yes Yes U A I No No
14 Yes Yes Yes F 21+ Yes M 31-50 21+ Yes Yes A A2+ I Yes No
15 Yes Yes Yes M 25-40 Yes M 25-45 37 Yes Yes A A3 M Yes No

490
Excavation Records
Jurmain 2000 Interpretation
Morley 1997 Interpretation Other
Interpretations Reconciliation of
Demographic Data Isotope Study
Bu
rial
#
Bur
ial R
ecor
d
For
m A
Art
ifac
t Log
B
Incl
uded
in J
urm
ain
2000
C
Sex
D
Age
Incl
uded
in M
orle
y 19
97 E
Sex
D
Age
Ran
ge F
Fin
al A
ge G
Incl
uded
in
Bel
lifem
ine
1997
H
Den
tal A
ge I
Dis
tinct
Ind
ivid
ual
(Hum
an)
J
Adu
lt/S
ubad
ult K
Age
Cod
e L
Sex
D
Sam
ple
Ava
ilabl
e M
Incl
uded
in S
tudy
N
16 Yes Yes Yes M 30-50 Yes M 30-50 46 Yes Yes A A3/E1 M Yes No
17 Yes Yes Yes I 35-55 Yes I 35-55 48 Yes Yes A E1 I No No
18 Yes Yes Yes F 25-35 Yes F 25-28 30 Yes Yes A A2 F Yes Yes
19 Yes Yes Yes I 25+ Yes I 35-50 43 Yes Yes A A2+ I Yes No
20 Yes Yes No I Indet. No N/A N/A N/A No No U U I No No
21 Yes Yes Yes I 18+ Yes I 18+ 18+ Yes Yes A A I Yes Yes 22
(Bear) Yes Yes No N/A No N/A N/A No No N/A N/A N/A Yes Yes
23 Yes Yes Yes I 9.5-12 Yes I 9-12 11 Yes 12 yrs ± 2.5 yrs
Yes S S3 I Yes Yes
24 Yes Yes Yes M 35-45 Yes M 35-45 39 Yes Yes A A3/E1 M Yes No
25 Yes Yes Yes M 40-50 Yes M 40-50 48 Yes Yes A E1 M Yes No
26 Yes Yes Yes M 30-50 Yes M 30-50 40 Yes Yes A A3/E1 M Yes No
27 Yes Yes Yes M 25-35 Yes M 30-35 30 Yes Yes A A2/A3 M Yes No
28 Yes Yes Yes F 40-50 Yes F 40-50 37 Yes Yes A A3/E1 F Yes Yes
29 Yes Yes Yes M 25-40 Yes M 25-40 38 Yes Yes A A3 M Yes No
30 Yes Yes Yes I 5-7 Yes I 5-7 6 Yes Yes S S2 I No No
30A No No Yes F 25+ Yes F 25+ 25+ Yes Yes A A2+ F No No
31 Yes Yes Yes F 50+ Yes F 50+ 54 Yes Yes A E2 F Yes Yes
32 Yes Yes Yes F 17-21 Yes F 17-21 23 Yes Yes A A1/A2 F Yes No
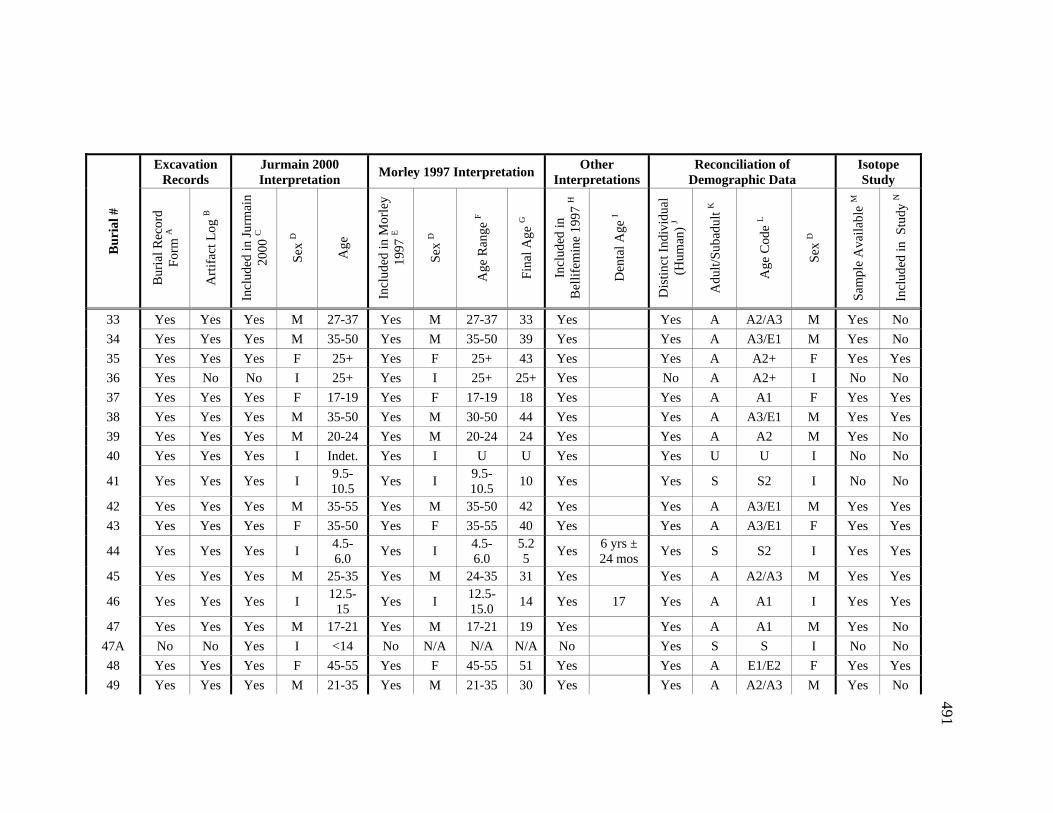
491
Excavation Records
Jurmain 2000 Interpretation
Morley 1997 Interpretation Other
Interpretations Reconciliation of
Demographic Data Isotope Study
Bu
rial
#
Bur
ial R
ecor
d
For
m A
Art
ifac
t Log
B
Incl
uded
in J
urm
ain
2000
C
Sex
D
Age
Incl
uded
in M
orle
y 19
97 E
Sex
D
Age
Ran
ge F
Fin
al A
ge G
Incl
uded
in
Bel
lifem
ine
1997
H
Den
tal A
ge I
Dis
tinct
Ind
ivid
ual
(Hum
an)
J
Adu
lt/S
ubad
ult K
Age
Cod
e L
Sex
D
Sam
ple
Ava
ilabl
e M
Incl
uded
in S
tudy
N
33 Yes Yes Yes M 27-37 Yes M 27-37 33 Yes Yes A A2/A3 M Yes No
34 Yes Yes Yes M 35-50 Yes M 35-50 39 Yes Yes A A3/E1 M Yes No
35 Yes Yes Yes F 25+ Yes F 25+ 43 Yes Yes A A2+ F Yes Yes
36 Yes No No I 25+ Yes I 25+ 25+ Yes No A A2+ I No No
37 Yes Yes Yes F 17-19 Yes F 17-19 18 Yes Yes A A1 F Yes Yes
38 Yes Yes Yes M 35-50 Yes M 30-50 44 Yes Yes A A3/E1 M Yes Yes
39 Yes Yes Yes M 20-24 Yes M 20-24 24 Yes Yes A A2 M Yes No
40 Yes Yes Yes I Indet. Yes I U U Yes Yes U U I No No
41 Yes Yes Yes I 9.5-10.5
Yes I 9.5-10.5
10 Yes Yes S S2 I No No
42 Yes Yes Yes M 35-55 Yes M 35-50 42 Yes Yes A A3/E1 M Yes Yes
43 Yes Yes Yes F 35-50 Yes F 35-55 40 Yes Yes A A3/E1 F Yes Yes
44 Yes Yes Yes I 4.5-6.0
Yes I 4.5-6.0
5.25
Yes 6 yrs ± 24 mos
Yes S S2 I Yes Yes
45 Yes Yes Yes M 25-35 Yes M 24-35 31 Yes Yes A A2/A3 M Yes Yes
46 Yes Yes Yes I 12.5-
15 Yes I
12.5-15.0
14 Yes 17 Yes A A1 I Yes Yes
47 Yes Yes Yes M 17-21 Yes M 17-21 19 Yes Yes A A1 M Yes No
47A No No Yes I <14 No N/A N/A N/A No Yes S S I No No
48 Yes Yes Yes F 45-55 Yes F 45-55 51 Yes Yes A E1/E2 F Yes Yes
49 Yes Yes Yes M 21-35 Yes M 21-35 30 Yes Yes A A2/A3 M Yes No
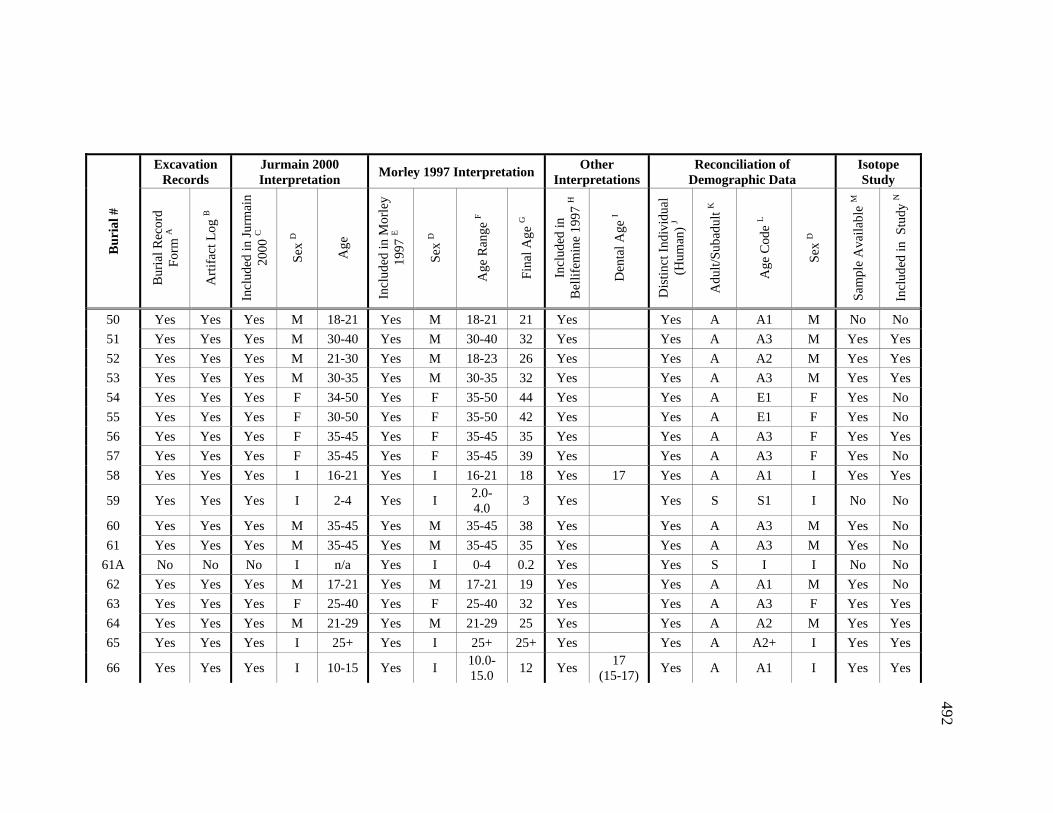
492
Excavation Records
Jurmain 2000 Interpretation
Morley 1997 Interpretation Other
Interpretations Reconciliation of
Demographic Data Isotope Study
Bu
rial
#
Bur
ial R
ecor
d
For
m A
Art
ifac
t Log
B
Incl
uded
in J
urm
ain
2000
C
Sex
D
Age
Incl
uded
in M
orle
y 19
97 E
Sex
D
Age
Ran
ge F
Fin
al A
ge G
Incl
uded
in
Bel
lifem
ine
1997
H
Den
tal A
ge I
Dis
tinct
Ind
ivid
ual
(Hum
an)
J
Adu
lt/S
ubad
ult K
Age
Cod
e L
Sex
D
Sam
ple
Ava
ilabl
e M
Incl
uded
in S
tudy
N
50 Yes Yes Yes M 18-21 Yes M 18-21 21 Yes Yes A A1 M No No
51 Yes Yes Yes M 30-40 Yes M 30-40 32 Yes Yes A A3 M Yes Yes
52 Yes Yes Yes M 21-30 Yes M 18-23 26 Yes Yes A A2 M Yes Yes
53 Yes Yes Yes M 30-35 Yes M 30-35 32 Yes Yes A A3 M Yes Yes
54 Yes Yes Yes F 34-50 Yes F 35-50 44 Yes Yes A E1 F Yes No
55 Yes Yes Yes F 30-50 Yes F 35-50 42 Yes Yes A E1 F Yes No
56 Yes Yes Yes F 35-45 Yes F 35-45 35 Yes Yes A A3 F Yes Yes
57 Yes Yes Yes F 35-45 Yes F 35-45 39 Yes Yes A A3 F Yes No
58 Yes Yes Yes I 16-21 Yes I 16-21 18 Yes 17 Yes A A1 I Yes Yes
59 Yes Yes Yes I 2-4 Yes I 2.0-4.0
3 Yes Yes S S1 I No No
60 Yes Yes Yes M 35-45 Yes M 35-45 38 Yes Yes A A3 M Yes No
61 Yes Yes Yes M 35-45 Yes M 35-45 35 Yes Yes A A3 M Yes No
61A No No No I n/a Yes I 0-4 0.2 Yes Yes S I I No No
62 Yes Yes Yes M 17-21 Yes M 17-21 19 Yes Yes A A1 M Yes No
63 Yes Yes Yes F 25-40 Yes F 25-40 32 Yes Yes A A3 F Yes Yes
64 Yes Yes Yes M 21-29 Yes M 21-29 25 Yes Yes A A2 M Yes Yes
65 Yes Yes Yes I 25+ Yes I 25+ 25+ Yes Yes A A2+ I Yes Yes
66 Yes Yes Yes I 10-15 Yes I 10.0-15.0
12 Yes 17
(15-17) Yes A A1 I Yes Yes
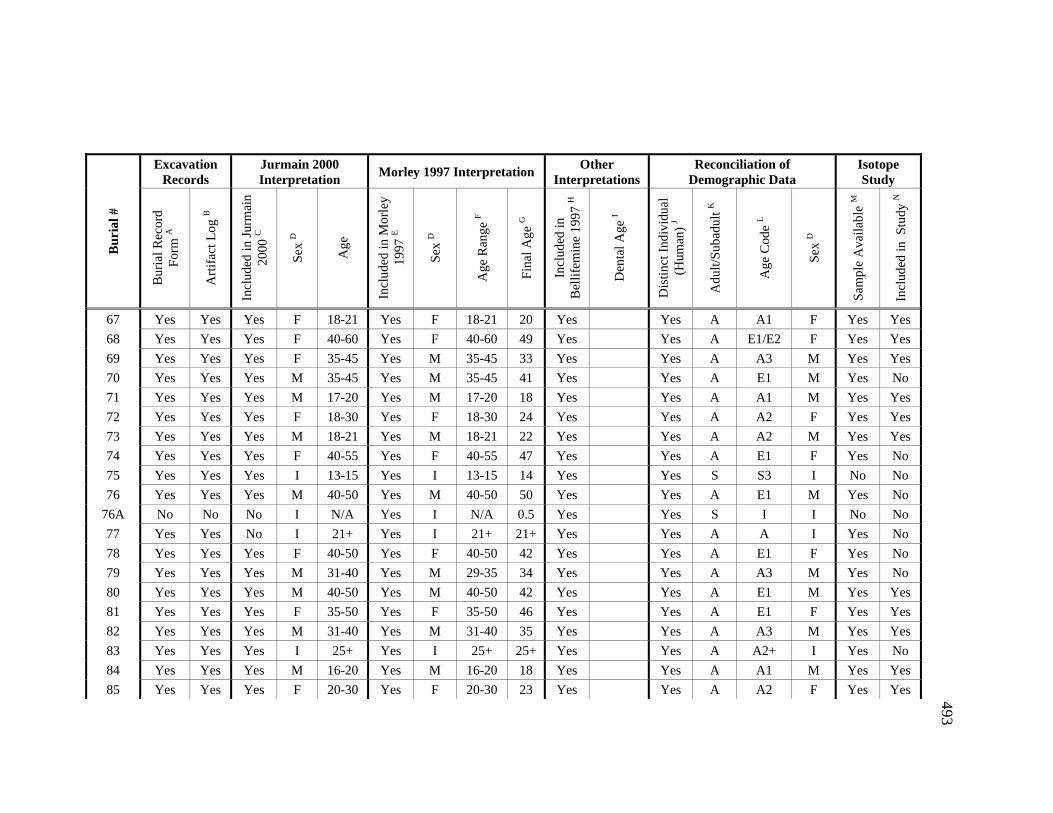
493
Excavation Records
Jurmain 2000 Interpretation
Morley 1997 Interpretation Other
Interpretations Reconciliation of
Demographic Data Isotope Study
Bu
rial
#
Bur
ial R
ecor
d
For
m A
Art
ifac
t Log
B
Incl
uded
in J
urm
ain
2000
C
Sex
D
Age
Incl
uded
in M
orle
y 19
97 E
Sex
D
Age
Ran
ge F
Fin
al A
ge G
Incl
uded
in
Bel
lifem
ine
1997
H
Den
tal A
ge I
Dis
tinct
Ind
ivid
ual
(Hum
an)
J
Adu
lt/S
ubad
ult K
Age
Cod
e L
Sex
D
Sam
ple
Ava
ilabl
e M
Incl
uded
in S
tudy
N
67 Yes Yes Yes F 18-21 Yes F 18-21 20 Yes Yes A A1 F Yes Yes
68 Yes Yes Yes F 40-60 Yes F 40-60 49 Yes Yes A E1/E2 F Yes Yes
69 Yes Yes Yes F 35-45 Yes M 35-45 33 Yes Yes A A3 M Yes Yes
70 Yes Yes Yes M 35-45 Yes M 35-45 41 Yes Yes A E1 M Yes No
71 Yes Yes Yes M 17-20 Yes M 17-20 18 Yes Yes A A1 M Yes Yes
72 Yes Yes Yes F 18-30 Yes F 18-30 24 Yes Yes A A2 F Yes Yes
73 Yes Yes Yes M 18-21 Yes M 18-21 22 Yes Yes A A2 M Yes Yes
74 Yes Yes Yes F 40-55 Yes F 40-55 47 Yes Yes A E1 F Yes No
75 Yes Yes Yes I 13-15 Yes I 13-15 14 Yes Yes S S3 I No No
76 Yes Yes Yes M 40-50 Yes M 40-50 50 Yes Yes A E1 M Yes No
76A No No No I N/A Yes I N/A 0.5 Yes Yes S I I No No
77 Yes Yes No I 21+ Yes I 21+ 21+ Yes Yes A A I Yes No
78 Yes Yes Yes F 40-50 Yes F 40-50 42 Yes Yes A E1 F Yes No
79 Yes Yes Yes M 31-40 Yes M 29-35 34 Yes Yes A A3 M Yes No
80 Yes Yes Yes M 40-50 Yes M 40-50 42 Yes Yes A E1 M Yes Yes
81 Yes Yes Yes F 35-50 Yes F 35-50 46 Yes Yes A E1 F Yes Yes
82 Yes Yes Yes M 31-40 Yes M 31-40 35 Yes Yes A A3 M Yes Yes
83 Yes Yes Yes I 25+ Yes I 25+ 25+ Yes Yes A A2+ I Yes No
84 Yes Yes Yes M 16-20 Yes M 16-20 18 Yes Yes A A1 M Yes Yes
85 Yes Yes Yes F 20-30 Yes F 20-30 23 Yes Yes A A2 F Yes Yes

494
Excavation Records
Jurmain 2000 Interpretation
Morley 1997 Interpretation Other
Interpretations Reconciliation of
Demographic Data Isotope Study
Bu
rial
#
Bur
ial R
ecor
d
For
m A
Art
ifac
t Log
B
Incl
uded
in J
urm
ain
2000
C
Sex
D
Age
Incl
uded
in M
orle
y 19
97 E
Sex
D
Age
Ran
ge F
Fin
al A
ge G
Incl
uded
in
Bel
lifem
ine
1997
H
Den
tal A
ge I
Dis
tinct
Ind
ivid
ual
(Hum
an)
J
Adu
lt/S
ubad
ult K
Age
Cod
e L
Sex
D
Sam
ple
Ava
ilabl
e M
Incl
uded
in S
tudy
N
86 Yes Yes Yes M 25+ Yes M 35-50 36 Yes Yes A A3 M Yes Yes
87 Yes Yes Yes M 35-50 Yes M 35-50 43 Yes Yes A E1 M Yes Yes
88 Yes Yes Yes M 21-35 Yes M 21-35 27 Yes Yes A A2 M Yes Yes
89 Yes Yes Yes M 40-50 Yes M 41-50 42 Yes Yes A E1 M No No
90 Yes Yes Yes F 21-25 Yes F 20-25 23 Yes Yes A A2 F Yes Yes
90A No No No I N/A Yes I 4 4 No Yes S S1 I No No
91 Yes Yes Yes I 16-20 Yes I 16-20 18 Yes Yes A A1 I Yes Yes
92 Yes Yes Yes M 35-45 Yes M 35-45 35 Yes Yes A A3 M Yes Yes
93 Yes Yes Yes F 45-55 Yes F 45-55 49 Yes Yes A E1/E2 F No No
94 Yes Yes Yes M 25-35 Yes M 25-35 31 Yes Yes A A2/A3 M Yes Yes
95 Yes Yes Yes I 15-17 Yes M 15-17 16 Yes Yes A A1 I Yes Yes
95A No No No** I 14+ Yes I 15-18 16 Yes Yes A A1 I No No
96 Yes Yes No I 17+ Yes I 17+ 17+ Yes Yes A A I Yes No
97 Yes Yes Yes M 18-23 Yes M 18-23 21 Yes Yes A A1/A2 M Yes Yes
98 Yes Yes Yes F 18-22 Yes F 18-22 22 Yes 16 (16-
18) Yes A A1 F Yes No
99 Yes Yes Yes F 25-35 Yes F 25-35 31 Yes Yes A A2/A3 F Yes Yes
100 Yes Yes Yes I 25+ Yes I 25+ 25+ Yes Yes A2+ I Yes No
101 Yes Yes Yes F 35-45 Yes F 35-45 41 Yes Yes A A3/E1 F No No
102 Yes Yes Yes I 9-13 Yes I 9-13 11 Yes Yes S S3 I Yes No
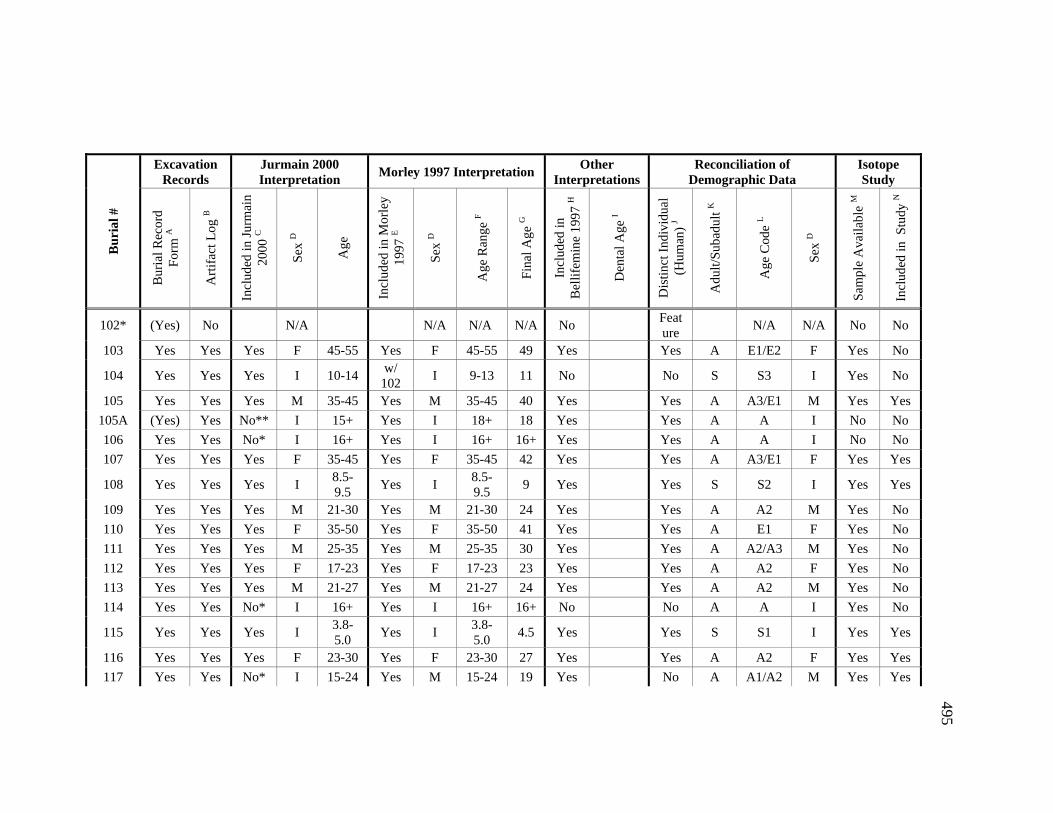
495
Excavation Records
Jurmain 2000 Interpretation
Morley 1997 Interpretation Other
Interpretations Reconciliation of
Demographic Data Isotope Study
Bu
rial
#
Bur
ial R
ecor
d
For
m A
Art
ifac
t Log
B
Incl
uded
in J
urm
ain
2000
C
Sex
D
Age
Incl
uded
in M
orle
y 19
97 E
Sex
D
Age
Ran
ge F
Fin
al A
ge G
Incl
uded
in
Bel
lifem
ine
1997
H
Den
tal A
ge I
Dis
tinct
Ind
ivid
ual
(Hum
an)
J
Adu
lt/S
ubad
ult K
Age
Cod
e L
Sex
D
Sam
ple
Ava
ilabl
e M
Incl
uded
in S
tudy
N
102* (Yes) No N/A N/A N/A N/A No Feature
N/A N/A No No
103 Yes Yes Yes F 45-55 Yes F 45-55 49 Yes Yes A E1/E2 F Yes No
104 Yes Yes Yes I 10-14 w/
102 I 9-13 11 No No S S3 I Yes No
105 Yes Yes Yes M 35-45 Yes M 35-45 40 Yes Yes A A3/E1 M Yes Yes
105A (Yes) Yes No** I 15+ Yes I 18+ 18 Yes Yes A A I No No
106 Yes Yes No* I 16+ Yes I 16+ 16+ Yes Yes A A I No No
107 Yes Yes Yes F 35-45 Yes F 35-45 42 Yes Yes A A3/E1 F Yes Yes
108 Yes Yes Yes I 8.5-9.5
Yes I 8.5-9.5
9 Yes Yes S S2 I Yes Yes
109 Yes Yes Yes M 21-30 Yes M 21-30 24 Yes Yes A A2 M Yes No
110 Yes Yes Yes F 35-50 Yes F 35-50 41 Yes Yes A E1 F Yes No
111 Yes Yes Yes M 25-35 Yes M 25-35 30 Yes Yes A A2/A3 M Yes No
112 Yes Yes Yes F 17-23 Yes F 17-23 23 Yes Yes A A2 F Yes No
113 Yes Yes Yes M 21-27 Yes M 21-27 24 Yes Yes A A2 M Yes No
114 Yes Yes No* I 16+ Yes I 16+ 16+ No No A A I Yes No
115 Yes Yes Yes I 3.8-5.0
Yes I 3.8-5.0
4.5 Yes Yes S S1 I Yes Yes
116 Yes Yes Yes F 23-30 Yes F 23-30 27 Yes Yes A A2 F Yes Yes
117 Yes Yes No* I 15-24 Yes M 15-24 19 Yes No A A1/A2 M Yes Yes
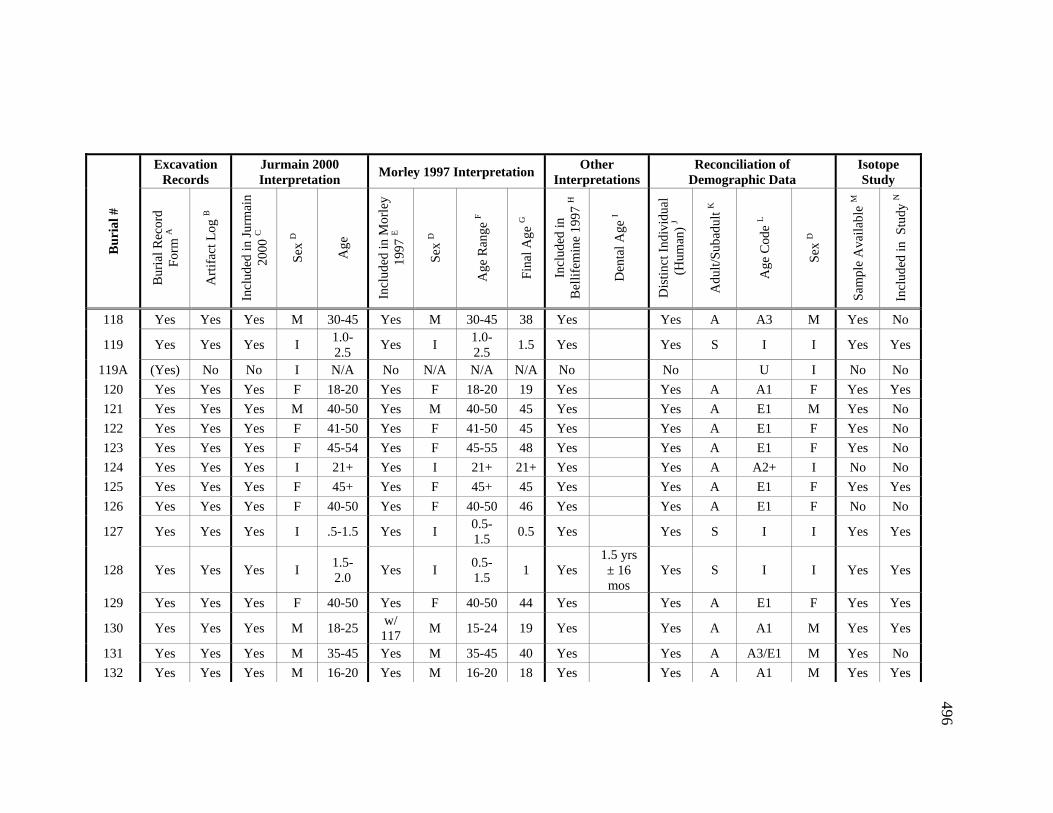
496
Excavation Records
Jurmain 2000 Interpretation
Morley 1997 Interpretation Other
Interpretations Reconciliation of
Demographic Data Isotope Study
Bu
rial
#
Bur
ial R
ecor
d
For
m A
Art
ifac
t Log
B
Incl
uded
in J
urm
ain
2000
C
Sex
D
Age
Incl
uded
in M
orle
y 19
97 E
Sex
D
Age
Ran
ge F
Fin
al A
ge G
Incl
uded
in
Bel
lifem
ine
1997
H
Den
tal A
ge I
Dis
tinct
Ind
ivid
ual
(Hum
an)
J
Adu
lt/S
ubad
ult K
Age
Cod
e L
Sex
D
Sam
ple
Ava
ilabl
e M
Incl
uded
in S
tudy
N
118 Yes Yes Yes M 30-45 Yes M 30-45 38 Yes Yes A A3 M Yes No
119 Yes Yes Yes I 1.0-2.5
Yes I 1.0-2.5
1.5 Yes Yes S I I Yes Yes
119A (Yes) No No I N/A No N/A N/A N/A No No U I No No
120 Yes Yes Yes F 18-20 Yes F 18-20 19 Yes Yes A A1 F Yes Yes
121 Yes Yes Yes M 40-50 Yes M 40-50 45 Yes Yes A E1 M Yes No
122 Yes Yes Yes F 41-50 Yes F 41-50 45 Yes Yes A E1 F Yes No
123 Yes Yes Yes F 45-54 Yes F 45-55 48 Yes Yes A E1 F Yes No
124 Yes Yes Yes I 21+ Yes I 21+ 21+ Yes Yes A A2+ I No No
125 Yes Yes Yes F 45+ Yes F 45+ 45 Yes Yes A E1 F Yes Yes
126 Yes Yes Yes F 40-50 Yes F 40-50 46 Yes Yes A E1 F No No
127 Yes Yes Yes I .5-1.5 Yes I 0.5-1.5
0.5 Yes Yes S I I Yes Yes
128 Yes Yes Yes I 1.5-2.0
Yes I 0.5-1.5
1 Yes 1.5 yrs ± 16 mos
Yes S I I Yes Yes
129 Yes Yes Yes F 40-50 Yes F 40-50 44 Yes Yes A E1 F Yes Yes
130 Yes Yes Yes M 18-25 w/
117 M 15-24 19 Yes Yes A A1 M Yes Yes
131 Yes Yes Yes M 35-45 Yes M 35-45 40 Yes Yes A A3/E1 M Yes No
132 Yes Yes Yes M 16-20 Yes M 16-20 18 Yes Yes A A1 M Yes Yes
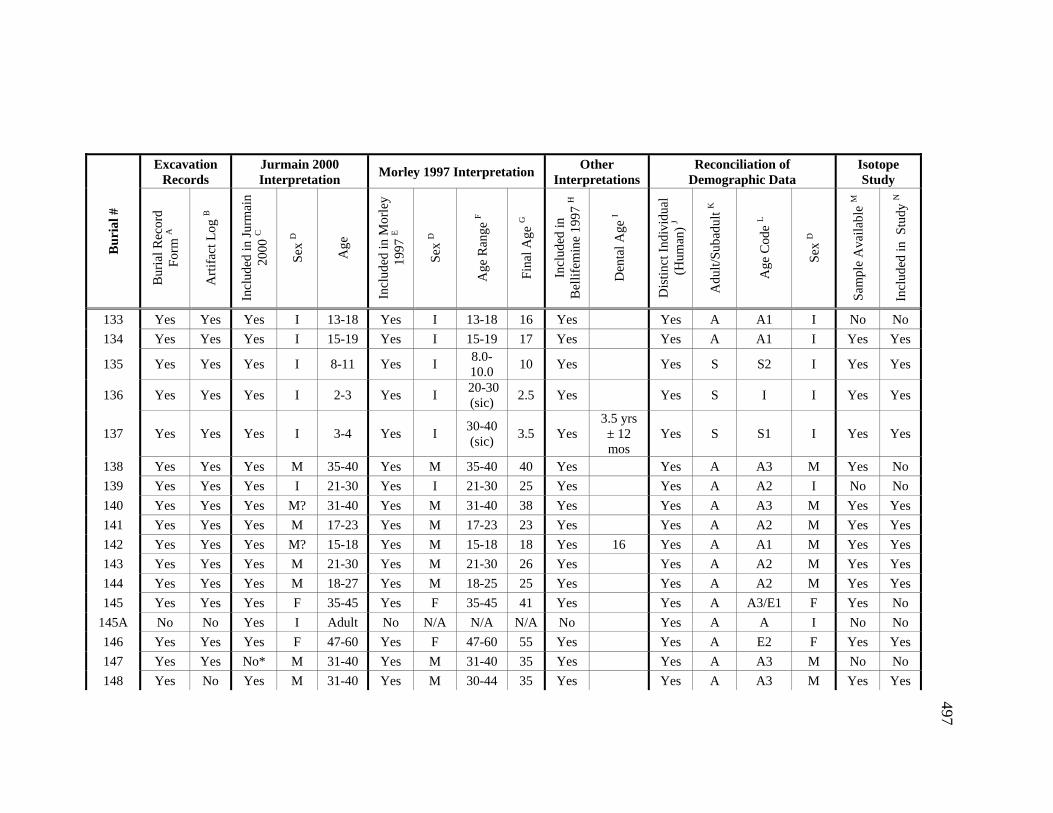
497
Excavation Records
Jurmain 2000 Interpretation
Morley 1997 Interpretation Other
Interpretations Reconciliation of
Demographic Data Isotope Study
Bu
rial
#
Bur
ial R
ecor
d
For
m A
Art
ifac
t Log
B
Incl
uded
in J
urm
ain
2000
C
Sex
D
Age
Incl
uded
in M
orle
y 19
97 E
Sex
D
Age
Ran
ge F
Fin
al A
ge G
Incl
uded
in
Bel
lifem
ine
1997
H
Den
tal A
ge I
Dis
tinct
Ind
ivid
ual
(Hum
an)
J
Adu
lt/S
ubad
ult K
Age
Cod
e L
Sex
D
Sam
ple
Ava
ilabl
e M
Incl
uded
in S
tudy
N
133 Yes Yes Yes I 13-18 Yes I 13-18 16 Yes Yes A A1 I No No
134 Yes Yes Yes I 15-19 Yes I 15-19 17 Yes Yes A A1 I Yes Yes
135 Yes Yes Yes I 8-11 Yes I 8.0-10.0
10 Yes Yes S S2 I Yes Yes
136 Yes Yes Yes I 2-3 Yes I 20-30 (sic)
2.5 Yes Yes S I I Yes Yes
137 Yes Yes Yes I 3-4 Yes I 30-40 (sic)
3.5 Yes 3.5 yrs ± 12 mos
Yes S S1 I Yes Yes
138 Yes Yes Yes M 35-40 Yes M 35-40 40 Yes Yes A A3 M Yes No
139 Yes Yes Yes I 21-30 Yes I 21-30 25 Yes Yes A A2 I No No
140 Yes Yes Yes M? 31-40 Yes M 31-40 38 Yes Yes A A3 M Yes Yes
141 Yes Yes Yes M 17-23 Yes M 17-23 23 Yes Yes A A2 M Yes Yes
142 Yes Yes Yes M? 15-18 Yes M 15-18 18 Yes 16 Yes A A1 M Yes Yes
143 Yes Yes Yes M 21-30 Yes M 21-30 26 Yes Yes A A2 M Yes Yes
144 Yes Yes Yes M 18-27 Yes M 18-25 25 Yes Yes A A2 M Yes Yes
145 Yes Yes Yes F 35-45 Yes F 35-45 41 Yes Yes A A3/E1 F Yes No
145A No No Yes I Adult No N/A N/A N/A No Yes A A I No No
146 Yes Yes Yes F 47-60 Yes F 47-60 55 Yes Yes A E2 F Yes Yes
147 Yes Yes No* M 31-40 Yes M 31-40 35 Yes Yes A A3 M No No
148 Yes No Yes M 31-40 Yes M 30-44 35 Yes Yes A A3 M Yes Yes
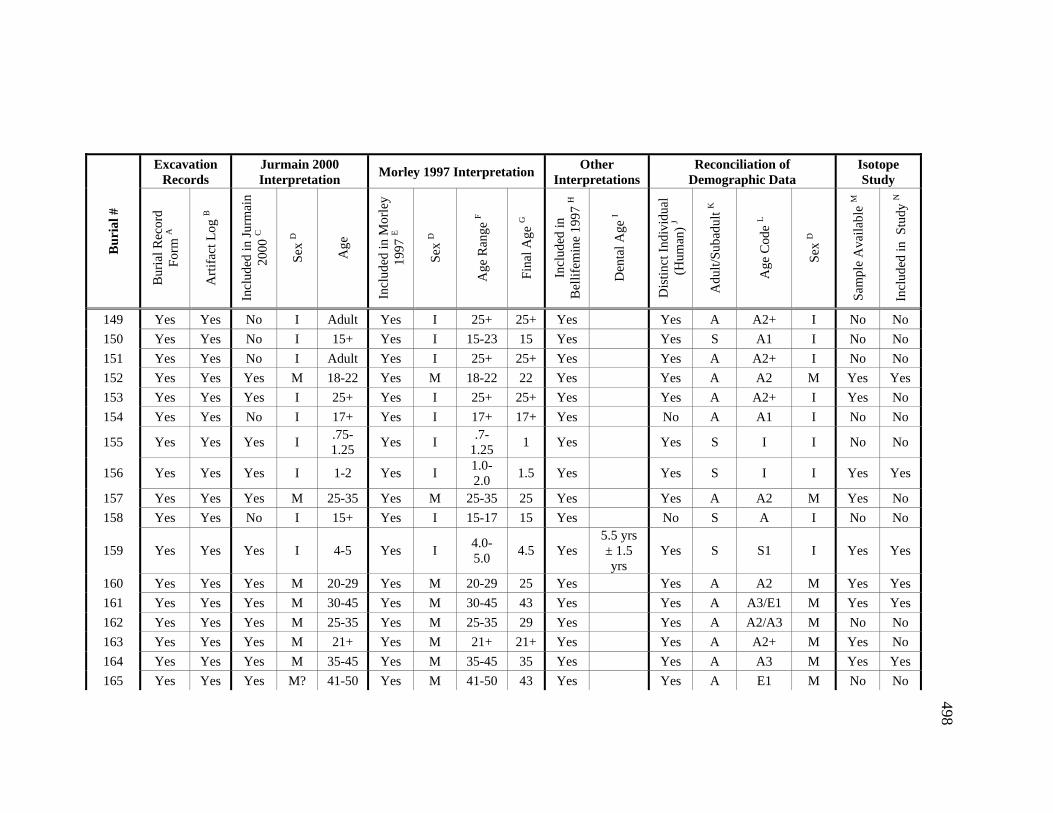
498
Excavation Records
Jurmain 2000 Interpretation
Morley 1997 Interpretation Other
Interpretations Reconciliation of
Demographic Data Isotope Study
Bu
rial
#
Bur
ial R
ecor
d
For
m A
Art
ifac
t Log
B
Incl
uded
in J
urm
ain
2000
C
Sex
D
Age
Incl
uded
in M
orle
y 19
97 E
Sex
D
Age
Ran
ge F
Fin
al A
ge G
Incl
uded
in
Bel
lifem
ine
1997
H
Den
tal A
ge I
Dis
tinct
Ind
ivid
ual
(Hum
an)
J
Adu
lt/S
ubad
ult K
Age
Cod
e L
Sex
D
Sam
ple
Ava
ilabl
e M
Incl
uded
in S
tudy
N
149 Yes Yes No I Adult Yes I 25+ 25+ Yes Yes A A2+ I No No
150 Yes Yes No I 15+ Yes I 15-23 15 Yes Yes S A1 I No No
151 Yes Yes No I Adult Yes I 25+ 25+ Yes Yes A A2+ I No No
152 Yes Yes Yes M 18-22 Yes M 18-22 22 Yes Yes A A2 M Yes Yes
153 Yes Yes Yes I 25+ Yes I 25+ 25+ Yes Yes A A2+ I Yes No
154 Yes Yes No I 17+ Yes I 17+ 17+ Yes No A A1 I No No
155 Yes Yes Yes I .75-1.25
Yes I .7-
1.25 1 Yes Yes S I I No No
156 Yes Yes Yes I 1-2 Yes I 1.0-2.0
1.5 Yes Yes S I I Yes Yes
157 Yes Yes Yes M 25-35 Yes M 25-35 25 Yes Yes A A2 M Yes No
158 Yes Yes No I 15+ Yes I 15-17 15 Yes No S A I No No
159 Yes Yes Yes I 4-5 Yes I 4.0-5.0
4.5 Yes 5.5 yrs ± 1.5 yrs
Yes S S1 I Yes Yes
160 Yes Yes Yes M 20-29 Yes M 20-29 25 Yes Yes A A2 M Yes Yes
161 Yes Yes Yes M 30-45 Yes M 30-45 43 Yes Yes A A3/E1 M Yes Yes
162 Yes Yes Yes M 25-35 Yes M 25-35 29 Yes Yes A A2/A3 M No No
163 Yes Yes Yes M 21+ Yes M 21+ 21+ Yes Yes A A2+ M Yes No
164 Yes Yes Yes M 35-45 Yes M 35-45 35 Yes Yes A A3 M Yes Yes
165 Yes Yes Yes M? 41-50 Yes M 41-50 43 Yes Yes A E1 M No No
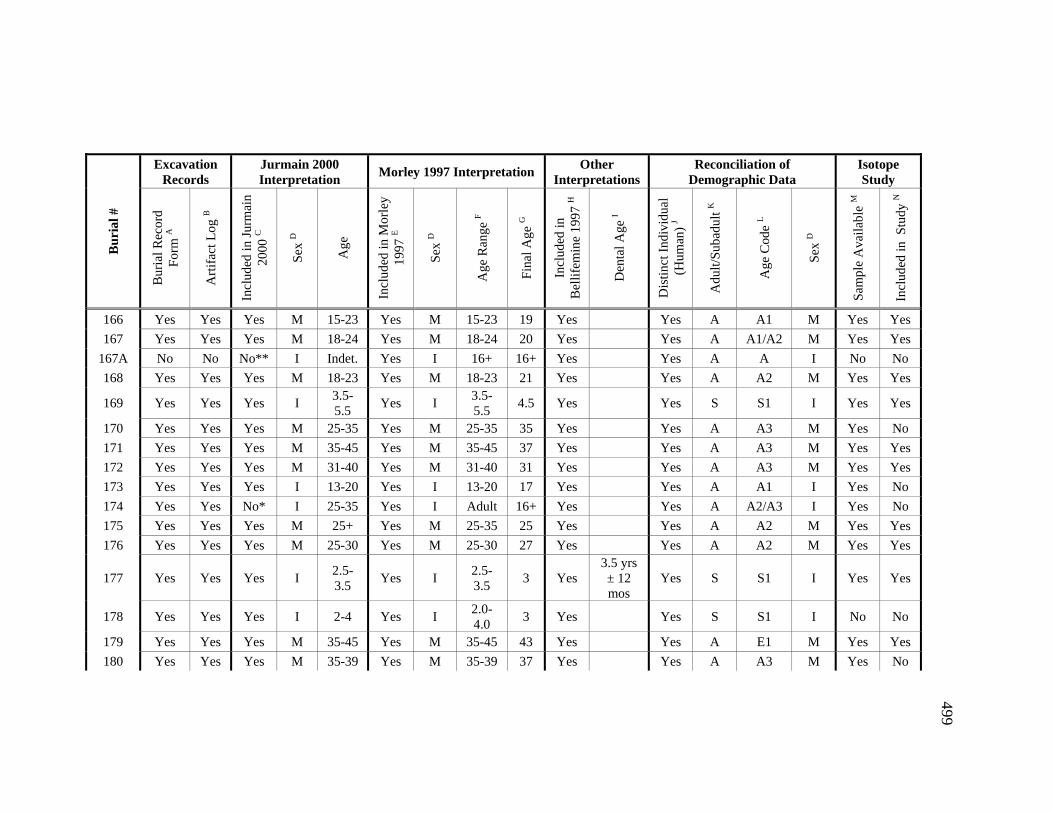
499
Excavation Records
Jurmain 2000 Interpretation
Morley 1997 Interpretation Other
Interpretations Reconciliation of
Demographic Data Isotope Study
Bu
rial
#
Bur
ial R
ecor
d
For
m A
Art
ifac
t Log
B
Incl
uded
in J
urm
ain
2000
C
Sex
D
Age
Incl
uded
in M
orle
y 19
97 E
Sex
D
Age
Ran
ge F
Fin
al A
ge G
Incl
uded
in
Bel
lifem
ine
1997
H
Den
tal A
ge I
Dis
tinct
Ind
ivid
ual
(Hum
an)
J
Adu
lt/S
ubad
ult K
Age
Cod
e L
Sex
D
Sam
ple
Ava
ilabl
e M
Incl
uded
in S
tudy
N
166 Yes Yes Yes M 15-23 Yes M 15-23 19 Yes Yes A A1 M Yes Yes
167 Yes Yes Yes M 18-24 Yes M 18-24 20 Yes Yes A A1/A2 M Yes Yes
167A No No No** I Indet. Yes I 16+ 16+ Yes Yes A A I No No
168 Yes Yes Yes M 18-23 Yes M 18-23 21 Yes Yes A A2 M Yes Yes
169 Yes Yes Yes I 3.5-5.5
Yes I 3.5-5.5
4.5 Yes Yes S S1 I Yes Yes
170 Yes Yes Yes M 25-35 Yes M 25-35 35 Yes Yes A A3 M Yes No
171 Yes Yes Yes M 35-45 Yes M 35-45 37 Yes Yes A A3 M Yes Yes
172 Yes Yes Yes M 31-40 Yes M 31-40 31 Yes Yes A A3 M Yes Yes
173 Yes Yes Yes I 13-20 Yes I 13-20 17 Yes Yes A A1 I Yes No
174 Yes Yes No* I 25-35 Yes I Adult 16+ Yes Yes A A2/A3 I Yes No
175 Yes Yes Yes M 25+ Yes M 25-35 25 Yes Yes A A2 M Yes Yes
176 Yes Yes Yes M 25-30 Yes M 25-30 27 Yes Yes A A2 M Yes Yes
177 Yes Yes Yes I 2.5-3.5
Yes I 2.5-3.5
3 Yes 3.5 yrs ± 12 mos
Yes S S1 I Yes Yes
178 Yes Yes Yes I 2-4 Yes I 2.0-4.0
3 Yes Yes S S1 I No No
179 Yes Yes Yes M 35-45 Yes M 35-45 43 Yes Yes A E1 M Yes Yes
180 Yes Yes Yes M 35-39 Yes M 35-39 37 Yes Yes A A3 M Yes No

500
Excavation Records
Jurmain 2000 Interpretation
Morley 1997 Interpretation Other
Interpretations Reconciliation of
Demographic Data Isotope Study
Bu
rial
#
Bur
ial R
ecor
d
For
m A
Art
ifac
t Log
B
Incl
uded
in J
urm
ain
2000
C
Sex
D
Age
Incl
uded
in M
orle
y 19
97 E
Sex
D
Age
Ran
ge F
Fin
al A
ge G
Incl
uded
in
Bel
lifem
ine
1997
H
Den
tal A
ge I
Dis
tinct
Ind
ivid
ual
(Hum
an)
J
Adu
lt/S
ubad
ult K
Age
Cod
e L
Sex
D
Sam
ple
Ava
ilabl
e M
Incl
uded
in S
tudy
N
181 Yes Yes No I Adult Yes I 19-24 32 (sic) Yes Yes A A2 I No No
182 Yes Yes Yes M 25-35 Yes M 25-35 30 Yes Yes A A2 M Yes Yes
183 Yes Yes Yes F 45-55 Yes F 45-55 46 Yes Yes A E1 F Yes Yes
184 Yes Yes Yes F 50-60 Yes F 50-60 60 Yes Yes A E2 F Yes Yes
185 Yes Yes Yes I 25+ Yes I 25+ 32 Yes Yes A A2+ I Yes No
186 Yes Yes Yes I .75-1.0
Yes I .75-1.0
1 Yes Yes S I I Yes Yes
187 Yes Yes Yes F 21-30 Yes F 21-30 20 Yes Yes A A2 F No No
188 Yes Yes Yes M 35-50 Yes M 35-50 42 Yes Yes A E1 M Yes Yes
189 Yes Yes Yes F 35-50 Yes F 35-50 48 Yes Yes A E1 F No No
190 Yes Yes Yes F? 35+ Yes F 35+ 35+ Yes Yes A A3+ F Yes No
191 Yes Yes Yes M 17-23 Yes M 17-23 20 Yes Yes A A1/A2 M Yes No
192 Yes Yes Yes I 25+ Yes I 25+ 50 Yes Yes A A2+ I Yes No
193 Yes Yes Yes F 25+ Yes F 25+ 25+ Yes Yes A A2+ F Yes No
194 Yes Yes Yes M 25-35 Yes M 25-35 31 Yes Yes A A2/A3 M Yes Yes
194A (Yes) Yes No** I 10-13 Yes I 10.0-13.0
12 Yes Yes S S3 I Yes Yes
195 Yes Yes Yes I 5-7 Yes I 5.0-7.0
6 Yes Yes S S2 I Yes Yes
195A No No No** I Adult Yes I 15-22 20 Yes Yes A A1 I No No

501
Excavation Records
Jurmain 2000 Interpretation
Morley 1997 Interpretation Other
Interpretations Reconciliation of
Demographic Data Isotope Study
Bu
rial
#
Bur
ial R
ecor
d
For
m A
Art
ifac
t Log
B
Incl
uded
in J
urm
ain
2000
C
Sex
D
Age
Incl
uded
in M
orle
y 19
97 E
Sex
D
Age
Ran
ge F
Fin
al A
ge G
Incl
uded
in
Bel
lifem
ine
1997
H
Den
tal A
ge I
Dis
tinct
Ind
ivid
ual
(Hum
an)
J
Adu
lt/S
ubad
ult K
Age
Cod
e L
Sex
D
Sam
ple
Ava
ilabl
e M
Incl
uded
in S
tudy
N
196 Yes Yes Yes F 16-23 Yes F 16-23 19 Yes Yes A A1 F Yes Yes
197 Yes Yes Yes M 35-45 Yes M 35-45 35 Yes Yes A A3 M Yes Yes
198 Yes Yes Yes M 25-35 Yes M 30-50 42 Yes Yes A E1 M Yes Yes
199 Yes No No N/A N/A No N/A N/A N/A No No N/A N/A No No
200 Yes No No N/A N/A No N/A N/A N/A No No N/A N/A No No
201 Yes Yes Yes M 35-50 Yes M 35-50 35 No Yes A A3 M Yes Yes
202 Yes Yes Yes M 25+ Yes M 25+ 42 Yes Yes A A2+ M Yes Yes
203 Yes Yes Yes I 7-10 Yes I 7.0-10.0
8.5 Yes Yes S S2 I Yes Yes
204 Yes Yes Yes M 16+ Yes M 16+ 16+ Yes Yes A A M No No
205 Yes Yes Yes F 35-50 Yes F 35-50 37 Yes Yes A A3/E1 F Yes No
205A No No No I N/A Yes I 7 7 No Yes S S2 I No No
206 Yes Yes Yes F 25-45 Yes F 25-45 40 Yes Yes A A3 F No No
207 Yes Yes Yes F 45-50 Yes F 45-50 47 Yes Yes A E1 F Yes Yes
208 Yes No No I Adult Yes I 18-23 20 Yes No A A1 I No No
209 Yes Yes Yes F 16-23 Yes F 16-23 20 Yes Yes A A1 F Yes Yes
210 Yes Yes Yes F 25+ Yes F 25+ 58 Yes Yes A E2 F Yes Yes
211 Yes No Yes I 25+ Yes I 25+ 28 Yes Yes A A2+ I Yes No
212 Yes Yes Yes F 35-45 Yes F 35-45 43 Yes Yes A E1 F Yes Yes
213 Yes Yes Yes M? 24-34 Yes M 24-34 29 Yes Yes A A2/A3 M Yes No

502
Excavation Records
Jurmain 2000 Interpretation
Morley 1997 Interpretation Other
Interpretations Reconciliation of
Demographic Data Isotope Study
Bu
rial
#
Bur
ial R
ecor
d
For
m A
Art
ifac
t Log
B
Incl
uded
in J
urm
ain
2000
C
Sex
D
Age
Incl
uded
in M
orle
y 19
97 E
Sex
D
Age
Ran
ge F
Fin
al A
ge G
Incl
uded
in
Bel
lifem
ine
1997
H
Den
tal A
ge I
Dis
tinct
Ind
ivid
ual
(Hum
an)
J
Adu
lt/S
ubad
ult K
Age
Cod
e L
Sex
D
Sam
ple
Ava
ilabl
e M
Incl
uded
in S
tudy
N
214 Yes Yes Yes I 4-6 Yes I 4.0-6.0
5 Yes 6 yrs ± 2 yrs
Yes S S1/S2 I Yes Yes
215 Yes Yes Yes F 40-50 Yes F 40-50 44 Yes Yes A E1 F Yes No
216 Yes Yes Yes I 16+ Yes I 16+ 16+ Yes Yes A A I Yes No
217 Yes Yes Yes I 5.5-6.5
Yes I 5 6 Yes Yes S S2 I Yes Yes
218 Yes Yes Yes F 35-45 Yes F 35-45 38 Yes Yes A A3 F Yes Yes
219 Yes Yes Yes M 25-30 Yes M 25-30 27 Yes Yes A A2 M Yes Yes
220 Yes Yes Yes I .5-1.0 Yes I .5-1.0 0.75
Yes Yes S I I Yes Yes
221 Yes Yes Yes F 25-35 Yes F 25-35 31 Yes Yes A A2/A3 F Yes Yes
222 Yes Yes Yes I 6-7 Yes I 6.0-7.0
6.5 Yes 6 yrs ± 2 yrs
Yes S S2 I Yes Yes
223 Yes Yes Yes F? 35+ Yes F 35-45 49 Yes Yes A E1 F Yes No
223A No No No I 1.5 Yes I U 15 (sic
) No Yes S I I No No
224 Yes Yes Yes M 21-26 Yes M 21-26 24 Yes Yes A A2 M Yes No
225 Yes Yes Yes I 17+ Yes I 17+ 25 Yes Yes A A I Yes Yes
226 Yes Yes Yes M? 17-21 Yes M 17-21 19 Yes Yes A A1 M Yes Yes
227 Yes Yes Yes I 15-19 Yes F 15-19 17 Yes Yes A A1 I Yes Yes
228 Yes Yes Yes M 25-35 Yes M 25-35 25 Yes Yes A A2 M Yes Yes

503
Excavation Records
Jurmain 2000 Interpretation
Morley 1997 Interpretation Other
Interpretations Reconciliation of
Demographic Data Isotope Study
Bu
rial
#
Bur
ial R
ecor
d
For
m A
Art
ifac
t Log
B
Incl
uded
in J
urm
ain
2000
C
Sex
D
Age
Incl
uded
in M
orle
y 19
97 E
Sex
D
Age
Ran
ge F
Fin
al A
ge G
Incl
uded
in
Bel
lifem
ine
1997
H
Den
tal A
ge I
Dis
tinct
Ind
ivid
ual
(Hum
an)
J
Adu
lt/S
ubad
ult K
Age
Cod
e L
Sex
D
Sam
ple
Ava
ilabl
e M
Incl
uded
in S
tudy
N
229 Yes Yes Yes M 35-45 Yes M 35-45 35 No Yes A A3 M Yes No
229A No Yes No I N/A Yes I U 0.2 No Yes S I I No No
230 Yes Yes Yes F 31-40 Yes F 31-40 35 Yes Yes A A3 F Yes Yes
230A No No No I Sub-adult
Yes I U 0.5 No Yes S I I No No
231 Yes Yes Yes M 30-40 Yes M 30-40 35 Yes Yes A A3 M Yes No
232 Yes Yes Yes F 35-50 Yes F 35-50 43 Yes Yes A E1 F Yes No
233 Yes Yes Yes M 30-45 Yes M 30-45 35 Yes Yes A A3 M Yes Yes
234 Yes Yes Yes F 35+ Yes F 35+ 50 Yes Yes A E F Yes Yes
235 Yes Yes Yes I 0.5-1.5
Yes I 3.5-5.0
1 Yes Yes S I I Yes Yes
235A No No No** I 2.5-4.0
Yes I 3.25 3.25
Yes Yes S S1 I No No
236 Yes No Yes F 21-30 Yes F 21-30 27 Yes Yes A A2 F Yes Yes
237 Yes Yes Yes M 18-25 Yes M 18-25 22 Yes Yes A A2 M Yes Yes
238 Yes Yes Yes M 25-35 Yes M 25-35 35 Yes Yes A A3 M Yes No
238A No No No I Infant Yes I U 0.5 No Yes S I I No No
239 Yes Yes Yes I 10-15 Yes I 10.0-15.0
12 Yes Yes S S3 I No No
240 Yes Yes Yes M 21-35 Yes M 21-35 30 Yes Yes A A2/A3 M No No
241 Yes Yes Yes M 25-35 Yes M 25-35 31 Yes Yes A A2/A3 M Yes No
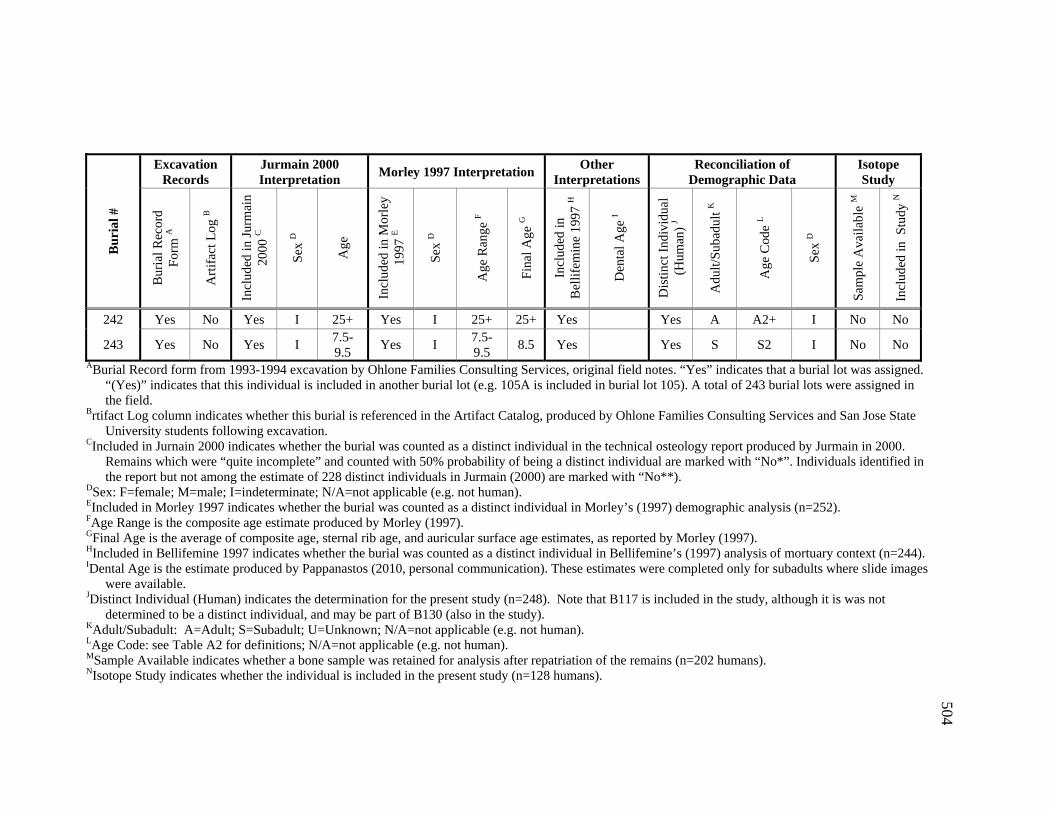
504
Excavation Records
Jurmain 2000 Interpretation
Morley 1997 Interpretation Other
Interpretations Reconciliation of
Demographic Data Isotope Study
Bu
rial
#
Bur
ial R
ecor
d
For
m A
Art
ifac
t Log
B
Incl
uded
in J
urm
ain
2000
C
Sex
D
Age
Incl
uded
in M
orle
y 19
97 E
Sex
D
Age
Ran
ge F
Fin
al A
ge G
Incl
uded
in
Bel
lifem
ine
1997
H
Den
tal A
ge I
Dis
tinct
Ind
ivid
ual
(Hum
an)
J
Adu
lt/S
ubad
ult K
Age
Cod
e L
Sex
D
Sam
ple
Ava
ilabl
e M
Incl
uded
in S
tudy
N
242 Yes No Yes I 25+ Yes I 25+ 25+ Yes Yes A A2+ I No No
243 Yes No Yes I 7.5-9.5
Yes I 7.5-9.5
8.5 Yes Yes S S2 I No No
ABurial Record form from 1993-1994 excavation by Ohlone Families Consulting Services, original field notes. “Yes” indicates that a burial lot was assigned. “(Yes)” indicates that this individual is included in another burial lot (e.g. 105A is included in burial lot 105). A total of 243 burial lots were assigned in the field.
Brtifact Log column indicates whether this burial is referenced in the Artifact Catalog, produced by Ohlone Families Consulting Services and San Jose State University students following excavation.
CIncluded in Jurnain 2000 indicates whether the burial was counted as a distinct individual in the technical osteology report produced by Jurmain in 2000. Remains which were “quite incomplete” and counted with 50% probability of being a distinct individual are marked with “No*”. Individuals identified in the report but not among the estimate of 228 distinct individuals in Jurmain (2000) are marked with “No**).
DSex: F=female; M=male; I=indeterminate; N/A=not applicable (e.g. not human). EIncluded in Morley 1997 indicates whether the burial was counted as a distinct individual in Morley’s (1997) demographic analysis (n=252). FAge Range is the composite age estimate produced by Morley (1997). GFinal Age is the average of composite age, sternal rib age, and auricular surface age estimates, as reported by Morley (1997). HIncluded in Bellifemine 1997 indicates whether the burial was counted as a distinct individual in Bellifemine’s (1997) analysis of mortuary context (n=244). IDental Age is the estimate produced by Pappanastos (2010, personal communication). These estimates were completed only for subadults where slide images
were available. JDistinct Individual (Human) indicates the determination for the present study (n=248). Note that B117 is included in the study, although it is was not
determined to be a distinct individual, and may be part of B130 (also in the study). KAdult/Subadult: A=Adult; S=Subadult; U=Unknown; N/A=not applicable (e.g. not human). LAge Code: see Table A2 for definitions; N/A=not applicable (e.g. not human). MSample Available indicates whether a bone sample was retained for analysis after repatriation of the remains (n=202 humans). NIsotope Study indicates whether the individual is included in the present study (n=128 humans).
505
Morley (1997) estimated that 252 distinct individuals were recovered. In addition
to those recognized by Jurmain’s team, she included ten of the eleven “very fragmentary”
individuals that they excluded (all except burial 20). Additionally, she included all six of
the quite fragmentary individuals. Unlike Jurmain’s team, Morley did not include burials
47A, or 145A. Additionally, she excluded burials 104 and 130, combining them with 102
and 117, respectively. She included the seven individuals identified but not counted by
Jurmain, as well as eight additional subadults (61A, 76A, 90A, 205A, 223A, 229A,
230A, 238A), determined to be distinct individuals when no other subadult remains were
recovered within a five meter radius (Morley 1997:62).
Bellifemine (1997) included all but nine of the individuals that Morley counted.
She did not include six of the added subadults (90A, 205A, 223A, 229A, 230A, or 238A).
Additionally, she excluded burial 114 as fragmentary and burials 201 and 229 for lack of
coordinates. Bellifemine differed from both Jurmain and Morley in that burials 117 and
130 were counted as two distinct burials. These adjustments brought her total estimate to
244 individuals.
Estimation of Age and Sex
Methods for Age Estimation
Age at death for the SCL-38 individuals was determined by referring to the
technical report of the osteology team (Jurmain 2000) as well as refined estimations by
Morley (1997) and supplemental dental analysis by the author and Dr. Leon Pappanastos
in 2010. Age categories were developed to facilitate statistical analysis (see Table A2).
When age estimations did not clearly fall within a single group, categories were
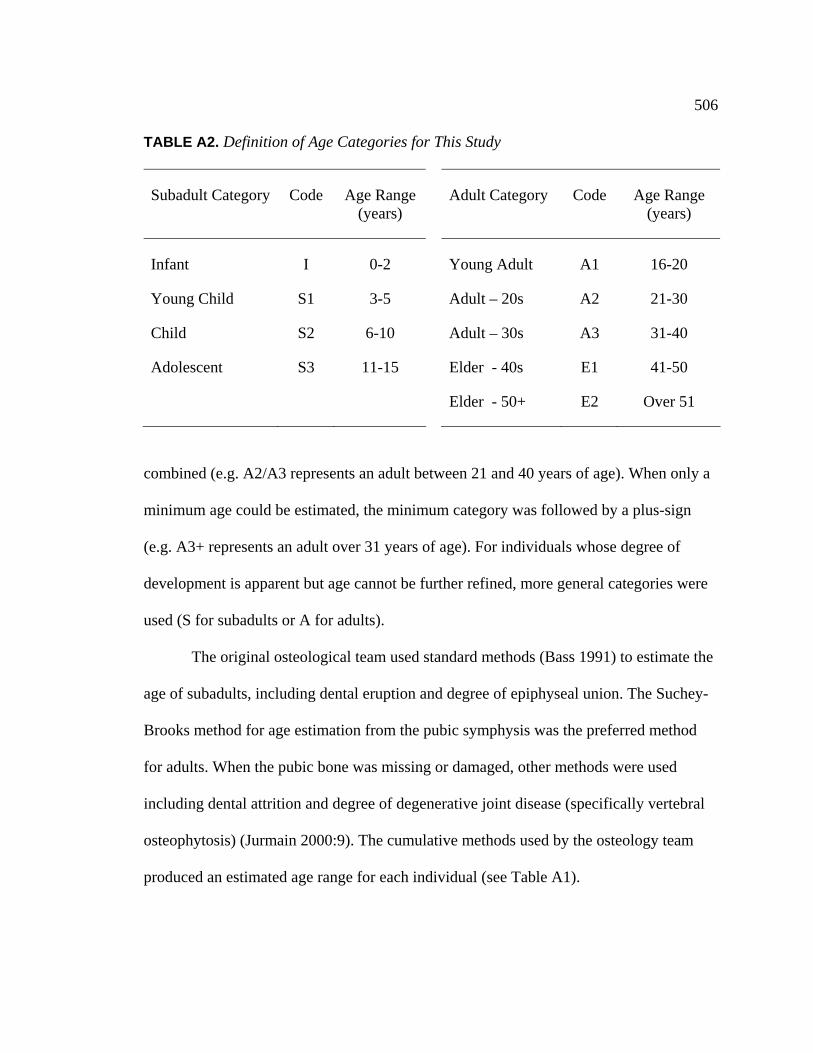
506
TABLE A2. Definition of Age Categories for This Study
Subadult Category Code Age Range (years)
Adult Category Code Age Range (years)
Infant I 0-2 Young Adult A1 16-20
Young Child S1 3-5 Adult – 20s A2 21-30
Child S2 6-10 Adult – 30s A3 31-40
Adolescent S3 11-15 Elder - 40s E1 41-50
Elder - 50+ E2 Over 51
combined (e.g. A2/A3 represents an adult between 21 and 40 years of age). When only a
minimum age could be estimated, the minimum category was followed by a plus-sign
(e.g. A3+ represents an adult over 31 years of age). For individuals whose degree of
development is apparent but age cannot be further refined, more general categories were
used (S for subadults or A for adults).
The original osteological team used standard methods (Bass 1991) to estimate the
age of subadults, including dental eruption and degree of epiphyseal union. The Suchey-
Brooks method for age estimation from the pubic symphysis was the preferred method
for adults. When the pubic bone was missing or damaged, other methods were used
including dental attrition and degree of degenerative joint disease (specifically vertebral
osteophytosis) (Jurmain 2000:9). The cumulative methods used by the osteology team
produced an estimated age range for each individual (see Table A1).
507
In collaboration with her graduate advisor, Robert Jurmain, Susan Morley (1997)
elaborated on the methods used by the original osteology team, and included assessment
of auricular surface and sternal rib stages. Morley calculated precise age estimations for
each individual by following the multifactorial approach developed by Lovejoy and
colleagues (1985). This method took the median point for the age range suggested by
each age estimation technique used by the original osteology team, and then calculated
the mean of the median points, producing a composite mean age. The composite mean
age was then averaged with the median values of age ranges suggested from sternal rib
end and auricular surface phase techniques to arrive at a “final age” estimate for each
individual. Morley presented her results in two ways: as an age range, based on the
original composite methods without the rib or auricular surface techniques, and as a
single-digit “final age” figure, which she uses in her demographic calculations. Table A1
includes both Morley’s range and final age estimations.
In an attempt to refine the age estimations for subadults included in this study, I
met with Dr. Leon Pappanastos, DMD, in October of 2010 to review slide images of
dentition. Using developmental stages outlined in Hillson (1996) based on Ubelaker
(1989), we reviewed the dental ages of fourteen subadults, resulting in refinement of age
estimations for seven individuals and age category reclassification of four individuals
(see Table A3).
When age estimations varied between sources, the work of Morley (1997) carried
greater weight than the Jurmain (2000) data, because Jurmain endorsed Morley’s revised
age estimations as her graduate advisor (Jurmain 2000:9). “Final Age” estimates provided

508
TABLE A3. Revision of Estimated Ages and Age Categories Based on Review of Dental Development
Age Estimates Age Category
Burial #
Reported RangeA
Revised RangeB
Average AgeB
Dental AgeC OriginalD RevisedD Basis C
46 12.5-15 12.5-15 14 ~17 S3 A1 Maxillary 3rd molars erupting.
66 10-15 10-15 12 ~17 (15-17)
S3 A1 Maxillary 3rd molars just emerging; mandibular 3rd molars almost in occlusion.
98 18-22 18-22 22 ~16 (16-18)
A2 A1 Emerging maxillary 3rd molars.
128 1.5-2 0.5-1.5 1 1.5 ± 6 mos
(1-2 years)
I I All incisors and 1st deciduous molars erupted, no canines or 2nd deciduous molars.
159 4-5 4-5 4.5 5.5 ± 1.5 yrs
S1 S1 Permanent I2s and I1s and I2s beginning to erupt.
177 2.5-3.5 2.5-3.5 3 3.5 ± 1 yr S1 S1 Maxillary 1st molars just beneath alveolus.
214 4-6 4-6 5 6 +/- 2 yrs S1 S2 Maxillary M1s erupted.
Sources: AJurmain, Robert, 2000, Analysis of the Human Skeletal Remains from CA-SCL-038: Technical Report. Manuscript on file at the Department of Anthropology, San Jose State University, San Jose, California. BMorley, Susan, 1997, The Paleodemography of the Yukisma Site, CA-SCl-38: A Prehistoric Cemetery of the South San Francisco Bay. Masters thesis, Department of Social Science, San Jose State University, California. CLeon Pappanastos, D.D.S., personal communication, October 22, 2010. DPresent study guidance for some classifications, but were not used exclusively (as greater precision
increases the risk of inaccuracy). Valuing direct experience over second-hand reports, my
own observations of dental images with Dr. Pappanastos were weighted preferentially
where there were discrepancies between sources.
509
Methods for Sex Estimation
Determination of biological sex for these individuals was a more straightforward
matter, as all resources generally agreed. Estimations from the original osteology team
(Jurmain 2000) and Morley (1997) are included in Table A1, along with the sex
estimation to be used in this study.
There were five cases where the two osteological sources disagreed on sex
estimation. When no further evidence was available for review, the sex of individuals
with conflicting information was classified here as indeterminate (Burials 14, 95, and
227). An excavation photo of Burial 69 was available which revealed a very narrow
sciatic notch, so this individual is classified as male. Burial 117 was also classified as
male because this was quite possibly the same individual as Burial 130, who was
classified as male in both Jurmain (2000) and Morley (1997).
The original osteology team used standard methods (Bass 1991) to estimate
biological sex, and also variation of long bone osteometrics (previously used for
prehistoric Central California populations by Dittrick and Suchey in 1986) and
mandibular ramus flexure (following the technique in Loth 1995) (Jurmain 2000:9).
Morley chose not to include osteometric variation or mandibular ramus flexure, and
focused her analysis on standard approaches, using sub-pubic concavity, presence or
absence of a ventral arc, the medial aspect of the ischiopubic ramus, and the length of the
pubis (Morley 1997:51). Sex was only estimated for adults, as morphological
differentiation between sexes becomes clear only after puberty.

510
Conclusion
Unpublished excavation records as well as published reports (Bellifemine 1997;
Jurmain 2000; and Morley 1997) were consulted in an effort to clarify discrepancies
between demographic data sets from CA-SCL-38. The conclusions of these researchers
as well as my own are summarized, and revised estimations of unique individuals and
their sexes and ages have been presented in Table A1. As a result of this reconciliation, a
total of 248 unique individuals were identified. Discrepancies between this estimation
and other sources were also reconciled. Additionally, age estimations have been
categorized for statistical calculations. It is my hope that this reconciliation will provide
clarity to future researchers as they reveal further information about the Yukisma Mound
and the ancestral Ohlone who were buried there.

511
REFERENCES CITED Bass, William M.
1991 Human Osteology: A Laboratory and Field Manual. Columbia, MO: Archaeological Society.
Bellifemine, Viviana
1997 Mortuary Variability in Prehistoric Central California: A Statistical Study of the Yukisma Site, CA-SCl-38. Masters thesis, Department of Anthropology, San Jose State University, California.
Dittrick, Jean and Judy Myers Suchey
1986 Sex Determination of Prehistoric Central California Skeletal Remains Using Discriminant Analysis of the Femur and Humerus. American Journal of Physical Anthropology 70:3-9.
Hillson, Simon
1996 Dental Anthropology. New York: Cambridge University Press. Jurmain, Robert
2000 Analysis of the Human Skeletal Remains from CA-SCL-038: Technical Report. Manuscript on file at the Department of Anthropology, San Jose State University, San Jose, California.
Loth, S.R.
1995 Age Assessment of the Spitalfields Cemetery Population by Rib Phase Analysis. American Journal of Human Biology 7:465-471.
Lovejoy, C. O., R. S. Meindl, T. R. Preyzbeck, and R. P. Mensforth
1985 Chronological Metamorphosis of the Auricular Surface of the Ilium: A New Method for the Determination of Adult Skeletal Age at Death. American Journal of Physical Anthropology 99:473-485.
Morley, Susan
1997 The Paleodemography of the Yukisma Site, CA-SCl-38: A Prehistoric Cemetery of the South San Francisco Bay. Masters thesis, Department of Social Science, San Jose State University, California.
Ubelaker, Douglas H.
1989 Human Skeletal Remains: Excavation, Analysis, Interpretation. 2nd edition. Washington, DC: Taraxacum.

APPENDIX B

513
MORTUARY PRACTICE AND BURIAL-
ASSOCIATED ARTIFACTS AT
CA-SCL-38
Introduction
This appendix presents detailed information about mortuary context and the
associated unworked organic material for each individual from the 1993 to 1994
excavations at the Yukisma Mound (see Table B1). Table B2 details artifact associations
with each burial, including the total number of artifacts with each individual, the number
of associated artifact types (a measure of artifact diversity), and the shell bead class (an
ordinal level measure of wealth based on shell bead abundance). Descriptions and
implications of mortuary context and artifact associations are described in Chapter III of
this thesis, along with total associations by demographic group. Information presented
here is based on reconciliation of original excavation notes, excavation photos, and the
Artifact Catalog, all produced by Ohlone Families Consulting Services (OFCS), as well
as osteological reports from Jurmain (2000), artifact observations from Bellifemine
(1997), consultation with Alan Leventhal, and personal observations of the author.

514
REFERENCES CITED
Bellifemine, Viviana
1997 Mortuary Variability in Prehistoric Central California: A Statistical Study of the Yukisma Site, CA-SCl-38. Masters thesis, Department of Anthropology, San Jose State University, California.
Jurmain, Robert
2000 Analysis of the Human Skeletal Remains from CA-SCL-038: Technical Report. Manuscript on file at the Department of Anthropology, San Jose State University, San Jose, California.

515
TABLE B1. Mortuary Context and Unworked Organic Material Associations by Burial at CA-SCL-38
Mortuary Context Burial-Associated Unworked Organic Material B
uria
l #
Spe
cies
Dis
tinct
Ind
ivid
ual A
(Hum
an)
Isot
ope
Stu
dy
Sex
B
Age
Cod
e C
Inte
rmen
t Typ
e D
Cre
mat
ion
Oth
er B
urni
ng
Roc
k ca
irn
Fle
xion
E
Pos
itio
n F
Fac
e
Ori
enta
tion
Nor
th: N
W-N
-NE
Eas
t: N
E-E
-SE
Sou
th: S
W-S
-SE
Wes
t: SW
-W-N
W
Dis
turb
ed
Bur
ial T
ype
G
Ass
ocia
ted
buri
als
Spa
tial C
lust
er H
% c
ompl
ete
She
llfi
sh
Cer
ethi
dea
She
lls
(sna
ils)
Ost
rea
lurid
a (o
yste
rs)
Mac
oma
nasu
ta (
Bor
ing
& B
entn
ose
clam
s)
Myt
ilus
(mus
sels
)
Aba
lone
She
ll (
Who
le)
Cra
b C
law
Fis
h V
erte
brae
/Bon
e
Tur
tle C
arap
ace
Fau
nal r
emai
ns
Bot
anic
al R
emai
ns
Bir
d B
one
1 Human Y Y M A2/A3 P Y Y N TF LS Down,
W N 75 E x x N S 1 75% Y Y N N N N N N N Y N N
2 Elk N N N/A N/A P N Y N N/A N O N/A Y Y Y Y N N N N N N N N
3 Human Y Y I S2 P N Y Y TF RS Down N 50 E / due N ?
x x Y S 1 30% Y Y Y Y N N N N N Y N N
4 Human Y Y F E1 P N Y N TF D Up, SW
N 50 E x x Y S 2 75% N N N N N N N N N Y N N
5 Human Y Y F A2 P N Y N F D N/S E 35 S x x Y S 1 15-
20% Y Y Y Y N N N N N Y N N
6 Human Y N I A2 P N Y N TF LS Up Due E x N S 3 75% Y Y Y N N N N N N Y N N
7 Human N N I U P N N N U Y S 4 < 10% Y Y Y N N N N N N Y N N
8 Human Y Y M A3 P N Y N TF O Down E 15 S x x Y S 2 90% Y Y Y N N N N N N Y N N
9 Human Y Y F E2 P N N N TF LS E Due N x Y S 2 65-
70% Y Y N N N N N N N N N N
10 Human Y Y M E1 P N Y N SF LS Down N S 2 95% Y Y N N N N N N N N N N
11 Human Y N I A2 P N N TF D E 30 S x x Y S 2 50% Y Y N N N N N N N N N N
12 Human Y N I E1 P N Y N TF D W N 60 E / Due E
x x Y S 2 1-3% Y Y Y N N N N N N N N N
13 Human Y Y M A3 P N Y N TF V Down,
W W 0 x N M
13a, 50
5 95% Y Y Y Y N N N N N Y Y N
13A Human Y N I A U N U N U U N M 13, 50 5 < 5% N N N N N N N N N N N N
14 Human Y N I A2+ P N N N TF D S/SE Due E x Y S 2 80-
85% Y Y N Y N N N N N N N N
15 Human Y N M A3 P N Y N TF D E 20 S x x Y S 1 75% Y Y Y Y N N N N N Y N N
16 Human Y N M A3/E1 P N Y N TF S N Due S x N S 1 85% Y Y Y Y N N N Y N Y N N
17 Human Y N I E1 P N N N F RS N E 30 S / Due S
x x N S 3 65-
70% Y Y Y N N N N N N N N N
18 Human Y Y F A2 P N Y N TF D 0 E x U S 4 50% Y Y Y Y N N Y N N Y N N
19 Human Y N I A2+ P N N N TF D Down N 60 W / Due N ?
x x Y S 1 85-
90% Y Y Y Y N
N N N N Y N N
20 Human N N I U P Y Y N N/A Up N S F Y Y Y Y Y N N N N Y N Y
21 Human Y Y I A P N N F U S 5 F Y Y Y Y N N Y N N Y N N
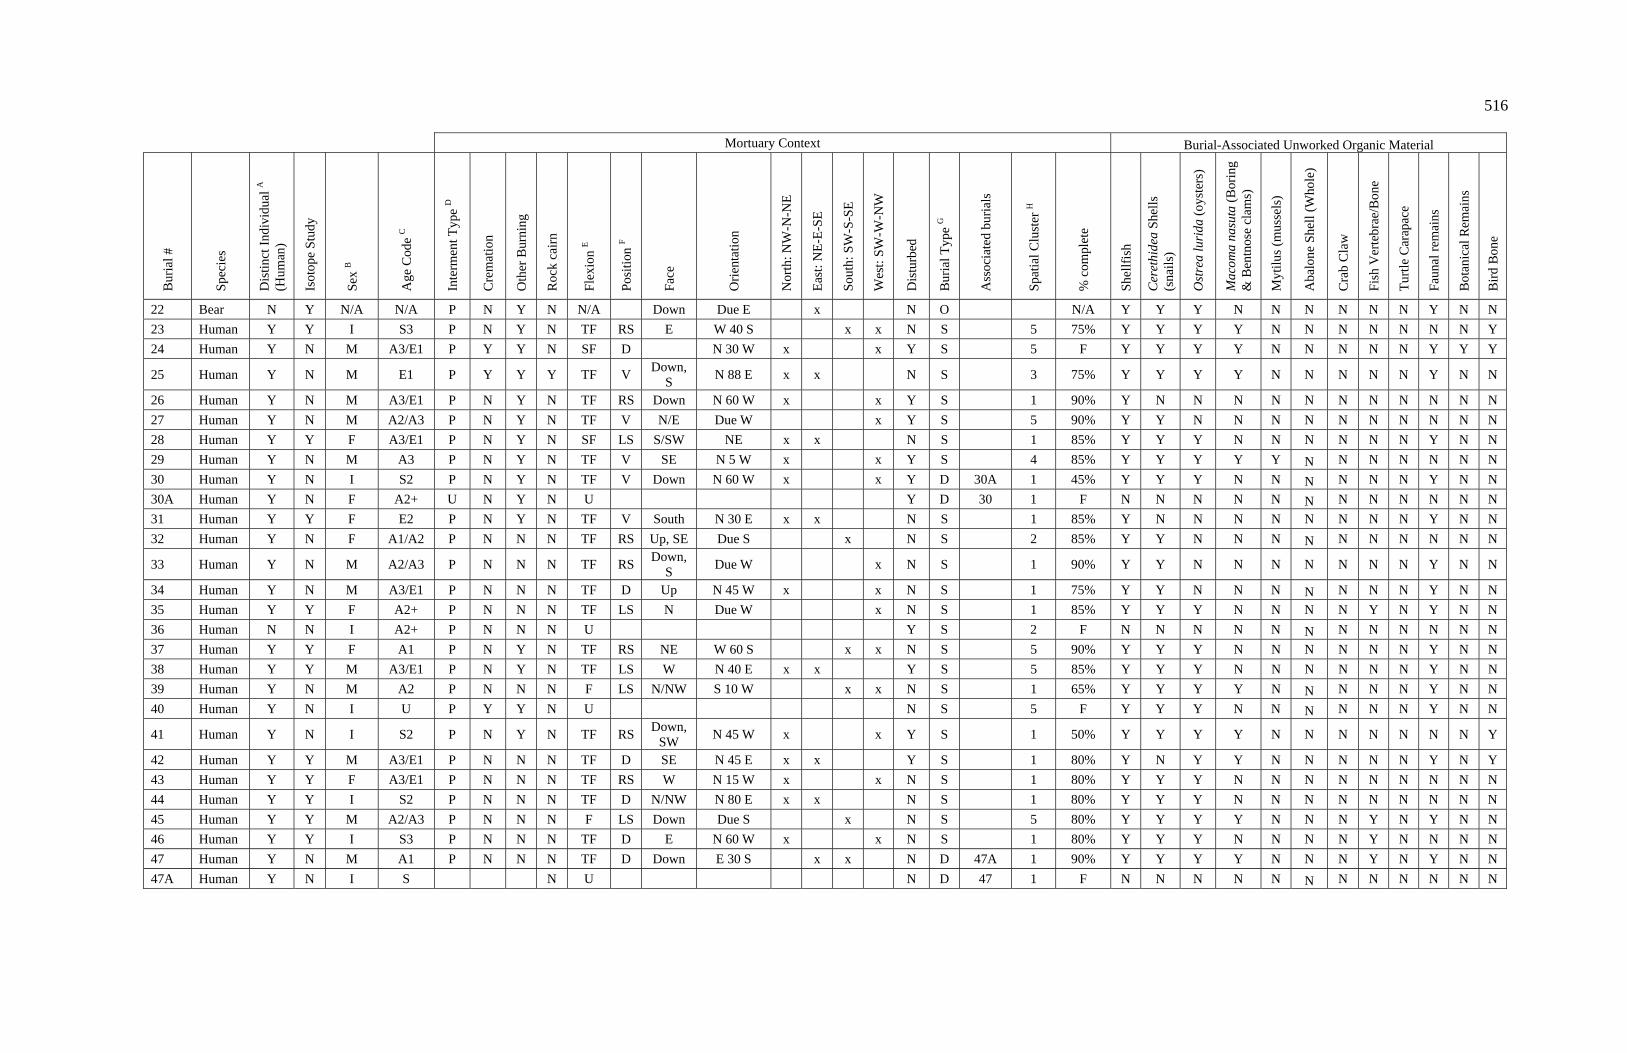
516
Mortuary Context Burial-Associated Unworked Organic Material
Bur
ial #
Spe
cies
Dis
tinct
Ind
ivid
ual A
(Hum
an)
Isot
ope
Stu
dy
Sex
B
Age
Cod
e C
Inte
rmen
t Typ
e D
Cre
mat
ion
Oth
er B
urni
ng
Roc
k ca
irn
Fle
xion
E
Pos
itio
n F
Fac
e
Ori
enta
tion
Nor
th: N
W-N
-NE
Eas
t: N
E-E
-SE
Sou
th: S
W-S
-SE
Wes
t: SW
-W-N
W
Dis
turb
ed
Bur
ial T
ype
G
Ass
ocia
ted
buri
als
Spa
tial C
lust
er H
% c
ompl
ete
She
llfi
sh
Cer
ethi
dea
She
lls
(sna
ils)
Ost
rea
lurid
a (o
yste
rs)
Mac
oma
nasu
ta (
Bor
ing
& B
entn
ose
clam
s)
Myt
ilus
(mus
sels
)
Aba
lone
She
ll (
Who
le)
Cra
b C
law
Fis
h V
erte
brae
/Bon
e
Tur
tle C
arap
ace
Fau
nal r
emai
ns
Bot
anic
al R
emai
ns
Bir
d B
one
22 Bear N Y N/A N/A P N Y N N/A Down Due E x N O N/A Y Y Y N N N N N N Y N N
23 Human Y Y I S3 P N Y N TF RS E W 40 S x x N S 5 75% Y Y Y Y N N N N N N N Y
24 Human Y N M A3/E1 P Y Y N SF D N 30 W x x Y S 5 F Y Y Y Y N N N N N Y Y Y
25 Human Y N M E1 P Y Y Y TF V Down,
S N 88 E x x N S 3 75% Y Y Y Y N N N N N Y N N
26 Human Y N M A3/E1 P N Y N TF RS Down N 60 W x x Y S 1 90% Y N N N N N N N N N N N
27 Human Y N M A2/A3 P N Y N TF V N/E Due W x Y S 5 90% Y Y N N N N N N N N N N
28 Human Y Y F A3/E1 P N Y N SF LS S/SW NE x x N S 1 85% Y Y Y N N N N N N Y N N
29 Human Y N M A3 P N Y N TF V SE N 5 W x x Y S 4 85% Y Y Y Y Y N N N N N N N
30 Human Y N I S2 P N Y N TF V Down N 60 W x x Y D 30A 1 45% Y Y Y N N N N N N Y N N
30A Human Y N F A2+ U N Y N U Y D 30 1 F N N N N N N N N N N N N
31 Human Y Y F E2 P N Y N TF V South N 30 E x x N S 1 85% Y N N N N N N N N Y N N
32 Human Y N F A1/A2 P N N N TF RS Up, SE Due S x N S 2 85% Y Y N N N N N N N N N N
33 Human Y N M A2/A3 P N N N TF RS Down,
S Due W x N S 1 90% Y Y N N N N N N N Y N N
34 Human Y N M A3/E1 P N N N TF D Up N 45 W x x N S 1 75% Y Y N N N N N N N Y N N
35 Human Y Y F A2+ P N N N TF LS N Due W x N S 1 85% Y Y Y N N N N Y N Y N N
36 Human N N I A2+ P N N N U Y S 2 F N N N N N N N N N N N N
37 Human Y Y F A1 P N Y N TF RS NE W 60 S x x N S 5 90% Y Y Y N N N N N N Y N N
38 Human Y Y M A3/E1 P N Y N TF LS W N 40 E x x Y S 5 85% Y Y Y N N N N N N Y N N
39 Human Y N M A2 P N N N F LS N/NW S 10 W x x N S 1 65% Y Y Y Y N N N N N Y N N
40 Human Y N I U P Y Y N U N S 5 F Y Y Y N N N N N N Y N N
41 Human Y N I S2 P N Y N TF RS Down,
SW N 45 W x x Y S 1 50% Y Y Y Y N N N N N N N Y
42 Human Y Y M A3/E1 P N N N TF D SE N 45 E x x Y S 1 80% Y N Y Y N N N N N Y N Y
43 Human Y Y F A3/E1 P N N N TF RS W N 15 W x x N S 1 80% Y Y Y N N N N N N N N N
44 Human Y Y I S2 P N N N TF D N/NW N 80 E x x N S 1 80% Y Y Y N N N N N N N N N
45 Human Y Y M A2/A3 P N N N F LS Down Due S x N S 5 80% Y Y Y Y N N N Y N Y N N
46 Human Y Y I S3 P N N N TF D E N 60 W x x N S 1 80% Y Y Y N N N N Y N N N N
47 Human Y N M A1 P N N N TF D Down E 30 S x x N D 47A 1 90% Y Y Y Y N N N Y N Y N N
47A Human Y N I S N U N D 47 1 F N N N N N N N N N N N N

517
Mortuary Context Burial-Associated Unworked Organic Material
Bur
ial #
Spe
cies
Dis
tinct
Ind
ivid
ual A
(Hum
an)
Isot
ope
Stu
dy
Sex
B
Age
Cod
e C
Inte
rmen
t Typ
e D
Cre
mat
ion
Oth
er B
urni
ng
Roc
k ca
irn
Fle
xion
E
Pos
itio
n F
Fac
e
Ori
enta
tion
Nor
th: N
W-N
-NE
Eas
t: N
E-E
-SE
Sou
th: S
W-S
-SE
Wes
t: SW
-W-N
W
Dis
turb
ed
Bur
ial T
ype
G
Ass
ocia
ted
buri
als
Spa
tial C
lust
er H
% c
ompl
ete
She
llfi
sh
Cer
ethi
dea
She
lls
(sna
ils)
Ost
rea
lurid
a (o
yste
rs)
Mac
oma
nasu
ta (
Bor
ing
& B
entn
ose
clam
s)
Myt
ilus
(mus
sels
)
Aba
lone
She
ll (
Who
le)
Cra
b C
law
Fis
h V
erte
brae
/Bon
e
Tur
tle C
arap
ace
Fau
nal r
emai
ns
Bot
anic
al R
emai
ns
Bir
d B
one
48 Human Y Y F E1/E2 P N N N TF LS Down,
E Due E x N S 1 75% N N N N N N N N N Y N N
49 Human Y N M A2/A3 P N N N TF D Up, NE N S 1 95% N N N N N N N N N N N N
50 Human Y N M A1 P N N N TF RS Down N 50 E x x N M 13 5 75% Y Y Y Y N N N N N Y N Y
51 Human Y Y M A3 P N Y N TF D N E 40 S x x N S 5 80% Y Y Y N N N N N N Y N N
52 Human Y Y M A2 P N N N TF RS Down,
S W 30 S x x N D 53 5 75% N N N N N N N N N N N N
53 Human Y Y M A3 P N N N TF RS E 270
degrees x N D 52 5 80% Y Y Y N N N N N N Y N N
54 Human Y N F E1 P N N N TF RS Down,
NE South x N S 5 65% Y Y Y N N N N N N Y N N
55 Human Y N F E1 P N N N TF D Up,
N/NE N 30 W x x N S 5 95% Y Y Y N N
N N N N N N N
56 Human Y Y F A3 P N Y N F D Down,
N E 40 S x x N S 1 85% N N N N N N N N N N N N
57 Human Y N F A3 P N N N TF V Up, E N 0 x N S 1 90% N N N N N N N N N Y N N
58 Human Y Y I A1 P N N N E V Down,
N 60 N/NE x x Y S 5 50% Y Y Y N N N N N N Y N N
59 Human Y N I S1 U N N TF N S 5 F N N N N N N N N N N N N
60 Human Y N M A3 P N Y N TF LS N 60 W x x Y S 1 75% Y Y Y N N N N N N Y N N
61 Human Y N M A3 P N Y N TF D Up, NE W 30 S x x N D 61A 5 90% Y Y Y Y N N N N N Y N N
61A Human Y N I I N Y N U U D 61 5 F N N N N N N N N N N N N
62 Human Y N M A1 P N N N SF D Up,
S/SW N 30 W x x N S 5 50% Y Y Y Y N N N N N Y N N
63 Human Y Y F A3 P N N N TF LS N S 40 W x x N S 5 75% Y Y Y N N N N N N Y Y Y
64 Human Y Y M A2 P N N N TF D Up, NE S 15 E x x N S 5 95% Y Y Y N N N N N N N N N
65 Human Y Y I A2+ P N N N TF RS Down,
S W 60 S x x N S 5 25% Y Y Y Y N N N N N N N Y
66 Human Y Y I S3 P N N N TF D N/NE W 60 S x x N S 1 40% Y Y Y N N N N N N Y N N
67 Human Y Y F A1 P N Y N TF D N/NW N 80 E x x N S 1 95% Y N Y N N N N N N Y N N
68 Human Y Y F E1/E2 D N N N TF D Down, S/SW
N 25 E x x Y S 4 50% Y Y Y Y N N N N N Y N N
69 Human Y Y M A3 P N Y N TF D Down,
N E 50 S x x N S 5 90% Y Y Y Y N N N N N Y N N
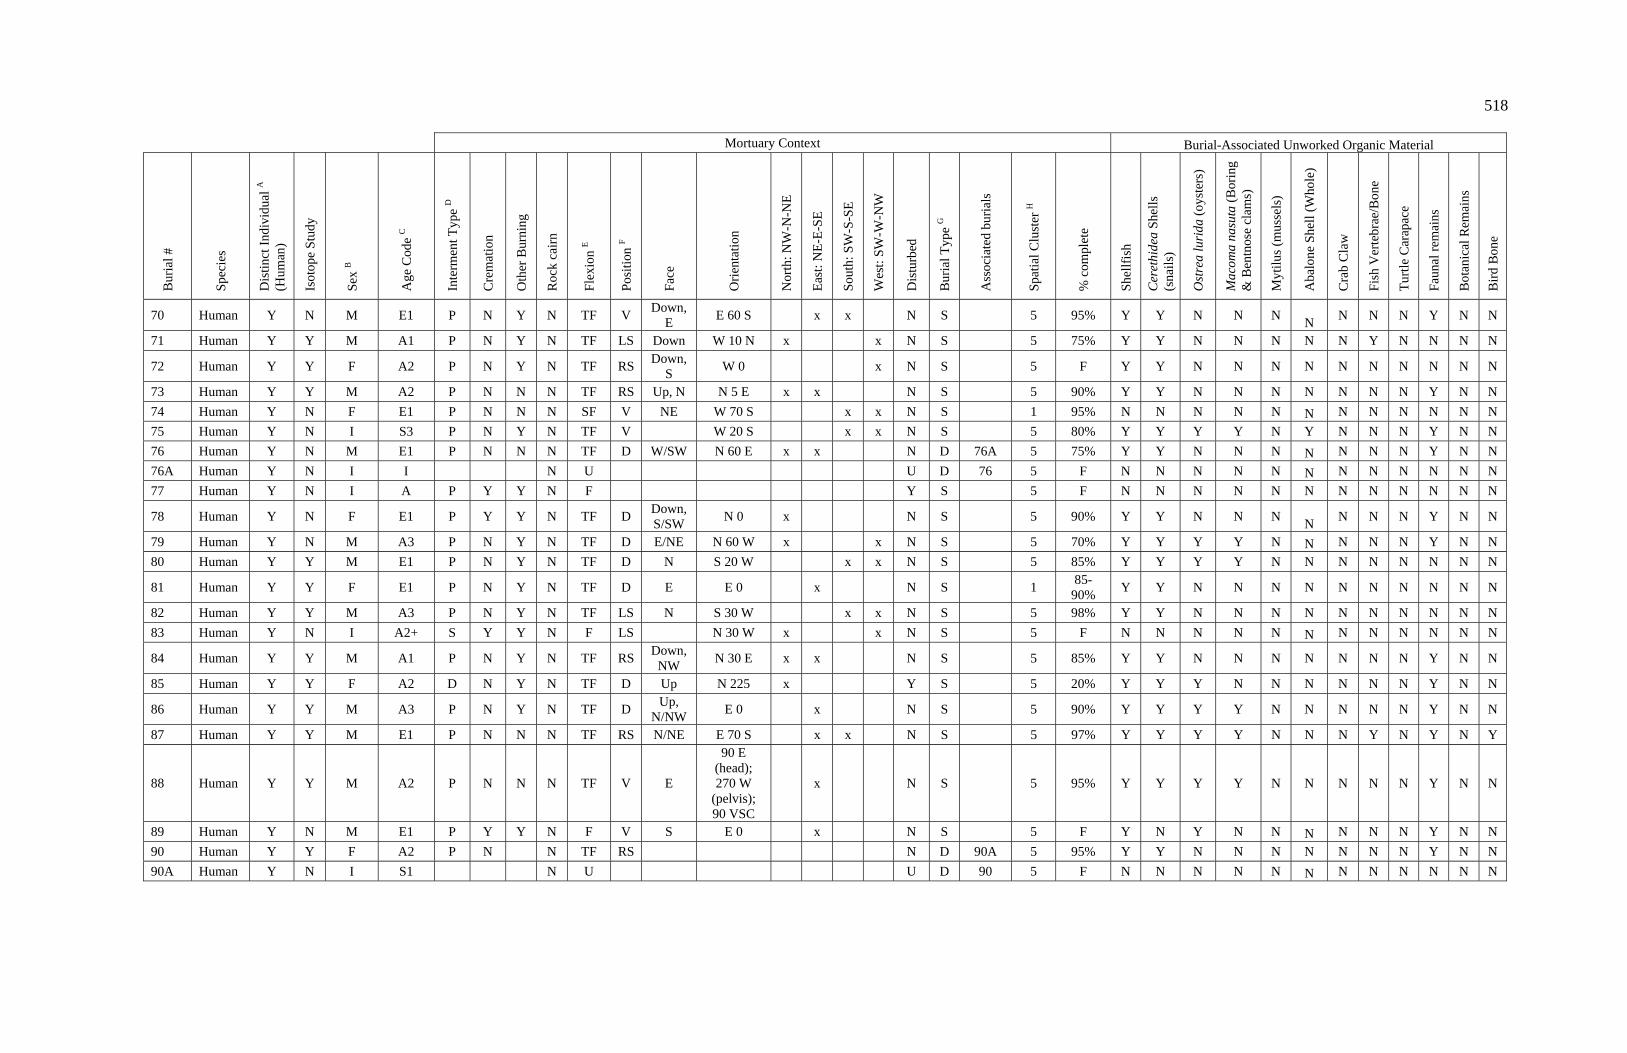
518
Mortuary Context Burial-Associated Unworked Organic Material
Bur
ial #
Spe
cies
Dis
tinct
Ind
ivid
ual A
(Hum
an)
Isot
ope
Stu
dy
Sex
B
Age
Cod
e C
Inte
rmen
t Typ
e D
Cre
mat
ion
Oth
er B
urni
ng
Roc
k ca
irn
Fle
xion
E
Pos
itio
n F
Fac
e
Ori
enta
tion
Nor
th: N
W-N
-NE
Eas
t: N
E-E
-SE
Sou
th: S
W-S
-SE
Wes
t: SW
-W-N
W
Dis
turb
ed
Bur
ial T
ype
G
Ass
ocia
ted
buri
als
Spa
tial C
lust
er H
% c
ompl
ete
She
llfi
sh
Cer
ethi
dea
She
lls
(sna
ils)
Ost
rea
lurid
a (o
yste
rs)
Mac
oma
nasu
ta (
Bor
ing
& B
entn
ose
clam
s)
Myt
ilus
(mus
sels
)
Aba
lone
She
ll (
Who
le)
Cra
b C
law
Fis
h V
erte
brae
/Bon
e
Tur
tle C
arap
ace
Fau
nal r
emai
ns
Bot
anic
al R
emai
ns
Bir
d B
one
70 Human Y N M E1 P N Y N TF V Down,
E E 60 S x x N S 5 95% Y Y N N N
N N N N Y N N
71 Human Y Y M A1 P N Y N TF LS Down W 10 N x x N S 5 75% Y Y N N N N N Y N N N N
72 Human Y Y F A2 P N Y N TF RS Down,
S W 0 x N S 5 F Y Y N N N N N N N N N N
73 Human Y Y M A2 P N N N TF RS Up, N N 5 E x x N S 5 90% Y Y N N N N N N N Y N N
74 Human Y N F E1 P N N N SF V NE W 70 S x x N S 1 95% N N N N N N N N N N N N
75 Human Y N I S3 P N Y N TF V W 20 S x x N S 5 80% Y Y Y Y N Y N N N Y N N
76 Human Y N M E1 P N N N TF D W/SW N 60 E x x N D 76A 5 75% Y Y N N N N N N N Y N N
76A Human Y N I I N U U D 76 5 F N N N N N N N N N N N N
77 Human Y N I A P Y Y N F Y S 5 F N N N N N N N N N N N N
78 Human Y N F E1 P Y Y N TF D Down, S/SW
N 0 x N S 5 90% Y Y N N N N
N N N Y N N
79 Human Y N M A3 P N Y N TF D E/NE N 60 W x x N S 5 70% Y Y Y Y N N N N N Y N N
80 Human Y Y M E1 P N Y N TF D N S 20 W x x N S 5 85% Y Y Y Y N N N N N N N N
81 Human Y Y F E1 P N Y N TF D E E 0 x N S 1 85-
90% Y Y N N N N N N N N N N
82 Human Y Y M A3 P N Y N TF LS N S 30 W x x N S 5 98% Y Y N N N N N N N N N N
83 Human Y N I A2+ S Y Y N F LS N 30 W x x N S 5 F N N N N N N N N N N N N
84 Human Y Y M A1 P N Y N TF RS Down,
NW N 30 E x x N S 5 85% Y Y N N N N N N N Y N N
85 Human Y Y F A2 D N Y N TF D Up N 225 x Y S 5 20% Y Y Y N N N N N N Y N N
86 Human Y Y M A3 P N Y N TF D Up,
N/NW E 0 x N S 5 90% Y Y Y Y N N N N N Y N N
87 Human Y Y M E1 P N N N TF RS N/NE E 70 S x x N S 5 97% Y Y Y Y N N N Y N Y N Y
88 Human Y Y M A2 P N N N TF V E
90 E (head); 270 W
(pelvis); 90 VSC
x N S 5 95% Y Y Y Y N N N N N Y N N
89 Human Y N M E1 P Y Y N F V S E 0 x N S 5 F Y N Y N N N N N N Y N N
90 Human Y Y F A2 P N N TF RS N D 90A 5 95% Y Y N N N N N N N Y N N
90A Human Y N I S1 N U U D 90 5 F N N N N N N N N N N N N
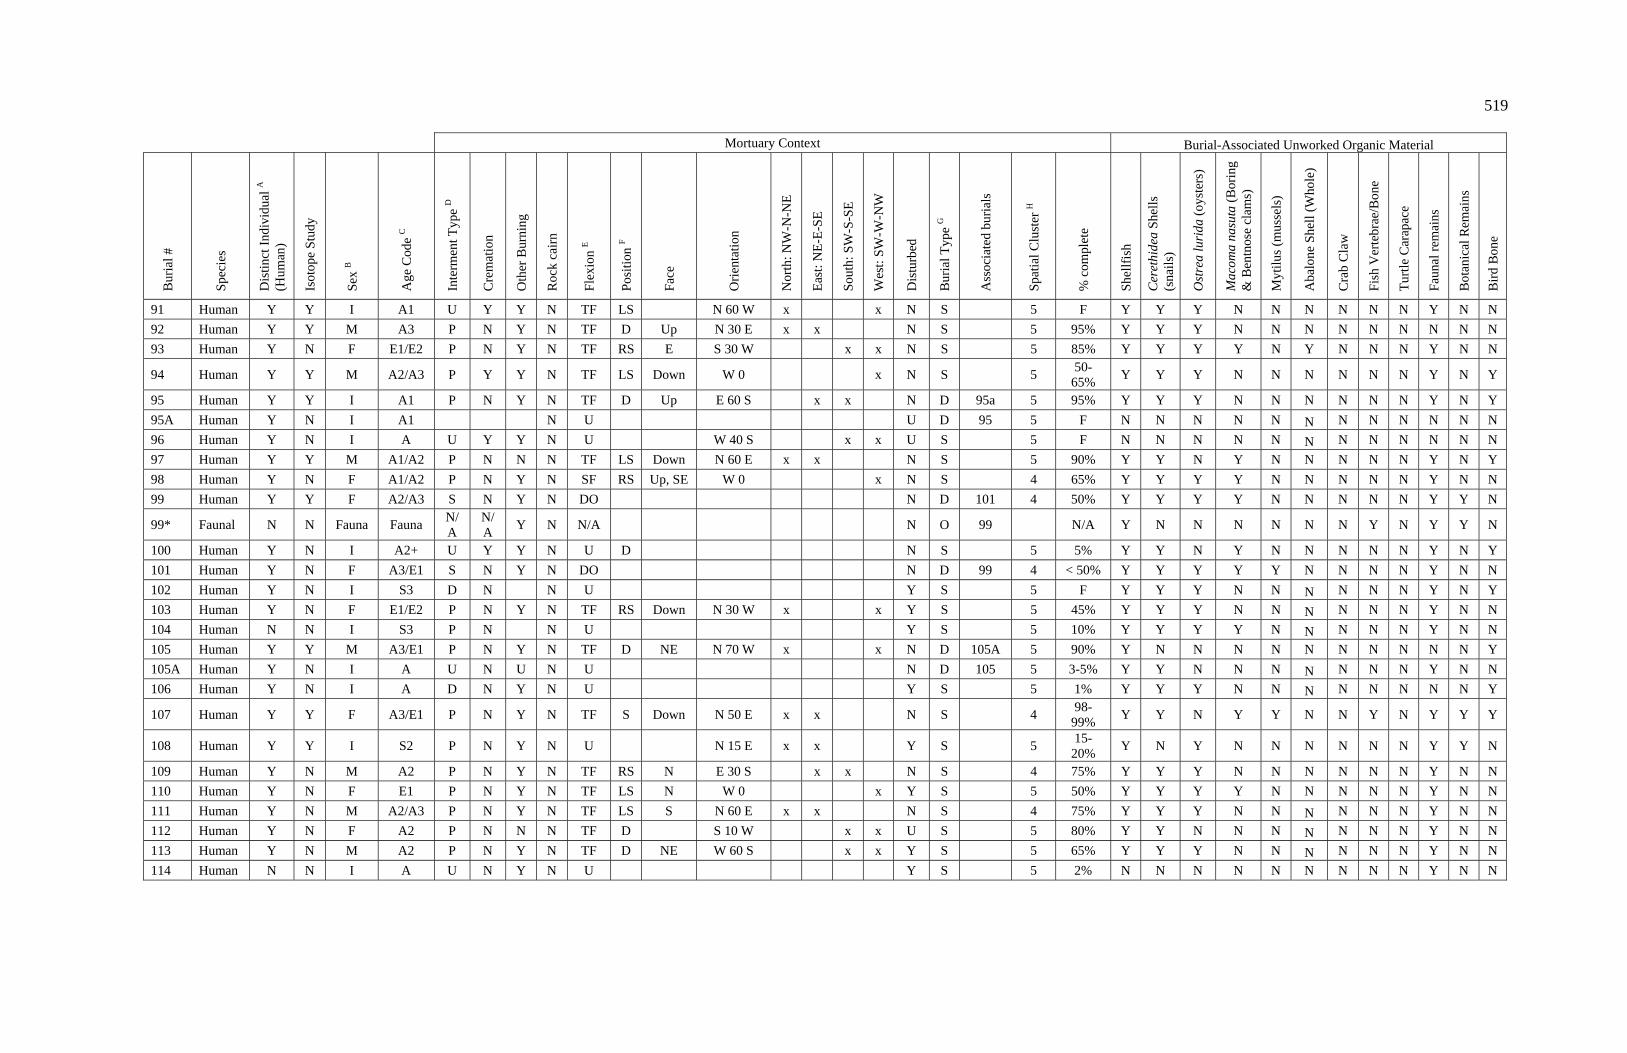
519
Mortuary Context Burial-Associated Unworked Organic Material
Bur
ial #
Spe
cies
Dis
tinct
Ind
ivid
ual A
(Hum
an)
Isot
ope
Stu
dy
Sex
B
Age
Cod
e C
Inte
rmen
t Typ
e D
Cre
mat
ion
Oth
er B
urni
ng
Roc
k ca
irn
Fle
xion
E
Pos
itio
n F
Fac
e
Ori
enta
tion
Nor
th: N
W-N
-NE
Eas
t: N
E-E
-SE
Sou
th: S
W-S
-SE
Wes
t: SW
-W-N
W
Dis
turb
ed
Bur
ial T
ype
G
Ass
ocia
ted
buri
als
Spa
tial C
lust
er H
% c
ompl
ete
She
llfi
sh
Cer
ethi
dea
She
lls
(sna
ils)
Ost
rea
lurid
a (o
yste
rs)
Mac
oma
nasu
ta (
Bor
ing
& B
entn
ose
clam
s)
Myt
ilus
(mus
sels
)
Aba
lone
She
ll (
Who
le)
Cra
b C
law
Fis
h V
erte
brae
/Bon
e
Tur
tle C
arap
ace
Fau
nal r
emai
ns
Bot
anic
al R
emai
ns
Bir
d B
one
91 Human Y Y I A1 U Y Y N TF LS N 60 W x x N S 5 F Y Y Y N N N N N N Y N N
92 Human Y Y M A3 P N Y N TF D Up N 30 E x x N S 5 95% Y Y Y N N N N N N N N N
93 Human Y N F E1/E2 P N Y N TF RS E S 30 W x x N S 5 85% Y Y Y Y N Y N N N Y N N
94 Human Y Y M A2/A3 P Y Y N TF LS Down W 0 x N S 5 50-
65% Y Y Y N N N N N N Y N Y
95 Human Y Y I A1 P N Y N TF D Up E 60 S x x N D 95a 5 95% Y Y Y N N N N N N Y N Y
95A Human Y N I A1 N U U D 95 5 F N N N N N N N N N N N N
96 Human Y N I A U Y Y N U W 40 S x x U S 5 F N N N N N N N N N N N N
97 Human Y Y M A1/A2 P N N N TF LS Down N 60 E x x N S 5 90% Y Y N Y N N N N N Y N Y
98 Human Y N F A1/A2 P N Y N SF RS Up, SE W 0 x N S 4 65% Y Y Y Y N N N N N Y N N
99 Human Y Y F A2/A3 S N Y N DO N D 101 4 50% Y Y Y Y N N N N N Y Y N
99* Faunal N N Fauna Fauna N/A
N/A
Y N N/A N O 99 N/A Y N N N N N N Y N Y Y N
100 Human Y N I A2+ U Y Y N U D N S 5 5% Y Y N Y N N N N N Y N Y
101 Human Y N F A3/E1 S N Y N DO N D 99 4 < 50% Y Y Y Y Y N N N N Y N N
102 Human Y N I S3 D N N U Y S 5 F Y Y Y N N N N N N Y N Y
103 Human Y N F E1/E2 P N Y N TF RS Down N 30 W x x Y S 5 45% Y Y Y N N N N N N Y N N
104 Human N N I S3 P N N U Y S 5 10% Y Y Y Y N N N N N Y N N
105 Human Y Y M A3/E1 P N Y N TF D NE N 70 W x x N D 105A 5 90% Y N N N N N N N N N N Y
105A Human Y N I A U N U N U N D 105 5 3-5% Y Y N N N N N N N Y N N
106 Human Y N I A D N Y N U Y S 5 1% Y Y Y N N N N N N N N Y
107 Human Y Y F A3/E1 P N Y N TF S Down N 50 E x x N S 4 98-
99% Y Y N Y Y N N Y N Y Y Y
108 Human Y Y I S2 P N Y N U N 15 E x x Y S 5 15-
20% Y N Y N N N N N N Y Y N
109 Human Y N M A2 P N Y N TF RS N E 30 S x x N S 4 75% Y Y Y N N N N N N Y N N
110 Human Y N F E1 P N Y N TF LS N W 0 x Y S 5 50% Y Y Y Y N N N N N Y N N
111 Human Y N M A2/A3 P N Y N TF LS S N 60 E x x N S 4 75% Y Y Y N N N N N N Y N N
112 Human Y N F A2 P N N N TF D S 10 W x x U S 5 80% Y Y N N N N N N N Y N N
113 Human Y N M A2 P N Y N TF D NE W 60 S x x Y S 5 65% Y Y Y N N N N N N Y N N
114 Human N N I A U N Y N U Y S 5 2% N N N N N N N N N Y N N

520
Mortuary Context Burial-Associated Unworked Organic Material
Bur
ial #
Spe
cies
Dis
tinct
Ind
ivid
ual A
(Hum
an)
Isot
ope
Stu
dy
Sex
B
Age
Cod
e C
Inte
rmen
t Typ
e D
Cre
mat
ion
Oth
er B
urni
ng
Roc
k ca
irn
Fle
xion
E
Pos
itio
n F
Fac
e
Ori
enta
tion
Nor
th: N
W-N
-NE
Eas
t: N
E-E
-SE
Sou
th: S
W-S
-SE
Wes
t: SW
-W-N
W
Dis
turb
ed
Bur
ial T
ype
G
Ass
ocia
ted
buri
als
Spa
tial C
lust
er H
% c
ompl
ete
She
llfi
sh
Cer
ethi
dea
She
lls
(sna
ils)
Ost
rea
lurid
a (o
yste
rs)
Mac
oma
nasu
ta (
Bor
ing
& B
entn
ose
clam
s)
Myt
ilus
(mus
sels
)
Aba
lone
She
ll (
Who
le)
Cra
b C
law
Fis
h V
erte
brae
/Bon
e
Tur
tle C
arap
ace
Fau
nal r
emai
ns
Bot
anic
al R
emai
ns
Bir
d B
one
115 Human Y Y I S1 U N Y N U Y S 1 5% Y N Y N N N N N N N N N
116 Human Y Y F A2 P N Y N TF RS Down S 15 E x x Y S 5 25% Y Y Y N N N N Y N Y N N
117 Human N Y M A1/A2 S Y Y N U N S 5 5% Y Y Y N Y N N N N Y N N
118 Human Y N M A3 P N Y N TF V N E 0 x N S 4 90% N N N N N N N N N Y Y N
119 Human Y Y I I P N Y N U Y D 120 4 5% Y N Y N N N N N N Y N N
119A Human N N I U S N U N U N/A
O 4 N/A N N N N N N N N N N N N
120 Human Y Y F A1 P N N N TF RS Down, N/NE
S 50 E x x N D 119 4 90% N N N N N N N N N N N N
121 Human Y N M E1 P N N N TF D S N 45 E x x N S 4 95% N N N N N N N N N Y N N
122 Human Y N F E1 P N N N TF D N 80 E x x Y S 4 45% Y Y Y N N N N N N N N Y
123 Human Y N F E1 P Y Y N TF D E 10 S x x Y S 5 25% Y Y Y N N N N N N Y N N
124 Human Y N I A2+ P N Y N TF D N S 10 W x x Y S 5 20-
25% N N N N N
N N N N N N N
125 Human Y Y F E1 P N Y N TF LS Y S 4 ~60% Y Y Y Y N N N N N Y Y Y
126 Human Y N F E1 P N Y N TF D NW S 0 x N S 5 90% Y Y Y Y N N N N N Y N N
127 Human Y Y I I D N N N U Y S 4 F Y N Y N N N N N N Y N Y
128 Human Y Y I I P N Y Y TF LS W/NW W 0 x Y S 4 65% Y Y N Y N N N N N N Y N
129 Human Y Y F E1 P N Y N TF RS Down E 20 S x x Y S 4 90% N N N N N N N Y N Y N N
130 Human Y Y M A1 P N Y N TF D Up S 40 W x x Y S 5 50% Y Y N N N N N N N Y N N
131 Human Y N M A3/E1 P N Y N TF RS W N 60 E x x N S 4 85% Y Y N N N N N N N Y N N
132 Human Y Y M A1 P N N N TF D N W 0 x N S 5 98% N N N N N N N N N Y Y N
133 Human Y N I A1 P N Y N TF RS W S 60 E x x N S 5 75% Y N N Y N N N N N Y Y N
134 Human Y Y I A1 P N Y N TF RS Down,
NW N 25 E x x Y D 160 5 75% Y N N N N Y N N N Y N Y
135 Human Y Y I S2 P Y Y N TF Up N 40 E x x N S 5 50% Y Y Y N N N N N N N N N
136 Human Y Y I I P N Y N TF D SE N 10 W x x N S 5 30% Y Y Y Y N N N N N Y N Y
137 Human Y Y I S1 U N N N TF RS S N 40 W x x N D 159 5 F N N N N N N N N N N N N
138 Human Y N M A3 P N N N TF S Down N 30 E x x N S 5 99% Y Y Y N N N N N N Y N N
139 Human Y N I A2 P Y Y N TF V SE W 30 S x x N S 5 50% Y N Y N N N N N N N N N
140 Human Y Y M A3 P N Y N TF D U S 5 80% N N N N N N N N N N N N
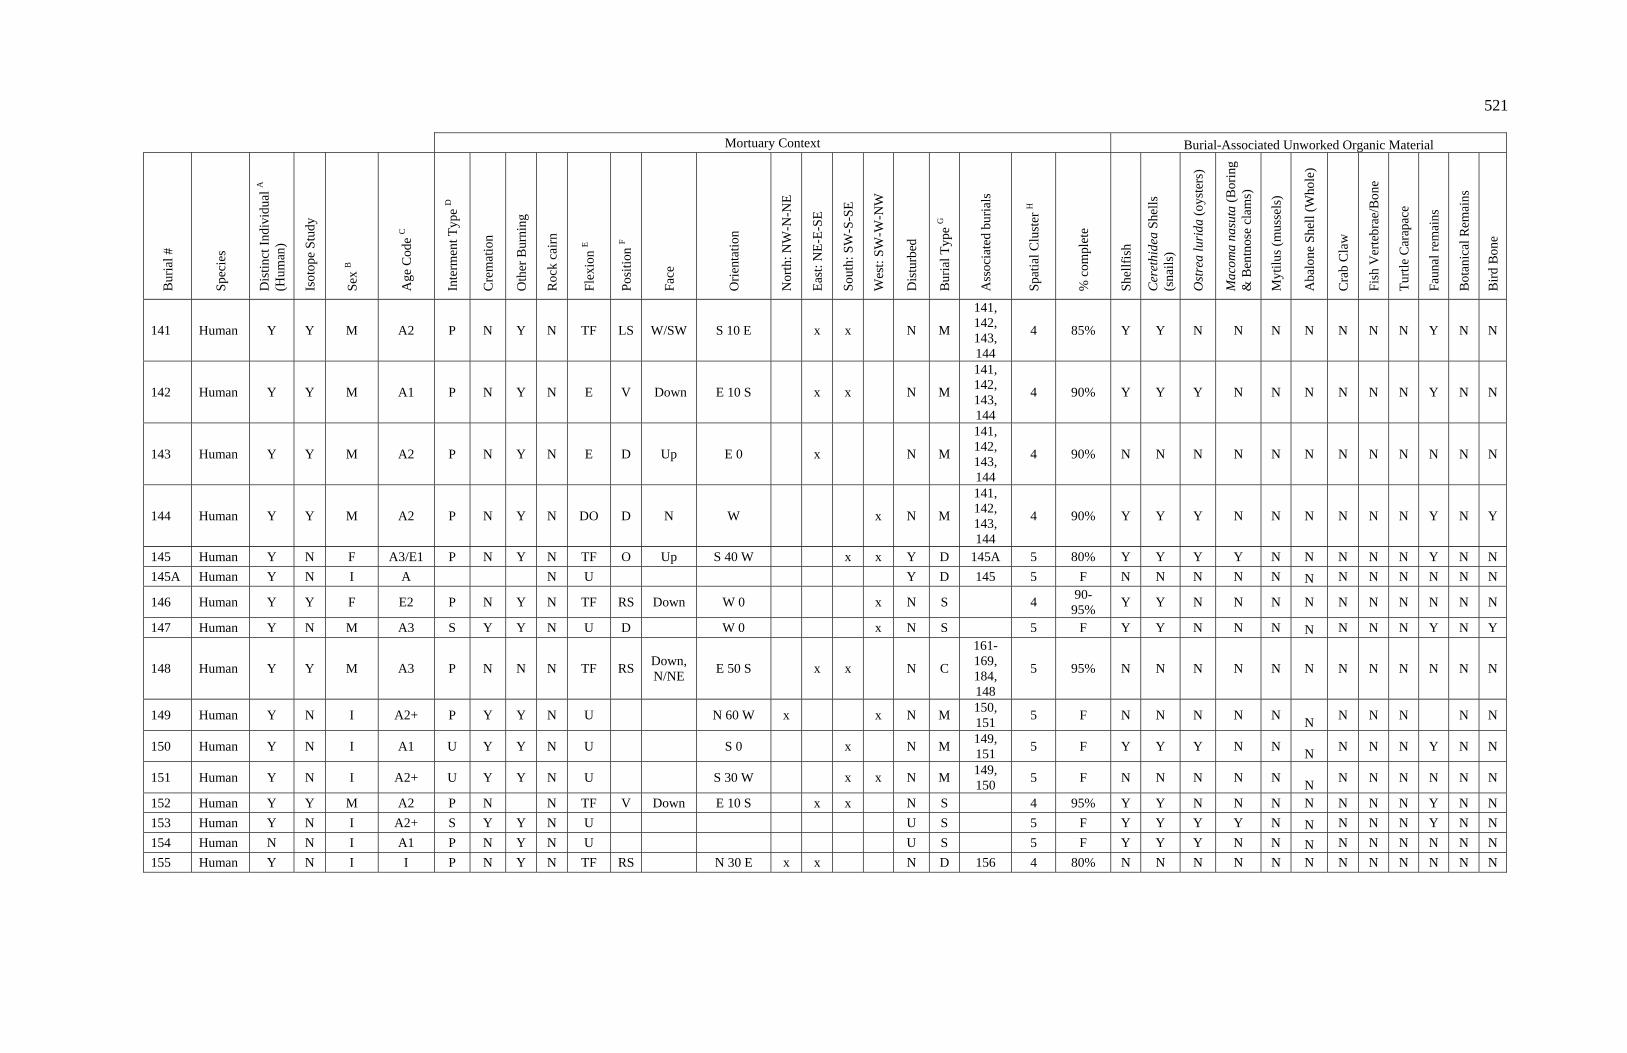
521
Mortuary Context Burial-Associated Unworked Organic Material
Bur
ial #
Spe
cies
Dis
tinct
Ind
ivid
ual A
(Hum
an)
Isot
ope
Stu
dy
Sex
B
Age
Cod
e C
Inte
rmen
t Typ
e D
Cre
mat
ion
Oth
er B
urni
ng
Roc
k ca
irn
Fle
xion
E
Pos
itio
n F
Fac
e
Ori
enta
tion
Nor
th: N
W-N
-NE
Eas
t: N
E-E
-SE
Sou
th: S
W-S
-SE
Wes
t: SW
-W-N
W
Dis
turb
ed
Bur
ial T
ype
G
Ass
ocia
ted
buri
als
Spa
tial C
lust
er H
% c
ompl
ete
She
llfi
sh
Cer
ethi
dea
She
lls
(sna
ils)
Ost
rea
lurid
a (o
yste
rs)
Mac
oma
nasu
ta (
Bor
ing
& B
entn
ose
clam
s)
Myt
ilus
(mus
sels
)
Aba
lone
She
ll (
Who
le)
Cra
b C
law
Fis
h V
erte
brae
/Bon
e
Tur
tle C
arap
ace
Fau
nal r
emai
ns
Bot
anic
al R
emai
ns
Bir
d B
one
141 Human Y Y M A2 P N Y N TF LS W/SW S 10 E x x N M
141, 142, 143, 144
4 85% Y Y N N N N N N N Y N N
142 Human Y Y M A1 P N Y N E V Down E 10 S x x N M
141, 142, 143, 144
4 90% Y Y Y N N N N N N Y N N
143 Human Y Y M A2 P N Y N E D Up E 0 x N M
141, 142, 143, 144
4 90% N N N N N N N N N N N N
144 Human Y Y M A2 P N Y N DO D N W x N M
141, 142, 143, 144
4 90% Y Y Y N N N N N N Y N Y
145 Human Y N F A3/E1 P N Y N TF O Up S 40 W x x Y D 145A 5 80% Y Y Y Y N N N N N Y N N
145A Human Y N I A N U Y D 145 5 F N N N N N N N N N N N N
146 Human Y Y F E2 P N Y N TF RS Down W 0 x N S 4 90-
95% Y Y N N N N N N N N N N
147 Human Y N M A3 S Y Y N U D W 0 x N S 5 F Y Y N N N N N N N Y N Y
148 Human Y Y M A3 P N N N TF RS Down, N/NE
E 50 S x x N C
161-169, 184, 148
5 95% N N N N N N N N N N N N
149 Human Y N I A2+ P Y Y N U N 60 W x x N M 150, 151
5 F N N N N N N
N N N N N
150 Human Y N I A1 U Y Y N U S 0 x N M 149, 151
5 F Y Y Y N N N
N N N Y N N
151 Human Y N I A2+ U Y Y N U S 30 W x x N M 149, 150
5 F N N N N N N
N N N N N N
152 Human Y Y M A2 P N N TF V Down E 10 S x x N S 4 95% Y Y N N N N N N N Y N N
153 Human Y N I A2+ S Y Y N U U S 5 F Y Y Y Y N N N N N Y N N
154 Human N N I A1 P N Y N U U S 5 F Y Y Y N N N N N N N N N
155 Human Y N I I P N Y N TF RS N 30 E x x N D 156 4 80% N N N N N N N N N N N N
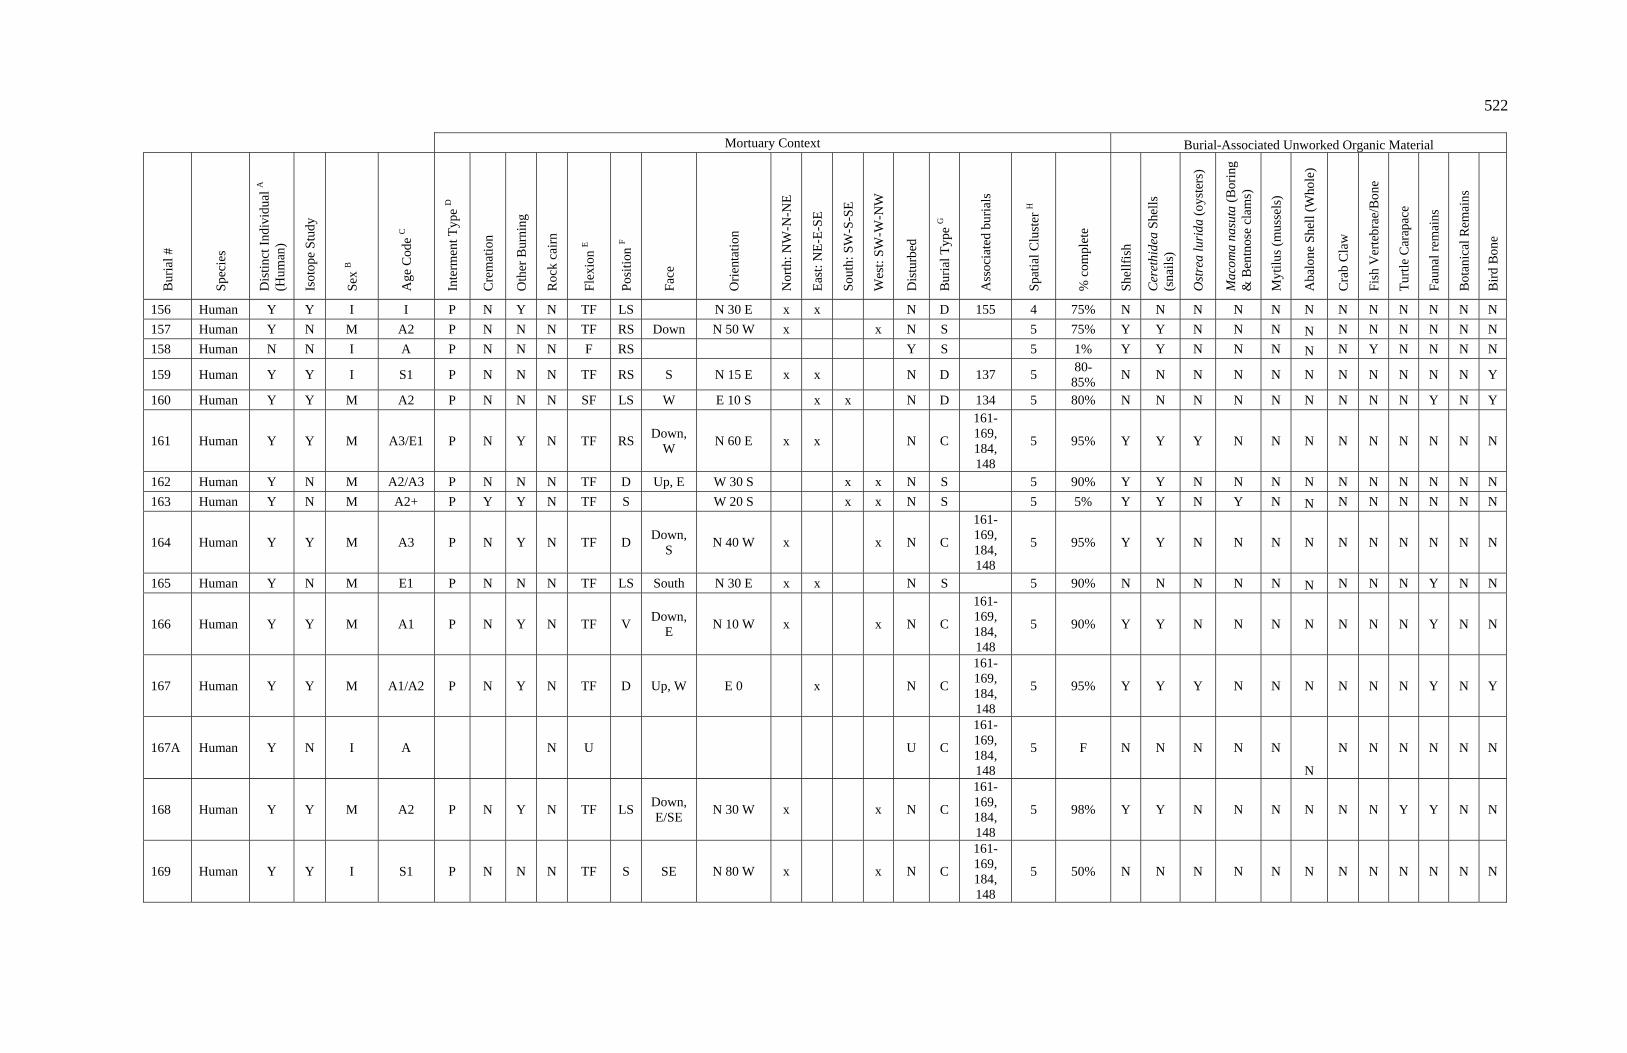
522
Mortuary Context Burial-Associated Unworked Organic Material
Bur
ial #
Spe
cies
Dis
tinct
Ind
ivid
ual A
(Hum
an)
Isot
ope
Stu
dy
Sex
B
Age
Cod
e C
Inte
rmen
t Typ
e D
Cre
mat
ion
Oth
er B
urni
ng
Roc
k ca
irn
Fle
xion
E
Pos
itio
n F
Fac
e
Ori
enta
tion
Nor
th: N
W-N
-NE
Eas
t: N
E-E
-SE
Sou
th: S
W-S
-SE
Wes
t: SW
-W-N
W
Dis
turb
ed
Bur
ial T
ype
G
Ass
ocia
ted
buri
als
Spa
tial C
lust
er H
% c
ompl
ete
She
llfi
sh
Cer
ethi
dea
She
lls
(sna
ils)
Ost
rea
lurid
a (o
yste
rs)
Mac
oma
nasu
ta (
Bor
ing
& B
entn
ose
clam
s)
Myt
ilus
(mus
sels
)
Aba
lone
She
ll (
Who
le)
Cra
b C
law
Fis
h V
erte
brae
/Bon
e
Tur
tle C
arap
ace
Fau
nal r
emai
ns
Bot
anic
al R
emai
ns
Bir
d B
one
156 Human Y Y I I P N Y N TF LS N 30 E x x N D 155 4 75% N N N N N N N N N N N N
157 Human Y N M A2 P N N N TF RS Down N 50 W x x N S 5 75% Y Y N N N N N N N N N N
158 Human N N I A P N N N F RS Y S 5 1% Y Y N N N N N Y N N N N
159 Human Y Y I S1 P N N N TF RS S N 15 E x x N D 137 5 80-
85% N N N N N N N N N N N Y
160 Human Y Y M A2 P N N N SF LS W E 10 S x x N D 134 5 80% N N N N N N N N N Y N Y
161 Human Y Y M A3/E1 P N Y N TF RS Down,
W N 60 E x x N C
161-169, 184, 148
5 95% Y Y Y N N N N N N N N N
162 Human Y N M A2/A3 P N N N TF D Up, E W 30 S x x N S 5 90% Y Y N N N N N N N N N N
163 Human Y N M A2+ P Y Y N TF S W 20 S x x N S 5 5% Y Y N Y N N N N N N N N
164 Human Y Y M A3 P N Y N TF D Down,
S N 40 W x x N C
161-169, 184, 148
5 95% Y Y N N N N N N N N N N
165 Human Y N M E1 P N N N TF LS South N 30 E x x N S 5 90% N N N N N N N N N Y N N
166 Human Y Y M A1 P N Y N TF V Down,
E N 10 W x x N C
161-169, 184, 148
5 90% Y Y N N N N N N N Y N N
167 Human Y Y M A1/A2 P N Y N TF D Up, W E 0 x N C
161-169, 184, 148
5 95% Y Y Y N N N N N N Y N Y
167A Human Y N I A N U U C
161-169, 184, 148
5 F N N N N N
N
N N N N N N
168 Human Y Y M A2 P N Y N TF LS Down, E/SE
N 30 W x x N C
161-169, 184, 148
5 98% Y Y N N N N N N Y Y N N
169 Human Y Y I S1 P N N N TF S SE N 80 W x x N C
161-169, 184, 148
5 50% N N N N N N N N N N N N

523
Mortuary Context Burial-Associated Unworked Organic Material
Bur
ial #
Spe
cies
Dis
tinct
Ind
ivid
ual A
(Hum
an)
Isot
ope
Stu
dy
Sex
B
Age
Cod
e C
Inte
rmen
t Typ
e D
Cre
mat
ion
Oth
er B
urni
ng
Roc
k ca
irn
Fle
xion
E
Pos
itio
n F
Fac
e
Ori
enta
tion
Nor
th: N
W-N
-NE
Eas
t: N
E-E
-SE
Sou
th: S
W-S
-SE
Wes
t: SW
-W-N
W
Dis
turb
ed
Bur
ial T
ype
G
Ass
ocia
ted
buri
als
Spa
tial C
lust
er H
% c
ompl
ete
She
llfi
sh
Cer
ethi
dea
She
lls
(sna
ils)
Ost
rea
lurid
a (o
yste
rs)
Mac
oma
nasu
ta (
Bor
ing
& B
entn
ose
clam
s)
Myt
ilus
(mus
sels
)
Aba
lone
She
ll (
Who
le)
Cra
b C
law
Fis
h V
erte
brae
/Bon
e
Tur
tle C
arap
ace
Fau
nal r
emai
ns
Bot
anic
al R
emai
ns
Bir
d B
one
170 Human Y N M A3 P N Y N TF LS S N 30 E x x N S 5 95% N N N N N N N N N N N N
171 Human Y Y M A3 P N N N TF RS NE S 0 x N S 5 95% Y Y Y Y N N N N N Y N Y
172 Human Y Y M A3 P N Y N TF RS Down E 20 S x x N S 5 95% Y Y Y N N N N N N Y N N
173 Human Y N I A1 P Y Y N TF V Down W 50 S x x Y S 5 70% Y Y N N N N N N N N N N
174 Human Y N I A2/A3 S N Y N U N S 5 < 1% Y Y Y N N N N N N Y Y N
175 Human Y Y M A2 P N Y N SF D W/SW E 30 S x x N S 5 90% N N N N N N N N N Y N N
176 Human Y Y M A2 P N Y N TF D Up,
S/SW N 40 E x x N S 5 90% Y N Y N N N N N N Y N N
177 Human Y Y I S1 P N Y N TF LS E N 40 W x x N S 5 80% Y N Y Y N N N N N Y N Y
178 Human Y N I S1 P N Y N SF RS E/SE S 30 W x x N S 4 75% N N N N N N N Y N N N N
179 Human Y Y M E1 P N Y N TF D W N 60 E x x Y S 5 95% Y Y N N N N N N N N N N
180 Human Y N M A3 P N N N TF RS E S 30 W x x Y S 5 85% Y Y Y N N N N Y N Y N N
181 Human Y N I A2 S Y Y N U RS N 60 E x x N S 5 F N N N N N N N N N N N N
182 Human Y Y M A2 P N N N TF LS S N 60 E x x Y S 5 45% Y N N N N N N N N Y N N
183 Human Y Y F E1 P N Y N DO D S N 15 W x x N S 5 90% N N N N N N N N N Y N N
184 Human Y Y F E2 P N N N TF D S/SE S 50 E x x N C
161-169, 184, 148
5 90% N N N N N N N N N N N
185 Human Y N I A2+ P N N N U Y S 6 25% Y Y N N N N N N N Y N N
186 Human Y Y I I D N N U N 20 E x x Y S 4 F Y Y Y N N N N N N Y N N
187 Human Y N F A2 P N N N TF LS N/NE S 30 W x x N S 4 75% Y Y Y N N N N N N Y N N
188 Human Y Y M E1 S N Y Y U N S x Y S 6 45% Y Y Y N N N N N N Y N N
189 Human Y N F E1 P N N N TF LS Down,
E N 10 E x x Y S 6 75% Y Y Y N N N N N N Y N N
190 Human Y N F A3+ P N Y N TF V Down N 10 W x x Y S 6 25% Y Y Y N N N N N N N N N
191 Human Y N M A1/A2 P N Y N SF LS NW E 40 S x x Y S 6 45% Y Y Y N N N N N N Y N N
192 Human Y N I A2+ S Y Y N U Y S 4 F Y Y Y N N N N Y N Y N N
193 Human Y N F A2+ S N Y N TF LS NE N 15 E x x Y S 4 75% Y Y N N N N N N N Y N N
194 Human Y Y M A2/A3 P N Y N TF RS Down W 5 E x N D 194a 6 75% Y Y Y N N N N N N Y N N
194A Human Y Y I S3 P N Y N F LS S 10 W x x N D 194 6 15% Y Y Y N N N N N N N N N
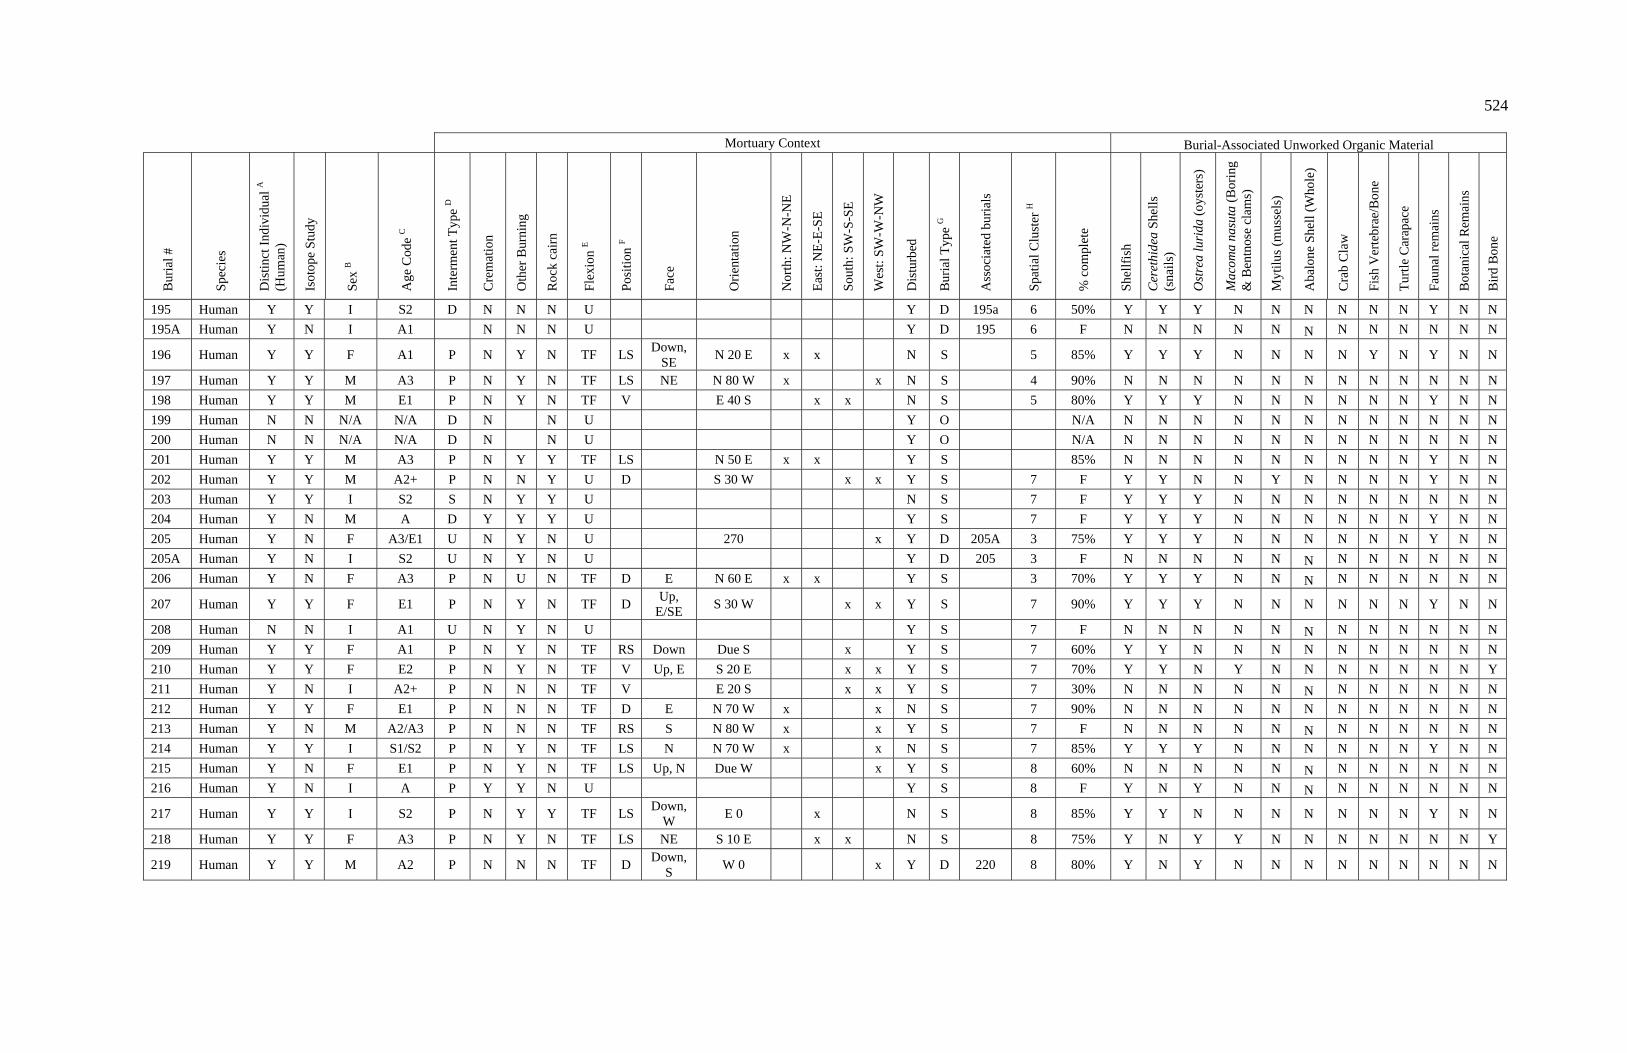
524
Mortuary Context Burial-Associated Unworked Organic Material
Bur
ial #
Spe
cies
Dis
tinct
Ind
ivid
ual A
(Hum
an)
Isot
ope
Stu
dy
Sex
B
Age
Cod
e C
Inte
rmen
t Typ
e D
Cre
mat
ion
Oth
er B
urni
ng
Roc
k ca
irn
Fle
xion
E
Pos
itio
n F
Fac
e
Ori
enta
tion
Nor
th: N
W-N
-NE
Eas
t: N
E-E
-SE
Sou
th: S
W-S
-SE
Wes
t: SW
-W-N
W
Dis
turb
ed
Bur
ial T
ype
G
Ass
ocia
ted
buri
als
Spa
tial C
lust
er H
% c
ompl
ete
She
llfi
sh
Cer
ethi
dea
She
lls
(sna
ils)
Ost
rea
lurid
a (o
yste
rs)
Mac
oma
nasu
ta (
Bor
ing
& B
entn
ose
clam
s)
Myt
ilus
(mus
sels
)
Aba
lone
She
ll (
Who
le)
Cra
b C
law
Fis
h V
erte
brae
/Bon
e
Tur
tle C
arap
ace
Fau
nal r
emai
ns
Bot
anic
al R
emai
ns
Bir
d B
one
195 Human Y Y I S2 D N N N U Y D 195a 6 50% Y Y Y N N N N N N Y N N
195A Human Y N I A1 N N N U Y D 195 6 F N N N N N N N N N N N N
196 Human Y Y F A1 P N Y N TF LS Down,
SE N 20 E x x N S 5 85% Y Y Y N N N N Y N Y N N
197 Human Y Y M A3 P N Y N TF LS NE N 80 W x x N S 4 90% N N N N N N N N N N N N
198 Human Y Y M E1 P N Y N TF V E 40 S x x N S 5 80% Y Y Y N N N N N N Y N N
199 Human N N N/A N/A D N N U Y O N/A N N N N N N N N N N N N
200 Human N N N/A N/A D N N U Y O N/A N N N N N N N N N N N N
201 Human Y Y M A3 P N Y Y TF LS N 50 E x x Y S 85% N N N N N N N N N Y N N
202 Human Y Y M A2+ P N N Y U D S 30 W x x Y S 7 F Y Y N N Y N N N N Y N N
203 Human Y Y I S2 S N Y Y U N S 7 F Y Y Y N N N N N N N N N
204 Human Y N M A D Y Y Y U Y S 7 F Y Y Y N N N N N N Y N N
205 Human Y N F A3/E1 U N Y N U 270 x Y D 205A 3 75% Y Y Y N N N N N N Y N N
205A Human Y N I S2 U N Y N U Y D 205 3 F N N N N N N N N N N N N
206 Human Y N F A3 P N U N TF D E N 60 E x x Y S 3 70% Y Y Y N N N N N N N N N
207 Human Y Y F E1 P N Y N TF D Up,
E/SE S 30 W x x Y S 7 90% Y Y Y N N N N N N Y N N
208 Human N N I A1 U N Y N U Y S 7 F N N N N N N N N N N N N
209 Human Y Y F A1 P N Y N TF RS Down Due S x Y S 7 60% Y Y N N N N N N N N N N
210 Human Y Y F E2 P N Y N TF V Up, E S 20 E x x Y S 7 70% Y Y N Y N N N N N N N Y
211 Human Y N I A2+ P N N N TF V E 20 S x x Y S 7 30% N N N N N N N N N N N N
212 Human Y Y F E1 P N N N TF D E N 70 W x x N S 7 90% N N N N N N N N N N N N
213 Human Y N M A2/A3 P N N N TF RS S N 80 W x x Y S 7 F N N N N N N N N N N N N
214 Human Y Y I S1/S2 P N Y N TF LS N N 70 W x x N S 7 85% Y Y Y N N N N N N Y N N
215 Human Y N F E1 P N Y N TF LS Up, N Due W x Y S 8 60% N N N N N N N N N N N N
216 Human Y N I A P Y Y N U Y S 8 F Y N Y N N N N N N N N N
217 Human Y Y I S2 P N Y Y TF LS Down,
W E 0 x N S 8 85% Y Y N N N N N N N Y N N
218 Human Y Y F A3 P N Y N TF LS NE S 10 E x x N S 8 75% Y N Y Y N N N N N N N Y
219 Human Y Y M A2 P N N N TF D Down,
S W 0 x Y D 220 8 80% Y N Y N N N N N N N N N

525
Mortuary Context Burial-Associated Unworked Organic Material
Bur
ial #
Spe
cies
Dis
tinct
Ind
ivid
ual A
(Hum
an)
Isot
ope
Stu
dy
Sex
B
Age
Cod
e C
Inte
rmen
t Typ
e D
Cre
mat
ion
Oth
er B
urni
ng
Roc
k ca
irn
Fle
xion
E
Pos
itio
n F
Fac
e
Ori
enta
tion
Nor
th: N
W-N
-NE
Eas
t: N
E-E
-SE
Sou
th: S
W-S
-SE
Wes
t: SW
-W-N
W
Dis
turb
ed
Bur
ial T
ype
G
Ass
ocia
ted
buri
als
Spa
tial C
lust
er H
% c
ompl
ete
She
llfi
sh
Cer
ethi
dea
She
lls
(sna
ils)
Ost
rea
lurid
a (o
yste
rs)
Mac
oma
nasu
ta (
Bor
ing
& B
entn
ose
clam
s)
Myt
ilus
(mus
sels
)
Aba
lone
She
ll (
Who
le)
Cra
b C
law
Fis
h V
erte
brae
/Bon
e
Tur
tle C
arap
ace
Fau
nal r
emai
ns
Bot
anic
al R
emai
ns
Bir
d B
one
220 Human Y Y I I P N N N TF RS N x N D 219 8 F Y N Y N N N N N N Y N N
221 Human Y Y F A2/A3 P N N N SF RS Down,
E S 10 W x x N S 3 97% Y Y N N N N N N N Y N N
222 Human Y Y I S2 P Y Y N TF RS Down,
SE W 30 S x x Y S 8 30% Y Y N N N N N N N Y N N
223 Human Y N F E1 P Y Y N TF V Up, SE S 0 x N D 223A 8 50% Y Y Y N N N N N N Y N N
223A Human Y N I I U N Y N U Y D 223 8 F N N N N N N N N N N N N
224 Human Y N M A2 P Y Y N TF V Up, E W 5 S x x N S 8 90% Y N Y N N N N N N N N Y
225 Human Y Y I A P Y Y N TF D Up, NW
N 60 E Y S 8 45% Y Y Y N N Y N N N N N N
226 Human Y Y M A1 P N N N TF D Up, S E 10 S x x Y D 227 8 90% Y N Y N N N N N N N N N
227 Human Y Y I A1 P N Y N TF V Down,
N N 60 W x x N D 226 8 90% Y Y N N N N N N N Y N N
228 Human Y Y M A2 P N Y N TF LS Up, SW
E 10 E x Y S 8 75% N N N N N N N N N N N N
229 Human Y N M A3 D N N U Y D 229A 25% N N N N N N N N N N N N
229A Human Y N I I U N N N U Y D 229 F N N N N N N N N N N N N
230 Human Y Y F A3 P Y Y N TF S Down,
W N 50 W x x N D 230A 8 90% Y Y Y N N N N N N Y N N
230A Human Y N I I U N Y N U U D 230 8 F N N N N N N N N N N N N
231 Human Y N M A3 P N N N TF D Down,
W N 45 E x x N S 8 80% Y Y Y N N
N N N N N N N
232 Human Y N F E1 P N Y N TF RS Down,
W N 40 E x x N S 3 90% Y Y Y N N N N N N Y N N
233 Human Y Y M A3 D N N N U Y S 7 90% Y Y Y N N N N N N N N N
234 Human Y Y F E P N N N TF RS Down,
S N 15 E x x Y S 7 50% Y Y Y N N N N N N N N N
235 Human Y Y I I U N Y N U S 30 W x x Y D 235a 3 25% Y Y Y N N N N N N Y N N
235A Human Y N I S1 U N Y N U Y D 235 3 F N N N N N N N N N N N N
236 Human Y Y F A2 P N N N TF D Down,
NW S 45 E x x N S 8 80% Y Y Y Y N N N N N N N N
237 Human Y Y M A2 P N N N TF S Down,
E W 10 S x x Y S 3 95% Y Y Y Y N N N N N N N N
238 Human Y N M A3 P N N N TF D Down,
N E 30 S x x N D 238A 8 75% Y Y Y Y N
N N N N Y Y N
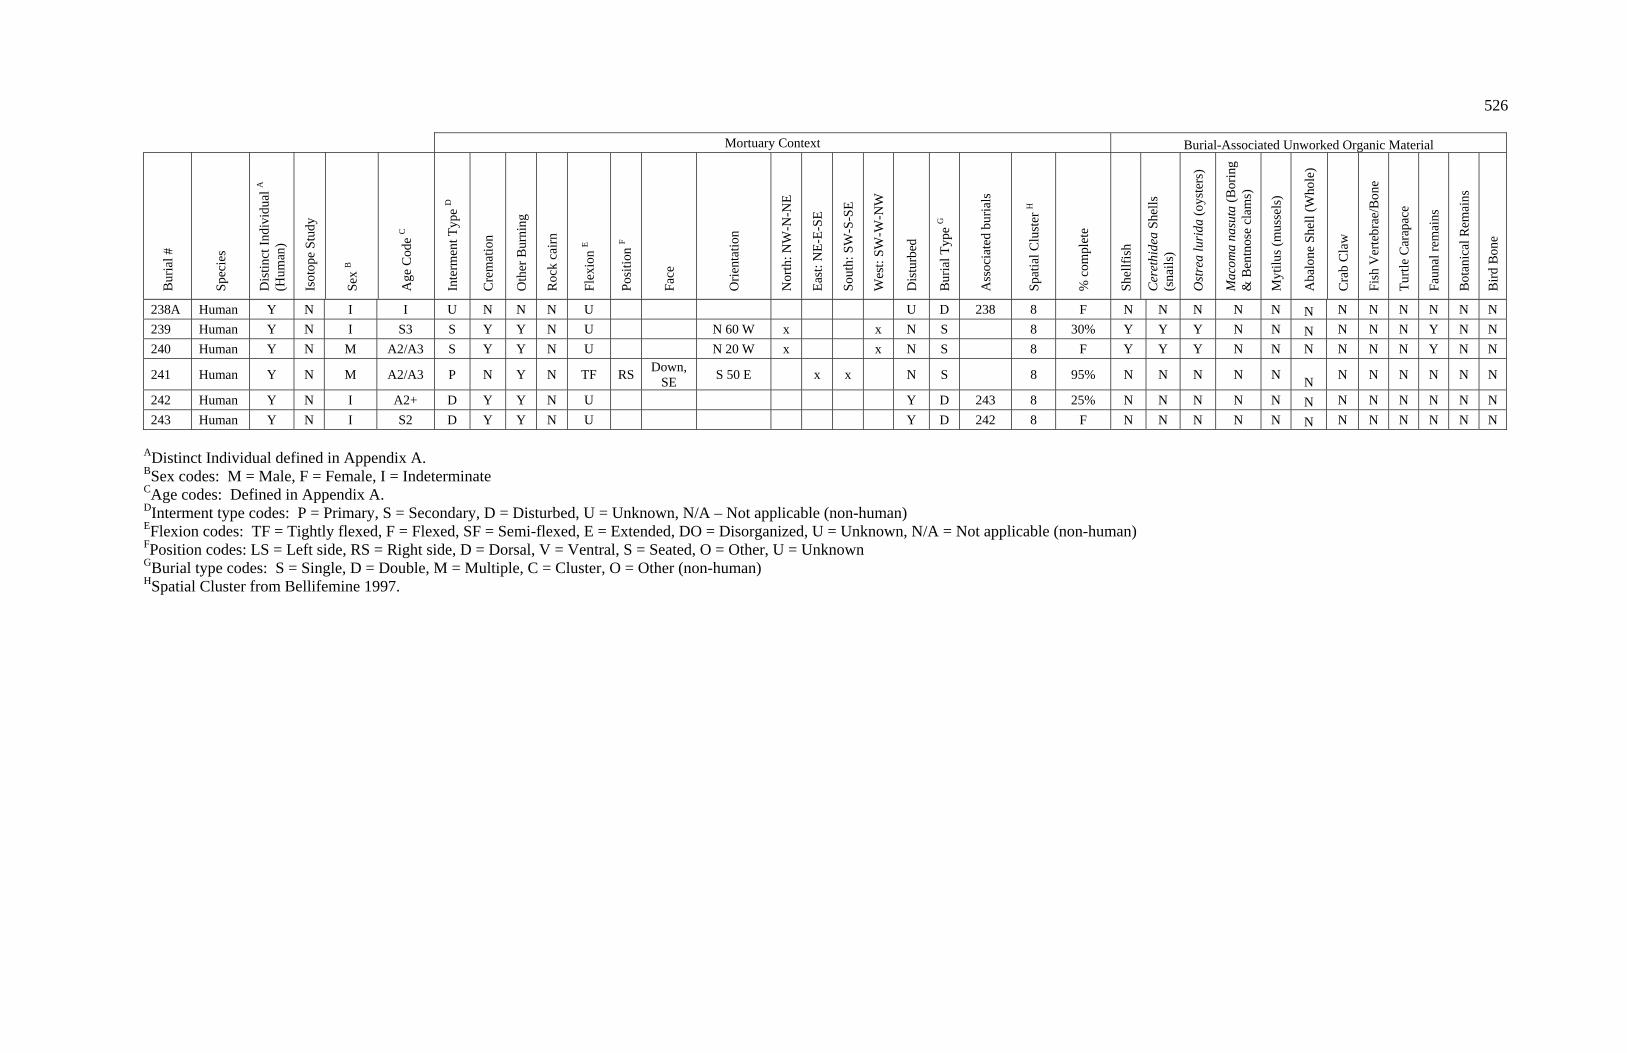
526
Mortuary Context Burial-Associated Unworked Organic Material
Bur
ial #
Spe
cies
Dis
tinct
Ind
ivid
ual A
(Hum
an)
Isot
ope
Stu
dy
Sex
B
Age
Cod
e C
Inte
rmen
t Typ
e D
Cre
mat
ion
Oth
er B
urni
ng
Roc
k ca
irn
Fle
xion
E
Pos
itio
n F
Fac
e
Ori
enta
tion
Nor
th: N
W-N
-NE
Eas
t: N
E-E
-SE
Sou
th: S
W-S
-SE
Wes
t: SW
-W-N
W
Dis
turb
ed
Bur
ial T
ype
G
Ass
ocia
ted
buri
als
Spa
tial C
lust
er H
% c
ompl
ete
She
llfi
sh
Cer
ethi
dea
She
lls
(sna
ils)
Ost
rea
lurid
a (o
yste
rs)
Mac
oma
nasu
ta (
Bor
ing
& B
entn
ose
clam
s)
Myt
ilus
(mus
sels
)
Aba
lone
She
ll (
Who
le)
Cra
b C
law
Fis
h V
erte
brae
/Bon
e
Tur
tle C
arap
ace
Fau
nal r
emai
ns
Bot
anic
al R
emai
ns
Bir
d B
one
238A Human Y N I I U N N N U U D 238 8 F N N N N N N N N N N N N
239 Human Y N I S3 S Y Y N U N 60 W x x N S 8 30% Y Y Y N N N N N N Y N N
240 Human Y N M A2/A3 S Y Y N U N 20 W x x N S 8 F Y Y Y N N N N N N Y N N
241 Human Y N M A2/A3 P N Y N TF RS Down,
SE S 50 E x x N S 8 95% N N N N N
N N N N N N N
242 Human Y N I A2+ D Y Y N U Y D 243 8 25% N N N N N N N N N N N N
243 Human Y N I S2 D Y Y N U Y D 242 8 F N N N N N N N N N N N N
ADistinct Individual defined in Appendix A. BSex codes: M = Male, F = Female, I = Indeterminate CAge codes: Defined in Appendix A. DInterment type codes: P = Primary, S = Secondary, D = Disturbed, U = Unknown, N/A – Not applicable (non-human) EFlexion codes: TF = Tightly flexed, F = Flexed, SF = Semi-flexed, E = Extended, DO = Disorganized, U = Unknown, N/A = Not applicable (non-human) FPosition codes: LS = Left side, RS = Right side, D = Dorsal, V = Ventral, S = Seated, O = Other, U = Unknown GBurial type codes: S = Single, D = Double, M = Multiple, C = Cluster, O = Other (non-human) HSpatial Cluster from Bellifemine 1997.
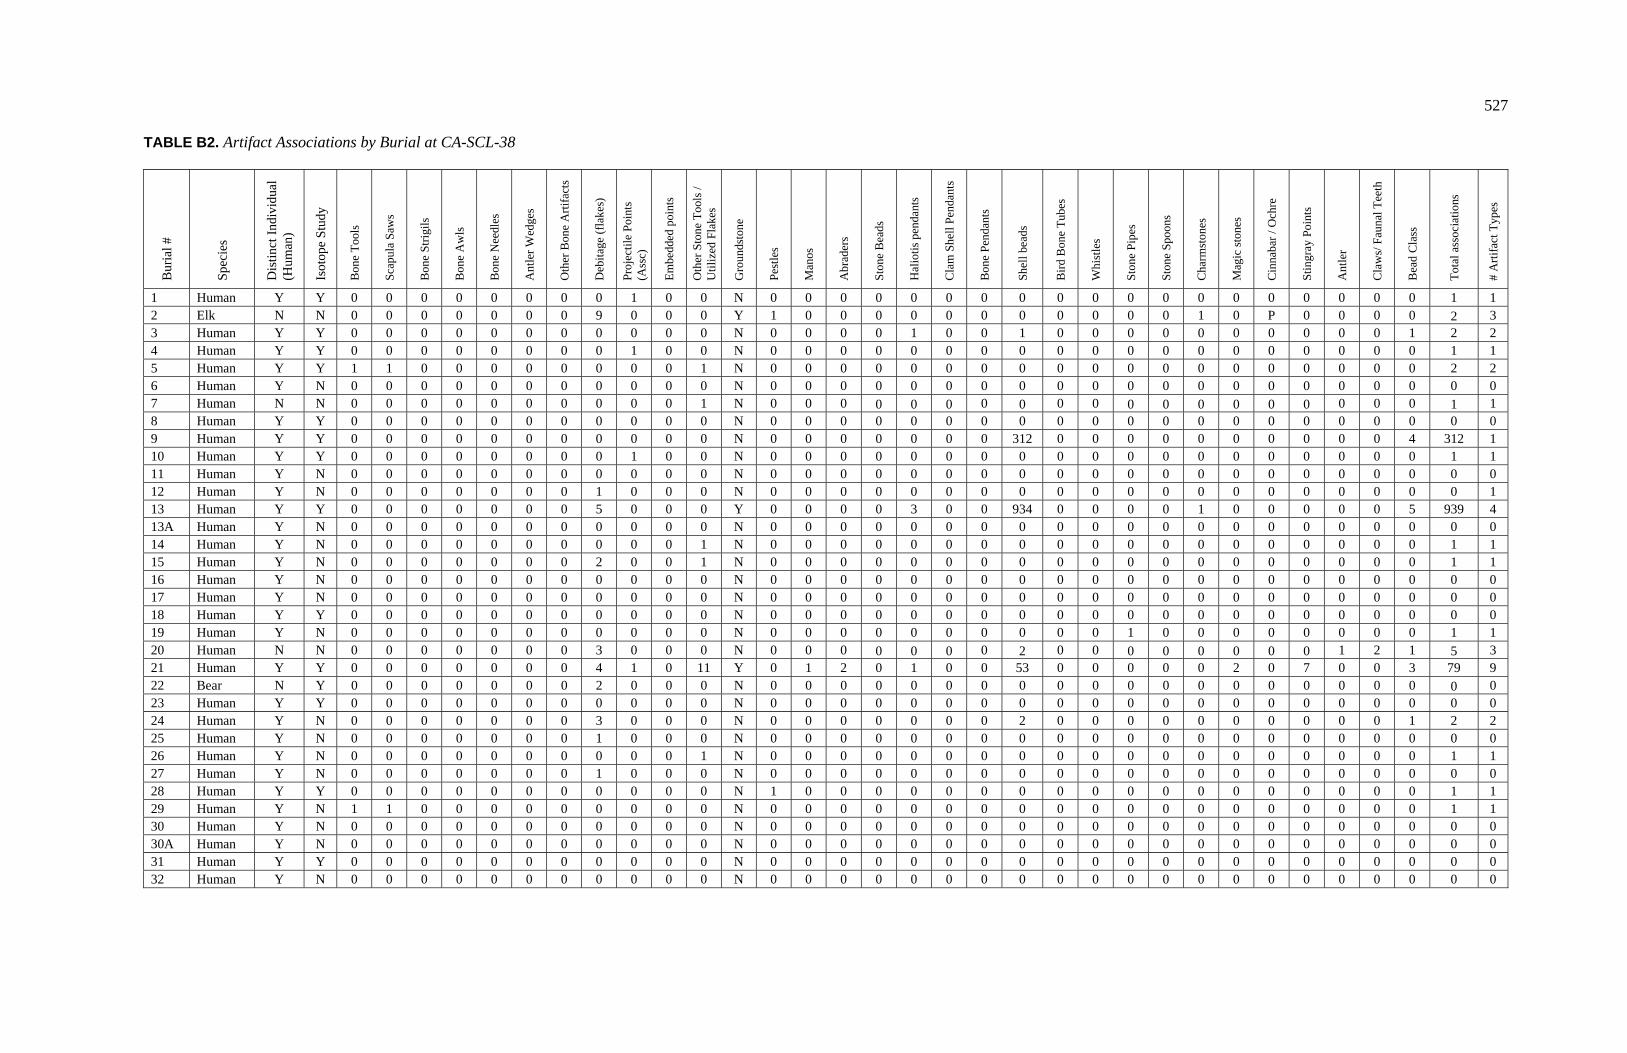
527
TABLE B2. Artifact Associations by Burial at CA-SCL-38
Bur
ial #
Spe
cies
Dis
tinct
Ind
ivid
ual
(Hum
an)
Isot
ope
Stu
dy
Bon
e T
ools
Sca
pula
Saw
s
Bon
e S
trig
ils
Bon
e A
wls
Bon
e N
eedl
es
Ant
ler
Wed
ges
Oth
er B
one
Art
ifac
ts
Deb
itag
e (f
lake
s)
Pro
ject
ile
Poi
nts
(Ass
c)
Em
bedd
ed p
oint
s
Oth
er S
tone
Too
ls /
U
tili
zed
Fla
kes
Gro
unds
tone
Pes
tles
Man
os
Abr
ader
s
Sto
ne B
eads
Hal
ioti
s pe
ndan
ts
Cla
m S
hell
Pend
ants
Bon
e P
enda
nts
Shel
l bea
ds
Bir
d B
one
Tub
es
Whi
stle
s
Sto
ne P
ipes
Sto
ne S
poon
s
Cha
rmst
ones
Mag
ic s
tone
s
Cin
naba
r / O
chre
Sti
ngra
y P
oint
s
Ant
ler
Cla
ws/
Fau
nal T
eeth
Bea
d C
lass
Tot
al a
ssoc
iati
ons
# A
rtif
act T
ypes
1 Human Y Y 0 0 0 0 0 0 0 0 1 0 0 N 0 0 0 0 0 0 0 0 0 0 0 0 0 0 0 0 0 0 0 1 1 2 Elk N N 0 0 0 0 0 0 0 9 0 0 0 Y 1 0 0 0 0 0 0 0 0 0 0 0 1 0 P 0 0 0 0 2 3 3 Human Y Y 0 0 0 0 0 0 0 0 0 0 0 N 0 0 0 0 1 0 0 1 0 0 0 0 0 0 0 0 0 0 1 2 2 4 Human Y Y 0 0 0 0 0 0 0 0 1 0 0 N 0 0 0 0 0 0 0 0 0 0 0 0 0 0 0 0 0 0 0 1 1 5 Human Y Y 1 1 0 0 0 0 0 0 0 0 1 N 0 0 0 0 0 0 0 0 0 0 0 0 0 0 0 0 0 0 0 2 2 6 Human Y N 0 0 0 0 0 0 0 0 0 0 0 N 0 0 0 0 0 0 0 0 0 0 0 0 0 0 0 0 0 0 0 0 0 7 Human N N 0 0 0 0 0 0 0 0 0 0 1 N 0 0 0 0 0 0 0 0 0 0 0 0 0 0 0 0 0 0 0 1 1 8 Human Y Y 0 0 0 0 0 0 0 0 0 0 0 N 0 0 0 0 0 0 0 0 0 0 0 0 0 0 0 0 0 0 0 0 0 9 Human Y Y 0 0 0 0 0 0 0 0 0 0 0 N 0 0 0 0 0 0 0 312 0 0 0 0 0 0 0 0 0 0 4 312 1 10 Human Y Y 0 0 0 0 0 0 0 0 1 0 0 N 0 0 0 0 0 0 0 0 0 0 0 0 0 0 0 0 0 0 0 1 1 11 Human Y N 0 0 0 0 0 0 0 0 0 0 0 N 0 0 0 0 0 0 0 0 0 0 0 0 0 0 0 0 0 0 0 0 0 12 Human Y N 0 0 0 0 0 0 0 1 0 0 0 N 0 0 0 0 0 0 0 0 0 0 0 0 0 0 0 0 0 0 0 0 1 13 Human Y Y 0 0 0 0 0 0 0 5 0 0 0 Y 0 0 0 0 3 0 0 934 0 0 0 0 1 0 0 0 0 0 5 939 4 13A Human Y N 0 0 0 0 0 0 0 0 0 0 0 N 0 0 0 0 0 0 0 0 0 0 0 0 0 0 0 0 0 0 0 0 0 14 Human Y N 0 0 0 0 0 0 0 0 0 0 1 N 0 0 0 0 0 0 0 0 0 0 0 0 0 0 0 0 0 0 0 1 1 15 Human Y N 0 0 0 0 0 0 0 2 0 0 1 N 0 0 0 0 0 0 0 0 0 0 0 0 0 0 0 0 0 0 0 1 1 16 Human Y N 0 0 0 0 0 0 0 0 0 0 0 N 0 0 0 0 0 0 0 0 0 0 0 0 0 0 0 0 0 0 0 0 0 17 Human Y N 0 0 0 0 0 0 0 0 0 0 0 N 0 0 0 0 0 0 0 0 0 0 0 0 0 0 0 0 0 0 0 0 0 18 Human Y Y 0 0 0 0 0 0 0 0 0 0 0 N 0 0 0 0 0 0 0 0 0 0 0 0 0 0 0 0 0 0 0 0 0 19 Human Y N 0 0 0 0 0 0 0 0 0 0 0 N 0 0 0 0 0 0 0 0 0 0 1 0 0 0 0 0 0 0 0 1 1 20 Human N N 0 0 0 0 0 0 0 3 0 0 0 N 0 0 0 0 0 0 0 2 0 0 0 0 0 0 0 0 1 2 1 5 3 21 Human Y Y 0 0 0 0 0 0 0 4 1 0 11 Y 0 1 2 0 1 0 0 53 0 0 0 0 0 2 0 7 0 0 3 79 9 22 Bear N Y 0 0 0 0 0 0 0 2 0 0 0 N 0 0 0 0 0 0 0 0 0 0 0 0 0 0 0 0 0 0 0 0 0 23 Human Y Y 0 0 0 0 0 0 0 0 0 0 0 N 0 0 0 0 0 0 0 0 0 0 0 0 0 0 0 0 0 0 0 0 0 24 Human Y N 0 0 0 0 0 0 0 3 0 0 0 N 0 0 0 0 0 0 0 2 0 0 0 0 0 0 0 0 0 0 1 2 2 25 Human Y N 0 0 0 0 0 0 0 1 0 0 0 N 0 0 0 0 0 0 0 0 0 0 0 0 0 0 0 0 0 0 0 0 0 26 Human Y N 0 0 0 0 0 0 0 0 0 0 1 N 0 0 0 0 0 0 0 0 0 0 0 0 0 0 0 0 0 0 0 1 1 27 Human Y N 0 0 0 0 0 0 0 1 0 0 0 N 0 0 0 0 0 0 0 0 0 0 0 0 0 0 0 0 0 0 0 0 0 28 Human Y Y 0 0 0 0 0 0 0 0 0 0 0 N 1 0 0 0 0 0 0 0 0 0 0 0 0 0 0 0 0 0 0 1 1 29 Human Y N 1 1 0 0 0 0 0 0 0 0 0 N 0 0 0 0 0 0 0 0 0 0 0 0 0 0 0 0 0 0 0 1 1 30 Human Y N 0 0 0 0 0 0 0 0 0 0 0 N 0 0 0 0 0 0 0 0 0 0 0 0 0 0 0 0 0 0 0 0 0 30A Human Y N 0 0 0 0 0 0 0 0 0 0 0 N 0 0 0 0 0 0 0 0 0 0 0 0 0 0 0 0 0 0 0 0 0 31 Human Y Y 0 0 0 0 0 0 0 0 0 0 0 N 0 0 0 0 0 0 0 0 0 0 0 0 0 0 0 0 0 0 0 0 0 32 Human Y N 0 0 0 0 0 0 0 0 0 0 0 N 0 0 0 0 0 0 0 0 0 0 0 0 0 0 0 0 0 0 0 0 0

528
Bur
ial #
Spe
cies
Dis
tinct
Ind
ivid
ual
(Hum
an)
Isot
ope
Stu
dy
Bon
e T
ools
Sca
pula
Saw
s
Bon
e S
trig
ils
Bon
e A
wls
Bon
e N
eedl
es
Ant
ler
Wed
ges
Oth
er B
one
Art
ifac
ts
Deb
itag
e (f
lake
s)
Pro
ject
ile
Poi
nts
(Ass
c)
Em
bedd
ed p
oint
s
Oth
er S
tone
Too
ls /
U
tili
zed
Fla
kes
Gro
unds
tone
Pes
tles
Man
os
Abr
ader
s
Sto
ne B
eads
Hal
ioti
s pe
ndan
ts
Cla
m S
hell
Pend
ants
Bon
e P
enda
nts
Shel
l bea
ds
Bir
d B
one
Tub
es
Whi
stle
s
Sto
ne P
ipes
Sto
ne S
poon
s
Cha
rmst
ones
Mag
ic s
tone
s
Cin
naba
r / O
chre
Sti
ngra
y P
oint
s
Ant
ler
Cla
ws/
Fau
nal T
eeth
Bea
d C
lass
Tot
al a
ssoc
iati
ons
# A
rtif
act T
ypes
33 Human Y N 0 0 0 0 0 0 0 1 0 0 0 N 0 0 0 0 0 0 0 0 0 25 1 0 0 0 0 0 1 0 0 27 3 34 Human Y N 0 0 0 0 0 0 0 0 0 0 0 N 0 0 0 0 0 0 0 0 0 0 0 0 0 0 0 0 0 0 0 0 0 35 Human Y Y 3 0 0 3 0 0 0 0 0 0 0 Y 1 0 0 0 0 0 0 97 0 0 0 0 0 0 0 0 0 0 3 101 3 36 Human N N 0 0 0 0 0 0 0 0 0 0 0 N 0 0 0 0 0 0 0 0 0 0 0 0 0 0 0 0 0 0 0 0 0 37 Human Y Y 0 0 0 0 0 0 0 0 0 0 0 N 1 0 0 0 0 0 0 543 0 0 0 0 0 0 0 0 0 0 5 544 2 38 Human Y Y 0 0 0 0 0 0 0 0 0 0 0 N 0 0 0 0 0 0 0 1 0 0 0 0 0 0 0 0 0 0 1 1 1 39 Human Y N 0 0 0 0 0 0 0 0 0 0 0 Y 0 0 0 0 0 0 0 0 0 0 0 0 0 0 0 0 0 0 0 1 1 40 Human Y N 0 0 0 0 0 0 0 0 0 0 0 Y 1 0 0 0 1 0 0 7 0 0 0 0 0 0 0 0 0 0 1 10 4 41 Human Y N 0 0 0 0 0 0 0 1 0 0 0 N 0 0 0 0 0 0 0 109 0 0 0 0 0 0 0 0 0 0 4 109 1 42 Human Y Y 10 0 0 10 0 0 0 4 1 0 0 N 0 0 0 0 0 0 0 0 11 0 0 0 0 0 0 0 0 0 0 22 3 43 Human Y Y 0 0 0 0 0 0 0 0 0 0 0 N 0 0 0 0 3 0 0 0 0 0 0 0 0 0 0 0 0 0 0 3 1 44 Human Y Y 0 0 0 0 0 0 0 0 0 0 0 N 0 0 0 0 0 0 0 0 0 0 0 0 0 0 0 0 0 0 0 0 0 45 Human Y Y 2 0 0 2 0 0 0 1 0 0 0 Y 0 0 0 0 0 0 0 324 0 0 0 0 0 0 0 0 0 0 4 327 3 46 Human Y Y 0 0 0 0 0 0 0 0 0 0 0 N 0 0 0 0 0 0 0 1 0 0 0 0 0 0 0 0 0 0 1 1 1 47 Human Y N 0 0 0 0 0 0 0 0 0 0 1 N 0 0 0 0 0 0 0 1 0 0 0 0 0 0 0 0 0 0 1 2 1 47A Human Y N 0 0 0 0 0 0 0 0 0 0 0 N 0 0 0 0 0 0 0 0 0 0 0 0 0 0 0 0 0 0 0 0 0 48 Human Y Y 0 0 0 0 0 0 0 0 0 0 0 N 0 0 0 0 0 0 0 0 0 0 0 0 0 0 0 0 0 0 0 0 0 49 Human Y N 0 0 0 0 0 0 0 0 0 0 0 N 0 0 0 0 0 0 0 0 2 0 0 0 0 0 0 0 0 0 0 2 1 50 Human Y N 1 0 0 0 0 1 0 2 0 0 0 Y 0 0 0 0 3 0 0 1446 0 0 0 0 0 0 0 0 0 0 6 1451 4 51 Human Y Y 0 0 0 0 0 0 0 1 0 0 0 N 0 0 0 0 4 0 0 1133 0 0 0 0 0 0 0 0 0 0 6 1137 2 52 Human Y Y 0 0 0 0 0 0 0 0 0 0 0 Y 1 0 0 0 21 0 0 3 1 0 0 0 0 0 0 0 0 0 1 26 4 53 Human Y Y 1 0 0 0 0 1 0 1 0 0 0 N 0 0 0 5 35 0 0 835 0 0 0 0 0 0 0 0 0 0 5 876 4 54 Human Y N 1 1 0 0 0 0 0 0 0 0 N 0 0 0 0 0 0 0 167 0 0 0 0 0 0 0 0 0 0 4 168 2 55 Human Y N 0 0 0 0 0 0 0 0 0 0 0 N 0 0 0 0 0 0 0 0 0 0 0 0 0 0 0 0 0 0 0 1 1 56 Human Y Y 0 0 0 0 0 0 0 0 0 0 0 N 0 0 0 0 0 0 0 0 0 0 0 0 0 0 0 0 0 0 0 0 0 57 Human Y N 0 0 0 0 0 0 0 0 0 0 0 N 0 0 0 0 0 0 0 0 0 0 0 0 0 0 0 0 0 0 0 0 0 58 Human Y Y 0 0 0 0 0 0 0 3 0 0 0 N 0 0 0 0 30 0 0 0 0 0 0 0 0 0 0 0 0 0 0 30 1 59 Human Y N 0 0 0 0 0 0 0 0 0 0 0 N 0 0 0 0 0 0 0 0 0 0 0 0 0 0 0 0 0 0 0 0 0 60 Human Y N 0 0 0 0 0 0 0 0 0 0 0 N 0 0 0 0 0 0 0 1 0 0 0 0 0 0 0 0 0 0 1 1 1 61 Human Y N 0 0 0 0 0 0 0 0 0 0 1 N 0 0 0 0 0 0 0 391 0 0 0 0 0 0 1 0 0 0 4 392 3 61A Human Y N 0 0 0 0 0 0 0 0 0 0 0 N 0 0 0 0 0 0 0 0 0 0 0 0 0 0 0 0 0 0 0 0 0 62 Human Y N 0 0 0 0 0 0 0 5 0 0 0 N 0 0 0 0 0 0 0 5 0 5 0 0 0 0 0 0 0 0 1 10 2 63 Human Y Y 1 0 1 0 0 0 1 0 0 0 N 0 0 0 0 8 0 1 5 2 1 0 1 0 0 0 0 0 1 1 20 7 64 Human Y Y 0 0 0 0 0 0 0 1 0 0 0 Y 1 0 0 0 35 0 0 329 0 0 0 0 0 0 0 0 0 0 4 365 3 65 Human Y Y 0 0 0 0 0 0 0 1 0 0 0 N 0 0 0 1 4 0 0 434 0 0 0 0 0 0 0 0 0 0 4 439 4 66 Human Y Y 0 0 0 0 0 0 0 1 0 0 0 N 0 0 0 0 0 0 0 0 0 0 0 0 0 0 0 0 0 0 0 0 0
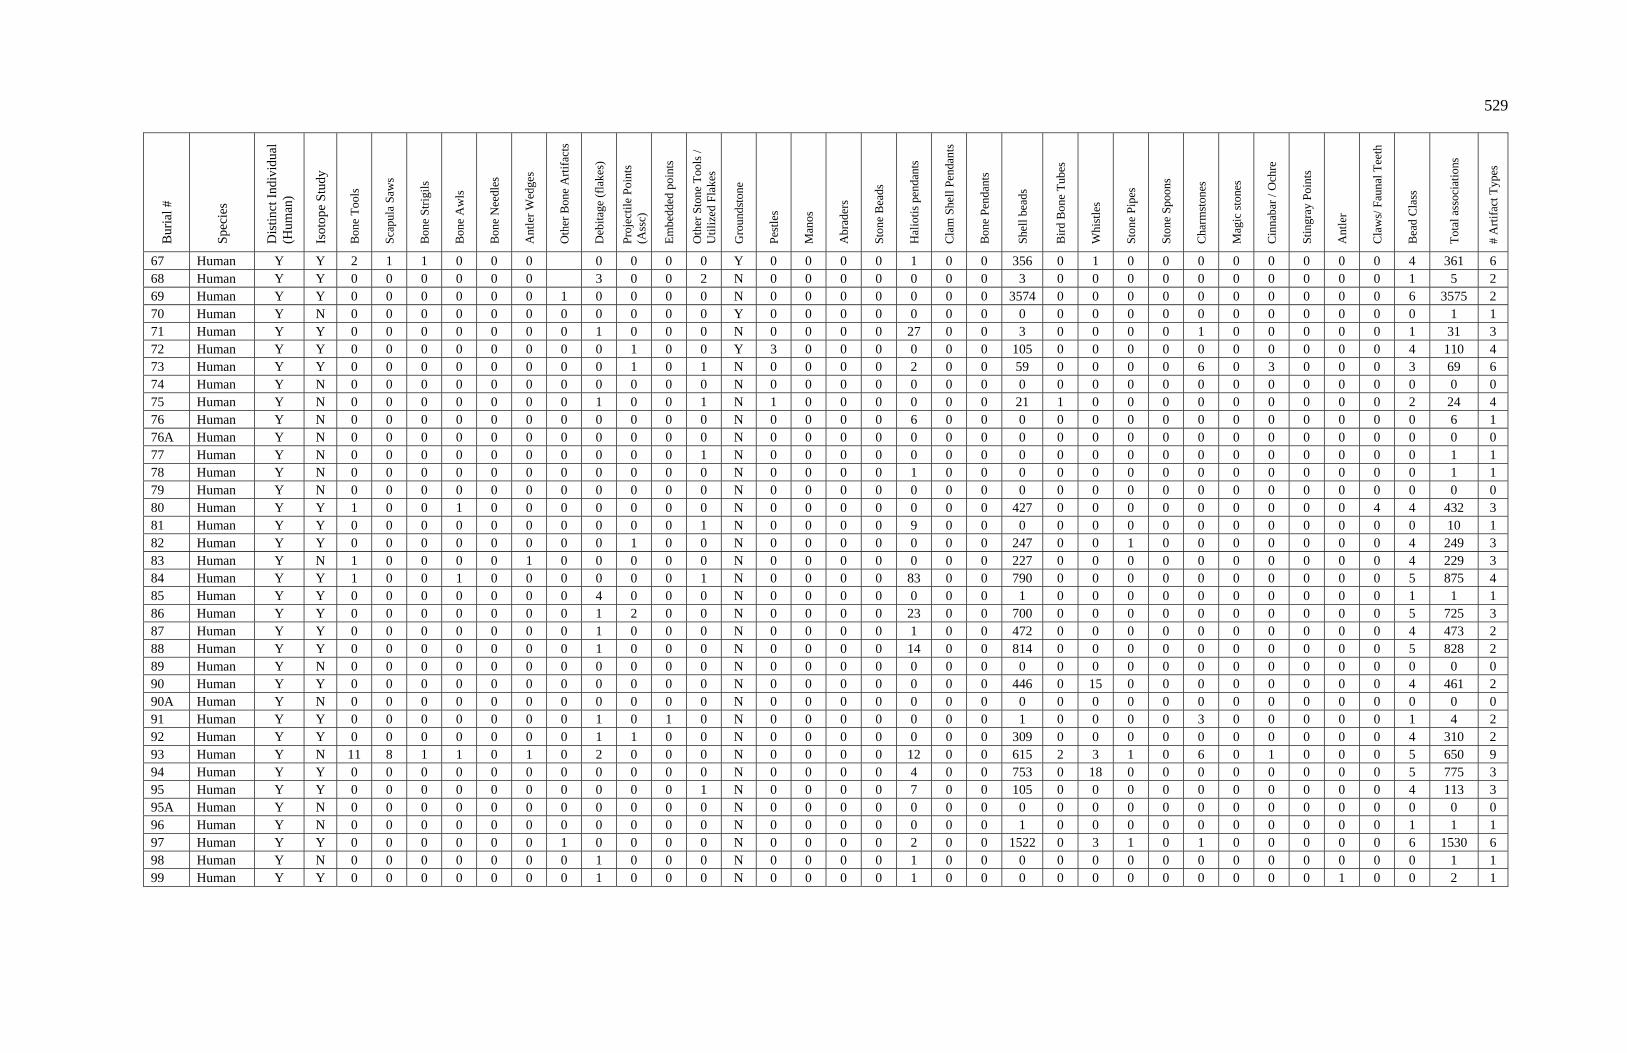
529
Bur
ial #
Spe
cies
Dis
tinct
Ind
ivid
ual
(Hum
an)
Isot
ope
Stu
dy
Bon
e T
ools
Sca
pula
Saw
s
Bon
e S
trig
ils
Bon
e A
wls
Bon
e N
eedl
es
Ant
ler
Wed
ges
Oth
er B
one
Art
ifac
ts
Deb
itag
e (f
lake
s)
Pro
ject
ile
Poi
nts
(Ass
c)
Em
bedd
ed p
oint
s
Oth
er S
tone
Too
ls /
U
tili
zed
Fla
kes
Gro
unds
tone
Pes
tles
Man
os
Abr
ader
s
Sto
ne B
eads
Hal
ioti
s pe
ndan
ts
Cla
m S
hell
Pend
ants
Bon
e P
enda
nts
Shel
l bea
ds
Bir
d B
one
Tub
es
Whi
stle
s
Sto
ne P
ipes
Sto
ne S
poon
s
Cha
rmst
ones
Mag
ic s
tone
s
Cin
naba
r / O
chre
Sti
ngra
y P
oint
s
Ant
ler
Cla
ws/
Fau
nal T
eeth
Bea
d C
lass
Tot
al a
ssoc
iati
ons
# A
rtif
act T
ypes
67 Human Y Y 2 1 1 0 0 0 0 0 0 0 Y 0 0 0 0 1 0 0 356 0 1 0 0 0 0 0 0 0 0 4 361 6 68 Human Y Y 0 0 0 0 0 0 3 0 0 2 N 0 0 0 0 0 0 0 3 0 0 0 0 0 0 0 0 0 0 1 5 2 69 Human Y Y 0 0 0 0 0 0 1 0 0 0 0 N 0 0 0 0 0 0 0 3574 0 0 0 0 0 0 0 0 0 0 6 3575 2 70 Human Y N 0 0 0 0 0 0 0 0 0 0 0 Y 0 0 0 0 0 0 0 0 0 0 0 0 0 0 0 0 0 0 0 1 1 71 Human Y Y 0 0 0 0 0 0 0 1 0 0 0 N 0 0 0 0 27 0 0 3 0 0 0 0 1 0 0 0 0 0 1 31 3 72 Human Y Y 0 0 0 0 0 0 0 0 1 0 0 Y 3 0 0 0 0 0 0 105 0 0 0 0 0 0 0 0 0 0 4 110 4 73 Human Y Y 0 0 0 0 0 0 0 0 1 0 1 N 0 0 0 0 2 0 0 59 0 0 0 0 6 0 3 0 0 0 3 69 6 74 Human Y N 0 0 0 0 0 0 0 0 0 0 0 N 0 0 0 0 0 0 0 0 0 0 0 0 0 0 0 0 0 0 0 0 0 75 Human Y N 0 0 0 0 0 0 0 1 0 0 1 N 1 0 0 0 0 0 0 21 1 0 0 0 0 0 0 0 0 0 2 24 4 76 Human Y N 0 0 0 0 0 0 0 0 0 0 0 N 0 0 0 0 6 0 0 0 0 0 0 0 0 0 0 0 0 0 0 6 1 76A Human Y N 0 0 0 0 0 0 0 0 0 0 0 N 0 0 0 0 0 0 0 0 0 0 0 0 0 0 0 0 0 0 0 0 0 77 Human Y N 0 0 0 0 0 0 0 0 0 0 1 N 0 0 0 0 0 0 0 0 0 0 0 0 0 0 0 0 0 0 0 1 1 78 Human Y N 0 0 0 0 0 0 0 0 0 0 0 N 0 0 0 0 1 0 0 0 0 0 0 0 0 0 0 0 0 0 0 1 1 79 Human Y N 0 0 0 0 0 0 0 0 0 0 0 N 0 0 0 0 0 0 0 0 0 0 0 0 0 0 0 0 0 0 0 0 0 80 Human Y Y 1 0 0 1 0 0 0 0 0 0 0 N 0 0 0 0 0 0 0 427 0 0 0 0 0 0 0 0 0 4 4 432 3 81 Human Y Y 0 0 0 0 0 0 0 0 0 0 1 N 0 0 0 0 9 0 0 0 0 0 0 0 0 0 0 0 0 0 0 10 1 82 Human Y Y 0 0 0 0 0 0 0 0 1 0 0 N 0 0 0 0 0 0 0 247 0 0 1 0 0 0 0 0 0 0 4 249 3 83 Human Y N 1 0 0 0 0 1 0 0 0 0 0 N 0 0 0 0 0 0 0 227 0 0 0 0 0 0 0 0 0 0 4 229 3 84 Human Y Y 1 0 0 1 0 0 0 0 0 0 1 N 0 0 0 0 83 0 0 790 0 0 0 0 0 0 0 0 0 0 5 875 4 85 Human Y Y 0 0 0 0 0 0 0 4 0 0 0 N 0 0 0 0 0 0 0 1 0 0 0 0 0 0 0 0 0 0 1 1 1 86 Human Y Y 0 0 0 0 0 0 0 1 2 0 0 N 0 0 0 0 23 0 0 700 0 0 0 0 0 0 0 0 0 0 5 725 3 87 Human Y Y 0 0 0 0 0 0 0 1 0 0 0 N 0 0 0 0 1 0 0 472 0 0 0 0 0 0 0 0 0 0 4 473 2 88 Human Y Y 0 0 0 0 0 0 0 1 0 0 0 N 0 0 0 0 14 0 0 814 0 0 0 0 0 0 0 0 0 0 5 828 2 89 Human Y N 0 0 0 0 0 0 0 0 0 0 0 N 0 0 0 0 0 0 0 0 0 0 0 0 0 0 0 0 0 0 0 0 0 90 Human Y Y 0 0 0 0 0 0 0 0 0 0 0 N 0 0 0 0 0 0 0 446 0 15 0 0 0 0 0 0 0 0 4 461 2 90A Human Y N 0 0 0 0 0 0 0 0 0 0 0 N 0 0 0 0 0 0 0 0 0 0 0 0 0 0 0 0 0 0 0 0 0 91 Human Y Y 0 0 0 0 0 0 0 1 0 1 0 N 0 0 0 0 0 0 0 1 0 0 0 0 3 0 0 0 0 0 1 4 2 92 Human Y Y 0 0 0 0 0 0 0 1 1 0 0 N 0 0 0 0 0 0 0 309 0 0 0 0 0 0 0 0 0 0 4 310 2 93 Human Y N 11 8 1 1 0 1 0 2 0 0 0 N 0 0 0 0 12 0 0 615 2 3 1 0 6 0 1 0 0 0 5 650 9 94 Human Y Y 0 0 0 0 0 0 0 0 0 0 0 N 0 0 0 0 4 0 0 753 0 18 0 0 0 0 0 0 0 0 5 775 3 95 Human Y Y 0 0 0 0 0 0 0 0 0 0 1 N 0 0 0 0 7 0 0 105 0 0 0 0 0 0 0 0 0 0 4 113 3 95A Human Y N 0 0 0 0 0 0 0 0 0 0 0 N 0 0 0 0 0 0 0 0 0 0 0 0 0 0 0 0 0 0 0 0 0 96 Human Y N 0 0 0 0 0 0 0 0 0 0 0 N 0 0 0 0 0 0 0 1 0 0 0 0 0 0 0 0 0 0 1 1 1 97 Human Y Y 0 0 0 0 0 0 1 0 0 0 0 N 0 0 0 0 2 0 0 1522 0 3 1 0 1 0 0 0 0 0 6 1530 6 98 Human Y N 0 0 0 0 0 0 0 1 0 0 0 N 0 0 0 0 1 0 0 0 0 0 0 0 0 0 0 0 0 0 0 1 1 99 Human Y Y 0 0 0 0 0 0 0 1 0 0 0 N 0 0 0 0 1 0 0 0 0 0 0 0 0 0 0 0 1 0 0 2 1

530
Bur
ial #
Spe
cies
Dis
tinct
Ind
ivid
ual
(Hum
an)
Isot
ope
Stu
dy
Bon
e T
ools
Sca
pula
Saw
s
Bon
e S
trig
ils
Bon
e A
wls
Bon
e N
eedl
es
Ant
ler
Wed
ges
Oth
er B
one
Art
ifac
ts
Deb
itag
e (f
lake
s)
Pro
ject
ile
Poi
nts
(Ass
c)
Em
bedd
ed p
oint
s
Oth
er S
tone
Too
ls /
U
tili
zed
Fla
kes
Gro
unds
tone
Pes
tles
Man
os
Abr
ader
s
Sto
ne B
eads
Hal
ioti
s pe
ndan
ts
Cla
m S
hell
Pend
ants
Bon
e P
enda
nts
Shel
l bea
ds
Bir
d B
one
Tub
es
Whi
stle
s
Sto
ne P
ipes
Sto
ne S
poon
s
Cha
rmst
ones
Mag
ic s
tone
s
Cin
naba
r / O
chre
Sti
ngra
y P
oint
s
Ant
ler
Cla
ws/
Fau
nal T
eeth
Bea
d C
lass
Tot
al a
ssoc
iati
ons
# A
rtif
act T
ypes
100 Human Y N 0 0 0 0 0 0 0 0 1 0 0 N 0 0 0 0 0 0 0 1 0 14 0 0 0 0 0 0 0 0 1 16 3 101 Human Y N 0 0 0 0 0 0 0 4 0 0 0 N 0 0 0 0 0 0 0 0 0 0 0 0 0 0 0 0 1 0 0 1 1 102 Human Y N 0 0 0 0 0 0 0 0 0 0 0 N 0 0 0 0 0 0 0 0 0 0 0 0 0 0 0 0 0 0 0 0 0 103 Human Y N 0 0 0 0 0 0 0 0 0 0 0 N 0 0 0 0 0 0 0 0 6 0 0 0 0 0 0 0 0 0 0 6 1 104 Human N N 0 0 0 0 0 0 0 0 0 0 0 N 0 0 0 0 0 0 0 0 0 0 0 0 0 0 0 0 0 0 0 0 0 105 Human Y Y 0 0 0 0 0 0 0 0 0 0 0 N 0 0 0 0 13 0 0 1152 0 2 0 0 0 0 0 0 0 0 6 1167 3 105A Human Y N 0 0 0 0 0 0 0 0 0 0 0 N 0 0 0 0 0 0 0 80 0 0 0 0 0 0 0 0 0 0 3 80 2 106 Human Y N 0 0 0 0 0 0 0 0 0 0 0 N 0 0 0 0 0 0 0 8 0 0 0 0 0 0 0 0 0 0 1 8 1 107 Human Y Y 0 0 0 0 0 0 0 1 0 0 0 Y 0 1 0 0 0 0 0 0 0 0 0 0 0 0 0 0 0 0 0 1 1 108 Human Y Y 0 0 0 0 0 0 0 0 0 0 0 N 0 0 0 0 0 0 0 0 0 0 0 0 0 0 0 0 0 0 0 0 0 109 Human Y N 0 0 0 0 0 0 0 1 0 0 0 N 0 0 0 0 0 0 0 0 0 0 0 0 0 0 0 0 0 0 0 0 0 110 Human Y N 0 0 0 0 0 0 0 1 0 0 0 N 0 0 0 0 0 0 0 6 0 0 0 0 0 0 0 0 0 0 1 6 1 111 Human Y N 0 0 0 0 0 0 0 0 0 0 0 N 0 0 0 0 0 0 0 0 0 0 0 0 0 0 0 0 0 0 0 0 0 112 Human Y N 0 0 0 0 0 0 0 0 0 0 0 Y 1 0 0 0 0 0 0 104 0 0 0 0 0 0 0 0 0 0 4 105 2 113 Human Y N 0 0 0 0 0 0 0 0 0 0 0 N 0 0 0 0 0 0 0 0 0 0 0 0 0 0 0 0 0 0 0 0 0 114 Human N N 0 0 0 0 0 0 0 1 0 0 0 N 0 0 0 0 0 0 0 0 0 0 0 0 0 0 0 0 0 0 0 0 0 115 Human Y Y 0 0 0 0 0 0 0 0 0 0 0 N 0 0 0 0 0 0 0 0 0 0 0 0 0 0 0 0 0 0 0 0 0 116 Human Y Y 0 0 0 0 0 0 0 0 0 0 0 N 0 0 0 0 4 0 0 0 0 0 0 0 0 0 0 0 0 0 0 4 1 117 Human N Y 0 0 0 0 0 0 0 0 0 0 0 N 0 0 0 1 0 0 0 52 0 0 0 0 0 0 0 0 0 0 3 53 2 118 Human Y N 0 0 0 0 0 0 0 0 0 0 0 N 0 0 0 0 0 0 0 0 0 0 0 0 0 0 0 0 0 0 0 0 0 119 Human Y Y 0 0 0 0 0 0 0 1 0 0 0 N 0 0 0 0 0 0 0 1 0 0 0 0 0 0 0 0 0 0 1 1 1 119A Human N N 0 0 0 0 0 0 0 0 0 0 0 N 0 0 0 0 0 0 0 0 0 0 0 0 0 0 0 0 0 0 0 0 0 120 Human Y Y 0 0 0 0 0 0 0 0 0 0 0 Y 1 0 0 0 0 0 0 3 0 0 0 0 0 0 0 0 0 0 1 5 3 121 Human Y N 0 0 0 0 0 0 0 0 0 0 0 Y 0 0 1 0 0 0 0 0 0 0 0 0 0 0 0 0 0 0 0 1 1 122 Human Y N 0 0 0 0 0 0 1 0 0 0 0 Y 1 0 0 0 0 0 0 0 0 0 0 0 0 0 0 0 0 0 0 2 2 123 Human Y N 0 0 0 0 0 0 0 1 0 0 0 N 0 0 0 0 0 0 0 0 0 0 0 0 0 0 0 0 0 0 0 0 0 124 Human Y N 0 0 0 0 0 0 0 0 0 0 0 N 0 0 0 0 0 0 0 53 0 0 0 0 0 0 0 0 0 0 3 53 1 125 Human Y Y 0 0 0 0 0 0 0 0 0 0 0 N 0 0 0 0 2 0 0 200 0 0 0 0 0 0 0 0 0 0 4 202 2 126 Human Y N 0 0 0 0 0 0 0 0 0 0 0 Y 0 1 0 0 0 0 0 0 0 0 0 0 0 0 0 0 0 0 0 1 1 127 Human Y Y 0 0 0 0 0 0 0 0 0 0 0 N 0 0 0 0 0 0 0 0 0 0 0 0 0 0 0 0 0 0 0 0 0 128 Human Y Y 0 0 0 0 0 0 0 0 0 0 0 N 0 0 0 0 0 0 0 0 0 0 0 0 0 0 0 0 0 0 0 0 0 129 Human Y Y 0 0 0 0 0 0 0 1 0 0 0 N 0 0 0 0 0 0 0 0 0 0 0 0 0 0 0 0 0 0 0 0 0 130 Human Y Y 0 0 0 0 0 0 0 3 0 0 1 Y 3 0 0 0 7 0 0 286 0 0 0 0 3 0 0 0 0 0 4 300 5 131 Human Y N 0 0 0 0 0 0 0 0 0 0 0 N 0 0 0 0 0 0 0 0 0 0 0 0 0 0 0 0 0 0 0 0 0 132 Human Y Y 2 0 0 2 0 0 0 1 0 0 0 N 0 0 0 0 6 0 0 27 0 0 0 0 0 0 48 0 0 0 2 35 4 133 Human Y N 0 0 0 0 0 0 0 0 0 0 0 N 0 0 0 0 6 0 0 0 0 0 0 0 0 0 0 0 0 0 0 6 1

531
Bur
ial #
Spe
cies
Dis
tinct
Ind
ivid
ual
(Hum
an)
Isot
ope
Stu
dy
Bon
e T
ools
Sca
pula
Saw
s
Bon
e S
trig
ils
Bon
e A
wls
Bon
e N
eedl
es
Ant
ler
Wed
ges
Oth
er B
one
Art
ifac
ts
Deb
itag
e (f
lake
s)
Pro
ject
ile
Poi
nts
(Ass
c)
Em
bedd
ed p
oint
s
Oth
er S
tone
Too
ls /
U
tili
zed
Fla
kes
Gro
unds
tone
Pes
tles
Man
os
Abr
ader
s
Sto
ne B
eads
Hal
ioti
s pe
ndan
ts
Cla
m S
hell
Pend
ants
Bon
e P
enda
nts
Shel
l bea
ds
Bir
d B
one
Tub
es
Whi
stle
s
Sto
ne P
ipes
Sto
ne S
poon
s
Cha
rmst
ones
Mag
ic s
tone
s
Cin
naba
r / O
chre
Sti
ngra
y P
oint
s
Ant
ler
Cla
ws/
Fau
nal T
eeth
Bea
d C
lass
Tot
al a
ssoc
iati
ons
# A
rtif
act T
ypes
134 Human Y Y 0 0 0 0 0 0 1 0 0 0 N 0 0 0 0 1 0 0 0 0 13 0 0 2 0 0 0 0 0 0 16 3 135 Human Y Y 0 0 0 0 0 0 0 0 0 0 0 N 3 0 0 0 0 0 0 0 0 0 0 0 0 0 1 0 0 0 0 3 2 136 Human Y Y 0 0 0 0 0 0 0 0 0 0 0 N 0 0 0 0 0 0 0 0 0 0 0 0 0 0 0 0 0 0 0 0 0 137 Human Y Y 0 0 0 0 0 0 0 0 0 0 0 Y 2 0 0 0 5 0 0 381 0 0 0 0 0 0 0 0 0 0 4 389 4 138 Human Y N 0 0 0 0 0 0 0 0 0 0 0 N 0 0 0 0 0 0 0 0 0 0 0 0 0 0 0 0 0 0 0 0 0 139 Human Y N 0 0 0 0 0 0 0 0 0 0 0 N 0 0 0 0 7 0 0 0 0 0 0 0 0 0 0 0 0 0 0 7 1 140 Human Y Y 0 0 0 0 0 0 0 0 0 1 0 N 0 0 0 0 1 0 0 16 0 0 0 0 3 0 0 0 0 0 2 20 3 141 Human Y Y 0 0 0 0 0 0 0 0 0 0 0 N 0 0 0 0 0 0 0 0 0 0 0 0 0 0 0 0 0 0 0 0 0 142 Human Y Y 0 0 0 0 0 0 0 1 0 1 1 N 0 0 0 0 0 0 0 0 0 0 0 0 0 0 0 0 0 0 0 1 0 143 Human Y Y 0 0 0 0 0 0 0 0 0 1 0 N 0 0 0 0 0 0 0 0 0 0 0 0 0 0 0 0 0 0 0 0 0 144 Human Y Y 0 0 0 0 0 0 0 3 0 1 0 N 0 0 0 0 0 0 0 0 0 0 0 0 0 0 0 0 0 0 0 0 0 145 Human Y N 0 0 0 0 0 0 0 1 0 0 0 N 0 0 0 0 0 0 0 0 0 0 0 0 0 0 0 0 0 0 0 0 0 145A Human Y N 0 0 0 0 0 0 0 0 0 0 0 N 0 0 0 0 0 0 0 0 0 0 0 0 0 0 0 0 0 0 0 0 0 146 Human Y Y 0 0 0 0 0 0 0 0 0 0 0 N 0 0 0 0 0 0 0 0 0 0 0 0 0 0 0 0 0 0 0 0 0 147 Human Y N 3 3 0 0 0 0 0 0 0 0 N 0 0 0 0 7 0 0 3 0 0 0 0 0 0 0 0 0 1 13 3 148 Human Y Y 0 0 0 0 0 0 0 0 0 0 0 N 0 0 0 0 2 0 0 0 0 0 0 0 1 0 0 0 0 0 0 3 2 149 Human Y N 0 0 0 0 0 0 0 0 1 0 0 N 0 0 0 0 0 0 0 15 0 0 0 0 0 0 0 0 0 0 2 16 2 150 Human Y N 0 0 0 0 0 0 0 0 0 0 N 0 0 0 0 0 0 0 0 0 0 0 0 0 0 0 0 0 0 0 0 0 151 Human Y N 0 0 0 0 0 0 0 0 1 0 0 N 0 0 0 0 0 0 0 0 0 0 0 0 0 0 0 0 0 0 0 1 1 152 Human Y Y 0 0 0 0 0 0 0 0 0 1 0 N 2 0 0 0 0 0 0 0 0 0 0 0 0 0 0 0 0 0 0 2 1 153 Human Y N 0 0 0 0 0 0 0 0 0 0 0 N 0 0 0 0 0 0 0 1 0 0 0 0 0 0 0 0 0 0 1 1 1 154 Human N N 0 0 0 0 0 0 0 0 0 0 0 N 0 0 0 0 0 0 0 0 0 0 0 0 0 0 0 0 0 0 0 0 0 155 Human Y N 0 0 0 0 0 0 0 0 0 0 1 N 0 0 0 0 0 0 0 100 0 0 0 0 0 0 0 0 0 0 3 101 2 156 Human Y Y 0 0 0 0 0 0 0 0 0 0 0 N 0 0 0 0 12 0 0 0 0 0 0 0 0 0 0 0 0 0 0 12 1 157 Human Y N 0 0 0 0 0 0 0 0 0 0 0 N 1 0 0 0 0 0 0 0 0 0 0 0 0 0 0 0 0 0 0 1 1 158 Human N N 0 0 0 0 0 0 0 0 0 0 0 N 0 0 0 0 0 0 0 0 0 0 0 0 0 0 0 0 0 0 0 0 0 159 Human Y Y 0 0 0 0 0 0 0 0 0 0 0 N 0 0 0 0 3 0 0 8 0 0 0 0 0 0 0 0 0 0 1 11 2 160 Human Y Y 0 0 0 0 0 0 0 1 0 0 0 N 0 0 0 0 0 0 0 0 0 0 0 0 1 0 0 0 0 0 0 1 1 161 Human Y Y 0 0 0 0 0 0 0 0 0 1 0 N 0 0 0 0 0 0 0 0 0 0 0 0 0 0 0 0 0 0 0 0 0 162 Human Y N 0 0 0 0 0 0 0 0 0 0 2 N 0 0 0 0 1 0 0 865 0 1 0 0 0 0 0 0 0 0 5 869 4 163 Human Y N 3 1 0 2 0 0 0 0 0 0 0 N 0 0 0 0 26 1 0 261 0 0 0 0 0 0 0 0 0 0 4 291 5 164 Human Y Y 0 0 0 0 0 0 0 0 0 0 1 N 0 0 0 0 13 0 0 554 0 4 0 0 0 0 0 0 0 0 5 572 4 165 Human Y N 0 0 0 0 0 0 0 0 0 0 0 N 0 0 0 0 0 0 0 2 0 0 0 0 0 0 0 0 0 0 1 2 1 166 Human Y Y 0 0 0 0 0 0 0 0 0 0 0 N 0 0 0 0 0 0 0 4091 0 2 0 0 0 0 0 0 0 0 6 4093 2 167 Human Y Y 0 0 0 0 0 0 0 0 0 0 0 Y 1 0 0 0 0 0 0 377 0 0 1 0 0 0 0 0 0 0 4 381 4 167A Human Y N 0 0 0 0 0 0 0 0 0 0 0 N 0 0 0 0 0 0 0 0 0 0 0 0 0 0 0 0 0 0 0 0 0 168 Human Y Y 0 0 0 0 0 0 0 0 1 0 0 N 0 0 0 0 1 17 0 1056 0 0 0 0 0 0 0 0 0 0 6 1075 4

532
Bur
ial #
Spe
cies
Dis
tinct
Ind
ivid
ual
(Hum
an)
Isot
ope
Stu
dy
Bon
e T
ools
Sca
pula
Saw
s
Bon
e S
trig
ils
Bon
e A
wls
Bon
e N
eedl
es
Ant
ler
Wed
ges
Oth
er B
one
Art
ifac
ts
Deb
itag
e (f
lake
s)
Pro
ject
ile
Poi
nts
(Ass
c)
Em
bedd
ed p
oint
s
Oth
er S
tone
Too
ls /
U
tili
zed
Fla
kes
Gro
unds
tone
Pes
tles
Man
os
Abr
ader
s
Sto
ne B
eads
Hal
ioti
s pe
ndan
ts
Cla
m S
hell
Pend
ants
Bon
e P
enda
nts
Shel
l bea
ds
Bir
d B
one
Tub
es
Whi
stle
s
Sto
ne P
ipes
Sto
ne S
poon
s
Cha
rmst
ones
Mag
ic s
tone
s
Cin
naba
r / O
chre
Sti
ngra
y P
oint
s
Ant
ler
Cla
ws/
Fau
nal T
eeth
Bea
d C
lass
Tot
al a
ssoc
iati
ons
# A
rtif
act T
ypes
169 Human Y Y 0 0 0 0 0 0 0 0 0 0 0 N 0 0 0 0 0 0 0 2 0 0 0 0 0 0 0 0 0 0 1 2 1 170 Human Y N 0 0 0 0 0 0 0 0 0 0 0 Y 1 0 0 0 0 0 0 239 0 0 1 0 0 0 0 0 0 0 4 241 3 171 Human Y Y 0 0 0 0 0 0 0 2 1 0 1 Y 7 0 0 0 46 0 0 0 0 0 0 0 0 0 0 0 0 0 0 56 5 172 Human Y Y 0 0 0 0 0 0 0 0 0 0 0 N 0 0 0 0 0 0 0 0 0 0 0 0 0 0 0 0 0 0 0 0 0 173 Human Y N 0 0 0 0 0 0 0 0 0 0 0 N 0 0 0 0 0 0 0 15 0 0 0 0 0 0 0 0 0 0 2 15 1 174 Human Y N 0 0 0 0 0 0 0 0 0 0 0 N 0 0 0 0 0 0 0 0 0 0 0 0 0 0 0 0 0 0 0 0 0 175 Human Y Y 2 0 0 1 1 0 0 7 0 0 1 Y 1 0 0 0 34 0 0 0 0 0 0 0 8 1 0 0 0 0 0 47 7 176 Human Y Y 1 1 0 0 0 0 0 1 0 0 0 N 0 0 0 0 0 0 0 679 0 0 0 0 0 0 0 0 0 0 5 680 2 177 Human Y Y 0 0 0 0 0 0 0 3 0 0 1 N 0 0 0 0 0 0 0 0 0 0 0 0 0 0 0 0 0 0 0 1 1 178 Human Y N 0 0 0 0 0 0 0 0 0 0 0 Y 1 0 0 0 1 0 0 299 0 0 0 0 1 0 P 0 0 0 4 302 5 179 Human Y Y 2 0 0 0 2 0 0 0 0 0 0 N 0 0 0 0 0 0 0 2091 0 0 0 0 0 0 0 0 0 0 6 2093 2 180 Human Y N 0 0 0 0 0 0 0 0 0 0 0 Y 1 0 0 0 0 0 0 57 0 0 0 0 0 0 0 0 0 0 3 58 2 181 Human Y N 0 0 0 0 0 0 0 0 0 0 0 N 0 0 0 0 0 0 0 0 0 0 0 0 0 0 0 0 0 0 0 0 0 182 Human Y Y 0 0 0 0 0 0 1 0 0 0 0 N 0 0 0 0 0 0 0 1135 0 24 0 0 0 0 0 0 0 4 6 1164 4 183 Human Y Y 0 0 0 0 0 0 0 0 0 0 0 N 0 0 0 0 0 0 0 0 0 0 0 0 0 0 0 0 0 0 0 0 0 184 Human Y Y 0 0 0 0 0 0 0 0 0 0 0 N 0 0 0 0 0 0 0 2 0 0 0 0 0 0 0 0 0 2 1 4 2 185 Human Y N 0 0 0 0 0 0 0 2 0 0 1 N 0 0 0 0 0 0 1 0 0 0 0 0 0 0 0 0 0 0 0 2 2 186 Human Y Y 0 0 0 0 0 0 0 1 0 0 0 N 0 0 0 0 0 0 0 0 0 0 0 0 0 0 0 0 0 0 0 0 0 187 Human Y N 1 0 0 0 1 0 0 0 0 0 1 N 0 0 0 0 0 0 0 0 0 0 0 0 0 0 0 0 0 0 0 2 2 188 Human Y Y 0 0 0 0 0 0 0 1 0 0 0 N 0 0 0 0 0 0 0 0 0 0 0 0 0 1 0 0 0 0 0 1 1 189 Human Y N 0 0 0 0 0 0 0 0 0 0 1 Y 0 0 0 0 3 0 0 0 0 0 0 0 0 0 0 0 0 0 0 5 3 190 Human Y N 0 0 0 0 0 0 0 1 0 0 0 N 0 0 0 0 0 0 0 49 0 0 0 0 0 0 0 0 0 0 2 49 1 191 Human Y N 0 0 0 0 0 0 0 1 0 0 0 N 0 0 0 0 0 0 0 0 0 0 0 0 0 0 0 0 0 0 0 0 0 192 Human Y N 0 0 0 0 0 0 0 0 0 0 0 N 0 0 0 0 0 0 0 0 0 0 0 0 0 0 0 0 0 0 0 0 0 193 Human Y N 0 0 0 0 0 0 0 0 0 0 0 N 0 0 0 0 0 0 0 0 0 0 0 0 0 0 0 0 0 0 0 0 0 194 Human Y Y 0 0 0 0 0 0 0 0 0 0 1 N 0 0 0 0 1 0 0 0 0 0 0 0 0 0 0 0 0 0 0 2 1 194A Human Y Y 0 0 0 0 0 0 0 0 0 0 0 N 0 0 0 0 0 0 0 0 0 0 0 0 0 0 0 0 0 0 0 0 0 195 Human Y Y 0 0 0 0 0 0 0 0 0 0 0 N 0 0 0 0 0 0 0 0 0 0 0 0 0 0 0 0 0 0 0 0 0 195A Human Y N 0 0 0 0 0 0 0 0 0 0 0 N 0 0 0 0 0 0 0 0 0 0 0 0 0 0 0 0 0 0 0 0 0 196 Human Y Y 0 0 0 0 0 0 0 0 0 0 0 N 0 0 0 0 0 0 0 0 0 0 0 0 0 0 0 0 0 0 0 0 0 197 Human Y Y 0 0 0 0 0 0 0 0 0 0 0 N 0 0 0 0 0 0 0 0 0 0 0 0 0 0 0 0 0 0 0 0 0 198 Human Y Y 0 0 0 0 0 0 0 0 0 0 0 Y 0 0 0 0 1 0 0 0 0 0 0 0 0 0 0 0 0 0 0 2 2 199 Human N N 0 0 0 0 0 0 0 0 0 0 0 N 0 0 0 0 0 0 0 0 0 0 0 0 0 0 0 0 0 0 0 0 0 200 Human N N 0 0 0 0 0 0 0 0 0 0 0 N 0 0 0 0 0 0 0 0 0 0 0 0 0 0 0 0 0 0 0 0 0 201 Human Y Y 0 0 0 0 0 0 0 0 0 0 0 N 0 0 0 0 0 0 0 0 0 0 0 0 0 0 0 0 0 0 0 0 0 202 Human Y Y 0 0 0 0 0 0 0 1 0 0 1 N 0 0 0 0 0 0 0 0 0 0 0 0 0 0 0 0 0 0 0 1 1
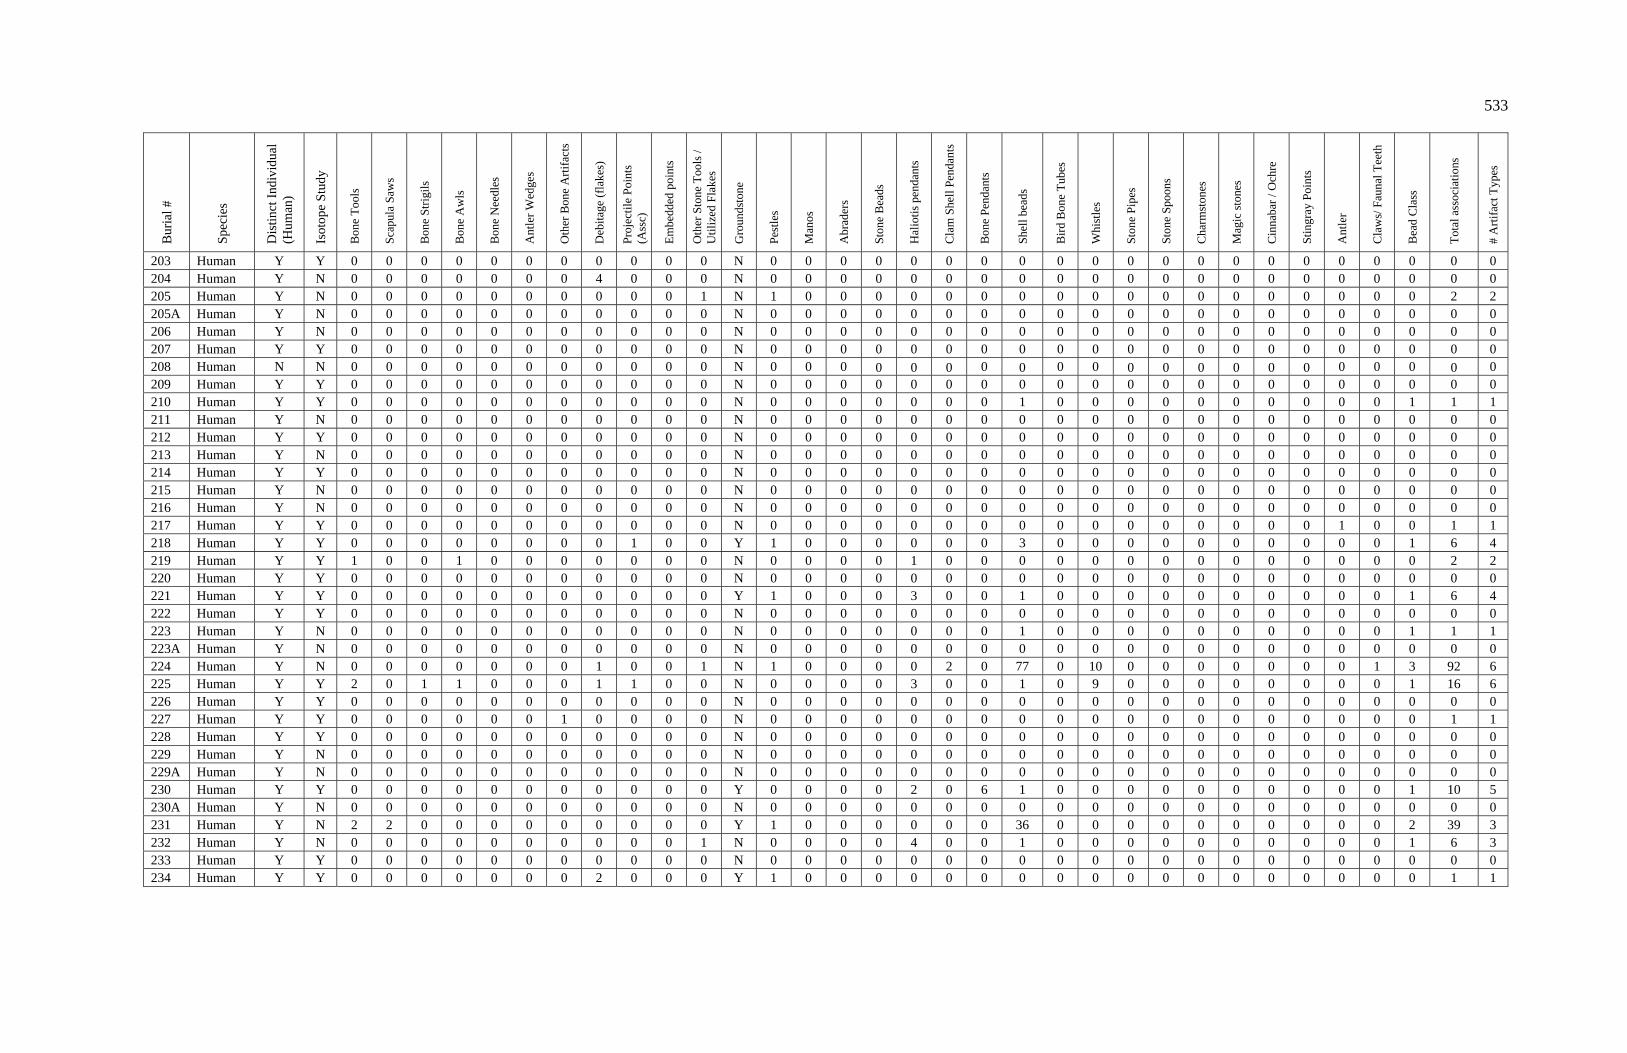
533
Bur
ial #
Spe
cies
Dis
tinct
Ind
ivid
ual
(Hum
an)
Isot
ope
Stu
dy
Bon
e T
ools
Sca
pula
Saw
s
Bon
e S
trig
ils
Bon
e A
wls
Bon
e N
eedl
es
Ant
ler
Wed
ges
Oth
er B
one
Art
ifac
ts
Deb
itag
e (f
lake
s)
Pro
ject
ile
Poi
nts
(Ass
c)
Em
bedd
ed p
oint
s
Oth
er S
tone
Too
ls /
U
tili
zed
Fla
kes
Gro
unds
tone
Pes
tles
Man
os
Abr
ader
s
Sto
ne B
eads
Hal
ioti
s pe
ndan
ts
Cla
m S
hell
Pend
ants
Bon
e P
enda
nts
Shel
l bea
ds
Bir
d B
one
Tub
es
Whi
stle
s
Sto
ne P
ipes
Sto
ne S
poon
s
Cha
rmst
ones
Mag
ic s
tone
s
Cin
naba
r / O
chre
Sti
ngra
y P
oint
s
Ant
ler
Cla
ws/
Fau
nal T
eeth
Bea
d C
lass
Tot
al a
ssoc
iati
ons
# A
rtif
act T
ypes
203 Human Y Y 0 0 0 0 0 0 0 0 0 0 0 N 0 0 0 0 0 0 0 0 0 0 0 0 0 0 0 0 0 0 0 0 0 204 Human Y N 0 0 0 0 0 0 0 4 0 0 0 N 0 0 0 0 0 0 0 0 0 0 0 0 0 0 0 0 0 0 0 0 0 205 Human Y N 0 0 0 0 0 0 0 0 0 0 1 N 1 0 0 0 0 0 0 0 0 0 0 0 0 0 0 0 0 0 0 2 2 205A Human Y N 0 0 0 0 0 0 0 0 0 0 0 N 0 0 0 0 0 0 0 0 0 0 0 0 0 0 0 0 0 0 0 0 0 206 Human Y N 0 0 0 0 0 0 0 0 0 0 0 N 0 0 0 0 0 0 0 0 0 0 0 0 0 0 0 0 0 0 0 0 0 207 Human Y Y 0 0 0 0 0 0 0 0 0 0 0 N 0 0 0 0 0 0 0 0 0 0 0 0 0 0 0 0 0 0 0 0 0 208 Human N N 0 0 0 0 0 0 0 0 0 0 0 N 0 0 0 0 0 0 0 0 0 0 0 0 0 0 0 0 0 0 0 0 0 209 Human Y Y 0 0 0 0 0 0 0 0 0 0 0 N 0 0 0 0 0 0 0 0 0 0 0 0 0 0 0 0 0 0 0 0 0 210 Human Y Y 0 0 0 0 0 0 0 0 0 0 0 N 0 0 0 0 0 0 0 1 0 0 0 0 0 0 0 0 0 0 1 1 1 211 Human Y N 0 0 0 0 0 0 0 0 0 0 0 N 0 0 0 0 0 0 0 0 0 0 0 0 0 0 0 0 0 0 0 0 0 212 Human Y Y 0 0 0 0 0 0 0 0 0 0 0 N 0 0 0 0 0 0 0 0 0 0 0 0 0 0 0 0 0 0 0 0 0 213 Human Y N 0 0 0 0 0 0 0 0 0 0 0 N 0 0 0 0 0 0 0 0 0 0 0 0 0 0 0 0 0 0 0 0 0 214 Human Y Y 0 0 0 0 0 0 0 0 0 0 0 N 0 0 0 0 0 0 0 0 0 0 0 0 0 0 0 0 0 0 0 0 0 215 Human Y N 0 0 0 0 0 0 0 0 0 0 0 N 0 0 0 0 0 0 0 0 0 0 0 0 0 0 0 0 0 0 0 0 0 216 Human Y N 0 0 0 0 0 0 0 0 0 0 0 N 0 0 0 0 0 0 0 0 0 0 0 0 0 0 0 0 0 0 0 0 0 217 Human Y Y 0 0 0 0 0 0 0 0 0 0 0 N 0 0 0 0 0 0 0 0 0 0 0 0 0 0 0 0 1 0 0 1 1 218 Human Y Y 0 0 0 0 0 0 0 0 1 0 0 Y 1 0 0 0 0 0 0 3 0 0 0 0 0 0 0 0 0 0 1 6 4 219 Human Y Y 1 0 0 1 0 0 0 0 0 0 0 N 0 0 0 0 1 0 0 0 0 0 0 0 0 0 0 0 0 0 0 2 2 220 Human Y Y 0 0 0 0 0 0 0 0 0 0 0 N 0 0 0 0 0 0 0 0 0 0 0 0 0 0 0 0 0 0 0 0 0 221 Human Y Y 0 0 0 0 0 0 0 0 0 0 0 Y 1 0 0 0 3 0 0 1 0 0 0 0 0 0 0 0 0 0 1 6 4 222 Human Y Y 0 0 0 0 0 0 0 0 0 0 0 N 0 0 0 0 0 0 0 0 0 0 0 0 0 0 0 0 0 0 0 0 0 223 Human Y N 0 0 0 0 0 0 0 0 0 0 0 N 0 0 0 0 0 0 0 1 0 0 0 0 0 0 0 0 0 0 1 1 1 223A Human Y N 0 0 0 0 0 0 0 0 0 0 0 N 0 0 0 0 0 0 0 0 0 0 0 0 0 0 0 0 0 0 0 0 0 224 Human Y N 0 0 0 0 0 0 0 1 0 0 1 N 1 0 0 0 0 2 0 77 0 10 0 0 0 0 0 0 0 1 3 92 6 225 Human Y Y 2 0 1 1 0 0 0 1 1 0 0 N 0 0 0 0 3 0 0 1 0 9 0 0 0 0 0 0 0 0 1 16 6 226 Human Y Y 0 0 0 0 0 0 0 0 0 0 0 N 0 0 0 0 0 0 0 0 0 0 0 0 0 0 0 0 0 0 0 0 0 227 Human Y Y 0 0 0 0 0 0 1 0 0 0 0 N 0 0 0 0 0 0 0 0 0 0 0 0 0 0 0 0 0 0 0 1 1 228 Human Y Y 0 0 0 0 0 0 0 0 0 0 0 N 0 0 0 0 0 0 0 0 0 0 0 0 0 0 0 0 0 0 0 0 0 229 Human Y N 0 0 0 0 0 0 0 0 0 0 0 N 0 0 0 0 0 0 0 0 0 0 0 0 0 0 0 0 0 0 0 0 0 229A Human Y N 0 0 0 0 0 0 0 0 0 0 0 N 0 0 0 0 0 0 0 0 0 0 0 0 0 0 0 0 0 0 0 0 0 230 Human Y Y 0 0 0 0 0 0 0 0 0 0 0 Y 0 0 0 0 2 0 6 1 0 0 0 0 0 0 0 0 0 0 1 10 5 230A Human Y N 0 0 0 0 0 0 0 0 0 0 0 N 0 0 0 0 0 0 0 0 0 0 0 0 0 0 0 0 0 0 0 0 0 231 Human Y N 2 2 0 0 0 0 0 0 0 0 0 Y 1 0 0 0 0 0 0 36 0 0 0 0 0 0 0 0 0 0 2 39 3 232 Human Y N 0 0 0 0 0 0 0 0 0 0 1 N 0 0 0 0 4 0 0 1 0 0 0 0 0 0 0 0 0 0 1 6 3 233 Human Y Y 0 0 0 0 0 0 0 0 0 0 0 N 0 0 0 0 0 0 0 0 0 0 0 0 0 0 0 0 0 0 0 0 0 234 Human Y Y 0 0 0 0 0 0 0 2 0 0 0 Y 1 0 0 0 0 0 0 0 0 0 0 0 0 0 0 0 0 0 0 1 1
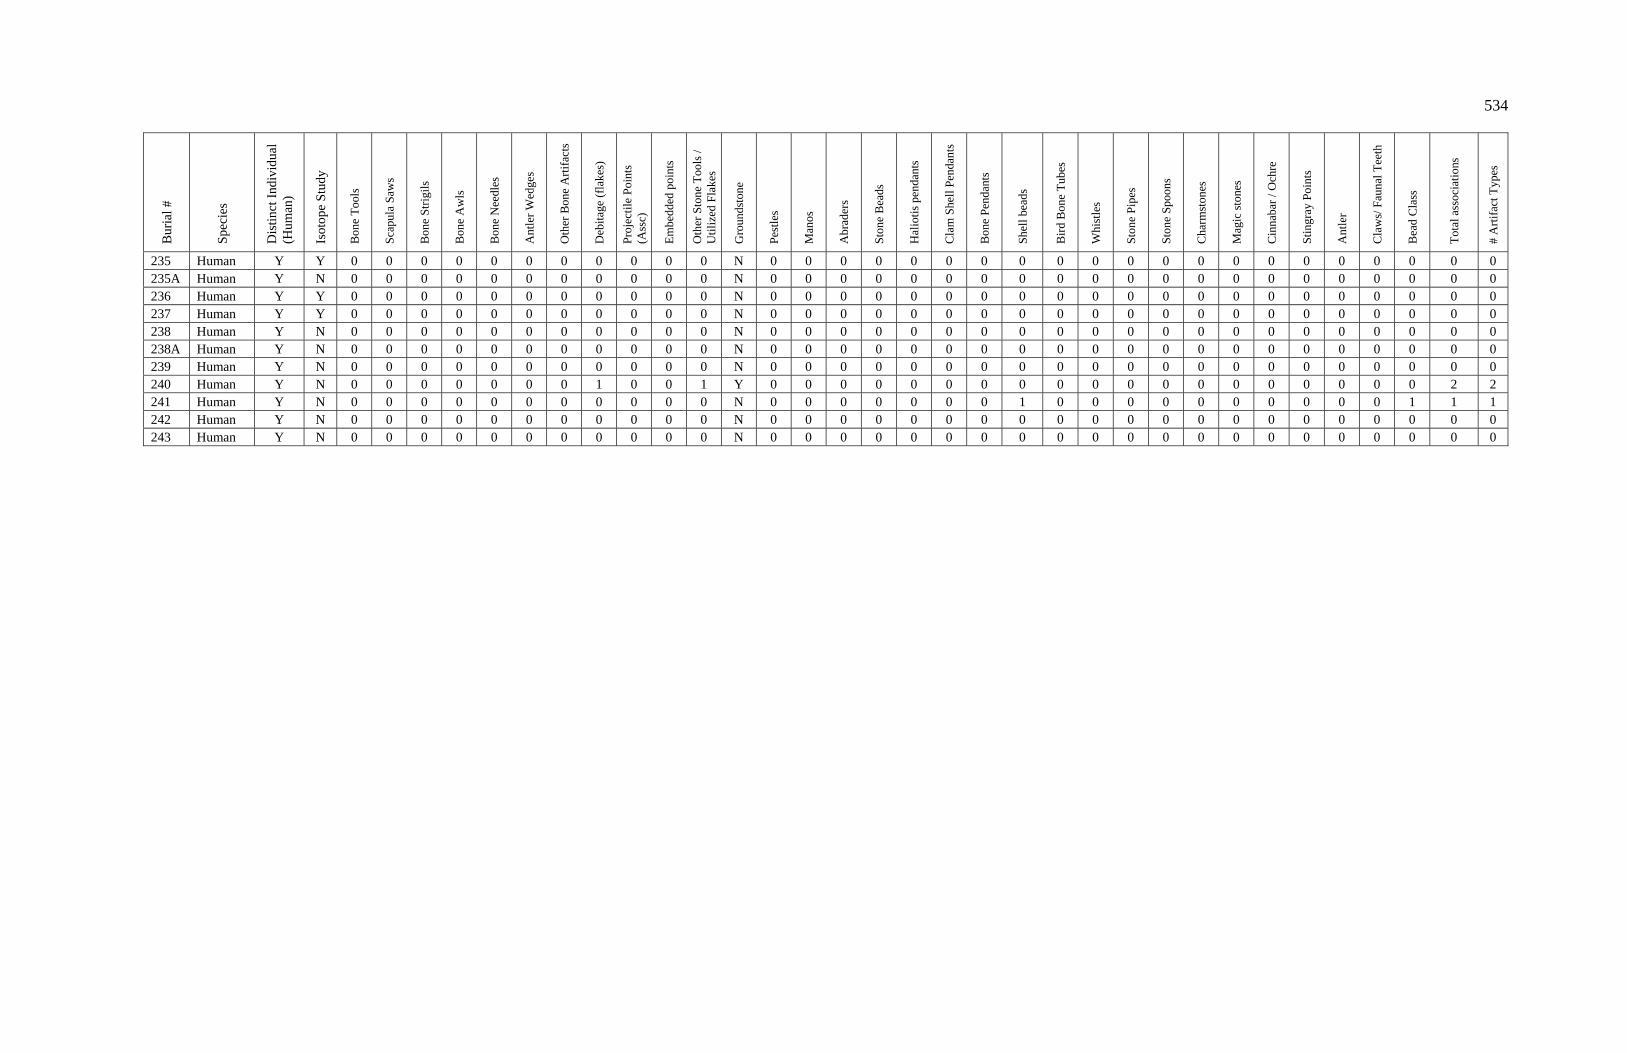
534
Bur
ial #
Spe
cies
Dis
tinct
Ind
ivid
ual
(Hum
an)
Isot
ope
Stu
dy
Bon
e T
ools
Sca
pula
Saw
s
Bon
e S
trig
ils
Bon
e A
wls
Bon
e N
eedl
es
Ant
ler
Wed
ges
Oth
er B
one
Art
ifac
ts
Deb
itag
e (f
lake
s)
Pro
ject
ile
Poi
nts
(Ass
c)
Em
bedd
ed p
oint
s
Oth
er S
tone
Too
ls /
U
tili
zed
Fla
kes
Gro
unds
tone
Pes
tles
Man
os
Abr
ader
s
Sto
ne B
eads
Hal
ioti
s pe
ndan
ts
Cla
m S
hell
Pend
ants
Bon
e P
enda
nts
Shel
l bea
ds
Bir
d B
one
Tub
es
Whi
stle
s
Sto
ne P
ipes
Sto
ne S
poon
s
Cha
rmst
ones
Mag
ic s
tone
s
Cin
naba
r / O
chre
Sti
ngra
y P
oint
s
Ant
ler
Cla
ws/
Fau
nal T
eeth
Bea
d C
lass
Tot
al a
ssoc
iati
ons
# A
rtif
act T
ypes
235 Human Y Y 0 0 0 0 0 0 0 0 0 0 0 N 0 0 0 0 0 0 0 0 0 0 0 0 0 0 0 0 0 0 0 0 0 235A Human Y N 0 0 0 0 0 0 0 0 0 0 0 N 0 0 0 0 0 0 0 0 0 0 0 0 0 0 0 0 0 0 0 0 0 236 Human Y Y 0 0 0 0 0 0 0 0 0 0 0 N 0 0 0 0 0 0 0 0 0 0 0 0 0 0 0 0 0 0 0 0 0 237 Human Y Y 0 0 0 0 0 0 0 0 0 0 0 N 0 0 0 0 0 0 0 0 0 0 0 0 0 0 0 0 0 0 0 0 0 238 Human Y N 0 0 0 0 0 0 0 0 0 0 0 N 0 0 0 0 0 0 0 0 0 0 0 0 0 0 0 0 0 0 0 0 0 238A Human Y N 0 0 0 0 0 0 0 0 0 0 0 N 0 0 0 0 0 0 0 0 0 0 0 0 0 0 0 0 0 0 0 0 0 239 Human Y N 0 0 0 0 0 0 0 0 0 0 0 N 0 0 0 0 0 0 0 0 0 0 0 0 0 0 0 0 0 0 0 0 0 240 Human Y N 0 0 0 0 0 0 0 1 0 0 1 Y 0 0 0 0 0 0 0 0 0 0 0 0 0 0 0 0 0 0 0 2 2 241 Human Y N 0 0 0 0 0 0 0 0 0 0 0 N 0 0 0 0 0 0 0 1 0 0 0 0 0 0 0 0 0 0 1 1 1 242 Human Y N 0 0 0 0 0 0 0 0 0 0 0 N 0 0 0 0 0 0 0 0 0 0 0 0 0 0 0 0 0 0 0 0 0 243 Human Y N 0 0 0 0 0 0 0 0 0 0 0 N 0 0 0 0 0 0 0 0 0 0 0 0 0 0 0 0 0 0 0 0 0

APPENDIX C
536
NEW RADIOCARBON DATE CALIBRATION
AND CALCULATION OF DIETARY
PERCENT MARINE
Introduction
To enhance the temporal context of the present study, fourteen new radiocarbon
dates for CA-SCL-38 were processed in 2010 at the Lawrence Livermore National
Laboratory’s Center for Accelerator Mass Spectrometry (LLNL CAMS) laboratory in
Livermore, California. One additional date was obtained in 2012 in support of Tammy
Buonosera’s dissertation research, using a human bone collagen sample from the present
stable isotope study as source material. This date was run by the University of Arizona
AMS facility. The methods for preparation, calculation of percent marine, and calibration
of these new dates are presented below.
Radiocarbon Dating
Radiocarbon dating measures the proportion of the radioactive carbon-14 (14C) in
a sample relative to the amount present in living systems. During life, the proportion of
14C within an organism will be the same as that found in ingested foods. After death, the
14C value within tissues declines, as the radioactive isotope slowly decays to a stable
form, that of nitrogen-14 (14N). Radioactive decay of 14C occurs at a predictable rate with
a half-life of 5370 years, making radiocarbon dating an excellent approach to dating
organic materials from the past 40,000 years or so (Bowman 1990). Archaeologists have
537
relied on radiocarbon dating methods since 1949 and techniques have improved through
the decades, allowing for more accurate and precise measurements from smaller samples.
Early techniques counted emissions of beta-particles, cast off as 14C decayed to
14N. This approach required large samples of material (e.g. 10-20 grams of charcoal, 100-
400 grams of bone, or 50-100 grams of shell) and produced results with wide standard
error ranges (Bowman 1990). Dates for SCL-38 estimated at the Washington State
University Radiocarbon Laboratory in 1996 and at Beta Analytic in 1988 were processed
using these techniques (see Chapter III, Tables 19 and 20, for reporting of previously
calibrated radiocarbon dates).
Accelerator mass spectrometry (AMS), on the other hand, detects the actual
proportional presence of carbon-14 atoms relative to carbon-13 atoms within a sample,
and thereby provides a more accurate result using smaller amounts of sample material
(e.g. 10 to 100 micrograms of charcoal, 0.5 to 1 grams of bone, or 50 to 100 micrograms
of shell) (Bowman 1990). The new dates, run at the LLNL CAMS Laboratory and at the
University of Arizona AMS Dating Laboratory were processed using accelerator mass
spectrometry.
Radiocarbon Dating Methods
To obtain the fourteen new burial-associated radiocarbon dates from CA-SCL-38,
a direct approach was used, dating the bone collagen of individuals rather than relying on
associated artifacts or charcoal. This approach avoids the hazards of “old wood,” where
the wood associated was actually felled long before it was used or burned at the site
(Schiffer 1986), and also the risks of dating heirlooms, found objects, or materials mixed
538
into the burial through bioturbation, none of which represent the lifetime of the individual
in question.
Sample Selection
The 14 individuals were selected non-randomly. Two were chosen to test earlier
radiocarbon results from the WSU 1996 group (Burial 4, a female in her 40s with a
projectile point in her chest cavity and no other associated artifacts, and Burial 166, a
teenage male adult found with bone whistles and beads). The remaining twelve were
selected in an attempt to build diversity in the dated population, to identify the date of
interesting artifacts, and to build on intriguing biographies. Of these individuals, five
were adult males (Burials 8, 84, 97, 132, and 182), six were adult females (Burials 5, 35,
90, 120, 209, and 210), and one was a young adult of indeterminate sex, possibly female
(Burial 227) (see Appendix A for reconciliation of age and sex).
Three of these individuals had few or no burial associations. Burial 8, a male in
his thirties, was buried in an unusual position, head first with hips and limbs above the
body. He had no associated artifacts. Burial 209, a young woman in her teens, had no
associated artifacts. Burial 210, an elder female, perhaps in her late fifties, was found
with a single shell bead.
Three individuals exhibited intriguing skeletal pathologies in combination with
interesting associations. Burial 90, a female in her twenties, was buried with a young
child. She had congenital spinal development problems (spina bifida and an unfused
spinous process on the eleventh thoracic vertebra). She also had a cache of bird bone
whistles, four of which were decorated with bead appliqué, and almost 450 shell beads.
539
Burial 97, a male in his teens or early twenties, also had evidence of congenital spinal
developmental problems (spina bifida and unfused neural arches in a few cervical and
thoracic vertebrae). He was found with seven types of artifacts, including a charmstone, a
stone pipe, bird bone whistles, more than 1,500 shell beads, and two Haliotis pendants.
This assemblage suggests that he had a spiritual role in the community (see Chapter IV
for discussion). Burial 120, a female adult in her teens, was buried with a shallow/hopper
mortar above her in which the remains of an infant (Burial 119) were found. A lytic
lesion on her left posterior parietal suggested a traumatic event approximately two years
before her death which would have likely caused severe behavioral or neurological
symptoms (Jurmain 2000:137, in consultation with Bruce Ragsdale). Additional artifacts
found with this burial included one pestle and three shell beads.
Three individuals were selected for radiocarbon dating because they were buried
with objects associated with wealth or ritual status. Burial 84, a male in his late teens,
was found with an astonishing sixty-three Haliotis pendants, as well as almost 800 shell
beads, a bone awl, and a hammerstone. Burial 132, a male adult in his late teens, was
found with a large cache of cinnabar nuggets, as well as several bone awls, beads, and
Haliotis pendants. Burial 182, a male in his twenties, was interred with four animal teeth
as well as several whistles and over 1,000 shell and bone beads.
The last individual included in the LLNL CAMS radiocarbon dating group is
Burial 35, a female adult of undetermined age, perhaps in her forties (Morley 1997). She
was buried with a fairly typical cache, including three bone awls and 86 shell beads. A
fish vertebra found in association with her is somewhat unusual in the faunal record at
this site.
540
Sample Preparation
Bone collagen samples from individual burials at SCL-38 had already been
purified and lyophilized (freeze-dried) for stable isotope analysis, and remaining portions
were repurposed for radiocarbon dating. Sample preparation was completed by the author
in the CAMS lab at LLNL, under the supervision of Paula Zermeño and Tom Guilderson,
and following the protocol guidelines of Brown et al. (1988) and Ramsey et al. (2004).
Two to 2.5 milligrams of prepared collagen was sealed together in a glass vial with
proportionate quantities of copper oxide (CuO) and silver (Ag), then baked at 700° C for
five hours to convert all available carbon to CO2. Gas samples were isolated on a
graphitizer line (see Groza 2002:Figure 5 for detail) and then baked into graphite. The
graphite was removed and compacted into targets, then submitted to the AMS facility for
analysis. Standards of known ages were processed with all batches for calibration and
quality control.
Prepared targets containing the graphite were then loaded into a sample wheel and
introduced to the accelerator mass spectrometer. The CAMS laboratory uses a high
intensity cesium-sputter source to accelerate the particles within each sample.
Accelerated particles are sorted within the high-energy portion of the spectrometer using
powerful magnets. The spectrometer then records the presence of particles by mass using
a gas-ionization detector, actually counting individual atoms and identifying particles
within the sample (CAMS https://cams.llnl.gov/, accessed 1/07/13). Results are presented
in Figure C1.
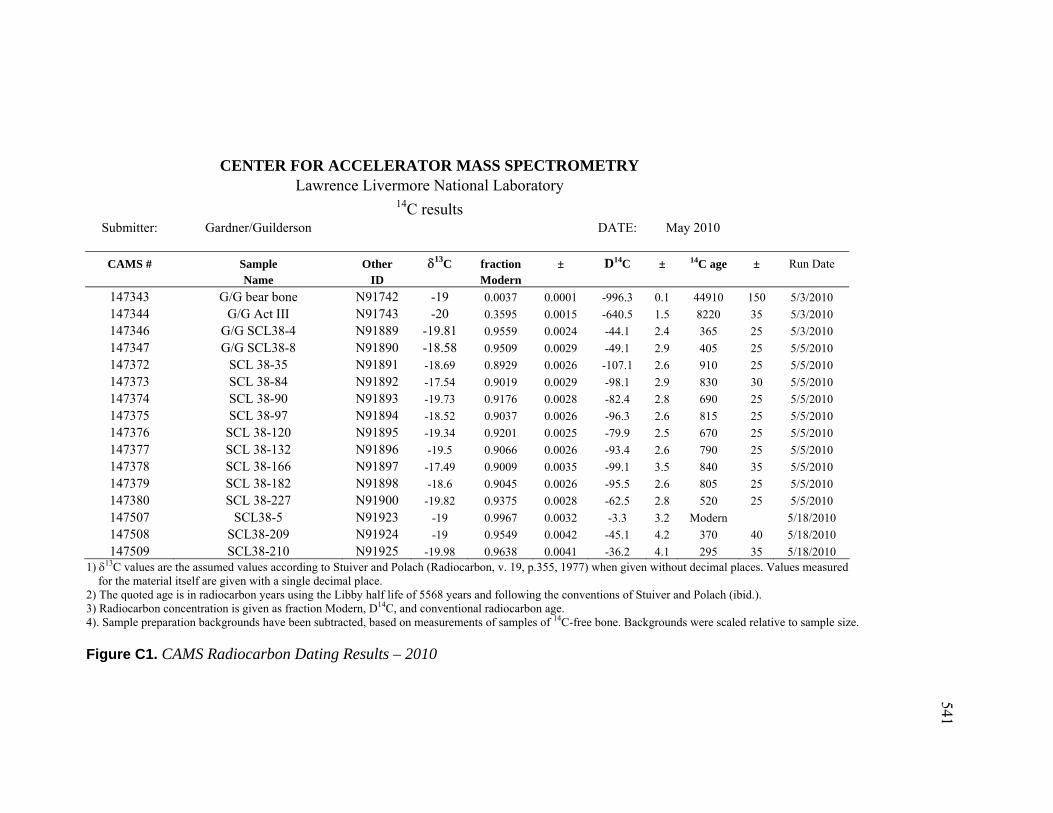
541
CENTER FOR ACCELERATOR MASS SPECTROMETRY
Lawrence Livermore National Laboratory 14C results
Submitter: Gardner/Guilderson DATE: May 2010
CAMS # Sample Other 13C fraction ± D14C ± 14C age ± Run Date Name ID Modern
147343 G/G bear bone N91742 -19 0.0037 0.0001 -996.3 0.1 44910 150 5/3/2010
147344 G/G Act III N91743 -20 0.3595 0.0015 -640.5 1.5 8220 35 5/3/2010
147346 G/G SCL38-4 N91889 -19.81 0.9559 0.0024 -44.1 2.4 365 25 5/3/2010
147347 G/G SCL38-8 N91890 -18.58 0.9509 0.0029 -49.1 2.9 405 25 5/5/2010
147372 SCL 38-35 N91891 -18.69 0.8929 0.0026 -107.1 2.6 910 25 5/5/2010
147373 SCL 38-84 N91892 -17.54 0.9019 0.0029 -98.1 2.9 830 30 5/5/2010
147374 SCL 38-90 N91893 -19.73 0.9176 0.0028 -82.4 2.8 690 25 5/5/2010
147375 SCL 38-97 N91894 -18.52 0.9037 0.0026 -96.3 2.6 815 25 5/5/2010
147376 SCL 38-120 N91895 -19.34 0.9201 0.0025 -79.9 2.5 670 25 5/5/2010
147377 SCL 38-132 N91896 -19.5 0.9066 0.0026 -93.4 2.6 790 25 5/5/2010
147378 SCL 38-166 N91897 -17.49 0.9009 0.0035 -99.1 3.5 840 35 5/5/2010
147379 SCL 38-182 N91898 -18.6 0.9045 0.0026 -95.5 2.6 805 25 5/5/2010
147380 SCL 38-227 N91900 -19.82 0.9375 0.0028 -62.5 2.8 520 25 5/5/2010
147507 SCL38-5 N91923 -19 0.9967 0.0032 -3.3 3.2 Modern 5/18/2010
147508 SCL38-209 N91924 -19 0.9549 0.0042 -45.1 4.2 370 40 5/18/2010
147509 SCL38-210 N91925 -19.98 0.9638 0.0041 -36.2 4.1 295 35 5/18/2010 1) 13C values are the assumed values according to Stuiver and Polach (Radiocarbon, v. 19, p.355, 1977) when given without decimal places. Values measured
for the material itself are given with a single decimal place. 2) The quoted age is in radiocarbon years using the Libby half life of 5568 years and following the conventions of Stuiver and Polach (ibid.). 3) Radiocarbon concentration is given as fraction Modern, D14C, and conventional radiocarbon age. 4). Sample preparation backgrounds have been subtracted, based on measurements of samples of 14C-free bone. Backgrounds were scaled relative to sample size. Figure C1. CAMS Radiocarbon Dating Results – 2010

542
Calculation of Dietary Percent Marine
Prior to calibration, the dietary contribution of marine foods for each individual
(hereafter called percent marine) was calculated using a linear mixing model. Calculation
of percent marine is a crucial step to accurate calibration, because carbon from marine
foods contains less 14C than contemporaneous terrestrial foods, due to the marine
reservoir effect. While the 14C content of carbonates in ocean surface waters is in
equilibrium with the atmosphere above, deep waters are reservoirs for older carbonates,
including those in dissolved in deep-sea waters as well as those within eroding limestone
deposits. These older carbonates are depleted in 14C. Upwelling mixes the deep-sea
depleted waters with surface waters, effectively diluting the 14C in the living environment
for marine organisms. The 14C concentrations within these organisms equilibrate with
their environment, causing them to have a lower concentration of 14C in their tissues than
contemporaneous terrestrial organisms would have. Consequently, uncorrected
radiocarbon dates for marine organisms (e.g., shell) appear to be approximately 400 years
older than when the organism actually lived, although the factor of variance varies
between locations due to differences in upwelling rates and factors of local geology
(Stuiver and Braziunas 1993).
To calibrate radiocarbon dates for humans eating a mixed-marine diet, it is crucial
to first calculate the proportion of marine foods likely to have been included in each
individual’s diet and then use the locally appropriate correction factor for the marine
reservoir (ΔR). The approach used in this study to calculate percent marine is a linear
mixing model based on measured δ13CCollagen values. Endpoints were selected to represent
local food values, based on the botanical and faunal isotope studies highlighted in
543
Bartelink’s (2006) review of Central California resources. While regional variation is
apparent in the δ13C values for California marine resources and terrestrial mammals (up
to 3 permil within a species), values for terrestrial plants appear to be fairly similar for all
regions reported in Bartelink (2006). Accordingly, where studies had been done using
San Francisco Bay Area resources, these were privileged in calculating endpoints for the
mixing model. No data was available for local acorns or nuts, so the Southern California
results were used to represent this important dietary source. Values used in determining
the mixing model end points are presented in Table C1.
The mean δ13C value of nut meats from previous studies was -23.94 permil. The
weighted average of marshland plants was -25.22 permil. Terrestrial mammal δ13C values
averaged -20.78 permil; just the artiodactyls averaged -22.71 permil. Reviewed as a
group, the most negative value found was for tule at -26.20 permil. Therefore, an
endpoint to represent an all terrestrial diet should not dip below -26 permil in this region.
Among marine resources, the average δ13C value of marine mammal protein was -
13.64 permil. For marine fish, the weighted average was -15.73 permil. Anadromous fish
are those which spend part of their lives in riverine systems and part in marine systems;
the weighted average in this group was -17.56 permil. Finally, bay shellfish and the crab
sample averaged -19.16 permil. Of these values, the highest (least negative) value is for
one rather anomalous sturgeon at -11.64 permil, and otherwise for marine mammals
trending just below -13 permil. Based on these data, an endpoint of -13 permil is
suggested to represent an entirely marine diet in the prehistoric San Francisco Bay Area.
These endpoints are then adjusted for fractionation between ingested δ13C values of
protein resources and δ13C values of human bone collagen by adding 5 permil (Ambrose
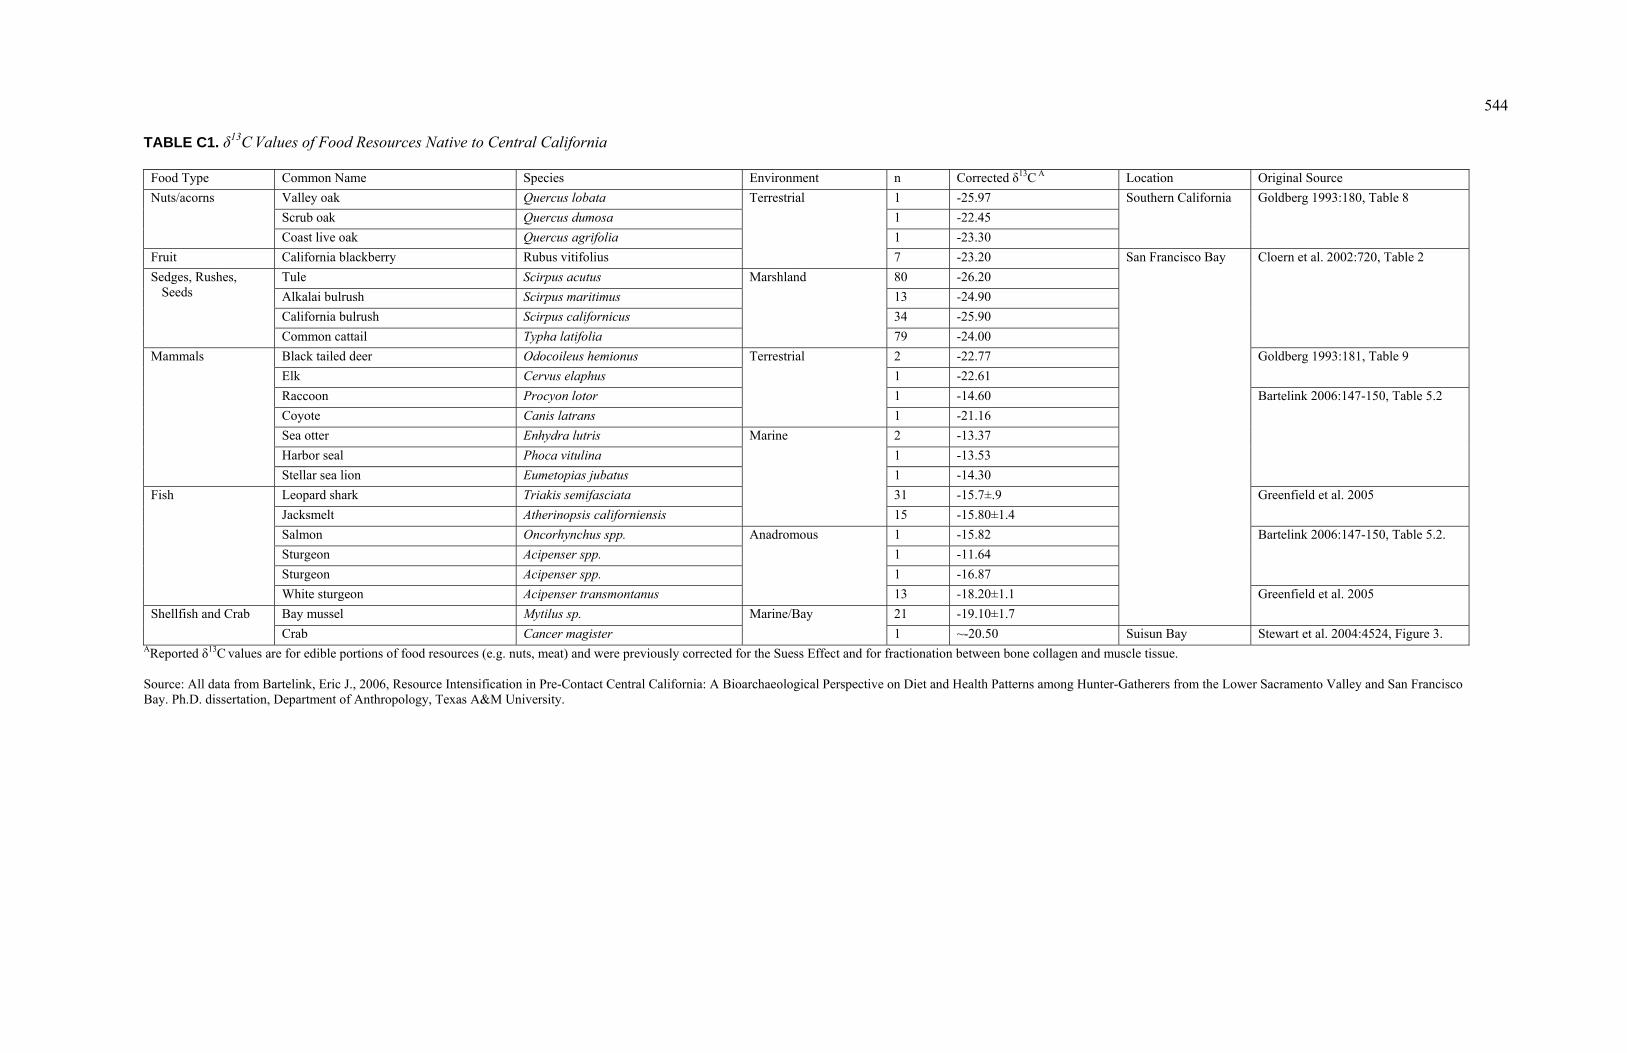
544
TABLE C1. δ13C Values of Food Resources Native to Central California
Food Type Common Name Species Environment n Corrected δ13C A Location Original Source
Valley oak Quercus lobata 1 -25.97
Scrub oak Quercus dumosa 1 -22.45
Nuts/acorns
Coast live oak Quercus agrifolia 1 -23.30
Southern California Goldberg 1993:180, Table 8
Fruit California blackberry Rubus vitifolius
Terrestrial
7 -23.20
Tule Scirpus acutus 80 -26.20
Alkalai bulrush Scirpus maritimus 13 -24.90
California bulrush Scirpus californicus 34 -25.90
Sedges, Rushes, Seeds
Common cattail Typha latifolia
Marshland
79 -24.00
Cloern et al. 2002:720, Table 2
Black tailed deer Odocoileus hemionus 2 -22.77
Elk Cervus elaphus 1 -22.61
Goldberg 1993:181, Table 9
Raccoon Procyon lotor 1 -14.60
Coyote Canis latrans
Terrestrial
1 -21.16
Sea otter Enhydra lutris 2 -13.37
Harbor seal Phoca vitulina 1 -13.53
Mammals
Stellar sea lion Eumetopias jubatus 1 -14.30
Bartelink 2006:147-150, Table 5.2
Leopard shark Triakis semifasciata 31 -15.7±.9
Jacksmelt Atherinopsis californiensis
Marine
15 -15.80±1.4
Greenfield et al. 2005
Salmon Oncorhynchus spp. 1 -15.82
Sturgeon Acipenser spp. 1 -11.64
Sturgeon Acipenser spp. 1 -16.87
Bartelink 2006:147-150, Table 5.2.
Fish
White sturgeon Acipenser transmontanus
Anadromous
13 -18.20±1.1
Bay mussel Mytilus sp. 21 -19.10±1.7
San Francisco Bay
Greenfield et al. 2005
Shellfish and Crab
Crab Cancer magister
Marine/Bay
1 ~-20.50 Suisun Bay Stewart et al. 2004:4524, Figure 3. AReported δ13C values are for edible portions of food resources (e.g. nuts, meat) and were previously corrected for the Suess Effect and for fractionation between bone collagen and muscle tissue. Source: All data from Bartelink, Eric J., 2006, Resource Intensification in Pre-Contact Central California: A Bioarchaeological Perspective on Diet and Health Patterns among Hunter-Gatherers from the Lower Sacramento Valley and San Francisco Bay. Ph.D. dissertation, Department of Anthropology, Texas A&M University.
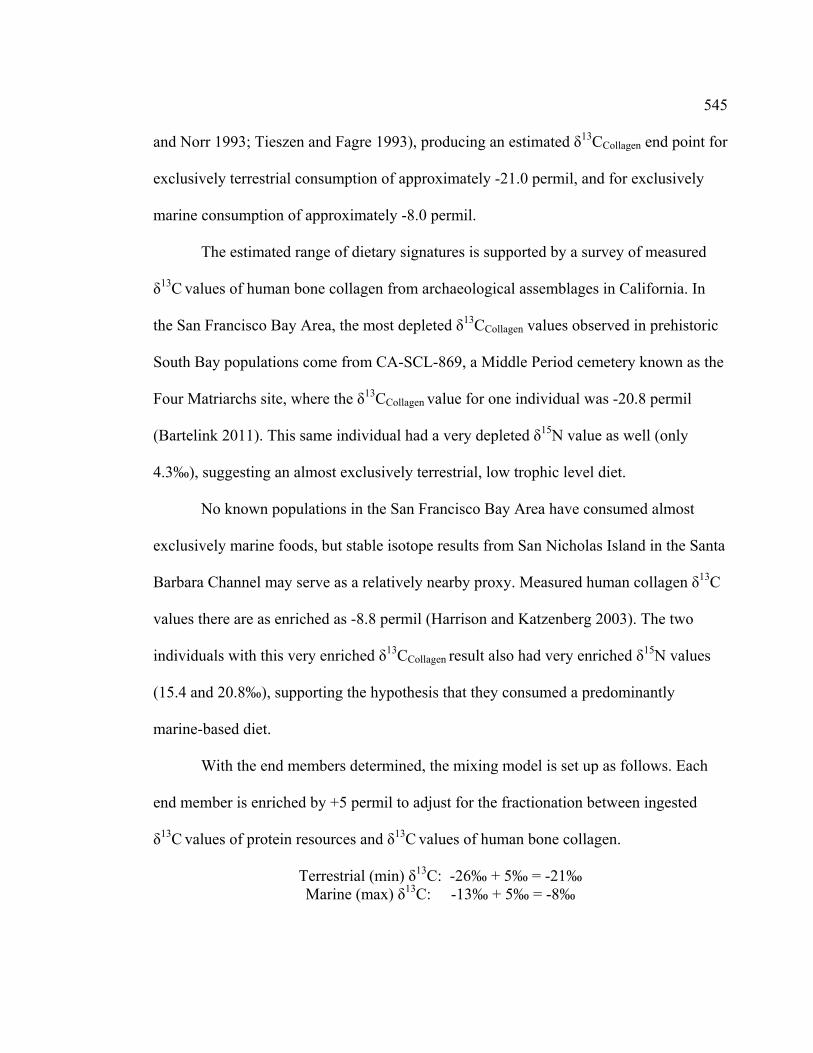
545
and Norr 1993; Tieszen and Fagre 1993), producing an estimated δ13CCollagen end point for
exclusively terrestrial consumption of approximately -21.0 permil, and for exclusively
marine consumption of approximately -8.0 permil.
The estimated range of dietary signatures is supported by a survey of measured
δ13C values of human bone collagen from archaeological assemblages in California. In
the San Francisco Bay Area, the most depleted δ13CCollagen values observed in prehistoric
South Bay populations come from CA-SCL-869, a Middle Period cemetery known as the
Four Matriarchs site, where the δ13CCollagen value for one individual was -20.8 permil
(Bartelink 2011). This same individual had a very depleted δ15N value as well (only
4.3‰), suggesting an almost exclusively terrestrial, low trophic level diet.
No known populations in the San Francisco Bay Area have consumed almost
exclusively marine foods, but stable isotope results from San Nicholas Island in the Santa
Barbara Channel may serve as a relatively nearby proxy. Measured human collagen δ13C
values there are as enriched as -8.8 permil (Harrison and Katzenberg 2003). The two
individuals with this very enriched δ13CCollagen result also had very enriched δ15N values
(15.4 and 20.8‰), supporting the hypothesis that they consumed a predominantly
marine-based diet.
With the end members determined, the mixing model is set up as follows. Each
end member is enriched by +5 permil to adjust for the fractionation between ingested
δ13C values of protein resources and δ13C values of human bone collagen.
Terrestrial (min) δ13C: -26‰ + 5‰ = -21‰ Marine (max) δ13C: -13‰ + 5‰ = -8‰
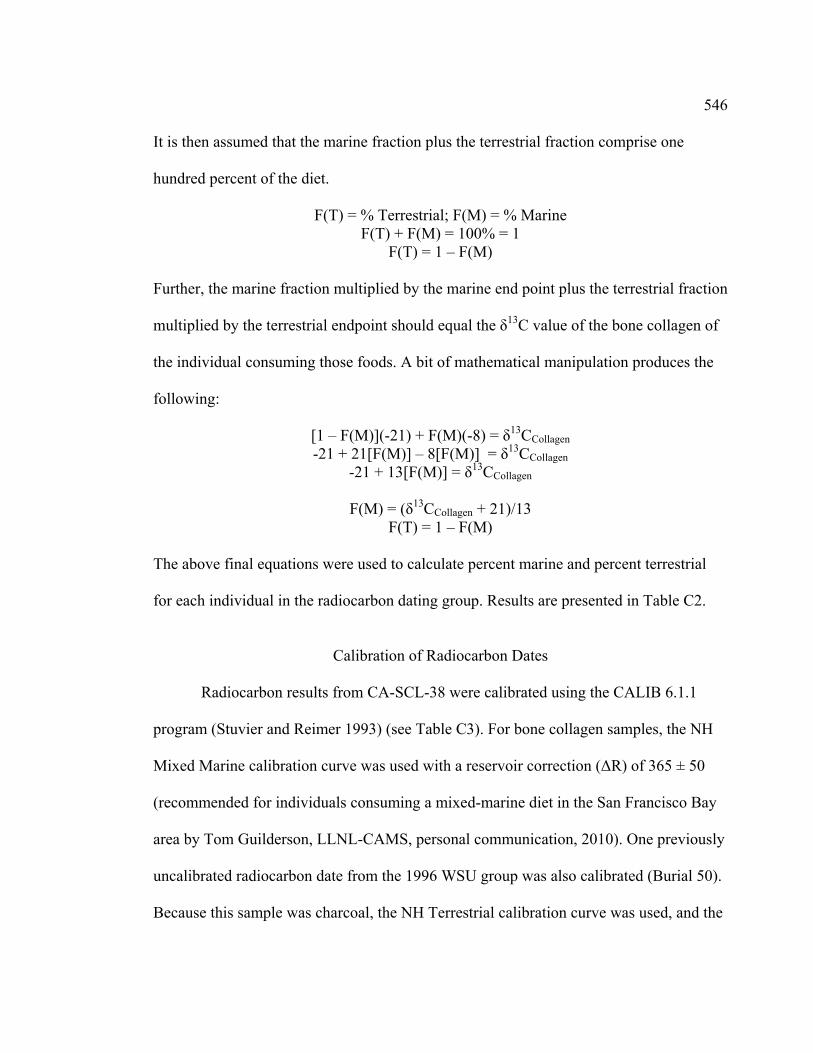
546
It is then assumed that the marine fraction plus the terrestrial fraction comprise one
hundred percent of the diet.
F(T) = % Terrestrial; F(M) = % Marine F(T) + F(M) = 100% = 1
F(T) = 1 – F(M)
Further, the marine fraction multiplied by the marine end point plus the terrestrial fraction
multiplied by the terrestrial endpoint should equal the δ13C value of the bone collagen of
the individual consuming those foods. A bit of mathematical manipulation produces the
following:
[1 – F(M)](-21) + F(M)(-8) = δ13CCollagen -21 + 21[F(M)] – 8[F(M)] = δ13CCollagen
-21 + 13[F(M)] = δ13CCollagen
F(M) = (δ13CCollagen + 21)/13
F(T) = 1 – F(M)
The above final equations were used to calculate percent marine and percent terrestrial
for each individual in the radiocarbon dating group. Results are presented in Table C2.
Calibration of Radiocarbon Dates
Radiocarbon results from CA-SCL-38 were calibrated using the CALIB 6.1.1
program (Stuvier and Reimer 1993) (see Table C3). For bone collagen samples, the NH
Mixed Marine calibration curve was used with a reservoir correction (ΔR) of 365 ± 50
(recommended for individuals consuming a mixed-marine diet in the San Francisco Bay
area by Tom Guilderson, LLNL-CAMS, personal communication, 2010). One previously
uncalibrated radiocarbon date from the 1996 WSU group was also calibrated (Burial 50).
Because this sample was charcoal, the NH Terrestrial calibration curve was used, and the

547
Table C2. Calculated Dietary Percent Marine for Newly Radiocarbon Dated Individuals from CA-SCL-38
Burial # δ13C (‰) % Marine % Terrestrial 4 -19.81 9% 91% 5 -19.00 15% 85% 8 -18.58 19% 81% 35 -18.69 18% 82% 84 -17.54 27% 73% 90 -19.73 10% 90% 97 -18.52 19% 81% 120 -19.34 13% 87% 132 -19.50 12% 88% 166 -17.49 27% 73% 182 -18.60 18% 82% 209 -19.00 15% 85% 210 -19.98 8% 92% 227 -19.82 9% 91%
reservoir correction was not necessary. Finally, an attempt was made to calibrate
the Beta Analytic date from 1988, using the Marine calibration curve because the sample
was shell, and a reservoir correction (ΔR) of 225 ± 35, based on the recommendations for
shell dating in Groza (2002). The marine reservoir effect is highlighted in this case, as the
uncorrected date of 500 ± 60 years before present is actually a modern result. Calibration
is not possible for this date. One of the LLNL-CAMS samples also produced a modern
result (Burial 5) and will be disregarded in further discussions of temporal context for
CA-SCL-38.
Summary
This appendix has presented a new linear mixing model to estimate marine
contribution to diet as well as detailing methods for preparation and calibration of new

548
TABLE C3. Newly Calibrated Radiocarbon Dates for CA-SCL-38A
Sample ID Test Facility Year
Mat
eria
l
ΔR B Calibration CurveC Uncalibrated 14-C Age (BP)
Corrected Date (BP)
(1-Sigma)
Calibrated Date (BC/AD) (1-Sigma)
Corrected Date (BP)
(2-Sigma)
Calibrated Date (BC/AD) (2-Sigma)
Midpoint/ intercept (BC/AD)
4 LLNL 2010 HBC 365 ± 50 NH Mixed Marine 365 ± 25 365 ± 25 1524-1573 365 ± 51 1510-1602 AD 1569 5 LLNL 2010 HBC 365 ± 50 NH Mixed Marine Modern Error, too recent for calibration. Sample contaminated. 8 LLNL 2010 HBC 365 ± 50 NH Mixed Marine 405 ± 25 405 ± 27 1532-1540 405 ± 53 1620-1672 AD 1646
35 LLNL 2010 HBC 365 ± 50 NH Mixed Marine 910 ± 25 910 ± 27 1231-1270 910 ± 53 1214-1280 AD 1250 84 LLNL 2010 HBC 365 ± 50 NH Mixed Marine 830 ± 30 830 ± 33 1300-1326 830 ± 66 1291-1401 AD 1350 90 LLNL 2010 HBC 365 ± 50 NH Mixed Marine 690 ± 25 690 ± 25 1303-1327 690 ± 51 1296-1399 AD 1351 97 LLNL 2010 HBC 365 ± 50 NH Mixed Marine 815 ± 25 815 ± 27 1282-1309 815 ± 54 1275-1323 AD 1306
120 LLNL 2010 HBC 365 ± 50 NH Mixed Marine 670 ± 25 670 ± 26 1322-1350 670 ± 52 1308-1366 AD 1353 132 LLNL 2010 HBC 365 ± 50 NH Mixed Marine 790 ± 25 790 ± 26 1274-1294 790 ± 51 1263-1307 AD 1286 166 LLNL 2010 HBC 365 ± 50 NH Mixed Marine 840 ± 35 840 ± 38 1296-1325 840 ± 75 1286-1401 AD 1348 182 LLNL 2010 HBC 365 ± 50 NH Mixed Marine 805 ± 25 805 ± 27 1284-1310 805 ± 53 1277-1325 AD 1312 209 LLNL 2010 HBC 365 ± 50 NH Mixed Marine 370 ± 40 370 ± 41 1526-1559 370 ± 81 1611-1686 AD 1650 210 LLNL 2010 HBC 365 ± 50 NH Mixed Marine 295 ± 35 295 ± 35 1640-1677 295 ± 70 1628-1687 AD 1669 227 LLNL 2010 HBC 365 ± 50 NH Mixed Marine 520 ± 25 520 ± 25 1432-1453 520 ± 51 1420-1472 AD 1444 45 D UA-AMS 2012 HBC 365 ± 50 NH Mixed Marine 769 ± 43 769 ± 44 1286-1320 769 ± 87 1181-1291 AD 1249 50 WSU 1996 CH N/A NH Terrestrial 410 ± 240 410 ± 240 1298-1678 410 ± 480 1209-1954 AD 1544
Unit 2: 10-20 cm Beta Analytic 1988 SH 225 ± 35 Marine 500 ± 60 Error, too recent for calibration. Sample contaminated.
ACalibration completed using CALIB 6.1.1 program. Percent marine was calculated for all human bone collagen samples using a linear mixing model with locally derived δ13C endpoints of -21‰ and -8‰. BΔR value of 365 ± 50 recommended for marine food sources from San Francisco Bay (Tom Guilderson, personal communication, 2010). ΔR value of 225 ± 35 recommended for shell dating by Groza (2002), however this date is too recent to be calibrated
using any ΔR value. CCalibration curve depends on sample material. NH Mixed Marine is used for bone collagen of humans eating a mixed marine diet in the northern hemisphere. NH Terrestrial is used for sample 50 because this is charcoal (from a terrestrial wood source).
Marine is used for shell. DThis date was previously calibrated by the University of Arizona AMS dating laboratory with exactly the same results.

549
radiocarbon dates for CA-SCL-38. Employing locally derived data points for use in
dietary models is crucial, as δ13C values in food resources may vary significantly with
climate and local environment. An appropriate estimation of the marine contribution to
diet and locally specific marine reservoir correction factors (ΔR) are necessary for
accurate calibration of radiocarbon dates.
The 14 new radiocarbon dates processed in 2010 at the LLNL CAMS laboratory
add to the temporal context for CA-SCL-38, however, they also raise questions about the
temporal range suggested by earlier radiocarbon dates. While previous dates suggested
over two thousand years of site use, all new dates fall within the Late Period (AD 1210-
1720) and midpoints of date ranges span only four hundred years. Additional radiocarbon
dates for this site could prove extremely valuable for understanding site use patterns, as
well as possible changes in diet and mortuary patterns through time.

550
REFERENCES CITED
Ambrose, Stanley H., and Lynette Norr 1993 Experimental Evidence for the Relationship of the Carbon Isotope Ratios of
Whole Diet and Dietary Protein to Those of Bone Collagen and Carbonate. In Prehistoric Human Bone: Archaeology at the Molecular Level. J. B. Lambert and G. Grupe, eds. Pp.1-37. New York: Springer-Verlag.
Bartelink, Eric J.
2006 Resource Intensification in Pre-Contact Central California: A Bioarchaeological Perspective on Diet and Health Patterns among Hunter-Gatherers from the Lower Sacramento Valley and San Francisco Bay. Ph.D. dissertation, Department of Anthropology, Texas A&M University.
2011 Paleo-Dietary Reconstruction at CA-SCL-869: Stable Carbon and Nitrogen Isotope Analysis of Four Human Burials. In Final Report on the Burial and Archaeological Data Recovery Program Conducted on a Portion of a Middle Period Ohlone Indian Cemetery, Katwáš Ketneyma Waréeptak (The Four Matriarchs Site) CA-SCL-869. Alan Leventhal, with Diane DiGiuseppe, Melynda Atwood, David Grant, Rosemary Cambra, Charlene Nijmeh, Monica V. Arellano, Susanne Rodriguez, Sheila Guzman-Schmidt, Gloria E. Gomez, Norma Sanchez, and Stella D’Oro, eds. Pp. 9.1-9.6. Report prepared for the Department of Public Works, City of San Jose, California.
Bowman, Sheridan
1990 Radiocarbon Dating. Berkeley: University of California Press. Brown, T. A., D. E. Nelson, J. S. Vogel, and J. R. Southon
1988 Improved Collagen Extraction by Modified Longin Method. Radiocarbon 30(2):171-177.
Groza, Randall Gannon
2002 An AMS Chronology for Central California Olivella Shell Beads. Master’s thesis, Department of Anthropology, San Francisco State University.
Harrison, Roman G., and M. Anne Katzenberg
2003 Paleodiet Studies Using Stable Carbon Isotopes from Bone Apatite and Collagen: Examples from Southern Ontario and San Nicolas Island, California. Journal of Anthropological Archaeology 22(3):227-244.
Ramsey, Christopher Bronk, Thomas Higham, Angela Bowles, and Robert Hedges
2004 Improvements to the Pretreatment of Bone at Oxford. Radiocarbon 46(2):155-163.

551
Schiffer, Michael 1986 Radiocarbon Dating and the “Old Wood” Problem: The Case of the Hohokam
Chronology. Journal of Archaeological Science 13:13-30. Stuiver, M., and T. F. Braziunas
1993 Modeling atmospheric 14C influences and 14C ages of marine samples to 10000 BC. Radiocarbon 35(1):137-91.
Stuvier, Minze, and Paula Reimer
1993 Extended 14C Database and Revised CALIB Radiocarbon Calibration Program. Radiocarbon 35:215-230.
Tieszen, Larry L., and Tim Fagre
1993 Effect of Diet Quality and Composition on the Isotopic Composition of Respiratory CO2, Bone Collagen, Bioapatite, and Soft Tissues. In Prehistoric Human Bone: Archaeology at the Molecular Level. J. B. Lambert and G. Grupe, eds. Pp. 121-144. New York: Springer-Verlag.