
Surface landmark quantification of embryonic mouse craniofacial morphogenesis
Upload
independentCategory
view
0download
0
De Cegli et al. Genome Biology 2010, 11:R64http://genomebiology.com/2010/11/6/R64
Open AccessR E S E A R C H
ResearchA mouse embryonic stem cell bank for inducible overexpression of human chromosome 21 genesRossella De Cegli†1, Antonio Romito†1,2, Simona Iacobacci1, Lei Mao3, Mario Lauria1, Anthony O Fedele1,4, Joachim Klose3, Christelle Borel5, Patrick Descombes6, Stylianos E Antonarakis5, Diego di Bernardo1, Sandro Banfi1, Andrea Ballabio1 and Gilda Cobellis*1,7
AbstractBackground: Dosage imbalance is responsible for several genetic diseases, among which Down syndrome is caused by the trisomy of human chromosome 21.
Results: To elucidate the extent to which the dosage imbalance of specific human chromosome 21 genes perturb distinct molecular pathways, we developed the first mouse embryonic stem (ES) cell bank of human chromosome 21 genes. The human chromosome 21-mouse ES cell bank includes, in triplicate clones, 32 human chromosome 21 genes, which can be overexpressed in an inducible manner. Each clone was transcriptionally profiled in inducing versus non-inducing conditions. Analysis of the transcriptional response yielded results that were consistent with the perturbed gene's known function. Comparison between mouse ES cells containing the whole human chromosome 21 (trisomic mouse ES cells) and mouse ES cells overexpressing single human chromosome 21 genes allowed us to evaluate the contribution of single genes to the trisomic mouse ES cell transcriptome. In addition, for the clones overexpressing the Runx1 gene, we compared the transcriptome changes with the corresponding protein changes by mass spectroscopy analysis.
Conclusions: We determined that only a subset of genes produces a strong transcriptional response when overexpressed in mouse ES cells and that this effect can be predicted taking into account the basal gene expression level and the protein secondary structure. We showed that the human chromosome 21-mouse ES cell bank is an important resource, which may be instrumental towards a better understanding of Down syndrome and other human aneuploidy disorders.
BackgroundAneuploidy refers to an abnormal copy number ofgenomic elements, and is one of the most commoncauses of morbidity and mortality in humans [1,2]. Theimportance of aneuploidy is often neglected becausemost of its effects occur during embryonic and fetaldevelopment [3]. Initially, the term aneuploidy wasrestricted to the presence of supernumerary copies ofwhole chromosomes, or absence of chromosomes, butthis definition has been extended to include deletions orduplications of sub-chromosomal regions [4,5]. Genedosage imbalance represents the main factor in deter-
mining the molecular pathogenesis of aneuploidy disor-ders [6].
Our interest is focused on the elucidation of the molec-ular basis of gene dosage imbalance in one of the mostclinically relevant and common forms of aneuploidy,Down syndrome (DS). DS, caused by the trisomy ofhuman chromosome 21 (HSA21), is a complex conditioncharacterized by several phenotypic features [6], some ofwhich are present in all patients while others occur onlyin a fraction of affected individuals. In particular, cogni-tive impairment, craniofacial dysmorphology and hypo-tonia are the features present in all DS patients. On theother hand, congenital heart defects occur in onlyapproximately 40% of patients. Moreover, duodenalstenosis/atresia, Hirschsprung disease and acute mega-karyocytic leukemia occur 250-, 30- and 300-times more
* Correspondence: [email protected] Telethon Institute of Genetics and Medicine, Via P. Castellino 111, Napoli, 80131, Italy† Contributed equallyFull list of author information is available at the end of the article
© 2010 De Cegli et al.; licensee BioMed Central Ltd. This is an open access article distributed under the terms of the Creative CommonsAttribution License (http://creativecommons.org/licenses/by/2.0), which permits unrestricted use, distribution, and reproduction inany medium, provided the original work is properly cited.

De Cegli et al. Genome Biology 2010, 11:R64http://genomebiology.com/2010/11/6/R64
Page 2 of 18
frequently, respectively, in patients with DS than in thegeneral population. Individuals with DS are affected bythese phenotypes to a variable extent, implying that manyphenotypic features of DS result from quantitative differ-ences in the expression of HSA21 genes. Understandingthe mechanisms by which the extra copy of HSA21 leadsto the complex and variable phenotypes observed in DSpatients [7,8] is a key challenge.
The DS phenotype is clearly the outcome of the extracopy of HSA21. However, this view does not completelyaddress the mechanisms by which the phenotype arises.Korbel et al. [9] provided the highest resolution DS phe-notype map to date and identified distinct genomicregions that likely contribute to the manifestation of eightDS features. Recent studies suggest that the effect of theelevated expression of particular HSA21 genes is respon-sible for specific aspects of the DS phenotype. Arron et al.[10] showed that some characteristics of the DS pheno-type can be related to an increase in dosage expression oftwo HSA21 genes, namely those encoding the transcrip-tional activator DSCR1-RCAN1 and the protein kinaseDYRK1A. These two proteins act synergistically to pre-vent nuclear occupancy of nuclear factor of activated Tcells, namely cytoplasmic, calcineurin-dependent 1(NFATc) transcription factors, which are regulators ofvertebrate development. Recently, Baek et al. showed thatthe increase in dosage of these two proteins is sufficientto confer significant suppression of tumour growth inTs65Dn mice [11], and that such resistance is a conse-quence of a deficit in tumour angiogenesis arising fromsuppression of the calcineurin pathway [12]. Overexpres-sion of a number of HSA21 genes, including Dyrk1a,Synj1 and Sim2, results in learning and memory defectsin mouse models, suggesting that trisomy of these genesmay contribute to learning disability in DS patients [13-15].
Many phenotypic features of DS are determined veryearly in development, when the tissue specification is notcompletely established [3]. Early postnatal developmentof both human patients and DS mouse models showedthe reduced capability of neuronal precursor cells to cor-rectly generate fully differentiated neurons [16], contrib-uting to the specific cognitive and developmental deficitsseen in individuals with DS [17]. Canzonetta et al. [18]showed that DYRK1A-REST perturbation has the poten-tial to significantly contribute to the development ofdefects in neuron number and altered morphology in DS.The premature reduction in REST levels could skew cell-fate decisions to give rise to a relative depletion in thenumber of neuronal progenitors.
The exact nature of these events and the role played byincreased dosage of individual HSA21 genes remainunknown. To contribute to answering these questions, wehave established a cell bank consisting of mouse embry-
onic stem (mES) cell clones capable of the inducible over-expression of each one of 32 selected genes, 29 murineorthologs of HSA21 genes and 3 HSA21 codingsequences, under the control of the tetracycline-responseelement (tetO). These genes include thirteen transcrip-tion factors, one transcriptional activator, six proteinkinases and twelve proteins with diverse molecular func-tions. By transcriptome and proteome analysis, we deter-mined that these clones, which are able to differentiate indifferent cell lineages, can be used to unveil the pathwaysin which these genes are involved. We believe that thisresource represents a valuable tool to analyse the geneticpathways perturbed by the dosage imbalance of HSA21genes.
ResultsValidation of an inducible/exchangeable system for generation of transgenic mES cellsIn order to generate a library of mES transgenic lines ofselected HSA21 genes, we used the ROSA-TET system.This integrates the inducible expression of the Tet-offsystem, the endogenous and ubiquitous expression fromthe ROSA26 locus, and the convenience of transgeneexchange provided by the recombination-mediated cas-sette exchange (RMCE) system [19]. Briefly, codingsequences are cloned into an expression vector, driven byan inducible promoter (Tet-off ), which can be easily inte-grated into the ROSA26 locus through a cassetteexchange reaction.
Understanding the expression kinetics of the systemwas essential to standardizing the generation of the mESlibrary encoding the HSA21 genes. Towards this goal, wefirst tested the system by introducing the luciferase (Luc)gene, cloned into an exchange vector. This enabled accu-rate quantification of cassette exchange and gene induc-ibility, at both the RNA and protein level. To this end, weprepared an exchange vector (pPTHC-Luc), which wasintroduced into the EBRTcH3 ES cell line (EB3), carryinga yellow fluorescent protein (YFP) gene integrated in theROSA26 locus. After the RMCE procedure, positiveexchanged clones were identified by PCR (Additional file1a) and their inducibility verified using both reportergenes. Quantitative PCR (q-PCR) analysis of Luc expres-sion showed that the system was activated upon theremoval of Tetracycline (Tc) from the medium. In thepresence of Tc (0 hours; see Materials and methods), LucmRNA was undetectable, indicating that the backgroundexpression level was almost zero, whereas a strong signalwas detected 15 hours after Tc withdrawal, and still sus-tained over a time window of 48 hours (Additional file1b). We then compared the mRNA level with the enzy-matic activity of the protein Luc. To this end, we preparedthe protein extracts of the Luc-inducible mES clones atthe same time points to quantify luminescence. In agree-

De Cegli et al. Genome Biology 2010, 11:R64http://genomebiology.com/2010/11/6/R64
Page 3 of 18
ment with the mRNA data, the enzymatic activity wasundetectable in the presence of Tc, whereas a strong sig-nal was measurable 15 hours after Tc withdrawal, indicat-ing a correct induction of Luc translation (Additional file1b).
We next verified the expression of the YFP reportergene, which is separated from the Luc gene in the recom-binant locus by an IRES sequence, and we detected acomparable level of YFP expression and protein accumu-lation following induction. The maximal expression ofthe reporter gene was observed 24 hours after completeremoval of Tc from the medium (Additional file 1c).
The level of gene expression can be regulated by adjust-ing the concentration of Tc in the culture media. Using aten-fold dilution of Tc, negligible expression of the YFPgene was seen (Additional file 1d), while further dilutionof Tc revealed increasing expression levels of YFP.
We then verified the growth properties of this mES line(EB3) compared to the parental line (E14) (data notshown) and the ability of these cells to differentiate alongthe three germ layers. The EB3 cells displayed theexpected transcript down-regulation of the pluripotencygene Oct3/4, and a marked increase of the mesoderm-specific marker Brachyury, of the ectoderm-specificmarker Gfap and the endoderm-specific marker Afp dur-ing mES differentiation (Additional file 1e).
Collectively these data suggest that, in mES cells, thissystem allows the efficient and long-term overexpressionof the transgene in a dose- and time-dependent manner.
It is therefore suitable for systematic expression of HSA21cDNAs.
Cell bank: the HSA21 gene collection in mES cellsHSA21 is syntenic to three different mouse chromosomalregions located on chromosomes 10, 16 and 17. Thesethree regions contain 175 murine orthologs of proteincoding HSA21 genes according to [20].
For the generation of mES clones with inducible over-expression, we selected a subset of 32 genes, 29 of whichare murine orthologs of HSA21 genes, and 3 of which arehuman coding sequences (see also Materials and meth-ods). The 32 genes encode 13 transcription factors (Aire,Bach1, Erg, Ets2, Gabpa, Nrip1, Olig1, Olig2, Pknox1,Runx1, Sim2, ZFP295, 1810007M14Rik), a single tran-scriptional activator (Dscr1-Rcan1), 6 protein kinases(DYRK1A, SNF1LK, Hunk, Pdxk, Pfkl, Ripk4) and 12 pro-teins with diverse molecular functions (Atp5j, Atp5o,Cct8, Cstb, Dnmt3l, Gart, Dscr2-Psmg1, Morc3, Mrpl39,Pttg1ip, Rrp1, Sod1) (refer to Additional file 2 for moregeneral information about these genes).
For a subset of the selected genes, there is evidence forthe presence of different alternatively spliced isoformsthat may differ in their coding sequence. In such cases,we overexpressed the longest annotated coding sequence.For one transcription factor (ZFP295) and two proteinkinases (DYRK1A, SNF1LK), we used the human codingsequences (see also Materials and methods). A schematicrepresentation of our experimental strategy is shown inFigure 1.
Figure 1 Schematic representation of the experimental strategy used. A set of 32 genes, 29 murine orthologs of HSA21 genes and 3 human cod-ing sequences, were cloned into the pPthC vector [19] and nucleofected along with a pCAGGS-Cre recombinase vector [41] into EBRTcH3 (EB3) cells. Puromycin-resistant clones were isolated and grown in medium deprived of tetracycline for varying periods of time to perform a time course of in-duction. The inducibility of selected clones was evaluated by q-PCR. Global transcriptome and proteome analysis was performed by hybridization onto an Affymetrix gene chip and by large-gel two-dimensional gel electrophoresis (2DGE), respectively, to delineate the consequences of gene dos-age imbalance on a single gene basis. WB, western blot.
Nucleofectioninto RM CE
modified mEScells
I nduciblemES clones
Time cour se
Affymetr ixgene-chip
WB: -3xFL AG
pCAGGS-Cr er ecombinase
vector
pPthC-ORFvector
2DGE

De Cegli et al. Genome Biology 2010, 11:R64http://genomebiology.com/2010/11/6/R64
Page 4 of 18
In order to generate the mES library overexpressing asubset of HSA21 ORFs, we employed the ROSA-TET sys-tem, as previously described. The expression constructcontained the 3xFLAG epitope at the carboxyl terminus,thus enabling monitoring of transgene protein product.We constructed exchange vectors carrying each of the 32ORFs and then nucleofected the plasmids into the RMCErecipient mES lines to generate stable clones (see Materi-als and methods). For each gene, an average of 20 drug-resistant clones were picked, amplified and characterizedby PCR analysis.
Three positive clones for each gene were grown inmedium deprived of Tc for varying periods of time to ver-ify the sensitivity of each mES line to Tc by performing atime course experiment to identify the capacity of eachtransgene to be overexpressed. In total we analyzed 96clones (3 biological replicates for 32 transgenes). Asshown in Additional file 3, we performed a time courseexperiment, at four different time points (17, 24, 39 and48 hours), for 16 genes: 3 transcription factors (Aire, Sim2and ZFP295), a protein kinase gene (Hunk) and for all the12 genes encoding proteins with diverse molecular func-tions (Atp5j, Atp5o, Cct8, Cstb, Dnmt3l, Gart, Dscr2-Psmg1, Morc3, Mrpl39, Pttg1ip, Rrp1, Sod1). Since themajority of the genes analyzed showed the highest level ofinduction after 24 hours of Tc deprivation, we decided totest the inducibility of the remaining clones at one timepoint only. As shown in Additional file 3, we tested 12clones at one time point: the transcription factors Bach1,Erg, Ets2, Gabpa, Nrip1, Olig1, Pknox1, Runx1,1810007M14Rik), the transcriptional activator Dscr1-Rcan1 and the protein kinases Pdxk and Pfkl. Finally, onetranscription factor (Olig2) and three protein kinases(DYRK1A, SNF1LK and Ripk4) were tested at three differ-ent time points (17, 24, and 39 hours). As a control, totalRNA extracted from uninduced clones (in the presence ofTc, 0 hours) was used.
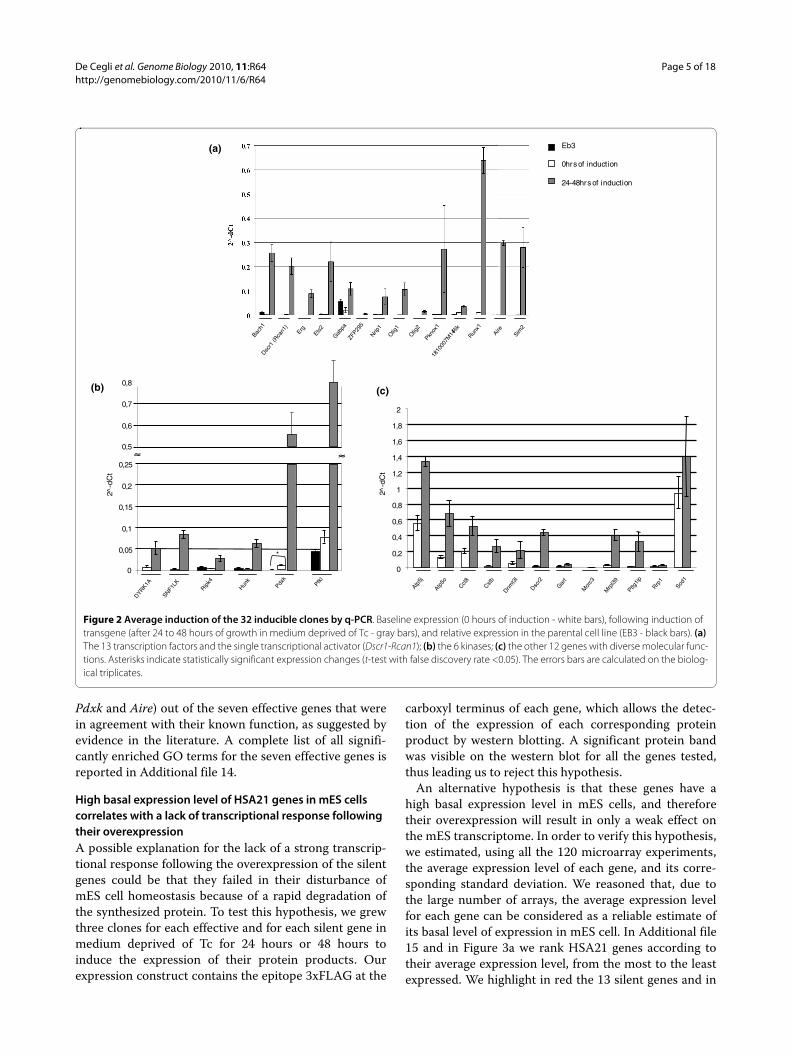
Figure 2 shows the average induction, evaluated by q-PCR (Additional file 4) and expressed as relative expres-sion (2-dCt), of the 13 transcription factors together withthe single transcriptional activator (Figure 2a), the 6kinases (Figure 2b), and the 12 genes with diverse molec-ular functions (Figure 2c). For the 13 transcription factorsand the transcriptional activator (Figure 2a) and the 6kinases (Figure 2b) we assessed the potential leakiness ofthe inducible system in our mES clones. To this aim, wecompared the basal expression level of each gene in theparental cell line (EB3) with the expression level in thecorresponding transgenic inducible clones (in the biolog-ical replicates) grown in the presence of Tc in themedium (0 hours of induction). Results are shown in Fig-ure 2a,b and in Additional file 5. We verified that only inthe case of Pdxk is there a statistically significant (cor-
rected P-value false discovery rate (FDR) = 0.04), albeitmild, leakiness.
We then checked for the proper ploidy of the clones fol-lowing extensive passages in culture. To this end, we per-formed a karyotype assay (Materials and methods) onparental ES cells (EB3) and on 20 different inducibleclones of our mES cell bank (representing the 7 effectiveand the 13 silent genes). All these clones turned out todisplay a normal karyotype (40 chromosomes).
Transcriptome analysis of mES cell linesIn order to identify the effects of the overexpression of asingle gene on the mES transcriptome, we performedAffymetrix Gene-Chip (Mouse 430_2) hybridizationexperiments for a set of clones overexpressing 20 of the32 genes (that is, the transcription factors and proteinkinases). As we used biological triplicate clones for eachgene, this analysis was performed on a total of 60 clones.Total RNA was extracted from each clone at the time-point of maximal expression (Additional file 3), followingTc removal from the medium (Materials and methods).As a control, total RNA extracted from un-inducedclones was also used. This procedure resulted in a total of120 hybridization experiments (the whole set of results isavailable in the Gene Expression Omnibus database[GEO:GSE19836]).
In order to identify downstream transcriptional effectsof the 20 overexpressed genes, microarray data were ana-lyzed to detect differentially expressed genes (that is, ininduced versus non-induced cells). We first normalizedtogether both induced and non-induced hybridizations,and then detected differentially expressed genes using aBayesian t-test method (Cyber-t) followed by FDR cor-rection (threshold FDR < 5%). The overexpression of 7out of 20 genes perturbed the mES transcriptome in astatistically significant manner: we will refer to theseseven genes as the 'effective' genes, as opposed to theother 13, 'silent' genes. In Additional files 6, 7, 8, 9, 10, 11and 12, we report complete lists of differentiallyexpressed genes following the overexpression of each ofthe effective genes.
The effective genes consisted of six transcription fac-tors (Runx1, Erg, Nrip1, Sim2, Olig2 and Aire) and onekinase (Pdxk). Differential expression was also validatedby q-PCR, selecting a subset of the most up-regulatedand down-regulated genes (Additional file 13). In order toidentify possible biological processes in which the effec-tive genes are involved, we performed a Gene Ontology(GO) enrichment analysis on the lists of differentiallyexpressed genes. We used the DAVID online tool [21-23],restricting the output to biological process terms of levels4 and 5, with a significance threshold of FDR < 5% andfold enrichment ≥ 1.5%. In Table 1 we report the subsetsof significant GO terms for six (Runx1, Erg, Nrip1, Olig2,
De Cegli et al. Genome Biology 2010, 11:R64http://genomebiology.com/2010/11/6/R64
Page 5 of 18
Pdxk and Aire) out of the seven effective genes that werein agreement with their known function, as suggested byevidence in the literature. A complete list of all signifi-cantly enriched GO terms for the seven effective genes isreported in Additional file 14.
High basal expression level of HSA21 genes in mES cells correlates with a lack of transcriptional response following their overexpressionA possible explanation for the lack of a strong transcrip-tional response following the overexpression of the silentgenes could be that they failed in their disturbance ofmES cell homeostasis because of a rapid degradation ofthe synthesized protein. To test this hypothesis, we grewthree clones for each effective and for each silent gene inmedium deprived of Tc for 24 hours or 48 hours toinduce the expression of their protein products. Ourexpression construct contains the epitope 3xFLAG at the
carboxyl terminus of each gene, which allows the detec-tion of the expression of each corresponding proteinproduct by western blotting. A significant protein bandwas visible on the western blot for all the genes tested,thus leading us to reject this hypothesis.
An alternative hypothesis is that these genes have ahigh basal expression level in mES cells, and thereforetheir overexpression will result in only a weak effect onthe mES transcriptome. In order to verify this hypothesis,we estimated, using all the 120 microarray experiments,the average expression level of each gene, and its corre-sponding standard deviation. We reasoned that, due tothe large number of arrays, the average expression levelfor each gene can be considered as a reliable estimate ofits basal level of expression in mES cell. In Additional file15 and in Figure 3a we rank HSA21 genes according totheir average expression level, from the most to the leastexpressed. We highlight in red the 13 silent genes and in
Figure 2 Average induction of the 32 inducible clones by q-PCR. Baseline expression (0 hours of induction - white bars), following induction of transgene (after 24 to 48 hours of growth in medium deprived of Tc - gray bars), and relative expression in the parental cell line (EB3 - black bars). (a) The 13 transcription factors and the single transcriptional activator (Dscr1-Rcan1); (b) the 6 kinases; (c) the other 12 genes with diverse molecular func-tions. Asterisks indicate statistically significant expression changes (t-test with false discovery rate <0.05). The errors bars are calculated on the biolog-ical triplicates.
Eb3
0hrs of induction
24-48hrs of induction
(a)
0
DYRK1A
SNF1LK
Ripk4
Hunk
Pdxk
Pfkl
0,05
0,1
0,15
0,2
0,25
2^-d
Ct
*
0,5
0,6
0,7
0,8(b)
(a)
1810
007M
14Rik
Bach1
Erg
Dscr1
(Rca
n1)
Gab
pa
Ets2
ZFP29
5
Nrip1
Olig
2
Olig
1
Pknox
1
Runx1
Sim2
Aire
Atp5j
Atp5o
Cct8
Cstb
Rrp1
Mor
c3
Mrp
l39
Pttg1i
p
Gar
t
Dnmt3
l
Dscr2
Sod1
2^-d
Ct
(c)
0
0,2
0,4
0,6
0,8
1
1,2
1,4
1,6
1,8
2

De Cegli et al. Genome Biology 2010, 11:R64http://genomebiology.com/2010/11/6/R64
Page 6 of 18
Table 1: Gene Ontology enrichment analysis for six out of seven effective genes whose overexpression perturbed the mES transcriptome in a statistically significant manner
Gene Gene Ontology term FDR Fold enrichment Reference
Runx1 Negative regulation of progression through cell cycle 2.8 1.5 [60,61]
Positive regulation of cell proliferation 0.5 1.5 [60,61]
Vasculature development 0.1 1.5 [62,63]
Blood vessel development 0.2 1.5 [62,63]
Blood vessel morphogenesis 0.1 1.6 [62,63]
Angiogenesis 0.1 1.6 [62,63]
Regulation of myeloid cell differentiation 0.8 2.1 [63]
Skeletal development 0.2 1.5 [64]
Skeletal morphogenesis 1.7 2.5 [64]
Regulation of cell differentiation 0.0 1.7 [65]
Erg Anatomical structure formation 0.2 1.5 [66]
Angiogenesis 0.0 1.6 [67,68]
Regulation of cell differentiation 0.8 1.5 [67,68]
Cell growth 2.3 1.5 [67,68]
Regulation of cell migration 1.3 1.8 [67,68]
Negative regulation of transcription, DNA-dependent 0.5 1.5 [68]
Nrip1 Muscle cell differentiation 2.0 4.3 [69]
Nervous system development 0,1 2.0 [70]
Negative regulation of transcription, DNA-dependent 3.6 2.6 [71]
Olig2 Organ morphogenesis 0.5 1.6 [72,73]
Placenta development 1.3 4.3 [74]
Negative regulation of progression through cell cycle 3.6 2.1 [75]
Pdxk Cellular macromolecule catabolic process 2.0 2.7 [76,77]
Cellular carbohydrate metabolic process 0.0 4.1 [76,77]
Amino acid biosynthetic process 0.6 7.3 [78]
Aire Cell morphogenesis 0.0 1.6 [79]
Regulation of progression through cell cycle 0.0 1.7 [79]
Regulation of cell differentiation 0.4 1.9 [79]
Cell migration 4.0 1.5 [80]
Perturbation of the mES transcriptome was as assessed by microarray analysis. GO analysis was performed on the list of differentially expressed genes using the DAVID tool, restricting the output to biological process terms of levels 4 and 5, with a significance threshold FDR < 5% and fold enrichment ≥ 1.5%. Supporting references confirming GO analysis are reported in the 'References' column.
blue the 7 effective genes. It is evident that the effectivegenes show a different distribution from the silent genes:the silent genes tend to be highly endogenously expressedin mES cells, whereas the effective genes tend to beexpressed at lower levels. A gene set enrichment analysis
(GSEA) [24] was performed to compute the significanceof this different distribution (see Materials and methods);this produced a significant enrichment score of 0.402(FDR q-value = 0). This observation supports the hypoth-esis that the lack of a strong transcriptional response fol-

De Cegli et al. Genome Biology 2010, 11:R64http://genomebiology.com/2010/11/6/R64
Page 7 of 18
lowing the overexpression of some of the HSA21 genes isdue to a high basal expression level of these genes.
Dosage sensitivity of HSA21 genes in mES cellsWe further investigated the cause of the lack of a strongtranscriptional response in the silent gene set in order topredict which genes are most sensitive to dosage. Arecent study has shown a strong correlation between thesensitivity to increased dosage of a gene and the degree ofa certain property of the encoded protein, called intrinsicdisorder [25]. The protein disorder is defined as the totalnumber of amino acids included in unstructured regionsof the protein. These regions usually contain shortsequence motifs (such as localization signals, or nuclearimport/export signal), leading to a higher sensitivity toprotein dosage [25]. We thus measured protein disorderfor both silent and effective genes, excluding the clones inwhich the human coding sequences were introduced(ZFP295, DYRK1A, SNF1LK) from this analysis becauseof the possible confounding effect represented by theirnon-murine origin. In Figure 3b, the silent and effectivegenes are clearly segregated according to their averagelevel of protein disorder (separation of means verifiedwith t-test, P-value = 0.043). The segregation is almostperfect (with a threshold value for the protein disorderequal to 180) with the only exception being Pdxk, whichis an effective gene despite its low disorder value of 26.We attribute this anomaly to the fact that Pdxk is a kinase(the only one in the effective gene list), and its functionmight place it at the crossroads of a number of crucialpathways.
Comparison with the transcriptional response of the transchromosomic Tc1 mouse lineTo demonstrate the potential value of our cell bank in elu-cidating the transcriptional changes underlying trisomy21, we compared the output of our overexpression exper-iments with the transcriptional profile obtained on the'transchromosomic' Tc1 mouse line [26]. The Tc1 ES cellscarry an extra copy of HSA21 and they represent a refer-ence model of trisomy 21 for which publicly accessibletranscriptional data in ES cells are available, enabling adirect comparison with our cell bank overexpressionexperiments. As reported in [26] the Tc1 line is missingsome portions of HSA21; however, we verified that all ofour 'effective' genes were included, based on the pub-lished chromosome map. We have verified that the seven'effective' genes are all included in the extra chromosomepresent in the Tc1 line.
Figure 4 shows a scatter plot of the differential expres-sion values following the overexpression of the cell bankgenes compared to the differential expression values ofgenes in the Tc1 ES cell line. We included in this analysisall of the genes that were significantly differentially
expressed in both Tc1 and at least one of the seven 'effec-tive' cell bank overexpression experiments. Of all thepoints in the graph, the ones with the same sign coordi-nates (both positive or both negative x, y values) repre-sent genes whose transcriptional up- or down-regulation,observed in at least one of the overexpression experi-ments, is concordant with the transcriptional changes inthe Tc1 cells versus control. A statistically significant 125out of a total of 168 points fall in same-sign quadrants (P< 1e-6). We also separately compared each of the sevenoverexpression experiments with Tc1 ES cells (Additionalfile 16); five out of seven effective genes had a statisticallysignificant number of genes with same sign fold-changeas in Tc1 cells (Runx1, Erg, Nrip1, Sim2, Aire; Additionalfile 17). These observations suggest that the transcrip-tional features of trisomic Tc1 cells can be partiallyexplained as an additive effect of single gene overexpres-sion, thus highlighting the usefulness of our cell bank inelucidating DS.
Refined analysis of the transcriptional response to the overexpression of silent genesWe verified the possibility to also detect differentiallyexpressed genes in those experiments involving the over-expression of silent genes by using a more sensitive statis-tical method than the standard t-test approach. Themethod we selected was Bayesian analysis of variance formicroarrays [27-29], a Bayesian spike and slab hierarchi-cal model, as implemented in the BAMarray tool (BAMa-rray 3.0) [27]. Using this procedure, transcriptionalchanges were detected in all silent gene overexpressionexperiments, despite the low fold change of differentiallyexpressed genes, which therefore could include morefalse positives than the standard t-test.
In order to identify possible biological processes inwhich the silent genes are involved, we performed theGO enrichment analysis on the list of newly identifieddifferentially expressed genes. In Additional file 18 wereport all the significantly enriched GO terms for 11 outof 13 silent genes (for the remaining two silent genes, Ets2and 1810007M14Rik, no significant GO terms werefound). In Additional file 19 we report the subset of sig-nificant GO terms for 5 (Bach1, Dscr1-Rcan1, DYRK1A,Gabpa and SNF1LK) out of 13 silent genes, which are inagreement with the known functions of these genes, asdetermined by evaluation of the literature.
Proteome analysis in mES cells overexpressing the Runx1 geneIn order to assess whether the overexpression of singlegenes in mES causes changes in the proteome compara-ble to those detected by microarray hybridization experi-ments, we performed a full proteomic analysis followingoverexpression of the transcription factor Runx1. This

De Cegli et al. Genome Biology 2010, 11:R64http://genomebiology.com/2010/11/6/R64
Page 8 of 18
involved high resolution large-gel two-dimensional elec-trophoresis (2DGE) followed by protein identificationperformed with database-assisted mass spectrometry.The peak of response at the proteomic level, as assessedby a pilot 2DGE assay on a single Runx1-overexpressingclone (E6), was observed at 48 hours after depletion of Tc,rather than at 24 hours as observed at the transcriptomelevel for this gene, suggesting a delayed effect due to thefact that protein synthesis occurs subsequent to that ofmRNA. We therefore decided to perform the analysis ontwo Runx1-overexpressing clones (E6 and E7; Additionalfile 3) by comparing the 2DGE results obtained from thenon-induced state (that is, cells grown in the presence ofTc) with those derived from cells grown in a mediumdeprived of Tc for 48 hours (in other words, cells overex-pressing the protein Runx1). For each of the two Runx1-overexpressing clones, three technical replicates werethen generated (see Materials and methods). Our 2DGEimage data have now been submitted to the World-
2DPAGE Repository of the ExPASy Proteomics Server[2DPAGE:0021] [30] for public access [31].
The induction of Runx1 changes the expression of atleast 54 proteins (Additional file 20). Of these, 24 wereconsistently down-regulated while 30 were up-regulatedafter 48 hours of induction of the protein Runx1. Theeffect of Runx1 overexpression on the proteome wascompared with the effect on the transcriptome, asdetected by microarray.
In Table 2, we compare changes in protein levels 48hours after induction of Runx1 to changes in mRNA lev-els 24 hours after induction of Runx1. There is a substan-tial overlap (15 out of 17 affected gene/protein pairsshowing similar trends of expression variations) betweenmicroarray data and data obtained from the 2DGE assay:6 out of 24 down-regulated proteins and 9 out of 31 up-regulated proteins displayed similar trends in the corre-sponding transcripts by microarray analysis. Only twogene/protein pairs, apoE and Sept1, showed opposite
Figure 3 The basal expression level and dosage sensitivity of HSA21 genes in mES cells. The effective genes are highlighted in blue, and the silent genes in red. (a) Selected HSA21 genes sorted according to their average expression level in mES cells, from the most (gene rank = 1) to the least expressed. (b) Selected HSA21 genes sorted according to the total length of the 'disordered' region of the encoded protein (measured with the GlobPlot tool).
(a) (b)
Increasing level
of protein disorder
Effective Genes
Silent Genes
Pdxk
Gabpa
Dscr1-Rcan1
Pknox1
Olig1
Ets2
Pfkl
Ripk4
1810007M14Rik
Bach1
Hunk
Olig2
Sim2
Erg
Runx1
Aire
Nrip1
Olig2
Sim2
Runx1
Erg
SNF1LK
Olig1
Nrip1
Ets2
1810007M14Rik
ZFP295
Ripk4
Dscr1-Rcan1
Bach1
Pknox1
Pdxk
DYRK1A
Aire
Hunk
Pfkl
Gabpa
Increasing basal
level of expression

De Cegli et al. Genome Biology 2010, 11:R64http://genomebiology.com/2010/11/6/R64
Page 9 of 18
behavior in the protein versus microarray assays. Bothproteins showed up-regulation, while their mRNA levelsshowed down-regulation, which suggests that themRNAs of these two genes might be unstable, leading tolonger half-lives of the proteins.
DiscussionThe mechanisms by which the presence of three copies ofHSA21 result in the complex and variable phenotypeobserved in DS patients are a major focus of research.Recently, it has been shown that only some genes arelikely to be dosage-sensitive [7,8]. There is a need for fur-ther experimental studies assessing the variability among
samples, tissues and developmental stages [32]. To over-come the problem of transcriptome and proteome vari-ability due to differences in the human population, mouseinter-strain variability, and tissue sampling and process-ing, we generated a cell bank of cultured mES cells. Foryears, the importance of mES cells to biology and medi-cine has been attributed both to their ability to proliferatefor an indefinite period of time while still retaining theirnormal karyotype following extensive passaging in cul-ture [33], and to their suitability as a model system forstudying, in vitro, the molecular mechanisms that regu-late lineage specification and differentiation [34].
Figure 4 Comparison of differentially expressed genes following single gene over-expression in our cell bank mouse ES cell lines versus transchromosomic Tc1 mouse ES cell lines. The colors indicate the overexpression experiment in which the expression value was found to be sig-nificant; for genes whose expression was significant in more than one overexpression experiment, only the one with the largest absolute value was considered. A total of 168 points are in the graph, of which 125 fall in same-sign quadrants. The regression line was forced to pass through the origin in order to highlight the general trend with respect to zero.
-2 -1.5 -1 -0.5 0 0.5 1 1.5 2 2.5 3-3
-2
-1
0
1
2
3
4
Tc1 expression value (log ratio)
Cel
l Ban
k ex
pres
sion
val
ue (
log
ratio
)
Cell Bank vs. Tc1 expression values Same sign percentage = 125/168 (P < 1.00e-006)
Linear regression coeff r: 0.33 (P = 1.25e-005)
AIREERGNRIP1OLIG2PDXK2RUNX1SIM2

De Cegli et al. Genome Biology 2010, 11:R64http://genomebiology.com/2010/11/6/R64
Page 10 of 18
Our work has produced the first resource for system-atic overexpression of single HSA21 genes in mES cellsusing an inducible system. Our cell bank can be used tounderstand how much, and in what way, the dosageimbalance of specific HSA21 genes perturb the molecularpathways in ES cells, and eventually in DS. This strategyhas the advantage of dramatically simplifying the investi-gation of single gene dosage effects, with the intrinsiclimitation given by the impossibility to study two or moregene interactions. In addition to providing a mES cellbank for the overexpression of 32 distinct genes, we alsodeveloped a standardized approach for the generation ofmES clones to be added to this cell bank. This opens thepossibility of using this system to study other aneuploidydisorders in which the gene dosage imbalance seems tobe the main cause of the disease, including the micro-aneuploidies recently described by assays based on com-parative genomic hybridization arrays [35]. We are awarethat the massive overexpression of the transgene may notfully reproduce the downstream effects on the cell tran-scriptome caused by the 3:2 dosage imbalance of trisomy21 [36]. However, we reasoned that most of the down-stream transcriptome effects may be shared by bothexperimental conditions, and at least some of the subtletranscriptome alterations present in trisomy 21 maybecome much more evident by massive overexpression oftrisomy 21 genes, thus facilitating their identification.Therefore, we decided not to induce a 3:2 overexpressionfor any of the analyzed genes. Moreover, Nishiyama et al.[37] have recently shown using a similar tet-inducible sys-tem for massive overexpression of transcription factorgenes in mouse ES cells that it is indeed possible to iden-tify their physiological function from transcriptome anal-ysis. We have also shown that some effects may be sharedby both experimental conditions (massive versus 3:2overexpression), since we observed concordant results bycomparing single gene overexpression and trisomic Tc1mES cell lines (Figure 4; Additional file 17). We suggestthat some of the transcriptional features of trisomic Tc1cells are partly due to an additive effect of single geneoverexpression. Although our data are not sufficient toprove that these responses are additive, in a genetic senseof the word their extent and the significance of their signconcordance is certainly worth future investigation.
Full gene expression profiling for all the mES clonesthat overexpress 29 murine coding sequences and 3HSA21 genes (refer to Additional file 2 for details) areprovided, thus facilitating the search for new HSA21 genetargets and the elucidation of the transcriptional networkunderlying gene function.
Only a subset of 7 out of 20 genes in our overexpressionstudy yielded a strong perturbation of the mES transcrip-tome, at least via microarray analysis. More subtle tran-
scriptional changes might be detected when using moresensitive techniques such as RNA-seq technology [38].We excluded the possible rapid degradation of the syn-thesized silent protein as an explanation of the inability ofthese overexpressed genes to produce significant changesin the mES transcriptome. We hypothesized an inversecorrelation between transcriptional response and thebasal expression level and the protein disorder of theoverexpressed genes (Figure 3). Our observation can beuseful to predict those genes with a higher probability ofdisplaying dosage-sensitivity. However, we cannotexclude the possibility that the absence of a transcrip-tional response to the overexpression of some transcrip-tion factors and protein kinase genes reflects, forexample, the absence of the proper protein partners inundifferentiated cells. In support of this hypothesis, noneof the transgenic mouse lines generated as an in vivomodel to study the effect of the overexpression of someHSA21 genes have so far been found to determineembryonic lethality, whereas they showed a clear pheno-type in differentiated tissues (that is, TG-DYRK1a inbrain, TG-DSCR1/Rcan1 in heart/vasculogenesis[39,40]). Therefore, future studies will be necessary toprove whether defects, which can take place early indevelopment (such as the elevated risk of miscarriage oftrisomic fetus), are due to the overexpression of effectivegenes.
We also quantified the effect of single gene overexpres-sion on the proteome. Specifically, we performed a pro-teomic analysis on one of the overexpressing clones(Runx1) by the high-resolution 2DGE method. The com-parison of the effect on the proteome with the effect onthe transcriptome showed a strong correlation, with 15out of 17 affected gene/protein pairs showing similartrends of expression variations (Table 2). However, twoproteins (apolipoprotein E and septin 1) showed bifur-cated regulation in protein and microarray assays. Bothproteins show up-regulation, while their mRNA levelsshow down-regulation. This could suggest that themRNAs of these two genes are unstable, leading to longerhalf-lives of the proteins.
ConclusionsWe have developed a mES cell bank for inducible expres-sion of a set of murine orthologs of HSA21 genes. Thisresource represents an invaluable tool for future studiesinvolving their differentiation into cardiomyocytes, andmyeloid and neuronal lineages, which represent celltypes/tissues affected by DS. The detection of earlychanges, at the level of undifferentiated mES cells, may beinstrumental to a better understanding of some pheno-typic features of DS, and possibly of other human aneu-ploidies.

De Cegli et al. Genome Biology 2010, 11:R64http://genomebiology.com/2010/11/6/R64
Page 11 of 18
Table 2: Correlation between differential protein expression by 2DGE (protein ratio) and differential gene expression by microarray (mRNA ratio)
Spot ID* Gene Protein name Protein ratio 48 h/0 h* mRNA ratio 24 h/0 h
3214 Uchl1 Ubiquitin carboxy-terminal hydrolase L1 0.58 0.63
662 Dppa4 Developmental pluripotency associated 4 isoform 1 0.65 0.75
3549 Igf2bp2 Insulin-like growth factor 2 mRNA-binding protein 2 (IGF-II mRNA-binding protein 2) (IMP-2)
0.65 1.39
2836 Sipa1l1 Signal-induced proliferation-associated 1-like protein 1
0.74 1.54
425 Lap3 Cytosol aminopeptidase (Leucine aminopeptidase) (LAP) (Leucyl aminopeptidase) (Leucine aminopeptidase 3) (Proline aminopeptidase)(Prolyl aminopeptidase)
0.76 0.72
2512 Hspd1 60 kDa heat shock protein, mitochondrial precursor (Hsp60) (60 kDa chaperonin) (CPN60) (Heat shock protein 60) (HSP-60) (Mitochondrial matrix protein P1) (HSP-65)
0.78 0.75
3410 Eif1a Eukaryotic translation initiation factor 1A, Y-linked 0.8 0.76
403 Pkm2 Pyruvate kinase isozyme M2 1.26 3.05
935 Bdh1 D-beta-hydroxybutyrate dehydrogenase, mitochondrial precursor
1.31 1.53
645 Serpinh1 Serine (or cysteine) proteinase inhibitor, clade H, member 1
1.44 1.36
2920 Ldhb Lactate dehydrogenase 2, B chain 1.46 0.64
3562 Cotl1 Coactosin-like 1 1.62 1.39
3653 S100a11 S100 calcium binding protein A11 (calizzarin) 1.89 1.18
3144 Sept1 Septin 1 2.28 0.71
1134 Gsto1 Glutathione S-transferase omega 1 2.77 3.73
3588 Fabp3 Fatty acid binding protein 3, muscle and heart 3.05 2.2
3078 Apoe Apolipoprotein E 3.28 0.8
Only two gene/protein pairs, apoE and Sept1, showed bifurcated regulation in protein and microarray assays.
Materials and methodsCell cultureThe cell line EBRTcH3 (EB3) was obtained from the labo-ratory of Dr Hitoshi Niwa and have been previouslydescribed in [19].
mES cells were grown in mES media + leukemia inhibi-tory factor (LIF) (DMEM high glucose (Invitrogen Ltd,Paisley, UK, catalog no. 11995-065) supplemented with15% fetal bovine serum defined (HyClone, Thermo Scien-tific, Logan, UT, USA, catalog no. SH30070.03), 0.1 mMnonessential amino acids (Gibco-Brl, Invitrogen Ltd,Paisley, UK, catalog no. 11140-050), 0.1 mM 2-mercapto-ethanol (Sigma-Aldrich, St. Louis, MO, USA, catalog no.M6250), and 1,000 U/ml ESGRO-LIF (Millipore, Biller-ica, MA, USA, catalog no. ESG1107)) at 37°C in an atmo-sphere of 5% CO2. All stable cell lines derived from EB3were grown in mES media + LIF supplemented with 1 μg/
ml Tc (Sigma, catalog no. T7660). For antibiotic selectionof RMCE lines, mES + LIF + Tc supplemented with 1.5μg/ml of puromycin (Sigma, catalog no. P9620) was used.In the case of two of the mES inducible clones (ZFP295,Hunk), these were grown in mES + LIF + Tc supple-mented with 7.5 μg/ml puromycin to decrease the varia-tion among the biological replicates of clones.
mES cells were trypsinized (in Trypsin-EDTA solution10×, Sigma, catalog no. T4174) and plated 1 day beforethe nucleofection on 0.1% gelatin (Gelatin Type I fromporcine skin, Sigma) coated 100-mm dishes (Nunc Gmbh& Co., Langenselbold, Germany, catalog no. 150350) inmES media + LIF supplemented with Tc. For nucleofec-tion 2 × 10⁶ cells were counted for each sample. Plasmidswere prepared using Qiagen plasmid Midi kit (Qiagenspa, Milano, Italy, catalog no. 12145): 5 to 6 μg of pPthCvector containing each ORF [19] were incubated with 3

De Cegli et al. Genome Biology 2010, 11:R64http://genomebiology.com/2010/11/6/R64
Page 12 of 18
μg of pCAGGS-Cre vector [41] and 100 μl of Mouse ESCell Nucleofector Kit (Amaxa, Lonza Cologne, Germany,catalog no. VPH-1001) was added to the plasmid mix.The nucleofection program used was the A30 program.Cells were then incubated for 10 to 15 minutes at roomtemperature in the presence of complete medium andplated. The day after the nucleofection, cells were washedtwice with PBS (Dulbecco Phosphate buffered Saline 1×,Gibco, catalog no. 14190), and switched to selectionmedia (mES + LIF + Tc + 1.5 μg/ml puromycin). The col-onies were grown for approximately 7 to 8 days beforethey were individually trypsinized and transferred to 96-well U-bottom plates (Nunc, catalog no. 163320).Trypsinized cells were neutralized with mES media + LIF,vigorously pipetted, and then each clone was equally dis-tributed among two gelatin-coated 48-well plates (Nunc,catalog no. 150687), the former with selection media andthe latter with mES + LIF + 150 μg/ml hygromicin(Hygromycin B in PBS, Invitrogen, catalog no. 10687-010). When confluent, the clones resistant to selectionmedia and completely dead in parallel in mES media +LIF + hygromicin were isolated, replicated in 12-wellplates (Nunc, catalog no. 150628) and when confluentreplicated in 6-well plates (Nunc, catalog no. 140675) toextract the genomic DNA using standard conditions.
The positive clones were identified by PCR using stan-dard conditions using the following primer pair: 5'-GCATCAAGTCGCTAAAGAAGAAAG-3' and 5'-GAGTGCTGGGGCGTCGGTTTCC-3'. All positiveclones analyzed were frozen at -135°C using standardconditions.
In compliance with our policy of distribution of pub-lished reagents, all the mES clones generated within thisproject are available for distribution to academic researchcenters upon request.
Cloning strategyThe exchange vector pPthC-Oct-3/4 was obtained fromthe laboratory of Dr Hitoshi Niwa and has been previ-ously described in [19].
For the cloning of each gene we decided to use only thecoding sequence, from the ATG to the stop codon, with-out the 5' and 3' untranslated regions. For 29 ORFs, wecloned the murine coding sequence, while for 1 transcrip-tion factor (ZFP295) and 2 protein kinases (DYRK1A;SNF1LK) we used the human coding sequence (see Addi-tional file 2 for more general information about thesegenes). For a subset of the selected genes there is evidencefor the presence of different alternatively spliced isoformsthat may differ in their coding sequence. In this case wedecided to clone the longest annotated coding sequence.
The exchange vector was modified, in the regionbetween XhoI and NotI restriction sites, by adding a mul-tiple-cloning site that contains sequences recognized by
three restriction enzymes (I-SceI, AscI and PacI) and byadding the epitope 3 × FLAG. Two double-stranded oli-gonucleotides, containing 3 × Flag sequence, with thesequences recognized by PacI and NotI at the 5' and 3'ends, respectively, were designed. These oligonucleotideswere then inserted into the exchange vector, and digestedby PacI-NotI. The epitope 3 × FLAG was designed to bein frame with the stop codon of each ORF.
The plasmids containing the cDNAs of Gabpa, Olig1and Dscr1 were obtained from Biotech Custom ServicesPrimm srl (Milano, Italy); the plasmid containing thecDNA of Olig2 was obtained from the laboratory of DrYaspo; the plasmid containing the cDNA of Runx1 wasobtained from the laboratory of Dr Groner; the plasmidcontaining the cDNA of Sim2 was obtained from the lab-oratory of Dr Whitelaw. The cDNAs of Aire,1810007M14Rik, Erg and Hunk were obtained by retro-transcription with SuperScript III Reverse transcriptase(Invitrogen, catalog no. 18080-044) from total RNAextract of embryonic stem cells. All other plasmids werepurchased from ImaGENES (formerly RZPD, Berlin,Germany).
The cDNAs were amplified using the plasmids as tem-plates by PCR in standard conditions. The forward andreverse primers used to amplify the cDNAs weredesigned to include in the sequence the restriction sitesrecognized by the enzymes AscI and PacI at the 5' and 3'ends, respectively.
Primer pair sequences used for the cloning are availablein Additional file 21. In the case of Cstb, the primersintroduce the sequence recognized by PacI at both endsof the amplified product while, in the case of Runx1, theprimers introduce the restriction sites of XhoI and NotIat the 5' and 3' ends, respectively. After digestion with thespecific restriction enzymes, the cDNA fragments werecloned into pTOPO-bluntII (Invitrogen, catalog no.K2875J10). The pTOPO-bluntII containing the cDNAswas then cleaved by AscI-PacI or only by PacI (for Cstb)or by XhoI-NotI (for Runx1). The fragments obtained bydigestion were separated from pTOPO-bluntII in a 1%agarose gel in TAE buffer and finally purified withQIAquick Gel Extraction kit (Qiagen, catalog no. 28706)using standard conditions. The purified cDNA fragmentswere then inserted into the appropriately digested andpurified pPthC vector [19]. We screened the Escherichiacoli positive clones in which the vector contained thecDNA fragments by enzymatic digestions and thensequencing the positive clones using the universalM13Fw primer and, for longer sequences, internal for-ward primers specific to the gene of interest.
Induction of transgene expressionThree positive clones coming from the six-well copy werethawed, amplified and tested for the inducibility of the
De Cegli et al. Genome Biology 2010, 11:R64http://genomebiology.com/2010/11/6/R64
Page 13 of 18
introduced gene to Tc. The complete removal of Tcresults in sufficient induction of the Tet-off system [42].Cells to be induced were washed twice with PBS, culturedfor more than 3 hours in DMEM without Tc, trypsinizedand re-plated onto new dishes. Clones were grown inmedium deprived of Tc to perform a time course ofinduction (17, 24, 39 and 48 hours). In the presence of Tc(0 hours), the expression of each mRNA was indicative ofthe basal expression level in mES cells. Total RNA sam-ples at various times of induction were purified byQIAshredder (catalog no. 79656) and extracted withRNeasy Protect Mini Kit (catalog no. 74126) using stan-dard conditions. Total RNA (1 μg) was reverse-tran-scribed by QuantiTect Reverse Transcription Kit(Qiagen, catalog no. 205313) according to the manufac-turer's instructions. q-PCR experiments were performedusing Light Cycler 480 Syber Green I Mastermix (Rochespa, Monza, Italy, catalog no. 04887352001) for cDNAamplification and in LightCycler 480 II (Roche) for signaldetection. q-PCR results were analyzed using the com-parative Ct method normalized against the housekeepinggene Actin B.
All primer pair sequences used for q-PCR are availablein Additional file 4. Luciferase assays on mES cells over-expressing the firefly luciferase (Luc) gene was performedusing Dual Luciferase Reporter Assay System (PromegaItalia, Milano, Italy). YFP fluorescence assay to detect theexpression of the YFP reporter was performed using theDM6000 Leica Microscope.
KaryotypingThe analysis was performed on 20 different inducibleclones of our mES cell bank (7 effective and 13 silentgenes) and on parental ES cells (EB3) at the beginning ofthis study on the cell line received from Dr Hitoshi Niwaand again 2 years later. A single inducible clone was cho-sen randomly within the biological triplicate for this anal-ysis. Cells at 70% confluence were treated with colcemid(Invitrogen) for 2 hours and harvested. Cell pellets wereresuspended in pre-warmed hypotonic solution (0.56%KCl) and incubated at 37°C. Cells were then fixed withfreshly prepared, ice-cold methanol-acetic acid solution(3:1 in volume) and mounted by dropping onto slidesfrom a height of 1 meter. Metaphase spreads were stainedwith 5% Giemsa solution (Invitrogen). Approximately 20images were taken, and 25 spreads were analyzed toassess the percentage of euploid cells.
Embryonic stem cell differentiationThe EB3 cells and the parental line E14 cells [43] wereallowed to differentiate using the 'hanging drop' method[44,45]. The differentiation medium consists of the mEScell medium depleted of LIF. The primer pair of Oct3/4used in q-PCR is reported in Additional file 4.
Western blottingWhole cell lysates were extracted after 24 or 48 hours ofinduction by lysis buffer (50 mM Tris-HCl (pH 8.0), 200mM NaCl, 1% Triton, 1 mM EDTA, 50 mM Hepes) con-taining 1% (v/v) of proteinase inhibitor cocktail (Sigma,catalog no. P8340). Thirty micrograms of protein extractfrom 4 out of 7 clones overexpressing effective genes (Erg,Nrip1, Runx1, Pdxk) and 11 out of 13 overexpressingsilent genes (Bach1, Ets2, Gabpa, Olig1, Pknox1,1810007M14Rik, Dscr1-Rcan1, DYRK1A, Hunk, Pfkl,Ripk4) were fractionated on 10% SDS-PAGE gels andelectroblotted onto Trans-Blot transfer membrane (Bio-rad Italy, Segrate, Milano, Italy, catalog no. 162-0112).After incubation in blocking buffer in standard condi-tions, the membranes were incubated with anti-Flag anti-body produced in rabbit (Sigma, catalog no. F7425) andthen with anti-rabbit IgG horseradish peroxidase linkedwhole antibody (Amersham Biosciences, GE HealthcareEurope GmbH, Milano, Italy, catalog no. NA934V).Luminescence was performed using Super Signal WestPico Chemiluminescent substrate (Pierce, Euroclone,Pero, Milano, Italy, catalog no. 34080).
Microarray hybridizationTotal RNA (3 μg) was reverse transcribed to single-stranded cDNA with a special oligo (dT)24 primer con-taining a T7 RNA promoter site, added 3' to the poly-Ttract, prior to second strand synthesis (One Cycle cDNASynthesis Kit by Affymetrix, Fremont, CA, USA). Bioti-nylated cRNAs were then generated, using the GeneChipIVT Labeling Kit (Affymetrix). Twenty micrograms ofbiotinylated cRNA was fragmented and 10 μg hybridizedto the Affymetrix GeneChip Mouse Genome 430_2 arrayfor 16 hours at 45°C using an Affymetrix GeneChip Flu-idics Station 450 according to the manufacturer's stan-dard protocols.
Microarray data processingLow-level analysis to convert probe level data to genelevel expression data was done using robust multiarrayaverage (RMA) implemented using the RMA function ofthe Affymetrix package of the Bioconductor project[46,47] in the R programming language [48]. The low-level analysis for the BAMarray tool was performed usingthe MAS5 method, implemented using the correspond-ing function of the same Bioconductor package.
Statistical analysis of differential gene expressionFor each gene, a t-test was used on RMA normalized datato determine if there was a significant difference inexpression between the two groups of microarrays(induced versus uninduced). P-value adjustment for mul-tiple comparisons was done with the FDR of Benjamini-Hochberg [49]. A FDR control was applied to correct formultiple comparisons; the thresholds used in the differ-

De Cegli et al. Genome Biology 2010, 11:R64http://genomebiology.com/2010/11/6/R64
Page 14 of 18
ent cases are reported in the main text. The BAM analysiswas performed with BAMarray v3.0. The analysis wasperformed on MAS5 normalized array data using thedefault settings except for the following parameters:accuracy was set to high, clustering was set to manualwith a value of 25, and variance was set to unequal.
t-Tests were also carried out to assess the significanceof the variation in the relative expression values of each ofthe 20 genes analyzed in the parental cell line (EB3) ver-sus the corresponding transgenic inducible clones (in thebiological replicates) grown in the presence of Tc (0 hoursof induction). In this statistical analysis the threshold forstatistical significance chosen was a FDR < 0.05. Theapparent increase of expression levels between EB3 cellsand the non-induced state (in the cases of Bach1 andGabpa, for example) was not statistically significant andtherefore can be explained by the biological variability ofexpression levels of these genes in mES cells. In Addi-tional file 5, we report the comparison of relative expres-sion of 20 genes in the EB3 cell line with thecorresponding transgenic inducible clones (in the biolog-ical replicates) grown in the presence of Tc (0 hours ofinduction).
Microarray data analysisIn the cases of Runx1 and Erg overexpression, a largenumber of genes were differentially expressed with FDR<5% (4,585 genes for Runx1 and 5,820 for Erg). Thismeans that the number of false positives obtained fromRunx1 and Erg experiments are 229 and 291, respectively.In order to reduce the number of false positives, wedecided to perform the GO analysis on the gene setobtained while filtering the array using a more stringentcriteria (FDR <1%). The differential expression of genesas obtained with the microarray was validated by q-PCRof the most up- and down-regulated genes as ranked bythe differential expression ratio. In Additional file 4 wereport the primer pair used in q-PCR.
Gene set enrichment analysisGSEA [24,50] was performed to determine if the set ofsilent genes was characterized by above average wild-typeexpression levels. The analysis was performed on thewhole list of 45,102 probesets using the online GSEAserver [51] with the default values for all the tool parame-ters and produced an enrichment score of 0.402 (FDR q-value = 0).
Protein disorder measurementThe protein disorder was measured using the GlobPlotonline tool v2.3 [52,53]. The disorder value for a proteinwas determined by a summation of the lengths of the dis-ordered regions determined by the tool.
Comparison with Tc1 cell lineThe results of our overexpression experiments were col-lectively and individually compared with the Tc1 expres-sion data. The MAS4 pre-processed Tc1 data wereretrieved from Array Express [ArrayExpress:E-MEXP-654] and subsequently processed according to the samecanonical statistical analysis (Cyber-t plus FDR correc-tion; FDR < 5%) as our expression data, yielding a total of284 significant genes (FDR < 0.05). Since the Tc1 datasetwas obtained with a different chipset from ours(MG_U74Av2), we first converted the probesets intotheir 430_2 equivalents using the Affymetrix 'best match'conversion table; the result of the conversion yielded 241genes. The probesets selected for each comparison werethose that were found to be significant in both the Tc1and the specific overexpression experiment; the composi-tion of the individual lists is reported in Additional file16. The total list used for Figure 4 was obtained by merg-ing the individual lists and removing duplicate genes bykeeping the maximum in absolute value and discardingthe others, yielding 168 genes. The scatter plots wereobtained by plotting the logarithm of the Tc1 fold change(ratio of treated versus untreated cell line) on the x axis,and the logarithm of the overexpressed gene on the y axis.The regression line coefficients were obtained using analgorithm computing a non-centered version of the cor-relation coefficient (the xcorr Matlab function) for theindividual plots, and a standard A = YX-1 algorithm forthe collective plot (the two algorithms are interchange-able). The P-value for the regression coefficients wascomputed using a Student's t distribution for a transfor-mation of the correlation. A P-value indicating the proba-bility of obtaining the shown ratio of same-sign over totaldots purely by chance was computed as follows. A set of n(x, y) pairs was created by randomly extracting x from thelist of Tc1 log ratio values and y from the list of currentgene values, where n is the number of dots in the graph;100,000 such sets were created (1 million in the case ofAire), and the percentage of sets for which x × y > 0 wastrue for at least k out of the n pairs was noted and takenas P-value, where k is the number of dots in the graphhaving same-sign coordinates.
Large-gel two-dimensional protein electrophoresisThe total protein extraction from mES cells was carriedout using our standard protocol [54]. Protein (70 μg) wasseparated in each 2DGE run. Transgenic and parental celllines were always run in parallel. The proteomic analysiswas carried out on two Runx1 overexpressing clones (E6and E7) out of the three clones (E6, E7 and F3) used forthe transcriptome analysis (Additional file 3). Three tech-nical repeats were performed for each clone. Overall, 12two-dimensional gels were run for each Runx1 overex-
De Cegli et al. Genome Biology 2010, 11:R64http://genomebiology.com/2010/11/6/R64
Page 15 of 18
pressing clone: 6 replicates for the non-induced state and6 replicates for the induced state (48 hours). All of theabove samples were always run simultaneously in thesame electrophoresis chamber to ensure gel pattern com-parability. The protein expression alterations upon Runx1overexpression were calculated by the ratio of the t48hours mean to the t0 hours mean, using the averaged val-ues across six gels (three technical replicates of each bio-logical replicate). The statistic significance was accessedby student's t-test, with P < 0.05, and in addition, only ifthere is an expression alteration greater than 20% asdescribed in [55]. Silver staining protocol was employedto visualize protein spots [56]. Computer-assisted gelevaluation was performed (Delta2D v3.4, Decodon,Greifswald Germany). Briefly, 2DGE gels were scanned athigh resolution (600 dpi; TMA 1600, Microtek, Willich,Germany). Corresponding gel images were first warpedusing 'exact mode' (manual vector setting combined withautomatic warping). A fusion gel image was subsequentlygenerated using 'union mode', which is a weighted arith-metic mean across the entire gel series. Spot detectionwas carried out on this fusion image automatically, fol-lowed by manual spot editing. Subsequently, spots weretransferred from fusion image to all gels. The signalintensities (volume of each spot) were computed as aweighted sum of all pixel intensities of each protein spot.Percent volume of spot intensities calculated as a fractionof the total spot volume of the parent gel was used forquantitative analysis of protein expression level. Normal-ized values after local background extraction were subse-quently exported from Delta2D in spreadsheet format forstatistical analysis. Student's t-test was carried out forcontrol versus induced cell lines to access statistical sig-nificance of the expression differences (pair-wise, two-sided). P < 0.05 was used as statistical significance thresh-old. To reduce the influence of data noise, only proteinexpression changes over 20% compared to control wereretained for further analysis. Additional file 22 shows theraw data of the proteomic analysis by 2DGE following theoverexpression of Runx1. The detailed spot quantifica-tion data, in the form of relative volume data of each spoton each individual 2DGE gel, are also provided in thistable. 2DGE gel image data have now been submitted tothe World-2DPAGE Repository of the ExPASy Proteom-ics Server [2DPAGE:0021] for public access [31].
Mass spectrometric protein identificationFor protein identification by mass spectrometry, high res-olution 2DGE gels were stained using a mass spectrome-try compatible silver staining protocol [57]. Protein spotsof interest were excised and subjected to in-gel trypsindigestion without reduction and alkylation. Tryptic frag-ments were analyzed using a LCQ Deca XP nano HPLC/
ESI ion trap mass spectrometer (Thermo Fisher Scien-tific, Waltham, MA, USA) as described previously [58].For database-assisted protein identification, monoiso-topic mass values of peptides were searched againstNCBInr (version 20061206, taxonomy Mus musculus),allowing one missed cleavage. Peptide mass tolerance andfragment mass tolerance were set at 0.8 Dalton. Oxida-tion of methionine and arylamide adducts on cysteine(propionaide) were considered as variable peptide modi-fications. Criteria for positive identification of proteinswere set according to the scoring algorithm delineated inMascot (Matrix Science, London, UK) [59], with an indi-vidual ion score cut-off threshold corresponding to P <0.05.
Additional material
Additional file 1 Identification and validation of inducible/exchange-able recombinant mES clones. (a) Recombinant mES clones were identi-fied by PCR analysis. (b) q-PCR analysis and Luciferase assays using Dual Luciferase Reporter Assay System was performed on mES clones overex-pressing the firefly luciferase (Luc) gene. The system was activated upon the removal of Tc (after 17, 24, 39 and 48 hours) from the medium. Protein extracts of mES cells were prepared at the same time points and lumines-cence quantified. (c) q-PCR analysis and YFP fluorescence assay to detect the expression of the YFP reporter. (d) Expression of mES cells overexpress-ing Luc after 24 hours from the complete removal of Tc from the medium; the degree of induction was easily manipulated by titrating the Tc. (e) Expression profile (q-PCR) of the pluripotency gene Oct3/4, and of markers of the mesoderm (Brachyury), ectoderm (Gfap) and endoderm (Afp) during differentiation of EB3 and of the parent cell line (E14).Additional file 2 List of 32 genes overexpressed in mouse ES cells. In this table we list the 32 genes selected to be integrated in the Rosa26 locus and overexpressed using the Tet-off system in mES cells.Additional file 3 Time course of induction of three clones (biological replicates) selected for each gene. In this table we report the time course of the induction of mES clones that overexpress the 32 ORFs. For each gene, three drug-resistant mES biological replicates, whose names are indicated in the specific column, were selected to be tested for their sensitivity to Tc removal from the medium.Additional file 4 Primer pairs used in q-PCR.
Additional file 5 Comparison of relative expression levels for 20 genes in the EB3 parental cell line and in the inducible clones at 0 hours of induction by multiple statistical t-tests. In this table we show the comparison of the relative expression of 20 genes (the 13 transcription factors, the single transcriptional activator and the 6 kinases) in the EB3 cell line versus the corresponding transgenic inducible clones (in the biological replicates) grown in the presence of Tc (0 hours of induction).Additional file 6 Complete list of differentially expressed genes fol-lowing the overexpression of Aire, one of the effective genes.Additional file 7 Complete list of differentially expressed genes fol-lowing the overexpression of Erg, one of the effective genes.Additional file 8 Complete list of differentially expressed genes fol-lowing the overexpression of Nrip1, one of the effective genes.Additional file 9 Complete list of differentially expressed genes fol-lowing the overexpression of Olig2, one of the effective genes.Additional file 10 Complete list of differentially expressed genes fol-lowing the overexpression of Pdxk, one of the effective genes.Additional file 11 Complete list of differentially expressed genes fol-lowing the overexpression of Runx1, one of the effective genes.Additional file 12 Complete list of differentially expressed genes fol-lowing the overexpression of Sim2, one of the effective genes.

De Cegli et al. Genome Biology 2010, 11:R64http://genomebiology.com/2010/11/6/R64
Page 16 of 18
Abbreviations2DGE: two-dimensional gel electrophoresis; DMEM: Dulbecco's modifiedEagle's medium; DS: Down syndrome; FDR: false discovery rate; GO: GeneOntology; GSEA: gene set enrichment analysis; HSA21: human chromosome21; LIF: leukemia inhibitory factor; mES: mouse embryonic stem; ORF: openreading frame; PBS: phosphate-buffered saline; q-PCR: quantitative PCR; RMA:robust multiarray average; RMCE: recombination-mediated cassette exchange;Tc: tetracycline; YFP: yellow fluorescent protein.
Authors' contributionsRDC and AR contributed equally to this work. RDC, AR and SI provided material,experimentation, data collection and analysis. RDC participated in writing themanuscript. LM and ML provided intellectual input for experimentation anddata analysis. AOF provided technical input with respect to cloning. GC, DdB,SB and AB participated in writing the manuscript and intellectual input.
AcknowledgementsWe thank Nicoletta D'Alessio for technical assistance in the generation of mES inducible clones. We thank Dr Lucia Perone and the Cell Culture and Cytoge-netics Core of Tigem for the karyotyping of mouse ES clones of the cell bank. We thank Dr Hitoshi Niwa for providing the recombinant plasmid pPthC-Oct-3/
4 and the cell line EBRTcH3 (EB3); Dr Yaspo for providing the recombinant plas-mid containing the cDNA of Olig2; Dr Groner for providing the recombinant plasmid containing the cDNA of Runx1; Dr Whitelaw for providing the recombi-nant plasmid containing the cDNA of Sim2. This work was supported by the FP7 European Union grant 'Aneuploidy' (contract number 037627), the Swiss Science Foundation and the Italian Telethon Foundation
Author Details1Telethon Institute of Genetics and Medicine, Via P. Castellino 111, Napoli, 80131, Italy, 2Current address: Université Paris Diderot - Paris 7, Paris Cedex 13, Paris, 75205, France, 3Institut für Humangenetik Charité, Campus Virchow-Klinikum, Universitätsmedizin Berlin, Augustenburger Platz 1, Berlin, D-13353, Germany, 4Current address: Lysosomal Diseases Research Unit, SA Pathology, 72 King William Road, North Adelaide, South Australia, 5006, Australia, 5Department of Genetic Medicine and Development, University of Geneva Medical School, 1 rue Michel-Servet, Geneva, CH-1211, Switzerland, 6Genomics Platform, University of Geneva Medical School, 1 rue Michel-Servet, Geneva, CH-1211, Switzerland and 7Current address: Dipartimento di Patologia Generale, Seconda Universita' di Napoli, Via De Crecchio 7, Napoli, 80100, Italy
References1. Jacobs PA: Chromosome mutations: frequency at birth in humans.
Humangenetik 1972, 16:137-140.2. Goad WB, Robinson A, Puck TT: Incidence of aneuploidy in a human
population. Am J Hum Genet 1976, 28:62-68.3. Hassold T, Hunt P: To err (meiotically) is human: the genesis of human
aneuploidy. Nat Rev Genet 2001, 2:280-291.4. Adler ID: Aneuploidy studies in mammals. Prog Clin Biol Res 1990,
340B:285-293.5. Griffin DK: The incidence, origin, and etiology of aneuploidy. Int Rev
Cytol 1996, 167:263-296.6. Torres EM, Williams BR, Amon A: Aneuploidy: cells losing their balance.
Genetics 2008, 179:737-746.7. Wiseman FK, Alford KA, Tybulewicz VL, Fisher EM: Down syndrome -
recent progress and future prospects. Hum Mol Genet 2009, 18:R75-83.8. Patterson D: Molecular genetic analysis of Down syndrome. Hum Genet
2009, 126:195-214.9. Korbel JO, Tirosh-Wagner T, Urban AE, Chen XN, Kasowski M, Dai L,
Grubert F, Erdman C, Gao MC, Lange K, Sobel EM, Barlow GM, Aylsworth AS, Carpenter NJ, Clark RD, Cohen MY, Doran E, Falik-Zaccai T, Lewin SO, Lott IT, McGillivray BC, Moeschler JB, Pettenati MJ, Pueschel SM, Rao KW, Shaffer LG, Shohat M, Van Riper AJ, Warburton D, Weissman S, et al.: The genetic architecture of Down syndrome phenotypes revealed by high-resolution analysis of human segmental trisomies. Proc Natl Acad Sci USA 2009, 106:12031-12036.
10. Arron JR, Winslow MM, Polleri A, Chang CP, Wu H, Gao X, Neilson JR, Chen L, Heit JJ, Kim SK, Yamasaki N, Miyakawa T, Francke U, Graef IA, Crabtree GR: NFAT dysregulation by increased dosage of DSCR1 and DYRK1A on chromosome 21. Nature 2006, 441:595-600.
11. Reeves RH, Irving NG, Moran TH, Wohn A, Kitt C, Sisodia SS, Schmidt C, Bronson RT, Davisson MT: A mouse model for Down syndrome exhibits learning and behaviour deficits. Nat Genet 1995, 11:177-184.
12. Baek KH, Zaslavsky A, Lynch RC, Britt C, Okada Y, Siarey RJ, Lensch MW, Park IH, Yoon SS, Minami T, Korenberg JR, Folkman J, Daley GQ, Aird WC, Galdzicki Z, Ryeom S: Down's syndrome suppression of tumour growth and the role of the calcineurin inhibitor DSCR1. Nature 2009, 459:1126-1130.
13. Altafaj X, Dierssen M, Baamonde C, Marti E, Visa J, Guimera J, Oset M, Gonzalez JR, Florez J, Fillat C, Estivill X: Neurodevelopmental delay, motor abnormalities and cognitive deficits in transgenic mice overexpressing Dyrk1A (minibrain), a murine model of Down's syndrome. Hum Mol Genet 2001, 10:1915-1923.
14. Voronov SV, Frere SG, Giovedi S, Pollina EA, Borel C, Zhang H, Schmidt C, Akeson EC, Wenk MR, Cimasoni L, Arancio O, Davisson MT, Antonarakis SE, Gardiner K, De Camilli P, Di Paolo G: Synaptojanin 1-linked phosphoinositide dyshomeostasis and cognitive deficits in mouse models of Down's syndrome. Proc Natl Acad Sci USA 2008, 105:9415-9420.
Additional file 13 Summary of q-PCR validation of microarray data. In this table we show the validation by q-PCR of the differential expression of a subset of the most up-regulated and down-regulated genes detected by microarray analysis of the seven effective genes, as ranked by differential expression ratio.Additional file 14 A complete list of significantly enriched GO terms for the seven effective genes.Additional file 15 List of all the mouse orthologs of HSA21 genes sorted according to their basal expression level in mES cells (from the most to the least expressed).Additional file 16 Summary of results derived from the comparison between the analysis of mES overexpressing effective clones and the transchromosomic Tc1 mouse line.
Additional file 17 Comparison of overexpression experiments with the transcriptional response of the transchromosomic tc1 mouse line. X-Y graphs comparing the transcriptional response of Tc1 with the response obtained in the individual overexpression experiments. Each dot represents a gene whose expression was statistically significant in both the Tc1 and the indicated overexpression experiment. The x axis corresponds to the log of the Tc1 ratio (trisomic versus wild type), and the y axis corre-sponds to the log of the ratio in the overexpression experiment (induced versus non-induced clone). The ratio of same-sign over total dots is reported for each graph.Additional file 18 A complete list of GO terms significantly enriched in the subsets of genes differentially expressed after overexpression of 11 out of 13 silent genes.Additional file 19 GO enrichment analysis for five (Bach1, Dscr1-Rcan1, DYRK1A, Gabpa and SNF1LK) out of thirteen silent genes, as assessed by microarray analysis. In this table we report the GO enrich-ment analysis for five out of thirteen silent genes (Bach1, Dscr1-Rcan1, DYRK1A, Gabpa, SNF1LK); supporting references for a subset of significant biological processes identified by the GO analysis are given.Additional file 20 Differential protein expression variation in mES cells overexpressing Runx1. In this table we report the complete list of the proteins whose expression changed following the induction of Runx1
Additional file 21 Primer pairs used in PCR.Additional file 22 Raw data of the proteomic analysis, using 2DGE, following the induction of two Runx1 overexpressing clones (E6 and E7). Three technical repeats were performed for each biological replicate: this comprises 6 gels for E6 and 6 gels for E7. For each clone we ran three replicates for t0 (control) and three replicates for t48 hours. Corresponding t0 and t48 hour samples were always run simultaneously in the same chamber to ensure gel pattern comparability. The detailed spot quantifica-tion data are provided in this table. We list the relative volume of each spot on each individual 2DGE gel, together with other spot parameters, such as pixel spot volume, x and y coordinates of spots on the fusion gel image, as well as spot quality index.
Received: 1 April 2010 Revised: 3 June 2010 Accepted: 22 June 2010 Published: 22 June 2010This article is available from: http://genomebiology.com/2010/11/6/R64© 2010 De Cegli et al.; licensee BioMed Central Ltd. This is an open access article distributed under the terms of the Creative Commons Attribution License (http://creativecommons.org/licenses/by/2.0), which permits unrestricted use, distribution, and reproduction in any medium, provided the original work is properly cited.Genome Biology 2010, 11:R64
De Cegli et al. Genome Biology 2010, 11:R64http://genomebiology.com/2010/11/6/R64
Page 17 of 18
15. Rachidi M, Lopes C, Charron G, Delezoide AL, Paly E, Bloch B, Delabar JM: Spatial and temporal localization during embryonic and fetal human development of the transcription factor SIM2 in brain regions altered in Down syndrome. Int J Dev Neurosci 2005, 23:475-484.
16. Mensah A, Mulligan C, Linehan J, Ruf S, O'Doherty A, Grygalewicz B, Shipley J, Groet J, Tybulewicz V, Fisher E, Brandner S, Nizetic D: An additional human chromosome 21 causes suppression of neural fate of pluripotent mouse embryonic stem cells in a teratoma model. BMC Dev Biol 2007, 7:131.
17. Pinter JD, Brown WE, Eliez S, Schmitt JE, Capone GT, Reiss AL: Amygdala and hippocampal volumes in children with Down syndrome: a high-resolution MRI study. Neurology 2001, 56:972-974.
18. Canzonetta C, Mulligan C, Deutsch S, Ruf S, O'Doherty A, Lyle R, Borel C, Lin-Marq N, Delom F, Groet J, Schnappauf F, De Vita S, Averill S, Priestley JV, Martin JE, Shipley J, Denyer G, Epstein CJ, Fillat C, Estivill X, Tybulewicz VL, Fisher EM, Antonarakis SE, Nizetic D: DYRK1A-dosage imbalance perturbs NRSF/REST levels, deregulating pluripotency and embryonic stem cell fate in Down syndrome. Am J Hum Genet 2008, 83:388-400.
19. Masui S, Shimosato D, Toyooka Y, Yagi R, Takahashi K, Niwa H: An efficient system to establish multiple embryonic stem cell lines carrying an inducible expression unit. Nucleic Acids Res 2005, 33:e43.
20. Yu T, Li Z, Jia Z, Clapcote SJ, Liu C, Li S, Asrar S, Pao A, Chen R, Fan N, Carattini-Rivera S, Bechard AR, Spring S, Henkelman RM, Stoica G, Matsui S, Nowak NJ, Roder JC, Chen C, Bradley A, Yu YE: A mouse model of Down syndrome trisomic for all human chromosome 21 syntenic regions. Hum Mol Genet 2010, 19:2780-2791.
21. Dennis G, Sherman BT Jr, Hosack DA, Yang J, Gao W, Lane HC, Lempicki RA: DAVID: Database for Annotation, Visualization, and Integrated Discovery. Genome Biol 2003, 4:P3.
22. Huang da W, Sherman BT, Lempicki RA: Systematic and integrative analysis of large gene lists using DAVID bioinformatics resources. Nat Protoc 2009, 4:44-57.
23. DAVID [http://david.abcc.ncifcrf.gov]24. Subramanian A, Tamayo P, Mootha VK, Mukherjee S, Ebert BL, Gillette MA,
Paulovich A, Pomeroy SL, Golub TR, Lander ES, Mesirov JP: Gene set enrichment analysis: a knowledge-based approach for interpreting genome-wide expression profiles. Proc Natl Acad Sci USA 2005, 102:15545-15550.
25. Vavouri T, Semple JI, Garcia-Verdugo R, Lehner B: Intrinsic protein disorder and interaction promiscuity are widely associated with dosage sensitivity. Cell 2009, 138:198-208.
26. O'Doherty A, Ruf S, Mulligan C, Hildreth V, Errington ML, Cooke S, Sesay A, Modino S, Vanes L, Hernandez D, Linehan JM, Sharpe PT, Brandner S, Bliss TV, Henderson DJ, Nizetic D, Tybulewicz VL, Fisher EM: An aneuploid mouse strain carrying human chromosome 21 with Down syndrome phenotypes. Science 2005, 309:2033-2037.
27. BAMarray 3.0 [http://www.bamarray.com/]28. Ishwaran H, Rao JS: Spike and slab gene selection for multigroup
microarray data. J Am Stat Assoc 2005, 100:764-780.29. Ishwaran H, Rao JS, Kogalur UB: BAMarraytrade mark: Java software for
Bayesian analysis of variance for microarray data. BMC Bioinformatics 2006, 7:59.
30. ExPASy Proteomic Server [http://world-2dpage.expasy.org/repository/]31. Hoogland C, Mostaguir K, Appel RD, Lisacek F: The World-2DPAGE
Constellation to promote and publish gel-based proteomics data through the ExPASy server. J Proteomics 2008, 71:245-248.
32. Kahlem P, Sultan M, Herwig R, Steinfath M, Balzereit D, Eppens B, Saran NG, Pletcher MT, South ST, Stetten G, Lehrach H, Reeves RH, Yaspo ML: Transcript level alterations reflect gene dosage effects across multiple tissues in a mouse model of down syndrome. Genome Res 2004, 14:1258-1267.
33. Suda Y, Suzuki M, Ikawa Y, Aizawa S: Mouse embryonic stem cells exhibit indefinite proliferative potential. J Cell Physiol 1987, 133:197-201.
34. Palmqvist L, Glover CH, Hsu L, Lu M, Bossen B, Piret JM, Humphries RK, Helgason CD: Correlation of murine embryonic stem cell gene expression profiles with functional measures of pluripotency. Stem Cells 2005, 23:663-680.
35. Munne S, Howles CM, Wells D: The role of preimplantation genetic diagnosis in diagnosing embryo aneuploidy. Curr Opin Obstet Gynecol 2009, 21:442-449.
36. Prandini P, Deutsch S, Lyle R, Gagnebin M, Delucinge Vivier C, Delorenzi M, Gehrig C, Descombes P, Sherman S, Dagna Bricarelli F, Baldo C, Novelli A,
Dallapiccola B, Antonarakis SE: Natural gene-expression variation in Down syndrome modulates the outcome of gene-dosage imbalance. Am J Hum Genet 2007, 81:252-263.
37. Nishiyama A, Xin L, Sharov AA, Thomas M, Mowrer G, Meyers E, Piao Y, Mehta S, Yee S, Nakatake Y, Stagg C, Sharova L, Correa-Cerro LS, Bassey U, Hoang H, Kim E, Tapnio R, Qian Y, Dudekula D, Zalzman M, Li M, Falco G, Yang HT, Lee SL, Monti M, Stanghellini I, Islam MN, Nagaraja R, Goldberg I, Wang W, et al.: Uncovering early response of gene regulatory networks in ESCs by systematic induction of transcription factors. Cell Stem Cell 2009, 5:420-433.
38. Mortazavi A, Williams BA, McCue K, Schaeffer L, Wold B: Mapping and quantifying mammalian transcriptomes by RNA-Seq. Nat Methods 2008, 5:621-628.
39. Ahn KJ, Jeong HK, Choi HS, Ryoo SR, Kim YJ, Goo JS, Choi SY, Han JS, Ha I, Song WJ: DYRK1A BAC transgenic mice show altered synaptic plasticity with learning and memory defects. Neurobiol Dis 2006, 22:463-472.
40. Vega RB, Rothermel BA, Weinheimer CJ, Kovacs A, Naseem RH, Bassel-Duby R, Williams RS, Olson EN: Dual roles of modulatory calcineurin-interacting protein 1 in cardiac hypertrophy. Proc Natl Acad Sci USA 2003, 100:669-674.
41. Araki K, Imaizumi T, Okuyama K, Oike Y, Yamamura K: Efficiency of recombination by Cre transient expression in embryonic stem cells: comparison of various promoters. J Biochem 1997, 122:977-982.
42. Rennel E, Gerwins P: How to make tetracycline-regulated transgene expression go on and off. Anal Biochem 2002, 309:79-84.
43. Hooper M, Hardy K, Handyside A, Hunter S, Monk M: HPRT-deficient (Lesch-Nyhan) mouse embryos derived from germline colonization by cultured cells. Nature 1987, 326:292-295.
44. Wobus AM, Guan K, Yang HT, Boheler KR: Embryonic stem cells as a model to study cardiac, skeletal muscle, and vascular smooth muscle cell differentiation. Methods Mol Biol 2002, 185:127-156.
45. Wobus AM, Boheler KR: Embryonic stem cells: prospects for developmental biology and cell therapy. Physiol Rev 2005, 85:635-678.
46. Bioconductor [http://www.R-project.org]47. Gentleman RC, Carey VJ, Bates DM, Bolstad B, Dettling M, Dudoit S, Ellis B,
Gautier L, Ge Y, Gentry J, Hornik K, Hothorn T, Huber W, Iacus S, Irizarry R, Leisch F, Li C, Maechler M, Rossini AJ, Sawitzki G, Smith C, Smyth G, Tierney L, Yang JY, Zhang J: Bioconductor: open software development for computational biology and bioinformatics. Genome Biol 2004, 5:R80.
48. R: A Language and Environment for Statistical Computing [http://cran.r-project.org/doc/manuals/refman.pdf]
49. Klipper-Aurbach Y, Wasserman M, Braunspiegel-Weintrob N, Borstein D, Peleg S, Assa S, Karp M, Benjamini Y, Hochberg Y, Laron Z: Mathematical formulae for the prediction of the residual beta cell function during the first two years of disease in children and adolescents with insulin-dependent diabetes mellitus. Med Hypotheses 1995, 45:486-490.
50. Mootha VK, Lindgren CM, Eriksson KF, Subramanian A, Sihag S, Lehar J, Puigserver P, Carlsson E, Ridderstrale M, Laurila E, Houstis N, Daly MJ, Patterson N, Mesirov JP, Golub TR, Tamayo P, Spiegelman B, Lander ES, Hirschhorn JN, Altshuler D, Groop LC: PGC-1alpha-responsive genes involved in oxidative phosphorylation are coordinately downregulated in human diabetes. Nat Genet 2003, 34:267-273.
51. GSEA [http://www.broad.mit.edu/gsea/]52. Linding R, Russell RB, Neduva V, Gibson TJ: GlobPlot:Exploring protein
sequences for globularity and disorder. Nucleic Acids Res 2003, 31:3701-3708.
53. GlobPlot [http://globplot.embl.de/]54. Klose J: Large-gel 2-D electrophoresis. Methods Mol Biol 1999,
112:147-172.55. Challapalli KK, Zabel C, Schuchhardt J, Kaindl AM, Klose J, Herzel H: High
reproducibility of large-gel two-dimensional electrophoresis. Electrophoresis 2004, 25:3040-3047.
56. Heukeshoven J, Dernick R: Improved silver staining procedure for fast staining in PhastSystem Development Unit. I. Staining of sodium dodecyl sulfate gels. Electrophoresis 1988, 9:28-32.
57. Nebrich G, Herrmann M, Sagi D, Klose J, Giavalisco P: High MS-compatibility of silver nitrate-stained protein spots from 2-DE gels using ZipPlates and AnchorChips for successful protein identification. Electrophoresis 2007, 28:1607-1614.
58. Zabel C, Mao L, Woodman B, Rohe M, Wacker MA, Klare Y, Koppelstatter A, Nebrich G, Klein O, Grams S, Strand A, Luthi-Carter R, Hartl D, Klose J, Bates GP: A large number of protein expression changes occur early in life

De Cegli et al. Genome Biology 2010, 11:R64http://genomebiology.com/2010/11/6/R64
Page 18 of 18
and precede phenotype onset in a mouse model for huntington disease. Mol Cell Proteomics 2009, 8:720-734.
59. Pappin DJ, Hojrup P, Bleasby AJ: Rapid identification of proteins by peptide-mass fingerprinting. Curr Biol 1993, 3:327-332.
60. Miyoshi H, Shimizu K, Kozu T, Maseki N, Kaneko Y, Ohki M: t(8;21) breakpoints on chromosome 21 in acute myeloid leukemia are clustered within a limited region of a single gene, AML1. Proc Natl Acad Sci USA 1991, 88:10431-10434.
61. Antonarakis SE, Lyle R, Dermitzakis ET, Reymond A, Deutsch S: Chromosome 21 and down syndrome: from genomics to pathophysiology. Nat Rev Genet 2004, 5:725-738.
62. Wang Q, Stacy T, Binder M, Marin-Padilla M, Sharpe AH, Speck NA: Disruption of the Cbfa2 gene causes necrosis and hemorrhaging in the central nervous system and blocks definitive hematopoiesis. Proc Natl Acad Sci USA 1996, 93:3444-3449.
63. Okuda T, van Deursen J, Hiebert SW, Grosveld G, Downing JR: AML1, the target of multiple chromosomal translocations in human leukemia, is essential for normal fetal liver hematopoiesis. Cell 1996, 84:321-330.
64. Stein GS, Lian JB, van Wijnen AJ, Stein JL, Montecino M, Javed A, Zaidi SK, Young DW, Choi JY, Pockwinse SM: Runx2 control of organization, assembly and activity of the regulatory machinery for skeletal gene expression. Oncogene 2004, 23:4315-4329.
65. Silva FP, Swagemakers SM, Erpelinck-Verschueren C, Wouters BJ, Delwel R, Vrieling H, van der Spek P, Valk PJ, Giphart-Gassler M: Gene expression profiling of minimally differentiated acute myeloid leukemia: M0 is a distinct entity subdivided by RUNX1 mutation status. Blood 2009, 114:3001-3007.
66. Remy P, Baltzinger M: The Ets-transcription factor family in embryonic development: lessons from the amphibian and bird. Oncogene 2000, 19:6417-6431.
67. Randi AM, Sperone A, Dryden NH, Birdsey GM: Regulation of angiogenesis by ETS transcription factors. Biochem Soc Trans 2009, 37:1248-1253.
68. Vlaeminck-Guillem V, Vanacker JM, Verger A, Tomavo N, Stehelin D, Laudet V, Duterque-Coquillaud M: Mutual repression of transcriptional activation between the ETS-related factor ERG and estrogen receptor. Oncogene 2003, 22:8072-8084.
69. Kiskinis E, Hallberg M, Christian M, Olofsson M, Dilworth SM, White R, Parker MG: RIP140 directs histone and DNA methylation to silence Ucp1 expression in white adipocytes. EMBO J 2007, 26:4831-4840.
70. Zhang X, Szabo E, Michalak M, Opas M: Endoplasmic reticulum stress during the embryonic development of the central nervous system in the mouse. Int J Dev Neurosci 2007, 25:455-463.
71. Augereau P, Badia E, Fuentes M, Rabenoelina F, Corniou M, Derocq D, Balaguer P, Cavailles V: Transcriptional regulation of the human NRIP1/RIP140 gene by estrogen is modulated by dioxin signalling. Mol Pharmacol 2006, 69:1338-1346.
72. Lu QR, Yuk D, Alberta JA, Zhu Z, Pawlitzky I, Chan J, McMahon AP, Stiles CD, Rowitch DH: Sonic hedgehog--regulated oligodendrocyte lineage genes encoding bHLH proteins in the mammalian central nervous system. Neuron 2000, 25:317-329.
73. Zhou Q, Wang S, Anderson DJ: Identification of a novel family of oligodendrocyte lineage-specific basic helix-loop-helix transcription factors. Neuron 2000, 25:331-343.
74. Watson ED, Mattar P, Schuurmans C, Cross JC: Neural stem cell self-renewal requires the Mrj co-chaperone. Dev Dyn 2009, 238:2564-2574.
75. Fu J, Tay SS, Ling EA, Dheen ST: High glucose alters the expression of genes involved in proliferation and cell-fate specification of embryonic neural stem cells. Diabetologia 2006, 49:1027-1038.
76. Cooper AJ, Meister A: An appreciation of Professor Alexander E. Braunstein. The discovery and scope of enzymatic transamination. Biochimie 1989, 71:387-404.
77. Moya-Garcia AA, Medina MA, Sanchez-Jimenez F: Mammalian histidine decarboxylase: from structure to function. Bioessays 2005, 27:57-63.
78. Muller IB, Wu F, Bergmann B, Knockel J, Walter RD, Gehring H, Wrenger C: Poisoning pyridoxal 5-phosphate-dependent enzymes: a new strategy to target the malaria parasite Plasmodium falciparum. PLoS One 2009, 4:e4406.
79. Hansenne I, Louis C, Martens H, Dorban G, Charlet-Renard C, Peterson P, Geenen V: Aire and Foxp3 expression in a particular microenvironment for T cell differentiation. Neuroimmunomodulation 2009, 16:35-44.
80. Laan M, Kisand K, Kont V, Moll K, Tserel L, Scott HS, Peterson P: Autoimmune regulator deficiency results in decreased expression of CCR4 and CCR7 ligands and in delayed migration of CD4 + thymocytes. J Immunol 2009, 183:7682-7691.
doi: 10.1186/gb-2010-11-6-r64Cite this article as: De Cegli et al., A mouse embryonic stem cell bank for inducible overexpression of human chromosome 21 genes Genome Biology 2010, 11:R64
Copyright © 2022 FDOKUMEN