Molecular cloning and characterization of the RAD1 gene of Saccharomyces cerevisiae
Upload
independentCategory
view
1download
0
Phenotypic effects of membrane proteinoverexpression in Saccharomyces cerevisiaeMarie Osterberg*†, Hyun Kim*†, Jonas Warringer†‡, Karin Melen*§, Anders Blomberg‡, and Gunnar von Heijne*§¶
*Center for Biomembrane Research, Department of Biochemistry and Biophysics, Stockholm University, SE-106 91 Stockholm, Sweden;§Stockholm Bioinformatics Center, AlbaNova, SE-106 91 Stockholm, Sweden; and ‡Department of Cell and Molecular Biology,Goteborg University, SE-413 90 Goteborg, Sweden
Communicated by H. Ronald Kaback, University of California, Los Angeles, CA, May 17, 2006 (received for review March 23, 2006)
Large-scale protein overexpression phenotype screens provide animportant complement to the more common gene knockoutscreens. Here, we have targeted the so far poorly understoodSaccharomyces cerevisiae membrane proteome and report growthphenotypes for a strain collection overexpressing �600 C-termi-nally tagged integral membrane proteins grown both under nor-mal and three different stress conditions. Although overexpressionof most membrane proteins reduce the growth rate in syntheticdefined medium, we identify a large number of proteins that,when overexpressed, confer specific resistance to various stressconditions. Our data suggest that regulation of glycosylphosphati-dylinositol anchor biosynthesis and the Na��K� homeostasis sys-tem constitute major downstream targets of the yeast PKA�RASpathway and point to a possible connection between the earlysecretory pathway and the cells’ response to oxidative stress. Wealso have quantified the expression levels for >550 membraneproteins, facilitating the choice of well expressing proteins forfuture functional and structural studies.
caffeine � paraquat � salt tolerance � yeast
A lthough a wealth of proteomics data relating to, e.g., proteinexpression profiles (1), organellar proteomes (2), global
protein localization patterns (3, 4), and protein–protein inter-action networks (5, 6) has been collected for Saccharomycescerevisiae, its membrane proteome is underrepresented consis-tently in such studies to date.
We have recently constructed a clone collection composed ofstrains overexpressing a total of 617 S. cerevisiae membraneproteins with two or more predicted transmembrane segments(7). Each protein in the collection is genetically fused to aC-terminal topology reporter composed of a hemagglutinin(HA) tag, a part of the Suc2p protein, and the catalytic C-domainof the His4p histidinol dehydrogenase enzyme (8, 9). By analysisof the reporter fusions, the location of the C terminus of eachprotein relative to the endoplasmic reticulum membrane couldbe determined, making it possible to produce ‘‘constrained’’topology models for �550 of the proteins in the collection (7).
Because earlier reports using various C-terminal tags to studyglobal protein expression, localization, and complex formation inS. cerevisiae suggest that the stability, localization, and functionof most of proteins are not compromised by C-terminal fusions(1, 4, 10), we decided to use the clone collection to examine theeffects of overexpression of individual membrane proteins ongrowth rate under different conditions (basal conditions, salt,oxidative, and caffeine stresses) and to estimate overexpressionlevels. Protein overexpression screens provide a complementaryapproach to the widely used gene knockout strategy for large-scale functional annotation (11, 12) and is useful particularlyuseful for the analysis of essential genes and for gene familiesthat, because of functional redundancy, are unsuitable fortargeted deletion studies.
Results and DiscussionOverexpression Levels. Before the functional studies, we under-took a quantitative Western blot analysis of the entire multicopy
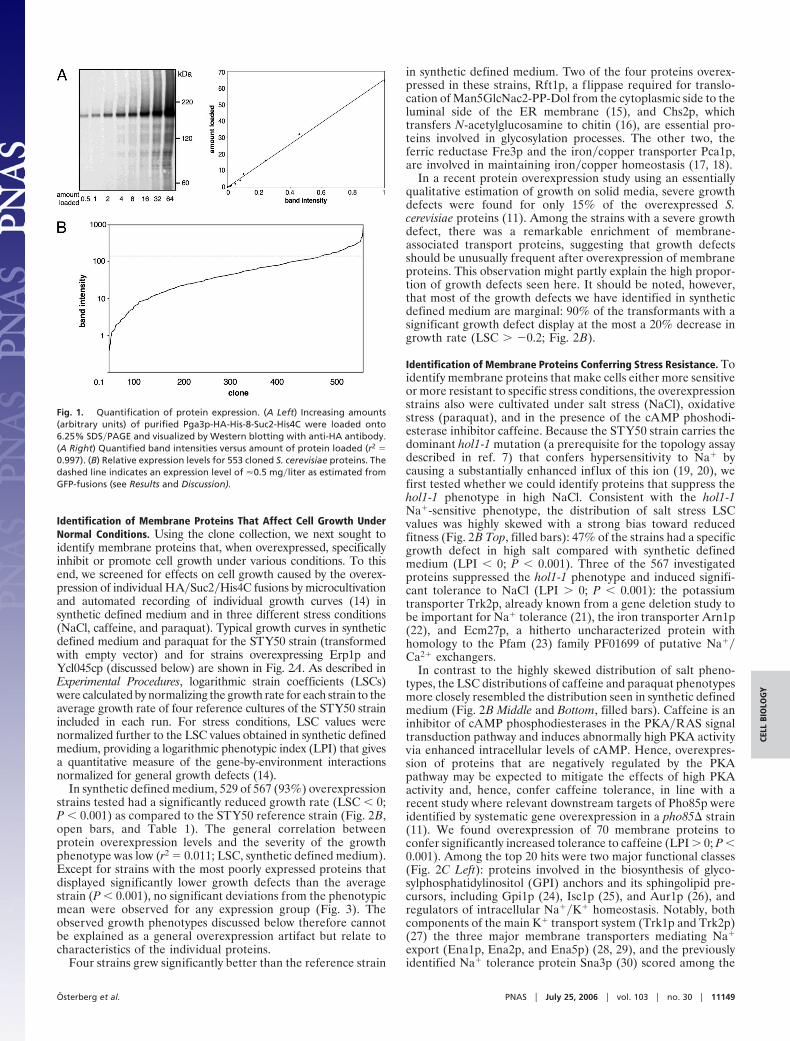
plasmid clone collection expressed from the strong TPI1 pro-moter in the same STY50 strain that was used in the topologymapping study (7, 13). The 122-kDa HA�Suc2�His4C reporterdomain helps in reducing protein aggregation and the uneventransfer efficiencies sometimes observed in Western blot analysisof membrane proteins (unpublished data). Pga3p, a 35-kDaprotein with two predicted transmembrane segments, was usedas an internal standard in the Western blots. Pga3p was producedas a HA�His8�Suc2�His4C fusion protein and purified by usingthe His8 tag. As shown in Fig. 1A, there is a good linearcorrelation between the amount of purified protein and theintensity of the Western blot.
Relative expression levels for 553 HA�Suc2�His4C fusionproteins were estimated from the Western blots (Fig. 5, which ispublished as supporting information on the PNAS web site) andare summarized in Fig. 1B and in Table 1, which is published assupporting information on the PNAS web site. These expressionlevels correlate well with absolute expression levels measured fora collection of GFP-fused proteins (unpublished data), with arelative expression level of 150 units corresponding roughly to0.5 mg of protein per liter of culture. Of the 553 proteins, 219were quantified in an earlier genomewide Western blot-basedexpression screen where chromosomally TAP-tagged genes ex-pressed from their endogenous promoters were analyzed (1). Forthese 219 proteins, expression from the strong TPI1 promoter inthe high-copy plasmid leads to up to 103-fold enhanced expres-sion levels compared with expression from the chromosomalgenes (data not shown).
We could not detect any specific functional classes to beoverrepresented among the proteins that displayed low expres-sion (�10 units relative expression level), indicating that expres-sion was not limited by the protein’s biological role. In contrast,among the proteins with the highest degree of expression (�100units relative expression level), stress response proteins (e.g.,Isc1p, Hsp30p, Ist2p, Orm2p, and Orm1p) were found to besignificantly overrepresented (P � 0.001; data not shown).
Four hundred seventy-seven of 603 proteins (79%) weredetected as a single band of the expected molecular mass,whereas 126 gave rise to two distinct products (Fig. 5). For 54 ofthe 126 proteins, neither of the two forms was sensitive to EndoH digestion, indicating that the C-terminal orientation is cyto-solic in both isoforms (7). For another 56 proteins, the highermolecular mass form was sensitive to Endo H, suggesting that thereporter is located in the endoplasmic reticulum (ER) lumen inonly a fraction of these molecules. The banding patterns of theremaining 16 proteins were more complex and could not beinterpreted easily (see ref. 7 for a more thorough discussion ofthe glycosylation-based topology mapping strategy).
Conflict of interest statement: No conflicts declared.
Abbreviations: ER, endoplasmic reticulum; GPI, glycosylphosphatidylinositol; HA, hemag-glutinin; LPI, logarithmic phenotypic index; LSC, logarithmic strain coefficient.
†M.O., H.K., and J.W. contributed equally to this work
¶To whom correspondence should be addressed. E-mail: [email protected].
© 2006 by The National Academy of Sciences of the USA
11148–11153 � PNAS � July 25, 2006 � vol. 103 � no. 30 www.pnas.org�cgi�doi�10.1073�pnas.0604078103
Identification of Membrane Proteins That Affect Cell Growth UnderNormal Conditions. Using the clone collection, we next sought toidentify membrane proteins that, when overexpressed, specificallyinhibit or promote cell growth under various conditions. To thisend, we screened for effects on cell growth caused by the overex-pression of individual HA�Suc2�His4C fusions by microcultivationand automated recording of individual growth curves (14) insynthetic defined medium and in three different stress conditions(NaCl, caffeine, and paraquat). Typical growth curves in syntheticdefined medium and paraquat for the STY50 strain (transformedwith empty vector) and for strains overexpressing Erp1p andYcl045cp (discussed below) are shown in Fig. 2A. As described inExperimental Procedures, logarithmic strain coefficients (LSCs)were calculated by normalizing the growth rate for each strain to theaverage growth rate of four reference cultures of the STY50 strainincluded in each run. For stress conditions, LSC values werenormalized further to the LSC values obtained in synthetic definedmedium, providing a logarithmic phenotypic index (LPI) that givesa quantitative measure of the gene-by-environment interactionsnormalized for general growth defects (14).
In synthetic defined medium, 529 of 567 (93%) overexpressionstrains tested had a significantly reduced growth rate (LSC � 0;P � 0.001) as compared to the STY50 reference strain (Fig. 2B,open bars, and Table 1). The general correlation betweenprotein overexpression levels and the severity of the growthphenotype was low (r2 � 0.011; LSC, synthetic defined medium).Except for strains with the most poorly expressed proteins thatdisplayed significantly lower growth defects than the averagestrain (P � 0.001), no significant deviations from the phenotypicmean were observed for any expression group (Fig. 3). Theobserved growth phenotypes discussed below therefore cannotbe explained as a general overexpression artifact but relate tocharacteristics of the individual proteins.
Four strains grew significantly better than the reference strain
in synthetic defined medium. Two of the four proteins overex-pressed in these strains, Rft1p, a flippase required for translo-cation of Man5GlcNac2-PP-Dol from the cytoplasmic side to theluminal side of the ER membrane (15), and Chs2p, whichtransfers N-acetylglucosamine to chitin (16), are essential pro-teins involved in glycosylation processes. The other two, theferric reductase Fre3p and the iron�copper transporter Pca1p,are involved in maintaining iron�copper homeostasis (17, 18).
In a recent protein overexpression study using an essentiallyqualitative estimation of growth on solid media, severe growthdefects were found for only 15% of the overexpressed S.cerevisiae proteins (11). Among the strains with a severe growthdefect, there was a remarkable enrichment of membrane-associated transport proteins, suggesting that growth defectsshould be unusually frequent after overexpression of membraneproteins. This observation might partly explain the high propor-tion of growth defects seen here. It should be noted, however,that most of the growth defects we have identified in syntheticdefined medium are marginal: 90% of the transformants with asignificant growth defect display at the most a 20% decrease ingrowth rate (LSC � �0.2; Fig. 2B).
Identification of Membrane Proteins Conferring Stress Resistance. Toidentify membrane proteins that make cells either more sensitiveor more resistant to specific stress conditions, the overexpressionstrains also were cultivated under salt stress (NaCl), oxidativestress (paraquat), and in the presence of the cAMP phoshodi-esterase inhibitor caffeine. Because the STY50 strain carries thedominant hol1-1 mutation (a prerequisite for the topology assaydescribed in ref. 7) that confers hypersensitivity to Na� bycausing a substantially enhanced influx of this ion (19, 20), wefirst tested whether we could identify proteins that suppress thehol1-1 phenotype in high NaCl. Consistent with the hol1-1Na�-sensitive phenotype, the distribution of salt stress LSCvalues was highly skewed with a strong bias toward reducedfitness (Fig. 2B Top, filled bars): 47% of the strains had a specificgrowth defect in high salt compared with synthetic definedmedium (LPI � 0; P � 0.001). Three of the 567 investigatedproteins suppressed the hol1-1 phenotype and induced signifi-cant tolerance to NaCl (LPI � 0; P � 0.001): the potassiumtransporter Trk2p, already known from a gene deletion study tobe important for Na� tolerance (21), the iron transporter Arn1p(22), and Ecm27p, a hitherto uncharacterized protein withhomology to the Pfam (23) family PF01699 of putative Na��Ca2� exchangers.
In contrast to the highly skewed distribution of salt pheno-types, the LSC distributions of caffeine and paraquat phenotypesmore closely resembled the distribution seen in synthetic definedmedium (Fig. 2B Middle and Bottom, filled bars). Caffeine is aninhibitor of cAMP phosphodiesterases in the PKA�RAS signaltransduction pathway and induces abnormally high PKA activityvia enhanced intracellular levels of cAMP. Hence, overexpres-sion of proteins that are negatively regulated by the PKApathway may be expected to mitigate the effects of high PKAactivity and, hence, confer caffeine tolerance, in line with arecent study where relevant downstream targets of Pho85p wereidentified by systematic gene overexpression in a pho85� strain(11). We found overexpression of 70 membrane proteins toconfer significantly increased tolerance to caffeine (LPI � 0; P �0.001). Among the top 20 hits were two major functional classes(Fig. 2C Left): proteins involved in the biosynthesis of glyco-sylphosphatidylinositol (GPI) anchors and its sphingolipid pre-cursors, including Gpi1p (24), Isc1p (25), and Aur1p (26), andregulators of intracellular Na��K� homeostasis. Notably, bothcomponents of the main K� transport system (Trk1p and Trk2p)(27) the three major membrane transporters mediating Na�
export (Ena1p, Ena2p, and Ena5p) (28, 29), and the previouslyidentified Na� tolerance protein Sna3p (30) scored among the
Fig. 1. Quantification of protein expression. (A Left) Increasing amounts(arbitrary units) of purified Pga3p-HA-His-8-Suc2-His4C were loaded onto6.25% SDS�PAGE and visualized by Western blotting with anti-HA antibody.(A Right) Quantified band intensities versus amount of protein loaded (r2 �0.997). (B) Relative expression levels for 553 cloned S. cerevisiae proteins. Thedashed line indicates an expression level of �0.5 mg�liter as estimated fromGFP-fusions (see Results and Discussion).
Osterberg et al. PNAS � July 25, 2006 � vol. 103 � no. 30 � 11149
CELL
BIO
LOG
Y

most caffeine-tolerant overexpression strains. The Ena1p-induced caffeine tolerance may be related to the fact that PKAactivity influences the nucleocytosolic localization of the basicleucine zipper repressor Sko1p (31) that, in turn, represses ENA1expression by binding to the cyclicAMP response-like element inthe ENA1 promoter (32).
Overexpression of proteins involved in GPI anchor biosyn-thesis and the Na��K� homeostasis system thus mitigates thetoxic effects of caffeine, suggesting that regulation of theseprocesses constitute major downstream targets of the yeastPKA�RAS pathway. In agreement with these results, othergenes in GPI anchor biosynthesis, including GPI1 (33), andcomponents of the saline response (34) earlier have been linkedto the activity of the PKA pathway.
Paraquat induces oxidative stress by redox-cycling, shuntingelectrons from the electron transport chain into oxygen,forming superoxide radicals (35). Consequently, perturbationsof the oxidative stress protection systems by removal ofreactive oxygen species scavengers or proteins regulating thehomeostasis of electron acceptors, such as iron and copper,lead to hypersensitivity to paraquat (J.W. and A.B., unpub-lished data). It therefore may be expected that overexpressionof such proteins should confer increased tolerance to super-oxide anions generated by paraquat. We identified 29 mem-brane proteins that confer significant tolerance to paraquat(LPI � 0; P � 0.001) when overexpressed (Fig. 2C Right).These proteins represent a wide diversity of functions, such asRgt2p and Hxt12p involved in glucose sensing and transport
Fig. 2. Phenotypic consequences of membrane protein overexpression. (A) Growth curves in synthetic defined medium (Upper) and under oxidative stress(Lower) for the reference strain transformed with empty vector (wt) and strains overexpressing Erp1p and Ycl045cp. (B) Distribution of phenotypes (LSC) duringno stress (open bars) and stress (filled bars). Negative LSC values indicate reduced fitness. (C) Phenotypes (LPI values) for the top 20 most stress tolerant (P � 0.001)overexpression strains.
11150 � www.pnas.org�cgi�doi�10.1073�pnas.0604078103 Osterberg et al.

(36, 37), the lipid biosynthesis proteins Ole1p and Ipt1p (38,39), and the endosomal, lipid-translocation-associated proteinCdc50p (40). In particular, overexpression of the multidrugtransporter Sge1p (41), the COPII vesicle transport proteinErp1p (42), and the functionally unclassified protein Ycl045cpinduces hypertolerance to paraquat.
Functional Inferences from Hierarchical Clustering of OverexpressionPhenotypes. To complement the statistical analysis, similarities inoverexpression phenotypes of 515 membrane proteins were ana-lyzed by hierarchical clustering (ref. 43; Fig. 4). The 515 membraneproteins segregated into nine major clusters (correlation coefficient�0.5). We find several subclusters of functionally related proteinssuggesting that the growth data captures relevant correlationsbetween different proteins. Notably, the two potassium transport-ers Trk1p and Trk2p form a distinct subcluster that also includes thepoorly characterized protein Ecm27p (cf. above). An equally tightcluster is formed by the dominant sodium exporters Ena1p, Ena2p,and Ena5p. The distinct profile of the sodium exporters are sharedby Hmg1p, one of the two 3-hydroxymethylglutaryl coenzymes inthe mevalonate synthesis pathway, suggesting a function in ionhomeostasis. In contrast to overexpression of Trk1p or Trk2p,overexpression of Ena1, Ena2, or Ena5 does not confer increasedtolerance to NaCl in the hol1-1 background but improves growth incaffeine. The phenotypically most distinct cluster is formed byPca1p and Fre2p, proteins involved in iron�copper import andreduction.
As a final example, overexpression of Erp1p, Ycl045cp, andStv1p dramatically reduces the growth rate in synthetic definedmedium, and this effect is completely reversed when cells aregrown in the presence of paraquat. Stv1p is a subunit of a Vtype ATPase of the Golgi apparatus and endosomes (44), andErp1p is a COPII vesicle transport protein. Ycl045cp has thesame predicted topology as Erp1p (they are both class Imembrane proteins with a large luminal domain and a shortC-terminal cytoplasmic tail), and we suggest that Ycl045cp isalso part of the ER-Golgi transport machinery. Consistentwith this proposal, a recent genomewide epistatic miniarrayanalysis (45) has identified genetic interactions betweenYCL045C and GET1 (involved in Golgi-ER trafficking), PMR1(Ca2� transport into the Golgi), and SSH1 (protein translo-cation into the ER).
ConclusionsIn an effort to functionally characterize the S. cerevisiaemembrane proteome, we have recorded growth rate effectsinduced by overexpression of nearly 600 membrane proteins inliquid synthetic defined medium and under three different
stress conditions (NaCl, paraquat, and caffeine). We also haveestimated overexpression levels and checked whether eachprotein is produced as a single or multiple molecular species.
By Western blotting, we estimate that 15% of the membraneproteins are overexpressed to �0.5 mg�liter without explicitattempts to optimize production levels and only a slightly lowervalue than found in a recent study (12), where a PGAL promoterand a His6�HA�ZZ tag were used. As for E. coli (46), we findno strong correlation between expression levels and mRNA orprotein characteristics such as codon usage, protein length, ornumber of transmembrane helices (data not shown), and theexpression data thus will facilitate the choice of well expressingproteins, e.g., for structural studies.
A small subset of the membrane proteins migrate on SDS�PAGE as two distinct bands. Of 126 such proteins, 54 wereinsensitive to Endo H digestion of the C-terminal HA�Suc2�His4C reporter domain, suggesting that the C terminus of bothforms is in the cytosol (7) and, hence, that the two forms eitherhave different N-termini or have undergone some partial post-translational modification not related to N-linked glycosylation.For 56 proteins, the two forms have opposite C-terminal orien-tations as assessed by Endo H digestion of the topology reporter.In the latter group, we expect to find dual topology proteins (47)
Fig. 3. Correlation between overexpression levels and degree of growthdefects. Average growth defect (LSC) of membrane protein overexpressionstrains were divided into equally sized bins according to level of proteinexpression (I, �14; II, 14–34; III, 34–70; IV, 70–120; V, �120 units relativeexpression level). Asterisks indicate significant (P � 0.001) deviation from themean growth defect of all investigated strains.
Fig. 4. Hierarchical clustering of overexpression phenotypes recorded insynthetic defined medium (basal conditions; LSC values) and different stressconditions (NaCl, caffeine, and paraquat; LPI values). Green indicates a re-duced growth rate, and red indicates an increased growth rate relative to thereference STY50 strain.
Osterberg et al. PNAS � July 25, 2006 � vol. 103 � no. 30 � 11151
CELL
BIO
LOG
Y
or proteins that are dually targeted to different compartmentssuch as the ER and mitochondria.
Using high-throughput growth studies in synthetic definedmedium, we find that overexpression of most of the membraneprotein–HA�Suc2�His4C fusions moderately reduces growthrates, whereas overexpression of four proteins involved in gly-cosylation (Rft1p and Chs2p) and iron�copper homeostasis(Fre3p and Pca1p) significantly increase growth rate. Rft1p is anessential ER protein involved in the assembly of the dolichol-linked oligosaccharide donor Dol-PP-GlcNAc2Man8Glc3 forN-linked glycosylation (15). This protein is proposed to be alimiting component in transferring Man5GlcNac2-PP-Dol pre-cursor from the cytoplasmic side to the luminal side of the ERmembrane, and the available evidence indicates that N-glycosylation efficiency increases when Rft1p is overexpressed(15, 48). Constitutive overexpression of Rft1p thus mightfacilitate N-linked glycosylation and the production of glyco-proteins. Chs2p is an essential protein (49) responsible forsynthesis of chitin, a major fungal cell wall polysaccharideimportant for septum formation during budding of the daugh-ter cell (16). Interestingly, this protein is found to be localizedat the bud neck at the end of mitosis and then undergoes rapiddegradation (50). Possibly, the constitutive overexpression ofChs2p might alter bud formation and lead to an increased rateof cytokinesis.
Under NaCl stress, half of the strains tested exhibit significantgrowth defects compared with synthetic defined medium, mostlikely caused by the hol1-1 mutation present in the STY50 strain,which dramatically increases the influx of sodium ions (19).Three proteins induce significant tolerance to NaCl in the hol1-1background: the potassium transporter Trk2p, the iron trans-porter Arn1p, and the previously uncharacterized putative Na��Ca2� exchanger Ecm27p. In particular, the increased NaCltolerance conferred by overexpression of Trk2p makes physio-logical sense because it is mainly the balance between K� andNa� that determines the physiological response to salt, andexternally added potassium can suppress the detrimental effectsfrom sodium (51, 52).
More than 70 proteins induce significant resistance to caf-feine, an inhibitor of cAMP phosphodiesterases in the PKA�RAS pathway, when overexpressed. Many of the top hits areinvolved either in the biosynthesis of GPI anchors or in K�
and�or Na� transport, suggesting that control of the GPI anchorand Na��K� homeostasis systems is a major function of thePKA�RAS pathway.
Finally, some 30 proteins representing a wide variety offunctions induce significant resistance to the oxidative stressagent paraquat. Three proteins stand out as particularly inter-esting in this context: Stv1p, Erp1p, and Ycl045cp. Overexpres-sion of these proteins leads to a drastic reduction in growth ratein synthetic defined medium but strongly increases growth ratecompared with the reference strain in oxidative stress conditions.Stv1p is a component of a Golgi- or endosome-localized V-typeATPase, and Erp1p is an ER protein involved in the formationof COPII vesicles. It thus seems likely that Ycl045cp also isinvolved in ER-Golgi trafficking, pointing to a possible connec-tion between the early secretory pathway and the cells’ responseto oxidative stress.
Experimental ProceduresYeast Genetic Manipulations. The construction of the expressionlibrary in plasmid pJK90 is described in ref. 7. To construct thepJK91 plasmid carrying a His8 tag between the HA tag and thestart of SUC2 in pJK90 (9), a His8 fragment was amplified froman unpublished plasmid (a kind gift from N. Meindl-Beinker,Stockholm University). Yeast homologous recombination wascarried out in strain STY50 (MATa, his4-401, leu2-3, -112,trp1-1, ura3-52, hol1-1, SUC2::LEU2) (13) with XhoI-
linearized pJK90 (9) and the His8 PCR product. Transfor-mants were selected on -Ura plates, plasmid was isolated, andthe correct sequence was confirmed by DNA sequencing.PGA3 was subcloned into pJK91 by PCR amplification fol-lowed by homologous recombination with SmaI-linearizedpJK91 in STY50.
Quantification of Protein Expression. For quantification of proteinexpression by Western blot analysis, Pga3p was selected as astandard and cloned as a HA-HIS8-SUC2-HIS4C fusion (seethe previous section). This construct was transformed intostrain STY50 (13), and the fusion protein was purified asfollows. A 250-ml cell culture in -Ura medium was grown at30°C to OD600 � 2, and the membrane fraction was preparedas described in ref. 53. The membrane pellet was resuspendedin 2 ml of buffer (20 mM phosphate, pH 7.4�0.5 M NaCl�1%Triton X-100�10 mM imidazole), the sample was centrifugedat 13,000 � g at 4°C for 5 min, and the pellet was discarded.Further purification of His-tagged protein was done by usingthe HisTrap HP kit (GE Healthcare, Uppsala, Sweden) ac-cording to the manufacturer’s protocol. For calibration, astandard curve was prepared by loading different amounts ofpurified protein on a 6.25% SDS gel, followed by Westernblotting with an anti-HA antibody and quantification in a FujiLAS-1000Plus charge-coupled device camera light box byusing Image Gauge v. 3.4 software. To estimate the relativeexpression levels of the cloned proteins, a standard amount ofpurified Pga3p fusion protein was included together with thecell lysates prepared from a 1-ml culture of the yeast trans-formants on each gel. Western blots were quantified, andrelative expression levels were calculated by normalizingagainst the intensity of the purified Pga3p.
The majority of the proteins (�84%, 462 of 553) were detectedas a single band, 78 of 553 (14%) proteins gave rise to two distinctproducts of different molecular mass, and 13 of 553 (2%)produced three products of different molecular mass (Fig. 5). Inthe latter cases, if two or three bands were of approximatelyequal intensity, they were merged in the quantification; if not,only the major band was quantified.
Growth Assay. Overexpression strains in the STY50 backgroundwere inoculated in 350 �l of synthetic defined medium (un-stressed condition) as described in ref. 14, in synthetic definedmedium containing 0.7 M NaCl, 650 �g�ml caffeine, or 300�g�ml paraquat. Two consecutive precultures were run, each for48 h. For experimental runs, strains were cultivated for 47 h withduplicates on separate 100-well plates (14). The rate of growthwas calculated as reported in ref. 14. In each growth plate, fourreplicates of the reference STY50 strain transformed with emptyplasmid were included and used for normalization in the calcu-lation of LSC defined as:
LSCij �
�r�1
2 � � 14 �
k�1
4 log(wtkjr )� � log(xij
r )�2
, [1]
where wtkj is the doubling time of the kth measurement of thereference strain in environment j, xij is the doubling time of straini in environment j, and r indicates the run.
The LSC value describes the growth of the mutant in relationto the growth of the reference strain (14). For the statistical testof the null hypothesis that LSC in unstressed conditions equals0, a threshold of 3.3 mean SEs (corresponding to P � 0.001) wasapplied.
For analysis of specific gene-by-environment interactions,LSC in stress conditions was normalized to LSC in no-stressconditions, forming an LPI (LPI � LSCstress � LSCnostress)
11152 � www.pnas.org�cgi�doi�10.1073�pnas.0604078103 Osterberg et al.

(14). Statistical tests of the null hypothesis that LPI equals 0were done by using a threshold of three mean SEs. In order notto reject the null hypothesis only because of a single extremevalue, a two-tailed, two-sample, Student’s t test also wasapplied (the combined statistical tests corresponded to P �0.001). Growth data also were analyzed by hierarchical clus-tering of synthetics defined medium (LSC) and stress pheno-types (LPI). Clustering was performed by using Cluster 3.0
(43), applying an uncentered similarity metric and averagelinkage clustering.
This work was supported by grants from the Swedish ResearchCouncil, The Marianne and Marcus Wallenberg Foundation, and theSwedish Foundation for Strategic Research and by the SwedishCancer Foundation (G.v.H.) and the Swedish Knowledge Founda-tion (K.M.).
1. Ghaemmaghami, S., Huh, W. K., Bower, K., Howson, R. W., Belle, A.,Dephoure, N., O’Shea, E. K. & Weissman, J. S. (2003) Nature 425, 737–741.
2. Sickmann, A., Reinders, J., Wagner, Y., Joppich, C., Zahedi, R., Meyer, H. E.,Schonfisch, B., Perschil, I., Chacinska, A., Guiard, B., et al. (2003) Proc. Natl.Acad. Sci. USA 100, 13207–13212.
3. Kumar, A., Agarwal, S., Heyman, J. A., Matson, S., Heidtman, M., Piccirillo,S., Umansky, L., Drawid, A., Jansen, R., Liu, Y., et al. (2002) Genes Dev. 16,707–719.
4. Huh, W. K., Falvo, J. V., Gerke, L. C., Carroll, A. S., Howson, R. W., Weissman,J. S. & O’Shea, E. K. (2003) Nature 425, 686–691.
5. von Mering, C., Krause, R., Snel, B., Cornell, M., Oliver, S. G., Fields, S. &Bork, P. (2002) Nature 417, 399–403.
6. Miller, J. P., Lo, R. S., Ben-Hur, A., Desmarais, C., Stagljar, I., Noble, W. S.& Fields, S. (2005) Proc. Natl. Acad. Sci. USA 102, 12123–12128.
7. Kim, H., Melen, K., Osterberg, M. & von Heijne, G. (2006) Proc. Natl. Acad.Sci. USA 103, 11142–11147.
8. Deak, R. & Wolf, D. (2001) J. Biol. Chem. 276, 10663–10669.9. Kim, H., Melen, K. & von Heijne, G. (2003) J. Biol. Chem. 278, 10208–10213.
10. Gavin, A. C., Bosche, M., Krause, R., Grandi, P., Marzioch, M., Bauer, A.,Schultz, J., Rick, J. M., Michon, A. M., Cruciat, C. M., et al. (2002) Nature 415,141–147.
11. Sopko, R., Huang, D., Preston, N., Chua, G., Papp, B., Kafadar, K., Snyder, M.,Oliver, S. G., Cyert, M., Hughes, T. R., Boone, C. & Andrews, B. (2006) Mol.Cell 21, 319–330.
12. Gelperin, D. M., White, M. A., Wilkinson, M. L., Kon, Y., Kung, L. A., Wise,K. J., Lopez-Hoyo, N., Jiang, L., Piccirillo, S., Yu, H., Gerstein, M., et al. (2005)Genes Dev. 19, 2816–2826.
13. Strahl-Bolsinger, S. & Scheinost, A. (1999) J. Biol. Chem. 274, 9068–9075.14. Warringer, J. & Blomberg, A. (2003) Yeast 20, 53–67.15. Helenius, J., Ng, D. T., Marolda, C. L., Walter, P., Valvano, M. A. & Aebi, M.
(2002) Nature 415, 447–450.16. Shaw, J. A., Mol, P. C., Bowers, B., Silverman, S. J., Valdivieso, M. H., Duran,
A. & Cabib, E. (1991) J. Cell Biol. 114, 111–123.17. Yun, C. W., Bauler, M., Moore, R. E., Klebba, P. E. & Philpott, C. C. (2001)
J. Biol. Chem. 276, 10218–10223.18. Rad, M. R., Kirchrath, L. & Hollenberg, C. P. (1994) Yeast 10, 1217–1225.19. Gaber, R. F., Kielland-Brandt, M. C. & Fink, G. R. (1990) Mol. Cell. Biol. 10,
643–652.20. Wright, M. B., Howell, E. A. & Gaber, R. F. (1996) J. Bacteriol. 178, 7197–7205.21. Warringer, J., Ericson, E., Fernandez, L., Nerman, O. & Blomberg, A. (2003)
Proc. Natl. Acad. Sci. USA 100, 15724–15729.22. Heymann, P., Ernst, J. F. & Winkelmann, G. (2000) FEMS Microbiol. Lett. 186,
221–227.23. Bateman, A., Coin, L., Durbin, R., Finn, R. D., Hollich, V., Griffiths-Jones, S.,
Khanna, A., Marshall, M., Moxon, S., Sonnhammer, E. L., et al. (2004) NucleicAcids Res. 32, D138–D141.
24. Leidich, S. D. & Orlean, P. (1996) J. Biol. Chem. 271, 27829–27837.25. Sawai, H., Okamoto, Y., Luberto, C., Mao, C., Bielawska, A., Domae, N. &
Hannun, Y. A. (2000) J. Biol. Chem. 275, 39793–39798.26. Nagiec, M. M., Nagiec, E. E., Baltisberger, J. A., Wells, G. B., Lester, R. L. &
Dickson, R. C. (1997) J. Biol. Chem. 272, 9809–9817.
27. Ko, C. H. & Gaber, R. F. (1991) Mol. Cell. Biol. 11, 4266–4273.28. Garciadeblas, B., Rubio, F., Quintero, F. J., Banuelos, M. A., Haro, R. &
Rodriguez-Navarro, A. (1993) Mol. Gen. Genet. 236, 363–368.29. Wieland, J., Nitsche, A. M., Strayle, J., Steiner, H. & Rudolph, H. K. (1995)
EMBO J. 14, 3870–3882.30. Nylander, M., Heino, P., Helenius, E., Palva, E. T., Ronne, H. & Welin, B. V.
(2001) Plant Mol. Biol. 45, 341–352.31. Pascual-Ahuir, A., Posas, F., Serrano, R. & Proft, M. (2001) J. Biol. Chem. 276,
37373–37378.32. Proft, M. & Serrano, R. (1999) Mol. Cell. Biol. 19, 537–546.33. Sobering, A. K., Watanabe, R., Romeo, M. J., Yan, B. C., Specht, C. A., Orlean,
P., Riezman, H. & Levin, D. E. (2004) Cell 117, 637–648.34. Park, J. I., Collinson, E. J., Grant, C. M. & Dawes, I. W. (2005) J. Biol. Chem.
280, 2529–2535.35. Hauptmann, N. & Cadenas, E. (1997) Oxidative Stress and the Molecular Biology
of Antioxidant Defenses (Cold Spring Harbor Lab. Press, Plainview, NY).36. Ozcan, S., Dover, J. & Johnston, M. (1998) EMBO J. 17, 2566–2573.37. Kruckeberg, A. L. (1996) Arch. Microbiol. 166, 283–292.38. Stukey, J. E., McDonough, V. M. & Martin, C. E. (1990) J. Biol. Chem. 265,
20144–20149.39. Dickson, R. C., Nagiec, E. E., Wells, G. B., Nagiec, M. M. & Lester, R. L. (1997)
J. Biol. Chem. 272, 29620–29625.40. Saito, K., Fujimura-Kamada, K., Furuta, N., Kato, U., Umeda, M. & Tanaka,
K. (2004) Mol. Biol. Cell 15, 3418–3432.41. Ehrenhofer-Murray, A. E., Seitz, M. U. & Sengstag, C. (1998) Yeast 14, 49–65.42. Marzioch, M., Henthorn, D. C., Herrmann, J. M., Wilson, R., Thomas, D. Y.,
Bergeron, J. J., Solari, R. C. & Rowley, A. (1999) Mol. Biol. Cell 10, 1923–1938.43. Eisen, M. B., Spellman, P. T., Brown, P. O. & Botstein, D. (1998) Proc. Natl.
Acad. Sci. USA 95, 14863–14868.44. Manolson, M. F., Wu, B., Proteau, D., Taillon, B. E., Roberts, B. T., Hoyt,
M. A. & Jones, E. W. (1994) J. Biol. Chem. 269, 14064–14074.45. Schuldiner, M., Collins, S. R., Thompson, N. J., Denic, V., Bhamidipati, A.,
Punna, T., Ihmels, J., Andrews, B., Boone, C., Greenblatt, J. F., et al. (2005)Cell 123, 507–519.
46. Daley, D. O., Rapp, M., Granseth, E., Melen, K., Drew, D. & von Heijne, G.(2005) Science 308, 1321–1323.
47. Rapp, M., Seppala, S., Granseth, E. & von Heijne, G. (2006) Nat. Struct. Mol.Biol. 13, 112–116.
48. Helenius, J. & Aebi, M. (2002) Semin. Cell Dev. Biol. 13, 171–178.49. Giaever, G., Chu, A. M., Ni, L., Connelly, C., Riles, L., Veronneau, S., Dow,
S., Lucau-Danila, A., Anderson, K., Andre, B., et al. (2002) Nature 418,387–391.
50. Chuang, J. S. & Schekman, R. W. (1996) J. Cell Biol. 135, 597–610.51. Camacho, M., Ramos, J. & Rodriguez-Navarro, A. (1981) Curr. Microbiol. 6,
295–299.52. Gomez, M. J., Luyten, K. & Ramos, J. (1996) FEMS Microbiol. Lett. 135,
157–160.53. Kim, H., von Heijne, G. & Nilsson, I. (2005) J. Biol. Chem. 280, 20261–
20267.
Osterberg et al. PNAS � July 25, 2006 � vol. 103 � no. 30 � 11153
CELL
BIO
LOG
Y
Copyright © 2022 FDOKUMEN


![[123doc vn] - tim-hieu-nam-men-saccharomyces-cerevisiae](https://static.fdokumen.com/doc/165x107/6345cd51f474639c9b0502af/123doc-vn-tim-hieu-nam-men-saccharomyces-cerevisiae.jpg)