
Utilisation de l'invertase de Saccharomyces cerevisiae pour l ...
Upload
ucberkeleyCategory
view
7download
0
In situ kinetic analysis of glyoxalase I and glyoxalase II inSaccharomyces cerevisiae
Ana Margarida Martins1, Pedro Mendes2, Carlos Cordeiro1,3 and Ana Ponces Freire1,3
1Grupo de Enzimologia, Centro de Estudos de BioquõÂmica e Fisiologia, Faculdade de CieÃncias da Universidade de Lisboa, Portugal;2Virginia Bioinformatics Institute, Virginia Polytechnic Institute and State University, Blacksburg, VA, USA; 3Departamento de QuõÂmica e
BioquõÂmica, Faculdade de CieÃncias da Universidade de Lisboa, Portugal
The kinetics of glyoxalase I [(R)-S-lactoylglutathione methyl-
glyoxal-lyase; EC 4.4.1.5] and glyoxalase II (S-2-hydroxy-
acylglutathione hydrolase; EC 3.1.2.6) from Saccharomyces
cerevisiae was studied in situ, in digitonin permeabilized
cells, using two different approaches: initial rate analysis
and progress curves analysis.
Initial rate analysis was performed by hyperbolic regres-
sion of initial rates using the program hyperfit. Glyoxalase I
exhibited saturation kinetics on 0.05±2.5 mm hemithio-
acetal concentration range, with kinetic parameters Km
0.53 ^ 0.07 mm and V (3.18 ^ 0.16) � 1022 mm´min21.
Glyoxalase II also showed saturation kinetics in the
S-d-lactoylglutathione concentration range of 0.15±3 mm
and Km 0.32 ^ 0.13 mm and V (1.03 ^ 0.10) �1023 mm´min21 were obtained.
The kinetic parameters of both enzymes were also
estimated by nonlinear regression of progress curves using
the raw absorbance data and integrated differential rate
equations with the program gepasi. Several optimization
methods were used to minimize the sum of squares of
residuals. The best parameter fit for the glyoxalase I reaction
was obtained with a single curve analysis, using the irrever-
sible Michaelis±Menten model. The kinetic parameters
obtained, Km 0.62 ^ 0.18 mm and V (2.86 ^ 0.01) �1022 mm´min21, were in agreement with those obtained
by initial rate analysis. The results obtained for glyoxa-
lase II, using either the irreversible Michaelis±Menten
model or a phenomenological reversible hyperbolic model,
showed a high correlation of residuals with time and/or
high values of standard deviation associated with Km. The
possible causes for the discrepancy between data obtained
from initial rate analysis and progress curve analysis, for
glyoxalase II, are discussed.
Keywords: glyoxalase I; glyoxalase II; methylglyoxal;
enzyme kinetics in situ; Saccharomyces cerevisiae.
The glyoxalase pathway is an enzymatic system, dis-covered independently in 1913 by Neuberg [1] and Dakin& Dudley [2], widely distributed in living organisms [3].It catalyses the conversion of 2-oxoaldehydes to the corre-sponding 2-(R)-hydroxyacids, using reduced glutathione(GSH) as cofactor and comprises two enzymes, glyoxa-lase I [(R)-S-lactoylglutathione methylglyoxal-lyase;EC 4.4.1.5] and glyoxalase II (S-2-hydroxyacylglutathionehydrolase; EC 3.1.2.6) [4,5].
Glyoxalase I acts upon the hemithioacetal formed non-enzymatically from the 2-oxoaldehyde and GSH, with the
formation of the S-2-hydroxyacylglutathione. Glyoxalase IIcatalyses the hydrolysis of this thioester to the correspond-ing 2-(R)-hydroxyacid, regenerating free GSH (Fig. 1).GSH is the physiological cofactor for glyoxalase I [6].Methylglyoxal is the predominant physiological a-oxo-aldehyde involved in the reaction [7], although othera-oxoaldehydes can be substrates for this enzyme [8±10].The hemithioacetal formed nonenzymatically from methyl-glyoxal and GSH is converted to S-d-lactoylglutathione byglyoxalase I and this thioester is hydrolysed to d-lactate ina reaction catalysed by glyoxalase II [4,5]. Glyoxalase Ifrom yeast is a cytoplasmatic protein [11] and glyoxalase IIexists as two isozymes encoded by separate nuclear genes,one of the isozymes is present in the cytoplasm and theother in mitochondria [12,13]. Yeast mitochondrial glyoxa-lase II is only expressed when yeast cells are grown inglycerol [12].
The kinetics of the glyoxalase enzymes has been widelystudied [14±16]. Both enzymes are considered as optimalcatalysts when [S] p Km; that is, the rate constant for thediffusion controlled encounter between the substrate andthe enzyme active site is exclusively determining of therate in the thermodynamically favourable direction [17].Glyoxalase I can use both diastereoisomers of hemithio-acetal, Hr and Hs, with the same catalytic efficiency [18].Glyoxalase II is also considered a near optimal catalyst forS-d-lactoylglutathione hydrolysis as kcat /Km is limited, inpart, by diffusion [14].
Eur. J. Biochem. 268, 3930±3936 (2001) q FEBS 2001
Correspondence to A. Ponces Freire, Departamento de QuõÂmica e
BioquõÂmica, Faculdade de CieÃncias da Universidade de Lisboa,
EdifõÂcio C8, 1749-016 Lisboa, Portugal. Fax: 1 351 217500088,
Tel.: 1 351 217500000 (ext. 28463), E-mail: [email protected]
Abbreviations: AGE, advanced glycation end-products; Nbs2,
5,5 0-dithiobis(2-nitrobenzoic acid); glyoxalase I,
(R)-S-lactoylglutathione methylglyoxal-lyase; glyoxalase II,
S-2-hydroxyacylglutathione hydrolase; GSH, reduced glutathione;
SDLGSH, S-d-lactoylglutathione; v0, initial reaction rate.
Enzymes: glyoxalase I ((R)-S-lactoylglutathione methylglyoxal-lyase;
EC 4.4.1.5); glyoxalase II (S-2-hydroxyacylglutathione hydrolase;
EC 3.1.2.6).
Note: web pages are available at http://www.correio.fc.ul.pt/,cebf,
http://www.vbi.vt.edu and http://www.fc.ul.pt
(Received 25 January 2001, revised 10 April 2001, accepted 21 May
2001)

Methylglyoxal is a highly toxic a-oxoaldehyde whoseformation in eukaryotic cells occurs mainly through thenonenzymatic b-elimination reaction of the phosphorylgroup from the common 1,2-enediolate form of both triosephosphates, intermediates in the glycolytic pathway [5,6].Therefore methylglyoxal formation is an unavoidableconsequence of glycolytic metabolism.
Methylglyoxal modifies arginine, lysine and cysteineresidues in proteins, forming advanced glycation end-products (AGE) and impairing the biochemical function-ality of these macromolecules [19]. Methylglyoxal alsoreacts with guanyl nucleotides in nucleic acids formingadducts [20] that can lead to DNA modification [21].Advanced glycation end-products formation is involvedin the clinical complications of diabetes mellitus andAlzheimer's disease [22]. A possible physiological functionof the glyoxalase pathway may be the detoxification ofthe cytotoxic methylglyoxal, a by-product of metabolism[5,23]. A critical role of the glyoxalase system in theprevention of AGE formation was shown by overexpressionof glyoxalase I which prevented increased AGE formationin bovine endothelial cells in hyperglycaemic culture [24].
For the stated reasons, it is very important to understandhow the glyoxalase system works in the detoxification ofmethylglyoxal in vivo.
This paper addresses part of this problem by studying thekinetics of both enzymes of the system in situ, usingpermeabilized yeast cells. Moreover, a comparison of dataprovided by initial rate analysis and by time course analysisenables the probing of reaction mechanism and the relativeimportance of the direct and reverse reactions.
In vivo NMR, probably one of the best noninvasivetechniques for studying cell metabolism in living cells [25],was used for investigating methylglyoxal metabolism inerythrocytes [15] and bacteria [26]. While the first workprovided kinetic parameter estimation for glyoxalase I andII using nonphysiological methylglyoxal concentrations,the second was aimed at flux distribution analysis. Thein situ approach, by making the cell membrane permeable
to low molecular mass molecules (substrates, products,cofactors) while enzymes and other macromolecules arekept within the cell boundaries, at unchanged concentra-tions, allows a better control of reaction conditions [27,28].
E X P E R I M E N T A L P R O C E D U R E S
Materials
The Coomassie Brilliant Blue G, S-d-lactoylglutathione,5,5 0-dithiobis(2-nitrobenzoic acid) (Nbs2), Mes and methyl-glyoxal dimethylacetal were purchased from Sigma Chemi-cal Co. GSH was obtained from Boheringer MannheimGmbH. Digitonin and d-glucose (Mikrobiologie grade)were from Merck. Peptone and yeast extract were fromDifco. Other reagents were of analytical grade. Deionized,double distilled water (Fisons) was used.
Methylglyoxal was prepared by the acid hydrolysisof methylglyoxal dimethylacetal in 10% (v/v) H2SO4, asdescribed [29]. The solution obtained was calibrated withglyoxalase I (from yeast, Sigma) and glyoxalase II (frombovine liver, Sigma).
A Hewlett-Packard HP8451A diode array spectrophoto-meter with a thermostated multicuvette holder, with stirring(HP 83075 A) was used for the determination of yeast cellconcentration, protein concentration and to monitor thereactions catalysed by glyoxalase I and glyoxalase II. Centri-fugations were performed in a refrigerated Beckman JA-21centrifuge equipped with a JA-20 rotor.
Methods
Yeast cell growth. Cultures of Saccharomyces cerevisiae[diploid strain Instituto Gulbenkian de CieÃncia (IGC) 4072,from Portuguese Yeast Culture Collection, Faculty ofSciences and Technology, New University of Lisbon,Portugal] were kept in YPGlu [0.1% (w/v) yeast extract,0.5% (w/v) peptone and 2% (w/v) d-glucose] agar slants.
Cells were batch grown for 16±18 h, at 30 8C in mini-mal liquid medium (K medium, Instituto Gulbenkian deCieÃncia) with 2% (w/v) d-glucose as energy and carbonsource, as described [30]. Cell concentration was calcu-lated with a calibration curve from the absorbance integralin the 400±800 nm range.
Permeabilization procedures
Cells were harvested by centrifugation (for 5 min at 4 8Cand 1000 g) at early stationary phase, washed twice withcold distilled water, resuspended in 0.1 m Mes/NaOHbuffer, pH 6.5 and made permeable by incubation with0.1% (w/v) digitonin, as described [31]. Cells were washedand concentrated four times in 0.1 m Mes/NaOH buffer,pH 6.5. Protein concentration was determined using theCoomassie Brilliant Blue G assay, as reported [32].
Enzyme kinetic studies
Enzyme activities were determined at 30 8C in a 2-mLreaction system, in 0.1 m Mes/NaOH buffer, pH 6.5. Cellconcentration used in all assays was about 107 cells´mL21.Magnetic stirring in the spectrophotometer cuvette wasused to prevent cell settling during the assay.
Fig. 1. The glyoxalase pathway. Methylglyoxal reversibly reacts with
glutathione (GSH) forming hemithioacetal. Hemithioacetal is isomer-
ized to SDLGSH in a reaction catalysed by glyoxalase I (Glx I). This
thioester is hydrolysed to d-lactate and GSH in a reaction catalyzed by
glyoxalase II. Glutathione has a catalytic role in the process
q FEBS 2001 In situ kinetics of the glyoxalase enzymes (Eur. J. Biochem. 268) 3931

Glyoxalase I was assayed as described by Racker [5].Methylglyoxal and GSH were incubated for 10 min in0.1 m Mes/NaOH buffer, pH 6.5, with stirring, to allow theformation of the hemithioacetal, substrate of glyoxalase I.Initial concentrations of methylglyoxal and GSH werecalculated in order to give substrate concentrations from0.05 to 2.5 mm, using the value of 3.0 mm for the hemi-thioacetal dissociation constant [33]. Reactions were startedby the addition of permeabilized cells and the formation ofS-d-lactoylglutathione was followed at 240 nm for 60 minand a D:240 � 2.86 mm21´cm21 [34] was used to calculatethe concentration of this compound.
Glyoxalase II was assayed as described by Martins andcoworkers [30]. Kinetic studies were performed using aS-d-lactoylglutathione concentration range from 0.15 to3 mm. A fixed sample (permeabilized cells) concentrationwas incubated with 0.75 mm Nbs2 for 15 min, with stirring.Reactions were started by the addition of S-d-lactoyl-glutathione and 2-nitro-5-thiobenzoic acid formationwas followed at 412 nm for 60 min. A D:412 �13.6 mm21´cm21 [35] was used to calculate productconcentrations.
Data analysis
Progress curves were analysed using two differentapproaches: steady state initial rate analysis and timeprogress curve analysis using the differential equationsdefined by different steady state kinetic models.
Initial rate data were fitted to irreversible single substrateMichaelis±Menten models for both enzymes. Nonweightedhyperbolic regression by the method of least squares wasperformed with the program hyperfit [36].
Progress curves were analysed with the program gepasi[37]. This program allows nonlinear regression usingarbitrary kinetic equations and a number of differentminimization algorithms [38]. For each enzyme, a modelwas set up that described a hypothetical mechanism for thereaction taking place in situ. The fitting procedure used theraw absorbance values as input such that the spectro-photometer offsets and the initial substrate concentrationsof each progress curve were also fitting parameters,alongside with the apparent Michaelis constants andlimiting rates. This has the advantage of taking intoconsideration the experimental uncertainty associatedwith the offset of the detector and with the substrateconcentration (i.e. errors are assumed both on x and yvariables).
For the irreversible Michaelis±Menten mechanism, thecomplete model assumed is represented by Eqn (1):
A � P ´ 1 1 offset
dP
dt� V ´ S
Km 1 S
Si � St� 0
8>>><>>>: �1�
where A is the absorbance, : the molar absorptioncoefficient, offset the instrument reading at zero absor-bance, S and P the time-dependent concentrations ofsubstrate and product, V the is enzyme limiting rate, Km
the Michaelis constant of the enzyme, and Si the initialsubstrate concentration. Using measured values of A in time
and knowing :, we fit for V, Km, offset and Si. For thereversible Michaelis±Menten mechanism this becomes:
A � P ´ 1 1 offset
dP
dt�
V
Kms
S 2P
Keq
� �1 1
S
Kms
1P
Kmp
Si � St� 0
8>>>>>>><>>>>>>>:�2�
One extra fitting parameter has been introduced, Kmp, theMichaelis constant for the product (Kms is the same as Km
in Eqn 1). Keq is the equilibrium constant of the reactionand is a known value. Finally, when considering a reversiblereaction with two products (glyoxalase II) the followingmodel was used:
A � P ´ 1 1 offset
dP
dt�
V
Kms
S 2P ´ Q
Keq
� �1 1
S
Kms
1P
Kmp
1Q
Kmq
Si � St� 0
8>>>>>>><>>>>>>>:�3�
The model of Eqn (3) has one more fitting parameter, Kmq,the Michaelis constant for the second product. Note the useof a phenomenological rate equation, which means that thethree Michaelis constants are only apparent constants.
Analyses were carried out for each progress curve alone(single-curve analysis) and for the whole set of progresscurves of each enzyme (global analysis [39]). Goodness of
Fig. 2. Initial rate kinetic analysis of the reactions catalysed by
glyoxalase I (A) and glyoxalase II (B). The v0 values were obtained
from progress curves, by linear regression using the least squares
method. A rectangular hyperbola was fitted to v0 values, using
hyperfit [36]. The kinetic parameters obtained are in Table 1. Data
from three independent experiments (average ^ standard deviation).
3932 A. Margarida Martins et al. (Eur. J. Biochem. 268) q FEBS 2001

fit was evaluated from the standard deviation of the fit, ofthe standard deviation of each individual parameter and byplotting residuals vs. time.
R E S U LT S A N D D I S C U S S I O N
The kinetics of the enzymes of the glyoxalase system wasstudied in situ, in cells of Saccharomyces cerevisiae
permeabilized with digitonin. Initial rates were used todetermine kinetic parameters by hyperbolic regression.Time courses were also used to estimate kinetic parametersby nonlinear regression with the program gepasi [37,38].The results obtained by the two approaches were thencompared and are discussed.
Table 1. Parameters obtained by the kinetic analysis in situ of glyoxalase I and glyoxalase II catalysed reactions in Saccharomyces cerevisiae
permeabilized cells. The parameters were obtained by two different approaches: initial rate analysis by hyperbolic regulation using hyperfit [36],
and nonlinear regression of progress curves of the raw absorbance data using gepasi [37,38]. NC, not comparable.
Glyoxalase I Glyoxalase II
Km (mm) V (mm´min21) Km (mm) V (mm´min21)
Initial rate analysis 0.53 �^ 0.07 (3.18 ^ 0.16) � 1022 0.32 �^ 0.13 (1.03 �^ 0.10) � 1023
Progress curves analysis 0.62 �^ 0.18 a (2.86 �^ 0.01) � 1022 a 0.09 �^ 0.05 b (1.82 �^ 0.70) � 1023 b
0.61 ^ 0.37 c (8.1 2 �^ 1.99) � 1022 c 0.44 �^ 0.60 d
0.49 ^ 0.39 e
(7.32 �^ 3.01) � 1024 d
(3.44 ^ 0.33) � 1023 e
Previously reported data 0.46 �^ 0.04 f NC 1.5 �^ 0.4 f NC
a Irreversible Michaelis±Menten model described in Eqn (1). b Irreversible Michelis±Menten model described in Eqn (1) fitted to the progress
curve of 0.075 mm SDLGSH. c Reversible Michaelis±Menten model described in Eqn (2). d Irreversible Michaelis±Menten model described in
Eqn (1) fitted to the progress curve of 0.3 mm SDLGSH. e Reversible hyperbolic model with one substrate and two products described by Eqn (3). f
In vivo time course analysis of the glyoxalase pathway in human erythrocytes [15].
Fig. 3. Kinetic analysis of the reaction catalysed by glyoxalase I,
considering the irreversible Michaelis±Menten model, by nonlinear
regression from progress curves using gepasigepasi [37]. The analysis was
performed using progress curves of the raw absorbance data. The best
results of the fitting were obtained with experimental data of the
progress curve of 0.25 mm hemithioacetal (A). The kinetic parameters
obtained are in Table 1. (B) Shows the variation of the residuals with
time for the fitting performed in (A).
Fig. 4. Kinetic analysis of the reaction catalysed by glyoxalase I,
considering the reversible Michaelis±Menten model, by nonlinear
regression from progress curves using gepasigepasi [37]. The analysis was
performed using progress curves of the raw absorbance data and the
best results were obtained by the fitting to experimental data (W) of all
progress curves (0.05, 0.1, 0.25, 0.5, 0.75, 1.0, 1.5, 2.0, 2.5 mm
hemithioacetal) (A). The kinetic parameters obtained are in Table 1. In
(B) is shown the variation of the residuals with time for the fitting
performed in (A).
q FEBS 2001 In situ kinetics of the glyoxalase enzymes (Eur. J. Biochem. 268) 3933
The initial rate analysis of the reaction catalysed byglyoxalase I showed saturation kinetics in the substrate(hemithioacetal) concentration range of 0.05±2.5 mm(Fig. 2A). The kinetic parameters, obtained by adjusting arectangular hyperbola, using hyperfit [36] to the v0
experimental values, were Km 0.53 ^ 0.07 mm and V(3.18 ^ 0.16) � 1022 mm´min21 (Table 1).
These parameters were also estimated by nonlinearregression from progress curves of the absorbance valuesat 240 nm, using gepasi [37,38]. This analysis considersthe initial concentrations of substrate and the spectro-photometer offset as adjustable parameters, with anassociated uncertainty. Several optimization methods wereused to minimize the sum of squares of the residuals [38].
The best fit for the reaction catalysed by glyoxalase I,when assuming that the enzyme follows the irreversibleMichaelis±Menten model, was obtained with a single curveanalysis. The progress curve for 0.25 mm hemithioacetal(Fig. 3A) gave the best estimate of kinetic parameters: Km
0.62 ^ 0.18 mm and V (2.86 ^ 0.01) � 1022 mm´min21
(Table 1). These values are in good agreement with thoseobtained by initial rate analysis.
Non-linear regression analysis of the progress curveswas then performed assuming the reversible Michaelis±Menten model. In this case the best fit was obtained with aglobal curve analysis [39] (Fig. 4A) and the kinetic para-meters were Km 0.61 ^ 0.37 mm and V (8.12 ^ 1.99) �1022 mm´min21 (Table 1). These values are also verysimilar to those obtained by initial rate analysis, however,
the residuals show a strong correlation with time (Fig. 4B)which indicates that the fit is not optimal. The irreversiblekinetic model is sufficient to explain the time course data inour experiments. This agrees with the observation that thereverse reaction catalysed by yeast and human erythrocytesglyoxalase I only occurs in nonphysiological conditionsthat allow the trapping of GSH and, even in this case, therate of the reverse reaction was less than 0.5% of the oneobserved for the direct reaction [40].
Initial rate analysis of the reaction catalysed by glyoxa-lase II also reveals saturation kinetics, being apparent towhitin the experimental error, in the substrate concentrationrange of 0.15±3 mm (Fig. 2B). With this analysis and byhyperbolic regression using hyperfit [36] the kineticparameters Km 0.32 ^ 0.13 mm and V (1.03 ^ 0.10) �1023 mm´min21 were obtained (Table 1). This kind ofanalysis was previously described to study glyoxalase IIkinetics in situ, in S. cerevisiae cells [30].
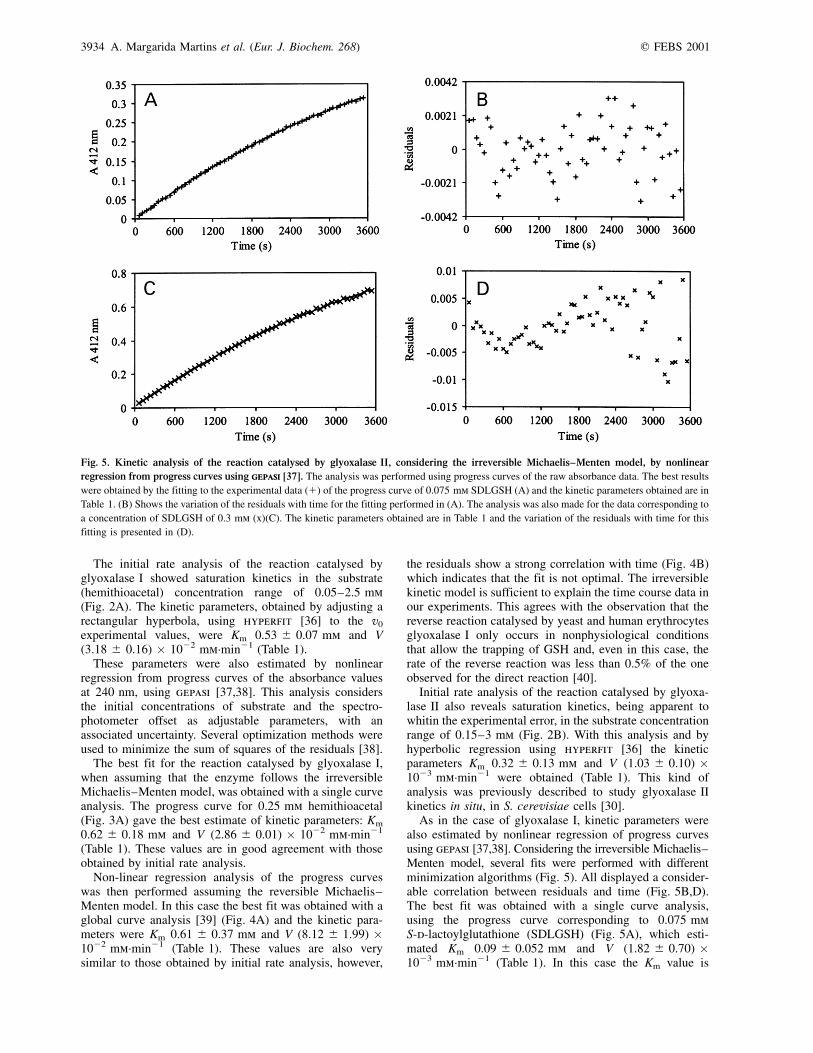
As in the case of glyoxalase I, kinetic parameters werealso estimated by nonlinear regression of progress curvesusing gepasi [37,38]. Considering the irreversible Michaelis±Menten model, several fits were performed with differentminimization algorithms (Fig. 5). All displayed a consider-able correlation between residuals and time (Fig. 5B,D).The best fit was obtained with a single curve analysis,using the progress curve corresponding to 0.075 mmS-d-lactoylglutathione (SDLGSH) (Fig. 5A), which esti-mated Km 0.09 ^ 0.052 mm and V (1.82 ^ 0.70) �1023 mm´min21 (Table 1). In this case the Km value is
Fig. 5. Kinetic analysis of the reaction catalysed by glyoxalase II, considering the irreversible Michaelis±Menten model, by nonlinear
regression from progress curves using gepasigepasi [37]. The analysis was performed using progress curves of the raw absorbance data. The best results
were obtained by the fitting to the experimental data (1) of the progress curve of 0.075 mm SDLGSH (A) and the kinetic parameters obtained are in
Table 1. (B) Shows the variation of the residuals with time for the fitting performed in (A). The analysis was also made for the data corresponding to
a concentration of SDLGSH of 0.3 mm (x)(C). The kinetic parameters obtained are in Table 1 and the variation of the residuals with time for this
fitting is presented in (D).
3934 A. Margarida Martins et al. (Eur. J. Biochem. 268) q FEBS 2001

different from that obtained from initial rate analysis. The fitobtained with the progress curve corresponding to a substrateconcentration of 0.3 mm (Fig. 5C) shows a stronger corre-lation between residuals and time (Fig. 5D) and yieldedkinetic parameters with higher standard deviations, Km
0.44 ^ 0.60 mm and V (7.32 ^ 3.01) � 1024 mm´min21
(Table 1). These results are, however, in better agreementwith those obtained by initial rate analysis.
Considering a phenomenological reversible hyperbolicmodel the best fit was obtained by global analysis ofprogress curves (Fig. 6A) [39]. The kinetic parametersobtained were Km 0.49 ^ 0.39 mm and V (3.44 ^ 0.33) �1023 mm´min21 (Table 1). These fits also allowed thecalculation of the apparent Km for the products of thereaction, d-lactate and GSH, Km,lac 1 � 104 mm andKm,GSH 2.28 � 1022 mm. The analysis considering thereversible model also produced distributions of residualshighly correlated with time (Fig. 6B).
For glyoxalase II progress curves analysis, the residualsare correlated with time in all cases. Whatever makes theprogress curves deviate from what would be generatedusing both models is not clear. Plausible hypotheses whichmay explain these deviations are the presence of iso-enzymes, association-dissociation of oligomers, interactionof the enzyme with other proteins, macromolecules ormembranes and inactivation [41].
The initial rate analysis performed for glyoxalase II(Fig. 2B) shows saturation kinetics in the substrateconcentration range used. The calculated kinetic parametersare trustworthy for several reasons: (a) the substrate con-centration range, 0.2 to 10 Km, was used as recommendedby Cornish-Bowden [42] assuming the Km of 0.36 mm,previously determined in situ [30]; (b) the kineticparameters obtained by initial rate analysis are similar tothose obtained in other studies [13,30]. Bito and coworkers,working with yeast purified glyoxalase II and using themethod that measures the consumption of S-d-lactoyl-glutathione at 240 nm, obtained a Km of 0.11 mm for thecytoplasmatic enzyme [13]. A similar Km was obtainedwhen the enzyme activity was determined in situ and incell-free extracts by measuring the product (GSH) formationat 412 nm, using the Nbs2 assay [30]. This comparisonstrongly supports the fact that glyoxalase II followsirreversible Michaelis±Menten kinetics.
In the case of glyoxalase I the two analyses are in goodagreement supporting the idea that this enzyme operatesaccordingly to irreversible Michaelis±Menten kinetics. Forglyoxalase II there is, as described, a discrepancy betweenthe results obtained by the two approaches. The resultsobtained by initial rate analysis support an irreversibleMichaelis±Menten kinetics for glyoxalase II, as discussedpreviously.
The initial rate analysis is, for some authors [43], the bestmethod for the analysis of kinetic data. However it has thedisadvantage of only estimating values of the parametersrelated with the forward reaction. Progress curve analysis,when successful, also provides kinetic parameters for thereverse reaction, which is extremely important whenconsidering the whole pathway, rather than the enzymesin isolation [44].
The knowledge of properties of an enzyme or enzymesof a pathway considered separately is not enough toknow what their role is and how they operate in vivo.The interactions between the elements of a system areessential and have a primary role in determining thefluxes and metabolite levels in the system [45]. Hence,the study reported in this paper, consisting in the kineticcharacterization of each enzyme of the glyoxalase pathwayin situ provides insight to further work in methylglyoxalmetabolism regulation.
A C K N O W L E D G E M E N T S
Ana Margarida Martins acknowledges FCT (FundacËaÄo para a CieÃncia e
a Tecnologia) the grant PRAXIS XXI/BD/2734/94. The authors also
acknowledge Centro de Estudos de BioquõÂmica e Fisiologia, Faculdade
de CieÃncias da Universidade de Lisboa.
R E F E R E N C E S
1. Neuberg, C. (1913) UÈ ber die ZerstoÈrung von MilchsaÈurealdehyd
und Methylglyoxal durch tierische Organe. Biochem. Z. 49, 502±
506.
2. Dakin, H.D. & Dudley, H.W. (1913) An enzyme concerned with
the formation of hydroxy acids from ketonic aldehydes. J. Biol.
Chem. 14, 155±157.
3. Hopkins, F.G. & Morgan, E.J. (1945) On the distribution of
glyoxalase and glutathione. Biochem. J. 39, 320±324.
Fig. 6. Kinetic analysis of the reaction catalysed by glyoxalase II,
considering a reversible hyperbolic model with one substrate and
two products, by nonlinear regression from progress curves using
gepasigepasi [37]. The analysis was performed using progress curves of the
raw absorbance data. The best results were obtained by the fitting to
the experimental data (W) of all the progress curves (0.075±3 mm) (A)
and the kinetic parameters obtained are summarized in Table 1. In (B)
is shown the variation of the residuals with time for the fitting
performed in (A).
q FEBS 2001 In situ kinetics of the glyoxalase enzymes (Eur. J. Biochem. 268) 3935

4. Racker, E. (1951) The mechanism of action of glyoxalase. J. Biol.
Chem. 190, 685±696.
5. Thornalley, P.J. (1990) The glyoxalase system: new developments
towards functional characterization of a metabolic pathway
fundamental to biological life. Biochem. J. 256, 1±11.
6. Lohman, K. (1932) Bitr. z. enzymat. Umwandlg. von synth.
Methylglyoxal in MilchsaÈure. Biochem. Z. 254, 332±354.
7. Richard, J.P. (1993) Mechanism for the formation of methyl-
glyoxal from trisephosphates. Biochem. Soc. Trans. 21, 549±553.
8. Weaver, R.H. & Lardy, H.A. (1961) Synthesis and some
biochemical properties of phosphohydroxypyruvic aldehyde and
of 3-phosphoglyceryl glutathione thiol ester. J. Biol. Chem. 236,
313±317.
9. Reeves, H.C. & Ajl, H.A. (1965) Enzymatic synthesis and meta-
bolism of hydroxypyruvic aldehyde. J. Biol. Chem. 240, 569±573.
10. Carrington, S.J. & Douglas, K.T. (1988) Hammett analysis of the
human erythrocyte glyoxalase I-catalysed rearrangement to
mandeloyl thiolesters of hemithioacetals formed from glutathione
and substituted arylglyoxals. J. Chem. Soc. Perkin Trans. II,
2071±2076.
11. Inoue, Y. & Kimura, A. (1996) Identification of the structural gene
for glyoxalase I from Saccharomyces cerevisiae. J. Biol. Chem.
271, 25958±25965.
12. Bito, A., Haider, M., Hadler, I. & Breitenbach, M. (1997) Iden-
tification and phenotypic analysis of two glyoxalase II encoding
genes from Saccharomyces cerevisiae, GLO2 and GLO4, and
intracellular localization of the corresponding proteins. J. Biol.
Chem. 272, 21509±21519.
13. Bito, A., Haider, M., Briza, P., Strasser, P. & Breitenbach, M.
(1999) Heterologous expression, purification and kinetic compari-
son of the cytoplasmatic and mitochondrial glyoxalase II enzymes,
Glo2p and Glo4p, from Saccharomyces cerevisiae. Prot. Expr.
Purif. 17, 456±464.
14. Guha, M.K., Vander Jagt, D.L. & Creighton, D.J. (1988) Diffusion-
dependent rates for the hydrolysis reaction catalyzed by glyoxalase
II from rat erythrocytes. Biochemistry 27, 8818±8822.
15. Rae, C., Berners-Price, S.J., Bulliman, B.T. & Kuchel, P.W. (1990)
Kinetic analysis of the human erythrocyte glyoxalase system using
NMR and a computer model. Eur. J. Biochem. 193, 83±90.
16. Shih, M.J., Edinger, J.W. & Creighton, D.J. (1997) Diffusion-
dependent kinetic properties of glyoxalase I and estimates of the
steady-state concentrations of glyoxalase-pathway intermediates in
glycolyzing erythrocytes. Eur. J. Biochem. 244, 852±857.
17. Albery, W.J. & Knowles, J.R. (1976) Evolution of enzyme
function and the development of catalytic efficiency. Biochemistry
15, 5631±5640.
18. Creighton, D.J. & Pourmotabbed, T. (1988) Glutathione-dependent
aldehyde oxidation reactions. In Mechanistic Principles of Enzyme
Activity (Liebman, J.F. & Greenberg, A., eds), pp. 353±386. VCH,
New York.
19. Takahashi, K. (1977) The reaction of phenylglyoxal and related
agents with proteins. J. Biochem. 81, 395±402.
20. Shapiro, R. & Hachman, J. (1966) The reaction of guanine deriva-
tives with 1,2-dicarbonyl compounds. Biochemistry 5, 2799±2807.
21. Papoulis, A., Al-Abed, Y. & Bucala, R. (1995) Identification of
N2-(1-carboxyethyl) guanine (CEG) as a guanine advanced glyco-
sylation end product. Biochemistry 34, 648±655.
22. Finch, C.E. & Cohen, D.M. (1997) Aging, metabolism and
Alzheimer's disease: review and hypothesis. Exp. Neurol. 143,
82±102.
23. Golubev, A.G. (1996) The other side of metabolism: a review.
Biochemistry (Moscow) 61, 2018±2039.
24. Shinohara, M., Thornalley, P.J., Giardino, I., Beisswenger, P.,
Thorpe, S., Onorato, J. & Brownlee, M. (1998) Overexpression of
glyoxalase-I in bovine endothelial cells inhibits intracellular
advanced glycation endproduct formation and prevents hyper-
glycemia-induced increases in macromolecular endocytosis.
J. Clin. Invest. 101, 1142±1147.
25. Friedrich, P. (1986) Supramolecular Enzyme Organization ±
Quaternary Structure and Beyond. Pergamon Press, Oxford, UK.
26. Fareleira, P., Legall, J., Xavier, A.V. & Santos, H. (1997) Pathways
for utilization of carbon reserves under fermentative and
respiratory conditions. J. Bacteriol. 179, 3972±3980.
27. Serrano, R., Gancedo, J.M. & Gancedo, C. (1973) Assay of yeast
enzymes in situ: a potential tool in regulation studies. Eur. J.
Biochem. 34, 479±482.
28. Ponces Freire, A., Martins, A.M. & Cordeiro, C. (1998) An
experiment illustrating metabolic regulation in situ using digitonin
permeabilized yeast cells. Biochem. Educ. 26, 161±163.
29. Kellum, M.W., Oray, B. & Norton. S.J. (1978) A convenient
quantitative synthesis of methylglyoxal for glyoxalase I assays.
Anal. Biochem. 85, 586±590.
30. Martins, A.M., Cordeiro, C. & Ponces Freire, A. (1999)
Glyoxalase II in Saccharomyces cerevisiae: in situ kinetics using
the 5,5 0-dithiobis (2-nitrobenzoic acid) assay. Arch. Biochem.
Biophys. 366, 15±20.
31. Cordeiro, C. & Ponces Freire, A. (1995) Digitonin permeabiliza-
tion of Saccharomyces cerevisiae cells for in situ enzyme assay.
Anal. Biochem. 229, 145±148.
32. Cordeiro, C. & Ponces Freire, A. (1994) Protein determination in
permeabilized yeast cells using the Coomassie Brilliant Blue dye
binding assay. Anal. Biochem. 223, 321±323.
33. Vander Jagt, D.L., Liang-Po, B. & Lehman, C.H. (1972)
Kinetic evaluation of substrate specificity in the glyoxalase I-
catalyzed disproportionation of a-ketoaldehydes. Biochemistry 11,
3735±3740.
34. Thornalley, P.J. (1988) Modification of the glyoxalase system
in human red blood cells by glucose in vitro. Biochem. J. 254,
751±755.
35. Ellman, G.L. (1959) Tissue sulphydril groups. Arch. Biochem.
Biophys. 82, 70±77.
36. Easterby, J.S.. (1992) HyperFit-Hyperbolic Regression Analysis of
Enzyme Kinetic Data. University of Liverpool, UK.
37. Mendes, P. (1997) Biochemistry by numbers: simulation of bio-
chemical pathways with Gepasi 3. Trends Biochem. Sci. 22,
361±363.
38. Mendes, P. & Kell, D. (1998) Non-linear optimization of
biochemical pathways: applications to metabolic engineering and
parameter estimation. Bioinformatics 14, 869±883.
39. Beechem., J.M. (1992) Global analysis of biochemical and
biophysical data. Methods Enzymol. 210, 37±54.
40. Sellin, S. & Mannervik, B. (1983) Reversal of the reaction
catalyzed by glyoxalase I. J. Biol. Chem. 258, 8872±8875.
41. Keleti, T. (1981) Data analysis from Michaelis±Menten kinetics:
ins and outs. In Kinetic Data Analysis. Design and Analysis of
Enzyme and Pharmacokinetics Experiments (Endrenyi, L., ed.),
pp. 353±373. Plenum Press, New York.
42. Cornish-Bowden, A. (1995) Fundamentals of Enzyme Kinetics,
revised edn. Portland Press Ltd, London.
43. Rudolph, F.B. & Fromm, H.J. (1996) Plotting methods for
analyzing enzyme rate data. In Contemporary Enzyme Kinetics
and Mechanism (Purich, D.L., ed.), pp. 89±109. Academic Press,
San Diego, USA.
44. Hofmeyr, J.-H.S. & Cornish-Bowden, A. (1997) The reversible
Hill equation: how to incorporate cooperative enzymes into
metabolic models. Comput. Applic. Biosci. 13, 377±385.
45. Kacser, H. & Burns, J.A. (1979) Molecular democracy: who shares
the controls? Trends Biochem. Sci. 7, 1149±1160.
3936 A. Margarida Martins et al. (Eur. J. Biochem. 268) q FEBS 2001
Copyright © 2022 FDOKUMEN


![[123doc vn] - tim-hieu-nam-men-saccharomyces-cerevisiae](https://static.fdokumen.com/doc/165x107/6345cd51f474639c9b0502af/123doc-vn-tim-hieu-nam-men-saccharomyces-cerevisiae.jpg)
