Craniofacial variability and modularity in macaques and mice
Upload
independentCategory
view
0download
0
Percival et al. BMC Developmental Biology 2014, 14:31http://www.biomedcentral.com/1471-213X/14/31
METHODOLOGY ARTICLE Open Access
Surface landmark quantification of embryonicmouse craniofacial morphogenesisChristopher J Percival1, Rebecca Green2, Ralph Marcucio3 and Benedikt Hallgrímsson1*
Abstract
Background: Morphometric quantification of subtle craniofacial variation in studies of experimentally modifiedembryonic mice has proved valuable in determining the effects of developmental perturbations on craniofacialmorphogenesis. The direct comparison of landmark coordinate data from embryos of many different mouse strainsand mouse models can advance our understanding of the bases for craniofacial variation. We propose a standardset of craniofacial surface landmarks, for use with embryonic day (E) 10.5-12.5 mice, to serve as the foundation forthis type of data compilation and analysis. We quantify the intra- and inter-observer landmark placement variationassociated with each landmark and determine how the results of a simple ontogenetic analysis might be influencedby selection of landmark set.
Results: Intraobserver landmark placement error for experienced landmarkers generally remains below 0.1 mm, withsome landmarks exhibiting higher values at E11.5 and E12.5. Interobserver error tends to increase with embryonic ageand those landmarks defined on wide inflections of curves or facial processes exhibit the highest error. Landmarks withhighest intra- or inter-observer are identified and we determine that their removal from the dataset does not significantlychange the vectors of craniofacial shape change associated with an ontogenetic regression.
Conclusions: Our quantification of landmark placement error demonstrates that it is preferable for a single observer toidentify all landmark coordinates within a single study and that significant training and experience are necessary before alandmarker can produce data for use in larger meta-analyses. However, we are confident that this standard landmarkset, once landmarks with higher error are removed, can serve as a foundation for a comparative dataset of facialmorphogenesis across various mouse populations to help identify the developmental bases for phenotypic variation inthe craniofacial complex.
Keywords: Morphometrics, Landmark error, Facial prominences, Craniofacial morphogenesis, Mouse embryo, 3Dimaging, Micro-CT
BackgroundMorphometric quantification of variation in complex phe-notypes is increasingly important to developmental studiesof morphogenesis [1-3]. Integrating morphometric methodsinto studies of experimentally modified embryonic develop-ment has proved valuable in determining the simultaneouseffects of a given perturbation on morphogenesis across thedeveloping head (eg. [4-9]). Similarly, these methods allowquantification of subtle changes in phenotype that is neces-sary when examining the simultaneous effects of multiple
* Correspondence: [email protected] of Cell Biology and Anatomy, Alberta Children’s HospitalInstitute for Child and Maternal Health, The McCaig Bone and Joint Institute,University of Calgary, Calgary, AB T2N 4N1, CanadaFull list of author information is available at the end of the article
© 2014 Percival et al.; licensee BioMed CentraCommons Attribution License (http://creativecreproduction in any medium, provided the orDedication waiver (http://creativecommons.orunless otherwise stated.
factors on development of a given trait, as is increasinglycommon in systems-biology informed approaches [3].Landmark based morphometric methods have commonly
been used to quantify the size and shape of individualcraniofacial bones, a skeletal region, or the whole skull(eg. [6,10-15]). While skeletal landmarks have been usedto quantify craniofacial morphogenesis during the lateembryonic period, there is also a need to quantify theeffects of epithelial-mesenchymal interactions that controlinitial growth and fusion of facial prominences beforeossification begins and which have a significant influenceon subsequent craniofacial morphology [16-19]. Given alack of skeletal features and difficulties distinguishing softtissue layers using computed tomography and other 3Dimaging modalities during the earliest period of facial
l Ltd. This is an Open Access article distributed under the terms of the Creativeommons.org/licenses/by/4.0), which permits unrestricted use, distribution, andiginal work is properly credited. The Creative Commons Public Domaing/publicdomain/zero/1.0/) applies to the data made available in this article,

Percival et al. BMC Developmental Biology 2014, 14:31 Page 2 of 12http://www.biomedcentral.com/1471-213X/14/31
morphogenesis, the external ectodermal surface of theembryo provides the best features upon which to placelandmarks for the measurement of craniofacial form [3].Head surface landmarks based on either 2D photographs
or 3D surfaces have previously served as a basis forquantifying the effect of developmental perturbations inembryonic chicks [7,20-22] and mice [5,6,23-25]. Withincreasing demand for quantification of craniofacialmorphogenesis during the earlier embryonic period [26],the direct comparison of morphometric data betweenstudies of different species, mouse strains, disease models,and ages becomes an enticing possibility. Just as largecollections of publically-available and well-annotatedgenomic data facilitate new directions in hypothesis-driven research, a phenomic collection of directly com-parable morphometric data has the potential to advanceour understanding of the bases for typical and dysmorphiccraniofacial variation [26,27].Standardization of landmark definitions and confidence
that datasets produced by multiple observers are com-parable is necessary before morphometric analyses oflandmarks from across a large number of mouse popula-tions can be completed. Typical difficulties encounteredwhen defining good landmarks (as discussed in [28-30])are exacerbated for ectodermal embryonic surfaces becausethe rapid growth of facial prominences and associatedshape changes make it more difficult to define homologouslandmarks (Figure 1). In addition, less reliable landmarksmay be necessary to adequately quantify phenotypic traitsacross the head [3,25]. Keeping these difficulties in mind,we defined and tested a standard set of landmarks onthe exterior surface of embryonic mice that includeonly explicitly homologous landmarks to serve as thebasis for ontogenetic analyses of facial prominence growthand development between embryonic days (E)10.5, E11.5,and E12.5.A biological definition of each landmark (Table 1),
practical definitions of landmark placement, illustrationsdefining standard orientation and anatomical directions,
E10.5 E11.5Dorsal
Ventral
Caudal Rostral
Landmark 9/26 Border between
Figure 1 Surface craniofacial morphology of E10.5-E12.5 mouse embrE11.5, and E12.5 reference specimens in standard orientation, with definitiolocation of landmark 9/26 (circle) is noted at the caudal-lateral end of the band the maxillary prominence (ventral of dashed line).
and examples of landmarks placed on the 3D surface ofa reference specimen at each age were developed in anattempt to maximize consistency in landmark placementby and between observers Additional files 1, 2, 3, 4 and5. Explicit biological definitions facilitate the interpret-ation of results from morphometric analyses by tyinglandmarks directly to biological features of interest. Thepractical definitions, which can vary by age, were writtento guide the placement of each landmark so that itmatches the biological definition. The illustrations andlandmark placement examples were meant to take theguesswork out of interpreting written definitions. Fourobservers, three of whom had experience taking land-marks and one of whom had never landmarked before,used these resources to collect landmark coordinatesfrom a sample of E10.5, E11.5, and E12.5 mouse embryosin order to measure the intra- and inter-observer errorassociated with this landmark set.Landmark homology is widely recognized as a critical
feature of sparse landmark based morphometrics, althoughthe definition of homology may shift depending on re-search question and sample [29,30]. Previous landmarkbased studies of mouse embryos between E10.5 and E12.5are typically related to questions of growth and develop-ment of facial prominences and the structures derivedfrom them [5,6,23-25]. Therefore, our landmark set, influ-enced greatly by this previous work, is composed of pointsat the borders between or at the extreme edges of promi-nences and/or other craniofacial features. Realizing thatthe specific cells found at the edges of a facial prominencemay shift as it grows outward (discussed in [30]), we definehomology based on the extent of the cellular populationswhose proliferation and differentiation serve to modify theform of a given prominence and its derivative craniofacialfeatures.For example, point 9/26 is placed in a position that is
near the ventral/rostral corner of the eye of E10.5 speci-mens (Figure 1). Based on this geometric relationship withthe eye, this landmark might also be placed at the corner
E12.5
Lateral Nasal and Maxillary Prominences
yos. Right lateral view of the surface craniofacial morphology of E10.5,ns of the anatomical directions used in the landmark definitions. Theorder between the lateral nasal prominence (dorsal of dashed line)

Table 1 Biological definitions of all landmarks and landmark subset categories
LM # Abbreviated biological definition Landmark subsets Trouble landmarks
1 The dorsal midline point between the growing forebrain and midbrain lobes. Non-Facial
2 The dorso-rostral midline extent of the growing forebrain. Non-Facial Trouble
3 The midline dorsal most extent of the face. Nasal
4 Midline most rostral extent of the medial nasal processes. Nasal
5 The ventral midline point on the primary palate, in the region that developsinto the vermillion of the lip.
Nasal
6 (23) The border between the medial nasal process and the forebrain, in line withthe center of the body of the medial nasal process.
Nasal
7 (24) Most dorsal extent of the rostral portion of the lateral nasal process, markingthe original rostrolateral intersection of the lateral nasal process and the forbrain.
Nasal Trouble
8 (25) The dorso-caudal most point of the lateral nasal process. Non-Facial
9 (26) The caudal most point of the intersection between the lateral nasal process andthe maxillary process, representing the caudal end of the future nasolacrimal duct.
Nasal
10 (27) The caudo lateral projection of the dorsal edge of the maxillary process. Maxillary/Mandibular Trouble
11 (28) Point at the nasal aperture representing the intersection of the lateral nasalprocess and the maxillary process.
Maxillary/Mandibular
12 (29) The most rostro-ventral intersection between the medial nasal process and the maxillaryprocess. Between E10.5 and E11.5, it shows the growth of the medial nasal process as acontributor to the labial margin.
Nasal
13 (30) The rostro-caudal most extension of the lateral nasal prominence, illustrating the rostralgrowth of the lateral nasal process between E10.5 and E12.5.
Nasal Trouble
14 (31) Point representing the middle of the medial side of the nasal aperture as a lateral extentof the medial nasal process.
Nasal
15 (32) The dorsal most point of the nasal aperture representing the rostro-dorsal extreme of theborder between the medial and lateral nasal processes.
Nasal
16 (33) The corner of the developing mouth, found at the most caudo-lateral point on the rostralborder of the maxillary and mandibular processes.
Maxillary/Mandibular
17 (34) The lateral extent of the center of the maxillary process as it exists in E10.5 and E11.5. Maxillary/Mandibular Trouble
18 (35) The intersection of the buldge of the trigeminal ganglion and the pontine flexure of thedeveloping brain.
Non-Facial Trouble
20 (37) The medial, rostral, dorsal corner of the developing mandibular process. Maxillary/Mandibular
21 (38) The ventral caudal most point on the bulge of the growing forebrain, as noted fromthe lateral perspective.
Non-Facial Trouble
22 The most caudal midline point on back of the head, just ventral to the midbrain. Non-Facial
Simplified biological definitions for all landmarks as well as landmark subset definitions. Full biological and practical definitions are provided in Additional file 1.Definitions of anatomical directions used here are found in Figure 1. Identifications of these landmarks on specimens are found in Figure 2 and in Additional file 5.
Percival et al. BMC Developmental Biology 2014, 14:31 Page 3 of 12http://www.biomedcentral.com/1471-213X/14/31
of the eye on E12.5 specimens. However, because ourmain questions are about the growth and relationshipbetween the facial prominences, it is more important thatlandmark 9/26 continue to represent the caudal end of theborder between the lateral nasal and maxillary processesat the developing lacrimal duct. It has been shown thatthe valley between the second and third whisker rows,counting from the dorsal aspect of the nose, representsthe border between tissues derived from these cell popula-tions [31,32]. Therefore, the E12.5 version of this pointwas defined at the posterior extreme of this valley betweenthe whisker rows, found halfway up the anterior border ofthe eye (Figure 1). Similarly, we chose age specific loca-tions for each landmark, as defined within the practical
definitions, to represent homologous biological features,as defined within the biological definitions.Even if landmarks represent relevant biological features
well, landmarks cannot be used to measure subtle vari-ation in craniofacial form if there is a large amount ofvariation in landmark coordinate identification. In orderto test the variation in landmark placement for our land-mark set (Table 1, Figure 2), we measured the intra- andinter-observer error associated with each landmark. Afteridentifying some landmarks with relatively high error, wetested how removing groups of landmarks from our setinfluences the results of a simple ontogenetic analysis.This latter question addresses the issue of how the com-position of the landmark set influences the extent to

38
2118
35
1 2
35(18)
38(21) 24(7)25(8)
26(9)
33(16)34(17)
27(10)
30(13)
28(11)
22
1
2
3
4
67
15
1314111220
2324
32
3130
2928
3734 17
5
43 15
131411
1734
12
32
3130
28
29
2037
1633
A B
C D
Landmark Subsets
Nasal
Maxillary/Mandibular
Non-Facial
Trouble LMs
Figure 2 Landmarks defined on the craniofacial ectoderm. Landmark locations identified on the A) right lateral, B) dorsal, C) rostral, andD) rostro-ventral views of an E11.5 reference specimen, including the identification of the landmark subsets removed from ontogenetic regressionanalyses. Landmarks identified on 3D surfaces of all three ages are available in Additional file 5.
Percival et al. BMC Developmental Biology 2014, 14:31 Page 4 of 12http://www.biomedcentral.com/1471-213X/14/31
which the set captures and represents, overall, the shapeof the face.
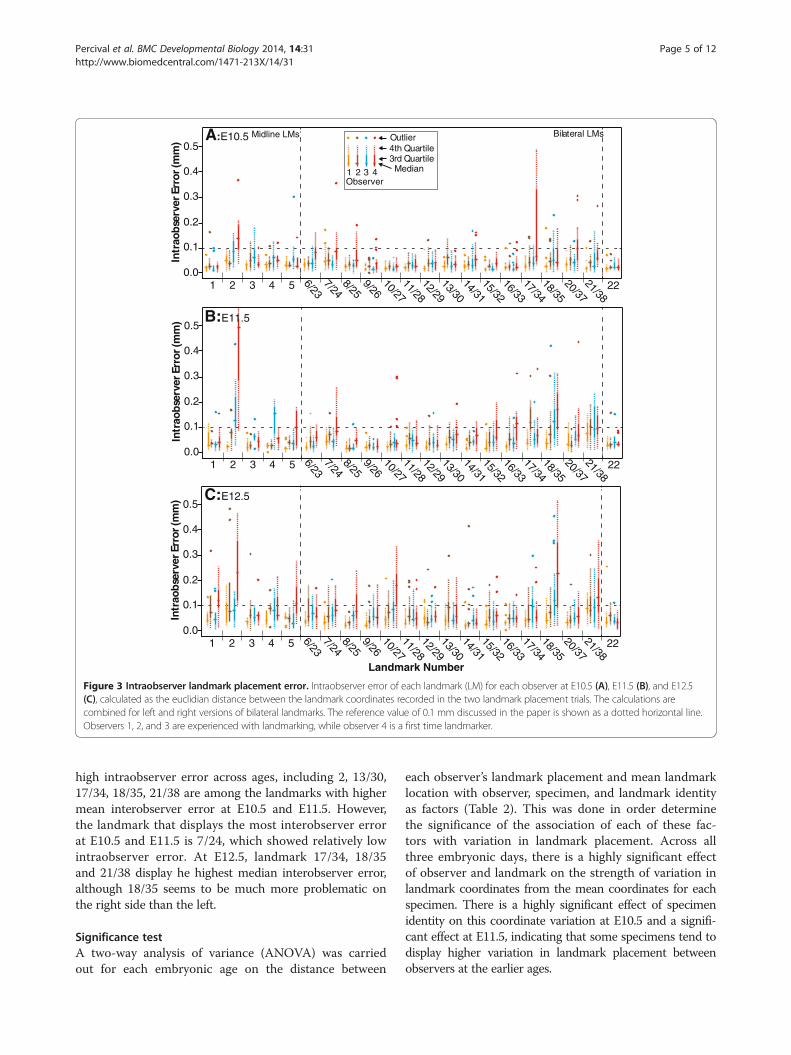
ResultsIntraobserver errorIntraobserver error, the variation in placement of a givenlandmark from trial to trial by the same person, wasmeasured as the Euclidian distance between the identi-fied coordinates of a landmark during two landmarkplacement trails. After determining that left and rightversions of bilateral landmarks showed similar patternsof intraobserver error, calculations of intraobserver errorfor bilateral landmarks include values from both sides.The median intraobserver error for landmarks taken bythe more experienced landmarkers on E10.5 specimens(Figure 3A) tend to be well below 0.1 mm, usually closerto 0.05 mm, with the less experienced landmarker show-ing higher median and variance of error overall. Whilethe more experienced landmarkers display low landmarkplacement error, the less experienced landmarker displayshigh median intraobserver error for landmark 2 and highvariance for 17/34.For E11.5 embryos (Figure 3B), the median intraobserver
error for the more experienced landmarkers is still wellunder 0.1 mm for most landmarks, although there are
some landmarks that display higher error. Looking at themore experienced landmarkers, point 2 shows the highestmedian value, while point 4 is also high for one experiencedobserver. Of the lateral points, 17/34, 18/35, and 21/38 me-dian values are above 0.1 for at least one of the experiencedlandmarkers. The median intraobserver errors are higherfor the E12.5 embryos then the other two ages (Figure 3C),although this might be expected given that the overalldimensions of the head have increased substantially sinceE10.5. For E12.5, landmark 21/38 consistently displays thehighest level of error for the experienced landmarkers,while the points 17/34, 18/35, and 13/30 display medianclose to 0.1 mm for at least one experienced landmarker.
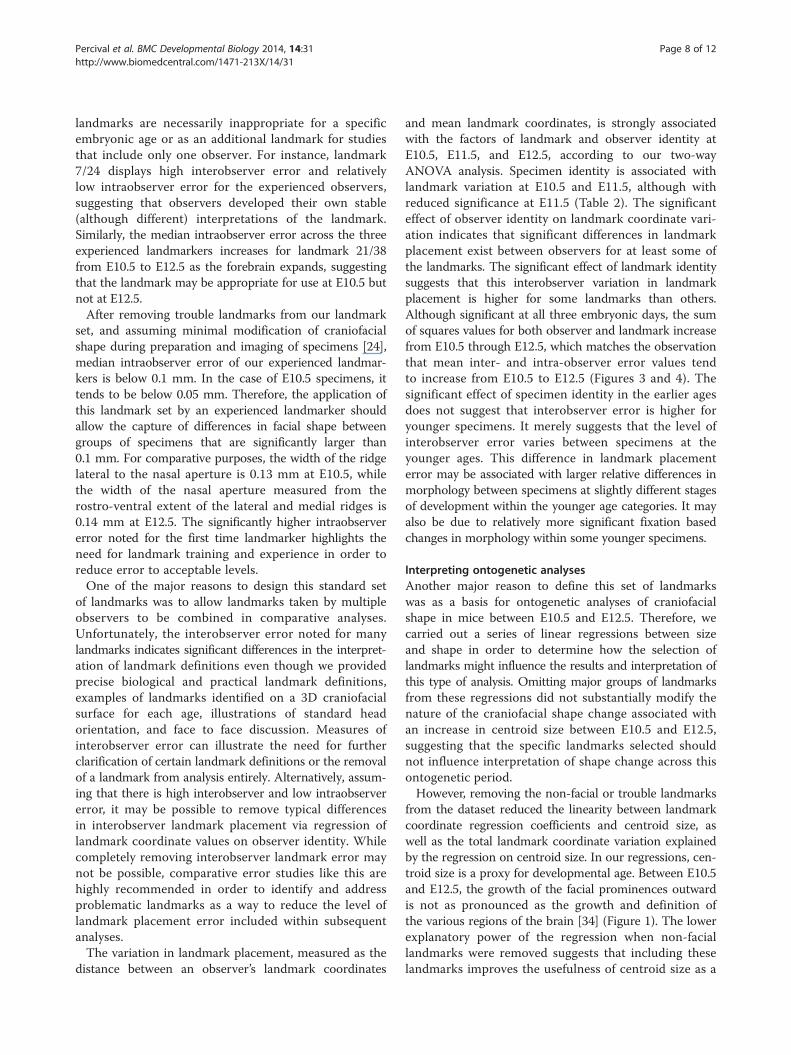
Interobserver errorInterobserver error was calculated for every landmark ofevery specimen as centroid size of the average landmarklocations chosen by the three experienced landmarkers(average between trials 1 and 2). Although centroid sizeis not directly interpretable as a Euclidian distance, cen-troid size values are comparable between ages in ouranalysis (Figure 4).Overall, the median and variance of interobserver
error is lower for E10.5 and E11.5 data than for E12.5data. Landmarks that were identified as having relatively
0.5
0.4
0.3
0.2
0.1
0.01 2 3 4 5 6/23
7/248/259/2610/2711/2812/2913/3014/3115/3216/3317/3418/3520/3721/38
22
)m
m( r orrE revresboart nI
A:E10.5
Observer1 2 3 4 Median
3rd Quartile4th QuartileOutlierMidline LMs Bilateral LMs
0.5
0.4
0.3
0.2
0.1
0.01 2 3 4 5 6/23
7/248/259/2610/2711/2812/2913/3014/3115/3216/3317/3418/3520/3721/38
22
)m
m( r orrE revresboart nI
B:
0.5
0.4
0.3
0.2
0.1
0.01 2 3 4 5 6/23
7/248/259/2610/2711/2812/2913/3014/3115/3216/3317/3418/3520/3721/38
22
Landmark Number
)m
m( rorrE re vresboart nI
C:E12.5
E11.5
Figure 3 Intraobserver landmark placement error. Intraobserver error of each landmark (LM) for each observer at E10.5 (A), E11.5 (B), and E12.5(C), calculated as the euclidian distance between the landmark coordinates recorded in the two landmark placement trials. The calculations arecombined for left and right versions of bilateral landmarks. The reference value of 0.1 mm discussed in the paper is shown as a dotted horizontal line.Observers 1, 2, and 3 are experienced with landmarking, while observer 4 is a first time landmarker.
Percival et al. BMC Developmental Biology 2014, 14:31 Page 5 of 12http://www.biomedcentral.com/1471-213X/14/31
high intraobserver error across ages, including 2, 13/30,17/34, 18/35, 21/38 are among the landmarks with highermean interobserver error at E10.5 and E11.5. However,the landmark that displays the most interobserver errorat E10.5 and E11.5 is 7/24, which showed relatively lowintraobserver error. At E12.5, landmark 17/34, 18/35and 21/38 display he highest median interobserver error,although 18/35 seems to be much more problematic onthe right side than the left.
Significance testA two-way analysis of variance (ANOVA) was carriedout for each embryonic age on the distance between
each observer’s landmark placement and mean landmarklocation with observer, specimen, and landmark identityas factors (Table 2). This was done in order determinethe significance of the association of each of these fac-tors with variation in landmark placement. Across allthree embryonic days, there is a highly significant effectof observer and landmark on the strength of variation inlandmark coordinates from the mean coordinates for eachspecimen. There is a highly significant effect of specimenidentity on this coordinate variation at E10.5 and a signifi-cant effect at E11.5, indicating that some specimens tend todisplay higher variation in landmark placement betweenobservers at the earlier ages.

0.4
0.3
0.2
0.1
0.01 2 3 4 5
Inte
rob
serv
er E
rro
r (C
S)
6 7 8 9 10 11 121314 15 16 1718 202122 232425 26 2728 2930 31 32 33 34 35 37 38
Embryonic Age10.5 11.5 12.5 Median
3rd Quartile4th Quartile OutlierMidline LMs Bilateral LMs
(Left)Bilateral LMs(Right)
Landmark Number
Figure 4 Interobserver landmark placement error. Interobserver error for each landmark (LM) at E10.5 (orange), E11.5 (blue), and E12.5 (red),calculated as the centroid size (CS) of the mean landmark coordinates of the three experienced landmarkers. Centroid size was calculated separatelyfor the left and right side of bilateral landmarks.
Percival et al. BMC Developmental Biology 2014, 14:31 Page 6 of 12http://www.biomedcentral.com/1471-213X/14/31
Ontogenetic analysisWe identified a list of trouble landmarks, based on theirhigh median intra- or inter-observer error values, forwhich we did not believe a clarification of landmark defin-ition would necessarily reduce error (see Discussion). Inorder to determine how removing these trouble landmarksor 3 other morphologically defined landmark groupsfrom our sample would modify the results of a simpleontogenetic analysis, we completed separate regressionsof landmark coordinates on centroid size for five subsetsof landmarks within MorphoJ (Table 1, Figure 2).The association between a summary regression score
and centroid size is roughly linear for each of the fiveregressions completed (Figure 5). The proportion of thetotal variation for which the regression including alllandmarks accounts is approximately 82.5%, while it is78.9% when the trouble landmarks are removed, 83.8%with nasal landmarks removed, 81.1% with maxillary/mandibular landmarks removed, and 73.3% with non-faciallandmarks removed. Based on a subjective comparison ofthe shape vectors associated with each regression, theremoval of any of these subsets of landmarks does notgrossly change the nature of the allometric shape changeof a given landmark during the developmental periodunder study (Figure 6). As the embryo develops betweenE10.5 and E12.5, the bilateral landmarks of the facebecome relatively more rostral and closer together. The
Table 2 Results of two-way ANOVA for association between r
E10.5
DF Sum Sq p-value DF
Specimen 9 0.0406 4.6E-08 8
Landmark 3 0.0282 6.9E-08 3
Observer 35 0.5857 <2.2E-16 35
Residual 1392 1.0711 1249
Two-way ANOVA results for the association between Specimen, Landmark, and Obsembryonic ages. Results include degrees of freedom (DF), sum of squares (Sum Sq)in landmark coordinates were calculated as Euclidian distances between a given lansame specimen.
facial landmarks closer to the midline also become rela-tively more ventral by E12.5. The landmarks found awayfrom the face are relatively more caudal and dorsal in theolder specimens.
DiscussionIntra- and inter-observer errorBookstein [28] defined a commonly used landmark classi-fication system based on the features used to determinelandmark location. Type 1 landmarks are defined as thelocation of a discrete anatomical structure, independent ofother anatomical features. Several of the landmarks in ourset (Figure 2) are Type 1, including 8/25 that is found atthe intersection of the eye, forebrain, and lateral nasalprominence. Type 2 landmarks are extreme points alongcurves or grooves and represent the majority of landmarksdefined on the surfaces of embryos for this and previouslydefined sets (eg. [6,25]). Type 3 landmarks, those definedwith respect to relatively distant anatomical structures, donot necessarily share biological meaning and homologyacross specimens. They are considered mathematicallydeficient, because their locations are partially dependenton the locations of other anatomical structures [28,33].However, because Type 1 and Type 2 landmarks cannotcomprehensively represent the shape of the early facialprominences [3], we defined a few landmarks on theextreme of craniofacial bulges in order to improve our
elevant factors and landmark coordinate variation
E11.5 E12.5
Sum Sq p-value DF Sum Sq p-value
0.0179 0.019 9 0.0340 0.1097
0.0874 <2.2E-16 3 0.5048 <2.2E-16
0.8070 <2.2E-16 35 3.1895 <2.2E-16
1.2124 1392 3.2834
erver factors and variation in identified landmark coordinates for the three, and p-value, which is highlighted in bold if highly significant (<.001). Variationdmark location and the mean location across observers for the

0.0
0.1
0.2
0.3
-0.1
-0.2
-0.34.0 5.0 6.0 7.0 8.0 9.0 10.0
Centroid Size
Reg
ress
ion
Sco
re 1
0.0
0.1
0.2
0.3
-0.1
-0.2
-0.33.0 3.3 3.6 3.9 4.2 4.5 4.8
Centroid Size
Reg
ress
ion
Sco
re 1
5.1
All Landmarks Non-Facial LMsRemoved
Figure 5 Results of a regression of landmark coordinates on centroid size. The association between centroid size and a summary score ofthe landmark coefficients associated with a multiple multivariate regression of landmark coordinates on centroid size (Regression Score 1). Thisassociation is illustrated for regressions when all landmarks (LMs) were included (left) and when non-facial landmarks were removed (right), whichrepresent the high end and low end of linearity for the regressions in our analyses.
Percival et al. BMC Developmental Biology 2014, 14:31 Page 7 of 12http://www.biomedcentral.com/1471-213X/14/31
coverage of the anatomical features of interest. Becausethe face develops quickly between E10.5 and E12.5(Figure 1), biologically homologous landmarks may switchbetween landmark types across this period of develop-ment. For example, landmark 17/34 is the extreme lateraledge of the maxillary prominence at E10.5 and E11.5 (type3), but is defined based on location between whisker rowsat E12.5 (type 2). Even if a landmark does not change type,the error associated with its identification may changeacross this developmental period.Our landmark set was compiled with the goals of 1)
creating an explicit homologous association between eachlandmark and a biological feature across E10.5-E12.5and 2) serving as the basis for ontogenetic analyses thatinclude datasets produced by multiple observers. Therefore,we have attempted to choose landmarks that represent rele-vant biological features well and which can be repeatablyplaced between trials and by multiple observers. However,we acknowledge that a given landmark may not necessarilybe more biologically relevant or repeatable than other
1
2
38
2524
263527
34
3328
29
3032
31
37
2322
4
5
6
7
21
8
918 15
1410
1311
1220
17
16
223
0.4-0.2 -0.1 0.0 0.1 0.2
-0.1
0.0
0.1
0.2
All Landmarks
Trouble LMs Rem
Nasal LMs RemoMax/Mand LMs R
Caudal/Rostral View Dorsal/V
Lateral
Dorsal
Ventral
La
Caudal
Figure 6 Comparison of ontogenetic shape change vectors for landmregressions of landmark coordinates on centroid size for all landmarks (blacmandibular removed (orange), and trouble landmarks removed (red). The vlandmark and all plotted relative to the mean procrustes coordinates of thaaxes are procrustes coordinates.
nearby locations, particularly if the landmark is definedalong a curve or curved surface (i.e. type 2 and 3 land-marks). We have endeavored to transparently report ourbiological interpretations of landmarks and the repeatabilityof landmark placement in order to allow other researchersto judge the usefulness of this landmark set for their ownstudies.None of the landmarks identified as having high intra-
or inter-observer error in this study are Type 1 landmarks.Instead, they tend to be Type 2 landmarks along curveswith wide inflection (eg 2, 7/24, 18/35) or Type 3 land-marks on the extreme extents of bulges (eg. 17/34). Afterreviewing the landmarks identified as having high error(the subset of trouble landmarks) we are confident thatwe can clarify the definitions of 10/27 and 13/30 in orderto reduce landmark placement error, based on notedsystematic differences in placement between landmar-kers. However, we suggest that 2, 7/24, 17/34, 18/35,and 21/38 be removed from our standardized landmarkset for E10.5-E12.5 mice. This does not mean that these
1821
38
35
21
15
37
20
179
8
10
11
1112
7 13
146
33 26
25
3427
29
2824 30
3231
235 2 3 4
0.3 0.2 0.1 0.0 -0.1
-0.2
-0.1
0.0
0.1
0.2
oved
ved emoved
entral View
Rostral
teral
ark subsets. Comparison of ontogenetic shape change vectors fork), when nasal landmarks (LMs) were removed (blue), maxillary/ectors are based on the regression coefficients for each axis of a givent landmark calculated when including all landmarks. The values of all
Percival et al. BMC Developmental Biology 2014, 14:31 Page 8 of 12http://www.biomedcentral.com/1471-213X/14/31
landmarks are necessarily inappropriate for a specificembryonic age or as an additional landmark for studiesthat include only one observer. For instance, landmark7/24 displays high interobserver error and relativelylow intraobserver error for the experienced observers,suggesting that observers developed their own stable(although different) interpretations of the landmark.Similarly, the median intraobserver error across the threeexperienced landmarkers increases for landmark 21/38from E10.5 to E12.5 as the forebrain expands, suggestingthat the landmark may be appropriate for use at E10.5 butnot at E12.5.After removing trouble landmarks from our landmark
set, and assuming minimal modification of craniofacialshape during preparation and imaging of specimens [24],median intraobserver error of our experienced landmar-kers is below 0.1 mm. In the case of E10.5 specimens, ittends to be below 0.05 mm. Therefore, the application ofthis landmark set by an experienced landmarker shouldallow the capture of differences in facial shape betweengroups of specimens that are significantly larger than0.1 mm. For comparative purposes, the width of the ridgelateral to the nasal aperture is 0.13 mm at E10.5, whilethe width of the nasal aperture measured from therostro-ventral extent of the lateral and medial ridges is0.14 mm at E12.5. The significantly higher intraobservererror noted for the first time landmarker highlights theneed for landmark training and experience in order toreduce error to acceptable levels.One of the major reasons to design this standard set
of landmarks was to allow landmarks taken by multipleobservers to be combined in comparative analyses.Unfortunately, the interobserver error noted for manylandmarks indicates significant differences in the interpret-ation of landmark definitions even though we providedprecise biological and practical landmark definitions,examples of landmarks identified on a 3D craniofacialsurface for each age, illustrations of standard headorientation, and face to face discussion. Measures ofinterobserver error can illustrate the need for furtherclarification of certain landmark definitions or the removalof a landmark from analysis entirely. Alternatively, assum-ing that there is high interobserver and low intraobservererror, it may be possible to remove typical differencesin interobserver landmark placement via regression oflandmark coordinate values on observer identity. Whilecompletely removing interobserver landmark error maynot be possible, comparative error studies like this arehighly recommended in order to identify and addressproblematic landmarks as a way to reduce the level oflandmark placement error included within subsequentanalyses.The variation in landmark placement, measured as the
distance between an observer’s landmark coordinates
and mean landmark coordinates, is strongly associatedwith the factors of landmark and observer identity atE10.5, E11.5, and E12.5, according to our two-wayANOVA analysis. Specimen identity is associated withlandmark variation at E10.5 and E11.5, although withreduced significance at E11.5 (Table 2). The significanteffect of observer identity on landmark coordinate vari-ation indicates that significant differences in landmarkplacement exist between observers for at least some ofthe landmarks. The significant effect of landmark identitysuggests that this interobserver variation in landmarkplacement is higher for some landmarks than others.Although significant at all three embryonic days, the sumof squares values for both observer and landmark increasefrom E10.5 through E12.5, which matches the observationthat mean inter- and intra-observer error values tendto increase from E10.5 to E12.5 (Figures 3 and 4). Thesignificant effect of specimen identity in the earlier agesdoes not suggest that interobserver error is higher foryounger specimens. It merely suggests that the level ofinterobserver error varies between specimens at theyounger ages. This difference in landmark placementerror may be associated with larger relative differences inmorphology between specimens at slightly different stagesof development within the younger age categories. It mayalso be due to relatively more significant fixation basedchanges in morphology within some younger specimens.
Interpreting ontogenetic analysesAnother major reason to define this set of landmarkswas as a basis for ontogenetic analyses of craniofacialshape in mice between E10.5 and E12.5. Therefore, wecarried out a series of linear regressions between sizeand shape in order to determine how the selection oflandmarks might influence the results and interpretation ofthis type of analysis. Omitting major groups of landmarksfrom these regressions did not substantially modify thenature of the craniofacial shape change associated withan increase in centroid size between E10.5 and E12.5,suggesting that the specific landmarks selected shouldnot influence interpretation of shape change across thisontogenetic period.However, removing the non-facial or trouble landmarks
from the dataset reduced the linearity between landmarkcoordinate regression coefficients and centroid size, aswell as the total landmark coordinate variation explainedby the regression on centroid size. In our regressions, cen-troid size is a proxy for developmental age. Between E10.5and E12.5, the growth of the facial prominences outwardis not as pronounced as the growth and definition ofthe various regions of the brain [34] (Figure 1). The lowerexplanatory power of the regression when non-faciallandmarks were removed suggests that including theselandmarks improves the usefulness of centroid size as a

Percival et al. BMC Developmental Biology 2014, 14:31 Page 9 of 12http://www.biomedcentral.com/1471-213X/14/31
proxy for developmental age, because it is linked to theoverall change in craniofacial size over this developmentalperiod. The intermediate reduction in explanatory powerfor the regression when the trouble landmarks wereremoved is likely based on the fact that a high propor-tion of the trouble landmarks are non-facial landmarks.We recommend that landmarks across the head be
included in ontogenetic analyses in order to better esti-mate centroid size as a measure of developmental age,but also to provide a broader anatomical context withinwhich to interpret morphological changes of the face oranother specific region of interest. If possible, using ameasure of developmental age that is independent of thelandmarks under analysis, such as tail somite number,may be preferable [6].
Future directionsGreat progress has been made in the automation of cra-niofacial surface quantification and comparison ([35-41]),which might make issues of intra- and inter-observerlandmark placement error irrelevant. However, despitesignificant effort, an adequate automatic method has notyet been developed that allows for the quantification ofsubtle craniofacial variation in young embryos. This ispartially due to difficulty in producing standardized andcomplete ectodermal surfaces from μCT images, as wellas the fact that craniofacial features change very quicklyduring embryonic development to the point where a greatdeal of variation exists within a sample of specimens froma single embryonic day. The human eye remains, unfortu-nately, superior to computational methods in locatinghomologous features on incomplete surfaces and acrossgradations of developmental age. The authors are involvedin work to automate embryonic landmark placement, butmust continue to rely on manual placement of landmarksets like this for the time being.
ConclusionStandardization of landmarking protocols is a necessaryfirst step, but not sufficient for phenotypic data to becomephenomic data. It must also be shown that the landmarkcoordinates identified using the standard protocol aresufficiently comparable between landmark trials andbetween observers. We developed and tested a set ofectodermal surface landmarks for the measurement ofcraniofacial morphology of mice between E10.5, E11.5,and E12.5. Our package of landmark definitions, illus-trations, and examples were developed in an effort toreduce variation in placement for all landmarks in ourset. Measurements of intra- and inter-observer errorfor four observers reinforce the idea that landmarkcoordinates identified from one landmarker will have lessvariability than landmarks taken by multiple observers.Intraobserver error comparisons also highlight the need
for landmarkers to be provided significant training andsupervision before the incorporation of their landmarksets into larger meta-analyses including multiple observers.However, we are confident that this standard landmark set,once landmarks with higher error are removed, can serveas a basis for the comparison of landmarks individuallycollected by experienced landmarkers for different mousestrains and disease models. Finally, our results suggest thatthe nature of craniofacial shape changes identified withsimple ontogenetic analyses are robust to the particularchoice of landmarks that are included in those analyses.By using these landmarks within a variety of futurestudies, perhaps as part of larger study or age specific land-mark sets, we plan to build a dataset for the comparison offacial morphogenesis across many mouse populationsin order to help identify the developmental bases forphenotypic variation in the craniofacial complex.
MethodsLandmark definitions and data collectionThis study was performed using a sample of 10 E10.5, 9E11.5, and 10 E12.5 CT images heads from mice of vari-ous backgrounds that were collected for other studies.None of these mice display gross dysmorphology duringthe early embryonic period. Care and use of mice for thisstudy were in compliance with relevant animal welfareguidelines approved by the University of Colorado -Denver and the University of Calgary. Fixation in 4%PFA/5% Gluteraldehyde was carried out according toprotocols designed to minimize the level of desiccation andcraniofacial shape change in these embryonic specimens[24]. All μCT images chosen for this study were producedwith a Scanco μ35 at the University of Calgary with 45 kV/177uA for images of 0.007 mm (E10.5 and E11.5) or0.012 mm (E12.5) voxel size.All landmarks in our landmark set (Table 1; Figure 2)
were given a biological definition representing a biologicalinterpretation of that landmark across all three ages ofinterest. A practical landmark was defined for each land-mark at each age in order to guide the placement of thelandmark so that its location at each age would match thebiological definition. Because some of these landmarks aredefined as the extremes of curved surfaces, the practicaldefinitions may include instruction on the orientation ofthe surface image that a landmark should be taken from.2D lateral images of an embryonic head from each agewere produced to define a standard orientation for land-marking. Terms of anatomical direction used within thedefinitions are in reference to a mouse head in standardadult position and may not match the directions asdefined by the embryonic body. Full landmark defini-tions and orientation images are available in Additionalfiles 1, 2, 3, 4 and 5. Last, each landmark was placed onthe 3D surface of a reference specimen of each embryonic

Percival et al. BMC Developmental Biology 2014, 14:31 Page 10 of 12http://www.biomedcentral.com/1471-213X/14/31
age as an example to be referenced during the process ofdata collection. Because of the relatively large file sizesinvolved, these surface files and associated landmarkcoordinates are available upon request to the authors.After a brief orientation and access to all landmark
reference materials, four observers completed two land-mark trials within MeshLab [42] on minimum-thresholdbased ectodermal surfaces produced from μCT imagesof each specimen. Trials 1 and 2 were completed at leastone week apart in order to reduce the influence of memoryon landmark placement during the second landmarkingtrial. The first two observers (1,2), who had experiencecollecting landmarks from CT images of mice, collaboratedto develop the landmark set definitions, the third(3) was also an experienced mouse landmarker, and thefourth (4) was a first time landmarker (numbers as definedin Figure 3.
Landmark error analysisIntraobserver landmark placement error was calculatedfor each landmarker (1-4) as Euclidian distances (mm)between the location of a landmark taken during land-mark trials 1 and 2. Boxplots were used to visualize themedian and variation of intralandmark error for eachlandmarker (Figure 3). After determining that the leftand right versions of bilateral landmarks show similarlevels of intraobserver error, we decide to combine thesevalues for both sides when calculating intraobserver errorfor the bilateral landmarks.Inter-observer landmark placement error was first
calculated as the centroid size of the mean landmarkcoordinates defined by each observer for each landmark(mean of trials 1 and 2). Because of the high intraobservererror noted for the less experienced observer, our interob-server error and all further analyses focus on the datafrom the three more experienced observers.The mean landmark coordinates for a given specimen
were calculated as the average of the mean landmarkcoordinates calculated from the two trials of each obser-ver. Variation in landmark coordinates were calculated asthe Euclidian distance between the coordinates collectedby a given observer on a given specimen and the meancoordinates for that specimen. A two-factor analysis ofvariance (ANOVA) was completed for each embryonicage to test whether specimen, landmark, or observeridentity are significantly associated with this variationin landmark coordinates.
Ontogenetic analysisRegressions of procrustes coordinates against centroidsize, a better proxy for developmental age than embryonicday, were performed in MorphoJ [43] to determine thestrength and nature of ontogenetic change in craniofacialshape from E10.5 to E12.5. This regression was performed
for the whole dataset and a dataset from which troublelandmarks with high intra- or inter-observer error wereremoved (Table 1; Figure 2). To further investigate howthe use of different subsets of landmarks might influencethe results of an ontogenetic analysis, regressions ofprocrustes coordinates against centroid size were alsocalculated for the dataset after removing nasal, maxillary/mandibular, or non-facial landmarks (Table 1; Figure 2). Asummary regression score representing the regressioncoefficients of each specimen [44] was plotted againstcentroid size in order to visualize the strength and lin-earity of this association between craniofacial shape andcentroid size. An estimate of the proportion of totalvariation for which a regression accounts, an analogueof an R-squared value, serves as an informal measure ofthe strength of this association.The vectors of landmark change associated with centroid
size provide a summary of the nature of the ontogeneticchanges in craniofacial shape between E10.5 and E12.5.These vectors are calculated as regression coefficients ofeach axis of each landmark added to the mean procrustescoordinate of the landmark along each axis. A figuredisplaying the relative ontogenetic vectors associatedwith four of the landmark subsets required the usethree landmarks to define parallel axes for procrustessuperimposition of each subset as the basis for eachregression against centroid size (these three landmarkswere not found in the fifth subset of landmarks). Theresulting coefficient vectors were plotted relative to themean shape of the dataset including all landmarks forthe purpose of visualization in R [45].
Availability of supporting dataThe full landmark definitions, the original embryo orienta-tion images, and an image illustrating the placement ofthe landmarks at all three embryonic days are available asAdditional files 1, 2, 3, 4 and 5. Because of the size of the3D surface meshes, these meshes and associated landmarkcoordinates for reference specimens at E10.5, E11.5, andE12.5 are available upon request to the authors.
Additional files
Additional file 1: Full biological and practical landmark definitions.The practical definitions, which can differ between embryonic ages areintended to guide landmark placement so that landmarks are placedhomologously across ages according to the biological definitions.
Additional file 2: Standard orientation for E10.5 embryos. An imagedefining standard lateral orientation of E10.5 embryonic specimens forlandmark placement.
Additional file 3: Standard orientation for E11.5 embryos. An imagedefining standard lateral orientation of E11.5 embryonic specimens forlandmark placement.

Percival et al. BMC Developmental Biology 2014, 14:31 Page 11 of 12http://www.biomedcentral.com/1471-213X/14/31
Additional file 4: Standard orientation for E12.5 embryos. An imagedefining standard lateral orientation of E12.5 embryonic specimens forlandmark placement.
Additional file 5: Landmark locations identified on embryos of allthree ages under study. These landmarks are defined in Table 1 andAdditional file 1. These landmarks are colored by groups on an E11.5specimen within Figure 2.
AbbreviationsμCT: Micro computed tomography; E: Embryonic day (followed by thenumber of days).
Competing interestsThe authors declare that they have no competing interests.
Authors’ contributionsAll authors participated in the design of the study. CJP and RG defined thelandmarks and carried out data collection. CJP completed analysis of thelandmark coordinate data and wrote the initial draft of the manuscript.All authors contributed to and approve the final manuscript.
AcknowledgementsSpecial thanks to Tatiana Almeida and Francis Smith for their participationas landmarkers in this study. Thanks also to Denise Liberton for discussionabout relevant statistical methods and R. We gratefully acknowledge fundingfrom NIH (R01-DE19638, R01-DE021708) and NSERC (Grant #238992-12) forresearch funding, as well as the CIHR Training Program in Genetics, ChildDevelopment and Health and the ACHRI for support to CJP.
Author details1Department of Cell Biology and Anatomy, Alberta Children’s HospitalInstitute for Child and Maternal Health, The McCaig Bone and Joint Institute,University of Calgary, Calgary, AB T2N 4N1, Canada. 2Department ofCraniofacial Biology and Program in Reproductive Sciences, University ofColorado – Denver, Denver, CO 80045, USA. 3Department of OrthopaedicSurgery, The Orthopaedic Trauma Institute, UCSF School of Medicine, SanFrancisco, CA 94143, USA.
Received: 13 March 2014 Accepted: 1 July 2014Published: 24 July 2014
References1. Klingenberg CP: Morphometrics and the role of the phenotype in studies
of the evolution of developmental mechanisms. Gene 2002, 287:3–10.2. Cooper WJ, Albertson RC: Quantification and variation in experimental
studies of morphogenesis. Dev Biol 2008, 321:295–302.3. Hallgrímsson B, Boughner JC, Turinsky A, Parsons TE, Logan C, Sensen CW:
Geometric Morphometrics and the Study of Development. In AdvancedImaging Biology and Medicine. Edited by Sensen CW, Hallgrímsson B. Berlin:Springer-Verlag; 2009:319–336.
4. Albertson RC, Yelick PC: Fgf8 haploinsufficiency results in distinctcraniofacial defects in adult zebrafish. Dev Biol 2007, 306:505–515.
5. Parsons TE, Kristensen E, Hornung L, Diewert VM, Boyd SK, German RZ,Hallgrimsson B: Phenotypic variability and craniofacial dysmorphology:increased shape variance in a mouse model for cleft lip. J Anat 2008,212:135–143.
6. Boughner JC, Wat S, Diewert VM, Young NM, Browder LW, Hallgrímsson B:Short-faced mice and developmental interactions between the brainand the face. J Anat 2008, 213:646–662.
7. Young NM, Chong HJ, Hu D, Hallgrímsson B, Marcucio RS: Quantitativeanalyses link modulation of sonic hedgehog signaling to continuousvariation in facial growth and shape. Development 2010, 137:3405–3409.
8. Cooper WJ, Wirgau RM, Sweet EM, Albertson RC: Deficiency of zebrafishfgf20a results in aberrant skull remodeling that mimics both humancranial disease and evolutionarily important fish skull morphologies. EvolDev 2013, 15:426–441.
9. Percival CJ, Huang Y, Jabs EW, Li R, Richtsmeier JT: Embryonic craniofacialbone volume and bone mineral density in Fgfr2+/P253R and nonmutantmice. Dev Dyn 2014, 243:541–551.
10. Wang Y, Xiao R, Yang F, Karim BO, Iacovelli AJ, Cai J, Lerner CP, Richtsmeier JT,Leszl JM, Hill CA: Abnormalities in cartilage and bone development in theapert syndrome FGFR2+/S252W mouse. Development 2005, 132:3537–3548.
11. Perlyn CA, DeLeon VB, Babbs C, Govier D, Burell L, Darvann T, Kreiborg S,Morriss-Kay G: The craniofacial phenotype of the crouzon mouse: analysisof a model for syndromic craniosynostosis using three-dimensionalMicroCT. Cleft Palate Craniofac J 2006, 43:740–748.
12. Hill CA, Reeves RH, Richtsmeier JT: Effects of aneuploidy on skull growthin a mouse model of down syndrome. J Anat 2007, 210:394–405.
13. Lieberman DE, Hallgrímsson B, Liu W, Parsons TE, Jamniczky HA: Spatialpacking, cranial base angulation, and craniofacial shape variation in themammalian skull: testing a new model using mice. J Anat 2008, 212:720–735.
14. Martínez-Abadías N, Percival C, Aldridge K, Hill C, Ryan T, Sirivunnabood S,Wang Y, Jabs E, Richtsmeier J: Beyond the closed suture in apert mousemodels: evidence of primary effects of FGFR2 signaling on facial shapeat P0. Dev Dyn 2010, 239:3058–3071.
15. Percival CJ, Wang Y, Zhou X, Jabs EW, Richtsmeier JT: The effect of abeare-stevenson syndrome Fgfr2 Y394C mutation on early craniofacial bonevolume and relative bone mineral density in mice. J Anat 2012, 221:434–442.
16. Hu D, Marcucio RS, Helms JA: A zone of frontonasal ectoderm regulatespatterning and growth in the face. Development 2003, 130:1749–1758.
17. Szabo-Rogers HL, Smithers LE, Yakob W, Liu KJ: New directions incraniofacial morphogenesis. Dev Biol 2010, 341:84–94.
18. Dixon MJ, Marazita ML, Beaty TH, Murray JC: Cleft lip and palate: understandinggenetic and environmental influences. Nat Rev Genet 2011, 12:167–178.
19. Young NM, Hu D, Lainoff AJ, Smith FJ, Diaz R, Tucker AS, Trainor PA,Schneider RA, Hallgrímsson B, Marcucio RS: Embryonic bauplans and thedevelopmental origins of facial diversity and constraint. Development2014, 141:1059–1063.
20. Chong HJ, Young NM, Hu D, Jeong J, McMahon AP, Hallgrimsson B,Marcucio RS: Signaling by SHH rescues facial defects following blockadein the brain. Dev Dyn 2012, 241:247–256.
21. Smith FJ, Hu D, Young NM, Lainoff AJ, Jamniczky HA, Maltepe E,Hallgrimsson B, Marcucio R: The effect of hypoxia on facial shapevariation and disease phenotypes. Dis Model Mech 2013, 6:915–924.
22. Li X, Young NM, Tropp S, Hu D, Xu Y, Hallgrímsson B, Marcucio RS:Quantification of shape and cell polarity reveals a novel mechanismunderlying malformations resulting from related FGF mutations duringfacial morphogenesis. Hum Mol Genet 2013, 22:5160–5172.
23. Young NM, Wat S, Diewert VM, Browder LW, Hallgrímsson B: Comparativemorphometrics of embryonic facial morphogenesis: implications forcleft-lip etiology. Anat Rec 2007, 290:123–139.
24. Schmidt EJ, Parsons TE, Jamniczky HA, Gitelman J, Trpkov C, Boughner JC,Logan CC, Sensen CW, Hallgrímsson B: Micro-computed tomography-basedphenotypic approaches in embryology: procedural artifacts on assessmentsof embryonic craniofacial growth and development. BMC Dev Biol 2010,10:1–14.
25. Parsons TE, Schmidt EJ, Boughner JC, Jamniczky HA, Marcucio RS,Hallgrímsson B: Epigenetic integration of the developing brain and face.Dev Dyn 2011, 240:2233–2244.
26. Hochheiser H, Aronow BJ, Artinger K, Beaty TH, Brinkley JF, Chai Y, Clouthier D,Cunningham ML, Dixon M, Donahue LR, Fraser SE, Hallgrimsson B, Iwata J,Klein O, Marazita ML, Murray JC, Murray S, Pardo-Manuel de Villena F,Postlethwait J, Potter S, Shapiro L, Spritz R, Visel A, Weinberg SM, Trainor PA:The FaceBase consortium: a comprehensive program to facilitatecraniofacial research. Dev Biol 2011, 355:175–182.
27. Houle D, Govindaraju DR, Omholt S: Phenomics: the next challenge. Nat RevGenet 2010, 11:855–866.
28. Bookstein FL: Morphometric Tools for Landmark Data: Geometry and Biology.Cambridge, UK: Cambridge University Press; 1991.
29. Lele S, Richtsmeier JT: An Invariant Approach to Statistical Analysis of Shapes.London: Chapman & Hall-CR Press; 2001.
30. Zelditch M, Swiderski D, Sheets DH, Fink WL: Geometric Morphometrics forBiologists: A Primer. San Diego: Elsevier Academic Press; 2004.
31. Yamakado M, Yohro T: Subdivision of mouse vibrissae on anembryological basis, with descriptions of variations in the number andarrangement of sinus hairs and cortical barrels in BALB/c (nu/+; nude,nu/nu) and hairless (hr/hr) strains. Am J Anat 1979, 155:153–173.
32. Van Exan R, Hardy M: A spatial relationship between innervation and theearly differentiation of vibrissa follicles in the embryonic mouse. J Anat1980, 131:643–656.

Percival et al. BMC Developmental Biology 2014, 14:31 Page 12 of 12http://www.biomedcentral.com/1471-213X/14/31
33. Gunz P, Mitteroecker P, Bookstein FL: Semilandmarks in Three Dimensions.In Modern Morphometrics in Physical Anthropology. New York: KluwerAcademic/Plenum Publishers; 2005:73–98.
34. Kaufman MH: The Atlas of Mouse Development. London; Tokyo: AcademicPress; 1992.
35. Kristensen E, Parsons TE, Hallgrímsson B, Boyd SK: A novel 3-D image-basedmorphological method for phenotypic analysis. IEEE Trans Biomed Eng 2008,55:2826–2831.
36. Ólafsdóttir H, Darvann TA, Hermann NV, Oubel E, Ersbøll BK, Frangi AF,Larsen P, Perlyn CA, Morriss-Kay GM, Kreiborg S: Computational mouseatlases and their application to automatic assessment of craniofacialdysmorphology caused by the crouzon mutation Fgfr2C342Y. J Anat2007, 211:37–52.
37. Wilamowska K, Wu J, Heike C, Shapiro L: Shape-based classification of 3Dfacial data to support 22q11. 2DS craniofacial research. J Digit Imaging2012, 25:400–408.
38. Liu X, Mio W, Shi Y, Dinov I, Liu X, Leporé N, Leporé F, Fortin M, Voss P,Lassonde M, Thompson PM: Models of Normal Variation and LocalContrasts in Hippocampal Anatomy. In Models Norm Var Local ContrastsHippocampal Anat MICCAI 2008 Lect Notes Comput Sci. Volume 5242.Heidelberg: Springer-Verlag Berlin; 2008:407–415.
39. Hammond P: The use of 3D face shape modelling in dysmorphology.Arch Child 2007, 92:1120–1126.
40. Claes P, Walters M, Vandermeulen D, Clement JG: Spatially-dense 3D facialasymmetry assessment in both typical and disordered growth. J Anat2011, 219:444–455.
41. Guo JG, Mei X, Tang K: Automatic landmark annotation and densecorrespondence registration for 3D human facial images. BMC Bioinformatics2013, 14:1–12.
42. MeshLab. In Visual Computing Lab – ISTI – CNR. [http://meshlab.sourceforge.net]43. Klingenberg CP: MorphoJ: an integrated software package for geometric
morphometrics. Mol Ecol Resour 2011, 11:353–357.44. Drake AG, Klingenberg CP: The pace of morphological change: historical
transformation of skull shape in St Bernard dogs. Proc R Soc B Biol Sci2008, 275:71–76.
45. R Developmental Core Team: R: A Language and Environment for StatisticalComputing. Vienna, Austria: R Foundation for Statistical Computing; 2008.
doi:10.1186/1471-213X-14-31Cite this article as: Percival et al.: Surface landmark quantification ofembryonic mouse craniofacial morphogenesis. BMC DevelopmentalBiology 2014 14:31.
Submit your next manuscript to BioMed Centraland take full advantage of:
• Convenient online submission
• Thorough peer review
• No space constraints or color figure charges
• Immediate publication on acceptance
• Inclusion in PubMed, CAS, Scopus and Google Scholar
• Research which is freely available for redistribution
Submit your manuscript at www.biomedcentral.com/submit
Copyright © 2022 FDOKUMEN