Rhesus Macaques Simian Immunodeficiency Virus Infection of ...
Upload
independentCategory
view
3download
0
Craniofacial Variability andModularity inMacaquesand Mice
BENEDIKT HALLGRIMSSONn1, KATHERINE WILLMORE2, CURTIS DORVAL3,AND DAVID M.L. COOPER 4
Department of Cell Biology & Anatomy and the Joint Injury and ArthritisResearch Group, University of Calgary, Calgary, Alberta T2N 4N1, CanadaDepartment of Medical Sciences, University of Calgary, Calgary,Alberta T2N 4N1, CanadaDepartment of Biological Sciences, University of Calgary, Calgary, Alberta,Canada T2N 1N4, CanadaDepartments of Archaeology and Medical Sciences, University of Calgary,Calgary, Alberta T2N 4N1, Canada
ABSTRACT Evolutionary developmental biology of primates will be driven largely by thedevelopmental biology of the house mouse. Inferences from how known developmental perturbationsproduce phenotypic effects in model organisms, such as mice, to how the same perturbations wouldaffect craniofacial form in primates must be informed by comparisons of phenotypic variation andvariability in mice and the primate species of interest. We use morphometric methods to comparepatterns of cranial variability in homologous datasets obtained for two strains of laboratory mice andrhesus macaques. C57BL/6J represents a common genetic background for transgenic models.A/WySnJ mice exhibit altered facial morphology which results from reduction in the growth of themaxillary process during formation of the face. This is relevant to evolutionary changes in facialprognathism in nonhuman primate and human evolution. Rhesus macaques represent a nonhumanprimate about which a great deal of phenotypic and genetic information is available. We findsignificant similarities in covariation patterns between the C57BL/6J mice and macaques. Among-trait variation in genetic and phenotypic variances are fairly concordant among the three groups, butamong-trait variation in developmental stability is not. Finally, analysis of modularity based onphenotypic and genetic correlations did not reveal a consistent pattern in the three groups. Wediscuss the implications of these results for the study of evolutionary developmental biology ofprimates and outline a research strategy for integrating mouse genomics and developmental biologyinto this emerging field. J. Exp. Zool. (Mol. Dev. Evol.) 302B:207–225, 2004. r 2004 Wiley-Liss, Inc.
Recent advances in genomics, bioinformaticsand developmental genetics has the potential torevolutionize research on the evolutionary devel-opmental biology of primates including humans(Haag and True, 2001). Through bioinformaticsand computational biology, developmental biologyis beginning to move from a focus on particulardevelopmental pathways to finding out how com-plex systems composed of such pathways producephenotypic variation. A major problem for apply-ing this sort of understanding to evolutionarycontexts is that so much of our knowledge ofdevelopment is limited to a few modelspecies(Hall, ’99). For mammals, our mechanistic under-standing of development is largely limited to whatcan be generalized from mice. Improvedunderstanding of the developmental basis for
evolutionary change and phenotypic variation inprimates will largely depend on our ability toextract information from mouse-based databases,generate hypotheses based on this information,and find ways to test them using genetic andphenotypic data from humans and other primates.This dictates that we need to know more abouthow mice differ from other species that we’reinterested in. Hence the motivation for theseemingly odd question posed in this paperFhow
Grant sponsors: NSERC #238992-02; CFI #3923; Alberta Innova-tion and Science #URSI-01-103-RI to B.H.
nCorrespondence to: Benedikt Hallgrımsson, Dept. of Cell Biology &Anatomy, University of Calgary, 3330 Hospital Dr., Calgary, AB T2N4N1, Canada. E-mail: [email protected]
Received 19 August 2003; Accepted 8 December 2003Published online in Wiley Interscience (www.interscience.wiley.
com). DOI: 10.1002/jez.b.21002
r 2004 WILEY-LISS, INC.
JOURNAL OF EXPERIMENTAL ZOOLOGY (MOL DEV EVOL) 302B:207–225 (2004)

similar are mice to macaques in terms of cranialmodularity and variability?
In this paper, we compare developmental stabi-lity, canalization, and integration in two strains ofmice and rhesus macaques. Macaca mulatta is aprimate species about which a great deal is knownin terms of both genetics and development. Rhesusmacaque genomic work is not far behind thebaboon and chimpanzee genome projects and therhesus macaque is by far the most commonly usedprimate species in biomedical research. C57BL/6Jis a mouse strain commonly used as a backgroundfor transgenic models. Transgenic mice are pro-duced using embryonic stem cells from strain 129mice and then the transgene is crossed to anotherstrain such as C57Bl/6J or C3H to boost breeding(Festing et al., ’99, 2001). A/WySnJ mice areincluded in this study because they represent amouse model thatis of potential interest forhuman and nonhuman primate evolution. Thesemice exhibit a reduction in the growth of themaxillary process during formation of the face(Wang and Diewert, ’92). Although this feature isassociated with increased susceptibility to cleft lip,this strain allows us to study a developmentalchange of potential relevance to evolutionarychanges in facial prognathismFan importantfeature in human evolution. In this study, analysisof this phenotype is limited to determining theextent to which the phenotypic change exhibitedby these mice creates a departure from the sharedcraniofacial variability pattern observed betweenmacaques and the unaffected C57BL/6J strain.
Addressing the three components of variabilityoutlined above, we focus on craniofacial skeletalvariation in adults and limit our analysis to 3specific questions:1. Is variation in cranial shape correlated betweenmice and macaques?2. Do homologous traits in mice and rhesusmacaques show similar levels of within and amongindividual variation?3. Do mice and macaques show similar patterns ofcraniofacial modularity based on phenotypic,genetic and asymmetry covariation?
The first question addresses the extent to whichmice and macaques exhibit similar patterns ofcranial shape covariation. This is importantbecause significant correlation between the covar-iance structures of the two species would helpjustify the use of mouse mutant models to predictthe phenotypic effects of specific developmentalchanges in primates. For example, Brachyrrhine(Br) express phenotype which involves a dramatic
shortening of the sphenoid bone (Lozanoff, ’93)and cascading effects throughout the cranium(Mc-Bratney et al., 2003). This model could be used totest the role of variation in basicranial length indetermining craniofacial shape (Lieberman andMcCarthy, ’99; Lieberman et al., 2000a, b). Thespecific developmental alteration produced by theBr mutation can only be inferred to produce asimilar cascade of craniofacial changes in primatecrania if there is some similarity in the underlyingpattern of craniofacial shape variation in primatesand wildtype mice. In other words, if sphenoidlength covaries differently with other craniofacialcomponents in mice than in primates, a short-ening of the sphenoid cannot be expected toproduce similar craniofacial changes in bothgroups.
The second question addresses the question ofwhether among and within-individual variancesare similarly patterned throughout the cranium inmice and macaques. Houle (’98) has argued thatthe genetic variance of traits is to a large degreedetermined by their developmental architecture-For by what he refers to as the mutational targetsize. Given that the developmental mechanismsunderlying cranial development are thought to bebroadly similar across mammals, one would pre-dict, therefore, that genetic and phenotypic var-iances should vary similarly across traits indifferent mammalian species. Similarly, develop-mental instability of different traits may bedetermined by their underlying developmentalarchitecture, including epigenetic effects such asmechanical loading. In this case, FA should varyamong traits in a coordinated fashion acrossmammalian species. This second expectation isweaker since so little is known about the develop-mental basis for variation in developmentalstability. We will test both predictions by compar-ing among the among trait variation for individualvariances, FA, and multivariate specific variancesacross the two mouse strains and macaques.
Finally, the third question deals with how thepattern of cranial variation can be decomposedinto developmental modules. By modules, we referto the idea that developmental systems consist ofpartially dissociable parts or processes (Hall, ’95;Wagner, ’96; Dassow and Munro, ’99; Magwene,2001). Modules can be defined at all levels ofbiological organization and can be hierarchicallyarranged and partially overlapping (Wolf et al.,2001; Gass and Bolker, 2003). The modularityconcept has guided much of the recent work onmorphological integration as the structure of
B. HALLGRIMSSON208

phenotypic covariation can be viewed as a reflec-tion of the underlying modularity in developmen-tal organization (Magwene, 2001; Marroig andCheverud, 2001).
Much of the existing work on integration andmodularity in the mammalian skull has been doneby Cheverud and colleagues on rhesus macaquesand tamarins (Cheverud, ’82; ’88; ’95; ’96;Ackermann and Cheverud, 2000). These studiesconfirm that functionally and developmentallyrelated traits in the cranium are integrated interms of phenotypic, genetic, and environmentalcorrelations. Although a considerable amount ofwork has been done on the mouse mandible(Cheverud et al., ’91; Atchley, ’93; Klingenberget al., 2001a), a study comparable to Cheverud’sanalyses of integration in primates has notbeen undertaken for the mouse cranium. In thisstudy, we perform an analysis of the patterningof integration in the skull based on amongindividual variation, genetic correlations andfluctuating asymmetry. Fluctuating asymmetry(FA) refers to the normally distributed deviationsfrom perfect symmetry that are usually attributedto developmental instability. As Klingenberg et al.have argued (2000, 2001b, 2003), the covariationof signed asymmetry values captures adistinct component of morphological integrationand provides a means of distinguishing covariationdue to direct versus parallel developmentalconnections.
Following Cheverud and Ackermann (Chever-ud, ’95; Ackermann and Cheverud, 2000), weconstructed hypothetical matrices of developmen-tal and functional integration. The reasoning usedto generate these hypotheses is similar to thatused to generate functional/developmental groupsin Cheverud’s (’95) analysis and is based ondevelopmental and functional principles that aregeneral to most mammals including mice. Thejustifications for the hypotheses are as follows:
Hypothesis 1: The first hypothesis divides thecranial bones by the mode of ossification. Much ofthe cranial base (sphenoid except for greater wing,petrous portion of temporal, occipital bone) andnasal ‘‘capsule’’ (ethmoid bone) is formed byendochondral ossification (Sperber, 2001). Thecells that form the mesenchymal condensationsfor the cranial base appear to be entirely derivedfrom paraxial mesoderm (Sperber, 2001). Theremaining bones of the skull (the face, and cranialvault) all form by intramembranous ossification(Sperber, 2001). These elements are derived fromneural crest, with the exception of the parietal
bone which is derived from paraxial mesoderm inmice (Jiang et al., 2002).
Hypothesis 2: Hypotheses 2 and 3 are basicallyvariations on Moss’s functional matrices. Hypoth-esis 2 differs from 1 in that the dermatocranium isdivided into a components corresponding to theface and the cranial vault. The reasoning is thatwhile the face is subjected to the potentiallyintegrative action of the stresses generated bymastication, the cranial vault is primarily influ-enced by the growth of the brain (Moss, ’62; Mossand Salentijn, ’69).
Hypothesis 3: Hypothesis 3 divides the facefurther into 3 components. The zygomatic archand the temporal fossa are hypothesized to beinfluenced primarily by the attachments of thetemporalis and masseter muscles. This is sug-gested by an analysis of the muscular dysgenesismouse mutant which shows arrested developmentof skeletal muscle. The absence of activity in themasseter and temporalis muscles is mainly re-flected in changes to the zygomatic arch andadjacent cranial vault (Herring and Lakars, ’82).The maxillary and premaxillary dimensions sur-rounding the dentition are hypothesized to beaffected by the stressed generated by mastication.This ‘‘palate’’ module corresponds to the ‘‘oral’’module in Cheverud’s analysis.
Finally, we hypothesize that the remainingfacial dimensions comprise a ‘‘face’’ module. Thedistances in this module, which mainly linkpalatal, orbital, and zygomatic landmarks, arehypothesized to be influenced by the combinedeffects of brain growth (facial width), muscleactivity, and masticatory stress. Given the com-plexity of the potential factors affecting thismodule, it is expected to be the least likely toshow significant integration.
MATERIALS AND METHODS
Composition of the sample
The macaque sample consists of 228 adult-Macaca mulatta crania from the Caribbean Pri-mate Research Center Museum in San JuanPuerto Rico (132 F and 96 M). All individualswere derived from the free ranging colony at CayoSantiago. The Cayo Santiago macaques foragefreely on the island but their diet is supplementedwith monkey chow (Rawlins and Kessler, ’86).
The mouse sample consists of samples from twostrains that differ significantly in craniofacialmorphology. C57BL/6J is the most commonly used
CRANIAL VARIABILITY AND MODULARITY IN MACAQUES AND MICE 209

inbred mouse strain for biomedical research and isone of the most common backgrounds for trans-genic mice (jaxmice.jax.org). A/WySnJ mice arederived from the ‘‘A’’ strain lineage. Both strainsare inbred, having been maintained by brothersister mating for 217 generations for the C57BL/6J mice and 247 for the A/WySnJ mice at TheJackson Laboratory. A/WySnJ mice are known todiffer significantly from C57BL/6J mice in em-bryonic facial growth. The facial prominences arelate to appose and exhibit a reduced degree ofcontact when compared to other strains (Wangand Diewert, ’92; Wang et al., ’95). These mice alsoshow an elevated background of cleft lip andincreased susceptibility to cleft palate (Diewert,’82; Juriloff et al., 2001; Diewert and Lozanoff,2002). This susceptibility is linked to two geneticfactors (clf1 and clf2) and a significant maternaleffect (Juriloff et al., 2001). The disruption in thetiming of the contact between the facial processesis due to a reduction in the growth of the maxillaryprocess prior to the formation of the face (Wangand Diewert, ’92; Wang et al., ’95). The presence ofthis malformation allows us to assess what theinfluence of a reduction in maxillary processgrowth is on craniofacial form.
We thus include this mouse strain in ouranalysis as an example of a mouse model exhibit-ing a phenotypic change of potential relevance toevolutionary developmental inference in humanevolution. Our mouse sample consists of 40C57BL/6J mice (21 F, 19 M) and 50 A/WySnJmice (28 F, 22 M). To obtain these samples, siblingbreeding pairs were obtained from Jackson labs.All mice were fed a standard diet ad libitum andsacrificed at 30 days by CO2 asphyxiation and thenstored frozen for future analysis. The mice are allraised in the same facility at roughly the sametime, but no other measures were taken to reduceenvironmental variance.
The macaque data consists of 35 3D landmarkscollected using a Microscribe 3D desktop digitizingsystem directly from macerated crania. Thisanalysis is based only on the 26 landmarks thatwere also digitized on the mouse sample. Theselandmarks are shown in Figure 1. Each individualwas digitized three times on separate occasions bythe same observer to allow quantification ofmeasurement error and assessment of the sig-nificance of FA.
The mouse dataset consists of 3D landmarksdigitized from 3D reconstructions based on com-puted microtomography scans. A Skyscan 1072-100kv microtomograph was used to scan eachindividual with an isotropic resolution of 19.43mm. Scans were performed with a 1 mm alumi-nium filter at 100Kv with 4 second exposures and3 frame averaging. After 2D reconstruction togenerate the image stacks, each stack was sub-jected to a three dimensional median filter usingImageJ (NIH, Bethesda MD) to improve the signalto noise ratio in each section. In this algorithm,each pixel value was averaged across its immediateneighbours in the x, y, and z dimensions. Eachstack was used to generate a 3 dimensionalreconstruction using Analyze 3D 4.0 (AnalyzeDir-ect Lenexa, KS). Three dimensional landmarkswere digitized directly from these reconstructions.Each individual was scanned and measured twiceto allow assessment of measurement error and thesignificance of FA.
Statistical methods
The statistical analysis was based on twodifferent approaches. To compare variation inoverall shape among species and strains, thecombined landmark datasets for all three groupswere subjected to Procrustes superimpositionusing Morpheus (Slice, ’94–’99). Rohlf (2000) has
Fig. 1. Landmarks used for this analysis. All landmarks are homologous or nearly so except for landmark 19. This landmarkwas excluded from direct comparisons between species. Landmarks 5 is also not strictly homologous since it is placed on theanterior edge of M1 in the mice and the upper canine in macaques. It is intended to capture variation in the length of themaxillary dentition and so was used in the analysis. Landmark 1 is also not strictly homologous as it lies on the anterior edge ofthe upper incisor in mice and the posterior alveolar margin in macaques.
Fig. 2. Variation along principal components 1 and 2 in lateral (a) and basicranial (b) views for all 3 groups. The wireframelinking the points used in the analysis was arbitrarily constructed to aid visualization. For each principal component, awireframe is shown for the sample average as well as for the upper and lower extremes of variation along that component in thesample.
B. HALLGRIMSSON210

CRANIAL VARIABILITY AND MODULARITY IN MACAQUES AND MICE 211

TABLE1. Inter-Landmark distances used in this study and their classi¢cation into hypothetical developmental and functional modules.The landmarks are shown in Figure 1 and the hypotheses are described in the text
Distance Hypothesis 1 Hypothesis 2 Hypothesis 3
1 to 19 Dermatocranium Face Palate1 to 2 Dermatocranium Face Palate1 to 21 Dermatocranium Face Face1 to 34 Dermatocranium Face Face1 to 5 Dermatocranium Face Palate10 to 14 Chondrocranium Basicranium Basicranium10 to 17 Chondrocranium Basioranium Basioranium12 to 14 Chondrocranium Basicranium Temporal12 to 26 Dermatocranium Neurocranium Neurocranium12 to 28 Chondrocranium Basictanium Temporal13 to 29 Chondrocranium Basicranium Temporal14 to 15 Chondrocranium Basicranium Temporal14 to 29 Chondrocranium Basicranium Temporal15 to 26 Dermatocranium Neurocranium Neurocranium15 to 28 Chondrocranium Basicranium Temporal17 to 12 Chondrocranium Basicranium Temporal17 to 14 Chondrocranium Basicranium Temporal17 to 26 Dermatocranium Neurocranium Neurocranium17 to 29 Chondrocranium Basicranium Temporal19 to 6 Dermatocranium Face Palate2 to 19 Dermatocranium Face Palate2 to 6 Dermatocranium Face Palate21 to 22 Dermatocranium Face Orbit21 to 28 Dermatocranium Neurocranium Neurocranium22 to 26 Dermatocranium Neurocranium Neurocranium24 to 2 Dermatocranium Face Face24 to 25 Dermatocranium Face Orbit25 to 17 Dermatocranium Neurocranium Neurocranium25 to 21 Dermatocranium Face Orbit25 to 26 Dermatocranium Neurocranium Neurocranium26 to 13 Dermatocranium Neurocranium Neurocranium26 to 34 Dermatocranium Neurocranium Neurocranium28 to 25 Dermatocranium Neurocranium Ncurocranium28 to 26 Dermatocranium Neurocranium Neurocranium3 to 13 Chondrocranium Basicranium Zygomatic3 to 21 Dermatocranium Pace Face3 to 4 Dermatocranium Face Zygomatic32 to 25 Dermatocranium Face Zygoroatic33 to 13 Dermatocranium Face Zygomatic33 to 24 Dermatocranium Face Zygomatic33 to 25 Dermatocranium Face Zygomatic33 to 32 Dermatocranium Face Zygomatic34 to 22 Dermatocranium Face Orbit4 to 8 Dermatocranium Face Zygomatic5 to 19 Dermatocranium Face Face5 to 3 Dermatocranium Face Palate5 to 34 Dermatocranium Face Face5 to 8 Dermatocranium Face Palate6 to 8 Dermatocranium Face Palate8 to 10 Chondrocranium Basicranium Basicranium8 to 15 Chondrocranium Basicranium Basicranium8 to 21 Dermatocranium Face Face8 to 22 Dermatocranium Face Face8 to 29 Chondrocranium Basicranium Basicranium8 to 34 Dermatocranium Face Face8 to 9 Chondrocranium Basicranium Basicranium9 to 10 Chondrocranium Basicranium Basicranium
B. HALLGRIMSSON212

shown that Procrustes methods capture overallshape variation very effectively for statisticalcomparisons of shapes and this is widely done,although Lele and others have presented analysesthat contradict this view (Lele, ’93; Lele andMcCulloch, 2002). Comparisons of very dissimilarshapes may be particularly problematic for Pro-crustes analysis (Lele and Richtsmeier, 2001).Separate principal components analyses were thenperformed for each group to visualize the principalcomponents of shape variation for each group.Morphologika (O’Higgins and Jones, ’99) was usedto visualize variation along specific principalcomponents. Regression of principal componentscores against centroid size was used to determinethe presence of allometric variation in shape.Matrix correlations and Mantel’s tests were usedto compare correlation matrices across groups.Separate matrices were obtained for each sex fromthe Procrustes data. When averaged across sexes,correlations were first subjected to the Fishertransformation.
To compare anatomically localized variation,however, we based our analysis on a set of inter-landmark distances. There is controversy aroundhow reliably the Procrustes method partitionsvariation across individual landmarks for theanatomical localization of variation (Lele andRichtsmeier, 2001). As we observed in our dataset,eliminating individual landmarks, particularlythose with high variance, can significantly alterthe covariance of Procrustes values for theremaining landmarks. This phenomenon led Klin-genberg, for example, to repeat the Procrustesfitting step in a permutation test for covariationamong regions of the mandible (Klingenberg,2004). We avoid this complication and rely onthe same methods used successfully by Cheverudet al. in earlier work (Cheverud, ’95; Ackermannand Cheverud, 2000; Marroig and Cheverud,2001).
We defined a set of 59 inter-landmark distancesfrom the 26 landmarks that defined anatomicalregions of interest without overlapping exces-sively. These distances are listed in Table 1. Asin previous studies of this kind, several inter-
landmark distances had common end-points butthis was minimized to the extent possible whilecapturing the anatomical regions of interest.
For comparisons of FA among groups, theanalysis followed the recommendations of Palmer(’94) and Palmer and Strobeck (’86; 2002). Eachinter-landmark distance was tested for outliers,significance of FA, significance of directionalasymmetry, deviation from normality, and sizedependence using the methods recommended byPalmer and Strobeck (2003). Traits were correctedfor linear size-dependence by log-transforming theraw data. To compare groups and traits, themeasure of FA employed in this study is Palmerand Strobeck’s FA10 which is calculated as:
FA10 ¼ 0:798 �ffiffiffiffiffiffiffiffiffiffiffiffiffiffiffiffiffiffiffiffiffiffiffiffiffiffiffiffiffiffiffiffiffiffiffiffiffiffiffi2 MSsj �MSm
� �=3
q:
where MSm is the among trial (measurementerror) mean squares and MSsj is the side xindividuals mean squares. This measure has theadvantage of correcting for measurement error.For comparing FA correlation matrices, we usedthe individual signed asymmetry value (L-R) onlog-transformed data. An F-test for multivariateprocrustes asymmetry (Klingenberg and McIn-tyre, ’98) was used to compare FA across sexeswithin groups.
Variation for inter-landmark distances wascalculated in two ways. The variance of the logtransformed distribution for each trait provides asize relative measure of variation for each trait(Lande, ’77). We also calculated the multivariatespecific variance for each trait. This value ismeasure of the variation in each trait that is notexplained by the structure of the correlationmatrix (Johnson and Wichern, ’99). The specificvariance of each trait is calculated as:
wt ¼ 1 � h2� �
where h2 is calculated as:
h2 ¼Xj
i¼i
l2ij
where l2ij is the loading of the ith variable on thejth factor.
9 to 12 Chondrocranium Basicranium Basicranium9 to 17 Chondrocranium Basicranium Basicranium
TABLE1. (continued)
Distance Hypothesis 1 Hypothesis 2 Hypothesis 3
CRANIAL VARIABILITY AND MODULARITY IN MACAQUES AND MICE 213
To calculate the phenotypic and genetic correla-tion matrices, the data were z-transformed withinsexes and groups so as to standardize each sex xgroup distribution to a mean of 0 and a variance of1. This minimizes the effect of sexual dimorphismon the correlation matrices (Cheverud, ’82).Signed asymmetry matrices were calculated basedon distributions of logL-LogR for each trait.
Genetic correlations were estimated differentlyin the two samples due to the nature of the data.For the Cayo Santiago macaques, the identity ofthe mother is known but that of the father is not.Siblings in this sample, therefore, can be eitherhalf or full sibs. We assumed that siblings had anequal probability of being half or full sibs.Heritability estimates were obtained using motheroffspring-pairs and siblings using the equationprovided by Cheverud (’82). Cotterman’s k-coeffi-cients were calculated according to Roff (’97). Forthe mouse sample, maternal values are notavailable. In this case, the ratio of the within-litter against the amongindividual variance pro-vides a crude estimate of heritability. Since theseestimates confound within-litter environmentaleffects with genetic effects, these genetic correla-tions are overestimates and should not be com-pared directly to values obtained from sampleswith more balanced breeding designs.
To determine and compare patterns of modu-larity in the cranium, we used two complementarymethods. First, following Cheverud and Acker-mann (Cheverud, ’95; Ackermann and Cheverud,2000), we constructed hypothetical matrices thatdescribed expected patterns of covariation basedon an hypothesis of modularity. Table 1 showshow the inter-landmark distances were classifiedinto hypothetical modules based on the threehypotheses of developmental and functional inte-gration. In each hypothetical matrix, cells thatlinked traits hypothesized to be correlated wereassigned a value of 1 and cells linking traitshypothesized to be uncorrelated were assigned avalue of 0. A consensus matrix was calculated byaveraging the cell values across the three hypoth-eses. Matrix correlations with Mantel’s tests forsignificance were then used to compare phenoty-pic, genetic and signed asymmetry correlationmatrices to the hypothetical integration matrices.
Modules were then further tested for signifi-cance against the correlation structure of eachmatrix as whole. Since we are testing a priorihypotheses about patterns of integration, weneeded a means of testing for the significance ofcorrelations among the sets of structures identi-
fied by our hypotheses. Simply obtaining thesignificance of those correlations is obviouslymisleading since the matrices, with the exceptionof the asymmetry matrixes, tend to be integratedas the result of size and most of the correlationsare significant. We therefore used the followingrandomization test. The matrix from which a setof correlations was drawn, such as the matrix of alllimb measurements, was randomized. At eachiteration, the set of correlations linking thestructures specified by the hypotheses was ob-tained from the reordered matrix and stored andthe average z-transformed value was calculated.The routine then calculated the probability ofobtaining the observed mean correlation (afterz-transformation) by dividing the number of timesa value was obtained that equaled or exceeded theobserved value and dividing by the total number ofiterations. For all tests, 1000 iterations were used.This method was used previously in our analysis oflimb element integration (Hallgrimsson et al.,2002).
RESULTS
Overall shape variation was assessed usingprincipal components analysis of Procrustessuperimposed landmark data. Figure 2 showsvariation along first two principal components offor Procrustes shape variation within each groupas deformations of a 3D wireframe. Visual inspec-tion of the changes in the wireframes along eachprincipal component shows that while the mainaxes of variation in each group are different, thereare similiarities. Variation along principal compo-nent 1 in both the C57BL/6J mice and macaques,for example, involves anteroposterior variation infacial length and change in cranial vault height.Variation for the A/WySnJ mice along the firstprincipal component appears to involve mainly theangulation of the palate. This variation may wellbe related to the prevalence of palatal dysmor-phology in this group. The similarity of thevariation along principal component 1 in C57BL/6J mice and macaques is confirmed by a low butsignificant positive correlation between the stan-dardized eigenvectors for PC1 (0.321, po0.01). Bycomparison, the correlation for the first principalcomponent eigenvectors between A/WySnJ miceand macaques was �0.152 and �0.070 for thecorrelation between the two mouse strains. Whilethe two mouse strains exhibit significantly corre-lated covariance structures for females, this is
B. HALLGRIMSSON214

evidently not due to variation along the firstprincipal component.
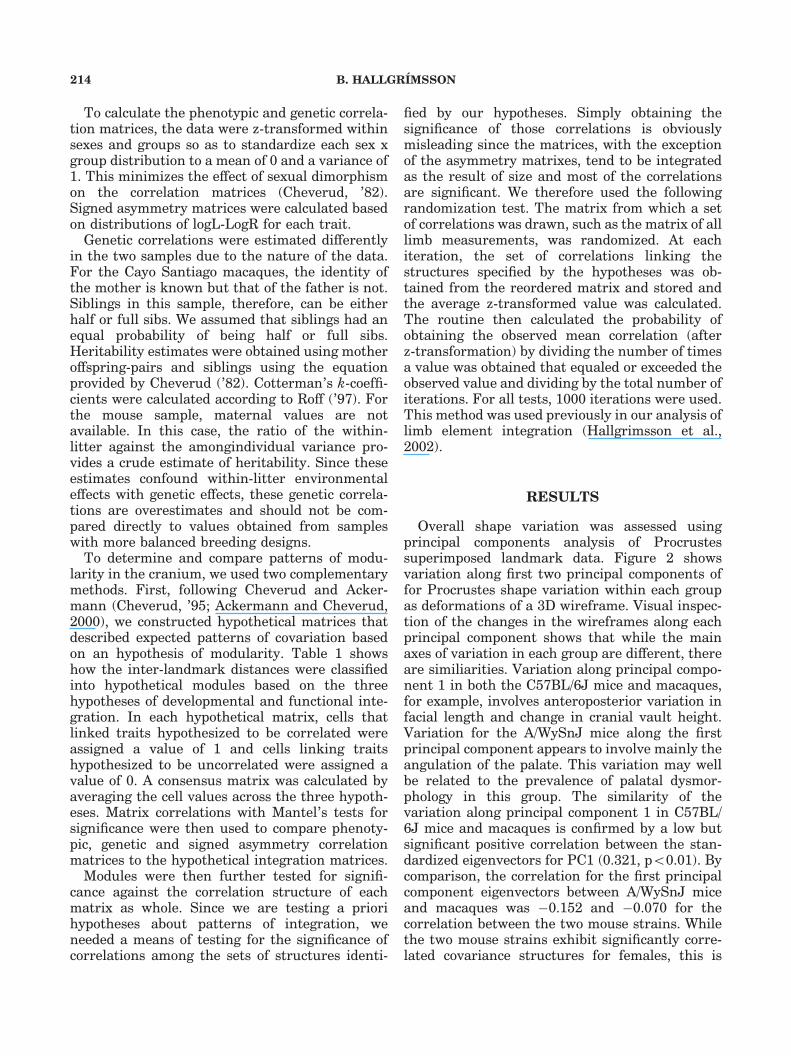
Plots of principal component 1 against centroidsize, shown in Figure 3, for both macaques andC57BL6tJ mice shows that variation along princi-pal component 1 is significantly related to size(Macaques, ANCOVA, r=0.87, po0.001; C57BL/6J, ANCOVA, r=0.86, po0.001). This implies thatin these two distantly related mammals, variationin cranial vault height and facial length shows asimilar relationship to size. Allometric shapevariation was not apparent for the other principalcomponents in these groups or for any principalcomponent in the A/WySnJ mice. Figure 4 shows
principal component scores for components 1 and2 for the combined mouse sample. This plot showsthe magnitude of the shape difference between thetwo mouse strains. Based on the degree of sexualdimorphism for shape in the macaques sample(Fig. 3), separate variance-covariance matrices bysex were obtained from the Procrustes data.
Table 2 shows the matrix correlations amongthese matrices and their significance as calculatedusing the Mantel procedure. The results shownhere confirm that while the A/WySnJ mice show apattern of variation that is very different frommacaques, the C57BL/6J mice show a pattern ofcovariation that is significantly correlated with the
Fig. 3. Scatterplots of principal component scores for factor 1 against centroid size for the macaque (A) and C57BL/6Jsamples (B).
CRANIAL VARIABILITY AND MODULARITY IN MACAQUES AND MICE 215
covariation pattern in macaques. This table alsoconfirms the significantly different pattern ofshape covariation in the two mouse strains.When the mouse variance-covariance matrices areaveraged across sexes and compared to the similarlyaveraged matrix for macaques, the matrix correla-tion is improved to 0.173 (Mantel’s test, po0.001).The same procedure for the A/WySnJ mice revealsan insignificant matrix correlation (0.053).
Following Palmer and Strobeck (2003), wesubjected the distance data to outlier analysisusing Grubb’s test prior to calculation of fluctuat-ing asymmetry variances. Measurement erroroutliers can occur because of movement of thespecimen during digitization, mislabelling of land-marks, misidentification of anatomical landmarksor in exceptional circumstances alteration (da-
mage) to the specimen between measurementtrials. Similarly, asymmetry outliers can occurbecause of specimen damage or pathology. Thisprocedure assumes that asymmetry values arenormally distributed and that extreme asymmetryoutliers are not reflections of developmentalinstability. See Gangestad and Thornhill (2003)for arguments as to why this assumption may notbe valid. Applying Grubb’s test to both themeasurement error variances and asymmetryvalues eliminated 445 out of 35,492 distancenindividual nside among trial variances becauseof measurement error and 36 out of 49,385distance nindividual nside ntrial asymmetry valuesbecause of extreme asymmetry. Histograms ofindividual distributions were inspected to verifythat the cases eliminated were indeed extreme
Fig. 4. Plot of principal component scores for the two mouse strains. This plot illustrates the magnitude of shape differencebetween the two mouse strains.
TABLE 2. Matrix correlations for variancc-covariance matrices from Procrustes data for all groups by sex.The lower left hand of thematrix contains the correlations while the upper contains the p value as obtained through theMantel procedure.Values that are signi¢cant
after Bonferroni adjustment at a=0.05 are bolded
Group Sex M. mulattaFemale
M. mulattoMale
AWySnJFemale
AWySnJMale
C57BL/6JFemale
C57BL/6JMale
M. mulatta F ^ po0.001 NS NS po0.001 po0.001M. mulatta M 0.767 ^ NS NS po0.001 po0.001AWySnJ F 0.044 0.048 ^ po0.001 po0.01 NSAWySnJ M 0.030 0.057 0.672 ^ po0.001 NSC57BL/6J F 0.127 0.137 0.178 0.206 ^ po0.001C57BL/6J M 0.122 0.169 0.063 0.07 0.488 ^
B. HALLGRIMSSON216

outlier. The data removed represents about 1.3%of the total dataset. 111 out of the 173 groupndistance asymmetry distributions showed signifi-cant FA. Significant directional asymmetry (DA)was found for the majority of traits (86 out of the111). The degree and direction of directionalasymmetry did not vary significantly among thethree groups (ANOVA, df=2, F=0.002, p=NS)although there was a significant interactionamong side ngroup ndistance (ANOVA, df=236,F=1.4, po0.001). Subsequent analyses were per-formed the signed FA distributions with the meanDA subtracted from each value. This does notremove genetic variation in the degree of direc-tional asymmetry (Palmer and Strobeck, ’92), butit does remove covariation among the signedasymmetry values of traits introduced by DA.
Correlations between the significant FA10 va-lues among groups were initially significant for all3 comparisons. However, after removing onelandmark that showed consistently high FA inall 3 groups, the correlations were not significant(Cayo vs C57BL/6J: r=0.26, p=0.17; Cayo vs AWS:r=0.02, p=0.9). Similarly, the comparison of thetwo mouse strains revealed an initially strongcorrelation of r=0.85 (po0.001) that was reducedto r=0.12 (p=0.6) when two traits that showedconsiderably higher FA were removed. Thus,traits do not appear to vary in developmentalstability in a coordinated fashion across groups,even among the two mouse strains. However, thecovariation among asymmetry values was concor-dant among the three groups. As Table 3 shows,the matrix correlation for the signed asymmetrydistributions after correction for DA were highlysignificant.
To compare variation in phenotypic variance foreach trait among groups, we obtained the var-iances of the log-transformed distributions withineach group. Since measurement error may vary ina similar fashion among traits in the three groups(e.g. with trait size), we obtained the residuals ofthe variances against measurement error, whichwas calculated as the mean among-trial varianceon the log-transformed data. Table 4 shows thecorrelations of the residuals of the phenotypicvariance against measurement error regressionamong groups as well as among the z-transformedgenetic correlations for each trait. The resultsshown in Table 4 indicate that the pattern ofamong trait variation in phenotypic and geneticvariance is, in fact, quite similar among thegroups, with the highest correlation for the twomouse strains.
Multivariate specific variances for each traitwere obtained as explained above from the load-ings of the first 10 factors as obtained by principalcomponents analysis on each correlation matrix.The specific variances obtained from the distancedata were not significantly correlated amongsamples (r=0.24 for Cayo vs C57BL/6J, p=0.06,�r=0.01 for Cayo vs A/WySnJ, p40.05 andr=0.10 for the two mouse strains, p40.05).Interestingly, the same analysis performed onthe Procrustes landmarks produced highly sig-nificant results (r=0.43 for Cayo vs C57BL/6J,po0.01, �r=0.50 for Cayo vs A/WySnJ, po0.01and r=0.61 for the two mouse strains, po0.001).These results are difficult to interpret in light ofthe contradictory results from the analysis ofinterlandmark distances. These results do notprovide conclusive evidence that among traitvariation in the degree of independence or unique-ness of each trait is similar in the three groups.
To assess the pattern of modularity in the threegroups, we compared phenotypic, signed asymme-try, and genetic correlation matrices to hypothe-tical connectivity matrices using matrixcorrelations and Mantel’s test as described above.These results are shown in Table 5. These resultsshow that while the functional-developmental
TABLE 4. Among group correlations of the residuals of the size-scaled phenotypic variance (var(log(x)) onmeasurement error
(mean among-trial variance on log-transformed data for each dis-tance (A) and the z-transformed genetic correlations for each dis-
tance (B)
M. mulatta A/WySnJ C57BL/6J
A. Phenotypic varianceM. mulatta 1 p=0.04 po0.001A/WySnJ 0.263 1 po0.001C57BL/6J 0.353 0.689 1
B. Genetic CorrelationsM. mulatta 1 po0.01 NSA/WySnJ 0.363 1 po0.01C57BL/6J 0.214 0.329 1
TABLE 3. Matrix correlation for the signed asymmetry distribu-tions [log(L)-Log(R)] after correction for DA
M. mulatta A/WySnJ C57BL/6J
M. mulatta 1 po0.001 po0.001A/WySnJ 0.293 1 po0.001C57BL/6J 0.285 0.401 1
CRANIAL VARIABILITY AND MODULARITY IN MACAQUES AND MICE 217

hypotheses appear to predict modularity forphenotypic and genetic covariation in the macaquecranium, as found earlier by Cheverud (’82), this isnot true of the two mouse strains. Hypotheses 2and 3 are the most strongly supported for themacaque cranium. By contrast, the signed asym-metry matrices are significantly correlated withboth hypothesis 2 and 3 for all three groups, withthe strongest support for hypothesis 3.
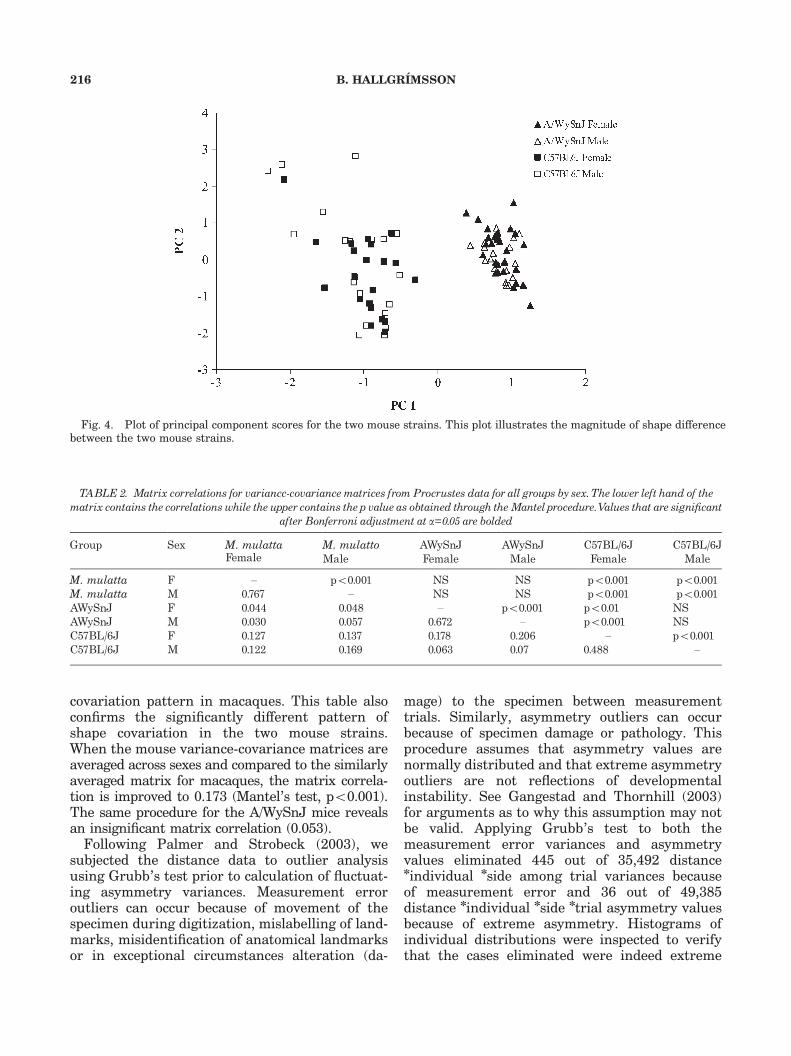
To investigate further the significance of themodules specified in hypothesis 3, we used arandomization method, as described above, to testthe significance of the mean z-transformed corre-lation coefficient for groups of traits definingmodules. These results, presented in Table 6,show very little consistency among the threedifferent types of correlation matrices in terms ofwhich modules are significant. After Bonferroniadjustment for 75 correlations, only the face issignificantly integrated at a=0.05 for the pheno-typic and genetic correlations in all three groups.However, there is fairly good correspondencebetween the modules identified by the three typesof correlation matrices in C57BL/6J mice andmacaques. For the phenotypic matrices, the faceemerges as significant in both groups for bothgenetic and phenotypic correlations and the orbitfor genetic correlations. For the FA matrix, thebasicranium and neurocranium emerge as signifi-cant in all three groups and both the macaquesand the A/WySnJ mice show significant integra-tion in the face.
Given the different results provided by the threetypes of matrices, we also obtained matrix correla-tions across the matrix types within groups (Table7). As these results show, there is a very goodcorrelation between the genetic and phenotypiccorrelation matrices as had been reported byCheverud (’88). There are low but significantcorrelations between the signed FA and thephenotypic matrices and lower correlations stillbetween the signed FA and the genetic matrix.This may indicate that most of the correlationbetween the signed FA and the phenotypic matrixis due to environmental correlations.
DISCUSSION
The ever-increasing availability of transgenicmice or mice with known mutations and the rapiddevelopment of mouse-based bioinformatics data-bases means that the developmental biology of thehouse mouse has become an important key forfuture progress in evolutionary developmentalbiology for all mammals including primates.Inferences based on mouse informatics about thephenotypic effects of genetic factors in primatesmust be informed by knowledge of how patterns ofvariation and variability differ between mice andthe species of interest. This study tests thehypothesis that since patterns of covariation andvariability in the primate skull are thought tolargely reflect underlying factors common toall mammals, the overall pattern of covariation
TABLE 5. Matrix correlations for comparisons between phenotypic, genetic, and FAmatrices to hypothetical connectivity matrices.Bolded values are signi¢cant after Bonferroni adjustment at po0.05
1. Phenotypic Correlation MatricesHypothesis 1 Hypothesis 2 Hypothesis 3 Consensus
M. mulatta 0.098 0.234 0.187 0.209A/WySnJ �0.005 �0.002 0.032 0.007C57BL6J 0.025 0.131 0.022 0.077
2. Genetic Correlation MatricesHypothesis 1 Hypothesis 2 Hypothesis 3 Consensus
M. mulatta 0.187 0.208 0.178 0.234A/WySnJ 0.009 �0.004 0.026 0.010C57BL6J 0.003 0.127 �0.018 0.052
3. Signed FACorrelation MatricesHypothesis 1 Hypothesis 2 Hypothesis 3 Consensus
M. mulatta 0.057 0.096 0.232 0.138A/WySnJ 0.044 0.085 0.130 0.100C57BL6J 0.102 0.096 0.108 0.122
B. HALLGRIMSSON218
and variability should be similar in mice andmacaques. We discuss the results under separateheadings below.
Phenotypic covariation
The finding that C57BL/6J mice, which is one ofthe more commonly used backgrounds for trans-genic models, show a pattern of phenotypiccovariation that is significantly correlated withthat of rhesus macaques is encouraging for the use
of mouse models for the study of the develop-mental basis for evolutionary change in primates.While the expectation is that covariance struc-tures are phylogenetically conserved (Lande, ’79;Steppan, ’97), it is also known that significantvariation does occur between closely relatedspecies (Ackermann and Cheverud, 2000). Thebasis for the expectation that mice and macaquesshow correlated patterns of phenotypic variation isthat these patterns should, at least in part, beunderlain by developmental factors common to allmammals, such as the integrating effects ofembryonic precursors, the growth of the brain,and the mechanical effects of mastication.
Given the similarity in variation pattern be-tween the C57BL/6J mice and macaques, thedeparture of A/WySnJ mice from the patterncaptured by the first principal component in theother two groups is significant. Morphometricstudies of embryonic development have shownthat in these strains, the facial prominences arelate to appose and exhibit a reduced degree of
TABLE6. Means of z-transformed correlations forblocks of traits de¢ninghypotheticalmodules for thephenotypic, genetic, and signedFAcorrelation matrices
Phenotypic Genetic Signed FA
z r z r z r
M. mulatta Overall 0.485 0.451 0.208 0.205 0.025 0.025Basicranium 0.738 0.628 0.171 0.169 0.198 0.195Face 1.162 0.822 0.560 0.508 0.074 0.074Neurocranium 0.544 0.496 0.338 0.326 0.161 0.159Orbit 0.371 0.355 0.323 0.313 0.039 0.039Palate 0.609 0.544 0.306 0.297 0.001 0.001Temporal 0.444 0.417 0.218 0.214 0.048 0.048Zygomatic 0.489 0.453 0.209 0.206 0.061 0.061
A/WySnJ Overall 0.296 0.296 0.147 0.146 0.017 0.017Basicranium 0.383 0.365 0.202 0.199 0.107 0.106Face 0.421 0.398 0.248 0.243 0.061 0.061Neurocranium 0.456 0.427 0.124 0.124 0.128 0.127Orbit 0.200 0.197 0.086 0.086 0.024 0.024Palate 0.241 0.237 0.176 0.174 �0.043 �0.043Temporal 0.225 0.221 0.153 0.142 0.031 0.031Zygomatic 0.238 0.233 0.096 0.096 0.016 0.016
C57BL/6J Overall 0.395 0.375 0.250 0.246 0.013 0.013Basicranium 0.513 0.472 0.328 0.316 0.139 0.139Face 0.748 0.634 0.393 0.374 0.041 0.041Neurocranium 0.215 0.212 0.042 0.042 0.170 0.169Orbit 0.457 0.428 0.339 0.326 0.044 0.044Palate 0.616 0.548 0.354 0.340 0.024 0.024Temporal 0.241 0.236 0.212 0.209 �0.017 �0.017Zygomatic 0.689 0.597 0.402 0.382 �0.005 �0.005
TABLE 7. Matrix correlations between the three di¡erent correla-tionmatrices for all three groups. Bold values are signi¢cant by
Mantel’s test at a=0.01
M. mulatta A/WySnJ C57BL/6J
Signed FAvs Phenotypic 0.300 0.190 0.174Signed FAvs Genetic 0.185 0.090 0.065Phenotypic vs Genetic 0.687 0.807 0.887
CRANIAL VARIABILITY AND MODULARITY IN MACAQUES AND MICE 219

contact when compared to other strains (Wangand Diewert, ’92; Wang et al., ’95). Although thishas not been shown, these changes in facialgrowth are presumably related to the two geneticfactors linked to increased predisposition for facialclefting in these mice (Juriloff et al., 2001). It istempting to infer that these mutations, mediatedthrough changes to epigenetic interactions, causethe A/WySnJ craniofacial covariance structure todepart from a basic mammalian condition. Thathypothesis, however, would need to be testedagainst a much larger comparative sample. Wecan conclude, however, that while covariancestructures in mice and a primate species such asM. mulatta can be quite similar, they can also varysignificantly within species as the result of one or afew developmental changes.
Within and among individual variation
The second aim of this paper was to test theassumption that patterns of within and among-individual variance are similar across two strainsof mice and our representative primate species, M.mulatta. This assumption is necessary to supportthe use of mouse models to determine what kindsof developmental changes produce changes invariance in other mammals, including nonhumanprimates and humans.
The assumption that determinants of varianceare fairly constant across mammals is also veryimportant for research on how the modulation ofphenotypic variance interacts with dysmorphol-ogy. In many etiologically complex traits, changesin among and within- individual variability as wellas covariation patterns may play important rolesin the generation of the dysmorphology (Shapiro,’75). Our results show that FA variances do notvary in a coordinated fashion across the threegroups. There are two possible explanations forthis result. One is that the FA variances in ourstudy are poorly estimated due to sample size.Sample size and measurement error are alwaysproblems for FA studies due to the small signal tonoise ratio. However, it is clear from our resultsthat there is at least not a particularly strongpositive correlation in FA variation among the twomouse strains and rhesus macaques. Secondly, itis possible that the developmental architectureunderlying variation for each trait is sufficientlydifferent to create a different among-trait patternof variation for FA. As a first approximation, thedevelopmental factors that determine the relativemagnitudes of FA for individual traits are cur-
rently unknown. Thus, it is difficult to predict theconditions under which the determinants ofdevelopmental stability in specific anatomicalcontexts would vary within and among species. Itis interesting, however, that the covariation ofsigned asymmetries shows a significant pattern ofcorrelation among the three groups with strongestcorrelation among the two mouse strains (Table 3).If this pattern is shown to hold true in a largercomparative sample, this would imply that thecovariation of signed asymmetry values doesreflect fairly basic aspects of the underlyingdevelopmental and functional architecture of thecranium. This hypothesis, which needs to betested using a larger comparative sample. wouldsupport Klingenberg’s (2003) arguments for usingsigned asymmetries to dissect out patterns ofmodularity.
In contrast to the FA variances, both thephenotypic and the genetic variance patterns ofamong-trait variation were significantly correlatedacross groups. Following Houle’s (’98) demonstra-tion that the developmental architecture deter-mines the genetic variance of traits, this suggeststhat there is a fairly high degree of similarityacross these distantly related mammal speciesbetween the genetic and developmental determi-nants of variance for individual traits. Althoughthis observation also needs to be corroborated in alarger comparative sample, it does lend supportfor the assumption that homologous developmen-tal changes produce similar changes in phenotypicvariance in mice and other mammals.
Modularity
Cheverud’s (’82, ’95) model of craniofacialmodularity in primate crania is based on ahypothetical developmental and functional orga-nization that is common to most mammals. Theexpectation is, therefore, that the same pattern ofmodularity should emerge from an analysis ofcovariation in all three groups in this study. Theassumption that the pattern of modularity in thecranium is common to most mammals, at least at agross level is very important if we intend touse mutant mouse models to predict the patternof phenotypic effect produced by specific muta-tions in primates. Can we, for instance, usemouse mutants in which components ofbasicranial growth are affected to predict theoutcome on the morphology of the neurocraniumand face?
B. HALLGRIMSSON220
The results of our analysis are somewhatcontradictory. The analysis of modularity basedon phenotypic and genetic correlations inthe macaque sample confirmed the pattern pre-viously reported by Cheverud (’82, ’95) forprimates, but failed to reveal the same patternfor the two mouse strains, indicating that thepattern of modularity in mice may be somewhatdifferent. For the mouse sample, the geneticcorrelations have a high error and potential biassince the number of litters in each sample isfairly small. These correlations may also beinflated by the confounding of genetic andwithin-litter effects due to the breeding design.By contrast to the phenotypic and genetic correla-tions, the signed asymmetry matrices showedthe pattern of modularity in all three groups.For the post-hoc tests of significance for specificmodules, none of the modules emerge as signifi-cant across both groups and types of correlationsalthough the face is significantly integrated for allbut the signed asymmetry correlations in A/WySnJ mice.
In this study, the hypothetical matrices werecomposed of homologous landmarks in the twospecies compared and not on separate assessmentsof how functional or developmental factors mightinfluence covariation in each species. Therefore,the difference in modularity pattern in macaquesand the two mouse strains may reflect a differencein how the functional and developmental determi-nants of covariation map on to homologous regionsin the cranium. The masseter or temporalismuscles, for instance, are likely associated with aregions of mechanical influence in both miceand macaques, but the anatomical distribution ofthose regions on the cranium may differsomewhat. This is not surprising given thesignificant anatomical and functional differencesbetween the two species compared here. However,this finding does highlight a caveat that needs tobe considered when using mouse models to inferhow changes in craniofacial components producecorrelated effects elsewhere in the craniofacialcomplex.
Another important consideration which maycontribute to the discrepancy in the results ofthe modularity analysis between mice and maca-ques is that the relative proportions of genetic andenvironmental variance are undoubtedly verydifferent in the mouse versus macaque samplesimply because the mice are inbred. This reducesgenetic variation and increases the proportionof variance accounted for by environmental
factors. Cheverud observed that genetic andenvironmental covariance matrices for cranialtraits in macaques are concordant (Cheverud,’82). However, if this is not true in micethe increased importance of the environmentalvariance in the inbred mouse straitns couldcontribute to an altered covariance pattern.The effect of both breeding structure and environ-mental conditions on the composition of pheno-typic variances is a potential confoundingfactor for future comparisons between variationwithin an inbred mouse model for some develop-mental change and naturally occurring variationin primates.
The results of the analysis of signed asymmetrycorrelation matrices were quite different from theanalyses of the phenotypic and genetic correlationmatrices. This may be because the integration ofthe signed asymmetry values captures a somewhatdifferent aspect of integration than the phenotypicand genetic matrices. Our results indicate that thesigned asymmetry matrices show a lower level ofintegration overall than either the genetic orphenotypic matrices. However, the pattern ofdirect developmental connection that is capturedby the signed asymmetry matrices shows a moreconsistent pattern of integration than either thephenotypic or genetic covariaton patterns. At leastin terms of the component of integration capturedby the signed asymmetry correlation matrices, thetwo strains of mice show a similar pattern ofmodularity to that reported here for macaques andearlier by Cheverud (’82, ’95). Although thecorrespondence of the signed asymmetry matricesacross the three groups analyzed for this studysupports the hypothesis that the basic pattern ofmodularity in the cranium does not vary amongmammals, this needs to be verified in a largercomparative sample.
Our results contrast with those obtained byDebat et al. (2000) in that we found low butsignificant correlations between the signed asym-metry matrix and the phenotypic correlationmatrices for all 3 groups. Debat measured 2Dlandmarks in dorsal view while our analysis isbased on 3D landmarks distributed across thecranium. The difference, therefore, may be due tothe more anatomically comprehensive sampling ofthe cranium in our study. Another possibleexplanation is methodology since Debat et al.’sused the covariance of the Procrustes super-imposed landmarks and not inter-landmark dis-tances. However, an analysis of the macaque dataused in this study using both techniques provided
CRANIAL VARIABILITY AND MODULARITY IN MACAQUES AND MICE 221
the same result (Willmore and Hallgrimsson,2003).
Using mouse informatics to study theevolutionary developmental biology of
primates
The motivation behind this study is the desire touse the wealth of information being generatedabout mouse development to aid the study of theevolutionary developmental biology of primates aswell as other groups of mammals. This would bedone by mining the informatics resources beingcreated for mouse development, such as the mouseinformatics resource maintained by Jackson La-boratories, for genetic factors relevant to under-standing the developmental basis for evolutionarychange in primates. Researchers interested in thedevelopmental genetic basis for particular aspectsof phenotypic information would start by finding amouse mutant model with a targeted gene disrup-tion (knockout) or a known spontaneously occur-ring mutation. The A/WySnJ mice which formpart of this study are a good example of apotentially useful mouse model with sponta-neously occurring mutations and a complexphenotype. These mice provide an opportunity toinvestigate the effects of changes to growth ratesof the facial processes during embryonic develop-ment on overall craniofacial form. The geneticfactors thought to cause the distinctive facialmorphology in these mice as well as their predis-position to dysmorphology have been mapped tosmall regions of chromosomes 11 and 13 and arelatively small list of candidate genes has beenidentified within these regions (Juriloff et al.,2001). Ongoing work will soon reveal which ofthese candidates are affected and what the precisenature of the mutations are. Once this is com-pleted and the appropriate studies are conductedto determine what the products of the genesaffected actually do during mouse craniofacialdevelopment, the stage is set to apply these resultsto understanding the developmental basis forchanges in craniofacial shape in primates.
It is important to realize that what is offeredthrough an analysis of mutant models such as A/WySnJ mice or knockouts of known genes is notthe identification of individual genes that underliephenotypic variation and microevolutionarychange. Rather, what is produced is the identifica-tion of developmental pathways, the componentsof which can contribute to variation and evolutionof the aspect of morphology affected by the
mutation (Wilkins, 2002). Once the mutationsthat identify the phenotypic changes of interestin mice are identified, the mouse informaticsresources can be mined to flesh out the genenetwork within which the affected gene can bethought to reside in terms of the phenotypic effectof interest. Assume, for example, that clf1 muta-tion in A/WySnJ mice is found to be in Dlx3 or anassociated DNA regulatory sequence. This is agood candidate gene because the mutation ismapped to a region close to this gene (Juriloffet al., 2001) and it is expressed in the neural crestwithin branchial arches 1 and 2 during day 9.5–10.5, prior to fusion of the facial processes (Krausand Lufkin, ’99; Sumiyama and Ruddle, 2003). Dlxgenes are a homeobox family that have a widevariety of functions in cranial development andelsewhere (Merlo et al., 2000). Dlx3, for example,is known to play an important role in placentaldevelopment (Cross et al., 2003). The elements ofthe gene network within which Dlx3 affectscraniofacial development are gradually becomingclearer. We know, for instance, that Dlx proteinsusually function in heterodimers with proteinsencoded by Msx genes (Kraus and Lufkin, ’99) andthat their transcription is regulated upstream bybone morphogenetic proteins (Bmp). Recently, atissue-specific enhancer for visceral arch expres-sion of Dlx3 has been described and found to behighly conserved between mice and humans(Sumiyama et al., 2002). This site shows bindingmotifs for the Dlx-3 protein, suggesting autoregu-lation of transcription, but also for GATA-3 and toPrd-like factors (Sumiyama and Ruddle, 2003).The various players and their regulatory elementswithin a complex such as this can be ranked interms of their probability of underlying phenoty-pic variability and microevolution in the structureof interest by examining what other developmen-tal functions they have and the phenotypespresented by their knockouts. As the mouseinformatics databases grow, the detail with whichnetworks like this can be fleshed out or evenmodelled will only increase.
Ideally, mining the mouse informatics resourceswould result in a manageable target list of genesor known promoters or other cis-regulatoryelements that could be scanned for polymorphismsusing high throughput DNA sequencing. Poly-morphisms identified in this way in DNA ex-tracted from primate species of interest could thenbe tested for phenotypic effects using morpho-metric methods. This endeavour would be aided bythe establishment of a primate phenome reposi-
B. HALLGRIMSSON222

tory similar to the mouse phenome project (Paigenand Eppig, 2000). Primate collections associatedwith banked extracted DNA such as the CayoSantiago collection of rhesus macaques at theCaribbean Primate Research Center will becomecritical for enabling research projects within thisgeneral paradigm.
CONCLUSION
Understanding the developmental basis forphenotypic variation and microevolutionarychange is a central problem in evolutionarybiology that has to this point remained elusive(Stern, 2000; Haag and True, 2001). It is widelyrecognized that the explosion of knowledge aboutthe development biology of a few model organismsis generating the knowledge necessary to effec-tively pry open this black box. Recent progress inunderstanding the evolutionary developmentalbiology of teeth in vertebrates, for example, hasbeen driven by the combination of inference fromthe developmental biology of model organisms(e.g., Stock, 2001) and a computational approachto modelling the effects of known genetic factors(Jernvall and Jung, 2000). As background to usingmouse developmental biology and informatics tostudy the evolutionary developmental biology ofthe primate cranium, this study reports on acomparison of patterns of phenotypic variationand variability in two strains of mice and rhesusmacaques. We report significant similarities be-tween the patterns of variation and variabilitywhich will help justify the use of mice as modelsfor the developmental basis for phenotypic varia-tion and microevolutionary change in primates.The similarities include the principal axes ofcraniofacial variation in a common strain of inbredmice (C57BL/6J) and macaques, similarity inamong-trait variation in phenotypic and geneticvariance, and similar patterns of modularity asrevealed through the analysis of the covariance ofsigned asymmetries. However, we also reportsignificant differences, such as in the pattern ofmodularity detected through the analysis ofphenotypic and genetic covariance structure.Comparison of two mouse strains that differ inphenotypically significant mutations affecting cra-niofacial development also shows that the patternsof phenotypic and genetic covariation hypothe-sized to be shared among mammals can also besignificantly altered within a species. Despitethese caveats, the results presented here supportthe application of mouse informatics to primate
evolutionary developmental biology. Given thenature of primate data, the integration of mouse-based informatics with genetic and phenotypicanalyses on primates will be the most productiveroute to significant progress in understanding thedevelopmental basis for primate evolution.
ACKNOWLEDGEMENTS
We are grateful to Wei Liu for technicalassistance and to Courtney Rippin for editing.We also thank Mae Chung, Michelle Dymond andJon Chung for discussions and assistance withvarious technical issues. We thank Brian Hall,Rebecca German, Dan Lieberman and Leigh VanValen for discussions. This work was supported byNSERC grant 238992-02 and CFI grant #3923and Alberta Innovation and Science grant #URSI-01-103-RI to BH.
LITERATURE CITED
Ackermann RR, Cheverud JM. 2000. Phenotypic covariancestructure in tamarins (genus Saguinus): a comparison ofvariation patterns using matrix correlation and commonprincipal component analysis. Am J Phys Anthropol111:489–501.
Atchley WR. 1993. Genetic and developmental aspects ofvariability in the mammalian mandible. In: Hanken J, HallBK, editors. The skull: development. Chicago: University ofChicago Press. p 207–247.
Cheverud JM. 1982. Phenotypic, genetic, and environmentalintegration in the cranium. Evol 36:499–516.
Cheverud JM. 1988. A comparison of genetic and phenotypiccorrelations. Evolution 42:958–968.
Cheverud JM. 1995. Morphological integration in the saddle-back tamarin (Saguinus fuscicollis) cranium. The AmericanNaturalist 145:63–89.
Cheverud JM. 1996. Developmental integration and theevolution of pleiotropy. American Zoologist 36:44–50.
Cheverud JM, Hartman SE, Richtsmeier JT, Atchley WR.1991. A quantitative genetic analysis of localized morphol-ogy in mandibles of inbred mice using finite element scalinganalysis. Journal of Craniofacial Genetics and Developmen-tal Biology 11:122–137.
Cross JC, Baczyk D, Dobric N, Hemberger M, Hughes M,Simmons DG, Yamamoto H, Kingdom JC. 2003. Genes,development and evolution of the placenta. Placenta24:123–130.
Dassow V, Munro E. 1999. Modularity in animal developmentand evolution: elements of a conceptual framework forEvoDevo. Journal of Experimental Zoology 285:307–325.
Debat V, Alibert P, David P, Paradis E, Auffray J-C. 2000.Independence between developmental stability and canali-sation in the skull of the house mouse. Proc Roy Soc Lond B267:423–430.
Diewert VM. 1982. A comparative study of craniofacial growthduring secondary palate development in four strains of mice.J Craniofac Genet Dev Biol 2:247–263.
Diewert VM, Lozanoff S. 2002. Animal models of facialclefting: experimental, congenital, and transgenic. In:
CRANIAL VARIABILITY AND MODULARITY IN MACAQUES AND MICE 223

Mooney MM, Siegel MI, editors. Understanding craniofacialanomalies: etiopahtogenesis of craniosynostoses and facialclefting. New York: Wiley-Liss.
Festing MF. 2001. Experimental approaches to the determina-tion of genetic variability. Toxicol Lett 120:293–300.
Festing MF, Simpson EM, Davisson MT, Mobraaten LE. 1999.Revised nomenclature for strain 129 mice. Mamm Genome10:836.
Gangestad SW, Thornhill R. 2003. Fluctuating asymmetry,developmental instability, and fitness: Toward model-basedinterpretation. In: Polak M, editor. Developmental Instabil-ity: Causes and consequences. Oxford: Oxford UniversityPress. p 62–80.
Gass GL, Bolker JA. 2003. Modularity. In: Hall BK, Olson W,editors. Keywords and concepts in evolutionary develop-mental biology. Cambridge, MA: Harvard University Press.
Haag ES, True JR. 2001. Perspective: From mutants tomechanisms? Assessing the candidate gene paradigm inevolutionary biology. Evolution Int J Org Evolution55:1077–1084.
Hall BK. 1995. Homology and embryonic development.Evolutionary Biology 28:1–36.
Hall BK. 1999. Evolutionary developmental biology. Dor-drecht: Kluwer.
Hallgrimsson B, Willmore K, Hall BK. 2002. Canalization,developmental stability, and morphological integration inprimate limbs. Am J Phys Anthropol Suppl 35:131–158.
Herring SW, Lakars TC. 1982. Craniofacial development inthe absence of muscle contraction. J Craniofac Genet DevBiol 1:341–357.
Houle D. 1998. How should we explain variation in the geneticvariance of traits? Genetica 102–103:241–253.
Jernvall J, Jung H-S. 2000. Genotype, phenotype, and theevolution of molar tooth characters. Yearbook of PhysicalAnthropology 48:171–190.
JIang X, Iseki S, Maxson RE, Sucov HM, Morris-Kay G. 2002.Tissue origins and interactions in the mammalian skullvault. Developmental Biology 241:106–116.
Johnson RA, Wichern DW. 1999. Applied multivariatestatistical analysis. Upper Saddle River, NJ.: Prentice Hall.
Juriloff DM, Harris MJ, Brown CJ. 2001. Unravelling thecomplex genetics of cleft lip in the mouse model. MammGenome 12:426–435.
Klingenberg CP. 2003. Developmental instability as a researchtool: Using patterns of fluctuating asymmetry to infer thedevelopmental origins of morphological integration. In:Polak M, editor. Developmental instability: causes andconsequences. Oxford: Oxford University Press. p 427–442.
Klingenberg CP, McIntyre GS. 1998. Geometric morpho-metrics of developmental instability: Analyzing patterns offluctuating asymmetry with Procrustes methods. Evolution52:1363–1375.
Klingenberg CP, Zaklan SD. 2000. Morphological integrationbetween developmental compartments in the Drosophilawing. Evolution 54:1273–1285.
Klingenberg CP, Badyaev, Alexander; Sawry, Susanna M.,Beckwith, Nathan, J. 2001a. Inferring developmentalmodularity from morphological integration: analysis ofindividual variation and asymmetry in bumblebee wings.The American Naturalist 157:11–23.
Klingenberg CP, Leamy LJ, Routman EJ, Cheverud JM.2001b. Genetic architecture of mandible shape in mice:Effects of quantitative trait loci analyzed by geometricmorphometrics. Genetics 157:785–802.
Klingenberg CP, Mebus K, Auffray JC. 2003. Developmentalintegration in a complex morphological structure: howdistinct are the modules in the mouse mandible? Evol Dev5:522–531.
Kraus P, Lufkin T. 1999. Mammalian Dlx homeobox genecontrol of craniofacial and inner ear morphogenesis. J CellBiochem Suppl 32–33:133–140.
Lande R. 1977. On comparing coefficients of variation.Systematic Zoology 26:214–217.
Lande R. 1979. Quantitative genetic analysis of multivariateevolution: applied to brain:body size allometry. Evolution33:203–215.
Lele S. 1993. Euclidean distance matrix analysis of landmarkdata: Estimation of mean form and mean form difference.Mathematical Geology 25:573–602.
Lele S, McCulloch CE. 2002. Invariance, identifiability andmorphometrics. Journal of American Statistical Association.
Lele S, Richtsmeier JT. 2001. An invariant approach to thestatistical analysis of shapes. Boca Raton: Chapman & Hall.
Lieberman DE, McCarthy RC. 1999. The ontogeny of cranialbase angulation in humans and chimpanzees and itsimplications for reconstructing pharyngeal dimensions.J Hum Evol 36:487–517.
Lieberman DE, Pearson OM, Mowbray KM. 2000a. Basicra-nial influence on overall cranial shape. J Hum Evol 38:291–315.
Lieberman DE, Ross CF, Ravosa MJ. 2000b. The primatecranial base: ontogeny, function, and integration. Am JPhys Anthropol Suppl:117–169.
Lozanoff S. 1993. Midfacial retrusion in adult brachyrrhinemice. Acta Anatomica 147:125–132.
Magwene PM. 2001. New tools for studying integration andmodularity. Evolution 55:1734–1745.
Marroig G, Cheverud JM. 2001. A comparison of phenotypicvariation and covariation patterns and the role of phylo-geny, ecology, and ontogeny during cranial evolution of newworld monkeys. Evolution 55:2576–2600.
McBratney BM, Margaryan E, Ma W, Urban Z, Lozanoff S.2003. Frontonasal dysplasia in 3H1Br/Br mice. Anat Rec271A:291–302.
Merlo GR, Zerega B, Paleari L, Trombino S, Mantero S, LeviG. 2000. Multiple functions of Dlx genes. Int J Dev Biol44:619–626.
Moss ML. 1962. The functional matrix. In: Kraus BS, RiedelRA, editors. Vistas in orthodontics. Philadelphia: Lea andFebiger. p 85–98.
Moss ML, Salentijn L. 1969. The primary role of functionalmatrices in facial growth. Am J Orthod 55:566–577.
Paigen K, Eppig JT. 2000. A mouse phenome project. MammGenome 11:715–717.
Palmer AR. 1994. Fluctuating asymmetry analyses: A primer.In: Markow TA, editor. Developmental Instability: ItsOrigins and Evolutionary Implications. Dordrecht: KluwerAcademic Publishers. p 355–364.
Palmer AR, Strobeck C. 1986. Fluctuating asymmetry:measurement, analysis, patterns. Annual Review of Ecologyand Systematics 17:391–421.
Palmer AR, Strobeck C. 1992. Fluctuating asymmetry as ameasure of developmental stability: Implications of non-normal distributions and power of statistical tests. ActaZoologica Fennica 191:57–72.
Palmer R, Strobeck C. 2002. Fluctuating asymmetry analysisunplugged. In: Polak M, editor. Developmental Instability(DI): Causes and Consequences: Oxford University Press.
B. HALLGRIMSSON224

Palmer R, Strobeck C. 2003. Fluctuating asymmetry analysisunplugged. In: Polak M, editor. Developmental Instability(DI): Causes and Consequences: Oxford University Press.p 279–319.
Rawlins RG, Kessler MJ. 1986. Demography of the free-ranging Cayo Santiago macaques. In: Rawlins RG, KesslerMJ, editors. The Cayo Santiago Macaques. Albany: StateUniversity of New York Press. p 47–72.
Roff DA. 1997. Evolutionary quantitative genetics. New York:Chapman & Hall.
Rohlf FJ. 2000. Statistical power comparisons among alter-native morphometric methods. Am J Phys Anthropol111:463–478.
Shapiro BL. 1975. Amplified developmental instability inDown’s syndrome. Ann Hum Genet 38:429–437.
Slice DE. 1994–1999. Morpheus. Stony Brook, NY.Sperber GH. 2001. Craniofacial Development. Hamilton, ON:
BC Decker, Inc. Steppan SJ. 1997. Phylogenetic analysis ofphenotypic covariance structure II. Reconstructing matrixevolution. Evolution 51:587–594.
Stern DL. 2000. Evolutionary developmental biology and theproblem of variation. Evolution Int J Org Evolution54:1079–1091.
Stock DW. 2001. The genetic basis of modularity in thedevelopment and evolution of the vertebrate dentition.Philos Trans R Soc Lond B Biol Sci 356:1633–1653.
Sumiyama K, Irvine SQ, Stock DW, Weiss KM, Kawasaki K,Shimizu N, Shashikant CS, Miller W, Ruddle FH. 2002.Genomic structure and functional control of the Dlx3-7bigene cluster. Proc Natl Acad Sci USA 99:780–785.
Sumiyama K, Ruddle FH. 2003. Regulation of Dlx3 geneexpression in visceral arches by evolutionarily conservedenhancer elements. Proc Natl Acad Sci USA 100:4030–4034.
Wagner GP. 1996. Homologues, natural kinds and theevolution of modularity. Am Zool 36:36–43.
Wang K-Y, Diewert VM. 1992. A morphometric analysis ofcraniofacial growth in cleft lip and noncleft mice. Journal ofCraniofacial Genetics and Developmental Biology 12:141–154.
Wang KY, Juriloff DM, Diewert VM. 1995. Deficient anddelayed primary palatal fusion and mesenchymal bridgeformation in cleft lip-liable strains of mice. Journal ofCraniofacial Genetics and Developmental Biology 15:99–116.
Wilkins AS. 2002. The evolution of developmental pathways.Sunderland, MA: Sinauer Associates.
Willmore K, Hallgrimsson B. Variance Components in theMacaque Cranium (abstract); 2003; Leeds, U.K.
Wolf JB, Frankino WA, Agrawal AF, Brodie ED, 3rd, MooreAJ. 2001. Developmental interactions and the constituentsof quantitative variation. Evolution Int J Org Evolution55:232–245.
CRANIAL VARIABILITY AND MODULARITY IN MACAQUES AND MICE 225
Copyright © 2022 FDOKUMEN