Craniofacial plasticity in ancient Peru
15
Anthropol. Anz. PrePub Article J. Biol. Clinic. Anthropol. published online February 2015 www.schweizerbart.de 0003-5548/15/0458 $ 3.75 2015 E. Schweizerbart’sche Verlagsbuchhandlung, Stuttgart, Germany DOI: 10.1127/anthranz/2015/0458 Craniofacial plasticity in ancient Peru Jessica H. Stone 1 , Kristen Chew 2 , Ann H. Ross 2 , and John W. Verano 3 1 Department of Anthropology, University of Oregon, Eugene, OR, USA [email protected] 2 Department of Sociology and Anthropology, North Carolina State University, Raleigh, NC, USA 3 Department of Anthropology, Tulane University, New Orleans, LA, USA With 4 figures and 6 tables Summary: Numerous studies have utilized craniometric data to explore the roles of genetic diversity and environment in human cranial shape variation. Peru is a particularly interesting region to examine cranial variation due to the wide variety of high and low altitude ecological zones, which in combination with rugged terrain have created isolated populations with vastly different physiological adaptations. This study examines seven samples from through- out Peru in an effort to understand the contributions of environmental adaptation and genetic relatedness to craniofacial variation at a regional scale. Morphological variation was investi- gated using a canonical discriminant analysis and Mahalanobis D 2 analysis. Results indicate that all groups are significantly different from one another with the closest relationship between Yauyos and Jahuay, two sites that are located geographically close in central Peru but in very different ecozones. The relationship between latitude/longitude and face shape was also examined with a spatial autocorrelation analysis (Moran’s I) using ArcMap and show that there is significant spatial patterning for facial measures and geographic location sug- gesting that there is an association between biological variation and geographic location. Key words: craniometric data, cranial shape variation, genetic diversity, environmental adap- tation. Introduction Craniometric studies within physical anthropology and skeletal biology have a long history back to the early twentieth century, when countless collections of cranial measurements and indices were collected globally (Boas 1912, Morton 1839, New- man 1943). However, without the development of multivariate statistics and technol- ogy to process and calculate these statistics, many of the early studies were limited in the extent to which meaningful interpretations could be made. Furthermore, investi- gations of global human variation involved matching cranial features and measure- ments to a racial typology, which has been rejected as studies of genetics and evolu- tionary mechanisms such as gene flow have shed light on the heritability of cranial shape (Armelagos et al. 1982, Kohn 1991, Sparks & Jantz 2002). More recent studies involving human variation based on craniometrics are primarily concerned with the roles of genetic diversity and environmental plasticity in population differences eschweizerbart_xxx
Transcript of Craniofacial plasticity in ancient Peru

Anthropol. Anz. PrePub ArticleJ. Biol. Clinic. Anthropol.published online February 2015
www.schweizerbart.de0003-5548/15/0458 $ 3.75
! 2015 E. Schweizerbart’sche Verlagsbuchhandlung, Stuttgart, Germany
DOI: 10.1127/anthranz/2015/0458
Craniofacial plasticity in ancient Peru
Jessica H. Stone1, Kristen Chew2, Ann H. Ross2, and John W. Verano3
1 Department of Anthropology, University of Oregon, Eugene, OR, [email protected] Department of Sociology and Anthropology, North Carolina State University, Raleigh, NC,USA3 Department of Anthropology, Tulane University, New Orleans, LA, USA
With 4 figures and 6 tables
Summary: Numerous studies have utilized craniometric data to explore the roles of geneticdiversity and environment in human cranial shape variation. Peru is a particularly interestingregion to examine cranial variation due to the wide variety of high and low altitude ecologicalzones, which in combination with rugged terrain have created isolated populations withvastly different physiological adaptations. This study examines seven samples from through-out Peru in an effort to understand the contributions of environmental adaptation and geneticrelatedness to craniofacial variation at a regional scale. Morphological variation was investi-gated using a canonical discriminant analysis and Mahalanobis D2 analysis. Results indicatethat all groups are significantly different from one another with the closest relationshipbetween Yauyos and Jahuay, two sites that are located geographically close in central Peru butin very different ecozones. The relationship between latitude/longitude and face shape wasalso examined with a spatial autocorrelation analysis (Moran’s I) using ArcMap and showthat there is significant spatial patterning for facial measures and geographic location sug-gesting that there is an association between biological variation and geographic location.
Key words: craniometric data, cranial shape variation, genetic diversity, environmental adap-tation.
IntroductionCraniometric studies within physical anthropology and skeletal biology have a longhistory back to the early twentieth century, when countless collections of cranialmeasurements and indices were collected globally (Boas 1912, Morton 1839, New-man 1943). However, without the development of multivariate statistics and technol-ogy to process and calculate these statistics, many of the early studies were limited inthe extent to which meaningful interpretations could be made. Furthermore, investi-gations of global human variation involved matching cranial features and measure-ments to a racial typology, which has been rejected as studies of genetics and evolu-tionary mechanisms such as gene flow have shed light on the heritability of cranialshape (Armelagos et al. 1982, Kohn 1991, Sparks & Jantz 2002). More recent studiesinvolving human variation based on craniometrics are primarily concerned with theroles of genetic diversity and environmental plasticity in population differences
eschweizerbart_xxx

related to cranial shape (e.g., Betti et al. 2010, Pietrusewsky 2010, Relethford 2004,Ross & Ubelaker 2010).
A number of studies have demonstrated the genetic neutrality of craniometric vari-ation, but the extent to which climate plays a role in cranial shape is still debated(Betti et al. 2010, Harvati & Weaver 2006, Relethford 2004, Roseman 2004, von-Cramon-Taubadel 2009a, von-Cramon-Taubadel 2009b). Hubbe et al. (2009) foundthat although cranial morphology is largely influenced by geographic distance,aspects of facial morphology are strongly correlated with climate. Selection due toclimate was found to be strongest in groups living in extreme cold environments andthe most highly correlated climatic aspect was temperature (Hubbe et al. 2009).South America is a particularly interesting region to examine cranial variation due tothe variety of the ecological zones located in the area as a result of high elevations inthe Andes Mountains. The rugged terrain in higher elevations in combination withthe overall rise in topography initially created isolated populations and requires dif-ferent physiological adaptations to ensure population survival (Sandweiss & Richard-son 2008). Therefore, clear morphological differences between populations as aresult of physiological adaptations and genetic distance should be present. A numberof studies have been undertaken to examine cranial variation throughout Latin Amer-ica on a regional scale, but rarely contain more than a few samples.
This study attempts to further examine cranial variation in Peru using a combina-tion of seven samples from lowland coastal and highland groups throughout thenorthern and central regions. Using samples collected by Ross et al. (2008), Howells(1973), and Verano (1987), this paper will focus on the relationship between cranio-facial variation, shifts in altitude, and geographic distance. Craniofacial variation willbe evaluated using traditional craniometric analyses such as discriminant functionanalysis (DFA). The relationship between face shape and geographic distance will beexamined using a spatial autocorrelation in ArcMap 10.1. Past research has shownthat highland groups are morphologically similar to one another in relation to low-land groups, creating a coastal and highland differentiation. Furthermore, geographi-cally close groups tend to be most similar to one another (Ditmar 1996, Haun & CockCarrasco 2010, Ross et al. 2008, Sardi et al. 2006). Given that the lowland groups arelocated in a north-south direction along the coast, we expect that the degree of simi-larity between these samples will result in a north-south gradient of variation.Despite the geographic distance between the two highland sites, we also expect to seesome degree of similarity between these groups as well.
Environmental background
Within Peru lies a portion of the Andes, a series of interconnected mountain rangesthat extend down the western coast of South America and result from the subductionzone between the Nazca and Antarctic Plates (Sandweiss & Richardson 2008). Withthe exception of the Himalayas in southern Asia, the Andes contain the only regionin the world at a high enough elevation to cause physical stress on human occupantsthrough increased isolation, extreme diurnal temperature ranges, lower atmosphericoxygen concentrations, and marginal resources. Due to sudden vertical changes inelevation, there is a high contrast between microenvironments from the coastal low-lands to the highest mountain elevations, requiring a range of physiological, techno-
2 Jessica H. Stone et al.
eschweizerbart_xxx

logical, and social adaptations (Dillehay & Kolata 2004, Keatinge 1988). Peruviangeographer Javier Pulgar Vidal divided Peru into eight “natural regions” or ecozonesbased on altitude, climate, and land use that are organized from west to east. Sand-weiss & Richardson (2008) have adapted this system to the Central Andes (Fig. 1).This modified system has been used to categorize our samples in order to furtherinvestigate smaller scale differences between ecozones.
Studies of cranial variation in the Americas
Examination of population variation has been a focus of physical anthropology forover 100 years. Scholars such as Hrdlicka, Boas, and Howells collected thousands ofcranial measurements and indices globally in order to examine the shifts in cranialform across populations (Howells 1973, Howells 2007). Though many of the multi-variate methods used today were not yet available, variation in craniofacial structureamong population groups was identified. Many of these observed differences wereused to create racial typologies (e.g., Mongoloid, Caucasoid, etc.) into which popula-
Fig. 1. Cross section of the Andes showing the eight major eco-zones (Sandweiss & Richard-son 2008).
Craniofacial plasticity in ancient Peru 3
eschweizerbart_xxx

tions were classified. Despite this general emphasis on racial typology, some earlyphysical anthropologists noted differences between groups that could be attributed toenvironmental variation and geographic distance (Howells 2007, Newman 1943). Asthe use of cranial shape for racial classification was rejected, studies utilizing cranio-metric data shifted focus to the relationship between population structure, environ-mental adaptation, and cranial shape. However, until recently, larger scale studies stillrelied on single samples to represent large geographic areas. For example, the Yauyossample from the Howells data set has been used as a Latin America representative innumerous studies (e.g., Relethford 1994, Relethford & Harpending 1994, Roseman2004, Roseman & Weaver 2004). However, Ross et al. (2008) found that Yauyos weresignificantly different morphologically from three other Peruvian groups examined,and that the most environmentally similar groups were also the most biologicallysimilar. Ross et al. (2002) also investigated the role of variation and environmentalfactors in the Americas to dispel the myth of a homogenized American “type” andfound similar results indicating that there is a wide range of variation within theAmericas.
More recently, a number of studies have undertaken research related to populationstructure and morphological variation both in relation to environmental change andacross geographical space throughout the Americas. Ditmar (1996) examined sevencranial measurements in Andean populations and found that they clustered into threemajor morphological “types” corresponding to coastal Peru, Chile, and highlandBolivia and Argentina. Not only was a difference noted across environments, but alsoas one moved east to west. A similar east-west gradient was noted by both Pucciarelliet al. (2006, 2008), who examined variation across both North and South America,and Rothhammer & Silva (1989), who noted change moving from northwest SouthAmerica towards the southeastern region. In order to assess inter-cemetery variationat Pacatnamu on the North Coast of Peru, Verano (1987) examined comparative sam-ples from coastal and highland populations in relation to a sample from Pacatnamuand found that highland and coastal groups were distinct from one another and thatgeographic distance between samples correlated with biological distance. Thesestudies have highlighted the significant range of variation in cranial shape throughoutLatin America and demonstrate the unsuitable grouping of populations into a single“Latin American” or “Hispanic” category. By integrating multiple data sets fromexisting studies to create a larger study sample over a smaller geographic area, we arealso able to examine the relationship between environmental factors, biological dis-tance, and craniofacial shape at a finer scale or micro level.
Material and methodsThe cultural periods of prehistoric Peru are divided into pre-ceramic and ceramic chronolo-gies. Pre-ceramic culture begins with initial human occupation of the area and is divided intosix major occupational periods reaching back to at least 11500 BP and going up to theappearance of ceramic artifacts around 3800 BP (Keatinge 1988). The ceramic period spansfrom 3800 BP up to European contact in AD 1534 and is divided into an Initial Period, Early,Middle, and Late Horizons. The Initial Period and Early Horizons, which span 3800–2200 BP, are characterized by the emergence and expansion of the Chavın culture, shifts insettlement patterns, and evidence of agricultural intensification in the highlands and on thecoast (Keatinge 1988, Pozorski & Pozorski 2008). The Middle Horizon, which begins~AD 600, is marked on the north coast of Peru by migration of Moche groups in response to
4 Jessica H. Stone et al.
eschweizerbart_xxx

a series of drought events (Stanish 2001). In the highlands, the Wari and Tiwanaku culturesemerge as major powers dominating much of coastal and highland Peru and Bolivia (Butters& Castillo 2008, Goldstein 2005, Isbell 2008, Proulx 2008). The Late Intermediate Periodspans AD 1000 to AD 1476, and is characterized culturally by the Chimu culture and devel-opment of Chan Chan as a major capital on the North Coast and the development of the Incaculture in the highlands around Cuzco (Keatinge 1988).
The seven samples used in this study date to the Middle and Late Horizons and were col-lected by the third author (Ross et al. 2008), Howells (1973), and last author (Verano 1987).The five lowland coastal samples consist of Makatampu, Jahuay, Pacatnamu, Malabrigo, andAncon (associated with the chala ecological zone), while the highland sample includes Yau-yos (Suni range) and Cajamarca (Quechua ecozone) (Fig. 2).
Makatampu is located on the central coast and consists of 50 crania excavated from thesite in the 1940s (Ross et al. 2008). The site dates to AD 1–800, a period broadly character-ized by replacement of the Chavın by the Moche on the North Coast, the Nazca to the south,and the Lima culture on the central coast. Based on associated Wari-style ceramics, theJahuay sample, which consists of 54 isolated crania collected from a looted cemetery on thecentral coast, has been assigned to this period. The Pacatnamu sample consists of 133 surfacecrania collected from nine Early and Late period cemeteries, as well as 28 excavated burialsfrom various areas of the site. The Early period cemeteries also date to the Middle Horizonand are contemporary with the Jahuay sample, while the Late Period cemeteries date to theLate Intermediate Period and are contemporary with the Malabrigo sample. The Malabrigosample was collected from a looted cemetery on the North Coast in the Chicama Valley andhas also been dated to the Late Intermediate Period by associated ceramics (Verano 1987).
Fig. 2. Map of Peru and the locations of the samples used in this study (lowland sites indi-cated by circle and highland sites indicated by triangles).
Craniofacial plasticity in ancient Peru 5
eschweizerbart_xxx

Ancon (n = 47) is a lowland site on the central coast that was excavated for the ColumbianExposition of 1893 and dates to the Late Intermediate Period (Ross et al. 2008, Weinstein2005).
The Cajamarca sample consists of two collections – Maqui-Maquis and Rumi Lanchi. Thetwo collections are closely associated and are some of the only samples from the northernsierra (~ 2700 m) region of Peru (Verano 1987). The Maqui-Maquis sample consists of iso-lated crania collected from several caves dated to the Early Intermediate period and is earlierthan the Early Period at Pacatnamu. The Rumi Lanchi sample consists of crania excavatedfrom rock tombs less than 10 km from Maqui-Maquis. The two samples are temporally dis-tinct; Rumi Lanchi dates to the Late Intermediate Period and is contemporary with the LatePeriod at Pacatnamu and the Malabrigo sample (Verano 1987). However, Ericksen (1962)concluded that this site represented regional continuity and thus the samples were combinedfor this study. Yauyos, the Latin American representative from the Howells data set, consistsof 110 crania collected by Julio C. Tello from burial caves in the central highlands (Howells1973). The total sample size for study is 507 individuals (Table 1).
Selection of cranial traits for this study was based on the consistency between the Rossand Verano data sets, meaning only measurements that were available for all seven of thesamples were included in the analysis, thus limiting the measurements used to 10 (Table 2).Undeformed adult crania were selected by Ross et al. (2008) and Verano (1987) for their sam-ples. The measurements used in this study have been thoroughly tested and are part of thestandard forensic set, which allows for incorporation of data from various sources with mini-
Table 1. Sample composition.
Group N (M/F) Temporal range Ecological zone Reference
Ancon 47 (37/2) AD 1000–1476 Central Coast (Chana) Ross 2008Cajamarca 56 (26/30) AD 1–100,
AD 1000–1200North Highland(Quechua)
Ross 2008
Jahuay 54 (29/25) AD 800–1000 Central Coast (Chana) Verano 1987Makatampu 50 (29/21) AD 1–800 Central Coast (Chana) Ross 2008Malabrigo 51 (27/23) AD 1100–1470 North Coast (Chana) Verano 1987Pacatnamu 139 (67/72) AD 600–1050,
AD 1100–1370North Coast (Chana) Verano 1987
Yauyos 110 (55/55) Pre-ContactNo conclusive datesexist
Central Highland (Suni) Howells 1973
Table 2. Measurement descriptions.
Measurement Descriptions
Basion-Prosthion Length(BPL)
Moore-Jansen et al. 1994:51 #6.
Nasion-Prosthion (NPH) Howells 1973: 174.Nasal Height (NLH) Howells 1973: 6 #14; Moore-Jansen et al. 1994:54 #13.Orbital Height (OBH) Moore-Jansen et al. 1994:55 #16.Orbital Breadth (OBB) Howells 1973: 175; Moore-Jansen et al. 1994:55 #15.Nasal Breadth (NLB) Howells 1973: 176; Moore-Jansen et al. 1994:54 #14.Maxillo-Alveolar Breadth(MAB)
Howells 1973:176; Moore-Jansen et al. 1994:51 #7.
Biorbital Breadth (EKB) Howells 1973:178; Moore-Jansen et al. 1994:55 #17.Interorbital Breadth (DKB) Moore-Jansen et al. 1994:55 #18.Frontal Chord (FRC) Howells 1973:181; Moore-Jansen et al. 1994:55 #19.
6 Jessica H. Stone et al.
eschweizerbart_xxx

mal interobserver error (Moore-Jansen & Jantz 1994, Ousley & Jantz 1998). In order toexamine the full range of biological variation within the groups and to increase sample sizes,males and females were pooled. Sardi et al. (2005) concluded that sex variation is negligiblewithin each sample population in among group comparisons. Missing values were estimatedusing the computer program NORM: Multiple imputations of incomplete multivariate dataunder a normal model (Schafer 1999), a simulation procedure that uses a type of Markovchain Monte Carlo technique to generate random draws where the distribution of each drawdepends on the previous (http://www.stat.psu.edu/~jls/misoftwa.html#misoftwa.html#mi).The general guidelines followed were not to accept any case for data replacement that hadmore than 20 % of missing values or no more than 2 variables per individual.
To examine the between-group variation, a canonical variates analysis (CVA) was con-ducted. In a CVA, linear combinations of predictor variables that summarize between-popula-tion variation are used to examine interrelationships among the samples in order to graphicallyrepresent the differences on canonical axes, which maximize the differences (Ross 2004). CVAwasselectedoverexploratoryanalyses suchasPCA(principal componentsanalysis) as thesam-ples are of known origin/provenance and the data are traditional craniometric data, which do notrequire a dimension reducing technique (Ross 2004). To measure the among-group differentia-tion, a Mahalanobis D2 matrix was also calculated. An unweighted pair-group method witharithmetic average (UPGMA) clustering analysis was performed using the distance matrix(Sneath & Sokal 1973) in order to visually assess the relationships among the groups. Theseanalyses were performed using the SAS system for Windows Version 9.3 (2011).
To examine the relationship between facial morphology including the frontal chord andgeographic distance based on latitude and longitude, a spatial autocorrelation analysis wasperformed using the Spatial Autocorrelation tool in ArcMap 10.1 (ESRI 2012). The tool usesGlobal Moran’s I to measure the degree to which a set of spatial feature locations and datavalues tend to cluster or disperse in space. Spatial autocorrelation measures the dependenceof the values of the craniometric variables on the same craniometric variables as a function ofspatial lags – in this case latitude and longitude – using Global Moran’s I (Sokal 1979, Sokal& Uytterschaut 1987, Fortin et al. 2002). Moran’s I is a product-moment coefficient, whichvaries from –1 (negative autocorrelation) to 1 (positive autocorrelation) and in the absence ofspatial autocorrelation with an expected value close to zero (Fortin et al. 2002). After the spa-tial autocorrelation tool calculates the Moran’s I index it calculates the Expected index andthese two values are then compared (ESRI 2012). The resulting z-score and p-values reflectthe overall variance of the features and dataset, which indicate whether differences are signif-icant or not (ESRI 2012).
Results
Craniometrics
The first three significant canonical axes are presented in Table 3, which account for87 % of the total variation. These indicate that approximately 52 % of the among-group shape variation is accounted for by the first canonical variate (CAN1), 22 % isaccounted for by CAN2, and 13 % by CAN3. The total canonical structure and corre-lation between the original variables and the canonical variates is presented inTable 4. The total canonical structure suggests that the variation on CAN1 is associ-ated with nasal breadth (NLB), CAN2 is associated with basion-prosthion height(BPL), and CAN3 with nasal height (NLH).
When CAN1 is plotted against CAN2 (Fig. 3) there is no obvious clustering, how-ever, the axes divide the samples into two major groups. Along CAN1, Jahuay, Mala-brigo, and Pacatnamu fall on the positive side of the axis, which coincides with a bro-ader nasal aperture, while the remaining samples fall on the negative side suggesting
Craniofacial plasticity in ancient Peru 7
eschweizerbart_xxx

Table 3. Significant canonical axes.
CanonicalCorrela-
tion
Eigen-value
Pro-portion
Cumu-lative
LikelihoodRatio
Approxi-mate
F-value
NumDF
DenDF
Pr > F
1 0.651234 0.7364 0.5236 0.5236 0.31538518 10.58 60 2577.6 <.00012 0.488900 0.3141 0.2233 0.7470 0.54764402 7.06 45 2203.9 <.00013 0.434105 0.2322 0.1651 0.9121 0.71965962 5.31 32 1819.7 <.00014 0.245732 0.0643 0.0457 0.9578 0.88676869 2.89 21 1419.1 <.00015 0.229484 0.0556 0.0395 0.9973 0.94375661 2.42 12 990 0.00426 0.061477 0.0038 0.0027 1.0000 0.99622058 0.38 5 496 0.8650
Table 4. Total Canonical Structure.
Variable Can1 Can2 Can3
BPL 0.016121 –0.538059 –0.237030NPH –0.191862 –0.429904 0.366076NLH –0.095327 –0.118800 0.488952OBH 0.178858 –0.446567 0.259341OBB 0.227674 –0.433801 –0.004685NLB –0.618963 0.045295 –0.431588MAB –0.019113 –0.219578 0.433322EKB 0.440798 –0.145461 –0.160437DKB 0.385113 0.336737 –0.349313FRC –0.190775 0.242235 0.054961
Fig. 3. CAN1/CAN2 plot.
8 Jessica H. Stone et al.
eschweizerbart_xxx

a narrower nasal aperture. Along the CAN2 axis, Yauyos, Cajamarca, and Pacatnamufall on the negative side with a shorter basion-prosthion height, while the remainingsamples falls on the positive side, characterized by a greater basion-prosthion height.There is no clear overall pattern related to environmental zones. However, the twohighland sites cluster fairly close together in the upper left quadrant, as well as twogroups (Makatampu and Ancon and Pacatnamu and Malabrigo) that are geographi-cally close to one another.
Mahalanobis squared distances (Table 5) indicate that all samples are significantlydifferent from each other based on the associated p-values presented on the lowerdiagonal of the table. The D2 values show that the most similar groups are Pacatnamuand Malabrigo, Jahuay and Malabrigo, and Ancon and Makatampu, followed byCajamarca and Pacatnamu. The most morphologically dissimilar are Yauyos andMalabrigo. The squared distances were also used to generate a dendrogram (Fig. 4)that illustrates three major clusters: Ancon and Makatampu, Yauyos and Cajamarca,and Pacatnamu and Malabrigo. The first two clusters are more similar to each otherthan they are to the other groups and Jahuay is most similar to the northern coastalgroups.
Spatial autocorrelation
The Global Moran’s I spatial autocorrelation results are presented in Table 6. A posi-tive autocorrelation coefficient implies similarity of localities at a given distance forthe variable in question (e.g. EKB), while a negative autocorrelation implies dissimi-larity. The patterns expressed can be clustered, dispersed or random. All of the pat-terns expressed with relation to latitude/longitude and cranial variables were signifi-cant, positive, and clustered with the exception of frontal chord (FRC), which wasrandom. The measurements z-scores indicate that there is less than one percent likeli-hood that these clustered patterns could be the result of random chance, which wascalculated from the overall variance of the dataset, variables and the variance betweenthe Expected index and the Observed (Moran’s I) index.
Discussion and conclusionThe first three canonical variates account for the majority of the overall variationbetween the samples used. Each sample was found to be significantly different fromthe others, and as a result when both CAN1 and CAN2 are plotted (Fig. 3), no obvi-ous clustering related to environmental zone occupation is apparent. On both plots(Figs 3 and 4), the samples that are in the closest proximity to one another geographi-cally are also closest to one another on the plots. However, relative distances do notappear to be correlated, as illustrated by the Jahuay and Yauyos samples, which aregeographically close despite being located at different altitudes. Relationshipsbetween high and low altitude groups are illustrated by Fig. 4, where Cajamarca andYauyos, the two highland groups, cluster together despite being located at the north-ern and southern margins of our sample area, respectively. The remaining coastalgroups cluster into pairs based on geographical proximity with the exception ofJahuay, which despite being located on the southern coast, clusters with the northerncoastal sites.
Craniofacial plasticity in ancient Peru 9
eschweizerbart_xxx

Tabl
e5.
Mah
alan
obis
Squa
red
Dis
tanc
es.T
hep-
valu
esfo
rea
chdi
stan
cear
elo
cate
dbe
low
the
diag
onal
.
Squa
red
Dis
tanc
eto
grou
pfr
omgr
oup
Mak
atam
puPa
catn
amu
Yau
yos
Anc
onC
ajam
arca
Jahu
ayM
alab
rigo
Mak
atam
pu0
4.18
173
3.38
911
1.56
845
2.14
035
4.20
292
4.10
304
Paca
tnam
u<.
0001
04.
6896
85.
1840
22.
1288
52.
7793
50.
9690
9Y
auyo
s<.
0001
<.00
010
2.73
346
2.13
290
3.91
613
5.26
978
Anc
on<.
0001
<.00
01<.
0001
03.
3533
92.
7397
93.
3912
8C
ajam
arca
<.00
01<.
0001
<.00
01<.
0001
03.
5802
42.
8015
6Ja
huay
<.00
01<.
0001
<.00
01<.
0001
<.00
010
1.67
698
Mal
abri
go<.
0001
0.00
01<.
0001
<.00
01<.
0001
<.00
010
Tabl
e6.
Spat
ialA
utoc
orre
latio
nan
alys
is.
Mor
an’s
Inde
xE
xpec
ted
Inde
xV
aria
nce
z-sc
ore
p-va
lue
BPL
0.00
6–0
.002
0.00
002.
668
0.00
8D
KB
0.07
9–0
.002
0.00
0026
.20
0.00
00FR
C0.
001
–0.0
020.
0000
1.03
80.
2994
EK
B0.
056
–0.0
020.
0000
19.9
10.
0000
MA
B0.
021
–0.0
020.
0000
4.57
0.00
00N
LB
0.07
2–0
.002
0.00
0023
.65
0.00
00N
LH
0.01
3–0
.002
0.00
004.
720.
0000
NPH
0.03
6–0
.002
0.00
0012
.30
0.00
00O
BB
0.01
6–0
.002
0.00
005.
720.
0000
OB
H0.
008
–0.0
020.
0000
3.23
0.00
00
10 Jessica H. Stone et al.
eschweizerbart_xxx
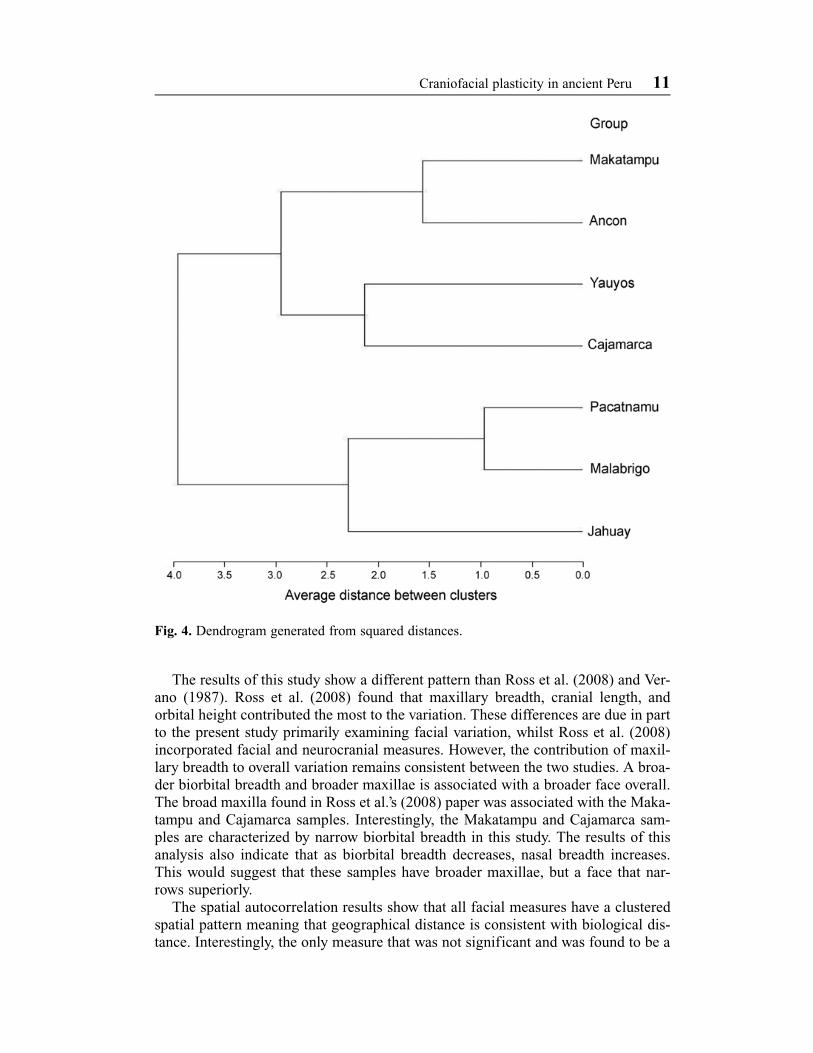
Fig. 4. Dendrogram generated from squared distances.
The results of this study show a different pattern than Ross et al. (2008) and Ver-ano (1987). Ross et al. (2008) found that maxillary breadth, cranial length, andorbital height contributed the most to the variation. These differences are due in partto the present study primarily examining facial variation, whilst Ross et al. (2008)incorporated facial and neurocranial measures. However, the contribution of maxil-lary breadth to overall variation remains consistent between the two studies. A broa-der biorbital breadth and broader maxillae is associated with a broader face overall.The broad maxilla found in Ross et al.’s (2008) paper was associated with the Maka-tampu and Cajamarca samples. Interestingly, the Makatampu and Cajamarca sam-ples are characterized by narrow biorbital breadth in this study. The results of thisanalysis also indicate that as biorbital breadth decreases, nasal breadth increases.This would suggest that these samples have broader maxillae, but a face that nar-rows superiorly.
The spatial autocorrelation results show that all facial measures have a clusteredspatial pattern meaning that geographical distance is consistent with biological dis-tance. Interestingly, the only measure that was not significant and was found to be a
Craniofacial plasticity in ancient Peru 11
eschweizerbart_xxx

random pattern was frontal chord. This is consistent with findings that the face andbase of the skull are more stable, while the vault is more plastic (Enlow 1990, Ross& Ubelaker 2009, Ross & Williams 2010). The variation seen among the groupstherefore is the result of a combination of genetic and environmental factors, thoughthe differences between highland and coastal environments do not appear to play alarge role given the lack of clear differentiation between the samples. Because thesamples do not exhibit clear temporal overlap, the degree of admixture and potentialgene flow between samples cannot be further determined as some samples containmaterial from multiple time periods even though it has been hypothesized that thereis regional continuity. Interestingly, however, there is a considerable amount of spatialpatterning for the facial variables coinciding with geographical location suggestinglocal adaptation or limited migration.
There are other potential environmental factors that could be contributing to theobserved differentiation in face shape, including subsistence-related masticatorystress. A number of studies have suggested that the craniofacial region respondsstrongly to diet composition, though there is no clear association with subsistencestrategy. Rather, the influences of masticatory loading on face shape appear morestrongly associated with localized variation in the hardness, toughness, and particlesize of foods (Gonzalez-Jose et al. 2005, Paschetta et al. 2010, Sardi et al. 2005). Thesamples used in this study are all representatives of agricultural groups for whichcommon dietary staples include quinoa, potato, maize, beans, squash, and peppers, aswell as a mixed marine fish and terrestrial mammal diet (Verano & DeNiro 1993).Specific dietary information is not available for all of the samples studied here, butisotopic and archaeological data from Pacatnamu support a diet consisting of maize,beans, squash, chili pepper, and various fruits, and a mixed marine and terrestrial pro-tein component consisting of camelids, fish and shellfish. Discrepancies betweenEarly and Late Period samples suggest an increase in the amount of marine resourcesconsumed over time (Verano & DeNiro 1993). Though it is possible that there aresome localized staples that may contribute to differences in masticatory loadingbetween the samples, the current lack of site-specific archaeological and isotopicdata prevent us from examining this possibility further.
In conclusion, the variation seen among prehistoric Peruvian groups in this studyis related to a combination of among-group variation as a result of geographic prox-imity to one another, which was supported by the spatial autocorrelation analysis.Further archaeological evidence of interaction between groups, as well as larger sam-ples of highland individuals would allow for investigation of the various potentialfactors at play in the range of cranial variation seen in this study. Inclusion of south-ern and eastern Peruvian samples would also present a broader regional picture ofvariation across the full range of environmental zones.
ReferencesArmelagos, G., Carlson, D. & Van Gerven, D. (1982): The Theoretical Foundations and
Development of Skeletal Biology. – In: Spencer, F. (ed.): A History of American PhysicalAnthropology. – Academic Press, pp. 305–328.
Baker, P. (1969): Human adaptation to high altitude. – Science 163 (3872): 1149–1156.Betti, L, Balloux, F., Hanihara, T. & Manica, A. (2010): The relative role of drift and selection
in shaping the human skull. – American Journal of Physical Anthropology 141: 76–82.
12 Jessica H. Stone et al.
eschweizerbart_xxx

Boas, F. (1912): The history of the American race. – Annals of the New York Academy ofSciences 21: 117–183.
Butters, L. & Castillo, S. (2008): The Mochicas. – In: Silverman, H. & Isbell, W. (eds): Hand-book of South American Archaeology. – Springer Press, pp. 707–729.
Dillehay, T. & Kolata, A. (2004): Long-term human response to uncertain environmentalconditions in the Andes. – Proceedings of the National Academy of Sciences 101 (12):4325–4330.
Ditmar, M. (1996): Study of the face structure of highland and lowland populations in prehi-spanic South America. – Colloquium Antropologicum 20: 95–110.
Enlow, D.H. (1990): Facial Growth. 3rd ed. – WB Saunders Company, Philadelphia.Ericksen, M. (1962): Undeformed Pre-Columbian crania from the North Sierra of Peru. –
American Journal of Physical Anthropology 20: 209–222.ESRI Inc. (2012): ArcMap 10.1. – ESRI Inc., Redlands, CA.Fortin, M.J., Dale, M. & Hoef, J. (2002): Spatial analysis in ecology – In: El-Shaarawi, A. &
Piegorsch, W. (eds): Encyclopedia of Environmetrics, vol 4. – Wiley & Sons, Chichester,pp. 2051–2058.
Goldstein, P. (2005): Andean diaspora: the Tiwanaku colonies and the origins of South Amer-ican empire. – University Press of Florida, Gainesville.
Gonzalez-Jose, R., Ramırez-Rozzi, F., Sardi, M., Martınez-Abadıas, N., Hernandez, M. &Pucciarelli, H. (2005): Functional-Cranial Approach to the Influence of Economic Strat-egy on Skull Morphology. – American Journal of Physical Anthropology 128: 757–771.
Harvati, K. & Weaver, T. (2006): Human cranial anatomy and the differential preservation ofpopulation history and climate signatures. – The Anatomical Record Part A 288A: 1225–1233.
Haun, S. & Cock Carrasco, G. (2010): A Bioarchaeological Approach to the Search for Mit-maqkuna. – In: Malpass, M. & Alconini, S. (eds): Distant Provinces in the Inka Empire:Towards a Deeper Understanding of Inka Imperialism. – University of Iowa Press, Iowa,pp. 193–220.
Howells, W. (1973): Cranial variation in man. A study by multivariate analysis of patterns ofdifference among recent human populations. – Peabody Museum of Archaeology and Eth-nology, Harvard University, Cambridge.
Howells, W. (2007): History of craniometric studies, the view in 1975. – In: Ubelaker, D.,Smith, B., Standford, D. & Sturtevant, W. (eds): Handbook of North American Indians,Volume 3: Environment, Origins, and Populations. – United States Government PrintingOffice, Washington DC, pp. 497–503.
Hubbe, M., Hanihara, T. & Harvati, K. (2009): Climate signatures in the morphological dif-ferentiation of worldwide modern human populations. – The Anatomical Record 292:1720–1733.
Isbell, W. (2008): Wari and Tiwanaku: International identities in the Central Andean MiddleHorizon. – In: Silverman, H. & Isbell, W. (eds): Handbook of South American Archaeol-ogy. – Springer Press, New York, pp. 731–759.
Keatinge, R. (1988): Peruvian prehistory: an overview of pre-Inca and Inca society. – Cam-bridge University Press, New York.
Kohn, L. (1991): The Role of Genetics in Craniofacial Morphology and Growth. – AnnualReview of Anthropology 20: 261–278.
Moore-Jansen, P. & Jantz, R. (1994): Data collection procedures for forensic skeletal mate-rial. Report investigation 48. – The University of Tennessee, Department of Anthropology,Knoxville.
Morton, S. (1839): Crania Americana; or, a comparative view of the skulls of various aborigi-nal nations of North and South America: to which is prefixed an essay on the varieties ofthe human species. – J. Dobson, Philadelphia.
Newman, M. (1943): A metric study of undeformed crania from Peru. – American Journal ofPhysical Anthropology 1: 21–45.
Craniofacial plasticity in ancient Peru 13
eschweizerbart_xxx

Ousley, S. & Jantz, R. (1998): Forensic data bank: documenting skeletal trends in the UnitedStates. – In: Reichs, K. (ed.): Forensic Osteology: Advances in the Identification ofHuman Remains. – CC Thomas, Springfield, pp. 441–458.
Paschetta, C., de Azevedo, S., Castillo, L., Martinez-Abadias, N., Hernandez, M., Lieber-man, D. & Gonzalez-Jose, R. (2010): The Influence of Masticatory Loading on Craniofa-cial Morphology: A Test Case Across Technological Transitions in the Ohio Valley. –American Journal of Physical Anthropology 141: 297–314.
Pietrusewsky, M. (2010): A multivariate analysis of measurements recorded in early andmore modern crania from East Asia and Southeast Asia. – Quaternary International 211:42–54.
Pozorski, S. & Pozorski, T. (2008): Early cultural complexity on the coast of Peru. – In: Sil-verman, H. & Isbell, W. (eds): Handbook of South American Archaeology. – SpringerPress, New York, pp. 607–631.
Proulx, D. (2008): Paracas and Nasca: regional cultures on the South Coast of Peru – In: Sil-verman, H. & Isbell, W. (eds): Handbook of South American Archaeology. – SpringerPress, New York, pp. 563–585.
Pucciarelli, H., Gonzalez-Jose, R., Neves, W., Sardi, M. & Rozzi, F. (2008): East-West cranialdifferentiation in pre-Columbian populations from Central and North America. – Journalof Human Evolution 54: 296–308.
Pucciarelli, H., Gonzalez-Jose, R., Neves, W., Sardi, M., Rozzi, F., Struck, A. & Bonilla, M.(2006): East-West cranial differentiation in pre-Columbian human populations of SouthAmerica. – Homo 57: 133–150.
Relethford, J. (1994): Craniometric Variation among Modern Human Populations. – Ameri-can Journal of Physical Anthropology 95: 53–62.
Relethford, J. (2004): Global patterns of isolation by distance based on genetic and morpho-logical data. – Human Biology 76: 499–513.
Relethford, J. & Harpending, H. (1994): Craniometric Variation, Genetic Theory, and Mod-ern Human Origins. – American Journal of Physical Anthropology 95: 249–270.
Roseman, C. (2004): Detecting interregionally diversifying natural selection on modernhuman cranial form by using matched molecular and morphometric data. – Proceedingsof the National Academy of Sciences, USA 101 (35): 12824–12829.
Roseman, C. & Weaver, T. (2004): Multivariate Apportionment of Global Human Craniome-tric Diversity. – American Journal of Physical Anthropology 125: 257–263.
Ross, A. (2004): Regional isolation in the Balkan region: an analysis of craniofacial varia-tion. – American Journal of Physical Anthropology 124 (1): 73–80.
Ross, A. & Ubelaker, D. (2010): A Morphometric approach to Taino biological distance inthe Caribbean. – In: Fitzpatrick, S. & Ross, A. (eds): Island Shores, Distant Pasts: Archae-ological and Biological Approaches to the Pre-Columbian Settlement of the Caribbean. –University Press of Florida, Gainesville, pp. 108–126.
Ross, A., Ubelaker, D. & Falsetti, A. (2002): Craniometric variation in the Americas. –Human Biology 74 (6): 807–818.
Ross, A., Ubelaker, D. & Guillen, S. (2008): Craniometric patterning within ancient Peru. –Latin American Antiquity 19 (2): 158–166.
Ross, A. & Ubelaker, D. (2009): Effect of intentional cranial modification on craniofaciallandmarks: A three-dimensional perspective. – Journal of Craniofacial Surgery 20 (6):2185–2187.
Ross, A. & Williams, S. (2010): Craniofacial growth, maturation and change: Teens to mid-adulthood. – Journal of Craniofacial Surgery 21 (2): 458–461.
Rothhammer, F. & Silva, C. (1989): Peopling of Andean South America. – American Journalof Physical Anthropology 78: 403–410.
Sandweiss, D. & Richardson, J. (2008): Central Andean Environments. – In: Silverman, H. &Isbell, W. (eds): Handbook of South American Archaeology. – Springer Press, New York,pp. 93–104.
14 Jessica H. Stone et al.
eschweizerbart_xxx

Sardi, M., Rossi, F., Gonzalez-Jose, R. & Pucciarelli, H. (2006): South American craniofacialmorphology: diversity and implications for Amerindian evolution. – American Journal ofPhysical Anthropology 128: 747–756.
SAS (2011): SAS 9.3 for Windows. – SAS Institute Inc., Cary, North Carolina.Schafer, J. (1999): NORM: Multiple Inputation of Incomplete Multivariate Data under a Nor-
mal Model, version 2.Sneath, P.H.A. & Sokal, R.R. (1973): Numerical taxonomy: the principles and practice of
numerical classification. – W.H. Freeman, San Francisco.Sokal, R. (1979): Ecological parameters inferred from spatial correlograms. – In: Patil, G.P.
& Rosenzweig, M.L. (eds): Contemporary quantitative ecology and related ecometrics. –International Co-operative Publishing House, Fairland, MD, pp. 167–196.
Sokal, R. & Uytterschaut, H. (1987): Cranial variation in European populations: A spatialautocorrelation study at three time periods. – American Journal of Physical Anthropology74 (1): 21–38.
Sparks, C. & Jantz, R. (2002): A reassessment of human cranial plasticity: Boas revisited. –Proceedings of the National Academy of Sciences 99 (23): 14636–14639.
Stanish, C. (2001): The origins of state societies in South America. – Annual Reviews ofAnthropology 30: 41–64.
Verano, J. (1987): Cranial microvariation at Pacatnamu: a study of cemetery population vari-ability. – PhD Dissertation, University of California at Los Angeles.
Verano, J. & DeNiro, R. (1993): Locals or Foreigners? Morphological, Biometric, and Isoto-pic Approaches to the Question of Group Affinity in Human Skeletal Remains Recoveredfrom Unusual Archaeological Contexts. – In: Sandford, M. (ed.): Investigations ofAncient Human Tissue: Chemical Analyses in Anthropology. – Gordon and Breach Sci-ence Publishers, Langhorne, PA, pp. 361–386.
von-Cramon-Taubadel, N. (2009a): Congruence of individual cranial bone morphology andneutral molecular affinity patterns in modern humans. – American Journal of PhysicalAnthropology 140: 205–215.
von-Cramon-Tuabadel, N. (2009b): Insights from a quantitative genetic approach to humanmorphological evolution. – Evolutionary Anthropology 18: 237–240.
Submitted: 26 February 2014;accepted: 20 August 2014.
Address for correspondence: Jessica Stone, Department of Anthropology, 308 CondonHall, 1321 Kincaid Street, Eugene, OR 97403, [email protected]
Craniofacial plasticity in ancient Peru 15
eschweizerbart_xxx