Delivrable WP7 Peru - Agritrop
28
Deliverable NTM-IMPACT Technical Workshop WP7 Public norms and private standards from US and EU: impact on Peruvian mangoes supply chain Sylvaine LEMEILLEUR CIRAD, UMR MOISA, F‐34398 Montpellier, France 73 rue Jean-François Breton, 34398 Montpellier Cedex 5 - France [email protected] Abstract The prevalence of food quality standards in international trade is constantly increasing and has a growing influence on developing countries. A wide range of literature in development economics focused on the determinants of the standard adoption and on the debate of whether international standards exclude small-scale farmers from high-value food markets. Otherwise, when exclusion is pointed out, very little is said on how problematic such forms of exclusion are. In this paper, we examine which behaviors small-scale farmers adopt face to the incontrovertible standards, what happens to the farmers that are excluded from a specific certified market, and to what extent small farmers are affected to not be certified. Based on an analysis of primary data collected to examine the implication of GlobalGap on the mango sector in Peru, we consider three main options for the small-scale farmers: “loyalty” (implementation of the standard under specific conditions), “switch” of market segment, and “exit” from the market. The last option leads farmers to sell all their production to small and volatile exporters, called golondrinos (swallows). We show empirically that some small-scale farmers (8% of the sample) comply with GlobalGap standard thanks to the support from exporters (farming contrats which include the certification cost), while others switch of market segment by complying with the organic certification (12,5%). Organic certification substitutes for the GlobalGap requirement in the EU market. Finally, we find a significant level of exit option (24%), especially among smaller farms, less specialized, and furthest from exporter plants. The latter seem very affected by the changes related to the GlobalGap standard requirements: price risk on their production has increased and their bargaining power and agricultural income have decreased. They are particularly vulnerable because their level of investment (mango trees) impedes to radically change of farm activity. Key words: standards, certification, small-scale farmer behaviors, mango, Peru Author’s acknowledgements: This paper was made possible by support provided by the EU NTM-Impact Project (www.ntm-impact.eu ). The data and qualitative details were gathered in Peru in collaboration with AVSF Peru. Thanks to Cesar Paz for helpful field work coordination.
-
Upload
khangminh22 -
Category
Documents
-
view
0 -
download
0
Transcript of Delivrable WP7 Peru - Agritrop

Deliverable
NTM-IMPACT Technical Workshop WP7
Public norms and private standards from US and EU: impact on Peruvian mangoes supply chain
Sylvaine LEMEILLEUR
CIRAD, UMR MOISA, F‐34398 Montpellier, France 73 rue Jean-François Breton,
34398 Montpellier Cedex 5 - France [email protected]
Abstract The prevalence of food quality standards in international trade is constantly increasing and has a growing influence on developing countries. A wide range of literature in development economics focused on the determinants of the standard adoption and on the debate of whether international standards exclude small-scale farmers from high-value food markets. Otherwise, when exclusion is pointed out, very little is said on how problematic such forms of exclusion are. In this paper, we examine which behaviors small-scale farmers adopt face to the incontrovertible standards, what happens to the farmers that are excluded from a specific certified market, and to what extent small farmers are affected to not be certified. Based on an analysis of primary data collected to examine the implication of GlobalGap on the mango sector in Peru, we consider three main options for the small-scale farmers: “loyalty” (implementation of the standard under specific conditions), “switch” of market segment, and “exit” from the market. The last option leads farmers to sell all their production to small and volatile exporters, called golondrinos (swallows). We show empirically that some small-scale farmers (8% of the sample) comply with GlobalGap standard thanks to the support from exporters (farming contrats which include the certification cost), while others switch of market segment by complying with the organic certification (12,5%). Organic certification substitutes for the GlobalGap requirement in the EU market. Finally, we find a significant level of exit option (24%), especially among smaller farms, less specialized, and furthest from exporter plants. The latter seem very affected by the changes related to the GlobalGap standard requirements: price risk on their production has increased and their bargaining power and agricultural income have decreased. They are particularly vulnerable because their level of investment (mango trees) impedes to radically change of farm activity. Key words: standards, certification, small-scale farmer behaviors, mango, Peru Author’s acknowledgements: This paper was made possible by support provided by the EU NTM-Impact Project (www.ntm-impact.eu). The data and qualitative details were gathered in Peru in collaboration with AVSF Peru. Thanks to Cesar Paz for helpful field work coordination.

2
1. Introduction
The last two decades witnessed unprecedented changes in the agro-food sector through the proliferation of standards in international agricultural trade. After a period during which the states of developed countries actively implemented food safety standards (this has been exacerbated by a series of food scandals (Henson and Caswell, 1999)), voluntary standards emerging from the private sector have been developed to attend to rising consumer concerns regarding the conditions of production and trade of the goods they buy (Jaffee and Henson, 2004). These voluntary standards combine a mixture of food safety, environmental, and social dimensions, while an inherent emphasis is being given to product traceability. Consequently, standards not only affect the safety of final products, but also the whole organization of the supply chain (Hammoudi et al., 2009). For many farmers in developing countries, investing in agricultural niches for exportation may appear as a profitable option. However, a wide range of empirical literature dealing with the impact of rising international standards in developing countries so far has been to show that the stringent conditions tend to lead to the exclusion of smallholders and the inclusion of larger farmers (Augier et al., 2005; Dolan and Humphrey, 2000; Escobal et al., 2000; Key and Runsten, 1999; Reardon et al., 2003; VanDerMeer, 2006). Lack of access to human, physical, and social capital and the costs of certification are the most common factors explaining the non-compliance of smallholders with standards (Busch and Bain, 2004; Vorley and Fox, 2004). On the contrary, some less pessimistic studies find positive effects on very small farms, which are included in the high-standard market through a contract-basis with the agro-exporters (Asfaw et al., 2010; Chemnitz, 2007a; Chemnitz et al., 2007b; Henson et al., 2011; Maertens and Swinnen, 2009; Minten et al., 2009).
In fact, standards affect all producers differently, depending on the nature of the standard as well as the institutional environment of the country and the characteristics of farms (Chemnitz et al., 2007b). However, very little literature examines what happens to the farmers that are excluded from a specific certified market and to what extent small farmers are affected to not be certified. Therefore, when there is some empirical evidence of exclusion of small farmers from high-standard market, very little is said on how problematic such form of exclusion are (Chemnitz et al, 2007b). Moreover, exclusion from the market requiring standards may not necessarily be problematic, depending on the alternative options (market, employment opportunities...) for farmers (Belton et al., 2011). One would expect that these farmers shift in final market but we know little about income effect, marketing risk, and labor market effects of these excluded farmers. Our paper is a contribution to the scarce literature analyzing the implications that international sustainability standards have on the behavior of small-scale farmers and their impacts in terms of marketing risks and income levels.
In this paper, we focus on small-scale producers of fresh mangos in Peru. The fresh mango sector in Peru is an interesting case, as public standard and growing private standard requirements in international mango trade are seen as threat to export for a significant part of small-scale mango producers. In particular, the private GlobalGap standard– the most important standard that applies to production of fresh mangos – has become quasi-mandatory for exportation to the European Union (EU) since 2007. Kleinwechter and Grethe (2006) have studied the adoption of the GlobalGap standard in the mango export sector in Peru in 2004-2005. However, they didn’t explore the implications for smallholders. Yet the new context raises the question of the manner in which Peruvian small-scale farmers respond to this new predominant standard. The concern is also interesting in Peru as mangos are exported both to the UE and the United States (US), allowing combination or substitution between theses both largest consumption markets, according to the type of standard required.

3
Drawing on an adaptation of Hirschman’s (1970) conceptual framework – also used by Henson and Jaffee (2008) on the food safety standard’s impact – we consider three main options for mango growers in Peru: “loyalty” (implementation of the standard), “switch” of market segment, and “exit” from the market. We first held some qualitative interviews with experts and supply chain actors before implementing a quantitative approach aimed at identifying the producers’ characteristics for each alternative option. Surveys were conducted with 223 small-scale mango producers from October 2010 to May 2011. Data was collected in the region of Piura, the main zone of mango production.
The paper proceeds as follows: section 2 provides a background of mango production and trade in Peru and the evolving international trade towards standards; section 3 develops the analytical framework used to formulate hypotheses; section 4 describes the survey and data; section 5 presents and discusses the empirical findings; and section 6 concludes the paper.
2. Fresh mango sector in Peru
a) Production and Trade
According to the World Bank definition, Peru is a low middle income country with GDP of USD 152.8 billion and per capita income of USD 9200 in 2010(Worldfactbook, 2010). In Peru, agriculture is still a source of economic development. It accounts for 8% of the GDP and provides 23% of direct and indirect employment (INEI, 2008). Contrary to numerous exported agricultural products, mango production in Peru is also locally consumed. Since 1985 with the first export towards US, the sector has grown at remarkable rates (figure 1). Between 2000 and 2010, the cultivated areas passed from nearly 18 700 of hectares to around 28 400 of hectares and the production from 125 thousand tons to 250 thousand tons (MINAG, 2010). Peru exports around 30% of its national production (105,724 tons in 2009/2010) and is the fifth largest mango exporter in the world. Fresh mangos are by far the most important of exported mangos (87% of exported mango volumes in 2009, according to customs). Exports go to both the EU (65%) and US (35%) markets but it is only since 2006 that the EU has surpassed the US as main destination market (Appendix 1 and Appendix 2) (Gerbaud, 2010).
Figure 1: figures of mango sector in Peru
Source: data from MINAG and PROMPERU Production is concentrated in northern Peru, in the region of Piura (around 70% of the
national production and 90% of exported production). The main mango varieties grown for
4
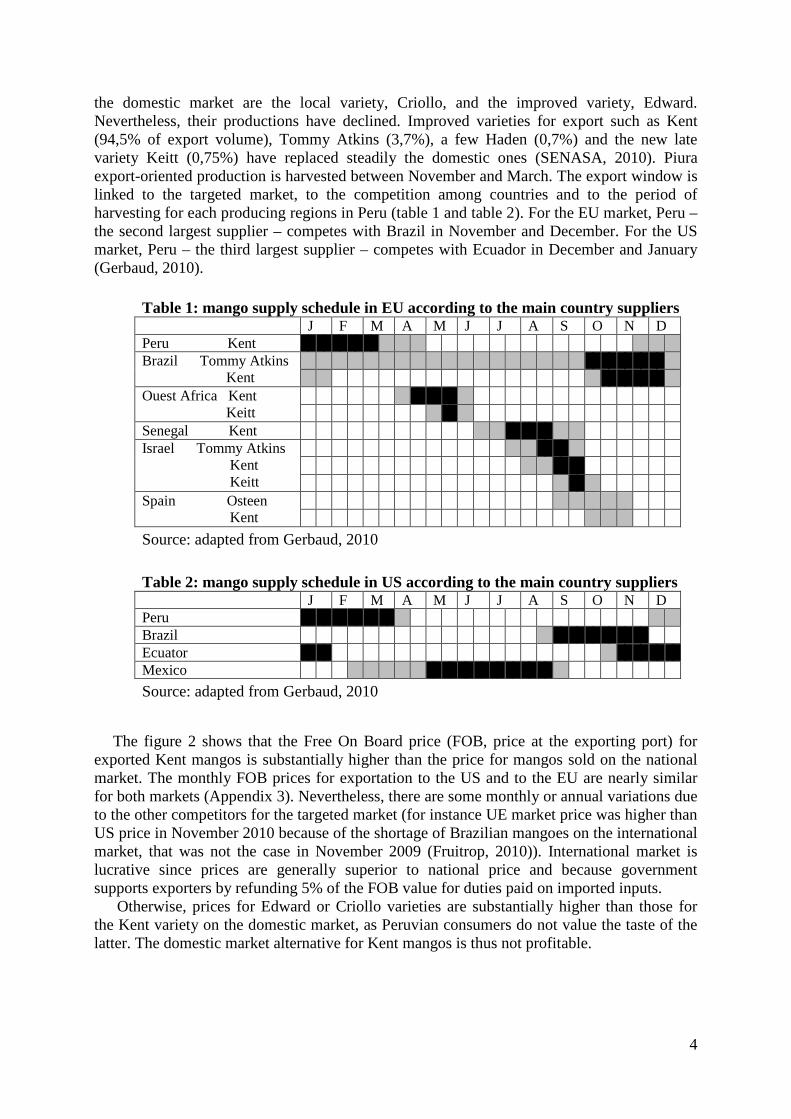
the domestic market are the local variety, Criollo, and the improved variety, Edward. Nevertheless, their productions have declined. Improved varieties for export such as Kent (94,5% of export volume), Tommy Atkins (3,7%), a few Haden (0,7%) and the new late variety Keitt (0,75%) have replaced steadily the domestic ones (SENASA, 2010). Piura export-oriented production is harvested between November and March. The export window is linked to the targeted market, to the competition among countries and to the period of harvesting for each producing regions in Peru (table 1 and table 2). For the EU market, Peru – the second largest supplier – competes with Brazil in November and December. For the US market, Peru – the third largest supplier – competes with Ecuador in December and January (Gerbaud, 2010).
Table 1: mango supply schedule in EU according to the main country suppliers J F M A M J J A S O N D Peru Kent Brazil Tommy Atkins Kent
Ouest Africa Kent Keitt
Senegal Kent Israel Tommy Atkins Kent Keitt
Spain Osteen Kent
Source: adapted from Gerbaud, 2010 Table 2: mango supply schedule in US according to the main country suppliers J F M A M J J A S O N D Peru Brazil Ecuator Mexico
Source: adapted from Gerbaud, 2010
The figure 2 shows that the Free On Board price (FOB, price at the exporting port) for
exported Kent mangos is substantially higher than the price for mangos sold on the national market. The monthly FOB prices for exportation to the US and to the EU are nearly similar for both markets (Appendix 3). Nevertheless, there are some monthly or annual variations due to the other competitors for the targeted market (for instance UE market price was higher than US price in November 2010 because of the shortage of Brazilian mangoes on the international market, that was not the case in November 2009 (Fruitrop, 2010)). International market is lucrative since prices are generally superior to national price and because government supports exporters by refunding 5% of the FOB value for duties paid on imported inputs.
Otherwise, prices for Edward or Criollo varieties are substantially higher than those for the Kent variety on the domestic market, as Peruvian consumers do not value the taste of the latter. The domestic market alternative for Kent mangos is thus not profitable.

5
Figure 2: Mango prices according to varieties and targeted market (in euro/ton).
Source: according to the data from MINAG, 2011.
b) Access to the market
For the domestic market, producers generally sell their mango production though brokers who supply the market of Lima. Most producers have informal contracts with their broker where price is flexible and depends on the final demand price. These middlemen deduct a commission (around 10%) of the sale price (AVSF, 2008). These types of transactions require long-term relationships and confidence between the producer and the broker (AVSF, 2008).
For the export market, the first constraint to accessing an outside market is related to the minimum volume required by the buyer (at least one container, i.e. 20 tons). This explains why small-scale producers (on average hardly producing 20 exportable tons) have to form an association in order to get export market access.
The second constraint is that the mango exporters must meet some commercial quality requirements: color (red), appearance (no scratches) and size (at least 450 g).
Transport is generally offer by exporter trucks to farmers after the former organized the harvest. There are 3 ports of the region of Piura: Paita, Talara and Bayovar. Fruits are generally transported by maritime routes - 90% of transport use boat (SENASA, 2010). The roads from the packing houses to the ports are well-maintained. The major problem is linked poor logistic and services in the port while the relative costs are very high. Scarcity of space in the ships caused delays and, in many cases, a large quantity of fruit became overripe and had to be discarded –knowing that shipping times to US is 14 days long and to Europe 21 days long. For the shipment, exporters are used to deal with transporters with a bill of landing (the transporter take temporarily the ownership of the products). Cargo carriers are only responsible for damages due to technical problem on boat but never damages due to fruits themselves.
For exporters, it is more difficult to find buyers and keep commercial relationship in EU than in US because it is further. Moreover, exporters can hardly move to UE when they want to check if buyers are cheating when they deduct penalty for bad quality. They are thus used to work with more than two buyers per area to control cheating behaviors and improve

6
bargaining power. They have generally not fixed quantity commitments over the season and they are paid the going market price. Importers deduct a commission from 8 to 10% on the final price. They generally paid sixty days later.
Lastly, although it doesn’t exist any compulsory Peruvian public norms on good practical practices for mango production for domestic market1, export-oriented producers require a phytosanitary certificate (the annual cost is USD 7/ha/year) from the SENASA (Servicio Nacional de Sanidad Agraria del Peru) – the public agency in charge of inspection, control, and eradication of the fruit fly2.
c) Non-tariff measures and constraints from the US and EU markets
For both the US and EU markets, exports are required to respect the Codex Alimentarius and maximum pesticide residual levels (MRL). Nevertheless, some differences exist between the market requirements: the major constraint from the US market is a public norm while from EU it is a private standard.
US mango regulation depends from two institutions: APHIS-USDA (U.S. Department of
Agriculture's Animal and Plant Health Inspection Service) which ensures the health and care of animals and plants in US and FDA (Food and Drug administration) which is in charge to protect and promote public health through the regulation and supervision of food safety.
First at all, APHIS decides of the positive list of the authorized fruits and vegetables export by country, and determine the requirements for their importation into the United States (this is listed in the Fruits and Vegetables Import Requirements database (FAVIR)). APHIS is in charge to write out emergency pest notifications to alert users if there is a change in the import status of a commodity or country and get the right to issue marketing orders to protect American agriculture. According to this process, before 1997, Peru couldn’t export mangoes to US, and there is only 4 years, that it could export citrus, and one year for avocado.
The most demanding norm for exportation to the US relates to a public norm: a
hydrothermal treatment is required to kill fruit flies; the mangos undergo a hot water treatment in a certified processing plant3. For this, the APHIS-USDA (U.S. Department of Agriculture's Animal and Plant Health Inspection Service) allocates personnel to each treatment plant so as to monitor the hydrothermal process during the fresh mango season (calibration of the hot water tanks and the length of immersion)4. The high costs of initial
1 Nevertheless, APEM supported by BID, has develop in 2007 a manual to promote voluntary good practical practices in mango. 2 However, according to this organization, inspections are partially hampered due to the lack of performing computers, lack of vehicles for inspection, lack of employees to reply at the simultaneous producer demand and to control plants. Finally this year, they face problems with stamp seals which were illegible or too breakable. At the producer and exporter side, SENASA report 2010 relates problems encountered during inspection which often lead to not deliver certificate or to reject products: 1) at the farm level, it is still common that the juridical forms are not updated; besides, fruits infected with fruit fly larvae due to a misuse of traps have been refused 2) at the plant level, detection of larvae have leaded to refuse the whole lot; presence of crickets have also leaded to close a plant for 2 days 3) at the shipping level, containers are sometimes dirty or foul-smelling and detection of insects could lead to refuse the whole container. 3 Chile, Argentina, China and Japan require also hydrothermal immersion treatment. 4 According to the SENASA report, in 2009-2010, 104 lots have been rejected for presence of fruit fly larvae. 4 lots have been rejected for problem of treatment temperature not high enough or because fruits are too big to undergo treatments. There are problems in plants linked to dirty treatment water or to technical failures (valves of solenoid, switch…). Moreover, according to Sivapalasingam et al., (2003) it appeared that the process of hot water treatment, preventing exportation of fruit fly, is a possible point of contamination with human pathogens such as salmonella Sivapalasingam et al, 2003. A Multistate Outbreak of Salmonella enterica Serotype Newport
7
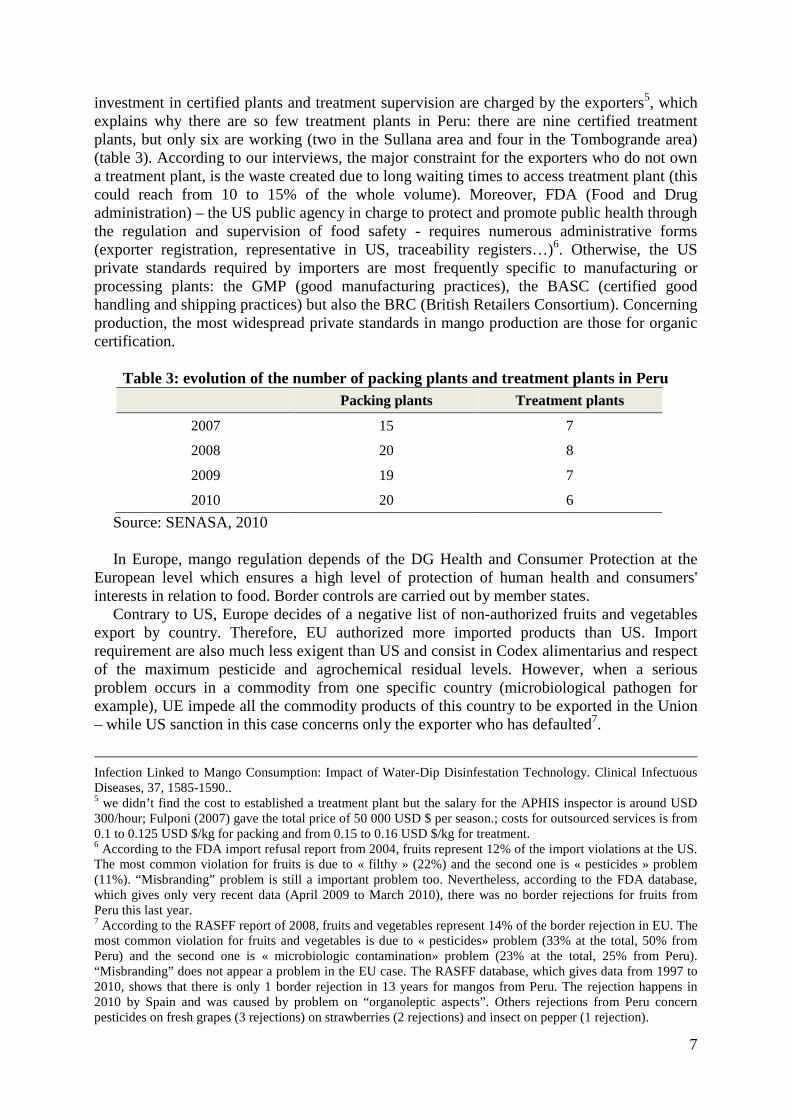
investment in certified plants and treatment supervision are charged by the exporters5, which explains why there are so few treatment plants in Peru: there are nine certified treatment plants, but only six are working (two in the Sullana area and four in the Tombogrande area) (table 3). According to our interviews, the major constraint for the exporters who do not own a treatment plant, is the waste created due to long waiting times to access treatment plant (this could reach from 10 to 15% of the whole volume). Moreover, FDA (Food and Drug administration) – the US public agency in charge to protect and promote public health through the regulation and supervision of food safety - requires numerous administrative forms (exporter registration, representative in US, traceability registers…)6. Otherwise, the US private standards required by importers are most frequently specific to manufacturing or processing plants: the GMP (good manufacturing practices), the BASC (certified good handling and shipping practices) but also the BRC (British Retailers Consortium). Concerning production, the most widespread private standards in mango production are those for organic certification.
Table 3: evolution of the number of packing plants and treatment plants in Peru
Packing plants Treatment plants
2007 15 7
2008 20 8
2009 19 7
2010 20 6
Source: SENASA, 2010 In Europe, mango regulation depends of the DG Health and Consumer Protection at the
European level which ensures a high level of protection of human health and consumers' interests in relation to food. Border controls are carried out by member states.
Contrary to US, Europe decides of a negative list of non-authorized fruits and vegetables export by country. Therefore, EU authorized more imported products than US. Import requirement are also much less exigent than US and consist in Codex alimentarius and respect of the maximum pesticide and agrochemical residual levels. However, when a serious problem occurs in a commodity from one specific country (microbiological pathogen for example), UE impede all the commodity products of this country to be exported in the Union – while US sanction in this case concerns only the exporter who has defaulted7.
Infection Linked to Mango Consumption: Impact of Water-Dip Disinfestation Technology. Clinical Infectuous Diseases, 37, 1585-1590.. 5 we didn’t find the cost to established a treatment plant but the salary for the APHIS inspector is around USD 300/hour; Fulponi (2007) gave the total price of 50 000 USD $ per season.; costs for outsourced services is from 0.1 to 0.125 USD $/kg for packing and from 0.15 to 0.16 USD $/kg for treatment. 6 According to the FDA import refusal report from 2004, fruits represent 12% of the import violations at the US. The most common violation for fruits is due to « filthy » (22%) and the second one is « pesticides » problem (11%). “Misbranding” problem is still a important problem too. Nevertheless, according to the FDA database, which gives only very recent data (April 2009 to March 2010), there was no border rejections for fruits from Peru this last year. 7 According to the RASFF report of 2008, fruits and vegetables represent 14% of the border rejection in EU. The most common violation for fruits and vegetables is due to « pesticides» problem (33% at the total, 50% from Peru) and the second one is « microbiologic contamination» problem (23% at the total, 25% from Peru). “Misbranding” does not appear a problem in the EU case. The RASFF database, which gives data from 1997 to 2010, shows that there is only 1 border rejection in 13 years for mangos from Peru. The rejection happens in 2010 by Spain and was caused by problem on “organoleptic aspects”. Others rejections from Peru concern pesticides on fresh grapes (3 rejections) on strawberries (2 rejections) and insect on pepper (1 rejection).

8
Contrary to the US, Europe does not require hydrothermal treatments. Mangos exported to
Europe are cleaned and then packed in 20 existing packing plants in Peru (table 3). Most of them are also located in the Sullana and Tombogrande areas. Beyond the Codex Alimentarius and the MLR, barriers to trade in the EU are therefore much more relative to private standards: at the plant level, the HACCP is essential; at the production level, GlobalGap has been becoming almost mandatory since 2007, and organic certification has spread.
Nowadays, there is an strong competition among approved certification bodies in Peru (the
principals are NSF, SGS Control Union, Biolatina) revealing the growing demand to certified production.
Finally, Peruvian exporters comply with public norms from US and EU. Major constraints
nowadays tend to come from the proliferation of private standards (GlobalGap, USGap, Organic, Tesco’s Nature’s Choice, Field to Fork, Fair trade, LEAF, SQF 1000, HACCP, BRC, BACS, ISO 22000…) each time different in terms of code of practices, registration and traceability forms.
d) Export-oriented organizations and stakeholders
In Peru, about 28,400 ha are cultivated for mango production, 70% of which are located in the Piura region. Most of the producers are small or very smallholders (i.e. 85% of them have less than 20 ha of total land including 15% who have less than 5 ha). This repartition and the rather small size of mango producers in Peru are due to the agrarian reform of 1969.
In 2009, 1,627 producers received phytosanitary certificates from the SENASA and were
thus allowed to export their mangos. Among these producers, 75% are smallholders (less than 20 ha of total land), 20% are medium farmers (from 20 to 50 ha), and 5% are large-scale farmers (more than 50 ha). They account for 30%, 30%, and 40% of exported produce, respectively. Larger farmers are generally vertically integrated into exporter enterprises and thus export their own mango production. However, there is large variability in mango production from year to year8. Thus, these exporters generally complete they own production by purchasing from smaller farmers. Suzuki et al. (2011) also note, in their case study on pineapple exporters in Ghana, that this strategy is undertaken, at least in part, to shift quantity risks (Suzuki et al., 2011). Small-scale producers may thus have annual contracts (written or oral contracts, but hardly enforceable). Through these contracts, they steadily delegate harvests to the exporter (or a third party assigned to harvest on behalf of the packing plant), since it becomes very difficult to gather daily workers. In addition, in many cases, producers hardly have any access to credit to pay workers. A disadvantage of that service is the high level of mangos discarded during the harvest – the discarded mango rate is on average 20%. Exporters are also in charge of carrying out transportation to the processing plant. Prices are rarely fixed and pay is often delayed. Nonetheless, for a monthly adjustment strategy, exporters do not implement farming contracts with smallholders.
In 2009-2010, there were 106 fresh mango-exporting companies (SENASA, 2010). While
the production is highly atomized, there is a rather medium concentration of exports in few exporting companies: the top 10 represent 46,8% of the total export volume (Table 4). However, when compared to the figures from 2005-2006 (Fulponi, 2007), this concentration 8 For example, the 2008-2009 season was disastrous in terms of production (due to agronomic reasons). Numerous producers mention a reduction of around 50% of their production level.

9
in the mango-exporting sector has decreased these last five years, revealing a still very attractive and expandable market: in 2005 there were around 70 mango exporters in Peru and the top 6 represented 54%; Moreover the top 1 accounted in 2006 for 22.1% of the total fresh mango export and in 2010 only for 10.2%. Otherwise, there are still few foreign exporter enterprises (it seems there are only two for the moment) but since the sector has been attractive for foreign investments few years ago, we found Peruvian enterprises with a part of foreign capital (from US, Colombia, Costa Rica…).
Table 4: Top 10 fresh mango exporting companies of Peru in 2009-2010
companies plant
aggregated
percentage percentage
net weight
(tons)
Sunshine packing treatment 10,2 % 10,2 % 10737
Camposol packing treatment 17,7 % 7,5 % 7970
FLP del Peru packing 23,2 % 5,5 % 5867
Empafrut packing treatment 27,9 % 4,6 % 4883
Peru frut. Trop. packing 32,0 % 4,1 % 4370
Dominus 35,1 % 3,1 % 3330
Agricola Mochica 38,3 % 3,1 % 3317
SA frontera del Peru 41,2 % 2,9 % 3060
Agroindus. Solcace
SAC 44,0 % 2,8 % 2960
M&C fruit SAC 46,8 % 2,8 % 2946
Other 100,0 % 53,2 % 56284
Total 100 % 100 % 105724
Source : established according to the data from SENASA, 2010. Furthermore, regarding the repartition of export companies according to their volume
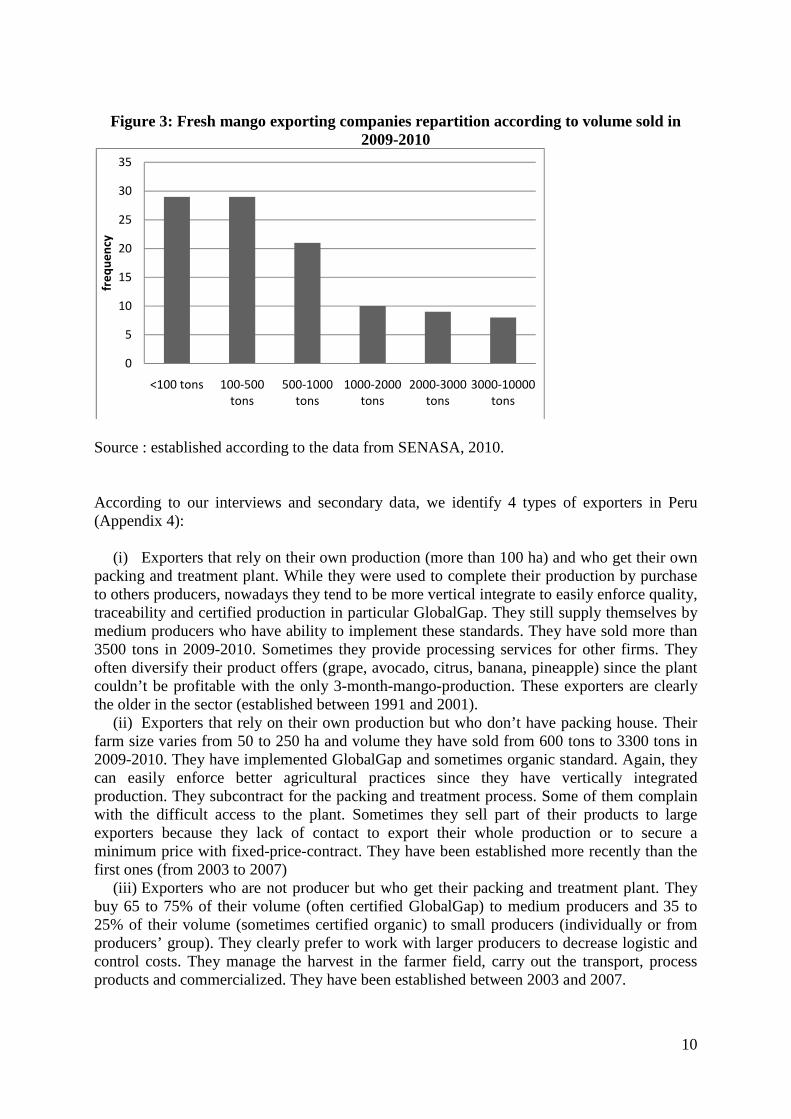
(figure 3), the sector shows a relatively low entry barrier for small exporting companies. Therefore, the sector actors complain about the high number of small and very volatile exporter firms (60% treat less than 500 tons per year) that enter the market for short run market opportunities (they also change of name each time they enter the market). These sporadic exporters are called “golondrinos” (meaning “swallows”). These firms affect the market by increasing rapidly the offer and thus decreasing the Peruvian exporting price. They are also subjected to the most border rejections, which have effect on the country’s reputation on the international trade.
10
Figure 3: Fresh mango exporting companies repartition according to volume sold in
2009-2010
Source : established according to the data from SENASA, 2010. According to our interviews and secondary data, we identify 4 types of exporters in Peru (Appendix 4):
(i) Exporters that rely on their own production (more than 100 ha) and who get their own packing and treatment plant. While they were used to complete their production by purchase to others producers, nowadays they tend to be more vertical integrate to easily enforce quality, traceability and certified production in particular GlobalGap. They still supply themselves by medium producers who have ability to implement these standards. They have sold more than 3500 tons in 2009-2010. Sometimes they provide processing services for other firms. They often diversify their product offers (grape, avocado, citrus, banana, pineapple) since the plant couldn’t be profitable with the only 3-month-mango-production. These exporters are clearly the older in the sector (established between 1991 and 2001).
(ii) Exporters that rely on their own production but who don’t have packing house. Their farm size varies from 50 to 250 ha and volume they have sold from 600 tons to 3300 tons in 2009-2010. They have implemented GlobalGap and sometimes organic standard. Again, they can easily enforce better agricultural practices since they have vertically integrated production. They subcontract for the packing and treatment process. Some of them complain with the difficult access to the plant. Sometimes they sell part of their products to large exporters because they lack of contact to export their whole production or to secure a minimum price with fixed-price-contract. They have been established more recently than the first ones (from 2003 to 2007)
(iii) Exporters who are not producer but who get their packing and treatment plant. They buy 65 to 75% of their volume (often certified GlobalGap) to medium producers and 35 to 25% of their volume (sometimes certified organic) to small producers (individually or from producers’ group). They clearly prefer to work with larger producers to decrease logistic and control costs. They manage the harvest in the farmer field, carry out the transport, process products and commercialized. They have been established between 2003 and 2007.
0
5
10
15
20
25
30
35
<100 tons 100-500
tons
500-1000
tons
1000-2000
tons
2000-3000
tons
3000-10000
tons
fre
qu
en
cy

11
(iv) Exporters who are not producer and who don’t get any plant. They are the more volatile exporters and generally focused on punctual volume (<100 tons a year) more than on quality.
Interviews with mango exporters also revealed that they would like to increase the production of mangoes on their own lands, obviously outside the contract system but land is very expensive nowadays. Escobal et al. (2000) found the same dynamic in the asparagus industry in Peru ten years ago.
Mango producing sector is few organized in Peru. According to an expert, this could be explain by the fact that there are a lots of small producers and mango season is very short, around 3 months (compare to the bananas sector which also involved a high number of small producers, bananas production organizations is easier to rise by the fact that bananas are produced all along the year). Nevertheless, since 2002, medium size producers tend to organize themselves in association, named PROMANGO (Asociación de medium and grande productores de mango del Peru). The association account for 30 producers with an average size of 30 ha (but farm sizes vary from around 10 ha to 500 ha). They gather around 1500 ha at the total and represent 30% of the total national production. 95% of its members already get Globalgap certifications and 2 members have Tesco’s Nature’s Choice’s certification. PROMANGO is trying hard to market itself member’s production but this year, only 12 members has really gather their production and export (that represent only 5 % of the volume). At the exporters’side, there are, on the other hand, several organizations:
(i) ADEX (Asociación De los EXportadores del Peru) was established in 1973 and accounts for 143 members (exporters, importers and service providers for international trade). ADEX is the biggest lobby for exporters since it has strong connections with the public authorities (PROMPERU and SENASA)
(ii) AGAP (Asociación de Gremios Agroexportadores del Peru) was established in 2003 and accounts for 500 members of whom 300 are fresh product growers (mango, avocado, grape). Members are gathering in commodity unions which represent around 80% of the total exported volume by commodity. AGAP is specialized in agroexportation and thus claim to be more relevant to negociate with political authorities.
(iii) Among AGAP unions, APEM (Asociación Peruana de Exportadores de Mango) is specialized on mango industry. The association has been established in 2000, accounts for 19 members and represents 60% of the mango exported volume. For 6 months, PROMANGO has become member too. One of the strengths of the association is based on the leadership to open international markets, as in the case of the US, China and now, Japan.
(iv) APROMALPI (Asociación de Pequenos Productores de Mango de Alto Piura) has been created in 1996 in Chulucanas (Region of Piura) with 40 initial members to sell mango at the national level. Since the beginning, they received help from the NGO PEDICAFE. In 2003, they started to export and get the certification Fair trade by FLO, then in 2005, the organic certification. The association gets a loan from Rabobank thanks to contracts with European buyers.
At the institutional level, two public agencies are working for mango exports in Peru:

12
(i) PROMPERU is the export promotion agency of the Ministry of External Trade and Tourism (MINCEUR). This agency provides support to the sector by sponsoring workshop and developing guidelines and recommendations to help exporters in complying international regulations.
(ii) SENASA (Servicio Nacional de Sanidad Agraria del Peru) is a public agency of Ministry or Agriculture, in charge of phytosanitary and zoosanitary surveillance and control system. It is responsible for inspection and delivery of phytosanitary certificates required to export products from Peru.
e) International standard schemes for fresh mangos
According to Chemnitz et al., (2007b), the nature of the standard (i.e. annual cost of compliance but also type of capital required) may affect producers differently.
The GlobalGap guideline ensures good agricultural practices focusing first on food-safety,
but also a number of issues concerning environment quality (soil, water and wildlife conservation), worker safety and hygiene, and traceability on the farm. The certificate includes some initial investments (such as toilets, canteens for workers, water taps, safety equipment, and storage facilities for agricultural inputs and outputs, respectively) that require substantial financial capital to upgrade the farm. It also entails annual costs for external inspection by a certification body. Finally it requires that the producer know how to read, write, and keep records – which means a high level of human capital. Producers have two options to obtain certification under the standard: they can apply individually or apply collectively for a producer group certificate. Forming producer groups may reduce costs at various levels (lower cost for external inspection, shared investments…) (Asfaw et al., 2010; Belton et al., 2011; Narrod et al., 2009).
Information on GlobalGap standard is relayed by government organizations, by producers and exporters’ organizations and NGOs. Kleinwechter and Grethe (2006) have study the adoption of the Eurepgap standards in the mango export sector in Peru. According to their results conducted in 2004-2005, they show that the first major barrier to adoption is linked to the access to information on standard. Since exporting enterprises were the most informed actors, the adoption of the standard is mostly found in the activities of exporter enterprises by vertical integration. They highlight the risk of exclusion of certain producer groups.
Concerning cost of compliance, our interviews’ results highlight a large variability of the costs of compliance, ranged between 150 and 833 US$/ha. This is influenced by the previous endowments in storage or other infrastructures and technical level of the farm, but also by the size of the farm (since infrastructure and technical level required are not size proportional). Some added costs are then spending for infrastructure maintenance. In spite of a large variability in their results, Kleinwechter and Grethe (2006) calculate a cost of compliance of 145 US$/ha/year on average and 9.51 US$/ton/year, i.e. 3,8% of the mango farm gate price. According to the producers’ perception, cost of implementation remains the major constraint from GlobalGap standard implementation.
The fixed cost of annual inspection is 2000 $US/year. This cost is high, all the more without premium in the product price. Size of individual enterprise is thus a major determinant of the standard adoption. According to primary data, the minimum profitable size to implement GlobalGap is around 15 and 20 ha.
Other problems of importance expresses by the interviewees are related to the high level of administrative forms required and therefore time required to fill the forms. Finally it is worthwhile to note that GlobalGap is weakly enforced and it is common that exporters mix certified production with uncertified production and sell it under the same
13
brand (Fulponi, 2007). Unfortunately GlobalGap figures are not available to compare surface certified and volume sold with GlobalGap standard.
Organic production represents 1% of the total mango production in Peru (3,000 tons in
2007). According to Promperu data from 2007, 36% of organic mangos are exported to the US and 64% to Europe (that is almost the same as the conventional mango market).
Organic certification focuses on food-safety, environment quality, and traceability on the farm through agricultural practices that do not involve chemical inputs. The certificate includes few initial investments, but entails annual costs for external inspection by a certification body – meaning a minimum level of financial capital– and requires that the produce be able to read, write, and keep records – meaning again a minimum level of human capital. Again, producers have two options to obtain certification under the standard: they can apply individually or apply collectively for a producer group certificate.
The cost of annual inspection is 2000 $US/year, but could be balance by the price premium of this certification and to the security of market access due to the product diversification (they highlight that organic product could sold in the both organic and conventional market). According to our interviews, the lower yield which is not always compensate by the premium is one of the major problem, above all due to neighboring effects (pest, …) when other farmers around are not taking care of their field. Organic farms are a majority of small farms. The market outlet is however quite small.
3. Analytical framework and hypotheses
a) An analytical framework
Given the scarcity of an adequate amount of literature to analyze the implications that international sustainability standards have on the behavior of farmers, we propose to draw on the simple conceptual framework developed by Hirschman (1970), who analyzed the economic and political behavior of firms, organizations, and states facing a declining situation. Henson and Jaffee (2008) then used this framework in the specific case of food safety standards to analyze the strategic responses of developing countries.
Hirschman compares strategic options by various organizations and describes strategy types through the concepts of “exit”, “loyalty”, and “voice” (Hirschman, 1970). The “voice” option involves complaining or negotiating through lobbying. Concerning food standards, Henson and Jaffee (2008) argue that “voice” could be understand as protesting again new standards, for example, at the WTO level when standards are judged unfair or as a protectionist barrier. The “loyalty” option involves the organization’s participation – this could be interpreted in the food sector as an alignment with the standard’s requirements (Henson and Jaffee, 2008). Lastly, the “exit” option involves ceasing participation – this could be interpreted in the food sector as choosing not to comply with the standard in a particular market, i.e. switching customers or particular markets if alternative profitable markets exist or, if no alternative is available, definitively stopping the activity. Moreover, Henson and Jaffee (2008) propose another dimension to Hirschman’s framework related to when option is implemented: ex-ante “proactive” behaviors (anticipating standards) or ex-post “reactive” behaviors (waiting and adapting). The most negative approach is thus a combination of “exit” and “reactive” behaviors.
As Chemnitz et al, (2007) and Henson and Jaffee (2008) have already highlighted, the ability to implement the various options will depend on several factors at the country, market, and firm levels, as well as the specific food standards.

14
b) Specificity of the case study
In our paper, we question the impacts of the restructuring of the mango supply chain by growing private standard requirements, GlobalGap in particular, on small-scale farmers. The farmers we surveyed are export-oriented (they grow the Kent variety, which is not valued locally), but may not be certified since they do not have enough land (they own less than 20 ha). This research work offers a path for research that is not much developed in the literature: understanding the alternatives for small-scale farmers potentially excluded by stringent standards.
We have to specify the above framework according to the relevant options for our case
study. For instance, because we focus our analysis on small-scale farmers in Peru who are very fragmented and little organized, the “voice” option does not appear relevant and most of these smallholders have “reactive” behaviors. As Higgins et al. (2008) argue in their paper, in developing countries, farmers may be only “standard takers”(Higgins et al., 2008). We thus specify three main alternative options available to small-scale export-oriented farmers:
(i) Loyalty: As we mentioned above, producers have two options to obtain certification under the standard: either by applying individually or by applying collectively for a producer group certificate. In the case of small farmers who hold less than 20 ha, the loyalty strategy at the individual level seems difficult due to the fixed costs of compliance. The other option is thus that farmers organize themselves within producer organizations so as to comply collectively with standards. Yet the length of the mango harvest (three months) seriously limits the opportunities for the development of efficient collective action. According to the results of Kleinwechter and Grethe (2006), small-scale producers do not comply with GlobalGap certification. Khiem et al. (2010) have also show that this type of collective action for certification is not a panacea for farmers (Khiem et al., 2010).
(ii) Switch9: Producers will continue to export to the EU and the US indifferently since they adopt organic certification. Organic certification substitutes for the GlobalGap requirement in the EU market.
(iii) Exit: They will no longer export to the EU and will target the US or domestic markets instead. This means that the “auspicious” export window is reduced for these producers, perhaps implying that the farmers replace their usual exporter. In extreme cases, the farmers may uproot their Kent mango trees (intended for export) and replant new orchards with Edward or Criollo mango trees for the domestic market (targeting the higher segment of the domestic market).
We must mention that non-certified producers do not yet face total exclusion from the EU market as a whole since EU importers can buy non-certified products when no GlobalGap produce is available. Consequently, some small-scale producers still have not chosen an option (later, they will be included in a control group named “continue”). Moreover, these alternatives are not totally exclusive, but we assume that the third is probably more frequent.
Besides, the above analysis framework does not give any idea of the benefits or disadvantages for small farmers to adopt one type of marketing behavior. We will thus additionally formulate a research hypothesis on the impacts of these options on income and marketing risk for farmers.
9 Contrary to Hirschman’s framework, in our particular case, we do not include switching customers in the exit option because “switching” here means to comply with another standard, which is related to an offensive strategy by farmers following the widespread use of GlobalGap certification.

15
c) Research hypotheses
It may be necessary to introduce some hypotheses to test the impacts of marketing options on prices and marketing risks. We think that GlobalGap’s introduction may have ambiguous impacts on non-certified smallholders.
First, when some small-scale producers choose the “loyalty” option (i.e. compliance with the GlobalGap standard), one could expect positive results on income and marketing stability:
(iv) Price and Stability: GlobalGap certification does not involve the price premium, but since it could increase market access when the EU export market is favorable, we expect prices to increase. Besides, since GlobalGap compliance often leads to stronger vertical coordination through farming contracts, we expect producer-exporter relationship stability to increase.
Second, the “switch” option may have positive results on the income and marketing stability for small-scale producers:
(v) Price and Stability: Organic certification involves the price premium, which could balance the costs of compliance. It could also increase the security of market access due to product diversification. Consequently, we expect price and market stability to increase.
Third, the “exit” option may have negative results on the income and marketing stability of non-certified smallholders:
(vi) Price: Non-certified producers switch to supplying the domestic market, where the price for Kent mangos is substantially lower than on the international market.
(vii) Risk: Non-certified producers switch to supplying “golondrinos” (unknown buyers). This is likely to increase their marketing risk (unstable relationships, low prices, etc.).
However, the demand for certified products may have indirect positive results on the income of non-certified producers:
(viii) Price: Conventional product demand from the US may mostly be satisfied by the supply chain responses of non-certified producers. In addition, the bargaining power of these producers compared to small-scale exporters, such as golondrinos, may increase. Consequently, we could expect non-certified producer prices to increase.
(ix) Hired labor: According to SOMO (2011), the increase in certified exporters’ own production increases the need for hired labor (SOMO, 2011). Consequently, we could expect a higher labor demand at the village level.
(x) Income: The increase of price for conventional mangos and the increase of hired labor may increase the total income of non-certified producers. The following sections examine various options for small scale farmers presented in the conceptual framework described above in the context of rising GG demand in the export supply chain in Peru.
4. Survey and data
a) Survey and method
This empirical study was led in the framework of the EU NTM-Impact Project (www.ntm-impact.eu), whose objectives include the analysis of the impacts of non-tariff measures (NTMs) from high-income countries – governmental regulations and private standards – on developing countries.
Between October 2010 and May 2011, we undertook a survey of 223 mango producers in the main mango region of Piura, where over 90% of exported mangos originate. We focus our

16
analysis here on small farmers with less than 20 ha and who represent 20-30% of mango exports and 70-80% of all mango producers. We randomly selected 19 villages located in the two main areas where exporters’ plants are found – Sullana and Tambogrande10. Within these villages, producer surveys were chosen randomly among the farmers growing Kent mangos (i.e. export-oriented) with holdings of less than 20 ha (i.e. small farmers for whom individual GlobalGap certification might be unprofitable). Surveys were conducted on a face-to-face basis. The data collected through the questionnaire include: farm and household general characteristics, household assets, mango production and marketing behavior, mango standard certifications (organic and GlobalGap), other activities, changes and perceptions since GlobalGap is required by exporters. According to the surveys, producers no longer know where their mangos are exported to because large exporters generally export to both markets. The producer does not choose an export target, but rather an exporter.
In addition, exporters interviews based on a semi-structured questionnaire were done to
collect supplemental contextual data from 10 exporters. Finally, this primary data were supplemented with information of prices.
b) Data analysis
To describe the sample of producers, descriptive statistics are applied. To describe factors that may have influenced the farmers’ marketing behaviors and determined perceived impacts of standard requirements, an analysis is performed using t-test and Chi²-test11. In this paper, we do not show a causal effect of GlobalGap certification on producers, but rather we depict the characteristics and perceptions that characterize the different types of producers in the alternative options.
Finally, estimating a regression model tests the hypothesis concerning the impact of these options on the price received for mangos. In addition, we also control for other factors considered to be relevant, such as the variables of farm and household characteristics and relationships with buyers. The dependant variable of the regression is the logarithm of the highest price received by the farmer (figure 4). We do not know the volume sold at this price, but since farmers generally harvest once or twice per season and that the discarded mangos could not have received the highest price, we can assume that it was a sizeable amount of the farmer’s production. We think that it could be a good proxy of the producer’s bargaining power and final income (given the volume of mangos).
10 We choose to not take into account the Chulucanas area since an NGO works actively with small farmers to participate into the high standard markets (Fair Trade, Organic and GlobalGap). This may has biased our results by the exogenous intervention. 11 We cannot use a multivariate logistic regression model because alternative options are not totally exclusive.
Figure 4: distribution of the dependent variable: logarithm of the higher price received
c) Characteristics of farmers and marketing behaviors
Within our sample of 223 producers, the average dedicated to mango production (85% of mangos, followed by traditional consumption). Most part of smalland cocoa (6%). 80% of respondents say that min terms of cash flow. Most smallor have extra agricultural income (14%)but most of them started after 2000the nearest plant (treatment or packing plant) is around 14 km.
(i) Loyalty: 31% of farmers surveyed 8% are GlobalGap certified. smallholder farmers. The average certification date is 2009 (from 2007 to 2010). The compliance cost is US$ 2,000 per year (without any variability among respondents). The certificate is paid sometimes by is under contract or by a producer organization (half of an organization, 22% of the total sample). Initial investments (such as toiletworkers, water taps) are more often paFinally, GG certified producers are scarce as we expected for smallholder farmers.
(ii) Switch: 12.5% of producers are certified organic. The average certification date is 2007 (from 2004 to 2010). The cospaid for by the producer himself or
Nine producers are both GlobalGap (iii) Exit: 9% of producers declare to have
market since 2007 (33% have decreased and 54% grow varieties for the domestic market (not increased these areas nor
: distribution of the dependent variable: logarithm of the higher price received by the farmer
of farmers and marketing behaviors
Within our sample of 223 producers, the average farm size is 8 ha, 3dedicated to mango production (85% of land dedicated to mango production
traditional mango varieties for the domestic market and Most part of small-scale producers growth also cereals (21%), lemon (39%)
80% of respondents say that mangos are the most important product growMost small-scale producers are also day laborers at
or have extra agricultural income (14%). On average, they have grown mangobut most of them started after 2000, when exportation raised dramatically. Their d
ent or packing plant) is around 14 km. Loyalty: 31% of farmers surveyed have heard about GlobalGap certification and only
certified. GlobalGap certified producers are scarce, as we expected for smallholder farmers. The average certification date is 2009 (from 2007 to 2010). The
000 per year (without any variability among respondents). The certificate is paid sometimes by the producer himself, but mostly by the exporter
producer organization (half of GlobalGap producers an organization, 22% of the total sample). Initial investments (such as toilet
) are more often paid for by the producers thanks to a certified producers are scarce as we expected for smallholder farmers.
5% of producers are certified organic. The average certification date is 2007 (from 2004 to 2010). The cost of certification is around US$ 2,000/year and is mostly
producer himself or a producer organization (in few cases by
GlobalGap and organic certified.
Exit: 9% of producers declare to have increased their volumes sold to market since 2007 (33% have decreased and 54% have experienced no change
domestic market (around 15% of their total mango area decreased the Kent variety areas. Otherwise,
17
: distribution of the dependent variable: logarithm of the higher price received
size is 8 ha, 3.3 ha of which is production is for Kent
domestic market and personal cereals (21%), lemon (39%)
the most important product grown at other farms (13%) mangos since 1997, Their distance from
certification and only as we expected for
smallholder farmers. The average certification date is 2009 (from 2007 to 2010). The 000 per year (without any variability among respondents). The
exporter if the farmer producers are members of
an organization, 22% of the total sample). Initial investments (such as toilets, canteens for a rural credit bank.
certified producers are scarce as we expected for smallholder farmers.
5% of producers are certified organic. The average certification date is 000/year and is mostly
producer organization (in few cases by the exporters).
sold to the domestic have experienced no change). All producers
area), but they have , 33% say that they

18
have increased their volumes sold to unknown traders since 2007 (29% have decreased and 35% have experienced no change). Unknown traders are generally golondrinos12, i.e. exporters with a very volatile existence. We already know that most producers (85%) work with unknown traders each year, particularly to sell any Kent mangos rejected by their usual exporters. 34% of producers declare selling low volumes to these traders and 42% of producers declare selling a high volume to these traders each year. 56% of producers who declare huge volumes to unknown traders say that these volumes have increased since 2007 – the latter (24% of the total sample) are considered among the “exit” option below because they no longer know to whom they are selling their mangos.
5. Results and discussion
While it appears not appropriate to analyze “voice” strategy at the producer level, it is worthwhile to mention as an element of context that, at the national level, Peru adopted the voice strategy. Indeed, in 2007, various developing countries, including Peru, complained at the WTO against the “untransparency” of private standards because these standards are not based on science and not even notified to the WTO. This “voice” strategy at the national level didn’t give any results, letting Peruvian producers to reactive strategy of “loyalty”, “switch” or “exit”.
Chi²-test and t-test procedures are used for comparison on the table 5 and table 6. At the producer level, thanks to our empirical data, we compare the three options proposed
above: loyalty (GlobalGap adopters), switch (organic adopters) and exit (selling mangos to unknown traders) behavior categories according to some selected variables.
As presented in Table 5, the average total land size of GlobalGap adopters (loyalty) is
significantly lower than the control group (continue). Yet similar to organic adopters (switch), the farmers are significantly more specialized in mango production (ratio of land size under mango are statistically significant below 0.05 level of probability). Regarding yield, there are no significant differences among the groups – the lower yield expected for organic farming is not significant. Regarding the exit option, the average size of total land is a little lower than their counterparts and these producers have a little less mango production (variables are statistically significant below 0.1 level of probability).
Household characteristics do not show any important results in terms of our comparison, except that farmer adopting organic standard are a little younger (that seems also explain that they have a few years of less experience) and GlobalGap adopters and exit producers are more likely to have income from an agricultural off-farm activity - below 0.05 level of probability. This could be explained in different ways: while it is proof of GlobalGap adopters’ access to financial capital that could be reinvested in their farms, conversely in this case of exit producers this could suggest that their farm is not profitable enough to bring sufficient income. They are also less likely to own a car.
12 This is less likely to be a new broker for the domestic market, which does not present a profitable opportunity for the Kent variety. In addition, in the domestic market, producers are used to working with the same broker, often a relative.

19
Table 5: Mean comparison of producer characteristics according to alternative options
Statistical significance at the 0.01 (***), 0.05 (**) and 0.1 (*) level of probability a Continue is the control group (i.e. the total sample without standard adopters and producers who declare
huge volume to unknown traders and said that this volume has increased since 2007). Among variables related to market access, the distance is significantly lower for standard
adopters - below 0.01 and 0.05 level of probability for respectively GlobalGap and organic adopters.. This could suggest that standard compliance may be more the result of an exporter’s decision rather than that of the farmer. This could be supported by the fact that it is the exporters who manage the harvest inside the mango farms. Other variables related to relationships with buyers, such as contracts (used to having written contracts or not) and advance payments, differ significantly - below 0.01 and 0.05 level of probability for
Continuea (n=137)
Loyalty (Globlgap)
(n= 18)
Switch (Organic)
(n=28)
Exit (Do not know anymore
their buyer) (n=49)
Farm characteristics
Total land size 8,81 4,2*** 6,8 7,18*
Ratio of land size under mangos
0,52 0,82*** 0,65** 0,53
Ratio of mango area under Kent
0,84 0,88 0,87 0,84
Volume of mangos 2009 16,96 10,4* 10,71* 12,48*
Yield 2009 8,00 8,34 6,69 7,47
Household characteristics
Age 55,6 51,4* 51,3** 57,7
Education 1,49 1,61 1,46 1,48
Experience 15,77 14,4 12,96** 15,57
Children (<15 years) 1,67 1,5 1,70 1,43
Mobile phone 0,64 0,77 0,64 0,65
Car 0,27 0,16 0,18 0,12**
Date of car 1995 2004* 2002* 1991
Agri. off farm Income 0,08 0,33*** 0,14 0,20**
Market access and relation w/ buyer
Distance to plant 14,9 7,8*** 11,5** 14,4
Packing plant 0,68 0,94** 0,68 0,84**
Works only w/ 1 exporter 0,71 0,88* 0,73 0,37
Used to have written contract 0,15 0,66*** 0,43*** 0,02**
Used to have no contract 0,57 0,27*** 0,39** 0,77***
Technical advices 0,5 0,77*** 0,5 0,02***
Advance payment 0,18 0,44*** 0,28* 0,04**
Month is important for buyer 0,27 0,22 0,14 0,39**
Color is important for buyer 0,49 1*** 0,90*** 0,44*
Weight is important for buyer 0,51 1*** 0,85*** 0,51

20
respectively GlobalGap and organic adopters.. Written contracts and advance payments attest to close relationships with the buyers. In the case of GlobalGap adopters, farmers are also more likely to receive technical advice from the buyer and the presence of nearby packing plant (namely exclusively EU-oriented) is significantly higher compared to the control group. The results lead to the same conclusion as Kleinwechter and Grethe, who have shown that vertical integration or some forms of vertical coordination, such as contract farming, can be seen as the most important factor influencing GlobalGap compliance (Kleinwechter and Grethe, 2006 ). Moreover, standard adopters’ buyers are significantly more demanding in terms of commercial quality (color and weight) than those of their counterparts. Finally, exit producers have significantly less contracts with buyers (below 0.01 level of probability); they do not benefit from technical advice or advance payments, even if a packing plant is generally and significantly more accessible for them than for the control group. For the exit option, buyers are more demanding on the month of the available production, suggesting that the buyers have shortened export windows.
Table 6: Mean comparison of producer perceptions according to alternative options
Continue
(n=137) Loyalty
(Globlgap) (n= 18)
Switch (Organic)
(n=28)
Exit (Don’t know anymore
their buyer) (n=49)
Risks and stability in market access
Production costs have increased 0,60 0,72 0,75 0,67
Production costs have decreased 0 0 0 0,12***
Price risk has increased 0,66 0,66 0,50** 0,82**
Price risk has decreased 0,15 0,11 0,28* 0,14
Stability of relation w/ buyer has increased
0,32 0,50** 0,43* 0,14**
Stability of relation w/ buyer has decreased
0,25 0,05** 0,25 0,37
Increased land under Kent 0,21 0,11 0,14 0,20
Increased land under cereals 0,22 0*** 0*** 0,35*
Increased land under fruit trees 0,36 0,61* 0,39 0,47
Increased land under cocoa 0,02 0,44*** 0,21*** 0
Income and bargaining power
Off farm labor has increased 0,07 0,16* 0,21*** 0**
Off farm labor has decreased 0,18 0,05 0,18 0,12
Mango prices have increased 0,37 0,55 0,57* 0,40
Mango prices have decreased 0,32 0,22 0,21 0,34
Earlier payment 0,24 0,38 0,14 0,24
Later payment 0,33 0,05** 0,28 0,24
Bargaining power has increased 0,26 0,33 0,32 0,08***
Bargaining power has decreased 0,31 0*** 0,17** 0,53***
Income has increased 0,34 0,55** 0,43 0,22
Income has decreased 0,30 0,16 0,32 0,48**
21
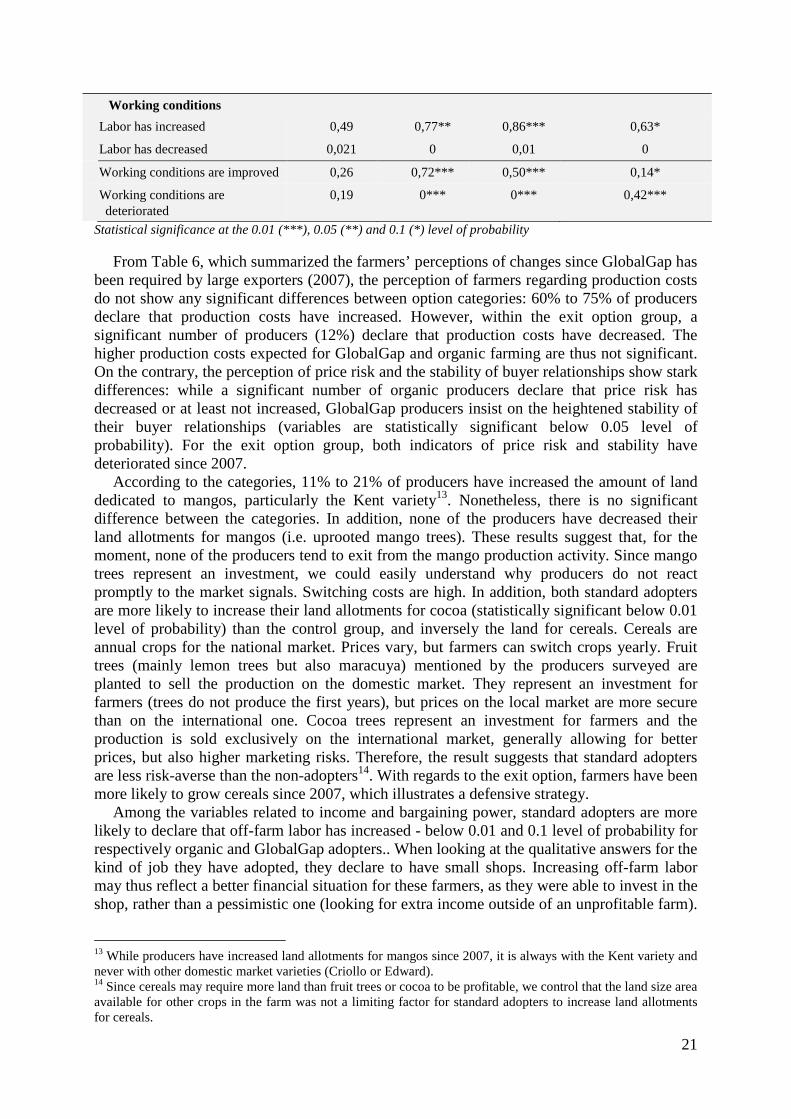
Statistical significance at the 0.01 (***), 0.05 (**) and 0.1 (*) level of probability From Table 6, which summarized the farmers’ perceptions of changes since GlobalGap has
been required by large exporters (2007), the perception of farmers regarding production costs do not show any significant differences between option categories: 60% to 75% of producers declare that production costs have increased. However, within the exit option group, a significant number of producers (12%) declare that production costs have decreased. The higher production costs expected for GlobalGap and organic farming are thus not significant. On the contrary, the perception of price risk and the stability of buyer relationships show stark differences: while a significant number of organic producers declare that price risk has decreased or at least not increased, GlobalGap producers insist on the heightened stability of their buyer relationships (variables are statistically significant below 0.05 level of probability). For the exit option group, both indicators of price risk and stability have deteriorated since 2007.
According to the categories, 11% to 21% of producers have increased the amount of land dedicated to mangos, particularly the Kent variety13. Nonetheless, there is no significant difference between the categories. In addition, none of the producers have decreased their land allotments for mangos (i.e. uprooted mango trees). These results suggest that, for the moment, none of the producers tend to exit from the mango production activity. Since mango trees represent an investment, we could easily understand why producers do not react promptly to the market signals. Switching costs are high. In addition, both standard adopters are more likely to increase their land allotments for cocoa (statistically significant below 0.01 level of probability) than the control group, and inversely the land for cereals. Cereals are annual crops for the national market. Prices vary, but farmers can switch crops yearly. Fruit trees (mainly lemon trees but also maracuya) mentioned by the producers surveyed are planted to sell the production on the domestic market. They represent an investment for farmers (trees do not produce the first years), but prices on the local market are more secure than on the international one. Cocoa trees represent an investment for farmers and the production is sold exclusively on the international market, generally allowing for better prices, but also higher marketing risks. Therefore, the result suggests that standard adopters are less risk-averse than the non-adopters14. With regards to the exit option, farmers have been more likely to grow cereals since 2007, which illustrates a defensive strategy.
Among the variables related to income and bargaining power, standard adopters are more likely to declare that off-farm labor has increased - below 0.01 and 0.1 level of probability for respectively organic and GlobalGap adopters.. When looking at the qualitative answers for the kind of job they have adopted, they declare to have small shops. Increasing off-farm labor may thus reflect a better financial situation for these farmers, as they were able to invest in the shop, rather than a pessimistic one (looking for extra income outside of an unprofitable farm).
13 While producers have increased land allotments for mangos since 2007, it is always with the Kent variety and never with other domestic market varieties (Criollo or Edward). 14 Since cereals may require more land than fruit trees or cocoa to be profitable, we control that the land size area available for other crops in the farm was not a limiting factor for standard adopters to increase land allotments for cereals.
Working conditions
Labor has increased 0,49 0,77** 0,86*** 0,63*
Labor has decreased 0,021 0 0,01 0
Working conditions are improved 0,26 0,72*** 0,50*** 0,14*
Working conditions are deteriorated
0,19 0*** 0*** 0,42***
22
For the exit option group, off-farm labor has not increased. Our hypothesis that certified exporters are more likely to increase their need for hired labor and thus the demand for labor at the village level (according to the results of SOMO, 2011) does not concern hired labor from the exit option group. Since labor contracts are for only three months, the mango season’s peak, we can think that the seasonal workers are thus generally not mango producers themselves. Organic farmers are more likely to declare that mango prices have increased (57% of them) since GlobalGap farmers a large number of them declare that their income has increased and that they do not receive later payment for that. In addition, both standard adopter categories perceive that their bargaining power has not decreased since 2007, while their counterparts dramatically perceive a decrease of their bargaining power. Lastly, among the variables related to working conditions, both standard adopter categories declare that the labor has increased in their farm since they have complied with the standard. However, their working conditions have also significantly improved. Actually, mango production is low labor-intensive. Yet because they comply with the standards, farmers have increased their labor time on the farm, mostly because they have to keep records of all their farm practices. On the contrary, exit option producers declare that their working conditions have deteriorated on the farm.
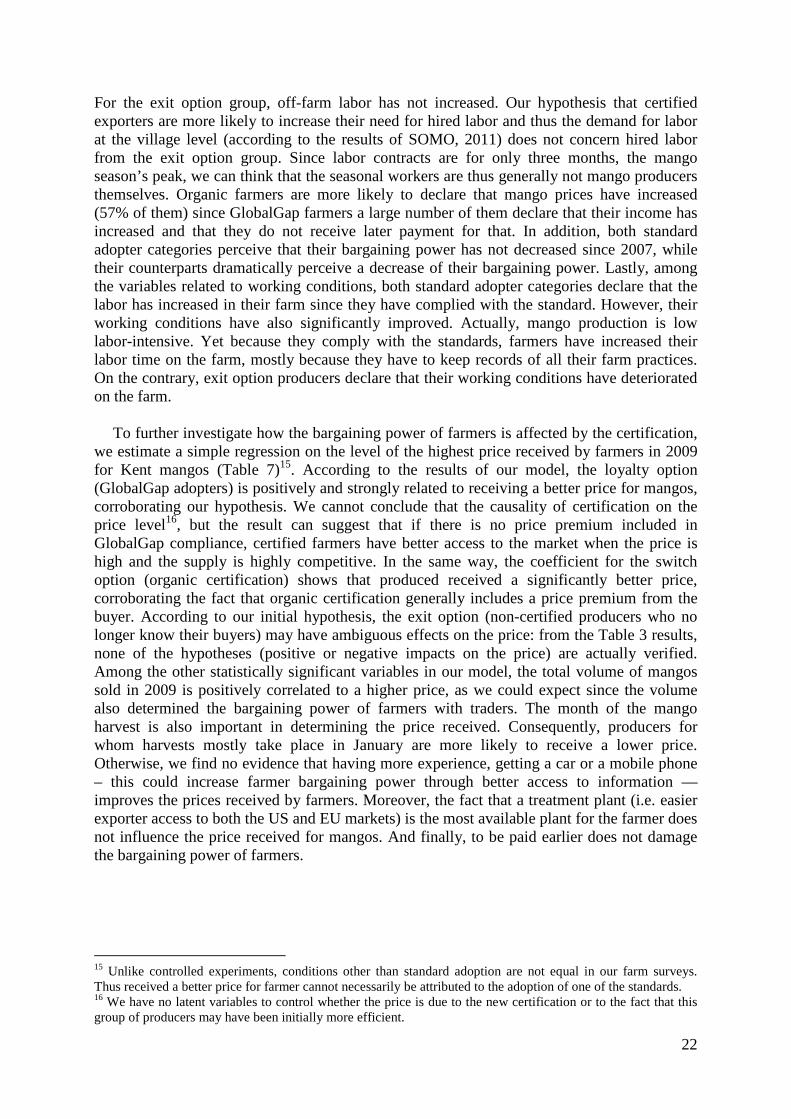
To further investigate how the bargaining power of farmers is affected by the certification,
we estimate a simple regression on the level of the highest price received by farmers in 2009 for Kent mangos (Table 7)15. According to the results of our model, the loyalty option (GlobalGap adopters) is positively and strongly related to receiving a better price for mangos, corroborating our hypothesis. We cannot conclude that the causality of certification on the price level16, but the result can suggest that if there is no price premium included in GlobalGap compliance, certified farmers have better access to the market when the price is high and the supply is highly competitive. In the same way, the coefficient for the switch option (organic certification) shows that produced received a significantly better price, corroborating the fact that organic certification generally includes a price premium from the buyer. According to our initial hypothesis, the exit option (non-certified producers who no longer know their buyers) may have ambiguous effects on the price: from the Table 3 results, none of the hypotheses (positive or negative impacts on the price) are actually verified. Among the other statistically significant variables in our model, the total volume of mangos sold in 2009 is positively correlated to a higher price, as we could expect since the volume also determined the bargaining power of farmers with traders. The month of the mango harvest is also important in determining the price received. Consequently, producers for whom harvests mostly take place in January are more likely to receive a lower price. Otherwise, we find no evidence that having more experience, getting a car or a mobile phone – this could increase farmer bargaining power through better access to information —improves the prices received by farmers. Moreover, the fact that a treatment plant (i.e. easier exporter access to both the US and EU markets) is the most available plant for the farmer does not influence the price received for mangos. And finally, to be paid earlier does not damage the bargaining power of farmers.
15 Unlike controlled experiments, conditions other than standard adoption are not equal in our farm surveys. Thus received a better price for farmer cannot necessarily be attributed to the adoption of one of the standards. 16 We have no latent variables to control whether the price is due to the new certification or to the fact that this group of producers may have been initially more efficient.
23
Table 7: Regression estimation results
6. Conclusion
This paper addresses the gap in the literature regarding the implications that international sustainability standards have on the behavior of (potentially) excluded farmers and their impacts in terms of marketing risks and income levels. Drawing on the adapted concepts of Hirschman (1970), we have used this analytical framework to compare alternative options that mango producers in Peru have been progressively following since GlobalGap exporter requirements are growing.
Data collected through a representative and large number of surveys with small-scale export-oriented producers (223 surveys) shows three main options -statistically distinguishable- adopted by these farmers. First, and contrary to the findings of Kleinwechter and Grethe (2006), we show evidence that the loyalty option exists since 8% of our sample are complying with GlobalGap. Exporting companies thus support these farmers in complying with the standard through farming contracts, technical advice, and by paying the annual certification costs. This kind of farming contract with smallholders have been described in others cases (Asfaw et al., 2007; Jaffee and Henson, 2004; Minten et al., 2009). This support allows small-scale producers to be included in the lucrative international market. According to the results of the Chi²-test and t-test procedures used for option comparison, these farmers are more likely to declare having a increasing stability of their relationship with their buyer, an increasing income and better working conditions since 2007. In addition, the results of the regression on the level of the higher price received by farmers in 2009 for mangos Kent, show that these farmers received a significatively better price for mangos. Therefore, while exporter companies GlobalGap certified tend to increase vertical integration of the mango production, it still exist a mixed picture of their mango supply, thanks to contract farming allowing the
Dependant variable: log. of highest price for mango in 2009
Coeff. Std. dev.
Alternative options
Loyalty 0.205*** 0.080
Switch 0.123** 0.064
Exit - 0.156 0.049
Farm characteristics
Volume of mangos 2009 0.002** 0.001
Production peak in December - 0.005 0.042
Production peak in January - 0.119*** 0.049
Household characteristics
Experience -0.002 0.002
Mobile phone 0.045 0.044
Car 0.067 0.050
Market access and relation w/ buyer
Packing plant 0.042 0.049
Risks and stability in market access
Earlier payment -0.057 0.047
Constant 2.382*** 0.141
Pseudo-R² 0.17
N 207

24
integration of small-scale farmers into the high standard market. Nonetheless, farmers who are integrating into this supply chain seem to be selected according to two characteristics: they are more specialized in mango production (more than 80% of their land) and they are closer to the exporter plant. Exporters may thus decrease transaction costs by selecting productive farmers close to their plant. Second, we found farmers who adopt another option (switch option) to bypass the difficulties of complying with GlobalGap certification by implementing organic certification. Organic certification, which required less initial investment from farmers, substitutes for the GlobalGap requirement in the EU market. According to the mean comparisons, these farmers are more likely to perceive that price risk has decreased and that their working conditions have been improved. The regression estimation show that they also received a rather better price for mangos, as expected. These farmers are also rather specialized in mango production (65% of their land area), they are quite close to the plant and have also contract farming. Third, we found a steady number of farmers who declare that they no longer know their mango buyers. These buyers are the well-known golondrinos, which represent 30% to 50% of the exporter companies and are very volatile. Farmers belonging to this option group seem to be very affected by this change: a large majority (82%) declares that price risk has increased, that stability with farmers has rather not increased (compared to their counterparts), their bargaining power and their agricultural income have decreased, and last that their working conditions have deteriorated. They are particularly vulnerable because their level of investment (mango trees) impedes to radically change of farm activity. Switching costs are high. These farmers – characterized by rather low total land size, low mango volume, and never used to getting any contract farming, technical advice, or advance payments – represent 24% of our total sample.
This study aimed to contribute to the analysis of the extent to which small-scale farmers are affected by non-certification and thus how problematic such forms of exclusion are. The latter is of interest to policymakers since Peruvian agriculture is still source of economic development and represents a large source of employment. We show in this case study a significant level of exit option (which is more an exit of the stable usual supply chain than a definite market exit). Consequences of growing international standards in different agricultural sectors are thus very important to analyze in order to develop adapted policy recommendations and support for farmers. The question is however whether policymakers can do anything to facilitate smallholders to comply with new sustainable standards? The success story of Kenya (Jaffee and Henson, 2004) could allow highlighting some interesting key points in particular with the development of the public guidelines for good agricultural practices by product and the definition of clear direction of programmes of technical assistance and support for small-scale farmers.
Finally, to pursue this analysis it would be interesting to better understand why some
farmers (the “continue” control group) are still not affected by the international standard requirements, without any changes to their way of supplying exporters. It would thus be necessary to interview their specific exporters. As mention by Belton et al. (2011) some small operators may continue as best they can to cater for markets at midterm but they face increased vulnerability due to reduced market share. Otherwise, this could be due to the lack of GlobalGap enforcement, since it is known that some exporters mix certified production with uncertified production and sell it under the same brand (Fulponi, 2007). Unfortunately, it is difficult to get GlobalGap figures to compare the surface certified and the volume sold with the global standard.
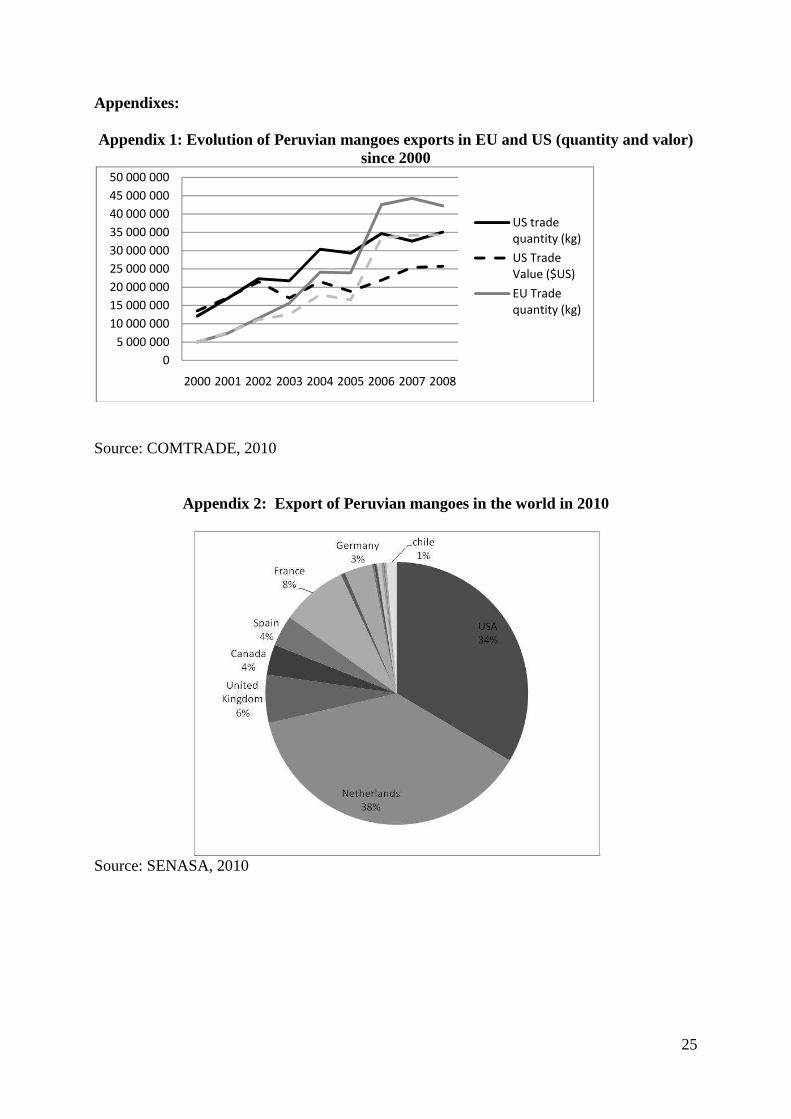
25
Appendixes:
Appendix 1: Evolution of Peruvian mangoes exports in EU and US (quantity and valor) since 2000
Source: COMTRADE, 2010
Appendix 2: Export of Peruvian mangoes in the world in 2010
Source: SENASA, 2010
0
5 000 000
10 000 000
15 000 000
20 000 000
25 000 000
30 000 000
35 000 000
40 000 000
45 000 000
50 000 000
2000 2001 2002 2003 2004 2005 2006 2007 2008
US trade
quantity (kg)
US Trade
Value ($US)
EU Trade
quantity (kg)

Appendix 3: Evolution of Peruvian mangoes price in EU and US since 2000
Source: COMTRADE, 2010
Appendix 4: characteristics of the 4 types of exporting companies
0
0,2
0,4
0,6
0,8
1
1,2
2000 2001 2002 2003 2004
: Evolution of Peruvian mangoes price in EU and US since 2000
: characteristics of the 4 types of exporting companies
2004 2005 2006 2007 2008
US price USD/kg
EU price USD/kg
26
: Evolution of Peruvian mangoes price in EU and US since 2000
: characteristics of the 4 types of exporting companies
US price USD/kg
EU price USD/kg

27
Bibliography Asfaw, S, Mithöfer, D and Waibel, H, 2010. Agrifood supply chain, private-sector standards,
and farmers' health: evidence from Kenya. Agricultural Economics, 41(3), 251-263. Augier, P, Gasiorek, M and Tong, C Lai, 2005. The Impact of Rules of Origin on Trade
Flows. Economic Policy, 20(43), 567-623. AVSF, 2008. Estudio de impacto del comercio justo en la asociación de productores de
mango del valle del alto Piura (Apromalpi-Perú), ONG report. Agronomes et Vétérinaires sans Frontières.
Belton, B, Haque, M M, Little, D C and Sinh, L X, 2011. Certifying catfish in Vietnam and Bangladesh: Who will make the grade and will it matter? Food Policy, 36, 289-299.
Busch, L and Bain, C, 2004. New! Improved? The transformation of the global agrifood system. Rural Sociology, 69(3), 321–346.
Chemnitz, C, 2007a. The Compliance Process of Food Quality Standards on Primary Producer Level: A Case Study of the EUREPGAP Standard in the Moroccan Tomato Sector. Humboldt University Berlin, Institute for Agricultural Economics and Social Sciences, Working Paper Series. Working Paper 81
Chemnitz, C, Grethe, H and Kleinwechter, U, 2007b, Quality Standards for Food Products –
A Particular Burden for Small Producers in Developing Countries?, EAAE Seminar “Pro-poor Development in Low Income Countries: Food, Agriculture, Trade, and Environment”, Montpellier, France.
Dolan, C and Humphrey, J, 2000. Governance and trade in fresh vegetables: the impact of UK supermarkets on the African horticulture industry. Journal of Development Studies, 37 (2), 147-176.
Escobal, J, Agreda, V and Reardon, T, 2000. Endogenous institutional innovation and agroindustrialization on the Peruvian coast. Agricultural Economics, 23, 267-277.
Fulponi, L, 2007. Market Access and Private Standards: Case Study of the Peruvian Fruit and Vegetable Markets, Directorate For Food, Agriculture and Fisheries Commitee For Agriculture, Working Party on Agricultural Policies and Markets. OCDE Report.
Gerbaud, P, 2010. La mangue. FruiTrop, 175, 13-42. Hammoudi, A, Hoffmann, R and Surry, Y, 2009. Food safety standards and agri-food supply
chains: an introductory overview. European Review of Agricultural Economics, 36(4), 469-478.
Henson, S and Caswell, J, 1999. Food safety regulation: an overview of contemporary issues. Food Policy 24 589–603.
Henson, S and Jaffee, S, 2008. Understanding Developing Country Strategic Responses to the Enhancement of Food Safety Standards. The World Economy, 31(4), 548–568.
Henson, S, Masakure, O and Cranfield, J, 2011. Do Fresh Produce Exporters in Sub-Saharan Africa Benefit from GlobalGAP Certification? World Development, 39(3), 375-386.
Higgins, V, Dibden, J and Cocklin, C, 2008. Neoliberalism and natural ressource management: agri-environmental standards and the governing of farming practices. Geoforum, 39, 1776-1785.
Hirschman, A O, 1970, Exit Voice and Loyalty: Responses to Decline in Firms, Organizations, and States. Harvard University Press, Cambridge, Massachussetts and London, England.
INEI, 2008. Censo Nacional Economico, Instituto Nacional de estadistica e Informatica, Peru.

28
Jaffee, S and Henson, S, 2004. Standards and Agro-Food Exports from Developing Countries: Rebalancing the Debate. World Bank Policy Research Working Paper No. 3348.
Key, N and Runsten, D, 1999. Contract Farming, Smallholders, and Rural Development in Latin America: The Organization of Agroprocessing Firms and the Scale of Outgrower Production. World Development, 27(2), 381-401.
Khiem, N T, Bush, S R, Chau, N M and Loc, V T T, 2010. Upgrading Smallholders in the Vietnamese Pangasius Chain, Giang University, Wagueningen University, Can Tho University.
Kleinwechter, U and Grethe, H, 2006 The adoption of the Eurepgap standard by mango exporters in Piura, Peru, International Association of Agricultural Economists Conference. Gold Coast, Australia, August 12-18, 2006.
Maertens, M and Swinnen, J, 2009. Trade, standards and poverty: Evidence from Senegal World Development, 37(1), 161–178. MINAG, 2010. Ministerio de Agricultura del Peru: http://www.minag.gob.pe. Minten, B, Reardon, T and Vandeplas, A, 2009. Linking urban consumers and rural farmers
in India: A comparison of traditional and modern food supply chains, International Food Policy Research Institute, Washingrton
Narrod, C, Roy, D, Okello, J, Avendano, B, Rich, K et al., 2009. Public–private partnerships and collective action in high value fruit and vegetable supply chains Food Policy, 34(1), 8-15.
Reardon, T, Timmer, C and Barrett, C, 2003. The rise of supermarkets in Africa, Asia and Latin America. American Journal of Agricultural Economics, 85(5), 1140-1146.
SENASA, 2010. Servicio Nacional de Sanidad Agraria del Peru: http://www.senasa.gob.pe/. Sivapalasingam, 2003. A Multistate Outbreak of Salmonella enterica Serotype Newport
Infection Linked to Mango Consumption: Impact of Water-Dip Disinfestation Technology. Clinical Infectuous Diseases, 37, 1585-1590.
SOMO, 2011. Socio-economic Issues in the Peruvian Mango Supply Chain of EU Supermarkets, Amsterdam.
Suzuki, A, Jarvis, L S and Sexton, R J, 2011. Partial Vertical Integration, Risk Shifting, and Product Rejection in the High-value Export Supply Chain: The Ghana Pineapple Sector. World Development, forthcoming.
VanDerMeer, C, 2006, Exclusion of small-sacle Farmers from coordinated supply chains: Market failure, policy failure or just economies of scale? In: R Ruben, M Slingerland and H Nijhoff (Eds.), The agro-food chains and networks for developement. Springer, Dordrecht, The Netherlands, pp. 209-218.
Vorley, B and Fox, T, 2004. Global Food Chains—Constraints and Opportunities for Smallholders, OECD, Agriculture and Pro-Poor Growth Task Team Helsinki workshop.
Worldfactbook, 2010, https://www.cia.gov/library/publications/the-world-factbook/geos/pe.html.