CA2AFRICA Working document - Agritrop - Cirad
36
1 CA2AFRICA Working document Implementation of Conservation Agriculture in the highlands of Vakinankaratra, Madagascar; constraints and opportunities. A non-adoption case study Maaike Hartog (Wageningen), Eric Penot (CIRAD UMR Innovation) & Yan de Graff (Wageningen) 2011
-
Upload
khangminh22 -
Category
Documents
-
view
1 -
download
0
Transcript of CA2AFRICA Working document - Agritrop - Cirad

1
CA2AFRICA
Working document
Implementation of Conservation Agriculture in the
highlands of Vakinankaratra, Madagascar;
constraints and opportunities.
A non-adoption case study
Maaike Hartog (Wageningen),
Eric Penot (CIRAD UMR Innovation) &
Yan de Graff (Wageningen)
2011

2
1 INTRODUCTION Madagascar, la Grande Île, is a place on earth with some most peculiar natural features. The current
degraded status of its soils is unfortunately less unique. The vulnerable environment suffers from the
increasing pressure of the growing population. Cropping on slopes causes erosion. Soil fertility is low,
and soil nutrient inputs are needed. The concept of Conservation Agriculture (CA) has been
introduced as the way to fight worldwide soil degradation and change soil mining agriculture into a
more sustainable system. At this time, the concept is used on 6-7% of the world’s cropland (FAO,
2009). The adoption rate among African smallholders has been very limited. This is the starting point
for the EU-project CA2AFRICA. It aims at examining the conditions that determine success or failure
of CA (CA2AFRICA, 2009). The project uses three scales to analyze CA: field, farm/village and regional.
This research is focused on the scale of farm and village.This research focuses on the highlands in the
region of Vakinankaratra. NGO’s and scientists have undertaken activities to introduce CA, but so far
the practices have not been implemented on a large scale in the highlands. The research has been
carried out from June to September 2010.
2 RESEARCH CONTEXT
REGIONAL INFORMATION
RESEARCH LOCATION The research takes place in Madagascar, an island-nation situated in the Indian Ocean.
Vakinankaratra is a region of Madagascar (see figure 2-1). The choice for the study area was made on
the basis of the administration of the BVPI-project, that defines its zones according to the irrigation
zones (perimètres irrigués). For this research two zones were chosen: Fitakimerina and Iandratsay
(both part of Lot 1 of the project). This was done because of their proximity to the town of Antsirabe,
and because of the low adoption rate of CA in these zones. There is a third zone that falls into this
category: Ikabona, but it was not chosen because of the limited time. Note that these zones
(perimètres irrigués) do not correspond with the administrative units that carry the same name.
Figure 2-1: Vakinankaratra (red) and study areas (Iandratsay and Fitakimerina), Source: CIRAD

3
After the region, the next administrative level is that of districts, which are divided into communes.
The research is conducted in the communes Vaninkarena (district Antsirabe II) and Mandritsara
(district Ikabona). The level that can be identified as ‘village’ is called fokontany. Because of the
complicated structure and the difference between BVPI and Malagasy administration, this report
refers to locations and sublocations rather than fokontany or county. The following sublocations
have been visited:
Location Sublocation Number of interviews
Fitakimerina (commune Vaninkarena)
Anjanamanjaka (BVPI: Ambohimanga&Ambohitraivo) 26
Tsaratanana 4
Iandratsay (commune Mandritsara)
Ambohimarina (BVPI: Est Anosy) 20
Ampamelomana 10
NATURAL FEATURES The highlands of Vakinankaratra have a warm rainy season from October/November to March/April.
The winter season is dry and cold, from April/May to September. Figure 2-2 gives a general picture of
the precipitation in this region. Table 2.1 presents natural features per location.
Figure 2-2 Monthly rainfall for 2003-2009, station Andranomalenatra-Kobama (Source: BVPI SE/HP, 2009b)
Table 2.1 Natural features of study locations
Location Sublocation Altitude (meter above sea level)
Soil types Annual precipitation
Fitakimerina Anjanamanjaka
1500
Hills: Acid ferralsol (pH 5.0), texture: sandy loam, poor in OM, very poor in P,Ca,Mg and K. Valleys: Deposit of lakes and rivers. Tsaratanana: Occurrence of hydromorph soil at flat tanety. 1200 mm, mainly in
January and February Tsaratanana
Iandratsay Ambohimarina
1600*
Hills : Rich vulcanic and poor ferralsol. Valleys : Less rich. 1450 mm in 110 days (85% in
November to March) Ampamelomana
*) Estimation from GoogleEarth
Source: BVPI SE/HP, 2008a-c

4
SOCIO-ECONOMIC FEATURES In 2008, 3 million tonnes of rice were produced in Madagascar. From the 1.9 million tonnes in 1970,
this figure has steadily grown, as has the population of la grande Île. The food supply per capita has
decreased since then and was about 160 kg /year in 2008 (FAOSTAT, 2010). Agricultural policy has
mostly been directed towards the intensification of rice cultivation. Since the eighties of last century,
a persistent economic crisis withheld farmers from buying the inputs needed for this intensive
cultivation. This led to more diversification, by growing crops during the counter season and making
more use of tanety fields (Seguy, 2003). The city of Antsirabe plays an important role in this region.
The highlands around the city supply food, especially dairy products, to its 159 000 inhabitants. The
dairy sector is sensitive to political struggle, since governors also have their share in economical
activities. Antsirabe is home to the brewery of STAR. This company buys barley from the farmers
through an organisation called Malto. Farmers receive the right seeds and inputs, money that is
extracted from the price they get for the harvested barley. Especially in Iandratsay, this is an
important source of income. At the studied locations, agriculture is the main economic activity. Three
different seasons can be distinguished:
Main season: From October (transplanting rice from nursery to fields)
until March/April/May (harvest of rice)
Intermediate season at tanety (hillsides): From December (after beginning of the rains)
Counter season at valleys: From March/April/May (harvest of rice) until October
During the intermediate season, most households have consumed all of their rice. This is the period
in which most people buy rice, even if they have been selling rice at harvest time (at a lower price).
An important feature of the area is the difference between the tanety and the valleys. Figure 3 shows
a flat valley, with barley growing in the paddy fields during the counter season. The tanety
surrounding it are mostly terraced.
Figure 2-3 Typical landscape for the region, photographed in Iandratsay.
It is not always possible to irrigate and drain the paddy fields effectively. Some fields are qualified as
RMME : rizières à mauvaise maîtrise de l'eau, paddy fields that are not effectively drained or
5
irrigated. In this kind of fields, the transplanting of rice from the nursery happens relatively late. In
Iandratsay, some fields are inundated during the rainy season (BVPI SE/HP, 2008a-c).
In table 2.2, some information on population and farming systems can be found per study location.
Table 2.2 Socio-economic features of study locations
Location Sublocation Inhabitants Presence of cows Principal crops
Tanety Paddy’s counter season
Fitakimerina Anjanamanjaka 2000 (Ambohimanga)
25% of inhabitants possesses Zebu cattle.
In order of importance : Maize, beans, pluvial rice, sweet potato, cassava, bambara groundnut.
In order of importance : Potato, barley, wheat, peas, garlic.
Tsaratanana 700
Iandratsay Ambohimarina 725* 65% of inhabitants possesses Zebu, average of 3/household. Dairy cattle sporadic.
Main season: Maize, beans, soja, potato, rice.
Wheat, barley, taro, beans, maize for cows, tomato, ray grass, legumes, peas, potato.
Ampamelomana Not known
*) Information from president of fokontany, 31-07-2010
Source: BVPI SE/HP, 2008a-c
The tenure status of most land is not legalized. At the location of Fitakimerina, 2/3 of the land is
bought and 1/3 inherited. 50% of the farmers are hiring the land. (BVPI SE/HP, 2008a) In Iandratsay,
most of the people are owners, but without a formal title (BVPI SE/HP, 2008b). Apart from
agriculture, the inhabitants have some opportunities to gain an off-farm income. In Ambohimanga
(Fitakimerina), sand is mined from the river. This activity is most important in the winter season, just
like the fabrication of bricks. Other sectors include work with the electricity plant of Jirama (the
electricity company) and construction of buildings (BVPI SE/HP, 2008a). Several people also run a
small shop or restaurant, or have a small revenue from handicraft from wheat stalks (BVPI SE/HP,
2008b).
Table 2.3 Farm data by (sublocation, from BVPI-database of Vakinankaratra, end of August 2010
Location Sublocation Selected BVPI parameters
Number of
persons (p)
Average total figures
Area exploited/
p (ha)
Area paddy/p
(ha)
No. draft oxen
No. Zebus
No. dairy cows
Fitakimerina Anjanamanjaka Villages Ambohimanga & Ambohitraivo 51 3.05 0.88 0.84 2.18 0.61
Tsaratanana Village Tsaratanana 34 1.22 0.22 0.44 0.64 0.12
Iandratsay Ambohimarina Terroir Est Anosy 102 1.03 0.27 2.24 1.73 1.64
Ampamelomana Terroir Ampamelomana 100 1.44 0.57 2.33 4.23 1.99
Source: BVPI SE/HP, 2010a

6
CONSERVATION AGRICULTURE The soils of the world are degrading and lose their fertility, partly as a result of conventional tillage
practices. Negative effects of tillage are for example oxidation of organic matter (OM) and
destruction of pores. The uncovered state of the soil after ploughing increases erosion risks (Hobbs,
2007). Several authors (Hobbs, 2007; Fowler & Rockström, 2001) have indicated the need to make
agriculture more sustainable. Sustainability is generally defined as a way of acting that does not “...
compromise the ability of future offspring to produce their food needs by damaging the natural
resources used to feed the population today” (Hobbs et al., 2008). The alternative agricultural
practices that are being developed, were by the Food and Agriculture Organisation of the United
Nations (FAO) considered as a package, and labelled as ‘Conservation Agriculture’. These practices
are: Continuous minimum mechanical soil disturbance, Permanent organic soil cover &
Diversification of crop species grown in sequence or associations.(FAO, 2010)
It aims at making better use of the agricultural resources in order to minimize external inputs. The
continuous soil cover protects the surface structure, so that the soil can keep more water.In a
brochure by the French Development Agency (AFD, 2007), a difference is made between CA and
direct seeding mulch-based cropping systems. The latter term refers to cropping systems that
exclude tillage and have permanent plant cover on the soil - be it with a living crop or dead mulch. In
French, these techniques are called: Système de Culture sur Couverture Végétale. The concept of
direct seeding mulch-based cropping systems was launched by CIRAD in 1999. It does not include
crop rotation explicitly, but it still can be seen as a special form of CA that does not differ much from
the FAO definition. In this proposal, the term ‘CA practices’ is consistently used to refer to this
particular package.
APPLICABILITY OF CA PRINCIPLES The promotion of Conservation Agriculture cannot take place without a critical reflection on the
principles of these practices. If we take the plough as a metaphor, the paradigm shift that took place
has changed this object from a useful tool to a dangerous soil-destroyer. Gowing and Palmer (2008)
call it a paradigm shift because CA requires a way of thinking that puts the health of the soil
ecosystem first. From this way of thinking, tillage becomes disturbance of the soil and has very
damaging effects.The new paradigm includes a shift from soil mining agriculture to sustainable
agriculture. Advocates of CA underline the importance of producing more food from less resources
(Hobbs et al., 2008). The confidence of the FAO in promoting CA becomes clear in citations like: “The
cases where CA did not perform as expected can usually be related to mistakes or shortcuts in the
management of the system, but not to any inherent failures in the system” (FAO, 2009). In a paper by
Giller et al. (2009), it is suggested that CA can be inappropriate in many cases. It places a heavy
burden on the livestock feeding, since crop residues are normally used for fodder. Another issue is
the shift of labour from ploughing (men’s work) to hand weeding (mostly done by women). The same
article points to the fact that CA is brought as a ‘inseparable’ package. It is not clear what the effect
of mulching is, when practiced apart from the minimum-tillage. Rabary et al. (2008) admit that their
study was also unable to isolate this effect. However, they add that mulching and conventional tillage
is a combination that is not commonly practiced. According to Wall (2007), small-scale farmers are
generally prepared to invest in a profitable CA-system, but lack access to (especially initially)
necessary inputs like herbicides and fertilizers. CA also implies changes in agricultural management
and the planning of a crop. This makes it a knowledge intensive system. Smallholders are

7
disadvantaged because their linkages are often within the community and less oriented to outside
information networks. To know whether the principles of CA are applicable for this particular
situation, the highlands of Madagascar, the pros and cons need to be profoundly analyzed. The
following chapters will elaborate on this.
ADOPTION OF CONSERVATION AGRICULTURE The process of adoption has been studied since the first extension services encountered their first
disappointing results. Adoption here is defined as the phase where a farmer makes effort and invests
in the implementation of conservation agriculture. De Graaff et al. (2008) distinguish between three
phases: acceptance, actual adoption and continued use. This last phase is the term that I use for
implementing CA without intensive supervision/sponsoring by a project. It indicates that farmers are
intrinsically motivated to maintain and replicate the CA measures. The final phase can only be
achieved when farmers have experience with the measures, it requires time.
Many different factors can be thought of when studying the behaviour of farmers as they decide
about adoption or non-adoption. But it is important to note that it is not a black-or-white decision.
The intensity of implementation is important to distinguish between trials and actual adoption.
Farmers also do not adopt a blueprint that is determined for them, they often adapt the measures to
their own situation (de Graaff et al., 2008). A research on farmer innovation in East Africa concluded
that an increase in income is the most important motivation to innovate. In this context, the author
poses that investments in conservation measures are stronger motivated by gains in production
(read: income, standard of living) than by environmental concerns (Critchley, 1999). The research of
Clay et al. (1998), in the highlands of Rwanda, found that the following features were positively
related to investments in land conservation: land that is owned, has a medium slope, is less
fragmented and is cultivated for a shorter time, and among smaller farmers and those with little land
in fallow, woodlot, and pasture. An off-farm income also stimulates these investments, because it
provides money, especially when households have little access to credit. The same can be said about
cash cropping. Lastly, this research mentions public investments in extension and roads as a way to
promote sustainable intensification.
Research in Bolivia and Peru observed that investment in soil- and water conservation (SWC)
measures was higher with increasing farm size. Also, market-oriented farmers invested more. In
Ethiopia, farmer’s age, farm size and steep slopes positively affected the initial use of SWC measures.
The involvement in or number of livestock had a significantly negative influence on it. But farm size
was negatively correlated to continued use, along with participation in off-farm work and family size.
In an overall comparison of these independent research projects, only age of head of household and
programme participation had a more or less general positive influence on initial adoption.
Profitability of SWC measures is mentioned as an important factor for their continued use (de Graaff
et al., 2008).
Apart from these resources, a lot more research has been done on the factors that influence farmers’
decisions. Knowler and Bradshaw (2007) wrote a synthesis of recent research related to adoption of
CA. The analyses that they compared, covered a range of economic, social, physical and institutional
factors. The authors conclude that “there are few if any universal variables that regularly explain the
adoption of conservation agriculture”. The observation that the results of these analyses are so
inconsistent, points to the importance of local management.

8
3 Problematic
It seems that the implementation of CA practices reaches a deadlock in the highland of
Vakinankaratra (BVPI SE/HP, 2010b). The objective of the current research is to know why the
farmers in this region are not using the CA practices that were suggested to them.
What are the past and present reasons why farmers are hesitant to adopt (certain) CA practices in
the highlands of Vakinankaratra?
Sub-questions
1. What were the most important roles of the different development organisations (including
research) in the highlands of Vakinankaratra in the past, concerning the adoption of CA
practices?
2. What are the past and present reasons* why farmers are hesitant to adopt (certain) CA
practices in the highlands of Vakinankaratra? (with special attention to adoption of the
particular system that has potential for the area)
*Two groups of reasons are distinguished: Those that can be influenced by farmers and those that
cannot (circumstances like climate). These two things strongly interact with each other.The first sub-
question is meant to provide background information and will not be treated very extensively. The
choice of the location has been made by E. Penot, according to the BVPI project demand and the
other research activities concerning CA evaluation in other areas. URP SCRID (Unité de Recherché en
Partenariat ‘Systèmes de Culture et Rizicultures Durables’) is still searching for CA systems adapted to
local conditions. This research hopes to contribute to that quest. This study focuses on the process
that led to the current situation, both from the side of the extension organisations and the side of
farmers. It will not go into details about technical aspects of the measures. Some attention will also
be given to the gender aspect of transferring CA practices.
4 METHODOLOGY Part of the research objective is to understand how CA practices have been introduced from the side
of development organisations. I have looked for the opinions of researchers and personnel of the
organisations that have experience in the region. The other part is about the farmers. The intention
was to start from the point of view of a farmer instead of reasoning from a package of measures that
should be implemented. This is why the term ‘constraints’ is avoided. The survey aimed at
interviewing the person who made the decision about CA, be it the man or the woman of the family.
The empirical part of the research consisted of a survey undertaken among 60 farmers. The fieldwork
took place during July and August 2010. Preparation and (part of) analysis was done in Antsirabe.
During the interviews I stayed in the villages. This paragraph will explain the way the sample was
determined.
Randrianarison et al. (2008) created a typology with six different types for the fokontany
Antsapanimahazo:
1. Farmers that have never tried CA;

9
2. Farmers who abandoned CA after 1 or 2 years;
3. Farmers who abandoned CA after 3 or 4 years;
4. Farmers who abandoned CA after more than 5 years;
5. Farmers practising CA for 1 or 2 years;
6. Farmers practising CA for 3 years or more.
In this typology, farmers of type 5 are called ‘experimental adopters’ and those of type 6 ‘real
adopters’. Type 4 was created because these farmers have distinguished reasons for abandoning.
Most farmers in the fokontany belong to type 1.
Figure 4-1: Percentages of adoption/abandoning of CA in relation to years practiced, in Antsapanimahazo
(Source: Randrianarison, 2008)
If farmers have never been into contact with CA practices, they have not yet been in a position to
choose. These farmers are not very useful to this research. The CA systems that are introduced in this
region, are described in section 5.1 and 5.2. The first level of determining the sample consists of
three groups:
1. Those that have never tried CA;
2. Those that have abandoned CA after some time;
3. Those that are still practising CA.
For the sample to be representative, it was subsequently drawn in a stratified random way, according
to the strata in table 4.1. The strata of farm size, number of dairy cows and gender of farmer were
considered important because they had the highest potential to influence attitude towards CA
(according to the theoretical framework). For each group, the research has aimed at the sample in
table 4.2. Following from the relatively high percentages of ‘unknown’ in the BVPI-database, the
reality was different from these data. The area of the exploitations turned out to be much smaller
than expected; in the whole study only one exploitation of more than 4 ha was encountered.

10
Table 4.1 Farm features, by location, according to BVPI-database of Vakinankaratra, 10 June 2010
Total Farm < 4 ha
Size unknown
>1 dairy cow *
Unknown number cows*
Women Gender unknown
Number Fitakimerina 89 68 14 14 19 32 7
Percentage Fitakimerina 100 76 16 16 21 36 8
Number Iandratsay 370 307 49 73 281 69 48
Percentage Iandratsay 100 83 13 20 76 19 13
*) In French: vache laitière Source: BVPI SE/HP, 2010a
Table 4.2 Composition of sample per study location
Farm size Dairy cows
Gender Fitakimerina Iandratsay
≥ 4 ha > 0 M/F 1 1 < 4 ha > 0 M 1 1 < 4 ha > 0 F 1 1 < 4 ha 0 M 4 5 < 4 ha 0 F 3 2
Total 10 10
All the interviewed persons were selected by the extension agent (technician) at the village. A list
from BVPI with persons who practise CA was used to compose the first group. For the two other
groups, the agent had a free choice.
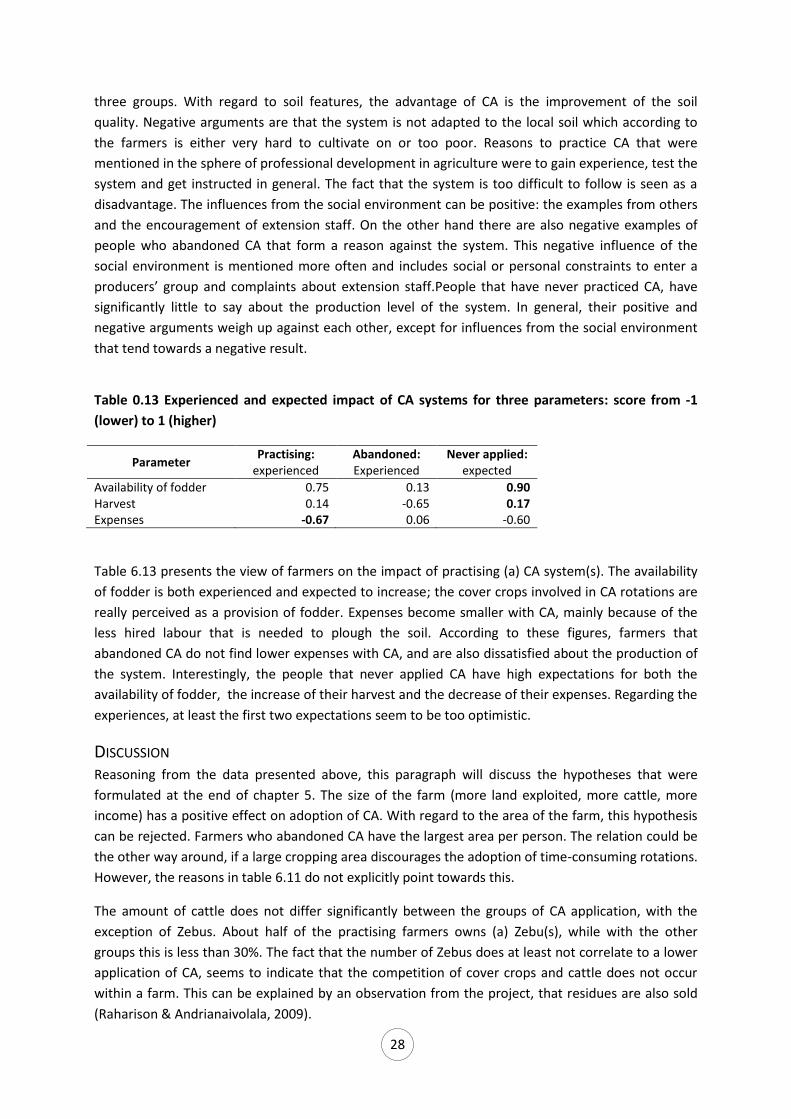
FARM TYPOLOGY USED In 2010, a farm typology (Ahmim-Richard et al., 2010) was made for the regions of Vakinankaratra
and Amoron’i Mania (neighbours the former in the south). The results of the current survey will refer
to this typology. Appendix A gives the determination keys for categorizing farmers.
Table 4.3 Farm typology for Vakinankaratra region, presented by Ahmim-Richard et al., 2010
Substantial off-farm
income
No substantial off-farm income
Self-sufficient in rice
Not self-sufficient in rice
Complementary off-farm income
No complementary off-farm income
Agriculture primary activity
Cattle 1A: cows 1BC: other
4A: cows 4BC: other
7A:
cows 7BC: other
No cattle
2 5 6 8: crop sales
9: no crop sales
Agriculture secondary activity
3
Table 4.3 depicts the structure of this farm typology. It consists of three basic farm types:
- Farmers receiving substantial off-farm income (1-3);
Abbreviated as ‘Off’

11
- Full-time farmers, self-sufficient in rice (4&5);
Abbreviated as ‘Prod’
- Resource-poor farmers, not self-sufficient in rice and with little off farm income (6-9).
Abbreviated as ‘Poor’
PERSONAL STORIES I
Figure 4-2 Solofson Randrianjarivo and his wife, with Rarivo (co-researcher)
Solofson got disappointed by CA
Solofson Randrianjarivo (52 years old) lives in Anjanamanjaka, Fitakimerina. His wife is
teacher at the primary school. Because of her salary, they fall into the category of ‘receiving
substantial off-farm income’ (see typology in 4.3). They have five children, of which two still
live with them. They own about 15 are of paddy fields and 12 are at tanety. For work at the
fields they hire a lot of labour each year.
Solofson tried the CA system one time, but was disappointed with the production of the
crops (maize and beans). He knows several groups of people who also have abandoned CA
practices.

12
Razafindrakoto has plans to start with CA
Razafindrakoto (50) is a full-time farmer and self-sufficient in rice. He owns two male Zebu
for traction, no cows. He and his wife (43) have four sons. The eldest (22) quit school after
primary school and works at the farm; the others are at secondary school. The family lives
in Ambohimarina, Iandratsay.
They own 0.7 hectare of land and use the counter season to grow forage on the paddy
fields. Barley is cultivated for Malto. Razafindrakoto has an individual attitude and has not
joined a producers’ organisation. He is into contact with a technician from SDMAD, who has
provided him with seeds of vetch. He has installed it and plans to plant upland rice in it this
year. In his opinion, CA only works for people who are very motivated. He would apply it to
grow fodder and increase the soil quality by the cover.
Charles has abandoned CA after one year
Charles Rakotondranaivo (59) is an enterprising farmer from Ambohimarina, Iandratsay. He
lives with his wife (50) and 2 sons, of which the eldest has finished secondary school and
already has its own parcels and cows. Charles owns 2 hectare of land, 4 Zebus, 2 cows and
other cattle. He produces milk and also grows forage. He is active within producer’s
associations.
Has talked to people from BVPI and explained that it is necessary for him to use the oats as
forage for his cows. The system does not work with the little cover that remains; weeds get
a lot of space and light to grow. A better opportunity for CA could arise if there comes a
cover crop that is not eaten by cows.

13
Figure 4-3 Entrance to the house of Charles Rakotondranaivo
5 Theoretical framework
This chapter aims to answer the question: What are the most important factors that explain the
hesitant attitude of farmers towards CA in this region? The first paragraph contains information from
the organisations that are active in dissemination of CA, to give an oversight of the current state of
affairs. Section 5.2 describes the technical constraints and opportunities while in 5.3 an attempt is
made to distillate the farmers’ point of view from literature. The chapter finishes with a conclusion,
that provides hypotheses to be tested by the survey.
The NGO TAFA was founded on January 1, 1995. It took over the role of ‘Blé Kobama’, an
organisation that had gone bankrupt. This organisation had started working on CA practices (literally:
système de culture avec couverture permanente des sols et technique de semis direct) since 1991, on
an experimental farm at Andranomanelatra. When TAFA took over, a start was made with the
dissemination of these new techniques. Since 1995, a partnership was formed with FOFIFA, the
national research centre for rural development at Antananarivo University (TAFA-FIFAMOR, 1995).
Also, a national network of institutions was set up, called GSDM: Direct seeding group of
Madagascar. Since 2004, GSDM coordinates the project ‘Support for the dissemination of agro
ecological techniques in Madagascar’. This project is funded by AFD and the Malagasy government.
In 2006, the project BVPI SE/HP was started; its full name is: Développement des Bassins Versants et
Périmètres Irrigués dans le Sud Est / Hauts Plateaux. It is part of the national program of BVPI, a
policy that was defined by the government. Bidder is the Minister of Agriculture (Ministère de
l’agriculture, de l'élevage et de la pêche). The project is mainly funded by AFD (BVPI SE/HP, 2009a-b).
In the past, the BVPI SE/HP project has worked on the infrastructure for irrigation. Operators in the
field are SDMAD (Semis Direct Madagascar) and BEST. If farmers are part of a producer’s association,
they get seeds and other inputs which they have to pay back after the harvest. SDMAD is a private
company. BVPI first pays the company for the inputs and after the payback of the farmers, SDMAD
gives the money again to BVPI. Each region has a technical agent, they are employees of SDMAD.
BEST is responsible for the water user associations, that group practically all farmers that use the
Volatine practices CA with help from her brother
Volatine Aronjahine Razafindrazaka (23) married five years ago and has two little
daughters. This keeps her mostly busy at the house. Her husband (26) works at both their
farm and other farms; in winter he also has an income from the production of bricks. The
young family lives at Tsaratanana, Fitakimerina. Their farm area is 0.12 hectare and their
only livestock consists of some poultry; they belong to the group of resource-poor farmers.
Since 2007, they practice CA on some of their land. Volatine is a sister of the SDMAD-
technician in Tsaratanana and he assists them with the techniques. She mentions the
positive effect of CA on the soil fertility.

14
paddy fields. In Iandratsay (Ambohimarina and Ampamelonana) and Anjanamanjaka, the promotion
of CA practices started in 2006. Tsaratanana followed in 2007. The scientific part of the project is
carried out by CIRAD and FOFIFA. Since 2001, they are combined in one group : URP SCRID (CIRAD,
2010). TAFA has an experimental station in Andranomanelatra (district of Antsirabe II) (Rabary et al.,
2008). In Fitakimerina and Iandratsay, It is not the purpose of TAFA to act at farmers’ level. They have
a test field at Tsaratanana (Fitakimerina) but that is for forage, not to demonstrate CA practices.
Box 1: Description of cover crops introduced in the region by BVPI
The first diagnostic research in the region was performed in the era of Blé Kobama. It showed that
the performance of agricultural activities on tanety with acid soils was very poor, with low
production levels and labour-intensive practices (Seguy, 2003).
EXPERIENCES FROM BVPI SE/HP As described above, the project BVPI SE/HP has recently started the introduction of CA practices at
the study locations. The CA systems that are currently used by farmers who are part of the project:
Fitakimerina Iandratsay
Beans + Oats
Maize + Beans +Oats (Iandratsay: + Potato)
Beans + Brachiaria Potato +oats
Cassava + Brachiaria Potato + Wheat
Pois de terre+Brachiaria Potato +Vetch (low part)
Pluvial/non-irrigated Rice + Crotalaire
Ray-grass + Vetch
Soja + Brachiaria Barley + Vetch
Soja + Crotalaire Beans + Vetch (mainly C2/C3)
Brachiaria/Oats pure Wheat + Vetch
In the zone of Fitakimerina, the dissemination of CA practices has not been successful until now.
Since the beginning of the project, the cover crops have been removed from the fields; often not
with a direct purpose for fodder but to sell the crop residues or exchange it for fertilizers. This
happens because the farmers cannot afford chemical fertilizers and also do not own enough cattle.
Farmers also prioritize the rice paddies above the tanety. According to BVPI SE/HP reporting,
adoption of CA practices cannot be expected in this zone (Raharison & Andrianaivolala, 2009).
Brachiaria (Brachiaria, 6 different species). Newly introduced, farmers discovered that it could be used as forage, since then exploited for Zebu.
Crotalaire (Crotalaire, different species). Weak production of biomass
Hairy vetch (Vicia villosa). Ued for cattle
Oats (Avena sativa). Used for cattle
New introduction: Eleusine (Eleusine coracana) (not yet known in the area, same can
happen as to Brachiaria?), radish, cowpeas

15
In Iandratsay, the pressure on crop residues is also high. The stalks of the maize are for example used
as firewood. But there is a potential for systems that improve the 3-cropping system that is practiced
on the tanety. In this rotation, oats can be added to provide extra biomass. It will be explained in the
next paragraph (Raharison & Andrianaivolala, 2009).
TECHNICAL CONSTRAINTS AND OPPORTUNITIES The high altitude of this zone limits the choice for cover crops. The cover crops that are mostly used,
do not support the cold temperatures. There are not that many leguminosae that grow enough
biomass and at the same time are not edible for cattle. If soils are more poor, it takes more time to
restructure the soil with a cover crop. In combination with the constraints coming from agricultural
practice, this can become a problem (Raharison & Andrianaivolala, 2009).
THE OATS-BASED SYSTEM The most common system that is practiced on tanety in Iandratsay, consists of two cycles (table 5.1):
Maize and beans in the main season, and potatoes, barley or wheat after the harvest of the beans.
BVPI SE/HP proposes to add oats to this cycle. But when 3 or 4 lines of oats are sown between the
potatoes, it does not produce enough biomass to cover the soil during the whole year. The
alternative of hairy vetch (Vicia villosa) needs water during the dry season, so it can only be used on
irrigated plots. For the system to work, the sequence of crops needs to change: Maize together with
potatoes and after that beans with oats. In this way, the oats grows enough to cover the soil and
serve as a live cover crop. But at the moment, this sequence is not commonly practiced (Charpentier,
2010).
Table 0.1 Rotations at tanety in Iandratsay
C1 : November - May C2: April – October
Common system Maize + Beans Potato/Barley/Wheat Proposed CA system Maize + Potato Beans + Oats/Vetch
VIEWS OF FARMERS
CROPS TO COVER OR TO USE ALTERNATIVELY As noted before, the focus of this research is on the farm and village level. Here an important factor
is the trade-off in the allocation of resources (CA2AFRICA, 2009). The fierce competition for crop
residues, as described by Giller et al. (2009), also arises here. For a farmer, there are several
possibilities when it comes to using his crop residues. He can use it as feed for his cattle, or as straw
which mingles with the cow dung to become fertilizer. He can also burn it to obtain fertile ashes, or
compost it. When a farmer implements a CA system, the possibility of leaving the residues on the
field is added to these. Dairy production is an important component of the regional economy. And as
land is scarce, every piece of vegetation is preferably used to feed the cows. Farmers even told that,
when they decided to leave the plants on their field, someone else stole it (Ahmim-Richard et al.,
2010). This theft of crop residues is a real problem. It even occurs with living plants, which is the
reason why farmers plant the cassava plants very close together. In this way, the roots become deep
and difficult to pull out (oral information, O. Husson).

16
The high pressure on soil resources was also observed in Betafo by Kasprzyk (2008). The dairy
farmers work with a “zero-loss” system, in which it is unimaginable to leave crop residues on the
field. For these farmers, labour is not expensive so the labour-saving side of CA does not appeal to
them. The systems that have potential should produce more biomass than these farmers are
currently experiencing. The amount needed to cover the soil is about 6-7 ton/ha. BVPI SE/HP
identifies this pressure on the use of crops as the main limiting factor for CA practices (Raharison &
Andrianaivolala, 2009). In the CA systems, it is also possible to use living crops for coverage of the
soil. Mulching of dead plants is better for the soil micro biota, but living cover crops have a higher
potential for farmers (Rabary et al., 2008). Quite surprising, the research of Razafimandimby (2007)
found out that farmers prefer the dead mulch over living cover crops.
AREA AVAILABLE FOR AGRICULTURE Especially in places with rich soils (like in Iandratsay), the population density is very high. This leads to
small parcels, as shown in the figures in subsection 2.1.3. When a farmer has such a limited amount
of land, it leads to relatively huge losses if he sets apart some land for cover crops. The Brachiaria
needs for example a year of growth to be able to enrich the soil.
FINANCIAL SITUATION In Antsapanimahazo , most of the farmers that have never tried CA, mentioned the high costs of
investment in CA as an obstacle for implementing it. The CA systems were in fact sold as a package in
the framework of intensification of agriculture. The systems require investment in chemical inputs
and specific equipment. These investments will not pay back before several years, and in the first
years the revenue from the parcel will be lower than before. For the farmers whose resources are
very scarce, it is important to minimize risks. The access to credit does not resolve this, because the
interest rates are said to be very high. When comparing different scales of income, it becomes clear
that the capacity to bear risks is a determining factor for deciding about CA. Most of the farmers who
have practiced CA for 3 years or more, are relatively rich (Randrianarison et al., 2008). The lack of
money was also the main problem that farmers mentioned in the research of Razafimandimby
(2007), conducted in Antsapanimahazo, Ampandrotrarana and Ivory. TAFA offers no assurance if the
harvest is lost, which can happen through natural causes. This research concluded that the credit
system should become less rigid, to enable more farmers to profit from it. It also observed that rich
landowners do not differ significantly from the average farmer in their willingness to practice CA.
Minimizing risk also often means that farmers prefer an off-farm job above their work at the farm.
This does not automatically lead to abandoning CA practices, but Randrianarison et al. (2008) found
that it did happen, especially when the father of the family was working off-farm. This leads to the
question why their wives apparently decided to abandon CA. Households with a small amount of
available labour and small capital availability to employ additional labourers, could profit from CA
practices because it often requires less labour. But the figures on this are not very convincing.
(Razafimandimby, 2007). Another important factor is the type of tenure. The poor farmers often rent
the land, with contracts that are just valid for several years. This is another reason why long-term
investments are probably not advantageous for them (Randrianarison et al., 2008).
EXPERIENCE WITH THE PROJECT Farmers that have never tried to implement CA, are often not enough informed about the system.
Witnessing other people abandoning CA is also a reason to stay away from it.

17
In cases where people have tried CA but abandoned it after some time, the organisation of the
dissemination turned out to be problematic. Credit can only be obtained when one is a member of a
farmer’s association. There is a lot of critique on these organisations. Complaints are about the
delivery of inputs and material, that is often late (Randrianarison et al., 2008).
CONCLUSION: HYPOTHESES With this information from different resources, we return to the question: What are the most
important factors that explain the hesitant attitude of farmers towards CA in this region? A summary
of the constraints that follow from experiences of BVPI, SCRID, TAFA and research of farmers’
preferences, in order of importance:
The choice for cover crops is restricted due to the cold climate.
Livestock feeding requirements compete with CA practices (mulch in the fields) for biomass.
The small size of the farming enterprises leaves little room for risks or ‘unproductive’ cover
crops.
Reasoning from these constraints, the hypotheses that are tested in the survey are the following:
1. The size of the farm (more land exploited, more cattle, more income) has a positive effect on
adoption of CA.
2. When crops on paddy fields represent the big(gest) share of agricultural activity, this
diminishes motivation for CA.
3. If the workload of women gets more heavy with CA practices, they are more inclined to
decide against CA.
4. When deciding about adoption of CA, economic reasons are the determining factor.
PERSONAL STORIES II
Martin expects a change from CA
Martin Randrianandrasana (21 years old) and his wife (19) live in Ambohimarina,
Iandratsay. They married in 2006 and have a son of 3 years old. They own 0.26 ha of land
and also work off-farm on other people’s land; the kind of off-farm employment that
generates the lowest income (about 0.5 euro per day). They are resource-poor farmers.
Last year they bought a pig, but had to sell it at a loss.
Since 2008, Martin has practiced CA on some land. He is not convinced of the benefits of
the system; especially the maize did not grow and produce well. He finds it hard to keep up
with the techniques of the system. Martin and his wife took part in the project with the
expectation to enhance their standard of living. This has not yet become true.

18
Figure 5-1 Martin Randrianandrasana and his wife
Eliane has never practiced CA
Eliane Lalahine Rabemananjara (32) lives at Anjanamanjaka, Fitakimerina, with her husband
(32) whom she married at the age of 17. She is a kind young woman and is surrounded by
her 6 children during the interview. Except for the youngest two, all of them attend school.
The production from their tiny agricultural enterprise (0.15 hectare, no cattle) does not
match up with the food requirements of the family. This is why both parents work a lot for
other farmers. It is clear that they belong to the type of ‘resource-poor farmers’.
She is not familiar with the concept of CA but has practiced a kind of controlled
underground burning. The system consists of digging a hole , burning residues in it and then
install sweet potato. They are not really into contact with an extension agent, but saw
someone else do it and found it productive.
Marie Henriëtte abandoned CA and the project
Rasoarimanana Marie Henriëtte (50) is married and has five children who all attend school.
Their farm at Ampamelonana, Iandratsay, consists of 0.19 hectare of land and some
poultry. 2 or 3 days a week, the parents work at other people’s lands.
She is dissatisfied with the project organisation. According to her, the technician blocked
the installation of her producers’ organisation. Marie Henriëtte tried CA one time, in 2007.
She has grown some wheat and vetch, but did not get seeds to continue. At the moment,
she is not into contact with a technician.

19
Figure 5-2 Zebus at work while we interviewed Marie Henriëtte
Results of survey
This paragraph will present the data obtained that describe the actual situation in the survey areas.
These data cover the year from April 2009 – May 2010. Most of the data is grouped according to
application of CA (practising, abandoned or never practiced), zone (Fitakimerina and Iandratsay, see
subsection 2.1.1) and farm type (as described in section 4.3). Table 6.1 gives information about the
composition of the distinguished groups. The distribution between zones and CA adoption is rather
even; the same counts for the ratio of CA (non)adopters per farm type. The distribution of the farm
types among the zones is less even. In both zones, about half of the surveyed farmers belongs to the
farm type ‘resource-poor’. One-third is receiving substantial off-farm income and a minority is of the
‘producing’ type. The presentation of the data will follow the outline of respectively: zone – farm
type – CA adoption. Amounts of money are expressed in Ariary, the monetary unit of Madagascar
with a rough exchange rate of 2600 Ariary per euro in July 2010.
Daniel has not yet tried CA
Daniel Rabenjamin (58) and his family migrated to Anjanamanjaka, Fitakimerina, in 2008.
Daniel is retired from his job at the Ministry of Agriculture, where he supervised rural
construction works. His wife (54) works as a seamstress. The pension provides for a
substantial off-farm income. They have 7 children, of which 4 still live with them.
Their farm covers a relatively large area: 2.5 hectare. The work is mostly delegated, so they
hire a lot of (wo)manpower. Daniel has heard of CA and is associated to the project BVPI
SE/HP. He thinks that the characteristics of the soil are a determining factor for success of
CA. But it would take a lot of training to actually practice the system. Since they have just
arrived in the area, Daniel has not tried it yet, but he is interested to enrich his experience
in agriculture, especially if this would increase production.

20
Table 0.1 Number of farmers applying CA or not, by farm type and by zone
Farm type Zone Total
Off-farm Producing Poor Fitakimerina Iandratsay
CA adoption
Practising 7 4 10 10 11 21 Abandoned 5 3 9 9 8 17 Never applied 6 4 12 11 11 22
Zone Fitakimerina 10 5 15 30 Iandratsay 8 6 16 30
Total 18 11 31 60
Households are most often composed of about 5 persons; this does not differ much between the
groups. One of the strata was the gender of the interviewed farmer. During the survey, it turned out
that in a married situation, the husband is practically always head of the household. Often during an
interview with a woman, her husband joined in the conversation. It is also a cultural aspect, in which
a woman does not decide about farming strategies, unless she is the single head of the family. This is
why the statistics for age were taken for the male part of a married couple. Exceptions to this were
two single women, of which one divorced and one widow. For labour availability, children that go to
school are not considered. Those that are not at school are counted 0.5 if they are 10-15 years old.
People older than 60 are also counted for 0.5 person equivalent.
Table 0.2 Family and labour features
Characteristic Total CA adoption Zone Farm type*
Pract Aband Never Fitak Iandr Off Prod Poor
Household size (persons) 5 5 5 6 5 5 6 4 6 Age head of household (hoh) 44 39 44 48 45 43 45 41 44 Education level hoh** 1.5 1.6 1.3 1.6 1.6 1.5 1.6 1.7 1.4 Labour availability within family (person equivalent) 2.1 1.8 2.2 2.4 2.2 2.1 1.8 2.3 2.3 Off-farm employment of household (days) 158 153 146 171 125 191 323 33 107 Off-farm income of household (1000 Ariary) 871 889 859 863 822 919 2 180 205 347 Number of hired man days 83 92 64 90 63 103 85 126 67
*) For explanation of these abbreviations, see section 4.3 **) Value between 1 = read and write, 2 = finished secondary school, 3 = finished university
Table 6.2 shows that people in Iandratsay count more days of off-farm employment. Numbers of
hired man days are also higher here. The other factors are more equally distributed. Labour
availability within family shows no clear pattern. The off-farm employment and income are highest
with the farm type ‘Off-farm’, as can be expected. Off-farm income ranges largely between zero and
1 800 thousand, with 6 exceptional cases up to 6 000 thousand Ariary. Concerning the age of the
head of the household, one thing is interesting: for the group that is practising some form of
Conservation Agriculture, average age is lowest. This while their education level is the same as that
of those who never practiced CA. For the group that has abandoned CA practices, the number of
hired man days is very low.

21
The survey also paid attention to tasks that are usually done by women. This was done in a
qualitative way. Most common activities that are assigned to women are sowing of different crops,
replanting of the rice and transport of manure and fertilizer.
EQUIPMENT Angady is a Malagasy term for a digging stick with a blade at its end. It is a tool that is very generally
present. The spraying equipment was also part of the survey and turned out to be scarcely present.
Only in Fitakimerina some people (9) own it; usually it is a shared tool from the organisation of
FIFAMANOR. This originally Norwegian organisation has in the past introduced dairy cattle and is still
mainly active in the field of milk and forage, but also with the dissemination of other crops.
Table 0.3 Equipment features
Equipment Total CA adoption Zone Farm type
Pract Aband Never Fitak Iandr Off Prod Poor
Percentage of households that owns this equipment
Angady (kind of spade) 97 100 94 95 97 97 89 100 100 Weeder 65 76 53 64 73 57 56 91 61 Plough 37 38 41 32 40 33 6 27 23 Cart 18 19 24 14 13 23 28 64 32
Average number of tools per household
Angady 2.8 2.5 3.0 2.8 2.5 3.0 2.4 3.3 2.8 Weeder 0.9 1.0 0.8 1.0 1.1 0.7 0.8 1.6 0.7 Plough 0.2 0.2 0.2 0.1 0.1 0.2 0.1 0.3 0.2 Cart 0.4 0.4 0.4 0.3 0.4 0.3 0.3 0.6 0.3
Average number of tools for households that own this equipment
Angady 2.9 2.5 3.2 3.0 2.6 3.1 2.7 3.3 2.8 Weeder 1.4 1.3 1.4 1.5 1.5 1.3 1.4 1.8 1.2 Plough 1.0 1.0 1.0 1.0 1.0 1.0 1.0 1.0 1.0 Cart 1.0 1.0 1.0 1.0 1.0 1.0 1.0 1.0 1.0
Only people who are receiving substantial off-farm income do not always own an angady. For the
other equipment it is clear in table 6.3 that the full-time farmers (‘producing’ type) have the highest
figures. Distribution between CA (non) adopters is very homogeneous.
LIVESTOCK The figures in table 6.4 only present the adult animals. The animal unit that is used counts Zebus and
cows as 1, pigs as 0.2 and poultry as 0.008 per unit.

22
Table 0.4 Livestock features
Type of livestock Total CA adoption Zone Farm type
Pract Aband Never Fitak Iandr Off Prod Poor
Animal unit 1.75 2.08 1.54 1.54 1.37 2.12 1.78 1.98 1.54 Liters of milk sold 314 166 421 372 67 561 408 300 245
Percentage of households that own this kind of livestock
Zebu 35 52 29 23 37 33 33 64 26 Cow (female) 42 43 35 45 30 53 39 27 48 Pig 57 57 35 73 53 60 50 73 55 Poultry 87 86 94 82 80 93 78 82 94
Average number of animals per household
Zebu 0.7 1.0 0.6 0.5 0.7 0.7 0.7 1.5 0.5 Cow (female) 0.7 0.8 0.6 0.7 0.4 1.0 0.8 0.5 0.7 Pig 1.0 0.9 0.9 1.1 0.7 1.3 1.0 1.0 1.0 Poultry 14.6 17.5 15.2 11.2 8.2 20.9 17.1 7.6 15.6
Average number of animals for households that own this type of livestock
Zebu 2.0 1.9 2.2 2.2 1.9 2.2 2.0 2.3 1.9 Cow (female) 1.7 1.8 1.7 1.6 1.4 1.8 2.0 1.7 1.5 Pig 1.7 1.6 2.6 1.5 1.3 2.1 2.0 1.3 1.8 Poultry 16.8 20.5 16.1 13.7 10.3 22.4 22.0 9.2 16.6
It is visible that in Iandratsay the emphasis is a bit more on dairy cattle, although the higher figure for
milk sales also comes from the overall difference in prosperity of the zones. This will also be dealt
with in the next paragraphs. Within the farm types, the ‘off-farm’ type sells the highest amount of
milk. The group of people that practises CA has the highest average animal unit. This can be
contributed to the relatively high percentage of households that own Zebus in this group.
LAND AND CROPS Table 6.5 presents the data obtained about owned land. According to the interviewed farmers, there
is no formal tenure system. People usually inherit their land, and buy some more. Only in Iandratsay,
9 people hired land during the surveyed year. Sharecropping and lending were less observed. For
paddy fields, the number of women involved in planting was used to calculate the area. This results
in most cases in a totally different figure than the estimation of the interviewed farmer, but it was
considered more accurate. The estimation of BVPI is that 1 woman can plant 1.5 are. Paddy fields
turned out to be practically always in use. Only one farmer mentioned 20 are of fallow paddy fields,
because of inundation. A remark should be made here about the term for ‘paddy fields’ that was
used during the survey – i.e. the Malagasy word tanimbary (tany= land, vary= rice). It could be that
this word is interpreted by the farmers in the strict sense of a rice field. In this case, inundated fields
are not considered to be tanimbary. For the total area of land used per person, every member of the
family counts as 1, except babies. Measuring the importance of paddy fields relative to tanety,
turned out to be complicated. When asked, almost everyone in Fitakimerina mentioned the paddy
fields as their first priority. In Iandratsay, the answers were more diffuse. Although rice is the main
staple crop, products from tanety fields provide cash income and some poor farmers only have land
at tanety. The input invested in both types of fields was surveyed by a very general question – if or
not fertilizer (NPK and/or urea) had been used. Table 6.5 shows the average scores.

23
Table 0.5 Land features
Feature Total CA adoption Zone Farm type
Pract Aband Never Fitak Iandr Off Prod Poor
Age of farm (years until 2010) 18 15 19 20 19 18 19 15 18 Soil type* 2.35 2.44 2.20 2.39 1.90 2.81 2.46 1.95 2.37
Area paddy fields (are) 28 31 22 29 34 22 30 52 16 Area tanety fields (are) 94 57 159 76 53 133 66 190 68 Percentage of tanety fields that are fallow (are) 27 30 28 22 34 19 23 38 23 Total area of used land per person (are) 38 16 98 13 12 64 14 143 10
Percentage that applied fertilizers to paddy fields 63 76 65 50 57 70 56 58 68 Percentage that applied fertilizers to tanety 65 90 76 32 53 77 72 50 65
*) Code: 1=sandy, 2=ferrous, 3=volcanic
Apparently, people in Iandratsay do not only dispose of the largest area of tanety fields but also
actively use the largest percentage of it. Fertilizers are more generally used than in Fitakimerina. The
soil is also more fertile in Iandratsay. Overall, the full-time farmers (‘producing’ type) have a relatively
large farm area. On average, the CA-practising farmers run the ‘youngest enterprises’. They also
slightly more often apply fertilizers to their fields. Of the people that have never applied CA, only a
third has used fertilizers for tanety cropping. Figures that stand out, are the high average area of
tanety fields used and of area per person, of the group that has abandoned CA practices.
Table 0.6 Most occurring and CA cropping patterns on tanety, number of farmers practising (first
column) and average area used (in are)
Cropping pattern* No. Average
area (are)
CA adoption Zone Farm type
Pract Aband Never Fitak Iandr Off Prod Poor
(Potato/ ) Maize + [beans or soja] 39 24 26 33 15 7 33 14 28 27
CA
Maize+[beans or soja] /oats 4 5 5 5 - - 5 5 3 5 Potato+oats / maize+beans 1 3 3 - - - 3 - - 3 Vetch / maize+beans 1 15 15 - - - 15 - - 15
Sweet potato(+maize) / upland rice 3 38 10 4 100 7 100 4 10 100
CA
Sweet potato+maize / upland rice+stylo 1 2 2 - - 2 - - 2 -
Brachiaria 9 9 9 6 11 12 8 4 7 13
CA
Cassava+brach / cassava(+maize)+beans 2 7 7 - - 7 - - 13 2 Brachiaria / beans+soja 1 3 3 - - 3 - - - 3 Brach/sw.pot/upl.rice +soja 1 2 2 - - 2 - - - 2
Cassava 11 7 13 7 5 5 8 1 8 6 Beans or soja 12 7 - 10 4 4 9 5 6 12
*) Between () is optional, between [] is a choice. After / comes the next season.
CA cropping systems are mostly practiced on the tanety fields, and so were the described CA cases of
this survey. That is why table 6.6 covers only those fields. The figures for average area are only

24
calculated from farmers who practice the particular cropping pattern. A hectare of sweet potato
followed by upland rice from a farmer in Iandratsay is very visible in the table. The table describes 11
cases of CA that were surveyed in detail. From the remaining 10 CA practising farmers, no detailed
information was available. One pattern is clear – the CA systems that involve oats are only practiced
in Iandratsay, while those with Brachiaria were only found in Fitakimerina. Because of the low
numbers, it is not possible to draw conclusions from this.
Farm income
Table 0.7 Average production sold (kg/year)
Crop Total CA adoption Zone Farm type
Pract Aband Never Fitak Iandr Off Prod Poor
Potato 306 257 429 257 29 583 491 309 187 Barley 257 324 165 265 83 431 89 377 301 Rice 90 96 61 108 124 57 38 267 50 Maize 39 21 69 32 4 73 31 58 35 Beans 34 52 26 25 3 66 49 28 28 Soja 32 33 51 16 1 64 52 4 30 Wheat 8 9 0 14 0 16 14 17 1 Sweet potato 8 12 6 5 15 0 0 37 1
Table 6.7 shows the quantities of crops that are traded most frequently. Except for one rich, female
farmer in Fitakimerina who sold 2500 kg, barley is only cultivated in Iandratsay (see subsection 2.1.3).
The amounts in table 6.8 represent just the gross income from sales of agricultural products,
including animals (mostly poultry and pigs) and milk. It can serve as an indicator of the relative
importance of trade between the groups. It is clear that production in Iandratsay is much more
market-oriented than it is in Fitakimerina. Between CA (non) adopters there is not really a clear
pattern.
Table 0.8 Returns from agricultural products (1000 Ariary)
Total Application of CA Zone Farm type
Pract Aband Never Fitak Iandr Off Prod Poor
Gross income from sales of agricultural products 718 754 686 707 174 1 261 785 748 643 Gross income (as above) divided by total area in use 15 19 9 14 7 22 18 16 12
Overall picture
The data described above firstly show the difference between the two zones. In Iandratsay there
exists more of a money economy, a fact that is already clear when one notices children with the
newest models of cell phones. People also work more off-farm than in Fitakimerina. The number of
animals per household is higher in Iandratsay, except for Zebus. This zone also has the largest area of
tanety fields per person. The CA systems that are practiced are rotations with oats, while in
Fitakimerina this is Brachiaria or Stylosanthes (1 time).

25
Secondly, the description of the different farm types generally meets the characteristics that were
laid out in section 4.3. The ‘producing’ type hires the most labour and has the highest average area of
tanety fields per person. In paddy fields, the difference is not significant. The ‘off-farm’ type generally
owns less equipment, but sells the highest amount of milk. Regarding crops, they mainly sell
potatoes.
Table 0.9 Correlation between farm features and CA adoption (P=2, A=1, N=0)
Spearman’s rho Significance 2-tailed Significance 1-tailed
Age -0.341** 0.008 No. Zebus 0.233* 0.073 0.037 Input paddy 0.230* 0.077 0.038 Age of farm -0.186 0.155 0.078 Income sold crops 0.119 0.364 0.182 Area pp 0.073 0.578 0.289 Off-farm income -0.043 0.742 0.371
*) significant at 0.05 level **) significant at 0.01 level
Lastly and most interesting for this research, there are some factors that distinguish between the
different groups of CA adoption. Factors of resources seem of little importance in this regard. Table
6.9 presents the results of a statistical analysis of correlation between farm features and CA
adoption. The only outstanding figures are the high number of Zebus and a higher use of fertilizers
on paddy fields for the group that practices CA, which are not very significant. Farmers who
abandoned CA practices have a large average tanety area but the smallest paddy area, although this
last difference is not significant. The only factor that correlates firmly to adoption of CA is a lower age
of the head of household. This does not seem to have a link with education level.
SOCIAL FEATURES INFLUENCING ADOPTION The BVPI SE/HP project and its operator SDMAD work through producers’ associations and
technicians in the fields. Table 6.10 lists some of the features that describe people’s experience with
the project.
Table 0.10 Experience with CA project
Feature Total CA adoption Zone Farm type
Pract Aband Never Fitak Iandr Off Prod Poor
% that knows the system (explains it right) 62 86 82 23 67 57 72 73 52 Knowledge of CA test field* 0.9 1.8 0.5 0.5 0.4 1.5 1.1 0.9 0.8 % that is connected to producers’ association 58 95 88 0 63 53 67 55 55 No. of years CA practiced 2 4 2 0 2 2 2 2 2 Known number of people who practice CA 4.5 6.3 0.9 5.8 4.1 4.9 4.3 9.3 2.7 Known number of people who have abandoned CA 9.1 10.3 14.3 4.0 7.7 10.5 10.2 9.2 8.2
*) Code between 0 = not heard of, 1 = knows but not visited, 2 = visited with project, 3 = visited ‘voluntary’

26
Not everyone that practices CA describes this system as a no-tillage rotation with cover crops. Within
the definition of the FAO, the emphasis lies on covering the soil. During the survey, no one
mentioned rotation as part of CA, and they often viewed mulching in combination with tillage as CA.
As can be expected, with the farmers who never practiced CA, knowledge of the system is lowest.
The test fields are not widely known. The producers’ associations have a strong link with the
extension of CA practices. Not one of the farmers that never applied CA is connected to such an
association. It is clear that CA is still in a start-up phase. Farmers have only very recently started
trying CA practices (since 2006). No one practices it on a significant scale (see table 6.6).
In general, people know more people who have abandoned CA than people who practice it. The
important influence of social structures becomes clear in the example of Tsaratanana (Fitakimerina),
where the whole family of the technician is involved in the project. Other people feel ignored, and
this does not stimulate a good relationship between the technician and potential CA practisers.
DECIDING ABOUT APPLICATION OF CA One of the pillars of Conservation Agriculture is the absence of tillage. Since this is a concept that is
very unfamiliar to the surveyed farmers, it is interesting to understand their view on tillage. Table
6.11 lists the reasons for tillage.
Table 0.11 Percentage of farmers that mentioned these reasons for tillage (more than one reason
per farmer)
Reason for tillage Total CA adoption Zone Farm type
Pract Aband Never Fitak Iandr Off Prod Poor
Necessary for production 70 67 59 82 60 80 61 73 74
Soil structure 20 14 29 18 27 13 33 27 10 Out of habit 12 14 18 5 7 17 6 18 13 Soil fertility 8 14 6 5 3 13 6 18 6 To control weeds 7 5 6 9 3 10 11 0 6
When asked about their primary reason to plough the soil, most people answered that it is necessary
for production. Surprisingly, this number is lowest with farmers who abandoned CA practices. The
question that followed was why it is necessary. These reasons are all interrelated, but table 6.11
attempts to categorize them somewhat. Maintaining/restoring a soil structure that favours plant
growth is mentioned most often, especially in Fitakimerina. Maintaining soil fertility (by
decomposition of OM and a flush of mineralized nitrogen) and controlling weed growth are in
general functions of tillage (Wall, 2007). In this case, most farmers do not perceive it as a primary
reason to plough. Table 6.12 presents the different reasons that were mentioned to practice or not
practice CA. For analysis, they were grouped in four categories: economical, soil features,
professional development in agriculture and influences from social environment. In general, people
in Iandratsay mention slightly more positive arguments than in Fitakimerina. After the table, the
categories are described in more detail.

27
Table 0.12 Percentage of farmers that mentioned this reason to practice (+) or not practice (-) CA
(more than one reason per farmer)
Category of reason
Total
CA adoption Zone Farm type Pract Aband Never Fitak Iandr Off Prod Poor
Economical + 37 52 18 36 23 50 44 33 32 - 48 48 71 32 50 47 61 33 45
Soil features + 20 29 6 23 20 20 17 50 10 - 20 14 29 18 27 13 22 8 23
Professional development in agriculture
+ 12 10 6 18 13 10 22 0 10
- 15 14 18 14 13 17 11 8 19 Influences social environment
+ 13 14 0 23 7 20 11 17 13 - 28 10 41 36 30 27 33 25 26
The economic (dis)advantages of the system are mentioned most often. Figures 6-1 and 6-2 show
the distribution of these arguments in more detail, with figures that can also be found in Appendix C.
Figure 0-1 Number of farmers that mentioned economic advantages of CA
A higher production and smaller demand for labour were the main economic advantages (figure 6-1).
These figures, as well as the percentage for lower expenses, are mainly shaped by opinions of CA
practising farmers. The factor ‘subsidised agricultural inputs’ was mostly mentioned by the group
that has never applied CA practices.
Figure 0-2 Number of farmers that mentioned disadvantages of CA
It is in particular the opinion of the group that has abandoned CA practices, that contributes (with 9
farmers) to a ‘low production’ (figure 6-2). This is also the main economic disadvantage according to
both this group and the practising group. ‘Time and labour consuming’ was mentioned evenly by the
7
6 5
5
3 Less labour consuming
High production
Subsidised agricultural inputs
Low expenses
Opportunity to grow fodder
14
8
6
4 2 Low production
Time and labour consuming
High expenses
Cows need cover crops
Lot of weeds
28
three groups. With regard to soil features, the advantage of CA is the improvement of the soil
quality. Negative arguments are that the system is not adapted to the local soil which according to
the farmers is either very hard to cultivate on or too poor. Reasons to practice CA that were
mentioned in the sphere of professional development in agriculture were to gain experience, test the
system and get instructed in general. The fact that the system is too difficult to follow is seen as a
disadvantage. The influences from the social environment can be positive: the examples from others
and the encouragement of extension staff. On the other hand there are also negative examples of
people who abandoned CA that form a reason against the system. This negative influence of the
social environment is mentioned more often and includes social or personal constraints to enter a
producers’ group and complaints about extension staff.People that have never practiced CA, have
significantly little to say about the production level of the system. In general, their positive and
negative arguments weigh up against each other, except for influences from the social environment
that tend towards a negative result.
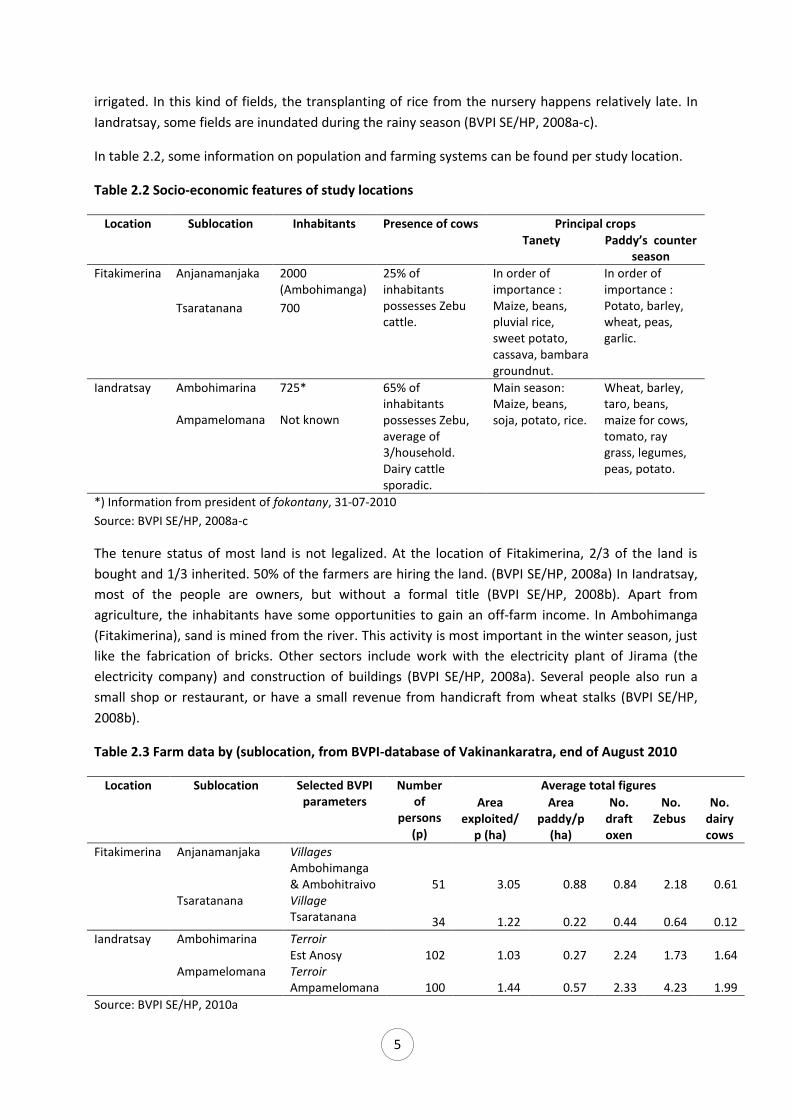
Table 0.13 Experienced and expected impact of CA systems for three parameters: score from -1
(lower) to 1 (higher)
Parameter Practising:
experienced Abandoned: Experienced
Never applied: expected
Availability of fodder 0.75 0.13 0.90 Harvest 0.14 -0.65 0.17 Expenses -0.67 0.06 -0.60
Table 6.13 presents the view of farmers on the impact of practising (a) CA system(s). The availability
of fodder is both experienced and expected to increase; the cover crops involved in CA rotations are
really perceived as a provision of fodder. Expenses become smaller with CA, mainly because of the
less hired labour that is needed to plough the soil. According to these figures, farmers that
abandoned CA do not find lower expenses with CA, and are also dissatisfied about the production of
the system. Interestingly, the people that never applied CA have high expectations for both the
availability of fodder, the increase of their harvest and the decrease of their expenses. Regarding the
experiences, at least the first two expectations seem to be too optimistic.
DISCUSSION Reasoning from the data presented above, this paragraph will discuss the hypotheses that were
formulated at the end of chapter 5. The size of the farm (more land exploited, more cattle, more
income) has a positive effect on adoption of CA. With regard to the area of the farm, this hypothesis
can be rejected. Farmers who abandoned CA have the largest area per person. The relation could be
the other way around, if a large cropping area discourages the adoption of time-consuming rotations.
However, the reasons in table 6.11 do not explicitly point towards this.
The amount of cattle does not differ significantly between the groups of CA application, with the
exception of Zebus. About half of the practising farmers owns (a) Zebu(s), while with the other
groups this is less than 30%. The fact that the number of Zebus does at least not correlate to a lower
application of CA, seems to indicate that the competition of cover crops and cattle does not occur
within a farm. This can be explained by an observation from the project, that residues are also sold
(Raharison & Andrianaivolala, 2009).

29
The income from crops sales is slightly higher for people who practice CA, but this is not significant.
Comparison with off-farm income also shows no correlation; contrary to conclusions of Clay et al.
(1998), availability of money does not stimulate adoption of CA. So overall, this hypothesis was only
confirmed with regard to the amount of Zebus. Another observation with a stronger relation, was
that lower age of the head of household correlates positively to adoption of CA. This outcome is the
opposite of earlier mentioned research in Ethiopia (de Graaff et al., 2008). Age can both stimulate
and hinder changes in agricultural practices; in this case younger farmers are apparently more
motivated to use CA than their older colleagues. Education level has no relation with this.
When crops on paddy fields represent the big(gest) share of agricultural activity, this diminishes
motivation for CA.
Comparing the importance of tanety and paddy fields turned out to be difficult, especially with a
general survey that does not include detailed information about labour inputs. The measured factor
was input spent on the fields in terms of fertilizers. At the paddy fields, this does not differ a lot
between the CA (non) adopters. However, there is a pattern whereby practising farmers apply most
and those who never tried CA least. This leads to a tentative rejection of the hypothesis.
In general, paddy will always stay more important relative to tanety. Rice is a source of liquidity;
saved amounts are sold when people need money to repair their house or to pay salaries.
If the workload of women gets more heavy with CA practices, they are more inclined to decide
against CA.
When a woman is married, it is her husband who makes the decisions. During most of the interviews
that were arranged with these women, her husband also took part. Estimations of workloads for
women would be biased by this. This hypothesis can be rejected because in general women do not
decide about implementation of CA.
When deciding about adoption of CA, economic reasons are the determining factor.
The effect of CA on production levels and demand for labour is definitely an important factor.
Complaints about a bad production and positive experiences with economized labour expenses are
the two opposite sides of the coin. Those people that have no experience with CA, apparently do not
decide on the basis of production levels but see benefits in the subsidised inputs that the project
provides. The perception of many of these farmers is that production will not increase with a CA
system. An often heard remark was that “the soil here is too hard and tillage is necessary to have a
production.” These are all economic reasons. But apart from this, it also seems that CA practices are
extension-intensive. Farmers think it will not work without a lot of attention from SDMAD-
employees. Social constraints form the second largest group of negative arguments. For a farmer to
jump the train of this new agricultural system, it is vital to be part of a producers’ association. This
implies good contacts with co-farmers and extension staff from BVPI SE/HP, and that is exactly what
is lacking in many cases.
Lastly, this discussion treats the information from the 11 farmers who described a CA system that
they practiced (introduced in table 6.6 and described in more detail in Appendix C). The five systems
that involve oats as a cover crop are all located in Iandratsay. This could be related to the relatively
higher importance of dairy production at this location. These systems still combine maize and beans

30
like in the usual rotation. Three of these farmers want to continue CA on that location. A weakness
seems to be the sensitivity to uncontrolled growth of weeds. The farmers that do not want to
continue, find the production of the system (with regard to maize and beans) lower than it usually
would be. If production would not be influenced by the combination with oats, people would
probably adopt it more. The four farmers that implemented a CA system with Brachiaria were all
content with the production levels and wanted to continue. The problem of weeds was not
mentioned. It is clear that they practice it on a very small scale.
Discussion of methods
FIGURES FOR THE FARM TYPOLOGY To use the farm typology of Ahmim-Richard et al. (2010), a figure for ‘self sufficiency in rice’ had to
be calculated. Because of an initial different understanding of this term, the total production of rice
was not asked in the survey. In order to apply to the definition of BVPI, this figure had to be
calculated from the area of paddy fields and the average yield, which does not make it very precise.
A situation of self sufficiency in rice is defined as: The household eats rice for at least 8 months a
year. It is calculated as follows:
In this way, an outcome ≥ 1 indicates that the household is self sufficient in rice.
The per-capita consumption of rice is estimated at 250 kg paddy/year. Because the survey did not
include the difference between well- and poorly managed parcels (RMME, rizières à mauvaise
maîtrise de l'eau), the average yield of the paddy fields is a very rough estimate. Rakotofiringa et al.
(2007) mention an average yield for irrigated rice of 3.3 ton/ha for the village of Andranomanelatra
(north of Antsirabe). It appears that this counts for the well-managed paddy fields. In the research of
Ahmim-Richard et al. (2010), figures vary according to the different types of farmers: 2 (type 1), 2.5
(type 5), 3 (type 4) or 3.2 (type 3) ton/ha. BVPI SE/HP (2009a) mentions 3 ton/ha for irrigated rice
(well-managed) in the highlands but has no figures for RMME in this region. In the South-East region
it ranges from 0.53 to 1.72 ton/ha. It is not clear which part of the paddy fields can be qualified as
RMME. The location of Fitakimerina reports 30% of the paddy-fields well-irrigated and 70% poorly
irrigated (BVPI SE/HP, 2008a), but this does not necessarily mean that 70% of the fields are RMME. In
general, the area of Iandratsay seems to have no RMME at all (BVPI SE/HP, 2009a).
Considering all this, the average yield of the paddy fields was estimated to be 2.5 ton/ha in
Iandratsay and 2 ton/ha in Fitakimerina. To account for losses during harvest and storage (10%) the
figures that are used are 22.5 kg/are and 18 kg/are. FAO data for Madagascar show a comparable
yield of 2.5 t/ha in 2008 (FAOSTAT, 2010).
A last remark on the farm typology: It is said (Ahmim-Richard et al., 2010) that type 5 occurs only in
the middle-west part of Vakinankaratra and Amoron’i Mania, but seeing that in this survey 6 cases
fell into this category, type 5 is also present in the highlands.

31
Social dimension
In the process of determining the sample, the technicians were too influential. As indicated in
chapter 4, they were asked to find people to interview within the strata of gender, farm size and
number of dairy cows. In this way, the survey in Fitakimerina was mainly held in the sublocation of
Anjanamanjaka. Only the last day was spent in Tsaratanana, a location closer to the highway and
because of that with some different features. A better distributed sample would have resulted in a
more balanced image. Everyone who has never practiced CA, said he or she wanted to start with it.
This is most probably caused by their perception of the interview – we were seen as extension
agents who can provide them with seeds and inputs. It is difficult, even impossible, to judge whether
people tell their true thoughts about CA or whether they tell a story to receive the things that they
want to get. In general, it is preferred to use a research method that avoids a one-way flow of
information, from the researcher to the subject. It is a bit suspicious that the research team requires
knowledge of a person’s age, income and possessions, while they themselves do not reveal
information about these personal details. At least the purpose of the survey should be clear, ideally
in a way that makes the results (this report) available to the interviewed farmers.
SOURCES OF INACCURACY The survey dangled a bit between an in-depth study to farming systems and a qualitative research to
opinions about CA. It would have been better to start with an empty database and create a survey to
collect the data. There are also constraints in data collection that probably every farming system
survey encounters. Most of the time, the area of parcels is not readily known. The survey was not
designed to visit all the fields, so this led to estimates like ‘2 times that field over there’. The same
counts for questions about soil types. If it is not possible for the researcher to visit the fields, it is
better to take pictures (or samples) of defined soil types and make it a multiple choice.
3 CONCLUSIONS “On ne développe pas, on se développe”
Prince Claus of the Netherlands (1926-2002)
This research aimed at identifying the past and present reasons why farmers are hesitant to adopt
Conservation Agriculture practices in the highlands of Vakinankaratra. In the first place, one should
note that real adoption, in the sense of continued use of CA practices, is not yet possible because the
introduction of CA in these zones only started in 2006. According to the results of the survey, the
only factor that correlates firmly with adoption of CA is a lower age of the head of household. The
amount of Zebus has a slightly positive effect on adoption of CA, so competition for livestock fodder
seems no big hindrance. Clearly, it is also not a matter of resources - relatively within these zones,
that is to say. Of course the surveyed farmers all have small enterprises and live in an agricultural
society with little resources. The idea of CA does not raise high expectations with regard to
production. This is mainly due to a lack of confidence in a no-tillage system; ´labour toujours´ seems
to be the device in the studied zones. People who applied CA mention this low production level as
the main economic disadvantage. Farmers without experience with CA are more inclined to decide
on the basis of subsidised inputs they can get through the project. The social threshold they need to
take to get involved in the project is their weakest link towards CA. This shows that the local context
involves more than ‘just’ climatic circumstances and financial possibilities. Changing an agricultural

32
practice requires strong support systems that provide inputs and equipment (Corbeels et al., 2011),
and above all a social environment that incites and stimulates this change.
Elaborating on the notion of change - the meaning of this concept depends highly on a person’s
circumstances. While a Dutch student may find moving to another country a big change, for a farmer
in Fitakimerina a change in crop rotation has much more influence on the income of the family and
issues like food security. So, one of the reasons why farmers are ‘hesitant’ to apply CA practices,
could be that they simply have no choice. Several of the families we encountered during the survey
had no capital to invest in whatever better system. While they are the ones that can use innovation
of agricultural practices, they are caught in the poverty-trap and do not have any power to choose.
‘Development’ in this sense means that they themselves create a way to raise their production or
income. For future study, it would be interesting to compare the dissemination of CA to another
(past) project of SDMAD in the region: reforestation with Eucalyptus. During the survey it became
clear that it was more popular than CA. Many trees could be seen and farmers mentioned it as a way
to protect the soil and the environment. Apart from questions about the effects of Eucalyptus, there
could be a lesson with regard to adoption.
Other examples are for instance the organisation of Malto, who buys barley from farmers (see
subsection 2.1.3) and the dairy producing industry that stimulates dairy cattle. In these cases, there
exists a market for the products. When de Graaff et al. (2008) conclude that profitability is an
important stimulus for investment in conservation practices, a special niche for CA-products can be
given some thought.
References
AFD/FFEM (2007) Direct seeding mulch-based cropping systems (DMC). Paris, France.
Ahmim-Richard, A., Bodoy, A., Penot, E. (2010). Caractérisation et typologie des exploitations
agricoles dans le Vakinankaratra et l’Amoron’i Mania, Madagascar. Document de travail BV lac n°
25BVPI/SCRID/FOFIFA/TAFA.
BVPI SE/HP (2008a) Diagnostic terroir Ambohimanga-Tsaratanana (Commune Vinaninkarena, Region
Vakinankaratra, Lot 1). Version du 16-06-08.
BVPI SE/HP (2008b) Diagnostic terroir Ampamelomana (Périmètre Iandratsay, Commune
Mandritsara, Region Vakinankaratra). Version du mars 2008.
BVPI SE/HP (2008c) Diagnostic terroir Est Anosy (Périmètre Iandratsay, Commune Mandritsara,
Region Vakinankaratra). Version du mars 2008.
BVPI SE/HP (2009a) Rapport Tri Annuel : octobre 2006 – septembre 2009.
BVPI SE/HP (2009b) Rapport de campagnes, region Vakinankaratra, Saison 2008-2009.
BVPI SE/HP (2010a) Base des données Vakinankaratra, Microsoft Access document.
BVPI SE/HP (2010b) Evolution de surface en SCV durant les 4 années du projet.

33
CA2AFRICA (2009) Annex I – Description of work. Conservation Agriculture in AFRICA: Analysing and
Foreseeing its Impact - Comprehending its Adoption.
Critchley, W. (ed.) (1999) Promoting Farmer Innovation Workshop Report no 2. UNDP/SIDA.
Charpentier, H. (2010) Rapport de mission auprès du projet BVPI SE/HP, 28 avril au 8 mai 2010.
CIRAD (2010) Website ‘Le Cirad à Madagascar’, URL: www.cirad.mg [29-03-2010].
Clay, D., Reardon, T., Kangasniemi, J. (1998) Sustainable Intensification in the Highland Tropics:
Rwandan Farmers’ Investments in Land Conservation and Soil Fertility. Economic Development and
Cultural Change, 46 (2): 351-377.
Corbeels M., Apina T., Koala S., Schuler J., Triomphe B., El Mourid M., Traore K., Nyagumbo I., Mrabet
R., Penot E., Gomez-Macpherson H., de Graaff J., Tittonell P. (2011) Impact and adoption of
conservation agriculture in Africa: a multi-scale and multi-stakeholder analysis.
FAO (2009) Adoption of Conservation Agriculture Technologies: Constraints and Opportunities, in:
Proceedings of the 4th World Congress on Conservation Agriculture, Lead Papers, New Delhi, 4-7
February, 257-264.
FAO (2010) Website ‘Conservation Agriculture’. URL: www.fao.org/ag/ca [21-04-2010].
FAOSTAT (2010) Website ‘FAOSTAT’. URL: http://faostat.fao.org [2-11-2010].
Fowler, R., Rockström, J. (2001) Conservation tillage for sustainable agriculture—an agrarian
revolution gathers momentum in Africa. Soil & Tillage Research, 61, 93–107.
Giller, K.E., Witter, E., Corbeels, M., Tittonell, P. (2009) Conservation agriculture and smallholder
farming in Africa: The heretics’ view. Field Crops Research, 114, 23-34.
Gowing, J.W., Palmer, M. (2008) Sustainable agricultural development in sub-Saharan Africa: the case
for a paradigm shift in land husbandry. Soil Use and Management, 24, 92–99.
Graaff, J. de, Amsalu, A., Bodnár, F., Kessler, A., Posthumus, H., Tenge, A. (2008) Factors influencing
adoption and continued use of long-term soil and water conservation measures in five developing
countries. Applied Geography, 28, 271-280.
Hobbs, P.R. (2007) Conservation agriculture: what is it and why is it important for future sustainable
food production? Journal of Agricultural Science, 145, 127–137.
Hobbs, P.R., Sayre, K., Gupta, R. (2008) The role of conservation agriculture in sustainable agriculture.
Philosophical Transactions of the Royal Society B, 363, 543–555.
Kasprzyk, M. (2008) Diversité des systèmes d’alimentation des troupeaux bovins laitiers à Betafo,
Région du Vakinankaratra, Madagascar. Thesis.
Knowler, D., Bradshaw, B. (2007) Farmers’ adoption of conservation agriculture : A review and
synhesis of recent research. Food Policy, 32, 25-48.

34
Rabary, B., Sall, S., Letourmy, P., Husson, O., Ralambofetra, E., Moussa, N., Chotte, J. (2008) Effects of
living mulches or residue amendments on soil microbial properties in direct seeded cropping systems
of Madagascar. Applied Soil Ecology, 39, 236-243.
Raharison, T., Andrianaivolala, E. (2009) Rapport Tri Annuel Octobre 2006 à Septembre 2009, Volet
Agro Ecologie, Cellule de projet BVPI SE/HP.
Rakotofiringa, A., Tokarski, Y., Penot, E. (2007) Caractérisation des exploitations agricoles dans la
commune rurale d'Andranomanelatra, Région Vakinankaratra, hauts plateaux de Madagascar.
Thesis.
Randrianarison, Narilala, Penot, Eric, Poncet, Christian (2008), Suivi et analyse des succès et des
abandons des systèmes a base de semis direct sous couverture végétale (SCV) : mise au point de la
méthodologie. Cas du fokontany d’Antsapanimahazo – Madagascar. Document de travail BV lac n° 3
Razafimandimby, A.J.W, Razafimandimby, S. (2007) Etude des mécanismes d’adoption des SCV : cas
d’Antsapanimahazo, Ampandrotrarana et d’Ivory, Dans la région du Vakinakaratra. Document de
travail BV lac no 7, BVPI/SCRID/FOFIFA/TAFA.
TAFA-FIFAMOR (1995) Rapport de campagne 1994-1995.
Seguy, L. (2003) Les techniques de semis direct sur couvertures végétales à Madagascar, ou comment
pratiquer une agriculture durable avec un minimum d'intrants chimiques. Le cas des régions des
Hauts Plateaux.
Wall, P.C. (2007) Tailoring Conservation Agriculture to the Needs of Small Farmers in Developing
Countries. Journal of Crop Improvement, 19 (1), 137-155.
35
Determination key
Off-farm income
>= 1.000.000 Ar/year
Cash income from cattle (milk or animals
sold)
Type 1 (A: milk, BC: other animals)
No cash income from cattle, but crops sold
Type 2
No cash income from cattle or crops
Type 3
Off-farm income
< 1.000.000 Ar/year
Self-sufficience in rice
Cash income from cattle (milk or animals
sold)
Type 4 (A: milk, BC: other animals)
No cash income from cattle
Type 5
No self-sufficience in rice
Off-farm income >= 100.000
Ar/capita/year Type 6
Off-farm income < 100.000
Ar/capita/year
Cash income from cattle (milk or animals
sold)
Type 7 (A: milk, BC: other animals)
No cash income from cattle
Crops sold Type 8
No crops sold Type 9
APPENDIX A – DETERMINATION KEYS FOR FARM TYPOLOGY
Figure A-1 Determination keys for farm typology (Source : Ahmim-Richard et al., 2010)

36