ID594074.pdf - Agritrop
64
INNOPRISE CORPORATION SDN. BHD. Forestry Division CIRAD-foret 45b, A venue de la belle gabrielle 94734 No gent sur Me P.O. BOX 11622 88817 Kota Kinabalu France Sabah, Malaysia ILENTATION OF A GEOGRAPHIC FORMATION SYSTEM (GIS) ON TYAYASAN SABAH CONCESSION ENGREF maine de Lavette BP 5093 34 Montפllier Fnce PRELIMINARY STUDY Collaborative project between - Innoprise Corporation Sdn.Bhd. and - CIRAD-foret Prepared by: Nicolas NGUYEN-E with the collaboration of : Sꝃ SAU MEE DECEMBER, 21, 1993
-
Upload
khangminh22 -
Category
Documents
-
view
0 -
download
0
Transcript of ID594074.pdf - Agritrop
INNOPRISE CORPORATION SDN. BHD.
Forestry Division CIRAD-foret
45b, A venue de la belle gabrielle 94 734 No gent sur Marne P.O. BOX 11622
88817 Kota Kinabalu France Sabah, Malaysia
IMPLEMENTATION OF A GEOGRAPHIC
INFORMATION SYSTEM (GIS)
ON THEY A Y ASAN SABAH CONCESSION
ENGREF Domaine de Lavalette BP 509334000 Montpellier France
PRELIMINARY STUDY
Collaborative project between
- Innoprise Corporation Sdn.Bhd. and
- CIRAD-foret
Prepared by: Nicolas NGUYEN-TI-IE with the collaboration of : SOO SAU MEE
DECEMBER, 21, 1993

AKNOWLEGEMENT
The study was made realizable with the support of Innoprise and I would like to
express by gratitude towards Mr. CYRIL PINSO and Mr. CHAN HING HON
respectively General Manager and Assistant General Manager of the Forestry
Division.
I am also deeply indebted to all the staff of the company which I could not
mention in totality but who has contributed to the study and who made me
appreciate my stay in Malaysia with their kindness and availability.
Moreover, I am very grateful to P. DURAND, M. C. HILAIRE and M. PAIN
from CIRAD-Foret for allowing me to participate in the project. Last but not
least, I express my gratitude to M. DESHA YES, P. COUTERON from ENGREF
and H. JEANJEAN from CIRAD-Foret for their help through out the study.
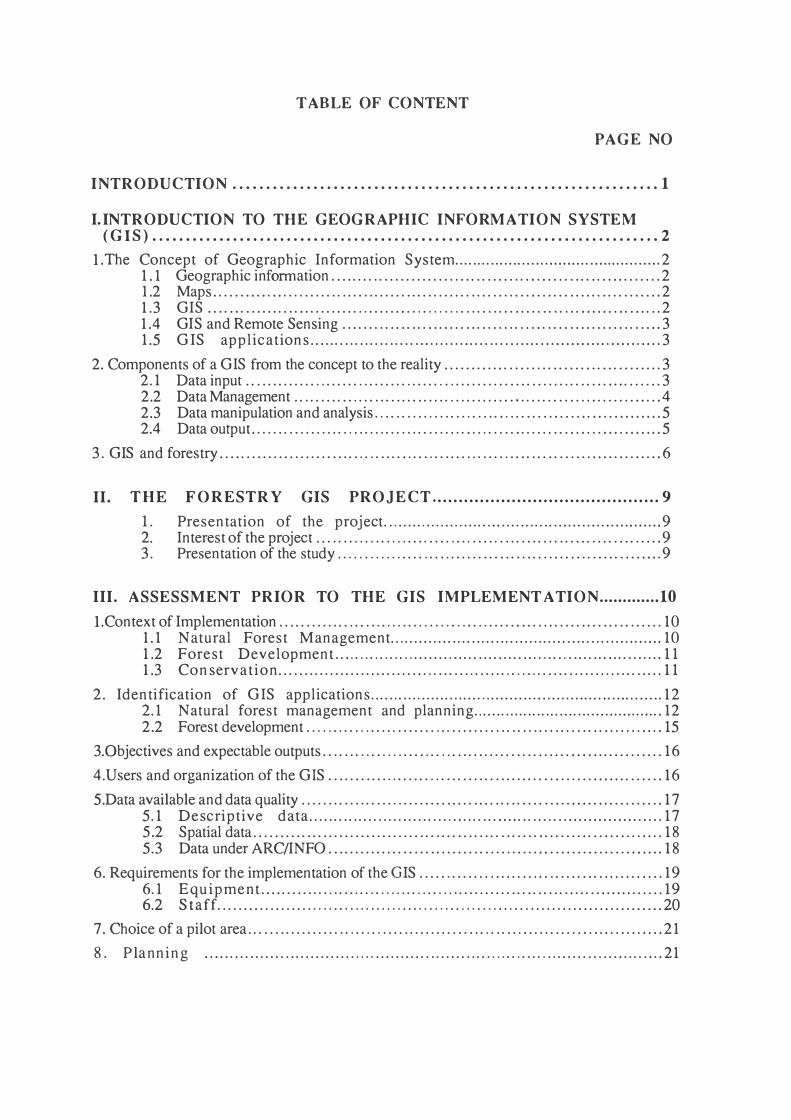
TABLE OF CONTENT
PAGE NO
INTRODUCTION ............................................................... 1
I.INTRODUCTION TO THE GEOGRAPHIC INFORMATION SYSTEM (GIS) ........................................................................... 2
l.The Concept of Geographic Information System .............................................. 2 1. 1 Geographic inf orrnation ............................................................. 2 1.2 Maps ................................................................................... 2 1.3 GIS .................................................................................... 2 1.4 GIS and Remote Sensing ........................................................... 3 1.5 GIS applications ...................................................................... 3
2. Components of a GIS from the concept to the reality ........................................ 3 2.1 Data input ............................................................................. 3 2.2 Data Management .................................................................... 4 2.3 Data manipulation and analysis ..................................................... 5 2.4 Data output. ........................................................................... 5
3. GIS and forestry .................................................................................. 6
II. THE FORESTRY GIS PROJECT ........................................... 9
1. Presentation of the project.. ......................................................... 9 2. Interest of the project ................................................................ 9 3. Presentation of the study ............................................................ 9
III. ASSESSMENT PRIOR TO THE GIS IMPLEMENT ATION ............. 10
l .Context of Implementation ....................................................................... 10 1.1 Natural Forest Management.. ....................................................... 10 1.2 Forest Development. ................................................................. 11 1.3 Conservation .......................................................................... 11
2. Identification of GIS applications ............................................................... 12 2.1 Natural forest management and planning .......................................... 12 2.2 Forest development .................................................................. 15
3.0bjectives and expectable outputs ............................................................... 16 4.Users and organization of the GIS .................................. : ........................... 16 5.Data available and data quality ................................................................... 17
5.1 Descriptive data ....................................................................... 17 5.2 Spatial data ............................................................................ 18 5.3 Data under ARC/INFO .............................................................. 18
6. Requirements for the implementation of the GIS ............................................. 19 6.1 Equipment. ............................................................................ 19 6.2 Staff .................................................................................... 20
7. Choice of a pilot area ............................................................................. 21 8. Planning ........................................................................................... 21
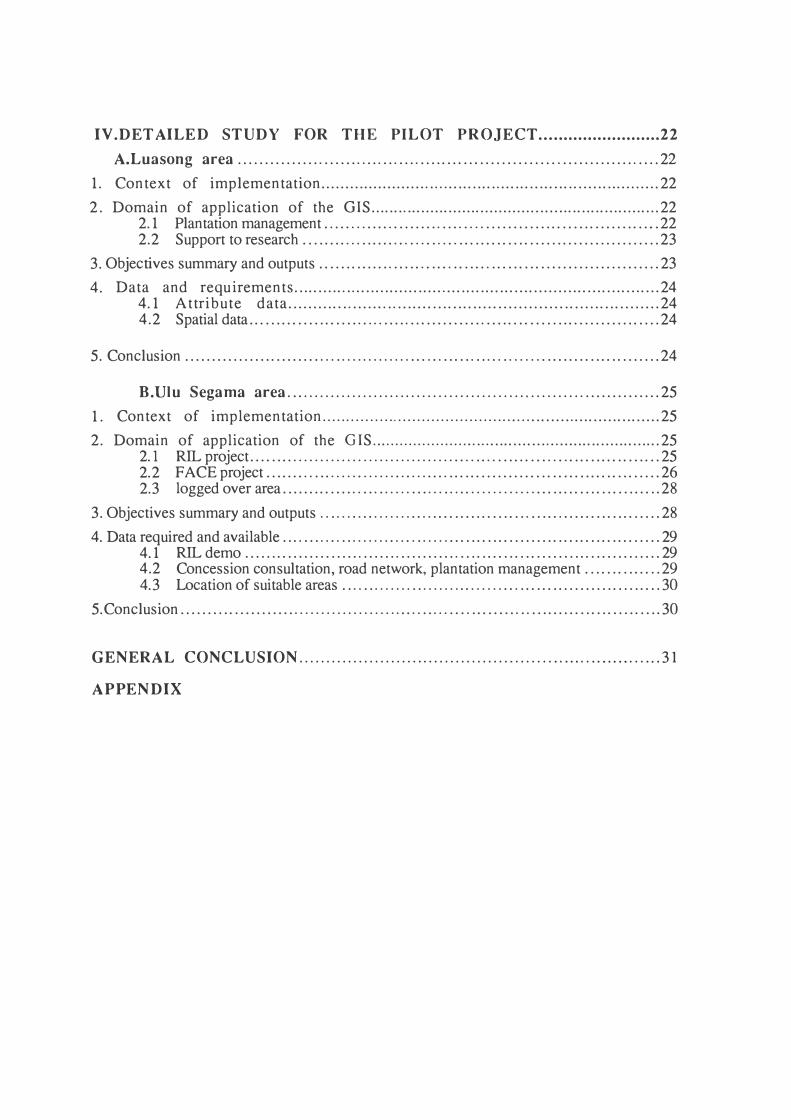
IV.DETAILED STUDY FOR THE PILOT PROJECT ......................... 22 A.Luasong area .............................................................................. 22
1. Context of implementation ....................................................................... 22 2. Domain of application of the GIS ............................................................... 22
2.1 Plantation management .............................................................. 22 2.2 Support to research .................................................................. 23
3. Objectives summary and outputs ............................................................... 23 4. Data and requirements ............................................................................ 24
4.1 Attribute data .......................................................................... 24 4.2 Spatial data ............................................................................ 24
5. Conclusion ........................................................................................ 24
B.Ulu Segama area ..................................................................... 251. Context of implementation ....................................................................... 25 2. Domain of application of the GIS ............................................................... 25
2.1 Ril.. project ............................................................................ 25 2.2 FACE project ......................................................................... 26 2.3 logged over area ...................................................................... 28
3. Objectives summary and outputs ............................................................... 28 4. Data required and available ...................................................................... 29
4.1 Ril.. demo ............................................................................. 29 4.2 Concession consultation, road network, plantation management .............. 29 4.3 Location of suitable areas ........................................................... 30
5.Conclusion ......................................................................................... 30
GENERAL CONCLUSION ................................................................... 31
APPENDIX
Summary
The present report is the result of 6 months study realized for the first phase of preliminary assessment of the "Forestry GIS project". The project is a collaboration between Innoprise Corporation and CIRAD-foret for the implementation of a Geographic Information System on the Yayasan Sabah concession.
The study concentrates first on a "preliminary assessment prior to the GIS implementation". Three main areas of activities should be covered by the GIS : Primary forest, Secondary forest and Plantation. ICSB needs more particularly a system to gather and display up-to-date information, and to produce maps easily and quickly. A need of demonstration has also been raised. According to the forest activities of the concession and the needs, 8 main objectives are proposed
-Demo to present the concession and its activities-Demo on a Reduce Impact Logging project-Concession progress consultation-Road network management-Preparation of coupe in Primary forest-Logged-over forest management-Plantation management-Support to research
The description of the data available and their quality allow to foresee the possible technical difficulties of implementation. The GIS should be organized from a main system based in the headquarter of Innoprise and monitored by an independent GIS team. Two other modules, more or less independent from the main system, could be developed later according to the equipment available: an Executive Information System to be handled by senior management for the purpose of demonstration and fast progress consultation, and a localized GIS for local management such as for Rattan plantation in Luasong.
For a first step of implementation, a solution with 2 PC 486 has been proposed. However, upgrading the system to workstation is desirable for a GIS on the whole concession. Moreover, satellite imagery should be a very interesting source of data for the system and must be envisaged later. Two pilot areas have been chosen to start the project on small scale: The Luasong project area and The Ulu Segama Forest Reserve. In the chapter "detailed information for the pilot project", the study proposes 6 objectives with expected outputs and gives the detail of the necessary data to be captured. Finally, the study proposes a planning of implementation for the pilot project that should be achieved quickly, between 6 months to 1 year.

INTRODUCTION
Geographic Information System are computer-based systems that are used to store and manipulate geographic information. This technology has developed rapidly over the past two decades and is now accepted as an essential tool for the effective use of geographic information.
Forestry is typically an area of activities which involves many geographic information. Examples of GIS implementation in temperate forests exist already but the introduction of such a system for the management of tropical forest is still a new experience.
In this context, the "Forestry GIS project" has been launched as a collaborative project between Innoprise Corporation Sdn. Bhd. (Malaysia) and CIRAD-foret (France). The purpose is to implement a GIS for the management of the Yayasan Sabah forestry concession, which covers almost 1 million ha in Sabah, Borneo.
1

CHAPTER I
INTRODUCTION TO THE
GEOGRAPHIC INFORMATION SYSTEM (GIS)
I. INTRODUCTION TO THE GEOGRAPHIC INFORMATION SYSTEM(GIS)
1. The Concept of Geographic Information System
1.1 Geographic information
Geographic Information refers to any information related to one point or a group of points spatially referenced on earth: natural resource distribution (soil, water, vegetation), administrative boundaries, location of roads, networks, building and even statistical data. Geographic information is very important for those who have to manage an area or objects scattered in this area.
1.2 Maps
Maps are the main way to display geographic information. The most common map is the topographic map which display the main elements of landscape like rivers, roads, building, vegetation. But other kinds of map are necessary to provide information on specific theme, the thematic map, for geology, soils, land capabilities, ... Maps are not only a descriptive tool, they help in management decision making. But maps printed on paper have some drawbacks:
map edition is time consuming and costly. to be easily legible, a map cannot display too much information at once. the map is a static vision of reality. Once it is printed, it will not evolve until the next updating. Some maps are already outdated when they are printed, this is a very important problem for those who have to manage a fast moving world.
no analysis can be easily undertaken if one wants to use data from different maps at the same time, especially when it is not the same scale.
Today, needs in geographic information go most often to documents quickly available, up to date and adapted to a specific purpose. Traditional maps do not respond to these new requirements.
1.3 GIS
Progress in computer technology have allowed people to digitize geographic information and to manage it with computer. Gradually, computers proved to be a very useful tool to assist map production and spatial analysis. Thus, was born in the 60s the concept of Geographic Information System (GIS).
GIS are computer based systems used to store, manage and manipulate georeferenced information. They gather geographical data, which can be drawn and descriptive data, which represent qualitative information corresponding to the geographical data.
2
1.4 GIS and Remote Sensing
Remotely sensed information have proved to be very efficient and useful source of data, especially to follow evolutive phenomenon such as deforestation, forest fires, erosion. The most common remotely sensed information are the aerial photos but a new technology has developed rapidly that offers more possibilities : the satellite imagery.
Specific softwares have been developed for the processing of these new data and for a short time, connected with Geographic Information System. The trend is nowadays to mix satellite image processing with geographic analysis, characteristic of the GIS, in only one system.
1.5 GIS applications
The size of GIS, in terms of computer equipment, staff, spatial extent and data number varies greatly from one application to another. But beyond these differences, 4 main types of application can be distinguished. In order of increasing complexity:
Cartography Management Analysis Modelisation
A GIS must be considered as a model of the real world that allows to elaborate, to test and to chose scenarios of actions.
2. Components of a GIS: from the concept to the reality
Four different components can be distinguished in a GIS : data input, data management, data manipulation and analysis, and data output.
2.1 Data input
It is the procedure of encoding data into a computer readable-form and writing the data to the GIS data base. Data input can be carried out by different ways :
• Input of spatial data
- Keyboard entry: the coordinates of the points (in vector model) or cells ( in rastermodel) are captured manually on the keyboard.
- Manual digitizing : the map whose features have to be captured is affixed to adigitizing table and a pointing device is used to trace the features. The digitizing table electronically encodes the position of the pointing device. It uses the vector model of representation. The accuracy depends on the number of points encoded and the skill of the operator. The process of tracing lines is time consuming and error prone but it requires few equipment: one computer, that can be separated from the system monitoring the database, is enough.
3
What are the characteristics of this soil?
polygonc# 51]
code
nom podzo1
pH 5.5
Which soils have a Pll>S?
polygoncW
SI)
SI �
. . .
code ...
)
19
. . .
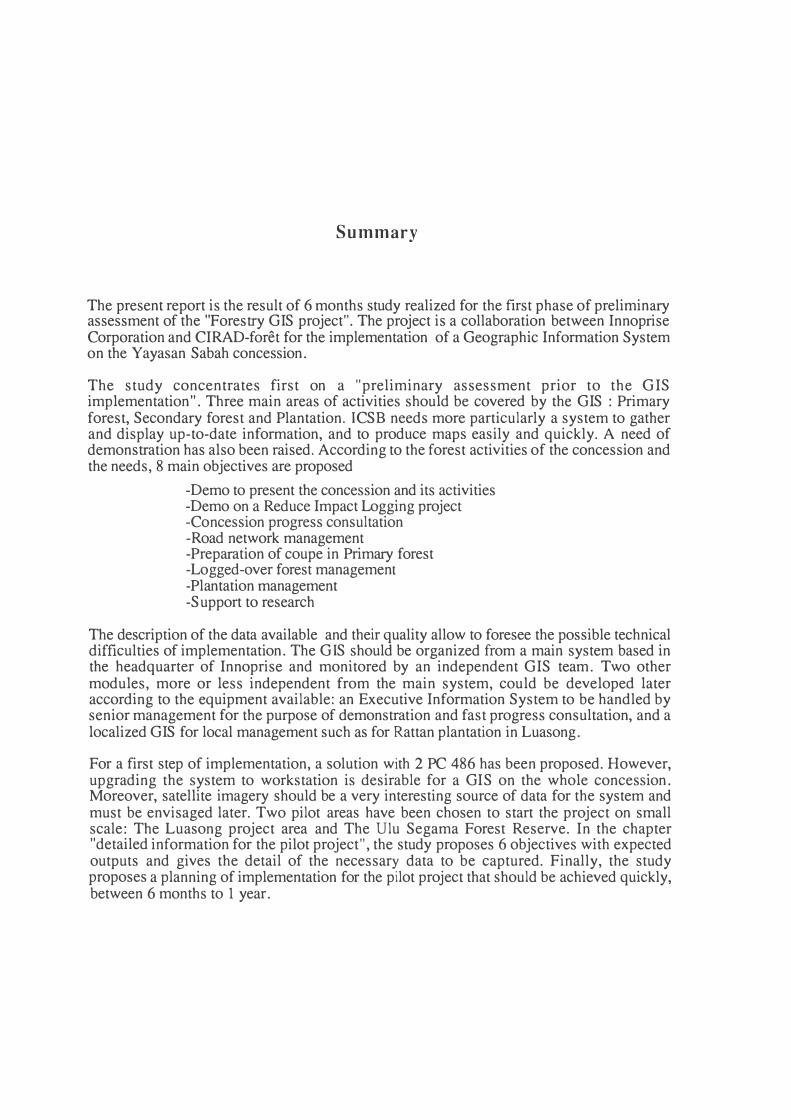
Fig.I.! The 2 types of query

- Scanning : in scanning a digital image of a map is produced by moving an electronicdetector across the map surface. It uses the raster model of representation. It is a fast and automatic way of digitizing, interesting for the acquisition of a great number of data. But it requires equipment (that can be shared) and more sophisticated softwares.
- Existing data : capturing data can be carried out by transferring existing files (afterpurchase or exchange). This is especially the way to input remote sensing data
• Input of attribute data
- Keyboard entry : database management systems are often more suitable than GISfor this task. Data are captured separately from the GIS and transferred afterwards.
- Existing data : programs can be achieved to extract data from an existing file and totransfer them to the GIS.
If the data and their quality are an important aspect of the data input component of the GIS, the database design is fundamental. The way the data.are structured (data structure) and the way files can be related to each other (organization of the database) influence the way in which data could be retrieved and the speed of the retrieval. It depends on the short and long term objectives of the user. A specialist is required for this design.
Data input procedure is said to be one of the most time consuming and the most expensive stage in the implementation of a GIS. Thus, it must not be under-estimated.
2.2 Data Management
The data management component of a GIS includes the functions of any data base management systems:
- Storage
- Data edition- Updating- Retrieval of data
- Back-up
it requires to take into account the size of the memory needed. to correct the mistakes of the database. to add new information the retrieval of information can be done either by an exhaustive consultation of files, or by making queries. There are two different types of query (fig. 1.1) :
- to ask for the attribute data of an object whose locationis known.
- to ask for the location of objects according to somespecific characteristics.
highly necessary to avoid to lose some data when a large amount is captured.
4
+ + +
t- +
+ t-
Tocal Numoer
/g:7 L� ;7
P<ry II 7.. O
3 7..
Ji.nc-in-?olygo.-i
?OiNTS
(Scraighc)
/
(Curved)
DlSTA.NCE
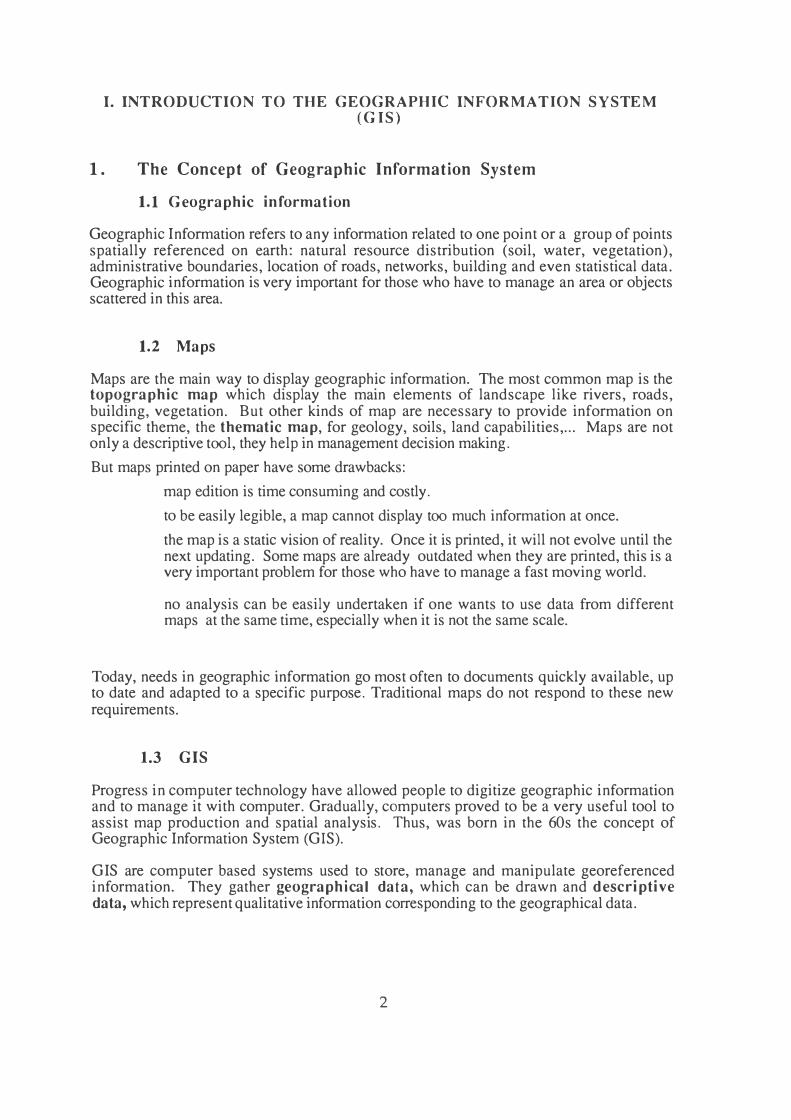
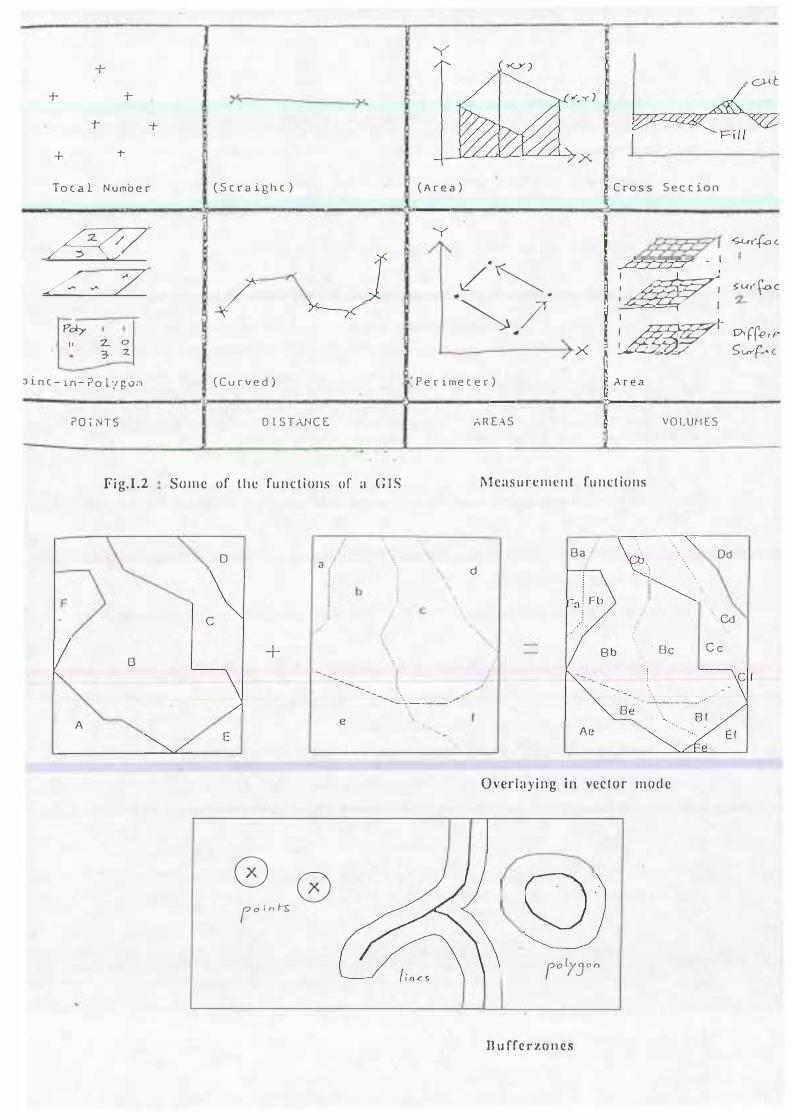
Fig.1.2 Some of the functions of a GIS
D a
B +
--------
y
)<..
(Area)
-y
/·�. �/ �
><.
'Perimecer)
-AR E.-\S
� Cross Seccion
i
� ;�, I/ I
1�·
� VOLUMES
C).J, t
�+c'l.
�u-.'t°c
0i(fe,P" SL.n'f.• c
Measurement functions
Ba Od d
· .. Cd
. Be Cc
----- . ---:;. _____ .,,.E
Ae A e
Overlaying in vector mode
0 0 foin/-s
fo l!.
J ° n
nuffcr:r.oncs

2.3 Data manipulation and analysis
These functions make the difference between GIS and other information systems. A GIS has especially the following possibilities (fig. 1.2):
• Measurement functions :
distance between two points alongside a segment or an arc, perimeters
calculation of areas
calculation of volume ( cuts and fills)
direction of a segment and angle between two segments
• Classification or aggregation functions :They allow to classify polygons according to a special criteria and merge them.
• Overlay operations :Two kinds of overlay operations can be distinguished. Arithmetic overlaysinclude operations such as addition, subtraction, division and multiplication ofeach value in a data layer by the value in the corresponding location in a seconddata layer. Logical overlays involve finding those areas where a specified set ofconditions occur together.
• Neighborhood operations :These operations are based on the spatial connection between objects. Amongmany operations, we can mention the following ones:
definition of buffer zones around polygons, or corridors around arcs.
assessment, from one point, of all the nearest points having special characteristic.
Computation of the slope from contours by means of a Digital Terrain Model.
Interpolation and contourage.
2.4 Data output
The information of a GIS can be output in different forms. In list or tables, figures or graphs, or in maps. The GIS has all the necessary tools to choose the area to be represented, to adjust the scale, to create symbols and legend or to add text. Some GIS modules can also provide 3.D image or a set of images for animation.
5
S TA N O N U M BER
89 20
VOLU M E LOSS M 3 / Ho.
- 4 0 - 32
TOTAL VOLUM E
700 1 6 1 0
CUM U L A T I V E V O LU M E
700 2 3 1 0
358 - 27 950 8900 1 0 7 -26 I I 00 10 000
H A f1 V E S 1
P E R I O D ---
. - -6
- - I 7 0 30 B 3 0 2 93 - / 4 I 4 60 2 2 90 2
2.20 - 8 · G8o 1 0 000 2 r--- - - - - - - - - - - - - - - - - - - - - - - - - - - - -- - - - - - - - - - - - - - - - - -
:3. . .
Fig . I .3
/ 4 9. - 6 I 6 !30 . I O 2 0 3
SI c ps 3 , 4 o n ll 5 i n ho rvc s l s c l1 c d u l i nQ . S l o n d s o r e s o r1 e d b y vo l u m e l o s s , t h e ha r ve s t p r o c e e d s f li r o u o h l h e q u e u e , o n d l h e r e s u l l i n Q l i m e ol ho r v e s l I s o s 3 i Q n e d . ( T h i & e x a m p l e u s e s 1 0 , 000 m J o , l h o p e r i o d i c ho r v e s l l e v e l )
P e r iod of ho r v n r
:)
I 3 2
4
I
3
G(O?"o ptiic s r o n d no. d o l o
� I X • y .
2 X , Y .
3 x , y .
4 X , Y .
:) X , Y .
G X , Y .
7 X , Y .
8 X , Y .
4 00 X , Y ) 4 0 1 X ,Y
S 1 , P1 .q o n d 5 I n ho r v ( , 1 1, c hf: d v l i f"'Q . V i a t he , t on d l d r n l i f i c o l i on nvrn tx r, 1 h r l i m r o t h o r .... , , r o r t r l b v1 , I i l i n k e d T o c.o - or d l no l t do l e f o r m o p p i n Q IN r r , v l l i n Q ,c ru d u l c .
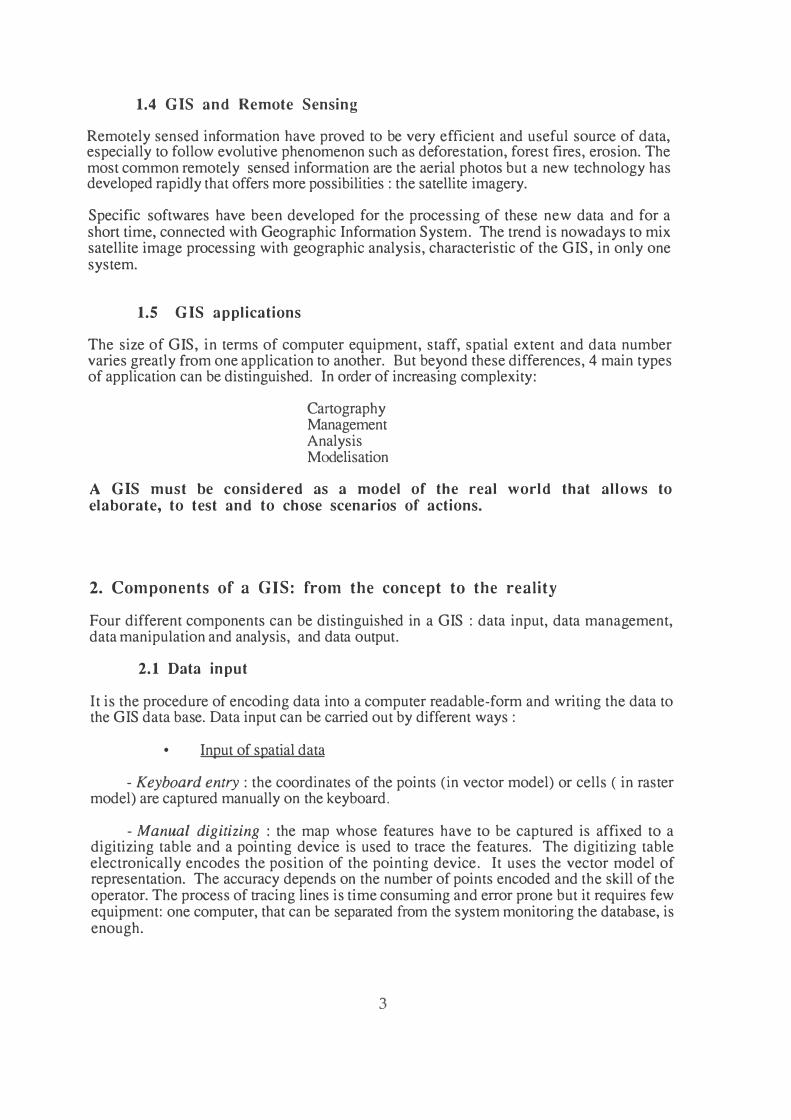
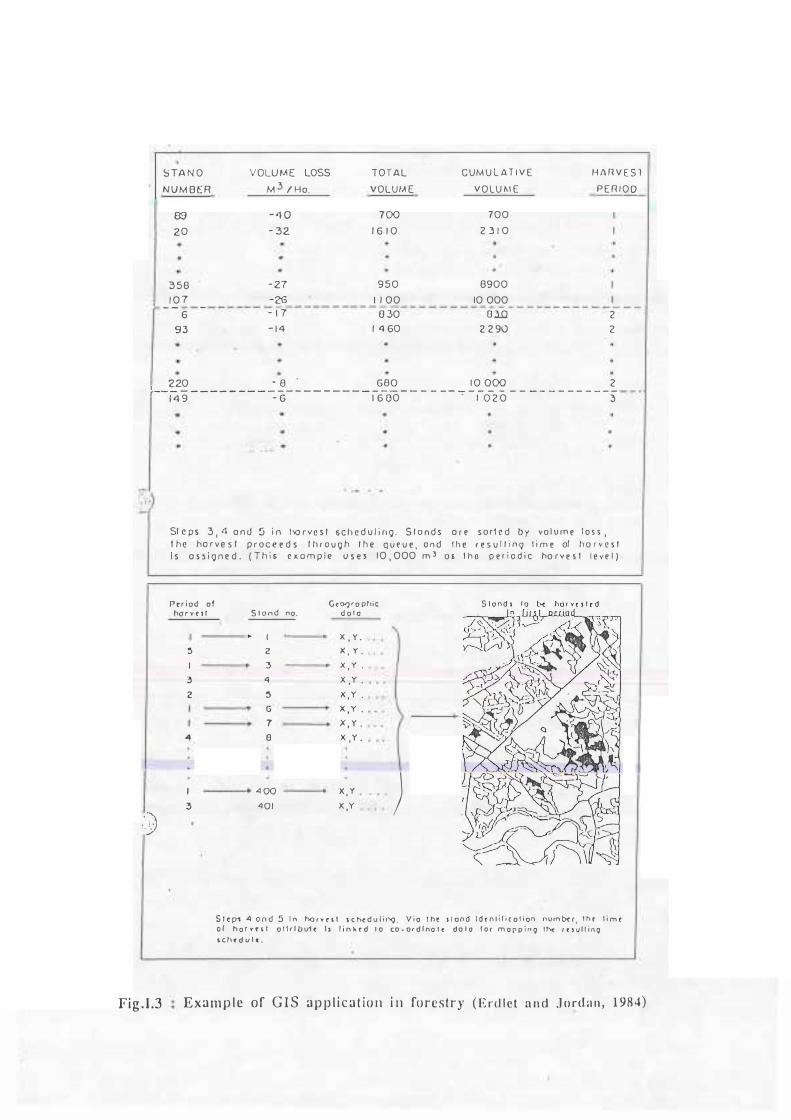
Exa m p l e of G I S a p p l i c a t ion i n forestry ( E rcl l c t a n d J o rd a n , 1 984)
3. GIS and forestry
Although not specifically designed for forestry, the functional capabilities of GIS have been successfully implemented in variety of forest management organization.
Forestry encompasses the management of a wide range of information and the need for more and more accuracy in these information increase the number of data to be stored and managed. Hence the interest of forestry companies or agencies for computer assisted system of database management. Moreover the needs for specific maps production have led to the use of Computer Assisted Design softwares. In that way, the GIS, gathering and managing both descriptive and georeferenced data seems to be a very promising tool for forestry.
The following examples of application come from different cases of GIS implemented on temperate forests.
Inventory data management An inventory gather typically both descriptive data like diameter, height, species and spatial data for the location of stands. Descriptive data are collected on the field while stand limits can be established by aerial photos or satellite imagery. GIS might be viewed merely as an advanced tool for maintaining a computer based forest inventory and providing information in a table or map form. (MURPHY, 1990).
Harvest scheduling The inventory is the basis for production planning. It provides the assessment of the resource available and determine directly the planning of the coupe or silvicultural treatment. The interest of the GIS is its capabilities to assist the programming of field operations, taking into account the spatial distribution of the stands (ERDLET & JORDAN G. 1984).
Figure 1.3, the rule states the oldest stands must be harvested first to minimize mortalityand maximize growth which means sorting stands in decreasing order of volume loss. Stands to be harvested during a period are chosen from the top of the sorted queue, until accumulated volume equals annual harvest level. A numeric period indication is attributed to each stand. Finally, a map provides location and harvest period for each stand.
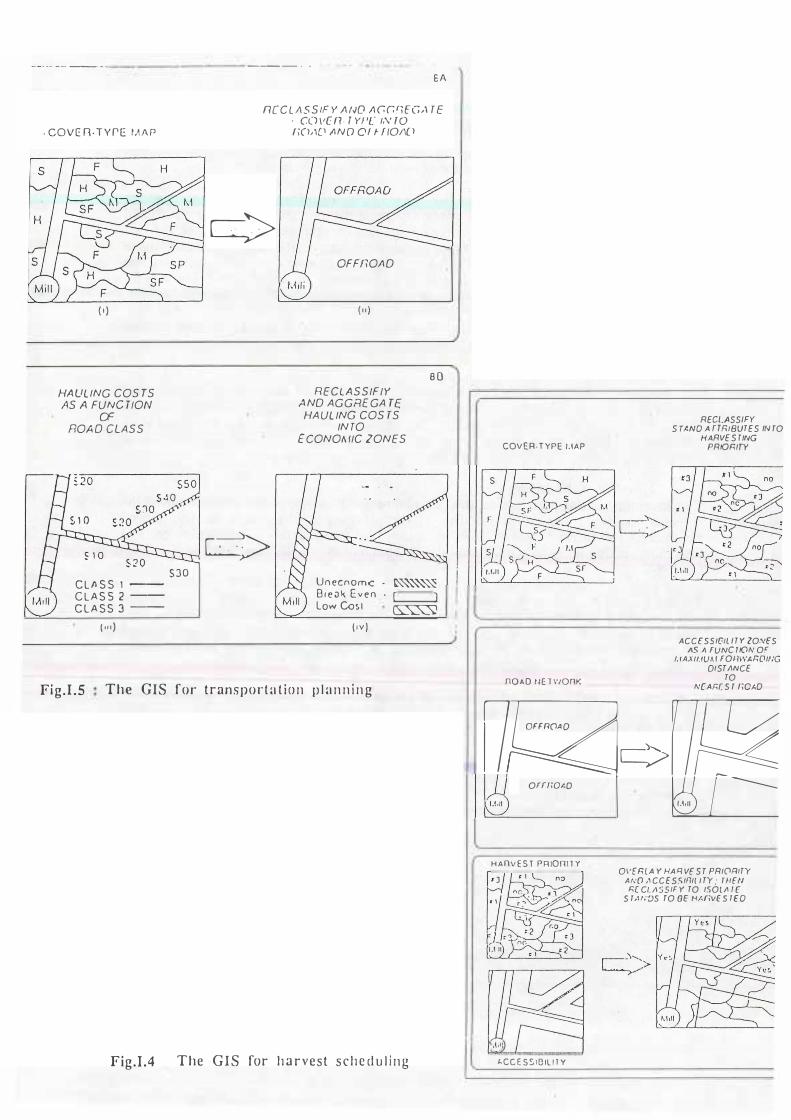
The figure 1.4 shows how to use the GIS for the following step in the scheduling. Aharvest schedule map is produced to take into consideration accessibility of stands as well as harvest priority.
Transportation planning A procedure might be programmed to produce a map highlighting the distribution of hauling costs (fig. 1.5).
6
--· -- -- ---·- · ---- ·· .
- COVE n - T Y P E IJ\ A P
( 1 )
HAUL ING COS TS AS A FUNC rtON
CF ROA D CLASS
SJO
C L l> S S 1 -
C L A S S 2 -
C L A S S 3 --
( 1 1 1 )
EA
n[C L !\ S S IF Y A f.JO A c;Gr;fc,, rE · C(W[ n. T Yl 't: I,\' TOr;(),\{.1 ANO Of f- f /Q/\( 1
c=>
L>
OFFf;OAO
( 1 1 )
REClASSIFIY ANO AGGAE GA TE HA UL ING COS TS
IN TO ECONOMIC ZONES
8 0
Un ecnom,c - �"-"-"-� B , e o k. Ev en · I J Low Co� I �
( i v )
Fi g.LS The GIS for transporta t i o n p l a n n i n g
Fig . 1 .4 The GIS for ha rvest s ch e d u l i n g
COVER-TYPE I . IAP
nOAD IIE n,onK
RECl..)ISSIFY S TI.NO A rTFUBUTES IN TO
HARVES flNG PRIORITY
ACCESSIC,IL / TY ZONES AS A FUNC Tl()N OF
/. IAXll.fUA I FOIIWARDlflG DISTANCE
TO N[AR[ S T /,QAO
��- � r 1 1 � �c;> ;K
orrr;o,,,o
H A nV E S T PRIQnt T Y
t.CC E S S l !3 1L I I Y
19 ; ---
0\'ER[A Y HA R VE S T PRIORITY AN0 ,1 CCE5Stnl( I TY ; TllfN F;[ CI.ASSIF Y TO ISOL/1 1 [
S T,l f.'OS TO BE HM,VE S TEO
These examples give a general view of the capabilities of a GIS in forestry. GIS proves to be a very precious tool, from a technical point of view, for map production, calculation or modelisation possibilities, as well as from a general management point of view with the possibilities to manipulate an up-to-date data base.
Satellite imagery provides an additional interest to GIS in forestry : aerial photos quickly become obsolete and they are cost-prohibitive when rephotographing is needed often. Remote sensing proved a very interesting tool for prestratification of forest areas into broad cover type classes and even to differentiate different classes of yield. Remote sensing is also used very efficiently to monitor changes in infrastructures or in the forest resource (BARKER & ROBINSON, 1982).
Conclusion :
Recent advances in computer hardware and software have brought GIS technology to a state where it is of practical and monetary appeal. All this explains the growing interest of forestry agencies for this new technology. GIS has been experimented and implemented successfully in many cases in temperate forest areas. But there are still few examples in tropical countries. Attempts to use GIS for natural resources management multiply in these areas but i t seems that few organization have really an operational system yet. In Asia, there is no example of forest concession managed with a GIS.
Forestry, and Forest management in general, is different in temperate and tropical countries. Most often, tropical ecosystems are more complex, less information are available and with less accuracy. Most probably the GIS application described previously could not be applied the same way. The implementation of a GIS in an Asian forest concession is thus a very new experience. With a GIS possibly complemented with remote sensing technology, we can expect a net improvement of the mastery of this environment.
7

BIBLIOGRAPHY
ARONOFF S., 1989. Geographic Information Systems : A management perspective. 294 p., WD2 publications Ottawa-CANADA.
BARKER, ROBINSON G., 1982. FRIS: St Regis' forest management approach. Remote sensing for resource management. Soil conservation Society of America ..
DIDON E., 1993. Systemes d' Information Geographique : concepts, fonctions, applications. Document CEMAGREF ENGREF, laboratoire cornmun de teledetection.Domaine de Lavalette, Montpellier, FRANCE.
ERDLE T.; JORDAN G., 1 984. Computer-based mapping in forestry : A view from New Brunswick. Canadian Forest Industries, 102(4):38-46.
Groupe des Util isateurs de la Teledetection du Languedoc-Rousil lon, 1993. Etude d'un Systeme d'Information Geographique pour la plantation de l"UAIC. Document GUTLAR, domaine de Lavalette, Montpellier, FRANCE.
MURPHY D. L., 1990. The use of GIS as a tool in forestry.
8
CHAPTER II
THE
FORESTRY GIS PROJECT
II. THE FORESTRY GIS PROJECT
1. Presentation of the project
The forestry GIS project is a collaborative project between the following two partners:
- Innoprise Corporation Sdn Bhd (ICSB):Malaysian company which has to manage an approximately 1 million ha forest
concession attributed for 100 years, in order to generate the funds necessary to the state organization Sabah Foundation (Yayasan Sabah) .
- CIRAD-Foret:French organization specialized in research and development in tropical forests.
The aim of the project is to jointly develop on the Yayasan Sabah Concession a Geographic Information System meeting the specific needs in resource management, planning and monitoring of a forest company.
2. Interest of the project
A forestry GIS, possibly connected with satellite imagery has first a technical interest. As described previously the possibilities of these tools in terms of data management and analysis and in terms of map production are now essential for the management of such a big area.
Moreover the ecological preoccupations of the international community lead nowadays to promote a sustainable management of natural resource and more particularly of tropical forests with safeguard of environment and a rational way of logging. GIS technology, well designed and adapted to the specific needs of forestry should be a good tool to take into account these recommendations.
3. Presentation of the study
The project is planned in two parts:a first phase of 6 months for a preliminary study of assessment a second phase of 2 years for the implementation
The present report is the result of the first phase. The purpose is to prepare the implementation of the GIS by gathering and defining all the necessary elements for it :
assessment of the needs of ICSB in terms of forestry management. definition of objectives. assessment of the data available or needed. definition of pilot areas to start the project on small scale. definition of the equipment and the staff needed. Recommendations and planning for the following steps.
9

CHAPTER III
AS S ES SMENT
PRIOR TO
THE GIS IMPLEMENTATION
III. ASSESSMENT PRIOR TO THE GIS IMPLEMENTATION
1 . Context of implementation
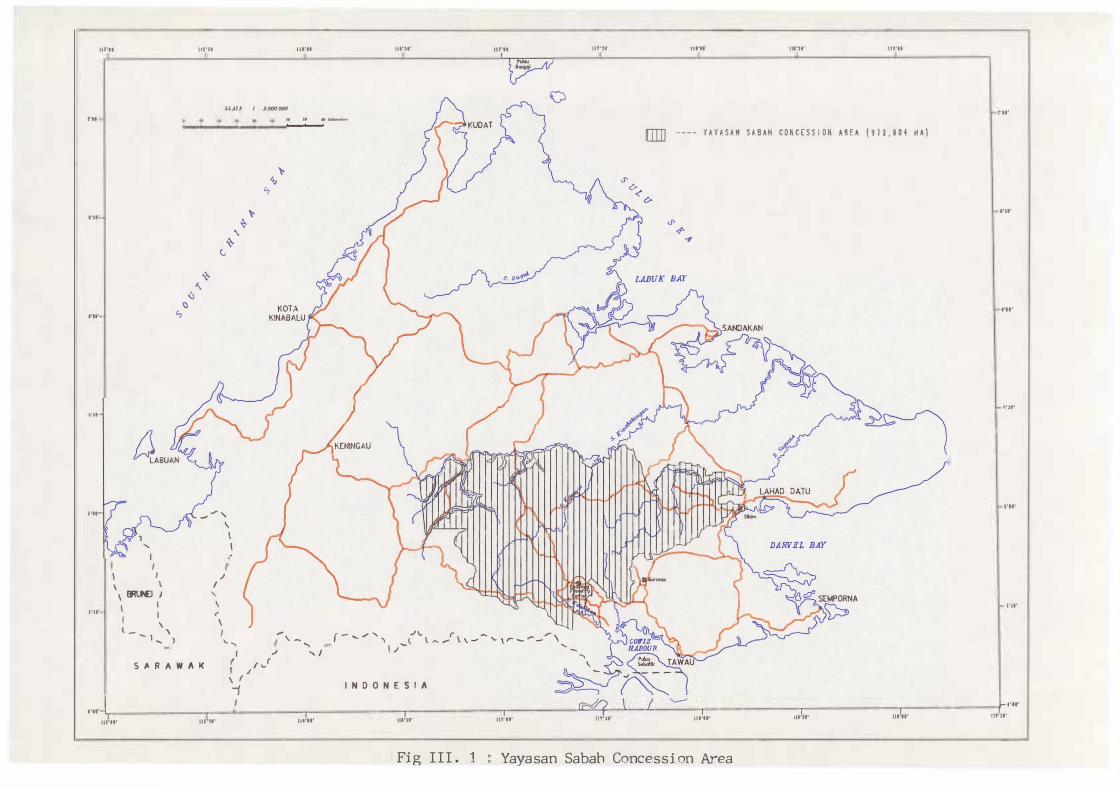
Yayasan Sabah is a statutory organization whose mission is to improve the quality of life and education of the people of Sabah. ICSB has been founded as the investment arm of Yayasan Sabah to generate the necessary fund to support its activities. The main source of revenue comes from the exploitation of a forest concession of approximately 1 million ha attributed for 1 00 years (fig. 111.1) Rakyat Berjaya (RBJ) is the forest management arm of ICSB.
A long term management plan was produced for the years 1984-2032 by RBJ. The aims of this plan can be summarized into two major points:
Maintaining, in perpetuity a productive resource base for the production of timber and other forest products economically justified . Conservation of bio-diversity and protection of environment.
In that way, three different areas of activity are currently developed on the Yayasan Sabah concession : natura l forest management , forest development and conservation.
1. 1 Natural Forest Management
Logging : Only first growth forests are currently being cut. Logging operations are carried out by contract loggers with tractor logging as the most common method used. Around 20,000 ha are logged every year. An important aspect of the management in this area of activity is to locate and delimit the next logging areas and to assess the expectable production through an inventory. The harvesting of a coupe must be planned up to 5 years in advance in order to carry out the survey of the coupe boundaries , the pre-felling inventory and to get the official coupe permit after submission to the Forestry Department.
Logged over forest management Although the remaining area of virgin forests can still allow harvesting for decades, ICSB tries from now on to take into account reharvesting possibilities of logged over forest areas. The present silvicultural system in Sabah is the Malayan Uniform System (MUS) with a theoretical rotation of 60 years. It means that this kind of forest should not be reharvested until 60 years after the first harvest but it actually depends on the intensity and the quality of the logging operations, and on the regenerating capabilities of the site concerned.
ICSB currently carry out inventories to improve the knowledge of the quality of the remaining stand. The Linear Regeneration Sampling (LRS) provides information in terms of stock and gives recommendation of silvicultural treatments. Moreover , an attempt to distinguish and delimit the different stands by photo interpretation has been carried out on two pilot projects.
10
IU'II IU'II IIS'U llt'II lll'JI· 11f'H IIT'U' 111'11' lll'JI'
t'II
f'U
..... _
,·n
5'11'
1•nt
I
I / I
',
' ' \ BfU£I )
I t I I l
\ - - , ' .... )
Cl
+ .....
\)
S .A R A W A I(
SCAJ,J I 1..000 000
" �'
',
" �
+ c.,
/ I ' \ <' '
I ,... \.. ..,
I _, r r r I J '-\ I
'1
, _ "
" I
( - '- _,, .., -'\. r ' l l � ..... \
I /-
I N D O N E S I A
Q
.J' O'
lilIIJ ---- Y A Y A S A N S A B AH C O N C E S S I O N A R E A { 9 1 2 , 8 0 4 H A )
.J' -ef' �
T'II'
I'll'
I'll'
.. ,..
S'II'
l'U'
, .... J I Ce4'.? \ / � i-,·11· l I I I I I I I I
IIS°II' 115'11' 111'11' 111'11' ,n u• IIT'!I' IU'ff' lll'H' 111'11' 111'11'
Fig III . 1 Yayasan Sabah Concessi on Area
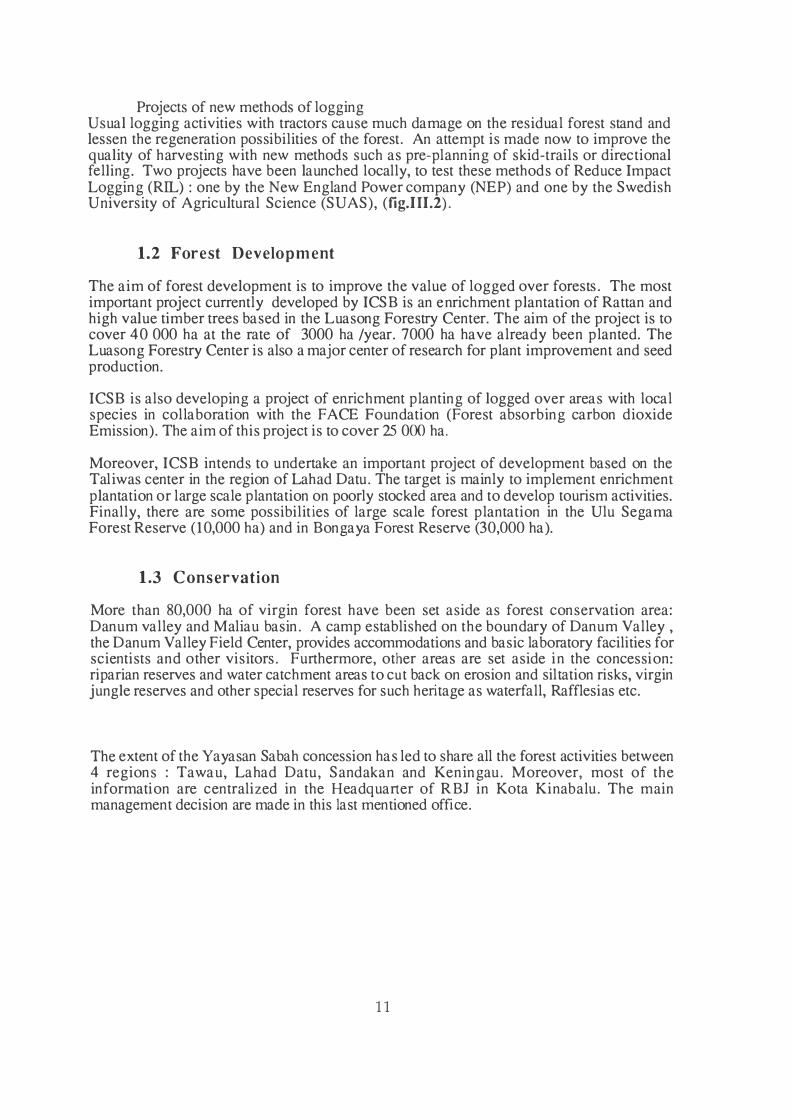
Projects of new methods of logging Usual logging activities with tractors cause much damage on the residual forest stand and lessen the regeneration possibilities of the forest. An attempt is made now to improve the quality of harvesting with new methods such as pre-planning of skid-trails or directional felling. Two projects have been launched locally, to test these methods of Reduce Impact Logging (RIL) : one by the New England Power company (NEP) and one by the Swedish University of Agricultural Science (SUAS), (fig.111.2).
1.2 Forest Development
The aim of forest development is to improve the value of logged over forests. The most important project currently developed by ICSB is an enrichment plantation of Rattan and high value timber trees based in the Luasong Forestry Center. The aim of the project is to cover 40 000 ha at the rate of 3000 ha /year. 7000 ha have already been planted. The Luasong Forestry Center is also a major center of research for plant improvement and seed production.
ICSB is also developing a project of enrichment planting of logged over areas with local species in collaboration with the FACE Foundation (Forest absorbing carbon dioxide Emission). The aim of this project is to cover 25 000 ha.
Moreover, ICSB intends to undertake an important project of development based on the Tali was center in the region of Lahad Datu. The target is mainly to implement enrichment plantation or large scale plantation on poorly stocked area and to develop tourism activities. Finally, there are some possibilit ies of large scale forest plantation in the Ulu Segama Forest Reserve ( 10,000 ha) and in Bongaya Forest Reserve (30,000 ha).
1 .3 Conservation
More than 80,000 ha of virgin forest have been set aside as forest conservation area: Danum valley and Maliau basin. A camp established on the boundary of Danum Valley , the Danum Valley Field Center, provides accommodations and basic laboratory facilities for scientists and other visitors. Furthermore, other areas are set aside in the concession: riparian reserves and water catchment areas to cut back on erosion and siltation risks, virgin jungle reserves and other special reserves for such heritage as waterfall, Rafflesias etc.
The extent of the Yayasan Sabah concession has led to share all the forest activities between 4 regions : Tawau, Lahad Datu, Sandakan and Keningau. Moreover, most of the information are centralized in the Headquarter of RBJ in Kota Kinabalu. The main management decision are made in this last mentioned office.
1 1
r - ...,, "" ...,. '- r \ - ,,... - "\ � l "" - "\. - '- 1. , _ ...... _ \ � 1 / - '
I N D O N E S I A
D 10 20 30 40 so 60 70 80 A"i/affl.f,t,rn •
�o,�
'!oo,'<>"� o;
i"' ...'",·
f A Y A S A N S A B A H C O N C E S S I O N A R E A
R E D U C E D I M P A C T L O G G l � G S I T E S
A = R B J / N £ P B = R J B / S U A S
Fi g III 2 Forest Management Activi ti es
� �
-y,
DARVEL BAY
�
C O N S E R V A T I O N A R E A
F A C E P R O J E C T A R E A
L U A S O N G P L A N T A T I O N P R O J E C T A R E A
2. Ident ification of GIS appl ications
As mentioned by S. ARONOfF l , there is a tendency for the principal use of an information system to evolve. New technology tends first to be used to perform the tasks in the "old" way. Later, as familiarity is gained, new ways of providing the same functions are developed and finally, new functions are found that take full advantage of the new technology.
At this level of the project we can, thus, give suggestions of objectives and a pp lications, and guidelines for the organiza tion of the GIS but we can expect that progressively, new needs and objectives wi l l a rise as the familiarity with the G IS possibi l i t ies is acquired.
All the activities of ICSB previously described are summarized in 3 major areas: natural forest management, forest development and conservation. The conservation activities do not involve many geographic information and no GIS application is envisaged for the moment. Natural forest management and forest development can represent2 main domains of applications. They involve the management of 3 different forest areas : primary forest, secondary forest and plantations. In that way, we can propose the following applications.
2. 1 Natural forest management an d p lanning.
A. General Consul tation
The first interest of the GIS is merely to provide an instant picture of the whole concession. The GIS must provide an up-to-date progress map with all the characteristics of the logged over areas, the remaining virgin forests, the reserves and conservation areas,... It involves the basic functions of retrieval and display of the GIS. This is a basic but fundamental tool of monitoring and management of the concession. An important aspect of map production is required. Especially, an efficient and fast production of up-to-date map i sexpected from the GIS. At this level, the GIS could be used moreover for a purpose of demonstration to present the concession.
The following points are particularly important to be taken into account in the GIS :
- Block and compartmentThe annual area of coupe is divided in blocks or coupes of approximately 1000 ha and each block is subdivided in compartments of approximately 200 ha. All the area logged by ICSB is therefore shared in blocks and compartments. The compartment is the basic forestry unit.
Many descriptive data are available for each; the GIS would be interesting to provide only a summary, especially for the following data:
Identification data: : these are basic information such as area, block orcompartment number, coupe perrnit number, contractor's name, year of coupe, etc. They are fundamental references for the management.
1 ARONOFF S. : Geographic Information Systems : a management perspective
12
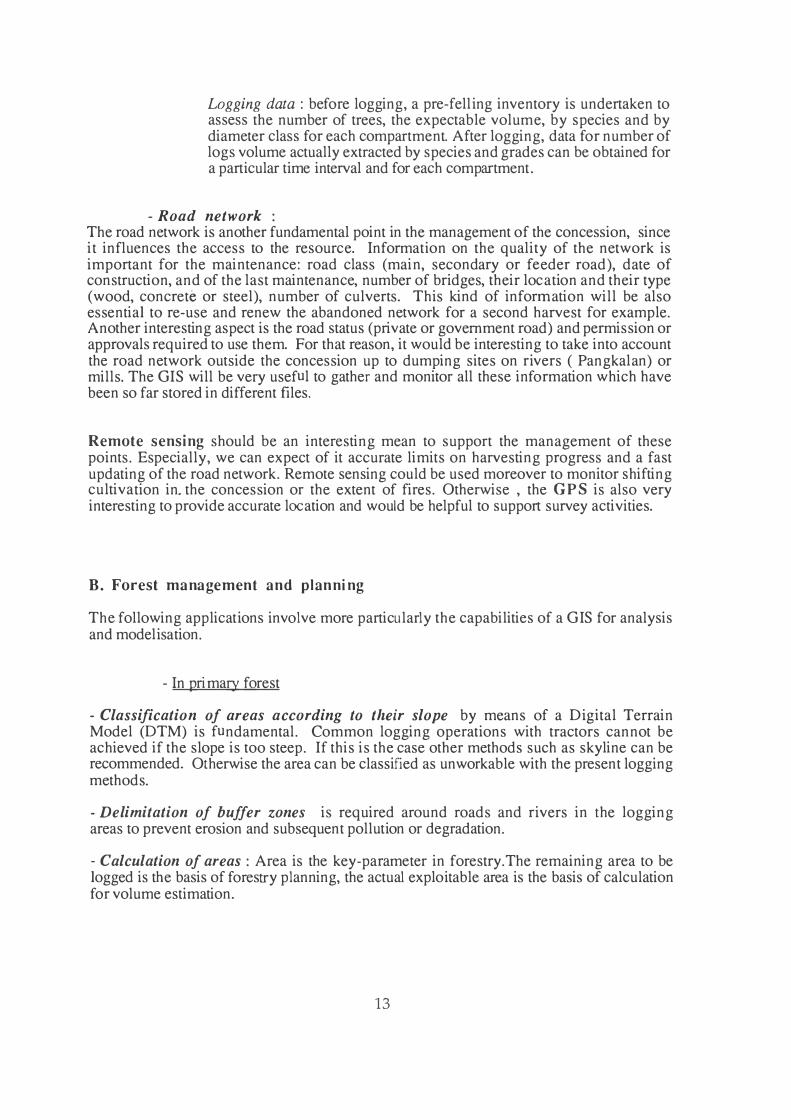
Logging data : before logging, a pre-fell ing inventory is undertaken toassess the number of trees, the expectable volume, by species and by diameter class for each compartment. After logging, data for number of logs volume actually extracted by species and grades can be obtained for a particular time interval and for each compartment.
- Road network :The road network is another fundamental point in the management of the concession, since i t influences the access to the resource. Information on the quality of the network is important for the maintenance: road class (main, secondary or feeder road), date of construction, and of the last maintenance, number of bridges, their location and their type (wood, concrete or steel), number of culverts. This kind of information will be also essential to re-use and renew the abandoned network for a second harvest for example. Another interesting aspect is the road status (private or government road) and permission or approvals required to use them. For that reason, it would be interesting to take into account the road network outside the concession up to dumping sites on rivers ( Pangkalan) or mills. The GIS will be very useful to gather and monitor all these information which have been so far stored in different files.
Remote sensing should be an interesting mean to support the management of thesepoints. Especially , we can expect of it accurate limits on harvesting progress and a fast updating of the road network. Remote sensing could be used moreover to monitor shifting cultivation in. the concession or the extent of fires. Otherwise , the G PS is also very interesting to provide accurate location and would be helpful to support survey activities.
B. Forest management and planning
The following applicat ions involve more particularly the capabilities of a GIS for analysis and modelisation.
- In primary forest
- Classification of areas according to their slope by means of a D igital TerrainModel (DTM) is fundamental. Common logging operations with tractors cannot beachieved if the slope is too steep. If this is the case other methods such as skyline can berecommended. Otherwise the area can be classified as unworkable with the present logging methods.
- Delimitation of buffer zones is required around roads and rivers in .the loggingareas to prevent erosion and subsequent pollution or degradation.
- Calculation of areas : Area is the key-parameter in forestry.The remaining area to belogged is the basis of forestry planning, the actual exploitable area is the basis of calculationfor volume estimation.
13
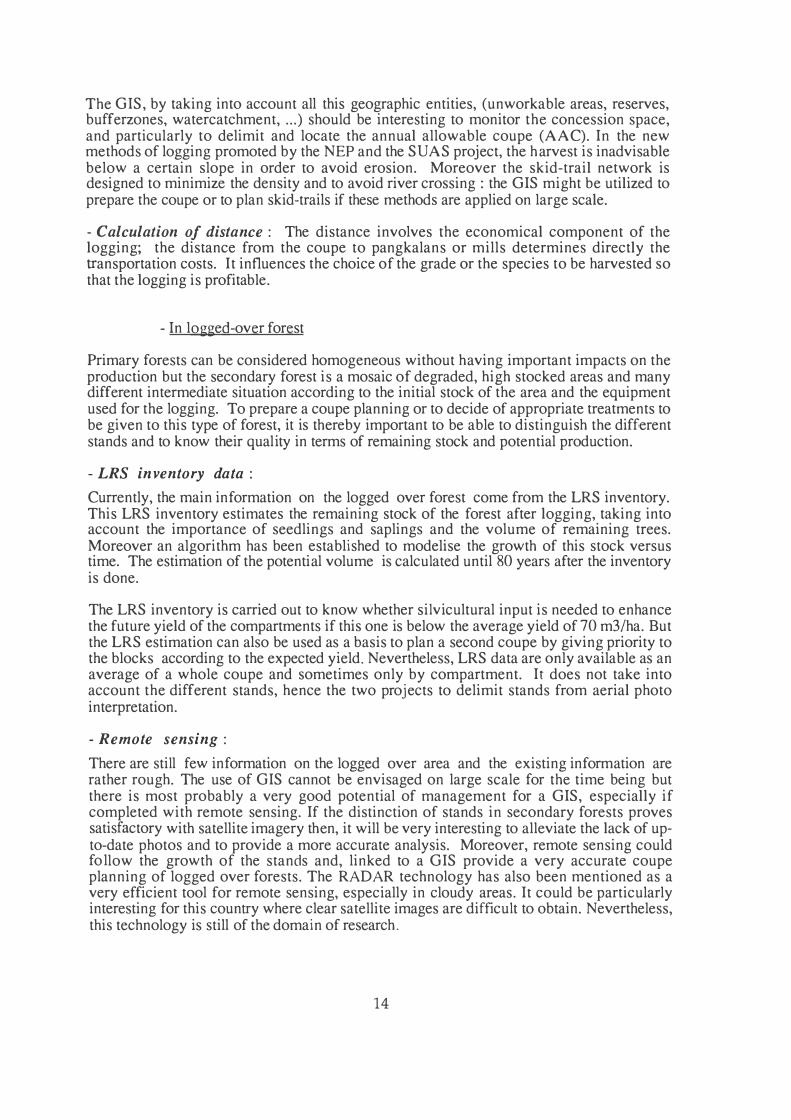
The GIS, by taking into account all this geographic entities, (unworkable areas, reserves, bufferzones, watercatchment, ... ) should be interesting to monitor the concession space, and particularly to delimit and locate the annual allowable coupe (AAC). In the new methods of logging promoted by the NEP and the SUAS project, the harvest is inadvisable below a certain slope in order to avoid erosion. Moreover the skid-trail network is designed to minimize the density and to avoid river crossing : the GIS might be utilized to prepare the coupe or to plan skid-trails if these methods are applied on large scale.
- Calculation of distance : The distance involves the economical component of thelogging; the distance from the coupe to pangkalans or mills determines directly thetransportation costs. It influences the choice of the grade or the species to be harvested sothat the logging is profitable.
- In logged-over forest
Primary forests can be considered homogeneous without having important impacts on the production but the secondary forest is a mosaic of degraded, high stocked areas and many different intermediate situation according to the initial stock of the area and the equipment used for the logging. To prepare a coupe planning or to decide of appropriate treatments to be given to this type of forest, it is thereby important to be able to distinguish the different stands and to know their quality in terms of remaining stock and potential production.
- LRS inventory data :Currently, the main information on the logged over forest come from the LRS inventory.This LRS inventory estimates the remaining stock of the forest after logging, taking intoaccount the importance of seedlings and saplings and the volume of remaining trees.Moreover an algorithm has been established to modelise the growth of this stock versustime. The estimation of the potential volume is calculated until 80 years after the inventoryis done.
The LRS inventory is carried out to know whether silvicultural input is needed to enhance the future yield of the compartments if this one is below the average yield of 70 m3/ha. But the LRS estimation can also be used as a basis to plan a second coupe by giving priority to the blocks according to the expected yield. Nevertheless, LRS data are only available as an average of a whole coupe and sometimes only by compartment. It does not take into account the different stands, hence the two projects to delimit stands from aerial photo interpretation.
- Remote sensing :There are still few information on the logged over area and the existing information arerather rough. The use of GIS cannot be envisaged on large scale for the time being butthere is most probably a very good potential of management for a GIS, especially ifcompleted with remote sensing. If the distinction of stands in secondary forests provessatisfactory with satellite imagery then, it will be very interesting to alleviate the lack of upto-date photos and to provide a more accurate analysis. Moreover, remote sensing couldfollow the growth of the stands and, linked to a GIS provide a very accurate coupeplanning of logged over forests. The RADAR technology has also been mentioned as avery efficient tool for remote sensing, especially in cloudy areas. It could be particularlyinteresting for this country where clear satellite images are difficult to obtain. Nevertheless,this technology is still of the domain of research .
14
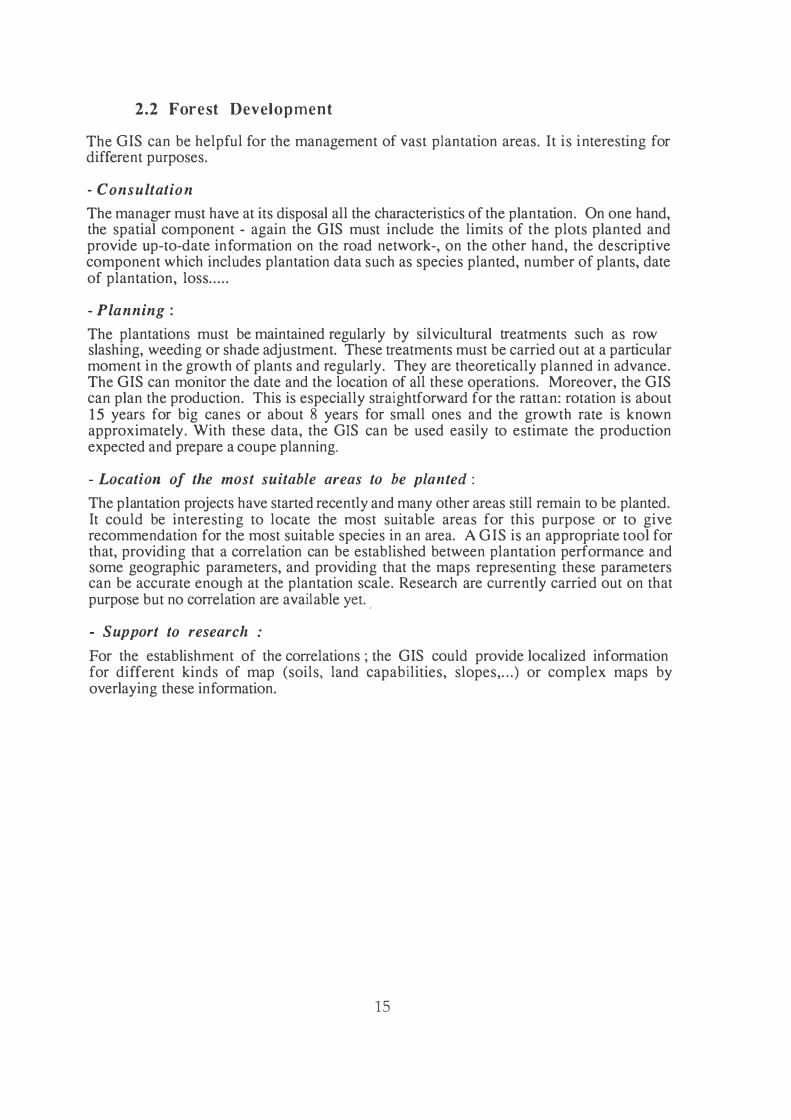
2.2 Forest Development
The GIS can be helpful for the management of vast plantation areas. It is interesting for different purposes.
- ConsultationThe manager must have at its disposal all the characteristics of the plantation. On one hand,the spatial component - again the GIS must include the limits of the plots planted andprovide up-to-date information on the road network-, on the other hand, the descriptivecomponent which includes plantation data such as species planted, number of plants, dateof plantation, loss .. . . .
- Planning :The plantations must be maintained regularly by silvicultural treatments such as rowslashing, weeding or shade adjustment. These treatments must be carried out at a particularmoment in the growth of plants and regularly. They are theoretically planned in advance.The GIS can monitor the date and the location of all these operations. Moreover, the GIScan plan the production. This is especially straightforward for the rattan: rotation is about15 years for big canes or about 8 years for small ones and the growth rate is knownapproximately. With these data, the GIS can be used easily to estimate the productionexpected and prepare a coupe planning.
- Location of the most suitable areas to be planted :The plantation projects have started recently and many other areas still remain to be planted. It could be interesting to locate the most suitable areas for this purpose or to give recommendation for the most suitable species in an area. A GIS is an appropriate tool for that, providing that a correlation can be established between plantation performance and some geographic parameters, and providing that the maps representing these parameters can be accurate enough at the plantation scale. Research are currently carried out on that purpose but no correlation are available yet. .
- Support to research :For the establishment of the correlations ; the GIS could provide localized informationfor different kinds of map (soils, land capabilities, slopes, . .. ) or complex maps byoverlaying these information.
15

OBJECTIVES
1-Demo concession
2-Demo Reduce Impact Logging
3-Concession progress consultation
4-Road network management
5-Preparation of coupe in primaryforest
6-Logged-over forest management
7-Plantation management
8-Support to research
OUTPUTS
Map showing the concession and its main components at different scales.
Maps of skid-trail network and showing the strategy of design according to site -condition parameters. Comparative maps of spatial distribution of residual stands, skid-trails and landings. Graphs and charts of results for both methods.
Progress map. Descriptive table including production, inventory, identification, account data, . . . summa"ry fonn.
Map of the network, past and present. Computation of distance and density. Descriptive table on bridges and road status.
Recommendation map to optimize the profit Location and delimitation of the coupe. Design of roads or skid-trails.
.. Map of the stands. Inventory table. Projection of yield. Establishment of a coupe planning.
Progress map. Descriptive table. Yield prediction. Establishment of a harvest schedule and maintenance planning. Location of suitable areas for plantation.
Complex maps by overlaying. · Delimitation of areas corresponding to special criteria.
Fig 111.3 : Objectives and expectable outputs

. 3. Objectives and expectable outputs
According to the needs and the possible applications described, we can propose the following objectives with the corresponding outputs (fig. III.3).
Besides objectives of management and planning, an objective of demonstration has been requested to be a part of the GIS : on one hand a demonstration to present at different scales the concession and locate the projects or activities carried out. On the other hand, a demonstration at the scale of a project is also expected to display main results of research. In that way, The RIL is a project for which many data are available and a good "demo" can be built.
The objective of support to research must be considered for the long-term only. The objective of logged over forest management, however important, can be considered only for medium to long term since few data are available at the moment.
4. Users and organization of the GIS
Once the objectives proposed, the. problem is to know what detail is needed and what data must be captured or not. It depends obviously on the user to whom the GIS will provide the information : the data captured on the rattan plantation will not be the same if they are used in the Headquarter for a purpose of general management or if they are used by a local team based in Luasong. The identification of the users is thereby a very important step for the implementation of the GIS.
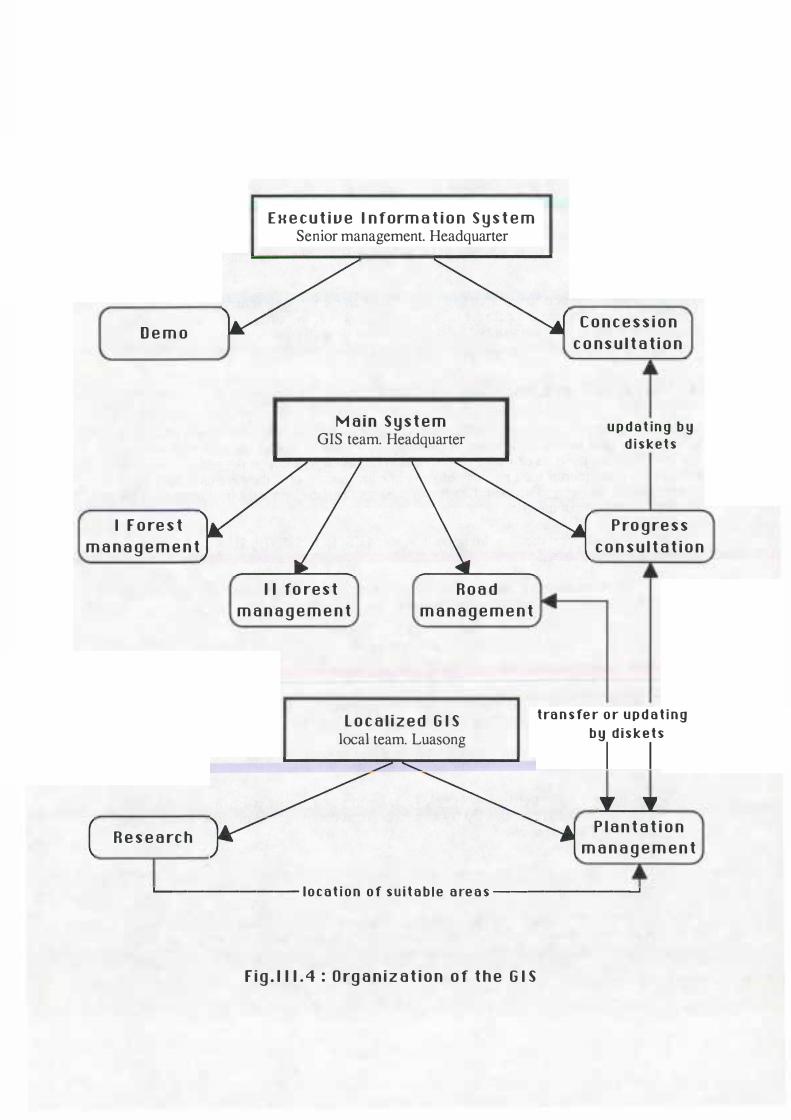
The following system can be imagine for the GIS in ICSB, (fig.111.4). Three levelsof users are distinguished :
- One main system, based in the headquarter of RBJ, handled by a GIS team andproviding information for any forest manager or officer on :
road network management, coupes in virgin forest, logged-over forest management general consultation.
- An Executive Information System, proposed to be handled separately bysenior management. This system, partly supplied by the main system, shouldprovide :
Progress information in a summary form. Demonstration modules.
- A local implementation level , in Luasong and Taliwas in the future. Thissystem should be supported by an independent database and provide informationfor local management
Plantation management support to research.
This 3 levels can be considered as an ideal organization of the GIS but the implementation of such a system depends obviously on the availability in equipment and staff. For a first step, priority must be given to the main system.
16
D e m o
I F o re s t
m a n a g e m e n t
R e s e a rc h
E H e c u t i u e I n form a t i o n S y s t e m Senior management. Headquarter
M a in S y s t e m GIS team. Headquarter
1 1 fo re s t
m a n a g e m e n t
R o a d
m a n a g e m e n t
L o c a l i z e d G I S local team. Luasong
C o n c e s s i o n
c o n s u l t a t i o n
u p d a t in g b y d i s k e t s
P ro g re s s
c o n s u l t a t i o n
t ra n s fe r o r u p d a t i n g b y d i ske t s
I I
P l a n t a t i o n
m a n a g e m e n t
....... -------- l o c a t i o n o f s u i t a b l e a re a s --------.....
F ig . 1 1 1 . 4 : O rg a n i z a t i o n o f t h e G I S

5. Data avai lable and data qual ity
5.1 Descriptive data
- Logging data :All the data concerning the logging i.e. pre felling inventory data and log flow data arestored in digital form. Special application programmes have been developed for thatpurpose.
- logflow data are captured under a system developed under REVELATION ( App.I).
- the inventory data base has been written under dBASE (App.2)
So far, these data have been captured in each branch and transferred afterwards to the HQ of RBJ in Kota Kinabalu. These logging data include all the identification data of the blocks and compartments.
It must be noted that the logging activities on the YS Concession have been carried out for more than 20 years. The first figures of production and inventory were captured manually and would be available most probably with difficulties.
- Rattan plantation :For rattan plantation also, the records are captured through a special application programmedeveloped with REVELATION. The rattan plantation has started recently (1989) andthereby all the data were captured in this program and they are easily available ( App.3).
- LRS inventory :LRS inventory data with the stand table projection are available in spreadsheet (Lotus).They have been gathered in the branch office of Sandakan (App.4).
The LRS inventory has two main drawbacks :
The LRS data are most often only an average on a whole coupe (1000 ha) and thereby embrace possible differences between stands. The projected yield, based both on these data and on assumptions from literature is obviously very rough. Undertaken since 1984, only a few coupes are covered by this inventory .
. - Road network information
All the information related to the status of the road, approval reference, duration, etc, are available in the HQ in different files, but few information have been recorded on the bridges, locations, quality,etc. One census is being undertaken on main roads (App.5).
All the data captured in files could be easily transferred to the GIS. A programme would have to be developed to extract and transform them into ARC/INFO format.
17

,,
TABLE A : PROGRESS OF ARC/INFO DATA ENTRY (DEC 1993)
Sca le 1 :250 000 Scale 1 :50 000 Coverage Map s heet no NB50- 1 1 Map sheet no N B50- 1 5 Map sheet no 4/ 1 1 7/6 (FD. 1 04)
River completed comple ted Contour - rn progress -Boundary - -Spot height - -
Grid ( 1 5 Geo-co) - -
Road - -Townsh ip - . . -
Coupe 1 1 1 progress 1 11 p rogress Final topography map completed completed
Soi l - comple ted on LFC Final soil map - completed LCC - -
Final LCC map - -

5.2 Spatial data
- Progress mapThe progress map is drawn by the mapping unit of RBJ and displays all the coupe andcompartment limits as well as concession boundaries or any boundaries of reserves,unworkable areas, . . . The progress map includes also the main road network with mainroads and secondary roads but does not represent the road network at the scale of a coupe(feeder roads, logging roads). Progress maps are available at 1 :50 00 or 1 :250 000 scale( fig.IV.2 ) .
All these limits have been surveyed on the ground i n terms of bearings and distances,which is a certain guarantee of accuracy. Coupe and compartment limits are surveyed by prismatic compass, the limits of the concession by theodolite, which is more accurate. Finally, the use of GPS recently acquired by ICSB should allow to get a very good level of accuracy and improve much the survey of all the limits of the concession.
- Topographic Map :ICSB has purchased 26 topomaps at 1 :50 000 scale and 4 at 1 :250 000 scale to cover thewhole concession. The contour interval depends on the topography, on the major part ofthe concession, it is 250 feet (75 m) which is quite rough. Ten maps of the east part of theconcession has a contour interval of 1 00 feet (30 m). Moreover, all the area on the eastside of Ulu Segama river is covered by 50 feet ( 15 m) contour interval topomap at 1 :25 000scale, provided by Pacific Hardwoods. These maps have been enlarged to 1 : 1 2 500 scalein order to display the road network up to logging roads.
- Thematic Map :Apart from the two previous kind of map immediately useful for the GIS, some thematicmaps covering the concession are avai lable in the mapping unit. They could be used ifnecessary:
- rainfall distribution- elevation classes- geology- pedology- land capabilities- forest cover
- Aerial photos :
1 : 1 000 000 1 : 250 000 1 : 500 000 1 : 50 000 1 : 50 000 1 : 50 000
ICSB has at its disposal 2 sets of aerial photos :
& 1 :250 000 & 1 :250 000
- 1 97 1 , covering the whole concession- 1986, covering only the east part
5.3 Data under ARC/INFO
ARC/INFO was purchased 3 years ago by ICSB. From that time, many spatial data have been digitized; at 1 :50 000 scale on the Luasong area and at 1 :250 000 scale from 1 of the 4 maps covering the concession, (Table A). Moreover, a topomap at 1 :5 000 scale covering the RIL project has been digitized as well as an overview map at 1 : 1 ,000,000 scale showing the YS Concession in Sabah with road network and rivers.
18
6. Requirements for the imp lementation of the GIS
6.1 Equipment
ICSB has already purchased the following equipment
Equipment a lrea dy available Hardware:
.1 unit M386/XP7 Olivetti RC, 25 MHz, RAM 4MB, HD 383 MB .1 unit calcomp 95 480 digitizer .1 unit calcomp 23 1 80 digitizer .1 unit calcomp Artisan 1025 plotter
Software:
.2 sets of PC ARC/INFO vers 3.4 D+
.1 set of ARC View 1 .0 under WINDOWS
Moreover, ICSB has now at its disposal .2 sets of GPS Magellan 5000 PRO .1 set of GPS Tremble Ensign
The option ARC/INFO under PC is sufficient for a fir st step of implementation of the GIS. However , the afore mentioned list reveals a lack of hardware ; ICSB has at its disposal 2 sets of the latest version of ARC/INFO under PC for only 1 PC whose capacities prove limited to manage an important database. Thereby, to start the implementation, it has been chosen to complete the hardware possibilities by the purchase of the following units
Equipment expected Hardware :
.2 units of olivetti M4-66, intel 80 486 DX 2/66, 1 6MB RAM
.1 unit pinnacle 5.25 optical disc system 600 MB
Subsequently, a functional GIS covering the whole concession will require to upgrade the system to worksta tion so as to manage easily the important database. Moreover , the purchase of an image processing package can be envisaged at this level.
19

6.2 Staff
One of the most important step in the implementation of the GIS is to form an independent GIS team. For an optimal work, the team should be composed of the following people
Quantity Designation Job description Time allocation
1 senior forest officer .Link between the technical team � 50 %(GIS coordinator) and the needs in term of forestry.
.Definition of output and checkin� of data quality .
1 forest officer . Implementation of the GIS. full time (GIS officer) .Data manipulation and analysis
1 system analyst .Design and organization of the 50 % database.
4 technician .Digitizing and capture of data. full time
20
7. Choice of a p i lot area
Before implementing the GIS on a such a big concession, it is important to start the project on small scale. A pilot project should allow first to get familiarity with the system and train people to the technology. Moreover, it must allow to test the efficiency and the interest of the system in different areas of activity. This might lead to make the objectives more accurate or to propose new areas of application.
Criteria: The choice of the pilot area is done on one hand according to the priority of the objectives. Particularly, a strong aspect of demonstration is expected from this pilot project. On the other hand, the pilot project must be as representative as possible of the future applications it is supposed to carry out.
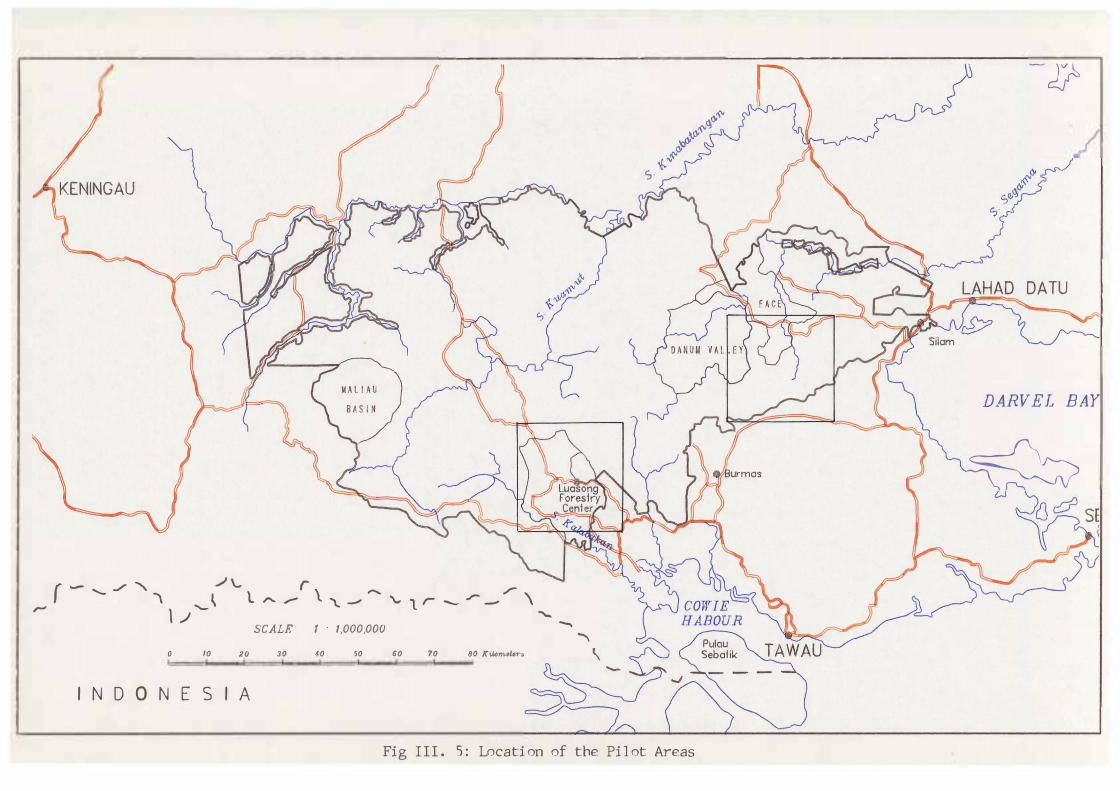
Two pilot areas : In that way, the plantation site of Luasong Forestry Center has been chosen for itsstrong interest for ICSB and since many geographical data have already been digitized in ARC/INFO. Moreover, another area has been proposed in the Ulu Segama Forest Reserve next to the Danum Valley conservation area. This area includes the NEP and theFACE projects and allows to display new methods of logging in primary forests, secondary forests areas and plantation activities.
In order to facilitate the digitizing, the 2 areas chosen correspond to the limits of the corresponding topographic map at 1 : 50,000 scale ( fig. 111.5 )
map sheet map sheet
4/ 1 1 7 /6 ( 1 04) for the Luasong area 4/ 1 1 7 /4 (92) in the Ulu Segama Forest Reserve
They represent each an area of approximately 77 ,000 ha. However the actual area concerned by the activities described covers 10,000 ha in Luasong and approximately 25,000 ha in Ulu Segama forest reserve.
8. Plann ing
The pilot project should be achieved quickly : from 6 month to 1 year after theacquisition of the equipment, according to the staff available.
The subsequent phase of implementation on the whole concession could be carried outin 2 years with a complete and trained GIS team, according also to the possibleavailability of new equipment.
Finally, a third phase could be imagined to develop more specifically some models or research aspects.
2 1
J
( - ./ "" / \.. r \ -. ,,,-
._ ' � t - ...- "\. - " 1 , - - - \ � \ / - ' SCALE 1 · 1,000,000
0 10 20 30 4-0 50 60 70 80 Kiton,..,101·,
I N D O N E S I A
-""\ '
�°'""
':O°'.,.p,""
Oi
i"'""
S·
Fig III . 5 : Locati on of the Pil ot Areas
-u
DARVEL BAY
�
CHAPTER IV
DETAILED STUDY
FOR
THE PILOT PROJECT

IV. DETAIL STUDY FOR THE PILOT PROJECT
A. Luasong area.
1. Context of implementation
The area chosen for the pilot project is the map sheet 4/1 1 7 /6 ( 104). It was previously harvested by the North Borneo Timber Company (NBT). Since the attribution of this area to the YS the logging has been carried on and nowadays it is totally logged over. The previous forest camp of NBT has turned in the actual Luasong Forestry Centre (LFC) which is nowadays a major base of development in the YS concession.
The main activi ty carried out from Luasong is enrichment planting of rattan. The a im of the project is to cover 40 000 ha wi th an annual planting target of 3000 ha. Moreover , for 1 0% of this area, the rattan plantation is supposed to be mi xed with high value ti mber trees such as Swietenia, Pterocapus, Khaya. The planting staned in 1 989 and so far, more than 7000 ha have been covered.
To support the plantation activi ty, a research component has been developed in the Luasong Forestry Centre, especi ally with the implementation of the PISP project (Plant Improvement and Seed Producti on). The aim of the research is genetic improvement, rattan growth moni toring, i mprovement of the methods of multi pl ication, and plantati on tri als of new spec ies both native (Dipterocarpus) or exotic (Khaya, Teak).
All the activ it ies of plantati on and research have been concentrated so far in an area of 1 0,000 ha beside the LFC (fig. IV.I ).
2. Domain of appl ication of the GJS
2.1 Plantation management
The GIS should be used very effic i ently to support the management of a plantati on, for basic consultation and planning purpose. The following points are panicularly important:
Limits : The plantation area is divi ded into compartments, which are sub-divided into several sub-blocks of approximately 40 ha each. The sub block is the basic plantation uni t.
Census : Two census are undertaken after the plantati on. One after 3 or 4 month to check the number of seedlings alive which is the basis of payment of the contractor and to assess the needs of refilling. Another census is carri ed out after 1 or 2 years to check whether the stock of plants alive i s i mportant enough or whether i t needs to be completed by new plantings (threshold value 80%). Apart from these assessments, the census are supposed to integrate i n the future shade measurements. These one will be used as a basis for operati ons of shade adjustment and could be used for a purpose of research so as to establ ish relati ons between growth and li ght or stand quali ty.
Mai.ntenance Maintenance operati ons are to be carried out on the plantati on. Especi ally slashing but also c ircle weeding. These operati ons must be achi eved theoretically wi thin steady intervals during the first two years after the plantation. There is a "planned date" for which rangers are sent on the field to make sure of the necessi ty of the operations and an "actual date" i f these ones are postponed. The following operati ons will be adjusted according to this new date.
22
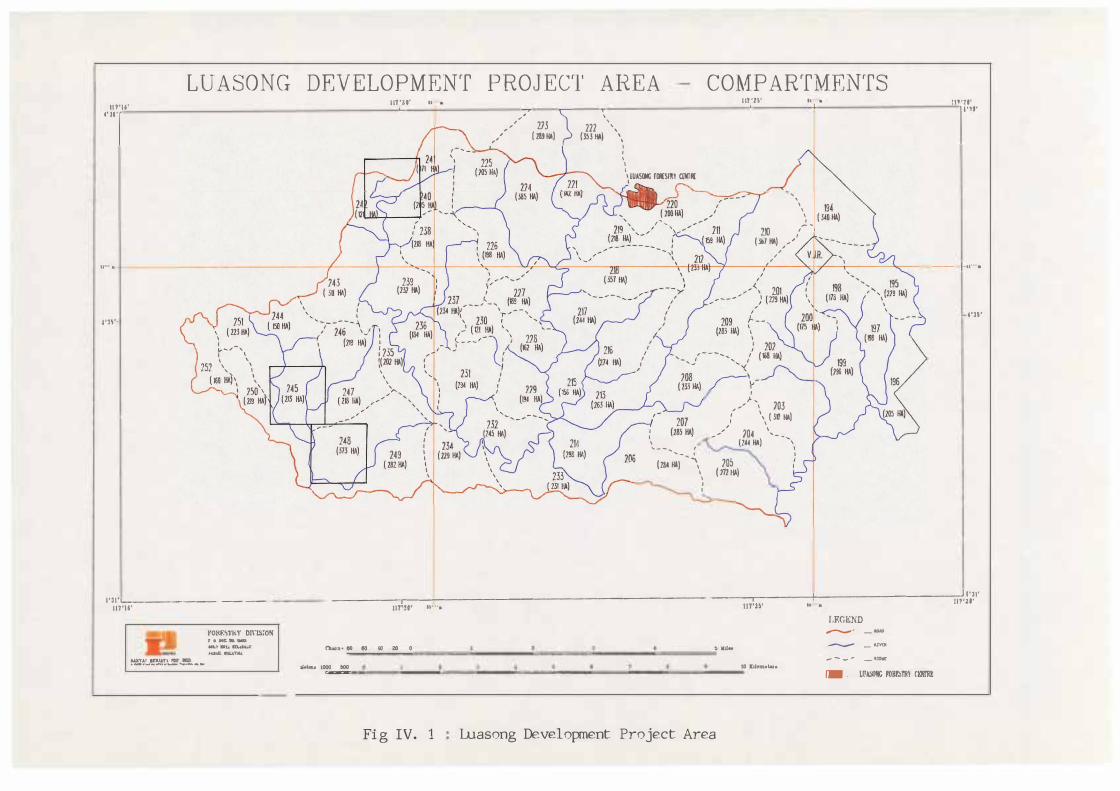
LUASONG DEVELOPMENT PROJ ECT AREA CO:t\1P ARTMENTS
, ' '' ::ru·
"';''' • . ,' > ', "'.' ,.. " ' . '"i: ,; ,.
/ U3 222 ' I ,/ ( 289 HA) (l5J HI) \
fl"' .
l'll'
I 'll ' ll)L'-16-' --------- -- --
��!.J!�!.'...:!!� ....
YO!!F.STRY DirlS!ON r o ux. • um 6'11:� DU IDWIAW Hl.r,ll, IUUTl44
I I I I I ', IU.IS(k; flllSIWI COOi(
I I ' , _ _ , ... _ ... i
(ZM HA) ", ' ' I I
' ' ' I I I
2!0 ,,- -(3&7 HI) /
I
, , /
,/ \ 703 ,' \ ( JI! HA) I \
,/ 704 \_ , (ZU HA)
205 ( 172 111)
- --- 1-tt""•
f'H'
--------:-:-::r:�--::---------------------- ------,r-----+-----------_J1•11• 117'.U' u a Jl?'21'
117'?0' n· ...
Chatn� eo l50 u, 20 o , ...,_ :.lot«• l.000 ,oo .___
Fi g IV. 1 Luasong Development Project Area
10 l:llomol.ol•
LF.GEND
,,.,,-..._.-.. _ 1:111:1 ------ _ .,....
- - - - _ IUVK
Ja . WA:>1JNC FORt>IRl CXN!R!
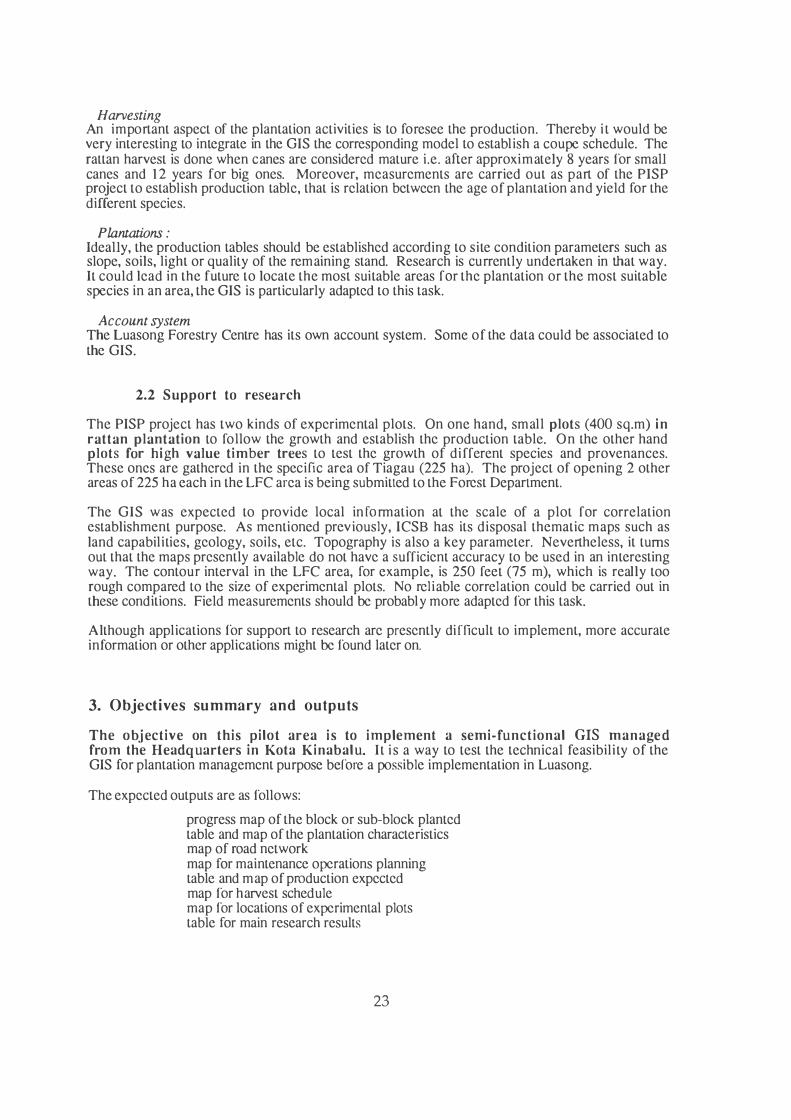
Harvesting An important aspect of the plantation activities is to foresee the production. Thereby i t would be very interesting to integrate in the GIS the corresponding model to establish a coupe schedule. The rattan harvest is done when canes are considered mature i .e. after approximately 8 years for small canes and 1 2 years for big ones. Moreover, measurements are carried out as part of the PISP project to establish production table, that is relation between the age of plantation and yield for the different species.
Plantations : Ideally, the production tables should be established according to site condition parameters such as slope, soils, light or quality of the remaining stand. Research is currently undertaken in that way. It could lead in the future to locate the most suitable areas for the plantation or the most suitable species in an area, the GIS is particularly adapted to this task.
Account system The Luasong Forestry Centre has its own account system. Some of the data could be associated to the GIS.
2.2 Support to research
The PISP project has two kinds of experimental plots. On one hand, small plots (400 sq.m) in rattan plantation to follow the growth and establish the production table. On the other hand plots for high value timber trees to test the growth of di fferent species and provenances. These ones are gathered in the specific area of Tiagau (225 ha). The project of opening 2 other areas of 225 ha each in the LFC area is being submitted to the Forest Department.
The GIS was expected to provide local information at the scale of a plot for correlation establishment purpose. As mentioned previously, ICSB has its disposal thematic maps such as land capabilities, geology, soils, etc. Topography is also a key parameter. Nevertheless, it turns out that the maps presently available do not have a sufficient accuracy to be used in an interesting way. The contour interval in the LFC area, for example, is 250 feet (75 m), which is really too rough compared to the size of experimental plots. No rel iable correlation could be carried out in these conditions. Field measurements should be probably more adapted for this task.
Although applications for support to research are presently di fficult to implement, more accurate information or other applications might be found later on.
3. Objectives summary and outputs
The objective on this pi lot area i s to implement a semi-fu nctional GIS managed from the Headquarters in Kota Kinabalu. I t i s a way to test the technical feasibili ty of theGIS for plantation management purpose before a possible implementation in Luasong.
The expected outputs are as follows:
progress map of the block or sub-block planted table and map of the plantation characteristics map of road network map for maintenance operations planning table and map of production expected map for harvest schedule map for locations of experimental plots table for main research results
23
4. Data and Requirements
4.1 Attribute data
- plantation data :
- PISP results :
All the plantation data are gathered and updated in the Luasong Forestry Centre in a program developed under the revelation system. A special appl ication will have to be developed to extract and transfer easily the necessary data.
The research results from the PISP plots are available in a spreadsheet form (lotus).
A suggestion of data to be captured for the pilot project is given in Appendix 6.
4.2 Spatial data
- topomap : The topomap of Luasong at 1 :50000 scale has already been digitized in ARC/INFO. It includes the following coverages: contours , rivers, di fferent boundaries, spot height, grid, township and road network.
The road network digitized is not up to date and an important part of it even remains to be surveyed before digitizing.
-coupe limits : The limits of all the compartments and some of the sub-blocks have already beendigitized in ARC/INFO.
-PISP :plot limits
A first set of limits has been digitized from surveyed limits. But the main drawback is that these limits have no tie points, which means that they are not geographically referenced. However accurate is this set of surveyed limits , it is not possible to overlay it with a georeferenced map such as topomap, LCC, soils, . . . A second set of limits has thus been digitized from rough l imits based on photo interpretation and simply drawn on the topomap. This set of lim its can be overlaid with referenced map but they have no accuracy.
The first set of limits, accurate, is obviously more important for the reliability of the GIS. A solution to the lack of spatial references should be brought with the GPS.
The plots created in the rattan plantation are too small to be a fully represented. A simple point on the topomap is enough to locate them. On the Tiagau area, the main l imits have been surveyed but not the l imit of the di fferent plots . This operation will have to be carried out if an accurate representation of these plots is needed.
-Remote sensing data : One SPOT scene was used for the project "Mapping from SPOT imagedata in tropical rain forest in Sabah-Malaysia" carried out in 1 987 on the Luasong area. The CCT can be obtained if necessary.
5. Conc lusion
On the Luasong area, almost all the geographic data are already captured. Moreover, all the attribute data are gathered in digital form and in the same files. The implementation of the G IS should not encounter major problem and be achieved quickly. The remaining things to do are as follows :
- creation of the database.- limits adjustment by means of the GPS.- Survey of the road network.
24
B.Ulu Segama area
1. Context of implementation
The area chosen to be a pilot area for the GIS project is the topographic map sheet 4/1 1 7 /4 (92).
The area located on the boundary of the YS Concession area is subdivided into several parts, (Fig IV.2) :
A part of the Danum Valley conservati on area, where the forest i s protected. The map sheet includes the DV Field Center (DVFC), a camp for scienti fic activ i ti es and tourism. An area that was already logged over by the North Borneo Timber forest company when the concession was attributed to the YS. A part of the Ulu Segama Forest Reserve. This area was logged after the concession was
• attributed to the Yayasan Sabah. Until 1 990, this area was logged by Pacific Hardwoods(PH) in joint venture with ICSB, and from 1 99 1 onwards the remaining coupe wereharvested by ICSB. The whole area is logged over now.An area kept as water catchment.
Two main projects are carried out on the areas: - RIL : The aim of this project is to develop a method to reduce the damages and soil
disturbance that occur wi th current logging activities. This project is carried out on a 430ha area included in the 1993 coupe.
- FACE : The aim is to undertake large scale rehabi litation of logged forest by enrichment planting and reclamation of degraded area using native tree species. The project was ini tiated in 1 993 on 300 ha; 2000 ha should be covered in that way over 3 years for api lot phase and 23 000 ha afterwards over 23 years.
2. Domain of application of the G IS
2.1 RIL projectBackground
The RIL project covers 8 d ifferent sub-blocks in the coupe 1 993. Four of them are logged under RIL methods and the 4 others under conventional logging in order to compare the results of the 2 methods. The RIL method is supposed to extract essentially the same volume of harvest timber as usual (8- 12 trees/ha; 70 m3/ha), using conventional yarding technology (bulldozer). However RIL involves distinct modifications:
a hundred percent inventory is carri ed out before logging. The locat ion of all commercial species is recorded on a large-scale topographic map (1 :5000) or stock map. pre-planning of ski d-trails.at scale 1 :5000 to achieve optimum alignments, minimizing steep slopes and stream crossings. The RIL tri es to reduce the density of skid trai l to 1 50 m/ha. Moreover the RIL tries to l imit the number of landings and to reduce thei r area. riparian reserves are left along streams accord ing to thei r width. Field techniques such as climber cutting 1 year before felling so that felled trees would not drag other trees down with them. Skid trai l and tree marking Directional felling towards skid trai l and away from potential crop trees.
25

)
l
D A N U M
C O N S E R VAT ION A E A
I : /
Area
1. . --
\ � ---(
Logge) by N Bi
j
,,,....-I
-/'. _/ J \
( · / �
J0 / , ( 4 / 1 1 8
7 )d=\� -·,._:l -. '\.:a.-..,��----'-------------(-4_/_1 1 7_/_8_)__,.
�
1j � . __J - - - - Yayasan Sabah Concess i on Boundary
-. )
'- - '\ I \ I f \
SOF TWO OS
BHO .
D Q D D
Danum Val l ey Conserv1'.lt ion Area Wc:iter Catchment Area Area Logged By NB T Area Logged By RBJ/PH
Fi g IV. 2 Ulu Segama Pil9t Area I
s
Applications :
The RIL project area should be logged over by the end of 1993 i.e. before the implementation of the GIS. Thus no GIS application could be implemented on this project except for a purpose of "Demo". Nevertheless, suggestion can be made if this method is used on large scale, on the whole concession.
The RIL project involve mostly field techniques for which the GIS cannot be used. But the GIS could be an interesting tool for the map preparation and skid trail planning, especially with its capacity to calculate the slope. With the RIL method, the logging must be achieved for slope below 350. The distribution of slope on the area to be harvested by means of a DTM could thereby beused very efficiently for planning purpose. Finally, GIS can be used to monitor length or densityof the trails network.
Nevertheless, such a planning on the RIL was made at large scale ( 1 :5000) with contour interval of 50 feet ( 15m). This detailed map was made by the contractor, by enlargement of the 1 :50 000 scale topomap in which contours have been completed and redrawn by hand from field observations. On the whole concession, only l :50 000 scale map are available with contour interval up to 250 feet (75 m). These maps are too rough to do a detailed planning at the scale of a skid trail . With the present accuracy, only a general planning can be envisaged. The final question is to know whether it is really interesting.
Otherwise, it was suggested to use the GIS on the RIL project for a purpose of "demo". Many detailed information are available on the RIL project. The "demo" can demonstrate the optimization of the skid-trail network according to slopes, rivers, contours, stocking map with the RIL method and to compare it with the common method of logging. Moreover, the "demo" can display the main results of research such as damage caused with the 2 methods, remaining stock volume extracted.
2.2 FACE project
Background :
The pilot phase of the FACE project aims at planting 2000 ha over 3 years. Almost 1 800 ha have already been planted. This first phase of the project rel ies on a strong research component that should provide the guidelines for the plantation of the balance of 23 000 ha. On that purpose, trials are made to test the performance of stands versus di fferent parameters such as age of logged forest, degree of disturbance, site conditions or fertil izers, spacing, size of planting hole . .
Hence, the 300 ha of the first year of plantation have been divided in 6 separate plots of approximately 50 ha each in order to cover different types of logged over areas: different ages, different topography, different method of logging (tractors or highlead). In that way, the 700 ha corresponding to the 2nd year of the program are divided in 8 different plots. Moreover each plot is planted with different species corresponding each to a line or a group of lines of plantation.
Applications :
- Plantation management :25 000 ha of plantation are planned as a long term objective. It is foreseeable that soon will arise the need for a management of the area planted . Just as for the rattan plantation in Luasong, the GIS could be used to monitor the plantation data of the Face project. Without going into the matter, we can already point out the importance of data such as area planted, and year of plantation, species planted and survival or growth rate. The GIS should be able to provide all the necessary information for the planning of coupe and possible silvicultural treatments.
26

- Assistance to the plantation :
Using as a basis that the enrichment plantation in logged over areas must be done where the remaining stand is the most degraded, the GIS can be used to locate these areas with simple parameters:
LRS Inventory Data: These data are interesting to provide a fi rst idea of the regeneration of the blocks and their potential production after 60 years.
Method of Logging used: Two different methods of logging are used: tractor logging or high lead. The latter is particularly destructive for the remaining stand. The areas logged with this method are appropriate for enrichment planting. The exact places where high lead were installed are located on the topomap at scale 1 : 1 2 500 used by contractors. At a smaller scale a map shows more simply which method was used by sub-block only.
Finally the year of coupe can be an interesting parameter to take into account. Regeneration is more advanced in oldest coupes and the lack of light in these areas lessen the growth of young plantation.
All these parameters can be easily captured in the GIS. All combined can provide a first logic to assist the location of plantation area, which can be improved afterwards.
Moreover, the GIS could be used to assist the choice of the species to plant:
Production and / or inventory figures give information on the main species harvested or present in a place, which represent probably the most sui table species for this place. These figures recorded by the contractors are available at large-scale, even by logging areas of 50 acres.
The research conducted on the FACE project might establish correlation between the growth of species with parameters such as soil , topography, land capabilities. Then, the GIS could be used to locate the most suitable area for a species or conversely the best species in an area provided that the maps available (soil, topography) are detailed and accurate enough.
- Support to research
It was suggested to use the GIS as a support for research in order to establish the correlation previously mentioned. The GIS would not be used as a statistical package but as a tool to display and overlay information at large scale. Topographic maps at 1 : 1 2 500 scale with contour interval of 50 feet are available and at this scale, the lines of plantation and even the location of the plants can be displayed.
Numerous information can be associated to each:
Soil and land capabilities: The maps available at 1 :50 000 scale are too rough to be used in an interesting way at this scale. A detailed survey has been undertaken on the first year of the FACE project and one is planned for the whole 25 000 ha.
Light: a grade of light is attributed to each point of plantation
Slope: by means of a DTM
Growth: plants will be divided in growth class.
27
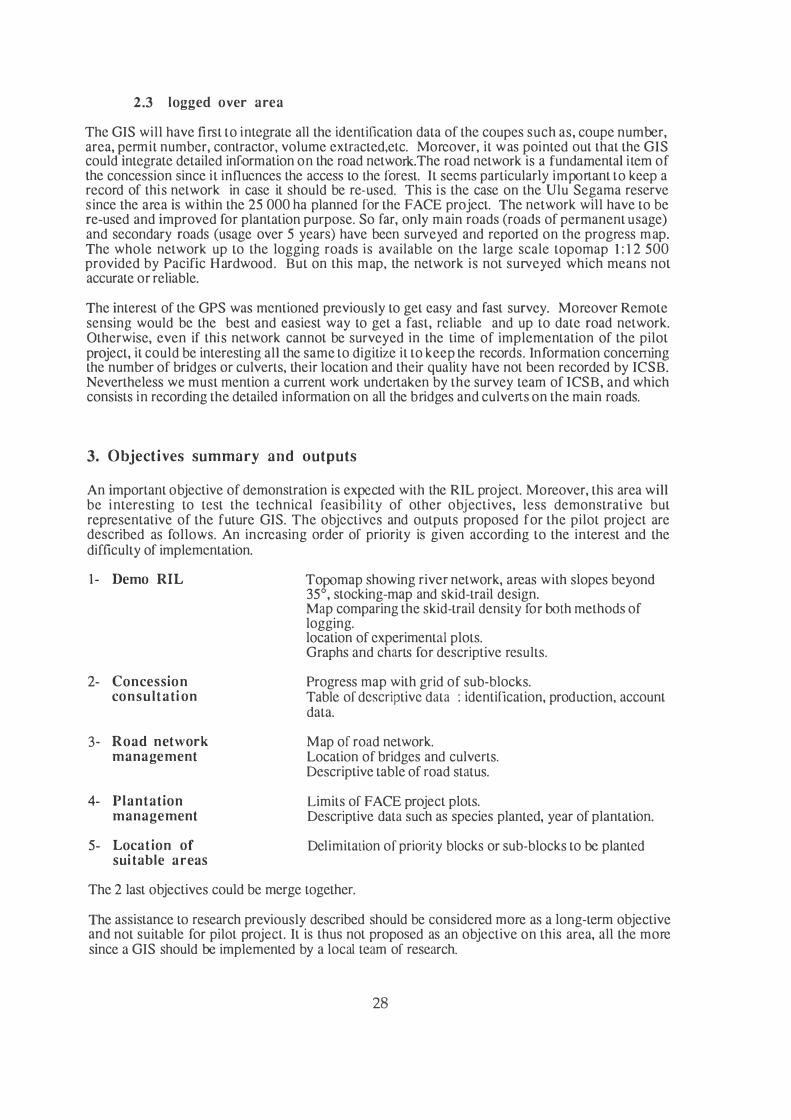
2.3 logged over area
The GIS will have first to integrate all the identification data of the coupes such as, coupe number, area, permit number, contractor, volume extracted.etc. Moreover, it was pointed out that the GIS could integrate detailed information on the road network.The road network is a fundamental i tem of the concession since i t influences the access to the forest. It seems particularly important to keep a record of this network in case it should be re-used. This i s the case on the Ulu Segama reserve since the area is within the 25 000 ha planned for the FACE project. The network will have to be re-used and improved for plantation purpose. So far, only main roads (roads of permanent usage) and secondary roads (usage over 5 years) have been surveyed and reported on the progress map. The whole network up to the logging roads is available on the large scale topomap 1 : 1 2 500 provided by Pacific Hardwood. But on this map, the network is not surveyed which means not accurate or reliable.
The interest of the GPS was mentioned previously to get easy and fast survey. Moreover Remote sensing would be the best and easiest way to get a fast, reliable and up to date road network. Otherwise, even if this network cannot be surveyed in the time of implementation of the pilot project, it could be interesting all the same to digitize it to keep the records. Information concerning the number of bridges or culverts, their location and their quality have not been recorded by ICSB. Nevertheless we must mention a current work undertaken by the survey team of ICSB, and which consists in recording the detailed information on all the bridges and culverts on the main roads.
3. Objectives summary and outputs
An important objective of demonstration is expected with the RIL project. Moreover, this area will be interesting to test the technical feasibil ity of other objectives, less demonstrative but representative of the future GIS. The objectives and outputs proposed for the pilot project are described as follows. An increasing order of priority is given according to the interest and the difficulty of implementation.
1 - Demo RIL
2- Concessionconsulta tion
3- Road networkmanagement
4- Plantationmanagement
5- Locat ion ofsuitable areas
Topomap showing river network, areas with slopes beyond 35° , stocking-map and skid-trail design. Map comparing the skid-trail density for both methods of logging. location of experimental plots. Graphs and charts for descriptive results.
Progress map with grid of sub-blocks. Table of descriptive data : identification, production, account data.
Map of road network. Location of bridges and culverts. Descriptive table of road status.
Limits of FACE project plots. Descriptive data such as species planted, year of plantation.
Delimitation of prio1ity blocks or sub-blocks to be planted
The 2 last objectives could be merge together.
The assistance to research previously described should be considered more as a long-term objective and not suitable for pilot project. It is thus not proposed as an objective on this area, all the more since a GIS should be implemented by a local team of research.
28

4. Data required and available
4.1 RIL demo
Spatial data : - Stocking map : to display the location of the commercial trees . The stocking map is
only available for the sub-blocks under RIL method.
- Topo map : The topomap at scale 1 : 5000 is digitized for the 4 sub-blocks under the RIL method but not for the 4 others. the sub-blocking is necessary to be add to distinguish the eight different areas of the project. The area with a slope above 35° will have to be displayed as well as the streams network.
- Skid trail network : All the skid-trails are supposed to be surveyed.
- Experimental plots location
Attribute data :
Production.figures by sub-block Inventory figures Forest Cover figures especially density Figures on the defects Figures of carbon offset
All the data from the experimental plots are captured in a special application programme developed under REVELATION.
4.2 Concession consultation, road network, plantation management
Spatial data :
Topomap : The topographic map, digitized under ARC/INFO has been obtained from UKM Sabah Campus. It includes the following coverage: vegetation, contours, rivers and roads settlement. The accuracy of the contours remains to be checked.
Progress map : At 1 :50,000 scale, it will allow to digitize the coupe limits, the main roads and unworked areas. The sub-blocking is not represented and will have to be added separately.
Road network : The complete but unsurveyed road network is available at the scale 1 : 1 2 500 from the map provided by PH.
FACE limits : The limits of the first two years of the project have been surveyed and already digitized in ARC/INFO.
RIL limits : Requires to digitize at least the sub-block l imits in the 1 993 coupe.
The 1 :50 000 scale could be sufficient to display the features corresponding to this objective.
29
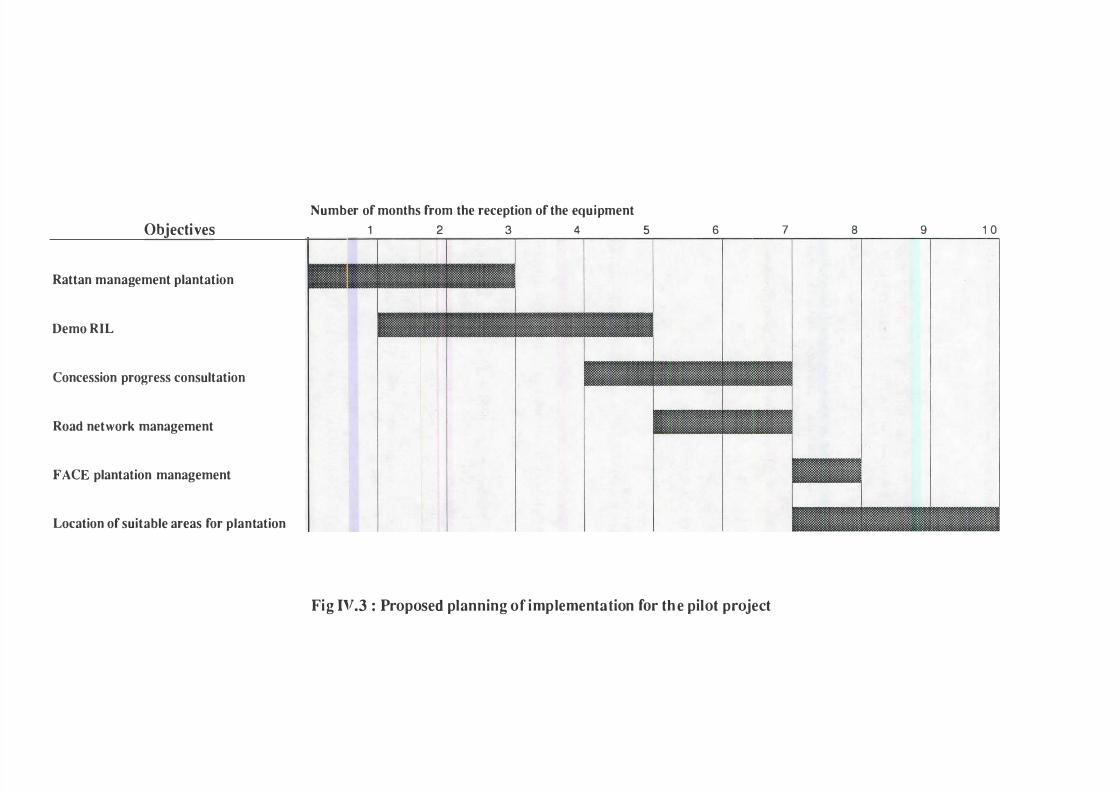
Number of months from the reception of the equipment Objectives 1 2 3 4 5 6 7 8 9 1 0
Rattan management plantation
Demo RIL
Concession progress consultation
Road network management
FACE plantation management
Location of suitable areas for plantation
Fig IV.3 : Proposed planning of implementation for the pilot project

Attribute data
On the area previously harvested by North Borneo Timber, no data are available. On the area harvested s ince the attribution of the concession to the Yayasan Sabah, two periods can be distinguished.
Until 1 990 PH was responsible for the logging activities in the Ulu Segama reserves. All the figures have been stored by PH, manually.
From 1991 onwards, ICSB was responsible for the logging through contractors. The logging data are stored in digi tal form in KK.
Identification data : block number, coupe permi t number, area, year of coupe contractor, volume extracted.
Road network : road type, hauling distance, . . . A census i s being undertaken on the main road to assess the number of bridges and culverts, quality, length, year of construction, location, . . .
Plantation data : mainl y year of plantation and species planted. The data are available from the FACE project.
4.3 Location of su itable areas
Spatial data :
The topomap and the progress map; The sub-blocking is necessary to display detailed information.
Attribute data :
- LRS inventory data
- Production and/or
Remaining volume of big trees, number of trees in advance growth, number of seedlings. Projected volume of trees above 60 cm dbh after 60 years, class of projected yield. The LRS data are available on all the coupe of the area except 89,92 and 93 coupe.
inventory data : Volume predicted/harvested by main species and by sub-block.
- Method of logging used available by sub-block.
S . Conclus ion
This pilot project is characterized by more objectives and more ambitious propositions compared to Luasong. Still few data are available in ARC/INFO and the implementation phase will probably have to face a problem of data collection because of the many different origins of the data. Moreover, the creation of the database from data captured manually will certainly prove long and tedious. The implementation of this pilot project should be thereby more time consuming.
However, the objectives of concession consultation, road network and plantation management should be achieved quickly. The abundance of data for the RIL project allow to expect a very interesting "demo". Only the last objective is more hazardous.
Finally, a planning of implementation is proposed for the pi lot project (fig. IV.3). It does not take into account the possible difficulties of staff availability.
30

GENERAL CONCLUSION
GIS is a new technology and few experiences of implementation exist for forestry management purpose. It is thereby difficult to be fully aware of the GIS capabilities and it is not so easy to express needs.
However, through visits to the different activities of the concession, discussions and meetings, some objectives have been identified and an organization imagined for the GIS. It could evolve in time. A first set of objectives should be carried out in less than 1 year during the pilot project. The implementation phase on the whole concession will allow to approach more long-term objectives, requiring either an important work because of the abundance of data (Progress consultancy) or the needs for models or special technology (logged over forest management). The possibility of data exchange with a GIS carried out by the Forestry Department could alleviate the work and increase the speed of implementation.
The equipment expected will allow to start the project on PC. The key parameter is now to constitute an independent GIS team since the availability of staff for the GIS will influence the efficiency and speed of the work. The question of the premises needed must not be neglected.
Subsequently, the upgrading of the system to worksta tion will be necessary, which will allow to create independent modules of GIS for local management. Additionally, a remote sensing package could be envisaged.
Finally, the implementation of this Forestry GIS should allow to approach the forestry management by a very interesting way. Moreover, the framework of ICSB and its dynamism is a very favorable context of implementation and much can be expected from the project.
31

APPENDIX
Appendix 1 : Log flow data Appendix 2 : Inventory data Appendix 3 : Rattan plantation data Appendix 4 : LRS inventory Appendix 5 : Census on road characteristics Appendix 6 : Proposed data to be captured on the pilot project of Luasong
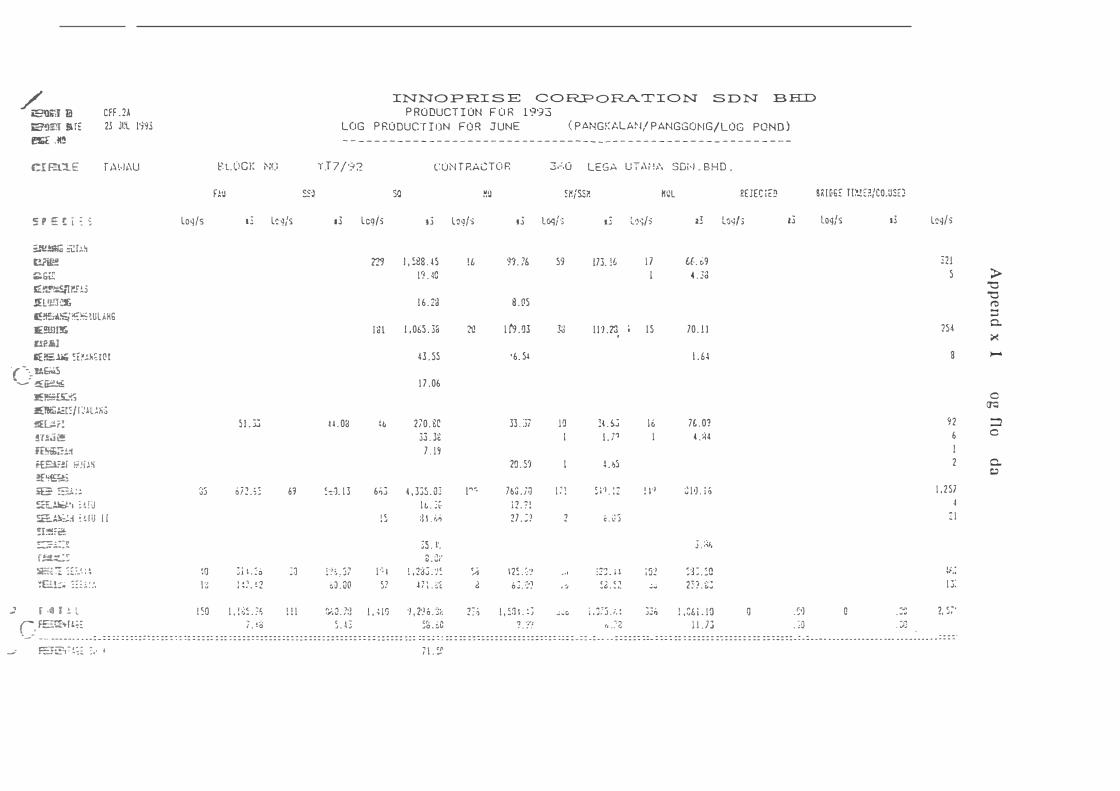
�n�J iil iE-'J=.lJ tlfE � .� CI ?-l'l..E
S P E ! i : 5
:.e'1!!...�C ;-t!r�� [!;""tfl!! �Gt
CFF . 2A 23 JI\ l'i�3
f s�t,J.\U
t'o:!',!!:/.�i)'J!.S .!H�!I!:t; 19511!::;!!:!'S \UL ,\HG IE!!l!ll'!I'. Cl!.il
1:'. L.OGl'. 1-:G
F�O ��
Loq/s 13 Li:�/s
INNO F RI S E C O RP ORATI O N S D N B FIT) P RODUCT I ON F O R 1993
LOG P RODUCT I ON FO R JUNE ( PANGi'.t,LMJ/ PANGGONG/LOG POND ) - - - - - - - - - - - - - - - - - - - - - - - - - - - - - - - - - - - - - - - - - - - - - - - - - - - - - - - - --
Y.T7/92 cu.-l T RACTO P. 3,0,0 LEGA UT MV, srn,1 . BHD .
so �u SH/�� Nill P.£JEC ,c!)
13 Lcg/s i3 L��/s 13 Loq/ s t.3 LiJ",/5 z3 Lo�/'i
m 1 , 588 . 4 5l9 . 40
1 6 .n
IB l l , 065 . 3:i
ll
?(!
91. )6
8 . 05
l l"U3
59 173. !l
3;J l l"J .7.l, I
l 7 l
l S
l(.. 69 J •. , , . .)O
13
srn6£ m.!f�/CO.USEJ
Log/s s3
�!S� �f�;.)i�l0l ·, --._�gs ·-- ���
43 . ss [ 7 . 06
·6. s�
70 . 1 1
l . 61
..)
...c=r�.;,: .z.;:r�-·-.:J
�.8;/ 1 '.!lU�G :tta.::!1'! .!L'.'J('!!IfSi&I=:.� .fES?!f S!f.lS �Pa .• � i8 SJ.:; ��·, ; � ! U sa!..J.£:1 : OU I I :I:!!,2: �;.::r f!:1:�� :.Ei '.;: :�:-•, : � ":El!.� ;:::.:. � .\
,., oJ
:o t ;;
S I . :i3
oi� _ ; ;
3 i 1 . �o l � ; . !2
H . 03
69 '.-::1. l 3
:� i\:� : J7 o� . 00
ii 270 . SC 33 . 3c 7 . I 9
6.;:; 4 , 3:;s . O}
� �
l '' I 57
l � . :(. :J L ;,�
35 . 1·. ,,, ., . ." · "''
I ·N- • 1< • • ... v.J , � -1 1 1 , . .,
� I I ' :.O C.
ioc.
'A
d
3Li7
20 . 51
7bG . iG 1 2 . ? !27 . :;:
12� . c·.' o: . �·)
IQ l
I
l ' ' , .
2
...
. ,
:U.i 1 . 70
us
s ; ·_l . ! Z
0 . \: J
:?: . i l , .. ( 1... G . _ ,.
16 l
! l ')
: G1 ;.j
7l . 01 4 . �4
� l •J . i �
j . :�1,
:� ; . :c 2:.:, . 8:
r ,� l ! L ! SO l , ! 8: :?� ! ! l �;. Q , ;:l l , rn ·) , 2'.l o . 1% 2:-.; l , :� 1 . : .j c,o i . ,:3 _ ;. : 33.; l ,;,l l . 10 0 .S•J O . :-; r- F=·-crr- ' ,.·. c j ' "' . , O .·,, ' ' I I J' · a -�t • _:,..__ . .- -:; :. / . - o .J . ,j .Jo . :.l.i . . : . r, . . G • J . •.:
. .JJ •
Lo�/,
�21 s
2S4
8
92 6 I 2
l , 2S7 4
: l
�;,; l •. ,.
2, s;·
·-- -- ------ - . - - : _ : : :; : : : : : : : : : :: : : : :: : : : :: : :: : : : : : : : :: : : : :: : : : : : : : : : : : : : : : : : : : : : : : : : ::: :: :; : : :: : :: : : : : : : : : : : : : : : : : : : : : ::: : _ : : . : . - - . : : : : :: ::_ : : : : :: : : : : : : : :: : : : : : : : : :: ::: : : . = - = - - - - - - - - - - - - - - - - - --- - - - - - - - - - - : : : : ·-· E:£!:17 !�� :;, + 7 1 . sr
� "O "O
rt)
::l 0. ;:.<
),-,i
0 cr;i ::2 0
0. c.:i
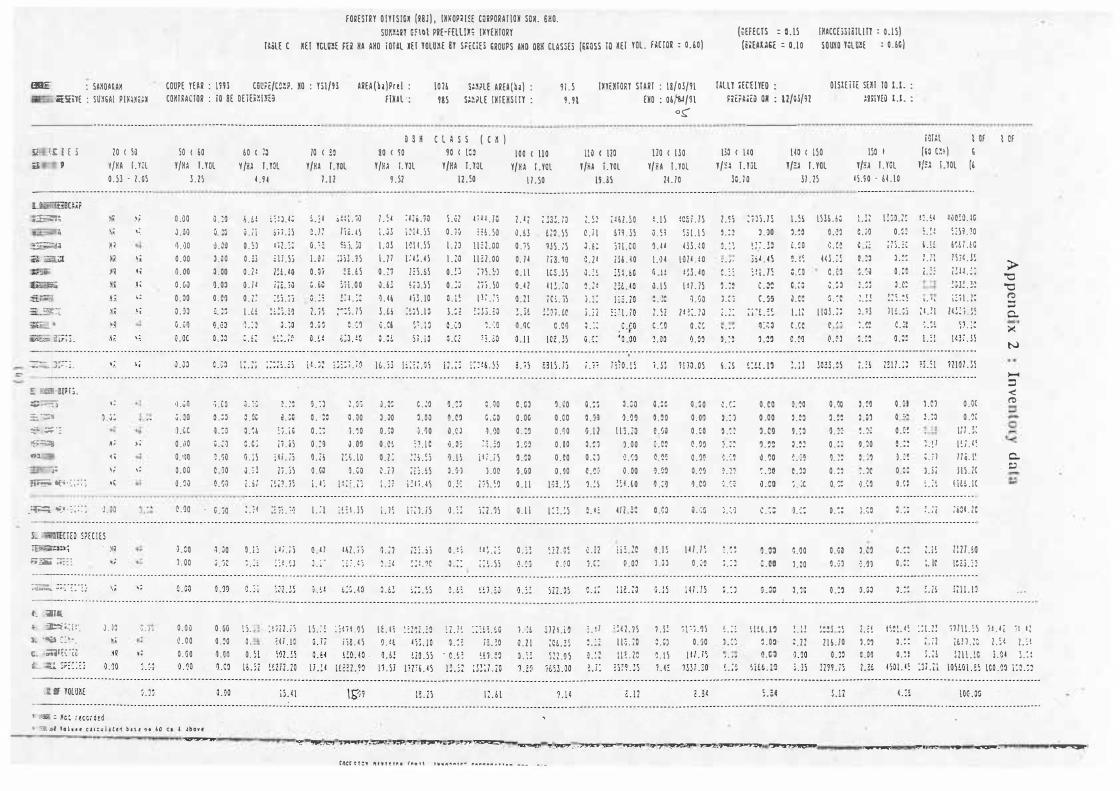
::::-
tmE : momH iiiiYE : sum1 mum
ct:
;t.
7:t I E S p
... ;.;;:,;:i� ..
! ::...-:1 :c_·:.., - -··=:· - .:.�;:-� ... ,,
4; � �-, ; : ; ;
10 ( 1, Y/HA l .m 0 .53 · I . vi
�; �� K l Ml Ii HI H, �; �9
, : u;
H ; , ; lj ; ;1
�; '� �i i; 1; " ·' '
, ;
,:
"
-� �i -, : : : : uo . ,
� �::
C ';lllG. i �•.: i ! '. 12_ ·� c:�-: . c... .;;;.l[Cic
)Q .�,
J . alO i,
'i . J i
, ;
fORESTRT O I Y!S IO! (18l ) , IMNOPmE CuiPORAf lOX SOX. SHO. SUMm Gf\Ol PRE-mu,; IXYEHTORT
tmE C KET lClr!E Hi HA AHO iO[ll lH IOLU�E s, S,[ClEi 6ROUPS AMO 08lf CLASSES (mss IO !El YOL . mm : 0 . &o )
COUPE YEAR : 1m m;[/C�!Jl. XO : TSl/!l AREA ( h1 ) P r 1 l : flMAL · : mmc roR : ro BE DEim1m
10 ( &O Y/HA I . YOL
0 . 00 J . U uo o . ua .u0 . 00o . nUl G . n
,1 . , n ; , QO :UC 0 . ,10 0.,:0 0 . 0 0 Uv
l . 21
uo o. �o uo0 . 0 00 . 000 . 0� 0 . CO �- :�
; . c o o . ci 0 . '.0 G . :� � . r,o uo Q . I"
HO · G . iO
60 ( il y /H� I . Tot.
UI
Ul U . i i 0 . 5,) Ul 0 . l 1 0 . i I 0 . 1 1 l . l!t: �
,1 . :, uo 0 . \1 c . c ; UI J . i l u:
i; ! J . 1; � i 1 . l S l it �: , I i . Ii 1!UO iiC:. i� ; � l :;j
! ���. i 0 i . ;o
1 '" • • • • 11
, . ;o : i . i t l1j)
i t i . ,i Ii . ii
; � ,) . 1 �
: . : t �; i: . :11
10 < �o Y /HA I . TOL
1 . 1 1
l _ j ! ·J .n0 . ' :l . O iUi U JC u . ;! 1 . i i' . � �
9 . :J o . . �oo . :: 0 . : i O . il uo i . l ;
;!� i . 'iO l i i . l \ �j l. !U
;m . 1 1 :U\
; : l .00 !, 1 . ::
;,:\ . I I c . c ry
•J . � ·j 0 . 001 . 1 0ua
1'.UO uo
I ! : : . , ;
l . : 1 , ! : I . J I
0 ! H 80 < 10
Y/HA I. YOL Ul
1 . 5 1 Ul l . O l 1 . ) 7 0 . ?1Ul U& l . li U!
u: uo uo U\ 0 . 1 : � . 1 1 l . ! l
:no .;o i ) l l . \l 1rn. 1 11 : 1J . I Il ii . 6 1\ iJ . 1 1 lil . 10
:ij\ . l , � '! . t �
c . :o uo HO
: ) . I C , � . ( .. ". , )i :UI
i '. V i . 4 \
l . J \ i : : 1 . i i
1016 smu AREA ( b,) : !UUlm m,LE lXTEHS I TT :
C U S S ( C N )90 < [:l
Y/HA T .m lUO
UI 0 . 1 � l . l l t . ;o O . ! j O . !J O . I � l . : ,
0 ·" uo 0 .�J •U: Q . l \ U·l O . J(
0 . ; ;
1 ;u . 10 , iuo
l l , l . 00 l l , 1 . 00 i l l . I,) ;; , . 10 l , . " • t • • ,
: , l l . ; 3 1 . ·: o
uo c . co uo
:uo i i i . i i
l . OC i i \ . :1
;:u1
lOO < 110 V /HA l .YOL
1 1 . \0
1 . 1 ; UJ 0 . )\ 0 . / I 0 . 1 1Q . 1 10 . l l! .HUC
0 . Cl O . OC 0 .. :0 UJ uo uo 0 . 1 1
O . 1 1
; m . 1 0 rn . 11 HI . II l i3 . ?0 !CS . J IH l . ;o ; c ; . ii
!'.�UC C .00
uo 0 .00 0 . 1 0 0 . 00a . co 0 . 00
1;3 . ! I
l '. : . !I
lXYtXTORT START : 18/0l/!l EXD : 0&/?,,1/H
os;'
110 < 120 l /HA i .lOL
lU\
�. 5� U l f,: C . l l 0 . : , � . 2 ! J . ! : L!i" · 'f . , ..
0 . r. � uo O . l l0 . ( 10 . , 1U:1 . ! I
� . , :
; l b l . \ O m . J I i l LCO I JUO
� . : o uo
l l i . iO uo ;L�� 0 . 00
! :UO
I/UC
120 < IJO V /HA l . YOL
lUO
1 . 1 1 Ul 1 , 1 1 t.,J I (i _! ! 0 . l l : . :�: Ul C .'.O
o . : o uo uo uo �. �� Ul 0 . :o
uo
!C� i . I I'.3 1 . l \m. i o
1 0 1 1 . r nl lUO1 ! / . 71
uo ] t � : . lJ
Uc
uo 0 . 00 0 . 00 uo uo 0. ��uo
0 . 1:0
(mms = ! . 11 (i,mm = 0. 10
mn mmrn : FitrAi[u OH : l2/0l/l1
mmmmm = 0.11 ) sou so mm : o . .. l
OlSHm sm 10 1 . 1 . : mmo u. :
llO < ! 10 1/,i 1 . m
lo . J O
uo < 1 10l/"l I . VOL
]7 . 1\
1\0 I T/,1 I . YGL
l \ .iO - 6UO
1 . ;1l . : lII ' � ,: . � � �- . J .
� . : : 0 . :1 l . : 1 t . : : .. . . .
� . C ) . : 1 0 . � J , . :: •! _ �, � . :1 � . � �
; , � ·]
: ;n. 1 s l . 00
! ;_? . !, ill . 4 1 ; ! i . 15
c . �c C . �5
� ; �L . :: o:,l
0 . co0 .00o . co� . ,::uo� . �o0 . co
� -�=
UI ,.:o l; . � O �. I � C . � Oo . : u u: L1Z UC
�. �o Ul O . (l J _,; ·� . ,;�Ulj . -�C
.J . ::
lllU, UI U!
w. ; \ o .bC . : o G . '. C
l !Ol . ; ; C ..,
uo o . ,:Ue o . :,0. i:o . :i 0. ��
0 . : :
I 1 "1 t . . 'l
uo � ;; O . "l � . :u 1 . �, -� . !Jl . 1J ; _ ��
O . '.O Ul ' . ��uo Ll : . 1c HO
L�O
un.:� O .�:
� ] ) . ! C l . '.t o . c: u:
! : � . : � HL:i
ui
Ul 0 , .•
U! o . := oJ . , !0 . : :0 .0
o . ::
rnt�t (&o c�i l
1/;! I .l0l
l Of • (6
t; . �!
s . � � I . I: : . :1 ' -�� � . ' l ; , .n ;: .1�
l .Cl 1 . :0
1 . ! 1 , . i 1 ·l . i j : . : �
. . . , , , (
!uO!O. IC \ : IUO ,m .ic 1 1 ,U'. i ! l l . '. : ! jJ! . ;,� l�i t . 2�
l�!l i . ��
0 . 0( 0 . �,
tn . !� l ( i . < '. 1 1, . I'. l lUC
l, i(l . l (
:iOUC
! Of
�'O 'O (t)
::i 0. X N
,,.... ::i < (t)
a. :,
J . CO 1 . 00
� . Jo o . l 'i i J ; _ ; ; o . o 1�1 . ; ) � . ;1 ;1 ; . ) 3 o . � 1 u � _ � ; o . ;3 � 1 1 . r, � � - Ii i i : . 2c 0 . 1 � tH . 7 � � . � � u� r. . oo o . GO l . ,l C ." 1 .E 1 l l 1 . !0
0 . O u uo 0 . 00
:i . J� : . : � :; ! . �J J . i · : � ? . ! 'j � , ;t � : ! . 1C o . :: � : � . )) 0 . ( j C . (·O 1 . C: O . Oj L�J O . j� j _ : J
0 . 00 uo un
� s.o .0 .
: : i l l . i) rn . 10
1 1 . : ! '. : lH . 1 1 i i! . 4 1
l E . 1 1 0 . 1(
'. :1 �L;o ! 1 . E1 . '. ,
. C . � :
: : : �� . L O i 3 . �o
\!1 . 1l
1 . ·:l 0 . 2 1 O . : l
Wl . i O �CL . � � � Z 2 . 0 )
: . ! l "' : � .. . . L
e . : z
' ! l l . 1 \ l lUO 1 1u:
1 . 1! Ul UI
� l ' ; . 1 1 0 . 00
£ . : ; l . : � , , ,J
C . CO UO
mu, ! .03· 0 .C�
! . l !: . 1 2
O . i l Ul
!:�J :� 1 1 1 . /0
Li! Ul 0 . 00
O . :: l. lt ICil . : ;
i�C l . t � : : t .n o . : : ; . I I o . � : La
rn1 1 . : 1 ; 1 _ 1 ; (£ 1 1 . !C 1 . � < l l l l . lC
:1 q I ' .I. . -L: :
1.. � .ol h l u , C J t : u l H r 1 b u , 'J I 60 Cl I JbCU! _,......,,. ze. ;p __ c,_ SAUQfC.f:-:.::.=?. '*'· Cj .. P,)W,PP_.P ... f» ASJP<.e.:.+ 9"L4jJ i,,QUL'J •. • ;::9:a:p \J:iP- n:;a.pys : } ,?P.......5F V*'2.lJ4UP>=J::;; JUSi>At)#» - 91, JC. •• • .......
c11c, t r :, flll 1 w 1 , 1 1t • 1 110 n "'·"'"'1t1, .. ........ .... . . ..... --- · · · -
-
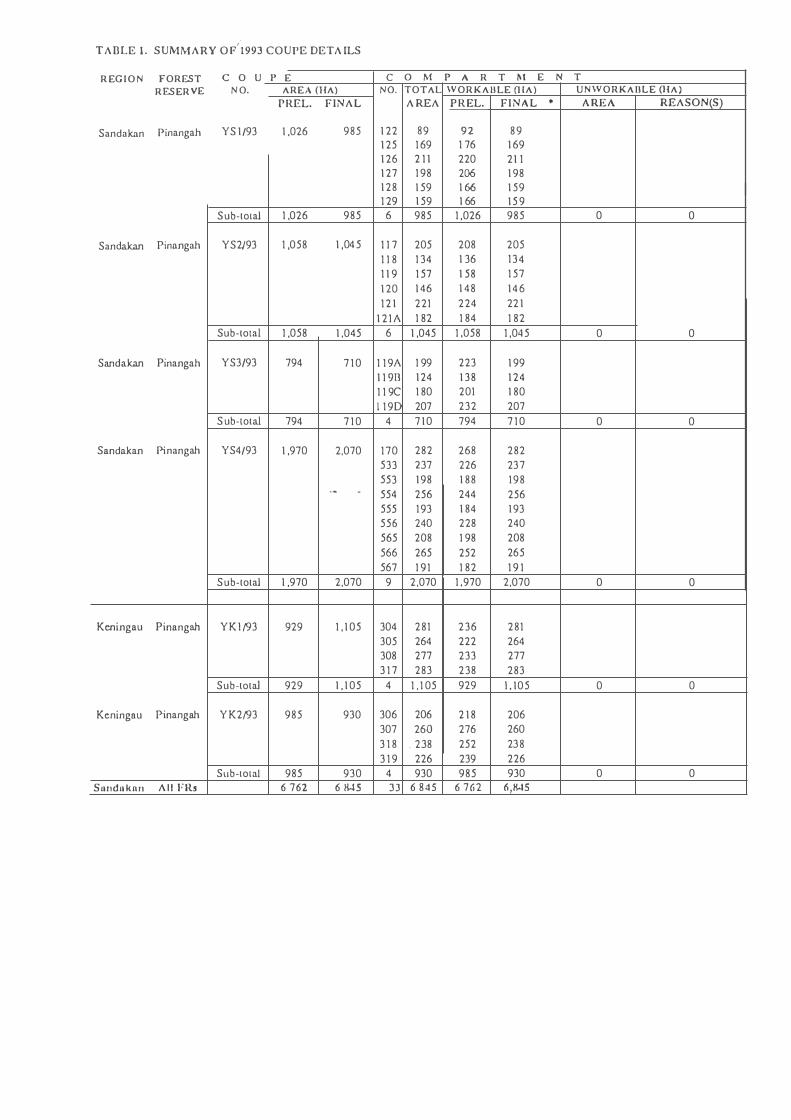
TADLE 1 . SUMMARY O F'i993 COUl'E DETA fLS
R EG I O N FOREST C O U P E C 0 M p A R T �1 E N T
RESER VE N O. AREA (HA) NO. TOTAL WOR K A U LE (! IA) UNWORKABLE (HA)
PREL. FINAL A REA PREL. FI NAL • A REA REASON(S)
Sandakan Pinangah YS 1 /93 1 ,026 985 1 22 89 92 89 1 25 1 69 1 76 1 69 1 26 2 1 1 220 21 1 1 27 1 98 206 1 98 1 28 1 59 1 66 1 59 1 29 1 59 1 66 1 5 9
Sub-total 1 ,026 985 6 985 1 ,026 985 0 0
Sandal<An Pinangah YS2/93 1 ,058 1 ,04 5 1 1 7 205 208 205 1 1 8 1 34 1 36 1 3 4 1 1 9 1 57 1 58 1 57 1 20 1 46 1 48 1 4 6 1 2 1 221 224 22 1
1 2 1 A 1 82 1 84 1 82 Sub-total 1 ,058 1 .045 6 1 ,045 1 ,058 1 ,04 5 0 0
Sandal<An Pinangah YS3/93 794 7 1 0 1 1 9A 1 99 223 1 99 1 1 9B 1 24 1 38 1 24 1 1 9C 1 80 201 1 80 l 1 9D 207 232 207
S ub-total 794 7 1 0 4 7 1 0 794 7 1 0 0 0
Sandakan Pinangah YS4/93 1 ,970 2,070 1 70 282 268 282 533 237 226 237 553 1 98 1 88 1 98 - - 554 256 244 256 555 1 93 1 84 1 93 556 240 228 240 565 208 1 98 208 566 265 252 265 567 1 9 1 1 82 1 9 1
Sub-total 1 ,970 2,070 9 2 ,070 1 .970 2,070 0 0
Keningau Pinangah YK l /93 929 1 , 1 05 304 281 236 281 305 264 222 264 308 277 233 277 3 1 7 283 238 283
Sub-total 929 1 , 1 05 4 1 , 1 05 929 l , 105 0 0
Keningnu Pinangah Y K2/93 985 930 306 206 2 1 8 206 307 260 276 260 3 1 8 . 238 252 238 3 1 9 226 239 226
Sub-total 985 930 4 930 985 930 0 0 Su11du k n 11 A l l FRJ 6 762 6 !W5 3] 6 845 6 762 6,!WS
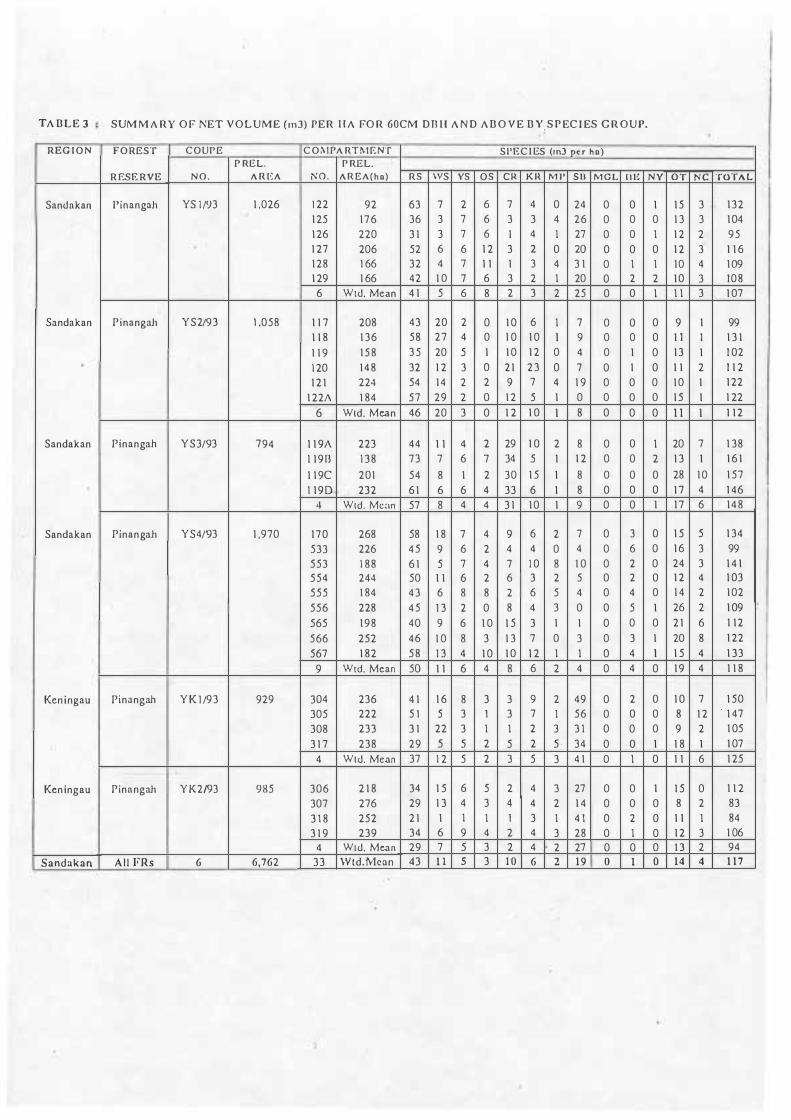
TA DLE 3 SUM M A RY OF NET VOLUME (mJ) PER H A FO R 60CM DnI-1 A N D A D O V E D Y. S P EC I ES C R OU P.
REG I O N FOREST COUPE CO,\ IPA RTI\IENT SPEC I ES (mJ pe r ho) P REL. P REL.
R ESE RVE N O . A R EA NO. A REA(ho) RS WS YS OS CR K R M P sn MGL l l 1' NY OT NC TOTA L
Sandakan l'inangah YS 1 /93 1 ,026 1 22 92 63 7 2 6 7 4 0 24 0 0 1 1 5 3 1 32 1 25 1 76 36 3 7 6 3 3 4 26 0 0 0 1 3" 3 1 04 1 26 220 3 1 3 7 6 1 4 I 27 0 0 I 1 2 2 95 1 27 206 52 6 6 1 2 3 2 0 20 0 0 0 1 2 3 1 1 6 1 28 1 66 32 4 7 1 1 1 3 4 3 1 0 I I 10 4 1 09 1 29 1 66 42 1 0 7 6 3 2 I 20 0 2 2 1 0 3 108 6 Wtd. Mean 4 1 5 6 8 2 3 2 25 0 0 I I I 3 1 07
Sandakan P inangah YS2/93 1 ,058 1 1 7 208 43 20 2 0 1 0 6 I 7 0 0 0 9 1 99 1 1 8 1 36 58 27 4 0 1 0 1 0 I 9 0 0 0 1 1 I 1 3 1 1 1 9 1 5 8 3 5 20 5 1 1 0 1 2 0 4 0 1 0 1 3 1 1 02 1 20 1 4 8 32 1 2 3 0 2 1 23 0 7 0 1 0 1 1 2 1 1 2 1 2 1 224 54 1 4 2 2 9 7 4 1 9 0 0 0 1 0 1 1 22
1 22/\ 1 84 57 29 2 0 1 2 5 1 0 0 0 0 1 5 1 1 22 6 Wtd. Mean 46 20 3 0 1 2 1 0 I 8 0 0 0 1 1 I 1 1 2
Sandakan Pinangah YS3/93 794 1 1 9/\ 223 44 1 1 4 2 29 1 0 2 8 0 0 I 20 7 1 38 I 1 90 1 38 73 7 6 7 34 5 1 1 2 0 0 2 1 3 1 1 6 1 1 1 9C 201 54 8 1 2 30 1 5 1 8 0 0 0 28 1 0 1 57 l 1 9D 232 6 1 6 6 4 33 6 1 8 0 0 0 1 7 4 1 46
4 Wtd. Mc:in 57 8 4 4 3 1 1 0 1 9 0 0 1 1 7 6 1 4 8
Sandakan Pinangah YS4/93 1 ,970 1 70 268 58 1 8 7 4 9 6 2 7 0 3 0 1 5 5 1 34 533 226 45 9 6 2 4 4 0 4 0 6 0 1 6 3 99 553 1 88 6 1 5 7 4 7 1 0 8 1 0 0 2 0 24 3 1 4 1 554 244 50 1 1 6 2 6 3 2 5 0 2 0 1 2 4 1 03 555 1 84 43 6 8 8 2 6 5 4 0 4 0 1 4 2 1 02 556 228 45 1 3 2 0 8 4 3 0 0 5 1 26 2 1 09 565 1 98 40 9 6 1 0 1 5 3 1 1 0 0 0 2 1 6 1 12 566 252 46 1 0 8 3 1 3 7 0 3 0 3 1 20 8 1 22 567 1 82 5 8 1 3 4 1 0 1 0 1 2 I I 0 4 I 1 5 4 1 33 9 Wtd. Mean 50 1 1 6 4 8 6 2 4 0 4 0 1 9 4 1 1 8
Ken ingau Pinangah Y K l /93 929 304 236 4 1 1 6 8 3 3 9 2 49 0 2 0 1 0 7 1 50 305 222 5 1 5 3 1 3 7 I 56 0 0 0 8 1 2 . 1 47 308 233 3 1 22 3 I I 2 3 J I 0 0 0 9 2 1 05 3 1 7 238 29 5 5 2 5 2 5 . 34 0 0 1 1 8 1 1 07 4 Wtd. Mean 37 1 2 5 2 J 5 3 4 1 0 I 0 1 1 6 1 25
Kcn ingau Pinangah YK2/93 985 306 2 1 8 34 1 5 6 5 2 4 J 27 0 0 1 1 5 0 1 1 2 307 276 29 1 3 4 3 4 4 2 1 4 0 0 0 8 2 83 3 1 8 252 2 1 1 I I I 3 I 4 1 0 2 0 1 1 I 84 3 1 9 239 34 6 9 4 2 4 3 28 0 I 0 1 2 3 1 06
4 Wtd. Mean 29 7 5 3 2 4 2 27 0 0 0 1 3 2 94 Sandakan Al l FRs 6 6,762 33 Wtd.Mcan 43 1 1 5 3 I O 6 2 19 0 1 0 14 4 1 17

A p pend ix 3 R a t t a n p l a n t a t i o n d a t a
C ON P A R TNE N T N O : 2 0 0 S P E C I E S : R S ' ' R O T A N S E G A C E NSUS CONHE N C E D : 0 2 / 2 5 / 9 2
U N P L A N T E D A R E A / S T ON Y / N O S E E D L I NG C E N SU S E D . : 1 4 1 3 2P A G E : I
D A T E : 0 5 AUG 1 9 9 3
C E H S U S R E P O R T
SUB - B L O C K : A
C E NS U S COHP L E T E D : 0 2 / 2 3 / 9 2
. 3 . 2 1 P L A II T E D A R E A I HA / : RAHG E R / HAHE : B A S A R T A R I B
I I P R E L I H ! HA R Y , ,
2 1 . 2 2
H E A L T H Y P E S T S / HO L E / HO E H P T Y / B U T E HP T Y L I N E H O R L A N T D I S E A S E S D I S T U R B A N C E L I F E S E E D L I NG P L A H T A B L E D E A D P O ! H T
I' r 4 2 2 2 0 I 6 4 5 8 · 2 J 9 5 2 4 0 4 I 9 6 4 4 8 1 9 I I B 4 3 4 I 5 I I 0 4 3 2 3 I 1 04 4 I l 2 6 4 2 5 0 4 I O 0 5 2 3 3 I 2 3 5 3 3 0 0 0 I I I
' 6 3 1 0 1 4 ) 4 5 1 3 0 9 5 ) 3 5 1 5 4 2 8 4 3 3 3 0 9 9 8 3 2 ) 5 3 6 1 4 4 1 2 2 9 19 3 ) ) 1 9 2 8 q 4 0 4 I O 2 I 0 3 3 1 2 4 4 0 3 9 § 2 9 1 3 6 I I 2 1 1 3 0 6 9 3 1 0 3 2 9 9
P L A H T A T I O H UN I T - L U A S O M G F O R E S T R Y C E N T E R - - - - - - - - - - - - - - - - - - - - - - - - - - - - - - - - - - - - - - - - -
COHPA R T H E N T N O : 2 0 0
S P E C I E S : . RS ' ' R O T A N S E G A P L A N T I NG D A T E : I I / 0 5 / 9 1 UII P L A N T E D A R E A / S T ON Y / S U R V E Y A R E A / HA / : P L A N T E D A R E A / HA /H O S E E D L I N G C E N S US E D H O S E E D L I N G D I S P A T CH E D
3 1 . 0 0 2 1 . 2 2
I 4 1 3 2 3 1 0 0
P L A N T IN G D E NS I T Y : 6 6 6 P L A H T I HG S P A C I N G ( N J : 2 . 5H X 1 2H RAN G E R / N A H E : I B B E H HOB I N
P L A N T ! t G R E CO R D R E PO R T - - - - - - - - - - - - - - - - - - - - -
SUB - B L O C K : A
2 . 2 1
CON T R A C T O R : S O O N ' ' S OO N S A N G P LA N T I I/ G CON T R A C T O R R E P O R T D A T E : 0 5 AUG 1 9 9 3
C I R C L E W E E D I NG F O R T H E U O N T H O F 0 9 / 9 1
COHP T / N O S UB / B L K C O N T R A C T O R · R H O D�R . ca�H I T A C T U A L P L l �
2 0 6
2 0 6
2 0 6
E
G
Ii
S AWANG D E V E L O FH E H T S DH 6 H D
P EHBURONG /WR/I !
A J UKO S O N . B H D .
0 9 / 9 1 0 9 / 1 1
C 9 f 9 1 C 9 / 9 1
O y / ; / 0 9 / 9 1
I 0 0 I O 4 I 2 0 I O � I I l 9 8
I O 2 9 5
1 0 6 1 4 1 I O 4
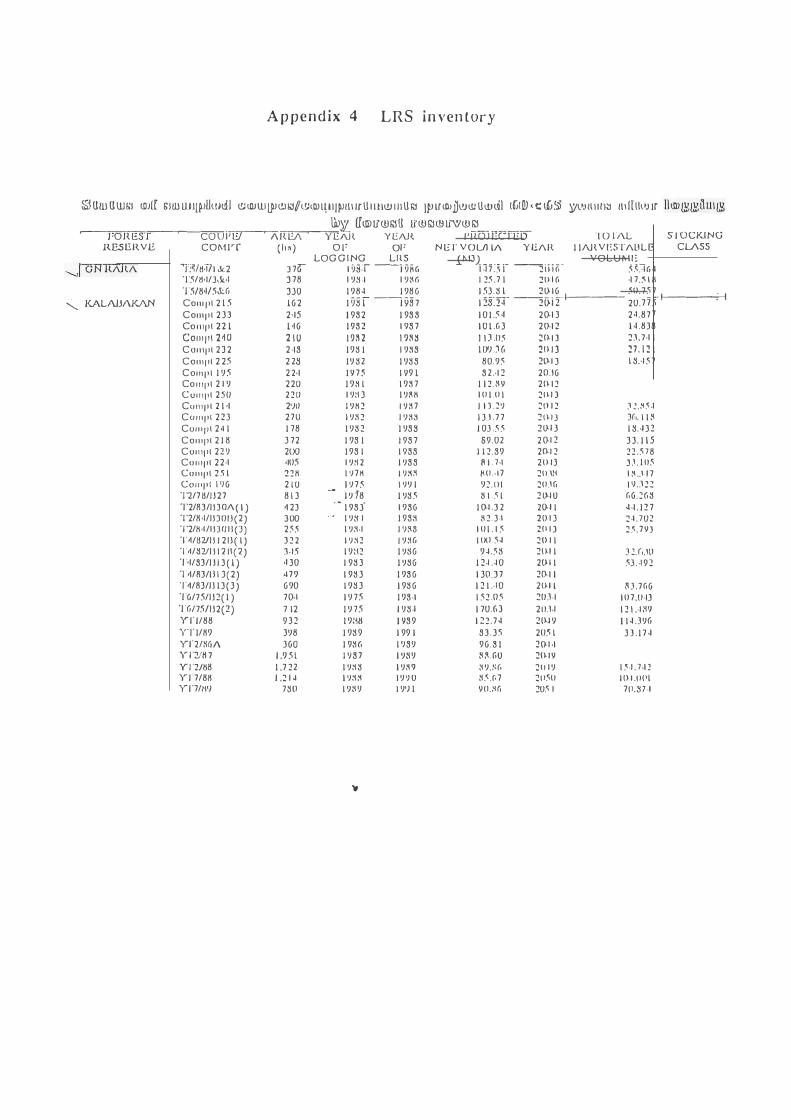
A p pend ix 4 LRS i n ven tory
�Uill UW!.1 uvlf r;1w w1lJlUillcil (!)\OJW [JH!l1.J#i.r.:,ru4u1�1t1 1r U 1 1 1 1w 1 u U 1:J J� lf \O.IJJVrn: UwciJ t6itID < t: t6i� :ii'l'Ja1 1 1·1:1 1u l[lt,u 1rlli)l IT@uwsill li'WSJ© tJ\i'W��-�F=o�R�E=, s=·T�-�-=c=o�u-·1�,r�,1 ��-11.-·1�t-0\-��Y-E/\Jl Y E/\Jl l' 1t=o�J �E-�c='1"·E'�D� TO r11.L
RESERVE COMV[ (h , ) O F or N L,T VOUl l./\ YE/\Jl 1 1/\JlVEST/\ULE LOG G I NG LllS (MJ) _ _ __ __ --· · · - · VOLUl\ l l i
,.i.�/8:V l &.2 ) 7G 1 i)ij:1 --i iiiic, 1 ,1 7 . .� I 2 1 � 1 (, � .nc,4
S l OCKJNG CLASS
'1 '5/8•1/].lt•I 3 78 1 9:l -l 1 9:16 1 25 . 7 1 W I (, ·1 7 . .� l HT5/8•1/5J:.G JJO 1 984 1 986 1 53 .8 1 WIG , _____ 50.7 .� 7 __ , ____ ___,Co111 pl 2 l 5 ! G2 1 98 l --l.Y87 l :!3°}4 --201 2 20.7 75 " J(ALAJJ/\.K/\.N Co111p 1 2 3 3 2•15 1 932 1 933 1 0 1 5 4 20.1 3 24 .877 Co 1 1 1p l n l l •I G 1 93 2 1 93 7 I O U, 3 2().1 2 H .8)8 Co1 1 1p l 2 �0 2 l 0 1 n 2 1 9:1 8 I \ J . I J5 W, I JCo1 1 1p 1 2 J 2 2 ·13 1 98 1 1 '183 l ()') J (, W I )Co1 1 1 J 1 1 2 25 2 23 1982 1 983 80.95 20..I JCo111 p 1 1 95 2 2•1 1 9 75 1 99 l 3 2 .·1 2 20.lGCo l l l f l l 2 1 9 220 1 9:l l 1 98 7 1 1 2 .l!Y 21� 1 2CO I I I J 1 1 2 5U 2 20 1 11:l J 1 9�H 1 0 1 .0 1 2 1 ( 1 )Co1 1 1 p 1 2 1 •1 2'/ll 1 9H 2 l 'J :l 7 I 1 3 . 2 '1 20 1 2Cu1 1 1p l 22) 270 I n 2 I 'J:lS I ) .l . 7 7 2 1 � 1 )Cu1 1 1 J1 1 2 4 1 1 78 1 98 2 1 938 l OJ .5 5 2lJ..l JCo1 1 1 J 1 1 2 1 8 3 72 1 93 1 1 93 7 S9.02 20.1 2Co1 1 1p 1 22 •1 200 1 93 1 1 933 1 1 2 .39 2�1 2Co1 1 1p 1 22 -I •105 1 9 :l 2 1 933 H l . 7 ·1 2 1 � 13Co1 1 1p l 2 .� I 22H l 'J 7K l 'J:l:l �0 . • 1 7 21 1.1:lCo1 1 1p 1 1 11 6 2 1 0 _ 1 11 75 1 •19 1 92 . l l l 20.1 c, '1'2/7 U/J J27 8 1 3 i 9 18 1 985 S U I 2 lJ..l UT2/83/I J JO/\( I ) � 2J · • 1 933' 1 936 1 0-1 .3 2 20.1 1T2/8 •1/I JJO I J (2) JOO · • 1 98' 1 1 93:l 8 2 . J ,I 2().I JT2/H�/I J 30 1 l ( J ) 255 1 9:l,I l 'Jl\8 1 0 1 . 1 5 W I )T�/U2/I J l 2 1 l ( I ) 3 2 2 l 'J:l2 1 9:l(, I IXU4 20 1 1T�/32/I J l 2 1J (2 ) J , 15 1 9:12 1 936 94 .58 2(� 1 1T•l/33/I J I J ( l ) 4 30 1 98 3 1 986 1 24 .4 0 20,.1 1T�/83/1 ) 1 3(2) 479 1 98 3 1 936 1 30 .37 2�1 1T�/83/l l l J ( 3 ) G90 1 98 3 1 986 1 2 1 .· 10 Wl lT(,/75/I J2 ( l ) 70.I 1 9 75 1 93 ,1 1 52 .05 '.!OJ-ITG/7 5/IJ2(2) 7 12 1 9 7 5 l 984 1 70.f, J 2 1 1.l-lYr l/88 932 1 9:lB 1 939 1 22 . 74 W-IYYT 1/89 398 1 989 1 99 1 33 . 35 2(1.� IYr2!H(,I\ )GO 1 9�6 1 '139 9G .3 1 2().1 ,1Y J '::>..IH 7 l ,9 S l 1 1137 1 9�9 11 ,H,U 2(� 1 YYl '2/tl8 1 ,7 22 1 9�8 1 9:l? :l 9.�f, 2 1 1 1 9Y 1 °7/88 l .2 1 4 I 'J�:l I 9 9 0 :l5.(,7 2 1 1511Yl'7/ll'/ 780 1 9:19 I 9'J l YO .,% 205 I
"
2J . 7 ·1 I 2 7 . I 2 lI 8.·1 5 7
J � ., ., -1 )(,, 1 1 11 1 8. -1 ) 2 3 3 . 1 1 5 22 . 578 ) ,1 , 1 1)5 I , .. H 7 l 'U ! 2 C,G . '.!(18 4 ,1 . 1 2 7 2UU2 2 .S . 7Y)
J !J,.10 5) . . 1 9 2
H7CiG I 07 .11·1) 1 2 1 .·1 ,W 1 1 4 . 396 3 ) . 1 7 4
l .' · 1 . 7 ·1 1 1 0 1 .l lPI 70.� 7 - l
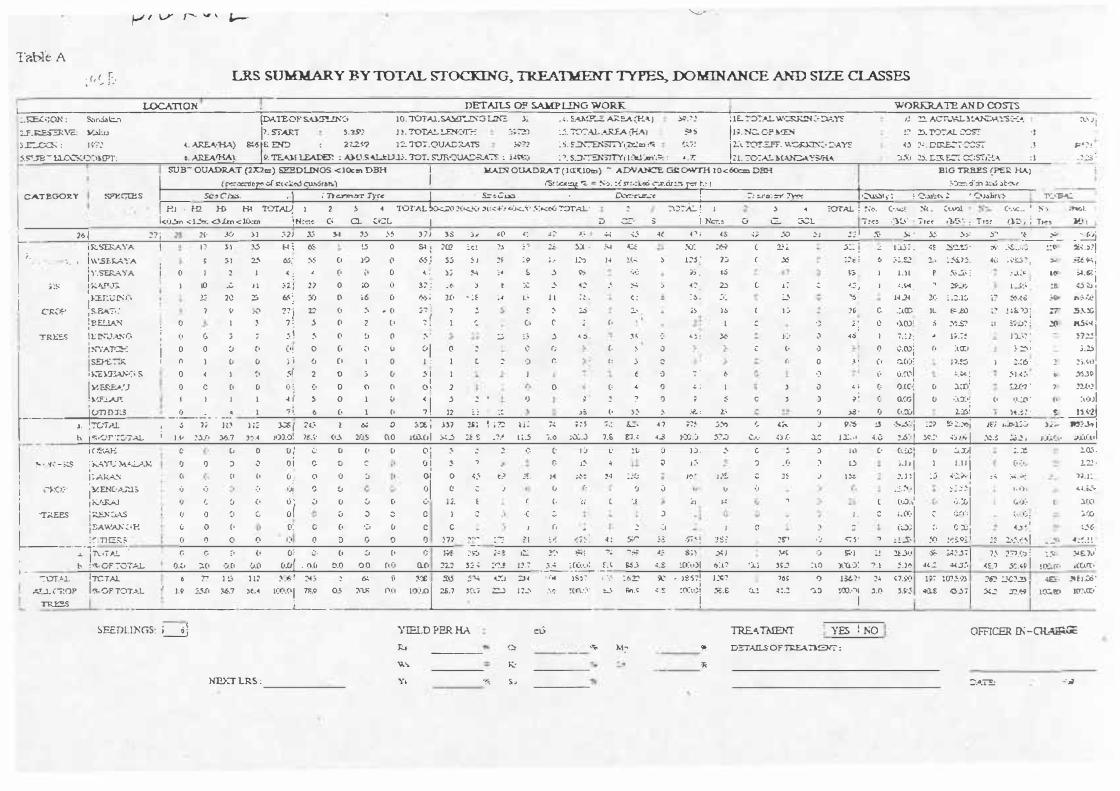
,..., I l...Y ,-.. " \ '-- "--'--'
T?.bfo A �_r, � E· LRS SUMMARY FY TOTAL STOCKING, TREATMENT � JX)MINANCE AND SIZE Cl.ASSES
LOCATION DETAILS OF S,AJ.{PL!NG WORK WORKR.AT£ AN D COSTS L---------==.::..:....:..:::::.:..:. ____ �-----�----------':.:...:::C-=----'----=-=-==------'------------+------------:.,;:E.:<;ON : S.."1r..ill�1
Y-'1"-> {DA.TEOP S..UT...I.K-c; 10. "J'OTAJ..�..2).:3 1..:N=: }; ., . S,•.MY....C: �!:.A (E.�J �.02 ; IE.. ,0".'.•.L W•::::RK:N:0::i.:.YS 1! � ACT .... �!,��.:�:s:::-: ...
!7 :!5... 1'07.Al.. � :-i_, J i
U' .. =""'3:\'e: 3r..,ca..; : ] Vi':
17 �•�T 5 -> �> J I """'T.'" • =·�- - -�, . , �,-,, .��. =-.· <:., < 1 1 · �,- rp ,� . � •......,..,_ • .:...>-.
-· �v r- _..c.;,1'-'.1 :: .,;� • --' _ _.:.. • - - -�- -'-IJ'\. :,r_ .1 • .J 71'. �''-- -· a·..L.;:"
<. ARE.�·�) �-S tE;. I:ND : 2i'..2.1-? ) � 107.QUAC�TS ;;..;-72 : s. ��'"':"'D\-sI7I01_2Y1rr(:� (;,_/� ·
1l."1. !D!.;.FF. \\":;-�:- �1AY'S 0 '." . DJJ:.E.."7·�37
'l.'.\:1 :!..\. L:3:. E-"-:- C:::;STJ:-'..�
·! J : !
J='- � !
55·,.re- u.r.:,__-;.:_,::,:,HPT: o. AllEA(HA): j9. TE.",J.! � : �ll.S.-\l.J:lJ.Ll. 'TOT. i,JR•:,uAc:-�.O.� : ;i�.::, : �. s.:J-�,rtYf l :)cl.:m:,<:::- : , _;,:- ,21. ,O:'A!. :bt.Ur..A:'SIH ... . � ..:.s : SUB- OUADRAT (2.X2m} SEEDLDIGS <lOc,n DBH I l.!.AI:N 01.lADR.AT (ICIIClOao) - ADVAN:::E ra: OWTH 10<60::m DBH BIG TRRES (Pf:!;: HA)
_:..:,=:-, -d"=h l!'.� .it"=',
I cm=•Y SF'EqES I (f::��r c( �(. .... �� 9:1:•,drb�) I i"S! :.r.:_�_·:?f�_-:._=_�_-,_. _:{_
· "-��:1_00_·_,-�:r_._cir_:_:.�r:r---,
�_.,_, ______________ -1------------------Sa., c�. ,· · l { n�!IT 1)1c:..: l · : s:-�c� . · .D.:c;-t"'...JT-'"'c: ..
! ':: !:..J�a:·!:'l' � ,.�, �· ! : �.lJ!.:.t\. � ' 0J.ilirv� 1':JB� � H2 H). H-1 'I{)TALJ! l 2 � -4 'IO!'AL ;O..:...."\J 2'(1�\f ;,L:.:--1:_. �,:,,_;;·· !-:,-..:OU �Al..: :'! :-C:'£ � J .) " !OTAL ! :;o. C·.'-ci �( . k(l5'n , l5'r-. <3.lM < ).(>:m
.? He-:,-:. C• Cl. CCL I ,) CZ· S ·1 N=., G C::. :--.:;L J:c: ,)�· · Jte<"
(t.V.U. ,),�' '.· : T,:t
(•.•.c. •• I � :, (l�· i i T,�:.
.;�I.
.:J'Yr
�· I i
26 ) 27 ' 2l· :�, >1 :,.2) .'> '4 :,5- _,5 3 ] J 3$ :i .. · ,0 '� .; ;- J.:. � .;5 ·U .p ; �S .;; XJ .)J .!'.; I 5:· > · �. �;.: 5:' ��:_ - �
4, . ,
;;�
CR(,;,
TRl:.::S
i R.�LRA.�'A I I ) S ) � � � & t.S O 5-1 ·; lW :.c! )J :• 2£. �jl · :� <\:.� V.. ;.t:,:J C 2_;� :r.:: i .i.. l :.U i . '1f =so::.!J · S· -� .. =::; ::o ::i.� .:i?I I ' ' '
I \VSf..��·A , � 3) 2.-\ �� �5 CJ lO (l �5 j S.J � J 2f :9 ; _. 1� H !(.:. ) l:'$ i 7-:,. ( � ;;-c ; 0 :,�.� !., �5':i..>�. 4(i :�•::..:, ; : .:,.;., .F�.� 1 I I ; I Y.SE.R.-',.YA ! (I J 2 1 < ; , (, ,, 0 ( : ); � ,, � .} 9; '�:, 1; . tS I'> . l l . l l F .\,..'.,., : .-.. \:• It! ,-1.t» j 1 �.t..!',J;. l lO -� J l :,2 J ,1 0 ;o (t 3-7 .: .t. ) t :C _, ·C· ., ::,..:. > -1� . 2.::,. (. l � .:. ".-:: 1 J .:..Y-1 . "" �...)J LJ'.� :t.. -i:5 � 1 � }.::E.f..-CN1:; !t 20 Z> 6.'- � :/J O i6 0 �� : l(, ... :f :-' 1.:. l l :! . ( : : � . .:,� �' '5 J.I � 2J:. : .:...1� i.? �.(<> �� �7-/Jt l ! s..p,;,;,-; : l � ;.:, '.n) 2:2 (J :> • (o :;-, ; 7 ! f. � :.S :',.., . ,> lS C 1 , ?G (. .:,a:; IL �_kl) .� ! :!,: 'J i � .5.\:C ; BE!.1A"{ : O I � 7 :_ 5 Cl 2 l• ; ; I ( C, (' ;- (, l C ·) -< '. () •).(\)' 5 Y;�: ii ;-;-;:,� : .!(I 11.i,� -
1 \l,;�._1.�',;'('1 : 1) (> 3 ; ) ' � (' � (l ;°' ' ;j. ;:.. .) L � . :, � •:• '- � : X°' J·:: ,) ,c._j ' J ";, : } : J l;t.:� J )..\:' : - �7�
1
\ !\l"A�: j O O � {1 (•! 0 (1 '7'l (J Gi J (\ � (': (; (. � 0 i (, ,) 0 ,\roi (1 :lOJ :, � , 3.2:>
i sEH::-:i;. 1 n J u C, ; i (J Cl I O J : I t : ·) I'.' r: :, C . (, 0 _, . (, C.(,): P.t:; 1 :.:6 · ? � •. �,l
l
, ,-.c:�T:.,>J,;,:; s o < 1 �· s( 2 o :; er � 1 1 J f :) � � -� ,. u.,d :."'- : :- 1 < :, , �.3� • I I ; I Y,E..r:;;B>.'J O C (1 (J O ' . • :, 0 () () O ! 2 0 (, < 0 � : L ) J L ; (, 0.lC•; Cr 1::er: :;.u-i · ' �U•J . ).�Fl.AP: f , 1 1 -t l � o 1 '-' < \ j � • 'J � � : o ; s o , ., � 1 C= o..:r; I o ,:LJ.•: c, •.1 . .:!l · t 1 : .. oJI I ; I
' , .;. 1.,I �TI U·�, r, . , l r '. t, (, l c, 7 , 12 ; ; :� ,� (• >� � .,r. , :t, 'J � - 0 C•.::U 2.:Y>! 1, 3 ; · ��
r---- J. , , (;'J'rl. I ---�-:;;-• 1i; l l� J..:;6 ( 2.(.' 2 6,;: � :,x : j.}7 !£: 1 i � l i � ;� ; : 1 -;,: u, -4 7 ;-:� j� � ,A ) 9,"'5 · !J -�-5-::J �:� �· 2..'."'>! l'fi "'-:0,1:.:, j:l;,.. �?�,,. j
I t\ J_�·OT' ':-.:J7AL i u, :'�D 3'5.7 3':·... Jl)).O� 1t.�· (1_\ 1(J_S C\O j{.l.).(J j �� � � :�.f l L.5 I.O ;V.:, . .) J.6, £1 . ..: -4...3 1,X;.J 5:.:J C..t.· :..J r.. .lC JJ.:.., 1 . 4.0 �.0::1 �.:' ..;:, ,_�, .\:!.� :: .• .L� i 1:);.tJ... ;JJ.'.l(.ll l
I j ( �,A}-:: C (J O £J ; i.; 0 (1 (J 0 '
1 :-,. � 1 ,:-. (· I J (· !(; ;J ) ) . � G ! :) I ll C· c-.xj (J .:...J..11
' . ' � · 'h· - =-�.s ?;,_.;,y1..: M.LV..h� o o ::, ,:-- 0 1 c -o c o ! � .., r. 1� -. o 1 �, :> . (• ) t5 j_J J I 1 1 .u 1
I 1 · • J.:._A._'. (I (I (1 C, n O :, r.l O .( \ t.:> :r. J4 . , ... ,,:i · :,, ,.,..� J '"' ""= -:< :, ) """ , ) .. ,
· 5 ..;-' ;,· · I
! c�:o:-· ii�>{C·-'�"'-1; ,; ,:, �- ·�i � � . ;1 .: ; � -- - '' ''. : . ·:� J : -� : -- - ,�'.�'.
, - ���� i
I ! "-'� fJ ,.. � (1 U / .J U ..J (, t...' u. E ( (. !i (. .E Ll j.. , ( (i;),:. •;."L I "r..:.J::£S j ;:J:.}, :;.� fJ Q � e, 0 I ;:, :> � C l � {. ;; J J . : ',('(, I � ,:,.<,,
I 1 :-AWAJ-:;E 0 o c, o; c c, -:, c, c c , r, • . : ::,
. , � ) : · ,c:>; :, r; :i::
1
� ; ,:TIER, 0 0 0 0 I) 0 ;) (; 0 I) · in •..• ,: : I '" -: ,:· . � ! 5":' .;., .,-< ! 1S: �.. ,; '-.l ' , ,�5' X, !¢::0. 1
--·�-lT'u1.o.!.. ·. 0 a::- r1 (1 o: ;:. c, � r, c 1.;.e, ::;; ;:.:t .� :?'°:' �l � �� 4_: s;) j; J �t :j s:;,J I! :!.£J(1 .� ;Ji�_ji' J
' h � % 0F :'07,t,.L OJ.J ::.o .,.o ·J.O (11!( . 0.(1 !:1.0 0. 0 [1.(1 QO �L::! 5� .;. :"':'.� t'.� -���-(-� .!� S.S.J .;_£ :..0:1.1)1 6J.7 ').j ,�� :l.O )tU:J'. ?.l �.l� .u...1 4-(.J:, I ·
--:o-r.<.1. A!_.l_ {r!OP
TR.e5
ITCT Al. ti T7 1 !..:.; l l� ,'.\·)�; ! � :, � 6!. f1 �<1: .S:tj �"l..; 1:-(J 7-},( I 1·� ]$� :' ! -�·· :62::' � , )�'57 ! J�·:' '0> ') J3t,:+; ::!� <7.!)(1 J 'Jl, OF T·::n.�.L 1.9 J_S.[r 'J.(,.7 �C-� l(('.(\! 71;.0 0.5 7,u; 1\(1 10)..01 2!i.) �(ci 2:!..J 1 :_, .\C· '.(O:Y w ""·' <.� :r:>:,,�1 Y..E fJ.! � :-� ��:i l00.·"
; ,.i:i �ss
---'-------- ______ 1.__ . .
B; •O..S
,Cf.'5:}) 0.},j
!.;
;. :e (• -:• ..
:""' . .;i:: 1 . 1) :
( .. ,,:, \ ... :i:. : <t.J � '.
:.: �'.:\r: � J J_\ �7J.(:J :
5� .• � I -<£.1
"'IL'"\ -;r, -n ave - - - � , �-= X..f-:9
[
_:_,.,., :�-
!�.:..ff• .;£:i,.
1tc..ro
!.05, .
12: · ,�.1: 4�.t>...'· ),[() A:.o
:5� -t;�. ! �
:,,E.)v' ,Cua:(
:!'1�1.::.0 ' ICT:,O::•
.-- , �EEDl.l}:GS: i--3 YIE1..D PER HA ru TRE."',ThlBIT YES ! t,;O OFFICER IN-Gt��
NEXT LRS :
J:;.,
"'" Y,
-----
-�
Cr
Kc
S.,
------------
'"' M� 9' D'.:::T AILl' OF n:.EA:lSN,' :
"' �.A.T£: .· ..
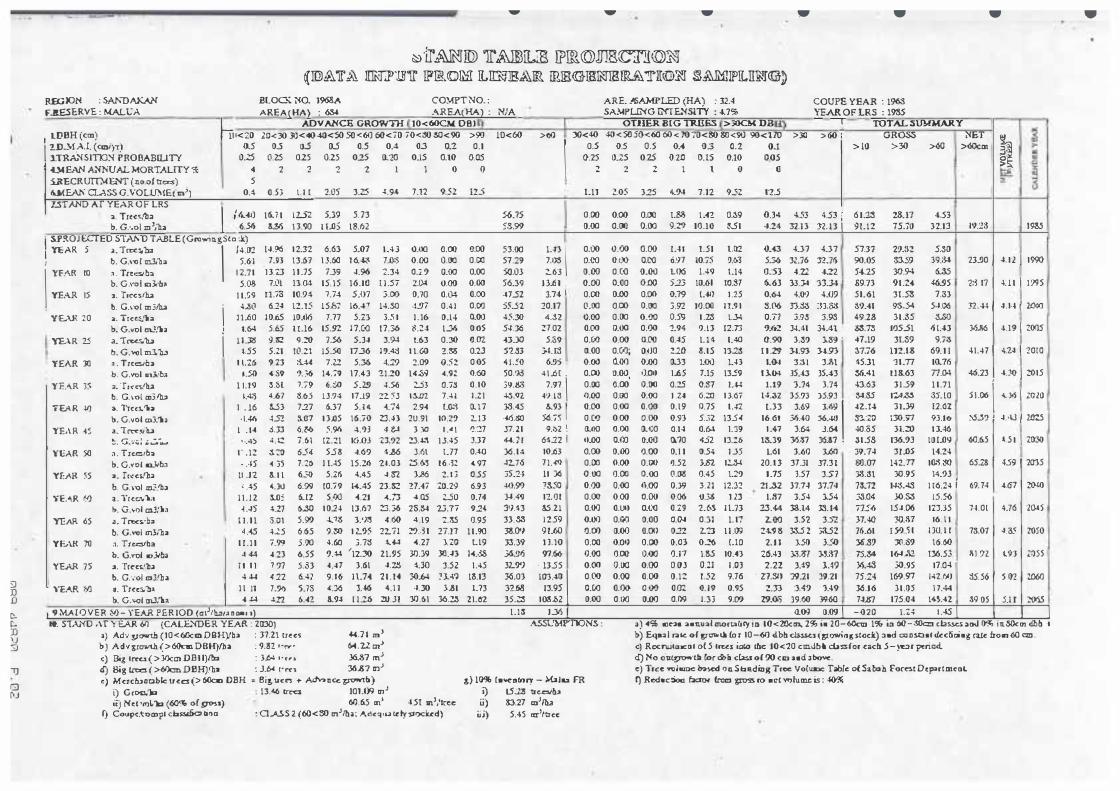
SJ D D D. e:.. :0 \J :s:,
,:J
G) �-J
R.EGJON : 5MTIAKAN F.ltESE.RVE : MALVA
- - .... • •
� 'lr �ill) 1I' &IB3ILlE IPfil @IBCT!I (Q)� (illlA'IT'..& rnJ>l�'1I' lFffiJD!M lLJThJJR�ID. ffi!E@IBWI8m&Y1I«J>� ��lf'ILIIi1I<rn)
BLOCK .iO. 191S8A CO:MPT NO. : ARE . .O. SAMPLED (HA) : l.2.4 COUPE YEAR : 1963 AREA(HA) : 6M AREA(HA) : N/A _ SAMPI.IHG INTE...'fSl.TY : 4-7% YEAR OF LRS : 1985
•
i LDBH (cm) ADVANCE GROWTII 10<60CM OBI OTHER BlG TRilES >30CM DB - �- - TOTAL :SUMMAR.Y
� •<ZO 2ll<30 3U<40 40<50 50<61l 60<,0 70<� 50<90 >90 10<60 >()() J0<4-0 -$0<:5050<60 60 < 70 70<80 80 <90 90<UO >JO > 60 : GROSS i'<ET 0.5 0.5 0.5 o..5 0.5 0.4 OJ 0.2 0.1
l
0.5 0.5 0.5 0.4 03 0.2 0.1 I > 10 >30 >® >60c.m ,.,ff: I
2D.:,,!.AJ. (cm.I;,) l.TRA.-...SITIJ� PROBABIUTY 0..1:5 0.2:5 0.25 0.25 0.25 0..'.10 0.15 0.10 0.05 0.25 �.25 0.25 0.20 0.1:5 0.10 D.O.S
1 4...\4EAfl A.'fNUAL MORTALITY � 4 2 2 2 2 I l O O 2 2 2 1 l O 0 5 :iRECR tJTD{L"l'f (no.of tia:s)
I U<E.AK CT..ASS G.VOUI'.>lEc'm;J 0.4 0.53_ ._...:.:1:.!_ l.STAND AT YEAR OF LRS
2.05 3.2:5 4.9-4 7.12 9 . .52 125
,. Trc�sto� I
.{6...fl) 16..7 1 12.:>"2 5_3� 5.73 b. G:.ol m';h2 6.56 3.M 13.90 l l..O� 18.62
j Sl'!WJ £CTEO STM l) TABLE (Gro....;ug Sta ck)
I YEAR 5 >. Tn:c.,,ha
I
/4.02 1 b. G.,-a t ailiha 5.6-1 I YEAR tO , . _Tw:s;t,, · . 1 2.71
b. G .,'Pl m31b• 5.CUJ YEAR 15 2. T,�:silu 1 1.�9
. b. G.,'Ol m 3.i!u .
1 4110 YE.AR 20 �- Trc�'b l l..60
YEAR 25
YEAR JO
· YF..".R 35
rl:AR 4/J
YE,\ R ��
I Yl;AR 5(J
Yf:.AR �5
. 'iE.�R M
YEAR 65
b. G.vol cn:!,'lia I 1.64 a. T roc.s.1u
\ 1 1 .:Rl
b. G.�l ail."h.l 1 . .55 :1 . Trcc:::sJC;1 b. G.v,:,I ,nJ/!» a. T,«s/lu b. G. ,ol m3./lu a. 1'rcc>.'li3 I>. G.sol co.J,'lia a. Tm::1ih.i �. G�-.·.;;! ,;i.:.,'".1,1.J il . T1e.otb� b. G.vol n3/ba 'll. r,�c.s./b� b. G. ,-01 m].'b3 a . Trcc..v'\:1 l>. G.,ol a,J,'lia •- Tn,c�·ba b. G.YOI m3/ba
l l.26 1.50
1 1 . 19
l�.91:5 12.32 6.6J 5.07 IAJ (U)() 0.00 7.93 13.67 U.l'.JO 1 6.� 7.0S 0.00 0.00
·nu . 1 1 .75 7_-y, �.96 2.34 o.:.9 o.oo 7.0i IJ.04 15. 15 16.IC ! J S7 2.1).t 0.00
11.73 10.94 1.14 5J)7 3.00 0.70 0.04 6.24 11.15 15.I,, 16.-4� 14 . .'lll �!J7 0.
41
1 0..iiS 10.d<S 7-77 5.23 3..� I l . 16 O.H 5.6.5 l I.16 15.92 l 7.C,O 17.36 �.24 1..36 ':l.!2 9.� 7 .54 5_3.i 3.94 l.63 0.30 5.;'.1 t(l.21 15.50 17.36 l ?-4-l I L.GO 2.36 9.23 :i.44 7.U 5.36 4.29 2.09 0.52 -4.S9 ?. :;6 1-4_;9 17.43 11 .20 14.::,-, -4.9� 5.6l 7.7'> 6.:50 5.29 4.� �3 o.,.:s 4-67 �.65 LJ.?4 17.19 Z2. 53 1.$.112 7.41 3....53 72.7 6..37 5. l 4 -4.74 2.9-« LO.i �5l :1.IJ7 l 3Jl5 16.70 !J.H 2U.91 I0.29 �.JJ '5.M 5.91\ 4.?3 4 .t-l 3 JO 1 .4 1 .1_.12 7.61 r.:.21 1<u1J ·nn 23.-'-, U.45 .1.W 654 558 .J.69 4116 Ht U7
0.00 0.00 0.00 0.00 0.00 0.00 0.00 o.os 0.02 0.2J 0 .05 0.60 0.10 l .1 1 0..17 2.13 l):!7 J.37 OAO
7."26 l !A5 15.:!41 '21.03 ZS.M 16.-3� -4.'17 6.� 5.Z� 4.45 .J.3"2 31!6 2. 1 3 0.55 6.9\J !0.79 14.45 23..:l;Z 27.47 :;:0_2':l 6.93 6..!Z 5.00 -4.21 -4.:D -'.05 UO 0.74 6M 1 024 13.67 �-36 2S.� 'D.77 924 5.99 � 1.-S J.•X, 4.60 4.19 2.� 0.9.5 6.65 1.ro 1 2..<>s 21.11 �-·" 21.n 11 .90
5-6.75 5S.9?
t.11
0.00 0.00
1.05 325 4..'M 7.12 9..52 t'.?.5
0.00 0.00 l.8l\ l ..f2 0.39 o.J4 4.53 4.53 r 6 1.'.lj 2&.11 4-53 0.00 D.00 9.29 10.10 �1 -1.24 32.n :n n 1 9u2 75.,u 32.1:i
53.00 l.fl
\
0.00 0.00 0.00 !Al 1.51 Ul2 0.-0 U7 U7 57.'37 29.l\2 5.SO 57.29 1.re o.w o.oo o.ro o.97 10.75 ?.OJ 5.36 3L76 n-16 90_05 SJ.59 39.� 50.0J �63 0.00 0.[0 0..00 Ul6 1.-+9 l.H O.:'H 4.22 4-22 H.25 30.94 li.35 56.39 I J..61 .· 0.00 0.00 0.00 5.23 !Ml 10.87 6..63 l3.J4 33.3-4 69.73 91 .1.J .io.95 -H.52 3.74 I 0.00 0..00 0.00 0.19 C.�l 1 .25 0.� 4.1)'} 4JJ9 51.61 31.53 7.33 55.S2 20.17 0.00 0.00 D.00 3.92 JQ.00 lt.9 1 :l.!.'6 :n.� :n.s.s �?.41 %.54 5-1.06 45.:30 4.S2 0.00 0.00 0.10 D.59 I .� 1..34 0.77 3.9� 3.9S 49.28 31 . .SS· ;s..SQ .5-U6 27.02 0.00 D.00 0.00 '2.94 9.13 12.73 ?.<,2 34.41 34.41 l!:S.7:l JIJ5.51 6 1.43 U.30 5.39 0.00 0.00 0.00 0.45 1. 14 1.40 0.90 3.3? 11!9 · 47.19 31.S9 9.,� 5'.1.�3 3-U:l 11.00 0.v'.l! O_tjQ Z.20 8.15 132.S ! 1 .2'1 34.93 3-4.93 �7.76 ll2.1S 69. 1 1 41 .!0 6.95 . 0.00 0..()() 0..00 0..33 JJJ,) LH 1.0-I 3.:U 3.l\1 45.31 11.77 10.76 50.'M 4 1 ..6 [ . 0.00 U.00, •J.011 1.65 7_15 1359 B .IH J5AJ 35.43 36.41 1 18-63 n.04 39.113 1.rn
\ o.oo o.oo o.oo o.:!5 o.S7 1.� l.l 9 J.74 J.14 43.63 3 1 .59 1 1.11
4-.:1.n �\1.11! 0.00 0.00 0.00 1 .24 6.;:o 1 3.67 H.32 35.!T.l 35.93 M.� l�.M 35. lO :i.,.45 t...93
1 0.00 0.00 0.00 0. 19 0.75 1 .42 1.33 3.69 J.�
I 42.?4 JI.JI) !2.62
-415.IIO 5<1.,5 O.(".l 0.00 0.00 0.9J 5 .• i2 13S4 16.61 315.40 36.-'IJ s:i.:;:o 130.>7 HI<> 37. 21 9.l>2 ! 0..110 0.00 0..1.:0 O.H 0.6-4 1.39 1 .47 3.64 J.1$-4 -IO.a5 31.ZO l l.46 �. 7 ! 6422 I 0.00 a.r.o o.00 0.70 452 IJ.:'.6 llU'9 �.37 J6.&7 : 31 .53 136..93 IO!Jl9 J6.14 10..63 0.00 0..00 IJ.00 0.1 1 0.54 D5 L61 3..6() l..60 39.74 3!..0S 14.24 �1.76 71 .¢ 0.00 0.00 0.00 �.5"2 3..62 1!..H 20.I J 37.JI 37.31 60.07 142.n 10-i.&l 35.2-i JI J6 0.00 0.00 !l.00 O.IJ!I 0.45 1.29 1.75 3.57 3.5] J.3.31 30.95 14.93 4'1.9? 7S5a o.oo o.oo <1.00 o.-y, 3.21 12.J2 21.,32 37.74 37.7-1 n.:n 1.i;s_..;s 1 16.24 i 1-H'J 1'2.0 1 0.00 0.00 0.00 0.06 O.:lll JD 1.,,1 J.54 1.54 33.04 30.S:S 15.� :J•}.43 &5.21 0.00 0.UO a.co o.:;:9 2.M I L73 2J.44 38.14 33. H 71.5-0 15.J.06 123.35 33.s:I 12.59 O.tl<l 0.f.O 0.00 O.� 0.Jl 1. 17 2.00 3.52 . 3.SZ J7.40 J0.117 16. 1 1 311.0\I 9 1.60 o.oo o.oo O.Oll 022 2.21 1 1 .00 z� <J S 33-5 2 :;.uz 1�.01 1 59 . .5 t nu. 1 1
YFJ\R 70 a. Ttedba
k4.5 1 .. 16 • l..f.6
I . l-4 , . .4)
, . . 12 · -.·15
ll .11 ' .45
1 1 . 1 2 � A5
[ 1 . 1 1 H.5
1 1 . 1 1 � 44
05 3. 1 1 oo UI� 4.11 3.01 L!S 7.99 -'.23 "7 'J7
5.00 6..55 5.,53
4.1'.JO 3.7::s :1.,1..; -4.27 120 LJ9 33.39 n10 o.oo o.oo o.oo o.o:; 02t. uo 2. 1 1 15l> J.50 J.6.8? JO.S? 16.tSO
YEAR 75
· l"EAR i'/J
b. G.vol .,Jiba 3. T«c,'b3 b. G:,ol c,3.'h
I I I I 4 4-1
?.44 '1z.JO 21.95 30.39 30.H J-4 .• :\S ;6.111.i 97.!So 0.00 0.00 0.00 1.17 1.ll5 10.0 215.43 J."l.ol J.3.:r? 75.34 16-1.,'\2 !36.5j H7 3.61 U.!$ 4.30 3..52 1 .45 32.9') ' 1355 0.00 0.00 0.00 O.o3 0.11 I .OJ 2.22 3.49 J.A? JIS.48 3,0.95 17.04
{.22 6.47 "9. 16 ll.7-4 2 1 . H 30..6-4 �J..4? l�.13 :l<i,03 103.40 I 0.00 0.00 0.00 0.12 t.S2 9.76 · 2'7.Sll '.l921 39.21 75.N 169.97 142./:,IJ a. Tr<c:s.11•
\ 1 1 11 7.'X> 5.7s 4.J<i 1.-16 4. 1 1 -1.JO 3�1 L73 n.68 IJ.95 a.oo o.oo o .O'.l om. o. i9 o.95 2.n :H? ,.49 �.16 31 .1)5 I 7.44
i,_ G.-01 m3/h -1 +-1 �.n 6.42 &.<J.J 1 1 .Zb 211.Jl 10.61 36.� 21.crz 35.� 10.u2 o.oo o.1JO o..oo o.1)9 1.33 9.0? 29.0., 19.60 3'9.60 7�JJ7 175.04 14H2
l<>.:23
o· ;,-
19..'\5
23..90 J -u2 1 1m
,1u1 I 4. 1 1 I 1?95
n.� I .J . 1-1 1 2.000
36.l\6 I 4.19 I ZOCJ.5
41.47 I {.24 I 20to
46.23 \ -L'O j 1015
5 1 .06 \
'1. 36 I wzu
:-5..,sry / �:LI I Ul"..5
<>0.6.5 I -0 I I 1030
65.18 t 459 I '2035
69. 74 I 4.67 I zo.«J
J.1 .0l I 4.76 I -z�5
73.07 l 4.3..< I wso
lll .72 I t9J I 1055
:i.5.56 f s .oz I Ul6IJ
!9 05 I 5.U I �
1 9.MA ! O VER W:-YEAR PER IOD (cnJ1h.:,/•no•11 1) l . 1� 1.:i.5 I Q09 0.09 I -020 l.Z� 1 .4.5 I I ) I lit. SlAJ'<O ,\T Y EAR 6ll (CALE..'IDER YEAR : 2030) A.SSl}MP'OONS : •) •% llln• �•nY�l m.oruucy in 10<20cm. 2% ia 20-60cm 1% ia oO-rocm class.es 3oJ 11% iu80cm dbb -t
a) Ad·, yo,,rth (l0<60cm DBHyb3 : 37.21 er«s "'4.? I m' l>) Eqa:il r.ik. of grcn,,llr fDr 10 -60 dbli ci=:s (growiog stod:) ad oonSOof d.cc5ciag raJ.c l:roo:, 60 cm. bJ Adv g.towt.b. (>60c1n DBH)/h:> : 9.!2 , • .,., 6-4.U al c) Rocnuf1DCof ot 5 frees i.ai:o cbe 10<-:20 ctndbti cbssfor uda 5 - yor p,:ru:,d. c) Bit ln"u ( > Jllcm DBl l}/la : Jt,.. , . ,., 36.37 mJ d) No o·u�·u, ror �b c� of 90 cm ud al>o\OC. a; Big Lra::s ( >60cm DBHJ.lh2 : J.� c-�, 36E7 mJ e) Tr<:e ..,l,ime ln� 0'1Sb11diug Trce Voluax Tabk ot Salxah Focet Depucmcol c) Mcrduaol>k u<:c:s (> 60c,o DBH = Bi!; ucn + A.dv:,nce �b) t) IO% [a,,....11fnry - M2lru FR I) Red•ctiou �c:to< lrom gro,,s ro act "'>!um.e is : -!0%
i) Gco,:i,1a : 13."'6 = IOU)II mJ i) t5.2l5 tr=>Jb.:o ii) ?iel ...,,L'li:2 (60% of gross) 60.65 i:n' 4.5t in','lrce ii) :0.27 a,J/h.a
I) Coupd:<>cnpl chs:silica li�a : O.ASS 2. (60<&1 m'llu: Adcqu., <dy:siock.cd) iii) 5.45 crr'ltrcc
•

-
:M:)lE
R
ra
·-.-
c=by
.aiioo.
- -
-----------
r t l ti I I I • I 1 I
� 1 1 l
'l :J I I I l
I
I
I
LOCATlON
CULVERT --------------------
I
3 LOGS I BOX CULVERT CULYE�T
I
I
I
I
I
I I
I
I
I
I
I I I I
-
J\lJMBER OF LOGS
I
1 ·l 1
'"""-A.n... I A.. l D :e'.KJ A. I A. .) u 1 'l""D nu
Monthly Report for Logging Road
- -
LE;\"GTH WIDTH
I I
I I
I
I I I
I BRIDGES
YEAR COVER TL\1 BER PLANKS
1 -C ONSTRUCTED WITH EARTH I EXPOSED
I I I I I I I , ·
I . . I . .
I I I I I I I I I I I I I I
- - -
CARR!AGcW A Y V.'l!JT":-i -----------ROAD LENGIB
1 1"1JMEER LE?',GTH 'WIDTi OF LOGS :TEI))
I I
I I
I � � "O .
"O
I I
I I
-l I':) ... c.. -, X
i I - -- ; ---I I
n I':) ... I
. I I C · · --
I I C
I I I I
... C
I I c..
I r,
I I I I
c., c., r,
. I I I':>
I I (JJ
I I r,
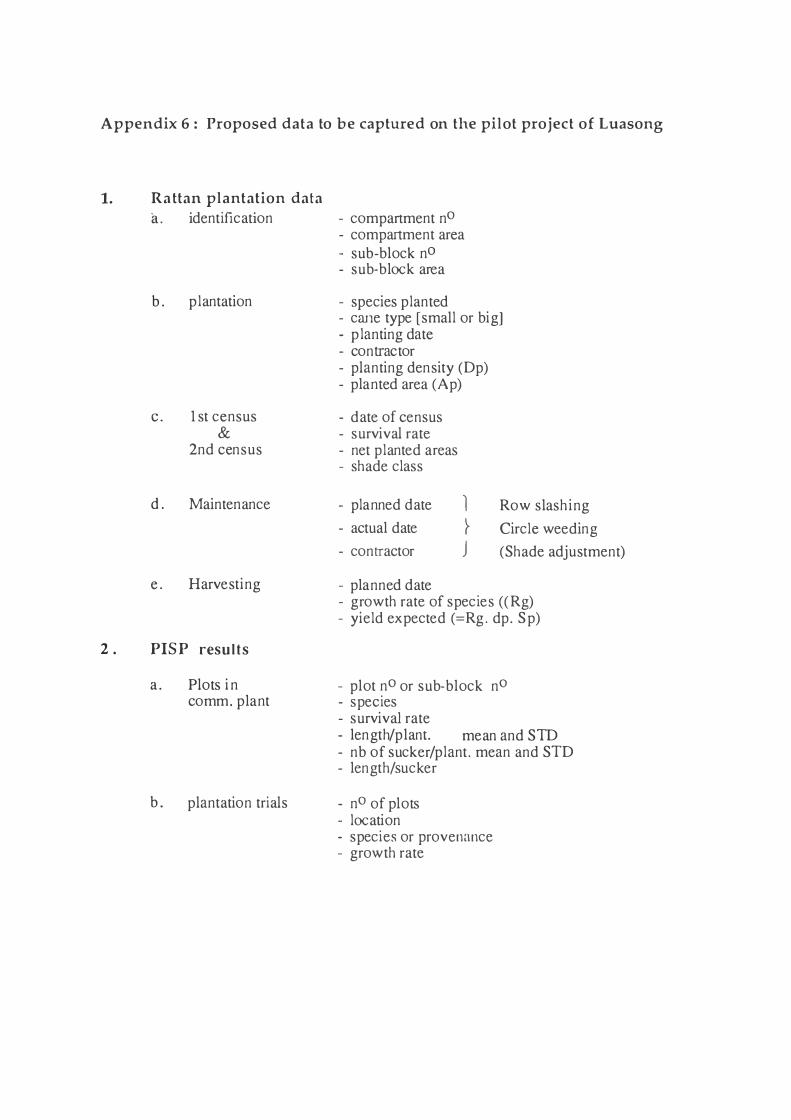
Appendix 6 : Proposed data to be captured on the pilot project of Luasong
1. Ra ttan plantation data
a . identification - compartment no
- compartment area- sub-block nO
- sub-block area
b. plantation - species planted- cane type [small or big]- planting date- contractor- planting density (Dp)- planted area (Ap)
C . 1st census - date of census& - survival rate
2nd census - net planted areas- shade class
d. Maintenance - planned date l Row slash ing - actual date r Circle weeding - contractor J (Shade adjustment)
e. Harvest ing - planned date- growth rate of species ((Rg)- yield expected (=Rg. dp. Sp)
2 . PIS P results
a . Plots i n - plot no or sub-block no
comm. plant - species- survival rate- length/plant. mean and STD - nb of sucker/plant. mean and STD- length/sucker
b. plantation trials - no of plots - location- species or provenance- growth rate