HHI AR PDF(0421)PDF - LACP
103
Hyundai Heavy Industries Annual Report 2008
-
Upload
khangminh22 -
Category
Documents
-
view
2 -
download
0
Transcript of HHI AR PDF(0421)PDF - LACP
Hyundai Heavy Industries
Annual Report 2008

02 Financial Highlights & Share Performance
04 HHI at a Glance
06 Message from the CEOs
08 Corporate Governance & Organization Chart
10 Vision & Strategies
11 Philosophy & Code of Conduct
14 Foundations
16 Leadership
18 Possibilities
22 Shipbuilding Division
24 Offshore & Engineering Division
26 Industrial Plant & Engineering Division
28 Engine & Machinery Division
30 Electro Electric Systems Division
32 Construction Equipment Division
34 Research & Development
38 HHI and the Community
40 HHI and the Environment
44 Management’s Discussion & Analysis
51 Independent Auditor’s Report
52 Non-Consolidated Financial Statements
60 Notes to Non-Consolidated Financial Statements
98 Overseas Network
101 Affiliated Companies & Corporate Data
Table of Contents

Most companies are launched with high expectations. For Hyundai Heavy
Industries, it would be no understatement to say that the expectations were great.
From the very outset, we set our sights on becoming the world’s greatest ship-
builder. It was quite an ambitious goal considering we didn’t have a shipyard or
even a day of experience in the business when we booked our first order for two
260,000 dwt oil tankers in 1972. We built those tankers and our shipyard simulta-
neously, a situation that required us to get very creative when construction of the
tankers got ahead of the yard. Even more remarkable was the fact that we had an
order backlog of six ships before we made a single delivery.
Just two years after construction began in June 1974, we celebrated the comple-
tion of both the tankers and our Ulsan shipyard. It was an amazing start to a
decade of explosive expansion and growth that propelled us to the top of the
industry in orders and tonnage for the first time in 1983. Our great expectations
had become a reality—one that has now lasted for 26 years.
Our expectations—and those of our stakeholders—have changed a lot over the
years. But they have always been great, even when conditions or circumstances
have made them seem improbable, if not impossible. Today, more than ever,
we’re committed to meeting—and exceeding—those expectations in fields far
beyond shipbuilding. And if the past is any indication of the future, our legendary
entrepreneurial spirit, combined with ingenuity and hard work, means that even
greater things lie ahead.
Financial Highlights
●Liabilities-to-Equity ●Debt-to-Equity
in KRW
200.8%208.4%
351.8%
4.3%
0.1%
3.5%
Financial Stability Ratios
‘06 ‘07 ‘08
●Payout Ratio *Dividend Yield
■Dividends Per Share
Dividends Per ShareTotal Assetsin KRW billions
EPSin KRW
‘06
‘07
‘08
12
,55
4.7
15
,53
3.0
19
,95
7.1
‘06
‘07
‘08
12
,99
6.1
16
,79
8.7
25
,28
0.4
11
,05
3
27
,77
8
37
,34
0
‘06
‘07
‘08
For the Year
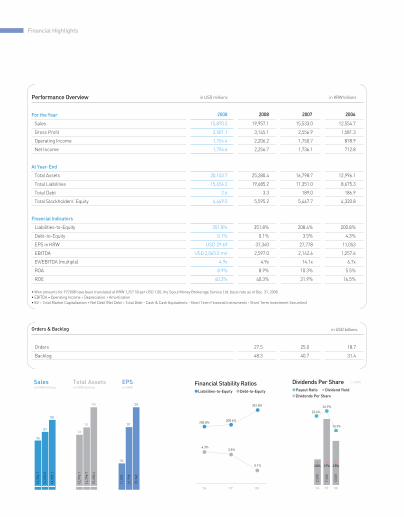
Sales 15,870.5 19,957.1 15,533.0 12,554.7
Gross Profit 2,501.1 3,145.1 2,556.9 1,581.3
Operating Income 1,754.4 2,206.2 1,750.7 878.9
Net Income 1,794.6 2,256.7 1,736.1 712.8
At Year-End
Total Assets 20,103.7 25,280.4 16,798.7 12,996.1
Total Liabilities 15,654.2 19,685.2 11,351.0 8,675.3
Total Debt 2.6 3.3 189.0 186.9
Total Stockholders’ Equity 4,449.5 5,595.2 5,447.7 4,320.8
Financial Indicators
Liabilities-to-Equity 351.8% 351.8% 208.4% 200.8%
Debt-to-Equity 0.1% 0.1% 3.5% 4.3%
EPS in KRW USD 29.69 37,340 27,778 11,053
EBITDA USD 2,065.2 mn 2,597.0 2,142.6 1,257.6
EV/EBITDA (multiple) 4.9x 4.9x 14.1x 6.7x
ROA 8.9% 8.9% 10.3% 5.5%
ROE 40.3% 40.3% 31.9% 16.5%
2008 2008 2007 2006
in USD millions in KRW billionsPerformance Overview
• Won amounts for FY2008 have been translated at KRW 1,257.50 per USD 1.00, the Seoul Money Brokerage Service Ltd. basic rate as of Dec. 31, 2008.
• EBITDA = Operating Income + Depreciation + Amortization
• EV = Total Market Capitalization + Net Debt (Net Debt = Total Debt - Cash & Cash Equivalents - Short Term Financial Instruments - Short Term Investment Securities)
Orders 27.5 25.0 18.7
Backlog 48.3 40.7 31.4
in USD billionsOrders & Backlog
Salesin KRW billions
‘06 ‘07 ‘08
2,5
00
7,5
00
5,0
00
*2.0%
*1.7%
*2.5%
22.6%
26.9%
13.3%

02+03Share Performance
After hitting an all-time high of 2,064.85 in October 2007, Korea’s KOSPI stock
index steadily declined throughout 2008 as the global financial crisis unfolded. The
rapid rise of oil to over USD 145 per barrel, skyrocketing prices for grain, minerals,
and other raw materials, bankruptcy concerns about major financial firms and
automakers, and a deepening global downturn sent the bourse tumbling to the
1,000-point level in early October, a full 53% off the historic high set a year before.
In December, the announcement of economic stimulus packages and cuts in key
interest rates buoyed optimism about credit and money market liquidity, lifting the
KOSPI to 1,124.47 at year-end, 39% lower than where it started.
The global shipbuilding industry enjoyed robust order growth and top vessel prices
through the first half of the year, only to see those prices fall and financing dry up
as the financial crisis deepened in the second half. According to Lloyd’s Register,
total tonnage ordered in 2008 was 86 million gross tons, nearly 50% off its historic
high of 170 million gross tons set in 2007. Just as our shares have dramatically
grown in value in recent years as the industry has boomed, they also suffered as it
contracted in 2008, closing the year 54% below where they started.
COMMENTARY
Jan Feb Mar Apr May June July Aug Sep Oct Nov Dec
120%
100%
80%
60%
40%
20%
0%
■HHI ■KOSPI2008 HHI Share Performance vs. KOSPI
Face Value in KRW 5,000 5,000 5,000
Number of Shares Issued 76,000,000 76,000,000 76,000,000
Total Market Capitalization in KRW billions 15,162 33,630 9,576
Share Price - High in KRW, Closing 409,000 528,000 144,000
- Low in KRW, Closing 103,000 123,500 65,400
- End in KRW, Closing 199,500 288,500 119,000
Foreign Ownership 14.8% 19.5% 22.1%
PER - High/Low/End 11.0x / 2.8x / 15.3x 19.0x / 4.4x / 10.4x 13.0x / 5.9x / 10.8x
Dividends Per Share in KRW 5,000 7,500 2,500
Payout Ratio 13.3% 26.9% 22.6%
2008 2007 2006Stock Facts
2008 HHI Foreign Ownership & Share Price
Jan Feb Mar MayApr June July Aug Sep NovOct Dec
in KRW
500,000
350,000
400,000
450,000
250,000
300,000
200,000
150,000
100,000
50,000
0
25.0%
20.0%
15.0%
10.0%
0.0%
■Foreign Ownership ■Share Price Shareholder Structure
1 Chung Mong-joon: 10.80%
2 KCC: 8.15%
3 Hyundai Mipo Dockyard: 7.98%
4 National Pension Service: 5.01%
5 Mirae Asset Investments: 4.50%
6 Hyundai Motor Company: 2.88%
7 Asan Foundation: 2.53%
8 Posco: 1.94%
9 Treasury Shares: 21.14%
10 Others: 35.07%
1
2
3
4
5
67
89
10

HHI at a Glance
DivisionOur diversifiedbusiness portfoliokeeps tomorrowgrowing.
Anchored by our industry-
leading shipbuilding busi-
ness, our diversified busi-
ness portfolio is one of the
most balanced and synergis-
tic in the heavy industrial
sector. Each of our six divi-
sions is a global innovator in
their field, constantly think-
ing ahead to deliver products
and solutions that keep
tomorrow growing.
+20.2%Sales Growth
Shipbuilding Division
We are the world’s No. 1 shipbuilder, a distinction we have held since 1983.
Our highly advanced and efficient Ulsan shipyard on Korea’s southeast
coast is the world’s largest with ten dry docks. In 2008, we built a record
102 vessels, accounting for over 11% of global deliveries. We have delivered
1,400 vessels to 245 shipowners in 46 countries to date.
+39.3%Sales Growth
Offshore &EngineeringDivision
We are a world leader in offshore facility fabrication. We have handled over
160 turnkey EPIC projects to date for more than 30 oil and gas majors,
including Total, ExxonMobile, BP, Shell, and Chevron. In 2008, we moved to
significantly expand our fabrication capabilities with the construction of H
Dock.
+35.2%Sales Growth
Industrial Plant & EngineeringDivision
We are a global EPC contractor capable of designing, engineering, fabricating,
procuring, and constructing a broad range of industrial plants anywhere in the
world. Our success in the Middle East and Africa in recent years enabled us to
book a USD 1.7 billion EPC contract in 2008—our largest to date—for the Al Dur
IWPP project in Bahrain.
+53.3%Sales Growth
Engine &MachineryDivision
We are the world’s No. 1 producer of marine diesel engines and turnkey
propulsion systems with approximately 35% of the two-stroke engine
market, a distinction we have held since 1988. We are also a leader in
diesel power stations, helping developing countries cost-effectively meet
their power needs. In 2008, we became the industry’s first two-stroke
engine maker to surpass the 80 million bhp production milestone.
+32.4%Sales Growth
Electro ElectricSystemsDivision
We are one of the world’s top-10 suppliers of electrical generation, trans-
mission, and distribution solutions as well as an emerging player in wind
and solar power solutions. We are currently in the middle of a major
expansion project that will boost our photovoltaic cell manufacturing
capacity up to 330 MW annually by 2010.
+17.0%Sales Growth
ConstructionEquipmentDivision
We are one of the world’s top-ten manufacturers of quality construction
equipment and industrial vehicles with state-of-the-art automated
manufacturing facilities in Korea, China, and India. In 2008, our global sales
and service network of roughly 500 dealers in 110 countries delivered over
32,700 pieces of equipment.

04+05
Major ProductsOrders & Backlog Sales Proportion of Sales
• VLCCs, Tankers, Product Carriers, Chemical Tankers
• Containerships, Bulk Carriers, OBO Carriers
• Ro-Pax Ships, Ro-Ro Ships, Pure Car Carriers
• LNG Carriers, LPG Carriers
• Drillships
• Submarines, Destroyers, Frigates
45.5%
in USD millions in KRW billions
‘06
‘07
‘08
• Floating Units: FPSOs, FPUs, TLPs, Semi-Submersible
Units
• Fixed Platforms: Topsides, Jackets & Piles, Jack-ups,
Modules & Quarters
• Pipelines & Subsea Facilities: Subsea Pipelines
• Offshore Installations: Platforms, Pipelines
15.5%
• Power Plants: Combined-Cycle, Cogeneration, and
Thermal Power Plants
• Process Plants: Oil and Gas, Refinery, Tank Farm, GTL,
and LNG Facilities
6.9%
• Two- and Four-Stroke Diesel Marine Engines
• HiMSEN Diesel Engines • Propellers and Crankshafts
• Marine Steam Turbines and Turbochargers
• Diesel and Gas Power Plant Engines
• Industrial and Marine Pumps • Marine Thrusters
• Industrial Robots
• Presses, Conveyor Systems, and Steel Strip Process Lines
12.6%
• Transformers
• Gas Insulated Switchgear
• Switchgear
• Low- and Medium-Voltage Circuit Breakers
• Rotating Machinery
• Power Electronics and Control Systems
• Solar Power Systems • Wind Power Systems
9.6%
• Excavators
• Wheel Loaders
• Forklifts
• Skid Loaders
8.9%
11,4
70
15,7
30
13,6
35
‘06
‘07
‘08
20,6
68
26,1
39
28,5
56
‘06
‘07
‘08
6,4
43
7,5
57
9,0
85
‘06
‘07
‘08
1,9
97
1,1
02
2,9
78
‘06
‘07
‘08
5,6
20
7,3
49
9,0
17
‘06
‘07
‘08
1,9
35
2,2
22
3,0
95
‘06
‘07
846
1,5
44
2,0
76
‘06
‘07
‘08
1,9
39
2,2
65
3,3
01
‘06
‘07
‘08
602
1,0
17
1,3
74
‘06
‘07
‘08
1,8
80
3,2
48
4,6
46
‘06
‘07
‘08
2,2
08
3,7
43
5,9
79
‘06
‘07
‘08
1,2
20
1,6
46
2,5
22
‘06
‘07
‘08
1,2
74
1,7
66
2,2
81
‘06
‘07
‘08
1,0
13
1,2
37
1,3
97
‘06
‘07
‘08
1,0
57
1,4
53
1,9
25
‘06
‘07
1,2
39
1,6
30
1,8
57
‘06
‘07
‘08
1,1
98
1,5
12
1,7
69
‘08
‘08
Message from the CEOs
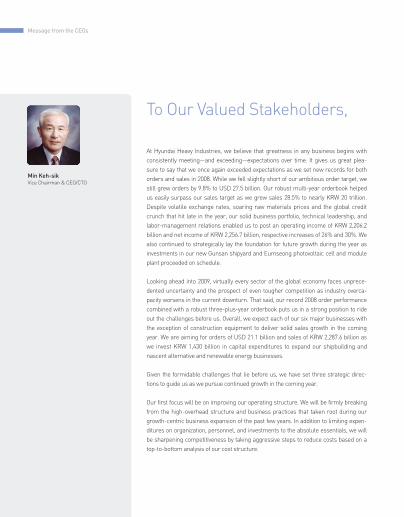
At Hyundai Heavy Industries, we believe that greatness in any business begins with
consistently meeting—and exceeding—expectations over time. It gives us great plea-
sure to say that we once again exceeded expectations as we set new records for both
orders and sales in 2008. While we fell slightly short of our ambitious order target, we
still grew orders by 9.8% to USD 27.5 billion. Our robust multi-year orderbook helped
us easily surpass our sales target as we grew sales 28.5% to nearly KRW 20 trillion.
Despite volatile exchange rates, soaring raw materials prices and the global credit
crunch that hit late in the year, our solid business portfolio, technical leadership, and
labor-management relations enabled us to post an operating income of KRW 2,206.2
billion and net income of KRW 2,256.7 billion, respective increases of 26% and 30%. We
also continued to strategically lay the foundation for future growth during the year as
investments in our new Gunsan shipyard and Eumseong photovoltaic cell and module
plant proceeded on schedule.
Looking ahead into 2009, virtually every sector of the global economy faces unprece-
dented uncertainty and the prospect of even tougher competition as industry overca-
pacity worsens in the current downturn. That said, our record 2008 order performance
combined with a robust three-plus-year orderbook puts us in a strong position to ride
out the challenges before us. Overall, we expect each of our six major businesses with
the exception of construction equipment to deliver solid sales growth in the coming
year. We are aiming for orders of USD 21.1 billion and sales of KRW 2,287.6 billion as
we invest KRW 1,430 billion in capital expenditures to expand our shipbuilding and
nascent alternative and renewable energy businesses.
Given the formidable challenges that lie before us, we have set three strategic direc-
tions to guide us as we pursue continued growth in the coming year.
Our first focus will be on improving our operating structure. We will be firmly breaking
from the high-overhead structure and business practices that taken root during our
growth-centric business expansion of the past few years. In addition to limiting expen-
ditures on organization, personnel, and investments to the absolute essentials, we will
be sharpening competitiveness by taking aggressive steps to reduce costs based on a
top-to-bottom analysis of our cost structure.
To Our Valued Stakeholders,
Min Keh-sikVice Chairman & CEO/CTO

06+07
Our second focus will be on ensuring our organization is capable of responding to
whatever challenges lie ahead. In addition to keeping a close eye on emerging busi-
nesses and product markets to get a competitive jump on those new opportunities, we
will be working closely with existing customers to ensure we keep their business. We
will also be looking for creative ways to optimize our current production and material
procurement systems for the current business climate as we sharpen our competitive-
ness by focusing on effectively managing the risks and opportunities of today’s volatile
currency exchange and raw materials markets.
Our third focus will be on ensuring we provide a safe and rewarding workplace for our
people. We will be stepping up our workplace health and safety initiatives as we contin-
ue to adopt and implement strict work standards and regulations. Guided by a spirit of
excellence and labor-management unity, we will also continue to foster a proactive and
progressive corporate culture that will help our people achieve their full potential as we
strive to live up to the highest standards of corporate citizenship.
In closing, we would like to thank you again for your interest in Hyundai Heavy
Industries. We have faced many business ups and downs since our founding in 1972,
overcoming every challenge that has come our way. We are confident that the strong
bonds of unity and cooperation we have forged with labor over the years will enable us
to wisely weather the present difficult business environment and emerge stronger than
ever in the years ahead. Whether you are an investor, customer, partner, employee, or
community member, we would be honored to have you on board with us in 2009 as we
continue to create new value that will satisfy great expectations around the globe.
Min Keh-sikVice Chairman & CEO/CTO
Choi Kil-seonPresident & CEO
Choi Kil-seonPresident & CEO

Corporate Governance
About the Board of Directors
The Hyundai Heavy Industries board is composed of seven directors, four of which are outside directors. Collectively, the directors assume ultimate
responsibility for decisions regarding corporate affairs and the financial well-being of shareholders. All board appointments are made pursuant to
the Articles of Incorporation, including due consideration of each individual's professional experience and expertise in fields such as law, economics,
finance, and accounting.
The board meets to discuss and resolve corporate matters. Its responsibilities include deciding on material matters as stipulated in relevant by-laws
and the Articles of Incorporation, dealing with issues delegated to it at the annual general shareholders' meeting, and addressing issues related to
the basic direction and execution of company operations. The board also has the authority to appoint the CEO and board chair as well as conduct
oversight of its members and company management. The board held a total of thirteen meetings in 2008.
About the Board Committees
Audit Committee
The Audit Committee is a standing committee composed of three outside directors. Its responsibilities include (1) deciding on matters related to
shareholders' meetings such as the calling of interim shareholders' meetings and setting forth its views on the agenda and the documents to be
presented; (2) conducting oversight of the board and its members, producing independent annual audits, and supervising the financial reporting
process; and (3) addressing matters relating to audits including contracts with independent auditors and the evaluation of their qualifications, eligi-
bility, and performance. The committee held a total of three meetings in 2008.
Outside Director Nominating Committee
The Outside Director Nominating Committee is a standing committee responsible for nominating qualified individuals to serve as outside direc-
tors on the board. The committee consists of one inside and two outside directors.
Outside Directors
Inside Directors Min Keh-sikVice Chairman &
CEO/CTO
Choi Kil-seonPresident & CEO
Lee Jai-seongSenior EVP and Chief of
Administration &
Assistance Headquarters
Park Jin-wonAttorney of
Shin & Kim Law Firm
Lee Jae-kyuDean of KAIST EEWS
Initiative, Professor,
Graduate School
of Management,
KAIST Business School
Park Young-juneProfessor, Electrical
Engineering and
Computer Science,
Seoul National University
Lee Man-woo Professor, Business
Administration,
Korea University
Lee Man-woo Park Jin-won Lee Jae-kyu
Board of Directors
Outside Director Nominating Committee Lee Jai-seong Park Jin-won Park Young-june
Audit Committee

08+09
Executive Officers
Board of Directors
Chief Executive
Officers
Audit Committee
Min Keh-sikVice Chairman &
CEO/CTO
Choi Kil-seonPresident & CEO
Lee Jai-seongSenior EVP and Chief of
Administration &
Assistance Headquarters
Lee Soo-hoSenior EVP and Chief
Financial Officer
Choe Weon-gilSenior EVP and COO of
Shipbuilding Division
Oh Byung-wookSenior EVP and COO of
Offshore & Engineering
and Industrial Plant &
Engineering Divisions
Yoo Seung-namSenior EVP and COO of
Engine & Machinery
Division
Kim Young-namSenior EVP and COO of
Electro Electric
Systems Division
Choe Byeong-guEVP and COO of
Construction Equipment
Division
Lee Choong-dongEVP and COO of
R&D Division
Shipbuilding
Division
Offshore &
Engineering
Division
Industrial
Plant &
Engineering
Division
Engine &
Machinery
Division
Electro Electric
Systems
Division
Construction
Equipment
Division
Administration
&
Assistance
Headquarters
R&D
CentersSeoul Office
Corporate
Planning
Overseas
Offices
and
Incorporated
Firms
Organization Chart

Vision & Strategies
Back in 1972, we booked our first ship order with nothing more than some seaside property
and an ambitious vision of becoming a world-class shipbuilder. Today, that same
indomitable spirit and passion continues to drive us as we pursue our vision of shaping the
future as a global leader in each of our businesses. By consistently innovating to deliver the
heavy machinery industry’s finest products, technologies, and service, we aim to deliver
superior satisfaction to our customers, more rewarding careers for our people, and greater
value to our shareholders.
Our Vision
Our Strategies
• Develop global sales, marketing, and R&D
networks
• Expand overseas production, service, and
parts distribution networks
• Enter promising new regional markets
• Enhance core technologies to a higher
level.
• Make major product lines leaders in their
global markets.
• Strengthen collaboration between R&D
centers and business divisions.
• Streamline and maximize efficiency at
existing facilities.
• Improve quality and productivity by ratio-
nalizing and automating facilities.
• Create efficient and integrated manage-
ment systems.
• Increase outsourcing of low-value-added
businesses and operations.
• Maintain flexibility in resource utilization
for facilities, people, and funds.
2 • Pursue market and technology leadership in
each core business
• Secure core technologies and top talent
through strategic expansion, alliances, and
acquisitions
• Pursue new business opportunities with high
synergy potential
• Strengthen core capabilities at every stage of
the value chain
• Exit unprofitable businesses
1
3 4 5
• Satisfy our customers with superior technology and quality
• Provide rewarding careers that help our people achieve their dreams
• Enhance corporate value with world-leading products
Structural Optimization Network Building
• Expand outsourcing of non-core and
low-value-added operations
• Implement integrated ERP system
3 Operational Innovation
• Make major product lines global leaders
• Develop eco-friendly, high-performance,
high-efficiency technologies
• Pursue innovations in production technology
to raise productivity and reduce costs
• Develop and patent innovative core
technologies
• Commercialize technologies that open
opportunities in new fields
5 • Maximize efficiency of existing facilities
• Streamline and automate facilities
• Implement integrated production manage-
ment system
4 Production Optimization Technology Development
• Package division and affiliate products and
services to create new markets
• Coordinate sales, procurement, and R&D to
reduce costs and raise competitiveness
• Expand flexibility in utilizing workforce and
facility resources
6 Synergy Building
10+11Philosophy & Code of Conduct
Over the past three decades, our creative, pioneering spirit and indomitable determination
have made us a global leader in shipbuilding and a number of other heavy manufacturing
industries. Today as we lead these industries into the future, we also aspire to make a dif-
ference around the globe. Our goal is to generate greater corporate and economic value
wherever we do business as we actively fulfill our legal and ethical responsibilities to each
local community. To guide us in this task, we have established the following five principles
as the framework for our corporate code of conduct.
OurPhilosophy
Our Code of Conduct
• Enhance core technologies to a higher
level.
• Make major product lines leaders in their
global markets.
• Strengthen collaboration between R&D
centers and business divisions.
• Streamline and maximize efficiency at
existing facilities.
• Improve quality and productivity by ratio-
nalizing and automating facilities.
• Create efficient and integrated manage-
ment systems.
• We actively seek out and cultivate business-
es with growth potential.
• We secure core capabilities essential to
future growth.
• We build flexible business management sys-
tems.
• We build a solid global business organiza-
tion.
1
3 4
We enhance corporatevalue by continuallygrowing.
• We respect laws and uphold business ethics.
• We support free market principles through
open and fair competition.
• We foster fair and clean business relation-
ships with suppliers.
2 We uphold fair andtransparent businesspractices.
• We provide pleasant and safe work environ-
ments.
• We prevent accidents by looking out for our
own and others’ safety.
• We proactively develop and adopt environ-
mentally friendly technologies.
• We strive to make our production activities
environmentally sound.
3 We pursue businesspractices that are safeand green.
• We foster a vibrant organizational culture
based on participation and trust.
• We faithfully fulfill all duties and responsibil-
ities to enhance corporate competitiveness.
• We strive to help our people reach their full
potential and improve their quality of life.
4 We build strong labor-management relationswith mutual respect andtrust.
• We strive to enhance community culture and
welfare.
• We contribute to national development
through honest tax payment and job creation.
• We contribute to human prosperity by work-
ing to create greater value.
5 We contribute to socialdevelopment as a globalcorporate citizen.

True greatness doesn’t come overnight. It takes vision and
ingenuity. It learns from its successes, and its mistakes.
It may face setbacks, but it never gives up. And as it grows,
it accomplishes amazing things.

GreatnessDefined
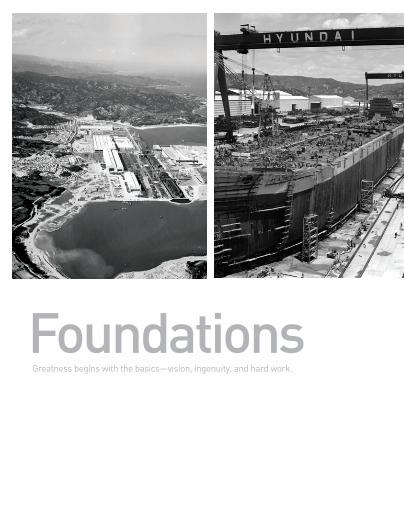
FoundationsGreatness begins with the basics—vision, ingenuity, and hard work.

14+15
Where greatness startsAt Hyundai Heavy Industries, we started out with little more than a vision, lots of ingenuity,
and a willingness to work hard. These were the driving forces that helped us rise from obscu-
rity to world’s No. 1 shipbuilder in little more than a decade. Twenty-six years on, we’re
stronger than we have ever been before. And that solid foundation has opened doors for
growth and leadership in dozens of related and new fields over the years.
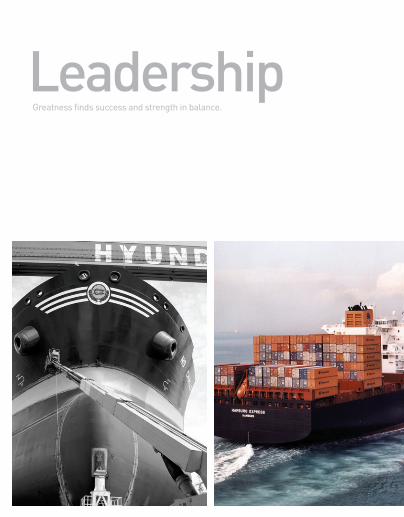
LeadershipGreatness finds success and strength in balance.

16+17
How greatness growsAt Hyundai Heavy Industries, our leadership has grown far beyond shipbuilding. Today, we’re
recognized as a global player in five other broad business fields, including offshore oil and gas
production facilities, power and process plants, diesel engines and industrial machinery, elec-
tronic and electric systems, and construction equipment. It’s a portfolio of businesses that is
both diversified and synergistic, keeping us remarkably resilient to changing business condi-
tions and markets.

PossibilitiesGreatness looks beyond today to transform tomorrow.
18+19
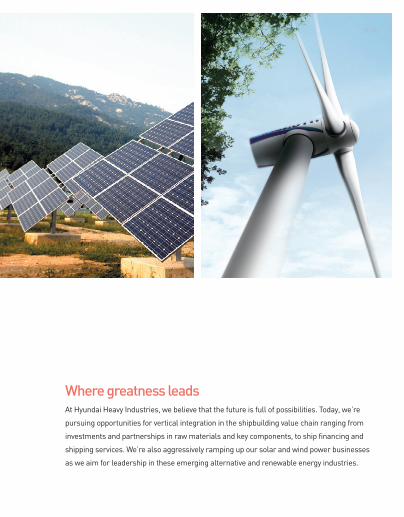
Where greatness leadsAt Hyundai Heavy Industries, we believe that the future is full of possibilities. Today, we’re
pursuing opportunities for vertical integration in the shipbuilding value chain ranging from
investments and partnerships in raw materials and key components, to ship financing and
shipping services. We’re also aggressively ramping up our solar and wind power businesses
as we aim for leadership in these emerging alternative and renewable energy industries.

True greatness has real substance. It isn’t shallow and
narrow. It’s deep and wide. It excels when times are good,
and when they aren’t. And as it grows, it doesn’t just lead—it
transforms.

Greatnessat Work

MSC Ivana Containership Delivery
In December 2008, we completed our largest
shipbuilding project to date. Ordered by MSC of
Switzerland back in 2006, this 11,700 TEU very-
large containership is 363 m long, 45.6 m wide,
and 29.7 m tall. To put this size in perspective,
the deck is roughly the size of four end-to-end
football pitches. It is powered by a 92,047 bhp
engine, and has a service speed of 25.4 knots.
2008 Overview
While the global shipbuilding industry enjoyed relatively smooth sailing in the first half of
2008, the market hit rough seas starting in September as the global credit crisis swept the
globe, freezing markets in its wake. According to Lloyd’s Register, the global industry
booked 86.4 million gross tons (mgt) in 2008, a drop of nearly 50% from the previous year’s
record high of 170 mgt. Despite this large decrease, industry orders for the year came in
significantly above the 78 mgt annual average for orders booked since 2000.
While the Korean shipbuilding industry continued to rank No. 1 globally in 2008 with a
steady 40% market share, Chinese shipbuilders lost momentum and slipped three per-
centage points to 33% as orders for bulk carriers plummeted. Very-large crude carriers
were the only class of vessel to experience order growth in 2008, rising from 37 vessels
totaling 1.6 mcgt to 107 vessels totaling 4.7 mcgt. Orders for bulk carriers and container-
ships both saw sharp declines. While robust demand and rising steel plate costs through
mid-year drove vessel prices to new highs, those prices began to soften in the fourth quar-
ter as demand fell.
At Hyundai Heavy Industries, orders for VLCCs, containerships, and Capesize bulk carriers
were robust through the first three quarters of the year before falling sharply in the fourth.
We increased our global market share from 7% to 11% as we booked USD 13.6 billion in
orders for the year, about 13% lower than our record-setting USD 15.7 billion performance
in 2007. Tankers led the way in 2008, accounting for 34% of total orders, followed by con-
Greatness always finds opportunity in adversity. In 2008, we boost-
ed our global shipbuilding market share from 7% to 11% despite a
nearly 50% drop in newbuild demand.
Ships of the Year
Our 60,000 cum LPG carrier Clipper Mars (pic-
tured above), 11,700 TEU containership MSC
Ivana, and 6,500 TEU containership NYK
Theseus were recognized as among the best
ships of 2008 in annual selections made by
industry journals Maritime Reporter, Marine
Log, and Naval Architect. We have now had a
total of 40 vessels recognized over the past 26
years, including at least one vessel each year
since 1983.
World’s First T-Shaped Dry Dock
In January 2009, we completed a unique expan-
sion project at Dock No. 1 that created the
world’s first T-shaped dry dock. The project
increased dock workspace by roughly 25% by
creating a 165 m long, 47 m wide addition to the
central section of the dock. Using tandem con-
struction methods, the expansion gives us the
ability to double annual dock turnover from four
10,000 TEU-class containerships to eight.
Review of Operations

22+23
Tankers Containerships LNG Carriers LPG Carriers Bulk Carriers Drillships Specialty &Naval
Other Vessels
2006~2008 Orders by Ship Typein USD millions
5,2
25
3,2
27
4,6
53
3,6
27
9,7
07
4,1
09
97
0
0
1,5
80
40
3
47
7
0
2,1
71
0 18
1
68 34
8 46
1
0
53
3
1,3
37
1,3
31
42
7
0
Backlogin USD millions
20
,66
8
26
,13
9 28
,55
6
2008 Order Breakdownby Value
1. Tankers: 34%
2. Containerships: 30%
3. Bulk Carriers: 16%
4. Drillships: 10%
5. LPG Carriers: 4%
6. Specialty & Naval: 3%
7. Other Vessels: 3%
1
2
3
4
56 7
tainerships with 30% and bulk carriers with 16%. We also followed up our first drillship
order in 2007 with orders for two more, allowing us to gain further production efficiencies.
At year end, our orderbook stood at 350 vessels worth USD 28.6 billion, enough work to
keep us operating at full capacity through 2011.
2009 Outlook
The shipbuilding industry outlook for 2009 is uncertain but bleak given the current global
economic downturn, credit crunch, and stagnant ocean shipping market. Tankers look to
be the ship category least affected by the current conditions, and we expect to see new
orders from end-user clients such as state-run shipping lines and oil majors. We also
anticipate the tender of several major LNG carrier projects that have been delayed in
recent years from Russia and Nigeria as well as new orders for LNG floating production,
storage and offloading (FPSO) and floating storage and regasification units (FSRU) as well
as other specialty vessels.
Given the current challenging global economic climate and newbuild market, the ship-
building industry appears to be headed into a period of restructuring and polarization. Tight
credit and an unfavorable outlook for the shipping industry make it likely that some clients
will request existing orders be delayed or, in some cases, cancelled. The inevitable restruc-
turing that lies ahead will further broaden the gap between leading shipbuilders and
greenfield yards, particularly those that have overinvested in facility expansion. On a more
positive note for the industry as a whole, restructuring will, over time, help resolve nagging
concerns about oversupply as well as provide an opportunity for the industry to return to
balanced, sustainable growth based on the long-term fundamentals of the shipping and
shipbuilding markets.
Considering the serious challenges to growth mentioned above, our first priority in 2009 will
be on boosting profitability as we rely on our strong three-year order backlog to get us
through the current downturn. We will be actively pursuing a variety of cost-reduction initia-
tives as we take advantage of falling steel plate prices and opportunities to improve productiv-
ity. Irrespective of the current environment, we believe that our industry leading quality and
engineering capabilities give us a formidable competitive advantage that will keep us at the
forefront of global shipbuilding, whatever course the industry may take in the years ahead.
Orders in USD millions
Salesin KRW billions
6,4
43 7
,55
7
9,0
85 11
,47
0 15
,73
0
13
,63
5
‘06 ‘07 ‘08‘06 ‘07 ‘08
‘06 ‘07 ‘08 ‘06 ‘07 ‘08 ‘06 ‘07 ‘08 ‘06 ‘07 ‘08 ‘06 ‘07 ‘08 ‘06 ‘07 ‘08 ‘06 ‘07 ‘08 ‘06 ‘07 ‘08 ‘06 ‘07 ‘08

Review of Operations
Akpo FPSO Sail Away
In June 2008, we turned over this completed turnkey vessel to
Total Upstream Nigeria. Measuring 310 m long, 61 m wide,
and 31 m high, the FPSO has a crude oil storage capacity of 2
mmbbl and can process 185,000 bopd of oil and 530 mmscfd
of gas. Ordered back in 2005, it began operations in March
2009 at OML 130 in 1,325 m of water about 150 km south of
Port Harcourt, Nigeria.
2008 Overview
Despite the financial crisis that swept the globe in the second half of 2008, global capex by
the energy exploration and production industry rose approximately 11% to USD 418 billion.
The industry trend toward large-scale deepwater floating production units and fixed plat-
forms kept the offshore facility market growing briskly, with global orders reaching USD 75
billion in 2008. Increased deepwater oil field development boosted overall demand for float-
ing facilities as rising demand for medium-size FPSO newbuilds and conversions outpaced
slowing demand for large FPSO newbuilds. In the latter part of the year, we began to receive
inquiries from the LNG industry about floating production units as well as large-scale
onshore modules. The pipeline industry saw brisk demand, led by oil field expansion and
pipeline replacement projects across the Middle East and India. The drilling rig newbuild
market also continued to enjoy steady growth.
At Hyundai Heavy Industries, we far surpassed all 2008 targets as we booked record orders
of USD 2.98 billion for a spectacular 170% year-on-year increase and set a new sales record
of nearly KRW 3.1 trillion. A steady stream of offshore facility orders for floating production
units and fixed platforms kept our production yard busy. We clinched the ultra-large Usan
FPSO unit order from Total—our fifth offshore production facilities order to date from that
French oil major. Our proven expertise and capabilities on major offshore projects such as
these firmly position us to win follow-on projects across Southeast Asia and Australia in the
coming years.
Salesin KRW billions
Orders in USD millions
1,9
35
2,2
22
3,0
95
1,9
97
1,1
02
2,9
78
2008 Order Breakdownby Value
1. Floating Units: 58%
2. Fixed Platforms: 37%
3. Subsea Pipelines: 5%
1
2
3
Greatness fosters loyalty. In 2008, we booked our second FPSO and
fifth project to date from Total as we attracted record orders from
the biggest names in energy exploration and production.
‘06 ‘07 ‘08 ‘06 ‘07 ‘08
24+25
2009 Outlook
With weak oil prices and the global credit crunch complicating project financing, global
capex for the energy exploration and production industries is expected to contract for the
first time since 2002. International investment bank Barclays Capital forecasts that global
capex will fall 12% to around USD 400 billion based on a survey of 357 exploration and
production firms from around the world. Despite this general downturn, steadily growing
global demand for energy will continue to drive deepwater oil field development in Africa
and South America, keeping demand for FPSOs steady. Over the next five years, market
forecasts estimate a total of 123 to 149 FPSS, FPU, FPSO, and other floating vessels and
platforms worth USD 43 billion will be ordered, including conversions, leases, and new-
builds.
In 2008, we neared completion of our first dry dock and added a second 1,600-ton gantry
crane as we continued to strategically upgrade our competitiveness. H Dock measures
490 m long by 115 m wide with over 56,000 sqm of workspace, allowing us to build FPSOs
and other large vessels with load capacities up to 1 million tons. These unrivaled fabrica-
tion capabilities will significantly enhance our competitiveness and profitability across-
the-board by shortening fabrication times, boosting productivity, and improving safety,
enabling us to flexibly respond to changes in the marketplace. Together with our
advanced installation capabilities, they will also enable us to aggressively pursue and win
EPIC (engineering, procurement, installation, commissioning) offshore production pro-
jects anywhere in the world.
Looking ahead to 2009 and beyond, we will be tailoring our product offerings to meet the
specific requirements of each region, product type, and client to ensure we deliver the
highest level of client satisfaction. We will be breaking new ground in the LNG field with
on-ground module fabrication and floating units as we continue to actively partner with
clients to develop new solutions for the offshore industry. We will be building partnerships
with local production yards around the world to enhance competitiveness as well as to
meet local content and other specific client requirements. We will also be expanding leas-
ing of idle pipeline installation vessels and equipment for local and regional projects to
further enhance our bottom line.
Backlog in USD millions
5,6
20
7,3
49 9
,01
7
Fixed Platforms Floating Units
1,3
32
81
2
1,1
14
19
3
15
5
1,7
19
47
2
13
5 14
5
Subsea Pipelines
2006~2008 Orders by Project Typein USD millions
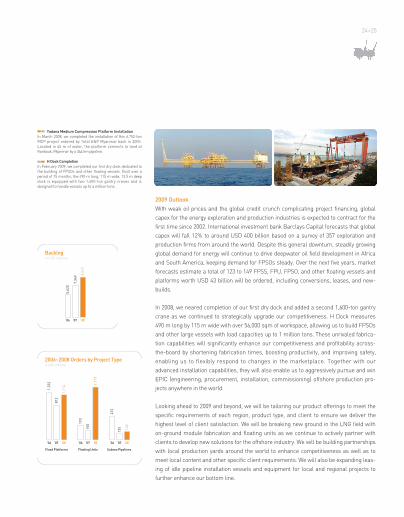
Yadana Medium Compression Platform Installation
In March 2008, we completed the installation of this 6,752-ton
MCP project ordered by Total E&P Myanmar back in 2005.
Located in 45 m of water, the platform connects to land at
Kanbauk, Myanmar by a 344 km pipeline.
H Dock Completion
In February 2009, we completed our first dry dock dedicated to
the building of FPSOs and other floating vessels. Built over a
period of 15 months, the 490 m long, 115 m wide, 13.5 m deep
dock is equipped with two 1,600-ton gantry cranes and is
designed to handle vessels up to a million tons.
‘06 ‘07 ‘08
‘06 ‘07 ‘08 ‘06 ‘07 ‘08‘06 ‘07 ‘08

2008 Overview
Orders for major energy and infrastructure projects continued to boom in the Middle East dur-
ing the first half of 2008, buoyed by record-high oil prices. However, the dramatic fall of oil
prices and global financial crisis that hit in the second half of the year brought project tenders
to a virtual standstill in the fourth quarter. Demand for combined-cycle power plants steadily
grew across the region. Similarly, demand for oil and gas plants continued to grow as rising
demand for energy brought a number of large-scale energy development projects to the
drawing board.
At Hyundai Heavy Industries, our world-class technical and construction capabilities in the
EPC combined-cycle power plant field helped us grow orders 35% in 2008 to USD 2.07 billion.
In September, we significantly raised our profile in Middle East desalination and power mar-
kets when we were selected as the EPC contractor for the Al Dur IWPP project in Bahrain, our
largest contract to date worth USD 1.76 billion. Scheduled for commissioning in 2011, the Al
Dur project includes a 1,245 MW gas-fired combined-cycle power plant and a 220,000 ton-per-
day reverse-osmosis desalination plant. Overall, this strong order performance combined with
a robust orderbook helped us boost sales more than 35% to KRW 1,374.4 billion as we contin-
ued to lay a solid foundation for future growth.
Review of Operations
Marafiq IWPP Project
In June 2007, we won a USD 1.07 billion EPC
contract to build the power plant portion of the
largest independent power and water plant pro-
ject to date in the Middle East. Scheduled to
begin commercial operations in 2010, the USD
3.5 billion Marafiq IWPP project in Saudi Arabia’s
Jubail Industrial City will have a 2,750 MW gas-
fired combined-cycle power plant and a 176 migd
multiple-effect distillation desalination plant.
Backlogin USD millions
‘07 ‘08‘06
1,9
39
2,2
65
3,3
01
Salesin KRW billions
Orders in USD millions
60
2
1,3
74
1,5
44 2
,07
6
Greatness thinks big. In 2008, we booked our largest order yet by
winning a USD 1.76 billion EPC contract to build the first phase of
Bahrain’s Al Dur IWPP project.
‘06 ‘07 ‘08 ‘06 ‘07 ‘08
84
61,0
17

26+27
2009 Outlook
While the prospects for independently funded power and water projects in the Middle East in
2009 are uncertain, public sector and other government-led projects are expected to move
forward on schedule. With population growth and industrialization increasing energy
demand by 3% to 10% annually in markets across the region, power plant projects will nec-
essarily continue to come up for tender. Although new oil and gas plant projects are expect-
ed to drop slightly due to lower oil prices and tight credit markets, projects already on the
drawing board are expected to move ahead. The gas field is one area in which projects are
expected to selectively proceed to meet steadily rising demand.
Given the ongoing nature of the global financial crisis, we’ll be aggressively pursuing new
business opportunities, relying heavily on our proven engineering capabilities and expert
knowledge of emerging growth markets worldwide. In the power plant field, we’ll be lever-
aging our experience on major power projects in Saudi Arabia as well as our strong name
recognition in the Middle East as we focus on winning profitable large-scale projects across
the region. We’ll also be stepping up collaboration with our turbine, boiler, and other main
equipment suppliers and partners, working closely together from the initial market survey
phase to maximize our opportunities for success. In the oil and gas field, we’ll be leveraging
our extensive portfolio of successful energy projects across the Middle East and in Nigeria
as we target upcoming oil and gas and tank farm projects in Arab Gulf markets with ambi-
tious expansion plans such as Saudi Arabia and the UAE. We’ll also be stepping up efforts to
sharpen our engineering and construction capabilities and strengthen partnerships with
local firms and industry leaders as we position ourselves to compete and win in today’s
challenging marketplace.
2008 Order Breakdownby Value
1. Power Projects: 83%
2. Plant Equipment: 11%
3. Oil & Gas Projects: 6%
1
2
3
Power Projects Oil & Gas Projects
17
0
1,1
52
55
1
24
1
11
7 12
5 15
1
23
2
Plant Equipment
2006~2008 Orders by Project Typein USD millions
Ahmadi Crude Oil Export Facility Project
We are now in the final stages of this USD 1.2
billion EPC project to upgrade and expand
Kuwait Oil Company’s crude oil export facilities
at Al Ahmadi Port. The contract includes an 11.4
million barrel storage facility with 19 tanks, off-
shore pipelines, gravity lines, metering systems,
and CALM buoys.
Al Dur IWPP Project
In September 2008, we won a USD 1.7 billion
EPC contract from Suez Energy International
and Gulf Investment Corporation to build the
first phase of what is expected to be a four-
phase IWPP development in Al Dur, Bahrain.
Scheduled to begin operations in 2011, the Al
Dur project will include a 1,245 MW gas-fired
combined-cycle power plant and a 48 migd
reverse-osmosis desalination plant.
1,7
27
‘06 ‘07 ‘08 ‘06 ‘07 ‘08 ‘06 ‘07 ‘08
2008 Overview
The global shipbuilding sector saw orders fall nearly 50% in 2008 as the global credit crisis
knocked the wind out of the industry’s sails in the final quarter of the year. Despite the huge
decline in new ship orders, the industry’s long order-to-delivery cycle largely insulated the
marine engine industry from the immediate impact of the downturn as engine orders for
2010 ship deliveries held steady for the year. In sharp contrast, the diesel power plant sec-
tor continued to boom, benefitting from strong demand in developing markets across Latin
America and Africa as well as Iraq, where post-war reconstruction is in full swing. The
machinery sector also continued to enjoy robust demand for industrial pumps in Middle
East power and desalination markets and industrial robots from automakers in the Czech
Republic, India, and China.
At Hyundai Heavy Industries, our timely production capacity expansions in recent years and
strong demand for marine and power plant engines enabled us to grow orders 43% as we
booked a record USD 4.65 billion in new contracts. Our marine engine business once again
captured 35% of the global and 60% of our home market as orders jumped 35% to reach
USD 3.65 billion, riding a surge of turnkey ship propulsion system orders from mid-size
local shipyards as well as new yards in China and Turkey.
Our power plant engine business had a breakout year in 2008, boosting orders 130% to
USD 675 million. Building on a string of successful deliveries of packaged power stations
(PPS)—containerized diesel generator sets—to Cuba approaching USD 1 billion over the
Review of Operations
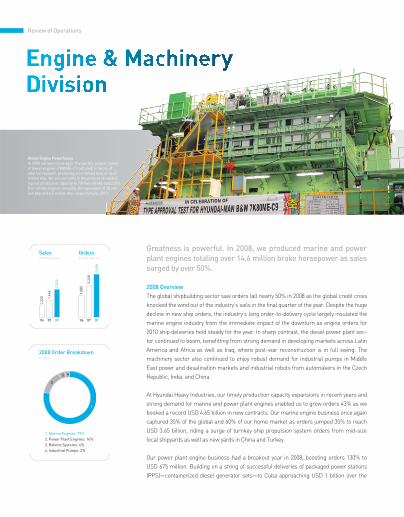
Global Engine Powerhouse
In 2008, we were once again the world’s largest maker
of diesel engines (7K80ME-C9 pictured) in terms of
total horsepower, producing a combined total of 14.67
million bhp. We are currently in the process of expand-
ing our production capacity to 700 two-stroke and 2,500
four-stroke engines annually, the equivalent of 20 mil-
lion bhp and 6.5 million bhp respectively by 2010.
2008 Order Breakdownby Value
1. Marine Engines: 79%
2. Power Plant Engines: 14%
3. Robotic Systems: 4%
4. Industrial Pumps: 3%
1
2
3 4
Salesin KRW billions
Orders in USD millions
1,2
20 1,6
46
2,5
22
1,8
80
3,2
48
4,6
46
Greatness is powerful. In 2008, we produced marine and power
plant engines totaling over 14.6 million brake horsepower as sales
surged by over 50%.
‘06 ‘07 ‘08 ‘06 ‘07 ‘08

28+29
past few years, we won orders from 13 nations across Latin America, the Middle East, and
Africa—including, Brazil, Nicaragua, Haiti, Iraq and Malawi.
Our machinery business saw orders for side thrusters rise as we continued to win business
from rival shipbuilders. Our industrial pumps steadily gained market share on overseas
power and desalination plant projects. Our robotic systems also won brisk orders for over
1,630 industrial robots from auto and LCD manufacturers in China, the Czech Republic,
Iran, the US, India, and Korea.
2009 Outlook
We expect marine engine sales to slow in 2009 as the shipbuilding market continues to
cool and shipowners reevaluate and make changes to vessel specifications or types for
previous orders in light of current shipping market conditions. On the positive side, we
expect demand for HiMSEN power plant engines to continue to grow across the Middle
East as oil and gas refinery and power infrastructure projects move forward. We also
expect demand for PPS solutions to steadily rise across Latin America, the Middle East,
and Africa.
Given the current challenges of the global marketplace, we are now accelerating a num-
ber of initiatives to expand our global market presence and bolster our marketing capabil-
ities as we pursue new opportunities that will help keep our orderbook in good shape. We
also continue to sharpen our competitiveness as we focus on the innovations that will
ensure we survive and thrive in tomorrow’s uncertain business climate.
New High-Power HiMSEN Engines
In December 2008, we completed type-approval
testing of a new line of four-stroke HiMSEM
engines with outputs of 6 to 10 MW. In contrast
with the inline cylinder configuration of our pre-
vious five lines, the H32/40V series features a
vee-configuration that delivers superior power
and efficiency, making it ideal for both marine
propulsion and generation and stationary gen-
eration applications.
Iraqi Diesel Power Plants
In June 2008, we booked an order from Iraq for
144 diesel power plant engines that will meet
the power needs of some 120,000 households.
This second order follows an order for 30 of our
PPS containerized diesel generator sets (pic-
tured above) in 2007, bringing orders from this
market to USD 420 million over the past two
years. Marine Engines Power Plant Engines Industrial Pumps
2006~2008 Orders by Productin USD millions
1,3
00
2,7
06
3,6
50
38
0
29
3
67
5
58
77 12
1
Robotic Systems
14
2 17
2 20
0
Backlogin USD millions
2,2
08 3
,74
3
5,9
79
‘06 ‘07 ‘08
‘06 ‘07 ‘08 ‘06 ‘07 ‘08 ‘06 ‘07 ‘08 ‘06 ‘07 ‘08

Review of Operations
2008 Overview
While the global credit crisis that swept the world in late 2008 sent demand plunging in
virtually every sector of industry, the electrical equipment industry was one of the few
that proved to be highly resilient. Demand for replacement equipment from the US mar-
ket held steady, as did demand for new equipment from emerging markets in the Middle
East, Russia, and Latin America. Demand for alternative and renewable energy systems
did experience a slight downturn primarily in Europe during the second half of the year
as the credit crisis temporarily made financing all but impossible.
At Hyundai Heavy Industries, we recorded robust growth of 29% in 2008, booking orders
worth USD 2.28 billion as we continued to successfully expand our market share in the
US and Middle East markets. Strong demand for replacement electrical equipment from
US and European utilities enabled us to post gains of 78% and 74% in those respective
markets, while orders from the Middle East held steady.
Looking closer at the results, our electrical equipment business recorded a strong 30%
growth in orders. Our fast-growing solar power systems business, which started the
year with photovoltaic cell and module manufacturing capacities of 30 MW and 70 MW
respectively, generated a spectacular 83% growth with orders of USD 128 million.
Currently the only Korean manufacturer to produce both photovoltaic cells and modules,
we are now entering the final year of a roughly KRW 300 billion investment program that
will boost our cell manufacturing capacity eleven-fold over 2007 to 330 MW by 2010.
Gas Insulated Switchgear
We manufacture a wide range of high-performance switchgear
solutions to meet any voltage requirement, including SF6 gas
insulated switchgear models ranging from 24 kV up to 800 kV
(362 kV pictured). In 2008, our switchgear orders rose 7% to
USD 306 million, part of a broader, balanced growth trend that
saw division orders grow by 29% for the year.
2008 Order Breakdownby Value
1. Transformers: 29%
2. Rotating Machinery: 22%
3. Switchgear: 13%
4. Gas Insulated Switchgear: 11%
5. Solar Power Systems: 6%
6. Other Equipment: 19%
1
23
4
5
6
Salesin KRW billions
Orders in USD millions
1,0
57
1,4
53 1
,92
5
1,2
74
1,7
66
2,2
81
Greatness is transforming. In 2008, we boosted our transformer
production capacity to 100,000 MVA as we positioned ourselves to
meet the world’s growing thirst for power.
‘06 ‘07 ‘08 ‘06 ‘07 ‘08

30+31
2009 Outlook
We believe ongoing electrical grid upgrades in the US and expansion in the Middle East
combined with new investment in Russia and other emerging markets will keep global
electrical equipment demand steady in 2009. We also expect alternative and renewable
energy projects in Europe and elsewhere to get back on track, with those segments of
the industry growing by around 60% in the coming year.
Given this favorable global growth outlook, we have increased our 2009 order target by
15% to USD 2.6 billion and our sales target by 46% to KRW 2.8 trillion. In the electrical
equipment field, we aim to make inroads in India’s high-voltage transformer and gas-
insulated switchgear markets as we step up our marketing to win a bigger share of the
US high-voltage transformer market and challenge major European players in Middle
Eastern markets. In the solar power systems field, we will be aggressively pursuing new
business in European growth markets such as Italy and Greece as we further expand
marketing in France, the Czech Republic, and other regional markets.Transformer Capacity Expansion
We marked our 21st year in the transformer
(765 kV pictured) business by passing the
500,000 MVA shipped milestone in September
2008. Then in December, we completed a new
state-of-the-art factory that boosted our annual
production capacity by 30,000 MVA to an indus-
try-leading 100,000 MVA, about 25% greater
than the current capacity of Korea’s entire
power distribution network.
Solar Power Systems
Our advanced photovoltaic solutions are helping
us make inroads into markets in Europe as well
as at home (1.6 MW plant pictured) with turnkey
utility-scale projects. We are now aggressively
upgrading production capacity and pursuing
opportunities for vertical integration as we set
our sights on becoming a global PV industry
leader by 2014.
Transformers Gas InsulatedSwitchgear
RotatingMachinery
2006~2008 Orders by Productin USD millions
38
7
61
9
65
5
18
9
27
9
24
2 29
6
37
4
51
1
Solar PowerSystems
16 7
0
12
8
OtherEquipment
94
13
9
43
9
Switchgear
29
2
28
5 30
6
Backlogin USD millions
1,0
13
1,2
37
1,3
97
‘06 ‘07 ‘08 ‘06 ‘07 ‘08 ‘06 ‘07 ‘08 ‘06 ‘07 ‘08 ‘06 ‘07 ‘08 ‘06 ‘07 ‘08 ‘06 ‘07 ‘08

2008 Overview
The global construction equipment industry enjoyed brisk sales in major resource-rich
regions such as the Middle East, Russia, and Brazil during the first half of 2008, buoyed
by rising oil and natural resource prices. However the credit crisis that started in the US
and rapidly spread worldwide in the second half of the year had a chilling effect on
demand, particularly in North America and Europe where orders slid more than 20%
year-on-year. In China, excavator orders grew at a strong 18% pace for the year but
stumbled in the fourth quarter, dropping nearly 30% year-on-year for the quarter. The
situation was similar in other emerging markets as well. Demand rose in the first half of
the year as major infrastructure projects moved forward only to plummet in the second
half. Demand in Korea also declined in the second half as local construction and real
estate markets cooled.
At Hyundai Heavy Industries, we grew orders by 14% to a record high of USD 1.86 billion
in 2008 despite the ongoing global economic slowdown. This growth was primarily driven
by emerging markets such as the Middle East, Africa, CIS, and Latin America where
ongoing resource development and infrastructure construction booms helped push new
orders up over 46% for the year. US equipment orders rebounded slightly, rising 8% on
relatively strong demand. European orders stumbled, falling 11% as the financial crisis
impacted markets across the continent and a housing slump hit the east. At home,
orders recorded a slight uptick as local governments moved forward with public works
projects and demand for medium- and heavy-duty forklifts picked up.
Review of Operations
R210LC-9 Excavator
Officially launched in December 2008, our flagship 9-series excavators significantly raise the bar for
performance. The completely redesigned series takes the most advanced features of our previous
top-of-the-line 7A-series and adds new ones such as our patented Posi-Nega hydraulic control sys-
tem, Hi-Mate GPS-based remote management system, and more standard features than any other
machine on the market.
Salesin KRW billions
Ordersin USD millions
1,1
98 1
,51
2
1,7
69
1,2
39 1,6
30
1,8
57
Consolidated Ordersin USD millions
2,1
37
2,2
83
1,5
25
Greatness is innovating. In 2008, we unveiled the world’s most
sophisticated hydraulic control system on our all-new 9-series
excavators and expanded our LPG forklift lineup with new muscle.
‘06 ‘07 ‘08 ‘06 ‘07 ‘08
‘06 ‘07 ‘08
32+33
2009 Outlook
The global construction equipment market will face a number of major challenges in
2009. The credit crunch triggered by the US subprime mortgage crisis has chilled mar-
kets around the world, setting the stage for steep declines in demand that will make an
already competitive industry even more so. Our proactive response to these challenges
includes special marketing programs that will provide active support to major dealers in
each market as well as more-attractive parts and service policies. We will also be
launching several new equipment lines, including our new 9-series excavator lineup and
backhoe loaders, as we focus on cutting costs and improving quality across our equip-
ment portfolio.
Given the ongoing global credit crisis, we have significantly lowered our 2009 order target
to USD 1.26 billion, a 31% year-on-year decrease. While equipment demand for private
sector projects is expected to be flat for the foreseeable future, we do see potential for
gradual gains as major government-led economic stimulus projects get underway in
China, the US, and other markets. Overall, we expect equipment orders to begin to slow-
ly pick up in the second half of the year as these stimulus plans start to have an impact
on the marketplace. In China, we expect excavator sales to grow around 8% as we
expand and upgrade the professionalism of our local agent network and improve and
expand leasing and purchase options. We will also continue to explore and develop mar-
ket opportunities across Africa, the CIS, and Asia as we work to maximize our long-term
growth potential in the global marketplace.
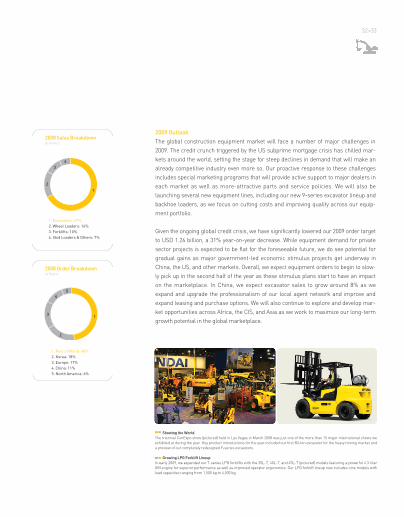
Showing the World
The triennial ConExpo show (pictured) held in Las Vegas in March 2008 was just one of the more than 15 major international shows we
exhibited at during the year. Key product introductions for the year included our first 80-ton excavator for the heavy mining market and
a preview of our completely redesigned 9-series excavators.
Growing LPG Forklift Lineup
In early 2009, we expanded our 7-series LPG forklifts with the 35L-7, 40L-7, and 45L-7 (pictured) models featuring a powerful 4.3-liter
GM engine for superior performance as well as improved operator ergonomics. Our LPG forklift lineup now includes nine models with
load capacities ranging from 1,500 kg to 4,500 kg.
2008 Sales Breakdownby Product
1. Excavators: 67%
2. Wheel Loaders: 16%
3. Forklifts: 10%
4. Skid Loaders & Others: 7%
1. Rest of World: 48%
2. Korea: 18%
3. Europe: 17%
4. China: 11%
5. North America: 6%
2008 Order Breakdownby Region
1
2
3
4
1
2
3
4
5

Review of Operations
At Hyundai Heavy Industries, innovation is an integral part of our corporate DNA. On aver-
age, our research organization has well over 1,400 projects underway at any given time.
Augmented by institutes in Hungary and China as well as a growing number of interna-
tional partnerships, our four Korea-based research institutes are the creative dynamos
that have helped us achieve a top-five global market share in 25 product categories to
date, including six in 2008 alone. Our goal is to expand this number to more than 35 cate-
gories by the end of the decade.
In 2008, we increased our investment in R&D by 13% to KRW 167 billion. We plan to invest
KRW 237 billion in 2009—42% more than we invested last year and the equivalent of 1.0%
of our projected sales—as we continue to innovate to enhance our global competitiveness.
Our unique research organiza-
tion is a powerful competitive
advantage that cannot be dupli-
cated, driving the innovation
that keeps us at the top of the
shipbuilding and heavy manu-
facturing industries.
R&D Strategies
In 2009, we will be focusing on sharpening our core capabilities in current business fields as
well as identifying and pursuing opportunities in new fields with strong potential for growth.
The following five strategies will guide us over the coming year.
• We will continue to advance our development efforts in five broad areas: core product leader-
ship, core technology advancement, production technology leadership, new technology and
product development, and new business development.
• We will continue to expand our efforts to identify and create new growth businesses.
• We will continue to improve our return on R&D investment.
• We will continue to foster excellence in research.
• We will continue to expand our global R&D network.
Ship Propulsion Performance Innovations• Fuel-economic hull form design technology• Systematic, optimal designs take construction
productivity into account

34+35
HYUNDAI MARITIME RESEARCH INSTITUTE (HMRI)
Founded in 1984, HMRI brings together the crucial engineering and performance testing capabilities
that make our ships, offshore structures, engines, pumps, and construction equipment among the
world’s best. Key areas of research include hydrodynamics, propulsion and maneuvering, structural
design, noise and vibration control, engine performance, and machinery design.
In 2008, HMRI completed sea trials of a full-scale thrust fin, a wing-shaped device mounted to ship
rudder horns in line with the propeller to enhance propulsion efficiency. The trials verified the 4% to 6%
efficiency gains predicted by the model tests, producing a fuel savings of over 300 tons per day. At cur-
rent fuel costs of around USD 350 per ton, this savings would add up to USD 1.4 million annually and
USD 35 million over the normal 25-year operating life of a larger containership. We are seeing strong
interest in this technology from the marine shipping industry. To date, we have delivered one thrust-fin
equipped 8,600 TEU containership to a German shipowner, a customer who has since added this option
to six more vessels currently on order.
HYUNDAI INDUSTRIAL RESEARCH INSTITUTE (HIRI)
Founded in 1983, HIRI’s mission is to optimize every aspect of engineering, productivity, and quality
from the drawing board to the shipping dock. Key areas of research include welding, casting and forg-
ing, materials, manufacturing automation, oil and gas system process optimization, alternative energy,
pollution control, coatings, and corrosion protection.
In 2008, HIRI completed development of a hot-wire electro-gas welding process that increases both
quality and efficiency when welding the extremely thick steel plating that is increasingly common in
ships and offshore structures. The innovative process was recognized as the top innovation of the year
at our annual corporate R&D awards.
HYUNDAI ELECTRO-MECHANICAL RESEARCH INSTITUTE (HEMRI)
Founded in 1991, HEMRI covers a broad spectrum of technical disciplines in the fields of electrical and
mechanical engineering with applications that span our entire product portfolio. Key areas of research
include power conversion systems, electric power machinery, plant and ship automation systems,
intelligent machines, and industrial robotics.
In 2008, HEMRI marked its second year in the LCD robot business with the development of the
HC2500BD handling robot for 8th generation LCD glass substrates. Designed entirely in-house, the
HC2500BD’s combination of price, performance, and quality enabled us to win orders for more than
100 units from LG Display in Korea during the year. We expect international orders for the robot to pick
up as other major LCD makers move to 8th generation production lines in the coming years.
TECHNO DESIGN INSTITUTE (TDI)
Founded in 2000, TDI enhances the quality and competitiveness of our products, communications, and
facilities through visual design. TDI collaborates with design research institutes and universities in Korea
as well partners overseas to ensure our customers get value that looks as good as it works.
In 2008, TDI completed development of the award-winning TP510 teaching pendant for our Hi5 industrial
robot controller. A comprehensive review of operating environment and ergonomic factors led to a
redesigned button layout and grip for enhanced usability. To date, the TP510 has been named a 2008 Pin
Up Design Award bronze winner in Korea as well as a 2009 iF Product Design Award winner in Germany.
TECHNOLOGY MANAGEMENT CENTER (TMC)
Founded in 2003, TMC provides the direction and supporting systems that drive our overall R&D strate-
gy. The center identifies business opportunities by tracking product and technology trends, facilitates
knowledge dissemination by gathering, analyzing, and organizing technical data from internal and
external sources, and maximizes the value of R&D investments by managing and monetizing our intel-
lectual property portfolio.
Capital Expendituresin KRW billions
1,0
87
39
2
1,8
98
‘06 ‘07 ‘08
R&D Expendituresin KRW billions
12
6
14
7
16
7
‘06 ‘07 ‘08
1,4
00
‘09(E)
23
7
‘09(E)

True greatness is always sustainable. It recognizes that its
future is intrinsically linked to the future of employees,
suppliers, and communities. It unites and serves. And as it
grows, it enriches life for all.

Greatnessin Respon-sibility

HHI and the Community
At Hyundai Heavy
Industries, we believe
that our people are our
greatest asset and the
driving force that keeps
us sustainably growing.
Human Resource Initiatives
At Hyundai Heavy Industries, we believe that our people are our greatest asset and the dri-
ving force that keeps us sustainably growing. Whether they are responsible for developing
business strategies or welding in a dry dock, we go to great lengths through our profes-
sional development programs and Hyundai Technical College to equip our people with the
knowledge and skills they need to excel in their jobs and further their careers.
We also believe in taking good care of our family with one of the best benefit packages in
the industry. In addition to competitive salaries and quality housing, we provide compre-
hensive family healthcare benefits, daycare programs and seasonal camps for depen-
dents, and a wide variety of leisure and cultural programs through our five community
centers. This strong commitment to employee growth and well-being forms the basis for
one of Korea’s most successful labor-management partnerships.
Labor-Management Relations
Trust and respect are the foundation of our win-win labor-management relationship.
While many Korean firms find themselves facing violent labor strikes and work slow-
downs, we marked our 14th straight strike-free year in 2008 as we continued to forge win-
win collective bargaining agreements with our people. The Korea Employers Federation
recognized our leadership in the field by selecting us the winner of the prestigious 2008
Labor-Management Cooperation Award in the large enterprise category.
Supplier Support Initiatives
As of the end of 2008, we relied on 195 onsite and offsite suppliers to meet our production
requirements. As part of our efforts to build strong win-win relationships, we work closely
with each supplier to ensure that their accounting, technical, personnel, and information sys-
tems are up-to-date and compatible with our high standards. We also provide their employ-
ees with the same online training, medical, and other benefits that our own people receive.
Community Service Initiatives
As a major employer in the Ulsan region, we believe that we have an important role to play
in making our community a better place to live. Every spring, our “Housewives College”
program gives homemakers a wide variety of opportunities for self improvement and com-
munity service. Our cafeterias and local food donation programs actively support local agri-
cultural and fisheries industries through their purchases. We subsidize school lunches for
about 1,000 needy local students each year. We have also partnered with the Korea Organ
and Tissue Donor Program since 2007 to run Korea’s most successful corporate organ
donation campaign. Approximately 8,800 employees of our shipbuilding group, which
includes Hyundai Samho Heavy Industries and Hyundai Mipo Dockyard, signed donation
cards during the 2008 campaign, bringing our total to over 15,000 donors to date.

38+39
English and ski camps [1~2] are just two of the popular vacation programs we run for the children of our employees,
union members, and suppliers. The International Supervisors Spring Festival [3~4] treats expat supervisors and
their families to a day of great food, friendly competition, and good entertainment each May.
We received the prestigious 2008 Labor-Management Cooperation Award [5] from the Korea Employers Federation
in recognition of our commitment to excellence in labor relations. Our second annual campaign with the Korea
Organ and Tissue Donor Program [6] signed up 8,800 donors across our three Hyundai shipbuilding group firms,
bringing total donor card signers to over 15,000, a remarkable 25% of our total combined workforces.
Our 49 cafeterias [7] support the Ulsan community by purchasing farm produce, meat, and seafood from local
sources whenever possible. Within 48 hours of Korea’s worst oil spill to date back in December 2007, our volunteers
were on-site [8] with equipment and supplies to aid in the massive cleanup effort. In 2008, we pledged KRW 1.1 bil-
lion [9] to support local social welfare programs. We have donated over KRW 8.5 billion to date to over 170 local ser-
vice organizations and groups to make our community a better, brighter place to live.
Employees as of December 31, 2008
Male Female Total
Administrative 8,152 840 8,992
Technical &
Skilled Workers 15,702 546 15,559
Total 23,854 1,386 25,240
1 2
5 6
7 8 9
3 4

Environmental Initiatives
At Hyundai Heavy Industries, minimizing our environmental footprint is a key priority in our
commitment to creating greater long-term value for all of our stakeholders. Since acquir-
ing ISO 14001 certification in 1997, we have continued to enhance our environmental man-
agement system, meet and exceed domestic and international environmental regulations,
build green manufacturing systems, and expand into eco-friendly businesses. We believe
that by working together toward these goals at all levels of our organization, we are helping
lead the global heavy manufacturing sector into a cleaner, greener sustainable future.
Our environmental initiatives cover a wide range of areas. In recent years, we have convert-
ed all worksite furnaces and boilers from bunker C and kerosene fuel to clean-burning
LNG, dramatically reducing sulfur oxide emissions. We have installed four regenerative
thermal oxidizer units—including two in 2008—significantly cutting volatile organic com-
pound emissions. We continue to steadily decrease wastewater discharges and improve
discharge water quality through ongoing process innovations and bi-monthly testing. These
innovations enabled us to cut our discharge volume by 48% in 2008. We also continue to
steadily reduce waste generation and improve recycling, keeping our hazardous waste
recycling ratio above 53% in 2008. Last, but not least, we actively promote environmental
protection and conservation in the greater Ulsan region, participating in a variety of pro-
grams to help keep local mountains, rivers, and coastlines clean, green, and safe.
Safety Initiatives
The safety of our employees, contractors, and local community is another top priority for us
as we strive for a zero-accident workplace. Our Safety Learning Center continues to be our
most popular and effective safety initiative. Rather than using theoretical, classroom-style
training, the center provides realistic, hands-on training on how to avoid and handle com-
mon workplace hazards. In 2008, more than 12,000 employees, on-site contractors, and
vocational trainees participated in center safety courses. We also run a comprehensive
accident prevention program that emphasizes workplace safety talk and systematic inspec-
tions in addition to monthly “safety days” to keep awareness high and accidents low.
Caring for the heath and well-being of our people is another one of our top priorities. Our
on-site medical clinic has a full-time staff of 28 medical professionals as well as a full com-
plement of consultation, physical therapy, and rehabilitation services. We also run a wide
range of health programs that focus on musculoskeletal, cardiovascular, and cerebrovas-
cular disorder and disease prevention as well as smoking cessation to better meet the
healthcare needs of our 25,000-strong workforce.
From green procure-
ment to green products,
we’re working hard to
ensure a sustainable and
safe future for our
employees, neighbors,
and customers.
HHI and the Environment

40+41
As a shipbuilder, we have a close affinity for the oceans and coasts. This is why we join the Ulsan community for reg-
ular clean-up events [3~5] to keep our local coastline healthy and safe. We also put safety first with comprehensive
systems and training. Our Safety Learning Center [6~7] is a key part of our training efforts, providing realistic sce-
narios for employees to learn how to stay safe in the workplace.
ISO 14001 OHSAS 18001
347
2005 2007 2008
348
336
2006
352
in kg/year
SOx Emissionsin kg/year
347
‘05 ‘07 ‘08
348
336
‘06
352
347
2005 2007 2008
348
336
2006
352
in kg/year
Hazardous WasteRecycling Ratio
43.2%
‘05 ‘07 ‘08
60.2%
46.3%
‘06
53.4%
Wastewater Dischargesin cum/year
40,203
29,070
35,500
15,086
Major Certifications
‘05 ‘07 ‘08‘06
We continue to improve air quality, water quality, and waste management performance at our Ulsan shipyard. Our
environmental facilities include four regenerative thermal oxidizer units [1] to reduce VOC emissions, two water
treatment plants [2], and one incinerator.
1 2
3
4
5
6
7

True greatness is consistently profitable. It looks far into the
future, but never loses sight of the present. It aims for the
best, but prepares for the worst. And as it grows, it creates
value and wealth for all stakeholders.

Greatnessin Results
The following discussion and analysis is based on financial
information prepared according to accounting principles generally
accepted in the Republic of Korea (Korean GAAP). References to the
“Company” are references to Hyundai Heavy Industries Co., Ltd.
The following sections contain descriptions of management plans and
objectives, including assumptions, plans, and expectations related to
financial condition, operational performance, and businesses of the
Company. Statements that are not historical facts, including
statements about the Company’s beliefs and expectations, are
forward-looking statements. Forward-looking statements involve
known and unknown risks, uncertainties, and other factors that may
cause the actual results or performance of the Company to be
materially different from any future results or performance expressed
or implied by such statements.
The Company does not make any representation or warranty,
expressed or implied, as to the accuracy or completeness of the
information contained in this section, and nothing contained herein is,
or shall be relied upon as, a promise, whether as to the past or the
future. Such forward-looking statements are based on current plans,
estimates, and projections of the Company and the political and
economic environment in which the Company will operate in the
future. You should therefore not place undue reliance on them.
Forward-looking statements only represent conditions as of the date
they are made, and the Company undertakes no obligation to update
publicly any of them in light of new information or future events.
Business Overview
The Company is composed of six major divisions: Shipbuilding,
Offshore & Engineering, Industrial Plant & Engineering, Engine &
Machinery, Electro Electric Systems, and Construction Equipment.
The majority of these businesses are sensitive to both local and
overseas economic trends. Since exports account for more than 80%
of sales, the Company’s performance is significantly impacted by
global business conditions.
Despite a rapidly deteriorating business environment in the wake of
the global financial crisis that started in the US, the Company booked
record sales of KRW 19,957.1 billion in 2008. The Company moved
forward with a number of major investment projects during the year,
including new shipbuilding facilities at Gunsan Port on Korea’s west-
central coast, the offshore yard’s first dry dock—known as H Dock—
capable of building vessels up to 1 million tons, and engine and
transformer plant expansions. The Company also accelerated
investment in the new and alternative energy fields, funding the
expansion of a photovoltaic cell and module manufacturing plant in
Eumseong and a planned wind turbine plant in Gunsan.
The Company achieved a number of major production milestones and
industry firsts in 2008. These included a single-year delivery record of
102 marine vessels, a single-year two-stroke marine engine
production record of 10 million bhp, and an accumulated two-stroke
marine engine production record of 80 million bhp. Other significant
milestones reached included 500,000 MVA of transformer production
in just 30 years, and 150,000 pieces of construction and industrial
equipment produced in just 20 years.
Results of Operations
Profit Analysis
Sales
The Company’s six business divisions generated sales of KRW
19,957.1 billion in 2008, a KRW 4,424.1 billion or 28.5% increase over
2007 due to strong growth in new orders and the depreciation of the
Korean won.
The Shipbuilding Division recorded sales growth of 20.2% to reach
KRW 9,084.9 billion on the back of rising orders for high-priced
vessels.
The Engine & Machinery Division recorded sales growth 53.3%,
reaching KRW 2,522.1 billion on strong demand for marine diesel
engines.
The Offshore & Engineering Division recorded sales growth of 39.3%
due to increased on-ground shipbuilding and offshore project orders
in recent years.
The Industrial Plant & Engineering Division recorded sales growth of
35.2% as orders grew strongly for a second straight year.
The Electro Electric Systems Division recorded sales growth of 32.4%
as global demand for power equipment continued to rise in the US,
China, and emerging markets.
The Construction Equipment Division recorded sales growth of 17.0%,
benefitting from continued robust infrastructure investment in China
and other emerging markets.
Management’s Discussion & Analysis
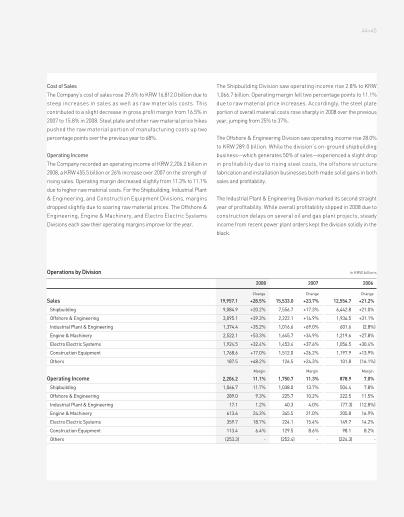
44+45
Cost of Sales
The Company’s cost of sales rose 29.6% to KRW 16,812.0 billion due to
steep increases in sales as well as raw materials costs. This
contributed to a slight decrease in gross profit margin from 16.5% in
2007 to 15.8% in 2008. Steel plate and other raw material price hikes
pushed the raw material portion of manufacturing costs up two
percentage points over the previous year to 68%.
Operating Income
The Company recorded an operating income of KRW 2,206.2 billion in
2008, a KRW 455.5 billion or 26% increase over 2007 on the strength of
rising sales. Operating margin decreased slightly from 11.3% to 11.1%
due to higher raw material costs. For the Shipbuilding, Industrial Plant
& Engineering, and Construction Equipment Divisions, margins
dropped slightly due to soaring raw material prices. The Offshore &
Engineering, Engine & Machinery, and Electro Electric Systems
Divisions each saw their operating margins improve for the year.
The Shipbuilding Division saw operating income rise 2.8% to KRW
1,066.7 billion. Operating margin fell two percentage points to 11.1%
due to raw material price increases. Accordingly, the steel plate
portion of overall material costs rose sharply in 2008 over the previous
year, jumping from 25% to 37%.
The Offshore & Engineering Division saw operating income rise 28.0%
to KRW 289.0 billion. While the division’s on-ground shipbuilding
business—which generates 50% of sales—experienced a slight drop
in profitability due to rising steel costs, the offshore structure
fabrication and installation businesses both made solid gains in both
sales and profitability.
The Industrial Plant & Engineering Division marked its second straight
year of profitability. While overall profitability slipped in 2008 due to
construction delays on several oil and gas plant projects, steady
income from recent power plant orders kept the division solidly in the
black.
Operations by Division
Sales 19,957.1 +28.5% 15,533.0 +23.7% 12,554.7 +21.2%
Shipbuilding 9,084.9 +20.2% 7,556.7 +17.3% 6,442.8 +21.0%
Offshore & Engineering 3,095.1 +39.3% 2,222.1 +14.9% 1,934.5 +31.1%
Industrial Plant & Engineering 1,374.4 +35.2% 1,016.6 +69.0% 601.6 (2.8%)
Engine & Machinery 2,522.1 +53.3% 1,645.7 +34.9% 1,219.6 +27.8%
Electro Electric Systems 1,924.5 +32.4% 1,453.4 +37.6% 1,056.5 +30.4%
Construction Equipment 1,768.6 +17.0% 1,512.0 +26.2% 1,197.9 +13.9%
Others 187.5 +48.2% 126.5 +24.3% 101.8 (16.1%)
Operating Income 2,206.2 11.1% 1,750.7 11.3% 878.9 7.0%
Shipbuilding 1,066.7 11.7% 1,038.0 13.7% 504.4 7.8%
Offshore & Engineering 289.0 9.3% 225.7 10.2% 222.5 11.5%
Industrial Plant & Engineering 17.1 1.2% 40.3 4.0% (77.3) (12.8%)
Engine & Machinery 613.6 24.3% 345.5 21.0% 205.8 16.9%
Electro Electric Systems 359.7 18.7% 224.1 15.4% 149.7 14.2%
Construction Equipment 113.4 6.4% 129.5 8.6% 98.1 8.2%
Others (253.3) - (252.4) - (224.3) -
2008 2007 2006
Margin Margin Margin
Change Change Change
in KRW billions

The Engine & Machinery Division continued to lead the way in
profitability growth as it saw operating income leap 77.5% to KRW
613.6 billion. Marine engine profitability continued to grow
incrementally, benefitting from both rising vessel prices and the
shipbuilding boom. Power plant engines also made major gains in
both sales and profitability as orders continued to grow.
The Electro Electric Systems Division saw operating income rise
60.5% as global demand for power continued to explode. Growing
demand for replacement power distribution equipment in the US and
robust investment in power generation facilities across the Middle
East over the past two years helped drive large gains in both sales and
profitability.
The Construction Equipment Division saw operating income fall 12.4%
as US demand continued to shrink in the face of a stagnant housing
market and previously booming demand in Europe, China, and other
emerging markets cooled.
Management’s Discussion & Analysis
'06 '07 '08
15.4%4.8%
9.7%
8.4%
9.5%
14.3%
6.5%
10.6%
9.4%
9.7%
15.5%
6.9%
12.6%
9.6%
8.9%
51.3% 48.6%45.5%
0.9% 0.9% 1.0%
■ Shipbuilding ■ Offshore & Engineering ■ Industrial Plant & Engineering ■ Engine & Machinery ■ Electro Electric Systems ■ Construction Equipment ■ Others
Sales Breakdown by Division
12,554.7
15,533.0
19,957.1
+28.5%
+23.7%
'06 '07 '08
Sales Trend in KRW billions

46+47
Non-Operating Income
The Company posted a net non-operating income of KRW 743.5 billion, a
15.5% year-on-year improvement. Improved profitability and growth in
advances from customers drove a 45.2% increase in interest income.
The Company also saw a 28.5% increase in net gains on valuation of
equity method accounted investments from Hyundai Samho Heavy
Industries and other investment holdings.
Net Income
The Company recorded net income of KRW 2,256.7 billion, a 30% year-
on-year increase. This growth was driven by rising Shipbuilding and
Engine & Machinery Division operating income from growing backlogs
and higher prices as well as solid operating results from the Offshore
& Engineering and Electro Electric Systems Divisions. Net earnings
per share continued to surge, rising 34% from KRW 27,778 in 2007 to
KRW 37,340.
Cash Flows Analysis
Net cash provided by operating activities shrank by 42% to KRW
2,382.7 billion in 2008 as both inventories and advance payments rose.
Net cash used in investing activities was KRW 1,183.7 billion as rising
investment in fixed assets far exceeded cash inflows from the disposal
of short-term financial instruments and investment securities.
Net cash used in financing activities jumped 193.4% due to the
distribution of a cash dividend and the buy-back of 3% of total issued
shares.
As a result of the above cash flows, cash and cash equivalents
dropped 30%, declining KRW 286.3 billion to KRW 667.5 billion at the
end of 2008.
Net Non-Operating Income / Expenses
Net Non-Operating Income/Expenses 743.5 643.7 270.7
Net interest income 273.4 188.3 79.2
Net gain on foreign currency translation 21.0 4.5 (9.7)
Net gain on foreign currency transactions 34.5 9.8 (66.3)
Net gain on valuation of equity method accounted investments 619.9 482.5 179.2
Net gain on foreign exchange forward contracts (221.6) (33.8) 96.3
Net of others 16.3 (7.6) (8.0)
2008 2007 2006
in KRW billions
in KRW billionsCash Flows
‘06
■Operating Activities ■Investing Activities ■Financing Activities■Operating Income ■Operating Income Margin
0
1,000
2,000
3,000
4,000
5,000
-1,000
-2,000
-3,000
-4,000
‘07 ‘08
1,639.1
-1,167.9
-95.8
4,116.0
-3,476.0
-506.2
2,382.7
-1,183.7-1,485.3
in KRW billionsOperating Income & Operating Income Margin
‘06 ‘07 ‘08
878.9
1,750.7
11.3%
2,206.2
11.1%
7.0%

Financial Structure Analysis
Assets
The Company’s total assets stood at KRW 25,280.4 billion at 2008
year-end, a 50.5% year-on-year increase of KRW 8,481.7 billion. The
Company applied fair-value hedge accounting to derivative
transactions regarding foreign shipbuilding contracts that met firm
commitment conditions as of September 30, 2008 in accordance with
the Financial Supervisory Service’s Practical Opinion on Financial
Reporting 2008-2. As a result, firm commitment assets increased by
KRW 4,559.1 billion. The related gain and loss on valuation of firm
commitments are recorded in non-operating income and expenses.
Liabilities
The Company’s total liabilities stood at KRW 19,685.2 billion at 2008
year-end, a 73.4% year-on-year increase of KRW 8,334.2 billion.
Strong shipbuilding order growth continued to push advances from
customers sharply upward, increasing them 27.0% to KRW 10,177.4
billion. The rapid depreciation of the Korean won increased foreign
exchange forward contract liabilities to KRW 5,654.9 billion. As a
result, the liabilities-to-equity ratio rose 143.4 percentage points to
351.8% at year-end. Total borrowings declined to KRW 3.3 billion due
to the increased cash generated from advances from customers,
effectively reducing the debt-to-equity ratio to effectively zero.
Stockholders’ Equity
The Company’s stockholders’ equity stood at KRW 5,595.2 billion at
2008 year-end, a 2.7% increase of KRW 147.5 billion. This
improvement was driven by a KRW 1,790.0 billion or 62% increase in
retained earnings, reflecting the solid 30% rise in net income for the
year. A KRW 832.7 billion share buy-back and a decline in share prices
during the year resulted in a 117% increase in capital adjustments to
KRW 1,762.0 billion.
Management’s Discussion & Analysis
in KRW billionsBalance Sheet Summary
Assets 25,280.4 16,798.7 12,996.1
Current assets 12,617.6 8,481.9 6,037.8
Non-current assets 12,662.8 8,316.8 6,958.3
Liabilities 19,685.2 11,351.0 8,675.3
Current liabilities 16,473.9 10,807.1 8,152.5
Non-current liabilities 3,211.3 543.9 522.8
Stockholders’ Equity 5,595.2 5,447.7 4,320.8
2008 2007 2006
Liabilities
Total Liabilities 19,685.2 11,351.0 8,675.3
Liabilities/Equity 351.8% 208.4% 200.8%
Total Debt 3.3 189.0 186.9
Debt/Equity 0.1% 3.5% 4.3%
Debt/EBITDA 0.1% 8.8% 14.9%
Debt/Capital 0.9% 49.7% 49.2%
2008 2007 2006
4.3%3.5%
200.8%208.4%
351.8%
Financial Stability Ratios
■Liabilities-to-Equity Ratio ■Debt-to-Equity Ratio
‘06 ‘07 ‘08
0.1%
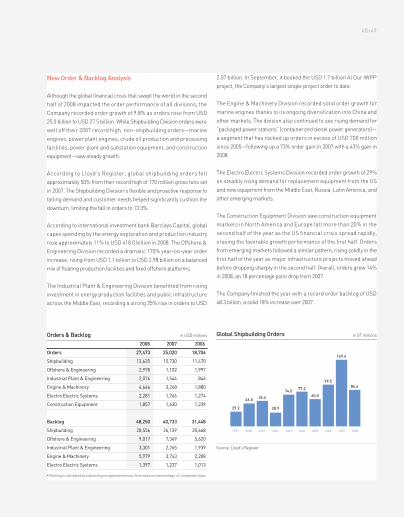
48+49
New Order & Backlog Analysis
Although the global financial crisis that swept the world in the second
half of 2008 impacted the order performance of all divisions, the
Company recorded order growth of 9.8% as orders rose from USD
25.0 billion to USD 27.5 billion. While Shipbuilding Division orders were
well off their 2007 record high, non-shipbuilding orders—marine
engines, power plant engines, crude oil production and processing
facilities, power plant and substation equipment, and construction
equipment—saw steady growth.
According to Lloyd’s Register, global shipbuilding orders fell
approximately 50% from their record high of 170 million gross tons set
in 2007. The Shipbuilding Division’s flexible and proactive response to
falling demand and customer needs helped significantly cushion the
downturn, limiting the fall in orders to 13.3%.
According to international investment bank Barclays Capital, global
capex spending by the energy exploration and production industry
rose approximately 11% to USD 418.0 billion in 2008. The Offshore &
Engineering Division recorded a dramatic 170% year-on-year order
increase, rising from USD 1.1 billion to USD 2.98 billion on a balanced
mix of floating production facilities and fixed offshore platforms.
The Industrial Plant & Engineering Division benefitted from rising
investment in energy production facilities and public infrastructure
across the Middle East, recording a strong 35% rise in orders to USD
2.07 billion. In September, it booked the USD 1.7 billion Al Dur IWPP
project, the Company’s largest single-project order to date.
The Engine & Machinery Division recorded solid order growth for
marine engines thanks to its ongoing diversification into China and
other markets. The division also continued to see rising demand for
“packaged power stations” (containerized diesel power generators)—
a segment that has racked up orders in excess of USD 700 million
since 2005—following up a 73% order gain in 2007 with a 43% gain in
2008.
The Electro Electric Systems Division recorded order growth of 29%
on steadily rising demand for replacement equipment from the US
and new equipment from the Middle East, Russia, Latin America, and
other emerging markets.
The Construction Equipment Division saw construction equipment
markets in North America and Europe fall more than 20% in the
second half of the year as the US financial crisis spread rapidly,
erasing the favorable growth performance of the first half. Orders
from emerging markets followed a similar pattern, rising solidly in the
first half of the year as major infrastructure projects moved ahead
before dropping sharply in the second half. Overall, orders grew 14%
in 2008, an 18 percentage point drop from 2007.
The Company finished the year with a record order backlog of USD
48.3 billion, a solid 18% increase over 2007.
Orders & Backlog
Orders 27,473 25,020 18,706
Shipbuilding 13,635 15,730 11,470
Offshore & Engineering 2,978 1,102 1,997
Industrial Plant & Engineering 2,076 1,544 846
Engine & Machinery 4,646 3,248 1,880
Electro Electric Systems 2,281 1,766 1,274
Construction Equipment 1,857 1,630 1,239
Backlog 48,250 40,733 31,448
Shipbuilding 28,556 26,139 20,668
Offshore & Engineering 9,017 7,349 5,620
Industrial Plant & Engineering 3,301 2,265 1,939
Engine & Machinery 5,979 3,743 2,208
Electro Electric Systems 1,397 1,237 1,013
2008 2007 2006
in USD millions in GT millions
Source: Lloyd’s Register
• Backlog is calculated by subtracting recognized revenues from sales on a percentage-of-completion basis.
Global Shipbuilding Orders
29.2
46.036.4
28.9
74.077.2
60.0
99.5
169.6
86.4
1999 2000 2001 2002 2003 2004 2005 2006 2007 2008

2009 Business Outlook
Sales
The Company believes that the unprecedented nature of the current
global economic recession makes the business outlook for 2009
extremely difficult to forecast. What is certain is that the Company’s
record 2008 order performance has given it a robust backlog that will
keep manufacturing operations busy for roughly the next three years.
For this reason, the Company expects to record sales of KRW 22,876.1
billion in 2009, a 14.6% year-on-year increase.
With the exception of the Construction Equipment Division, which
expects the ongoing economic downturn to further depress sales, the
Company expects its five other divisions to continue to post
incremental sales growth. The following two divisions in particular are
expected to perform exceptionally well. The Engine & Machinery
Division is aiming for a dramatic increase in sales due to recent
increases in new orders and production capacity. The Electro Electric
Systems Division also anticipates major growth as new capacity
comes online and the solar power system market takes off.
Orders
The Company is targeting orders of USD 21.1 billion in 2009, a 23.2%
year-on-year decrease. In light of the current global credit freeze and
economic slowdown, the Shipbuilding and Construction Equipment
Divisions are certain to see lower order growth. While the slowdown in
shipbuilding orders will significantly impact marine engine orders, the
Engine & Machinery Division expects strong demand for diesel power
plants, such as HiMSEN-engine-based PPS packaged power stations,
to help limit the decline. The Offshore & Engineering Division expects
order growth to surpass its 2008 performance as the energy
exploration and development industry continues to grow. The Electro
Electric Systems Division also expects higher growth than 2008,
backed by steady global demand for electric equipment as well as new
growth businesses such as solar and wind power systems.
Capital Expenditures
The Company will continue with push forward with major investment
projects that are currently underway. These include the construction
of a new shipyard at Gunsan Port, additional engine-building capacity,
and new and additional manufacturing facilities for the solar and wind
power businesses. All other new projects will be shelved or scaled
back as the 2009 capital expenditures budget shrinks by 24.7% to
KRW 1,430.0 billion.
Management’s Discussion & Analysis

50+51
The Board of Directors and Stockholders
Hyundai Heavy Industries Co., Ltd:
We have audited the accompanying non-consolidated balance sheet of Hyundai Heavy Industries Co., Ltd. (the “Company”) as of December
31, 2008, and the related non-consolidated statement of income, appropriation of retained earnings, changes in equity and cash flows for the
year then ended. These non-consolidated financial statements are the responsibility of the Company's management. Our responsibility is to
express an opinion on these non-consolidated financial statements based on our audit. The accompanying non-consolidated financial
statements of the Company as of December 31, 2007, were audited by other auditors, whose report thereon dated February 22, 2008,
expressed an unqualified opinion on those statements.
We conducted our audit in accordance with auditing standards generally accepted in the Republic of Korea. Those standards require that we
plan and perform the audit to obtain reasonable assurance about whether the financial statements are free of material misstatement. An
audit includes examining, on a test basis, evidence supporting the amounts and disclosures in the financial statements. An audit also includes
assessing the accounting principles used and significant estimates made by management, as well as evaluating the overall financial
statement presentation. We believe that our audit provides a reasonable basis for our opinion.
In our opinion, the non-consolidated financial statements referred to above present fairly, in all material respects, the financial position of the
Company, as of December 31, 2008 and the results of its operations, appropriation of its retained earnings, the changes in its equity and its
cash flows for the year then ended in conformity with accounting principles generally accepted in the Republic of Korea.
Seoul, Korea
February 26, 2009
Independent Auditors’ Report
Based on a report originally issued in Korean
Notice to Readers
This report is effective as of February 26, 2009, the audit report date. Certain subsequent events or circumstances, which may occur between the audit report date and the
time of reading this report, could have a material impact on the accompanying non-consolidated financial statements and notes thereto. Accordingly, the readers of the
audit report should understand that there is a possibility that theabove audit report may have to be revised to reflect the impact of such subsequent events or
circumstances, if any.

NON-CONSOLIDATED BALANCE SHEETS
AS OF DECEMBER 31, 2008 AND 2007
CURRENT ASSETS:
Cash and cash equivalents (Notes 28 and 34) ₩ 667,492,156 ₩ 953,756,858
Short-term financial instruments (Note 3) 1,676,394,826 2,154,137,014
Short-term investment securities (Note 5) 102,459,800 503,388,199
Trade accounts and notes receivable, net of allowance for doubtful accounts of
₩96,532,225 in 2008 and ₩70,815,544 in 2007 (Notes 22, 27 and 28) 4,498,868,535 2,740,673,266
Accounts receivable - other, net of allowance for doubtful accounts of
₩296,094,108 in 2008 and ₩268,303,195 in 2007 (Notes 17, 27 and 28) 162,113,211 147,455,116
Advanced payments, net of allowance for doubtful accounts of
₩17,757,919 in 2008 and ₩12,567,027 in 2007 852,779,452 336,144,870
Accrued income 58,732,447 30,528,517
Foreign exchange forward contracts (Note 16) 1,851,056,213 167,882,896
Deferred income tax assets (Notes 16 and 23) 212,461,924 70,990,353
Inventories (Note 4) 2,263,296,422 1,119,219,452
Other current assets (Note 6) 271,913,270 257,729,822
Total current assets 12,617,568,256 8,481,906,363
NON-CURRENT ASSETS:
Long-term financial instruments (Notes 3 and 28) 15,322,748 9,003,360
Long-term investment securities (Note 7) 496,260,357 714,663,412
Equity method accounted investments (Notes 8 and 26) 2,712,825,310 2,222,730,033
Property, plant and equipment, net (Notes 9 and 29) 6,189,953,763 4,968,785,355
Intangible assets (Notes 10 and 29) 262,296,296 236,048,362
Long-term trade accounts and notes receivable,
net of allowance for doubtful accounts of ₩832,009 in 2008 and ₩965,609 in 2007 82,368,900 95,595,244
Foreign exchange forward contracts 2,815,240,074 17,637,724
Other non-current assets (Notes 11 and 28) 88,565,217 52,334,858
Total non-current assets 12,662,832,665 8,316,798,348
Total assets ₩ 25,280,400,921 ₩ 16,798,704,711
(Continued)
ASSETS 2008 2007
Korean won (In thousands)

52+53NON-CONSOLIDATED BALANCE SHEETS (CONTINUED)
AS OF DECEMBER 31, 2008 AND 2007
CURRENT LIABILITIES:
Trade accounts and notes payable (Notes 27 and 28) ₩ 2,337,258,676 ₩ 1,495,173,461
Accounts payable - other (Notes 27 and 28) 180,439,441 122,492,217
Advances from customers (Note 22) 10,177,418,459 8,013,303,994
Accrued expenses (Notes 27 and 28) 289,674,793 250,899,632
Income tax payable (Note 23) 457,058,997 455,564,205
Current maturities of debentures and long-term borrowings,
net of discounts of ₩ in 2008 and ₩298,966 in 2007 (Notes 13 and 28) - 187,341,034
Foreign exchange forward contracts (Note 16) 2,798,264,234 125,422,256
Other current liabilities (Note 12) 233,766,414 156,881,303
Total current liabilities 16,473,881,014 10,807,078,102
NON-CURRENT LIABILITIES:
Debentures and long-term borrowings (Notes 13 and 28) 3,314,633 1,625,627
Long-term accrued expenses (Notes 17) - 1,029,341
Provision for retirement and severance benefits, net of severance insurance deposits
and others of ₩1,112,905,108 in 2008 and ₩1,079,968,485 in 2007 (Note 14) 139,018,332 110,865,582
Deferred income tax liabilities (Notes 8, 16, 23 and 26) 133,497,415 276,376,968
Foreign exchange forward contracts (Note 16) 2,856,649,956 80,564,196
Other long-term liabilities (Note 15) 78,820,055 73,455,854
Total non-current liabilities 3,211,300,391 543,917,568
Total liabilities 19,685,181,405 11,350,995,670
STOCKHOLDERS’ EQUITY:
Common stock of ₩5,000 par value 380,000,000 380,000,000
Authorized – 160,000,000 shares
Issued and outstanding – 76,000,000 shares in 2008 and 2007
Capital surplus (Notes 18 and 16) 2,818,590,688 2,813,693,355
Capital adjustments (Notes 20 and 26) (1,762,040,031) (811,302,031)
Accumulated other comprehensive income (Notes 5, 7, 8, 16, 23, 24 and 26) (498,454,758) 198,258,025
Retained earnings (Note 19) 4,657,123,617 2,867,059,692
Total stockholders’ equity 5,595,219,516 5,447,709,041
Total liabilities and stockholders’ equity ₩ 25,280,400,921 ₩ 16,798,704,711
See accompanying notes to non-consolidated financial statements.
LIABILITIES AND STOCKHOLDERS’ EQUITY 2008 2007
Korean won (In thousands)

NON-CONSOLIDATED STATEMENTS OF INCOME
FOR THE YEAR ENDED DECEMBER 31, 2008 AND 2007
Sales (Notes 16, 22, 27 and 29) ₩ 19,957,080,881 ₩ 15,533,013,307
Cost of sales (Notes 22 and 27) 16,811,989,016 12,976,118,554
Gross profit 3,145,091,865 2,556,894,753
Selling, general and administrative expenses (Note 30) 938,918,930 806,197,217
Operating income 2,206,172,935 1,750,697,536
NON- OPERATING INCOME:
Interest and dividend income 288,868,980 205,072,125
Gain on foreign currency transactions 677,244,920 87,926,436
Gain on foreign currency translation 140,564,809 12,923,568
Gain on valuation of equity method accounted investments (Note 8) 771,497,568 489,179,298
Gain on foreign exchange forward contracts (Note 16) 1,773,396,856 40,963,544
Gain on disposition of property, plant and equipment 48,774,129 6,709,012
Others 126,755,536 112,014,629
Non-operating income 3,827,102,798 954,788,612
NON- OPERATING EXPENSES:
Interest expense 6,472,122 11,402,580
Loss on foreign currency transactions 642,757,743 78,099,571
Loss on foreign currency translation 119,579,748 8,360,813
Loss on impairment of long-term investments securities - 105,249
Loss on disposition of property, plant and equipment 57,568,485 33,263,439
Loss on valuation of equity method accounted investments (Note 8) 151,574,109 6,643,654
Loss on foreign exchange forward contracts (Note 16) 1,995,002,134 74,793,871
Others 110,689,186 98,431,106
Non-operating expenses 3,083,643,527 311,100,283
Income before income taxes 2,949,632,206 2,394,385,865
Income taxes expense (Note 23) 692,967,361 658,325,534
Net income ₩ 2,256,664,845 ₩ 1,736,060,331
Earnings per share
Basic earnings per share (Note 25) ₩ 37,340 ₩ 27,778
See accompanying notes to non-consolidated financial statements.
2008 2007
Korean won (In thousands, except per share amounts)

54+55NON-CONSOLIDATED STATEMENTS OF APPROPRIATIONS OF RETAINED EARNINGS
FOR THE YEAR ENDED DECEMBER 31, 2008 AND 2007
Unappropriated retained earnings
Balance at beginning of year ₩ 4 ₩ 9
Net income 2,256,664,845 1,736,060,331
Balance at end of year before appropriation 2,256,664,849 1,736,060,340
Transfer from voluntary reserves
Reserve for research and human development 6,666,667 17,690,636
Reserve for legal reserve 21,543,399 -
Unappropriated retained earnings available for appropriation 2,284,874,915 1,753,750,976
Appropriation of retained earnings
Legal reserve - 46,660,092
Reserve for research and human development 1,985,207,630 1,240,489,960
Cash dividends (Note 21) 299,667,280 466,600,920
Unappropriated retained earnings to be carried over to subsequent year ₩ 5 ₩ 4
See accompanying notes to non-consolidated financial statements.
2008 2007
Korean won (In thousands)
Date of Appropriation for 2008: March 13, 2009
Date of Appropriation for 2007: March 14, 2009

NON-CONSOLIDATED STATEMENTS OF CHANGES IN EQUITY
FOR THE YEAR ENDED DECEMBER 31, 2008 AND 2007
Korean won (In thousands)
Accumulated other Total
comprehensive stockholder’s
Capital stock Capital surplus Capital adjustments income Retained earnings equity
Balance at January 1, 2007 ₩ 380,000,000 ₩ 2,771,383,687 ₩ (351,821,818) ₩ 386,855,426 ₩ 1,292,233,001 ₩ 4,478,650,296
Cumulative effect of change
in accounting policy - - (135,429,138) (76,847,171) - (212,276,309)
Balance at January 1, 2007,
restated 380,000,000 2,771,383,687 (487,250,956) 310,008,255 1,292,233,001 4,266,373,987
Dividends - - - - (161,233,640) (161,233,640)
Balance after appropriations - - - - 1,130,999,361 4,105,140,347
Net income - - - - 1,736,060,331 1,736,060,331
Changes in capital surplus on
valuation of equity method
accounted investments - 42,309,668 - - - 42,309,668
Change in treasury stock - - (344,907,695) - - (344,907,695)
Change in equity method
accounted treasury stock - - 22,492,574 - - 22,492,574
Changes in capital adjustments
on valuation of equity method
accounted investments - - (1,635,954) - - (1,635,954)
Gain on valuation of investment
securities - - - 63,184,877 - 63,184,877
Changes in unrealized gain on
valuation of equity method
accounted investments - - - 102,123,889 - 102,123,889
Negative Changes in unrealized
gain on valuation of equity
method accounted investments - - - (9,801,583) - (9,801,583)
Change in the valuation of
derivatives - - - (267,257,413) - (267,257,413)
Balance at December 31, 2007 ₩ 380,000,000 ₩ 2,813,693,355 ₩ (811,302,031) ₩ 198,258,025 ₩ 2,867,059,692 ₩ 5,447,709,041
(Continued)

56+57NON-CONSOLIDATED STATEMENTS OF CHANGES IN EQUITY (CONTINUED)
FOR THE YEAR ENDED DECEMBER 31, 2008 AND 2007
Korean won (In thousands)
Accumulated other Total
comprehensive stockholder’s
Capital stock Capital surplus Capital adjustments income Retained earnings equity
Balance at January 1, 2008 ₩ 380,000,000 ₩ 2,771,383,687 ₩ (696,729,513) ₩ 169,794,560 ₩ 2,867,059,692 ₩ 5,491,508,426
Cumulative effect of change
in accounting policy - 42,309,668 (114,572,518) 28,463,465 - (43,799,385)
Balance at January 1, 2008,
restated 380,000,000 2,813,693,355 (811,302,031) 198,258,025 2,867,059,692 5,447,709,041
Dividends - - - - (466,600,920) (466,600,920)
Balance after appropriations - - - - 2,400,458,772 4,981,108,121
Net income - - - - 2,256,664,845 2,256,664,845
Changes in capital surplus on
valuation of equity method
accounted investments - 4,897,333 - - - 4,897,333
Change in treasury stock - - (832,711,782) - - (832,711,782)
Change in equity method
accounted treasury stock - - (11,234,489) - - (11,234,489)
Changes in capital adjustments
on valuation of equity method
accounted investments - - (106,791,729) - - (106,791,729)
Gain on valuation of
investment securities - - - (262,816,255) - (262,816,255)
Changes in unrealized gain on
valuation of equity method
accounted investments - - - (20,318,477) - (20,318,477)
Negative Changes in
unrealized gain on valuation of
equity method accounted
investments - - - (102,820,239) - (102,820,239)
Change in the valuation of
Derivatives - - - (310,757,812) - (310,757,812)
Balance at December 31, 2008 ₩ 380,000,000 ₩ 2,818,590,688 ₩ (1,762,040,031) ₩ (498,454,758) ₩ 4,657,123,617 ₩ 5,595,219,516
See accompanying notes to non-consolidated financial statements.

NON-CONSOLIDATED STATEMENTS OF CASH FLOWS
FOR THE YEAR ENDED DECEMBER 31, 2008 AND 2007
Cash flows from operating activities
Net income ₩ 2,256,664,845 ₩ 1,736,060,331
Adjustments for:
Depreciation 347,327,963 351,718,296
Accrual for severance benefits 230,151,603 198,841,279
Accrual for allowance for doubtful accounts 35,565,244 12,877,187
Loss on foreign currency translation 117,775,185 8,329,771
Loss on disposition of property, plant and equipment 57,568,485 33,263,439
Equity in net loss of equity accounted investees 151,574,109 6,643,654
Amortization of development costs 41,423,910 38,181,230
Loss on valuation of foreign exchange forward contracts 2,966,525,406 59,199,240
Accrual for foreseeable losses on construction contracts 65,158,129 -
Loss on impairment of long-term investment securities - 105,249
Gain on foreign currency translation (137,571,569) (11,252,407)
Equity in net income of equity method accounted investees (771,497,568) (489,179,298)
Gain on valuation of foreign exchange forward contracts (1,713,371,925) (234,959,971)
Gain on reversal of provision (1,421,861) (6,392,055)
Others, net (28,132,693) (48,750,885)
3,617,739,263 1,654,685,060
Changes in assets and liabilities:
Change in trade accounts and notes receivable (1,724,001,640) (256,285,468)
Change in accounts receivable-other (16,578,847) 66,031,312
Change in accrued income (28,203,930) (24,969,810)
Change in advanced payments (552,953,561) 61,724,429
Change in inventories (1,144,075,525) 9,557,776
Change in foreign exchange forward contracts (990,190,623) 303,208,956
Change in trade accounts payable 854,632,361 312,601,393
Change in accounts payable-other 49,677,150 (3,826,357)
Change in advances from customers 2,459,903,477 1,768,443,574
Change in accrued expenses (24,520,129) 60,504,616
Change in income tax payable 1,494,792 287,846,165
Change in long-term accrued expenses (1,029,342) (1,239,893)
Change in deposits for retirement and severance benefits (37,269,107) (142,655,720)
Payments of retirement and severance benefits (169,062,230) (143,195,698)
Change in deferred income tax assets (42,217,698) (70,990,353)
Change in deferred income tax liabilities 18,379,478 161,765,351
Others, net 110,987,270 72,803,493
Net cash provided by operating activities ₩ 2,382,711,159 ₩ 4,116,008,826
(Continued)
2008 2007
Korean won (In thousands)

58+59NON-CONSOLIDATED STATEMENTS OF CASH FLOWS (CONTINUED)
FOR THE YEAR ENDED DECEMBER 31, 2008 AND 2007
Cash flows from investing activities
Withdrawal of short-term financial instruments ₩ 2,390,621,000 ₩ 1,030,621,000
Disposition of short-term investment securities 2,382,649,007 1,178,453,619
Disposition of long-term investment securities 13,355,791 17,193,951
Disposition of equity method accounted investments 70,937 6,585,516
Disposition of long-term financial instruments 2,004,095 539,893
Disposition of other non-current assets 4,523,174 1,721,898
Disposition of property, plant and equipment 83,417,532 18,924,381
Acquisition of short-term financial instruments (1,912,945,045) (2,950,621,000)
Acquisition of short-term investment securities (1,960,000,000) (1,424,000,000)
Acquisition of long-term investment securities (136,397,826) (246,507,801)
Acquisition of equity method accounted investments (148,056,640) (133,347,454)
Acquisition of long-term financial instruments (6,003,410) (367,473)
Acquisition of other non-current assets (35,805,532) (9,563,269)
Acquisition of property, plant and equipment (1,791,434,120) (910,854,533)
Acquisition of intangible assets (69,711,129) (54,750,934)
Net cash used in investing activities (1,183,712,166) (3,475,972,206)
Cash flows from financing activities
Increase in long-term borrowings 1,689,006 282,600
Repayment of current portion of long-term borrowings and other long-term liabilities (187,640,000) (341,960)
Payment of cash dividends (466,600,920) (161,233,640)
Acquisition of treasury stock (832,711,781) (344,907,695)
Net cash used in financing activities (1,485,263,695) (506,200,695)
Net increase (decrease) in cash and cash equivalents (286,264,702) 133,835,925
Cash and cash equivalents at beginning of year 953,756,858 819,920,933
Cash and cash equivalents at end of year ₩ 667,492,156 ₩ 953,756,858
See accompanying notes to non-consolidated financial statements.
2008 2007
Korean won(In thousands)

NOTES TO NON-CONSOLIDATED FINANCIAL STATEMENTS
FOR THE YEAR ENDED DECEMBER 31, 2008
1. Organization and Description of Business
2. Summary of Basis of Presenting Financial Statements and Significant Accounting Policies
Hyundai Heavy Industries Co., Ltd. (the “Company”) was incorporated in 1973, under the Commercial Code of the Republic of Korea to
manufacture and sell ships, offshore structures, plants, engines and other items.
The Company listed its shares on the Korea Stock Exchange in August 1999, and a total of 76,000,000 shares (par value: ₩5,000, authorized:
160,000,000 shares) of common stock were issued and 59,933,456 shares of common stock were outstanding as of December 31, 2008. Of the
total issued shares, the company’s major stockholders Mong-Joon Chung, KCC Corp., Hyundai Mipo Dockyard Co., Ltd., National Pension
Corp.,and Mirae Asset investment management Co., Ltd. own 10.80%, 8.15%, 7.98%, 5.01% and 4.50%, respectively.
Under the Articles of Incorporation, the Company is authorized to issue 20,000,000 shares of cumulative, participating, non-voting preferred stock
and to issue convertible debentures and debentures with common or preferred stock purchase options up to ₩400,000 million each, depository
receipts free from any preemptive rights of shareholders by the approval of the board of directors and grant stock options to the Company’s
employees and directors, up to 15% of issued common stock; however, no preferred stock, convertible debentures or debentures with stock
options and depository receipts have been issued, and no stock options have been granted to the Company’s employees and directors as of
December 31, 2008. The Company may also raise capital with obtaining the approval of the Board of Directors by issuing stock to old
shareholders, issuing stock through a general public subscription under 30% of outstanding shares, issuing stock through the issue of
Depository Receipts under the Securities and Exchange Act and issuing stock to employees under certain circumstances.
Basis of Presenting Financial Statements
The Company prepares the non-consolidated financial statements in accordance with generally accepted accounting principles in the Republic of
Korea. Except for the items explained in note 16 and 26 related to accounting changes and the adoption of changes to Statements of Korean
Accounting Standards (“SKAS”), No.15 Investments in Associates, Korea Accounting Institute Opinion 06-2 (Deferred Income Taxes on
Investments in Subsidiaries, Associates and Interests in Joint Ventures), and Financial Supervisory Services Staff Opinions on Financial Reporting
2008-2 (Forecast transactions contracted in a foreign currency that meet the definition of firm agreement), the Company applied the same
accounting policies that were adopted in the previous year’s non-consolidated financial statements.
The significant accounting policies followed by the Company in the preparation of its non-consolidated financial statements are summarized
below.
Cash and Cash Equivalents
Cash and cash equivalents include cash on hand and short-term deposits and short-term financial instruments with maturities of three months
or less on acquisition date, which can be converted into cash and whose risk of value fluctuation arising from changes of interest rates is not
material.

60+61
Allowance for Doubtful Accounts
Allowance for doubtful accounts is estimated based on an analysis of individual accounts and past experience of collection. When the terms of
trade accounts and notes receivable (the principal, interest rate or term) are varied, either through a court order, such as a reorganization, or by
mutual formal agreement, resulting in a reduction in the present value of the future cash flows due to the Company, the difference between the
carrying value of the relevant accounts and notes receivable and the present value of the future cash flows is recognized as bad debt expense.
Inventories
Inventories are stated at the lower of cost or net realized value. Net realizable value is the estimated selling price in the ordinary course of
business, less the estimated selling costs. Cost is determined using the moving average method, except for materials in-transit for which cost is
determined using the specific identification method. Quantities of inventories at year-end are determined based on physical counts.
Investments in Securities (excluding investments in associates, subsidiaries and joint ventures)
Classification
Upon acquisition, the Company classifies debt and equity securities (excluding investments in subsidiaries, associates and joint ventures) into the
following categories: held-to-maturity, available-for-sale or trading securities. This classification is reassessed at each balance sheet date.
Investments in debt securities where the Company has the positive intent and ability to hold to maturity are classified as held-to-maturity.
Securities that are acquired principally for the purpose of selling in the short term are classified as trading securities. Investments not classified
as either held-to-maturity or trading securities are classified as available-for-sale securities.
Initial recognition
Investments in securities (excluding investments in subsidiaries, associates and joint ventures) are initially recognized at cost.
Subsequent measurement and income recognition
Trading securities are subsequently carried at fair value. Gains and losses arising from changes in the fair value of trading securities are included
in the income statement in the period in which they arise. Available-for-sale securities are subsequently carried at fair value. Gains and losses
arising from changes in the fair value of available-for-sale securities are recognized as accumulated other comprehensive income, net of tax,
directly in equity. Investments in available-for-sale securities that do not have readily determinable fair values are recognized at cost less
impairment, if any. Held-to-maturity investments are carried at amortized cost with interest income and expense recognized in the income
statement using the effective interest method.
Fair value information
The fair value of marketable securities is determined using quoted market prices as of the period end. Non-marketable debt securities are fair
valued by discounting cash flows using the prevailing market rates for debt with a similar credit risk and remaining maturity. Credit risk is
determined using the Company’s credit rating as announced by accredited credit rating agencies in Korea. The fair value of investments in money
market funds is determined by investment management companies.
Presentation
Trading securities are presented as current assets. Available-for-sale securities, which mature within one year from the balance sheet date or
where the likelihood of disposal within one year from the balance sheet date is probable, are presented as current assets. Held-to-maturity
securities, which mature within one year from the balance sheet date, are presented as current assets. All other available-for-sale securities and
held-to-maturity securities are presented as long-term investments.
Impairment
The Company reviews investments in securities whenever events or changes in circumstances indicate that the carrying amount of the
investments may not be recoverable. Impairment losses are recognized when the reasonably estimated recoverable amounts are less than the
carrying amount and it is not obviously evidenced that impairment is unnecessary.
NOTES TO NON-CONSOLIDATED FINANCIAL STATEMENTS
FOR THE YEAR ENDED DECEMBER 31, 2008
An impairment loss is reversed if the reversal can be related objectively to an event occurring after the impairment loss was recognized and a
reversal of an impairment loss shall not exceed the carrying amount that would have been determined (net of amortization or depreciation) had
no impairment loss been recognized in the asset in prior years. For financial assets measured at amortized cost and available-for-sale assets
that are debt securities, the reversal is recognized in profit or loss. For available-for-sale financial assets that are equity securities, the reversal is
recognized directly in equity.
Investments in Associates and Subsidiaries
Associates are entities of the Company and its subsidiaries that have the ability to significantly influence the financial and operating policies. It is
presumed to have significant influence if the Company holds directly or indirectly 20 percent or more of the voting power unless it can be clearly
demonstrated that this is not the case. Subsidiaries are entities controlled by the Company.
Differences between the initial purchase price and the Company’s initial proportionate ownership of the net book value of the investee are
amortized over the reasonable periods within 20 years using the straight-line method. Under the equity method, the change in the Company’s
portion of an investee’s net equity resulting from a change in an investee’s net equity is reflected in the Company’s net income (loss), retained
earnings and accumulated other comprehensive income, in accordance with the causes of the change, which consist of the investee’s net
income (loss), changes in retained earnings and changes in capital surplus, capital adjustments and accumulated other comprehensive income.
Unrealized profit arising from sales by the Company to equity method investees is fully eliminated. The Company’s proportionate unrealized profit
arising from sales by the equity method investees to the Company or sales between equity method investees is also eliminated. The Company
has used the most available financial statements of the controlled investees, which have not been audited and reviewed due to the timing of
closing of the controlled investees’ financial statements.
If the amount recoverable from investment securities accounted for using the equity method is less than its carrying amount, impairment loss is
recognized. The Company determines whether there is objective evidence that impairment loss has been incurred, and when such evidence
exists, impairment loss is recognized as impairment losses. The recoverable amount is determined as the higher of value in use or expected
amount of net cash inflows from disposal of the investment securities accounted for using the equity method. The amount of impairment loss is
included in current earnings.
When applying the equity method by translating the financial statements of an overseas investee, the Company applies (a) the foreign exchange
rate as of the Company’s balance sheet date to the investee’s assets and liabilities, (b) the foreign exchange rate as of the date on which the
Company acquired its equity interest in the investee to the Company’s share of the investee’s equity interest, and (c) the foreign exchange rate as
of each transaction date to the remaining equity interest in the investee after excluding any increase in retained earnings after the Company’s
acquisition of its equity interest in the investee. For the income statement items, the average rate for the pertinent period is applied in the
translation. After translating into Korean Won (KRW), from the difference between the total equity and the amount obtained by deducting
liabilities from assets, the amount relating to the Company’s share of the investee’s equity interest is accounted for as accumulated other
comprehensive income.
Property, Plant and Equipment
Property, plant and equipment are stated at cost, except in the case of revaluations made in accordance with the Asset Revaluation Law, which
allowed for asset revaluation prior to the Law being revoked, net of accumulated depreciation. The acquisition cost of property, plant, and
equipment is comprised of its purchase price or manufacturing costs and any other directly attributable costs of bringing the asset to the working
condition of its intended use. Any trade discounts and rebates are deducted in arriving at the purchase price.
Significant additions or improvements extending useful lives of assets are capitalized. Normal maintenance and repairs are charged to expense
as incurred. The interest incurred on borrowings to finance the purchase of construction of property, plant and equipment and manufacture of
inventories are charged to current income.

62+63
Depreciation is computed using the straight-line method, based on the estimated useful lives of the assets as described below.
The Company assesses any possible recognition of impairment loss when there is an indication that expected future economic benefits of a
tangible asset is considerably less than its carrying amount as a result of technological obsolescence or rapid decline in market value. When it is
determined that a tangible asset may have been impaired and that its estimated total future cash flows from continued use or disposal is less
than its carrying amount, the carrying amount of a tangible asset is reduced to its recoverable amount and the difference is recognized as an
impairment loss.
If the recoverable amount of the impaired asset exceeds its carrying amount in subsequent reporting period, the amount equal to the excess is
treated as reversal of the impairment loss; however, it cannot exceed the carrying amount that would have been determined had no impairment
loss been recognized.
Intangible Assets
Intangible assets, such as development costs and usage rights for the donated properties, are stated at cost, net of accumulated amortization,
which is computed using the straight-line method based on the estimated service lives of the intangibles assets as described below.
Development costs are incurred in respect of particular development activities and directly related to new products or technology. The
Company’s management believes that the value of development costs will be recovered through their future economic benefits.
Discount on Debentures
Discount on debentures issued, which represents the difference between the face value and issuance price of debentures, is amortized using the
effective interest method over the life of the debentures. The amount amortized is included in interest expense.
Foreign Currency Translation
Monetary assets and liabilities denominated in foreign currencies are translated into Korean Won at the balance sheet date, with the resulting
gains or losses recognized in the income statement. Monetary assets and liabilities denominated in foreign currencies are translated using the
Seoul Money Brokerage Service Ltd. Basic Rate, which was ₩1,257.50 and W 938.20 to USD1.00 at December 31, 2008 and 2007, respectively,
and translation gains or losses are reflected in current operations. Non-monetary assets and liabilities denominated in foreign currencies, which
are stated at historical cost, are translated into Korean Won at the foreign exchange rate on the date of the transaction.
Foreign currency assets and liabilities of foreign-based operations and companies accounted for using the equity method are translated at the
rate of exchange at the balance sheet date. Foreign currency amounts in the statement of income are translated using an average rate and
foreign currency balances in the capital account are translated using the historical rate. Translation gains and losses arising from collective
translation of the foreign currency financial statements of foreign-based operations are recorded net as accumulated other comprehensive
Buildings and structures 20 – 40
Machinery and equipment 10
Ships 12
Vehicles 5
Tools, furniture and fixtures 5
Useful lives (years)
Development costs 5
Usage right for donated properties 20 - 40
Service lives (years)

NOTES TO NON-CONSOLIDATED FINANCIAL STATEMENTS
FOR THE YEAR ENDED DECEMBER 31, 2008
income. These gains and losses are subsequently recognized as income in the year the foreign operations or the companies are liquidated or
sold.
Provision for Foreseeable Losses from Construction Contracts
When a loss on construction is expected based on cost estimates, the expected loss is charged to current operations and is included in the
balance sheet as a provision for foreseeable losses from construction contracts.
Provision for Construction Warranty
The Company generally provides a warranty within the contract on rectification of defects after the contract’s completion and accrues the
rectification expense on defects based on actual claims history as provision for construction warranty.
Provision for Product Warranty
The Company generally provides a warranty relating to product defects for a specified period of time after sales and accrues estimated costs as
provision for product warranty, which may occur due to product liability suits.
Retirement and Severance Benefits
Employees who have been with the Company for more than one year are entitled to lump-sum payments based on salary rates and length of
service at the time they leave the Company. The Company's estimated liability under the plan which would be payable if all employees left on the
balance sheet date is accrued in the accompanying non-consolidated balance sheets. A portion of the liability is covered by an employees’
severance benefits trust where the employees have a vested interest in the deposit with the insurance company or the bank in trust. The deposit
for severance benefits held in trust is, therefore, reflected in the accompanying non-consolidated balance sheets as a reduction of the liability for
retirement and severance benefits.
Through March 1999, under the National Pension Scheme of Korea, the Company transferred a certain portion of retirement allowances for
employees to the National Pension Service. The amount transferred will reduce the retirement and severance benefit amount to be paid to the
employees when they leave the Company and is accordingly reflected in the accompanying non-consolidated financial statements as a reduction
of the retirement and severance benefits liability. However, due to a new regulation effective April 1999, such transfers to the National Pension
Fund are no longer required.
Revenue Recognition
Revenues from long-term contracts, including shipbuilding contracts, are recognized using the percentage-of-completion method, measured by
the units of work performed. Revenues from other sales are recognized upon delivery of goods.
Under the percentage-of-completion method, revenues are recognized based on the percentage of costs incurred (including man hours and raw
material costs) over total estimated costs for each contract. As a result, the timing of revenue recognition of which the Company reports may
differ materially from the timing of actual contract payments received. The Company’s estimates reflect information during construction
activities. In addition, since most contracts are completed over several months, the timing of the recognition of related revenues could have a
significant impact on quarterly operating results. The revenue recognized in excess of the payment received by the Company is reflected as
accounts receivable, while the payments received in excess of the revenue recognized by the Company are reflected as advances from
customers. The expenditures incurred before the construction contract is entered into are recognized as prepaid construction costs, if they are
directly related to making a contract, separately identifiable and reliably measurable, and an agreement to construction is probable. The prepaid
construction costs are transferred to construction cost at the commencement of the construction.
Income Taxes
Income tax on the income or loss for the year comprises current and deferred tax. Income tax is recognized in the statement of income except to
the extent that it relates to items recognized directly in equity, in which case it is recognized in equity.

64+65
Current tax is the expected tax payable on the taxable income for the year, using tax rates enacted.
Deferred tax is provided using the asset and liability method, providing for temporary differences between the carrying amounts of assets and
liabilities for financial reporting purposes and the amounts used for tax purposes. The amount of deferred tax provided is based on the expected
manner of realization or settlement of the carrying amount of assets and liabilities, using tax rates enacted or substantively enacted at the
balance sheet date.
A deferred tax asset is recognized only to the extent that it is probable that future taxable income will be available against which the unused tax
losses and credits can be utilized. Deferred tax assets are reduced to the extent that it is no longer probable that the related tax benefit will be
realized.
Deferred tax assets and liabilities are classified as current or non-current based on the classification of the related asset or liability for financial
reporting or the expected reversal date of the temporary difference for those with no related asset or liability such as loss carryforwards and tax
credit carryforwards. The deferred tax amounts are presented as a net current asset or liability and a net non-current asset or liability.
Derivative Instruments
All derivative instruments are accounted for at fair value with the valuation gain or loss recorded as an asset or liability. If the derivative
instrument is not part of a transaction qualifying as a hedge, the adjustment to fair value is reflected in current operations.
Hedge accounting
Where a derivative, which meets certain criteria, is used for hedging the exposure to changes in the fair value of a recognized asset, liability or
firm commitment, it is designated as a fair value hedge. Where a derivative, which meets certain criteria, is used for hedging the exposure to the
variability of the future cash flows of a forecasted transaction it is designated as a cash flow hedge.
The Company documents, at the inception of the transaction, the relationship between hedging instruments and hedged items, as well as its risk
management objective and strategy for undertaking various hedging transactions. The Company also documents its assessment, both at hedge
inception and on an ongoing basis, of whether the derivatives that are used in hedging transactions are highly effective in offsetting the changes in
fair values or cash flows of hedged items.
Fair value hedge
Changes in the fair value of derivatives that are designated and qualify as fair value hedges are recorded in the statement of income, together
with any changes in the fair value of the hedged asset or liability that are attributable to the hedged risk.
Cash flow hedge
The effective portion of changes in the fair value of derivatives that are designated and qualify as cash flow hedges is recognized in equity. The
gain or loss relating to any ineffective portion is recognized immediately in the statement of income. Amounts accumulated in equity are recycled
to the income statement in the periods in which the hedged item will affect profit or loss. When a hedging instrument expires or is sold, or when a
hedge no longer meets the criteria for hedge accounting, any cumulative gain or loss existing in equity at the time remains in equity and is
recognized when the forecast transaction is ultimately recognized in the statement of income. When a forecast transaction is no longer expected
to occur, the cumulative gain or loss that was reported in equity is immediately transferred to the statement of income.
Derivatives that do not qualify for hedge accounting
Changes in the fair value of derivative instruments that are not designated as fair value or cash flow hedges are recognized immediately in the
statement of income.
Separable embedded derivatives
Changes in the fair value of separable embedded derivatives are recognized immediately in the statement of income.

NOTES TO NON-CONSOLIDATED FINANCIAL STATEMENTS
FOR THE YEAR ENDED DECEMBER 31, 2008
Financial instruments which are restricted in use subject to withdrawal restrictions in relation to certain short-term and long-term borrowings,
and shipbuilding contracts as of December 31, 2008 and 2007 are as follows:
Inventories as of December 31, 2008 and 2007 are summarized as follows:
Short-term investment securities consist of available-for-sale securities (current assets only) as of December 31, 2008 and 2007 are summarized
as follows:
Available-for-sale securities are stated at fair value with unrealized holding gain on valuation of available-for-sale securities (net of tax effect)
amounting to ₩1,864,531 thousand and ₩3,181,444 thousand in accumulated other comprehensive income as of December 31, 2008 and 2007,
respectively.
3. Restricted Financial Instruments
4. Inventories
5. Short-term Investment Securities
Short-term financial instruments ₩ 2,257,812 ₩ -
Long-term financial instruments 5,460,565 33,000
₩ 7,718,377 ₩ 33,000
2008 2007
Korean won (In thousands)
Merchandise ₩ 70,561,858 ₩ 48,769,359
Finished goods 198,528,892 125,533,379
Work-in-progress 651,163,931 332,450,119
Raw materials 865,977,551 346,780,441
Supplies 21,243,329 20,392,577
Materials-in-transit 455,820,861 245,293,577
₩ 2,263,296,422 ₩ 1,119,219,452
2008 2007
Korean won (In thousands)
Beneficiary certificates ₩ 102,459,800 ₩ 478,376,100
Subordinated debentures
(Dong Yang Securities Inc.) - 25,012,099
₩ 102,459,800 ₩ 503,388,199
2008 2007
Korean won (In thousands)

66+67
Other current assets as of December 31, 2008 and 2007 are summarized as follows:
(a) Long-term investment securities, which consist of available-for-sale securities (non-current assets only) as of December 31, 2008 and 2007
are summarized as follows:
(b) Equity securities stated at fair value included in long-term investment securities as of December 31, 2008 and 2007 consist of the following:
6. Other Current Assets
7. Long-term Investment Securities
Short-term loans ₩ 30,000,000 ₩ -
Prepaid expenses 238,690,207 254,860,452
Other current deposits 3,223,063 2,869,370
₩ 271,913,270 ₩ 257,729,822
2008 2007
Korean won (In thousands)
Available-for-sale securities (non-current)
Marketable securities ₩ 359,745,209 ₩ 645,820,238
Non-marketable securities 136,515,148 68,843,174
₩ 496,260,357 ₩ 714,663,412
2008 2007
Korean won (In thousands)
Listed equity securities:
Kia Motors Corp. 0.03 ₩ 2,681,616 ₩ 578,005 ₩ 891,275
Korea Line Corp. 2.71 55,130,663 20,610,678 -
Tong Yang Investment Bank 3.40 99,828,399 24,119,644 71,025,510
Mirae Asset Securities Co., Ltd. 0.10 6,654,173 2,921,441 6,873,980
SK Broadband Corp. 0.00 7,947,667 6,518 12,301
Hyundai Elevator Co., Ltd. 2.16 1,632,339 10,010,585 20,791,215
Hyundai Motor Company 3.45 519,246,924 300,335,090 544,404,872
Hyundai Corp. 0.36 11,227,434 1,163,248 1,821,085
₩ 704,349,215 ₩ 359,745,209 ₩ 645,820,238
Percentage of ownership Acquisition cost Fair value Fair value
2008 2007
Korean won (In thousands)

NOTES TO NON-CONSOLIDATED FINANCIAL STATEMENTS
FOR THE YEAR ENDED DECEMBER 31, 2008
(c) Equity securities stated at acquisition cost included in long-term investment securities as of December 31, 2008 and 2007 consist of the
following:
(*1) The book value of unlisted equity security was recorded at their acquisition cost because the fair value cannot be estimated reliably.
(*2) The fair value is calculated by using the discounted cash flow and imputed market value method.
(*3) The fair value is calculated by using the free cash flows to shareholders method and estimation of stock price distribution.
(*4) In conformity with financial accounting standards in the Republic of Korea, the equity securities of Hyundai Technologies Center Hungary Kft. and others were not accounted
for using the equity method of accounting since the Company believes the changes in the investment value resulting from the changes in the net assets of the investees, whose
Unlisted equity securities: (*1)
Gangwon Football Club Co., Ltd. 0.02 ₩ 1,000 ₩ 1,000 ₩ -
Kuk Dong Heavy Conveyance Co., Ltd. 7.50 501,720 501,720 501,720
Novelis Korea Ltd. 0.39 14,598,913 1,405,452 1,405,452
Daehan Oil Pipeline Corp.(*2) 6.39 14,511,802 30,051,393 15,851,427
Dong-A Precision Machinery. Co., Ltd. 0.74 35,640 - -
Doosan Capital Co., Ltd.(*3) 9.99 10,000,000 24,378,000 26,146,000
Bexco, Ltd. 7.96 9,460,000 9,460,000 9,460,000
Chonggu Co., Ltd. 0.00 188,260 - -
Postec Electronic Power Fund Co. 1.75 500,000 500,000 500,000
Hanwha Electric Venture Fund. 2.00 500,000 500,000 500,000
Hyundai Research Institute 14.40 1,440,000 1,440,000 1,440,000
Hyundai Climate Control Co., Ltd. 10.00 50,000 50,000 50,000
Enova System Inc. 1.45 1,314,583 1,314,583 3,042,465
PT. Golden Hyundai Machinery 20.83 155,250 155,250 -
HHI Mauritius Limited(*4) 100.00 122 122 122
Hynix Semiconductor America Inc. 1.33 34,525,619 - -
Hyundai Heavy Industries France SAS.(*4) 100.00 22,787 22,787 22,787
Hyundai (Malaysia.) SDN BHD (*4) 100.00 17,286 - -
Hyundai S/V Indonesia.(*4) 45.00 261,864 - -
Hyundai Technologies Center
Hungary Kft.(*4) 100.00 26,302 26,302 26,302
Hyundai-Enova Innovative
Technical Center Inc.(*4) 60.00 3,360,000 3,360,000 3,360,000
KC Karpovsky BV 10.00 2,443 2,443 2,443
Korea Ship Finance Co., Ltd. 2.36 200,000 200,000 200,000
Nikorma-Transport Limited 11.50 10,914 10,914 -
Pheco Inc.(*4) 100.00 2,303,555 236,621 236,621
93,988,060 73,616,587 62,745,339
Subordinated Debentures
(Dong Yang Securities Inc.)(*5) 50,000,000 47,776,067 -
Marketable securities 20,110,728 9,964,384 6,097,835
Investments in capital 5,158,110 5,158,110 -
₩ 169,256,898 ₩ 136,515,148 ₩ 68,843,174
Percentage of ownership Acquisition cost Fair value Fair value
2008 2007
Korean won (In thousands)

68+69
individual beginning balance of total assets or paid-in capital as of December 31, 2007 and 2006, is less than W 7,000 million, are not material.
(*5) The fair value is measured at the discounted future cash flows by using a discount rate that appropriately reflects the credit rating of the issuing entity assessed by a publicly
reliable independent credit rating agency.
(d) Valuation of available-for-sale securities in accumulated other comprehensive income (net of tax effect), all of which are classified into long-
term investment securities stated at fair value as of December 31, 2008, is as follows:
(e) Valuation of available-for-sale securities in accumulated other comprehensive income (net of tax effect), all of which are classified into long-
term investment securities stated at fair value as of December 31, 2007, were as follows:
Kia Motors Corp. ₩ (1,297,998) ₩ (342,819) ₩ (1,640,817)
Korea Line Corp. - (26,925,588) (26,925,588)
Tong Yang Investment Bank 20,087,727 (35,062,679) (14,974,952)
Mirae Asset Securities Co.,Ltd. 159,360 (3,070,890) (2,911,530)
SK Broadband Corp. 8,919 (3,835) 5,084
Hyundai Elevator Co., Ltd. 13,890,185 (7,355,153) 6,535,032
Hyundai Motor Company 18,239,512 (188,990,743) (170,751,231)
Hyundai Corp. 793,331 (452,929) 340,402
Daehan Oil Pipeline Corp. 971,228 11,149,653 12,120,881
Doosan Capital Co., Ltd. 11,705,850 (491,010) 11,214,840
64,558,114 (251,545,993) (186,987,879)
Investments in capital 304,530 (304,530) -
Subordinated bonds - (1,734,668) (1,734,668)
Marketable securities - (7,914,149) (7,914,149)
₩ 64,862,644 ₩ (261,499,340) ₩ (196,636,696)
Balance at Increase Balance at
January 1, 2008 (Decrease) December 31, 2008
2008
Korean won (In thousands)
Kia Motors Corp. ₩ (1,083,673) ₩ (214,325) ₩ (1,297,998)
Tong Yang Investment Bank (1,300,571) 21,388,298 20,087,727
Mirae Asset Securities Co., Ltd. - 159,360 159,360
SK Broadband Corp. 6,780 2,139 8,919
Hyundai Elevator Co., Ltd. 6,275,209 7,614,976 13,890,185
Hyundai Motor Company (405,601) 18,645,113 18,239,512
Hyundai Corp. 703,179 90,152 793,331
Daehan Oil Pipeline Corp. - 971,228 971,228
Doosan Capital Co., Ltd. - 11,705,850 11,705,850
4,195,323 60,362,791 64,558,114
Government and municipal 40,390 (40,390) -
Subordinated bonds (300,894) 300,894 -
Investments in capital 281,662 22,868 304,530
₩ 4,216,481 ₩ 60,646,163 ₩ 64,862,644
Balance at Increase Balance at
January 1, 2007 (Decrease) December 31, 2007
2007
Korean won (In thousands)

NOTES TO NON-CONSOLIDATED FINANCIAL STATEMENTS
FOR THE YEAR ENDED DECEMBER 31, 2008
(a) Investments in companies accounted for using the equity method as of December 31, 2008 were as follows:
8. Equity Method Accounted Investments
Hyundai Oilbank (*1) 48,700,540 19.87 ₩ 266,150,343 ₩ 289,760,570
Hyundai Finance Corp. (*2) 12,350,000 67.49 78,197,738 88,945,279
Hyundai Samho Heavy Industries
Co., Ltd. (*2) 37,967,000 94.92 204,259,700 1,040,405,978
Incheon Airport Energy 3,284,884 31.00 16,424,420 -
Hyundai Heavy Industries Co. Bulgaria (*2) 12,155,829 99.09 11,620,593 38,119,093
New Korea Country Club 16,457 20.00 500,000 3,613,235
Hyundai Dongahn Steel (*2&3) - 54.99 1,231,036 -
Hyundai Heavy Industries Europe N.V. (*2) 10 100.00 35,656,728 8,884,122
Hyundai Vinashin Shipyard (*2,3&4) - 10.00 2,543,678 14,982,234
H.C.E U.S.A (*2) 23,900,000 100.00 26,712,810 4,170,513
Vladivostock Business Center (*2&3) - 57.14 5,891,667 -
Koentec Co., Ltd. (*5) 3,792,000 7.58 6,617,040 4,721,024
HHI China Investment Co., Ltd. (*2&3) - 100.00 154,057,029 246,276,553
Hyundai Merchant Marine Co., Ltd.
(Common stock) (*6) 23,424,037 17.60 404,039,118 481,689,397
Hyundai Merchant Marine Co., Ltd.
(Preferred stock) (*6) 3,516,688 17.58 52,750,320 56,303,455
Qinhuangdao Shouqin Metal Materials
Co., Ltd. (*3) - 20.00 67,658,226 164,661,077
Hyundai Ideal Electric Co. (*2) 1,000 100.00 11,241,600 17,943,929
Hyundai Financial Leasing Co., Ltd. (*2&3) - 60.03 16,988,743 24,053,234
Hyundai Construction Equipment
India Private Ltd. (*2) 17,184,775 100.00 39,354,139 34,423,101
Wartsila Hyundai Engine Company
Ltd. (*3) - 50.00 33,930,000 32,894,351
Ulsan Hyundai Football Club. Ltd. (*2) 2,000,000 100.00 10,000,000 1,181,505
HYMS(*2) 29,600,000 100.00 148,000,000 114,593,849
KAM Corp. 8,330,000 49.00 41,650,000 42,481,873
Grand China Hyundai Shipping
Company Ltd. 1,000,000 50.00 1,016,600 1,261,438
Komas Corp. 754,414 100.00 3,772,070 1,459,500
₩ 1,640,263,598 ₩ 2,712,825,310
Company Number of shares Percentage of ownership Historical cost Book value
Korean won (In thousands)
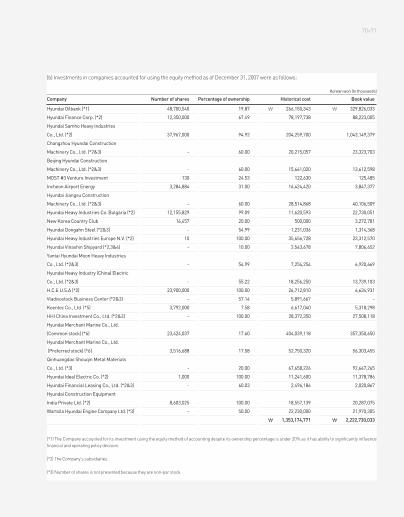
70+71
(b) Investments in companies accounted for using the equity method as of December 31, 2007 were as follows:
(*1) The Company accounted for its investment using the equity method of accounting despite its ownership percentage is under 20% as it has ability to significantly influence
financial and operating policy decision.
(*2) The Company’s subsidiaries.
(*3) Number of shares is not presented because they are non-par stock.
Hyundai Oilbank (*1) 48,700,540 19.87 ₩ 266,150,343 ₩ 329,826,033
Hyundai Finance Corp. (*2) 12,350,000 67.49 78,197,738 88,223,005
Hyundai Samho Heavy Industries
Co., Ltd. (*2) 37,967,000 94.92 204,259,700 1,043,149,379
Changzhou Hyundai Construction
Machinery Co., Ltd. (*2&3) - 60.00 20,215,057 23,323,703
Beijing Hyundai Construction
Machinery Co., Ltd. (*2&3) - 60.00 15,661,020 13,612,598
MOST #3 Venture Investment 130 24.53 122,630 125,485
Incheon Airport Energy 3,284,884 31.00 16,424,420 3,847,377
Hyundai Jiangsu Construction
Machinery Co., Ltd. (*2&3) - 60.00 28,514,868 40,106,509
Hyundai Heavy Industries Co. Bulgaria (*2) 12,155,829 99.09 11,620,593 22,730,051
New Korea Country Club 16,457 20.00 500,000 3,272,781
Hyundai Dongahn Steel (*2&3) - 54.99 1,231,036 1,314,368
Hyundai Heavy Industries Europe N.V. (*2) 10 100.00 35,656,728 23,312,570
Hyundai Vinashin Shipyard (*2,3&4) - 10.00 2,543,678 7,806,652
Yantai Hyundai Moon Heavy Industries
Co., Ltd. (*2&3) - 54.99 7,254,254 6,920,669
Hyundai Heavy Industry (China) Electric
Co., Ltd. (*2&3) - 55.22 18,256,250 13,739,103
H.C.E U.S.A (*2) 23,900,000 100.00 26,712,810 6,634,931
Vladivostock Business Center (*2&3) - 57.14 5,891,667 -
Koentec Co., Ltd. (*5) 3,792,000 7.58 6,617,040 5,318,298
HHI China Investment Co., Ltd. (*2&3) - 100.00 28,372,350 27,508,118
Hyundai Merchant Marine Co., Ltd.
(Common stock) (*6) 23,424,037 17.60 404,039,118 357,350,650
Hyundai Merchant Marine Co., Ltd.
(Preferred stock) (*6) 3,516,688 17.58 52,750,320 56,303,455
Qinhuangdao Shouqin Metal Materials
Co., Ltd. (*3) - 20.00 67,658,226 92,647,265
Hyundai Ideal Electric Co. (*2) 1,000 100.00 11,241,600 11,378,786
Hyundai Financial Leasing Co., Ltd. (*2&3) - 60.03 2,496,186 2,020,867
Hyundai Construction Equipment
India Private Ltd. (*2) 8,603,025 100.00 18,557,139 20,287,075
Wartsila Hyundai Engine Company Ltd. (*3) - 50.00 22,230,000 21,970,305
₩ 1,353,174,771 ₩ 2,222,730,033
Company Number of shares Percentage of ownership Historical cost Book value
Korean won (In thousands)

NOTES TO NON-CONSOLIDATED FINANCIAL STATEMENTS
FOR THE YEAR ENDED DECEMBER 31, 2008
(*4) Since the percentage of ownership of the Company and its subsidiary is more than 20% and the Company is able to exercise significant influence over the operating and
financial policies, equity securities are accounted for using the equity method.
(*5) Since the Company is able to exercise significant influence over the operating and financial policies, investment in Koentec Co., Ltd. was accounted for using the equity
method of accounting deposit its ownership percentage is under 20%. In addition, the closing price of Koentec Co., Ltd. on the KOSDAQ. was ₩1,080 per share at December 31,
2008.
(*6) Since the ownership’s percentage of the Company and its subsidiary exceeded over 20% and the Company is able to exercise significant influence over the operating and
financial policies, investment in these securities are accounted for using the equity method of accounting. In addition, the closing common stock price of Hyundai Merchant
Marine Co., Ltd. on the stock market of the Republic of Korea was ₩ 37,100 per share at December 31, 2008. Its preferred stock has no market price because it is unlisted.
(c) Under the equity method of accounting, the differences between the initial purchase price and the Company’s initial proportionate ownership
of the net book value of the investee are amortized (reversed) over the reasonable periods within 20 years and the changes in the differences for
the year ended December 31, 2008 were as follows:
(d) Changes in the opening and closing balances of investments in companies accounted for using the equity method for the year ended
December 31, 2008 were as follows:
Hyundai Vinashin Shipyard ₩ (99,085) ₩ - ₩ 99,085 ₩ -
Koentec Co., Ltd. 1,382,971 - (691,485) 691,486
Hyundai Merchant Marine Co., Ltd.
(common stock) 52,673,525 - (16,207,239) 36,466,286
Qinhuangdao Shouqin Metal Materials
Co., Ltd. 11,367,799 - (2,843,062) 8,524,737
₩ 65,325,210 ₩ - ₩ (19,642,701) ₩ 45,682,509
Balance at Increase Balance at
Company January 1, 2008 (Decrease) Amortization December 31, 2008
Korean won (In thousands)
Hyundai Oilbank ₩ 329,826,033 ₩ (58,699,470) ₩ 18,634,007 ₩ - ₩ 289,760,570
Hyundai Finance Corp. 88,223,005 (21,164) 1,978,438 (1,235,000) 88,945,279
Hyundai Samho Heavy Industries Co., Ltd. 1,043,149,379 594,375,706 (521,185,107) (75,934,000) 1,040,405,978
Changzhou Hyundai Construction Machinery
Co., Ltd. 23,323,703 - - (23,323,703) -
Beijing Hyundai Jingcheng Construction
Machinery Co., Ltd. 13,612,598 - - (13,612,598) -
MOST #3 Venture Investment 125,485 - - (125,485) -
Incheon Airport Energy(*2) 3,847,377 (3,847,377) - - -
Hyundai Jiangsu Construction
Machinery Co., Ltd. 40,106,509 - - (40,106,509) -
Hyundai Heavy Industries Co. Bulgaria 22,730,051 6,606,628 8,782,414 - 38,119,093
New Korea Country Club 3,272,781 440,454 - (100,000) 3,613,235
Hyundai Dongahn Steel (*3) 1,314,369 (1,534,453) 220,084 - -
Hyundai Heavy Industries Europe N.V. 23,312,570 (24,637,991) 10,209,543 - 8,884,122
Hyundai Vinashin Shipyard 7,806,651 4,499,454 3,417,479 (741,350) 14,982,234
Accumulated other
Balance at Net income comprehensive Other increase Balance at
Company January 1, 2008 (loss) income (decrease) December 31, 2008
Korean won (In thousands)

72+73
(*1) Use of the equity method was discontinued since the value of investments is less than zero due to accumulated deficit. In addition, cumulative unrecognized loss due to
suspension of applying the equity method amounts to ₩93,079 million, including ₩10,322 million increased for the year ended December 31, 2008, and allowance amounting to
W 79,156 million was provided for accounts receivables-other for Vladivostok Business Center.
(*2) Use of the equity method was discontinued since the value of investments is less than zero due to accumulated deficit. In addition, cumulative unrecognized loss due to
suspension of applying the equity method amounts to ₩3,598 million for the year ended December 31, 2008.
(*3) Use of the equity method was discontinued since the value of investments is less than zero due to accumulated deficit. In addition, cumulative unrecognized loss due to
suspension of applying the equity method amounts to ₩90 million for the year ended December 31, 2008.
Yantai Hyundai Moon Heavy Industries
Co., Ltd. 6,920,669 - - (6,920,669) -
Hyundai Heavy Industry (China) Electric
Co., Ltd. 13,739,102 - - (13,739,102) -
H.C.E U.S.A. 6,634,931 (6,883,517) 4,419,099 - 4,170,513
Vladivostok Business Center (*1) - - - - -
Koentec Co., Ltd. 5,318,298 (498,939) (3,535) (94,800) 4,721,024
HHI China Investment Co., Ltd. 27,508,118 25,345,990 67,461,678 125,960,767 246,276,553
Hyundai Merchant Marine Co., Ltd.
(Common stock) 357,350,650 102,669,927 33,380,838 (11,712,018) 481,689,397
Hyundai Merchant Marine Co., Ltd.
(Preferred stock) 56,303,455 2,110,013 - (2,110,013) 56,303,455
Qinhuangdao Shouqin Metal Materials
Co., Ltd 92,647,265 31,413,281 40,600,531 - 164,661,077
Hyundai Ideal Electric Co. 11,378,786 2,397,083 4,168,060 - 17,943,929
Hyundai Financial Leasing Co., Ltd. 2,020,867 803,706 6,736,104 14,492,557 24,053,234
Hyundai Construction Equipment
India Private Ltd. 20,287,075 (10,138,027) 3,477,053 20,797,000 34,423,101
Wartsila Hyundai Engine Company Ltd. 21,970,306 (775,955) - 11,700,000 32,894,351
Ulsan Hyundai Football Club. Ltd. - (8,818,495) - 10,000,000 1,181,505
HYMS - (33,406,151) - 148,000,000 114,593,849
KAM Corp. - 831,873 - 41,650,000 42,481,873
Grand China Hyundai Shipping Company Ltd. - 3,453 241,385 1,016,600 1,261,438
Komas Corp. - (2,312,570) - 3,772,070 1,459,500
₩ 2,222,730,033 ₩ 619,923,459 ₩ (317,461,929) ₩ 187,633,747 ₩ 2,712,825,310
Accumulated other
Balance at Net income comprehensive Other increase Balance at
Company January 1, 2008 (loss) income (decrease) December 31, 2008
Korean won (In thousands)

NOTES TO NON-CONSOLIDATED FINANCIAL STATEMENTS
FOR THE YEAR ENDED DECEMBER 31, 2008
(e) Gain or loss on valuation of investment securities is accounted after eliminating unrealized profit arising from the inter-company transactions.
For the years ended December 31, 2008 and 2007, unrealized gain eliminated under the equity of accounting method of accounting are
₩119,093,738 thousand and ₩40,499,079 thousand, respectively.
(f) Equity securities accounted for using the equity method as of December 31, 2008 are valued based on the financial statements of the investees
as of the same balance sheet date, which were neither audited nor reviewed by an external auditor. Those net asset values from using the
provisional settlement were as follows:
(*1) The Company adjusted the material difference of accounting principle for similar transactions and accounting events between the Company and investees.
Hyundai Oilbank ₩ 289,760,570 ₩ - ₩ 289,760,570
Hyundai Finance Corp. 88,945,279 - 88,945,279
Hyundai Samho Heavy Industries Co., Ltd.(*1) 1,362,291,641 (311,111,503) 1,051,180,138
Incheon Airport Energy - - -
Hyundai Heavy Industries Co. Bulgaria 38,172,499 - 38,172,499
New Korea Country Club 3,613,235 - 3,613,235
Hyundai Dongahn Steel - - -
Hyundai Heavy Industries Europe N.V. 42,550,739 - 42,550,739
Hyundai Vinashin Shipyard 14,982,234 - 14,982,234
H.C.E U.S.A. 17,002,524 - 17,002,524
Vladivostok Business Center - - -
Koentec Co., Ltd. 4,029,538 - 4,029,538
HHI China Investment Co., Ltd.(*1) 274,055,536 (7,599,321) 266,456,215
Hyundai Merchant Marine Co., Ltd. (Common stock) 445,223,111 - 445,223,111
Hyundai Merchant Marine Co., Ltd. (Preferred stock) 56,303,455 - 56,303,455
Qinhuangdao Shouqin Metal Materials Co., Ltd. 156,136,341 - 156,136,341
Hyundai Ideal Electric Co. 17,943,929 - 17,943,929
Hyundai Financial Leasing Co., Ltd 24,053,234 - 24,053,234
Hyundai Construction Equipment India Private Ltd. 39,104,008 - 39,104,008
Wartsila Hyundai Engine Company Ltd. 32,894,351 - 32,894,351
Ulsan Hyundai Football Club Ltd. 1,181,505 - 1,181,505
HYMS 149,194,656 - 149,194,656
KAM Corp. 42,481,873 - 42,481,873
Grand China Hyundai Shipping Company Ltd. 1,261,438 - 1,261,438
Komas Corp. 3,765,667 - 3,765,667
₩ 3,104,947,363 ₩ (318,710,824) ₩ 2,786,236,539
Net asset value before Net asset value
Company adjustments Adjustments after adjustments
Korean won (In thousands)

74+75
(g) Summarized financial information of equity-accounted investments as of and for the year ended December 31, 2008 is as follows:
Hyundai Oilbank ₩ 4,807,118 ₩ 3,333,822 ₩ 14,766,964 ₩ (254,155)
Hyundai Finance Corp. 142,857 11,060 6,171 (2,729)
Hyundai Samho Heavy Industries Co., Ltd. 7,427,241 5,992,003 3,750,648 632,545
Incheon Airport Energy 157,231 168,839 80,381 (23,976)
Hyundai Heavy Industries Co. Bulgaria 57,488 18,964 62,711 7,421
New Korea Country Club 23,897 5,831 12,840 2,420
Hyundai Dongahn Steel 16,032 16,195 17,710 (2,952)
Hyundai Heavy Industries Europe N.V. 181,449 138,898 355,816 (5,246)
Hyundai Vinashin Shipyard 377,488 227,666 205,498 44,198
H.C.E U.S.A. 88,002 70,999 135,008 (683)
Vladivostok Business Center 25,912 188,809 13,043 (827)
Koentec Co., Ltd. 66,725 13,593 24,227 2,326
HHI China Investment Co., Ltd. 311,052 36,996 12,618 28,325
Hyundai Merchant Marine Co., Ltd. 8,273,176 5,423,632 8,003,039 681,747
Qinhuangdao Shouqin Metal Materials
Co., Ltd. 2,207,053 1,426,372 2,109,211 180,297
Hyundai Ideal Electric Co. 45,688 27,745 57,590 2,879
Hyundai Financial Leasing Co., Ltd. 138,485 98,419 7,179 1,339
Hyundai Construction Equipment
India Private Ltd. 79,493 40,389 6,314 (5,457)
Wartsila Hyundai Engine Company Ltd. 155,853 90,064 31,914 (1,717)
Ulsan Hyundai Football Club Ltd. 1,678 496 2,463 (8,818)
HYMS 253,207 104,013 83,203 1,195
KAM Corp. 92,229 5,531 - 1,709
Grand China Hyundai Shipping Company
Ltd. 2,549 26 - 7
Komas Corp. 3,776 11 129 (6)
Company Assets Liabilities Sales Net income (loss)
Korean won (In thousands)

NOTES TO NON-CONSOLIDATED FINANCIAL STATEMENTS
FOR THE YEAR ENDED DECEMBER 31, 2008
(a) Property, plant and equipment as of December 31, 2008 and 2007 are as follows:
(b) The changes in property, plant and equipment for the year ended December 31, 2008 are as follows:
(*1) The Company established Gunsan shipbuilding yard with the government subsidy received for the amount of ₩5,455,000 thousand and accounted for the establishment as
a deduction from the land of Gunsan shipbuilding yard.
9. Property, Plant and Equipment
Buildings and structures ₩ 3,049,528,786 ₩ 2,572,752,181
Machinery and equipment 2,404,550,660 2,169,947,389
Ships 208,674,068 186,009,863
Vehicles 33,420,855 30,439,712
Tools, furniture and fixtures 1,111,073,115 975,914,777
6,807,247,484 5,935,063,922
Less: Accumulated depreciation (3,194,142,671) (2,944,344,006)
3,613,104,813 2,990,719,916
Land 1,592,414,576 1,550,415,149
Less: Government subsidy (5,455,000) -
1,586,959,576 1,550,415,149
Construction-in-progress 989,889,374 427,650,290
₩ 6,189,953,763 ₩ 4,968,785,355
2008 2007
Korean won (In thousands)
Beginning of period ₩ 1,550,415,149 ₩ 1,769,948,921 ₩ 802,803,260 ₩ 2,169,947,389 ₩ 1,620,014,642 ₩ 7,913,129,361
Acquisition and other 126,424,000 434,394,979 128,142,829 319,250,723 788,675,142 1,796,887,673
Disposal (84,424,573) (72,336,515) (13,424,688) (84,647,452) (65,632,372) (320,465,600)
End of period 1,592,414,576 2,132,007,385 917,521,401 2,404,550,660 2,343,057,412 9,389,551,434
Government subsidy(*1) (5,455,000) - - - - (5,455,000)
Depreciation - (50,334,387) (20,842,084) (159,234,377) (116,917,115) (347,327,963)
Accumulated depreciation - (396,796,079) (180,731,330) (1,682,561,906) (934,053,356) (3,194,142,671)
Machinery and
Land Buildings Structures equipment Other Total
2008
Korean won (In thousands)

76+77
(c) The changes in property, plant and equipment for the year ended December 31, 2007 were as follows:
A substantial portion of buildings, machinery and equipment are insured against fire and other casualty losses up to approximately ₩2,726,878
million as of December 31, 2008. The Company maintains insurance coverage against fire and other casualty losses of up to ₩6,945,491 million for
ships and sea structures under construction and the insurance proceed of ₩1,404,530 million is pledged as collateral for loans from the Export-
Import Bank of Korea as of December 31, 2008.
In addition to the above insurance, most valuable property owned by the Company is covered by a general liability insurance policy up to ₩1,324,571
million as of December 31, 2008. The Company also maintains insurance on cargo against damage and claims losses of up to ₩6,916,250 million for
products being exported and imported as of December 31, 2008.
Construction in progress is block assembling factories and H Dock construction for the year ended December 31, 2008.
As of December 31, 2008 and 2007, the value of land owned by the Company is₩1,458,969 million and₩1,364,161 million, respectively, as
announced by the Korean government.
(a) Intangible assets as of December 31, 2008 and 2007 are as follows:
(b) Details of changes in intangible assets for the years ended December 31, 2008 and 2007 are summarized as follows:
Beginning of period ₩ 1,365,024,824 ₩ 1,720,045,695 ₩ 732,649,010 ₩ 2,093,584,301 ₩ 1,249,333,286 ₩ 7,160,637,116
Acquisition and other 193,045,712 84,983,518 70,643,937 138,858,689 423,321,289 910,853,145
Disposal (7,655,387) (35,080,292) (489,687) (62,495,601) (52,639,933) (158,360,900)
End of period 1,550,415,149 1,769,948,921 802,803,260 2,169,947,389 1,620,014,642 7,913,129,361
Depreciation - (43,842,312) (18,753,331) (186,520,439) (102,602,214) (351,718,296)
Accumulated depreciation - (360,856,814) (161,350,202) (1,559,756,993) (862,379,997) (2,944,344,006)
Machinery and
Land Buildings Structures equipment Other Total
2007
Korean won (In thousands)
10. Intangible Assets
Beginning balance ₩ 213,873,947 ₩ 197,304,243 ₩ 22,174,415 ₩ 24,213,698
Capitalized 69,711,128 54,750,934 - -
Amortization (41,423,910) (38,181,230) (2,039,284) (2,039,283)
Ending balance ₩ 242,161,165 ₩ 213,873,947 ₩ 20,135,131 ₩ 22,174,415
2008 2007 2008 2007
Korean won (In thousands)
Development Cost Usage right for donated properties
Development costs ₩ 242,161,165 ₩ 213,873,947
Usage right for donated properties 20,135,131 22,174,415
₩ 262,296,296 ₩ 236,048,362
2008 2007
Korean won (In thousands)

NOTES TO NON-CONSOLIDATED FINANCIAL STATEMENTS
FOR THE YEAR ENDED DECEMBER 31, 2008
Research costs amounting to₩17,857 million and₩17,530 million, and ordinary development costs amounting to₩79,443 million and₩75,060
million are included in selling and administrative expenses for the years ended December 31, 2008 and 2007, respectively. The amortized
development costs of₩41,424 million and₩38,181 million are included in the cost of sales and selling and administration expenses for the
years ended December 31, 2008 and 2007, respectively.
Other non-current assets as of December 31, 2008 and 2007 are summarized as follows:
Other current liabilities as of December 31, 2008 and 2007 are summarized as follows:
(a) Debentures as of 2008 and 2007 are summarized as follows:
11. Other Non-current Assets
12. Other Current Liabilities
13. Debentures and Long-term Borrowings
Guarantee deposits ₩ 6,519,197 ₩ 5,354,714
Other non-current assets 82,046,020 46,980,144
₩ 88,565,217 ₩ 52,334,858
2008 2007
Korean won (In thousands)
Withholdings of income taxes ₩ 129,518,237 ₩ 99,603,636
Unearned revenues 19,276 18,206,896
Provision for construction losses 104,228,901 39,070,771
₩ 233,766,414 ₩ 156,881,303
2008 2007
Korean won (In thousands)
111th non-guaranteed debenture 2008.09.22 6M L+0.475 ₩ - ₩ 187,640,000
Current portion - (187,640,000)
₩ - ₩ 187,640,000
Maturity Annual interest rate 2008 2007
Korean won (In thousands)

78+79
(b) Foreign currency loans as of December 31, 2008 and 2007 are as follows:
(c) The maturities of long-term debt as of December 31, 2008 are not readily determinable since the long-term debt is paid by installment in case
of success in the oil development business.
Accrued severance benefits of December 31, 2008 and 2007 are as follows:
Accrued retirement and severance benefits are funded approximately 86.3% and 87.6% as of December 31, 2008 and 2007, respectively, through
certain insurance plans with Kyobo Life Insurance Co., Ltd. and other insurance companies. The unused portion of retirement and severance
insurance deposits for these insurance plans is deducted from accrued severance benefits.
Other long-term liabilities as of December 31, 2008 and 2007 are summarized as follows:
Business loans from
Korea National Oil Corporation 2.00 USD 2,929,258 ₩ 3,314,633 USD 1,742,806 ₩ 1,625,627
2,929,258 3,314,633 1,742,806 1,625,627
Current portion - - - -
USD 2,929,258 ₩ 3,314,633 USD 1,742,806 ₩ 1,625,627
Interest rate as of
December 31, 2008 (%) 2008 2007
Korean won (In thousands)
14. Retirement and Severance Benefits
15. Other Long-term Liabilities
Beginning balance ₩ 1,190,834,067 ₩ 1,135,188,486
Retirement and severance payment (169,062,230) (143,195,698)
Provisions 230,151,603 198,841,279
1,251,923,440 1,190,834,067
Less: Retirement and severance insurance (1,080,063,958) (1,042,794,852)
National pension (32,841,150) (37,173,633)
Ending balance ₩ 139,018,332 ₩ 110,865,582
2008 2007
Korean won (In thousands)
Deposits received ₩ 12,467,827 ₩ 13,652,846
Provision for construction warranties 22,343,521 23,720,007
Provision for product warranties 44,008,707 36,083,001
₩ 78,820,055 ₩ 73,455,854
2008 2007
Korean won (In thousands)

NOTES TO NON-CONSOLIDATED FINANCIAL STATEMENTS
FOR THE YEAR ENDED DECEMBER 31, 2008
(a) The Company has entered into bank overdraft agreements with 8 banks amounting to ₩188,100 million as of December 31, 2008.
(b) As of December 31, 2008, the Company has entered into credit facilities agreements with various banks for the Company’s exports and
imports such as letter of credit including usance L/C, totaling USD 2,188,740 thousand.
(c) In order to secure the guarantees provided by the banks for the borrowings and the performance of construction contracts entered into by the
Company, the Company has provided 13 blank checks and notes as of December 31, 2008.
(d) The outstanding balance of note receivables, guaranteed by the importers’ Government or others and sold to financial institutions with
recourse is USD 36,452 thousand, equivalent to ₩45,839 million, as of December 31, 2008. Also, the Company’s outstanding balance of trade
receivables sold with recourse amounts to₩6,634 million as of December 31, 2008.
(e) As of December 31, 2008, the Company is contingently liable for loan guarantees of its foreign subsidiaries and affiliated companies,
amounting to USD 130,384 thousand and₩36,844 million. The Company has provided certain performance guarantees for bareboat charters
amounting to USD 581,093 thousand to ship owners on behalf of Hyundai Merchant Marine Co., Ltd. Also, the Company entered into joint
shipbuilding contracts with Hyundai Samho Heavy Industries Co., Ltd. (“HSHI”), one of the Company’s subsidiaries, for the construction of 18
ships (Contract amount: USD 2,296,223 thousand).
(f) In connection with the Company’s contract performance guarantees, the Company has also been provided with guarantees up to₩2,461,727
million and USD 15,040,327 thousand by various banking facilities.
(g) In an effort to alleviate fluctuations in future cash flows that would be incurred out of the timing difference between the receipt of the ship
sales amounts and the payment of imported raw-materials, the Company has entered into currency forward contracts with 22 banks including
Korea Exchange Bank. As of December 31, 2008, the valuation and gain (loss) on transaction of the forward contracts are as follows:
According to Financial Supervisory Service's practical opinion on financial reporting 2008-2, the Company applied fair value hedge accounting to
derivatives transactions regarding foreign ship contracts qualifying as firm commitments since September 30, 2008. Therefore, forward exchange
gains and loss related to fair value hedge which had been recorded in other comprehensive income were reclassified as firm commitment assets
and liabilities. For comparative purposes, the accounts of current and non-current derivative assets and liabilities in the prior year were reclassified
to reflect the changes of accounts in current financial statements and these reclassifications have no effect on the prior year’s net income or net
16. Commitments and Contingencies
Contract amount
USD 1,829,901 USD 19,440,002 USD 243,265 USD 21,513,168
EUR 223,425 - EUR 367 EUR 223,792
JPY 464,090 - - JPY 464,090
Adjustment to sales ₩ (182,836) (1,374,879) - ₩ (1,557,715)
Non-operating income (expense) 25,413 (155,356) (89,704) (219,647)
Other comprehensive income (418,674) - - (418,674)
Firm commitment – asset - 4,559,055 - 4,559,055
Firm commitment – liability - 38,771 - 38,771
Derivatives – asset 107,241
Derivatives – liability 5,616,143
Description
Cash flow hedge Fair value hedge For trading Total
Korean won (In thousands)

80+81
assets.
The Company reflected the consequential effects on the deferred tax asset (liability) and changes in unrealized gain on valuation of equity method
investments in the financial statements.
As of December 31, 2008, the Company applies cash flow hedge accounting, out of which the Company accounted for the effective portion of the
hedge amounting to₩(-)317,481 million (net of deferred income tax adjustment of₩(-)101,193 million) as gain on valuation of derivative in
accumulated other comprehensive income (net of tax effect). The expected period of exposure on cash flow risk, where cash flow hedge
accounting is applied, is approximately within 36 months, and the amount among gain on valuation of foreign exchange contract that is expected
to be realized as addition to transaction gain or deduction from transaction loss within 12 months from December 31, 2008 is ₩(-)412,929
million. The valuation of the ineffective portion of the hedge and the valuation of other derivatives to which cash flow hedge accounting is not
applied, are reflected in current income.
In relation to the shipbuilding contracts in foreign currency as of December 31, 2008, the Company entered into foreign exchange forward
contracts and accounted for such contracts as fair value hedge. As a result, net balance of firm commitment assets and liabilities were
₩4,520,284 million and related gain and loss on valuation of the firm commitments were recorded as ₩1,616,949 million and ₩39,134 million,
respectively, in non-operating income and expenses.
Gain and loss on derivatives transactions that matured within the current year were recorded as ₩59,704 million and ₩583,912 million,
respectively in non-operating income and expense. Gain and loss on valuation of derivatives are recorded as ₩96,423 million
and₩1,369,676 million, respectively in non-operating income and expense.
In relation to valuation of derivatives that have not reached to maturity dates, the Company accounted for derivative assets of ₩107,241 million
and derivative liabilities of₩5,616,143 million.
Besides the above financial derivatives, the interest swap contract which the Company has entered into with CSFB to hedge the exposure to
interest rate risk of floating rate debentures (variable interest rate: 6M Libor, fixed interest rate: 4.50%) amounting to USD 200,000 thousand
matured on September 22, 2008. Related recognized gain and loss on derivatives transactions were recorded as₩321 million and₩2,280
million, respectively in non-operating income and expense.
Firm commitment asset (current) ₩ - ₩ 1,782,772
Firm commitment asset (non-current) - 2,776,283
Firm commitment liability (current) - 22,735
Firm commitment liability (non-current) - 16,036
Other comprehensive income ₩ (3,804,582) ₩ (317,481)
Description Before After
Korean won (In thousands)

NOTES TO NON-CONSOLIDATED FINANCIAL STATEMENTS
FOR THE YEAR ENDED DECEMBER 31, 2008
(a) The Company has filed a protest against a penalty amounting to ₩19,415 million that had been imposed on the Company by the Korean Fair
Trade Commission, relating to the construction equipment sales with affiliated companies, relating to the transactions from 2001 to 2004. As a
result, the penalty decreased by ₩4,186 million pursuant to the resolution of the Korea Fair Trade Commission on January 5
and 24, 2006 and the Company filed litigation for the remainder of the penalty to Seoul High Court.
In addition, the Company has been brought into 4 legal actions by its employees with claims amounting to₩242 million for damages from
industrial disaster, all of which are pending as of December 31, 2008.
(b) Hynix Semiconductor Inc. (“HSI") sold 13 million shares of Hyundai Investment Trust & Securities Co., Ltd. (“HITS”) for USD13.46 per share to
Canadian Imperial Bank of Commerce (“CIBC”) on June 4, 1997. In relation to this transaction, the Company made a Share Option Agreement
with CIBC under which the Company was obligated to buy back the 13 million shares of HITS for USD16.96 per share, if CIBC exercised its option.
Based on this agreement, the Company was provided a written promissory note from HSI and Hyundai Securities Co., Ltd. (“HSC”) on July 1, 1997
to compensate the Company for losses incurred in connection with the transaction with CIBC under certain circumstances. Based on the above
agreement, on July 20, 2000, the Company repurchased the 13 million shares from CIBC for USD 220,480 thousand. The Company required HSI
and HSC to honor their written promissory note; however, HSI and HSC refused. Accordingly, the Company filed a lawsuit against HSI and HSC
on July 28, 2000 and deposited the stocks repurchased from CIBC in Suwon District Court. On January 25, 2002, the Company partially won the
litigation for the settlement of claim amounting to ₩171,800 million of principal and accrued interest thereon and recovered ₩220,933 million.
However, the Company didn’t accept the court’s decision. Pursuant to the resolution of the board of directors on January 27, 2002, the Company
filed an appeal to a High Court for claiming the whole amount of the principal and accrued interest. Also, the Company has filed a lawsuit for the
advanced payments and reimbursable expenses for those companies that were not covered in the litigation above. In relation to the intermediate
appeal for a partial settlement of the claim, the Company partially won the litigation at Seoul High Court on June 14, 2006 for the settlement of the
claim amounting to₩192,900 million of principal and accrued interest. However, the Company didn’t accept the Court’s decision and filed an
appeal to the Supreme Court of Korea. The Company has provided an allowance for doubtful accounts on the above amount as of June 30, 2006.
The management and legal advisor of the Company predict that the case will be decided in the Company’s favor; however, the ultimate effect of
these litigations cannot presently be determined and no adjustment that may result has been made in the accompanying financial statements.
(c) The National Tax Service imposed additional income tax amounting to ₩107,600 million on March 27, 2006. The assessment resulted from
the participation in the capital increase of Hyundai Space and Aircraft Co., Ltd. when Korea was under foreign currency exchange crisis in late
1990’s. The National Tax Service concluded this capital increase to be unfair financial support for the insolvent affiliate. The Company appealed
judgment by National Tax Tribunal and the case is in progress as of December 31, 2008.
(d) As of March 25, 2008, the Company determined that International Petroleum Investment Co. (hereafter “IPIC”), the major shareholder of
Hyundai Oilbank, breached the Contract between Shareholders entered into with the former shareholders of the Hyundai Group, including
Hyundai Heavy Industries and notified IPIC to exercise IPIC’s Deemed Offer (stock purchase option) against its shares of Hyundai Oilbank of
171,557,695 shares (70%). The Company also filed for arbitration at the International Court of Arbitration of the International Chamber of
Commerce, in regard to IPIC’s breach of contract and exercise of the Deemed Offer. The arbitration will be processed in Singapore. The notified
Deemed Offer may not be rescinded and in case IPIC does not agree to the stock purchase, the offer will need to be determined by the arbitration
judgment. As of December 31, 2008, the arbitration period and the exercise price of the stock purchase options are undetermined.
17. Litigations

82+83
Capital surplus as of December 31, 2008 and 2007 is as follows:
Other capital surplus is composed of₩33,381 million of gain on disposal of investment in Hyundai Mipo Dockyard Co. Ltd., which was transferred
to Hyundai Samho Heavy Industries Co., Ltd., W 10,123 million thousand of gain on disposal of treasury stock (net of tax effect) and₩21,830
million of gain on business combination and others.
Capital surplus is only available for the reduction of accumulated deficit or transfer to capital stock.
(a) Retained earnings as of December 31, 2008 and 2007 are as follows:
(b) The Korean Commercial Code requires the Company to appropriate as a legal reserve an amount equal to at least 10% of annual cash
dividends for each accounting period until the reserve equals 50% of capital. This reserve is not available for the payment of cash dividends but
may be transferred to common stock or used to offset accumulated deficit, if any, through a resolution of shareholders.
(c) Under provisions of the Tax Exemption and Reduction Control Law, an amount equivalent to the amount of income tax benefits to which the
Company is entitled in connection with tax credits for research and human development and investment for facilities is required to be recorded
as a reserve for research and human development and investment for facilities.
(d) Only available for the reduction of accumulated deficit or transfer to capital stock in accordance with related laws.
(e) Pursuant to the Tax Exemption and Reduction Control Law, the Company is allowed to make a reserve for overseas market development, a
reserve for export losses and a reserve for research and human development by appropriating retained earnings. These reserves are voluntary
reserves, which are available for the payment of dividends when these reserves are properly reversed.
18. Capital Surplus
19. Retained Earnings
Paid-in capital in excess of par value ₩ 843,324,390 ₩ 843,324,390
Asset revaluation surplus 1,862,725,081 1,862,725,081
Other capital surplus 65,334,216 65,334,216
Capital surplus on valuation of equity method investments 47,207,001 42,309,668
₩ 2,818,590,688 ₩ 2,813,693,355
2008 2007
Korean won (In thousands)
Appropriated:
Legal reserve (A & C) ₩ 211,543,400 ₩ 164,883,307
Reserve for corporate development (C) 30,000,000 30,000,000
Reserve for research and human development (B) 230,000,000 247,690,637
Reserve for facilities (B) 78,270,000 78,270,000
Other voluntary reserves (D) 1,850,645,368 610,155,408
Unappropriated retained earnings 2,256,664,849 1,736,060,340
₩ 4,657,123,617 ₩ 2,867,059,692
2008 2007
Korean won (In thousands)

NOTES TO NON-CONSOLIDATED FINANCIAL STATEMENTS
FOR THE YEAR ENDED DECEMBER 31, 2008
(a) Treasury stock
As of December 31, 2008 and 2007, treasury stock is as follows:
The Company has been operating special money in trust for treasury stock amounting to₩705,000 million since January 2000 for the purpose of
stabilizing the share price of the Company, and disposed 11,631,580 shares of treasuring stock amounting to ₩392,000 million in 2003.
In addition, pursuant to the resolution of the board of directors on January 31, 2008, the Company made a decision to acquire 2,280 thousand
shares for the purpose of stabilizing the share price of the Company, and has completed the acquisition by May 2, 2008.
(b) Other capital adjustments
As of December 31, 2008 and 2007, other capital adjustments are as follows:
(a) Proposed dividends for 2008 and 2007 are summarized as follows.
(b) Yields to market price of proposed dividend for 2008 and 2007 are as follows:
20. Capital Adjustments
21. Dividends
Treasury stock ₩ (1,529,441,294) ₩ (696,729,512)
2008 2007
Korean won (In thousands)
Treasury stock owned by subsidiaries ₩ (103,565,209) ₩ (92,330,720)
Capital adjustments on valuation of equity method (129,033,528) (22,241,799)
₩ (232,598,737) ₩ (114,572,519)
2008 2007
Korean won (In thousands)
2008 Common stock 59,933,456 ₩ 5,000 100 % ₩299,667,280 ₩2,256,664,845 13.28%
2007 Common stock 62,213,456 ₩ 5,000 150 % ₩466,600,920 ₩1,736,060,331 26.88%
Year Description Number of Par value Dividend rate Cash dividend Net income Dividend to
shares (*) net income
Korean won in thousand expect par value
2008 Common stock ₩ 5,500 ₩199,500 2.5%
2007 Common stock ₩ 7,500 ₩442,500 1.7%
Year Description Dividends Closing price Yield to
per share market price
Korean won in thousand expect par value
(*) Net of 16,066,544 shares and 13,786,544 shares of treasury stock as of December 31, 2008 and 2007
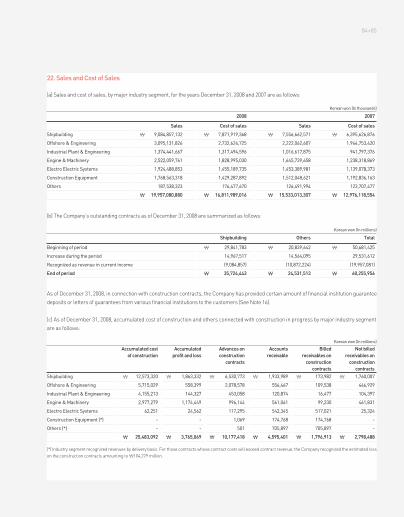
84+85
(a) Sales and cost of sales, by major industry segment, for the years December 31, 2008 and 2007 are as follows:
(b) The Company’s outstanding contracts as of December 31, 2008 are summarized as follows:
As of December 31, 2008, in connection with construction contracts, the Company has provided certain amount of financial institution guarantee
deposits or letters of guarantees from various financial institutions to the customers (See Note 16).
(c) As of December 31, 2008, accumulated cost of construction and others connected with construction in progress by major industry segment
are as follows:
22. Sales and Cost of Sales
Sales Cost of sales Sales Cost of sales
Shipbuilding ₩ 9,084,857,132 ₩ 7,871,919,368 ₩ 7,556,662,571 ₩ 6,395,626,876
Offshore & Engineering 3,095,131,826 2,732,624,725 2,222,062,607 1,944,753,420
Industrial Plant & Engineering 1,374,441,667 1,317,494,596 1,016,617,875 941,797,376
Engine & Machinery 2,522,059,761 1,828,995,030 1,645,739,658 1,238,318,869
Electro Electric Systems 1,924,488,853 1,455,189,735 1,453,389,981 1,139,078,373
Construction Equipment 1,768,563,318 1,429,287,892 1,512,048,621 1,192,836,163
Others 187,538,323 176,477,670 126,491,994 123,707,477
₩ 19,957,080,880 ₩ 16,811,989,016 ₩ 15,533,013,307 ₩ 12,976,118,554
2008 2007
Korean won (In thousands)
Beginning of period ₩ 29,841,783 ₩ 20,839,642 ₩ 50,681,425
Increase during the period 14,967,517 14,564,095 29,531,612
Recognized as revenue in current income (9,084,857) (10,872,224) (19,957,081)
End of period ₩ 35,724,443 ₩ 24,531,513 ₩ 60,255,956
Shipbuilding Others Total
Shipbuilding ₩ 12,573,320 ₩ 1,863,332 ₩ 6,530,773 ₩ 1,933,989 ₩ 173,982 ₩ 1,760,007
Offshore & Engineering 5,715,029 558,399 2,078,578 556,467 109,538 446,929
Industrial Plant & Engineering 4,155,213 144,327 453,058 120,874 16,477 104,397
Engine & Machinery 2,977,279 1,174,449 996,144 561,061 99,230 461,831
Electro Electric Systems 62,251 24,562 117,295 542,345 517,021 25,324
Construction Equipment (*) - - 1,069 174,768 174,768 -
Others (*) - - 501 705,897 705,897 -
₩ 25,483,092 ₩ 3,765,069 ₩ 10,177,418 ₩ 4,595,401 ₩ 1,796,913 ₩ 2,798,488
Accumulated cost Accumulated Advances on Accounts Billed Not billed
of construction profit and loss construction receivable receivables on receivables on
contracts construction construction
contracts contracts
Korean won (In millions)
Korean won (In millions)
(*) Industry segment recognized revenues by delivery basis. For those contracts whose contract costs will exceed contract revenue, the Company recognized the estimated loss
on the construction contracts amounting to ₩104,229 million.

NOTES TO NON-CONSOLIDATED FINANCIAL STATEMENTS
FOR THE YEAR ENDED DECEMBER 31, 2008
(a) The Company was subject to income taxes on taxable income at the following normal tax rates.
In December 2008, the Korean government reduced the corporate income tax rate (including resident tax) and increased the tax base from₩100
million to ₩200 million beginning in 2008. Effective January 1, 2008, the income tax rate for those having their taxable income less than ₩200
million was reduced from 14.3 % to 12.1%.
(b) Income tax expense for the years ended December 31, 2008 and 2007 is as follows:
(c) For the years ended December 31, 2008 and 2007, the differences between income before income tax in financial accounting and taxable
income pursuant to the Corporate Income Tax Law of Korea are as follows:
23. Income Taxes
Up to ₩100 million Up to ₩200 million 14.3% 12.1% 12.1% 11%
Over ₩100 million Over ₩200 million 27.5% 27.5% 24.2% 22%
Taxable income Tax rate
Prior to 2008 Thereafter Prior to 2008 2008 2009 Thereafter
Korean won (In millions)
Current income tax ₩ 716,805,582 ₩ 567,550,538
Changes in deferred income taxes due to temporary differences (284,351,124) 62,405,721
Changes in deferred income taxes directly adjusted in equity 260,512,903 28,369,275
Income tax expense 692,967,361 658,325,534
Income before income tax 2,949,632,206 2,394,385,865
Effective income tax rate 23.50% 27.50%
2008 2007
Korean won (In thousands)
Income before income tax ₩ 2,949,632,206 ₩ 2,394,385,865
Temporary differences (265,789,847) (372,702,227)
Non-temporary differences 2,095,326 28,276,727
Taxable income ₩ 2,685,937,685 ₩ 2,049,960,365
2008 2007
Korean won (In thousands)

86+87
(d) Details of changes in, and effects on income tax expense of, cumulative temporary differences for the years ended December 31, 2008 and
2007 are summarized as follows:
(e) The deferred tax assets and liabilities that were directly charged or credited to capital adjustments as of December 31, 2008 are as follows:
Investment securities accounted
for using the equity method (*1) ₩ (815,831,141) ₩ (788,296,615) ₩ (334,964,461) ₩ (815,831,141)
Loss on valuation of
investment securities 74,558,133 74,558,133 70,374,032 74,558,133
Reserve for technology development (230,000,000) (223,333,333) (247,690,636) (230,000,000)
Allowance for doubtful accounts (*1) 146,465,573 158,039,183 187,042,333 146,465,573
Accrued income (28,499,206) (56,690,429) (2,824,172) (28,499,206)
Loss on valuation of receivables 859,903 859,903 859,903 859,903
Loss on valuation of short-term
investment securities and others - - 121,273 -
Currency forward contracts 37,679,354 710,042,273 (458,399,783) 37,679,354
Other 67,906,967 395,956,287 265,550,983 67,906,967
(746,860,417) 271,135,402 (519,930,528) (746,860,417)
Tax rate 27.5% 27.5%
Cumulative tax effects 74,562,236 (205,386,615)
Effects of income tax rate change 4,402,273 -
Deferred income tax assets,
end of period 78,964,509 (205,386,615)
Deferred income tax assets,
beginning of period (205,386,615) (142,980,894)
Changes in deferred income taxes
on temporary differences ₩ 284,351,124 ₩ (62,405,721)
2008 2007
Balance at Balance at Balance at Balance at
Description January 1, 2008 December 31, 2008 January 1, 2007 December 31, 2008
Korean won (In thousands)
(*1) The temporary difference amounting to ₩(-)164,034 million, which were not recognized as deferred income tax asset is included.
Capital surplus on valuation of equity method investments ₩ 2,733,699
Capital adjustments on valuation of equity method investments 28,578,061
Gain(loss) on valuation of short-term and long-term investment securities 80,676,187
Changes in equity arising on application of the equity method 24,009,174
Negative changes in equity arising on application of the equity method 25,873,392
Loss on valuation of foreign exchange forward contract 98,642,390
Tax effects
Korean won (In thousands)

NOTES TO NON-CONSOLIDATED FINANCIAL STATEMENTS
FOR THE YEAR ENDED DECEMBER 31, 2008
(f) Deferred income tax assets (liabilities) as of December 31, 2008 are as follows:
Statements of comprehensive income for the years ended December 31, 2008 and 2007 are as follows:
Basic income per share is computed by dividing net income by the weighted average number of common shares outstanding for the years ended
December 31, 2008 and 2007.
Basic income per share and for the years ended December 31, 2008 and 2007 is calculated as follows:
Accumulated temporary difference ₩ 877,941,835 ₩ (606,806,433) ₩ 271,135,402
Tax rate 24.2% 22.0% 22.0%(24.2%)
Tax effects 212,461,924 (133,497,415) 78,964,509
Deferred income tax assets (liabilities) ₩ 212,461,924 ₩ (133,497,415) ₩ 78,964,509
Current Non-current Total
Korean won (In millions)
24. Statements of Comprehensive Income
25. Earnings Per Share
Net income ₩ 2,256,664,845 ₩ 1,736,060,330
Other comprehensive income (696,712,783) (111,750,230)
Gain (loss) on valuation of short-term and long-term investment securities, net of tax effects of
₩80,676,187 in 2008, ₩(-)23,966,678 in 2007 (262,816,255) 63,184,877
Changes in equity arising on application of the equity method, net of tax effects of
₩24,009,174 in 2008, ₩(-)8,564,757 in 2007 (20,318,477) 102,123,889
Negative changes in equity arising on application of the equity method,
net of tax effects of ₩25,873,392 in 2008, ₩4,724,634 in 2007 (102,820,239) (9,801,583)
Gain (loss) on valuation of financial derivatives, net of tax effects of
₩98,642,390 in 2008, ₩101,373,498 in 2007 (310,757,812) (267,257,413)
Comprehensive income ₩ 1,559,952,062 ₩ 1,624,310,100
2008 2007
Korean won (In thousands)
Net income (In thousands of Won) ₩ 2,256,664,845 ₩ 1,736,060,331
Weighted average number of outstanding common shares (In thousands of shares) 60,435 62,498
Income per share (In Won) ₩ 37,340 ₩ 27,778
2008 2007
Korean won (In thousands)

88+89
(a) Equity method accounted investment in subsidiaries
The Company put retained earning and capital adjustment from equity method into additional paid-in-capital in conformity with scheme of the
Company's consolidated financial statements, because SKAS No. 15 has revised the amendment that the amount of net income and net asset of
the controlling entity should be identical to the proportional amount of those from the consolidated financial statements in applying equity
method of accounting to subsidiaries.
(b) Recognition of deferred income tax regarding internally unrealized gain (loss)
The Company adopted the Implementations on SKAS 06-2, ‘Accounting appliances on recognizing deferred income tax regarding investment
assets on shares from subsidiary, investment on equity method or joint venture’. As allowed by this standard, the Company recognized the
deferred income tax liabilities and income tax amounted to 25,648 million, in conformity with the consolidated financial statements.
(c) These changes of accounting policies are included in the restatement of Company's financial statements retrospectively, and related
monetary effects are as follows:
26. Changes in Accounting Policy
Equity method accounted investments ₩ 2,248,120,981 ₩ 2,222,730,033
Deferred income tax liabilities 257,968,531 276,376,968
Capital surplus on valuation of equity method accounted investments - 42,309,668
Equity method treasury stock - (92,330,720)
Capital adjustment on valuation of equity method accounted investments - (22,241,798)
Changes in equity arising on application of the equity method of accounting 141,649,351 169,090,934
Negative changes in equity arising on application of the equity method of accounting (33,175,068) (32,153,186)
January 1, 2008 Before After
Korean won (In thousands)

NOTES TO NON-CONSOLIDATED FINANCIAL STATEMENTS
FOR THE YEAR ENDED DECEMBER 31, 2008
(a) The Company is the ultimate holding company and its subsidiaries as of December 31, 2008 are as follows:
27. Transactions and Balances with Related Companies
Hyundai Samho Heavy Industries Co., Ltd. Shipbuilding
Hyundai Mipo Dockyard Co., Ltd. Shipbuilding
Hyundai Finance Corporation Granting of credit
Hyundai Venture Investment Corporation Granting of credit
Hyundai Futures Corporation Entrust and brokerage of futures transaction
HVIC IT Fund 3rd Other financial intermediation
Hyundai Investment Fund 1 on patent Technology Other financial intermediation
Mipo engineering co., Ltd. Other engineering service
Changzhou Hyundai Construction Machinery Co., Ltd. Sale and manufacture of machinery equipment for construction
Hyundai Heavy Industries Europe N.V. Sale of machinery equipment for construction
Beijing Hyundai Jingcheng Construction Machinery Co., Ltd. Sale and manufacture of machinery equipment for construction
Hyundai Dongahn Steel Tower Manufacturing Co., Ltd. Manufacture of structural metal products
H.C.E U.S.A Sale of machinery equipment for construction
Hyundai Heavy Industry Co., Bulgaria Sale and manufacture of transformers
Vladivostok Business Center Hotels
Hyundai Vinashin Shipyard Repairing of ships
Yantai Hyundai Moon Heavy Industries Co., Ltd. Sale and manufacture of industrial boilers
Hyundai Heavy Industry (China) Electric Co., Ltd. Sale and manufacture of switch board for electric distribution
Hyundai Jiangsu Construction Machinery Co., Ltd. Sale and manufacture of machinery equipment for construction
HHI China Investment Co., Ltd. Holding company
Changzhou Hyundai Hydraulic Machinery Co., Ltd. Sale and manufacture of hydraulic cylinder for construction equipment
Hyundai Technologies Center Hungary Kft Research and development on technology
Hyundai (Malaysia) SDN BHD Trading
Hyundai S/V Indonesia Maintenance and repair services of transformers
HHI Mauritius Manufacturing
PHECO Inc. Design services for offshore facilities
Hyundai-Enova Innovative Technical Center Inc. Research and experimental development on technology
Hyundai Heavy Industries France SAS Manufacturing
Hyundai Ideal Electric Co. Sale and manufacture of industrial electric equipment
Taishan Financial Leasing Co., Ltd. Financial lease and operating lease
Hyundai Construction Equipment India Private Ltd. Sale and manufacture of machinery equipment for construction
Ulsan Hyndai Football Club.Ltd. Football Club
HYMS Sale and manufacture of machinery equipment for shipbuilding
Komas Corp. Shipbuilding
HI Investment & Securities Co., Ltd Securities brokerage
HI Management Co., Ltd Asset management
Controlled subsidiary Particulars

90+91
(b) Significant transactions and outstanding balances with subsidiaries and affiliated companies within the Hyundai Heavy Industries Group of
companies and former affiliated companies of Hyundai Group for the year ended and as of December 31, 2008 are as follows:
(c) The Company has entered into rental agreements (deposits received of₩148 million) with Hyundai Mipo Dockyard Co., Ltd. and other
affiliated companies as of December 31, 2008. In addition, the Company is contingently liable for loan guarantees and performance guarantees of
construction contracts of Hyundai Samho Heavy Industries Co., Ltd. (HSHI) and other affiliated companies including joint construction contracts
with HSHI (See Note 16).
(d) The Company has fully provided an allowance for receivable from Vladivostok Business Center amounting to₩79,156 million as of December
31, 2008.
(e) The compensation for the key management of the Company for the year ended December 31, 2008 is as follows:
The key management of the Company comprises directors and internal auditors who have important right and responsibility of planning,
operation and control of the Company.
Hyundai Samho Heavy Industries
Co., Ltd. ₩ 527,039,483 ₩ 27,170,142 ₩ 307,912,636 ₩ 34,128,636
Hyundai Mipo Dockyard Co., Ltd. 404,902,668 10,023,019 142,562,203 1,929,002
Hyundai Oilbank 1,322,451 137,747,129 4,216 7,805,577
Beijing Hyundai Jingcheng
Construction Machinery Co., Ltd. 57,483,825 2,153,759 10,974,295 373,395
Hyundai Heavy Industries Europe N.V. 329,088,833 2,504,526 67,854,996 1,543,288
H.C.E U.S.A. 122,949,444 2,633,331 19,809,319 867,160
Hyundai Jiangsu Construction
Machinery Co., Ltd. 144,244,654 11,049,011 19,524,887 862,611
Yantai Hyundai Moon Heavy
Industries Co., Ltd. 463,572 14,289,478 20,998 -
Hyundai Jiangsu Construction
Machinery Co., Ltd. 10,228,138 17,239,081 9,604,580 617,612
HYMS 12,850,061 80,815,171 4,583,809 32,188,186
₩ 1,610,573,129 ₩ 305,624,647 ₩ 582,851,939 ₩ 80,315,467
Related Party Sales Purchases Receivables Payables
Korean won (In millions)
The compensation for the key management ₩ 2,789,679
2008
Korean won (In thousands)

NOTES TO NON-CONSOLIDATED FINANCIAL STATEMENTS
FOR THE YEAR ENDED DECEMBER 31, 2008
Assets and liabilities denominated in foreign currencies as of December 31, 2008 and 2007 are as follows:
28. Assets and Liabilities Denominated in Foreign Currencies
Assets:
Cash and cash equivalents USD 84,777 102,404 ₩ 106,606,752 96,075,225
EUR 1,568 243 2,785,069 335,485
Others - - 23,354,869 38,331,487
Trade accounts and notes receivable USD 2,695,452 1,971,617 3,389,531,038 1,849,771,383
EUR 104,122 155,043 184,942,816 214,154,216
Others - - 52,977,506 42,287,627
Accounts receivable-other USD 65,852 71,016 82,808,521 66,626,817
EUR 1,766 371 3,136,317 512,935
Others - - 118,799 15,272,851
Long-term trade accounts and notes receivable USD 66,164 102,921 83,200,909 96,560,853
Long-term financial instruments & others USD 7,965 7,542 10,016,181 7,076,331
EUR 3,079 13 5,469,733 17,680
Others - - 2,539,770 1,309,631
₩ 3,947,488,280 2,428,332,521
Liabilities:
Trade accounts and notes payable USD 332,382 217,852 ₩ 417,970,851 204,388,331
EUR 41,649 26,985 73,977,828 37,273,968
Others - - 47,487,173 24,251,064
Current maturities of long-term borrowings USD - 200,000 - 187,640,000
Long-term borrowings USD 2,929 1,743 3,314,633 1,625,627
Accounts payable-other and other liabilities USD 247,260 227,716 310,929,310 213,642,721
EUR 10,850 10,436 19,272,376 14,414,274
Others - - 27,761,676 11,451,174
₩ 900,713,847 694,687,159
Account Currency 2008 2007 2008 2007
Korean won (In thousands)Foreign currencies (In thousands)

92+93
The Company is classified into industry segments of Shipbuilding, Offshore & Engineering, Industrial Plant & Engineering, Engine & Machinery,
Electro Electric Systems, Construction Equipment and others on the basis of product, feature of manufacturing process, market and sales
method. Financial information by industry segment is as follows:
(a) As of and for the year ended December 31, 2008
(b) As of and for the year ended December 31, 2007
Sales ₩ 9,084,857,132 ₩3,095,131,826 ₩1,374,441,667 ₩2,522,059,761 ₩1,924,488,853 ₩1,768,563,318 ₩187,538,324
Operating income
(loss) 1,066,721,745 289,031,494 17,087,508 613,559,947 359,682,154 113,373,636 (253,283,549)
Tangible & intangible
assets 2,080,340,057 579,487,564 36,788,853 777,695,653 385,703,693 179,427,270 2,412,806,969
Depreciation (130,200,547) (47,668,281) (5,163,066) (65,130,747) (30,274,234) (17,160,360) (51,730,728)
Shipbuilding Offshore & Industrial Plant Engine & Electro Electric Construction Others
Engineering & Engineering Machinery Systems Equipment
Korean won (In thousands)
Sales ₩ 7,556,662,571 ₩2,222,062,607 ₩ 1,016,617,875 ₩ 1,645,739,658 ₩1,453,389,981 ₩1,512,048,621 ₩ 126,491,994
Operating income
(loss) 1,037,967,535 225,679,131 40,353,336 345,551,579 224,069,089 129,518,206 (252,441,340)
Tangible & intangible
assets 1,565,525,891 390,891,025 49,841,759 496,453,168 270,181,751 149,637,828 2,282,302,295
Depreciation (133,667,874) (42,770,243) (7,843,103) (69,864,673) (33,715,026) (15,258,311) (48,599,066)
Shipbuilding Offshore & Industrial Plant Engine & Electro Electric Construction Others
Engineering & Engineering Machinery Systems Equipment
Korean won (In thousands)
29. Segment Information

NOTES TO NON-CONSOLIDATED FINANCIAL STATEMENTS
FOR THE YEAR ENDED DECEMBER 31, 2008
Selling and administrative expenses for the years ended December 31, 2008 and 2007 are as follows:
The financial performance for the three months ended December 31, 2008 and 2007 (Unaudited) is summarized as follows:
The Company has introduced and constructed an environmental management system, operated systematically by its environmental
management organization, to effectively manage any environmental effects incurred from its business activities. The Company obtained the ISO-
14001 certification for its environmental management system from the DNA-QA (Det Norske Veritas QA Ltd.) to ensure transparent
environmental management system and also to prepare for environmental trade barrier. To maintain and develop its environmental
management system, the Company continuously works to minimize the environmental effects from its overall business activities, from research
and development, purchase, production, transport and disposal, by adopting advanced environmental management system such as periodic
evaluation of activities of environment management, eco-friendly plan, evaluation of environment results and other.
The Company has established and applies its own standards, which is twice as strict compared to current regulations for permissible exhaust
standards, to the operations of the air exhaustion facility, control facility and waste water disposal plant that treat the polluted substance
generated from its manufacturing process. The Company maintains its actual exhaustion density below 20%. In addition, the Company achieved
63.1% of waste reclamation rate by minimizing the generation of wastes and managing proper separate garbage collection. Also, to properly
treat wastes, the Company operates an incinerator that has a capacity to treat waste of 400 tons per day, furnished with advanced equipment to
prevent environmental pollution.
30. Selling, General and Administrative Expenses
31. Financial Performance in the last interim period
32. The Company’s Environmental Standards and Policies
Wages ₩ 269,166,844 ₩ 254,595,885
Accrual for severance benefits 30,127,495 26,919,167
Employee welfare 67,958,772 69,392,575
Advertisement 37,636,684 21,847,528
Ordinary development expenses 79,443,398 75,059,849
Accrual for allowance for doubtful accounts 35,565,244 12,877,187
Depreciation 32,276,786 26,432,935
Service charges 75,339,184 54,071,315
Transportation 100,266,504 66,384,117
Sales commission 39,665,555 39,554,181
After-service expenses 42,734,638 40,084,111
Others 128,737,826 118,978,367
₩ 938,918,930 ₩ 806,197,217
2008 2007
Korean won (In thousands)
Sales ₩ 6,050,872,596 ₩ 4,252,304,003
Net income 867,323,996 512,884,688
Net income per share 14,471 8,244
2008 2007
Korean won (In thousands)

94+95
For employee welfare, the Company granted scholarship funds of W 54,782 million for the employees’ children (middle, high, college students)
and W 8,342 million for medical benefits, such as health inspection and medical treatment, to its employees and their families during the year
ended December 31, 2008. In addition, the Company provided 16,000 apartment buildings for employee housing and the rate of housing supplied
for employees reached approximately 94%. The Company also operates 7 culture welfare union halls and the Hyundai Arts Center, established in
December 1998, to provide members of the community and its employees with various art and musical performances.
Significant non-cash investing and financing activities for the years ended December 31, 2008 and 2007 are summarized as follows:
33. Employee Welfare and Contributions to Society
34. Non-cash investing and Financing Activities
Expense for human development and discipline ₩ 22,538 ₩ 12,988
Expense for social welfare facilities and religion donation 13,736 19,587
Donation for Social Overhead Capital and Government 22 135
₩ 36,296 ₩ 32,710
2008 2007
Korean won (In thousands)
Transfer of long-term trade accounts to current assets ₩ 46,222,745 ₩ 34,486,027
Transfer of long-term investment securities to current assets - 25,012,099
Transfer of construction-in-progress to plant assets 817,191,986 372,987,616
Transfer of debenture - 187,640,000
Investment in kind of equity method accounted investments 130,724,418 -
Unrealized gain (loss) on valuation of available-for-sale securities 262,816,255 63,184,877
Capital surplus on valuation of equity method accounted investments 4,897,333 42,309,668
Equity method treasury stock 11,234,489 22,492,574
Capital adjustment on valuation of equity method accounted investments 106,791,729 1,635,954
Changes in equity arising on application of the equity method 20,318,477 102,123,889
Negative changes in equity arising on application of the equity method 102,820,239 9,801,583
Gain (loss) on valuation of financial derivatives 310,757,812 267,257,413
2008 2007
Korean won (In thousands)

To the President of
Hyundai Heavy Industries Co., Ltd.
We have reviewed the accompanying Report on the Operations of Internal Accounting Control System (“IACS”) of Hyundai Heavy Industries
Co., Ltd (the “Company”) as of December 31, 2008. The Company's management is responsible for designing and maintaining effective IACS
and for its assessment of the effectiveness of IACS. Our responsibility is to review management's assessment and issue a report based on our
review. In the accompanying report of management’s assessment of IACS, the Company’s management stated: “Based on the assessment
on the operations of the IACS, the Company’s IACS has been effectively designed and is operating as of December 31, 2008, in all material
respects, in accordance with the IACS Framework issued by the Internal Accounting Control System Operation Committee.”
We conducted our review in accordance with IACS Review Standards, issued by the Korean Institute of Certified Public Accountants. Those
Standards require that we plan and perform the review to obtain assurance of a level less than that of an audit as to whether Report on the
Operations of Internal Accounting Control System is free of material misstatement. Our review consists principally of obtaining an
understanding of the Company’s IACS, inquiries of company personnel about the details of the report, and tracing to related documents we
considered necessary in the circumstances. We have not performed an audit and, accordingly, we do not express an audit opinion.
A company's IACS is a process designed to provide reasonable assurance regarding the reliability of financial reporting and the preparation of
financial statements for external purposes in accordance with generally accepted accounting principles. Because of its inherent limitations,
however, IACS may not prevent or detect misstatements. Also, projections of any evaluation of effectiveness to future periods are subject to
the risk that controls may become inadequate because of changes in conditions, or that the degree of compliance with the policies or
procedures may deteriorate.
Based on our review, nothing has come to our attention that Report on the Operations of Internal Accounting Control System as of December
31, 2008 is not prepared in all material respects, in accordance with IACS Framework issued by the Internal Accounting Control System
Operation Committee.
This report applies to the Company’s IACS in existence as of December 31, 2008. We did not review the Company’s IACS subsequent to
December 31, 2008. This report has been prepared for Korean regulatory purposes, pursuant to the External Audit Law, and may not be
appropriate for other purposes or for other users.
February 26, 2009
Independent Accountants’ Review Report on Internal Accounting Control System
English translation of a Report Originally Issued in Korean
Notice to Readers
This report is annexed in relation to the audit of the non-consolidated financial statements as of December 31, 2008 and the review of internal accounting control system
pursuant to Article 2-3 of the Act on External Audit for Stock Companies of the Republic of Korea.

96+97Report on the Operations of Internal Accounting Control System
English translation of a Report Originally Issued in Korean
To the Board of Directors and Internal Auditor (Audit Committee) of
Hyundai Heavy Industries Co., Ltd.
I, as the Internal Accounting Control Officer (“IACO”) of Hyundai Heavy Industries Co., Ltd (the “Company”), have assessed the status of the
design and operations of the Company’s internal accounting control system (“IACS”) as of December 31, 2008.
The Company’s management, including IACO, is responsible for the design and operations of its IACS. I, as the IACO, have assessed whether
the IACS has been effectively designed and is operating to prevent and detect any error or fraud which may cause any misstatement of the
financial statements, for the purpose of establishing the reliability of financial statement preparation and presentation for external uses. I, as
the IACO, applied the IACS Standards established by the IACS Operations Committee for the assessment of design and operations of the
IACS.
Based on the assessment of the operations of the IACS, the Company’s IACS has been effectively designed and is operating as of December
31, 2008, in all material respects, in accordance with the IACS Standards issued by the IACS Operations Committee.
January 29, 2009
Lee Jai-seong, Internal Accounting Control Officer
Min Keh-sik, Chief Executive officer

ASIATOKYO
8TH FLOOR, YURAKUCHO DENKI
BLDG.,1-7-1 YURAKU-CHO, CHIYO-
DA-KU, TOKYO 100-0006, JAPAN
TEL: 81-3-3211-4799
FAX: 81-3-3211-2093
OSAKA
I-ROOM 5TH FLOOR NAGAHORI
PLAZA BLDG. 2-4-8 MINAMI SENBA,
CHUO-KU, OSAKA 542-0081, JAPAN
TEL: 81-6-6261-5766~7
FAX: 81-6-6261-5818
SINGAPORE
7 TEMASEK BOULEVARD
#41-02, SUNTEC TOWER ONE
038987, SINGAPORE
TEL: 65-6337-2366
FAX: 65-6337-4680
MUMBAI
301, 3RD FLOOR SARJAN PLAZA
100, ANNIE BESANT ROAD, WORLI
MUMBAI 400 018, INDIA
TEL: 91-22-2498-6022
FAX: 91-22-2498-6020
MIDDLE EASTDUBAI
LEVEL 2, UNIT 205 EMAAR SQUARE
BLDG. 4 SHEIKH ZAYED ROAD
P.O.BOX 252458 DUBAI, U.A.E
TEL: 971-4-425-7995
FAX: 971-4-425-7996
AFRICALUANDA
RUA LUCRECIA PAIM NO. 28/30
LUANDA, ANGOLA
TEL: 244-222-370669
FAX: 244-222-399667
MOSCOW
WORLD TRADE CENTER, ENT.
3#1902, KRASNOPRESNENSKAYA
NAB. 12, MOSCOW, 123610, RUSSIA
TEL: 7-495-258-1381
FAX: 7-495-258-1382
NORTH AMERICANEW JERSEY
300 SYLVAN AVENUE
ENGLEWOOD CLIFFS
NJ 07632, U.S.A.
TEL: 1-201-816-4080
FAX: 1-201-816-4083
HOUSTON
1400 BROADFIELD, SUITE 110
PARK 10 CENTER, HOUSTON
TEXAS 77084, U.S.A.
TEL: 1-281-578-7097
FAX: 1-281-578-8317
ORLANDO
3452 LAKE LYNDA DRIVE
SUITE 170 ORLANDO
FLORIDA 32817, U.S.A.
TEL: 1-407-249-7350
FAX: 1-407-275-4940
PANAMA
AVE. SAMUEL LEWIS, EDIF
HSBC PISO NO. 12
OBARRIO, PANAMA CITY, PANAMA
TEL: 507-213-7657
FAX: 507-213-7660
EUROPELONDON
2ND FLOOR, THE TRIANGLE, 5-17
HAMMERSMITH GROVE
LONDON, W6 0LG, U.K.
TEL: 44-20-8741-0501
FAX: 44-20-8741-5620
OSLO
HYUNDAI OSLO (LIAISON) OFFICE
RAADHUSGT. 20, 0151
OSLO, NORWAY
TEL: 47-2241-0920
FAX: 47-2242-6671
ATHENS
73, POSIDONOS AVENUE
175 62, PALEO FALIRO
ATHENS, GREECE
TEL: 30-210-428-2992
FAX: 30-210-428-2144
ROTTERDAM
FOLKERT ELSINGASTRAAT 7
3067 NW, ROTTERDAM
THE NETHERLANDS
TEL: 31-10-212-1567
FAX: 31-10-212-5134
ISTANBUL
ESKI BUYUKDERE CADDESI PARK
PLAZA, NO:22 KAT: 5 MASLAK 34398,
ISTANBUL, TURKEY
TEL: 90-212-345-1261
FAX: 90-212-345-1263
OVERSEAS OFFICES
CHANGZHOU
(CHANGZHOU HYUNDAI
HYDRAULIC MACHINERY CO.,LTD.)
326, HUANG HE WEST RD,
CHANGZHOU, JIANGSU, CHINA
TEL : 86-519-8302-1726
FAX : 86-519-8302-1710
YANGZHONG
(HYUNDAI HEAVY INDUSTRIES
(CHINA)ELECTRIC CO., LTD.) NO.9,
XIANDAI ROAD, XINBA SCIENTIFIC
AND TECHNOLOGIC ZONE,
YANGZHONG, JIANGSU, P.R.C.
ZIP:212212, CHINA
TEL: 86-511-8842
FAX: 86-511-8842-0668,0231
YANTAI
(YANTAI HYUNDAI MOON
HEAVY INDUSTRIES CO., LTD.)
No. 333 CHANGJIANG ROAD
YANTAI ETDA, SHANDONG, CHINA
TEL: 86-535-216-5801
FAX: 86-535-216-5810
SHANGHAI
(HHI CHINA INVESTMENT CO., LTD.)
ROOM 2305, NORTH TOWER,
SHANGHAI, STOCK EXCHANGE
BUILDING, #528, PUDONG SOUTH
ROAD, SHANGHAI, CHINA
TEL: 86-21-6880-0808
FAX: 86-21-6880-0608
SHANGHAI
(TAISHAN FINANCIAL LEASING
CO., LTD.) ROOM 3301, CHINA
MERCHANTS TOWER, #161 EAST
LU JIA ZUI ROAD, SHANGHAI,
CHINA
TEL : 86-21-6888-0505
FAX : 86-21-5876-4027
SHANGHAI
(GRAND CHINA HYUNDAI SHIPPING
CO., LTD.) 8F YOU YOU INTERNA-
TIONAL PLAZA, NO.76 PUJIAN
ROAD, PUDONG SHANGHAI, 200127
TEL : 86-21-5881-4784
FAX : 86-21-5881-4744
HANOI
(HYUNDAI DONGANH STEEL
TOWER CO.,LTD.) BLOCK 23
DONGANH TOWN, HANOI, VIETNAM
TEL: 84-4-3883-3649
FAX: 84-4-3883-3648
PUNE
HYUNDAI CONSTRUCTION EQUIP-
MENT INDIA PVT., LTD. PLOT NO. A-
2, CHAKAN INDUSTRIAL AREA,
VILL.-KHALUMBRE. TALUT.-KHED.,
DIST.-PUNE 410 501, INDIA
TEL : 91-21-3530-1700
FAX : 91-21-3530-1712
AFRICAPORT HARCOURT
(HYUNDAI HEAVY INDUSTRIES CO.
NIGERIA, LTD.) INTELS CAMP KILO-
METER 16, PORT HARCOURT - ABA
EXPRESS WAY, PORT HARCOURT,
RIVERS STATE, NIGERIA
TEL: 234-803-544-2774 (M.P)
FAX: 234-84-231-305 (Ext.2018)
ABUJA
NO.7 CHAD CRESCENT, MAITAMA,
ABUJA, NIGERIA
TEL: 234-803-775-6984 (M.P)
NORTH AMERICACHICAGO
(HYUNDAI CONSTRUCTION EQUIP.
U.S.A. INC) 955 ESTES AVENUE
ELK GROVE VILLAGE, IL 60007,
U.S.A.
TEL: 1-847-228-8847
FAX: 1-847-437-3574
OHIO
[HYUNDAI IDEAL ELECTRIC CO.]
330 EAST FIRST STREET
MANSFIELD, OH 44902, U.S.A.
TEL : 1-419-522-3611
FAX : 1-419-522-9386
CALIFORNIA
(HYUNDAI - ENOVA ITC)
879 W. 190th St. SUITE 580
GARDENA, CA 90248, U.S.A.
TEL: 1-310-533-7436
FAX: 1-310-755-6171, 527-7888
ASIABEIJING
(BEIJING HYUNDAI JINGCHENG
CONSTRUCTION MACHINERY CO.,
LTD.) NO.2, NANLI, LUGUOQIAO
FENGTAI DISTRICT, BEIJING, CHINA
TEL: 86-10-8321-8348
FAX: 86-10-8321-1353
CHANGZHOU
(HYUNDAI(JIANG SU) CONSTR-
UCTION MACHINERY CO., LTD.)
288, HEHAI WEST ROAD, XINBEI
DISTRICT, CHANGZHOU
JIANGSU, 213022, CHINA
TEL: 86-519-519-1002
FAX: 86-519-519-1385
EUROPEGEEL
(HYUNDAI HEAVY INDUSTRIES
EUROPE N.V.) VOSSENDAAL
11, 2440 GEEL, BELGIUM
TEL: 32-14-56-2211
FAX: 32-14-59-3405
SOFIA
(HYUNDAI HEAVY INDUSTRIES CO.
- BULGARIA) 1271, SOFIA 41
ROJEN BLVD, BULGARIA
TEL: 359-2-803-3200
FAX: 359-2-803-3203
PARIS
(HYUNDAI HEAVY INDUSTRIES
FRANCE SAS) RUE BEFFROY 17,
92200, NEUILLY-SUR-SEINE,
FRANCE
TEL: 33-1-4637-1761
FAX: 33-1-4637-1295
BUDAPEST
(HYUNDAI TECHNOLOGIES CENTER
HUNGARY LTD.) 1146, BUDAPEST
HERMINA UT 22, HUNGARY
TEL: 36-1-273-3730
FAX: 36-1-220-6708
VLADIVOSTOK
(HOTEL HYUNDAI VLADIVOSTOK)
29, SEMENOVSKAYA STREET
VLADIVOSTOK, 690091, RUSSIA
TEL: 7-4232-40-7300
FAX: 7-4232-40-7007
OVERSEAS INCORPORATED FIRMS

AFFILIATED COMPANIES
HYUNDAI MIPO DOCKYARD CO., LTD.
Shipbuilding, Conversion & Repairs
Hyundai Samho Heavy Industries Co., Ltd. (41.09%)
KRW 100,000 million
HYUNDAI FINANCE CORP.
Corporate Financing, Management Consulting
Hyundai Heavy Industries Co., Ltd. (67.49%)
KRW 91,500 million
MIPO ENGINEERING CO., LTD.
Ship Design & Engineering
Hyundai Mipo Dockyard Co., Ltd. (100%)
KRW 1,387 million
WARTSILA - HYUNDAI ENGINE CO., LTD.
Manufacturing of Dual-Fuel Engines
Hyundai Heavy Industries Co., Ltd. (50%)
KRW 67,860 million
HYUNDAI HEAVY MATERIAL SERVICE
Manufacturing of Ship Components
Hyundai Heavy Industries Co., Ltd. (100%)
KRW 140,000 million
HI INVESTMENT AND SECURITIES
Securities Services
Hyundai Mipo Dockyard Co., Ltd. (76.15%)
KRW 259,134 million
HOTEL HYUNDAI
Hospitality
Hyundai Heavy Industries Co., Ltd. (100%)
KRW 400 million
HYUNDAI SAMHO HEAVY INDUSTRIES CO., LTD.
Shipbuilding
Hyundai Heavy Industries Co., Ltd. (94.92%)
KRW 200,000 million
HYUNDAI VENTURE INVESTMENT CORP.
Venture Fund Investments
Hyundai Finance Corp. (68.38%)
KRW 30,000 million
HYUNDAI FUTURES CORP.
Overseas Futures & Options Brokerage
Hyundai Finance Corp. (65.20%)
KRW 23,000 million
ULSAN HYUNDAI FOOTBALL CLUB
Professional Sports Club
Hyundai Heavy Industries Co., Ltd. (100%)
KRW 10,000 million
KOMAS
Shipping
Hyundai Heavy Industries Co., Ltd. (100%)
KRW 3,772 million
HI ASSET MANAGEMENT
Securities Services
Hyundai Mipo Dockyard Co., Ltd. (7.4%),
HI Investment and Securities (91.28%)
KRW 34,263 million
HOTEL HYUNDAI GYEONGPODAE
Hospitality
Hyundai Heavy Industries Co., Ltd. (100%)
KRW 200 million
Business Line
Major Shareholder
Paid-In Capital
Business Line
Major Shareholder
Paid-In Capital
Business Line
Major Shareholder
Paid-In Capital
Business Line
Major Shareholder
Paid-In Capital
Business Line
Major Shareholder
Paid-In Capital
Business Line
Major Shareholder
Paid-In Capital
Business Line
Major Shareholder
Paid-In Capital
CORPORATE DATA
Head Office
#1, Jeonha-dong, Dong-gu
Ulsan 682-792, Republic of Korea
Tel: 82-52-202-2114
Fax: 82-52-202-3432
Seoul Office
14th Fl. Hyundai Bldg
Gye-dong Jongno-gu
Seoul 100-793, Republic of Korea
Tel: 82-2-746-4603
Fax: 82-2-746-4662
Date of Establishment
December 28, 1973
Paid-in Capital
KRW 380 billion
Common Stock
76,000,000 shares
Number of Employees
25,240
General Shareholders’ Meeting
March 13, 2009
Listing
Listed on the Korea Stock Exchange in
August 1999.
KSE Ticker: 009540
Investor Relations Team
General Manager: Cho Young-cheul
(822-746-4555, [email protected])
Manager: Son Sung-min
(822-746-4728, [email protected])
Associate Manager: Jang Jun-young
(822-746-4565, [email protected])
Assistant Manager: Yu Jae-hun
(822-746-4633, [email protected])
Assistant Manager: Choi Jung-in
(822-746-4775, [email protected])

OVERSEAS OFFICES INCORPORATED FIRMS
LONDON U.K.
OSLO NORWAY
MUMBAI INDIA
PUNE INDIA
ATHENSGREECE
SINGAPORE
SOFIABULGARIA
HANOI VIETNAM
BUDAPEST HUNGARY
GEEL BELGIUM
PARIS FRANCE
PORT HARCOURTNIGERIA
ABUJA NIGERIA
ROTTERDAMNETHERLANDS
MOSCOWRUSSIA
ISTANBUL TURKEY
DUBAI U.A.E.
TOKYO JAPAN
LUANDA ANGOLA
VLADIVOSTOKRUSSIA
CHANGZHOUCHINA
BEIJING CHINA
YANTAI CHINA
YANGZHONG CHINA
OSAKA JAPAN

ORLANDO U.S.A.
NEW JERSEY U.S.A.
HOUSTON U.S.A.
SHANGHAI CHINA
OHIO U.S.A.
PANAMA CITY PANAMA
CHICAGO U.S.A.
CALIFORNIA U.S.A.