Phoenix Mills ar 09
95
The Phoenix Mills Limited Annual Report 2008-09
-
Upload
khangminh22 -
Category
Documents
-
view
2 -
download
0
Transcript of Phoenix Mills ar 09

The Phoenix Mills Limited Annual Report 2008-09

1
CMYK Spot colour
NoticeNOTICE is hereby given that the 104th ANNUAL GENERAL MEETING of the Shareholders of THE PHOENIX MILLSLIMITED will be held on Tuesday, the 22nd day of September, 2009 at 11.00 A.M. at Sunville Deluxe Pavilion, 9, Dr. AnnieBesant Road, Worli, Mumbai – 400 018 to transact the following business:
ORDINARY BUSINESS:
1. To receive, consider and adopt the Balance Sheet as at 31st March, 2009 and Profit and Loss Account for the yearended on that date together with Reports of Directors and Auditors thereon.
2. To declare Dividend on Equity Shares for the year ended on 31st March 2009.
3. To appoint a Director in place of Shri Anand Bajoria, who retires by rotation at the ensuing Annual General Meeting andbeing eligible, offers himself for re-appointment.
4. To appoint a Director in place of Shri Amit Dalal, who retires by rotation at the ensuing Annual General Meeting andbeing eligible, offers himself for re-appointment.
5. To appoint M/s A. M. Ghelani & Company, Chartered Accountants and M/s Chaturvedi & Shah, Chartered Accountantsas the Statutory Auditors of the Company to hold office from the conclusion of this Annual General Meeting until theconclusion of the next Annual General Meeting and to authorise the Board of Directors to fix their remuneration.
For and on behalf of the Board of Directors
Place: Mumbai Ashokkumar RuiaDate: 27th July, 2009 Chairman and Managing Director
NOTES:
1. A MEMBER ENTITLED TO ATTEND AND VOTE AT THE MEETING IS ENTITLED TO APPOINT A PROXY TOATTEND AND ON A POLL, TO VOTE INSTEAD OF HIMSELF/HERSELF AND THE PROXY NEED NOT BE AMEMBER OF THE COMPANY.
2. Proxies, in order to be effective, must be received at the Company’s Registered Office not later than 48 (forty-eight)hours before the time fixed for holding the meeting.
3. Members desirous of obtaining any information concerning the accounts and operations of the Company are requestedto address their queries to the Registered Office of the Company at least seven days before the date of the meeting, toenable the Company to make available the required information at the meeting, to the extent possible.
4. The Register of Members and Share Transfer Books will remain closed from Tuesday, 15th September, 2009 toTuesday, 22nd September 2009 (both days inclusive).
5. The payment of dividend, if any, declared at the Annual General Meeting, will be made to those shareholders whosenames shall appear on the Company’s Register of Members on 15th September 2009 or to their nominees. In respect ofshares in dematerialized form, dividend will be paid to the beneficial owners as at the end of business hours on 22nd
September, 2009 as per the details to be furnished by the Depositories for the purpose.
6. Members are requested to notify immediately any change in their address/bank mandate to their respective DepositoryParticipant (DP) in respect of their electronic share accounts and to the Company’s Registrar & Share Transfer Agent atLink Intime India Private Limited, C-13, Pannalal Silk Mills Compound, L.B.S. Marg, Bhandup (West), Mumbai- 400 078in respect of their physical share folios.
7. Members are requested to bring their copy of Annual Report to the Meeting.
8. Members are requested to bring the Attendance Slip sent herewith duly filled for attending the Meeting.
For and on behalf of the Board of Directors
Place: Mumbai Ashokkumar RuiaDate: 27th July, 2009 Chairman and Managing Director

2
CMYK Spot colour
BRIEF RESUME OF PERSONS PROPOSED TO BE RE-APPOINTED AS DIRECTOR OF THE COMPANY AT THEANNUAL GENERAL MEETING:
Name Shri Anand Bajoria Shri Amit Dalal
Age 36 (Yrs.) 46 (Yrs.)
Qualification B.B.A B.Com, PGDBM
Profile and Experience Shri Amit Dalal has worked asan investment analyst in theUnited States of America. Heis currently the ManagingDirector of Amit NalinSecurities Private Limited —a broking Company and amember of the National StockExchange of India Limited andBombay Stock ExchangeLimited since October 1997.Mr. Dalal holds a postgraduate diploma in BusinessManagement from Universityof Massachusetts.
Shri Anand Bajoria, is currentlya Director of an establishedbusiness group based inKolkata. He has been engagedin several jute mills and teagardens. Mr. Bajoria hascompleted his education fromthe University of Pennsylvania(B.B.A). He is currentlyinvolved in the production ofTea and exporting the same toUK and Germany. Hiscompany is also diversifyinginto medicinal crops andJutropha plantations and Teatourism.
Details of Directorship held inother Companies*
1. Huldibari Industries & Pln Co.Ltd2. Sombaria Co. Ltd3. IndoCarbon Industries Ltd4. Express Newspapers Ltd
1. HL Investment Co. Ltd.2. Manugraph India Ltd.3. Sutlej Textiles & Industries Ltd.
Details of chairmanship/membership held in committeesof other Companies
None
Shareholding in the Company Nil
* The List of Companies in which the Directors hold other directorship excludes private limited companies.
None
Nil

3
CMYK Spot colour
Affix
Re. 1.00
Revenue Stamp
(Signature)
✄
THE PHOENIX MILLS LIMITEDRegistered office:
462, Senapati Bapat Marg, Lower Parel (West), Mumbai - 400 013.
I/We __________________________________________________________________________________________
of ____________________________________________________________________________________
being a Shareholder/Shareholders of THE PHOENIX MILLS LIMITED hereby appoint ___________________________
__________________________________________of _________________________________________________or
failing him/her ________________________________________ of _____________________________________ as
my/our Proxy to attend and vote for me/us and on my/our behalf at the 104th Annual General Meeting of theCompany to be held on Tuesday, the 22nd day of September, 2009 at Sunville Deluxe Pavilion, 9, Dr. Annie BesantRoad, Worli, Mumbai - 400 018 at 11.00 A.M. and at any adjournment thereof.
Regd Folio No. ____________________ No. of Shares held __________________
Client I.D. No. ____________________ DP.ID. No. _________________________
Signed this _______________________ day of ________________________ 2009
Note: 1. The Proxy Form should be signed across the stamp as per specimensignature recorded with the Company. 2. The Proxy form duly completed andsigned must be deposited at the Registered Office of the Company not lessthan 48 hours before the time for holding the Meeting.
THE PHOENIX MILLS LIMITEDRegistered office:
462, Senapati Bapat Marg, Lower Parel (West), Mumbai - 400 013.
ATTENDANCE SLIP
I/We hereby record my/our presence at the 104th Annual General Meeting of the Company held on Tuesday, the 22ndday of September, 2009 at Sunville Deluxe Pavilion, 9, Dr. Annie Besant Road, Worli, Mumbai - 400 018 at 11.00 A.M.
Name__________________________________________________________________________________________________
Regd Folio No. ____________________ No. of Shares held __________________
Client I.D. No. ____________________ DP.ID. No. ________________________
Name of Proxy/Representative, if any ______________________________________
Signature of the Shareholder(s)/Proxy/Representative __________________________
Note : Member/Proxy attending the Meeting must fill in this Attendance Slip and hand it over at the entrace of thevenue of this meeting.
✄
PROXY FORM

01Deliver
08Message from the MD
10Financial Snapshot
12Corporate Information
13Directors' Report
17Management Discussion & Analysis
21Corporate Governance Report
33Auditors' Report on Standalone Accounts
34Annexure to Auditors' Report
36Standalone Accounts
63Auditors' Report on Consolidated Accounts
64Consolidated Accounts
Contents

Deliver is a powerful word. The power is in understanding what it means.
There is promise within the word deliver. And that's what we stand for.
Deliver to millions of Indian's a global shopping experience by building
India's consumption infrastructure.
Deliver responsibility. Deliver aspiration. Deliver hope. Deliver
expectation. And deliver a better tomorrow.
During the year, we opened Grand Galleria at High Street Phoenix, while
EWDPL launched Treasure Central at Indore. Our Market City projects
are at various stages of development. Phoenix United at Lucknow which
is being developed by our partner Big Apple will see customer walk-in by
January 2010.
At Phoenix Mills, we continue to deliver world class shopping centres
and experiences in every part of India. And in time. If yesterday was
about identifying the best location and the best architects to build
consumption infrastructure, today and tomorrow, at Phoenix is solely
dedicated to Deliver.

Grand Galleria
Grand Galleria, is a new shopping complex which was added during the current year. The centre spreads over
approximately 60,000 sq ft in two floors and houses a variety of fashion apparels and accessories, home décor and
furnishings, bath and body, leisure, travel and outdoor merchandise in addition to a seven-screen PVR multiplex
which started in December 2008.
High Street Phoenixdeliver
High Street Phoenix (HSP), the first consumption centre developed in India, covers approximately 3 million sq ft of
space and houses retail, entertainment, commercial and residential complexes with parking space. Still under
expansion, it already attracts 12 million shoppers a year.
Consisting of four phases of development, the third phase is nearing completion. The Phase III will have a five-star
Deluxe hotel Shangri-La, a luxury mall called Palladium, a parking lot which would accommodate approximate
3,000 cars and a health club besides the just opened PVR cinema & Grand Galleria. Phase IV of the mall, for which
construction would begin this year, will relocate Big Bazaar, further increase the parking and have more stores.
2
3
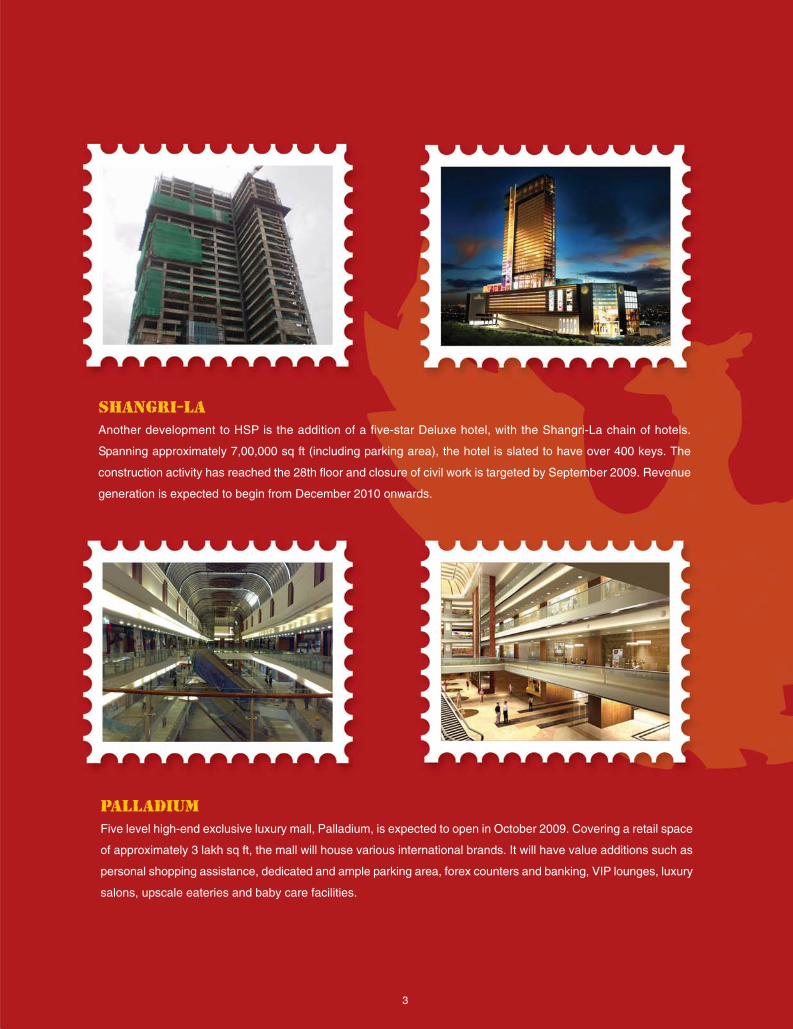
Palladium
Five level high-end exclusive luxury mall, Palladium, is expected to open in October 2009. Covering a retail space
of approximately 3 lakh sq ft, the mall will house various international brands. It will have value additions such as
personal shopping assistance, dedicated and ample parking area, forex counters and banking, VIP lounges, luxury
salons, upscale eateries and baby care facilities.
Shangri-La
Another development to HSP is the addition of a five-star Deluxe hotel, with the Shangri-La chain of hotels.
Spanning approximately 7,00,000 sq ft (including parking area), the hotel is slated to have over 400 keys. The
construction activity has reached the 28th floor and closure of civil work is targeted by September 2009. Revenue
generation is expected to begin from December 2010 onwards.

Pune Market City - Expected to be functional by June 2010.
Mumbai Market City - Expected to be functional by June 2010.
4
Market Citiesdeliver
Market Cities are iconic large format retail-led mixed use developments in city centric locations. They are a
one-stop-shop for consumers offering malls, office space, hotels and entertainment avenues such as bowling alleys,
night clubs, video arcade, food courts etc. The below projects are in various stages of development.

Bangalore Market City - Expected to be functional by September 2010.
Chennai Market City - Expected to be functional by March 2011.
5

6
Indore Central, Indore
This development of 2,76,000 sq ft is located in the heart of the city at RNT Marg and has commenced its
operations from May 29, 2009. The Central format is captivating the serious shopper with its seamless
sophistication, accessibility and sheer grandeur. Apart from retail space, it also offers approximate 58,000 sq ft of
commercial space.
EWDPL and Big Appledeliver
The Phoenix Mills Limited has partnered with Entertainment World Developers Pvt. Ltd. (EWDPL) and Big Apple
Real Estate Pvt. Ltd. (Big Apple) to build retail-led mixed use development centres in Tier II cities through this
partnership.
EWDPL is a Tier II city centric retail mall and a mixed use developer and operates under the 'Treasure Island'
brand. Big Apple together with Phoenix Mills will develop malls by the brand name 'Phoenix United' across North
India, particularly in the state of Uttar Pradesh.

Treasure Bazaar, Nanded
Treasure Bazaar is the first convenience mall of Nanded as well as the first mall in entire Marathwada region to
house a multiplex and a star category hotel of 57,000 sq ft. This 2,50,000 sq ft mall will commence its operations
in October 2009.
Phoenix United, Lucknow
This shopping mall covers approximately 3,60,000 sq ft and features 3 levels of car parking of 2,20,000 sq ft.
Within this impressive structure, there will be ample room for large anchors, vanilla shops, a hypermart and a
family entertainment centre with a modern food court. In addition, it will also feature specialty restaurants,
entertainment space and a six screen multiplex.
This total development of 5,80,000 sq ft is strategically located in LDA colony, Kanpur Road, few minutes from
the city centre, in the heart of Alambagh, one of Lucknow's most prominent growth corridors. Customer walk-in
is expected by January 2010.
7

8
Dear Shareholders,
2008-09 was a very challenging year. The global financial services crisis lead to the collapse of
growth across every country and continent. While India was no exception, it was less impacted.
India grew by 5.7% in 2008. Not a bad achievement given the world economic collapse.
Real estate as a sector was severally affected too. Not just by demand and supply but also by price
reduction and inflow of liquidity, both from banks and capital markets.
However, it is in this period of gloom that I feel very confident. Confident about India and India's
growth. Not just over the next year or two but on a structural growth path for the next few decades.
Confident about the power of youth. Confident about the confidence of India tomorrow. And
powering this confidence is consumption. I am very confident that consumption and only
consumption can take India into structural 8% plus GDP growth for years to come.
And one year of tough environment doesn't change this. And shouldn't too. This is how I look at India
in the next few years. India is a one trillion dollar economy today with per capita GDP of USD 1000.
In the next seven to eight years, it is expected to be a two trillion dollar economy, with per capita
GDP of USD 2000. And that's what is most exciting.
Message from the MD

9
If you look at the consumption patterns in India
today, a lot of it is commodity-led due to low per
capita GDP. As an average youth will make two
times what he makes today, incremental spend
on lifestyle and aspirational products and services
will only increase. It's about the tipping point. And
at that tipping point, India will consume. Spend in
malls and shopping centres, on travel and leisure
and on entertainment. .
And we are building that infrastructure for India
tomorrow, today.
Having set the tone for our focus on building
consumption infrastructure for tomorrow, let me
share with you the developments during the year
and how the next few years look for Phoenix.
Developments during 2008-09
In a way, Phoenix was not affected by the liquidity
crisis both globally, and in India. We raised
resources at the right time and used them for
execution. Most of projects have achieved
financial closure and our focus today is executing
these projects on time, and within costs.
We added Grand Galleria at High Street Phoenix
(HSP) during the year. Grand Galleria has been
leased out in the last quarter of FY 2008-09 at an
average lease rental of Rs. 261 per sq ft. Through
our investee company EWDPL, we opened
Central Mall in Indore on May 29, 2009. I am told
that sales per sq.foot at both these malls is
encouraging.
Development of our high-end mall Palladium at
HSP is almost complete and the mall is currently
in its advanced stage of fit-outs. We will open
doors this September/October. Palladium will
redefine the shopping experience in Mumbai.
We will also open the Lucknow, Phoenix United
Mall in the last quarter of this financial year. We
expect this mall to be the dominant shopping
centre in Lucknow both due to its scale and due to
the ideal brand mix.
Construction activity of the Shangri-La Hotel at
HSP is in full swing. Fit-outs are expected to be
completed over the next one year and we project
revenue generation from October - December
2010 onwards. Total constructed area is in excess
of 6,00,000 sq ft and over 400 keys. We have
already constructed the cold shell for over 400
rooms and expect to top up the hotel latest by
October. We will take up the construction of
Phase IV in the next financial year.
Market City Projects
We are building very large retail-led consumption
centres across India in several metro cities to
facilitate the convergence of retail, entertainment,
hospitality and commercial. They are large
2 - 3 million sq ft developments that will redefine
the face of consumption in India.
In the next few years we expect to open Market
City Mumbai, Market City Pune, Market City
Chennai, Market City Bangalore among several
other projects.
As I look ahead, I see a new India emerging. A
new India that is young, confident and one that
will embrace consumption. Phoenix is part of this
new India, a consumption-led new India with no
inhibition to spend.
The next few years will see a lot of our dreams of
yesterday shaping up with Market City projects
opening up.
Thank you for your patience, trust and continued
support in Phoenix Mills.
Atul Ruia

10
Financial Snapshot
(Rs. in crores)
Consolidated Accounts 2008-09 2007-08 2006-07 2005-06 2004-05
Results of Operations
Total Income 149.93 106.13 100.49 57.53 46.38
Earnings before Depreciation, Interest,
Extra Ordinary Items and Tax (EBDITA) 110.49 74.68 73.24 32.01 21.50
Depreciation 9.35 7.63 7.25 4.68 3.08
Interest 5.47 5.03 3.81 4.33 2.11
Profit Before Tax (PBT) 95.67 62.02 62.17 23.00 16.31
Profit After Tax (PAT) 76.69 42.77 40.16 16.90 11.58
Financial Position
Share Capital 28.97 27.13 12.25 12.25 2.45
Reserves and Surplus 1,485.76 1,255.58 75.28 39.51 35.28
Minority Interest 211.86 81.26 - - -
Networth 1,514.73 1,284.45 87.40 51.70 37.69
Investments 452.49 633.97 10.72 10.48 9.58
Net Block 1,342.30 832.59 232.57 162.01 95.73
Net Current Assets 475.85 202.95 197.94 (24.97) 7.69
Cash and Bank Balances 190.98 2.23 10.70 0.44 2.60
Stock Information
No. of shares 14,48,45,445 13,56,78,780 1,22,50,000 1,22,50,000 2,45,000
Face Value Rs. 2 2 10 10 100
Earnings per share (In Rs.) 5.41 4.07 33.00 14.00 472.55

11
Networth (Rs. in crores)
04-05
87.4051.7037.69
05-06
1,284.45
06-07 07-08 08-09
EBDITA (Rs. in crores)
04-05 05-06 06-07 07-08 08-09
1,514.73
Total Income (Rs. in crores)
04-05
100.49
57.5346.38
05-06
106.13
06-07 07-08 08-09
149.93
73.24
32.0121.50
74.68
110.49
Profit After Tax (Rs. in crores)
04-05 05-06 06-07 07-08 08-09
40.16
16.9011.58
42.77
76.69

CorporateInformation
BOARD OF DIRECTORS
Shri Ashokkumar Ruia Chairman and Managing Director
Shri Atul Ruia Jt Managing Director
Shri Kiran Gandhi Whole Time Director
Shri Bharat Bajoria Director
Shri Anand Bajoria Director
Shri Amitkumar Dabriwala Director
Shri Amit Dalal Director
Shri Sivaramakrishnan Iyer Director
Shri Sribhanu Patki Director
Shri Suhail Nathani Director
AUDITORS
M/s A.M.Ghelani & Co.
Chartered Accountants
M/s Chaturvedi & Shah
Chartered Accountants
BANKERS
Corporation Bank
COMPANY SECRETARY
Ms. Preeti Moorkoth Khanna
Ms. Minal Bhate Dandekar (w.e.f 17th August, 2009)
CORPORATE OFFICE
Shree Laxmi Woolen Mills Estate,
2nd Floor, R. R. Hosiery Bldg,
Off. Dr. E. Moses Rd,
Mahalaxmi,
Mumbai - 400 011
Tel: 022 - 30016730
Fax: 022 - 30016818
REGISTRAR AND SHARE TRANSFER AGENT
Link Intime India Private Limited
C-13, Pannalal Silk Mills Compound,
L. B. S. Marg, Bhandup (West),
Mumbai - 400 078.
Tel: 022 - 25963838
Fax: 022 - 25946969
REGISTERED OFFICE
462, Senapati Bapat Marg,
Lower Parel,
Mumbai - 400 013.
Tel: 022 - 24964307
Fax: 022 - 24938388
Website: www.thephoenixmills.com
Email: [email protected]
12

13
Directors’Report
Dear Members,
Your Directors have pleasure in presenting the 104th Annual Report on the operations of the Company together with theAudited Accounts for the year ended 31st March, 2009.
FINANCIAL RESULTS:
(Rs. in Crores)
Particulars Year ended Year ended31.03.09 31.03.2008
Sales and other Income 140.03 229.59
Profit before Interest, Depreciation, Extraordinary items and Tax 110.09 199.69
Less: Interest & Finance Charges 4.94 4.75
Less: Depreciation 8.37 7.26
Profit before Tax 96.77 187.68
Less: Provision for Taxation
Current Tax 18.60 19.50
Fringe Benefit Tax 0.24 0.22
Deferred Tax (0.28) (0.69)
Net Profit after tax 78.21 168.65
Balance brought forward from Previous Year 251.74 130.26
Profit available for appropriation 329.95 298.91
Appropriations:
Proposed Dividend 14.48 14.48
Corporate Dividend Tax 2.46 2.46
Dividend for earlier years — 4.47
Corporate Dividend Tax for earlier years — 0.76
Balance Carried Forward to:
(a) General Reserves 30.00 25.00
(b) Profit & Loss Account 283.00 251.74

14
PERFORMANCE:
The Global economic recession faced during the year2008 – 2009 had severally hit the Real Estate Industry. Inresponse to the changing times, we are continuously strivingto make our Group as market driven and agile as possible.
Inspite of the odds, your Company was able to generate atotal income of Rs.140.03 crores during the year underreview. Corrective steps taken in the direction of consolidationof business activities and moving ahead with the expansionplans has helped substantial additions to Gross Block ofFixed Assets which stood at Rs. 37.06 cores as against Rs.9.78 crores in the previous year. With the signs of revivalseen in the current year, your Company believes that theaforesaid steps shall enable the Company to tap theemerging opportunities as and when available.
Your Company was able to report a profit after tax ofRs. 78.22 crores. After adjusting the balances broughtforward from the previous years, the net profit available forappropriation has increased to Rs. 329.95 crores as againstRs 298.91 crores in the previous year.
A detailed review of the Company’s performance and thefuture prospects is included in the Management Discussion& Analysis section of the Annual Report.
DIVIDEND:
Your Directors are pleased to recommend dividend at therate of 50% i.e. Re.1/- per share (Previous Year 50%) subjectto the approval by the shareholders.
The dividend declared for the year 2008-09 shall not betaxable in the hands of the members.
CHANGES TO SHARE CAPITAL
Allotment of Shares pursuant to the Scheme ofArrangement
During the year under review, the Hon’ble High Court,Bombay had sanctioned the Scheme of Arrangementbetween Ruia Real Estate Development Private Limited(“transferor Company”) and the Company, pursuant to whichthe Company had allotted 91,66,665 Equity Shares of facevalue of Rs. 2/- each at par to the Shareholders of thetransferor Company. The said shares have been listed onthe Bombay Stock Exchange Limited and the National StockExchange of India limited.
EMPLOYEE STOCK OPTION SCHEME (ESOP):
The Compensation Committee, at its meeting held on 10th
June, 2008 granted options exercisable into 6,50,000 equityshares of face value Rs. 2/- each at an Exercise Price ofRs. 270/- each.
The disclosures required to be made under SEBI (EmployeeStock Option Scheme and Employee Stock PurchaseScheme) Guidelines, 1999, are given in the Annexure tothis Report.
BOARD OF DIRECTORS:
The following directors are liable to retire by rotation andbeing eligible, offer themselves for re-appointment at theensuing Annual General Meeting.
i. Mr. Anand Bajoria
ii. Mr. Amit Dalal
A brief profile of all the above Directors as required byClause 49 (IV) (G) of the Listing Agreement with the StockExchanges is given in the Notice of the Annual GeneralMeeting. The Board recommends the re-appointment of theaforementioned directors.
During the year under review Ms. Preeti Khimji, IndependentDirector of the Company, tendered her resignation from theBoard of Directors, on 3rd March, 2009. The Board wouldlike to place on record their appreciation for the servicesrendered by her during her tenure as the Director of theCompany.
PARTICULARS OF EMPLOYEES:
As required by the provisions of section 217 (2a) of thecompanies act, 1956 read with the companies (particularsof employees) rules, 1975 as amended, the names andother particulars of employees are set out in the annexureto the directors’ report. However, as per the provisions ofsection 219(1) (b) (iv) of the said act, the annual report andaccounts are being sent to all members of the companyexcluding the aforesaid information. Any member interestedin obtaining such particulars may write to the company at itsregistered office.
RECRUITMENT AND RETENTION:
Your Company considers its manpower as its most valuableasset. Employee policies of your Company are designatedto ensure fairness to and growth of all individuals in theorganization and continuously strive to provide a challengingwork environment. Our attrition level has been below theindustry average throughout the year. The number ofemployees on the Company’s payroll was 124 as on 31st
March, 2009 as compared to 125 as on 31st March, 2008.
DIRECTORS’ RESPONSIBILITY STATEMENT:
Pursuant to the requirements of Section 217(2AA) of theCompanies Act, 1956, your Directors confirm the following:
- that in the preparation of the annual accounts, theapplicable accounting standards have been followed;
- that the Directors have selected such accounting policiesand applied them consistently and made judgments andestimates that are reasonable and prudent so as togive a true and fair view of the state of affairs of theCompany as at 31st March, 2009 and of the profit of theCompany for the year ended on that date;
- that the Directors have taken proper and sufficient carefor the maintenance of adequate accounting records inaccordance with the provisions of the Companies Act,1956, for safeguarding the assets of the Company andfor preventing and detecting fraud and otherirregularities.
- that the annual accounts for the year ended 31st March,2009 have been prepared on a going concern basis.
CORPORATE GOVERNANCE:
Your Company has been practicing the principles of goodcorporate governance. A Report on Corporate Governance

15
along with a certificate from M/s. Rathi & Associates,Company Secretaries in practice, regarding compliance ofrequirements of Corporate Governance, as also aManagement Discussion & Analysis Report pursuant toClause 49 of the Listing Agreement with the Stock Exchangesare annexed hereto.
MANAGEMENT DISCUSSION AND ANALYSIS
A report on Management Discussion and Analysis (MDA),which forms part of this Report, inter-alia, deals adequatelywith the operations as also current and future outlook of theCompany.
AUDITORS
M/s. A.M. Ghelani and Company, Chartered Accountantsand M/s. Chaturvedi and Shah, Chartered Accountants, JointStatutory Auditors of the Company retiring at the ensuingAnnual General Meeting, have expressed their willingnessto be re-appointed as Statutory Auditors of the Company.
The Company has received certificates from both the auditorsto the effect that, if re-appointed, their appointment will bein accordance with the limits specified in the Section 224(1B) of the Companies Act, 1956.
If appointed by the members in the Annual General Meeting,M/s A.M. Ghelani and Company, Chartered Accountants andM/s Chaturvedi and Shah, Chartered Accountants shall beJointly Statutory Auditors of the Company for the FinancialYear 2009-2010 and the said appointment shall be in forcefrom the conclusion of this Annual General Meeting until theconclusion of the Next Annual General Meeting.
AUDITORS’ REPORT
The observations made by the Auditors in their Report readwith the relevant notes as given in the Notes on Accountsfor the year ended 31st March, 2009, are detailed and self-explanatory and therefore do not call for any furthercomments, under Section 217(3) of the Companies Act, 1956.
PUBLIC DEPOSITS
Your Company has not accepted any deposits from thepublic, during the year under review.
SUBSIDIARY COMPANIES
Big Apple Real Estate Private Limited (‘BAREPL’), the ownersof United Malls Brand, became a subsidiary of your companyw.e.f. 1st April, 2008 pursuant to the sanction of the schemeof amalgamation between BAREPL & Market City DevelopersLimited (a subsidiary of your company) vide court ordersdated 17th October, 2008 (passed by the Hon’ble High Courtof Judicature at Bombay) & 26th June, 2009 (passed byHon’ble High Court of Judicature at Allahabad). As on 31stMarch, 2009 your company’s stake in BAREPL is 73.47%.BAREPL is currently developing projects at Lucknow, Kanpur,Agra, Bareilly & Benaras.
Gangetic Developers Private Limited, UPAL Developersprivate Limited & Blackwood Developers Private Limitedwhich are the subsidiaries of BAREPL, have also becomethe subsidiaries of your company, subsequent to this sanctionof the scheme of amalgamation.
The Government of India, Ministry of Corporate Affairs, hasgranted its approval under Section 212(8) of the CompaniesAct, 1956, exempting the Company from attaching the fulltext of the financial statements of the subsidiaries of theCompany.
Pursuant to the said approval, necessary disclosures aremade in respect of the said subsidiaries in this Annual Reportalong with the statement pursuant to Section 212 of theCompanies Act, 1956.
Any shareholder who wishes to have a copy of the annualaccounts and detailed information about the subsidiarycompany may write to the subsidiary company and/or to thecompany for the same. The annual accounts of the subsidiarycompanies will also be kept for inspection by any memberat the Registered Offices of the Company and itssubsidiaries.
CONSERVATION OF ENERGY, TECHNOLOGYABSORPTION AND FOREIGN EXCHANGE EARNINGSAND OUTGO:
During the year under review, your Company has neitherundertaken any manufacturing activities nor any Research& Development activities in the field of construction, etc.nor imported any technology therefore. Hence, particularsregarding conservation of energy & technology have notbeen furnished. The particulars regarding foreign exchangeearnings and expenditure appear in Items no.13 and 14respectively, of the Schedule annexed to and forming partof the Annual Accounts.
ACKNOWLEDGEMENT
Your Directors would like to express their sincereappreciation and gratitude to all the regulatory authoritiesincluding SEBI, Stock Exchanges, Ministry of CorporateAffairs, Registrar of Companies and the Depositories, allBankers and Financial Institutions, the Central and StateGovernments as well as their respective Departments andDevelopment Authorities in India and abroad connected withthe business of the Company for their co-operation andcontinued support. In addition, the management takes thisopportunity to convey their thanks to the members, suppliers,contractors and customers for the trust and confidencereposed by them in the Company.
Your Directors also deeply appreciate the hard work,competence, loyalty, cooperation and professionalism of theemployees of the Company and its subsidiaries, at all levels.
On behalf of the BoardFor The Phoenix Mills Limited
Place: Mumbai Ashokkumar RuiaDate: 27th July, 2009 Chairman and Managing Director

16
Annexure to theDirectors’ Report
Disclosures pursuant to SEBI (Employee Stock Option Scheme and Employee Stock Purchase Scheme) Guidelines, 1999,
A. Summary of Status of Options Granted
Total number of options approved 33,90,000 (As per the Scheme approved, an aggregate number of6,78,000 convertible into One Equity Share of Rs.10/- upon exercisewere available for grant. Consequent to sub-division of the equitycapital from Rs.10 per share to Rs.2/- per share , necessaryadjustments were made to the total number of options)
Pricing Formulae Closing price on the stock Exchange where volumes recorded higheston a day previous to the date of grant.
Total Options granted 6,50,000
Options vested 52,500
Options Exercised Not applicable
Options Unexercised 33,90,000
Options Lapsed and available for re-grant 1,25,000*
Total number of options in force(including options lapsed and available for regrant) 33,90,000
Variation in terms of ESOP Not applicable
Total number of shares arising as a result of exercise of option Not applicable
Money realized as a result of exercise of options Not applicable.
*An aggregate of 1,25,000 Options granted earlier had lapsed due to resignation tendered by 4 employees namely FarzanaMojgani, Sanjay Chaudhary, Mitish Somani and Jayanand Potdar.
B. Employeewise details of options granted during financial year 2008 - 09
Senior Managerial Personnel
(i) Nil
(ii) No employee has been granted options exceeding 0.5% of the total issued and paid up equity capital at the time ofgrant of options.
(iii) No employee has been identified and granted options exceeding 1% of the issued capital (excluding outstandingwarrants and conversions) of the Company at the time of grant.
C. Disclosures with respect to Diluted EPS pursuant to issue of shares on exercise of options calculated in accordancewith Accounting Standard (AS) 20 and weighted average exercise price of options granted during the year is notapplicable since no options were exercised during the financial year.
The Company has also received a certificate from M/s A.M. Ghelani & Company, Chartered Accountants, StatutoryAuditor of the Company that the Scheme has been implemented in accordance with the SEBI Guidelines.

17
Management Discussionand
AnalysisOVERVIEW OF THE ECONOMY
India, South Asia’s most dynamic economy in recent years,is reeling from the direct effect of the global financial crisison its banking systems and financial markets which startedin the second half of 2008. During the fiscal year 2008-09growth rate of Gross Domestic Product dipped from anaverage of over 9 per cent to 6.7 per cent. Inflation hasbeen an ongoing threat in India.
Though affected by the current global economic meltdown,India has fared much better than other countries of theworld. In response to the crisis, the Indian government hasmade aggressive use of fiscal and monetary policy, withparticular focus on fiscal stimulus in infrastructure investment.The package of USD 1.1 trillion to restore credit and growthtogether with national measures constitutes a global planfor recovery on an unprecedented scale.
The Indian economy has shock absorbers that will facilitateearly revival of growth. First, the banks are financially soundand well capitalized. The foreign exchange reserves positionremains comfortable and the external debt position has beenwithin the comfort zone. Despite the slowdown in growth,investment remained relatively buoyant, growing at a ratehigher than that of GDP. GDP is estimated to grow to 7.5per cent in 2009-10 with contribution of the services sectorto GDP at well over 50 per cent and share of merchandisetrade doubling to 38.9 per cent.
INDUSTRY OVERVIEW
The effect of the global economic meltdown was on the realestate industry and it was one of the largest affected. Theslowdown led to price rationalization in real estate products,delay in project completions, a continued wait-and-watchsentiment amongst end user and investor alike and reductionin demand for developments across sectors. Over the lastfew months, real estate prices across the country havecorrected by over 30-40 per cent from their peak.
While the effects of the economic crisis were expected tolinger in the near term future, the Indian real estate industrydisplayed resilience and tenacity in countering the
unpredictable conditions and reiterating the viability of India’sfundamental value proposition. According to industryestimates, the pan-India cumulative demand projection forthe real estate sector across office, residential, retail andhospitality is expected to be approximately 1,098 millionsq.ft. by the year 2012.
RETAIL
Despite the downturn, India has reclaimed its position asthe most attractive destination for global retailers accordingto the Global Retail Development Index (GRDI) brought outby US-based global management consulting firm, A TKearney.
India was declared the best option amongst 30 emergingmarkets. Incidentally, the country was ranked the secondmost attractive market for retailers after Vietnam in 2008.This year, it is ranked at the top followed by Russia at thesecond and China at the third spot.
The GRDI report further noted that “larger, resilientdeveloping countries sit atop the 2009 GRDI as they aremost likely to lead the economic recovery.” It also statedthat India has become the most attractive destination forretail investment for the fourth time in five years.
The total retail market size in India in 2008 was estimatedat USD 353 billion and growth is expected to be around 8per cent. Organized retail, which accounts for almost 5 percent of the market, is expected to grow at a CAGR of 40per cent from USD 20 billion in 2007 to USD 107 billion by2013.
Malls have been gradually dominating the Indian retailmarket. Industry experts estimate the number of operationalmalls to grow more than two-fold, to cross 412, with 205million sq ft by 2010, and a further 715 malls to be addedby 2015, with major retail developments in Tier-II and Tier-III cities in India.
With the competition growing fiercer in Indian retail sector,malls are resetting the trends and transforming thefundamental activity of shopping into a lifestyle statement.

18
HOSPITALITY
India’s hospitality industry has enjoyed robust growth forthe past few years buoyed by growing business and leisuretravel owing to a favourable economic atmosphere. However,the astronomical growth rates seen in select businessdestinations have slowed down. Lower corporate travelexpenditures and the fallout of the financial crisis emanatingfrom the US triggered a downward spiral in RevPARs acrossbusiness destinations. Leisure destinations too suffered onaccount of an anticipated slowdown in foreign touristbookings.
However, the hospitality sector needs Rs 400 crore to createan additional 150,000 rooms, ahead of the CommonwealthGames in 2010. As per FHRAI (Federation of Hotel &Restaurant Association of India), 10 million foreign touristsare expected to arrive in 2010. This means that there remainsa stable demand for good hotels in India and thus existinghotels of good repute will definitely see a turnaround in thenew future.
BUSINESS OVERVIEW
The Phoenix Mills Limited (Phoenix) is a leading developerand operator of iconic large format retail-led mixed usedevelopments, namely Market Cities. Market Cities are largesized projects in excess of 2.5 million sq ft of area in primelocations and help unlock huge real estate value and featureretail stores, hypermarkets, multiscreen theatres,entertainment zones, food courts and hotels.
Phoenix began its journey with High Street Phoenix (HSP),a prototype of the Market City concept developed in Mumbai.HSP is a lifestyle centre with optimized mix of retail,entertainment, and commercial tenants to cater to all therequirements of consumers.
During the year, HSP added a new shopping centre in itsvicinity. Branded Grand Galleria, it has 32 stores in additionto a seven-screen PVR multiplex. Croma, the consumerdurables and electronics retail arm of Tata group is the mainAnchor. With a sprawling 13,000 sq ft retail space, thismegastore offers a widest range of electronic products. Theopening of PVR Cinemas in December 2008 and the Cromastore has added value to it and the footfalls have increasedmanifold.
Development of our luxury mall, Palladium at HSP is in fullswing. The Company expects the same to be completed byOctober 2009. The approximately 3, 00,000 sq ft mall willhave 3 floor levels with a dining restaurant on each floor. Itwill house some of the world’s best luxury and premiumbrands.
Shangri-La Hotels and Resorts, Asia Pacific’s leading luxuryhotel group, has signed an agreement with Pallazzio Hoteland Leisure Limited (a wholly owned subsidiary of PhoenixMills Limited) to manage the Shangri-La Hotel, Mumbai.Development is underway and over 400 keys hotel isexpected to open in December 2010.
After the success of HSP, Phoenix is building several MarketCities in cities like Chennai, Bangalore, Pune and anotherone in Mumbai.
Expected Completion Date
Market City, Chennai Jan-March 2011
Market City, Pune April-June 2010
Market City, Bangalore July-Sept 2010
Market City , Mumbai May-June 2010
During the previous year, the Company had acquired stakein Entertainment World Developers Pvt. Ltd (EWDPL) andBig Apple Real Estate Pvt. Ltd to enter into retail leddevelopment in Tier-II cities under the brand Treasure Islandand Phoenix United respectively.
Treasure Central, Indore commenced operations in May2009, while other projects are in various stages ofdevelopment:
RISKS AND CONCERNS
Globalization has taken on new meaning as the credit crisiscontinues to ripple across economies and real estate marketsaround the world.
Faced with the current crisis, the real estate industry, likemany other industries, is also facing various risks
1. Continued Uncertainty and Impact Of The CreditCrunch
The restrictions on availability of credit and the short-term inability to deploy capital at acceptable levels ofreturn have paralyzed the transaction sector of the realestate industry.
The RBI took a number of monetary easing and liquidityenhancing measures including reduction in cash reserveratio, statutory liquidity ratio and key policy rates. Theobjective was to facilitate flow of funds from the financialsystem to meet the needs of productive sectors. Thishas helped the real estate industry deal with the creditcrunch.
2. Global, Economic & Market Fluctuations
Short-term reduced rents are affecting the profitabilityof companies, while economic and market fluctuationsare likely to reduce long-term investment in the sector.As the economic meltdown unfolded in late 2008,commercial realty became the worst hit segment in thesector and lease rental and property rates fell by 30-40per cent in the metros and the bigger cities.
The lower prices, in turn, have triggered some big ticketsales in recent months. The returns for such propertiesare as high as 12-13 per cent compared to 3-4 per centin residential projects. Some six months after they fledthe real estate sector, investors are gradually makingtheir way back. This time around, High NetworthIndividuals (HNIs) and domestic funds are putting moneymainly into office and retail spaces.

19
3. Impact Of Aging Or Inadequate Infrastructure
Owing to the inaccessibility of credit and theskyrocketing costs of materials needed in construction,infrastructure budgets have tightened and theimplementation of many new initiatives has been delayedor cancelled.
In the measures in the second fiscal package forinfrastructure projects announced by the Governmentof India on January 2nd, 2009, the Government hastried to provide a level playing field for domestic steeland cement producers by imposing counter-veiling dutyon steel products (TMT bars and structural) and counter-veiling duty plus special counter-veiling duty on cementimports in lieu of the excise duty that is being paid bydomestic producers. This has helped companies controltheir construction costs. The Union Budget 2009-2010has also reinforced the Government’s commitmenttowards spurring infrastructure growth.
4. War For Talent
It is often said that India is faced with a “talent paradox”.While jobs are growing at a faster rate than thepopulation, unemployment is also growing. The dualproblem of unemployment and talent scarcity presentsgovernments and employers with a human resourceparadox: tackling a talent shortage in the midst of plenty.
Phoenix is continuously working on its ability to up-skillits people capability. People processes and frameworksplay a key role in ensuring a continuous up-gradationof skills. Phoenix is an organization that is non-hierarchical, encourages dialogue, transparency, respectand is focused on high performance. Phoenix identifiesthe development needs of its employees, and providessupport to them through technical, professional andmanagerial training programs, seminars andconferences.
5. Pricing Uncertainty
There are two key issues related to pricing uncertainty.The first concerns overvaluation of real estate portfoliosand, more precisely, a discrepancy between propertyvaluations and current transaction prices.
At Phoenix, site evaluation is a key process and siteappraisals are carried out in detail including externaladvice where appropriate. Property acquisitions aresubject to approval by the Board depending upon thevalue and nature of the contract. Development inprogress are controlled and managed through theCompany’s operating structure and procedures includingrigorous and regular review of forecast revenue andcosts to complete.
FINANCIAL PERFORMANCE
1) Turnover- During the year under review, the Companyhas achieved a turnover of Rs 150 crore, registering agrowth of 42% over last year’s turnover of Rs 106 crore.Profit after Tax increased from Rs 43 crore in 2007-08to Rs 77 crore in 2008-09.
2) Equity share Capital- The share capital has gone upfrom Rs 27.13 crore to Rs 28.97 crore on account of
91,66,665 shares allotted to the share holders of RuiaReal estate Development on account of amalgamationin 2008-09. Reserves and Surplus increased from Rs1,256 crore to Rs 1,486 crore during 2008-09.
4) Secured Loans- There was an increase in secured loansfrom Rs 237 crore to Rs 511 crore. This increase waspartly due to term loan borrowings and loan taken fromfinancial institutions
5) Fixed Assets- The Company’s fixed asset (gross block)increased from Rs 369 crore to Rs 488 crore in theyear 2008-09 while capital work in progress from Rs500 crore to Rs 900 crore during the same period.
6) Current assets-
Sundry Debtors- There has been an increase in sundrydebtors translating into a rise in the outstandings fromRs 21.6 crore to Rs 35 crore. But the increase in debtorswas mostly considered good.
Cash and Bank- The Company’s liquidity improved fromRs 2 crore to Rs 191 crore due to several reasonssuch as issue of debentures and long term loan availed.
Operational Performance
1) Sales - There has been an increase in the sales of theCompany from Rs 82.1 crore to Rs 99.6 crore,registering a growth of 21% over the previous year.The other income has also doubled from Rs 24 crore toRs 50 crore due to profit on sale of investment andinterest income receipt.
2) Direct cost- The direct cost for the year under reviewwork out to 28% of the sales as against 32% last year.
3) Employee cost- has also nearly doubled from Rs 5.3crore to Rs 10.8 crore due to both increase in thenumber of work force and pay hikes to curb attrition.
4) Finance cost- has increased from Rs 4.5 crore to Rs5.5 crore. This is partly due to increase in interest ratesand partly on account of increase in the quantum ofloans.
OUTLOOK
The real estate sector plays a significant role in India’seconomy. Almost 5 per cent of the country’s GDP iscontributed by housing alone and a unit increase inexpenditure in this sector has a multiplier effect and thecapacity to generate income as high as five times theincrease in expenditure. The sector has been characterizedby an increasing presence of a large number of publiccompanies, along with the opening up of this sector to foreigndirect investment (FDI) and private equity firms. Anothercharacteristic has been that the pace of activity has beenshifting to smaller cities.
Growth in the real estate sector is fuelled by the growth inorganized retail, followed by housing and informationtechnology and information technology-enabled services.Hence, in recent times, real estate has been seeing a plungein demand with retail shying away from exorbitantly pricedspaces or paying high rentals. Reduced consumer spendinghas also translated into a retail slowdown.

20
However, India’s favourable demography, low mortgagepenetration, falling interest rates and ongoing infrastructuredemand will keep the retail real estate downturn from beingprotracted. The fundamentals of the sector are good and itsgrowth should continue in the foreseeable future. Expertsestimate that India’s property sector could begin to improvefrom late 2009 and may attract up to USD 12.11 billion inreal estate investment over a five-year period. Despite theslowdown, Foreign Direct Investment (FDI) into India in thereal estate sector for the fiscal year 2008-09 has been USD12.62 billion approximately, according to the latest data givenby the Department of Policy and Promotion (DIPP).
In fact, the retailers in the country are currently looking atestablishing themselves in this high-growth space as earlyas possible to ensure that they capture as much marketshare in terms of retail space and consumer spend. Playershave set out plans to invest close to USD 25 billion over thenext four years.
A report by the Indian Council of Research in InternationalEconomic Relations (ICRIER) submitted to the Indiangovernment last year said the nation’s Indian retail marketwas estimated to be of USD 322 billion in 2007 and isexpected to reach a figure of USD 590 billion by 2011-12.
Phoenix Mills believes it is well poised to leverage its strengthas a retail-led consumption developer across the countryincluding Tier -II and Tier-III cities with its partners EWDPLand Big Apple and emerge as a strong player in the growingopportunity space.
INTERNAL CONTROL SYSTEMS AND THEIRADEQUACY
Effective governance consists of competent management;implementation of standard policies and processes;maintenance of an appropriate audit program with internalcontrol environment, effective risk monitoring andmanagement information systems. Phoenix has an integratedapproach for management of risk and has formulated theframework for regulatory and risk management, standardizingthe definition of internal controls. It also provides a frameworkfor risk management and regulatory compliance, whichrequires risk assessments and related policies, a control-based environment and activities, information andcommunication procedures, and a monitoring mechanismfor the control environment.
Phoenix has a sound system of Internal Controls for financialreporting of various transactions, efficiency of operationsand compliance with relevant laws and regulations
commensurate with its size and nature of business. It hasa well-defined system of management reporting and periodicreview of businesses to ensure timely decision-making.These internal control procedures ensure the following:
• Efficient use and protection of resources.
• Compliance with policies, procedures and statutes.
• Accuracy and promptness of financial reports.
The Management Information System (MIS) forms anintegral part of the Company’s control mechanism. Alloperating parameters are monitored and controlled, withmaterial deviations from the annual planning and budgetingand business outlook including capital expenditure reportedto the Board on quarterly basis. Reports of internal auditorsare reviewed by the Audit Committee, and correctivemeasures are carried out towards further improvement insystems and procedures and compliance with InternalControl System. The Board also recognizes the work ofthe auditors as an independent check on the informationreceived from the management on the operations andperformance of the company.
HUMAN RESOURCE DEVELOPMENT
Phoenix firmly believes in and has consistently practicedprogressive HR values. It’s philosophy is reflected by thevalues of transparency, professionalism and accountability.Phoenix endeavors to improve on these aspects on anongoing basis and thereby perpetuate it to generate long-term, socio-economic values for its shareholders, customersand employees.
At Phoenix, people from divergent disciplines work in perfectharmony to attain greater growth and development. Thishas been made possible through a consistent emphasison every individual’s sense of responsibility and ability toexercise initiative and judgment while working as a memberof the team.
The HR department organizes internal training programmesfor personality development, behavior, talent managementand communication to help enhance the employee’s skillsand capabilities.
Disclaimer
Except for the historical information and discussioncontained herein, statements included in this analysisinclude “forward-looking statements”. These statementsinvolve a number of risks, uncertainties and other factorsthat could cause actual results to differ materially fromthose that may be projected by these forward lookingstatements.

21
Corporate Governance Report
1. COMPANY’S PHILOSOPHY ON CODE OF CORPORATE GOVERNANCE
Corporate Governance is the set of policies, processes and practices by which a company conducts its affairs in pursuitof its business goals. In order to ensure sustainable returns to all stakeholders of the business, it is imperative,especially for large organizations, to adopt and follow certain policies, procedures and processes, which togetherconstitute a “Code of Corporate Governance.” It is important that such a Code is institutionalized, to ensure transparency,consistency and uniformity of decision making processes and actions. The Phoenix Mills Limited has always believed insuch a “Sound” Code of Corporate Governance. The Company believes that all its actions must serve the underlyinggoal of enhancing overall shareholding value over a sustained period of time and sound corporate governance is criticalto enhance and retain investor trust.
2. BOARD OF DIRECTORS
a) Composition of the Board
As on 31st March 2009, the Board comprises of Three Executive Director and Seven Non-Executive Directors.The Chairman of the Board is an Executive Director and one half of the Board comprises of Independent Directors.
The composition of the Board and other relevant details relating to Directors are given below:
Number of Other
Name of the Director Relationship Designation Category of Director- Committee Committeewith other Directorship ships* Chairman- Member-Directors ship ship
Shri. Ashokkumar Ruia Father of Chairman & Promoter, 8 - -Mr. Atul Ruia Managing Director Executive;
Non Independent
Shri. Atul Ruia Son of Joint Managing Promoter, Executive; 10 - -Mr. Ashok Ruia Director Non Independent
Shri. Kiran Gandhi None Whole Time Executive; 3 - -(appointed w.e.f. Director Non-Independent22/04/2008)
Shri. Anand Bajoria Nephew of Director Non-Executive; 5 - -Mr. Ashok Ruia Non-Independent
Shri. Bharat Bajoria Brother-in-law of Director Non-Executive; 8 2 2Mr. Ashok Ruia Non- Independent
Shri. Amitkumar None Director Non-Executive; 2 - -Dabriwala Independent

22
Number of Other
Name of the Director Relationship Designation Category of Director- Committee Committeewith other Directorship ships* Chairman- Member-Directors ship ship
Shri. Amit Dalal None Director Non-Executive; 4 1 -Independent
Shri. Sivarama- None Director Non-Executive; 3 3 1krishnan Iyer Independent
Shri. ShribhanuPatki None Director Non-Executive; - - -
Independent
Shri. Suhail Nathani None Director Non-Executive; 1 - -Independent
* Directorships in Private and Foreign Companies, if any are excluded.
# Memberships of only Audit Committee and Shareholders’ Grievance Committee have been considered
b) Re-appointment of Directors:
Pursuant to the provisions of Sections 255 & 256 of the Companies Act, 1956, Shri. Anand Bajoria and Shri. AmitDalal shall retire by rotation at the ensuing Annual General Meeting.
The Board has recommended the re-appointment of Shri. Anand Bajoria and Shri. Amit Dalal as Directors to theshareholders. The detailed resume of the aforesaid proposed appointees is provided in the notice of the AnnualGeneral Meeting.
c) Board Meetings and Annual General Meeting:
During the financial year 2008-09, Five Board Meetings were held on – 22nd April 2008, 28th July 2008, 4th August2008, 22nd October 2008 and 29th January 2009. The previous Annual General Meeting of the Company was heldon 23rd September 2008. The details of attendance of Directors in Board Meetings and the previous AnnualGeneral Meeting are as follows;
Name of the Directors Number of Board Number of Board Attendance atMeetings held Meetings attended Previous Annual
during the tenure General Meeting
Shri. Ashokkumar Ruia 5 5 Yes
Shri. Atul Ruia 5 5 Yes
Shri. Kiran Gandhi(appointed w.e.f. 22/04/2008) 4 4 Yes
Shri Pramod Rawool(Resigned w.e.f. 12/08/2008) 3 2 No
Shri. Anand Bajoria 5 Nil No
Shri. Bharat Bajoria 5 Nil No
Shri. Amitkumar Dabriwala 5 5 Yes
Shri. Amit Dalal 5 5 No
Shri. Sivaramakrishnan Iyer 5 5 Yes
Shri. Shribhanu Patki 5 2 No
Smt. Priti Khimji(Resigned w.e.f 03/03/2009) 5 3 Yes
Shri. Suhail Nathani 5 3 No

23
d) Code of Conduct
The Board has laid down a code of conduct for all Board members and senior management of the Company.The Company has obtained the confirmation of the Compliance with the Code from all members of the Board andsenior management of the Company for the year 2008-09. As required by Clause 49 of the Listing Agreement, thedeclaration on compliance of the Company’s code of conduct signed by Managing Director and Joint ManagingDirector forms a part of this Annual Report.
3. AUDIT COMMITTEE
a) Constitution of Audit Committee:
The Board of Directors at their meeting held on 28th July 2008 have reconstituted the composition of AuditCommittee whereby Mr. Amit Dalal was appointed as a member of the Committee and Mr. Sivaramakrishan Iyerwas appointed as Chairman to fill in the vacancy caused by resignation of Mr. Amit Kumar Dabriwala as Chairmanof the Committee. Mr. Dabriwala had due to his other pre-occupations tendered resignation as Chairman of theCommittee but has conveyed his willingness to continue as a member of the Committee.
As on 31st March 2009, the Committee comprises of four Non- Executive Directors majority of whom are IndependentDirectors. All the members of the Audit Committee have good knowledge of finance, accounts and company law.The Chairman of the Committee is a Chartered Accountant and has accounting and related financial managementexpertise.
b) Composition of Audit Committee and Number of Meetings Attended:
During the Financial year 2008-09, Four Audit Committee Meetings were held on 22nd April 2008, 28th July 2008,22nd October 2008 and 29th January 2009. The composition of the Audit Committee and the number of meetingattended were as under:
Committee Members Designation No. of meetings No. ofheld during meetingsthe tenure attended
Shri Sivaramakrishnan Iyer Chairman 04 04
Shri Amit Kumar Dabriwala Member 04 04
Shri Atul Ruia Member 04 04
Shri Amit Dalal (appointed w.e.f 28.07.08) Member 02 02
c) Attendees:
The Audit Committee invites such of the executives, as it considers appropriate to be present at its meetings. TheStatutory Auditors, Company Secretary and Internal Auditors are invited to attend these meetings whenever required.
d) The Terms of Reference of the Audit Committee:
The terms of reference of the Audit Committee are in accordance with all the items listed in Clause 49(II)(D) and(E) of the listing agreement and Section 292A of the Companies Act, 1956 as follows:
i) Hold discussions with the auditors periodically about internal control systems, the scope of audit including theobservations and review of the quarterly, half-yearly and annual financial statements before submission to theBoard and also ensure compliance of internal control systems.
ii) Overseeing the Company’s financial reporting process and the disclosure of its financial information to ensurethat the financial statement is correct, sufficient and credible.
iii) Recommending, the appointment, re-appointment and, if required, the replacement or removal of the statutoryauditor and the fixation of audit fee.
iv) Approve payment for any other services rendered by the statutory auditors.
v) Reviewing, with the management, the annual financial statements before submission to the Board for approval,with particular reference to:
(a) Matters required to be included in the Director’s Responsibility Statement included in the Board’s Report interms of clause (2AA) of section 217 of the Companies Act, 1956.
(b) Changes, if any, in accounting policies and practices and reasons for the same.

24
(c) Major accounting entries based on the exercise of judgment by management.
(d) Significant adjustments made in the financial statements arising out of audit findings.
(e) Compliance with listing and other legal requirements relating to financial statements.
(f) Disclosure of any related party transactions.
(g) Qualifications in the draft audit report.
vi) Reviewing, with the management, the quarterly financial statements before submission to the Board forapproval.
vii) Reviewing, with the management, performance of statutory and internal auditors, adequacy of the internalcontrol systems.
viii) Reviewing the adequacy of internal audit function, if any, including the structure of the internal audit department,staffing and seniority of the official heading the department, reporting structure coverage and frequency ofinternal audit.
ix) Discussion with internal auditors on any significant findings and follow up there on.
x) Reviewing the findings of any internal investigations by the internal auditors into matters where there issuspected fraud or irregularity or a failure of internal control systems of a material nature and reporting thematter to the Board.
xi) Discussion with statutory auditors before the audit commences, about the nature and scope of audit as well aspost-audit discussion to ascertain any area of concern.
xii) To look into the reasons for substantial defaults in the payment to the depositors, debentureholders, shareholders(in case of non-payment of declared dividends) and creditors.
xiii) Review of information as prescribed under Clause 49 (II)(E) of the listing agreement.
e) Powers of the Audit Committee:
The Audit Committee has the following powers:
i) To Investigate any activity within its terms of reference as above.
ii) To seek information from any employee.
iii) To obtain outside legal or other professional advice, if necessary.
iv) To secure attendance of outsiders with relevant expertise, if it considers necessary.
4. REMUNERATION COMMITTEE
a) Constitution and Composition of Remuneration Committee:
The Board of Directors at their meeting held on 28th July 2008 have reconstituted the composition of RemunerationCommittee whereby Shri. Suhail Nathani has been appointed as Chairman in place of Shri. Amit Kumar Dabriwalawho tendered his resignation due to other pre-occupations. In addition, Shri Sribhanu Patki was appointed as amember of the Committee.
Presently, the committee comprises of three members. All the members are Non-Executive, Independent Directors.
b) Composition of Remuneration Committee and Number of Meetings Attended:
During the Financial year 2008-09, Two meetings of the Remuneration Committee were held on 22nd Apri,l 2008and 18th February, 2009. The composition of the Audit Committee and the number of meeting attended were asunder:
Committee Members Designation No. of Meetings No. ofheld during Meetingsthe tenure Attended
Shri Suhail Nathani Chairman 2 2
Shri Sribhanu Patki (Appointed w.e.f. 28th July, 2008) Member 1 1
Shri Sivaramakrishnan Iyer Member 2 2
Shri. Amit Dabriwala (Resigned w.e.f. 28th July, 2008) Member 1 1

25
c) Terms of reference:
The committee has the mandate to review and recommend compensation payable to the Executive Directors andsenior management of the company. The committee may review the performance of the Executive Directors, if anyand for the said purpose may lay down requisite parameters for each of the Executive Directors at the beginning ofthe year.
d) Remuneration Policy:
i) Management Staff :
Remuneration of employees largely consists of basic remuneration and perquisites. The components of thetotal remuneration vary for different grades and are governed by industry patterns, qualifications and experienceof the employee, responsibilities handled by him, his individual performance, etc.
ii) Non-Executive Directors :
The Company pays sitting fees to all the Non-executive Directors of the Company. The sitting fees paid iswithin the limits prescribed under the Companies Act, 1956. In accordance with the decision of the Board ofDirectors, sitting fees of Rs.7,500/- for each meeting of Board of Directors and Rs. 5,000/- for each meeting ofthe Audit Committee Meeting is paid to such members who have attended the meeting. Details of the Sittingfees paid during the year 2008-09 are as under:
Name of the Non-Executive Director Sitting Fees paid (Rs.)
Board Meeting Audit Committee
Shri. Amitkumar Dabriwala 37,500 20,000
Shri. Amit Dalal 37,500 10,000
Shri. Sivaramakrishnan Iyer 37,500 20,000
Shri. Shribhanu Patki 15,000 N.A.
Smt. Priti khimji (resigned w.e.f. 3rd March, 2009) 22,500 N.A.
Shri. Suhail Nathani 22,500 N.A.
Total 1,72,500 50,000
iii) Executive Directors :
The appointment and remuneration of the Executive Directors is governed by resolutions passed by the Boardof Directors and shareholders of the Company, which covers terms of such appointment, read with the servicerules of the Company. Remuneration paid to the Executive Directors is recommended by the RemunerationCommittee, approved by the Board and is within the limits set by the shareholders at the General Meetings.
Details of remuneration paid to Executive Directors during year ended March 31, 2009 are given below:
Name of the Designation Salary & Contribution TotalExecutive Director Allowances to PF (Amt. in Rs.)
(Amt. in Rs.) (Amt. in Rs.)
Shri Ashokumar Ruia Chairman &Managing Director 24,80,522 - 24,80,522
Shri Atul Ruia Joint ManagingDirector 24,00,000 - 24,00,000
Shri Kiran Gandhi Whole-Time Director 62,18,499 - 62,18,499
Shri Pramod Rawool Whole-Time Director 5,39,317 - 5,39,317(Resigned w.e.f.12th August, 2008)

26
5. SHAREHOLDERS/ INVESTORS GRIEVANCE COMMITTEE
a) Constitution and Composition of Shareholders’ Grievance Committee:
The Shareholders/Investors Grievance Committee has been constituted to look into investor’s complaints liketransfer of shares, non-receipt of declared dividends, etc. and take necessary steps for redressal thereof. TheCommittee is a Board level committee under the Chairmanship of Mr. Amit Kumar Dabriwala, a Non-ExecutiveDirector. Twenty Two Meetings of Shareholders / Investors Grievance Committee were held during the financialyear 2008-09.
The present composition of the Shareholders/Investors Grievance Committee and the number of meeting attendedwere as under:
Name of Director Designation No. of Meetings held No. of Meetingduring the tenure Attended
Shri Amitkumar Dabriwala Chairman 22 22
Shri Ashokkumar Ruia Member 22 22
Shri Atul Ruia Member 22 22
b) During the year 2008-09, the Company has received 54 complaints from Shareholders / Investors. There were nocomplaints pending as at end of the year
c) Share Transfers in Physical Mode
Shares received for physical transfer are generally registered and returned within a period of 15 days from the dateof receipt, if the documents are clear in all respects. The Shareholders / Investors Grievance Committee of theCompany meets as often as required.
6. GENERAL BODY MEETINGS
i) Location, time and date of holding of the previous three Annual General Meetings (AGM) are given below:
Financial Year Date Time Location of the Meeting
2005-06 16.09.2006 11.00 A.M. Sunville Deluxe Pavilion, 9, Dr. Annie Besant Road,Worli, Mumbai - 400018
2006-07 05.11.2007 11.00 A.M. Sunville Deluxe Pavilion, 9, Dr. Annie Besant Road,Worli, Mumbai - 400018
2007-08 23.09.2008 11.00 A.M. Sunville Deluxe Pavilion, 9, Dr. Annie Besant Road,Worli, Mumbai - 400018
ii) Special Resolutions during previous three Annual General Meetings:
Financial Year Particulars of Special Resolutions Passed
2005-06 Nil
2006-07 - Appointment of Shri. Ashokkumar Ruia as Managing Director for a period of 3years w.e.f. 1st April, 2007.
- Appointment of Shri. Atul Ruia as Whole-Time Director designated as JointManaging Director for a period of 3 years w.e.f. 1st April, 2007.
- Appointment of Shri. Pramod Rawool as Whole-Time Director for a period of 3years w.e.f. 1st November, 2007.
- Change of name of the Company from “The Phoenix Mills Limited” to “PhoenixLimited”
- Authority to Board of Directors to invest in exces of the limits specified u/s. 372Aof the Companies Act, 1956.
2007-08 Appointment of Shri Kiran Gandhi as Whole Time Director of the Company for aperiod of 3 years w.e.f. 22nd April, 2008.
iii) During the year 2008-09, no resolutions were been passed by Postal Ballot.
iv) Resolutions if any passed by Postal Ballot shall be in accordance with the provisions of Section 192A of theCompanies Act, 1956 read with Companies (Procedure for Passing of Postal Ballot) Rules, 2001.
v) No Special resolution is proposed to be passed through Postal Ballot.

27
7. MEANS OF COMMUNICATION
(i) The quarterly results of the Company are published in at least one English and one Regional language leadingnewspaper. Generally, the same are published in Free Press Journal or Business Standard (English language) andNavshakti or Mumbai Lakshadweep (Marathi language).The Company proposes that all quarterly, half-yearly andfull year audited results be published at least in 2 newspapers. The quarterly results are further submitted to theBombay Exchange Limited and National Stock Exchange of India Limited immediately after the conclusion of therespective meetings.
(ii) No presentations were made to institutional investors or to the analysts during the year under review.
(iii) Pursuant to clause 51 of the Listing Agreement, all data related to quarterly financial results, shareholding pattern,etc. are hosted on the Electronic Data Information Filing and Retrieval (EDIFAR) website at www.sebiedifar.nic.inwithin the time frame prescribed in this regard.
(iv) The Management Discussion and Analysis Report forms part of this Annual Report.
8. GENERAL SHAREHOLDER INFORMATION
i. Annual General Meeting:
Day, Date and Time : Tuesday, 22nd September, 2009 at 11.00 a.m.
Venue : Sunville Deluxe Pavilion, 9, Dr. Annie Besant Road, Worli, Mumbai - 400018
ii. Financial Year:
The Company follows April-March as its financial year. The results for every quarter beginning from April aredeclared in the month following the quarter.
iii. Book Closure: 15th September, 2009 to 22nd September, 2009(both days inclusive)
iv. Dividend Payment: On or after 25th September, 2009 but within the statutory time limit of 30 days, subject toshareholders’ approval.
v. Listing on Stock Exchanges:
The Company’s shares are listed on Bombay Stock Exchange Limited (“BSE”) and National Stock Exchange ofIndia Limited (“NSE”). The Company has paid the listing fees to the Stock Exchange(s) within the prescribed time
vi. Stock Code/SymbolBSE – 503100NSE – PHOENIXLTD
vii. Market Price Data:
The monthly high and low quotations of shares traded on the Bombay Stock Exchange Limited and National StockExchange of India Limited along with the volumes is as follows:
Month BSE NSE
High (Rs.) Low (Rs.) Traded High (Rs.) Low (Rs.) TradedVolume Volume
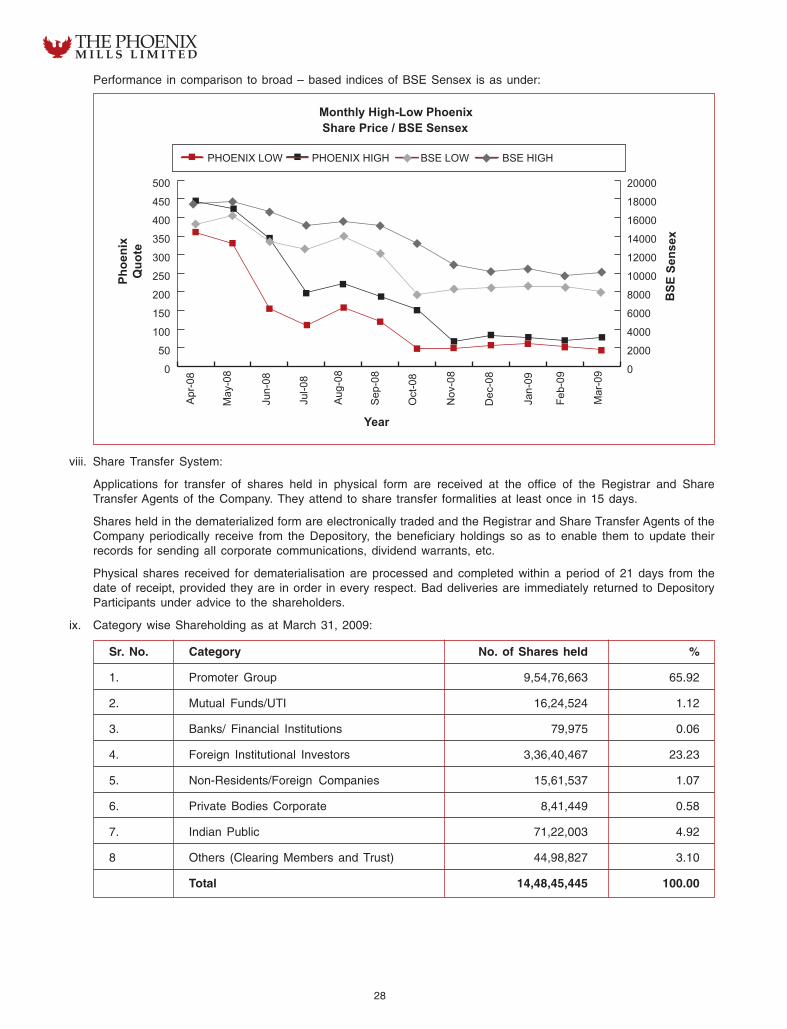
April, 2008 443.90 361.10 1,66,149 460 339.5 1,22,900
May, 2008 425.00 331.00 2,04,512 445 331 2,37,159
June, 2008 342.65 155.00 8,83,444 349.5 155 10,04,287
July, 2008 197.60 110.00 39,24,620 197 109.1 31,29,990
August, 2008 222.00 159.00 15,13,725 223 159.15 15,05,752
September, 2008 188.00 120.10 60,11,077 188 127.5 34,62,417
October, 2008 153.00 47.60 13,27,677 153 45.3 19,44,503
November, 2008 67.40 48.40 7,75,561 67 49 9,99,824
December, 2008 84.35 56.95 6,71,253 85 57 8,70,784
January, 2009 78.00 60.85 4,82,133 77.75 56.2 5,00,720
February, 2009 69.70 52.60 1,37,135 66.5 52.05 3,66,732
March, 2009 78.50 44.50 33,55,787 77.2 44.25 23,43,341
28
Performance in comparison to broad – based indices of BSE Sensex is as under:
viii. Share Transfer System:
Applications for transfer of shares held in physical form are received at the office of the Registrar and ShareTransfer Agents of the Company. They attend to share transfer formalities at least once in 15 days.
Shares held in the dematerialized form are electronically traded and the Registrar and Share Transfer Agents of theCompany periodically receive from the Depository, the beneficiary holdings so as to enable them to update theirrecords for sending all corporate communications, dividend warrants, etc.
Physical shares received for dematerialisation are processed and completed within a period of 21 days from thedate of receipt, provided they are in order in every respect. Bad deliveries are immediately returned to DepositoryParticipants under advice to the shareholders.
ix. Category wise Shareholding as at March 31, 2009:
Sr. No. Category No. of Shares held %
1. Promoter Group 9,54,76,663 65.92
2. Mutual Funds/UTI 16,24,524 1.12
3. Banks/ Financial Institutions 79,975 0.06
4. Foreign Institutional Investors 3,36,40,467 23.23
5. Non-Residents/Foreign Companies 15,61,537 1.07
6. Private Bodies Corporate 8,41,449 0.58
7. Indian Public 71,22,003 4.92
8 Others (Clearing Members and Trust) 44,98,827 3.10
Total 14,48,45,445 100.00
0
50
100
150
200
250
300
350
400
450
500
Mar
-09
Feb-
09
Jan-
09
Dec
-08
Nov
-08
Oct
-08
Sep
-08
Aug
-08
Jul-0
8
Jun-
08
May
-08
Apr
-08 0
2000
4000
6000
8000
10000
12000
14000
16000
18000
20000
Monthly High-Low PhoenixShare Price / BSE Sensex
Phoe
nix
Quo
te
BSE
Sen
sex
Year
PHOENIX LOW PHOENIX HIGH BSE LOW BSE HIGH

29
x. Distribution of Shareholding as at March 31, 2009:
No. of Equity Shares No. of % of Total No. of Shares % of TotalShareholders
1-500 9,098 82.14 12,74,076 0.88
501 - 1000 670 6.04 5,50,391 0.38
1001 - 2000 544 4.91 8,06,924 0.56
2001 - 3000 277 2.50 7,02,621 0.48
3001 – 4000 127 1.15 4,65,917 0.32
4001 – 5000 54 0.48 2,49,944 0.18
5001 – 10000 161 1.45 11,44,958 0.79
10001 and above 147 1.33 13,86,50,614 96.41
TOTAL 11,078 100.00 14,48,45,445 100.00
xi. Dematerialisation of Shares and Liquidity:
About 97.64% of the shares have been dematerialized as on March 31, 2009.
xii. Outstanding GDRs/ADRs/Warrants or any Convertible Instruments conversion date and likely impact on equity:
The Company has not issued any GDRs/ADRs. There were no outstanding convertible warrants as on March 31,2009.
xiii. Registrar and Share Transfer Agents:Link Intime India Private Limited.C-13, Pannalal Silk Mills Compound,L.B.S. Marg, Bhandup (West),Mumbai – 400 078
xiv. Plant Locations: The Company does not carry any manufacturing activities and hence does not have any plantlocations.
xv. Address for Correspondence:
For any assistance regarding dematerialisation of shares, share transfers, transmissions, change of address, non-receipt of dividend or any other query relating to shares:
Link Intime India Private Limited.C-13, Pannalal Silk Mills Compound,L.B.S. Marg, Bhandup (West),Mumbai – 400 078.Tel. No.: 022-25963838Fax No.: 022-25946969Email:[email protected]
xvi. For general correspondence:
The Phoenix Mills Limited462, Senapati Bapat Marg,Lower Parel-West, Mumbai - 400 013.Tel No. 022-24964307Fax No. 022- 24938388Email: [email protected]
9. OTHER DISCLOSURES
a. The Company did not have any related party transactions, i.e. transactions of the Company of material nature, withits Promoters, Directors or the Management, their subsidiaries or relatives, etc., which may have potential conflictwith the interests of the Company at large. Related Party transactions have been disclosed in the Notes toAccounts in the financial statements as at March 31, 2009.

30
b. Shareholdings of the Non-Executive Directors as on 31st March, 2009 is as under :
Name of the Director No. of Shares held
Shri. Amitkumar Dabriwala Nil
Shri. Amit Dalal Nil
Shri. Sivaramakrishnan Iyer Nil
Shri. Shribhanu Patki 2875
Shri. Suhail Nathani Nil
Shri. Anand Bajoria Nil
Shri. Bharat Bajoria Nil
c. The Company has complied with the requirements of Regulatory Authorities on Capital Markets and no penalty/stricture was imposed on the Company during the last three years.
d. The Company has complied with the mandatory requirements of Corporate Governance. The Company hasadopted non-mandatory requirements relating to Remuneration Committee.
10 NON-MANDATORY REQUIREMENTS:
I. The Board
(a) An office for the use of the Chairman is made available whenever required.
(b) At present there is no policy fixing the tenure of independent directors.
II. Remuneration Committee
Particulars of constitution of Remuneration Committee and terms of reference thereof has been detailed earlier.
III. Shareholders’ Rights
Half yearly financial results including summary of the significant events in last six months are presently, not beingsent to shareholders of the Company.
IV. Audit Qualifications
The financial accounts of the Company are unqualified.
V. Training of Board Members
There is no formal policy at present for training of the Board Members of the Company as the members of theBoard are eminent and experienced professional persons.
VI. Mechanism for evaluating non-executive Board members
There is no formal mechanism existing at present for performance evaluation of Non-Executive Directors.
VII. Whistle Blower Policy
The Company has not implemented the whistle blower policy.

31
CERTIFICATE ON CORPORATE GOVERNANCE
ToThe MembersPhoenix Limited
We have examined the compliance of conditions of Corporate Governance by Phoenix Limited (“the Company”) for the yearended March 31, 2009 as stipulated in Clause 49 of the Listing Agreement of the said Company with the Stock Exchange.
The compliance of conditions of Corporate Governance is the responsibility of the Management. Our examinations werelimited to procedures and implementation thereof, adopted by the Company for ensuring the compliance of the conditions ofCorporate Governance. It is neither an audit nor an expression of opinion on the financial statements of the Company.
In our opinion and to the best of our information and according to the explanations given to us, we certify that the Companyhas compiled with the conditions of Corporate Governance as stipulated in the above mentioned Listing Agreement
We further state that such compliance is neither an assurance as to the future viability of the Company nor the efficiency oreffectiveness with which the Management has conducted the affairs of the Company.
For Rathi & AssociatesCompany Secretaries
Narayan RathiPartner
CP No. 1104
Place: MumbaiDated: 27th July, 2009
CODE OF CONDUCT DECLARATION
Pursuant to Clause 49 I (D) of the Listing Agreement entered into with the Stock Exchanges, I hereby declare that theCompany has obtained affirmative compliance with the code of conduct from all the Board members and senior managementpersonnel of the Company.
Place: Mumbai Ashokkumar Ruia Atul RuiaDate: 27th July, 2009 Managing Director Jt. Managing Director

32
FINANCIALS

33
Auditors’ Report
ToThe Members ofTHE PHOENIX MILLS LIMITED
1. We have audited the attached Balance Sheet ofTHE PHOENIX MILLS LIMITED, as at 31st March, 2009,the Profit and Loss Account and the Cash FlowStatement for the year ended on that date annexedthereto. These financial statements are the responsibilityof the Company’s management. Our responsibility is toexpress an opinion on these financial statements basedon our audit.
2. We conducted our audit in accordance with auditingstandards generally accepted in India. Those Standardsrequire that we plan and perform the audit to obtainreasonable assurance about whether the financialstatements are free of material misstatement. An auditincludes examining, on a test basis, evidence supportingthe amounts and disclosures in the financial statements.An audit also includes assessing the accountingprinciples used and significant estimates made bymanagement, as well as evaluating the overall financialstatement presentation. We believe that our auditprovides a reasonable basis for our opinion.
3. As required by the Companies (Auditors’ Report) Order,2003 issued by the Central Government of India in termsof Section 227(4A) of the Companies Act, 1956, weenclose in the Annexure a statement on the mattersspecified in paragraphs 4 and 5 of the said Order, tothe extent applicable to the Company.
4. Further to our comments in the Annexure referred to inparagraph 3 above we report that:
(a) We have obtained all the information andexplanations, which to the best of our knowledgeand belief were necessary for the purposes of ouraudit.
(b) In our opinion, the company has kept proper booksof account as required by law so far as appearsfrom our examination of those books.
(c) The Balance Sheet, the Profit and Loss Accountand the Cash flow Statement dealt with by thisreport are in agreement with the books of accounts.
(d) In our opinion, the Balance Sheet, the Profit andLoss Account and the Cash Flow Statement dealtby this report are in compliance with the mandatoryAccounting Standards referred to in Section 211(3C)of the Companies Act, 1956.
(e) On the basis of the written representations receivedfrom the directors as on 31st March, 2009 and takenon record by the Board of Directors, we report thatnone of the directors are disqualified as on 31st
March 2009 from being appointed as directors interms of clause (g) of sub-section (1) of Section274 of the Companies Act, 1956.
(f) In our opinion and to the best of our informationand according to the explanations given to us, thesaid accounts read together with the significantaccounting policies and other notes thereon givethe information required by the Companies Act,1956, in the manner so required and give a trueand fair view in conformity with the accountingprinciples generally accepted in India:-
i) In the case of the Balance Sheet, of the stateof affairs of the Company as at 31st March,2009 ;
ii) In the case of the Profit and Loss Account, ofthe Profit of the Company for the year endedon that date; and
iii) In the case of the Cash Flow Statement, of thecash flows for the year ended on that date.
For A. M. Ghelani & Company For Chaturvedi & ShahChartered Accountants Chartered Accountants
Chintan A. Ghelani Amit ChaturvediPartner PartnerMembership No: 104391 Membership No: 103141
Place: MumbaiDate: 27th July, 2009

34
Annexure to Auditors’ Report
(Referred to in Paragraph 3 of our report of even date)
1) In respect of its Fixed Assets: -
a) The Company has maintained proper recordsshowing the particulars and situation of its fixedassets.
b) According to the information and explanations givento us, the fixed assets were physically verified bythe management in accordance with the programmeof verification, which in our opinion, is reasonablehaving regard to the size of the Company andnature of its assets. The discrepancies noticed onphysical verification were not material and havebeen properly dealt with in the books of accounts.
c) During the year, the Company has not disposed offany substantial part of the fixed assets.
2) a) According to the information and explanations givento us, the stock of finished goods have beenphysically verified by the management at the endof the year. In our opinion, the frequency ofverification is reasonable.
b) According to the information and explanations givento us, in our opinion, the procedures for the physicalverification of stocks followed by the managementare reasonable and adequate in relation to the sizeof the Company and the nature of its business.
c) The Company is maintaining proper records ofinventory. The discrepancies noticed on verificationbetween the physical stocks and book records werenot material, having regard to the size of theoperations of the Company.
3) In respect of loans, secured or unsecured, granted ortaken by the company to/from Companies, firms orparties covered in the register maintained under section301 of the Companies Act, 1956: -
a) The Company has granted unsecured loans to threewholly owned subsidiaries and two other companiescovered in the Register maintained under section301 of the Companies Act, 1956. In respect of thesaid loans, the maximum amount outstanding atany time during the year is Rs. 3,71,95,50,351/-and the year-end balance is Rs. 2,09,02,97,670/-.
b) In our opinion and according to the informationand explanations given to us, the terms andconditions of such interest free loans given to thesubsidiaries and the loans given to the othercompanies covered in the Register maintainedunder section 301 of the Companies Act, 1956 arenot prima facie prejudicial to the interest of theCompany.
c) As per the information and explanation given to us,the principal amounts and interest, whereverapplicable, of the said loans are repayable ondemand and there is no repayment schedule.Therefore, the question of overdue amounts doesnot arise.
d) The company had taken an interest free, unsecuredloan of Rs. 49,78,45,610/- from a Company coveredunder register maintained under section 301 of theCompanies Act, 1956. In respect of the said loan,the maximum amount outstanding at any time duringthe year was Rs. 49,78,45,610/-. The said loanhas been fully squared up as at the end of theyear.
e) In our opinion and according to the informationand explanations given to us, the terms andconditions of the said loan taken were not primafacie prejudicial to the interest of the Company.
f) In respect of the said loan, the principal amountwas repayable on demand and there was norepayment schedule. Therefore, the question ofoverdue amount does not arise.
4) In our opinion and according to the information andexplanations given to us, there is an adequate internalcontrol system commensurate with the size of thecompany and the nature of its business for the purchaseof inventory and fixed assets and also for the sale ofgoods and services. During the course of our audit, wehave not observed any continuing failure to correct majorweaknesses in the internal control systems in respectof the above areas.
5) In respect of transactions covered under section 301 ofthe Companies Act, 1956, in our opinion and accordingto the information and explanations given to us;

35
a) The transactions made in pursuance of contractsor arrangements, that needed to be entered in theregister maintained under section 301 of theCompanies Act, 1956 have been so entered.
b) These transactions have been made at prices whichare comparable to similar transactions entered intowith other parties.
6) According to the information and explanations given tous, the company has not accepted any deposits fromthe public during the year. Therefore the provisions ofclause (vi) of paragraph 4 of the order are not applicableto the Company.
7) In our opinion, the Company has an internal audit systemcommensurate with the size of the Company and thenature of its business.
8) As per the information and explanations given to us,the Central Government has not prescribed themaintenance of cost records under section 209(1)(d) ofthe Companies Act, 1956 in respect of the businessactivities conducted by the Company during the year.
9) a) As per the information and explanations given tous, the company has generally been regular indepositing the undisputed statutory dues includingProvident Fund, Employee’s State Insurance,Income Tax and Sales Tax with the appropriateauthorities and there were no undisputed amountspayable in respect of such dues which haveremained outstanding as at 31st March, 2009 for aperiod of more than six months from the date theybecame payable except Rs.26,226/- [excludinginterest and penalty, if any] towards E.S.I.C. duesconfirmed by the E.S.I.C. Court where no demandnotice, we are informed, has been issued by theE.S.I.C. Department.
b) The statutory dues that have not been depositedon account of disputes pending before theappropriate authorities are Excise duty amountingto Rs. 1,13,76,598 for the period from 1986-87 to1992-93 where the dispute is pending before TheCommissioner (Appeals) – as directed by CEGAT.
10) The Company does not have accumulated losses atthe end of the financial year. The Company has notincurred cash losses in the financial year under reportas well as in the immediately preceding financial year.
11) As per the information and explanations given to us,the Company has not defaulted in repayment of duesto financial Institutions/banks. The Company has notborrowed any funds by way of issue of debentures.
12) According to the information and explanations given tous, the Company has not granted loans/advances onthe basis of security by way of pledge of shares,debentures and other securities and therefore, theprovisions of the clause (xii) of paragraph 4 of the Orderare not applicable.
13) In our opinion, the Company is not a chit fund / nidhi /mutual benefit fund / society. Therefore, the provisionsof clause (xiii) of paragraph 4 of the Order are notapplicable to the Company.
14) In our opinion, the Company has maintained properrecords of the transactions and contracts in respect ofdealing in shares, securities and other investments andtimely entries have been made therein. All shares,securities and other investments have been held by theCompany in its own name except :-
a) Securities pledged with the banks/ financialinstitutions; and
b) Equity shares pending issue on account of Merger/Amalgamation.
15) According to the information and explanations given tous and the records examined by us, the Company hasgiven a guarantee for loan taken by its subsidiary fromfinancial institutions. In our opinion, based on theinformation and explanations given to us, the termsand conditions of the same are prima facie notprejudicial to the interest of the Company.
16) As per the information and explanations given to us,the term loans have prima facie, been applied for thepurpose for which they were obtained.
17) According to the information and explanations given tous, and the records examined by us, the funds raisedon short term basis have prima facie, not been usedduring the year for long term investments.
18) According to the information and explanations given tous, the Company has not made any preferentialallotment of shares, during the year, to parties andcompanies covered in the Register maintained undersection 301 of the Companies Act, 1956.
19) The Company has not issued any debentures and hencethe question of creating any securities in respect thereofdoes not arise.
20) During the earlier years, the Company had raised moneyby way of placement of equity shares to qualifiedinstitutions. We have verified the end use of the moneyraised as disclosed by the Management in the Notes toaccounts.
21) To the best of our knowledge and belief and accordingto the information and explanations given to us, nofraud on or by the Company has been noticed orreported during the year.
For A. M. Ghelani & Company For Chaturvedi & ShahChartered Accountants Chartered Accountants
Chintan A. Ghelani Amit ChaturvediPartner PartnerMembership No: 104391 Membership No: 103141
Place: MumbaiDate: 27th July, 2009

36
Balance Sheet as at 31st March, 2009
Schedule As at As at31st March, 2009 31st March, 2008
Rs. Rs. Rs.SOURCES OF FUNDS
SHAREHOLDERS’ FUNDSShare Capital A 28,96,90,890 27,13,57,560Equity Share Suspense - 1,83,33,334Reserves & Surplus B 14,70,83,00,862 14,09,65,39,500
14,99,79,91,752 14,38,62,30,394LOAN FUNDS
Secured Loans C 1,65,15,83,737 1,55,14,70,890Unsecured Loans D - 49,78,45,610
1,65,15,83,737 2,04,93,16,500
Total 16,64,95,75,489 16,43,55,46,894
APPLICATION OF FUNDSFIXED ASSETS E
Gross Block 1,99,74,35,275 1,62,94,63,976Less: Depreciation 44,67,31,200 36,44,06,260
Net Block 1,55,07,04,075 1,26,50,57,716Capital Work-in-Progress 3,16,09,86,412 1,78,16,91,793
4,71,16,90,487 3,04,67,49,509INVESTMENTS F 5,32,99,93,558 5,73,19,57,028DEFERRED TAX ASSETS (Net) 1,25,59,991 96,98,545CURRENT ASSETS, LOANS AND ADVANCES
Inventories G 32,98,400 27,03,688Sundry Debtors H 33,23,51,340 19,88,97,765Cash & Bank Balances I 1,54,39,88,451 2,00,56,631Loans & Advances J 5,84,93,35,129 8,35,10,81,778
7,72,89,73,320 8,57,27,39,862Less : CURRENT LIABILITIES & PROVISIONS
Current Liabilities K 90,98,67,863 71,20,68,920Provisions L 22,37,74,004 21,35,29,130
1,13,36,41,867 92,55,98,050
NET CURRENT ASSETS 6,59,53,31,453 7,64,71,41,812MISCELLANEOUS EXPENDITURE M - -
(To the extent not written off / remaining unadjusted)
Total 16,64,95,75,489 16,43,55,46,894
Significant Accounting Policies and Notes on Accounts T
Schedules referred to herein form an integral part of the Balance Sheet.
As per our report of even dateFor A.M.Ghelani & Company For Chaturvedi & Shah For and on behalf of the Board of DirectorsChartered Accountants Chartered Accountants
Ashokkumar R. RuiaChairman & Managing Director
Chintan A. Ghelani Amit Chaturvedi Atul Ruia Sivaramakrishnan IyerPartner Partner Jt. Managing Director Director
Mumbai Kiran B. Gandhi Amit DalalDated : 27th July, 2009 Whole-time Director Director

37
Profit and Loss Account for the year ended 31st March, 2009
Schedule 2008-09 2007-08
Rs. Rs. Rs.INCOME
Sales and Services N 90,14,94,940 2,03,58,43,853
Other Income O 49,88,39,753 24,00,79,977
Total 1,40,03,34,693 2,27,59,23,830
EXPENDITURE
Purchase for resale and variation in inventory P 61,03,457 70,41,724
Employee Costs Q 4,30,37,381 3,41,84,826
Operating and other Expenses R 25,02,96,503 24,34,82,419
Interest and Finance Charges S 4,94,78,699 4,18,08,459
Depreciation 8,46,56,807 7,35,57,933
Less: Transfer from Revaluation Reserve (9,41,989) 8,37,14,818 (9,30,698)
(Refer to Note No. B-2 of Schedule “T”)
Total 43,26,30,858 39,91,44,663
PROFIT BEFORE TAX 96,77,03,835 1,87,67,79,167
Less : Provision for Taxation
Current Income Tax 18,60,00,000 19,50,00,000
Fringe Benefit Tax 24,00,000 22,00,000
Deferred Tax (28,61,446) 18,55,38,554 (69,43,522)
PROFIT AFTER TAX 78,21,65,281 1,68,65,22,689Balance brought forward from previous year 2,51,73,77,188 1,30,25,63,200
PROFIT AVAILABLE FOR APPROPRIATION 3,29,95,42,469 2,98,90,85,889
APPROPRIATIONS
Transferred to General Reserve 30,00,00,000 25,00,00,000Proposed Dividend 14,48,45,447 14,48,45,447
Tax on Proposed Dividend 2,46,16,484 2,46,16,484
Dividend for earlier year - 4,46,57,267Tax on Dividend for earlier year - 75,89,503
BALANCE CARRIED TO BALANCE SHEET 2,83,00,80,538 2,51,73,77,188
Basic and Diluted EPS (Face Value Rs.2) 5.52 16.10
Significant Accounting Policies and Notes on Accounts T
Schedules referred to herein form an integral part of theProfit and Loss Account
As per our report of even dateFor A.M.Ghelani & Company For Chaturvedi & Shah For and on behalf of the Board of DirectorsChartered Accountants Chartered Accountants
Ashokkumar R. RuiaChairman & Managing Director
Chintan A. Ghelani Amit Chaturvedi Atul Ruia Sivaramakrishnan IyerPartner Partner Jt. Managing Director Director
Mumbai Kiran B. Gandhi Amit DalalDated : 27th July, 2009 Whole-time Director Director

38
Cash Flow Statement for the year ended on 31st March, 2009
31st March, 2009 31st March, 2008Rupees Rupees Rupees Rupees
A CASH FLOWS FROM OPERATING ACTIVITIES
Net Profit before tax as per the Profit and Loss Account 96,77,03,835 1,87,67,79,167
Adjustments for :
Depreciation 8,37,14,818 7,26,27,235
Loss on Assets sold/discarded 58,342 1,09,35,242
Interest Expenses 4,94,78,699 4,18,08,459
Balances in Debtors/Advances written off 75,91,086 27,75,558
Provision for Doubtful Debts and Advances (21,32,000) 86,815
Interest Income (9,78,83,503) (1,94,37,981)
Dividend Income (6,14,35,034) (17,67,16,946)
Profit on sale of Investments (31,48,49,139) (3,82,12,859)
(33,54,56,731) (10,61,34,477)
Operating Cash flow before working capital changes 63,22,47,104 1,77,06,44,690
Adjustment for Working Capital changes :
Inventories (5,94,712) 3,88,774
Trade and other Receivables (72,99,934) (44,62,72,921)
Trade and other Payables 20,33,68,810 24,68,06,613`
19,54,74,164 (19,90,77,534)
Cash generated from Operations 82,77,21,268 1,57,15,67,156
Direct Taxes Paid (18,58,71,536) (20,60,98,774)
Net Cash from Operating Activities A 64,18,49,732 1,36,54,68,382
B CASH FLOWS FROM INVESTING ACTIVITIES
Purchases of Fixed Assets (1,74,99,14,432) (90,83,24,872)
Sale of Fixed Assets 2,58,305 -
Inter Corporate Deposits & Loans (placed)/refunded (Net) 1,45,29,04,498 (2,38,13,60,934)
Purchase of Investments (3,33,36,87,066) (27,37,67,42,882)
Sale of Investments 4,05,04,99,675 21,37,18,03,801
Share Application Money 94,92,89,662 (1,95,99,39,877)
Interest Received 6,58,23,262 1,94,37,981
Income from Investments 6,14,35,034 17,67,16,946
Net Cash generated from/(used in) Investing Activities B 1,49,66,08,938 (11,05,84,09,837)
C CASH FLOWS FROM FINANCING ACTIVITIES
Long term loans availed 24,70,97,965 95,86,67,387
Long term loans (repaid) (14,69,85,118) (1,90,10,66,509)
Short term loans availed / (repaid )(Net) (49,78,45,610) (1,77,47,36,553)

39
Cash Flow Statement for the year ended on 31st March 2009 (Contd.)
31st March 2009 31st March 2008Rupees Rupees Rupees Rupees
Interest paid (4,94,78,699) (4,18,08,459)
Proceeds from issue of Share Capital(net of issue expenses) - 12,45,14,94,678
Dividend paid (including tax on Dividend) (16,73,15,388) (9,39,34,128)
Net Cash generated from/(used in) Financing Activities C (61,45,26,850) 9,59,86,16,416
D Net Increase/(Decrease) in Cash and
Cash Equivalents A+B+C 1,52,39,31,820 (9,43,25,039)
Cash and Cash equivalents at the beginning of the year 2,00,56,631 9,93,91,076
Add: on Amalgamation - 1,49,90,594
Cash and Cash equivalents at the end of the year 1,54,39,88,451 2,00,56,631
Note : The Cash Flow Statement has been prepared under the “Indirect Method” as set out in the Accounting Standard 3 “Cash FlowStatements” as notified by the Companies (Accounting Standards) Rules 2006.
As per our report of even dateFor A.M.Ghelani & Company For Chaturvedi & Shah For and on behalf of the Board of DirectorsChartered Accountants Chartered Accountants
Ashokkumar R. RuiaChairman & Managing Director
Chintan A. Ghelani Amit Chaturvedi Atul Ruia Sivaramakrishnan IyerPartner Partner Jt. Managing Director Director
Mumbai Kiran B. Gandhi Amit DalalDated : 27th July, 2009 Whole-time Director Director

40
Schedules Annexed to and forming part of the Balance Sheet
As at As at31st March 2009 31st March 2008
Rs. Rs. Rs.SCHEDULE “A”
SHARE CAPITAL
AUTHORISED :
15,00,00,000 (P. Y. 15,00,00,000) Equity Shares of Rs. 2/- each 30,00,00,000 30,00,00,000
ISSUED, SUBSCRIBED AND PAID UP:
14,48,45,445 (P Y. 13,56,78,780) Equity Shares of Rs. 2/- eachfully paid up 28,96,90,890 27,13,57,560
TOTAL 28,96,90,890 27,13,57,560
Note:
Of the above:
i) 5,46,00,000 (P. Y. 5,46,00,000) Equity shares of Rs.2/- eachhave been alloted as fully paid up Bonus Shares bycapitalisation of Reserves.
ii) 4,00,00,000 (P. Y. 4,00,00,000) Equity Shares of Rs.2/- eachwere allotted to the share holders of Ashok Ruia EnterprisePvt. Ltd. as per the scheme of amalgamation withoutpayments being received in cash.
iii) 91,66,665 (P. Y. Nil) Equity Shares of Rs.2/- each wereallotted to the share holders of Ruia Real EstateDevelopment Company Pvt. Ltd. as per the scheme ofamalgamation without payments being received in cash.
33,90,000 (P. Y. 33,90,000) Equity Shares have beenreserved for allotment under The Phoenix Mills Employees’Stock Option Plan 2007.
6,50,000 (P. Y. Nil) Options have been granted under ‘ThePhoenix Mills Employees’ Stock Option Plan 2007' of which1,25,000 Options have been forfeited during the year.
SCHEDULE “B”
RESERVES & SURPLUS
Capital Reserve 1,84,13,824 1,84,13,824As per last Balance Sheet
General ReserveAs per last Balance Sheet 79,17,64,734 54,05,06,246Add: Transfer from Investment Allowance Reserve - 8,97,259
Transfer from Workmen’s Welfare Reserve - 3,61,229Transfer from Profit & Loss Account 30,00,00,000 25,00,00,000
1,09,17,64,734 79,17,64,734Securities Premium Account
As per last Balance Sheet 10,65,92,63,354 -Received during the year - 12,90,83,52,040Less : Expenditure in connection with the issue of Shares - 40,40,95,476
On Amalgamation - 1,84,44,87,410Transfer to Miscellaneous Expenditure - 5,05,800
10,65,92,63,354 10,65,92,63,354

41
Schedules Annexed to and forming part of the Balance Sheet
As at As at31st March 2009 31st March 2008
Revaluation ReserveAs per last Balance Sheet 10,97,20,400 11,06,51,098Less: Additional Depreciation on Revaluation of Assets
transferred to Profit & Loss Account 9,41,989 9,30,698
(Refer to Note No.B-2 of Schedule “T”) 10,87,78,411 10,97,20,400Balance in Profit & Loss Account 2,83,00,80,538 2,51,73,77,188
TOTAL 14,70,83,00,862 14,09,65,39,500
SCHEDULE “C”
SECURED LOANS
LOANS FROM BANKS
Term Loans 1,29,02,74,384 1,18,59,21,157
Working Capital Loans 35,91,64,510 36,20,66,545
(Secured by Equitable Mortgage of deposit of Title deeds 1,64,94,38,894 1,54,79,87,702in respect of certain immovable properties and byhypothecation of rentals receivable from licencees.)
VEHICLE LOANS 21,44,843 34,83,188(Secured by hypothecation of the respective vehicles)
TOTAL 1,65,15,83,737 1,55,14,70,890
SCHEDULE “D”UNSECURED LOANS
Inter Corporate Loans - 49,78,45,610
TOTAL - 49,78,45,610
Rs. Rs. Rs.SCHEDULE “B” (Contd.)
RESERVES & SURPLUS
SCHEDULE “E”
FIXED ASSETS
(Amount in Rupees)
GROSS BLOCK [AT COST] DEPRECIATION NET BLOCK
Description As at Additions Deductions As at Upto For the Deductions Upto As at As at1.04.2008 during during 31.03.2009 1.04.2008 year during 31.03.2009 31.03.2009 31.03.2008
the year the year the year
Freehold Land 1,06,69,783* - - 1,06,69,783 - - - - 1,06,69,783 1,06,69,783
Right on Leasehold Land 6,97,61,432* - - 6,97,61,432 46,17,171 42,359@ - 46,59,530 6,51,01,902 6,51,44,261
Buildings 1,36,70,07,750* 28,76,55,488 - 1,65,46,63,238 28,91,53,918 6,02,13,066 - 34,93,66,984 1,30,52,96,254 1,07,78,53,832
Plant and Machinery 5,09,40,538* 4,01,68,205 1,60,530 9,09,48,213 2,02,88,458 65,40,331 - 2,68,28,789 6,41,19,424 3,06,52,080
Motor car , Lorries & Vehicles 3,28,64,228 - 24,87,984 3,03,76,244 1,54,90,598 44,75,780 23,31,866 1,76,34,512 1,27,41,732 1,73,73,630
Office Furniture & Equiptment 9,82,20,245 4,27,96,120 - 14,10,16,365 3,48,56,115 1,33,85,270 - 4,82,41,385 9,27,74,980 6,33,64,130
Total 1,62,94,63,976 37,06,19,813 26,48,514 1,99,74,35,275 36,44,06,260 8,46,56,807 23,31,866 44,67,31,199 1,55,07,04,075 1,26,50,57,716
Previous Year 1,57,45,96,517 9,77,91,662 4,29,24,203 1,62,94,63,976 32,27,98,858 7,35,57,933 3,19,50,531 36,44,06,260 1,26,50,57,716 1,57,06,60,830
Capital Work in Progress 3,16,09,86,412 1,78,16,91,793
Notes : 1) * Amount added on Revaluation ( as at 31.03.1985) Rs.18,48,43,610/- (Net of Depreciation). Refer to Note No. B-2 of Schedule “T”.2) @ Represents write off on the basis of the period of the lease.3) Lease Hold Land
a) Includes land leased for period of 999 years as from 1951 renewal at the option for further like period.b) Includes Rs.2,66,38,617/- (as revalued) leased in perpetuity against which there is no writeoff required.
4) Capital Work in Progress includes pre-operative expenses of Rs. 48,76,70,689/- (P. Y. Rs. 29,19,82,057/-). Refer to Note No. 18 of Schedule “T”.

42
Rs. Rs. Rs.SCHEDULE “F”INVESTMENTSA. LONG TERM - TRADE
1. INVESTMENT IN GOVERNMENTSECURITIES : (Unquoted)3% Conversion Loan deposited with the Collector of Central 13,734 13,734Excise (Matured but not encashed.) Face Value Rs. 21,500/-12 years National Savings Certificates 12,050 12,050(Deposited with State Government and Excise authorities as security)
6 years- National Savings Certificates VIII Issue 5,000 5,000(Deposited with State Government and other authorities as security)
7 years - National Savings Certificates 5,160 5,160(Deposited with State Government and other authorities as security)
6 years - National Savings Certificates - 40,000
35,944 75,944
2. INVESTMENT IN COMPANIES : (Unquoted)(Equity Shares of face value of Rs. 10/- each fully paid-up)5,000 (P.Y. 5,000) - Bartraya Mall Dev. Co. Pvt. Ltd 50,000 50,000- (P.Y. 10,000) - Bhopal Entertainment World Dev. Pvt. Ltd - 1,00,00020,00,000 (P.Y. 20,00,000) - Classic Mall Development Pvt. Ltd. 21,32,37,771 21,32,37,77110,010 (P.Y. 10,010) - Classic Software Tech & ITPark Pvt. Ltd. 1,28,892 1,28,89251,48,298 (P. Y. 51,48,298) - Entertainment World Dev. Pvt. Ltd. 45,01,24,554 45,01,24,55425,000 (P.Y. 25,000) - Escort Developers Pvt. Ltd. 1,59,50,000 1,59,50,0006,667 (P.Y. 6,667) - Island Star Mall Developers Pvt. Ltd. 69,069 69,0694,500 (P.Y. 4,500) - Juniper Developers Pvt. Ltd. 46,620 46,62072,65,080 (P.Y. 72,65,080) - Offbeat Developers Pvt. Ltd.* 24,70,37,912 24,70,37,9121,66,670 (P. Y. Nil) - Picasso Developers Pvt. Ltd. 2,00,00,400 -3,33,333 (P.Y. 3,33,333) - Ramayana Merchants Pvt. Ltd. 4,41,86,012 4,41,86,01210 (P.Y. Nil) - Treasure World Developers (India) Pvt. Ltd. 8,500 -
99,08,39,730 97,09,30,830(Preference Shares of Rs. 10/- each fully paid-up)53,45,833 (P.Y. 53,45,833) - Island Star Mall Developers Pvt. Ltd. 5,53,82,361 5,53,82,361(Compulsorily Fully Convertible Debentures ofRs. 10/- each fully paid-up)10,00,00,000 (P.Y. Nil) - Treasure World Developers(India) Pvt. Ltd. 1,00,00,00,000 -
2,04,62,22,091 1,02,63,13,1913. INVESTMENT IN THE CAPITAL OF
PARTNERSHIP FIRMPhoenix Construction Company 1,99,59,173 3,09,13,186
4. OTHER INVESTMENTS (Unquoted)10 (P. Y. 10) ordinary shares of Rs. 50/-each -fullypaid of Sukhsagar Premises Co-op. Society Ltd. 500 5005 (P. Y. 5) ordinary shares of Rs. 50/-each -fullypaid of Vivina Co-op. Housing Society Ltd. 250 25080 (P. Y. 80) ordinary shares of Rs. 25/- each -fullypaid of Rashtriya Mazdoor Madhyavarti Sahakari 2,000 2,000Grahak Sangh (Maryadit)
2,750 2,750
Schedules Annexed to and forming part of the Balance Sheet
As at As at31st March 2009 31st March 2008
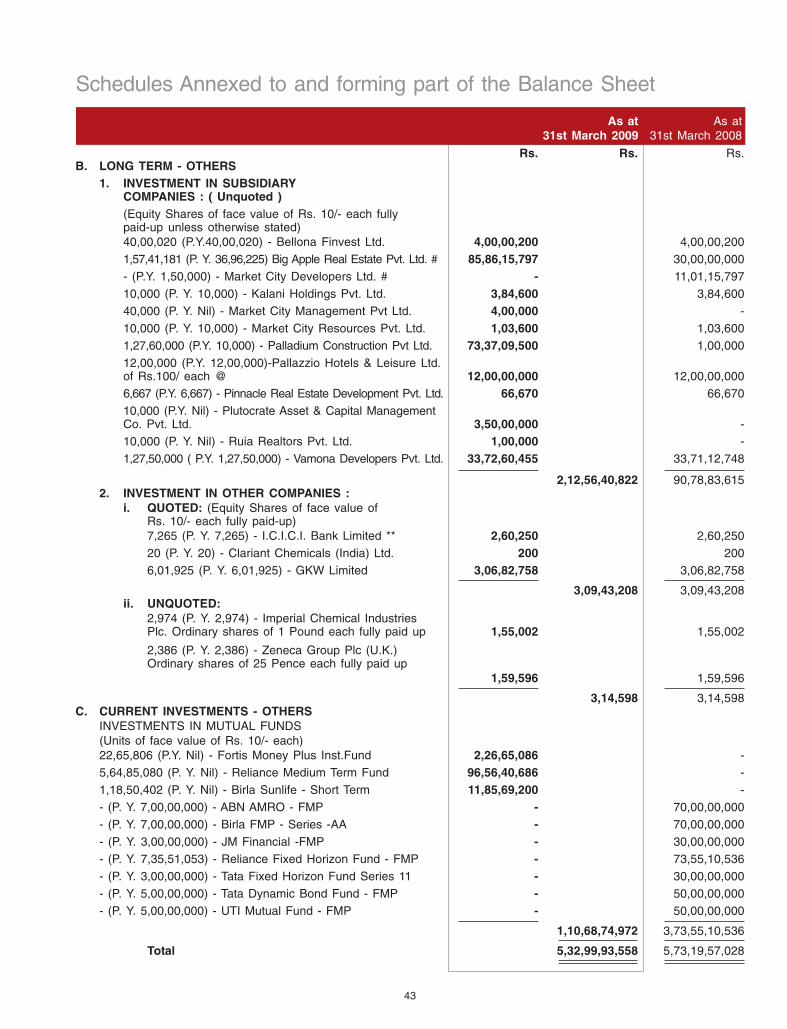
43
Rs. Rs. Rs.B. LONG TERM - OTHERS
1. INVESTMENT IN SUBSIDIARYCOMPANIES : ( Unquoted )(Equity Shares of face value of Rs. 10/- each fullypaid-up unless otherwise stated)40,00,020 (P.Y.40,00,020) - Bellona Finvest Ltd. 4,00,00,200 4,00,00,2001,57,41,181 (P. Y. 36,96,225) Big Apple Real Estate Pvt. Ltd. # 85,86,15,797 30,00,00,000
- (P.Y. 1,50,000) - Market City Developers Ltd. # - 11,01,15,797
10,000 (P. Y. 10,000) - Kalani Holdings Pvt. Ltd. 3,84,600 3,84,60040,000 (P. Y. Nil) - Market City Management Pvt Ltd. 4,00,000 -
10,000 (P. Y. 10,000) - Market City Resources Pvt. Ltd. 1,03,600 1,03,6001,27,60,000 (P.Y. 10,000) - Palladium Construction Pvt Ltd. 73,37,09,500 1,00,000
12,00,000 (P.Y. 12,00,000)-Pallazzio Hotels & Leisure Ltd.of Rs.100/ each @ 12,00,00,000 12,00,00,0006,667 (P.Y. 6,667) - Pinnacle Real Estate Development Pvt. Ltd. 66,670 66,670
10,000 (P.Y. Nil) - Plutocrate Asset & Capital ManagementCo. Pvt. Ltd. 3,50,00,000 -10,000 (P. Y. Nil) - Ruia Realtors Pvt. Ltd. 1,00,000 -
1,27,50,000 ( P.Y. 1,27,50,000) - Vamona Developers Pvt. Ltd. 33,72,60,455 33,71,12,748
2,12,56,40,822 90,78,83,6152. INVESTMENT IN OTHER COMPANIES :
i. QUOTED: (Equity Shares of face value ofRs. 10/- each fully paid-up)7,265 (P. Y. 7,265) - I.C.I.C.I. Bank Limited ** 2,60,250 2,60,250
20 (P. Y. 20) - Clariant Chemicals (India) Ltd. 200 2006,01,925 (P. Y. 6,01,925) - GKW Limited 3,06,82,758 3,06,82,758
3,09,43,208 3,09,43,208ii. UNQUOTED:
2,974 (P. Y. 2,974) - Imperial Chemical IndustriesPlc. Ordinary shares of 1 Pound each fully paid up 1,55,002 1,55,002
2,386 (P. Y. 2,386) - Zeneca Group Plc (U.K.)Ordinary shares of 25 Pence each fully paid up
1,59,596 1,59,596
3,14,598 3,14,598C. CURRENT INVESTMENTS - OTHERS
INVESTMENTS IN MUTUAL FUNDS(Units of face value of Rs. 10/- each)22,65,806 (P.Y. Nil) - Fortis Money Plus Inst.Fund 2,26,65,086 -5,64,85,080 (P. Y. Nil) - Reliance Medium Term Fund 96,56,40,686 -
1,18,50,402 (P. Y. Nil) - Birla Sunlife - Short Term 11,85,69,200 -
- (P. Y. 7,00,00,000) - ABN AMRO - FMP - 70,00,00,000- (P. Y. 7,00,00,000) - Birla FMP - Series -AA - 70,00,00,000
- (P. Y. 3,00,00,000) - JM Financial -FMP - 30,00,00,000- (P. Y. 7,35,51,053) - Reliance Fixed Horizon Fund - FMP - 73,55,10,536
- (P. Y. 3,00,00,000) - Tata Fixed Horizon Fund Series 11 - 30,00,00,000
- (P. Y. 5,00,00,000) - Tata Dynamic Bond Fund - FMP - 50,00,00,000- (P. Y. 5,00,00,000) - UTI Mutual Fund - FMP - 50,00,00,000
1,10,68,74,972 3,73,55,10,536
Total 5,32,99,93,558 5,73,19,57,028
Schedules Annexed to and forming part of the Balance Sheet
As at As at31st March 2009 31st March 2008

44
Schedules Annexed to and forming part of the Balance Sheet
As at As at31st March 2009 31st March 2008
1. Aggregate value of Quoted Investments:Book Value 3,09,43,208 3,09,43,208Market Value 1,90,33,405 6,44,98,015
2. Aggregate value of Investment in Mutual Funds:Book Value 1,10,68,74,972 3,73,55,10,536Net Asset Value 1,10,68,74,972 3,94,25,29,970
3. Aggregate book value of other Unquoted Investments: 4,19,21,75,378 1,96,55,03,284
Notes :* Investment in the Companies under the same management.** Out of 7,265 shares, 1,995 shares are held by a Bank in their
name as security@ 6,12,000 Shares are pledged with the Financial Institutions
for the Loans borrowed by a subsidiary company.# Pursuant to the scheme of amalgamation of Market City
Developers Limited (MCDL) with Big Apple Real Estate PrivateLimited [BAREPL] from appointed date of 1st April 2008, theCompany is entitled to 65,19,100 equity shares of BAREPL inlieu of 1,50,000 equity share of MCDL. The said shares areyet to be issued. Pursuant to the said merger BAREPL hasbecome a subsidiary of the Company.
Rs. Rs.
No. of Units Cost Rupees
Investment purchased and sold during the year :Mutual Fund unitsFortis Money Plus Institutional Fund 4,24,86,829 42,61,85,382Birla Sunlife Short Term Fund 2,19,87,907 22,10,88,401LIC MF Liquid Fund - Dividend Plan 6,55,98,306 72,02,75,963Reliance Medium Term Fund 1,46,23,731 25,00,00,000Tata Floater Fund -Daily Dividend 4,79,32,750 50,39,17,005UTI Money Market Fund-Daily Dividend Option 3,03,54,056 5,49,014,260
Rs. Rs. Rs.SCHEDULE “G”INVENTORIESAs taken, valued & certified by the managementStock in Trade 32,98,400 27,03,688
TOTAL 32,98,400 27,03,688
SCHEDULE “H”SUNDRY DEBTORSUNSECURED (considered good unless otherwise stated)
Debts outstanding for a period exceeding six monthsConsidered Good 13,88,61,791 2,34,45,548Considered Doubtful 73,32,883 73,32,883
14,61,94,674 3,07,78,431Less: Provision for Doubtful Debts 73,32,883 73,32,883
13,88,61,791 2,34,45,548Other Debts 19,34,89,549 17,54,52,217
TOTAL 33,23,51,340 19,88,97,765
Debtors include Rs. 1,50,69,231 (Previous year: Rs. 98,57,162) fromprivate limited companies in which a director is a director/member.
As at As at31st March 2009 31st March 2008

45
Rs. Rs. Rs.SCHEDULE “I”CASH AND BANK BALANCESCash on hand 17,02,670 17,46,087Balances with Scheduled Banks:
In Current Accounts 26,95,078 1,35,46,353In Fixed Deposit Accounts 1,53,41,80,417 15,00,448[Deposit receipt of Rs.14,88,448 (Previous year : 14,88,448)pledged as security]In Dividend Accounts 54,10,286 32,63,743
TOTAL 1,54,39,88,451 2,00,56,631
SCHEDULE “J”LOANS AND ADVANCES
Unsecured (considered good unless otherwise stated)Loans to Subsidiaries 2,09,02,97,670 3,48,25,67,618Advances recoverable in cash or in kind or for valueto be received 42,31,43,920 52,13,75,807Less : Provision for Doubtful Advances - 21,32,000
42,31,43,920 51,92,43,807Inter Corporate Deposits 22,92,80,943 28,99,15,493Share Application Money pending allotment 2,63,36,50,215 3,58,29,39,877Other Deposits 47,29,62,381 47,64,14,983
TOTAL 5,84,93,35,129 8,35,10,81,778
Advances include Rs. 41,94,33,719/-(Previous year: Rs. 40,76,54,004/-) from privatelimited companies in which a director is a director/member.
SCHEDULE “K”CURRENT LIABILITIES
Sundry CreditorsMSME - -Others 25,64,12,122 16,01,73,644
Security Deposits from Occupants/Licencees 52,53,19,505 40,16,37,269Unpaid Dividends 54,10,286 32,63,743Other Liabilities 12,27,25,950 14,69,94,264
TOTAL 90,98,67,863 71,20,68,920
SCHEDULE “L”PROVISIONSGratuity 59,78,871 28,82,953Leave encashment 86,70,821 40,50,329Taxation (including Fringe Benefit Tax) (net of advances) 3,96,62,381 3,71,33,917Proposed Dividend 14,48,45,447 14,48,45,447Tax on Proposed Dividend 2,46,16,484 2,46,16,484
TOTAL 22,37,74,004 21,35,29,130
SCHEDULE “M”MISCELLANEOUS EXPENDITURE(To the extent not written off / remaining unadjusted )
Expenses on increase in Share CapitalBalance as per last Balance Sheet - 5,05,800Less: Adjusted against Securities Premium Account - 5,05,800
TOTAL - -
Schedules Annexed to and forming part of the Balance Sheet
As at As at31st March 2009 31st March 2008

46
Schedules Annexed to and forming part of Profit and Loss Account
2008-09 2007-08
Rs. Rs. Rs.SCHEDULE “N”
SALES & SERVICES
Sales 83,50,865 95,02,983
License Fees and Rental Income 57,25,87,976 50,47,05,878
Service Charges 31,21,98,241 24,87,43,415
Income from Events 83,57,858 1,63,31,577
Sale of Land Development Rights - 1,25,65,60,000
TOTAL 90,14,94,940 2,03,58,43,853
SCHEDULE “O”
OTHER INCOME
Dividend Income
Current (other than trade) 6,11,35,083 17,46,92,872
Long Term (other than trade) 2,99,951 20,24,074
6,14,35,034 17,67,16,946
Profit on sale of current Investments 31,48,49,139 3,82,12,859
Share of Profit from Partnership Firm in which Companyis a partner 2,46,34,912 47,20,941
(Refer to Note B-5 of Schedule”T”)
Interest 9,78,83,503 1,94,37,981
(TDS Rs. 2,20,94,793 Previous year Rs. 38,86,759)
Miscellaneous Receipts 37,165 9,91,250
TOTAL 49,88,39,753 24,00,79,977
SCHEDULE “P”
PURCHASE FOR RESALE AND VARIATION IN INVENTORY
Purchase for resale 66,98,169 66,52,950
Variation in Inventory
Stocks at commencement 27,03,688 30,92,462
Stocks at close 32,98,400 27,03,688
Net (Increase)/Decrease (5,94,712) 3,88,774
TOTAL 61,03,457 70,41,724

47
Rs. Rs. Rs.SCHEDULE “Q”
EMPLOYEE COSTS
Salaries, Wages & Bonus 3,00,26,346 2,92,35,405
Gratuity and Leave encashment 90,58,896 7,02,829
Contribution to Provident Fund & Other Funds 13,67,576 7,64,387
Staff Welfare Expenses 25,84,563 34,82,205
TOTAL 4,30,37,381 3,41,84,826
SCHEDULE “R”
OPERATION AND OTHER EXPENSES
Electricity (Net) 2,84,42,111 4,86,80,870
Repairs and Maintenance:-
Buildings 14,22,787 5,67,122
Machinery & Vehicles 57,71,550 23,42,121
Others 1,08,86,611 35,66,868
1,80,80,948 64,76,111Insurance 25,74,097 14,54,437
Rent 55,33,436 53,88,556
Rates & Taxes 2,75,72,546 2,91,91,373
Water Charges 1,22,40,589 1,41,93,731
Legal and Professional charges 4,28,91,270 4,09,85,363
Travelling Expenses 76,95,626 1,30,72,967
Auditors’ Remuneration 31,67,000 30,25,000
Directors’ Remuneration and sitting fees 1,18,60,838 65,17,649
Donation 3,11,817 3,32,807
Loss on Assets discarded/sold 58,342 1,09,35,242
Prior Period Expenses 53,397 2,90,141
Advertisement & Sales Promotion 4,49,51,731 2,02,55,679
Bad debts & Sundry balances written off 75,91,086 27,75,558
Provision for Doubtful Debts & Advances/(written back) (21,32,000) 54,59,086 86,815
Bank charges 5,75,288 57,21,138
Security Charges 1,64,76,289 1,13,88,301
Other Miscellaneous Expenses 2,23,52,092 2,27,10,681
TOTAL 25,02,96,503 24,34,82,419
SCHEDULE “S”
INTEREST AND FINANCE CHARGES
Interest on fixed loans 1,70,31,658 4,01,51,705
Interest on other loans 3,24,47,041 16,56,754
TOTAL 4,94,78,699 4,18,08,459
Schedules Annexed to and forming part of Profit and Loss Account
2008-09 2007-08

48
SCHEDULE “T”
SIGNIFICANT ACCOUNTING POLICIES AND NOTES ON ACCOUNTS FORMING PART OF THE BALANCE SHEET ASAT 31st MARCH, 2009 AND THE PROFIT AND LOSS ACCOUNT FOR THE YEAR ENDED ON THAT DATE
A. SIGNIFICANT ACCOUNTING POLICIES
a) Basis of preparation of financial statements:
The financial statements are prepared under the historical cost convention, except for certain fixed assets whichare revalued, in accordance with the generally accepted accounting principles in India and the provisions of theCompanies Act, 1956.
b) Use of estimates:
The preparation of financial statements requires estimates and assumptions to be made that affect the reportedamount of assets and liabilities on the date of the financial statements and the reported amount of revenues andexpenses for the reporting period. The difference between the actual results and estimates are recognised in theperiod in which the results are known/materialised.
c) Fixed Assets:
i) Fixed Assets are stated at cost net of CENVAT credit and include amounts added on revaluation, lessaccumulated depreciation and impairment loss, if any.
ii) Expenditure incurred on construction/erection of assets, which are incomplete as at balance sheet date, areincluded in Capital Work in Progress.
d) Depreciation:
i) Leasehold land is amortized over the period of lease.
ii) Depreciation on plant and machinery is provided on straight line method at the rates and in the mannerspecified in Schedule XIV to the Companies Act, 1956
iii) Depreciation on other fixed assets (excluding land and lease land in perpetuity) is provided on written downvalue method at the rates and in the manner specified in schedule XIV to the Companies Act, 1956
iv) In respect of certain revalued assets, (land, buildings and plant & machinery) depreciation has been calculatedon the revalued figures as per the rates and in the manner specified by the valuers in their Revaluation Report.The difference between the depreciation so computed and that computed as per (i), (ii) and (iii) above hasbeen charged to the Revaluation Reserve.
e) Impairment of Assets:
In accordance with AS 28 on “Impairment of Assets” as notified by the Companies (Accounting Standards) Rules,2006, where there is any indication of impairment of the Company’s assets related to cash generating units, thecarrying amounts of such assets are reviewed at each Balance Sheet date to determine whether there is anyimpairment. The recoverable amount of such assets is estimated as the higher of its net selling price and its valuein use. An impairment loss is recognised whenever the carrying amount of such assets exceeds its recoverableamount. Impairment Loss, if any, is recognised in the Profit and Loss Account.
f) Investments:
Long term investments are valued at cost of acquisition less diminution if any, of a permanent nature. CurrentInvestments are stated at cost or market/fair value whichever is lower.
g) Inventories:
Inventories are valued at lower of cost or net realisabile value. Cost is determined on FIFO basis.
h) Borrowing Costs:
Borrowing costs that are attributable to the acquisition or construction of qualifying assets are capitalised as part ofthe cost of such assets. A qualifying asset is an asset that necessarily takes a substantial period of time to getready for its intended use or sale. All other borrowing costs are recognised as an expense in the period in whichthey are incurred.
SCHEDULE ANNEXED TO AND FORMING PART OF THE BALANCE SHEET AND PROFIT AND LOSS ACCOUNT

49
SCHEDULE ANNEXED TO AND FORMING PART OF THE BALANCE SHEET AND PROFIT AND LOSS ACCOUNT
i) Revenue recognition:
Revenue is recognised when it is earned and no significant uncertainty exists as to its realisation or collection.License fees, Rental income and Service charges are recognised based on contractual rights. Interest is recognisedon time proportion basis. Dividend income is recognised when the right to receive the same is established.
j) Employee Benefits:
i) Short term employee benefits are recognised as expenses at the undiscounted amounts in the profit & lossaccount of the year in which the related service is rendered.
ii) Post employment and other long term employee benefits are recognised as an expense in the Profit & LossAccount for the year in which the employee has rendered services. The expenses are recognised at thepresent value of the amounts payable determined using actuarial valuation techniques. Actuarial gains andlosses in respect of post employment and other long term benefits are charged to the Profit & Loss Account.
k) Foreign Currency transactions:
i) Transactions denominated in foreign currencies are recorded at the exchange rate prevailing at the time of thetransaction.
ii) Exchange differences arising as a result of the subsequent settlements of transactions are recognised asincome or expense in the profit and loss account.
l) Share issue expenses:
Expenses in connection with issue of shares are adjusted against Securities Premium Account.
m) Taxes on Income:
i) Provision for income tax (current tax) is determined on the basis of the taxable income of the current year inaccordance with the Income Tax Act, 1961.
ii) Deferred tax is recognised in respect of Deferred Tax Assets (subject to the consideration of prudence) andDeferred Tax Liabilities on timing differences, being the difference between taxable income and accountingincome that originate in one year and are capable of reversal in one or more subsequent years.
iii) Provision for Fringe Benefit Tax is determined on the basis of the value of the taxable Fringe Benefits conferredby the Company during the year.
n) Provisions, Contingent Liabilities and Contingent Assets:
Provisions involving substantial degree of estimation in measurement are recognised when there is a presentobligation as a result of past events and it is probable that there will be an outflow of resources. ContingentLiabilities are not recognised but are disclosed in the Notes on Accounts. Contingent Assets are neither recognisednor disclosed in the financial statements.
B. NOTES ON ACCOUNTS: -
1. CONTINGENT LIABILITIES NOT PROVIDED FOR IN RESPECT OF:-
i) Disputed excise duty liability amounting Rs.1,13,76,598/- (P.Y. Rs. 1,13,76,598/- )
ii) Other claims against the Company amounting to Rs. 43,02,309/- not acknowledged as debts.(P.Y. Rs. 43,02,309/-)
iii) Corporate guarantee issued by the Company amounting to Rs. 50,00,00,000 (P.Y. Rs. Nil ) to secure financialassistance being availed by a subsidiary company.
iv) Outstanding guarantees given by Banks Rs. 26,79,969/- (Previous year Rs. 80,00,000/-).
v) Estimated amount of contracts remaining to be executed on capital account and not provided for in theaccounts is Rs. 51,69,20,853/- (P.Y. Rs. 28,05,23,397/- ) net of advance paid.
vi) Demand notices received for damages / interest on account of arrears / late payments of Provident Fund andE.S.I.C dues amounting to Rs. 31,48,254/- are disputed by the Company. The Company has paid Rs. 10,00,000/-against P.F. damages to the P.F. authorities and has also furnished a Bank Guarantee for Rs. 14,71,165/-.
In respect of the demands for additional contribution (excluding interest, damages etc.) amounting to Rs.26,226 towards E.S.I.C. dues, the E.S.I.C court has confirmed the said liability of the Company, which hassince been unpaid.
SCHEDULE “T” : (Continued)

50
SCHEDULE ANNEXED TO AND FORMING PART OF THE BALANCE SHEET AND PROFIT AND LOSS ACCOUNT
vii) The Income tax assessments of the Company have been completed up to Assessment Year 2005-06. However,the company as well as the Income Tax Department are in appeal before the Appellate Authorities against theassessments of earlier Financial Years. The impact thereof, if any, on the tax position can be ascertained onlyafter the disposal of the above appeals. Accordingly, the accounting entries arising therefrom will be passed inthe year of the disposal of the said appeals.
2. Based on the valuation reports of the Government approved valuers, the Company had revalued its assetsconsisting of Land including Leasehold Land and Land leased in perpetuity, Buildings and Plants and Machinery ason 31st March 1985. Depreciation on revalued Land, Building and Plant and Machinery has been calculated as perthe rates specified by the valuers, which includes an additional charge amounting to Rs. 9,41,989 (P.Y. Rs.9,30,698 ) in comparison to depreciation provided under the Companies Act, 1956, and an equivalent amount hasbeen withdrawn from Revaluation Reserve and credited to Profit and Loss Account.
3. The High Court of Judicature at Mumbai in the writ petition filed by Retailers Association of India has passed aninterim order dated 30th July, 2008, staying the collection of service tax on rental of immovable property from themembers of the association. The company has, however, based on the legal advice continued to levy the servicetax on the license/conducting fees/common area maintenance charges and has accounted the correspondingservice tax liability. Based on the aforesaid interim order, the association members have not paid the service taxcomponent billed to them and the Company has also not deposited the said Service Tax amount.
The Balances of the sundry debtors [licensees] are subject to confirmations from the respective parties and arepending reconciliations/adjustments arising on account of the Service Tax billed.
4. The balances in respect of sundry creditors, loans and advances, deposits and fixed deposits pledged with exciseauthorities, either debit or credit as appearing in the books of accounts have been substantially confirmed by therespective parties.
5. The Company is a partner in a partnership firm M/s. Phoenix Construction Company. The accounts of the partnershipfirm have been finalised upto the financial year 2007-2008. The details of the Capital Accounts of the Partners asper the latest Financial Statements of the firm are as under:-
Sr. Profit Total Capital onNo. Name of the Partners Sharing ratio
31/03/2008 31/03/2007Rs. Rs.
1. The Phoenix Mills Ltd. 50% 6,52,51,828 2,81,16,915
2. Gold Seal Holding Pvt.Ltd. 50% 6,67,44,642 4,21,09,729
The Company has accounted for its share of profit amounting to Rs. 2,46,34,912/- pertaining to the financial year2007-2008 in the current year. The share of profit/loss for the current financial year will be accounted in the booksof the Company on the finalisation of the accounts of the firm.
6. Disclosure as per Accounting Standard 15 (Revised) “Employee Benefits” as notified by the Companies (AccountingStandards) Rules, 2006.
(a) Defined Contribution Plan, recognised as expenses for the year are as under :
Employer’s Contribution to Provident and Pension Fund Rs. 11,20,228/-.
The Company makes contributions towards provident fund and pension fund for qualifying employees to theRegional Provident Fund Commissioner.
(b) Defined Benefit Plan:
The Company provides gratuity benefit to it’s employees which is a defined benefit plan. The present value ofobligation is determined based on actuarial valuation using the Projected Unit Credit Method, which recognizeseach period of service as giving rise to additional unit of employee benefit entitlement and measures each unitseparately to build up the final obligation. The obligation for leave encashment is recognised in the samemanner as gratuity.
SCHEDULE “T” : (Continued)

51
SCHEDULE ANNEXED TO AND FORMING PART OF THE BALANCE SHEET AND PROFIT AND LOSS ACCOUNT
2008-09 2007-08
Leave LeaveGratuity Encashment Gratuity Encashment
(Unfunded) (Unfunded) (Unfunded) (Unfunded)Rs. Rs. Rs. Rs.
a) Change in Present Value of Obligation
Present value of the obligation at thebeginning of the year 28,82,953 40,50,329 55,71,700 34,67,980
Current Service Cost 7,49,790 10,75,811 4,99,406 27,56,263
Interest Cost 2,30,636 3,24,026 4,45,736 2,77,438
Actuarial (Gain) / Loss on Obligation 26,59,994 40,06,054 (17,25,965) (15,16,183)
Benefits Paid (5,44,502) (7,85,399) (19,07,924) (9,35,169)
Present value of the obligation at the endof the year 59,78,871 86,70,821 28,82,953 40,50,329
b) Amounts Recognised in theBalance Sheet:
Present value of Obligation at the endof the year 59,78,871 86,70,821 28,82,953 40,50,329
Fair value of Plan Assets at the endof the year - - - -
Net Obligation at the end of the year 59,78,871 86,70,821 28,82,953 40,50,329
c) Amounts Recognised in the statementof Profit and Loss:
Current Service Cost 7,49,790 10,75,811 4,99,406 27,56,263
Interest cost on Obligation 2,30,636 3,24,026 4,45,736 2,77,438
Expected return on Plan Assets - - - -
Net Actuarial (Gain) / Loss recognisedin the year 26,59,994 40,06,054 (17,25,965) (15,16,183)
Net Cost Included in Personnel Expenses 36,40,420 54,05,891 (7,80,823) 15,17,518
d) Actuarial Assumptions
i) Discount Rate 8% P.A. 8% P.A. 8% P.A. 8% P.A.
ii) Expected Rate of Return onPlan Assets - - - -
iii) Salary Escalation Rate 6% P.A. 6% P.A. 6% P.A. 6% P.A.
iv) Mortality L.I.C 1994-96 L.I.C 1994-96 L.I.C 1994-96 L.I.C 1994-96ULTIMATE ULTIMATE ULTIMATE ULTIMATE
The estimates of rate of escalation in salary considered in actuarial valuation, take into account inflation, seniority,promotion and other relevant factors including supply and demand in the employment market. The above informationis certified by the Actuary.
SCHEDULE “T” : (Continued)

52
SCHEDULE ANNEXED TO AND FORMING PART OF THE BALANCE SHEET AND PROFIT AND LOSS ACCOUNT
SCHEDULE “T” : (Continued)
7. The Auditors’ Remuneration includes:
2008-09 2007-08Particulars (Rs.) (Rs.)
Audit fees 25,00,000 25,00,000
Tax Audit fees 5,00,000 5,00,000
Certification and other fees 1,67,000 5,25,000
Service Tax 3,91,441 4,35,690
Total 35,58,441 39,60,690
8. a) The following amounts have been paid / are payable as remuneration to the Directors (including managingDirectors) for services rendered by them: -
2008-09 2007-08Particulars (Rs.) (Rs.)
Salary 1,13,10,742 37,46,320
House Rent Allowance 70,194 18,79,200
Other Perquistes/Reimbursements 2,57,402 5,29,629
Total 1,16,38,338 61,55,149
b) Computation of Net Profit in accordance with Section 198 of the Companies Act, 1956 for the calculation of theRemuneration payable to the Directors:
Profit before tax as per Profit & Loss Account 96,77,03,835
Add : Managerial Remuneration 1,16,38,338
Directors’ fees 2,22,500
Prior period expenses 53,397
Loss on assets sold/discarded 58,342
Depreciation 8,37,14,818 9,56,87,395
106,33,91,230
Less : Profit on sale of investments 31,48,49,139
Depreciation as per section 350 8,46,56,807 39,95,05,946
Net profit in accordance with Section 198 of the Companies Act, 1956 66,38,85,284
11% of the Net profit as computed above: 7,30,27,381
9. Out of the total Rs. 980 Crores raised through Qualified Institutional Placements (QIP), Rs. 827.89 Crores havebeen spent towards projects, repayment of bank loans and QIP related expenses. The balance Rs.152.11 Croresare invested in mutual funds, bank deposits and inter corporate deposits.
10. There are no Micro, Small and Medium Enterprises, to whom the Company owes dues, which are outstanding formore than 45 days as at March 31, 2009. The above information, regarding Micro, Small and Medium enterpriseshas been determined to the extent such parties have been identified on the basis of the information available withthe Company. This has been relied upon by the Auditors.

53
SCHEDULE ANNEXED TO AND FORMING PART OF THE BALANCE SHEET AND PROFIT AND LOSS ACCOUNT
SCHEDULE “T” : (Continued)
11 The disclosure in respect of Segment information as per Accounting Standard : AS 17 on “Segment Reporting”notified by the Companies (Accounting Standards) Rules, 2006 is as under:
[Rs. in Thousand]PRIMARY SEGMENTS - Business Segments
Sr. Particulars Property & Textile / Cloth Unallocated TotalNo. Related Services Trading
A REVENUE1 Income from Operations & Sales 8,93,144 8,351 9,01,495
(7,33,039) (9,503) (7,42,542)2 Sale of Land Development Rights - - - -
(12,56,560) - - (12,56,560)3 Other Income 4,98,840 4,98,840
(2,40,080) (2,40,080)
TOTAL 14,00,335(22,39,182)
B RESULTS1 Profit Before Tax & Interest 5,16,273 2,071 4,98,840 10,17,184
(16,76,223) (2,284) (2,40,080) (19,18,587)2 Less: Interest 49,479 49,479
(41,808) (41,808)3 Profit Before Tax 9,67,705
(18,76,779)4 Less : Provision for Taxation 1,85,539
(1,90,256)
5 NET PROFIT AFTER TAX 7,82,166(16,86,523)
C OTHER INFORMATION1 Segment Assets 56,20,999 3,690 1,21,45,968 1,77,70,657
(37,52,388) (3,085) (1,35,95,973) (1,73,51,446)2 Deferred Tax Assets / Liabilities (Net) 12,560 12,560
(9,699) (9,699)
3 Total Assets 1,77,83,217(1,73,61,145)
4 Segment Liabilities 9,17,830 1,277 1,866,118 27,85,225(7,15,453) (285) (22,59,176) (29,74,914)
5 Capital Expenditure 17,49,598 - 17,49,598(9,09,844) - (9,09,844)
6 Depreciation 83,715 - 83,715(72,627) - (72,627)
7 Non Cash Expenses other than Depreciation
a) Provision for Doubtful Debtors 2,132and Advances (87)
b) Bad Debts & balances written off 7,591(2,776)
Notes:i The Company has disclosed Business Segment as the primary Segment. In the opinion of the Management,
the Company is organised into two main business segments namely, Property & Related Services andTextile / Cloth Trading. These segments have been identified in line with AS-17 on segment reporting.
ii The activities of the Company being carried on totally within India, the information about Secondary Segment(Geographic Segments) is not required to be given.
iii Segment Revenue, results and other information includes the respective amounts identifiable to each of thesegments as also amounts allocated on a reasonable basis. The items/information which relate to the Companyas a whole and cannot be directly identified with any particular business segment have been shown separately.

54
SCHEDULE ANNEXED TO AND FORMING PART OF THE BALANCE SHEET AND PROFIT AND LOSS ACCOUNT
SCHEDULE “T” : (Continued)
12 In view of the Accounting Standard : AS 18 on Related Parties Disclosures as notified by the Companies (AccountingStandards) Rules 2006, the disclosure in respect of related party transactions for the year ended on31st March, 2009 is as under.
a) RELATIONSHIPS
Category I : Subsidiaries of the CompanyBlackwood Developers Private Limited ( w.e.f. 5th March, 2009)Bellona Finvest LimitedBig Apple Real Estate Private Limited ( w.e.f. 1st April, 2008)Gangetic Developers Private Limited ( w.e.f. 1st April, 2008)Kalani Holdings Private LimitedMarket City Developers Private LimitedMarket City Management Private Limited ( w.e.f. 18th July, 2008)Marketcity Resources Private LimitedPalladium Constructions Private LimitedPallazzio Hotels and Leisure LimitedPinnacle Real Estate Development Private LimitedPlutocrate Capital and Asset Management Private Limited ( w.e.f. 15th July, 2008)Ruia Realtors Private LimitedUpal Developers Private Limited ( w.e.f. 1st April, 2008)Vamona Developers Private Limited
Category II : Associates of the CompanyBartraya Mall Development Company Private LimitedClassic Software Tech & IT Park Private LimitedClassic Mall Development Private LimitedEntertainment World Developers Private LimitedEscort Developers Private LimitedIsland Star Mall Developers Private LimitedJuniper Developers Private LimitedOffbeat Developers Private LimitedPicasso Developers Private LimitedRamayana Merchants Private Limited
Category III : Other related parties where common control exists.B.R.InternationalAshok Apparels Private LimitedR.R.Hosiery Private LimitedR.R. HosieryR.R. TextilesPhoenix Construction CompanyGalaxy Entertainment Corporation LimitedPhoenix Hospitality Company Private LimitedRuia International Holding Company Private Limited
Category IV : Key Management PersonnelAshokkumar R. Ruia Chairman & Managing DirectorAtul Ruia Jt. Managing DirectorPramod S. Rawool Whole-time DirectorKiran B. Gandhi Whole-time Director
Category V : Relatives of Key Management PersonnelAmla A. RuiaGayatri A. RuiaAtul A. Ruia HUFAshok Kumar Ruia HUF

55
SCHEDULE ANNEXED TO AND FORMING PART OF THE BALANCE SHEET AND PROFIT AND LOSS ACCOUNT
SCHEDULE “T” : (Continued)
b) The following transactions were carried out with the related parties in the ordinary course of business in thefinancial year under report :
(Rs. in Thousands)
Sr.No. TRANSACTIONS Category I Category II Category III Category IV Category V
1 Rent,Compensation & Other 49,801 204 92,350 - -recoveries (Ser. Charges) (46,927) - (65,875) - -
2 Interest Received - 12,586 - - -
3 Remuneration / Salary Paid - - - 11,638 -- - - (6,155) -
4 Administrative & Other 29,339 - 6,153 - -Charges paid (Excluding (32,876) (48,457) (6,182) - -Service Tax)
5 Cloth Purchased from - - 1,729 - -- - (793) - -
6 Cloth Sold to - - 288 - -- - (710) - -
7 Loans taken from - - - - -- (589,986) (814,478) - -
8 Repayment of loans to - - 497,846 - -- (92,140) (1,783,933) - -
9 Loans given to 383,282 250,000 - - -(2,055,170) (420,000) (135,000) - -
10 Loans returned by 1,847,550 80,000 - - -(248,662) - (1,858,383) - -
11 Deposits received / returned - - - - -(-30,100) - (-3,825) (-18,194) (-3,825)
12 Deposit Given 5,000 - - - -- - - - -
13 Compensation / Surrender of - - 65,254 402,002 71,688Tenancy rights paid - - (27,729) (32,848) (8,842)
14 Investment in Shares/ 1,579,810 310,000 200,200 - -application money (1,640,016) (3,354,175) (613,400) - -pending allotment
15 Purchase of Fixed Assets - - 48,189 - -(2,239) - (25,773) - -
16 Sale of Land Development - - - - -Rights (1,256,560) - - - -
17 Allocation of Common 72,000CWIP cost (473,524)
18 Balance written off - 2,400 - - -- - - - -

56
SCHEDULE ANNEXED TO AND FORMING PART OF THE BALANCE SHEET AND PROFIT AND LOSS ACCOUNT
SCHEDULE “T” : (Continued)
c) The following balances were due from / to the related parties as on 31-03-2009(Rs. in Thousands)
Sr.No. TRANSACTIONS Category I Category II Category III Category IV Category V
1 Unsecured Loans - - - - -- (497,846) - - -
2 Investment in Equity 2,125,641 1,056,214 - - -Shares / pref shares (607,884) (1,326,313) - - -
3 Investment in Capital - - 6,306 - -of Partnership Firm - - (30,913) - -
4 Loans and Advances (Net) 2,090,298 210,783 - - -(3,482,568) - (119,033) - -
5 Sundry Debtors - - 40,167 - -(12,271) - (14,308) - -
6 Sundry Creditors 1,265 - 22,259 - -- - (4,711) - -
7 Deposits received - - 25,446 - -- - (25,446) (18,194) -
8 Deposits Given 15,000 - 450,000 - -(10,000) - (450,000) - -
9 Application money pending 836,617 615,793 967,403 - -allotment (1,172,926) (2,410,014) - - -
10 Corporate Guarantee given 500,000 -
d) Disclosure in Respect of Material Related Party Transactions during the year:i) Rent & other recoveries include received from Market city Resources Private Limited Rs. 4,98,01,482/-, Galaxy
Entertainment Corporation Limited Rs. 9,23,49,559/-
ii) Interest received include received from Classic Mall Development Private Limited Rs. 1,07,83,036/-.
iii) Administrative & other expenses include paid to Market City Resources Private Limited Rs. 2,93,38,571/- andR.R. Hosiery Private Limited Rs.38,73,756/-
iv) Compensation / surrender of tenancy rights includes paid to Ashok Apparels Private Limited Rs.6,52,54,024/-,Ashok Ruia Rs.22,33,60,908/- and Atul A. Ruia Rs.17,86,40,628/-
v) Cloth and Garments sold to R. R. Textiles Rs.2,88,255/-
vi) Cloth and Garments purchase includes purchase from R. R. Hosiery Private Ltd. Rs.12,50,223/- and R. R.Textiles Rs.4,78,966/-
vii) Repayments of loan to Ruia International Holding Company Private Ltd. Rs.49,78,45,610/-
viii) Loan returned by parties include repayment from Bellona Finvest Limited Rs.28,89,50,000/- and from PallazzioHotels & Leisure Limited Rs.1,54,30,00,000/-
ix) Loan given includes loan given to Bellona Finvest Limited Rs.36,76,81,310/-, Classic Mall Developers PrivateLimited Rs.17,00,00,000/- and Offbeat Developers Private Limited Rs. 8,00,00,000/-
x) Deposit given to Market City Resources Private Ltd. Rs.50,00,000/-
xi) Investment in Shares/Application Money pending allotment includes Palladium Construction Private Ltd.Rs.1,13,09,09,500/-, Big Apple Real Estate Private Ltd. Rs.44,85,00,000/-.
xii) Purchase of Fixed Assets includes purcgase from Phoenix Construction Company Rs.4,81,88,925/-.
xiii) Allocation of common capital work-in-progress cost includes Pallazzio Hotels & Leisure Limited Rs.7,16,17,399/-

57
SCHEDULE “T” : (Continued)
13. Expenditure in foreign currency :
2008-2009 2007-2008Rs. Rs.
Foreign Travelling 27,94,100 1,11,53,792
Payment towards Capital Goods 4,36,11,968 63,52,184
Professional Fees - 3,13,76,343
14 Earning in foreign exchange :
Dividend Rs. 2,41,781/- Rs. 19,71,013/-
15 Amount remitted in foreign currency on account of dividend:
The Company has not remitted any amount in foreign currencies on account of dividends during the year and doesnot have information as to the extent to which remittances, if any, in foreign currencies on account of dividendshave been made by/on behalf of non-resident shareholders. The particulars of dividends declared and paid to non-resident shareholders, are as under :
Dividends for the year 2007-2008 2006-2007
Number of non- resident share holders 108 78
Number of Equity Shares held by them 3,79,75,933 78,98,961
Face Value of Equity Share Rs. 2/- Rs. 10/-
Gross Amount of Dividend 3,79,75,933 2,36,96,883
16 DEFERRED TAX
In accordance with the Accounting Standard - (AS) 22 “Accounting for Taxes on Income” as notified by theCompanies (Accounting Standards) Rules 2006, the company has created deferred tax assets of Rs.28,61,446/- forthe current year. The break up of the net deferred tax asset as on 31st March, 2009 is as under:
Particulars Deferred tax Current Year Deferred taxAsset / (Charge) Asset /
(Liability) Credit (Liability)
as at as at
1.04.08 31.03.09Rs. Rs. Rs.
Disallowance u/s 43B and others 23,56,622 26,22,807 49,79,429
Provision for Doubtful debts and advances 32,17,115 (7,24,667) 24,92,448
Difference between Book and Tax depreciation 41,24,808 9,63,306 50,88,114
Deferred Tax Assets (Net) 96,98,545 28,61,446 1,25,59,991
SCHEDULE ANNEXED TO AND FORMING PART OF THE BALANCE SHEET AND PROFIT AND LOSS ACCOUNT

58
SCHEDULE ANNEXED TO AND FORMING PART OF THE BALANCE SHEET AND PROFIT AND LOSS ACCOUNT
SCHEDULE “T” : (Continued)
17 EARNING PER SHARE (EPS)
Basic as well as Diluted EPS 2008-2009 2007-2008
Net Profit after Tax (Rs.) 78,21,65,281 1,68,65,22,689
Weighted Average No. of Equity Shares 14,17,06,177 10,47,59,147
Nominal Value of Equity Shares (Rs.) 2/- 2/-
Basic Earning Per Share (Rs.) 5.52 16.10
18 PROJECT DEVELOPMENT EXPENDITURE
(In respect of Projects upto 31st March, 2009, included under Capital Work-in-Progress)
Preoperative Income / Expenses transferred to Capital Work-in-Progress
Particulars 2008-09 2007-08
Rs. Rs.
Opening Balance 29,19,82,057 8,78,87,236
Expenditure
Interest 17,84,88,748 19,90,13,878
Salary and Allowances 1,87,56,821 71,68,875
48,92,27,626 29,40,69,989
Less : Project Development Expenses
Capitalised during the year 15,56,937 20,87,932
Closing Balance 48,76,70,689 29,19,82,057
19 Loans and Advances in the nature of Loans given to Subsidiaries :
Particulars 2008-09 MaximumBalance
during the yearRs. Rs.
Pallazzio Hotels & Lesiure Ltd 1,39,09,66,025 2,86,19,65,966
Bellona Finvest Limited 57,00,09,545 63,64,59,545
Kalani Holdings Pvt Limited 12,93,22,100 12,93,22,100
Notes :
(a) Loans and Advances shown above are in the nature of loans which are repayable on demand and do not haveany repayment schedule.
(b) All the above loans are interest free.
(c) Inter Company Deposits are not considered as they are repayable on demand and interest is charged at marketrates.

59
SCHEDULE ANNEXED TO AND FORMING PART OF THE BALANCE SHEET AND PROFIT AND LOSS ACCOUNT
SCHEDULE “T” : (Continued)
20 Quantitative particulars of finished goods in respect of trading activity :
Class of goods Unit Purchases Turnover
Quantity Value Rs. Quantity Value Rs.
Cloth & Garments Pcs. 78,500 75,088
(82,265) (90,351)
Doz. 496 66,98,169 482 83,50,865
(395) (66,52,950) (579) (95,02,982)
Mtrs. 289 244
(125) (139)
Class of goods Unit Opening Stock Closing Stock
Quantity Value Rs. Quantity Value Rs.
Cloth & Garments Pcs. 31,758 35,084
(39,974) (31,758)
Doz. 134 27,03,688 144 32,98,400
(317) (30,92,462) (134) (27,03,688)
Mtrs. 57 101
(73) (57)
21 The previous year’s figures have been regrouped and / or recasted wherever necessary so as to conformto the current year’s classification.
As per our report of even dateFor A.M.Ghelani & Company For Chaturvedi & Shah For and on behalf of the Board of DirectorsChartered Accountants Chartered Accountants
Ashokkumar R. RuiaChairman & Managing Director
Chintan A. Ghelani Amit Chaturvedi Atul Ruia Sivaramakrishnan IyerPartner Partner Jt. Managing Director Director
Place : Mumbai Kiran B. Gandhi Amit DalalDated : 27th July, 2009 Whole-time Director Director

60
Statement pursuant to section 212 of the Companies Act, 1956 relating to Subsidiary Companies
Sr.
Nam
e of
the
Sub
sidi
ary
Bla
ckw
ood
Bel
lona
Big
App
leG
ange
ticK
alan
iM
arke
tM
arke
tcity
Pal
ladi
umP
alla
zzio
Pin
nacl
eP
luto
crat
eR
uia
Upa
lVa
mon
aN
o. D
evel
oper
sFi
nves
tR
eal
Dev
elop
ers
Hol
ding
sC
ityR
esou
rces
Con
truc
tins
Hot
els
Rea
lC
apita
lR
ealto
rsD
evel
oper
sD
evel
oper
sP
rivat
eLi
mite
dE
stat
e P
rivat
eP
rivat
eM
anag
e-P
rivat
eP
rivat
ean
dE
stat
ean
d A
sset
Priv
ate
Priv
ate
Priv
ate
Par
ticul
ars
Lim
ited*
Priv
ate
Lim
ited*
Lim
ited
men
tLi
mite
dLi
mite
dLe
isur
eD
evel
op-
Man
age-
Lim
ited
Lim
ited*
Lim
ited
Lim
ited
Priv
ate
Lim
ited
men
tm
ent
Lim
ited
Priv
ate
Priv
ate
Lim
ited
Lim
ited
(A)
Fina
ncia
l yea
r of
the
31st M
arch
,31
st M
arch
,31
st M
arch
,1st
Mar
ch,
31st M
arch
,31
st M
arch
,31
st M
arch
,31
st M
arch
,31
st M
arch
,31
st M
arch
,31
st M
arch
,31
st M
arch
,31
st M
arch
,31
st M
arch
,S
ubsi
diar
y C
ompa
nies
2009
2009
2009
2009
2009
2009
2009
2009
2009
2009
2009
2009
2009
2009
(B)
Sha
res
of t
he s
ubsi
diar
y he
ld b
yth
e C
ompa
ny o
n th
e ab
ove
date
s N
umbe
r of
Sha
res
9,98
040
,00,
020
1,57
,41,
181
48,5
6,25
010
,000
60,0
0010
,000
10,0
0012
,00,
000
6,66
710
,000
10,0
0066
,25,
000
1,27
,50,
000
Face
val
ue :
Rs.
1010
1010
1010
1010
100
1010
1010
10
Ext
end
of H
oldi
ng73
.32%
100.
00%
73.4
7%41
.19%
100.
00%
54.6
9%10
0.00
%10
0.00
%10
0.00
%66
.67%
100.
00%
100.
00%
45.9
2%51
.00%
(C)
The
net
aggr
egat
e am
ount
of
Pro
fit/L
oss
of t
he S
ubsi
diar
yC
ompa
nies
, s
o fa
r as
itco
ncer
ns t
he m
embe
rs o
f th
eP
hoen
ix M
ills
Lim
ited.
(a)
Not
dea
ltwith
the
acc
ount
sof
the
Pho
enix
Mill
s Li
mite
dfo
r th
e ye
ar e
nded
31st
Mar
ch,
2009
am
ount
ed t
o :-
(i)fo
r th
e su
bsid
iarie
s’fin
anci
al y
ear
ende
dR
s. (
44.2
0)R
s. (
48.2
4)R
s. 0
.83
Rs.
12.
42R
s. (
63.3
6)R
s. (
0.24
)R
s. (
0.42
)R
s. (
0.25
)as
in (
A)
abov
eN
IL
Lakh
s L
akhs
NIL
Lakh
sLa
khs
Lakh
sN
ILN
ILLa
khs
Lakh
sLa
khs
NIL
NIL
(ii)
for
the
prev
ious
fin
anci
alye
ar o
f th
e S
ubsi
diar
ies
sinc
e th
ey b
ecam
e th
eH
oldi
ng C
ompa
ny’s
Rs.
210
.86
Rs.
(0.
69)
Rs.
(5.
50)
Rs.
(8.
36)
Rs.
(0.
27)
Sub
sidi
arie
sN
ILLa
khs
NIL
NIL
Lakh
sN
ILLa
khs
NIL
Lakh
sLa
khs
NIL
NIL
NIL
NIL
(b)
Dea
ltwith
the
acc
ount
s of
the
Pho
enix
Mill
s Li
mite
dfo
r th
e ye
ar e
nded
31st
Mar
ch,
2009
am
ount
ed t
o :-
(i)fo
r th
e su
bsid
iarie
s’fin
anci
al y
ear
ende
das
in (
A)
abov
eN
ILN
ILN
ILN
ILN
ILN
ILN
ILN
ILN
ILN
ILN
ILN
ILN
ILN
IL
(ii)
for
the
prev
ious
finan
cial
yea
r of
the
Sub
sidi
arie
s si
nce
they
beca
me
the
Hol
ding
Com
pany
’s S
ubsi
diar
ies
NIL
NIL
NIL
NIL
NIL
NIL
NIL
NIL
NIL
NIL
NIL
NIL
NIL
NIL
Sta
tem
ent
pu
rsu
ant
to e
xem
pti
on
rec
eive
d u
nd
er s
ecti
on
212
(8)
of
the
Co
mp
anie
s A
ct,
1956
rel
atin
g t
o S
ub
sid
iary
Co
mp
anie
sR
s. i
n L
akh
s
Rep
ortin
gE
xcha
nge
Cap
ital
Res
erve
sTo
tal
Tota
lIn
vest
men
tT
urno
ver
Pro
fit b
efor
e P
rovi
sion
Pro
fitP
ropo
sed
Cou
ntry
Cur
renc
y R
ate
Ass
ets
Liab
ilitie
s O
ther
tha
nTa
xatio
nfo
raf
ter
Div
iden
dIn
vest
men
t in
Taxa
tion
Taxa
tion
Sub
sidi
ary
Bla
ckw
ood
Dev
elop
ers
Priv
ate
Lim
ited
*IN
R1
1.00
(16.
16)
3,68
0.76
3,69
5.92
--
--
-N
ilIn
dia
Bel
lona
Fin
vest
Lim
ited
INR
140
0.00
167.
386,
716.
206,
148.
825,
471.
238.
00(4
4.19
)0.
02(4
4.21
)N
ilIn
dia
Big
App
le R
eal
Est
ate
Priv
ate
Lim
ited
INR
12,
142.
626,
931.
489,
147.
4173
.31
2.00
117.
07(6
3.90
)1.
76(6
5.66
)N
ilIn
dia
Gan
getic
Dev
elop
ers
Priv
ate
Lim
ited
*IN
R1
866.
253,
440.
145,
048.
3174
1.93
--
--
-N
ilIn
dia
Kal
ani
Hol
ding
s P
rivat
e Li
mite
dIN
R1
1.00
(1.4
2)1,
293.
991,
294.
401,
291.
46-
1.26
0.43
0.83
Nil
Indi
aM
arke
t C
ity M
anag
emen
t P
vt.
Ltd
INR
110
.00
22.3
889
.56
57.1
8-
258.
7536
.04
13.3
222
.72
Nil
Indi
aM
arke
tcity
Res
ourc
es P
rivat
e Li
mite
dIN
R1
1.00
(66.
34)
1,74
4.67
1,81
0.01
-2,
111.
40(3
9.50
)24
.67
(64.
17)
Nil
Indi
aP
alla
dium
Con
truc
tins
Priv
ate
Lim
ited
INR
12,
026.
0017
,611
.33
27,7
43.8
78,
106.
545.
26-
--
-N
ilIn
dia
Pal
lazz
io H
otel
s an
d Le
isur
e Li
mite
dIN
R1
1,20
0.00
16,3
15.9
542
,330
.58
24,8
14.6
34,
192.
30-
--
-N
ilIn
dia
Pin
nacl
e R
eal
Est
ate
Dev
elop
men
t P
rivat
e Li
mite
dIN
R1
1.00
(0.5
7)68
1.12
680.
6951
8.29
0.09
(0.3
5)-
(0.3
5)N
ilIn
dia
Plu
tocr
ate
Cap
ital
and
Ass
et M
anag
emen
t P
rivat
e Li
mite
d’IN
R1
1.00
(0.4
1)1.
440.
85-
-(0
.32)
-(0
.32)
Nil
Indi
aR
uia
Rea
ltors
Priv
ate
Lim
ited
INR
11.
00(0
.45)
0.68
0.13
--
(0.2
5)-
(0.2
5)N
ilIn
dia
Upa
l D
evel
oper
s P
rivat
e Li
mite
d *
INR
11,
060.
0033
9.43
7,97
0.93
6,57
1.50
--
--
-N
ilIn
dia
Vam
ona
Dev
elop
ers
Priv
ate
Lim
ited
INR
12,
500.
0014
,091
.72
40,4
23.4
123
,831
.69
110.
75-
--
-N
ilIn
dia
* F
ello
w S
ub
sid
iari
es o
f B
ig A
pp
le R
eal
Est
ate
Pri
vate
Lim
ited
For
and
on
beha
lf of
Boa
rd o
f D
irect
ors
Ash
okku
mar
R.
Rui
aS
ivar
amak
rishn
an I
yer
Cha
irman
& M
anag
ing
Dire
ctor
Dir
ecto
r
Atu
l R
uia
Am
it D
alal
Jt.
Man
agin
g D
irect
orD
irec
tor
Pla
ce :
Mum
bai
Kira
n B
Gan
dhi
Dat
e :
27th J
uly,
200
9W
hole
-tim
e D
irect
or

61
Additional information as required under Part IV of the Schedule VI of the Companies Act, 1956.
1 Registration Details :
Registration No. L17100MH1905PLC000200
State 11
Balance Sheet Date 31st March 2009
2 Capital raised during the year (Amount Rs. in thousands)
Public Issue Nil
Rights Issue Nil
Bonus Issue Nil
Private Placements Nil
Issued to Promoters Nil
3 Position of mobilisation and deployment of funds (Amount Rs. in thousands)
Total Liabilities 1,77,83,217
Total Assets 1,77,83,217
Sources of Funds
Paid up Capital 2,89,691
Reserves & Surplus 1,47,08,301
Secured Loans 16,51,584
Unsecured Loans Nil
Application of Funds
Net Fixed Assets 47,11,690
Investments 53,29,994
Net Current Assets / (Liabilities) 65,95,331
Deferred tax Assets 12,560
4 Performance of Company (Amount Rs. in thousands)
Turnover (Gross Revenue) 14,00,335
Total Expenditure 4,32,631
Profit Before Tax 9,67,704
Profit After Tax 7,82,165
Earnings per Shares (Rs.) 5.52
Dividend Rate 50%
5 Generic Names of three Principal Products / Service of the Company
Item Code NO.(ITC Code) -
Product Description Property Development
Item Code NO.(ITC Code) 520722
Product Description Cloth
Item Code NO.(ITC Code) -
Product Description Garment
BALANCE SHEET ABSTRACT AND COMPANY’S GENERAL BUSINESS PROFILE:

62
CONSOLIDATEDACCOUNTS

63
TO THE BOARD OF DIRECTORS
The Phoenix Mills Limited
We have audited the attached Consolidated Balance Sheetof The Phoenix Mills Limited (“the Company”) and itssubsidiaries as at 31st March, 2009, and also theConsolidated Profit and Loss Account and the ConsolidatedCash Flow Statement for the year ended on that dateannexed thereto. These financial statements are theresponsibility of the Company’s Management and have beenprepared by the Management on the basis of separatefinancial statements and other financial information regardingcomponents. Our responsibility is to express an opinion onthese financial statements based on our audit.
We have conducted our audit in accordance with generallyaccepted auditing standards in India. Those Standardsrequire that we plan and perform the audit to obtainreasonable assurance about whether the financial statementsare free of material misstatement. An audit includes,examining on a test basis, evidence supporting the amountsand disclosures in the financial statements. An audit alsoincludes assessing the accounting principles used andsignificant estimates made by management, as well asevaluating the overall financial statement presentation. Webelieve that our audit provides a reasonable basis for ouropinion.
1. Financial statements of seven subsidiaries, which reflecttotal assets of Rs. 78,69,88,520/- as at 31st March,2009, total revenues of Rs. 23,80,23,929/- and net cashflows amounting to Rs. (1,45,690/-) for the year thenended have been audited by one of us.
2. We did not audit the financial statements of fivesubsidiaries. We have relied on the unaudited financialstatements of these five subsidiaries whose unauditedfinancial statements reflect total assets of Rs.6,06,76,06,426/- as at 31st March, 2009, total revenueof Rs. 1,17,07,151/- and cash flows amounting to Rs.16,57,72,152/- for the year then ended. These unauditedfinancial statements as approved by the respectiveBoard of Directors of these Companies have beenfurnished to us by the Management and our report inso far as it relates to the amounts included in respectof the subsidiary is based solely on such approvedunaudited financial statements.
3. We have relied on the unaudited financial statementsof two other subsidiaries whose financial statementsreflect total assets of Rs. 5,80,08,77,390/- as at31st March, 2009, total revenue of Rs. Nil and cash
Consolidated Auditors’ Report
flows amounting to Rs. 10,02,11,367/- for the year thenended and on the unaudited financial statements of tenassociates wherein the Group’s share of profitaggregates to Rs. Nil. These unaudited financialstatements as approved by the respective Board ofDirectors of these companies have been furnished tous by the Management and our report in so far as itrelates to the amounts included in respect of thesubsidiary and associates is based solely on suchapproved unaudited financial statements.
4. We report that the consolidated financial statementshave been prepared by the Company’s management inaccordance with the requirements of AccountingStandard 21, Consolidated Financial Statements andAccounting Standard 23, Accounting for Investments inAssociates in Consolidated Financial Statements asnotified by Companies (Accounting Standards) Rules,2006.
5. Based on our audit and on consideration of reports ofother auditors on separate financial statements and onthe other financial information of the components, andaccounts approved by the Board of Directors asexplained in paragraph 3 above and to the best of ourinformation and according to the explanations given tous, we are of the opinion that the attached consolidatedfinancial statements give a true and fair view inconformity with the accounting principles generallyaccepted in India:
(a) in the case of the Consolidated Balance Sheet, ofthe consolidated state of affairs of the Companyand its subsidiaries as at 31st March, 2009;
(b) in the case of the Consolidated Profit and LossAccount, of the consolidated profits of the Companyand its subsidiaries for the year then ended; and
(c) in the case of the Consolidated Cash FlowStatement, of the consolidated cash flows of thecompany and its subsidiaries for the year thenended.
For A. M. Ghelani & Company For Chaturvedi & ShahChartered Accountants Chartered Accountants
Chintan A. Ghelani Amit ChaturvediPartner PartnerMembership No: 104391 Membership No: 103141
Place: MumbaiDate: 27th July, 2009

64
Consolidated Balance Sheet as at 31st March 2009
Schedule As at As at31st March 2009 31st March 2008
Rs. Rs. Rs.SOURCES OF FUNDS
SHAREHOLDERS’ FUNDSShare Capital A 28,96,90,890 27,13,57,560Equity Share Suspense - 1,83,33,334Reserves & Surplus B 14,85,76,56,505 12,55,58,26,378
15,14,73,47,395 12,84,55,17,272MINORITY INTEREST 2,11,85,86,168 81,26,08,406LOAN FUNDS
Secured Loans C 5,10,96,47,074 2,36,98,90,247Unsecured Loans D 34,19,22,335 67,78,11,167
5,45,15,69,409 3,04,77,01,414
Total 22,71,75,02,972 16,70,58,27,092
APPLICATION OF FUNDSFIXED ASSETS E
Gross Block 4,88,11,14,654 3,68,89,03,420Less: Depreciation 46,24,88,789 36,87,88,141
Net Block 4,41,86,25,865 3,32,01,15,279Capital Work-in-Progress 9,00,43,79,395 5,00,57,99,326
13,42,30,05,260 8,32,59,14,605INVESTMENTS F 4,52,49,57,023 6,33,96,59,557DEFERRED TAX ASSETS (NET) 1,10,14,773 97,54,121CURRENT ASSETS, LOANS AND ADVANCES
Inventories G 32,98,400 27,03,688Sundry Debtors H 35,08,98,894 21,58,26,598Cash & Bank Balances I 1,90,98,40,270 2,23,04,336Loans & Advances J 4,07,71,13,545 4,05,20,62,853
6,34,11,51,109 4,29,28,97,475Less : CURRENT LIABILITIES & PROVISIONS
Current Liabilities K 1,35,43,96,745 2,04,67,30,327Provisions L 22,82,28,448 21,67,14,247
1,58,26,25,193 2,26,34,44,574
NET CURRENT ASSETS 4,75,85,25,916 2,02,94,52,901MISCELLANEOUS EXPENDITURE M - 10,45,908(To the extent not written off / remaning unadjusted)
Total 22,71,75,02,972 16,70,58,27,092
Significant Accounting Policies and Notes on Accounts T
Schedules referred to herein form an integral part of the Balance Sheet
As per our report of even dateFor A.M.Ghelani & Company For Chaturvedi & Shah For and on behalf of the Board of DirectorsChartered Accountants Chartered Accountants
Ashokkumar R. RuiaChairman & Managing Director
Chintan A. Ghelani Amit Chaturvedi Atul Ruia Sivaramakrishnan IyerPartner Partner Jt. Managing Director Director
Mumbai Kiran B. Gandhi Amit DalalDated : 27th July, 2009 Whole-time Director Director

65
Consolidated Profit and Loss Account for the year ended 31st March 2009
Schedule 2008-09 2007-08
Rs. Rs. Rs.INCOME
Sales and Services N 99,62,92,637 82,11,93,085
Other Income O 50,29,96,422 24,00,84,591
Total 1,49,92,89,059 1,06,12,77,676
EXPENDITUREPurchase for resale and variation in inventory P 61,03,457 70,41,724Employee Costs Q 10,77,88,159 5,33,70,608Operating and other Expenses R 28,04,92,856 25,98,31,616Interest and Finance Charges S 5,47,71,400 4,45,22,349Depreciation 9,44,17,083 7,72,37,034Less: Transfer from Revaluation Reserve (9,41,989) 9,34,75,094 (9,30,698)(Refer to Note No.7 of Schedule “T”)
Total 54,26,30,966 44,10,72,633
PROFIT BEFORE TAX 95,66,58,093 62,02,05,043Less : Provision for Taxation
Current Income Tax 18,72,71,940 19,60,85,000Fringe Benefit Tax 37,26,997 33,58,970Deferred Tax (12,60,652) 18,97,38,284 (69,45,543)
PROFIT AFTER TAX 76,69,19,809 42,77,06,616Add : Share of Minority 7,70,929 -
PROFIT AFTER TAX AND MINORITY INTEREST 76,76,90,738 42,77,06,616Less: Short provision of Income Tax for earlier years - 9,99,288Balance brought forward from previous year 3,68,97,836 8,18,99,209
PROFIT AVAILABLE FOR APPROPRIATION 80,45,88,572 50,86,06,537
APPROPRIATIONSTransferred to General Reserve 30,00,00,000 25,00,00,000Proposed Dividend 14,48,45,447 14,48,45,447Tax on Proposed Dividend 2,46,16,484 2,46,16,484Dividend for earlier year - 4,46,57,267Tax on Dividend for earlier year - 75,89,503
BALANCE CARRIED TO BALANCE SHEET 33,51,26,643 3,68,97,836
Basic and Diluted EPS (Face Value Rs.2) 5.41 4.07
Significant Accounting Policies and Notes on Accounts T
Schedules referred to herein form an integral part of the Profit and Loss Account
As per our report of even dateFor A.M.Ghelani & Company For Chaturvedi & Shah For and on behalf of the Board of DirectorsChartered Accountants Chartered Accountants
Ashokkumar R. RuiaChairman & Managing Director
Chintan A. Ghelani Amit Chaturvedi Atul Ruia Sivaramakrishnan IyerPartner Partner Jt. Managing Director Director
Mumbai Kiran B. Gandhi Amit DalalDated : 27th July, 2009 Whole-time Director Director

66
Consolidated Cash Flow Statement for the year ended on 31st March 2009
31st March 2009 31st March 2008Rupees Rupees Rupees Rupees
A CASH FLOWS FROM OPERATING ACTIVITIES
Net Profit before tax as per the Profit and Loss Account 95,66,58,093 62,02,05,043
Adjustments for :
Depreciation 9,34,75,094 7,63,06,336
Loss on Assets sold/discarded 58,342 1,09,35,242
Interest Expenses 5,47,71,400 4,18,08,459
Miscellaneous Expenditure written off 3,95,632 8,98,145
Balances in Debtors/Advances written off 75,91,086 28,06,885
Provision for Doubtful Debts and Advances/(written back) (21,32,000) 86,815
Interest Income (10,16,42,468) (1,94,37,981)
Dividend Income (6,18,32,738) (17,67,21,560)
Profit on sale of Investments (31,48,49,139) (3,82,12,859)
(32,41,64,791) (10,15,30,518)
Operating Cash flow before working capital changes 63,24,93,302 51,86,74,525
Adjustment for Working Capital changes :
Inventories (5,94,712) 3,88,774
Trade and other Receivables (31,62,94,109) (41,89,57,018)
Trade and other Payables 38,79,43,507 30,90,71,823
7,10,54,686 (10,94,96,421)
Cash generated from Operations 70,35,47,988 40,91,78,104
Direct Taxes Paid (19,04,16,495) (20,86,80,273)
Net Cash from Operating Activities A 51,31,31,493 20,04,97,831
B CASH FLOWS FROM INVESTING ACTIVITIES
Purchases of Fixed Assets (4,43,75,37,508) (5,92,21,15,784)
Sale of Fixed Assets 2,58,305 -
Inter Corporate Deposits & Loans(placed)/refunded (Net) 8,94,90,426 (33,69,76,278)
Purchase of Investments (2,65,01,38,745) (28,41,71,42,692)
Sale of Investments 4,52,61,54,743 21,44,88,03,801
Share Application Money 31,31,07,595 (81,45,38,495)
Interest Received 6,95,82,227 1,94,37,981
Dividend Income 6,18,32,738 17,67,21,560
Net Cash used in Investing Activities B (2,02,72,50,219) (13,84,58,09,907)

67
Consolidated Cash Flow Statement for the year ended on 31st March 2009 (Contd.)
31st March 2009 31st March 2008Rupees Rupees Rupees Rupees
C CASH FLOWS FROM FINANCING ACTIVITIES
Long term loans availed 2,70,79,23,128 96,02,09,697
Long term loans (repaid) (14,69,85,118) (1,90,10,66,509)
Short term loans availed / (repaid )(Net) (40,61,94,532) (87,71,42,612)
Interest paid (4,97,92,562) (4,18,08,459)
Proceeds from issue of Share Capital(net of issue expenses) 8,55,70,420 15,09,02,07,419
Proceeds from issue of Debentures 1,28,07,30,814 40,00,29,792
Dividend paid (including tax on Dividend) (16,73,15,388) (9,39,34,128)
Net Cash generated from Financing Activities C 3,30,39,36,762 13,53,64,95,200
D Net Increase/(Decrease) in Cash andCash Equivalents A+B+C 1,78,98,18,036 (10,88,16,876)
Cash and Cash equivalents at the beginning of the year 2,23,04,336 10,69,56,476
Add: on Amalgamation/Acquisition of New Subsidiaries 9,77,17,898 2,41,64,736
Cash and Cash equivalents at the end of the year 1,90,98,40,270 2,23,04,336
Note : The Cash Flow Statement has been prepared under the “Indirect Method” as set out in the Accounting Standard 3“Cash Flow Statements” as notified by the Companies (Accounting Standards) Rules 2006.
As per our report of even dateFor A.M.Ghelani & Company For Chaturvedi & Shah For and on behalf of the Board of DirectorsChartered Accountants Chartered Accountants
Ashokkumar R. RuiaChairman & Managing Director
Chintan A. Ghelani Amit Chaturvedi Atul Ruia Sivaramakrishnan IyerPartner Partner Jt. Managing Director Director
Mumbai Kiran B. Gandhi Amit DalalDated : 27th July, 2009 Whole-time Director Director

68
Schedules Annexed to and forming part of the Consolidated Accounts
As at As at31st March 2009 31st March 2008
Rs. Rs. Rs.SCHEDULE “A”
SHARE CAPITAL
AUTHORISED:
15,00,00,000 (P. Y. 15,00,00,000) Equity Shares of Rs. 2/- each 30,00,00,000 30,00,00,000
ISSUED, SUBSCRIBED AND PAID UP:
14,48,45,445 (P Y. 13,56,78,780) Equity Shares of Rs. 2/- eachfully paid up 28,96,90,890 27,13,57,560
TOTAL 28,96,90,890 27,13,57,560
Of the above:
i) 5,46,00,000 (P. Y. 5,46,00,000) Equity shares of Rs.2/- eachhave been alloted as fully paid up Bonus Shares bycapitalisation of Reserves.
ii) 4,00,00,000 (P. Y. 4,00,00,000) Equity Shares of Rs.2/- eachwere allotted to the share holders of Ashok Ruia EnterprisePvt. Ltd. as per the scheme of amalgamation withoutpayments being received in cash.
iii) 91,66,665 (P. Y. Nil) Equity Shares of Rs.2/- each wereallotted to the share holders of Ruia Real EstateDevelopment Company Pvt. Ltd. as per the scheme ofamalgamation without payments being received in cash.
33,90,000 (P. Y. 33,90,000) Equity Shares have been reservedfor allotment under The Phoenix Mills Employees’ Stock OptionPlan 2007.
6,50,000 (P. Y. Nil) Options have been granted under ‘ThePhoenix Mills Employees’ Stock Option Plan 2007' of which1,25,000 Options have been forfeited during the year.
SCHEDULE “B”
RESERVES & SURPLUS
Capital Reserve
As per last Balance Sheet 1,84,13,824 1,84,13,824
General Reserve
As per last Balance Sheet 83,92,84,438 54,05,77,746
Add:Transfer from Investment Allowance Reserve - 8,97,259
Transfer on Amalgamation 4,49,112 4,74,48,204
Transfer from Workmen’s Welfare Reserve - 3,61,229
Transfer from Profit & Loss Account 30,00,00,000 25,00,00,000
1,13,97,33,550 83,92,84,438
Securities Premium Account
As per last Balance Sheet 10,65,91,29,671 -
Received during the year - 12,90,83,52,040
Less : Expenditure in connection with the issue of Shares - 40,42,29,159
On Amalgamation - 1,84,44,87,410
Transfer from Miscellaneous Expenditure 80,822 5,05,800
10,65,90,48,849 10,65,91,29,671

69
Schedules Annexed to and forming part of the Consolidated Accounts
As at As at31st March 2009 31st March 2008
Rs. Rs. Rs.SCHEDULE “B” (Contd.)
RESERVES & SURPLUS
Debenture Premium AccountAs per last Balance Sheet 42,20,00,392 -Received during the year 1,21,04,25,114 42,20,00,392
1,63,24,25,506 42,20,00,392Revaluation Reserve
As per last Balance Sheet 10,97,20,400 11,06,51,098Less:Additional Depreciation on Revaluation of Assetstransferred to Profit & Loss Account (Refer to Note No. B-4of Schedule “T”) 9,41,989 9,30,698
10,87,78,411 10,97,20,400Capital Reserve (on Consolidation) 96,41,29,722 47,03,79,817Balance in Profit & Loss Account 33,51,26,643 3,68,97,836
TOTAL 14,85,76,56,505 12,55,58,26,378
SCHEDULE “C”SECURED LOANSLoan From Financial Institutions 75,00,00,000 -Loan From Banks
Term Loans 3,99,45,91,349 2,00,27,98,204Working Capital Loans 35,91,64,510 36,20,66,545
(Secured by Equitable Mortgage of deposit of Title deedsin respect of certain immovable properties and byhypothecation of rentals receivable from licencees.) 4,35,37,55,859 2,36,48,64,749
VEHICLE LOANS 58,91,215 50,25,498(Secured by hypothecation of the respective vehicles)
TOTAL 5,10,96,47,074 2,36,98,90,247
SCHEDULE “D”UNSECURED LOANS
Inter Corporate Loans 3,30,87,235 61,42,81,7676,35,294 Zero Coupon compulsory ConvertibleDebentures Series “A” of Rs. 100 each 6,35,29,400 6,35,29,4007,03,057 Zero Coupon Compulsory ConvertibleDebentures Series “B” of Rs. 100 each 7,03,05,700 -Debenture Application Money 17,50,00,000 -
TOTAL 34,19,22,335 67,78,11,167

70
Schedules Annexed to and forming part of the Consolidated AccountsSCHEDULE “ E ”
FIXED ASSETS
(Amount in Rupees)
GROSS BLOCK [AT COST] DEPRECIATION NET BLOCK
Description As at Additions Deductions As at Upto For the Deductions Upto As at As at1.04.2008 during during 31.03.2009 1.04.2008 year during 31.03.2009 31.03.2009 31.03.2008
the year the year the year
Freehold Land 2,51,18,11,196* 24,41,77,076 - 2,75,59,88,272 - - - - 2,75,59,88,272 2,01,97,02,283
Right on Leasehold Land 6,97,61,432* - - 6,97,61,432 46,17,171 42,359 @ - 46,59,530 6,51,01,902 6,51,44,261
Buildings 1,36,70,07,750* 28,76,55,488 - 1,65,46,63,238 28,91,53,918 6,02,13,066 - 34,93,66,984 1,30,52,96,254 1,07,78,53,832
Plant and Machinery 5,09,40,538* 4,06,40,850 1,60,530 9,14,20,858 2,02,88,458 65,90,405 - 2,68,78,863 6,45,41,995 3,06,52,080
Motor car , Lorries & Vehicles 3,67,44,455 33,02,725 24,87,984 3,75,59,196 1,58,80,699 53,03,863 23,31,867 1,88,52,695 1,87,06,501 1,93,19,281
Office Furniture & Equipment 12,84,46,728 6,09,23,142 - 18,93,69,870 3,87,93,002 2,11,47,112 - 5,99,40,114 12,94,29,756 9,02,63,823
Leasehold Improvements 1,76,37,561 6,47,14,227 - 8,23,51,788 4,57,842 23,32,761 - 27,90,603 7,95,61,185 1,71,79,719
Total 4,18,23,49,660 70,14,13,508 26,48,514 4,88,11,14,654 36,91,91,090 9,56,29,566 23,31,867 46,24,88,789 4,41,86,25,865 3,32,01,15,279
Previous Year 1,57,53,18,817 2,15,66,33,306 4,30,48,703 3,68,89,03,420 32,33,56,893 7,73,93,889 3,19,62,641 36,87,88,141 3,32,01,15,279 -
Capital Work in Progress 9,00,43,79,395 5,00,57,99,326
Notes :1) * Amount added on Revaluation (as at 31.03.1985) Rs.18,48,43,610 (Net of Depreciation). Refer to Note No. B-4 of Schedule “T”2) @ Represents write off on the basis of the period of the lease.3) Lease Hold Land
a) Includes land leased for period of 999 years as from 1951 renewal at the option for further like period.b) Includes Rs.2,66,38,617 (as revalued) leased in perpetuity against which there is no writeoff required.
4) Capital Work in Progress includes pre-operative expenses of Rs. 111,02,85,419 (P. Y. Rs. 33,90,50,329). Refer to Note No. B-11 of Schedule “T”.5) Opening Gross Block include Rs. 49,34,46,240 of assets of new subsidiaries acquired during the year.

71
Rs. Rs. Rs.SCHEDULE “F”
INVESTMENTS
A. LONG TERM - TRADE
1. INVESTMENT IN GOVERNMENT SECURITIES :(Unquoted)
3% Conversion Loan deposited with the Collector of 13,734 13,734Central Excise (Matured but not encashed.)Face Value Rs. 21,500/-
12 years National Savings Certificates 12,050 12,050(Deposited with State Government and ExciseAuthorities as security)
6 years- National Savings Certificates VIII Issue 5,000 5,000(Deposited with State Government and otherauthorities as security)
7 years - National Savings Certificates 5,160 5,160(Deposited with State Government and otherauthorities as security)
6 years - National Savings Certificates - 40,000
35,944 75,944
2. INVESTMENT IN COMPANIES : (Unquoted)
(Equity Shares of face value of Rs. 10/- eachfully paid-up unless otherwise stated)
5,000 (P.Y. 5,000) - Bartraya Mall Dev. Co. Pvt. Ltd 50,000 50,000
10,000 (P.Y. 10,000) - Bhopal Entertainment World - 1,00,000Developers Pvt. Ltd
20,00,000 (P.Y. 20,00,000) - Classic Mall Development Pvt. Ltd. 22,33,34,854 22,33,41,254
10,010 (P.Y. 10,010) - Classic Software Tech & IT Park Pvt. Ltd. 1,28,892 1,28,892
63,39,235 (P. Y. 63,39,235) - Entertainment WorldDevelopers Pvt. Ltd. 57,92,70,269 57,92,70,269
25,000 (P.Y. 25,000) - Escort Developers Pvt. Ltd. 1,59,50,000 1,59,50,000
9,780 (P.Y. 9,780) - Island Star Mall Developers Pvt. Ltd. 1,33,606 1,33,606
4,500 (P.Y. 4,500) - Juniper Developers Pvt. Ltd. 46,620 46,620
72,65,080 (P.Y. 72,65,080) - Offbeat Developers Pvt. Ltd.* 39,33,34,468 24,70,37,912
1,66,670 (P. Y. Nil) Picasso Developers Pvt. Ltd. 2,00,00,400 -
3,33,333 (P.Y. 3,33,333) - Ramayana Merchants Pvt. Ltd. 4,41,86,012 4,41,86,012
10 (P.Y. Nil) - Treasure World Developers (India) Pvt. Ltd. 8,500 -
25,00,000 (P. Y. 25,00,000) Galaxy Entertainment India Ltd. 2,50,00,000 2,50,00,000
- (P. Y. 36,96,225) Big Apple Real Estate Pvt. Ltd. - 30,00,00,000
- (P. Y. 31,06,250) - Gangetic Developers Pvt. Ltd. - 8,07,06,439
- (P. Y. 29,15,000) - Upal Developers Pvt. Ltd. - 2,92,22,875
1,30,14,43,621 1,54,51,73,879
Schedules Annexed to and forming part of the Consolidated Accounts
As at As at31st March 2009 31st March 2008

72
(Compulsorily Fully Convertible Debentures ofRs. 10/- each fully paid-up)
10,00,00,000 (P.Y. Nil) - Treasure World Developers 1,00,00,00,000 -(India) Pvt. Ltd.
(Preference Shares of Rs. 10/- each fully paid-up) 10,71,46,457 10,71,46,457
78,42,720 (P.Y. 78,42,720) Compulsory ConvertiblePreference Shares of Island Star Mall Developers Pvt. Ltd.
10,00,000 (P. Y. 10,00,000) - 7% Optionally 1,00,00,000 1,00,00,000Convertible Preference Shares of Rs. 10/- eachfully paid up of Galaxy Entertainment India Ltd.
2,50,000 (P. Y. 2,50,000) - 7% Optionally Convertible 1,25,000 1,25,000Preference Shares of Rs. 10/- each Rs. 0.50 paid upof Galaxy Entertainment India Ltd.
2,41,87,15,078 1,66,24,45,336
3. INVESTMENT IN THE CAPITAL OFPARTNERSHIP FIRM
Phoenix Construction Company 1,99,59,173 3,09,13,186
4. OTHER INVESTMENTS
10 (P. Y. 10) ordinary shares of Rs. 50/-each -fully paid 500 500of Sukhsagar Premises Co-op. Society Ltd.
5 (P. Y. 5) ordinary shares of Rs. 50/-each -fully paid 250 250of Vivina Co-op. Housing Society Ltd.
80 (P. Y. 80) ordinary shares of Rs. 25/- each -fully 2,000 2,000paid of Rashtriya Mazdoor Madhyavarti SahakariGrahak Sangh (Maryadit)
2,750 2,750
B. LONG TERM - OTHERS
2. INVESTMENT IN OTHER COMPANIES :
i. QUOTED: (Equity Shares of face value ofRs. 10/- each fully paid-up)
7,265 (P. Y. 7,265) - I.C.I.C.I. Bank Limited ** 2,60,250 2,60,250
20 (P. Y. 20) - Clariant Chemicals (India) Ltd. 200 200
57,11,577 (P. Y. 46,30,890) - GKW Limited 46,83,71,279 36,01,72,287
36,86,484 (P. Y. 34,11,003) - Galaxy Entertainment 7,43,09,402 7,43,09,402Corporation Limited.
54,29,41,131 43,47,42,139
ii. UNQUOTED:2,974 (P. Y. 2,974) - Imperial Chemical Industries 1,55,002 1,55,002Plc. Ordinary shares of 1 Pound each fully paid up2,386 (P. Y. 2,386) - Zeneca Group Plc (U.K.) 1,59,596 1,59,596Ordinary shares of 25 Pence each fully paid up
3,14,598 3,14,598
Schedules Annexed to and forming part of the Consolidated Accounts
As at As at31st March 2009 31st March 2008
Rs. Rs. Rs.SCHEDULE “F” (Contd.)
RESERVES & SURPLUS

73
Schedules Annexed to and forming part of the Consolidated Accounts
As at As at31st March 2009 31st March 2008
Rs. Rs. Rs.SCHEDULE “F” (Contd.)
C. CURRENT INVESTMENTS - OTHERS
INVESTMENTS IN MUTUAL FUNDS
(Units of face value of Rs. 10/- each )
22,65,806 (P.Y. Nil) Fortis Money Plus Inst.Fund 2,26,65,086 -
719,55,532 (P. Y. Nil) Reliance Medium Term Fund 1,23,01,15,799 -
1,29,57,297 (P. Y. Nil) Birla Sunlife - Short Term 12,96,44,241 -
1,53,87,205 (P. Y. Nil) Kotak Floater Long Term Fund daily dividend 15,50,99,949 -
141110 (P. Y. Nil) Kotak Bond Unit Scheme 99 deposit plan 20,00,000 -
2,68,133 (P. Y. Nil) Fidelity Flexi Gilt Fund 32,82,821 -
11804 (P. Y. 2,89,84,360) - Reliance Liquid Fund 1,80,453 28,99,33,459
- (P. Y. 7,00,00,000 ) - ABN AMRO - FMP - 70,00,00,000
- (P. Y. 7,00,00,000) - Birla FMP - Series -AA - 70,00,00,000
- (P. Y. 3,00,00,000) - JM Financial -FMP - 30,00,00,000
- (P. Y. 7,35,51,053) - Reliance Fixed Horizon Fund - FMP - 73,55,10,536
- (P. Y. 3,00,00,000) - Tata Fixed Horizon Fund Series 11 - 30,00,00,000
- (P. Y. 5,00,00,000) - Tata Dynamic Bond Fund - FMP - 50,00,00,000
- (P. Y. 5,00,00,000) - UTI Mutual Fund - FMP - 50,00,00,000
- (P.Y. 7,096 ) - LIC Liquid Mutual Fund - 77,916
- (P. Y. 1,12,59,783) - HDFC Cash Management Fund - 11,29,52,516
- (P.Y. 72,60,188) - Principal Floating Rate Fund - 7,26,91,177
1,54,29,88,349 4,21,11,65,604
TOTAL 4,52,49,57,023 6,33,96,59,557
Notes :
1. Aggregate value of Quoted Investments:
Book Value 54,29,41,131 43,47,42,139
Market Value 19,95,05,179 65,24,56,974
2. Aggregate value of Investment in Mutual Funds: 1,54,29,88,349 4,21,11,65,604
3. Aggregate book value of other Unquoted Investments: 2,43,90,27,543 1,69,37,51,814
* Investment in the Companies under the same management.
** Out of 7,265 shares, 1,995 shares are held by aBank in their name as security
SCHEDULE “G”
INVENTORIES
As taken, valued & certified by the management
Stock in Trade 32,98,400 27,03,688
TOTAL 32,98,400 27,03,688

74
Schedules Annexed to and forming part of the Consolidated Accounts
As at As at31st March 2009 31st March 2008
Rs. Rs. Rs.SCHEDULE “H”SUNDRY DEBTORSUNSECURED (considered good unless otherwise stated)
Debts outstanding for a period exceeding six months
Considered Good 13,88,61,791 4,10,45,548
Considered Doubtful 73,32,883 73,32,883
14,61,94,674 4,83,78,431Less: Provision for Doubtful Debts 73,32,883 73,32,883
13,88,61,791 4,10,45,548Other Debts 21,20,37,103 17,47,81,050
TOTAL 35,08,98,894 21,58,26,598
SCHEDULE “I”CASH AND BANK BALANCESCash on Hand 22,84,294 21,18,093
Balances with Scheduled Banks:In Current Accounts 34,58,46,048 1,54,22,052
In Fixed Deposit Accounts 1,55,62,99,642 15,00,448[Deposit receipt of Rs.14,88,448(Previous year : 14,88,448) pledged as security]In Dividend Accounts 54,10,286 32,63,743
TOTAL 1,90,98,40,270 2,23,04,336
SCHEDULE “J”LOANS AND ADVANCES
Unsecured (considered Good unless otherwise stated)Loans to Subsidiaries
Advances recoverable in cash or in kind or for value 83,46,87,885 62,57,52,133to be receivedLess : Provision for Doubtful advances - 21,32,000
83,46,87,885 62,36,20,133
Inter Corporate Deposits 67,88,50,817 54,85,15,493
Share Application Money pending allotment 2,09,69,06,015 2,41,00,13,610Other Deposits 46,66,68,828 46,99,13,617
TOTAL 4,07,71,13,545 4,05,20,62,853
SCHEDULE “K”CURRENT LIABILITIES
Sundry Creditors
MSME - -Others 43,94,34,023 20,62,80,659
Security Deposits from Occupants 52,60,84,548 40,24,02,312Unpaid Dividends 54,10,286 32,63,743
Other Liabilities 30,03,70,024 29,33,00,276
Interest accrued but not due 49,78,838 -Share Application Money received by Subsidiaries 5,42,44,537 1,14,14,83,337
Book Overdraft 2,38,74,489 -
TOTAL 1,35,43,96,745 2,04,67,30,327

75
Schedules Annexed to and forming part of the Consolidated Accounts
As at As at31st March 2009 31st March 2008
Rs. Rs. Rs.SCHEDULE “L”
PROVISIONS
Gratuity 85,29,678 39,51,547
Leave encashment 1,18,41,321 54,87,692
Taxation (including FBT)[Net of Advance Tax] 3,83,95,518 3,78,13,077
Proposed Dividend 14,48,45,447 14,48,45,447
Tax on Proposed Dividend 2,46,16,484 2,46,16,484
TOTAL 22,82,28,448 21,67,14,247
SCHEDULE “M”
MISCELLANEOUS EXPENDITURE
(To the extent not written off / remaining unadjusted)
Expenses on increase in Share Capital
Balance as per last Balance Sheet 10,45,908 18,56,768
Add: Amount incurred during the year 77,02,364 12,69,418
Less: Amount written off during the year 3,95,632 15,74,478
Less: Adjusted against Securities Premium Account 83,52,640 5,05,800
TOTAL - 10,45,908
SCHEDULE “N”
SALES & SERVICES
Sales 83,50,865 95,02,983
License Fees and Rental Income 52,81,97,012 46,64,11,438
Service Charges 45,13,86,902 32,89,47,087
Income from Events 83,57,858 1,63,31,577
TOTAL 99,62,92,637 82,11,93,085
SCHEDULE “O”
OTHER INCOME
Dividend Income
Current (other than trade) 6,15,32,787 17,46,97,486
Long Term (other than trade) 2,99,951 20,24,074
6,18,32,738 17,67,21,560
Profit on sale of current Investments 31,48,49,139 3,82,12,859
Share of Profit from Partnership Firm in which 2,46,34,912 47,20,941Company is a partner
Interest 10,16,42,468 1,94,37,981
Miscellaneous Receipts 37,165 9,91,250
TOTAL 50,29,96,422 24,00,84,591
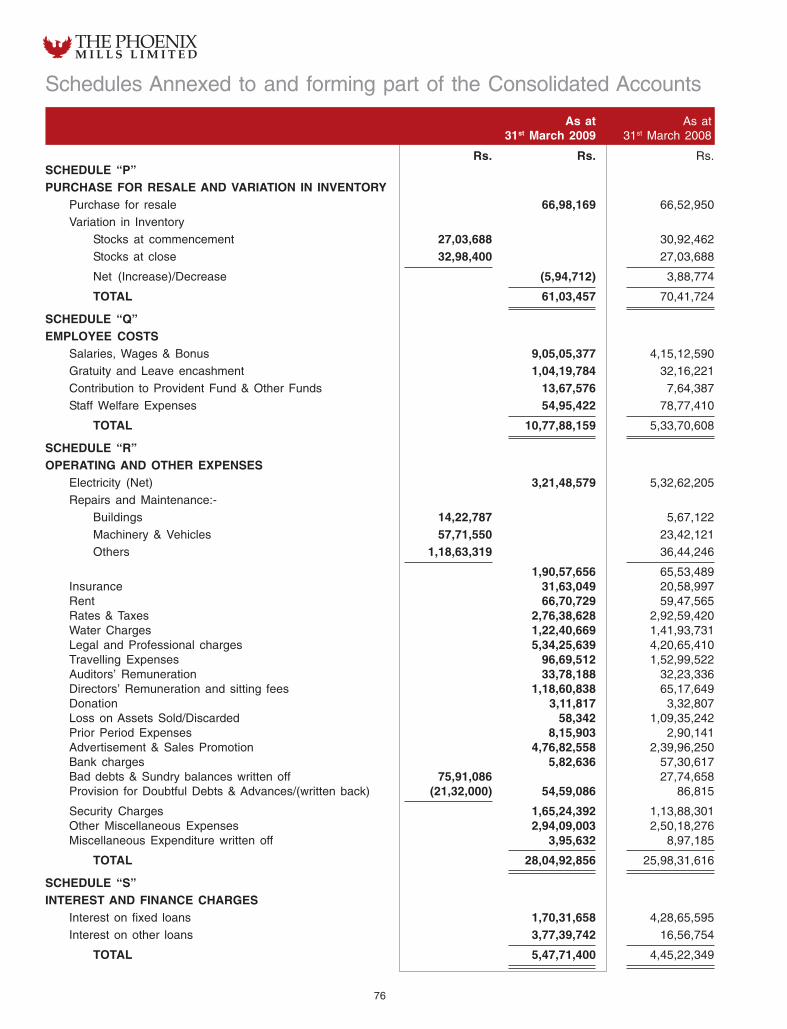
76
Rs. Rs. Rs.SCHEDULE “P”PURCHASE FOR RESALE AND VARIATION IN INVENTORY
Purchase for resale 66,98,169 66,52,950Variation in Inventory
Stocks at commencement 27,03,688 30,92,462
Stocks at close 32,98,400 27,03,688
Net (Increase)/Decrease (5,94,712) 3,88,774
TOTAL 61,03,457 70,41,724
SCHEDULE “Q”EMPLOYEE COSTS
Salaries, Wages & Bonus 9,05,05,377 4,15,12,590Gratuity and Leave encashment 1,04,19,784 32,16,221
Contribution to Provident Fund & Other Funds 13,67,576 7,64,387
Staff Welfare Expenses 54,95,422 78,77,410
TOTAL 10,77,88,159 5,33,70,608
SCHEDULE “R”OPERATING AND OTHER EXPENSES
Electricity (Net) 3,21,48,579 5,32,62,205Repairs and Maintenance:-
Buildings 14,22,787 5,67,122
Machinery & Vehicles 57,71,550 23,42,121Others 1,18,63,319 36,44,246
1,90,57,656 65,53,489Insurance 31,63,049 20,58,997Rent 66,70,729 59,47,565Rates & Taxes 2,76,38,628 2,92,59,420Water Charges 1,22,40,669 1,41,93,731Legal and Professional charges 5,34,25,639 4,20,65,410Travelling Expenses 96,69,512 1,52,99,522Auditors’ Remuneration 33,78,188 32,23,336Directors’ Remuneration and sitting fees 1,18,60,838 65,17,649Donation 3,11,817 3,32,807Loss on Assets Sold/Discarded 58,342 1,09,35,242Prior Period Expenses 8,15,903 2,90,141Advertisement & Sales Promotion 4,76,82,558 2,39,96,250Bank charges 5,82,636 57,30,617Bad debts & Sundry balances written off 75,91,086 27,74,658Provision for Doubtful Debts & Advances/(written back) (21,32,000) 54,59,086 86,815
Security Charges 1,65,24,392 1,13,88,301Other Miscellaneous Expenses 2,94,09,003 2,50,18,276Miscellaneous Expenditure written off 3,95,632 8,97,185
TOTAL 28,04,92,856 25,98,31,616
SCHEDULE “S”INTEREST AND FINANCE CHARGES
Interest on fixed loans 1,70,31,658 4,28,65,595
Interest on other loans 3,77,39,742 16,56,754
TOTAL 5,47,71,400 4,45,22,349
Schedules Annexed to and forming part of the Consolidated Accounts
As at As at31st March 2009 31st March 2008

77
SCHEDULE ANNEXED TO AND FORMING PART OF THE CONSOLIDATED ACCOUNTS
SCHEDULE “T”:
SIGNIFICANT ACCOUNTING POLICIES AND NOTES ON CONSOLIDATED ACCOUNTS FORMING PART OF THEBALANCE SHEET AS AT 31ST MARCH, 2009 AND THE CONSOLIDATED PROFIT AND LOSS ACCOUNT FOR THEYEAR ENDED ON THAT DATE
A. SIGNIFICANT ACCOUNTING POLICIES
1. Principles of consolidation
a) The financial statements of the Company and its subsidiary companies are combined on a line-by-line basis byadding together the book values of like items of assets, liabilities, income and expenses, after fully eliminating intra-group balances and intra-group transactions resulting in unrealised profits or losses in accordance with AccountingStandard (AS) 21 - “Consolidated Financial Statements” as notified by the Companies (Accounting Standards)Rules, 2006.
b) The difference between the cost of investment in the subsidiaries, over the net assets at the time of acquisition ofshares in the subsidiaries is recognised in the financial statements as Goodwill or Capital Reserve as the case maybe.
c) Minority Interest’s share of net profit of consolidated subsidiaries for the year is identified and adjusted against theincome of the group in order to arrive at the net income attributable to shareholders of the Company.
d) Minority Interest’s share of net assets of consolidated subsidiaries is identified and presented in the ConsolidatedBalance Sheet separate from liabilities and the equity of the Company’s shareholders.
e) In case of associates where the Company directly or indirectly through subsidiaries holds more than 20% of equity,Investments in associates are accounted for using equity method in accordance with Accounting Standard (AS) 23- “Accounting for investments in associates in Consolidated Financial Statements” as notified by the Companies(Accounting Standards) Rules, 2006.
f) The Company accounts for its share in the change in the net assets of the associates, post acquisition, aftereliminating unrealised profits and losses resulting from transactions between the Company and its associates tothe extent of its share, through its Profit and Loss Account to the extent such change is attributable to theassociates’ Profit and Loss Account and through its reserves for the balance, based on the available information.
g) The difference between the cost of investment in the associates and the share of net assets at the time ofacquisition of shares in the associates is identified in the financial statements as Goodwill or Capital Reserve as thecase may be.
h) As far as possible, the consolidated financial statements are prepared using uniform accounting policies for liketransactions and other events in similar circumstances and are presented in the same manner as the Company’sseparate financial statements.
2. Investments other than in subsidiaries and associates have been accounted as per Accounting Standard (AS) 13“Accounting for Investments”.
3. Other significant accounting policies
a) Use of estimates:
The preparation of financial statements requires estimates and assumptions to be made that affect the reportedamount of assets and liabilities on the date of the financial statements and the reported amount of revenues andexpenses for the reporting period. The difference between the actual results and estimates are recognised in theperiod in which the results are known/materialised.
b) Fixed Assets:
i) Fixed Assets are stated at cost net of CENVAT credit and include amounts added on revaluation, lessaccumulated depreciation and impairment loss, if any.
ii) Expenditure incurred on construction/erection of assets, which are incomplete as at balance sheet date, areincluded in Capital Work in Progress.
c) Depreciation:
i) Leasehold land is amortized over the period of lease.
ii) Depreciation on plant and machinery is provided on straight line method at the rates and in the mannerspecified in Schedule XIV to the Companies Act, 1956

78
SCHEDULE ANNEXED TO AND FORMING PART OF THE CONSOLIDATED ACCOUNTS
SCHEDULE “T” : (Continued)
iii) Depreciation on other fixed assets (excluding Land and Lease Land in perpetuity) of holding company and allfixed assets of subsidiaries are provided on written down value method at the rates and in the mannerspecified in schedule XIV to the Companies Act, 1956
iv) In respect of certain revalued assets of holding company, (Land, Buildings and Plant & Machinery) depreciationhas been calculated on the revalued figures as per the rates and in the manner specified by the valuers in theirRevaluation Report. The difference between the depreciation so computed and that computed as per (i), (ii)and (iii) above has been charged to the Revaluation Reserve.
d) Impairment of Assets:
In accordance with AS 28 on “Impairment of Assets” as notified by the Companies (Accounting Standards) Rules,2006, where there is any indication of impairment of the Company’s assets related to cash generating units, thecarrying amounts of such assets are reviewed at each Balance Sheet date to determine whether there is anyimpairment. The recoverable amount of such assets is estimated as the higher of its net selling price and its valuein use. An impairment loss is recognised whenever the carrying amount of such assets exceeds its recoverableamount. Impairment Loss, if any, is recognised in the Profit and Loss Account.
e) Investments:
Long term investments are valued at cost of acquisition less diminution if any, of a permanent nature. CurrentInvestments are stated at cost or market/fair value whichever is lower.
f) Inventories:
Inventories are valued at lower of cost or net realisabile value. Cost is determined on FIFO basis.
g) Borrowing Costs:
Borrowing costs that are attributable to the acquisition or construction of qualifying assets are capitalised as part ofthe cost of such assets. A qualifying asset is an asset that necessarily takes a substantial period of time to getready for its intended use or sale. All other borrowing costs are recognised as an expense in the period in whichthey are incurred.
h) Revenue recognition:
Revenue is recognised when it is earned and no significant uncertainty exists as to its realisation or collection.License Fees, Rental Income and Service Charges are recognised based on contractual rights. Interest is recognisedon time proportion basis. Dividend income is recognised when the right to receive the same is established.
i) Employee Benefits:
i) Short term employee benefits are recognised as expenses at the undiscounted amounts in the Profit & LossAccount of the year in which the related service is rendered.
ii) Post employment and other long term employee benefits are recognised as an expense in the Profit & LossAccount for the year in which the employee has rendered services. The expenses are recognised at thepresent value of the amounts payable determined using actuarial valuation techniques. Actuarial gains andlosses in respect of post employment and other long term benefits are charged to the Profit & Loss Account.
j) Foreign Currency transactions:
i) Transactions denominated in foreign currencies are recorded at the exchange rate prevailing at the time of thetransaction.
ii) Exchange differences arising as a result of the subsequent settlements of transactions are recognised asincome or expense in the Profit and Loss Account.
k) Share issue expenses:
Expenses in connection with issue of shares are adjusted against Securities Premium account.
l) Taxes on Income:
i) Provision for income tax (current tax) is determined on the basis of the taxable income of the current year inaccordance with the Income Tax Act, 1961.
ii) Deferred tax is recognised in respect of Deferred Tax Assets (subject to the consideration of prudence) andDeferred Tax Liabilities on timing differences, being the difference between taxable income and accountingincome that originate in one year and are capable of reversal in one or more subsequent years.
iii) Provision for Fringe Benefit Tax is determined on the basis of the value of the taxable Fringe Benefits conferredby the Company during the year.

79
SCHEDULE ANNEXED TO AND FORMING PART OF THE CONSOLIDATED ACCOUNTS
SCHEDULE “T” : (Continued)
m) Provisions, Contingent Liabilities and Contingent Assets:
Provisions involving substantial degree of estimation in measurement are recognised when there is a presentobligation as a result of past events and it is probable that there will be an outflow of resources. ContingentLiabilities are not recognised but are disclosed in the Notes on Accounts. Contingent Assets are neither recognisednor disclosed in the financial statements.
B NOTES TO ACCOUNTS
1. The Subsidiary Companies considered in the consolidated financial statements are:
Name of the Subsidiaries Country of Proportion ofIncorporation ownership interest
Pallazzio Hotels and Leisure Limited India 100%
Bellona Finvest Limited India 100%
Marketcity Resources Private Limited India 100%
Pinnacle Real Estate Development Private Limited India 66.67%
Palladium Constructions Private Limited India 62.98%
Kalani Holdings Private Limited India 100%
Ruia Realtors Private Limited (from 02-06-2008) India 100%
Plutocrat Assets & Capital Management Private Limited (from 15-07-2008) India 100%
Big Apple Real Estate Private Limited (BAREPL) (from 01-04-2008) India 73.47%
Vamona Developers Private Limited India 51%
Upal Developers Private Limited (subsidiary of BAREPL from 1-4-2008) India 45.92%
Blackwood Developers Private Limited (subsidiary of BAREPL from 05.03.09) India 73.46%
Gangetic Developers Private Limited (subsidiary of BAREPL from 1-4-2008) India 41.19%
Market City Management Private Limited (from 18-06-2008) India 54.69%
2. The Associate Companies considered in the consolidated financial statements are:
Name of the Subsidiaries Country of Proportion ofIncorporation ownership interest
Entertainment World Developers Private Limited India 40.28%
Island Star Mall Developers Private Limited India 21.41%
Escort Developers Private Limited India 50.00%
Classic Software Technology Park Developers Private Limited India 32.00%
Classic Mall Development Company Private Limited India 32.00%
Ramayana Realtors Private Limited India 33.33%
Juniper Developers Private Limited India 45.00%
Offbeat Developers Private Limited India 25.54%
Picasso Developers Private Limited (from 25-08-2008) India 33.33%
Bartraya Mall Development Company Private Limited India 50.00%

80
SCHEDULE ANNEXED TO AND FORMING PART OF THE CONSOLIDATED ACCOUNTS
SCHEDULE “T” : (Continued)
Investment in Associates includes :
Name of Associates Cost of Goodwill/ Acquisition (Capital Reserve)
included in cost ofacquisition
Entertainment World Developers Pvt. Ltd. 57,92,70,269 24,57,45,102
Island Star Mall Developers Pvt. Ltd. 1,33,606 (30,93,83,325)
Escort Developers Pvt. Ltd. 1,59,50,000 2,268
Classic Software Technology Park Developers Pvt. Ltd. 1,28,892 (3,37,653)
Classic Mall Development Company Pvt. Ltd. 21,32,37,771 10,78,557
Ramayana Realtors Pvt. Ltd. 4,41,86,012 77,37,461
Juniper Developers Pvt. Ltd. 46,620 8,478
Offbeat Developers Pvt. Ltd. 24,70,37,912 (34,31,30,685)
Picasso Developers Pvt. Ltd. 2,00,00,400 24,90,607
Bartraya Mall Development Co. Pvt. Ltd. 50,000 Nil
3. Contingent liabilities not provided for in respect of:-
i) Disputed excise duty liability amounting Rs. 1,13,76,598/- (P.Y. Rs. 1,13,76,598/- )ii) Other claims against the Company amounting to Rs. 43,02,309/- not acknowledged as debts. (P.Y. Rs. 43,02,309/- )iii) Corporate guarantee issued by the Company amounting to Rs. 50,00,00,000/- (P.Y. Rs. Nil) to secure financial
assistance being availed by a company under the same management.iv) Disputed entry tax liability amounting to Rs. 1,02,44,297/- (P.Y. Rs. Nil).v) Outstanding guarantees given by Banks Rs. 2,21,32,469/- (Previous year Rs. 80,00,000/-).vi) Estimated amount of contracts remaining to be executed on capital account and not provided for in the accounts is
Rs. 276,91,25,624/- (P.Y. Rs. 325,86,06,216/-) net of advance paid.vii) Demand notices received for damages / interest on account of arrears / late payments of Provident Fund and
E.S.I.C. dues amounting to Rs. 31,48,254/- are disputed by the Company. The Company has paid Rs. 10,00,000/-against P.F. damages to the P.F. authorities and has also furnished a Bank Guarantee for Rs. 14,71,165/- .In respect of the demands for additional contribution (excluding interest, damages etc.)amounting to Rs. 26,226/-towards E.S.I.C. dues, the E.S.I.C. court has confirmed the said liability of the Company, which has since beenunpaid.
viii) The Income tax assessments of the Company have been completed up to Assessment Year 2005-06. However, thecompany as well as the Income Tax Department are in appeal before the Appellate Authorities against theassessments of earlier Financial Years. The impact thereof, if any, on the tax position can be ascertained only afterthe disposal of the above appeals. Accordingly, the accounting entries arising therefrom will be passed in the yearof the disposal of the said appeals.
4. Based on the valuation reports of the Government approved valuers, the Group had revalued the assets of holdingcompany consisting of Land including Leasehold Land and Land Leased in perpetuity, Buildings and Plants andMachinery as on 31st March 1985. Depreciation on revalued land, building and plant and machinery has been calculatedas per the rates specified by the valuers, which includes an additional charge amounting to Rs. 9,41,989/-(P.Y. Rs.9,30,968/-) in comparison to depreciation provided under the Companies Act, 1956, and an equivalent amounthas been withdrawn from Revaluation Reserve and credited to Profit and Loss account.
5. The High Court of Judicature at Mumbai in the writ petition filed by Retailers Association of India has passed an interimorder dated 30th July, 2008, staying the collection of service tax on rental of immovable property from the members ofthe association. The Company has, however, based on the legal advice continued to levy the service tax on the license/conducting fees/common area maintenance charges and has accounted the corresponding service tax liability. Basedon the aforesaid interim order, the association members have not paid the service tax component billed to them and theCompany has also not deposited the said service tax amount.
The Balances of the sundry debtors [licensees] are subject to confirmations from the respective parties and are pendingreconciliations/adjustments arising on account of service tax billed.

81
SCHEDULE ANNEXED TO AND FORMING PART OF THE CONSOLIDATED ACCOUNTS
SCHEDULE “T” : (Continued)
6. The balances in respect of sundry creditors, loans and advances, deposits and fixed deposits pledged with exciseauthorities, either debit or credit as appearing in the books of accounts have been substantially confirmed by therespective parties.
7. The Group’s holding company is a partner in a partnership firm M/s. Phoenix Construction Company. The accounts ofthe partnership firm have been finalised upto the financial year 2007-2008. The details of the Capital Accounts of thePartners as per the latest Financial Statements of the firm are as under:-
Sr. Name of the Partners Profit Total Capital onNo. Sharing ratio
31/03/2008 31/03/2007Rs. Rs.
1. The Phoenix Mills Ltd. 50% 6,52,51,82 82,81,16,915
2. Gold Seal Holding Pvt.Ltd. 50% 6,67,44,642 4,21,09,729
The Group has accounted for its share of profit amounting to Rs. 2,46,34,912/- pertaining to the financial year2007-2008 in the current year. The share of profit/loss for the current financial year will be accounted in the books of theCompany on the finalisation of the accounts of the firm.
8. The Auditors’ Remuneration includes:
Particulars 2008-09 2007-08(Rs.) (Rs.)
Audit fees 25,00,000 25,00,000
Tax Audit fees 5,00,000 5,00,000
Certification and other fees 1,67,000 5,25,000
Service Tax 3,91,441 4,35,690
Total 35,58,441 39,60.690
9. The following amounts have been paid / are payable as remuneration to the Directors (including managing Directors) forservices rendered by them: -
2007-08 2006-07Particulars (Rs.) (Rs.)
Salary 1,13,10,742 37,46,320
House Rent Allowance 70,194 18,79,200
Other Perquistes/Reimbursements 2,57,402 5,29,629
Total 1,16,38,338 61,55,149
10. Zero Coupon Compulsory Convertible Debentures
“Series A”
Pallazzio Hotels & Leisure Limited (“Pallazzio”) has issued 6,35,294 Non Cumulative Unsecured Convertible Debentures(the “CDs”) “Series A” of face value of Rs.100/- each. The investors have the option to convert each CD into one equityshare of Pallazzio of Rs.100/- at any time on or after 1.4.2016. The CDs shall carry Zero Coupon till 31st March 2016and not more than 2% p.a., as may be decided by the company, for the period of non conversion after 31.3.2016. At theend of the 10th year from the date of the issue, each CD will compulsorily convert into one equity share of Rs.100/- ofPallazzio.

82
SCHEDULE ANNEXED TO AND FORMING PART OF THE CONSOLIDATED ACCOUNTS
SCHEDULE “T” : (Continued)
“Series B”
Pallazzio has issued 7,03,057 Non Cumulative Unsecured Compulsory Convertible Debentures “Series B” of face value ofRs. 100/- each at a premium of Rs.1721.66/- per Debenture. The investors have the option to convert each Debentureinto one equity share of the Company of Rs.100/- at any time on or after 1.4.2015. The Debenture shall carry ZeroCoupon till 31st March 2015 and for the period of non conversion after 31.3.2015 the instrument may be entitled tocoupon rate of not more than 2% p.a., as may be decided by the Company. On 1st April 2017 each Debenture willcompulsorily convert into one equity share of Rs.100/- each of Pallazzio.
11. Expenditure incurred during construction period :
The Group’s various projects relating to construction of commercial, retail, hotel and entertainment complexes are inprogress. The expenditure incurred during the construction period is treated as “Project Development Expenditure”pending capitalisation. The same has been included under Capital Work In Progress and will be apportioned to fixedassets on the completion of the project.
The details of Project Development Expenditure as on the date of Balance sheet are as under:
Particulars2008-09 2007-08Amount Amount
(Rs.) (Rs.)
Opening Balance 33,90,50,329 8,84,28,575
Opening Balance of New Subsidiaries 11,24,15,035 -
Expenditure
Salary & Allowances 4,72,08,198 99,91,360
Project Management Fees 1,15,58,079 2,29,51,872
Rent, Rates & Taxes 5,35,02,111 4,78,209
Legal, Professional & Consultancy Fees 2,83,18,073 1,30,78,116
Travelling Expenses 1,20,38,463 21,95,969
Computer Consumables, Print. & Stat. 5,81,170 30,318
Entertainment & Business Expense 2,69,168 24,760
Miscellaneous Expenses 1,97,77,955 59,31,920
Bank Charges 3,71,744 20,983
Auditors’ Remuneration 7,80,538 1,88,540
Depreciation 12,12,484 -
Interest 58,02,46,536 21,06,93,842
Total 75,58,64,519 26,55,85,889
Income
Dividend income on Current Investments 5,54,87,527 1,28,76,203
Total 5,54,87,527 1,28,76,203
Less : Project Development Expenses Capitalised during the year 15,56,937 20,87,932
Closing Balance 115,02,85,419 33,90,50,329

83
SCHEDULE ANNEXED TO AND FORMING PART OF THE CONSOLIDATED ACCOUNTS
SCHEDULE “T” : (Continued)
12. The disclosure in respect of Segment information as per Accounting Standard (AS) 17 on “Segment Reporting” asnotified by the Companies (Accounting Standards) Rules, 2006, is as under:
Sr. Particulars Property & Textile / Cloth Unallocated TotalNo. Related Services Trading
A REVENUE1 Income from Operations & Sales 9,87,942 8,351 9,96,293
(7,74,948) (9,503) (7,84,451)2 Other Income 5,02,996 5,02,996
(2,40,085) (2,40,085)
TOTAL 14,99,289 (10,24,536)
B RESULTS 1 Profit Before Tax & Interest 5,06,362 2,071 5,02,996 10,11,429
(4,22,358) (2,284) (2,40,085) (6,64,727)2 Less: Interest 54,771
(44,522)3 Profit Before Tax 9,56,658
(6,20,205)4 Less : Provision for Taxation 1,89,738
(1,92,498)
5 NET PROFIT AFTER TAX 7,66,920 (4,27,707)
C OTHER INFORMATION 1 Segment Assets 1,46,88,300 3,690 95,97,123 2,42,89,113
(90,51,634) (3,085) (99,01,055) (1,89,55,774)2 Intangible Assets- Misc.Exp. -
(1,046)3 Deferred Tax Assets / Liabilities (Net) 11,015
(9,754)4 Total Assets 2,43,00,128
(1,89,66,574)5 Segment Liabilities 13,13,836 1,277 78,37,668 91,52,781
(9,18,542) (285) (43,99,724) (53,18,551)
6 Capital Expenditure 51,91,566 - 51,91,566 (61,92,794) - (61,92,794)
7 Depreciation 93,475 - 93,475 (76,306) - (76,306)
8 Non Cash Expenses other than Depreciation
a ) Provision for Doubtful Debtors and Advances -2,132 (87)
b ) Bad Debts & balances written off 7,591 (2,775)
Notes:i The Group has disclosed Business Segment as the primary Segment. In the opinion of the Management, the
Group is organised into two business segments namely, Property & Related Services and Textile / Cloth Trading.These segments have been identified in line with AS-17 on segment reporting.
ii The activities of the Group being carried on totally within India, the information about Secondary Segment (GeographicSegments) is not required to be given.
iii Segment Revenue, results and other information includes the respective amounts identifiable to each of thesegments as also amounts allocated on a reasonable basis. The items/information which relates to the Group as awhole and cannot be directly identified with any particular business segment have been shown separately.

84
SCHEDULE ANNEXED TO AND FORMING PART OF THE CONSOLIDATED ACCOUNTS
SCHEDULE “T” : (Continued)
13. In view of the Accounting Standard : AS 18 on Related Parties Disclosures as notified by the Companies (AccountingStandards) Rules 2006, the disclosure in respect of related party transactions for the year ended on31st March 2009 is as under:
a) RELATIONSHIPS
Category I : Associates
Entertainment World Developers Private Limited
Escort Developers Private Limited
Ramayana Realtors Private Limited
Juniper Developers Private Limited
Offbeat Developers Private Limited
Island Star Mall Developers Private Limited
Classic Mall Development Company Private Limited
Classic Software Technology Park Developers Private Limited
Bartraya Mall Development Company Private Limited
Picasso Developers Private Limited
Category II : Other Related Parties where common control exists
B. R. International.
Ashok Apparels Private Limited
R.R.Hosiery Private Limited
R.R. Hosiery
R.R. Textiles
Phoenix Construction Company
Galaxy Entertainment Corporation Limited
Phoenix Hospitality Company Private Limited
Ruia International Holding Company Private Limited
Category III : Key Managerial Personnel
Ashokkumar R. Ruia
Atul Ruia
Pramod S. Rawool
Kiran B. Gandhi
Category IV : Relatives of Key Managerial Personnel
Amla A Ruia
Gayatri A Ruia
Atul A Ruia HUF
Ashokkumar Ruia HUF

85
SCHEDULE ANNEXED TO AND FORMING PART OF THE CONSOLIDATED ACCOUNTS
SCHEDULE “T” : (Continued)
b) The following transactions were carried out with the related parties in the ordinary course of business in thefinancial year under report :
(Rs. in Thousands)
Sr.No. TRANSACTIONS Category I Category II Category III Category IV
1 Rent, Compensation &Other recoveries 204 92,350 - -
- (65,875) - -2 Interest Received 12,586 - - -
3 Remuneration / Salary Paid - - 11,638 -- - (6,155) -
4 Administrative & Other Charges paid 126,912 6,153 - -(48,457) (6,182) - -
5 Cloth Purchased from - 1,729 - -- (793) - -
6 Cloth Sold to - 288 - -- (710) - -
7 Loans taken from - 26,050 - -(589,986) (814,478) - -
8 Repayment of loans to 26,000 497,846 - -(92,140) (1,783,933) - -
9 Loans given to 250,000 - - -(420,000) (135,000) - -
10 Loans returned by 80,000 - - -- (1,858,383) - -
11 Deposits received / returned 5,000 - - -- (-3,825) (-18,194) (-3,825)
12 Compensation / Surrender of Tenancy - 65,254 402,002 71,688rights paid - (27,729) (32,848) (8,842)
13 Investment in Shares/applicationmoney pending allotment 310,000 200,200 - -
(3,354,175) (613,400) - -14 Purchase of Fixed Assets - 48,189 - -
- (25,773) - -
15 Balance written off 24 - - -- - - -

86
c) The following balances were due from / to the related parties as on 31-03-2009(Rs. in Thousands)
Sr.No. TRANSACTIONS Category I Category II Category III Category IV
1 Unsecured Loans - - - -
(497,846) - - -
2 Investment in Equity Shares / pref shares 1,056,214 - - -
(1,326,313) - - -
3 Investment in Capital of Partnership Firm - - - -
- (30,913) - -
4 Loans and Advances (Net) 210,783 50 - -
- (119,033) - -
5 Sundry Debtors - 40,167 - -
- (14,308) - -
6 Sundry Creditors - 22,259 - -
- (4,711) - -
7 Deposits received - 45,047 - -
- (25,446) (18,194) -
8 Deposits Given - 450,000 - -
- (450,000) - -
9 Application money pending allotment 967,403 - - -
(2,410,014) - - -
14. Earnings per share (EPS): 2008-09 2007-08
Net Profit after Tax (Rs.) 76,78,19,447/- 42,67,07,328/-
Weighted Average No. of Equity Shares 14,17,06,177 10,47,59,147
Nominal Value of Equity Shares (Rs.) 2/- 2/-
Basic Earning Per Share (Rs.) 5.42 4.07
SCHEDULE ANNEXED TO AND FORMING PART OF THE CONSOLIDATED ACCOUNTS
SCHEDULE “T” : (Continued)

87
15. Deferred Tax:
In accordance with the Accounting Standard (AS) 22 “Accounting for Taxes on Income” as notified by the Companies(Accounting Standards) Rules 2006, the Company has created deferred tax assets of Rs.14,44,794/- for the currentyear. The break up of the net deferred tax asset as on 31st March, 2009 is as under:
Particulars Deferred tax Current Year Deferred tax Asset/(Liability) (Charge)/ Asset/(Liability)
as at 1-04-08 Credit as at 31-03-09Rs. Rs. Rs.
Deferred Tax Asset
Disallowance u/s 43B and Others 32,35,530 27,88,585 60,24,115
Provision for Doubtful debts and advances 32,17,115 (7,24,667) 24,92,448
Difference between Book and Tax 33,01,476 (8,03,266) 24,98,210
Depreciation
Deferred Tax Assets (Net) 97,54,121 12,60,652 1,10,14,773
16. The previous year’s figures have been regrouped and / or recasted wherever necessary so as to conform to the currentyear’s classification.
SCHEDULE ANNEXED TO AND FORMING PART OF THE CONSOLIDATED ACCOUNTS
SCHEDULE “T” : (Continued)
As per our report of even dateFor A.M.Ghelani & Company For Chaturvedi & Shah For and on behalf of the Board of DirectorsChartered Accountants Chartered Accountants
Ashokkumar R. RuiaChairman & Managing Director
Chintan A. Ghelani Amit Chaturvedi Atul Ruia Sivaramakrishnan IyerPartner Partner Jt. Managing Director Director
Mumbai Kiran B. Gandhi Amit DalalDated : 27th July, 2009 Whole-time Director Director

88
NOTES

Disclaimer
In this Annual Report, we have disclosed forward-looking information to enable investors to comprehend our prospects and
take informed investment decisions. This report and other statements - written and oral - that we periodically make contain
forward-looking statements that set out anticipated results based on the management's plans and assumptions. We have tried
wherever possible to identify such statements by using words such as 'anticipate', 'estimate', 'expects', 'projects', 'intends',
'plans', 'believes' and words of similar substance in connection with any discussion of future performance. We cannot guarantee
that these forward-looking statements will be realised, although we believe we have been prudent in our assumptions. The
achievement of results is subject to risks, uncertainties and even inaccurate assumptions. Should known or unknown risks or
uncertainties materialise, or should underlying assumptions prove inaccurate, actual results could vary materially from those
anticipated, estimated or projected. Readers should bear this in mind. We undertake no obligation to publicly update any forward-
looking statements, whether as a result of new information, future events or otherwise.

AP
RIS
M s
olut
ion
(ww
w.p
rism
.net
.in)
Prin
ted
at In
fom
edia
18 L
td.
The Phoenix Mills Limited
462, Senapati Bapat Marg, Lower Parel, Mumbai - 400 013.
Ph: +91 022 2496 4307/08/09 • www.thephoenixmills.com