Rapport de mission - Cirad Authentication Service
81
State of Knowledge Report Inventory of State of Knowledge on Breeding for Quality of Roots, Tubers and Bananas Montpellier, November 2018 WP4 Leader, Hâna Chaïr, Cirad, Montpellier, France Cassava: Hernan Ceballos, CIAT, Cali, Colombia Robert Kawuki, NaCRRI, Namulongue, Uganda Emphraim Nuwamanya, NaCRRI, Namulongue, Uganda Esuma Williams, NaCRRI, Namulongue, Uganda Chiedozie Egesi, NRCRI, Umudike, Nigeria Yam: Asrat Amele, IITA, Ibadan, Nigeria Jude Obidiegwu, NRCRI, Umudike, Nigeria, Michel Kouakou Amani, CNRA, Abidjan, Côte d’Ivoire, Fabien Cormier, Cirad, Guadeloupe, France, Potato: Thiago Mendes, CIP, Uthiru, Kenya Sweetpotato: Robert Mwanga, CIP-SSA, Kampala, Uganda Matooke: Brigitte Uwimana, IITA, Kampala, Uganda Michael Batte, IITA, Kampala, Uganda
-
Upload
khangminh22 -
Category
Documents
-
view
9 -
download
0
Transcript of Rapport de mission - Cirad Authentication Service

State of Knowledge Report
Inventory of State of Knowledge on Breeding for Quality of Roots, Tubers
and Bananas
Montpellier, November 2018 WP4 Leader, Hâna Chaïr, Cirad, Montpellier, France
Cassava: Hernan Ceballos, CIAT, Cali, Colombia Robert Kawuki, NaCRRI, Namulongue, Uganda
Emphraim Nuwamanya, NaCRRI, Namulongue, Uganda Esuma Williams, NaCRRI, Namulongue, Uganda
Chiedozie Egesi, NRCRI, Umudike, Nigeria Yam: Asrat Amele, IITA, Ibadan, Nigeria
Jude Obidiegwu, NRCRI, Umudike, Nigeria, Michel Kouakou Amani, CNRA, Abidjan, Côte d’Ivoire,
Fabien Cormier, Cirad, Guadeloupe, France, Potato: Thiago Mendes, CIP, Uthiru, Kenya
Sweetpotato: Robert Mwanga, CIP-SSA, Kampala, Uganda Matooke: Brigitte Uwimana, IITA, Kampala, Uganda
Michael Batte, IITA, Kampala, Uganda

1
This report has been written in the framework of RTBfoods project.
To be cited as:
Hâna CHAIR, Hernan CEBALLOS, Robert KAWUKI, Emphraim NUWAMANYA, Esuma WILLIAMS, Chiedozie EGESI, Yam: Asrat AMELE, Jude OBIDIEGWU, Michel Amani KOUAKOU, Fabien CORMIER, Thiago MENDES, Robert MWANGA, Brigitte UWIMANA, Michael BATTE. 2018; Inventory of State of Knowledge on Breeding for Quality of Roots, Tubers and Bananas. Montpellier (France). RTBfoods Project Report, 80 p.
Image cover page © Dufour D. for RTBfoods.

2
CONTENTS Table of Contents
1. Breeding cassava for quality traits .............................................................................................. 10
Introduction .................................................................................................................................... 10
1.1. Cassava Breeding for Quality Traits at CIAT: Colombia ...................................................... 11
1.1.1. Genetic variation among cassava clones adapted to different end uses....................... 11
1.1.2. Quality traits required for boiling cassava and marketing considerations ...................... 12
1.1.3. Post-harvest physiological deterioration (PPD) ............................................................ 14
1.1.4. Dry matter content ....................................................................................................... 17
1.1.5. Cyanogenic potential .................................................................................................... 21
1.1.6. Boiling time .................................................................................................................. 23
1.1.7. Cooking quality ............................................................................................................ 27
1.2. Cassava Breeding for Quality Traits at NaCRRI: Uganda .................................................... 28
1.2.1. Assessment for root dry matter content ........................................................................ 29
1.2.2. Cassava total carotenoid determination ....................................................................... 29
1.2.3. Determination of cyanide content ................................................................................. 30
1.2.4. Assessment of softness of cooked roots ...................................................................... 32
1.2.5. Genetic variability in NaCRRI breeding program .......................................................... 33
1.3. Cassava Breeding for Quality Traits at NRCRI: Nigeria ....................................................... 34
1.3.1. Phenotyping for quality traits at NRCRI, Umudike ........................................................ 35
1.3.2. Participatory quality evaluation of cassava by farmers and consumers ........................ 37
1.3.3. Genetic variability in NRCRI cassava breeding program .............................................. 38
1.4. Cassava Gap Analysis ........................................................................................................ 39
2. Breeding yam for quality traits .................................................................................................... 42
Introduction .................................................................................................................................... 42
2.1. Yam Breeding for Quality Traits at IITA : Nigeria ................................................................. 43

3
2.1.1. Phenotyping for quality traits ........................................................................................ 43
2.1.2. Genetic variability in IITA breeding program ................................................................. 44
2.2. Yam Breeding for Quality Traits at NRCRI: Nigeria ............................................................. 45
2.2.1. Phenotyping for quality traits ........................................................................................ 45
2.2.2. Status of NRCRI breeding populations in respect to quality ......................................... 46
2.3. Yam Breeding for Quality Traits at CNRA IITA: Côte d’Ivoire .............................................. 50
2.3.1. Phentotyping for quality traits ....................................................................................... 51
2.3.2. Participatory quality evaluation by farmers and consumers .......................................... 51
2.3.3. Genetic variability in CNRA breeding program ............................................................. 52
2.4. Yam Breeding for Quality Traits at CIRAD-INRA: Guadeloupe ............................................ 52
2.5. Yam Breeding for Quality Gap Analysis .............................................................................. 54
3. Breeding potato for quality traits ................................................................................................. 56
Introduction .................................................................................................................................... 56
3.1. Potato Breeding for Quality Traits at CIP: Uganda .............................................................. 56
3.1.1. Quality traits assessment at CIP .................................................................................. 56
3.1.2. Breeding potato for quality traits ................................................................................... 57
3.2. Potato Breeding for Quality Gap Analysis ........................................................................... 57
4. Breeding sweetpotato for quality traits ........................................................................................ 60
Introduction .................................................................................................................................... 60
4.1. Sweetpotato Breeding for Quality Traits at CIP: Uganda ..................................................... 61
4.1.1. Phenotyping for quality traits ........................................................................................ 62
4.1.2. Genetic variability in CIP breeding program ................................................................. 63
4.2. Sweetpotato Breeding for Quality Gap Analysis .................................................................. 64
5. Breeding matooke for quality traits ............................................................................................. 66
Introduction .................................................................................................................................... 66
5.1. Matooke Breeding for Quality Traits at IITA: Uganda .......................................................... 66
5.1.1. Breeding programs ...................................................................................................... 66
5.1.2. Phenotyping for quality traits ........................................................................................ 67

4
5.2. Matooke Breeding for Quality Gap Analysis ........................................................................ 68
6. References ................................................................................................................................. 69
7. Annexes ..................................................................................................................................... 74
7.1. Annex 1: List of yams officially released in Nigeria .............................................................. 74
7.2. Annex 2: List of Morphological traits, Agronomical traits and Characteristics post-harvest for potato at CIP.................................................................................................................................. 76
7.3. Annex 3: Characteristics of CIP392797.22 variety available online at Catalogue of CIP Potato Varieties. ....................................................................................................................................... 79
Table of Figures
Figure 1. Different value chains of cassava roots for table consumption. A. African local markets. B. Frozen sections of cassava roots sold in a Colombian supermarket. ................................................. 12
Figure 2. Illustration of simple processing technologies of cassava for table consumption. A. Selection in the field of roots with adequate size and shape. B. Brushing and washing roots. C. Treating roots with fungicide. D. Drying roots after fungicide treatment. E. Waxing roots with melted paraffin. F. Illustration of waxed roots (top) and non-waxed roots bagged and ready to delivery, for example, to restaurants. ....................................................................................................................................... 13
Figure 3. A. Illustration of frozen cassava kept at temperatures below 0 °C. B. An emerging market for table consumption of cassava in China. C. Boiled and canned cassava roots. .................................. 13
Figure 4. Histogram with frequencies for dry matter content in more than 4000 cassava genotypes (3272 landraces, including 12 wild relatives, from the germplasm collection at CIAT and 772 improved clones). Source: Sanchez et al., 2009. ........................................................................................................... 18
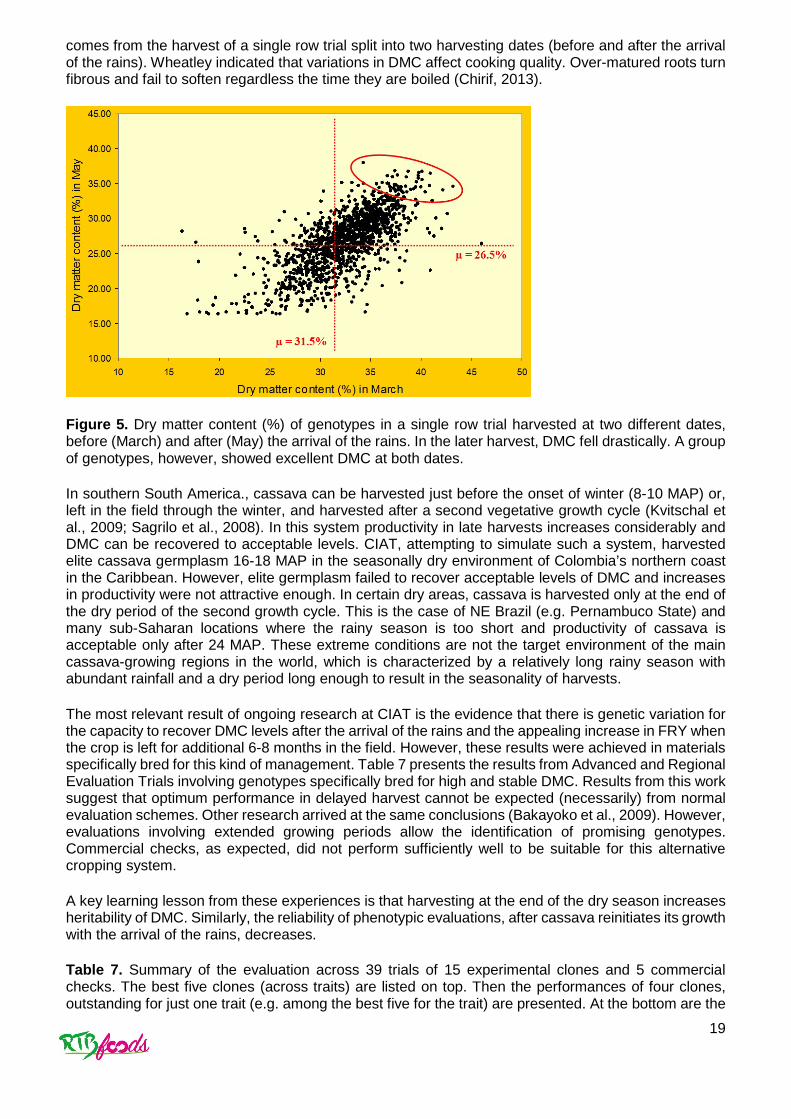
Figure 5. Dry matter content (%) of genotypes in a single row trial harvested at two different dates, before (March) and after (May) the arrival of the rains. In the later harvest, DMC fell drastically. A group of genotypes, however, showed excellent DMC at both dates. .......................................................... 19
Figure 6. Dry matter content (%) from seven genotypes harvested every other week through 15 months of harvest in a single location (Palmira, Colombia). Source CIAT (unpublished data). ....................... 21
Figure 7. Histogram illustrating distribution of cyanogenic potential (HCN in ppm) of landraces and improved cassava. There is a clear asymmetry with a long tale to the right and the distribution of improved clones tends to be more concentrated around lower HCN values. ..................................... 22
Figure 8. HCN values measured by spectrophotometry and predicted by NIRs in a large sample of more than 3,000 cassava roots. ................................................................................................................. 23
Figure 9. Relationship between dry matter content (%) and cooking time (minutes) in a sample of 546 cassava roots from 392 genotypes (in some cases more than one root sample per genotype was available). .......................................................................................................................................... 24
Figure 10. Relationship between cooking time and cyanogenic potential (HCN) in root samples from 392 genotypes. The frequency of materials suitable for boiling (red circle) is very low. ..................... 25

5
Figure 11. Reduction of firmness (e.g. softening) in roots from nine Indian cassava clones through boiling. Source: Sajeev et al., 2010. .................................................................................................. 25
Figure 12. Relationship between shear strength in uncooked cassava roots and boiling time. Source: Talma et al., 2013. ............................................................................................................................ 27
Figure 13. Scatter plot and histograms of TCC vs. root dry matter content. Color represents pigmentation of the root parenchyma such that 1-WT = white; 2-LC = light cream; 3-CM = cream, 4-LY = light yellow; 5-YL = yellow; 6-DY = deep yellow; red lines on histograms indicate means. Adopted from Esuma et al 2016; https://doi.org/10.1270/jsbbs.15159. ............................................................ 32
Figure 14. Step by step process of assessing softness of boiled cassava roots: a) roots harvested from the field waxed and stored at room temperature; b) root samples boiled in a water bath maintained at 900C; and c) softness assessed using a penetrometer; upto 4 root sections sampled per clone. ...... 33
Figure 15 : Pro-vitamin A in Nigeria showing the six biofortified varieties released and those in the pipeline.............................................................................................................................................. 39
Figure 16. Farmers preferred tuber quality traits in Umudike location ................................................ 48
Figure 17. Farmers preferred tuber quality traits in Makurdi location ................................................. 48
Figure 18. Farmers preferred tuber quality traits in Uyo location ....................................................... 48
Figure 19. Farmers preferred tuber quality traits in Igbariam location ................................................ 49
Figure 20. Farmers preferred sensory traits in Umudike .................................................................... 49
Figure 21. Farmers preferred sensory traits in Makurdi ..................................................................... 49
Figure 22. Farmers preferred sensory traits in Uyo ........................................................................... 50
Figure 23. Farmers preferred sensory traits in Igbariam .................................................................... 50
Figure 24. Smooth tuber of the variety Amadouo .............................................................................. 51
Figure 25. White and purple flesh tubers of Dioscorea alata.............................................................. 51
Figure 26. Pounded yam and a woman participating to the sensory evaluation at Bouaké. ............... 52
Figure 27. Example of the browning phenotyping method (Denis Cornet, Cavalbio project). ............. 53
Figure 28. The biparental populations in field (Gemma Arnau, AfricaYam project). ........................... 53
Figure 29. EAHB improvement scheme: breeding starts with landrace 3x to ensure the preservation of “matooke” quality Source: (Nyine et al., 2018) ................................................................................... 68
Tables
Table 1. Post-harvest physiological deterioration (PPD) quantified 5, 10, 20 and 40 days after harvest. Average total carotenoid content (TCC) and dry matter content (DMC) Source: Morante et al. 2010 15

6
Table 2. Mean squares from the analysis of variance for PPD (transformed by the Arc sine function), DMC and scopoletin expressed on a fresh- and dry-weight basis. .................................................... 16
Table 3. Averages for the four variables analyzed in this study for the three most relevant sources of variation (years, duration of the storage period and clones). ............................................................. 16
Table 4. Relevant results of the regression analyses conducted across clones and for each individual clone. The sequence of the parameters in the model has been respected in each case. The estimates are presented for each parameter and the respective sum of squares are also presented within parentheses. In some cases (clones AM 206-5 and MPER 183) the best model was obtained by using the scopoletin quantification at day 0 either on a fresh weight (Sco. FW(0)) or dry weight (Sco. DW(0)) basis. ................................................................................................................................................ 16
Table 5. Relationship between the undesirable glassy characteristic in boiled roots and dry matter, starch and total sugars contents. Source: Wheatley, 1991. ............................................................... 17
Table 6. Root quality traits from more than 4000 cassava genotypes (3272 landraces, including 12 wild relatives, from the germplasm collection at CIAT and 772 improved clones). Source: Sanchez et al., 2009. ................................................................................................................................................. 18
Table 7. Summary of the evaluation across 39 trials of 15 experimental clones and 5 commercial checks. The best five clones (across traits) are listed on top. Then the performances of four clones, outstanding for just one trait (e.g. among the best five for the trait) are presented. At the bottom are the five commercial checks. Harvests took place from 9 to 18 months after planting. Source: Lenis et al., 2018 .................................................................................................................................................. 19
Table 8. Consistency in repeated measurements (from 2 to 5 samples per clone) on roots from the same genotypes (a total of 154) ........................................................................................................ 24
Table 9. Texture profile parameters of cooked tuberous roots of cassava varieties. Source: Sajeev et al., 2010.a .......................................................................................................................................... 25
Table 10. Physico-chemical properties of raw tubers of different varieties of cassava. Source: Sajeev et al., 2010. a ..................................................................................................................................... 26
Table 11. Gelatinization properties of cassava starches by the DSC thermograms. Source: Sajeev et al., 2010. a ......................................................................................................................................... 26
Table 12. Pasting properties from starches of more than 4000 cassava genotypes. Source: Sanchez et al., 2009 ............................................................................................................................................ 26
Table 13. Performance of parents and their respective F1 progeny across two locations in Uganda during 2014-2015 .............................................................................................................................. 30
Table 14. GCA effects of cassava parental lines used in a 6x6 half-diallel analysis of five traits ........ 31
Table 15. Genetic parameter estimates for five traits of 6x6 half diallel F1 families evaluated at two locations in Uganda ........................................................................................................................... 31
Table 16. BLUPs and heritability estimates of cassava root softness following four different cooking durations. .......................................................................................................................................... 33
Table 17. Dry matter content of gari granules from a Uniform Yield Trial (UYT) grown and processed at NRCRI, Umudike. .............................................................................................................................. 35

7
Table 18. Some cooking characteristics of the gari granules from a Uniform Yield Trial (UYT) grown and processed at NRCRI, Umudike. .................................................................................................. 35
Table 19. Mean scores of sensory perception and consumer acceptance of Eba prepared from selected cassava varieties in a Uniform Yield Trial (UYT) grown and processed at NRCRI, Umudike. ............ 36
Table 20. Means of dry matter and starch contents from fresh roots of cassava varieties evaluated at Ibadan and Umudike both in Nigeria. ................................................................................................ 36
Table 21. Proximate composition of selected cassava varieties from a national variety pre-release trial in Nigeria in 2011. ............................................................................................................................. 36
Table 22. Gari (Eba) quality assessment of cassava varieties under on-farm pre-release trial in some states of Nigeria during 2010/2011 cropping season ......................................................................... 38
Table 23. Fufu quality assessment of cassava varieties under on-farm pre-release trial in some states of Nigeria during 2010/2011 cropping season. .................................................................................. 38
Table 24. Quality traits being assessed on yam products .................................................................. 44
Table 25. Methods being used for assessing yam food quality traits ................................................. 44
Table 26. Type of genetic materials being assessed for quality traits under different studies at IITA. This table summarized very recent and on-going studies for quality breeding in yams at IITA .................. 45
Table 27. Candidate clone selection for on-farm trial ......................................................................... 47
Table 28. Important root traits used to rank preference of sweetpotato cultivars in a participatory plant breeding trial in Central Uganda (there were no orange-fleshed cultivars) ......................................... 63
Table 29. Description of the parents from population Uganda A & B. In bold and italic are the landrace cultivars. ............................................................................................................................................ 64
Table 30. Banana PRODUCT PROFILE: Matooke (Source: IITA and NARO Banana Breeding Programmes) .................................................................................................................................... 67

8
ABSTRACT The main tropical root, tuber and banana crops addressed within RTBfoods project are: cassava (Manihot esculenta), yam (Dioscorea spp.), sweetpotato (Ipomoea batatas), potato (Solanum tuberosum) and the East African Highland banana (Musa AAA group): Matooke. These crops share common biological traits: they are vegetatively propagated, flowering of varieties is erratic, ploidy levels are variable, they are allogamous and highly heterozygous. Breeding starts with the selection of parents based on their individual value. Hybrids are evaluated for a few traits and undesirable genotypes are discarded as soon as possible (Lebot, 2013).
The national programs and CGIAR have been conducting RTB breeding programs for more than 30 years. A lot of progress has been made in the characterization of genetic resources, development of phenotyping tools, optimization of breeding schemes and lastly the integration of genomic tools in breeding programs. Genome Wide Association Studies and/or Genomic Selection are applied to all the crops concerned. Implementing of genetic and molecular approaches is contributing actively to the acceleration of the rate of genetic gains in the different on-going breeding projects. These efforts allowed the release of high yielding varieties and abiotic and/or biotic resistant ones. The quality is a trait, which is addressed from the beginning of the process or at the end when the breeding for the targeted traits was reached (Friedmann et al. 2018). Breeders use basic quality parameters associated with consumer preference (high dry matter, color, oxidation, and various attributes of the roots, tubers, or fruit) as selection criteria. The heritability of roots, tubers and banana quality traits valued by processors and end-users is little known or completely lacking for certain crops.
Indeed, the means and subsequently the research investment on each crop, for quality and breeding, are not equal. We reviewed the statistics on the papers published on each crop by the international scientific community, recorded in the Web of Science. We applied the filter on the quality alone and in combination with the breeding filter. We found that research on quality in potatoes is far ahead with 3805 references recorded when the quality filter is applied alone and 273 when the quality and breeding filters are applied together. Cassava comes in second place (578, 57) followed by sweetpotato (154, 38) and yam (115, 10). For Matooke only 11 references were found without filter application. Although these statistics can be discussed and most likely are not as accurate, they reflect the scarcity of data and studies on breeding for the quality for these crops.
Although, the work on RTB breeding for quality is not exhaustive and did not encompass all the quality traits, it can be very instructive. Within an institute, due to the turn-over, different researchers might have worked on this field. Data are stored but not shared or mined for the targeted traits. In universities and institutes, students have produced theses. The results have not been published in peer-reviewed papers but they are still of interest and could be used. In this document, each institute has gathered the information they have access to, to report the state of knowledge on the targeted crop.
The objective of this review is to make an inventory of the previous activities on RTB breeding for quality, based on the papers published by the scientific community and on the activities conducted by research centers partners of the project. This review focuses on the breeding for product quality and is not intended to cover all breeding activities conducted within the different on-going projects. This review is a starting point, which will allow us to identify the gap analysis for each crop. Subsequently, within the RTBfoods projects, using the high throughput phenotyping (HTPP) methods developed, the breeding activities can be conducted in a way to fill up these gaps.

9

10
1. BREEDING CASSAVA FOR QUALITY TRAITS Introduction
Cassava (Manihot esculenta Crantz) is the most important crop among the tropical root and tuber crops (Pujol et al., 2002; Meireles da Silva et al., 2003). It originated in South America (Allem, 2002) and was domesticated less than 10,000 years ago (Elias et al., 2001). Cassava is a very rustic crop that grows well under marginal conditions where few other crops could survive. A large proportion of cassava varieties is drought-tolerant, can produce in degraded soils, and is resistant to the most important diseases and pests. The crop is naturally tolerant to acidic soils, and offers the convenient flexibility that it can be harvested when the farmers need it.
Cassava is a remarkable crop. Every tissue of the plant can be exploited. The most important commercial product of cassava is the storage root, which is full of starch. Mankind has learned to take advantage of the roots for many different purposes. Amerindians in the Amazon basin, the likely center of domestication of the crop, have selected varieties for specific end uses over the millenniums. There are many ways to process roots for human consumption, the simplest being boiling them. The requirements for the roots to be suitable for different processing techniques vary widely as described below. Roots can also be used for starch and flour production and for animal feeding (Ceballos and Hershey, 2017; Ceballos et al., 2017). Cassava is the second most important source of starch worldwide (Stapleton, 2012). End uses of cassava drastically define the traits that breeders have to take into consideration. For starch, ethanol or dried chips for animal feeding the key traits will be dry matter content (DMC) and fresh root yield (FRY). White parenchyma is preferred by the starch industry, but the enhanced nutritional quality of yellow roots would be preferable for animal feeding.
Stems cuttings are the most common source of planting material and are used for the commercial propagation of the crop. Cassava foliage is not widely exploited in spite of its high nutritive value, although consumption of leaves by human populations is relatively common in certain countries of Africa and Asia. Foliage is also used for animal feeding. Crude protein content in leaves typically ranges from 20 to 25% of dry weight (Babu and Chatterjee, 1999; Buitrago, 1990; Gomez et al., 1983), but levels as high as 30% have been identified (Buitrago, 1990). Exploitation of foliage in cassava is expected to increase because of the recent developments and testing of mechanical harvesters and alternative cultural practices to exploit it (Cadavid Lopez and Gil Llanos, 2003).
The great diversity of food uses of cassava was thoroughly described by Balagopalan (2002). Some regional and ethnic uses of cassava such as “farinha” and “casabe” (Amazon basin), “kokonte” (Ghana), “gaplek” and “krupuk” (Indonesia) or tapioca pearls (India) would also benefit from adequate DMC and FRY. However other ethnic uses require additional traits. Boiled cassava roots require low levels of cyanogenic glucosides, reduced boiling time and consumer preferred texture. On the other hand, African products such as fufu and gari require proper poundability or mealiness. It is not clear which are the anatomical or biochemical characteristics that define many of these characterisitics. There is ongoing research, however, to elucidate the histological and biochemical basis of these characteristics to ultimately facilitate the selection process made by breeders.
Cassava is a perennial plant species which is handled as an annual crop. It does not have a pre-established development such as that of the cereals where the plants germinate, grow, flower, fill the grain, mature and die. Cassava grows when conditions are favorable and, when they are not the plant drops the leaves and assumes dormancy until favorable conditions return. These characteristics have a profound effect on root quality traits that will be addressed in this report. A distinctive feature of the quality of cassava roots is that it fluctuates widely depending on the age of the plant and environmental conditions. Coping with this variation is a major challenge for several of the many chain values involving this crop.
The difference between root and tubers has profound implication beyond the botanical distinction. Roots, for example, cannot be used for reproductive purpose. The only evolutionary purpose of cassava roots is to serve as a reserve organ to the mother plant. Once roots are excised from the plant that

11
function ceases to exist. Roots have a very short shelf life due to a process known as post-harvest physiological deterioration (PPD). According to Montaldo (1996) up to 30% of roots arriving to the central market in Caracas (Venezuela) are lost to PPD. In addition to the drastic impact of PPD stored cassava roots undergo changes due to respiration, transpiration and biochemical changes such as conversion of starch into sugars and reduction of ascorbic acid (Montaldo, 1996; Sánchez et al., 2013). It has been estimated that cassava roots lose 1% of starch per day of storage (Sánchez et al., 2013).
1.1. Cassava Breeding for Quality Traits at CIAT: Colombia
1.1.1. Genetic variation among cassava clones adapted to different end uses
Amerindians in the Amazon basin, the likely center of domestication of the crop, have selected varieties for specific end uses over the millenniums. They were the first to recognize the differences in root quality traits, its variation through time and age of the plant, and to develop suitable processing techniques. They recognized, for example, that when roots are harvested too late or “over-matured”, they turn fibrous and fail to soften regardless the time they are boiled. In the local language these roots are called “caulla” (Chirif, 2013). People such as Bora, Huitotos and Ocaina (eastern Peru) have recognized three main type of cassava (bitter, good and sweet) based on the cyanogenic glucoside and starch contents. The “good” cassava mentioned above is the one widely used for table consumption: it has average levels of starch or dry matter content and low levels of cyanogenic potential (HCN). High HCN levels, on the other hand, is the distinguishing feature of “bitter” cassava. “Sweet” varieties for these peoples are not the same as cool cassava (e.g. low cyanogenic potential). The former produce a limited amount of starch and is used in the preparation of indeed sweet beverages (called Manicuera in Brazil). It may be more appropriate to call them “sugary” cassavas. This type of cassava has been technically described by Carvalho et al. (2004). Sugary cassava is called “mandiocaba” in Brazil and the roots texture and taste resemble sugarcane stems. This type of cassava is not the subject of the RTB-Foods project and will not be described further.
The cultural differences among tribes in the Amazon basin define the way the consume cassava and this, in turn, define the type of cassava clones grown by them. Bora, Huitoto, Ocaina and Secoya people grow cassava clones that produce bitter roots, which need to be carefully processed to release the high HCN levels present in them. One common and popular product is “cassabe” in the Amazon basin. Another popular product widely spread even in urban centers is “farinha”. Other tribes, however, grow good cassava and boil or roast their roots for consumption (Chirif, 2013). There is a generalized belief that bitter cassava has higher productivity; higher content and better quality of starch; enhanced resistance to pests and that they are better suited for the production of cassabe (Isendahl, 2011). However, there is also a generalized dissent regarding these beliefs. For example, Secoya people acknowledge that roots from good and bitter clones are equally suitable for the production of cassabe (Chirif, 2013). There is some scientific support to the idea that bitter cassava is more tolerant to pests, although there is no indication that high levels of cyanogenic glucosides prevent the attach by arthropods (insects and mites can prosper equally well in bitter and good cassava), it is possible that mammals avoid bitter ones (Chiwona-Karltun et al., 1998). There is also circumstantial evidence that the additional requirement of low cyanogenic potential for good varieties to the list of traits required reduces, to some extent, the probabilities of identifying genotypes that are also high yielding. This is the reason why the cassava breeding program at CIAT abandoned the idea of breeding for double-purpose cassava varieties (e.g. clones that are outstanding for both fresh consumption and industrial processing) by the year 2000.
This distinction in root quality traits, particularly HCN, is so important that it has even lead to the use of two different scientific names for such type of cassava: Manihot palmata and M. aypin. These two taxa, however, are no longer accepted and all cassava germplasm is now grouped into the M. esculenta gene pool. The distinction of bitter and sweet cassava genotypes is relevant for RTB-Food because cyanogenic potential is one key characteristic taken into consideration when boiling the roots for table consumption.

12
1.1.2. Quality traits required for boiling cassava and marketing considerations
The value chain of roots for boiling are relatively straightforward and, in some cases, require simple processing. Until few decades ago roots were sold in local markets and, more recently, in supermarkets. PPD is a major bottleneck in the marketing cassava roots for table consumption and the simple processing mentioned above is mainly directed at preventing it. Roots may be sold as they are harvested with just brushing and/or washing them to remove the soil from their surface (Figure 1.A). A second alternative is to peel the roots after brushing and washing, cut them in sections of suitable size and quick freeze them (Figure 1.B). This approach allows storing the roots for several months and is often used for the export markets to satisfy the ethnic markets in developed countries in North America, Europe and Asia. In addition to brushing and washing the roots may also be waxed with melted paraffin to extend their shelf life for up to 2-3 weeks (Figure 2). There are emerging technologies that all require roots with low cyanogenic potential and good cooking quality (Figure 3).
Regardless of the specific value chain roots for table consumption must have low HCN levels, adequate levels of DMC (roots suitable for boiling have usually intermediate levels) and excellent taste and texture after boiling. When roots are sold in local markets and supermarkets the external appearance (e.g. size, external and internal color of the peel, color of the parenchyma, etc.) is very important. Buyers (more often than not women) use these external traits as morphological markers that are traditionally used to identify roots from clones that are known to have good cooking quality. Although these morphological traits are not necessarily linked to good cooking quality breeders must be aware that they matter. Chiroza is the best-known variety for table consumption in Colombia. People are used to scratch the outer peel of the roots in search of a pinkish to purple coloration underneath the peel. This is a key marker associated with good cooking quality in Colombia. However, roots from many clones have the same characteristics but fail miserably to meet the standard for cooking quality. Similarly, other clones with excellent cooking quality fail to show that key pinkish to purple coloration.
Figure 1. Different value chains of cassava roots for table consumption. A. African local markets. B. Frozen sections of cassava roots sold in a Colombian supermarket.
The size and shape of the root is also important, not only when they are sold in local markets and supermarkets but also for the waxed roots value chain. Ideally roots should have intermediate (around 30 cm long) and diameter (8-10 cm) size, a conical or cylindrical shape. The peduncle should not be too short otherwise the parenchyma may be damaged while detaching the roots from the mother plant, thus promoting rapid onset of PPD. Length of peduncle and shape of the root and have been reported (Luciani, 1996) to have relatively high [broad sense] heritability (36 and 48%, respectively). Long roots break more easily and this also results in quick onset of PPD. Round or globular roots tend to suffer

13
more peel damage during transport and storage than those with a cylindrical shape (Aristizábal et al., 2007).
Figure 2. Illustration of simple processing technologies of cassava for table consumption. A. Selection in the field of roots with adequate size and shape. B. Brushing and washing roots. C. Treating roots with fungicide. D. Drying roots after fungicide treatment. E. Waxing roots with melted paraffin. F. Illustration of waxed roots (top) and non-waxed roots bagged and ready to delivery, for example, to restaurants.
Figure 3. A. Illustration of frozen cassava kept at temperatures below 0 °C. B. An emerging market for table consumption of cassava in China. C. Boiled and canned cassava roots.
Sanitary issues are certainly a key requirement for cassava roots that will be sold for the table consumption. In addition to the non-infectious PPD process, roots may rot because of bacterial or fungal infections. Roots showing even mild symptoms should be discarded, otherwise the entire batch may eventually be affected. In some cases, symptoms may be difficult to detect. For example, symptoms of the subterranean burrower bug (Cyrtomenus bergi Froeschner) cannot be detected before peeling the

14
roots. The symptoms induced by this subterranean sucking insect are particularly damaging for the frozen cassava roots value chain (Figure 1.B).
1.1.3. Post-harvest physiological deterioration (PPD)
Cassava roots have a very short shelf life because of PPD. The visible symptoms of PPD in the roots are the blue-black discoloration that starts in the vascular tissue towards the periphery of the parenchyma (Han et al., 2001; Reilly et al., 2001; 2003; 2007; Wheatley, 1982; Wheatley and Gomez, 1985). Over time symptoms spreads extensively through much of the root. Fluorescence under UV light is detectable prior to and during the discoloration process (Liu et al., 2017). PPD rapidly renders the roots unpalatable and unmarketable. Consequently cassava roots need to be consumed soon after harvest (van Oirschot et al., 2000). The processes involved in PPD resemble changes typically associated with the plant’s response to wounding. The symptoms result from the accumulation of phenolic compounds and their oxidation by reactive oxygen species (Djabou et al., 2017; Liu et al., 2017; Sánchez et al., 2013). Specific genes involved in PPD have been identified and characterized, and their expression evaluated. Several secondary metabolites, particularly hydroxycoumarins, such as scopoletin, accumulate in the process (Bayoumi et al., 2010; Blagbrough et al., 2010; Gnonlonfin et al., 2012; Liu et al., 2017; Reilly et al., 2007; Sánchez et al., 2013; Uarrota and Maraschin, 2015; Uarrota et al., 2015).
Shelf life of cassava roots can be extended by different treatments (e.g. waxing their surface to isolate the parenchyma from oxygen, freezing or drying). Recently the exogenous application of melatonin was reported to delay PPD (Hu et al., 2016). However, these methods are expensive or logistically difficult to implement. There are several reports on genetic variation for the reaction to PPD (Liu et al., 2017; Morante et al., 2010; Moyib et al., 2015). Genetic tolerance to PPD is envisioned as the most economical approach to overcome the problem. Vlaar and co-workers estimated in 2007 that extending shelf life of cassava roots to 45 days after harvest, would result in a benefit of approximately US $ 35 million for Thai cassava farmers and factory owners. However, breeding approaches have not proved successful due the polygenic nature of the trait and the unfortunate correlation between PPD with dry matter content (DMC). A major factor affecting research on PPD is the large influence of environmental conditions (particularly at harvest time), age of the plant, handling of the roots during harvest and thereafter, storage conditions, etc. (Cortés et al., 2002; Morante et al., 2010; Sánchez et al., 2006; 2013). Experimental errors, therefore, are typically large and this tends to mask true genetic differences that may exist. In spite of early promising results (Sayre, 2011) and huge financial efforts, genetic transformation did not contribute to alleviating the problem either. Regardless the difficulties associated with research on PPD in cassava few trends have been clearly established over the years: a. It is a process involving the genetic system of the plant along with reactive oxygen species; b. Environmental factors influence it greatly; c. There are genetic factors influencing it as well; d. Dry matter content in the roots is positively correlated with PPD; e. There is a negative association between PPD and carotenoids content; f. PPD has been linked to scopoletin in the roots; and g. Experimental errors associated with measuring PPD are very large.
Breeding for tolerance to PPD is difficult because proper assessment of the reaction to PPD requires relatively large number of commercial-size roots. Assessment is based on a destructive assay that is affected by large variation often resulting in high experimental errors (as some of the results presented in Table 1 illustrate). In addition, most of the germplasm is discarded at early stages of selection when only one or a few plants per genotype are available and, therefore, not enough roots can be harvested for properly quantifying PPD (Morante et al., 2005). Little progress, therefore, has been made so far to improve tolerance to PPD through genetic enhancement. There is growing evidence that yellow roots tended to have a delayed onset of PPD by one or two days. Dry matter content and PPD are known to be positively correlated (Morante et al., 2010). Pruning the plants a few days before harvest also delays PPD, but at the expense of a reduction in dry matter content of the root (van Oirschot et al., 2000). These alternatives do not offer a practical solution and PPD has remained an elusive problem to solve.
One of the main problems related to root quality traits, including reaction to PPD, is the variation related to the age of the plant and environmental conditions during its growth, particularly at the time of harvest. Studies related to PPD are particularly weak because of the strong influence of these factors. At CIAT

15
a lengthy study was carried out as a continuation of the research reported by Sánchez et al. (2013). It focused only in PPD, DMC and scopoletin, but through the analysis of roots from five different clones. There was no genotype involving yellow roots in this study. Analyses were conducted over three harvesting seasons from 2013 through 2015. Storage period was up to seven days after harvest (DAH). Data has not been yet formally published. Table 2 provides the results of the analysis of variance for PPD, DMC and scopoleting content (on freh and dry weight basis). All main sources of variation and their interactions were found to be highly significant (except for the interaction between year and duration of the storage period, which was significant only at 5% probability level). These results illustrate the complexity of the reaction to PPD and traits that influence it).
The averages for the three main sources of variation are presented in Table 3. The variation observed for the averages of the three years is particularly striking. As expected, PPD levels increased drastically after two days of storage. The lowest average PPD levels were observed in AM 206-5, which is also the clone with the lowest DMC. In general, the higher the DMC the higher the PPD. Scopoletin levels were particularly high in clone HMC-1. There was no apparent relationship between scopoletin and PPD levels looking at the average values presented in Table 3.
Table 1. Post-harvest physiological deterioration (PPD) quantified 5, 10, 20 and 40 days after harvest. Average total carotenoid content (TCC) and dry matter content (DMC) Source: Morante et al. 2010
Clone Post-harvest physiological deterioration (%) TCC DMC 5 10 20 40 Mean (ug g-1) (%)
Commercial checks
CM 523-7 27.1(5) 40.7(5) 57.1(5) 64.1(5) 47.2 0.4 44.8 MCol 1505 25.7(5) 31.6(5) 71.6(5) 66.4(5) 48.8 0.7 40.1 MPer 183 5.4 4.0 5.3 9.2 6.0 0.5 41.3 Mutagenized (gamma rays irradiation) genotypes 2G15-1 0.5(2) 0.0(1) 0.0(1) 6.9(3) 1.9 1.0 44.0 5G108-4 2.9(3) 3.7(3) 7.1(3) 7.3(3) 5.3 0.7 45.4 Back-crosses from crosses between M. escultenta and M. walkerae CW 429-1 12.5(4) 20.7(4) 23.2(4) 18.6(4) 18.7 0.6 37.2 BC284-42 16.8(4) 14.1(4) 16.0(4) n.a. 15.6 0.7 40.5 BC284-49 4.7(3) 4.8(3) 23.3(4) n.a. 10.9 2.5 27.4 BC289-30 0.0(1) 1.0(3) 0.0(1) 0.0(1) 0.3 0.5 34.5 Selected material with increased levels of carotenoids in the roots CB 7-9 3.6(3) 10.9(4) 0.0(1) 1.0(2) 3.8 10.2 35.8 CB 44-15 0.5(2) 0.0(1) 1.0(3) 1.0(3) 0.6 11.5 29.5 GM 905-66 0.0(1) 0.0(1) 0.0(1) 0.0(1) 0.0 11.1 38.3 MBra 253 1.5(3) 0.0(1) 2.9(3) 0.0(1) 1.1 9.5 42.0 MCol 2436 0.0(1) 26.3(5) 38.9(4) n.a. 21.7 9.1 34.6 Waxy starch sources AM 206-5 0.0(1) 0.0(1) 0.0(1) 0.0(1) 0.0 0.7 38.5 Waxy 2 3.7(3) 8.0(3) 3.6(3) 3.6(3) 4.7 0.6 35.6 Waxy 3 0.2(2) 0.0(1) 3.7(3) 6.8(3) 2.7 0.5 42.2 Waxy 4 0.0(1) 0.0(1) 0.0(1) 0.0(1) 0.0 0.6 36.2 Waxy 5 0.0(1) 0.0(1) 4.1(3) 0.0(1) 1.0 0.9 40.2 Waxy 6 3.4(3) 1.4(3) 4.7(3) 2.2(3) 2.9 0.5 36.1 Waxy 7 18.2(5) 31.1(5) 30.4(4) 30.4(4) 27.5 1.0 40.0 Mean 6.0 9.4 13.9 12.1 10.5 2.8 39.9
Significance of reaction types: (1) Significantly lower than the average PPD of tolerant check (confidence intervals); (2) PPD values significantly lower than that of the tolerant check (LSD test); (3) PPD values similar to that of the tolerant check; (4) PPD values significantly higher than that of the tolerant check but lower than those of the susceptible checks; (5) values significantly higher than that of the tolerant check and similar to those of susceptible checks.
Table 4. Presents the results of step-wise regression analyses across genotypes (top of the table) and for each individual clone. The best model to explain PPD across genotypes included duration of the storage period as the first parameter. Duration of the storage period was also the most important independent variable when reaction to PPD was analyzed individually in each genotype, except for clone MCol 22. DMC was the second most important parameter in the model for the analysis combined across genotypes followed by scopoletin on a dry weight basis and finally scopoletin on a fresh weight basis.

16
However, DMC was not so important in the analysis for each clone. This makes sense as variation in DMC is mostly between the different clones, and there is reduced variation for this variable among roots from the same clone.
Table 2. Mean squares from the analysis of variance for PPD (transformed by the Arc sine function), DMC and scopoletin expressed on a fresh- and dry-weight basis.
Source of variation df PPD DMC Scopoletin (nmol/g) Arc Sin (%) (%) FW DW
Year 2 0.501** 1203.20** 20451** 94355** Day 7 2.505** 4.97** 5964** 39710** Clon 4 1.491** 444.95** 9245** 45355** Year*Day 13 0.059* 8.97** 1110** 6603** Clon*Day 28 0.075** 9.33** 491** 2724** Year*Clon 8 0.300** 39.38** 1481** 5520** Year*Clon*Day 51 0.055** 5.51** 221** 1185** Error 563 0.034
194 0.03 114 8.7 48
*, ** Significant at the 5% and 1% probability level, respectively.
Table 3. Averages for the four variables analyzed in this study for the three most relevant sources of variation (years, duration of the storage period and clones).
Class PPD1 DMC1 Scopoletin FW1 Scopoletin DW1 n (%) n n (nmol/g) n (nmol/g)
Years 2013 238 8.73 b 120 33.58 c 80 19.18 c 80 57.12 c 2014 209 15.53 a 71 40.30 a 70 52.16 a 70 127.65 a 2015 230 15.37 a 117 38.40 b 78 32.19 b 78 82.38 b Duration of the storage period 0 90 0.00 e 41 36.69 d 30 3.27 g 30 8.83 f 1 90 1.73 d 40 37.29 b 30 29.24 e 30 73.92 e 2 90 12.79 c 40 37.35 b 30 50.61 a 30 131.16 a 3 89 13.68 c 40 37.10 c 30 37.65 c 30 95.59 c 4 90 17.53 b 40 36.46 e 30 42.43 b 30 110.89 b 5 90 19.07 a
b 40 37.17 c 30 35.63 d 30 92.30 d
6 89 22.59 a 40 37.45 a 30 41.78 b 30 106.65 b 7 49 21.06 a 27 35.78 f 18 26.59 f 18 74.57 e Clone AM 206-5 131 7.10 d 60 33.40 e 44 23.11 c 44 67.88 d MCOL22 134 8.69 d
c 62 36.77 c 46 23.96 c 46 62.40 e
MPER183 136 9.65 c 62 35.36 d 46 31.76 b 46 86.94 b HMC-1 138 14.72 b 62 39.24 b 46 58.04 a 46 140.95 a CM523-7 138 24.80 a 62 39.91 a 46 31.44 b 46 78.08 c
1 Duncan and LSD tests for contrasts among averages yielded the same conclusions regarding the statistical differences among them. For each category and response variable, averages with the same letter are not significantly different.
Results presented in Tables 2-4 are presented to highlight the complexities when analyzing PPD. The R2 value in the analysis across clones was around 0.30. This clearly demonstrate that factors other than DMC and scopoletin have strong influence on PPD. The higher the average PPD, however, the better the model explained the variation on PPD. In the case of CM 523-7 the average PPD was the highest 24.8 (Table 3) and the R2 value in the regression analysis (Table 4) was relatively high (0.43).
Table 4. Relevant results of the regression analyses conducted across clones and for each individual clone. The sequence of the parameters in the model has been respected in each case. The estimates are presented for each parameter and the respective sum of squares are also presented within parentheses. In some cases (clones AM 206-5 and MPER 183) the best model was obtained by using

17
the scopoletin quantification at day 0 either on a fresh weight (Sco. FW(0)) or dry weight (Sco. DW(0)) basis.
Sum of squares R2 Parameters following the sequence in the best model
Intercept Day DMC Sco. Sco. Model Residual (n) (%) DW FW Regression across the five clones 63562 159050 0.286 -58.162 3.253 1.552 0.185 -0.402
(115961) (38581) (24093) (887) (989) AM 206-5 4462 11516 0.279 Intercept Day Sco.DW(0)
-7.281 2.377 0.782 (6605) (3482) 980
MCOL 22 8845 22256 0.284 Intercept Sco.FW Day Sco.DW
-1.166 2.564 2.870 -0.977 (10114) (6032) (1232) (2351)
MPER 183 6405 15202 0.297 Intercept Day Sco.FW(0) DMC EscDW(0)
118.302 2.189 2.240 -2.114 -4.826 (12675) (4046) (1202) (904) (257)
HMC-1 12597 27810 0.312 Intercept Day Sco.FW
-2.734 3.559 0.095 (29898) (10740) (1857)
CM523-27 37036 48303 0.434 Intercept Day Sco.FW DMC
-90.599 5.537 0.313 2.165 (84846) (18721) (15338) (2977)
It is clear that there is genetic variation regarding PPD among different sources and they seem to be acting through different biochemical/genetic mechanisms. Further studies should concentrate on elucidating which of the genes involved in the cascade of reactions leading to PPD are related to the different sources of tolerance. For the time being, unfortunately, the only reliable way for determining the reaction to PPD of a given genotype is by testing at least ten roots in at least three different seasons. Storing roots for 5-7 days is adequate to maximize differences among genotypes (Ospina et al., 2018a: 2018b; Tran et al., 2018).
1.1.4. Dry matter content
DMC is an important root quality trait. It is critical for industrial uses of cassava roots (starch, animal feed and ethanol industries) but also influences cooking quality. A clear example of the relationship between DMC and cooking quality was published by Wheatley in 1991. Hongbété et al., (2011) supported these earlier findings. When DMC is low, the uncooked root looks “watery” and, after boiling, it assumes a “glassy” appearance (tends to be translucent and its texture is hard to penetrate). A reduction in the level of DMC (and a parallel increase in sugar contents) results in glassiness in the boiled root, which is highly undesirable. Wheatley linked the reduction of DMC to stresses suffered by the plants.
Table 5. Relationship between the undesirable glassy characteristic in boiled roots and dry matter, starch and total sugars contents. Source: Wheatley, 1991.
Glassinessa Dry matter content (%)b Starch content(%)b Total sugars content (%)b
0.0 35.9ab 86.4a 1.82a 0.0 35.9ab 86.8a 2.72b 1.0 37.4a 87.3a 2.53b 1.3 34.4b 85.9b 3.62c 2.0 33.2c 82.3b 5.13d 2.3 33.4c 79.7b 4.97d
a Glassiness estimated using a score in which 0=not glassy; 1=slightly glassy; 2=glassy; and 3=strongly glassy b Values within a column with different letters indicate significant differences at the 5% probability level

18
DMC varies widely in cassava. Sanchez et al. published in 2009 a study involving a large sample of cassava clones from the germplasm collection at CIAT (3272 accessions), 772 improved genotypes and 12 wild Manihot species. Table 6 provides a summary of the most relevant traits in this study, including DMC. Figure 4 presents a histogram with data for DMC showing the slight negative skewness (a tendency for longer tails to the left). Average DMC was 33.6%. As it is the case for PPD, DMC for a single genotype varies drastically with age of the plant and environmental conditions.
Table 6. Root quality traits from more than 4000 cassava genotypes (3272 landraces, including 12 wild relatives, from the germplasm collection at CIAT and 772 improved clones). Source: Sanchez et al., 2009.
Dry matter Starch Cyanogenic Ease of Parameter content content potential Cooking (%) (%) (ppm) (min) Maximum 48,1 91,0 3274 5,6 Minimum 14,3 65,0 14 1,1 Average 33,6 84,5 327,4 2,8 Standard Deviation 6,47 3,34 397,7 0,72 Skewness -0,40 -0,65 2,96 0,33 Count 4051 4049 4050 4051
Figure 4. Histogram with frequencies for dry matter content in more than 4000 cassava genotypes (3272 landraces, including 12 wild relatives, from the germplasm collection at CIAT and 772 improved clones). Source: Sanchez et al., 2009.
There is considerable amount of information in relation to DMC in cassava roots. Cassava responds well to selection to increase DMC and many reports, particularly from SE Asia, demonstrate it (Kawano, 2003; Kawano and Cock., 2005; Kawano et al., 1998). DMC in the roots is highly heritable but also greatly affected by the environment and age of the plant. Broad sense heritability for DMC is intermediate (0.42) according to Kizito et al., 2007.Genotype-by-environment interactions, therefore, are usually significant (Benesi et al., 2004; 2008; Kawano et al., 1987; Morante et al., 2006). Cassava is generally grown in areas with a lengthy dry season. In these cases, farmers typically plant the stem cuttings soon after the arrival of the rains and harvest the roots (and the stems that will be used as planting material for the following cycle) just before the start of a new rainy season, around 10-12 months after planting (MAP). This system allows harvesting the roots when their DMC is at a maximum (around 35%) and results in a short storage period for the stems. During the dry period, cassava drops the leaves and enters a “dormant” state. With the arrival of the rains, starch from the roots is hydrolyzed for the mother plant to have the energy it requires to reinitiate growth. Therefore, when cassava is harvested after the arrival of the rains, DMC is reduced drastically to the point that industries often reject the roots (Bakayoko et al., 2009; Hongbété et al., 2011). Figure 5 illustrates this phenomenon. Data
0
50
100
150
200
250
300
350
400
450
Num
ber o
f gen
otyp
es
Dry matter content (%)
19
comes from the harvest of a single row trial split into two harvesting dates (before and after the arrival of the rains). Wheatley indicated that variations in DMC affect cooking quality. Over-matured roots turn fibrous and fail to soften regardless the time they are boiled (Chirif, 2013).
Figure 5. Dry matter content (%) of genotypes in a single row trial harvested at two different dates, before (March) and after (May) the arrival of the rains. In the later harvest, DMC fell drastically. A group of genotypes, however, showed excellent DMC at both dates.
In southern South America., cassava can be harvested just before the onset of winter (8-10 MAP) or, left in the field through the winter, and harvested after a second vegetative growth cycle (Kvitschal et al., 2009; Sagrilo et al., 2008). In this system productivity in late harvests increases considerably and DMC can be recovered to acceptable levels. CIAT, attempting to simulate such a system, harvested elite cassava germplasm 16-18 MAP in the seasonally dry environment of Colombia’s northern coast in the Caribbean. However, elite germplasm failed to recover acceptable levels of DMC and increases in productivity were not attractive enough. In certain dry areas, cassava is harvested only at the end of the dry period of the second growth cycle. This is the case of NE Brazil (e.g. Pernambuco State) and many sub-Saharan locations where the rainy season is too short and productivity of cassava is acceptable only after 24 MAP. These extreme conditions are not the target environment of the main cassava-growing regions in the world, which is characterized by a relatively long rainy season with abundant rainfall and a dry period long enough to result in the seasonality of harvests.
The most relevant result of ongoing research at CIAT is the evidence that there is genetic variation for the capacity to recover DMC levels after the arrival of the rains and the appealing increase in FRY when the crop is left for additional 6-8 months in the field. However, these results were achieved in materials specifically bred for this kind of management. Table 7 presents the results from Advanced and Regional Evaluation Trials involving genotypes specifically bred for high and stable DMC. Results from this work suggest that optimum performance in delayed harvest cannot be expected (necessarily) from normal evaluation schemes. Other research arrived at the same conclusions (Bakayoko et al., 2009). However, evaluations involving extended growing periods allow the identification of promising genotypes. Commercial checks, as expected, did not perform sufficiently well to be suitable for this alternative cropping system.
A key learning lesson from these experiences is that harvesting at the end of the dry season increases heritability of DMC. Similarly, the reliability of phenotypic evaluations, after cassava reinitiates its growth with the arrival of the rains, decreases.
Table 7. Summary of the evaluation across 39 trials of 15 experimental clones and 5 commercial checks. The best five clones (across traits) are listed on top. Then the performances of four clones, outstanding for just one trait (e.g. among the best five for the trait) are presented. At the bottom are the

20
five commercial checks. Harvests took place from 9 to 18 months after planting. Source: Lenis et al., 2018
Clon n FRYa DMCa DMYa t/hab Rank (%)b Rank t/hab Rank
SM3134-5 169 27.06 a 2 35.08 ab 2 9.60 a 1 SM2834-31 177 24.73 bc 4 34.39 cde 5 8.59 bcd 3 SM2629-36 168 27.26 a 1 32.27 hi 16 8.79 b 2 GM579-13 168 25.17 c 3 32.54 hi 15 8.25 bcd 4 SM2828-28 170 23.51 c 10 34.36 de 6 8.12 cde 6 SM3110-15 176 24.41 bc 5 33.22 g 13 8.16 cd 5 SM3139-22 167 21.18 de 12 34.60 cd 4 7.43 ghf 10 SM3134-73 172 20.89 de 13 34.77 bc 3 7.35 gh 11 SM3144-42 167 14.82 h 20 35.25 ab 1 5.30 k 20 Tai 157 24.40 bc 6 29.72 l 19 7.28 gh 12 Costeña 160 20.38 de 15 31.71 j 17 6.57 ij 15 Verónica 121 19.94 ef 16 31.06 k 18 6.32 j 17 Ginés 116 24.19 bc 8 29.59 l 20 6.98 hi 14 Caiseli 96 17.80 fg 18 34.07 ef 9 6.17 j 18
a FRY: fresh root yield; DMC: dry matter content; DMY: dry matter yield b Averages (for each trait) followed by the same letter are not significantly different at P ≤ 0.05
Figure 6 summarizes the analysis of DMC in roots from seven different clones harvested every other week for a period of 15 months. These clones had been planted also every other week thus roots were harvested always at the same age, but under varying environmental conditions. Figure 6 is presented to illustrate two main features: i) the differences in DMC in some harvesting dates were very wide (e.g. 26 to 39%) whereas few days later they shrank drastically (e.g. 35 to 41%); ii) only after several harvests at different times it becomes clear that clone CM523-7 tends to have higher and more stable DMC than, for example, roots from MPer 183. In many cases DMC in roots from CM523-7 was much higher than those from MPer 183. However, sometimes the differences became negligible and, in few cases, the tendency even reverted. As was the case for PPD (and perhaps because of the variation in DMC) there is wide oscilation in DMC and, therefore, only after many harvests at different times it is possible to reliably detect genotypic differences. This is very relevant because DMC, to some extent, influences cooking quality as demonstrated by Wheatley in 1991 and reaction to PPD (as demonstrated above).

21
Figure 6. Dry matter content (%) from seven genotypes harvested every other week through 15 months of harvest in a single location (Palmira, Colombia). Source CIAT (unpublished data).
1.1.5. Cyanogenic potential
It was mentioned in the introduction that only “good” cassava (low cyanogenic potential) is suitable for boiling (Chirif, 2013). Farmers and folk culture are well aware of the differences between high and low cyanogenic cultivars and their uses (Mkumbira et al., 2003; Peroni et al., 2007). Interestingly, bitter cassava varieties tend to predominate in areas were cassava is an important crop. Good clones tend to occupy smaller areas around the households (Dufour, 1993; 1995). The distinction and separation between bitter and cool clones has led to a genetic differentiation and incipient creation of two gene pools (Peroni et al., 2007).
High levels of cyanogenic glucosides (HCN) affect the cooking quality of the roots because boiling does not remove all of them. An unacceptably high level of cyanogenic glucosides remain in boiled roots from bitter varieties which results in unpleasant taste. Aroma and taste differences may remain after different approaches to produce and consume cassava flour (Iwuoha, 1997). Although bitterness is mainly attributed to the cyanogenic glucosides in the roots other compounds in the parenchyma and cortex have been detected to contribute to the taste (King and Bradbury, 1995; Wheatley et al., 1991). Moreover, the remaining cyanogenic glucosides may reach toxic levels (Wheatley et al., 1991). Bitter cassava has been associated with several health problems (Oluwole et al., 200; Tylleskär et al., 1991). Taking Africa as a whole, the cyanogenic related Konzo disease may not be a major public health problem. However, for affected communities, the disease is a major burden. Increasing cassava production, declining production of other foods, global warming, more frequent droughts, wars and social unrest and population displacement have set the schene for Konzo to persist (Nzwalo and Cliff, 2011). Konzo is a distinct neurological entity with selective upper motor neuron damage, characterized by an abrupt onset of an irreversible, non-progressive, and symmetrical spastic para/tetraparesis. The disease is associated with high dietary cyanogen consumption from insufficiently processed roots of bitter cassava combined with a protein-deficient diet.
As Amerindians did thousands of years ago, cassava breeders today develop varieties with high, intermediate and low levels of cyanogenic potential. Each type of clone will serve specific purposes. The work published by Sanchez and co-workers in 2009 also involved measuring HCN. Table 6 shows that the range of variation was from 14 to 3274 ppm, with strong positive skewness. Figure 7 presents detailed information regarding the distribution frequencies of HCN in a large sample of genotypes. The skewness value in Figure 7 suggested the long tale to the right observed in Figure 7. Improved
26
29
32
35
38
41
44
47
31/01/2016 10/05/2016 18/08/2016 26/11/2016 06/03/2017 14/06/2017 22/09/2017
CM523-7 HMC-1 MCOL 1505 MCOL 22
MPER 183 NIG 11 SM1219-9

22
germplasm tend to have lower levels of HCN but selection for it is required (Pizarro et al., 2018). Transgenic acyanogenic cassava has been produced but not grown commercially (Jørgensen et al., 2005)
Cyanogenic potential is controlled by quantitative inheritance genes and broad sense heritability values in five different trials ranged from 0.00 to 0.50 with an average of 0.25 (Dixon et al., 1994). According to Kizito and co-workers (2007), broad sense heritability for HCN is intermediate (0.43). The contrasts in these heritability values are likely due to the influence of environmental conditions: The evaluations by Dixon and co-workers included genotype-by-environment interactions, whereas Kizito’s work was conducted in a single location. Transgressive effects have been reported for HCN (Whankaew et al., 2011) but a different study found the inheritance to be mostly additive in nature (Kizito et al., 2007). Traditional farmers are well aware that the level of cyanogenic potential varies with the environmental conditions (Chirif, 2013; Grace, 1977). These empirical observations have been validated through scientific research (Burns et al., 2010; Dixon et al., 1994; Vandegeer et al., 2013). Cultural practices and soil fertilization also influence cyanogenic potential (Omar et al., 2012). Molecular marker studies have been conducted for the development of QTLs. (Kizito et al., 2007; Mkumbiraet al., 2003; Whankaew et al., 2011) but they have not been used to support breeding efforts for reduced HCN levels. Marker-assisted selection, therefore, has not been yet implemented.
There are two main approaches to assess levels of cyanogenic potential. Total cyanide content can be measured quantitatively through a colorimetric protocol after coloration with 1,3-dimethyl barbiturate/isonicotinate reagent (Essers et al., 1993). This method requires hydrolysis with exogenous linamarase prepared in the lab from cassava peel extraction. A qualitative approach has been used while harvesting cassava in the field. A simple picrate paper kit method is useful for qualitatively assess cyanogenic potential while harvesting cassava in the field. Root samples are placed in glass test tubes and left to react overnight with the previously prepared reagents, including yellow picrate paper (Egan et al., 1998). The correlation of both methods is excellent (Borges et al., 2002). It has been postulated that NIRS can be used to predict cyanogenic potential in fresh cassava roots (Davrieux et al., 2016). Therefore, CIAT began building a database (> 3000 samples) in which NIRS spectra from fresh roots are taken along with the quantification of cyanogenic potential. Unpublished results suggest that NIRS can distinguish, at least, genotypes with low (< 200 ppm), intermediate (200-600 ppm) and high (> 600 ppm) of cyanogenic potential. Figure 8 presents actual HCN values in 3051 root samples and those predicted by NIRS. The R2 value is 0.73. However, this data covers a wide range of variation for HCN. It would be important to improve the reliability of predictions to separate samples below or above a threshold (e.g. 200 ppm).
0
200
400
600
800
1000
Ranges of variation to HCN content (ppm)
Num
ber o
f clo
nes Landraces
Improved
0
100
200
300
400
500
750
1000
1250
1500
1750
2000
2500
3000
4000
0
200
400
600
800
1000
Ranges of variation to HCN content (ppm)
Num
ber o
f clo
nes Landraces
ImprovedLandracesImproved
0
100
200
300
400
500
750
1000
1250
1500
1750
2000
2500
3000
4000
Figure 7. Histogram illustrating distribution of cyanogenic potential (HCN in ppm) of landraces and improved cassava. There is a clear asymmetry with a long tale to the right and the distribution of improved clones tends to be more concentrated around lower HCN values.

23
The cassava-breeding program at CIAT has established a threshold of 200 ppm in the selection for genotypes suitable for the table consumption markets (e.g. > 200 ppm is rejected). This is a rather high threshold. The main justification for this decision is that, given the large variation and environmental influence on HCN expression, it is acceptable to have a lenient approach in early stages of selection.
Figure 8. HCN values measured by spectrophotometry and predicted by NIRs in a large sample of more than 3,000 cassava roots.
1.1.6. Boiling time
Perhaps the most relevant trait to identify cassava roots suitable for table consumption (in addition to low cyanogenic potential) is that they soften upon boiling. Natives in the Amazon basin have a name (caulla) for those roots that fail to soften (Chirif, 2013). There is a large variation in the time required by the roots to get soft in response to boiling. In some cases, even after an hour of boiling, roots fail to soften. Similarly, there is large variability in how easy roots soften when they are submerged in water to promote fermentation (a critical step for many ethnic food preparations based on cassava). The biochemical basis for softening in response to boiling or fermentation have not yet been established. The degree of association between these two response variables has not been determined either. What is clear is that boiling results in a gradual and consistent reduction of starch and cyanogenic glucosides in the root (Ezeigbo et al., 2015).
An ongoing evaluation of accessions from the germplasm collection at CIAT is screening roots for their dry matter content, cyanogenic potential and boiling time. A total of 392 genotypes haven been analyzed. However, in some cases it was possible to analyze samples from the same genotype grown in different seasons. Three genotypes offered five different root samples. Four root samples were available in the case of 11 genotypes. There were 27 and 113 genotypes with three and two root samples available, respectively. Finally, there was just one root sample available for the remaining 238 genotypes. In total, 546 root samples were screened for the three variables mentioned above. Table 8, presents a summary of this ongoing study. The average differences between the minimum and maximum values (within the same genotype) for DMC, HCN and cooking time were respectively 4.04%, 167.34 ppm and 16.56 min. This type of information provides a general idea of how variable information from samples obtained in different growing seasons may be.
Figure 9 presents the relationship between DMC and cooking time across the 546 samples. There is no obvious trend and both variables seem to be independent from each other. Figure 10 presents the averages (when more than root samples was available) or single values (when only one root sample per genotype was available) for boiling time and cyanogenic potential in the 392 accessions from the germplasm collection screened. This Figure has been included to highlight the relatively low frequency
y = 0.7325x + 85.89R² = 0.7252
-500
0
500
1000
1500
2000
2500
3000
3500
4000
0 500 1000 1500 2000 2500 3000 3500 4000 4500
HC
N p
redi
cted
by
NIR
S (p
pm)
HCN by spectrophotometry (ppm)

24
of accessions in the germplasm collection that meet the requirements of quick boiling (e.g. < 20 min) and low cyanogenic potential (e.g. < 200 ppm).
Table 8. Consistency in repeated measurements (from 2 to 5 samples per clone) on roots from the same genotypes (a total of 154)
Parameter DMC (%) HCN (ppm) Cooking Time(min) Average across 151 repeated genotypes 37,43 266,89 36,66 Average difference between minimum and maximum 4,04 167,34 16,56 Minimum difference between minimum and maximum 0,02 0,59 0,00 Maximum difference between minimum and maximum 12,48 796,99 47,00 Average St. deviation in data from same genotype 1,91 79,87 8,28
Sajeev and collaborators reported in 2010 on the thermal softening behavior in roots from nine cassava clones. They used linear regression and fractional conversion techniques, rheological properties of the gelated starch by Maxwell and power law models. The results showed that textural, rheological and gelatinization properties varied considerably among the varieties and besides the physico-chemical properties, interaction between them and structural make up of the tuber parenchyma had a great influence on cooking quality and rheological properties. Figure 11 reproduces the original data presented by Sajeev et al., in 2010. There is a remarkable difference in the softening or root tissue during boiling. Roots from Koliakodan and Sre Prabha showed a reduction in firmness above 80% after only five minutes. By ten minutes of boiling roots from all clones (except Sree Rekha and Venjaramoodan) had lost firmness above 80%. Very relevant in this data is that there is no major changes through time. Roots that softened quickly kept softening faster through time. On the other hand, roots that were initially slow in their softening were consistently slow through time. In practical terms, therefore, it is reasonable to propose to assess response to boiling at a standard time (e.g. after 10 minutes of boiling) uniformly across all genotypes under evaluation.
Figure 9. Relationship between dry matter content (%) and cooking time (minutes) in a sample of 546 cassava roots from 392 genotypes (in some cases more than one root sample per genotype was available).
y = -0,2926x + 49,292R² = 0,0051
10
20
30
40
50
60
70
20 25 30 35 40 45 50
Coo
king
tim
e (m
in)
Dry matter content (%)

25
Figure 10. Relationship between cooking time and cyanogenic potential (HCN) in root samples from 392 genotypes. The frequency of materials suitable for boiling (red circle) is very low.
Sajeev et al. (2010) not only assessed the loss of firmness through boiling of the roots from nine cassava genotypes, but also the texture profile parameters of these cooked. Table 9 reproduces the results published by these authors. Cooking time and texture profiles can be linked to root physico-chemical and starch gelatinization properties presented respectively in Tables 10 and 11.
Figure 11. Reduction of firmness (e.g. softening) in roots from nine Indian cassava clones through boiling. Source: Sajeev et al., 2010.
Table 9. Texture profile parameters of cooked tuberous roots of cassava varieties. Source: Sajeev et al., 2010.a
Clone Hardness, N
Adhesiveness,Ns Springiness Cohesiveness Chewiness
Kaliamanja 55.1 ab −0.49 a 1.23 a 0.260 a 13.9 a Koliakodan 58.2 ab −1.83b 1.23 a 0.332 a 21.7 a Adukkumuttan 84.2 a −1.25 ab 0.82 0.340 a 23.3 a Narayanakappa 43.0 b −0.58 a 1.10 ab 0.321 a 14.0 a Sree Prabha 90.2 a −0.31 a 0.89 ab 0.317 a 24.5 a H152 66.2 ab −0.38 a 1.02 abc 0.320 a 18.7 a Venjaramoodan 78.4 ab −0.94 a 1.02 abc 0.282 a 22.7 a Sree Prabha 59.7 ab −0.34 a 0.85 bc 0.332 a 15.1 a H740 72.0 ab −0.43 a 0.76c 0.305 a 14.8 a
a Means followed by same superscripts in a column are not significantly different (p<0.05)
0
10
20
30
40
50
60
0 200 400 600 800 1000
Coo
king
tim
e (m
in)
HCN (ppm)

26
Table 10. Physico-chemical properties of raw tubers of different varieties of cassava. Source: Sajeev et al., 2010. a
Clone DMC Starch Sugars Fiber Ash Amylose (%) (%) (% wb) (% db) (% db) (% db) Apparent Total
Kaliamanja 68,6c 27,6 a 2,0 e 1,01 d 2,0 b 18,2 b 19,6 bc Koliakodan 62,0 e 27,5 a 1,9 f 0,46 f 1,8 c 15,6 de 19,1 c Adukkumuttan 67,0 d 25,2c 1,6 b 0,97 d 1,9 bc 16,8 bcd 21,3 b Narayanakappa 70,6b 24,9 cd 1,9 f 0,95 d 2,0 b 17,7 bc 19,8 bc Sree Prabha 72,4 a 20,9 2,4 c 1,28 b 2,4 a 14,5 ef 16,7 d H152 66,1d 26,5b 2,8 a 0,97 d 1,5 d 20,6 a 23,4 a Venjaramoodan 67,1 d 23,2 e 2,3 d 1,19 c 1,8 c 16,3 cd 19,8 bc Sree Prabha 72,5 a 21,4f 1,8g 0,78 e 2,3 a 15,3 de 18,8 c H740 67,5 cd 24,3d 2,5 b 1,57 a 2,4 a 13,4 f 15,6 d
a Means followed by same superscripts in a column are not significantly different (p<0.05)
Table 11. Gelatinization properties of cassava starches by the DSC thermograms. Source: Sajeev et al., 2010. a
Clone Enthalpy Gelatinisation temperature (°C Peak Swelling Solubility
(%) height Volume
Onset Peak Endset Range index (ml/g) Kaliamanja 11.6 bc 64.9 bc 68.3 c 79.4 bc 14.5 abc 3.5 ab 56.2 a 14.4 a Koliakodan 12.3 a 66.1 a 70.5 a 80.8 ab 14.7 abc 2.8 ab 43.8 e 20.8 b Adukkumuttan 12.2 ab 66.7 a 70.1 ab 80.1 bc 13.4 bc 3.7 ab 50.0 e 21.5 b Narayanakappa 12.2 ab 64.1 c 68.7 bc 76.3 d 12.2 c 2.6 b 36.9 e 15.2 cd Sree Prabha 12.0 ab 65.6 ab 69.3 abc 79.4 bc 13.7 abc 3.3 ab 52.5 b 16.9 cd H152 11.1 c 64.2 c 68.7 bc 77.9 cd 13.6 abc 2.5 b 47.5 d 18.4 bx Venjaramoodan 11.9 ab 65.7 ab 68.7 bc 80.5 ab 14.8 ab 4.1 a 47.5 d 27.3 a Sree Prabha 12.1 ab 66.7 a 70.4 a 82.7 a 16.0 a 3.2 ab 43.7 e 14.4 d H740 11.2 c 65.6 ab 69.2 abc 78.9 bc 13.4 bc 3.1 ab 50.0 c 25.8 a
a Means followed by same superscripts in a column are not significantly different (p<0.05)
Table 12. Pasting properties from starches of more than 4000 cassava genotypes. Source: Sanchez et al., 2009
Pasting Maximum Breakdown
(cP)
Consistency
(cP)
Setback
(cP)
Ease of Parameter Temperature Viscosity Cooking (oC) (cP) (min) Maximum 71,2 1505,0 859.0 626.0 273.0 5,6 Minimum 58,8 146,0 28.1 0.0 -702.0 1,1 Average 65.3 777,5 298.1 155.8 -144.5 2,8 St. Dev. 1.75 165,03 107.1 57.8 96.2 0,72 Skewness -0,13 0.22 0.81 0.94 -0.38 0,33 Count 4051 4051 4051 4051 4051 4051
According to the information published by Sanchez et al., in 2009 (Table 12) there was a positive correlation between easy of cooking and amylose content (0.12). As expected, the regression of easy of cooking on amylose content was positive but with very small R2 value (0.015). The correlation between dry matter content and easy of cooking was small and negative (-0.08). The R2 value of the regression of easy of cooking on dry matter content was also negligible (0.006).
Talma and co-workers reported in 2013 the responses to boiling in roots from 15 cassava clones. There was significant correlation between the shear strength of the cooked pulp and the cooking time (0.62), but the correlation between cooking time and shear strength of fresh roots was considerably lower (0.35). Figure 12 presents the relationship between shear strength in the raw roots failed to predict cooking time. The average CV for cooking time was acceptable (7.57 %). However, higher values were obtained for the coefficient of variation of the texture measurements, highlighting the heterogeneity of the roots. Cooking time in this study ranged from 17 to 31 minutes.

27
Figure 12. Relationship between shear strength in uncooked cassava roots and boiling time. Source: Talma et al., 2013.
There is a contradiction between the perception of Amerindians regarding the effect of age of the plant and cooking time and more recent studies. Azevedo Miranda et al. (2008) reported on the evaluation of roots from six different cassava clones grown in two different environment and harvested 8, 10, 12, 14 , 16, 18 and 20 MAP. There were significant differences among the six clones for cooking time. In general, there was a good correlation (0.70) between average cooking time (across harvesting dates) of each clone at the two different locations. These results clearly indicate that boiling time is under genetic control. Interestingly, cooking times increased with age of the plant reaching a maximum (at both locations) in plants harvested 16 MAP and then decreased sharply.
Lorenzi reported in 1994 differences in boiling time in different types of comparisons for a single genotype. Within a root proximal, intermediate and distant section of the roots boil increasingly faster (31, 24 and 19 minutes, respectively). In agreement with Azevedo Miranda (2008) boiling time increased in roots from plants harvested after 12 months of age. Differences were not large for roots from plants harvested at of before 12 months of age. Boiling time of roots from 15 months-old plants showed a wider range of variation. Lorezni also provided evidence that type of soil has a strong effect on cooking time when roots from five clones were evaluated monthly from the 7th through the 15th month of age (53 vs 36 min in two contrasting soils).
Other reports have also found an effect of age of the plant on boiling time (Pereira et al., 1983; 1985; Fukuda & Borges, 1988; 1990; Fukuda et al., 1988). An earlier report (Borges et al., 2002) on 26 cassava clones evaluated two consecutive years at Cruz das Almas (Brazil) and harvested 8, 10 and 12 MAP indicated an increase of fresh root yield with age of the plants which was unrelated to starch and dry matter content in the roots. More importantly, there was no much influence of years of harvest or age on the plants on boiling time. However, this early work included only harvests between 8 and 12 MAP. Azevedo Miranda and co-workers found the effect of age of the plant mostly at harvest beyond 12 MAP.
1.1.7. Cooking quality
Cooking quality is associated with boiling time. According to Lorenzi (1994) roots that soften quickly upon boiling tend to offer better culinary quality. An interesting study by Hongbété et al. was published in 2011. These researchers analized roots from seven genotypes harvested 10, 12 and 14 months after planting and in three different seasons. Age of plant and environmental conditions during growing affect texture (friability) and taste of boiled cassava roots. Sensory taste (sweet or bitter) of boiled cassava root could not be correlated with sugar content and/or cyanide potential, which both interfere with taste perception. The authors concluded that bitterness is not a good indicator of the poisonous character of cassava roots. Wheatley had reported in 1991 the presence of many volatile compounds (different from HCN) having a sensory effect whose concentration increase upon boiling the roots. Improved cultivars generally showed lower friability scores, independently of plant age (10–14 months) or season. Rainfall before harvest directly lowers dry matter and mealiness of boiled roots. Pectins (higher content for
y = -0,0252x + 14,423R² = 0,0012
10
12
14
16
18
20
22
24
15 20 25 30 35
Shea
r stre
ngth
(N)
Cooking time (min)

28
improved cultivars) are suspected to be the major biochemical cause of vegetable mealiness or friability. A puncture test can confidently be used for evaluating cassava friability; it correlates with both texture sensorial evaluation and disintegration visual appearance.
Culinary quality of cassava roots depends of many factors (DMC, HCN, boiling time) as described in the previous sections. Some of these factors have a direct or indirect effect. There is a strong influence of the environment, genotype and genotype-by-environment interactions in cooking quality. Cooking quality also depend strongly on age of the plant and season in which harvest takes place. Ultimately, a panel of experts is required for properly assessing quality of boiled roots (Wheatley, 1991).
1.2. Cassava Breeding for Quality Traits at NaCRRI: Uganda
This year 2018, cassava marks its 158th anniversary since its introduction in Uganda. As of this writing, seven aspects characterize the cassava value-chain in Uganda: 1) cassava is grown by ~7.4 million people majority of whom are women on smallholdings that ~850,000 hectares in total; 2) the crop is popular among the populace owing to its flexible harvesting times and diversity of food and non-food products to which its starchy roots and/or leaves can be subjected to; 3) upon harvest, inefficient cassava processing and storage methods are commonplace; 4) the crop suffers from acute and variable on-farm productivity owing to an array of biotic and abiotic constraints; 5) drudgery is commonplace during, production, processing and marketing; 6) the crop has opened up new vistas for income generation arising from sale of stems and/or new cassava-based products; and 7) existence of inefficient extension services to support cassava production, processing and marketing.
It’s apparent from the foregoing that cassava’s landscape in Uganda has had, and continues, to witness both exciting opportunities and acute development challenges. Research interventions over the past decades have attempted to address some of these challenges. Indeed, we acknowledge three significant research interventions. Firstly, the Colonial Government, which made first attempts in 1941. These efforts led to the release of 13 varieties, some of which are still surviving today and thus referred to as “local varieties”. Secondly, interventions in the late 1980s by the Government of Uganda and development partners; notable of these interventions were the intensive selections from introduced germplasm from the International Institute of Tropical Agriculture (IITA). These efforts led to the release of 12 high-yielding varieties. And thirdly, interventions initiated in 2004; these were largely responding to: 1) the outbreak of cassava brown streak disease that caused substantial reduction in production in the 2000s; 2) the need for nutritious cassava (with beta-carotene); and 3) growing need of high starch varieties for the highly competitive and growing cassava starch industries.
Through these various intervention, experience has taught us that end-user preferences are critical for success. For instance, as cassava virus incidences and severities decreased owing to breeding interventions, farmers reluctantly cultivated these improved varieties, and resorted back to their locally adapted varieties, for which, they have had a long historic association. This was partly attributed to the notion that many of the released varieties lacked desirable root quality attributes (taste, mealiness, texture and aroma) as compared to locally adapted varieties. This reversion by farmers to local susceptible varieties after the control of major disease pandemics motivated NaCRRI to initiate cross-functional cassava breeding schemes guided by breeding objectives tailored towards: 1) increased and stable yields; 2) improved nutritional value and organoleptic properties; 3) improved root quality; 4) improved disease and pest resistance; and 5) improved cassava agronomics; and 6) improved tolerance to abiotic stresses. In all these interventions, our ultimate desire is to benefit cassava farmers, processors and consumers.

29
Our desire is to have cassava varieties that have “must-have-traits” and/or “value-added traits” The “must-have-traits” ensure that cassava optimally yields despite the prevailing pests, diseases and abiotic stresses in farmers’ fields. Of keen interest for WP 4 is to focus on the “value-added traits” most of which deal with root quality and use. Accordingly, our immediate target traits for 2018 are: 1) root dry matter content; 2) softness; and 3) cyanogenic potential. For 2019, our target traits will be: 1) root dry matter content; 2) beta carotene content; 3) softness; 4) cyanogenic potential; and 5) starch content. Beyond 2019, we may add fibre content to these aforementioned five root quality traits. Prioritization of this trait list will be informed by information collected from end-user surveys conducted under WP1. Hereafter we provide a brief assessment procedure on each of the target traits
1.2.1. Assessment for root dry matter content
Done for all breeding trials at harvest (12 months) using two methods; specific gravity or the oven dry method. For oven dry method, roots (3-5 per plot) should be sampled randomly from several plants within the plot and peeled. Root samples weighing 100 – 200g of fresh roots per plot are cut into thin slices using a knife (<1 cm thick) and then weighed. Drying in a forced air oven (Leader engineering, Cheshire, England) is done at 60oC until constant weight. The DMC is expressed as a percentage of fresh root weight as: DMC (%) = ("Dry sample weight" /"Fresh sample weight)" ×100. DMC when multiplied by fresh root yield provides estimates of root dry yield of a clone. For the specific gravity method, root samples weighing 3–5 kg are sampled/plot. These samples were weighed in air (Wa) and in water (Ww) using a suitable balance. Thereafter, the specific gravity (Sg) is computed as a ratio of Ww and the difference between Wa and Ww. DMC content is then computed using the formula: DMC = (158.3 * SgI) – 142. Heritability of DMC ranges between 0.14 to 0.75.
1.2.2. Cassava total carotenoid determination
Total carotenoid content is analysed both on fresh and processed samples, using an icheckTM carotene kit (BioAnalyt Laboratory, Germany) (www.bioanalyt.com). Fresh samples are analysed within four hours of harvest, in a dark room, to minimize losses resulting from photo oxidation. Opposite quarters of sectioned roots are selected, chopped into small pieces and pooled. About 5 g of the finely chopped root samples are pounded and ground into a smooth and fine paste using a mortar and pestle. To aid grinding of the sample, 20 ml of distilled water is often added gradually and the resulting solution is transferred into a 50 ml calibrated tube. The tube content is shaken thoroughly and 0.4 ml of the solution is injected into the iExTM CAROTENE vial using the syringe and needle provided with the kit.
Vials are placed on a solid surface for approximately 5 min, shaken again and allowed to stand until two solution phases appear inside the vial: a clear upper phase and a turbid lower phase. At this point, the absorbance of the vial content (the upper solution phase) is measured at a wavelength of 450 nm using the iCheckTM CAROTENE device. Total carotenoids content is calculated as:
TCC (Ppm)= WsVs × A
Where Ws = weight of sample, Vs = volume of solution transferred to the tube and A = absorbance of the iExTM CAROTENE vial contents. The processed samples are treated in a similar manner for carotenoids content, and percentage retention calculated using the formula: retention (%) = c1× wb
c2× wb' ×100
where; c1= carotenoids content in processed roots, c2 = carotenoids content in fresh roots, wb = weight of processed roots, wb′ = weight of unprocessed roots.

30
1.2.3. Determination of cyanide content
Cyanide content is determined using the method of Howard et al., 1994. Fifty grams (50g) of fresh cassava root is extracted by 160 ml of 1M orthophosphoric acid by homogenization using a waring blender (Waring, New Hartford, USA). The homogenate is centrifuged for 30 minutes at 12000 rpm, 4oC using a refrigerated centrifuge (Hermle Z300K, Wehingen, Germany). The supernatant containing the extracted linamarin (0.1 ml) is buffered with 0.4 ml of phosphate buffer (pH 7.0) and hydrolysed to cyanide using linamarase enzyme. The released cyanide is chlorinated using 0.1 ml of 0.4 % (w/v) Chloramine T solution, followed by reaction with 0.6 ml of 0.2M Isonicotinic/ barbituric acid solution (pH 6.5). Cyanide is quantified spectrophotometrically (Biowave ii+, Cambridge, England) by measuring absorbance of the colored complex at a wave length of 605 nm, against standard potassium cyanide. The cyanide content is expressed in parts per million (ppm).
Table 13. Performance of parents and their respective F1 progeny across two locations in Uganda during 2014-2015
Parent/Family Numbera TCCb DMCc
NASE 3 (P1) - 0.2 37.3 CPCR24B-10 (P2) - 4.4 32.3 MH05-2870 (P3) - 4.3 33.4 MH05-0233 (P4) - 4.9 29.0 CPCR15B-26 (P5) - 5.3 30.7 MH02-073HS (P6) - 10.4 22.2 P1 x P2 17 2.1 34.4 P1 x P3 18 3.1 31.0 P1 x P4 19 3.1 31.3 P1 x P5 20 2.4 33.9 P1 x P6 16 2.6 28.1 P2 x P3 15 2.7 32.4 P2 x P4 15 3.1 32.1 P2 x P5 20 3.2 32.1 P2 x P6 17 3.7 29.6 P3 x P4 20 2.3 33.0 P3 x P5 16 3.2 32.9 P3 x P6 20 3.7 29.7 P4 x P5 20 4.3 33.6 P4 x P6 20 4.4 29.0 P5 x P6 19 5.8 22.2 Mean 3.8 30.9 SEh 0.062 0.150 LSD0.05i 0.127 0.304
aNumber of genotypes evaluated per F1 family; bTotal carotenoid content (µg g-1); cDry matter content of roots (%);gValues based on all F1 genotypes evaluated; hStandard error; iLeast significant difference at 5% confidence level; jNumber of F1 genotypes evaluated: reduction from the total population (272) indicates proportion of genotypes whose roots were not sufficient for measuring TCC and/or DMC. Adopted from Esuma et al 2016; https://doi.org/10.1270/jsbbs.15159

31
Table 14. GCA effects of cassava parental lines used in a 6x6 half-diallel analysis of five traits
Parent TCCa DMCb
NASE 3 -1.60*** 1.75***
CPCR24B-10 -0.38** 0.87**
MH05-2870 -0.07 0.82**
MH05-0233 0.03** -0.17*
CPCR15B-26 0.28** 0.44**
MH02-073HS 1.93*** -3.72***
LSD0.05f 0.253 0.607
SEg 0.041 0.097
aTotal carotenoid content (µg g-1); bDry matter content (%);fLeast significant difference at 5% confidence level; gStandard error. *, ** and *** significant at P < 0.05, P < 0.01 and P < 0.001, respectively. Adopted from Esuma et al 2016; https://doi.org/10.1270/jsbbs.15159
Table 15. Genetic parameter estimates for five traits of 6x6 half diallel F1 families evaluated at two locations in Uganda
Component TCCa DMCb
δ2Af 6.47 12.01
δ2Dg 4.46 11.94
δ2A x Eh 0.01 0.87
δ2D x E 0.00 3.71
h2i 0.48 0.41
H2j 0.94 0.82
aTotal carotenoid content (µg g-1); bDry matter content (%);fAdditive genetic variance; gDominance genetic variance; hEnvironmental effect; iNarrow sense heritability; jBroad sense heritability. Adopted from Esuma et al 2016; https://doi.org/10.1270/jsbbs.15159

32
Figure 13. Scatter plot and histograms of TCC vs. root dry matter content. Color represents pigmentation of the root parenchyma such that 1-WT = white; 2-LC = light cream; 3-CM = cream, 4-LY = light yellow; 5-YL = yellow; 6-DY = deep yellow; red lines on histograms indicate means. Adopted from Esuma et al 2016; https://doi.org/10.1270/jsbbs.15159.
1.2.4. Assessment of softness of cooked roots
Assessed on either fresh or waxed root samples; waxing is appropriate when analyzing many root samples, as it maintains sample integrity for up to one month. Two roots sampled/plot are peeled and sliced into four 3cm sections. Next, the four sections are loosely wrapped in perforated aluminum foil and heated (cooked) in a water bath set at a constant near boiling temperature of 90°C. Boiling is undertaken for 45 minutes. Once this is completed, a 7.9 mm diameter tip of a digital penetrometer (Model number: FHT-1122, Vetus Industrial Company Limited, Hefei, China) is pushed to a depth of 1 cm into three different sides of the cooked root section (i.e., three technical measurements taken per root section). Softness is recorded as the maximum force used to penetrate the root section. The only study that has quantified heritability was one by Paula Iragaba (unpublished data), which documented that heritability for softness ranged from 0.17 for samples boiled for 60 minutes to 0.37 for samples boiled for 45 minutes.

33
Table 16. BLUPs and heritability estimates of cassava root softness following four different cooking durations.
Cooking time (min)a No. cassava genotypesb
BLUPsc Broad-sense heritability
Mean (N) SDd (N) Range (N) Estimate SEe
15 268 3.33 0.155 2.94 - 3.76 0.22 0.087
30 268 2.78 0.154 2.45 - 3.27 0.28 0.081
45 267 2.47 0.205 1.94 - 3.21 0.37 0.076
60 267 2.20 0.096 1.89 - 2.49 0.17 0.092 aData based on analysis across two locations; Arua (west Nile region) and Mubende (central region); Back-transformed BLUPs are reported for the 15 min time point; bOnly 267 genotypes were evaluated at the 45 and 60 min cooking times, because one of the genotypes did not have enough roots for phenotypic evaluation; cBLUPs, best linear unbiased predictors; dSD, standard deviation of the BLUPs and eSE, standard error of heritabilities. Adopted from Iragaba et al Unpublished data.
Figure 14. Step by step process of assessing softness of boiled cassava roots: a) roots harvested from the field waxed and stored at room temperature; b) root samples boiled in a water bath maintained at 900C; and c) softness assessed using a penetrometer; upto 4 root sections sampled per clone.
1.2.5. Genetic variability in NaCRRI breeding program
At NaCRRI, we have different cassava populations and/or clones at different evaluation stages. It’s these populations and/or trials that we shall use to constitute the target population for WP 4. First, for 2018, our target population was the NextGen C1 population that comprised of ~730 clones established at Namulonge (NaCRRI). This trial was harvested in September 2018, roots sampled, waxed and shipped to the laboratory for trait analyses.
Second, we specifically established a WP 4 trial comprising of 73 clones (52 elite and 21 local). This trial was established in August 2018 at two sites: Namulonge (central region) and Serere (eastern region), and will be due for harvesting in August 2019. Third, if resources permit, we shall also target a portion (~400 clones) of the NextGen C2 cassava seedling population that was established at Namulonge in October 2018; this trial will be due for harvesting in October 2019.
A B C

34
1.3. Cassava Breeding for Quality Traits at NRCRI: Nigeria
The Nigerian cassava sector is unique and quite massive. It has maintained its place as the leading cassava producing country in the world at an estimated 57 million MT (FAO, 2016) and contributing over 20% of the world’s annual production. However, domestic production is not meeting the national need for cassava root for food security and several industrial needs.
The National Root Crops Research Institute (NRCRI) Umudike is charged with a national mandate of genetic improvement of root and tuber crops in Nigeria to enable farmers, processors and commercial producers maximize their output per unit input, improve their livelihoods and wellbeing and meet their daily food needs. Even though NRCRI and her partners (IITA and CIAT) together have officially released 46 cassava varieties, recent studies by the Cassava Monitoring Survey (CMS) showed the top most popular 10 varieties in the different growing areas of Nigeria (Wossen et al., 2017). A lot of attention is given to the productivity traits such as fresh root yields per unit area and resilience to pests and diseases. Even though consideration is usually given root quality parameters, it has hardly occupied the priority list because a lot of scientists believe that much of the outcome of the quality of gari or fufu depends on the processing methods and the duration of fermentation of fresh roots. This is gradually changing and there are prospects for including boiled roots as an avenue to convey micronutrients since it is retained due to minimal processing.
Cassava production and processing is a core livelihood activity in Nigeria, a major source of income for over 4 million farmers in production and providing food for over 100 million persons (IITA 2012, FAOSTAT 2016). Nigeria’s cassava industry is growing with diverse end-users and growing industrial use. However, small-scale farming and processing represents by far the largest cassava food product agribusiness cluster in Nigeria (Forsythe et al., 2016; Onyenweaku and Simonyan 2014). Gari and Fufu are most widely consumed products of cassava root and a component of daily diets of over 60% of Nigeria’s 190 million people.
Gari is most preferred because of its convenience, long shelf life and its easy to eat form either as a snack or a meal, eba (Ernest et al., 2000; Onabolu, 2001; Ajala et al., 2000) Cassava breeding has been aimed at developing improved varieties that are more acceptable and nutritious to the end-users in terms of its sensory attributes such as mouldability, adhesiveness, drawability, colour and general acceptance (Chijioke et al., 2018). Oparinde et al. (2012) and Tumuhimbise et al. (2012) also described sweetness, dry matter content, carotenoids and its influence on the colour, appearance, taste, smell, and texture among the attributes and criteria that influences acceptance of this product.
End-user preference is cardinal to all production activities among smallholder farmers and processors in Nigeria. Therefore, the higher the demand for specific products from a specific processor there is increased business opportunity. This entails that certain product characteristics define its market viability. Such deal-breaker traits has over the years been viewed from the processing end of the value chain thus leaving the consumers needs unmet and in turn, market opportunities are not maximized. The Cassava breeding team at NRCRI, has identified this need and has over the past few years, focused on consumer preferred traits as key to defining their breeding objectives. The higher the demands for certain product trait characteristics, the more the derived demand for cassava varieties with such quality traits increases leading to higher adoption rates and better yields for farming families and smallholder cassava processing agribusinesses.
Cassava breeding has over time evolved with the inclusion of consumer preferences in traits identified through participatory studies useful in mapping out traits of top quality that drives market demand for cassava. These include colour, taste, consistency for products like garri and fufu.

35
1.3.1. Phenotyping for quality traits at NRCRI, Umudike
Cassava breeding programmes have explored a wide spectrum research and development interventions through innovative partnerships towards increased resistance to pest and diseases, improved nutritional quality, best agronomic traits for cassava stems and roots, drought tolerance in changing climate and most of all increased yields to benefit smallholder farmers and processors who hold the highest stake in the Nigerian cassava sector.
Furthermore, of topmost priority is genetic improvement of cassava varieties for identified quality traits based on diverse end-user preferences. These traits of preference include root dry matter content (relevant for root mealiness), product consistency (for garri and fufu) associated with cassava starch content, colour (especially with respect to beta carotene content), aroma and taste. Chijioke et al., 2018 evaluated the sensory attributes and consumer acceptance of eba prepared from some cassava clones at the uniform yield trial (UYT) breeding stage. This study assessed seven cassava genotypes at UYT and 2 controls [1 national check white (TMS30572) and a biofortified variety (UMUCASS36)] harvested from NRCRI’s HarvestPlus trial fields planted at NRCRI Umudike experimental plots. Gari was processed from the different cassava varieties using the a standard processing method. Dry matter content of gari was determined using the method of AOAC (2005). Eba was prepared from the 9 varieties and method of preparation was optimized by quantifying volume of hot water needed to reconstitute 100 g of dry gari granules. The weight of resultant dough was determined. Sensory perception and consumer acceptance of some selected sensory properties of eba was determined by 50 semi-panelist trained using a 5-point hedonic scale: 5= like extremely, 3= neither like nor dislike, 1= dislike extreme. The datasets (Table17-19) showed the ranking of the newly developed varieties compared to the check variety, TMS30572, and that some were better preferred.
Table 17. Dry matter content of gari granules from a Uniform Yield Trial (UYT) grown and processed at NRCRI, Umudike.
Sample Dry matter (%) NR120103 90.30a TMS30572 81.30d* NR120118 88.85c NR120212 87.50c NR120122 90.80a UMUCAS36 83.50d* NR120047 89.00b NR120220 89.10b NR120214 89.40b
Table 18. Some cooking characteristics of the gari granules from a Uniform Yield Trial (UYT) grown and processed at NRCRI, Umudike.
Sample Volume of water absorbed/100 g gari (mL)
Weight of Eba/100 g gari
TMS30572 209.32 514.79 UMUCASS36 238.97 312.76 NR120122 209.94 316.43 NR120220 209.99 301.33 NR120118 349.70 407.87 NR120103 280.11 351.72 NR120047 280.07 356.01 NR120212 280.19 344.07

36
Table 19. Mean scores of sensory perception and consumer acceptance of Eba prepared from selected cassava varieties in a Uniform Yield Trial (UYT) grown and processed at NRCRI, Umudike.
Sample Mouldability Adhesiveness Colour Drawability General Acceptability
NR120103 4.16a±0.69 3.92a±0.76 3.80bc±0.91 3.72ab±1.02 20ab±0.71 TMS30572 3.80abc±0.87 3.80a±0.65 3.12d±0.93 3.48b±0.92 3.80bc±0.82 NR120122 3.68bc±0.95 3.72ab±0.84 4.28a±0.54 3.52b±0.71 4.04ab±0.73 NR120118 4.12ab±0.73 3.88a±0.73 4.36a±0.76 4.20a±2.45 4.28a±0.79 UMUCASS36 3.44c±0.87 3.32bc±0.80 3.04d±0.68 3.44b±0.77 3.52c±0.71 NR120212 3.44c±0.87 3.16c±0.99 4.08ab±0.64 3.28b±0.84 3.80bc±0.65 NR120047 3.68bc±0.90 3.52abc±0.82 3.84b±0.69 3.44b±0.92 3.80bc±0.58 NR120214 3.88abc±0.73 3.60ab±0.65 3.40cd±0.87 3.52b±0.77 3.80bc±1.00 NR120220 1.88d±0.73 2.32d±0.75 2.56e±0.87 2.28c±0.54 2.28d±0.74
Chijioke et al., 2018
In 2011, NRCRI evaluated a set of clones from a national pre-release trials including the first wave of 3 biofortified cassava varieties for root quality traits (Table20). Average mean dry matter contents of varieties range from 30-35%, for starch 16-22% and for gari was 18-21%. Further studies include the determination of the proximate composition of key biophysical parameters as shown in Table21.
Table 20. Means of dry matter and starch contents from fresh roots of cassava varieties evaluated at Ibadan and Umudike both in Nigeria.
Clone Dry matter content (%)
Starch content (%) Gari yield from 20kg tubers (kg)
Ibadan Umudike Ibadan Umudike Umudike
AR182 30.85 34.00 22.10 20.90 3.50 AR37108 34.45 26.50 21.80 16.60 3.00 CR1245 32.40 32.00 19.70 19.70 3.70 UMUCASS40 38.50 39.50 22.40 22.80 4.00 UMUCASS39 29.45 33.50 21.50 22.20 3.50 UMUCASS38 28.90 32.50 17.50 20.50 3.70 UMUCASS37 30.45 31.00 16.20 20.20 3.85 UMUCASS36 30.50 36.30 21.90 18.80 3.80 TMS30572 37.25 37.00 18.90 21.50 3.50 Antiota/Nwaibibi* 35.80 39.50 21.60 28.20 4.00
*Antiota and Nwaibibi were local checks at Ibadan and Umudike, respectively.
Table 21. Proximate composition of selected cassava varieties from a national variety pre-release trial in Nigeria in 2011.
Clone Root Pulp Colour Amylose
Crude Fiber (%)
Ash (%)
Reducing Sugar (%)
HCN (mg/100g)
UMUCASS36 Yellow 14.5 1.7 0.50 4.09 10.78 UMUCASS37 Yellow 14.4 2.25 1.05 4.12 8.08 UMUCASS38 Yellow 15.8 2.45 0.85 3.75 11.11 UMUCASS39 Cream 18.9 1.95 0.45 4.18 10.2 UMUCASS40 Cream 19.8 1.25 0.75 5.32 19.7 TMS30572 White 24.74 1.26 2.81 1.90 10.76
Current breeding focus through several breeding programmes is focused on evaluating sensory properties on consumer-preferred traits with product specification for profiling. This is aimed at determining the correlation between root biophysical properties and product sensory properties that drive market demand for its products. Current emphasis for Nigeria is on gari and fufu as the most widely consumed in Nigeria. There exists an opportunity for a boiled biofortified cassava root food

37
product, as this will be important for nutrient retention. Currently, Kelechi Uchendu (PhD candidate at University of Ghana) is conducting a genome wide associated study of mealiness of biofortified cassava varieties using a panel of 150 individuals. The work will involve phenotyping for root mealiness of boiled roots and the quantification using spectral reads from portable NIRS (Qualispect) equipment. In Nigeria, two local landraces (Isunikakiyan or TMEB117 and TMEB693) represent standard checks for good root mealiness.
Ongoing research has identified clones from new cassava varieties of derived from NextGen Cassava and HarvestPlus projects using TMEB419 as a national check for experimental populations for biophysical and sensory evaluations. The RTBFoods project targets such goals as developing product profiles from selected cassava varieties. This involves gender-responsive participatory research and is aimed at developing descriptors so as to enable high throughput phenotyping and matching these with biophysical traits that are important for food products derived from the varieties. A majority of product studies have focused on processing there is a dearth in literature on the correlation between roots biophysical properties and consumer preferred traits. One class of traits that have limited information and their causative effects on food products are the textural traits and presents an opportunity for further studies.
Through the NextGen Cassava project, NRCRI and her partners developed and validated a rapid assay for root quality parameters for traits such as dry matter, beta carotene and starch contents (Ikeogu et al., 2017). It represents a game-changing technique for high throughput phenotyping as the accuracy of genetic predictions are dependent on the quality and reliability of the phenotypic data. The study also involved a genome wide association mapping which determined the genomic regions that control the accumulation of the different carotenoids in cassava roots.
1.3.2. Participatory quality evaluation of cassava by farmers and consumers
In Nigeria, cassava value chain actors are being engaged in participatory research to identify the traits of quality, of high demand, market value and market drivers in terms of product quality. These evaluations cascade down the best agronomic traits for farmers in production and the optimal production levels possible in the prevailing variations in climatic elements. Participatory quality evaluation is cardinal to the entire cassava value chain to help with product profiling as it defines what the farmers produce, drives demand and sketches the trajectory for consumer patronage and agribusiness activities within the cassava value chain. This is the core of the objectives of NRCRI cassava breeding unit. To meet consumers needs and preferences, increase market value and empower smallholder agribusinesses within the value chain which in this case is a female-dominant sector. These activities are currently being implemented under the NextGen Cassava – RTBFoods collaboration. Gender mainstreaming is a global phenomenon and it’s impact in all aspects of life cannot be over emphasized. Gender differentials in every cassava value chain that influence the levels of adoption, use, market participation or inclusion and opportunities for agribusinesses are embedded in the varied roles and values of individuals from diverse cultures, religion and ethnic groups in Nigeria (Teeken et al., 2018). It regulates demands, practices, choices, opportunities, aspirations and actions according to different needs, preferences and use of cassava by men, women and children (male and female). In the long run, it defines the entirety of their economic empowerment in cassava business, general wellbeing, food security and existence. Nigeria is a multicultural and multi-ethnic, country with a relatively huge population- home to over 190 million1 people who consume cassava as a major staple in their daily meals.
As a pre-requisite for a variety to be released, it must have been evaluated both in research stations representing a diverse agro-ecological conditions and by farmers in those areas. In Nigeria, a minimum set of 50-100 cassava farmers are usually engaged in the trials. In 2011, 104 cassava farmers each tested a set of 5 varieties in a design that regarded each of the 13 states used a trial unit whereby 8 farmers were regarded as replicates. The acceptable food quality (for gari – eba and fufu) attributes of the varieties as tested and ranked by most of the farmers distinguished these varieties for the
1 http://www.worldometers.info/world-population/nigeria-population/

38
appropriate food forms and thus the basis for their necessary release to farmers (Tables 22 and23). These varieties were preferred over the national or local checks for the gari and fufu products.
Table 22. Gari (Eba) quality assessment of cassava varieties under on-farm pre-release trial in some states of Nigeria during 2010/2011 cropping season
State Cassava Variety
UMUCASS3
6 UMUCASS3
7 UMUCASS3
8 UMUCASS3
9 UMUCASS4
0 TMS30572 Local
check Benue V. Good (1) V. Good (1) V. Good (1) V. Good (1) V. Good (1) V. Good (1) N.T.
Cross River
V. Good (2) V. Good (2) Excellent (1) V. Good (2) V. Good (2) V. Good (2) V. Good (2)
Delta V. Good (1) V. Good (1) V. Good (1) V. Good (1) V. Good (1) Good (6) Good (6)
Enugu V. Good (1) V. Good (1) V. Good (1) V. Good (1) V. Good (1) V. Good (1) V. Good (1)
Imo Excellent (1) V. Good (2) V. Good (2) V. Good (2) V. Good (2) Good (6) Good (6)
Nasarawa V. Good (2) V. Good (2) V. Good (2) Excellent (1) V. Good (2) V. Good (2) V. Good (2)
Ogun Poor (5) Good (4) Poor (5) Good (4) V. Good (1) V. Good (1) V. Good (1) Mean* 1.85 (3) 1.85 (3) 1.85 (3) 1.71 (2) 1.42 (1) 2.71 (6) 3.0 (7)
The figure in parenthesis is the rank on a scale of 1–7, where 1 = most preferred and 7 = least preferred. N.T = Not tested. * = mean ranking
Table 23. Fufu quality assessment of cassava varieties under on-farm pre-release trial in some states of Nigeria during 2010/2011 cropping season.
State Cassava Variety
UMUCASS3
6 UMUCASS3
7 UMUCASS3
8 UMUCASS3
9 UMUCASS4
0 TMS30572 Local
check Benue Good (3) V. Good (1) Good (3) Good (3) Good (3) V. Good (1) N.T. Cross River Excellent (1) V. Good (5) Excellent (1) Excellent (1) Excellent (1) Poor (7) Good (6) Delta V. Good (1) V. Good (1) V. Good (1) V. Good (1) V. Good (1) V. Good (1) V. Good (1) Enugu Excellent (1) V. Good (4) Excellent (1) Excellent (1) V. Good (4) Good (6) Good (6) Imo V. Good (2) V. Good (2) Good (6) V. Good (2) Excellent (1) V. Good (2) Good (6) Nasarawa Good (3) Good (3) Poor (6) N.T. Good (3) V. Good (1) V. Good (1) Ogun Good (3) V. Good (1) Good (3) Good (3) Good (3) V. Good (1) N.T. Mean* 2.0 (2) 2.42 (4) 3.0 (6) 1.83 (1) 2.28 (3) 2.71 (5) 4.0 (7)
The figure in parenthesis is the rank on a scale of 1–7, where 1 = most preferred and 7 = least preferred. N.T = Not tested. * = mean ranking Gender responsive cassava breeding seeks to identify and breed products that address the specific needs of men and women alike while recognizing that women are the true custodians of household food security and their opinion and preferences in terms of cassava preferred traits are of uttermost importance. This defines NRCRI’s breeding objective as a shift towards increased freedoms, opportunities for both men and women and a more equal and food secure Nigeria.
1.3.3. Genetic variability in NRCRI cassava breeding program
There exists a minimal genetic variability for the different root quality traits in cassava such as dry matter content, starch, root mealiness, etc. Recent efforts have yielded improvements through new introductions of cassava from South America. For example in 2012, Nigeria officially released a variety, CR36-5, originally received as an in vitro seedling from CIAT after national evaluation trials. The variety is currently one of the highest dry matter and starch yielding ones. Accumulation of genes for prioritized root quality trait can be aided with the power of genomics if the most critical traits responsible for the best gari and fufu quality are determined.
Biofortified cassava with enhanced levels of beta carotene are being cultivated by Nigerian farmers since 2012 (Fig. 1) and it has become apparent that scaling out will be more successful if the biofortified

39
varieties have higher dry matter and starch contents. Genomic dissection of the genes controlling both beta carotene and dry matter indicated that they are co-located on at least chromosome 1 (Rabbi et al., 2017). Genetic methods to manipulate this in a pleitropic manner might be helpful.
NRCRI will work from 2019 to ensure that validated high throughput phenotyping methods for root quality traits such as for dry matter, starch, carotenoids are used routinely. We shall seek to further collaborate with the RTBFoods and NextGen Cassava projects to develop more for mealiness and high cyanogenic potentials. These would be subsequently be predictable using the portable NIRS. The NextGen Cassava will further used these to develop models for genomic predictions for the most relevant traits and to enlist them in the genomic selection index being developed for cassava.
Figure 15 : Pro-vitamin A in Nigeria showing the six biofortified varieties released and those in the pipeline.
1.4. Cassava Gap Analysis At CIAT, the biochemical basis for softening in response to boiling or fermentation have not yet been established. The degree of association between these two response variables has not been determined either. What is clear is that boiling results in a gradual and consistent reduction of starch and cyanogenic glucosides in the root (Ezeigbo et al., 2015).
In Nigeria, determination of most critical traits responsible for the best gari and fufu quality, is the major focus of the RTBFoods project. For example, studies by Teeken et al. (2018) identified the trait dynamics differentiated by gender and during focus group discussions indicated that preferences were governed by the stretch-ability of the gari and fufu. Would it be sufficient that the pectin or amylose contents would be key determinant of preferred gari and fufu and if yes, what would be the thresholds? Would the size of starch granules play any role in root mealiness?
In Uganda, by the end of this project, data on five traits are expected to be generated: 1) root dry matter content; 2) beta carotene content; 3) softness; 4) cyanogenic potential; and 5) starch content. This presents opportunities to address both knowledge and/or methodological gaps notable of which will include:
• empirical assessment of both narrow-sense and broad-sense heritabilities for the target traits; • assessment of genetic gain associated with breeding for the five target traits; • development of less-drudgery and efficient root trait phenotyping methods for the five target traits; • documentation of protocols to be used for routine assessment of the five target traits.
TMS30572
TMS961089A
UMUCASS36UMUCASS37UMUCASS38
UMUCASS42UMUCASS43UMUCASS44
2 varieties projected
0 2 4 6 8 10 12 14 16
<2007
2008
2011
2014
2020
Total Carotenoid content FW (ug/g)
Yea
r

40

41

42
2. BREEDING YAM FOR QUALITY TRAITS Introduction
Yam (Dioscorea spp.) is a versatile staple crop which posses a huge potential to address sustainable food supply and predictable source of income in tropics and sub-tropics: (1) it produces more agricultural value per unit area of land compared to all major arable crops, (2) it is largely traded locally and nationally, not internationally hence far less susceptible to large-scale market shocks and price speculation experienced by more widely traded staples, such as grains. The crop is most important in West Africa where 93.5% of its global production (ca. 62 million tonnes in 2016) occurs. It supports the livelihood of over 300 million people as a source of staple food and cash income. Yam ranks as the most important source of dietary calories in West Africa. It also makes a substantial contribution to protein in the diet, ranking as the third most important source of supply, much greater than the more widely grown cassava, and even above animal protein sources. Yam is a crop with the highest gross value of production which is about $14 billion US dollar. The yam value exceeds all other African staple crops and is equivalent to the summed value for the top three cereal crops (maize, rice and sorghum) (FAO, 2000-2016). Yam-based cropping systems occupied 20% of the lowland humid and sub-humid zones of nine countries in West Africa (Manyong et al. (1996) where population is increasing most quickly (Alabi et al., 2019). Yam is a strategic crop for sustainable food production and wealth creation in West Africa and beyond to efficiently address the ever-expanding food, nutrition and income demand. The yam farming, however, is complex and presents many challenges than any other crops in the region and characterized with very low productivity where farmers achieving only 20% of its potential yield (FAO, 2016). Yam farming has relied heavily on area expansion instead of progressive productivity gain. Its cultivation, traditionally practiced in a shifting-rotation ‘bush-fallow’ system, is now evolving towards permanent plot farming with reduced fallow periods due to limitations of new land availability. The crop requires fertile land rich in organic matter for optimum productivity but the current sedentary type of yam farming being practiced with low or no externally added nutrients and underdeveloped agronomic and post-harvest practices is facing chronic yam productivity and quality challenges. The co-occurrence of soil nutrient decline with multiple stresses from diseases, pests, and weeds that limits productivity and reduces product quality in many traditional yam belt areas, which are further exacerbated by the complexity of global climate change modifying the growing environments and/or adding new stress factors, are becoming major challenges. Yam production systems of West Africa must cope with these challenges that can result in annual yield losses of over 50% (Amusa 2001, Adeniji et al., 2012). The vast majority of yam production occurs in smallholdings which require integrated low-tech solutions to these problems, and small-scale growers are particularly vulnerable to variable incomes. Processing and culinary innovation that uses an optimal mix of techniques can improve yam product quality and deliver social benefits. However, integrated food system technologies that adequately improve yam food product quality while reducing dead-ends from yam genetic improvement are currently lacking. Opportunities exist for investments in food quality to improve the yam sector in West Africa and beyond. West Africa is known for very long-standing practices and engagements with yam cultivation, trading, processing, and consumption. The economic value of the yam industry has grown quite rapidly in recent years. Yam as a non-traditional export commodity is shooting upwards in Ghana and starting with great boom in Nigeria. There is an increasing demand for yams for consumption as food in both the domestic and foreign markets, as well as a growing interest in developing starch extracts from yams for industrial use. Yam sector is very strategic for West Africa as a source of food, income generation, and social relevance. Real and potential opportunities exist for research intensifying the role of yam crop for food security and economic development in the region. Studies on efficiency-equity trade-offs (Alene et al., 2009) and poverty-based priority setting (Alene et al., 2007) have together demonstrated the possibility of directing greater benefits to the poor through increased yam improvement research. Over a 20-year period, such research generates an economic surplus of over US$7.5 billion in Nigeria, with over US$677 million accruing to poor households. The internal rate of return to investments in yam research is estimated at 131%. Increased yam research has the potential to reduce poverty by >4.5%. If improved varieties were used and a 30% yield increase realized, the production value of yam will increase to $17.9 billion. However, the current lack of improved yam-based food technologies that further support the yam productivity gains from genetic improvement are the main challenges in current yam production practices. Product quality and culinary innovations are

43
essential to change the current yam production practices and to thereby satisfy the food and nutritional needs of an ever-increasing African population. Investment in yam-based food product quality research will improve yam crop production and strengthen value chain through novel yam product processing and quality solutions that are intrinsically linked to the sustainable yam production.
2.1. Yam Breeding for Quality Traits at IITA : Nigeria The International Institute of Tropical Agriculture (IITA) in collaboration with its national yam research programme partners in West Africa have made significant progress in yam breeding. The primary focus of this collaborative breeding effort is development and deployment of robust varieties with unique combinations of preferred traits required for production and consumption majorly on two extensively cultivated species, Dioscorea rotundata and Diocorea alata. The breeding programs generally targeted traits related with yield limiting and quality reducing factors, however, the specific breeding targets varied according to the region and species involved (Mignouna et al., 2007). From the inception of formal yam breeding in 1970’s to date, the breeding targets have evolved over the years to meet the changing needs and preferences of farmers and other end-users. The breeding targets have since then been gradually included new traits along with basic focus on high and stable tuber yield, higher dry matter, resistance to economically important diseases (e.g. anthracnose, viruses, tuber rots) and pests (e.g. nematodes), tuber characteristics cherished by consumers (e.g. size, shape, and culinary quality) in the region; and plant architecture (e.g. dwarf genes) that reduces the need for staking (Asiedu et al., 1998; IITA, 1999, Mignouna et al., 2007). These efforts over the last five decades have resulted in identification of trait progenitors and commercial release of improved cultivars, however, farmers continued to grow landrace cultivars with low or minimal rate of variety turnover or replacement in the production system. High level resistance genes to virus, anthracnose, and nematodes, shrub-like or dwarf plant architecture with stiff or stout vine base and early branching, tubers less susceptibility to deformation in the soil, tolerance to low soil fertility, drought and heat, and high level of sensory and processing attributes suit consumer and market needs for fresh and processed yams are some of the missing traits in advanced breeding lines and released cultivars. The local farmer varieties are still the leading and dominate cultivars in the yam cultivation and consumption systems of Africa. In order to address the apparent less successful product innovation with yams breeding, the goal setting or specifications of the varieties have been refocused and restructure in recent years. As a result, the breeding targets have been transformed from undifferentiated product portfolio to a differentiated product concept where client needs are clearly profiled and translated to product specification. The yam breeding program currently focusing on what clients really want as centre of its variety development plan. Accordingly, precise description of what product to breed for and traits or features that constitute the preferred product or varieties are the current targets. The yam teams are implementing a product concept in yam breeding by identification and prioritization of right features or traits for the varieties the clients (growers and consumers) require or demand with clear roadmap to achieve the target product in a specified timeframe. The general framework for new variety design in yams is whom and where the new variety is targeted to serve. The new product concept attempt to ensure tangible benefits to the clients (growers and consumers) with clear product differentiation: key attributes of the product for the target client and benchmark for improvement. The yam breeding program therefore envision implementing best product concept that can drive rapid and successful uptake of new variety in the production and consumption system. With the current framework, in addition to the traditional traits, the yam breeding activities are focusing on tuber quality, nutritional value and metabolites that define yam cultivar acceptability for consumption. Traits such as colour of tuber flesh, tuber oxidation, tuber shape, starch property, dry matter content and other functional properties are now routinely measured in breeding programmes as they influence the acceptability of newly developed yam varieties.
2.1.1. Phenotyping for quality traits
The yam quality phenotyping routinely used in yam breeding programs includes fresh tuber physical quality assessment, and physico-chemical and functional properties of fresh tuber for predicting boiled yam and pounded yam food quality. In addition, breeding lines and trait progenitors are being phenotyped for yam flour characteristics.

44
Long list of nutritional and anti-nutritional quality traits related with yam flour characteristics, pounded yam characteristics and boiled yam characteristics are now being routinely measured in breeding programs. These included traits such as colour of tuber flesh, tuber oxidation, tuber shape, dry matter, peel loss, starch yield, pasting property of starch, flour yield, and other functional properties such as ash content, total protein, fat, amylose, sugar, vitamin, phytate and tannin are now routinely measured in breeding programmes as they influence the acceptability of newly developed yam varieties.
Table 24. Quality traits being assessed on yam products
Product profile Traits Pounded yam Pasting profile of starch using RVA, color, consistency, stretchability,
texture Boiled yam Sensory attributes: taste, color, texture, aroma, over all acceptability of
boiled yam slices Yam flour Peel loss, flour yield, flour color
Methods
Table 25. Methods being used for assessing yam food quality traits
Method Traits Consumer preference Color, taste, aroma, texture, overall acceptability of boiled or
pounded yam Proximate composition Dry matter, ash, protein, fat, amylose, starch and sugar, vitamin,
phytate and tannin NIRS Prediction of moisture content, ash, protein, crude fibre, tannin,
sugar, phytate, amylose content on fresh tuber and processed food products
Gas Chromatography‑Mass Spectrometry
(GC‑MS) Profiling
Metabolites
RVA Pasting properties of yam starch
2.1.2. Genetic variability in IITA breeding program
Currently the active yam breeding programs in West Africa are composed of IITA and its national partner programs from Benin, Côte d’Ivoire, Ghana and Nigeria. Through collaborative effort, the IITA-derived breeding lines, released varieties, popular farmer cultivars and landrace accessions are being extensively characterized for fresh tuber and processed food quality traits in West Africa. The programs are currently studying physicochemical and functional properties for predicting food quality and pasting characteristics of fresh yam as indicators of textural quality in major food products. In addition, tuber micronutrient density, specifically for iron, zinc, total carotenoids, ascorbic acid (vitamin C), phytate, and tannin content have been assessed in different yam germplasms. A diverse panel of accessions from four Dioscorea species routinely used in yam breeding programmes are also being studied for metabolomic profiles in collaboration with advanced research institutes to augment the breeding of new yam varieties with improved consumer and agronomic traits. Physico-chemical and functional properties of diversity panels, mapping populations, trait progenitors and breeding lines were assessed at IITA with support from Africayam, EDITYAM and other projects.

45
Table 26. Type of genetic materials being assessed for quality traits under different studies at IITA. This table summarized very recent and on-going studies for quality breeding in yams at IITA
Genetic material Different studies Breeding lines A total of 232 genotypes (61 D. rotundata and 171 D. alata) grown at
three sites in Nigeria (Abuja, Ibadan and Ubiaja) were evaluated for nutritional and anti-nutritional quality traits: Dry matter, ash, protein, fat, amylose, starch, sugar, vitamin, phytate and tannin.
Elite clones under multi-location trials for release
20 D. rotundata and 12 D. alata elite clones in multi-environment trails were assessed for consumer preference traits (boiled yam) and RVA properties
Diversity panels 119 D. rotundata diversity panels being assessed for tuber oxidation, tuber flesh color and pasting properties of starch using RVA
Trait progenitors 36 trait progenitors routinely used in yam crossing block were evaluated for tuber oxidation, tuber flesh color, yam flour characteristics and pasting properties of starch using RVA
Advanced breeding lines 49 advanced breeding lines grown at two sites in Nigeria were assessed for yam flour characteristics, dry matter, peel loss and pasting profile of starch
Early and advanced breeding lines
Routinely assessed for tuber flesh color, tuber oxidation and dry matter content
2.2. Yam Breeding for Quality Traits at NRCRI: Nigeria The goal of NRCRI’s yam research (National Root Crops Research Institute) has been to enhance the adoption of improved technologies by farmers, and thus contribute to a sustainable increase in productivity of yam-based systems. In contributing to achievement of this goal, the objective of the genetic improvement component has been to develop and disseminate improved yam genotypes with high and stable yield of tubers with good storage and food qualities suited to the relevant cropping systems. Yam breeding has resulted to 21 varietal releases and more recently official registration of five landraces (See Annex1). The breeding pipeline adopted within these process include seedling evaluation, clonal evaluations, preliminary yield trials, advanced yield trials, uniform yield trials, two years multilocational trials and one year on farm verification.
2.2.1. Phenotyping for quality traits
At the early stage of breeding cycles, we characterize and advance clones based on yield, response to diseases and pest. Food quality traits often considered alongside the agronomic traits include tuber flesh colour, physico-chemical factors in fresh yam tubers (granule morphology; starch granule size, histological structure of the cells), physico-chemical composition of yam starch (amylose/ amylopectin ratio, swelling, water binding capacity), pasting characteristics of fresh yam tubers, as well as calcium, phosphorus and cellulose contents of yam tubers that are indicators of textural quality in ‘pounded yam. These quality attributes are significant in determining the quality of yam end use products (Otegbayo et al., 2010). Starch accounts for 80% (on dry weight basis) of the yam tuber. It has been reported as one of the dominant factors which affects the physicochemical, rheological and textural characteristics of food products from different yam species (Amani et al., 2004). Otegbayo et al., (2011), reported that granule size, swelling power, amylose and water binding capacity of yam starch can be indicators of textural quality in ‘pounded yam’. Investigating the physico chemical properties of yam flour, starch and also non-starchy polysaccharides (lignin, pectin, cellulose, hemicelluloses ) in yam could also give insight to quality factors which can predict the quality of food products such as boiled yam, thus serving as screening tools to breed for these specific traits in order to produce tubers with qualities that will be acceptable by the end users (farmers, consumers, processors). In boiled yam quality attributes such as colour and taste (sweet, bland, sour) as well as textural attributes such as hardness, mealiness/sogginess/waxiness is very important.
At the advanced stages of evaluation we consider food qualities using participatory varietal selection. Breeders, farmers and processors involved in the improvement of yam for food quality have to cook the yam into various food forms to assess the suitability of clones for specific products. Carrying out such assessment is very cumbersome; extremely time consuming, expensive and the result could be subjective. Optimum cooking time is assessed by placing a sample each in pre-heated (boiled) water

46
and checking at intervals to detect changes in texture. An approximate of ten chunks of each sample is placed in boiling water and first checked after 10 min of boiling and thereafter at 5 min interval to determine optimum cooking time of each genotype. The optimum cooking time is taken to be the approximate time within which samples were cooked right through the middle. This is determined by piercing through with a fork. Consumers of the two most important food products (boiled yam and pounded yam) describe their subjective impressions either in qualitative tests e.g. focus group discussing or in quantitative tests. A hedonic scale of 1 - 5, where 1 = like very much and 5 = dislike very much, is always used for descriptive purposes, to assess colour attractiveness, texture, aroma, taste description and perception, after-taste and general acceptance. The intensity of taste and after-taste, are measured on a scale of 1 - 5 where 1 = very sweet and 5 = bitter. Texture is scored on a scale of 1 - 4 where 1 = very mealy and 4 = waxy; aroma on a scale of 1 - 5 where, 1 = very high and 5 = none; colour on a scale of 1 - 5 where 1 = white and 5 = purple and general acceptability on a scale of 1 - 4, where 1 = very good and 5 = very bad. Data is collected on enzymatic oxidation (time for browning of cut surface) 1 - 3; 1 = < 1 min, 2 = 1 - 2 min and 3 > 2 min. The genotypes are thus ranked for individual attributes and general acceptability. The mean rank for each genotype is normally calculated. The percentage of farmers, processors and consumers giving a particular ranking to an attribute of a genotype is calculated as well. It is important to note that due to the limited capacity of sensory analysis; only a few lines can be objectively evaluated within a short time. Secondly, owing to the quantity of material required in each sample to be evaluated, such screening can only be done close to the end of the selection cycle when there are sufficient numbers of tubers per genotype. However by this stage the numbers of genotypes have been significantly reduced on the basis of other selection criteria and several lines with potentially superior tuber quality would have been lost. Hence it has been difficult to make progress in the breeding of yams for food quality because of lack of appropriate screening techniques.
2.2.2. Status of NRCRI breeding populations in respect to quality
Based on the protocols mentioned above the underlisted trials (starting with the most advanced) are ongoing
On farm verification of D. rotundata genotypes
One of the pre-requisite for varietal release is a nationally coordinated multi locational testing and evaluation. The potential candidate(s) for release need to be tried across diverse agro-ecological zones to ascertain their area of specific and wide range agro ecological adaptation /stability and consumer acceptability. The two years data set (2016 and 2017) resulted to a reliable estimation of the genotype mean yield across locations, response to abiotic/ biotic stress and post-harvest traits.
The twenty D. rotundata genotypes that were evaluated at multisite include TDr8902157, TDr1100585, TDr1100034, TDr0900002, TDr1100873, TDr8902665, TDr1100835, Amula, TDr1100163, TDr1100497, TDr1100396, TDr1100421, TDr0900058, TDr1100101, TDr0500491, TDr1100278, TDr1100492, Meccakusa (control), TDr0900082, and TDr1100582.
Post-harvest data collection encompassed participatory varietal selection (PVS) cooking qualities using a set of well-structured questionnaire, sensory evaluation and farmer perceptions (See Figures 1-8). This provided reliable guidance for selecting the best genotypes that were advanced to on- farm verification in 2018.

47
Table 27. Candidate clone selection for on-farm trial
Based on tuber yield advantage over the best check variety in the trial
Based on consumer acceptability for boiled yams (taste, color, aroma, appearance
Mean yield and preference by farmers at harvest/vegetative trait
Best candidate for on-farm verification
TDr0500491
TDr0900002
TDr1100101
TDr1100582
TDr1100585
TDr1100835
TDr1100492
45% of the test location performed better than best check variety
TDr11000497
TDr1100396
TDr1100163
TDr0500491
TDr1100421
TDr1100492
Rated good for sensory traits in majority of the test location as per logistic regression analysis
TDr1100163
TDr1100497
TDr0900058
TDr0900002
TDr1100492
Based on over all tuber yield and farmer preference at harvest and vegetative stage
TDr1100163
TDr1100497
TDr1100492
These three clones merit for yield advantage and preference of farmers for harvest and sensory traits
The three selected clones have been established in eight locations this year for farmers verification. Candidate(s) that pass will be nominated for varietal release late this year.
Multi locational evaluation of 16 D. rotundata genotypes
Sixteen D. rotundata genotypes that passed uniform yield trial evaluation in 2016 were advanced to multi location testing in 2018. Selections will be participatory with farmers and consumers at vegetative, harvest and post-harvest stages for two years. The clones include TDr0002405, TDr0900061, TDr0900067, TDr1000003, TDr1000006, TDr1000016, TDr1000021, TDr1000048, TDr1000078, TDr1000179, TDr1000344, TDr1000360, TDr1000459, TDr1400633, TDr8902665, and local checks.
(c) Multiplication and screening of two D. rotundata breeding populations for agronomic and post-harvest qualities
Surviving one hundred and forty seven and one hundred and twenty individuals generated from 2015 crosses will be multiplied in 2018 under field conditions. These individuals from two independent populations have been previously maintained in screenhouse. Individuals from these populations will be phenotyped for multiple traits including post-harvest traits like tuber flesh colour, oxidation, pasting characteritiscs, starch quality and dry matter.
Evaluation of four early breeding populations
Evaluation of D. rotundata clonal materials generated from seeding advancement in 2017 will be undertaken. The four independent populations is already established under screen house condition. Individuals will be screened for tuber flesh colour and oxidative qualities.

48
Figure 16. Farmers preferred tuber quality traits in Umudike location
Figure 17. Farmers preferred tuber quality traits in Makurdi location
Figure 18. Farmers preferred tuber quality traits in Uyo location
05
10152025303540
Smooth tuberskin
Goodcylinderical
shape
High tuber yieldWare tuber size Clean tuber Non-oxidativetuber fleshTu
ber q
ualit
y tra
it ra
nk S
core
Umudike location
Male Female Pool Score
05
10152025303540
High yield long tubershape
Smooth Skin Moderate size Big tuber size Hairy & cleantuber
Small sizetuber
Tube
r Qua
lity
trait
rank
Sco
re
Makurdi location
Male Score Female Score Pool Score
0
5
10
15
20
25
Smallsize(seed
yam)
Big size(wareyam)
Smooth skin multipletubering
Long tubershape
Rotund shape Hairing tuber
Tube
r qua
lity
trait
rank
sco
re
Uyo location
Male Female Pool Score

49
Figure 19. Farmers preferred tuber quality traits in Igbariam location
Figure 20. Farmers preferred sensory traits in Umudike
Figure 21. Farmers preferred sensory traits in Makurdi
0
5
10
15
20
25
30
35
40
Smooth tuberskin
cylindericalshape
High tuberyielding
Ware tubersize
Clean tuber Non-oxidativetuber flesh
Tube
r qua
lity
trait
rank
sco
re
Igbariam location
Male Female Pool Score
0
5
10
15
20
25
30
35
40
Sweet taste Aroma Whitishappearance
Easycooked
Soft texture Easy to cut Smooth cutsurface
Easy topeel
Sens
ory
trait
rank
Sco
re
Umudike location
Male Female Pool Score
0
10
20
30
40
50
60
Sweet taste Whitish appearance Soft texture Good aroma
Sens
ory
trait
rank
sco
re
Markurdi location
Male Score Female Score Pool Score

50
Figure 22. Farmers preferred sensory traits in Uyo
Figure 23. Farmers preferred sensory traits in Igbariam
2.3. Yam Breeding for Quality Traits at CNRA IITA: Côte d’Ivoire
The main objective of yam breeding program at CNRA is the selection of varieties for food quality, particularly for boiled and pounded yam. Dioscorea alata and Discorea rotundata are the two species considered. To reach this objective, breeding starts by selecting clones which are resistant to pests and diseases and have high tuber qualities. The main traits observed are: the shape and the smoothness of the tubers (that means absence of roots or hair on the tubers), the colour of the tuber flesh, the dry matter content, the oxidation, the absence of brown spot, the appreciation of the boiled and pounded yam by consumers. The last attribute is appreciated by participatory evaluation by farmers and consumers. They appreciate the cooking time, the aroma, the acceptability, the flavor, the lumpiness,
0
5
10
15
20
25
30
35
40
45
Sweet taste White Colour Soft texture Sweet Smell(aroma)
Easy to peel Smoothpeeledsurface
Goodpoundability
Sens
ory
trait
rank
sco
re
Uyo location
Male Female Pool Score
0
5
10
15
20
25
30
35
40
Sweet taste Aroma Whitishappearance
Easy cooked Soft texture Easy to cut Smooth cutsurface
Easy to peel
Sens
ory
qua
lity
trait
rank
sco
re
Igbariam location
Male Female Pool Score

51
the springiness, the looseness, the sweetness, the steakiness, the smoothness, the firmness, the elasticity. The other traits are appreciated by visual observation and weighing for the dry matter.
2.3.1. Phentotyping for quality traits
In 2010, a study was conducted on 91 accessions of D. alata yam germplasm of CNRA. This study showed that most of the accessions had desired traits for the external aspect of the tuber.
The presence of anchor roots on the tuber, the level of ramification of the tuber and the tuber shape gave the best description of the yam tuber. Most accessions (70.33 %) do not have anchor roots on the tuber. Eighty-five percent of the accessions had tubers not ramified and 44 % of the germplasm had round shape of tuber. For the flesh, 91 % did not have oxidation whereas 72 % showed smooth aspect of the parenchyma;
Figure 24. Smooth tuber of the variety Amadouo
Figure 25. White and purple flesh tubers of Dioscorea alata
2.3.2. Participatory quality evaluation by farmers and consumers
In 2006, participatory evaluation was conducted on four landraces of slicing, pre-cooking and drying in the yam chips process. The survey conducted on 122 farmers revealed four ways of yam processing: roasted, boiled, stewed and pounded yams. In one region, flour was made for couscous.
In 2018, a participatory evaluation was done on 59 breeding lines of D. alata and D. rotundata.The sensory parameters testes were : the color, the perception of the cooked tuber, the presence of brown spot, the presence of fiber, the cooking time, the friability, the firmness, the elasticity, the aroma, the savor and the global acceptance. For the color, the values varied from 2,00 ± 0,71 (TDa0700154) to 4,75 ± 0,45 (Krenglè). The range went fom 1 (bad) to 5 (very good). This work is on-going. Preliminary results showed a variability among the varieties selected for food qualiy according to farmers and consumers. Farmers and consumers indicated also their preferences. These observations have to be

52
measured by precise tools like NIRs or physico-chemical methods to establish links for the breeding scheme.
Figure 26. Pounded yam and a woman participating to the sensory evaluation at Bouaké.
2.3.3. Genetic variability in CNRA breeding program
The genetic material is tested at the earlier stage for diseases and the row tuber is phenotyped (shape, absence of roots, oxidation). After the advanced yield level, the food quality traits are accessed. In 2018, 10 clones (5 D. alata and 5 D. rotundata) were tested at Bouaké and Gagnoa. Two were selected from the yam germplasm and 8 were from the breeding clones introduced from IITA. Five of them are submitted for releasing. Many other clones are in the pipeline for quality testing during the next years. Twenty parents having contrasted quality traits (10 D. alata and 10 D. rotundata) are used for crosses. More than 2000 hybrids have been created and are at different stages of breeding.
2.4. Yam Breeding for Quality Traits at CIRAD-INRA: Guadeloupe
CIRAD and INRA breeding programs have been oriented to the creation of hybrids (diploid for INRA and polyploid for CIRAD) combining a good quality as regard to Caribbean preferences, anthracnose resistance and enhanced tuber yield.
Several improved hybrids have already been released through the process of participatory evaluation in the framework of RITA (https://coatis.rita-dom.fr/guadeloupe/?HomePage). Since 2012, in this multi-sites selection platform hosted by farmers, a total of 19 hybrids pre-selected by CIRAD and INRA were evaluated in 10 sites. Quality (i.e. taste, flesh browning, and colour) was evaluated during groups tasting. These tastings were conducted during farmers meetings and were a qualitative evaluation of the cooked hybrids. A website have been design that compiles all results from these evaluation plateform to help farmers to choose among varieties (https://ziyanmannou.cirad.fr).
To now, the main criteria linked to quality applied during the selection process are related to the tuber form, the flesh browning and colour and are visually assessed. More complex traits such as taste or cooking ability are used during the final selection stages on few promising hybrids and on hedonic scales.
Phenotyping related to quality is mainly conducted on diversity panel to identify possible genitors. These work is also the support of “high-throughput” phenotyping methods development. To now, most of the work has been done on physico-chemical characterization. Lebot et al., (2006) studied 48 accessions from Vanuatu and linked physico-chemical analysis to boiled quality assessed as “good”, “average” or “poor”. Good quality accessions were characterized by a higher starch content and amylose/starch ratio which is related to firmness and elasticity (Bourrieau, 2000). A broader diversity was also characterised

53
for these parameters, without comparing it to cooked quality (Lebot and Malapa, 2013), in order to develop NIRS calibration for D. alata breeding programs.
At CIRAD_Guadeloupe, during two growing seasons, physico-chemical analysis were conducted on 23-27 accessions producing flower in order to identify genitors (Arnau G., Cavalbio project, 2014-2017, European Union and Guadeloupe regional grant). In parallel, several “high-throughput” phenotyping methods have been develop to measure other traits related to quality (Cornet D., Cavalbio project, 2014-2017, European Union and Guadeloupe regional grant). These methods are mainly based on picture analysis and will allow the phenotyping of large populations. For example, tuber flesh browning and colour are now automatically assessed using repeated pictures of sliced tubers.
Figure 27. Example of the browning phenotyping method (Denis Cornet, Cavalbio project).
In the framework of AfricaYam, two biparental populations have been created to develop genetic resources/tools and select improved hybrids. Parents have been chosen to study quality traits. The tuber shape of the common female (74F) is cylindrical and the flesh is yellowish, while males shapes are oval and flesh colour is white for Kabusa and white-cream for 14M. Males are also characterized by a higher starch content and a lower sugar content than the female.
Figure 28. The biparental populations in field (Gemma Arnau, AfricaYam project).
These populations were the support of the development of the first D. alata high-dense genetic map and will be the support of the studies of genetic determinism of quality traits.

54
2.5. Yam Breeding for Quality Gap Analysis Development of yam varieties highly cherished by consumers for food quality is the main target of yam breeding programs. Large number of breeding materials have been profiled for quality traits using different methods. The quality trait evaluation is laborious and often challenging when it comes to screening larger number of genotypes and samples. In this sense, most of the traits related to quality had been evaluated in few combination of genotypes × environment. Moreover, yam breeding is based on the creation of new hybrids (heterozygous). The first gap to fill to improve selection process is thus to estimate the part of variance related to genotype and the part of variance related to additive genetic variance that can be combined in progenies. Indeed, the heritability (narrow/broad-sense) of the most important traits have to be addressed before going further.
Efficiency in breeding for quality breeding would be improved by adopting high-throughput and low cost early screening to eliminate “bad” genotypes. Indeed, it will allow to reduce the cost of maintenance of large populations or increase breeding population size at a constant cost. This goal is aimed by the RTBfoods project using NIRS technology or genetic/genomic information. Whether, these methods are concerning early-phenotyping or marker assisted selection. However, to be sure they can be adopted, our project needs to go further that methods development and should address the question of their day-today uses, that is to say:
• when to apply them? Indeed, during the first generation only few materials are available to test and multiply progenies (few small tubers).
• what is their efficiency in breeding populations? Indeed, if methods are developed on diversity panel, their application in breeding populations (reduced and oriented diversity) have to be discussed.
• And more generally, at which cost (human work and price) for which efficiency? This question may be program specific.
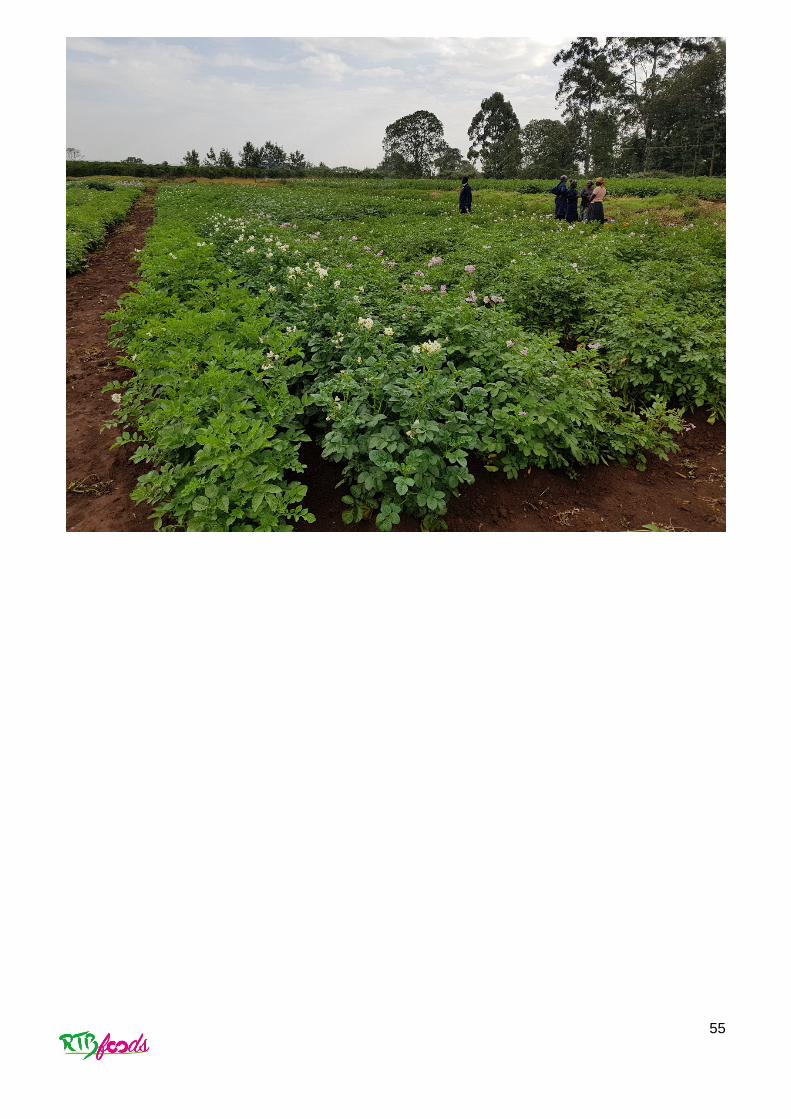
55

56
3. BREEDING POTATO FOR QUALITY TRAITS Introduction
As one of the most versatile food crops, which produces more dry matter and protein per hectare than the major cereal crops, potato (Solanum tuberosum) has been planted worldwide (Carputo et al., 2005, Storey, 2007). The most important aspects of potato production are tuber quality, that includes biological, sensorial, and industrial traits. Since most quality traits are genetically controlled, breeding work can successfully meet the needs of a changing and demanding world. The potato needs a continued improvement of quality that are most likely influenced by consumer’s choice (Carputo et al., 2005).
Develop an efficient selection method for quality traits can increase the adoption by fulfilling the end-user expectations. Once genetic variability has been produced, it is necessary to identify selection procedures that reduce time and costs to develop a new variety. Breeding potato for quality traits at International Potato Center is a continuous effort, where the primary objective is to obtain information about the potential or aptitude of intermediate and advanced clones for diverse end-users, ranging from fresh consumption to processed products. This provides important information to guide potato breeding and selection programs, as well as for the recommendation of varieties for specific uses and determination of parental value for quality traits.
3.1. Potato Breeding for Quality Traits at CIP: Uganda Three hundred “trait observation network” (TON) panel clones are set for phenotyping assessment in Uganda in 2019. A corresponding single nucleotide polymorphism (SNP) dataset will be available in an open access database at International Potato Center (CIP) for further genotyping. Within RTBFOODS, at least 150 genotypes (panel clones) and locally-preferred varieties will be phenotyped within diverse environments that influence quality traits (e.g., cool highlands and warm mid-elevation or lowland agro-ecology) in Uganda. Phenotypic data and GWAS for productivity and resilience traits can be contributed from the BMZ/GTZ funded project “Accelerating the Development of Early-Maturing-Agile Potato for Food Security through a Trait Observation and Discovery Network”, established in Ethiopia, Peru and China.
This panel is mostly comprised of CIP’s advanced tetraploid populations B3, B1 and LTVR and is a dynamic collection of bred clones previously subject to analysis of structure and successfully used for genome-wide association studies (GWAS). Population B is under improvement for high levels of horizontal resistance to late blight along with economically important traits such as tuber yield, quality for table and industry, adaptation to wide environments and tolerance to other biotic/abiotic stresses. The LTVR population is characterized mainly for its resistance to the most important virus diseases [potato virus V (PVY), potato virus Y (PVX) and potato leafroll virus (PLRV)) of potato, early tuberization in short day-length conditions, mid-maturity under long days and adaptation to warm, arid environments.
3.1.1. Quality traits assessment at CIP
The quality assessment on potato at CIP has mainly been applied for advanced clonal selection and genetics studies for parental value prediction. CIP has adopted standard procedures2 for determining: i) specific gravity and dry matter content, ii) texture and flavor components of cooking quality, iii) storage behavior, iv) chipping and French-frying performance, v) oil content, and vi) contents of undesirable secondary products such as glycoalkaloids. However, quality traits have not been a target on CIP’s breeding population.
2 https://research.cip.cgiar.org/confluence/display/SET/Processing+Protocol

57
Gastelo et al. 2014 have explained that the potato breeding program of CIP aims to generate improved populations and clones with resistance or tolerance to biotic (virus and late blight) and abiotic stresses (drought and heat). For that CIP has used wide genetic resources (including wild, landrace and improved germplasm) to develop improved populations adapted to stressful conditions of the tropics on highland and lowlands. CIP has also increased the level of micronutrient densities (Fe and Zn) on a diploid population by recurrent selection and introgressed those traits to tetraploid population, combining high level of micronutrients with tolerance to biotic and abiotic stresses.
Advanced potato clones combining different traits for a diverse potato agroecologies are available for international distribution. CIP has developed catalogue3 to provide relevant information about advanced potato clones that combine several traits, such as resistance to late blight, viruses, high productivity, quality traits among others. Annex 2 shows list of morphological, agronomical and post-harvest traits for potato assessed at CIP’s breeding program.
3.1.2. Breeding potato for quality traits
Several publications have discussed breeding strategies for several quality traits on potato (Bradshaw et al., 2003, D’hoop et al., 2008, Bradshaw et al., 2009, Slater et al., 2016, Gastelo et al., 2017). However, it’s expected greater genetic gain combining new tools (HTTP, GWAS, GWS) accessing in earlier breeding stages, characteristics such as sugar profiles, texture profile (dry matter, cooking time, cell wall, cooking time), nutritional and antinutritional (glycoalkaloid) and sensorial (aroma, taste).
Approaches as mapping association for quality traits and genomic wide selection in potato has been successfully applied (D’hoop et al., 2008, Werij, 2011, Slater et al., 2016). Slater et al. 2016 comparing the expected genetic gain from genomic selection with the expected gain from phenotypic/pedigree selection, found that genetic gain can be substantially improved by using genomic selection approach. Understanding the genetics of potato quality traits associate with marker assisted breeding, can also improve tuber quality.
Pedigree database and variety catalogue are valuable information for breeding. In potato there are some open data information available online (exp. Annex 3), as potato pedigree database of Wageningen UR, (http://www.plantbreeding.wur.nl/potatopedigree/), the European cultivated potato database (http://www.europotato.org/menu.php) and Catalogue of CIP’s advanced clones (https://research.cip.cgiar.org/redlatinpapa/pages/home.php).
The factors affecting tuber quality in potato include the genetic (cultivar), crop maturity, agronomic practices, environmental conditions, storage temperatures, the presence of pests and diseases. Traits that are genetically controlled can be grouped as follows: 1) biological traits (proteins, carbohydrates, vitamins, minerals, reduced amounts of toxic glycoalkaloids; 2) sensorial traits (flavour, texture, colour); and 3) industrial traits (tuber shape and size, dry matter content, cold sweetening, oil absorption, starch quality) (Bradshaw et al., 1994, Carputo et al., 2002, D’hoop et al., 2008, ). Color, size and shape are also crucial quality aspects for consumers. Breeders must take all the demands into account from farmers, processors, distributors and consumers while at the same time realize that “quality” is a continuously changing concept for each of the parties involved in the process.
The big challenge remains on the integration of all the knowledge in a genomics-assisted breeding strategy and high-throughput phenotyping platforms aiming genetic gain increment for yield/selection of varieties with outstanding quality.
3.2. Potato Breeding for Quality Gap Analysis Particularly in early stages, the breeding process for quality traits in potato is a laborious task. It starts with thousands of seedling and after several steps of clonal selection a small number of elite clones combining desirable traits, will be promoted as a potential variety. This process can be divided in two
3 https://research.cip.cgiar.org/redlatinpapa/pages/home.php

58
major phases - hybridization and clonal selection. “Good by Good” is the old adage been used by many breeders to emphasize the importance of choosing the best parents for the hybridization. With the right genetic variability on hands, the next steps will be the adoption of the most efficient selection scheme to identify the elite lines.
The lack of more efficiente and effective tools to access target quality traits on potato in early selection stages, such as sugar/texture profile, nutritional/antinutritional and sensory analysis, have restricted the use of the genetic resources available to development varieties that meet end-user’s preferences. It is expected an efficient high-throughput phenotyping tool will help to develop new improved varieties and breeding parents with high genetic merit for quality traits for boiled and fried potato.

59

60
4. BREEDING SWEETPOTATO FOR QUALITY TRAITS Introduction
Sweetpotato, Ipomoea batatas (L.) Lam. (2n = 6x = 90), is an important food crop, ranking seventh globally with 106.6 million tons production (FAOSTAT 2014). Sweetpotato provides a rich source of carbohydrates, dietary fiber, vitamins, and micronutrients, is low in fat and cholesterol, and due to its resilience and adaptability, it serves an important role in food security for subsistence farmers in sub-Saharan Africa (SSA) and many developing countries on other continents. Provitamin A-rich orange-fleshed sweetpotato (OFSP) cultivars are important in combating vitamin A deficiency, the leading cause of blindness and premature death in sub-Saharan Africa (SSA).
In SSA, sweetpotato roots are consumed mainly in homes although they may be eaten in restaurants as part of a meal on the street as a snack. The basic methods of cooking roots used in almost all areas are boiling, steaming, baking or roasting and frying. Variations on these basic methods may be used to produce a variety of dishes with characteristics to suit the tastes of local consumers. Most methods of preparation are simple, but consisting of boiling or baking the sweetpotato in its skin, after which the root is peeled or the flesh is scooped out and eaten. Alternatively, roots may be peeled and cut into pieces before boiling. Boiling is the commonest method in rural areas in most SSA countries (Woolfe, 1992; Suguri et al., 2012).
Consumer preference and sensory evaluation plays an important role in research projects and has been applied in rural village settings. Various sensory and consumer approaches have been developed and applied and various statistical tools used to analyze and interpret the results. For example, in cultivar selection, sensory panels and consumer preference studies have been used to investigate regional and seasonal variations in the preference and sensory characteristics of sweetpotato cultivars (Tomlins et al., 2007). There are models relating sensory attributes used by a trained panel to consumer preference. There are simple techniques for use by farmers to evaluate sweetpotato under field conditions.
Consumer testing requires evaluation of suitable methods for rapidly assessing preference in rural and urban locations. Tomlins et al. (2007; 2003) used sweetpotato cultivars and a sensory panel to develop models for selecting local sweetpotato cultivars for quality and understanding sensory changes during shelf-life.
Consumer testing is time consuming and expensive because it requires interviewing at least 100 consumers. In East Africa, consumers in rural locations may be remote and vary in literacy and education. Tomlins et al. (2007; 2003) developed simplified methods for rapidly measuring consumer acceptability in both rural and urban locations, such as the ranking method (ISO reference) and a simpler approach based on asking the consumer to say which of the sweetpotato cultivars they prefer the most.
Most consumer preference studies are undertaken in developed nations and are directed towards high income consumers. However, appropriate consumer preference and sensory evaluation approaches can have an important role to play in sweetpotato research, production and marketing for low-income consumers in developing countries, leading to increased uptake by these groups. In consumer preference, by interviewing sufficient consumers (100 or more) it is possible to assess the views of the low-income consumers and how they make a choice. The use of simplified consumer testing methods (only to choose the most preferred cultivars out of those offered) can facilitate consumer preference studies where people have minimal education such as in rural areas and the urban poor. The application of appropriate statistical tools (e.g. principal component analysis, discriminant analysis) allows models to be developed that enable consumer preference to be combined with sensory panels so that sensory results can be used as a low-cost approach for predicting consumer preference of sweetpotato culitvars. Consumer preference of some sweetpotato culitvars varies from season to season implying that new cultivars should be evaluated over more than one season (Tomlins et al., 2007).

61
In Uganda, the traits in preferred sweetpotato are high yielding, resistance to common pests and diseases, early or medium maturity with good in-ground storability, suitable for piecemeal harvest with no fibers, and of good marketability, medium sweetness, and powdery texture (Bashaasha et al., 1995).
The food product profile selected for the study under WP4 is: a) boiled sweetpotato – which is the commonest form in which sweetpotato is consumed in most countries in SSA b) puree (mashed sweetpotato) – for producing bakery and other products is increasing in importance. C) and fried sweetpotato.
4.1. Sweetpotato Breeding for Quality Traits at CIP: Uganda
Uganda has released to-date 27 sweetpotato cultivars; 5 released in 2017 and 22 between 1995 and 2013 (Mwanga et al., 2016). Most of the cultivars were evaluated on-farm for acceptability. Most of the parents are in two separate breeding populations at Namulonge, Uganda, separated on the basis of simple sequence repeat markers (David et al., 2018).
Mapping populations developed under the Genomic Tools for Sweetpotato Improvement (GT4SP) project, including the bi-parental Beauregard x Tanzania (BxT) population (317 genotypes) phenotyped for SPVD resistance at Namulonge, and an 8 x 8 (population Uganda B x population Uganda A) panel of roughly 1900 genotypes is being phenotyped in Uganda in three locations (Namulonge, Kachwekano and Serere) representing different agroecologies. The 16 sweetpotato cultivars (parents) are part of germplasm sourced from different agroecologies and a few selected introductions. The parents have been extensively used as parents in African sweetpotato breeding programs. Previous work using 31 simple sequence repeat (SSR) markers separated the 16 accessions into two genetic groups, Population Uganda A and Population Uganda B. To revisit their phylogeny and genetic diversity, and to reveal genes and alleles associated with agronomic traits, the parents were re-sequenced and aligned to the reads of the diploid sweetpotato wild relatives Ipomoea trifida and I. trilobal reference assemblies (http://sweetpotato.plantbiology.msu.edu/). These populations are likely to have the diversity of user preference traits of interest for the targeted product profiles. The BxT population has been phenotyped for SPVD resistance in Uganda and phenotyping in Ghana is in progress. Consideration of quality attributes is already anticipated in Ghana under GT4SP, and this project will allow for application of the specific HTPP methods. Genomic data of both populations and analytical methods for QTL/GWAS will be available from GT4SP. Heterosis increment studies in sweetpotato (All use NIRS for quality traits – beta carotene, minerals and sugars): 1) Mega-clones (important clones across regions) – 4 x 12 crosses (48 families) – without
separation of genepools, without selection of recombining ability, without inbreeding (Peru). 2) PJ1 x PZ1 population (two populations at CIP developed independently since 2004) - 231
families clones (49 PJ parents and 31 PZ parents) - with separation of genepools, without selection of recombining ability, without inbreeding (Peru).
3) A x B population with 8 x 8 parents (64 families) from Namulonge tested at Namulonge - with separation of genepools, without selection of recombining ability, without inbreeding (Namulonge, Uganda).
4) Population Uganda A x Population Uganda B with 8 x 8 parents (64 families) from Namulonge tested at Umbelusi / Mozambique) - with separation of genepools, without selection of recombining ability, without inbreeding (Mozambique)
5) PJ and PZ populations (tracing back to 49 PJ parents and 31 PZ parents - with separation of genepools, without selection of recombining ability, with inbreeding, ready to cross PJ” x PZ” to determine the gain of one complete reciprocal recurrent selection cycle (Peru)
6) New parents (42 PJ’ and 42 PZ’ parents for wide adaptation & earliness (WAE) (Peru) 7) 25 PJ’’ and 28 PZ’’ parents for non-sweet sweetpotato (NSSP) (Peru and Ghana) 8) 23 PJ’’’ and 23PZ’’’ parents for high iron (HIFE) in experiments to determine genetic gains due
to heterosis increments and recurrent selection (Peru and Mozambique) 9) SPVD resistance cross (80 x50) (Uganda)

62
10) Phenotyping SPVD resistance (8 x6) (Uganda) 11) Beuregard x Tanzania mapping population (Peru, Uganda)
4.1.1. Phenotyping for quality traits
NIRS is used for quality traits – beta carotene, minerals and sugars at all the sweetpotato support platforms in SSA (Ghana, Mozambique and Uganda). In Uganda, the traits in preferred in sweetpotato are high yielding, resistance to common pests and diseases, early or medium maturity with good in-ground storability, suitable for piecemeal harvesting with no fibers, and of good marketability, medium sweetness, and powdery texture (Bashaasha et al., 1995). National sweetpotato programs in sub-Saharan Africa evaluate acceptability of storage based on a common procedure developed by the programs and consider the following traits (Grüneberg, 2010):
1. Fresh weight of storage roots 2. Dry weight of storage root samples 3. Dry matter content 4. Appearance of cooked samples assessed using a 1 to 9 scale where 1 = very appealing, 3 =
appealing, 5 = somewhat appealing, 7 = unappealing, 9 = very unappealing, with numbers in between representing intermediate ratings.
5. Fibers in cooked storage roots, assessed by inspection and tasting (scale, 1 to 9 scale where 1 = non-fibrous, 3 = slightly fibrous, 5 = moderately fibrous, 7 = fibrous and 9 = very fibrous, with numbers in between representing intermediate ratings).
6. Storage root sweetness in cooked samples, determined by taste test (scale, 1 to 9 scale where 1 = non-sweet, 3 = slightly sweet, 5 = moderately sweet, 7 = sweet and 9 = very sweet, with numbers in between representing intermediate ratings).
7. Storage root texture in cooked samples, determined by taste test (scale, 1 to 9 scale where 1 = very moist, 3 = moist, 5 = moderately dry, 7 = dry and 9 = very dry, with numbers in between representing intermediate ratings)
8. Overall taste of cooked samples assessed using a scale of 1 to 9 scale where 1 = excellent, 3 = good, 5 = fair, 7 = poor and 9 = horrible, with numbers in between representing intermediate ratings.
9. Appearance of cooked samples assessed using a 1 to 9 scale where 1 = very appealing, 3 = appealing, 5 = somewhat appealing, 7 = unappealing, 9 = very unappealing, with numbers in between representing intermediate ratings.
In participatory plant breeding in central Uganda, farmers used 52 traits for ranking sweetpotato consumer preference (Table 28). What is in the farming system is driven by a combination of taste preference and field performance.

63
Table 28. Important root traits used to rank preference of sweetpotato cultivars in a participatory plant breeding trial in Central Uganda (there were no orange-fleshed cultivars)
1 Good root yield
27 Good root yield on poor soils
2 Roots sweet when cooked
28 Easy/quick to cook
3 Big roots
29 Ample planting material
4 Drought resistance
30 Resistant to Alternaria
5 Roots mealy when cooked
31 Few exposed roots
6 Early root maturity
32 Long-lived plants
7 Weevil resistance
33 Crop resistant to weeds
8 Attractive colour of roots
34 Less ‘kigave’‡ of roots
9 Non-fibrous roots when cooked
35 Easy peeling roots
10 Continuous root yield for piecemeal harvesting
36 Does not require big ridges/mounds
11 Marketability
37 Roots close to surface for easy harvesting
12 Straight roots
38 Many roots
13 Resistant to caterpillars (Acrae acereta)
39 Crop resistant to rain
14 Long storage of roots in soil
40 Crop resistant to diverse weather conditions
15 Soft texture of roots when cooked
41 Roots resistant to millipedes
16 Long roots
42 Smooth skin on roots
17 Resistant to rats and other vertebrates
43 Thin peel on roots
18 Resistant to SPVD
44 Few black spots on skin of roots
19 Extensive foliage
45 Hard (solid) storage roots
20 Non-sappy roots
46 Good root shape
21 No loss of taste as the crop gets older
47 Roots do not break during harvesting
22 Nice looking at table
48 Attractive flesh
23 Nice flavour when cooked
49 Roots not too sweet when cooked
24 Few cracks in roots
50 Roots not watery when cooked
25 Yields satisfactorily in poorly tilled soil
51 Lots of foliage for animal feed
The food product profile selected for the study under WP4 in Uganda is: a) boiled sweetpotato – which the commonest form in which sweetpotato is consumed in most countries in SSA b) puree (mashed sweetpotato) C) and fried sweetpotato. The key traits are: resistance to sweetpotaot weevil and sweetpotato virus disease (SPVD), drought and heat tolerance, storage life, and culinary quality including beta-carotene.
Traits data to record: Establishment, number of plants, vigor, vine weight, virus, Alternaria blight, number of roots, root shape, weight of market and non-marketable roots, root weight, skin color, flesh color, weevil damage. Quality traits: dry matter, beta-carotene, iron, zinc, calcium, magnesium. NIRS will be calibrated for quality traits of cooked storage roots.
4.1.2. Genetic variability in CIP breeding program
Specifically, Population Uganda B x Population Uganda A (64 families, about 1,880 genotypes) at Namulonge, Uganda, will be used to provide information required for WP4. Other populations will be a source of information to complement results from Population Uganda A x Population Uganda B.

64
Table 29. Description of the parents from population Uganda A & B. In bold and italic are the landrace cultivars.
Accession Name Country of origin
Ancestral data Other identification Flesh Color
Parents from Population Uganda A (small crossing block) CIP443750 Ejumula Uganda Farmer variety of unknown
parentage TC--/SP/UG 417 Orange
CIP191133.1 NASPOT 1 Uganda Selection from bulked seed from a 1991 polycross block with 24 parents
TC--/SP/UG 440; NIS/91/52
Cream
CIP443752 Dimbuka-Bukulula
Uganda Farmer variety of unknown parentage
Farmer variety described in breeding reports
Cream
NASPOT5/58 NASPOT 5/58 Uganda Selection from bulked seed from a 1991 polycross block with 24 parents
Breeding line (progeny of NASPOT 5), not released
Orange
CIP100200.1 NASPOT 7 Uganda Progeny of Kakamega (SPK004) from seed produced in a 2000 polycross block with 24 parents
NIS/2002/SPK004/1 Orange
CIP441768 Kakamega (SPK004)
Kenya Farmer variety of unknown parentage
SPK004 Orange
CIP100200.4 Kabode (NASPOT 10 O)
Uganda Progeny of Kakamega (SPK004) from seed produced in a 2000 polycross block with 24 parents
TC08/SP/UG 055; NIS/2002/SPK004/6/; NASPOT 10 O
Orange
NK259L NK259L Uganda Breeding line (progeny) from New Kawogo selected at same time as NASPOT 11 (also from same parent)
Breeding line selected during participatory plant breeding but not released
White
Parents from Population Uganda B (big crossing block) CIP440001 Resisto USA Obtained from CIP/Kenya,
KEPHIS Used in crossing block as parental source of beta-carotene
Orange
Magabali Magabali Uganda Farmer variety of unknown parentage
Farmer variety described in survey and germplasm characterization reports
Cream
CIP191133.5 NASPOT 5 Uganda Selection from bulked seed from a 1991 polycross block with 24 parents
TC--/SP/UG 446; NIS/91/316
Orange
CIP440167 Wagabolige Uganda Farmer variety of unknown parentage
TC08/SP/PE 152; TC--/SP/UG 355;TC08/SP/UG 108;TC08/SP/UG 188
Cream
Mugande Mugande Uganda Farmer variety of unknown parentage
Farmer variety described in survey and germplasm characterization reports
White
CIP100201 NASPOT 11 (Tomulabula)
Uganda Progeny of New Kawogo from seed produced in a 2000 polycross block with 24 parents
TC08/SP/UG 027; NIS/2003/NKA1081L; NASPOT 11
Cream
CIP441745 New Kawogo Uganda Farmer variety of unknown parentage
Farmer variety described in survey and germplasm characterization reports,
Cream
CIP420020 Huarmeyano CIP/Peru Breeding landrace from Peru Farmer variety from Peru used in crossing block in Uganda; source for SPFMV resistance,
Orange
4.2. Sweetpotato Breeding for Quality Gap Analysis Food product profiles are high priority following major constraints such as diseases e.g. SPVD and pests such as weevils have been controlled e.g. using cultivars with disease field resistance. Equipment ideal for field screening for quality traits (e.g. beta-carotene, starch and sugars, dry matter) would increase accuracy and precision and would be more rapid enabling faster release of cultivars.

65

66
5. BREEDING MATOOKE FOR QUALITY TRAITS Introduction
The East African Highland bananas (Musa AAA group) also referred to as EAHB, is an endemic group of bananas found in the Great Lakes region (Uganda National Council for Science and Technology 2007). They are grown at altitudes between 900 and 2000 m above sea level, and are mainly found in Burundi, Kenya, Rwanda, Tanzania, and Uganda, plus in some areas of Cameroon and the Democratic Republic of Congo. As described by Batte et al., (2018), the cultivars within the group require an average of 2000–2500 mm of rain evenly distributed throughout the year (Uganda National Council for Science and Technology 2007) as they are very drought susceptible (Kissel et al., 2015, 2016).
In Uganda, cooking banana cultivars are locally known as ‘matooke’ and serve as staple food to a large part of the population. Uganda produces over 8 million tons of ‘matooke’ bananas annually, which makes it the second largest banana producer in the world (Batte et al., 2018). The banana breeding programme at the International Institute of Tropical Agriculture (IITA) works on improving three types of bananas: “matooke”, “mchare” bananas and plantains. “Matooke” improvement is carried out in Uganda where IITA collaborate with the Banana Research Programme of the Ugandan National Research Organization (NARO). “Mchare” breeding is done in Arusha in Tanzania, while plantain breeding takes place in Ibadan and Onne in Nigeria. This document in particular concerns “matooke” breeding, which is the focus of WP4 under the project “RTBFoods”.
5.1. Matooke Breeding for Quality Traits at IITA: Uganda
5.1.1. Breeding programs
“Matooke” breeding started in Uganda in 1992, as a collaboration between IITA and Ugandan National Agricultural Research Organization (NARO). The key breeding objective was to improve yield through the incorporation of resistance to black Sigatoka. “Matooke” quality was a priority from the start. The aim was not to improve the quality or “matookeness”, but to maintain or stay as close as possible to the quality of the landraces. This was incorporated in the product profile for “matooke” breeding, where the trait “table quality” was, and still is, given the highest market priority, in the same range as yield. Selection objective is set to an acceptable threshold of a score of 4 and above on a hedonic scale of 1 to 6 (Table 30).

67
Table 30. Banana PRODUCT PROFILE: Matooke (Source: IITA and NARO Banana Breeding Programmes)
Banana PRODUCT PROFILE: Matooke
Region/Market segment
Trait (economic, sustainability, livelihood) and value
Target trait level Market Priority
Selection Objective
Highlands of East and Central Africa
Fresh market and processing
Yield 25% greater than Mbwazirume variety across a range of soil and management conditions
1 Maximize
Table quality A general acceptability score of at least 4 (on a hedonic scale of 1 to 6), using Mbwazirume as a check (acceptability is tested after cooking as taste, aroma, colour, texture/mouth-feel)
1 Reach threshold
Earliness: planting to harvest
300 to 390 days 2 Minimize
Plant stature (girth at 1m/height ratio)
A ratio of at least 0.15 2 Maximize
Plant height Less than 350 cm 2 Minimize
Suckering behavior 75% follower sucker growth at harvest 2 Maximize
Resistance to black Sigatoka
INSL at flowering of 70% and above 2 Reach threshold
Resistance to weevils Resistance higher than that of the susceptible check (Kibuzi)
2 Maximize
Resistance to Radopholus similis
Resistance higher than that of the susceptible check (Valery)
2 Maximize
Resistance to BXW Sources of resistance to be identified 2 Opportunistic
Bunch orientation Pendulous score of 1 or 2 1 Opportunistic
Drought tolerance (water productivity)
Tools to be developed 3 Reach threshold
High ProVitA content Average -Carotene(μg/100 g) higher than 150
1 Opportunistic
5.1.2. Phenotyping for quality traits
Astringency (or lack of), yellow pulp colour, aroma, taste, and mouthfeel have been identified as the best indicators of “matookeness” (Ssemwanga, 1995; Ssemwanga and Thompson, 1994). However, these have not yet been conclusively associated with physio-chemical compounds. Evaluation for “matooke” quality in the hybrids is done qualitatively at different stages of trials, starting with Early Evaluation Trials (EET) up to variety release. At EET level, testing is done in a simple way, where each triploid hybrid carrying a bunch with the right fruit-filling attributes, and resistant to black Sigatoka is checked by the breeding team for: • Colour of the pulp: creamish/yellow desired in matooke • Browning of the pulp and sap upon oxidation: poor matookeness • Astringency of the pulp and sap: astringent hybrids indicate poor “matookeness”
At the Preliminary Yield Trial (PYT) level, the advanced hybrids from EET are tasted systematically in a sensory preference test. Landrace “Mbwazirume” is used as a control in a blind test, where all the lines are coded. Each evaluation seating comprises at most five hybrids. The bunches are cooked following the traditional method of cooking “matooke”, using banana leaves to wrap the peeled fingers,

68
adding little water to the pot and steaming. To avoid differences in cooking, each line is individually wrapped and labelled, and all the small packages of wrapped lines are wrapped together in more banana leaves in one same cooking pot. Steaming is done on wooden fire until steam comes through the wrapped genotypes (muwumbo), a general indication that the bananas are well cooked. After steaming, the individually wrapped lines are mashed. A team of 15 to 20 people, Ugandans, evaluates the lines and gives them a score on a hedonic scale of 1 to 6, where 6 is the best quality. Scoring is done on pulp colour, aroma, taste, mouthfeel and general acceptability, with the first four traits being indicators of the last one. A genotype with an average score of 4 or above for general acceptability and meeting the agronomic traits requirements qualifies for advancement to further evaluation, namely Advanced Yield Trial (AYT), and Multilocational/On-Farm Trial. At AYT level, the sensory preference test is repeated. At the on-farm trial level, the last evaluation for “matooke” hybrids, the sensory preference test is carried out with farmers as panel members. At this level, the hybrids are prepared in all possible ways that banana is cooked in the specific area where the trial is conducted. Data collected at on-farm trials level are included in the variety release process (Ssali et al., 2010).
To ensure that the hybrids produced have “matooke” quality, and to cater for sterility and poor seed set observed in triploids, banana breeding is carried out in 3 phases as summarized in Erreur ! Source du renvoi introuvable. (Nyine et al., 2018). Briefly, breeding starts with EAHB 3x x 2x crosses, 3x, the pest and disease susceptible landrace, but with the right “matooke” quality is used as a female parent. The 2x used at this level carries the required resistance to meet the needs of the product profile for yield and other agronomic traits (Table 30). At this level, the number of seeds is very low. This cross produces 2x, 3x and 4 x hybrids. After evaluation, depending on the requirements for each ploidy, the 2x can be incorporated in the 2x x 2x breeding scheme, where they can later be used to improve 4x. The 3x hybrids can be advanced for further testing. The 4x hybrids start another stage of pollination, where they are crossed with improved 2x to generate 3x to be evaluated in EET.
Figure 29. EAHB improvement scheme: breeding starts with landrace 3x to ensure the preservation of “matooke” quality Source: (Nyine et al., 2018)
5.2. Matooke Breeding for Quality Gap Analysis Evaluation for “matooke” quality in the developed banana hybrids is a tedious task, involving a lot of logistics and people. Moreover, we rely on “matooke” consumers for evaluation, making the whole method biased. There is a need to develop easily measurable, field-based, precise method to quantify “matookeness” at an early stage of breeding. Those traits could be genetically/genomically mapped, and molecular tools would be further developed for selection at nursery level, even before EET.

69
6. REFERENCES Abass A.S., N.T. Dziedzoave, B.E. Alenke and B.D. James. (2012). Quality Management Manual for the Production of gari.
International Institute of Tropical Agriculture (IITA) 2012, Ibadan Nigeria. Adeyinka O. (2001). Cassava processing, consumption and dietary cyanide exposure IHCAR Karohnska Institute, Sweden,
Pp. 6-7. Ajala, A.S., J A. Adejuyitan, G.O, Babarinde and F.D Adeola (2008). Some Physiochemical properties of gari obtained from
some cottage/household processing locations in Ogbomosho, southwest Nigeria. Proceeding 32nd Annual Conference/General Meeting of the Nigeria Institute of Food Science and Technology, October 13-17, 2008. Ogbomosho, Nigeria pp. 272-273.
Allem, A.C. (2002). The origins and taxonomy of cassava. In: Hillocks, R.J., Tresh, J.M. and Bellotti, A.C. (Eds.). Cassava: biology, production and utilization. CABI Publishing, pp 1-16.
Amani, N.G., Buleon A., A. Kamenan and P. Colonna (2004). Variability in starch physicochemical and functional properties of yam ( Dioscorea sp.) Cultivated in Ivory Coast. J. Sci. Food Agric.84: 2085-2096.
Aristizábal, J., T. Sánchez and D. Mejía Lorio (2007). Guía Técnica para producción y análisis de almidón de yuca. Boletín de Servicios Agrícolas de la FAO 163. Food and Agriculture Organization (FAO). Rome, Italy.
Asiedu, R., S.Y.C. Ng, K.V. Bai, I.J. Ekanayake and N.M.W. Wanyera (1998). Genetic improvement. In: G.C. Orkwor, R. Asiedu, and I.J. Ekanayake, editors, Food yams: Advances in research. IITA and NRCRI, Nigeria. p. 63–104.
Assfaw Wossen, T., Girma Tessema, G., Abdoulaye, T., Rabbi, I. Y., Olanrewaju, A., Bentley, J.Alene, A. Feleke, S., Kulakow, P.A., Asumugha, G., Adebayo, M.A., Tokula, M., Manyong, Victor M. (2017). The cassava monitoring survey in Nigeria: final report (p.66). Ibadan: IITA. https://hdl.handle.net/10568/80706.
Azevedo Miranda, L., A.del Pino Beleia and N. Fonseca Jr. (2008). Cassava cooking time. Gene conserve 7: 489:496. Babu, L. and S.R. Chatterjee (1999). Protein content and amino acid composition of cassava tubers and leaves. J. Root Crops
25(20): 163-168. Bakayoko, S., A. Tschannen, C. Nindjin, D. Dao, O. Girardin and A. Assa (2009). Impact of water stress on fresh tuber yield
and dry matter content of cassava (Manihot esculenta Crantz) in Côte d´Ivoire. African Journal of Agriculture Research 4, 21-27.
Bashaasha, B., R. O. M. Mwanga, C.Ocitti P'obwoya and P. T. Ewell (1995). Sweetpotato in the Farming and Food Systems of Uganda: a Farm Survey Report. Nairobi, Kenya & Kampala, Uganda: International Potato Center & National Agricultural Research Organisation.
Bayoumi, S.A.L., M.G. Rowan, L.R. Beeching, and I.S. Blagbrough (2010). Constituents and secondary metabolite natural products in fresh and deteriorated cassava roots. Phytochemistry 71: 598–604
Benesi, I.R.M., M.T. Labuschagne, A.G.O. Dixon and N.M. Mahungu (2004). Stability of native starch quality parameters, starch extraction and root dry matter of cassava genotypes in different environments. J.Sci. Food Agr. 84: 1381-1388.
Benesi, I.R.M., M.T. Labuschagne, L. Herselman, N.M. Mahungu and J.K. Saka (2008). The effect of genotype, location and season on cassava starch extraction. Euphytica 160: 59-74.
Blagbrough, I.S., S.A.L. Bayoumi, M.G. Rowan, and J.R. Beeching (2010). Cassava: anappraisal of its phytochemistry and its biotechnological prospects. Phytochemistry 71: 1940–1951.
Bourrieau M. 2000. Valorisation des racines et tubercules tropicaux pour l’alimentation humaine en Océanie: le cas du laplap au Vanuatu. These de Mastere en génie agro-alimentaire méditerranéen et tropical (MSc thesis), ENSAI/SIARC,Montpellier, France, 122 pp
Bradshaw, J.E., M.F.B. Dale and G.R. Mackay (2009). Improving the yield, processing quality and disease and pest resistance of potatoes by genotypic recurrent selection. Euphytica 170:215–227. doi:10.1007/s10681- 009-9925-4
Bradshaw, J.E. and G.R. Mackay (1994). Breeding strategies for clonally propagated potatoes. In: J.E. Bradshaw and G.R. Mackay, editors, Potato genetics. CAB International, Wallingford. p. 467–497.
Bradshaw, J., M. Dale, and G. Mackay (2003) Use of mid-parent values and progeny tests to increase the efficiency of potato breeding for combined processing quality and disease and pest resistance. Theor. Appl. Genet. 107:36–42. DOI 10.1007/s00122-003-1219-y.
Buitrago-A., J.A. (1990). La yuca en la alimentación animal. Centro Internacional de Agricultura Tropical (CIAT), Cali, Colombia 446 p.
Burns, A., R. Gleadow, J. Cliff, A. Zacarias and T.Cavagnaro (2010). Cassava: the drought, war and famine crop in a changing world. Sustainability 2: 3572-3607.
Cadavid López, L.F. and J.L. Gil Llanos (2003). Investigación en producción de yuca forrajera en Colombia. Informe annual de Actividades CLAYUCA. Apdo Aéreo 6713, Cali Colombia, pp.266-275.
Carputo, D., L. Frusciante, L. Monti, M. Parisi and A. Barone (2002). Tuber quality and soft rot resistance of hybrids between Solanum tuberosum and the incongruent wild relative S. commersonii. Amer. J. Potato Res. 79:345-352.
Carvalho, L.J.C.B., C.R.B. de Souza, J.C.M. Cascardo, C.B. Junior and L. Campos (2004). Identification and characterization of a novel cassava (Manihot esculenta Crantz) clone with high free sugar content and novel starch. Plant Molecular Biology 56: 643-659.
Ceballos, H. and C.H. Hershey (2017). Cassava. In: H. Campos and P.D.S. Caligari (Eds.). Genetic improvement of Tropical Species. Springer (ISBN:978-3-319-59817-8). pp.129-180.
Ceballos, H., N. Morante, F. Calle, J.I. Lenis and S. Salazar (2017). Cassava Breeding. In: Hershey, C. (ed.), Achieving sustainable cultivation of cassava Volume 2: Genetics, breeding, pests and diseases, Burleigh Dodds Science Publishing, Cambridge, UK (ISBN: 9781786760043; www.bdspublishing.com). pp. 49-90.
Chijioke, U., M. Ofoeze, C. Obenta, N. Onwuneme, V. Nwadili, J. Emetole, H. Ogbuekiri, D. Njoku, and C.N. Egesi. (2018). Sensory perception, consumer acceptance and biophysical properties of eba prepared from some provitamin A cassava varieties at UYT stage. The Nigerian Agricultural Journal Vol. 49.
Chirif, A. (2013). Pueblos de la yuca brava. Historia y culinaria (Peoples of the bitter cassava: history and culinary). Ore, Nouvelle Planette, Instituto del Bien Común, IWGIA Publication. Lima, Peru. 288 p.

70
Chiwona-Karltun, L., J. Mkumbira, J. Saka, M. Bovin, N.M. Mahungu and H. Rosling (1998). The importance of being bitter- a qualitative study on cassava cultivar preference in Malawi. Ecol. Food Nutr. 37: 219-245.
Cortés, D.F., K. Reilly, E. Okogbenin, J.R. Beeching, C. Iglesias and J. Tohme (2002) Mapping genes implicated in post-harvest physiological deterioration (PPD) in cassava (Manihot esculenta Crantz). Euphytica 128:47–53.
Davrieux, F., D. Dufour, P. Dardenne, J. Belalcazar, M. Pizarro, J. Luna, L. Londoño, A. Jaramillo, T. Sanchez, N. Morante, F. Calle, .LA. Becerra and H. Ceballos (2016). LOCAL regression algorithm improves NIRS predictions when the target constituent evolves in breeding populations. JNIRS 24:109-117.
D’hoop, B. B., M. J. Paulo, R. A. Man, H. J. van Eck and F. A. van Eeuwijk. Association mapping of quality traits in potato (Solanum tuberosum L.). Euphytica (2008) 161:47–60 DOI 10.1007/s10681-007-9565-5.
David, M.C., F.C. Diaz, R.O.M. Mwanga, S. Tumwegamire, R.C. Mansilla, and W.J. Grüneberg. 2018. Gene pool subdivision of East African sweetpotato parental material. Crop Science. doi:10.2135/cropsci2017.11.0695
Dixon, A.G.O., R. Asiedu, and M. Bokanga (1994) Breeding of cassava for low cyanogenic potential: problems, progress and perspectives. Acta Hort 375:153-161.
Djabou, A.S.M, L.J.C.B. Carvalho, Q.X. Li, N. Niemenak and S. Chen (2017) Cassava postharvest physiological deterioration: a complex phenomenon involving calcium signaling, reactive oxygen species and programmed cell death. Acta Physiol Plant 39:91
Dufour, D.L. (1993). The bitter is sweet: A case study of bitter cassava (Manihot esculenta) use in Amazonia. In: Hladik, C.M., A. Hladik, O.F. Linares and H. Pagezy (eds.), Tropical Forests, People and Food: Biocultural Interactions and Applications to Development, pp. 575–588. UNESCO/Parthenon, Paris.
Dufour, D.L. (1995). A closer look at the nutritional implications of bitter cassava use. In: L.E. Sponsel (ed.), Indigenous Peoples and the Future of Amazonia. An Ecological Anthropology of an Endangered World, pp. 149–65. The Tucson, University of Arizona.
Egan, S.V., H.H. Yeoh and J.H. Bradbury (1998). Simple picrate paper kit for determination of the cyanogenic potential of cassava flour. Journal of the Science of Food and Agriculture 76(1): 39-48
Elias, M., D. McKey, O. Panaud, M.C. Anstett and T. Robert (2001). Traditional management of cassava morphological and genetic diversity by the Makushi Amerindians (Guyana, South America): perspectives for on-farm conservation of crop genetic resources. Euphytica 120: 143-157.
Ernesto M., A.P. Cardosso, J. Cliff and J.H. Bradbury (2000). Cyanogesis Cassava Flour and root and urinary thiocyanate concentration in Mozambique. Journal of food Composition and Analysis. 13: 1-12.
Essers, S.A.J.A., M. Bosveld, R.M. Der VanGrift, and A.G.J. Voragen (1993). Studies on the quantification of specific cyanogens in cassava products and introduction of a new chromogen. J. Sci. Food Agric. 6 (3): 287 – 296.
Esuma, W., R. S. Kawuki, L. Herselman and M. T. Labuschagne (2016). Diallel analysis of provitamin A carotenoid and dry matter content in cassava (Manihot esculenta Crantz). Breeding Science doi:10.1270/jsbbs.15159.
Ezeigbo, O.R., M.U. Ekaiko and Z.O. Ibegbulem (2015). Effect of cooking time on starch and cyanide contents of freshly harvested cassava tubers used for tapioca production. British Biotechnology Journal 8(4): 1-6.
FAOSTAT (2016). Statistical Database_FAOstat. Forsythe, L., H. Posthumus, and M. Adrienne. 2016. A crop of one's own? Women’s experiences of cassava commercialization
in Nigeria and Malawi. Journal of Gender, Agriculture and Food Security 1(2): 110-128. http://faostat3.fao.org/wds/rest/exporter/streamexcel
Fukuda, W. M. G. and M. de F. Borges (1988). Avaliação qualitativa de cultivares de mandioca de mesa. Revista Brasileira de Mandioca. 7:63-71.
Fukuda, W. M. G. and M. de F. Borges (1990). Influência da idade de colheita sobre a qualidade de raízes em diferentes cultivares de mandioca de mesa. Revista Brasileira de Mandioca 9:7-19.
Fukuda, W. M. G., R. de A. Silva and M. de F. Borges (1988). Seleção de variedade de mandioca para o consumo in natura. Revista Brasileira de Mandioca 7:7-18.
Gastelo Benavides M.A., L. Diaz, G. Burgos, T. Zum Felde and M. Bonierbale (2017) Heritability for Yield and Glycoalkaloid Content in Potato Breeding under Warm Environments. Open Agriculture; 2: 561–570. https://doi.org/10.1515/opag-2017-0059.
Gastelo, M., U. Kleinwechter and M. Bonierbale (2014).Global Potato Research for a Changing World. International Potato Center (CIP), Lima, Peru. Working Paper 2014-1. 43 p.
Gnonlonfin, G.J.B., A. Sanni, and L. Brimer (2012). Review scopoletin – a coumarin phy-toalexin with medicinal properties. Critical Reviews in Plant Sciences 31: 47–56.
Gomez, G., J. Santos, and M. Valdivieso (1983). Utilización de raíces y productos de yuca en alimentación animal. In: Domínguez, C.E. (Ed.), Yuca: investigación, producción y utilización. Working Document No. 50. Centro Internacional de Agricultura Tropical (CIAT), Cali, Colombia.
Grace, M.R. (1977) La elaboración de la yuca. Colección FAO: Producción y Protección Vegetal No. 3. Food and Agriculture Organization (FAO). Rome, Italy. 162 p.
Grüneberg, W.J., R.Eyzaguirre, J. Espinoza, R.O.M. Mwanga, M. Andrade, H. Dapaah, S. Tumwegamire et al. (2010)"Procedures for the evaluation and analysis of sweetpotato trials." International Potato Center, Lima, Peru. (http://www.sweetpotatoknowledge.org/files/procedures-for-the-evaluation-and-analysis-of-sweetpotato/)
Han, Y., R. Gómez-Vásquez, K. Reilly, H. Li, J. Tohme, R.M. Cooper and J.R. Beeching (2001). Hydroxyproline-rich glycoproteins expressed during stress responses in cassava. Euphytica 120: 59-70.
Hongbété, F., C. Mestres, N. Akissoé, B. Pons, D.J. Hounhouigan, D. Cornet, C.M. Nago (2011). Effects of cultivar and harvesting conditions (age, season) on the texture and taste of boiled cassava roots. Food Chemistry 126: 127–133.
Hu, W., H. Kong, Y. Guo, Y. Zhang, Z. Ding, W. Tie, Y. Yan, Q. Huang, M. Peng, H. Shi, and A. Guo (2016). Comparative physiological and transcriptomic analyses reveal the actions of melatonin in the delay of postharvest physiological deterioration of cassava. Front. Plant Sci. 7:736. doi: 10.3389/fpls.2016.00736
Isendahl, C. (2011). The domestication and early spread of manioc (Manihot esculenta Crantz): a brief synthesis. Latin American Antiquity 22(4):452-468.
IITA (1999). Project 13. Improvement of yam-based systems, Annual report 1998. IITA, Ibadan, Nigeria.

71
IITA. 2012. An annual report on cassava production. http://newint.iita.org/wp-content/uploads/2016/04/Annual-Report-2012.pdf.
Ikeogu, U.N., F. Davrieux, D. Dufour, H. Ceballos, C.N. Egesi and J-L Jannink. 2017. Rapid analyses of dry matter and carotenoids in fresh cassava roots using a portable visible and near infrared spectrometer (Vis/NIRS). PlosOne 12: e0188918.
Iwuoha, C.I., E.O.I. Banigo and F.C. Okwelum (1997). Cyanide content and sensory quality of cassava (Manihot esculenta Crantz) root tuber flour as affected by processing Food Chemistry 58: 285.-288.
Jørgensen, K., S. Bak, P.K. Busk, C. Sørensen, C.E. Olsen, J. Puonti-Kaerlas, B.L. Møller (2005). Cassava plants with a depleted cyanogenic glucoside content in leaves and tubers. Distribution of cyanogenic glucosides, their site of synthesis and transport, and blockage of the biosynthesis by RNA interference technology. Plant Physiol. 139(1):363-74.
Kawano, K. (2003). Thirty years of cassava breeding for productivity – biological and social factors for success. Crop Sci. 43: 1325-1335.
Kawano K., and J.H. Cock (2005). Breeding cassava for underprivileged: institutional, socio-economic and biological factors for success. J. Crop Improv.14, 197-219.
Kawano, K., K. Narintaraporn, P. Narintaraporn, S. Sarakarn, A. Limsila, J. Limsila, D. Suparhan, V. Sarawat, and W. Watananonta (1998.) Yield improvement in a multistage breeding program for cassava. Crop Sci. 38: 325-332.
Kawuki, R.S., E.Nuwamanya, M.E.Ferguson, L.Labuschagne and L. Herselman (2011). Segregation of selected agronomic traits in six S1 cassava families. Journal of Plant Breeding and Crop Science, 3(8):154-160.
Kawuki R. S., L. Herselman, M. T. Labuschagne, I. Nzuki, I. Ralimanana, M. Bidiaka, M. C. Kanyange, G. Gashaka, E. Masumba, G. Mkamilo, J. Gethi, B. Wanjala, A. Zacarias, F. Madabula and M. E. Ferguson (2012). Genetic diversity of cassava (Manihot esculenta Crantz) landraces and cultivars from southern, eastern and central Africa. Plant Genetic Resources: Characterization and Utilization; 1–12 doi:10.1017/S1479262113000014
King, N.L.R. and J.H. Bradbury (1995). Bitterness of cassava: Identification of a new apiosyl glucoside and other compounds that affect its bitter taste. J. Sci. Food Agric. 68: 223-230.
Kizito, E.B., A-C. Rönnberg-Wästljung, T. Egwang, U. Gullberg, Martin Fregene and A, Westerbergh (2007). Quantitative trait loci controlling cyanogenic glucoside and dry matter content in cassava (Manihot esculenta Crantz) roots. Hereditas 144: 129-136.
Kvitschal, M.V., P. Soares Vidigal Fo, C.A. Scapim, M.C. Gonçalves-Vidigal, E. Sagrilo, M.G. Pequeno and F. Rimoldi (2009). Comparison of methods for phenotypic stability analysis of cassava (Manihot esculenta Crantz) genotypes for yield and storage root dry matter content. Braz. Arch. Biol. Technol. 52: 163-175.
Lebot, V., R. Malapa, T. Molisale, and J.L. Marchand (2006). Physico-chemical characterization of yam (Dioscorea alata L.) tubers from Vanuatu. Genetic and Resources and Crop Evolution 53:1199-1208.
Lebot, V., and R. Malapa (2013). Application of near infrared reflectance spectroscopy for the evaluation of yam (Dioscorea alata) germplam and breeding lines. Journal of the science of food and agriculture DOI 10.1002/jsfa.6002
Leighton C.S., H.C. SchoÖÖnfeldt and R. Kruger (2010). Quantitative descriptive sensory analysis of five different cultivars of sweetpotato to determine sensory and textural profiles. Journal of Sensory Studies. DOI: 10.1111/j.1745-459X.2008.00188.x
Lenis, J.I., E.A. Rosero, N. Morante, S. Salazar, and H. Ceballos (2018). Experiences in breeding for high and stable dry matter content in cassava roots. 18th Triennal Symposium of ISTRC. Cali, Colombia.
Liu, S., I.M. Zainuddin, H. Vanderschuren, J. Doughty and J.R. Beeching (2017) RNAi inhibition of feruloyl CoA 6′-hydroxylase reduces scopoletin biosynthesis and post-harvest physiological deterioration in cassava (Manihot esculenta Crantz) storage roots. Plant Mol Biol 94:185–195.
Lorenzi, J.O. (1994). Variação na qualidade culinária das raízes de mandioca. Bragantia 53(2):237-245. Luciani, J.F. (1996). Mejoramiento genético de la yuca. In A. Montaldo (Ed.) La yuca frente al hambre del mundo tropical.
Universidad Central de Venezuela. Maracay. p. 119-130. Wolfe M.D., D. P. Del Carpio, O. Alabi, C. Egesi, L. C. Ezenwaka, U.N. Ikeogu, R. S. Kawuki, I. S. Kayondo, P. Kulakow, R.
Lozano, I. Y. Rabbi, E. Williams, A. A. Ozimati and J.L. Jannink (2017). Prospects for genomic selection in cassava breeding. https://doi.org/10.1101/108662
McMahon, J.M., W.L.B. White, and R.T. Sayre (1995). Cyanogenesis in cassava (Manihot esculenta Crantz). J. Exp. Bot. 46:731-741.
Mignouna, H.D., M.M. Abang, and R. Asiedu. (2007). Advances in yam (Dioscorea spp.) genetics and genomics. Proceedings of the 13th ISTRC symposium. 9-15 Nov 2003, Arusha, Tanzania, pages 72-81.
Mkumbira, J., L. Chiwona-Karltun, U. Lagercrantz, N.M. Mahungu, J. Saka, A. Mhone, M. Bokanga, L. Brimer, U. Gullberg and Hans Rosling (2003). Classification of cassava into ‘bitter’ and ‘cool’ in Malawi: From farmers’ perception to characterisation by molecular markers. Euphytica 132: 7–22.
Montaldo, A. (1996). Conservación de las raíces tuberosas de yuca. In A. Montaldo (Ed.) La yuca frente al hambre del mundo tropical. Universidad Central de Venezuela. Maracay. p.207-216.
Morante, N., X. Moreno, J.C. Pérez, F. Calle, J. I. Lenis, E. Ortega, G. Jaramillo, and H. Ceballos (2005). Precision of selection in early stages of cassava genetic improvement. J. Root Crops 31: 81-92.
Morante, N., T. Sánchez, H. Ceballos, F. Calle, J.C. Pérez, C. Egesi, C.E. Cuambe, A.F. Escobar, D. Ortiz and A.L. Chávez (2010). Tolerance to post-harvest physiological deterioration in cassava roots. Crop Science 50:1333-1338.
Moyib, K.O., J. Mkumbira, O.A. Odunola, A.G. Dixon, M.O. Akoroda and P. Kulakow (2015) Genetic variation of postharvest physiological deterioration susceptibility in a cassava germplasm. Crop Sci. 55:2701–2711
Mwanga, O.M., G. Kyalo, G.N. Ssemakula, C. Niringiye, B. Yada, M.A. Otema, J. Namakula, A. Alajo, B. Kigozi, R.N.M. Makumbi, A. Ball, W.J. Grüneberg, J.W. Low, and G.C. Yencho. (2016). ‘NASPOT 12 O’ and ‘NASPOT 13 O’ Sweetpotato, HortScience 51(3): 291-295.
Nyine M, B. Uwimana, N. Blavet, E. Hřibová, H. Vanrespaille, M. Batte, V. Akech, A. Brown, J. Lorenzen, R. Swennen and J. Doležel (2018) Genomic Prediction in a Multiploid Crop: Genotype by Environment Interaction and Allele Dosage Effects on Predictive Ability in Banana. The Plant Genome 11 170090.

72
Okechukwu D E. Okoye I C. 2010.Evaluation of soaking time on the cyanide content of Abacha slices.34th Annual Conference and General Meeting Nigerian Institute of Food Science and Technology. Port-Harcourt, Nigeria. Pp 136-137.
Omar, N.F., S.A. Hassan, U.K. Yusoff, N.A. P.Abdullah, P.E.M. Wahab and U.R. Sinniah (2012). Phenolics, Flavonoids, Antioxidant Activity and Cyanogenic Glycosides of Organic and Mineral-base Fertilized Cassava Tubers. Molecules 17: 2378-2387.
Onyenwoke, C. A. and K. J. Simonyan. 2014. Cassava post-harvest processing and storage in Nigeria: A review. African Journal of Agricultural Research 9(53): 3853-3863.
Oparinde, A., Birol, E., Ilona, P.,Bamire, S., and Asumugha, G. (2012).Consumer acceptance of biofortified (yellow) cassava in Imo State and Oyo State. HarvestPlus Report June, 2012, Nigeria.
Ospina, M.A., T. Tran, M. Pizarro, J. Luna, W. Trivino, J. Belalcazar, S. Salazar, D. Dufour, L. A. Becerra López-Lavalle (2018a). Diversity of post-harvest phenotypic traits among the CIAT cassava germplasm collection” – Oral presentation at Global Cassava Partnership (GCP21) Congress, Cotonou (Benin), 11-15 June 2018.
Ospina, M.A., T. Tran, M. Pizarro, J. Luna, W. Trivino, J. Belalcazar, S. Salazar, D. Dufour, L. A. Becerra López-Lavalle (2018b). Diversity of post-harvest phenotypic traits among the CIAT cassava germplasm collection – Oral presentation at ISTRC conference, Cali (Colombia), 22-25 October 2018
Otegbayo, BO, M. Bokanga, R. Asiedu , (2011). Physico-chemical composition of yam starch: Effect on textural quality of yam food product (Pounded yam). Journal of Food, Agriculture and Environment. 9 (1), 145-150
Otegbayo, B.O., F.O. Samuel, A.L. Kehinde, T.E. Sangoyomi and C.C. Okonkwo (2010). Perception of food quality in yams among some Nigerian farmers. African Journal of Food Science Vol. 4(8), pp. 541- 549
Pereira, A. S., J.O. Lorenzi and T.L. Valle (1985). Avaliação do tempo de cozimento e padrão de massa cozida em mandioca de mesa. Revista Brasileira de Mandioca 4: 27-32
Pereira, A.S., J.O. Lorenzi, E. Klatilova, S. Perim, I.R.S. Costa, S. Penna, T.L. Valle, J.de P. M França (1983). A mandioca na cozinha Brasileira. Instituto Agronomico, Campinas (Brazil) 266 p.
Perim, S., I.R.S. Costa, S. Penna, T.S. Valle, and J.P.M. França (1983). A mandioca na cozinha brasileira. Inst. Agron Campinas (Sao Paulo, Brazil). Boletim 212.
Peroni, N., P.Y. Kageyama and A. Begossi (2007). Molecular differentiation, diversity, and folk classification of ‘‘sweet’’ and ‘‘bitter’’ cassava (Manihot esculenta) in Caiçara and Caboclo management systems (Brazil). Genet Resour Crop Evol 54:1333–1349.
Pizarro, M., M. A. Ospina, J. Luna, J. Belalcazar, S. Salazar, D. Dufour, T. Tran, L. A. Becerra López-Lavalle (2018). Phenotypic diversity of cyanide content and distribution in cassava plants, in association with carotenoids and protein content” – Poster at ISTRC conference, Cali (Colombia), 22-25 October 2018.
Pujol, B., G. Gigot, G. Laurent, M. Pinheiro-Kluppel, M. Elias, M. Hossaert-McKey and D. McKey (2002). Germination ecology of cassava (Manihot esculenta Crantz Euphorbiaceae) in traditional agroecosystems: seed and seedling biology of a vegetatively propagated domesticated plant. Economic Botany 56: 366-379.
Meireles da Silva, R., G. Bandel and P.S. Martins (2003). Mating system in an experimental garden composed of cassava (Manihot esculenta Crantz) ethnovarieties. Euphytica 134: 127-135.
Oluwole, O.S.A., A.O. Onabolu, K. Mtunda and N. Mlingi (2007). Characterization of cassava (Manihot esculenta Crantz) varieties in Nigeria and Tanzania, and farmers’ perception of toxicity of cassava. Journal of Food Composition and Analysis 20: 559–567
Rabbi I.Y, L. Udoh, M. Wolfe, E.Y. Parkes, M.A. Gedil, A. Dixon, P. Ramu, J-L. Jannink and P. Kulakow. 2017. Genome wide association mapping of correlated traits in cassava: dry matter and total carotenoid content. Plant Genome 10:1-14. doi: 10.3835/plantgenome2016.09.0094
Reilly, K., Y. Han, J. Tohme, and J.R. Beeching (2001). Isolation and characterization of a cassava catalase expressed during post-harvest physiological deterioration. Biochim Biophys Acta 1518:317-323.
Reilly, K., R. Gomez-Vasquez, H. Buschman, J. Tohme, and J.R. Beeching (2003). Oxidative stress responses during cassava post-harvest physiological deterioration. Plant Molecular Biology 53: 669-685.
Reilly, K., D. Bernal, D.F. Cortes, R. Gomez-Vasquez, J. Tohme, and J.R. Beeching. (2007). Towards identifying the full set of genes expressed during cassava post-harvest physiological deterioration. Plant Molecular Biology 64:187-203.
Safo-Kantanka, O. and J. Owusu-Nipah (1992). Cassava varietal screening for cooking quality: relationship between dry matter, starch content, mealiness and certain microscopic observations of the raw and cooked tuber. J Sci Food Agric 60:99-104.
Sagrilo E., P. Soares Vidigal Fo., M.G. Pequeno, M.C. Gonçalves-Vidigal and M.V. Kvitschal (2008). Dry matter production and distribution in three cassava (Manihot esculenta Crantz) cultivars during the second vegetative plant cycle. Brazilian Archives of Biology and Technology 51: 1079-1087.
Sajeev, M.S. J. Sreekumar, M. Unnikrishnan, S.N. Moorthy, S. Shanavas (2010). Kinetics of thermal softening of cassava tubers and rheological modeling of the starch. J Food Sci Technol 47(5):507–518.
Sánchez, T., A.L. Chávez, H. Ceballos, D.B. Rodriguez-Amaya, P. Nestel and M. Ishitani (2006). Reduction or delay of post-harvest physiological deterioration in cassava roots with higher carotenoid content. Journal of the Science of Food and Agriculture 86: 634-639.
Sánchez, T., G. Mafla, N. Morante, H. Ceballos, D. Dufour, F. Calle, X. Moreno, J.C. Pérez and D. Debouck (2009). Screening of starch quality traits in cassava (Manihot esculenta Crantz). Starch/Stärke 61:12-19.
Sánchez, T., D. Dufour, J.L. Moreno, M. Pizarro, I. Arango, M. Domínquez and H. Ceballos (2013). Changes in extended shelf life of cassava roots during storage in ambient conditions. Postharvest Biology and Technology 86:520-528.
Sayre, R. (2011) The BioCassava plus program: biofortification of cassava for sub-Saharan Africa. Annu Rev Plant Biol 62:251–272. doi:10.1146/annurev-arplant-042110-103751
Slater, A. T., N. O.I. Cogan, J. W. Forster, B. J. Hayes, and H. D. Daetwyler (2016). Improving Genetic Gain with Genomic Selection in Autotetraploid Potato. Plant Genome 9. doi:10.3835/plantgenome2016.02.0021
Ssali, R.T., K.Nowankunda, R.Barekye Erima, M.Batte, and W.K. Tushemereirwe, (2010). On-farm participatory evaluation of East African highland banana 'matooke' hybrids (Musa spp.). Acta Hortic. 879, 585-591. doi: 10.17660/ActaHortic.2010.879.65

73
Ssemwanga J.K. (1995) A list of attributes of matooke banana cultivars as seen by farmers and traders in Uganda. MusAfrica 7:6-9.
Ssemwanga J.K. and A.K. Thompson (1994) Investigation of postharvest and eating qualities likely to influence acceptability of matooke banana cultivars to be introduced into Uganda. Aspects Appl Biol 39:207-213.
Stapleton, G. (2012) Global starch market outlook and competing starch raw materials for starches by product segment and region. Cassava Starch World 2010. Centre for Management Technology (CMT), Cambodia
Sugri, I., S.K. Nutsugah, A.N. Wiredu, P.N.T. Johnson and D. Aduguba (2012). Kendall’s Concordance Analysis of Sensory Descriptors Influencing Consumer Preference for Sweet Potatoes in Ghana. American Journal of Food Technology, 7: 142-150.doi: 10.3923/ajft.2012.142.150
Talma, S.V., R. M.P. Lima, H.D. Vieira, P.A. Berbert (2013). Tempo de cozimento e textura d raízes de mandioca. Campinas 16(2): 133-138.
Teeken, B., O. Olaosebikan, J. Haleegoah, E. Oladejo, T. Madu, A. Bello, E. Parkes, C. Egesi, P. Kulakow, H. Kirscht and H.A. Tufan. 2018. Cassava trait preferences of men and women farmers in Nigeria: implications for breeding. Economic Botany 20: 1-15.
Tomlins, K., G. Ndunguru, K. Stambul, N. Joshua and T. Ngendello, E. Rwiza, R. Amour, B. Ramadhani, A. Kapande and A. Westby (2007). Sensory evaluation and consumer acceptability of pale-fleshed and orange-fleshed sweet potato by school children and mothers with preschool children. J. Sci. Food Agric., 87: 2436-2446.
Tran, T., J. Luna, M.A. Ospina, M. Pizarro, W. Trivino, J. Belalcazar, S. Salazar, D. Dufour, L. A. Becerra López-Lavalle (2018). Phenotyping postharvest physiological deterioration (PPD) in cassava: Implications for selection. Oral presentation at ISTRC conference, Cali (Colombia), 22-25 October 2018.
Tumuhimbise, R., P. Shanahan, R. Melis and R. Kawuki (2014) Genetic variation and association among factors influencing storage root bulking in cassava. Journal of Agricultural Science (2015), 153, 1267–1280
Tumuhimbise R., R. Melis, P. Shanahan and R. Kawuki (2012) Farmers' Perceptions on Early Storage Root Bulking in Cassava (Manihot esculenta Crantz) in East and Central Uganda and their Implication for Cassava Breeding. World Journal of Agricultural Sciences 8 (4): 403-408, 2012
Tylleskär, T., M. Banea, N. Bikangi, L. Fresco, L.A. Persson and H. Rosling (1991). Epidemiological evidence from Zaire for a dietary etiology of konzo, an upper motor neuron disease. BullWHO 69: 581–590.
Uarrota, V.G., and M. Maraschin (2015) Metabolomic, enzymatic, and histochemical analyzes of cassava roots during postharvest physiological deterioration. BMC Res Notes 8:648. doi:10.1186/s13104-015-1580-3
Uarrota, V.G., E. Nunes, L. Peruch, E. Neubert, B. Coelho, R. Moresco, M. Domínguez, T. Sánchez, J. Meléndez, D. Dufour, H. Ceballos, L. Becerra Lopez-Lavalle, C. Hershey, M. Rocha and M. Maraschin (2015). Toward better understanding of postharvest deterioration: Biochemical changes in stored cassava (Manihot esculenta Crantz) roots. Food Science & Nutrition doi: 10.1002/fsn3.303.
Vandegeer, R., R.E. Miller, M. Bain, R.M. Gleadow and T.R. Cavagnaro (2013). Drought adversely affects tuber development and nutritional quality of the staple crop cassava (Manihot esculenta Crantz). Functional Plant Biology 40: 195–200
van Oirschot, Q.E.A., G.M. O’Brien, D. Dufour, M.A. El-Sharkawy and E. Mesa (2000). The effect of pre-harvest pruning of cassava upon root deterioration and quality characteristics. J Sci Food Agric 80:1866-1873.
Vlaar, P.W.L., P. van Beek and R.G.F. Visser (2007). Genetic modification and its impact on industry structure and performance: post-harvest deterioration of cassava in Thailand. Journal on Chain and Network Science 7, 133–142.
Werij (2011) Genetic analysis of potato tuber quality traits. Thesis, Wageningen University, Wageningen, NL. ISBN 978-94-6173-092-3.
Whankaew, S. S.Poopear, S. Kanjanawattanawong, S. Tangphatsornruang, O. Boonseng, D.A. Lightfoot and K. Triwitayakorn (2011). A genome scan for quantitative trait loci affecting cyanogenic potential of cassava root in an outbred population. BMC Genomics 12:266
Wheatley, C. and G. Gomez (1985). Evaluation of some quality characteristics in cassava storage roots. Plant Foods for Human Nutrition 35, 121–129.
Wheatley, C. (1989). Conservation of cassava roots in polythene bags. CIAT, Series: 04SC-07.06. Wheatley, C. (1991). Calidad de las raíces de yuca y factores que intervienen en ella. En: Hershey, C.H. (ed.) Mejoramiento
genético de la yuca en América Latina. Publicación CIAT No. 82. Centro Internacional de Agricultura Tropical (CIAT). Apartado Aéreo 6713, Cali, Colombia.
Woolfe, J. A. (1992) Sweet potato: an untapped food resource. Cambridge University Press, 643 p.

74
7. ANNEXES 7.1. Annex 1: List of yams officially released in
Nigeria
Variety name Outstanding characteristics Agro-ecological zones
Year of release
TDR 89/02677
Stable yield, very good cooking and pounding qualities, cream tuber parenchyma, 25% tuber dry matter content
Forest and Southern Guinea Savanna
2001
TDR 89/02565
Stable yield, very good cooking and pounding qualities, cream non oxidizing parenchyma, 35% tuber dry matter.
Forest and Southern Guinea Savanna
2001
TDR 89/02461
Stable yield, very good as cooking and pounding qualities, cream parenchyma, 26.7% tuber dry matter.
Forest and Southern Guinea Savanna
2001
TDR 89/02665
Stable yield, very good cooking and pounding qualities, cream non oxidizing parenchyma, 35.3% tuber dry matter
Forest and Southern Guinea Savanna
2003
TDR 89/01213
Stable yield, very good cooking and pounding qualities, white non-oxidizing parenchyma, tuber dry matter = 29.8%
Forest and Southern Guinea Savanna
2003
TDR 89/01438
Stable yield, very good cooking and pounding qualities, white non-oxidizing parenchyma, tuber dry matter = 29.3%
Forest and Southern Guinea Savanna
2003
TDR 95/01924
Stable yield, very good cooking and pounding qualities, white non-oxidizing parenchyma, tuber dry matter = 32.8%
Forest and Southern Guinea Savanna
2003
DRN 200/4/2
High yielding, pests and diseases tolerant, very good for fufu, frying and boiling (35t/ha)
Yam Zones in Nigeria
2008
TDa 98/01176
High yielding, pests and diseases tolerant, very good for pounded yam, frying and boiling, suitable for both rainy and dry seasons yam production (26-30t/ha)
Yam Zones in Nigeria
2008
TDa 98/01168
High yielding, pests and diseases tolerant,good for pounded yam, frying and boiling. (24-28t/ha)
Yam Zones in Nigeria
2008
TDa 98/01166
High yielding, pests and diseases tolerant, very good for pounded yam, frying and boiling, suitable for both rainy and dry seasons yam production (26-30t/ha
Yam Zones in Nigeria
2008
TDr 95/19158
High yielding, pests and diseases tolerant,good for pounded yam, frying and boiling. (29.4t/ha)
Yam Zones in Nigeria
2008
TDr 89/02602
High yielding, pests and diseases tolerant, very good for yam, fufu, frying and boiling. (31.5t/ha)
Yam Zones in Nigeria
2009
TDr 89/02660
High yielding, pests and diseases tolerant, very good for yam, fufu, frying and boiling. (31t/ha)
Yam Zones in Nigeria
2009
TDa 00/00194
High yielding, pests and diseases tolerant, very good for yam, fufu, frying and boiling. (37.5t/ha)
Yam Zones in Nigeria
2009
TDa 00/00104
High yielding, pests and diseases tolerant, very good for yam, fufu, frying and boiling. (37.5t/ha)
Yam Zones in Nigeria
2009
UMUDa-4
High Yielding good for Amala, pounded yam, frying and boiling. (33.3t/ha)
Yam Zones in Nigeria
2010

75
UMUDr - 17
High yielding under dry season yam cropping system. (30t/ha)
Yam Zones in Nigeria
2010
UMUDr - 18
High yielding, pests and diseases tolerant, very good for yam fufu, frying and boiling. (31t/ha)
Yam Zones in Nigeria
2010
UMUDr /020 High yielding (37.2t/ha), adaptable to low soil fertility and low soil moisture
Yam Zones in Nigeria
2016
UMUDr/021 High yielding (33.2t/ha), adapted to low soil fertility. Yam Zones in Nigeria
2016
UMUDr/022 (Obiaturugo)
High yield (28.6t/ha), tolerant to major pests and diseases
South west and South east
2016
UMUDr/023 Amola) Tolerant to viruses South west and South east and North central
2016
UMUDr/024 (Hembakwasi)
Tolerant to viruses, moderately yielding Yam Zones in Nigeria
2016
UMUDr/025 (Ekpe) Tolerant to viruses, moderately yielding Forest zones 2016
UMUDr/026 ( Aloshi)
Tolerant to viruses Foests zone 2016

76
7.2. Annex 2: List of Morphological traits, Agronomical traits and Characteristics post-harvest for potato at CIP.
# Name of
Trait Description of Trait
Trait Class Describe how measured (method)
Bibliographic Reference
Scale
1 Predominant tuber skin color
Freshly tubers harvested washed and dried before the evaluation of tubers. Skin color-register must be the most representative of the tuber and recorded with the help of the color table.
Morphological traits
Visual categorization Gomez, R. 2004.
1 = White- cream; 2 = Yellow; 3 = Orange; 4 = Brownish; 5 = Pink; 6 = Red; 7 = Purplish-red; 8 = Purple; 9 = Blackish
2 Predominant Tuber flesh color
Observation of the secondary color described cross sections made approximately in the center part of the freshly harvested tubers
Morphological traits
Visual categorization Gomez, R. 2004.
1 = White; 2 = Cream; 3 = Pale; 4 = Yellow; 5= Intense Yellow; 6 = Red; 7 = Purple; 8 = Violet
3 General tuber shape
Observation of the general shape of the tubers, the ratio between the diameter and the length of the overall shapes delimiting tuber
Morphological traits
Visual categorization Gomez, R. 2004.
1 = Compressed; 2 = Rounded; 3 = Ovoid; 4 = Obovoid; 5 = Elliptical; 6 = Oblong; 7 = Long-oblong; 8 = Elongated
4 Tuber shape depth of eyes
Observate several tubers and determine the depth of eyes
Morphological traits
Visual categorization Gomez, R. 2004.
1 = Protruding; 3 = Shallow; 5 = Slightly deep; 7 = Deep; 9 = Very deep
5 Dormancy Period (DLS) Lowland
The dormancy period should be evaluated in Diffuse light storage to Lowland
Agronomical traits
The dormancy period should be counted as number of days from haulm cutting to sprouting of 80% of the tubers (8 to 12 tubers depending on the size of the experimental unit) with at least one sprout longer than 2 mm. Tubers should be checked at 10 day-intervals for monitoring sprouting initiation and growth, and to accurately record the dormancy period
Carli et al. 2010.
6 Dormancy period (DLS) Highland
The dormancy period should be evaluated in Diffuse light storage to highland
Agronomical traits
The dormancy period should be counted as number of days from haulm cutting to sprouting of 80% of the tubers (8 to 12 tubers depending on the size of the experimental unit) with at least one sprout longer than 2 mm.
Carli et al. 2010.

77
Tubers should be checked at 10 day-intervals for monitoring sprouting initiation and growth, and to accurately record the dormancy period
7 Flavor Taste the cooked tuber, immediately determining after cooking
Characteristics post-harvest
Tuber flavor after cooking in a 1-5 scale
International Potato Center (CIP) 2014.
1 = Very poor; 2 = Poor; 3 = Intermediate; 4 = Good; 5 = Very good
8 Texture of tuber after cooking
Test the texture of the tuber, immediately determining after cooking
Characteristics post-harvest
Visual categorization International Potato Center (CIP) 2014.
1 = Watery; 2 = Less watery; 3 = Waxy; 4 = Less mealy; 5 = Mealy
9 Oil Absorption Rate
The method requires a knife to press, scales, paper towels and samples of chips
Characteristics post-harvest
Oil absorption =100- [(weight final / weight initial) *100]
International Potato Center (CIP). 2006.
10 Cooking Quality
Cooking test Characteristics post-harvest
Visual categorization International Potato Center (CIP) 2014.
1=A = Totally solid and firm; 2=AB = Solid; 3=B = Partially Solid; 4=BC = Partially and Slightly disintegrated; 5=C = Partially disintegrated; 6=CD = Totally disintegrated; 7=D = Totally and strongly disintegrated
11 After cooking darkening
Measure the degree of darkness immediately after cooking
Characteristics post-harvest
Visual categorization International Potato Center (CIP) 2014.
1 = Light; 2 = Moderately light; 3 = Moderately dark; 4 = Dark
12 Flesh Color after cooking
Observe the color of the pulp after cooking
Characteristics post-harvest
Visual categorization International Potato Center (CIP) 2014.
1= Cream; 2= Dark Yellow; 3= Light Cream; 4= Light Yellow; 5= Purple; 6= White; 7= Yellow; 8= Dark cream
13 Chipping color
Measure the degree of darkening that occurs during frying
Characteristics post-harvest
Visual categorization International Potato Center (CIP). 2006.
1 = Light; 2 = Moderately light; 3 = Moderately dark; 4 = Dark; 5 = Very Dark
14 Percentage Dry matter
Percent dry matter content of tubers
Characteristics post-harvest
Percentage Dry matter of the tubers, estimated by multiplying by 100 the ratio between the dry weight (obtained after drying the tubers in the oven until constant weight), and the fresh weight of the sample, using a sample of about 100 grams of fresh samples.
International Potato Center (CIP). 2006.
15 Cooking Time (minutes)
Choose two or three well washed tubers and cook them,
Characteristics post-harvest
Visual categorization International Potato Center (CIP) 2014.
1=10-15; 2=16-20; 3=21-25; 4=26-30; 5=>30

78
evaluate every 5 minutes
16 Vitamin C (mg/100g, dry weight basis)
The vitamin C concentration is quantified through comparison with a standard curve of the L-ascorbic acid.
Biochemical traits
The vitamin C concentration is quantified through comparison with a standard curve of the L-ascorbic acid. Accessed on https://research.cip.cgiar.org/confluence/display/cipqnl/Ascorbic+acid
International Potato Center (CIP) 2014.
17 Content of iron in dry weight basis
Content of iron in dry weight basis
Biochemical traits
The mineral concentrations (Fe, Zn, Ca, K, Na, Mg and P) are determined by inductively coupled plasma--optical emission spectrophotometry (ICP-OES) using a Radial View.
International Potato Center (CIP) 2014.
18 Content of zinc in dry weight basis
Content of zinc in dry weight basis
Biochemical traits
The mineral concentrations (Fe, Zn, Ca, K, Na, Mg and P) are determined by inductively coupled plasma--optical emission spectrophotometry (ICP-OES) using a Radial View.
International Potato Center (CIP) 2014.
19 Anthocyanins Total
Tubers with skin and flesh color red and purple are used for the detection of anthocyanins.
Biochemical traits
TA analysis of freeze dried samples was optimized for freeze dried and milled potato samples from the method proposed by Jansen and Flamme (2006)
Burgos et al. 2013.
20 Antioxidant Ability Hydrophilic
Antioxidant Hydrophilic Ability
Biochemical traits
AAH evaluation was done by the ABTS and DPPH assays which were optimized for freeze dried potatoes based on the methods reported by Re et al. (1999) and Brand-Williams et al. (1995).
Burgos et al. 2013.
21 Antioxidant Ability Lipophilic
Antioxidant Lipophilic Ability
Biochemical traits
AAL evaluation was done by the ABTS and DPPH assays which were optimized for freeze dried potatoes based on the methods reported by Re et al. (1999) and Brand-Williams et al. (1995).
Burgos et al. 2013.
Burgos G., Amoros W., Muñoa L., Sosa P., Cayhualla E., Sanchez C., Díaz C., Bonierbale M. 2013 Total phenolic, total anthocyanin and phenolic acid concentrations and antioxidant activity of purple-fleshed potatoes as affected by boiling. Journal of Food Composition and Analysis. International Potato Center (CIP) 2014. Catalogue of Potato Varieties and Advanced Clones. Retrived from www.cipotato.org/catalogue. (Accessed on 05/22/2014) Gomez, R. 2004 Seminar - National Workshop in situ characterization. In situ conservation of landraces and wild relatives PER/98/G33 Project. Guide to Basic Morphological Characterizations in Collections Native Potato (sixth approximation). Peru. Carli,C.; Mihovilovich, E; & Bonierbale, M. 2010. Assessment of Dormancy and Sprouting Behavior of Elite and Advanced Clones. Retrieved from https://research.cip.cgiar.org/confluence/display/GDET4RT/Protocols (Accessed on 05/22/2014) International Potato Center (CIP). 2006. Procedures for standard evaluation trials of advanced potato clones. An International Cooperators’ Guide.Lima. Borgtoft, H.

79
7.3. Annex 3: Characteristics of CIP392797.22 variety available online at Catalogue of CIP Potato Varieties.

80
Institution: Cirad – UMR QualiSud
Address: C/O Cathy Méjean, TA-B95/15 - 73 rue Jean-François Breton - 34398 MONTPELLIER Cedex 5 - France
Contact Tel: +33 4 67 61 44 31
Contact Email: [email protected]