A Secure Authentication Infrastructure for Mobile ... - CiteSeerX
Upload
khangminh22Category
view
0download
0
IT Infrastructure & Microservices
Authentication
Srison Kadariya
Final project presented to Escola Superior de Tecnologia e Gestão for obtaining
master’s degree in Informatics
Work done under the supervision of:
Professor José Luís Padrão Exposto
Bragança
June 2021


iii
Dedication
This project is dedicated to my Parents who have raised me to be the person I am today,
who have righteously guided me. Thank you for all the love, support, and guidance and
for making me believe in myself, to accomplish any challenging work.
Dedicated to the loving memory of my beloved grandfather who recently passed away.


v
Acknowledgments
I would like to express my deepest appreciation to the special people of my life who have
contributed to the enhancement of my life and who have supported me in daily basics
with their unparallel love.
First of all, I am immensely grateful to my supervisor Doctor José Exposto for the
continuous support and encouragement to complete my project with the correct guideless.
I am also grateful to all the professors of Instituto Politécnico de Bragança from Bachelors
in Informatics Engineering and Masters in Informatics for guiding and supporting me
starting from my Bachelor’s degree until the final year of my Master’s degree.
I would like to thank my parents for the countless times they have helped me in the
journey of my study. Without the help and understanding of my parents, it would have
been impossible to reach here. My parents have been incredibly supportive of my every
decision. Thanks for making me strong to overcome all the struggles, pains, and
hardships. I am and I will be forever indebted to my parents for giving me the
opportunities and experiences that have made me who I am today. I am also thankful to
Dibya Giri for her love and support throughout my studies and my dearest friends Carmen
Silva and Seifeldien Soliman for their care and support. Thank you.


vii
Abstract
BIOma - Integrated solutions in BIOeconomy for the Mobilization of the Agrifood chain
project is structured in 6 PPS (Products, Processes, and Services) out of which, a part of
PPS2 is covered in this work. This work resulted in the second deliverable of PPS2 which
is defined as PPS2.A1.E2 - IT infrastructure design and graphical interface conceptual
design. BIOma project is in the early stage and this deliverable is a design task of the
project.
For defining the system architecture, requirements, UML diagrams, physical architecture,
and logical architecture have been proposed. The system architecture is based on
microservices due to its advantages like scalability and maintainability for bigger projects
like BIOma where several sensors are used for big data analysis. Special attention has
been devoted to the research and study for the authentication and authorization of users
and devices in a microservices architecture.
The proposed authentication solution is a result of research made for microservices
authentication where it was concluded that using a separate microservice for user
authentication is the best solution.
FIWARE is an open-source initiative defining a universal set of standards for context data
management that facilitates the development of Smart solutions for different domains like
Smart Cities, Smart Industry, Smart Agrifood, and Smart Energy.
FIWARE’s PEP (Policy Enforcement Point) proxy solution has been proposed in this
work for the better management of user’s identities, and client-side certificates have been
proposed for authentication of IoT (Internet of Things) devices.
The communication between microservices is done through AMQP (Advanced Message
Queuing Protocol), and between IoT devices and microservices is done through MQTT
(Message Queuing Telemetry Transport) protocol.
Keywords: Authentication, Authorization, BIOma, Food waste, Microservices,
Monolithic, PPS, Software Development Life Cycle, System Architecture.

viii
Contents
Dedication ........................................................................................................................ iii
Acknowledgments ............................................................................................................ v
Abstract ........................................................................................................................... vii
Contents ......................................................................................................................... viii
Abbreviations ................................................................................................................... x
Index of Figures ............................................................................................................. xiii
Index of Tables ............................................................................................................... xv
Chapter 1 Introduction ................................................................................................ 1
1.1. Context ............................................................................................................... 1
1.2. Objectives .......................................................................................................... 3
1.3. Scope and Limitations ....................................................................................... 4
1.4. Document Structure ........................................................................................... 5
Chapter 2 Problem Statement ...................................................................................... 7
2.1. Introduction ........................................................................................................ 7
2.2. BIOma ................................................................................................................ 8
PPS Definition ............................................................................................ 9
2.3. System Architecture ......................................................................................... 12
Chapter 3 Bibliographic Review ............................................................................... 14
3.1. Software project design ................................................................................... 14
Development Methods .............................................................................. 15
Functional and Non-Functional Analysis Requirements ........................ 25
3.2. System Architectures ....................................................................................... 30
Physical Architectures .............................................................................. 31
Logical Architecture ................................................................................. 31
3.3. Microservices Authentication and Authorization ............................................ 35
User and Device authentication ................................................................ 35
Research on Microservices Authentication .............................................. 41
Conclusion ................................................................................................ 51
Chapter 4 Proposed System Architecture ................................................................. 53
4.1. Location and user identification ...................................................................... 53
4.2. System Requirements ...................................................................................... 55
4.3. UML Diagrams ................................................................................................ 57
Use-case Diagram ..................................................................................... 57
User Stories .............................................................................................. 60

ix
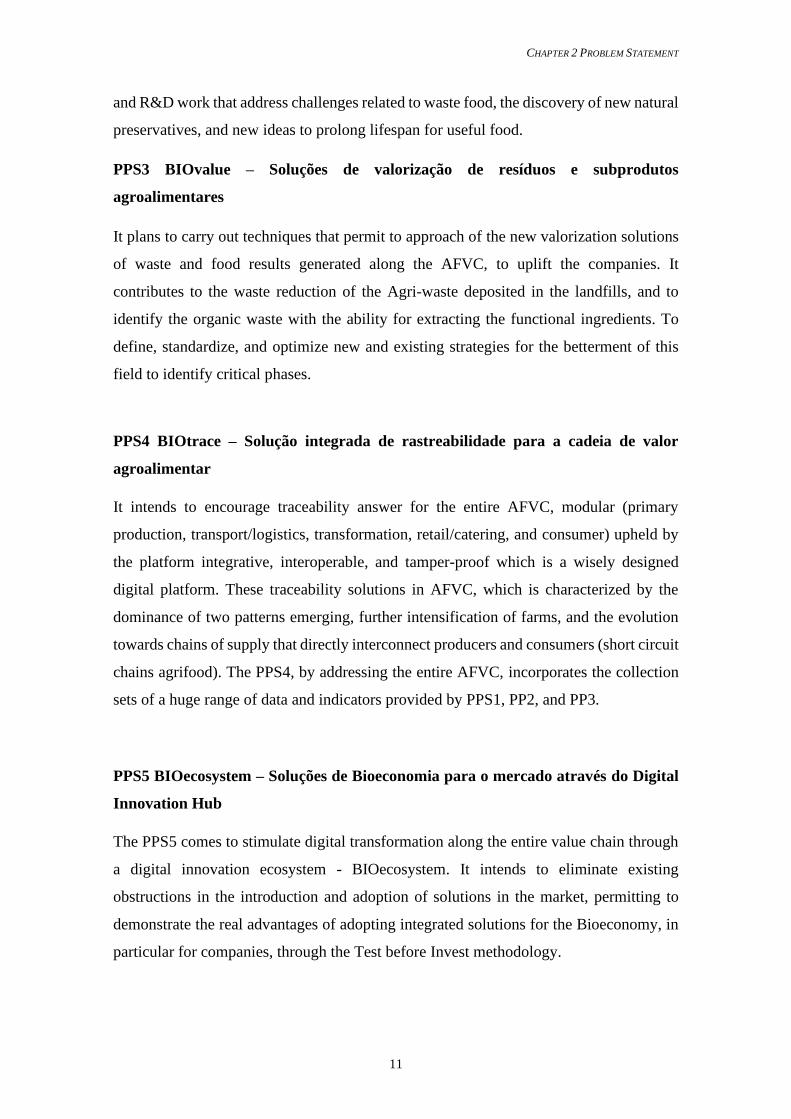
Class Diagram .......................................................................................... 64
4.4. Physical Architecture ....................................................................................... 81
4.5. Logical Architecture ........................................................................................ 86
4.6. Authentication Solution ................................................................................... 87
User Authentication and Authorization .................................................... 87
Device Authentication .............................................................................. 89
Proposed Authentication Solution Discussion ......................................... 91
Chapter 5 Analysis and Result Discussion ................................................................ 95
5.1. Introduction ...................................................................................................... 95
5.2. Analysis and result of the proposed architecture ............................................. 95
5.3. Conclusion ....................................................................................................... 98
Chapter 6 Conclusions and Future Work .................................................................. 99
6.1. Conclusion ....................................................................................................... 99
6.2. Future Work ................................................................................................... 100
Bibliography ................................................................................................................. 101
Appendix A Identity and Access Management Standards ........................................... 109
Appendix B Certificates and Labels ............................................................................. 112
Appendix C Use Case Diagrams PPS2 ........................................................................ 113
Appendix D Class Diagrams PPS2 ............................................................................... 118
Appendix E System Architecture ................................................................................. 126

x
Abbreviations
AAA – Authentication, Authorization, and Accounting.
AFVC – Agri-food Value Chain.
AFVC – Agri-food Value Chain.
API – Application Programming Interface.
BDA – Big Data Analytics.
BIOma – Soluções integradas de BIOeconomia para a mobilização de cadeia
Agroalimentar.
CA – Certified Authority.
CAMPOTEC – Conservação e Transformação de Hotofrutícolas, S.A.
CIOs – Chief Information Officers.
CN – Common Name.
DIH – Digital Innovation Hubs.
DSDM – Dynamic System Development Method.
ECDSA – Elliptic Curve Digital Signature Algorithm.
EEA – European Economic Area.
EU – European Union.
FCUP – Univerisidade do Porto – Faculdade de Ciências.
FFUP – Univerisidade do Porto – Faculdade de Farmácia.
FEUP – Univerisidade do Porto – Faculdade de Engenharia.
GDPR – General Data Protection Regulations.
GHG – Green House Gas.
HORECA – Hotels, Restaurants, and Catering.
IAM – Identity and Access Management.

xi
IDM – Identity Management.
IoT – Internet of Things.
IPB – Instituto Politécnico de Bragança.
IPS – Instituto Politécnico Santarém.
IPVC – Instituto Politécnico de Viana do Castelo.
ISQ – Instituto de Soldadura e Qualidade.
IT – Information Technology.
JSON – JavaScript Object Notation.
JWT – Json Web Tokens.
LIPOR – Serviço Intermunicipalizado de Gestão de Resíduos do Grande Porto.
MORE – Laboratório Colaborativo Montanhas De Investigação – Associação.
MQTT – Message Queuing Telemetry Transport.
NAS – Network Acess System.
OIDC – Open ID Connect.
PEP – Policy Enforcement Point.
PKI – Public Key Infrastructure.
PPS – Products, Processes and Services.
RAD – Rapid Application Development.
REST – Representational State Transfer.
RSA – Rivest – Shamir – Adleman.
SDLC – Software Development Life Cycle.
SSO – Single Sign – On.
UCP – Universidade Caólica.
UEVORA – Universidade de Évora.

xii
UML – Unified Modeling Language
XP – Extreme Programming.

xiii
Index of Figures
Figure 1 The Waterfall process Model ........................................................................... 16 Figure 2 The V Process Model ....................................................................................... 18 Figure 3 The spiral model ............................................................................................... 19 Figure 4 Iterative development ....................................................................................... 21
Figure 5 System prototyping .......................................................................................... 22 Figure 6 Agile development ........................................................................................... 23 Figure 7 Three-tier structure ........................................................................................... 32
Figure 8: Business microservice with several physical services .................................... 34 Figure 9 SSO server timing diagram .............................................................................. 36 Figure 10 Authentication and Authorization Orchestrator ............................................. 42 Figure 11 Unified authentication .................................................................................... 44 Figure 12 System hierarchical authentication model ..................................................... 45
Figure 13 Client token with API Gateway ..................................................................... 47 Figure 14 Food waste locations and actors ..................................................................... 54 Figure 15 BIOma user authentication ............................................................................. 89 Figure 16 Device authentication ..................................................................................... 90
Figure 17 SAML2.0 Flow ............................................................................................ 109 Figure 18 OAuth2 Flow ................................................................................................ 110
Figure 19 OIDC Use Case ............................................................................................ 111
Figure 20 Certificates and Labels ................................................................................. 112
Figure 21 Class Diagram PPS2 .................................................................................... 118 Figure 22 Physical Architecture PPS2 ......................................................................... 126
Figure 23 Data reading node ........................................................................................ 127 Figure 24 Logical Architecture..................................................................................... 128
Figure UC 1 Management Package .............................................................................. 113 Figure UC 2 Smart Procurement Package .................................................................... 114
Figure UC 3 Smart Monitoring Package ...................................................................... 115 Figure UC 4 Smart Waste Package .............................................................................. 116 Figure UC 5 Smart Education Package ........................................................................ 117
Figure C1 1 Meal Management .................................................................................... 119
Figure C1 2 User management ..................................................................................... 119 Figure C1 3 Media Management .................................................................................. 119
Figure C1 4 Location Management .............................................................................. 120 Figure C1 5 Food Units Management .......................................................................... 120 Figure C1 6 Product Management ................................................................................ 121
Figure C2 1 Food Donations ........................................................................................ 121
Figure C2 2 Waste Measurement ................................................................................. 121 Figure C2 3 Waste Generation ..................................................................................... 122
Figure C2 4 Waste Alert System .................................................................................. 122 Figure C2 5 Food Waste ............................................................................................... 122
Figure C3 1 Sustainable Standards ............................................................................... 123

xiv
Figure C3 2 Supplier/Producer Management ............................................................... 123
Figure C4 1 Actions ...................................................................................................... 124 Figure C4 2 Common ................................................................................................... 124 Figure C4 3 Training .................................................................................................... 125 Figure C4 4 Articles ..................................................................................................... 125

xv
Index of Tables
Table 1 Project Methodologies Comparison .................................................................. 23 Table 2 Comparative study of authentication methods .................................................. 51 Table 3 User stories PPS2 .............................................................................................. 61

1
Chapter 1 Introduction
1.1. Context
Integrated solutions in BIOeconomy for the Mobilization of the Agrifood chain – BIOma
joins together 24 national entities in the agri-food sector to reposition companies of the
agri-food value chain at more competitive and sustainable levels, promoting strategies
that foster innovatively, the adoption of integrated bioeconomic solutions. BIOma project
is structured in 6 PPS (Products, Processes, and Services). BIOma is a collaborative
project and the proposal in this work is made for one of the deliverables of PPS2.
PPS2 aims to address challenges associated with food waste, enhancing the reduction of
the environmental impact of food waste, which results in large economic losses and high
consumption of resources. PPS2 contains 4 different activities, and this proposal focuses
on the first design activity of the PPS2, PPS2.A1.E2 – IT infrastructure design and
graphical interface conceptual design. Activity 1 from PPS2 aims to specify all technical
and functional requirements, the necessary infrastructure for the FoodSaver modular
platform, as well as to idealize the concept of the graphical interfaces of the FoodSaver
modular platform. FoodSaver is an innovative digital platform at an international level,
mainly in the collective catering segment which will define the selection criteria and
acquisition of food products, promoting the sustainable consumption of local production
in public canteens and cafeterias.
A critical aspect of the design for any large software system is its overall structure
represented as a high-level organization of computational elements and interaction
between those elements. The structure of a system has been recognized as an important
issue of concern in modern days. Software architecture has begun to emerge as an explicit

CHAPTER 1 INTRODUCTION
2
field of study for software engineering practitioners and researchers (Garlan & Perry,
1995).
Successful software applications result from a set of decisions that determine user
acceptance and market success. Such choices can be made early or late in the software
development life cycle. Identification of such choices in an early stage is generally known
as waterfall development and delaying these selections until they are needed is defined as
agile development.
Requirements evolve over the development lifecycle of a software project which can be
challenging. To address this challenge, agile practices are designed which shows early
and continuous progress towards project goals. An agile approach allows stakeholders to
adapt the scope and capabilities of a development release to changing market needs. Such
an approach has been recommended for developing the architecture of software systems,
enabling the design the support current requirements and early release while evolving to
meet future expectations (Harper & Dagnino, 2014).
The emerging period of big data is driving us to an innovative way of understanding our
world and making decisions. Specifically, it is the data analytics that in the long run
uncovers the potential values of datasets and completes the value chain of big data. Driven
by increasing Big Data Analytics (BDA) demand, numerous frameworks and tools have
been developed dedicated to BDA platforms. Such frameworks and tools generally
combine data processing logics with computing resource management. The current BDA
implementation still requires a huge effort on environmental configurations and platform
manipulations (Li et al., 2019).
When it comes to flourishing the ecosystem with the Internet of Things (IoT), such a
mechanism will require tremendously extra overhead for big data collection from largely
distributed sensors/devices for later analytics. With the continuous development and
evolvement of the IoT, the monolithic application becomes much larger to scale and even
more complex in structure. IoT-oriented data analytics could eventually become
inefficient and expensive if we always transfer and process data cumulatively in a central
repository because many IoT-oriented BDA problems can be addressed without
combining the originally distributed data (Sun et al., 2017a) and (Li et al., 2019).

CHAPTER 1 INTRODUCTION
3
A microservice is an approach to developing a single application as a suite of small
services, each running in its process and communicating with lightweight mechanisms.
Microservice is preferred for several reasons like composing functionality, self-contained
service, independent scaling, and independent deployment (He & Yang, 2017).
For any system, authentication and authorization of the end-users or devices are essential.
It protects the boundaries of the system. Authentication is the process of verifying who
we are, and authorization is the process of verifying that we have access to something.
Authentication and authorization in microservice can be imitated like the one in a
monolithic application. Each service uses its database or shared database that stores
credential data and implements its function to verify the user or devices independently.
This is an easy way to understand but it has various challenges. When joining a new
service in the system, we must re-implement the authorization function for the new
service. To improve this architecture, and to adapt to the microservice design principles,
we need to put a separate authentication microservice. The authentication microservice
focuses on the authentication and authorization of the users and devices. Other services
authenticate the user’s identity and authority by interacting with this microservice. As a
result, each service is focused on its own business, while improving the scalability and
loosely coupling the system.
1.2. Objectives
The objective of this work is to propose an infrastructure design for PPS2 of the BIOma
project. PPS2 of BIOma needs a solution to combat food waste. The objective of PPS2 is
to develop a modular platform for the reduction of food waste at different levels and, in
parallel, develop tools to identify the quantities and types of most wasted foods, through
weighing and image processing. It is divided into various modules,
• Smart procurement: Promoting sustainable and smart purchases.
• Smart monitoring: Monitoring the food waste.
• Smart waste: Management of food waste.
• Smart education: Consumer awareness and education against food waste.

CHAPTER 1 INTRODUCTION
4
BIOma is a collaborative project, and this work is focused on one of the activities of
PPS2, PPS2.A1.E2. In this activity, IT infrastructure design and graphical interface
conceptual design needs to be delivered. The objective of this work is to design the IT
infrastructure for this activity of the PPS2.
Requirements are needed to be defined which serve as a basis for designing the use-case
diagram, user stories, and class diagrams.
Physical and logical architecture is needed to be also proposed for the system. Physical
architecture serves to have a general overview of where the food waste happens, who is
responsible to monitor the waste, and where the sensors are located. Logical architecture
gives a vision of how the internally connected sensors and services are working.
This project proposal follows microservices architecture due to its advantage in the
modern infrastructure of data gathering and analytics. Several IoT sensors are used in this
project that uploads the readings to other microservices. Employees of an organization
are also responsible for uploading data from various food units. Before either of them
accesses the system, they must be authenticated and authorized to perform the actions.
A solution has to be proposed for how authentication and authorization will be handled
in a microservices architecture by researching the approaches that have already been
implemented until the present day and selecting the one that best fits the project.
1.3. Scope and Limitations
This work cares about proposing system architecture for BIOma and one of its macro-
activity, PPS2. PPS2 has several activities, and this work is a proposal of IT infrastructure
design for PPS2.A1.E2. This work also devotes major attention to authentication and
authorization in microservices. The scope of this project is to define requirements for
PPS2, create UML diagrams that can visually represent the system, propose a physical
and logical architecture, and an authentication and authorization mechanism for users and
devices of this project.
This project follows an agile approach to development. PPS2 from the BIOma project is
still in an early stage of development and this work proposes the design task for the first

CHAPTER 1 INTRODUCTION
5
iteration of the project. The architecture that has been proposed might cover most of the
goals from the PPS2 and give a solution for how to achieve that goal but still, since this
is a collaborative project, this proposal has to go through evaluations through the partners
of this project which might introduce changes to the architecture. This initial version of
the proposal serves as a basis for the development of BIOma and PPS2.
Despite the multiple authentication strategies already developed and researched, it is
difficult to have a perfect strategy for microservices authentication because of the inter-
services communication, dependencies, and response time. A suitable mechanism for
authentication depends upon the requirement of a project and its size.
1.4. Document Structure
This work has been divided into 6 different chapters. Chapter 1 focuses on the need for a
system architecture for a project with the objectives, scope, and limitations of this project
itself. Chapter 2 gives an overview of BIOma and the problem that this work is supposed
to solve. Chapter 3 contains the comparison of several software development methods,
an overview of functional and non-functional requirements, the definition of system
architecture, a comparison of various authentication approaches in general, and a
comparison of several studies and research that have been done for the authentication and
authorization of microservices.
With chapter 4 comes the solution that has been proposed. This chapter provides the
requirements for the project, UML diagrams, physical and logical architecture, and
authentication and authorization strategy for users and devices of project BIOma.
Alternative solutions are also described for this project with the reasons why they are not
being used in the current status of the project. Chapter 5 produces the analysis and results
of the proposed solution and chapter 6 concludes the project.


7
Chapter 2 Problem Statement
2.1. Introduction
BIOma–Soluções integradas de Bioeconomia para a Mobilização da cadeia
Agroalimentar proposes a macro-activity PPS2 which involves the investigation and
development of the FoodSaver solution that aims to monitor and create favourable
conditions for the reduction of food waste at the restaurant and catering levels. This
platform proposes the promotion of sustainable and smart shopping and monitoring daily
food waste in various sectors. This solution allows systematizing the reasons that are at
the origin of food waste.
Food waste can happen in numerous sections like a warehouse, in-site storage, kitchen
storage, while cooking, after consumption, etc. Such locations are needed to be identified
precisely and there should be employees who are responsible to control and monitor food
waste. After food waste occurs, there should be a smart way to handle these food wastes.
Depending upon the waste type, there should be a solution to treat them treated
accordingly. Education should also be provided to the general public to be aware of food
waste.
For handling these issues, a system can be developed which can ease this task for
monitoring and controlling food waste. Developing such systems can be problematic as
plenty of things have to be taken into account. First, the architecture of the system has to
be discussed and defined. Depending upon the structure, size, and goals of a project, a
monolithic or microservices architecture are needed to be identified to take advantage of
the tools and software that are available in the present day.

CHAPTER 2 PROBLEM STATEMENT
8
2.2. BIOma
BIOma is a large association of several companies which reunites 24 national entities
that fit in the agri-food sector such as fruit, vegetables, wine, and olive oil. Agri-food
means the preparation, processing, and packaging of agricultural products for human
consumption. Agri-food sector BIOma works to adjust Agri-Food Value Chain (AFVC).
Agri-food value change is deeply connected with various challenges that mankind is
currently facing,
• Climate Change
• Loss of soil production area
• Exponential Population growth.
In all periods of the AFVC, resources are consumed, organic waste and inorganic waste
is produced which means greenhouse gas (GHG) releases on an enormous scale.
Simultaneously, agriculture and also the world food system are being challenged to feed
an expected worldwide population of 9.7 billion individuals by 2050 with the diminishing
land and water assets. These situations are compelling the system to search for new and,
more effective approaches to produce, transform, and devour that regard the
environmental furthest reaches of the planet.
BIOma proposes to relocate the companies at more elevated and sustainable levels that
are serious and supportable, by implementing advanced strategies and an ecosystem that
innovatively enhances the adoption of integrated Bioeconomics solutions. To accomplish
the various objective, the themes have been addressed, such as Sustainability, Food waste,
Valorisation of by-products and Agri-Food waste, Traceability, and Digital Ecosystem.
Therefore, for the Agrifood esteem chain - Sustainability Index for Bioeconomy, ensuring
its applicability through sustainable development of an index, programmed examining to
scan automatically to its critical action points. Secondly, this project BIOma also seeks
to respond in terms of food waste, through research, and also advancement of an answer
for monitoring food waste in the different channel which has been given name as HoReCa
(Hotels, Restaurants, and Catering) channel, and does battle with the food waste, by
expanding the timeframe of realistic usability of items. Similarly, this project proposes
the Valorisation of by-products and agri-food waste, through the development and
implementation of new and different methods of extraction of active substances at the
industrial level, given their value in the agri-food chain new functional ingredients. This

CHAPTER 2 PROBLEM STATEMENT
9
project focuses on Traceability and Digital ecosystems as well. Traceability is conducted
in response to the challenges of the Agri-Food Value Chain (AFVC) and to investigate
and to develop a solution to the traceability for the entire AFVC module
(logistics/transport information, catering, retail, and consumer and primary production).
Likewise, Digital Ecosystem intends to develop through Digital Ecosystem Innovation
Hub, an integrative advanced stage upheld by open field strategies for showing
arrangements in a real environment: Test Before Invest, to enhance the adoption of
Bioeconomy solutions, as well as the digital transformation of AFVC.
Through the BIOma project, the association aims to adjust the AAFVC of companies at
more competitive and sustainable levels, encouraging various techniques and an
ecosystem that will innovatively improve the adoption of integrated BIOeconomy
solutions.
CAMPOTEC is the main organization in the BIOma association which unites 13
organizations and 11 non-benefit substances of the R&D System, where the MORE –
Laboratório Colaborativo Montanhas de Investigação, LIPOR, FEUP, FCUP, FFUP, ISQ,
IPS, IPB, IPVC, UEVORA, UCP that in a collaborative environment and information
sharing, will complete R&D exercises focused on bringing about new items, cycles, and
administrations to be embedded in the agri-food esteem chain. As well as adding to the
impression of the public methodology for the Bioeconomy found in the course, BIOma
will set out new development open doors and reposition the public AFVC. The venture's
R&D results will furnish organizations with new abilities, expanding the intensity of
Portugal as a great provider of problematic answers for supportability, a decrease of
waste, recuperation of buildups, and discernibility of the AFVC.
PPS Definition
Through the BIOma project, the association plans to reposition the AFVC organizations
in more serious and feasible levels, advancing procedures and a biological system that
upgrades creatively the selection of incorporated Bioeconomy arrangements. The
undertaking project BIOma is organized in 6 PPS (Products, Processes, and Services),
one of which is Management and Spread, which will occur over a time of a day and a
half, building up the mechanical limit, advancement, and R&D of organizations in a joint
effort with ENESII. To accomplish the project destinations, six PPS were planned with

CHAPTER 2 PROBLEM STATEMENT
10
the accompanying explicit goals. Each PPS has its meaning which has been mentioned
below:
PPS1 siBIO – Solução digital de avaliação de sustentabilidade para a cadeia de valor
agoralimentar
It intends to respond to one of the pillars of the Bioeconomy Strategy, specifically the
sustainability assessment, through the improvement and development of a digital solution
for the asses of sustainability. Taking into consideration, there is a gap due to the lack of
sustainability assessment methodologies in each part of the member state. Organizations
are unknown how they can reach elevated levels of sustainability, also they are unknown
about the respective environmental, economic, and social effects. Thus,
Desenvolvimento de Uma solução digital de avaliação de sustentabilidade (siBIO) –
works in additional to enable the evaluation of sustanability. Additionally, it provides a
guide of a roadmap to elevate the supportability levels of the companies.
PPS2 BIOsave – Soluções de combate ao desperdício alimentar
It plans to address the challenges related to food waste generated along the AFVC,
enhancing the reduction of the economic, social, and environmental effects of food waste
and inefficiencies along the chain, which result in large economic losses and high
consumption of assets. The difficulties will be controlled with the improvement of new
services and products that will advance the decrease of food waste either by expanding
the timeframe of realistic usability utilizing new INCs or by utilizing the modular digital
platform to decrease the unnecessary waste. FoodSaver includes monitoring,
management, and education solutions to support the commitment to decide on the
prevention of food waste, problems of loss of quality, and food safety.
PPS2 is promoted by associations with scientific experience, technological, and relevant
business sectors in search for the illustrated destinations, to reach these objectives:
Develop digital platform module to reduce food waste and to work in FoodSaver;
Develop natural preservations and additional protection in regard as a support for a
solution to answers for expanding the timeframe of food. It demonstrates solutions to
decrease food waste in an operational environment with impact assessment economic. To
achieve these goals, scientific competencies are ensured by ENESII (IPB, MORE, IPB,
FEUP, FFUP, FCUP, UCP, ISQ, and MORE). These entities have a huge series of studies
CHAPTER 2 PROBLEM STATEMENT
11
and R&D work that address challenges related to waste food, the discovery of new natural
preservatives, and new ideas to prolong lifespan for useful food.
PPS3 BIOvalue – Soluções de valorização de resíduos e subprodutos
agroalimentares
It plans to carry out techniques that permit to approach of the new valorization solutions
of waste and food results generated along the AFVC, to uplift the companies. It
contributes to the waste reduction of the Agri-waste deposited in the landfills, and to
identify the organic waste with the ability for extracting the functional ingredients. To
define, standardize, and optimize new and existing strategies for the betterment of this
field to identify critical phases.
PPS4 BIOtrace – Solução integrada de rastreabilidade para a cadeia de valor
agroalimentar
It intends to encourage traceability answer for the entire AFVC, modular (primary
production, transport/logistics, transformation, retail/catering, and consumer) upheld by
the platform integrative, interoperable, and tamper-proof which is a wisely designed
digital platform. These traceability solutions in AFVC, which is characterized by the
dominance of two patterns emerging, further intensification of farms, and the evolution
towards chains of supply that directly interconnect producers and consumers (short circuit
chains agrifood). The PPS4, by addressing the entire AFVC, incorporates the collection
sets of a huge range of data and indicators provided by PPS1, PP2, and PP3.
PPS5 BIOecosystem – Soluções de Bioeconomia para o mercado através do Digital
Innovation Hub
The PPS5 comes to stimulate digital transformation along the entire value chain through
a digital innovation ecosystem - BIOecosystem. It intends to eliminate existing
obstructions in the introduction and adoption of solutions in the market, permitting to
demonstrate the real advantages of adopting integrated solutions for the Bioeconomy, in
particular for companies, through the Test before Invest methodology.

CHAPTER 2 PROBLEM STATEMENT
12
PPS6 Gestão e Disseminação do Projeto
“Project Management and Dissemination” has a mandatory and transversal nature to the
whole project, permitting to safeguard the overall coordination of the work connecting all
the PPS conveyed out in the management of the technical, administrative, and financial
components. Additionally, in the implementation of initiatives capabilities are associated
with the promotion, disclosure, and spreading of the results achieved throughout the
project.
Following the description of the PPS, this project mainly focuses on creating a solution
for the problem presented by PPS2 and also proposes a system architecture in general for
BIOma.
2.3. System Architecture
For this project of BIOma, sensors will be used to send the real-time values of the food
waste which helps in analyzing the food waste data. Such sensors might be located in
various food units of the organization. Traditional monolithic applications are built as an
entity that is composed of everything in one piece with interdependent components. When
using sensors for uploading data from various food units, a monolithic application might
not be able to respond to the request as expected which can harm the performance of the
system. Also, if one part of the application goes down, the whole application is needed to
be turned off. This problem can be solved by the use of microservices architecture but it
also has its challenges.
User authentication and authorization are necessary before they have access to any system
resources. Since this project also uses sensors for measuring weight and image
recognition, their authentication should also be handled before any readings are registered
into the database of the system. This is not challenging for monolithic applications but
for this project, monolithic doesn’t offer scalability. If new components are needed to be
added to the system either physically or logically, maintainability becomes challenging
in a monolithic system. Microservices is a better option where big data analytics (Li et
al., 2019) are needed to be handled and scalability is required but handling authentication
and authorization is itself challenging in such architecture.

CHAPTER 2 PROBLEM STATEMENT
13
Authentication and authorization cannot be handled as easily as in monolithic systems.
Challenges with authentication might be easier to be solved by using tokens and verifying
them in each microservice but, verifying roles and permissions which is part of the
authorization might be complicated with such solutions. There might be a problem with
a single point of failure, and there should also be a concern regarding performance,
security, and impact of failure when authentication and authorization are developed for a
microservice architecture.

14
Chapter 3 Bibliographic
Review
3.1. Software project design
Most of the IT (Information Technology) departments receive the demand for developing
IT projects whose resources are unable to be supplied by the department. Every decade,
the business application growth has been exploding, and are challenged to select the
project which will provide the highest return upon the investment while managing the
risks alongside. Historically, most of the IT departments have been selecting the projects
based on first-in, first-out; political clout; or the squeaky wheel gets the grease. Recently,
IT departments have been collecting the project’s information and mapping such
information to business goals. Prioritizing, selecting, and monitoring project results have
been a critical success factor for IT departments which has been facing too many projects
with too few resources (Dennis et al., 2012a).
When a project is selected in an organization, it undergoes a thorough process of project
management. Project management is the process of planning and controlling the project
within a specified time frame with minimum cost, with the desired outcomes. A project
manager has the responsibility to manage the hundreds of tasks and roles which should
be carefully coordinated. Despite the presence of training and software which help project
managers, unreasonable demands created by project sponsors and business managers can
make project management a difficult task.
A crucial success factor for project management is to start with a realistic assessment of
the work which must be accomplished and then manage the project as per the plan. Such
success can be achieved by following the basic steps of project management. The project
manager must first select the system development methodology which fits the project’s
characteristics. Based on the system size, the time frame estimates should be made and

CHAPTER 3 BIBLIOGRAPHIC REVIEW
15
after that, a list of tasks to be performed must be created that forms the basis of the project
work plan.
The system request and feasibility analysis are presented to an information systems
approval committee which decides whether the project should be undertaken. The
approval committee is responsible for evaluating not only the project’s costs and expected
returns, but also the technical and organizational risks that are associated with the
project. They must be selective about where to allocate resources as the
organization might have limited funds. For example, if there are three potentially high-
payoff projects with high risk, then only one of them must be selected. Once the project
is selected by the approval committee, it is time for project planning. The project
management phase generally consists of initiation, planning, execution, control, and
closure (Dennis et al., 2012a).
Development Methods
The Software Development Life Cycle (SDLC) provides the foundation for the processes
used to develop an information system. There are several systems development
methodologies that vary in terms of the progression that is followed through the phases
of SDLC. A process model represents a development process and indicates the form in
which it must be organized. The process model helps the software engineers in the
identification of the relationship between activities and the techniques that are part of the
development process (Fernandes & Machado, 2016a). When the development process is
systemized, through the definition of the respective model, one tries to reach the following
objectives:
• Identifying the activities that must be followed for system development.
• Introducing consistency in the development process while ensuring that the
systems are developed according to the same methodological principles.
• Using several control points to evaluate the results obtained and to verify the
observance of the deadlines and the required resources.
• Stimulating the bigger reuse of the components during the design and
implementation phase to increase the productivity of the development teams.
The software process is a joint set of activities that contains associated information which
is required to specify, design, implement and test software systems. Each organization

CHAPTER 3 BIBLIOGRAPHIC REVIEW
16
consists of its specific software process but these individual approaches usually follow
some more abstract generic process model (Sommerville, 1996a). There are several
software processes, but all involve:
• Specification – the functionality of the software and its operating constraints are
specified in depth.
• Design – is a creative activity in which the software components are identified
and their relationships, based on the requirements of customers.
• Implementation – is the process of realizing the design as a program.
• Validation – checks if it satisfies the customer’s needs.
• Evolution – create changes on the system based on the changes of the client’s
needs.
The following section describes the process models focusing more on one of the process’s
side, the activities. Activities are a set of tasks that must be executed for system
development.
3.1.1.1. Waterfall
The waterfall is the oldest software development process model. It is composed of various
phases which include analysis, design, implementation, and testing as shown in Figure 1.
This model has been coined as the waterfall model as it depicts irreversibility. Once one
of the phases has been completed, it cannot be revisited. It follows a top-down approach
(from the most abstract to the most concrete) and, in a high-level perspective, the strictly
sequential progression between consecutive phases (Yourdon, 1988a).
Figure 1 The Waterfall process Model
Source: (Fernandes & Machado, 2016a)
During the first phase, analysis, the functioning of the system is specified by identifying
various requirements which must be considered. The specification document serves as a

CHAPTER 3 BIBLIOGRAPHIC REVIEW
17
basis for the upcoming phases, so, ideally, one should use implementation-independent
notations and allow all stakeholders to clearly understand the intended functionality.
The second phase, the design phase happens when the specification document of the
system under development is accepted. The design phase consists of transforming a
specification into an architecture. During software development, the most complex
activity is precisely the transformation of the requirements into an architecture (Bosch,
2000a). This phase is divided into 2 steps, architectural design, and detailed design.
Architectural design, which is the first step, describes how the system is constituted and
is, in many cases, one of the most creative tasks in all the development process (R. Stevens
et al., 1998a). The second step, the detailed design establishes in detail the components,
to include enough information to allow its implementation. In this phase, the main
objective is to define the architecture of the system at hand.
The major difference between the analysis and design phase is that the analysis phase
produces an abstract model that mimics the fundamental aspects of the existing needs in
the problem area whereas, the design phase creates a model that specifies the components
that structure a particular system solution. In simpler words, the analysis phase describes
what the system does whereas the design phase describes how it is done.
The third phase, the implementation phase also considered as codification or
programming phase converts the models defined in the design phase into executable code.
This phase is considered as a purely mechanical, simple, and straightforward task by
many authors (Hatley & I.A., 1987a), (Booch et al., 1999a), (Whytock, 1993a) as the
intellectual and creative work has already been completed in the analysis and design
phase. In the implementation phase, the final code must be generated based on the
specifications obtained in the previous phase. Despite these facts, it has been often found
that it is not always so easy to deal with this phase. Object-oriented programming permits
a system development that is organised in a collection of objects. Each object is an
instance of a class and each class is a member of a structure where there is presence of
hierarchical relationship.
The final phase, the testing phase was traditionally executed at the end of the development
process. This has been changed now since it is realized that it is more than just debugging.
Testing complex software is estimated to take 40% of the development cost nowadays
(Ebert & Jones, 2009a). Software testing has its lifecycle which is realized at different

CHAPTER 3 BIBLIOGRAPHIC REVIEW
18
distinct levels. It starts simultaneously at the requirements elicitation and from that point
on, continues in parallel with the development process. For each phase or activity of the
development process, there is associated testing activity. It is shown in Figure 2 which is
also known as the V process model.
Figure 2 The V Process Model
Source: Own elaboration with the source (Ebert & Jones, 2009a)
In the V process model, the testing phase starts with unit testing. Unit testing involves
testing the individual units of functionality using the decisions taken in the detailed design
as a reference. Component integration testing involves testing the integrated functionality
of the complete system. When dealing with very large software systems, functions may
be integrated into a component. Many components are then brought together to form a
system. In this case, there is the presence of one more level, called component integration
testing. The purpose of such testing consists in guaranteeing that the interfaces between
the components have the behaviors estimated during architectural design. In the system
integration testing, it is verified if the software system fulfills the requirements specified
in the analysis phase. Finally, the acceptance testing is validated by the end-users. They
verify if their expectations are met by the software system as contracted. All these phases

CHAPTER 3 BIBLIOGRAPHIC REVIEW
19
which are related among them should not be neglected during the development of a
system.
3.1.1.2. Spiral
The spiral model is based on the risk-drive approach rather than the document or the code
(Fernandes & Machado, 2016b). Risk is the measurement of uncertainty in achieving an
object or fulfilling the requirements. In this model, the risk is such a potentially adverse
circumstance that can harm the development process and can affect the quality of the
system. In this model, the development team starts with a small set of requirements and
then goes through them individually in the development phase. Therefore, the
development team has a chance to learn new lessons from the initial iteration (Adel &
Abdullah, 2015a).
The various activities are organized in cycles, as shown in Figure 3 The spiral model.
Each cycle of the spiral is constituted of four main tasks, and each one is represented by
a quadrant of the diagram. In the diagram, the radius of the spiral represents the progress
in the process and the angular dimension indicates the accumulated cost in the process.
Figure 3 The spiral model
Source: (The Spiral Model - The Ultimate Guide to the SDLC, n.d.)

CHAPTER 3 BIBLIOGRAPHIC REVIEW
20
Four activity quadrants of the spiral are further described below,
• Determine objectives
In this activity, one identifies the objectives which include performance, functionality,
easiness of modification, etc. for the system under development, concerning the
quality levels to be achieved. Alternatives such as build vs. buy, if existing
components can be reused or subcontract should be made are examined.
• Identify and resolve risks
In the second activity, one evaluates the alternatives previously identified for the
objectives and restrictions, which frequently implies the recognition of uncertain
situations that represent potential risk sources. Identification and resolving all the
possible risks in the project such as lack of experience, new technology, tight
schedules, poor process, etc. are also major tasks in this activity.
• Development and test
During this activity, one should develop and verify the system for the upcoming cycle
using a risk-oriented strategy. The usual pattern of creating and review design, code,
inspect code, and test should be followed.
• Plan the next iteration
In this final activity, one should review the prototype to recognize strengths,
weaknesses, and risks. The obtained results are reviewed and the next spiral cycle, if
that is the case, is planned. Requirements for the second prototype should also be
elicited.
For systems whose requirements are less clear, several cycles may be necessary to achieve
the expected outcomes, which results in an incremental and iterative process. The spiral
model allows the choice of the best combination and composition of the process models
for each situation that it is applied for.
3.1.1.3. Rapid Application Development
Rapid Application Development (RAD) is a collection of methodologies that emerged in
response to the weakness of waterfall development. It can help to improve the speed and
quality of systems development but may also introduce a problem in managing user

CHAPTER 3 BIBLIOGRAPHIC REVIEW
21
expectations. As the systems are developed quickly and users gain a better experience
with the system, the user expectations might increase dramatically which results in the
expansion of system requirements during the project.
Iterative development is one of the varieties of RAD. It breaks the overall project into a
series of versions that are developed sequentially. This version is developed quickly by
the mini-waterfall process, and once implemented, users can provide feedback to be
incorporated in the following versions. Since users are working with the system,
important requirements might be identified. During this development, users must accept
the fact that only the most critical requirements of the system will be available in the early
versions and must be patient with the repeated introduction of new system versions.
Iterative development has been represented in Figure 4.
Figure 4 Iterative development
Source: (Dennis et al., 2012a)
System prototyping is another variety of RAD which perform the analysis, design, and
implementation phases concurrently to quickly develop a simplified version of the
requested system. The system is a “quick and dirty” version of the final system and only
provides minimal features. The developers reanalyze, redesign, and reimplement a second
prototype following the reaction and comments from the users. The newer prototype
corrects the deficiencies and adds more features. This cycle continues until the users,

CHAPTER 3 BIBLIOGRAPHIC REVIEW
22
analysts, and sponsors agree that the prototype provides sufficient functionality to be
installed and used in the organization. Such an approach is helpful with the users who
have difficulty in expressing requirements for the system. System prototyping is
represented in Figure 5.
Figure 5 System prototyping
Source: (Dennis et al., 2012a)
3.1.1.4. Agile Development
Agile development is a group of programming-centric methods that aims at making the
SDLC more efficient and effective. Face-to-face communication is preferred more in
agile development and much of the design and documentation overhead is eliminated. A
project gives more importance to simple, iterative application development in which each
iteration is a complete software project that includes planning, requirements analysis,
design, coding, testing, and documentation. Each cycle is kept short and lasts around 1-4
weeks, and the development team focuses on adapting to the existing business
environment. Agile development is also represented in Figure 6. Various approaches like
extreme programming (XP), Scrum, and Dynamic Systems Development Method
(DSDM) are popular in agile development.

CHAPTER 3 BIBLIOGRAPHIC REVIEW
23
Figure 6 Agile development
Source: (Dennis et al., 2012a)
Extreme Programming (XP) underlines customer satisfaction and teamwork. Designs are
kept simple and clean, and developers communicate with customers and fellow
programmers. An extreme programming project starts with user stories that define the
system requirements. After that, programmers code in small, simple modules and test to
meet those requirements. For small projects with highly inspired, unified, committed, and
experienced teams, extreme programming should work sufficiently. However, if the
teams are not bonded and the project size is big, then the success probability for the
extreme programming project is reduced. Since little analysis and design documentation
is created with XP, there is only code documentation which results in maintenance of
large systems nearly impossible.
3.1.1.5. Project methodologies comparison
This section focuses on comparing the strengths and weaknesses of the previous Software
Development Life Cycle Models.
Table 1 Project Methodologies Comparison
Source: Own elaboration using the source (Adel & Abdullah, 2015b) and (Dennis et al.,
2012a).
Model Strength Weakness When to use
Waterfall • Easy to understand and
implement.
• Known and used widely.
• All requirements must
be recognized early.
• Inflexible.
• Difficult and expensive
to visit the previous
• When quantity is more
important than schedule
or cost.

CHAPTER 3 BIBLIOGRAPHIC REVIEW
24
• Defined before design
and designed before
coding.
• Easy to implement being
a linear model.
• Minimizes planning
overhead.
phase to solve the
mistakes.
• Clients may not be clear
about what they want.
• Not preferable for
complex and object-
oriented projects.
• Requirements are well
known, clear, and fixed in
the early stage.
• A new version of the
existing system is
needed.
Spiral • The high amount of risk
analysis.
• Strong approval and
documentation control.
• Extra functionalities can
be added later.
• Project monitoring is
effective and easier.
• Suitable to develop a
highly customized
product.
• High cost.
• Risk assessment
expertise is required.
• Time spent on risk
identification in a low-
risk project is high.
• Project success is
dependent on the risk
analysis phase.
• Suitable for medium
to high-risk projects.
• When risk evaluation
and costs are important.
• When significant
changes are expected.
• When users are unsure
about their needs.
RAD • Suitable with a short
schedule.
• Useful in developing a
system with schedule
visibility
• Unsuitable
with unfamiliar
technology.
• Not useful for a
complex system.
• When the user
requirements are unclear.
• When the budget
permits the use of
automated code
generating tools.
Agile
Development
• Reduced risks
• Better control
• Increased flexibility
• Improved project
predictability
• Difficult planning.
• Professional teams are
vital.
• Problems with
workflow coordination.
• When new changes are
needed to be
implemented.
• When there are tight
deadlines.
• When there is a team of
independent thinkers.

CHAPTER 3 BIBLIOGRAPHIC REVIEW
25
Until present, despite the various problem that the waterfall model contains, it still is one
of the most preferred software development processes due to its conceptual simplicity.
This model is only able to produce a satisfactory result when the requirements are clear
and the chances of changing them are low. An example could be, while developing a
compiler, based on a grammar completely defined and which is not likely to change, the
waterfall model seems perfectly sufficient (Ghezzi et al., 1991a).
However, for this project, Agile development will be used because of its various
advantages. In Agile, project requirements can change constantly. In Waterfall, it is
explained only once by the business analyst. Agile performs testing alongside software
development whereas, in Waterfall methodology, testing comes after the build stage. In
an agile project’s description, details can be improved anytime, which is not possible with
Waterfall.
Functional and Non-Functional Analysis
Requirements
Requirements are necessary attributes defined for an item before efforts to develop a
design for the item. Requirement analysis is a structured, or organized, methodology for
identifying an appropriate set of resources to satisfy a system need and the requirements
for those resources that provide a sound basis for the design or selection of those
resources. The basic process decomposes a statement of customer need through a
systematic exposition of what the system must do to satisfy that need.
3.1.2.1. Non-functional Requirement
A non-functional requirement corresponds to a set of restrictions imposed on the system
to be developed, establishing, for example, how attractive, useful, fast, or reliable it can
be. The relevance of a non-functional requirement must be discussed and agreed upon
between the clients and the development team to avoid taking design and implementation
decisions prematurely. The non-functional requirement can also be known as a quality
requirement. The criteria of the non-functional requirement have been discussed in this
section with a few of their examples in a project.
1. Operational
Operational requirements describe what the system must do to work correctly in the
environment where it is inserted(Fernandes & Machado, 2016a). It is relevant to indicate

CHAPTER 3 BIBLIOGRAPHIC REVIEW
26
whether a system must be prepared to work. An example could be if a system is prepared
to work or not in a marine environment where there are high levels of humidity, ripple.
Following requirements are a few of the common examples to fulfil the operational
requirement,
• The use of external dependencies or services should be documented.
• The application should be able to cope with missing dependencies and log the
errors as it might deal with databases or web services in cloud environments.
• After the application upgrade, the previous codebase should be compatible with
the new environment or the new code base should be compatible with the previous
environment.
• Where possible, hard-coding values must be avoided as the application moves
between different environments and need to configure the application for each
environment.
• Feature flags should be used upon every added feature as they allow to easily back
out some errors without having to roll back the entire code base and assists in
controlling performance and scalability.
2. Load and Performance
Performance refers to the capacity of a system to respond to its stimulus, that is, the time
necessary for responding to the events or the number of events processed by the time unit.
It is the degree to which a system can accomplish its functionalities within a given set of
constraints. The performance of a system is related to the processing time of the tasks,
the response time of the operations, accuracy of the results, reliability, availability, fault-
tolerance, storage capacity, scalability (Romano et al., 2009a). Following requirements
are a few of the common examples to fulfill load and performance.
• Answer the request of users at the appropriate time.
• Support simultaneous access.
• Depend on the server and technology.
Various metrics should be used for the calculation of the load and performance with the
help of a load balancer which helps in generating the virtual clients. Following metrics
are some of the recommendations.
• Load size: Number of virtual clients running during the reporting interval.

CHAPTER 3 BIBLIOGRAPHIC REVIEW
27
• Throughput: The average number of bytes per second transmitted from the
system to the virtual clients running the test script.
• Receive time: Time elapsed while receiving the first byte and the final byte.
• Connection time: Time is taken for the virtual client to connect to the server.
• Failed hits: Total number of times virtual client made the HTTP request but did
not receive the correct HTTP response.
• DNS Lookup time: Time spent to resolve the host name and convert to IP by
calling the DNS server.
• Following the tests, it should be concluded if the application is stable or not with
simultaneous interaction of the virtual clients.
3. Navigability
Following enumerations are some examples commonly used to fulfill navigability criteria
(Romano et al., 2009a).
• Do not have broken links on the page.
• Every page should be reachable from the home page.
• Following metrics are some of the recommendations for software testing,
• Unreachable Pages: Number of total pages in the server that cannot be reached.
• Not found Pages: Number of pages that return 404 Error – Not Found.
• Reachable Pages through Main Page: Total number of pages in the server that
cannot be reached from the main page.
• Closed Cycles Identification: Identification of a cyclic sequence of steps in which
it is possible to return to the initial page.
4. Security
Security is a measure of the ability to resist unauthorized attempts to access while
continuing to provide its services to authorized users. It is related to access,
confidentiality, protection, and integrity of the data. Confidentiality is a set of rules that
prevents restricted information from reaching the wrong people and ensures that the
authorized ones can receive the information. Integrity is related to the reliability and
accuracy of the information. Following requirements are a few of the common examples
to fulfill security (‘A Basic Non-Functional Requirements Checklist’, 2014),

CHAPTER 3 BIBLIOGRAPHIC REVIEW
28
• The application must recover quickly or withstand in the face of attacks.
• The application shall reject the introduction of incorrect data. The application’s
behaviour must be accurate and predictable.
• The application must ensure the integrity of the customer account information.
• Access permissions for application data should only be changed by the system’s
data administrator.
• Users with specific roles should be confined to specific functionalities.
• Password should be fulfilling the requirements such as length, special characters,
2FA, expiry, recycling policies.
• All external communication between the system’s data server and clients must be
encrypted.
5. Cultural
Cultural requirements are factors related to the stakeholder’s culture and habits. Such
requirements are relevant when product serves different professional groups, due to
differentiated cultures that exist from profession to profession(Fernandes & Machado,
2016a). It is also critical when the product is commercialized in different countries.
Following enumerations are some examples to refer to while writing the cultural
requirements.
• The system should be designed with a concurrent multilingual system as it can
support multiple languages at the same time.
• The application should not contain any text, images, or media that offend any
culture or countries that have access to it.
• The application should not display religious symbols or words associated with
mainstream religions.
6. Legal
Any system, regardless of the technology, is bounded to respect the established laws.
Legal requirements are laws, rules, and standards that apply to the system so that it can
operate. General Data Protection Regulation (GDPR) is a regulation in EU law that came
to force on 25 May 2016 and applied since 25 May 2018 (Data Protection in the EU,
2021). It governs the data protection and privacy in the European Union (EU) and

CHAPTER 3 BIBLIOGRAPHIC REVIEW
29
European Economic Area (EEA). To comply with GDPR, it must be ensured that the
appropriate checks and balances are put in place in the application. Development teams
should consult lawyers, legal advisors, and jurists, for knowing whether any law or rule
is being broken by the system. The following aspects could be taken as an example for
legal requirement fulfillment (GDPR and Cookie Consent | Compliant Cookie Use,
2020).
• Ensure that the user is informed about the intentions at or before the data
collection.
• Encryption and pseudonymization of personal data.
• Establishing a process for regular security testing and assessment of the
effectiveness of security practices and solutions in place.
• In the case that a user refuses data processing, no unessential cookies must be set-
Essential cookies will be set regardless of the user accepts or refuses.
• Inform the users regarding the purpose of individual cookies separately to ensure
that specific consent for each cookie objective is obtained.
• Once valid consent from a user is obtained, it is free to collect and process personal
data for the purposes that the user was informed of before.
• The application should permit a user to remove personal information.
7. Reliability & Scalability
Reliability is the capacity of a system to remain in operation over time and is associated
with the possibility of a system producing correct results in a certain period. There is a
various business that relies completely on computer-based systems that support them,
being expectable that those systems are always accessible and dependable. Scalability is
the ability of a system to continue to show a high quality of service, even when subjected
to a higher number of requests. It can be correlated with the capability to serve more users
simultaneously, treat a higher volume of information and respond to more requests
(Fernandes & Machado, 2016a). Various examples of such non-functional requirements
could be,
• The application should not cause crashes, unhandled exceptions, or script errors.
• When various limits are exceeded in the application, it should be recorded how it
copes with such limits.
• After a fatal error in the application, it should be recoverable and usable.

CHAPTER 3 BIBLIOGRAPHIC REVIEW
30
• The application’s behavior should be predictable, trustworthy, and consistent.
• All types of data should remain intact throughout the application.
• Despite the highest workloads, the system should continue to meet the
performance requirements.
3.1.2.2. Functional Requirement
A functional requirement describes functionality to be made available to the users of the
system, characterizing partially its behaviour as an answer to the stimulus that it is subject
to. Such type of requirement does not mention any technological issue. The set of
functional requirements must be complete and coherent. It is considered complete if it
considers all the necessities that the client wishes to see satisfied and coherent if there are
no contradicts among its elements.
Functional requirements define a system or its component and what a system should do.
Functional requirements are defined at a component level and are captured in a use case.
It also helps to verify the functionality of the software.
Well-documented requirements maintain all developers, designers, and QA testers on the
same page and working towards the same goal while avoiding misunderstandings. When
the team has a shared understanding and a written record, the need for regular meetings
is avoided. Projects can also become more predictable with the help of functional
requirements as the team can estimate the development time and cost more accurately.
Problems can be identified in earlier phases while thoroughly capturing the functional
requirements (A Guide to Functional Requirements (with Examples), n.d.).
3.2. System Architectures
A system architecture is a conceptual method that defines the structural and behavioral
views of a system. It encompasses decisions on where to place a specific software
component, and if the components should be on the same or different machines. An
enterprise may have a specific high-speed processing server or high-end reliable storage

CHAPTER 3 BIBLIOGRAPHIC REVIEW
31
facility which they want to leverage for specific components. Such decisions will lead to
several architectural organizations.
Physical and logical architecture defines and documents the physical and logical
components of a system, respectively, to provide clarity around how those component
elements relate to one another (System Modeling: Understanding Logical and Physical
Architecture - Data Science Central, 2021). The following subsections further discuss the
physical and logical architectures.
Physical Architectures
Physical architecture is a structural design that provides sufficient detail to implement
and deploy a solution. What makes physical architecture differ from logical architecture
is that logical architecture concerns with identifying functional elements of the system
whereas, physical architecture specifies the actual devices that those functional elements
execute on. Several items identified in logical architecture can physically reside in the
same location or devices. When developing a physical architecture, the following key
activities are performed,
• Analysis of the physical architecture and the appropriate allocation,
• Analysis of the constraint requirements,
• Identification and definition of physical interfaces and components, and
• Identification of critical attributes of the physical components which also includes
design budget like weight, reliability, etc.
The 3-tier web application’s logical architecture as identified in Figure 7 can be validly
implemented as different physical architectures are logically identical. The only
limitations are the performance and capabilities of the physical device.
Logical Architecture
Logical architecture is a structural design that provides as much detail possible without
constraining the architecture to a particular technology or an environment. The purpose
of logical architecture is to plan and communicate architecture. The development of a
particular system is more concerned with logical architecture than with physical
architecture. Several systems follow the same common 3-tier structure with a request-
response cycle which are provided as follows,

CHAPTER 3 BIBLIOGRAPHIC REVIEW
32
• The user requests the presentation tier which is handed off to the application tier.
• The application retrieves any required data from the data tier.
• The application tier then generates a response and hands it back to the presentation
tier.
• Finally, the presentation tier returns the response to the user.
The above progress cycle is represented in Figure 7.
Figure 7 Three-tier structure
Source: (System Modeling: Understanding Logical and Physical Architecture -
Data Science Central, 2021).
Various tiers can be found in Figure 7 which are common in web applications in which,
• The presentation tier is the webserver,
• The application tier is code called by, and generating responses to, the web server,
written in any language or framework, and
• Data-tier is a back-end data-store variant that persists application data between
the requests.
3.2.2.1. Microservices
With the continuous growth of the Internet of Things (IoT), monolithic applications have
become much larger in scale and possess complex structures. This results in poor
scalability, extensibility, and maintainability. For resolving this issue, microservice
architecture has been introduced to the IoT field which has the advantage of flexibility,
lightweight, and loose coupling (Sun et al., 2017a).

CHAPTER 3 BIBLIOGRAPHIC REVIEW
33
In the monolithic architecture, the system is deployed as a single application, in which
functionally differentiated aspects are all interwoven. It has natural advantages like
module independence, uniform standards, and technology. With the growth of system
functions, IoT becomes more complex than ever in the distributed environment. This
results in inevitable defects in a monolithic architecture. First, the whole system is a
united application where only multiple deployments can improve the performance of the
system, while the overloaded functions create a bottleneck, which is a waste of computing
resources. Second, in any case of changes, changing a function may impact other
functions due to high dependencies. Such architecture also brings complexity for re-
deployment, maintenance, and continuous integration.
To overcome these drawbacks from the monolithic architecture, researchers are starting
to adopt the microservice architecture (Sun et al., 2017a). Microservice architecture is a
new software design pattern that suggests that a single large complex application should
be further divided into groups where each group deals with the related services. Each
service can be dedicated to an individual business function and as a result, it can be easily
deployed and released internally to the production environment in isolation, and
modifying or maintaining one service will not impact the performance of the whole
system.
The design of the new generation IoT framework considers the reuse of existing
information service systems with high cohesion and loose coupling in open and scalable
platform design. The main idea of the design is to adapt the microservice architecture to
the existing IoT system, reconstructing all the business functions by decoupling them into
individual and independent services. The design also focuses on using lightweight
communication between services with a minimal overload.
Microservices is a logical architecture, and it does not require the use of any specific
technology. Also, when microservices are physically implemented as a single service,
process, or container, the parity between business microservice and physical service isn’t
necessarily required in all cases when a large and complex application is built that
contains dozens or hundreds of services (nishanil, 2021). The logical architecture of a
system does not necessarily map one-to-one to the physical architecture. This is what
makes the difference between physical and logical architecture. Coincide between logical
and physical architecture can happen but often it does not. This is not important but what

CHAPTER 3 BIBLIOGRAPHIC REVIEW
34
matters the most is that a business microservice must be autonomous by allowing code
and state to be independently versioned, deployed, and scaled.
A microservice might contain several processes or services which could be using any web
service or HTTP protocol. Such services could share the same data if they are united
concerning the same business domain. This is also shown in Figure 8.
Figure 8: Business microservice with several physical services
Source: (nishanil, 2021)
In a microservices architecture, there should be an effort to minimize the communication
between the internal microservices. The fewer communications, the better. In many cases,
there’ll somehow be the necessity to integrate the microservices. When this is done, the
critical rule is that the communication between them should be asynchronous. It doesn’t
mean that a specific protocol should be used but it just means that the communication
between microservices should be done only by propagating data asynchronously
(doodlemania2, 2019).
Asynchronous messaging has some advantages that can be used in microservice
architecture like,
• Reduced coupling – the sender doesn’t need to know about the consumer.
• Failure isolation – If the consumer fails, the sender can still send messages. The
message will be picked when the consumer recovers.
• Responsiveness – An upstream service can reply faster if it does not wait on
downstream services. If there is a chain of service dependencies, waiting on
synchronous calls can add an unacceptable amount of latency.
Due to these advantages, asynchronous messaging is preferred in microservices
architecture over synchronous messaging.

CHAPTER 3 BIBLIOGRAPHIC REVIEW
35
3.3. Microservices Authentication and Authorization
Security is a requirement that guarantees the confidentiality, integrity, and availability of
user, application, device, and network information and physical resources (McCabe,
2007a). The security component architecture defines how system resources are to be
protected from theft, damage, denial of service, or unauthorized access.
This contains the procedures used to apply security, which may include such hardware
and software capabilities as Virtual Private Networks (VPNs), encryption, firewalls,
routing filters, and network address translation (NAT).
Creating security procedures that can protect all parts of a complex network while having
a limited effect on the simplicity of use and performance is one of the most significant
and troublesome tasks related to network design. Security design is confronted by the
complexity and permeable nature of modern networks which include public servers for
e-commerce, extranet connections for business partners, and remote-access services for
users reaching the network from home (Developing Network Security Strategies >
Network Security Design | Cisco Press, 2010a).
The security and privacy architecture is important as it describes to what extent security
and privacy will be fulfilled in the network, where the critical areas that need to
be protected are, and how it will influence and relate with the other architectural
mechanisms.
Solving the problem of authentication and authorization can be challenging in terms of
microservices. Such strategies need to be developed and tested to be applied in a
microservice-based project. Accordingly, various research performed and developed has
been provided.
User and Device authentication
Authentication is an integral part of how most applications are interacted with. It is
important to recognize several authentication strategies, evaluate, and use them as per the
system needs. Since the infrastructure of this project is based on microservices,
authentication of the client devices and sensors should also be handled appropriately.
Various authentication strategies can be applied for fulfilling the need for microservices
authentication.

CHAPTER 3 BIBLIOGRAPHIC REVIEW
36
3.3.1.1. SSO Server
Single sign-on (SSO) is a session and user authentication service in which users can have
access to multiple services using one login credential (Ayoub, 2018). In this
authentication mechanism, the user requests access to the resource’s server. To obtain the
resource that the user requires, the user needs to provide the login credential to the SSO
server. SSO server will verify the credentials and return the user with a token. After the
user obtains a token, user requests the access to resources. The resource server verifies
the token that the user has supplied with the SSO server. Once the SSO server validates
the token and replies resource server about this validation, the user can get access to the
required resource. This has also been represented in Figure 9.
In an SSO server, the one-time login that the user has made is usually opaque. Every time
user requests access to any of the resource servers, the token needs to be validated with
the SSO server.
Figure 9 SSO server timing diagram
Source: Own elaboration with the help of (Ayoub, 2018)

CHAPTER 3 BIBLIOGRAPHIC REVIEW
37
IAM (Identity and Access Management) standards have been developed to support all
authentication and authorization activities at a corporate level. There are various IAM
standards available, of which, the established and effective are SAML, OAuth, and OIDC
(Naik et al., 2017). Analysis and comparison of SAML, OAuth, and OIDC are as follows,
1. SAML
Security Assertion Markup Language (SAML) is a version of the SAML standard for
exchanging authentication and authorization identities between security domains. It
enables web-based, cross-domain SSO, which helps in reducing the administrative
overhead of distributing multiple authentication tokens to the user (SAML v2.0 Technical
Overview, 2008). The common flow of SAML is shown in Figure 17 of Appendix A.
The scenario of SAML flow is described as following,
• A - user opens a browser and tries to access a website where his personal
information is stored. The website here is represented as Client. This client doesn’t
handle the authentication on its own.
• B – for authentication of the user, the client constructs a SAML Authnrequest,
signs it, and encodes it. The client then redirects the user’s browser to the identity
provider for authentication. The identity provider receives the request, decodes it,
and verifies the signature.
• C – with a valid Authnrequest, the identity provider will request the user to
provide the login credentials.
• D – once the user is authenticated successfully, the identity provider generates a
SAML token that includes user information. The user is redirected back to the
client with the token.
• E – client verifies the SAML token, and extracts the identity information of the
user which reveals the user’s roles and permission for the website. The client then
logs the user into its system in a form of cookies and sessions.
HTTP Redirect and HTTP POST binding are defined in the SAML 2.0 specification.
HTTP Redirect is great for short SAML messages, but it is not recommended for longer
messages such as SAML assertions (Choosing an SSO Strategy, 2013). The SAML
assertion is the XML document that the identity provider sends to the service provider
which contains the user information. There are 3 types of SAML assertions which are
authentication, attribute, and authorization decision.

CHAPTER 3 BIBLIOGRAPHIC REVIEW
38
2. OAuth2.0
OAuth 2.0 is a standard designed to permit a website or application to access resources
hosted by other web applications on behalf of a user. It focuses on client developer
simplicity while providing specific authorization flows for web applications, mobile
phones, and living room devices (OAuth 2.0 — OAuth, n.d.). OAuth defines four roles,
• Resource Owner/User
• Resource server
• Authorization server
• Client/Application
The flow of OAuth2 is shown in Figure 18 of Appendix A,
1. User requests resource access from a client using a browser.
2. The client forwards this request to the authorization server and the request includes
client id, redirect URI, response type, and scope.
3. The authorization server presents an authentication form to the user and the user will
provide his credentials.
4. After the user credentials are verified, the authorization code is provided to the client.
5. The client exchanges the authorization code for token and this time, the request
includes client id and client secret.
6. Authorization replies with an access token to the client.
7. The client uses the access token to request access to the resource server.
8. The resource server validates the token with the authentication server.
After the token validation is completed, the resource server provides the requested
resource to the client.
The communication from the authorization server to the client and resource server is done
over HTTP Redirects with the token information that is provided as query parameters.
OAuth doesn’t require signing the messages by default.
3. OpenID Connnect (OIDC)
OpenID Connect is a framework that transmits the identity using RESTful APIs and is
developed as a profile of OAuth 2.0. It uses two main tokens, an Access token, and an ID
token. The flow of the OIDC use case is represented in Figure 19 of Appendix A.

CHAPTER 3 BIBLIOGRAPHIC REVIEW
39
OIDC is a platform-independent, vendor-neutral, and open standard. OIDC token
contains user identity information but not credentials. It uses JSON, HTTP, and REST
protocols and supports both web and native mobile applications (Naik et al., 2017).
4. Conclusion
This subsection presented three different identity and access management standards for
protecting the applications. SAML has many legacy features that are not compatible with
mobile phones as it was developed before smart mobile phones were introduced (Naik et
al., 2017). SAML token contains the user identity information because of the signing. For
OAuth2, this information can only be retrieved after the resource server has validated the
token with the authentication server. With OAuth2, an access token can be invalidated on
the authorization server, preventing further unauthorized access to the resource server.
SAML and OAuth both allow for SSO opportunities. SAML handles authentication
whereas OAuth handles authorization. Both of them can be used combined to grant access
and to allow access to a protected resource (Choosing an SSO Strategy, 2013).
OpenID is best suitable for mobile computing and communication as it fulfills their
requirements. Despite being the most suitable among the three, OpenID is still a
developing standard and is not as widely compatible as OAuth and SAML (Naik et al.,
2017).
3.3.1.2. Client-Side SSL Certificates
Device authentication is a key aspect of IoT security. If device authentications are not
made correctly, it can lead to a serious security breach and an unauthorized person can
do anything that the device has permission to. An entire infrastructure could even crash
with a single IoT device.
Using the authentication for a device ensures that a trusted set of devices are used in the
infrastructure. Several mechanisms can be used for device authentication like password
authentication, token authentication, and client-side SSL.
Uploading digital certificates to IoT devices is the best solution as it is a lightweight
solution that can be outfitted without being concerned about efficiency. Certificates
require a small amount of space in the device and provide strong authentication.

CHAPTER 3 BIBLIOGRAPHIC REVIEW
40
Client-side SSL is one of the most secure authentication mechanisms as the device owns
the secret instead of the server. The only way for a person to impersonate the device is by
having the physical device and extract the private key data from it. Client-side SSL
validates the identity of a client. The client could be an individual IoT device. Instead of
the client verifying the identity of the server, in client-side SSL, the server verifies the
identity of the client. Client-side SSL uses Public Key Infrastructure (PKI) for
authentication. Client certificates don’t encrypt any data, instead, they’re installed for
validation purposes only (IoT Device Authentication: Benefits of Client-Side SSL, 2019).
3.3.1.3. RSA and ECDSA Cryptography
Asymmetric cryptography is a branch of cryptography where a secret key can be divided
into two parts, public key, and private key. The public key is given to anyone whereas,
the private key is kept secret. Asymmetric cryptography can be used for authentication
and confidentiality. Using asymmetric cryptography, messages can be signed with a
private key, and then anyone with the public key can verify that the message was created
by someone who possesses the corresponding private key (Asymmetric Algorithms —
Cryptography 35.0.0.Dev1 Documentation, n.d.). Asymmetric cryptography uses
encryption algorithms like RSA and ECDSA to create public and private keys.
RSA (Rivest-Shamir-Adleman) algorithm is an asymmetric cryptographic algorithm that
works on the private and public keys. RSA is used in fields of SSL/TLS certificates,
cryptocurrencies, email encryption, and a variety of other applications. RSA uses the
prime factorization method for one-way encryption of the message. In this method, two
large-sized numbers are chosen randomly and multiplied to create another huge number.
Determining the original two prime numbers from this result is almost impossible
ECDSA (Elliptic Curve Digital Signature Algorithm) is an asymmetric cryptography
algorithm that is constructed around elliptical curves and an underlying function which is
known as a “trapdoor function”. In ECDSA, a number on the curve is multiplied by
another number and, as a result, produces a point on the curve. Despite the knowledge of
the original point, figuring out the new point is challenging.
ECDSA is better in terms of key generation as well as in signature generation when
compared with RSA whereas, while verifying a signature, RSA has better performance
than ECDSA. ECDSA provides optimal security with shorter key lengths. It requires a

CHAPTER 3 BIBLIOGRAPHIC REVIEW
41
lesser load for network and computing power which as a result, is great for devices with
constrained power and resources (Toradmalle et al., 2018).
RSA and ECDSA do not provide user or device authentication themselves but they can
create the public and private keys when asymmetric cryptography is being used for user
or device authentication.
Research on Microservices Authentication
Various research and implementations have been made until the present day for solving
the challenge for microservices authentication and authorization. Each of the solution
focus on the project’s goal and structure. This sub-section focuses on describing the
research that has been made in the recent past few years to solve this challenge.
3.3.2.1. Authentication Orchestrator
An authentication and authorization orchestrator has been used in research made by
(Bánáti et al., 2018). This solution was implemented for a healthcare application. Since
the data in such fields are extremely sensitive, the major focus of the study was on user
authentication. This solution also uses microservices architecture and it helps the doctor
to track and monitor the state of a patient or even to make a diagnosis remotely based on
the database.
In this research, the writers have compared various security solutions which include
Security Assertion Markup Language (SAML), Authentication, Authorization, and
Accounting (AAA), User/Password, Certificate, and JWT/OAuth2/OpenID/SSO. After
comparing these authentication mechanisms, they found JWT/OAuth2/OpenID/SSO the
best fit for their solution.
To avoid authentication by microservices each time a request is made, they implemented
a service that realized this function which is represented in Figure 10. They used SSO for
a unified authentication process. They designed an Identity and Access Management
(IAM) module that would authenticate the user and generate a JWT token on their behalf
that would be appended in every request. This token contained the user’s username and
email, and timestamps. IAM also had abilities to issue and withdraw tokens and to
determine the roles of the users represented by the tokens. They also designed an IAM

CHAPTER 3 BIBLIOGRAPHIC REVIEW
42
authentication module in the REST part of the microservice which could determine the
token’s validity.
Figure 10 Authentication and Authorization Orchestrator
Source: (Bánáti et al., 2018)
One of the good parts about this research was how well they were handling the traffic for
this orchestrator. Since every JWT token has an expiry time, they also had a default expiry
time of 5 minutes. When the load increased, the timer was set to a higher value to prevent
frequent refresh. They also developed a client API that was capable of providing
authentication and authorization information to the microservice without the need for
changing the internal logic of the microservices itself. For improving the performance,
they also built a cache into the API which resulted in less load on the orchestrator
microservice and decreased security overhead of the microservices.
The problem with this solution is that it is difficult to implement and manage. Each
microservice has an IAM authentication module that can determine the token validation.

CHAPTER 3 BIBLIOGRAPHIC REVIEW
43
If something needs to be changed in the system, each IAM module inside microservices
must be changed as well. This results in inconvenience while managing or expanding the
system.
3.3.2.2. Unified Authentication
A solution created by (ShuLin & JiePing, 2020) has focused on unified authentication,
improving the efficiency of authority verification, and accelerating the system
development speed under the microservice architecture. The writers have focused on
implementing unified authentication because for a microservice architecture, every
microservice needs to write an authentication module, which is not only troublesome but
also inconvenient for unified management and expansion.
In this research, writers have used OAuth2 for verifying user login credentials. OAuth2
can authenticate users but cannot generate a token that carries user information. The
resource server needs to contact the authorization server every time resource access is
requested from the user. To solve this issue, as soon as authentication is validated by
OAuth2, JWT tokens are generated. JWT tokens can verify the signature, they can contain
useful user information, and the token verification can be done in the resource server
itself.
JWT adopts asymmetric encryption and uses RSA to generate public and private keys. In
this solution, Zuul gateway has been used which is a gateway service that provides
dynamic routing, monitoring, resiliency, and security. Along with Zuul, the Eureka server
is also used whose purpose is to register every microservice.
When users try to access any resource server, they have to pass through the Zuul gateway.
If they have not authenticated yet, they are redirected to the OAuth 2.0 authorization
server for authentication and authorization. Login will be handled by OAuth2 and when
login is successful, public and private keys are generated along with JSON token. The
authorization server uses the private key to sign and encrypt the JWT. The private key is
stored in the authorization server and the public key is stored in Zuul and other
microservices.

CHAPTER 3 BIBLIOGRAPHIC REVIEW
44
After the user has JWT, the user carries this JWT to visit the resource server. Zuul
decrypts the JWT using the public key previously provided by the authorization server
and if verification is passed, the request will be released for the microservices. When the
request arrives at the microservices, the microservice parses JWT with the public key for
obtaining the user information without accessing the authorization server. This has been
represented in Figure 11.
Figure 11 Unified authentication
Source: Own elaboration using (ShuLin & JiePing, 2020)
This technique of authentication enables unified authentication and improves efficiency.
With the use of JWT, the resource server doesn’t need to communicate with the
authentication server for the verification of the tokens as they can verify it themselves
using the public keys. This reduces the payload for the authentication server and improves
performance. Zuul gateway also realizes unified authentication, which is convenient for
authentication management.
3.3.2.3. Microservices hierarchical authentication
In a research made by (Yang et al., 2021), the author considers the user authentication
challenges faced by the microservices architecture and proposes the concept of

CHAPTER 3 BIBLIOGRAPHIC REVIEW
45
microservices hierarchical authentication. In this research, the security level of services
in microservices has been split into first-grade and second-grade authentication. The first-
grade authentication method decrypts the client’s token, verifies the token’s validity, and
passes the verification if it is within the valid period. Second-grade authentication checks
the abnormal user list in the Redis cluster after the first-grade authentication has passed.
The system hierarchical authentication model is shown in Figure 12.
The system storage is divided into Redis cache and MySQL database. Redis cache stores
the abnormal users' list, using a bitmap data structure in Redis. Each unit in the data can
store either 0 or 1 as an array in bits. The primary key of the user corresponds to a binary
bit in the Redis system. If the value is 1, it means that the user is locked and cannot apply
multiple tokens.
Figure 12 System hierarchical authentication model
Source: (Yang et al., 2021)
In this authentication solution, the API gateway performs second-grade authentication
with high availability on all requests, as the public entrance for the microservices. The
authorization server responds to the user’s login credential and returns a JWT token if the
login is successful. Redis cache server caches users with abnormal status in the
microservice where the cached object is the user’s primary key.
The authentication before API gateway adopts the second-grade authentication for higher
security because all the services exposed by the API gateway need to be exposed publicly.

CHAPTER 3 BIBLIOGRAPHIC REVIEW
46
Since the requests after intercepted by the API gateway are the request for access to
microservice’s resources and this interaction is frequent, the first-grade authentication is
used here. Using second-grade authentication beyond API gateway also increases
network expenses and hardware costs.
In this authentication mechanism, a client sends the login request. This request is
forwarded to the authentication server by the API gateway. When the credentials are
validated, the authentication server sends the token to the API gateway which is
forwarded to the user. When the client receives the token, they send a request for access
to the microservice resources. Before the request arrives at microservices, the second-
grade authentication is performed. The API gateway verifies the validity of the token. If
the token is valid, it requests Redis's abnormal list to check if the user is in that list. When
both of these verifications pass, the API gateway forwards the resource request to the
microservices and then the first-grade authentication comes into action. After the
microservices receive the token, they check the token’s validity. When this is confirmed,
they return the resources to the client.
Using different grades authentication in this model ensures the security of the entire
system by gradually filtering out risky requests. This solves the challenge of fast user
authentication which is faced by microservice architecture.
3.3.2.4. Client token with API Gateway
This solution was presented by (Ayoub, 2018) where the author provides a solution for
invalidating JWT on the server-side. Whenever JWT is used in a microservices
architecture for user authentication and authorization, such tokens cannot be revoked
from the server code on-demand and the tokens can still be valid despite user logout.
There is no control over the expiry time of the token.
In this solution, an API gateway is used where every request of the user passes through
this gateway. In this approach, when a user requests access to the resource server, it is
first checked if the user has a valid token. If the request is made appending a token but
the token is invalid or expired, the user is unauthorized for the resources. If the request
has been made for the first time without the token, the user is redirected to the
authentication server by the API gateway.

CHAPTER 3 BIBLIOGRAPHIC REVIEW
47
Figure 13 Client token with API Gateway
Source: Own elaboration with the help of (Ayoub, 2018)
Once the user authenticates himself successfully through OAuth2 by using his preferred
identity provider or, by supplying the login credentials, the authentication server replies
with a valid JWT token. This token is taken to the API gateway and the API gateway
translates the JWT token to an opaque token that only it can resolve. API gateway replies
to the user with an opaque token and when a user requests the resource with the opaque
token, the API gateway maps the opaque token to the origin token and forwards the
request to the resource server. The resource server upon receiving the origin token
validates the token and replies with the resources. This flow can be seen in Figure 13.

CHAPTER 3 BIBLIOGRAPHIC REVIEW
48
With this transfer of the JWT token to an opaque token, the token relationship in the API
gateway can be removed and when a user requests to logout, the API gateway can revoke
the user’s token and also adds extra protection to the token from being decrypted by
hiding it from the client.
With this solution, the JWT tokens can be revoked from the server-side and also offers
better security as the user outside the system doesn’t have access to the original token.
Despite these advantages, the API gateway needs to make this translation of opaque token
to auth/JWT token and vice-versa. This mapping of the token is only done through the
API gateway and when the API gateway receives a lot of requests, the response time for
a resource is higher than usual.
3.3.2.5. Wilma PEP Proxy
A Policy Enforcement Point (PEP) is a component of policy-based management which
might be a Network Access System (NAS). When a user tries to access a file on a network
or server that uses policy-based access management, the PEP describes the attributes of
the user to other entities on the system. The PEP gives the PDP (Policy Decision
Point) the job of deciding whether to or not to authorize a user based on the description
of attributes that have been provided. The user’s roles, the action, the resource, and the
application ID are forwarded to the Authorization PDP server which compares the request
with the set of access policies that are stored in the server (CPS Wi-Fi Configuration
Guide, 2016a).
A PEP Proxy acts as a gatekeeper and is found in front of a secured resource. It is an
endpoint found at a public location. Users who want access to the secured resources must
supply sufficient information to the PEP Proxy. When PEP Proxy verifies the
information, it passes the request to the real location of the secured resource. The outside
user who makes the request is unknown about the actual location of the resource.
FIWARE is an open-source initiative defining a universal set of standards for context data
management that facilitates the development of Smart solutions for different domains like
Smart Cities, Smart Industry, Smart Agrifood, and Smart Energy. In a smart solution,
there is a need to gather and manage context information, processing that information,
and informing external actors, enabling them to actuate and therefore alter or enrich the

CHAPTER 3 BIBLIOGRAPHIC REVIEW
49
current context. FIWARE context broker is the core component of the FIWARE platform.
It enables the system to perform updates and access the current state of the context.
FIWARE Wilma is an implementation of PEP Proxy which combines works with
FIWARE Keyrock Generic Enabler. When a user requests to access the
resources, PEP proxy describes the user’s attributes to the Policy Decision Point (PDP),
requests a security decision, and enforces the decision which will be Permit or Deny. The
authorized users receive the same response as they had direct access to a resource with
minimal disruption whereas unauthorized users are returned a 401 – Unauthorized
response (FIWARE PEP Proxy, n.d.).
Keyrock is the FIWARE component that is responsible for Identity Management. With
the help of Keyrock together with PEP Proxy, it enables us to add OAuth2-based
authentication and authorization security for our services and application. The following
objects are common within the Keyrock Identity Management database,
• User: They are the users who register themselves to the application and can make
identification with their email and password. They can be assigned rights
individually or as a group.
• Application: It is the securable FIWARE application. It has the client role in the
OAuth 2.0 architecture and requests protected user data. Applications define roles
and permissions to manage the authorization of users and organizations. Roles and
permissions can be created within an application as needed. It can also register
IoT agents, and PEP Proxy for the protection of backends.
• Organization: Organization is the group of users that share the resources of an
application which includes roles and permissions. Users of an organization can be
either members or owners of that organization.
• OrganizationRole: In an organization, users can either be an admin or a member.
Admins can add or remove the users from the organization whereas members only
get the roles and permissions of an organization. With such rules, the need for
super-admin is removed as each organization can be responsible for its members.
• Role: A role is considered as a descriptive bucket for a set of permissions. Provider
and purchaser are the default roles in Keyrock IDM and inside the role provider,
there is a set of permissions which are,
o Get and assign all internal application roles.

CHAPTER 3 BIBLIOGRAPHIC REVIEW
50
o Manage the application.
o Manage roles.
o Manage Authorizations.
o Get and assign all public application roles.
o Get and assign only public-owned roles.
New roles can be created, and more permissions can be added to them. Each permission
is composed of HTTP action and the resource it permits the access to (Example: action:
GET, resource: Login). Roles can be assigned either to an individual or an organization.
When the users are authenticated with their credentials, they get all the permissions from
their roles, plus the roles which are associated with their organization. The roles of a user
in an application can be either purchaser or provider. New roles can be defined within an
application.
Solution of Wilma PEP proxy can be used for authentication and authorization in a
microservices architecture. Keyrock IDM could be a separate microservice solely
dedicated to authentication and authorization purpose. Whenever a request arrives in the
form of a token at an application secured by the Wilma PEP proxy, the PEP proxy can
verify the validity of the token with Keyrock IDM and extract roles and permissions of
the user with PDP which is also a part of the Keyrock. With a valid token, roles, and
permissions, PEP proxy can provide resources requested by external users.

CHAPTER 3 BIBLIOGRAPHIC REVIEW
51
3.3.2.6. Security Solution Analysis
This section compares all the previously discussed authentication researches that have
been made for microservices authentication and authorization.
Table 2 Comparative study of authentication methods
Solution Easily
Scalable
Cost and
complexity
Authentication
mode
Tokens User
Authorization
Authentication
Orchestrator
No High OAuth2 JWT No
Unified
Authentication
Yes Medium OAuth2 JWT Yes
Microservices
Hierarchical
Yes High User-Password JWT No
Client Token
with API
Gateway
Yes Medium OAuth2/User-
Password
JWT +
Opaque
Tokens
No
Wilma PEP
Proxy
Yes Low OAuth2/User-
Password
OAuth
Tokens
Yes
Concluding the results from Table 2, we can analyze and adapt the advantages of each
authentication solution to this BIOma project. We can either use the RSA-signed JWT
tokens from the idea of Unified Authentication or use the idea of Wilma PEP proxy by
FIWARE as both of the solutions offer user authorization.
Conclusion
Various authentication solutions have been researched and implemented until the present
day. Each of them has its advantage depending upon the goal of the research and structure
of the project. A solution like Wilma PEP Proxy might be easy to implement but might
contain issues with performance and a single point of failure when the number of requests
on the authentication server is high.

CHAPTER 3 BIBLIOGRAPHIC REVIEW
52
A solution like Authentication Orchestrator and Microservices Hierarchical is more
reliable but expensive to implement, difficult to manage, and they don’t provide user
authorization. Solution of Unified authentication along with Client token with API
Gateway offers token verification in each microservice, user authorization, and token
invalidation on demand but also adds the dependency on the API gateway for token
translation.
Analyzing this research and implementation for microservices authentication and
authorization, it can be concluded that all these solutions help with user authentication
but only Unified Authentication and Wilma PEP Proxy can help with the authorization.
We can take advantage of identity and access management from Wilma PEP proxy and
if needed, a separate module for token verification can be developed in each microservice
as used in the solution of Authentication Orchestrator for reducing traffic in
authentication microservice.

53
Chapter 4 Proposed System
Architecture
This chapter intends to demonstrate the system architecture defined for the PPS2 of the
BIOma project. The work presented in this chapter is done as a design task during the
first iteration of the BIOma project. This is the first proposal for the infrastructure design
which might receive changes throughout the project development. The work done in this
chapter is a result of the discussion with the collaborators of this project.
4.1. Location and user identification
This section describes the identification of locations and users for tracking food waste.
This identification is important to recognize the locations where the food waste happens,
and the users who are responsible to monitor and minimize it. The result of the
identification has been shown in Figure 14. The following list describes the identifications
made,
• Inventory Manager/Administrator: The inventory manager is present in several
locations of the product storage which might include off-site warehouse, on-site
warehouse, and kitchen storage. His prime responsibility is to register the
products, move products between storages, make purchase suggestions, and track
waste that happens during the storage. He is also responsible for making a
sustainable purchase from the suppliers following sustainability and responsible
production certifications and labels. The labels and certifications which are one of
the evaluation criteria of the suppliers are represented in Figure 20 of Appendix
B.

CHAPTER 4 PROPOSED SYSTEM ARCHITECTURE
54
• Menu Manager/Unit Manager: The menu manager is responsible to create the
food menus for the organization. He creates the menu based on the food history
and products that are approaching the expiry date. Food history means the meal
that was mostly wasted in the previous menus.
Figure 14 Food waste locations and actors
• Cooks/Unit Collaborator: Cooks work in the preparation zone. They also access
the products based on the expiration date and cook based on food history. They
are responsible for tracking the waste that happens while storing in the preparation
zone.
• Attendant/Unit Collaborator: Attendants work in the plating zone and also in the
canteen. They are responsible for serving the foods to the consumer. Their
responsibility is to track the amount of food waste in the plating zone and canteen.
This waste happens due to an excessive amount of food prepared compared to the
number of consumers. Attendants also work in the dishwashing room who tracks
the food waste from the consumer. This is the amount of food that was not
consumed after serving to the customers.
From this analysis, the responsibility of workers in their locations is identified and it is
easier to keep track of food waste based on various locations.

CHAPTER 4 PROPOSED SYSTEM ARCHITECTURE
55
4.2. System Requirements
This section enumerates the system requirements for 5 different packages of PPS2.
1. Management package
1.1. The system should manage three user roles: administrator, unit manager, and unit
collaborator.
1.2. The system should manage or access external databases (or Web API) to import
food units.
1.3. The system should assign users to food units.
1.4. The system should access external databases (or Web API) to import Common
Procurement Vocabulary (CPV) classification system, General Standard for Food
Additives (CODEX GSFA) Codes; United Nations Central Product
Classification (UN CPC) System; Global Product Classification (GPC) codes;
United Nations Standard Products and Services Code (UNSPSC) codes.
1.5. The system should manage product classification.
1.6. The system should manage or access external databases (or Web API) to import
purchase information of products, suppliers, producers, cost, weight, and meal
products by food unit.
1.7. The system should register or access external databases (or Web API) to import
meals sold and served by the unit.
1.8. The system should register or access external databases (or Web API) to import
organizations that receive donations.
2. Smart procurement package
2.1. The system should manage certifications/labels.
2.2. The system should manage the best production practices in the sector.
2.3. The system should define supplier policies for sustainable purchases and supplier
criteria typology and evaluation methods.
2.4. The system should manage suppliers, their policies, and evaluation results.
2.5. The system should present reports of product purchases in value amount and
weight in tons, by-product typology, product family, certifications, labels, and
best practices.
2.6. The system should present reports of product purchases in value amount, by the
supplier, producer, and geographical origin.
2.7. The system should present reports of supplier policies and evaluations.

CHAPTER 4 PROPOSED SYSTEM ARCHITECTURE
56
2.8. The system should order or assign a score to each supplier based on the
certifications, best practices, product origins, supplier policies, and submitted
evaluations.
3. Smart monitoring package
3.1. Waste generation sub-package
3.1.1. The system should register in situ or access external databases (or Web
API) to import weight of waste and additional information by unit, type of
waste material (Urban, biodegradable, paper/cardboard, packages (plastic,
metal, ECAL), glass, OAU, other residues and danger residues) and type of
measurement (weighted, eGAR), destination type (valorization, disposal or
waste-product)
3.1.2. The system should register the amount of reused waste per unit type in situ
or by accessing external databases.
3.1.3. The system should collect data from external connected sensors to
measure the weight of waste.
3.2. Food waste sub-package
3.2.1. The system should register in situ or access external databases (or Web
API) to import weight of food waste and additional information by unit, life
cycle phase (Reception, Storage, Preparation, Confection, Distribution of
Main Meals, Distribution of Intermediate Meals, Consumption), type of
material (edible, non-edible) and meal type.
3.2.2. The system should collect data from external connected sensors to
measure weight and photos of food waste by unit, life cycle phase, type of
material (edible, non-edible), and meal type.
3.3. Food donations sub-package
3.3.1. The system should register the number of donated meal doses and
estimated weight by unit, unit type, meal type (soup, main course, dessert),
and receiver organization.
3.3.2. The system should notify organizations that receive donations about
available meals.
4. Smart waste package
4.1. The system should define thresholds for waste weight by life cycle phase and
issue alerts.

CHAPTER 4 PROPOSED SYSTEM ARCHITECTURE
57
4.2. The system should present reports of waste by unit, unit type, type of waste
material, and destination.
4.3. The system should present a normalized waste index per meal.
4.4. The system should present reports of food waste by unit, unit type, life cycle
phase, per cost, type of material, and estimated value.
4.5. The system should present a normalized waste index per cost and sold meal.
4.6. The system should present reports of donated meal doses by unit type, meal type,
and receiver organization.
5. Smart education package
5.1. The system should register or access external databases (or Web API) to import
different types of actions (initiatives, sensibilization) to different targets
(consumers, the public) by the food unit.
5.2. The system should fire events of the actions to major social networks (channel)
and retrieve visualizations.
5.3. The system should present events of the actions to the end-users as an educational
portal.
5.4. The system should register individuals present in educational events per
geographical region.
5.5. The system should register or access external databases (or Web API) to import
training actions to collaborators by food unit.
5.6. The system should present reports of the actions by unit, unit type, target, and
channel, and determine an impact index.
4.3. UML Diagrams
Use-case Diagram
This section presents the use-case diagram for 5 different packages of PPS2. The actors
participating in these use-case diagrams are Administrator, Manager, Collaborator,
Sensor, and Web API. This diagram is designed based on the requirements presented in
section 4.2. The representation of the diagrams is done per package and the packages are,

CHAPTER 4 PROPOSED SYSTEM ARCHITECTURE
58
1. Management Package
This package for use-case is designed based on the requirements from
Management Package. Every use case from this package is performed by the actor
Administrator. For every use case except Manage product classification, and
Assign user to food units, actor Web API also interacts with the use cases for
importing or exporting data from or to the system. The management package use-
case is represented in Figure UC 1 of Appendix C.
In this package, the Administrator can manage different user roles which can
include administrator, unit manager, or unit collaborator. The administrator can
import food units, import classification systems, manage the classification of the
product, import purchase information of products, suppliers, producers, cost,
weight, and meal products by food unit, import meals sold by the unit, and import
donation receiving organization by accessing external Web API or database.
2. Smart Procurement Package
The use cases defined in this package are based on the Smart Procurement
Package defined in the system requirements. Use cases are divided among two
actors, administrator, and manager. The actor Administrator can manage
certifications or labels, manage best production practices in the sector, can
manage supplier policies for sustainable purchases, and can manage suppliers and
their policies and evaluation results. The smart procurement package use-case is
represented in Figure UC 2 of Appendix C.
The actor Manager can define supplier policies, evaluation methods, and supplier
criteria per typology. For all these actions, it should be verified if similar entries
already exist in the system or not.
This actor can view reports of product purchases in value amount and weight in
tons, by-product typology, family, certifications, labels, and best practices. The
system also permits this actor to view reports of product purchases in value
amount, by the supplier, producer, and geographical region.
Reports of supplier policies and evaluations can also be viewed by this actor and,
he can assign a score to each supplier based on certifications, best practices,
product origin, supplier policies, and submitted evaluations.

CHAPTER 4 PROPOSED SYSTEM ARCHITECTURE
59
3. Smart Monitoring Package
This use case is based on the requirements from the Smart Monitoring Package
and its sub-packages. Actors Manager, Collaborator, Sensor, and Web API
participate in this package. Web API actor is responsible for importing and
exporting data from or to the system. In this use case when the Collaborator
registers the donated meal, the receiving organization is notified about this meal
donation. The sensor here is responsible for registering weight and photographic
readings to the system. The Smart Monitoring Package use case is represented in
Figure UC 3 of Appendix C.
In this use case, the actor Manager can register waste weight and additional
information by unit, type of waste material (Urban, paper, plastic, glass, etc.),
type of measurement (manually weighted, eGAR), and destination type (disposal,
waste-product) in the system by accessing the external database or Web API. He
can also register the amount of reused waste per unit type, and register food waste
by unit, life cycle phase (Reception, Storage, Preparation, etc.), type of material
(edible and non-edible), and meal type. Managers can measure weight and photos
of food waste by unit, life cycle phase, type of material, and meal type with the
help of externally connected sensors.
Actor collaborator can register the number of donated meal doses and estimated
weight by unit, unit type, meal type, and receiver organization. Upon this
registration, the receiver organization is notified about it.
4. Smart Waste Package
The smart waste package use case is based on the system requirements of the
Smart Waste Package. Actors Administrator, Manager, and Collaborator
participate in this package. The Smart Waste package use case is represented in
Figure UC 4 of Appendix C.
In this package, the actor administrator can define a threshold for waste weight by
life cycle phase and issue alerts accordingly. Actor Manager can view reports of
waste by unit, unit type, type of waste material, and destination.
Actor Unit Collaborator can view normalized waste index per meal, reports of
food waste by unit, unit type, life cycle phase, per cost, type of material, and

CHAPTER 4 PROPOSED SYSTEM ARCHITECTURE
60
estimated value, and view reports of donated meal doses by unit type, meal type,
and receiver organization. He can also view a normalized waste index per cost
and sold meal.
5. Smart Education Package
The use cases defined in Smart Education Package are based on the system
requirements defined in the Smart Education Package. Actors Manager and Web
API participate in this package. Web API is responsible for importing or exporting
the system data. In this package, the system permits the actor Manager to register
actions to consumers or employees by the food unit, register the individuals
present in the education events per region and he can also view reports of the
actions by unit, unit type, target, and channel, and determine an impact index. The
smart education use case is represented in Figure UC 5 of Appendix C.
User Stories
User stories are a simple description of a product feature told from the perspective of the
person who wants that feature. The team can work in a collaborative environment and
decide how to best serve the user and meet the goal specified.
User stories mentioned here will help the developers to identify for whom are they
developing the feature and for what purpose. Table 3 contains user stories for PPS2 based
on the system requirements and use-case specified. Each package has been labeled by the
numbers where,
• Package 1 is the Management Package,
• Package 2 is the Smart Procurement Package,
• Package 3 is the Smart Monitoring Package,
• Package 3.1 is the Waste generation sub-package,
• Package 3.2 is the Food waste sub-package,
• Package 3.3 is the Food donations sub-package.
• Package 4 is the Smart Waste Package, and
• Package 5 is the Smart Education Package.

CHAPTER 4 PROPOSED SYSTEM ARCHITECTURE
61
Table 3 User stories PPS2
Package As a I want to So that I can
1 Administrator Manage user roles Each user can get permissions
based on their roles.
1 Administrator Import food units Monitor the food waste in each
unit and personnel assigned to it.
1 Administrator Assign user to food
units
Prevent unauthorize access.
1 Administrator Import CPV
classification system
Assign codes to the products.
1 Administrator Manage product
classification
View products based on family
and sub-family
1 Administrator Import purchase
information
manage the sustainable
purchases made for the
organization.
1 Administrator Import meals sold by
unit
Monitor the flow of food
consumption per unit
1 Administrator Import donation
receiving organizations
Assign donation amount per
organization
2 Administrator Manage certifications
and labels
Permit the organization to view
the most relevant certifications
and labels that fits their
sustainable purchase policy.
2 Administrator Mange the best
production practices in
the sector
Increase product purchases from
producers who follow best
production practices.
2 Administrator Manage suppliers’
policies
Check if their policies are
eligible for organizational
purchases.
2 Administrator Manage supplier’s
evaluation result
Check the number of purchases
made from eligible evaluated
suppliers and non-eligible
suppliers.

CHAPTER 4 PROPOSED SYSTEM ARCHITECTURE
62
2 Manager Define supplier policies Assign policies that each
supplier follows.
2 Manager Define evaluation
methods
Evaluate suppliers.
2 Manager Define supplier criteria
typology
Classify suppliers based on the
typology.
2 Manager View product purchase
report in value amount
and weight per product
typology, per
certification and label,
per family, and best
practice
Manage important financial
costs from the organization and
analyze the growth in purchases
following the organization’s
sustainable purchase policy.
2 Manager View product purchase
report in value amount
per supplier, per
producer, and
geographical region
Manage organizational
purchases promoting the local
producers and suppliers that fit
the best sustainable policy.
2 Manager View supplier policies
and evaluation report
Prioritize and increase purchase
amounts from the highest
evaluated suppliers and the ones
that fit the organization’s
purchase policy.
2 Manager Assign a score to
suppliers
Check if they are eligible for
organizational sustainable
purchase policy.
3.1 Manager Register waste weight
per unit, per waste
material, per
measurement type, and
destination type.
Categorize each recorded waste.

CHAPTER 4 PROPOSED SYSTEM ARCHITECTURE
63
3.1 Manager Register reused waste Compare the weight of reused
waste with the total
organizational waste per unit.
3.1 Manager View waste weight
tracked by sensors
Record the wastes that were
read from sensors and registered
manually.
3.1 Manager Register food waste by
unit, lifecycle phase,
type of material, and
meal type
Organize and analyze each food
waste.
3.2 Collaborator Register the weight of
donated meals based on
meal type and receiver
organization
Record which organization
benefitted the most and what
meal-type was most fitted for
human consumption even after
the waste.
3.3 Collaborator Receive donations
notification alongside
with targeted
organization
Ensure that the donations are
being received in the correct
places.
4 Administrator Define waste weight
threshold in lifecycle
phases
Prevent over-accumulation of
food waste in each lifecycle
phase.
4 Manager View waste report based
on unit, unit type, waste
material type, and
destination.
Analyze the type of waste
generated by the organization
and create an attempt to reduce
or reuse it.
4 Collaborator View normalized waste
index per meal
Track progress towards the
reduction of food waste.
4 Collaborator View normalized waste
index per cost and sold
meal
Help organizations manage
financial information.

CHAPTER 4 PROPOSED SYSTEM ARCHITECTURE
64
4 Collaborator View donated meal
report by unit type, meal
type, and target
organization.
Acknowledge the amount of
edible food waste and the
organization's benefitted from it.
5 Manager Register training actions
to collaborators
Ensure each collaborator from
the organization is getting
training against food waste.
5 Manager Register various
initiatives based on the
target group by food
unit
Track the number of people
being aware of food waste.
5 Manager Notify various target
groups on social media
regarding major events
Ensure that end users are
missing such important events.
5 Manager Register individuals
present in event per
geographical region
Track effectiveness of such
events per geographical region.
5 Manager View reports of the
events based on type,
target, and impact index
Manage future events and
actions to reduce food waste.
Class Diagram
This section presents and describes the class diagram for PPS2 of the BIOma project. An
overview of the class diagram is shown in Figure 21 in Appendix D. The class diagram
is divided into 4 different packages which include Common Management, Smart
Monitoring/Smart Waste, Smart Procurement, and Smart Education. Each package is
further classified into sub-packages and each of them will be discussed in this section.
1. Common Management
I. Meal Management
This package focuses on different types of meals cooked and served. Various
recipes can be used for cooking different kinds of meals. It also monitors the
amount of planned and served doses. All this information can help monitor what

CHAPTER 4 PROPOSED SYSTEM ARCHITECTURE
65
meals were more wasted than the others and can also check the difference between
planned and served doses to check the number of food wastes. The class diagram
for this package is shown in Figure C1 1 of the Appendix D. The classes and their
relationship in this package are as follows,
• Recipe
This class is for the recipe of the food meal. It contains 2 attributes, a name, and
a description of the recipe. It has 1 to many relationships with ‘RecipeMealTypes’,
1 to many with ‘ScheduledMealRecipeMealType’, many to 1 with ‘MealPart’,
and 1 to many with ‘RecipeProduct’ classes.
• RecipeProduct
It is the relational link class between ‘Recipe’, and ‘Product’. This class has
attributes of quantity and order. This class defines what quantity of the product
has to be used and in what order for a recipe. It has many to 1 relationship with
the classes ‘UnitOfMeasure’ and ‘Product’, and many to 1 relationship with the
class ‘Recipe’. While defining the quantity, the relationship with the class
‘UnitOfMeasure’ defines what measurement unit is used for defining the quantity.
• MealPart
This class has 2 attributes - name and order. It defines the part of the meal like
soup, main course, dessert, etc. It has 1 to many relationship with the class
‘Recipe’.
• RecipeMealTypes
It is the relational link class between ‘Recipe’ and ‘MealType’. It has 1 attribute -
order. It has Many to 1 relationship with both classes.
• MealType
This class is for the type of meal that will be cooked. This class has 2 attributes,
name and order. The meal type could be breakfast, lunch, dinner, etc. It has 1 to
many relationship with the classes ‘RecipeMealTypes’ and
‘ScheduledMealRecipeType’

CHAPTER 4 PROPOSED SYSTEM ARCHITECTURE
66
• ScheduledMeal
This class is for the meals that have been scheduled to be cooked. It has 2
attributes, date and planned_doses. It has 1 to many relationship with
‘ScheduledMealRecipeType’ and many to 1 with ‘FoodUnit’. This class defines
the date of scheduled meals in different food units with the number of planned
doses.
• ScheduledMealRecipeType
It is the relational link class between the classes ‘ScheduledMeal’, ‘Recipe’, and
‘MealType’. It has many to 1 relationship with ‘ScheduledMeal’, ‘Recipe’, and
‘MealType’, 0 or 1 to many with ‘StockMovement’, 1 to many with
‘MealDonation’, and 1 to many with ‘FoodWasteMeasurement’. It has 1 attribute
– served_doses. This class defines the served doses for the meal using a particular
recipe of a meal type, on a scheduled date.
II. User Management
This package handles the user-related information which includes the information
of the user, his roles, and sets of permission assigned to a role. The class diagram
for this package is shown in Figure C1 2 of the Appendix D. The classes and their
relationship in this package are as follows,
• User
This class is for the user of the system. It has 3 attributes – username, email, and
password. It has 1 to many relationship with the classes ‘Staff’ and’UserRole’.
• Role
This class defines the role of the user and the permission that each role has. A role
can have sets of permissions and permission can belong to many roles. It has 2
attributes – name and description and has 1 to Many relationship with
‘RolePermission’. A role in this system could be an administrator, manager, or
collaborator.
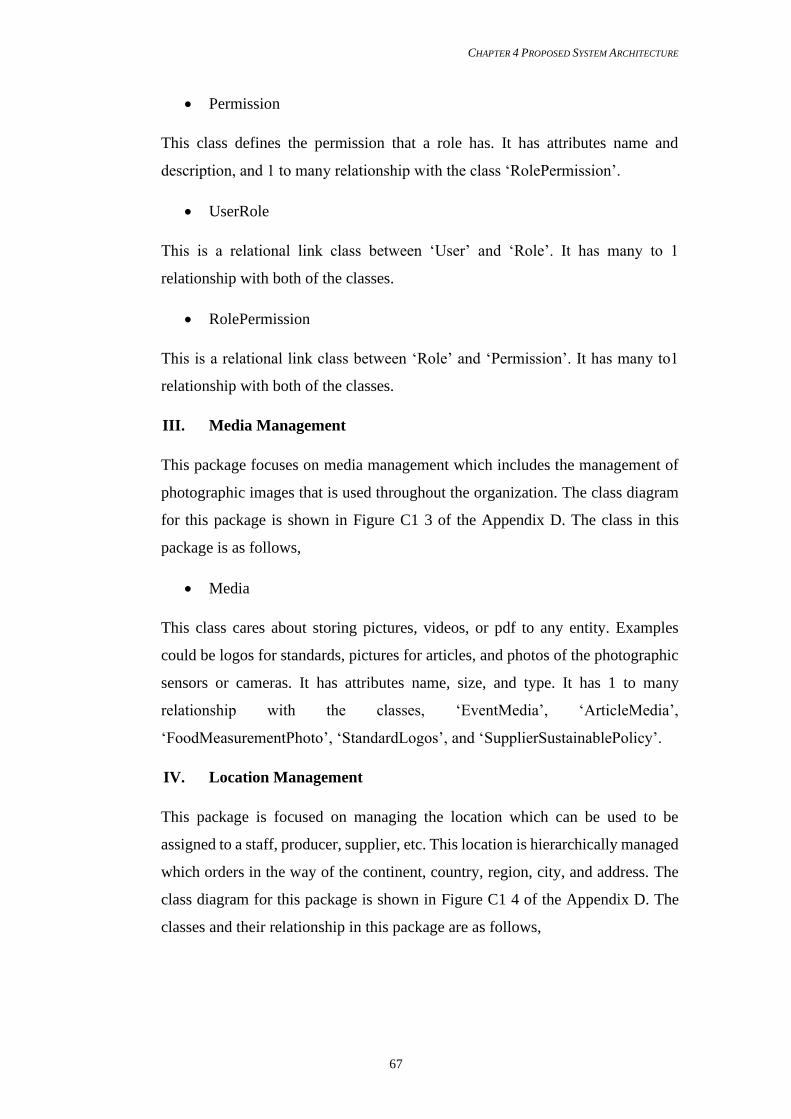
CHAPTER 4 PROPOSED SYSTEM ARCHITECTURE
67
• Permission
This class defines the permission that a role has. It has attributes name and
description, and 1 to many relationship with the class ‘RolePermission’.
• UserRole
This is a relational link class between ‘User’ and ‘Role’. It has many to 1
relationship with both of the classes.
• RolePermission
This is a relational link class between ‘Role’ and ‘Permission’. It has many to1
relationship with both of the classes.
III. Media Management
This package focuses on media management which includes the management of
photographic images that is used throughout the organization. The class diagram
for this package is shown in Figure C1 3 of the Appendix D. The class in this
package is as follows,
• Media
This class cares about storing pictures, videos, or pdf to any entity. Examples
could be logos for standards, pictures for articles, and photos of the photographic
sensors or cameras. It has attributes name, size, and type. It has 1 to many
relationship with the classes, ‘EventMedia’, ‘ArticleMedia’,
‘FoodMeasurementPhoto’, ‘StandardLogos’, and ‘SupplierSustainablePolicy’.
IV. Location Management
This package is focused on managing the location which can be used to be
assigned to a staff, producer, supplier, etc. This location is hierarchically managed
which orders in the way of the continent, country, region, city, and address. The
class diagram for this package is shown in Figure C1 4 of the Appendix D. The
classes and their relationship in this package are as follows,

CHAPTER 4 PROPOSED SYSTEM ARCHITECTURE
68
• Continent
This class defines the continent in the world. The attributes are name and code.
Examples could be Europe, Asia, Australia, etc. It has 1 to many relationship with
‘Country’.
• Country
This class represents a country and also stores the continent it belongs to. It has 2
attributes - name and country and has 1 to many relationship with ‘Region’ and
many to 1 relationship with ‘Continent’.
• Region
This class specifies the region of a particular country. It has attributes name and
code and 1 to many relationship with ‘City’.
• City
This class specifies the city of a particular region. It has an attribute – name. This
class has 1 to many relationship with the class ‘Address’.
• Address
This class describes the address in a particular city. This class has 4 attributes –
address1, address2, postcode, and place. It has 1 to many relationship with the
class ‘FoodUnit, 0 or 1 to many relationship with ‘Staff’, Many to 1 with the class
‘Producer’, 1 to many with the class ‘Supplier’, and many to 1 with the class
‘City’.
V. Food Units Management
This package is responsible for the management of the food units. Here the
information about the food unit is managed which includes the storage of the
products, types of storage units, movement of products inside or outside the food
units, the staff responsible to work here, lifecycle phase, size of the food unit, and
type of the food unit. The class diagram for this package is shown in Figure C1 5
of the Appendix D. The classes and their relationship in this package are as
follows,

CHAPTER 4 PROPOSED SYSTEM ARCHITECTURE
69
• Storage
This class has two attributes, name and code. This class defines the type of storage
in each food unit. It has many to 1 relationship with the classes ‘StorageType’ and
‘FoodUnit’, and 1 to many relationship with the class ‘StockMovement’.
• StorageType
This class defines the type of storage that the organization has. It could be dry,
fridge, or freezer storage. This class has 3 attributes – name, min_temperature,
and max_temperature. It has 1 to many relationship with the class ‘Storage’.
• StockMovement
This class defines the movement of the food product stock. It has 4 attributes -
quantity, sign, date, and price. It has many to 0 or 1 relationship with
‘ScheduleMealRecipeMealType’, many to 1 with ‘Staff’, many to 1 with
‘Storage’, many to 1 with ‘Product’, and 1 to many with ‘StandardStockProduct’.
• Staff
This class is defined for the staff of an organization. This class has 3 attributes –
name, phone, and alternative_email. This class has 1 to many relationship with
the class ‘StockMovement’, 1 to many with ‘FoodUnitStaff’, Many to 0 or 1 with
‘Address’, and many to 1 with the class ‘User’.
• FoodUnit
This class defines the food units. It is a location that was identified where
monitoring of food waste was necessary. This class defines the size and type of
food unit alongside the location. It has 4 attributes – name, code, cost_center, and
client_name. This class has 1 to many relationship with ‘ScheduledMeal’, many
to 1 with ‘Address’, 1 to many with ‘FoodUnitMeasurement’, 1 to many with
‘EventFoodUnit’, many to 1 with ‘FoodUnitType’, many to 1 with
‘FoodUnitSize’, 1 to many with ‘FoodUnitStaff’, and 1 to many with the class
‘Storage’.

CHAPTER 4 PROPOSED SYSTEM ARCHITECTURE
70
• FoodUnitStaff
This is a relational link class between ‘FoodUnit’ and ‘Staff’ and defines the role
of a staff belonging to a food unit. It also has a relationship with the class ‘Role’.
This class contains many to 1 relationship with all the classes it relates with.
• FoodUnitType
This class defines the types of food units. It has 1 to many relationship with the
class ‘FoodUnit’ and contains an attribute, name.
• FoodUnitSize
This class defines the size of a food unit and has 1 to many relationship with the
class ‘FoodUnit’ and contains attributes – name and code.
• FoodUnitLifeCyclePhase
This class defines the life cycle phase of the food unit. The life cycle phase could
be the reception, storage, preparation, confection, distribution of the main meals,
distribution of the intermediate meals, and consumption. This class has 1 to many
relationship with the class ‘FoodWasteMeasurement’ and contains 2 attributes,
name and order.
VI. Product Management
This package is responsible for the management of the product inside the
organization. This package includes the information of the product which includes
the Common Procurement Vocabulary, if the product is a generic product or a
branded product, brand information can be extracted, the unit of measurement is
also covered in this package, product’s typology, and family are also included
here. The class diagram for this package is shown in Figure C1 6 of the Appendix
D. The classes and their relationship in this package are as follows,
• CommonProcurementVocabulary
This class focuses on CPV (Common Procurement Vocabulary) which is a single
classification system for public procurement aimed at standardizing the references
used by contracting authorities and entities to describe procurement contracts
(Anonymous, 2016). It has a self-association that establishes a hierarchy. This

CHAPTER 4 PROPOSED SYSTEM ARCHITECTURE
71
class contains 2 attributes – name and code. It also contains a 0 or 1 to many
relationship with the class ‘GenericProduct’.
• Product
This class defines the products of an organization. It has 8 attributes which include
name, code, description, is_active, importance, UPC, EAN13, and weight. UPC
and EAN13 are the 12 and 13 digits barcode symbols respectively. It has a
generalization relationship with the class ‘Pack’ where ‘Pack’ is the child.
It has 1 to many relationship with the class ‘RecipeProduct’, many to 1 with
‘ProductLot’, 1 to many with ‘StockMovement’, 1 to many with
‘ProductSupplier’, many to 1 with ‘UnitOfMeasure’, and 1 to many with ‘Pack’.
• Brand
This class defines the brand of a product and the producer that uses this specific
brand. It has 2 attributes – name and code and 1 to many relationship with the
class ‘Product’ and many to 1 with ‘Producer’.
• Pack
It is a child class of ‘Product’. It carries all the attributes, operations, and
relationship from ‘Product’ but it has one distinct attribute which is quantity.
• ProductLot
This class defines the lot for products. It has 3 attributes – code, date_produced,
and date_expiry. It has 1 to many relationship with the class ‘Product’.
• UnitOfMeasure
This class defines the measurement unit. It has 2 attributes – name and
short_name. It has 1 to many relationship with ‘FoodUnitMeasurement’, 1 to
many with ‘Product’, 1 to many with ‘UOMConversion’, and 1 to many with
‘RecipeProduct’.
• UOMConversion
This class permits to specify how one unit of measure will be converted to another
unit of measure. It has many to 1 relationship with the class ‘UnitOfMeasure’ and

CHAPTER 4 PROPOSED SYSTEM ARCHITECTURE
72
contains an attribute ‘conversion_function’. This attribute defines the function
that is used for the unit of measurement conversion.
• ProductFamily
This class defines the family and sub-family of the product. Examples of family
could be fruit, pork meat, fish, etc. and subfamily could be olive, olive imported,
potatoes, freshly prepared potatoes, etc. This class has 2 attributes – name and
level. This class has a self-association that establishes a hierarchy and also has a
1 to many relationship with the class ‘ProductTypology’.
• ProductTypology
ProductTypology defines a group of products that fulfill a similar need for a
market segment or market as a whole. It could be consumer goods, oils, chemicals,
packaging, pulp, glass, etc. It has many to 1 relationship with the class
‘ProductFamily’ and 1 to many with ‘GenericProduct’. It has an attribute called
name.
• GenericProduct
This class defines generic products. It has many to 0 or 1 relationship with the
class ‘CommonProcurementVocabulary’, many to 1 with ‘ProductTypology’, 1
to many with ‘Product’, and 1 to many with ‘StandardAppliedToGenericProduct’.
It contains an attribute – name.
2. Smart Monitoring and Smart Waste
I. Food Donations
This package helps to monitor the amount of edible food waste that was donated.
Information about the receiver organization can be stored here. The class diagram
for this package is shown in Figure C2 1 of the Appendix D. The classes and their
relationship in this package are as follows,
• MealDonation
This class defines the meal that was donated to an organization with the donated
doses. It contains an attribute donated_doses. This class has many to 1 relationship

CHAPTER 4 PROPOSED SYSTEM ARCHITECTURE
73
with the class ‘ScheduledMealRecipeMealType’ and many to 1 with
‘DonatedOrganization’.
• DonationOrganization
This class defines the organization which benefited from the donation. It has 1 to
many relationship with the class ‘MealDonation’ and contains 3 attributes – name
email, and contact.
II. Waste Measurement
This package focuses on the waste measurement. The amount of food or non-food
waste can be stored here using several units of measurement. Also, photographic
images can be stored in this package. The class diagram for this package is shown
in Figure C2 2 of the Appendix D. The classes and their relationship in this
package are as follows,
• FoodUnitMeasurement
This class defines the measurement of the food units. It has attribute value and
date. It generalizes two classes, ‘FoodWasteMeasurement’ and
‘WasteMeasurement’. It has many to 1 relationship with the class
‘UnitOfMeasure’, many to 1 with ‘FoodUnit’, and many to 1 with
‘ThresholdContext’.
• FoodWasteMeasurement
This class defines the measurement of food waste and is a child of the class
‘FoodUnitMeasurement’. It has 1 to many relationship with the class
‘FoodMeasurementPhoto’, many to1 with ‘FoodUnitLifeCyclePhase’, many to 1
with ‘TypeOfMaterial’, and many to 1 with ‘ScheduledMealRecipeMealType’.
• WasteMeasurement
This class defines the measurement of the waste and is a child of the class
‘FoodUnitMeasurement’. It has many to 1 relationship with the class
‘WasteDestionation’, many to 1 with ‘WasteMeasurementType’, and many to 1
with ‘WasteType’.

CHAPTER 4 PROPOSED SYSTEM ARCHITECTURE
74
• FoodMeasurementPhoto
This class is responsible for handling the photos of the food waste measurement.
It has many to 1 relationship with the class ‘FoodWasteMeasurement’and class
‘Media’.
III. Waste Generation
This package focuses on the management of waste generation. Information about
waste generation is covered by this package which includes the destination of the
waste, waste type, and the method that was used for waste measurement. The class
diagram for this package is shown in Figure C2 3 of the Appendix D. The classes
and their relationship in this package are as follows,
• WasteDestination
This class defines the destination of the wastes. It has an attribute, name. The
weight destination could be valorization, disposal, or waste-product. It has 1 to
many relationship with the class ‘WasteMeasurement’.
• WasteType
This class defines the type of wastes. It has an attribute, name. The type of wastes
can be urban, biodegradable, paper, glass, etc. It has 1 to many relationship with
the class ‘WasteMeasurement’.
• WasteMeasurementType
This class defines the type of the waste measurement. The waste measurement
type could be manually weighted or eGAR. eGAR is governmental legislation that
defines an electronic waste transport document. It has an attribute, name, and 1 to
many relationship with the class ‘WateMeasurement’.
IV. Waste Alert System
This package focuses on providing an alert system for waste management. Several
food units might have sensors that are used in the garbage can for warning about
the food waste threshold. When the garbage can is almost full, the sensors alert
the employees to replace the garbage bag in each unit. The class diagram for this

CHAPTER 4 PROPOSED SYSTEM ARCHITECTURE
75
package is shown in Figure C2 4 of the Appendix D. The classes and their
relationship in this package are as follows,
• ThresholdValue
This class defines the value of the thresholds. Such thresholds could be used while
measuring the wastes in various food units. This class has an attribute, value and
contains many to 1 relationship with the class ‘ThresholdLevel’.
• ThresholdLevel
This class defines the level of the thresholds. Such a level of thresholds could be
used while measuring the wastes in various food units. This class has an attribute,
name and contains 1 to many relationship with the class ‘ThresholdValue.
• ThresholdContext
This class defines the context of the thresholds. Such a context of thresholds could
be used while measuring the wastes in various food units. This class has an
attribute, name and contains 1 to many relationship with the class
‘ThresholdValue and ‘FoodUnitMeasurement’.
V. Food Waste
This package keeps the record of the amount of food waste by material that could
be edible or non-edible. The class diagram for this package is shown in Figure C2
5 of the Appendix D. The classes and their relationship in this package are as
follows,
• TypeOfMaterial
This class contains the type of material of the waste. It could be edible or non-
edible waste. Edible food waste is sent to various organizations for donation. This
class has an attribute, name and establishes a 1 to many relationship with the class
‘FoodWasteMeasurement’.
3. Smart Procurement
I. Sustainable Standards

CHAPTER 4 PROPOSED SYSTEM ARCHITECTURE
76
This package focuses on the various standards that are followed by the suppliers
in an organization. Keeping information about standards is important to make
sustainable purchases in the organization by analyzing the supplier’s policy. The
class diagram for this package is shown in Figure C3 1 of the Appendix D. The
classes and their relationship in this package are as follows,
• Standard
This class defines the standard for a product. It has 2 attributes – name and weight.
It contains 1 to many relationship with the classes ‘StandardLogos’,
‘StandardAppliedToGenericProduct’, and ‘StandardStockProduct’. It also
consists of many to 1 relationship with the class ‘StandardType’.
• StandardType
This class defines the type of standards which could be certification, label and
best practice. It has an attribute, name and contains 1 to many relationship with
the class ‘Standard’.
• StandardLogos
This class defines the logos of the standards that the organization establishes. It
has an attribute, order and has many to 1 relationship with the classes ‘Standard’,
and ‘Media’.
• StandardAppliedToGenericProduct
It is a relational link class between the class ‘Standard’ and ‘GenericProduct’. This
class contains many to 1 relationship with both of the classes.
• StandardStockProduct
It is a relational link class between the class ‘Standard’ and ‘StockMovement’.
This class has many to 1 relationship with both of the classes.
II. Supplier and Producer Management
This package focuses on the management of the supplier and the producers for the
organization. They are also evaluated with several evaluation criteria and this
package holds all those information. Evaluation of such entities helps for better

CHAPTER 4 PROPOSED SYSTEM ARCHITECTURE
77
management of future organizational purchases. The class diagram for this
package is shown in Figure C3 2 of the Appendix D. The classes and their
relationship in this package are as follows,
• Supplier
This class defines the supplier of the organization. This class has an attribute,
name, and relationship with multiple classes. It has 1 to many relationship with
the class ‘EvaluationTopicSupplier’, 1 to many with ‘SupplierSustainablePolicy’,
1 to many with ‘ProductSupplier’, and many to 1 with the class ‘Address’.
• ProductSupplier
It is a relational link class between ‘Product’ and ‘Supplier’. This class contains
an attribute ‘active’ and contains many to 1 relationship with both of the classes.
• SustainablePolicy
This class defines the sustainable policy of a supplier from the organization. It has
an attribute name, and has a 1 to many relationship with the attribute
‘SupplierSutainablePolicy’.
• SupplierSustainablePolicy
It is a relational link class between ‘Supplier’ and ‘SustainablePolicy’. This class
contains many to 1 relationship with both of the classes.
• Evaluation
This class is used for defining the evaluation of a supplier. It has an attribute
‘name’ and contains 1 to many relationship with a relational link class,
‘EvaluationTopicSupplier’.
• EvaluationTopic
This class defines the evaluation topic for a supplier. It has an attribute called
name and contains many to 1 relationship with the class ‘EvaluationtopicGroup’
and 1 to many relationship with the class ‘EvaluationTopicSupplier’.
• EvaluationTopicSupplier
CHAPTER 4 PROPOSED SYSTEM ARCHITECTURE
78
This class defines the evaluation of a supplier in an evaluation topic. It is a
relational link class between ‘Evaluation’, ‘Supplier’ and ‘EvaluationTopic’. This
class contains an attribute - value, and many to 1 relationship with all 3 classes.
• EvaluationTopicGroup
This class defines the evaluation topic group for a supplier. Evaluation topic group
could be criteria typology, method evaluation, etc. It has 1 to many relationship
with the class ‘EvaluationTopic’. It has an attribute – name.
• Producer
This class defines the producer for the organization. It has an attribute called name
and has relationship with 2 classes. It has 1 to many relationship with ‘Brand’ and
the same for ‘Address’ as well.
4. Smart Education
I. Actions
This package focuses on keeping information about several initiatives and
sensibilization given in the form of events to the organization’s employees and
the general public to combat food waste. Information about such actions can help
to check the effectiveness of the events by analyzing the difference of the food
waste before and after the events. The class diagram for this package is shown in
Figure C4 1 of the Appendix D. The classes and their relationship in this package
are as follows,
• ActionType
This class defines the types of actions which might include initiatives,
sensibilization, etc. It has 1 to many relationship with the class ‘Action’. It has an
attribute – name.
• Action
This class is a child of the class ‘Event’ and includes all the attribute from this
class which include title, description, start_date, end_date, duration, and
is_recurring. This class has many to 1 relationship with ‘ActionType’ and 1 to
many with ‘ActionTarget’.

CHAPTER 4 PROPOSED SYSTEM ARCHITECTURE
79
• Target
It class defines the various target group of the actions which can include
consumers, the general public, employees, etc. This class has 1 to many
relationship with the class ‘ActionTarget’. It has an attribute – name.
• ActionTarget
It is a relational link class between ‘Action’ and ‘Target’. This class contains many
to 1 relationship with both of the classes.
II. Common
This package provides information about the events that happened or are
scheduled to happen for providing education to people about food waste.
Notification of such events is also provided on several social media platforms
which can include Facebook. Twitter etc. The class diagram for this package is
shown in Figure C4 2 of the Appendix D. The classes and their relationship in this
package are as follows,
• Event
This class defines the educational event that occurs for various target groups for
awareness of food waste and contains attributes - title, description, start_date,
end_date, duration, and is_recurring. This class has 1 to many relationship with
‘EventFoodUnit’, ‘EventSocialNetwork’, and ‘Event Media’. This class also has
children in 2 different packages, Training, and Action. One child is the class
‘Action’ and the other is ‘Training’.
• SocialNetwork
This class defines various social networks like Facebook, Twitter, etc., and
contains attributes – name and provider_id. This class has 1 to many relationship
with the class ‘EventSocialNetwork’.
• EventSocialNetwork
This class is a relational link class between ‘Event’ and ‘SocialNetwork’ thus
containing many to one relationship with both of them.

CHAPTER 4 PROPOSED SYSTEM ARCHITECTURE
80
• EventFoodUnit
This class is a relational link class between ‘Event’ and ‘FoodUnit’ thus
containing many to one relationship with both of them.
• EventMedia
This class is a relational link class between ‘Event’ and ‘Media’ thus containing
many to one relationship with both of them. It has an attribute – order.
III. Training
This package provides information about the training given to the employees of
the organization at certain events. It also keeps track of the number of employees
that participated. The class diagram for this package is shown in Figure C4 3 of
the Appendix D. The classes and their relationship in this package are as follows,
• Training
This class defines the training events for the organization employees with the
number of participants in such events to combat food waste. It is a child of the
‘Event’ class and contains all the attributes that the parent posses with a distinct
attribute, num_participants.
IV. Articles
This package focuses on the articles in a form of news that were created by the
organization and its staff towards food waste and the initiatives done by them to
reduce and control it. The class diagram for this package is shown in Figure C4 4
of the Appendix D. The classes and their relationship in this package are as
follows,
• Article
This class serves the purpose of writing an article for an organization. It has
attributes –title, description, and date. It also has 1 to many relationship with the
class ‘ArticleMedia’, many to 1 with ‘ArticleType’, and many to 1 with ‘Staff’.

CHAPTER 4 PROPOSED SYSTEM ARCHITECTURE
81
• ArticleType
This class defines the types of the article. The different types can be news,
recommendation etc. It has an attribute, name and contains 1 to many relationship
with the class ‘Article’.
• ArticleMedia
This class is a relational link class between ‘Article’ and ‘Media’ thus containing
many to one relationship with both of them.
4.4. Physical Architecture
A physical architecture describes the whereabouts and connection of several necessary
components in the system. Such a diagram helps the reader to easily identify how various
components are interrelated and how their purpose is being served for a system to work.
Figure 22 of Appendix E describes several components from the project and where they
are supposed to be located. The diagram has been divided into 6 different segments. The
segments are,
• Production and storage,
• Food Unit,
• Waste Generation,
• Sensor,
• Data Inputs, and
• Data Processing.
1. Production and storage
Food products are produced by various producers who might be foreign or domestic.
The products are distinguished by the origin of the product. Producers supply these
products to national or foreign suppliers. National and foreign suppliers might have
their facility at any location of the country. They store the products provided by the
producers. Suppliers are distinguished or identified by their tax numbers. They are
responsible to provide the products necessary for the kitchen. The products provided

CHAPTER 4 PROPOSED SYSTEM ARCHITECTURE
82
by suppliers are stored in an off-site warehouse that might be near, but not
necessarily, to the designated kitchen.
2. Food unit
A food unit is a canteen or a restaurant inside a school, hospital, or social service. This
is the unit with various phases of food waste. In every food unit, there is the presence
of a data reading node which is demonstrated in Figure 23 of Appendix E. This node
is responsible for weight measurement and taking the images. This node will be
further described after this description of the physical diagram. Food waste can
happen in any of the following described 6 different phases,
I. Reception: This is the first phase of the food unit where the products from
the off-site warehouse are received.
II. Storage: In this phase, the products that have been received are stored. It
is divided into dry and freezer storage. The products are stored at the
necessary temperatures.
III. Preparation: This phase involves the preparation of food. It includes large-
scale equipment for baking, steaming, and cooking foods. Equipment
selection highly affects menu variety and types of foods served.
IV. Confection: This is the phase where food is made up of a variety of
ingredients or materials.
V. Distribution: This phase is the distribution of the meals. It is further into 2
different types, intermediate meals distribution, and main meals
distribution. Intermediate meals include breakfast, snack and, supper
whereas main meals include lunch and dinner.
VI. Consumption: This is the final phase of the food unit. Here, the customer
receives the food for consumption.
3. Waste Generation
This is the segment that exists in every kitchen type previously mentioned. This
segment keeps track of the food waste generated from the food unit. Such waste could
be inedible waste or leftovers. The leftovers are transported for donation. The waste

CHAPTER 4 PROPOSED SYSTEM ARCHITECTURE
83
generation segment might consist of a weight sensor for automated weighing of food
waste or manually weighing machines.
4. Sensor
As mentioned in the Waste Generation, a weight sensor/manual weighing is present
for the measurement of food waste.
The Weight of food waste can be measured in 2 different approaches, either manually
or in an automated manner. To measure the waste manually, the food waste will be
taken to a measuring scale by the kitchen employees and the data will be recorded by
the end of each day. To measure it in an automated manner, the sensors will be
embedded into the measure bin/scale and the food waste data will be sent to the IoT
agent. This has also been further described in Figure 23.
5. Data Inputs
Data will be collected with the help of other segments. To start, the in-site inventory
which is located near every kitchen helps to provide data about the stock of the
product. Data of the in-site inventory is managed by the inventory manager. When
food waste occurs, the leftovers are sent for donation. The track of the amount of
donation should also be made. Various awareness and educational programs are
conducted for employees and the public to make aware of the food waste. The track
of waste before and after the awareness program should also be made per typology to
observe the relevancy of such programs.
6. Data Processing
The previously recorded data are managed from the web or mobile application. Users
can view or update the stocks in an inventory, get the readings from the various
sensors, and amount of food waste and the donations made. All these data are stored
in the data center which consists of a database and web server and can be in any part
of the country. Users can retrieve or upload the data into the database with the help of
the application.

CHAPTER 4 PROPOSED SYSTEM ARCHITECTURE
84
In this project, we need to register the weight of food waste and the images for AI
analysis. This is one of the requirements that has been specified in the project. For
achieving this goal, two approaches have been created which can be seen in Figure
23. In the first approach, everything will be automatic. The kitchen staff will take the
weight to the weighing scale and, the weight value and the image will be automatically
sent to the server. In the second approach, staff will use their tablets to capture images,
select the meal type and send the weight to the server. Regarding how we can achieve
such a goal has been described in the following paragraphs.
In the first scenario, as shown in Figure 23 of Appendix E, a Load cell is used as a sensor.
A Load Cell is a forcer sensor that is principally used for measuring weight. It transforms
force or pressure into electrical output. The magnitude of this electrical output is directly
proportional to the force which is being applied. Load cells have a strain gauge, which
measures strain using a change in resistance. The strain gauge deforms when pressure is
applied. It generates an electrical signal as its effective resistance changes on deformation
(Load Sensors, 2020).
The electrical signal generated by the Load cell is in few millivolts and they should be
further amplified. Such amplification is performed by HX711. HX711 is a precision 24-
bit analog-to-digital converter designed for weighing scales and industrial control
applications to interface directly with a bridge sensor (‘24-Bit Analog-to-Digital
Converter (ADC) for Weigh Scales’, n.d.). HX711 module amplifies the low electric
output of Load cells and then this amplified and digitally converted signal is sent to
Arduino.
When the Arduino receives the reading combined from the Load cell and HX711, the
ESP32-CAM comes into play. ESP32-CAM is a full-featured microcontroller that also
has an integrated video camera and microSD card socket. This camera will also be
connected to Arduino and when the weight results are received from the other sensor, it
captures an image, and then it is sent to Arduino. Both Load cell and ESP32-CAM will
be attached to a rig to facilitate the weight measurement and image capture process.
Inside the Arduino, ESP32 is connected which is a series of low-cost, low-power systems
on a chip microcontroller with integrated Wi-Fi and Bluetooth. ESP32 will be used here
for its Wi-Fi capabilities. For sending the HX711’s reading and image, both sensors will
be authenticated against the PEP proxy. ESP32 will send a POST request to the PEP proxy

CHAPTER 4 PROPOSED SYSTEM ARCHITECTURE
85
with the credentials of the sensors. Sensors are already registered in the identity manager
with their respective credentials. Upon successful authentication, PEP returns an OAuth2
token. This OAuth2 token is used again by ESP32, and a new POST request is made to
the PEP proxy with the readings and images that were generated by the sensors. Since the
sensors might have limited bandwidth and memory resources, it uses Ultralight protocol
which is a lightweight text-based protocol for constrained devices. The body of this new
POST request will be based on Ultralight protocol and later when the IoT agent receives
it, the syntax will be converted into the one that API supports. In this case, NGSIv2.
In the second scenario, the staff sends the data manually to the server. This has to be done
when there is any problem with the sensors, or the readings are incorrect. In this case,
staff first authenticates to the system from an input device like a tablet. Upon successful
authentication, staff will be granted an OAuth2 token, and they will be prompted to a new
screen where they can manually input these values. They can select the meal type, capture
the images from their tablet and, they will receive the weight measured by sensors directly
into their application.
To receive the values from Arduino to the tablet, the staff’s tablet will be connected to
Arduino via Bluetooth. Arduino will receive Bluetooth abilities with the help of HC-06.
HC-06 is a Bluetooth module designed for establishing short-range wireless data
communication between two microcontrollers or systems. The Bluetooth capabilities
from ESP32 could have been used for this purpose but while the ESP32 is
sending/receiving a Bluetooth packet, it cannot listen or send a Wi-Fi packet.
When the staff receives the sensors reading successfully and they provide the required
user input, they will send all these values with the OAuth2 token to the PEP proxy. After
the access token is validated, the PEP proxy forwards the user inputs to the IoT Agent. 2
PEP proxies have been shown in the figure to visualize things easily but they are the same
PEP proxy that stands before the IoT agent.
In case of PEP proxy not being used for authentication, digitally signed certificates issued
by a Certificate Authority (CA) will be sent to the server along with the readings made
by the IoT devices. Readings made by the devices will be signed using the private key of
the certificate and this signature can only be verified with the corresponding public key.
Once the signed message arrives at the server, the server verifies the signature of the
message using the public key and then registers the readings.

CHAPTER 4 PROPOSED SYSTEM ARCHITECTURE
86
4.5. Logical Architecture
This section focuses on describing the logical architecture designed for the microservices
architecture of PPS2. This architecture focuses on the workflow of client applications and
sensors interacting with the microservices. Figure 24 in Appendix E represents the
diagram for the logical architecture of PPS2.
The users can interact with the system using their mobile device, tablet, or computer.
When they try to access any resources, they first need to identify themselves to the system.
Before they interact with any microservices directly, every request is handled by the API
gateway and is forwarded to the targeted resource server.
API gateway first verifies if the user has a valid token to make the request or not. If the
user is not authenticated yet, his request will be forwarded to the IDM(Identity Manager)
microservice where OAuth2 will be used for the authorization. OAuth2 will redirect him
to his identity provider where he will provide his credentials and authenticate himself.
Upon successful authentication, an access token will be generated on his behalf. This
token is forwarded to the user by the API gateway. After the user receives the token, they
can make the request again to access the resources appending the token they received
from the Identity Manager. API gateway verifies the token and forwards the request to
the targeted microservice. When microservices receive the request for resource access, a
PEP proxy from that specific application verifies the token and check if the user is
authorized to access the requested resource. If the authorization is valid, they reply with
the resource to the clients.
The communication between the microservices is handled using an AMQP broker. Each
microservice can be a producer, consumer, or both depending upon the communication
that is needed to be handled.
Whenever a publisher microservice sends a message, they are published to exchanges,
which are often compared to post offices or mailboxes. Exchanges then distribute the
copies of messages to the queues. After the copies are received in the queues, the broker
delivers the message to the consumers who are subscribed to queues. Consumers can also
pull messages from queues on demand rather than broker sending them automatically.
Sensors here are denoted by the Reading Node which already has been represented in
Figure 23 of Appendix E. Communication between the reading node and microservice is

CHAPTER 4 PROPOSED SYSTEM ARCHITECTURE
87
done through the MQTT broker which uses publish/subscribe messaging protocol. MQTT
has been used while communicating between the microservice and IoT devices because
it is a lightweight protocol that allows it to be implemented on both heavily constrained
device hardware as well as high latency/limited bandwidth networks. Its flexibility also
makes it possible to support diverse application scenarios for IoT devices and services
(‘What Is MQTT?’, 2017).
MQTT broker filters all the incoming messages from the publisher and distributes them
correctly to the subscribers who are subscribed to a topic. In this scenario, both weight
and image sensors are publishers and, the Stream Analytics Microservice is the
subscriber. The readings sent through sensors can be accessed by different microservices
or users using stream analytics API gateway.
Stream Analytics Microservice has the representation of Apache Kafka which is an event
streaming platform. It can publish or subscribe streams of events, store streams of the
event for the required duration, and process streams of events as they occur. This event
streaming platform in this project helps to continuously capture and analyze sensor data
from IoT devices.
4.6. Authentication Solution
Analyzing several security solutions for microservices authentication and authorization
from various studies and research in chapter 3.3, this section describes a proposed solution
for user and IoT devices authentication and authorization in the microservice architecture
of project BIOma.
User Authentication and Authorization
This solution secures the user’s identity as their credentials are not stored in this system,
and access tokens are used alongside the proxy for access to several resources. Figure 15
visually represents the flow of user authentication and authorization solution.
This solution is based on the idea of FIWARE’s Wilma PEP proxy with Keyrock IDM
(Identity Management). A separate microservice called Identity Manager is dedicated for
the sole purpose of handling the authentication and authorization of the system. Several

CHAPTER 4 PROPOSED SYSTEM ARCHITECTURE
88
authentications and authorization solutions were described in chapter 3.3.2 but this
solution was the most preferrable one due to its simplicity and the IAM (Identity and
Access Management) it offers. This solution offers full control over user’s roles and
permissions. Such roles and permissions can be revoked or modified at any time. Every
time a user wants to access a particular resource, the PEP proxy verifies the request with
the IDM (Identity Manager) and PDP (Policy Decision Point) if he possesses sufficient
permissions to access the resource. Each application can have a PEP proxy and users
authorized to that application with their roles and permissions in this solution.
Arguably, JWT could be used for roles and permissions in the form of JWT claims and
tokens could be validated in each microservice as used in the ‘Authentication
Orchestrator’ solution but it cannot be controlled when the token expires. Even after the
user has logged out, an app cannot kill it with the server code. This problem can be solved
using the combination of the ‘Client token with API Gateway’ solution but this solution
also has a drawback in the performance as the API gateway needs to make the token
translation every time the request is made.
In this proposed solution for user authentication and authorization, whenever a user
requests access to the system’s resources, his request is first handled by the API Gateway.
The API gateway checks if the user has an access token to make this request. If the user’s
request is not appended with a token, he will be redirected to the Identity Manager. The
user’s identity will be managed using OAuth2.
The flow of OAuth2 and choosing OAuth2 over SAML and OIDC is briefly described in
subsection ‘SSO Server’. Users can authenticate using their preferable identity providers
like Google, GitHub, or FIWARE, and authorize OAuth2 to use their personal
information. After a user is successfully authenticated using his identity provider and user
information is obtained, an access token is generated on behalf of the user. The access
token is forwarded to the user through the API Gateway.

CHAPTER 4 PROPOSED SYSTEM ARCHITECTURE
89
Figure 15 BIOma user authentication
After the user receives the access token, he again requests to access the resource in the
system. This time, API Gateway can confirm that the request has been made appending
an access token and the request is forwarded to the respective PEP proxy. Each
application in the system has its PEP proxy. After the request reaches the PEP proxy, it
sends a request to the Identity Manager for the access token verification. Here, the Identity
Manager also includes the PDP (Policy Decision Point) which is responsible for verifying
the user’s permission to access the resource of the request. After the verification is done
by the Identity Manager, it provides PEP proxy the user information, roles that the user
has for that application, HTTP verb that he can use, and the resource path of the
application that he is authorized to.
After all this information is received by the PEP proxy, it forwards the resource request
to the microservice depending upon the user’s roles and permissions. This resource
location is unknown to the outside users. After the information is retrieved from the
resource server, it is passed back to the user.
Device Authentication
The scope of this device authentication solution is to authenticate the IoT devices to the
server. Device authentication is handled by certificate-based authentication where Digital
Certificates are used to identify the devices before granting access to the resources.
Certificate-based authentication is used here for device authentication as it is stronger
compared to password authentication (SSL/TLS Client Authentication – Know How It

CHAPTER 4 PROPOSED SYSTEM ARCHITECTURE
90
Works, 2018). The certificate of each device should be signed by the CA (Certificate
Authority) and should contain information of digital signature, expiration date, name of
the CA, and device ID as CN (Common Name).
MQTT (Message Queuing Telemetry Transport) will be used for communication between
the microservice and IoT devices. MQTT server should be configured to use certificates
so that while the devices want to publish any message on a specific topic, only devices
with valid certificates can perform this action. Moreover, since the CN of the certificate
will be the device ID, it should also be stored on the server for additional verification.
Figure 16 Device authentication
In Figure 16, the IoT device has been represented as Reading Node. Each IoT device
should possess a certificate issued by the CA and a private key of that certificate. When
the device wants to publish the sensor reading to a specific topic in the MQTT broker, it
should first digitally sign the data using the ECDSA private key.
ECDSA key pair has been used over RSA during device authentication as ECDSA
provides optimal security with shorter key lengths which are optimal for IoT devices. It
also requires a lesser load for network and computing power as mentioned in section
‘RSA and ECDSA Cryptography’.
The data and the digital signature constitute evidence of the private key’s validity. The
digital signature can be created only with that private key and can be validated with the
corresponding public key against the signed data. The device sends both certificate and
the evidence to the MQTT broker.
When the message reaches the designated topic, the server uses the certificate and the
evidence to authenticate the device’s identity. After the device is validated, the message

CHAPTER 4 PROPOSED SYSTEM ARCHITECTURE
91
that it has published will be distributed to all the clients that are subscribed to that topic.
Subscribing clients will be the Stream Analytics Microservice in this case.
Proposed Authentication Solution Discussion
A solution is proposed for solving the authentication challenge in microservices one for
the user, and the other for IoT devices. For user authentication, the problem is solved
using a microservice that is responsible for identity and access management. This section
discusses further in-depth the possible outcomes of each authentication solution.
I. User authentication and authorization
A separate microservice is used for access control management of users in the application.
This microservice gives greater control of user access and decreases the effort required to
manage the identity and access management tasks. Each application is protected with a
PEP proxy which works alongside the identity manager to enforce access control to the
applications.
Using identity manager, applications can be registered with the users authorized to access
that application. Users in any application can be assigned roles and permissions. A role
can be added, edited, or removed using identity manager and any single role can have a
set of permissions. Such permissions can have a name, description, HTTP verb, and
resource rule.
Whenever a request is made to access the resource from the resource server, the PEP
proxy validates this request with the identity manager, gets the appropriate roles and
permissions of the user in that application, checks if he is authorized to make this request,
and gets the resources from the resource server on user’s behalf.
With this solution, user authentication and authorization are well handled for
microservices, but it also comes with some issues. This solution is proposed in the first
iteration of the project. The number of users having access to the application is
undetermined. Having a greater number of application users or requests might bring
performance issues.
If several users try to access the application at the same time, PEP proxies from different
microservices will make token validation requests with a single microservice. Not only
this, but some requests might also require resources from more than one microservice.

CHAPTER 4 PROPOSED SYSTEM ARCHITECTURE
92
All these requests are taken to the identity manager microservice. If network traffic high
in a single microservice, the latency of this microservice will affect the performance of
every other depending upon it.
Alternative solution
An alternative to this solution could be the use of JWT tokens instead of access tokens.
JWT can be signed using RSA. RSA is preferred over ECDSA in terms of signature
verification as discussed in “RSA and ECDSA Cryptography”. Roles and permissions
can be assigned to the JWT token in the payload. This alternative eliminates the use of
PEP proxy and the JWT token signature is verified by the microservices themselves.
Microservices can decode the token, check the permissions, and provide the resources as
requested after the signature has been verified.
This alternative itself has problems as well. If each microservice can validate the JWT
token and some changes related to token and security are introduced to the system, such
changes are needed to be executed in each microservice individually. Roles and
permission management with such tokens can be complicated. Each user might have
different roles and permission for each application. Generating a token that is fit for every
authorized request can be complex to implement. Moreover, authorization will be more
scattered around multiple services. When having a lot of roles that change frequently, it
becomes tiring to manage (Authentication and Authorization in Microservices | The
Startup, 2020).
When microservices are making the token validation, tokens cannot be revoked on
demand. In situations like change in user’s roles and permission, remote logout request
by the user, or user’s account deletion, the token cannot be invalidated. The token remains
valid until the expiry time has been reached despite the user logout. Moreover, eliminating
the use of proxies and users getting direct access to the resource server might increase
vulnerabilities in the system.
JWT tokens have several vulnerabilities in themselves as well. Since the signature of the
token is verified based on the algorithm defined in the header, if someone intercepts the
token, changes the algorithm to ‘none’, changes the payload, and sends the token to the
resource server, the server will check if there is an algorithm for signature verification

CHAPTER 4 PROPOSED SYSTEM ARCHITECTURE
93
and finds that the algorithm is set to none. The system passes the token as valid without
having a look over the signature.
In another scenario, someone can intercept the token and change the algorithm to HMAC
(Hash-based Message Authentication Code) which uses symmetric keys. The attacker can
use the public key to sign the token and forward it to the resource server. The resource
server when receives this token, verifies the signature with the public key and passes the
token as valid.
To solve the issues for the alternative solution, algorithm verification should always be
performed when a token is received. It should be ensured in the system what algorithm
will be used for the signature verification. The header should not determine the algorithm
of the token. If performance is required in JWT, ECDSA can be used but to avoid brute
force, RSA should be used. There should be a balance between performance and security.
Additional claims like ‘nbf’ - not valid before, ‘iat’ - issued time, ‘jti’ - unique JWT
identifier can be used for security, but each claim should always be validated.
The solution proposed in ‘Client token with API Gateway’ can be used to invalidate
tokens on demand and add an extra layer of security in the API gateway but with this
solution, if multiple requests are received in the API gateway, the response time for a
resource will be higher due to token translation. Such solutions are difficult to implement
and manage which adds complexity to the project.
II. Device Authentication
Client-side SSL is proposed as an authentication solution for IoT devices in this project.
This solution is secure as it is based on public and private keys where private keys are
stored in the device itself. With the use of client authentication, the identity of the device
is validated using a trusted CA which permits for centralized management of certificates
and makes revocation of the certificate easier.
Before any messages are published in the MQTT server, the publisher (IoT device) should
possess a valid certificate issued by the CA. The CN in the certificate will be the device
id and this CN in the certificate should be stored in the MQTT server as well. Later when
the device presents the valid CA certificate, the CN name will also be verified in the

CHAPTER 4 PROPOSED SYSTEM ARCHITECTURE
94
MQTT server. This ensures that the microservices in the system are only receiving the
data from authenticated sensors.
While using client certificates issued by the CA, an extra level of security is added but
such certificates aren’t issued for free. They add extra cost to the project and since
individual devices have unique certificates, the cost increases with the increase in the
number of IoT devices.
While using client certificates, it is important to manage the lifecycle of the client
certificates. If the organization doesn’t have a PKI (Public-Key-Infrastructure), managing
hundreds of client certificates like certificate revocation and certificate renewal can be a
difficult task.
Alternative solution
If cost and management should be considered in an organization, FIWARE’s solution can
be used for authenticating the IoT devices as well which was the initial proposed idea that
has been represented in the data reading node of chapter 4.4.
When any sensor sends a reading, they first need to authenticate themselves with the PEP
proxy. PEP proxy verifies the credentials with the IDM and sends them the access token.
Upon receiving the access token, the request is made again appending the token and upon
successful token validation, the request is forwarded to the IoT agent. The readings are
sent in form of UltraLight syntax which is a lightweight syntax used by IoT devices. IoT
Agent converts the UltraLight syntax into the one that API supports and forwards the
request to the specific topic in the MQTT broker. Stream analytics microservice will be
subscribed to the same topic and then will receive the readings from the sensors.
Password authentication is less secure than certificate authentication. If the attacker
somehow gets the credentials of the IoT devices, he can impersonate as an IoT device and
send malicious data in the network. This balance between cost and security should be
well thought before implementing any authentication solution.

95
Chapter 5 Analysis and Result
Discussion
5.1. Introduction
This chapter aims to discuss the work that has been done for proposing the architecture
of BIOma and PPS2. This work has focused on proposing the system requirements, UML
diagrams, physical and logical architecture, and especially on authentication solutions.
Such architectures are always needed to be defined in the initial phase of a project. This
work is analyzed thoroughly by collaborators involved in this project and necessary
changes are introduced to the system as the iteration goes by. Changes could start from
the system requirements. If the requirements are changed drastically, the UML diagrams,
physical architecture, and logical architecture of the system will also need a change.
5.2. Analysis and result of the proposed architecture
The solution in this work has been proposed as per the problem description of BIOma and
PPS2. Discussion with the project collaborators was made in the initial month of the
project, October 2020 to identify more clearly what technologies had to be used and what
was the goal of the PPS2. Following such meetings, this project has been started and
solutions have been proposed.
For the initial phase of the project, the locations were identified where the food waste
could happen. Every location was taken into consideration during location identification
for monitoring and controlling the waste amount. Employees for each location with their
purpose were also identified.
Following the location identification, system requirements were defined for the project.
While specifying the system requirements, it went through several revisions, and they

CHAPTER 5 ANALYSIS AND RESULT DISCUSSION
96
were categorized into packages and sub-packages. These system requirements are not still
considered as the final version because despite including the goals of the project and being
passed through several revisions, they can still go under evaluation by the collaborators
of this project and there might be requirements which are needed to be further changed.
While developing this work, after the requirements were specified, use case diagrams
were designed based on the requirements. Use case diagram included 3 major actors,
administrator, unit manager, and unit collaborator. This diagram was divided into
packages following the order of user requirements.
After the use case diagrams were finished, user stories were written based on what
features were needed in the system, for whom, and why. User stories and use case
diagrams did not go through several iterations as requirements did, but they were designed
considering the requirements and goals of the PPS2 system.
After the use case and user stories were created, class diagrams were designed for the
deliverable. Class diagrams in this work have also been categorized into packages. Each
package corresponds to the package of the system requirements with an extra package
which is Common Management. Several classes, attributes, and relationships are
identified which fulfills visualizing the system graphically. If changes are introduced in
the system requirements class diagrams are subject to change as well.
Writing requirements and creating these UML diagrams already gives an overview of
what is needed for the system. Even if these requirements and diagrams might not be
perfect and might need some changes, anyone joining this project can figure out what this
project intends to do.
After the UML diagrams were created, physical and logical diagrams were created for the
project. Since waste could happen in various locations, they were already identified in the
initial phase of the project. These locations were defined as food units, and they were
represented visually in sequential order in the physical diagram. This project also uses
several IoT sensors to send readings to the server. In every food unit, some users or
sensors interact with the data in the system. Such users and sensors were represented in a
separate diagram as the data reading node. This separation of diagrams allowed to briefly
represent how staff or sensors were interacting with the data inside each food unit.
CHAPTER 5 ANALYSIS AND RESULT DISCUSSION
97
This work proposes the BIOma and PPS2 project to use microservices architecture as
such architecture offers independent deployability, scalability, and also offers better
security. The logical architecture of this project represented how the microservices were
working, how they would communicate with each other, and how users or sensors were
interacting logically with the system. The logical architecture was designed based on
documentation by (nishanil, n.d.-b). After reading this documentation, it was concluded
that asynchronous protocol is better for communication between services in a
microservices architecture.
A separate stream analytics microservice was dedicated for sensors because, in the case
of PPS2, there are only 2 different types of sensors identified so far but in the case of
other PPS of BIOma, there might be sensors that can continuously upload data in the
server. Apache Kafka was used as an event streaming platform to continuously analyze
and capture the stream of data that is generated by the sensors. This microservice and
sensors communicate through the MQTT broker.
Physical and Logical architecture both went through several iterations by being evaluated
by the project’s supervisor. The physical and logical architecture presented in this work
is the latest version of the model at the time this solution was proposed.
Authentication and authorization were another major part of this work. Researches done
for microservices authentication were discussed in chapter 3.3.2. These researches were
extracted from IEEE Xplore, FIWARE’s documentation, and the web. Based on the study
made from these researches, an authentication mechanism for user authentication and
authorization was proposed. After analyzing the advantages, complexity, security
approaches of each research, FIWARE’s solution was concluded as the optimal solution
for the current structure of the project. This selection was made based on the goal of the
project. The problem with authentication was easier to handle than authorization. An
Identity Manager was proposed for this project’s architecture to tackle issues of access
management and authorization in microservices.
While discussing the device authentication in the reading node of chapter 4.4, the initial
idea was to use the PEP’s proxy solution. The PEP proxy was handling the device’s
authentication and the IoT agent was used to convert the UltraLight syntax used by IoT
sensors to the syntax that the API supports. This solution didn’t offer a good level of
security. To resolve this issue, the solution of PEP proxy for IoT devices was eliminated
CHAPTER 5 ANALYSIS AND RESULT DISCUSSION
98
and digital certificate authentication was proposed for the authentication of IoT devices
despite increased costs and the need for PKI infrastructure deployment. Security is
ensured with the help of client certificates as sensors can validate their identity with the
MQTT broker.
While developing this work, I had little knowledge about the differences between
monolithic and microservices architecture. Microservice was completely a new topic to
me and I didn’t know how it was working. After reading the documentation from
Microsoft as per the recommendation of the project’s supervisor, I had a general
knowledge of what it was and when we should use it. I also had to develop few projects
that were based on microservices architecture just to know its principles and inter-services
communication. RabbitMQ was used during the study for communication between the
services and the applications were deployed in the Docker container. With the help of this
study, it gave me a better idea of how I could move forward in this project. This helped
me create the system architecture for the project and better understand the challenges of
authentication in a microservices architecture.
5.3. Conclusion
There can always be an alternative to this solution that has been proposed. This solution
cannot be considered as a perfect solution of the project architecture because requirements
can still change for the project, the need of the partners and stakeholders might change
which will consequently affect the architecture of the system. As described in chapter
4.6.3, there still are alternatives that could be used for various issues with user
authentication. Each solution has its advantages and disadvantages. With the current
status and for the first iteration of this project, this architecture has been proposed for
BIOma and PPS2.

99
Chapter 6 Conclusions and
Future Work
6.1. Conclusion
This work intended to propose a system architecture for BIOma and one of its macro-
activities, PPS2 for combating food waste. The proposed work has resulted as a
deliverable for PPS2.A1.E2. The work that has been proposed in this solution is done at
the early stage of the project and is done as a design task. Further changes are normal to
happen throughout the evaluation and discussion of the project’s collaborators.
In terms of authentication and authorization, it was divided into 2 different parts, one for
user authentication and authorization, and the other for IoT device authentication.
FIWARE’s PEP proxy solution has been initially proposed in this work for solving the
issues with user’s authorization to various microservices. As an alternative, JWT with
RSA signature was also discussed but it comes with vulnerabilities and complexities for
authorization. For device authentication, a solution with client-side certificate
authentication was proposed. MQTT server validates the certificate of the devices and
after the validation, it allows to publish the readings on a specific topic. This solution for
devices is costly but this price has to be paid for better system security.
As a result of this work, with the problem that BIOma and PPS2 presented, an architecture
for a system was designed that would serve as a base for solving this problem. A solution
has been proposed that would promote sustainable purchases in an organization. The
system permits the evaluation of suppliers according to their sustainable policy, producers
at local and national levels are promoted, and food waste is identified in several locations
with measures to control and monitor them. Various events can also be registered and

CHAPTER 6 CONCLUSIONS AND FUTURE WORK
100
organized with the help of this system which aware the general public of the need for food
consumption, and the impact of food waste.
6.2. Future Work
The next works will be devoted to implementing the system once the requirements and
proposed architecture go until the final iteration and are accepted by the collaborators
from this work. The initial version of the system architecture has been described in this
work. While developing the system, authentication and authorization should be kept as a
major focus as it is a crucial part of the system. Once there is an actual estimation of the
sensors and active users that will participate in the system, the authentication strategy
should be followed accordingly for better performance.
There might be an adjustment to the requirements as the requirements submitted in this
deliverable is at the early stage. This is a collaborative project and is gone through several
iterations and evaluations by the project’s collaborators. Adjustment to such requirements
might require changes to the use case diagram, user stories, class diagrams, and also to
the system’s physical and logical architecture.
Solutions for authentication and authorization have been proposed by the research that
was made during this work was done. In the coming years, there might be more relevant
research and implementation that will be worth studying for better management of user
and device authentication and authorization in a microservice architecture.

101
Bibliography
24-Bit Analog-to-Digital Converter (ADC) for Weigh Scales. (n.d.). Avia
Semiconductor.
https://cdn.sparkfun.com/datasheets/Sensors/ForceFlex/hx711_english.pdf
A Basic Non-Functional Requirements Checklist. (2014, January 8). Thoughts from the
Systems Front Line.... https://dalbanger.wordpress.com/2014/01/08/a-basic-non-
functional-requirements-checklist/
A Guide to Functional Requirements (with Examples). (n.d.). Retrieved 18 June 2021,
from https://www.nuclino.com/articles/functional-requirements
Adel, A., & Abdullah, B. (2015a). A comparision Between Three SDLC Models
Waterfall Model, Spiral Model, and Incremental/Iterative Model. IJCSI
International Journal of Computer Science Issues, 12(1).
Adel, A., & Abdullah, B. (2015b). A comparision Between Three SDLC Models
Waterfall Model, Spiral Model, and Incremental/Iterative Model. IJCSI
International Journal of Computer Science Issues, 12(1), Article 1.
Anonymous. (2016, July 5). Common procurement vocabulary [Text]. Mercado Interno,
Indústria, Empreendedorismo e PME - European Commission.
https://ec.europa.eu/growth/single-market/public-procurement/digital/common-
vocabulary_en
Asymmetric algorithms—Cryptography 35.0.0.dev1 documentation. (n.d.). Retrieved 25
June 2021, from https://cryptography.io/en/latest/hazmat/primitives/asymmetric/
Authentication and Authorization in Microservices | The Startup. (2020, September 11).
https://medium.com/swlh/authentication-and-authorization-in-microservices-
how-to-implement-it-5d01ed683d6f

102
Ayoub, M. (2018, April 25). Microservices Authentication and Authorization Solutions.
Medium. https://medium.com/tech-tajawal/microservice-authentication-and-
authorization-solutions-e0e5e74b248a
Bánáti, A., Kail, E., Karóczkai, K., & Kozlovszky, M. (2018). Authentication and
authorization orchestrator for microservice-based software architectures. 2018
41st International Convention on Information and Communication Technology,
Electronics and Microelectronics (MIPRO), 1180–1184.
https://doi.org/10.23919/MIPRO.2018.8400214
Booch, G., J., R., & I., J. (1999a). The unified modeling language user guide.
Booch, G., J., R., & I., J. (1999b). The unified modeling language user guide.
Bosch, J. (2000a). Design and use of software architectures: Adopting and evolving a
product-line approach.
Bosch, J. (2000b). Design and use of software architectures: Adopting and evolving a
product-line approach.
Choosing an SSO Strategy: SAML vs OAuth2. (2013, May 9). Mutually Human.
https://www.mutuallyhuman.com/blog/choosing-an-sso-strategy-saml-vs-
oauth2/
CPS Wi-Fi Configuration Guide. (2016a). Cisco Systems, Inc.
https://www.cisco.com/c/en/us/td/docs/wireless/quantum-policy-suite/R10-0-
0/bk_CPS100WiFiConfigurationGuide.pdf
CPS Wi-Fi Configuration Guide. (2016b). Cisco Systems, Inc.
https://www.cisco.com/c/en/us/td/docs/wireless/quantum-policy-suite/R10-0-
0/bk_CPS100WiFiConfigurationGuide.pdf

103
Data protection in the EU. (n.d.). [Text]. European Commission - European
Commission. Retrieved 22 March 2021, from https://ec.europa.eu/info/law/law-
topic/data-protection/data-protection-eu_en
Data protection in the EU. (2021, March 22). [Text]. European Commission - European
Commission. https://ec.europa.eu/info/law/law-topic/data-protection/data-
protection-eu_en
Dennis, A., Wixom, B., & Roth, R. (2012a). System Analysis & Design (5th ed.). Wiley.
Dennis, A., Wixom, B., & Roth, R. (2012b). System Analysis & Design (5th ed.). Wiley.
Developing Network Security Strategies > Network Security Design | Cisco Press.
(2010a, October 4). https://www.ciscopress.com/articles/article.asp?p=1626588
Developing Network Security Strategies > Network Security Design | Cisco Press.
(2010b, October 4). https://www.ciscopress.com/articles/article.asp?p=1626588
doodlemania2. (2019, May 23). Interservice communication in microservices—Azure
Architecture Center. https://docs.microsoft.com/en-
us/azure/architecture/microservices/design/interservice-communication
Ebert, C., & Jones, C. (2009a). Embedded Software: Facts, Figures, and Future.
Computer, 42(4), 42–52. https://doi.org/10.1109/MC.2009.118
Ebert, C., & Jones, C. (2009b). Embedded Software: Facts, Figures, and Future.
Computer, 42(4), 42–52. https://doi.org/10.1109/MC.2009.118
Fernandes, J. M., & Machado, R. J. (2016a). Requirements in Engineering Projects.
Springer International Publishing. https://doi.org/10.1007/978-3-319-18597-2
Fernandes, J. M., & Machado, R. J. (2016b). Requirements in Engineering Projects.
Springer International Publishing. https://doi.org/10.1007/978-3-319-18597-2
FIWARE PEP Proxy. (n.d.). FIWARE PEP Proxy. Retrieved 25 June 2021, from
https://documenter.getpostman.com/view/513743/RWaHxUgP

104
Garlan, D., & Perry, D. (1995). Introduction to the Special Issue on Software
Architecture. 6.
GDPR and cookie consent | Compliant cookie use. (2020, October 27).
https://www.cookiebot.com/en/gdpr-cookies/
Ghezzi, C., M., J., & D., M. (1991a). Fundamentals of software engineering.
Ghezzi, C., M., J., & D., M. (1991b). Fundamentals of software engineering.
Harper, K. E., & Dagnino, A. (2014). Agile Software Architecture in Advanced Data
Analytics. 2014 IEEE/IFIP Conference on Software Architecture, 243–246.
https://doi.org/10.1109/WICSA.2014.16
Hatley, D. J., & I.A., P. (1987a). Strategies for real-time system specification.
Hatley, D. J., & I.A., P. (1987b). Strategies for real-time system specification.
He, X., & Yang, X. (2017). Authentication and Authorization of End User in
Microservice Architecture. Journal of Physics: Conference Series, 910, 012060.
https://doi.org/10.1088/1742-6596/910/1/012060
IoT Device Authentication: Benefits of Client-Side SSL. (2019, October 8).
https://www.verypossible.com/insights/iot-device-authentication-benefits-of-
client-side-ssl
Li, Z., Seco, D., & Sánchez Rodríguez, A. E. (2019). Microservice-Oriented Platform
for Internet of Big Data Analytics: A Proof of Concept. Sensors, 19(5), 1134.
https://doi.org/10.3390/s19051134
Load Sensors. (2020, March 6). https://dewesoft.com/daq/measure-weight-with-load-
cell-sensors
McCabe, J. (2007a). Network Analysis, Architecture, and Design (3rd ed.). Morgan
Kaufmann.

105
McCabe, J. (2007b). Network Analysis, Architecture, and Design (3rd ed.). Morgan
Kaufmann.
Naik, N., Jenkins, P., & Newell, D. (2017). Choice of suitable Identity and Access
Management standards for mobile computing and communication. 2017 24th
International Conference on Telecommunications (ICT), 1–6.
https://doi.org/10.1109/ICT.2017.7998280
nishanil. (n.d.-a). Logical architecture versus physical architecture. Retrieved 24
February 2021, from https://docs.microsoft.com/en-
us/dotnet/architecture/microservices/architect-microservice-container-
applications/logical-versus-physical-architecture
nishanil. (n.d.-b). .NET Microservices. Architecture for Containerized .NET
Applications. Retrieved 15 June 2021, from https://docs.microsoft.com/en-
us/dotnet/architecture/microservices/
nishanil. (2021, February 24). Logical architecture versus physical architecture.
https://docs.microsoft.com/en-us/dotnet/architecture/microservices/architect-
microservice-container-applications/logical-versus-physical-architecture
OAuth 2.0—OAuth. (n.d.). Retrieved 12 June 2021, from https://oauth.net/2/
Pereira-Vale, A., Márquez, G., Astudillo, H., & Fernandez, E. B. (2019). Security
Mechanisms Used in Microservices-Based Systems: A Systematic Mapping.
2019 XLV Latin American Computing Conference (CLEI), 01–10.
https://doi.org/10.1109/CLEI47609.2019.235060
R. Stevens, P., B., K., J., & S., A. (1998a). Systems engineering: Coping with
complexity.
R. Stevens, P., B., K., J., & S., A. (1998b). Systems engineering: Coping with
complexity.

106
Romano, B. L., Silva, G. B. e, Campos, H. F. de, Vieira, R. G., Cunha, A. M. da,
Silveira, F. F., & Ramos, A. C. B. (2009a). Software Testing for Web-
Applications Non-Functional Requirements. 2009 Sixth International
Conference on Information Technology: New Generations, 1674–1675.
https://doi.org/10.1109/ITNG.2009.209
Romano, B. L., Silva, G. B. e, Campos, H. F. de, Vieira, R. G., Cunha, A. M. da,
Silveira, F. F., & Ramos, A. C. B. (2009b). Software Testing for Web-
Applications Non-Functional Requirements. 2009 Sixth International
Conference on Information Technology: New Generations, 1674–1675.
https://doi.org/10.1109/ITNG.2009.209
SAML v2.0 Technical Overview. (2008, March 25). https://docs.oasis-
open.org/security/saml/Post2.0/sstc-saml-tech-overview-2.0-cd-
02.html#1.Introduction|outline
ShuLin, Y., & JiePing, H. (2020). Research on Unified Authentication and
Authorization in Microservice Architecture. 2020 IEEE 20th International
Conference on Communication Technology (ICCT), 1169–1173.
https://doi.org/10.1109/ICCT50939.2020.9295931
Sommerville, I. (1996a). Software Process Models. ACM Comput. Surv., 28, 269–271.
https://doi.org/10.1145/234313.234420
Sommerville, I. (1996b). Software Process Models. ACM Comput. Surv., 28, 269–271.
https://doi.org/10.1145/234313.234420
SSL/TLS Client Authentication – Know How it Works. (2018, June 5).
https://comodosslstore.com/blog/what-is-ssl-tls-client-authentication-how-does-
it-work.html

107
Sun, L., Li, Y., & Memon, R. A. (2017a). An open IoT framework based on
microservices architecture. China Communications, 14(2), 154–162.
https://doi.org/10.1109/CC.2017.7868163
Sun, L., Li, Y., & Memon, R. A. (2017b). An open IoT framework based on
microservices architecture. China Communications, 14(2), 154–162.
https://doi.org/10.1109/CC.2017.7868163
System Modeling: Understanding Logical and Physical Architecture—Data Science
Central. (n.d.). Retrieved 24 February 2021, from
https://www.datasciencecentral.com/profiles/blogs/system-modeling-
understanding-logical-and-physical-architecture
System Modeling: Understanding Logical and Physical Architecture—Data Science
Central. (2021, February 24).
https://www.datasciencecentral.com/profiles/blogs/system-modeling-
understanding-logical-and-physical-architecture
The Spiral Model—The Ultimate Guide to the SDLC. (n.d.). Retrieved 23 February
2021, from https://ultimatesdlc.com/spiral-model/
Toradmalle, D., Singh, R., Shastri, H., Naik, N., & Panchidi, V. (2018). Prominence Of
ECDSA Over RSA Digital Signature Algorithm. 2018 2nd International
Conference on 2018 2nd International Conference on I-SMAC (IoT in Social,
Mobile, Analytics and Cloud) (I-SMAC)I-SMAC (IoT in Social, Mobile,
Analytics and Cloud) (I-SMAC), 253–257. https://doi.org/10.1109/I-
SMAC.2018.8653689
What is MQTT? Why use MQTT? (2017, May 12). IBM Developer.
https://developer.ibm.com/technologies/messaging/articles/iot-mqtt-why-good-
for-iot/

108
Whytock, S. (1993a). The development life-cycle.
Whytock, S. (1993b). The development life-cycle.
Yang, J., Hou, H., Li, H., & Zhu, Q. (2021). User Fast Authentication Method Based on
Microservices. 2021 IEEE International Conference on Power Electronics,
Computer Applications (ICPECA), 93–98.
https://doi.org/10.1109/ICPECA51329.2021.9362656
Yourdon, E. (1988a). Managing the system life cycle: A software development
methodology overview (2nd ed.).
Yourdon, E. (1988b). Managing the system life cycle: A software development
methodology overview (2nd ed.).

109
Appendix A Identity and Access Management
Standards
Figure 17 SAML2.0 Flow
Source: (Choosing an SSO Strategy, 2013)

APPENDIX
110
Figure 18 OAuth2 Flow

APPENDIX
111
Figure 19 OIDC Use Case
Source: (Naik et al., 2017)

APPENDIX
112
Appendix B Certificates and Labels
Figure 20 Certificates and Labels
Logo Certifications/Labels
4C (The Common Code for the Coffee Community)
Agricultura Biológica (EU Organic Logo)
Aquaculture Stewardship Council (ASC)
Blue Angel
Comprovativo de Compra em Lota (CCL)
Denominação de Origem Protegida (DOP) / Indicação geográfica
protegida (IGP) / Indicações geográfica (IG)
Dolphin Safe
Energy Star
EU Ecolabel
Fair for Life - Social & Fair Trade certified / For Life Social
Responsibility certified
Fair Trade Certified
FairTrade International
Forest Stewardship Council (FSC)
GlobalG.A.P.
Global Organic Textile Standard (GOTS)
Marine Stewardship Council (MSC)
Oeko-Tex Standard 100
Portugal sou Eu
Rainforest Alliance / UTZ
Roundtable on Responsible Soy (RTRS)
Roundtable on Sustainable Palm Oil (RSPO)
RSPCA Assured
UEBT UTZ
V-Label

APPENDIX
113
Appendix C Use Case Diagrams PPS2
Figure UC 1 Management Package

APPENDIX
114
Figure UC 2 Smart Procurement Package

APPENDIX
115
Figure UC 3 Smart Monitoring Package

APPENDIX
116
Figure UC 4 Smart Waste Package

APPENDIX
117
Figure UC 5 Smart Education Package
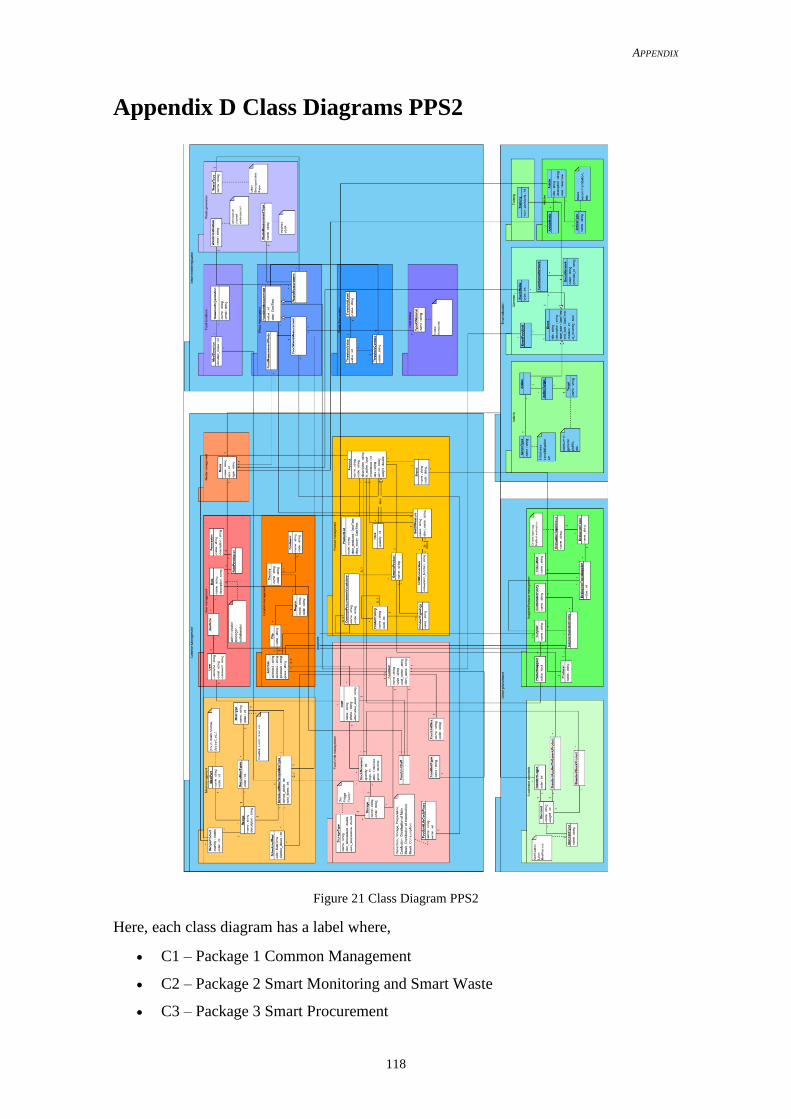
APPENDIX
118
Appendix D Class Diagrams PPS2
Figure 21 Class Diagram PPS2
Here, each class diagram has a label where,
• C1 – Package 1 Common Management
• C2 – Package 2 Smart Monitoring and Smart Waste
• C3 – Package 3 Smart Procurement

APPENDIX
119
• C4 – Package 4 Smart Education
Figure C1 1 Meal Management
Figure C1 2 User management
Figure C1 3 Media Management

APPENDIX
120
Figure C1 4 Location Management
Figure C1 5 Food Units Management

APPENDIX
121
Figure C1 6 Product Management
Figure C2 1 Food Donations
Figure C2 2 Waste Measurement
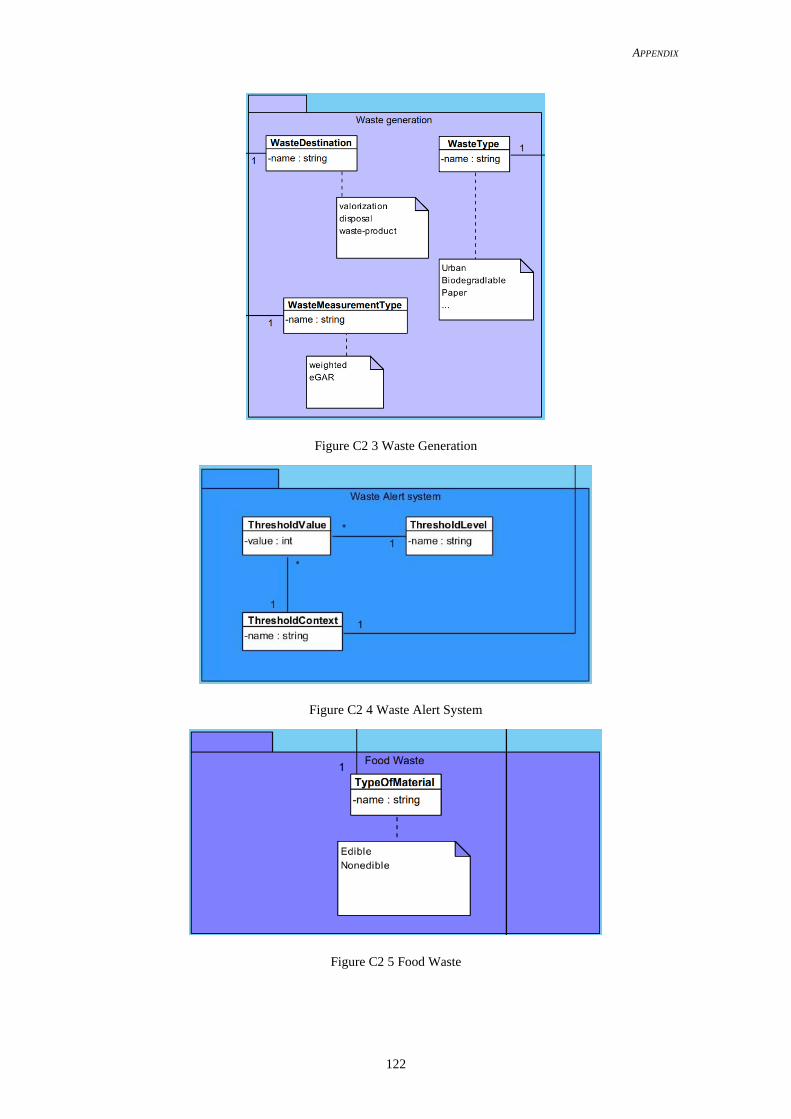
APPENDIX
122
Figure C2 3 Waste Generation
Figure C2 4 Waste Alert System
Figure C2 5 Food Waste

APPENDIX
123
Figure C3 1 Sustainable Standards
Figure C3 2 Supplier/Producer Management
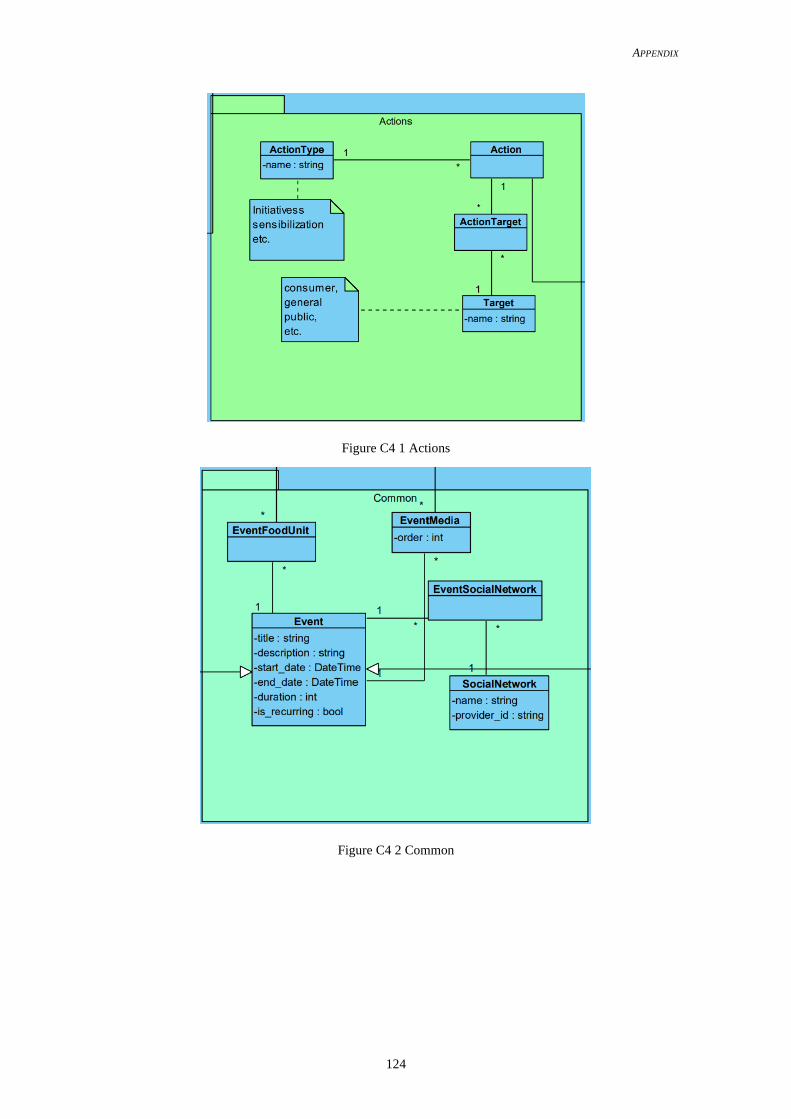
APPENDIX
124
Figure C4 1 Actions
Figure C4 2 Common

APPENDIX
125
Figure C4 3 Training
Figure C4 4 Articles

APPENDIX
126
Appendix E System Architecture
Figure 22 Physical Architecture PPS2

APPENDIX
127
Figure 23 Data reading node

APPENDIX
128
Figure 24 Logical Architecture
Copyright © 2022 FDOKUMEN