Web Fraud Prevention, Identity Verification & Authentication ...
Upload
khangminh22Category
view
1download
0
CRAMO PLCKALLIOSOLANTIE 2
01740 VANTAA
FINLAND
WWW.CRAMO.COMANNUAL REPORT 2007
CR
AM
O P
LC
• A
NN
UA
L R
EP
OR
T 2
00
7
A YEAROF GROWTH CRAMO PLC

CONTACTS
POWERING YOUR BUSINESS
GROUP HEADQUARTERSCramo OyjKalliosolantie 2FI-01740 Vantaa FinlandTel +358-10 661 10www.cramo.com
GROUP OPERATIONAL CENTRECramo ABTorshamnsgatan 35SE-164 95 KistaSwedenTel +46-8 623 5400www.cramo.com
EQUIPMENT RENTALFINLANDCramo Finland OyKalliosolantie 2FI-01740 VantaaFinlandTel +358-10 661 10www.cramo.fi
SWEDENCramo Sverige ABTorshamnsgatan 35SE-164 95 KistaSwedenTel +46-8 623 5400www.cramo.se
NORWAYCramo ASPB 34, AlnabruNO-0614 OsloNorwayTel +47-23 37 55 60www.cramo.no
DENMARKCramo A/SFabriksparken 30-32DK-2600 GlostrupDenmarkTel +45-4363 0100www.cramo.dk
ESTONIACramo Estonia ASKadaka tee 131EE-129 15 TallinnEstoniaTel +372-6 830 800www.cramo.ee
LATVIASIA CramoGanibu dambis 27/5LV-1005 RigaLatviaTel +371-7 387 554www.cramo.lv
LITHUANIAUAB CramoVerkiu str. 50LT-09109 VilniusLithuaniaTel +370-5 235 7040www.cramo.lt
POLANDCramo Sp.zo.o.Ul. Pulawska 405PL-02801 WarsawPolandTel +48-22 211 98 98www.cramo.pl
Cramo Podestry Ruchome Sp.zo.oUl. Biskupinska 16PL-30732 KrakowPolandTel +48-12 2903 10www.cramo-podesty.pl
RUSSIAZAO CramoZanevka 48/1RU-195298 St.PetersburgRussiaTel +7-812 521 8558www.cramo.ru
ZAO Cramo RentakranBoltino VillageMytischi District Moscow Region141032 RussiaTel +7-495-651 70www.cramorentakran.ru
MODULAR SPACE, FINLANDCramo Instant OyP.O. Box 9, Huurretie 19FI-33471 YlöjärviFinlandTel +358-10 661 5500www.cramo.fi
MODULAR SPACE, SCANDINAVIACramo Instant ABTorshamnsgatan 35SE-164 95 Kista SwedenTel +46-8 623 5470www.cramo.se
Cramo Instant ASPB 33, Tverrveien 1NO-3056 Solbergelva, NorwayTel +47-32 27 30 30www.cramo.no
Cramo A/SFabriksparken 30-32DK-2600 GlostrupDenmarkTel +45-4363 0100www.cramo.dk
MARKET AREA
POWERINGYOURBUSINESS

3CONTENTS
CONTENTS PAGE
STRATEGY AND HIGHLIGHTS
Information for shareholders 5
Cramo in brief 6
Year 2007 highlights 7
CEO’s review 8
Strategy 10
Growth drivers & market trends 14
BUSINESS REVIEW
Business overview 18
Finland 20
Sweden 22
Western Europe 24
Other Europe 26
Modular space 28
FINANCIAL REVIEW 30
GOVERNANCE
Economic responsibility 75
Human resources 76
Environmental responsibility 79
Corporate Governance 80
Risk management 83
Board of Directors 31 December 2007 86
Group Management 31 December 2007 88
Product portfolio 90
Contacts Inside cover

4 2007 / ANNUAL REPORT / CRAMO PLC / POWERING YOUR BUSINESS
ONE CRAMOONE BRAND

5INFORMATION FOR SHAREHOLDERS
INFORMATION FOR SHAREHOLDERSANNUAL GENERAL MEETINGThe Annual General Meeting of Cramo Plc will be held on
Wednesday, 23 April 2008, at 10 am, in the Finlandia Hall.
The address of the venue is Mannerheimintie 13e, Helsinki
(entrance from doors M4 and K4). Admission of registered
shareholders begins at 9 am.
Shareholders who wish to attend the AGM must notify the company
of their attendance no later than 16 April 2008 at 4 pm in
writing to Castrén & Snellman Attorneys Ltd., Mr Antti Rintakoski,
P.O. Box 233, FI-00131 Helsinki, by telephone to +358 7765 315 /
Antti Rintakoski on weekdays Monday to Friday from 9 am to 4 pm
(Finnish time), by fax to +358 20 7765 001/ Antti Rintakoski, or by
e-mail to [email protected] .
DIVIDEND PAYMENTThe Board of Directors proposes to the AGM that a dividend of EUR
0.65 per share be paid for the fi nancial year 2007. The matching
day for the payment of dividends is 28 April 2008, and the proposed
dividend payment date is 6 May 2008.
CRAMO BASIC SHARE INFORMATION- Listed at the OMX Nordic Exchange Helsinki
- Trading code: CRA1V
- Industry: Commercial Services & Supplies
- Number of shares, 31 Dec 2007: 30,660,189
Additional information about shares and shareholders is
presented in Note 36 in the Consolidated Financial Statements
in the Financials.
FINANCIAL REPORTING- Annual report, March 31, 2008
- Interim report for January-March, May 13, 2008
- Interim report for January-June, August 12, 2008
- Interim report for January-September, November 11, 2008
The annual reports and interim reports are available in Finnish
and English and can also be read on Cramo’s website at
www.cramo.com/investors.
Cramo’s management serves analysts and the media with regular
press conferences. Management also gives interviews on a one-
on-one and group basis. Cramo participates in various conferences
for investors.
Cramo observes a three week closed period preceding the
publication of its results.
INVESTOR RELATIONSVesa Koivula, President and CEO, tel. +358 10 661 1240,
e-mail: [email protected]
Martti Ala-Härkönen, CFO, tel. +358 10 661 1270,
e-mail: [email protected]
Päivi Dahlqvist, Executive Assistant, tel. +358 10 661 1241,
e-mail: [email protected]
Financial documents can be obtained from Cramo Plc,
Kalliosolantie 2, FI-01740 Vantaa, tel. +358 10 661 1241,
e-mail: [email protected].
Investor information is available online at www.cramo.com/investors.
The investor section contains the information presented here, together
with other IR-related information, including a share monitor, delayed
by 15 minutes, a list of company’s public permanent insiders and their
holdings, a collection of presentation materials and current market
data as well as services such as an investment calculator.
CHANGE OF ADDRESSIf your address or account number for dividend payment changes,
we request that you send a written notifi cation of this to the particular
register holding your Book Entry Account. If your account is held at the
Finnish Central Securities Depository Ltd’s account operator, please
send the written notifi cation to: Finnish Central Securities Depository
Ltd., PO Box 1110, FI-00101 Helsinki, fax +358 20 770 6656.
ANALYSTSTo our knowledge at least the following fi nancial analysts follow
Cramo’s development on their own initiative. They have analysed
Cramo and drawn up reports and comments and they are able to
evaluate the company as an investment target. Cramo takes no
responsibility for the opinions expressed.
ABN AMRO Securities
Carnegie
Danske Markets
eQ Bank
Evli Bank Plc
Glitnir Securities
Handelsbanken Capital Markets
Kaupthing Bank
Nordea Markets
Pohjola Bank plc
SEB Enskilda Equities
Updated contact information on analysts following Cramo is
available at www.cramo.com/investors.
DISTRIBUTION OF
SHAREHOLDING BY
SECTOR, 31 DEC 2007
Households 87.5%
Private companies 8.4%
Non-profi t organisations 2.4%
Others 1.8%
ION OF
BY
7
87.5%
8.4%2.4%
1.8%
DISTRIBUTION OF
SHAREHOLDING BY SIZE
RANGE, 31 DEC 2007
1–100 24.5%
101–500 41.6%
501–1,000 15.3%
1,001–5,000 14.8%
5,001–10,000 1.8%
10,001–50,000 1.5%
more than 50,000 0.5%
ON OF
ZE
%
24.5%14.8%
41.6%
15.3% 240
120
02004 2005 2006 2007
360
600
480
MARKET CAPITALISATION,
MEUR

6 2007 / ANNUAL REPORT / CRAMO PLC / POWERING YOUR BUSINESS
17
1
13
15
5
18
6610426
3
CRAMO IN BRIEF
Cramo is a service company specialising in equipment rental
services, as well as the rental and sale of modular space. Its
equipment rental services comprise machinery and equipment
rentals as well as rental-related services. As one of the industry’s
leading service providers in Europe, Cramo operates in Finland,
Sweden, Norway, Denmark, Estonia, Latvia, Lithuania, Poland,
the Czech Republic and Russia.
Cramo provides modern rental solutions through the Cramo
Concept. Under the Cramo concept, construction companies and
customers in trade, industry and the public sector, as well as
private customers, are provided with machinery, equipment and
modular space through different rental solutions and services.
By combining the product portfolio with its extensive offering of
services, Cramo reduces the capital invested by its customers and
can create total rental solutions for every need for both the short
and long term.
Through a total of 268 depots and offi ces, with the number of rental
items totalling approximately 175,000, Cramo’s 2,270 employees
serve over 80,000 customers in ten countries. The wide geographical
spread of operations enables Cramo to combine the commitment of a
local company with the strength and access to professional business
management of a large company.
Cramo shares are listed on the OMX Nordic Exchange in Helsinki.
CRAMO GROUP BUSINESS SEGMENTS
MARKET AREAS
Number of depots by country as of 31 December 2007.
Business segment EQUIPMENT RENTAL MODULAR SPACE
Geographical segment Finland Sweden Western Europe Other Europe All markets
Market Finland Sweden NorwayDenmark
EstoniaLatviaLithuaniaPolandRussiaThe Czech Republic
FinlandSwedenNorwayDenmark
Sales, EUR 1,000(of Group’s sales, %)
75,761(15.1)
214,515 (42.7)
77,462 (15.4)
58,202 (11.6)
76,733 (15.3)
EBITA, EUR 1,000(of Group’s EBITA, %)
14,493(13.2)
47,952 (43.8)
10,513 (9.6)
17,082 (15.6)
19,358 (17.7)
Personnel 584 618 300 529 239
Market position estimate
#2 in Finland #1 in Sweden #3 in Norway#4 in Denmark
#1 in Estonia and Lithuania
#2 in Latvia and St. Petersburg area
#3 Poland
#1 in the Nordic countries
Competative landscape
Two strong players with a number of local competitors.
Two strong players with a number of local competitors.
Four strong players with a number of local competitors in Norway. Fragmented markets under consolidation in Denmark.
Mainly smaller national and local players with a few Western European competitors.
Finland and Sweden dominated by few strong players. Norway and Denmark fragmented markets under consolidation.
7YEAR 2007 HIGHLIGHTS
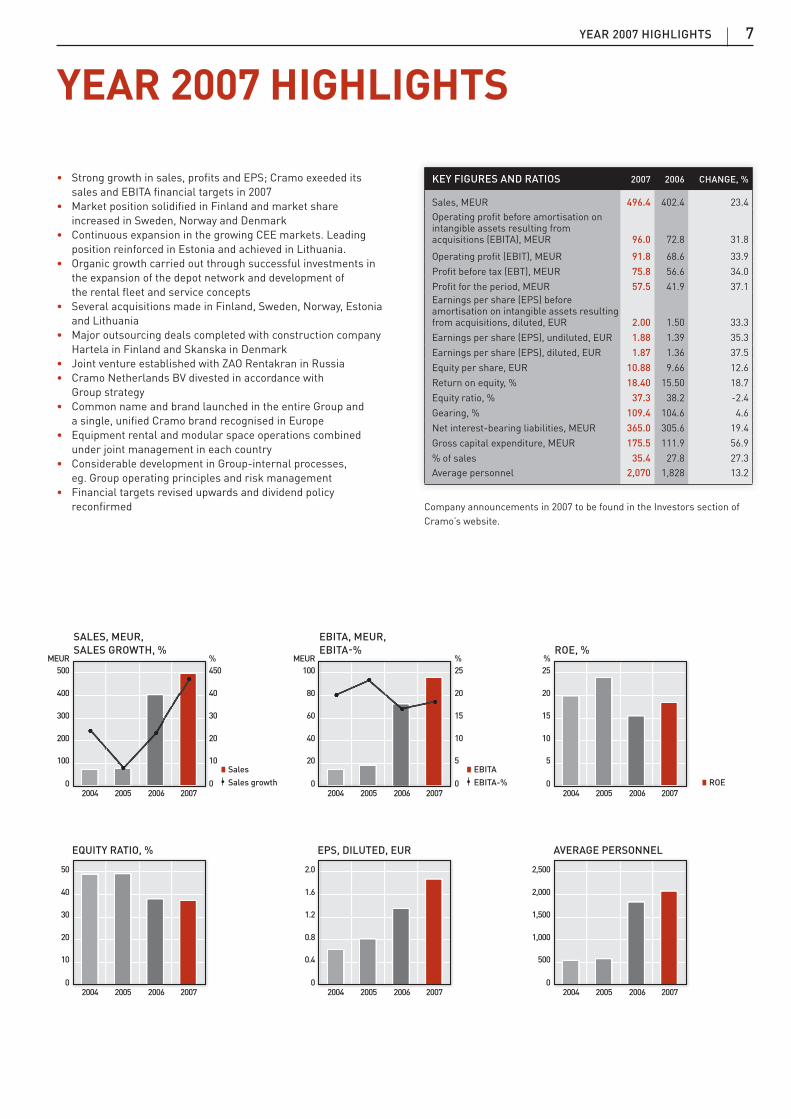
YEAR 2007 HIGHLIGHTS
• Strong growth in sales, profi ts and EPS; Cramo exeeded its
sales and EBITA fi nancial targets in 2007
• Market position solidifi ed in Finland and market share
increased in Sweden, Norway and Denmark
• Continuous expansion in the growing CEE markets. Leading
position reinforced in Estonia and achieved in Lithuania.
• Organic growth carried out through successful investments in
the expansion of the depot network and development of
the rental fl eet and service concepts
• Several acquisitions made in Finland, Sweden, Norway, Estonia
and Lithuania
• Major outsourcing deals completed with construction company
Hartela in Finland and Skanska in Denmark
• Joint venture established with ZAO Rentakran in Russia
• Cramo Netherlands BV divested in accordance with
Group strategy
• Common name and brand launched in the entire Group and
a single, unifi ed Cramo brand recognised in Europe
• Equipment rental and modular space operations combined
under joint management in each country
• Considerable development in Group-internal processes,
eg. Group operating principles and risk management
• Financial targets revised upwards and dividend policy
reconfi rmed Company announcements in 2007 to be found in the Investors section of
Cramo’s website.
Company announcements in 2007 to be found in the Investors section of
Cramo’s website
KEY FIGURES AND RATIOS 2007 2006 CHANGE, %
Sales, MEUR 496.4 402.4 23.4
Operating profi t before amortisation on intangible assets resulting from acquisitions (EBITA), MEUR 96.0 72.8 31.8
Operating profi t (EBIT), MEUR 91.8 68.6 33.9
Profi t before tax (EBT), MEUR 75.8 56.6 34.0
Profi t for the period, MEUR 57.5 41.9 37.1
Earnings per share (EPS) before amortisation on intangible assets resulting from acquisitions, diluted, EUR 2.00 1.50 33.3
Earnings per share (EPS), undiluted, EUR 1.88 1.39 35.3
Earnings per share (EPS), diluted, EUR 1.87 1.36 37.5
Equity per share, EUR 10.88 9.66 12.6
Return on equity, % 18.40 15.50 18.7
Equity ratio, % 37.3 38.2 -2.4
Gearing, % 109.4 104.6 4.6
Net interest-bearing liabilities, MEUR 365.0 305.6 19.4
Gross capital expenditure, MEUR 175.5 111.9 56.9
% of sales 35.4 27.8 27.3
Average personnel 2,070 1,828 13.2
20
10
02004 2005 2006 2007
30
50
40
EQUITY RATIO, %
0.8
0.4
02004 2005 2006 2007
1.2
2.0
1.6
EPS, DILUTED, EUR
1,000
500
02004 2005 2006 2007
1,500
2,500
2,000
AVERAGE PERSONNEL
200
100
02004 2005 2006 2007
300
500
400
20
10
0
30
450
MEUR %
40
SALES, MEUR,
SALES GROWTH, %
Sales
Sales growth
40
20
02004 2005 2006 2007
60
100
80
10
5
0
15
25
MEUR %
20
EBITA, MEUR,
EBITA-%
EBITA
EBITA-%
10
5
02004 2005 2006 2007
15
25
20
%ROE, %
ROE

8 2007 / ANNUAL REPORT / CRAMO PLC / POWERING YOUR BUSINESSWe continued to successfully advance our growth strategy in all markets resulting in a strong fi nancial performance.Markets favoured us in all our operating countries.
CEO’S REVIEW

9CEO’S REVIEW
In 2007, we continued to successfully advance our growth strategy
in all markets, resulting in a strong fi nancial performance.
We fuelled organic growth on a country level with all time high
investments and by opening up more new depots than planned.
At the same time we further strengthened our market position
by acquiring a number of companies.
Markets favoured us in all our operating countries. Growth
in construction continued and the rental business developed
favourably throughout the year. In Finland, we focused on
developing our operations after the integration. The entire
customer service and sales staff attended a new type of sales and
marketing training. This, combined with a renewed organisation,
was refl ected in increased market share during the second
half of the year. Strong growth throughout the year in Cramo
Sweden contributed to an increase in market share and improved
profi tability. The good result was facilitated by a professional
organisation and successful investments in the development of
the equipment fl eet, depot network and ser vice concepts.
Good development also continued in Norway and Denmark where,
in addition to opening 14 depots, we made a major outsourcing
deal by acquiring Skanska Danmark’s rental organisation and
signing a pan-Nordic cooperation agreement between Cramo
structure enlarged in every sector. The share of the construction
industry sector increased compared to the other sectors during
last year.
We are happy with our profi t development and continuous work on
profi tability showed results. Some good examples of profi t improve-
ment activities during the year include the centralisation of repairs
for building machinery in Sweden and the development of our hub
network structure. Strong growth coupled with the strengthening of
market share in certain markets has affected profi tability.
Consolidation continues slowly in the rental business and
Cramo will carry on as an active player especially in Central and
Eastern Europe where we continuously seek growth opportunities.
Competition in the Nordic countries is also tightening as more
international players enter the markets. At the same time,
construction growth is expected to slow down in Northern Europe
while the growth in Central and Eastern Europe will continue on
a high level. I am confi dent that our strong performance provides
us with a solid foundation for continued success in these markets
despite tightening competition.
The launch of a single unifi ed Cramo brand was received extremely
positively in all our markets. Lining up under a single brand
OUR STRONG PERFORMANCE PROVIDES A SOLID FOUNDATION FOR CONTINUED SUCCESS
In 2007, we experienced a year of exciting growth for Cramo. After the successful
business integration of Rakentajain Konevuokraamo and Cramo in 2006, the company updated
its strategic plans in autumn 2007, introducing more ambitious time schedules and targets.
Now we will concentrate on growth in all businesses and seek potential for improvement.
and Skanska. In line with our strategy, we divested our Dutch
operations in March.
Our Central and Eastern European operations developed positively,
speeding up the achievement of already ambitious targets. To
benefi t from the huge growth potential in Russia, we opened a
new depot in St. Petersburg and established a joint venture in
Moscow with ZAO Rentakran in August. The joint venture provides
us with a good base to enlarge our business outside St. Petersburg
and Moscow. Reorganisation of our business in Russia in early
2007 was refl ected in improved operations and further growth.
YIT Lentek, for example, selected Cramo as a preferred supplier.
New depots were opened also in key areas in Poland. The Czech
operations performed according to plan and we continued to
investigate possibilities of entering new markets within Central
and Eastern Europe. In Estonia, Cramo reinforced its leading
position. In Lithuania, we grew into a #1 position and also in Latvia
we saw a major improvement in our market position.
I am especially delighted with the favourable development of the
modular space business both in growth and profi tability. During the
reporting year, equipment rental and modular space businesses
were combined under joint management in each country. By
combining all our products and services in a single organisation in
each country, we expect that we will be able to more effectively take
advantage of the existing synergies and further develop our entire
operations and service offering. The modular space operations will
be launched in the Baltic countries in 2008.
Our equipment utilisation rates reached all time highs in many
countries. However, as there is still room for improvement, we
have launched country-level development projects. Our customer
yields clarity and cost-effi ciency. The advantage of working as one
company is also refl ected in the enhanced Cramo Team spirit,
which is felt every day. Quite simply, it means that your Cramo
team is better than ever.
We have achieved a great deal in 2007, none of which would
have been possible without commitment and dedication. To our
employees, I offer my deepest thanks for your contribution to
Cramo’s success. To our shareholders, I thank you for placing your
trust in Cramo and for your continued support.
Cramo is well positioned to continue achieving fi nancial and
operational success, while generating value for our investors. We
intend to work hard to continue reaching our targets and to create
ongoing value in the years ahead. I am confi dent that we will stay
ahead by focusing on the customer and on operational excellence.
We look forward to growing together with our stakeholders in 2008
and beyond.
Vesa Koivula
President and CEO

10 2007 / ANNUAL REPORT / CRAMO PLC / POWERING YOUR BUSINESS
FOCUSED STRATEGY CREATING PROFITABLE GROWTH
Since 2004, Cramo has implemented its strategy of profi table international growth.
In 2007, management focus has shifted from the integration of Rakentajain Konevuokraamo and
Cramo to the creation of one company and strong international growth. At the same time,
the company continues to exploit profi t improvement opportunities by strongly focusing on
the customer, investing in the right people and excelling in fl eet management.
STRATEGY
MISSIONCramo’s mission is to help customers improve their competitiveness
through modern rental solutions, thereby creating value for
Cramo’s shareholders. For its employees, Cramo aims to promote
professional growth.
VISIONCramo’s ambition is to be the preferred rental solutions provider in
the eyes of customers. Cramo aims to rank among the two largest
industry players in every market it operates in, and to be one of
the most profi table companies in the industry.
BUSINESS MODELCramo provides modern, full-service rental solutions to construction
companies and customers in trade, industry and the public sector via
the Cramo Concept, the total solution provider concept.
a company oriented towards common systems and approaches,
IT platforms are shared, customer driven organisation is scalable
and the company has one face towards the customer. Equipment
rental and modular space are optimised in terms of the offering,
fl eet development and synergies.
Through long-term contracts, the modular space business widens
the product offering and offers a fi nancial hedge to the shorter-
term contracts of the equipment rental business.
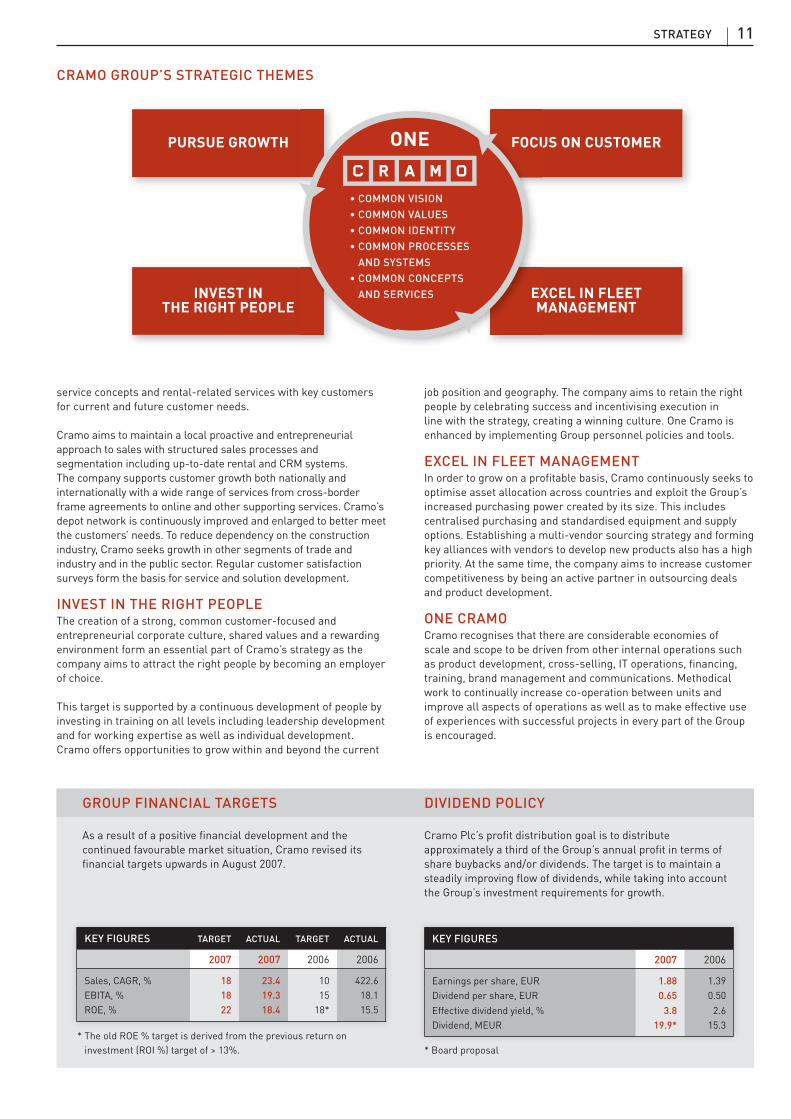
STRATEGIC THEMESCramo’s strategic themes are based on the company’s vision,
values and identity. They are related to improving customer
satisfaction, strengthening market position and improving
profi tability. Strategic themes defi ne the current strategic
focus areas and priorities to attain profi table growth.
VALUES • Customer orientation
• Innovativeness
• Personal growth
• Credibility
• Result orientation
ONE CRAMO FOCUSED ON PROFITABLE GROWTHCramo’s goal is to provide sustainable long-term value growth for
its shareholders from its two core businesses, equipment rental
and modular space, by leveraging the power of a unifi ed Cramo.
The company focuses on its core markets in the Nordic countries
and on the fast growing Central and Eastern European markets.
Focused strategy ensures discipline in taking the Cramo Concept
into new markets.
Equipment rental primarily serves the construction industry, but
also companies and organisations in other segments of trade and
industry as well as the public sector, by offering total solutions
from building site facilities to building machinery and rental-
related services. Modular space offers high quality customisable
modular buildings, typically for schools, day care, or offi ce
purposes to all types of industry and the public sector.
As complementary business areas, equipment rental and modular
space create economies of scale through consolidated fl eet
management, sharing of best practices and resources combined
customer effi ciency and cross-organisational teaming. Cramo is
PURSUE GROWTHTo reach its goal of profi table growth, Cramo has a differentiated
growth strategy and focus in each market. The company is
primarily seeking growth in regions enjoying the strongest growth
in construction and rental services. In the next few years, Central
and Eastern Europe is expected to show the most robust growth in
construction and rental penetration rates in Europe.
At the same time the company will boost growth in equipment
rental in the Nordic countries by developing innovative offerings
and promoting outsourcing. To maintain better sustainable
performance over business cycles, the modular space business
develops the latent demand for temporary space in the Nordic
countries.
Cramo aims to support growth by introducing the Cramo Concept
throughout the Group and by complementing organic growth with
acquisitions. Furthermore, rental services are developed in order
to create turnkey solutions.
FOCUS ON CUSTOMERCramo aims to fully leverage its total customer-driven organisation
approach to speed up market impact and ensure one face to the
customer. Cramo’s goal is to continuously serve its customers
more effectively and more effi ciently. Building strong customer
relations based on trust and understanding, while adapting to
customer needs at the local and international level in order to
deliver more value than the competition, is the highest priority.
This includes focusing on developing new and increasingly effi cient
11STRATEGY
PURSUE GROWTH
INVEST IN THE RIGHT PEOPLE
FOCUS ON CUSTOMER
EXCEL IN FLEET MANAGEMENT
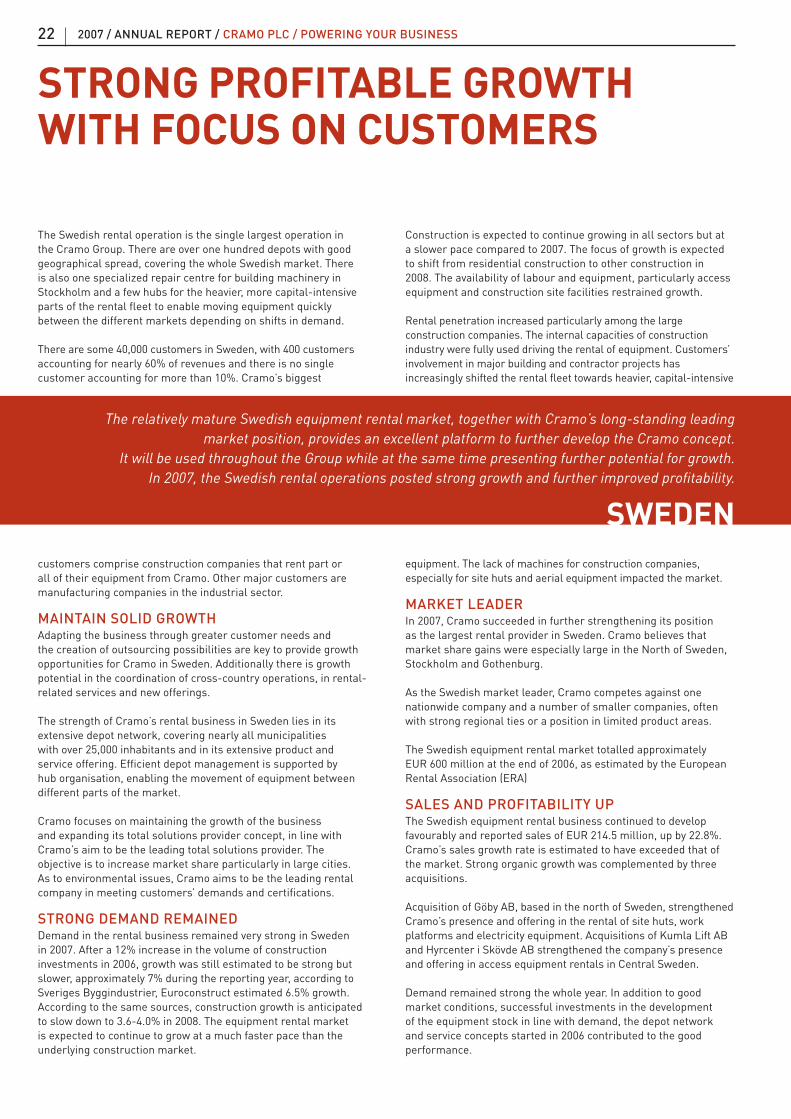
* The old ROE % target is derived from the previous return on
investment (ROI %) target of > 13%. * Board proposal
DIVIDEND POLICY
Cramo Plc’s profi t distribution goal is to distribute
approximately a third of the Group’s annual profi t in terms of
share buybacks and/or dividends. The target is to maintain a
steadily improving fl ow of dividends, while taking into account
the Group’s investment requirements for growth.
GROUP FINANCIAL TARGETS
As a result of a positive fi nancial development and the
continued favourable market situation, Cramo revised its
fi nancial targets upwards in August 2007.
service concepts and rental-related services with key customers
for current and future customer needs.
Cramo aims to maintain a local proactive and entrepreneurial
approach to sales with structured sales processes and
segmentation including up-to-date rental and CRM systems.
The company supports customer growth both nationally and
internationally with a wide range of services from cross-border
frame agreements to online and other supporting services. Cramo’s
depot network is continuously improved and enlarged to better meet
the customers’ needs. To reduce dependency on the construction
industry, Cramo seeks growth in other segments of trade and
industry and in the public sector. Regular customer satisfaction
surveys form the basis for service and solution development.
INVEST IN THE RIGHT PEOPLEThe creation of a strong, common customer-focused and
entrepreneurial corporate culture, shared values and a rewarding
environment form an essential part of Cramo’s strategy as the
company aims to attract the right people by becoming an employer
of choice.
This target is supported by a continuous development of people by
investing in training on all levels including leadership development
and for working expertise as well as individual development.
Cramo offers opportunities to grow within and beyond the current
job position and geography. The company aims to retain the right
people by celebrating success and incentivising execution in
line with the strategy, creating a winning culture. One Cramo is
enhanced by implementing Group personnel policies and tools.
EXCEL IN FLEET MANAGEMENTIn order to grow on a profi table basis, Cramo continuously seeks to
optimise asset allocation across countries and exploit the Group’s
increased purchasing power created by its size. This includes
centralised purchasing and standardised equipment and supply
options. Establishing a multi-vendor sourcing strategy and forming
key alliances with vendors to develop new products also has a high
priority. At the same time, the company aims to increase customer
competitiveness by being an active partner in outsourcing deals
and product development.
ONE CRAMOCramo recognises that there are considerable economies of
scale and scope to be driven from other internal operations such
as product development, cross-selling, IT operations, fi nancing,
training, brand management and communications. Methodical
work to continually increase co-operation between units and
improve all aspects of operations as well as to make effective use
of experiences with successful projects in every part of the Group
is encouraged.
* The old ROE % target is derived from the previous return on
KEY FIGURES TARGET ACTUAL TARGET ACTUAL
2007 2007 2006 2006
Sales, CAGR, % 18 23.4 10 422.6
EBITA, % 18 19.3 15 18.1
ROE, % 22 18.4 18* 15.5
* Board proposal
KEY FIGURES
2007 2006
Earnings per share, EUR 1.88 1.39
Dividend per share, EUR 0.65 0.50
Effective dividend yield, % 3.8 2.6
Dividend, MEUR 19.9* 15.3
CRAMO GROUP’S STRATEGIC THEMES
FOCU
EXM
ONE
• COMMON VISION
• COMMON VALUES
• COMMON IDENTITY
• COMMON PROCESSES
AND SYSTEMS
• COMMON CONCEPTS
AND SERVICES

12 2007 / ANNUAL REPORT / CRAMO PLC / POWERING YOUR BUSINESS
By combining its broad product portfolio with its extensive offering
of services, Cramo can create total rental solutions for every need.
Flexible and customised solutions range from satisfying short-
term rental needs to completing longer term project agreements
in which Cramo assumes responsibility for the equipment
needs of an entire project. Cramo’s offering also covers function
agreements where the customer is guaranteed equipment over
a longer period and outsourcing solutions in which Cramo takes
over the ownership and operation of a customer’s machinery fl eet.
With cross-border agreements, companies expanding abroad
can administer their equipment use in a single comprehensive
solution.
A well-developed depot network with a broad mix of machinery
and equipment serves local customers and expanding companies
with operations in many places. A number of service depots
supplement the rental depots with specialist services and an
expanded inventory of spare parts and technical expertise.
For a heavier, more capital-intensive assortment, there are
a number of hubs from which equipment can quickly be moved
between different markets depending on shifts in demand.
This means that all the equipment in the Group is available to all
customers. The hub structure has so far been developed most
extensively in Sweden, from where it has been brought into other
Cramo countries.
THE TOTAL SOLUTION PROVIDER CONSEPT
CRAMO’S DISTINCTIVE CAPABILITIES
UNDERSTANDING CUSTOMER NEEDS
Cramo has an extensive customer base, facilitating a deeper
understanding of various customer needs both locally and
internationally. Understanding and adapting to customer needs
forms the basis for service and solution development.
LEADERSHIP IN INNOVATION AND
CUSTOMER OFFERINGS
Cramo has a strong position in the solutions and services it
has selected. The company aims to be a forerunner in offering
services and know how for the use of more complex equipment
and machinery.
TECHNICAL AND FUNCTIONAL EXPERTISE
Cramo ensures that all equipment is up-to-date and technically
well maintained and served. Cramo analyses the adaptation of
new technical innovations to increase effi ciency. Cramo has the
power and resources of a large company, allowing for the most
effi cient organisation of specialised skills in areas such as IT,
fl eet management, communications and fi nance and control.
EFFICIENT FLEET MANAGEMENT
A strong market position, combined with presence in many
countries, enables Cramo to move equipment quickly between
markets depending on changes in demand. The scale and scope
of Cramo’s operations enable high levels of effi ciency in fl eet
management throughout the rental asset lifecycle, all the way
from procurement to disposal.
PRODUCT AREAS
SITE SERVICES
ERECTION, CLEANINGIT, TELEPHONY
MATERIALHANDLING
TRANSPORTS
EDUCATION
ELECTRICALSYSTEMS
SITE HUTS ANDOFFICE SPACE,MODULAR SPACE
CONSTRUCTIONEQUIPMENT
FENCES, SAFETY,HOISTS, CONTAINERS
AERIAL EQUIPMENT
HEATINGEQUIPMENT
BUILDINGMACHINERY
MODULARSPACE
BUILDINGSITE FACILITIES
AERIALS AND FORKLIFTS
CONSTRUCTION MACHINERY
BUILDING MACHINERY
BUSINESS SUPPORT
CUSTOMISED RENTAL CONCEPTS
CUSTOMER SUPPORT
CONSTRUCTION SITE SERVICES
TOTAL SOLUTION PROVIDER
SERVICE RANGE CONSTRUCTION SITE DEMAND CURVE

13STRATEGY IN ACTION IN 2007
STRATEGY IN ACTION IN 2007
DISCIPLINED PURSUIT OF GROWTH• Growth strategy updated
• Organic growth achieved in all markets through successful
investments into the development of rental fl eet and service
concepts as well as an expansion of the depot network
• Operations expanded through acquisitions in several key
market areas
• Signifi cant new outsourcing agreements signed
• Joint rental operation established in Russia
• New markets in the CEE area reviewed
• Decision to expand modular space operations into the Baltic
Countries taken
• The Dutch operations divested to focus growth effort on
the main market areas
CUSTOMER-DRIVEN ORGANISATION• Key Account Management structure launched
in new countries
• CRM systems developed and launched in several countries
• New product groups launched particularly in the CEE
countries to build up a comprehensive product offering
• New products introduced in all countries
• New customer-driven service concepts developed and
introduced in many countries
RIGHT PEOPLE WITH THE RIGHT SKILLS• Resources geared up for further growth particularly in
the CEE area
• Cramo School, aimed at sales and customer service training,
carried out in several countries
IMPROVED AGILITY IN FLEET MANAGEMENT• Fleet management strategy revised and aligned with
Group strategy
• Further development of the depot network and hub structure
carried out
• The hub structure adopted in several operating countries
• Focus on KPI’s in fl eet management increased
• Fleet standardisation
• Multi-vendor sourcing
• Facilitate cross-border transfer
TOWARDS ONE CRAMO• Rebranding project successfully carried out in the whole Group
• Equipment rental and modular space operations combined under
single management in each country of operation
• Reporting systems integrated
• Management system developed to facilitate the cross- border
sharing of management resources and knowledge
Local growth• Company
founded
in 1953
Domestic growth• OTC listing in 1988
• Listing on the Helsinki Ex-
changes main list
in 1998
Domestic consolidation /Start internationalisation• Expansion into modular
space in 2000
• Internationalisation starts
with Russia, Estonia and
Poland
402 496
SALES(EUR M)
117
5477
Strong internationalgrowth• Acquisition of
Cramo Group in 2006
• Several acquisitions in
all key market areas
CRAMO’S TRACK RECORD
1953 1975 1990 2000 2005 2006 2007

14 2007 / ANNUAL REPORT / CRAMO PLC / POWERING YOUR BUSINESS
GDP GROWTH STRONG IN CRAMO COUNTRIESThe European economy was characterised by positive developments
in 2007 and the EU averaged a 2.9% real GDP growth rate according
to estimates collected by Eurostat. Substantially stronger growth
continued in Central and Eastern Europe (CEE) as well as in Russia.
The highest real GDP growth in Cramo’s market area within CEE
MARKETS FAVOURED CRAMO
REAL CONSTRUCTION OUTPUT GROWTH ESTIMATES, 2007-08 (CONSTANT PRICES)
EQUIPMENT RENTAL PENETRATION RATEESTIMATED RENTAL PENATRATION RATES, %
Source: Euroconstruct, November 2007 Source: Cramo estimates, International Rental News
growth in 2007 varied from 1.2−6.5% in the Nordic countries,
and between 6.0−19.0% in the CEE as estimated by Eurocostruct.
This development was mainly driven by the positive economic
development and rapidly increasing wealth creation particularly in
the CEE countries as well as major infrastructure projects in the
industry and the public sector.
Economic development remained favourable with respect to Cramo’s business environment.
Growth in residential and non-residential construction activity coupled with major infrastructure
projects in the industry and public sector continued to fuel growth in the equipment rental and
modular space businesses. At the same time, other growth drivers such as increasing rental
penetration made the rental market a clear growth market.
GROWTH DRIVERS & MARKET TRENDSis recorded in Latvia, estimated by Euroconstruct at 10.5% and
the lowest in the Czech Republic, estimated at 5.8%. After years of
exceeding the EU average growth rate, the pace of growth slowed
somewhat in the Nordic Countries. Finland led the market with
an estimated 4.2%, while the growth rate in Sweden was 3.5%.
In Norway, GDP growth improved from 2006 to an estimated 3.5%,
while Denmark fell back to an estimated 2.0% growth rate.
In 2008 the GDP is projected to grow in the Nordic countries by
2.0%–3.8% and in the CEE area Cramo operates by 5.0–9.5%.
CONSTRUCTION MARKETS BOOMINGThe European construction market continued to grow in all the
countries in which Cramo operates. Real construction market
Growth rates differ within construction segments due to differences
in development cycles over time. Since customers have differing
equipment needs depending on the type of construction project.
Customer requirements guide fl eet investment and allocation
decisions, as meeting customer needs and reaching an optimal
utilisation level require good cross-border mobility of the rental
fl eet.
In 2007, the residential construction market slowed down in
all Nordic Countries. Growth rates ranged from an estimated
4.0%–6.4% in the Nordic countries to 11.1%–30.0% in the CEE
area. The Danish residential market was set back the most. Growth
in the non-residential market was also on a high level, estimated at
2.9–13.6% and 10.0–18.0% respectively. The non-residential market
0 10 20 30 40 50 60 70 80 90
United Kingdom
Sweden
Denmark
Norway
Finland
Baltic Countries
Poland
Russia (St. Petersburg)
-5 0 5 10 15 20 25
Finland
Sweden
Norway
Denmark
Estonia
Latvia
Lithuania
Poland
Czech Republic
Russia
2007 estimate 2008 estimate

15GROWTH DRIVERS & MARKET TRENDS
in Finland grew particularly fast, along with all the CEE markets.
Cycles in civil engineering developed differently in different markets.
The CEE countries varied between estimated 2.5%–25.0%, with
the Czech market declining but both Lithuania and Poland growing
strongly. The growth rates for Nordic Countries varied between an
estimated 0.0%–11.1%, with Sweden growing most strongly while
Denmark remained on the same level as in 2006.
Nordic construction growth is expected to stabilise on a slightly
lower level in 2008 apart from Denmark, which is expected to
show positive growth in 2008 after a small decline in 2007. Central
and Eastern Europe are projected to experience sustained, strong
growth in construction. In Poland, the anticipated growth rate
exceeds even that of year 2007.
INCREASING RENTAL PENETRATION Equipment rental services expanded at a faster rate in Cramo’s
market areas compared to general growth in construction. This
was due to a number of factors, such as the increasing rental
penetration rates as customers get more knowledgeable of rental
services and accustomed to the benefi ts of the rental option
compared with the ownership of equipment. The demand for
modular space continued to increase, supported by relocations,
demographic changes and industry needs for increasingly fl exible
building solutions.
At the end of 2006, according to estimations by the European rental
association and Cramo, the volume of the European equipment
rental market was estimated to total EUR 2.3–2.4 billion for the
markets in which Cramo operates. The rental penetration rate
continued to range in the Nordic Countries from 30 to 40% while
in CEE the rates were less than 10% in most countries, giving
room for substantial growth potential. Nordic penetration rates
are expected to reach approximately 60%, the level observed in
countries with most developed rental operations, such as the UK
(80%) and Japan.
The equipment rental market is anticipated to continue to grow
faster than the construction market in 2008 on an increasing
penetration rate. Demand for modular space is also expected to
continue increasing particularly for lower sophistication and lower
cost modules as well as turnkey solutions. The general increase in
the penetration rate is expected to continue in the Nordic countries
but at a lower pace. Construction companies’ internal capacity is
fully used increasing the demand for the rental of equipment. The
lack of machines for construction companies, especially for site
huts and access equipment, will have an impact on the market.
MARKET CHARACTERISTICSThe rental industry is characterised by a multitude of different
customers in diversifi ed segments. This requires excellent
marketing, sales orientation and communication skills from
the rental companies. Numerous and often small transactions put
high demands on logistics and supporting IT systems.
Heavy investments into rental machinery and equipment present
high demands on fi nance and control and fl eet management.
OUTSOURCING INCREASINGConstruction companies as well as other parts of trade and
industry and the public sector seek to free up capital to fuel the
growth in their respective core operations. In order to reduce
capital tied up in construction machinery and equipment, many
companies have chosen to outsource their construction equipment
fl eet. By doing so, they are able to enjoy the benefi ts available to
rental customers, including fl exibility, better services and greater
logistics effi ciency. In addition, equipment rental companies can
achieve better utilisation rates for the equipment.

16 2007 / ANNUAL REPORT / CRAMO PLC / POWERING YOUR BUSINESS
TECHNOLOGICAL INNOVATIONS SUBSTITUTE MANPOWERIn the construction sector there is a general trend of substituting
manpower for technology. The need for increased operational
effi ciency is more pronounced in the mature construction markets,
in which labour costs have a signifi cant impact on profi tability.
The same trend is also emerging in the CEE, where old and
sometimes manual working methods are changed to more effi cient
ones with the help of modern technology. Equipment rental
companies have the resources to be in the forefront of technological
innovation with the latest equipment available. In addition, the
major rental companies have the capacity and resources to build
expertise in various types of equipment, even in highly specialised
equipment. Increasing standardisation drives growth.
POTENTIAL IN RENTAL RELATED SERVICESRental related services, such as construction site set-up services,
provide substantial growth opportunities for the equipment rental
industry in the future. Equipment rental companies can benefi t from
this by building up expertise and service concepts around these
rental related service areas, thus enabling rental companies to take
broader responsibility for projects to fulfi l customers’ needs.
INCREASING MARKET CONSOLIDATIONThe European equipment rental market is mainly divided between a
few strong players and a large number of smaller regional or local
players. In some market areas, such as in the CEE, competition
is becoming more intense as some equipment manufacturers are
interested in launching their own rental operations. The competitive
arena may also undergo changes as a result of the entry of non-
European rivals into Cramo’s market and by mergers between
the European and US-based players. As an example, the Danish
rental industry is undergoing a consolidation phase and a major
international player entered the market by acquiring the business
formed from two smaller companies.
The market for modular space is still relatively young and being
developed, except in Sweden and Finland where it has a longer
history. Until the autumn of 2007, when new international
competitors entered the market, there were only a few competitors
mainly focusing on sales operations in Finland. The Swedish
modular space industry is undergoing a consolidation phase.
ENVIRONMENTAL AND SAFETY LEGISLATION AS DRIVERSEnvironmental and safety legislation are becoming increasingly
important drivers to be taken into account in rental equipment life
cycle management, from producement to disposal.
CUSTOMER BENEFITS OF RENTINGThere are lots of reasons to rent machinery and modular space
instead of buying them. The rental of machinery and equipment
allows companies to focus on their core business. Rental solutions
also reduce the amount of assets and release capital for better
usage. They also increase transparency by giving a clear overview
of costs for every item rented. Budgeting and control are simplifi ed
and hidden costs become visible. With a rental solution, many
companies share the capital and maintenance costs of equipment,
making it considerably cheaper for each and every company.
A rental solution enables companies to expand or reduce the
equipment fl eet delivered on the site according to the situation.
Companies have a large diversity of state of the art equipment
available when needed while rental companies ensure quality,
safety and regulation compliance of the machinery. Modular space
rental solutions similarly allow the volume of available space to be
adjusted according to customer needs.
EUROPEAN RENTAL MARKET SIZE 2006TOTAL RENTAL TURNOVER (EUR MILLION)
Source: European Rental Association “Best Estimates”, June 2007,
except for the St. Petersburg market size, which is Cramo’s estimate.
0 1,000 2,000 3,000 4,000 5,000 6,000 7,000
UK
France
Germany
Spain
Italy
Sweden
Norway
The Netherlands
Denmark
Belgium
Finland
Austria
Portugal
Switzerland
Ireland
Poland
Greece
Czech Republic
Luxenburg
Estonia
Latvia
Hungary
Lithuania
St. Petersburg
Slovakia
Romania
Bulgaria
6,000
3,950
3,500
2,250
1,300
600
600
480
450
370
350
300
300
300
200
110
100
50
50
45
40
35
30
30
30
30
30
TOTAL EUROPE:
EUR 21,500 MILLION
LEADING RENTAL COMPANIES BY EUROPEAN SALESSALES 2006 (EUR MILLION)
Source: International Rental News, June 2007
0 100 200 300 400 500 600
Loxam
(France)
Speedy Hire plc
(UK)
Ramirent
(Finland)
Hewden Stuart plc
(UK)
Cramo (Finland)
Algeco
(France)
Select Plant Hire
(UK)
Mediaco Lifting
(France)
Liebherr-Mietpartner
(Germany)
A-Plant
(UK)
541
498
498
420
402
376
334
300
290
269

17RENTAL MARKET
Ask 20 business analysts in Europe to nominate their most
dynamic industry and you are unlikely to see anyone choosing
equipment rental. Rental, if it means anything, means cars or
apartments. Equipment rental – a service industry depending
largely on the unglamorous construction sector – has a profi le
that could be described accurately as low.
And yet, it is possible to argue that Europe’s €21.5 billion
equipment rental sector is currently one of the most
fascinating businesses in Europe.
What makes this so is an almost bewildering set of market
conditions that combines mature rental markets (the UK,
France) with completely undeveloped areas (eastern Europe);
high and low growth economies; business cultures that favour
or resist renting; and trends in equipment use that play directly
into the hands of rental (a good example being powered access
platforms.)
At the same time, you have major equipment manufacturers
– companies like Caterpillar, Komatsu, JCB, Terex and Volvo –
all taking their own approaches to the development of rental.
Some of these, like Cat, emphasise the creation of their own
‘captive’ rental networks through distributors, while others,
such as Komatsu and JCB, are focused on being suppliers to
independent rental companies.
Add into that mix the drive towards consolidation of rental
companies and the presence of very large, acquisitive rental
giants – both inside and outside Europe – and you have
the perfect recipe for a truly dynamic market.
All of which makes it diffi cult to predict how the equipment
rental scene will look in fi ve years time. To take just a few
specifi c examples: how quickly will rental be adopted in eastern
Europe, where currently less than 5% of all equipment is sold
directly to rental companies, compared to 80% in the UK?
Will that adoption be hastened by healthy construction growth,
or will recession – and the resulting pressures to cut costs –
best drive the take-up of rental? When will rental in Germany
– still Europe’s biggest economy – evolve into a true rental
service business and away from the dealer/rental model that
currently predominates.
Equally, how long before North America’s multi-billion dollar
rental businesses decide to move across the Atlantic, and
how long, too, before the UK’s bigger players start to act on
the obvious potential in mainland Europe?
None of these questions can be answered with certainty, but
everyone can have their best guess. Here, for what it’s worth,
are mine. The recent merger of US-based Williams Scotsman
and UK-owned Algeco in the portable accommodation rental
sector will not be the last transatlantic rental deal. However,
expect further consolidation among the big US players before
they set sail for Europe. This delay has the further advantage of
letting Europeans do the consolidation ‘legwork’ before the US
companies swoop.
Look out for consolidation among the bigger rental companies
in Europe, fi rms like Loxam, Ramirent and – yes – Cramo.
UK rental companies could well be involved in this, although
perhaps just as likely is a strategic investment by UK players
in big national rental companies on the continent.
Germany will grow steadily but still, in fi ve years, be considered
a market that is not realising its full rental potential. Eastern
Europe will see continued high growth in rental, from a low
base, although in fi ve year’s time it is unlikely that Cramo and
Ramirent will be alone among big west European renters in
developing this market. And expect Europe to have a rental
market valued at over €30 billion by 2012.
What else? I confi dently predict that equipment rental will still
be an unglamorous business, but then it probably always will be.
Murray Pollok, Editor
International Rental News
THE RENTAL MARKET AS SEEN BY AN INDUSTRY EXPERT

18 2007 / ANNUAL REPORT / CRAMO PLC / POWERING YOUR BUSINESS
BUSINESSREVIEW

19BUSINESS OVERVIEW
A SUCCESSFUL YEAR IN ALL MARKETSAll Cramo’s business segments developed favourably in 2007. Growth in sales and EBITA continued and market
shares were maintained or increased in all the markets. Cramo’s operations are divided into two business
segments: equipment rental and modular space. The reporting of equipment rental segment is based on
geographical areas, which are divided into four main areas, Finland, Sweden, Western Europe including Norway
and Denmark and Other Europe including Estonia, Latvia, Lithuania, Poland, the Czech Republic and Russia.
BUSINESS OVERVIEWTARGETS FOR 2007
KEY ACTIVITIES AND ACHIEVEMENTS 2007 TARGETS FOR 2008
EQUIPMENT RENTAL
Finland • Improve the growth rate and profi tability• Increase the awareness of Cramo brand• Extend services and products for
civil engineering projects• Increase sales and market share as
a provider of rental-related services
• Growth rate up to 25.8% with improved profi tability• Maintained a leading position • Renewed sales process • Acquired three companies • Sales and marketing training for
the entire customer service and sales staff
• Continue profi table growth• Increase customer focus and
improve customer services
Sweden • Grow both through organic measures as well as outsourcing and acquisitions
• Improve profi tability and return on investment
• Increased market share • Acquired three companies • Successful investments to develop the rental fl eet• A major repair centre for building machinery
opened in Stockholm• Key account management system expanded to
some 500 largest customers
• Continue profi table growth both through organic measures as well as outsourcing and acquisitions
• Focus on total solutions provider concept and add-on sales as well as competence development
• Improve customer service
Western Europe
• Grow in a balanced manner towards a leadership position through organic measures as well as outsourcing and acquisitions
• Expand depot network and wide the range of offerings particularly in larger cities
• Improve profi tability and return on investment
• Increased market share • Acquired two companies in Norway and Skanska’s
rental fl eet in Denmark• Successful investments to develop the rental fl eet• Depot network strengthened by 7 in Norway and
by 7 in Denmark• Dutch operations divested in March.
• Continue rapid growth in a balanced manner into a leadership position
• Focus on total solutions provider concept, add-on sales and competence development
• Further expansion of depot networks
Other Europe
• Strengthen market share in all markets• Expand depot network in St. Petersburg and
nationwide in Poland and the Baltic countries • Plan for expansion in Russia• Expand strongly the rental equipment fl eet
throughout Other Europe• Develop the total solution provider concept• Investigate the possibility to enter
new markets in the CEE area
• Increased market share and high profi tability in all markets
• Growth rate was 51.4%• Several new depots opened in Poland, Lithuania and
Latvia and expansion in Estonia by an acquisition in Tallinn
• New depot in St. Petersburg and a joint rental operation started in Moscow
• Rental equipment fl eet expanded and service offering widened
• Supply of services associated with rental increased in the CEE area
• Continue strong organic growth• Achieve high profi tability in all markets• Increase rental equipment investments to meet
the needs of the growing markets• Focus on improving service in order to better
meet customer needs and keener competition • Enter new markets where appropriate• Further expansion of depot network
MODULAR SPACE
• Sustain profi table growth in the Nordic countries
• Maintain market position in Finland and Sweden
• Improve productivity and market share in Denmark and Norway
• Evaluate potential entry into the CEE area
• Sales up by 17.1%• Substantial increase in profi tability• Leadership position maintained in Finland and Sweden• Increased market share in Norway and Denmark• Decision to start operations in the Baltic countries
• Sustain high utilisation rate in Finland and Sweden
• Improve market share in Denmark and Norway• Convert latent demand• Start operations in the Baltic countries• Investigate the possibility of entering
new markets in the CEE area
42.7%
15.4%
11.6%
15.3%
15.1%
SALES BY SEGMENT, %
(2006)
Sweden 42.7% (43.1%)
Western Europe 15.4% (16.4%)
Modular Space 15.3% (16.2%)
Finland 15.1% (14.9%)
Other Europe 11.6% (9.5%)
43.8%
17.7%
9.6%
15.6%
13.2%
EBITA BY SEGMENT, %
(2006)
Sweden 43.8% (43.9%)
Modular Space 17.7% (18.3%)
Other Europe 15.6% (14.7%)
Finland 13.2% (12.7%)
Western Europe 9.6% (10.3%)
28%
19%
12%
9%
17%
15%
SALES BY PRODUCT GROUP, %
(2006)
Building machinery rentals 28% (28%)
Site set-up infrastructure and services 19% (19%)
Aerial and forklift rentals 17% (17%)
Modular space services 15% (17%)
Construction machinery rentals 12% (12%)
Merchandise sales and other 9% (7%)

20 2007 / ANNUAL REPORT / CRAMO PLC / POWERING YOUR BUSINESS
A YEAR OF GROWTH AND INCREASED EFFICIENCY IN FINLAND
construction companies restrained from investing in construction
machinery and equipment. The rental penetration rate is estimated
to have increased in Finland.
A LEADING PLAYERThere are two leading players in Finland with a relatively large
number of small and highly specialised local competitors.
Cramo maintained its position as one of the two leading players in
Finland, holding its estimated market share.
The volume of equipment rental market in Finland in 2006 was
estimated by the European Rental Association (ERA) to be EUR 350
million.
SALES AND PROFITS UPSales of the Finnish equipment rental operations grew as planned
in 2007 to EUR 75.8 million (growth of 25.8% compared to 2006).
Organic growth was mainly facilitated by a continued increase
in demand for equipment rental services throughout Finland,
complemented by the acquisitions of the rental assets of Oskarin
Vuokrakone Oy, JM-Alltrans Oy and Jyväskylän Konevuokraamo
Oy. In addition, Cramo acquired Sisu Diesel Inc.’s heavyweight
class diesel generator leasing business in November, expanding
services for sites requiring a short-term power supply. A major new
outsourcing agreement was made with Hartela for about 200 site
huts. Dedicated efforts taken to develop rental-related services also
contributed to an increase in sales.
EBITA increased to EUR 14.5 million in 2007 or 39.8% from 2006,
accounting for 19.1% of sales. Profi tability was burdened by costs
associated with the further development of services, extensive staff
training and the launch of a new name and brand.
The Finnish equipment rental market provides Cramo with a good base for developing its
rental-related service offering. Furthermore, the Finnish equipment rental business
generates solid sales, profi ts and a steady cash fl ow.
FINLAND
In Finland, Cramo provides its customers with a broad range of
rental solutions, ranging from over the counter machinery rental to
complex rental equipment solutions and services.
Customers can order or pick up equipment in a depot or rent project-
based solutions for all or part of their machinery and equipment
needs delivered on-site. Rental related and contracting services
help customers with jobs such as drying, dehumidifi cation, infrared
photography, diamond drilling the laying of concrete for fl ooring,
heating and temporary electrifi cation.
Demand for Cramo’s Finnish rental services comes mainly from
companies in construction, trade and industry as well as the public
sector. Compared with other parts of the Group, there is also
a relatively large number of private individuals as customers
in Finland.
FOCUS ON RENTAL-RELATED SERVICESAdapting the business through greater customer focus and the
creation of outsourcing possibilities provides growth opportunities
for Cramo in Finland. There is also growth potential in the
coordination of cross-country, rental-related services and new
offerings as well as a possibility to improve rental utilisation rates.
Growth opportunities also lie in outsourcing and acquisitions.
The strength of Cramo’s Finnish equipment rental business lies
in its strong market position and wide range of rental-related
services. The unit focuses on supporting profi table growth by
developing these customer-driven services, which in due time will
be rolled out in other markets.
CONSTRUCTION REMAINED ACTIVEThe Finnish construction market had a year of strong growth
in 2007 with a growth rate between 5.0% (the Confederation
of Finnish construction industries) and 6,1% (Euroconstruct).
According to the same sources, growth is forecasted to decrease to
2.5–3.0% in 2008.
Housing construction growth was roughly 6.0%, as estimated
by the confederation of Finnish construction industries. Non-
residential construction continued developing favourably driven
by offi ce and storage buildings, but residential construction
decreased a little. Civil engineering projects continued to grow
steadily, and new road construction projects saw their launch
towards the end of the year. Renovation activity developed
favourably in Finland des pite of the slight slowdown of residential
construction.
The availability of skilled labour restrai ned construction growth,
especially in growth centres in southern Finland.
Growth in equipment rental and associated services continued
across the country at a higher rate than construction industry
growth. This was mainly driven by the growth in construction
focused on segments favouring equipment rental while

21FINLAND
HUB ORGANISATION UNDERWAYCramo aims to develop a hub organisation for the heavier, more
capital-intense equipment in Finland. By distributing heavier
equipment from a number of strategically placed specifi c depots,
the company can improve its logistic effi ciency. It can maintain
a high service level at all depots as equipment can easily be moved
between different parts of the markets depending on shifts in
demand.
Locations for hubs, complementing those already existing in
the Helsinki region, were chosen during the year and one new hub
was opened in Oulu. In 2008, when all the hubs are in operation,
there will be 9 hubs serving customers.
Methodical work is continuously carried out to improve the effi ciency
of the rental fl eet. The rental utilisation rate was increased during
the year by increasing co-operation between regions and depots and
by scrapping and selling out-of-date equipment.
Dedicated efforts continued in the development of rental-related
services. A new electrical installation service was launched in
early 2007 and scaffolding system and heating installation services
were rolled out throughout the country. Cross-border rental
solutions for customers with international operations were further
developed in collaboration with other parts of the Group.
Implementation of the Group-wide fi nancial system continued.
The new system will begin being used in 2008.
OUTLOOK 2008 POSITIVEThe market outlook for 2008 is positive. Demand for equipment
rental services in Finland is projected to continue to increase,
supported especially by civil engineering projects and an
KEY FIGURES
2007 2006 Change %
Sales, MEUR 75.8 62.2 21.9
EBITA, MEUR 14.5 10.4 39.8
EBITA-% 19.1 17.2 11.2
Gross capital expenditure, MEUR 16.4 18.3 -10.6
Number of depots 69 62 11.3
Average number of employees 584 449 30.1
SHARE OF GROUP SALES, % SHARE OF GROUP EBITA, %
15.1% 13.2%
active market for commercial construction. There seems to
be no increase in the availability of skilled labour, restraining
construction growth, especially in southern Finland.
Cramo will target continuous growth while keeping profi tability
on a good level. At the same time, the company aims to increase
customer focus and improve customer satisfaction. Cramo will
also invest further in rental-related services and the development
of building site services.
22 2007 / ANNUAL REPORT / CRAMO PLC / POWERING YOUR BUSINESS
STRONG PROFITABLE GROWTH WITH FOCUS ON CUSTOMERS
equipment. The lack of machines for construction companies,
especially for site huts and aerial equipment impacted the market.
MARKET LEADERIn 2007, Cramo succeeded in further strengthening its position
as the largest rental provider in Sweden. Cramo believes that
market share gains were especially large in the North of Sweden,
Stockholm and Gothenburg.
As the Swedish market leader, Cramo competes against one
nationwide company and a number of smaller companies, often
with strong regional ties or a position in limited product areas.
The Swedish equipment rental market totalled approximately
EUR 600 million at the end of 2006, as estimated by the European
Rental Association (ERA)
SALES AND PROFITABILITY UPThe Swedish equipment rental business continued to develop
favourably and reported sales of EUR 214.5 million, up by 22.8%.
Cramo’s sales growth rate is estimated to have exceeded that of
the market. Strong organic growth was complemented by three
acquisitions.
Acquisition of Göby AB, based in the north of Sweden, strengthened
Cramo’s presence and offering in the rental of site huts, work
platforms and electricity equipment. Acquisitions of Kumla Lift AB
and Hyrcenter i Skövde AB strengthened the company’s presence
and offering in access equipment rentals in Central Sweden.
Demand remained strong the whole year. In addition to good
market conditions, successful investments in the development
of the equipment stock in line with demand, the depot network
and service concepts started in 2006 contributed to the good
performance.
The relatively mature Swedish equipment rental market, together with Cramo’s long-standing leading
market position, provides an excellent platform to further develop the Cramo concept.
It will be used throughout the Group while at the same time presenting further potential for growth.
In 2007, the Swedish rental operations posted strong growth and further improved profi tability.
SWEDEN
The Swedish rental operation is the single largest operation in
the Cramo Group. There are over one hundred depots with good
geographical spread, covering the whole Swedish market. There
is also one specialized repair centre for building machinery in
Stockholm and a few hubs for the heavier, more capital-intensive
parts of the rental fl eet to enable moving equipment quickly
between the different markets depending on shifts in demand.
There are some 40,000 customers in Sweden, with 400 customers
accounting for nearly 60% of revenues and there is no single
customer accounting for more than 10%. Cramo’s biggest
customers comprise construction companies that rent part or
all of their equipment from Cramo. Other major customers are
manufacturing companies in the industrial sector.
MAINTAIN SOLID GROWTHAdapting the business through greater customer needs and
the creation of outsourcing possibilities are key to provide growth
opportunities for Cramo in Sweden. Additionally there is growth
potential in the coordination of cross-country operations, in rental-
related services and new offerings.
The strength of Cramo’s rental business in Sweden lies in its
extensive depot network, covering nearly all municipalities
with over 25,000 inhabitants and in its extensive product and
service offering. Effi cient depot management is supported by
hub organisation, enabling the movement of equipment between
different parts of the market.
Cramo focuses on maintaining the growth of the business
and expanding its total solutions provider concept, in line with
Cramo’s aim to be the leading total solutions provider. The
objective is to increase market share particularly in large cities.
As to environmental issues, Cramo aims to be the leading rental
company in meeting customers’ demands and certifi cations.
STRONG DEMAND REMAINEDDemand in the rental business remained very strong in Sweden
in 2007. After a 12% increase in the volume of construction
investments in 2006, growth was still estimated to be strong but
slower, approximately 7% during the reporting year, according to
Sveriges Byggindustrier, Euroconstruct estimated 6.5% growth.
According to the same sources, construction growth is anticipated
to slow down to 3.6-4.0% in 2008. The equipment rental market
is expected to continue to grow at a much faster pace than the
underlying construction market.
Construction is expected to continue growing in all sectors but at
a slower pace compared to 2007. The focus of growth is expected
to shift from residential construction to other construction in
2008. The availability of labour and equipment, particularly access
equipment and construction site facilities restrained growth.
Rental penetration increased particularly among the large
construction companies. The internal capacities of construction
industry were fully used driving the rental of equipment. Customers’
involvement in major building and contractor projects has
increasingly shifted the rental fl eet towards heavier, capital-intensive

23SWEDEN
The rental utilisation rate remained high, and Cramo carried out
price increases as of the beginning of the year.
The profi tability of the Swedish operations improved clearly,
with an EBITA of EUR 48.0 million, accounting for 22.4% of sales.
A major repair centre for building machinery started its operations
in Stockholm, decreasing investments needs, while increasing
utilisation rates. The LKAB project in Kiruna, started in 2005 and
extending into 2008, continued according to plans.
IMPROVED CUSTOMER SERVICECustomers continued to streamline their operations and become
increasingly international. Cramo continued to develop rental-
related services, supporting entire building projects. A key account
management system was extended to cover approximately the 500
largest customers at national, regional and depot levels.
To better serve international customers, Cramo developed
its pricing system further during the year. A CRM system was
introduced during the year. Development of a new rental system,
started in 2006, continued. The new system will be implemented
in 2009. Work with a new business intelligence system aimed at
improving the linking of fi nancial fi gures with operational fi gures
continued.
STRONG OUTLOOK INTO 2008Outlook for the next few years is expected to remain good. This
mainly refl ects the situation in the general construction sector,
given the number of infrastructure projects, which continue
to drive demand. In the building sector, demand is expected to
remain strong and outsourcing to further increase.
In 2008 Cramo will focus on the further development of the
total service provider concept offering and add-on sales while
continuing sales and management competence development.
KEY FIGURES
2007 2006 Change %
Sales, MEUR 214.5 174.7 22.8
EBITA, MEUR 48.0 35.9 33.7
EBITA-% 22.4 20.5 9.3
Gross capital expenditure, MEUR 44.1 29.2 50.8
Number of depots 113 106 6.6
Average number of employees 618 610 1.3
SHARE OF GROUP SALES, % SHARE OF GROUP EBITA, %
42.7% 43.8%
Customer service will be further improved. Additionally,
quality and the environment concept, aimed at improving the
working quality at Cramo’s depots and at customers’ sites will
be developed. A new call centre concept will be introduced
in Stockholm. Sales and customer synergies are also sought
between the core businesses.

24 2007 / ANNUAL REPORT / CRAMO PLC / POWERING YOUR BUSINESS
MARKET SHARE GAINS BYOPENING UP NEW DEPOTS
STRONG CHALLENGERCramo ranks among top (fi ve) rental companies in Norway and
Denmark. The Norwegian market is characterised by one market
leader, a few medium-sized players and several local rental
service companies. The Danish rental industry was characterised
by a large number of mid or small size services providers
until July 2007 when a strong player was formed by a major
international rental company acquiring the businesses of two
smal ler companies.
The equipment rental market grew faster than the construction
industry, totalling EUR 600 million in Norway and EUR 450 million
in Denmark at the end of 2006, according to estimates by the
European rental association (ERA).
STRONG GROWTH HAD AN IMPACT ON PROFITABILITYBoth Norway and Denmark showed strong sales development.
The Western European equipment rental business reported sales
of EUR 77.5 million, up by 16.8% from 2006. Cramo estimates that
the growth rate exceeded that of the market.
Demand remained strong the whole year. In addition to good
market conditions, successful investments in the development of
the equipment fl eet together with the depot network and service
concepts started in 2006 contributed to the good performance.
Organic growth was complemented by two acquisitions in Norway
and a major outsourcing deal in Denmark.
The rental utilisation rate remained high. The depot network was
enhanced in Norway to 26 depots and in Denmark to 17.
The profi tability of the Western European operations decreased
by 24.3% to EUR 6.4 million, accounting for 8.3% of sales. Rapid
expansion eroded profi tability.
Cramo’s equipment rental business in Western Europe covers
its Norwegian and Danish operations. In these markets, Cramo
provides its customers with almost everything from over the
counter machinery rental to complex solutions for the machinery
needs of an entire construction project.
Operations are organised on well tested principles for example in
terms of the structure of depot networks. Some of the depots also
function as service depots having specialist expertise in service
and maintenance. Hubs for the heavier, more capital-intense parts
of the rental fl eet enable equipment to be moved quickly between
the different areas depending on shifts in demand.
Cramo’s customers in Norway and Denmark consist mainly of
building and construction companies outsourcing part or all of
their equipment to Cramo. Other customers include municipalities
and industrial customers such as shipping and the oil and gas
industry.
EXPANDING DEPOT NETWORK AND OFFERING In Norway and Denmark Cramo provides growth opportunities by
adapting the business to customer needs and through the creation
of outsourcing potential.There is also growth potential in the co-
ordination of cross-country opportunities, in rental-related servic-
es and new offerings as well as a possibility to improve rental uti-
lisation rates. Growth opportunities also lie in outsourcing and
acquisitions.
The strength of Cramo’s rental business in Norway and Denmark
lies in its dynamic organisation and quickly growing size as well
as in the Cramo concept and processes already proven in other
markets.
Cramo is focusing on sales growth and increasing market share
by opening new depots and providing more extensive offerings in
particular in major cities. In Norway, Cramo aims to grow through
acquisitions as well as organically. Target customers are bigger
building and construction companies. In Denmark, Cramo’s goal is
to obtain full country coverage.
MARKETS REMAINED LIVELYIn Norway, growth in construction is estimated to have remained
at 5.9% but is expected to decline to 0.6% in 2008 according to
Euroconstruct. During 2007, the residential market grew strongly
Norway and Denmark present growth potential in the equipment rental business.
At the same time Cramo can develop its total solutions provider concept in these markets.
In 2007 saw the divestment of the Dutch operations according to the Group’s strategy.
WESTERN EUROPE
and there were extensive infrastructure projects in progress,
particularly in the energy sector.
Construction remained lively in Denmark, with the exception of
residential construction in the Copenhagen region. Denmark is
expected to post a negative growth rate of -1.2% in 2007, but it
is estimated to return to a 0.5% growth track in 2008. The non-
residential segment remained strong. Outsourcing is expected to
increase in both countries and the focus to shift to non-residential
construction and civil engineering in 2008.

25WESTERN EUROPE
ACTIVE EXPANSIONCramo continued to provide a more extensive offering, particularly
in major cities. In Norway, the company invested specifi cally in the
manufacturing sector given the large number of projects, especially
in the energy sector. In Denmark, investments were made especially
in equipment for construction. The development of rental-related
services, to support the whole construction project, continued.
Acquisitions of Kongsberg Maskinutleie and Hamar Liftutleie
strengthened Cramo’s presence in Norway and the outsourcing
of Skanska Danmark’s rental organisation with all the personnel,
existing machine fl eet and related external rental contracts
in Denmark. As a part of the outsourcing deal Cramo and
Skanska signed a pan-Nordic cooperation agreement. The
outsourcing will fi ll product gaps in heavy scaffolding, hoists
and larger construction equipment. At the same time it will
accelerate Cramo’s efforts to continue taking an active part in the
consolidation of a fairly fragmented Danish rental market. Cramo
opened 7 new depots in Norway and 7 in Denmark. Cramo’s
Dutch operations were divested in March according to plan.
A new CRM system and further developed pricing system for
international customers was introduced during the year. A new
rental system will be implemented in 2009 and a new business
intelligence system, which more effectively links fi nancial fi gures
with operational fi gures, in 2008.
EXCELLENT BASIS FOR FUTURE GROWTHThe economic outlook and Cramo’s market position provide an
excellent basis for considerable growth. The manufacturing sector,
given the large number of projects, is anticipated to be a growth
driver in Norway. Road construction and the housing sector are
also expected to be sectors with considerable growth potential.
In Denmark, the outlook is generally good but with fewer major
infrastructure projects than in Norway.
KEY FIGURES
2007 2006 Change %
Sales, MEUR 77.5 66.3 16.8
EBITA, MEUR 10.5 8.5 24.5
EBITA-% 13.6 12.7 7.1
Gross capital expenditure, MEUR 53.5 20.3 163.5
Number of depots 44 39 12.8
Average number of employees 306 253 20.9
SHARE OF GROUP SALES, % SHARE OF GROUP EBITA, %
15.4%9.6%
Cramo aims to further increase its market share in Norway and
Denmark in 2008, but the target is also to improve profi tability.
The development of the total site service offering and add-on
sales while continuing sales, and management competence
development, are going to remain a focus. Customer service will
be further improved and the quality and environment concept,
created to improve working quality at Cramo’s depots and at
customers’ sites, developed. Sales and customer synergies are
also sought between the core businesses.

26 2007 / ANNUAL REPORT / CRAMO PLC / POWERING YOUR BUSINESS
Cramo Other Europe comprises equipment rental operations in
Estonia, Latvia, Lithuania, Russia, Poland and the Czech Republic.
In Russia, Cramo operates a wholly owned subsidiary in the St.
Petersburg area, and a joint venture together with one of Russia’s
leading crane rental companies in Moscow.
The main focus in the Baltic countries, Russia and Poland is
equipment rental to companies in the building and general
construction sector. In St. Petersburg area, the focus is on the
rental of heavier equipment, given the relatively undeveloped
market penetration, with many companies still choosing to own
the less capital-intensive machinery. There is a hub organisation
in place in most countries to meet the needs in the area for heavy
the growth of construction in St. Petersburg and Moscow.
The rapid economic growth has also attracted major international
construction companies, thus increasing the usage and acceptance
of rental. The need for equipment is expected to be very large
over the next few years. The construction growth rate in Russia is
expected to remain at 9.5% in 2008.
The robust growth of construction stabilised in the Baltic
countries. Some overheating was seen mainly in residential
construction, which is expected to slow down slightly. Residential
construction in the Baltic countries is expected to decline in 2008,
relieving the risk of overheating. The Latvian government already
started actions to cool down the economy.
MARKET POSITION STRENGTHENED IN ALL MARKETS
The relatively young Central and Eastern European rental market offers huge growth potential for Cramo’s
rental business. Furthermore, the Central and Eastern European market provides an important
operational hedge against economic fl uctuations in the Nordic countries.
OTHER EUROPEmachinery and access equipment. Some of Cramo’s largest
customers in the Baltics and St. Petersburg are international
companies in building and general construction with a strong
position in the booming construction market. The other customers
are primarly local construction companies.
AIMING FOR ROBUST GROWTH Leveraging Cramo’s full product and service offering provides
growth potential for the company in the CEE area. Increased
investments in all the Baltic countries and Poland boost growth
and strengthen market position. At the same time, good
development in the Czech Republic continues. Large demand for
site huts continues in all markets and the market window is open
in Russia. The new Cramo brand gives good market visibility.
The strength of Cramo Other Europe’s rental business lies in
its early entry into the market, its proven rental concept and the
transferable best practices it employs in the new markets. It is
further enhanced by the continuously increasing supply of rental
equipment.
Cramo focuses on strengthening its market position in Central and
Eastern Europe while growing profi tably. The goal is to increase
sales by 50% annually during the next few years.
CONSTRUCTION BOOM CONTINUESStrong construction growth continued in all Central and Eastern
Europe markets where Cramo operates. Construction in Russia
is estimated to have grown by 10.4% in 2007 and in the Baltic
countries 13.0–19.0% as estimated by Euroconstruct. In Poland,
construction growth rate is estimated to have reached 13.1% while
in the Czech Republic it stayed at 6.0%.
Various large residential segment and major commercial and
industrial projects announced and underway have enhanced
Strong growth in construction continued in Poland and the Czech
Republic. EU funding in the new EU member countries has
facilitated the fi nancing of construction projects and boosted
construction. This, combined with the strengthening market
position of international construction fi rms has increased demand
for equipment rental services. Due to major infrastructure projects
underway, construction in Poland is estimated to show double-digit
growth rates for the next two years. Infrastructure and construction
projects act as growth drivers also in the Czech Republic market
with estimated growth rates of 3.7% in 2008 and 5.4% in 2009. The
rental penetration rate overall in the Other Europe’s markets also
increased.
INCREASED MARKET SHARECramo estimates that it has increased its market share in every
individual country as well as in the Other Europe area in total
during the year. In Estonia, solid market leadership was maintained.
Cramo won market share continuously in Lithuania and Latvia, and
achieved market leadership in Lithuania as a result of an acquisition
and strong organic growth. In Poland and St. Petersburg, Cramo is
among the three biggest players. In Poland, the Group maintained
its market leadership in access equipment. In the Czech Republic,
Cramo is expanding its operations rapidly.
There are only a few Western European equipment rental service
providers serving the Central and Eastern European market. In
all Cramo’s countries of operation, competition comes mainly
from a few national players and a number of locally based rental
companies. In Poland, there is growing competition from Western
companies.
The total value of the equipment rental market in 2006 was
approximately EUR 115 million in the Baltic countries, 110 million in
Poland and EUR 50 million in the Czech Republic, according
to estimates by the European Rental Association (ERA).

27OTHER EUROPE
HIGH SALES AND PROFITABILITY Cramo’s Other Europe operations sales grew above the target
to EUR 58.2 million. Cramo’s growth rate, 51.4% exceeded that of
the market.
The mild and short winter stimulated construction and resulted
in new projects being rescheduled to an earlier date. Early
investments in equipment contributed favourably to the growth.
The demand for access equipment and other heavy equipment
increased in Poland, Russia and Latvia. The demand in the Czech
Republic market increased quickly. Heavy demand for site huts
continued in all markets. The rebranding of Cramo improved
market visibility considerably and contributed to an increase in
sales, especially in St. Petersburg and Poland.
Profi tability remained very high with the absolute EBITA increased
51.4% the prior year. Utilisation rates reached high level and
investments were made ahead of schedule.
STRENGTHENED PRESENCECramo increased its supply of access equipment in Poland and
Czech Republic and started the rental of construction equipment
in Poland. The supply of services associated with rental also
increased. Equipment investment levels increased signifi cantly
from 2006 in all the Other Europe markets. At the same time,
Cramo has developed its reliability performance.
The depot network was expanded from 38 to 54 by opening 16 new
depots in Poland, St. Petersburg, Latvia and Lithuania. The depot
network in Estonia was expanded to 18 depots by acquisition of a
Tallinn depot of the Bygg & Maskin company. In Lithuania, Cramo
acquired at the end of 2006 Aukstumines Sistemos, the leading
Lithuanian access platform rental company with three depots.
A heavy equipment hub was also implemented, and several new
depots were opened in Latvia and Lithuania.
In August, Cramo established a joint rental operation, ZAO
Cramo Rentakran in Moscow with ZAO Rentakran, the leading
heavy lifting rental service company in Russia. The wholly owned
subsidiary ZAO Cramo opened a second depot in September in St.
Petersburg. A preferred supplier agreement was signed with YIT in
St. Petersburg. Other entries into new Russian, such as Krasnodar
and Yekaterinburg cities as well as new markets are in plan.
OUTLOOK STILL FAVOURABLE The outlook for 2008 remains good. The demand for equipment
rental services in Central and Eastern Europe is projected to
continue to increase, supported by the booming economy, rising
penetration rates and an increasing presence of international
construction fi rms. However, the limited awareness of the benefi ts
of rental combined with working methods, which differ from
those in Western Europe, may keep rental penetration growth to
a more modest level. While salary levels increase quickly, fi nding
experienced personnel becomes challenging. Increasing competition
may also have an effect on equipment rental price levels.
To encourage further growth, Cramo will put even greater effort
into new acquisitions, as there is a lack of qualifi ed candidates in
the emerging markets. The company will stay focused on keeping
profi tability at a good level and developing competences. Local
sales training started during the year will continue in 2008 and
new management leadership training has also been initiated.
The depot network and the organization will be strengthened and
machinery and equipment will be increased in all countries to
better meet customer needs. In Russia, Cramo plans to launch
its offering in more large cities to satisfy the huge demand.
KEY FIGURES
2007 2006 Change %
Sales, MEUR 58.2 38.5 51.4
EBITA, MEUR 17.1 12.0 42.5
EBITA-% 29.3 31.2 -6.1
Gross capital expenditure, MEUR 38.3 26.7 43.3
Number of depots 55 38 44.7
Average number of employees 529 358 47.8
SHARE OF GROUP SALES, % SHARE OF GROUP EBITA, %
11.6%15.6%

28 2007 / ANNUAL REPORT / CRAMO PLC / POWERING YOUR BUSINESS
SUBSTANTIAL INCREASE IN MODULAR SPACE PROFITABILITY
Until the autumn of 2007 when a major international competitor
begun its operations there were only marginal competitors mainly
focusing on sales operations in Finland. After consolidation
taking place in 2007, Sweden has four large suppliers totalling
approximately 80% of the market share. In Norway, there are only a
few larger players with some new international companies entering
the market during 2007. The Danish market is highly fragmented with
a large group of relatively small international or regional companies.
Competition will intensify also in Central and Eastern Europe.
At the end of 2007, the size of the modular space market in Finland
was estimated to be EUR 15 million, in Sweden EUR 65 million, in
Norway EUR 25 million and in Denmark EUR 20 million according to
estimates by Cramo.
SALES AND PROFITABILITY UPThe increased demand experienced since late 2006 continued to
intensify in 2007. Cramo’s proactive approach to marketing and
sales helped growing markets in all the countries of operations. The
utilisation rate remained strong throughout the year and fuelled an
increase in sales of 17.1%. The increase in rental contracts reduced
sales of modules, although the sales of halls increased. The order
book value for rental improved, whereas the order book value for
sales remained at a lower level than a year ago.
The vast majority of sales still came from Finland and Sweden
where the utilisation rates remained especially high while the
operations grew at the same rate as the markets as a whole. In
Norway and Denmark, Cramo intensifi ed operations and reached
good positions for the future. The growth in Norway continued
at a considerable pace while in Denmark growth remained more
moderate. At the end of the year the company had a markedly
stronger order book than in the previous year.
Despite increased costs, Cramo was able to improve its margins and
show a substantial increase in profi tability. EBITA was up to 25.2 %
The modular space rental agreements, often signed on a long-term basis, combined with different customer
segment focus compared to equipment rental make the Group less vulnerable to economic fl uctuations.
Furthermore, modular space solutions enlarge Cramo’s total rental offering in large residential and non-
residential projects to a unique level. A renewed organisation structure was based on the drive to
better reap synergies between equipment rental and modular space and increase sales growth.
MODULAR SPACE
Cramo’s modular space operations meet its customers’ demands
for temporary premises by providing space with the same level
of standards as permanent structures. Highly prefabricated
and pre-equipped building modules are fl exible, functional and
environmentally friendly. The most important applications include
schools, day-care centres and offi ces. Demand originates mainly
from large privately held companies that are expanding as well as
organisations in the public sector.
Along with its core rental business Cramo also sells site huts
and industrial halls and manufactures them in two factories in
Finland, with one factory producing site huts and modules, and
the other industrial halls. Extensive experience in modular space,
combined with knowledge about customer needs, has led to an
expansion in the offering with a number of services, such as
facility management, customer support and architectural design
services. While its Finnish operations involve the rental, sale and
manufacture of modular space, operations in Sweden, Norway
and Denmark are fully focused on rental. Sweden and Finland
currently represent the main markets.
FOCUS ON PROFITABLE GROWTHIncreased rental penetration rate with additional organic growth
by new applications create growth potential for Cramo in modular
space. There is further potential in the conversion of latent
demand in the Nordic countries and in the new markets such as
the Baltic countries and Poland. Increased co-operation between
Cramo entities combined with acquisitions, further enhance
realisation of the strategy.
The main focus of modular space’s strategy is on sustained
profi table growth. As a part of the rebranding process carried
out in 2007, modular space rental operations in Finland were
named Cramo Instant and one of the factories Cramo Master
in early 2007. Increasing rental business and effi ciency in fl eet
management are further priorities supporting the strategy.
The strength of Cramo in modular space lies in its nationwide
sales and project organisation with local expertise, long customer
relationships, the large fl eet of modules and quick delivery as well
as a strong order book.
MARKETS FAVOURED CRAMODuring the reporting period, due to a booming economy, the public
sector showed an increasing demand for modular space rental.
Other growth drivers such as increasing rental penetration, made
the rental market a strong growth market.
Migration of people to larger cities and towns continued, creating
an increasing need for fl exible space solutions at both ends.
When the demographic structure changes, there will probably be
growing demand for care-home services. The need for fl exibility
increased the use of facilities.
LEADING POSITION MAINTAINEDThe company succeeded in maintaining its leading position in
Finland and Sweden in 2007. Cramo reached a position among
the biggest players in Norway and strengthend its position in
Denmark where the market share still remained relatively small.

29MODULAR SPACE
of sales, thanks to a strong volume growth enabled by increased
manufacturing capacity, improved price levels and a more effi cient
fl eet management. During 2007, the public sector in particular
showed an increasing need for new premises.
Cramo has been able to increase the average length of rental
contracts. The lengthening of contracts is expected to continue.
NEW SERVICE SOLUTIONSIncreased competition has emphasised the need for strategic agility
and fl exibility while strongly growing demand has placed high
requirements on long-term planning and effi cient distribution of
resources between the different markets. Cramo intensifi ed focus
on the long-term rental of modular space according to the strategy.
Development of the product and service offering to different
segments continued in 2007. A new total service solution for day-
cares with facility management services was introduced in Finland.
One of the fi rst long term contracts was signed with the Nurmijärvi
municipality. The care-home segment is under investigation.
Equipment rental and modular space service ranges and operations
were organised under one management, making the directors of
geographical segments responsible for both businesses in their
respective market area. The objective is to increase synergy benefi ts
and to increase sales for the modular space business particularly in
Norway, Denmark, the Baltic countries and Poland. Further sources
of Group level synergy are under evaluation.
The Group-wide project launched in 2006 on the enterprise resource
planning system, which aimed to increase effi ciency in fl eet
management, reached the process identifi cation phase in modular
space unit in 2007. The new enterprise resource planning system
was implemented in the modular space plants. Work to develop it
for the use of rental services continued.
KEY FIGURES
2007 2006 Change %
Sales, MEUR 76.7 65.5 17.1
EBITA, MEUR 19.4 15.0 29.5
EBITA-% 25.2 22.8 10.5
Gross capital expenditure, MEUR 20.4 17.4 17.3
Number of depots
Average number of employees 239 194 23.2
15.3%
SHARE OF GROUP SALES, %
17.7%
SHARE OF GROUP EBITA, %
GOOD OPPORTUNITIES FOR GROWTHThe outlook for 2008 is expected to continue to be favourable.
Demand for modular space is anticipated to remain strong in all
Cramo’s markets, supported by relocations, demographic changes
and industry needs for fl exible solutions.
Cramo will focus on sustaining high utilisation rates in Finland and
Sweden, while improving market share in Denmark and Norway.
Share of long-term rental business will be increased. Modular
space operations will be started in the Baltic countries utilising
Cramo’s existing presence.

30 2007 / ANNUAL REPORT / CRAMO PLC / POWERING YOUR BUSINESS
FINANCIALSTATEMENTSOF THE GROUP

31BOARD OF DIRECTORS’ REVIEW
BOARD OF DIRECTORS’ REVIEW OF THE 54TH YEAR IN OPERATIONBUSINESS OVERVIEWAccording to preliminary data, construction volumes grew in 2007
in all of Cramo’s operating regions, with the exception of Denmark.
While the Confederation of Finnish Construction Industries RT
estimated that construction volumes grew by some fi ve per
cent in Finland, the Swedish Construction Federation estimated
construction to have grown by some seven per cent in Sweden.
Euroconstruct, an international construction business research
group, estimated that the Norwegian construction business saw
an increase of 5.9 per cent while construction decreased by 1.2 per
cent in Denmark. In Russia and Central and Eastern Europe, the
construction investment growth rate is considerably higher than in
the Nordic region. For 2007, country-specifi c growth rate estimates
in Central and Eastern Europe varied between 6 and 19 per cent.
Cramo estimates that equipment rental services in all of its market
areas have shown a faster growth rate than the overall growth rate
of the construction industry, owing, among other things, to the rising
rental penetration rate. Demand for modular space is also estimated
to have increased faster than growth in the construction business.
Cramo believes this trend will continue throughout the next few years.
CONSOLIDATED SALES AND PROFITThe growth of Cramo’s consolidated sales and profi t continued
throughout the year. The sales for 2007 amounted to € 496.4
(402.4) million, showing growth of 23.4 per cent. Growth in sales
for continuous operations, i.e. sales excluding the Dutch business
operations that were divested on 1 April 2007, amounted to 26.6 per
cent.
Sales for the equipment rental business amounted to € 425.9 (339.7)
million, while that for modular space business € 76.7 (65.5) million.
Such growth was driven by the continuation of favourable market
conditions, higher rental equipment penetration rate, positive price
development, strong expansion through the opening of new depots
and through acquisitions, and successful equipment investments.
Consolidated operating profi t for 2007 before amortisation on
intangible assets resulting from corporate acquisitions (EBITA)
amounted to € 96.0 (72.8) million, or 19.3 (18.1) per cent of
consolidated sales. EBITA increased by 31.8 per cent compared to the
previous year. Healthy demand, growth in rental equipment utilisation
rates and the synergy benefi ts derived from the combination of
Rakentajain Konevuokraamo and Cramo boosted profi tability.
The most signifi cant synergy benefi ts came, as targeted, from the
rationalisation of overlapping operations, larger order volumes
in purchasing, the optimised production of modular space, and
more effective fl eet management. In addition, all Cramo’s business
activities were brought under one Cramo brand, and the Group’s key
processes and policies were strongly unifi ed using best practices.
EBITA for the equipment rental business amounted to € 90.0 (66.7)
million, or 21.1 (19.6) per cent of sales. EBITA grew by 35.0 per cent
year on year. For the modular space business, EBITA totalled € 19.4
(14.9) million, or 25.2 (22.8) per cent of sales, up by 29.5 per cent year
on year.
Consolidated operating profi t (EBIT) for 2007 was € 91.8 (68.6)
million, representing 18.5 (17.0) of sales. Profi t before tax in 2007 was
€ 75.8 (56.6) million while profi t for the year was € 57.5 (41.9) million.
Undiluted earnings per share were € 1.88 (1.39) and diluted earnings
per share € 1.87 (1.36).
Profi t for 2007 includes a € 4.0 million non-recurring capital gain from
the divestment of the Dutch business recognised in other operating
income, and expenses worth € 4.2 million and amortisations worth
€ 0.2 million associated with the Cramo brand change.
Return on investment (rolling 12-month ROI) stood at 13.7 (11.7) per
cent and return on equity (rolling 12-month ROE) at 18.4 (15.5) per
cent.
CAPITAL EXPENDITURE AND DEPRECIATION/AMORTISATIONGross investments of € 175.5 (111.9) million was mainly allocated
to the purchase of rental equipment. Company acquisitions carried
out during the reporting period are not included in gross capital
expenditure.
Reported depreciation on property, plant and equipment, and
software totalled € 62.4 (51.1) million. Amortisation on intangible
assets resulting from acquisitions totalled € 4.1 million. At the end of
the period, goodwill totalled € 152.4 million.
Growing demand in all of the Group’s main markets will require
continued capital expenditure growth in 2008.
FINANCIAL POSITION AND BALANCE SHEETThe Group showed a positive net cash fl ow of € 138.7 (103.9) million
from operating activities. Net cash fl ow used in investing activities
was € -175.2 (-96.3) million, while that used in fi nancing activities
amounted to € 13.7 (10.8) million. At the end of the period, cash
and cash equivalents amounted to € 18.5 (41.8) million, with the net
change coming to € -22.8 (18.4) million.
On 31 December 2007, Cramo Group’s gross interest-bearing
liabilities totalled € 383.5 (347.5) million. The Group has used interest-
rate swaps of around € 138.4 million to hedge its non-current loans,
and applies hedge accounting to that amount. On 28 September 2007,
Cramo signed an agreement for additional long-term additional
fi nancing of € 50 million in order to fi nance its growth strategy.
On 31 December 2007, Cramo Group’s net interest-bearing liabilities
totalled € 365.0 (305.6) million with gearing at 109.4 (104.6) per cent.
Consolidated balance sheet total on 31 December 2007 stood at
€ 895.0 (770.9) million, and the equity ratio was 37.3 (38.2) per cent.
Property, plant and equipment amounted to € 487.0 million, with
equipment rental representing € 367.7 million, or 75.5 per cent,
modular space representing € 119.3 million, or 24.5 per cent. Off-
balance sheet operating lease liabilities totalled € 54.2 (30.3) million
on 31 December 2007.
The net working capital on 31 December 2007 amounted to € 28.0
million, with equipment rental representing € 24.6 million, or 87.8
per cent, and modular space representing € 3.4 million, or 12.2 per
cent. Inventories amounted to € 16.9 million, with modular space
representing € 10.8 million, or 64.0 per cent.
GROUP STRUCTUREAt the end of the fi nancial year, the Cramo Group comprised the
following companies: Cramo Plc (parent company), its fully-owned
subsidiaries in Finland, Sweden, Norway, Denmark, Estonia, Latvia,
Lithuania and Poland, Cramo Instant Oy’s subsidiaries in Finland as

32 2007 / ANNUAL REPORT / CRAMO PLC / POWERING YOUR BUSINESS
well as Suomen Tähtivuokraus Oy’s subsidiaries in Poland, the Czech
Republic and St. Petersburg in Russia. Moreover, Cramo Plc owns a
75 per cent stake in Cramo JV Oy, with ZAO Cramo Rentakran acting
as its subsidiary in Russia. Cramo Instant Oy operated under the
name Tilamarkkinat Oy until 31 March 2007.
The Group’s legal structure was simplifi ed by taking measures such
as reducing the number of subsidiaries. On 1 April 2007, the parent
company, Cramo Plc’s equipment rental operations within Finland
were transferred Cramo Finland Oy, a subsidiary wholly owned by
the parent company. On the same date, the majority of the Group’s
operating subsidiaries outside Finland were transferred under
Cramo Plc’s direct ownership. Non-operating subsidiaries were
closed down in Sweden, and operating subsidiaries were combined.
The Dutch operations were discounted on 1 April 2007 by selling
Cramo Plc’s Dutch subsidiary Cramo Nederland B.V. to the Dutch
Jaston Groep B.V.
Equipment rental services are provided through a network of 268
depots. Cramo Instant Oy in Finland and Cramo Instant AB in
Sweden, Norway and Denmark are engaged in the modular space
business.
BUSINESS DEVELOPMENT AND ACQUISITIONS AND DIVESTMENTS Cramo’s key objective for 2007 was to fuel its international growth
and to improve profi tability.
During the year, measures were taken to pursue the development
work started on 1 January 2006 to exploit the synergies derived
from the combination of Rakentajain Konevuokraamo and Cramo’s
operations. Measures were taken to improve the consistency and
effi ciency of the Group’s internal processes and policies, and to
develop the Group’s shared IT systems. To benefi t from the synergies
between the business segments, a decision was made in September
to combine the operations and service ranges of equipment rental
and modular space businesses, giving the directors of geographic
segments responsibility for both equipment rental and modular
space in their respective market areas. The objective is to increase
the sales of the modular space business, particularly in Norway,
Denmark, the Baltic countries and Poland.
Measures associated with the change in the Cramo brand
were completed as planned during the autumn. All of Cramo’s
subsidiaries and depots in different countries now operate under
the same Cramo brand. The objective is to develop the total service
provider concept further in the rental business, and to make use of
the synergy benefi ts derived from equipment rental and modular
space businesses.
In August, Cramo Plc’s Board revised the Group’s fi nancial targets.
The sales growth target was increased from “more than 10 per cent”
annually to “more than 18 per cent”. The EBITA target was increased
from “more than 15 per cent” to “more than 18 per cent” of sales.
The return on equity (ROE) target was set to “more than 22 per cent”,
up from the equivalent of more than 18 per cent as derived from the
previous return on investment (ROI) target of “more than 13 per cent”.
The Board confi rmed that Cramo’s strategic objectives are to
rank among the two largest industry players in each of its market
areas, to develop into the preferred supplier from the customer’s
perspective and to be one of the most profi table companies in
the industry. Growth is targeted through both organic growth and
acquisitions.
On 9 November 2007, Cramo announced that it was exploring its
opportunities to sell its real estate facilities in Finland. After the
potential sale, Cramo would continue as a tenant in most of the
properties placed for sale. The possible sale is expected to take place
in the fi rst half of 2008.
ACQUISITIONS AND DIVESTMENTS
On 14 November 2007, Cramo’s wholly-owned Swedish subsidiary
Cramo Sverige AB acquired the entire share capital of two companies
specialising in access equipment rental, Kumla Lift AB and Hyrcenter
i Skövde AB. The estimated aggregate sales of these two companies
amounted to about € 3.2 million in 2007, and the companies have 11
employees. The acquisition took effect on 1 December 2007.
On 30 October 2007, Cramo and Skanska Denmark agreed on
outsourcing Skanska’s rental machinery and equipment to Cramo
in Denmark. The deal includes Skanska’s personnel, the existing
machine fl eet and the related external rental contracts. This
acquisition took effect on 1 November 2007. Cramo estimates that
the acquisition will increase its sales by at least € 13.5 million a
year. The integration of operations has convened as planned. The
transaction includes a cooperation agreement, the objective of which
is to increase Cramo’s rental service provision to Skanska also in
other Nordic countries.
In September, Cramo’s Finnish subsidiary Cramo Finland Oy
concluded an agreement on outsourcing Rakennusosakeyhtiö
Hartela’s building site huts to Cramo. The fi ve-year agreement,
covering approximately 200 site huts, is one of the fi rst outsourcing
agreements in the industry in Finland.
In August, Cramo Plc and the leading heavy lifting rental service
company in Russia, ZAO Rentakran, agreed to establish a joint
venture in Russia. While Cramo Plc owns 75 per cent and ZAO
Rentakran 25 per cent of the new company, Cramo has an option to
buy the minority share in the spring of 2011. The company began
operating in Moscow in November, and its expansion to other major
Russian cities such as Yekaterinburg and Kransnodar is scheduled to
take place in 2008.
In June, Cramo Finland Oy acquired the rental and sales business
of Oskarin Vuokrakone Oy operating in the Jyväskylä region. The
company’s sales in the 12-month accounting period that ended on 28
February 2007 amounted to approximately € 0.8 million. The business
was consolidated with the Group on 1 July 2007.
On 1 June 2007, Cramo Plc’s Estonian subsidiary Cramo Estonia AS
acquired the operations of Madara service offi ce located in Tallinn,
from the company Bygg & Maskin. The service offi ce’s net sales in
2006 amounted to approximately € 0.1 million. The business was
consolidated with the Cramo Group on 1 May 2007.
In May, Cramo Finland Oy acquired the equipment rental business of
JM-Alltrans Oy. JM-Alltrans is based in Kirkkonummi, Finland, and
specialises in the rental of small earth construction equipment. Its
sales in 2006 amounted to approximately € 1.1 million. The business
was consolidated with the Cramo Group on 1 May 2007.
In March, Cramo Sverige AB, the Swedish wholly-owned subsidiary of
Cramo Plc, signed an agreement to acquire the entire share capital
of Göby AB, a rental service company based in Sundsvall in the north
of Sweden. Göby specialises in the rental of site huts, work platforms
and electricity equipment. The company’s sales in 2006 amounted
to approximately € 3.5 million. Göby’s two depots in Sundsvall were
integrated with Cramo as of 1 May 2007.
On 1 March 2007, Cramo Plc acquired the rental and sales business of
Jyväskylän Konevuokraamo Oy. Jyväskylän Konevuokraamo has one
depot, and the acquired business was consolidated into the Cramo
Group on 1 March 2007.
In Norway, Cramo expanded its operations with two business
acquisitions in early 2007. Cramo’s Norwegian subsidiary Cramo
AS acquired the entire share capital of Hamar Liftutleie AS on 2
January 2007, and of Kongsberg Maskinutleie AS on 4 January
2007. The aggregate sales of these companies in 2006 amounted to

33BOARD OF DIRECTORS’ REVIEW
approximately € 2.65 million. Both companies were consolidated into
the Cramo Group as of 1 January 2007. Similarly, Lithuania’s leading
lifting equipment rental company UAB Aukstumines Sistemos (AS),
acquired by Cramo’s Lithuanian subsidiary UAB Cramo in December
2006, was consolidated into the Cramo Group on 1 January 2007.
In March, Cramo divested its Dutch operations. With an agreement
dated on 21 March 2007, Jaston Groep B.V. acquired the Group’s
Dutch subsidiary Cramo Nederland B.V. The acquisition took effect
on 11 April 2007. Cramo Nederland is a general equipment rental
company active in the Dutch rental market with sales amounting to
approximately € 12.6 million in 2006, and a staff of 90. This divestment
of the Dutch operations is in line with the Group’s strategy of focusing
on its core Nordic markets, and its emerging Central and Eastern
European equipment rental services markets.
GROUP MANAGEMENT Vesa Koivula continued as President and CEO of the Group. At the
end of the year, the Cramo Executive Committee comprised CEO Vesa
Koivula, Deputy CEO Göran Carlson and CFO Matti Ala-Härkönen.
The Group Management Team also included Senior Vice Presidents
Tatu Hauhio (Finland), Magnus Rosén (Scandinavia), Jarmo Laasanen
(rest of Europe) and Ossi Alastalo (development of modular space
business) as well as Vice President of Corporate Communications
Anders Collman, Vice President of Asset Management Mats Stenholm
and CIO Eva Harström.
The Group’s deputy CEO Göran Carlson was appointed responsible
Director for business development and strategic planning as of 1
January 2008. Göran Carlson will continue as deputy CEO, reporting to
CEO Vesa Koivula. Senior Vice President, Scandinavia who previously
reported to Göran Carlson, will now report directly to CEO Vesa Koivula.
HUMAN RESOURCESDuring the reporting period, Group staff averaged 2,270 (1,828)
people. The equipment rental business had an average of 2,031 (1,634)
employees and the modular space business 239 (194) employees.
Corporate acquisitions and transactions as well as outsourcing
contracts brought in a total of some 110 employees. The divestment of
the Dutch operations involved the loss of 90 employees.
The geographical distribution of personnel is as follows: Finland 34.5
(33.2) %, Sweden 28.8 (33.4) %, Western Europe 13.5 (13.8) % and
Other Europe 23.2 (19.6) %.
The company’s strong growth will require the constant development
of staff competencies. In 2007, the local needs of markets were
emphasised with regard to staff development. A particular focus
was placed on the development of sales and customer service as
well as supervisor skills, and the bolstering of technical expertise
relating to rental equipment. In the future, Cramo will strive to extend
staff development programmes over the entire Group on a more
systematic basis than previously. In 2007, the reward systems for
the management and staff were unifi ed, and the bonus system was
extended to cover nearly all staff.
STAFF SEGMENTS Number of Per cent of
employees the entire staff
2007 2006 2007 2006
Equipment rental
Finland 584 449 25.7 24.6
Sweden 618 574 27.2 31.4
Western Europe 306 253 13.5 13.8
Rest of Europe 529 358 23.3 19.6
Equipment rental, total 2,037 1,634 89.7 89.4
Modular space rental 233 194 10.3 10.6
Total 2,270 1,828 100.0 100.0
STAFF AGE DISTRIBUTION Number of Per cent of
employees the entire staff
-23 135 82 6.0 4.5
24-35 696 477 30.7 26.1
36-45 714 618 31.4 33.8
46-60 601 534 26.5 29.2
60- 124 117 5.4 6.4
2,270 1,828 100.0 100.0
Employed by parent
company on average 20 449
RISK MANAGEMENTCramo Group revised its risk management policy in 2007. The
objective of risk management is to ensure that risks related to
Cramo’s business operations are identifi ed as well as constantly
evaluated and monitored. Risk management at Cramo is continuous
and systematic, its objectives being to prevent personal injuries,
protect Cramo Group’s assets as well as ensuring a steady, profi table
economic growth for the company.
STRATEGIC RISKS
The Group’s business operations are dependent on general
economic trends and the rate of activity in the construction and
real estate markets. Unfavourable developments in these markets
could have detrimental effects on the Group’s operations, profi t and
fi nancial standing. Cramo has attempted to mitigate the risks related
to demand and price developments by separating its business
operations into various product and customer segments, and by
reducing its dependency on any single geographical market.
Historically, seasonal variations have proven typical of the
construction business. Despite the fact that Cramo has reduced
its dependency on the construction business, the Group’s turnover
and profi t markedly fl uctuate between quarters, typically for the
equipment rental business. Since the Group’s business operations are
dependent on general economic conditions, economic fl uctuations
impact on the Group’s business results and fi nancial standing. The
Group attempts to balance potentially detrimental effects of economic
fl uctuations by ensuring that its services are cost-effi cient and that its
range of equipment and services remains competitive.
Expansion and business development is partially based on corporate
acquisitions. Risks associated with corporate acquisitions might be
related to issues such as knowledge of local markets, customers,
key persons and suppliers. The goal is to take the risks into account
by means of careful preparation and systematic monitoring of the
acquisition. Expansion into new geographic areas will subject the
company to cultural, political, economic, regulatory and legal risks.
There are additional risks related to the quantity, focusing and timing
of the Group’s investments as well as other risks related to strategic
business decisions. The objective is to manage investment-related
risks by means of, for instance, a meticulous approval procedure
for investments and the utilisation of external and internal risk
indicators, evaluated monthly by the operating companies.
OPERATIONAL RISKS
The Group’s operational risks include personnel risks, contract risks,
occupational safety risks, IT-related risks, risks related to conform-
ance with laws and regulations, risks related to the management
policies of the Group as well as business process-related risks.
The Group Management Team determined and prioritised the
Group’s primary risks in 2007. Procedural plans and risk indicators
were further developed in order to manage the primary risks, and
a separate contingency plan for an economic recession was also
drafted. The Group also revised and implemented new corporate
governance instructions in 2007.

34 2007 / ANNUAL REPORT / CRAMO PLC / POWERING YOUR BUSINESS
FINANCIAL RISKS
The objective of fi nancial risk management is to ensure high-quality
internal and external fi nancial reporting and the availability of Group
fi nancing as well as minimising any adverse effects that the operating
environment and changes in the fi nancial markets may have on the
Group’s profi t.
The primary fi nancial risks are the cash fl ow interest rate risk,
currency risk, credit risk and the liquidity risk. In order to control
the interest rate risk, the Group’s borrowings and investments
are distributed over fi xed and fl oating rate instruments. Derivative
instruments such as interest rate swaps are also used in order to
manage the interest rate risk. The currency risk mainly arises from
net investments in foreign operations and loans denominated in
foreign currency. Moreover, the Group uses forward contracts in order
to hedge the currency risk. The objective of these measures is to
protect the Group against signifi cant fi nancial risks.
The Group Treasury implemented a revised fi nancing policy in 2007.
This policy determines the objectives and principles of protective
actions as well as fi nancing responsibilities and operating methods.
Group fi nancing operations are centralised with the parent company
while the fi nancing of the Group’s companies is primarily performed
using internal Group loans. The Group Treasury identifi es, evaluates
and hedges fi nancing risks in partnership with the Group’s companies.
BUSINESS TRANSACTION RISKS
The Group’s business transaction risks include risks related to
equipment rental and the undisturbed continuation of operations that
can be managed by means of insurance. Comprehensive insurance
cover forms a crucial part of Cramo Group’s risk management policy.
ENVIRONMENTAL RISKS
Environmental responsibility is an ever more vital part of Cramo’s
business model. Cramo’s environmental responsibility includes
ensuring that the rented equipment and facilities are of high quality
as well as carefully maintained and renovated. In purchasing
decisions relating to equipment, the environmental load generated by
the manufacture and use of the equipment is taken into account. Long
equipment life cycles are ensured by means of careful maintenance.
Cramo’s operations in Sweden, Denmark and Norway are certifi ed in
accordance with the ISO 14001 environmental and ISO 9001 quality
management systems. In Finland, Cramo’s quality management
and operational system is controlled by the ISO 9001:2000 quality
certifi cate, granted by Det Norske Veritas.
The Group strives to minimise ill-effects on the environment by
rotating equipment and facilities between users. An attempt is
made to reduce its environmental load by delivering all equipment
to customers tested, and without unnecessary packaging. Regional
profi t centres are responsible for the storage and treatment of
chemicals and hazardous waste. All material originating from the
equipment and subject to disposal is recycled as much as possible.
By aiming at a high utilisation ratio for its machinery fl eet, the Group
can reduce the environmental impact of construction.
SHARES, SHARE CAPITAL AND STOCK OPTION SCHEMES On 31 December 2007, Cramo Plc had a share capital of
€ 24,834,753.09 and the total number of shares was 30,660,189.
Share capital and the number of shares were increased during the
year as follows:
A total of 362,596 Cramo shares were subscribed with 2002A/B stock
options rights between January and March. The resulting increases of
the share capital, a total of € 293,702.76, were entered into the Trade
Register on 8 March, 12 April and 8 May 2007. Trading in the shares
on the OMX Nordic Exchange in Helsinki began on 9 March, 13 April
and 9 May 2007.
Subscriptions for 74,551 shares under Cramo’s 2002A/B option
scheme were approved in April-June. A share capital increase
amounting to € 54,067.50, due to share subscriptions, was registered
in the Trade Register on 12 April 2007. This increased the share capital
to € 24,828,515.28 and the number of shares to 30,652,488. The new
shares have been traded on the OMX Nordic Exchange since 13 April
2007. A share capital increase amounting to € 6,237.81 was registered
in the Trade Register on 8 May 2007, and the new shares have been
traded since 9 May 2007.
The subscription period under the stock option scheme established by
the Annual General Meeting on 4 April 2002 expired on 31 March 2007.
The 2002 stock option scheme involved issuing 670,000 stock options
to the company’s key personnel, which entitled them to subscribe for
670,000 Cramo Plc shares. The maximum increase in share capital
resulting from the option scheme was € 1,132,300.00. The actual
increase was € 1,132,279.70. The share subscription price was the
trading-weighted average price of the company’s B share between 5
April and 4 June 2002 plus 10 per cent, in other words € 5.27, deducted
by the dividends to be distributed before share subscription on the
record date. As a result of dividend payment, the subscription price
was decreased by € 0.50 on 7 April 2003, by € 0.50 on 7 April 2004, by
€ 0.30 on 13 December 2004, by € 0.25 on 11 April 2005 and on 11 April
2006, resulting in a subscription price of € 3.47 per share. The B stock
options associated with the 2002 stock option scheme have been listed
for trading together with the 2002 A stock options since 2 May 2006.
VALID STOCK OPTION SCHEMESThe Extraordinary General Meeting held on 20 November 2006 decided
on an option scheme under which 3,000,000 stock options will be
issued, entitling their holders to subscribe for a maximum of 3,000,000
new shares in the company. The subscription period for stock options
2006A is from 1 October 2009 to 31 January 2011, for options 2006B
from 1 October 2010 to 31 January 2012, and for options 2006C
from 1 October 2011 to 31 January 2013. The subscription price for
stock options 2006A is € 14.51, in other words the trading-weighted
average price of the Cramo Plc share between 1 and 31 October 2006.
Subscription price for stock options 2006B is the trading-weighted
average share price between 1 and 31 October 2007, or € 26.47, and for
stock options 200C the trading-weighted average share price between
1 and 31 October 2008. Annual dividends will be deducted from the
subscription price.
On 31 December 2007, Cramo Group’s key personnel held a total of
813,000 2006A stock options and 904,000 2006B stock options. The
2006 option scheme covers approximately 80 key persons of the Group.
ANNUAL GENERAL MEETINGCramo Plc’s Annual General Meeting (AGM) of 18 April 2007 discussed
the matters assigned to the AGM in the Articles of Association, and
approved the fi nancial statements of the company and the Group for
2006.
Based on the proposal of the Board of Directors, the AGM decided that
a dividend of € 0.50 per share be distributed. The AGM discharged the
members of the Board of Directors and the President and CEO from
liability for the fi nancial year 2006.
The AGM re-elected Gunnar Glifberg, Stig Gustavson, Eino Halonen,
Hannu Krogerus and Juhani Nurminen to the Board of Directors.
Esko Mäkelä was elected as a new member to the Board. Esko Mäkelä
(M.Sc.Eng., MBA) served as the Executive Vice President and CFO of
YIT Corporation between 1987 and 2006.
The AGM elected Tomi Englund, Authorised Public Accountant, and the
auditing fi rm Ernst & Young Oy as the company’s auditors.
VALID BOARD AUTHORISATIONSThe Board has no valid authorisations to issue convertible bonds,
increase share capital or buy back treasury shares.

35BOARD OF DIRECTORS’ REVIEW
CORPORATE GOVERNANCE AND AUDITORSAs of 18 April 2007, Cramo Plc’s Board of Directors consists of
Stig Gustavson (Chairman), Eino Halonen (Vice Chairman), Gunnar
Glifberg, Hannu Krogerus, Juhani Nurminen and Esko Mäkelä.
The Audit Committee members are Eino Halonen (Chairman), Esko
Mäkelä and Juhani Nurminen. Members of the Nomination and
Compensation Committee are Stig Gustavson (Chairman), Gunnar
Glifberg and Hannu Krogerus.
Board members Stig Gustavson, Hannu Krogerus, Esko Mäkelä
and Juhani Nurminen are deemed independent of the company and
its major shareholders. Gunnar Glifberg is deemed independent
of major shareholders, but as the former President and CEO of
Cramo AB until the autumn of 2005, he is deemed dependent of the
company until the autumn of 2008. Eino Halonen is independent of
the company but as the President and CEO of Suomi Mutual Life
Assurance Company he is dependent of major shareholders until 31
December 2007.
The Board members until 18 April 2007 were Gunnar Glifberg,
Stig Gustavson, Phil van Haarlem, Eino Halonen, Pekka Heusala,
Hannu Krogerus and Juhani Nurminen. Until 18 April 2007, the
Audit Committee members were Pekka Heusala (Chairman), Eino
Halonen and Phil van Haarlem. Members of the Nomination and
Compensation Committee were Stig Gustavson (Chairman), Pekka
Heusala and Hannu Krogerus. All Board members except for Gunnar
Glifberg are independent of the company. Glifberg, Gustavson,
Heusala, Nurminen, Krogerus and Phil van Haarlem are independent
of major shareholders.
In 2007, the Board met nine times, the Audit Committee four times,
and the Nomination and Compensation Committee three times.
On 31 December 2007, the Board members, the President and
CEO, and his deputy held, either directly or through companies in
which they exercise control, a total of 111,549 Cramo Plc shares,
representing 0.36 per cent of the company’s shares and votes, and a
total of 0 stock options.
The company’s auditors were Tomi Englund, Authorised Public
Accountant, and Ernst & Young Oy Authorised Public Accountants,
with Erkka Talvinko as the main responsible auditor.
Cramo Plc observes the Corporate Governance Recommendation
for Listed Companies issued by the OMX Nordic Exchange Helsinki,
the Central Chamber of Commerce of Finland and the Confederation
of Finnish Industry and Employers. Cramo Plc’s insider guidelines
are based on the Securities Market Act, rules and regulations
issued by the Financial Supervision Authority, as well as the insider
guidelines of the Helsinki Stock Exchange effective since 1 January
2006. Finnish Central Securities Depository Ltd maintains an insider
register of Cramo Plc’s permanent insiders, whose holdings are also
available on Cramo Plc’s website.
BOARD OF DIRECTOR’S PROPOSAL FOR PROFIT DISTRIBUTIONIn February 2007, the Board of Directors specifi ed the company’s
new profi t distribution policy as follows: “Cramo Plc’s profi t
distribution goal is to distribute around a third of the Group’s annual
profi t in terms of share buybacks and/or dividends. The target is to
maintain a steadily improving fl ow of dividends, however while taking
into account the Group’s investment requirements for growth.”
The Board of Directors proposes to the Annual General Meeting
that a dividend of € 0.65 per share be paid for the fi nancial year 1
January – 31 December 2007. The Board of Directors has assessed
the company’s future business operations and considers that the
proposed dividend distribution does not constitute a risk to the
company’s solvency.
EVENTS AFTER THE FINANCIAL YEAROn 10 January 2008, Cramo announced an agreement between its
Swedish subsidiary Cramo Sverige AB and Skanska Sverige AB
making Cramo Skanska’s preferred supplier of lifting equipment. At
this stage, the agreement applies to Sweden, but it may be extended
to cover Skanska’s other Nordic companies. The contracting parties
estimated the annual volume of the agreement to be in the region of
€ 6.5 million.
Magnus Rosén, Senior Vice President for the Scandinavian
operations, announced his resignation on 14 January 2008.
On 21 January 2008, UBS AG notifi ed Cramo that shares held by
UBS AG (Switzerland) and UBS AG London Branch in Cramo Plc
had exceeded the fi ve per cent limit on 28 January 2008. After the
notifi cation, the company held 1,677,610 shares, accounting for 5.47
percent of Cramo Plc shares and votes.
FUTURE PROSPECTSIn spite of the instability of the fi nancial markets and US economic
development, brisk demand for rental services is expected to
continue in Cramo’s business environment. Growth in construction
activity coupled with major infrastructure projects in industry and
the public sector will continue to fuel growth in the equipment
rental business. Nordic construction is expected to continue its
growth, but at a slightly lower rate than in previous years. Although
overall growth in construction is hampered by the decline in
residential construction, industrial and commercial construction
as well as civil engineering projects will continue to grow. Central
and Eastern Europe are expected to see sustained strong growth
in construction, although this growth is decelerating in the Baltic
countries. Equipment rental services will expand at a faster rate
compared to general growth in construction, due to factors such as
increasing penetration rates for these services, increased equipment
outsourcing, and growth in the demand for rental-related services.
Continued growth is also anticipated in demand for modular space.
This demand is supported by relocations, demographic changes, and
industry needs for increasingly fl exible building solutions.
Growing demand in all of the Group’s main markets will require
continued capital expenditure growth in 2008.
In line with its strategy, the Group intends to further enhance its
position in all of its market areas. The Group will continue to map
out its growth potential in the Nordic countries and Central and
Eastern Europe, with the objective of being one of the top two service
providers in each market. The supply of modular space in Central
and Eastern Europe is seen as a new growth opportunity.
Besides global economic development, the most signifi cant
uncertainties faced by Cramo’s business are associated with general
cyclical and economic development in each country, changes in
interest and foreign-exchange rates as well as the success of the
Group’s acquisitions. So far, the growing uncertainty in the fi nancial
markets and the US economy have had little impact on Cramo’s
business.
The Group’s internal, as well as market indicators support a sales
growth above 18% and EBITA above 18% of sales in 2008, in line with
the Group’s fi nancial targets. However, macroeconomic development
may change this picture.

36 2007 / ANNUAL REPORT / CRAMO PLC / POWERING YOUR BUSINESS
DISCLAIMER
This review includes certain forward-looking statements based on management’s expectations at the time they are made.
Therefore, they involve risks and uncertainties and are subject to change due to changes in general economic and industry conditions.
HISTORICAL SHARE PRICE, € TURNOVER OF SHARES PER MONTH, NUMBER
6,000,000
3,000,000
1,000,000
800,000
600,000
400,000
200,000
02003 2004 2005 2006 2007
9,000,000
15,000,000
12,000,000
2003 2004 2005 2006 2007
16
8
4
12
0
32
28
24
20
40
36
KEY FIGURES AND RATIOS
IFRS IFRS IFRS IFRS FAS FAS
KEY FIGURES ON FINANCIAL PERFORMANCE 2007 2006 2005 2004 2004 2003
Revenue M€ 496.4 402.4 77.0 71.4 73.0 58.7
Change -% % +23.4 +422.6 +7.8 +24.2 -3.8
Operating profi t M€ 91.8 68.6 18.0 14.4 12.1 10.1
% of revenue % 18.5 17.0 23.3 20.1 16.6 17.2
Profi t before taxes M€ 75.8 56.6 16.2 13.0 11.5 9.8
% of revenue % 15.3 14.1 21.1 18.2 15.8 16.7
Profi t for the period M€ 57.5 41.9 11.9 9.2 8.0 8.0
% of revenue % 11.6 10.4 15.5 12.9 10.9 13.7
Return on equity % 18.4 15.5 24.0 19.9 16.4 21.1
Return on investment % 13.7 11.7 18.6 16.6 16.9 15.6
Equity ratio % 37.3 38.2 49.0 48.9 56.3 61.3
Gross capital expenditure M€ 175.5 111.9 29.6 15.0 12.0 16.6
% of revenue % 35.4 27.8 38.5 21.0 16.4 28.2
Equity M€ 333.7 292.2 54.1 45.4 47.1 52.8
Net interest-bearing liabilities M€ 365.0 305.6 48.6 44.2 26.2 20.5
Gearing % 109.4 104.6
Average number of personnel No. 2,070 1,828 569 538 538 447
PER-SHARE RATIOS
Earnings per share € 1.88 1.39 0.83 0.64 0.56 0.57
Earnings per share diluted *) € 1.87 1.36 0.81 0.63 0.55 0.56
Shareholder’s equity per share € 10.88 9.66 3.77 3.17 3.29 3.60
Dividend per earnings % 34.6 36.0 30.8 39.5 44.6 140.4
Dividend per share € 0.65** 0.50 0.25 0.25 0.80
Market capitalisation of
A/B Series share capital M€ 531.0 571.8 170.4 93.4 82.5
Trading volume of B Series shares No. 45,714,185 37,070,980 6,830,907 3,495,110 3,048,642
% of total number % 149 123 54 28 24
Issue-adjusted average number
of A series shares No. 1,728,000 1,728,000 1,728,000
Issue-adjusted average number
of B series shares No. 30,586,040 30,121,137 12,611,807 12,586,507 12,832,518
Issue-adjusted average number
of A series shares at fi nancial year end No. 1,728,000 1,728,000 1,728,000
Issue-adjusted average number
of B series shares at fi nancial year end No. 30,660,189 30,332,793 14,699,675 12,586,507 12,832,518
P/E ratio 9.2 13.9 15.2 10.3 11.7 10.1
Effective dividend yield % 3.8 2.6 2.0 3.8 13.9
Market capitalisation of share capital M€ 531.0 571.8 155.9 82.4 73.8
Average price € 26.66 13.44 8.42 6.36 5.02
Closing price at year end € 17.32 18.90 12.36 6.55 5.75
Lowest quotation € 16.75 11.10 6.15 5.70 4.35
Highest quotation € 38.80 19.00 12.46 7.45 5.90
*) Adjusted by the dilution effect of shares entitled by warrants
**) Board proposal

37FINANCIAL STATEMENTS (IFRS)
CONSOLIDATED BALANCE SHEET, 1,000 €
ASSETS Note 31.12.2007 31.12.2006
NON-CURRENT ASSETS
Tangible assets 6 487,038 367,950
Intangible assets 7 95,359 95,452
Goodwill 7 152,367 152,802
Financial assets available for sale 6 332 320
Deferred tax assets 14 2,974 2,423
Receivables 9 3,954 446
Total non-current assets 742,024 619,393
CURRENT ASSETS
Inventories 8 16,903 15,788
Trade receivables and other receivables 9 115,250 91,469
Income tax receivables 2,298 2,310
Derivative fi nancial instruments 29 113
Cash and cash equivalent 10 18,489 41,823
Total current assets 152,940 151,503
TOTAL ASSETS 894,964 770,896
EQUITY AND LIABILITIES Note 31.12.2007 31.12.2006
EQUITY
Share capital 12 24,835 24,508
Share issue 12 143
Share premium 12 186,910 185,836
Fair value reserve 12 117 117
Hedging fund 12 6,334 3,301
Translation differences 12 -1,867 2,818
Retained earnings 12 117,351 75,521
Total equity 333,680 292,244
NON-CURRENT LIABILITIES
Reserves 11 363 348
Deferred tax liabilities 14 62,200 51,829
Interest-bearing liabilities 13 274,087 306,968
Total non-current liabilities 336,650 359,145
CURRENT LIABILITIES
Interest-bearing liabilities 13 109,387 40,499
Trade and other liabilities 15 105,762 76,274
Income tax liabilities 9,485 2,734
Total current liabilities 224,634 119,507
Total liabilities 561,284 478,652
TOTAL EQUITY AND LIABILITIES 894,964 770,896

38 2007 / ANNUAL REPORT / CRAMO PLC / POWERING YOUR BUSINESS
CONSOLIDATED INCOME STATEMENT, 1,000 €
Note 1.1.–31.12.2007 1.1.–31.12.2006
REVENUE 496,428 402,425
Other operating income 17 7,798 3,507
Changes in inventories 18 966 -184
Production for own use 15,379 7,754
Materials and services 18 -106,396 -74,256
Employee benefi t expenses 19 -101,608 -83,773
Depreciation 6 -62,356 -51,060
Amortisation on intangible assets resulting from acquisitions 7 -4,119 -4,265
Other operating expenses 20 -154,248 -131,579
OPERATING PROFIT 91,844 68,569
Finance cost (net) 21 -16,036 -11,984
PROFIT BEFORE TAX 75,808 56,585
Income tax expense 22 -18,323 -14,641
PROFIT OF THE YEAR 57,485 41,944
Calculated from shareholder’s profi t:
Earnings per share, € 23 1.88 1.39
Diluted earnings per share, € 23 1.87 1.36
CHANGES IN CONSOLIDATED STATEMENT OF EQUITY, 1,000 €
Share Share Share Fair value Hedging Translation Retained
capital issue premium reserve fund difference earnings Total
EQUITY AS AT 1.1.2006 24,234 32 1,607 117 114 28,027 54,131
Translation difference 2,704 2 2,706
Hedging fund 3,301 3,301
Total income and expense for
the year recognised directly in equity 3,301 2,704 2 6,007
Profi t for the period 41,944 41,944
Total income and expense for the year 3,301 2,704 41,946 47,951
Dividend distribution -7,513 -7,513
Exercise of options, registered 196 -32 650 814
Exercise of options, unregistered 143 143
Share-based payment 442 442
Combining of share classes 560 560
Shares of Cramo Holding B.V. 12,137 184,159 196,296
Share issue costs of
Cramo Holding B.V. -580 -580
Reduction of par value -12,619 12,619
Total 274 111 184,229 3,301 2,704 47,494 238,113
EQUITY AS AT 31.12.2006 24,508 143 185,836 117 3,301 2,818 75,521 292,244
EQUITY AS AT 1.1.2007 24,508 143 185,836 117 3,301 2,818 75,521 292,244
Translation difference -4,685 -2,134 -6,819
Hedging fund 3,033 3,033
Total income and expense for
the year recognised directly in equity 3,033 -4,685 -2,134 -3,786
Profi t for the period 57,485 57,485
Total income and expense for the year 3,033 -4,685 55,351 53,699
Dividend distribution -15,326 -15,326
Exercise of options, registered 327 -143 1,074 1,258
Share-based payment 1,805 1,805
Total 327 -143 1,074 3,033 -4,685 41,830 41,436
EQUITY AS AT 31.12.2007 24,835 186,910 117 6,334 -1,867 117,351 333,680

39FINANCIAL STATEMENTS (IFRS)
CONSOLIDATED CASH FLOW STATEMENT, 1,000 €
1.1.–31.12.2007 1.1.–31.12.2006
Cash fl ows from operating activites
Operating profi t 91,844 68,569
Adjustments for:
Depreciation 66,474 55,326
Change in working capital 1) 112 -2,135
Financial expenses -14,731 -13,128
Financial income 694 1,523
Taxes -3,170 -4,745
Other non cash corrections -2,570 -1,530
Net cash fl ow from operating activities 138,653 103,880
Cash fl ow from investing activities
Investments in tangible and intangible assets -175,493 -109,015
Sale of tangible and intangible assets 9,490 13,416
Acquisition of subsidiaries and business operations,
net of cash aquired -20,638 -655
Disposal of a subsidiary 11,407
Cash fl ow used in investing activities -175,234 -96,254
Cash fl ow from fi nancing activities
Proceeds from issue of share capital 1,258 787
Increase (+)/decrease (-) in liabilities 34,393 -17,066
Increase (+)/decrease (-) in lease liabilities -6,590 34,610
Dividends paid -15,326 -7,513
Net cash fl ow from fi nancing activities 13,735 10,818
Net (decrease)/increase in cash and cash equivalents -22,846 18,444
Cash and cash equivalents at beginning of the year 41,823 1,850
Translation difference -488 302
Cash and cash equivalents from acquisition of Cramo Holding B.V. 21,227
Cash and cash equivalents at year end 18,489 41,823
1) Change in working capital
Increase (-)/decrease (+) in inventories -1,217 -3,966
Increase (-)/decrease (+) in short-term receivables -26,551 -14,697
Increase (+)/decrease (-) in short-term non-interest bearing liabilities 27,880 16,528
Total 112 -2,135

40 2007 / ANNUAL REPORT / CRAMO PLC / POWERING YOUR BUSINESS
NOTES TO THE CONSOLIDATED FINANCIAL STATEMENTS1 GENERAL INFORMATIONCramo Plc is a service company specialising in construction
machinery and equipment rental and rental-related services, as
well as the rental and sale of modular space. Cramo operates in ten
countries in the Nordic countries and in Central and Eastern Europe
with 268 depots and 2,270 employees.
The address of Cramo Oyj´s registered offi ce is Kalliosolantie 2,
01740 Vantaa, Finland. The parent company of the Group is domiciled
in Vantaa.
Cramo Oyj has its listing at the OMX Nordic Exchange Helsinki.
These consolidated fi nancial statements have been approved for issue
by the Board of Directors on 14 February 2008.
2 SUMMARY OF SIGNIFICANT ACCOUNTING POLICIESThe principal accounting policies adopted in the preparation of the
consolidated fi nancial information are set out below. These policies
have been consistently applied to all the years presented, unless
otherwise stated.
2.1 BASIS OF PREPARATION
The consolidated fi nancial statements of Cramo have been prepared
in accordance with International Financial Reporting Standards (IFRS)
as adopted by the EU.
This IFRS consolidated fi nancial statements have been prepared
under the historical cost convention, except available-for-sale
investments and interest rate derivatives, which have been recognised
at fair value.
The preparation of the consolidated fi nancial statements in conformity
with generally accepted accounting principles requires the use of
estimates and assumptions that affect the reported amounts of assets
and liabilities and the disclosure of contingent assets and liabilities
at the date of the fi nancial statements, and the reported amounts
of revenue and expenses during the reporting period. While these
estimates are based on management’s best knowledge of current
events and actions, actual results ultimately may differ from those
estimates. Areas where assumptions and estimates are signifi cant
to the consolidated fi nancial statements are discussed in Note 4.
These IFRS consolidated fi nancial statements have been prepared on
a going concern basis which assumes the Company will continue to
realise its assets and discharge its liabilities in the normal course of
business.
2.2 CONSOLIDATION
The consolidated fi nancial statements include those subsidiaries,
in which the Company has an interest of more than one half of the
voting rights or otherwise has power to exercise control to govern
the fi nancial and operating policies of an entity or business so as to
obtain benefi ts from its activities. Subsidiaries are consolidated from
the date on which control is transferred to the Company, and are no
longer consolidated from the date that control ceases. Intercompany
transactions, balances and unrealised gains on transactions between
group companies are eliminated; unrealised losses are also eliminated
unless cost cannot be recovered. Accounting policies for subsidiaries
have been changed to ensure consistency with the policies adopted by
the Company.
The purchase method of accounting is used to account for the
acquisition of subsidiaries by the Company. The cost of an acquisition
is measured as the fair value of the assets given, equity instruments
issued and liabilities incurred or assumed at the date of exchange,
plus costs directly attributable to the acquisition. Identifi able assets
acquired and liabilities and contingent liabilities assumed in a
business combination are measured initially at their fair values at
the acquisition date, irrespective of the extent of any minority interest.
The excess of the costs of acquisition over the fair value of the
Company’s share of the identifi able net assets acquired is recorded
as goodwill. If the cost of acquisition is less than the fair value of
the Group’s share of the net assets of the subsidiary acquired, the
difference is recognised directly in the income statement.
2.3 SEGMENT REPORTING
Business segments provide products or services that are subject
to risks and returns that are different from those of other business
segments. Geographical segments provide products or services
within a particular economic environment that is subject to risks
and returns that are different from those of components operating in
other economic environments.
The company’s primary segment reporting is based on the following
lines of business:
- Equipment rental
- Modular space
The reporting of the equipment rental segment is based on
geographical areas which are divided into four main areas: Finland,
Sweden, Western Europe including Norway, Denmark and the
Netherlands (until 31 March 2007), and Other Europe including
Poland, Lithuania, Latvia, Estonia, the Czech Republic and Russia.
2.4 FOREIGN CURRENCY TRANSLATION
Items included in the fi nancial statements of each of the Group’s
entities are measured using the currency of the primary economic
environment in which the entity operates (“the functional currency”).
The consolidated fi nancial information is presented in Euros, which
is the functional and presentation currency of the parent company.
Foreign currency transactions are translated into functional currency
using the exchange rates prevailing at the date of the transactions.
Gains and losses resulting from the settlement of such transactions,
and from the translation of monetary assets and liabilities
denominated in foreign currencies, are recognised in the income
statement under sales, materials and services, or under fi nancial
income and expenses based on the nature of transaction.
Income statements and cash fl ows of foreign entities are translated
into the Company’s reporting currency at the weighted average
exchange rates for the year, while balance sheets are translated at
the exchange rates on the balance sheet date. Exchange differences
arising from the translation of the net investment in foreign entities
are taken to shareholders’ equity. When a foreign entity is partially
disposed of or sold, exchange differences that were recorded in
equity are recognised in the income statement as part of the gain or
loss on sale.
Goodwill and fair value adjustments arising from the acquisition of a
foreign entity are treated as assets and liabilities of the foreign entity
in the functional currency of the entity, and translated at the closing
rate.

41NOTES TO THE CONSOLIDATED INCOME STATEMENT
2.5 PROPERTY, PLANT AND EQUIPMENT
All property, plant and equipment are stated at historical cost less
depreciation less any impairment loss. Historical cost includes
expenditure that is directly attributable to the acquisition of the
items. Subsequent costs are included in the asset’s carrying amount
or recognized as a separate asset when it is probable that the future
economic benefi ts associated with the item will fl ow to the Group,
and the cost can be measured reliably. Repairs and maintenance
costs are charged to the income statement during the fi nancial
period in which they are incurred.
Depreciation is calculated on the straight-line method to write off
the cost of each asset, to their residual values over their estimated
useful life as follows:
Buildings and structures 15–50 years
For rental:
- Modular space 10–20 years
- Machinery and equipment 6–10 years
- Tents and shelters 6 years
Machinery and equipment for services 6–10 years
Machinery and equipment for own use 3–6 years
Other tangible assets 3–10 years
Where the carrying amount of an asset is greater than its estimated
recoverable amount, it is written down immediately to its recoverable
amount. Gains and losses on disposals are determined by comparing
proceeds with the carrying amount, and are included in the operating
profi t.
Interest costs on borrowings to fi nance the construction of property,
plant and equipment are expensed when incurred.
2.6 INTANGIBLE ASSETS
Goodwill
Goodwill, arising from the acquisitions after 1 January 2004,
represents the excess of the cost of an acquisition over the fair value
of the Group’s share of the net identifi able assets of the acquired
subsidiary/associate at the date of acquisition. For the goodwill,
arising from the acquisitions before 1 January 2004, the carrying
amount of goodwill under previous GAAP at the date of transition to
IFRS is used as the deemed cost of goodwill under IFRS at that date.
Customer relationships, brand and depot network
Valuation of customer relationships has been prepared by applying
the Multi-period Excess Earnings Method. The fair value of the
Cramo brand and co-brand has been determined by applying the
relief-from-royalty method. The depot network has been valued
based on the benefi t gained, compared to the earnings of a depot in
normal course of business with the earnings of a start-up depot. The
useful life of the brand has been defi ned indefi nite because there is
no foreseeable limit to the period over which the asset is expected to
generate cash infl ows.
Goodwill and brand are not amortised, instead, they are tested
annually for impairment and carried at cost less accumulated
impairment losses. Goodwill and brand are allocated to cash-
generating units for the purpose of impairment testing. Brand has
been considered as a corporate-level asset and for testing purposes
the brand is reallocated to cash generating units annually based on
sales. The allocation of assets is presented in Note 7.
Research and development
Research expenditure is recognised as an expense as incurred.
Development costs are capitalised when an entity can demonstrate
the technological and commercial feasibility of a product and the
cost can be measured reliably. Other development expenditures are
recognised as expenses.
Currently the development work the entity is performing, is of such
nature that it does not fulfi l the criteria of capitalisation and thus
the development costs are recognised as expense as incurred.
Other intangible assets
Intangible assets include mainly computer software and some other
intangible rights. Acquired software licences are capitalised on the
basis of the costs incurred to acquire and bring to use the specifi c
software. These costs are amortised over their estimated useful life
of 3–7 years.
Other intangible assets are carried at cost less amortisation less any
impairment loss. These are amortised over their estimated useful
life as follows:
- Customer relationships 10 years
- Depot network 20 years
- Co-brand 3 years
- Other intangible assets 3–5 years
2.7 IMPAIRMENT OF ASSETS
Goodwill and other assets that have an indefi nite useful life are
tested annually for impairment.
Assets that are subject to amortisation are reviewed for impairment
whenever events of changes in circumstances indicate that the
carrying amount may not be recoverable. If there is any indication
of impairment, the recoverable amount is estimated as the higher
of the net selling price and the value in use, with an impairment
loss being recognised to income statement whenever the carrying
amount exceeds recoverable amount. For the purposes of
impairment, assets are grouped at the lowest levels for which there
are separately identifi able cash fl ows (cash-generating units).
A previously recognised impairment loss is reversed if there has
been a change in the estimates used to determine the recoverable
amount. The increased carrying amount must not, however, exceed
the carrying amount that would have been determined had no
impairment loss been recognised in prior years. However, previously
recognised impairment loss of goodwill is not reversed.
2.8 FINANCIAL ASSETS
The Company classifi es its fi nancial assets into the following
categories; a) fi nancial assets at fair value through profi t and loss,
b) loans and receivables, and c) available-for-sale investments. The
classifi cation is dependent on the purpose for which the investments
were acquired. Management determines the classifi cation of
its fi nancial assets at initial recognition and re-evaluates such
designation on a regular basis.
a) Financial assets at fair value through profi t and loss
Financial assets at fair value through profi t or loss are fi nancial
assets held for trading. A fi nancial asset is classifi ed in this category
if acquired principally for the purpose of selling in the short term.
Derivatives are classifi ed as held for trading unless hedge accounting
is applied. Assets in this category are classifi ed as current assets.
b) Loans and receivables
Loans and receivables are non-derivative fi nancial assets with fi xed
or determinable payments that are not quoted in an active market.
They are included in current assets, except for maturities greater
than 12 months after the balance sheet date. These are classifi ed
as non-current assets. Loans and receivables are classifi ed as trade
and other receivables in the balance sheet in Note 9.
c) Available-for-sale investments
Available-for-sale investments are non-derivatives that are
either designated in this category or not classifi ed in any of the
other categories. They are included in non-current assets unless
management has the express intention of holding the investment for

42 2007 / ANNUAL REPORT / CRAMO PLC / POWERING YOUR BUSINESS
less than 12 months from the balance sheet date, in which case they
are included in current assets.
Purchases and sales of fi nancial assets are recognised on the trade
date, which is the date that the Group commits to purchase or sell
the asset.
Investments are initially recognised at fair value plus transaction
costs for all fi nancial assets not carried at fair value through profi t or
loss. Financial assets carried at fair value through profi t or loss are
initially recognised at fair value, and transaction costs are expensed
in the income statement.
Available-for-sale fi nancial assets and fi nancial assets at fair value
through profi t or loss are subsequently carried at fair value. Loans
and receivables are carried at amortised cost using the effective
interest method.
All unrealised gains and losses arising from changes in the fair
value of available-for-sale securities are recognised in equity. When
securities classifi ed as available-for-sale are sold or impaired, the
accumulated fair value adjustments recorded in equity are included
in the income statement in fi nancial income and expenses.
Financial assets are derecognised when the rights to receive cash
fl ows from the investment have expired or have been transferred,
and the Group has substantially transferred all risks and rewards of
ownership.
The Group assesses at each balance sheet date whether there is
objective evidence that a fi nancial asset or a group of fi nancial assets
is impaired. In the case of equity securities classifi ed as available for
sale, a signifi cant or prolonged decline in the fair value of the security
below its cost is considered as an indicator that the securities are
impaired. If any such evidence exists for available-for-sale fi nancial
assets, the cumulative loss – measured as the difference between
the acquisition cost and the current fair value, less any impairment
loss on that fi nancial asset previously recognised in profi t or loss
– is removed from equity and recognised in the income statement.
Impairment losses recognised in the income statement on equity
instruments are not reversed through the income statement.
2.9 DERIVATIVE FINANCIAL INSTRUMENTS
AND HEDGING ACTIVITIES
Derivatives are initially recognised at fair value on the date a derivative
contract is entered into, and are subsequently remeasured at their fair
value. The method of recognising the resulting gain or loss depends on
whether the derivative is designated as a hedging instrument, and if
so, the nature of the item being hedged. The Group designates certain
derivatives as either:
(a) Hedges of the fair value of recognised liabilities (fair value hedge);
(b) Hedges of a particular risk associated with a recognised liability or
a highly probable forecast transaction (cash fl ow hedge); or
(c) Hedges of a net investment in a foreign operation (net investment
hedge).
The group had loans in Swedish krona which loans were considered as
a net investment in a foreign operation on the balance sheet date.
The Group documents, at the inception of the transaction, the
relationship between hedging instruments and hedged items, as
well as its risk management objectives and strategy for undertaking
various hedging transactions. The Group also documents its
assessment, both at hedge inception and on an ongoing basis, of
whether the derivatives that are used in hedging transactions are
highly effective in offsetting changes in fair values or cash fl ows of
hedged items.
The effective portion of changes in the fair value of derivatives that
are designated and qualify as cash fl ow hedges are recognised
in equity. The gain or loss relating to the ineffective portion is
recognised immediately in the income statement and classifi ed in
fi nance cost.
Amounts accumulated in equity are recognised in the income
statement in the periods when the hedged item affects profi t or loss.
The gain or loss relating to the effective portion of an interest rate
swap hedging variable rate borrowings is recognised in the income
statement within fi nance costs.
When a hedging instrument expires or is sold, or when a hedge no
longer meets the criteria for hedge accounting, any cumulative gain or
loss existing in equity at that time remains in equity and is recognised
when the forecast transaction is ultimately recognised in the income
statement. When a forecast transaction is no longer expected to occur,
the cumulative gain or loss that was reported in equity is immediately
transferred to the income statement within fi nance cost.
The fair values of various derivative instruments used for hedging
purposes are disclosed in Note 12. Movements on the hedging
reserve in shareholders’ equity are shown in Note 12. The full fair
value of a hedging derivative is classifi ed as a non-current asset or
liability when the remaining hedged item is more than 12 months;
it is classifi ed as a current asset or liability when the remaining
maturity of the hedged item is less than 12 months. Derivatives, for
which hedge accounting is not applied, are classifi ed as a current
asset or liability.
Derivatives, for which hedge accounting is not applied are accounted
for at fair value through profi t or loss. Changes in the fair value of
these derivative instruments are recognised immediately in the
income statement, and classifi ed in fi nance cost.
2.10 INVENTORIES
Inventories are stated at the lower of cost or net realisable value.
Cost is determined using the fi rst-in, fi rst-out (FIFO) method.
The cost of fi nished goods and work in progress comprises raw
materials, direct labor, other direct costs and related production
overheads. Net realisable value is the estimated selling price in the
ordinary course of business, less the costs of selling.
2.11 TRADE RECEIVABLES
Trade receivables are recognised initially at fair value and
subsequently measured at amortised cost using the effective interest
method, less provision for impairment. A provision for impairment of
trade receivables is established when there is objective evidence that
the Company will not be able to collect all amounts due according to
the original terms of receivables. The amount of the provision is the
difference between the carrying amount and the recoverable amount,
being the present value of expected cash fl ows. The amount of the
loss is recognised in the income statement within other operating
expenses´ and against the allowance account for trade receivables.
2.12 CASH AND CASH EQUIVALENTS
Cash and cash equivalents, which include cash accounts and short-
term cash deposits at banks, have maturities of up to three months.
Bank overdrafts are shown within borrowings in current liabilities on
the balance sheet.
2.13 SHARE CAPITAL
Share capital consists solely of ordinary share capital.
External costs directly attributable to the issue of new shares are
shown as a deduction, net of tax, in equity from the proceeds.
Where any Group company purchases the Company’s equity share
capital (treasury shares), the consideration paid and any directly
attributable incremental costs (net of taxes) are deducted from equity.
43NOTES TO THE CONSOLIDATED INCOME STATEMENT
2.14 BORROWINGS
Borrowings are recognised initially at the proceeds received, net
of transaction costs incurred. In subsequent periods, borrowings
are stated at amortised cost using the effective interest method;
any difference between proceeds (net of transaction costs) and the
redemption value is recognised in the income statement over the
period of the borrowings using the effective interest rate method.
Borrowings are classifi ed as current liabilities unless the Group has
an unconditional right to defer settlement of the liability for at least
12 months after the balance sheet date (Note 13).
2.15 BORROWING COSTS
Borrowing costs are recognised as an expense when incurred.
2.16 DEFERRED INCOME TAX
Deferred income tax is provided in full, using the liability method, on
temporary differences arising between the tax bases of assets and
liabilities and their carrying amounts in the fi nancial statements.
However, the deferred income tax is not accounted for impairment
losses that are not taxable, or investments in subsidiaries where
the timing of reversal of the temporary difference is controlled by
the Group and it is probable that the temporary difference will not
reverse in the foreseeable future. Tax rates enacted or substantively
enacted by the balance sheet date are used to determine deferred
income tax.
Deferred tax assets are recognised to the extent that it is probable
that future taxable profi t will be available against which the
temporary differences can be utilised.
2.17 EMPLOYEE BENEFITS
Pension obligations
The Group companies have various pension schemes in accordance
with the local conditions and practises in the countries in which they
operate. The schemes are generally funded through payments to
insurance companies. Currently all pension schemes are classifi ed
as defi ned contribution plans.
Defi ned contribution plan is a pension plan under which the
Company pays fi xed contributions to the insurance company, and the
Group has no further obligations to pay contributions. Under defi ned
contribution plans the payments are accounted as expenses for the
period for which the payment is made.
Share-based payments
The Group has two equity-settled, share-based compensation plans.
The fair value of the employee services received in exchange for the
grant of the options is recognised as an expense. The total amount
to be expensed over the vesting period is determined by reference
to the fair value of the options granted, excluding the impact of
any non-market vesting conditions. At each balance sheet date,
the entity revises its estimates of the number of options that are
expected to become exercisable and recognises the impact of the
revision of original estimates, if any, in the income statement, with a
corresponding adjustment to equity.
The proceeds received net of any directly attributable transaction
costs are credited to share capital and share premium when the
options are exercised.
2.18 GOVERNMENT GRANTS
Grants from the government are recognised at their fair value
where there is a reasonable assurance that the grant will be
received and the Group will comply with all attached conditions.
Research and development grants related to income are credited
to other operating income in the income statement. Government
grants relating to the purchase of property, plant and equipment are
presented by deducting the grant from the carrying amount of the
assets, and are credited to the income statement by decreasing the
depreciation of the asset on a straight line basis over the expected
lives. Impact of government grants is presented in Note 6.
2.19 PROVISIONS
Provisions are recognised when the Company has a present legal
or constructive obligation, as a result of past events, it is probable
that an outfl ow of resources will be required to settle the obligation,
and a reliable estimate of the amount can be made. The amount to
be recognised, as a provision is the best estimate of the expenditure
required to settle the obligation. Where the effect of time value of
money is material, the amount of the provision is discounted.
2.20 REVENUE RECOGNITION
Revenue is measured at fair value of the consideration received or
receivables of the sale of goods and services, net of value-added tax,
rebates and discounts. Revenue is recognised as follows:
Sales of goods
Sales of goods are recognised when a Group entity has delivered
the products to the customer, collectibility of the related receivables
is reasonably assured, the selling entity has no signifi cant risks
and rewards of ownership, and the selling entity retains neither
managerial commitment nor control of the sold goods.
Rental contracts (lessor)
Lease income from operating leases has been recognised in income
on a straight-line basis over the lease term, unless another systematic
basis has been more representative of the time pattern in which use
benefi t derived from the leased asset is diminished. Costs, including
depreciation, incurred in earning the lease income have been
recognised as an expense.
The sales of modular space, which also include a rental agreement
with the third party, and when the modular space has been sold to a
fi nance company on a repurchase commitment, has been considered
as a lease agreement, because to the signifi cant risks and rewards
incidental to ownership are not considered to transfer to the fi nance
company. The proceeds of the sale of the buildings with the related
rental agreements are recognised as rental income over time. Interest
on the liability is calculated using the effective interest rate method.
When assets are leased out under a fi nance lease, the lease income is
recognised over the term of using the net investment method, which
refl ects a consistent periodic rate of return.
Other services
Sales of services are recognised in the accounting period in which the
services are rendered.
2.21 LEASES
Lessee
Leases where a signifi cant portion of the risks and rewards of ownership
are retained by the lessor are classifi ed as operating leases. Leases
where the Group has substantially all the risks and rewards of owner-
ship are classifi ed as fi nance leases. The Group has several leases that
are classifi ed as fi nance leases, in which the Group is the lessee.
Finance leases are capitalised at the lease’s commencement at the
lower of the fair value of the leased property and the present value of
the minimum lease payments. The corresponding rental obligations
are included in other long-term payables. The interest element of
the fi nance cost is charged to the income statement over the lease
period so as to produce a constant periodic rate of interest on the
remaining balance of the liability for each period. The property, plant
and equipment acquired under fi nance leases are depreciated over the
shorter of the useful life of the asset or the lease term.
The Group has entered into various operating leases, the payments
under which are treated as rentals and charged to the income
statement on a straight-line basis over the lease term.

44 2007 / ANNUAL REPORT / CRAMO PLC / POWERING YOUR BUSINESS
Lessor
When assets are leased out under a fi nance lease, the present value
of the lease payments is recognised as a receivable. The difference
between the gross receivable and the present value of the receivable is
recognised as unearned fi nance income.
2.22 DIVIDEND DISTRIBUTION
Dividend distribution to shareholders is recognised as a liability in the
Group´s fi nancial statements in the period in which the dividends are
approved by shareholders.
2.23 STANDARDS EFFECTIVE IN 2007
IFRS 7, Financial instruments: Disclosures, and the complementary
amendment to IAS 1, Presentation of fi nancial statements, introduces
new disclosures relating to fi nancial instruments, and does not have
any impact on the classifi cation and valuation of the Group’s fi nancial
instruments.
2.24 NEW STANDARDS AND INTERPRETATIONS
THAT ARE NOT YET EFFECTIVE
Certain new standards, amendments and interpretations to existing
standards have been published that are mandatory for the Group´s
accounting periods beginning on or after 1 January 2008 or later
periods, but which the Group has not yet adopted:
- IFRS 8, Operating Segments. Company estimates that the
standard will somewhat change disclosures presented in fi nancial
statements. Changes are not assessed to be signifi cant.
- IFRIC 12, Service Concession Arrangements. The interpretation is
not applicable in the Group’s business.
- IFRIC 13, Customer loyalty programmes. The interpretation is not
relevant to the Group’s operations.
- IFRIC 14, IAS 19 – The limit on defi ned benefi t assets, minimum
funding requirements and their interaction. The interpretation is
not relevant to Group’s employee benefi ts.
3 FINANCIAL RISK MANAGEMENTThe Group’s activities expose it to a variety of fi nancial risks: market risk
(including currency risk and cash fl ow interest rate risk), credit risk and
liquidity risk. The Group’s overall risk management programme focuses
on the unpredictability of fi nancial markets and seeks to minimise
potential adverse effects on the Group’s fi nancial performance. Group
uses derivative fi nancial instruments to hedge certain risk exposures.
Risk management is carried out by a central treasury department
(Group Treasury). Group Treasury identifi es, evaluates and hedges
fi nancial risks in close co-operation with the Group’s operating units.
3.1 MARKET RISK
3.1.1 Interest rate risk
The Group’s interest rate risk arises from long-term borrowings.
The Group is mainly exposed to cash fl ow interest rate risk related to
borrowings issued at variable rates. At the balance sheet date 39.0
percentage of outstanding interest-bearing liabilities including impact
of derivatives were at fi xed interest rates. The weighted average fi xing
period for Gross debt was 1.8 years. The limits according to Treasury
Policy are 20–50% (fi xed to fl oat) and 1–3 years (duration). During the
fi nancial period the Group moved towards the lower end of the range
in both values.
The Group manages its cash fl ow interest rate risk by using fl oating-
to-fi xed interest rate swaps within the Treasury Policy. Such interest
rate swaps have the economic effect of converting borrowings from
fl oating rates to fi xed rates. IAS 39 Hedge accounting is applied on
interest rate swaps.
The following table illustrates the impact of change in interest rates
in the profi t and loss statement as well as in the balance sheet. The
sensitivity analysis is based on Gross debt at closing date and includes
interest rate swaps. Reasonable change is assumed to be 1% point.
Impact in thousand euros EUR SEK Other
P&L -1,143 -738 -453
Equity 2,710 2,396
The Group has hedged internal funding with currency derivatives.
The maturity structure of these derivatives is shown in Note 31. These
derivatives are recognised in profi t and loss statement. 1% point rise
in Euribors would have had a positive impact of € 362 thousand in
the Group’s profi t and loss statement.
As the Group has no signifi cant interest-bearing assets, the Group’s
income and operating cash fl ows are substantially independent of
changes in market interest rates.
Interest bearing liabilities and their average interest rates are
presented in Note 13.
3.1.2 Currency risk
The Group operates internationally and is thus exposed to foreign
exchange risks, arising from various currency exposures. Foreign
exchange risk arises primarily from net investments in foreign
operations and recognised assets and liabilities.
Since Cramo has subsidiaries outside the Eurozone, the euro-domi-
nated value of the shareholders´ equity is exposed to fl uctuations in
exchange rates. Equity changes caused by movements in foreign
exchange rates are shown as a translation difference in the Group
consolidation. The Group Treasury is regularly monitoring and evaluat-
ing the translation risk and manages the hedges. At 31st December
2007 the Group had hedged part of its SEK nominated equity with an
external currency loan. The foreign exchange difference arising from
the loan is recognised in translation differences in equity.
Foreign exchange risk arising from recognised assets and liabilities is
managed primarily through forward contracts and swaps.
Sales in Group companies are carried out in the functional currency of
the local entities and thus the Group estimates not to be exposed to sig-
nifi cant foreign exchange risk arising from these transaction exposures.
Purchases are carried out both in Euros and local currencies. The im-
pact of the currency differences recognised in profi t and loss statement
arising from purchases is considered insignifi cant and according to the
Treasury Policy these future commitments are not hedged.
The open Euro exposure against other functional currencies arises
from accounts payables, leasing liabilities in other than local currency,
and open exposure of Group Treasury. The exposure is shown in table
below. According to the Treasury Policy the Group aims to have limited
risks from the impact of currency fl uctuations in the income statement.
31.12.2007, 1,000 €
SEK 1,247
LTL 1,154
LVL 1,155
NOK 986
DKK 4,291
Other 5,151
Total 13,983
At the closing date the change in value of EUR (appreciation) against
other functional currencies of the Group would have had a negative
impact of € 699 thousand in the income statement.
3.1.3 Price risk
The Group holds a minor amount of unquoted shares, which do not
expose to material price risk. The Group is not exposed to commodity
price risks.
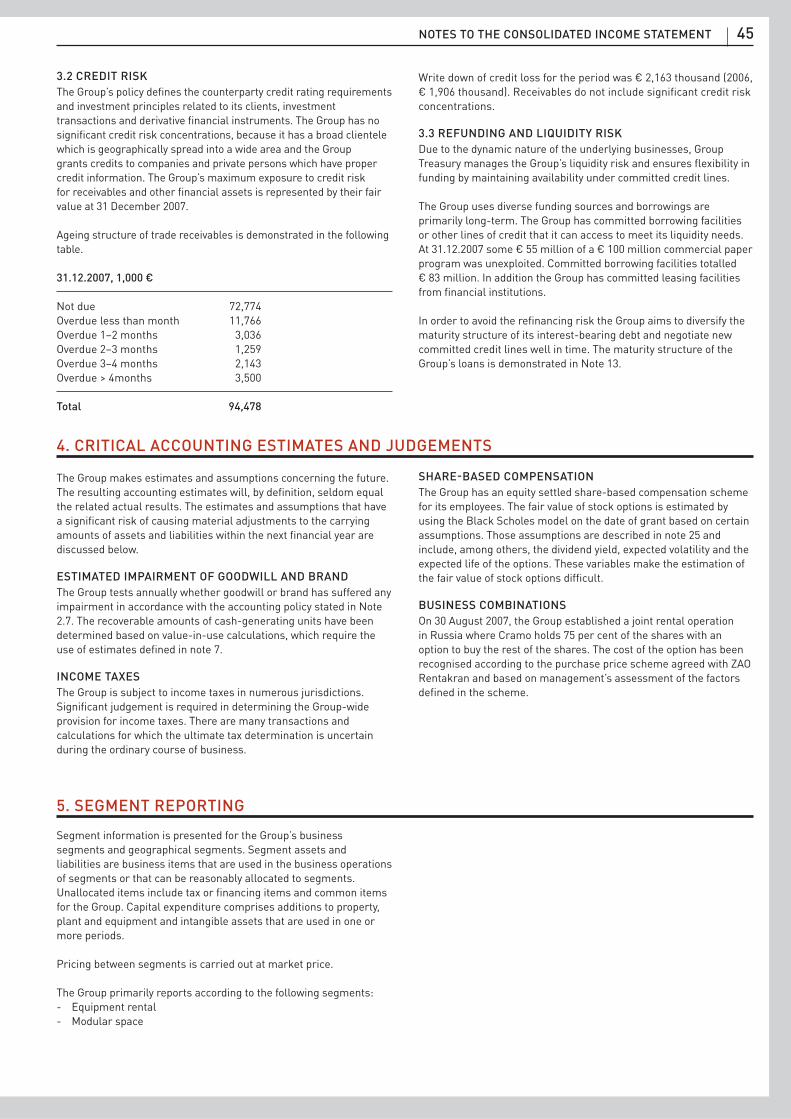
45NOTES TO THE CONSOLIDATED INCOME STATEMENT
5. SEGMENT REPORTING
3.2 CREDIT RISK
The Group’s policy defi nes the counterparty credit rating requirements
and investment principles related to its clients, investment
transactions and derivative fi nancial instruments. The Group has no
signifi cant credit risk concentrations, because it has a broad clientele
which is geographically spread into a wide area and the Group
grants credits to companies and private persons which have proper
credit information. The Group’s maximum exposure to credit risk
for receivables and other fi nancial assets is represented by their fair
value at 31 December 2007.
Ageing structure of trade receivables is demonstrated in the following
table.
31.12.2007, 1,000 €
Not due 72,774
Overdue less than month 11,766
Overdue 1–2 months 3,036
Overdue 2–3 months 1,259
Overdue 3–4 months 2,143
Overdue > 4months 3,500
Total 94,478
Write down of credit loss for the period was € 2,163 thousand (2006,
€ 1,906 thousand). Receivables do not include signifi cant credit risk
concentrations.
3.3 REFUNDING AND LIQUIDITY RISK
Due to the dynamic nature of the underlying businesses, Group
Treasury manages the Group’s liquidity risk and ensures fl exibility in
funding by maintaining availability under committed credit lines.
The Group uses diverse funding sources and borrowings are
primarily long-term. The Group has committed borrowing facilities
or other lines of credit that it can access to meet its liquidity needs.
At 31.12.2007 some € 55 million of a € 100 million commercial paper
program was unexploited. Committed borrowing facilities totalled
€ 83 million. In addition the Group has committed leasing facilities
from fi nancial institutions.
In order to avoid the refi nancing risk the Group aims to diversify the
maturity structure of its interest-bearing debt and negotiate new
committed credit lines well in time. The maturity structure of the
Group’s loans is demonstrated in Note 13.
4. CRITICAL ACCOUNTING ESTIMATES AND JUDGEMENTS
The Group makes estimates and assumptions concerning the future.
The resulting accounting estimates will, by defi nition, seldom equal
the related actual results. The estimates and assumptions that have
a signifi cant risk of causing material adjustments to the carrying
amounts of assets and liabilities within the next fi nancial year are
discussed below.
ESTIMATED IMPAIRMENT OF GOODWILL AND BRAND
The Group tests annually whether goodwill or brand has suffered any
impairment in accordance with the accounting policy stated in Note
2.7. The recoverable amounts of cash-generating units have been
determined based on value-in-use calculations, which require the
use of estimates defi ned in note 7.
INCOME TAXES
The Group is subject to income taxes in numerous jurisdictions.
Signifi cant judgement is required in determining the Group-wide
provision for income taxes. There are many transactions and
calculations for which the ultimate tax determination is uncertain
during the ordinary course of business.
SHARE-BASED COMPENSATION
The Group has an equity settled share-based compensation scheme
for its employees. The fair value of stock options is estimated by
using the Black Scholes model on the date of grant based on certain
assumptions. Those assumptions are described in note 25 and
include, among others, the dividend yield, expected volatility and the
expected life of the options. These variables make the estimation of
the fair value of stock options diffi cult.
BUSINESS COMBINATIONS
On 30 August 2007, the Group established a joint rental operation
in Russia where Cramo holds 75 per cent of the shares with an
option to buy the rest of the shares. The cost of the option has been
recognised according to the purchase price scheme agreed with ZAO
Rentakran and based on management’s assessment of the factors
defi ned in the scheme.
Segment information is presented for the Group’s business
segments and geographical segments. Segment assets and
liabilities are business items that are used in the business operations
of segments or that can be reasonably allocated to segments.
Unallocated items include tax or fi nancing items and common items
for the Group. Capital expenditure comprises additions to property,
plant and equipment and intangible assets that are used in one or
more periods.
Pricing between segments is carried out at market price.
The Group primarily reports according to the following segments:
- Equipment rental
- Modular space

46 2007 / ANNUAL REPORT / CRAMO PLC / POWERING YOUR BUSINESS
BUSINESS SEGMENTS 2007, 1,000 €
Equipment Rental
Western Other Modular Total
Finland Sweden Europe Europe space Eliminations Group
Sales 75,761 214,515 77,462 58,202 76,733 502,673
Inter-segment sales -227 -6,017 -6,244 -6,244
Total revenue 75,761 214,288 77,462 58,202 70,716 -6,244 496,428
Segment EBITA 14,493 47,952 10,513 17,082 19,358 -576 108,822
Non-allocated -12,859
EBITA 95,963
Net fi nance items -16,036
Profi t before taxes 75,808
Income taxes -18,323
Net profi t for the period 57,485
Segment assets
Intangible assets 18,924 94,700 29,466 40,121 31,392 214,603
Non-allocated 33,123
Tangible and other assets 81,265 200,100 125,053 107,176 134,354 -710 647,238
Total assets 100,189 294,800 154,519 147,297 165,746 894,964
Segment liabilities 42,148 157,442 106,596 67,675 74,844 448,705
Non-allocated 112,216
Total liabilities 560,921
Capital expenditure 16,367 44,055 53,497 38,247 20,371 2,957 175,494
Depreciations -11,307 -17,955 -11,173 -12,320 -9,042 -558 -62,356
Amortisations -265 -2,686 -670 -497 -4,119
Western Europe includes the revenue of € 2,954 thousand and the capital gain of € 4.0 million from the divestment of rental operations in the
Netherlands.
BUSINESS SEGMENTS 2006, 1,000 €
Equipment Rental
Western Other Modular Total
Finland Sweden Europe Europe space Eliminations Group
Sales 60,227 174,721 66,319 38,446 65,513 405,227
Inter-segment sales -300 -121 -2,382 -2,802 -2,802
Total revenue 59,927 174,601 66,319 38,446 63,132 -2,802 402,425
Segment EBITA 10,370 35,874 8,447 11,991 14,949 -183 81,448
Non-allocated -8,616
EBITA 72,832
Net fi nance items -11,984
Profi t before taxes 56,585
Income taxes -14,641
Net profi t for the periods 41,944
Segment assets
Intangible assets 21,704 112,276 38,941 36,175 35,560 244,655
Tangible and other assets 73,538 187,378 71,438 59,683 134,204 526,241
Total assets 95,242 299,654 110,379 95,858 169,764 770,896
Segment liabilities 44,058 116,635 60,661 37,620 87,308 346,282
Non-allocated 132,022
Total liabilities 478,304
Capital expenditure 18,309 29,207 20,306 26,681 17,362 111,864
Depreciations 9,292 16,259 9,535 7,748 8,226 51,060
Amortisations 265 2,689 816 496 4,265
VALUE OF OUTSTANDING ORDERS FOR THE SALES AND RENTAL OF MODULAR SPACE, 1,000 € 2007 2006
Sales 5,309 7,452
Rental 89,250 74,507
Total 94,559 81,959

47NOTES TO THE CONSOLIDATED INCOME STATEMENT
GEOGRAPHICAL SEGMENTS 2007, 1,000 €
Western Other Total
Finland Sweden Europe Europe Eliminations Group
Sales 113,416 248,456 85,177 58,278 -8,897 496,428
Assets by segment 151,759 408,976 154,519 147,297 -710 861,841
Non-allocated 33,123
Total assets 894,964
Capital expenditure 17,771 65,726 53,750 38,245 175,494
GEOGRAPHICAL SEGMENTS 2006, 1,000 €
Western Other Total
Finland Sweden Europe Europe Eliminations Group
Sales 91,671 206,094 70,803 38,451 -4,595 402,424
Assets by segment 155,192 409,469 110,379 95,858 770,898
Capital expenditure 23,353 39,227 20,306 23,697 106,583
Revenue is allocated to geographical segments based on the country in which the customer is located while assets are allocated based on where
the assets are located.
6. NON-CURRENT ASSETS, 1,000 €
TANGIBLE ASSETS Machinery
and Uncompleted
Land Buildings equipment purchases Total
Acquisition cost 1 Jan 2007 4,194 22,585 433,060 459,839
Additions 2,444 169,967 126 172,537
Acquisition of subsidiaries 122 19,801 19,923
Disposals -93 -579 -33,902 -34,574
Transfer -655 655
Translation differences 2 27 -3,822 -3,793
Acquisition cost 31 Dec 2007 3,448 25,254 585,104 126 613,932
Accumulated depreciation 1 Jan 2007 -7,439 -84,450 -91,889
Disposals 579 26,075 26,654
Depreciation for the period -1,728 -59,930 -61,658
Book value 31 Dec 2007 3,448 16,666 466,799 126 487,038
Acquisition cost 1 Jan 2006 3,299 18,004 111,050 323 132,676
Additions 284 2,306 107,501 110,091
Acquisition of subsidiaries 760 2,490 225,963 229,213
Disposals -128 -35 -21,961 -323 -22,447
Translation differences -21 -180 10,507 10,306
Acquisition cost 31 Dec 2006 4,194 22,585 433,060 459,839
Accumulated depreciation 1 Jan 2006 -6,102 -34,727 -40,829
Depreciation for the period -1,337 -49,723 -51,060
Book value 31 Dec 2006 4,194 15,146 348,610 367,950

48 2007 / ANNUAL REPORT / CRAMO PLC / POWERING YOUR BUSINESS
AVAILABLE-FOR-SALE INVESTMENTS, 1,000 € 2007 2006
Acquisition cost 1 Jan 320 306
Additions 12 36
Disposals -22
Book value 31 Dec 332 320
Available-for-sale investments consist of shares in As Oy Saarihely and Golf Sarvik and unquoted shares in telephone companies. The value of
shares in Saarihely is based on the assessment of an external expert and the value of shares in Golf Sarfvik on reference from the market. The value
of unquoted shares is stated at historical cost.
FINANCE LEASE CONTRACTS, MACHINERY AND EQUIPMENT, 1,000 €
Acquisition cost 31 Dec 190,177 185,061
Accumulated depreciation 31 Dec -53,732 -43,914
Book value 31 Dec 136,445 141,147
Finance lease contracts are included in Machinery and equipment.
7. GOODWILL AND OTHER INTANGIBLE ASSETS, 1,000 €
Other
intangible
Goodwill assets Total
Acquisition cost 1 Jan 2007 157,026 100,299 257,324
Additions 1,603 2,956 4,559
Acquisition of subsidiaries 3,676 6,024 9,700
Disposals -3,202 -2,798 -6,000
Translation differences -2,512 -1,458 -3,970
Acquisition cost 31 Dec 2007 156,591 105,023 261,613
Accumulated depreciation 1 Jan 2007 -4,224 -4,847 -9,071
Amortisations for the period -4,817 -4,817
Book value 31 Dec 2007 152,367 95,359 247,725
Acquisition cost 1 Jan 2006 15,839 1,413 17,251
Additions 76 76
Acquisition of subsidiaries 138,771 94,683 233,454
Disposals
Translation differences 2,416 4,127 6,543
Acquisition cost 31 Dec 2006 157,026 100,299 257,324
Accumulated depreciation 1 Jan 2006 -4,224 -582 -4,806
Amortisations for the period -4,265 -4,265
Book value 31 Dec 2006 152,802 95,452 248,254
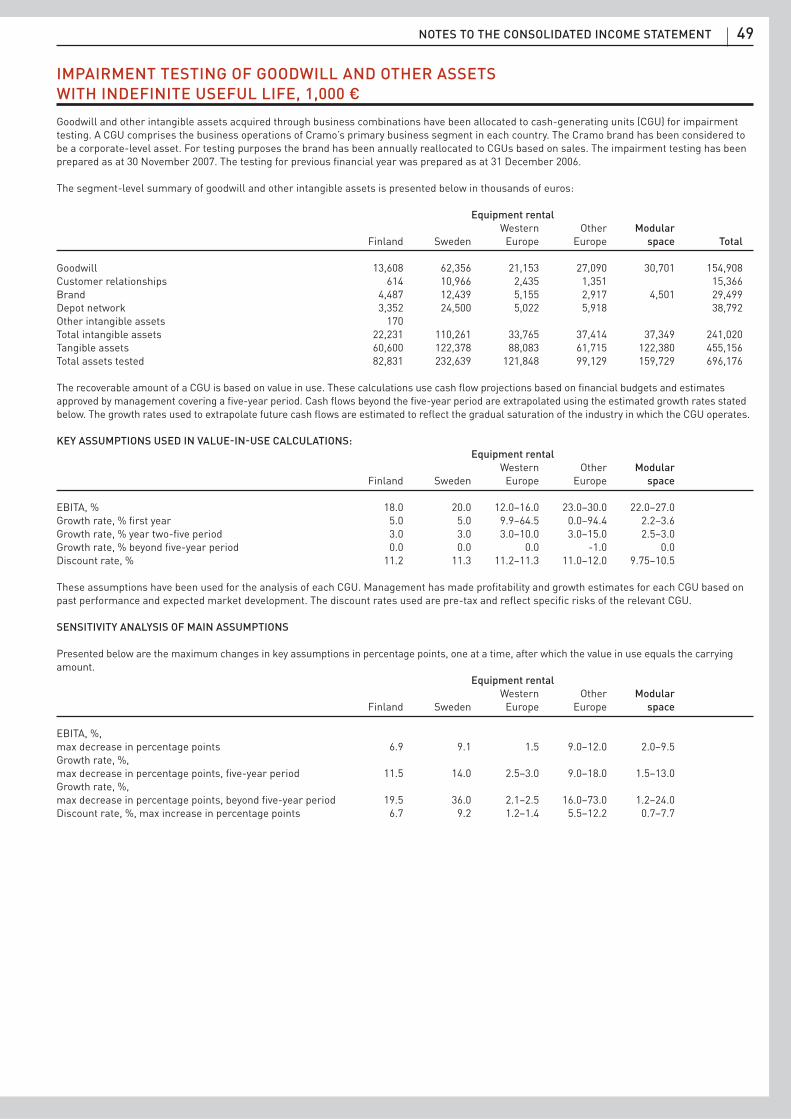
49NOTES TO THE CONSOLIDATED INCOME STATEMENT
IMPAIRMENT TESTING OF GOODWILL AND OTHER ASSETS
WITH INDEFINITE USEFUL LIFE, 1,000 €
Goodwill and other intangible assets acquired through business combinations have been allocated to cash-generating units (CGU) for impairment
testing. A CGU comprises the business operations of Cramo’s primary business segment in each country. The Cramo brand has been considered to
be a corporate-level asset. For testing purposes the brand has been annually reallocated to CGUs based on sales. The impairment testing has been
prepared as at 30 November 2007. The testing for previous fi nancial year was prepared as at 31 December 2006.
The segment-level summary of goodwill and other intangible assets is presented below in thousands of euros:
Equipment rental
Western Other Modular
Finland Sweden Europe Europe space Total
Goodwill 13,608 62,356 21,153 27,090 30,701 154,908
Customer relationships 614 10,966 2,435 1,351 15,366
Brand 4,487 12,439 5,155 2,917 4,501 29,499
Depot network 3,352 24,500 5,022 5,918 38,792
Other intangible assets 170
Total intangible assets 22,231 110,261 33,765 37,414 37,349 241,020
Tangible assets 60,600 122,378 88,083 61,715 122,380 455,156
Total assets tested 82,831 232,639 121,848 99,129 159,729 696,176
The recoverable amount of a CGU is based on value in use. These calculations use cash fl ow projections based on fi nancial budgets and estimates
approved by management covering a fi ve-year period. Cash fl ows beyond the fi ve-year period are extrapolated using the estimated growth rates stated
below. The growth rates used to extrapolate future cash fl ows are estimated to refl ect the gradual saturation of the industry in which the CGU operates.
KEY ASSUMPTIONS USED IN VALUE-IN-USE CALCULATIONS:
Equipment rental
Western Other Modular
Finland Sweden Europe Europe space
EBITA, % 18.0 20.0 12.0–16.0 23.0–30.0 22.0–27.0
Growth rate, % fi rst year 5.0 5.0 9.9–64.5 0.0–94.4 2.2–3.6
Growth rate, % year two-fi ve period 3.0 3.0 3.0–10.0 3.0–15.0 2.5–3.0
Growth rate, % beyond fi ve-year period 0.0 0.0 0.0 -1.0 0.0
Discount rate, % 11.2 11.3 11.2–11.3 11.0–12.0 9.75–10.5
These assumptions have been used for the analysis of each CGU. Management has made profi tability and growth estimates for each CGU based on
past performance and expected market development. The discount rates used are pre-tax and refl ect specifi c risks of the relevant CGU.
SENSITIVITY ANALYSIS OF MAIN ASSUMPTIONS
Presented below are the maximum changes in key assumptions in percentage points, one at a time, after which the value in use equals the carrying
amount.
Equipment rental
Western Other Modular
Finland Sweden Europe Europe space
EBITA, %,
max decrease in percentage points 6.9 9.1 1.5 9.0–12.0 2.0–9.5
Growth rate, %,
max decrease in percentage points, fi ve-year period 11.5 14.0 2.5–3.0 9.0–18.0 1.5–13.0
Growth rate, %,
max decrease in percentage points, beyond fi ve-year period 19.5 36.0 2.1–2.5 16.0–73.0 1.2–24.0
Discount rate, %, max increase in percentage points 6.7 9.2 1.2–1.4 5.5–12.2 0.7–7.7

50 2007 / ANNUAL REPORT / CRAMO PLC / POWERING YOUR BUSINESS
8. INVENTORIES, 1,000 € 2007 2006
Materials and supplies 5,154 6,693
Work in progress 7,015 8,273
Finished goods 4,734 821
Total 16,903 15,788
The write-downs of inventories to net realisable value amounted to € 80 (€ 123) thousand.
9. TRADE AND OTHER RECEIVABLES, 1,000 € 2007 2006
Non-current receivables
Finance leases - gross receivables 3,822
Unearned fi nance income -1,543
Total 2,279
Current receivables
Finance leases - gross receivables 217
Unearned fi nance income -123
Total 94
Gross receivable from fi nance leases
No later that 1 year 217
Later than 1 year and no later than 5 years 1,019
Later that 5 years 2,804
Total 4,039
Non-current receivables
Trade receivables 1,211 136
Finance lease receivables 2,279
Other receivables 464 310
Total 3,954 446
Fair value of non-current trade receivables is € 3,289 thousand.
Current receivables
Trade receivables 93,267 74,928
Finance lease receivables 94
Tax receivables 2,298 2,310
Other receivables 3,142 3,306
Prepaid expenses and accrued income 18,747 13,235
Total 117,548 93,779
The Group has recognised credit losses from receivables for € 2,163 thousand for the period (€ 1,906 thousand in 2006). Receivables do not include
signifi cant credit risk concentrations.
The book value of receivables corresponds to fair value in material parts.
10. CASH AND CASH EQUIVALENTS, 1,000 € 2007 2006
Cash in hand and at bank* 18,489 41,823
Total 18,489 41,823
* Includes € 160.7 thousand escrow account related to the purchase of Säve Sp.zo.o in 2006.
11. RESERVES
The Group has two non-cancellable lease contracts which do not produce an economic benefi t. The provision amounts to € 363 thousand at the end
of the period (€ 348 thousand in 2006) which covers the loss caused by these contracts.

51NOTES TO THE CONSOLIDATED INCOME STATEMENT
12. SHARE CAPITAL AND EQUITY FUNDS, 1,000 €
Share Share Share Fair value Hedge
capital issue premium reserve fund Total
1.1.2006 24,234 32 1,607 117 25,990
Change 274 111 184,229 3,301 187,915
31.12.2006 24,508 143 185,836 117 3,301 213,905
Change 327 -143 1,074 3,033 4,291
31.12.2007 24,835 186,910 117 6,334 218,196
Number of Percentage of Percentage of
Share capital at 31.12.2007 is distributed as follows: shares shares votes
Shares 30,660,189 100 100
Number of shares
1.1.2007 30,256,368
Subscription of options 403,821
31.12.2007 30,660,189
Equity funds are described below:
Fair value reserve
The fair value reserve includes the change in fair values of assets classifi ed as available-for sale.
Hedge fund
Net investments in Swedish crowns are hedged to reduce the effect of exchange rate fl uctuations. The hedging instruments are foreign currency
loans and interest swaps.
Dividends
After closing date the Board has proposed a dividend of EUR 0.65 (0.50) per share.
13. INTEREST-BEARING LIABILITIES, 1,000 €
2007 2006
Non-current interest-bearing liabilities Book value Fair value Book value Fair value
Syndicated bank loan 173,753 173,753 192,034 192,034
Other bank loans 2,721 2,721
Repurchase liabilities 4,116 4,090 7,535 7,499
Rent advances 2,422 2,404 5,922 5,893
Finance lease liabilities 91,075 91,075 101,477 101,477
Total 274,087 274,043 306,968 306,903
Current interest-bearing liabilities
Syndicated bank loan 31,978 14,595
Other bank loans 2,608
Repurchase liabilities 3,277 1,142
Rent advances, 1,768 2,727
Finance lease liabilities 24,471 22,035
Commercial papers 45,285
Total 109,387 40,499
Total interest-bearing liabilities 383,474 347,467

52 2007 / ANNUAL REPORT / CRAMO PLC / POWERING YOUR BUSINESS
Book values of current liabilities approximate their fair values. All bank loans are at fl oating rate and thus their fair values do not differ materially
from their carrying amounts. Repurchase and rent advance liabilities are at fi xed rate and their fair values are calculated by discounting contract
amounts with the market rate.
Other bank loans consist of overdraft limits and other loans acquired through acquisitions.
The main covenants of the syndicated loan facility are the gross debt to EBITDA ratio, the interest coverage ratio and the equity ratio. In addition,
there are other general terms related to the loan. Gross debt to EBITDA determines the interest rate of the syndicated loan quarterly within a
fl uctuation range of 0.5% p.a. The maximum values of the fi nancial covenants will change during the loan period. The maximum and actual values
of the fi nancial covenants as at 31.12.2007 are presented below:
Values of covenants Actual
31.12.2007 31.12.2007
Gross debt to EBITDA, maximum 3.75:1 2.55:1
Interest Coverage Ratio, minimum 5.00:1 9.87:1
Equity Ratio, %, minimum 30.0 37.3
INTEREST BEARING LIABILITIES MATURE AS FOLLOWS, 1,000 €
2008 2009 2010 2011 2012 2012+ Total
Bank loans 34,586 12,978 12,876 12,674 12,737 125,209 211,060
Repurchase liabilities 3,277 1,742 1,334 802 0 238 7,393
Rent advances 1,768 1,258 759 183 61 161 4,190
Finace lease liabilities 24,471 24,955 20,509 16,527 13,442 15,642 115,546
Commercial papers 45,285 45,285
Total 109,387 40,933 35,478 30,186 26,240 141,250 383,474
SYNDICATED LOAN BY CURRENCY AND MATURITY, 1,000€
2008 2009 2010 2011 2012 2012+ Total
EUR 22,479 4,000 4,000 4,000 4,000 75,027 113,506
SEK 9,499 8,382 8,382 8,382 8,382 49,198 92,225
Total 31,978 12,382 12,382 12,382 12,382 124,225 205,731
FINANCE LEASE LIABILITIES, 1,000 € 2007 2006
Payable < 1 year from balance sheet date 30,555 22,328
Payable 1–5 years from balance sheet date 87,768 86,204
Payable > 5 years from balance sheet date 16,850 24,275
Total 135,173 132,806
Future interest payments 19,627 9,294
Present value of minimum future fi nance lease payments 115,546 123,512
FINANCE LEASE LIABILITIES BY CURRENCY, 1,000 €
SEK 66,929
NOK 16,254
DKK 8,808
LTL 7,755
Others 15,800
Total 115,546
WEIGHTED AVERAGE MATURITY AND INTEREST RATES 31.12.2007
Maturity Interest
(years) %
Bank loans 3.6 5.24
Bank loans including interest rate swaps 3.6 4.47
Finance leases 3.0 5.84
Repurchase liabilities 1.6 3.99
Rent advances 2.6 3.77
Commercial papers 0.1 4.74

53NOTES TO THE CONSOLIDATED INCOME STATEMENT
14. DEFERRED TAXES, 1,000 € 2007 2006
Deferred tax assets
Losses for the previous years 2,927 3,379
Appropriation 670 33
Financial leases 7,594 7,378
Fair value of hedging fund 798
Elimination of internal profi t 799 533
Other temporary differences 1,191 722
Total 13,979 12,045
Deferred tax liabilities
Appropriation 36,512 26,638
Financial leases 8,636 7,075
Fair value of hedging fund 2,226 1,160
Valuation of assets to fair value in business combinations 24,478 25,885
Other temporary differences 1,353 693
Total 73,205 61,451
Deferred tax liabilites net 59,226 49,406
Refl ected in the balance sheet as follows
Deferred tax asset 2,974 2,423
Deferred tax liabilities 62,200 51,829
Deferred tax liabilities net 59,226 49,406
Change in deferred tax liabilities and assets recognised in the balance sheet
Deferred tax liabilities net as at 1.1. 49,406 3,286
Acquired and disposed subsidiaries 2,107 34,607
Items recognised in the income statement 7,213 9,897
Items recognised in equity 1,066 1,160
Exchange rate differences -566 456
Deferred tax liabilities net as at 31.12. 59,226 49,406
15. TRADE AND OTHER LIABILITIES, 1,000 € 2007 2006
Trade payables 49,514 34,561
Advances received 8,357 6,694
Accrued liabilities and deferred income 35,082 32,317
Other current liabilities 12,809 2,702
Other liabilities total 56,248 41,713
Total 105,762 76,274
Material items included in accrued liabilities and deferred income consist of personnel expenses and periodised interest expenses of liabilities.
16. OPERATIONAL LEASE PAYMENTS, 1,000 € 2007 2006
Payable < 1 year from balance sheet date 17,735 10,469
Payable 1-5 years from balance sheet date 35,613 18,441
Payable > 5 years from balance sheet date 840 1,396
Total 54,188 30,306
The operational lease agreements consist mostly of the equipment rental fl eet. The terms of agreements do not include any extraordinary clauses.
Operational lease liabilities have fl oating rate and are mainly based on Euribor, Stibor, Nibor and Cibor varying between 1 and 3 months.
The maximum maturity of operational lease payments is six years.

54 2007 / ANNUAL REPORT / CRAMO PLC / POWERING YOUR BUSINESS
17. OTHER OPERATING INCOME, 1,000 € 2007 2006
Rental of premises and other revenues 1,700 1,703
Profi t of sold tangible assets and available-for-sale investments 1,986 1,804
Capital gain of disposals 4,111
Total 7,798 3,507
Capital gain relates to the sale of operations in the Netherlands.
18. MATERIALS AND SERVICES, 1,000 € 2007 2006
Purchases 41,060 30,029
External services 65,336 44,226
Total 106,396 74,256
Change in inventories of work in progress 966 -184
Total 966 -184
19. PERSONNEL EXPENSES, 1,000 € 2007 2006
Salaries and fees of Board members 206 257
Wages 77,138 62,846
Pensions 8,724 8,306
Other statutory employee costs 15,540 12,364
Total 101,608 83,773
Salaries and fees of key management (note 26)
Average number of personnel 2,270 1,828
20. OTHER OPERATING EXPENSES, 1,000 € 2007 2006
Premises and equipment rentals 14,915 13,504
Marketing 12,689 7,359
Maintenance and accessories 66,396 60,800
Other expenses for premises 8,436 7,321
Operational leases 16,361 8,001
Temporary staff 6,402 5,310
Other personnel related expenses 9,092 6,997
Other expenses 19,958 22,287
Total 154,248 131,579
21. NET FINANCIAL ITEMS, 1,000 € 2007 2006
Interest income from bank deposit and receivables 694 1,523
Other fi nance income 593 110
Exchange rate difference -501 118
Change in fair value of fi nancial instruments -186 113
Interest expenses
Borrowings -10,414 -9,409
Finance leases -5,903 -3,800
Other fi nance expenses -319 -639
Total -16,036 -11,984
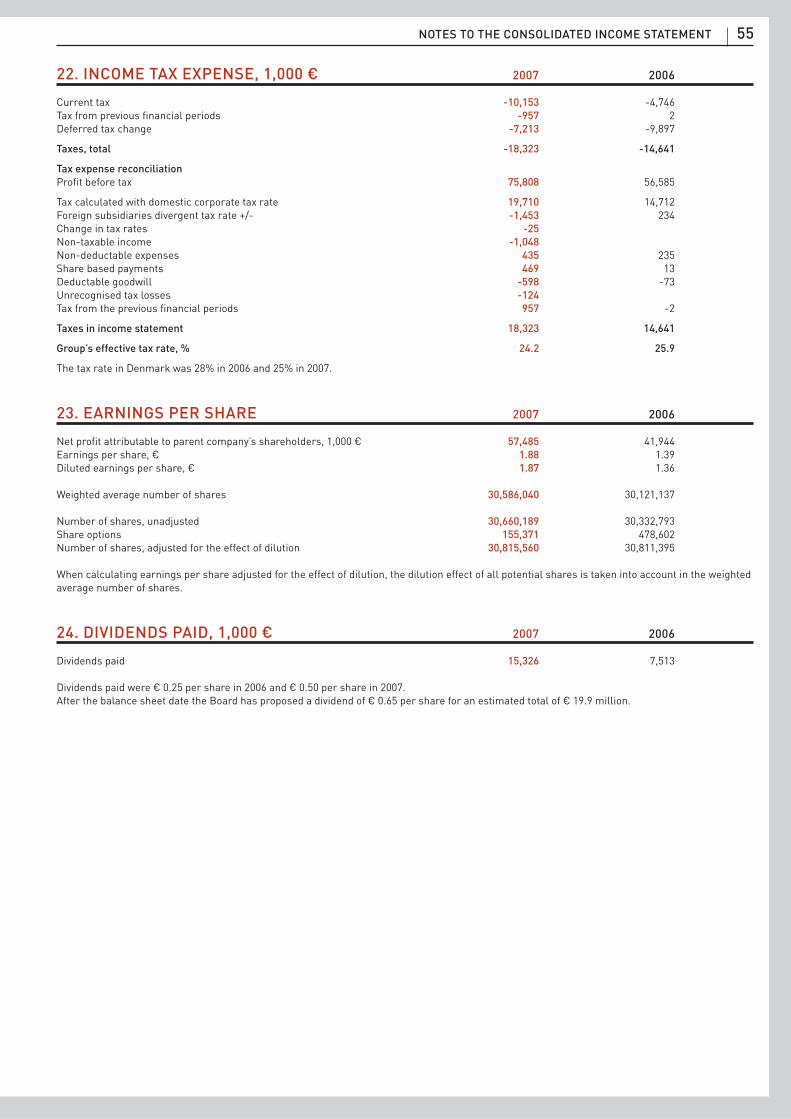
55NOTES TO THE CONSOLIDATED INCOME STATEMENT
22. INCOME TAX EXPENSE, 1,000 € 2007 2006
Current tax -10,153 -4,746
Tax from previous fi nancial periods -957 2
Deferred tax change -7,213 -9,897
Taxes, total -18,323 -14,641
Tax expense reconciliation
Profi t before tax 75,808 56,585
Tax calculated with domestic corporate tax rate 19,710 14,712
Foreign subsidiaries divergent tax rate +/- -1,453 234
Change in tax rates -25
Non-taxable income -1,048
Non-deductable expenses 435 235
Share based payments 469 13
Deductable goodwill -598 -73
Unrecognised tax losses -124
Tax from the previous fi nancial periods 957 -2
Taxes in income statement 18,323 14,641
Group’s effective tax rate, % 24.2 25.9
The tax rate in Denmark was 28% in 2006 and 25% in 2007.
23. EARNINGS PER SHARE 2007 2006
Net profi t attributable to parent company’s shareholders, 1,000 € 57,485 41,944
Earnings per share, € 1.88 1.39
Diluted earnings per share, € 1.87 1.36
Weighted average number of shares 30,586,040 30,121,137
Number of shares, unadjusted 30,660,189 30,332,793
Share options 155,371 478,602
Number of shares, adjusted for the effect of dilution 30,815,560 30,811,395
When calculating earnings per share adjusted for the effect of dilution, the dilution effect of all potential shares is taken into account in the weighted
average number of shares.
24. DIVIDENDS PAID, 1,000 € 2007 2006
Dividends paid 15,326 7,513
Dividends paid were € 0.25 per share in 2006 and € 0.50 per share in 2007.
After the balance sheet date the Board has proposed a dividend of € 0.65 per share for an estimated total of € 19.9 million.

56 2007 / ANNUAL REPORT / CRAMO PLC / POWERING YOUR BUSINESS
25. SHARE BASED PAYMENTS
Cramo had two option schemes in operation during the period. The schemes were approved by Cramo annual general shareholders’ meetings in
2002 and 2006. The annual general meeting of shareholders has authorized Cramo Board of directors to grant up to 3.67 million options to the Group
key employees entitling the holders to subscribe for a total of 3.67 million Cramo shares. The stock options have a term up to 6 years from the grant
date. After expiration of a 2 to 4 year vesting period, the options may be freely transferred or exercised. The options are forfeited if the employee
leaves the Group before the options vest.
Key characteristics and terms of Cramo option schemes are listed in the table below.
OPTIONS OPTION PLAN 2002 OPTION PLAN 2006
Basic information 2002A 2002B 2006A 2006B 2006C
Annual General Shareholders’ Meeting date 4.4.2002 4.4.2002 20.11.2006 20.11.2006 20.11.2006
Grant date 21.12.2006 14.11.2007
27.2.2007
Maximum number of stock options 335,000 335,000 1,000,000 1,000,000 1,000,000
The number of shares subscribed by one option 1 1 1 1 1
Initial exercise price, € 5.27 5.27 14.51 26.47 *
Dividend adjustment Yes Yes Yes Yes Yes
Exercise price Dec. 31, 2005, € * 3.72 3.72 -- -- --
Exercise price Dec. 31, 2006, € * 3.47 3.47 14.51 -- --
Exercise price Dec. 31, 2007, € * expired expired 14.01 26.47 *
Beginning of exercise period, date (vesting) 1.5.2004 1.5.2006 1.10.2009 1.10.2010 1.10.2011
End of excercise period, date (expiration) 31.3.2007 31.3.2007 31.1.2011 31.1.2012 31.1.2013
Remaining contractual life Dec. 31, 2007, years expired expired 3.1 4.1 5.1
Number of persons Dec. 31, 2007 -- -- 40 76 not granted
* Subscription price is the weighted average price of Cramo share in October 2006 (2006A) and in October 2007 (2006B) and in October 2008 (2006C).
The dividend to be distributed annually will be deducted from the share subscription price of the stock options.
OPTIONS OPTION PLAN 2002 OPTION PLAN 2006
Changes in 2007 2002A 2002B 2006A 2006B 2006C Yhteensä
Number of options 1.1.2007
Granted 339,500 346,500 786,000 1,472,000
Returned 4,500 11,500 16,000
Forfeited
Exercised 188,546 118,846 307,392
Outstanding 146,454 216,154 786,000 1,148,608
Non-distributed 214,000 1,000,000 1,000,000 2,214,000
Non-distributed
Granted 27,000 904,000 - 931,000
Returned
Forfeited -
Exercised 146,454 216,142 - 362,596
Weighted average price of share
during the exercise period, € * 22.00 22.00 - - - -
Expired 12 - 12
Number of options 31.12.2007
Granted 339,500 346,500 813,000 904,000 2,403,000
Returned 4,500 11,500 16,000
Forfeited
Exercised 335,000 334,988 669,988
Outstanding 813,000 904,000 1,717,000
Non-distributed 187,000 96,000 1,000,000 1,283,000
The number of unvested options 31.12. 2007 813,000 904,000 1,717,000
* The weighted average price of Cramo share from January to March 2007.

57NOTES TO THE CONSOLIDATED INCOME STATEMENT
OPTIONS OPTION PLAN 2002 OPTION PLAN 2006
Changes in 2006 2002A 2002B 2006A 2006B 2006C Yhteensä
Number of options 1.1.2006
Granted 325,000 325,000 650,000
Returned 4,500 11,500 16,000
Forfeited
Exercised 33,800 33,800
Outstanding 286,700 313,500 600,200
Non-distributed 14,500 21,500 36,000
Non-distributed
Granted 14,500 21,500 786,000 822,000
Returned
Forfeited
Exercised 154,746 118,846 273,592
Weighted average price of share
during the exercise period, € * 13.44 13.44 - - - -
Expired
Number of options 31.12.2006
Granted 339,500 346,500 786,000 1,472,000
Returned 4,500 11,500 16,000
Forfeited
Exercised 188,546 118,846 307,392
Outstanding 146,454 216,154 786,000 1,148,608
Non-distributed 214,000 1,000,000 1,000,000 2,214,000
The number of unvested options 31.12. 2006 786,000 786,000
* The weighted average price of Cramo share during the year 2006.
DETERMINATION OF FAIR VALUE
The fair value of options have been determined at grant date and the fair value is recognised to personnel expenses during the vesting period. Grant
date is the date of the decision of the Board of directors to grant stock options. According to IFRS-standards those options, which have been granted
before 11 November 2002, have not been recognised as expenses. The fair value of stock options has been determined by using the Black–Scholes
valuation model. The most signifi cant inputs used to estimate the fair value are presented in the table below. The total fair value of options granted
during the year was € 4.2 million. The effect of all employee stock options on the Company’s earnings in 2007 was € 1.8 million of which 2006A
options accounted for € 1.6 million and 2006B options accounted for € 0.2 million.
MOST SIGNIFICANT INPUTS IN BLACK–SCHOLES MODEL
Granted in 2006 Granted in 2007
2006A 2006A 2006B
Number of granted options 786,000 27,000 904,000
Average price of share at grant date, € 17.64 22.16 22.34
Subscription price, € 14.51 14.51 26.47
Interest rate, % 3.9 3.9 4.1
Maturity, years 4.1 3.9 4.2
Volatility *, % 22.4 23.9 26.2
Probability of returned options, % 10.0 10.0 8.0
Expected dividends ** 0 0 0
Fair value totally, € 4,301,749 246,281 3,954,612
* Volatility has been estimated on the basis of historical data during the 5 year period prior to the grant date excluding a period of abnormal
volatility June to August 2007
** From the share subscription price of stock options will be deducted the amount of the dividend distributed annually. Thus expected dividends are
not taken into account when estimating the fair value.
CHANGES DURING THE PERIOD AND THE WEIGHTED AVERAGE EXERCISE PRICES, 2007
Number of options Exercise price ,€ *
Granted 1.1. 1,472,000 9.37
Outstanding 1.1. 1,148,608 11.02
Granted during the period 931,000 26.11
Returned during the period 0 -
Exercised during the period 362,596 3.47
Expired during the period 12 3.47
Granted 31.12 2,403,000 14.70
Outstanding 31.12 1,717,000 20.57
* Exercise price in the beginning of the period is the status on 31.12.2006. Dividend adjustment has been taken into account during the period for
stock options 2006 and exercise price is based on the status on 31.12.2007. For stock options 2002 the exercise price is based on the status on
31.12. 2006 because the options expired before the dividend adjustment.

58 2007 / ANNUAL REPORT / CRAMO PLC / POWERING YOUR BUSINESS
26. RELATED PARTY TRANSACTIONS
The Group has following interests in its subsidiaries:
% of shares
Subsidiaries Domicile Parent Company Group
AS Cramo Estonia Tallinn Estonia 100
Cramo A/S Glostrup Denmark 100
Cramo AS Oslo Norway 100
Cramo Finland Oy Vantaa Finland 100
Cramo Holding BV Amsterdam Netherlands 100
Cramo Instant AB Sollentuna Sweden 100
Cramo Instant Oy Ylöjärvi Finland 100
Cramo JV Oy Vantaa Finland 75
Cramo New Holding AB Sollentuna Sweden 100
Cramo SIA Riga Latvia 100
Cramo Sverige AB Sollentuna Sweden 100
Cramo UAB Vilnius Lithuania 100
Kiinteistö Oy RK-Kehä Vantaa Finland 100
Kiinteistö Oy Vantaan Viinikankaari 9 Vantaa Finland 100
Suomen Tähtivuokraus Oy Vantaa Finland 100
Aukstumines Sistemos UAB Vilnius Lithuania 100
Cramo AB Sollentuna Sweden 100
Cramo Dutch Holding BV Rotterdam Netherlands 100
Cramo Enteprenadmaskiner AB Sollentuna Sweden 100
Cramo Instant AS Drammen Norway 100
Cramo Master Oy Leppävirta Finland 100
Cramo Podesty Sp.zo.o. Cracow Poland 100
Cramo Sp.zo.o Warsaw Poland 100
Cramo Trade AB Sollentuna Sweden 100
Cramo ZAO St. Petersburg Russia 100
Cramo Rentakran ZAO Moscow Russia 100
Fastigheten Tändstiftet HB Sollentuna Sweden 100
Hamar Liftutleie AS Hamar Norway 100
Hyrcenter i Skövde AB Sollentuna Sweden 100
Kumla Lift AB Sollentuna Sweden 100
Lokalnu i Sverige AB Stockholm Sweden 100
Maropol Cz s.r.o. Lesetinska Czech Republic 100
Maropol Sp.zo.o. Radzionkow Poland 100
Mupol Förvaltnings AB Stockholm Sweden 100
Parmaco Oy Pyhäjoki Finland 100
Merged and liquidated subsidiaries
Addum Intressenter AB Sollentuna Sweden
Addum Industri AB Sollentuna Sweden
Byggmaskiner i Andestorp AB Gislaved Sweden
Byggmaskiner i Hudiksvall AB Hudiksvall Sweden
Liftcenter i Malmö AB Sollentuna Sweden
Lappri AB Västerås Sweden
Kjell Åkesson Entreprenad AB Sollentuna Sweden
Cramo Truck AB Sollentuna Sweden
Cramo Funktion AB Sollentuna Sweden
Eklind Invest i Kumla AB Kumla Sweden
Hyr-City i Skåne AB Malmö Sweden
Hyrpunkten i Helsingborg AB Helsingborg Sweden
Pilängens Maskinuthyrning AB Kumla Sweden
Rolf Nilander AB Stockholm Sweden
Rosenlund & Co i Helsingborg AB Helsingborg Sweden
Kramo Citarent Uthyrnings AB Sollentuna Sweden
Kiinteistö Oy Vikkiniitty Lempäälä Finland
Suomen Ykköstilat Oy Kouvola Finland
Unicast AB Sollentuna Sweden
Real estate rent to the amount of € 266 (260) thousands has been paid to Kiinteistö Oy Hosionrinne, whose joint-owner is Tatu Hauhio, Senior Vice
President of Equipment Rental Finland.

59NOTES TO THE CONSOLIDATED INCOME STATEMENT
EXECUTIVE REMUNERATION, 1,000 €
2007 2006
Salaries and other short-term benefi ts
Vesa Koivula, CEO 371 354
Board Members
Stig Gustavson 48 37
Eino Halonen 34 34
Gunnar Glifberg 29 28
Hannu Krogerus 31 31
Esko Mäkelä 31
Juhani Nurminen 31 28
Pekka Heusala 3 64
Phil van Haarlem 1 35
Board total 206 257
Salaries and fees for the Group management 1,589 1,431
Post-employment benefi ts 74 73
The retirement age for the president and CEO is 63 years and the notice period of the agreement is 18 months with full compensation.
Loans to related parties
The company has not granted any loans to related parties.
27. PENSION OBLIGATIONS
In Sweden the ITP pension plans operated by Alecta are multi-employer benefi t plans. It has not been possible to receive suffi cient information
for the calculation of obligation and assets by employer from Alecta and due to that the plan has been treated as a defi ned contribution plan in the
fi nancial statements. In addition, the Group has defi ned benefi t plans in Norway which are not signifi cant and those plans are considered to be
treated as defi ned contribution plans.
28. COLLATERAL AND CONTINGENT LIABILITIES, 1,000 € 2007 2006
COLLATERAL GIVEN ON OWN BEHALF
Debts, secured by collateral
Loans from credit institutions 205,731 206,905
Collateral given
Mortgages on real estates 5,663 5,663
Mortgages on company assets 83,317 77,487
Pledges 80,156 107,212
Commitments, secured by collateral
Repurchase commitments 9,019 9,171
Construction and warranty guarantees 522 624
29. DERIVATIVE FINANCIAL INSTRUMENTS, 1,000 € 2007 2006
Nominal value Fair value Nominal value Fair value
Interest rate derivatives
Interest rate swaps 138,395 5,492 152,803 4,461
Forward exchange agreements 87,151 -194 19,911 113
MATURITY OF INTEREST DERIVATIVE INSTRUMENTS
2008 2009 2010 2011 2012 2012+ Total
EUR 51,000 51,000
SEK 291,713 291,713 241,713 825,140
in EUR 30,897 30,897 25,601 87,395
Total, EUR 30,897 30,897 76,601 138,395
The hedge accounting has been applied to interest rate derivatives and the fair value of interest derivative instruments have been recognised in
equity net of tax.
MATURITY OF FORWARD EXCHANGE AGREEMENTS
2008 2009 2010 2011 2012 2012+ Total
65,766 11,037 10,348 87,151
The hedge accounting has not been applied to forward exchange contracts and the fair value of derivative fi nancial instruments has been recognised
in the income statement.

60 2007 / ANNUAL REPORT / CRAMO PLC / POWERING YOUR BUSINESS
30. BUSINESS COMBINATIONS
During the fi nancial year the Group has concluded ten acquisitions which provide equipment rental services.
On 30 August 2007, the Group and ZAO Rentakran established a joint rental operation in Russia. Cramo holds 75 per cent and ZAO Rentakran 25 per
cent of the shares in the new company, ZAO Cramo Rentakran. According to the agreement Cramo has an option to buy ZAO Rentakran´s share in
ZAO Cramo Rentakran at the earliest 1 May 2011. The cost of the option has been recognised in the fi nancial statements according to the purchase
price scheme agreed with ZAO Rentakran and based on management´s assessment of the factors of the scheme.
Based on the option terms ZAO Cramo Rentakran has been consolidated as a 100 per cent subsidiary since 1 December 2007. The contributed
amount of revenues and net profi t of start up operation was immaterial due to the short time of period during the fi nancial year.
31. EVENTS AFTER BALANCE SHEET DATE
On 10 January 2008, Cramo announced an agreement between its Swedish subsidiary Cramo Sverige AB and Skanska Sverige AB making Cramo
Skanska’s preferred supplier of lifting equipment. At this stage, the agreement applies to Sweden, but it may be extended to cover Skanska’s other
Nordic companies. The contracting parties estimated the annual volume of the agreement to be in the region of € 6.5 million.
Magnus Rosén, Senior Vice President for the Scandinavian operations, announced his resignation on 14 January 2008.
32. BOARD AUTHORIZATIONS
The Board has no valid authorisations to issue convertible bonds, increase share capital or buy back treasury shares. The board has a valid
authorisation to grant 2006 stock options comprising a maximum amount of 3,000,000 as decided in EGM of 20 November 2006.
Purchase consideration, ZAO Cramo Rentakran, 1,000 €
Fair value of earn out option 6,949
Total purchase consideration 6,949
Fair value of net assets acquired 6,219
Goodwill 730
Goodwill of ZAO Cramo Rentakran is attributable to the market
presence, geographical coverage, skilled workforce and synergy
benefi ts expected to arise as a result of the acquisition.
1,000 € Fair value Book value
Non-current assets
Customer relationships 2,959
Brand 388
Depot network 750
Non-competition agreement 552
Property, plant and equipment 2,500 2,500
Financial assets
Deferred tax assets
Current assets
Inventories
Trade and other receivables
Cash and cash equivalent
Assets total 7,149 2,500
Non-current liabilities
Borrowings 930
Deferred tax liabilities
Current liabilities
Trade and other payables
Liabilities total 930
Net assets as at 1 December 2007 6,219 2,500
Other nine acquisitions have been considered individually minor and
are presented as a summary. The acquired nine businesses conributed
revenues of € 7,560 thousand and net profi t of € 903 thousand
during the period. If the acquisitions had occured on 1 January 2007,
the Group revenue would have been € 500,549 thousand, and net
profi t would have been € 58,388 thousand. The amounts have been
calculated using the Group´s accounting policies and by adjusting
the results of subsidiaries and operations to refl ect the depreciations
and amortisations that would have been charged assuming the fair
value adjustments had applied from 1 January 2007 including the
consequential tax effect.
Purchase consideration, other purchases, 1,000 €
Cash considerations 18,644
Direct costs relating to the acquisition 82
Adjustment of purchase considerations -45
Aggregate purchase considerationä 18,681
Fair value of net assets acquired 14,372
Goodwill 4,309
Goodwill of other nine acquisitions is attributable to the strengthening
of local market position, geographical coverage, skilled workforce and
synergy benefi ts expected to arise as a result of the acquisition.
1,000 € Fair value Book value
Non-current assets
Customer relationships 1,013
Depot network 420
Non-competition agreement 890
Property, plant and equipment 19,923 19,010
Financial assets 14 14
Deferred tax assets 71
Current assets
Inventories 207 207
Trade and other receivables 2,095 2,095
Cash and cash equivalent 600 600
Assets total 25,233 21,926
Non-current liabilities
Borrowings 5,314 5,314
Deferred tax liabilities 2,952 2,004
Current liabilities
Trade and other payables 2,595 2,595
Liabilities total 10,861 9,913
Net assets acquired 14,372 12,013
Purchase consideration settled in cash 18,681
Cash and cash equivalents in subsidiary aquired -600
Cash fl ow on acquisition 18,081
61NOTES TO THE CONSOLIDATED INCOME STATEMENT
33. NOTIFICATIONS REGARDING CHAPTER 2, SECTION 9 AND 10 IN ACCORDANCE
WITH THE SECURITIES MARKET ACT
On 15 November 2007, Fidelity International Limited announced that on 14 November 2007 Fidelity International Limited and its direct and indirect
subsidiaries have crossed below the 5% threshold. The exact proportion of voting rights and share capital of Cramo Plc is 1,520,760 shares and 4.96
percent of the shares and voting rights in total.
On 20 August 2007, Fidelity International Limited announced that on 16 August 2007 Fidelity International Limited and its direct and indirect
subsidiaries have crossed above the 5% threshold. The exact proprotion of voting rights and share capital of Cramo Plc is 1,587,777 shares and 5.18
percent of the shares and voting rights in total.
On 11 July 2007, Suomi Mutual Life Assurance Company announced that its holding had lowered to less than one tenth (1/10) of Cramo Plc’s share
capital and votes with the new holding totalling 3,027,658 shares, or 9.87 per cent of the shares and votes.
On 17 April 2007, Suomi Mutual Life Assurance Company announced that its holding had lowered to less than three twentieth (3/20) of Cramo Plc’s
share capital and votes with the new holding totalling 4,590,440 shares, or 14.98 per cent of the shares and votes.
34. MAIN TERMS OF SHAREHOLDERS AGREEMENT
Parties
Parties to this Agreement are Pon Holdings B.V., ABN AMRO Bank N.V., Suomi Mutual Life Assurance Company, and Rakennusmestarien Säätiö.
The share holding of the parties in Cramo Plc.
Each party is committed not to submit shares or any documents or securities entitling submitting shares so that its ownership would rise over
30 per cent of the Cramo Plc. without written commitment given beforehand by other parties. This commitment does not include the funds under
command of ABN AMRO Bank N.V.
Use of voting rights
The old Cramo Holding B.V. shareholders (Pon Holdings B.V., ABN AMRO Bank N.V.) jointly and severally undertake not to use their voting rights to
extent to total number of voting rights in the Cramo Plc. exceeds 20 per cent.
Term and termination
“This Agreement remains in force for a period of three years since 3 January 2006, and will expire automatically thereafter or earlier for a party in
case the following criteria are not met:
- in the part of Pon Holdings B.V. as long as its individual ownership of equity securities will not permanently fall to a level below 10 per cent or at
any one time fall to a level below 7.5 per cent of all the equity securities in the Cramo Plc.,
- in the part of Suomi Mutual Life Assurance Company as long as its individual ownership of equity securities will not permanently fall to a level
below 10 per cent or at any one time fall to a level below 3.75 per cent of all the equity securities in Cramo Plc.,
- in the part of ABN AMRO Bank N.V. as long as its individual ownership of equity securities will not fall permanently to a level below 5 per cent or at
any one time fall to a level below 2.5 per cent of all the equity securities in Cramo Plc., and
- in the part of Rakennusmestarien Säätiö as long as its individual ownership of equity securities will not fall permanently to a level below 5 per cent
or at any one time fall to a level below 2.5 per cent of all the equity securities in Cramo Plc.”
Contractual penalty
Violation against the clause regulating the use of voting rights leads to the penalty payment of € 15,000,000.
35. CALCULATION OF THE KEY FIGURES AND RATIOS
KEY FIGURES ON FINANCIAL PERFORMANCE:
Return on equity, %
= 100 x (profi t for the period)
Shareholders’ equity + minority interest
(mean calculated by the values of the balance sheet
of the fi nancial year and the previous fi nancial year)
Return on investment, %
= 100 x (profi t before taxes + interest expenses
and other fi nancial expenses)
Balance sheet total – non-interest bearing liabilities
(mean calculated by the values of the balance sheet
of the fi nancial year and the previous fi nancial year)
Equity ratio, %
= 100 x (shareholders’ equity + minority interest)
Balance sheet total – advance payments received
Personnel on average
= Mean of the number of personnel at the end of the month,
adjusted with the number of part-time employees
Gearing
= interest bearing liabilities – cash and cash equivalents x 100
equity + minority interest
PER-SHARE RATIOS:
Earnings per share
= Profi t before extraordinary items +/– minority interest – taxes
Average number of issue-adjusted shares for the Financial year
Shareholders’ equity per share
= Shareholders’ equity
Number of issue-adjusted shares on the date of closing of the accounts
Dividend per share
= Dividend distribution for the fi nancial year
Number of issue-adjusted shares on the date of closing of the accounts
Dividend per earnings, %
= 100 x dividend per share
Earnings per share
Effective dividend yield, %
= 100 x dividend per share
Issue-adjusted closing price for a B Share at the end of the Financial year
Price / earnings ratio (P/E)
= Issue-adjusted closing price for a B Share at the end of the Financial year
Earnings per share
Market capitalisation
= Number of A Shares on the fi nal day of the fi nancial year x average share
price for a B Share + Number of B Shares on the fi nal day of the fi nancial
year x closing price for a B Share at the end of the fi nancial year
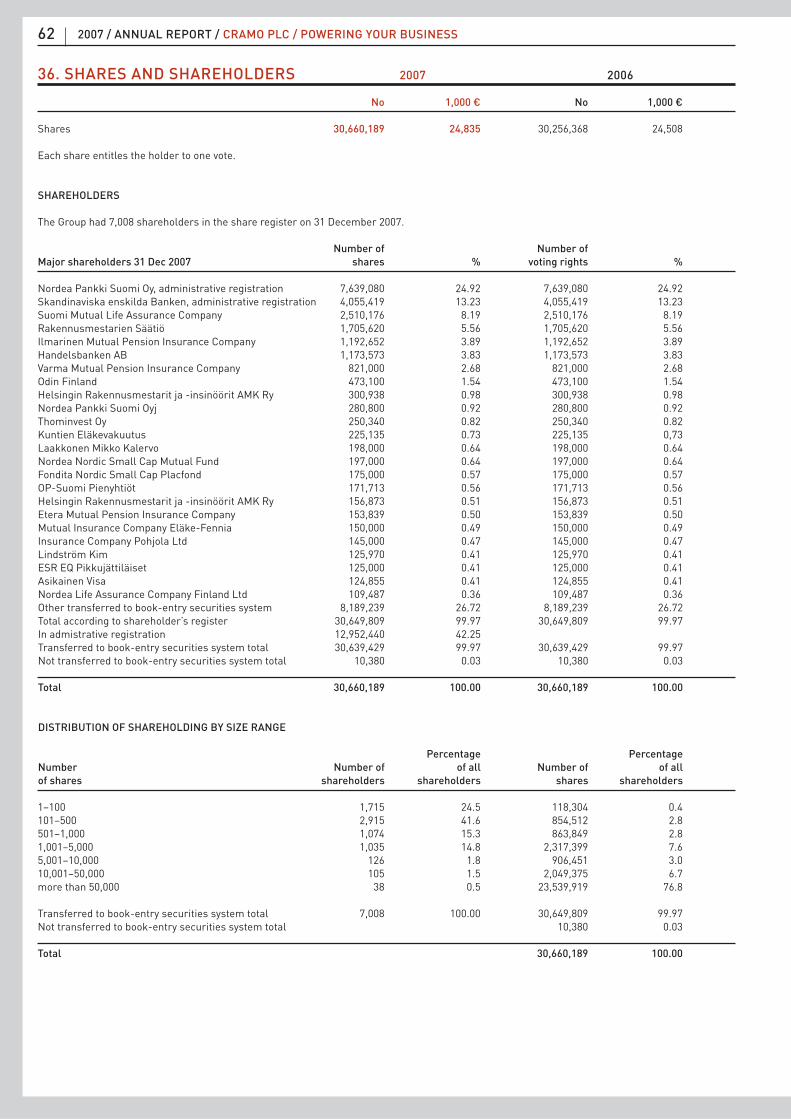
62 2007 / ANNUAL REPORT / CRAMO PLC / POWERING YOUR BUSINESS
36. SHARES AND SHAREHOLDERS 2007 2006
No 1,000 € No 1,000 €
Shares 30,660,189 24,835 30,256,368 24,508
Each share entitles the holder to one vote.
SHAREHOLDERS
The Group had 7,008 shareholders in the share register on 31 December 2007.
Number of Number of
Major shareholders 31 Dec 2007 shares % voting rights %
Nordea Pankki Suomi Oy, administrative registration 7,639,080 24.92 7,639,080 24.92
Skandinaviska enskilda Banken, administrative registration 4,055,419 13.23 4,055,419 13.23
Suomi Mutual Life Assurance Company 2,510,176 8.19 2,510,176 8.19
Rakennusmestarien Säätiö 1,705,620 5.56 1,705,620 5.56
Ilmarinen Mutual Pension Insurance Company 1,192,652 3.89 1,192,652 3.89
Handelsbanken AB 1,173,573 3.83 1,173,573 3.83
Varma Mutual Pension Insurance Company 821,000 2.68 821,000 2.68
Odin Finland 473,100 1.54 473,100 1.54
Helsingin Rakennusmestarit ja -insinöörit AMK Ry 300,938 0.98 300,938 0.98
Nordea Pankki Suomi Oyj 280,800 0.92 280,800 0.92
Thominvest Oy 250,340 0.82 250,340 0.82
Kuntien Eläkevakuutus 225,135 0.73 225,135 0,73
Laakkonen Mikko Kalervo 198,000 0.64 198,000 0.64
Nordea Nordic Small Cap Mutual Fund 197,000 0.64 197,000 0.64
Fondita Nordic Small Cap Placfond 175,000 0.57 175,000 0.57
OP-Suomi Pienyhtiöt 171,713 0.56 171,713 0.56
Helsingin Rakennusmestarit ja -insinöörit AMK Ry 156,873 0.51 156,873 0.51
Etera Mutual Pension Insurance Company 153,839 0.50 153,839 0.50
Mutual Insurance Company Eläke-Fennia 150,000 0.49 150,000 0.49
Insurance Company Pohjola Ltd 145,000 0.47 145,000 0.47
Lindström Kim 125,970 0.41 125,970 0.41
ESR EQ Pikkujättiläiset 125,000 0.41 125,000 0.41
Asikainen Visa 124,855 0.41 124,855 0.41
Nordea Life Assurance Company Finland Ltd 109,487 0.36 109,487 0.36
Other transferred to book-entry securities system 8,189,239 26.72 8,189,239 26.72
Total according to shareholder’s register 30,649,809 99.97 30,649,809 99.97
In admistrative registration 12,952,440 42.25
Transferred to book-entry securities system total 30,639,429 99.97 30,639,429 99.97
Not transferred to book-entry securities system total 10,380 0.03 10,380 0.03
Total 30,660,189 100.00 30,660,189 100.00
DISTRIBUTION OF SHAREHOLDING BY SIZE RANGE
Percentage Percentage
Number Number of of all Number of of all
of shares shareholders shareholders shares shareholders
1–100 1,715 24.5 118,304 0.4
101–500 2,915 41.6 854,512 2.8
501–1,000 1,074 15.3 863,849 2.8
1,001–5,000 1,035 14.8 2,317,399 7.6
5,001–10,000 126 1.8 906,451 3.0
10,001–50,000 105 1.5 2,049,375 6.7
more than 50,000 38 0.5 23,539,919 76.8
Transferred to book-entry securities system total 7,008 100.00 30,649,809 99.97
Not transferred to book-entry securities system total 10,380 0.03
Total 30,660,189 100.00

63NOTES TO THE CONSOLIDATED INCOME STATEMENT
DISTRIBUTION OF SHAREHOLDING BY SECTOR
Shareholding by sector Percentage Percentage Percentage
Number of of all Number of of all Number of of all
shareholders shareholders shares shares votes votes
Private companies 589 8.4 1,816,006 5.9 1,816,006 5.9
Public companies 1 0.0 21,682 0.1 21,682 0.1
Financial institutions, insurance companies 56 0.8 17,165,307 56.0 17,165,307 56.0
Public corporations 20 0.3 2,721,118 8.9 2,721,118 8.9
Non-profi t organisations 167 2.4 2,916,266 9.5 2,916,266 9.5
Households 6,135 87.5 5,413,799 17.7 5,413,799 17.7
Foreign shareholders 40 0.6 595,631 1.9 595,631 1.9
Transferred to book-entry securities system total 7,008 100.0 30,649,809 99.97 30,649,809 99.97
Not transferred to book-entry securities system total 10,380 0.03 10,380 0.03
Total 30,660,189 100.00 30,660,189 100.00
Shareholding of Board members and CEO of the Group
On 31 December 2007, the Board members, the President and CEO, and his deputy held, either directly or through companies in which they exercise
control, a total of 111,549 Cramo Plc shares, representing 0.36 per cent of the company’s shares and votes, and a total of 293,000 stock options.
Insider guidelines
Since 1 July 2004, Cramo Plc. has applied the recommendation for Listed Companies’ Corporate Governance confi rmed by the HEX Helsinki
Exchanges, the Central Chamber of Commerce and the Confederation of Finnish Industry and Employers.

64 2007 / ANNUAL REPORT / CRAMO PLC / POWERING YOUR BUSINESS
FINANCIALSTATEMENTSOF THE PARENT COMPANY

65FINANCIAL STATEMENTS OF THE PARENT COMPANY (FAS)
INCOME STATEMENT OF THE PARENT COMPANY 1.1.–31.12.2007 1.1.–31.12.2006
Note € €
Sales 2 14,809,370.54 50,773,636.36
Other operating income 3 519,723.70 5,429,425.31
Materials and services 4 -1,334,841.57 -4,091,973.86
Personnel expenses 5 -6,579,001.43 -16,056,130.56
Depreciation and amortisation 6 -2,525,477.02 -6,980,461.52
Other operating expenses 8 -9,224,368.00 -20,040,885.76
Total -19,663,688.02 -47,169,451.70
Operating profi t -4,334,593.78 9,033,609.97
Net fi nancial items 9 29,501,083.16 -777,801.10
Profi t before extraordinary items 25,166,489.38 8,255,808.87
Extraordinary income and expenses 10 11,722,760.00 4,494,000.00
Profi t after extraordinary items 36,889,249.38 12,749,808.87
Appropriations 7 2,246,086.27 -1,070,283.92
Income taxes 11 -1,755,315.90 -1,670,853.95
Profi t for the period 37,380,019.75 10,008,671.00
BALANCE SHEET OF THE PARENT COMPANY 31.12.2007 31.12.2006
Note € €
ASSETS
Fixed assets
Intangible assets 12 115,563.35 1,303,820.31
Tangible assets 12 4,785,171.94 48,163,727.21
Investments 12
Shares in Group companies 241,120,179.92 43,676,762.50
Shares in other companies 119,563.13 119,563.13
Total fi xed assets 246,140,478.34 93,263,873.15
Current assets
Inventories 13 660,214.91
Non-Current receivables 14 148,894,979.35 178,705,301.04
Current receivables 15 128,463,854.33 8,252,616.19
Cash and bank 750,895.76 9,934,669.25
Total current assets 278,109,729.44 197,552,801.39
Total assets 524,250,207.78 290,816,674.54
EQUITY AND LIABILITIES
Equity 16
Share capital 24,834,753.09 24,507,658.08
Share issue 33,392.25
Share premium fund 3,331,086.25 2,366,580.89
Retained earnings 14,599,062.14 19,916,635.14
Profi t for the period 37,380,019.75 10,008,671.00
Total equity 80,144,921.23 56,832,937.36
Appropriations 17 556,684.27 12,213,205.03
Liabilities 18
Non-current liabilities 173,753,048.15 192,198,808.22
Current liabilities 269,795,554.13 29,571,723.93
Total liabilities 443,548,602.28 221,770,532.15
Total equity and liabilities 524,250,207.78 290,816,674.54
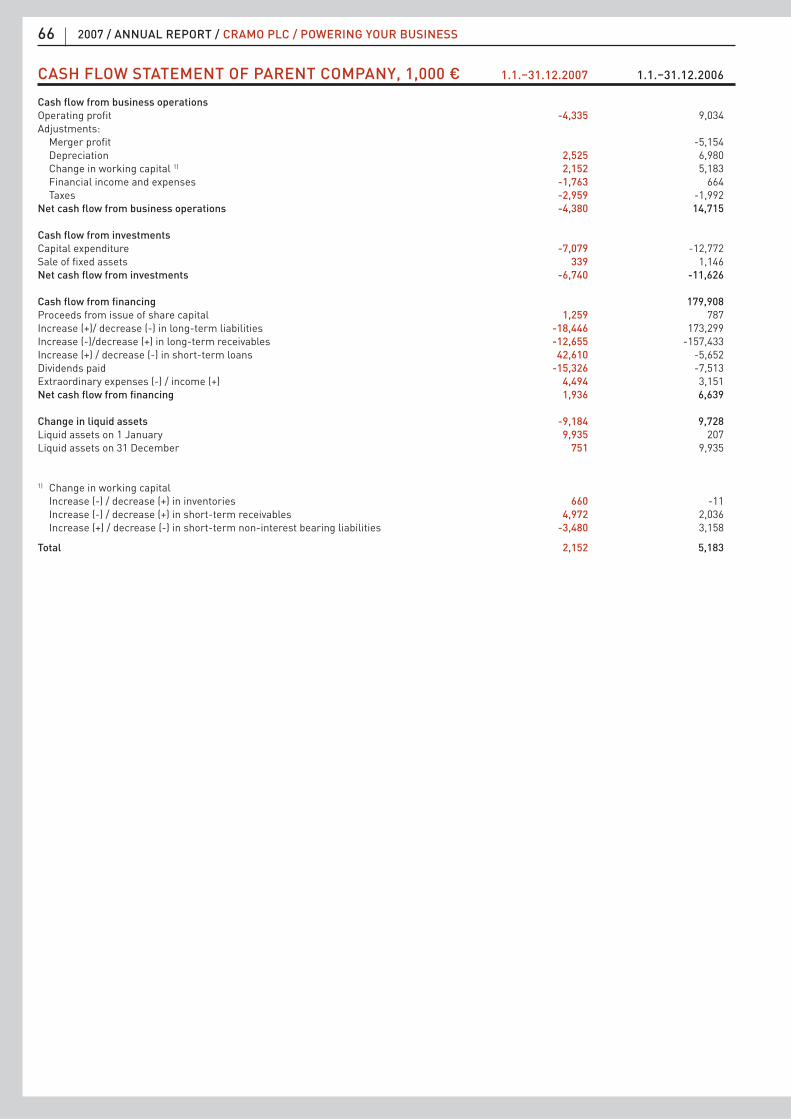
66 2007 / ANNUAL REPORT / CRAMO PLC / POWERING YOUR BUSINESS
CASH FLOW STATEMENT OF PARENT COMPANY, 1,000 € 1.1.–31.12.2007 1.1.–31.12.2006
Cash fl ow from business operations
Operating profi t -4,335 9,034
Adjustments:
Merger profi t -5,154
Depreciation 2,525 6,980
Change in working capital 1) 2,152 5,183
Financial income and expenses -1,763 664
Taxes -2,959 -1,992
Net cash fl ow from business operations -4,380 14,715
Cash fl ow from investments
Capital expenditure -7,079 -12,772
Sale of fi xed assets 339 1,146
Net cash fl ow from investments -6,740 -11,626
Cash fl ow from fi nancing 179,908
Proceeds from issue of share capital 1,259 787
Increase (+)/ decrease (-) in long-term liabilities -18,446 173,299
Increase (-)/decrease (+) in long-term receivables -12,655 -157,433
Increase (+) / decrease (-) in short-term loans 42,610 -5,652
Dividends paid -15,326 -7,513
Extraordinary expenses (-) / income (+) 4,494 3,151
Net cash fl ow from fi nancing 1,936 6,639
Change in liquid assets -9,184 9,728
Liquid assets on 1 January 9,935 207
Liquid assets on 31 December 751 9,935
1) Change in working capital
Increase (-) / decrease (+) in inventories 660 -11
Increase (-) / decrease (+) in short-term receivables 4,972 2,036
Increase (+) / decrease (-) in short-term non-interest bearing liabilities -3,480 3,158
Total 2,152 5,183

67PARENT COMPANY NOTES TO THE FINANCIAL STATEMENTS
PARENT COMPANY NOTES TO THE FINANCIAL STATEMENTSMeasurement of property, plant and equipment
Property, plant and equipment are recorded at cost, including fi xed
manufacturing costs less depreciation according to plan. Land includes
revaluations made before 1989. The company estimates that the market
value of the land is higher than the book value. Maintenance and repair
costs are recognised as expenses in the year in which they are incurred.
Depreciation according to plan is calculated, based on Group wide princip-
les, on a straight-line basis over the expected useful lives of the assets.
Depreciation according to plan is as follows:
Buildings and structures 15–50
For rent:
Machinery and equipment 6–10
Tents and shelters 6
Machinery and equipment for services 6–10
Machinery and equipment for own use 3–6
Other long-term assets 10
Other tangible assets 10
Goodwill 5
Other intangible assets 5
Inventories
Inventories are stated at the lower of acquisition cost or replacement
cost or likely net realizable value. Cost is determined on a fi rst-in-fi rst-
out (FIFO) basis. The total sum of inventories coming from materials and
supplies includes direct acquisition costs.
Items denominated in foreign currencies
Assets and liabilities denominated in currencies other than those of the
euro zone are translated into euros at the average rate on the date of
closing the accounts. Exchange gains and losses are recognised through
profi t and loss.
Appropriations
The accumulated difference between planned and book depreciation is
shown under appropriations.
Deferred taxes
Deferred tax liabilities and assets are not entered in to company’s balance
sheet. Deferred tax liabilities and assets signifi cant to the company are
disclosed in the notes.
Revenue and revenue recognition
Based on the term of rental, income from rental operations is recognised
on an accrual basis. Income from drying and diamond cutting services is
recognised upon performance of a service or part of it.
In calculating revenue, sales are recorded net of indirect taxes, discounts
and rebates.
Other operating income
Other operating income includes, among other things, rental income
and contributions received as well as gain/loss from mergers.
Pension schemes
Pensions are accounted as expense for the period they incurred. There
are no uncovered pension liabilities. The pension scheme is based on
pension insurance in compliance with the Employees’ Pensions Act and
the Employment Pensions Fund. The contractual retirement age of the
managing Director is 63 years.
Research and development
Research and development costs are expensed as incurred.
Extraordinary items
As an extraordinary items include income and expenses which are
based on material and non-frequent transactions departing from
ordinary business or changes of accounting policies as well as received
and given Group contributions.
Income taxes
Income taxes for the fi nancial year and the previous fi nancial years are
recognised through taxes in profi t and loss.
Valuation of fi nancial derivative instruments
Financial derivative instruments consist of interest rate swap
agreements and forward exchange agreements. The forward exchange
agreements designate as hedges of cash fl ow changes in foreign
currency. Interest rate swap is recognised under hedge accounting.
The fair values of derivative instruments are not recognised in the
accounts but they are disclosed as commitments. The effects of hedge
instruments are recognised in the income statement as an adjustment
to interest expenses which are based on the hedged item.
2. SALES BY BUSINESS AREA, € 2007 2006
Equipment rental and construction-site services 14,809,370.54 50,773,636.36
Total 14,809,370.54 50,773,636.36
3. OTHER OPERATING INCOME, € 2007 2006
Rental of premises 339,408.50 109,568.36
Profi t on sale of real estate 169,175.24 105,710.54
Merger profi t 5,154,569.81
Other 11,139.96 59,576.60
Total 519,723.70 5,429,425.31
4. MATERIALS AND SERVICES, € 2007 2006
Materials and supplies
Purchases 703,395.71 2,296,400.26
Change in inventory -11,043.84
Total 703,395.71 2,285,356.42
External services 631,445.86 1,806,617.44
Total 1,334,841.57 4,091,973.86
1. ACCOUNTING PRINCIPLES

68 2007 / ANNUAL REPORT / CRAMO PLC / POWERING YOUR BUSINESS
5. PERSONNEL EXPENSES, € 2007 2006
Wages and salaries 5,340,569.89 12,483,004.25
Pensions 701,588.20 2,252,877.91
Other statutory employer contributions 536,843.34 1,320,248.40
Total 6,579,001.43 16,056,130.56
Average number of personnel 102 450
Executive remuneration
Wages and salaries with fringe benefi ts
Managing Director 371,414.00 300,479.00
Management 374,138.00 589,105.00
Board members 206,000.00 257,000.00
Total 951,552.00 1,146,584.00
6. DEPRECIATION AND AMORTISATION, € 2007 2006
Amortisation on intangible assets 88,680.70 236,892.25
Depreciation on tangible assets 2,436,796.32 6,743,569.27
Total 2,525,477.02 6,980,461.52
7. APPROPRIATIONS, € 2007 2006
Depreciation difference, increase (-) / decrease (+):
Buildings and structures 22,282.79 -42,000.72
Machinery and equipment 2,223,803.48 -983,283.20
Goodwill -45,000.00
Total 2,246,086.27 -1,070,283.92
8. OTHER OPERATING EXPENSES, € 2007 2006
Premises and equipment rentals 1,372,274.75 4,780,844.56
Marketing 819,736.55 2,504,427.63
Transport and vehicles 996,285.71 3,260,723.43
Maintenance and accessories 836,297.90 2,099,980.08
Other expenses 5,199,773.09 7,394,910.06
Total 9,224,368.00 20,040,885.76
9. NET FINANCIAL ITEMS, € 2007 2006
Dividend income
From Group Companies 31,922,035.22
Other companies 375.00
Total dividend income 31,922,410.22
Interest income from long-term investments
From Group companies 10,387,390.72 7,151,225.60
From others 206,255.53 73,491.16
Total fi nancial income 10,593,646.25 7,224,716.76
Interest and other fi nancial expenses
To Group companies -5,688,766.82 -100,629.40
To others -7,326,206.49 -7,901,888.46
Total fi nancial expenses -13,014,973.31 -8,002,517.86
Net fi nancial items total 29,501,083.16 -777,801.10
10. EXTRAORDINARY ITEMS, € 2007 2006
Group contribution 11,722,760.00 4,494,000.00
11. INCOME TAXES, € 2007 2006
Current tax 1,141,663.59 -624,207.46
Taxes from previous fi nancial periods 150,938.11 121,793.51
Taxes on extraordinary income -3,047,917.60 -1,168,440.00
Total -1,755,315.90 -1,670,853.95
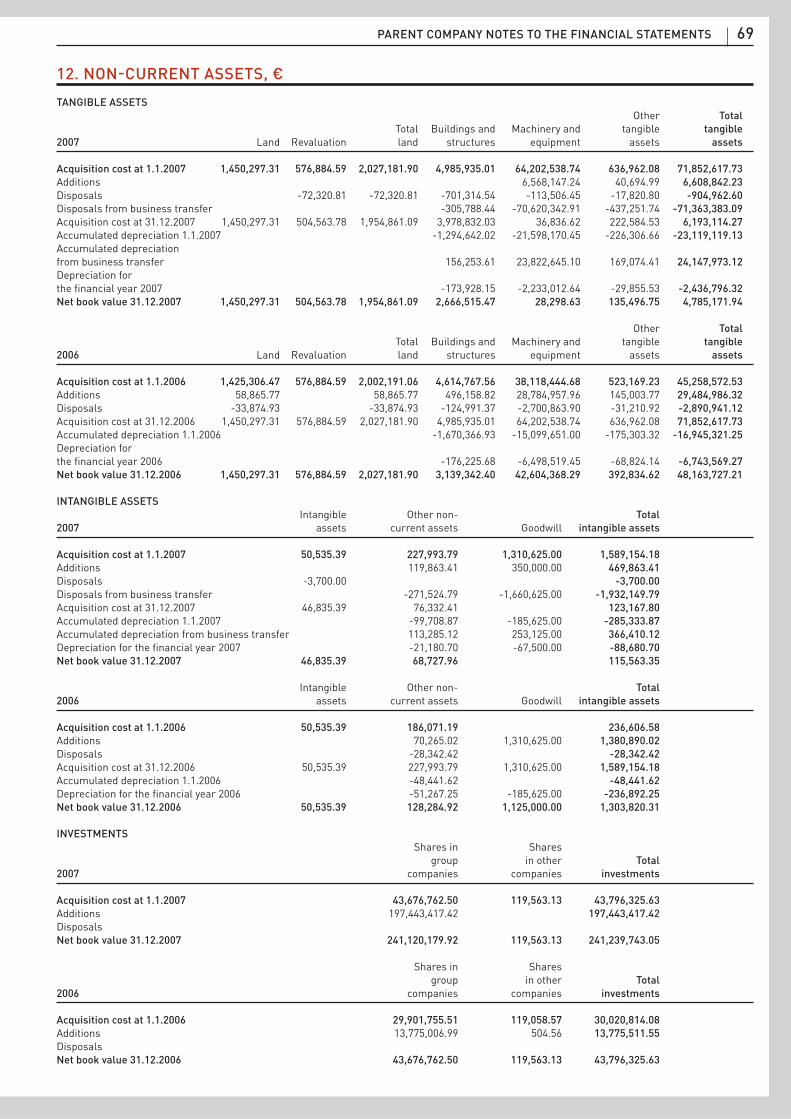
69PARENT COMPANY NOTES TO THE FINANCIAL STATEMENTS
12. NON-CURRENT ASSETS, €
TANGIBLE ASSETS
Other Total
Total Buildings and Machinery and tangible tangible
2007 Land Revaluation land structures equipment assets assets
Acquisition cost at 1.1.2007 1,450,297.31 576,884.59 2,027,181.90 4,985,935.01 64,202,538.74 636,962.08 71,852,617.73
Additions 6,568,147.24 40,694.99 6,608,842.23
Disposals -72,320.81 -72,320.81 -701,314.54 -113,506.45 -17,820.80 -904,962.60
Disposals from business transfer -305,788.44 -70,620,342.91 -437,251.74 -71,363,383.09
Acquisition cost at 31.12.2007 1,450,297.31 504,563.78 1,954,861.09 3,978,832.03 36,836.62 222,584.53 6,193,114.27
Accumulated depreciation 1.1.2007 -1,294,642.02 -21,598,170.45 -226,306.66 -23,119,119.13
Accumulated depreciation
from business transfer 156,253.61 23,822,645.10 169,074.41 24,147,973.12
Depreciation for
the fi nancial year 2007 -173,928.15 -2,233,012.64 -29,855.53 -2,436,796.32
Net book value 31.12.2007 1,450,297.31 504,563.78 1,954,861.09 2,666,515.47 28,298.63 135,496.75 4,785,171.94
Other Total
Total Buildings and Machinery and tangible tangible
2006 Land Revaluation land structures equipment assets assets
Acquisition cost at 1.1.2006 1,425,306.47 576,884.59 2,002,191.06 4,614,767.56 38,118,444.68 523,169.23 45,258,572.53
Additions 58,865.77 58,865.77 496,158.82 28,784,957.96 145,003.77 29,484,986.32
Disposals -33,874.93 -33,874.93 -124,991.37 -2,700,863.90 -31,210.92 -2,890,941.12
Acquisition cost at 31.12.2006 1,450,297.31 576,884.59 2,027,181.90 4,985,935.01 64,202,538.74 636,962.08 71,852,617.73
Accumulated depreciation 1.1.2006 -1,670,366.93 -15,099,651.00 -175,303.32 -16,945,321.25
Depreciation for
the fi nancial year 2006 -176,225.68 -6,498,519.45 -68,824.14 -6,743,569.27
Net book value 31.12.2006 1,450,297.31 576,884.59 2,027,181.90 3,139,342.40 42,604,368.29 392,834.62 48,163,727.21
INTANGIBLE ASSETS
Intangible Other non- Total
2007 assets current assets Goodwill intangible assets
Acquisition cost at 1.1.2007 50,535.39 227,993.79 1,310,625.00 1,589,154.18
Additions 119,863.41 350,000.00 469,863.41
Disposals -3,700.00 -3,700.00
Disposals from business transfer -271,524.79 -1,660,625.00 -1,932,149.79
Acquisition cost at 31.12.2007 46,835.39 76,332.41 123,167.80
Accumulated depreciation 1.1.2007 -99,708.87 -185,625.00 -285,333.87
Accumulated depreciation from business transfer 113,285.12 253,125.00 366,410.12
Depreciation for the fi nancial year 2007 -21,180.70 -67,500.00 -88,680.70
Net book value 31.12.2007 46,835.39 68,727.96 115,563.35
Intangible Other non- Total
2006 assets current assets Goodwill intangible assets
Acquisition cost at 1.1.2006 50,535.39 186,071.19 236,606.58
Additions 70,265.02 1,310,625.00 1,380,890.02
Disposals -28,342.42 -28,342.42
Acquisition cost at 31.12.2006 50,535.39 227,993.79 1,310,625.00 1,589,154.18
Accumulated depreciation 1.1.2006 -48,441.62 -48,441.62
Depreciation for the fi nancial year 2006 -51,267.25 -185,625.00 -236,892.25
Net book value 31.12.2006 50,535.39 128,284.92 1,125,000.00 1,303,820.31
INVESTMENTS
Shares in Shares
group in other Total
2007 companies companies investments
Acquisition cost at 1.1.2007 43,676,762.50 119,563.13 43,796,325.63
Additions 197,443,417.42 197,443,417.42
Disposals
Net book value 31.12.2007 241,120,179.92 119,563.13 241,239,743.05
Shares in Shares
group in other Total
2006 companies companies investments
Acquisition cost at 1.1.2006 29,901,755.51 119,058.57 30,020,814.08
Additions 13,775,006.99 504.56 13,775,511.55
Disposals
Net book value 31.12.2006 43,676,762.50 119,563.13 43,796,325.63

70 2007 / ANNUAL REPORT / CRAMO PLC / POWERING YOUR BUSINESS
2007 2006
ACCUMULATED DIFFERENCES IN TOTAL DEPRECIATION
AND DEPRECIATION ACCORDING TO PLAN
Production machinery and equipment
Net book value at 31.12. 42,073,845.81
Buildings and structures
Accumulated difference in total depreciation and
depreciation according to plan at 1.1. 631,838.36 561,602.68
Increase in accumulated depreciation
difference for the period of 1.1-31.12. -75,825.26 70,235.68
Accumulated difference in total depreciation and
depreciation according to plan at 31.12. 556,013.10 631,838.36
Machinery and equipment
Accumulated difference in total depreciation and
depreciation according to plan at 1.1. 11,536,366.67 7,751,955.79
Increase in accumulated depreciation
difference for the period of 1.1-31.12. -11,535,695.50 3,784,410.88
Accumulated difference in total depreciation and
depreciation according to plan at 31.12. 671.17 11,536,366.67
Goodwill
Accumulated difference in total depreciation and
depreciation according to plan at 1.1. 45,000.00 45,000.00
Increase in accumulated depreciation
difference for the period of 1.1-31.12. -45,000.00
Accumulated difference in total depreciation and
depreciation according to plan at 31.12. 45,000.00
13. INVENTORIES, € 2007 2006
Finished goods 660,214.91
14. NON-CURRENT RECEIVABLES, € 2007 2006
Group companies
Loan receivables 148,894,979.35 178,705,301.04
15. CURRENT RECEIVABLES, € 2007 2006
Group companies
Accounts receivables 177,997.10
Loan receivables 126,057,474.94 696,469.54
Other companies
Accounts receivables 6,429,822.52
Loan receivables 15,907.00
Pre-paid expenses and accrued income 2,406,379.39 932,420.03
Total 128,463,854.33 8,252,616.19
16. EQUITY, € 2007 2006
Share capital at 1.1. 24,507,658.08 24,234,273.83
Registered share issue
Reduction of par value -12,619,030.16
Registered increase of the share capital 12,697,312.14
Registered increase of the share capital 327,095.01 195,102.27
Share capital at 31.12. 24,834,753.09 24,507,658.08
Share issue at 1.1. 33,392.25 31,620.00
Registered share issue -33,392.25 -31,620.00
Subscribtion share issue 233,397.45 29,484.00
Registered subscribtion share issue -233,397.45 -29,484.00
Subscribtion share issue 54,067.50 165,618.27
Registered subscribtion share issue -54,067.50 -165,618.27
Subscribtion share issue 6,237.81
Registered subscribtion share issue -6,237.81
Subscribtion share issue 33,392.25
Share issue at 31.12. 33,392.25

71PARENT COMPANY NOTES TO THE FINANCIAL STATEMENTS
2007 2006
Share premium fund at 1.1. 2,366,580.89 1,607,116.17
Issue premium 766,465.70 105,924.00
Issue premium 177,555.00 543,882.22
Issue premium 20,484.66 109,658.50
Share premium fund at 31.12. 3,331,086.25 2,366,580.89
Retained earnings at 1.1. 7,297,604.98 5,363,098.14
Profi t from previous period 10,008,671.00 9,447,482.09
Reduction of par value 12,619,030.16 12,619,030.16
Dividend -15,326,244.00 -7,512,975.25
Profi t from previous period at 31.12. 14,599,062.14 19,916,635.14
Profi t for the period 37,380,019.75 10,008,671.00
Total equity 80,144,921.23 56,832,937.36
SHARE CAPITAL
No. € No. €
Shares 30,660,189 24,834,753.09 30,256,368 24,507,658.08
Option rights
Option right details issued by the company and the Board of directors are disclosed in the consolidated fi nancial statements.
17. APPROPRIATIONS, € 2007 2006
Accumulated depreciation difference 556,684.27 12,213,205.03
18. LIABILITIES, € 2007 2006
NON-CURRENT LIABILITIES
Loans from credit institutions 173,753,048.15 192,198,808.22
CURRENT LIABILITIES
Borrowings from Group companies
Trade payables 842,659.40
Accrued liabilities and deferred income 5,177,105.40 188,461.94
Other liabilities 185,872,024.26 6,615,471.83
Total 191,049,129.66 7,646,593.17
To others
Loans from credit institutions 29,381,613.00 13,084,499.00
Trade payables 570,717.53
Accrued liabilities and deferred income 5,275,213.17 6,854,396.60
Commercial papers 44,003,876.92
Other current liabilities 85,721.38 1,415,517.63
Total 78,746,424.47 21,925,130.76
Total current liabilities 269,795,554.13 29,571,723.93
Total liabilities 443,548,602.28 221,770,532.15
NON-INTEREST BEARING AND INTEREST BEARING LIABILITIES
Non-current
Interest bearing 173,753,048.15 192,198,808.22
Total 173,753,048.15 192,198,808.22
Current
Non-interest bearing 6,387,163.05 9,871,753.10
Interest bearing 263,408,391.08 19,699,970.83
Total 269,795,554.13 29,571,723.93

72 2007 / ANNUAL REPORT / CRAMO PLC / POWERING YOUR BUSINESS
19. OTHER NOTES, € 2007 2006
COLLATERAL AND CONTINGENT LIABILITIES
Guarantees given on own behalf
Debts, secured by collateral
Loans from credit institutions 203,134,661.15 202,930,370.18
Other contingent liabilities
Leasing liabilities in the following year 52,774.27 1,384,000.00
Subsequent leasing liabilities 55,088.12 2,804,500.00
Securities given
Mortgages on real estates 739,992.00 739,992.00
Mortgages on company assets 11,657,711.73 5,827,711.73
Pledges 80,155,537.79 22,771,091.53
Guarantees given on behalf of the group
Securities given 32,644,084.00 7,834,588.00
20. ACCRUALS, € 2007 2006
For personnel expenses 592,943.42 2,454,811.30
For interest expenses 9,054,126.77 2,043,202.31
For taxes 92,383.11 1,228,657.36
Other accruals 798,586.65 1,127,725.63
Total 10,538,039.95 6,854,396.60
21. SHAREHOLDINGS
Parent company
% of holdings and
Subsidiaries Domicile shares voting rights %
Cramo Holding B.V. Amsterdam Netherlands 100 100
Kiinteistö Oy RK-Kehä Vantaa Finland 100 100
Kiinteistö Oy Vantaan Viinikankaari 9 Vantaa Finland 100 100
Cramo Instant Oy Ylöjärvi Finland 100 100
Suomen Tähtivuokraus Oy Vantaa Finland 100 100
Cramo New Holding AB Sollentuna Sweden 100 100
Cramo Sverige AB Sollentuna Sweden 100 100
Cramo Instant AB Sollentuna Sweden 100 100
Cramo AS Oslo Norway 100 100
Cramo A/S Glostrup Denmark 100 100
AS Cramo Estonia Tallinn Estonia 100 100
SIA Cramo Riga Latvia 100 100
Cramo UAB Vilnius Lithuania 100 100
Cramo Finland Oy Vantaa Finland 100 100
Cramo JV Oy Vantaa Finland 75 75
Shares and shareholders, see consolidated fi nancial statements in Note 36.
22. DERIVATE FINANCIAL INSTRUMENTS, 1,000 €
2007 2006
Book value Fair value Book value Fair value
Interest rate derivatives
Interest rate swap 138,395 5,491 152,803 4,370
23. CURRENCY DERIVATIVES, 1,000 €
2007 2006
Book value Fair value Book value Fair value
Company has hedged loans
from subsidiaries in foreign currencies 82,575 -238 19,911 113

73PARENT COMPANY NOTES TO THE FINANCIAL STATEMENTS
24. DEFERRED TAXES, € 2007 2006
Deffered tax receivable from currency derivates 61,891.70
Deferred tax expense from depreciation difference 144,737.91 3,175,433.00
Deferred tax expense from currency derivatives 29,380.00
Deferred tax expense from fi nancial derivative instruments 1,427,833.42 1,136,200.00
Total 1,510,679.63 4,341,013.00
BOARD PROPOSAL TO THE ANNUAL GENERAL MEETING
Cramo Plc’s net profi t for the fi nancial year totalled € 37,380,019.75. The Group’s profi t attributable to shareholders at the Annual General Meeting’s
disposal totalled € 51,979,081.89. The Board proposes to the Annual General Meeting that a pre-share dividend of € 0.65 be paid to shareholders
entitling to dividends and the rest be held in retained earnings. On 14 February 2008, the number of shares entitling their holders to receive full
dividends totalled 30,660,189, the corresponding dividend amounting to € 19,929,122.85. The Board of Directors has assessed the company´s future
business operations and considers that the proposed dividend distribution does not constitute a risk to the company´s solvency.
Vantaa, 14 February 2008
Stig Gustavson Eino Halonen Gunnar Glifberg
Hannu Krogerus Esko Mäkelä Juhani Nurminen
Vesa Koivula, CEO
AUDITORS´ REPORT
TO THE SHAREHOLDERS OF CRAMO PLCWe have audited the accounting records, the report of the Board
of Directors, the fi nancial statements and the administration of
Cramo Plc for the fi nancial year 2007. The Board of Directors and
the Managing Director have prepared the consolidated fi nancial
statements, prepared in accordance with International Financial
Reporting Standards as adopted by the EU, as well as the report
of the Board of Directors and the parent company’s fi nancial
statements, prepared in accordance with prevailing regulations
in Finland, containing the parent company’s balance sheet,
income statement, cash fl ow statement and notes to the fi nancial
statements. Based on our audit, we express an opinion on the
consolidated fi nancial statements, as well as on the report of the
Board of Directors, the parent company’s fi nancial statements and
the administration.
We conducted our audit in accordance with Finnish Standards
on Auditing. Those standards require that we perform the audit
to obtain reasonable assurance about whether the report of
the Board of Directors and the fi nancial statements are free of
material misstatement. An audit includes examining on a test basis
evidence supporting the amounts and disclosures in the report and
in the fi nancial statements, assessing the accounting principles
used and signifi cant estimates made by the management, as
well as evaluating the overall fi nancial statement presentation.
The purpose of our audit of the administration is to examine
whether the members of the Board of Directors and the Managing
Director of the parent company have complied with the rules of the
Companies Act.
CONSOLIDATED FINANCIAL STATEMENTSIn our opinion the consolidated fi nancial statements, prepared in
accordance with International Financial Reporting Standards as
adopted by the EU, give a true and fair view, as defi ned in those
standards and in the Finnish Accounting Act, of the consolidated
results of operations as well as of the fi nancial position. The
consolidated fi nancial statements can be adopted.
PARENT COMPANY’S FINANCIAL STATEMENTS, REPORT OF THE BOARD OF DIRECTORS AND ADMINISTRATIONIn our opinion the parent company’s fi nancial statements and
the report of the Board of Directors have been prepared in
accordance with the Finnish Accounting Act and other applicable
Finnish rules and regulations. The parent company’s fi nancial
statements and the report of the Board of Directors give a true
and fair view of the parent company’s result of operations and
of the fi nancial position. The report of the Board of Directors is
consistent with the consolidated fi nancial statements.
The parent company’s fi nancial statements can be adopted
and the members of the Board of Directors and the Managing
Directors of the parent company can be discharged from
liability for the period audited by us. The proposal by the Board
of Directors regarding the disposal of distributable funds is in
compliance with the Companies Act.
Vantaa, March 3, 2008
ERNST & YOUNG OY
Authorized Public Accountant Firm
Erkka Talvinko Tomi Englund
Authorized Public Authorized Public
Accountant Accountant

74 2007 / ANNUAL REPORT / CRAMO PLC / POWERING YOUR BUSINESS
GOVERNANCE

75ECONOMIC RESPONSIBILITY
GROWTH IN SALESFor the past few years, the focus on the management agenda has
been profi table international growth. The company aims to fully
exploit the growth opportunities of favourable market situations
and to capitalise on its strong local presence, customer service
capabilities and know how, which provide business agility for
transactions in different markets.
In 2007, Cramo revised its fi nancial targets upwards and is
pursuing annual sales growth of more than 18%, both organically
and through acquisitions. The sales growth in 2007 was 23.4% and
Cramo completed ten acquisitions.
EXPENSES INCREASEDThe success of the year is also refl ected in increased expenses and
investments. Capitalisation on the economies of scale reduced the
prices on procured items in many cases while the total investment
value of products, components and services that Cramo purchased
increased by 56.8% compared to 2006 EUR 175.5 million. The
growth was primarily due to the development of the rental fl eet.
The company invested in the different product areas in line with
the Cramo concept. Heavy machinery and aerials are the most
capital-intensive products purchased. Activities aimed to develop
fl eet management had a positive impact on profi tability.
The number of employees in 2007 averaged 2,270. Investments
in sales and customer service competence development had
a positive impact on sales and the quality of customer service.
The total value of wages, salaries, remuneration and indirect
employee costs was up from EUR 83.8 million in 2006 to EUR
101.6 million, or 20.5% of sales.
GOOD YEAR FOR ALL STAKEHOLDERS
The amount of income taxes Cramo paid increased by 134.2% to
EUR 11.1 million. In its operational areas, Cramo paid the most
income taxes in Sweden and Finland.
The net fi nancial expenses of Cramo increased from the previous
year and were EUR 16.1 million, or 3.4% of net sales. Cramo’s cash
fl ow from operations was strong as a result of good operational
results. Net interest-bearing liabilities increased from the previous
year due to heavy investments in the rental fl eet.
SHAREHOLDER VALUE UPCramo redefi ned its dividend policy in 2007. The goal is to
distribute approximately a third of the Group’s annual profi t in
terms of share buybacks and/or dividends. Due to good results,
the Board of Directors proposes to the AGM that a dividend of
EUR 0.65 per share be distributed for 2007. This would add up
to a total of EUR 19.9 million, or 4.0% of net sales. At the end of
the year, Cramo’s market capitalization was EUR 531 million.
For further information on shares and shareholders please refer
to pages 62−63.
SOCIAL RESPONSIBILITYCramo strives to support the positive development of the local
communities in which it operates. An example is the decision
to increase its fi ve-year support of SOS Children’s Villages by
signing a main sponsorship contract focusing on the fi nalisation
of the new SOS village in Ukraine. As a highly respected and
independent non-governmental social development organisation,
SOS Children’s Villages stands for values that Cramo shares and
has operations in all Cramo markets.
Cramo’s sound profi tability and growth is refl ected in monetary fl ows.
The fi nancial targets were revised upwards and the good performance
also increased the staff’s profi t-based bonuses.
ECONOMIC RESPONSIBILITY
GENERATION AND USAGE OF VALUE ADDED AMONG VARIOUS STAKEHOLDERS
2007 2006 Change %
Generation of value addedCustomers Sales 496,428 402,425 23.4
Suppliers Gross capital expenditure 175,494 111,864 56.9
Distribution of value addedEmployees Salaries, wages 77,138 62,846 22.7
Public sector Taxes and social security charges 19,834 13,050 52.0
Creditors Finance expenses 16,636 13,848 20.1
Shareholders Dividends 15,326 7,513 104.0

76 2007 / ANNUAL REPORT / CRAMO PLC / POWERING YOUR BUSINESS
PROFESSIONAL GROWTH KEY TO SUCCESS
Professional personnel development represents a key factor for the success of Cramo.
As long as it goes in line with the business strategy, human resource management is
the responsibility of subsidiaries and business units.
HUMAN RESOURCES
In 2007, Cramo started to harmonise its HR policy, including
measures to draw up shared guidelines for incentive schemes
by subsidiary and unit. Further harmonisation is underway.
PERSONAL GROWTH ONE OF THE VALUESPersonal growth forms one of the values which guides Cramo’s
business operations. Professional growth and development
are supported by training and development programs and
by developing a culture of trust and personal accountability.
Training and competence development aim to meet the mounting
by providing a competitive remuneration in each country.
Almost all of Cramo’s staff are covered by a country or subsidiary-
specifi c annual profi t-based incentive scheme. Under the scheme
employees are rewarded with a bonus based on various key
performance indicators.
JOB SATISFACTION UNDER SURVEY Cramo’s subsidiaries and business units are responsible for
monitoring job satisfaction. HR development plans are done based
on survey results and realisation is monitored at a subsidiary and
country level.
A SAFE WORKPLACE FOR ALLCramo aims to be a safe and stimulating working environment,
enhancing its competitiveness not only as an employer but also
as a provider of rental services. Safety aspects are taken into
consideration throughout operations and safety training forms an
integral part of new employees’ familiarisation and management
training.
KEY FIGURES
2007 2006 Change %
Average number of employees 2,070 1,828 13.2
Number at 31 Dec 2,270 1,984 14.4
needs and requirements that customers and the technological
advancement of equipment set for the company. All subsidiaries
provide various internal training programs related to their
own needs. Cramo’s leadership principles stress respect for
individuals, the principles of teamwork and managers’ and
supervisors’ role as a coach. The company also encourages its
managers and supervisors to coach each other and share the
operating models, which have proved best in practice.
FOCUS ON SALES AND CUSTOMER SERVICE SKILLSIn order to sustain its employees’ high professional skills, Cramo
co-operates with training institutes, suppliers and manufacturers
of equipment in the provision of tailored courses, and promotes
and supports its staff’s self-managed learning and competence
development.
Cramo focuses on the development of sales and customer service
skills as well as management and leadership skills. For example,
the extensive three-year sales and management training program,
Cramo School, is aimed at improving sales and leadership skills.
Cramo also focuses on developing motivation and work safety.
In addition to these, Cramo invests in skills required in the use of
its equipment and is in the process of strengthening competences
needed for international expansion.
SHARED GUIDELINES FOR REMUNERATIONCramo harmonised remuneration guidelines for management
in 2007. The guidelines support the company’s strategic targets

77HUMAN RESOURCES
EMPLOYEES BY COUNTRY (2006)
Finland 783 (607)
Sweden 652 (610)
Estonia 182 (151)
Denmark 160 (74)
Norway 146 (102)
Poland 129 (103)
Lithuania 125 (56)
Russia 46 (18)
Latvia 44 (30)
The Czech Repulic 3 (0)
Y (2006)
607)
)
)
30)
lic 3 (0)
783
125
652
182
160
146
129
46 44 3
HR FOCUS AREAS BY BUSINESS SEGMENTS
Actio
ns a
nd a
chie
vem
ents
200
7Fo
cus
area
s 20
08
In an effort to maintain the employee’s working capacity and to
reduce sick leave absences, the Group subsidises its employees’
sports activities.
PERSONNEL STRUCTUREIn 2007 Cramo employed an average of 2,070 (1,828) people in
ten countries. At the end of the year the number of personnel
was 2,270 (1,984). 89% (89%) of the personnel worked for the
equipment rental business and 11% (11%) for the modular space
business.
Actio
ns a
nd a
chie
vem
ents
200
7Fo
cus
area
s 20
08
EQUIPMENT RENTAL MODULAR SPACE
Finland Sweden Western Europe Other Europe All markets
• HR activities strengthened• Extensive sales and
customer service training• Management training
aimed at improving leadership skills started
• A specifi c Motivo project survey carried out
• Occupational safety specialists recruited for each region
• Membership of the Zero Accidents Forum
• Training for the new CRM system
• First internet-based training courses
• Learning Management System (LMS) implemented to further systemise training
• Strong promotion of employees’ preventive health care
• Cramo School continued• Training for the new CRM
system• LMS implemented to
further systemise training• Strong promotion of
employees’ preventive health care
• Systematic development of sales and customer service competencies started
• Management training aimed at improving leadership skills started
• A management position responsible for health, safety, security and environment protection development implemented in most countries
• Cramo School started in Lithuania
• A three-year Personal Business Fitness program continued with a focus on motivation and work safety
• Competence development, job well-being and familiarisation
• A yearly development discussion practise will be launched
• Job satisfaction survey• Competence development
through Cramo School combined with a rewarding bonus system
• Job satisfaction survey• Competence development
through Cramo School combined with a rewarding bonus system
• Competence development• Management and
leadership training will continue
• Increasing job satisfaction and information fl ow, development of remuneration and training
• Development discussion culture
EMPLOYEES BY GEOGRAPHICAL SEGMENT
31 DEC (2006)
Finland 783 (607)
Sweden 652 (610)
Other Europe 529 (358)
Western Europe 306 (253)
GMENT
06)
7)
783
306
652
529
Of the Group total, 783 employees worked in Finland, 654 in
Sweden, 306 in Western Europe and 527 in Other Europe. The
number of employees increased during the year by 286 people.
Acquisitions increased personnel by 15 in Finland, by 12 in
Sweden, by 5 in Norway, by 35 in Denmark and by 31 in Lithuania.
The company divested its Dutch subsidiary with 90 employees.
The overall geographical structure of Cramo was expanded further
East as a result of establishing the joint venture in Moscow.

78 2007 / ANNUAL REPORT / CRAMO PLC / POWERING YOUR BUSINESS
SUSTAINABLEDEVELOPMENT

79ENVIRONMENTAL RESPONSIBILITY
INCREASING FOCUS ON ENVIRONMENTAL MATTERS
For Cramo, environmental work is furthest advanced in Nordic
countries, where the work with environmental and quality
performance has become an ever more important argument
for customers choosing rental solutions.
Equipment rental operations in Finland are certifi ed according
to ISO 9001:2000 while the plants of the modular space business
have their own quality system waiting to be certifi ed. All operations
in Sweden, Norway and Denmark are certifi ed according to ISO
19001 (quality) and ISO 14001 (environment).
HIGH STANDARDSEffectively implemented work with environmental performance,
quality and work environment constitutes an important basis for
the development of Cramo’s operations. It promotes long-term
development and serves as an increasingly powerful competitive
tool vis-à-vis customers.
The goal of Cramo’s environmental and quality management
systems is to ensure that the company meets high environmental
and quality assurance standards. Local depots are responsible for
operative environmental management and activities.
FOCUS ON PREVENTIVE WORKIn all Scandinavian depots there are emergency preparations and
preventive work to reduce the risk of chemical spills and fi re. Risk
analysis and emergency drills are carried out on a regular basis.
An emergency plan is available in every depot. Use of products
that are harmful to people’s health or the environment are avoided
whenever possible, and chemical products are treated in a safe
manner.
Employees are given training in environmental and quality control
matters. Cramo’s basic environment and quality assurance
training was updated during the year.
HIGH QUALITY EQUIPMENTThe company evaluates its suppliers on a continuous basis,
and works to improve collaboration with suppliers in order to
ensure high quality standards and a minimum environmental load.
The Group provides customers not only with professional advice
but also explicit instructions for equipment maintenance and
safety. In Sweden, construction machinery and access equipment
have environmental labels which describe their environmental
performance with information about aspects like emissions, oils
and noise.
Quality management system certifi cation requires continuous
improvements in processes and quality management systems.
Such improvements contribute to better service, fewer errors,
higher productivity and greater occupational safety.
ENERGY-EFFICIENCY AND LOW EMISSIONS Cramo can provide modular space which is energy effi cient and
includes building materials that have environmental labels. The
company continuously carries out work to reduce transportation
emissions and sets environmental standards for the carriers it
hires.
Cramo uses environmentally-sound oils and fuels in its machinery
in Sweden. By the end of 2008 Cramo aims to sell and use only
environmentally friendly gasoline in Norway. Customers can also
purchase environmentally friendly gasoline at Cramo’s Swedish
depots.
MINIMISING WASTE, INCREASING RECYCLING, DECREASING CHEMICAL PRODUCTSCramo works continually to minimise the amount of waste
produced while ensuring that there are safety systems in place
for handling the waste from operations. Equipment is delivered to
customers without unnecessary packaging. Machinery is washed
in places, which have an oil separator. The separators are emptied
on a regular basis and the contents are treated as hazardous
waste.
All recyclable materials, such as waste wood and scrap metal
are recycled as much as possible. Specialist fi rms take charge of
the recycling of hazardous waste while Cramo’s regional centres
answer for the appropriate storage and reprocessing of chemicals
and hazardous waste according to local legislation and Group’s
guidelines.
ACTIVE MONITORINGRegular external and internal audits facilitate improvements in
operations and service. The observance of laws and government
regulations is monitored on a regular basis. Customer surveys
provide information about what is important to customers and how
well Cramo meets such demands.
Cramo shall contribute to ecologically sustainable development in society by taking environmental
considerations in the Group’s operations. Because of different local legislations, the approach to environmental
matters varies somewhat between countries. Local law and regulation is, however, the minimum standard in
Cramo’s operations in all countries, while the aim is always to reach higher.
ENVIRONMENTAL RESPONSIBILITY

80 2007 / ANNUAL REPORT / CRAMO PLC / POWERING YOUR BUSINESS
REVISED GROUP OPERATING PRINCIPLES IMPLEMENTED
Cramo Group’s headquarters are in Vantaa, Finland. It is listed on the OMX
Nordic Exchange Helsinki. Corporate governance at Cramo is based on
the laws of Finland and the company’s Articles of Association.
CORPORATE GOVERNANCE
Cramo Group complies with Corporate Governance Recommenda-
tion for Listed Companies in Finland. Cramo prepares annual
fi nancial statements and interim reports conforming to Finnish
legislation. They are published in Finnish and English. The Interna-
tional Financial Reporting Standard (IFRS) was adopted in 2005.
Furthermore, Cramo complies with the Rules of OMX Nordic
Exchange Helsinki. The Board of directors approved revised Group
operating principles in September 2007.
GOVERNING BODIESThe Company’s control and management responsibilities are
divided between the General Meeting of Shareholders, the Board
of directors with its two committees, and the President and CEO,
assisted by the Executive Committee and Group management
team, managing directors of operating companies and the general
management meeting. The Board of directors supervises the
performance of the company, its management and organisation on
behalf of the shareholders. The Board of directors and the Group
management team are separate bodies, and nobody serves as
a member of both.
Day-to-day operational responsibility at the Group level rests with
the President and CEO, assisted by the Executive Committee and
the Group management team.
GENERAL MEETING OF SHAREHOLDERSThe right of shareholders to make decisions over company
matters is exercised at an appropriate convened General Meeting
of Shareholders by those shareholders present, or by their
authorised representatives. In accordance with the Articles
of Association, a notice to convene the General Meeting of
Shareholders is issued by the Board of directors. The notice is
delivered no later than 17 days prior to the meeting by publishing
the notice in a newspaper determined by the Board of directors
and as a stock exchange release available on the company’s
website. The Annual General Meeting is held once a year, at
the latest by the end of June. The duties of the Annual General
Meeting are, among other things, to approve the parent company
and consolidated income statement and balance sheet, agree
on the amount of dividends, appoint the members of the Board
of directors and decide on their compensation, and elect the
Auditors. The Board of directors may call an Extraordinary General
Meeting of Shareholders whenever necessary.
The shareholders who are registered as shareholders in
the company’s shareholder register, which is maintained by
Finnish Central Securities Depository Ltd, by the record date
for the General Meeting, are entitled to attend the meeting.
To take part in the General Meeting of Shareholders the
shareholder shall register with the company at the latest by the
date mentioned in the notice convening the meeting, and which
may be no more than 10 days before the meeting. If a shareholder
wishes to bring up a matter for consideration by the General
Meeting of Shareholders, they shall present the matter in writing
to the Board of directors early enough for the matter to be
included in the notice convening the meeting.
A dividend as decided by the General Meeting is paid to sharehold-
ers who, on the date of record for dividend payment, are registered
as shareholders in the company’s shareholder register.
The Annual General Meeting in 2007 held on 18 April, approved
the parent company’s and consolidated fi nancial statement for
the fi nancial period 1 January–31 December 2006 and granted
discharge from liability to the members of the Board of directors
and the President and CEO. The dividend for 2006 was decided to
be EUR 0.50 per share.
BOARD OF DIRECTORSThe Board of directors is responsible for Cramo Group’s
governance and appropriate management and for ensuring that
the business complies with the relevant rules and regulations,
Cramo’s articles of Association, and the instructions given by
the General Meeting of the Shareholders. The Board of directors
is responsible for the company’s strategic development and
supervising and steering the business. It also decides on the
Group’s key policies and practices, approves the business strategy
and the budget, approves the fi nancial statements and interim
reports, appoints and dismisses the President and CEO and his/
her deputy and decides their compensation, decides the Group’s
structure, acquisitions and disposals as well as company fi nances
and investment.
The Board of directors comprises 5−7 members, who are elected
at the Annual General Meeting for a one-year term of offi ce, which
expires at the end of the fi rst Annual General Meeting following
their election. More than half of the members must be present

81CORPORATE GOVERNANCE
to constitute a quorum. The President and CEO, his/her deputy
and the CFO have a right to attend Board meetings. Other Group
management members may attend the Board meetings when
required to provide information to the Board or upon invitation by
the Board.
The Chairman of the Board, together with the President and CEO,
prepares the items for discussion and to be decided upon at the
Board of directors’ meetings.
The Board of directors has defi ned its roles and responsibilities in
the Group’s operating principles / corporate governance manual.
For Cramo’s Board of directors, Board remuneration in 2007, please
refer to page 59.
Board until 18 April 2007 consisted of the following persons:
Mr. Pekka Heusala (Chairman), Mr. Stig Gustavson (Vice-Chairman),
Mr. Gunnar Glifberg, Mr. Phil van Haarlem, Mr. Eino Halonen,
Mr. Hannu Krogerus and Mr. Juhani Nurminen.
At the 2007 Annual General Meeting, the following persons were
elected to the Board of directors: Mr. Stig Gustavson, Mr. Eino
Halonen, Mr. Gunnar Glifberg, Mr. Hannu Krogerus, Mr. Esko Mäkelä
and Mr. Juhani Nurminen. The Board’s convening meeting elected
Stig Gustavson as the Chairman of the Board and Eino Halonen as
the Vice-Chairman of the Board.
In 2007, the Board of directors met nine times at an average
attendance rate of 98%. In addition to steering and supervising the
company’s operational and fi nancial development, the main items
during the year were decisions related to the Group’s investments,
acquisitions and divestment, a review of the Group strategy, and
subsequent supervision of several strategic projects.
BOARD COMMITTEESTwo permanent committees, the Audit Committee and the
Nomination and Compensation Committee, assist the Board
of directors, which elects committee members from among its
members. In 2007, the Audit Committee had three members and
the Nomination and Compensation Committee had three members.
A quorum is more than half of the members. Members are
appointed for a one-year term of offi ce, which expires at the end
of the fi rst Annual General Meeting following the election.
The Board has approved written charters for the committees.
The main contents of these rules are outlined below.
The Audit Committee assists the Board of directors in its supervisory
responsibilities. The committee supervises and controls corporate
fi nancial reporting, external and internal audit and risk management.
It also proposes the auditors to be elected and assesses the effects of
any exceptional or signifi cant business transactions.
Meeting four times in 2007, the Audit Committee was chaired
by Eino Halonen. Its members until 18 April 2007 were Phil van
Haarlem and Pekka Heusala and from 18 April 2007 Esko Mäkelä
and Juhani Nurminen. The main items during the year included
reviewing and hearing a report from the Group’s auditors both
after the Q3 interim closing and the closing of the year’s fi nancial
statements, planning the external audit for 2007, reviewing the
Group’s impairment tests, reviewing the Group’s internal audit
function, and reviewing the Group’s risk management policy and
treasury policy.
The Nomination and Compensation Committee is tasked
with preparing a proposal for the Board members and their
remuneration presented to the Annual General Meeting. It also
prepares a proposal to the Board of directors for the President and
CEO’s appointment and his/her employment terms, and prepares
matters pertaining to the company’s compensation systems.
Meeting three times in 2007, the Nomination and Compensation
Committee was chaired by Stig Gustavson. Its members until
18 April 2007 were Pekka Heusala and Hannu Krogerus and
from 18 April 2007 Gunnar Glifberg and Hannu Krogerus. The
main items during the year included reviewing the Group’s bonus
principles and bonus targets for the current year, reviewing the
bonus calculations of the previous year, reviewing the employment
contracts and benefi ts of Group management, and preparing
a recommendation for the division of Cramo options 2006B.
ASSESSMENT OF THE BOARD OF DIRECTORSThe Board of directors conducts an annual self-assessment in
order to develop the work of the Board.
REMUNERATION FOR BOARD SERVICESThe Annual General Meeting 2007 confi rmed the following
remuneration for Board service:
REMUNERATION FOR BOARD SERVICE, EUR/YEAR
2007
Chairman 45,000
Vice-Chairman 31,000
Members 27,500
Fee / committee meeting 1,000
40% of the annual fees are paid in the form of Cramo shares.
The fee for attendance at committee meetings is paid in cash.
The Board’s members are not covered by the company’s stock
option scheme or bonus scheme.
PRESIDENT AND CEOThe Managing Director, who also acts as the President and
CEO is in charge of the Company’s day-to-day management
in accordance with the Finnish Companies Act, and related
legislation, instructions and orders given by the Board of directors.
The President and CEO is supported by the Executive Committee
and the Group management team.
The performance of the President and CEO is evaluated annually
by the Board of directors. The period of notice on the President
and CEO’s executive contract is 18 months, during which he/she
receives a full salary.
EXECUTIVE COMMITTEEComprising the President and CEO, the deputy CEO and the CFO, the
Group’s Executive Committee is responsible for the implementation
of the Group’s strategic lines issued by the Board of directors. It
also formulates the Group vision, strategy and action plans, while
overseeing fi nancial issues, top management resources and policy
issues concerning the Group as a whole.
The legal nature of the Executive Committee is consultative. It
meets regularly to discuss and prepare the most important issues
of the Company and tasks delegated by the Board of directors.
GROUP MANAGEMENT TEAMThe Group management team consists of Executive Committee
members and four Senior Vice Presidents being responsible for
the Group’s business areas. The Group management team meets
regularly on a monthly basis. Every second month, the meeting is
also attended by three heads from corporate support units.
The Group management team carries out strategic decisions
made by the Board and monitors business units’ performance and
operations. For Cramo’s Group management team members and
their individual responsibilities and remuneration, please refer to
pages 88−89.

82 2007 / ANNUAL REPORT / CRAMO PLC / POWERING YOUR BUSINESS
GENERAL MANAGERS OF SUBSIDIARIESThe General Managers located in the domicile of the operating
country act as the Managing Director of the operating subsidiary
company. When they are responsible for the business operations of
an entire country, they also act as a Country Manager.
The General Managers are in charge of the day-to-day
management in accordance with the strategy defi ned by the
Cramo Plc and operating countries’ Board of directors. At regular
intervals, they report on the company’s and its subsidiaries’
fi nancial position and implemented business operations to their
superior, and to the operating company Board of directors.
All the subsidiary companies have own Boards of directors
consisting of, at least, the CEO, the deputy CEO, the CFO and
the General Manager.
GENERAL MANAGEMENT MEETINGThe General Management Meeting is a management meeting
held 1−2 times a year, attended by the Group management team,
general managers and other key group and operating personnel.
The GMM lasts 1−2 days.
REMUNERATION POLICYCramo offers a competitive compensation package for the
management and its key personnel.
PROFIT-BASED INCENTIVE SCHEMESCramo’s short-term incentive system is aimed at supporting
the company’s strategic targets by strengthening a strong
performance culture. Management and key personnel are covered
by a country- or subsidiary-specifi c annual profi t-based incentive
schemes.
Management remuneration is based on an individual compensation
package, which includes all taxable fringe benefi ts. Management
bonuses are tied to the achievement of the Group’s and operating
countries’ fi nancial targets approved by the Nomination and
Compensation Committee. The size of annual bonus is dependent
on the Group’s fi nancial performance. Maximum management
bonuses range between 10% and 50% of the person’s annual base
salary.
LONG TERM-INCENTIVESCramo’s stock option schemes for the top management and key
employees and management launched in 2002 (2002A, 2002B) and
in 2006 (2006A, 2006B and 2006C) all support the achievement of
the Group’s long-term goals by attracting and retaining identifi ed
key personnel. At the present, approximately 80 managers and
key personnel, all of whom have been elected by the Nomination
and Compensation Committee and the Board of directors are
participants. For more information about the stock option
programmes, please refer to the pages 56-57.
PENSIONCramo’s Finnish executives participate in the Finnish TEL pension
system, which provides for a retirement benefi t based on years of
service and earnings according to the prescribed statutory system.
Finnish pension legislation offers a fl exible retirement from age 63
to age 68 without any full pension limits.
For the President and CEO the retirement age is 63.
In addition to the statutory system, Cramo offers a voluntary
pension insurance for the President and CEO.
INSIDER GUIDELINESCramo observes the Guidelines Insiders issued by the Helsinki
Stock Exchange. Cramo’s own internal insider rules are regularly
updated and made available to all permanent insiders, as well as
employees. Finnish Central Securities Depository Ltd maintains an
insider register for Cramo’s permanent insiders.
Cramo requires that its employees and partners comply with the
Insider Guidelines. The co-ordination and control of insider affairs
are included in the responsibilities of the CFO.
INTERNAL CONTROL AND INTERNAL AUDITCramo Group’s internal control is based on an independent
Internal Audit function, internal policies and guidelines, fi nancial
reporting, supervision and documentation, as well as transparent
processes and procedures. The Group pays particular attention to
systematic operations at its offi ces, rental equipment management
and clear reporting.
The Group’s Internal Audit unit pays regular visits to depots and
offi ces in different countries. It reports administratively to the CFO
as well as to the Audit Committee and the Board of directors as
necessary and/or requested by these bodies. The Audit Committee
approves its charter and the annual audit plan as well as assesses
its operations.
AUDITORSThe company has a minimum of one and a maximum of two
Authorised Public Accountants (APA) or fi rms of Authorised Public
Accountants, chartered by the Central Chamber of Commerce of
Finland. Their term of offi ce expires at the end of the next Annual
General Meeting following their election. If the AGM elects only
one auditor, which is not a fi rm of Authorised Public Accountants
chartered by the Central Chamber of Commerce, it must elect one
deputy auditor.
TOTAL COMPENSATION FOR EXTERNAL AUDITING, EUR 1,000
2007 2006 Change %
Audit fees 443 462 -4.1
Tax assignment 123 105 17.1
Other fees 100 77 29.9
Total fees 666 644 3.4

83RISK MANAGEMENT
ENTERPRISE RISK MANAGEMENT CONCEPT IMPLEMENTED
With continuous and systematic activities aimed at preventing personal
injuries and safeguarding the assets of the Cramo Group and its Group
companies, Cramo aims to secure its long-term competitiveness.
RISK MANAGEMENT
Cramo renewed its risk management policy in 2007. The focus
areas in business risk management included implementing
the forward-looking indicator and early warning signals system
into the standard reporting package of operating companies and
monthly reporting, on-going hedging against a potential downturn,
and contingency planning. Furthermore, the Group’s entire risk
management policy was formulated under the Cramo Enterprise
Management (ERM) framework.
RISK MANAGEMENT PRINCIPLESThe new Enterprise Risk Management concept forms an import ant
part of Cramo Group’s monitoring and control system. It is aimed
at ensuring that the Group identifi es its business-related risks and
assesses and monitors them on an ongoing basis.
Enterprise Risk Management is a continuous process which
is integrated into Cramo Group’s strategy process, operative
planning, daily decision-making and the monitoring of operations.
It is also part of the Group’s internal control environment.
The Board of directors, Group management and Group Finance
& Control are responsible for managing strategic, operational,
fi nancial, event and environmental risks as well as the related
insurance cover. The General Manager of each operating country
shall also draft a country-specifi c risk profi le for his/her operating
country annually when preparing the budget. The risk profi le and
the related risk management policy shall have to be adapted by
the respective operating company.
RISK MANAGEMENT RESPONSIBILITIESThe Board of directors monitors and is responsible for ensuring
that the Cramo Group’s risk management process functions and is
comprehensive. It defi nes the risk bearing tolerance continuously,
according to the current conditions.
The Group’s operative management is responsible for achieving
the set goals and controlling and managing risks that threaten
them. The operative management is committed to fully supporting
the implementation of the risk management work, and to ensuring
the performance of the risk management process and the
availability of suffi cient resources.
Risk management assessments are coordinated by the Group
Finance & Control function, which supports the management,
business units and other support functions in implementing the
risk management policy. It is responsible for instructions and
advice to the units, and monitoring the practical implementations
of the process.
The internal audit unit of Group Finance and Control collaborates
closely with corporate risk management and concentrates on
assessing risks.
Business units and corporate functions identify and assess, within
their area of responsibility, signifi cant risks in their planning
processes and prepare themselves accordingly and take necessary
corrective measures, as well as report in the agreed manner.
RISKS IDENTIFIED AND CATEGORISED Cramo has identifi ed risks related to the strategic themes at Group
and operating country levels during the reporting year. Identifi ed
risks have been categorised into strategic, operational, fi nancial,
event, environmental and other risks. Risk areas have been
prioritised with regard to the extent of impact and likelihood, and
an action plan has been completed.
MAIN IDENTIFIED RISKS STRATEGIC RISKS
• Strategic internal risks relating to acquisitions, investments
and strategic level business decisions
• Strategic external risks arising from changes in
macroeconomic or political situations, strategic level regulatory
environment or competitive situation
OPERATIONAL RISKS
• Organisation and HR risks related to HR processes such as
recruiting and retaining people
• Process risks associated with the Group’s key operative
processes such as fl eet management as well as support
processes such as internal communications
• Health and safety risks arising from health and safety
procedures
• Contractual risks associated with various contracts such as
acquisition, customer, supplier and employee contracts
• IT and business continuity risks connected, e g, with key
software projects, IT infrastructure and IT security
• Laws and regulatory risks related to compliance issues
with various regulations such as stock market regulations,
and laws such as competition and company laws
• Corporate governance risks associated with governance
structure, key internal policies and procedures as well as
authorities and responsibilities

84 2007 / ANNUAL REPORT / CRAMO PLC / POWERING YOUR BUSINESS
FINANCIAL RISKS
• Financial market risks such as interest rate risks, foreign
exchange risks and liquidity risks related to short term
investments
• Liquidity risks related to own business operations such as
effectiveness of planning, and management of cash reserves
or facilities
• Credit risks associated with customers or fi nancial market
counterparties
• Finance operations related risks such as fi nance processes and
controls, as well as internal and external fi nancial reporting
EVENT RISKS
• Fleet-related event risks
• Business interruptions
• Natural catastrophes
PROACTIVE MONITORINGCramo actively follows a defi ned set of forward-looking indicators
and early-warning signals to give early indication of any changes
in the market environment or the operations of the company.
The early warning signals can be divided into external indicators,
such as GDP and construction growth rates in operating countries,
and internal indicators, such as time utilisation of the rental fl eet
and order book of modular space. In addition to the formalized
indicators, Cramo follows a number of weak signals originating in
the day-to-day rental business.
MANAGEMENT OF STRATEGIC RISKS Cramo Group’s expansion and business development are partly
based on corporate acquisitions. Risks associated with acquisitions
may involve, for example, knowledge of local markets, customers,
key personnel and suppliers. The aim is to take the related risks
into account through careful pre- arrangements and the systematic
monitoring of corporate acquisitions.
The other main strategic risk area relates to the Group’s
equipment investments. Consequently, Cramo Group uses a lot
of time to plan and analyse its rental and non-rental investments,
and the utilisation ratios of its machine fl eet on an on-going basis.
The Group’s Fleet Management and Finance & Control functions
have the most important role in investment planning and analysis.
Cramo Group’s strategic risks are managed by the Board of
directors. The Board of directors decides on all of the Group’s
acquisitions, and quarterly monitors and releases for management
to use the next quarter’s planned fl eet investments. In addition,
strategic risks are monitored and assessed yearly as part of the
strategy process.
MANAGEMENT OF OPERATIONAL RISKSCramo Group’s business largely depends on construction and
property markets characterised by seasonal fl uctuations. Modular
space business acts as an important operational hedge against
fl uctuations as its contract times are longer than in equipment
rental. If correctly managed, the return curve in modular space
will have less volatility over a cycle and will peak later compared to
equipment rental.
The Group is not dependent on individual customers or projects,
since its extensive customer base is spread across several areas.
Cramo continuously seeks to further expand, broaden and balance
its customer base. Geographic expansion is sought from current
and new Central and Eastern European markets.
The constant managing and optimising of the Group’s equipment
fl eet’s utilisation rates is a highly important success factor for
the Group. The company focuses on high capital effi ciency and
utilisations as well as on a fl exible fi nancing mix. The international
network of depots and centralised fl eet management combined
with a standardised fl eet enable asset transfer and relocation
between markets depending on the shifts in demand.
The estimated optimal point of scrapping and selling equipment
combined with actively managed and used sales channels for used
equipment ensure continuous fl eet clean-up based on utilisation
rates. At the same time, Cramo creates and monitors the
fulfi lment of the optimal fi nancing mix at the Group level.
Group management and the business units are responsible for
managing the risks of their own operations. Group management
supports the business units by co-operating and transferring best
practises between business units.
In addition, Cramo has a contingency plan in place, which
determines the actions to be taken in a market downturn.
MANAGEMENT OF FINANCIAL RISKSIn addition to cash fl ow fi nancing, the Group raises bank loans and
concludes equipment lease agreements in fi nancing its operations.
Its main fi nancial risks relate to interest-rate risks associated
with cash fl ows, currency risks, credit risks and liquidity risks. To
manage its interest-rate risks, Group borrowings and investments
are spread across fi xed and fl oating interest rate instruments.
In an effort to manage its interest-rate risks, the Group can make
use of derivative contracts, such as interest-rate swaps. Currency
risks mainly involve net investments in foreign units and foreign-
currency denominated loans, with currency forward contracts
used as hedging instruments. Since Group companies mainly carry
out their sales and purchases in the unit’s functional currency,
the Group is not exposed to any major foreign-exchange risks
associated with these transactions.
In co-operation with Group companies, fi nancial risks are analysed
and managed by the Group Treasury and the Group’s Finance &
Control function.
Cramo Group adopted a new Treasury policy at the end of 2007,
which determines in more detail the risk levels for different types
of fi nancial risks. Starting in 2008, Cramo will implement the new
Treasury policy and there related effi ciency measures within
the Group’s Treasury function.
MANAGEMENT OF EVENT RISKS AND INSURANCE COVERThe event risks are managed by the operating companies and
co-ordinated by Group Finance & Control and Group management.
The event risks are mitigated by the use of insurance whenever it
is economically feasible.
Extensive insurance cover forms an integral part of Cramo Group’s
risk management. The Group’s management, both Group level and
in operating companies, must continuously assess the adequacy
and scope of its insurance cover, in view of the extent and nature of
Group operations.
Insurance coverage solutions should always contain the
catastrophic coverage to secure maintaining of operations
essential for the continuous carrying of business and high enough
deductibles that would motivate suffi cient loss prevention.
To maintain appropriate local services, domestic insurance
companies (or a broker) in each country or a foreign insurance
company with a local representative are normally utilised as
primary insurers. In addition, Cramo Group seeks to utilise group-
wide insurances, when such insurances bring economies of scale
in terms of pricing and coverage.

85RISK MANAGEMENT
MANAGEMENT OF ENVIRONMENTAL RISKSCramo Group’s environmentally sound corporate mission refers
to the high utilisation rates of professionally serviced equipment
and the minimisation of the environmental burden caused by
the use of equipment and energy, the aspects to which the Group
pays special attention in purchasing its rental machinery and
equipment.
ENTERPRISE RISK MANAGEMENT (ERM) IS LINKED TO STRATEGY AND MANAGEMENT PROCESSES
ENTERPRISE RISK MANAGEMENT
STRATEGIC PLANNING
• Strategic planning provides the basis for ERM
• Strategic themes
and Strategic
projects
• OPCO business
plans
• Other input into
ERM
• Identifi cation of risk areas related to the strategic themes at Group and OpCo levels
• Categorisation of risks
• Strategic
• Operational
• Financial
• Event
• Environment
• Other
• Prioritisation of risk areas with regard to
• Extent of impact
• Likelihood
• Action plan
• Selection of the most important processes impacting the achievement of objectives and implementation of the strategy
• Identifi cation of key controls • Review of other processes (e.g. support
functions) and key controls
• Selection of early warning signals to refl ect the priority risk areas and to measure extent of risks
• EWS should include both external (market) and internal (company) indicators
• EWS to be used together with normal management reporting information
• Monitoring process of EWS
• Implications of EWS to be taken into day-to-day business decisions/activities
• Creation of operational hedges for rental business
• Identifi cation and determination of situation severity with the help of EWS
• Contingency planning for the actions to be taken in a given situation
• Implementation of contingency plan as needed
Id tifi ti f i k
RISK IDENTIFICATION AND PRIORITIZATION
S l ti f th t i t t
PROCESSES & CONTROLS INVESTMENT MANAGEMENT
• Acquisition CAPEX• Investment CAPEX• Cost of capital and approvals
SELECTION OF EARLY WARNING SIGNALS (EWS)
CONTINGENCY PLANNING
NORMAL CONDITIONS DOWNTURN CRISIS
Cramo quality management system is based on the ISO 9001:2000
quality management certifi cate granted by Det Norske Veritas,
covering all of the Company’s operations and depots in Finland.
Cramo’s operations in Sweden, Denmark and Norway are based
on the ISO 14001 environmental and ISO 9001 quality management
certifi cates.

86 2007 / ANNUAL REPORT / CRAMO PLC / POWERING YOUR BUSINESS
BOARD OF DIRECTORS31 DECEMBER 2007
1. STIG GUSTAVSON
Born 1945, Dr.Tech. (hon.) and M.Sc. (Eng.)
Chairman since 2007, Board member since 2006
Chairman of the Nomination and Compensation Committee
Primary work experience:
KCI Konecranes Plc’s President and CEO during 1994−2005
President of KONE Cranes division 1988–1994
Simultaneous positions of trust:
Board Chairman: KCI Konecranes Plc, Dynea Oy, Eltel Group Oy,
Mercantile Oy Ab, Arcada Foundation, Handelsbanken Regional Bank
Finland, Tammet Oy
Board member: Fastems Oy Ab, Vaisala Corporation, Technology
Industries of Finland. Supervisory Board member of Mutual Pension
Insurance Company Varma
Deemed independent of the Company and the major shareholders
2. EINO HALONEN
Born 1949, B.Sc. (Econ.)
Vice-Chairman since 2007, Board member since 2003
Chairman of the Audit Committee
Primary work experience:
Suomi Mutual Life Assurance Company’s President and CEO
2000–2007
Simultaneous positions of trust:
Board member: Finsilva Oyj, Metsäliitto Cooperative, OKO Bank
Plc, Sato Oyj, YIT Corporation
Deemed independent of the Company and, in his role as Suomi
Mutual Life Assurance Company’s President and CEO (until 31
December 2007), dependent of the major shareholders
3. GUNNAR GLIFBERG
Born 1943, B.Sc. (Eng.)
Board member since 2006
Member of the Nomination and Compensation Committee
Primary work experience:
Cramo AB’s President and CEO during 1994−2005
As Cramo AB’s previous President and CEO, deemed dependent
of the Company until autumn of 2008, independent of the major
shareholders
4. HANNU KROGERUS
Born 1949, LL.M., Attorney-at-Law
Board member since 2006
Member of the Nomination and Compensation Committee
Main occupation:
Senior Partner of Krogerus Attorneys Ltd, founding Member of
Krogerus Attorneys Ltd
Simultaneous positions of trust:
Board Chairman: Krogerus Attorneys Ltd, Adelec Industries Ltd. Oy,
North-West Russia Development Company Ltd.
Board member: Genelec Oy, Startex Oy
Deemed independent of the Company and the major shareholders
5. ESKO MÄKELÄ
Born 1943, M.Sc. (Eng.), MBA
Board member since 2007
Member of the Audit Committee
Primary work experience:
Executive Vice President, CFO of YIT Corporation
Deemed independent of the Company and the major shareholders
6. JUHANI NURMINEN
Born 1939, Construction Engineer
Board member during 1989−1995, 1999−2000 and since 2001
Member of the Audit Committee
Main occupation:
Rakennus-Bettene Oy’s Managing Director
Simultaneous positions of trust:
Member of the Board of Trustees of the Construction Engineers’
Foundation
Deemed independent of the Company and the major shareholders

87BOARD OF DIRECTORS
The members of the Board of directors are all independent of
the Company and its major shareholders except Mr. Eino Halonen,
who is deemed independent of the Company but in his role as
Suomi Mutual Life Assurance Company’s President and CEO (until
31 December 2007) is dependent of major shareholders, and
Mr. Gunnar Glifberg, who is independent of major shareholders
but as Cramo AB’s previous President and CEO is deemed
dependent of the Company until the autumn of 2008. “Independent”
means that such a member of the Board does not have a material
relationship with Cramo apart from his/her Board membership,
and that the member is independent of a signifi cant shareholder of
the company.
SHARES HELD BY THE MEMBERS OF THE BOARD OF DIRECTORS ON 31 DECEMBER 2007
Shares
Stig Gustavson 76,403
Juhani Nurminen 6,491
Gunnar Glifberg 4,701
Eino Halonen 3,758
Esko Mäkelä 1,395
Hannu Krogerus 1,001
TOTAL REMUNERATION FOR BOARD OF DIRECTORS PAID BY CRAMO, EUR
2007
Chairman 48,000
Vice-Chairman 34,000
Other members of the Board 124,000
88 2007 / ANNUAL REPORT / CRAMO PLC / POWERING YOUR BUSINESS
1. VESA KOIVULA
Born: 1954, M.Sc. (Eng.)
President and CEO since 2003
Employed by Cramo since 2003
Previous positions:
Fiskars Inha Ähtäri Works, Managing Director 2001−2003 and Vice
Managing Director 1995−2001, Morus Oy, Managing Director 1992−1995
2. GÖRAN CARLSON
Born: 1958
Deputy CEO since 2006
Member of the Group management team since 2006
Employed by Cramo since 2005
Previous positions:
Cramo AB, CEO 2005, FläktWoods Group, SVP 2002−2004, Electrolux
South Africa, Managing Director 1998–2001, The Lux Group, CEO
1993−1998, Lux France, Managing Director 1991−1993, Electrolux
Philippines, Managing Director 1986−1991, Electrolux Far East,
Managing Director 1984−1986
3. MARTTI ALA-HÄRKÖNEN
Born: 1965, Dr.Sc. (Econ.), Lic.Sc. (Tech.)
CFO since 2006
Member of the Group management team since 2006
Employed by Cramo since 2006
6. JARMO LAASANEN
Born: 1950, MBA
Senior Vice President, Other Europe since 2006
Member of the Group management team since 2006
Employed by Cramo since 2004
Previous positions:
Cramo Suomi Oy, President 2004−2005, Addsoft Solutions Oy , Managing
Director 2001−2004, Getronics Oy/Corp., General Manager, North East Europe
Area Manager, Vice President 1998−2001, Olivetti Oy, Service Director, Managing
Director 1992−1998, Unisys Oy, Sales Manager, Sales Director 1980−1992
7. OSSI ALASTALO
Born: 1966, Studies at the Tampere University of Technology
Senior Vice President, Modular Space since 2006
Member of the Group Management team since 2006
Employed by Cramo since 2000
Previous positions:
Tilamarkkinat Oy (later Cramo Instant Oy), Managing Director 2001−2006,
Deputy Managing Director 1999−2001 and Logistic Manager 1989−1999
8. ANDERS COLLMAN
Born: 1954, PhD (Bus. Adm.)
Vice President, Marketing and Communications since 2006
Member of the Group management team since 2006
Employed by Cramo since 1998
GROUP MANAGEMENT 31 DECEMBER 2007
Previous positions:
WM-data Oy, SVP, Finance and Administration, 2004−2006, Novo Group Oyj,
SVP-Business Development, CFO, 1998−2003, Postipankki Ltd, Finance
manager, Manager-Corporate Finance, 1995−1998
Simultaneous positions of trust:
Board member, Society for Economic Education 2006−
4. MAGNUS ROSÉN
Born: 1962, MBA
Senior Vice President, Scandinavia since 2006
Member of the Group management team since 2006
Employed by Cramo since 1997
Previous positions:
BT Svenska, Service market Director 1994–1997, BT Hyrsystem, Managing
Director 1991–1994, BT Industrier, Financial Manager 1989–1991
5. TATU HAUHIO
Born: 1970, M.Sc. (Econ.)
Senior Vice President, Finland since 2006
Member of the Group management team since 2006
Employed by Cramo since 2004
Previous positions:
RK Group, Director for Project Rental and foreign operations 2004−2005,
Suomen Projektivuokraus Oy, Business Development Director 2003,
Cap Gemini Oy, it-consultancy, quality and risk management positions
1997−2002.
Previous positions:
Cramo, Communications director 1998−2006, SalsAnsvar, Communications
director 1998, Addum, fi nancial reconstruction 1992−1998, Nordea, consultant
and investment banking 1986−1992, University of Uppsala, professor and
research 1978−1986
9. MATS STENHOLM
Born: 1947, B.Sc.
Vice President, Fleet Management since 2006
Member of the Group management team since 2006
Employed by Cramo since 1998
Previous positions:
Cramo AB, Head of Asset Management (rental fl eet) 1997−2006, Cramo AB,
Product manager Construction equipment 1992−1997, Cramo AB, Sales
manager Temp. heating division 1988−1992, Eurenius Byggmaskiner AB,
Rental manager 1979−1988, C.G.Eurenius AB, Sales manager construction
equipment 1973−1979
10. EVA HARSTRÖM
Born: 1961, M.Sc. (Ind. Mgt. and Eng.)
CIO since 2006
Member of the Group management team since 2006
Employed by Cramo since 2006
Previous positions:
St. Jude Medical AB, Project Manager, IT Manager, Director of IT 1995−2006,
IBS Sverige AB, System analyst and Project Manager 1986−1995

89GROUP MANAGEMENT
SHAREHOLDING, GROUP MANAGEMENT TEAM
Shares 31 Dec, 2007
Ossi Alastalo 21,114
Vesa Koivula 12,900
Tatu Hauhio 5,750
Göran Carlson 4,900
Martti Ala-Härkönen 4,900
Magnus Rosén 4,050
Mats Stenholm 2,500
Jarmo Laasanen 2,100
Anders Collman 1,250
Eva Harström 1,250
REMUNERATION FOR THE PRESIDENT AND CEO AND THE GROUP MANGEMENT TEAM, EUR
2007
Salaries and fringe benefi tsPresident and CEO 371,000
Other Management team members 1,589,000
Total 1,960,000
OPTION RIGHTS, GROUP MANAGEMENT TEAM, 31 DEC 2007
2006A received
2006B received
Vesa Koivula 80,000 88,000
Göran Carlson 60,000 65,000
Martti Ala-Härkönen 60,000 65,000
Magnus Rosén 45,000 50,000
Jarmo Laasanen 35,000 40,000
Tatu Hauhio 35,000 35,000
Ossi Alastalo 35,000 35,000
Anders Collman 30,000 30,000
Eva Harström 30,000 30,000
Mats Stenholm 30,000 30,000

90 2007 / ANNUAL REPORT / CRAMO PLC / POWERING YOUR BUSINESS
BUILDING MACHINERY
Wheel tractors and garden machineryForklift trucksCarts and trailersConcrete mixing machineryMortar mixing machineryPlaster and concrete spray equipmentConveyorsMaterial containment bins and tanksSoil compaction vibrators
Concrete handling equipmentGeneratorsElectrical equipmentSteam generatorsDrying and heating facilitiesVentilation fansPumpsLifting equipmentJacks, pulley blocks and telphersSoil- and rock-drilling equipmentChisels and pneumatic hammersScrewing and hammering toolsCross-cutting machinery and sawsSoldering equipmentDrilling machinerySanding and milling machineryCutting and bending machineryMeasurement instrumentsSignaling equipmentCleaning equipment, fi lter separatorsLight metal scaffoldingCompressorsCrane equipmentTrolley hoists, winches and coilers
DumpersCompact loaders and wheel-mounted loadersExcavatorsRollersBench drilling equipmentDemolition equipmentCompressors, heavy-dutyGenerators, heavy-duty
Trailer-mounted liftsVertical column liftsScissor liftsKnuckleboom liftsTelescopic liftsLifting trolleysCounterbalanced forklift trucksPallet trucksStand-up stackersReach trucks
AERIALS AND FORKLIFTS
Offi ce and employee site hutsCramodulesEvacuation apartmentsPortable toilets/washroom facilitiesRepair shop facilitiesTrailersContainersStorage facilities/protection from weatherConstruction hoistsWork platformsScaffolding systemsOn-site building electricity
SITE INFRASTUCTURE
MODULAR SPACE
Offi cesSchoolsDay care and care homesManufacture and sales of site huts & halls
CONSTRUCTION EQUIPMENT
SITE SERVICES, SUCH AS DRYING, HEATING, SCAFFOLDING, ELECTRIFICATION, DIAMOND DRILLING, FLOOR GRINDING AND MILLING.
RELATED SERVICES, SUCH AS FACILITIES MANAGEMENT, CUSTOMER SUPPORT AND ARCHITECTURAL DESIGN SERVICE.
Equipment Rental services the construction industry, other industries and the public sector by offering total
solutions from building site facilities to building machinery and rental-related services. Modular Space offers
high quality customisable modular buildings to the construction and other industries and the public sector.
CRAMO PRODUCT PORTFOLIO

CONTACTS
POWERING YOUR BUSINESS
GROUP HEADQUARTERSCramo OyjKalliosolantie 2FI-01740 Vantaa FinlandTel +358-10 661 10www.cramo.com
GROUP OPERATIONAL CENTRECramo ABTorshamnsgatan 35SE-164 95 KistaSwedenTel +46-8 623 5400www.cramo.com
EQUIPMENT RENTALFINLANDCramo Finland OyKalliosolantie 2FI-01740 VantaaFinlandTel +358-10 661 10www.cramo.fi
SWEDENCramo Sverige ABTorshamnsgatan 35SE-164 95 KistaSwedenTel +46-8 623 5400www.cramo.se
NORWAYCramo ASPB 34, AlnabruNO-0614 OsloNorwayTel +47-23 37 55 60www.cramo.no
DENMARKCramo A/SFabriksparken 30-32DK-2600 GlostrupDenmarkTel +45-4363 0100www.cramo.dk
ESTONIACramo Estonia ASKadaka tee 131EE-129 15 TallinnEstoniaTel +372-6 830 800www.cramo.ee
LATVIASIA CramoGanibu dambis 27/5LV-1005 RigaLatviaTel +371-7 387 554www.cramo.lv
LITHUANIAUAB CramoVerkiu str. 50LT-09109 VilniusLithuaniaTel +370-5 235 7040www.cramo.lt
POLANDCramo Sp.zo.o.Ul. Pulawska 405PL-02801 WarsawPolandTel +48-22 211 98 98www.cramo.pl
Cramo Podestry Ruchome Sp.zo.oUl. Biskupinska 16PL-30732 KrakowPolandTel +48-12 2903 10www.cramo-podesty.pl
RUSSIAZAO CramoZanevka 48/1RU-195298 St.PetersburgRussiaTel +7-812 521 8558www.cramo.ru
ZAO Cramo RentakranBoltino VillageMytischi District Moscow Region141032 RussiaTel +7-495-651 70www.cramorentakran.ru
MODULAR SPACE, FINLANDCramo Instant OyP.O. Box 9, Huurretie 19FI-33471 YlöjärviFinlandTel +358-10 661 5500www.cramo.fi
MODULAR SPACE, SCANDINAVIACramo Instant ABTorshamnsgatan 35SE-164 95 Kista SwedenTel +46-8 623 5470www.cramo.se
Cramo Instant ASPB 33, Tverrveien 1NO-3056 Solbergelva, NorwayTel +47-32 27 30 30www.cramo.no
Cramo A/SFabriksparken 30-32DK-2600 GlostrupDenmarkTel +45-4363 0100www.cramo.dk
MARKET AREA
POWERINGYOURBUSINESS

CRAMO PLCKALLIOSOLANTIE 2
01740 VANTAA
FINLAND
WWW.CRAMO.COMANNUAL REPORT 2007
CR
AM
O P
LC
• A
NN
UA
L R
EP
OR
T 2
00
7
A YEAROF GROWTH CRAMO PLC
Copyright © 2022 FDOKUMEN