A survey of constraint-handling techniques based on evolutionary multiobjective optimization

APPLICATION OF OPTIMIZATION TECHNIQUES IN DETERMINING THE EFFICIENT CONFIGURATION OF HEALTHCARE FACILITIES: A CASE STUDY
ABSTRACT The objective of this study is to determine an optimal configuration of healthcare facilities in the underserved rural counties of northeast North Carolina. We use the Geographic Information System (GIS) to estimate the distances between the proposed clinic locations and population clusters. Additional data was also collected from the Economic Development Intelligence System (EDIS), a North Carolina Department of Commerce portal (SAS Business Systems, 2007). For this study, ten contiguous distressed counties in northeast North Carolina are selected; each county is divided into three demand areas or population clusters. Then the optimization problem can be stated as follows: given a fixed number of clinics, where should they be located so that the number of patient-miles travelled is minimized? It belongs to the class of location-allocation problems in network-optimization theory, and can be formulated as a p-median problem. Using SITATION (2002) software, we solve the p-median problem generated from actual data, and identify the optimal locations of clinics, subject to a specified limit on the number of clinics, among the many potential locations. As the number of clinics increases, the total patient miles travelled decreases from 5.588 million miles to 1.512 million miles. From the point of view of healthcare economics, the model allows policymakers to do cost-benefit analyses and select the optimal number of clinics based on budget constraints. Key Words: Optimal location models, distressed rural counties, healthcare economics, clinic location
1. INTRODUCTION This study focuses on identifying optimal locations for healthcare facilities in ten underserved counties of northeast North Carolina. The geography of these economically distressed counties is such that it hinders development of healthcare facilities that can sustain services and respond adequately to meet the needs of at-risk populations. In these areas, obtaining even the most basic level of healthcare services is also hampered by limited access to transportation and concerns of travelling long distances (Ricketts 2000). Understanding how rural residents perceive distance when accessing healthcare is another important factor in planning decisions as well as service delivery (Ricketts, Kobetz and Goldsmith 2002). In this study, we utilize a location-allocation model referred to as the -median problem in determining the
optimal configuration of the healthcare facilities. We hope to contribute to the overall understanding of the decision making process, and provide a tool that can assist healthcare resource planners in generating more efficient outcome-based solutions. Location decisions are inherently strategic and therefore critical to the long term planning process in the public sector (Nijkamp 1999). In addition, policymakers are faced with Pareto-optimality (how changes in policy can make at least some people better off without making anyone else worse off) and the issues posed by such considerations (Henderson 2008). The approach advocated by many economists even though it is somewhat difficult to implement in practice is that resource allocation decisions should systemically seek to obtain the greatest benefit at the least cost (Palmer and Torgerson 1999). In this paper, we attempt to emulate the goal of this approach in developing the clinic location model. The remainder of the paper is organized as follows. In Section 2, a brief review of relevant literature is presented. The mathematical formulation of the p-median problem is given in Section 3. In Section 4, the data sources are described. The results of the solution are discussed in Section 5, and the conclusions and limitations of the study are presented in Section 6.
2. BRIEF REVIEW OF RELEVANT LITERATURE There is a vast amount of literature dealing with location-allocation models. We will just mention only the relevant ones here. In the literature, the p-median problem belongs to the field of network theory and

deals with facility location (Reese 2005). As a min-sum location-allocation problem, it determines the optimal location of facilities and allocates demand points to one or more supply points (Daskin 1995). Since the 1960's when network-based facility location models were developed, their applications have continued to grow in number and importance and hold particular significance for public sector healthcare (Daskin 2010). For instance, early studies include the location of supply centers, to meet the demand
from a set of m demand points (Hakimi 1964) with focus on minimizing the total costs or weighted-distances. Even so, these works did not include a formulation of the p-median version as an integer programming problem. ReVelle and Swain were the first to accomplish this in 1970, which opened the pathway for new solution procedures (Marianov and Serra 2004).
3. FORMULATION OF THE P-MEDIAN PROBLEM The mathematical formulation of the p-median problem (un-capacitated version – with no capacity constraints on service facilities) can be summarized as follows (ReVelle & Swain, 1970):
Min = ij
m
i
n
j
idw 1 1
ijx (1)
Subject to:
11
n
j
ijx i (2)
jij yx ,, ji (3)
n
j
jy1
,p (4)
ijx 0 or 1 ,, ji
(5)
jy = 0 or 1 j
Where:
is the total number of demand points or population clusters,
n is the total number of potential locations for clinics,
ijx is 1 if demand point i is assigned to clinic at point j , 0 otherwise, (decision variable)
jy is 1 if a clinic is located at point j , 0 otherwise, (decision variable)
iw is the size of the population at demand point i , (input data)
ijd is the distance from point i to point j , (input data)
p is the specified number of clinics to be located, (input data)
Each of the p points selected, among the many potential locations, serves as a healthcare facility and each of the m population clusters is served by one of the p service facilities located in the network. The optimal set of p points will minimize the weighted-distance (patient-miles travelled) from the m demand points to the p clinics (Hoelting et al. 1995). Of course, public sector location decisions are innately strategic and often, involve conflicting or multiple objectives and may require tradeoffs (Henderson & Schilling 1984). For instance, there may be more than one level of health services in a facility or one may encounter a hierarchical system in which levels of services are managed based on their complexity. In the

current problem, we make the simple assumption that all clinics are identical and can provide services to all the patients that visit them (mathematically, the un-capacitated version of the p-median problem).
4. COLLECTION OF DATA ON POPULATION CLUSTERS AND DISTANCES
This study utilizes the Geographic Information System (GIS) and Economic Development Intelligence System (EDIS), a state of North Carolina Department of Commerce portal, which has a wide variety of statistical data mapped to North Carolina communities (SAS Business Systems 2007). Since the optimization of healthcare service locations necessitates highly reliable input data, careful selection of datasets is essential. Aggregation can corrupt the solution results of a location problem and decrease the quality of the solution (Kitchin and Fotheringham 1997). Others argue that the aggregation literature in location analysis has identified several different sources of error, a number of which may result from poor choices made by analysts at different stages of the analysis (Erkut and Bozkaya 1999). However, others report stable resolutions with the p−median problem, when aggregated data is utilized (Murray and Gottsegen 1997). Besides, since the p−median problem is based on spatially distributed demand values with total population utilized as demand, it is reasonable to assume that demand can be specified more accurately in most instances (Daskin 1995). This is particularly the case in rural areas where travel distance to a service facility can be lengthy and an optimization analysis can provide greater accessibility (Kaiser, 2000). As a consequence, the definition of “rural” can have great latitude, forcing healthcare planners and policy makers to contend with different definitions. However, these definitions generally have common criteria including availability, quality, coordination of care, access, coverage and income, which when taken together add up to economically "distressed" areas. From a demographic perspective, rural populations need more medical attention since they tend to be older, poorer and employed in more hazardous occupations, which makes access more acute than that of their urban counterparts (Christianson & Moscovice 1993). Furthermore and from a comparative standpoint, a sample of elderly living in rural areas showed that these populations were satisfied if they were with within a reasonable driving distance of urban areas with major medical facilities (Blazer et al. 1995). Our study focuses on ten contiguous counties of northeast North Carolina, shown in Figure 1, that are located in economically distressed areas aggravated by lack of economic development opportunities and high unemployment; they are poor rural populations who contend with inadequate healthcare services and long-distance travel requirements.
Source: http://www.bing.com/images/search?q=map+of+easternh+carolina+counties
http://www.censusfinder.com/mapnc.htm
Figure 1. Ten Contiguous Counties in Northeast North Carolina Counties Included in the Study: Bertie, Gates, Halifax,
Northampton, Tyrell, Martin, Washington, Hyde, Beaufort and Hertford

Specifically, several criteria determine the distressed designation. Those include average rate of employment, per capita income and population growth. In testimony before a Congressional forum, it was reported that the state’s economic poverty is a major challenge (Agency for Healthcare Research and Quality 1997). Currently, the ten contiguous counties included in the study are: (1) Bertie, (2) Gates, (3) Halifax, (4) Northampton, (5) Martin, (6) Tyrell, (7) Washington,(8) Hyde, (9) Beaufort, and (10) Hertford. They are shown in figure 1 (a map of counties in northeast North Carolina). Their geographic location is such that they do not have the required healthcare facilities adequate to support the at-risk population. Utilizing various atlas sources including the Rural Assistance Center (2010) and population demographics from the U.S. Census Bureau; we developed a basis for determining demand areas and demand clusters based upon population and distance (miles) for each of the ten selected counties in northeast North Carolina. MapQuest software was also used in estimating the distances between population clutsers and potential locations of clinics. We divide each county into three demand areas or population clusters and thus, have a total of 30 demand areas for all the ten counties together. A map of Beaufort County with its three population clusters is shown in figure 2.
Source: http://upload.wikimedia.org/wilipedia/commons/7/79
Figure 2: Map of Beaufort County included in Study
(1) Demand Area One = Demand Point One @ Bath (1BAT) includes the sum of the populations:
Bath (275) + Washington (9,583) +Washington Park (440) + Chocowinity (733) + Aurora
(583) + Belhaven (1,968) + Mesic (257) = 13,582
(2) Demand Area Two = Demand Point Two @ Washington (2WAS) includes the sum of the populations:
Washington (9,583) + Washington Park (440) + Chocowinity (733) + River Road (4,094)
Grimesland (440) +Simpson (464) + Bath (275) + Vanceboro (898) = 15,927
(3) Demand Area Three = Demand Point Three @ Belhaven (3BEL) includes the sum of populations of:
Belhaven (1,968) + Bath (275) + Aurora (583) + Roper (613) + Plymouth (4,107) + Mesic
(257) = 7.803
The data on the populations of the 30 demand points is shown in Table 1. Each of 30 demand points is identified with a number and three-letter combination. Also, the distances between the demand points and the potential clinic locations are shown in Table 2. The identifier starts for each hospital or clinic starts with the letter C and a number. It may be noted that the first ten locations indicate existing hospital facilities, and the other 15 denote potential locations for new clinics.
Demand
Area 2
Demand Area 1
Demand Area 3
Demand (2)
Demand (1)
Demand (3)
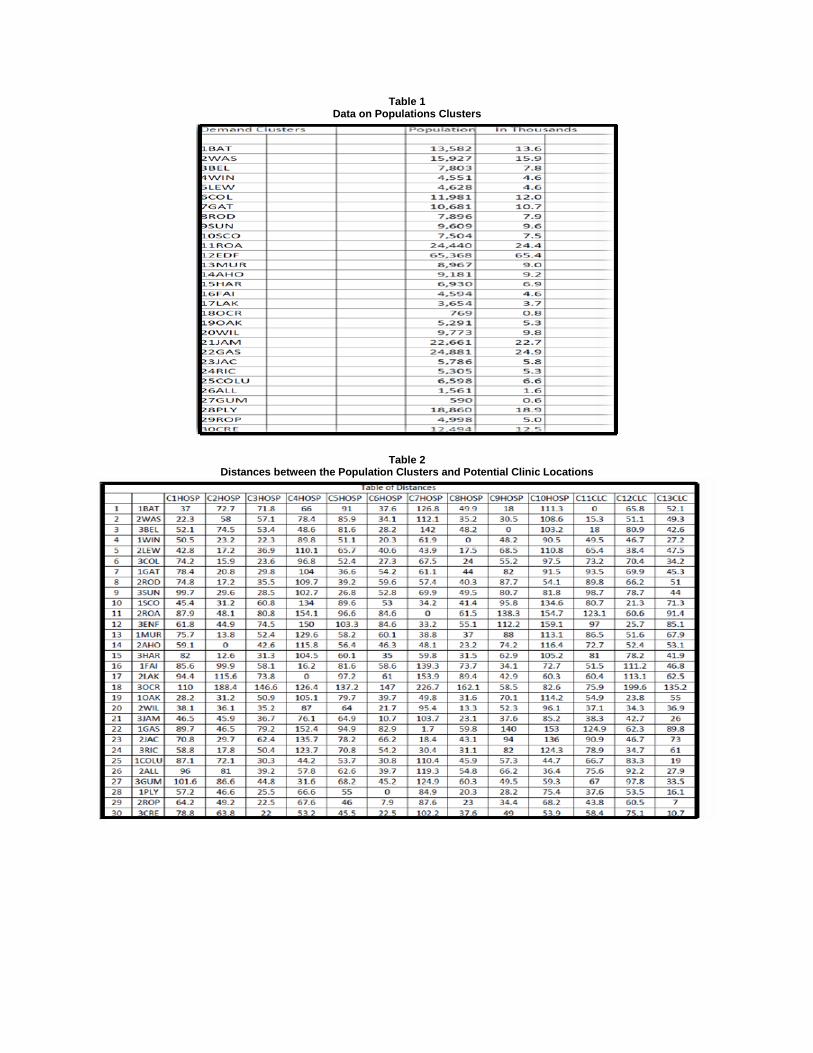
Table 1 Data on Populations Clusters
Table 2 Distances between the Population Clusters and Potential Clinic Locations
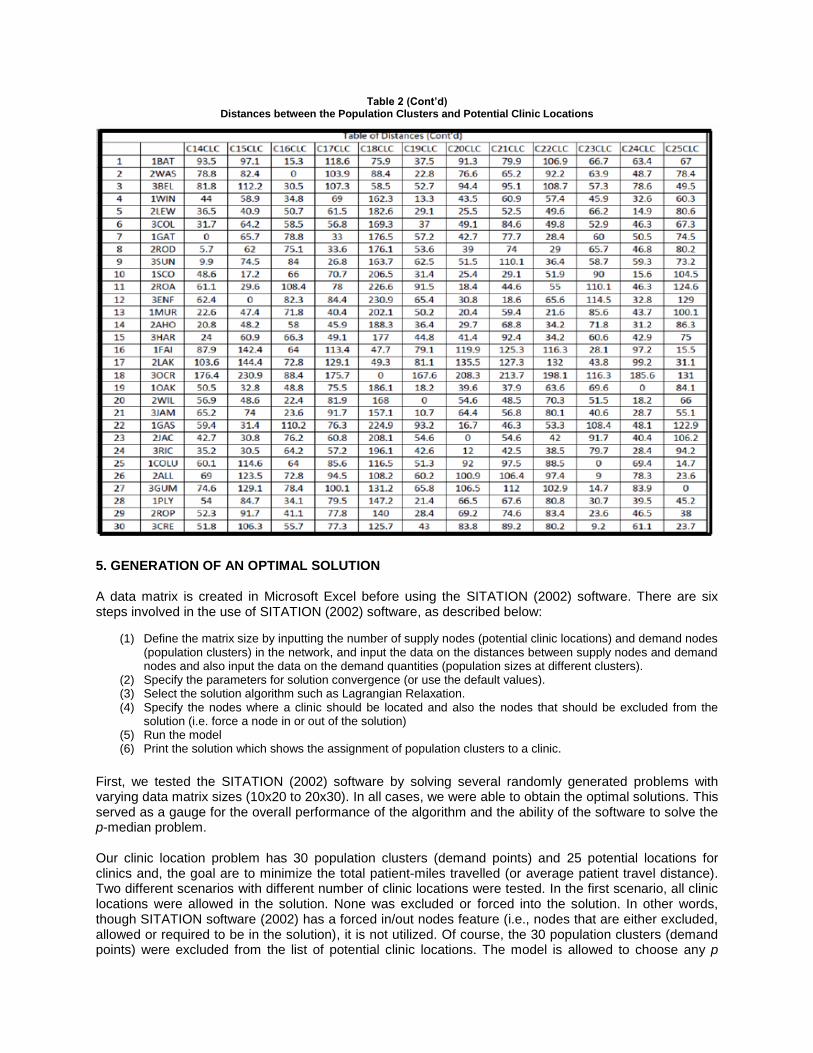
Table 2 (Cont’d) Distances between the Population Clusters and Potential Clinic Locations
5. GENERATION OF AN OPTIMAL SOLUTION A data matrix is created in Microsoft Excel before using the SITATION (2002) software. There are six steps involved in the use of SITATION (2002) software, as described below:
(1) Define the matrix size by inputting the number of supply nodes (potential clinic locations) and demand nodes (population clusters) in the network, and input the data on the distances between supply nodes and demand nodes and also input the data on the demand quantities (population sizes at different clusters).
(2) Specify the parameters for solution convergence (or use the default values). (3) Select the solution algorithm such as Lagrangian Relaxation. (4) Specify the nodes where a clinic should be located and also the nodes that should be excluded from the
solution (i.e. force a node in or out of the solution) (5) Run the model (6) Print the solution which shows the assignment of population clusters to a clinic.
First, we tested the SITATION (2002) software by solving several randomly generated problems with varying data matrix sizes (10x20 to 20x30). In all cases, we were able to obtain the optimal solutions. This served as a gauge for the overall performance of the algorithm and the ability of the software to solve the p-median problem. Our clinic location problem has 30 population clusters (demand points) and 25 potential locations for clinics and, the goal are to minimize the total patient-miles travelled (or average patient travel distance). Two different scenarios with different number of clinic locations were tested. In the first scenario, all clinic locations were allowed in the solution. None was excluded or forced into the solution. In other words, though SITATION software (2002) has a forced in/out nodes feature (i.e., nodes that are either excluded, allowed or required to be in the solution), it is not utilized. Of course, the 30 population clusters (demand points) were excluded from the list of potential clinic locations. The model is allowed to choose any p

locations from the list of 25 potential locations. The model is executed several times, each time restricting the value of p, the number of clinics, to 1, 2, 3...17. With just one clinic, it was found that the average travel distance per patient was 42.56 miles; but as more clinics were added, the average distance dropped to 6.19 miles with 9 clinics and to 3.97 miles with 17 clinics, as it should, given the nature of the optimization problem. The results are shown in Figure 3.
Figure 3. Average Miles per Patient
The total patient-miles traveled is reduced from 14.35 million miles with just one clinic to 1.34 million miles when there are 17 clinics, as shown in Figure 4.
Figure 4. Total Patient-Miles in Millions
Figure 5. Percent Savings
Lastly, the percentage savings resulting from the addition of more clinics are shown in Figure 5. It can be seen from this figure that the addition of the second clinic leads to savings of 41.58%, but the addition of the 17th clinic results is savings of only 0.25%.

Figure 6. Patient-miles with and without current clinic locations in the solution In the second scenario, SITATION (2002) software’s forced in/out feature is used to force the first ten existing facility locations into the solution, and then, allow the other locations into the solution based on the optimization criteria. The model is executed with ten current locations first, and then with p=11, 12, 17. The results of the forced solutions are shown in Figure 6. It can be observed from Figure 6, the average of patient-miles traveled decreases from 18.62 to1.34 as clinics are added to the ten existing hospitals on a successive basis. Further, the total patient miles traveled decreases from 5.588 million with ten existing hospitals to 1.512 million when seven more clinics are added. The results demonstrate the model's ability to minimize the average distances and assist policy makers in doing cost-benefit analyses and planning decisions. 6. CONCLUSIONS AND DIRECTIONS FOR FUTURE RESEARCH The purpose of this research has been to examine the challenge of providing healthcare services to rural underserved populations utilizing a location-allocation decision model known as the p-median problem. From the standpoint of healthcare resource planning, some issues related to the accessibility of healthcare services for the at-risk population in the designated, distressed counties of northeast North Carolina have been addressed. To arrive at an “optimal” solution, a facility location and resource allocation model based on Lagrangian relaxation algorithms is employed for solving the p-median problem or min-sum multi-center network design problem. The model is designed to identify clinic locations so that average patient travel distance is minimized. Obviously, the average travel distance decreases as more healthcare clinics are added in the optimization process. These results are also reflected in the total patient miles traveled (this paper is a summary of the author’s doctoral dissertation). In this study, the fixed costs associated with the construction of clinics are not considered. If the construction costs differ significantly from one clinic to the next, the model can be adapted to handle this

feature easily. However, the fundamental assumption of the model is that all the clinics have identical capabilities in treating patients and also have enough capacity to accommodate all in-coming patient flow. In practice, different clinics may offer different levels and types of patient care. Moreover, some clinics may have limitations on the number of patients they can accommodate. The current model cannot manage these hierarchical relations among the clinics or their capacity limitations. Future research can focus on these extensions to the current model. REFERENCES Agency for Healthcare Research and Quality. 1997, November 21. “Strenghening the rural
healthcare infrastructure.” In U.S. Department of Health and Human Services. Retrieved May 6, 2006. from http://archive.ahrq.gov/news/ulp/ulpstren4.htm
Blazer, D. G., Landerman, L. R., G. Fillenbaum, and R. Homer. R. 1995. “Health services access and use among older adults in North Carolina: Urban vs. rural residents.” American Journal of Public Health 85: 1384-1390.
Daskin, M. S. 1995. Network and discrete location models, algorithms, and applications. New York, NY: John Wiley & Sons, Inc.
Daskin, M. S. 2010. Service Science. Hoboken, N.J: John Wiley & Sons, Inc. Erkut, E., & Bozkaya, B. 1999. “Analysis of aggregation errors for the p-median problem.”
Computers and Operations Research 26: 1075-1096. Federation for American Immigration Reform. 2008. “Immigration issues centers:
Labor and economics.” Retrieved November 2008, from http://www.fairus.org/site/PageNavigator/issues/labor_and_economics/
Hakimi, S. L. 1964. “Optimum distribution of switching centers in a communication network and some related graph theoretic problems.” Operations Research 13: 462-475.
Henderson, D. 2008, October 27. “Library of economics and liberty” Retrieved February 14, 2009, from EconLib: http://econlog.econlib.org/archives/2008/10/a_pareto-optima.html Henderson, J., & Schilling, D. 1984. September. “Design and implementation of decision support systems
in the public sector”. Retrieved June 2008, from http://dspace.mit.edu/bitstream/handle/1721.1/2090/SWP-1591-12173714-CISR-116.pdf?
sequence=1 Hoelting, C., D. A. Schoenefeld, and R.L. Wainwright.1995. Approximation techniques for
variations of the p-median problem. Proceedings of the ACM/SIGAPP Symposium on Applied Computing. pp. 293-299.
Kaiser, C. 2000. “Optimizing the location of services: The case of pharmacies in western Australia.” Unpublished doctoral thesis. University of Adelaide, Adelaide, Australia.
Kitchin, R, M., and A.S. Fotheirngham. 1997. “Aggregation issues in cognitive mapping.” The Professional Geographer 49(3): 269-280.
MapQuest. 2008. North Carolina maps. In MapQuest. Retrieved April 14, 2009. from http://www.mapquest.com/
Marianov, V. and D. Serra. 2004. “New trends in public facility location modeling.” UPF Economics & Business Working Paper No. 755. Retrieved June 8, 2011 from http://ssrn.com/abstract=563843 Murray, A. T. and J. M. Gottsegen (1997). “The influence of data aggregation on the stability of p-median location model solutions.” Location Science 5(3):197-199. Nijkamp, P. 1999. “Advances in comparative assessment research in the space economy. Research Memorandum.” 5: 1-21. Retrieved March 10, 2009, from http://dare.ubvu.vu.nl/bitstream/1871/1503/1/19990005.pdf North Carolina Rural Health Research & Policy Analysis Center. 2009. “A case study of rural healthcare
in the economic downturn.” Retrieved December 7, 2009, from http://www.shepscenter.unc.edu/research_programs/rural_program/pubs/other/AsheProfile.pdf
Palmer, S. and D.J. Torgerson. 1999. “Definitions of efficiency.” British Medical Journal. 318(1791): 1136. Reese, J. 2005. “Methods for Solving the p-Median Problem: An Annotated Bibliography”. Retrieved March 5, 2010 from http://ramanujan.math.trinity.edu/tumath/research/reports/report96.pdf ReVelle, C. S. and R.W. Swain. 1970. “Central Facilities Location.” Geographical Analysis. 2(1): 30- 42. ReVelle, C. S., D. Marks and J.C. Liebman. 1970. “An analysis of private and public sector
location models.” Management Science.” 16(11): 692-707. Ricketts, T. C., E. Kobetz, and L. 2002, March 13. “Geography and Disparity in
Health.” Institute of Medicine of the National Academies.” 1-47. Retrieved September 12, 2009. from http://www.iom.edu/~/media/Files/Activity%20Files/Quality/NHDRGuidance/Disparities Ricketts.ashx
Ricketts, T.C. (2000). “Healthcare in rural communities.” Western Journal of Medicine173 (5): 294-295. Rural Assistance Center. 2010, October 13. “Maps illustrating rural health and human services
issues.” Retrieved December 1, 2010. from http://www.raconline.org/maps/ SAS Business Systems. 2007. Economic development intelligence system. Raleigh, North
Carolina, USA. SITATION Facility Location Software. 2002. United States: Mark S. Daskin.
Retrieved December 7, 2009. from http://users.iems.northwestern.edu/~msdaskin/Mark%20S.%20Daskin%20Software.html #SITATION_Software
Copyright © 2022 FDOKUMEN