ML053610092.pdf - Nuclear Regulatory Commission
276
40,W Safety Significance Evaluation of Kewaunee Power Station Turbine Building Internal Floods Volume 1 Revision 1 December 1, 2005 :PDominion
-
Upload
khangminh22 -
Category
Documents
-
view
0 -
download
0
Transcript of ML053610092.pdf - Nuclear Regulatory Commission

40,W
Safety Significance Evaluation of
Kewaunee Power Station Turbine
Building Internal Floods
Volume 1
Revision 1
December 1, 2005
:PDominion

Table of Contents
Executive Summary .............. 2
Table of Contents .............. 3
I Introduction .............. 4
2 Conclusions............... . 5
3 Evaluation .............. 6
3.1 Flood Sources ................ 6
3.2 Accident Scenarios ............... 6
3.3 Accident Sequence Progression .7
3.4 Operator Actions .9
3.5 Results .9
3.6 Conservatisms .9
3.7 Sensitivity Analyses .10
Table 3-1. Flood Initiating Events and Frequencies . . 11
Table 3-2. Flood Levels Impacting Class I Equipment . .12
Table 3-3. Flood Scenario Contributors to Turbine BuildingFlooding Results 13
Table 3-4: Sensitivity Cases............................................................................. 14
4 References .............. 17

Table of Contents (cont.)
Appendix A - Initiating Events Analysis for Turbine Building FloodsAttachment 1 - Turbine Sump Alarm HistoryAttachment 2 - Circulating Water Expansion Joint Rupture FrequencyAttachment 3 - High Energy Line Break Initiating Event Frequencies
Appendix B - Flood Area Definition for Turbine Building Basement
Appendix C - Fault Tree AnalysisAttachment 1 - Human Error ProbabilitiesAttachment 2 - Operator Cues for Analyzed EventsAttachment 3 - Crew Exercise - Large Feedwater Line Break
Appendix D - Accident Sequence AnalysisAttachment 1 - Battery Discharge AnalysisAttachment 2 - TimelinesAttachment 3 - Assessment of Potential Spray on Reserve Auxiliary
Transformer Breakers on Mezzanine LevelAttachment 4 - Loss of Reserve Auxiliary Transformer Auxiliaries C,,Attachment 5 - Steam Generator Power-Operated Relief Valve OperationAttachment 6 - Technical Support Center Diesel Fuel Oil Supply,Attachment 7 - Flood Impact on 4kV Control Power
Appendix E - Non-Seismic Quantification
Appendix F - Seismic AnalysisAttachment 1 - Human Error ProbabilitiesAttachment 2 - Components Determined Not Significant to Seismic
Flooding ModelAttachment 3 - Hotwell and Main Condenser VolumesAttachment 4 - SHIP Code Output Files - BaselineAttachment 5 - SHUP Code Output Files - SensitivitiesAttachment 6 - Tank Volume CalculationAttachment 7 - Valve SW-281 1 Operation

Executive Summary

'eExecutive Summary
A performance deficiency was identified in NRC Inspection Report 05000305/2005011regarding internal flooding design features. The inspectors found that there was inadequatedesign control to ensure Class I equipment was protected against damage from the rupture of apipe or tank resulting in serious flooding or excessive steam release to the extent that the Class Iequipment's function was impaired. Specifically, the design did not ensure that the auxiliaryfeedwater (AFW) pumps, 480-volt (V) safeguards buses, safe shutdown panel, emergency dieselgenerators (EDGs) IA and 1B, and 4160-V safeguards buses 1-5 and 1-6 would be protectedfrom random or seismically-induced failures of non-Class I systems in the turbine building.Flood paths were present which would allow flood water from the turbine building to flow intothe safeguards alley compartments containing the identified Class I equipment. These floodpaths included floor drains without check valves, doors with sufficient bottom clearances toallow water to pass through, and open floor trenches which communicate between safeguardsalley compartments.
The past safety significance of this performance deficiency was evaluated by performing aprobabilistic risk assessment (PRA) of the subject internal flooding scenarios leading to coredamage. The flood initiating events considered included: random pipe breaks, condenserexpansion joint failures, steam line breaks with fire sprinkler actuation, feedwater line breakswith fire sprinkler actuation, seismic-induced breaks, turbine-missile induced breaks, andtornado-induced breaks. The scenarios were analyzed based on: surveyor floor measurements,dynamic flood level analysis using GOTHIC, equipment survivability evaluations, room heatupcalculations using GOTHIC, simulator exercises, review of operator training materials, testing of480-V breakers in simulated flooding conditions, and seismic fragility assessments. The turbinebuilding flood sources capable of causing failure of Class I equipment in safeguards alley weredetermined to be: circulating water, service water, firewater, feedwater, condensate, and thecondensate and reactor makeup water storage tanks.
The total contribution to core damage frequency (CDF) from this deficiency based on the plantdesign in 2004 was evaluated to be 7.2E-05 per year, which would be classified as Yellow in theNRC Reactor Oversight Process (ROP) Significance Determination Process (SDP) riskdetermination. The total large early release frequency (LERF) contribution from this deficiencywas estimated to be at least a factor of ten below the CDF, and thus not limiting in the NRC ROPSDP risk determination. Sensitivity evaluations were performed to determine the impact ofchanges in key assumptions such as initiating event frequencies and human error probabilities.
Page 2 of 17 l

- Table of Contents
Table of Contents .. 2.
Executive Summary ............... 2
I Introduction ................ 4
2 Conclusions ............... 5
3 Evaluation ............... 6
3.1 Flood Sources .. 6
3.2 Accident Scenarios .6
3.3 Accident Sequence Progression .7
3.4 Operator Actions .. 9
3.5 Results .9
3.6 Conservatisms .9
3.7 Sensitivity Analyses . 10
Table 3-1. Flood Initiating Events and Frequencies 1 l
Table 3-2. Flood Levels Impacting Class I Equipment . .12
Table 3-3. Flood Scenario Contributors to Turbine Building Flooding Results 13
Table 34: Sensitivity Cases .. 14
4 References .. 17
Page 3 of 17

Table of Contents (cont.)
Appendix A - Initiating Events Analysis for Turbine Building FloodsAttachment 1 - Turbine Sump Alarm HistoryAttachment 2 - Circulating Water Expansion Joint Rupture FrequencyAttachment 3 - High Energy Line Break Initiating Event Frequencies
Appendix B - Flood Area Definition for Turbine Building Basement
Appendix C - Fault Tree AnalysisAttachment 1 - Human Error ProbabilitiesAttachment 2 - Operator Cues for Analyzed EventsAttachment 3 - Crew Exercise - Large Feedwater Line Break
Appendix D - Accident Sequence AnalysisAttachment 1 - Battery Discharge AnalysisAttachment 2- TimelinesAttachment 3 - Assessment of Potential Spray on Reserve Auxiliary
Transformer Breakers on Mezzanine LevelAttachment 4 - Loss of Reserve Auxiliary Transformer AuxiliariesAttachment 5 - Steam Generator Power-Operated Relief Valve OperationAttachment 6 - Technical Support Center Diesel Fuel Oil SupplyAttachment 7 - Flood Impact on 4kV Control Power
Appendix E - Non-Seismic Quantification
Appendix F- Seismic AnalysisAttachment 1 - Human Error ProbabilitiesAttachment 2 - Components Determined Not Significant to Seismic
Flooding ModelAttachment 3 - Hotwell -and Main Condenser VolumesAttachment 4 - SHIP Code Output Files - BaselineAttachment 5 - SHIP Code Output Files - SensitivitiesAttachment 6 - Tank Volume CalculationAttachment 7 - Valve SW-2811 Operation
Page 4 of 17 l

I Introduction
A performance deficiency was identified in NRC Inspection Report 05000305/2005011regarding internal flooding design features (Ref. 1). The inspectors found that there wasinadequate design control to ensure Class I equipment was protected against damage from therupture of a pipe or tank resulting in serious flooding or excessive steam release to the extent thatthe Class I equipment's function was impaired. Specifically, the design did not ensure that theauxiliary feedwater (AFW) pumps, 480-volt (V) safeguards buses, safe shutdown panel,emergency diesel generators (EDGs) 1A and 1B, and 4160-V safeguards buses 1-5 and 1-6would be protected from random or seismically induced failures of non-Class I systems in theturbine building. Flood paths were present which would allow flood water from the turbinebuilding to flow into the safeguards alley compartments containing the identified Class Iequipment. These flood paths included floor drains without check valves, doors with sufficientbottom clearances to allow water to pass through, and open floor trenches which communicatebetween safeguards alley compartments.
Page 5 of 17 l

2 Conclusions
The total contribution to core damage frequency (CDF) from this deficiency based on the plantdesign in 2004 was evaluated to be 7.2E-05 per year, which would be classified as Yellow in the |NRC Reactor Oversight Process (ROP) Significance Determination Process (SDP) riskdetermination. The total large early release frequency (LERE) contribution from this deficiencywas estimated to be at least a factor of ten below the CDF, and thus not limiting in the NRC ROPSDP risk determination. Sensitivity evaluations were performed to determine the impact ofchanges in key assumptions such as initiating event frequencies and human error probabilities.
:Q
Page 6 of 17 |

3 Evaluation
3.1 Flood Sources
In this analysis, failures of non-Class I water system piping and equipment at Kewaunee PowerStation (KPS) that can flood the turbine building and subsequently impact Class I componentshave been evaluated. Systems with sufficient inventory and flow rates to fail Class I equipmentin safeguards alley were determined to be: circulating water, service water, firewater, feedwater,condensate, and condensate and reactor makeup water storage tanks. Twelve different random(9), tornado-induced (1), turbine-missile induced (1), and seismic-induced (1) flooding initiatingevents listed in Table 3-1 were evaluated. The frequencies of these flooding events weredetermined based on plant-specific analyses and industry references.
The critical flood levels for Class I equipment in safeguards alley potentially-impacted byturbine building floods are listed in Table 3-2. These levels were determined by measurements,engineering evaluations, and tests of equipment in flooded conditions.
3.2 Accident Scenarios
Based on identification and analysis of internal flood areas in the KPS turbine building andsafeguards alley (including consideration of unoccupied floor space, risk-significant componentsand associated submergence depths, drainage paths and capacity, detection methods, operatoractions, and propagation paths to/from other flood areas), accident scenarios were developed foreach of the flooding initiating events described above. The accident scenarios for each initiatingevent are very similar with differences only in detection method and time to fail Class Iequipment. For each initiating event the propagation paths into safeguards alley and thesubsequent component damage are the same.
A flooding event due to a non-Class I break would be indicated by a turbine building ^miscellaneous sump level high alarm in the control room due to high level in either the turbinebuilding or screenhouse sump. The drains and sumps 41aarm procedure instructs the operator todispatch personnel to locally investigate the sump when this alarm sounds. Indication may alsobe provided by alarms related to the system with the break (e.g., low condenser vacuum, servicewater low discharge pressure, fire pump running or fire protection header pressure low, or steamgenerator low level depending on the break). The break would deposit water from the circulatingwater, service water, fire water system, or condensate and reactor makeup water storage tanksonto the turbinelbuilding floor. In addition, a break in the feedwater or main steam system thatactuates the fire sprinklers would increase the temperature in the turbine building, which wouldimpact the timing for investigation and isolation of the leak.
The water levels in the 480 V switchgear bus 61 and 62 room, the motor-driven auxiliaryfeedwater pump 1B (MDAFP 1B) room, the turbine-driven auxiliary feedwater pump (TDAFP)room, the MDAFP IA room, and the C02 storage tank 1B room would closely match the water
Page 7 of 17 l

level in the turbine building because the drain lines that connect these rooms to the turbinebuilding sump do not contain check valves and would allow water to flow from the sump tothese rooms. The water-level in the 480 V switchgear bus 51 and 52 (bus 51/52) room would belower than the turbine building because water would be entering this room via leakage under thedoors from adjacent compartments. Water would rise in the bus 51/52 and diesel generator IA(DG IA) rooms simultaneously due to the trench connecting the two rooms. The only drainagefrom the DG IA room would be leakage to the screenhouse pipe tunnel via the gap under thedoor and a four-inch opening into the trench. The DG 1A room drain line would not remove anyof the flood water because its drain line (which contains a check valve) empties into the turbinebuilding sump, which would already be above this level. If the water level in DG 1 A exceeds adepth of 4 inches, 4 kV bus 5 and 480 V Buses 51 and 52 (which are powered from 4 kV bus 5)are conservatively evaluated to fail.
The water level in DG lB room would also be fed by leakage under a door. The only drainagefrom the DG 1B room would be leakage under the door leading to the screenhouse pipe tunnel,because the room drain line (which contains a check valve) leads to the turbine building sump.Prior to late 2004, there was a six-inch curb in the DG 1B room that protected the dieselgenerator and 4 kV bus 6 from floods below six-inches. This curb was removed in late 2004.The curb has minimal impact on the analysis based on the dynamic water level evaluation andwas not credited in the analysis.
Although propagation of water from the turbine building to the 4 kV buses would require someperiod of time, without a procedure or equipment for removing water from the room, it wouldhave been inevitable for the water to eventually reach the buses if the flood source was not iisolated.
3.3 Accident Sequence Progression
From the flooding initiating events and damage scenarios described above, the accident sequenceprogression has been analyzed. The accident sequence progression for each flooding eventconsiders the response of the plant and operators to the initiating events and subsequentequipment failures, and is represented with an event tree. The flooding event trees are based onthe KPS internal events PRA model event tree for loss of feedwater. In each case, if the operatorsuccessfully terminates the flood prior to failure of any buses, the accident progression would beidentical to that of the existing loss of feedwater sequences except for equipment failed by sprayfrom the initiating line break.
As with the accident scenarios, the accident sequence progression for each initiating event isvery similar with differences only in the operator actions needed (i.e., isolation of the appropriateflood source) and the time required and available for those actions. The accident sequenceprogression following failure to isolate the flood before failure of any buses is described below.
A circulating water break would be isolated by manually tripping the circulating water pumps.For a service water break, the operator would isolate the turbine building header by closingvalves SW-4A and 4B. For a high energy line break leading to fire sprinkler actuation, theoperator would implement a procedure to isolate the discharge from the fire water system into U
Page 8 of 17 l
the turbine building by isolating the fire sprinklers on the turbine building mezzanine level, andisolating deluge and fire sprinkler valves in the turbine building basement. Also, the operatorscould trip the fire pumps locally at the 480V breakers or locally close the pump discharge valvesto stop flow, but the operators were conservatively not credited to pass through floodedswitchgear areas in safeguards alley to perform these actions.
If the operator fails to isolate a flood before all RCP seatcooling systems are lost, then an RCP sealLOCA could occur. The response to the RCP seal LOCA would depend on the leakage rate. TheWOG 2000 RCP seal LOCA model as modified by the NRC was used for this evaluation.
If the operator fails to isolate the break initially, the water level would continue to rise in safeguardsalley. Although 4 kV bus 5 motor-loads would fail, buses 51/52, 4 kV bus 6 and associated 480 Vbuses 61/62 would still be available, as well as the TDAFP. There is a second isolation opportunityin order to prevent eventual failure of the TDAFP's ability to start due to submergence of theassociated auxiliary lube oil pump (at 9 inches). A third isolation opportunity exists to preventeventual failure of 4 kV bus 6 (at 4 inches) and associated 480 V buses 61/62 (at 11 inches). Thetotal volume of water required in the turbine building to flood 4 kV bus 6 is almost equal to thatrequired to flood 480 V buses 61/62. A fourth isolation is also modeled to prevent submergencefailure of the MDAFPs at 13 inches. This isolation also ensures that power to 480 VAC buseswill remain available.
If the second or third isolation opportunity were successful, 4 kV power would be available to thealready operating MDAFP lB. If continued operation of this MDAFW pump succeeds, theoperator performs RCS cooldown and depressurization by opening a SG PORV'(which if necessarycan be performed locally) to reduce RCP seal leakage. If cooldown fails, the operator could stillremove decay heat by restoring RCS inventory using the available SI pump and throttling SI flow toconserve the water in the RWST per procedure.
If the available MDAFP fails, the TDAFP would be available to provide secondary heat removal.Successful cooldown using the TDAFP also requires opening a SG PORV. Additionally, long-terminstrument power must be available to allow the operator to monitor SG level and preventoverfilling the SG and failing the TDAFP. Because the normal battery chargers would beunavailable due to the loss of the 480 V buses, providing long-term DC power for steam generatorlevel indication and auxiliary feedwater control is credited by a number of means, includingautomatic or manual transfer of the inverters source from the batteries to their alternate source(offsite power), which would be available in many scenarios. In addition, a normal or spare batterycharger could be powered from offsite power or the Technical Support Center (TSC) diesel torestore long term battery capacity and provide SG level indication. Due to the long time to steamgenerator dryout due to reduced decay heat levels at the earliest point the batteries might be depleted(eight hours), much more than eight hours would be available in the most limiting cases toimplement these recovery actions (e.g., a minimum of 24 hours of battery life is available if theinverters are transferred to their alternate source at four hours).
A final isolation opportunity can prevent the water level in the turbine building from reaching 18inches. If the water level reaches this height, core damage is assumed since the electricalconnections of the reserve auxiliary transformer (RAT) to 4 kV buses 1 and 2 will be submerged
Page 9 of 17 |

leading to a loss of offsite power and the eventual failure of all safety-related buses.Additionally, this water level will result in the failure of the diesel generators since their air i isupply fans are powered from 480 V buses 51/52 and 61/62.
Seismic-induced floods were analyzed based on the EPRI 1989 hazard curve and associated spectra,detailed fragility assessments of the systems capable of causing critical floods in the turbinebuilding impacting Class I components in safeguards alley, and random failures taken from the PRAmodels from the random pipe break analyses. Combinations of breaks which could occur inseismic events were explicitly considered in the analysis.
3.4 Operator Actions
As described above, the accident sequence progression for each initiating event is very similarwith differences only in the operator actions and the time required and available for thoseactions. Most of these operator actions fall into one of three groups: isolation of the flood source'before 4 kV bus 5 fails, isolation of the flood source before the TDAFP auxiliary lube oil pumpfails, or isolation of the flood source before 4 kV bus 6 and associated 480 V buses 61/62 fail, orisolation before submergence of the motor-driven AFW pumps.
The human error probabilities (HEPs) for these actions vary for each flooding initiating event,based on the specific actions to be taken to isolate the particular flood source, the time requiredto complete those actions, the time available to complete those actions (based on the flow rate ofthe source), and the environment in which the actions must be performed. As noted above, thehot water and/or steam released from a feedwater or main steam line break would impact the Uoperators' ability to investigate and isolate the flood. The impact of these conditions anddependencies among these three actions are also considered.
3.5 Results
The turbine building flooding analysis summarized above represents a conservative assessmentfor occurrence, plant response, and operator response to a flooding event in the turbine building.Quantification of this conservative analysis provides the core damage frequency (CDF) for theplant configuration in the year 2004. Table 3-3 presents the individual and total CDFs for eachof the flooding scenarios.
The total contribution to CDF from the deficiency for the analyzed turbine building floodscenarios was calculated to be 7.2E-05. More than 79% of the CDF is due to four floodscenarios: large breaks in an inlet circulating water expansion joint (50%), feedwater line breaksthat results in full flow discharge from the fire pumps (14%), main steam line breaks that resultsin full flow discharge from the fire pumps (15%), and seismic induced breaks of firewater,service water and condensate and reactor makeup water storage tanks (9%).
3.6 Conservatisms
Development of the initiating events, accident scenarios, accident sequence progression, andhuman error probabilities for turbine building floods in some cases required the use of
Page lOof 17 l

conservative modeling methods or conservative assumptions. The noteworthy conservatismsinherent in the KPS turbine building flooding analysis are summarized below.
1. The impact of tripping the feedwater and condensate pumps prior to emptying the hotwellwas not evaluated. Instead it was conservatively determined that the entire feedwater andcondensate inventory of 80,000 gallons would be pumped onto the turbine building floor.The feedwater pumps would likely be tripped early (within approximately ten minutes perthe emergency operating procedures), and an extremely large break size (8,000 gpm) wouldbe required to discharge 80,000 gallons within that period. A smaller break size would resultin less water discharged and allow more time to isolate the break to prevent failure of risksignificant components.
2. Credit for operators isolating the firewater pumps following high energy line break events byeither tripping the firewater pumps at the 480V switchgear, closing the firewater pumpdischarge valves, or initiating a manual safety injection signal (which automatically trips thefirewater pumps) were not included in the analysis.
3.7 Sensitivity Analyses
Development of the initiating events, accident scenarios, accident sequence progression, andhuman error probabilities for turbine building floods requires many assumptions. To helpcharacterize the modeling and data uncertainty due to assumptions made for this evaluation, aseries of sensitivity analyses were performed and are summarized in Table 3-4.
N .,
Page I1 of 17 I
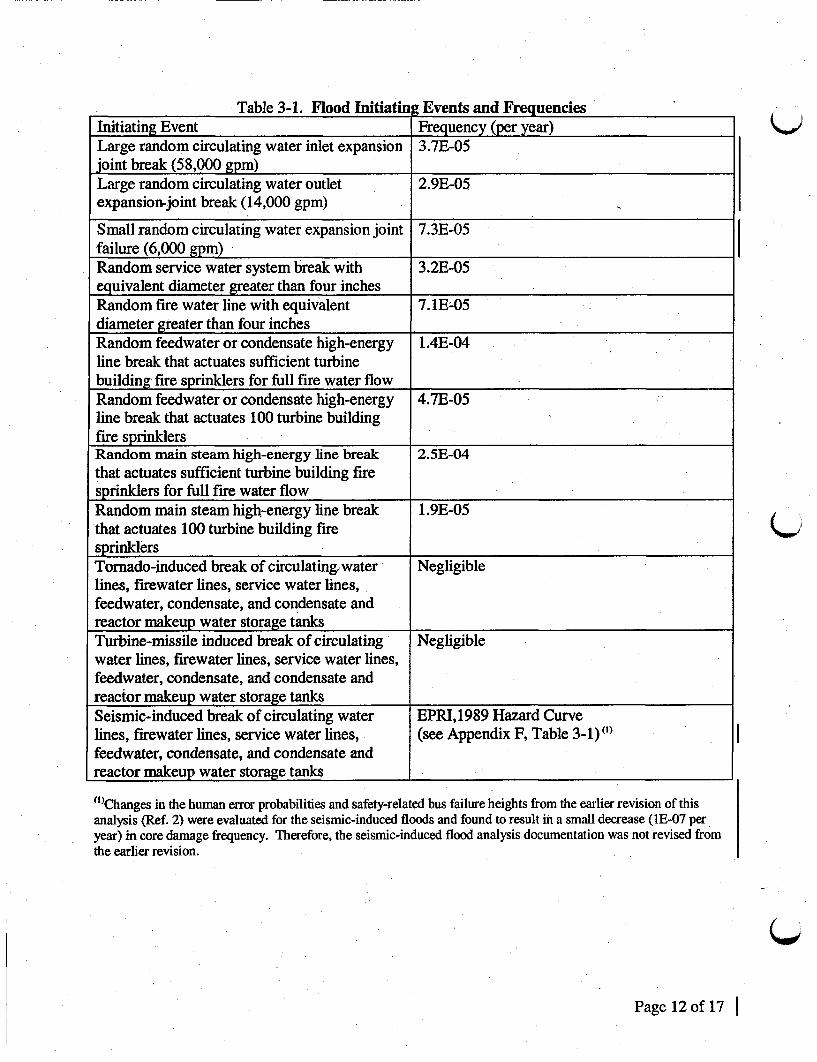
Table 3-1. Flood Initiatin Events and FrequenciesInitiating Event Frequency (per year)Large random circulating water inlet expansion 3.7E-05joint break (58,000 gpm) _
Large random circulating water outlet 2.9E-05expansion-joint break (14,000 gpm)
Small random circulating water expansion joint 7.3E-05failure (6,000 gpm)Random service water system break with 3.2E-05equivalent diameter greater than four inchesRandom fire water line with equivalent 7. 1E-05diameter greater than four inchesRandom feedwater or condensate high-energy 1.4E-04line break that actuates sufficient turbinebuilding fire sprinklers for full fire water flowRandom feedwater or condensate high-energy 4.7E-05line break that actuates 100 turbine buildingfire sprinklersRandom main steam high-energy line break 2.5E-04that actuates sufficient turbine building firesprinklers for full fire water flowRandom main steam high-energy line break 1.9E-05that actuates 100 turbine building firesprinklersTornado-induced break of circulating water Negligiblelines, firewater lines, service water lines,feedwater, condensate, and condensate andreactor makeup water storage tanksTurbine-missile induced break of circulating Negligiblewater lines, firewater lines, service water lines,feedwater, condensate, and condensate andreactor makeup water storage tanksSeismic-induced break of circulating water EPRI,1989 Hazard Curvelines, firewater lines, service water lines, (see Appendix F, Table 3-1) lfeedwater, condensate, and condensate andreactor makeup water storage tanks
QWI
("Changes in the human error probabilities and safety-related bus failure heights from the earlier revision of thisanalysis (Ref. 2) were evaluated for the seismic-induced floods and found to result in a small decrease (lE-07 peryear) in core damage frequency. Therefore, the seismic-induced flood analysis documentation was not revised fromthe earlier revision.
Page 12 of 17 |

Table 3-2. Flood Levels Impacting Class I EquipmentTrain A/B 480V switchgear (buses 51, 52, 61, 62)_ 2.75" flood level trips bottom row of breakersD 4" flood level control power lost a4C* 11" flood level bus stabs covered and bus failsTrain A/B 4kV switchgear (buses 5 and 6 located in respective EDG rooms)* 4" flood level control power connections covered, 4kV motor loads will receive lockout
signal, and breaker control fails (however, supply to 480V buses will remain energized)* 18" flood level bus stabs covered and bus failsTurbine-driven AFW pump* 9" flood level auxiliary lube oil pump fails* 18" flood level pump failsMotor-driven AFW pumps* 9" flood level auxiliary lube oil pump fails* 13" flood level pump failsInstrument air compressors (A, B, C)* 11" flood level compressor failsEmergency diesel generators and dedicated shutdown panel* Equipment is above 6" flood level, however associated 4kV buses fail @ 6" flood level
Note: Flood levels impacting equipment failure were conservatively assessed from measuredlevels to allow for measurement uncertainty (typically 1/4" to 1/2" less than measurement). Floodlevels provided in this table are relative to floor elevation at equipment. Flood levels used inanalysis were relative to sea level.
Page 13 of 17 l

Table 3-3. Flood Scenario Contributors to Turbine Building Flooding ResultsFlood Scenario Total
CDF (perr)
Large random circulating water inlet expansion joint break (58,000 gpm) 3.7E-05Large random circulating water outlet expansion joint break (14,000 gpm) 4.4E-06Small random circulating water expansion joint failure (6,000 gpm) 1 .9E-06Random service water system break with equivalent diameter greater than four 1.3E-06inchesRandom fire water line with equivalent diameter greater than four inches 1.9E-06Random feedwater or condensate high-energy line break that actuates sufficient 9. IE-06turbine building fire sprinklers for full fire water flowRandom feedwater or condensate high-energy line break that actuates 100 turbine 1.2E-07building fire sprinklersRandom main steam high-energy line break that actuates sufficient turbine 9.7E-06building fire sprinklers for full fire water flowRandom main steam high-energy line break that actuates 100 turbine building fire 5.OE-08sprinklersTornado induced break of circulating water lines, firewater lines, service water Negligiblelines, feedwater, condensate, and condensate and reactor makeup water storagetanksTurbine missile induced break of circulating water lines, firewater lines, service Negligiblewater lines, feedwater, condensate, and condensate and reactor makeup waterstorage tanksSeismic induced break of circulating water lines, firewater lines, service water 6.6E-06lines, feedwater, condensate, and condensate and reactor makeup water storagetanksTotal 7.2E-05
Page 14 of 17 |
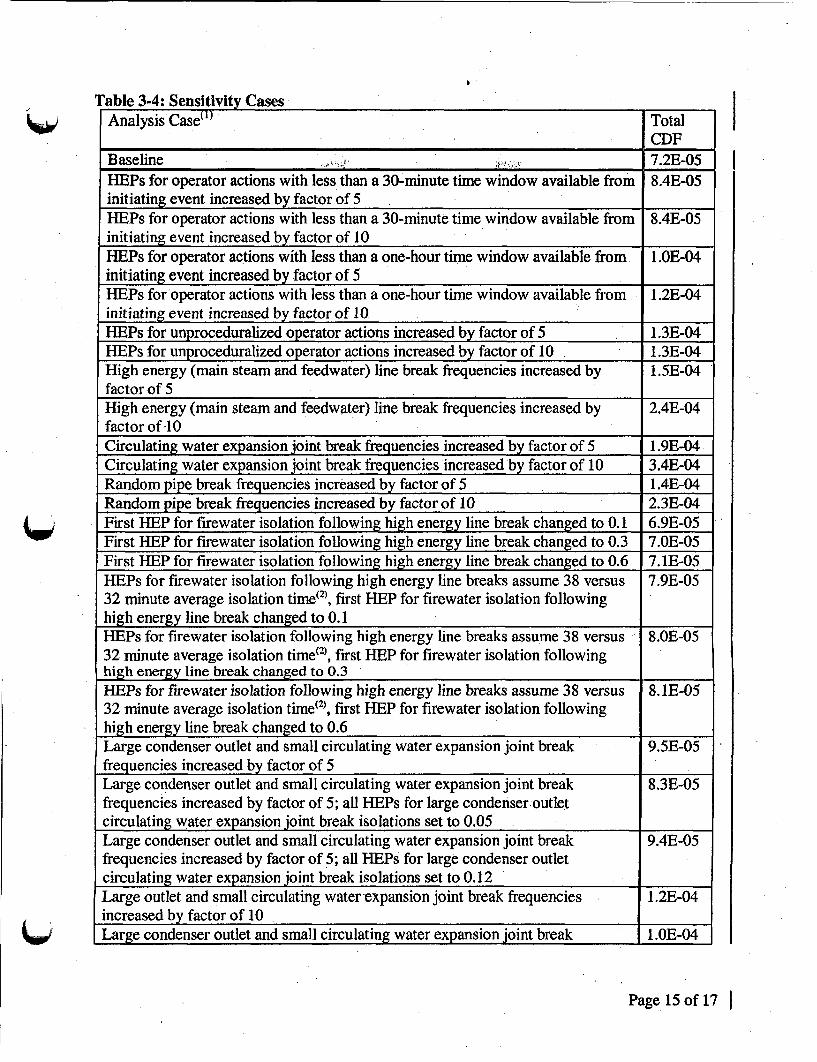
Table 3-4: Sensitivity CasesAnalysis Case") Total
CDFBaseline 7.2E-05HEPs for operator actions with less than a 30-minute time window available from 8.4E-05initiating event increased by factor of 5HEPs for operator actions with less than a 30-minute time window available from 8.4E-05initiating event increased by factor of 10HEPs for operator actions with less than a one-hour time window available from L.OE-04initiating event increased by factor of 5HEPs for operator actions with less than a one-hour time window available from 1.2E-04initiating event increased by factor of 10HEPs for unproceduralized operator actions increased by factor of 5 1.3E-04HEPs for unproceduralized operator actions increased by factor of 10 1.3E-04High energy (main steam and feedwater) line break frequencies increased by 1.5E-04factor of 5High energy (main steam and feedwater) line break frequencies increased by 2.4E-04factor of-l 10Circulating water expansion joint break frequencies increased by factor of 5 1.9E-04Circulating water expansion joint break frequencies increased by factor of 10 3.4E-04Random pipe break frequencies increased by factor of 5 1.4E-04Random pipe break frequencies increased by factor of 10 2.3E-04First HEP for firewater isolation following high energy line break changed to 0.1 6.9E-05First HEP for firewater isolation following high energy line break changed to 0.3 7.OE-05First HEP for firewater isolation following high energy line break changed to 0.6 7.1ME-05HEPs for firewater isolation following high energy line breaks assume 38 versus 7.9E-0532 minute average isolation time(', first HEP for firewater isolation followinghigh energy line break changed to 0.3HEPs for firewater isolation following high energy line breaks assume 38 versus 8.OE-0532 minute average isolation time(2), first HEP for firewater isolation followinghigh energy line break changed to 0.3HEPs for ndrewater isolation following high energy line breaks assume 38 versus 8.5E-0532 minute average isolation time("), first HEP for fire water isolation followinghigh energs line break changed to 0.6Large condenser outlet and small circulating water expansion joint break 9.5E-05frequencies increased by factor of 5Large condenser outlet and small circulating water expansion joint break 8.3E-05frequencies increased by factor of 5; all HEPs for large condenser outletcirculating water expansion joint break isolations set to 0.12Large condenser outlet and small circulating water expansion joint break 9.4E-05frequencies increased by factor of 5; all HEPS for large condenser outletcirculating water expansion joint break isolations set to 0.12Large outlet and small circulating water-expansion joint break frequencies 1.2E-04increased by factor of 10Large condenser outlet and small circulating water expansion joint break- l.OE
Page lS of 17 |
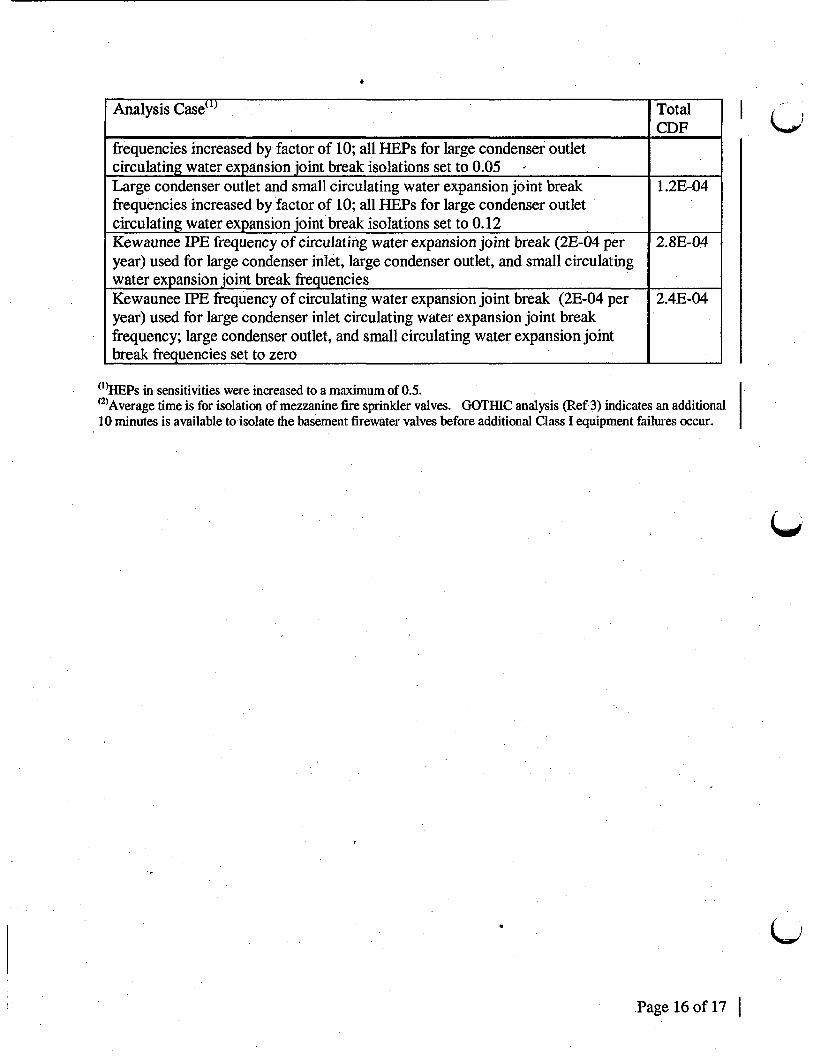
Analysis Cased) TotalCDF
frequencies increased by factor of 10; all HEPs for large condenser outletcirculating water expansion joint break isolations set to 0.05Large condenser outlet and small circulating water expansion joint break 1.2E-04frequencies increased by factor of 10; all HEPs for large condenser outletcirculating water expansion joint break isolations set to 0.12Kewaunee IPE frequency of circulating water expansion joint break (2E-04 per 2.8E-04year) used for large condenser inlet, large condenser outlet, and small circulatingwater expansion joint break frequenciesKewaunee IPE frequency of circulating water expansion joint break (2E-04 per 2.4E-04year) used for large condenser inlet circulating water expansion joint breakfrequency; large condenser outlet, and small circulating water expansion jointbreak frequencies set to zero
I
(')HEPs in sensitivities were increased to a maximum of 0.5.(2)Average time is for isolation of mezzanine fire sprinkler valves. GOTHIC analysis (Ref 3) indicates an additional10 minutes is available to isolate the basement firewater valves before additional Class I equipment failures occur.
Page 16 of 17 l

'i 4 References
1. Letter, USNRC (Mark Satorius) to Dominion (David Christian), NRC Inspection Report05000305/200501 1(DRP) Preliminary Greater than Green Finding Kewaunee Power Station,October 6, 2005.
2. Letter, Dominion Energy Kewaunee, Inc (Michael G. Gaffney) to USNRC, "KewauneePower Station Flooding Significance Determination Process Risk Assessment Report,"October 31, 2005.
3. MPR Associates Inc. Calculation No. 0064-0515-LYS-01, "Evaluation of Flooding Levelsfor Various PRA Cases", Rev. 1, November 18, 2005.
Page 17 of 17 l

Appendix A
Initiating Events Analysis for TurbineBuilding Floods
Page 1 of 66 1

INTERNAL FLOODING - Initiating Events Analysis for Turbine Building Floods &'
Owner's Acceptance: tB y 6L By lSignature
I I1N44A-S G A4cot
Print Name
Date

| INTERNAL FLOODING - Initiating Events Analysis for Turbine Building Floods |
1 �W4
Kewaunee Power Station
Initiating Events Analysis for Turbine Building Floods
Revision No. 1
Effective Date: November 2005
5 e. 6Ltwx4As UtLAe*tL
Prepared By: S. E. Guokas
Reviewed By: R. J. Dremel
14c1tsDate
k -4o'I OsDate
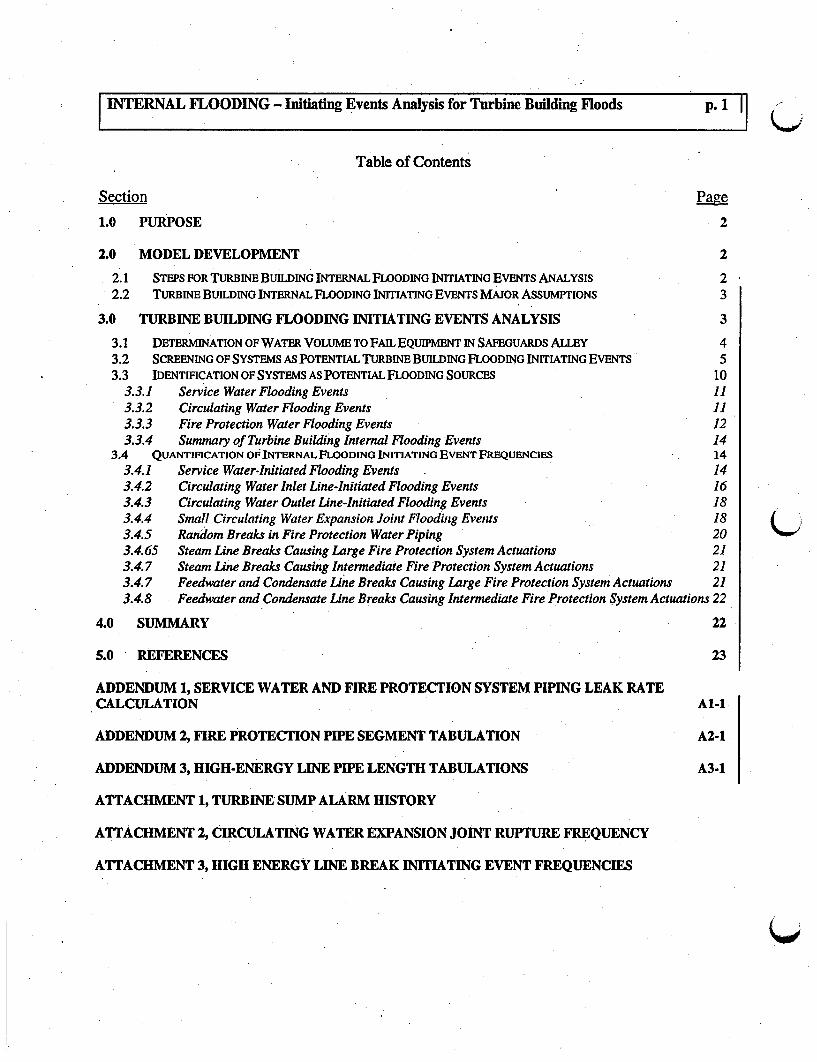
INTERNAL FLOODING - Initiating Events Analysis for Turbine Building Floods P. I
Table of Contents
Section Page
1.0 PURPOSE 2
2.0 MODEL DEVELOPMENT 2
2.1 STEPS FOR TURBINE BUILDING INTERNAL FLOODING INITIATING EVENTS ANALYSIS 22.2 TURBINE BUILDING INTERNAL FLOODING INITIATING EVENTS MAJOR ASSUMPTIONS 3
3.0 TURBINE BUILDING FLOODING INITIATING EVENTS ANALYSIS 3
3.1 DETERMINATION OF WATER VOLUME TO FAIL EQUIPMENT IN SAFEGUARDS ALLEY 43.2 SCREENING OF SYSTEMS AS POTENTIAL TURBINE BUILDING FLOODING INITIATING EVENTS 53.3 IDENTIFICATION OF SYSTEMS AS POTENTIAL FLOODING SOURCES 10
3.3.1 Service Water Flooding Events 113.3.2 Circulating Water Flooding Events 113.3.3 Fire Protection Water Flooding Events 123.3.4 Summary of Turbine Building Internal Flooding Events 14
3.4 QUANTIFICATION OF INTERNAL FLOODING INITIATING EVENT FREQUENCIES 14
3.4.1 Service Water-Initiated Flooding Events 143.4.2 Circulating Water Inlet Line-Initiated Flooding Events 163.4.3 Circulating Water Outlet Line-Initiated Flooding Events 183.4.4 Small Circulating Water Expansion Joint Flooding Events 183.4.5 Random Breaks in Fire Protection Water Piping 203.4.65 Steam Line Breaks Causing Large Fire Protection System Actuations 213.4.7 Steam Line Breaks Causing Intermediate Fire Protection System Actuations 213.4.7 Feedwater and Condensate Line Breaks Causing Large Fire Protection System Actuations 213.4.8 Feedwater and Condensate Line Breaks Causing Intermediate Fire Protection System Actuations 22
4.0 SUMMARY 22
5.0 REFERENCES 23
ADDENDUM 1, SERVICE WATER AND FIRE PROTECTION SYSTEM PIPING LEAK RATECALCULATION Al-1
ADDENDUM 2, FIRE PROTECTION PIPE SEGMENT TABULATION A2-1
ADDENDUM 3, HIGH-ENERGY LINE PIPE LENGTH TABULATIONS A3-1
ATTACHMENT 1, TURBINE SUMP ALARM HISTORY
ATTACHMENT 2, CIRCULATING WATER EXPANSION JOINT RUPTURE FREQUENCY
ATTACHMENT 3, HIGH ENERGY LINE BREAK INITIATING EVENT FREQUENCIES

INTERNAL FLOODING - Initiating Events Analysis for TurbineBuilding foods p.2 2j
1.0 PURPOSE
The purpose of the internal flooding initiating events analysis is to define, quantify, and documentthe frequency results for potential internal flooding initiating events caused by breaks of non-safety-related piping/components in the Turbine Building before February 2005. That is, theanalysis considers the plant prior to installation of the flood mitigation modifications installed inand around safeguards alley. Flooding events caused by earthquakes are considered separately.
The following information is identified, correlated, and developed as part of this analysis:
* Identification of pipe breaks of concern* Quantification of the frequency expected for pipe breaks in those systems.
2.0 MODEL DEVELOPMENT
Internal flooding analysis encompasses the effects from the accumulation of fluids arising from therupture, cracking or incorrect operation of piping/components within the station. In practice,major internal floods have occurred in nuclear power plants, from the rupture of pipes, valves andexpansion joints as well as from operator errors during plant maintenance activities. All potentialinternal flood sources in the turbine building are considered in this analysis.
The steps for conducting the internal flooding initiating events analysis are described in the followingsection.
2.1 Steps for Turbine Building Internal Flooding Initiating Events Analysis
The analysis of the Turbine Building internal flooding initiating events analysis consists of thefollowing steps:
1. Determine the volume of water that can be released before failure of equipment in safeguardsalley would be expected.
2. Screen from consideration, those systems that cannot be significant contributors to the overallturbine flooding risk. Screen from consideration systems that are not capable of causing failureof equipment even if the entire system volume is released or if a break in the system wasallowed to flow for a long period of time.
3. Review information collected from the internal flooding walkdown and screening analysis[NBO1] to identify potential flood sources. Review drawings to identify other potential floodsources not included in [NB01].

INTERNAL FLOODING - Initiating Events Analysis for Turbine Building Floods p.3 3 l
4. Identify the specific piping and components that can cause an internal flood. For these pipesand components, calculate the frequency for flooding events of concern.
The results from each of these steps are presented in Section 3.0.
Development of the flood scenarios and accident sequence progression for each of the identifiedinitiating events is documented in a separate report.
2.2 Turbine Building Internal Flooding Initiating Events Major Assumptions
The key assumptions that were made during the internal flooding initiating events analysis arediscussed in Section 3.0 for each of the specific flooding scenarios. In addition, the followinggeneral assumptions apply:
1. Actuation of fire sprinkler heads can also occur due to localized heating from operatingequipment, aging failure, or impact damage from maintenance activities. Inadvertentactuation will result in discharge from a single sprinkler head, with a maximum rate of 30 gpm[CALC01]. The low flow rate from actuation of a single sprinkler head is assumed to be toolow to cause equipment damage outside of the immediate area and, therefore it would be nomore severe than a loss of main feedwater event. Therefore, it is concluded that floodingevents that result only in failure of equipment located in the Turbine Building can beconsidered subsumed by the frequency of loss-of-main-feedwater transient events.
2. All piping systems in the Turbine Building are assumed to be non-safety related. Therefore,all pipes are initially considered as potentially causing an initiating event.
3. All flooding events in the Turbine Building are assumed to cause a loss of main feedwater and,therefore, result in a reactor trip. If a flooding event does not cause a reactor trip, the floodcould be excluded as an initiator. The effect of this assumption is that all pipe breaks areinitially considered as potentially causing an initiating event.
4. The service water return lines are assumed to operate at the same pressure as the supplyheaders. The impact of this assumption is that some breaks in service water return lines thatmay be screened as initiating events are included in the overall initiating event frequency. Theimpact of this assumption is expected to result in only a slight increase in the overall initiatingevent frequency.
3.0 TURBINE BUILDING FLOODING INITIATING EVENTS ANALYSIS
Identification and quantification of Turbine Building internal flooding initiating events is discussedbelow.
INTERNAL FLOODING - Initiating Events Analysis for Turbine Building Floods p. 4
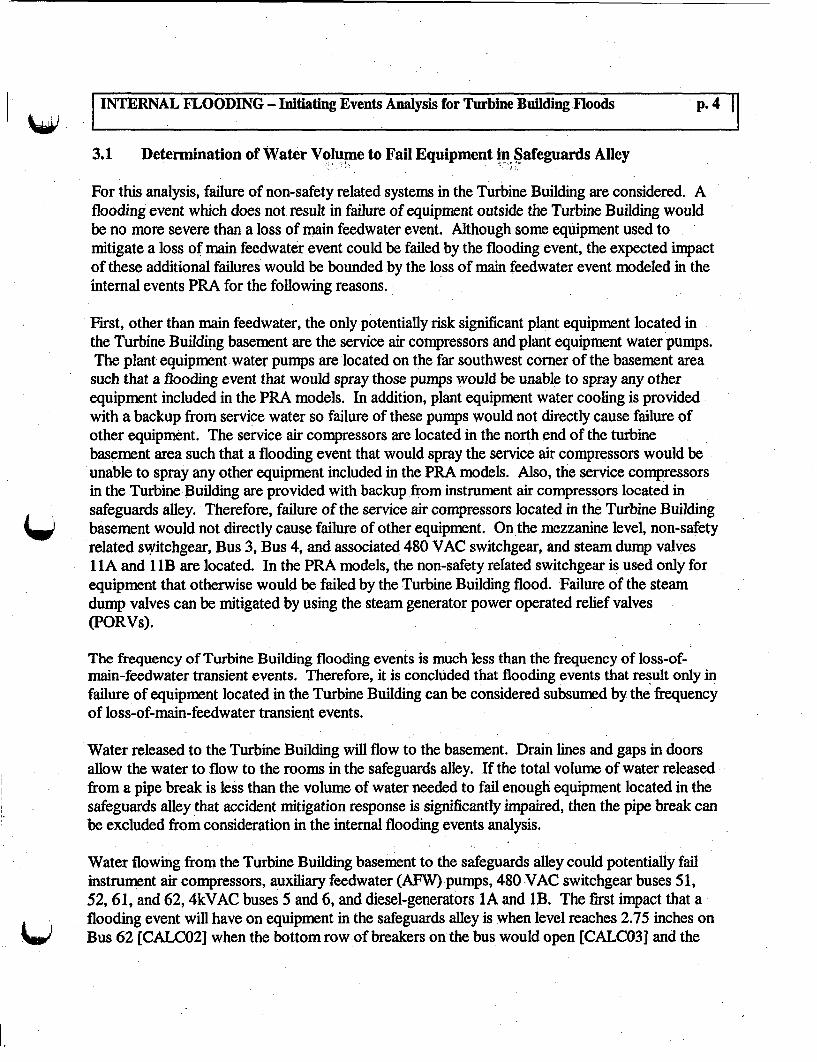
3.1 Determination of Water Volume to Fail Equipment in Safeguards Alley
For this analysis, failure of non-safety related systems in the Turbine Building are considered. Aflooding event which does not result in failure of equipment outside the Turbine Building wouldbe no more severe than a loss of main feedwater event. Although some equipment used tomitigate a loss of main feedwater event could be failed by the flooding event, the expected impactof these additional failures would be bounded by the loss of main feedwater event modeled in theinternal events PRA for the following reasons.
First, other than main feedwater, the only potentially risk significant plant equipment located inthe Turbine Building basement are the service air compressors and plant equipment water pumps.The plant equipment water pumps are located on the far southwest corner of the basement area
such that a flooding event that would spray those pumps would be unable to spray any otherequipment included in the PRA models. In addition, plant equipment water cooling is providedwith a backup from service water so failure of these pumps would not directly cause failure ofother equipment. The service air compressors are located in the north end of the turbinebasement area such that a flooding event that would spray the service air compressors would beunable to spray any other equipment included in the PRA models. Also, the service compressorsin the Turbine Building are provided with backup from instrument air compressors located insafeguards alley. Therefore, failure of the service air compressors located in the Turbine Buildingbasement would not directly cause failure of other equipment. On the mezzanine level, non-safetyrelated switchgear, Bus 3, Bus 4, and associated 480 VAC switchgear, and steam dump valves11A and 1 lB are located. In the PRA models, the non-safety related switchgear is used only forequipment that otherwise would be failed by the Turbine Building flood. Failure of the steamdump valves can be mitigated by using the steam generator power operated relief valves(PORVs).
The frequency of Turbine Building flooding events is much less than the frequency of loss-of-main-feedwater transient events. Therefore, it is concluded that flooding events that result only infailure of equipment located in the Turbine Building can be considered subsumed by the frequencyof loss-of-main-feedwater transient events.
Water released to the Turbine Building will flow to the basement. Drain lines and gaps in doorsallow the water to flow to the rooms in the safeguards alley. If the total volume of water releasedfrom a pipe break is less than the volume of water needed to fail enough equipment located in thesafeguards alley that accident mitigation response is significantly impaired, then the pipe break canbe excluded from consideration in the internal flooding events analysis.
Water flowing from the Turbine Building basement to the safeguards alley could potentially failinstrument air compressors, auxiliary feedwater (AFW) pumps, 480 VAC switchgear buses 51,52, 61, and 62, 4kVAC buses 5 and 6, and diesel-generators 1A and lB. The first impact that aflooding event will have on equipment in the safeguards alley is when level reaches 2.75 inches onBus 62 [CALCO2J when the bottom row of breakers on the bus would open [CALCO31 and the
IINTERNAL FLOODING - Initiating Events Analysis for Turbine Building Floods p.5 S I
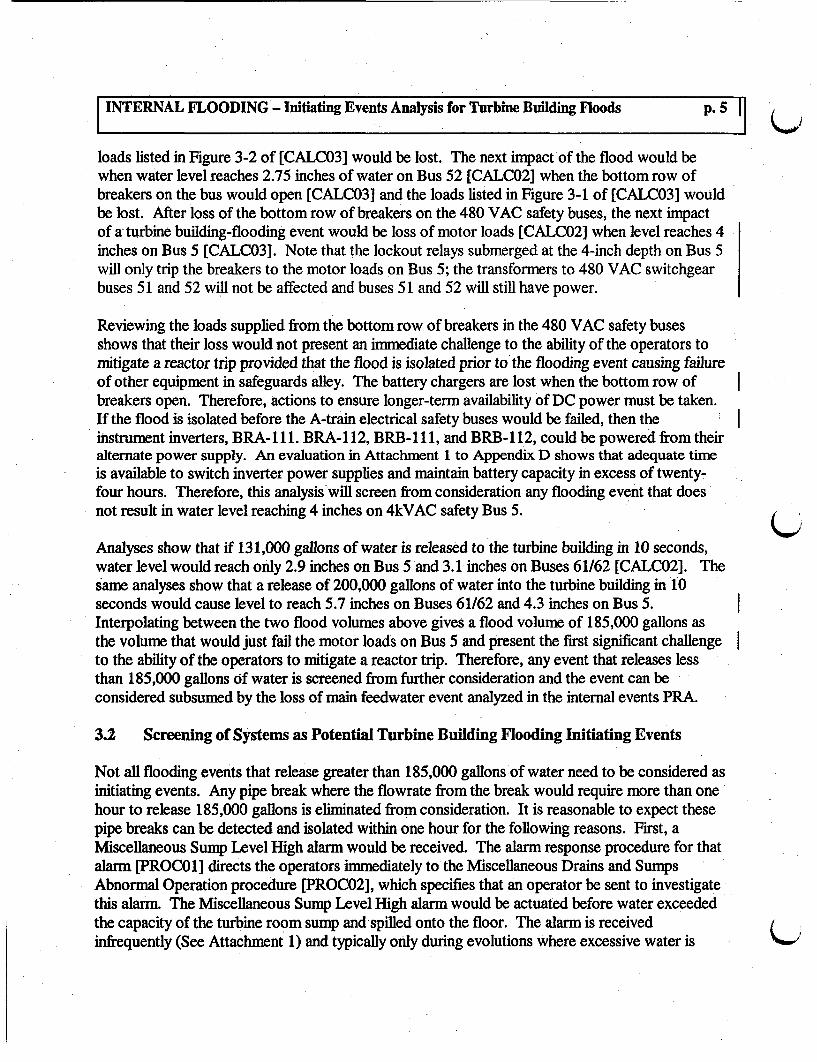
loads listed in Figure 3-2 of [CALC03] would be lost. The next impact of the flood would bewhen water level reaches 2.75 inches of water on Bus 52 [CALC02] when the bottom row ofbreakers on the bus would open [CALC03] and the loads listed in Figure 3-1 of [CALC03] wouldbe lost. After loss of the bottom row of breakers on the 480 VAC safety buses, the next impactof a turbine building-flooding event would be loss of motor loads [CALC02] when level reaches 4inches on Bus 5 [CALC03]. Note that the lockout relays submerged at the 4-inch depth on Bus 5will only trip the breakers to the motor loads on Bus 5; the transformers to 480 VAC switchgearbuses 51 and 52 will not be affected and buses 51 and 52 will still have power.
Reviewing the loads supplied from the bottom row of breakers in the 480 VAC safety busesshows that their loss would not present an immediate challenge to the ability of the operators tomitigate a reactor trip provided that the flood is isolated prior to the flooding event causing failureof other equipment in safeguards alley. The battery chargers are lost when the bottom row ofbreakers open. Therefore, actions to ensure longer-term availability of DC power must be taken.If the flood is isolated before the A-train electrical safety buses would be failed, then theinstrument inverters, BRA-111. BRA-112, BRB-l11, and BRB-112, could be powered from theiralternate power supply. An evaluation in Attachment 1 to Appendix D shows that adequate timeis available to switch inverter power supplies and maintain battery capacity in excess of twenty-four hours. Therefore, this analysis will screen from consideration any flooding event that doesnot result in water level reaching 4 inches on 4kVAC safety Bus 5.
Analyses show that if 131,000 gallons of water is released to the turbine building in 10 seconds,water level would reach only 2.9 inches on Bus 5 and 3.1 inches on Buses 61/62 [CALC02]. Thesame analyses show that a release of 200,000 gallons of water into the turbine building in 10seconds would cause level to reach 5.7 inches on Buses 61/62 and 4.3 inches on Bus 5.Interpolating between the two flood volumes above gives a flood volume of 185,000 gallons asthe volume that would just fail the motor loads on Bus 5 and present the first significant challengeto the ability of the operators to mitigate a reactor trip. Therefore, any event that releases lessthan 185,000 gallons of water is screened from further consideration and the event can beconsidered subsumed by the loss of main feedwater event analyzed in the internal events PRA.
3.2 Screening of Systems as Potential Turbine Building Flooding Initiating Events
Not all flooding events that release greater than 185,000 gallons of water need to be considered asinitiating events. Any pipe break where the flowrate from the break would require more than onehour to release 185,000 gallons is eliminated from consideration. It is reasonable to expect thesepipe breaks can be detected and isolated within one hour for the following reasons. First, aMiscellaneous Sump Level High alarm would be received. The alarm response procedure for thatalarm [PROC01] directs the operators immediately to the Miscellaneous Drains and SumpsAbnormal Operation procedure [PROC02], which specifies that an operator be sent to investigatethis alarm. The Miscellaneous Sump Level High alarm would be actuated before water exceededthe capacity of the turbine room sump and spilled onto the floor. The alarm is receivedinfrequently (See Attachment 1) and typically only during evolutions where excessive water is U

INTERNAL FLOODING - Initiating Events Analysis for Turbine Building Floods p. 6
being directed to the sump. From [PROC02] the operators would enter the appropriate abnormaloperating procedure for the affected system.
For a system with a nominal pressure of 100 psig, a break with a three-inch equivalent diameter ina 4-inch line would result in a flow rate of 2100 gpm and a 3-inch equivalent diameter break in a6-inch line would result in a flow rate of 1800 gpm (See Addendum 1 for details of the associatedflow calculations). These flow rates are what would be expected from a sharp orifice-like break ina pipe and do not include any flow reduction that may occur due to head losses in the pipe fromthe pump to the break. With these flow rates, 88 and 102 minutes respectively would be availablefor the operators to isolate the break before equipment in safeguards alley would be threatened tothe point that the ability of the operators to mitigate a reactor trip would be seriously challengedby the failure of Bus 5 motor loads. For lines smaller than 4-inches, the release rate would be,much less, allowing significantly longer than one hour to isolate the break.The service watersystem supply headers are maintained at a nominal pressure of between 90 and 100 psig[REPORT06]. The service water return lines operate at a lower pressure, but will be assumed tooperate at the same pressure as the supply headers. The fire protection system, when in standby ismaintained at a pressure between 128 and 143 psig [REPORT01l].
Although the volume of the potable water and service water pre-treatment systems is essentiallyunlimited, the systems contain only small-diameter lines and operate at pressures generally lowerthan 100 psig. A break in these systems would be expected to result in a release rate that wouldallow significantly longer than one hour to isolate the break. Therefore, these systems areeliminated from further consideration as causing a negligible increase in flooding risk.
The turbine oil systems contain less than 185,000 gallons and, therefore, are eliminated fromfurther consideration.
The reactor makeup storage tanks have a maximum capacity of 80,000 gallons and, therefore, areeliminated from further consideration.
The condensate storage tanks (CSTs) have a maximum capacity of 150,000 gallons and,therefore, are eliminated from further consideration.
Therefore, all systems except the circulating water, fire protection water, service water, and high-energy line breaks (HELBs) that result in fire protection water system actuation are screened fromconsideration as flooding sources.

INTERNAL FLOODING - Initiating Events Analysis for Turbine Building Floods p.7 7 i
Turbine Missile-Induced Flooding Events
A flooding event could be caused if failure of the turbine generates a missile which then impactsand fails a system capable of causing a significant flooding event. An evaluation of turbine missileeffects is presented in Appendix B.9 of the Kewaunee Power Station (KPS) Updated SafetyAnalysis Report (USAR) and is used as the basis for this analysis.
The probability of turbine missile generation due to fatigue has been determined to be much lessthan L.OE-08. For stress corrosion, the probability of failure and missile generation by the originallow-pressure turbine rotors is determined to be 1.64E-03 at rated speed and 1.49E-05 foroverspeed [CALC05]. Note that the latter value is lower than the former because the latterincludes the probability of the overspeed condition. The total probability of turbine missilegeneration is the sum of these two values or:
PTMSS = PMissWtate + PMissOver
PTtm = 1.64E-03 + 1.49E-05
PTOm = 1.65E-03
These failure probability values are based on a five-year inspection interval so the frequency of (_)turbine missile generation is determined as follows:
FToliSS = PToteMiss / 5 years
FTOtMiSS= 1.65E-03 / 5 years
From.SS = 3.30E-04 per year.
Since the performance of the analysis that generated the above values, the low-pressure rotorshave been replaced. As stated in USAR section 9.1, the probability of failure of the new rotors isless than the original rotors so the frequency calculated above is bounding for the current plantconfiguration.
Given that a turbine missile is generated, the probability that it impacts and fails a system capableof causing a significant flood must be considered. Missiles that occur on the operating deck mayresult in a steam release and could potentially impact the feedwater piping located on thesouthwest side of the building. Analyses [CALC06] have concluded that steam breaks on theturbine operating deck do not actuate sufficient fire protection sprinkders to present a floodingconcern. Therefore, a turbine missile that impacts steam pipe on the operating deck does notpresent a flooding concern.

I INTERNAL FLOODING - Initiating Events Analysis for Turbine Building Floods p. 8 l
The feedwater piping on the operating deck is located on the southwest end of the building acrossfrom the southernmost low-pressure turbine. Between the turbine and feedwater piping is amoisture separator reheater (MSR), steam piping, and building structural supports. Only a verysmall portion of the piping could be impacted by a turbine missile that does not first impact theintervening equipment and structures. Assuming that a missile that impacts the interveningequipment will not cause failure of the feedwater piping on the operating deck, it is estimatedbased on visual inspections that only 5% of the missiles would be capable of impacting thefeedwater piping. Assuming that all turbine missiles that impact the feedwater piping cause failureof the piping and actuate fire protection sprinklers, the frequency of such events is:
(3.30E-04 per year) * 0.05 = 1.65E-05 per year.
As described above, this frequency is bounding because the probability of failure for the newrotors is less than that of the old rotors on which these values are based. Also, this value assumesthat all missiles that impact the feedwater piping penetrate the piping. Therefore, the frequency ofturbine-missile-induced failures of feedwater piping on the operating deck would be negligible.
Turbine missiles that exit below the turbine shaft would be stopped by the concrete turbinesupport structure or imbedded in the condenser structure itself. Given the physical configurationof the turbine support structure and the condenser, a turbine missile would need to exit downward
(J at a near vertical trajectory to imbed in the condenser. In doing so, the missile would contact thein-condenser feedwater heaters prior to contacting the circulating water tubes. If the missile didcontact the circulating water tubes, such a failure would allow flow of circulating water back tothe lake. Therefore, it is concluded that the flooding risk posed by turbine missiles that exit belowthe turbine rotor is considered negligible.
As described above, a conservative analysis of turbine-generated missiles concludes that thefrequency of flooding events initiated by turbine missiles is sufficiently small as to be excludedfrom further analysis.
Tornado-Induced Flooding Events
Flooding events in the Turbine Building potentially could be initiated by the occurrence of atornado which could fail systems either directly by wind loading or indirectly by causing atornado-induced missile to impact and perforate a fluid system. Unlike random pipe failureswhere only a single system failure is considered at a time, a tornado could affect multiple systemssimultaneously, thereby increasing the resulting flood height.
As described above, all systems except the circulating water, fire protection water, service water,and high-energy line breaks (IELBs) were screened from consideration as flooding sources. Thesystems were screened from consideration either because they contained insufficient inventory to
- damage equipment outside of the turbine building or because the flow rate that would result fromany break would be low enough so that a very long time would be available for operator action to

INTERNAL FLOODING - Initiating Events Analysis for Turbine Building Floods p. 9
isolate any flooding event prior to equipment damage outside the Turbine Building.
The screening of systems above is still valid with two exceptions; the condensate storage tanks(CSTs) and the reactor makeup storage tanks (RMSTs). When considered individually, thevolume for each of these two sources is low enough that a flood which released their contentscould not damage enough equipment outside the Turbine Building to seriously impair the abilityof the operators to mitigate a reactor trip. Because the two sources are located near each other, atornado could cause near simultaneous failure of all the tanks.
The primary flood risk in a tornado is due to a failure of the RMSTs and the CSTs in the tankroom to the south of the auxiliary building. [CALC07] shows that the RMSTs would fail at lowerwind loads than the CSTs. The capacity of each RMST is 40,000 gallons. Although some watercould spill to other locations, such as outside, the maximum amount of water released from bothRMSTs is 80,000 gallons. As discussed above, at least 185,000 gallons must be deposited in theturbine building basement to result in equipment failures in safeguards alley. Therefore, windssevere enough to fail the RMSTs, but not the CSTs, would not result in a significant risk increase.Since the combined capacity of the CSTs is 150,000 gallons, there is a potential of damage to
equipment in safeguards alley due to flooding from the combination of the four tanks.
[CALC08] shows that the frequency of CST damage due to direct tornado impact is 6.7E-7 peryear. This reference also includes a discussion of tornado missiles. Specifically, the documentstates that tornado missiles are not a concern with wind speeds below 212 mph, whichcorresponds to an exceedance frequency of 7. 1E-6 per year. It also points out that most missileswould hit the upper portion of the tank, resulting in less that the full 150,000 gallons beingreleased into the basement. Furthermore, for a missile to puncture the tank, the pipe must strikethe tank nearly end-on along a radial line of the tank diameter. Any object that strikes slightly offnormal or off the radial line would not be expected to penetrate the tank, but rather would beexpect to glance off the tank without perforating it. Of the potential missiles that come withinstriking distance of the CST, only a fraction of them would be expected to strike the tank in sucha manner as to be able to penetrate the tank. Therefore, the frequency of a tornado missilecausing a flood of greater than 185,000 gallons of water to enter the turbine building basement isnegligible.
Tornado-induced failure of the circulating water system is considered unlikely for several reasons.First, the majority of the piping is located in the basement under the main turbine. The turbine
building is designed such that it will not collapse (although the panels may fail) following atornado so it is unlikely that the piping would be failed directly by the tornado. Secondly, thecirculating water pumps are powered from the non-safety buses which require offsite power. It islikely that a tornado severe enough to threaten the circulating water piping would also cause aloss of offsite power, thereby removing the motive force for system flow and stopping the flood.Third, tornado missile-induced failure is unlikely. A tornado missile risk analysis of the KewauneePower Station (KPS) was performed using the TORMIS methodology [CALC09]. In that study,the yearly probability of a tornado missile hitting either the diesel oil day tank vents, diesel exhaust

INTERNAL FLOODING - Initiating Events Analysis for Turblni Building Floods p. 10 I
stacks, or the turbine-driven auxiliary feedwater pump exhaust pipe is 9.5E-06 per year and theprobability of damaging one of the targets 1.7E-06 per year. These values are dominated by theconcrete paver blocks located on the Turbine Building roof. Since all the circulating water pipingis located below the turbine operating deck and, therefore, protected from such missiles, it isconcluded that the tornado missile-induced failure probability is negligible.
The fire protection water header is located entirely in the Turbine Building basement, belowgrade. Several branch lines do extend to the mezzanine level to deluge valves and otherequipment supporting system operation. Once on the mezzanine level, piping size reducesquickly. Only very short lengths of small-diameter piping to hose stations are located on theoperating deck. As with the circulating water system, the fire protection water piping would beprotected from direct failure in a tornado because of the ability of the Turbine Building to remainstanding following such an event. The failure of fire protection water piping by missile impact isconsidered to be much lower than that calculated in [CALC07] and discussed above. Therefore,it is concluded that the risk from fire protection water flooding events initiated by tornados isnegligible.
As with the fire protection water system, the majority of service water piping is located in theTurbine Building basement, below grade. No service piping is located on the operating deck.Service water piping located on the mezzanine level is generally smaller in size, e.g., less than sixinches nominal pipe size. Because the Turbine Building is designed to not collapse under tornadowinds, direct failure of the service water piping is not expected. Failure of service water pipingdue to missile impact is considered to be a negligible contribution to risk as discussed above.Also, the turbine header isolation valves would be available to isolate the Turbine Building headerfollowing a tornado. Therefore, it is concluded that the risk from service water flooding eventsinitiated by tornados is negligible.
For a tornado to cause a IRELB, the event must first expose the Turbine Building to the outsidewinds. Because the Turbine Building contains blowout panels that are designed to fail, it is likelythat the building would be open to the outside winds. The analysis of sprinkler actuation due toBELB [CALC06] shows that Turbine Building temperatures are reduced rapidly once theblowout panels fail. For a tornado-induced HELB, the blowout panels would fail prior to theBELB and the tornado winds would help mitigate any temperature rise caused by steam release.Therefore, the number of sprinklers actuated for any HELB caused by a tornado would be muchless than a similar size break initiated internally to the Turbine Building. Also, feedwater,condensate, and steam piping of concern to flooding events is designed for very high pressuresand, therefore, much less likely than the diesel exhaust stacks to be damaged by tornado missiles.Therefore, it is concluded that the risk from tornado-induced HELBs that actuate the fireprotection system is negligible.
3.3 Identification of Systems as Potential Flooding Sources

INTERNAL FLOODING - Initiating Events Analysis for Turbine Building Floods p. 11
For piping in the turbine building, only the service water, circulating water, and fire protectionwater contain sufficient volume or lines large enough to release fluid to the point that equipmentin safeguards alley would be threatened in less than one hour. As described above, all othersystems were screened as negligible contributors to flooding risk. Further analysis of thesesystems as potential flooding initiators is given in the sections that follow.
3.3.1 Service Water Flooding Events
This initiating event will assume that all service water piping in the turbine building is suppliedfrom the 20-inch turbine building header and is downstream of motor-operated valves SW-4A andSW-4B. There is service water piping that is in the turbine building but is not supplied from theturbine building header. Examples include auxiliary feedwater pump room cooler return lines tothe standpipe, diesel cooling return lines, and air compressor cooling lines. With the exception ofthe diesel cooling return lines, piping in the turbine building that is not supplied from the turbinebuilding header is small, e.g., 1.5-inches or less. Any leak from such lines would result in a lowflow rate thereby providing the operators with a long time period to isolate the break usingmanually-operated valves local to the component. The diesel cooling return lines are normallyisolated so any break in those lines would not result in a flooding event.
As discussed in Section 3.2, service water lines with a nominal diameter of less than four incheswould not release of sufficient water in one hour to threaten enough equipment in safeguards alleythat accident mitigation would be significantly impaired. Therefore, only breaks in service waterlines four inches or greater are considered as potential initiating events.
3.3.2 Circulating Water Flooding Events
A break from the circulating water system could result in the release of a very large amount ofwater in a short period of time. Calculations [CALC10] show that rupture of an expansion jointon the circulating water supply lines could be expected to release up to 58,000 gpm of flow.Because the pressure on the return lines is less and because gravitational effects would tend todirect flow to the return header, a break in the circulating water return lines would release lessflow to the turbine building. A rupture of an expansion joint on the circulating water return linescould be expected to release up to 14,000 gpm to the Turbine Building basement [CALCIO].Because there is significant difference in the rate of release for the two locations, a large break ineach location is considered as a unique initiating event. A break of the piping will be assumed toresult in the same flow rate as the largest flow from a rupture of the expansion joint. In additionto the largest break sizes, an expansion joint rupture that results in less than the maximum flow isconsidered. For circulating water expansion joint ruptures less than the maximum flow, breaksizes which lead to ruptures with leak flows between 2,000 and 10,000 gpm are considered.

INTERNAL FLOODING - Iniiaftg Events Analysis for TurbineBulilding Floods p. 12
3.3.3 Fire Protection Water Flooding Events
The flooding event could be caused by an uncontrolled release of water from the fire protectionsystem either because of a random break in the system or as a consequential release caused by ahigh energy line break (HELB). As discussed in Section 3.2, fire protection water lines with anominal diameter of less than four inches would not release sufficient water in one hour tothreaten equipment in safeguards alley. Therefore, only random breaks in fire protection waterlines four inches or greater are considered as potential initiating events.
A HELB could raise temperatures in the Turbine Building to the point that fire protectionsprinklers or deluge systems actuate. If a large number of sprinklers actuate, the potential existsto threaten equipment in safeguards alley. Breaks in the feedwater or condensate lines release alarge quantity of water to the Turbine Building in addition to actuating fire protection systems.Breaks in the steam systems do not result in an appreciable quantity of water being released to theTurbine Building. Therefore, steam line breaks are considered separately from feedwater andcondensate line breaks.
Steam Line Breaks
Analyses show that steam line breaks greater than nine inches equivalent diameter and upstreamof the turbine building throttle valves will result in a safety injection (SI) signal [CALC06].Because a SI signal inhibits operation of the fire pumps [REPORTOI], large breaks in the mainsteam system can be excluded as initiating events. In addition, the same analyses show that steamline breaks on the operating deck of the turbine building and-less than nine-inches in diameter willnot actuate any fire sprinklers. Therefore, all steam lines on the operating deck can be excludedas initiating events.
For steam line breaks below the operating deck, calculations show that breaks smaller than twoinches equivalent diameter actuate no fire protection sprinklers [CALC06], however, for thehighest pressure main steam lines, i.e., upstream of the turbine throttle valves, a three-inchequivalent diameter break will actuate enough sprinlders that the fire pumps can be assumed to beproviding full flow to the system.
For the extraction steam supply to the 15 feedwater heaters, a four-inch equivalent diameter breakwould actuate about 100 sprinklers while a six-inch or larger break would actuate enoughsprinklers that the fire pumps can be assumed to be providing full flow to the system.
After steam exits the high-pressure turbine, a four-inch equivalent diameter break would actuateno fire protection systems while a six-inch break would actuate about 100 sprinlders.
Based on these results, two initiating events are analyzed for flooding events. The first is a steamX ,line break that actuates enough fire sprinlders to result in full flow from both fire pumps to the
Turbine Building. This event includes any break upstream of the turbine throttle valves with an
INTERNAL FLOODING - Initiating Events Analysis for Turbine Building Floods p. 13 |j
I I
equivalent diameter less than nine inches but greater than two inches, any break in the extractionsteam line greater than six inches, and any break in a line after exiting the high-pressure turbinewith an equivalent diameter of six inches or greater.
The second event is a steam line break that actuates approximately 100 sprinlders. The TurbineBuilding HELB models show that 100 sprinklers is representative of moderate releases. Thisevent includes breaks in the extraction steam lines with an equivalent break size between two andsix inches, and breaks in a line after exitipg the high-pressure turbine and having an equivalentdiameter of two to six inches.
Feedwater and Condensate Line Breaks
This event initially considers breaks in any pipe containing main turbine working fluid abovesaturation conditions and includes all piping from the outlet of second feedwater heaters (12A and12B). Analyses show that breaks upstream of the fourth feedwater heaters (14A and 14B) do notactuate any fire protection systems [CALC06]. In addition, the volume of water released fromsuch breaks is less than the 185,000 gallons needed to threaten any equipment in safeguards alley.Therefore, all breaks upstream of the fourth feedwater heaters can be excluded from further
consideration.
For piping between the 14 and 15 feedwater heaters, breaks smaller than four inches equivalent C)diameter actuate no sprinklers. A six-inch equivalent diameter break in these lines would actuateabout 100 sprinklers and a nine-inch equivalent break would actuate enough sprinklers that thefire pumps can be assumed to be providing full flow to the system.
For piping after the 15 feedwater heaters, a two-inch or smaller equivalent diameter break wouldactuate no fire protection systems. A four-inch break would actuate enough sprinklers that thefire pumps can be assumed to be providing full flow to the system
Based on these results, two initiating events are analyzed for flooding events. The first is afeedwater or condensate line break that actuates enough fire sprinkders to result in full flow fromboth fire pumps to the Turbine Building. This event includes any break between the 14 and 15feedwater heaters with an equivalent diameter of greater than six inches or any break downstreamof the 15 feedwater heaters with an equivalent diameter greater than two inches.
The second event is a feedwater or condensate line break that actuates approximately 100sprinklers. The Turbine Building HELB models show that 100 sprinlders is representative ofmoderate releases. This event includes breaks in the lines between the 14 and 15 feedwaterheaters with an equivalent diameter between four and six inches.

INTERNAL FLOODING - Initiating Events Analysis for Turbine Building noods Ip. 1 4 I|
3.3.4 Summary of Turbine Building Internal Flooding Events
For internal flooding events in the turbine building, nine different initiating events have beendefined for further analysis. The first is a break in the service water system in the TurbineBuilding and having an equivalent diameter of greater than four inches. The second event is abreak in the circulating water supply lines. The third is a break in the circulating water returnlines. The fourth is a circulating water break between 2,000 and 10,000 gpm. The fifth is arandom break in fire protection water piping with the break having an equivalent diameter ofgreater than four inches. The sixth is a steam line break that actuates enough fire sprinklers toresult in full flow from both fire pumps to the Turbine Building. The seventh is a steam line breakthat actuates approximately 100 fire sprinklers. The eighth is a feedwater or condensate linebreak that actuates enough fire sprinklers to result in full flow from both fire pumps to theTurbine Building. The ninth is a feedwater or condensate line break that actuates approximately100 fire sprinklers.
3.4 Quantification of Internal Flooding Initiating Event Frequencies
Quantification of the initiating event frequency for each of the nine events discussed above isperformed in the following sections. Described within each section is the source of data used forsystem break frequency determination and how that data was used to calculate the initiating eventfrequency.
3.4.1 Service Water-Initiated Flooding Events
To determine the frequency of service water-initiated flooding events, the frequency of pipebreaks is calculated using the methodology presented in EPRI TR 102266, "Pipe Failure StudyUpdate", April 1993 [REPORT02]. Newer data sources that can be used to determine internalflooding initiating event frequency values have recently been published, i.e., EPRI TR 1012302,"Pipe Rupture Frequencies for Internal Flooding Probabilistic Risk Assessments (PRAs),"[REPORT04]. However, service water initiating event frequency values calculated using the dataand methodology of [REPORT04] are not expected to be significantly different from thosecalculated using [REPORT02]. Generally, it is expected that lower initiating event frequencyvalues will result if calculated using [REPORT04] instead of [REPORT02]. In addition, the pipesegment data needed to calculate initiating event frequency values using the methodology of[REPORT02] is already available. A significant effort would be needed to determine the pipelength data needed to employ the methodology of [REPORT04]. In addition, service water-initiated flooding events have been shown in prior, scoping studies to be a small contribution tooverall risk from turbine building floods.
Therefore, the frequency of service water-initiated flooding events will be calculated using themethodology presented in [REPORT02].
Using that methodology, pipe breaks are categorized as large, medium, and small. A break in a
INTERNAL FLOODING - Initiating Events Analysis for Turbine Building Floods p.15||. .
large pipe will not always be categorized as large. There is a probability that a large pipe willhave a break in the medium or small category. Similarly, a medium pipe may have a break in thesmall category. When determining the frequency of breaks that result in the different categories,the recommended values from [REPORT02] will be used to determine the probability ofequivalent break sizes.
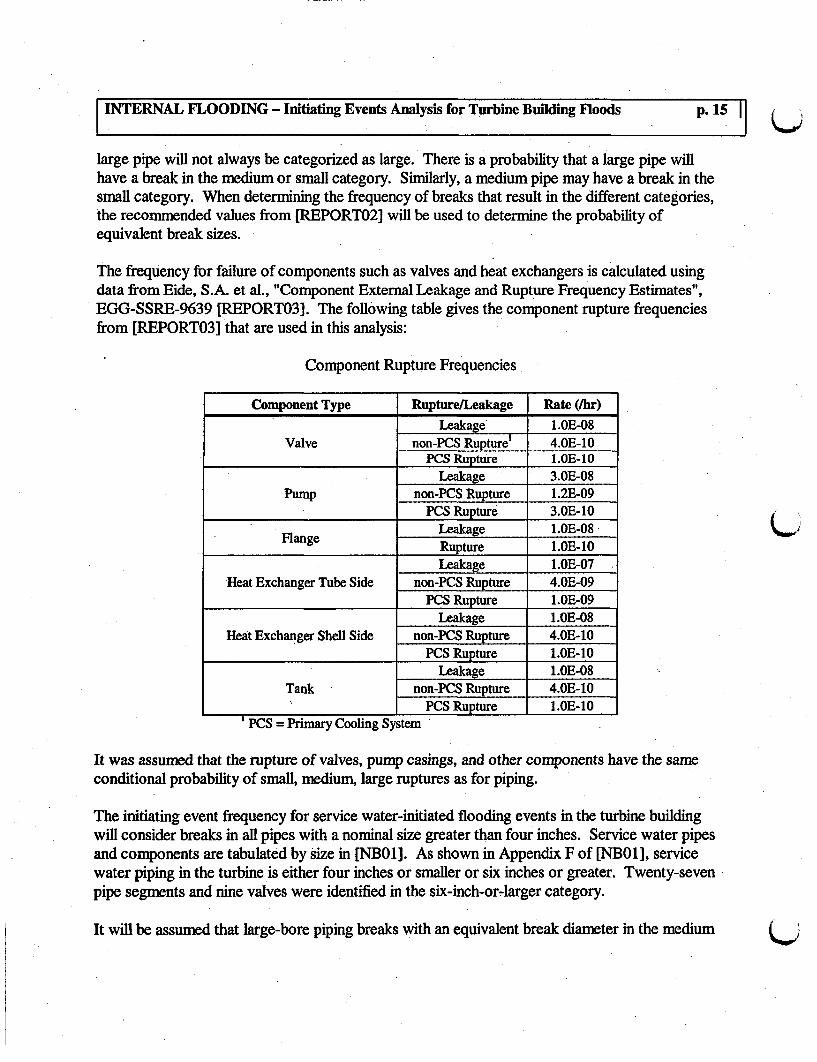
The frequency for failure of components such as valves and heat exchangers is calculated usingdata from Eide, S.A. et al., "Component External Leakage and Rupture Frequency Estimates",EGG-SSRE-9639 [REPORT03]. The following table gives the component rupture frequenciesfrom [REPORT03] that are used in this analysis:
Component Rupture Frequencies
Component Type Rupture/Leakage Rate (/hr)Leakage L.OE-08
Valve non-PCS Rupture' 4.OE-10PCS Rupture 1.OF10
Leakage 3.OE-08Pump non-PCS Rupture 1.2E-09
PCS Rupture 3.OE-10Leakage l.OE-08Rupture 1.OE-10Leakage 1.OE-07
Heat Exchanger Tube Side non-PCS Rupture 4.OE-09PCS Rupture L.OE-09
Leakage .OE-08Heat Exchanger Shell Side non-PCS Rupture 4.OE-10
-PCS Rupture L.OE-10Leakage .OE-08
Tank non-PCS Rupture 4.OE-10PCS Rupture L.OE-10
'PCS = Primary Cooling System
It was assumed that the rupture of valves, pump casings, and other components have the sameconditional probability of small, medium, large ruptures as for piping.
The initiating event frequency for service water-initiated flooding events in the turbine buildingwill consider breaks in all pipes with a nominal size greater than four inches. Service water pipesand components are tabulated by size in [NB01]. As shown in Appendix F of [NB01], servicewater piping in the turbine is either four inches or smaller or six inches or greater. Twenty-sevenpipe segments and nine valves were identified in the six-inch-or-larger category.
It will be assumed that large-bore piping breaks with an equivalent break diameter in the medium

INTERNAL FLOODING - Initiating Events Analysis for Turbine Building Floods p. 16 | |
(two-to-six-inch) category are not large enough to be of concern because breaks that size in large-bore piping have a sufficiently low flow rate to allow more time for recovery and, therefore, arenot included in the total frequency of service water flooding events. Therefore, the frequency oflarge service water initiated flooding events in the Turbine Building was calculated to be:
Fsw = Fswpi~e + Fswvaive
Fsw = ((27 pipe segments) * (1.39E-10 / pipe segment-hour) + (9 valves) * (4.0E-10 Ivalve-hour)) * 0.5 conditional probability of a large break [REPORT02]
Fsw = (3.75E-09 I hour + 3.6E-09 I hour) * 0.5
Fsw = 3.78E-09 / hour
Fsw = 3.22E-05 per year.
The contribution of maintenance-induced flooding events is considered negligible for severalreasons. First, the maintenance event must be such that the event breaches the service watersystem pressure boundary but still permits operation of the plant and the turbine building header.Actions such as cleaning heat exchanger water boxes could be performed. However, most valvesin the systems could not be breached without securing the entire header. Therefore, the frequencyof maintenance events is expected to be small. Second, the isolation valves for the service water-cooled heat exchangers are all manual valves located near the component being serviced. Shoulda breach of an unisolated component occur, the maintenance personnel would be able to quicklyisolate the leak.
3.4.2 Large Circulating Water Inlet Line-Initiated Flooding Events
Large flooding events from the circulating water system inlet lines could occur due to threecauses, failure of the expansion joints, rupture of the piping and components in the system, ormaintenance errors. The frequency of large failures, i.e., greater than 10,000 gpm, of expansionjoints is documented in Attachment 2, which provides a failure frequency of 6.08E-06 per yearper expansion joint. With four inlet expansion joints, the total frequency of expansion jointfailures is calculated to be:
FcWItEXP = 2.43E-05 per year.
As with service water-initiated flooding events, the frequency of system breaks (excludingexpansion joint breaks) is calculated using the methodology of [REPORT02]. Use of thismethodology over the newer methodology recently published in [REPORT04] is judged to beacceptable for the same reasons explained in Section 3.4.1.
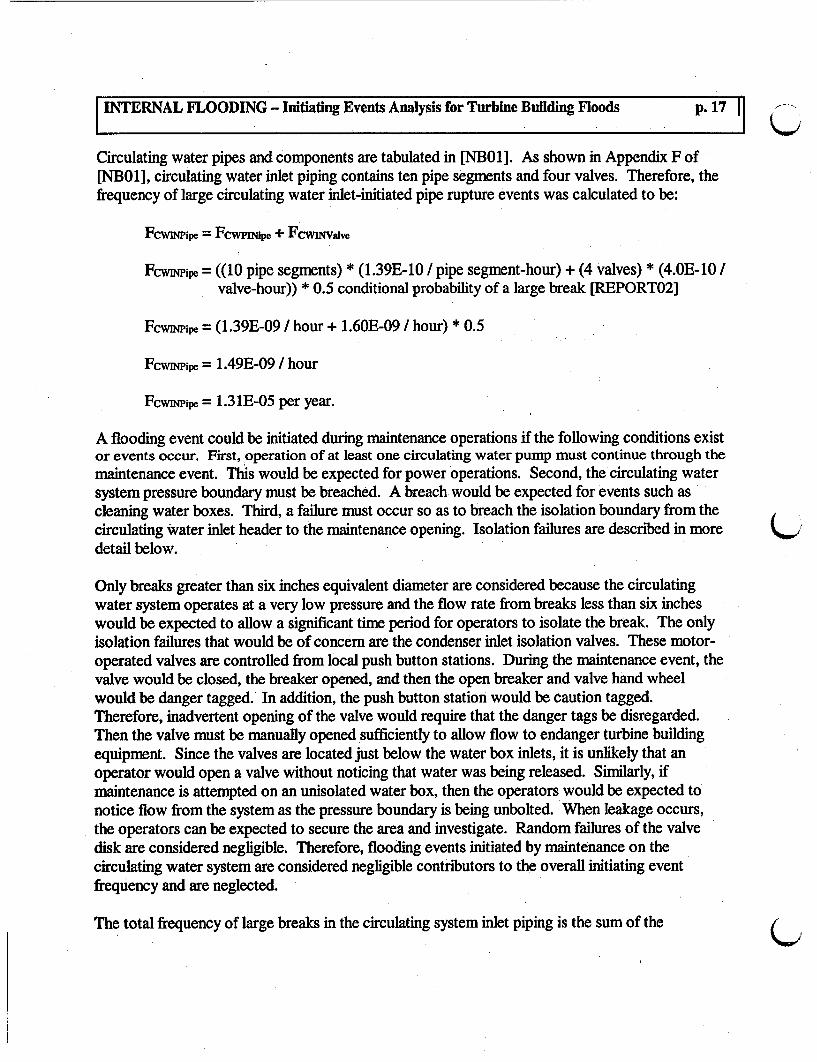
INTERNAL FLOODING - Initiating Events Analysis for Turbine Building Floods p. 17 |
Circulating water pipes and components are tabulated in [NB01]. As shown in Appendix F of[NBO1], circulating water inlet piping contains ten pipe segments and four valves. Therefore, thefrequency of large circulating water inlet-initiated pipe rupture events was calculated to be:
FcWINPipC = FcwpINipe + FCWINValve
Fcwmnpipe = ((10 pipe segments) * (1.39E-10 / pipe segment-hour) + (4 valves) * (4.OE-10 /valve-hour)) * 0.5 conditional probability of a large break [REPORT02]
FcwmNpipe = (1.39E-09 / hour + 1.60E-09 / hour) * 0.5
Fcwuipipe = 1.49E-09 / hour
FcwmNPipe = 1.31E-05 per year.
A flooding event could be initiated during maintenance operations if the following conditions existor events occur. First, operation of at least one circulating water pump must continue through themaintenance event. This would be expected for power operations. Second, the circulating watersystem pressure boundary must be breached. A breach would be expected for events such ascleaning water boxes. Third, a failure must occur so as to breach the isolation boundary from thecirculating Water inlet header to the maintenance opening. Isolation failures are described in moredetail below.
Only breaks greater than six inches equivalent diameter are considered because the circulatingwater system operates at a very low pressure and the flow rate from breaks less than six incheswould be expected to allow a significant time period for operators to isolate the break. The onlyisolation failures that would be of concern are the condenser inlet isolation valves. These motor-operated valves are controlled from local push button stations. During the maintenance event, thevalve would be closed, the breaker opened, and then the open breaker and valve hand wheelwould be danger tagged. In addition, the push button station would be caution tagged.Therefore, inadvertent opening of the valve would require that the danger tags be disregarded.Then the valve must be manually opened sufficiently to allow flow to endanger turbine buildingequipment. Since the valves are located just below the water box inlets, it is unlikely that anoperator would open a valve without noticing that water was being released. Similarly, ifmaintenance is attempted on an unisolated water box, then the operators would be expected tonotice flow from the system as the pressure boundary is being unbolted. When leakage occurs,the operators can be expected to secure the area and investigate. Random failures of the valvedisk are considered negligible. Therefore, flooding events initiated by maintenance on thecirculating water system are considered negligible contributors to the overall initiating eventfrequency and are neglected.
Q.-I
0..The total frequency of large breaks in the circulating system inlet piping is the sum of the

INTERNAL FLOODING - Initiatifg Events Analysis for Turbind Building Floods p. 18 |j
frequency of expansion joint ruptures and the frequency of large pipe ruptures, or,
FcwiN = FcwmNEp + Fcwmnwipe.
FcwIN = 2.43E-05 per year + 1.3 1E-05 per year
FcwIN = 3.74E-05 per year.
3.4.3 Large Circulating Water Outlet Line-Initiated Flooding Events
Flooding from the circulating water system outlet lines could occur due to three causes, failure ofthe expansion joints, rupture of the piping in the system, or maintenance errors. Failure ofexpansion joints used the information from Attachment 2 that provided a failure frequency of6.08E-06 per year per expansion joint for failures with flow greater than 10,000 gpm. With fouroutlet expansion joints, the total frequency of expansion joint failures is calculated to be:
Fcwoumexp = 2.43E-05 per year.
As with service water-initiated flooding events, the frequency of system breaks (excludingexpansion joint breaks) is calculated using the methodology of [REPORT62]. Use of thismethodology over the newer methodology recently published in [REPORT04] is judged to beacceptable for the same reasons explained in Section 3.4.1.
Circulating water pipes and components are tabulated in [NBO1]. As shown in Appendix F of[NBO1], circulating water outlet piping contains eight pipe segments but no components otherthan the expansion joints discussed above. Therefore, the frequency of large circulating wateroutlet-initiated pipe rupture events was calculated to be:
Fcwournipe = ((8 pipe segments) * (1.39E-10 / pipe segment-hour)) * 0.5 conditionalprobability of a large break [REPORT02]
Fcwourpipe (I.IIE-09 / hour) * 0.5 ;,
Fcwiwpipe = 4.87E-06 per year.
A flooding event could be initiated during maintenance operations if the follow' conditions existor events occur. First, operation of at least one circulating water pump must c'bntinue through themaintenance event. This would be expected for power operations. Second, t'h circulating watersystem pressure boundary must be breached. A breach would be expected for vents such ascleaning water boxes. Third, a failure must occur so as to breach the isolation odndary from thecirculating water inlet header to the maintenance opening. Isolation failures are described in moredetail below.

INTERNAL FLOODING - Initiating Events Analysis for Turbine Building Floods p. 19
Only breaks greater than six inches equivalent diameter are considered because the circulatingwater system operates at a very low pressure and the flow rate from breaks less than six incheswould be expected to allow a significant time period for operators to isolate the break. The onlyisolation failures that would be of concern are the condenser inlet isolation valves. These motor-operated valves are controlled from local push button stations. During the maintenance event, thevalve would be closed, the breaker opened, and then the open breaker and valve hand wheelwould be danger tagged. In addition, the push button station would be caution tagged.Therefore, inadvertent opening of the valve would require that the danger tags be disregarded.Then the valve must be manually opened sufficiently to allow flow to endanger turbine buildingequipment. Since the valves are located just below the water box inlets, it is unlikely that anoperator would open a valve without noticing that water was being released. Similarly, ifmaintenance is attempted on an unisolated water box, then the operators would be expected tonotice flow from the system as the pressure boundary is being unbolted. When leakage occurs,the operators can be expected to secure the area and investigate. Random failures of the valvedisk are considered negligible. Therefore, flooding events initiated by maintenance on thecirculating water system are considered negligible contributors to the overall initiating eventfrequency and are neglected.
The total frequency of large breaks in the circulating system outlet piping is the sum of thefrequency of expansion joint ruptures and the frequency of large pipe ruptures, or,
FcwouT = Fcwoump + Fcwourmipe.
FcwouT = 2.43E-05 per year + 4.87E-06 per year
FcwouT = 2.92E-05 per year.
3.4.4 Small Circulating Water Expansion Joint Flooding Events
Flooding from the circulating water system could result in break flow rates less than the maximumused flow described above. Such events could occur in either the inlet or outlet lines. Because allpipe breaks are assumed to result in the maximum flow and the pipe break frequency is included inthe first two circulating water events, pipe breaks are not considered in this event. Therefore, thisevent considers only failures of the circulating water expansion joints that result in less than themaximum flow, which for this analysis is between 2000 and 10,000 gpm. (A 6000-gpm breakwas -deemed to be most representative of a small rupture.) The frequency for such events isdocumented in Attachment 2 which provides a failure frequency of 9.17E-06 per year perexpansion joint. With four inlet expansion joints and four outlet expansion joints, the totalfrequency of expansion joint failures is calculated to be:
Fcwap = 7.34E-05 per year.

INTERNAL FLOODING - Initiating Events Analysis for TurbinieBuilding Floods p. 20 |
3.4.4 Random Breaks in Fire Protection Water Piping
As with service water-initiated flooding events, the frequency of system breaks is calculated usingthe methodology of [REPORT02]. Use of this methodology over the newer methodologyrecently published in [REPORT04] is judged to be acceptable for the same reasons explained inSection 3.4. 1.
The initiating event frequency for random breaks in the fire protection water system considersbreaks in all pipes with a nominal size greater than four inches. Piping drawings for the fireprotection water system were reviewed and piping and components that are located in the turbinebuilding and that cause a flooding event of concern were tabulated by pipe size. The pipingtabulation in Addendum 2 identified 40 piping segments, 20 valves, and 26 flanges with a nominalsize greater than four inches. Assuming that fire protection water piping is classified in the "othersafety related" category used in [REPORT02], the frequency of fire protection water-initiatedflooding events is calculated to be:
FFPR = FFPPipe + FFPvaivC + FFipnge
FFPR = ((40 pipe segments) * (1.39E-10 / pipe segment-hour) + (20 valves) * (4.OE-10 Ivalve-hour) + (26 Flanges) * (1.OE-10 / flange-hour)) * 0.5 conditionalprobability of a large break [REPORT02I
FFPR = (5.56E-09 I hour + 8.OOE-09 I hour + 2.6E-09 I hour) * 0.5
FFPR = 8.08E-09 I hour
FR = 7.08E-05 per year.
It will be assumed that large-bore piping breaks with an equivalent break diameter in the two-to-six-inch category are not large enough to be of concern because breaks that size in large-borepiping have a sufficiently low flow rate to allow more time for recovery and are not included inthe total frequency of fire protection water flooding events.
The contribution of maintenance-induced flooding events is considered negligible for severalreasons. First, the maintenance event must be such that the event breaches the fire protectionwater system pressure boundary but still allows the system to be pressurized. There are very fewlarge-bore components that would permit such maintenance. Potentially, certain deluge valvescould be breached. Next, the maintenance must be such that the breach would allow flooding tocontinue undetected for a significant time period following any operator error that resulted in aninadvertent breach. For deluge valves in the fire protection system, their associated isolationvalve is immediately adjacent to the valve. Therefore, should a breach of an unisolatedcomponent occur, the maintenance personnel would be able to quickly isolate the leak. For these
INTERNAL FLOODING - Initiating Events Analysis for Turbine Building Floods p. 21 | |
reasons, the frequency of maintenance events to the fire protection flooding initiating eventfrequency is considered negligible.
3.4.5 Steam Line Breaks Causing Large Fire Protection System Actuations
The first step in determining the frequency of steam line breaks that cause large fire protectionsystem actuations is to determine the length and location of the steam pipes of concern. Pipinglayout drawings were reviewed and the dimensions indicated on them were used to determine the |length of steam pipes that are of concern to turbine building flooding events. Details of the pipelength data are listed in Addendum 3. Summing the lengths of high-pressure main steam pipinglocated on the mezzanine and basement levels gives a total of 884.6 linear feet of piping.Summing the lengths of extraction steam piping located on the mezzanine and basement levelsgives a total of 176.5 linear feet of piping. Summing the lengths of lower-pressure steam pipinglocated on the mezzanine and basement levels gives a total of 621.7 linear feet of piping. Allother steam piping was located either on the operating deck or in the Auxiliary Building. (Noteall of the steam piping tabulated is at least 6-inch diameter, and therefore of sufficient size to havethe break flow required for a large fire protection actuation.)
Because not all high-energy line breaks would result in a turbine building flooding event, aseparate analysis was performed to determine the frequency for steam line breaks of interest. Thisseparate analysis uses the data of [REPORT04] and is documented in [REPORT05]. Refer to C)[REPORT05], which is included as Attachment 3, for details of the calculations. From thatanalysis, the frequency of steam line breaks (including failures of valves, flanges, etc.) that resultin large fire protection system actuations, FSLBL, is:
FSLBL = 2.53E-04 per year
3.4.6 Steam Line Breaks Causing Intermediate Fire Protection System Actuations
Calculation of the frequency of this event is performed in [REPORT05] using the pipe length datadescribed in Section 3.4.5 for large steam line breaks. From [REPORT05], the frequency ofsteam line breaks (including failures of valves, flanges, etc.) that result in intermediate fireprotection system actuations, FSLBM, is:
FSLBM = 1.87E-05 per year
3.4.7 Feedwater and Condensate Line Breaks Causing Large Fire Protection SystemActuations
As discussed in Section 3.3.3, this event includes any break with an equivalent diameter greaterthan two inches in piping downstream of the 15 feedwater heaters and any break with anequivalent diameter greater than six inches between the 14 and 15 feedwater heaters.
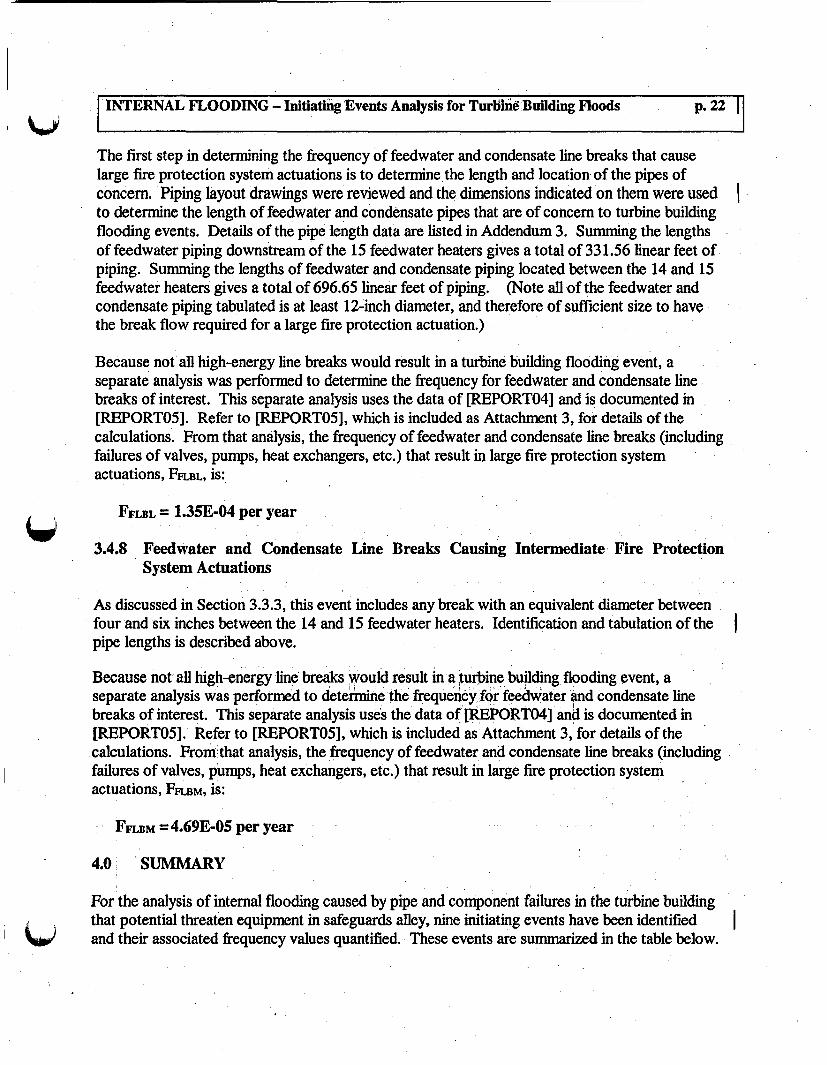
INTERNAL FLOODING - Initiating Events Analysis for Turbind Building Floods p. 22 |
The first step in determining the frequency of feedwater and condensate line breaks that causelarge fire protection system actuations is to determine the length and location of the pipes ofconcern. Piping layout drawings were reviewed and the dimensions indicated on them were usedto determine the length of feedwater and condensate pipes that are of concern to turbine buildingflooding events. Details of the pipe length data are listed in Addendum 3. Summing the lengthsof feedwater piping downstream of the 15 feedwater heaters gives a total of 331.56 linear feet ofpiping. Summing the lengths of feedwater and condensate piping located between the 14 and 15feedwater heaters gives a total of 696.65 linear feet of piping. (Note all of the feedwater andcondensate piping tabulated is at least 12-inch diameter, and therefore of sufficient size to havethe break flow required for a large fire protection actuation.)
Because not all high-energy line breaks would result in a turbine building flooding event, aseparate analysis was performed to determine the frequency for feedwater and condensate linebreaks of interest. This separate analysis uses the data of [REPORT04] and is documented in[REPORT05]. Refer to [REPORT05], which is included as Attachment 3, for details of thecalculations. From that analysis, the frequency of feedwater and condensate line breaks (includingfailures of valves, pumps, heat exchangers, etc.) that result in large fire protection system,actuations, FFLBL, is:
FFLBL = 1.35E-04 per year
3.4.8 Feedwater and Condensate Line Breaks Causing Intermediate Fire ProtectionSystem Actuations
As discussed in Section 3.3.3, this event includes any break with an equivalent diameter betweenfour and six inches between the 14 and 15 feedwater heaters. Identification and tabulation of thepipe lengths is described above.
Because not all high-energy line breaks would result in a turbine building flooding event, aseparate analysis was performed to determine the frequency for feedwater and condensate linebreaks of interest. This separate analysis uses the data of [REPORT04] and is documented in[REPORT05]. Refer to [REPORT05], which is included as Attachment 3, for details of thecalculations. From that analysis, the frequency of feedwater and condensate line breaks (includingfailures of valves, pumps, heat exchangers, etc.) that result in large fire protection systemactuations, FFLBM, is:
FFLBM =4.69E-0S per year
4.0 SUMMARY
For the analysis of internal flooding caused by pipe and component failures in the turbine buildingthat potential threaten equipment in safeguards alley, nine initiating events have been identifiedand their associated frequency values quantified. These events are summarized in the table below.

INTERNAL FLOODING - Initiating Events Analysis for Turbine Building Floods P.I3 LJ
Event Consequence Frequency(per year)
Random Releases a large flow of Service Water to the Turbine Building 3.22E-05ServiceWater BreakLarge Releases 58,000 gallons per minute to the Turbine Building 3.74E-05CirculatingWater InletPiping BreakLarge Releases 14,000 gallons per minute to the Turbine Building 2.92E-05CirculatingWater OutletPiping BreakSmall Releases 6,000 gallons per minute to the Turbine Building 7.34E-05CirculatingWaterExpansionJoint FailureRandom Fire Releases full flow from both fire water pumps to the Turbine 7.08E-05Protection BuildingWater BreakLarge Steam Actuates enough fire sprinklers that full fire protection water 2.53E-04Line Break flow is released to the Turbine BuildingIntermediate Actuates 100 fire sprinklers that release fire protection water 1.87E-05Steam Line flow is released to the Turbine BuildingBreakLarge Actuates enough fire sprinklers that full fire protection water 1.35E-04Feedwater or flow is released to the Turbine BuildingCondensateLine BreakIntermediate Actuates 100 fire sprinklers that release fire protection water 4.69E-05Feedwater or flow is released to the Turbine BuildingCondensateLine Break
. _
5.0 REFERENCES
[CALCO1] X-K-204-1696, Revised 4/5/1972.
[CALC02] MPR Calculation 064-0515-LYS-01, "Evaluation of Flooding Levels for Various

INTERNAL FLOODING - Initiating Events Analysis for Turbine Building Floods p.24 |
PRA Cases," Revision 0.
[CALC03]
[CALC05]
[CALCO6]
[CALC071
[CALC08I
[CALC09]
[CALC10]
[NBO1]
MPR Report 2823, "Past Operability Evaluation of Electrical Equipment Due ToFlooding in Kewaunee Nuclear Power Plant," Revision 2.
"Results of Probability Analyses of Disc Rupture and Missile Generation," CT-24108, Revision 0, August 1980, Westinghouse Electric Corporation.
MPR Calculation 0064-0509-DEC-03, Revision 0, "Turbine Building HELB FireProtection Actuation Analysis."
Stevenson & Associates Calculation CAL-002: Evaluation of CST and RMSTWind Load.
PRA Application 05-13: Core Damage Frequency due to Tornadoes DamagingCondensate Storage Tanks
"Tornado Missile Risk Analysis for Kewaunee Nuclear Plant," July 2005, AppliedResearch Associates, Inc.
MPR Calculation 0064-0011-SPK-1, Revision 1, "Postulated Leaks ThroughCirculating Water Expansion Joint."
KPS Internal Flooding Analysis "Qualitative Screening Assessment and FloodFrequency Development," SCIENTECH, LLC.
[MANKl] "CRANE Technical Paper No. 410, Flow of Fluids Through Valves, Fittings, andPipe", CRANE CO., 1988.
[PROC01l
[PROC02]
MDS-30, Annunciator Number 47033-P, "Miscellaneous Sump Level High," IRevision A, 5/28/1996.
A-MDS-30, Miscellaneous Drains and Sumps Abnormal Operation," Revision N,3/5/2002.
[REPORT01] KPS System Description, "Fire Protection System," Rev. 2.
[REPORT02] Electric Power Research Institute, EPRI TR 102266, "Pipe Failure Study Update,"April 1993.
INTERNAL FLOODING - Initiating Events Analysis for Turbine Building Floods p. 25
[REPORT03] Eide, S.A. et al., 1991, "Component External Leakage and Rupture FrequencyEstimates", EGG-SSRE-9639, INEL, November 1991.
[REPORT04] Electric Power Research Institute, EPRI TR 1012302, "Pipe Rupture Frequenciesfor Internal Flooding Probabilistic Risk Assessments (PRAs)," September, 2005.
[REPORT05] Fleming, K.N. et al, "High Energy Line Break Initiating Event Frequencies for theKewaunee PRA", October 2005.
[REPORT06] KPS System Description, "Service Water System," Rev. 3.
[REPORT07] Fleming, K. N. et al., "Expansion Joint Failure Rates for the Kewaunee PRA",Final Report, November 2005.
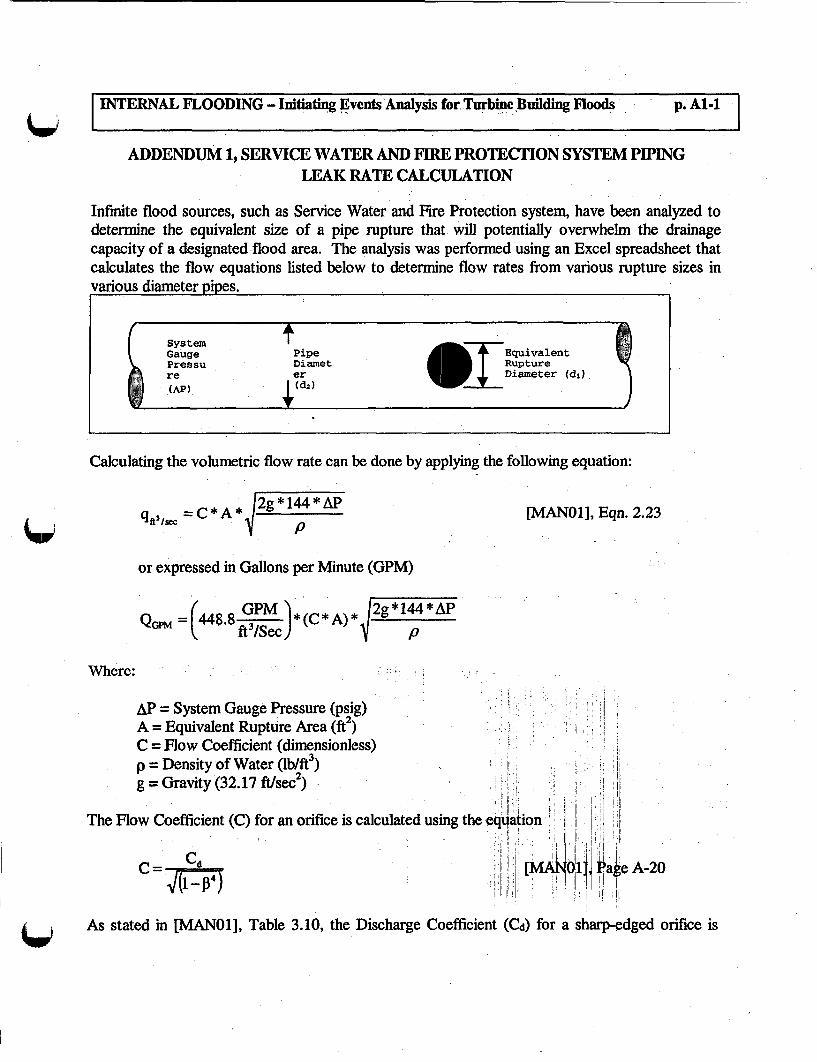
INTERNAL FLOODING - Initiating Events Analysis for TurbineBuilding Floods p. Al-1 I
ADDENDUM 1, SERVICE WATER AND FIRE PROTECTION SYSTEM PIPINGLEAK RATE CALCULATION
Infinite flood sources, such as Service Water and Fire Protection system, have been analyzed todetermine the equivalent size of a pipe rupture that will potentially overwhelm the drainagecapacity of a designated flood area. The analysis was performed using an Excel spreadsheet thatcalculates the flow equations listed below to determine flow rates from various rupture sizes invarious diameter pipes.
System _Gauge Pipe EquivalentPressu Diamet Rupturere er , Diameter (di(AP) ;(d2) _ '
Calculating the volumetric flow rate can be done by applying the following equation:
qft3,/. =C*A* 2g*l44*AP [MANO1], Eqn. 2.23
or expressed in Gallons per Minute (GPM)
QGPM (4 8 GPM *(C*A)* *144*APt=ft3 /Sec) p
Where:
AP = System Gauge Pressure (psig)A = Equivalent Rupture Area (ft2)C = Flow Coefficient (dimensionless)p = Density of Water (1b/ft3)g = Gravity (32.17 ft/sec2)
t
The Flow Coefficient (C) for an orifice is calculated using the equation
CdC = V11I!: I
. � ; I�, � �J
I � I IA�b &je A-20
. I1� I .
As stated in [MAN01], Table 3.10, the Discharge Coefficient (Cd) for a sharp-edged orifice is

INTERNAL FLOODING - Initiating Events Analysis for Turbine Building Floods p. A1-2 I C0.62.
The ratio of small to large diameter in an orifice (13) is defined as:
13= (dj)
(d 2 )[MANO11, Page A-20
For calculation of the flow rates from a ruptured Service Water System, the following constantsare used:
Piping Inside Diameters1" Standard Schedule 40 Pipe:2" Standard Schedule 40 Pipe:4" Standard Schedule 40 Pipe:6" Standard Schedule 40 Pipe:
1.049"2.067"4.026"6.065"
PressureNormal Service Water System Pressure (AP):
DensityWater Density at 540F: 62.39 1b/ft3Water Density at 740F*: 62.27 lb/ft3
[MANO1], Page B-16[MANO1], Page B-16[MANO1], Page B-16[MANO1], Page B-16
90-100 psig [REPORT06]
[MANO1], Page A-6[MANO1], Page A-6
0For calculation of the flow rates from a ruptured Fire Protection System, the following constantsare used:
PressureFire Protection System Pressure (AP) (standby):
DensityWater Density at 850F: 62.17 lb/ft3
128-143 psig [REPORT01]
[MAN01], Page A-6
The table below shows the resultant flow rates for various rupture sizes in pipes with diameters 1inch, 2 inch, 4 inch, and 6 inch for the service water and fire protection system pipes. Thecalculations used to develop the table used a pressure of 108 psig which is representative of theaverage pressure expected in both the service water and fire protection water systems. Since theflowrate is a function of the square route of the pressure, any differences on pressure have a minorimpact on the overall results.
QI1

f IC fIINTERNAL FLOODING - Initiating Events Analysis for Turbine Building Floods p.A1-31
'tTable Al-i: Fire Protection System Piping Rupture Flow Rates (Pressure = 108 psig @ 85 0F)
Pipe Equivalent Diameter Rupture Flow Rupture Flow
Inside Pipe Cross. Rupture Equivalent Ratio Beta Flow Rate Rate
Diameter Sectional Area Diameter Rupture Area Factor Coefflcient ,(q) Q
(in) (fe)(in) (ft_) (_)_(C) (ftsec) (GPM)
1 0.0060 0.50 0.0014 0.4766 0.6366 0.1101 49.4270
(ID 0 1.049) 0.75 0.0031 0.7150 0.7214 0.2808 126.0101
2 0.0233 0.50 0.0014 0.2419 0.6211 0.1074 48.2171
(ID = 2.067) 0.75 0.0031 0.3628 0.6254 0.2434 109.2536
0.90 0.0044 0.4354 0.6315 0.3539 158.8363
1.00 0.0055 0.4838 0.6377 0.4413 198.0387
1.50 0.0123 0.7257 0.7293 1.1355 509.6005
4 0.0884 0.50 0.0014 0.1242 0.6201 0.1073 48.1402
(ID = 4.026) 0.75 0.0031 0.1863 0.6204 0.2415 108.3678
0.90 0.0044 0.2235 0.6208 0.3479 156.1508
1.00 0.0055 0.2484 0.6212 0.4298 192.9053
1.50 0.0123 0.3726 0.6261 0.9747 437.4454
2.00 0.0218 0.4968 0.6398 1.7708 794.7316
3.00 0.0491 0.7452 0.7455 4.6425 2083.5477
6 02006 0.50 0.0014 0.0824 0.6200 0.1073 48.1356
(ID = 6.065) 0.75 0.0031 0.1237 0.6201 0.2413 108.3152
0.90 0.0044 0.1484 0.6202 0.3476 155.9935
1.00 0.0055 0.1649 0.6202 0.4292 192.6091
1.50 0.0123 0.2473 0.6212 0.9671 434.0229
2.00 0.0218 0.3298 0.6237 1.7263 774.7457
3.00 0.0491 0.4946 0.6394 3.9821 1787.1590
4.00 0.0873 0.6595 0.6885 7.6230 3421.2024
5.00 0.1364 0.8244 0.8452 14.6210 6561.8827

INTERNAL FLOODING - Initiating Events Analysis for Turbine Building Floods p. A2-1
ADDENDUM 2, FIRE PROTECTION PIPE SEGMENT TABULATION

C C CINTERNAL FLOODING - Initiating Events Analysis for Turbine Building Floods
I
p. A2-2I-
l
Table A2-1: Turbine Building Fire Protection Water Piping
IDto 6" 2D ' 0.5' Q- 1D 2targ Plpe Medlum P SIM" PlpeP ID Diameter From To Vohm Reno" From To Valve. Fle From To Valves
-r__ 1 WeltO53 ________ _ ___1___ _ _____ _ ________TU-t 10 Wait Tto FP 5-3TU-2 10 Tto FP 5-3 Tto FP 5-2 _TW-3 10 Tto FP 5-2 Tto FPS.4 54TU-4 10 Tto FP-4 tto FP 28-2 _TU-5 10 Tto FP 28-2 TtoFP 54TU16 10 Tto FP s Tto FP 5-6 _ -TU-7 10 Tto FP S FP1t1 -_*
at FP 1-1 Northto Turbine
T1 10 Dulidno Well Tto FP I5-1 IT at FP 1-1 South
1U4 10 to Tat FP 22-1 Tet FP 22-1 .T1-10 10 Tto FP 22-1 *TtoFPS-11TU-11 10 TtoFP5-11 TtoFP2S-1TU-12 10 TtoFP28-1 TtoFP3-6TU-13 10 Tto FP 3-6 Tto FP 3-5TU-14 10 Tto FP 3- Tto FP 3-4TiJ-15 10 T to FP 3-4 TtoFP"3 3TU-16 10 Tto FP 3-3 T to FP 3-2 _
10 to 64inchTU-17 10 Tto FP 3-2 reducerto FP 3-1TU118 2.5 _ Tto FP 5-3 FP 5-3 1 2
T to hoseTtJ119 2.5 _ FP 6-3 connection lines
T to hoseTU-20 1.5 . connection lines Up to FP 90-14 1
T to hoseTL1-21 1.5 connection lines down to FP 90.7 1TU-22 2.5 T to FP 5-2 FP 5-2 1 2TU-23 2.5 FP 5-2 Tto FP 90-4
Down to FP 90-T11-24 1.5 t to FP 9D-4 4
Up to Tto FP 90-125 2.5 _ to FP 9o-4 13 -= TF_ 3 ___91TU-28 1.5 __ ___ ____ ___ TtoFP90-13 FP 90-13 1 ___TU-27 1.5 _TtoFP90-13 uptoFP _90_3TU-28 2.5 t to FP -4 FP5-4 1 2
Strainer andTU-29 2.5 f P 5-4 Deluge Valve 2 4TU-30 8 Tto FP 28-2 FP 28-2 1 2TU-31 4 f FP 28-2 FP 56-1

INTERNAL FOODING - Initiating Events Analysis for Turbine Building Floods p. A2-3I. I
Table A2-1: Turbine Building Fire Protection Water Piping
ID 6 2 ID-cm I 0.5 M' ID - 2.Large Plpe Medium Plp Smsll Pipe
PRiAMI Dbmsetr Froml To V|lves P From To Volve.$ R. From To Valve. Fln.es
_____ _____ ________________ _______ I_ _ 561___tTC ___ __TU-32 4 FP 55-1 Wait to TSC
Tto MezzaNineSpdnkler Isolation
TU43 8 FP 28-2 ValveTto Mezzanine BasementSpdnkler Isolation Sprinider Isdation
__ T-34 a Vael V.ah1TW5 2.5 Tto FP 5-5 FP 5-5 1 2TW5-3 2.5 FP 5-5 RedcIng T .TU-37 1.5 Reducina T FP 90-9 1TW-38 2.5 Reducna T FP 90-15 1TW-39 1.5 . FP 90-15 FP-91-5 1TW-40 2.5 Tto FP 5-6 FP 5-6 1 2TU-41 2.5 FP 5-6 Tto FP 90-1OTU-42 2.5 Tto FP 90-10 Tto FP 90-16 ITU-43 1.5 _ Tto FP 90-16 Hose Station 21TW4 1.5 . Tto FP 90-10 FP 90-10TU-45 2 _ _ * _ . Tto FP 22-1 FP 22-1 1TW-6 2.5 Tto FP 5-11 FP 5-11 1 2
T to HoseTU1-47 2.5 FP 5-11 station 10 .
T to HoseTW-48 1.5 Station 10 Hose Station 10 I
T to HoseTW9 1.5 Station 10 Hose Staton 16 1TU-50 1.5 FP 5-11 Hose Station I 1TU-51 8 Tto FP 28-1 FP 28-1 1 2 :
Tto SprinklerTU-52 8 FP 28-1 Branch Unes ._.
BasementTto SpdnWler Sprinkler Isolation
TU-3 6 Branch Unes ValwTU-54 6 Tto FP 3-6 FP 19-6 2 2TU-55 6 Tto FP 34 FP 19-5 2 2 .TU4-6 6 Tto FP 3-4 FP 19-4 2 2TU-57 6 Tto FP 3-3 FP 19-3 2 2- 11-U8 6 Tto FP 3-2 FP 19-2 2 2TU-59 6 Elbow to FP 3-1 FP19 1 2 2T1U1-0 2.5 I TtoFP5-12 FP 5-12 1 2 .TU-61 2.5 I FPS-12 TtoFP90-2 .
C7 C C

C C
INTERNAL FLOODING - Initiating Events Analysis for Turbine Building Floods p. A2-4
Table A2-1: Turbine Building Fire Protection Water Piping
I 2 c.1D 6- 0.5 . 1D < 2_ _ _ _ _ _ LaMe Pipe Medium Pip __ _ __ _ __ _ _ _ _ __ _ _ Pipe_
PiphlD Diameter Fron To F Rs From To Valv Rlan From To LVa Fi_ __- ___-_ _ iTto FP 90-12
TU-62 2.5 Tto FP 90-2 and fP 90.17
Tto FP 9-12TU-63 1.5 and iP 90-17 iP 90-12 tTU644 1.5 _ TtoFP90-2 FP 90-2TU-65 6 _ _ Tto FP 90-17 FP 90-17 1
Tat column 8 thatTtoMezranine spIis to 3-inchSpdnider iaolation header and 5inch
ni4-66 6 Vaie Une 111= header 2 3_.T at column 8that splits to 3-Inch header and
1.1-67 5 5-inch header RiserT and Riser.
TU-68 5 Riser labeled 0 _Tand Riser T and dserto
TU-69 5 labeled 0 branch 317Tand dserto
TU-70 5 branch 317 Rlser labeiedK K__ _TU-71 5 Riser labeled K Riser labeled G .
BasementSprinklerIsolation Tto lines 21 and
IU-72 6 Valve 15 2 S :T to lines 21 and T to Riser labeled
1U-73 6 15 J
BasementSpwtnkier Isolation
TU-74 6 VaivW ine TU-53) T to dser labeled S 2 31.1-75 10 TtoFP15-1 TtoP 5-10
TU-76 10 Tto FP 5-10 Wail _TU-77 3 Tto iP 5-10 Wall 1 4TU-78 Z5 Tto fP 5-10 FP 23- 1- _- __Tu_____ 1 __ 2 1____ _
78 ToteIS 40 _ _ _ _ __ 20 26 22__ _ _ _ _ _ _ 15 26 16___ _ __ _ __ _ 13 0

INTERNAL FLOODING - Initiating Events Analysis for Turbine Building Floods p. A3-1 I
ADDENDUM 3, HIGH-ENERGY LINE PIPE LENGTH TABULATIONS

c -rINTERNAL FLOODING - Initiating Events Analysis for Turbine Building Floods p. A3-2
Table A3-1: High-Pressure Main Steam Piping
BLDG Dwg. No. I Building Level Drawing Coordlnates/Deseriptlon Detail I HorizJVert. PipeLengt Clued#,Letter(floorD I I Dla fin% I IranII /A--I. I 1 I-ng C I nlen n lc
Aux M-238 MOA- 1to 9I0 BMndMS1A to 90 Band
JII1V IFLu IV onILz.
Aux M-238 62Z-0"' 30 A3 - "lA" Train MS Piping from 900 Horiz 16.52 6S, MBend to 90° Bend I
Aux M-238, - 622-0" to 639-6" 30 A3 - "lA Train MS Piping from 900 "15-15" Vert. 17.50 6S, M240 Bend to Floor Penetration at 639-6"
Aux M-238 639'-6" to 30 A3 - *1A" Train MS Piping from Floor Vert. 27.45 6S, M664'-1 1 7/186 Penetration at 639-6" to 90° Bend
Aux M-238 664-1i1 7/16" 30 A3- -'A' Train MS Piping frorn 960 Horiz. 29.43 6S-6, M-LBend to 400 Bend
Aux M-238 664-4 3/4" 30 B4 - *1A' Train MS Piping from 400 Horiz. 98.43 6, L-HBend to 90° Bend
Aux M-238 664'-4 3/4" 30 E4 - *1A' Train MS Piping from 90° Horiz. 34.52 6-7, HBend to 900 Bend
Aux M-238, - 664-3- to 30 E4 - *1A Train MS Piping from 900 *16-16" Vert. 11.27 7, H240 652'- 1 3/4 Bend to 900 Bend
Aux M-238, - 652-11 3/4" 30 E5 - "lA" Train MS Piping from 900 *16-16" Horiz. 58.99 7, H-G240 Bend to Turbine Building Wall
Penetration (Oper. Deck Level)
Aux M-238 620'-0- 30 F2 - *1 B" Train MS Piping from MSIV Horz. 35.92 4, HE-G. MS1 B to 90° Bend
Aux M-238 620'-" _ 30 G2 - *1 B" Train MS Piping from 900 Horiz. 31.46 - 4-5, GBend to 900 Bend
Aux M-238 -620wt: 30 G2 - "18" Train MS Piping from 90°Bend to Turbine Building WailPenetration (Mez. Level)
Horiz. 5.49 I 5, G
Linear FT on 622'+ Level 277.59Linear FT on 622' - Level 97.02
Linear FT on Basement Level 0.00Total Length (Llnear FT) 374.61

INTERNAL FLOODING - Initiating Events Analysis for Turbine Building Floodsp p. A3-3 I
l
Table A3-1: High-Pressure Main Steam Piping (cont.)-
BLDG Dwg. No. Building Level Nom. Drawing Coordinates/Descriptlon Detail HorizJVerL Pipe Length Quad #,Letter (floorI ID .. . Aiel. I I| _Section I /Angle I (Linear FT) I plan quads)
�, � �-�ienwiu � - - -
TB M-984-1 Oper Deck 30 E8 - '1A' Train MS Piping ThroughTS Vert.T 28.19 7-8, G-FWall (Approx 660' elev.) 90° Elbow
_ Through Pipe Chase to TB Mez.TB M-984-1 Mez. 30 F8-'1A'Train MS Piping From Oper. Horui. 73.04 7-8,G-C
Deck Opening Thnu Mez. 900 Elbow to900 Towards HP Turbine
TB M-984-1 Mez. 30 H6- 1A Train MS Piping From Mez. Vert. 9.42 7-8, D-C90 Elbow to Oper. Deck. PenetrationTowards HP Turbine
TB M-984-1 Mez. 30 H6 -'1A'Train MS Piping From Oper. Vert. 4.75 7-8, D-CDeck. Penetration Towards HP Turbineto 90 Elbow
TB M-984-1 Oper Deck 30 H6 -'"1A Train MS Piping Frorn 900 Hodz. 16.06 7-8, D-CElbow at Oper. Deck. PenetrationTowards HP Turbine Stop Valve InletConnection
TB X-K-101- Oper Deck 30 '1A' MS Piping From Valve MS-3A to Vert. 4.06 6-7,D-C_ 30 Oper. Deck Floor Penetration (U-PIPE) _______
TB X-K-101- Mez. 30 '1A' MS Piping From Oper. Deck Floor Vert. 19.50 6-7,D-C30 Penetration to 90 Elbow
TB X-K-101- Mez. 30 | 1A MS Piping From 900 Elbow to 90 | Horlz. 5.75 6-7,D-C30 Elbow _ _____
TB X-K-101- Mez. 30 | 1A" MS Piping From 900 Elbow to HP Vert. 13.30 6-7,D-C30 Turbine
TB M-985-1, Mez. 30 D8/D9-'1B"TralnMSPipingThruTB Horiz. 117.08 5-8,G-D-2 Wall into Mez. Level to 90 Elbow to
| Oper. DeckTB M-985-2 Mez. 30 D - '1B' Train MS PipingFrom 900 Vert. 4.00 7-8, E-D
Elbow in the Mez. to Oper. DeckPenetration
C C C

C C C|INTERNAL FLOODING - Initiating Events Analysis for Turbine Building Floods p. A3-4
Table A3-1: High-Pressure Main Steam Piping (cont.)
BLDG Dwg. No. Building Level Norn. Drawing Coordinates/Description Detail HorlziVerL Pipe Length Quad #,Letter (floorDia. (In) Section /Angle (Linear FT) plan quads)
TB M-985-2 Oper Deck 30 C7 - ' 1B3 Train MS Piping From Oper. Vert. 10.33 7-8, E-DDeck Penetration to 900 Elbow
TB M-985-2 Oper Deck 30 C7 - *1B' Train MS Piping From 90° Horiz. 13.69 7-8, E-DElbow at Oper. Deck. PenetrationTowards HP Turbine Stop Valve InletConnection
TB X-K-101- Oper Deck 30 '1B" MS Piping From Valve MS-3A to Vert. 4.06 6-7,E-D30 Oper. Deck Foor Penetration (U-PIPE)
TB X-K-101- Mez. 30 '1B' MS Piping From Oper. Deck Floor Vert. 19.50 6-7,E-D30 Penetration to 900 Elbow _
TB X-K-101- Mez 30 '1 B MS Piping From 900 Elbow to 900 Horiz. 5.75 6-7,E-D30 Elbow _
TB X-K-101- Mez 30 *1B" MS Piping From 900 Elbow to HP Vert. 13.30 6-7,E-D30 Turbine
Fro me aper. ec k Flo or tDMez.7 6e3 9.l l S l9 0 0 E l b w B e Lnda-
L 0i 0|gLnear FT on Mez. Level 285.399,1_Total Length (Linear FT) 361.78
TB M-239 |OperDeck 18 A6 --lA' TrainS Steam Dump Piping 8-8' Horiz. 3.68 7-8, F-GI II Ifrom Tee with 30' MSLhne Too 1 1
F 0 Elbow Bend t 90 EloTB |M-239 |OperDeck | 18 |A6-'lA'Train Steam DumpBPipingn90d | - Vert. 2.97 78,F-G
Elbow Bend Thru Oper.-Deck Floor to ||Mez.
TB M-239 |Mez. | 18 |A6 -'1A' Train Steam Dump Piping | 8-8' Vert. 4.10 |7-8, F-G|From Oper. Deck Floor to Mez. Level |90° Elbow Bend
TB M-239 |Mez. | 18 |A6 -'1A'Train MS SteamnDump Piping Horkz. 13.55 7-8, F-G||From 90° Elbow Bend to 90°Elbow
|Bend .

INTERNAL FLOODING - Initiating Events Analysis for Turbine Building Floods p. A3-5|IINTERNAL FLOODING - Initiating Events Analysis for Turbine Building Floods , p. A3-5 I
Table A3-1: High-Pressure Main Steam Piping (cont.)
BLDG Dwg. No. Building Level Nom. Drawing CoordinatesaDescription Detail HoriziVert. Pipe Length Quad #,Letter (floorDia. (In) Section /Angle (Linear FT) plan quads)
TB M-239 Mez. 18 A6 - "1A Train Steam Dump Piping 18-8" Angle 5.17 7-8, F-GFrom 90 Bend Thru 30° Down AngleTowards "7 Une
TB M-239 Mez. 18 A6 - "lA" Train Steam Dump Piping Horiz. 35.38 6-7, F-GFrom End of 300 Down Angle To 900Elbow Bend
TB M-239, - Mez. 18 B4- 1lA! Train Steam Dump Piping "19-19" Horiz. 15.17 5-6, F-G240 From 90° Bend to Capped End
TB M-239 Mez. 18 A3 - 1 B" Train Steam Dump Piping Horiz. 4.96 5-4, F-Gfrom Tee in 30" MS Une 450 ElbowBend at "5" Une
TB M-239, - Mez. 18 D8 - "1B" Train Steam Dump Piping "25-25" Angle 3.18 5-4, F-G241 from 45° Elbow Bend to 450 Elbow Bend
TB M-239 Mez. 18 A3 - *1"B Train Steam Dump Piping Honz. 14.40 4-5, F-Gfrom 45 Elbow Bend to 90° Elbow Bend
TB M-239, - Mez. 18 A3 - '1B" Train Steam Dump Piping "20-20" Angle 3.03 4-5, F-G241 from 900 Thru a 45° Declined Angle to
450 Elbow Bend
TU M-239 Mez. 18 A3 - 1 B" Train Steam Dump Pipingfrom 450 Elbow Bend to Capped End
Horiz. 18.17 4-5, E-F
C C. 0

C C ,,IINTERNAL FLOODING - Initiating Events Analysis for Turbine Building Floods p. A3-6I
Table A3-1: High-Pressure Main Steam Piping (cont.)
BLDG Dwg. No. Building Level Nom.. Drawing Coordinates/Descrlption Detail HoriziVert Pipe Length Quad #,Letter (floorDla 11111 Section /A le (Linear F glen Suads
TB M-239, - Mez. 8 B4- "lA" Train 8' Steam Dump Piping "22-22' Horiz. 208 5-6, E-F241 From 18 Main Header to 90° Elbow (2
of 3)TB M-239, - Mez. 8 B4- 'AA' Train 8' Steam Dump Piping "22-22 Vert. 36 5-6, E-F
241 (2 of 3) From 900 Elbow to 900 ElbowTB M-2S9, - Mez 8 84- *tA' Train 8" Steam Dump Piping '22-22' Hoiz. 1.67 5-6, E-F
241 (2 of 3) From 900 Elbow to 90° ElbowTB M-239, - Mez. 8 B4- *tA' Train 8" Steam Dump Piping *22-22' VerL 7.87 5-6, E-F
241 (2 of 3) From 9 0 Elbow to 90 ElbowTB M-239, - Mez. 8 B4 - *tA' Train 8" Steam Dump Piping *22-22' Horiz. 16.67 5-6, E-F
241 (2 of 3) From 900 Elbow to Tee in 16'Une
TB M-2S9, - Mez 8 B4 - lA1 Train 8" Steam Dump Piping *2-22 Horiz 375 5-6. E-F241 From 18" Main Header to 90° Elbow (3
of 3)TS M-2S9,- Mez. 8 B4 - 'tA- Train 8" Steam Dump Piping *-222' Vert 2.21 5-6, E-F
241 (3 of 3) From 9 0 Elbow to 90 Elbow _TB M-239, - Mez. 8 B4- *tA Train 8" Steamn Dump Piping '22-22Y Horiz. 225 5-6, E-F
241 (3 of 3) From 90 Elbow to 90° EbowTB M-2S9, - Mez 8 B4 - 'lA' Train 8" Steam Dump Piping -22-22' Vert. 929 5-6, E-F
241 (3 of 3) From 900 Elbow to 900 ElbowTB M-239, - Mez. 8 B4 - 'IA' Train 8" Steam Dump Piping "22-22' Horiz. 8.83 5-6, E-F
241t (3 of 3) From 900 Elbow to Tee in 16'_Une
TB M-239, - Mez. 8 B3 -8 "B Train 8" Steam Dump Piping "20-20" VerL 2n00 4-5, E-F241 (1 of 3)Fromt8 MainHeaderto9 0° '18-18'
Elbow__ _ _ _ _ _ _ _
TB M-239, - Mez. 8 B3 - "1B" Train 8' Steam Dump Piping "18-18" Houz. 22.00 3-5, E-F241 (1 of 3) From 90° ElbowThru 1800
Retum t 900 Elbow

INTERNAL FLOODING - Initiating Events Analysis for Turbine Building Floods p. A3.7 I
I
Table A3-1: High-Pressure Main Steam Piping (cont.)
BLDG Dwg. No. Building Level Nom. Drawing Coordinates&Description Detail HorizJVert Pipe Length Quad #,Letter (floorDla. (In) Section /Angla (Linear FT) plan quads)
TB M-239, - Mez. B3 - *1"B Train 8" Steam Dump Piping *20-20" Angle 0.00 (FT included in 9.15241 (1 of 3) From 90° Elbow at 450 Declined below) 4-5, E-F
Angle to 450 Elbow
TB M-239,- Mez. 8 B3- 'IB" Train 8" Steam Dump Piping "20-20" Vert. 9.15 4-5, E-F241 (1 of 3) From 450 Elbow to Capped Tee
TB M-239, - Mez. 8 B3 - 1 B- Train 8" Steam Dump Piping "20-20- Hor.z 9.00 45, E-F241 (1o )Fon8Tee to t16 x8 Reducer
TB M-239, - Mez. 8 B3 - "1B" Train 8" Steam Dump Piping "21-21" Vert 1.83 45, E-F241 (2 of 3) From 18" Main Header to 90
ElbowTB M-239 Mez. 8 B3 - '1B" Train 8" Steam Dump Piping Hodz. 3.58 45, E-F
_ (2 of 3) From 900 Elbow to 900 ElbowTB M-239, - Mez. 8 B3 -"1B" Train 8" Steam Dump Piping "21-21" Vert. 4.13 4-5, E-F
241 1 (2 of 3) From 900 Elbow to 90° ElbowTB M-239, - Mez. 8 B3 - "1B Train 8" Steam Dump Piping "21-21" Horiz. 30.13 4-5, E-F
241 (2 of 3) From 900 Elbow Thru 1800 Bendto 900 Elbow
TB M-239, - Mez. 8 B3 - 'IB" Train 8" Steam Dump Piping "21-21" Horiz. 2.50 4-5, E-F241 (2 of 3) From 900 Elbow to 900 Elbow
TB M-239, - Mez. 8 B3 - "1B" Train 8" Steam Dump Piping "21-21" Vert. 7.69 4-5, E-F241 (2 of 3) From 900 Elbow Thru SD1-5 to
900 Elbow
TB M-239, - Mez. 8 B3 - "iB" Train 8" Steam Dump Piping "21-21" Horiz. 6.17 4-5, E-F241 (2 of 3) From 900 Elbow Thnu FCV-
484E and SD2-5 to 900 Elbow
TB M-239 Mez. 8 B3 - *1B Train 8 Steam Dump Piping Horiz. 3.50 45, E-F(2 of 3) From 900 Elbow toTee In 16"Une
TB M-239, - Mez. 18 83- "iB Train 8" Steam Dump Piping "21-21" Vert. 3.00 45, E-F241 (3 of 3) From 18" Main Header to 90°
Elbow
C C C)

C C
INTERNAL FLOODING - Initiating Events Analysis for Turbine Building Floods p.A3-8]
Table A3-1: High-Pressure Main Steam Piping (cont.)
BLDG Dwg. No. Building Level Nom. Drawing Coordinates/Descriptlon Detail HorlzJVert Pipe Length Quad #,Letter (floorDia. (In) Section /Angle (Linear FT) plan quads)
TB M-239, - Mez. 8 B3 - "1B" Train 8" Steam Dump Piping "21-21" Horkz. 10.45 4-5, E-F241 (3 of 3) From 90° Elbow to 90° Elbow
TB M-239, - Mez. 8 B3 " '15B Train 8" Steam Dump Piping "21-21" Vert. 7.58 4-5, E-F241 (3 of 3) From 90° Elbow to 9W0 Elbow
TB M-239, - Mez. 8 B3 - 'IB- Train 8" Steam Dump Piping "21-21" Horiz. 7.13 4-5, E-F241 (3 of 3) From 900 Elbow to 90 Elbow
TB M-239, - Mez. 8 B3 -"1B Trahn 8" Steam Dump Piping *21-21" Horiz. 7.25 4-5, E-F241 (3 of 3) From 90 Elbow to 90° Elbow
TB M-239, - Mez. 8 B3 - '1B Train 8" Steam Dump Piping "21-21" Horkz. 11.83 4-5, E-F241 (3 of 3) From 900 Elbow to 90° Elbow
TB M-239, - Mez. 8 B3 - "1 B6 Train 8" Steam Dump Piping "21-21" Horiz. 4.00 4-5, E-F241 (3 of 3) From 900 Elbow to 90 Elbow
TB M-239, - Mez 8 63- "16B Train 8" Steam Dump Piping "21-21" Vert. 6.08 4-5, EF241 (3 of 3) From 90° Elbow Thru Valve
SD1-6 to 90 Elbow
TB M-239 Mez. 8 B3 - "16B Train 8" Steam Dump Piping Horiz. 6.17 4-5, E-F(3 of 3) From 90" Elbow Thru ValvesFCV-484F and SD2-6 to 90° Elbow
TB M-239 Mez. 8 83 - "1 B Train 8" Steam Dump Piping Horiz. 5.75 4-5, E-F(3 of 3) From 900 Elbow to Tee in 16"Une
TB M-239 Mez. 8 C6 - *1A Train 8" Steam Une From 30" "5-5" Horiz. 7.42 D4, 7-8Main Header to 900 Elbow *SA-5A"
TB M-239 Mez. 8 C6- "IA" Train 8" Steam Une From 90° *SA-5A" Veir. 2.29 D4, 7-8Elbow to 900 Elbow
TB M-239 Mez 8 6- *1A' Train 8" Steam Une From 90 Horiz.-C, 7-8Elbow to 900 Elbow
TB M-239 Mez. 8 C6/D6 - 'IA' Train 8" Steam Une From "6"i 99.00 B-C, 8-4900 Elbow to 8"x4 Reducer
Linear FT on Oper. Deck 0.00Linear FT on Mez. Level .381.87
Liea FT on Bmn L vl00Linear FT on Basement Level 0.00

INTERNAL FLOODING - Initiating Events Analysis for Turbine Building Floodsp.A- p. A3-9.1
I.Table A3-: High-Pressure Main Steam Piping (cont.)
BLDG _I Dwg. No. I Building Level Norn. Drawing Coordinates/Description Detaill HorlziVert.I Pipe Length Quad #,Letter (floorII I Dia. (in) IISection /Angle (Linear FT) I plan quads) I
II Y-r-.t i - 41. ~ I . a.. 0 I
FVMC..
240Mez. 0 13 --- , XI rain Vo.tearnUne TronMI -
Steam Dump to 900 ElbowTB M-239, - Mez. 6 B4AB5 - 'lA Train 6" Steam Une from "17-17" Vert. 6.75 5-7, F-E
240 91f Elbow to Oper. Deck Level________Penetration
TB M-239, - Oper Deck 6 B4/B5 - "1A"Train 6"SteamnUno from "17-17" Vert. 2.00 5-7, F-E240 Oper. Deck Level Penetration to 900
_ _ _ _ _ _ _ _ _ _ _ _ _ _ _ _Elbow
TB M-203, - Oper Deck 6 B.4/B5 - '1lA" Train 6" Steam Uno fr om '17-17" Horiz. 7.65 5-7, F-E239, -240 90Elbow Thru Valves (MS200B1,
_____ ____ ____MS201 B1) to 90 Elbow
TB M-239, - Oper Deck 6 B4/B5 - '1 A~ Train 6" Steam Line from "17-17" Vert. 8.34 5-7, F-E240 90 Elbow to 900 Elbow
TB M-239, - Oper Deck 6 B5 - "l A" Train 6" Steam Une fromi 900 "17-17" Hodz. 11.50 5-7, F-E:240 Elbow Thru Orifice to 900 Elbow
TB, M-239, - Oper Deck 6 B5 - "l A' Train 6" Steam LUne fromi 900 "17-17" Houlz.675 57 E240 Elbow to 90 Elbow
TB M-239, - Oper Deck 6 B5- "1A"Traln6"'Steam Une from 960 "17-17" Angle200 57 E240 Elbow to Moisture Sep/Reheater Bi
TB M-239, - Mez. 6 B3 -"1 B"Traln6"'Steam Une from 18" "18-18" Vert.308 53 E____240 _______Steam Dump to 900 Elbow ___ ______
TB M-239, - Mez. 6 B2/B3 - 'IB"Train 6"Steam Une from "18-18" Horiz. 1.3 53 -240 900 Elbow to 900 Elbow
TB M-239,,- Mez. 6 B2/B3 - '1 B" Train 6" Steam Une from "18-18" Vert. 3.25 5-3, F-E'240 900 Elbow to Oper. Deck Level
PenetrationTB M-239, - Oper Deck 6 B2/B3 - "i B" Train 6' Steam Una from "18-18" Vert. 2.00 5-3, F-E
240 Oper. Deck Level Penetration to 900____ ___ ____ ___ ____ ___Elbow
C C C

C CF CINTERNAL FLOODING - Initiating Events Analysis for Turbine Building Floods p. A3-10
Table A3-1: High-Pressure Main Steam Piping (cont)
BLDG Dwg. No. Building Level Nom. Drawing CoordinatesIDescriptlon Detail HorlzJVerL Pipe Length Ouad #,Letter (floorDia. (In) Section /Angle (Unear F plan quads)
TB M-239, - Oper Deck 6 B2/B3 -. "B" Train 68" Steam Une from "18-18" Horiz 7.65 5-3, F-E240 90° Elbow Thru Valves (MS200B2,
MS201B2) to 90° ElbowTB M-239, - Oper Deck 6 B21B3 - *1B"Traln 6' Steam Une from "1-18 Vert. 8.34 5-3, F-E
240 900 Elbow to 90° ElbowTB M-239, - Oper Deck 6 B2 - *1B- Trahn6 Steam Unefrom 90° 18-186 Horiz. 11.50 5-3, F-E
. 240 Elbow Thru Orifice to 900 ElbowTB M-239 Oper Deck 6 B2 - *1 B- Train 6" Steam Une from 90 Horiz. 6.75 5-3, F-E
Elbow to 900 ElbowTB M-239, - OperDeck 6 B2 - *1B Train 6" Steam Unefrom 900 "18-18" Angle 2.50 5, F-E
240 Elbow to Moisture Sep/Reheater B2
TS M-239 Mez. 6 D4/E4 - *lA" Train 6" Steamr Une from .9-9, Vert. 5.19 6-7, B-C8" Steam Supply Une to Oper. DeckPenetrton
TB M-239 Oper Deck 6 D4/E4-'IAP Train 6" Steam Une from "9-90 Hofiz. 2.00 6-7, B-COper. Deck Penetration to 90 Elbow
TB M-239 Oper Deck 6 D5/E5 - '1A' Train 6" Steam Une from .9-9. Horiz. 7.65 6-7, B-C900 Elbow Thru Valves (MS200A1,MS201Al) to 900 Elbow :_.
TB M-239 Oper Deck 6 D5/E5 - l A' Train 6" Steam Line from r9n9" Vert. 8.34 6-7, B-C900 Elbow to 900 Elbow
TB M-239 Oper Deck 6 D5WE5 - 'lA' Train 6' Steam Une from .9-9. Horiz. 11.50 6-7, B-C900 Elbow Thru Orifice to 90 Elbow
TB M-239 Oper Deck 6 D5/E5 - *1A' Train 6' Steam Une from Horiz. 6.75 6-7, B-C900 Elbow to 90° Elbow
TB M-239 Oper Deck 6 D5/E5 - 'lA' Train 6" Steam Une from .9-9. Angle 250 6900 Elbow to Moisture Sep/Reheater Al
TS M-239 Mez. /- *1A Train 6" Steam Une from 6 Vert. 5.52 4-3, B-Cj8 Steam Supply Une to Oper. DeckPenetration _

INTERNAL P1OODING - Initiating Events Analysis for Turbine Building Floods p. A3-11I.
Table A3-1: High-Pressure Main Steam Piping (cont.)
BLDG Dwg. No. Bullding Level Nom. Drawing CoordinateslDescription Detail HorkzJVerL Pipe Length Quad #,Letter (floorDia. (In) Section /Angle (Linear FT) plan quads)
TB M-239 Oper Deck 6 D2/E2 - "lA" Train 6" Steam Line from "6-6' Horiz 2.00 4-3, B-COper. Deck Penetration to 900 Elbow
TB M-239 Oper Deck 6 D2/E2 - "1A" Train 6" Steam Une from "6-6" Horiz. 7.65 4-3, B-C900 Elbow Thru Valvs (MS200A2,MS201A2) to 900 Elbow
TB M-239 Oper Deck 6 D2/E2 - "IA" Train 6" Steam Une from "6-6" Vert. 8.34 4-3, B-C900 Elbow to 900 Elbow
TB M-239 Oper Deck 6 D2/E2 - "1 A Trah 6" Steam Une from "6-6" Horiz. 11.50 4-3, B-C900 Elbow Thru Orifice to 900 Elbow
TB M-239 Oper Deck 6 D2/E2- "1A' Train 6" Steam Une from Horiz. 6.75 4-3, B-C900 Elbow to 900 Elbow
TB M-239 Oper Deck 6 D21E2 - "lA* Train 6" Steam Une from "6-6" Angle 2.50 4-3, B-C90 Elbow to Moisture Sep/Reheater A2
Llnear FT o n Oper. Deck 154.46_ULnear FT on Mez. Level 48.67
Total Length (Linear 0r 20303MINw~ tEADERW Qli QUA ENE(0?IE i g LLg iSgE
TB M-985-2 Mez. 20 B6 - Equalizing Une Between Main An Horiz. 42.25 7-8, F-E_ andNB' Steam Headers
= Linear FT on Oper. Deck 42 25
;;YXEl |Total Len (Linear FT) 42.25
TB M-239, - Mez. 16 B4/C4 - "1A" Train 16" Steam Une 119-19" Horkz. 4.67 5-6,E240 From 1 6"xB" Reducer to Low Pressure
Turbine
TB M-239, - Mez. 16 B3/C3-M1B- Train 16" Steam Une "19-19" Horiz. 4.67 4-5,E240 From 16"x8" Reducer to Low Pressure
_ _Turbine
C C C

C C ETINTERNAL FLOODING - Initiating Events Analysis for Turbine Building Floods p. A3-121
Table A3-1: High-Pressure Main Steam Piping (cont.)
BLDG Dwg. No. Building Level Norn. Drawing Coordinates/Descriptlon Detail I HorizNert.I I Dia. (ln) I I Section | /Anale
Pipe Length(Linear FT)
Quad #,Letter (floorplan auads)
Linear FT on Oper. Deck 0.00Linear FT on Mez. Level - 9.34
Linear FT on Basement Level 0.00Total Length (Linear FT) 9.34
�71,

INTERNAL FLOODING - Initiating Events Analysis for Turbine Building Floods p. A3-13
Table A3-2: Extraction Steam Piping
BLDG I Dwg. No. I Building Level Nom. | Drawing CoordInates/Description Detail HorizJVerL Pipe Length Quad #,Letter (floorI I . fin% I I S §nn I /Anl. I l inenr PT I niun nonds II
M-1z58 Mez. DI 1 - oieea steam Piping Fromm urIMneShell Insulation to 900 Elbow
van. o.Z/ f O-(, u
TB M-1258 Mez. 12 B1 1/A10 - Bleed Steam Piping From 900 Horiz. 18.98 6-7, D-EElbow to 450 Declined Angle Bend
TB M-1258 Mez 12 A10 - Bleed Steam Piping From 450 Angle 3.67 6-7, EDeclined Angle Bend to 1 6x12 90°Reducing Elbow .
TB M-1258 Mez. 16 A10/E3 - Bleed Steam Piping From Horiz. 71.09 7-4, E16 x-i2 90 Reducing Elbow to 900Elbow .
TB M-1258 Mez. 16 E3/D2 - Bleed Steam Piping Frcrn 900 Horiz. 23.80 4, E-FElbow to 16'X10 900 Reducing Elbow
TB M-1258 Mez. 12 Cl1 - Bleed Steam Piping From Turbine Vert. 2.83 6-7, DShell Insulation to 900 Elbow
TB M-1258 Mez. 12 C11/C10 - Bleed Steam Piping From Horiz. 8.04 6-7, E-D900 Elbow to 90° Elbow
TB M-1258 Mez. 12 C10 - Bleed Steam Piping From 900 Vert. 4.58 6-7, E-DElbow to 900 Elbow
TB M-1258 Mez. 12 C10 - Bleed Steam Piping From 900 Horiz. 7.50 6-7, E-DElbow to 450 Declined Angle Bend
TB M-1258 Mez. 12 C9 - Bleed Steam Piping From 450 Angle 3.67 6-7, E-DDeclined Angle Bend to 450 Angle Bend
TB M-1258 Mez. 12 C9 - Bleed Steam Piping Fron 45° Horiz. 4.85 6-7, EAngie Bend to 45° Angle Bend
TB M-1258 Mez. 12 C9 - Bleed Steam Piping From 450 Horiz. 3.54 6-7, EAngle Bend to 450 16'x122 LateralReducer
TB M-1258 Mez. 10 D/El - Bleed Steam Piping From Horiz. 6.96 4, E-F16"X16"X10 Tee to 12 x10 900Reducing Elbow
C Cs C
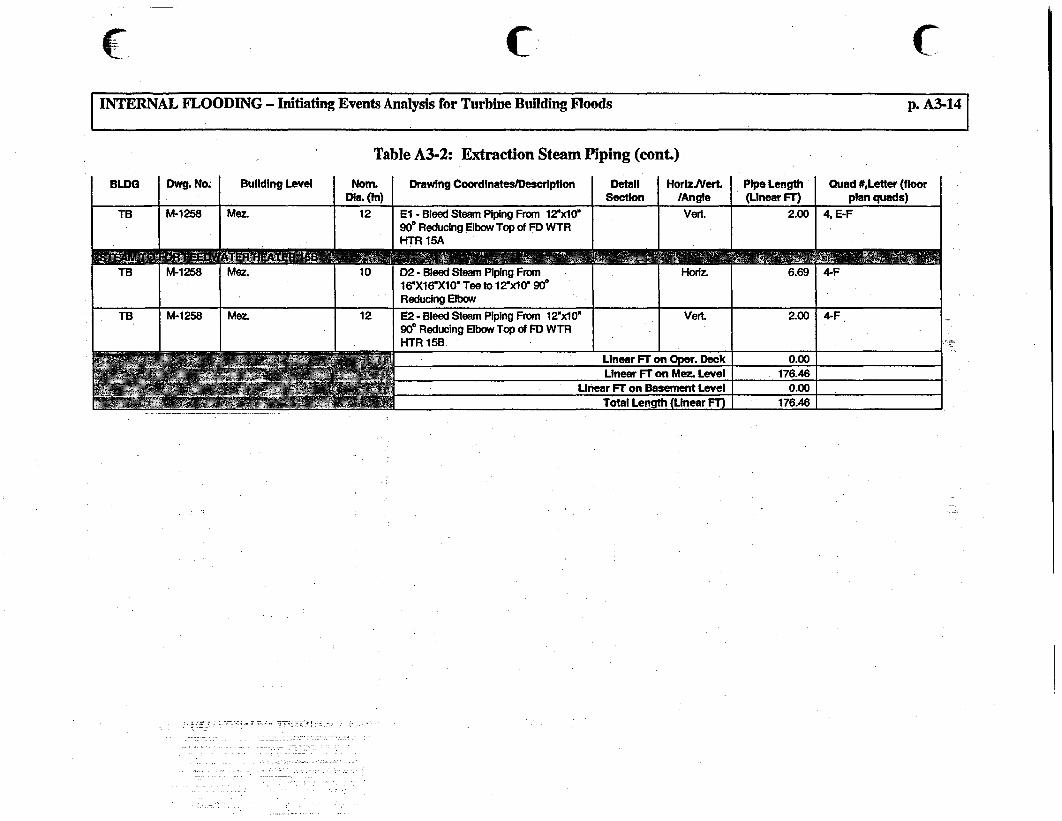
C C C
INTERNAL FLOODING - Initiating Events Analysis for Turbine Building Floods p. A3-14I
Table A3-2: Extraction Steam Piping (cont.)
BLDG Dwg. No. Building Level Nom.Dia (in)
Drawing Coordinates/Descriptlon DetailSection
HorlziVert./Angle
Pipe Length(Linear FT)
Quad #,Letter (floorplan quads)
TB M-1258 Mez. 12 El -Bleed Steam Piping From 12"x10" Vert 2.00 4, E-F900 Reducing Elbow Top of FD WTRHTR 15A
TB M-1258 Mez. 10 D2 - Bleed Steam Piping From Haiz 6.69 4-F16"X16"X10 Tee to 12x10" 90°Reducing EFbow
TB M-1258 Mez. 12 i-2 - Bleed Stean Piping Frorn 12"x10"900 Reducing Elbow Top of FD WTRHTR 15B
Vert. 2.00 4-F
. Linear FT on Oper. Deck 0.00Linear FT on Mez. Level 176.46
Linear FT on Basement Level 0.00Total Length (Linear FT) % 176.46

| rINTERNAL FLOODING - Initiating Events Analysis for Turbine Building Floods p. A3-151
Table A3-3: Lower-Pressure Steam Piping
BLDG | Dwg. No. Building Level Nom. Drawing Coordinates/Description Detail HorlzJVert Pipe Length Quacd #,Letter (floorI I I Me lIn1 I I Itin IA..1- I II I---- = I nln I.
M-Z4Z Mez. E7 - Reneat steam Froam WUCrossunder Piping to 90 Elbow
xiz.
TB M-242, - Mez 16 E7 - Reheat Steam From 90° Elbow to "0-C" Vert. 20.73 6-7, D-E423 900 Elbow
TB M-242, - Mez 16 E7 - Reheat Steam From 900 Elbowh Horiz. 5.66 6-7, D-E423 450 Angle Bend Into 24" Reheat Steam r
Header
TB M-242 Mez. 16 F8 - Reheat Steam From 30" Houiz. 1.75 6-7, DCrossunder Piping to 900 Elbow
TB M-242, - Mez. 16 F8 - Reheat Steam From 90 Elbow to 0C-C Vert. 20.73 6-7, D423 24"x16" 900 Reducing Elbow
TB M-242 Mez. 24 F8 - Reheat Steam From 24"x16" 90° Honz 28.50 6-7, D-EReducing Elbow to S0e Elbow
TB M-242 Mez. 24 D8 - Reheat Steam From 900 Elbow to Honiz. 14.33 6-7, E900 Elbow
TB M-242 Mez. 24 D9 - Reheat Steam From 900 Elbow to Honz. 6.00 7, E90 Elbow
TB M-242, - Mez. 24 D9/C9 - Reheat Steam From 900 Elbow "C-C Vert. 14.21 7, E-F423 to 900 Elbow
TB M-242, - Mez. 24 D9/C9 - Reheat Steam From 900 Elbow "C-C" Horiz. 14.92 7, E-F423 to 24"x16" 900 Reducing Elbow For FD
WTR HTR 14B
TB M-242 Mez. 16 C9 - Reheat Steam from 24"x24"x16" Horiz. 9.17 6-7, E-FTee to 900 Elbow
TB M-242, - Mez. 16 C8 - Reheat Steam from 90 Elbow To C-C" Vert. 2.00 6-7, E-F423 FD WTR HTR 14A
TB M-242 Mez. 16 B9 - Reheat Steam from 24"x16" 90Hoz. 9.17 6-7, FReducing Elbow to 90° Elbow For FDWTR HTR 14B
C C C

C C CINTERNAL FLOODING - Initiating Events Analysis for Turbine Building Floods p. A3-16
Table A3-3: Lower-Pressure Steam Piping (cont.)
BLDG Dwg. No. Building Level Norm Drawing Coordinates/Descriptlon Detail HoriziVerL Pipe Length Quad #,Letter (floorI Dla (In) Section /Angle (Linear FT) plan quads)
TB M-242, - Mez. 16 B8 - Reheat Steam from 90 Elbow To "C-C" Angle 2.15 6-7, F423 . D- WTR HTR 14B
TB M242 Me 10 Heatin Sta = Linear FT Ebn Oper. Deck 0.00 7| 8<Llnear FT on Mez.Level 151.07
iTotal Length (Linear -) 151.07
TB M-242 Mez. 10 C98- Healing Steam from 245 Reheat Co Vert. 7.10 7, E-F423 Steamrnine Tee to 90°ElbowTB1 | M-242 |Mez 10 |C9 -Heating SteamnFrorn90Elbow to || Horiz. |4.00 7| 7E-F
l l l 1 90° ElbowTB; | M-242 |Mez | 10 |C9 -Heaffng SteamnFrorn90Elbow to || Horiz. |6.04 7| 7E-F
450 BendTB |M-242 Mez. 10 C8 -Heating StemrnFrorn4!5*Bend to | Horiz . 9.90 7-6, F
1 1 | 1 45°90Bend-TB M-242 Mez, 10 8 8- Heating Steam From 450 Bend to Horiz. 47.00 7-5, F
90 Declined ElbowTB M-242, - Mez. 10 B4-Heating Steam From 900 Declined "C-C" Angle 8.44 5, F-G
423 Elbow to 900 ElbowTB M-242 Mez. 10 B4-Heating Steam From 90 Elbow to Horiz. 56.50 5-3, F-G
|60 BendTB M-242 Mez. 10 |1 -Heating Steam From 600 Bend to Horiz. 9.50 3, F-G
900 ElbowTB M-242, - Mez. 10 Al - Healing Steam From 90 Elbow to | J-J" Vert. 11.02 3,G
423 Mez. Floor Penetration _______
TB M-242, - Basement 10 Al -Heating Steam From Mez. Floor | .J-J | Vert. 4.81 3, G423 Penetration to 900 Elbow ______|
TB *M-242, - Basement 10 Al - Heating Steam From 90 Elbow to | JJ I Horliz. 20.25 3-2, G423 90° Elbow
TB M-423 Basement 10 H4- Heating Steam From 90 Elbow to Horiz. 10.00 3-2, G-GGAux Bid Wall Pen. I III
Linear FT on Oper. Deck 0.00

INTENALFLODIN - nitatin EvntsAnaysi fo TubineBuidin Flodsp. 3-1INTERNAL F1,00DING - Initiating Events Analysis for Turbine Building Floods
I-P. A3-17 I
Table A3-3: Lower-Pressure Steam Piping (cont.)
Nom. Drawing Coordinates/Descriptlon | DdalDie. (in) | Section
Ar.-1U1 -
30, XK-101-33
Renea stearn Crossunder Piping (to*A MSRs - Front Pipe) from HPTurbine to 90° Elbow
TB XK-101- Mez 30 Reheat Steam Crossunder Piping (to Vert. 10.56 6-7, C-D30, XK- 'A' MSRs - Rear Pipe) from HP Turbine101-33 to 90 Elbow
TB XK-101- Mez. 30 Reheat Steam Crossunder Piping (to Horiz. 8.86 6-7, C-D30, XK- 'A' MSRs - Rear Pipe) from 90° Elbow101-33 to90° Elbow
TB XK-101- Mez. 30 Reheat Steam Crossunder Piping (to Horiz 8.54 6-7, C-D30, XK- 'A MSRs - Rear Pipe) from 900 Elbow101-33 to 42" Crossunder Piping to "A" MSRs
TB XK-101- Mez. 30,42 Reheat Steam Crossunder Piping (to Horiz. 25.00 7-5, C-B30, XK- "A' MSRs - Header) from 30" 900 Elbow101-33 Thru 42"x30" Reducer to 42" 90° Elbow
TB XK-101- Mez 30,42 Reheat Steam Crossunder Piping (to Horiz. 53.38 7-5, C-B30, XK- WA" MSRs - Header) from 42" 900 Elbow101-33 Thru 42"x30" Reducer to 30" 900 Elbow
TB XK-101- Mez. 30 Reheat Steam Piping to MSR *1A" from Vert. 10.56 5, B-C30, XK- 42" Crossunder Header to Oper. Deck101-33 Floor Penetration
TB XK-101- Oper Deck 30 Reheat Steam Piping to MSR "A from Vert. 4.75 5, B-C30, XK- Oper. Deck Floor Penetration to 30" 90°101-33 Elbow
C C C
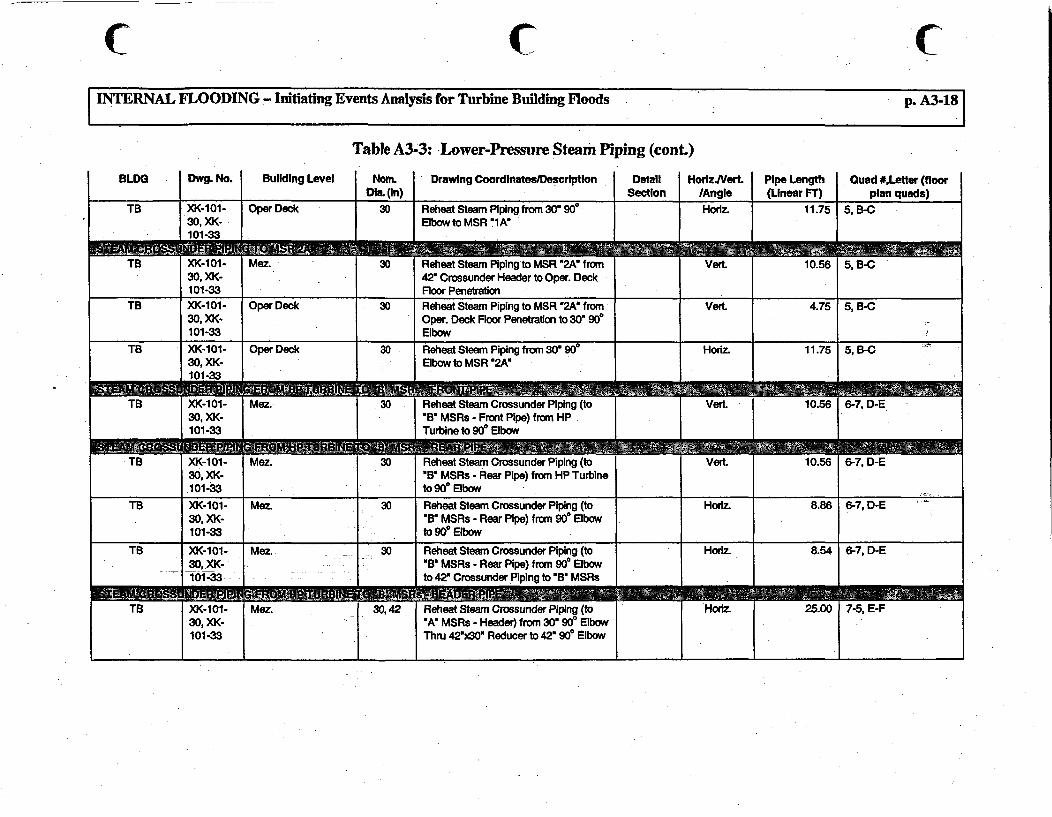
4: C .CINTERNAL FLOODING - Initiating Events Analysis for Turbine Building Floods . .318
Table A3-3: Lower-Pressure Steam Piping (cont.)
BLDG Dwg. No. Building Level Nom. Drawing CoordinatesiDescriptlon Detail HorlziVerL Plpe Length Quad #,Letter (floorDia. (In) Section /Angle (Linear FT) plan quads)
TB XK-101- Oper Deck 30 Reheat Steam Piping from 30 90°0 Horiz 11.75 5, B-C30, XK- Elbowto MSR *1A!101-33
TB XK-101- Mez. 30 Reheat Steam Piping to MSR '2A7 from VerL 10.56 5, B-C30, XK- 42" Crossunder Header to Oper. Deck101-33 Floor Penetration
TB XK-101- Oper Deck 30 Reheat Steam Piping to MSR "2A" from VertL 4.75 5, B-C30, XK- Oper. Deck Floor Penetration to 30" 90°101-33 Elbow
TB XK-101- Oper Deck 30 Reheat Steam Piping from 30" 90 Horiz. 11.75 5, B-C30, XK- Elbow to MSR *2A"101-33
TB XK-101- Mez. 30 Reheat Steam Crossunder Piping (to Vert. 10.56 6-7, D-E30, XK- "B" MSRs - Front Pipe) from HP101-33 Turbine to 90° Elbow
TB XK-101- Mez. 30 Reheat Steam Crossunder Piping (to VerL. 10.56 6-7, D-E30, XK- "B" MSRs - Rear Pipe) from HP Turbine101-33 to 900 Elbow
TB XK-101- Mez 30 Reheat Steam Crossunder Piping (to Horz. 8.86 6-7, D-E30, XK- -B" MSRs - Rear Pipe) from 90 Elbow101-33 to 90° Elbow
TB XK-101- Mez. 30 Reheat Steam Crossunder Piping (to Horiz. 8.54 6-7, D-E30, XK- "B" MSRs - Rear Pipe) from 900 Elbow1- 01-33 to 42" Crossunder Piping to "B" MSRs
TB XK-101- Mez 30,42 Reheat Steam Crossunder Piping (to Horiz. 25.00 7-5, E-F-30, XK- 'A" MSRs - Header) from 30" 900 Elbow101-33 Thnr 42"x30 Reducer to 42" 900 Elbow

INTER.NAL FLOODING - Initiating Events Analysis for Turbine Building Floods p. A3 19
Table A3-3: Lower-Pressure Steam Piping (cont.)
BLDG Dwg. No. Building Level Nom. Drawing Coordinates/Description Detail HoriziVert. Pipe Length Ouad #,Letter (floorI Dia. (in) Section /Angle (Linear Fr) plan quads)
TB XK-101- Mez. 30,42 Reheat Steam Crossunder Piping (to Horiz. 53.38 7-5, E-F30, XK- WB MSRs - Header) from 42" 90° Elbow101-33 Thnu 42",30" Reducer to 30" 900 Elbow
TB XK-101- Mez. 30 Reheat Steam Piping to MSR "18" from Vert. 10.56 5, E-F30, XK- 42" Crossunder Header to Oper. Deck101-33 Floor Penetration
TB XK-101- Oper. Deck 30 Reheat Steam Piping to MSR "1' from Vert. 4.75 5, E-F30, XK- Oper. Deck Floor Penetration to 30" 90g101-33 Elbow
TB XK-101- Oper. Deck 30 Reheat Steam Piping from 30" 960 Horiz. 11.75 5, E-F30, XK- Elbow to MSR " Bo101-33
TB XK-101- Mez. 30 Reheat Steam Piping to MSR '2B" from Vert. 10.56 5, E-F30, XK- 42" Crossunder Header to Oper. Deck101-33 Floor Penetration
TB XK-101- Oper. Deck 30 Reheat Steam Piping to MSR "2B" from Vert. 4.75 5, E-F30, XK- Oper. Deck Floor Penetration to 30" 90°101-33 Elbow _ _-_ _ _ __
TB XK-101- '30, XK-1 Ml -_-'3
Oper. Deck 30 Reheat Steam Piping from 30" 90'Elbow to MSR "2B"
Horiz. 11.75 5, E-F
C, C C

C C C
INTERNAL FLOODING - Initiating Events Analysis for Turbine Building Floods p. A3-20
Table A3-3: Lower-Pressure Steam Piping (cont.)
BLDG DW9. No. Building Level Nom. Drawing Coordinates/Descriptlon Detail HorizVert. Pipe Length Quad #,Letter (floorDia. (In) Section /Angle (Linear FT) plan quads)
101-33
TB X-K-101- Oper. Deck 30 Steam Crossover Piping from 900 Elbow Honz. 27.50 6-5, B-D30, X-K- to Bend into LP Turbine #1101-33
TB X-K-101- Oper. Deck 30 Steam Crossover Piping from Bend Into Vert. 3.50 6-5, D30, X-K- LP Turbine #1 to Common Inlet101-33
TB X-K-101- Oper. Deck 30 Steam Crossover Piping from MSR 1B Vert. 13.42 6, E-F30, X-K- to 90° Elbow101-33
TB X-K-101- Oper. Deck 30 Steam Crossover Piping from 90° Elbow Honz. 12.00 6-5, E-F30, X-K- to 900 Elbow101-33 _ _
TB X-K-101- Oper. Deck 30 Steam Crossover Piping from 90° Elbow Horiz 27.50 6-5, E-D30. X-K- to Bend into LP Turbine #1101 -33
_ _ _ _ _ _
TB X-K-101- Oper. Deck 30 Steam Crossover Piping from Bend Into Vert. 3.50 6-5, D30, X-K- LP Turbine #1 to Common Inlet'
. 101-33
TB X-K-101- Oper. Deck 30 Steam Crossover Piping from MSR 2A Vert. 13.42 4, B-C30, X-K- to 900 Elbow101-33 .
TB X-k-101- Oper. Deck 30 Steam Crossover Piping from 900 Elbow floriz. 12.00 4-5, B-C300i ,X-3K- 0to 90° Eibow
TB X-K-101- Oper. Deck 30 Steam Crossover Piping from 90° Elbow Horiz. 27.50 4-5, B-D30, X-K- to Bend Into LP Turbine #2101-33 _ = -_ _ _
TB X-K-101- Oper, Deck_, ,.30 Steam Crossover Piping from Bend into VerL 3.50 4-5, D30, X-K- LP Turbine #2 to Comrmon Inlet101-33 --
_CEM
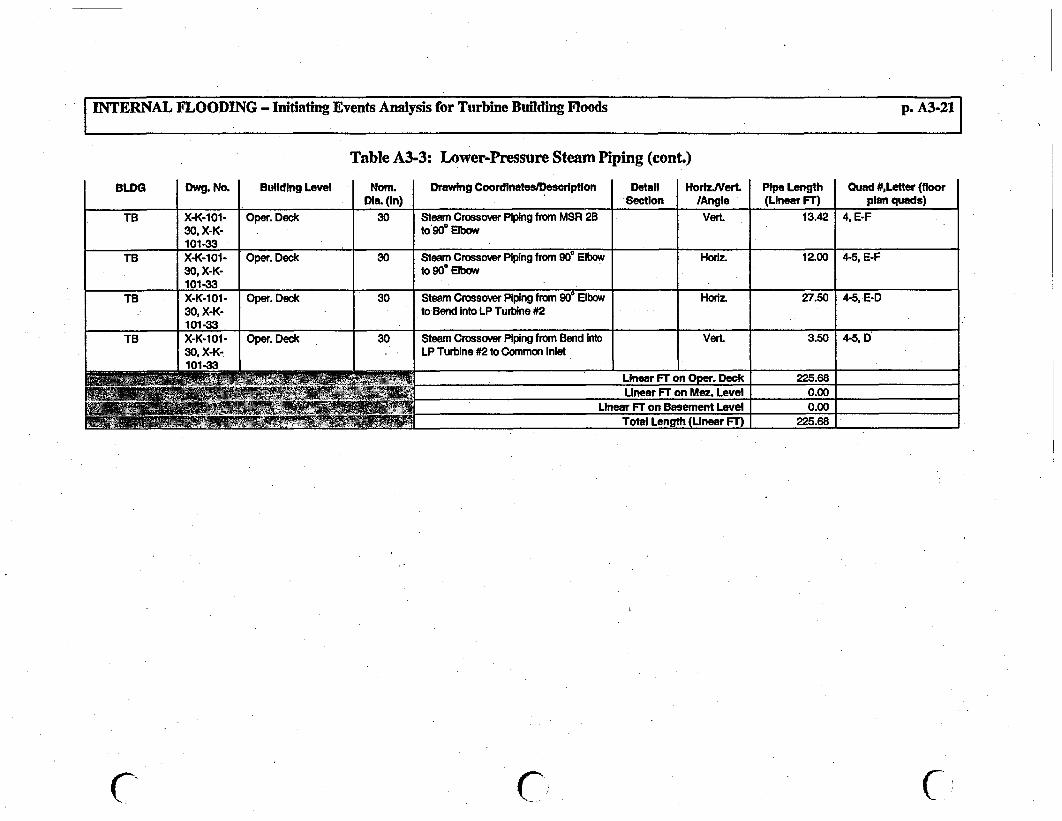
INTERNAL FLOODING - Initiating Events Analysis for Turbine Building Floods p. A3-21
Table A3-3: Lower-Pressure Steam Piping (cont.)
BLDG Dwg. No. Building Level Nom. Drawing CoordinateeiDescriptlon Detail HoriziVert Pipe Length Quad #,Letter (floorDla. (In) Section /Angle (Linear Fr) plan quads)
TB X-K-101- Oper. Deck 30 Steam Crossover Piping from MSR 2B Vert. 13.42 4, E-F30, X-K- to 900 Elbow101-33 _ _
TB X-K-101- Oper. Deck 30 Steam Crossover Piping from 900 Elbow Horlz. 12.00 4-5, E-F30, X-K- to 90° Elbow101-33
TB X-K-101- Oper. Deck 30 Steam Crossover Piping from 900 Elbow Horiz. 27.50 4-5, E-D30, X-K- to Bend into LP Turbine #2101-33
TB X-K-101-30. X-K-
Oper. Deck 30 Steam Crossover Piping from Bend IntoLP Turbine #2 to Common Inlet
Vert. 3.50 4-5, D
Linear FT on Oper. Deck 225.68Linear FT on Mez. Level 0.00
Linear FT on Basement Level 0.00Total Length (Linear FT) 225.68 .
C C. C
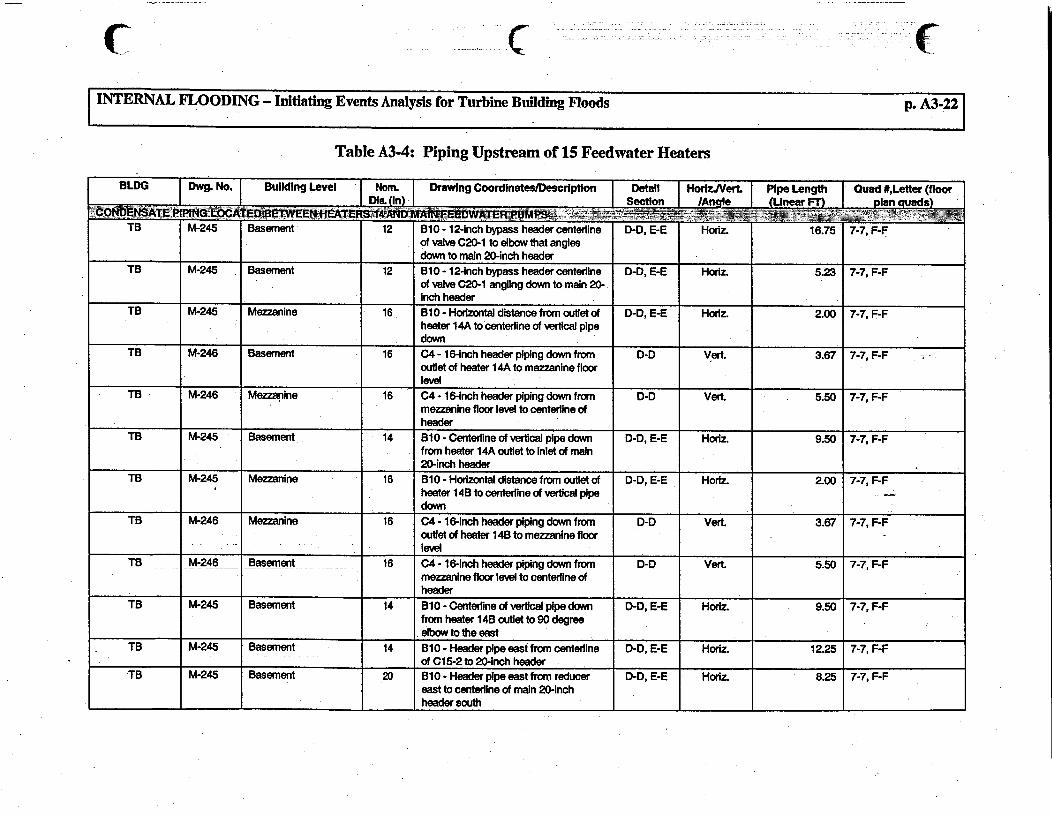
C C,INTERNAL FLOODING - Initiating Events Analysis for Turbine Building Floods p. A3-22
Table A3-4: Piping Upstream of 15 Feedwater Heaters
BLDG | Dwg. No. Building Level iNom. Drawing Coordinates/Description Detail HorlzJVerL Pipe Length Quad #,Letter (floorI Die (in) I sectlon /Anale (Linear FT) Plan quad!)
TB M-245 Basement 12 B1O - 12-inch bypass header centerline D-D, E-E Horiz. 16.75 7-7, F-Fof valve C20-1 to elbow that anglesdown to main 20-inch header
TB M-245 Basement 12 B10 - 12-inch bypass header centerline D-D, E-E Houlz. 5.23 7-7, F-Fof valve C20-1 angling down to main 20-Inch header
TB M-245 Mezzanine 16 Bl0 - Hoeizontal distance from outlet of D-D, E-E Hodz. 2.00 7-7, F-Fheater 14A to centerline of vertical pipe
. down
TB M-246 Basement 16 C4 - 16-inch header piping down from D-D Vert. 3.67 7-7, F-Foutlet of heater 14A to mezzanine floorlevel
TB M-246 Mezzanine 16 C4 - 16-Inch header piping down from D-D Vert. 5.50 7-7, F-Fmezzanine floor level to centerline ofheader
TB M-245 Basement 14 Bl0 - Centerline of vertical pipe down D-D, E-E Hortz. 9.50 7-7. F-Ffrom heater 14A outlet to inlet of main20-Inch header
TB M-245 Mezzanine 16 B10 - Horizontal distance from outlet of D-D, E-E Horiz. 2.00 7-7, F-Fheater 14B to centerline of vertical pipedown
TB M-246 Mezzanine 16 C4 - 16-inch header piping down from D-D Vert. 3.67 7-7, F-Foutlet of heater 14B to mezzanine floorlevel
TB M-246 Basement 16 C4 - 16-Inch header piping down from D-D Vert. 5.50 7-7, F-Fmezzanine floor level to centerline ofheader
TB M-245 Basement 14 Bl0 - Centerline of vertical pipe down D-D, E-E Hodz. 9.50 7-7, F-Ffrom heater 14B outlet to 90 degreeelbow to the east
TB M-245 Basement 14 B10 - Header pipe east from centeline D-D, E-E Horiz. 12.25 7-7, F-Fof C15-2 to 20-inch header -
TB M-245 Basement 2 B10 - Header pipe east from reducer D-D, E-E Horiz. 8.25 7-7, F-Feast to centerline of main 20-inchheader south
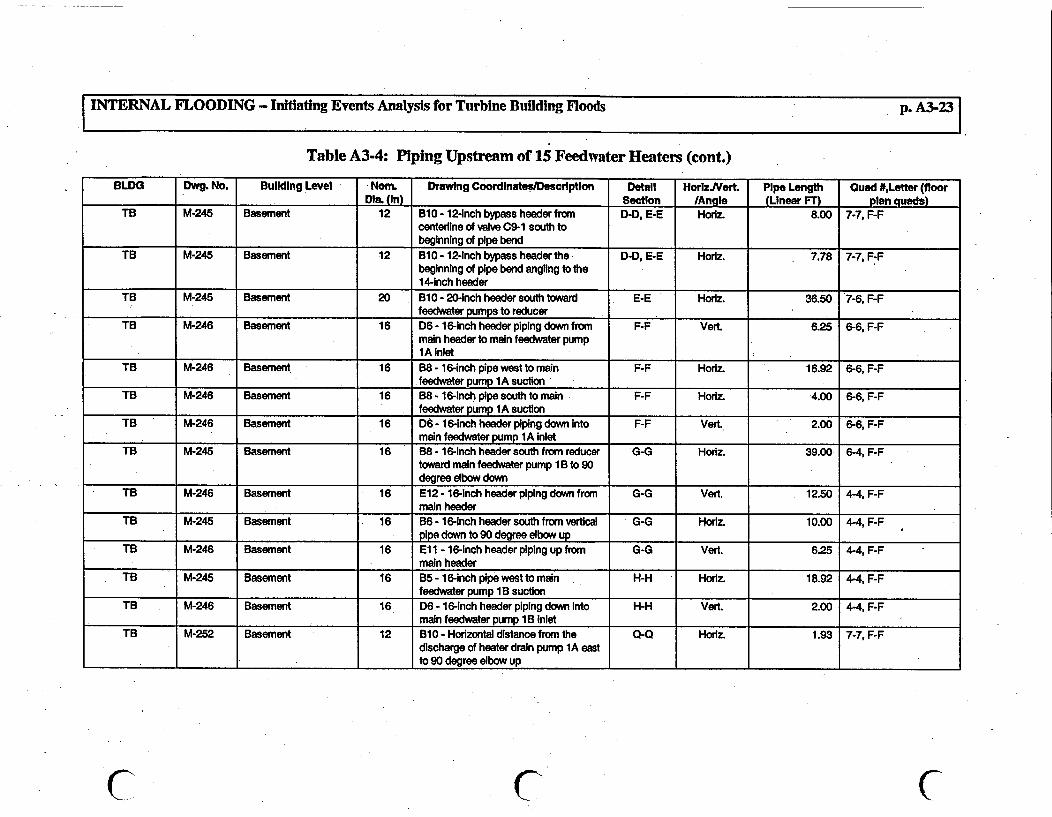
INTERNAL FLOODING - Initiating Events Analysis for Turbine Building Floods p. A3-23
Table A3-4: Piping Upstream of 15 Feedwater Heaters (cont.)
BLDG Dwg. No. Building Level Noam Drawing Coordinates/Descriptlon Detail HorlzjVert. Pipe Length Quad #,Letter (floorDia. (in) Section /Angle (Linear FT) plan quads)
TB M-245 Basement 12 Bl0 - 12-Inch bypass header from D-D, E-E Hofz. 8.00 7-7, F-Fcenterline of valve C9-1 south tobeginning of pipe bend _
TB M-245 Basement 12 Bl0 - 12-inch bypass header the D-D, E-E Horlz. 7.78 7-7, F-Fbeginning of pipe bend angling to the14-inch header
TB M-245 Basement 20 B10 - 20-inch header south toward E-E Horiz. 36.50 7-6, F-F_ _feedwater pumps to reducer
TB M-246 Basement 16 D6 - 16-inch header piping down from F-F Vert. 6.25 6-6, F-Fmain header to main feedwater pump1A Inlet _ _.
TB M-246 Basement 16 B8 - 16-inch pipe west to main F-F Horiz. 16.92 6-6, F-Ffeedwater pump lA suction
TB M-246 Basement 16 B8 - 16-inch pipe south to main F-F Horiz. 4.00 6-6, F-Ffeedwater pump IA suction
TB M-246 Basement 16 D6 - 16-inch header piping down Into F-F Vert. 2.00 6-6, F-Fmain feedwater pump 1A inlet
TB M-245 Basement 16 B8- 16-inch header south from reducer G-G Horiz. 39.00 6-4, F-Ftoward main feedwater pump 1 B to 90degree elbow down
TB M-246 Basement 16 E12 - 16-inch header piping down from G-G Vert. 12.50 4-4, F-Fmain header
TB M-245 Basement 16 B6 - 16-Inch header south from vertical G-G Horkz. 10.00 4-4, F-Fpipe down to 90 degree elbow up
TB M-246 Basement 16 ElI - 16-Inch header piping up from G-G Vert. 6.25 4-4, F-Fmain header
TB M-245 Basement 16 B5 - 16-inch pipe west to main H-H Horiz. 18.92 4-4, F-Ffeedwater pump 1 B suction
TB M-246 Basement 16 D6 - 16-inch header piping down Into H-H Vert. 2.00 4-4, F-Fmain feedwater pump 1 B Inlet
TB M-252 Basement 12 B10 - Horizontal distance from the Q-Q Horlz. 1.93 7-7, F-Fdischarge of heater drain pump IA eastto 90 degree elbow up
C C C

C r CINTERNAL FLOODING - Initiating Events Analysis for Turbine Building Floods p. A3-24
Table A3-4: Piping Upstream of 15 Feedwater Heaters (cont.)
BLDG Dwg. No. Building Level Hr. Drawing Coordinates/Desoriptlon Detail iHorlziVert Pipe Length Quad #,Letter (floorDla (in) Section /Angle (Linear FT) plan quads)
TB M-252 Basement 12 B10 - Horizontal distance from the 0-0 Horiz. 1.93 7-7, F-Fdischarge of heater drain pump 1 B eastto 90 degree elbow up
TB M-253 Basement 12 Bi0 - Vertical distance from centerline 0-0 Vert. 7.15 7-7. F-Fof heater drain pump IA discharge to
_ 14-inch lineTB M-253 Basement 12 BIG - Vertical distance from centedine 0-0 Vert. 7.15 7-7, F-F
of heater drain pump 1 B discharge to14-nch line
TB M-252 Basement 14 Bi0 - Horizontal distance from the 0-0 Horiz. 19.75 7-6, F-E.discharge of heater drain pump 1Asouth to 90 degree elbow turning to theeast
TB M-252 Basement 14 B10 - Horizontal distance from 0-0 Horiz. 5.52 6-6, F-Fcenterline of 14-inch pump dischargeheader east to 90 degree elbow up
TB M-253 Basement 14 BI0 - Vertical distance from centerline 0-0 Vert. 6.19 6-6, F-Fof 14-inch pump header to centerline of20-inch feedwater header
TB M-252 Basement 20 Bi0 - Horizontal distance from the 0-0 Horiz. 13.46 7-7, F-Fcenterline of heater drain tank to thedischarge of heater drain pump 1A Up
TB M-252 Basement 20 B10 - Horizontal distance from the 0-0 Horiz. 13.46 8-6, F-F'centerline of heater drain tank to the
._ discharge of heater drain pump 1 BTB M-253 Basement 20 B10 - Vertical distance from heater 0-0 Vert. 4.00 7-7, F-F
drain tank outlet to centerline of heaterdrain pump IA Inlet
TB M-253 Basement 20 BIO - Vertical distance from heaterdrain tank outlet to centerline of heaterdrain pump 158 inlet
Q-Q Vert. 4.UU 7-7, tF-t
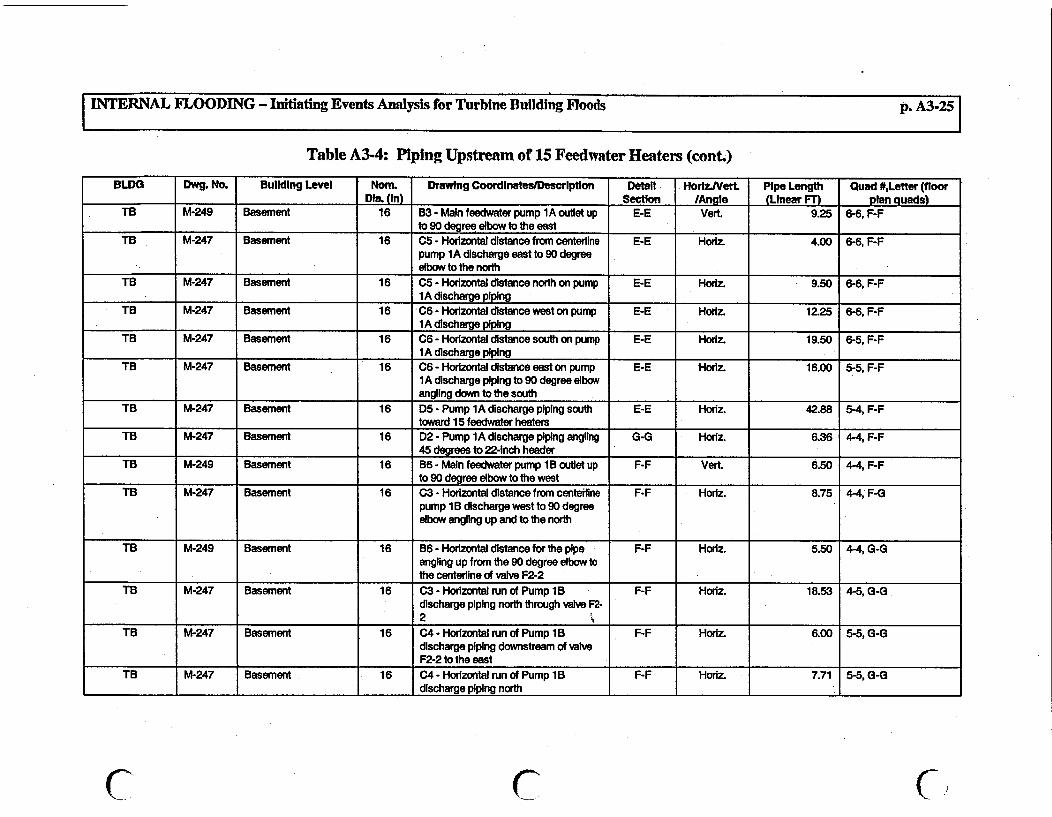
INTERNAL FLOODING - Initiating Events Analysis for Turbine Building Floods p. A3-25
Table A3-4: Piping Upstream of 15 Feedwater Heaters (cont.)
BLDG Dwg. No. Building Level Nom. Drawing Coordinates/Descriptlon Detail HorizJVerL Pipe Length Quad #,Letter (floorDia. (In) Section /Angle (Linear Fr) plan quads)
TB M-249 Basement 16 B8 - Main feedwater pump 1 A outlet up E-E Vert. 9.25 6-6, F-Fto 90 degree elbow to the east
TB M-247 Basement 16 CS - Horizontal distance from centerline E-E Houiz. 4.00 6-6, F-Fpump 1A discharge east to 90 degreeelbow to the north
TB M-247 Basement 16 C5 - Horizontal distance north on pump E-E Horxz. 9.50 6-6, F-F__A discharge piping
TB M-247 Basement 16 -C6 - Horizontal distance west on pump E-E Horiz. 12.25 6-6, F-F__A discharge piping
TB M-247 Basement 16 C6 - Horizontal distance south on pump E-E Horiz. 19.50 6-5, F-F1A discharge piping
TB M-247 Basement 16 C6 - Horizontal distance east on pump E-E Horiz. 16.00 5-5, F-F1A discharge piping to 90 degree elbowangling down to the south
TB M-247 Basement 16 D5 - Pump 1A discharge piping south E-E Horiz. 42.88 5-4, F-Ftoward 15 feedwater heaters
TB M-247 Basement 16 D2 - Pump 1A discharge piping angling G-G Horiz. 6.36 4-4, F-F45 degrees to 22-inch header
TB M-249 Basement 16 B6 - Main feedwater pump 1 B outlet up F-F Vert. 6.50 4-4, F-Fto 90 degree elbow to the west
TB M-247 Basement 16 C3 - Horizontal distance from centerline F-F Horiz. 8.75 4-4, F-Gpump 1 B discharge west to 90 degreeelbow angling up and to the north
TB M-249 Basement 16 B6 - Horizontal distance for the pipe F-F Horiz. 5.50 4-4, G-Gangling up from the 90 degree elbow tothe centerline of valve F2-2
TB M-247 Basement 16 C3 - Horizontal run of Pump 1B F-F Horiz. 18.53 4-5, G-Gdischarge piping north through valve F2-2 4
TB M-247 Basement 16 C4 - Horizontal run of Pump 1B F-F Horiz. 6.00 5-5, G-Gdischarge piping downstream of valveF2-2 to the east ;
TB M-247 Basement 16 C4 - Horizontal run of Pump 1B F-F Horiz. 7.71 5-5, G-Gdischarge piping north
C C

C C CINTERN4AL FLOODING - Initiating Events Analysis for Turbine Building Floods p. A3-26
Table A3-4: Piping Upstream of 15 Feedwater Heaters (cont.)
BLDG Dwg. No. Building Level Nom. Drawing Coordinates/Description Detail HorlzJVerL Pipe Length Quad #,Letter (floorI Dia. in) Section /Angle (Linear FT) plan quads)
TB M-247 Basement 16 C4 - Horizontal run of Pump 1 E-E Hodz. 13.50 5-5, G-Fdischarge piping east to the elbowangling down
TB M-249 Basement 16 86 - Main feedwater pump 1 B discharge E-E Vert. 2.67 5-5, F-Fpiping down to header towards 15feedwater heaters
TB M-247 Basement 16 B6 - Main feedwater pump 1 B discharge G-G Horiz. 41.60 5-4, F-Fpiping south towards 15 feedwater
___ _ __ |heaters up to the reducerTB M-247 Basement 22 B2 -22-inch header for main feedwater G-G Horiz. 7.79 4-4 F-F-
discharge piping from reducer to T ant__ 15 heaters
TB M-247 Basement 22 D2 - Centerline of T in 22-inch header G-G Horiz. 8.50 3-3, F-Feast to reducing elbow
TB M-247 Basement 16 D2 - From centedline of reducing elbow G-G Horiz. 17.04 3-3, F-Fsouth through valve F3-1 to 90 degreereducing elbow to the west
TB M-247 Basement 20 D2 - Straightline distance north through G-G Horiz. 5.00 3-3, F-Fthe two 90 degree elbows toward the15A heater
TB M-247 Basement 20 D2 - 20-inch piping north toward heater G-G Horiz 13.29 3-3, F-F:- _ 15A
TB M-249 Basement 20 C12 - Vertical piping from 20-Inch H-H Vert. 5.92 3-3, F-Fihorizontal pipe up to mezzanine floor
| toward heater 15ATB M-249 Basement 20 C12 - Vertical piping from mezzanine H-H Vert. 1.52 3-3, F-F
floor to heater 1SA inletTB M-249 Basement 14 F1 - Vertical 14-inch bypass piping from H-H Verl. 5.92 3-3, F-F
20-inch horizontal pipe up to mezzaninefloor toward heater 15A ___ _ _
TB M-249 Mez. 14 COf - Vertical piping from mezzanine H-H VerL 1.50 3-3, F-F-_foor to valve F11-1 nlet
TB M-247 Basement 22 D2 - Centerline of T in 22-inch header G-G Horiz. 11.00 3-3, F-Fwest to reducing elbow
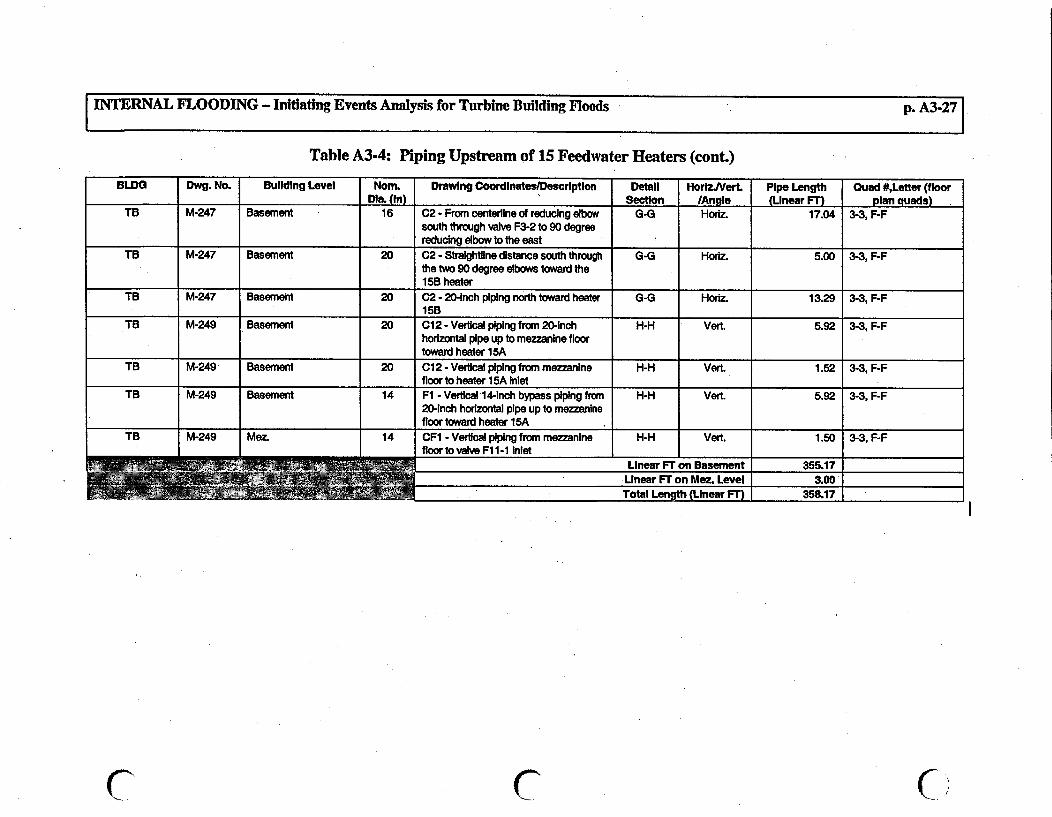
|INTERNAL FLOODING - Initiating Events Analysis for Turbine Building Floods p. A3-27|
Table A3-4: Piping Upstream of 15 Feedwater Heaters (cont.)
BLDG Dwg. No. Building Level Nom. Drawing Coordinates/Descriptlon Detail HorkzJVerL Pipe Length Quad #,Letter (floorDia. (In) Section /Angle (Linear FT) plan quads)
TB M-247 Basement 16 C2 - From centerline of reducing elbow G-G Horiz. 17.04 3-3, F-Fsouth through valve F3-2 to 90 degreereducing elbow to the east -
TB M-247 Basement 20 C2 - Stralghtine distance south through G-G Horiz. 5.00 3-3, F-Fthe two 90 degree elbows toward the15B heater
TB M-247 Basement 20 C2 - 20-inch piping north toward heater G-G Horkz. 13.29 3-3, F-F15B
TB M-249 Basement 20 C12 - Vertical piping from 20-inch H-H Vert. 5.92 3-3, F-Fhorizontal pipe up to mezzanine floortoward heater 15A
TB M-249 Basement 20 C12 - Vertical piping from mezzanine H-H Vert. 1.52 3-3, F-F._ floor to heater 15A Inlet
TB M-249 Basement 14 Fl - Vertical 14-inch bypass piping from H-H Vert. 5.92 3-3. F-F20-inch horizontal pipe up to mezzanine
__________ .. ___._ .. _____ ._ _ floor toward heater 15A . .... .. _ _ _TB M-249 Mez. 14 CFt -Vertical piping from mezzanine
floor to valve Ft -1 inletH-H Vert. 1.50 3-3, F-F
Linear FTon Basement 355.17 _
Linear FT on Mez. Level 3.00Total Length (Linear FT) 358.17
I
r C C
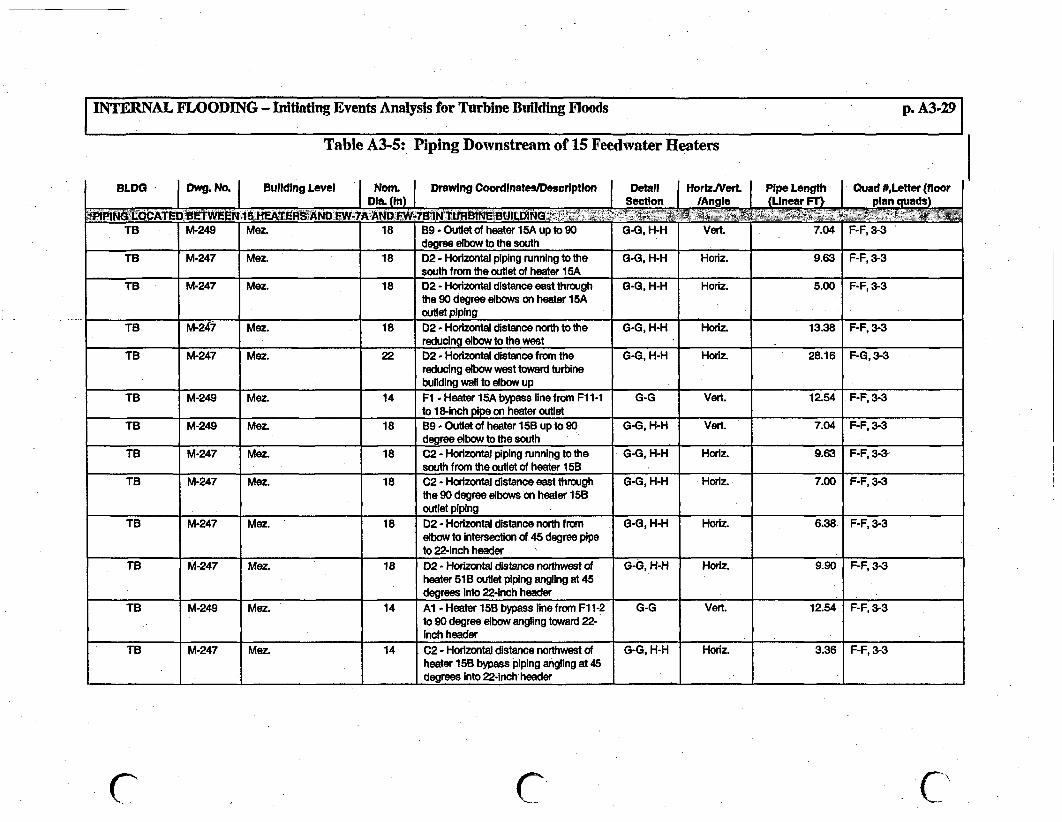
INTERNAL FLOODING - Initiating Events Analysis for Turbine Building Floods p. A3-29
Table A3-5: Piping Downstream of 15 Feedwater Heaters
BLDG | Dwg. No. Building Level | Nom. | Drawing CoordInates/Descriptlon Detail | Horiz/Vert| Pipe Length | Quad #,Letter (floor_ _Dl_. (In)I Section /Angle (Linear FT plan quads
~PPNLCT TEf15HEAT AND FW4ANDF~T~iN TIJRINBUIL~tNG 7.TB M-249 Mez. 18 B9 - Outlet of heater 15A up to 9O G-G, H-H Vert. 7.04 F-F, 3-3
degree elbow to the southTB M-247 Mez. 18 D2 - Horizontal piping running to the G-G, H-H Horiz. 9.63 F-F, 3-3
south from the outlet of heater 15ATB M-247 Mez. 18 D2 - Horizontal distance east through G-G, H-H Horiz. 5.00 F-F, 3-3
the 90 degree elbows on heater 15Aoutlet piping
TB M-247 Mez. 18 D2 - Horizontal distance north to the G-G, H-H Horiz. 13.38 F-F, 3-3reducing elbow to the west
TB M-247 Mez. 22 D2 - Horizontal distance from the G-G, H-H Horliz. 28.16 F-G, 3-3reducing elbow west toward turbinebuilding wall to elbow up
TB M-249 Mez. 14 Fl -Heater 15A bypass line from F11-1 G-G Vert. 12.54 F-F, 3-3to 18-Inch pipe on heater outlet
TB M-249 Mez. 18 B9 - Outlet of heater 15B up to 90 G4-, H-H Vert. 7.04 F-F, 3-3_ degree elbow to the south
TB M-247 Mez. 18 C2 -Horizontal piping running to the G-G, H-H Horiz. 9.63 F-F, 3-3-south from the outlet of heater 15B
TB M-247 Mez. 18 C2 - Horizontal distance east through G-G, H-H Horiz. 7.00 F-F, 3-3the 90 degree elbows on heater 15Boutlet piping
TB M-247 Mez. 18 D2 - Horizontal distance north from G-G, H-H Hodz. 6.38 F-F, 3-3elbow to intersection of 45 degree pipeto 22-inch header
TB M-247 Mez. 18 D2 -HorizontaJ distance northwest of G-G, H-H Horiz. 9.90 F-F, 3-3heater 51 B outlet piping angling at 45degrees into 22-inch header
TB M-249 Mez. 14 Al - Heater 15B bypass line from Fl 1-2 G-G Vert. 12.54 F-F, 3-3to 90 degree elbow angling toward 22-inch header
TB M-247 Mez. 14 C2 - Horizontal distance northwest of G-G, H-H Hoiz. 3.36 F-F, 3-3heater 15B bypass piping angflng at 45degrees Into 22-Inch header -
Cf C C\
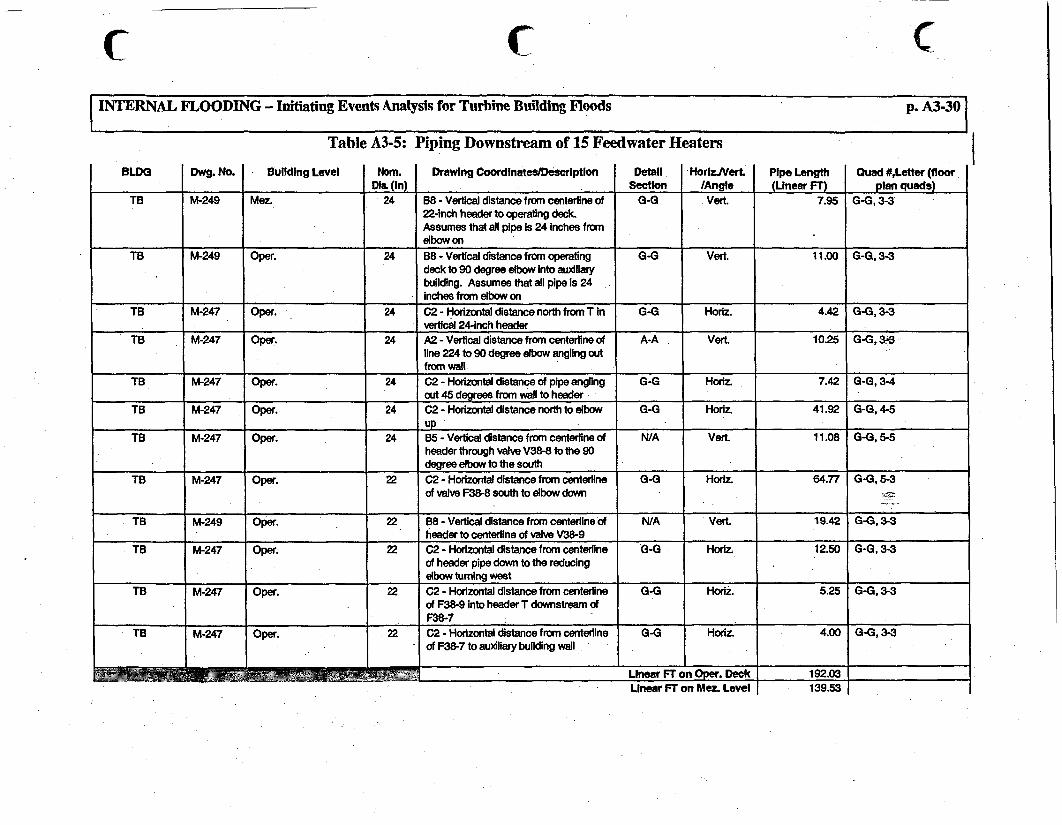
C C7 CINTERNAL FLOODING - Initiating Events Analysis for Turbine Building Floods p. A3-30
Table A3-5: Piping Downstream of 15 Feedwater HeatersBLDG Dwg. No. Building Level Nom. Drawing Coordinates/Description Detail HorizVert. Pipe Length Quad #,Letter (floor
I Di. (in) Section /Angle (Linear FT) plan quads)TB M-249 Mez. 24 B8 - Vertical distance frorn centerline of G-G Vert. 7.95 G-G, 3-3
22-Inch header to operating deck.Assumes that all pipe is 24 Inches fromelbow on
TB M-249 Oper. 24 B8 - Vertical distance from operating G4- Vert. 11.00 G-G, 3-3deck to 90 degree elbow into autdliarybuilding. Assumes that all pipe is 24inches from elbow on
TB M-247 Oper. 24 02 - Horizontal distance north from T in G-G Horiz. 4.42 G-G, 3-3verical 24-inch header
TB M-247 Oper. 24 A2 - Vertical distance from centeriine of A-A Vert. 10.25 G-G, 3-3line 224 to 90 degree elbow angling outfrom wall -
TB M-247 Oper. 24 C2 - Horizontal distance of pipe angling G-G Horiz. 7.42 G-G, 3-4out 45 degrees from wall to header
TB M-247 Oper. 24 C2 - Horizontal distance north to elbow G-G Horiz. 41.92 G-G, 4-5
TB M-247 Oper. 24 B5 - Vertical distance from centerline of N/A Vert. 11.08 G-G, 5-5header through valve V38-8 to the 90degree elbow to the south
TB M-247 Oper. 22 C2 - Horizontal distance from centerline G-G Horiz. 64.77 G-G, 5-3of valve F38-8 south to elbow down
TB M-249 Oper. 22 B8 - Vertical distance from centerine of N/A Vert. 19.42 G-, 3-3_ _ header to centerline of valve V38-9
TB M-247 Oper. 22 02 - Horizontal distance from centerline G-G Horiz. 12.50 G-G, 3-3of header pipe down to the reducingelbow turning west -
TB M-247 Oper. 22 C2 - Horizontal distance from centerline G-G HorlZ. 5.25 G-G, 3-3of F38-9 Into header T downstream of
_ _ _ _ _ _ _ _ _ _ _ _ _ _ _ _ _ _ _ _ _ _ _ _ _ _ _ _ _ _ _ _ _ _F 38 -7 _ _ _ _ _ _ _ _
TB M-247 Oper. 22 C2 - Horizontal distance from centerfine G-G Horiz 4.00 G-G, 3-3of F38-7 to auxdliary building wall
Linear FT on Oper. Deck 192.03
I
Linear FT on Mez. Level 139.53

INTERNAL FLOODING - Initiating Events Analysis for Turbine Building Floods p. A3-31|
Table A3-5: Piping Downstream of 15 Feedwater Heaters
BLDG Dwg. No. | Building Level Nom. Drawing Coordinates/Descriptlon I Detail I HorilzVert| Pipe Length Quad #,Letter (floorl Dia. (in) } | Section | /Angle (Linear Fr) plan quads)
Total Length (Linear Fr) 331.56 1
-C C C'

Appendix A
Initiating Events
Attachment 1 - Turbine Sump Alarm History
Page I of 5

Turbine Building Sump Alarm History
Prepared by: , 4 I 6e'A4..W_ Signature c.- Print Name
10 /it/ofDate
Reviewed by: 5efA7 7,oSignature
F4raere r SMAXoML),Print Name
-/ - O..r
Date
Q4Page 2 of 5
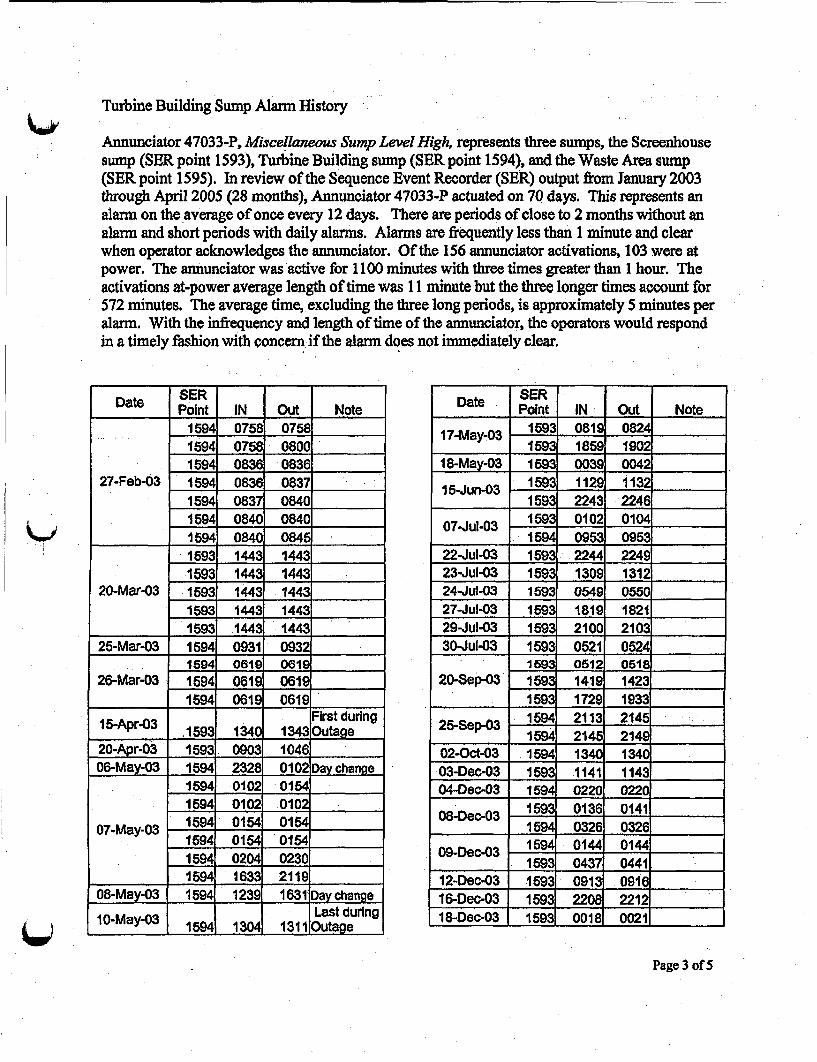
Turbine Building Sump Alarm History
Annunciator 47033-P, Miscellaneous Sump Level High, represents three sumps, the Screenhousesump (SER point 1593), Turbine Building sump (SER point 1594), and the Waste Area sump(SER point 1595). In review of the Sequence Event Recorder (SER) output from January 2003through April 2005 (28 months), Annunciator 47033-P actuated on 70 days. This represents analarm on the average of once every 12 days. There are periods of close to 2 months without analarm and short periods with daily alarms. Alarms are frequently less than 1 minute and clearwhen operator acknowledges the annunciator. Of the 156 annunciator activations, 103 were atpower. The annunciator was active for 1100 minutes with three times greater than 1 hour. Theactivations at-power average length of time was II minute but the three longer times account for572 minutes. The average time, excluding the three long periods, is approximately 5 minutes peralarm. With the infrequency and length of time of the annunciator, the operators would respondin a timely fashion with concern if the alarm does not immediately clear.
Dae SERDate Point IN Out Note
1594 0758 07581594 0758 0800.1594 0836 0836
27-Feb-03 1594 0836 08371594 0837 08401594 0840 08401594 0840 08451593 1443 14431593 1443 1443
20-Mar-03 1593 1443 14431593 1443 14431593 1443 1443
25-Mar-03 1594 0931 09321594 0619 0619
26-Mar-03 1594 0619 0619
9 1594 19 0619Firt during
15-Apr03 .1593 1340 1343 Outage
20-Apr-03 1593. 0903 1046 . _
06-May-03 1594 2328 0102 Day change1594 0102 01541594 0102 0102
07-May-03 1694 0154 01541594 0154 01541594 0204 02301594 1633 2119
08-May-03 1594 1239 1631 Day change
10-May-03 1Last during10My-3 1594 1304 1311 Outage
Date SER_____Point IN out Note
17-May-0 1593 0819 0824159 1859 1902
18-May-03 1593 0039 00421
15-Jun-03 1593 1129 113211593 2243 2246
07-Jul-03 1593 0102 0104. 1594 0953 0953
22-Jul-03 1593 2244 224923-Jul-03 1593 1309 131 _
24-Jul-03 159 0549 055027-Jul-03 1593 1819 182129-Jul-03 1593 2100 210330-Jul-03 1593 0521 0524
1593 0512 0518_20-Sep-03 1593 1419 1423
1593 1729 1933
25-Sep-03 1594 2113 21451594 2145 2149
02-Oct-03 1594 1340 134003-Dec-03 1593 1141 114304-Dec-03 1594 0220 0220
08-Dec-03 1593 0136 01411594 0326 0326
09De-03 1594 0144 01441593 0437 04411 _
12-Dec-03 1593 0913 0916 116-Dec-03 1593 2208 2212 :1 8-Dec-03 1593 0018 00211
Page 3 of 5

[Pointi ut I ,Note 122-DeC-03 1 16941 12411 12411
25-Dec-03 115931 11361 11381i
1593 1400 1402|28-Dec03 1593 1412 1415
1593 1724 17262 1593 1243 1246
29-Dec-031593 2246 2249
31-Dec-03 1593 1609 1513
01-Jan-04 1593 0632 063501-Jan-04 1593 0924 092610-Jan-04 1593 1723 1727
13-Jan-04 1593 0341 0344
13-Jan-04 1593 0645 06491593 2118 2121
15-Jan04 1593 1828 1832 First during1593 1939 1943 Outage1593 0149 0153
16-Jan-04 1593 0533 05371593 1257 13001
1593 1412 1415
28-Jan-04 1593 1245 2349. 1593 2145 2148
1593 0312 031829-Jan-04 1594 2256 2301
1594 2300 0038 Day change1594 0038 0039 Last during
30-Jan-04 1594 0039 003 9 Outage
1594 0039 01321594 0303 03141594 0359 0406
31-Jan-04 1594 0508 051
1593 0659 06031594 0802 0810
01-Feb-04 1593 1647 1650
1593 0053 0057
1593 0236 0240
02-Feb-04 1593 0921 09241593 1209 12131593 1430 1435
. 1693 1550 165601-Mar-04 1594 1246 125102-Mar-04 1594 075 0753 .
1594 0759 0800
Date RPoint IN Out Note
1594 0759 07591594 0946 09461594 0947 09471594 0947 09541594 0955 10071594 1043 10431594 1043 10441594 1107 .1107
02-Mar-04 1594 1129 1132Cont. 1594 1152 11521
1694 1154 11541594 1156 11591694 1304 13041594 1311 13111594 1311 1311
14-Jun-04 1594 0833 083318-Jun-04 1593 0832 0832
1594 1230 12301594 1230 1230
16-Aug-4 1594 1230 12301594 1230 12301594 1230 1230
20-Sep-04 1594 1346 14141594 1333 16331
01-Oct-04 1594 1655 16551594 1718 17581
20-Oct-04 First during1593 2237 2332 Outage1594 1209 12101594 1210 12131594 1313 1314
02-Nov-04 1594 1314 13141594 1314 13141594 1314 13321594 1314 131411594 1332 1421
04-Nov-04 1594 1405 140506-Dc-04Lost during
06-Dec-04 1594 0537 0610 Outage1595 1043 10441595 1044 1044
09-Feb-05 1595 1044 10441595 1049 10491595 1117 1117.
_ 1595 1117 11171
Qw,
Page 4 of 5

Date SERif)_DatePoint IN Out Note
First during23-Feb-05 1593 2157 2158 Outage. 1593 2157 2157,
10-Mar-05 1593 0827 0834 SERIES13-Mar-05 1594 1101 110414-Mar-05 1594 0808 0808
17-Mar-05 1593 0925 09251593 1018 1018
22-Mar-05 1593 1739 174302-Apr-05 1594 1451 145703-Apr-05 1594 062 065004-Apr-05 1594 1225 123605-Apr-05 1594 0629 064406-Apr-05 1594 0616 0634
09-Apr-05 1594 1546 15471 1594 1550 1550
Page 5 of 5

Appendix A
Initiating Events
Attachment 2 - Circulation WaterExpansion Joint Rupture Frequency

Circulation Water Expansion JointRupture Frequency
Owner's Acceptance: nr.bi G ,SM'-Signature
Ti-qbt& & S tocA
Print Name
Date
EXPANSION JOINT FAILURE RATES FOR THEKEWAUNEE PRA
Final Report
Prepared for
Dominion EnergyKewaunee Power Station
By
Karl N. FlemingBengt O.Y. Lydell
In Cooperation withMaracor Software & Engineering, Inc.
Karl N. Fleming Consulting Services LLCA Callfomia Limited Liability Company
616 Sereno View RoadEncinitas, CA 92024
United States of America
November, 2005

Expansion Joint Failure Rates for Kewaunee PRA
TABLE OF CONTENTS
Section Title Page
1. INTRODUCTION .................... 31.1 Purmose .................... 31.2 Scope..............................................................................................................31.3 Obiectives .................... 31.4 Report Guide .................... 3
2. TECHNICAL APPROACH .................... 42.1 Overview ................... 42.2 Uncertainty Treatment .................... 42.3 Component Rupture Model .................... 42.4 Definition of Expansion Joint Failure Mode Cases ........................................... 7
3. CIRCULATING WATER SYSTEM EXPANSION JOINT FAILURE RATES ..... 83.1 Background ....................................................... 83.2 Revised Data Analysis ...................................................... s93.3 Revised Expansion Joint Failure Rate ....................................................... 93.4 Revised Conditional Probability of RuDture .................................................... 103.5 Results ...................................................... 113.6 Plan to Update EPRI Report of Reference 1`11 ................................................. 1 1
4. REFERENCES ....................................................... 19
TABLE OF FIGURESTitle Page
Figure 2-1 Flow Chart for Bayes' Estimates of System. Size, and Damage MechanismSpecific Pipe Failure Rates (A) and Rupture Frequencies () .6
Figure 3-1 Uncertainty Distribution Expansion Joint Rupture Frequency (>10,000 gpm).......................................................................................................................... 17
LIST OF TABLESTitle Page
Table 3-1 CW-Expansion Joint Failure Rate & Rupture Frequency (Reproduced fromTable A-35 from Reference 1i 1) .8
Table 3-2 Analysis of Events Involving Expansion Joint Failures .12Table 3-3 Uncertainty Distribution Results for Expansion Joint Failure Rates.. 17
Karl N. Fleming Consulting Services LLC Page 2 of 21

Expansion Joint Failure Rates for Kewaunee PRA
1. INTRODUCTION
1.1 Purpose
The purpose of this report is to document the derivation of failure rates for different failuremodes for rubber expansion joints of the type used in LWR circulating water systems. Thiswork was performed via Subcontract to Maracor Software Engineering, Inc. on behalf ofDominion Energy's Kewaunee Power Station. This report is prepared to be an integral part ofthe overall turbine building internal flooding initiating events analysis.
1.2 Scope
The scope of work covered in this report includes:
* Development of failure rates and rupture frequencies for rubber expansion joints of thetype used in the Kewaunee Circulating Water System
* Development of point estimates and probability uncertainty distributions for allparameters subject to data uncertainties
1.3 Objectives
The objective is to perform a state of the art data analysis that is consistent with the applicablerequirements of ASME PRA Standard Capability Category II for data analysis and initiatingevent frequency development. Consistent with this objective, the report is intended to provide atraceable basis for the calculations so that the results could be independently reproduced fromthe information provided.
1.4 Report GuideA major part of this report is devoted to the development of a set of failure rates and rupturefrequencies for use in the intemal flooding initiating event development. The technical approachto developing these failure rates and rupture frequencies is summarized in Section 2. In Section3 the failure rates for rubber expansion joints are developed for different expansion joint failuremodes including leakage and ruptures with flow1 rates less than 2,000 gpm, ruptures with flowrates greater than 2,000 and ruptures with flow rates greater than 10,000 gpm. Section 4 liststhe references used as inputs to the data development and methodology. Supporting detailsare provided in the Appendices.
Karl N. Fleming Consulting Services LLC Page 3 of 21

Expansion Joint Failure Rates for Kewaunee PRA
2. TECHNICAL APPROACH
2.1 OverviewThe model used to estimate piping component failure frequencies for the initiating event modelsin this calculation is the same as that used in a recent EPRI report on internal flooding initiatingevent frequencies (1], and similar to that used in recent NRC studies regarding loss of coolantaccident (LOCA) initiating event frequencies [2] [3]. The source of pipe failure and exposuredata used to quantify the failure rates used in these models is known as "PIPExp-2004" [4]. Asummary of this database is provided in Appendix A
2.2 Uncertainty TreatmentUncertainties in these failure rates were quantified using a Bayes' methodology that wasdeveloped in the EPRI RI-ISI program [5] and approved by the NRC for use in applied RI-ISIevaluations [6]. An independent review of this pipe failure rate uncertainty treatment wasperformed to support the NRC Safety Evaluation and results of this favorable review areprovided in Reference [7]. An earlier EPRI report [8] developed a set of pipe failure rates foruse in the EPRI RI-ISI applications which was also approved and independently reviewed inReferences [6] and [7]. These earlier failure rate estimates were derived from a pipe failuredatabase that had been developed in Reference [10]. During subsequent work in applyingthese estimates in applied RI-ISI evaluation, a significant number of data classification errors inthe original data source [10] were identified and improved estimates of the exposure populationbecame available. These factors, as discussed more fully in Reference [9], were the primemotivation to switch to the more comprehensive and validated uPIPExp-2004" database whenReference [1], was developed. The most recent NRC sponsored work on LOCA frequencies [3]is also based in part on the "PIPExp-2004" database.
2.3 Component Rupture ModelThe model used for relating failure rates and rupture frequencies for piping components usesthe following simple model that is widely used in piping reliability assessment and was used inrecent updates of recommended Loss of Coolant Accident frequencies [6]. The failure modesincluded in the estimation of failure rates include leaks and ruptures and, in some cases, cracksmay also be included depending on the application. The model is expressed in the followingequation:
M MP Epi =Z'ikP"RIF (2.1)
k=1 =1
Where:= total rupture frequency of rupture size x for pipe size i in
system j= rupture frequency of rupture size x for pipe of size i in system
j due to damage mechanism k= failure rate of pipe of size i in system j due to damage
Karl N. Flenming Consulting Services LLC Page 4 of 21

Expansion Joint Failure Rates for Kewaunee PRA
mechanism kPgk{RXF} = conditional probability of rupture size x given failure for pipe
size i in system j and damage mechanism kM = Number of different damage mechanisms
In general, a point estimate of the frequency of pipe failures, Ap, is given by the followingexpression:
n k.i2 j jk (2.2)
fJk fNu Tu
Wherenok= the number of failures (cracks, wall thinning, leaks and ruptures)
events for pipe size i in system j due to damage mechanism kT = the total time over which failure events were collected for pipe
size i in system jNij = the number of components that provided the observed pipe
failures for size i in system jfij= the fraction of number of components of size i in system j that are
susceptible to failure from damage mechanism k for conditionalfailure rates given susceptibility to damage mechanism k, 1 forunconditional failure rates
Note that all failure modes that result in pipe repair are included in the failure rate and that allfailures thus defined are regarded as precursors to rupture. Some events that have noevidence of leakage are screened out prior to the calculation of failure rates. The eventscounted as ruptures are based on a specific definition of rupture which is application specific.For internal flooding applications, we seek unconditional failure rates and hence we cancombine these equations under the condition: fqik =1 to obtain the following expression for thepoint estimate of the rupture frequency.
M M n
p, =Zpou =ZA4*(k|FJ= aJR.|F} (2.3)__1 = k-I NUTU
In the development of Bayes' uncertainty distributions for these parameters, prior distributionsare developed for the parameters Alp and Plk(R IF) and these prior distributions are updatedusing the evidence from the failure and exposure data as in standard Bayes' updating. Theexposure terms (denominator of the fractions on the right hand side of Equation (2.3) also haveuncertainty as these terms must be estimated for the entire nuclear industry that provides thenumber of failures for the failure rate estimation. This uncertainty is treated in this process byadopting three hypotheses about the values of the exposure terms which requires three Bayesupdates for each failure rate. The resulting posterior distributions for each parameter on theright hand side of Equation (2.3) are then combined using Monte Carlo sampling to obtainuncertainty distributions for the pipe rupture frequencies. A picture of this process is shown inFigure 2-1. This flow chart shows the full treatment of uncertainty needed for the RISIformulation in Equation (2.2). For the internal flooding formulation of Equation (2.3) the damage
Karl N. Fleming Consulting Setvices LLC .Page 5 of 21
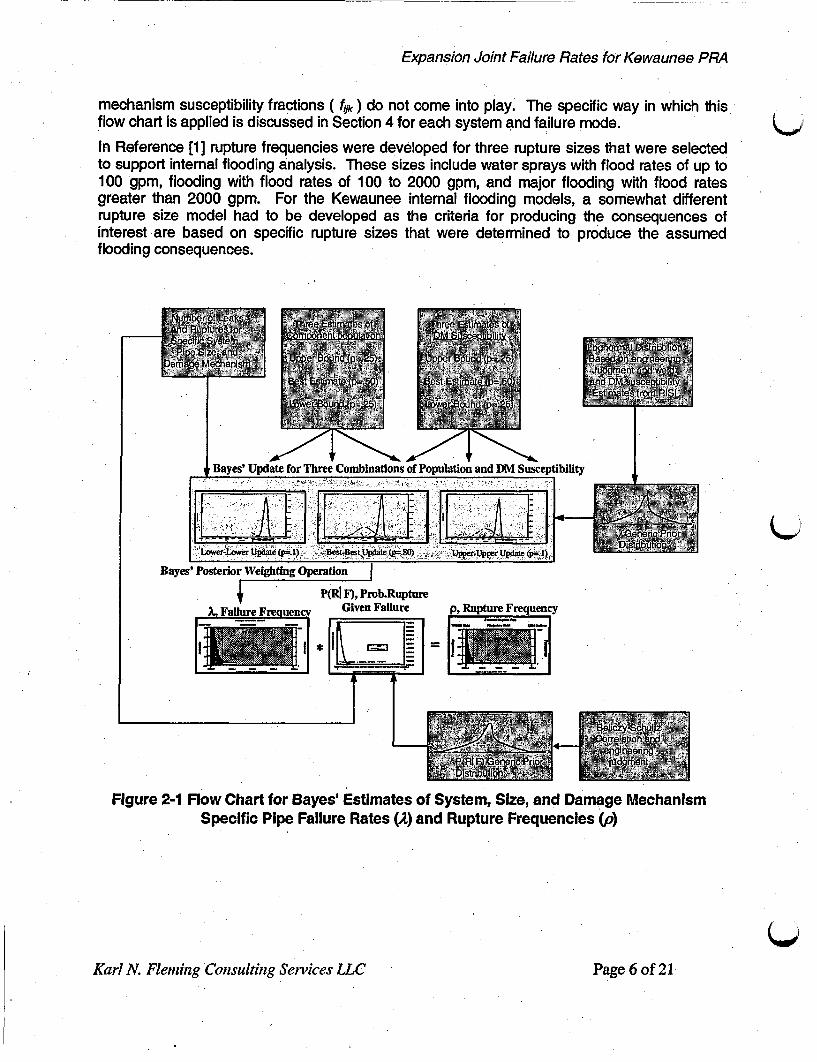
Expansion Joint Failure Rates for Kewaunee PRA
mechanism susceptibility fractions ( fjk ) do not come into play. The specific way in which thisflow chart is applied is discussed in Section 4 for each system and failure mode.
In Reference [1] rupture frequencies were developed for three rupture sizes that were selectedto support internal flooding analysis. These sizes include water sprays with flood rates of up to100 gpm, flooding with flood rates of 100 to 2000 gpm, and major flooding with flood ratesgreater than 2000 gpm. For the Kewaunee internal flooding models, a somewhat differentrupture size model had to be developed as the criteria for producing the consequences ofinterest are based on specific rupture sizes that were determined to produce the assumedflooding consequences.
Lowertoer Update :(1=.) es-Bi^ sErest Updat (* .Si). a
Bayes' Posterior Weighting Operation
1 r P(RI F), Prob.Rupturei nn.-.... -.m- Given Failure
(hw)
Figure 2-1 Flow Chart for Bayes' Estimates of System, Size, and Damage MechanismSpecific Pipe Failure Rates (A) and Rupture Frequencies (p)
Karl N. Fleming Consulting Services LLC Page 6 of 21

Expansion Joint Failure Rates for Kewaunee PRA
2.4 Definition of Expansion Joint Fallure Mode Cases
Failure rates are developed in this report for the following cases.
1. Total failure rate for all failure modes involving leaks and ruptures
2. Rupture frequency for leaks and ruptures with flow rates less than or equal to 2,000 gpm
3. Rupture frequency for ruptures with flow rates greater than 2,000 gpm
4. Rupture frequency for ruptures with flow rates greater than 10,000
Note that Case 3 is inclusive of Case 4, i.e. Case 3 includes leak flows less than, equal to, andgreater than 10,000 gpm.
Karl N. Fleming Consulting Services LLC Page 7 of 21

Expansion Joint Failure Rates for Kewaunee PR4
3. CIRCULATING WATER SYSTEM EXPANSION JOINT FAILURERATES
3.1 Background
Failure rates and rupture frequencies for circulating water system expansion joints weredeveloped in Reference [1] by the authors of this report. The results obtained in thatanalysis are summarized in Table 3-1 reproduced from Table A-35 in Reference [1]below.
Table 3-1 CW-Expansion Joint Failure Rate & Rupture Frequency (Reproducedfrom Table A-35 from Reference [11])
Component & Failure Mode Unc ertainty Distriution [1/EXJ .YRType Failure Mode Mean St Median se
_ Percentile PercentileCW Rubber EXJ Spray 1.11 E-04 4.13E-05 i 9.51 E-05 2.38E-04CW-Rubber EXJ Major Flooding 1 .49E-05 3.92E-06 1 .20E-05 3.61 E-05
The evidence used to develop these results consisted of the following:
The failure rate for sprays was based on 4 events involving LWR circulating watersystem rubber expansion joint failures that occurred at Comanche Peak (1 event),LaSalle (1 event), and Catawba (2 events). The exposure term was estimated basedon 2899 LWR reactor years of service data in the PIPExp database through 2004 and anestimate of 12 rubber expansion joints per LWR circulating water system.
The prior distribution used for the analysis was based on the failure rate developed inthe Oconee PRA [19] whose mean value-is 2.5x10⁴ per component year and a rangefactor of 100 was assumed.
To estimate the conditional probability of rupture for major flooding given failure, whichwas defined in Reference [1] to be a rupture with flooding in excess of 2,000 gpm, alarger population of expansion joint, failure events covering different systems andincluding an HTGR event at Ft. St. Vrain was developed. This population had a total of35 events including the 4 events used in the above described failure rate calculation.One of these ruptures was the LaSalle event considered in the failure rate calculationand the other 3 ruptures in this population occurred at Ft. St. Vrain, Beaver Valley, andComanche Peak. Note that the information presented in Reference [1] did not identifythe 3 rupture events other than the one at LaSalle. Also note that the events at BeaverValley and Comanche Peak were not in the circulating water service system nor were 31of the 35 events considered in this larger population of expansion joint failures. Theapproach of specializing the failure rate data to the system of interest and then using a
Karl N. Fleming Consulting Services LLC Page 8 of 21

Expansion Joint Failure Rates for Kewaunee PRA
larger sample size for the conditional rupture probability is consistent with the approachused in Reference [1] for all the piping system failure rates that were developed.
3.2 Revised Data AnalysisIn the current study, more information was collected on the events that were analyzed inReference [1] and additional expansion joint events were identified. This wasaccomplished by augmenting the data queries from the PIPExp database that was usedin Reference [1] by consulting additional sources including those of References [20Jthrough [34]. In addition to the 35 events used in Reference [1], the revised analysisincluded an additional 7 events that are summarized in Table 3-2. As a result of thisadditional information, the 43 events in Table 3-2 are analyzed as follows by tabulatingthe assessments in the last column of Table 3-2.
Total No. Events 42Events screened out due to non-leakage 6Events involving leaks or ruptures in LWR Circ. water systems 5Events Involving Leaks 27Events involving Ruptures with leak flows < 2,000gpm 6Events involving Ruptures with leak flows 2,000-1 0,000gpm 2Events involving Ruptures> 10,000 gpm 1Total Number of Faillures (leaks + ruptures) 36
3.3 Revised Expansion Joint Failure RateConsistent with the methodology adopted in Reference [1], the failure rate for thecirculating water system expansion joints is based on data from LWR circulating watersystems only and does not include data from expansion joints in other systems. Thisapproach is used to capture system specific factors that may impact the degradationmechanism responsible for failure and is expected to influence the likelihood of failure. Inthe Reference [1] analysis of expansion joint failure rates 4 events were classified asLWR Circulating water system failures and in the revised analysis this is increased to 5.The assumptions regarding population exposure and the assumed prior distribution areunchanged from Reference [1] in this revised analysis: namely, that there are on theaverage of 12 circulating water expansion joints per reactor unit and that the reactoryears of exposure data that was estimated in Reference [1] of 2899 reactor operatingyears is still valid. According to the methodology described in Section 2, uncertainty inthis exposure term estimate was accounted for by admitting hypotheses that theseestimates are 50% higher and 50% lower than this best estimate. The net result of therevised circulating water system failure counts are an increase in the assessed failurerate by a factor of 1.25. The resulting failure rate distribution is presented in Table 3-3and this distribution was used for each of the different failure mode cases describedbelow.
Karl N. Fleming Consulting Services LLC Page 9 of 21

Expansion Joint Failure Rates for Kewaunee PRA
3.4 Revised Conditional Probability of RuptureConsistent with the methodology adopted in Reference [1], the data set for theestimation of conditional rupture probabilities is expanded to include expansion joints inother systems because this parameter is viewed to be more a function of the propertiesof the component than is the case with the failure rate. System specific factors mayinfluence the failure rate, but the conditional probability of rupture given failure is notexpected to vary from system to system. The use of different data sets for the failurerate and the conditional probability of rupture given failure is consistent with the pipefailure data handling methodology that was developed for the EPRI RI-ISI evaluations inReference [8] and approved by the NRC in Reference [7]. In that reference, data fromdifferent systems was pooled to support the conditional rupture probabilities, but suchpooling was not performed for the failure rates. The motivation is to have a statisticallysignificant sample size for each parameter. More discussion on this point can be foundin Reference [9].
In the Reference [1 ] analysis there was one rupture case developed for ruptures withleak flows greater than 2,000 gpm. The evidence for that analysis was four ruptureevents in 35 failure events. In the updated analysis there is a total of 36 events involvingleaks and ruptures. For for leak flows greater than 2,000 gpm, there are 3 eventsincluding 2 events with leak flows between 2,000 gpm and 10,000 gpm and 1 event withleak flow greater than 10,000. One of the events classified as rupture in the Reference[1 ] analysis at Comanche Peak was determined by contacting Plant personnel(Reference [33]) to be a leak with a flow rate substantially less than 2,000 gpm whichflooded a small room over a protracted period of time and hence in this revised analysisit was classified as a leak. The remaining 3 ruptures in Reference [1] remain soclassified here. The most severe was the expansion joint rupture at Ft. St. Vrain whichhad a reported leak rate of 15,000 gpm.
So the evidence for the conditional probability of rupture is 3 events out of 36 failureevents involving leak flows greater than 2,000 gpm, 2 events out of 36 failure events forleak flows between 2,000 gpm and 10,000 and 1 event out of 36 failure events involvingleak flows greater than 10,000.
In the Reference [1] analysis a Beta distribution was used to characterize the uncertaintyin the conditional probability of rupture. The prior distribution was assumed to be a flatprior indicating a non-informative state of knowledge. Given the current knowledgebased on the Reference [1] results we now know that the vast majority of expansion jointfailures are leaks and not major ruptures. In the revised analysis, the A and Bparameters for the prior Beta distribution are set at 1 and 9, respectively consistent withan assumed mean conditional rupture probability of 0.1. This yields the following meanvalues of the Bayes' updated Beta Distribution.
Mean{Rupture> 2,000gpm} Post=rion = (APrior +3) (1+3) =.087Apgtcri +Bposterior (APrior +3 )+(BPrior +33) (1+3)+(9+33)
Karl N. Flenming Consulting Services LLC Page 10 of 21

Expansion Joint Failure Rates for Kewaunee PRA
Mean{Rupture2,000tolO,OOOgpm} = APosteCon (Apr, or + 2) (1+2) =.065fA1stedor + BPosteror (Apr for + !) + (B~r +35) (1+2)+(9+35)
Mean{Rupture > 10,OOOgpm)= APosternon = (Apr=or+1) (1+1) 044APosteror + Bp0ostnr (Apr icr + 1) + (Bpr0o, + 35) (1+1) +(9+35)
3.5 ResultsThe results using the methodology of Reference [1] and summarized in Section 2 wereobtained using Crystal Ball and yielded the failure rates and rupture frequencies for theCirculating Water system rubber expansion joints given in Table 3-3. The frequencydistribution from the Monte Carlo analysis for the expansion joint rupture frequency withleak flows greater than 10,000 gpm is shown in Figure 3-1.
3.6 Plan to Update EPRI Report of Reference [11This revised analysis of Circulating Water System Expansion Joint failure rates andrupture frequencies will be included in an update of the EPRI internal flooding frequencyreport of Reference [1 ] which will be published in early 2006.
Karl N. Fleming Consulting Senvices LLC Page II of 21
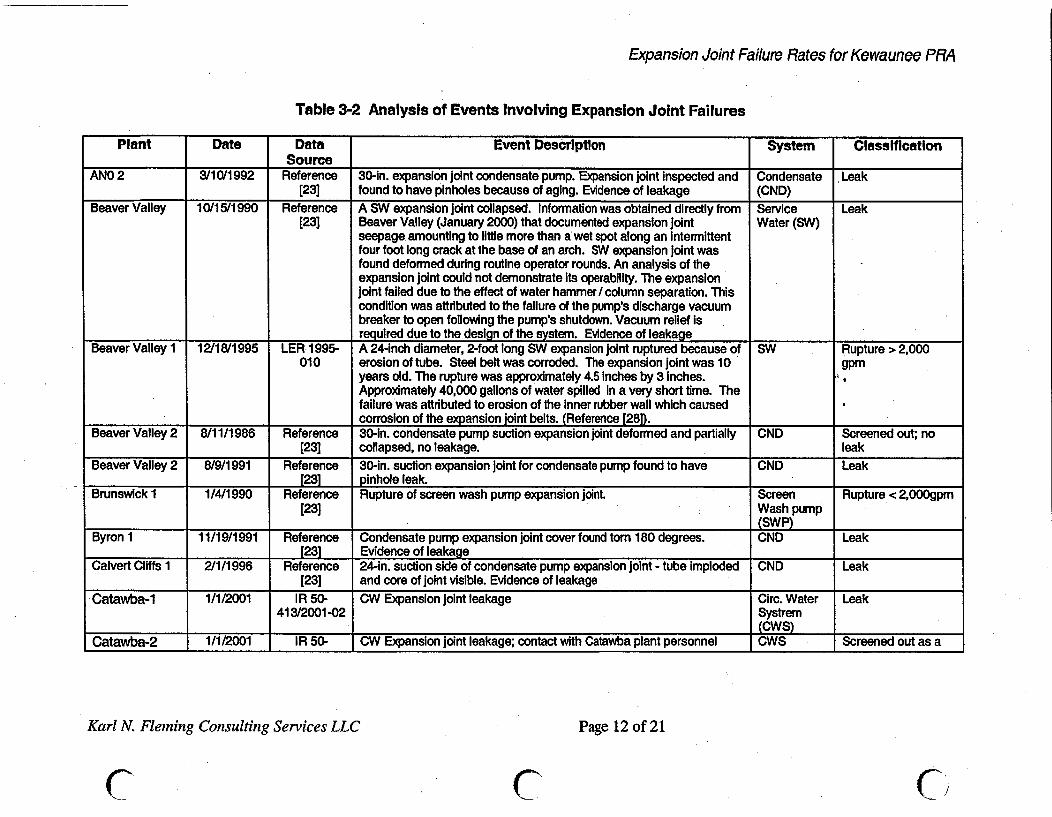
Expansion Joint Failure Rates for Kewaunee PRA
Table 3-2 Analysis of Events Involving Expansion Joint Failures
Plant Date Data Event Description System ClassificationSource
ANO 2 3/10/1992 Reference 30-in. expansion joint condensate pump. Expansion joint inspected and Condensate Leak[23] found to have pinholes because of aging. Evidence of leakage (CND)
Beaver Valley 10/15/1990 Reference A SW expansionjoInt collapsed. Informationwas obtained directlyfrom Service Leak[23] Beaver Valley (January 2000) that documented expansion Joint Water (SW)
seepage amounting to little more than a wet spot along an intermittentfour foot long crack at the base of an arch. SW expansion joint wasfound deformed during routine operator rounds. An analysis of theexpansion joint could not demonstrate its operability. The expansionjoint failed due to the effect of water hammer/ column separation. Thiscondition was attributed to the failure of the pump's discharge vacuumbreaker to open following the pump's shutdown. Vacuum relief isrequired due to the design of the system. Evidence of leakage :
Beaver Valley 1 12/18/1995 LER 1995- A 24-inch diameter, 2-foot long SW expansion joint ruptured because of SW Rupture >2,000010 erosion of tube. Steel belt was corroded. The expansion joint was 10 gpm
years old. The rupture was approximately 4.5 inches by 3 inches.Approximately 40,000 gallons of water spilled in a very short time. Thefailure was attributed to erosion of the inner rubber wall which causedcorrosion of the expansion joint belts. (Reference [28D.
Beaver Valley 2 8/11/1986 Reference 30-in. condensate pump suction expansion joint deformed and partially CND Screened out; no[23] collapsed, noleakage. leak
Beaver Valley 2 8/9/1991 Reference 30-in. suction expansion joint for condensate pump found to have CND Leak[23] pinhole leak.
Brunswick 1 1/4/1990 Reference Rupture of screen wash pump expansion joint. Screen Rupture <2,OOOgpm[23] Wash pump
(SWP)Byron 1 11/19/1991 Reference Condensate pump expansion joint cover found tom 180 degrees. CND Leak
[231 Evidence of leakageCalvert Cliffs 1 2/1/1996 Reference 24-in. suction side of condensate pump expansion joint - tube imploded CND Leak
[23] and core of Joint visible. Evidence of leakageCatawba-1 1/1/2001 IR 50- CW Expansion joint leakage Circ. Water Leak
413/2001-02 Systrem(CWS)
Catawba-2 1/1/2001 IR 50- CW Expansion joint leakage; contact with Catawba plant personnel CWS Screened out as a
Karl N. Fleming Consulting Services LLC Page 12 of 21
C C C7

C C Expansion Joint Failure Rates for Kewaune( RA
Plant Date Data Event Description System ClassificationSource .
414/2001-02 revealed that this event is the same event as noted above for Catawba- separate event1 and Is not counted separately. (Reference [30]) _
Clinton 1 8/15/1989 Reference Inlet expansion joint to condenser leaking (1 cup/hr.), replaced CWS Leak[23] expansion joint later outage.
Clinton 1 3/18/1990 Reference Condenser water box over-pressurized, damage to water box CND Screened out; no[23] expansion joint, no leakage. leak
Comanche 6/6/1993 Reference Comanche Peak Unit 1 was at 85% power when rubber expansion joint Auxiliary LeakPeak 1 [23] on the circulation lube water pump discharge leaked resulting in six feet Systemof water in the circulating discharge room over a period of time. (AUX)Expansion joint failed under vacuum when the pump was stopped.Failure attributed to normal aging. Circulation pump 02 rubberexpansion joint was replaced and the unit brought to 100% power.This event involved leakage but not a catastrophic rupture (Reference[331). _Crystal River 3 8/14/1985 Reference 10In., SW pump suction expansion joint failed - hole in joint, aging (12 SW Leak
[23] years). A crack in the joint was discovered to be weeping. Theexpansion joints were replaced (Reference [26]). Evidence of leakage
D.C. Cook 1 7/29/1990 Reference 8-Inch diameter expansion joint header connected to the Condensate CND Leak[23] Storage Tank leaked because of 4-in. gash in the joint, cause unknown.
Expansion joint is composed of fabric and is two-feet long. Fabric 2'long._
D.C. Cook 2 8/28/1987 Reference Expansion Joint XJ-54N in the discharge header west essential service SW Rupture < 2,000gpm[23] water pump ruptured. Most probable cause of failure attributed to time /
function degradation aggravated by the impure quality of the raw waterin this system. Replaced expansion joint. A phone conversation with acognizant engineer indicated the expansion joint is 8 inches in diameter.Nominal operating pressure is 80 psi. During the summer, at the timeof this event, operating pressure was likely higher, at 85 to 90 psi. Theexpansion joint is in a line that serves as a minimum flow path duringnormal operations. The flow through the joint during normal operations
___ _is typically 2000 gpm (Reference [34]). -
Karl N. Fleming Consulting Services LLC Page 13 of 21

Expansion Joint Failure Rates for Kewaunee PRA
Plant Date Data Event Description System Classification_____________ Source __ _ _ _ _ _ _ _ _ _ _ _ _ _ _ _ _ _ _ _ _ _ _ _ _ _
Diablo Canyon 1211/1998 Reference Two cooling water system synthetic expansion joints experienced SWP 2 ruptures <20001,2 [23] catastrophic failures. One failure caused a 500 to 1000 pgm leak from gpm
a 16" elastomeric expansion joint in a connection between screenwashwater system and a pipe embedded In the intake building wall that isconnected to the turbine building cooling system (a configurationallowed by procedure). Eighteen hours later, a 6" elastomericexpansion joint in the closed loop intake cooling water system (coolsthe circulating water pump motors) occurred. These expansion jointsare installed in locations not obviously visible and involve a wet(saltwater) location. Root cause was degradatalon due to corrosion ofmetal in the joint; saltwater introduction from the exterior of the joint.Expansion joints were 23 years old and were not part of the inspectionprogram. Expansion joints are designed similar to a tire, inside out tirewaterproof internal, cotton core that wraps it for pressure control; steelstiffening rings; protective cover had breached __ _
Ft. St. Vrain 1 D 4/7/1988 LER 88-006 CW expansion joint failed because of degradation, 54, 15 years old; CWS Rupture > 10,00015" tear that resulted in a 15,000 gpm leak flow (Reference [22]). gpm
Hatch 1 2/27/1977 Reference A forced shutdown resulted from a recirculation pump trip followed by a CND Rupture <2,000gpm[35] condenser bellows rupture; not clear if this is a rubber expansion joint
Indian Point 3 6/15/1988 Reference 30-in. condensate pump expansion joint leaking. CND Leak[23]
Indian Point 3 12/8/1992 Reference 30-in. expansion joint on suction side of condensate pump had minor CND Leak[23] leakage (excessive forces).
Indian Point 3 1/14/1993 Reference Expansion joint on suction side of condensate pump deformed and CND Leak[23] leaked because of degradation.
Indian Point 3 2/3/1993 Reference Expansion joint on suction side of condensate pump deformed and -CND Leak[23] leaked because of degradation.
LaSalle 1 &2 5/31/1985 LER 1985- 108-in. cir. water pump expansion joint failed resulting in flooding '(2000 CWS Rupture > 2,000045 gpm), due to water hammer (LER 50-302/1989-011). Failure occurred gpm
in the Lake Screen House. ILimerick 1 1/3/1998 Reference Leak in expansion joint on suction side of condensate pump. CND Leak
Karl N. Fleming Consulting Services LLC Page 14 of 21
C C C

C C Expansion Joint Failure Rates for KewauneC .A
Plant Date Data Event Description System ClassificationSource
Limerick 2 12/115t1998 Reference Urmedck Unit 2 while at full load found a leak on the ESW EXJ after SW Leak[23] starting the ESW pump. A small V shaped tear was observed at
approximately 6:00 outside of the direct flow path. A failure analysiswas performed on the EXJ after removal and it was concluded that theleak was due to an age related (end of life) failure. The failure workedits way through the expansion joints two plies and an arc ofapproximately 120 degrees before exiting the outer protective layer.
Millstone 2 4/28/1977 Reference 240-in SW pump expansion joint had ballooned out because of leakage SW Leak[23] thru tube.
Oyster Creek Reference After the ESW pump WA was started during a surveillance test, the SW Rupture < 2,000gpm[35] rubber expansion joint ruptured. The reactor was shutdown for
refuelingSequoyah 1 8/25/1994 Reference Main feedwater pump turbine condenser pump expansion joint CND Leak
[23] developed leak because of high temp.St. Lucie 1 7/28/1986 Reference 30-inch intake cooling water system, rubber steel-reinforced expansion SW Leak - -
[23] joint on the intake cooling water system (essentially equivalent to a SWsystem) pump outlet developed a leak (<1 00gpm). Failure was causedby aging and cyclic fatigue. The intake cooling water system is a seawater system that cools component cooling water and turbine coolingwater, and is essentially equivalent to a SW system [CORRESP07].Evidence of leakage. -_ _
St. Lucie 1 2/18/1990 Reference Intake 30-in. cooling water expansion joint had through wall leak, aging. SW Leak. .[231 _
Turkey Point 3 6/14/1988 Reference 30-in. suction expansion joint for condensate pump leaking. CND Leak_ _ _ _ _ _ _ _ _ _ _ _ _ _ _ _ _ _ _ _ _ _ [23 ]
VC Summer 214/1991 Reference 36-in. expansion joint on suction side of condensate pump had a hole in CND Leak[23] liner with small leakage. . .
VC Summer 2/1'4/1991 Reference 36-in. expansion joint on suction side of condensate pump developed CND Leak[231 leak, cycic fatigue.
VC Summer 3/30/1993 Reference 36-in. expansion joint on suction side of condensate pump developed CND Leak[231 leak, cyclic fatigue.
Karl N. Fleming Consulting Services LLC Page 15 of 21

Expansion Joint Failure Rates for Kewaunee PRA
Plant Date Data Event Description System ClassificationSource _
Surry 2 6/17/1986 LER 1986 While at 100% power, operations personnel discovered a SW Leak06. service water leak in Unit 2 containment. The leak of
approximately one gpm was In an expansion joint on the servicewater return line from a recirculation spray heat exchanger. TheInlet and outlet service water valves were closed to isolate theleak. It was determined that repairs could not be made with the72 hour LCO, therefore a rampdown was commenced and anunusual event was declared. The leak in the expansion joint wascaused by galvanic corrosion.
Beaver Valley 2/2/1996 Reference Load reduction to 90% for expansion joint replacement at the CWS Screened out; no[20] outlet of the D waterbox of the main condenser. leak
Susquehanna 3/29/1989 Reference Manual shutdown due to circulation water system expansion CWS Leak1 [29] joint leak - early refueling. Expansion joints leaked starting with
minor dripping to ultimately about 1 gpm. Expansion joints aresteel reinforced. During prior refueling outage, wear was noted
._ on the interior of the joints (Reference [29]).Catawba 1 6/12/1993 Reference Shutdown to repair expansion joint leakage. This event involved CWS Leak
[30] leakage of a rubber expansion joint reinforced by stainless steel(Reference [30]). Contributing causes: wear and arrangement.
River Bend 1 2/14/1989 Reference Load reduction to repair waterbox B expansion joint. No CWS Screened out; no[20] evidence of leakage leak
Catawba 2 10/21/2001 Reference Refuel outage delay for condenser circulating water expansion CWS Screened out; no_ [20] joint repair. No evidence of leakage leak
Clinton 1 5/9/1990 LER 1990- The unit was shutdown when diesel generators (Division 1 & 2) SW Screened out; no010 were declared inoperable because expansion joints in the leak
shutdown service water system piping for the DG heatexchangers did not have required tie rods installed to preventexpansion beyond design limitations. The cause was aconstruction/installation error. The expansion joints are installedbetween the SWS piping and the DG heat exchangers to isolatevibratory motion between SWS piping and the DGs. The tie rodsshould have been located between the flanges of the expansionjoints to prevent their expansion beyond design limitations.
Karl N. Fleming Consulting Services LLC Page 16 of 21
C 'C C

Expansion Joint Failure Rates for Kewaunee PRA
Ii
t4-14)Table 3-3 Uncertainty Distribution Results for Expansion Joint Failure Rates
Component & Failure Mode Uncertaint Distribution [1/EXJ.YRType Failure Mode Mean 6th Median 95est
_ _ _ __ Percentile PercentileFailures (leaks + 1.40E-04 5.69E-05 1.23E-04 2.84E-04
ruptures)
EWS Rubber Ruptures with 1 .22E-05 2.92E-06 9.75E-06 2.97E-05Expansion Joint leak flows > 2,000
Ruptures with 9.17E-06 1.82E-06 7.1 OE-06 2.33E-05Leak flows from2,000 to 10,000
gpmRuptures with 6.08E-06 8.81 E-07 4.44E-06 1.67E-05leak flows >10,000 gpm .
GW EXJ Flooding > 10,000 gpm
7000.
60 00 - - -- - - -- - - -- - - -- - - - -- - - - - - - -- - - -
5 0 0 0 - - - - - - - - I - - - - - - - - - - - - - - - - - - -U-a 4000 t- -- -- -- - -- - --- -- -- -- -- -- -- -- -- -- -- -- -- -- ----------ICIl' 3000 -- -- - -- - - - - - - - - - - - - - - - - -0
<) 2000 - -- - -- - - -- - - - - - - - - - - - - - - - - -
1000 - - -- -- - - - - - - - - -- - - -- - - -0
2.33E-07 4.70E-06 9.17E-06 1.36E05 1.81 E-05
Expansion Joint Rupture Frequency ( >10,000 gpm)
Figure 3-1 UncertaInty Distribution Expansion Joint Rupture Frequency (>10,000 gpm)
Karl N. Fleming Consulting Services LLC
Page 17 of 21

Expansion Joint Failure Rates for Kewaunee PRA
Q,,
KrN. Flmn osligSrie L
Page 18 of 21

Expansion Joint Failure Rates for Kewaunee PRA
- 4. REFERENCES
(1] Fleming, K.N. and B.O.Y. Lydell, "Pipe Rupture Frequencies for Internal Flooding PRAs",prepared by Karl N. Fleming Consulting Services LLC for EPRI, August 2005
[2] Poloski, J.P. et al, Rates of Initiating Events at U.S. Nuclear Power Plants, NUREG/CR-5750, U.S. Nuclear Regulatory Commission, Washington (DC), 1999.
[3] Tregoning, R., L. Abramson and P. Scott, Estimating Loss-of-Coolant Accident (LOCA)Frequencies Through the Elicitation Process, Draft Report for Comment, NUREG-1 829,U.S. Nuclear Regulatory Commission, Washington (DC), June 2005.
[4] Lydell, B.O.Y., "PIPExp/PIPE-2004: Monthly Summary of Database Content (Status as of31 -Dec-2004)", RSA-R-2004-01.07, RSA Technologies, Fallbrook (CA). Monthly summaryreports have been issued since January 1999.
[5] Fleming, K.N. et al, "Piping System Reliability and Failure Rate Estimation Models for Usein Risk-informed In-Service Inspection Applications", TR-1 10161 (EPRI Licensed Material),EPRI, Palo Alto (CA), 1998.
[6] U.S. Nuclear Regulatory Commission, Safety Evaluation Report Related to 'Revised Risk-Informed In-service Inspection Evaluation Procedure (EPRI TR-1 12657, Rev. B, July 1999,Washington (DC), 1999.
[7] H. Martz, TSA-1 /99-164: 'Final (Revised) Review of the EPRI-Proposed MarkovModeling/Bayesian Updating Methodology for Use in Risk-informed Inservice Inspection ofPiping in Commercial Nuclear Power Plants,", Los Alamos National Labaratory, June 1999
[8] Fleming, K.N., Mikschl, T.J., 'Piping System Failure Rates and Rupture Frequencies forUse in Risk Informed In-service Inspection Applications", EPRI Report No. TR-1 11880(EPRI Licensed Material), EPRI, Palo Alto (CA), 1999.
[9] Fleming, K.N. and B.O.Y. Lydell, "Database Development and Uncertainty Treatment forEstimating Pipe Failure Rates and Rupture Frequencies," Reliability Engineering andSystem Safety, 86:227-246, 2004
[10] Bush, S. et al, "Piping Failures in the US Nuclear Power Plants 1961-1995," SKI Report96:20, Swedish Nuclear Power Inspectorate, Stockholm (Sweden), January 1996
[11] U.S. General Accounting Office, "Action Needed to Ensure That Utilities Monitor and RepairPipe Damage," GAO/RCED-88-73, Washington (DC), March 1988.
[12] Cragnolino, G., C. Czajkowski and W.J. Shack, Review of Erosion-Corrosion in Single-Phase Flows, NUREG/CR-5156, U.S. Nuclear Regulatory Commission, Washington (DC),April 1988.
[13] International Atomic Energy Agency, "Corrosion and Erosion Aspects in Pressure BoundaryComponents of Light Water Reactors," Proceedings of a Specialists Meeting organized bythe IAEA and Held in Vienna, 12-14 September 1988, IWG-RRCP-88-1, Vienna (Austria),April 1990.
Li Karl N. Fleming Consulting Services LLC
Page 19 of 21
Expansion Joint Failure Rates for Kewaunee PRA
[14] OECD Nuclear Energy Agency, "Specialist Meeting on Erosion and Corrosion of NuclearPower Plant Materials," NEANCSNI/R(94)26, Issy-les-Moulineaux (France), 1995.
[15] Beliczey, S. and H. Schulz, 'The Probability of Leakage in Piping Systems of PressurizedWater Reactors on the Basis of Fracture Mechanics and Operating Experience," NuclearEngineering and Design, 102:431-438,1987.
[16] Tulay, M. et al, Expansion Joint Maintenance Guide, Revision 1, 1008035, Electric PowerResearch Institute, Palo Alto (CA), May 2003.
[17] Duke Power, Plans for Repair of Recirculating Cooling Water (RC) System RubberExpansion Joints, York (SC), March 2002 (NRC-PDR Accession No. ML020880630).
[18] Atomic Energy of Canada Limited, Generic CANDU Probabilistic Safety Assessment -Reference Analysis, 91 -03660-AR-002, Rev. 0, Sections 7.3 and H.5.1, Mississauga(Ontario), Canada, July 2002.
[19] NSAC-60, "Oconee PRA"[20] Vess, J., OPEC Database Query, Energy Central, Colorado, October 3,2005.[21] Stone and Webster Engineering Corporation, 'Surry Power Station Individual
Plant Examination Review of Internal Flooding", SWEC 1991 A, 1991.[22] Section 3 from Surry Internal Flood Analysis Supplemental Report.[23] Tulay, M., "EPRI Expansion Joint Maintenance", EPRI TR-1 008035, Charlotte,
NC, 2003.[24] Kinsey, S., "Circulating Water Piping Expansion Joint Evaluation", MPR
Associates.lnc., Alexandria, VA, 2005.[25] Garlock On Site Internal Inspection of Expansion Joints, Julie Benzer, Garlock
Sealing Technologies, March 11, 2005. ,_[26] Phone conversation between Eric Jorgenson, Maracor and Dave Miskiewicz,
352-795-6486 ext 3019, Crystal River, October 3, 2005.[27] Phone conversation between Eric Jorgenson, Maracor and Joe Anatasio, 805-
545-4909, Diablo Canyon, September 29,2005.[28] Phone conversation between Eric Jorgenson, Maracor and Bob Boyle, 724-682-
4726, Beaver Valley, October 4,2005.[29] Phone conversation between Eric Jorgenson, Maracor and Steve Ellis, 610-774-
2519, Susquehanna, October 4, 2005.[30] Phone conversation between Eric Jorgenson, Maracor and Steve Nader, 980-
373-4273, Catawba, October 4, 2005.[31] Phone conversation between Eric Jorgenson, Maracor and Chris Hicks, Product
Manager, Garlock Sealing Technologies, 1-800-448-6688, October 4,2005.[32] Phone conversation between Eric Jorgenson, Maracor and John Priolo, Design
Engineering, St. Lucie, 772-467-7272, October 6, 2005.[33] Based on E-message between Eric Jorgenson, Maracor and Dan Tirsun,
Comanche Peak, 254-897-0865, October 6,2005.
Karl N. Fleming Consulting Services LLC CjPage 20 of 21

Expansion Joint Failure Rates for Kewaunee PRA
[34] Phone conversation between Eric Jorgenson, Maracor and Steve Cherba, D.C.Cook, 269-465-5901 ext. 1126, October 6, 2005.
[35] P. Janzen, "Atomic Energy of Canada Limited - A Study of Piping Failures inU.S. Nuclear Power Plants", AECL-Misc-204, April 1981
Karl N. Fleming Consulting Services LLC
Page 21 of 21

Appendix A
Initiating Events
Attachment 3 - High Energy Line Break Report
Page I of 2

High Energy Line Break Report
Owner Acceptance:tan1 4 c *M 'PbHA- G-. % 4oo V<Print NameSignature
1O117xSDate
(401
Page 2 of 2
HIGH ENERGY LINE BREAK INITIATING EVENTFREQUENCIES FOR THE KEWAUNEE PRA
Final Report
Prepared for
Dominion EnergyKewaunee Power Station
By
Karl N. FlemingBengt O.Y. Lydell
In Cooperation withMaracor Software & Engineering, Inc.
Karl N. Fleming Consulting Services LLCA California Limited Liabiflty Company
616 Sereno View RoadEncinitas, CA 92024
United States of America
October, 2005

HELB Initiating Event Frequencies for Kewaunee PRA
TABLE OF CONTENTS
Section Title Page
1. INTRODUCTION .. 41.1 Purpose .. 41.2 Scope ... 41.3 Objectives .. 41.4 Report Guide .. 4
2. TECHNICAL APPROACH .. 62.1 Overview ..2.2 Uncertainty Treatment .. 62.3 Pipe Rupture Model .. 62.4 Definition of Pipe Failure Rate Cases .. 9
3. KEWAUNEE HELB-INITIATED INTERNAL FLOODING INITIATING EVENTS. .......................................................................................... 12
3.1 Definition of ............................................................... 123.1.1 Steam Line.Breaks .123.1.2 Feedwater and Condensate Line Breaks .2
3.2 Break Frequency Calculations .. 133.2.1 Steam Line Breaks Causing Large Fire Protection System Actuations 13 ---3.2.2 Steam Line Breaks Causing Intermediate Fire Protection System UActuations .. 143.2.3 Feedwater and Condensate Line Breaks Causing Large Fire ProtectionSystem Actuations 153.2.4 Feedwater and Condensate Line Breaks Causing Intermediate FireProtection System Actuations .1
3.3 Model Quantification . . .164. PIPE FAILURE RATES AND RUPTURE FREQUENCIES ... 17
4.1 System Boundaries . . .174.2 Database Screening . . .174.3 Database Query Results . . . 184.4 Exposure Term Data . . .234.5 Conditional Pipe Failure Probability.................................................................234.6 Results for Failure Rates and Rupture Frequencies . . . 26
5. HELB INITIATING EVENT FREQUENCIES . . .335.1 Calculation Steps . . . 335.2 Summary of Results . . .345.3 Sensitivity Study . . .37
6. REFERENCES................................................................... ........... 39APPENDIX A PiPExp DATABASE DESCRIPTION . . . .41APPENDIX B PIPE FAILURE RATES & RUPTURE FREQUENCIES APPLICABLE TO NON-CODE PIPING SYSTEMS ................. 51
Karl N. Fleming Consulting Services LLC Page 2 of 53 (

HELB Initiating Event Fr¶equencies for Kewaunee PRA
TABLE OF FIGURESTitle Page
Figure 2-1 Flow Chart for Bayes' Estimates of System, Size, and Damage MechanismSpecific Pipe Failure Rates (A) and Rupture Frequencies (p) ............... ................ 8
Figure 4-1 PWR-Specific Worldwide Service Experience ............................................... 19Figure 4-2 PWR-Specific Worldwide Service Experience with non-Code Steam Piping
1970-2004 [1] ............................................ 19Figure 4-3 Empirical Conditional Probability of Pipe Failure as a Function of Type of
Piping System & Through-Wall Flow Rate Threshold Value ............................... 25Figure 4-4 Impact of Different Data Screening Assumptions on FWC Piping Reliability32Figure 4-5 Impact of Different Data Screening Assumptions on Steam Extraction Piping
Reliability ............................................... 32Figure 6-1 Crystal Ball Results for Large Feedline Break Frequency ............................ 35Figure 5-2 Crystal Ball Results for Intermediate Feedline Break Frequency ........... ....... 35Figure 5-3 Crystal Ball Results for Large Steam Line Break ........................................... 36Figure 5-4 Crystal Ball Results for Intermediate Steam Line Break ................................ 36Figure 5-5 Impact of Alternative Data Screening Regarding FAC .................................. 38
LIST OF TABLESTthe Page
Table 2-1 Pipe Failure Rate Analysis Cases ..........I .............. 10Table 4-1 Service Experience with non-ASME Code FWC Piping ................................ 21Table 4-2 Service Experience with non-Code Steam Piping ....................... .................. 22Table 4-3 Piping Population Exposure Data ........................................................... 23Table 4-4 Parameters of Posterior Beta Distribution for Pik{RIF) for non-Code FAC-
Susceptible High-Energy Piping & non-Code FAC-resistant High-Energy Piping............................................................................. 27 ............................... 27
Table 4-5 Summary of FAC-Susceptible Piping Rupture Events with Equivalent BreakSize........................................I,...., . :........................................................... 28
Table 4-6 Summary of FAC-Susceptible Piping Rupture Events with Equivalent BreakSize > 6-inch Diameter (EBS2) .2.. ...................... 9.. i . . . 29
Table 4-7 Mean Values of Failure Rate and Rupture Frequency Parameters .............. 31Table 5-1 Uncertainty Distribution Results for HELB-lnitiated Internal Flooding Initiating
Event Frequencies .. ............. . . . .34Table 5-2 Impact of Alternative Assumptions Regarding Data Screening on HELB-
Initiated Internal Flooding Inttiating Event Frequencies ........................................ 37
Karl N. Fleming Consulting Services LLC page 3 of 53
HELB Initiating Event Frequencies for Kewaunee PRA
1. INTRODUCTION
1.1 Purpose
The purpose of this report is to document the derivation of initiating event frequencies that willbe used as input to the turbine building internal flooding risk assessment at Dominion Energy'sKewaunee Power Station. Specifically, Initiating event frequency values associated withruptures of high-energy lines that in turn cause actuation of fire protection systems will bedetermined. This work was performed via Subcontract to Maracor Software Engineering, Inc.on behalf of Dominion Energy's Kewaunee Power Station. This report is intended to be anintegral part of the overall turbine building internal flooding initiating events analysis.
1.2 Scope
The scope of work covered in this report includes:
* Development of pipe failure rates and rupture frequencies for high energy piping (i.e.piping with water or steam above saturation temperature) in PWR plants including thefollowing systems:
o steam, including high pressure, low pressure, and extraction steam systemso feedwater system, including feedwater heaters and drain systemso condensate system
* Development of point estimates and probability uncertainty distributions for allparameters subject to data uncertainties
* Calculation of Kewaunee HELB initiating event frequencies including point estimates andprobability uncertainty distributions based on information provided by Kewaunee andMaracor on initiating event success criteria and piping lengths
1.3 Objectives
The objective is to perform a state of the art data analysis that Is consistent with the applicablerequirements of ASME PRA Standard Capability Category II for Initiating event frequencydevelopment Consistent with this objective, the report is intended to provide a traceable basisfor the calculations so that the results could be Independently reproduced from the informationprovided.
1.4 Report GuideA major part of this report is devoted to the development of a set of failure rates and rupturefrequencies for use in the turbine building HEW-initiated internal flooding initiating eventdevelopment. The technical approach to developing these failure rates and rupture frequencies
Karl N. Fleming Consulting Services LLC Page 4 of 53
HELB Initiating Event requencies for Kewaunee PRA
is summarized in Section 2. in Section 3 the HELB-initiated internal flooding initiating eventmodels for the Kewaunee PRA are described Including the success criteria for screening pipelocations and break sizes that apply to each event. The details of the development of the breaksezes and locations for these events and break sizes are provided in Section 3.2 in the turbinebuilding internal flooding Initiating events analysis, into which this report is to be integrated. Theinformation in Section 3 of this -report is based on Information in Section 3.2 of the main reportand was provided to the authors by Kewaunee and Maracor. The development of failure ratesand rupture frequencies for this model using the methodology of Section 2 Is documented inSection 4. The results for the Initiating event frequencies Including point estimates anduncertainty distributions are summarized In Section 5. Section 6 lists the references used asinputs to the data development and methodology. Supporting details are provided In theAppendices.
. II
Karl N. Fleming Consulting Services LLC Page 5 of, 53

HELB Initiating Event Frequencies for Kewaunee PRA
2. TECHNICAL APPROACH
2.1 OverviewThe model used to estimate pipe break frequencies for the initiating event models in thiscalculation Is the same as that used in a recent EPRI report on Internal flooding initiating eventfrequencies [1], and similar to that used In recent NRC studies regarding loss of coolantaccident (LOCA) initiating event frequencies [2] [3]. The source of pipe failure and exposuredata used to quantify the failure rates used In these models is known as OPIPExp-2004" [4]. Asummary of this database is provided in Appendix A.
2.2 Uncertainty TreatmentUncertainties in these failure rates were quantified using a Bayes' methodology that wasdeveloped in the EPRI RI-ISI program [5] and approved by the NRC for use in applied RI-ISIevaluations [6]. An independent review of this pipe failure rate uncertainty treatment wasperformed to support the NRC Safety Evaluation and results of this favorable review areprovided In Reference [7]. An earlier EPRI report 18] developed a set of pipe failure rates foruse In the EPRI RI-ISI applications which was also approved and independently reviewed inReferences [6] and [7]. These earlier failure rate estimates were derived from a pipe failuredatabase that had been developed. In Reference [10]. During subsequent work in applyingthese estimates In applied RI-ISI evaluation, a significant number of data classification errors Inthe original data source [10] were Identified and improved estimates of the exposure populationbecame available. These factors, as discussed more fully in Reference [9], were the primemotivation to switch to the more comprehensive and validated "PIPlExp-2004m database whenReference 11], was developed. The most recent NRC sponsored work on LOCA frequencies 13] C iis also based In part on the "PIPExp-20040 database.
2.3 Pipe Rupture ModelThe model used for relating failure rates and rupture frequencies uses the following simplemodel that is widely used in piping reliability assessment and was used in recent updates ofrecommended Loss of Coolant Accident frequencies [6]. The failure modes included in theestimation of failure rates include leaks and ruptures and, in some cases, cracks may also beincluded depending on the application. The model Is expressed in the following equation:
u M
pax sPk 2AP#* {RxIF) (2.1)k-1 k-b
Where:= total rupture frequency of rupture size x for pipe size I in
system i= rupture frequency of rupture size x for pipe of size I in system
j due to damage mechanism k= failure rate of pipe of size I In system j due to damage
mechanism k
Karl N. Fleming Consulting Services LLC Page 6 of 53

HEL8 Initiating Even equencles for Kewaunee PRA
P1{RF) = conditional probability of rupture size x given failure for pipesize I in system j and damage mechanism k
M = Number of different damage mechanisms
In general, a point estimate of the frequency of pipe failures, 4' Is given by the followingexpression:
- . .k
A(k = (2.2)
Whereni= the number of failures (cracks, wall thinning, leaks and ruptures)
events for pipe size I In system j due to damage mechanism kTo z the total time over which failure events were collected for pipe
size i in system JNU = the number of components that provided the observed pipe
failures for size i in system jk = the fraction of number of components of size I In system j that are
susceptible to failure from damage mechanism k for conditionalfailure rates given susceptibility to damage mechanism k, 1 forunconditional failure rates
Note that all failure modes that result in pipe repair are included In the failure rate and that allfailures thus defined are regarded as precursors to rupture. The events counted as ruptures arebased on a specific definition of rupture which is application specific. For Internal flooding andHELB applications, we seek unconditional failure rates and hence we can combine theseequations under the condition: fug =1 to obtain the following expression for the point estimate ofthe rupture frequency.
Rol PkIc Z k 4&PA{R. IF)X PtR IF) (2.3)W= = k-i NAU
In the development of Bayes' uncertainty distributions for these parameters, prior distributionsare developed for the parameters 4k and P*R IF) and these prior distributions are updatedusing the evidence from the failure and exposure data as in standard Bayes' updating. Theexposure terms (denominator of the fractions on the right hand side of Equation (2.3) also haveuncertainty as these terms must be estimated for the entire nuclear Industry that provides thenumber of failures for the failure rate estimation. This uncertainty is treated in this process byadopting three hypotheses about the values of the exposure terms which requires three Bayesupdates for each failure rate. The resulting posterior distributions for each parameter on theright hand side of Equation (2.3) are then combined using Monte Carlo sampling to obtainuncertainty distributions for the pipe rupture frequencies. A picture of this process is shown inFigure 2-1. This flow chart shows the full treatment of uncertainty needed for the RISIformulation in Equation (2.2). For the Internal flooding and HELB formulation of Equation (2.3)the damage mechanism susceptibility fractions ( fp ) do not come Into play. The specific way inwhich this flow chart is applied is discussed in Section 4 for each system and failure mode.
Karl N. Fleming Consulting Services LLC Page 7 of.53

HELB Initiating Event Frequences for Kewaunee PRA
In Reference [11 rupture frequencies were developed for three rupture sizes that were selectedto support internal flooding analysis. These sizes Include water sprays with flood rates of up to100 gpm, flooding with flood rates of 100 to 2000 gpm, and major flooding with flood ratesgreater than 2000 gpm. For the Kewaunee HELB-initiated internal flooding models, asomewhat different rupture size model had to be developed as the criteria for producing theconsequences of interest are based on specific rupture sizes that were determined in adeterministic calculation, based on the energy required to activate fire protection systemsprinklers.
Nkver or Lot Tmreo rmes @ Three Esu,~ of
-pd cibuiystmaon . AMM
Pipe 6ecl nd Upper Bound )u .25) Upper Bound (p.25)Dm*ae MechanismBest Esfmata (pAO) B"s BlA~te (psAO)
LWer Bound (P.2L). Lwer Bound (p]25)
Bayes' Update fbr Three Combinations of Population and DM Susc
Lower-L.waUpde ( Beat.3st Updat(y-.SO) Upe2Updat.(p
Bayes' Posterior Weighting Operation
-,P(IP F), Prob.RuptureI iuu ren, rn-rnenv Given Failure p, Ruoture Freque
Logo DomalbuonnBased en angonee""nJudgmentand weldand OM susceppil4 tEDsmats*Om RISI
lI
Q.
3nerl Priora .
Figure 2-1 Flow Chart for Bayes' Estimates of System, Size, and Damage MechanismSpecific Pipe Failure Rates (A) and Rupture Frequencies (p)
Karl N. Fleming Consulting Services LLC Page 8 of 53 hi
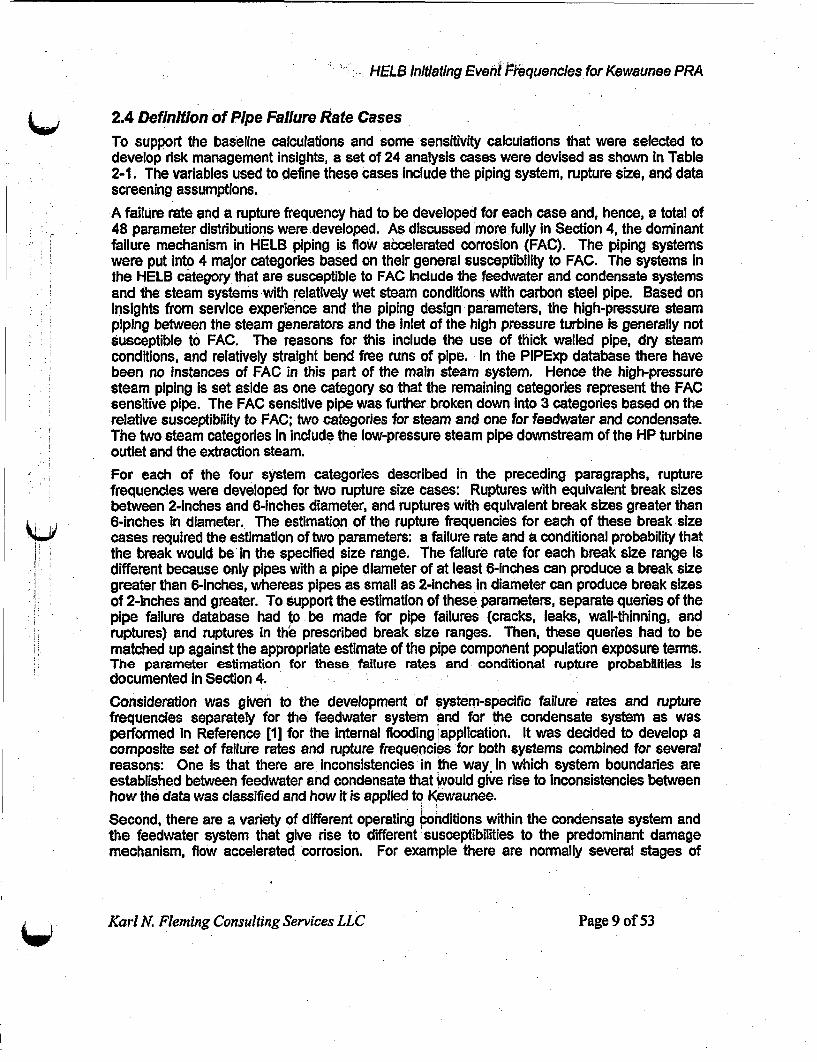
- HELB Initiating Event !kequencies for Kewaunee PRA
2.4 Definition of Pipe Failure Rate CasesTo support the baseline calculations and some sensitivity calculations that were selected todevelop risk management insights, a set of 24 analysis cases were devised as shown In Table2-1. The variables used to define these cases Include the piping system, rupture size, and datascreening assumptions.A failure rate and a rupture frequency had to be developed for each case and, hence, a total of48 parameter distributions were developed. As discussed more fully in Section 4, the dominantfailure mechanism in HELB piping is low accelerated corrosion (FAC). The piping systemswere put Into 4 major categories based on their general susceptibility to FAC. The systems inthe HELB category that are susceptible to FAC Include the feedwater and condensate systemsand the steam systems with relatively wet steam conditions with carbon steel pipe. Based onInsights from service experience and the piping design parameters, the high-pressure steampiping between the steam generators and the Inlet of the high pressure turbine Is generally notsusceptible to FAC. The reasons for this include the use of thick walled pipe, dry steamconditions, and relatively straight bend free runs of pipe. In the PIPExp database there havebeen no Instances of FAC in this part of the main steam system. Hence the high-pressuresteam piping is set aside as one category so that the remaining categories represent the FACsensitive pipe. The FAC sensitive pipe was further broken down Into 3 categories based on therelative susceptibility to FAC; two categories for steam and one for feedwater and condensate.The two steam categories in include the low-pressure steam pipe downstream of the HP turbineoutlet and the extraction steam.For each of the four system categories described In the preceding paragraphs, rupturefrequencies were developed for two rupture size cases: Ruptures with equivalent break sizesbetween 2-Inches and 6-inches diameter, and ruptures with equivalent break sizes greater than6-inches In diameter. The estimation of the rupture frequencies for each of these break sizecases required the estimation of two parameters: a failure rate and a conditional probability thatthe break would be in the specified size range. The failure rate for each break size range isdifferent because only pipes with a pipe diameter of at least 6-inches can produce a break sizegreater than 6-inches, whereas pipes as small as 2-Inches In diameter can produce break sizesof 2-Inches and greater. To support the estimation of these parameters, separate queries of thepipe failure database had to be made for pipe failures (cracks, leaks, wall-thinning, andruptures) and ruptures In th'e prescribed break size ranges. Then, these queries had to bematched up against the appropriate estimate of the pipe component population exposure terms.The parameter estimation for these failure rates and conditional rupture probabilities isdocumented In Section 4.Consideration was given to the development of system-specific failure rates and rupturefrequencies separately for the feedwater system and for the condensate system as wasperformed in Reference [1] for the internal flooding application. It was decided to develop acomposite set of failure rates and rupture frequencies for both systems combined for severalreasons: One Is that there are inconsistencies in the way. in which system boundaries areestablished between feedwater and condensate that would give rise to Inconsistencies betweenhow the data was classified and how it is applied to Kewaunee.Second, there are a variety of different operating conditions within the condensate system andthe feedwater system that give rise to different susceptibilities to the predominant damagemechanism, flow accelerated corrosion. For example there are normally several stages of
Karl N. Fleming Consulting Services LLC Page 9 of 53

HELA Initiating Event Frequencies for Kewaunee PRA
feedwater heating in the condensate and additional stages in the feedwater system. Feedwaterdrains and heater and main feedwater and condensate lines have much different conditions.
Third, there is no noticeable trend in the failure and rupture service experience between the twosystems. And finally, breaking up the data Into separate systems reduces the statistical qualityof each data cell, i.e. would subdivide the data cells too finely so that the frequency of eventswithin each data cell are statistically insignificant.
Based on what was learned In this study, the authors plan to Issue a revision to Reference [11 toreplace the system specific rates In that reference with a composite set of rates for thefeedwater and condensate systems.Based on the success criteria discussed in Section 3, for each set of failure rates, two rupturemodes had to be distinguished: those with equivalent break sizes between 20 and 6" and thosewith break sizes in excess of 6 inches. Depending on the location of the pipe break either orboth of these rupture modes may contribute to a specific HELB-initiated Internal floodingInitiating event, as discussed more fully in Section 3. Separate conditional rupture probabilitymodels had to be developed to distinguish these cases.
Table 2-1 Pipe Failure Rate Analysis Cases
Q
Case System Pipe Size Data ScreeningAssumptions
KNPPO1 FWC 2 2 inch Post-1988 data onlyKNPP02 FWC > 6 inch Post-1988 data onlyKNPP03 FWC k 2 inch Data up to 1988 onlyKNPP04 FWC > 6 inch Data up to 1988 onlyKNPPO5 FWC - 2 Inch FAC events removedKNPP06 FWC > 6 Inch FAC events removedKNPP07 Extraction Steam 2 2 Inch Post-1988 data onlyKNPP08 Extraction Steam > 6 Inch Post-1988 data onlyKNPP09 Extraction Steam 2 2 Inch Data up to 1988 onlyKNPPIO Extraction Steam > 6 inch Data up to 1988 onlyKNPP11 Extraction Steam 2 2 inch FAC events removedKNPP12 Extraction Steam > 6 Inch FAC events removedKNPP13 Low Pressure Steam 2 2 Inch Post-1988 data onlyKNPP14 Low Pressure Steam > 6 inch Post-1988 data onlyKNPP15 Low Pressure Steam 2 2 Inch Data up to 1988 onlyKNPP16 Low Pressure Steam > 6 Inch Data up to 1988 onlyKNPP17 Low Pressure Steam 2 2 inch FAC events removedKNPP18 Low Pressure Steam > 6 inch FAC events removedKNPP19 High Pressure Steam 2 2 inch Post-1988 data onlyKNPP20 High Pressure Steam > 6 inch Post-1988 data onlyKNPP21 High Pressure Steam 2 2 Inch X Data up to 1988 onlyKNPP22 High Pressure Steam > 6 Inch Data up to 1988 onlyKNPP23 High Pressure Steam 2 2 Inch FAC events removedKNPP24 High Pressure Steam > 6 Inch FAC events removed
(up
Karl N. Fleming Consulting Services LLC Page 10 of 53

HELB Initiating Event Frequencies for Kewaunee PRA
A review of the piping service data as discussed more fully in Section 4 reveals a significantimprovement in piping system performance around 1988. It is reasonable to assume that thistrend In performance Is due to industry and NRC efforts to improve plant performance in general,and in particular to address flow accelerated corrosion in augmented Inspection, repair andreplacement programs. For the base case analysis only the service data since 1988 was usedto calculate the failure rates as this data is viewed to be representative of current industrypractice in managing piping system performance. As a contrast, the second case consideredonly the service data up to and including 1988. A third case was defined by screening out allthe FAC related pipe failures. The purpose of the three cases was to understand theImportance of the prevailing failure mechanism for experienced high energy line breaks.
Failure rates were specialized for the wet and dry steam systems, and for the feedwater andcondensate systems, by specializing the data analysis for the failure rates. The data from theFAC sensitive steam, feedwater, and condensate systems were combined for the purposes ofestimating the conditional rupture size probabilities. The justification for this Is that essentiallyall the pipe ruptures In these systems are due to FAC and occur in similar carbon steel pipes.The system-specific factors that influence the rupture frequencies are judged to be adequatelyreflected in the specialized failure rates. The conditional probability of rupture size is viewed tobe primarily related to properties of the pipe material and the damage mechanism and lessrelated to the property of the system. The piping system materials for all the FAC sensitivepiping are very similar. This is consistent with the data treatment in References [1J, [3J, and [8J.
In summary, the piping failure rates and rupture frequencies developed in this study werequantified to address 4 different pipe system categories, 2 break size categories, and 3 datascreening assumptions, giving rise to 24 data analysis cases. For each case, a pipe failure ratecovering all failure modes, and a rupture frequency covering a specific break size range wasdeveloped and hence 48 parameters were developed.
Karl N. Fleming Consulting Services LLC Page I11 of 53

HELB Initiating Event Frequencies for Kewaunee PRA
3. KEWAUNEE HELB-INITIATED INTERNAL FLOODINGINITIATING EVENTS
3.1 Definition of Breaks
Quantification of the HELB-initiated internal flood initiating event frequency values Isperformed for each initiating event defined In the turbine building internal floodingInitiating events analysis. A summary of the HELB-related initiating events is providedbelow.
3.111 Steam Line Breaks
For steam line breaks, two HELB-initiated internal flooding Initiating events are analyzed.The first is a steam line break that actuates enough fire sprinklers to result in full flowfrom both fire pumps to the Turbine Building. This event includes any break upstream ofthe turbine throttle valves below the operating deck with an' equivalent diameter lessthan nine inches but greater than two inches, any break In the extraction steam linegreater than six Inches, and any break In a line after exiting the high-pressure turbinewith an equivalent diameter of six Inches or greater.
The second event Is a steam line break that actuates approximately 100 sprinklers. TheTurbine Building HELB models show that 100 sprinklers are representative of moderatereleases. This event includes breaks in the extraction steam lines with an equivalentbreak size between two and six Inches, and breaks in a line after exiting the high-pressure turbine and having an equivalent diameter of two to six inches.
3.1.2 Feedwater and Condensate Line Breaks
For feedwater and condensate line breaks, two HELB-nitiated Internal flooding initiatingevents are analyzed. The first is a feedwater or condensate line break that actuatesenough fire sprinklers to result in full flow from both fire pumps to the Turbine Building.This event includes any between the fourth and fifth feedwater heaters with anequivalent diameter of greater than six Inches or any break downstream of the fifthfeedwater heaters with an equivalent diameter greater than two inches.
The second event Is a feedwater or condensate line break that actuates approximately100 sprinklers. The Turbine Building HELB models show that 100 sprinklers arerepresentative of moderate releases. This event Includes breaks in the lines betweenthe fourth and fifth feedwater heaters with an equivalent diameter between two and sixinches.
Karl N. Fleming Consulting Services LLC Page I.2 of 53
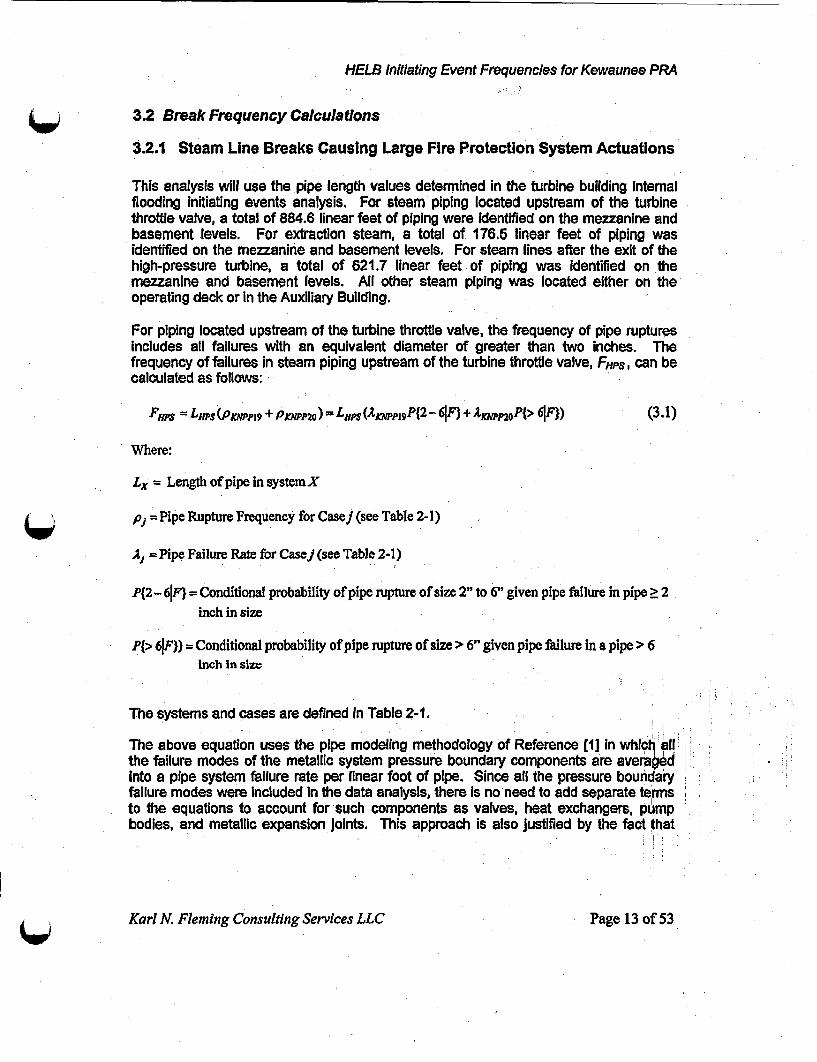
HELB Initiating Event Frequencies for Kewaunee PRA
3.2 Break Frequency Calculatons
32.1 Steam Line Breaks Causing Large Fire Protection System Actuations
This analysis will use the pipe length values determined in the turbine building Internalflooding initiating events analysis. For steam piping located upstream of the turbinethrottle valve, a total of 884.6 linear feet of piping were identified on the mezzanine andbasement levels. For extraction steam, a total of 176.5 linear feet of piping wasidentified on the mezzanine and basement levels. For steam lines after the exit of thehigh-pressure turbine, a total of 621.7 linear feet of piping was identified on themezzanine and basement levels. All other steam piping was located either on theoperating deck or in the Auxiliary Building.
For piping located upstream of the turbine throttle valve, the frequency of pipe rupturesincludes all failures with an equivalent diameter of greater than two inches. Thefrequency of failures in steam piping upstream of the turbine throttle valve, Fops, can becalculated as follows:
FHps =LHPS(PftPPi + PKWPP,0) =LHPS(1AJPPI9P{2 - 6jF) + Ayjwp2OP{> IF)) (3.1)
Where:
Lx Length of pipe in systemX
=O -Pipe Rupture Frequency for Case] (see Table 2-1)
AX =Pipe Failure Rate for Case] (see Table 2-1)
P{2 - 61F} = Conditional probability of pipe rupture of size 2" to 6" given pipe failure in pipe > 2inch in size
pi> 61F)) = Conditional probability of pipe rupture of size > 6" given pipe failure in a pipe > 6inch in size
The systems and cases are defined In Table 2-1.
The above equation uses the pipe modeling methodology of Reference [1] in which illthe failure modes of the metallic system pressure boundary components are averagedInto a pipe system failure rate per linear foot of pipe. Since all the pressure boundaryfailure modes were Included In the data analysis, there is no need to add separate termsto the equations to account for such components as valves, heat exchangers, pumpbodies, and metallic expansion Joints. This approach is also justified by the fact that
Karl N. Fleming Consulting Services LLC Page 13 of 53

HELB Initiating Event Frequencies for Kewaunee PRA
most of the experienced pipe failures occur in pipes or where pipes are welded to otherpipes or piping components.
For extraction steam piping, the frequency of pipe ruptures includes all failures with anequivalent diameter of greater than six inches. The frequency of failures in theextraction steam piping can be calculated as follows:
is= LESpwpog - LIES (ApNPPOP{ 61F} (3.2)
For steam piping after the exit of the high-pressure turbine, the frequency of piperuptures Includes all failures with an equivalent diameter of greater than six inches. Thefrequency of failures in this piping can be calculated as follows:
For= LRSPP]4= LRS(AXVP 4Pf> PjF) (3.3)
The total frequency for steam line breaks that actuate enough fire protection sprinklers toresult In full system flow to the turbine building is the sum of the three values calculatedabove or:
FSZ8L F=ps + F6s + FRS (3.4)
3.2.2 Steam Line Breaks Causing Intermediate Fire Protection SystemActuations (_)
Calculation of the frequency of this event Is performed as shown in Section 3.2.1 forlarge steam line breaks. Pipe length data also are identified in that section.
For extraction steam piping, the frequency of pipe ruptures Includes failures with anequivalent diameter of between two and six inches. The frequency of failures in theextraction steam piping can be calculated as follows:
FESM = Lapm ALEd = L=Ap"P{2 - 6IFJ (3.5)
For steam piping after the exit of the highpressure turbine, the frequency of piperuptures Includes all failures with an equivalent diameter of between two and six inches.The frequency of failures In this piping can be calculated as follows:
F=.W LrPF13 = LprSPM P(2 2- IF) (3.6)
The total frequency for steam line breaks that actuate approximately 100 fire protectionsprinklers Is the sum of the two values calculated above or
Karl N. Fleming Consulting Services LLC Page 14 of 53
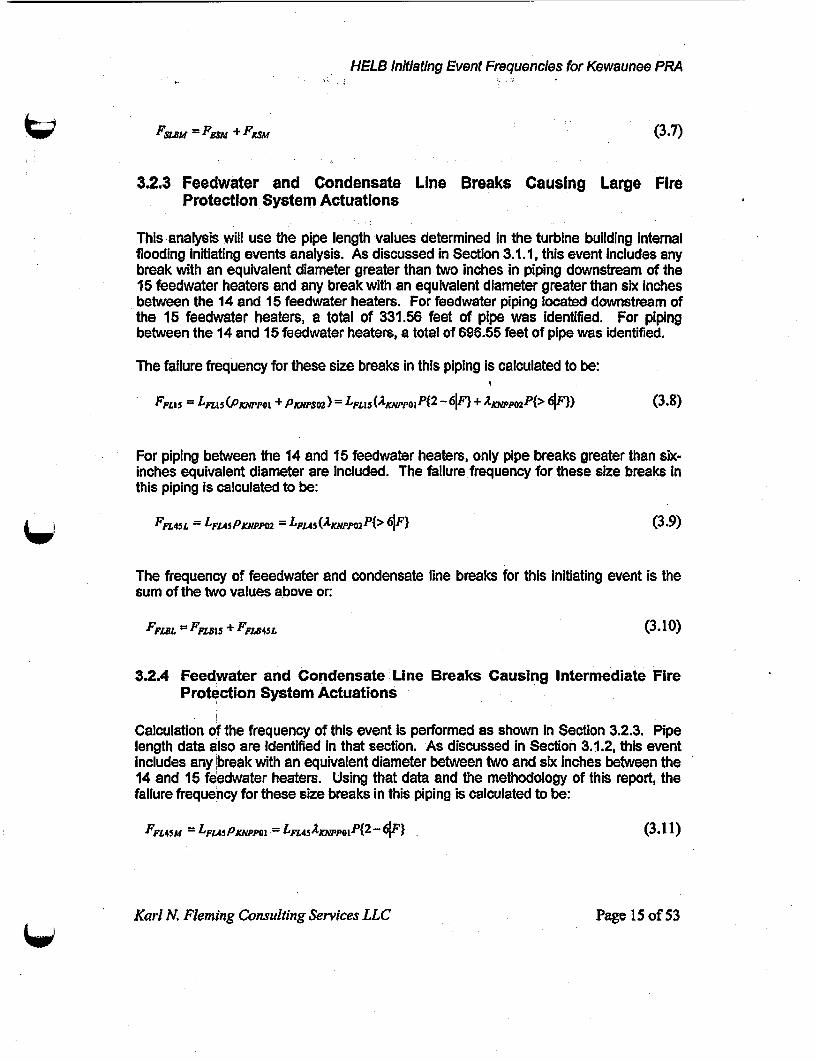
HELB Initiating Event Frequencies for Kewaunee PRA
FSZM = F&M + FSM (3.7)
3.2.3 Feedwater and Condensate Line Breaks Causing Large FireProtection System Actuations
This analysis will use the pipe length values determined In the turbine building internalflooding initiating events analysis. As discussed in Section 3.1.1, this event includes anybreak with an equivalent diameter greater than two inches in piping downstream of the15 feedwater heaters and any break with an equivalent diameter greater than six Inchesbetween the 14 and 15 feedwater heaters. For feedwater piping located downstream ofthe 15 feedwater heaters, a total of 331.56 feet of pipe was identified. For pipingbetween the 14 and 15 feedwater heaters, a total of 696.55 feet of pipe was identified.
The failure frequency for these size breaks in this piping is calculated to be:
FPLIS = -LLI5(PENPOe + PWPS02) = LfLli(AKNppol P{2 -61F} + AWMP{> 61F)) (3.8)
For piping between the 14 and 15 feedwater heaters, only pipe breaks greater than six-inches equivalent diameter are included. The failure frequency for these size breaks Inthis piping Is calculated to be:
Fn45L = L4USpPMNPPO2 = LFL45(AKXppO2P{> 61F} (3.9)
The frequency of feeedwater and condensate line breaks for this Initiating event is thesum of the two values above or:
FFLBL =FFLI5 + FFL245L (3.10)
3.2.4 Feedwater and Condensate Line Breaks Causing Intermediate FireProtection System Actuations
Calculation of the frequency of this event Is performed as shown In Section 3.2.3. Pipelength data also are Identified in that section. As discussed in Section 3.1.2, this eventincludes any break with an equivalent diameter between two and six Inches between the14 and 15 feedwater heaters. Using that data and the methodology of this report, thefailure frequency for these size breaks in this piping is calculated to be:
FFL45M = LFUSPXNPPO1 = LFL45AJNpPQOIP{2 -661F) (3.11)
Karl N. Fleming Consulting Services LLC Page 15 of 53

HELB initiating Event Frequencies for Kewaunee PRA
3.3 Model Quantffication
The technical approach to model quantification Is to develop uncertainty distributions foreach of the parameters defined In this section and then to propagate these distributionsthrough the equations using Monte Carlo simulation, a traditional approach to PRAuncertainty quantification. The development of the pipe failure rate and rupturefrequency parameters in these models Is documented In Section 4 and the results of theMonte Carlo analysis are provided In Section 5. The pipe length estimates described Inthe above section were provided to the authors by Maracor and are documented in themain body of the turbine building internal flooding initiating events report of which thisanalysis will be an attachment Uncertainly In pipe length estimates is modeled usingnormal distributions with the estimated pipe lengths taken as the mean values and astandard deviation of 10% of these length estimates.
Karl N. Fleming Consulting Services LLC Page 16 of 53

HELB Initiating Event Frequencies for Kewaunee PRA
4. PIPE FAILURE RATES AND RUPTURE FREQUENCIES
4.1 System Boundaries
This evaluation is concerned with non-ASME Code piping systems Inside the Turbine Buildingof Pressurized Water Reactor (PWR) plants. The following systems are considered;
* Feedwater & Condensate (FWC) piping: The Condensate piping system extends fromthe Condenser Hotwell up to and including the Low Pressure Heaters. It also Includesthe Drains and Vents System piping from the Low Pressure and High Pressure Heaters.The Feedwater piping system boundary considered in this evaluation consists of thepiping from the Low Pressure Heaters, the Feedwater pump suction/discharge piping,High Pressure Heater inletloutlet piping up to the outboard containment isolation valves.Due to comparable susceptibilities to flow accelerated corrosion (FAC) and plant to plantvariabilities In how the boundaries between these systems Is defined, a composite set ofdata parameters are developed for FWC piping.
* Steam Extraction piping: In a typical PWR the high pressure portion of the turbine hasextraction connections for two stages of feedwater heating. The low pressure portion ofthe turbine has extraction connections for four stages of feedwater heating.
* Low Pressure Steam piping: In this evaluation, the low pressure steam piping Includespiping between the high pressure (HP) and low pressure (LP) turbine stages, includingsteam cross-over and cross-under piping, and Moisture Separator Reheater (MSR)piping. The MSR piping is also located between the HP and LP turbines and it is used toextract moisture from the steam and reheat the steam to improve the turbineperformance.
* HP Steam piping:. In this evaluation the HP steam piping is upstream of the HP turbinethrottle valve and extends to the outboard containment isolation valves.
4.2 Database Screening
The pipe failure rates and rupture frequencies In this evaluation are derived from service dataIncluded in the PIPExp database (Appendix A). The full PIPExp includes on the order of 6,700data records covering Code Class 1-3 and non-Code piping in commercial light water reactorplants. Input parameters to the pipe failure rate calculation in this evaluation are obtainedthrough database queries that Include filters for excluding any non-relevant service data:
* Initial screening on the basis of Code Class and PWR plant system. Retain failure dataassociated with non-Code piping in Turbine Building including the following systems:o Condensate Systemo Extraction steam pipingo Feedwater heater drain and vent piping
Karl N. Fleming Consulting Services LLC P�gc 17 of 53

HELB Initiating Event Frequencies for Kewaunee PRA
o Main Feedwater (from LP feedwater heaters to outboard containment isolationvalves)
o Main Steam (from outboard containment isolation valve to High Pressure turbinesteam admission valve, and turbine cross-over/cross-under piping)
o Moisture Separator Reheater piping
* Results of Initial screening subjected to additional screening on the basis of nominal pipesize and through-wall flaw size:
* The evaluation considers piping of nominal pipe size (NPS) greater than 2-inch diameteras piping less than 2-inch is not within the scope of the HEL-initiated internal floodinginitiating event models described in Section 3.
The service data involving through-wall flaws are reviewed In accordance with the KewauneeHELB-initiated internal flooding initiating event analysis requirements (i.e., "moderate" versus'major" release). This means that the service data are screened further on the basis of flaw size('equivalent diameter break size'). The results of this screening step are input to the derivationof posterior Beta distribution parameters for calculation of conditional pipe failure probabilitiesfor 2" to 6" and greater than 6" break sizes.
4.3 Database Query Results
The results of the database queries are summarized In charts (Figures 4-1 and 4-2) and tables(Tables 4-1 and 4-2). Flow-accelerated corrosion (FAC) Is a predominant degradationmechanism for the systems that are included in the study scope except for the high pressuresteam system. Most If not all plant owners have implemented programs to mitigate FACsusceptibilities. These programs include Implementing non-destructive examination (NDE)programs, pro-active monitoring of pipe wall wear rates, and replacing the original carbon steelpiping with FAC-resistant piping material such as stainless steel, carbon steel clad on the insidediameter with stainless steel, or chrome-molybdenum alloy steel. The purpose of these initialdata queries was to identify the appropriate data set to use that represents current industrypractice for predicting the initiating event frequencies at Kewaunee. The use of time trendanalysis is a requirement of the ASME PRA standard for Capability Category 3 analyses. Inaddition, evaluating the trending of events avoids important insights In the data that would bemissed by simply averaging all the industry experience.
Karl N. Fleming Consulting Services LLC Page 18 of 53

HELB Initiating Event Frequencies for Kewaunee PRAei . .w.
inI
16
dz
1COND (B6Recrds)1FWM330Records) I
-l 14 le le 4, 4,P 4,e~ ~
Figure 4-1 PWR Worldwide Experience with non-Code FWC Piping 1970-2004
160
J 100
leo60
40
Figure 4-2 PWR Worldwide Experience with non-Code Steam Piping 1970-2004 [11
Karl N. Fleming Consulting Services LLC Page 19 of 53
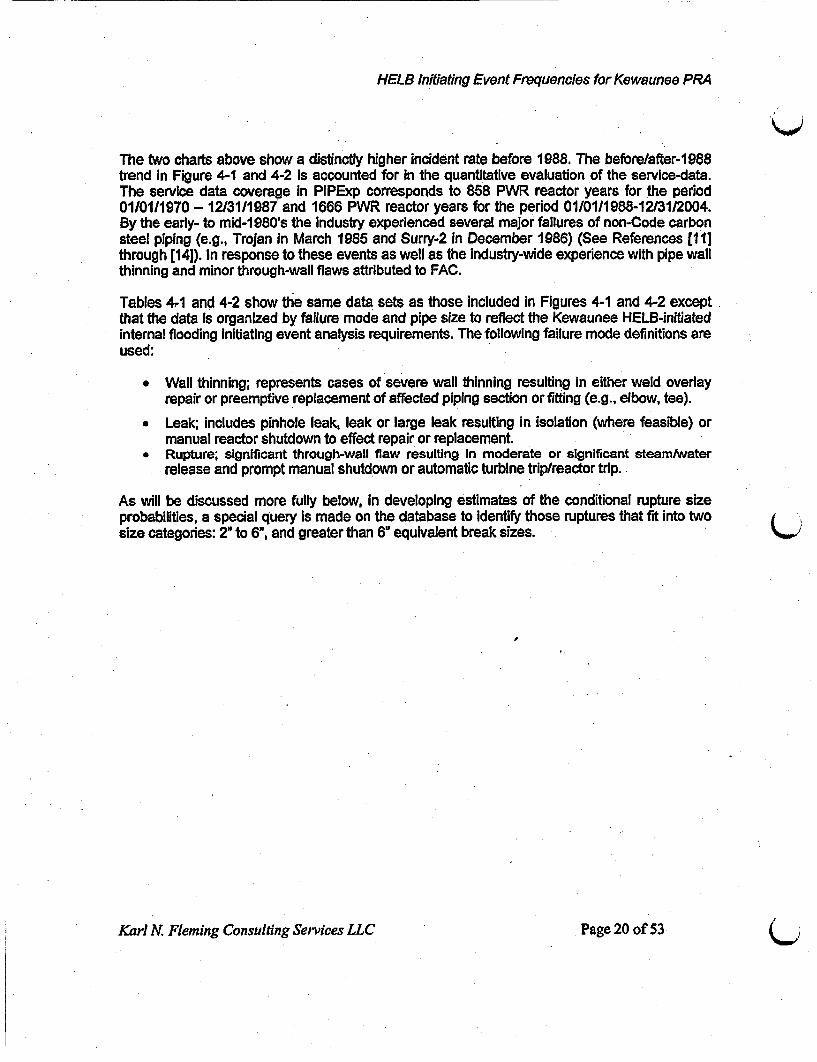
HELB InitiatIng Event Frequencles for Kewaunee PRA
The two charts above show a distinctly higher incident rate before 1988. The before/after-1988trend in Figure 4-1 and 4-2 is accounted for in the quantitative evaluation of the service-data.The service data coverage In PIPExp corresponds to 858 PWR reactor years for the period01011/1970 - 12/31/1987 and 1666 PWR reactor years for the period 01101/1988-12131/2004.By the early- to mid-1980's the industry experienced several major failures of non-Code carbonsteel piping (e.g., Trojan In March 1985 and Surry-2 in December 1986) (See References [11]through [14]). In response to these events as well as the Industry-wide experience with pipe wallthinning and minor through-wall flaws attributed to FAC.
Tables 4,1 and 4-2 show the same data sets as those included in Figures 4-1 and 4-2 exceptthat the data is organized by failure mode and pipe size to reflect the Kewaunee HELB-initiatedinternal flooding initiating event analysis requirements. The following failure mode definitions areused:
* Wall thinning; represents cases of severe wall thinning resulting In either weld overlayrepair or preemptive replacement of affected piping section or fitting (e.g., elbow, tee).
* Leak; includes pinhole leak, leak or large leak resulting In isolation (where feasible) ormanual reactor shutdown to effect repair or replacement.
* Rupture; significant through-wall flaw resulting in moderate or significant steamnfaterrelease and prompt manual shutdown or automatic turbine trip/reactor trip.
As will be discussed more fully below, In developing estimates of the conditional rupture sizeprobabilities, a special query is made on the database to identify those ruptures that fit into twosize categories: 2" to 6", and greater than 6" equivalent break sizes.
Karl N. Fleming Consulting Services LLC Page 20 of 53

f CHEL --- -ni - in Event F f e - RA
HELB Initiating Event Frequencies for Kewaunee PRA
_Table 4_1 Sen_ _e Experience with non-ASME Code FWC PipingNominal ripe Slze 1970-1987 1988-2004
-w ) Total Wall Leak Rupture Totl Wanl Leak Rapture[inch) __ _ Thnning_ Thinning
2 < NPS 6" 14 5 6 3 18 7 t_4NPS > 6" 300 275 17 8 52 30 i 7
Total 314 280 23 1 1 1 70 37 1 22 11NOW* Service experience in Table I derived from 2524 reactor-years of PWR operation worldwide; 858 reactor-years pre-1988 and 1666
reactor-years post-1987* Failure data includes contributions from FAC (dominant degradation mechanism), vibration-fatigue and water hammer* The rootcause of post-1987 events in many cases is attnbuted to programatic errors orweaesses in the Owner's FAC progran* Appendix A includes information on the coverage and completeness of the PIPExp database
Karl N. Fleming Consulting Services LLC Page 21 of 53

HELB Initiating Event Frequencies for Kewaunee PRA
Table 4-2 Service Experience with non-Code Steam PipingNominal Pipe Size 1970-1987 1988-2004
System (NPS) Total Wall Leak Rupture Total Wall Leak Rupture[Inch] Thinning Thinninu
EXT-St 2"<NPSS6" 10 0 8 2 9 1 7 1NPS > 6"1 392 385 4 3 7 2 2 3
2"<NPS56n 14 0 11 3 15 1 10 4LP-Steam NPS>6" 61 60 1 0 14 2 9 3HP-Steam NPS>2" 24 19 3 2 9 1 7 1
_ Total: 501 464 27 10 54 7 35 12
* 'EXT-Steam' includes HP & LP steam extraction piping. Most of this piping is > NPS6.* 'LP-Steam' includes piping between the HP and LP turbine stages, including cross-over/under piping and Moisture Separator Reheater piping.* 'HP-Steam' includes piping upstream of the HP turbine throttle valve.* Service experience in Table I derived from 2524 reactor-years of PWR operation worldwide; 858 reactor-years pre-1988 and 1666 reactor-
years post-1987* Failure data includes contributions from FAC (dominant degradation mechanism), vibration-fatigue and water hammer* The root cause of post-1987 events min many cases is attributed to programmatic errors or weaknesses in the Owner's FAC program* Appendix A includes information on the coverage and completeness of the PIPExp database
Karl N. Fleming Consulting Serices LLC Page 22 of 53
C C C

HELB Initiating Even Frequencies for Kewaunee PRA
4.4 Exposure Term Data
In pipe failure rate estimation, the exposure term is the product of either the number ofcomponents (e.g., fittings, welds) or total length of piping that provides the observed pipefailures and the total time over which failure events are collected. There is variability in thepopulation counts. In part this variability stems from differences across NSSS types and balanceof plant design differences, and In part it stems from different piping design and fabricationpractices (e.g., use of cold bent piping versus use of welded fittings). Also, design modificationsare Implemented during the lifetime of a plant to enhance flow conditions, minimize systemvibrations, and to Improve the access for non-destructive examination (NDE), etc. Table 4-3summarizes piping population data for the systems covered in the Kewaunee HELB-initiatedInternal flooding Initiating events analysis.
Table 4-3 Piping Popul aion Exposure DataSystem / System Group Linear ft of Piping Information Source / Comment
EPRI TR-1 11880, Table A-5; in the failure rateFWC (> NPS2) 14,037 ft calculation the given length is input as a median
. valueEntergy Nuclear Northeast (Indian Point-3 FAC
EXT-Steam 1,500 ft program information). In the failure rate calculationthe given length is input as a median value.Dominion Energy; the given length is for KNPP and
LP-Steam 622 ft in the filure rate calculation it is input as a lower.__ .bound value
Dominion Energy; the given length is for KNPP and]HP-Steam 885 f in the failure rate calculation it is input as a lower
bound value
4.5 Conditional Pipe Failure Probability
For FAC-susceptible piping the likelihood of rapid or unexpected flaw propagation given wallthinning is quite high and can be estimated directly from service data. In the case of pipematerials or systems that are not susceptible to FAC such as the high pressure main, steamsystem at Kewaunee, there are much fewer events from which to derive the conditional ruptureprobability. "in this case the estimation of the likelihood of sudden pipe failure relies on Insightsfrom service experience with different piping systems and materials under different loadingconditions in combination with engineering judgment and fracture mechanics evaluations.
The likelihood of a through-wall flaw propagating to a significant structural failure is expressedby the condIitional failure probability P&({R/F. It is determined from service experience insightsand engineering judgment, with the uncertainty treated using the Beta Distribution.
Karl N. Fleming Consulting Services LLC Page 23 of 53

HELB Initiating Event Frequencies for Kewaunee PRA
The beta distribution takes on values between 0 and I and is defined by two parameters, A andB (some texts refer to these as "Alpha" and "Beta"). It is often used to express the uncertainty inthe estimation of dimensionless probabilities such as MGL common cause parameters andfailure rates per demand. The mean of the Beta Distribution is given by.
Mean = A (4.1)A+B
If A = B = 1, the beta distribution takes on a flat distribution between 0 and 1. If A = B = %, thedistribution Is referred to as a Jeffery's non-informative prior and Is a U shaped distribution withpeaks at 0 and 1. Expert opinion can be Incorporated by selecting A and B to match up with anexpert estimate of the mean probability. For example, to represent an expert estimate of 10'2,A=1 and B=99 can be selected. These abstract parameters A and B can be associated withthe number of failures and the number of successes in examining service data to estimate afailure probability on demand. A + B represents the number of trials.
The beta distribution has some convenient and useful properties for use In Bayes' updating. Aprior distribution can be assigned by selecting the initial parameters for A and B, denoted asApr,, and Bpj,. Then when looking at the service data, if there are N failures and M successesobserved, the Bayes updated or posterior distribution is also a Beta distribution with thefollowing parameters:
A =.Ai,,, + X (4.2)B = Bprior + M (4.3)
The above explains how the Beta distribution is used In this study to estimate conditionalrupture probabilities. The priors are selected to represent engineering estimates of theprobabilities "prior" to the collection of evidence. Equations (4.2) and (4.3) are used to computethe parameters of the Bayes' updated distribution after applying the results of the data queriesto determine N and M. N corresponds to the number of ruptures In the specified size range andM corresponds to the number of pipe failures that do not result in a rupture in the specified sizerange.
A review of service data provides some insights about the conditional pipe failure probability fordifferent types of piping systems. Figure 4-3 shows the conditional failure probability for different,observed through-wall flow rate threshold values. For comparison the Beliczey-Schulzcorrelation [15] is re-calibrated for through-wall flow threshold values rather than pipe size; thiscorrelation only applies to Code Class I piping. According to Beliczey-Schulz, for 1-Inch pipingthe conditional probability of a major structural failure (MSF) or rupture is on the order of5.OxlO2 (corresponding to a liquid flow rate of about 800 gpm (completely severed pipe), whichis well beyond the upper threshold value in Figure 4-3. This information is presented to helpjustify the prior distribution parameters A and B selected for this analysis.
Karl N. Fleming Consulting Services LLC Page 24 of 53

HELB Initiating Event Frequencies for Kewaunee PRA
1.OE-0Oi
1.0E-02
E 1.0E-03 -UaClss I (RCPB piping) C
-&- Class 3 (Moderate Energy Piping - All Systems)-*-High-Energy, FAC Susceptible Piping-- o senzey-WuLz 11987) - Class I Piping
n>O n>1 n>5 n10 n>50 n>100 n>200 n>300Observed Release Rate Thershold Values gpm]
Figure 4-3Empirical Conditional Probability of Pipe Failure as a Function of
Type of Piping System & Through-Wall Flow Rate Threshold Value'
The WAG parameter of the Beta Distribution corresponds to a significant consequence (spray,Internal flooding or major flooding event) and the "Br parameter corresponds to the remainingfailure experience (significant wall thinning or through-wall flaw). The total number of failures Inthe database Is equal to A+B. Table 4-4 is a summary of the prior and posterior BetaDistribution parameters for non-Code FWC and steam piping used in this report. The posteriordistribution parameters are derived by performing a Bayes' update of the assumed priordistributions using service data from PIPExp and the conjugate properties of the BetaDistribution.
Part of the Information presented In Table 4-4 Is the screening of pipe ruptures in different breaksize ranges In the FAC sensitive piping. The 26 events with equivalent break sizes between 2'and 6n are listed in Table 4-5, and the 33 events with break sizes greater than 6-inches are inTable 4-6.
'Plotted in tet figure are the conditional probabilities of leak flow rates given pipe failure as estimated by the fraction of the pipe failures in thefailure data population with the indicated leak flow rte.
Karl N. Fleming Consulting Services LLC Page 25 of 53

HELB Initiating Event Frequencies for Kewaunee PRA
4.6 Results for Failure Rates and Rupture Frequencies
Using the methodology described In Section 2, uncertainty distributions were developed for thefailure rates and rupture frequencies for each of the analysis cases in Table 2-1. The meanvalues of these distributions are presented In Table 4-7. The full uncertainty distributions werepropagated through the HELB-initiated Internal flooding initiating event models that weredescribed In Section 3 and the results are presented in Section 5. Parameters of thesedistributions are presented In Appendix B.
To support sensitivity calculations that are summarized in Section 5, comparisons were madeamong the data screening sensitivity cases for each system group that were identified. As seenin Figures 4-4 and 4-5 the results for the case using only data from prior to 1988 before FACprograms became effective would increase by more than an order of magnitude. Statedanother way, the failure rates and rupture frequencies based on the service data before 1988are more than an order of magnitude greater than those considering only data from events after1988 when the FAC programs were In effect.. Conversely, if all the FAC-related events wereprecluded by some type of plant change, an order of magnitude reduction In the relevant pipefailure rates and rupture frequencies would be expected.
Karl N. Fleming Consulting Services LLC Page 26 of 53

f ::c CrHELB Initiating Event Frequencies for Kewaunee PRA
Table 4-4Parameters of Posterior Beta Distribution for P,,{RIFJ for non-Code
FAC-SusceDtible Hich-Enerav PiDina & non-Code FAC-resistant Hiah-Enerav PiDingAnysIs Case Prior Beta Parameters Posterior Beta Parameters
Piping Eqnialent Constraint Apr Bprw Ap BA., t MeanMaterial Break Size (EBS)
CarbonSteel r2<EBS56" 1.01-2 I 99 27(l) 1254 2.11E-02and EBS > 6" L.OE-2 1 99 3 1072 3.07B-02
FAC-susceptible X .Stainless Steel 2" < EBS S 6" 1.OE-3 1 999 10 1062 9.33E-03
or EBS > 6"' .OE-31 999 8 1036 7.661-03FAC-resistant
Notes:(1) A through-wall flaw of size 2" < EBS s 6" can occur iany FAC-susceptible piping of nominal pipe size (NPS) >
2". The database screening criteria include consideration of NPS and through-wall flaw size.(2) A through-wall flaw of size BBS > 6" can occur in any FAC-susceptible piping of NPS > 6".* EBS - Equivalent Break Size* NPS = Nominal Pipe Size [inch]* The posterior Beta distribution parameters are obtained from PIPExp database (accounts for service experience
applicable to non-Code FWC and steam piping in Light Water Reactors):- B1p = By + (Bjde.. - AEON- AErae - Total number of ruptures in specified size range- BEH =Total number of failure records -1181 records (carbon steel FWC piping of nominal pipe size greater
than 2. There are 1006 records for piping > 6" NPS.- A dopg Al + AEO.; the evidence is 26 records for which the through-wal defect is sufficient to
create a significant outflow of steam/condensate corresponding to 2" < EBS S 6" (Table 4-5).- Ap]smj = Apfrd + Aw,~,; the evidence is 33 records involving major structural failure of FAC-susceptible
piping corresponding to EBS > 6-inch diameter (Table 4-6)* The Beta distnbution parameters for 'stainless steel or FAC resistant case' arc obtained by screening out any data
record involving degradation or failure caused by FAC. A total of 72 records involve non-FAC failures and of these,44 records involve piping > NPS6.
Karl N. Fleming Consulting Services LLC Page 27 of 53

HELB Initiating Event Frequencies for Kewaunee PRA
Table 4-5 Summary of FAC-Susceptible Piping Rupture Events with Equivalent Break SizeBetween 2-inch Diameter and 6-Inch Diameter (EBS1
DATABASE EVN LN YTM NOMINALRECORD DATE PLANT NAME COUNTRY PLAT SYSTEM SGROYS PIPE SIZE
NO. DAETP[RU inch]2962 4/22/1995 Ahniarnz-1 ES PWR COND FWC 615272 2/13/2001 Balakovo-2 RU PWR FW FWC 3.22907 7(27/1993 Bohunica-3 SK PWR MS STEAM 6455 9/28/1983 Browns Feny-t US BWR MSR STEAM 6456 11/1/1977 Browns Fonfy-3 US BWR EXT-Stea STEAM 63722 8/10/1999 Callaway US PWR FW FWC 61166 9/25/1985 Dresden-2 US BWR COND FWC 62787 11/17/1986 Fernni-2 US BWR FW FWC 61425 4/28/1970 H.B. Robinson-2 US PWR MS STEAM 61975 3/1/1977 Hatch-) US BWMR CON__D FWC __4
1463 9/2611989 Indian Point-2 US PWR MS STEAM 42866 4/3/1987 Indian Point-2 US PWR FW FWC -_62498 11/24/1993 KRla-4 RU PWR MS STEAM 4_999 1/1/1972 Millstone- - US BWR MS STEUUI 4494 12/0/1973 Millstone-l US BWR CON__D FWC 4
2161 12/31/1990 Millstono-3 US PWR MSR STEAM 6498 12131/1990 Millstone-3 US PWR MSR STEAM_ 6501 3/19/1983 Oconee-2 US PWR MSR STEAM 32949 12/15/1996 Paks,3 HU PWR EXT-STEAM STEAM 6478 7M9/1986 RE. Gmnna US PWR MS STEAM 6850 11/1&8977 Ringhals-2 SE PWR FW FWC 6607 3/23/1990 Surry-l US PWR MSR STEAM 4540 8f7/1972 _______ us_ US__PWR MSR STEAM 41536 1/9/1982 Troman US PWR EXT-STEAM STEAM 6697 8/1/1983 Zion-I US PWR EXT-STEAM STEAM 62458 7/28/1991 7 Zio__2 US PWR FW FWC 3
Karl N. Fleming Consulting Services LLC Page 28 of 53
C7 C) C!

IC C (HELB Initiating Event Frequencies for Kewaunee PRA
Table 46 Summary of FAC-Susceptible Piping Rupture Events with Equivalent Break Size > 6-inch Diameter (EBS2)
RCORtD EVENT PLANTNAME COUNTRY PLANT SYSTEM SYSTEM PNOINALREOD DATE TYPE GROUP PIESZNO. _ _ _ __ _ _ _[Inchl
2865 12/18/1991 Ahnaraz-1 ES PWR MS STEAM 8445 4118/1989 ANO-2 (Arkansas-2) US PWR MS STEAM 14454 9/29/1982 Browns Fary-I US BWR MS STEAM 8453 6/24/1982 Browns FeWr-4 US BWR MSR STEAM 8
15185 8/15/1983 Brons Fery-I US BWR MS STEAM 8462 11/20/1984 Calvert Cliffs-I US PWR EXT-STEAM STEAM 16465 1/15/1988 Catawba-1 US PWR COND FWC 82912 9/25/1987 Doel-I BE PWR COND FWC 82504 4/10/1993 Fermi-2 US BWR EXT-STEAM STEAM 82785 4/21/1997 Fot Calhoun-I US PWR FW FWC 12483 4/25/1986 Hatch-2 US BWR FW FWC 2037 6/27/1985 KMK Mlheirm-Krlich DE PWR FW FWC 18
2598 12/29/1984 Krsko Sll PWR FW FWC 142446 5/6/1991 Kwusheng-2 TW BWR COND FWC 12
85 5/28/1990 Loviisa-l FI PWR FW FWC 1276 2/251t993 Loviisa-2 FI PWR FW FWC 8
2928 6f14/1996 Manshan-21 TW PWR MS STEAM 1620056 8/9/2004 Miha n-3 JP PWR FW FWC 201307 11/6/1991 Milistone-2 US PWR MSR STEAM 81320 8M81995 MiUstone-2 US PWR Heater-Drain FWC 8500 6/23/1982 Oconee2 US PWR EXT-STEAM STEAM 24865 t/1/1985 Ckonee-2 US PWR FW FWC 10
2701 9/24/1996 Ckonee-2 US PWR, MSR STEAM 18504 9/17/1986 OConee-3 US PWR Heater-Drain FWC 10976 6/10/1974 Quad Cities-2 US BWR FW FWC 182913 1/1/1989 Santa Maria de Gaona ES BW1R FW FWC 163092 2/9/1980 Santa Maria de Garona ES BWR EXT-STEAM STEAM 16
Karl N. Fleming Consulting Services LLC Page 29 ~of 53

HELB Inftiating Event Frequencies for Kewaunee PRA
DATABASE NOMINALRCOR EVENT PLANT NAME COUNTRY LASYSTEM SYSTEM PIPE SIZE
O. DATE TYPE GROUP jnh
2278 3/1/1993 Sequoyah-2 US PWR MS STEAM 10541 10115/1983 Surry-1 US PWR FW FWC 26542 12/9/1989 Surry-1 US PWR Heater-Drain FWC 10595 12/9/1986 Sumrr-2 US PWR FW FWC 18545 3/9/1985 Trojan US PWR FW FWC 14920 12/2/1971 Turkey Point-3 US PWR MS STEAM. 12
Karl N. Fleming Consulting Services LLC Page 30 of 53
C C C

f C CHELB Initiating Event Frequencies for Kewaunee PRA
Table 4-7 Mean Values of Failure Rate and Rupture Frequency Parameters,
Results - Mean ValuesCase Description Failure Rate Rupture Frequency
( l/ft~yrj lI/t~YrlKNPPO1 FWG EBSI with Post-1988 data 3.19E-06 .6.72E-08KNPP02 FWC. EBS2 with Post-1988 dfat 3.56E-06 1.09E-07KNPP03 FWC, EBSI with data through 1988 2.78E-05 5.85E-07KNPP04 FWC; EBS2 with data through 1988 3.98-05 1.22E-06KNPP05 FWC EBS1 wit FAC events screened out 9.21E-07 8.60E-09KNPP06 FWC; EBS2 with FAC events screened out 8.29E-07 635E.09KNPPO7 _Steam Extraction pipng EBSI with Post-1988 data 3.40B-06 7.17E-08KNPP08 Steam Extraction piping; EBS2 with Post-1988 data 2.58E-06 7.93E-08KNPP09 Steam Extraction piping EBSI with data through 1988 3.32E-04 6.99E-06KNPPIO Steam Extraction piping, EBS2 with data though 1988 4.86E-04 1A9E-05KNPPI 1 Steam Extraction piping; EBSI with FAC events screened out 1.93E07 1.80E-09.KNPP12 Steam Exinaction OipM= EBS2 with PAC events screned out 2.68E-07 2.07E-09KNPP13 Steam pimg downstream P trbine, EBSI Post-1988 data 1.33E4-05 2.80E-07KNPP14 Steampipng downsemnEPtbine, EBS2 Post-1988 data 1.07E45 3.29E-07KNPP15 Steampiping downs-trmHPine, EBSI with datarough 1988 7.15SE5 1.51E-06KNPP16 Steam piping downtm BHP trbine. EBS2 with data fthough 1988 9.09E-05 2.79E-06KNPP17 Steam phpmgg downstream HP turbine, EBSI with PAC events sceaend out 2.2SB-07 2.10-09KNPP18 Steam piping downstream HP turbine; EBS2 with FAC events seened out 9.22E-07 7.05E-09KNPP19 MS piping upstm HP trietvtle valve, EBSI Post-1988 data 3.25E-06 3.03E-08KNPP2O MS piping upstream HP trbine thrwotle valve, EBS2 Post-1988 data 1.16E-06 8.90E-09KNPP21 MS piping upstream HP turbine throttle valve, EBS I with data through 1988 1.60E-05 1.49E-07KNPP22 MS piping upsteam HP trbine throttle valve, EBS2 with data tbrough 1988 2.50E-05 1.91E-07KNPP23 MS pipin upstram HP turbine throttle valve, EBS1 with FAC events screened out 1.74E-07 1.64E-09KNPP24 MS piping upstream HP turbine throttle valve, EBS2 with FAC events screened out 236E-07 I .80E-09
Notes:* EBS - Equivalent (Diameter) Break Size* EBSI: 2 < EBS S 6" equivalent diameter break size - moderate energy release* EBS2: EBS > 6" equivalent diameter ba size - major energy release
Karl N. Fleming Consulting Services LLC Page 31 of 53
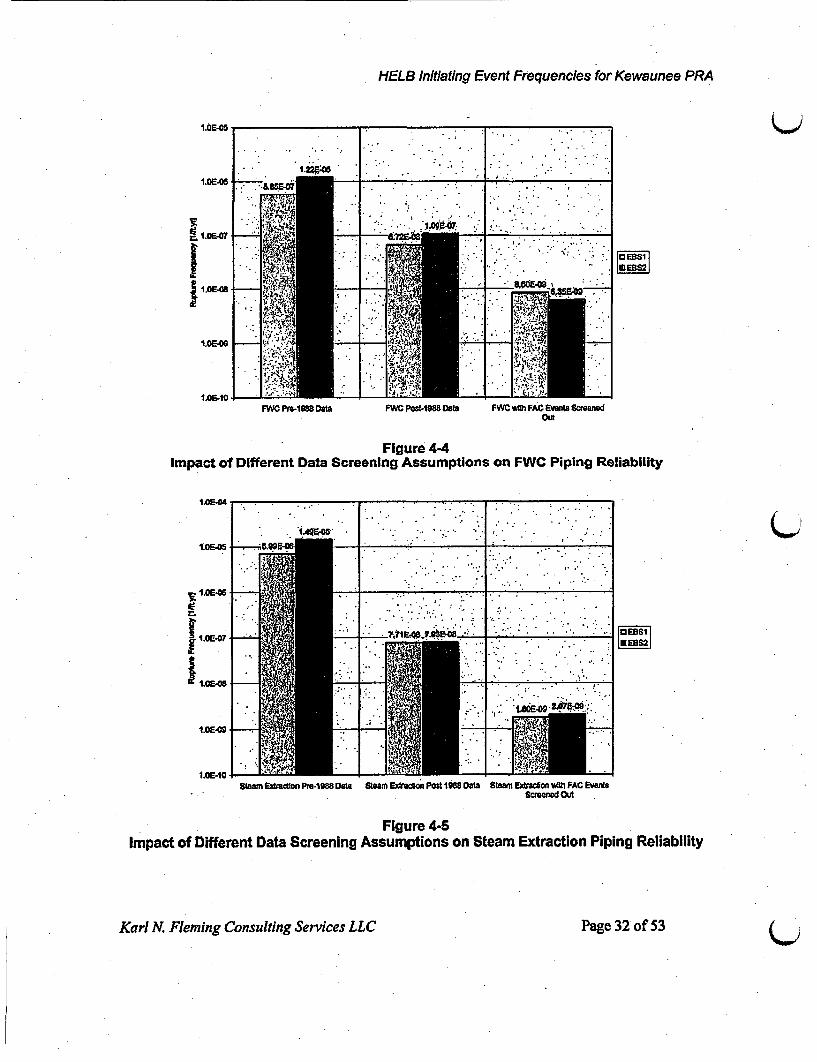
HELB Initiating Event Frequencies for Kewaunee PRA
FY4C Pr-1988 Data FWC Pot-1988Data FWCM m FAC Evuts mnedOut
Figure 4-4Impact of Different Data Screening Assumptions on FWC Piping Reliability
1.E.O 6040.A"
1.OE405 ' ... G- -''' -,'
I"I0 =I Cfarm
Stoam Extracton Pro-1918 Data Seanta Pot198ata SenExtraionl with FAC EventsS'"uned Out
Figure 4-5Impact of Different Data Screening Assumptions on Steam Extraction Piping Reliability
Karl N. Fleming Consulting Services LLC -Page 32 of 53

HELB Initiating Event Frequencies for Kewaunee PRA
5.HELB INITIATING EVENT FREQUENCIES
5.1 Calculation Steps
The results for the initiating event frequencies were obtained using the equations in Section 3and the data parameters developed in Section 4. The uncertainties were calculated using thetechnical approach described in Section 2 and is comprised of the following steps."'
1. A prior distribution for each failure rate was obtained from Reference [1]. The prior is alognormal distribution with a mean value of 1.50x10⁴ failures per foot of pipe with a rangefactor of 100. The same prior was used for all 24 cases in Table 2-1.
2. For each case listed in Table 2-1, Bayes' updates were performed using the prior from Step1, the number of failures obtained from the PIPExp database for each case, and estimatesof the piping population exposures that are documented in Section 4. Bayes' updates wereperformed using the program BARTTM developed by ERIN Engineering and Research, Inc.
3. To account for uncertainty in the population exposure estimates the Bayes' updates wereperformed for three estimates of the exposure: a best estimate with a probability weight of80% and a high and low estimate with weights of 10% each.
4. A composite uncertainty distribution was developed for each of the 24 cases of failure ratesusing a posterior weighting procedure using Crystal BalT and Microsoft Excel.
5. The process listed in Steps 1-4 was repeated for two ranges of pipe size: one for pipesgreater than or equal to 2", which could produce ruptures of size 2" and greater, and one forpipes sizes greater than 6" which could produce rupture sizes exceeding 6". Hence a totalof 48 failure rate distributions were developed: one for 2" and greater, and one for 6" andgreater pipe size ranges for each of the 24 cases in Table 2-1.
6. A Beta distribution was developed to represent the conditional probability of rupture for tworupture sizes: 2" to 6", and greater than 6" equivalent break size using the data described inSection 4. These beta distributions include prior distribution parameters that represent theauthors expert judgment on the values of these probabilities, and service data experiencethat Is documented in Section 4. Two sets of distributions were developed: one for FACsensitive carbon steel pipe In systems subject to FAC, and the other for FAC resistant pipeor systems that are not susceptible to FAC, e.g., the high-pressure main steam pipingupstream of the turbine throttle valves.
7. The rupture frequencies for rupture sizes between 2" and 6" were obtained by combining thefailure rates for 2" and greater pipes and the conditional rupture probabilities developed inStep 6. The rupture frequencies for greater than 6" breaks were obtained by combining thefailure rates for greater than 6" pipe sizes with the appropriate conditional rupture probability.
B. The HELB-initiated internal flooding Initiating event frequencies were obtained bypropagating the uncertainties in the appropriate rupture frequencies through the equationsof Section 3 using the Monte Carlo process using Cystall Ballm and Microsoft Excel. Toproperly treat the state of knowledge dependencies all the uncertainty calculations from theoutput of the Bayes' updates through Step 8 were performed In a single integrated MonteCarlo procedure. In each Monte Carlo trial a failure rate was sampled for each case and
Karl N. Fleming Consulting Services LLC Page 33 of 53
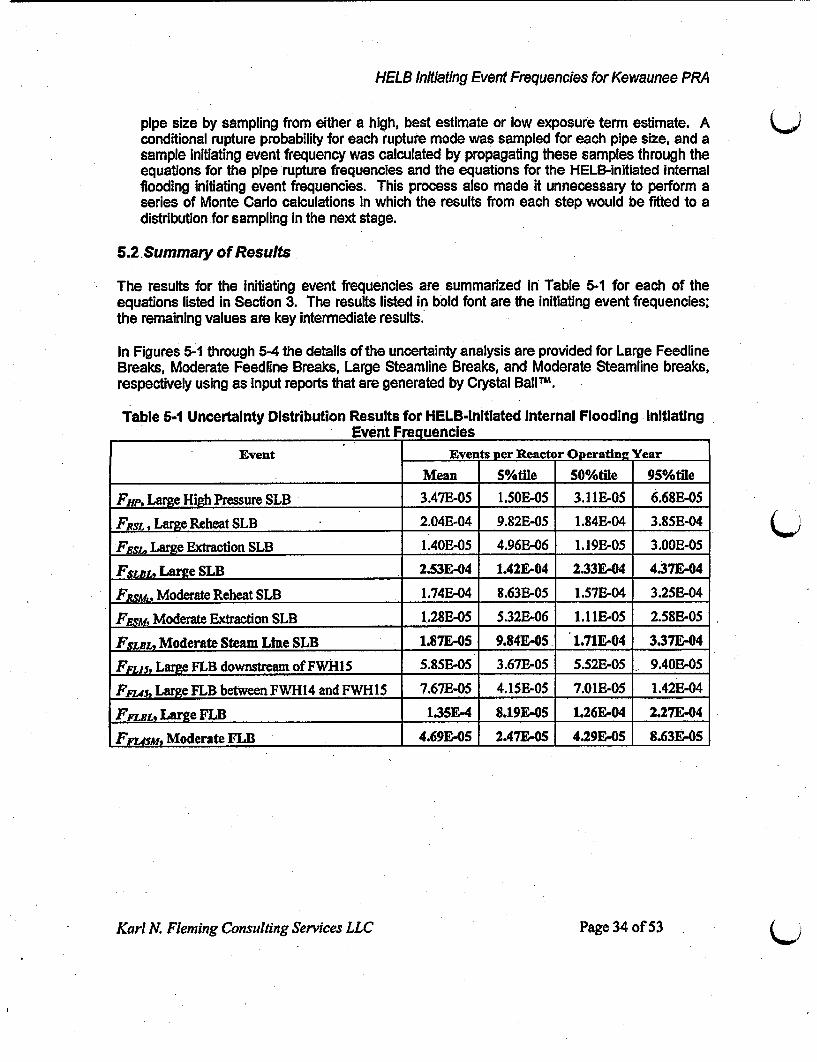
HELB Initiating Event Frequencies for Kewaunee PRA
pipe size by sampling from either a high, best estimate or low exposure term estimate. Aconditional rupture probability for each rupture mode was sampled for each pipe size, and asample initiating event frequency was calculated by propagating these samples through theequations for the pipe rupture frequencies and the equations for the HELB-initiated internalflooding initiating event frequencies. This process also made it unnecessary to perform aseries of Monte Carlo calculations In which the results from each step would be fitted to adistribution for sampling In the next stage.
5.2.Summary of Results
The results for the Initiating event frequencies are summarized In Table 5-1 for each of theequations listed in Section 3. The results listed in bold font are the initiating event frequencies;the remaining values are key intermediate results.
In Figures 6-1 through 5-4 the details of the uncertainty analysis are provided for Large FeedlineBreaks, Moderate Feedline Breaks, Large Steamline Breaks, and Moderate Steamline breaks,respectively using as Input reports that are generated by Crystal BallTm.
Table 5-1 UncertaInty Distribution Results for HELB-initlated Internal Flooding InitiatingEvent Frequencies
Event Events per Reactor Operating Year
Mean 5%t/le 50%tile 95%tfle
Flip, Large High Pressure SLB 3.47E-05 1.50E-05 3.1 1E05 6.68E-05
FASL, Lage Reheat SLB 2.04E-04 9.82E-05 1.84E-04 3.85E-04
FESL, Large Extraction SLB 1.40E-05 4.96EM06 1.19E-05 3.00E-05
FSLRu Lare SLB 2.53E-04 1.42E-04 2.33E-04 4.37E-04
FRksm, Moderate Reheat SLB 1.74E-04 8.63E-05 1.57E-04 3.25E-04
FkSM, Moderate Extraction SLB 1.28E-05 5.32E-06 1.1IE-05 2.58E-05
FsLBL, Moderate Steam Line SLB 1.87E-05 9.84E-05 1.71E-04 337E-04
F>FL)S, Large FLB downstrUem of FWH15 5.85E-05 3.67E-05 5.52E-05 9.40E-05
Fazs, Large FLB between FWH14 and FWH15 7.67E-05 4.15E-05 7.01E05 1.42E-04
FFLBL, Large FLB 1.35E-4 8.19-05 1.26E&04 2.27E-04
FFUSM, Moderate FLB 4.69E-05 2A7E-05 4.29E-05 8.63E-05
Karl N. Fleming Consulting Services LLC Page 34 of 53 U'

HELB Initiating Event Frequencies for Kewaunee PRA
FL4OL Large Foed line Break
TOOO
I2000,
2Oo o
IOW
.- - - . - - - - - - - - - - - - - - - - - - -
- - - - - --- - - - - - - - - - - - - - - - - - - -
- - - - - - - - - - - - - - - - - - - - - - - - -
- - - - - - - Ir ----- -------.111 hini ----
E&MM= @ Et at0% 4A18-056% 19.E0510% 9.04E-516% 9.85E-020% 1.02E425% 16EM-0430% 1.10E-0435% 1.14E-0440% 1.18E-0445% 1.222-4400% 1.26E-4465% 1.30E-0460% 1.34E-0485% 139E.0470% 1.44E4475% 1.50E4460% 1.68E-0465% 1.69E-449D% 1.87E4495% 227E.04100% 4.90E44
L _....ULJLLLJUWE-is06 IJI.-04 US7E-0a alOEs-
Td~as 100.000Mean 1.35E-04Median 1.28E-04ModeStandard Deviation 4.E0-05Varlance 2.02E-9Skewness 1.76Kurtosts 10.7CCooff. of Verebility 0.33MiUmum 416E45Masmum 4.90E44Ra eWdth 449E-04Mean Sid. Enrr IA2E-07
Figure 6.1 Crystal Ball Results for Large Feedline Break Frequency
FLE45M -Medium Feedline Break
G000
4000,
3000
2000W-
towo-
. ---- . - - . - - -- - - - - - - - -- - - - - - - - - - -I
- - - - - - - - - - - - - - - -
- - - - - . . - . - - - - - - -
--all] I I h ill-1-1 II I --" -
Eten= Forecast values0% 1 S2E-05B% 2.472-05
10% 2.811-0515% 3.05E-0O20% 3.27E-0525% 3.45E-0530% S.62E-0535% 3.79E-0540% S.05E.0545% 4.11E-0650% 4"E-0565% 4.4SE-060% 4.65E-0565% 4.AE4-0570% 6.09E4575% 5.38E-05. 0% 6.70E-0565% 6.17E-490% 658E2-0595% 6.63E-05
110% 2.16E-04
l
4.745.5.....- . ........1.11nuuE.0 .W& 4ira AWUEE IIUE tEEN ENuhe~e~**
Sta~s: Eoreest values|TM$al 100.00Moan 4.69E-45Median 4.20145|Mode _-Standard Deviation 1.04E-05Varlance 3.75E-10Skewness 1.83Kuftosis 11.10Cooff. f Variability OAtMinimum 1.02E4-5Madmum 2.15E-04Range Wadth 2.E-04Mean Sti Error S.12E-08
Figure 5-2 Crystal Ball Results for Intermediate Feedline Break Frequency
Karl N. Fleming Consulting Services LLC Page 35 of 53

HELB Initiating Event Frequencies for Kewaunee PRM
FSLBL Large Steam Une Beak
WmCe _ . . -_ __ _ .
l oo .. _ __- __1 wo __m--- I . _ __-- . _ _
low '--1 .. .. ., I
Parcentiesa Forecast Wiues0% S.87E-Cs5% 1.42E-04
10% 1.582415% 1.70E-0420% 1.8OE-0425% 1.9OE004
0% 1.U8E4435% 2.07E-0440% 2.15E-044S% 2.24E-04f0% 233E-04SS% 2A2E0480% 53E-0465% 2e4E-0470% 236E-04756 2.91F-0480% 3.09E-0485% 3.33E-0490% A09E-0495% 4.37E-04
100% 1.16E-03
?72E45 f.4244 2MrM6 3ASE-61 k.8624
Stasics Forecast valuesTilels 100.000Mean 2.83E-04Median 2.33E44ModeStandard Deviaton .61E-05Vauiance 0.24E-0Skewness 182Kurtsis 11.77Coe. of Vaieblly 038Mininum 6.7E-05Mawnum .16A 3Range Width 1.10E-03Mean Sld. Seror 3.042-07
Figure 5-3 Crystal Ball Results for Large Steam Une Break
Percentiies- . -ForecadtyaluesF-SLBM * Medium Steam Line Break 0% 3.93E-05
. % 9.84E-6000 10% 1.11E-04
15% 1.21E-048000 ------ -- ---------- -- .- 20% 1.29E-04
4coo -----1111 30- 2S% 1.36E-04400 2% 1A382-04
am11 ------1- - - ----- 35% 1.S0E-04I:alMl 40% 1.572-04412050 111 45% 1.642-44000 50% 1.71E-04
70% 2.04h-04
76% 2.16E-0480% 2.30-E04
| lisbes: Fomiast y= 185% 2.49E-04Tdals 100.000 90% 2.78E204Mean 187E-04 96% 3.37E-04Median 1.71E-04 100% 1.02E2-ModeStandard Deiattion 7.75E-06Vadance 601E-09Skewns 1.89Kuotos s 1203Coeff. f Variability 0.41Minimum 3.932-05Mandmumn 1.02E-03RangeWidth 9.82204Mean Std. Ermr 2.45E071
Figure 5-4 Crystal Ball Results for Intermediate Steam Line Break
U
Karl N. Fleming Consulting Services LLC Page 36 of 53 U

-ELB Initiating Event Frequencies for Kewaunee PRA
5.3 Sensitivity Study
As a sensitivity study, the initiating event frequencies were recalculated using differentassumptions regarding how the data was screened as discussed in Section 4. Thisstudy was performed by propagating the results for the pipe failure rates and rupturefrequencies for the different data screening strategies through the equations for theinitiating event frequencies In Section 3. The results are summarized In Table 5-2 andFigure 5-5. As seen In these exhibits, the impact of using the service data from 1988 torepresent the current Industry practice and as a basis to predict the HELB-initiatedinternal flooding frequencies Is approximately an order of magnitude compared with thecase of using pre-1988 data. This shows the Impact of Industry improvement programs,particularly the FAC programs, which were responsible for reducing the frequency ofpipe breaks since about 1988. Although these programs were effective in reducing thepipe break frequencies, as seen in the third case in which all the FAC related failuressince 1988 were removed, FAC Is still a dominant failure mechanism for these systems.The initiating event frequencies would be an order of magnitude lower If all the FACrelated failures were removed from the data analysis.
Table 5-2 Impact of Alternative Assumptions Regarding Data Screening on HELB-InItiated Internal Flooding initiatino Event Freauencies
Mean Initiating Event Frequencyper Reactor Operatin Year
Initiating Event Base Case Data up to Data afterData after 1988 only 1988 with1988 only FAC events
removed
FPi, Large High Pressure SLB 3.47E-05 3.01 E-04 3.04E-06
F Lar e Reheat SLB 2.04E-04 1.73E-03 4.38E-06
Fun, Large Extraction SLB 1.40E-05 2.6303 4.77E-07
Fs___L, Large SLB 2.53E-04 4.67E-03 7.09E"6FJSM,, Moderate Reheat SLB 1.74E-04 9.39E-04 1.31-M06
F1 sm, Moderate Extraction SLB 1.28&05 1.23E-03 3.18E-07
FSLeL, Moderate Steam Line SLB 1.87E-05 2.17E-03 1.62E-06
FFLIs. Large FLB downstream of FWHIS 5.85E-05 5.98E-04 4.96E-06
Prls, Lare FLB between FWH-1 4 and FWHI5 7.67E-05 8.50E-04 4.42E-06
PFFLL, Lane FLB 1.35E-4 1.45E-03 9.38E-06
FFUSM, Moderate FLB 4.69E-O5 4.07E-04 4.29E-5
Karl N. Fleming Consulting Setvices LLC -Palsy 37 of 53

HELB Initiating Event Frequencies for Kewaunee PRA
lE_~" 1' - -- -
*FLBL - Large Feedline Break1FLBM - Intemrediate Feedlne BreaESLBL - Large Steam Line Break*SLBM - Intermediate Feedline Brea
J
._ _
1E.M _
1.
ntil
E..IV§iE0
wl Post 1988 Data
lb
._
1E46 _-
wl FAC Events Screened OutI E-54B _
wl Pre-1988 Data
Figure 5-5 Impact of Alternative Data Screening Regarding FAC
Karl N. Fleming Consulting Services LLC Page 38 of 53 U.
HELB Initiating Event Frequencies for Kewaunee PRA
6. REFERENCES
[11 Fleming, K.N. and B.O.Y. Lydell, "Pipe Rupture Frequencies for Internal FloodingPRAs", prepared by Karl N. Fleming Consulting Services LLC for EPRI, August2005
[2] Poloski, J.P. et al, Rates of Initiating Events at U.S. Nuclear Power Plants,NUREGICR-6750, U.S. Nuclear Regulatory Commission, Washington (DC), 1999.
[3] Tregoning, R., L. Abramson and P. Scott, Estimating Loss-of-Coolant Accident(LOCA) Frequencies Through the Elicitation Process, Draft Report for Comment,NUREG-1829, U.S. Nuclear Regulatory Commission, Washington (DC), June 2005.
[4] Lydell, B.O.Y., 'PIPExpIPIPE-2004: Monthly Summary of Database Content (Statusas of 31-Dec-2004)', RSA-R-2004-01.07, RSA Technologies, Fallbrook (CA).Monthly summary reports have been Issued since January 1999.
[5] Fleming, K.N. et at, "Piping System Reliability and Failure Rate Estimation Modelsfor Use In Risk-informed In-Service Inspection Applications", TR-110161 (EPRILicensed Material), EPRI, Palo Alto (CA), 1998.
[6] U.S. Nuclear Regulatory Commission, Safety Evaluation Report-Related to 'RevisedRisk-informed In-service Inspection Evaluation Procedure (EPRI TR-1 12657, Rev. B,July 1999, Washington (DC), 1999.
[7) H. Martz, TSA-1/99-164: "Final (Revised) Review of the EPRI-Proposed MarkovModeling/Bayesian Updating Methodology for Use in Risk-informed InserviceInspection of Piping in Commercial Nuclear Power Plants,*, Los Alamos NationalLabaratory, June 1999
[8] Fleming, K.N., Mikschl, T.J., "Piping System Failure Rates and Rupture Frequenciesfor Use in Risk Informed In-service Inspection Applications", EPRI Report No. TR-111880 (EPRI Licensed Material), EPRI, Palo Alto (CA), 1999.
[9] Fleming, K.N. and B.O.Y. Lydell, "Database Development and UncertaintyTreatment for Estimating Pipe Failure Rates and Rupture Frequencies," ReliabilityEngineering and System Safety, 86:227-246, 2004
1101 Bush. S. et al, "Piping Failures In the US Nuclear Power Plants 1961-1995,m SKIReport 96:20, Swedish Nuclear Power Inspectorate, Stockholm (Sweden), January1996
[III U.S. General Accounting Office, "Action Needed to Ensure That Utilities Monitor andRepair Pipe Damage,' GAOIRCED-88-73, Washington (DC), March 1988.
[12] Cragnolino, G., C. Czajkowski and W.J. Shack, Review of Erosion-Corrosion InSingle-Phase Flows, NUREGICR-5156, U.S. Nuclear Regulatory Commission,Washington (DC), April 1988.
[13] International Atomic Energy Agency, "Corrosion and Erosion Aspects in PressureBoundary Components of Light Water Reactors," Proceedings of a SpecialistsMeeting organized by the IAEA and Held in Vienna, 12-14 September 1988, IWG-RRCP-88-1, Vienna (Austria), April 1990.
Karl N. Fleming Consulting Services LLC Pago 39 of 53

HELB Initiating Event Frequencies for Kewaunee PRA
[14] OECD Nuclear Energy Agency, "Specialist Meeting on Erosion and Corrosion of QJNuclear Power Plant Materials," NEAICSNI/R(94)26, Issy-les-Moulineaux (France),1995.
[15] Beliczey, S. and H. Schulz, "The Probability of Leakage in Piping Systems ofPressurized Water Reactors on the Basis of Fracture Mechanics and OperatingExperienced Nuclear Engineering and Design, 102:431-438, 1987.
Karl N. Fleming Consulting Services LLC Page 40 of 53

HELB Initiating Event Frequencies for Kewaunee PRA
APPENDIX A PIPExp DATABASE DESCRIPTION
I III
I I.
'I
I
Karl N. Fleming Consulting Services LLC Page 41 of 53
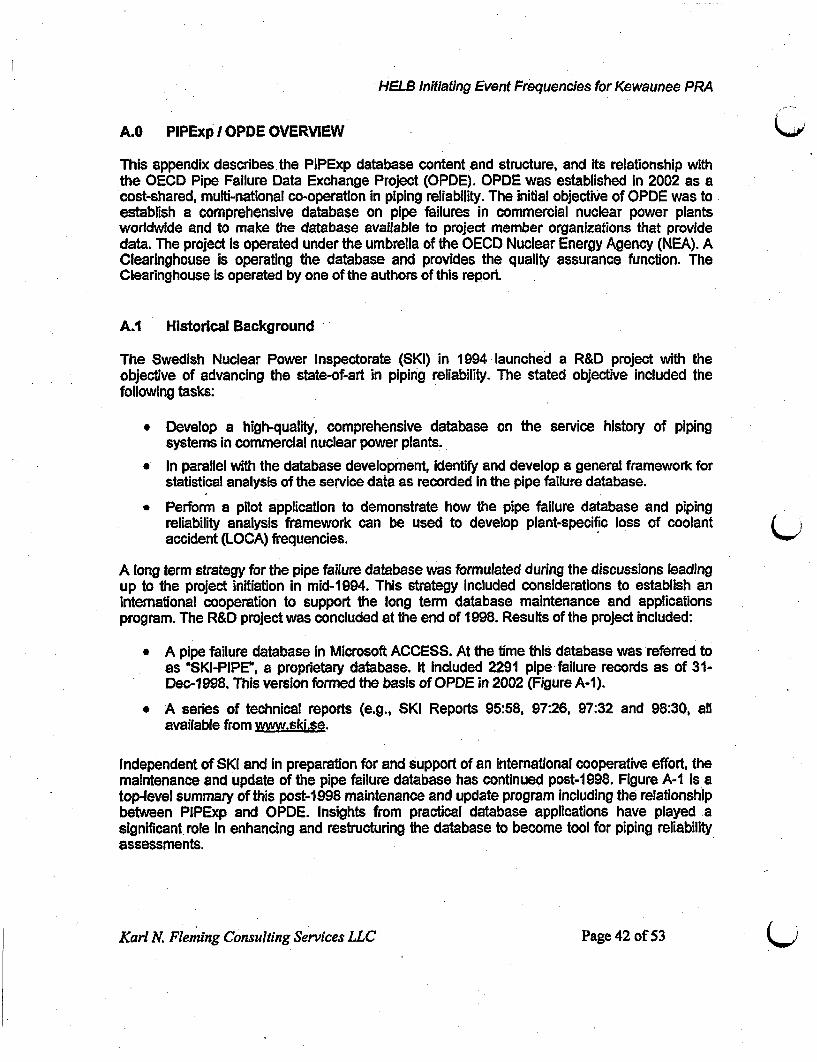
HELB Initiating Event Frequencies for Kewaunee PRA
A.0 PIMExp I OPDE OVERVIEW
This appendix describes the PIPExp database content and structure, and its relationship withthe OECD Pipe Failure Data Exchange Project (OPDE). OPDE was established In 2002 as acost-shared, multi-national co-operation in piping reliability. The initial objective of OPDE was toestablish a comprehensive database on pipe failures in commercial nuclear power plantsworldwide and to make the database available to project member organizations that providedata. The project Is operated under the umbrella of the OECD Nuclear Energy Agency (NEA). AClearinghouse is operating the database and provides the quality assurance function. TheClearinghouse Is operated by one of the authors of this report
A.1 Historical Background
The Swedish Nuclear Power Inspectorate (SKI) in 1994 launched a R&D project with theobjective of advancing the state-of-art in piping reliability. The stated objective Included thefollowing tasks:
* Develop a high-quality, comprehensive database on the service history of pipingsystems in commercial nuclear power plants.
* In parallel with the database development, Identify and develop a general framework forstatistical analysis of the service data as recorded In the pipe failure database.
* Perform a pilot application to demonstrate how the pipe failure database and pipingreliability analysis framework can be used to develop plant-specific loss of coolantaccident (LOCA) frequencies.
A long term strategy for the pipe failure database was formulated during the discussions leadingup to the project initiation in mid-1994. This strategy included considerations to establish aninternational cooperation to support the long term database maintenance and applicationsprogram. The R&D project was concluded at the end of 1998. Results of the project included:
* A pipe failure database in Microsoft ACCESS. At the time this database was referred toas *SKI-PIPE", a proprietary database. It included 2291 pipe failure records as of 31-Dec-1998. This version formed the basis of OPDE in 2002 (Figure A-1).
* A series of technical reports (e.g., SKI Reports 95:58, 97:26, 97:32 and 98:30, allavailable from www.ski.se.
Independent of SKI and in preparation for and support of an International cooperative effort, themaintenance and update of the pipe failure database has continued post-1998. Figure A-1 is atop-level summary of this post-1998 maintenance and update program including the relationshipbetween PIPExp and OPDE. Insights from practical database applications have played asignificant role In enhancing and restructuring the database to become tool for piping reliabilityassessments.
Karl N. Fleming Consulting Services LLC Page 42 of 53

HELB Initiating Event Frequencies for Kewaunee PRA
SKI R&D Proiect 1994-1998* SOAR on piping reliabiity analysis as IK relates to PSA (SKI Report 05:58)* Basis for deriving pipe falluro parameters from service data (SKI Report 97:28;* SKI-PIPE (1998) pipe failure database (2291 records as of 12-31.1998)
. .
PIPExp DatabsePoject (1999 -to date) -independentof SKI. Active maintenance program (wekl updates);* QA program - extensive data validation;* Practical applIcations & enhancements to db-structure
U 317 dbrecordS i
PIPExo2000 (24120001 OPD Peolect 002 8.* 3879 db records * Based en SKIPPE (1998);
* Validation of selected records by___PEX__00_M2_31_200_ Natlonal Coordinators;* 3957dbrecords 9 * Harmonized db-structure;
* Coding Guideline I OA Program_ PPEgg-2002 U24312002)7 J* 4215db records / o 3g1241.003F
___________ _a 2427 dbrecords
| 43 * db records It / Oi201 084103a * db records
PMExO.205s941-2005),* 6395 db records (pipe)* 250 db records (non-plpe.
passive Code Class I & 2components, excl. SGtube)
* 463 water hammerrecords (wlo structural
Figure A-1Evolution of PIPExp Pipe Failure Database
A.2 PIPExp Quality Management
All work associated with database maintenance Is controlled by a QA program. Sourceinformation Including text files, drawings and photographs associated with each database recordis stored in an electronic archive. Each data record In PIPExp Is assigned a "Quality Index" (orcompleteness Index) per the definitions in Table A-1. The Quality Index is used to! assess thecompleteness and technical accuracy of the source information as well as the classified andcoded Information In the database. Table A-2 summarizes the evolution of the database since1 998.
Karl N. Fleming Consulting Services LLC Page 43 of 53

HELB Initiating Event Frequencies for Kewaunee PRA
Table A-1Definition o Qualitv Index for Database Management
Quality-Index DefinitionI Validated - all source data has been
accessed & reviewed - no further actionrequired
2 Validated - source data may be missingsome, non-critical Information - no furtheraction anticipated
3 Validated - incomplete source data -assumptions made about material gradeandlor exact flaw location - no further actionanticipated
4 Validation based on incomplete Information -
depending on application requirements,further action may be necessary
5 Validation based on available, incompleteinformation - further action expected (e.g.,retrieval of additional source data)
6 Not validated - validation is pending, orrecord Is subject to deletion from database
Table A-2Database Content by Quality Index
Database as of 12-31-1998No. Pipe Failure Records b Quality Index
Plant Type Totals 1 2 3 4 5 6BWR 673 210 66 3 74 7 277
PHWR 100 30 3 - 56 1 10PWR 1376 386 123 6 152 84 746
RBMK 57 3 6 - 19 28 12291 629 198 9 301 120 1034
Database as of 12-31-2002No. Pipe Failure Records byQuality Index
Plant Type Totals 1 2 3 -4 5 6BWR 1872 1216 174 12 219 75 176
PHWR 106 51 2 - 42 11 -
PWR 2077 1011 198 6 351 233 278RBMK 160 48 - _ 18 81 -
4215 2290 379 22 721 349 454Database as of 09-30-2005
No. Ppe Failure Records by Quaity IndexPlant Type Totals 1 2 3 4 | 5 6
BWR 2510 1489 300 172 282 204 63GCR, 12 8 _ 2 1 1 -
HWLWRPHWR 131 47 4 23 42 15 -PWR 3563 1318 323 300 453 1070 99
RBMK 179 12 -21 4 110 32 -
6395 2874 648 501 888 1322 162
Karl N. Fleming Consulting Services LLC Page 44 of 53
C C C

HELB Initiating Event Frequencies for Kewaunee PRA
A.3 PIPExp Database Input Forms
This section gives and overview of the database Input requirements. All data entry is done viathe four forms (Form I through F&M,4).'
A.3.1 Form I - Event Descriptions
Form I is shown In Figure A-2. It consists of 35 fields; seven of which are free-format with thebalance defined by roll-down menus with key words (or data filters). The data entryrequirements are defined below:
p. p.,. . MI
L.~ im5eanssel ! .u iz ~ .i rj * ..IEle KM~ sew own rtm*Pnn Remors lods Mnow U*%)a
Tusay cobrO, 04 PIPF-xpDATABASE _____
EiD MP~ Evet Repodt EvetaeN~ Pk"~t atfoelte048 4 L"! rg2 * K0ebC*2dShpidown
eec*Reference -swcary vesl5IIA4 EA, Pailaplnoi iIR aoteti____________
Rceieenco*- Tertkoy Reference.quatlaw inyee_ _ _ _ _ _ _ _ _ _ _ _ _ _ _ _ _em D e a d
ColltetadDamage I CocarctMActon Imata k Operationm TTR ITTRt.Oe
Evera Hatative, Gw*Rdoa Reed Leak Rite sel -SYSTEMDwhe plnwwkon fteWqatr2001 "age ofKoebergr2 &Ak=ofd 1 I___
k&Age as foud an t Safey I~con vj~m ixf wl~ cnnaem Grow onupm~nnh Sto Wthe kw4iead aalewi ection ando GO u.=1 ay pump. FUthe iR , vpp
oketaw! saface dye-ponetant and meta ,atipaod istons cowfmad SCCat a S .CdOmIDWnubefc bcatmn - "~ to iesklual lomio stesm In Oaplpino g cm edM9
krvvtuhd ola camdotm The flaws WAun during theW oftea waere VA.otApp~ioWj 2foetayi*ed lo stuafle tank mam envionmentalcoeio cngafteWsrtemm WC1 mt
pngweettompnertratibn ar ent scaled,.euigi waa~ aiWn______lies seehorn k oom othFuel rDulf AD O p~pe work =Wsdered at dsk is 304
areentcatalenu~ steel itme Hi..-Ted ptra work entonon-amnnated satae. 9~WG_ pdmauDei he 8Reluetr Oftae .mafr I 2001. trza p~pc babo and one straigNr sechion A3 TP30vi oatdW 7FdppwasolzdAVmuinspeinpm wasvutplenebt=kxthe ther ppowppstCas W~s
Aovx at 'wrat uhIspcin Ove otla kkOmperating cycle. AnOpnouiedaeevawluetinhereof eranimd th defe*t mmt of fth some M taserawrexperienced enetwere bked in uae to dug tohe nctiond capabfly aflaikeaio
piewas ri Impaired Evidence of 9CC has ualsoabeen foundin Ihe RWST. Indweisancoe Ome cracks ONoh-t Ira Sat ri iuctsibqp wldfro.os
1Rwia ut r 2614l[' H Ill* -Of MS'
'Figure A-2Event Descriptions - Form I
Form I Data Entry Recuirements* EID (Event ID) is a uniquely defined database record number (or *prmary key"); it is
generated automatically by Access.* Multiple Event Report is checked if one source document (reference) includes
Information about more than one pipe failure and at different piping system locations.
Karl N. Fleming Consulting Services LLC -Page 45 of 53

HELB Initiating Event Frequencies for Kewaunee PRA
Mainly, this field supports database management activities (e.g., answer to question*have all pipe failures been adequately recorded in PIPExp?").
* Quality Index (a number 1 to 6); a roll-down menu defines the different options togetherwith definitions.
* Event Date Is always required.• Plant Name; a roll-down menu with listing of all commercial nuclear power plants in NEA
member and non-member countries.* Plant Operational State; a roll-down menu defines the different options.* Reference; there are four free-format fields for primary and supplemental references.
Electronic copies of each reference are stored on CD.* Event Type; a roll-down menu defines the different options.* Event Category; a roll-down menu defines the different options.* Collateral Damage; a roll-down menu defines the different options. 'NIA - None' is used
as the default.* Corrective Action; a roll-down menu defines the different options. Note that the term
'Temporary Repair' always implies that a 'Code Repair' or 'Replacement' be performedduring the next scheduled outage lasting 30 days or more, but no later than the nextrefueling outage.
* TTR (lime to Repair) Is for the repair time in hours.* TT-Class Is a data filter, a roll-down menu defines the different options with definitions.* Event Narrative Is a free-format memo field.* Quantity Released Is free format field; the dimension can be [lb], [kg], [ton], or [m3].* Leak Rate Class Is a data filter; a roll-down menu defines the different options with
definitions.* System is a free format field for the system name; a roll-down menu includes a selection
of BWR- and PWR-speclfic, English language names.* System Group Is a data filter, a roll-down menu defines the different options.* Piping Component is a data filter, a roll-down menu defines the different options.* Weld Configuration; a roll-down menu defines the different options.* Code Class; a roll-down menu defines the different options. A cross-reference table
compares the different national safety classifications with ASME Section Ill.* Diameter Class Is a data filter; a roll-down menu defines the different options and
definitions.* Diameter [mm] is used for the measured diameter.* Diameter [inch] is used for the measured diameter.* Material is a data filter, a roll-down menu defines the different options.* Material Designation; a roll-down menu defines the different options. A cross-reference
includes different carbon steel and stainless steal material designations.* Process Medium, a roll-down menu defines the different options.* ISI History (Form 3) is checked only if information is available.* Root Cause Information (Form 4) is checked only if information is available.* Flaw Size Information (Form 2) Is checked only if flaw size (e.g., crack orientation, depth,
length) information is available.
Karl N. Fleming Consulting Setvices LLC Page 46 of 53 L /

HELB Initiating Event Frequencies for Kewaunee PRA
A.3.2 Form 2 - Flaw Size Information
Form 2 is shown in Figure A-3. It consists of 28 fields. The data entry requirements are definedbelow:
UIVFIXII1 P.VW I=F In, U
IUXi!N sarosew a;
~' 5.rdm!o De * W at Pbmat: leods 10*l S&idow U*Tp qusiwo t -e a J
Ttx~dwj,Odtober W.2DC44A2-23PFM PIPExp DATABASE
I r__ E____ '_ ForFAC*Orducd degiadatim a y.pM e Upr~mt sosoi fIinrad iwo. IFcp t~ eet.m M prem408 .q&Avatmt hasd w fan~ t. MX p* 1G I~k ~d=k= arrnn* u Rlanaa be o ihitr~csaie ai~
Hoa inpipe aw = dra ~ uy3/8tch o14ndi ametai
DO-1I CF1 01.2 CV2 1 02-3 C.O D3.4 CF0 0 0 0 0 0 .- I I
I 4D I CF5 N I5- 6F 067 I 0 7-8 CFO DO-B I C9 I 0D910 I CF100 I U. 0 0 0 1 a I U I U I 0
Ra66 of Cmck LuiVh to ECkaxlwerecpdoato
Record: 1I4141 r 2545 i I Pt II* of2645WW: tio of cracdmetha) to flowlergd(L)
Figure A-3Flaw Size Information - Form 2
Form 2 Data Entry ReauirementsFlaw Description Is a free-format memo field. For through-wall flaws, information aboutdimensions (e.g., equivalent diameter) should be included in this field. For part through-wall flaws, this field should include information onW flaw depth (a) and length (O, andotientation. For multiple flaws, the number of flaws and their lengths are recorded in thedesignated fields.
* Check If Multiple Circumferential Flaws. This check box typically applies to flawsattributed to IGSCC. In PIPExp, on the order of 15% of the records on IGSCC involvemultiple, single plane circumferential cracks.
* nCF (number of Circumferential Flaws) includes the total number of flaws in an affectedweld.
* D## Is the distance, in [mm], between adjacent circumferential flaws; e.g., DO-1 is thedistance from the TDC (12 o'clock) position to flaw #1, and D2-3 is the distance between
Karl N. Fleming Consulting Services LLC Page 47 of 53

HELB Initiating Event Frequencies for Kewaunee PRA
flaw #2 and flaw #3, etc. A blank field Indicates that no information on the spacing isavailable in the database.
* CF-# is the length of circumferential flaw V' [mm]. The flaw number is relative to the 0-degree position; CF-1 is the first circumferential flaw from the reference position, etc.
* Crack Depth f%] is the ratio of crack depth to pipe wall thickness.* Axial Length [mm]; this field relates to the Flaw Description.* Ratio of Crack Length to Circumference; this ratio should be relative to the inside pipe
circumference.* Aspect Ratio; this is the ratio of crack depth to crack length and relates to the information
under Flaw Description.
A.3.3 Form 3 - ISI History
Form 3 is shown in Figuie4-4. It consists of 3 fields. While primarily intended for [SI programweaknesses, the free-formiat field may be- used to document any information pertaining to theISI of the affected component, or ISI history such as time of most recent Inspection.
ft. Oft tew re* Igmt' Iecd Bos pidow s V-p -r * _ F X
Tu=4~dy. DctWeM8. 20044:336tPM PlPExp DATABASE
r-1-10 -e1 ihfed so 191 Vwouam 1WW -
MECO pedonmUdaciv .eniTed byac6aonk lo onSW pi hting da t chai o e Oawed li The npecton didret malaW aUw dewa~dde. The wAtown ho jenq lods tat nraog a lot bdes hciss 12haw .hJL-
Reackw& I*4 1 2374 ' 1 Idl of 12645
Figure A-4ISI History- Form 3
Karl N. Fleming Consulting Services LLC Page 48 of 53

HELB Initiating Event Frequencies for Kewaunee PRA
A.3A Form 4 - Root Cause Information
Form 4 is shown in Figure A-5. It consists of 9 fields. The data entry requirements are definedbelow:
13 _ _ I. . , : ,U
fat 0eaw knertetVgM* secirds Ipk W0dow tietp Tg.ot5 iIstkn h*e * _ X.w y Ocoe .,, 2D-, ,
4.3813PM PlPExp DATABASEI EID
1 4070 ..Location Fae -FenJ
WBa)aweciandonsendowtreaimohe A"Lw PieswLP TIbiria Wft FAC- FlwAcceiewate 1msionHD Oea Pump 119D4*2ALLV; beween etownd vikallffo a f Debdbn | ndwii Ca1 * t
. thd UT Fabdcabo Unde4i Ca2e2
Rom E-AndydsiThM pipe lccired d a dow waa ofb lw oo*a valw Twaace hcdsaewar now rofls tA valc lcresed .1 .irate d p4o wea decsear the wl vaDUicess lo poiS wher pae Wame occuid Th. awe am t e oed wes not preftowfr *inmeded hx vodn/corosicn as pa tdltSeconr gmiandCConnen Ipecfon Pwogan The filed pipe scidn wasa scibendonseadmof ecnol vadve andtwe n t eiedwn hMpedctionkgownidr k Aneibow=&te*nda ebrmelafaedpipetad piasvbu been irnspected nd a* hoinch wds cirmsdanet band at be dowubeamendof Oefilhd section btA i had not Wwnned lothpoel vir U Inspection of Me dpeda pov was MCukedd Idnwsby opwaf oene Wounadon rcei"ed in 1987 nd 19S8 hdceed
gt e d sr1h poe seakm donIrem vetf corir vau b a wiion wsm grater tnhpwt 'beahv wehr., Ihkinfomalon wm ad audelydssemfnaoed tier vrdior n Wn humen dami
Cs
Record: j411 263S iij l*l efz2645Poot cewega) o wcrft~ dwsdeslof wdaruscm) A
Figure A-5Root Cause Information - Form 4
FoIm 4 Data Entry Reauirements* Location of Failure; this is a free-format mnemo fietd describing the location of a flaw (e.g.,
line or weld number, or using a P&ID reference).* Plant Location; a roll-down menu defines the different options.* Method of Detection; a roll-down menu defines the different options.* Method of Fabrication; a free-format text field.* Apparent Cause; a roll-down menu defines the different options. Normally this field has
already been filled in.* Underlying Cause -1; a roll-down menu defines possible contributing factors.* Underlying Cause- 2; a roll-down menu defines possible contributing factors.* Root Cause Analysis; a free-formatimemo field. This field should Include any relevant
information on the cause-consequence relationship and should be supplemental to theEvent Narrative In Form I.
Karl N. Fleming Consulting Services LLC Page 49 of 53-

HELB Initiating Event Frequencies for Kewaunee PRA
* Comments: a free-format memo field. It is intended for any other, relevant informationthat is not captured by other database fields.
A.4 Database Accessibility
PIPExp is a proprietary database whereas the OPDE database is restricted. The full OPDEdatabase is available to participating organizations that supply data. An unrestricted version ofOPDE ('OPDE-Light') is available to Interested parties upon request to respective NationalCoordinator (the U.S. representative in the project is the Nuclear Regulatory Agency, Office ofNuclear Regulatory Research). OPDE-Light does not include any proprietary information or anyinformation that enables the Identification of plant name.
Karl N. Fleming Consulting Services LLC Page 50 of 53

HELB Initiating Event Frequencies for Kewaunee PRA
APPENDIX B PIPE FAILURE RATES & RUPTURE FREQUENCIESAPPLICABLE TO NON-CODE PIPING SYSTEMS
Karl N. Fleming Consulting Services LLC Page 51 of 53
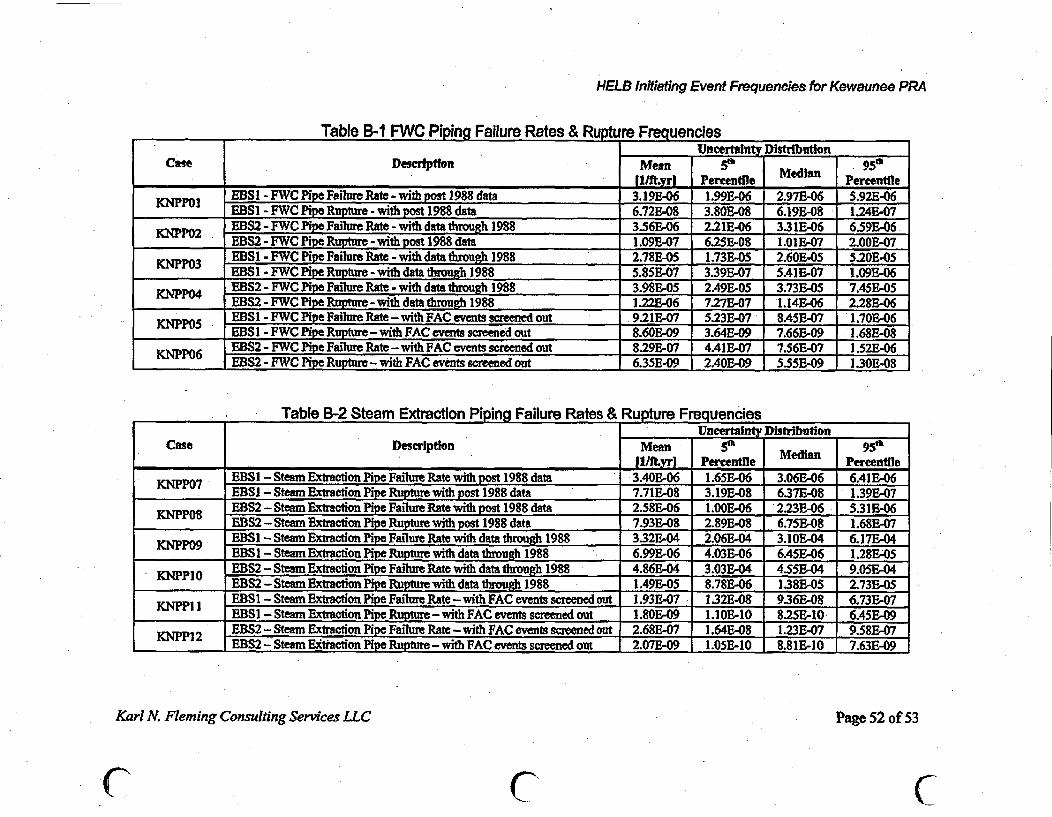
HELB Initiating Event Frequencies for Kewaunee PRA
Table B-1 FWC Piping Failure Rates & Rupture Frequences_Uncertnty Distribution
Cose Descripfton Mean 95_IlM.Yrl Percentile MedPn Percentile
EBSI - FWC Pipe Failur Rate - with post 1988 data 3.191E-06 1.99E-06 2.97E-06 5.92E-06KNPPOI EBSI - FWC Pipe Ruptwe - with post 1988 data 6.72E-08 3.80E-08 6.19E-8 1.24E-07KEBS2 - FWC Pipe Failur Rat - with data through 1988 3.56E-06 2.21E-06 3.311E-06 659EM06
EBS2 - FWC Pipe Rupte -with poM 1988 data 1.09E1-07 6.25E-08 1.01E-07 2.00E-07EBSI - FWC Pipe Failure Rate - with data dmuth 1988 2.78E-05 1.73E-05 2.60E1-5 5.20E-05
KEPP03 EBSI - FWC Pipe Rupore -with data though 1988 5.85E-07 3.39E-07 5AIE-07 1.09E-06EBS2 - FWC Pipe Fafiure Rate - with data trough 1988 3.98E-05 2.49E&05 3.73E-05 7.45E-05
CNPPO4 EBS2 - FWC Pipe Rupture - with data through 1988 1221E-06 7.27E-07 1.14E306 2.28E-06KENPP0 EBSI - FWC EPpe Faihne Rate - wvth FAC events sreened out 9.21E-07 5.23E-07 8.45E07 1.70E-06
EBSI - FWC Pipe Rupture - with FAC event screened out 8.60E-09 3.64E-09 7.66E-09 1.68E-08
KNPPo6 EBS2 - FWC Pipe Failue Rate - with FAC events screened out 8.29E-07 4.41E-07 7.56E-07 1.52E-06_ EBS2 - FWC Pipe Rupture - with FAC events screned out 6.35B-09 2AOE-09 5.55E-09 1.30E-08
Table B-2 Steam Extraction Piping Failure Rates & Rupture FrequenciesUncertanty Dstribution _
Case Descrpton Mean a_/iftyrl Percentile Median Percentile
EBSI - Steam Extaction Pipe Failure Rate with post 1988 daa 33AOE-06 1.65E-06 3.06E-06 6.41E-06EBS1 - Steam Exraction Pipe Rupture with post 1988 data 7.71B-08 3.19E-08 637E-08 1.39E-07
KNPP08 EBS2 - Steam Extracion Pipe Failure Rate with post 1988 data 2.58E-06 1.OOE-06 2.23E-06 5.3113-06EBS2 - Steam Extraction Pipe Rupture with post 1988 data 7.93E-08 2.89E-08 6.75E-08 1.68E-07EBSI - Steam Extraction Pipe Failure Rate with data through 1988 3.32E-04 2.06E-04 3.1OB-04 6.17E-04EBSI - Steam Extraction Pipe Rupture with data through 1988 6.99E&06 4.03E-06 6.45E-06 1.28E,05
NPP EBS2-Steam Extraction P Failue Rate with datathrough 1988 4.86E-04 3.03E-04 4.55E-04 9.05E-04EBS2-SteamExtrcton Ru ewith datatou 1988 1.49E-05 8.78E-06 1.38E-05 2.73E-05EBSI - Steam Extraction Pipe Failure Rate - with FAC events screened out 1.93E-07 1.32E-008 9.36E-08 6.73E-07
KNPPI I EBSI - Steamn Extraction Pipe Rupture -with FAC events screened out 1.80E-09 1.IOE-10 82SE-10 6.45E-09EBS2 - Steam Extracton Pipe Failure Raft - with FAC events sceened out 2.68E-07 1.64E-08 1.23E-07 9.58E-07KNPP12 EBS2 - Steam Eitraction Pipe Rupture - with FAC events screened out 2.07E-09 1.05E-10 8.81E-10 7.63E-09
Karl N. Fleming Consulting Servces LLC Page 52 of 53
C C (7
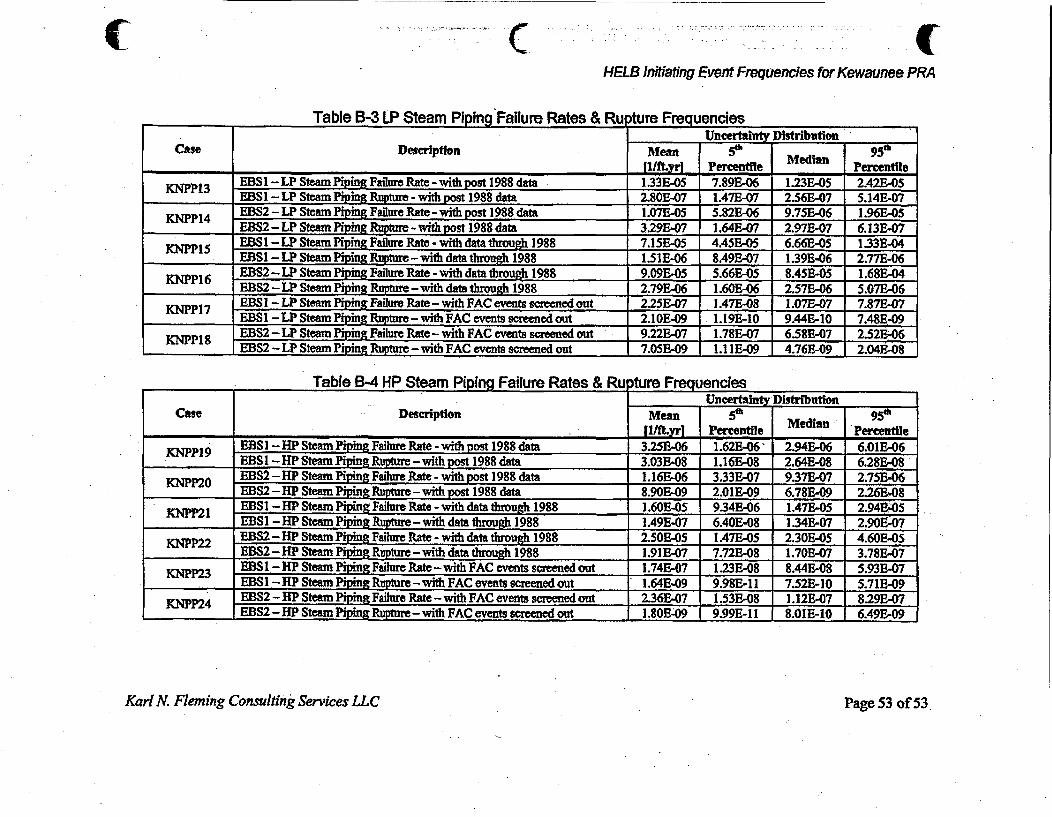
C C H L I t-g e F r e q u e n c I e -o -e :
IfEI B In~aiting Event Frequencdes for Kewaunee PRA
Table B-3 LP Steam Pipin Failure Rates & Ru tUre FrequenciesUncertainty Distribution
Case Description Mean SO 9 PI /ftyrl Percentile Median Percentie
KNEBSI - LP Steam PI1ing Faile Rate - with post 1988 data 1.33E-05 7.89E-06 1.23E-05 2.42EBO5KEBSI - LP Steam Piping Rupture - with post 1988 data 2.80E-07 1.473-07 2.56E-07 5.14E-07
KNPP14 EBS2 - LP Steam Piping Faiure Rate - with post 1988 data 1.071S05 5.82E-06 9.75E-06 1 .96E-05EBS2 - LP Steam Piping Rupm - with post 1988 data 3.29E-07 1.64E-07 2.97E-07 6.13E-07KNPPIS EBSI - LP Steam Piping Faihlre Rate - with data throigh 1988 7.15E-05 4A5E-05 6.66E-05 1.33E-04
EBS1 -LP Steam Piping Ruftre-with data through 1988 1.51E-06 8A9E-07 1.39E-06 2.77E-06KNPP16 EBS2 - LP Steam Piping Falue Rate - with data t__uh 1988 9.09E-05 5.66ES05 8.45E-O5 1.68E-04
P EBS2 - LP Steam PiPing Rte - with data through 1988 2.79E-06 1.60E-06 2.57E-06 5.07R-06KNPP17 EBS I - LP Steam Piping Faflure Rate - with FAC events screened out 2.25E-07 1.47E-08 1.07E-07 7.87E-07
EBSI - LP Steam Piping Rupture - with FAC events screened out 2.1OE-09 1.19E-10 9.44E-10 7.48E-09KNPP8 EBS2 - LP Steam Piping Failure Rate - with FAC events screened out 9.22E-07 1.78E-07 658E-07 2.52E-06
EBS2 - LP Steam Piping Rptne - with FAC events screened out 7.0E509 1.1 IE-09 4.76E-09 204E-08
Table B-4 HP Steam Piping Failure Rates & Ru ture FrequenciesUncertainty Distribution
Case Description Mean 5f 95PIl/ft.yrl PerC Percentile
KNPPl9 EBSI -BPSteamPipingFaihireRate-withpost 1988 dat 3.251-06 1.62E-06' 2.94E-06 6.01E-06-EBSI -HP Steam Piping Rupture-with post 1988 data 3.03E-08 1.16E-08 2.64E-08 6.28E-08
KNPP20 E;BS2 -HP Steam Pipin_ Failue Rate - with _2st 1988 data 1.16E-06 3.33E-7 9.37E-07 2.751E-06EBS2 - BP Steam Piping Rpte - with post 1988 data 8.90E-09 2.01E-09 6.78E-09 2.26E-08EBS1 - HP Steam Piping Failue Rate - with data rough 1988 1.601i05 9.34E-06 1.47E-05 2.94E-05
KNPP2 EiBSl - HP Steam Piping Ruptre - with data through 1988 1.49E-07 6.40E-08 1 341-07 2.90O07KNPP22 EBS2 - HP Steam Piping Faihure Rate - with data through 1988 2.50E-05 IA7E-05 2.30E-05 4.60E-05
EBS2 - HP Steam Pipn R ture - with data thugh 1988 1.91E-07 7.72E-08 1.70E-07 3.78E-07EBSI - HP Steam Piping Faihlre Rate -with FAC events screened out 1.74E-07 1.23E-08 8.44E-08 5.93E-07
KNPP23 EBSI - HP Steam Piping Rup -with FAC events screened out 1.64E-09 9.98E-1 7.52E-10 5.71E-09EBS2 - HP Steam Piping Failure Rate - with FAC events sceened out 236E-07 1.53E-08 I .12E-07 8.29E-07
KNPP24 EBS2 - HP Steam Piping Rupure - with FAC events screened out I.80E-09 9.99E-11 8.01E-10 6.49E-09
Karl N. Fleming Consulting Services LLC Page 53 of 53 �

Appendix B
Flood Area Definition for Turbine BuildingBasement
I

IINTERNAL FLOODING - Flood Area Definition for Turbine Building BasementP. I 11 �p)
Flood Area Definition for Turbine BuildingBasement
Prepared by: S .5 44w-e& ULP- eMA-Signature Print Name
I-L b-i IbDate L)
Reviewed by: T T I "Z4t EL UI.- _OA
Signature IPrint Name
t-21 6- LI Q~Date
I

INTERNAL FLOODING - Flood Area Definition for Turbine Building Basement p. 2
1.0 PURPOSE
Internal floods are defined as those floods that result from the failure, incorrect operation(including errors in maintenance), or incorrect alignment of components within the plant.Accident sequences initiated by internal floods can be a significant contributor to risk because ofthe potential of the event to impair, simultaneously, multiple components required for accidentmitigation. The overall objective of the internal flooding analysis is to determine the contributionof accident sequences initiated by such flooding events to core damage and individual accidentclass frequencies.
An internal flooding PRA requires that areas of the plant be identified that contain equipmentneeded to mitigate accidents and that are subject to flooding effects. Areas are defined asseparate for flooding purposes where physical boundaries are present that prevent propagation ofa flood source in one area from causing damage to equipment in another area. For each floodarea, flooding sources are identified in the area that have the potential to damage equipmentwithin the area or that have the potential to propagate from the area to another area and damageequipment needed for accident mitigation. Propagation paths are identified and defined betweenflood areas. The flooding walkdowns confirmed the boundaries between flood areas andidentified barriers in the boundaries that separate the flood areas. This information can be used toidentify areas of the plant that can be designated as separate, independent flood areas.
In order to streamline the accident sequence analysis it is beneficial to limit the analysis to onlythose sequences that will contribute to flooding risk. Such risk-significant sequences areidentified through the application of a screening process. Each flood area is evaluated againstimportant factors including the existence of flooding initiators, the existence of safety-significantequipment, and ability of a flooding initiator to cause a reactor trip to determine which flood areasare worthy of additional analysis and quantification.
This document designates independent flood areas that will be analyzed in further detail throughaccident sequence analysis and initiating event frequency analysis. Development of independentflood areas will support the high level requirements identified in the Flood Area DefinitionGuideline [GUIDEO1]. This document also applies a screening analysis to all the defined floodareas to focus the accident sequence analysis on risk-significant scenarios. Application of ascreening process will support some of the high level requirements identified in the Accident:Sequence Analysis Guideline [GUIDE02].
2.0 METHODOLOGY
2.1 Flood Area Definition
A flood area addresses physical boundaries that impact the propagation of water and the potentialto damage equipment. The subject water originates from a pipe break in the flood area and is

INTERNAL FLOODING - Flood Area Definition for Turbine Building Basement p. 3 | &'categorized as a submergence event or a spray event, thus flood areas are defined differently forthese two events. A submergence event is defined as a pipe break with sufficient flow rate tooverwhelm the flood area's flood mitigation equipment, accumulate in such a manner as todamage equipment, and has the potential to propagate laterally in an amount significant enough todamage additional equipment. A spray event is a pipe break with a flow rate within the capacityof the flood area's mitigation equipment (especially floor drains) that can damage equipment fromdirect spray, but cannot propagate laterally. Thus, a pipe break in a spray flood area is expectedto result in direct damage to equipment in the area and to result in the vast majority of that waterexiting the flood area via the floor drains and floor openings. Any water that propagates laterallyfrom a spray flood area will be of insignificant quantity and will not cause equipment damage inadjoining areas. Each flood area is analyzed for both spray events and submergence events.
Lateral propagation for submergence events occurs due to lack or failure of barriers separatingthe areas. Typical barrier failures are of doors, but could include water that flows through openpenetrations through walls, water that flows over protective curbs and weirs, water thatbackflows through drain lines, and structural failure of gypsum walls. Normally closed accessdoors are able to withstand some amount of force due to accumulated water, however when thewater level reaches a critical depth the door is expected to fail. Thus, water will propagatelaterally through such failed doors. Since a failure is required for this lateral propagation tooccur, these lateral zones are not included in the flood area definition. Only zones with opencommunication are considered in defining flood areas.
2.2 Assumptions
The following assumptions were utilized in the definition of flood areas:
1. Leakage under and around doors is the only form of drainage inside Safeguards Alley since apipe break in the Turbine Hall will fill the Turbine Building sump and subsequently fill thedrain lines connecting the sump to the floor drains in Safeguards Alley. Thus, the floor drainswill not be able to remove water from Safeguards Alley. Gaps under doors are documentedas part of the GOTHIC input. [CALC02]
2. KPS access doors inside the Turbine Building generally can withstand a water height of 4 feetwhen the water is pushing the door open and 5 feet when the water is pushing the doorclosed. Exceptions to this include doors 243 and 244 which can withstand 3 feet 3 incheswhen water is opening the door and 4 feet 9 inches when water is closing the door, and door 8which can withstand 3 feet 9 inches when water is opening the door. [CALCO1]
3. All junction boxes are gasketed and not vulnerable to spray unless otherwise noted in theWalkdown Sheets [FLOOD01].
4. Flood-induced failure of motor-operated valves (MOVs) involves the valve operator's loss of

INTERNAL FLOODING - Flood Area Definition for Turbine Building Basement I P. 4
function, but does not involve the MOV changing position. The MOV is expected to remainin the same position, however any new change in position will require manual action to turnthe handwheel.
5. Flood-induced failure of air-operated valves (AOVs) involves the valve operator's loss offunction, but would also involve the AOV failing to its fail-safe position.
6. Sealed penetrations are assumed to pass no fluid. Penetrations make use of various types ofsealant including grout and elastomer. Grout behaves similar to concrete and is basicallyimpervious to water.
7. Cable insulation is not subject to failure from submergence or spray.
8. Walls and trench barriers are assumed to remain intact throughout a flooding event with theexception of the firewall separating flood areas TU-95A and TU-95B-1. This gypsum wallwas analyzed and determined to be structurally capable of withstanding only approximately 3feet of water. [CALC01]
9. The probability of rupture of encapsulated high-energy lines is insignificant as both the innerpipe and the surrounding guard pipe must fail.
10. Environmentally qualified (EQ) components are assumed to be able to perform their safetyfunctions when exposed to spray conditions and high heat and humidity due to a pipe break.For example, the solenoid operators for feedwater valves in the feedwater valve room, bydesign, perform their safety functions during high-energy line break (HELB) events.
11. Lines that are not normally pressurized or charged such as drain lines and dry fire protectionpiping are not considered as credible flood or spray sources.
12. Flooding in containment is not considered in this analysis. This is a subset of the Loss ofCoolant Initiating Event (LOCA) in the Internal Events PRA.
13. Rupture of seismic Class I tanks (e.g., concrete reinforced refueling water storage tank) is notconsidered credible in this analysis.
14. Failure of a fire protection deluge valve is not analyzed as a potential initiator in this analysis.The flow rate of a single deluge valve is insufficient to cause flooding concerns in SafeguardsAlley. The simultaneous failure of multiple deluge valves has an insignificantly smallprobability.
3.0 DESCREMON OF FLOOD AREAS IN TURBINE BUILDING BASEMENT
I

INTERNAL FLOODING - Flood Area Definition for Turbine Building Basement p.5
Flood areas were defined in a previous analysis [FLOOD01]. Walkdowns of the various floodareas were performed earlier and are documented on walkdown forms [Appendix C ofFLOOD01]. For each flood area these walkdowns recorded information that included residentequipment, flood sources, and barriers (including doors). The information from these walkdownscombined with the information obtained from the general arrangement drawings [DWGO1]provides the basis for the following flood area descriptions.
This analysis is concerned only with flood events that originate in the Turbine Building and thenpropagate to Safeguards Alley. Therefore, flood areas associated with the Battery Rooms on themezzanine level of the Turbine Building and the Turbine Oil Storage Area in the Turbine Buildingbasement as well as flood areas in the Auxiliary Building are disregarded as flooding areas ofinterest in this analysis.
Figure 1 identifies the various flood areas and their important features.
TU-22-1
Description - Flood Zone TU-22-1 comprises all of the general areas of the Turbine Buildingincluding the Operating Deck on the 626'-O" elevation, the Mezzanine Floor on the 606'-O"elevation, and the Basement on the 586'-O" elevation. It also includes the rooms in the southend of the Auxiliary Building basement from the waste neutralizer tank (room 17B) west to theReactor Building Support Ring (room 1 IB) since these rooms are not part of the radiological areaand communicate openly with the Turbine Building basement. Additionally, the shop area,working material storage area, and steam generator blowdown area in the south end of the 606'-0" elevation of the Auxiliary Building are also included in this flood zone since these roomscommunicate openly with the other Auxiliary Building rooms in Flood zone TU-22-1 and sincethese areas are not part of the radiologically controlled area. Table 1 contains a complete listingof the fire zones and room numbers that comprise each flood zone. On the 626'-O" elevation thezone is bounded on the north by the Technical Support Center and exterior walls, on the south bythe Transformer Area and exterior walls, on the west by the Auxiliary Building, and on the east bythe Administration Building and exterior walls. On the 606'-0" elevation the zone is bounded onthe north by zones TU-97 and TU-98, the Technical Support Center, exterior walls, theContainment Building, and zone AX-32-1, on the south by the Transformer Area, exterior walls,and zones AX-33 and AX-39, on the west by the Auxiliary Building and Containment Building,and on the east by the Administration Building and exterior walls. Zones TU-94, TU-95A, TU-95B-1, TU-95B-2, TU-95C, TU-96, TU-97, and TU-98 lie beneath zone TU-22-1 and zone TU-96 and the Turbine Building roof lie above.
All wall and ceiling penetrations are sealed. The floor of this zone is the basement floor and isfinished concrete. The north wall has a normally-closed door (120) on the 626'-O" elevation ofthe Auxiliary Building leading to a stairwell, normally-closed doors (47 and 48) leading to zonesTU-97 and TU-98, normally-closed doors (46 and 280) on the 606'-O' elevation of the Turbine &

INTERNAL FLOODING - Flood Area Definition for Turbine Building Basement p. 6
Building leading outdoors, normally-closed doors (11, 15, and 16) on the 586'-0" elevation of theAuxiliary Building leading to zones AX-20B, AX-21-1, and AX-23A-1, normally-closed door 401leading to zone TU-94, and normally-closed doors (4 and 6) leading to zone TU-95B-1. Thesouth wall has a normally-closed door (117) on the 626'-0" elevation leading to the ControlRoom, a normally-closed roll-up door (42) on the 606'-0" elevation leading to-the outdoors,normally-closed doors (70 and 74) leading to zones AX-39 and AX-33 on the 606'-0" elevation,and no doors on the 586'-0" elevation. The east wall has a normally-closed door (109) on the626'-0" elevation and a normally-closed door (39) on the 606'-0" elevation leading to theAdministrative Building, and no doors on the 586'-0" elevation. The west wall has normally-closed doors (118, 133, and 161) leading to zones AX-32-1 and AX-37 on the 626'-O" elevation,normally-closed doors (41, 44, and 49) leading to zones AX-32-1 and AX-30 on the 606'-O"elevation of the Auxiliary Building, a normally-open door (68) leading to the dosimetry offices onthe 606'-0" elevation, a normally-closed door (75) in the Electric Shop leading outdoors, and anormally-closed door (7) on the 586'-0" elevation leading to zone TU-96. The east wall has anormally-closed door (109) on the 626'-0" elevation leading to the Administration Building,normally-closed doors (39 and 40) on the 606'-0" elevation leading to the AdministrationBuilding and outdoors, and no doors on the 586'-0" elevation.
The major PRA equipment in zone TU-22-1 includes the feedwater pumps (1A and 1B), thecondensate pumps (IA and IB), MCC 45-F, and the Redundant Overspeed Trip System Cabinet.
Q The Internal Flood Walkdown Form [Appendix C of FLOOD01] for zone TU-22-1 contains acomplete listing of the flood-susceptible PRA equipment in this zone.
Potential flood sources in this zone include fire protection piping, feedwater piping, service waterpiping, main steam piping, and circulating water piping which are the primary flood sources andrepresent both a flooding hazard and a spray hazard.
Flood mitigation is present in this zone in the form of floor grating, open stairways and sumppumps.
Analysis - Water from a pipe break in TU-22-1 will readily propagate to the basement level. Theeffects of a spray source in any part of the zone are limited to equipment in the vicinity of thespray source. Water is likely to splash onto equipment on lower levels as it passes through thefloor grating. Accumulation is possible in the basement level (586'-O") of the zone.
As water from any pipe break in zone TU-22-1 makes its way into the Turbine Building basement,it will eventually fill the Turbine Building Sump. The sump contains two pumps with designcapacities of < 100 gpm each. The level switch for the Turbine Building omp pump control is amechanically alternating device. A high water level (30") starts one pumpr A return to low level(12") stops the pump. A subsequent high level starts the alternate pump.' [SYSTEM01]
If a high-high water level (34.5") is reached, the level switch starts the second pump. Both pumps
I

INTERNAL FLOODING - Flood Area Definition for Turbine Building Basement p. 7 |
continue to run until an intermediate level cutoff point, 19", is reached. At this point, the levelswitch turns off the leading (first) pump. The lagging (second) pump continues to run until thelow-level setpoint, 12", is reached. [SYSTEM01]
The Turbine Building sump contains Level Switch LA-16666 that actuates Control Room Alarm47033P when a high-high-high water level setpoint, 34.5", is reached. [SYSTEM01]
Thus, only pipe breaks of greater than 200 gpm, the combined discharge capacity of the TurbineBuilding sump pumps, are of concern for zone TU-22-1.
The first indication of such a break would be a Turbine Building sump high level alarm in thecontrol room. The procedure for abnormal operation of the miscellaneous drains and sumpsinstructs the operator to dispatch someone to investigate the source of the alarm. If the source ofleakage is from a break in the Circulating Water System, the operator is instructed to trip thecirculating water pumps, trip the reactor, and perform a shutdown using emergency operatingprocedure E-0.
The effectiveness of such operator actions is dependent on the size of the pipe break. A smallpipe break would likely afford the operator the time to perform the actions necessary to protectvital equipment in the Turbine Building basement. A large break would result in significantaccumulation in the Turbine Building basement and could challenge the flood protection featuresin place to protect equipment located in adjacent zones. Water level in areas TU-94, TU-95B-1,TU-95B-2, and TU-95C would closely mirror the water level in TU-22-1 due to leakage underdoors 4, 6, and 401 and due to flow through the drain lines that connect Safeguards Alley and theTurbine Building sump (these lines do not have check valves). Since drainage in these areas willbe disabled due to the water in the Turbine Building, water will begin to accumulate in theserooms and begin to propagate to zones TU-90, TU-92, and TU-95A due to leakage under doors3, 263, and 268. Power to the motor loads on the 4 kV buses in TU-90 and TU-92 will fail whenthe water level reaches 4 inches, submerging the lockout relays and tripping the breakersassociated with the motor loads.
Summary - Pipe breaks in zone TU-22-1 can result in both equipment spray and submergence.For spray events TU-22-1 becomes a flood area by itself since only equipment in TU-22-1 issusceptible to damage from direct spray originating in zone TU-22-1. However, water from sucha spray event can result in the splashing of equipment in other elevations of the zone. Forsubmergence events, zone TU-22-1 combines with all the zones in Safeguards Alley due toleakage under the doors associated with these rooms. When the water level in the TurbineBuilding sump reaches the high-high setpoint (approximately 34.5 inches above the sump floor)an annunciator sounds in the control room. Power to the motor loads on the 4 kV buses isexpected to fail at 4 inches of water (although power will still be available to the 480 V buses),the 480 V buses will then fail at 11 inches of water, and the turbine-driven auxiliary feedwater(TDAFW) pump will fail to start at 9 inches of water and fail to continue running at
I

INTERNAL FLOODING - Flood Area Definition for Turbine Building Basement p. 8
approximately 18 inches of water.
Zone TU-22-1 is a relatively large room such that any water from a pipe break is expected tospray only equipment in zone TU-22-1 that is in close proximity to the pipe break.
For a pipe break in zone TU-22-1, equipment in zones TU-22-1, TU-90, TU-92, TU-94, TU-95A, TU-95B-1, TU-95B-2 and TU-95C can be vulnerable and could be at risk.
TU-90.
Description - Flood Zone TU-90 is Diesel Generator Room 1A on the 586'-O" elevation. Thezone is bounded on the north by an exterior wall, on the south by zone TU-92, on the east by anexterior wall and the pipe tunnel leading to the Screenhouse, and on the west by zones TU-94 andTU-95A. The Administrative Building lies above zone TU-90 and exterior soil lies below.All penetrations in zone TU-90 are sealed. The south wall has a normally-closed access door (2)leading to a Screenhouse pipe tunnel and the west wall has a normally-closed access door (136)leading to zone TU-95A.
The major PRA equipment in zone TU-90A includes Diesel Generator 1A, 4 kV Switchgear Bus5, and MCC 52A. The Internal Flood Walkdown Form (Appendix C of FLOOD01] for zoneTU-90 contains a complete listing of the flood-susceptible PRA equipment in this zone.
Potential flood sources in this zone include service water piping and fire protection piping whichrepresent both a flooding hazard and a spray hazard.
Flood mitigation is present in this zone in the form of a trench which is sealed to prevent flowfrom traveling to zones TU-94 and TU-95A, but is open via a 4-inch pipe to the pipe tunnelleading to the Screenhouse. Floor drains will transfer water to the Turbine Building sump.
Analysis - Water from a pipe break in TU-90 will easily propagate to the pipe tunnel leading tothe Screenhouse through an open 4-inch pipe that connects the two areas in the existing trench.Floor drains will divert water to the Turbine Building sump. Thus, only pipe breaks that exceedthe capability of the floor drains are a concern for accumulation in zone TU-90. Equipmentdamage from spray sources in TU-90 is limited to the equipment residing in that zone.
Zone TU-90 is equipped with two normally closed doors that initially prevent lateral propagationof water from pipe breaks beyond the capacity of the floor drains. Door 2 (double door with a1/64" gap) opens outwardly to the pipe tunnel leading to the Screenhouse and door 136 (doubledoor with a 1/8" gap) opens inwardly from zone TU-95A. Initially water would flow through thefloor drains to the Turbine Building sump and flow through the open 4-inch pipe to theScreenhouse sump. However, given the limited capacity of the floor drains and the 4-inch pipe inTU-90, neither the Turbine Building sump nor the Screenhouse sump will reach a level high
I
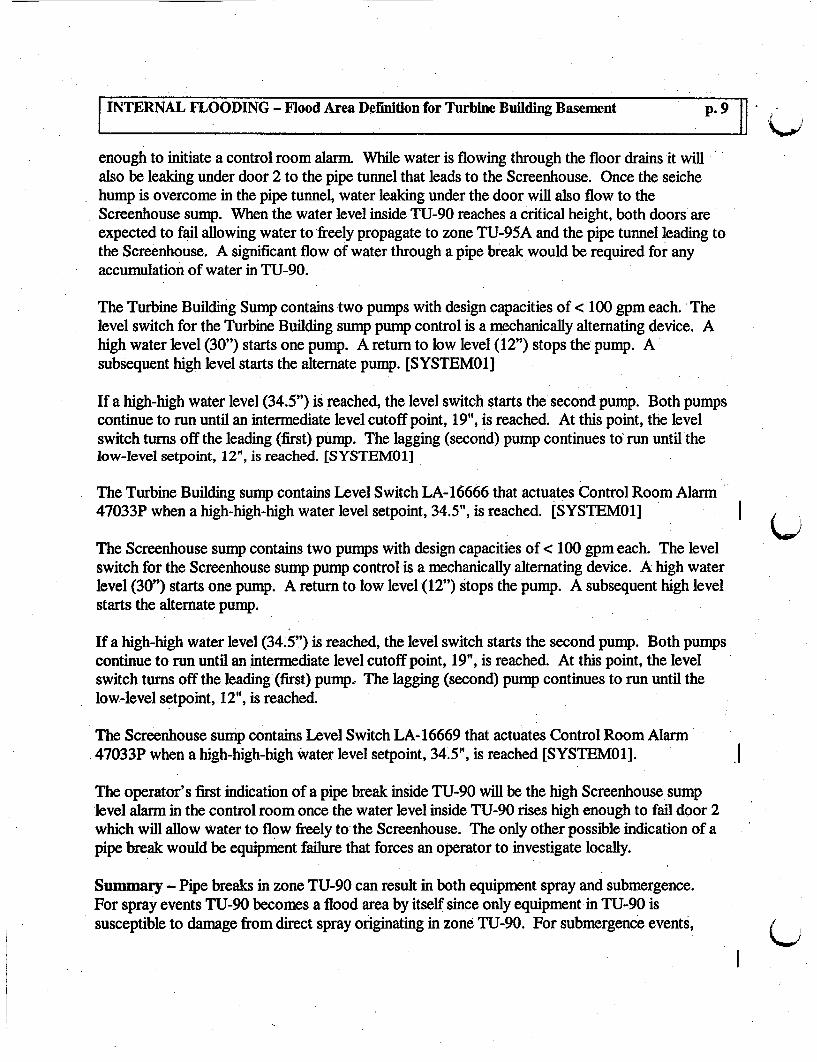
INTERNAL FLOODING - Flood Area Definition for Turbine Building Basement p.9
enough to initiate a control room alarm. While water is flowing through the floor drains it willalso be leaking under door 2 to the pipe tunnel that leads to the Screenhouse. Once the seichehump is overcome in the pipe tunnel, water leaking under the door will also flow to theScreenhouse sump. When the water level inside TU-90 reaches a critical height, both doors areexpected to fail allowing water to freely propagate to zone TU-95A and the pipe tunnel leading tothe Screenhouse. A significant flow of water through a pipe break would be required for anyaccumulation of water in TU-90.
The Turbine Building Sump contains two pumps with design capacities of < 100 gpm each. Thelevel switch for the Turbine Building sump pump control is a mechanically alternating device. Ahigh water level (30") starts one pump. A return to low level (12") stops the pump. Asubsequent high level starts the alternate pump. [SYSTEM01]
If a high-high water level (34.5") is reached, the level switch starts the second pump. Both pumpscontinue to run until an intermediate level cutoff point, 19", is reached. At this point, the levelswitch turns off the leading (first) pump. The lagging (second) pump continues to run until thelow-level setpoint, 12", is reached. [SYSTEMOl]
The Turbine Building sump contains Level Switch LA-16666 that actuates Control Room Alarm47033P when a high-high-high water level setpoint, 34.5", is reached. [SYSTEM01]
The Screenhouse sump contains two pumps with design capacities of < 100 gpm each. The levelswitch for the Screenhouse sump pump control is a mechanically alternating device. A high waterlevel (30") starts one pump. A return to low level (12") stops the pump. A subsequent high levelstarts the alternate pump.
If a high-high water level (34.5") is reached, the level switch starts the second pump. Both pumpscontinue to run until an intermediate level cutoff point, 19", is reached. At this point, the levelswitch turns off the leading (first) pump. The lagging (second) pump continues to run until thelow-level setpoint, 12", is reached.
The Screenhouse sump contains Level Switch LA-16669 that actuates Control Room Alarm47033P when a high-high-high water level setpoint, 34.5", is reached [SYSTEMOl].
The operator's first indication of a pipe break inside TU-90 will be the high Screenhouse sumplevel alarm in the control room once the water level inside TU-90 rises high enough to fail door 2which will allow water to flow freely to the Screenhouse. The only other possible indication of apipe break would be equipment failure that forces an operator to investigate locally.
Summary - Pipe breaks in zone TU-90 can result in both equipment spray and submergence.For spray events TU-90 becomes a flood area by itself since only equipment in TU-90 issusceptible to damage from direct spray originating in zone TU-90. For submergence events, (
I

INTERNAL FLOODING - Flood Area Definition for Turbine Building Basement p. 10 11I ., A\ ................ :.i 11�M
zone TU-90 combines with zone TU-95A and the pipe tunnel leading to the Screenhouse due toleakage under the doors.
Zone TU-90 is a relatively small room such that any water from a pipe break is expected to sprayall the equipment in zone TU-90.
For a pipe break in zone TU-90, equipment in the zone zones TU-90, TU-95A, and the pipetunnel leading to the Screenhouse can be vulnerable and could be at risk.
TU-92
Description - Flood Zone TU-92 is Diesel Generator Room 1B on the 586'-0" elevation. Thezone is bounded on the north by zones TU-90 and the pipe tunnel leading to the Screenhouse, onthe south by an exterior wall, on the east by an exterior wall and the pipe tunnel leading to theScreenhouse, and on the west by zones TU-94 and TU-22-1. The Administrative Building liesabove and exterior soil lies below.
All penetrations in zone TU-92 are sealed. The north wall has a normally-closed access door (1)leading to a service water piping tunnel that leads to the Screenhouse and the west wall has anormally-closed access door (3) leading to zone TU-94.
The major PRA equipment in zone TU-92 includes Diesel Generator 1B, 4 kV Switchgear Bus 6,and MCC 62A. The Internal Flood Walkdown Form [Appendix C of FLOOD01] for zone TU-92 contains a complete listing of the flood-susceptible PRA equipment in this zone.
Potential flood sources in this zone include service water piping and fire protection piping whichrepresent both a flooding hazard and a spray hazard.
Flood mitigation is present in this zone in the form of floor drains. (A six-inch curb that ran eastand west just north of all the equipment protected the equipment from water originating fromoutside the room until late 2004, however it has since been removed.)
Analysis - Water from a pipe break in TU-92 will not easily propagate elsewhere since all thepenetrations are sealed. Floor drains will divert water to the Turbine Building sump. Thus, onlysignificant pipe breaks are a concern for accumulation in zone TU-92. Equipment damage fromspray sources in TU-92 is limited to the equipment residing in that zone.
Zone TU-92 is equipped with two normally closed doors that initially prevent lateral propagationof water from pipe breaks beyond the capacity of the floor drains. Door 1 (double door with a1/64" gap) opens outwardly to the pipe tunnel leading to the Screenhouse and door 3 (doubledoor with a 1/64" gap) opens inwardly from zone TU-94. Initially water would flow through thefloor drains to the Turbine Building sump, but given the limited capacity of the floor drains in TU-
I

INTERNAL FLOODING - Flood Area Definition for Turbine Building Basement p. 11 -|I .. 1
92, the Turbine Building sump will not reach a level high enough to initiate a control room alarm.While water is flowing through the floor drains it will also be leaking under door 1 to the pipe
tunnel that leads to the Screenhouse. Once the seiche hump is overcome in the pipe tunnel, waterleaking under the door will flow to the Screenhouse sump. When the water level inside TU-92reaches a critical height, both doors are expected to fail allowing water to freely propagate tozone TU-94 and the pipe tunnel leading to the Screenhouse.
The Turbine Building Sump contains two pumps with design capacities of < 100 gpm each. Thelevel switch for the Turbine Building sump pump control is a mechanically alternating device. Ahigh water level (30") starts one pump. A return to low level (12") stops the pump. Asubsequent high level starts the alternate pump. [SYSTEM01]
If a high-high water level (34.5") is reached, the level switch starts the second pump. Both pumpscontinue to run until an intermediate level cutoff point, 19", is reached. At this point, the levelswitch turns off the leading (first) pump. The lagging (second) pump continues to run until thelow-level setpoint, 12", is reached. [SYSTEM01]
The Turbine Building sump contains Level Switch LA-16666 that actuates Control Room Alarm47033P when a high-high-high water level setpoint, 34.5", is reached. [SYSTEM01]
The Screenhouse sump contains two pumps with design capacities of < 100 gpm each. The levelswitch for the Screenhouse sump pump control is a mechanically alternating device. A high waterlevel (30") starts one pump. A return to low level (12") stops the pump. A subsequent high levelstarts the alternate pump.
If a high-high water level is reached, the level switch starts the second pump. Both pumpscontinue to run until an intermediate level cutoff point, 19", is reached. At this point, the levelswitch turns off the leading (first) pump. The lagging (second) pump continues to run until thelow-level setpoint, 12", is reached.
The Screenhouse sump contains Level Switch LA-16669 that actuates Control Room Alarm47033P when a high-high-high water level setpoint, 34.5", is reached [SYSTEM01].
The operator's first indication of a pipe break inside TU-92 will be the high Screenhouse sumplevel alarn in the control room once the water level inside TU-92 rises high enough to fail door 1which will allow water to flow freely to the Screenhouse. The only other possible indication of apipe break would be equipment failure that forces an operator to investigate locally.
Summary - Pipe breaks in zone TU-92 can result in both equipment spray and submergence.For spray events TU-92 becomes a flood area by itself since only equipment in TU-92 issusceptible to damage from direct spray originating in zone TU-92. For submergence events,zone TU-92 combines with zone TU-94 and the pipe tunnel leading to the Screenhouse due to
I

INTERNAL FLOODING - Flood Area Definition for Turbine Building Basement p. 12
leakage under the doors.
Zone TU-92 is a relatively small room such that any water from a pipe break is expected to sprayall the equipment in zone TU-92.
For a pipe break in zone TU-92, equipment in the zone zones TU-92, TU-94, and the pipe tunnelleading to the Screenhouse can be vulnerable and could be at risk.
TU-94
Description - Flood Zone TU-94 is the C02 Storage Tank Room 1B on the 586'-O" elevation.The zone is bounded on the north by zone TU-95A, on the south by zone TU-22-1, on the east byzones TU-90 and TU-92, and on the west by zone TU-22-1. Zone TU-22-1 lies above andexterior soil lies below.
All penetrations in zone TU-94 are sealed. The north wall has a normally-closed access door (5)leading to zone TU-95A, the south wall has a normally-closed access door (401) leading to zoneTU-22-1, and the east wall has a normally-closed access door (3) leading to zone TU-92.
The major PRA equipment in zone TU-94 includes Station and Instrument Air Compressor 1A.The Internal Flood Walkdown Form for zone TU-94 contains a complete listing of the flood-susceptible PRA equipment in this zone.
Potential flood sources in this zone include service water piping and fire protection piping whichrepresent both a flooding hazard and a spray hazard.
Flood mitigation is present in this zone in the form of a floor drain in a trench that is sealed at theboundary of zone TU-90.
Analysis - Water from a pipe break in TU-94 will not easily propagate elsewhere since all thepenetrations are sealed. Floor drains will divert water to the Turbine Building sump. Thus, onlysignificant pipe breaks are a concern for accumulation in zone TU-94. Equipment damage fromspray sources in TU-94 is limited to the equipment residing in that zone.
Zone TU-94 is equipped with three normally closed doors that initially prevent lateral propagationof water from pipe breaks beyond the capacity of the floor drains. Door 3 (double door with a1/64" gap) opens outwardly to zone TU-92, door 5 (double door with 1/64" gap) opens inwardlyfrom zone TU-95A, and door 401 (double door with 7/8" gap) opens outwardly to zone TU-22-1. Initially water would simply leak under doors 3 and 5 to flood areas TU-92 and TU-95A,respectively. Water will also flow to the Turbine Building sump via the floor drains. When thewater level inside TU-94 reaches a critical height, doors 3 and 401 are expected to fail allowingwater to freely propagate to zones TU-92 and TU-22-1, respectively.
I
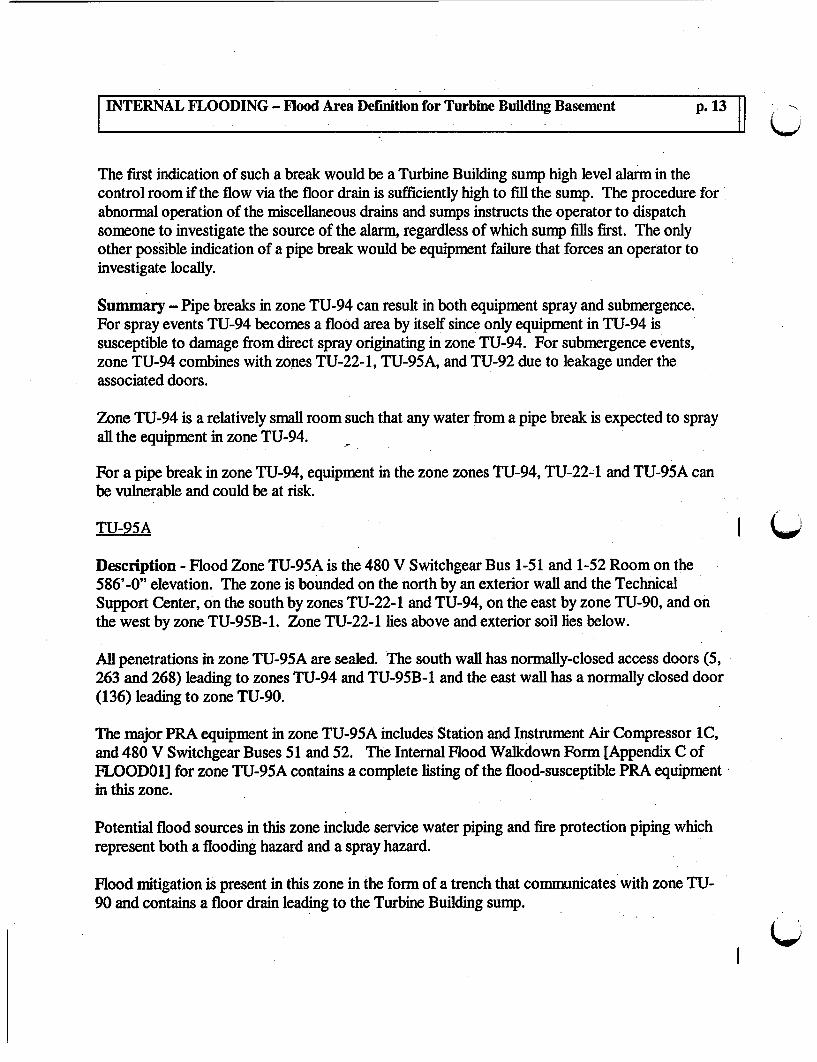
INTERNAL FLOODING - Flood Area Definition for Turbine Building Basement p. 13 |
The first indication of such a break would be a Turbine Building sump high level alarm in thecontrol room if the flow via the floor drain is sufficiently high to fill the sump. The procedure forabnormal operation of the miscellaneous drains and sumps instructs the operator to dispatchsomeone to investigate the source of the alarm, regardless of which sump fills first. The onlyother possible indication of a pipe break would be equipment failure that forces an operator toinvestigate locally.
Summary - Pipe breaks in zone TU-94 can result in both equipment spray and submergence.For spray events TU-94 becomes a flood area by itself since only equipment in TU-94 issusceptible to damage from direct spray originating in zone TU-94. For submergence events,zone TU-94 combines with zones TU-22-1, TU-95A, and TU-92 due to leakage under theassociated doors.
Zone TU-94 is a relatively small room such that any water from a pipe break is expected to sprayall the equipment in zone TU-94.
For a pipe break in zone TU-94, equipment in the zone zones TU-94, TU-22-1 and TU-95A canbe vulnerable and could be at risk.
TU-95A I Q
Description - Flood Zone TU-95A is the 480 V Switchgear Bus 1-51 and 1-52 Room on the586'-0" elevation. The zone is bounded on the north by an exterior wall and the TechnicalSupport Center, on the south by zones TU-22-1 and TU-94, on the east by zone TU-90, and onthe west by zone TU-95B-1. Zone TU-22-1 lies above and exterior soil lies below.
All penetrations in zone TU-95A are sealed. The south wall has normally-closed access doors (5,263 and 268) leading to zones TU-94 and TU-95B-1 and the east wall has a normally closed door(136) leading to zone TU-90.
The major PRA equipment in zone TU-95A includes Station and Instrument Air Compressor 1C,and 480 V Switchgear Buses 51 and 52. The Internal Flood Walkdown Form [Appendix C ofFLOOD01] for zone TU-95A contains a complete listing of the flood-susceptible PRA equipmentin this zone.
Potential flood sources in this zone include service water piping and fire protection piping whichrepresent both a flooding hazard and a spray hazard.
Flood mitigation is present in this zone in the form of a trench that communicates with zone TU-90 and contains a floor drain leading to the Turbine Building sump.
I

INTERNAL FLOODING - Flood Area Definition for Turbine Building Basement p. 14
Analysis - Water from a pipe break in TU-95A will easily propagate to zone TU-90 via an open4-inch pipe under door 136. Floor drains will divert water to the Turbine Building sump. Thus,only significant pipe breaks are a concern for accumulation in zone TU-95A. Equipment damagefrom spray sources in TU-95A is limited to the equipment residing in that zone.
Zone TU-95A is equipped with three normally closed doors that initially prevent lateralpropagation of water from pipe breaks beyond the capacity of the floor drains. Door 5 (doubledoor with 1/64" gap) opens outwardly to zone TU-94, door 136 (double door with 1/8" gap)opens outwardly to zone TU-90, door 263 (double door with 3/16" gap) opens outwardly to zoneTU-95B-1, and door 268 (single door) opens outwardly to zone TU-95B-1. Additionally, afirewall constructed of gypsum board separates TU-95A and TU-95B-1. Initially water wouldsimply leak under doors to the various adjoining zones and flow to the Turbine Building sump viathe floor drains. When the water level inside TU-95A reaches a critical height, the firewall isexpected to fail structurally allowing water to freely propagate to zones TU-95B-1.
The first indication of such a break would likely be from investigation of failed equipment sincefree flow to either the Screenhouse sump or the Turbine Building sump does not occur until waterlevel accumulates to several feet and doors and gypsum wall begin to fail.
Summary - Pipe breaks in zone TU-95A can result in both equipment spray and submergence.For spray events TU-95A becomes a flood area by itself since only equipment in TU-95A issusceptible to damage from direct spray originating in zone TU-95A. For submergence events,zone TU-95A combines with zones TU-90, TU-94, and TU-95B-1 due to leakage under theassociated doors and an open pipe that allows communication between TU-95A and TU-90.
Zone TU-95A is a relatively small room such that any water from a pipe break is expected tospray all the equipment in zone TU-95A.
For a pipe break in zone TU-95A, equipment in zones TU-94, TU-95B-1, TU-90, and TU-95Acan be vulnerable and could be at risk.
TU-95B-1
Description - Flood Zone TU-95B-1 consists of the 480 V Switchgear Bus 61 and 62 Room andthe Auxiliary Feedwater Pump 1B Room on the 586'-O" elevation. These two rooms areconnected via an open trench such that any water in one room will travel freely to the other, thusthey are combined to form a single flood area for submergence issues. The zone is bounded onthe north by the Technical Support Center, on the south by zone TU-22-1, on the east by zonesTU-95A, TU-95B-2, and TU-95C, and on the west by zone AX-23B-1. Zone TU-22-1 liesabove and exterior soil lies below.
All penetrations in zone TU-95B-1 are sealed. The south wall has normally-closed access doors
I

INTERNAL FLOODING - Flood Area Definition for Turbine Building Basement p. 15 |
(4 and 6) leading to zone TU-22-1, the north wall has normally-closed access doors (268, 263,262, and 261) leading to zones TU-95A and TU-95C, the west wall has a normally-closed accessdoor (244) leading to zone TU-95B-2 and a normally-closed access door (8) leading to theAuxiliary Building, and the east wall has a normally-closed door (243) leading to zone TU-95B-2.
The major PRA equipment in zone TU-95B-1 includes Station and Instrument Air Compressor1B, Motor Driven Auxiliary Feedwater Pump B, and 480 V Switchgear Buses 1-61 and 1-62.The Internal Flood Walkdown Form [Appendix C of FLOOD01] for zone TU-95B-1 contains acomplete listing of the flood-susceptible PRA equipment in this zone.
Potential flood sources in this zone include service water piping, CST piping, main steam piping,and fire protection piping which represent both a flooding hazard and a spray hazard.
Flood mitigation is present in this zone in the form of a trench that is sealed at the boundary ofzone TU-95A and zone TU-95B-1. The trench contains a floor drain leading to the TurbineBuilding sump.
Analysis - Water from a pipe break in TU-95B-1 will not easily propagate elsewhere since all thepenetrations are sealed. Floor drains will divert water to the Turbine Building sump. Thus, onlysignificant pipe breaks are a concern for accumulation in zone TU-95B-1. Equipment damage 0from spray sources in TU-95B-1 is limited to the equipment residing in that zone unless it is aprolonged spray. A prolonged spray (greater than 90 minutes) in the western half of the areawould probably degrade the gypsum board that comprises area TU-95C to the point that theauxiliary feedwater components housed inside TU-95C would be damaged.
Zone TU-95B-1 is equipped with seven normally closed doors that initially prevent lateralpropagation of water from pipe breaks beyond the capacity of the floor drains. Door 4 (doubledoor with a 1/8" gap) opens outwardly to zone TU-22-1, door 6 (double door with 1/4" gap)opens outwardly to zone TU-22-1, door 243 (single door with 1/32" gap) opens outwardly toTU-95B-2, door 244 (single door with 1/32" gap) opens outwardly to TU-95B-2, door 261(single door with 3/16" gap) opens inwardly from TU-95C, door 262 (double door with 3/16"gap) opens inwardly from TU-95C, door 263 (double door with 3/16" gap) opens inwardly fromzone TU-95A, and door 268 (single door) opens inwardly from zone TU-95A. Initially waterwould simply leak under doors to flood areas TU-95A, TU-95B-2, and TU-95C as well as flow tothe Turbine Building sump via the floor drains. When the water level inside TU-95B-1 reaches acritical height, doors and gypsum walls are expected to fail allowing water to freely propagate toadjoining areas. As doors fail water will propagate to TU-22-1 where it will fill the TurbineBuilding sump.
The Turbine Building Sump contains two pumps with design capacities of < 100 gpm each. Thelevel switch for the Turbine Building sump pump control is a mechanically alternating device. A
I
INTERNAL FLOODING - Flood Area Definition for Turbine Building Basement p. 16l : .
high water level (30") starts one pump. A return to low level (12") stops the pump. Asubsequent high level starts the alternate pump. [SYSTEM0l]
If a high-high water level (34.5") is reached, the level switch starts the second pump. Both pumpscontinue to run until an intermediate level cutoff point, 19", is reached. At this point, the levelswitch turns off the leading (first) pump. The lagging (second) pump continues to run until thelow-level setpoint, 12", is reached. [SYSTEM01]
The Turbine Building sump contains Level Switch LA-16666 that actuates Control Room Alarm47033P when a high-high-high water level setpoint, 34.5", is reached. [SYSTEM01]
The first indication of such a break would be a Turbine Building sump high level alarm in thecontrol room. The procedure for abnormal operation of the miscellaneous drains and sumpsinstructs the operator to dispatch someone to investigate the source of the alarm. The only otherpossible indication of a pipe break would be equipment failure that forces an operator toinvestigate locally.
Summary - Pipe breaks in zone TU-95B-1 can result in both equipment spray and submergence.For spray events TU-95B-1 becomes a flood area by itself since only equipment in TU-95B-1 issusceptible to damage from direct spray originating in zone TU-95B-1. For submergence events,zone TU-95B-1 combines with zones TU-22-1, TU-95B-2, TU-95C, and TU-95A due to leakageunder the associated doors.
Zone TU-95B-1 is separated into two distinct sections by zone TU-95B-2. Each of these sectionsis a relatively small area such that any water from a pipe break is expected to spray all theequipment in that area of zone TU-95B- 1.
For a pipe break in zone TU-95B-1, equipment in zones TU-95B-1, TU-22-1, TU-95B-2, TU-95C, and TU-95A can be vulnerable and could be at risk.
TU-95B-2
Description - Flood Zone TU-95B-2 is the Turbine Driven Auxiliary Feedwater Pump Room onthe 586'-O" elevation. The zone is bounded on the north by an exterior wall and the TechnicalSupport Center, on the south by zone TU-22-1, on the east by zones TU-95B-1 and TU-95C, andon the west by zone TU-95B-1. Zone TU-95B-2 makes use of a false ceiling for HELB purposesand Zone TU-95B-1 actually lies above. Exterior soil lies below.
Ail penetrations in zone TU-95B-2 are sealed. The east wall has a normally closed access door(244) leading to zone TU-95B-1 and the west wall has a normally closed door (243) leading tozone TU-95B-1. The south wall has a normally closed blowout panel that opens to zone TU-22-1.
I

INTERNAL FLOODING - Flood Area Definition for Turbine Building Basement p. 17
The major PRA equipment in zone TU-95B-2 includes the Turbine Driven Auxiliary FeedwaterPump. The Internal Flood Walkdown Form [Appendix C of FLOOD01] for zone TU-95B-2contains a complete listing of the flood-susceptible PRA equipment in this zone.
Potential flood sources in this zone include service water piping, CST piping, and main steampiping which represent both a flooding hazard and a spray hazard.
Flood mitigation is present in this zone in the form of a covered trench that communicates withzone TU-95B- 1. A floor drain approximately 4 inches above the ground also communicates withthis trench.
Analysis - Water from a pipe break in TU-95B-2 will not easily propagate elsewhere since all thepenetrations are sealed. Floor drains will divert water to the Turbine Building sump. Thus, onlysignificant pipe breaks are a concern for accumulation in zone TU-95B-2. Equipment damagefrom spray sources in TU-95B-2 is limited to the equipment residing in that zone.
Zone TU-95B-2 is equipped with two normally closed doors that initially prevent lateralpropagation of water from pipe breaks beyond the capacity of the floor drains. Door 243 (singledoor with 1/32" gap) opens inwardly from TU-95B-1 and door 244 (single door with 1/32" gap)opens inwardly from TU-95B-1. Initially water would simply leak under doors to the various Uadjoining zones and flow to the Turbine Building sump via the floor drains. When the water levelinside TU-95B-2 reaches a critical height, one of two things will occur. Either the blowout panelwill fail allowing water to propagate to TU-22-1 and subsequently to the Turbine Building sumpor both doors will fail allowing water to freely propagate to zone TU-95B-1. When the waterlevel inside TU-95B-1 reaches a critical height, doors are expected to fail allowing water to freelypropagate to TU-22-1 where it will fill the Turbine Building sump. In either case water will reachthe Turbine Building sump.
The Turbine Building Sump contains two pumps with design capacities of < 100 gpm each. Thelevel switch for the Turbine Building sump pump control is a mechanically alternating device. Ahigh water level (30") starts one pump. A return to low level (12") stops the pump. Asubsequent high level starts the alternate pump. [SYSTEM01]
If a high-high water level (34.5") is reached, the level switch starts the second pump. Both pumpscontinue to run until an intermediate level cutoff point, 19", is reached. At this point, the levelswitch turns off the leading (first) pump. The lagging (second) pump continues to run until thelow-level setpoint, 12", is reached. [SYSTEM01]
The Turbine Building sump contains Level Switch LA-16666 that actuates Control Room Alarm47033P when a high-high-high water level setpoint, 34.5", is reached. [SYSTEM01]
I
INTERNAL FLOODING - Flood Area Definition for Turbine Building Basement p. 18
The first indication of such a break would be a Turbine Building sump high level alarm in thecontrol room. The procedure for abnoiial operation of the misce1laneous drains and sumpsinstructs the operator to dispatch someone to investigate the source of the alarm. The only otherpossible indication of a pipe break would be equipment failure that forces an operator toinvestigate locally.
Summary - Pipe breaks in zone TU-95B-2 can result in both equipment spray and submergence.For spray events TU-95B-2 becomes a flood area by itself since only equipment in TU-95B-2 issusceptible to damage from direct spray originating in zone TU-95B-2. For submergence events,zone TU-95B-2 combines with zone TU-95B-1 due to door leakage.
Zone TU-95B-2 is a relatively small room such that any water from a pipe break is expected tospray all the equipment in zone TU-95B-2.
For a pipe break in zone TU-95B-2, equipment in zones TU-95B-1 and TU-95B-2 can bevulnerable and could be at risk.
TU-95C
Description - Flood Zone TU-95C is the Motor Driven Auxiliary Feedwater Pump IA Room onthe 586'-O" elevation. The zone is bounded on the north by the Technical Support Center, on thesouth by zone TU-95B-1, on the east by zone TU-95B-2, and on the west by zone TU-95B-1.Zone TU-22-1 lies above and exterior soil lies below.
All penetrations in zone TU-95C are sealed. The south wall has normally-closed access doors(261 and 262) leading to zone TU-95B-1. The south and west walls are constructed of simpledrywall and are expected to initially survive a spray event, but prolonged exposure to water willresult in failure of the walls.
The major PRA equipment in zone TU-95C includes Motor Driven Auxiliary Feedwater Pump1A. The Internal Flood Walkdown Form [Appendix C of FLOOD01] for zone TU-95C containsa complete listing of the flood-susceptible PRA equipment in this zone.
Potential flood sources in this zone include service water piping, CST piping, and main steampiping which represent both a flooding hazard and a spray hazard.
Flood mitigation is present in this zone in the form of a floor drain approximately 4 inches abovethe ground that communicates with the trench in zone TU-95B-1.
Analysis - Water from a pipe break in TU-95C will not initially propagate elsewhere since all thepenetrations are sealed. Floor drains will divert water to the Turbine Building sump. Thus, onlysignificant pipe breaks are a concern for accumulation in zone TU-95C. Equipment damage from
I

INTERNAL FLOODING - Flood Area Definition for Turbine Building Basement p. 19
spray sources in TU-95C is initially limited to the equipment residing in that zone.
However, a sustained pipe break could eventually spray equipment in the western half of TU-95B-1 since the west and south walls of TU-95C are constructed of gypsum that is not expectedto survive a sustained spray of water.
Zone TU-95C is equipped with two normally closed doors that initially prevent lateralpropagation of water from pipe breaks beyond the capacity of the floor drains. Door 261 (singledoor with 3/16" gap) opens outwardly to TU-95B-1 and door 262 (double door with 3/16" gap)opens outwardly to TU-95B-1. Initially water would simply leak under doors to the variousadjoining zones and flow to the Turbine Building sump via the floor drains. However, since thewest and south walls of TU-95C are constructed of drywall, any sustained exposure to water isexpected to result in failure of walls and open communication with TU-95B-1. Regardless of thefailure mechanism, water will propagate to TU-95B-1.
When the water level inside TU-95B-1 reaches a critical height, doors are expected to failallowing water to freely propagate to TU-22-1 where it will fill the Turbine Building sump.
The Turbine Building Sump contains two pumps with design capacities of < 100 gpm each. Thelevel switch for the Turbine Building sump pump control is a mechanically alternating device. Ahigh water level (30") starts one pump. A return to low level (12") stops the pump. Asubsequent high level starts the alternate pump. [SYSTEM01]
If a high-high water level (34.5") is reached, the level switch starts the second pump. Both pumpscontinue to run until an intermediate level cutoff point, 19", is reached. At this point, the levelswitch turns off the leading (first) pump. The lagging (second) pump continues to run. until thelow-level setpoint, 12", is reached. [SYSTEM01]
The Turbine Building sump contains Level Switch LA-16666 that actuates Control Room Alarm47033P when a high-high-high water level setpoint, 34.5", is reached. [SYSTEM01|
The first indication of such a break would be a Turbine Building sump high level alarm in thecontrol room. The procedure for abnormal operation of the miscellaneous drains and sumpsinstructs the operator to dispatch someone to investigate the source of the alarm. The only otherpossible indication of a pipe break would be equipment failure that forces an operator toinvestigate locally.
Summary - Pipe breaks in zone TU-95C can result in both equipment spray and submergence.For spray events TU-95C combines with TU-95B-1 to become a flood area since the drywallconstruction of the TU-95C walls cannot withstand sustained exposure to water spray. Forsubmergence events, zone TU-95C combines with TU-95B-1 to become a flood area due to doorleakage and eventual door failure or gypsum wall failure.
INTERNAL FLOODING - Flood Area Definition for Turbine Building Basement p. 20
Zone TU-95C is a relatively small room such that any water frd a pipe break is expected tospray all the equipment in zones TU-95C and TU-95B-1.
For a pipe break in zone TU-95C, equipment in zones TU-95C and TU-95B-1 can be vulnerableand could be at risk.
4.0 REFERENCES
[DWG01] Drawings
a. A-203 Rev. AW, General-Arrangement Turbine and Administration BuildingBasement Floor
b. A-204 Rev. BC, General Arrangement Reactor and Auxiliary BuildingBasement Floor
c. A-205 Rev. AM, General Arrangement Turbine and Administration BuildingMezzanine Floor
d. A-206 Rev. BS, General Arrangement Reactor and Auxiliary BuildingMezzanine Floor
e. A-207 Rev. U, General Arrangement Turbine and Administration BuildingOperating Floor
f. A-208 Rev. BL, General Arrangement Reactor and Auxiliary Building
g. A-209 Rev. Y, General Arrangement Reactor and Auxiliary BuildingMiscellaneous Floor Plans
h. A-212 Rev. Y, General Arrangement Miscellaneous Plans and Sections
i. A-213 Rev. Y, General Arrangement Screenhouse and Circulating WaterDischarge
I

INTERNAL FLOODING - Flood Area Definition for Turbine Building Basement p. 21 11 I[CALC01]
[CALC02]
[FLOOD01]
[GUIDE01]
[GUIDE02]
[NOTEBOOK01]
[PROC01]
[STANDARD01]
[SYSTEM01]
"Evaluation of Various Doors and Walls for HELB Flooding - TurbineBuilding Basement," Revision 1, Scientel Wireless, LLC.
Attachment "KNPP Design Input Document.pdf' to email from LingYu Song (MPR) to Dale Franson (NMC) and Paul Miller (NMC), April8, 2005.
Kewaunee Nuclear Plant Internal Flooding Analysis - QualitativeScreening Assessment and Flood Frequency Development,SCIENTECH, LLC.
Dominion Probabilistic Risk Assessment Manual, Part II, Chapter G,Section 2, Flood Area Definition, Revision 0.
Dominion Probabilistic Risk Assessment Manual, Part II, Chapter G,Section 4, Accident Sequence Analysis, Revision 0.
KPS Internal Flooding Accident Sequence Analysis Notebook, Rev. 0
KNPP Operating Procedure A-MDS-30, Rev. P, "Miscellaneous Drainsand Sumps (MDS) Abnormal Operation"
ASME RA-S-2002, "Standard for Probabilistic Risk Assessment forNuclear Power Plant Applications," 2002
KPS System Description 30, Rev. 2, "Miscellaneous Drains and Sumps(MDS)"
U)
I

INTERNAL FLOODING - Flood Area Definition for Turbine Building Basement p. 22 11
Table 1 - Flood Area Descriptions
Flood Zone Room Number Room DescriptionTurbine Building - (Condenser) Basement
6B Floor120 Turbine Building - Mezzanine Floor121 Turbine Building - Mezzanine Floor122 Turbine Building - Mezzanine Floor123 Turbine Building - Mezzanine Floor124 Turbine Building - Mezzanine Floor125 Turbine Building - Mezzanine Floor126 Turbine Building - Mezzanine Floor127 Turbine Building - Mezzanine Floor128 Turbine Building - Mezzanine Floor
220A Turbine Building - Operating FloorTU-22-1 10B Elevator B Machine Room
11B Corridor and Ramps17B Waste Tank Area144 Welding Shop147 Corridor149 Main Shop and Corridor (147)150 Working Material Storage Area154 Shop Office155 Electric Shop
Cation, Brine, and Mixed Beds - Water234 Treatment Area
234A SG Boric Acid Area2B Diesel Generator A Room
171-90 25B Diesel Generator A Fuel Oil Day Tank RoomTU-923B Diesel Generator B Room
24B Diesel Generator B Fuel Oil Day Tank RoomTU-94 4B C02 Storage Room
TU-95A SB 480V Swgr Bus 1-51 and 1-52 Room5B-1 480V Swgr Bus 1-61 and 1-62 Room
TU-95B-1 5B-3 Aux FW Pump B RoomTU-95B-2 5B-4 Turbine Driven Aux FW Pump RoomTU-95C SB-2 Aux FW Pump A Room
I
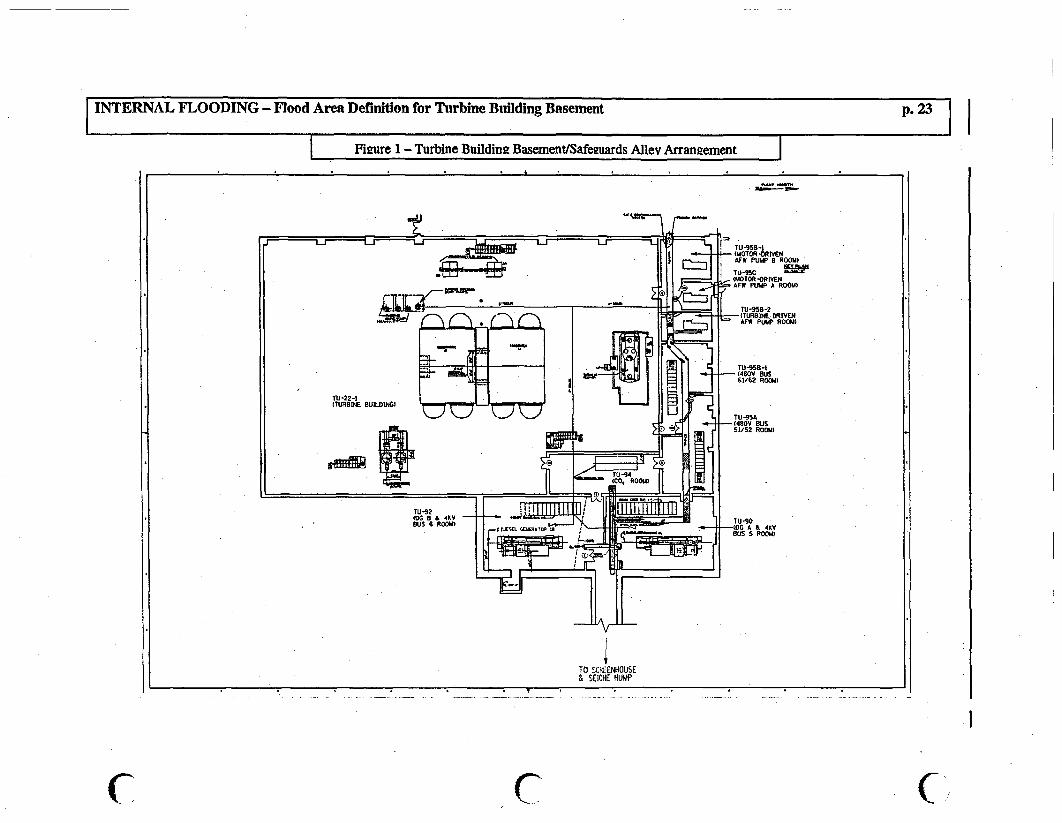
INTERNAL FLOODING - Flood Area Definition for Turbine Building Basement
p.23lI Figure 1 - Turbine Building Basement/Safeguards Allev Arrangement - -�� -- - -
-
I,_
4TO SCREENHOUSE& SEICHE HUMP
I
C c c

Appendix C
Fault Tree Analysis
1

Fault Tree Analysis
Owner's Acceptance: e_16 __ _ _LSignature
Tabk 6 a46-Print Name
Date
2

INTERNAL FLOODING - Fault Tree Analysis for Turbine Building Floods
Kewaunee Power Station
Fault Tree Analysis for Turbine Building Floods
Effective Date: November 2005 I
S. solve LULf HELDatePrepared By: J. R. Sharpe
3T & Jbfq5fs l,)A l A4LDateReviewed By: D. Jones
3

INTERNAL FLOODING - Fault Tree Analysis for Turbine Building Floods
Table of ContentsSection Fage
1.0 PURPOSE .................................. 52.0 MODEL SCOPE .................................. 53.0 UNIT DIFFERENCES .................................. 54.0 RISK MONITOR CONSIDERATIONS .................................. 55.0 MODEL DEVELOPMENT ................................. 5
5.1 FAULT TREES .... 5.............................55.2 HUMAN ERROR PROBABILITIES ................................. 75.3 DATA ................................. 30
6.0 MODEL EVALUATION (EQUATIONS) ................................. 316.1 EVALUATION OF TOP EVENT AFZ ................................. 316.2 EVALUATION OF TOP EVENT AFX ................................. 35
7.0 REFERENCES .................................. 41
List of Tables
Table Page
1 Summary of KPS Turbine Building Flood Human Actions for Isolation 39
2 Basic Events Added to KNPP.BED 43
List of Figures
Figure Page
1 Fault Tree AFM.LGC 49
2 Fault Tree FLOODING.LGC 67
3 Placement of New Basic Event 16-BATCLG--F-HE 82
4

INTERNAL FLOODING - Fault Tree Analysis for Turbine Building Floods
1.0 PURPOSE
The purpose of this notebook is to document the WinNUPRA model that was developed to analyzeflooding scenarios originating from pipe breaks in the Turbine Building before February 2005.
The following information is identified, correlated, and developed as part of this analysis:
* Fault trees developed to support event tree analysis* Basic event data used to support the flooding model* Human error probabilities,(HEPs) used to support the flooding model
2.0 MODEL SCOPE
This notebook documents the models that were developed for evaluating internal flooding sequencesdue to pipe breaks in the Turbine Building before February 2005.
3.0 UNIT DIFFERENCES
Kewaunee Power Station is a single unit site so there are no unit differences.
4.0 RISK MONITOR CONSIDERATIONS
The risk monitor used at KPS is the Safety Monitor. The Safety Monitor was not modified to reflectthis analysis.
5.0 MODEL DEVELOPMENT
5.1 FAULT TREES
The existing system fault trees for the KPS internal events PRA [NB01] comprise the majority ofthe Turbine Building Flood model. Two new fault trees were developed to support this analysis;AFM.LGC and FLOODING.LGC are described below in Sections 5.1.1 and 5.1.2. Fault treeAFM.LGC contains the logic associated with Auxiliary Feedwater (AFW) failures and fault treeFLOODING.LGC was developed to accommodate new initiating events and new human actionsspecifically related to Turbine Building flooding. Of the existing fault trees from the internalevents PRA, only those for DC power were modified, as described in Section 5.1.3.
The human error probabilities (HEPs) used in the analysis are documented in Attachment 1. Thebases for the HEPs from a review of procedures (e.g., cues) and training materials is provided inAttachment 2. A summary of a simulator exercise performed to determine timing for operator
5

INTERNAL FLOODING - Fault Tree Analysis for Turbine Building Floods
actions in the feedwater line break scenario with actuation of all the fire sprinklers in the turbinebuilding is provided in Attachment 3.
5.1.1 Fault Tree AFM
Fault Tree AFM is presented as Figure 1. This fault tree contains the logic associated with failureof the Turbine Driven AFW pump and Motor Driven AFW Pump B (MDAFP B) to deliver flowto the steam generators. The logic in AFM is simply copied from Fault Tree AFW in the InternalEvents PRA [NBO1I] and rearranged for use in this flooding analysis. No new analysis wasperformed in the development of fault tree AFM. Top Event AFS (as defined in the AccidentSequence Analysis, Appendix D) uses gate GAFM302 to model the failure of MDAFP B to start.Top Event AFR uses gate GAFM700 to model the failure of MDAFP B to run and provide flowto Steam Generator B. Top Event AFT uses gate GAFM1002 to model the failure of the TDAFPto start and run.
5.1.2 Fault Tree FLOODING
Fault Tree FLOODING is presented as Figure 2. This fault tree contains the logic used to modelthe initiating events used for Turbine Building floods and the HEPs associated with the isolationof pipe breaks and the operation of mitigating equipment. In some cases the hardware failurebasic events are also included.
5.1.3 DC Power Fault Tree Modifications
The DC power fault trees were modified to include basic event 16-BATCLG--F-HE, whichrepresents operator action to establish battery room cooling. This event applies to floodingscenarios where the 480 V buses have failed, thereby causing failure of normal battery roomcooling. After the Battery Room A/B Exhaust Flow Low annunciator activates in the controlroom, the operator is directed to use the fire equipment to ventilate the Battery Rooms. The airtrunks and fans are then rigged to supply battery room cooling.
Figure 3 shows the placement of new event 16-BATCLG--F-HE in fault tree BRA104, at gridlocation "2-3". The same event is similarly placed in the following DC power fault trees:
BRA104B BRB104 BRB127BRA104T BRB104B BRC103BRA105 BRB104T BRC103TBRA1OST BRB105 BRD103BRA113 BRB1O5T BRD103TBRA127 BRB 114 BRD115
6
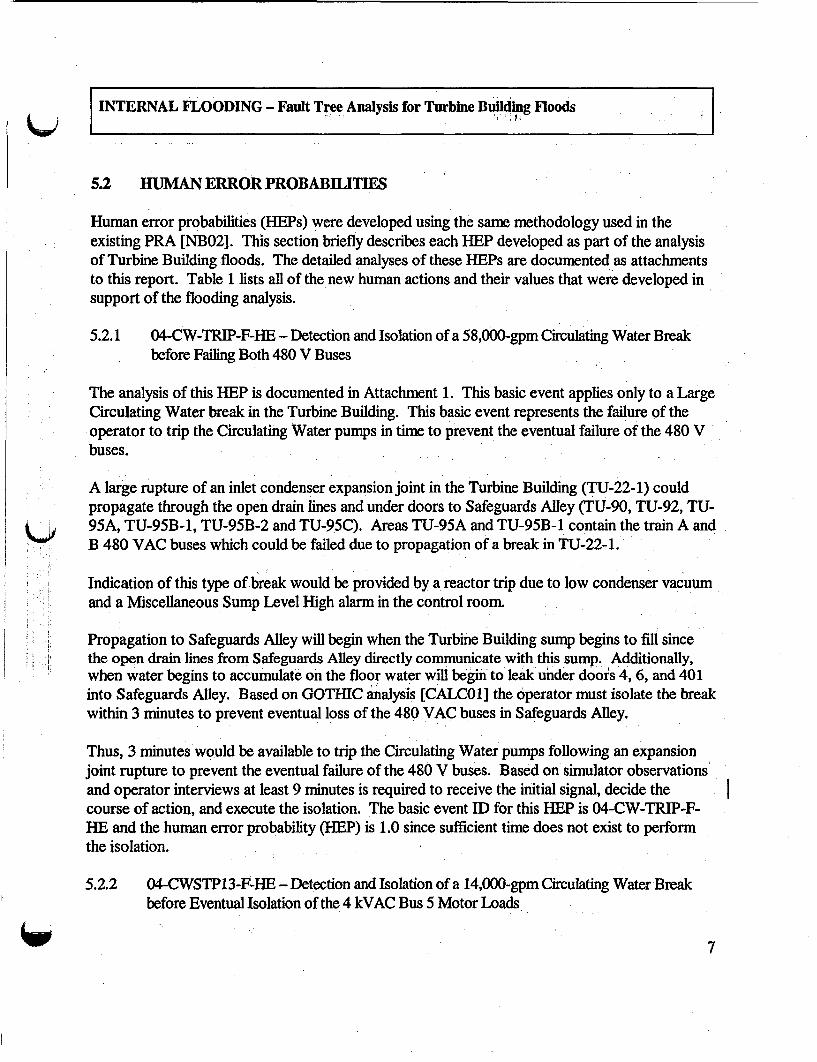
INTERNAL FLOODING - Fault Tree Analysis for Turbine Building Floods
5.2 HUMAN ERROR PROBABILITIES
Human error probabilities (HEPs) were developed using the same methodology used in theexisting PRA [NB02]. This section briefly describes each HEP developed as part of the analysisof Turbine Building floods. The detailed analyses of these HEPs are documented as attachmentsto this report. Table 1 lists all of the new human actions and their values that were developed insupport of the flooding analysis.
5.2.1 04-CW-TRIP-F-HE - Detection and Isolation of a 58,000-gpm Circulating Water Breakbefore Failing Both 480 V Buses
The analysis of this HEP is documented in Attachment 1. This basic event applies only to a LargeCirculating Water break in the Turbine Building. This basic event represents the failure of theoperator to trip the Circulating Water pumps in time to prevent the eventual failure of the 480 Vbuses.
A large rupture of an inlet condenser expansion joint in the Turbine Building (TU-22-1) couldpropagate through the open drain lines and under doors to Safeguards Alley (TU-90, TU-92, TU-95A, TU-95B-1, TU-95B-2 and TU-95C). Areas TU-95A and TU-95B-1 contain the train A andB 480 VAC buses which could be failed due to propagation of a break in TU-22-1.
Indication of this type of break would be provided by a reactor trip due to low condenser vacuumand a Miscellaneous Sump Level High alarm in the control room.
Propagation to Safeguards Alley will begin when the Turbine Building sump begins to fill sincethe open drain lines from Safeguards Alley directly communicate with this sump. Additionally,when water begins to accumulate on the floor water will begin to leak under doors 4, 6, and 401into Safeguards Alley. Based on GOTHIC analysis [CALCOI the operator must isolate the breakwithin 3 minutes to prevent eventual loss of the 480 VAC buses in Safeguards Alley.
Thus, 3 minutes would be available to trip the Circulating Water pumps following an expansionjoint rupture to prevent the eventual failure of the 480 V buses. Based on simulator observationsand operator interviews at least 9 minutes is required to receive the initial signal, decide thecourse of action, and execute the isolation. The basic event ID for this HEP is 04-CW-TRIP-F-HE and the human error probability (HEP) is 1.0 since sufficient time does not exist to performthe isolation.
5.2.2 04-CWSTP13-F-HE - Detection and Isolation of a 14,000-gpm Circulating Water Breakbefore Eventual Isolation of the 4 kVAC Bus 5 Motor Loads
7

INTERNAL FLOODING - Fault Tree Analysis for Turbine Building Floods
The analysis of this HEP is documented in Attachment 1. This basic event applies only to aModerate Circulating Water break in the Turbine Building. This basic event represents the failureof the operator to trip the Circulating Water pumps in time to prevent the eventual isolation of the4 kVAC Bus 5 motor loads due to the automatic tripping of the associated circuit breakers.
A rupture of an outlet condenser expansion joint in the Turbine Building (TU-22- 1) couldpropagate through the open drain lines and under doors to Safeguards Alley (TU-90, TU-92, TU-95A, TU-95B-1, TU-95B-2 and TU-95C). Area TU-90 contains kVAC Bus 5 which could befailed due to propagation of a break in TU-22- 1.
Indication of this type of break would be provided by a Miscellaneous Sump Level High alarm inthe control room.
Propagation to Safeguards Alley will begin when the Turbine Building sump begins to fill sincethe open drain lines from Safeguards Alley directly communicate with this sump. Additionally,when water begins to accumulate on the floor water will begin to leak under doors 4, 6, and 401into Safeguards Alley. Based on GOTHIC analysis [CALC01] the operator must isolate the breakwithin 13 minutes to prevent eventual isolation of 4 kV Bus 5 motor loads.
Thus, 13 minutes would be available to trip the Circulating Water pumps following an outletexpansion joint rupture to prevent the eventual isolation of 4 kV Bus 5 motor loads due to theautomatic tripping of the associated circuit breakers. Based on simulator observations andoperator interviews at least 9 minutes is required to receive the initial signal, decide the course ofaction, and execute the isolation. The basic event ID for this HEP is 04-CWSTP13-F-HE and thehuman error probability (HEP) is 2.6E-01.
5.2.3 04-CWSTP19-F-HE - Detection and Isolation of a 14,000-gpm Circulating Water Breakbefore Failing the Turbine Driven AFW PuMp Auxiliary Lube Oil Pump
The analysis of this HEP is documented in Attachment 1. This basic event applies only to aModerate Circulating Water break in the Turbine Building. This basic event represents the failureof the operator to trip the Circulating Water pumps in time to prevent the eventual failure of theTurbine Driven AFW pump auxiliary lube oil pump.
This event is identical to the one described in section 5.2.2 except that the failure of interest is theTurbine Driven AFW pump auxiliary lube oil pump at 9 inches of water. Based on GOTHICanalysis [CALC01] the operator must isolate the break within 19 minutes to prevent eventual lossof the ability to start the TDAFP.
Based on simulator observations and operator interviews at least 9 minutes is required to receivethe initial signal, decide the course of action, and execute the isolation. The basic event ID for
8

INTERNAL FLOODING - Fault Tree Analysis for Turbine Builfing Floods
this HEP is 04-CWSTP19-F-HE and the human error probability (HEP) is 1.2E-01.
5.2.4 04-CWSTP22-F-HE - Detection and Isolation of a 14,000-gpm Circulating Water Breakbefore Failing 480 VAC Buses 61 and 62 and Eventual Isolation of the 4 kVAC Bus 6Motor Loads
The analysis of this HEP is documented in Attachment 1. This basic event applies only to aModerate Circulating Water break in the Turbine Building. This basic event represents the failureof the operator to trip the Circulating Water pumps in time to prevent submergence failure of 480VAC Buses 61 and 62 and the eventual isolation of the 4 kV Bus 6 motor loads due to theautomatic tripping of the associated circuit breakers. Based on GOTHIC analysis [CALC01] theoperator must isolate the break within 22 minutes to accomplish these objectives.
Based on simulator observations and operator interviews at least 9 minutes is required to receivethe initial signal, decide the course of action, and execute the isolation. The basic event ID forthis HEP is 04-CWSTP22-F-HE and the human error probability (HEP) is 1.2E-01.
5.2.5 04-CWSTP25-F-BE - Detection and Isolation of a 14,000-gpm Circulating Water Breakbefore Failure of the Motor Driven AFW Pumps and a Water Level of 18 Inches in theTurbine Building
The analysis of this HEP is documented in Attachment 1. This basic event applies only to aModerate Circulating Water break in the Turbine Building. This basic event represents the failureof the operator to trip the Circulating Water pumps in time to prevent the submergence failure ofthe motor driven AFW pumps and prevent the water level from reaching 18 inches in the TurbineBuilding. Based on GOTHIC analysis [CALC01] the operator must isolate the break within 25minutes to accomplish these objectives.
Based on simulator observations and operator interviews at least 9 minutes is required to receivethe initial signal, decide the course of action, and execute the isolation. The basic event ID forthis HEP is 04-CWSTP25-F-HE and the human error probability (HEP) is 1.2E-01.
5.2.6 02-SW4A-B29F-HE - Detection and Isolation of a Service Water Break before EventualIsolation of the 4 kVAC Bus 5 Motor Loads
The analysis of this REP is documented in Attachment 1. This basic event applies only to a LargeService Water break in the Turbine Building. This basic event represents the failure of theoperator to close MOVs SW-4A and SW-4B in time to prevent the eventual isolation of the 4kVAC Bus 5 motor loads due to the automatic tripping of the associated circuit breakers.A large Service Water pipe break in the Turbine Building (TU-22-1) could propagate through the
9

INTERNAL FLOODING - Fault Tree Analysis for Turbine Building Floods
open drain lines and under doors to Safeguards Alley (TU-90, TU-92, TU-95A, TU-95B-1, TU-95B-2 and TU-95C). Area TU-90 contains kVAC Bus 5 which could be failed due topropagation of a break in TU-22-1.
Indication of this type of break would be provided by a Miscellaneous Sump Level High alarm inthe control room.
Propagation to Safeguards Alley will begin when the Turbine Building sump begins to fill sincethe open drain lines from Safeguards Alley directly communicate with this sump. Additionally,when water begins to accumulate on the floor water will begin to leak under doors 4, 6, and 401into Safeguards Alley. Based on GOTHIC analysis [CALC01] the operator must isolate the breakwithin 29 minutes to prevent eventual isolation of 4 kV Bus 5 motor loads.
Thus, 29 minutes would be available to close MOV SW-4A or SW-4B (only one will be opennormally) following a Service Water pipe break to prevent eventual isolation of 4 kV Bus 5 motorloads due to the automatic tripping of the associated circuit breakers.. Based on simulatorobservations and operator interviews about 13 minutes are required to diagnose the cause of thehigh sump level alarm, decide the course of action, and execute the isolation. The basic event IDfor this HEP is 02-SW4A-B29F-HE and the human error probability (HEP) is 2.0E-02.
5.2.7 02-SW4A-B45F-HE - Detection and Isolation of a Service Water Break before Failing theTurbine Driven AFW Pump Auxiliary Lube Oil Pump
The analysis of this BEP is documented in Attachment 1. This basic event applies only to a LargeService Water break in the Turbine Building. This basic event represents the failure of theoperator to close MOVs SW-4A and SW-4B in time to prevent the eventual failure of the TurbineDriven AFW pump auxiliary lube oil pump.
This event is identical to the one described in Section 5.2.6 except that the failure of interest is the |Turbine Driven AFW pump auxiliary lube oil pump at 9 inches of water. Based on GOTHICanalysis [CALC01] the operator must isolate the break within 45 minutes to prevent eventual lossof the ability to start the TDAFP.
Based on simulator observations and operator interviews about 13 minutes is required to receivethe initial signal, decide the course of action, and execute the isolation. The basic event ID forthis HEP is 02-SW4A-B45F-HE and the human error probability (REP) is 2.OE-02.
10

INTERNAL FLOODING - Fault Tree Analysis for Turbine Building Floods
0 5.2.8 02-SW4A-B5 IF-HE - Detection and Isolation of a Large Service Water Break beforeFailing 480 VAC Buses 61 and 62 and Eventual Isolation of the 4 kVAC Bus 6 MotorLoads
The analysis of this HEP is documented in Attachment 1. This basic event applies only to a LargeService Water break in the Turbine Building. This basic event represents the failure of theoperator to close MOVs SW-4A and SW-4B in time to prevent submergence failure of 480 VACBuses 61 and 62 and the eventual isolation of the 4 kV Bus 6 motor loads due to the automatictripping of the associated circuit breakers. Based on GOTHIC analysis [CALC01] the operatormust isolate the break within 51 minutes to accomplish these objectives.
Based on simulator observations and operator interviews at least 13 minutes is required to receivethe initial signal, decide the course of action, and execute the isolation. The basic event ID forthis HEP is 02-SW4A-B5lF-HE and the human error probability (HEP) is 2.OE-02.
5.2.9 02-SW4A-B60F-HE - Detection and Isolation of a Large Service Water Break beforeFailure of the Motor Driven AFW Pumps
The analysis of this REP is documented in Attachment 1. This basic event applies only to a LargeService Water break in the Turbine Building. This basic event represents the failure of theoperator to close MOVs SW-4A and SW-4B in time to prevent the eventual submergence failureor the MDAFPs at 13 inches.
This event is identical to the one described in Section 5.2.6 except that the result of interest issubmergence of the motor driven AFW pumps. Based on GOTHIC analysis [CALC01] theoperator must isolate the break within 60 minutes to prevent the submergence failure of the motordriven AFW pumps.
Based on simulator observations and operator interviews at least 13 minutes is required to receivethe initial signal, decide the course of action, and execute the isolation. The basic event ID forthis HEP is 02-SW4A-B60F-HE and the human error probability (HEP) is 2.OE-02.
5.2.10 02-SW4A-B66F-HE - Detection and Isolation of a Large Service Water Break before WaterLevel Reaches 18 Inches in the Turbine Building
The analysis of this BEP is documented in Attachment 1. This basic event applies only to a LargeService Water break in the Turbine Building. This basic event represents the failure of theoperator to close MOVs SW-4A and SW-4B in time to prevent the water level from reaching 18inches in the Turbine Building.
11

INTERNAL FLOODING - Fault Tree Analysis for Turbine Building Floods
This event is identical to the one described in Section 5.2.6 except that the result of interest is 18inches of water in the Turbine Building. Based on GOTHIC analysis [CALC01] the operatormust isolate the break within 66 minutes to prevent 18 inches of water in the Turbine Building.
Based on simulator observations and operator interviews at least 13 minutes is required to receivethe initial signal, decide the course of action, and execute the isolation. The basic event ID forthis HEP is 02-SW4A-B66F-HE and the human error probability (HEP) is 2.OE-02.
5.2.11 08-FPISO29-F-HE - Detection and Isolation of a Fire Protection Water Break beforeEventual Isolation of the 4 kVAC Bus 5 Motor Loads
The analysis of this HEP is documented in Attachment 1. This basic event applies only to a LargeFire Protection Water break in the Turbine Building. This basic event represents the failure of theoperator to isolate flow from the Fire Pumps either by closing the manual discharge isolationvalve on each pump or by securing the power to the pumps in time to prevent the eventualisolation of the 4 kVAC Bus 5 motor loads due to the automatic tripping of the associated circuitbreakers.
A large Fire Protection Water pipe break in the Turbine Building (TU-22-1) could propagatethrough the open drain lines and under doors to Safeguards Alley (TU-90, TU-92, TU-95A, TU-95B-1, TU-95B-2 and TU-95C). Area TU-90 contains kVAC Bus 5 which could be failed due topropagation of a break in TU-22-1.
Indication of this type of break would be provided by the Fire Pump Abnormal alarm in thecontrol room and a Miscellaneous Sump Level High alarm in the control room.
Propagation to Safeguards Alley will begin when the Turbine Building sump begins to fill sincethe open drain lines from Safeguards Alley directly communicate with this sump. Additionally,when water begins to accumulate on the floor water will begin to leak under doors 4, 6, and 401into Safeguards Alley. Based on GOTHIC analysis [CALC01] the operator must isolate the breakwithin 29 minutes to prevent eventual isolation of the 4 kV Bus 5 motor loads.
Thus, 29 minutes would be available to close the Fire pump discharge manual valves or isolatepower to the Fire pumps following a Fire Protection Water pipe break to prevent eventualisolation of the 4 kV Bus 5 motor loads due to the automatic tripping of the associated circuitbreakers. Based on simulator observations and operator interviews about 32 minutes is requiredto receive the initial signal, decide the course of action, and execute the isolation. The basic eventID for this HEP is 08-FPIS029-F-HE and the human error probability (HEP) is 1.0.
Q
C4)
12

INTERNAL FLOODING - Fault Tree Analysis for Turbine Builg Floods
5.2.12 08-FPISO45-F-HE - Detection and Isolation of a Fire Protection Water Break before Failingthe Turbine Driven AFW Pump Auxiliary Lube Oil Pump
The analysis of this HEP is documented in Attachment 1. This basic event applies only to a LargeFire Protection Water break in the Turbine Building. This basic event represents the failure of theoperator to isolate flow from the Fire Pumps either by closing the manual discharge isolationvalve on each pump or by securing the power to the pumps in time to prevent the eventual failureof the Turbine Driven AFW pump auxiliary lube oil pump.
This event is identical to the one described in Section 5.2.11 except that the failure of interest isthe Turbine Driven AFW pump auxiliary lube oil pump at 9 inches of water. Based on GOTHICanalysis [CALC01] the operator must isolate the break within 45 minutes to prevent eventual lossof the ability to start the TDAFP.
Based on simulator observations and operator interviews about 32 minutes is required- to receivethe initial signal, decide the course of action, and execute the isolation. The basic event ID forthis HEP is 08-FPIS045-F-HE and the human error probability (HEP) is 6.6E-02.
5.2.13 08-FPISO56-F-HE - Detection and Isolation of a Fire Protection Water Break before Failing480 VAC Buses 61 and 62 and Eventual Isolation of the 4 kVAC Bus 6 Motor Loads
The analysis of this REP is documented in Attachment 1. This basic event applies only to a LargeFire Protection Water break in the Turbine Building. This basic event represents the failure of theoperator to isolate flow from the Fire Pumps either by closing the manual discharge isolationvalve on each pump or by securing the power to the pumps in time to prevent submergence failureof 480 VAC Buses 61 and 62 and the eventual isolation of the 4 kV Bus 6 motor loads due to theautomatic tripping of the associated circuit breakers. Based on GOTHIC analysis [CALC01] theoperator must isolate the break within 56 minutes to accomplish these objectives.
Based on simulator observations and operator interviews nearly 32 minutes is required to receivethe initial signal, decide the course of action, and execute the isolation. The basic event ID for'this HEP is 08-FPISO56-F-HE and the human error probability (REP) is 2.4E-02.
5.2.14 08-FPISO68-F-HE - Detection and Isolation of a Fire Protection Water Break beforeFailure of the Motor Driven AFW Pumps
The analysis of this HEP is documented in Attachment 1. This basic event applies only to a FireProtection Water break in the Turbine Building. This basic event represents the failure of theoperator to isolate flow from the Fire Pumps either by closing the manual discharge isolationvalve on each pump or by securing the power to the pumps in time to prevent the submergencefailure of the motor driven AFW pumps.
13

INTERNAL FLOODING - Fault Tree Analysis for Turbine Building Floods
This event is identical to the one described in Section 5.2.11 except that the result of interest issubmergence of the motor driven AFW pumps. Based on GOTHIC analysis [CALC01] theoperator must isolate the break within 68 minutes to prevent the submergence failure of the motordriven AFW pumps.
Based on simulator observations and operator interviews at least 32 minutes is required to receivethe initial signal, decide the course of action, and execute the isolation. The basic event ID forthis HEP is 08-FPISO68-F-HE and the human error probability (HEP) is 1.6E-02.
5.2.15 08-ISO-FS18F-HE - Detection and Isolation of a Large Flood due to a Feedwater Breakbefore Eventual Isolation of the 4 kVAC Bus 5 Motor Loads
The analysis of this HEP is documented in Attachment 1. This basic event applies only to aFeedwater break resulting in a large Fire Protection System discharge in the Turbine Building. AFeedwater line break in the Turbine Building will spill the contents of the hotwell onto the TurbineBuilding floor and result in an elevated building temperature that actuates multiple fire sprinklers. Thisbasic event represents the failure of the operator to isolate flow from the Fire Pumps either byclosing the manual discharge isolation valve on each pump, securing the power to the pumps, orclosing the manual isolation valves for the sprinklers in time to prevent the eventual isolation of Uthe 4 kVAC Bus 5 motor loads due to the automatic tripping of the associated circuit breakers.A Feedwater pipe break in the Turbine Building (TU-22-1) would set off multiple fire sprinklersin addition to pumping the hotwell inventory into the Turbine Building. This water couldpropagate through the open drain lines and under doors to Safeguards Alley (TU-90, TU-92, TU-95A, TU-95B-1, TU-95B-2 and TU-95C). Area TU-90 contains kVAC Bus 5 which could befailed due to propagation of a break in TU-22-1. This event analyzes a Feedwater pipe breakresulting in a 6000-gpm discharge of the Fire Protection system.
Indication of this type of break would be provided by the Fire Pump Abnormal alarm in thecontrol room and a Miscellaneous Sump Level High alarm in the control room.
Propagation to Safeguards Alley will begin when the Turbine Building sump begins to fill sincethe open drain lines from Safeguards Alley directly communicate with this sump. Additionally,when water begins to accumulate on the floor water will begin to leak under doors 4, 6, and 401into Safeguards Alley. Based on GOTHIC analysis [CALC01] the operator must isolate the breakwithin 18 minutes to prevent eventual isolation of the 4 kV Bus 5 motor loads.
Thus, 18 minutes would be available to isolate the sprinklers following a Feedwater pipe break toprevent eventual isolation of the 4 kV Bus 5 motor loads due to the automatic tripping of theassociated circuit breakers. In order to isolate the sprinklers the operators must receive the initialsignal, decide the course of action, and execute isolation of the sprinklers, which first requires
14
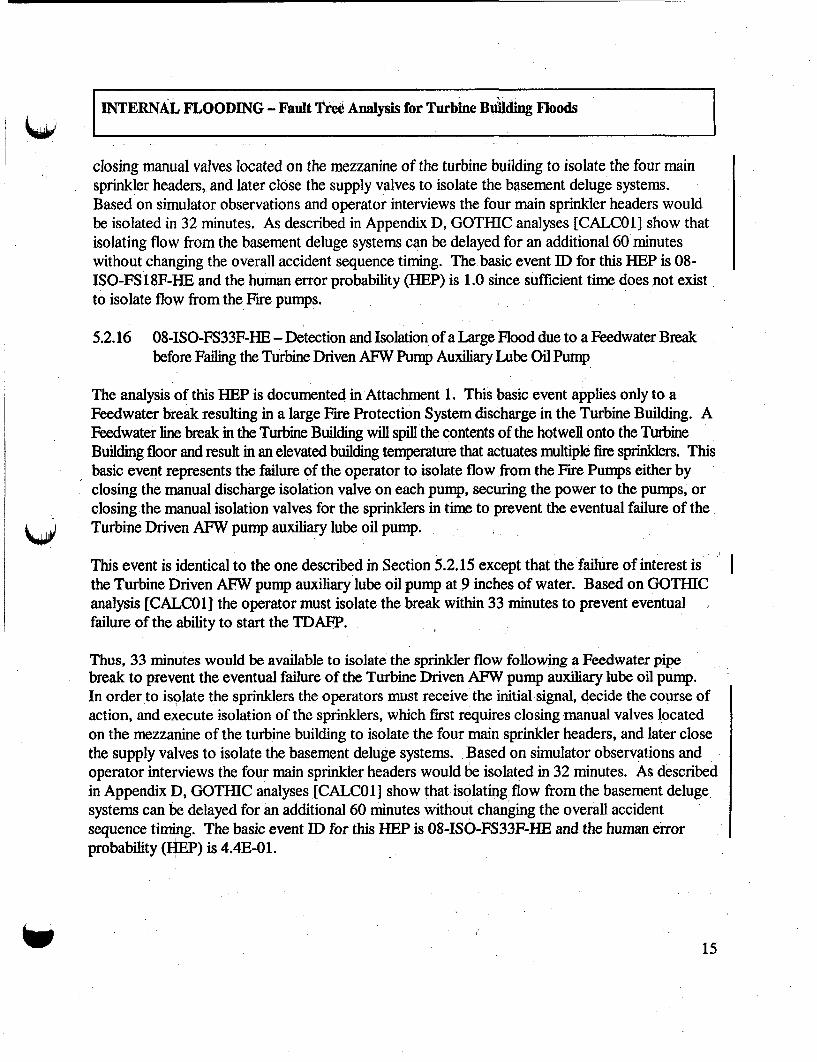
INTERNAL FLOODING - Fault Tree Analysis for Turbine Building Floods
closing manual valves located on the mezzanine of the turbine building to isolate the four mainsprinkler headers, and later close the supply valves to isolate the basement deluge systems.Based on simulator observations and operator interviews the four main sprinkler headers wouldbe isolated in 32 minutes. As described in Appendix D, GOTHIC analyses [CALCOL] show thatisolating flow from the basement deluge systems can be delayed for an additional 60 minuteswithout changing the overall accident sequence timing. The basic event ID for this HEP is 08-ISO-FS18F-HE and the human error probability (HEP) is 1.0 since sufficient time does not existto isolate flow from the Fire pumps.
5.2.16 08-ISO-FS33F-HE - Detection and Isolation of a Large Flood due to a Feedwater Breakbefore Failing the Turbine Driven AFW Pump Auxiliary Lube Oil Pump
The analysis of this HEP is documented in Attachment 1. This basic event applies only to aFeedwater break resulting in a large Fire Protection System discharge in the Turbine Building. AFeedwater line break in the Turbine Building will spill the contents of the hotwell onto the TurbineBuilding floor and result in an elevated building temperature that actuates multiple fire sprinklers. Thisbasic event represents the failure of the operator to isolate flow from the Fire Pumps either byclosing the manual discharge isolation valve on each pump, securing the power to the pumps, orclosing the manual isolation valves for the sprinklers in time to prevent the eventual failure of the
Q Turbine Driven AFW pump auxiliary lube oil pump.
This event is identical to the one described in Section 5.2.15 except that the failure of interest isthe Turbine Driven AFW pump auxiliary lube oil pump at 9 inches of water. Based on GOTHICanalysis [CALC01] the operator must isolate the break within 33 minutes to prevent eventualfailure of the ability to start the TDAFP.
Thus, 33 minutes would be available to isolate the sprinkler flow following a Feedwater pipebreak to prevent the eventual failure of the Turbine Driven AFW pump auxiliary lube oil pump.In order to isolate the sprinklers the operators must receive the initial signal, decide the course ofaction, and execute isolation of the sprinklers, which first requires closing manual valves locatedon the mezzanine of the turbine building to isolate the four main sprinkler headers, and later closethe supply valves to isolate the basement deluge systems. Based on simulator observations andoperator interviews the four main sprinkler headers would be isolated in 32 minutes. As describedin Appendix 13, GOTHIC analyses [CALCOI] show that isolating flow from the basement delugesystems can be delayed for an additional 60 minutes without changing the overall accidentsequence timing. The basic event ID for this HEP is 08-ISO-FS33F-HE and the human errorprobability (HEP) is 4.4E-01.
15

INTERNAL FLOODING - Fault Tree Analysis for Turbine Building Foods
5.2.17 08-ISO-FS40F-HE - Detection and Isolation of a Large Flood due to a Feedwater Breakbefore Failing 480 VAC Buses 61 and 62 and Eventual Isolation of the 4 kVAC Bus 6Motor Loads
The analysis of this HEP is documented in Attachment 1. This basic event applies only to aFeedwater break resulting in a large Fire Protection System discharge in the Turbine Building. AFeedwater line break in the Turbine Building will spill the contents of the hotwell onto the TurbineBuilding floor and result in an elevated building temperature that actuates multiple fire sprinklers. Thisbasic event represents the failure of the operator to isolate flow from the Fire Pumps either byclosing the manual discharge isolation valve on each pump, securing the power to the pumps, orclosing the manual isolation valves for the sprinklers in time to prevent submergence failure of480 VAC Buses 61 and 62 and the eventual isolation of the 4 kV Bus 6 motor loads due to theautomatic tripping of the associated circuit breakers. Based on GOTHIC analysis [CALC01] theoperator must isolate the break within 40 minutes to accomplish these objectives.
Thus, 40 minutes would be available to isolate the sprinkler flow following a Feedwater pipebreak to prevent eventual failure of 480VAC Buses 61 and 62, and 4 kVAC Bus 6. In order toisolate the sprinklers the operators must receive the initial signal, decide the course of action, andexecute isolation of the sprinklers, which first requires closing manual valves located on the 0mezzanine of the turbine building to isolate the four main sprinkler headers, and later close thesupply valves to isolate the basement deluge systems. Based on simulator observations andoperator interviews the four main sprinkler headers would be isolated in 32 minutes. As describedin Appendix D, GOTHIC analyses [CALCOI] show that isolating flow from the basement delugesystems can be delayed for an additional 60 minutes without changing the overall accidentsequence timing. The basic event ID for this HEP is 08-ISO-FS40F-HE and the human errorprobability (HEP) is 1.3E-01.
5.2.18 08-ISO-FS54F-HE - Detection and Isolation of a Large Flood due to a Feedwater Breakbefore Failure of the Motor Driven AFW Pumps
The analysis of this REP is documented in Attachment 1. This basic event applies only to aFeedwater break resulting in a large Fire Protection System discharge in the Turbine Building.This basic event represents the failure of the operator to isolate flow from the Fire Pumps eitherby closing the manual discharge isolation valve on each pump, securing the power to the pumps,or closing the manual isolation valves for the sprinklers in time to prevent the eventualsubmergence failure of the motor driven AFW pumps.
This event is identical to the one described in Section 5.2.15 except that the result of interest issubmergence of the motor driven AFW pumps. Based on GOTHIC analysis [CALCO1] theoperator must isolate the break within 54 minutes to prevent the submergence failure of the motor
16

INTERNAL FLOODING - Fault Tree Analysis for Turbine Bulding Floods
driven AFW pumps.
In order to isolate the sprinklers the operators must receive the initial signal, decide the course ofaction, and execute isolation of the sprinklers, which first requires closing manual valves locatedon the mezzanine of the turbine building to isolate the four main sprinkler headers, and later closethe supply valves to isolate the basement deluge systems. Based on simulator observations andoperator interviews the four main sprinkler headers would be isolated in 32 minutes. As describedin Appendix D, GOTHIC analyses [CALC01] show that isolating flow from the basement delugesystems can be delayed for an additional 60 minutes without changing the overall accidentsequence timing. The basic event ID for this HEP is 08-ISO-FS54F-HE and the human errorprobability (HEP) is 3.OE-02.
5.2.19 08-ISO-FS55F-HE - Detection and Isolation of a Medium Flood due to a Feedwater Breakbefore Eventual Isolation of the 4 kVAC Bus 5 Motor Loads
The analysis of this HEP is documented in Attachment 1. This basic event applies only to aFeedwater break resulting in a moderate Fire Protection System discharge in the TurbineBuilding. A Feedwater line break in the Turbine Building will spill the contents of the hotwell onto theTurbine Building floor and result in an elevated building temperature that actuates multiple firespriniders. This basic event represents the failure of the operator to isolate flow from the FirePumps either by closing the manual discharge isolation valve on each pump, securing the power tothe pumps, or closing the manual isolation valves for the sprinklers in time to prevent the eventualisolation of the 4 kVAC Bus 5 motor loads due to the automatic tripping of the associated circuitbreakers.
A Feedwater pipe break in the Turbine Building (TU-22-1) would set off multiple fire sprinklersin addition to pumping the hotwell inventory into the Turbine Building. This water couldpropagate through the open drain lines and under doors to Safeguards Alley (TU-90,'TU-92, TU-95A, TU-95B-1, TU-95B-2 and TU-95C). Area TU-90 contains kVAC Bus 5 which could befailed due to propagation of a break in TU-22-1. This event analyzes a Feedwater pipe breakresulting in a 2000-gpm discharge of the Fire Protection system.
Indication of this type of break would be provided by the Fire Pump Abnormal alarm in thecontrol room and a Miscellaneous Sump Level High alarm in the control room.
Propagation to Safeguards Alley will begin when the Turbine Building sump begins to fill sincethe open drain lines from Safeguards Alley directly communicate with this sump. Additionally,when water begins to accumulate on the floor water will begin to leak under doors 4, 6, and 401into Safeguards Alley. Based on GOTHIC analysis [CALC01] the operator must isolate the breakwithin 55 minutes to prevent eventual isolation of the 4 kV Bus 5 motor loads.
17

INTERNAL FLOODING - Fault Tree Analysis for Turbine Building Floods
Thus, 55 minutes would be available to isolate the sprinkler flow following a Feedwater pipebreak to prevent eventual isolation of the 4 kV Bus 5 motor loads due to the automatic tripping ofthe associated circuit breakers. In order to isolate the sprinklers the operators must receive theinitial signal, decide the course of action, and execute isolation of the sprinklers, which firstrequires closing manual valves located on the mezzanine of the turbine building to isolate the fourmain sprinkler headers, and later close the supply valves to isolate the basement deluge systems.Based on simulator observations and operator interviews the four main sprinkler headers wouldbe isolated in 32 minutes. As described in Appendix D, GOTHIC analyses [CALCOl] show thatisolating flow from the basement deluge systems can be delayed for an additional 60 minuteswithout changing the overall accident sequence timing. The basic event ID for this BEP is 08-ISO-FS55F-HE and the human error probability (HEP) is 3.OE-02.
5.2.20 08-ISO-FS97F-HE - Detection and Isolation of a Medium Flood due to a Feedwater Breakbefore Failing the Turbine Driven AFW Pump Auxiliary Lube Oil Pump
The analysis of this BEP is documented in Attachment 1. This basic event applies only to aFeedwater break resulting in a moderate Fire Protection System discharge in the TurbineBuilding. A Feedwater line break in the Turbine Building will spill the contents of the hotwell onto theTurbine Building floor and result in an elevated building temperature that actuates multiple firesprinklers. This basic event represents the failure of the operator to isolate flow from the FirePumps either by closing the manual discharge isolation valve on each pump, securing the power tothe pumps, or closing the manual isolation valves for the sprinklers in time to prevent the eventualfailure of the Turbine Driven AFW pump auxiliary lube oil pump.
This event is identical to the one described in Section 5.2.19 except that the failure of interest isthe Turbine Driven AFW pump auxiliary lube oil pump at 9 inches of water. Based on GOTHICanalysis [CALC01] the operator must isolate the break within 97 minutes to prevent eventualfailure of the ability to start the TDAFP.
In order to isolate the sprinklers the operators must receive the initial signal, decide the course ofaction, and execute isolation of the sprinklers, which first requires closing manual valves locatedon the mezzanine of the turbine building to isolate the four main sprinkler headers, and later closethe supply valves to isolate the basement deluge systems. Based on simulator observations andoperator interviews the four main sprinkler headers would be isolated in 32 minutes. As describedin Appendix D, GOTHIC analyses [CALC01] show that isolating flow from the basement delugesystems can be delayed for an additional 60 minutes without changing the overall accidentsequence timing. . The basic event ID for this REP is 08-ISO-FS97F-HE and the human errorprobability (HEP) is 3.OE-02.
5.2.21 08-ISO-FS2HF-HE - Detection and Isolation of a Medium Flood due to a Feedwater Breakbefore Failing 480 VAC Buses 61 and 62 and Eventual Isolation of the 4 kVAC Bus 6
18

T F G Te Ani f 'ul od
INTrERNAL FLOODING - Fault Tree Analysis for Turbine Building Floods|
Motor Loads
The analysis of this HEP is documented in Attachment 1. This basic event applies only to aFeedwater break resulting in a moderate Fire Protection System discharge in the TurbineBuilding. A Feedwater line break in the Turbine Building will spill the contents of the hotwell onto theTurbine Building floor and result in an elevated building temperature that actuates multiple firesprinklers. This basic event represents the failure of the operator to isolate flow from the FirePumps either by closing the manual discharge isolation valve on each pump, securing the power tothe pumps, or closing the manual isolation valves for the sprinklers in time to preventsubmergence failure of 480 VAC Buses 61 and 62 and the eventual isolation of the 4 kV Bus 6motor loads due to the automatic tripping of the associated circuit breakers. Based on GOTHICanalysis [CALCOI] the operator must isolate the break within 2 hours to accomplish theseobjectives.
In order to isolate the sprinklers the operators must receive the initial signal, decide the course ofaction, and execute isolation of the sprinklers, which first requires closing manual valves locatedon the mezzanine of the turbine building to isolate the four main sprinkler headers, and later closethe supply valves to isolate the basement deluge systems. Based on simulator observations andoperator interviews the four main sprinkler headers would be isolated in 32 minutes. As describedin Appendix D, GOTHIC analyses [CALCOI] show that isolating flow from the basement, delugesystems can be delayed for an additional 60 minutes without changing the overall accidentsequence timing. . The basic event ID for this HEP is 08-ISO-FS2HF-HE and the human errorprobability (HEP) is 1.7E-02.
5.2.22 08-FPSISO29F-HE - Detection and Isolation of a Large Flood due to a Steamline Breakbefore Eventual Isolation of the 4 kVAC Bus 5 Motor Loads
The analysis of this HEP is documented in Attachment 1. This basic event applies only to aSteamline break resulting in a large Fire Protection System discharge in the Turbine Building. ASteamline break in the Turbine Building will result in an elevated building temperature that actuatesmultiple fire sprinlders. This basic event represents the failure of the operator to isolate flow fromthe Fire Pumps either by closing the manual discharge isolation yalve on each pump, securing thepower to the pumps, or closing the manual isolation valves for the sprinklers in time to preventthe eventual isolation of the 4 kVAC Bus 5 motor loads due to the automatic tripping of theassociated circuit breakers.
A Steamline pipe break in the Turbine Building (TU-22-1) would set off multiple fire sprinklers inthe Turbine Building. This water could propagate through the open drain lines and under doorsto Safeguards Alley (TU-90, TU-92, TU-95A, TU-95B-1, TU-95B-2 and TU-95C). Area TU-90contains kVAC Bus 5 which could be failed due to propagation of a break in TU-22-1. Thisevent analyzes a Steamline break resulting in a 6000-gpm discharge of the Fire Protection system.
19

INTERNAL FLOODING - Fault Tree Analysis for Turbine Building Floods
Indication of this type of break would be provided by the Fire Pump Abnormal alarm in thecontrol room and a Miscellaneous Sump Level High alarm in the control room.
Propagation to Safeguards Alley will begin when the Turbine Building sump begins to fill sincethe open drain lines from Safeguards Alley directly communicate with this sump. Additionally,when water begins to accumulate on the floor water will begin to leak under doors 4, 6, and 401into Safeguards Alley. Based on GOTHIC analysis [CALCOl] the operator must isolate the breakwithin 29 minutes to prevent eventual isolation of 4 kV Bus 5 motor loads.
Thus, 32 minutes would be available to isolate the sprinkler flow following a Steamline pipe breakto prevent eventual isolation of 4 kV Bus 5 motor loads due to the automatic tripping of theassociated circuit breakers. In order to isolate the sprinklers the operators must receive the initialsignal, decide the course of action, and execute isolation of the sprinklers, which first requiresclosing manual valves located on the mezzanine of the turbine building to isolate the four mainsprinkler headers, and later close the supply valves to isolate the basement deluge systems.Based on simulator observations and operator interviews the four main sprinkler headers wouldbe isolated in 32 minutes. As described in Appendix D, GOTHIC analyses [CALC01] show thatisolating flow from the basement deluge systems can be delayed for an additional 60 minuteswithout changing the overall accident sequence timing. . The basic event ID for this HEP is 08-FPSISO29F-HE and the human error probability (HEP) is 1.0.
5.2.23 08-FPSISO45F-BE - Detection and Isolation of a Large Flood due to a Steamline Breakbefore Failing the Turbine Driven AFW Pump Auxiliary Lube Oil Pump
The analysis of this HEP is documented in Attachment 1. This basic event applies only to aSteamline break resulting in a large Fire Protection System discharge in the Turbine Building. ASteamline break in the Turbine Building will result in an elevated building temperature that actuatesmultiple fire sprinkders. This basic event represents the failure of the operator to isolate flow fromthe Fire Pumps either by closing the manual discharge isolation valve on each pump, securing thepower to the pumps, or closing the manual isolation valves for the sprinlders in time to preventthe eventual failure of the Turbine Driven AFW pump auxiliary lube oil pump.
This event is identical to the one described in Section 5.2.22 except that the failure of interest isthe Turbine Driven AFW pump auxiliary lube oil pump at 9 inches of water. Based on GOTHICanalysis [CALC01] the operator must isolate the break within 45 minutes to prevent eventualfailure of the ability to start the TDAFP.
In order to isolate the sprinklers the operators must receive the initial signal, decide the course ofaction, and execute isolation of the sprinklers, which first requires closing manual valves locatedon the mezzanine of the turbine building to isolate the four main sprinkler headers, and later close
20

INTERNAL FLOODING - Fault Tree Analysis for Turbine Building Floods
the supply valves to isolate the basement deluge systems. Based on simulator observations andoperator interviews the four main sprinkler headers would be isolated in 32 minutes. As describedin Appendix D, GOTHIC analyses [CALCOI] show that isolating flow from the basement delugesystems can be delayed for an additional 60 minutes without changing the overall accidentsequence timing. The basic event ID for this HEP is 08-FPSISO45F-HE and the human errorprobability (HEP) is 6.6E-02.
5.2.24 08-FPSIS056F-HE - Detection and Isolation of a Large Flood due to a Steamline Breakbefore Failing 480 VAC Buses 61 and 62 and Eventual Isolation of the 4 kVAC Bus 6Motor Loads
The analysis of this HEP is documented in Attachment 1. This basic event applies only to aSteamline break resulting in a large Fire Protection System discharge in the Turbine Building. ASteamline break in the Turbine Building will result in an elevated building temperature that actuatesmultiple fire sprinklers.- This basic event represents the failure of the operator to isolate flow fromthe Fire Pumps either by closing the manual discharge isolation valve on each pump, securing thepower to the pumps, or closing the manual isolation valves for the sprinklers in time to preventsubmergence failure of 480 VAC Buses 61 and 62 and the eventual isolation of the 4 kV Bus 6motor loads due to the automatic tripping of the associated circuit breakers. Based on GOTHIC
Q analysis [CALCOl] the operator must isolate the break within 56 minutes to accomplish theseobjectives.
In order to isolate the sprinklers the operators must receive the initial signal, decide the course ofaction, and execute isolation of the sprinklers, which first requires closing manual valves locatedon the mezzanine of the turbine building to isolate the four main sprinkler headers, and later closethe supply valves to isolate the basement deluge systems. Based on simulator observations andoperator interviews, the four main sprinkler headers would be isolated in 32 minutes. Asdescribed in Appendix D, GOTHIC analyses [CALCOI] show that isolating flow from thebasement deluge systems can be delayed for an additional 60 minutes without changing the overallaccident sequence timing. The basic event ID for-this HEP is 08-FPSISO56F-HE and the humanerror probability (HEP) is 3.OE-02.
5.2.25 08-FPSISO68-F-HE - Detection and Isolation of a Large Flood due to a Steamline Breakbefore Failure of the Motor Driven AFW Pumps
The analysis of this BEP is documented in Attachment 1. This basic event applies only to aSteamline break resulting in a large Fire Protection System discharge in the Turbine Building.This basic event represents the failure of the operator to isolate flow from the Fire Pumps eitherby closing the manual discharge isolation valve on each pump, securing the power to the pumps,or closing the manual isolation valves for the sprinkders in time to prevent the submergence failureof the motor driven AFW pumps.
21
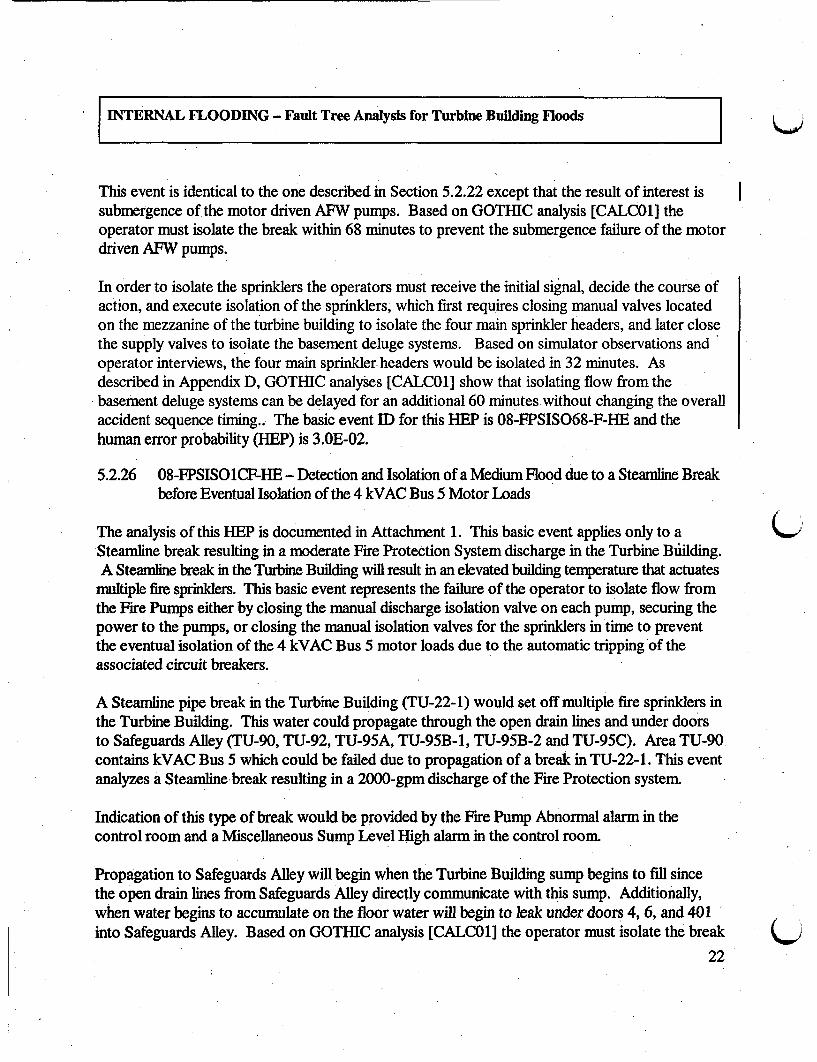
INTERNAL FLOODING - Fault Tree Analysis for Turbine Building Floods
This event is identical to the one described in Section 5.2.22 except that the result of interest issubmergence of the motor driven AFW pumps. Based on GOTHIC analysis [CALC01] theoperator must isolate the break within 68 minutes to prevent the submergence failure of the motordriven AFW pumps.
In order to isolate the sprinklers the operators must receive the initial signal, decide the course ofaction, and execute isolation of the sprinklers, which first requires closing manual valves locatedon the mezzanine of the turbine building to isolate the four main sprinkler headers, and later closethe supply valves to isolate the basement deluge systems. Based on simulator observations andoperator interviews, the four main sprinkler headers would be isolated in 32 minutes. Asdescribed in Appendix D, GOTHIC analyses [CALC01] show that isolating flow from thebasement deluge systems can be delayed for an additional 60 minutes without changing the overallaccident sequence timing.. The basic event ID for this HEP is 08-FPSISO68-F-HE and thehuman error probability (HEP) is 3.OE-02.
5.2.26 08-FPSISO1CF-HE - Detection and Isolation of a Medium Flood due to a Steanmine Breakbefore Eventual Isolation of the 4 kVAC Bus 5 Motor Loads
The analysis of this HEP is documented in Attachment 1. This basic event applies only to a (Steamline break resulting in a moderate Fire Protection System discharge in the Turbine Building.A Steamline break in the Turbine Building will result in an elevated building temperature that actuates
multiple fire sprinlders. This basic event represents the failure of the operator to isolate flow fromthe Fire Pumps either by closing the manual discharge isolation valve on each pump, securing thepower to the pumps, or closing the manual isolation valves for the sprinkders in time to preventthe eventual isolation of the 4 kVAC Bus 5 motor loads due to the automatic tripping of theassociated circuit breakers.
A Steamline pipe break in the Turbine Building (TU-22-1) would set off multiple fire sprinklers inthe Turbine Building. This water could propagate through the open drain lines and under doorsto Safeguards Alley (TU-90, TU-92, TU-95A, TU-95B-1, TU-95B-2 and TU-95C). Area TU-90contains kVAC Bus 5 which could be failed due to propagation of a break in TU-22- 1. This eventanalyzes a Steamline break resulting in a 2000-gpm discharge of the Fire Protection system.
Indication of this type of break would be provided by the Fire Pump Abnormal alarm in thecontrol room and a Miscellaneous Sump Level High alarm in the control room.
Propagation to Safeguards Alley will begin when the Turbine Building sump begins to fill sincethe open drain lines from Safeguards Alley directly communicate with this sump. Additionally,when water begins to accumulate on the floor water will begin to leak under doors 4, 6, and 401into Safeguards Alley. Based on GOTHIC analysis [CALC01] the operator must isolate the break
22

INTERNAL FLOODING - Fault Tree Analysis for Turbine Building Floods
within 100 minutes to prevent eventual isolation of the 4 kV Bus 5 motor loads.
Thus, 100 minutes would be available to isolate the sprinkler flow following a Steamline pipebreak to prevent eventual isolation of the 4 kV Bus 5 motor loads due to the automatic tripping ofthe associated circuit breakers. In order to isolate the sprinklers the operators must receive theinitial signal, decide the course of action, and execute isolation of the sprinklers, which firstrequires closing manual valves located on the mezzanine of the turbine building to isolate the fourmain sprinkler headers, and later close the supply valves to isolate the basement deluge systems.Based on simulator observations and operator interviews, the four main sprinkler headers wouldbe isolated in 32 minutes. As described in Appendix D, GOTHIC analyses [CALCOII show thatisolating flow from the basement deluge systems can be delayed for an additional 60 minuteswithout changing the overall accident sequence timing. The basic event ID for this HEP is 08-FPSISO1CF-HE and the human error probability (HEP) is 3.OE-02.
5.2.27 08-FPSIS02CF-BE - Detection and Isolation of a Medium Flood due to a Steamline Breakbefore Failing the Turbine Driven AFW Pump Auxiliary Lube Oil Pump
The analysis of this HEP is documented in Attachment 1. This basic event applies only to aSteamline break resulting in a moderate Fire Protection System discharge in the Turbine Building.A Steamline break in the Turbine Building will result in an elevated building temperature that actuates
multiple fire sprinklers. This basic event represents the failure of the operator to isolate flow fromthe Fire Pumps either by closing the manual discharge isolation valve on each pump, securing thepower to the pumps, or closing the manual isolation valves for the sprinklers in time to preventthe eventual failure of the Turbine Driven AFW pump auxiliary lube oil pump.
This event is identical to the one described in Section 5.2.26 except that the failure of interest isthe Turbine Driven AFW pump auxiliary lube oil pump at 9 inches of water. Based on GOTHICanalysis [CALCOI] the operator must isolate the break within 150 minutes to prevent eventualfailure of the ability to start the TDAFP.
In order to isolate the sprinklers the operators must receive the initial signal, decide the course ofaction, and execute isolation of the sprinklers, which first requires closing manual valves locatedon the mezzanine of the turbine building to isolate the four main sprinkler headers, and later closethe supply valves to isolate the basement deluge systems. Based on simulator observations andoperator interviews, the four main sprinkler headers would be isolated in 32 minutes. Asdescribed in Appendix D, GOTHIC analyses [CALC01] show that isolating flow from thebasement deluge systems can be delayed for an additional 60 minutes without changing the overallaccident sequence timing. The basic event ID for this HEP is 08-FPSIS02CF-HE and the humanerror probability (HEP) is 3.OE-02.
5.2.28 08-FPSIS03CF-HE - Detection and Isolation of a Medium Flood due to a Steamnline Break
23

INTERNAL FLOODING - Fault Tree Analysis for Turbine Building Floods
before Failing 480 VAC Buses 61 and 62 and Eventual Isolation of the 4 kVAC Bus 6Motor Loads
The analysis of this HEP is documented in Attachment 1. This basic event applies only to aSteamline break resulting in a moderate Fire Protection System discharge in the Turbine Building.A Steaniline break in the Turbine Building will result in an elevated building temperature that actuates
multiple fire sprinklers. This basic event represents the failure of the operator to isolate flow fromthe Fire Pumps either by closing the manual discharge isolation valve on each pump, securing thepower to the pumps, or closing the manual isolation valves for the sprinklers in time to preventthe eventual submergence failure of 480 VAC Buses 61 and 62 and the eventual isolation of the 4kV Bus 6 motor loads due to the automatic tripping of the associated circuit breakers. Based onGOTHIC analysis [CALC01] the operator must isolate the break within 170 minutes toaccomplish these objectives.
In order to isolate the sprinklers the operators must receive the initial signal, decide the course ofaction, and execute isolation of the sprinklers, which first requires closing manual valves locatedon the mezzanine of the turbine building to isolate the four main sprinkler headers, and later closethe supply valves to isolate the basement deluge systems. Based on simulator observations andoperator interviews, the four main sprinkler headers would be isolated in 32 minutes. Asdescribed in Appendix D, GOTHIC analyses [CALC01] show that isolating flow from the 0basement deluge systems can be delayed for an additional 60 minutes without changing the overallaccident sequence timing. The basic event ID for this REP is 08-FPSISO3CF-HE and the humanerror probability (REP) is 3.OE-02.
5.2.29 04-CWSTP29-F-HE - Detection and Isolation of a Small Circulating Water Break beforeEventual Isolation of the 4 kVAC Bus 5 Motor Loads
The analysis of this BEP is documented in Attachment 1. This basic event applies only to a SmallCirculating Water break in the Turbine Building. This basic event represents the failure of theoperator to trip the Circulating Water pumps in time to prevent the eventual isolation of the 4kVAC Bus 5 motor loads due to the automatic tripping of the associated circuit breakers.
A small rupture of an inlet or outlet condenser expansion joint in the Turbine Building (TU-22-1)could propagate through the open drain lines and under doors to Safeguards Alley (TU-90, TU-92, TU-95A, TU-95B-1, TU-95B-2 and TU-95C). Area TU-90 contains kVAC Bus 5 whichcould be failed due to propagation of a break in TU-22-1.
Indication of this type of break would be provided by a Miscellaneous Sump Level High alarm inthe control room.
Propagation to Safeguards Alley will begin when the Turbine Building sump begins to fill since
24

INTERNAL FLOODING - Fault Tree Analysis for Turbine Building foods
the open drain lines from Safeguards Alley directly communicate with this sump. Additionally,when water begins to accumulate on the floor water will begin to leak under doors 4, 6, and 401into Safeguards Alley. Based on GOTHIC analysis [CALC01] the operator must isolate the breakwithin 29 minutes to prevent eventual isolation of the 4 kV Bus 5 motor loads.
Thus, 29 minutes would be available to trip the Circulating Water pumps following a SmallCirculating Water break to prevent eventual isolation of 4 kV Bus 5 motor loads due to theautomatic tripping of the associated circuit breakers.. Based on simulator observations andoperator interviews about 10 minutes are required to diagnose the cause of the high sump levelalarm, decide the course of action, and execute the isolation. The basic event ID for this HEP is04-CWSTP29-F-HE and the human error probability (BEP) is 4.3E-02.
5.2.30 04-CWSTP45-F-HE - Detection and Isolation of a Small Circulating Water Break beforeFailing the Turbine Driven AFW Pump Auxiliary Lube Oil Pump
The analysis of this HEP is documented in Attachment 1. This basic event applies only to a SmallCirculating Water break in the Turbine Building. This basic event represents the failure of theoperator to trip the Circulating Water pumps in time to prevent the eventual failure of the TurbineDriven AFW pump auxiliary lube oil pump.
This event is identical to the one described in Section 5.2.29 except that the failure of interest isthe Turbine Driven AFW pump auxiliary lube oil pump at 9 inches of water. Based on GOTHICanalysis [CALC01] the operator must isolate the break within 45 minutes to prevent eventual lossof the ability to start the TDAFP.
Based on simulator observations and operator interviews about 10 minutes is required to receivethe initial signal, decide the course of action, and execute the isolation. The basic event ID forthis HEP is 04-CWSTP45-F-HE and the human error probability (HEP) is 1.7E-02.
5.2.31 04-CWSTP5 1-F-HE - Detection and Isolation of a Small Circulating Water Break beforeFailing 480 VAC Buses 61 and 62 and-Eventual Isolation of the 4 kVAC Bus 6 MotorLoads
The analysis of this HEP is documented in Attachment 1. This basic event applies only to a SmallCirculating Water break in the Turbine Building. This basic event represents the failure of theoperator to trip the Circulating Water pumps in time to prevent submergence failure of 480 VACBuses 61 and 62 and the eventual isolation of the 4 kV Bus 6 motor loads due to the automatictripping of the associated circuit breakers. Based on GOTHIC analysis [CALC01] the operatormust isolate the break within 51 minutes to accomplish these objectives.
Based on simulator observations and operator interviews at least 10 minutes is required to receive
25

INTERNAL FLOODING - Fault Tree Analysis for Turbine Building Floods
the initial signal, decide the course of action, and execute the isolation. The basic event ID forthis HEP is 04-CWSTP5 1-F-HE and the human error probability (HEP) is 1.4E-02.
5.2.32 04-CWSTP60-F-HE - Detection and Isolation of a Small Circulating Water Break beforeFailure of the Motor Driven AFW Pumps
The analysis of this HEP is documented in Attachment 1. This basic event applies only to a SmallCirculating Water break in the Turbine Building. This basic event represents the failure of theoperator to trip the Circulating Water pumps in time to prevent submergence failure of theMDAFPs at 13 inches.
This event is identical to the one described in Section 5.2.29 except that the result of interest issubmergence of the motor driven AFW pumps. Based on GOTHIC analysis [CALCOl] theoperator must isolate the break within 60 minutes to prevent the submergence failure of the motordriven AFW pumps.
Based on simulator observations and operator interviews at least 10 minutes is required to receivethe initial signal, decide the course of action, and execute the isolation. The basic event ID forthis REP is 04-CWSTP60-F-HE and the human error probability (HEP) is 1.2E-02.
5.2.33 04-CWSTP66-F-HE - Detection and Isolation of a Small Circulating Water Break beforeWater Level Reaches 18 Inches in the Turbine Building
The analysis of this REP is documented in Attachment 1. This basic event applies only to a SmallCirculating Water break in the Turbine Building. This basic event represents the failure of theoperator to trip the Circulating Water pumps in time to prevent the water level from reaching 18inches in the Turbine Building.
This event is identical to the one described in Section 5.2.29 except that the result of interest is 18 linches of water in the Turbine Building. Based on GOTHIC analysis [CALC01] the operatormust isolate the break within 66 minutes to prevent 18 inches of water in the Turbine Building.
Based on simulator observations and operator interviews at least 10 minutes is required to receivethe initial signal, decide the course of action, and execute the isolation. The basic event ID forthis HEP is 04-CWSTP66-F-BE and the human error probability (HEP) is 1.2E-02.l
5.2.34 16-BATCLG--F-BE - Establish Battery Room Cooling
The analysis of this REP is documented in Attachment 1. This basic event applies to floodingscenarios where the 480 V buses have failed, thereby causing failure of normal battery roomcooling. After the Battery Room A/B Exhaust Flow Low annunciator activates in the control (_
26

INTERNAL FLOODING - Fault Tree Analysis for Turbine Building Floods
room, the operator is directed to use the fire equipment to ventilate the Battery Rooms. The airtrunks and fans are then rigged to supply battery room cooling.
The operator must execute the action within 180 minutes to prevent excessive Battery Roomheatup. Based on simulator observations and operator interviews about 77 minutes is requiredto receive the initial signal, decide the course of action, and execute the action. The basic eventID for this HEP is 16-BATCLG--F-HE and the human error probability (HEP) is 7.9E-02.
5.2.35 27A-ORR----F-HE - Failure to Throttle SI Flow to Conserve RWST Inventory
The analysis of this HEP is documented in Attachment 1. This basic event applies to floodingscenarios where secondary cooldown has failed and the remaining SI pump is available. Ifsecondary cooldown fails, the flow rate through existing RCP Seal LOCA is expected to worsen.The operator would attempt to replace the lost RCS inventory using the available SI pump. Sincehigh-pressure recirculation is unavailable due to the failure of the CCW pump power supplies, theoperator must conserve the RWST inventory. This is done by manually throttling the SI pumpdischarge flow.
The operator must execute the action within 67 minutes to extend the time the RWST is available.Based on simulator observations and operator interviews about 58 minutes is required to receive
the initial signal, decide the course of action, and execute the action. The basic event ID for thisHEP is 27A-ORR----F-HE and the human error probability (HEP) is 5.OE-03.
5.2.36 05B-BYALOP-F-HE - Failure to Bypass AFW Auxiliary Lube Oil Pressure Interlock
The analysis of this HEP is documented in Attachment 1. This basic event applies to floodingscenarios where the water level in the AFW pump area has risen to 9 inches and the operatorneeds to start an AFW pump. If the auxiliary lube oil pump is failed due to submergence, then theassociated AFW pump will not start due to a lube oil pressure interlock. This basic eventaddresses the bypass of this interlock to allow starting of the AFW pump.
The operator must execute the action within approximately 4 hours to restart an AFW pump.Based on simulator observations and operator interviews about 3.5 hours is required to receivethe initial signal, decide the course of action, and execute the action. The basic event ID for thisREP is 05B-BYALOP-F-HE and the human error probability (HEP) is 4.4E-01.
5.2.37 06-NOLNDAFWF-BE - Failure to Feed Steam Generator Without Level Indication
The analysis of this HEP is documented in Attachment 1. This basic event applies to floodingscenarios where power to the instrument bus is failed and AFW operation is required to maintainsteam generator level. The operator must then provide makeup to the steam generators without
27

INTERNAL FLOODING - Fault Tree Analysis for Turbine Building Floods
instrument power to allow monitoring of steam generator level and prevent overfilling the steamgenerator and failing the TDAFP.
The basic event ID for this HEP is 06-NOINDAFWF-HE and the human error probability (BEP)is 6.4E-01.
5.2.38 06--OC2----F-HE - Failure to Perform RCS Cooldown Using Natural Circulation
The analysis of this HEP is documented in Attachment 1. This basic event applies to floodingscenarios where RXCP seal cooling systems, i.e., charging and CCW, are not failed by theflooding event, but fail randomly shortly into the event. For this event, the operators mustcooldown and depressurize the RCS per ES-0.2.
The operator must execute the action within approximately 6 hours to perform cooldown. Basedon simulator observations and operator interviews about 3 hours is required to receive the initialsignal, decide the course of action, and execute the action. The basic event ID for this HEP is 06--OC2----F-HE and the human error probability (HEP) is 7.4E-02.
5.2.39 06--OC6----F-HE - Failure to Perform RCS Cooldown with Boration
The analysis of this HEP is documented in Attachment 1. This basic event applies to floodingscenarios where 480 VAC power is lost to all charging and CCW pumps. In these scenarios, aRXCP seal LOCA is assumed to occur and the operators would cooldown and depressurize theRCS per ES-1.2.
The operator must execute the action within approximately 200 minutes to perform cooldown.Based on simulator observations and operator interviews about 65 minutes is required to receivethe initial signal, decide the course of action, and execute the action. The basic event ID for thisHEP is 06--OC6----F-HE and the human error probability (HEP) is 9.2E-02.
5.2.40 05B-MDPTD36F-HE - Failure to Start Turbine Driven AFW Pump Before Loss of MotorDriven AFW Pump (36 Minutes)
The analysis of this HEP is documented in Attachment 1. This basic event applies to theModerate Circulating Water pipe break. After the Motor Driven AFW pumps have failed, theoperator must start the Turbine Driven AFW pump within 36 minutes of the initial pipe break toavoid submergence of the auxiliary lube oil pump and subsequent failure of the Turbine DrivenAFW pump to start due to a lube oil pressure interlock. [CALC01]
Based on simulator observations and operator interviews about 18 minutes is required to receivethe initial signal, decide the course of action, and execute the action. The basic event ID for this
28

INTERNAL FLOODING - Fault Tree Analysis for Turbine Building Floods
HEP is 05B-MDPTD36F-HE and the human error probability (HEP) is 4.7E-01.
5.2.41 05B-MDPTD49F-HE - Failure to Start Turbine Driven AFW Pump Before Loss of MotorDriven AFW Pump (49 Minutes)
The analysis of this HEP is documented in Attachment 1. This basic event applies to theFeedwater pipe break with a large Fire Protection sprinkler discharge to the turbine building.After the Motor Driven AFW pumps have failed, the operator must start the Turbine Driven AFWpump within 49 minutes of the initial pipe break to avoid submergence of the auxiliary lube oilpump and subsequent failure of the Turbine Driven AFW pump to start due to a lube oil pressureinterlock. [CALCOI]
Based on simulator observations and operator interviews about 18 minutes is required to receivethe initial signal, decide the course of action, and execute the action. The basic event ID for thisHEP is 05B-MDPTD49F-HE and the human error probability (HEP) is 4.7E-01.
5.2.42 05B-MDPTD61F-HE - Failure to Start Turbine Driven AFW Pump Before Loss of MotorDriven AFW Pump (61 Minutes)
The analysis of this HEP is documented in Attachment 1. This basic event applies to the LargeService Water, Fire Protection Water, and Steamline pipe breaks with a large Fire Protectionsprinkler discharge. After the Motor Driven AFW pumps have failed, the operator must start theTurbine Driven AFW pump within 61 minutes of the initial pipe break to avoid submergence ofthe auxiliary lube oil pump and subsequent failure of the Turbine Driven AFW pump to start dueto a lube oil pressure interlock. [CALCO1]
Based on simulator observations and operator interviews about 18 minutes is required to receivethe initial signal, decide the course of action, and execute the action. The basic event ID for thisHEP is 05B-MDPTD6 IF-HE and the human error probability (HEP) is 3. IE-01.
5.2.43 05B-MDPTDlCF-HE - Failure to Start Turbine Driven AFW Pump Before Loss of MotorDriven AFW Pump (109 Minutes)
The analysis of this REP is documented in Attachment 1. This basic event applies to theFeedwater pipe break with a moderate Fire Protection sprinkler discharge to the turbine building.After the Motor Driven AFW pumps have failed, the operator must start the Turbine Driven
AFW pump within 109 minutes of the initial pipe break to avoid submergence of the auxiliary lube |oil pump and subsequent failure of the Turbine Driven AFW pump to start due to a lube oilpressure interlock. [CALCOI1
Based on simulator observations and operator interviews about 18 minutes is required to receive
29

INTERNAL FLOODING - Fault Tree Analysis for Turbine Building Floods
the initial signal, decide the course of action, and execute the action. The basic event ID for thisHEP is 05B-MDPTD1CF-HE and the human error probability (HEP) is 1.6E-01.
5.2.44 05B-MDPTD2HF-HE - Failure to Start Turbine Driven AFW Pump Before Loss of MotorDriven AFW Pump (2.5 Hours).
The analysis of this HEP is documented in Attachment 1. This basic event applies to theSteamline pipe break with a moderate Fire Protection sprinkler discharge to the turbine building.After the Motor Driven AFW pumps have failed, the operator must start the Turbine Driven AFWpump within 2.5 hours of the initial pipe break to avoid submergence of the auxiliary lube oilpump and subsequent failure of the Turbine Driven AFW pump to start due to a lube oil pressureinterlock. [CALC01]
Based on simulator observations and operator interviews about 18 minutes is required to receivethe initial signal, decide the course of action, and execute the action. The basic event ID for thisHEP is 05B-MDPTD2HF-HE and the human error probability (HEP) is 4. IE-02.
5.2.45 86-INSTRRCRF-HE - Failure to Recover AFW Control
The analysis of this HEP is documented in Attachment 1. This basic event applies to all scenarioswhere AFW flow exists and at least one train of safety-related AC power is available. Underthese conditions the operator is instructed to control AFW flow using the AFW pump dischargevalves to adjust the flow rate to the steam generators. If these valves cannot be controlledremotely from the control room, then the operator has approximately 11 hours to operate themmanually from the pump room. [CALC01].
Based on simulator observations and operator interviews about 9.5 hours is required to receivethe initial signal, decide the course of action, and execute the action. The basic event ID for thisHEP is 86-INSTRRCRF-HE and the human error probability (HEP) is 1.8E-02.
5.3 DATA
The KNPP.BED database was used for the flooding analysis. The Turbine Building floodinginitiators and the HEPs discussed in Section 5.2 were added toKNPP.BED, along with the basicevents modeled in fault tree FLOODING.LGC. One other new basic .event was also added to thedatabase:
Basic Event 05B-FRACTDP-OFF represents the fraction of time that the operator isexpected to trip the Turbine Driven AFW pump early in a flooding event given that bothMotor Driven AFW pumps have successfully started.
30

INTERNAL FLOODING - Fault Tree Analysis for Turbine Building Floods
No other basic events were added.
Table 1 lists all of the new operator actions and their HEPs that were developed in support of theflooding analysis.
Table 2 lists all the new basic events (and their values) that were added to KNPP.BED in supportof the flooding analysis.
6.0 MODEL EVALUATION (EQUATIONS)
Each fault tree used to represent an event tree top event in this analysis is quantified various timesunder different initial conditions. Each of these fault tree quantifications produces an equation.The equation's location on the event tree (i.e., which previous top events have succeeded andfailed) dictates the initial conditions used to quantify the fault tree and develop that uniqueequation. Such initial conditions are modeled by setting to TRUE the failure rates of equipmentthat is known to be unavailable due to the flooding event. The same fault tree is then quantifiedwith different initial conditions to yield different equations.
With the exception of Top Events AFZ and AFX (which are described in more detail in the@ following subsection), this analysis generally develops two unique equations for each top event.
The initial conditions for' the first equation consist of the flood-induced failures of equipment inthe Turbine Building as well as the bottom row of breakers on Buses 51/52 and 61/62. Thisrepresents the flood-induced equipment failures that occur very early in the event. For example,when analyzing the Large Feedwater scenario (WI06B) the equation for Top Event AFR usingthese initial conditions is named AFRWI06B
The initial conditions for the second equation simply build on those of the first equation. Inaddition to the equipment failures of the first equation, the second equation adds the flood-induced failures of 480 VAC Buses 61 and 62. Thus, the second equation is quantified assumingthe failure of 480 VAC Train B safety-related power. ;For example, when analyzing the LargeFeedwater scenario (WI06B) the equation for Top Event AFR using these initial conditions isnamed AFRWI064.
6.1 EVALUATION OF TOP EVENT AFZ
Instead of quantifying the same fault tree various times to develop different equations, theequations associated with Top Event AFZ use multiple fault trees that are quantified a single time.This is due to the complexity added by various human actions and the potential of equipment to
already be running. Only the equations associated with a Large Feedwater Break are describedhere (e.g., AFZ-AWIB). The descriptions of the equations associated with all other initiators(e.g., AFZ-ACXB, AFZ-ASIB, AFZ-ATIB, etc.) are identical except for the name of the initiator
31

INTERNAL FLOODING - Fault Tree Analysis for Turbine Building Floods
and the timing associated with the model.
6.1.1 AFZ-AWIB
This equation is used to model failure of the operator to provide AFW flow for decay heatremoval using the turbine-driven AFW pump. The equation is used to model operator action-related failures only. Hardware-related failures of the turbine-driven AFW train are evaluated byother equations in the event tree.
This equation is used for sequences with the following conditions:
* The water volume released to the turbine building will result in opening the bottom row ofbreakers on 480 VAC Buses 51, 52, 61, and 62.
* The break was isolated before the volume of water released in the turbine building wouldcause water level in the AFW pump rooms to submerge the TDAFP auxiliary lube oilpump.
* The break was isolated before the volume of water released in the turbine building wouldcause water level in the B-train 4kVAC room to reach a level that would fail 4 kVAC Bus6 motor loads or 480 VAC Buses 61/62.
* The water volume released to the turbine building will result in failure of 4kVAC Bus 5motor loads.
* The B-train motor-driven AFW pump successfully started.* The B-train motor-driven AFW pump failed to run. By definition of the sequences where
equation AFZ-AWIB is used, the mission time for the AFW pump is 24 hours. Onaverage, the pump is assumed to run halfway through the mission time or 12 hours.
For the sequences where equation AFZAW1B is used, several potential success paths exist.First, the operators may have recognized that the flooding event could threaten the motor-drivenAFW pumps and would maintain the turbine-driven AFW pump running throughout the event.Second, if the turbine-driven AFW pump were secured, then restart would merely require that theoperators take the control switch from pull-to-lock. Then, even if the operators did not start thepump, it would automatically start on a low-low steam generator level signal.
6.1.2 AFZ-BWIB
This equation is used to model failure of the operator to provide AFW flow for decay heatremoval using the turbine-driven AFW pump. The equation is used to model operator action-related failures only. Hardware-related failures of the turbine-driven AFW train are evaluated byother equations in the event tree.
This equation is used for sequences with the following conditions: C)32

INTERNAL FLOODING - Fault Tree Analysis for Turbine Building Floods
* The water volume released to the turbine building will result in opening the bottom row ofbreakers on 480 VAC Buses 51, 52, 61, and 62.
* The water volume released to the turbine building will result in failure of 4kVAC Bus 5motor loads.
* The water volume released to the turbine building would cause water level in the AFWpump rooms to submerge the TDAFP auxiliary lube oil pump.
* The break was isolated before the volume of water released in the turbine building wouldcause water level in the B-train 4kVAC room to reach a level that would fail 4 kVAC Bus6 motor loads or 480 VAC Buses 61/62.
* The B-train motor-driven AFW pump successfully started.* The B-train motor-driven AFW pump failed to run. By definition of the sequences where
equation AFZ-BWIB is used, the mission time for the AFW pump is 24 hours. Onaverage, the pump is assumed to run halfway through the mission time or 12 hours.
For the sequences where equation AFZ-BWIB is used, multiple potential success paths exist.First, the operators could have maintained the turbine-driven AFW pump running throughout theevent. The pump would be maintained running if either motor-driven AFW pump failed or if theoperators recognized that the flooding event could threaten the motor-driven AFW pumps andwould want the added reliability of the third AFW pump. Second, even if the turbine-driven AFWpump was secured early in the event, then the operators could recognize that the rising waterlevels would soon threaten the motor-driven AFW pumps and may restart the turbine-drivenAFW pump. By definition of the sequences where equation AFZ-BWIB is used, water level willreach a level that will submerge the turbine-driven AFW pump auxiliary lube oil pump.Therefore, for the operators to successfully start the pump from the control room, action must betaken before 49 minutes. Otherwise, the auxiliary lube oil pump would be submerged, therebypreventing the turbine-driven AFW pump from starting.
If the turbine-driven pump is not started within 49 minutes after flood initiation and thenmaintained running, then the pump could be started if the low oil pressure interlock is bypassed.Bypass of the low oil pressure interlock may be directed by personnel manning the technicalsupport center and would need to be completed before water level in either of the steamgenerators dropped to less than 5-percent wide range, the point that bleed and feed cooling wouldbe initiated.
Given the definition of the sequences where equation AFZ-BWIB is used, the B-train motor-driven AFW pump started, but failed to run. Since, on average, the pump is assumed to fail one-half way through the mission time, or 12 hours, steam generator water level would be at or nearnormal level when flow from the motor-driven AFW pump is lost. Previous analyses have shownthat about three hours are required for water level in the steam generators to decrease from
_ nominal to 5-percent wide range. Therefore, three hours would be available to bypass the33

|INTERNAL FLOODING - Fault Tree Analysis for Turbine Building Floods
interlock.
6.1.3 AFZBWI4
This equation is used to model failure of the operator to provide AFW flow for decay heatremoval using the turbine-driven AFW pump. The equation is used to model operator action-related failures only. Hardware-related failures of the turbine-driven AFW train are evaluated byother equations in the event trees.
This equation is used for sequences with the following conditions:
* The water volume released to the turbine building will result in opening the bottom row ofbreakers on 480 VAC Buses 51, 52, 61, and 62.
* The water volume released to the turbine buding will result in failure of 4kVAC Bus 5motor loads.
* The water volume released to the turbine building would cause water level in the AFWpump rooms to submerge the TDAFP auxiliary lube oil pump.
* The water volume released to the turbine building would cause water level in safeguardsalley to submerge 480 VAC Buses 61 and 62.
* The water volume released to the turbine building would cause water level in the B-train4kVAC room to reach a level that would fail 4 kVAC Bus 6 motor loads.
* The break was isolated before the volume of water released in the turbine building wouldcause water level in the safeguards alley to fail the turbine-driven AFW pump if it wasalready running.
For the sequences where equation AFZ-BWI4 is used, the only method available for long-termdecay heat removal is the turbine-driven AFW pump. Although the B-train motor-driven AFWpump may start and provide flow, the pump will be lost when water level on 4 kVAC Bus 6reaches the level at which bus failure is expected. Therefore, no credit is taken for operation ofthe B-train motor-driven AFW pump.
Multiple potential success paths exist for the conditions where equation AFZ-BWI4 is used.First, the operators could have maintained the turbine-driven AFW pump running throughout theevent. The pump would be maintained running if either motor-driven AFW pump failed or if theoperators recognized that the flooding event could threaten the motor-driven AFW pumps andwould want the added reliability of the third AFW pump. Second, even if the turbine-driven AEWpump was secured early in the event, then the operators could recognize that the rising waterlevels would soon threaten the motor-driven AFW pumps and may restart the turbine-drivenAFW pump. By definition of the sequences where equation AFZ-BWIB is used, water level willreach a level that will submerge the turbine-driven AFW pump auxiliary lube oil pump.Therefore, for the operators to successfully start the pump from the control room, action must be
34

iINTERNAL FLOODING - Fault Tree Analysis for Turbine Building Floods
taken within 49 minutes. Otherwise, the auxiliary lube oil pump would be submerged, therebypreventing the turbine-driven AFW pump from starting.
If the turbine-driven pump is not started within 49 minutes after flood initiation and thenmaintained running, then the pump could be started if the low oil pressure interlock is bypassed.Bypass of the low oil pressure interlock may be directed by personnel manning the technicalsupport center and would need to be completed before water level in either of the steamgenerators dropped to less than 5-percent wide range, the point that bleed and feed cooling wouldbe initiated.
6.2 EVALUATION OF TOP EVENT AFX
Instead of quantifying the same fault tree various times to develop different equations, theequations associated with Top Event AFX use multiple fault trees that are quantified a singletime. This is due to the complexity added by various human actions and the potential ofequipment to already be running. Only the equations associated with a Large Feedwater Breakare described here (e.g., AFX-1WIB). The descriptions of the equations associated with all otherinitiators (e.g., AFX-1CXB, AFX-1SIB, AFX-1TIB, etc.) are identical except for the name of theinitiator and the timing associated with the model.
~ 6.2.1 AFX-1WIB
This equation is used to model failure of the operator to control AFW flow to maintain level inthe steam generators.
This equation is used for sequences with the following conditions:
* The water volume released to the turbine building will result in opening the bottom row ofbreakers on 480 VAC Buses 51, 52, 61, and 62. i
* The break was isolated before the volume of water released in the turbine building wouldcause water level in the AFW pump rooms to submerge the TDAFP auxiliary lube oilpump.
* The break was isolated before the volume of water released in the turbine building wouldcause water level in the B-train 4kVAC room to reach a level that would fail 4 kVAC Bus6 motor loads or 480 VAC Buses 61/62.
* The water volume released to the turbine building will result in failure of 4kVAC Bus 5motor loads.
* The B-train motor-driven AFW pump successfully started.* The B-train motor-driven AFW pump can successfully run for 24 hours.
By definition, all equipment in the turbine building basement is assumed failed by the initiating35

INTERNAL FLOODING - Fault Tree Analysis for Turbine Building Floods
event. Therefore, service air compressors are lost. Also by definition of the sequences whereequation AFX-1WIB is used, the B-train electrical safety buses (4kVAC and 480 VAC) areavailable. Because the B-train 480 VAC safety buses are available, the B-train instrument aircompressor, ClB, is potentially available, as are the alternate power supplies to the 120 VACinstrument inverters. In addition, the A-train 480 VAC safety buses would be available soinstrument air compressor CIC is potentially available.
Even though the B-train 480 VAC safety buses are available, the bottom row of breakers on the480 VAC buses will have opened. When these breakers open, several loads that impact theflooding accident sequence progression are lost. These loads include the power supply to theassociated train battery room fan cooling units, battery chargers, standby power supplies for 120VAC instrument inverters, battery room exhaust fans, and auxiliary lube oil pumps for the motor-driven AFW pumps.
Given the conditions described above, success of the AFX-1WIB equation can be achieved byseveral means. First the B-train motor-driven AFW pump could be maintained running and flowcontrolled using AFW-2B. If air and power are available, then flow can be controlled from thecontrol room. Air could be supplied from instrument air compressors ClB or C1C and power isprovided from panel BRD-115, which is supplied with power from either battery BRD-101 orMCC-62C. These power sources can be backed up by DC distribution cabinet BRC-102 viaeither battery BRC-101 or MCC-46C. Given the redundancy and diversity of these four powersupplies, explicit consideration of their failure is assumed to be insignificant and need not bemodeled. If air is not available, then AFW-2B can be operated locally.
Second, if the operators secure the B-train AFW pump, then the turbine-driven AFW pump canbe used. If the turbine-driven AFW pump was maintained running, then no additional actions arerequired. If the turbine-driven AFW pump was secured, then taking the control switch from pull-to-lock would restart the pump when level reached the low-low setpoint. Once the turbine-drivenAFW pump is running, flow can be controlled using valves AFW-10A/B. For either of theseoptions, either a long-term source of DC power must be provided for instrumentation or steamgenerator level must be controlled following a loss of all level indication. Lastly, if the motor-driven AFW pump 1B has been secured, then the low oil pressure interlock can be bypassed toallow starting the motor-driven AFW pumps without the auxiliary lube oil pumps.
Provision of a long-term source of DC power can be ensured by multiple means for sequencesinvolving equation AFX-1WIB. First, the 120 VAC instrument inverters can be aligned to theiralternate power source. Since 480 VAC Buses 61 and 62 are available, the alternate sources areavailable. Evaluations have shown that if the instrument inverters are removed from battery BRB-101, then the battery can supply needed DC loads for well in excess of 24 hours. Alignment ofthe instrument inverters to their alternate power source also ensures that steam generator levelindication is available in the control room even if the battery fails or is depleted. If needed, an
36

INTERNAL FLOODING - Fault Tree Analysis for Turbine Building Floods
alternate power source can be aligned to the DC buses. Alternatives include installation of analternate power source to the existing battery charger or installation of a spare battery chargerwith power from an alternative source.
Given the availability of equipment for sequences where equation AFX-1WIB is used and themultiple success paths that are available, it is likely that many hours would be available for theoperators to initiate the actions. Therefore, time would not be critical to completing any of theactions and explicit evaluation of timing is not necessary.
6.2.2 AFX-2WIB
This equation is used to model failure of the operator to control AFW flow to maintain level inthe steam generators.
This equation name is used for sequences with the following conditions:
* The water volume released to the turbine building will result in opening the bottom row ofbreakers on 480 VAC Buses 51, 52, 61, and 62.
* The break was isolated before the volume of water released in the turbine building wouldcause water level in the B-train 4kVAC room to reach a level that would fail 4 kVAC Bus6 motor loads or 480 VAC Buses 61/62.
* The water volume released to the turbine building will result in failure of 4kVAC Bus 5motor loads.
* The B-train motor-driven AFW pump successfully started.* The B-train motor-driven AFW pump failed to run. By definition of the sequences where
equation AFX-2WIB is used, the mission time for the AFW pump is 24 hours. Onaverage, the pump is assumed to fail to run halfway through the mission time or 12 hours.
* The turbine-driven AFW pump has been started and can successfully operate for 24 hours.
By definition, all equipment in the turbine building basement is assumed failed by the initiatingevent. Therefore, service air compressors are lost. Also by definition of the sequences whereequation AFX-2WIB is used, the B-train electrical safety buses (4kVAC and 480 VAC) areavailable. Because the B-train 480 VAC safety buses are available, the B-train instrument aircompressor, CIB, is potentially available, as are the alternate power supplies to the 120 VACinstrument inverters. In addition, the A-train 480 VAC safety buses would be available soinstrument air compressor CIC is potentially available.
Even though the B-train 480 VAC safety buses are available, the bottom row of breakers on the480 VAC buses will have opened. When these breakers open, several loads that impact theflooding accident sequence progression are lost. These loads include the power supply to the
_ associated train battery room fan cooling units, battery chargers, standby power supplies for 12037

INTERNAL FLOODING - Fault Tree Analysis for Turbine Building Floods
VAC instrument inverters, battery room exhaust fans, and auxiliary lube oil pumps for the motor-driven AFW pumps.
Given the conditions described above, success of the AFX-2WIB equation can be achieved bycontrolling AFW flow using valves AFW-1OA/B. If a long-term source of DC power is available,then steam generator level can be controlled from the control room. Provision of a long-termsource of DC power can be ensured by multiple means for sequences involving equation AFX-2WIB. First, the 120 VAC instrument inverters can be aligned to their alternate power source.Since 480 VAC Buses 61 and 62 are available, the alternate sources are available. Evaluationshave shown that if the instrument inverters are removed from battery BRB-101, then the batterycan supply needed DC loads for well in excess of 24 hours. Alignment of the instrument invertersto their alternate power source also ensures that steam generator level indication is available in thecontrol room even if the battery fails or is depleted. If needed, an alternate power source can bealigned to the DC buses. Alternatives include installation of an alternate power source to theexisting battery charger or installation of a spare battery charger with power from an alternative-source.
Given the availability of equipment for sequences where equation AFX-2WIB is used and themultiple success paths that are available, it is likely that many hours would be available for theoperators to initiate the actions. Therefore, time would not be critical to completing any of theactions and explicit evaluation of timing is not necessary.
6.2.3 AFX-lAWI
This equation is used to model failure of the operator to control AFW flow to maintain level inthe steam generators.
This equation is used for sequences with the following conditions:
* The water volume released to the turbine building will result in opening the bottom row ofbreakers on 480 VAC Buses 51, 52, 61, and 62.
* The water volume released to the turbine building will result in submergence of theTDAFP auxiliary lube oil pump.
* The break was isolated before the volume of water released in the turbine building wouldcause water level in the B-train 4kVAC room to reach a level that would fail 4 kVAC Bus6 motor loads or 480 VAC Buses 61/62.
* The water volume released to the turbine building will result in failure of 4kVAC Bus 5motor loads.
* The B-train motor-driven AFW pump successfully started.* The B-train motor-driven AFW pump can successfully run for 24 hours.
38

INTERNAL FLOODING - Fault Tree Analysis for Turbine Building Floods
By definition, all equipment in the turbine building basement is assumed failed by the initiatingevent. Therefore, service air compressors are lost. Also by definition of the sequences whereequation AFX-lAWI is used, the B-train electrical safety buses (4kVAC and 480 VAC) areavailable. Because the B-train 480 VAC safety buses are available, the B-train instrument aircompressor, ClB, is potentially available, as are the alternate power supplies to the 120 VACinstrument inverters. In addition, the A-train 480 VAC safety buses would be available soinstrument air compressor ClC is potentially available.
Even though the B-train 480 VAC safety buses are available, the bottom row of breakers on the480 VAC buses will have opened. When these breakers open, several loads that impact theflooding accident sequence progression are lost. These loads include the power supply to theassociated train battery room fan cooling units, battery chargers, standby power supplies for 120VAC instrument inverters, battery room exhaust fans, and auxiliary lube oil pumps for the motor-driven AFW pumps.
Given the conditions described above, success of the AFX-lAWI equation can be achieved byseveral means. First the B-train motor-driven AFW pump could be maintained running and flowcontrolled using AFW-2B. If air and power are available, then flow can be controlled from thecontrol room. Air could be supplied from instrument air compressors ClB or C1C and power isYJ provided from panel BRD-115, which is supplied with power from either battery BRD-101 orMCC-62C. These power sources can be backed up by DC distribution cabinet BRC-102 viaeither battery BRC-101 or MCC-46C. Given the redundancy and diversity of these four powersupplies, explicit consideration of their failure is assumed to be insignificant and need not bemodeled. If air is not available, then AFW-2B can be operated locally.
Second, if the operators secure the B-train AFW pump, then the turbine-driven AFW pump canbe used. By definition of the sequences where equation AFX-1AWI is used, water level willreach a level that will submerge the turbine-driven AFW pump auxiliary lube oil pump.Therefore, for the operators to successfully start the pump from the control room, action must betaken within 49 minutes. Otherwise, the auxiliary lube oil pump would be submerged, therebypreventing the turbine-driven AFW pump from starting.
If the turbine-driven pump is not started within 49 minutes after flood initiation and thenmaintained running, then the pump could be started if the low oil pressure interlock is bypassed.Bypass of the low oil pressure interlock may be directed by personnel manning the technicalsupport center and would need to be completed before water level in either of the steamgenerators dropped to less than 5-percent wide range, the point that bleed and feed cooling wouldbe initiated.
For either of these options, either a long-term source of DC power must be provided for_p instrumentation or steam generator level must be controlled following a loss of all level indication.
39

INTERNAL FLOODING - Fault Tree Analysis for Turbine Building Floods
Provision of a long-term source of DC power can be ensured by multiple means for sequencesinvolving equation AFX-lAWI. First, the 120 VAC instrument inverters can be aligned to theiralternate power source. Since 480 VAC Buses 61 and 62 are available, the alternate sources areavailable. Evaluations have shown that if the instrument inverters are removed from battery BRB-101, then the battery can supply needed DC loads for well in excess of 24 hours. Alignment ofthe instrument inverters to their alternate power source also ensures that steam generator levelindication is available in the control room even if the battery fails or is depleted. If needed, analternate power source can be aligned to the DC buses. Alternatives include installation of analternate power source to the existing battery charger or installation of a spare battery chargerwith power from an alternative source.
40

INTERNAL FLOODING - Fault Tree Analysis for Turbine Building Floods
6.2.4 AFX-2WI4
This equation is used to model failure of the operator to control AFW flow to maintain level inthe steam generators.
This equation is used for sequences with the following conditions:* The water volume released to the turbine building will result in opening the bottom row of
breakers on 480 VAC Buses 51, 52, 61, and 62.* The water volume released to the turbine building will result in failure of 4kVAC Bus 5
motor loads.* The water volume released to the turbine building would cause water level in the AFW
pump rooms to submerge the TDAFP auxiliary lube oil pump.* The water volume released to the turbine building would cause water level in safeguards
alley to submerge 480 VAC Buses 61 and 62.* The water volume released to the turbine building would cause water level in the B-train
4kVAC room to reach a level that would fail 4 kVAC Bus 6 motor loads.* The break was isolated before the volume of water released in the turbine building would
cause water level in the safeguards alley to fail the turbine-driven AFW pump if it wasalready running.
* The turbine-driven AFW pump has been started and can successfully operate for 24 hours.
By definition of the sequences where equation AFX-2WI4 is used, all AC power will be lost. Inaddition, all DC power may eventually be lost because of the loss of power to the batterychargers.
Success of the AFX-2WI4 equation requires that the operators control flow using valves AFW-1OA/B. In addition, either a long-term source of DC power must be provided for instrumentationor steam generator level must be controlled following a loss of all level indication.
7.0 REEERENCES
[CALC01] Calculation 0064-0515-LYS-01, Evaluation of Flooding Levels for Various PRACases, Revision 2, MPR Associates, Inc.
[NBO1] KPS Internal Events PRA, Volumes 2 through 4.
[NB02] KPS Internal Events PRA, Section 4.15, "Human Reliability Analysis."
41

INTERNAL FLOODING - Fault Tree Analysis for Turbine Building Floods
Table 1Summary of KPS Turbine Building Flood Hunan Actions
Basic Event ID Basic Event Description HEP02-SW4A-B29F-HE Detection and Isolation of a Service Water Break before Eventual Isolation of the 4 2.OE-02
kVAC Bus 5 Motor Loads02-SW4A-B45F-HE Detection and Isolation of a Service Water Break before Failing the Turbine Driven 2.OE-02
AFW Pump Auxiliary Lube Oil Pump02-SW4A-B5lF-HE Detection and Isolation of a Large Service Water Break before Failing 480 VAC 2.OE-02
Buses 61 and 62 and Eventual Isolation of the 4 kVAC Bus 6 Motor Loads02-SW4A-B60F-HE Detection and Isolation of a Large Service Water Break before Failure of the 2.0E-02
Motor Driven AFW Pumps02-SW4A-B66F-HE Detection and Isolation of a Large Service Water Break before Water Level 2.OE-02
Reaches 18 Inches in the Turbine Building04-CWSTP13-F-HE Detection and Isolation of a 14,000-gpm Circulating Water Break before Eventual 2.6E-01
Isolation of the 4 kVAC Bus 5 Motor Loads04-CWSTP19-F-HE Detection and Isolation of a 14,000-gpm Circulating Water Break before Failing the 1.2E-01
Turbine Driven AFW Pump Auxiliary Lube Oil Pump04-CWSTP22-F-HE Detection and Isolation of a 14,000-gpm Circulating Water Break before Failing 1.2E-01
480 VAC Buses 61 and 62 and Eventual Isolation of the 4 kVAC Bus 6 MotorLoads
04-CWSTP25-F-HE Detection and Isolation of a 14,000-gpm Circulating Water Break before Water 1.2E-01Level Reaches 18 Inches in the Turbine Building
04-CWSTP29-F-HE Detection and Isolation of a Small Circulating Water Break before Eventual 4.3E-02Isolation of the 4 kVAC Bus 5 Motor Loads
42
C, C C
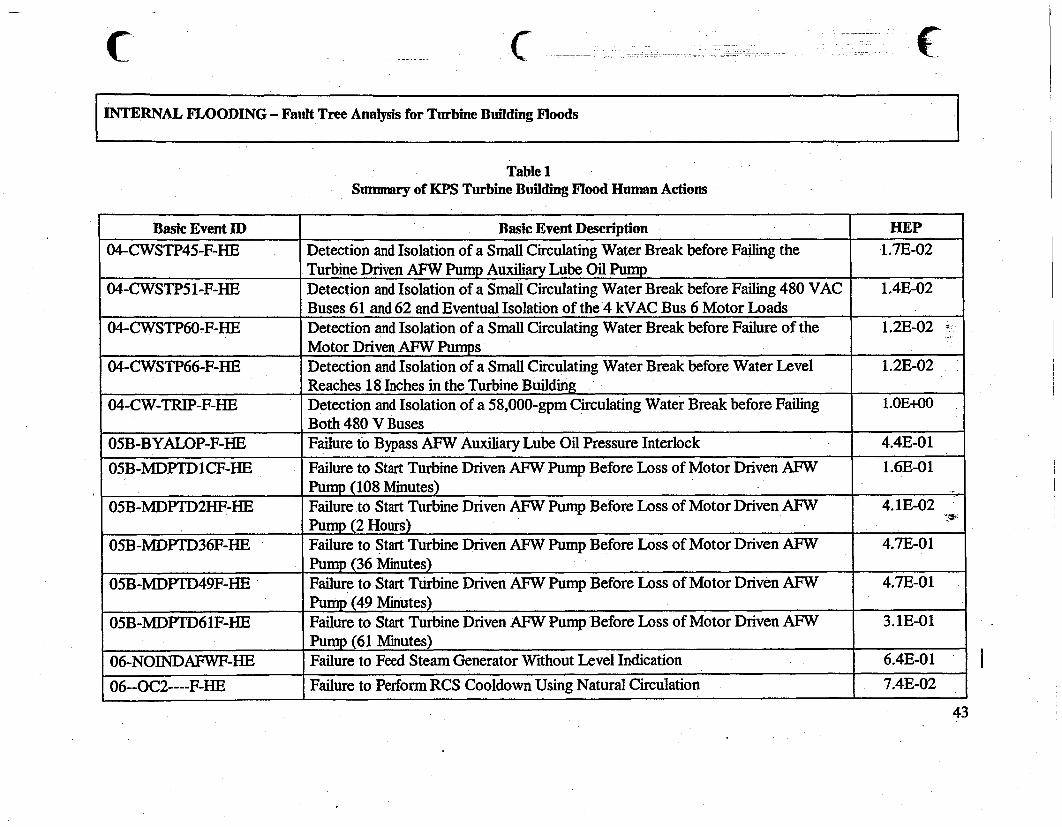
4: C CINTERNAL FLOODING - Fault Tree Analysis for Turbine Building Floods
Table 1Sunmary of KPS Turbine Building Flood Human Actions
Basic Event ID Basic Event Description HEP04-CWSTP45-F-HE Detection and Isolation of a Small Circulating Water Break before Failing the 1.7E-02
Turbine Driven AFW Pump Auxiliary Lube Oil Pump04-CWSTP51-F-HE Detection and Isolation of a Small Circulating Water Break before Failing 480 VAC 1.4E-02
Buses 61 and 62 and Eventual Isolation of the 4 kVAC Bus 6 Motor Loads04-CWSTP60-F-HE Detection and Isolation of a Small Circulating Water Break before Failure of the 1.2E-02
Motor Driven AFW Pumps04-CWSTP66-F-HE Detection and Isolation of a Small Circulating Water Break before Water Level 1.2E-02
Reaches 18 Inches in the Turbine Building04-CW-TRIP-F-BE Detection and Isolation of a 58,000-gpm Circulating Water Break before Failing 1.0E1+00
Both 480 V Buses05B-BYALOP-F-HE Failure to Bypass AFW Auxiliary Lube Oil Pressure Interlock 4.4E-0105B-MDPTD1CF-HE Failure to Start Turbine Driven AFW Pump Before Loss of Motor Driven AFW 1.6E-01
Pump (108 Minutes)05B-MDPTD2HF-HE Failure to Start Turbine Driven AFW Pump Before Loss of Motor Driven AFW 4. lE-02
_______ Pump (2 Hours)05B-MDPTD36F-HE Failure to Start Turbine Driven AFW Pump Before Loss of Motor Driven AFW 4.7E-01
Pump (36 Mnutes)05B-MDPTD49F-HE Failure to Start Turbine Driven AFW Pump Before Loss of Motor Driven AFW 4.7E-01
Pump (49 Mnutes)05B-MDPTD61F-HE Failure to Start Turbine Driven AFW Pump Before Loss of Motor Driven AFW 3. lE-01
Pump (61 Mnutes)06-NOINDAFWF-HE Failure to Feed Steam Generator Without Level Indication 6.4E-0106--OC2----F-HE Failure to Perform RCS Cooldown Using Natural Circulation 7.4E-02
43
I

INTERNAL FLOODING - Fault Tree Analysis for Turbine Building Floods
Table 1Summary of KPS Turbine Building Flood Hmnan Actions
Basic Event II) Basic Event Description HEP06--OC6----F-HE Failure to Perform RCS Cooldown with Boration- 9.2E-0208-FPISO29-F-HE Detection and Isolation of a Fire Protection Water Break before Eventual Isolation 1.0E+00
of the 4 kVAC Bus 5 Motor Loads08-FPISO45-F-HE Detection and Isolation of a Fire Protection Water Break before Failing the Turbine 6.6E-02
Driven AFW Pump Auxiliary Lube Oil Pump08-FPISO56-F-HE Detection and Isolation of a Fire Protection Water Break before Failing 480 VAC 2.4E-02
Buses 61 and 62 and Eventual Isolation of the 4 kVAC Bus 6 Motor Loads08-FPISO68-F-HE Detection and Isolation of a Fire Protection Water Break before Failure of the 1.6E-02
Motor Driven AFW Pumps08-FPSISOICF-HE Detection and Isolation of a Medium Flood due to a Steamline Break before 3.OE-02
Eventual Isolation of the 4 kVAC Bus 5 Motor Loads08-FPSISO29F-HE Detection and Isolation of a Large Flood due to a Steamihne Break before Eventual 1.0
Isolation of the 4 kVAC Bus 5 Motor Loads08-FPSISO2CF-HE Detection and Isolation of a Medium Flood due to a Steamline Break before Failing 3.OE-02
the Turbine Driven AFW Pump Auxiliary Lube Oil Pump08-FPSISO3CF-HE Detection and Isolation of a Medium Flood due to a Steamline Break before Failing 3.OE-02
480 VAC Buses 61 and 62 and Eventual Isolation of the 4 kVAC Bus 6 MotorLoads
08-FPSISO45F-HE Detection and Isolation of a Large Flood due to a Steamline Break before Failing 6.6E-02the Turbine Driven AFW Pump Auxiliary Lube Oil Pump
08-FPSISO56F-HE Detection and Isolation of a Large Flood due to a Steamline Break before Failing 3.OE-02480 VAC Buses 61 and 62 and Eventual Isolation of the 4 kVAC Bus 6 MotorLoads
44
C C (7
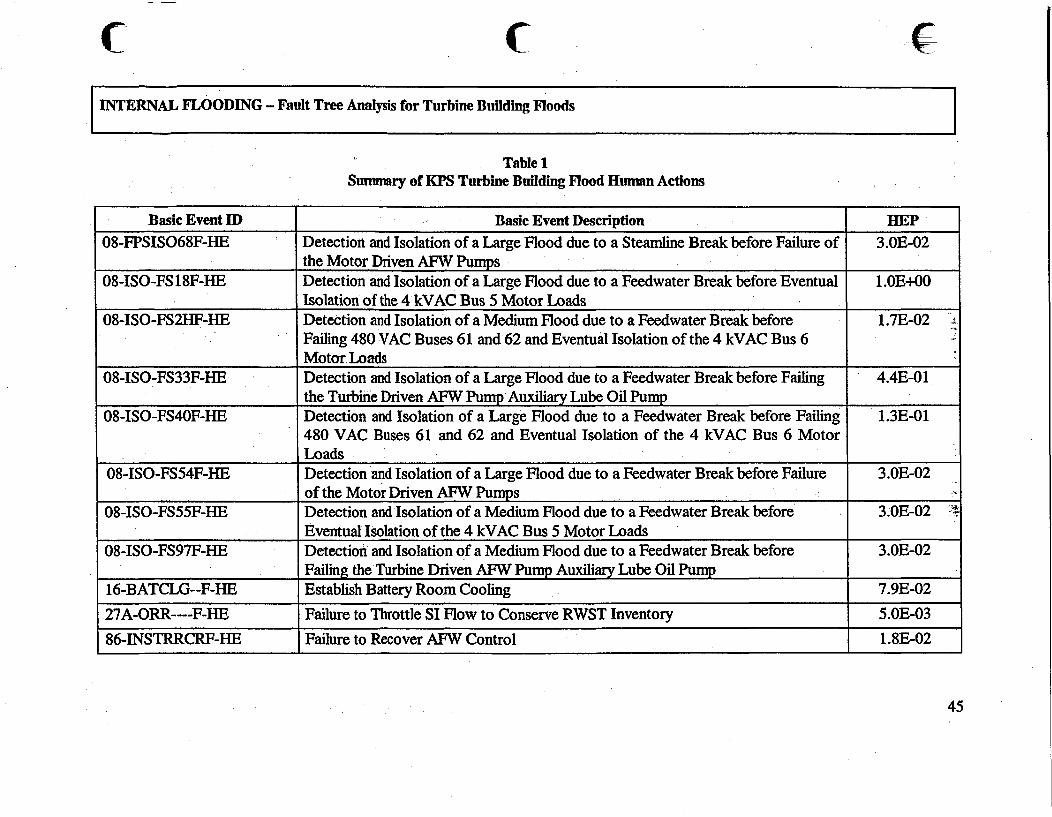
C 4: (INTERNAL FLOODING - Fault Tree Analysis for Turbine Building Floods
Table 1Suinmary of KPS Turbine Building Flood Human Actions
Basic Event IED Basic Event Description HEP08-FPSISO68F-HE Detection and Isolation of a Large Flood due to a Steamline Break before Failure of 3.OE-02
the Motor Driven AFW Pumps ;08-ISO-FS 18F-HE Detection and Isolation of a Large Flood due to a Feedwater Break before Eventual 1.OE+00
Isolation of the 4 kVAC Bus 5 Motor Loads08-ISO-FS2HF-HE Detection and Isolation of a Medium Flood due to a Feedwater Break before 1.7E-02
Failing 480 VAC Buses 61 and 62 and Eventual Isolation of the 4 kVAC Bus 6Motor Loads
08-ISO-FS33F-HE Detection and Isolation of a Large Flood due to a Feedwater Break before Failing 4.4E-01_____ the Turbine Driven AFW Pump Auxiliary Lube Oil Pump
08-ISO-FS40F-HE Detection and Isolation of a Large Flood due to a Feedwater Break before Failing 1.3E-01480 VAC Buses 61 and 62 and Eventual Isolation of the 4 kVAC Bus 6 MotorLoads
08-ISO-FS54F-HE Detection and Isolation of a Large Flood due to a Feedwater Break before Failure 3.OE-02of the Motor Driven AFW Pumps
08-ISO-FS55F-HE Detection and Isolation of a Medium Flood due to a Feedwater Break before 3.0E-02 4Eventual Isolation of the 4 kVAC Bus 5 Motor Loads
08-ISO-FS97F-HE Detection and Isolation of a Medium Flood due to a Feedwater Break before 3.OE-02Failing the Turbine Driven AFW Pump Auxiliary Lube Oil Pump
16-BATCLG--F-HE Establish Battery Room Cooling 7.9E-02
27A-ORR----F-HE Failure to Throttle SI Flow to Conserve RWST Inventory 5.OE-03
86-INSTRRCRF-HE Failure to Recover AFW Control 1.8E-02
45

Table 2: Basic Events Added to KNPP.BED
Basic Event ID Basic Event Description Point Estimate02-S W4A-B29F-1HE Detection and Isolation of a Service Water Break before Eventual Isolation of the 4 kVAC 2.OE-02
____ ____ ____ ____ us 5 M otor Loads_ _ _ _ _ _ _
2-S W4A-B45F-BE etcinand Isolation of a Service Water Break before Failing the Turbine Driven AFW 2.OE-02_____________ ump Auxiliary Lube Oil Pump_____
2S W4A-B5 iF-BE Detection and Isolation of a Large Service Water Break before Failing 480 VAC Buses 61 2.OE-02________________nd 62 and Eventual Isolation of the 4 kVAC Bus 6 Motor Loads
02-S W4A-B 60F-1HE Detection and Isolation of a Large Service Water Break before Failure of the Motor Driven 2.OE-02____AFWPumps__
02-S W4A-B66F-BE Detection and Isolation of a Large Service Water Break before Water Level Reaches 18 2.OE-02______ ______ _____ nches in the Turbine Building_ _ _ _ _ _ _
0-CWSTP 13-F-HE Detection and Isolation of a 14,000-gpm Circulating Water Break before Eventual Isolation 2.6E-01________________f the 4 kVAC Bus_5 Motor Loads
0-CWSTP19-F-BE Detection and Isolation of a 14,000-gpm Circulating Water Break before Failing the- 1.2E-01____________ urbine Driven AFW Pump Auxiliary Lube Oil Pump
)-CWST'P22-F-BE Detection and Isolation of a 14,000-gpm Circulating Water Break before Failing 480 VAC 1.2E-01________________uses 61 and 62 and Eventual Isolation of the 4 kVAC Bus 6 Motor Loads
)-CWSTP25-F-1HE Detection and Isolation of a 14,000-gpm Circulating Water Break before Water Level 1.2E-01________________eaches 18 Inches in the Turbine Building
0-CWSTP29-F-BE Detection and Isolation of a Small Circulating Water Break before Eventual Isolation of the 4.3E-02_______________ kVAC Bus 5 Motor Loads
04CWSTP45-F-BE Detection and Isolation of a Small Circulating Water Break before Failing the Turbine 1 .7E-02_____________ riven AFW Pump Auxiliary Lube Oil Pump_____
46
C7 C C
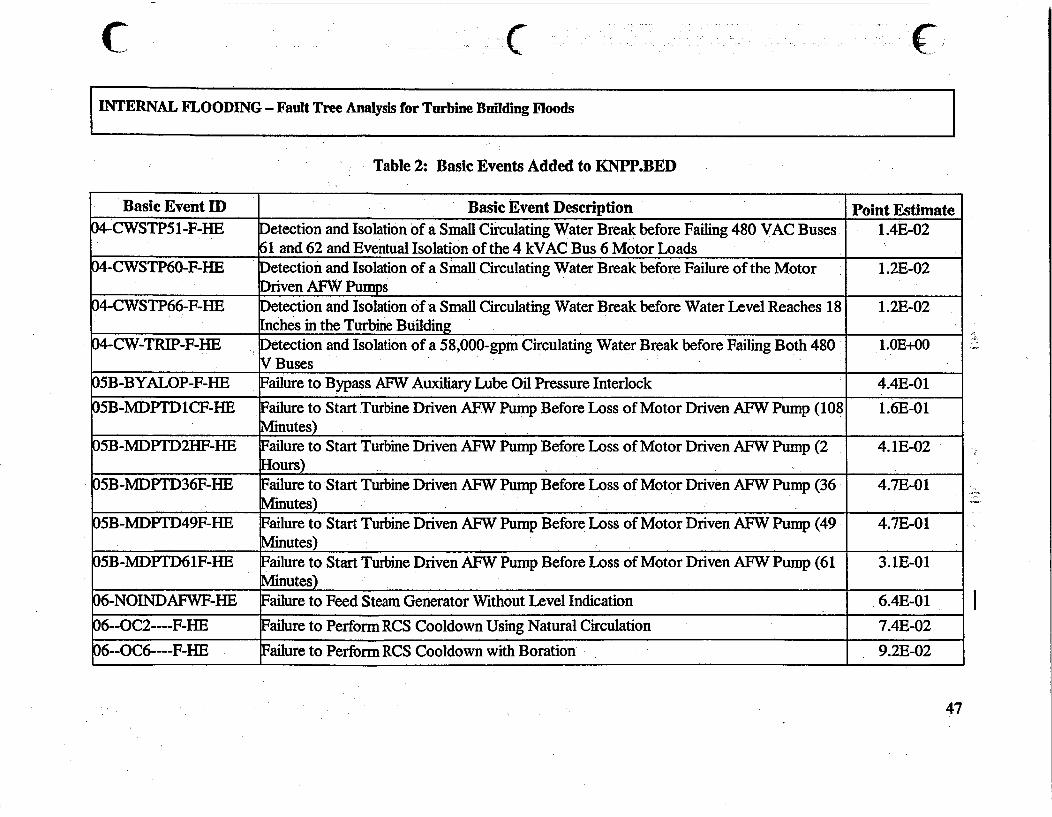
.
;INTERNAL FLOODING - Fault Tree Analysis for Turbine Building Floodsl
Table 2: Basic Events Added to KNPP.BED
Basic Event ID Basic Event Description Point Estimate04-CWSTP51-F-HE Detection and Isolation of a Small Circulating Water Break before Failing 480 VAC Buses 1.4E-02
61 and 62 and Eventual Isolation of the 4 kVAC Bus 6 Motor Loads04-CWSTP60-F-HE Detection and Isolation of a Small Circulating Water Break before Failure of the Motor 1.2E-02
Driven AFW Pumps4-CWSTP66-F-HE Detection and Isolation of a Small Circulating Water Break before Water Level Reaches 18 1.2E-02
Inches in the Turbine Building04-CW-TRIP-F-IHE Detection and Isolation of a 58,000-gpm Circulating Water Break before Failing Both 480 1.0E+00
V Buses)5B-BYALOP-F-HE Failure to Bypass AFW Auxiliary Lube Oil Pressure Interlock 4.4E-01D5B-MDPlD1CF-HE Failure to Start Turbine Driven AFW Pump Before Loss of Motor Driven AFW Pump (108 1.6E-01
Minutes)05B-MDPTD2HF-HE Failure to Start Turbine Driven AFW Pump Before Loss of Motor Driven AFW Pump (2 4. 1E-02
- _ Hours)05B-MDPTD36F-HE Failure to Start Turbine Driven AFW Pump Before Loss of Motor Driven AFW Pump (36 4.7E-01
Minutes)05B-MDPTD49F-HE Failure to Start Turbine Driven AFW Pump Before Loss of Motor Driven AFW Pump (49 4.7E-01
Minutes)05B-MDPTD61F-HE Failure to Start Turbine Driven AFW Pump Before Loss of Motor Driven AFW Pump (61 3.lE-01
Minutes)06-NOINDAFWF-HE Failure to Feed Steam Generator Without Level Indication 6.4E-01
06--OC2----F-HE Failure to Perform RCS Cooldown Using Natural Circulation 7.4E-0206--OC6----F-HE Failure to Perform RCS Cooldown with Boration 9.2E-02
I
47
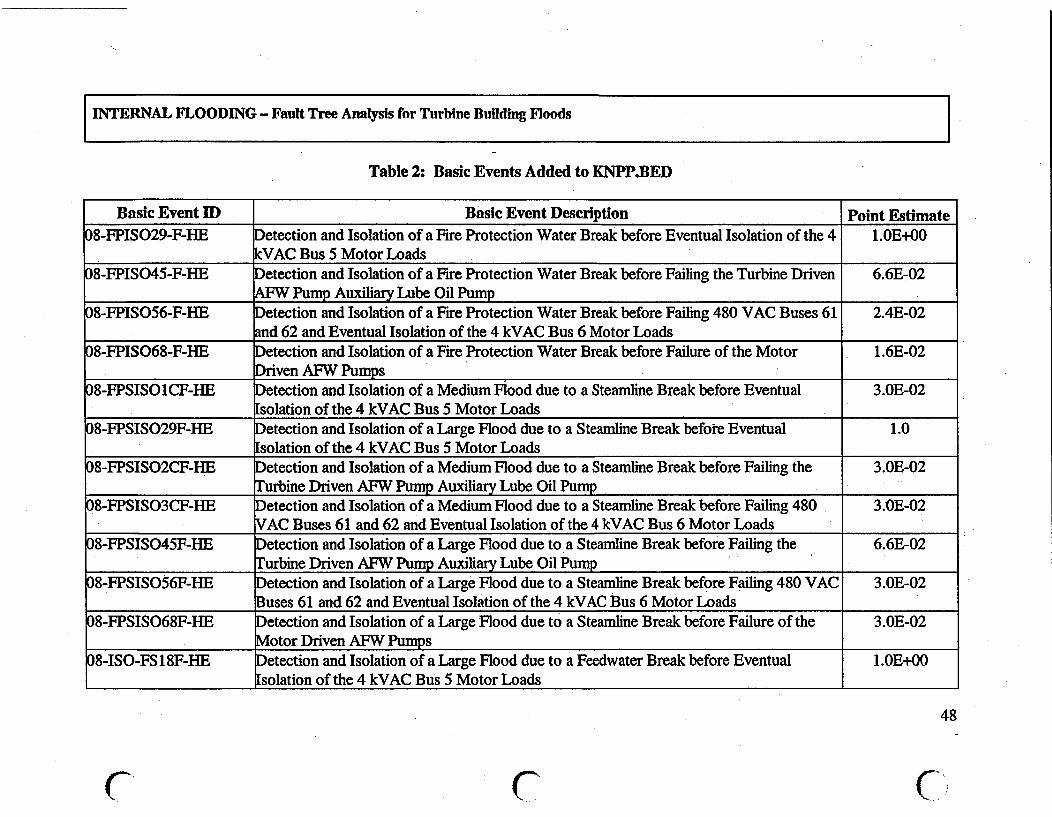
|INTE RNAL FLOODING - Fault Tree Analysis for Turbine Building Floodsl
Table 2: Basic Events Added to KNPP.BED
Basic Event ID Basic Event Description Point Estimate08-FPIS029-F-HE Detection and Isolation of a Fire Protection Water Break before Eventual Isolation of the 4 1.OE+00
kVAC Bus 5 Motor Loads08-FPISO45-F-HE etection and Isolation of a Fire Protection Water Break before Failing the Turbine Driven 6.6E-02
__AFPump Auxiliary Lube Oil Pump08-FPISO56-F-HE Detection and Isolation of a Fire Protection Water Break before Failing 480 VAC Buses 61 2.4E-02
and 62 and Eventual Isolation of the 4 kVAC Bus 6 Motor Loads8-FPISO68-F-HE Detection and Isolation of a Fire Protection Water Break before Failure of the Motor 1.6E-02
Driven AFW Pumps8-FPSISOICF-HE Detection and Isolation of a Medium Flood due to a Steamline Break before Eventual 3.OE-02
Isolation of the 4 kVAC Bus 5 Motor Loads08-FPSISO29F-HE Detection and Isolation of a Large Flood due to a Steamline Break before Eventual 1.0
Isolation of the 4 kVAC Bus 5 Motor Loads08-FPSISO2CF-HBE Detection and Isolation of a Medium Flood due to a Steamline Break before Failing the 3.OE-02
Turbine Driven AFW Pump Auxiliary Lube Oil Pump)8-FPSISO3CF-HE Detection and Isolation of a Medium Flood due to a Steamline Break before Failing 480 3.OE-02
VAC Buses 61 and 62 and Eventual Isolation of the 4 kVAC Bus 6 Motor Loads
)8-FPSISO45F-HE Detection and Isolation of a Large Flood due to a Steamline Break before Failing the 6.6E-02Turbine Driven AFW Pump Auxiliary Lube Oil Pump
)8-FPSISO56F-HE Detection and Isolation of a Large Flood due to a Steamline Break before Failing 480 VAC 3.OE-02Buses 61 and 62 and Eventual Isolation of the 4 kVAC Bus 6 Motor Loads
)8-FPSISO68F-HE Detection and Isolation of a Large Flood due to a Steamline Break before Failure of the 3.OE-02Motor Driven AFW Pumps
8-ISO-FS18F-HE Detection and Isolation of a Large Flood due to a Feedwater Break before Eventual 1.OE+00Isolation of the 4 kVAC Bus 5 Motor Loads
48
C C C 1

C C C
INTERNAL FLJOODING - Fault Tree Analysis for Turbine Building Floodsl
Table 2: Basic Events Added to KNPP.BED
Basic Event ID Basic Event Description Point Estimate08-ISO-FS2HF-BE Detection and Isolation of a Medium Flood due to a Feedwater Break before Failing 480 1.7E-02
.___ VAC Buses 61 and 62 and Eventual Isolation of the 4 kVAC Bus 6 Motor Loads08-ISO-FS33F-HE etection and Isolation of a Large Flood due to a Feedwater Break before Failing the 4.4E-O1
Turbine Driven AFW Pump Auxiliary Lube Oil Pump08-ISO-FS40F-HE etection and Isolation of a Large Flood due to a Feedwater Break before Failing 480 1.3E-01
__ AC Buses 61 and 62 and Eventual Isolation of the 4 kVAC Bus 6 Motor Loads8-ISO-FS54F-HE Detection and Isolation of a Large Flood due to a Feedwater Break before Failure of the 3.0E-02
Motor Driven AFW Pumps8-ISO-FS55F-HE Detection and Isolation of a Medium Flood due to a Feedwater Break before Eventual 3.0E-02
Isolation of the 4 kVAC Bus 5 Motor Loads08-ISO-FS97F-HE Detection and Isolation of a Medium Flood due to a Feedwater Break before Failing the 3.0E-02
Turbine Driven AFW Pump Auxiliary Lube Oil Pump16-BATCLG--F-HE Establish Battery Room Cooling 7.9E-0227A-ORR----F-E Failure to Throttle SI Flow to Conserve RWST Inventory 5.0E-0386-INSTRRCRF-HE Failure to Recover AFW Control 1.8E-02
04-CW-MDAFPAMHE Operator Fails to Control MDAFP Med CW Break AC Avail 1.00E-01)4-CW-TRIP-F-BE FAIL TO ISOL LRG CIRC WTR BRK BEFORE FAILURE OF 480V BUS 1.OOE+0005B-FRACTDP-OFF Prob of Conditions Where TDAFP Is Secured 9.00E-01CX06-ISOL-A Fail to Isolate Before Failure of any Buses CW Mod5.00-01
X06-ISOL-B Fail to Isolate Before Failure of AFWP CW Mod 5.00E-01X06-ISOL-C Fail to Start MDAFP CW Moderate 5.00E-01X06-ISOL-D Fail to Start MDAFP CW Moderate 5.00E_-0_1_
49

|INTERNAL FLOODING - Fault Tree Analysis for Turbine Building FloodsI
Table 2: Basic Events Added to KNPP.BED
Basic Event ID Basic Event Description Point Estimate
FI06-ISOL-A Fail to Isolate Before Failure of any Buses FP Large 5.00E-01
FI06-ISOL-B Fail to Isolate Before Failure of AFWP FP Large 5.OOE-01FI06-ISOL-C Fail to Start MDAFP FP Large 5.OOE-01IE-CI06B LARGE CIRC WTR LINE BREAK IN TURB BLDG BASEMENT 4.76E-05
E-CX06B MEDIUM CIRC WIR LINE BREAK IN TURB BLDG BASEMENT 4.76E-05E-CY06B SMALL CIRC WTR LINE BREAK IN TURB BLDG BASEMENT 7.34E-05E-FI06B LARGE FIRE PROTECT LINE BREAK IN TURB BLDG BASEMENT 1.05E-04E-SI06B LARGE SERVICE WTR LINE BREAK IN TURB BLDG BASEMENT 3.22E-05
E-TI06B STEAMLINE BRK IN TURB BLDG CAUSES LARGE FIRE PROTr 9.OOE-03E-TX06B STEAMLINE BRK IN TURB BLDG CAUSES MEDIUM FIRE PROT 9.OOE-03E-WI06B [GE FEDWATER BREAK IN TURBINE BLDG BASEMENT 9.41E-04E-WX06B MEDIUM FEEDWATER BREAK IN TURBINE BLDG BASEMENT 9.41E-04SI06-ISOL-A Fail to Isolate Before Failure of any Buses SW Large 1.00E+00
I06-ISOL-B Fail to Isolate Before Failure of AFWP SW Large 5.OOE-01SI06-ISOL-C Fail to Start MDAFP SW Large 5.OOE-01SI06-ISOL-D FAIL ISOLATION BEFORE 18 INCHES ON TDAFP SW LARGE 5.OOE-01SL21-CD RCP SEAL LOCA GREATER THAN 21 GPM NO RCS COOLDOWN 2.OOE-01
SL21-NO-CD RCP SEAL LOCA GREATER THAN 21 GPM NO RCS COOLDOWN 6.OOE-01106-ISOL-A Fail to Isolate Before Failure of any Buses STM Large 5.OOE-01
50
C C C
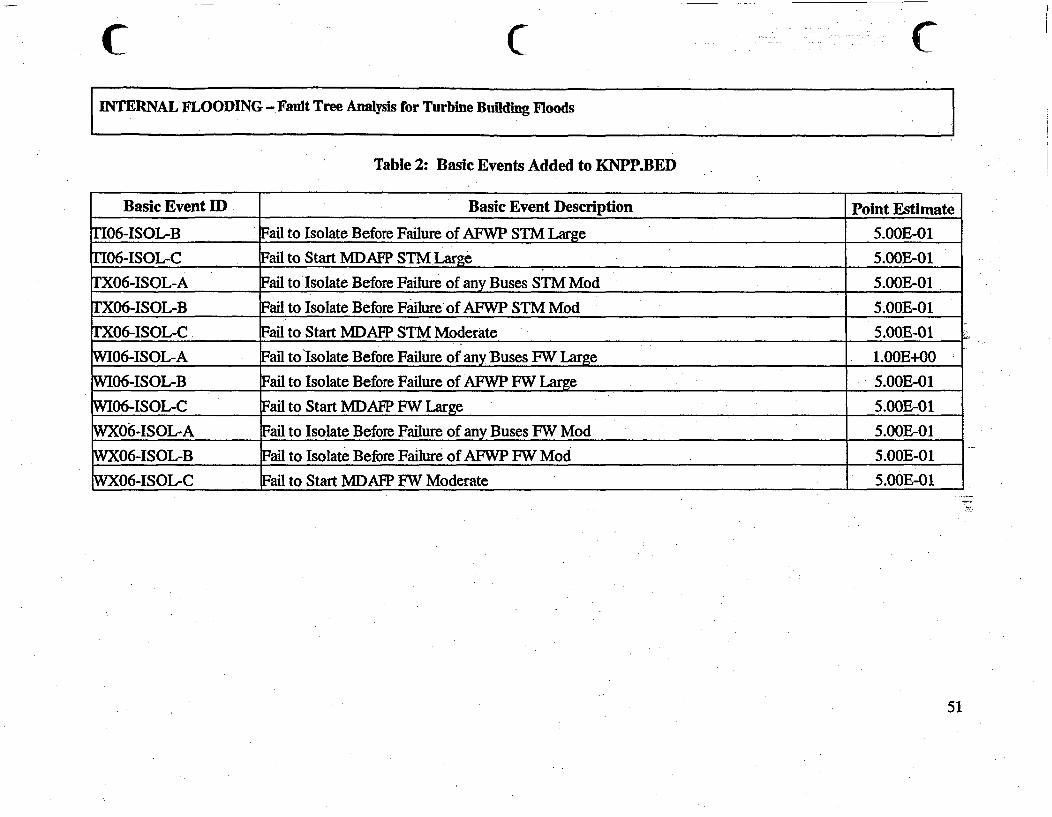
r C C
INTERNAL FLFOODING - Fault Tree Analysis for Turbine Building Floods
Table 2: Basic Events Added to KNPP.BED
Basic Event ID Basic Event Description Point Estimate
TI06-ISOL-B Fail to Isolate Before Failure of AFWP STM Large 5.00E-01
T106-ISOL-C Fail to Start MDAFP STM Large 5.OOE-01
TX06-ISOL-A Fal to Isolate Before Failure of any Buses STM Mod 5.OOE-01
TX06-ISOL-B Fal to Isolate Before Failure of AFWP STM Mod 5.00E-01
06-ISOL-C Fail to Start MDAFP STM Moderate 5.OOE-01
WI06-ISOL-A Fail to Isolate Before Failure of any Buses FW Large 1.OOE+00
WI06-ISOL-B Fall to Isolate Before Failure of AFWP FW Large 5.OOE-01
WI06-ISOL-C Fall to Start MDAFP FW Large 5.OOE-01
WX06-ISOL-A Fail to Isolate Before Failure of any Buses FW Mod 5.00E-01
WX06-ISOL-B Fal to Isolate Before Failure of AFWP FW Mod 5.OOE-01
WX06-ISOL-C rail to Start MDAFP FW Moderate 5.OOE-01
51
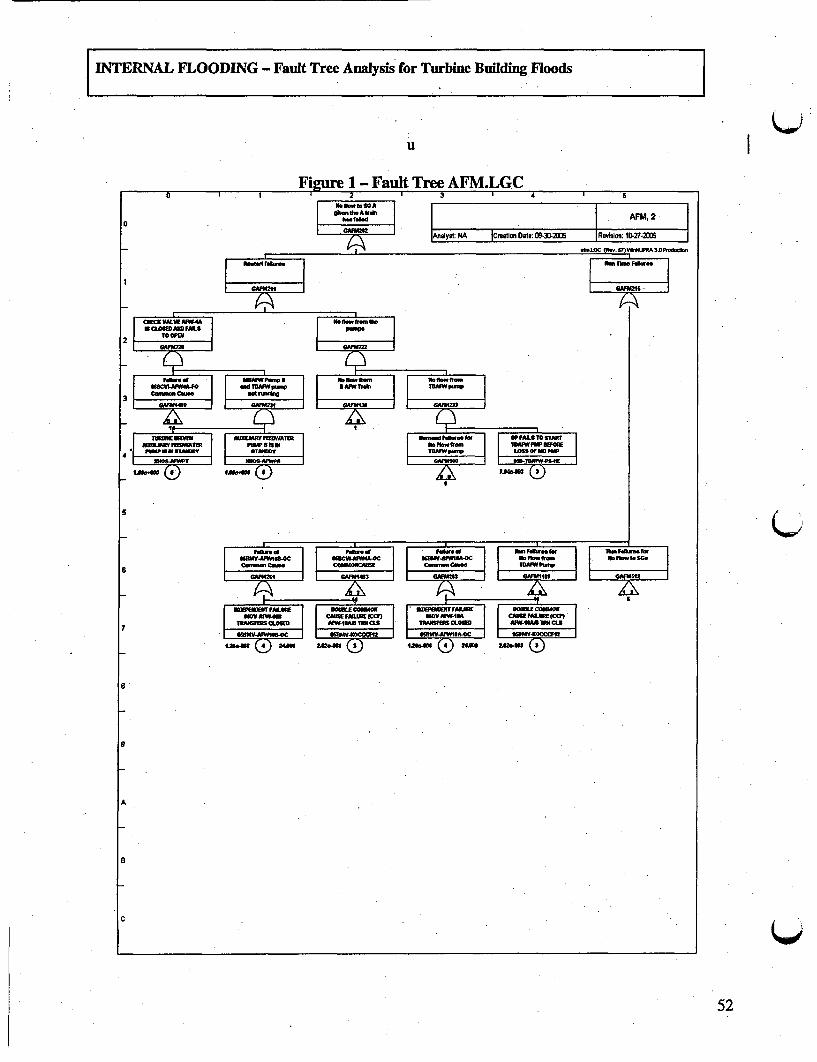
INTERNAL FLOODING - Fault Tree Analysis for Turbine Building Floods |
Q
Figure 1- Fault Tree AFM.LGCO I 3 1 4 1 5
O.-th.Afi AFM, 2
AAnalyt : NA lCrestion Date' M3-21 R0i05on: 10 D-27D
mtIOC .n a
1r I I
ma.OmAM2IS
IS Cl OSMI ANID FAIIL S
2 CAFM2M
DAIWPw. A bflFW.*h UlGA .3 egrqa "4_
_OP FLS TO STARTSm/FlWAlR FIW 5111 r Fbh lDA"PW KSFORE'.STANU STAMM LO W .OFVA P.P
5 ~ AF0
52
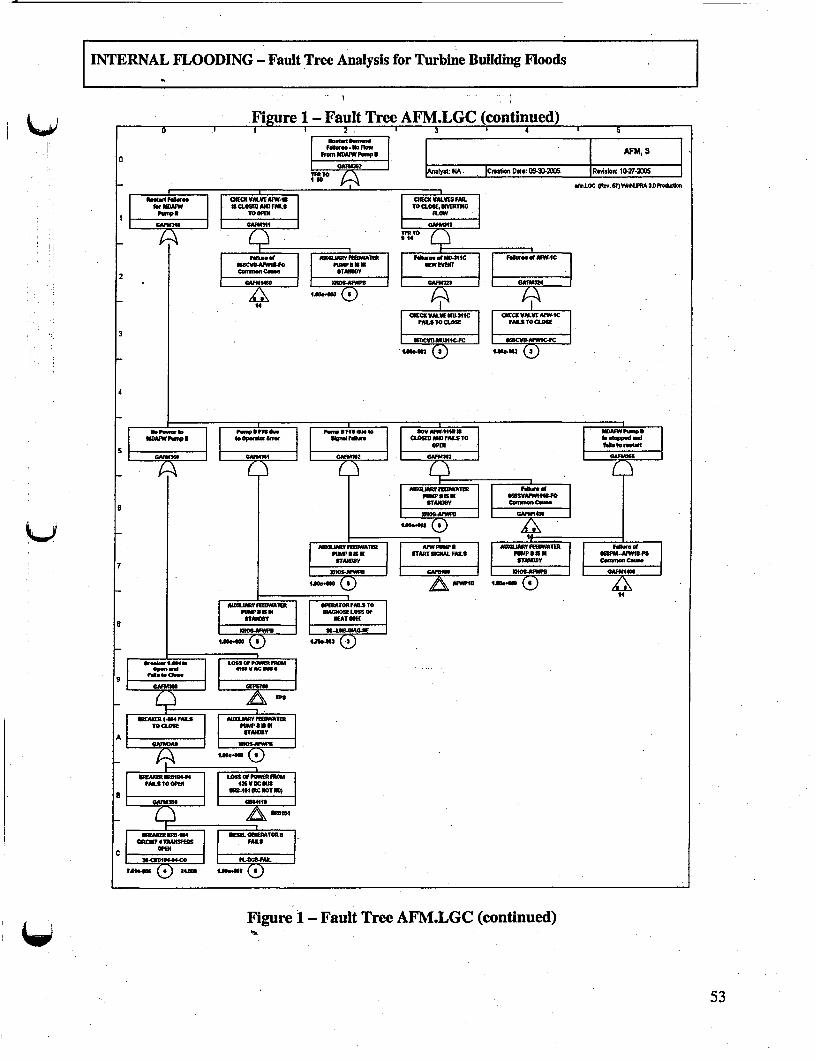
INTERNAL FLOODING - Fault Tree Analysis for Turbine Building Floods
Ia
I
2
3
4
5
6
7
a
9
A
a
Figure 1- Fault Tree AFM.LGC (continued)
53

INTERNAL FLOODING - Fault Tree Analysis for Turbine Building FloodsI
u I I 3 S
a
I
2
3
4
5
6
7
B
9
A
B
C
Figure 1- Fault Tree AFM.LGC (continued)
0
54

INTERNAL FLOODING - Fault Tree Analysis for Turbine Building Floods
U I 4 5
la
I
2
3
4
5
6
7
8
II Is
9
A
C
Figure 1- Fault Tree AFM.LGC (continued)
55

INTERNAL FLOODING - Fault Tree Analysis for Turbine Building Floods
l
U I1 I -21 4 * &I
I
2
3
4
6
6
7
8
9
A
a
C
Figure 1- Fault Tree AFM.LGC (continued)
(4mJ
56
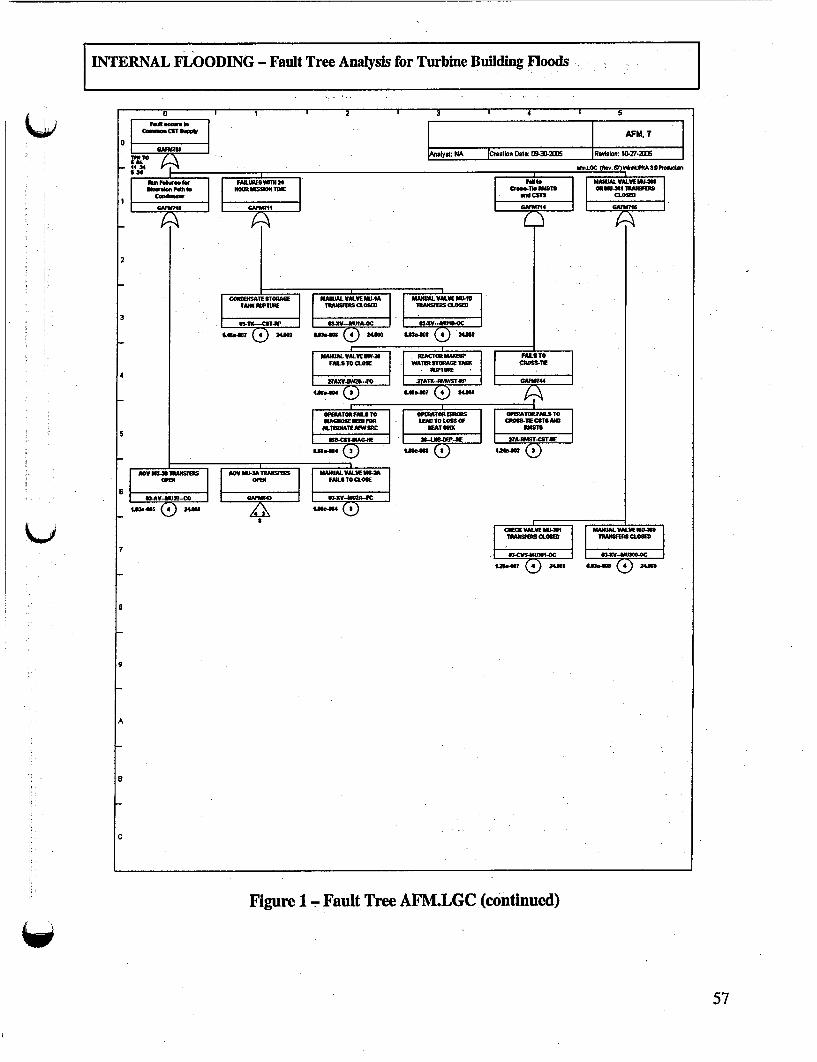
INTERNAL FLOODING - Fault Tree Analysis for Turbine Building Floods
a I I 3 I 4 I 5
0
1
2
3
4
5
ffl-TR O OPMTCROW_ OPATORFALTODoff 1 FO. I LE TO LOF iRMS-1W CM AME
I TEIU 4T4 (W9 I (CFITT_Lr. 16m B4-_^4.M #P(ji)S~I
B
7
0
9
A
a
C
Figure 1- Fault Tree AFM.LGC (continued)
57
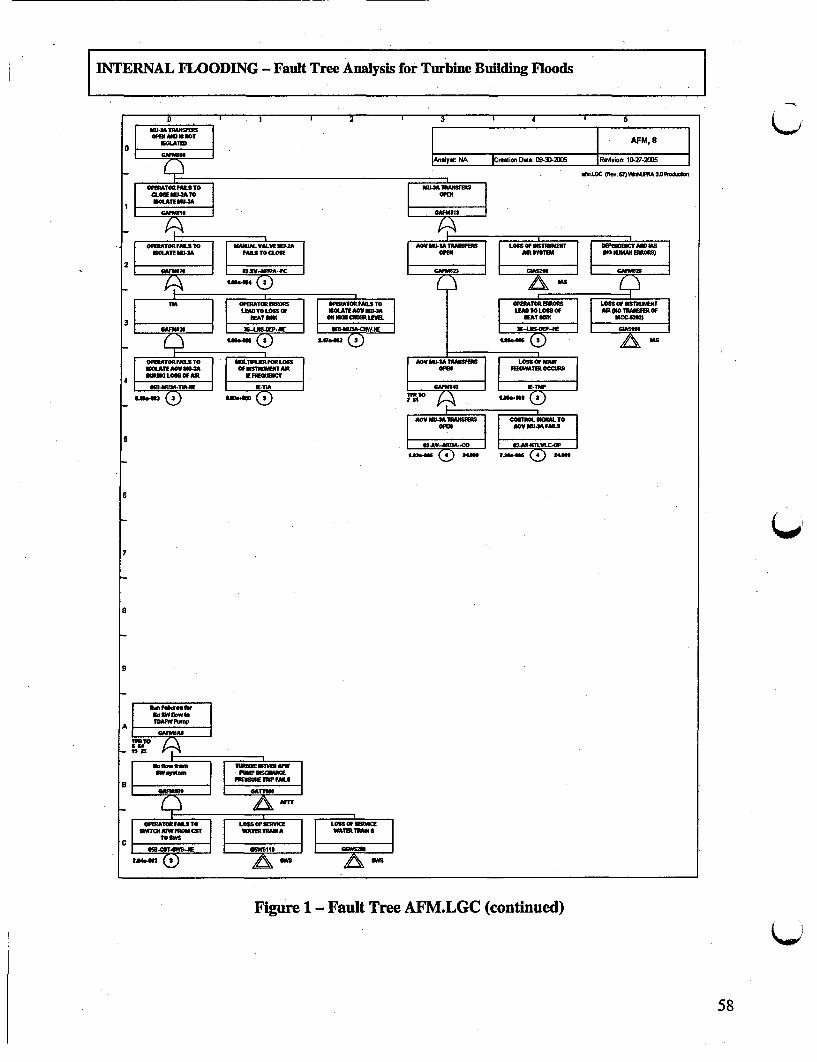
INTERNAL FLOODING - Fault Tree Analysis for Turbine Building Floods
0
i-/
I2
3
4
5
I
a
9
A
B
C
Figure 1- Fault Tree AFM.LGC (continued)
58

INTERNAL FLOODING - Fault Tree Analysis for Turbine Building Floods
-0 - - I I I 2 1
0
3 I 4 1 5
elAtS9: KA lCreation Date: ISD-33X5 Reso: 02.
aleLDC (Ro. S7)Vki4PRA 3DWore.5M
,
An.4P
2
_
4
5
13
6
7
8
S
A
a
C
Figure 1- Fault Tree AFM.LGC (continued)
59

INTERNAL FLOODING - Fault Tree Analysis for Turbine Building Floods
U
a
I 12
- .am
3 I 4 1 5
I I AFM, 10Iyt: NA Creation Date; 03205 I Revision: 10-27-2005
BLOC 0w.S7)1vIRA* 3 on
0
I4 . I
na.n___P.W
2
3
4
5
6
7
a
9
A
ID
C
Figure 1- Fault Tree AFM.LGC (continued)
60
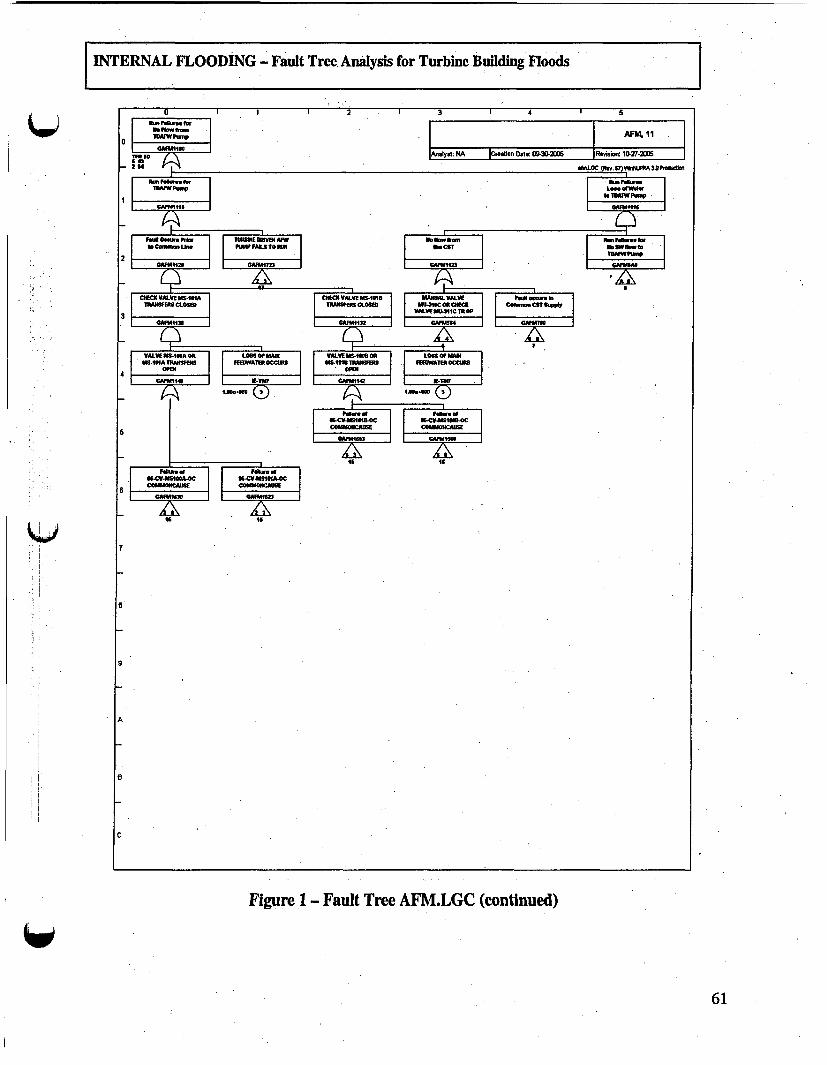
INTERNAL FLOODING - Fault Tree: Analysis for Turbine Building Floods
Figure 1- Fault Tree AFM.LGC (continued)
61

INTERNAL FLOODING - Fault Tree Analysis for Turbine Building Floods
I L It 2 I
o
3 I 4 5
1 1 APM, 12jAnalyst NA Creation Date: 3C-205 IRevision: 10.27-235 1
-fSLOC Ot..S7)VkORA3D
1
2
3
4
5
6
C1AWTORFALSTO LO# OF SICS _ Fd r _ LOSS OF ISMICE _A&S AORMLSTOOMAUAMLVWALWS TRAWA ICVMa" TO VAlUITASMIB OM MANUAL VALWS
7 WM"&= e R mo. cemm S*41u AIER TST
- U .h AM9 US L~!.... uivuaaAS Se£Ja.6 .
e
0
A
B
C
Figure 1- Fault Tree AFM.LGC (continued)
62

INTERNAL FLOODING - Fault Tree Analysis for Turbine Building Floods
N 0V 1 2 3 4
_CLORAND tFAIF TO
> X n natyst: NA Cm stbn Dte: 09420
i O S1AILi TO I U EttRItitVE IWillAUXUJM YMWMT
FPUMPU0STAN=lO
OGOV Blom .A I *ND
C11e~EA SWttwp
r~-4cCNTU hAilto t 1FIS TO _ TIPIAIWPWA EAT ttlIT
4~W4JWOffE
F I Falt TSred
C6# l512F A 2
Figure 1- Fal ATree A#JLCcntnud
63
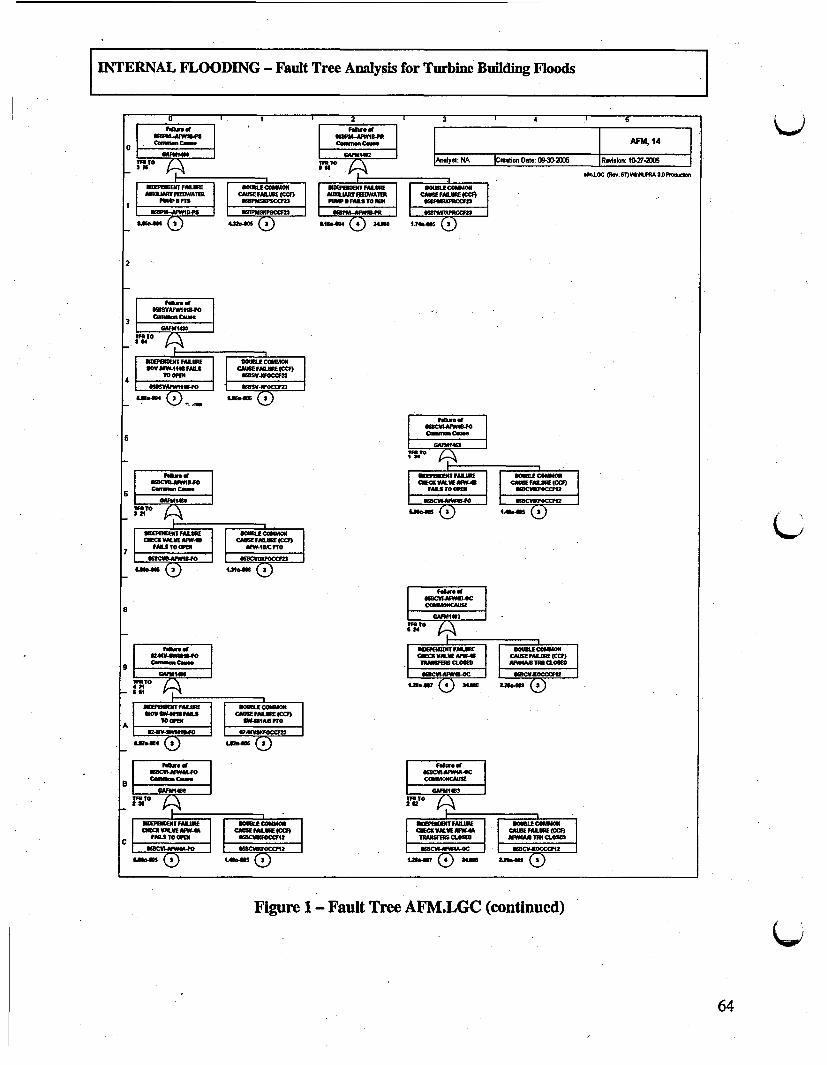
INTERNAL FLOODING - Fault Tree Analysis for Turbine Building Floods
WmWMS41 GSPM-AMB-PR
GAIMiaI GA1142AFM,142
1-TO TM To ye A Creation Date: W3- ri~nt-7~tftn.GC44H57 WiP &Sh~re.fl.d
11108MBET PALUREI.EcmO 1111"MN1 MALUR DOUBLECO&SONDiOflART FEMATt CAS FALUR (CCI) AU50iLMW FE1T CAUSE MALUES (CCF)
PMP a ITl UGBtAiSICSCCI22 PO3W SIMAS TO -U OGBPMORCCI2SX
mBPmCCF415I IWIIM3P GPWRCCF23
156.m Q4 42 3 0 A4.m66 4 2450 8.434064 (2
2
1TO'3 64_
I FM~T Aa.IRE n90"Em-COMMINWOVAIW-44161 . CAUSES P8AL0 (CCF)
TOO 095SV4W0WC23
uas.vrm Qm ~~ M a
5
M TO3 a
CNECRI VALVE M~3 ICAr "50 CI7 568.A TOOMP It IWiCT
7 omm~
66-U(2) I J.6 ~
8
cmm.m
WWAM!SC
-10T
I 0133 VALE 138.6 I CAUS! FAILURE VCC)
CGAIMNCAIGAFMo (3
I 0130 VALVE AW4A 11 eM! P81.3 (CCI)
t.3.46? (4) 418 .76.IN a
I
56aw. of
1I T OO 9 6 1 4 1 A T
1-AT OT
8 . 6 BCI N ( 2 )1 .4 .1 8 ( j
Figure 1- Fault Tree AFM.LGC (continued)
64

INTERNAL FLOODING - Fault Tree Analysis for Turbine Building Floods
U 1
TO OC I
MIVAIV AIm; I CA mm"AMICd
TRANOSI Ea TOPSIIAFAa cuTI,
w -VUA4C GSOCCt2
IM)N FXd I OBECMO3 C M. MN CAS CAR I E E
120406 240 $2MA
011Oa° Q
COE1W FALURE (CCI)T I LOSID0 I S. A TRANS CLS
4
1.28 (8 ) 2J2U4 24400
5
1100 W14-P6~ COM
"A
lRAISFES CL aSswe X C
1.0.0 (W 2480 2 _86U~ 0 2.J0I
h
mvd.n~o9 Cl3mC
lO TooIll 00. W~S CC)TO 0v110 0 .WBIOCCFU2
O0SA11BF .wcC2
3 I , 4 1 . 5
AFM, 16
Analyst: NA |Croation Dae: 0932XS RWrosn: 10-27-2M6
ISLOC 0Go.7)WWS.PRa3,O
1U-CV.NSIA4CCOMMO MSAS 1
el_
u.CVII SAIIIB-OCC F ICF
0c4148C02 1
1.207 240 22640
I CVJS18BC1 I
I c"16a 3
TO TO
I CPIEC UTwACUREB 1 NUS FA SCE
ISTMAIWESCLOWE .I1"ALUc
IW C I I "OCCC21
1TQ) 20 2(9
I 6 "PIM11G.F0
I 44T
| AV011iCFAL | CAUSEFACUREMc
N eSw"M'111CF0" *5S V
~~ 0.G). uCJ9C
a
C
Figure 1- Fault Tree AFM.LGC (continued)
65

INTERNAL FLOODING - Fault Tree Analysis for Turbine Building Floods
Figure 1- Fault Tree AFM.LGC (continued)
66

INTERNAL FLOODING - Fault Tree Analysis for Turbine Building Floods
U
O CONmon C~O"Im
T olFf14E mm NULCOMM0Namwse FALURE
F.Mv4wml-Fo
I
4242400"
I eelw. TOf4 11.114aE ITe oMa2 C C
CIEftVALEtC"IC CAUSE VFALUE (CCF)3 FALS TO OPEN I UtNBl C FT0
S3C-UM1C F0
_ Wa
3 4 I 5
II AFM, 17Analyst: NA Creation Date: WI3-2Xt6 |RvAsim: 10F27.M,
OtO0C Q. 97A 'tRA3Dfrdn
06CV0WCFO
6GAFILMI
1"A TO
t E I j CAUSE ALRE (C01)
6 tAl I.IAC eO
lilarn () lIa-aa (!)
l94PT~s~c-
TM4 TO9 44
P59.9TO 9PTAtSCW2TsuT40 Q)9
IT FK ~aE r ,9, Co09TDlaea 3l w3 FU1
on C C~
TFRI.C1M
T. FeLE-C0MM01clrLbnsCWUSEVFLILtCCF)I
C F TS0PI 4N`occn2I 516sCo4WOCCF12 I
ImW US
US-Cw-mS1aA-1OcC-C
GAFUIT
I areafs A ull T0UI CO MMON2
I oI SS-C 1 1 Ct 2
S Wm W
Figure 1- Fault Tree AFM.LGC (continued)
67

INTERNAL FLOODING - Fault Tree Analysis for Turbine Building floods
IU I
I a c.. aMat 115W110 Ca r_ .V -
'. YmVnow"TO
z
l l AFM, 18
lAnalyst:NA Creaton Date: 3D2 IRaswn: 1027-2D5 l
__t10C Otv.Mf)t"RA3Ifs&.thn
I
2
3
4
5
U~ilATOS ETO _. AL1At TIRAUAITO |as5.1uaE CAIT ASa~o~ uaD WO .OSS OF magg FOR l
6 i . T t W TTE
A-MST cTJIE 2?AOV F X4JE-I SlAG-I
L36a-S C tS
("W/
9
A
B
C
Figure 1- Fault Tree AFM.LGC (continued)
68
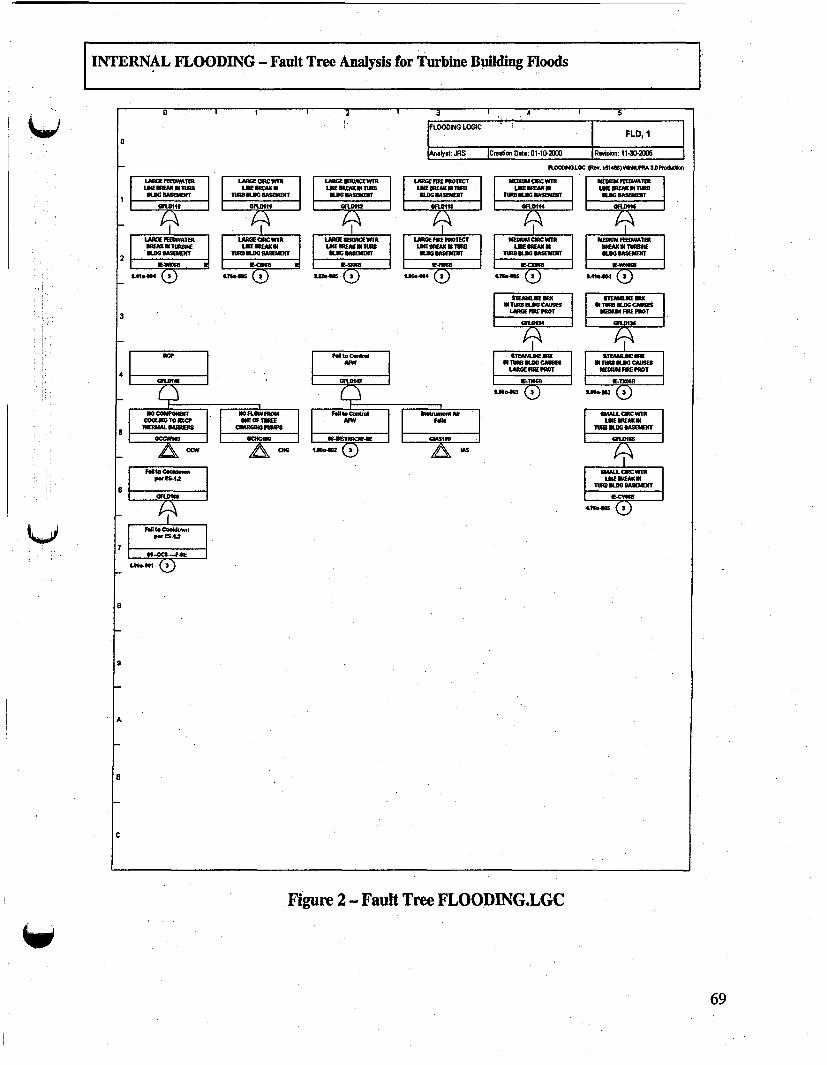
INTERNAL FLOODING - Fault Tree Analysis for Turbine Building Floods
u I* 4 I
A alyhat: ARS 1Creatin 0ete: 01 .10 -M M R _iio: L O, I
LARGE MIV T~
I 1-SGBSEEN
PREAKEININNREE
e&le.e (9
LAmeCWmcwmLIEBEAII
OM DGASWMN
GIPLA1111
IUIESEDAKI
L=1109AEMNI R-Co( 9
LARMe eawicwri LARE MM riUCTLME EEAKEINTUR WIENE@MUI
I J E M BAS uUENT IU E GBA K.IuEI
G"12 I LIM
LARGESER)ICE R eARG FIEPRTC
3
M MOE WIOLO C h 4 t E h ft 3 l r @ o
NEeRCICWM WIEDRW PEORMTEWEEIMENU LINE URE MEIN TM
GFLD114 @19 115
LIKE BEAKe IN OReEM lcUR IE I
( a ) e.6 4ee0 4" ( a)
SIEAAIKeE WS STEMILE -RmimeR SLUG CAUSES *TWWKMDCAMjeE*LAME MME PROT MEcUMa FME PROT
I mBDCAUESI IN TURIDSLGCAUSEES
( 9 IMO =Q
ILINE BEAKEE
IIKEScAKINTUD M ASMENI
1E.ZZ1'nS.M
4 1 A1 (
8
9
A
B
Figure 2 - Fault Tree FLOODING.LGC
69

INTERNAL FLOODING - Fault Tree Analysis for Turbine Building Floods
u I -- 3 I 4 I 5
FLOODING LOGIC FLD ,2
[nlyst JRS lCnationi Date: 01-10OMM Revision: 11-3D-2M5a
I
FLOODL
I f rfi of MOU
I olds . I O F F IMOn agft rh.f OFal VOV
I wa&IW~wo Scftsm<a~I SM0AI |
|-W 4
0Caw.45Belch"PS o
2
3
4
6
6
7
6
9
A
C
Figure 2 - Fault Tree FLOODING.LGC (continued)
(low
70
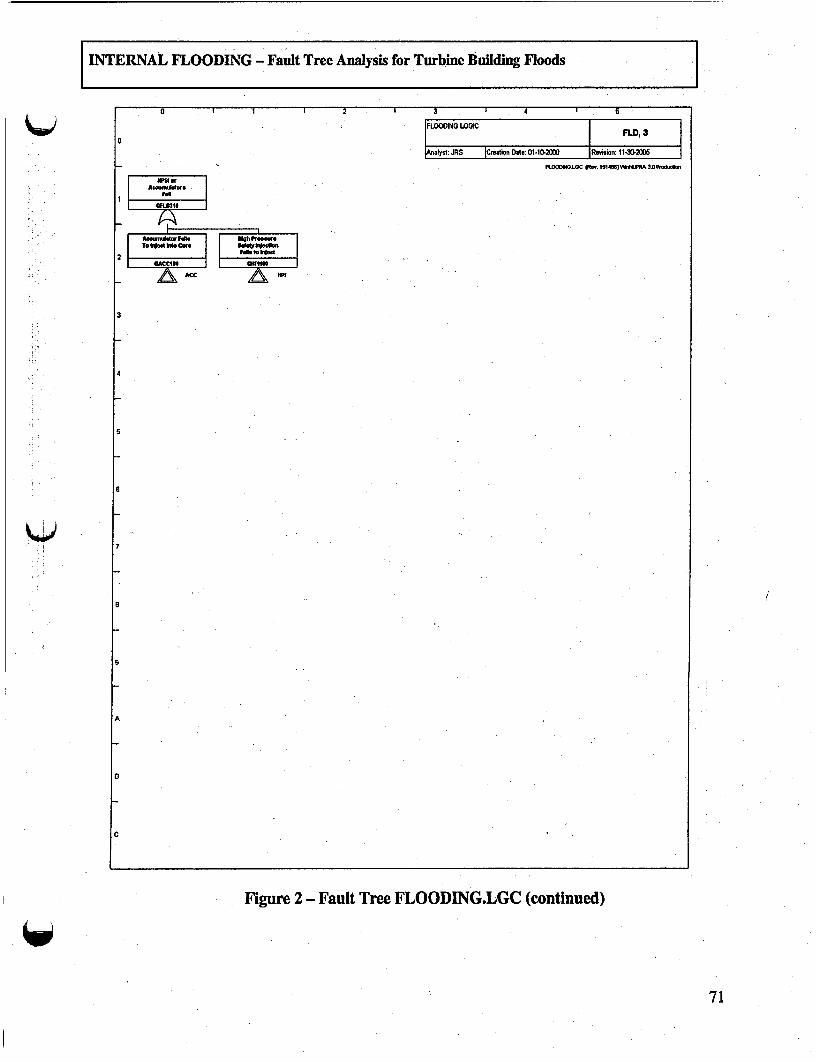
INTERNAL FLOODING - Fault Tree Analysis for Turbine Building Floods
0 I 1- 2 I
2 ahWFLD3I@
2 tl &S e ,
cacC a o F
3 I 4 I 5
FLOODING LOGICD,
|FnOIGIGI FLD, 3 l
Analyst: JRS |Creation Dale: 01-10.200D Resion: I1-3-0065
Ml.OODMXC 0t1r 1S146)ee*'A3nV Uno
3
4
6
6
7
a
9
A
8
C
Figure 2 - Fault Tree FLOODING.LGC (continued)
71

INTERNAL FLOODING - Fault Tree Analysis for Turbine Building Floods
U I I d
FLOODING LOGIC | FLD, 1
l7ye1: RS lCrstion Dais: 01-1020 I Revsiom. 113-MS
3LOOLOCct~.1.1a1ae)tUAS30at.,nsn
2db.t..lWNaie
hit. bakd
al.. hidt.wa
Iidaa.Fad.Ik-l (9
hit.0bald3.1.FdW mdt
2 _awPlYLe I
VW- &h
_ ,WbaaFL
'--u (9
U-a-u (9)
0.1b.efto*se
hitntal U
B~d. a...
rP~iI ra. haa a
Usut(
hit bld.
.1M.
LioJC!
I .W I"
I IAL.w
UIJOO (9| H lo #IN DAM
Gnim
br. hi..I T4SOL.-CI
M62
I Sat.. e IGPLM
II wFargI
.tM W
11919SL?
hit.balda
. h.
| Hlei.
.wWBaFWM.d
GF.D4t3
w ShrF- $TM id
GF1B
I Sal.. h1 a I
Ut.JMft(9
I Sa t.
h1im a
I d..5 Fda a I
FM to "odJ
mom, o
hito bd. Htb W m0dwSataFWlb. dMd.d
0RD414 GRLDtH5
I~ dOS< L "i
I' ald .M31MDIMW Rn ma
Ut.JHQ) Q
bald. S hi.U dMDA
Al Fab.d CAlal
Ut. bW.SMM
tb44 1 | 455. 11hI t. t.at M I
inLM 9 Lga Q
i d11 b # MUF | ^1*Std W |
I amft I I if 0*
Le"u4_ (9 k I
'"Lww ' W~.
rO""DAWQI unw
I am
ft ft SdW map" J E
FP LO
i 1e.d4W
FI tWM I
1 4 ft |
L HX d M W
9
A
B
C
Figure 2 - Fault Tree FLOODING.LGC (continued)
72

INTERNAL FLOODING - Fault Tree Analysis for Turbine Building Floods
U I I 2 3 4 I 5
jFLOODING LOGIC L,
jAnatytl JRS lCreation Date 01-10-2C Rereagon. 11-02.ROHLOC We-.15148MMORAUn
ra . aat.I.miafara heWk of5w. .a6
I1 2 -1 N 2
II
I Odom Ih . ot IIrtw .. a,2
us-." 4 1)
FM t. "
mow
I2JMI
EhZ2J4m..e (9
IfWeleideaIn T(rb BW
KIZ
3
5
8
9
I M" IInfnratmomd
I n Icer her ,r : VALIIESISW Ae~e
t @ 04AOB..1us4.. 2
- T4
A
B
C
1FFe. Li( o t n e
Figure 2 - Fault Tree FLOODiN,.LGC (continued)
73
INTERNAL FLOODING - Fault Tree Analysis for Turbine Building Floods
. ..
a I I 2
0
FALIJNTOOL.A1IE
LAR.EIblW
IRKIN UR MM2 FMI
tIla (91,11M t
I 4 b
FLOD IOICFILD, 21
Analyst: ~S Creaion Oate: 0I-I91Rsso:I-l~
FLObGJ.GC W ASUPrsi I
3
4
S
S
(40�
7
6
9
A
8
C
Figure 2 - Fault Tree FLOODING.LGC (continued)
74

INTERNAL FLOODING - Fault Tree Analysis for Turbine Building Floods
0a I I 1 2 3 4
FLOCODNG LOGIC FDS
[Aalyht: JRS Preation Date: 01-10-20 Revision: I11.303.0
FLOIOMMOC 0y.A514M.PRtA36 n
3
GR!AT~tTHMI21 GPM
GMATin1IMa1Huu
ua.960 (2)
P" AL LOCA
I tW~I mfcscMAoLOC
IWATRTm@ GI
Iin OLUMaawu
I oscoLDtI
LOB.4H (9
6
7
6
9
A
B
C
Figure 2 - Fault Tree FLOODING.LGC (continued)
75

IINTERNAL FLOODING - Fault Tree Analysis for Turbine Building FloodsI
0 I 1 2 1
a
3 4 I 5
I I PLD, 32[Anulyst: R~S O0eto ae 1-10-MM Revision: 11-33.2M5
IftbODILOJ.C #W1I6)V"PAj
VrLE O Mi
2 &I A4 -4f
(9111142Q
3
4
6
(qg
7
B
9
A
I
C
Figure 2 - Fault Tree FLOODING.LGC (continued)
76
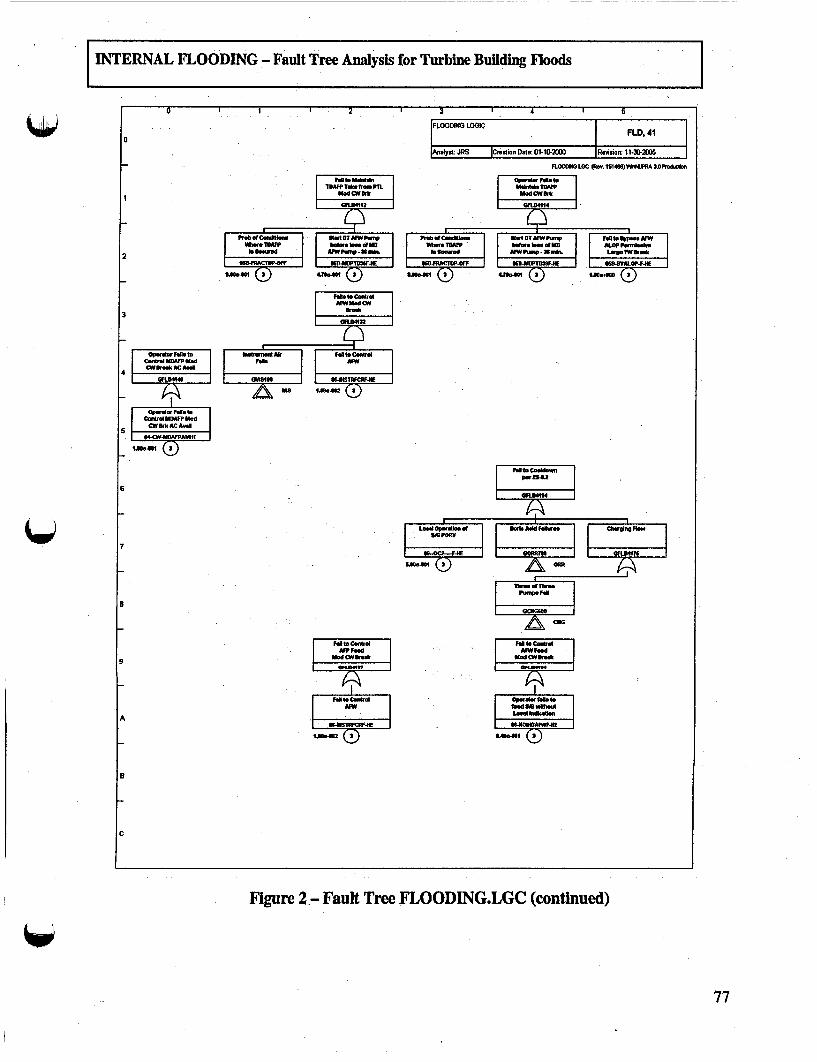
INTERNAL FLOODING - Fault Tree Analysis for Turbine Building Floods
0 I 7 2 i 3 l 4 1 5
FLOODING LOGIC FLD,41
[alyst: JRS lCreation Date: O1.lO. I Reviion. 1Il-3-2a
Irdbafftnntlf
b~rIA of" I.. of tA I Th. AIP I
m-,C K8CWUf
_~e.u a E 4flat aaI1 (a) (
34 M
I~APWMI
M.w.k ACW An H4
canel MDAIP Und
S 6 lkALoALJ
Wjoil(
FIDODHOLMC 0W .1at4MV*owA3SB~1bnW
Op.eWdnIdl.%NWton TOIW
Madl
_la B? AIWsa Idl H1 lp...PW
NIWP^mp.2Snd Lg FIbdI
I naMw JE I DALOP.F.If
.I 2 . 3
6
7
8
9I UlA~d I
MWd
jAb
2 (9
f~d &G _KWIA adI-
' 9A
C
Figure 2.- Fault Tree FLOODING.LGC (continued)
77
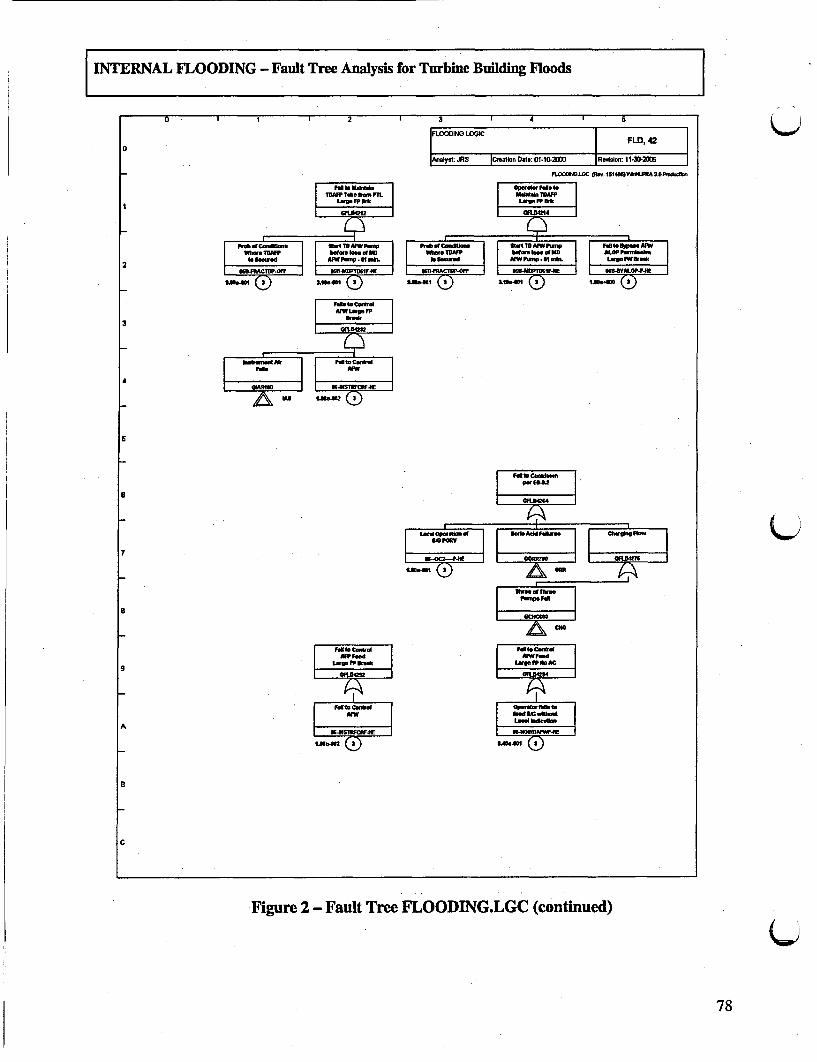
INTERNAL FLOODING - Fault Tree Analysis for Turbine Building Floods
0
0
I
___ -T- 2 I-- 3
flFLOODING LOW
TDAWY Tdre. FIL
FWA t 1D bAIwt .nk ms _
t.N.-NI 2 2if."6-N (2)M.S
I 4 1 5
I nd - WFLD,4 1:2lCreation Date:- ~01-l02- RFeelgior II.3D-2D
PLOWH2±C WAv.51U4VhMA1DFA.&nd
opffdwfdmt. I_Idf TDIIII
I Lg.W PIrkk
AMLOP
D-PIDSF4E A6.BJYALOP-FIE
.16. J.C 2
2
3
4
5
s
7
a
9
AFP foodL'.6
I' NW
I A2fl (9
LWFPMACGNWP4.d4L4~
1 (9A
C
Figure 2 - Fault Tree FLOODING.LGC (continued)
78

INTERNAL FLOODING - Fault Tree Analysis for Turbine Building Floods
Figure 2 - Fault Tree FLOODING.LGC
79

INTERNAL FLOODING - Fault Tree Analysis for Turbine Building Floods
U I t 2 J 4 I 5
FLOODING LOGIC FLD,d4
Analyst: JRS Ceation Date: 01-102-D RlResion: 11-302005O
_YA- Ipp - belmo-mo A- nA2
IeSecd omnp.nn. M_ s "
80IW OFF DP4C-MF4E Ra"ctW-W
9.89,,, (1 001 U3 SAD W
FlOOvWlOC T-v.1S4flU"JRA3O0Pwb.n
I idn tCAFPlI L.M U 9k
I QXD40
_ Q4bd~~~~op A r _S jF 11T
l_ d iD ILOP P~re *n mk w0FW411rk_ PTF4E II P F4E
S1 0041_ @FA2
4
5
6
| f F -11.0d
hi Al CanbISIWtCRF
h st I VW~r I
r " 1 r "4IL.STIMl.II
29 r Wk
dLao _MM AtI " .htft I
I _odkr*m II f fR i
0 (
U.7
8
9
A
a
C
Figure 2 - Fault Tree FLOODING.LGC (continued)
80

INTERNAL FLOODING - Fault Tree Analysis for Turbine Building Floods 10 i I I 2 3 4 5
FLOODING LOGIC | FLD,4 l
jAnslyst: JRS lCreation Date: 01-10-20 Revision: 11l3.2005
0
t
2
I is.mawmakIDAW T1*_fVPTL
M.d SIM rk
PinS atCalniin Madi Tb AWPWVp h d I1~ev lUMAP hS _* d dD Iw.n1FPI
eWW-_ U4R E aUPIUMw~f
sJm..u s 41.-u2 s sJe.as (9
14LODOLOC onA 154M'3M DlRlNi
uk TIM
I GIFL04514 I
5nia le dUD AL5P Pn*Shns21l t. "-AWpWN.2HF Lo.PWBIa.k
I .M WTB"W. IS UB4DOP4P.
4am.w a.9 til.-Mi (2
3
4
6
6
IMPd". S I
II~GMSM I UMW-GV4 I
sA wS areE ,!
W 1e Cd
"wrwHb Fc
IhPWaad
I Lbad 5 eIrldu I
(9lona40m Q
7
a
A
C
Figure 2 - Fault Tree FLOODING.LGC (continued)
81

INTERNAL FLOODING - Fault Tree Analysis for Turbine Building Floods
0
2
0 T - I 1 2 3 T . 4 1 5
FLO 4
1FdOCING s LOGC FLeDioDate01.1D.0 j PLO, 46
Q.i,)#LGOOLMC V.1S1488)ViItM3A0ftoOf,
TIWP ~~owd Tlm 1m hlnto^1db PFM Pd.70WL9.Wphk MW VW**
U9h412 Gf/;61
W.UATIP 1 11_ d MD W.ION hdtoob_ 11Dn ALOP ihr_1ffd _IWPm-Or*I. bauW* d NWrpS. - Id.. I .q p k
_- O _ IDP1UWif KPAC1W.41 I8DPTOFH_IJo4 I 4Xb-Iui W a-.JO 2 4l-Sl 2 184 I
3
*
5
6
'wI."'
. A
4jo. 51W~ ffC*
I- L2i
V" JISWVI
9" IS b1 W
IAMdP."I
I blD* SR dh.IL.GF"bAI--4 Qr ) to
fft M"f kh
na~m~ 1
U7
a
9
E
C
Figure 2 - Fault Tree FLOODING.LGC (continued)
82

INTERNAL FLOODING - Fault Tree Analysis for Turbine Building Floods
U O 1 A
0
j 4 5
FLOODING LOGIC
I I FLO, 47Analyst: JRS |Cretion Os. 0nt110. 10 Rnsien: 11-30-2005
I fLOOOCtIOC r.1i.4U)V4JnRA1Dft0*st
I MUM4 I00
hi*r*I
TDAFP Tae ft
P~b.MD0l"
SJO/" TD( f", V
W~Md F- .Ir
M~lIAIW WT11CF471E
2j 1 S-M e
I bdnn. i.e. �MD
INs-US (�)
IALCPPa-*ai-I
L�i(9
3
4
5
6
raiic."
GILO142
AM
I WSTCRF41E I
"G.M II!
.I
hb NW
cUOsm (.2)
IAIWFnOlI
jh~dSCd~aww.401 (
G_ a4
7
8
A
a
C
Figure 2 - Fault Tree FLOODING.LGC (continued)
83

INTERNAL FLOODING - Fault Tree Analysis for Turbine Building Floods
�%-# I
e ' 3 4 I 5
a
I
2
3
4
S
6
7
a
A
B
C
Figure 3 - Placement of New Basic Event 16-BATCLG--F-HE
84