environmental - Nuclear Regulatory Commission
168
NU REG-0417 environmental etatement r3 lated to Operation Of EDWIN 1. HATCH NUCLEAR PLANT UNIT NO. 2 Georgia Power Company M ARCH 1978 Docket No. 50-366 1561 054 7911150 N " U. S. Nuclear Regulatory Commission e Rea tor egu ton
-
Upload
khangminh22 -
Category
Documents
-
view
3 -
download
0
Transcript of environmental - Nuclear Regulatory Commission

NU REG-0417
environmentaletatement
r3 lated to Operation Of
EDWIN 1. HATCHNUCLEAR PLANT
UNIT NO. 2Georgia Power Company
M ARCH 1978
Docket No. 50-366
1561 054
7911150 N"
U. S. Nuclear Regulatory Commission e Rea tor egu ton

Available fromNational Technical Information Service
Springfield, Virginia 22161Price: Printed Copy: $8.00 ; Microfiche: $3.00
The price of this document for requesters outsideof the North American Continent can be obtainedfrom the National Technical Information Service.
\S6\ 050

flUREG-0417
March 1978
FINAL ENVIRONMENTAL STATEMENT .
related to operation of
THE EDWIN I. HATCH NUCLEAh DLANT UllIT NO. 2
Georgia Power Company
Docket No. 50-366
U.S. NUCLEAR REGULATORY COMMISSION
OFFICE OF NUCLEAR REACTOR REGULATION
1561 056
SUMMARY AND CONCLUSIONS
This Final Environmental Statement was prepared by the U.S. Nuclear Regulatory Commission. Officeof Nuclear Reactor Regulation (the staff).
1. The action is administrative.
2. The proposed action is the issuance of an operation license to the Georgia Power Companyfor the startup and operation of the Edwin I. Hatch Nuclear Plant, Unit No. 2 (Docket No.50-366), located on the Altamaha River in Appling County, approximately 11 miles north fromBaxley, Georgia.
This facility will employ a boiling-water reactor to produce a nominal rating of 2436megawatts-thermal (MWt). A steam turbine-generator will use this heat to provide up to 820(803 net) megawatts electrical (MWe) of electrical power capacity. The plant will belicensed for operation with a thermal output up to 2550 MWt which corresponds to a grosselectrical output of 835 MWe. The exhaust stream will be condensed by water circulatedthrough mechanical draf t cooling towers; makeup water for the cooling towers will be drawnfrom the Altamaha River.
3. The information in this Statement represents the second assessment of the environmentalimpact associated with the Edwin 1. Hatch Nuclear Plant, Unit No. 2, pursuant to theguidelines of the National Environmental Policy Act of 1969 (NEPA) and 10 CFR Part 51 ofthe Commission's Regulations. Af ter receipt of an app'! cation, in 1970, to construct thisplant, the staff carried out a review of impact that would occur during the constructionand operation of this plant. That evaluation was issued as a Final Environmental Statementin October 1972. As the result of that environmental review, a safety review, an evaluatior.by the Advisory Comittee on Reactor Safeguards, and a public hearing in Baxley, Georgiaand Washington, D.C., the AEC (noe NRC) issued a permit in December 1972, for the construc-tion of Unit No. 2 of the Edwin 1. Hatch Nuclear Plant. As of January 1978, the construc-tion of Unit No. 2 was 99% complete. With a proposed fuel-loading date of April 1978 forUnit No. 2, the applicant has petitioned for license to operate Unit No. 2 and has submitted(July 1975) the required safety and environmental reports to substantiate this petition.The staff has reviewed the activities associated with the proposed operation of this plantand the potential impact, with both beneficial and adverse ef fects, is sumarized asfollows:
a. A total of about 2244 acres (9.08 x 10⁶ sq. meters) will be used for the Hatch site ofwhich approximately 200 acres will be used for plant facilities and other constructionactivities. ALaut 105 of these acres will be restored upon completion of construction.Approximately 1548 acres (6.26 x 10⁶ sq. meters) are required for transmission linerights-of-way (Section 2.2.2).
b. The major water supply for the heat dissipation system will be from the AltamahaRiver. A maximum of 34,000 gpm (2145 1./sec.) will be withdrawn by the service watersystem for cooling tower operation and makeup supply of which a maximum of 23,600 gpm(14891./sec. ) will be returned to the river. Approximately 19,300 gpm (12361./sec. )from the service water system will be used to supply makeup water to the coolingtowers to replace evaporative, drif t and blowdown quantities. For Unit No. 2 operation,the consumption water use from the Altamaha River is about 2% of minimum recordedriver flow (Sections 3. 2.1, 3. 3. 3, and 5. 3. 6) .
c. The approximate volume of thermal discharge (26 cfs) (736 1./sec.) for Unit No. 2operation is very small compared with the average river flow (13,000 cf s) (368,1601./sec). There will be no significant increase in the totally-mixed river temperature.Estimates of the extent of the thermal plume under conservative conditions are smalland the effect on the river biota is not considered significant (Sections 5.3.1.2 and
5.4.2.2).
d. Based upon data from the impingement monitoring program for Unit No.1, postulatedincremental losses due h the operation of Unit No. 2 will not significantly affectthe resident or anadromous fish population in the Altamaha River (Section 5.4.2.1).
1561 057iii
e. Assuming 100% mortality of entrained shad eggs &nd larvae during passage through thecondenser and cooling system, losses to shad populations due to operation of the unitw 11 be insignificant (less than 2% at low flow conditions) (Section 5.4.2.1).
f. 'ne concentration of chemicals and sanitary wastes discharged to the Altamaha Riverwill be in conformance with the effluent limits contained in the NPDES permitissued by the State of Georgia. (Section 5.3.4 and Appendix F).
g. The risk associated with accidental radiation exposure is very low (Section 7.1).
h. No significant environmental impacts are anticipated from normal operational releasesof radioactive materials. The approximate radiation dose from all Unit No. 2 releasesto the estimated year 1992 population that reside within 50 miles of the site is oneman-rem / year. This is a small fraction of the 23,000 man-rems / year that this popula-tion receives from natural background radiation (Table 5.5-3).
4 The following Federal, State, and local agencies were asked to cormient on the DraftEnvironmental Statement issued in April 1977.
Advisory Council on Historic PreservationDepartment of AgricultureDepartment of the Army, Corps of Er;gineersDepartment of CommerceDepartment of Health, Education and WelfareDepartment of Housing and Urban DevelopmentDepartment of the InteriorDepartment of TransportationEnergy Research and Development AdministrationEnvironmental Pro action AgencyFederal Energy AdministrationFederal Power CommissionGovernor, State of GeorgiaState Clearinghouse, State of GeorgiaDepartment of Natural Resources State of GeorgiaGeorgia Public Service CommissionGeorgia Water Quality Control BoardAltamaha Georgia Southern Area Planning and Development CommissionAppling County ComissionersSuperintendent of Schools - Appling CountyMayor, City of BaxleyCity Manager, City of Baxley
Comments on the Draf t Environmental Statement were received f rom tne tor iowing:
Department of Agriculture, Agricultural Research ServiceDepartment of Agriculture, Forest ServiceDepartment of Agriculture, Soil Conservation ServiceDepartment of Commerce, National Oceanic and Atmospheric AdministrationEnergy Research and Development Administration (now Department of Energy)Environmental Protection Agency, Region IV OfficeDepartment of Health,' Education and WelfareDepartment of Housing and Urban DevelopmentDepartment of the InteriorAltamaha Georgia Southern Area Planning and Development CommissionAppling County Chamber of CommerceState of Georgia. Office of Planning and BudgetGeorgia Power Company
,pendix A.Copies of these coments are included in this Final Environmental Statement as '
The staff has considered these coments, and the responses are located in Section 11.
t This Final Environmental Statement was made available to tile public, to the EnvironmentalProtection Agency, and to other specified agencies ~:n March 1978,
1561 058
iv

6. On the basis of the analysis and evaluation set forth in the Final Environmental Statement,and after weighing the environmental, economic, technical and other benefits againstenvironmental costs and af ter considering available alternatives at the constructionstage, it is concluded that the action called for under NEPA and 10 CFR Part 51, is theissuance of an operating license for Unit ho. 2 of the Edwin I. Hatch Nuclear Plant subjectto the following conditions for the protection of the environment:
a. License Conditions
Before engaging in additional construction or operational activities which may resultin a significant adverse environmental impact that was not evaluated or that is signifi-cantly greater than that evaluated in this En"ironmental Statement, the applicant shallprovide written notification to the Director, Office of Nuclear Reactor Regulation.
b. Significant Environmental Technical Specification Requirements
The environmental technical specifications issued for the Edwin I. Hatch NuclearPlant, Unit No. 2, will include but not be limited to the following requirements:
(1) The applicant will carry out the environmental (thermal, chemical, radiological, andecological) monitoring programs outlined in this Statement, and in the FinalEnvironmental Statement for the construction permit as modified end approved bythe staff and implemented in the environmental technical specifications incor-porated in the operating license for the Edwin I. Hatch Nuclear Plant Unit No. 2
(Section 6).
(2) If, during the operating life of the station, effects or evidence of irreversibleenvironmental damage is detected, the applicant wil provide to the staff ananalysis of the condition and proposed corrective action.
(3) The applicant will conduct a monitoring program as described in the environmentaltechnical specifications to determine the quantity and type of corrosion productsin the cooling system discharge (Sections 5.3.4, 5.3.5, and 6.3.4).
(4) The applicant will conduct a monitoring program as described in the environmentaltechnical specifications to verify two-unit operational effects upon benthicorganisms as well as impingement and entrainment effects (Section 6.3.5).
(5) The applicant will conduct a terrestrial monitoring program as dee ribed in theenvironmental technical specifications to verify two-unit operational effectson vegetation and erosion (Sections 5.4.1 and 6.3.6).
(6) The applicant will conduct an offsite radiological monitoring program as describedin the environmental technical specifications to measure radiation levels in the
site environs (Section 6.3.7). i
1561 059
V
TABLE OF CONTENTS
Pale
SUMMARY AND CONCLUSIONS. iii. .
LIST OF FIGURES. ix. . .
LIST OF TABLCS. . . . . . . . x
FOREWORD. xii.. .
1. INTRODUCTION. 1-1
1.1 HISTORY. 1-1. .
1.2 PERMITS AND LICENSES. 1-1
2-12. THE SITE. . ..
2.1 R55UM5. 2-1. .
2.2 REGIONAL DEMOGRAPHY AND LAND USE. 2-1.
2.2.1 Changes in Population. 2-12.2.2 Changes in Land Use. 2-1.
2.2.3 Changes in the Local Economy. 2-32.2.4 Historical and Natural Landmarks. 2-3.
2-62.3 WATER USE. . . .
2.3.1 Regional Water Use. 2-6.
2.3.2 Surface Water Hydrology. 2-6..
2.3.3 Groundwater Hydrology. 2-8..
2.3.4 Wa ter Quality. 2-8.
2.4 METEOROLOGY. 2-8.
2.5 SITE ECOLOGY. 2-9
2.5.1 Terrestrial Geology. 2-92.5.2 Aquatic Ecology. 2-9
2.6 BACKGROUND RADIOLOGICAL CHARACTERISTICS. 2-20
REFERENCES FOR SECTION 2. 2-21
3. THE PLANT. 3-1.
3.1 RESUM5. 3-13.2 DESIGN AND OTHER SIGNIFICANT CHANGES. 3-1
3.2.1 Plant Water Use. 3-13.2.2 . Heat Dissipation System. 3-13.2.3 Radioactive Waste Tr eatment. 3-43.2.4 Chemical, Sanitary and Other Waste Treatment. 3-123.2.5 Transmission Lines. 3-12
REFERENCES FOR SECTION 3. 3-13
4. STATUS OF SITE PREPARATION AND CONSTRUCTION. 4-1.
4.1 R$5UM5ANDSTATUSOFCONSTRUCTION. 4-1.
4.2 IMPACTS ON TERRESTRIAL ENVIRONMENT. 4-1
4.3 IMPACTS ON AQUATIC ENVIRONMENT. 4-1
4.3.1 Effects on Water Use. 4-14.3.2 Ef fects on Aquatic Biota. 4-1
4.4 SOCIO-ECONOMIC IMPACTS. 4-2
REFERENCES FOR SECTION 4. 4-3
''
1561 060
TABLE OF CONTENTS (Cont'd)
Page
5. ENVIRONMENTAL EFFECTS OF STATION OPERATION. 5-1
5.1 RkSUM5. 5-1.. . .
5.2 IMPACTS ON LAND USE. . . .. . 5-1
5.2.1 Station Operation. 5-1. .
5.2.2 Transmission Lines. . . 5-1
5.3 IMPACTS ON WATER USE. . 5-2.
5.3.1 Thermal Impacts of Water Use. 5-2. ... . .. .
5.3.2 Industrial Chemical Wastes. . . . 5-35.3.3 Sanitary Wastes. . 5-35.3.4 EPA Effluent Guidelines and Limitations. 5-35.3.5 Effects on Water Users Through Changes in Water Quality. 5-65.3.6 Effects on Surface Water Supply. 5-6. . .
5.3.7 Effects on Groundwater Supplies. 5-6
5.4 ENVIRONMENTAL IMPACTS. 5-6
5.4.1 Impacts on the Terrestrial Environment. 5-65.4.2 Impacts on the Aquatic Environment. 5-7
5.5 RADIOLOGICAL IMPACTS. 5-19.
5.5.1 Radiological Impact on Man. 5-19.
. . 5-275.5.2 Radiological Impact on diota Other Than Man.5.5.3 Environmental Effects of the Uranium Fuel Cycle. 5-33
5.6 SOCIO-ECONOMIC IMPACTS. 5-36
REFERENCES FOR SECTION 5. 5-37
6. ENVIRONMENTAL MONITORING. 6-1
6.1 R$5UM5. 6-16.2 PREOPERATIONAL MONITORING PROGRAMS. . 6-1
6.2.1 Onsite Meteorological Program. 6-1.
6.2.2 Water Quality Monitoring. 6-16.2.3 Groundwater Monitoring. 6-16.2.4 Radiological Environmental Monitoring. 6-1.
6.3 OPERATIONAL MONITORING PROGRAMS. 6-4
6.3.1 Onsite Meteorological Program. 6-46.3.2 Water Quality Monitoring. . 6-46.3.3 Crcundwater Monitoring. 6-46.3.4 Chemical Effluents Monitoring. . . 6-46.3.5 Aquatic Biological Monitoring. C-56.3.6 Terrestrial Monitoring Program. 6-96.3.7 Radiological Environmental Monitoring. 6-9
REFERENCES FOR SECTION 6. 6-10
7. ENVIRONMENTAL IMPACT OF PO$TULATED PLANT ACCIDENTS. 7-1
7.1 R55UME'. . 7-17.2 ENVIRONMENTAL IMPACT OF POSTULATED ACCIDENTS. 7-17.3 TRANSPORTATION ACCIDENTS. 7-1
)
vii
TABLE OF CONTENTS (Cont'd)
Page
8-18. NEED FOR PLANT. . . . .. . . .. . . .. ..
8-18.1 RESUME. . .. .. .. ...
8.2 APPLICANT'S SERVICE AREA AND REGIONAL RELATIONSHIPS. 8-1
8-18.2.1 Applicant's Service Area. . . .. . . . . .
8.2.2 Regional Relationships. 8-1. . .
8-48.3 BENEFITS OF OPERATING THE PLANT. . . . .. ..
8.3.1 Minimization of Production Costs. 8-4. . . ..
. . .. . 8-48.3.2 Energy Demand.
REFERENCES FOR SECTION 8. . . . 8-7
9. EVALUATION OF THE PROPOSED ACTION. 9-1.
9.1 ADVERSE EFFECTS WHICH CANNOT BE AVOIDED. 9-19-19.2 SHORT-TERM USES AND LONG-TERM PRODUCTIVITY. . .
9.3 IRREVERSIBLE AND IRRETRIEVABLE COMMITMENT 5 0F RESOURCES.. 9-19.4 DECOMMISSIONING AND LAND USE. 9-1. ..
REFERENCES FOR SECTION 9. . . . . . . 9-3
10. BENEFIT-COST ANALYSIS. 10-1. .
10-110.1 RESUME. . .
10.2 BENEFITS. 10-110.3 ECONOMIC COSTS. 10-1.
10-210.4 ENVIRONMENTAL COSTS. . . .
10.5 SOCIETAL COSTS. 10-2. .
10.6 ENVIRONMENTAL COSTS OF THE URANIUM FUEL CYCLE. 10-2. . 10-210.7 ENVIRONMENTAL COSTS OF URANIUM FUEL TRANSPORTATION.
10.8 SUMMARY OF BENEFIT COST. . 10-2
11. DISCUSSION vF COMMENTS RECEIVED ON THE DRAFT ENVIRONMENTAL STATEMENT. 11-1
REFERERENCES FOR SECTION ll .
APPENDIX A - COMMENTS ON DRAFT ENVIRONMENTAL STATEMENT. A-1.
APPENDIXB-FINALENVIRONMENTALSTATEMENT,CONSTRUCTIONPERMITSTAGE(See).@ REG:025/). B-1
APPENDIX C - U.S. EPA STEAM ELECTRIC POWER GENERATING POINT SOURCE CATEGORYEFFLUENT GUIDEL,INES AND STANDARDS. . . C-1
APPENDIX D - NEPA POPULATION DOSE ASSESSMENT.. . . .. .. . D-1
APPENDIX E - REFERENCES AND EXPLANATION OF' BENEFIT-COST SUMMARY IN TABLE 10.4-1. E-1.y
APPENDIX F - GEORGI A NPDES PERMIT FOR HATCH NUCLEAR POWER PLANT, UNIT NOS.1AND 2, RESPONSE TO NRC COMMENTS ON DRAFT NPDES PERMIT . F-1
APPENDIX G - STAFF COMMENTS ON DRAFT NPDES PERMIT FOR HATCH NUCLEAR PLANT,UNITS NOS. 1 AND 2. G-1
\) -
viii

LIST OF FIGURES
Figures Page
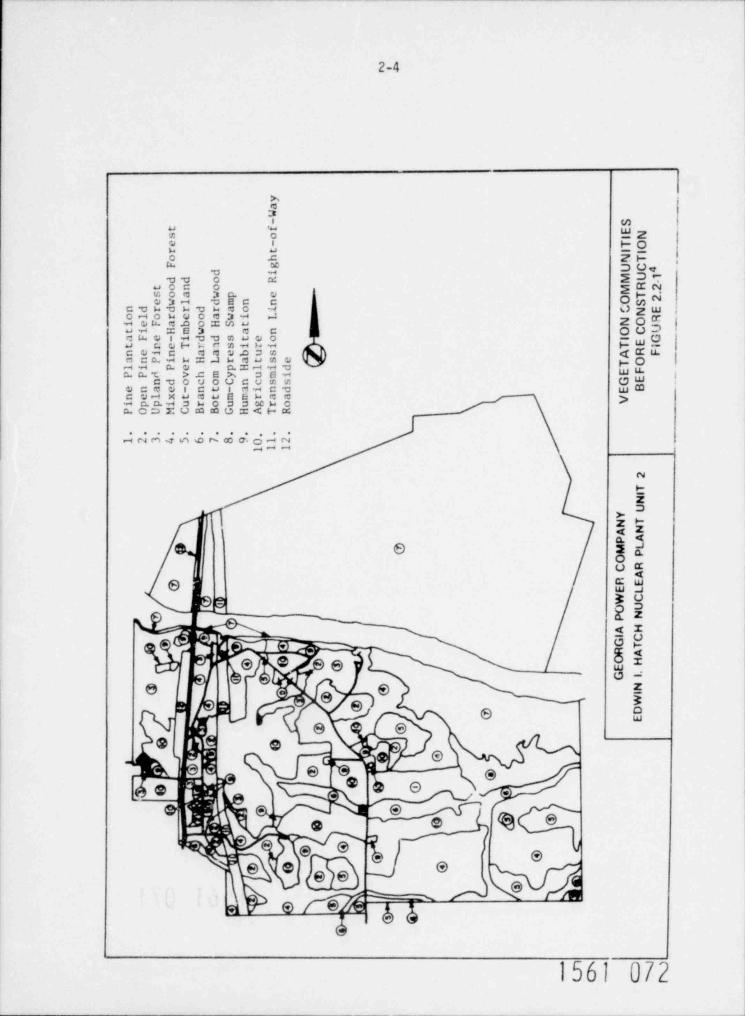
2.2-1 Vegetation Communities Before Construction . . . 2-4. .. ..
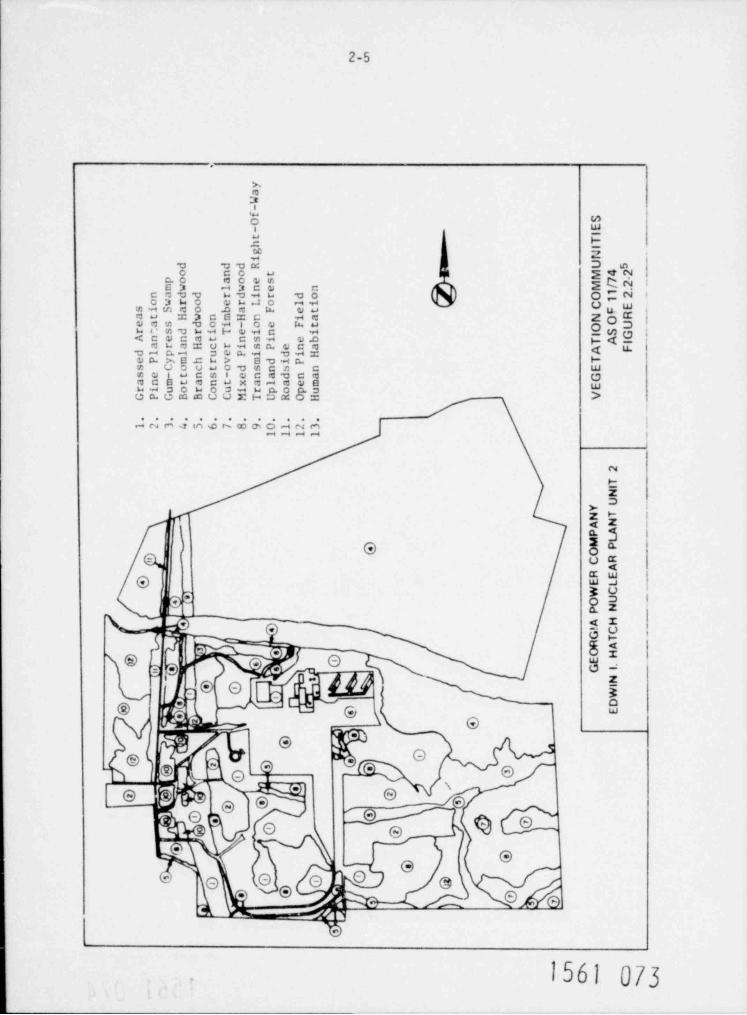
2.2-2 Vegetstion Comunities as of 11/74 2-5.
2.5-1 Generalized Vegetation Map of the Hatch Plant Site 2-10. ..
3.1-1 Aerial View of Edwin I. Hatch Nuclear Plant 3-2
3.2-1 Plant Cooling Water and Plant Service Water System 3-3. .. . .
3.2-2 Li uid Radwaste System for Hatch Nuclear Plant, Unit Nos. I and 2 3-5.
3.2-3 Gaseous Radwaste System for Hatch Nuclear Plant. Unit Nos.1 and 2 . 3-7
5.4-1 Edwin I. Hatch Nuclear Plant Unit 2: Normal 2-Unit Operation During AverageWinter Meteorological Colditions 5-12
5.4-2 Edwin I. Hatch Nuclear Plant Unit 2: Normal 2-Unit Operation During AverageSummer Meteorological Conditions 5-13. .
5.4-3 Edwin I. Hatch Nuclear Plant Unit 2: 2-Unit Operation During Extreme WinterMeteorological Conditions 5-14.. .
5.4-4 Edwin I. Hatch Nuclear Plant Unit 2: 2-Unit Operation During Extreme SumerMeteorological Conditions 5-15.
5.4-5 Edwin I. Hatch Nuclear Plant Unit 2: 2-Unit Cold Shutdown Without Off-SitePower During Winter With Minimum River Temperature 5-16
5.4-6 Edwin I. Hatch Nuclear Plant Unit 2: 2-Unit Cold Shutdown Without Off-SitePower During Sumer With High River Temperature 5-17. . .
5.5-1 Exposure Pathways to Man 5-20. .
5.5-2 Exposure Pathways to Biota Other Than Man 5-31
6.3-1 Edwin I. Hatch Nuclear Plant. Altamaha River Aquatic Sampling Stations 6-8.
8.2-1 Georgia Power Company Service Area and Divisions 8-2
8.2-2 Federal Po er Commission's Southeast Regional Advisory Committee - Region III -Load Concentration Areas 8-3. .
1561 063
ix
LIST OF TABLES
Table PaSe
2.2-1 1975 Population Distribution Estimate (0-50 Miles). 2-2. . .
2.2-2 Preconstruction and Present (11/75) Plant Communities on theEdwin I. Hatch Nuclear Plant Site. ... 2-3.
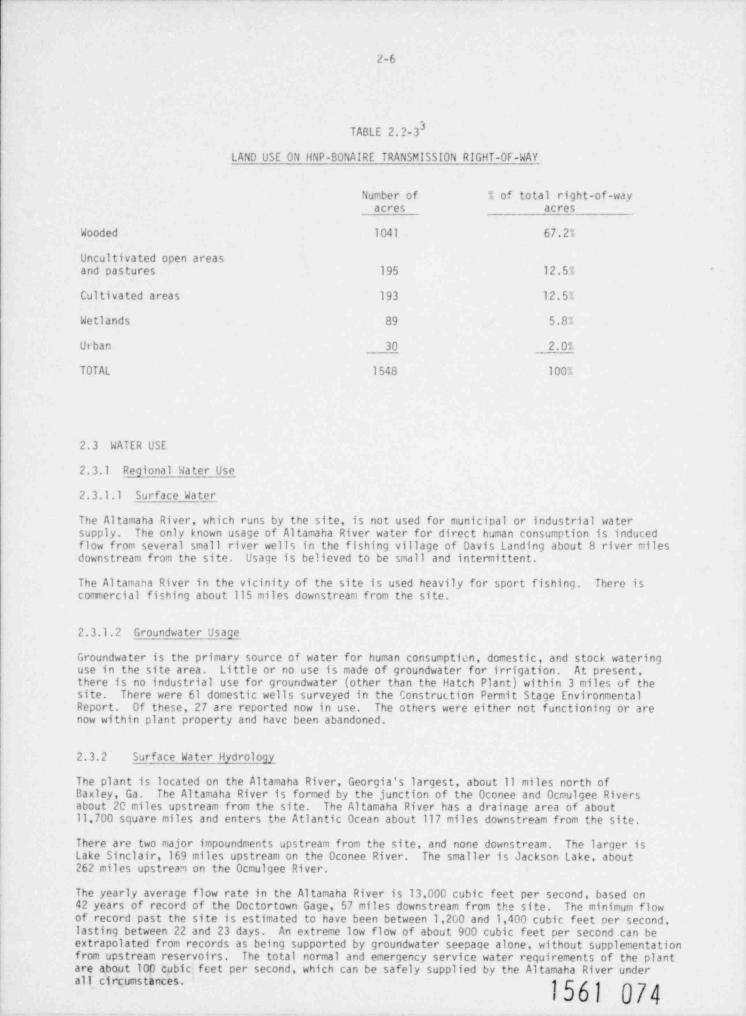
2.2-3 Land Use on HNP-Bonaire Transmission Right-of-Way. 2-6.
2.2-4 Indicators of Economic Growth in Appling County, 1969-1975. 2-72.d-1 vominant Plant Species. . 2-11. .~.
2.5-1A Principal Soil Types. 2-II A |. .
2.5-2 Terrestrial Fauna. 2-12. . .
2.5-3 Fish Taxa in Vicinity of HNP. 2-15
2.5-4 Annual Comercial Catches of Shad. Altamaha River, 1964 to 1975. 2-18.
3.2-1 Principal Parameters and Conditions Used in Calculating Releases ofRadioactive Material in Liquid and Gaseous Effluents from Hatch.Unit Nos.1 and 2. 3-8.
3.2-2 Calculated Releases of Radioactive Materials in Liquid Effluents fromHatch Nuclear Plant, Unit Nos. 1 or 2. 3-10
3.2-3 Calculated Releases of Radioactive Materials in Gaseous Effluents fromHatch Nuclear Plant, Unit Nos. I and 2. 3-11 -
3.2-4 Chemical Characteristics of Hatch Station Makeup andEf fluent Dater Quality. 3-12.
5.3-1 Chemical Characteristics (mg/1) of HNP Makeup and Effluent Water Quality. 5-4
5.4-1 Entrainment Versus River Flow. 5-8
5.4-2 Rate of Entrainment of Icthyofauna (1975). 5-10
5.4-3 Thermal Plume Characteristics - Two Unit Operation Under Normal andConservative Conditions. 5-18
5.5-1 Summary of Atmospher;c Dispersion Factors and Deposition Values forSelected Locations Near the Hatch Nuclear Power Station. 5-21
5.5-2 Annual Dose Commitments to a Maximum Individual Due to Atmospheric Releases. 5-22
5.5-3 Annual Population Dose Comitments in the Year 1992. 5-23
5.5-4 Summary of Hydrologic Transport and Dispersion for Liquid Releases fromthe Hatch Unit No. 2 Nuclear Power Plant. 5-25
5.5-5 Annual Individual Dose Commitments Due to Liquid Effluents. 5-26
5.5-6 Environmental Impact of Transportation of Fue; and Waste to and fromOne Light-Water-Cooled Nuclear Power Reactor. 5-28
5.5-7 Comparison of Calculated Doses to a Maximum Individual from Hatch UnitNos.1 & 2 Operation With Guides for Design Objectives Proposed by theStaff. 5-29.
1561 064X
LIST OF TABLES (Cont'd)
Table Page
5.5-8 Comparison of Calculated Doses to a Maximum Individual from HatchUnit No. 2 Operation with Appendix I Design Objectives. 5-30.
5.5-9 Dose Estimates for Typical Biota at the Hatch Unit No. 2 Site., 5-32.
5.5-10 Summary of Environmental Considerations for Uranium Fuel Cycle. 5-34
6.2-1 Environmental Radiological Monitoring Program.. 6-2
Salyt 6-3
(s . 3- 1 Aquatic aan,p i iny s e equenc ies un trie n e to.aorio niver. 6-6
7.1 Environmental Risks of Accidents in Transport of Fuel and Waste to andfrom a Typical Light-Water-Cooled Nuclear Power Reactor. 7-1.
8.2-1 Energy Consumption in the Georgia Power Company Service Area: 1963-1975. 8-1
8.3-1 Comparison of Selected System Production Costs for 1979, with andwithout Hatch Unit No. 2. 8-5. .
8.3-2 Forecast Base, Intermediate, and Peaking Loads for Georgia PowerService Area, 1975-1981 8-6
8.3-3 System Capability, Reserves, and Reserve Margins for Georgia PowerService Area, 1975-1981. 8-6.
8.3-4 Population Projections for Georgia, Southeastern U.S., and the UnitedStates, 1970-2020. 8-6.
10.3-1 Capital Cost of Hatch Unit No. 2. 10-1.
10.4-1 Benefit-Cos t Sumary. 10-3.
1561 065
xi
FOREWORD
This environmental statement was prepared by the U.S. Nuclear Regulatory Conmission, Office ofNuclear Reactor Regulation (the staff) in accordance with the Commission's rW ulation, 10 CFR51, which implements the requirements of the National Environmental Policy Act of 1969 (NEPA).
The NEPA states, among other things, that it is the continuing responsibility of the FederalGovernment to use all practicable means, consistent with other essential considerations ofnational policy, to improve and coordinate Federal plans, functions, programs, and resources tothe end that the Nation may:
Fulfill the responsibilities of each generation as trustee of the environment for-
succeeding generations.
Assure for all Americans safe, healthful, productive, and esthetically and culturally-
pleasing surroundings.
Attain the widest range of beneficial uses of the environment without degradation,-
risk to health or safety, or other undesirable and unintended corsequences.
Preserve important historic, cultural, and natural aspects of our national heritage,-
and maintain, wherever possible, an environment which supports diversity and varietyof individual choice.
Achieve a balance between population and resource use which will permit high standards-
of living and a wide sMring of life's amenities.
Enhance the quality of renewable resources and approach the maximum attainable recycling-
of depletable resources.
Further, with respect to major Federal actions significantly affecting the quality of the humanenvironment, Section 102(2)(C) of the NEPA calls for preparation of a detailed statement on:
(i) the environmental impact of the proposed action;
(ii) any adverse environmental effects which cannot be avoided should the proposal beimplemented;
(iii) alternatives to the proposed action;
(iv) the relationship beteen local short-term uses of man's environment and the maintenanceand enhancement of long-term productivity; and,
(v) any irreversible and irretrievable commitments of resources which would be involved inthe proposed action should it be implemented.
An environmental report accoppanies each application for a construction permit or a full-poweroperating license. A notice is published in the FEDERAL REGISTER regarding the availability ofthe report. Any connents by interested persons on the report are considered by the staff. Inconducting the required NEPA review, the staff meets with the applicant to discuss items ofinformation in the environmental report, to seek new information from the applicant that mightbe needed, for an adequate assessment, and generally to ensure that the staff has a thoroughunderstanding of the proposed project. In addition, the staff seeks information from othersources that will assist in the evaluation and visits and inspects the project site and surround-ing vicinity. Members of the staff may meet with State and local officials who are chargedwith protecting State and local interests. On the basis of all the foregoing and other suchactivities or inquiries as are deemed useful and appropriate, the staff makes an independentassessment of the considerations specified in Section 102(2)(C) of the NEPA and 10 CFR Part 51.
This evaluation leads to the publication of a draf t environmental statement, prepared by theOffice of Nuclear Reactor Regulation, which is then circulated to Federal, State and localgovernmental agencies for coment. A summary notice is published in the Federal Register of theavailability of the applicant's environmental report and the draft environmental statement.
1561 066m

Interested persons are also invited to comment on the proposed action and the draf t statement.Coments should be addressed to the Director Division of Site Safety and Environmental Analysis,at the address shown below.
Af ter receipt and considerations of connents on the draf t statement, the staf f prepares a finalenvironmental statement, which includes a discussion of questions and objections raised by thecomments and the disposition thereof; a final benefit-cost analysis, which considers and balancesthe environmental effects of the facility and the alternatives available for reducing or avoidingadverse environmental effects with the environmental, economic, technical, and other benefits ofthe f acility; and a conclusion as ta whether--af ter the environmental, economic, technical, andother benefits are weighed against environmental costs and af ter available alternatives havebeen considered--the action called for, with respect to environmental issues, is the issuance ordenial of the proposed permit or license or its appropriate conditioning to protect environmentalvalues. This final environmental statement and the safety evaluation report prepared by thestaf f are submitted to the Atomic Safety and Licensing Board for its consideration in reachina adecision on the application.
This environmental review deals with the impact of operation of the Edwin I. Hatch Nuclear PlantUnit No. 2. Assessments that are found in this statement supplement those described in theFinal Environmental Statement (FES-CP) that was issued in October 1972 in support of issuanceof a construction permit for Unit No. 2 and an operating license for Unit No. 1. The informa-tion to be found in the various sections of this Statement updates the FES-CP in four ways: (1)by identifying differences between environmental ef fects of operation (including those whichwould enhance as well as degrade the en/ironment) currently projected and the impacts that weredescribed in the preconstruction review; (2) by reporting the results of studies that had notbeen completed at the time of issuance of the FES-CP and which were under mandate from the NRCstat f to be completed before initiation of the operational review; (3) by evaluating the appli-cant's preoperational monitoring program; and factoring the results of this program into thedesign of a post-operational surveillance program and into the development of environmentaltechnical specifications; and (4) by identifying studies being performed by the applicant thatwill yield additional information relevant to the environmental impacts of operating the Edwin1. Hatch Nuclear Plant Unit No. 2.
The staf f recognized the dif ficulty a reader would encounter in trying to establish the confqrm-ance of this review with the requirements of the National Environmental Policy Act with only" updating information." ConsequentlyacopyoftheFES-CPwasincludedintheDraftEnvironmentaljStatenent issued in April 1977 (NUREG-0257). In addition, introductory resumbs in appropriatesections of this Statement will sumarize both the extent of " updating" and the degree to whichthe staf f considers the subject to be adequately reviewed.
Copies of this Final Statement may be purchased from the National Technical Information Serviceas indicated on the inside f ront cover. Mr. Clifford A. Haupt is the NRC Environnental ProjectManaqer for this Statement. Should there be ary questions regarding its contents, Mr. Haupt maybe contacted at the followinq address:
Division of Site Safety and Environmental AnalysisOffice of Nuclear Peactor PegulationU. S. Nuclear Requlatory ComissionWashinqton, D. C. 20555
Phone: (301) 492-8434
1561 067
xiii

1. INTRODUCTION
1.1 HISTORY
On July 17, 1970, the Georgia Power Company (applicant) filed an application with the AtomicEnergy Commission (now Nuclear Regulatory Comission) for a permit to construct the Edwin I.Hatch Nuclear Plant Unit No. 2. Construction Permit No. CPPR-90 was issued accordingly onDecember 27, 1972 following reviews by the AEC Regulatory staff and its Advisory Committee onReactor Safeguards, as well as public hearings before an Atomic Safety and Licensing Board inBaxley, Georgia on September 8 and September 19, 1972 and in Wasnington, D.C. on November 17,1972. The conclusions cbtained in the staff's environmental review were issued as a FinalEnvironmental Statement in October 1972. In April 1977, a Draft Environmental Statement relatedto the operation of Edwin I. Hatch Nuclear Plant, Unit f;o. 2, was issued by the NRC asNUREG-0257. As of January 1978, construction of Unit No. 2 was approximately 99% complete andthe reactor is expected to be ready for fuel loading in April 1978. The unit has a boiling-waterreactor which will produce up to ?436 MHt and a net electrical output of 803MWe.
In July 1975, the Georgia Power Company submitted an application including a Final Safety AnalysisReport (FSAR) and Environmental Report (ER0L) requesting issuance of an operating license forUnit No. 2. These docurents were docketed on October 21, 1975 and the operational safety andenvironmental reviews initiated at that time.
Hatch Ur.it No. 2 is owned jointly by Georgia Power Company (GPC) (50.1%), Oglethorpe ElectricMembership Corporation (0EMC)(30.0%), the Municipal Electric Authority of Georgia (MEAG),an instrumentality of the State (17.7%), and the City of Dalton (2.2%).
1.2 PERMITS AND LICENSES
The applicant has provided a status listing of environmentally related permits, approvals, andlicenses, required from Federal, regional, State, and local agencies in connection with theproposed project. This information may be found in Chapter 12 of the ER0L. The staff hasreviewed that listing and hos discussed the status, of required permits with the Georgia Depart-mo nt of Natural Resources and the U.S. Environmental Protection Agency. No significant environ-nental issues have been identified during these discussions and the staff is not aware of anynon-NRC licensing activities that would preclude or significantly delay the scheduled operationof this plant.
The applicant applied for a National Pollutant Discharge Elimination System (NPDES) pennit andthe Georgia Department of Natural Resources Environmental Protection Division, issued this permitin June 1977. (See Appendix F).
1561 068

2. THE SITE
. .
2.1 RESUME
The staff revisited the Edwin I. Hatch Nuclear Plant site in March 1976 to determine whatchanges had occurred at the site and in the surrounding environs since the preconstructionenvironmental review in 1972. Of interest were changes in regional demography predictions andland use caused by available new information and construction of the plant facilities respectively.Population distribution estimations in the vicinity of the site have been revised. Changes inland utilization are indicated, reflecting construction of the Edwin I. Hatch Nuclear Plant UnitNo. 2. Changes in the local economy due to construction are also discussed. The staf''s assess-ments of these recent findings are presented in Section 2.2. Since the issuance of the FES-CP,additional information has been made available regarding water use and quality. This new infor-mation has been assessed and is discussed in Section 2.3. The meteorology section has beenupdated to include new information. This information is included in Section 2.4. Additionalbackground information related to the aquatic and terrestrial biota within the environs of thesite and the Altamaha River are discussed in Section 2.5. The aquatic discussion has beenconsiderably expanded from that presented in the FES-CP, incorporating new material on theAltamaha River ade available since that time. This material also considers the present conditionsand influence at the Edwir.1. Hatch Nuclear Plant due to the operation of Unit No.1.
2.2 REGIONAL DEMOGRAPHY AND LAND USE
2.2.1 Changes in Population
The population projections for the 50-mile radius surrounding the site have been revised downward.The primary reason for the revision is that the FES-CP projections were based on State popula-tion estimates prior to the availability of the 1970 Federal census data. The FES-CP estimatedthe population distribution within 50 miles as 253,465 in 1972 and 270,917 in 2012. The currentpopulation estimates are 211,145 and 245,335 in 1972 and 2012, respectively.
All population data are based on the 1970 census, future population levels for 1982, 1992, and2012 are based on allocations of the population projected by the Georgia Social Science AdvisoryCommittee.
Table 2.2-1 presents the 1975 population estimate within 50 miles of the site.
2.2.2 Changes in Land Use
There have been no significant changes in land use in the region surrounding the Hatch sitesince the issuance of the FES-CP. The primary land use changes due to plant construction haveoccurred on site where approximately 95 acres have been committed to the plant facilities. Anadditional 105 acres have been in use for construction purposes. Soil disposal and borrow areashave claimed nine acres of gum-cypress swamp, sixteen acres of bottomland hardwood, ten acresof cut-over timberland and forty-nine acres of agricultural land. These areas ha.e all beengrassed as have those construction areas which are no longer needed. All 105 acres of constructionarea will have been returned to some type of vegetative cover by completion of construction.Table 2.2-2 and Figures 2.2-1 and 2.2-2, present a summary of the distribution of preconstruc-tion plant communities on site and the status of the site as of November 1974. The applicanthas indicated (See 11.2.2.2) that upon completion of construction of the Hatch Nuclear Plant,Unit No. 2, as much of the temporary construction land areas as possible will be returned totinber production.
In addition to the direct changes in land use on site, approximately 1041 acres of wooded landhave been cleared and grassed in conjunction with construction of the HNP-Bonaire transmissionline. An additional 507 acres occur in areas where only the tower bases preclude continuationof prior uses. The land use on the right-of-way for the HNP-Bonaire transmission line is summarizedin Table 2.2-3.
( f)
2-1

_
ITABLE 2.2-1
1975 POPULATION DISTRIBUTION ESTIMATE (0-50 MILES)
Direction
Miles N NNE NE ENE r ESE SE SSE S SSW SW WSW W WNW NW NNW
0-1 0 0 0 0 0 0 0 4 3 0 17 8 21 0 0 0
1-2 4 0 0 0. 0 0 0 8 17 4 12 25 0 0 0 0
2-3 8 4 0 0 0 0 8 41 4 29 25 8 21 0 0 8
3-4 24 8 16 0 0 12 25 25 0 45 12 17 0 0 fl 39
4-5 50 4 24 12 4 12 45 62 41 41 12 12 4 0 12 24
5-10 218 218 218 256 276 264 264 264 264 264 254 245 231 212 210 21810-20 4,634 964 2,944 1,254 i ,o2 988 928 1,424 4,694 1,055 1,021 5,305 2,082 619 1,331 10,029
i
"
20-30 1,442 1,717 2,183 2,862 4,654 944 928 1,898 1,718 5,968 1,960 1.568 1,293 2,078 3,528 1,45030-40 2,071 4,943 5,556 2,788 1,687 2,276 10,330 2,768 2,274 3,441 2,454 3,406 1,560 5,931 2,178 5,02140-50 9,596 3,899 3,873 4,523 11,560 1,506 951 2,909 2,643 2,391 12,963 3,514 3,185 3,877 3,729 3,936
SUBTOTALS: 18,047 11,757 14.814 11,695 19,433 6,002 13,479 9,403 11,655 13,238 19,730 i4,108 8,397 12,717 10,996 20,725TOTAL 50-MILE F0PULATION: 216,196
-
Ch-
NCD

2-3
2TABLE 2.2-2
PRECONSTRUCTION AND PRESENT (11/75) PLANT C0ftMUNITIESON THE EDWIN I. HATCH NUCLEAR PLANT SITE
Before Construction Condition as of 11/74
Pine Plantation 38 111
Open Pine Field 143 38
Upland Pine Forest 78 59
Mixed Pine-Hardwood Forest 354 395
Cut-over Timberland 85 45
Branch Hardwood 76 76
Bottomland Hardwood 1032 1016
Gum-Cypress Swamp 46 36
Homestead 30 --
Agriculture 286 0
Transmission Line Right-of-Way 41 14
Roadside 30 33
Lake 4 --
Construction Area -- 200
Grassed Area (Includes right-of-wayon southern half of property) -- 220
TOTAL 2243 2243
2.2.3 Changes in the Lncal Economy
Construction activity on Hatch Unit No.1 peaked from mid-1971 to mid-1972 when approximately1600 workers were employed at the site. The peak force working on Unit No. 2 was reached in1974-1975. Although the staff is unable to estoolish a causal relationship, the data in Table 2.2-4suggest that the economic impact of the Hatch Nuclear Power Plant on Appling County and the Cityof Baxley has been substantial.
2.2.4 Historical and Natural Landmarks
As indicated in the FES-CP and FEDERAL REGISTER (43 FR 5361, 2/7/78)istori:, no historical areas or |natural landmarks have been identified in the National Register of H Places for Arpling
County.
1 f5(51 ()71
-,
~E
yaW
- St f Es o I Ne - TOr t I I
o h NT -F g UC4d i
dd o R MU1 -
t on o M R2s oa wp e T 2ewl d mn n O Sndrd rd r ao i C NEol ore oawi Li eF ab OHS t NO 9 -t i H mw a n OC UaFe - idd st eo I Gt net r a siri T E I
n ei n aaebus ARFanPi rHL rat se TOl i P e pHl i dppd vh my umi EF
-nd ocoC ncs s GE -
enae- nt - ai nd E Bnel xt at mr raa Vri ppi ur ouugroPOUMCBBGHATR
. . . . . . . . . . . .
12345678901 21 1 1
2
TNIU
YN TA NP AL@ M
j ~PO
C RA
R Eg E LWCO UP NIA H,
j
G TC@ R Aq O Hg O e E.
-
G 1
@ e IN
g W\
D @@ D'
E\
" @ g@ 0DM
g Oa
O O_ gg 0 eO%g O -
N-
@Q@ 0 a@
- e me @
@ g g
;/g $h *.
&e
- C-.
CNNDh
ma
.
yaW
-f SO E-t
I
Th Ig N
po aoes 7 - _.i
d ddR U 5
M42o no t
mw l wne n M/ 2 -1nadd rdi r d o O 2 -1owro erLo l i C Esis ao b a F et F -R -at H wnmH n i a N O -eas d oi - oe F t O Ur~ sd riT ein i I S GA nenat nsi eb TAIaraHcrisP ena A Fdl pl uePi diH
eP ymh rv mdiP Ts C oct od s ns n Es e- t ns - enad na Ganmt ant xal aem Eri uorouirpopuGPCBBCCMTUROH V
-
-. . ...........
1 2345678901 231 11 1 -
-
2
TI
NU
YN TA N
' 'P A
LM@ O P
h - C RA
R E@ - E L
WC .g(. O U -
_,
P N/ ) & i A H
* ! C' G T
, MQR AO H .
.
@ 1} E.
G 1_00 7' Ni
gM'"- @
I
WD
@ E,I
| I
@
@ _ @g1
O g @(
',
@ @@ @
g a@ @- T
& @g @
fg@g
g @g'
(b @,
[
i
rh. DCC . CN,
2-6
3TABLE 2.2-3
LAND USE ON HNP-BONAIRE TRANSMISSION RIGHT-0F-WAY
Number of % of total right-of-wayacres acres
Wooded 1041 67.2%
Uncultivated open areasand pastures 195 12.5%
Cultivated areas 193 12.51
Wetlands 89 5.87
U ban 30 2.0!
TOTAL 1548 100%
2.3 WATER USE
2.3.1 Regional Water Use
2.3.1.1 Surface Water
The Altamaha River, which runs by the site, is not used for municipal or industrial watersupply. The only known usage of Altamaha River water for direct human consumption is inducedflow from several small river wells in the fishing village of Davis Landing about 8 river milesdownstream from the site. Usage is believed to be small and intermittent.
The Altamana River in the vicinity of the site is used heavily for sport fishing. There iscommercial fishing about 115 miles downstream from the site.
2.3.1.2 Groundwater Usage
Groundwater is the primary source of water for human consumption, domestic, and stock wateringuse in the site area. Little or no use is made of groundwater for irrigation. At present,there is no industrial use for groundwater (other than the Hatch Plant) within 3 miles of thesite. There were 61 domestic wells surveyed in the Construction Permit Stage EnvironmentalReport. Of these, 27 are reported now in use. The others were either not functioning or arenow within plant property and have been abandoned.
2.3.2 Surface Water Hydrology
The plant is located on the Altamaha River, Georgia's largest, about 11 miles north ofBaxley, Ga. The Altamaha River is formed by the junction of the Oconee and Ocmulgee Riversabout 20 miles upstream from the site. The Altamaha River has a drainage area of about11,700 square miles and enters the Atlantic Ocean about 117 miles downstream from the site.
There are two major impoundments upstream from the site, and none downstream. The larger isLake Sinclair,169 miles upstream on the Oconee River. The smaller is Jackson Lake, about262 miles upstream on the Ocmulgee River.
The yearly average flow rate in the Altamaha River is 13,000 cubic feet per second, based on42 years of record of the Doctortown Gage, 57 miles downstream from the site. The minimum flowof record past the site is estimated to have been between 1,260 and 1,400 cubic feet oer second,lasting between 22 and 23 days. An extreme low flow of about 900 cubic feet per second can beextrapolated from records as being supported by groundwater seepage alone, without supplementationfrom upstream reservoirs. The total normal and emergency service water requirements of the plantare about 100 cubic fcet per second, which can be safely supplied by the Altamaha River underall circumstances.
2

_
6TABLE 2.2-4Y
INDICATORS OF ECONOMIC GROWTH IN APPL.INC COUNTY, 1969-1975- .
4
Appling County City of Baxley
Ad Valorem Septic Tank Residential Value of Connercial Water Value of BusinessTax Mileage Tax Yield Permits Permits Buildings Connections Licenses *
1969 26 $ 728,737 NA 2 NA 26 $30,064
1970 26 $ 925,880 36 20 $ 82,500 37 $32,277
1971 26 $1,156,153 84 15 5 68,500 76 $35,687
1972 16 $1,455,907 133 25 $496,760 104 $35,970
1973 16 $1.833,517 96 9 $189,347 84 $36,330
1974 16 $2,646,366 47 3 $369,029 31 $37,467
1975 16.25 $3,513,411 55 4 $ 75,315 23 $37,104
NA = Data not available.*Value of individual firms license based on previous year's gross receipts.
~
Ch-
NL.T1
_ _ _ .
. . _ . _ _ .
2-8
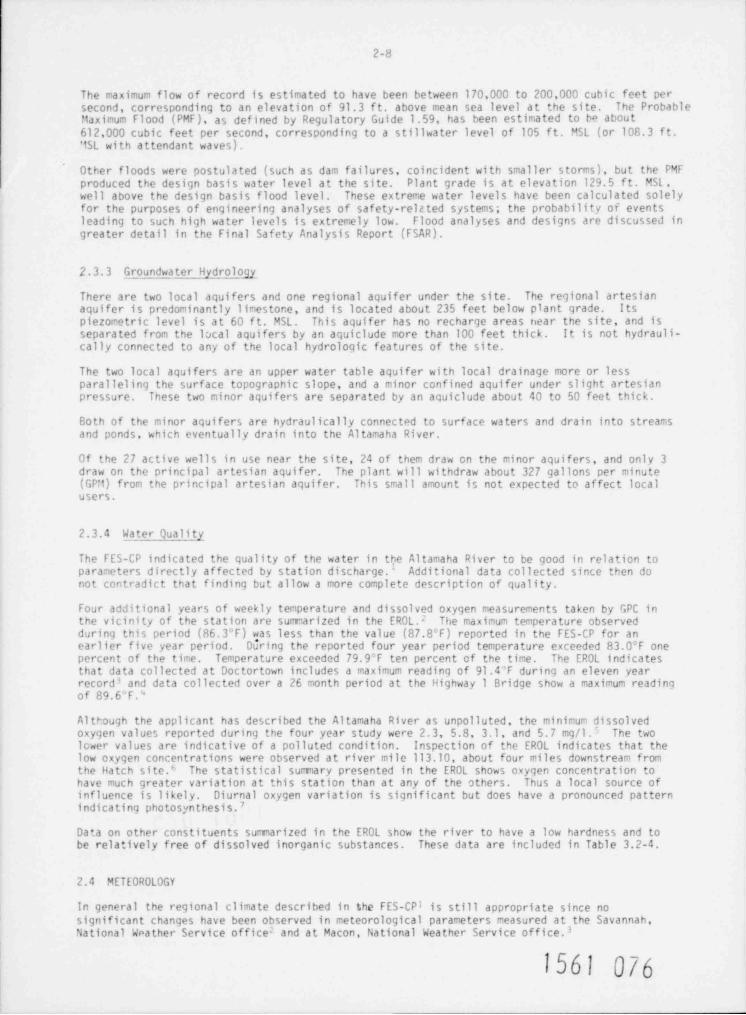
The maximum flow of record is estimated to have been between 170,000 to 200,000 cubic feet persecond, corresponding to an elevation of 91.3 f t. above mean sea level at the site. The ProbableMaximum Flood (PMF), as defined by Regulatory Guide 1.59, has been estimated to ba about612,000 cubic feet per second, corresponding to a stillwater level of 105 f t. MSL (or 108.3 f t.'iSL with attendant waves).
Other floods were postulated (such as dam failures, coincident with smaller storms), but the PMFproduced the design basis water level at the site. Plant grade is at elevation 129.5 f t. MSL ,well above the design basis flood level. These extreme water levels have been calculated solelyfor the purposes of engineering analyses of safety-reltted systems; the probability of eventsleading to such high water levels is extremely low. Flood analyses and designs are discussed ingreater detail in the Final Safety Analysis Report (FSAR).
2.3.3 Groundwater HydroloJy,
There are two local aquifers and one regional aquifer under the site. The regional artesianaquifer is predominantly limestone, and is located about 235 feet below plant grade. Itspiezometric level is at 60 f t. MSL. This aquifer has no recharge areas near the site, and isseparated from the local aquifers by an aquiclude more than 100 feet thick. It is not hydrauli-cally connected to any of the local hydrologic features of the site.
The two local aquifers are an upper water table aquifer with local drainage more or lessparalleling the surface topographic slope, and a minor confined aquifer under slight artesianpressure. These two minor aquifers are separated by an aquiclude about 40 to 50 feet thick.
Both of the minor aquifers are hydraulically connected to surface waters and drain into streamsand ponds, which eventually drain into the Altamaha River.
Of the 27 active wells in use near the site, 24 of them draw on the minor aquifers, and only 3draw on the principal artesian aquifer. The plant will withdraw about 327 gallons per minute(GI"i) from the principal artesian aquifer. This small amount is not expected to affect localusers.
2.3.4 Water Quality
The FES-CP indicated the quality of the water in the Altamaha River to be good in relation toparameters directly affected by station discharge.1 Additional data collected since then donot contradict that finding but allow a more complete description of quality.
Four additional years of weekly temperature and dissolved oxygen measurements taken by GPC inthe vicinity of the station are summarized in the ER0L.2 The maximum temperature observedduring this period (86.3 F) was less than the value (87.8*F) reported in the FES-CP for anearlier five year period. DJring the reported four year period temperature exceeded 83.0 F onepercent of the time. Temperature exceeded 79.9*F ten percent of the time. The ER0L indicatesthat data collected at Doctortown includes a maximum reading of 91.4'F during an eleven yearrecordi and data collected over a 26 month period at the Highway 1 Bridge show a maximum readingof 89.6 F. "
Although the applicant has described the Altamaha River as unpolluted, the minimum dissolvedoxygen values reported during the four year study were 2.3, 5.8, 3.1, and 5.7 mg/1.' The twolower values are indicative of a polluted condition. Inspection of the EROL indicates that thelow oxygen concentrations were observed at river mile 113.10, about four miles downstream fromthe Hatch site.6 The statistical summary presented in the ER0L shows oxygen concentration tohave much greater variation at this station than at any of the others. Thus a local source ofinfluence is likely. Diurnal oxygen variation is significant but does have a pronounced patternindicating photosynthesis.7
Data on other constituents summarized in the ER0L show the river to have a low hardness and tobe relatively free of dissolved inorganic substances. These data are included in Table 3.2-4.
2.4 METEOROLOGY
In general the regional climate described in the FES-CPI is still appropriate since nosignificant changes have been observed in meteorological parameters measured at the Savannah,National Weather Service office 2 and at Macon, National Weather Service office.3
1561 076

2-9,
Onsite meteorological data collected from June 1970 through September 1974 was supplied in theER0L" for use in evaluation of relative concentration X/Q and relative deposition D/0 at various
points surrounding the plant. The values detennined are the result of gaseous releases undernormal operating conditions and were derived using the assumptions and methods identified inRegulatory Guide 1.111.5 The results of this analysis appear in Section 5 of this Statement.
2.5 SITE ECOLOGY
2.5.1 Terrestrial Ecology
At the time of issuance of the FES-CP (October 1972) there was little information available onthe terrestrial systems on the Hatch site. Work was progressing at that time to acquire therelevant information and the results were submitted at the operating license stage.'
Three general vegetation types have been found to occur on site.1 Figure 2.5-1 presents thedistribution of these corrunities and indicates by letter the study plots which were used inobtaining information on the site vegetation.
The three main habitat types were identified as: (1) dry upland vegetation (site A), (2) flood-plain (sites B, C and D), and (3) planted pine-old field (site E).1 The dominant species oneach of the plots are listed in Table 2.5-1. The canopy vegetation on site A is dominated byloblolly pines with an understory of huckleberry and several species of hardwoods. The relativedensities indicate a mixed pine forest succeeding to hardwood. Site B consists of an area ofridges and sloughs close to the river and an inland area which is relatively flat. The ridgeand slough section is dominated by blue beech with little understory and an herb layer of poisonivy. The inland area has a greater diversity of tree species with loblolly pine dominating thecanopy. A very dense understory was reported that was characterized in many places by densethickets of blackberry and other shrubs which made the area nearly impassable. Site C is aflood plain comunity in the northwest portion of the site (upstream and across the river fromthe plant). Sweetgum is the dominant of the larger tree species with black willow, blue beechand loblolly pine also frequent. Blue beech is the most numerous understory tree species.Switch cane, possum haw, palmetto and sweetgum are also frequent in the understory. Site D isdownstream and across the river from the plant. This area consists of dense areas of tangledblackberry stems or switch cane covered by grape vine, pepper vine and greenbriar on the ridgesinterspersed with more open areas along the sloughs with sweetgum the most comon tree. Outsideof the tangle areas, the understory contains many blue beech, palmetto and holly. In site E,planted slash pine dominates the canopy with trees averaging four meters tall. There is littleunderstory and the herb layer is dominated by one species of aster and two species of goldenrod. This area is typical of abandoned farmland succeeding to woodland. A more complete descrip-tion of these areas is provided in the ER0L.1 Table 2.5-l A identifies the principal soil typespresent at the Hatch site. Those soils which meet the requirements for classification as primef analands are also indicated.Eleven species of mamals, thirty-one species of birds, eleven species of amphibians and thirteenspecies of reptiles were observed on site (see Table 2.5-2). One of these species is regardedas rare or endangered.
2.5.2 Aquatic Ecolo y
As a result of discussions between the Georgia Power Company and U.S. EPA phycologists, itwas concluded that due to high flow rates and high turbidity phytoplankton would not be a majorcontributor to primary productivity in the river and the utility's ef forts should be concentratedon periphyton rather than phytoplankton." Thus, although a phytoplankton study was proposed bythe applicant,I no study was conducted. Hynes concluded that rivers with high flow rates andt
high turbidity carry little true phytoplankton. The source of most planktonic algae occurringin fast flowing rivers with high turbidity is either populations released from upstream reservoirsor the suspension of scoured periphyton. Two upstream reservoirs do exist on the AltamahaRiver, Lake Sinclair and Jackson Lake; however, they are respectively 169 and 268 rivermilesabove the plant site and do not contribute significantly to the true phytoplankton populationsexisting in the vicinity of the plant.
The staff concludes that true phytoplankton in the vicinity of the Hatch plant is insignificantand that the major portion of any that may be observed represents scoured periphyton in suspension.
1561 077

2-10
eo
i | 5g , -
| 2 e'
T h~ i,. , . -
tud:0
q ""e
0 ''% ,,,,,8b
rten sm!'
.
,
m . @i
. _ . _ -visiwas cum 58
Q h-af v @m
im - f' rtAxtg
) @g
e ON_ OOi e e ' v.mius
,
e----/
w.// g
2Figure 2.51 Generalized Vegetation Map of the Hatch Plant Site.Type 1: Floodplain VegetationType it: Upland Mixed Pine - HardwoodType til: Transitional Between I and ilType IV: Cleared and Cultivated (Planted Pine)
1561 078
2-11
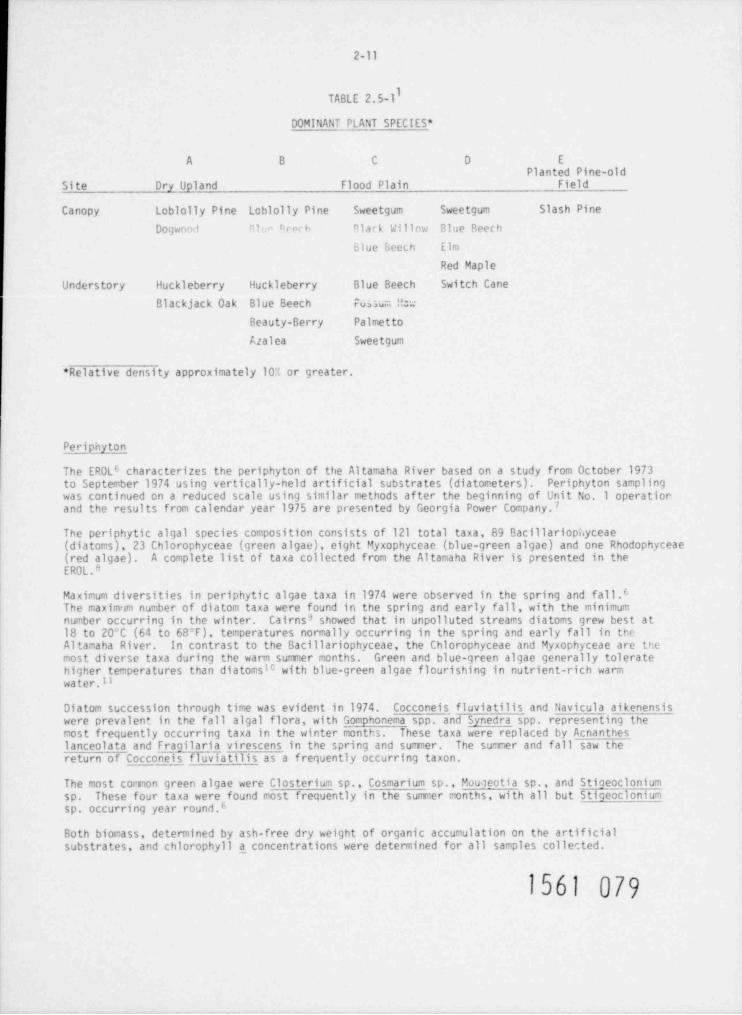
ITABLE 2.5-1
DOMINANT PLANT SPECIES *
A B C D E
Planted Pine-oldSite Dry Upland Flood Plain Field
Canopy Loblolly Pine Loblolly Pine Sweetgum Sweetgum Slash Pine
DogwoM P1: rwcb Dlack Willow Blue BeechBlue beech Elm
Red Maple
Understory Huckleberry Huckleberry Blue Beech Switch Cane
Blackjack Oak Blue Beech Fussum "Le
Beauty-Berry Palmetto
Azalea Sweetgum
* Relative density approximately 10% or greater.
Periphyton
The ER0L6 characterizes the periphyton of the Altamaha River based on a study from October 1973to September 1974 using vertically-held artificial substrates (diatometers). Periphyton samplingwas continued on a reduced scale using similar methods after the beginning of Unit No. 1 operatiorand the results from calendar year 1975 are presented by Georgia Power Company.7
The periphytic algal species composition consists of 121 total taxa, 89 Bacillariopi.yceae(diatoms), 23 Chlorophyceae (green algae), eight Myxophyceae (blue-green algae) and one Rhodophyceae(red algae). A complete list of taxa collected from the Altamaha River is presented in theER0L.8
Maximum diversities in periphytic algae taxa in 1974 were observed in the spring and fall.6The maximum number of diatom taxa were found in the spring and early fall, with the minimumnumber occurring in the winter. Cairns 3 showed that in unpolluted streams diatoms grew best at18 to 20 C (64 to 68 F), temperatures normally occurring in the spring and early fall in theAltamaha River. In contrast to the Bacillariophyceae, the Chlorophyceae and Myxophyceae are themost diverse taxa during the warm summer months. Green and blue-green algae generally tolerate
10higher temperatures than diatoms with blue-green algae flourishing in nutrient-rich warmwater.11
Diatom succession through time was evident in 1974. Cocconeis fluviatilis and Navicula aikenensiswere prevalent in the fall algal flora, with Gomphonema spp, and Synedra spp. representing themost frequently occurring taxa in the winter months. These taxa were replaced by Acnantheslanceolata and Fragilaria virescens in the spring and sunmer. The summer and fall saw thereturn of Cocconeis fluviatilis as a frequently occurring taxon.
The most comon green algae were Closterium sp., Cosmarium sp., Mouleotia sp., and Stigeocloniumsp. These four taxa were found most frequently in the summer months, with all but Stigeocloniumsp. occurring year round.6
Both biomass, determined by ash-free dry weight of organic accumulation on the artificialsubstrates, and chlorophyll a_ concentrations were determined for all samples collected.
1561 079

2-11A
TABLE 2.5-1A
PRI;iCIPAL SOIL TYPES *
Potential forPrime Famland
Soil Tn e
Albany sand .___.............. .......____.........___..__...__
Bayboro loam .....__________________....... ....____......____.Carnegie loamy sand, 2 to 5 percent slopes _.....____...__ ... . YesCarnegie loamy sand, 2 to 8 percent slopes _______._...._______.Cowarts loamy sand, 2 to 5 percent slopes _.......__________.... YesCowarts loamy sand, 5 to 8 percent slopes._________...._.......
Coxville loam...___________.._____.. ........................__
Dunba r loamy sand, 5 to 12 percent slopes...__.. _ __ __.........Dupli n l oamy sa nd , 2 to 5 percent sl opes....................__. Yes
Duplin loamy sand. 5 to 8 percent slopes..___ ...........___.._ YesFuquay loamy sand, O to 5 percent slopes._____ ...__.______..._Hazlehurst loamy sand. ........__......___ .... __._.__....__..
Irvington loamy sand.____._.....___.....____.._________ ....... YesJohnston and Rains soils
J o h ns t o n pa r t _ _ _ _ . . . . . . _ _ _ _ . . . . . . _ _ _ _ _ _ . . _ _ _ _ _ _ . . . . .. _ _ _
Rains part ........._...__......__...__..__ ___..__ ....__
Ke rshaw sa nd , 2 to 8 pe rcent slopes._ _..__ __ _._ ______ ........_L ee f i e l d s 0 i l s . . . . . . . . . . . _ . . . . . . , _ . .. . . . . . . _ . . . . _ _ _ _ _ _ . . . . . . . . Y e s
Lee f i e l d l oa my s a nd.. .. .. _ _ _._.._ _ . .. . . . . . ._. _ _ .. .. _ _ _ _ _. .. . . Y es
Mascotte sand ____..._....._______._......._.___.....____.......Norfolk loamy sand, 2 to 5 percent slopes.._ .............____.O l us t e e s a n d . _ _ _ _ _ _ _*. . . . . . . _ _ _ . . _ .. . . . _ _ _ . . . . . . . _ _ _ _ _ _ _ . . _ _ _ _ Y e t
Pelham loamy sand ___.._.___.. ______.____.........__...._..____Sunsweet sandy loam, 5 to 12 percent slopes, eroded ______ ....
Surrency loamy sand ___.....________...._........______..______.Troup sand, O to 5 percent slopes.____...._.................__.
Ti f ton loamy sand , O to 2 percent slopes _.. ._ ......... __....Ti f ton loamy sand, 2 to 5 percent s inpes...._._,_-___....._____ Yes
Troup-Wicksburg complex, 8 to 12 percent slopes.____._......... Yes
!licksburg gravelly coarse sand, 2 to 8 percent slopes _..____...Wa h ee a nd Cox v i l l e 5 0115.. .. _. . . .. . ... . _ _ _ . . .. .... ._ _ _ _ __.... .
*U. S. Department of Agriculturo, Snil Conservation Service, Soil Survey of Applingand Jeff Davis Counties, Georgia, May 1975 Map Sheets 4 and 10 and Map Unit Guide.
1561 080

lTABLE 2.5-2
TERRESTRIAL FAUNA
MAMMALS BIRDS AMPHIBI At45 REPTILES
Oppossum Belted Kingfisher Mocking Bird Spotted Salamander Comon Musk Turtle
Southeastern Shrew Blue Jay Mourning Dove Marbled Salamander Eastern Eox TurtleShorttail Shrew Bobwhite Osprey Three-lined Salamander River CooterEastern Cottontail Brown Thrasher Parula Warbler Southern Toad Yellow-bellied TurtleEastern Gray Squirrel Cardinal Prothonatary Warbler Fowler's Toad Gopher TortoiseBeaver Carolina Wren Red-eyed Vireo Southern Cricket Frog Green AnaleCotton Mouse Common Crow Red-tailed Hawk Green Tree Frog Six-lined RacerunnerHispid Cotton Rat Eastern Bluebird Robin Pine Woods Tree Frog Five-lined SkinkHouse Mouse Eastern Meadowlark Rufous-sided Towhee Little Grass Frog Broad-headed SkinkRaccoon Eastern Wood Peewee Song Sparrow Ornate Chorus Frog Southeastern Five-lined
SkinkWhitetail Deer Great Blue Herron Starling Bullfrog Southern Black Racer
Hermit Thrush Turkey Vulture Eastern King SnakeHouse Sparrow White-throated Sparrow
Banded Water SnakeKilldeer Yellow-bellied Sapsucker
"Loggerhead Shrike Yellow-shafter FlickerLD
Ch Mallard-
00-
a

2-13
Artificial substrate recovery was hampered by winter and spring flooding during both years ofdata collection. Fluctuations in flow of the Altamaha River contributed to the observed widefluctuations in biomass, chlorophyll a determination, and diversity between samples. Biomasswas shown to have peaked in early and70r late summer for both years at all stations.7 Therewere considerable decreases in chlorophyll a_ concentrations at north bank stations in 1975compared to 1974.7
Macroinvertebrate Drift
A macroinvertebrate drif t fauna study from the Altamaha River was conducted during calendar year1973. A total of 143,966 individual aquatic and semi-aquatic macroinvertebrates representing115 taxa were collected and identified, when possible, to the generic level. The ER0L12 liststhe taxa identified from the drift samples taken in the vicinity of the Hatch plant. Immaturemayflies (Ephemeroptera) represented the largest portion of the total annual number of driftorganisms (29.5 percent). The n ost abundant genera were Baetis, Pseudocloeon, Stenonema,Isonychia, and Tortopus. Larval and adult aquatic beetles (Coleoptera) aTsTcomprised a largepcr uon of the drift T29.3 percent). Most abundant were larvae of the dytiscid beetle, Hydroporous,which accounted for 19.3 percent of the total number of drif t organisms. Numerous, also, wereadult and larval Elmidae: Stenelmis sp., Macronychus glabratus, and Ancyronyx variegatus.Immature stoneflies (Plecoptera) represented 8.0 percent of the total drif t. The most abund3ntstonefly was Perlesta. Immature caddisflies (Tricoptera) comprised 6.4 percent of total drif t.The most abundant of this group were genera of the family Hydropsychidae: Hydropsyche, Macronemum,Potamyia and Ch_eumatopsyche.
_
Other groups abundant in the drif t were gladocera (17.3 percent) and immature Diptera (4.7 percent).lAverage values for the Shannon/ Weiner _ diversity index were prepared for each day and nightsampling period. Values for diversity H were significantly greater (at .05 level) for nightsamples than for day samples. The mean number of taxa per sample was significantly greater (atthe .05 level) in night samples than in day samples. During spring and summer sampling periods,tsually three times as many taxa were collected at night compared to corresponding day samples.The number of taxa collected for both day and night samples decreased in the fall. The maximummean value per sanple exceeded 30 taxa during the May sampling period.
The mean number of aquatic macroinvertebrates per sample increased with rising temperature anddischarge during spring. A peak occurred in early April with the number of organisms decreasingfor the remainder of April and May concurrent with a decrease in discharge. A second peakoccurred in early June with a corresponding increase in discharge. The mean number of organismsdecreased regularly from early June to the end of September when the mean number leveled off andremained somewhat constant for the remainder of the year. The average number of organismscollected per sampling period was significantly higher (.05 level) at night. Usually 10 timesas many organisms were obtained during night sampling periods than during corresponding daysampling periods.
Estimated density of macroinvertebrate drif t organisms was also significantly greater at night.Peak densities of macroinvertebrates collected at night occurred in April and June withcorresponding increases in discharge.
Benthos
Benthos from the Altamaha River in the vicinity of Unit 2 were collected at six week intervalsfrom July 1973 through July 1974 and quarterly through 1975. Sampling was performed using Dendymulti-plate samplers and a Petersen dredge.
Approximately 100 taxa have been identifie j including members of the Crustacea, Collembola,Ephemeroptera, Odonata, Plecoptera, Hemiptere, Megaloptera, Coleoptera, Tricoptera, Diptera,Mollusca, and Hydracarina. A complete specie, list is given in the ER0Ll" and updated in theAnnual Environmental Surveillance Report (AESR).7
The mayfly ([phemeroptera) populations showed high numbers of individuals in the spring andsummer with emergence in mid-fall. Caddisfly (Trichoptera) populations exhibited the sametrends shown by the mayflies, with high numbers in the spring and summer. Chironomidae exhibita multivoltine life cycle with increases in individuals during early winter and summer. Lownumbers were found during mid-fall and late winter. In general, most benthic species found inthe Altamaha River in the vicinity of the site demonstrated seasonal abundance. Spring andsummer months yielded higher numbers of organisms.
Species diversity (II). Shannon/ Weiner index,13 of all stations showed the Same generaltrends with h values being slightly lower during the winter and increasing in the spring.
1561 082
2-14
Af ter operation of Unit No. I diversity values at downstream stations were compared to upstreamstations and did not reflect any imediate deleterious ef fects from operation of the Hatch plant.
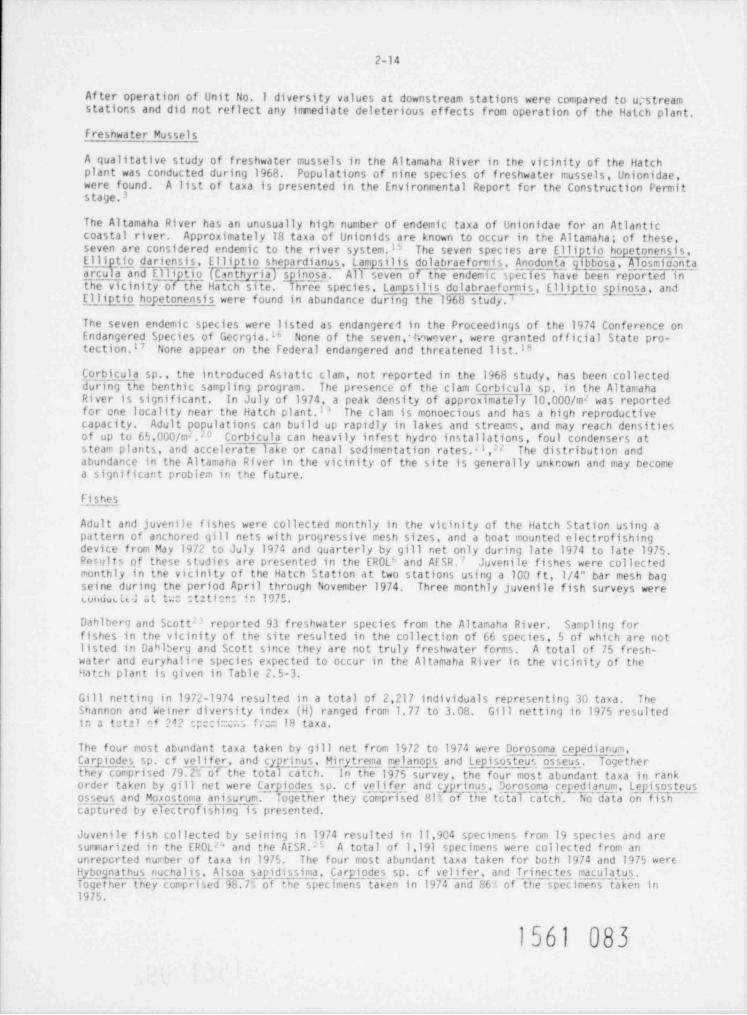
Freshwater Mussels
A qualitative study of freshwater mussels in the Altamaha River in the vicinity of the Hatchplant was conducted during 1968. Populations of nine species of freshwater mussels, Unionidae,were found. A list of taxa is presented in the Environmental Report for the Construction Permitstage.3
The Altamaha River has an unusually high number of endemic taxa of Unionidae for an Atlanticcoastal river. Approximately 18 taxa of Unionids are known to occur in the Altamaha; of these,seven are considered endemic to the river system.15 The seven species are Elliptio hopetonensis,Elliptic dariensis, Elliptio shearcula and El_Tiitio (C nth _yr_i]) pardianus, Lampsilis dolabraeformis, Anodonta gibbosa, AlosmicantaJ spinosa. All seven oT the endemic species have been reported inthe vicinity of the Hatch site. Three species Lampsilis dolabraeformis, E g g n n_osa, andElliptio hopetonensis were found in abundance during the 1968 study.3
The seven endemic species were listed as endangerc'1 in the Proceedings of the 1974 Conference onEndangered Species of Gecrgia.M None of the seven,-hnwever, were granted of ficial State pro-tection.17 None appear on the Federal endangered and threatened list.l"
C_orbicula_ sp., the introduced Asiatic clam, not reported in the 1968 study, has been collectedduring the benthic sampling program. The presence of the clam Corbicula sp. in the AltamahaRiver is significant. In July of 1974, a peak density of approximately 10,000/m2 was reportedfor one locality near the Hatch plant.Il The clam is monoecious and has a high reproductivecapacity. Adult populations can build up rapidly in lakes and streams, and may reach densitiesof up to 65,000/m .23 Corbicula,can heavily infest hydro installations, foul condensers at2
steam plants, and accelerate lake or canal sedimentation rates.21,N The distribution andabundance in the Altamaha River in the vicinity of the site is generally unknown and may becomea significdnt problem in the future.
Fishes
Adult and juvenile fishes were collected monthly in the vicinity of the Hatch Station using apattern of anchored gill nets with progressive mesh sizes, and a boat mounted electrofishingdevice f rom May 1972 to July 1974 and quarterly by gill net only during late 1974 to late 1975.Pesults of these studies are presented in the EROL6 and AESR.' Juvenile fishes were collectedmonthly in the vicinity of the Hatch Station at two stations using a 100 f t, 1/4" bar mesh bagseine during the period April through November 1974. Three monthly juvenile fish surveys weretoi.u n d et twc :t:tiem B 1975.
Dahlberg and Scott > 3 reported 93 freshwater species from the Altamaha River. Sampling forfishes in the vicinity of the site resulted in the collection of 66 species, 5 of which are notlisted in Dahlberg and Scott since they are not truly freshwater forms. A total of 75 fresh-water and euryhalice species expected to occur in the Altamaha River in the vicinity of theHatch plant is given in Table 2.5-3.
Gill netting in 1972-1974 resulted in a total of 2,217 individuals representing 30 taxa. TheShannon and Weiner diversity index (H) ranged from 1.77 to 3.08. Gill netting in 1975 resultedin a total c' 242 :;'c:imm fcc 18 taxa.
The four most abundant taxa taken by gill net from 1972 to 1974 were Dorosoma cgedianum,Carpiodes sp. cf velifer, and cyprinus, Mirytrema melanops and Lepisosteus osseus. Togetherthey comprised 79.2% of the total catch,_ in the 1975 survey, the four most abundant taxa in rank
order taken by gill net were Carpiodes sp. cf velifer and cygrinus, Dorosoma_ h. ped _ianum, lea sosteusce i
osseus and Moxostnma anisurum. Together they comprised 81t of the t0tal catc No data on fishUp~t'u' red by eTectrofishing is presented.
~ -
Juvenile fish collected by seining in 1974 resulted in 11,904 specimens from 19 species and aresunmarized in the ER0LM and the AESR.~5 A total of 1,191 specimens were collected from anunreported nurber of taxa in 1975. The four most abundant taxa taken for both 1974 and 1975 were
Hyb,ognathus nuchalis, Alsoa sapidissima, Carpi _ odes sp. cf velifer, and Trinectes maculatus.Together they comprised 98.7; of the specimens taken in 1974 and 86L of the specimens taken in1975.
1561 083

2-15
TABLE 2.5-3
FISH TAXA IN VICINITY OF HNP
ACIPENSERIDAE - Sturgeons
Acipenser brevirostrum Shortnose sturgeonAcipenser oxyrhynchus Atlantic sturgeon
LEPISOSTEIDAE - Gars
Lepisosteus osseus Longnose garLepisosteus platyrhincus Florida gar
AMIIDAE - Bowfins
Amia calva Bowfin
ANGUILLIDAE - Freshwater Eels
Anguilla rostrata American eel
CLUPEIDAE - Herrings
Alosa aestivalis Blueback herringA Wsa mediocris Hickory shadAlosa sapidissima American shadDorosoma cepedianum Gi_'ard shad j
*Dorosoma petenense The cadfin shd
UMBRIDAE - Muiminnows
Umbra pygmaea Eastern mudminnow
ESOCIDAE - Pikes
Esox americanus Redfin pickerclEsox niger Chain pickerel
CYPRINIDAE - Minnows and Larps
Cyprinus carpio CarpHybognathus nuchalis Silveryminnoy*Hybopsis rubrifrons . Rosyface chubNotem m_ onus crysoleucas Golden shinerNotropis callisema Ocmulgee shinerNotropis cummingsae Dusky shinerNotropis hudsonius Spottail shine*Notropis leedsi Choopeeshiner{
.
Longnose shinerNotropis longirostrisNotropis maculatus Taillight shinerNotropis petersoni Coastal shinerPimeph W s promelas Pluntnose minnow
CATOSTOMIDAE - Suckers
Carpiodes sp. cf c_yprinusCarpiodes sp. cf veliferErimyzon oblongus Creek chubsucker
*Erimyzon succetta Lake chubsuckerMinytrema melanops Spotted suckerMoxostoma_ anisurum Silver redhorse j
*M_oxostoma robustum Smallfin redhorseo
1561 084

2-16
ICTALURIDAE - Freshwater Catfishes
Ictalurus brunneus Snail bullheadTctalurus catus White catfishIctalurus natH is Yellow bullhead
-
Ictalurus nebulosus Brown bullheadIctalurus platycephalus Flat bullheadIctalurus punctatus Channel catfishNoturus gyrinus Tadpole madtomNoturus leptacanthus Speckled madtom
AMBLYOPSIDAE - Cavefishes
*Chologaster cornuta Swampfish
APHRED0DERIDAE - Pirate Perches
Aphredoderus sayanus Pirate perch
~BELONIDAE - Needlefishes
Strongylura marina Atlantic needlefish
CYPRINODONTIDAE - Killifishes
Fundulus notti Starhead topminnowLeptolucania omnata Pygmy killifish
POECILIIDAE - Livebearers
Gambusia affinis MosquitofishHeterandria formosa Least killifish
ATHERINIDAE - Silversides
Labidesthes sicculus Brook silverside
PERCICHTHYIDAE - Temperate basses
Morone chrysopi White bassMorone saxatilis Striped bass
CENTRARCHIDAE - Sunfishes
Acantharchus pomotis Mud sunfishCentrarchus macropterus Flier
-
Elassoma eiergladei Everglades pygmy sunfish-
*E]assoma okefenokee Okefer.okee pygmy sunfish)Elassoma zonatum Danded pygmy sunfish[Enneacanthus gT6riosus Bluespotted sunfish
~ ~ ~ -
Enneacanthus obesus Banded sunfishLeponis auritus Redbreast sunfishLepomis gulosus WarmouthLepomis macrochirus BluegillLepomis marginatus Dollar sunfishLepomis microlophus Redear sunfish(epomispunctatus Spotted sunfishMicropterus salmoides
Largemouthbags*Fomoxis annularis White crappieFomoxis nigromaculatus Black crappie
PERCIDAE
2*Etheostoma fusiforme~
Christmas darterSwamp darter
Etheostoma horkinsiEtheostoma olmstedi Tessellated darterPerca flavescens Yellow perch
)"EcIna nigrof asciata Blackbanded darter
. - - .
--
2-17
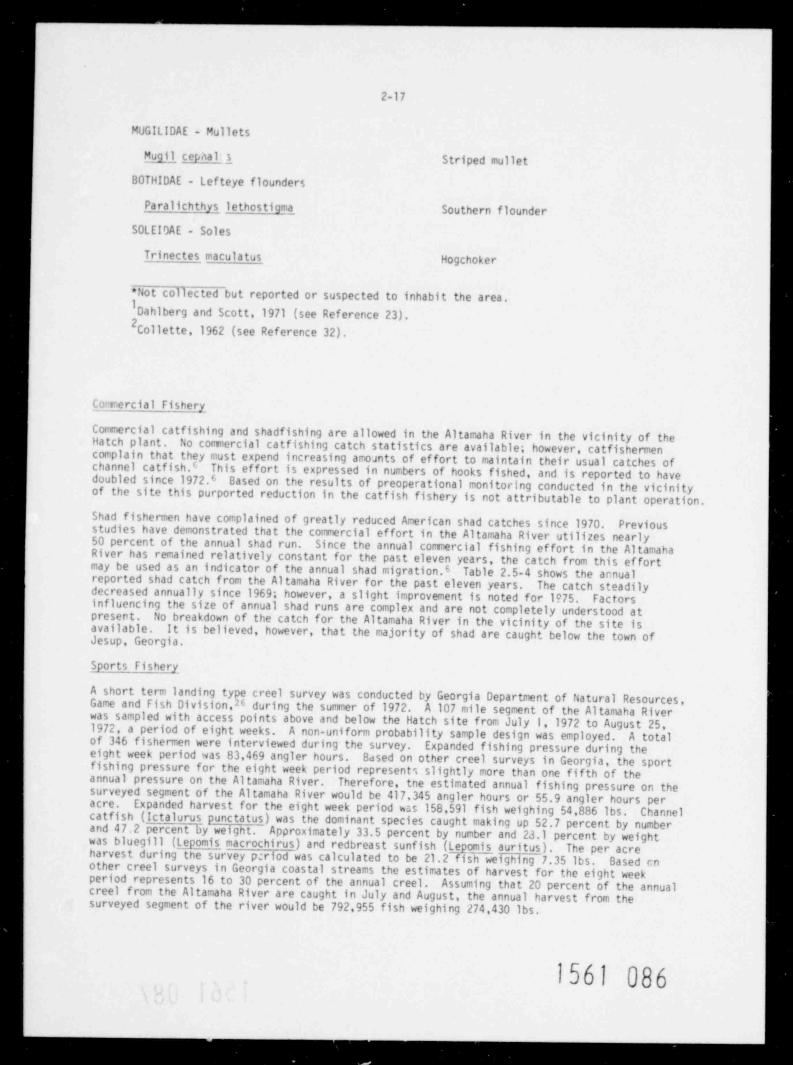
MUGILIDAE - Mullets
Mugil cephal'1 Striped mullet
BOTHIDAE - Lefteye flounders
Paralichthys lethostigma Southern flounder
50LEIDAE - Soles
Trinectes maculatus Hogchoker
*Not collected but reported or suspected to inhabit the area.Dahlberg and Scott,1971 (see Reference 23).
2Collette, 1962 (see Reference 32).
Co"r ercial Fishery
Commercial catfishing and shadfishing are allowed in the Altamaha River in the vicinity of theHatch plant. No cocinercial catfishing catch statistics are available; however, catfishermencomplain that they must expend increasing amo;nts of effort to maintain their usual catches ofchannel catfish.6 This effort is expressed in numbers of hooks fished, and is reported to havedoubled since 1972.6 Based on the results of preoperational monitoring conducted in the vicinityof the site this purported reduction in the catfish fishery is not attributable to plant operation.
Shad fishermen have complained of greatly reduced American shad catches since 1970. Previousstudies have demonstrated that the commercial effort in the Altamaha River utilizes nearly50 percent of the annual shad run. Since the annual commercial fishing effort in the AltamahaRiver has remained relatively constant for the past eleven years, the catch from this effortmay be used as an indicator of the annual shad migration.6 Table 2.5-4 shows the arnualreported shad catch from the Altamaha River for the past eleven years. The catch steadilydecreased annually since 1969; however, a slight improvement is noted for 1975. Factorsinfluencing the size of annual shad runs are complex and are not completely understood atp re ser t . No breakdown of the catch for the Altamaha River in the vicinity of the site isavailable. It is believed, however, that the majority of shad are caught below the town ofJesup, Georgia.
Sports Fishery
A short term landing type creel survey was conducted by Georgia Department of Natural Resources,Game and Fish Division.26 during the summer of 1972. A 107 mile segment of the Altamaha Riverwas sampled with access points above and below the Hatch site from July 1,1972 to August 25,1972, a period of eight weeks. A non-uniform probability sample design was employed. A totalof 346 fishermen were interviewed during the survey. Expanded fishing pressure during theeight week period was 83,469 angler hours. Based on other creel surveys in Georgia, the sportfishing pressure for the eight week period represents slightly more than one fif th of theannual pressure on the Altamaha River. Therefore, tne estimated annual fishing pressure on thesurveyed segment of the Altamaha River would be 417,345 angler hours or 55.9 angler hours peracre. Expanded harvest for the eight week period w:s 158,591 fish weighing 54,886 lbs. Channelcatfish (Ictalurus punctatus) was the dominant species caught making up 52.7 percent by numberand 47.2 percent by weight. Approximately 33.5 percent by number and 23.1 percent by weightwas bluegill (Lepomis macrochirus) and redbreast sunfish (Lepomis auritus). The per acreharvest during the survey p;riod was calculated to be 21.2 fish weighing 7.35 lbs. Based cnother creel surveys in Georgia coastal streams the estimates of harvest for the eight weekperiod represents 16 to 30 percent of the annual creel. Assuming that 20 percent of the annualcreel from the Altamaha River are caught in July and August, the annual harvest from thesurveyed segment of the river would be 792,955 fish weighing 274,430 lbs.
1561 086
-
_-

2-10
TABLE 2.5-4
ANNUAL COMMERCIAL CATCHES OF SHAD,ALTAMAHA RIVER, 1964 TO 1975*
Year Pounds Value
1964 182,369 $ 59,2241965 192,267 65,4811966 158,810 41.9951967 137,126 23,8571968 295.907 71,6771969 407,700 119,1111970 345,400 99,1401971 241,900 79,0871972 154,500 55,474
.
1973 76,827 30,4831974 54,930 20,0161975** 87,662 50,441
*Edwin I. Hatch Nuclear Plant Unit No. 2 Environmental Report - OperatingLicensa Stage, July 1975 Vo!ume 2. Appendix A Table 5.2-3.
** Annual Environmental Surveillance Report No. 2, January 1-December 31, 1975,Section 5.6.
No breakdown of angling pressure or annual harvest is available in the vicinity of the Hatchplant.
The Georgia Power Company staff monitored sport fishing activity at river mile 118.5, upstreamfrom the site on Saturday, May 19, 1973.' Fif ty-five fishing boats were launched from a paidboat ramp with an average of two fishermen per boat. The applicant estimated that there wereapproximately 440 fishermen on a ten mile stretch of river in the vicinity of the Hatch plant.Although Georgia Power Company personnel were unable to record the ef forts of the fishermen,several legal limits of 50 redbreast sunfish (Lepom_is_ auritus) per fisherman was observed. Theapplicant concluded that sport fishing pressure in the vicinity of the plant is significant.
In 1975 Georgia Power Company personnel interviewed a local shad fisherman who estimated thatno more than 200 American shad were caught in the vicinity of the plant.27
Based on the state creel survey, the sports fishery monitoring efforts by the applicant, andthe number of pay and non-pay Doat ramps upstream and downstream of the Route 1 bridge, thestaff concludes that an extensive sports fishery exists in the Altamaha River in the vicinityof the Hatch plant.
Rare or Endangered Fis,hes
The list of fishes known from the Altamaha River in the vicinity of the Hatch plant has beencompared to both the Federal and State Endangered and Threatened Species Lists.17,lF Onespecies, the shortnose sturgeon (Ac_ipense, ne g o_ strum) has been reported from the plant siteand appears on both the Federal and State lists. A single adult sper.imen was collected by gillnet on March 13, 1974 in the vicinity of the Hatch site. Three additional specimens of Aciyens_ersp., two juveniles and one larva were collected but could not be identified to the specieslevel.
The shortnose sturgeon is a rare form restricted to the eastern seaboard of North America fromthe Saint Johns River in New Brunswick to the Saint Johns River of eastern Florida.' Littleis known of the life history of this form due to its rarity. Spawning takes place in thespring in the middle reaches of large tidal rivers from April to early June, depending onlatitude. Adults apparently return to a parent stream for spawning. The shortnose sturgeon iscaptured most of ten in large tidal rivers but is also taken in brackish and salt water.
1561 087

2-19
Captures in the Gulf of Maine indicate that it goes to sea and travels some distance from theparent stream.28 Gut analysis of Hudson River specimens has shown that the diet consists ofsludgeworms, Chironomid larvae, small crustaceans, and plants.
Important Species
Two important species of fish found in the Altamaha River are the American shad (Alosa sapidissima)and the hickory shad (Alosa mediocris). Eoth species have annual spring spawning runs up theAltamaha River. The present upstream limit of the shad run is in the vicinity of Hawkinsville,Georgia, a distance of 252 miles f rom the mouth of the Altamaha.M Tagging studies donein 1968 resulted in population estimates for both hickory and American shad. The populationestimate for American shad was 989,213 lbs, for hickory shad 117,648 lbs. The shad spawn inthe Altamaha River from January to April depending on water temperature. Some shad spawningmay occur at water temperatures f rom 8'C to 26'C with peak spawning activity occurring attemperatures between 14*C and 21 C. M
During 1967 and 1968, spawning areas for the Altamaha were determined by the use of egg col-lecting nets. Some spawning occurred throughout the river system with the major spawning areaextending f rom about 60 miles upstream into the tributaries.'' The largest catch per uniteffort of shad eggs occurred at stations located below the site.
Other important species utilizing the Altamaha River channel proper are the largemouth bass(Micropterus salmoides), blueback herring (Alosa aestivalis), striped bass (Morone saxatilis),and the Atlantic sturgeon (Acipenser oxyrhynchus).
Fish Eggs and Larvae
Fish eggs and larvae were collected during drif t and entrainment studies from the Altamaha Riverin the vicinity of the Hatch plant. Samples were collected weekly from February through Junefrom 1973 through 1975. Both day and night samples were taken.
In 1973, American shad (Alosa sapidissima) eggs were collected in the river from early Februarythrough June. Mean densities approached 30/10'M3 in March night collections and in May daycollections. Average numbers collected per sampling period were greater at night as comparedto corresponding day samples. Mean egg densities in both day and night samples varied inverselywith river flow. Larvae of American shad were present in drif t samples from March through
June. Larval densities never exceeded 3/10'M3 30
In 1974, Alosa sapidissima eggs were present in the drif t from February through July. Bothday and night collections reached a maximum of 25-30/10"M - Egg density remained above3
10/10"M3 consistently f rom mid-March through May. In 1975, A.. sapidissima eggs were present3 in bothin the drif t f rom February through June, with a maximum in mid-May of about 50/10"M
day and night collections. Density of eggs fluctuated inversely with river discharge throughJune. In general, density of Alosa sapidissima eggs remained higher for a longer period oftime in 1974 than in 1973 of 1975 probably as a result of increased river flow in 1973 and1975. No data on larval density for American shad are available for 1974 and 1975 samplingperiods.
In 1973, Hickory shad (Alosa mediocris) eggs and larvae were rare in the drif t. Hickory shadhave extremely adhesive eggs and utilize tributaries and oxbows rather than the main channelto spawn.31 A total of nine eggs and one larva were collected. Egg densities were negligiblefor most of the season and reached 1.7/104M3 during one day and night sampling period in earlyMarch. Maximum density of A. mediocris larvae occurred in March and reached 0.5/10"M3 for aday sampling period.
In 1973, blueback herring (Alosa aestivalis) eggs and larvae were rare in the drif t. No eggsand only 14 larvae were collected. Density of A. aestivalis larvae exceeded 1/10'M3 in threenight sampling periods in March and April. PeaE density of larvae was 1.3/10'M -3
In the 1974 and 1975 sampling periods, there was no attempt to identify eggs and larvae ofAlosa mediocris from Alosa aestivalis. Combined densities of larvae only were reported underthe taxon Alosa spp.
Larvae of Alosa spp were present in the 1974 drif t from February through July. Both day andnight densities peaked in March and in early May reaching a maximum of 30-40/10'M3 In 1975,the larval density of Al_o_sa_ spp. was suppressed early in the season as a result of extremeriver flow in February through May. As river flow decreased in May, larval density
1561 088
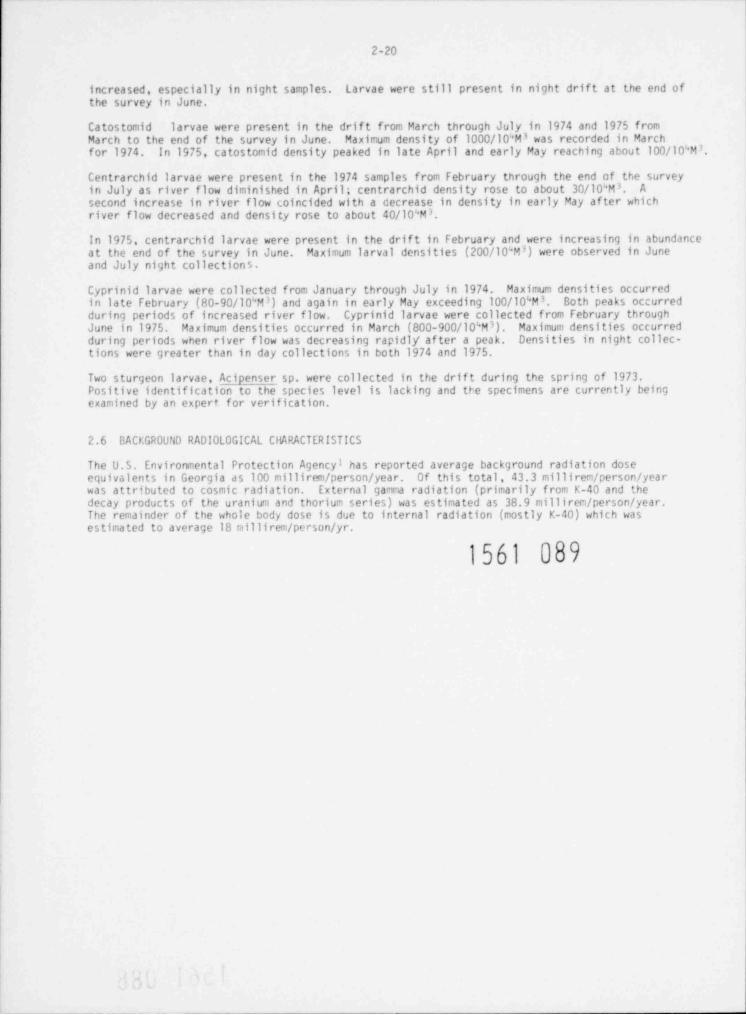
2-20
increased, especially in night samples. Larvae were still present in night drif t at the end ofthe survey in June.
Catostomid larvae were present in the drif t from March through July in 1974 and 1975 fromMarch to the end of the survey in June. Maximum density of 1000/10-M 3 was recorded in Marchfor 1974. In 1975, catostomid density peaked in late April and early May reaching about 100/10'M3
Centrarchid larvae were present in the 1974 samples from February through the end of the survey3in July as river flow diminished in April; centrarchid density rose to about 30/10"M . A
second increase in river flow coincided with a decrease in density in early May af ter whichriver flow decreased and density rose to about 40/10'Mt
In 1975, centrarchid larvae were present in the drif t in February and were increasing in abundance3at the end of the survey in June. Maximum larval densities (200/10'M ) were observed in June
and July night collections.
Cyprinid larvae were collected from January through July in 1974. Maximum densities occurredin late February (80-90/10"M 3) and again in early May exceeding 100/10'*M 3 Both peaks occurredduring periods of increased river flow. Cyprinid larvae were collected from February through
3June in 1975. Maximum densities occurred in March (800-900/10'M ). Maximum densities occurredduring periods when river flow was decreasing rapidly af ter a peak. Densities in night collec-tions were greater than in day collections in both 1974 and 1975.
Two sturgeon larvae, Acipenser sp. were collected in the drif t during the spring of 1973.Positive identification to the species level is lacking and the specimens are currently beingexamined by an expert for verification.
2.6 BACKGROUND RADIOLOGICAL CHARACTERISTICS
The U.S. Environmental Protection Agencyl has reported average background radiation doseequivalents in Georgia as 100 millirem / person / year. Of this total, 43.3 millirem / person / yearwas attributed to cosmic radiation. External gamma radiation (primarily from K-40 and thedecay products of the uranium and thorium series) was estimated as 38.9 millirem / person / year.The remainder of the whole body dose is due to internal radiation (mostly K-40) which wasestimated to average 18 millirem / person /yr.
1561 089

. _ . ---
2-21
REFERENCES FOR SECTION 2
References for Section 2.2
1. Georgia Power Company Supplement I to Edwin I. Hatch Nuclear Plant Unit No. 2-
Environmental Report - 0perating License Stage, January 1976, Table 2.21TSIT.-
2 Ibid., p. 20.
3. Georgia Power Company Edwin I. Hatch Nuclear Plant Unit No. 2 Environmental Report -Op rating License Stage, July 1975 Table 4.2-1.
4. Op. cit., Reference 1. Table '..J-1(S1).
5. Op. cit., Reference 1, Table 4.3-2(51).
6. Georgia Power Company, Supplement 2 to Edwin I. Hatch Nuclear Plant Unit No. 2Environmental Report - Operating License Stage, April 1976, Table 8.0-SC(S2).
References for Section 2.3
1. U.S. Atomic Energy Commission, Final Environmental Statement for Edwin I. HatchNuclear Plant Unit 1 and Unit 2, Docket Nos. 50-321 and 50-366, October 1972, p. I1-12.
2. Georgia Power Company, Edwin I. H_atch Nuclear Plant Unit No. 2 Environmental Report -Operating License Stage, July 1915 Table 2.5-6.
3. Ibid., Table 2.5-3.
4 Ibid., Table 2.5-4.
5. Ibid., Table 2.5-6.
6. Ibid., Table 2.5-5.
7. Ibid., Fiqure 2.5-12.
8. Ibid., Table 2.5-7.
References for Section 2.4
1. U.S. Atomic Energy Comission, Final Environmen_tal Statement for Edwin I. HatchNuclear Plant Unit 1 and Unit 2. Docket Nos. 50-321 and 50-366, October 1972,p. II-13.
2. Local Climatological Data, Annual Summary with Comparative Data, Savannah, Georgia,Published Annually, NOAA, Environmental Data Science, Asheville, N.C.
3. Local Climatological Data, Annual Summary with Comparative Date Macon, Georgia,Published Annually, NOAA, Environmental Data Service, Asheville, N.C.
4. Georgia Power Company Edwin I. Hatch Nuclear Plant Unit No. 2 Environmental Report -Operating License Sta e, July 1975, Section 2.6.s
5. U.S. Nuclear Regulatory Commission, Regulatory Guide 1.111. Methods for EstimatingAtmospheric Transport and Dispersion of Gaseous Effluents in Routine Releases FromLight-Water-Cooled Reactors, March 1976.
1561 090
.

2-22
Refm 2nces for Section 2.5
1. Georgia Power Company, Edwin I. Hatch Nuclear Plant Unit No. 2 Environmental Report -Operating License Stage, July 1975 Volume 2, Appendix C.
2. Ibid., pp. C-16. C-17.
3. Georgia Power Company, Edwin I. Hatch Nuclear Plant Enviror. mental Report,Construction Permit Stage, February 1971, Section III.
4 Georgia Power Company Environmental Report on Edwin I. Hatch Nuclear Plant Unitho. 2, Operating License Stage, Supplement 2, April 1976, p. 4.
5. Hynes, H. B. N., The Ecology of Running Waters, Liverpool University Press,Liverpool, 1970.
6. Op. cit., Reference 1 Appendix A, Section 5.
7. Georgia Power Company, Annual Environmental Surveillance Report No. 2, January 1 -December 31, 1975.
8. Op. cit., Reference 1, Appendix A. Table 5.4-4.
9. Cairns, J., Effects of Increase Temperatures on Aquatic Organisms IndustrialWastes, 1, 4, 150-152 T T50 .
10. Patrick, R., Sote Effects of Temper _ature on Freshwater Algae, pages 161-185 inBiological Aspects of Tnermal Pollution, P. A. Krenkel and F. L. Parker (Eds.).Vanderbilt University Press, 1969.
11. Hutchinson, G. E., A Treatise on Limnology, Volume !!, John Wiley and Sons, Inc.,New York, 1967.
12. Op. cit., Reference 1, Appendix A, Table 5.3-1.
13. Margalef, R., La Teoria de la Informacion en Ecologis, Mem. Real. Acad. Cienc.Artes Barcelona, 22:373-449(1957).
14. Op. cit. , Reference 1, Appendix A, Table 5.5-1.
15. Sickle, J. B., Murray State University, Kentucky, Personal Communication, May 1976.
16. Georgia Department of Natural Resources, Endangered Species of Georgia, Proceedingsof the 1974 Conference, Atlanta, Georgia. T-66 pp. Mimeo.
-
17. Georgia State Department of Natural Resources, Game and Fish Division. Rules andRegulations for the Protection of Endangered, Threatened, Rare or UnusuaT Fpecies,March 25, 1976. 1-9 pp. Mimeo.
18. U.S. Department of the Interior, Fish and Wildlife Service. Endangered andThreatened Wildlife and Plants. Fed. Register 40:197, September 26,7 W E
19. Gardner, J. A. , Woodall, H R. et al . , The Invasion of the Asiatic Clam _[Corbicula ManilensisPhilippi) in the Altanaha River, Georgia, The Nautilus. Vol. 90Tf), July 21, 1976, nn 117.1 3.
_
20. Sinclair, R. M., Corbicula Variation and Dreissena Parallels, paper presented tothe 36th Annual Meeting of American Malucological Union, Key West, Florida (1970).
21. Anonymous, TVA's Division of Power Production Experience with Asiatic Clams - Corbicula,Manuscript [196M.
22. Prohcpovich, N. P. and D. J. Hebert, Sedimentation in the Delta - Mendota Canal,Journ. Amer. Water Works Assoc., 57:3, 375-385~T M 5).
23. Dahlberg, fi. D. and D. C. Scott, The Freshwater Fishes of Georgia, Bull . Georgia Acad.Sci., 29:1-64 (1971).
1561 091

2-23
References for Section 2.5 (Cont'd)
24. Op. cit., Reference 1. Appendix A. Table 5.2-5.
25. Op. cit., Reference 7. Table 5.6-5.
26. Holder. D. R. and D. Smith, A Short Term Fishermen Survey on the Altamaha River,Georgia Department of NaturaTTesources Game and7Is~h Olvision,lnternal Rcport,
-
1-9 pp. (1972).
27. Op. cit., Reference 4, p. 11.
28. Scott, W. B and E. J. Crossman, Freshwater Fishes of Canada, Bull. 184 Fish.Resear. Bd. of Canada, (1973),1-966.
-
29. Godwin, W. T., The Shad Fishery of the Altamaha River, Georgia, Georgia Game andFish Comm., 1-39 (1968).
30. Georgia Power Company, Semi-Annual Environnental Surveillance Report No. 1. Period ~Ending December 31,1974~ Amendment. ATy T976-
31. Adams, J. G., Clupeids in the Altamaha River, Geo nia, Georgia Game and Fish Conn.,1-27 (1970).
32. Collette, B. B., The Swamp Darters of the Subgenus Hololepis (Pisces Percidae).Tulane Stud. ZoolT9T4TFT5T-~2T1 (1962).
References for Section 2.6
1. Oakley, D. T. Natural Radiation Exposure in the United States, ORP/SID72-1,U.S. Environmental Protection Agency, June 1972.
1561 092
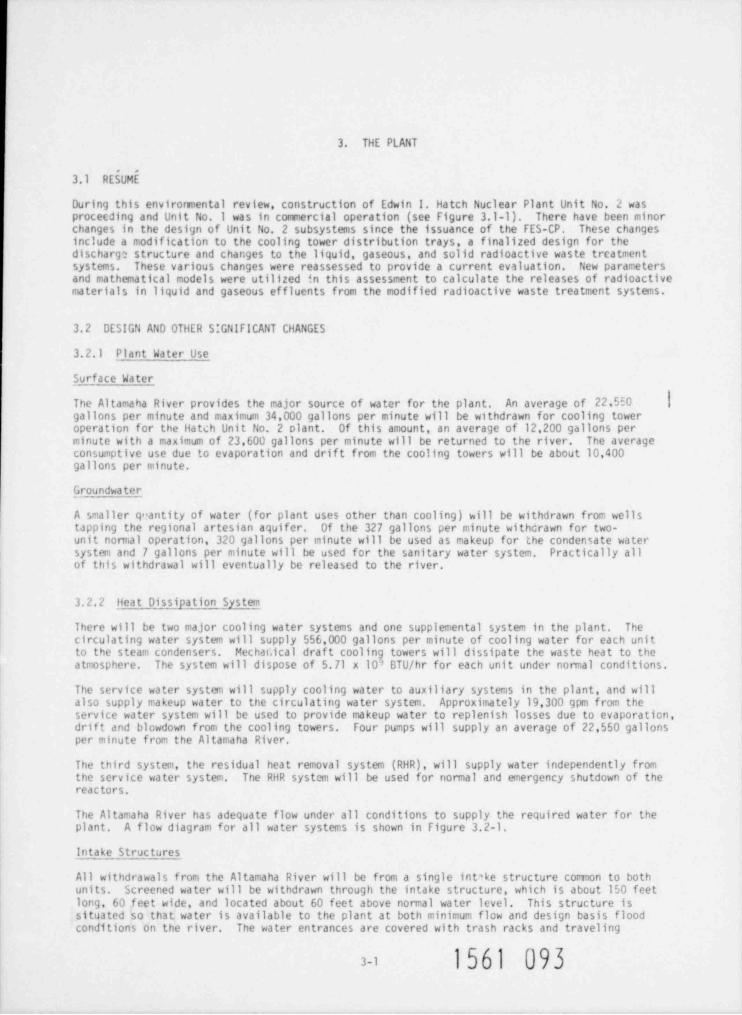
3. THE PLANT
. .
3.1 RESUME
During this environmental review, construction of Edwin I. Hatch Nuclear Plant Unit No. 2 wasprocecding and Unit No. I was in commercial operation (see Figure 3.1-1). There have been minorchanges in the design of Unit No. 2 subsystems since the issuance of the FES-CP. These changesinclude a modification to the cooling tower distribution trays, a finalized design for thedischarg2 structure and changes to the liquid, gaseous, and solid radioactive waste treatmentsystems. These various changes were reassessed to provide a current evaluation. New parametersand mathematical models were utilized in this assessment to calculate the releases of radioactivematerials in liquid and gaseous effluents from the modified radioactive waste treatment systems.
3.2 DESIGN AND OTHER SIGNIFICANT CHANGES
3.2.1 Plant Water Use
Surface Water
The Altamaha River provides the major source of water for the plant. An average of 22,550 |gallons per minute and maximum 34,000 gallons per minute will be withdrawn for cooling toweroperation for the Hatch Unit No. 2 olant. Of this amount, an average of 12,200 gallons perminute with a maximum of 23,600 gallons per minute will be returned to the river. The averageconsumptive use due to evaporation and drif t from the cooling towers will be about 10,400gallons per minute.
Groundwater
A smaller q"antity of water (for plant uses other than cooling) will be withdrawn from wellstapping the regional artesian aquifer. Of the 327 gallons per minute withcrawn for two-unit nonnal operation, 320 gallons per minute will be used as makeup for the condensate watersystem and 7 gallons per minute will be used for the sanitary water system. Practically allof this withdrawal will eventually be released to the river.
3.2.2 Heat Dissipation System
lhere will be two major cooling water systems and one supplemental system in the plant. Thecirculating water system will supply 556,000 gallons per minute of cooling water for each unit
Mechanical draft coolin towers will dissipate the waste heat to theto the steam condensers.The system will dispose of 5.71 x 10g' BTU /hr for each unit under normal conditions.atmosphere.
The service water system will supply cooling water to auxiliary systems in the plant, and willalso supply makeup water to the circulating water system. Approximately 19,300 gpm from theservice water system will be used to provide makeup water to replenish losses due to evaporation,drif t and blowdown f rom the cooling towers. Four pumps will supply an average of 22,550 gallonsper minute from the Altamaha River.
The third system, the residual heat removal system (RHR), will supply water independently fromthe service water system. The RHR system will be used for normal and emergency shutdown of thereactors.
The Altamaha River has adequate flow under all conditions to supply the required water for theplant. A flow diagram for all water systems is shown in Figure 3.2-1.
Intake Structures
All withdrawals from the Altamaha River will be from a single int'ke structure comon to bothunits. Screened water will be withdrawn through the intake structure, which is about 150 feetlong, 60 feet wide, and located about 60 feet above normal water level. This structure issituated so that water is available to the plant at both minimum flow and design basis floodconditions on the river. The water entrances are covered with trash racks and traveling
1561 0933-i

3-2
|ig/ 'p.e,
.C p.s A:p .
's/* ,
;w'x
3;I'm4 +
;,3!*
'f
L|9|w .
<'
JJ:e; r, , yy
g.
, , * " ,.
'r
s, *.
** ,
[' , e.f , <
V': //'
s ~
.g, ,/,
,'\ ., A'
.
s
. ' ' -.y,.,
Q,.*s -
/ | ~
, n|.Y|*4>|
',
g-,.
.
, ,
'
j', s
e -. .
"
t.'[ ~
D,C-
' 1j&,ryU.sY e ,v,-
s# f!
q.c ;9 ;v4 'G :. i
^
8p; j
-
'
. [< p . /< e,.. ,~,*4'
|C'w .: y . s' " ,",'
di; , . v" g ~.ae'$
'% Wp'. *'
.
-g, ( g/..%.
4 <'~
/ |,p,. '
'l'
isp., ;f ;'
gs-
.'| . g|' ,;m Y :g;m /
w* <,
A|s' ;.,
p. u " :s, . .
%}f ::.
,,
, N,'
./,
n. . ,
y y','O ..
-i
;( , e,4':
j('|Wf;ffg
y, .
.-'
*'*,,3,
:g,7:v4~ ,. ~
afs:- .-
/S67 094

w
TNA
- L
PMDE" .sI
m < . . NT
K" W . u.ra . AS '- Yt
*A
0,.us " RS 1G u
_f o* E
-u
P
7 3 R 2,O tS"- *
T E 3A T EWA- 1
GW UR
'
, , NIE G.*, LI FICv m-, OVe
._ ORCE
W Wg _ TS.m w
e ,ND,,, .
L , .s Mg AL ,a O, L
L POA,tI
,sD ,,
d/ na
-L
re .EG Tt
- de ,p
Gg S.48 NO u_ pD AL
DLaG
M/B _ L LJ PD. IA,, Rs
AT,L,
EA,d ag L
g
CU 2
- NI
m' T. H N. C U
T$,' - .
s .f AG.a s . t
M" He. e e
I .e
D-.n
G-uEt g s
E.e
g
=.t f Dt .<m A .E'' ,
tt sAs e
AG EL..> s
S
t 3W u . 1u vtf 9 i e. gC
D # N'ATA. R
G. O ' * , . .S.c o N.a o p
. e. o. ost RNA
G, A ..e1t A. s. , 4
tu . p..
I
h.- s .E
. c.e - .. W*O. .O. s
D.
E1 .-
yg R8
e.Mg 4.g
_ g ,R_.G. . _gi
a .E et
.o
G at
..
s
R . Ae
.A A
_E "H R . I
,5..
EN'8 n~ _,_C J-U
_. .rR
S . 0
-I T eD C SGm.
s R ,uU a R .R .. GV . s w.R'..k e C s e'
.1t t
E W a uTV S au. g
N
e0e ,
b - )-I S
7 D5 n..rO( be
H. a. t.A.P .I ."'R.. t ( (. i'<
t. .
.'.v
. " ".
.
e4> ,g <Hq ."44
*
ns- eo- gW(J)

34
screens which can be backwashed to remove debris and impinged fish. The maximum intake velocityat the design low flow in the river will be 1.9 f t/sec. and proportionately less at higherriver flows.
Discharge Structure
The various service water and RHR streams depicted in Figure 3.2-1 will enter a mixing boxcommon to both uni M , and will then be discharged to the river through two a2-inch pipes extending120 feet into the river perpendicular to shore and approximately 1260 feet downstream from theintake structure. The discharge pipes are at elevations 59 f t. MSL, or about 4 feet below theriver surface at its lowest anticipated level. Discharge velocity under normal conditions willbe 3.0 ft/sec.
3.2.3 Radioactive Waste Treatment
Since the FES-CP was issued, the applicant has modified the liquid, gaseous and solid radioactivewaste treatment systems as proposed in the Final Safety Analysis Report (FSAR). The staff hascalculated revised liquid and gaseous source terms and annual quantity of solid waste withradioactive contents based on more recent operating data applicable to the Hatch Nuclear Plant.
On April 30, 1975, the Nuclear Regulatory Commission announced its decision in the rulemakingproceeding (RM-50-2) concerning numerical guides for design objectives and limiting conditionsfor operation to meet the criterion "as low as is reasonably achievable" for radioactive materialin light-water-cooled nuclear power reactor ef fluents. This decision is implemented in theform of Appendix I to 10 CFR Part 50. To effectively implement the requirements of Appendix I,the NRC staff has reassessed the parameters and mathematical models used in calculating releasesof radioactive materials in liquid and gaseous effluents in order to comply with the Commission'sguidance. This guidance directed that current operating data, applicable to proposed radwastetreatment and effluent control systems for a facility, be considered in the assessment of theinput paraneters. The staf f has completed its reassessment and these parameters, models andtheir bases are given in Regulatory Guide 1.112. " Calculation of Releases of RadioactiveMaterials in Gaseous and Liquid Ef fluents from Light-Water-Cooled Power Reactors," April 1976,and the staf f's BWR-GALE Code, NUREG-0016.
In compliance with Section V.B of Appendix I to 10 CFR Part 50, the applicant submitted, onJune 4, 1976, information necessary to evaluate the capability of the Hatch Nuclear Plant, UnitNos. I and 2. for keeping levels of radioactivity in effluents to unrestricted areas. "as lowas is reasonably achievable." In these sutnittals, the applicant chose to comply with theComission's September 4,1975 am.ndment to Appendix I, eliminating the necessity of performinga cost-benefit analysis as required by Paragraph II.D of Appendix I.
The staf f has evaluated the radioactive waste treatment systems proposed f or Hatch NuclearPlant. Unit Nos.1 and 2, to reduce the quantities of radioactive materials released to theenvironnent in liquid and gaseous effluents. The staf f has generated new liquid and gaseoussource terms to determine conformance with Appendix ! based on new operating data applicable tothe Hatch Nuclear Plant, Unit Nos. I and 2. on changes to the radwaste treatment systems providedin the applicant's June 4, 1976 submittals and described below, and on changes in the calcula-tional model. The calculated releases of radioactive material in liquid and gaseous effluentsare provided in Tables 3.2-2 and 3.2-3 and are based on the parameters given in Table 3.2-1 usingthe calculational model presented in NUREG-0016. The new source terms were used to calculatethe dose estimates discussed in Section 5.5. The staff believes that the radionuclide compositionset forth in Tables 3.2-2 and 3.2-3 reasonably characterizes the annual average calculatedreleases of radioactive material in liquid and gaseous effluent from the Hatch Nuclear Plant.Unit Nos. I and 2.
3.2.3.1 . Liquid Ra_dwaste System Modifications
The liquid radwaste system for Hatch Nuclear Plant, Unit Nos. I and 2, is a separate system witha single laundry facility at Unit No. 1, as shown in Figure 3.2-2. The liquid radwaste effluentradiation monitor has been modified to include automatic isolation of the discharge line,rather than manual control, if the radiation measurements exceed a predetermined level in thedischarge line. Spent resins from the waste demineralizer and the floor drain demineralizerwill be processed by the solid waste system, rather than regenerated as was stated in the FES-CP.
1561 096

ym
r-
, e '~o,I' -'y' ge
'
m .i
y s o*' , . ns
N" o , =g* , g ~
c; t.i w~.%* g,e nc* g
G"
m ,v c.",
E' n t .
ha ct feu og 1ge.
o ,ft. c
y . v iHs~,f .
A_j | |
J_
,kgs
... a =. _ ...'g ' m
_ 2e. " _ fa
iV
a.s O ' t W.
" .s e
aL mOs
f
.4 u0 _dg ' =88 aC .. nn .. Iig
t.u .a E
si wtu * C . L
m D.Te
_ u.Wa
..C
.aGL
.su a. o. .u .
IO uS
A .y
.
N ,,, j_ o_ s
. I=g 8. N
.D . ,
3 ht P , Qa, t_
_5 itO
t,,
e, .ua .
,ts
- ,
g " - Ut
o, .e _ n., ti pi|I| !0L e_ ,,o. eu
s
t
n
M __P
. as
" laos
,,, aT7e
.ss
1. ,
.e
3 0 .ote .t
a rn .=-o W
s 0
4ss o, g,- p m ae .wa a
o,?4
eu 915 t.
o t "lec.
8t
o
"ot c4L ..'G a
o, ccs
O e
a u as i. tI
-u
a.C< i
t
3p , Narmoema. D (
nt nh. -wG c at,
DL t _ es Ig
.a O s c..e
5 c c. - t
S a .. a.u a
.
. g
, - H4 fe -
., ,| t ~a
h+#'"'x=+S.t=g
tto E
,
o.
t " r. s= e
..s ..a t o
~wfE c u }} ta
tT q
~..T av
'A .a t . .aau e _ tv eav ,
a~ m
_ ,| ii
"4 et m% t c
0 M.t _e tm=t9
p
ess% ema4 ^,
wtg a
,,9h=regw , s4 .
_C as t. ,
,
y0 . (o s
0 C Cau ,,
_ _ ,O a Igge,,,, , , ,T%t,
t s,,,,,o,,GU4 I g t; t
= ,,aw5%P
f.
i,
C - .EGa .A
. emd
'GO . .P aL5" R
c. - - 5 .A, _ - iu
. mm
,, 1 t. st
5a . dGt- ,
+ .ajO
o.-. .g ,
-iq
rq'< .n
i
Li
1 s
7gt ,4as
4
G ,0 At .&m . t
2.
Oij . tee,, ero
,E
s
,
a&, ia ,.f G s -, T
ha,- Gs- o .6, o
g = ,, , 2u pe,
S .as.a-ge ,
gs,| f_ tb.,- i
{-ef-t
u,- L5' u t _ - 3P oo v ,, _ a t ,y -
hs _- ems
S .s A i.s ro tS ,c - o5e
- ig4u_c C cA
, g c,9
E o9
u 4, . - F'{, G
| re e
.seL-!
84
.t o
u T, .. v
. aI '
t1|
EfE ..uvg 4
s*s' . C o*s'y o .s@e g 'p'"' " a,
o
*
O O;it
-O L
7" ,ee, 'w0
e-Ca'
,
4' i O
m. Com "A Ot j E"L , ,,
tE73b.
pv
F|C t ,
es = TC t-
y}-<
e
,nT.ts c. .** see
9 w , 4T.
*4e 4E
.eDmn Ta *
#a _
,
OE,,:S,
A.s *T . g }NSG LL , a Ds &
m.|g A,- * , , /,,$
%lm~ OTN'li
3-6
3.2.3.2 Gaseous Radwaste System Modifications
The gaseous radwaste system modifications consist of routing the waste gas building ventilationflow of 2400 cfm to the main stack and changes to the turbine building ventilation system, asshown in figure 3.2-3. The turbine building ventilation system design will include an airrecirculation and cooling system to reduce the ventilation air flow rate to permit treatmentbefore release to the environment. The turbine building ventilation air exhausts will betreated by two 12,500 cfm filter trains consisting of HEPA filters and charcoal absorbers.
3.2.3.3 Solid Radwaste System Modifications
Modifications to the solid radwaste system consist of state-of-the-art improvements in packagingsolid wastes for offsite shipment te a licensed burial site.
Wet solid wastes, consisting mainly of spent demineralizer resins collected in a 1200 gallonspent resin tank, and sludges from the six phase separators will be dewatered by a centrifugeand mixed with cener.: or urea-formaldehyde solidification agent. The mixer will utilize liquidwastes from the 4500 gallon concentrated waste tank that collects waste evaporator bottoms forliquid needed for proper solidification.
The staf f estimates that approximately 31,000 f t3 of packaged wet solid waste containingapproximately 3700 Ci and 4700 ft3 of dry solid waste containing a total of less than 5 Ci willbe shipped offsite annually per reactor. Greater than 90% of the radioactivity associated withthe solid waste will be long-lived fission and corrosion products, principally Cs-134. Cs-137,Co-58, Co-60 and Mn-54. Tne applicant estimates that approximately 20,000 f t3 (2000 drums) of |wet solids totaling approximately 1770 Cl will be shipped offtite annually per reactor.
All containers will be shipped to licensed burial sites in accordancc with NRr and DOT regulations.The solid waste system will t,e similar to systems that have been evaluated and found to beacceptable in previo % license applications. Therefore, the staff finds this solid wastesystem to be acceptable.
3.2.3.4 Evaluation
The liquid source term calculated for each reactor using the parameters in Table 3.2-1 andRegulatory Guide 1.112 (BWR-GALE Code NUREG-0016) is 0.32 C1/yr, excluding tritium, and 32 Ci/yrof tritium as shown in Table 3.2-2. The gaseous source term calculated for each reactor isapproxima; ley 31,000 Ci/yr of noble gases. 0.12 Ci/yr of iodine-131, 32 C1/yr of tritium, 9.5Cf /yr of carbon-14 and 0.003 Ci/yr of particulates for each reactor as shown in Table 3.2-3.These source terms were used to calculate the doses and provide comparison with the designobjectives of Appendix I to 10 CFR Part 50 as given h Section 5.5.
The staff's evaluation concludes that the liquid and gaseous radioactive waste treatmentsystems for Hatch Unit Nos. I and 2, are capable of maintaining releases of radioactivematerials in ef fluents to "as low as is r;asonably achievable" levels in accordance with 10 CFR50.34a during normal operation, including anticipated operational occurrences. As shown inSection 5.5, the resulting doses associated with Hatch Nuclear Plant, Unit Nos. I and 2 meetthe dose design objectives set forth in Sections II.A B and C of Appendix I to 10 CFR Part 50and satisfy the dose and curie design objectives in RM-50-2 in accordance with the September 4,1975 option to Section II.D of Appendix !. On this basis, the staff finds these systemsacceptable.
1561 098
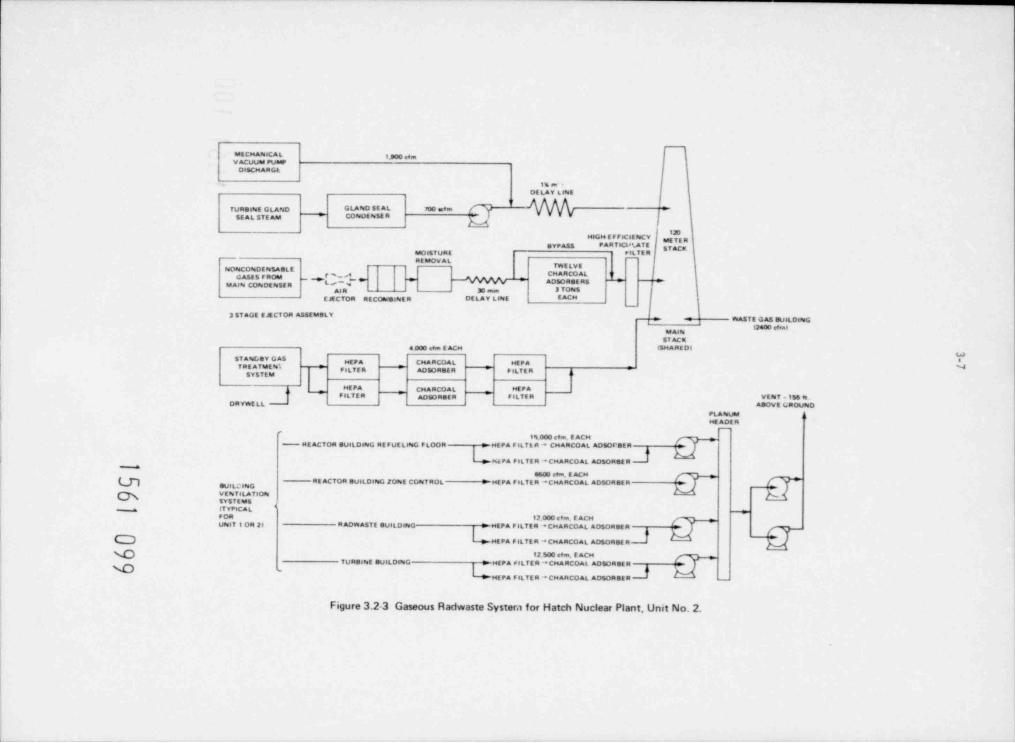
MECMAhtCAL gm g.V ACUUM PUMP
De$CMARG&
116 m -DE LAV LINE
TURRINE GLAND GLAND SE AL Mo nfmSE AL STE Ag CONOE NSE R
McGM E F FICaE NCY gnSVPASS PARitcutATE STACK
MO6STURE PIL TE RRE MOV A L
TWELVENONCONDENSA8tECMA RCO AL,i >GASES F ROM .,AD50RSER5 *
MAIN CONOEN5ER '~ 30 m 3 TONE
E JE C TOR RECObvetNE R DE LAY LsNE EACM
3 5TAGE EJECTOR ASSEMBLY -
WASTE GAS BUaLDeNG,
MAINETACK
4 000 e#m E ACM (SMART D4WSTAE8V GAS eMEPA CHARCOAL MEPA
TRE ATME N". e NF ILT E R AOSORSER F ILT E RSYSTEM
F LTER AO aR F TE R VE NT - 156 8tDRYWELL A E GROUNO
PLA NUMME ADE R
e14000 efm. E ACM
- HE ACTOR BufLDING REFUELtNG F LOOR MEPA F sLTt m * CMARCOAL ADSOr sER
hePA FILTER * CMARCOAL AD50RSER
E6(E e#m. E ACM
Q RE ACTOR BueLDING EONE CONTROL 2 MEPA FILTER *CMARCOAL ADSORSER _
VEN YaLA TIONSV 5TE MS
% (T YPICA LFOR 12.000 efm. E ACMUNa71 OR 2) R ADWA$TE BUILDaNG ' EPA FILTER * CHARCOAL ADSORBER
C MEPA FILTER * CMARCOAL ADSORSE R
g 12 500 eem. E ACMTURS NE SuaLDING MEPA FILTER *CMARCOAL AD$ORSERY *
v
MEPA FILTER * CHARCOAL ADSORSER
Figure 3.2-3 Gaseous Radwaste Systera for Hatch Nuclear Plant, Unit No. 2.

3-8
TABLE 3.2-1
PRINCIPAL PARAMETERS AND CONDITIONS USED IN
CALCULATING RELEASES OF RADI0 ACTIVE MATERIAL IN
LIQUID AND GASEOUS EFFLUENTS FROM HATCH, 'JNIT N05.1 OR 2 |
(PER UNIT)
Reactor Power Level (MWt) 2537
Plant Capacity Factor 0.80
Fraction of Fuel Releasing Radioactivity
to the Primary Coolant
Noble gases 60,000 oCi/sec for
3,400 MWt af ter 30 min
Iodinc-131 (independent of power level) 5 x 10⁻³ uCi/gm
Primary toolant System
5Weight of liquid in reactor vessel (Ib) 4.57 x 10⁵Cleanup demineralizer flow (1b/hr) 1.0 x 10
Steam flow rate (lb/hr) 1.05 x 10 |7
Cendenser air inleakage (scfm) 20
7Condensate demineralizer flow (lb/hr) 1.05 x 10
,Dilution Flow (gal / min) 12,000
lodine Partition Factors (gas / liquid)
Steam / liquid in the reactor vessel 0.02
Fraction of Iodine Getting Through
Condensate demineralizer 0.01
Cleanup demineralizer 0.1
Holdup Times
1561 100Holdup pipe 30 min
Charcoal delay krypton 0.76 days
Charcoal delay xenon 13.5 days

.._ _ _ _
3-9
TABLE 3.2-1 cont'd
Decontamination Factors I Cs Others
2 2Waste collection system (high purity) 10 10 10
2 2Floor drain neutral 12er system (low purity) 10 2 10
3 4 4Chemical waste system 10 10 10
All Nuclides
Except ludine Iodine4 3Waste Evaporator DF 10 10
Demineralizer Type Cation Anion Cs, Rb
2 2fiixed-Red-Deep-Bed on Clean Waste 10 (10) 10 (10) 10(10)a
(H + OH) DF
2 2Mixed-Bed-Deep-Bed on Floor Drain 10 (10) 10 (10) 2(10)
(H + OH) DF'
Mixed-Bed (Powdex) DF 10 10 2
3Dynamic Adsorption CoefficientsCm /Sm
Kr (operating temperature 77*F,
dew point 45 F) 18.5
Xe (operating temperature 77 F,
dew point 45 F) 330
1561 101
'For two demineralizers in series, the DF for the second demineralizer is given in parentheses.
-
..
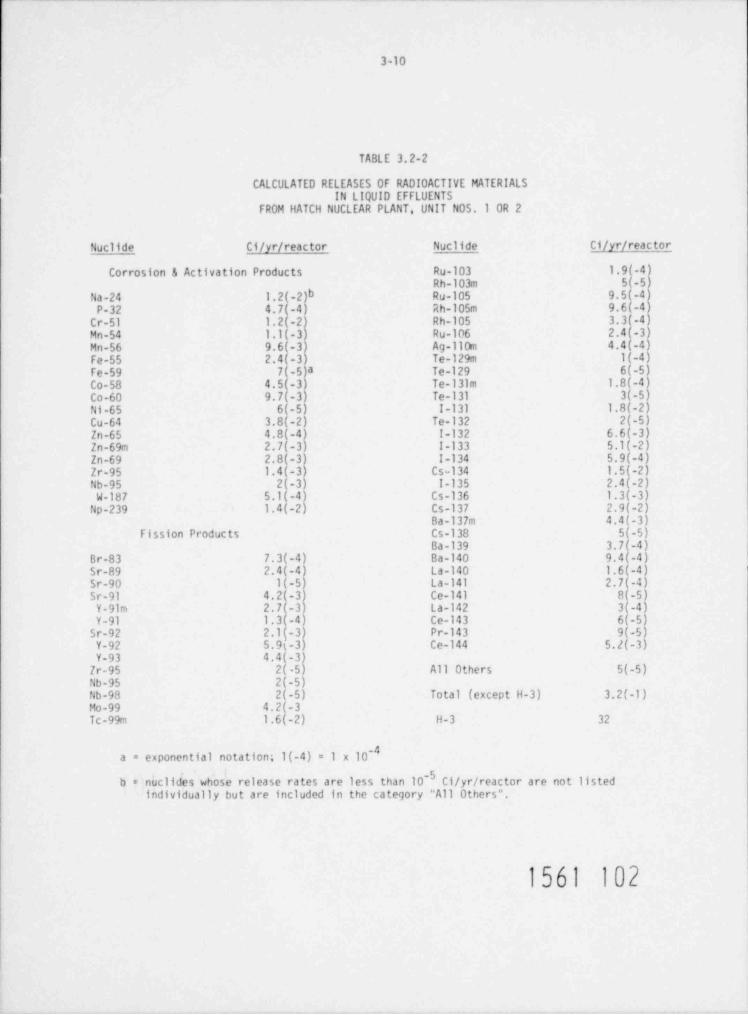
3-10
TABLE 3.2-2
CALCULATED RELEASES OF RADI0 ACTIVE MATERIALSIN LIQUID EFFLUENTS
FROM HATCH NUCLEAR PLANT, UNIT N05. 1 OR 2
Nuclide Ci/yr/ reactor Nuclide C1/yr/ reactor
Corrosion & Activation Products Ru-103 1.9(-4)Rh-103m 5(-5)
Na-24 1.2(-2)b Ru-105 9.5(-4)P-32 4.7(-4) Rh-105m 9.6(-4)
Cr-51 1.2(-2) Rh-105 3.3(-4)Mn-54 1.l(-3) Ru-106 2.4(-3)Mn-56 9.6(-3) Ag-110m 4.4(-4)Fe-55 2.4(-3) Te-129m 1(-4)Fe-59 7(-5)a Te-129 6(-5)Co-58 4.5(-3) Te-131m 1.8(-4)Co-60 9.7(-3) Te-131 3(-5)Ni-65 6(-5) I-131 1.8(-2)Cu-64 3.8(-2) Te-132 2(-5)In-65 4.8(-4) 1-132 6.6(-3)Zn-69m 2.7(-3) 1-133 5.1(-2)Zn-69 2.8(-3) I-134 5.9(-4)Zr-95 1.4(-3) Cs-134 1.5(-2)Nb-95 2(-3) I-135 2.4(-2)W-187 5.l(-4) Cs-136 1.3(-3)
Np-239 1.4(-2) Cs-137 2.9(-2)Ba-137m 4.4(-3)
Fission Products Cs-138 5(-5)Ba-139 3.7(-4)
Br-83 7.3(-4) Ba-140 9.4(-4)Sr-89 2.4(-4) La-140 1.6(-4)Sr-90 1(-5) La-141 2.7(-4)Sr-91 4.2(-3) Ce-141 8(-5)
Y-91m 2.7(-3) La-142 3(-4)Y-91 1.3(-4) Ce-143 6(-5)
Sr-92 2.1{-3) Pr-143 9(-5)Y-92 5.9t-3) Ce-144 5.2(-1)Y-93 4.4(-3)
7r-95 2( -5) All Others 5(-5)Nb-95 2(-5)Nb-98 2(-5) Total (except H-3) 3. 2 (-1 )Mo-99 4.2(-3Tc-99m 1.6(-2) H-3 32
a = exponential notation; 1(-4) = 1 x 10-
b = nuclides whose release rates are less than 10-5 Ci/yr/ reactor are not listedindividually but are included in the category "All Others"
1561 102
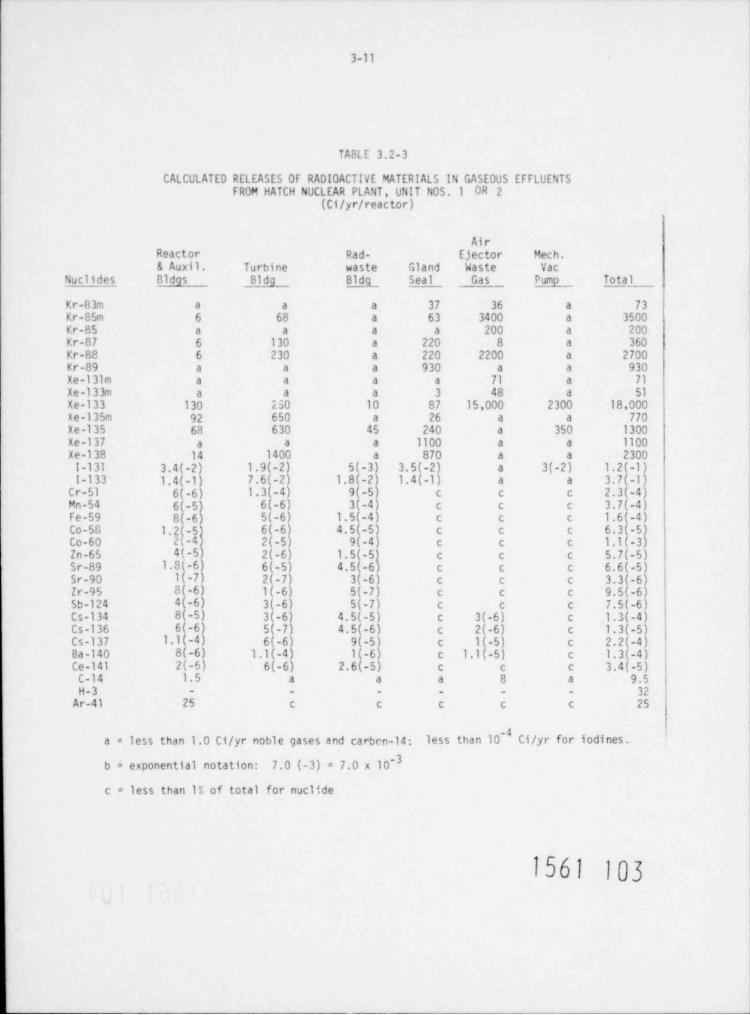
3-11
TABLE 3.2-3
CALCULATED RELEASES OF RADI0 ACTIVE MATERIALS IN GASE0US EFFLUENTSFROM HATCH NUCLEAR PLANT, UNIT NOS. 1 OR 2
(C1/yr/ reactor)
AirReactor Rad- Ejector Mech.& Auxil. Turbine waste Gland Waste Vac
Nuclides Bldgs B__ hB Seal Gas Pump Total
Kr-83m a a a 37 36 a 73Kr-85m 6 68 a 63 3400 a 3500Kr-85 a a a a 200 a 200Kr-87 6 130 a 220 8 a 360Kr-88 6 230 a 220 2200 a 2700Kr-89 a a a 930 a a 930Xe-131m a a a a 71 a 71
X e -133m a a a 3 48 a 51
Xe-133 130 H0 10 87 15,000 2300 18,000X e-135m 92 650 a 26 a a 770Xe-135 68 630 45 240 a 350 1300Xe-137 a a a 1100 a a 1100Xe-138 14 1400 a 870 a a 2300
1-131 3.4(-2) 1.9(-2) 5(-3) 3.5(-2) a 3(-2) 1.2(-1)1-133 1.4(-1) 7.6(-2) 1.8(-2) 1.4(-1) a a 3.7(-1)
Cr-51 6(-6) 1.3(-4) 9(-5) c c c 2.3(-4)Mn-54 6(-5) 6(-6) 3(-4) c c c 3.7(-4)Fe-59 8(-6) 5(-6) 1.5(-4) c c c 1.6(-4)
5 6(-6) 4.5(-5) c c c 6.3(-5)Co-5C1.2(242( 2(-5) 9(-4) c c c 1.l(-3)Co-60
Zn-65 4(-5 2(-6) 1.5(-5) c c c 5.7(-5)Sr-89 1.8(-6) 6(-5) 4.5(-6) c c c 6.6(-5)Sr-90 l(-7) 2(-7) 3(-6) c c c 3.3(-6)Zr-95 8(-6) 1(-6) 5(-7) c c c 9.5(-6)Sb-124 4(-6) 3(-6) 5(-7) c c c 7.5(-6)Cs-134 8(-5) 3(-6) 4.5(-5) c 3(-6) c 1.3(-4)Cs-136 6(-6) 5(-7) 4.5(-6) c 2(-6) c 1.3(-5)Cs-137 1.l(-4) 6(-6) 9(-5) c 1(-5) c 2.2(-4)Ba-140 8(-6) 1.1(-4) 1(-6) c 1.l(-5) c 1.3(-4)Ce-141 2(-6) 6(-6) 2.6(-5) c c c 3.4(-5)
C-14 1.5 a a a 8 a 9.5H-3 - - - - - - 32
Ar-41 25 c c c c c 25
a = less than 1.0 Ci/yr noble gases and carbcn-14: less than 10' Ci/yr for iodines.
b = exponential notation: 7.0 (-3) = 7.0 x 10⁻³
c = less than 1% of total for nuclide
1561 103

3-12
3.2.4 C_homical, Sanitary and Other Waste Treatment
The sources of wastes discharged to the Altamaha River have been described in the FES-CP.'Collection of additional data on quality of makeup water have made refinements possible incalculated discharge concentrations. The calculations have been repeated to make use oflatest information. It should be noted that these changes do not result from conceptualchanges in operation. Therefore, the description of chemical usage is not repeated. To someextent the dif ference between the new numbers and the old merely further attest to the naturalvariability of ambient water quality. The numbers are illustrative but not absolute.
During operation of Unit No. 2. chemical wastes will be produced in the processing of highpurity feedwater for steam generation. Chemicals in makeup water will be concentrated byevaporation from the cooling tower system. No corrosion or scale inhibitor will be used inthe cooling water. However, chlorine will be injected into the service water and circulatingwater to control biological fouling.
The updated results of the analyses of river water are sumarized in Table 3.2-4, and theconcentration of various ions in the discharge are included for comparison.
Experience with operation of Unit No.1 resulted in a need for less chlorine than was predictedin the FES-CP. The Amertap System was effective for maintaining condenser tube cleanliness.The cooling tower design for Unit No.1 includes covered distribution trays which has resultedin minimal fouling of the trap by algae. The manufacturer of tLe Unit No. I tower also recom-mended a low chlorine application rate to protect the wooden packing. The Unit No. 2 towerdesign has the distribution trays exposed to direct sunlight. Greater photosynthetic productionwill occur in these trays and thus is expected that a greater use of chlorine will be necessaryto control algae in Unit No. 2. The asbestos cement packing used in the Unit 2 towers does notcarry the limitation on chlorine usage prescribed for the Unit 1 tower packing. The GeorgiaPower Company expects that the chlorine usage program described in the FES-CP will be followed.The NPR'i paruit (f.ppe.Wix F) issued by the State specifies that a colorine minimizationprogram shall be conducted by the applicant.
TASLE 3.2 8
CHD1ICAL CHIRACTERISTICS (in nq/l) 0F HATCH STATIONMAKEUP AND EFFLUENT WATER OVALITY
DCombined Plant Ef fluentaMa(eup Water Quality (Demineralizer Waste and Blowdown)
Average fia ximum Average Maximum
Calcium 8.0 12.8 19 60
Magnesium 2.1 6.7 3.3 9.0Manganese 0.09 0.15 0.18 **
Sodium 6.8 20.0 15 56
Potassium 1.9 4.0 3.9 14
Iron 0.7 1.5 1.5 5.5Chlorides 5.0 10.0 11 38
Sulfates 6.5 12.8 9.6 41
Nitrates 0.3 0.6 0.6 3.5Phosphates 0.4 2.6 0.8 **
Silicates 11.7 22.9 25 73
Bicarbonates 32.4 57.3 74 240** **Total Dissolved Solids 65.1 95.3
dEdwin I Hatch Nuclear Plant Unit No. 2 Environmental Report-0perating License Stage,July 1975. Table 5.4-2.Edwin I. Hatch Nuclear Plant Unit No. 2 Environmental Report-0perating License Stage,July 1975. Table 3.6-1.
*,
Estimates have not been made for these parameters.1561 104
3.2.5 Transn;ssion Lines
There have been no changes to the transmission system as described in the FES-CP.
3-13
REFERENCES FOR SECTION 3
1. Georgia Power Company, Edwin 1. Hatch Nuclear Plant Unit No. 2 Environmental Pep ~ ort -0 prating L_icense Staje, July 13757TTgure 3.3-1.
~ ~ - ~ ~ ~ ~ - ~ ~ ~ ~ ~ ~
2. U.S. Atomic Energy Connission, Final Environmental Statement for Edwin I. HatchNuclear Plant Unit I and Unit 2, Docket Nos. 50-32T and 50-366, October 1972,p. lTI-la.
-
1561 105
4. STATUS OF SITE PREPARATION AND CONSTRUCTION
4.1 R55UM5ANDSTATUSOFCONSTRUCTION
As of January 1978, the construction of Edwin I. Hatch Nuclear Plant Unit No. 2 was approxi- |
mately 99% complete. Aside from the effects of sediment runoff into the south floodplain and i
onsite streams, construction impacts on the terrestrial and aquatic environment do not differfrom those presented in the FES-CP. The assessment on the socio-economic effects of plant con-struction has been updated and the staff conclusions presented in the FES-CP remain valid.
4.2 IMPACTS ON TERRESTRIAL ENVIRONMENT
The impacts of site preparation and construction on the terrestrial environment have been as aresult of changes in land use. Decreases in some comunities are a result of comitment to plantstructures (about 95 acres) or a change to some other natural cover. The decreases and increasesare tabulated in Tables 2.2-2 and 2.2-3. The greatest single change is the 1041 acres of woodedland which have been cleared for the HNP-Bonaire transmission line and will be managed for grassesor low growing shrubs.
On site there has been some damage to the south floodplain community due to erosion of one ofthe spoil piles with the resultant sediment runoff being carried into the floodplain where sometrees have been killed.1 The semiannual monitoring reports have indicated that the causes of thedamage in these areas are uiider control and that there is no evidence of additional damage sincethe 1973-1974 observations which first revealed the damage.
The discussion as presented in Section IV.B.1 of the FES-CP remains valid for the topics discussedthere.
4.3 IMPACTS ON AQUATIC ENVIRONMENT
4.3.1 Effects on Water Use
Most construction which would have affected the river in any way had been completed before theissuance of the FES-CP. There are no additional water use impacts due to construction which arenot sufficiently discussed in the FES-CP.
4.3.2 Effects on Aquatic Bio _ta
Altamaha River
Prior to construction of Unit No.1, which preceded and to some extent was concurrent with theconstruction of Unit No. 2, there exists inadequate baseline data to allow a direct quantitativetemporal evaluation of construction impacts. The applicant did not present a discussion in theEROL of impacts to the aquatic biota in either the Altamaha River or onsite streams due toconstruction of Unit No. 2. Although there is no evidence that the applicant has conducted aquantitative temporal monitoring program to specifically evaluate construction effects on aquaticbiota due to construction of unit No. 2, a spatial evaluation of impacts to the aquatic biotaof the Altamaha River can be made by examining data from the 1974 and 1975 preoperational bio-logical sampling program. Comparison of data for each year from sampling stations in the AltamahaRiver above and below the plant site indicate no major differences in the parameters measuredthat could be causally related to construction activities. This observation suggests that anyconstruction effects that may have occurred prior to 1974, primarily related to construction ofthe common intake and discharge structures, were of a temporary nature because such effects arenot evident f rom subsequent monitoring ef forts.
Onsite Streams
The EROLI indicates that several onsite streams located near a spoils pile had received highlyturbid runoff due to erosion. Severe siltation of the streams was noted during terrestrial
surveys. The effect of this siltation on the aquatic biota of the streams was not addressed ineither the ER0L or the preoperational environmental surveillance report.
1561 1064-1

4-2
The staff is unable to assess the impact of increased Siltation on the aquatic biota of theonsite strea*! since no data are presented. Horser, based on the staff's experience in assessingconstruction effects at other facilities, the staff assumes that the irpact was severe but of atemporary nature. The staff finds that the remaining construction activities are of such a naturethat further impacts on aquatic biota due to siltation loadings are not anticipated. Therefore,no long term irretrievable d rage to the onsite streams is expected.
The EROLI also indicates that a small stream located be. tween the cooling towers and the flood-plain on the eastern edge of the plant received a cement or concrete like ef fluent from a drainpipe on the southwest side of the plant fence. This concrete like effluent was due to operationsat a truck washing area which included the cleaning of concrete delivery trucks near the cement-batch plant located on the site. In September 1976, the cement plant was being dismantled andtrucks were no longer washed down at this location. A subsequent inspection' by the U.S. NRCOffice of Inspection and Enforcement verified that there are no concrete discharges to any streamsat the site.
Remaining Constructional Activities
No constructional activities remain that would significantly affect local aquatic biota. Theintake and discharge structures are completed. The present preoperational moHtoring program isbelieved to be adequate to detect any subsequent major impacts to the Altamaha River that couldresult from the remaining grading and excavating required for roadway, parking lots and clearedareas no longer needed for construction activities. Seeding of the spoils pile during the fallof 1974 has severely limited erosion and continued siltation of the onsite streams should cease.The staff concludes that the applicant is presently exercising adequate efforts to minimizeconstruction impacts on the aquatic biota. The March 1976 site visit by members of the NRCstaff, during which construction practices designed to minimize impact to the aquatic biota wereobserved, verifies this conclusion. The staff further is of the opinion that any biologicalchanges occurring in the aquatic environment f rom the remaining activities will be minor andtemporary and will not have an adverse impact on biota in the vicinity of the station.
4.4 SOC 10-ECONOMIC IMPACTS
A reassessment of construction impacts that may have been imposed on the local camunity, i.e.,school crowding, housin; croblems, crime increases, traffic increases, changes in the businesseconomy has shown that tne analysis presented in Section IVB-3 of the FES-CP remains essentiallyunchanged. Construction workers were housed primarily in trailer parks and in the towns ofVidalia and Baxley. Appling County, which includes the town of Baxley, has experienced netincreases in population and in the business sector since the start of construction at the Hatchsite, but the staff at this time has been unable to speciffeally correlate these increases withthe construction of the plant.
1561 107

4-3
PEFERENCES FOR SECTI0'4 4
References for Section 4.2
1. Georgia Power Corrpany, Edwin I. Hatch Nuclear Plant Unit t'o. 2 EnvironmentalReport - Operating License Stage, Jiay 1975. Volume 2, Appendix C, p. c-8.
References for Section 4.3
1. Georgia Power Company, Edwin I. Hatch Nuclear Plant Unit No. 2 EnvironmentalReport - Operatino License Staje, July 1975, Volume 2, Appendix C, p. c-8.
2. U.S. Nuclear Pegulatory Comission. Inspection and Enforcement Peport No. IE:II:LEF,50-366/76-8, September 8, 1976.
1561 108

__ . . _ . . _ _ _ . _ _ _ _
5. ENVIRONMENTAL EFFECTS OF STATION OPERATION
, .
5.1 RESUME
Several minor changes relative to the environmental effects of Unit No. 2 operation have beenidentified in this staff evaluation since the issuance c' the FES-CP. Staff conclusions regard-
ing impacts on land and water presented in the FES-CP continue to be valid. A reassessment andupdating of information has been provided with respect to both impacts upon the aquatic environ-ment and water quality standards (EPA Effluent Guidelines) and impacts. Radiological impactswere updated and revised by utilizing new source term calculations, and by providing a comparisonof station radioactive emission levels with Appendix ! limitations. Also, new generic informa-tion has been included on the transportation of radioactive material and additional informationdescribing the environmental effects of the uranium fuel cycle reflecting the Commission'sInterim Rule have been incorporated.
5.2 IMPACTS ON LAND USE
5.2.1 Station Operation
The operation of the E. I. Hatch Nuclear Plant, Unit No. 2, will have minimal impact on offsiteactivities. There may be some increase in fogging due to operation of the mechanical draftcooling towers but experience from Unit No. I has indicated no noticeable effectl and there isnot likely to be any significant difference due to the addition of Unit No. 2. The discussionsin Section V.A of the FES-CP remain valid except that the conservative arguments with respect tocooling tower effects are superseded by experience with the operation of Unit No. 1.
5.2.2 Transmission Lines
The land uses along the HNP-Bonnaire transmission line are presented in Table 2.2-3. Use of thecorridor is encouraged by the applicant for growing of crops and pasture of gens ral low growingcrops and ground cover. The statements concerning transmission lines in Section V.A.1 of theFES-CP remain valid.
The FES-CP did not address the effects of ozone production by extra high voltage (EHV) trans-mission lines or induced electrical effects. Data have been presented in the literature byScherer et al2 and Frydman et al 3 indicating that ozone prodJCtion by energized transmissionlines up To765 kV is highly unTikely to add detectably to existing atmospheric background
- - ~ ~
levels. The staff has made an analysis of these reports and has concluded that no basis existsat present for predicting adverse biological or environmental effects due to ozone from 500 kVtransmission lines.
Recent information4 Indicates that electrostatic effects in fences, metal building, and motorvehicles, while possible, d'o not present hazards of lethal electric shock to humans or animals.However, shock ranging from " barely perceptible" to "real jolt" have been received from metalstructures and vehicles beneath EHV lines. A fire hazard exists beneath EHV lines if vehiclesare refueled within the right-of-way.
The staf f concludes that electrostatic induction could cause inconvenience and varying degree ofnuisance to residents who live near the corridors but there is no likelihood of mortality causedby electrocution of persons or animals from the applicants 500-kV lines or lines of lower volt-ages. There is reasonable possibility that electric shock could be involved as an indirect causeof human injury or death by aggravatina a pre-existing health cundition, for example, or causinga fall from or loss of control of a vehicle or by causing a fire during vehicle refueling.
The remedy for electrostatic induction is to gro w d all structures which could be affected suchas fences, metal farm buildings and the like. The staff recomends that grounding be performedon all potentially affected structures along 500-kV lines associated with Unit No. 2.
The effect of electric fields on humans working or living under or around EHV transmission lineshas received much attention. A review of the work to date has been sponsored by the ElectricPow U Research Institute.5 An excerpt from the final report (Page 78) states:
1561 109s-i
- - -
- - . - . . - ,

5-2
"In summary, all of the American and West European test results on humans(except for Spain) at present field levels (less than about 20 kV/m) gaveno indication of hazardous ef fects. Many of the European laboratory testswere conducted under very carefully controlled conditions which eliminatedthe possibility of unrecognized and overshadowing environmental factors such aslow-frequency acoustical noise. The fact that the Soviets and Spanish researchershave not considered other environmental influences which could cause similar effects,such as low-frequency acoustical noise, and the fact that both the Soviet and WestEuropean research scientists have not been able to observe the reported switchyardworner symptoms in a significant way in tests conducted under carefully controlledlaboratory conditions, support the view that factors other than electric fieldas normally encountered were responsible for the observed symptoms."
While experimental work is still underway on the biological effects of ground level electricfields along EHV transmission lines, the weight of current of evidence points to the conclusionthat there are no significant biological effects attributable to the fields associated with suchlines. The staff, therefore, concludes that there will be no significant adverse impacts asso-clated with the operation of the 500-kV transmission lines for Unit No. 2.
The staf f reconnends that for a four (4) year period.or until the Hatch-Bonnaire corridor is Icertified as stabilized, that an inspectic't pronram be conducted tn determine any incidences oferosior, or other environmental denradation. A report of any erosion nhenomena, including actionstaken to correct such erosion effects, shall be submitted to the Director of the NRC Region IV i
Office with a copy to the Director of the Division of Operatina Reactors. Headquarters. Thisrecomendation will be incorporated in the monitorinq proqrams described in Section 6.
,
5.3 IMPACTS OF WATER USE
5.3.1 Thermal Impacts of Water Use
5.3.1.1 Standards
Georgia water quality requirements applicable to the plant thermal discharge into the AltamahaRiver require that the receiving water terperature be maintained at less than 903F and notexceed E*F above the ambient temperature. The NPDES pemit specifies that tenperature be measured |500 feet downstream of the discharae pipe at a depth of 3 feet. Preopegationalsurveillanceindicati s that the river ambient temperature may occasionally exceed 90 F.
.
5.3.1.2 Nomal Operation
Nornal two-unit operation will require about 45,000 gallons per minute of water from theAltamaha River. Of this, approximately 21,801 gallons per minute will be lost as evaporationand drif t from the cooling towers, and the re'aining 23,200 gallons per minute will be returnedto the river. The impact of the release is r<pected to be minimal. This amount of waterrepresents only 4.6 percent of the mininum , ver flow of record (1200 cubic feet per second).The returned water contains only 2 percent of *he heat discharged by the plant. There will beno significant increase in the totally-mixed river temperature as a result of normal plantoperation.
5.3.1.3 Shutdown Conditions
Cold shutdown of the plant under emergency conditions will place a more severe heat load on theriver than would normal operation. Under the most severe circumstances, up to 32,000 gallonsper minute would be discharged, with a temperature of up to 50'F above ambient. This watercould be mixed with up to 32,000 gallons per minute of service water before mixing if desired.No criteria for mixing has been established however. At the lowest seasonal flow of record(1200 cubic feet per second), this added heat would raise the totally mixed river temperatureabout 2*F. This extreme case could only occur during emergency shu+.down of both units, loss ofoffsite power, and record low river flow. Although State standards might Se temporarily vio-lated, emergency conditions are not normally considered for their environmental impact or con-pliance with environtrental standards.
5.3.1.4 Modelin L tud_i_esS
The applicant perforred several mathematical simulations of the impact of themal discharge onthe temperature in the Altamaha River, under a variety of normal and severe conditions. The
1561 110
. . _ _ _ .. . _ _ _ _ _ _
5-3
results of these studies are presented in the EROL and will not be repeated here. Field studiesof discharges of the plant into the Altamaha River from the Hatch Unit No. I plant have shownthat temperature rise is small, and barely neasurable under nost conditions.1 Based nn theselimited field data, the simulations presented in the ER0L appear to be conservative.
5.3.1.5 Conclusions
The simulations for norral operation generally show only trall surface areas where the terpera-turcs above ambient is greater than 5'F. If the rodeling predictions are correct, tho Stat 9 nfGeornia standards for te perature above a-bient levels beyond the mixinq zone will not beviolated.
Compliance with the standard on maximum river terperature of 90^F outside of the nixing zone iscomplicated by the fact that data recorded near the site and downstream at the Doctortown gageindicate that the ambient river terperature will occasionally exceed 90'F. The terperature ofwater being discharged could also exceed 90'F under extrere reteorological conditions. There-fore. if both river temperature and discharge terperature were above 90 F coincidentally, theplant could be operating in violation of the thermal standards. This issue has not yet beenresolved.
5.3.2 Industrial Chemical Wastes
Table 3.2-4 listed the concentrations of various substances in the station effluent. Thevalues in that table include the rajor chenical additions to cooling tower blowdown. Table 3.2-4also includes values for make-up water quality which is the ar.bient concentration of the sub-stances in the river.
Cecause the river flow rate is qJite large relative to the blowdown flow rate, the concentrationof the substances in the river will be close to the anbient values as the discharge becoresmixed with the river water. To illustrate the rapidity with which discharge concentrations arereduced to ambient values, concentrations have been computed in the discharqe plume at a distanceof 250 feet downstream from the point of discharge. The applicant's therral dispersion modelpresented in Section 5 as rigure 5.4-2 indicates that at low river flow the discharge is dilutedto 20 of its initial concentration at the distance of 250 feet. Table 5.3 1 shows the computedconcentrations based on this dilution.
The column labelled "raxirun" is the concentration which might exist if arbient concentrationsand discharge concentrations were simultaneously at their highest values and at the same timethe inw river flow prevailed. Thus, it is an intemittently, or nore likely, a rarely occurringcondi' ion.
5.3.3 Sanitary Wastes
The objectives for processing and dis n al of sanitary waste remain the same as described inthe FES-CP. The applicant has reported that the treatment will include two packaged units eachwith capacity to process a flow of 7E00 ngd rather than a single unit of this capacity asdescribed on page 111-20 in the FES-CP.
5.3.4 EF!. Effluent Guidelines and Limitations
The State of Georgia Environmental Protection Division is authorized to issue the NPDES dis-charge pemit for the facility under the Federal Water Pollution Control Act. Effluent 'imita-tions will be established as part of the pemitting procedure.
The station must comply with provisions of 40 CFR 423.12 (copy of applicable sections includedes Appendix C) shortly after startup. These provisions set forth " Effluent limitation guide-lines representing the degree of treattrent attainable by the application of the best practicalcontrol technology currently available." Additionally, in establishing effluent limits for theNPDES permit the State may consider more stringent limitations where necessary to protect otherwater uses. Compliance with State Water Quality Standards usually satisfies these latter limita-tions. Applicable sections of the State standards were summarized in the EROL.' An NPDES pemitwas issued by the State of Georgia on June 6. 1977 (See Appendix F).
dbnes b koyxpected station perforrance relative to the effluent limitationg s
1561 111-
__ ___ ..
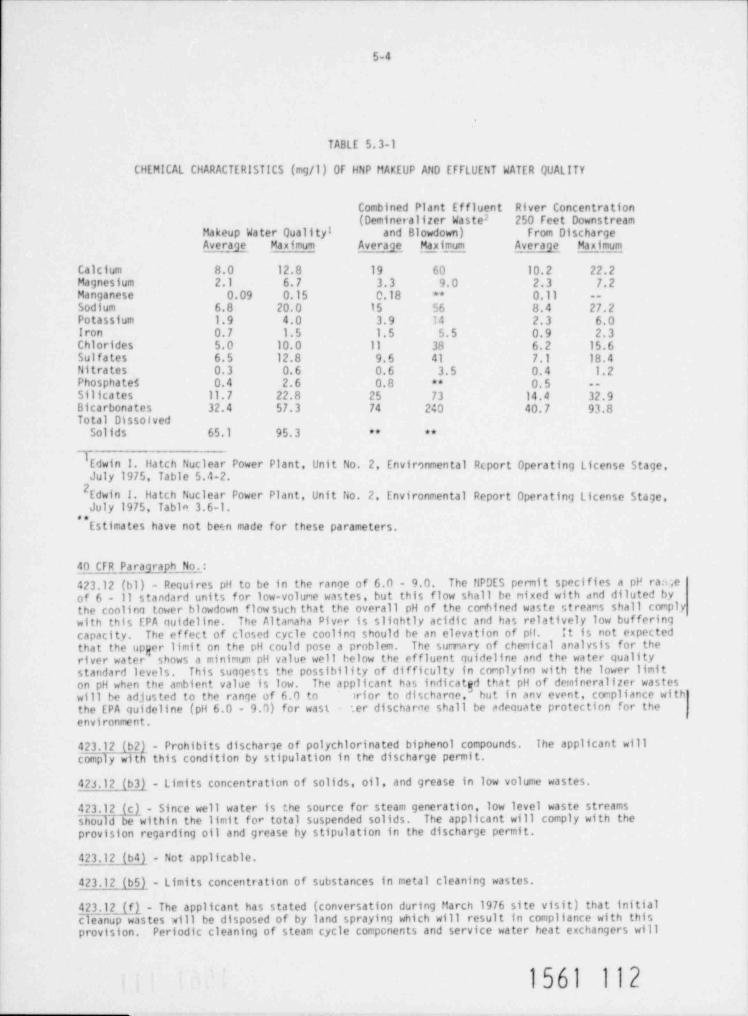
5-4
TABLE 5.3-1
CHEMICAL CHARACTERISTICS (mg/1) 0F HNP MAKEUP AND EFFLUENT WATER QUALITY
Combined Plant Effluent River Concentration(Demineralizer Waste? 250 feet Downstream
Makeup Water Quality! and Blowdown) from DischargeAve _raje Maximum Averaje Maximum Average Maximum_
Calcium 8.0 12.8 19 60 10.2 22.2Magnesium 2.1 6.7 3.3 9. 0 2.3 7.2Manganese 0.09 0.15 0.18 0.11 --"
Sodium 6.8 20.0 15 56 8.4 27.2Potassium 1.9 4.0 3.9 14 2.3 6.0Iron 0.7 1.5 1.5 5.5 0.9 2.3Chlorides 5.0 10.0 11 38 6.2 15.6Sulfates 6.5 12.8 9.6 41 7.1 18.4Nitrates 0.3 0.6 0.6 3.5 0.4 1.2Phosphates 0.4 2.6 0.8 ** 0.5 --
Silicates 11.7 22.8 25 73 14.4 32.9Bicarbonates 32.4 57.3 74 240 40.7 93.8Total Dissolved
Solids 65.1 95.3 ** **
I Edwin I. Hatch Nuclear Power Plant, Unit No. 2 Environmental Report Operating License Stage,July 1975, Table 5.4-2.
2Edwin 1. Hatch Nuclear Power Plant, Unit No. 2. Environmental Report Operating License Stage.July 1975. Tabla 3.6-1.
**Estimates have not be6n made for these parameters.
40 CFR Paragraph No.
423.12 (bl) - Pequires pH to be in the ranqe of 6.0 - 9.0. The NPDES permit specifies a pH raa,eof 6 - 11 standard units for low-volume wastes, but this flow shall be mixed with and diluted bythe coolinq tower blowdown flow such that the overall pH of the conbined waste streans shall complywith this EPA quideline. The Altamaha Piver is slightly acidic and has relatively low bufferingcapacity. The effect of closed cycle coolinq should be an elevation of pH. It is not expected
that the upger limit on the pH could pose a problem. The sunmary of chemical analysis for theriver water shows a mininun pH value well Felow the effluent quideline and the water qualitystandard levels This suaqests the possibility of difficulty in complyina with the lower limiton pH when the ambient value is low. The applicant has indicatgd that pH of demineralizer wasteswill be adjusted to the range of 6.0 to ~ )rior to discharqe, but in any event, compliance with
the EPA quideline (pH 6.0 - 9.0) for wast .er discharoe shall be adequate protection for the
environment.
423.12 (b21 - Prohibits discharge of polychlorinated biphenol compounds. The applicant willfoVmy with this condition by stipulation in the discharge permit.
42J.12 (b31 - Limits concentration of solids, oil, and grease in low volume wastes.
423.12 (c) - Since well water is the source for steam generation, low level waste streamssfioild be within the limit for total suspended solids. The applicant will comply with theprovision regarding oil and grease by stipulation in the discharge permit.
423.12 (b4) - Not applicable.
423.12 (b5) - Limits concentration of substances in metal cleaning wastes.
423.12]fl - The applicant has stated (conversation during March 1976 site visit) that initialcleanup wastes will be disposed of by land spraying which will result in compliance with thisprovision. Periodic cleaning of steam cycle compcnents and service water heat exchangers will
1561 112

. __- --
5-5
be required. Offsite disposal by a licensed contractor or discharne in compliance with theNPDES Permit (Part II Items 2, 3, and 6) should assure that the impacts of such dischargesare insionificant-
423.12 (b6) - Limits concentration of substances in tsoiler blowdown. There will be no blowdownfrom the steam cycle. Thus, this provision will be met.
423.12 (b7) - Not applicable.
423.12 (b8) - Limits concentration of chlorine in cooling tower blowdown to an average concentra-tion of 0.2 og/l and a maximum of 0.5 mg/1.
423.12 111 - The applicant has proposed that the average free residual concentration at thedischarge be 0.5 mg/1.6 This would not comply with the provision. Furthermore, a limitationmore stringent than the guideline level may be imposed by the State of Georgia to assure com-pliance with receiving water standards.
423.12 (b9) - Limits discharge of chlorine to two hours per day per unit and prohibits simul-taneous discharge of chlorine from two units. Because of the limited use of chlorine for UnitNo.1, the applicant should have no dif ficulty in complying with this provision.
423.12 (b10) - Declare that above provisions apply prior to mixing of waste streams. Thisprovision was recognized in making the above evaluations. The limitation under 423.12 (b8)applies prior to mixing of the discharges of the two units.
In 1983, the Hatch Nuclear Plant will be subject to the following additional requirements speci-fied in 40 CFR 423.13:
423.13 (11 -Adds limits on the concentration of corrosion inhibitors. The applicant has |indicated 7 that no corrosiu i inhibitors will be added to the coolinq uter. Nevertheless, if I
later operating experience demonstrates the need for such inhibitors, the staff will require theGPC to conduct and submit an environmental review prior to their use. The present proposal to |operate without inhibitors will result in compliance with this part of the provision.
423.13 (1) - The applicant will discharge from the cold side of the cooling system, therebymeeting this provision.
There are several aspects of the discharge which may be further limited by receiving waterstandards. Temperature data for the Altamaha show that ambient values approach and perhapsexceed the 90 F (32.2 C) requirement for the river.e Both the U.S. EPA and Georgia EnvironmentalProtection Division have concluded that a discharge from the Hatch Nuclear Plant which is lessthan or equal to the upstream ambient river temperature is acceptable. The applicant, never-theless, plans to obtain an exemption to Section 316 (a) of the FWPCA. Although no mixing zonehas been specified yet, the staff understands that the State is currently reviewing data so as todefine such a mixing zone for the Hatch Nuclear Plant discharge.
The applicable State water quality standards also prohibit discharge of toxic wastes in con-centrations that would harm man, fish or game, or other beneficial aouatic life.9 The staffbelieves that this receiving water requirement should result in a limitation on the discharge ofchlorine nore stringent than the effluent guideline limit.
The Georgia DEP has indicated (Appendix G) that they do not anticipate that the discharne willcontain sufficient residual chlorine to result in receivinq strean concentrations in excess ofthe reconrended criteria of 10.0 microqrans per liter of total residual chlorine for fresh waterand marine ornanisms.
The effluent limitation guidelines do not address corrosion products in the condenser coolingwater. The staff believes, based nn a determination of the Langlier Index for average make upwater quality, that there will be a strong tendency for corrosion. A determination of corrosionproducts in the cooling tower blowdown should be made during the first year of operation.Appropriate corrective actions, if found necessary, should be recowended by the applicant andsubmitted to NRC for environmental review.
1561 113
-
_ ..

5-6
5.3.5 Effects on Water Users Through Chanhes in Water Quality
The analysis in the FES-CP remains valid. The only uses of the Altamaha River downstream ofHatch are fishing and recreation. The staff has reassessed chemical discharges to considerinformation obtained since the publication of the FES-CP. In the FES-CP, the staff evaluated
the impact of blowdown containing a total residual chlorine concentration of 2 mg/1. In theER0L, the applicant indicated that the free residual concentration in the discherge would be keptbelow a maximum of 0.5 mg/1. This was done in recognition of EPA effluent limitation guidelines.The guidelines further require that the average free residual be less than 0.2 mg/1. Consistentwith the guidelines, the applicant did not address total residual chlorine. The average level of0.2 mg/l free residual will be met prior to mixing the Unit No. 2 blowdown with the Unit No. Iblowdown. The staff believes that in meeting the guideline for free residual, the total residualwould be much less than the value of 2 mg/l evaluated in the FES-CP.
Based on definitive work by others10,11 on the impact of residual chlorine on aquatic biotawhich was published af ter the issuance of the FES-CP, the staff now believes that a concentra-tion of total residual chlorine in the station discharge in excess of 0.2 mg/l could be toxic toaquatic biota. In accordance with regulations of the Georgia Environmental Protection DivisionEPD) the discharge must not be at toxic level The NPDES permit issued by the State of Georniah(as lu, n ted the ef fluent concentration of chlor $.ine to the EPA rpideline level (0.2 no
~
f ree residual and 0.5 ma/l for naximum residual) from a single unit prior to mixing.'/l averageThe pemitfurther renuires a study of annlirable mothnds tn rod"ra tdal residual Chlorine levels.
The rapid dilution of the discharge in the river, as described in the FES-CP, will reduce theconcentration further. With concentration at a lower value, the conclusion of the FES-CP thatthere will be no impact due to chlorine discharge remains valid.
The staff has estimated that the discharge of corrosion products will be an intermittent occur-rence at the Hatch Station. If at toxic levels, this will be unacceptable under the Statewater quality standards. This occurrence is controllable by proper management of circulatingwater chemistry through blowdown control and addition of chemicals. Any such program for use ofinhibitors will be subject to environmental review under the NPDES pemit and the environmental jtechnical specifications for Hatch Onit No. 2. Because of the uncertainty of the need and varietyof control alternatives, any speculation as to magnitude of impact is unwarranted at this time.
As indicated in Sectinr. 6.3.4, th3 ambient pH of the Altamaha River occasionally exceeds therange specified for pH in the EPA ef fluent limitation guidelines. Under this condition, it isconceivable that plant discharge would r.ot meet guideline requirements. It is the staff's opinionthat discharge at a pH below the EPA gciceline level because of ambient river conditions wouldnot result in any environmental impact.
5.3.6 Ef fects on Surface Water SuppA
The Hatch Nuclear Plant is expected to have a negligible effect on surface water supplies of theregion. For combined two-unit operation, the consumptive use of Altamaha River water will beabout 21,800 gallons per minute, which represents less than 0.4 percent of the average riverflow of 13,000 cubic feet per second and about 4 percent of the minimum recorded flow of 1200cubic feet per second.
5.3.7 .Ef fects on Groundwa ter Supplies
A minimal quantity of groudwater, 327 gallons per minute, will be withdrawn by two wells from theregional artesian aquifer for norcal two-unit operation. Drawdown of the peizometric head inthis aquifer is estimated to be only 3 feet at each of the wells. Of the wells surveyed nearthe plant, only three others withdraw from the regional artesian aquifer. The remainder with-draw from the minor shallow aquifers which are not Fydraulically connected to the regionalaquifer. Groundwater usage at the site is not expected to affect any other users.
5.4 ENVIRONMENTAL IMPACTS
5.4.1 Jmpacts on the Terrestrial Environment
The only source of potential damage to the terrestrial environment from the operation of theHatch Unit No. 2: Nuclear Plant is due to opention of the closed cycle cooling system. Dis-solved salts in the circulating water will be carried out of the tower in entrained dropletsreferred to as drift. These drops and their salt burden are eventually deposited on the ground
1561 114

_ _ _-
5-7
or become airborne particulates after evaporation. The FES-CP addressed the question of driftwith simple conservative arguments and concluded that no damage should result from the operationof the Unit No. 2 mechanical draf t cooling towers. Nevertheless, a vegetative monitoring programwas required for Unit No. 1.
At this time, more advanced models could be applied to the problem, but since there is opera-tional data from the Unit No. I monitoring program, it is more appropriate to address ourselvesto these results. Based on the information from the first year of operation of Unit No.1. novegetative effects attributable to cooling tower drift had been observed.1 d The high annualrainfall and fresh water make up to the cooling towers both contribute to make it highly unlikelythat drift effects will be observed for Unit No. 2. However, since the d-ift load will approxi-mately double af ter addition of Unit No. 2, the staff recomends continuation of the currentmonitoring program af ter start-up of Unit No. 2 for a period of at least four (4) years. |(ternination continnent on staff review and approval) and correlation of results with low altitudetrue and false color aerial photography. The photographic techniques will allow an inexpensivelong-term check on drift effects.
5.4.2 Inpacts on the Aquatic Environment
5.4.2.1 Intake Effects
Impingement
The number of fish impinged at the E. I. Hatch Nuclear Plant Unit No. 2 will be a function ofintake velocity, volume of water pumped, river flow, area of the intake structure, fish popu-lations in the area and the degree to which fish are drawn or attracted to the intake structure.The normal operation of Unit No. 2 will require the withdrawal of approximately 22,500 gpm(50 cfs) of water from the Altamaha River. The average flow for the Altamaha River is 13,000cfs, with a minimum daily low flow of 1,200 cfs at the plant site computed from flow records atDoctortown, Georgia, 57.5 river miles downstream from the plant site. An analysis of annualminimum flows at Charlotte, Georgia indicates that the extrapolated minimum low flow (withoutreservoir supplementation) is 900 cfs. The estimate of the maximum flood of record ranges from170,000 to 200,000 cfs.3 The calculated velocity of water through the traveling screens of theintake structure is 1.9 fps at the minimum assumed river flow and less than 1 fps under averageriver flow conditions." During ti.e shad spawning season (February through May) when the densityof fishes in the river is high, t7e average river flow is 20,170 cfs and intake velocities
would be about 0.7 fps. The density of fishes in the vicinity of the intake structure and thedegree to which fish are drawn or attracted to the intaR structure are unknown although qualita-tive information is available.
Impingement of fish on the traveling screens at the intake structure was evaluated for Unit No. Iby counting the numbers of fish impinged during a 24-hour period once a week during the periodNovember 1974 through December 1975, some 62 samples. Data are sumarized in the Semi-AnnualEnvironmental Surveillance Rcport and the ER0L.M A total of 68 fish from 13 taxa were col-lected. The maximum number of specimens reported from a sample was 15 in January 1975. Themost diverse sample contained four species (six organisms) and was taken in July 1975. The mostcomon species impinged was Trinectes maculatus with 48 specimens being collected during thesampling period. The total weight of all specimens taken during the period November 1974 toDecember 1975 was 468.5 g.
These unusually low impingement values are probably the result of the high river velocity pastthe shoreline inta! e structure and low intake velocities across the traveling screens.
No sturgeons or shad were collected during the impingement sampling program.
Due to the complexity of the interactions between flow rates, velocities across the intakescreens, behavior of fish in the vicinity of the screens and the uncertainty of fish densitiesin the region of the screens, no precise estimate of anticipated incremental impingement lossdue to operation of Unit No. 2 can be presently made. A preliminary analysis of data from theIndian Point Nuclear Power Plant Unit No. 1 and the Millstone Nuclear Power Plant has shown thatimpingement losses did not increase linearly with the addition of a second unit and impingementlosses were greater than twice the previous year's totals from the single unit. The BrownsFerry Nuclear Power Plant, however, reported less than twice the previous year's losses afterstartup of the second unit. Due to conflicting results of the preliminary analysis and the factthat none of the plants remove their cooling water from a riverine environment, estimates onincremental impingement losses at the Hatch Nuclear Plant due to the operation of Unit No. 2cannot be accurately made; however, even a tenfold increase in the carrent Unit No. I relatedimpingement losses, an extremely conservative estimate, would not significantly affect theresident or anadromous fish populations in the Altamaha River.
1561 115-
.. -

5-8
Entrainment
Organisms less than 3/8 inch in size entrained in the intake water are likely to pass throughthe traveling screens and pass through the plant's heat removal system. They will be exposed tomechanical shock, hydrostatic pressure changes, chemical toxicity and elevated temperatures.The staff concludes that 1001 mortality will result for organisms entrained in the cooling watersystem. No tidal flows or changes in flow due to tides are known from the Altamaha River in thevicinity of the Hatch Nuclear Plant.
Due to the high flow rates and velocities of water passing the intake, most planktonic organismsare probably well mixed in the water column. Assuming that the distribution of organisms in thewater column is essentially random and that the mortality experienced by entrained organisms is100t, the losses sustained by populations with individuals small enough to pass through thetraveling screens would be proportional to the flow through the plant. Table 5.4-1 providesboth the percent of total flow entrained under various river flow conditions passing through thecondenser cooling system during operation of Unit No. 2 and for the combined operation of UnitsNo. I and 2.
TABLE 5.4-1
ENTRAINMENT VERSUS RIVER FLOW
Percent Flow Percent FlowEntrained By Entrained ByOperation Of Operation Of
River flow (cfs) Unit No. 2 Both Unit No. I and Unit No. 2
Calculated minimum 900 5.5% 11.8%
Observed minimum daily flow 1,200 4.2% 8.9%
Average flow 13,000 .387 .821
Maximum flood of record 180,000 .0284: .06%
Anticipated losses and the significance of these losses to the riverine populations of thevarious biotic comunities are presented in the following.
_Phy toplank ton
High turbidity and flow rates in the Altamaha River result in fairly low population levels. Theoverall contribution by phytoplankton to primary productivity in the river is insignificant whencompared to periphyton. Losses sustained by various chytoplankton populations even underextreme low flow conditions would be about an 11% recaction in numbers. The regenerative abilityof phytcplankton would rapidly offset these Insses as the water mass moves past the plant intake.The impact of phytoplankton losses on other organisms in the food chain would be minimal sincethe present populations of phytoplankten are considered insignificant.
_ eriphytonp
Periphyton, or attached organisms, would not be expected to sustain losses due to entrainment.High flows and high turbidity may result in suspension of a portion of these organisms in thewater column making them susceptible to entrainment; however, losses will probably be insignifi-cant when compared to the total population.
Macroinvertebrate Drift
Maximum populations of macroinvertebrate drif t for 1973 0: curred from early April to lateSeptember. The mean discharge at Doctortown, Georgia, for this period was about 20,000 cfs orslightly greater in the vicinity of the Hatch Nuclear Plant. Assuming a random distribution inthe vicinity of the plant intake structure, approximately .251 of the flow would have beenentrained by Unit No. 2 or with both units operating approximately .5 of the flow. f .25'
incremental reduction in total drif t due to operation of Unit No. 2 would be undetectable. Themean flow for the past 10 years during the sarre time interval ( April through September) is
1561 116

5-9
approximately 13,000 cfs. The combined effect of the two units, again assuming a random distri-bution of drif t organisms, would reduce population levels by .7%. Macroinvertebrate driftorganisms occur in lower densities in fall through spring. Minimum river flow occurs in September,October, and November. The 10-year average flow during these three months is 6,557 cfs. Assum-ing a random distribution of macroinvertebrate drift organisms, approximately .75% of the drif twould experience mortality due to entrainment from Unit No. 2 operation or a combined reductiondue to entrainment from the operation of both units of 1.5%. The staff concludes that a mortality
rate of 1.5% is insignificant.
Fish Eggs and Larvae
The Altamaha River is utilized as spring spawning ground for several migratory fish species,including American shad (Alosa sapidissima), hickory shad (Alosa mediocris) and blueback herring(Alosa aestivalis). Two TH H1 specimens of Acipenser sp. were collected in drift samples in19T3-- Larvae of Catostomidae, Centrarchidae and Cyprinidae were collected in considerablenumbers during the spring and early sumer of 1974 and 1975 in the vicinity of the Hatch NuclearPlant. Densities of organisms from these three families during spring and early summer of 1974and 1975 are presented in Section 2.5.2.
During the spring and early summer of 1975, two additional weekly drif t amples were takenimmediately in front of the intake structure. The circulating water system for Unit No. 1 wasfully operational during the survey.
Day and night averages along both transects and the intake samples were computed for densities ofabundant taxa from samples collectcd during each weekly survey. Analysis of variance of the datafor abundance was used to compare day and night densities and to compare densities of samplescollected near the intake structure with densities collected along the transects. Mean nightdensities were significantly greater than day densities for total fish larvae and for larvae ofCatostomidae, Centrarchidae, Cyprinidae, and Alosa spp. There was no significant differencebetween mean day and night densities of Alosa sapidissima eggs. The mean density of other fisheggs collected was significantly greater in night samples than in day samples. Only the Centrar-chidae and Cyprinidae were found to have a significantly greater mean density of larvae near theintake structure than in the rest of the river. Both families prefer shallow quiet areas of theriver and floodplains for spawning and rearing and may have accumulated near the shoreline as aresult of low velocities and eddies.
Estimates of number of abundant fish eggs and larvae entrained were prepared by multiplyingaverage densities for day and night sampling periods by the fraction of the river flow entrainedduring the sampling periods. These are presented in Table 5.4-2.
Since the intake volume remains constant at 50 cfs, changes in numbers of eggs and larvae entrainedare a result of variations in river flow and spawning activity upstream of the Hatch Plant.Estimates of entrained Cyprinidae and Centrarchidae in Table 5.4-2 have been multiplied by afactor to reflect their grepter abundance in the vicinity of the intake structure.
Assuming that the relationship between entrainment and intake flow is linear, the level of entrain-ment mortality in spring and early summer of 1975, if both units were operating, would be doublethe values shown in Table 5.4-2. Since the maximum fraction of daily river flow entrained ascooling water in 1975 for Unit No. I was less than .5%, or postulated two unit operation of lessthan 1.0 percent, there should be no significant reduction in the ichthyoplankton populations inAltamaha River near the Hatch Nuclear Plant.
The historic flow records of the Altamaha River report the 10 year average monthly flow (1964-1973) in the Altamaha Rivar near Doctortown, Georgia, is 33,607 cfs for March and 26,675 cfs forApril during which the greatee.t mean number of shad eggs and larvae are present in the AltamahaRiver. Flow rates in the vicinity of the Hatch Nuclear Plant are slightly lower. Approximately.14% of the flow in March and .18% of the flow in April would have been entrained during operationof Unit No. 2 or .28% for March and .32% of the flow for April with operation of both units. Thelowest average monthly flow rates for the Altamaha River over the 10 year period 1964-1973 was11,980 cfs for March and 7,930 cfs for April. Approximately .4% of the flow in March and .6% of'to flow in April would have been entrained during operation of Unit No. 2 or .8% for March and
of the flow for April with operation of both units. Assuming 100% mortality of fish eggslarvae from condenser and cooling tower passage and a random distribution of fish eggs and
le ae, the losses to the shad populations due to entrainment from operation of Unit No. 2 andthe incremental losses due to operation of buth units will be insignificant even during thehistoric average low flow for March and April.
1561 117
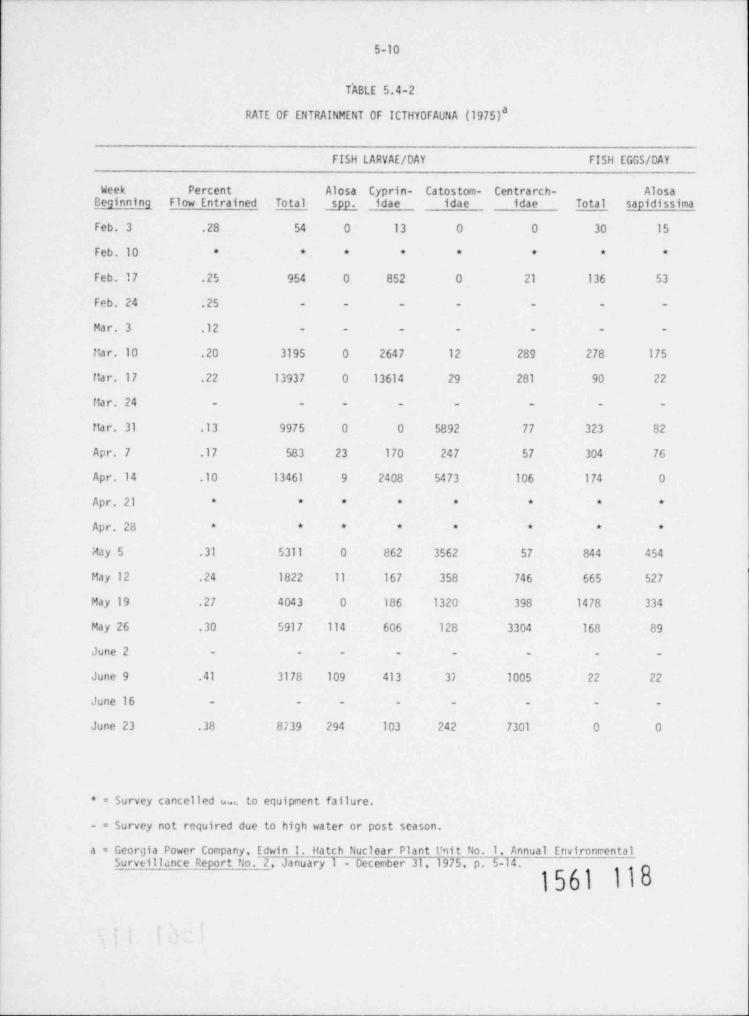
5-10
T'BLE 5.4-2A
RATE OF ENTRAINMENT OF ICTHY0 FAUNA (1975)a
FISH LARVAE / DAY FISH EGGS /0AY
Week Percent Alosa Cyprin- Catostom- Cen tra rch- AlosaBeginning Flow Entrained Total _ spp_., idae idae idae Total sapidissima
Feb. 3 .28 54 0 13 0 0 30 15
Feb. 10 * * * * * * * *
Feb.17 .25 954 0 852 0 21 136 53
Feb. 24 .25 - - - - - - -
Mar. 3 .12 - - - - - - -
fia r. 10 .20 3195 0 2647 12 289 278 175
fla r. 17 .22 13937 0 13614 29 281 90 22
flar. 24 - - - - - - - -
tia r. 31 .13 9975 0 0 5892 77 323 82
Apr. 7 .17 583 23 170 247 57 304 76
Apr. 14 .10 13461 9 2408 5473 106 174 0
Apr. 21 * * * * * * * *
Apr. 28 * * * * * * * *
May 5 .31 5311 0 862 3562 57 844 454
May 12 .24 1822 11 167 358 746 665 527
May 19 .27 4043 0 186 1320 398 1478 334
May 26 .30 5917 114 606 128 3304 168 89
June 2 - - - - - - - -
June 9 .41 3178 109 413 37 1005 22 22
June 16 - - - - - - - -
June 23 .38 8739 294 103 242 7301 0 0
* = Survey cancelled um to equipment failure.
= Survey not required due to high water or post season.
a = Georgia Power Company, Edwin I. Hatch Nuclear Plant l' nit tio.1, Annual EnvironmentalSurveillance Report No.7, January 1 - December 31, 1975, p. 5-14.
1561 118

. . . _ . . _ __ _ _ _
5-11
5.4.2.2 Discharge Effects
Temperature
Normal operation of both Unit Nos.1 and 2 requires the withdrawal of approximately 100 cfs ofwater from the Altamaha River. Approximately 49 cfs of this withdrawal will be lost due toevaporation and drif t from the cooling towers, with the remaining 51 cfs being returned to theriver. The amount of heated effluent (51 cfs) is approximately .4% of the average river flow(13,000 cfs), approximately 4.6% of the minimum observed river flow (1200 cfs), and approximately5.6% of the calculated minimum river flow (900 cfs).
Since no thermal stratification exists in the river in the vicinity of the Hatch Nuclear Plant,no temperature changes attributable to hydraulic mixing due to withdrawal of water from the riverexists.
The discharge pipes extend approximately 120 feet from the river bank and are located 4 feet 1below the surface of the river at minimum flow (1200 cfs). During normal operating conditions,the average total discharge for both Units No. I and 2 including the service water discharge willbe 58 cfs, resulting in a discharge velocity of 3 fps perpendiculac to the river flow.
The applicant modeled the discharge plume using the Motz-Benedict model for horizontal jet dis-charges. Based on the results of the modeling effort, several predicted plumes for variousoperating and meteorological conditions are presented in Figures 5.4-1 through 5.4-6. Figures5.4-1 and 5.4-2 depict plumes under normal two unit operating conditions for winter and summer.Figures 5.4-3 and 5.4-4 illustrate normal two unit operation with a high wet bulb temperature anda low river temperature for winter and sumer representing a conservative estimate of maximumplume dimension and maximum AT. Figures 5.4-5 and 5.4-6 show the least likely and most thermallysevere cases for winter and summer which would occur only when the following conditions exist:(a) river flow equal to lowest seasonal flow of record; (b) both units being brought to a coldshutdown condition; and (c) loss of offsite power at which time the cooling towers would beinoperative.
The staff has evaluated the results of the Motz-Benedict model and have found them to be accept-able. The area within the 1, 3*, and 5 F isotherm has been determined for nomal and conserva-tive meteorological and riverine conditions for both the summer and winter season and are presentedin Table 5.4-3.
Under normal operating conditions, the Hatch Plant discharge will meet all State thermal standards.It is evident from Figures 5.4-1 through 5.4-6 the State standards can be met after a shortmixing zone even under conservative conditions. If the following conditions should occur simulta-neously (1) lowest estimated seasonal flow of record, (2) both units being brought to the coldshutdown state, and (3) an onsite power outage resulting in inoperative cooling towers, thethermal discharge would be in violation of State standards.
Elevated surface water temperatures during summer and early fall in the immediate vicinity of thedischarge area will not significantly affect phytoplankton or periphyton. Pnytoplankton existsin relatively low concentrations in the river and the high flow rates past the discharge structurewill result in insignificant acute or chronic mortality to populations. Storr7 showed thatplankton exhibits very low (St or less) mortality for temperatures under 95 F. After 95 F,lethality increases rapidly to 1001 at 105 F. Under normal and severe summer operating conditionsof high river temperature and cold shutdown without offsite rower, the area of the dischargeplume in excess of 95'F would be less than .3 acres.
The effect of thermal plume passage on drifting macroinvertebrates is considered to be insignifi-cant. Most macroinvertebrates have upper lethal temperatures in excess of the normal dischargetemperatures. Thermal plume passage time will be brief and the area of highest plume temperaturesis small.
Neither the applicant's model nor the one proposed by the staff predict even an occasional sinkingplume that might intersect with the bottom. Therefore, no acute or chronic effects on periphytonor benthos are predicted either by scour or elevated temperatures.
Numerous mechanisms by which fish populations may be detrimentally influenced directly or indirectlyby a themal plume have been proposed, these include: thermal shock to adults and juveniles dueto plume passage, disruption of migratory routes due to thermal blockage, cold shock duringwinter as a result of rapid plant shutdown, alteration of the thermal regime at fish reproductiveareas, exceeding the upper lethal thermal maximum for a particular species, enhancement of fishdiseases due to elevated temperatures, gas bubble disease, entrainment in the plume of fish eggsor larvae, and disruption of interspecific relationships betweer "ihes or other organisms, suchas a food source.
1561 119, ,
. _ . .

rg
,
t %.f
WT
t AR R g - eL t R T g
N ( I EF P, N ~*
W OTW aO T .A
R E L C rE T F A e> . vM AE t G G N E
OT r t RI
T
Ni
N A gR e H H T E nf t C C U u'v v S S! l I I IL rlR a D C D P u
D= . * = = =
w it
np g r TT O T Q D o
- arepO
_ .,~ it
nU
-
4FF9 297T5F..211,0 l
a.
m..
0,,00D0r
- oN
N.'
T :
A5321 S 2RE t
E is,WG O nn_RA UoT
- -H G t it
+ N'
CN5 ndi,
, 1 I aL n-
O Pl oDCO rCC
~ 6" a ls N Mlcicea3 D
N
y'NNF'N I.M
R ug0 No
mg c l
hogr
T cE t o
~ aesM E tHe- FE
-GRA 0 I
n rh 8 eC E iwtT6
I-S s n
- LuA di
_W
D EWC$ S
S
Em0.F 82C 0 14
1 -
~- _ "0 4R 0
5E 0
NV 1I g eR Q r
uPA F ILig
~ W F W 4A0 C F8w 8 L 4 \A F . 6 LE
LT 9 dIL 4 L R
F_A E A= B F
h N OgT A E
F 0R TUS
NRE
sT
_ M
m& - NC)-

T~w
~
N
fR eUT , g
I A ~ aG a o - rU t G T
T P is D eA M 0 T - v
AR E L CT F A1
luE .s
,F pW u
T F i WOie g
E L G N l nt
Ni
A If
rR R n T 4L u% %E (
i
al I
J DLe tL
Rl
1D C D P n= = = = = = ~
~iot
f Ta % aT Q LT rN e
p
%- it
O
nU
-
2'
_ l
a_
T T mr
6 D _ oF.3 ]0 N_
- D0 :
'
I hT _2 ,
s_ it n3 S
R noT .iA) 6 E
EW UtG iCR t dTA nnH
, GC N l
oa- - II _
S PCL
- D O r la a*O _ cei_ C
_ l
'6 _ cg-
M' O ulo3
\
MFm.w NoR
w r4 h o
N c e7
_t t
E ae, E
~ HMr- F
"jT. . -1 e- N . r
F E.s G - -
I
inms i,0* A 0 E wm_ 5 H 8 's ;* C A d u- S '
-,6 C -
C ES
"7 I
-, SD e- 8
G',-<,v 2
-w"
,6
-3 2 4- 4 -
5,-
D -> e: ' .ry
)
N|
4f * uig
: g.
Fy yP:
'
pI
x' Ls.
sL
w*' 'i W AS -C
- El5 3
. iG g " iM- . 5 ' E IEAL R F_
'31 5 B FE* C= = " C
Ag' f E
~ OR TUS
sRET
* A- k-
1* T NLO- - g----

Ta = R!ytR TEPF[ RAIL 4;f
Op = RivtR FLC%
T = D15thlUtGE TEMPERAIVRE
Q = DISCHARGE FLOW
^DF = O t t UT ION F AC YOR
m T = PtiME f tMP. - fp
- ".7w/;-A :,,ER '
,
~g 37..o ..g . 9.' , c F s=
=.~.s -
S.n l . % 'Q'%...
-
ICQ = Si.M t r's s -pT=63.79 N ihf2_ . ' Q,N . N
f ~ %~ |. ,
N<N/ bg N -
WATER SURFACE EL. 63.3 W ' '%w
''7.% r;,
TEMPORARYBARGE SLIP
.
N " 42" $ DISCHARGE ''-
s - 4N
~ ~ ' - 80 - N AT D.F.'
5 0.178c s- 's 3 0.1T)T
2 0.0 CTOE OF FILL T ~ l 0.036
LTl'
\ " * DISCHARGE%
36mFROM COOLING TOWERS
-
N 50 1McN 1C0 0 zc0
SCALE IN FEET
Figure 5.4-38 Edwin 1. Hatch Nuclear Plant Unit 2:2-Unit Operation During Extreme WinterMeteorlogical Ccnditions.
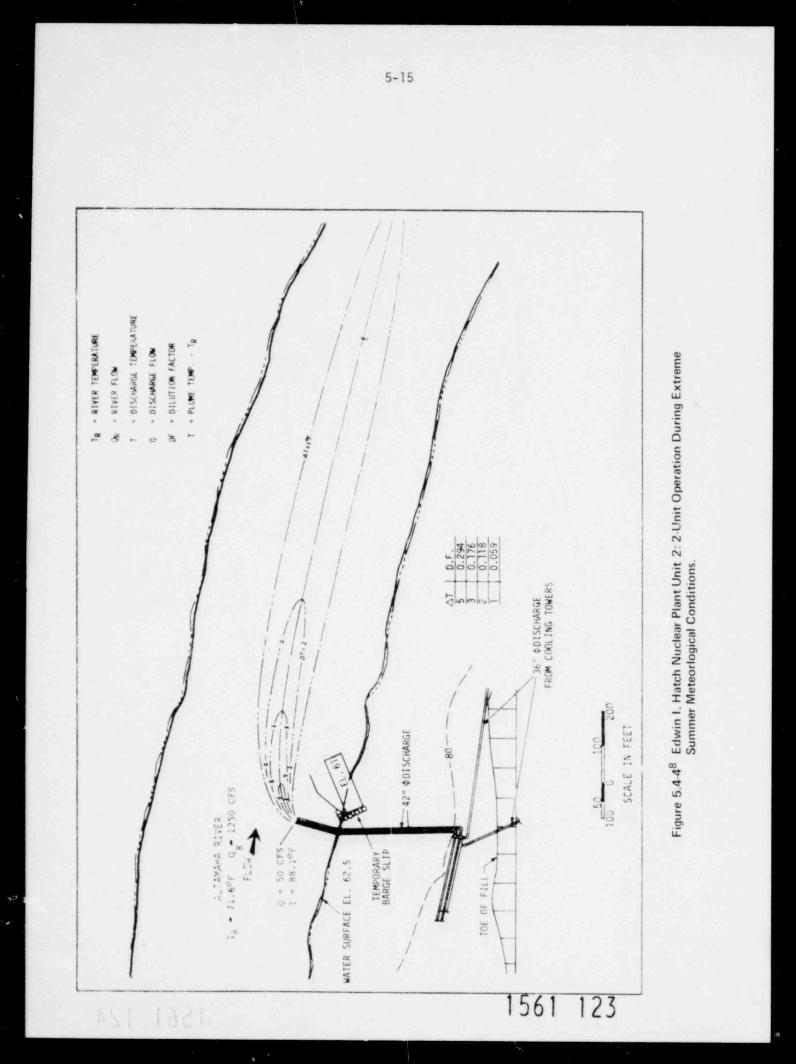
. . . - - - . -
5-15
/ | |'/
/ !
/;
,/ / '
i,
| f'
% iig 3 / .,.
s se!: /''
-
< sr,:-=*==g 2s= - =*b ?Y 5- 555$EsI
,/g.g. . . . . . ,
/- - o.4 8 e- o
,
i | | 8
/ si/ $"'
| 0
/| /.t
* c=
w. em
~(rs|8 .y g/ m
| | | ase8i iE Ln!-| gh 5j
=e -,
|
( ;.p,
- go.,
N
|Ii u n4 Q g
-
ns ?$''?| -a"' 2f
i i. - ,a/s/ a 3*
-..
i =a., , c
|$. fEI ~.
.E E'gf r
l'./'t:I $
'O g d jE: -
ce / 4' s J$
\{ .k{'
l/ G M i / 5 m
l')I./L> 4? 5 i
'-\;\\L%m - u .\e
%.~
~,9- .
a i y a'a s
= f. et \, /['mw
3 =- |1=: -.c.s ..
yg /| -(s g L' SE 3 '
: / I :" ''a
u~ - w I, , .-Nw [ C
5 / E, ;< s -
I-
t a ,
; e i,
2
1561 123;
_ _.

RIER TMNWTae
On = alvte rtCw_
T Dt%MEE Ttw[RATORI=
'xw Q DIMHAA6E FLOld=
DF = OILUTION F ACTOR../ ~~ _ 3 T PL5E T[MP. - Tg=,p-
s - p* DA- A a ;', E ; '.#~%
,.'17"I!g Qg1940 Cis
*
F. 7a' k., , N
''--
, , ,.
.
-
% .
147 Crs' ' ' * ~ ' ' '''N. -
i . .,;o r N -
"N'N ..
f|
,N N800 FT.
O'gWTER SURFACE EL. 63.8
e
TEMPORARY 'BARGE SLIP
'
7,
N D 42"9 DISCHARGE ''- *% -
% AT DF'
. - - 80 - ~ N 10 0.353'N s ' \ 5 0.167_
.0
~ ~ x x " CD15 CHARGE'
36
FROM COOLING TOWERS
-
UlON c:5L _ _l M
100 0.
200m
SCALE IN FEET-
NO 8Figure 5.4-5
Edwin I. Hatch Nuclear Plant Unit 2: 2-Unit Cold Shutdown Without Off-SitePower During Winter With Minimum River Temperature.

.. _
-
5-17
/
5a sI I a a ~= 5s -:Ea~ a ! 5e=f|t= yEE9aEE 2..o o o s'
.t. . ....
!=es-o a-
S.
| o*
3iewBsuoaoa,
i!IAL,yk.. .
Pr.98J.70000 7t:j j o 0
.I, ,/-~g,
,
NE.
; *F"~- E igss Si
(l : % nsi Ms Es'
'l ; Es s 'ti
* '
/ :o " uE/ m3 3 E,
"4 *a%. '' /j| "/ .. o m
\. c- .Eg
I 'I e Isi,
\\\:
f^\.I d JOw
\\ \.\ .9 i '! i, .s, t,.-; e e j, ..
y// ~ V ' \\\ s M i s 3ej <,'
c ? I'NL f{,. ~"ilg =,
, ,. :: ,-
b,a, g ,.,
,3 p / s >' 42. g '
#w *i,
-
' n - ,'
e|-~ < > C ;- 'n
u~i a e-<
,) ' '; g Q /I*
-
.
-e i s4
g / 5,
m /
| * /5<
.
- - -
1561 125._
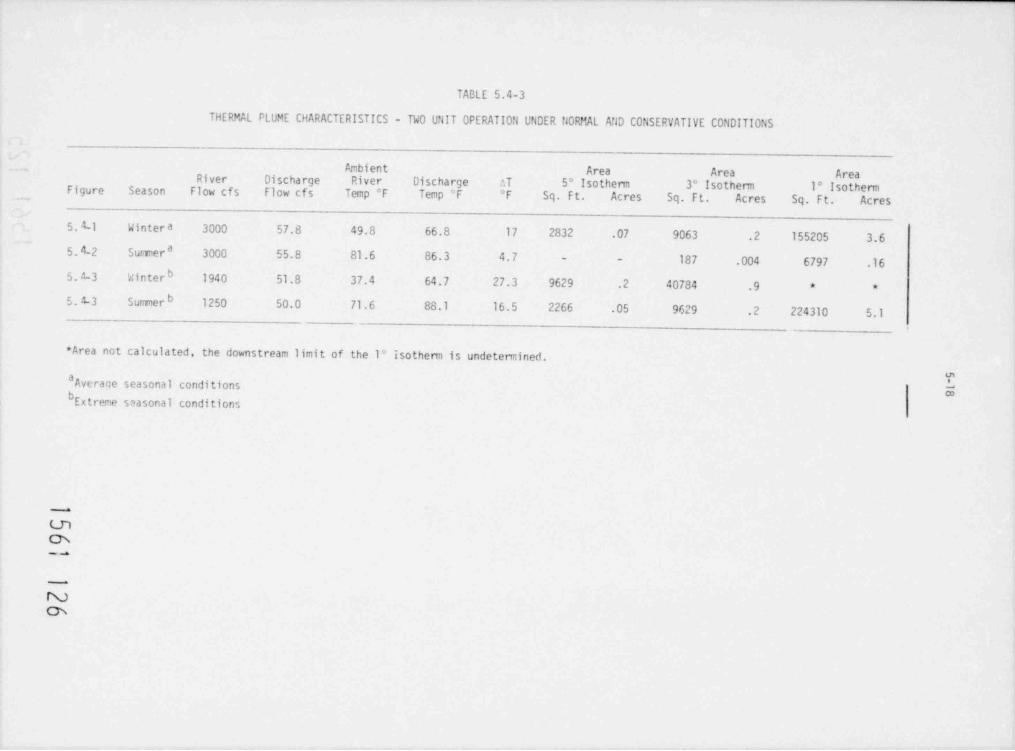
TABLE 5.4-3
THERMAL PLUME CHARACTERISTICS - TWO UNIT OPERATION UNDER NOPJtAL AND CONSERVATIVE CONDITIONS
Ambient Area Area AreaRiver Discharge River Discharge e.T 5 Isothem 3 Isotherm 1 IsothermFigure Season Flow cfs Flow cfs Temp F Temp F F Sq. ft. Acres Sq. ft. Acres Sq. Ft. Acres
5. 4-1 Wintera 3000 57.8 49.8 66.8 17 2832 .07 9063 .2 155205 3.65. 4-2 Surrer 3000 55.8 81.6 86.3 4.7 - - 187 .004 6797 .16
b5.?-3 Winter 1940 51.8 37.4 64.7 27.3 9629 .2 40784 .9 * *
5. 4-3 Summerb 1250 50.0 71.6 88.1 16.5 2266 .05 9629 .2 224310 5.1
* Area not calculated, the downstream limit of the 1" isotherm is undetermined.
a TAverage seasonal conditions 5bExtreme s?asonal conditions
-
Ch~
w
Ch

5-19
The staff has considered the possibility of the existence of these mechanisms at the Hatch siteard has concluded that due to the small size of the thermal plume even under conservative condi-tions, the demonstrated acility of fishes to avoid elevated temperature that may be lethal orsublethal to the fish, the lack of the possibility of a thermal blockage in the Altamaha River,the lack of temperatures in excess of the upper lethal temperature of important adult speciesover a significant area in the discharge plume, and the existence of ichthyoplankton of importantspecies only durira the spring when temgaratures are low and the flow is high, no adverse effecton fishes is expected.
Thermal cold shock resulting from r? actor shutdown during either controlled or scram conditionsis considered insignificant since there is no imediate ieduction of heat being discharged to theriver. Approximately 24 hours are required for the discharge heat to be reduced significantly.3
5.5 RADIOLOGICAL IMPACTS
5.5.1 Radiological Impact on Man
The models and considerations for environmental pathways leading to estimates of radiation dosecocinitrrents to individuals are discussed in. detail in draf t Regulatory Guide 1.109. Similarly,use of these models, and additional assumptions, for population dose estimates are described inAppendix D of this statement.
5.5.1.1 Exposure Pathways
The environmental pathways which were considered in preparing this section are shown in Fig-ure 5.5-1. Estimates were made of radiation doses to man at and beyond the site boundary basedon NRC staf f estimates of expected ef fluents as shown in Tables 3.2-2 and 3.2-3, site meteoro-logical and hydrological considerations, and exposure pathways at the Hatch nuclear power station.
Inhalation of air and ingestion of food (and water) containing C-14 and radiocesium, and imersionin the gaseous plume containing radioactive noble gases are estimated to account for essentiallyall of the total body radiation dose commitments to individuals and the population within 50miles rf the Hatch station.
5.5.1.2 Dose Commitments from Radioactive Releases to the Atmosphere
Radioactive ef fluents released to the atmosphere from the Hatch f acility will result in smallradiation doses to the public. NRC staf f estimates of the expected gaseous and particulatereleases listed in Table 3.2-3 and the site meteorological considerations discussed in Section 2 4of this statement and summarized in Table 5.5-1 were used to estimate radiation doses to individ-uals and populations. The results of the calculatinns are discussed below.
Radiation Dose Comitments to individuals
The predicted dose commitments to " maximum" individuals at the offsite locations where doses areexpected to be largest are listed in Table 5.5-2. A maximum individual is assumed to consumewell above average quantities of the foods considered (see Table A-2 in Draf t RegulatoryGuide 1.109). The standard NRC models were used to realistically model features of the HatchUnit No. 2 plant design and the site environs.
Radiation Dose Commitments to Populations
The estimated annual radiation dose commitment to the population (within 50 miles) for the HatchUnit No. 2 nuclear power plant from gaseous and particulated releases were based on the projectsite population distribution for the Year 1992. Doses beyond the 50-mile radius were based onthe average popu ation densities discussed in Appendix D of this Statement. The annual popula-1
tion dose comitments are presented in Table 5.5-3. Background radiation doses are provided forcomparison. The doses f rom atmospheric releases from the Hatch Unit No. 2 facility duringnormal operation represent an extremely small increase in the normal population dose from back-ground radiation sources.
1561 127
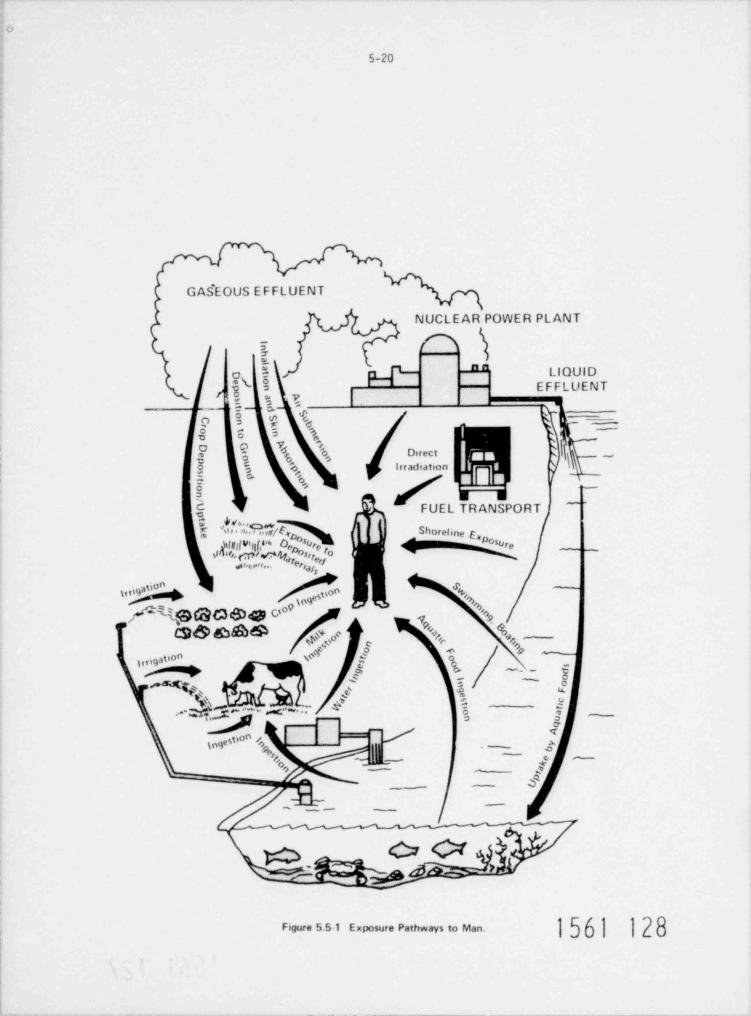
o
5-20
GASEOUS EFFLUENT
NUCLEAR POWER PLANT
f, # LIQUIDo3 EFFLUENTj, ,
E E 5 =
{ $ **$ Y ~=g
[ $ i o, Direct 2g,
k_
$ o,,\Irradiationo
o o 7-~'
@ FUEL TRANSPORT
' --,r
$ ~u
' ',#Il9@Q @@ C' ' 'o,g
%,'c'
C98 db8@ &p ocv e
pyggapO ge Y NO'
M s > ~- jeM T O
/ 1, ;,. . . ~ . ~ . . .
/
4+g 4 = ; _
f- -
-~~
k- -~ - _.___
O
561 128Figure 5.5-1 Exposure Pathways to Man.

5-21
TABLE 5.5-1
SUMMARY OE ATMOSPHERIC OISPERSION FACTORS AND DEPOSITIONVALUES FOR SELECTED LOCATIONS NEAR THE HATCH NUCLEAR POWER STATION *
Relative3_ Location Source X/0 (sec/m ) Deposition (m-[
Nearest ** Site A 7.34E-07 1.28E-07Water Boundary B 1.79E-07 6.06E-08(0.28 mi. NNW) C 1.40E-07 3.60E-08 |
Nearest Site A l.78E-06 2.lcE-08Land Boundary B 1.19E-07 1.37E-08(0.94 mi WSW) C 4.54E-07 4.61E-08
Nearest Residence A 1.57E-06 1.50E-03(0.99 mi SW) B 9.81E-08 9.16E-09
C 4.28E-07 3.58E-08
Nearest Garden / Meat A 1.24E-06 9.15E-09(1.2 mi SW) B 9.09E-08 5.71E-09
C 4. 54 E-07 2.63E-08
Nearest Residence, A 2.59E-07 1.49E-09Garden, Milk and B 4.46E-08 1.05E-09Meat Animals C 2.93E-07 6.09E-09(2.9 mi NNE)
*
The doses presented in the following tables are corrected for radioactive decay and clouddepletion from deposition, where appropriate, in accordance with Regulatory Guide 1.111" Methods for Estimating Atmospheric Transport and Dispersion of Gaseous Effluents in RoutineReleases from Light Water Reactors," March 1976.
**" Nearest" refers to that type of location where the highest radiation dose is expected tooccur from all appropriate pathways.
Source A is a continuous ground-level release from reactor vents.Source B is a continuous release from the 120m stack.Source C is a periodic release from the 120m stack; 4/yr 24 hours duration.
1561 129

TABLE 5.5-2
AYiUAL DOLE COMMITMENTS TO A t'AXIMUM INDIVIDUAL DUE TO ATMOSPHERIC RELEASESa
DOSE (rren/yr)LOCATION PATHWAY TOTAL E0DY GI-TPACT BONF LIVER THYROID LUNG SKIN
?.earest* Plume 0.78 0.78 0.78 0.78 0.78 0.78 1.7Pesidence Ground Deposit 0.01 0.01 0.01 0.01 0.01 0.01 0.02(0.99 mi SW) Inhalation (Infant) ** ** " ** 0.13 ** **
Nearest Residenc2/ Pl'une 0.07 0.07 0.07 0.07 0.07 0.07 0.07Garden / Milk and Ground Deposit ** ** ** ** ** ** **Meat Animals Inhalation (Infant) " ** ** ** 0.02 ** **(2.9 mi NNE Meat (Child) ** " ** " 0.02 ** "
f1 ilk ()ofan{* Child)I 0.02 0.02 0.02 0.03 3.1 0.02 0.02wenetA ion 0.02 0.02 0.02 0.02 0.14 0.02 0.02Nearest Garden / Plume 0.60 0.60 0.60 0.60 0.60 0.60 1.4Meat Animals Ground Deposit
. ** ** ** ** **** **
(1.2 mi SW) Inhalation (Infant) ** ** ** ** 0.22 ** *Vegetation (Child) 0.06 0.C6 Of6 0.12 0.66 0.06 0.06Meat (Child) ** ** **- ** **
Y'Nearest Site Plurre 0.92 0.92 0.92 0.92 0.92 0.92 1.8 %Eaundary Ground Deposit 0.02 0.02 0.02 0.02 0.02 0.02 0.02(0.94 mi WSW Inhalation ** ** " ** 0.15 " **
*The doses are for Unit N J. 2 only; the dose from both units would be twice the values in this table since the units are identical." Nearest" refers to that type of location where the highest radiation dose is expected to occur from all appropriate pathways.**Less than 0.01 mren/yr.
-
m-
M
CD

TABLE 5.5-3
aANNUAL POPULATION DOSE COMMITMENTS IN THE YEAR 1992
Population Dose Comitment (man-rem)Category 50 miles U.S. Population
-.
c dNatural Radiation Background 23,000 25,000,000
Hatch Unit No. 2 Nuclear Power Plant Operation
** 500 tPlant Work ForceGeneral Public (Total) 1 29
* 3.7Noble Cases Submersion* *
Inhalation* *
Ground Deposition i
24 I*Terrestrial Foods* *
Drinking Water* *
Aquatic Foods* *
RecreationTransportation of nuclear
** 3fuel and radioactive wastes m
baThe dose commitments shown are for the Unit No. 2 cnly; the commitment from both units would be twice thevalues in this table since the units are identical.
b" Natural Radiation Exposure in the United States," U.S. Environmental Protection Agency, ORP-SID 72-1 (June 1972).CUsing the average Georgia state background dose (100 mrem /yr) in (a), and year 1992 projected population of
230,000.dUsing the average U.S. background dose (102 mrem /yr) in (a), and year 1990 projected U.S. population from" Population Estimates and Projections," Series II, U.S. Ept. of Commerce, Bureau of Census, Series P-25,No. 541 (Feb. 1975).
*Less than 1 man-rem /yr
** Included in the U.S. population, since some exposure is received by persons residing outside 50 mile radius.~
LT'1ON~
%
~

5-24
5.5.1.3 Dose Comitments from Radioactive Liquid Releases to the Hydrosphere
Radioactive effluents released to the hydrosphere from the Hatch Unit No. 2 facility duringnormal operation will result in small radiation doses to individuals and populations. NRC staffestimates of the expected liquid releases listed in Table 3.2-2, and the site hydrological con-siderations discussed in Section 2.3 of this statement and sumarized in Table 5.5-4 were used toestimate radiation dose commitments to individuals and populations. The results of the calcula-tions are discussed below.
Radiation Dose Comitments to Individuals
The estimated dose commitments to individuals at selected offsite locations where exposures areexpected to be largest are listed in Table 5.5-5. The standard NRC models given in Draft Regula-tory Guide 1.109 were used for these analyses.
Radiation Dose Commitments to Populations
The estimated population radiation dose commitments to 50 miles for the Hatch Unit No. 2 facilityform liquid releases, based on the use of water and biJta from the Altamaha River, are shown inTable 5.5-3. Dose commitments beyond 50 miles were based on the assumptions discussed in Appen-dix D.
Background radiation doses are provided for comparison. The dose commitments from liquid releasesfrom the Hatch Unit No. 2 facility represent small increases in the population dose from back-ground radiation sources.
5.5.1.4 Direct Radiation
Radiation from the Facility
Radiation fields are produced in nuclear plant environs as a result of radioactivity containedwithin the reactor and its associated components. Although these components are shielded, doserates around the plants have been observed to very from undetectable levels to values of theorder of I rem / year.
Doses from sources within the plant are primarily due to nitrogen-16, a radionuclide produced inthe reactor core. For boiling water reactors, nitrogen-16 is transported with the primary coolantto the turbine building. The orientation of piping and turbine components in the turbine buildingdetermines, in part, the exposure rates outside the plant. Because of variations in equipmentlayout, exposure rates are strongly dependent upon overall plant design.
Based on the radiation surveys which have been performed around several operating BWR's, itappears to be very difficult to develop a reasonable model to predict direct shine doses. Thus,older plants should have actual measurements performed if information regarding direct radiationand skyshine rates is needed.
For newer BWR plants with a standardized design, dose rates have been estimated using sophisti-cated Monte Carlo techniques. The turbine island design proposed in the Braun SARI is estimatedto have direct radiation and skyshine dose rates of the order of 20 mrem / year / unit at a typicalsite boundary distance of 0.4 mile from the turbine building. This dose rate is assumed to betypical of the new generation of boiling water reactors. The integrated population dose fromsuch a facility would be less than one man-rem / year / unit.
Low level radioactivity storage containers outside the plant are estimated to contribute lessthan 0.01 mrem / year at the site boundary.
Occupational Radiation Exposure
Based on a review of the applicant's safety analysis report, the staff has determined that theapplicant is connitted to design features and operating practices that will assure that indi-vidusl occupational radiation doses (occupational dose is defined in 10 CFR Part 20) and indi-vidual and total plant population doses will be as low as is reasonably achievable.2 For thepurpose of portraying the radiological impact of the plant operation on all onsite personnel, itis necessary to estimate a man-rem occupational radiation dose. For a plant designed and pro-posed to be operated in a manner consistent with the 10 CFR Part 20, there will be many variableswhich influence exposure and make it difficult to determine a quantitative total occupationalradiation dose for a specific plant. Therefore, past exposure experience from operating nuclearpower stations has been used to provide a widely applicable estimate to be used for all light3
i561 132

TABLE 5.5-4
SUMMARY OF HYDROLOGIC TRANSPORT AND DISPERSION FOR LIQUID RELEASES FROM THE HATCH UNIT NO. 2 NUCLEAR POWER PLANT
LOCATION TRANSIT TIME (Hours) DILUTION FACTOR
Nearest Drinking 9.7 40
Water Intake (River Well)(8 mi downstream)
Nearest Sport 0.01 3.4Fishing Location(0.28 mi NNW)**
Nearest Shoreline 2.5 2.7(2 mi downstream)
*See Regulatory Guide 1.112, " Analytical fiodels for Estimating Radioisotopes Concentrations in Different Water Bodies," (1976).
,
Assumed for purposes of an upper limit estimate-detailed information not available.Y'M
-
Ch-
-
U

TABLE 5.5-5
ANNUAL INDIVIDUAL DOSE C0ff!TMENTS DUE TO LIQUID EFFLUENTS8
DOSE (mren/yr)LOCATION PATHWAY TOTAL BODY BONE LIVER THYROID LUNG GI TRACTNearest River Water Drinking Water ** ** ** 0.02 ** **Use (river well)(C 8 mi downstream)
Nearest Fish Fish 1.1 2.0 1.5 0.09 0.16 0.34Production (0utfall Area)(0.28 mi NNW)*
Nearest Sediments ** ** ** ** ** **Shoreline(2 mi downstream)
a
The doses shown are for Unit No. 2 only; the dose from both units would be twice the values in this table since the unitsare identical.
*
Assumed for purposes of an upper limit estimate-detailed information on usage and productivity not available.+,
Less than 0.01 mrem /yr. mA,cn
w
&
== ese
4

5-27
water reactor power plants of the type and size for Hatch Unit No. 2. This experience indicatesa value of 500 man-rem per year per reactor unit. On this basis, the projected occupationalradiatior, exposure impact of the Hatch Unit No. 2 is estimated to be 500 man-rem per year.
Transportatior of Radioactive Material
The transportation of cold fuel to a reactor, of irradiated fuel from the reactor to a fuelreprocessing plant, and of solid radioactive wastes from the reactor to burial grounds is withinthe scope of the NRC report entitled, " Environmental Survey of Transportation of RadioactiveMaterials to and from Nuclear Power Plants." The environmental effects of such transportationare sumarized in Table 5.5-6.
5.5.1.5 Site Specific Data
The applicant's site and environmental data provided in the EROL and in subsequent answers to NPCstaff questions was used extensively in the dose calculations. Any additional data receivedwhich cnuld significantly affect the conclusions reached in this draft statement will be used inpreparing the final statement for the operating license for this plant.
5.5.1.6 Evaluation of Radiological Impact
The radiological impact of operating the proposed Hatch Unit No. 2 Nuclear Power Plant is pre-sented in terms of individual dose conmitments in Tables 5.5-2 and 5.5-5. The annual individualdose conmitments resulting from routine operation of the plant are a small fraction of the doselimits specified in 10 CFR Part 20. The population dose commitments presented in Table 5.5-3are small fractions of the dose from natural environmental radioactivity. As a result, the staffconcluded that there will be no measurable radiological impact on man from routine operation ofthe Hatch Unit No. 2 plant.
"nce Unit Nos. I and 2 are identical plants, the radiological impact due to the operation of thetwo-unit station would be twice that determined for 'Jnit No. 2. However, the conclusions withregard to Unit No. 2 operation also are valid for botn units during normal operation due to thesmall dose commitments.
5.5.1.7 Comparison of Calculated Doses with NRC Design Objectives
Tables 5.5-7 and 5.5-8 show a comparison of calculated doses f rom rcutine releases of liquid andgaseous ef fluents from the Hatch Unit No. 2 plant with the design objectives of Appendix ! to10 CFR 50 and with the proposed staff design objectives of Rf1-50-2.
5.5.2 Radiological Impact ce Biota Other Than Man
The models and considerations for environmental pathways leading to estimates of radiation casesto biota are discussed in detail in Volume 2, " Analytical Models and Calculations" of WASH-1258.4
5.5.2.1 .Eg osure Pathways
The environmental pathways which were considered in preparing this section are shown in Fig-ure 5.5-2. Dose estimates were made for biota at the nearest land and water boundaries of thesite, and in the aquatic environment at the point where plant's liquid effluents mix with theAltamaha River. The estimates were based on estimates of expected effluents as shown inTables 3.2-2 and 3.2-3, site meteorological and hydrological considerations, and the exposurepathways anticipated at the Hatch Unit No. 2 Nuclear Power Plant.
5.5.2.2 Doses to Biota from Radioactive Releases to the Biosphere
Depending on the pathway (as discussed in Draf t Regulatory Guide 1.109), terrestrial and aquaticbiota will receive doses approximately the same or somewhat higher than man receives. Doseestimates for some typical biota at the Hatch Unit No. 2 site are shown in Table 5.5-9. Doses toa greater number of similar biota in the offsite environs will generally be much lower.
1561 135
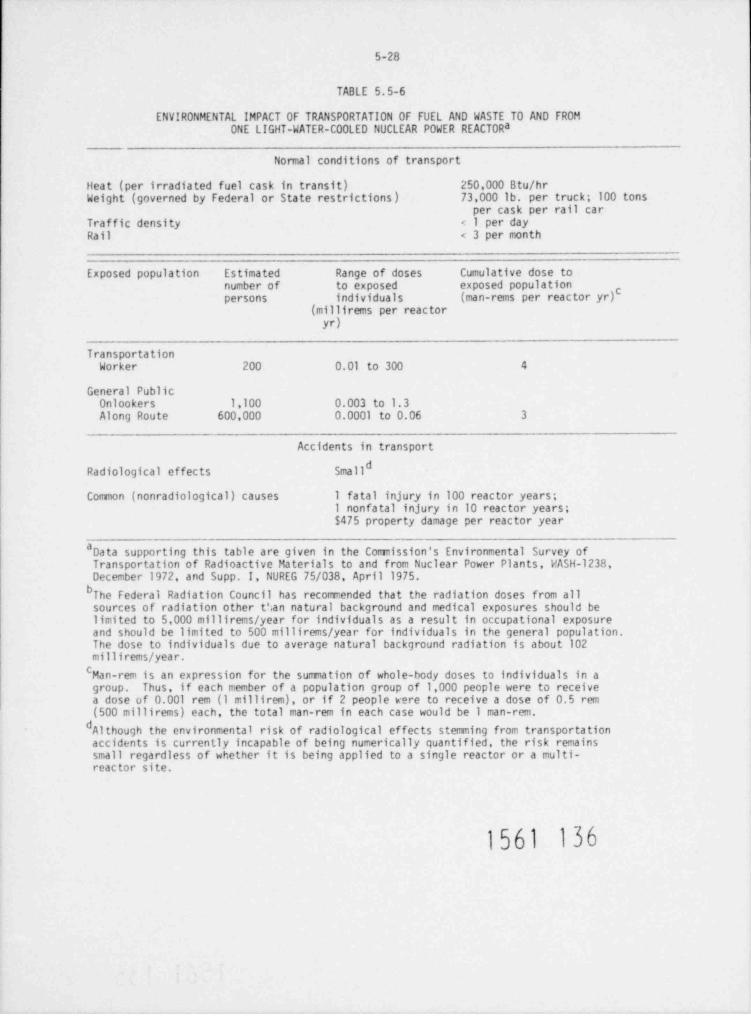
5-28
TABLE 5.5-6
ENVIRONMENTAL IMPACT OF TRANSPORTATION OF FUEL AND WASTE TO AND FROMONE LIGHT-WATER-COOLED NUCLEAR POWER REACTORa
Normal conditions of transport
Heat (per irradiated fuel cask in transit) 250,000 Btu /hrWeight (governed by Federal or State restrictions) 73,000 lb. per truck; 100 tons
per cask per rail carTraffic density < 1 per dayRail < 3 per month
Exposed population Estimated Range of doses Cumulative dose tonumber of to exposed exposed populationpersons individuals (man-rems per reactor yr)c
(millirems per reactoryr)
Transporta tionWorker 200 0.01 to 300 4
General PublicOnlookers 1,100 0.003 to 1.3Along Route 600,000 0.0001 to 0.06 3
Accidents in transportdRadiological effects Small
Common (nonradiological) causes 1 fatal injury in 100 reactor years;1 nonfatal injury in 10 reactor years;$475 property damage per reactor year
* Data supporting this table are given in the Commission's Environmental Survey ofTransportation of Radioactive Materials to and from Nuclear Power Plants, PASH-1238,December 1972, and Supp. I, NUREG 75/038, April 1975.
b The Federal Radiation Council has recommended that the radiation doses from allsources of radiation other t'ian natural background and medical exposures should belimited to 5,000 millirems / year for individuals as a result in occupational exposureand should be limited to 500 millirems / year for individuals in the general population.The dose to individuals due to average natural background radiation is about 102millirems / year.
CMan-rem is an expression for the summation of whole-body doses to individuals in agroup. Thus, if each member of a population group of 1,000 people were to receivea dose of 0.001 rem (1 millirem), or if 2 people were to receive a dose of 0.5 rem(500 millirems) each, the total man-rem in each case would be 1 man-rem.
dAlthough the environmental risk of radiological effects stemming from transportationaccidents is currently incapable of being numerically quantified, the risk remainssmall regardless of whether it is being applied to a single reactor or a multi-reactor site.
1561 136

5-29
TABLE 5.5-7
COMPARISCN OF CALCULATED DOSES TO A MAXIMUM INDIVIDUAL FROMHATCH UNIT NOS. 1 & 2 OPERATION WITH GUIDES FOR
DESIGN OBJECTIVES PROPOSED BY THE STAFFa
RM-50-2 CALCULATEDCRITER!ON DESIGN OBJECTIVE DOSE
Liquid Effluents
Dose to total body or anyorgan from all pathways 5 mrem /yr 4.0 mrem /yr
Noble Gas Effluents (at site boundary)
Gansna dose in air 10 mrad /yr 0.92 mrad /yr
Beta dose in air 20 mrad /yr 3.0 mrad /yr
Dose to total body of anindividual 5 mrem /yr 1.8 mrem /yr
Dose to skin of anindividual 15 mrem /yr 3.6 mrem /yr
Radioiodine ard Par ticulates
Dose to any organ from allpathways 15 mrem /yr 6.3 mrem /yr
a Guides on Design Objectives proposed by the NRC staff on February 20, 1974; considersdoses to individuals from all units on site. From " Concluding Statement of Positionof the Regulatory Staff," Docket No. RM-50-2, Feb. 20,1974, pp. 25-30, U.S. AtomicEnergy Commission, Washington, D.C.
bCarbon-14 and tritium have been added to this category.
1561 137

5-30
TABLE 5.5-8
COMPARISON OF CALCULATED DOSES TO A MAXIMUM INDIVIDUAL FROMa
HATCH UNIT NO. 2 CPERATION WITH APPENDIX ! DESIGN OBJECTIVES
APPENDIX ! CALCUL ATEDCRITERION DESIGN OBJECTIVE DOSES
Liquid Effluents
Dose to total body fromall pathways 3 mrem /yr 1.1 mrem /yr
Dose to any organ fromall pathways 10 mrem /yr 2.0 mrem /yr
Noble Gas Effluents (at site boundary)
Gamma dose in air 10 mrad /yr 0.46 mrad /yr
Beta dose in air 20 mrod/yr 1.5 mrad /yr
Dose to total body of anindividual 5 mrem /yr 0.92 mrem /yr
Dose to skin of anindividual 15 mrem /yr 1.8 mrem /yr
bRadiciodines and ParticulatesDose to any organ from allpathways 15 mrem /yr 3.1 mrem /yr
8Appendix I Design Objectives from Sections II.A II.B. II.C of Appendix I, 10 CFRPart 50: considers doses te maximum individual per reactor unit. From FederalRegister V. 40, r.19142, May 5,1975.
bCarbon-14 ar.d tritium have been added to this category.
1561 138
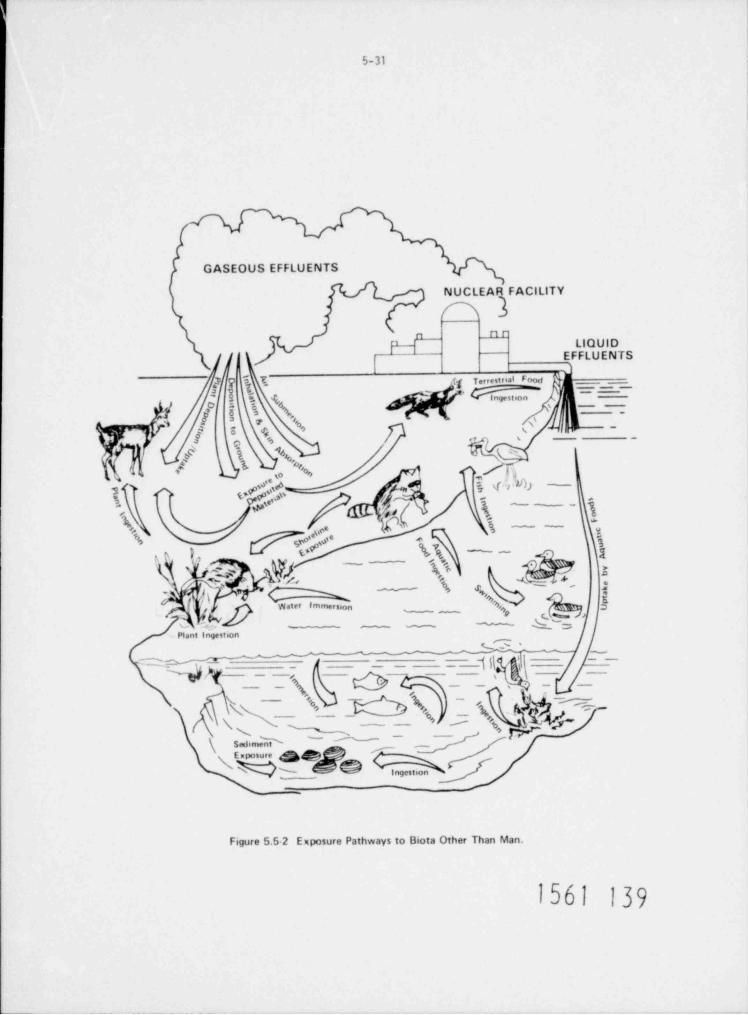
5-31
GASEOUS EFFLUENTS
NUCLEAR FACILITY
OLIQUID
EFFLUENTS
f k . . *I - = ' ~ -
Ed / 2 6\'e
' -
te' j i i ,fi -
_,
gh / S|,'%s M '
s
1[ "I5'A . 'g[I_ g'- er
r6 1&~ v\
-
,(.s %, #1-
[ '* *s " =-
(, water immers,on 3
"' ~ ~ ~
Nant I 9esten%G'
~~ ~ ~
O _ _ - 1) |~ -
__\ _ _ _ _
\- 'o~ ~M-a,_
r y
\_
- - -
' ~ ~( sahmeD _
\' % @ # 8 @ D J
Figure 5.5 2 Exposure Pathways to Biota Other Than Man.
1561 139
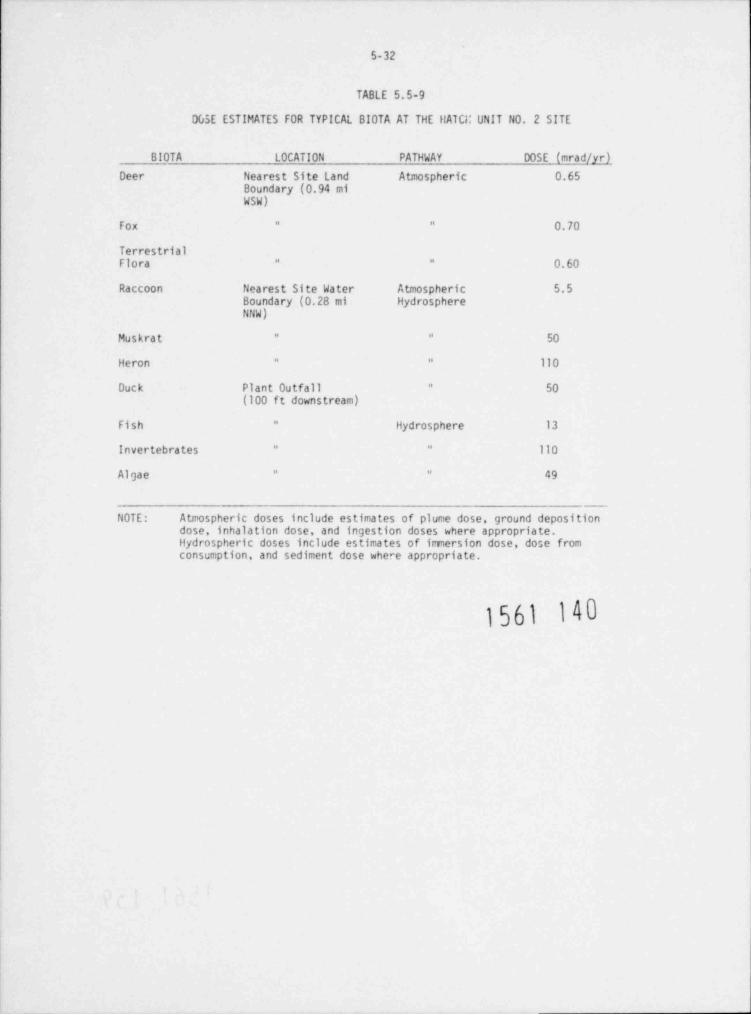
5-32
TABLE 5.5-9
DGSE ESTIMATES FOR TYPICAL BIOTA AT THE HATCi: UNIT NO. 2 SITE
BIOTA LOCATION PATHWAY DOSE (mrad /yr)
Deer Nearest Site Land Atmospheric 0.65Boundary (0.94 miWSW)
Fox 0.70" "
TerrestrialFlora 0.60" "
Raccoon Nearest Site Water Atmospheric 5.5Boundary (0.28 mi HydrosphereNNW)
Muskrat 50" "
Heron 110" "
Duck Plant Outfall 50"
(100 f t downstream)
Fish Hydrosphere 13"
Invertebrates 110" "
Algae 49" "
NOTE: Atmospheric doses include estimates of plume dose, ground depositidose, inhalation dose, and ingestion doses where appropriate.Hydrospheric doses include estimates of imnersion dose, dose fromconsumption, and sediment dose where appropriate.
1561 140
5-33
5.5.2.3 Doses to Biota from Direct Radiation
Although many of the terrestrial species may be continuously exposed and thereby receive higherdoses than man, aquatic species and some terrestrial species may receive somewhat lower dosesdepending on shielding by water or soil (e.g., burrows). As a result of these uncertainties, itWas assumed that the direct rar11ation doses to biota at the site boundary will be about the sameas for man. As discussed in Section 5.5.1.4, direct radiation doses will generally be on theorder of 20 mrad /yr.
55.5.2.4 Evaluation of the Radiological Impact on Biota
Although guidelines have not been established for desirable limits for radiation exposure tospecies other than man, it is generally agreed that the limits established for humans are alsoconservative for other species. Experience has shown that it is the maintenance of populationstability that is crucial to the survival of a species, and species in most ecosystems sufferrather high mortality rates f rom natural causes. While the existence of extremely radiosensi-tive biota is possible and while increased radiosensitivity in organisms may result from environ-mental interactions with other stresses (e.g., heat, blacides, etc.), no biota have yet beendiscovered that show a sensitivity (in terms of increased disease or death) to radiation expo-sures as low as those expected in the area surrounding the Hatch Unit No. 2 nuclear power plant.
6 concluded that the evidence to date indicates t: at no other living organismsThe "BEIR" Reportare very much more radioserisitive than man. Therefore, no measurable radiological impact onpopulations of biota is expected from the radiation and radioactivity released to the biosphereas a result of the routine operation of the Hatch Unit No. 2 Nuclear Power Plant.
5.5.3 Environmental Effects of the Uranium fuel Cycle
On March 14, 1977, the Comission presented in the FEDEPAL REGISTER (42FR13803) an interim ruleregarding the environmental considerations of the uranium fule cycle. It is effective throughSeptember 13, 1978 and revises Table S-3 cf 10 CFR Paet 51. Final rulemaking proceedings will beconducted so as to allow for additional public comment and specific details with respect to time,place, and format of such proceedings shall be presented in a subsequent FEDERAL REGISTER notice.
The interim rule reflects new and updated information relative to reprocessing of spent 'uel andradioactive waste management as discussed in NUREG-Oll6, Environmental Survey of the Reprocessingand Waste Management Portions of the LWR Fuel Cycle and NUREG-6216 which presents stW responsesto comments on NUREG-Oll6. The rule also considers other environmental factors of the uraniumfuel cycle including mining and milling, isotopic enrichment, fuel fabrication, and managementof low and high level wastes. These are described in the AEC report WASH 1248, EnvironmentalSurvey of the Uranium Fuel Cycle.
Specific categories of natural resource use are included in Table S-3 of tt ' interim rule andare reproduced in this Statement as Table 5.5-10. These categories relate to land use, waterconsumption and thermal ef fluents, electrical energy use, fossil fuel combustion, chemical andradioactive effluents, burial of transuranic and high/ low level wastes, and radiation dosesf rom transportation and occuoational exposures. The contributions in Table 5.5-10 for reproc-essing, waste management, and transportation of wastes are maximized for either of the two fuelcycles (uranium only and no recycle), that is, the cycle which resulted in the greater impact wasused.
In accordance with the interim rule, the assessment of the environmental impacts of the fuelcycle as related to the operation of the Edwin I. Hatch Nuclear Plant Unit No. 2 is based uponthe values given in Table 5.5-10. For the sake of consistency, the ar.alysis of fuel cycle impactsother than that due to land use has been cast in terms of a model 1000 MWe LWR. Our conclusionsregarding the effects of these impacts would not be altered if the analysis was based on the net803 MWe electrical power capacity of the Hatch Unit No. 2 plant.
The total annual land requirements far the fuel cycle supporting a model 1000 MWe LWR is approxi-mately 100 acres (94 acres temporarily committed and 7.1 acres permanently comitted). Over the30-year operating life of the plant, this amounts to about 2l00 acres,31 which is less thanone-third of the total land comitment for the Hatch plant itself.
To cast the land requirement into further perspective, the traorarily comitted land forwaste management and reprocessing activities to suppurt a model 1000 MWe LWR during itsprojected 30-year operating life is come 2% of the approximately 6700 acres of land tempo-rarily committed for operation of the Hatch plant. Considering comrmn classes of land usein the United States, the fuel cycle land requirement related to the operation of HatchUnit No. 2 dces not constitute a significant impact.N e temporarily comitted land at the reprocessing plant is not prorated over. 30 years, sinceTh
the complete temporary impact accrues regardless of whether the plant services one rea tor forone year or 57 reactors for 30 years. (See footnote "2" to Table 5.5-10) j {j
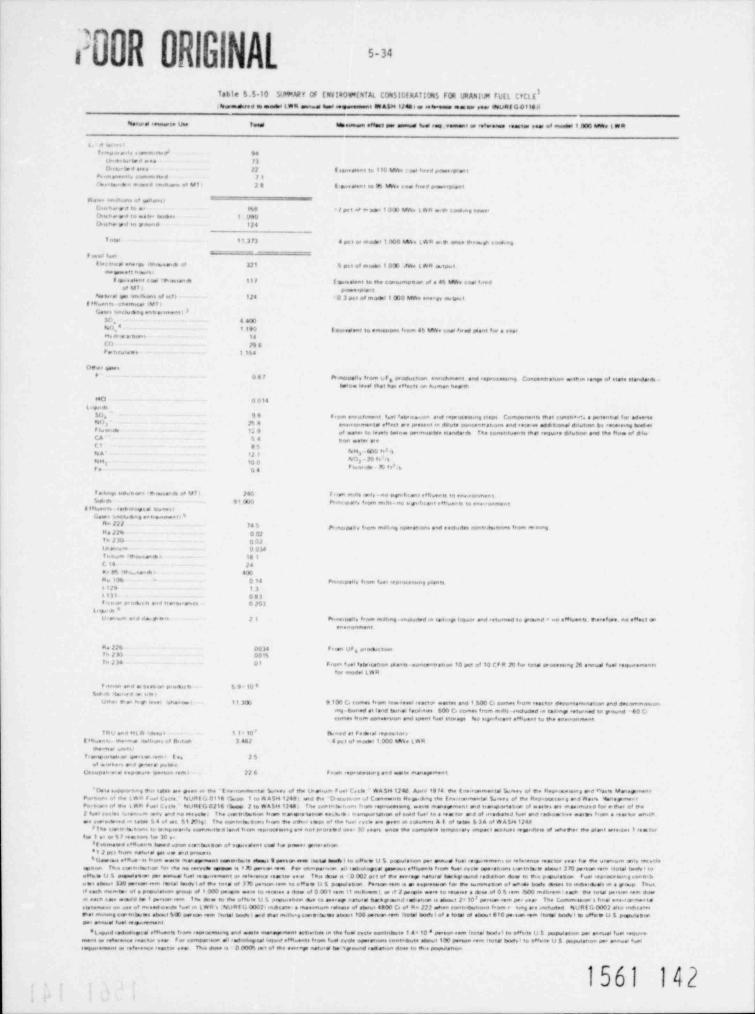
P30RORGNAL -
ITable S.$ 10 M*'APf 0F twvgaWitttAL C0fi$1MRAfi')NS FOR UpAulse rtgt tvCLE,tsemented es medes tWEl annom tune IR A1841J45 e e sees =emme ea ese peer ofWUAE G @lto al
%eewd esteisrce use Ieed Meownem eMeet pe moeud heel seg sement er ee8erones eesstes ,ee et needes t Ono Wee t WW A
L. s0 nor wf em, w e.i, c amm.ete d $4
une.his and ees 73D eewsved sees 27 ( se,eessent to 110 Une r ass feed passerp<ane
re em eneau, cosnanisied 79he tsweima mered wuere asse of Isif i 28 i e,soment es 95 MWe s ea 9. sos pismeepsent
Wew sie . asian, osgeleeni
Enw hee e 6 en e- 94 9 * i act ne = sies 10* UW t AM e,tn seideas some.Chutie erd ee mene aemeet i D90lbsahe pd to pensed 974
I ntae il 3P3 4 pge os seiedes 1000 henne Lam a e ence meame seas.non
F aswt Ives__. -- _
tiecenas energe senem .e.m os 371 6 pre of seiamei 1 OOD .sne t $81 e,* pusnie sseme*, aan,es s
f gerenne c eel **smomane it7 igemenent to tese sonwmpean of a 46 MWe coes feeedse Ut r poweepient
heteral ess tesulhone of et'+ 124 0 3 oct et aierset 120 MWe sae ev en smusl'#weMS -48=emeses 5U t )
Geset isnt4apabeg omWas'essteet P3
50, 4 400%i8, * 1 190 Eeweesons to emesedene ham 45 h8We coes heed pesas fw e reos8*e *iar er mont 14(O 19 &Pe t.c iews 1 154
Otet samesf 06F Psaiepeal, feone of moduction esw chment and reprocessene Concenweteen m.msn eenge of siese stendere-a
hpoe seed that has e*4 cts on homen hos**
een 0 094Lop e
SO 99 f rosa everschsuneet bet 8atsrate.aosi cod reparetsang seeps Componente met centst**=*e e potentedfat edeoeteS
88 0 7% 4 enewanments eMeet es peesent en dewte conceatretsons and race.ee aseteenaf diretsen bv reememe had,es3
8 b*"d* 13 9 et meter to sevets aussom seemeseitse teendase the constrevenn that reemse edeteen and the Wee e8 dieCA ' ' S4 pon eseos arefI 8%4A' %J t D- '
4e4 10 0 2-g,3 f ewm do - M 993 gg4
f a.senge satuhene Seesensen ot WT s 240 f e ma metes anov ne egrn8stens e'fe enta to one.sonmentwSed.de 91000 Princ esseesosa milti-no a y r. cent e'te ease to easieonmentw
S fituente egetsieregte lcunes iGenes i.nch.en, ehemameno *
#a 2J 7 74 % p,s,c,,en, e,om ends.cig opseat.ons and endwest conteitastooses team * matDe Ji% 0 07Tm J IG 0 01Us an wm 0 Q AaT he .m reaviana s. _ 13 IC 14 24a e 8% musae * 4 30pu 306 0 14 p mcepees, tenesi fuei ,epeatesseng peaatsa 119 138 lit 0515.iman peetets and tvaneuestae 0 201
L e essoa *U r enes*stend daw y new 2) prostreesity feom md4eng astouded eds feelmgt 4 sensor enst returned to pened * no GNitsee O Pe*efere 80 emote an
enooteesitenf
fle 226 0014 f smn Uf 8'*dW5 8'*''67% 1 10 00 %ThJ 54 0t f reen f see telyscation sulenn -<tosi<eatration 10 set of 10 CF P 2D Iw gate s'ocetmag 26 eanwat ewes re<suesmeans
for 9ecs9011981
f -***an and a test et psoduce S 9 10 *See ets :tesM e yesto s
Othes o'en stagP* desee 4thatseele ! )I 3@ $ IOG (a tesneSOeOm lendeso4 reerte" wastet and t 500 C. eametfrom seacem devoatemenstron and deramm.eesuns8'S-4pueced at eartd befaas detsisO*o9 W Ce tenutes frgen setsfes agcpiedad se taffestg settersted gn pe pad - SQ Cpe
comes Grosse gen setsen enst spent faset Storage %e sayudetent e flueest to 50te esseneensamentse
74tV ene tot n titeou s 1 1 = 10 ' huesed et f asereas eeece t. net| 84.sem e s tenen'ne .Isftegne ef Brutetet 3 448 O ps t eO futotea1000 44%e teR
shenemal v htss
Yeasiqpetese ee tperten esmi $ 46 IIes emno s and paes e pues.e
UEtth$be91'ptW eitp@gste giortshftsent h Nh h sWebFearWeepy SRd 6 meteP*eOt
' Dete tieppeytnaq $A edige ge geen ese Wie- [ seystenseneetW betew of efue Veebege f tsel f ath ~ R AID 41248 Aersf t$ I4 989 Ime'esenmente bewey et $4Res.Neteste ed Wesie Ue epmentPo man, ne sh,L e se F ,,es (,ces s U#f 6 0:te rby, 1 to e A5eo 1248 6 eid ei D scason eawt Cassiniente fueen+ie the ineseems.am bewe, of the Repeassimag and messa teampamate e
PO'9'Emnt 98 ene L Ao f uel Cy(de " $Rshf G 0216 Fhgp } to $4544 t}43 4 76ee gwnthhwhant feem repseteteng este metstement and trengpertelee el egeet are samemseed tas er etse of gheI hsel Cyt et he onsw* enIV and me eetyrded The gaperituut> set from weitpe emese est.be o wansportaq>en et seed heel te e see ses ePd of eregeeted fuss and redeem Dee meses f asen a rear kse asneCMl r
We genedesed en eense 5 4 of set 5% Jttegl The eenenth esume feares ete eWeses gepe e8 Wie hsee cycle are poem en tcGessut#5 & f et esse 5 34 of A A$se 124N# The emner en.6cne to tempeens, ressuus. sed sand tram oproteams one nos preseed esse 30,eens once she compaese tempece, empact areewes seasseness at senetoe the s6ene teevices I rear tas
fWI ysse b I som eers to 30,if 69tattend e'# wen $5 heaed span swa hsegen of gges, West 9 and 9e pesees pageestege
O t 2 pre Ivese stener W est we eid presetss
O bearames e99 se 95 Store eette utensesenset eenetthr o shmene 9 paesan seen insges hund,6 se eMee U 1 popwetesa ses einue tuoi rees.somens er sefe ones eescoes weer to the urowse stee esucssu
gttem Thag genersbestse 'fbe une see eerygh w se * E pistsee me See asseaportgen est e@eleggs ppaist effelsene ftSple hsed twCe We50raste CW'tsthse GEsenet 3 P0 Seele sem statef Eindy I toeeese u 5 eesswomen see einem fuss see .rement er eemeence eestcan wee Thm done a 0 002 art ** eie areen, actierW herbyesad seeemen des se she pewsesen f uss eeseecessm, gene.best SIbnere 1.80 sieemose s*= imical todyI se me tened of 3 m peetos resse se esse U S posesseease Perman ensui se si emppeteesi f ee sie aussummeeren et tenise had, esses to andresesent en a youp Tsi.seof part misshee, of a papis gesen grense af 1000 peapse mese to se< sees e desse of C 00 t eem i1 m.peseeni es et 2 enente esse to eewswe e eine se 0 6 eem ih00 =dheem i sacs * ee tats # persan som doora
I8te dem hp GBue et8 ite U $ panesseseen ese to aseesy nesie<W betweens restem is Wiense 2 10' persson sessi see seer fpee Gississesessari s has esse +eeassaedsee eetit $9e eesid W I pe*SWI sesus t
stetosuteae eneste et sunseedee de 8 east est (W4 t tel19f G WBO?l estaficeve. e sineessseisse esteene of shows 4800 Cs es pa 222 esmen eentesheet.Osas treni e 9.sig are ame*iereed hi>Rf G 0007 mee ease.tseos**u senaaeng centnames edismet S4 person som festet teser) &=d est samtleeg ceneignetse samt 100 seese men Meer hash I et a som of easewe 5 to y se 'em Heti hadv 1 e eMee U $ popuissanpee enses,g tusse syge,sesseret
O L supeed seesubopte eMhseng fesan reemorsesong and eebte amenopmeen ereweties se the fire $ eyese sentaterte 14 a 108 person eessi (intet bruf el to eM ete U S popuf steen por enassi bee romeweS
f or essenstasette We redoedag>cellegised eMissesets feesus f nal eyde opere9sont ces*Motpute shout 100 poenese com seets hnsP,I to eMoete U S popuseesen pos snawa Neistucat er ee8eeesere seer.4ee weer i
Yttee dose se 0 000% ert of the eenes'ge natis d be %yaisad vesbeeien does to ens poenseenenposesseesumeses er esfesesare eesctor yee e
1561 142.

5-35
The annual total water us g e and thermal effluents associated with fuel cycle operations tosupport a 1000 MWe LWR are given in Table 5.5-10. Since the Hatch plant utilizes cooling towers,it can be compared to the .nodel 1000 MWo plant with cooling towers referenced in Table 5.5-10.Thus, the amount of water discharged to the air related to the fuel cycle rept esents abuut 2of the principal consunptive water use, i.e., evaporative losses to the air, for the Hatch plant.The quantity of heat discharged in fuel cycle operations is less than 4% of the thernal outputfrom a model 1000 MWe LWR. The staff finds these quantities of indirect water consumption andthermal loadings to be acceptable relative to the use of water and thernal discharges at thepower plant.
Electrical energy and process heat are required during various phases of the fuel cycle process.The electrical energy is usually produced by the combustion of fossil fuel at conventional powerplants. As indicated in Table 5.5-10, electrical energy associated with the fuel cycle representsless than 51 of the annual electrical power production of a typical 1000 MWe nuclear plant.Process heat is primarily generated by the combustion of natural gas. As noted in Table 5.5-10,this gas consumption if used to generate electricity would be less than 0.31 of the electricaloutput f ran a 1000 MWe plant. The staf f finds therefore, that both the direct and indir ect con-sumption of electrical energy for fuel cycle operations to be small and acceptable elative tothe net power production of the power plant.
The quantities of chemical gaseous and particulate effluents associated with fuel cycle processesare givan in Table 5.5-10. The principal species are 50x, NOx and particulates. Based upon datain a CEQ peport + 'ho staff finds that these emissions constitute an extremely small additionalatmospheric loading in comparhM to the same emissions from the stationary f uel coc bustion andtransportation sectors in the U.S., i.e. , approximately .02; of the annual (1974 base) nationalreleases for each of these species. The staf f telieves such small increases in releases ofthese pollutants are acceptable.
Liquid chemical effluents produced in fuel cycle processes are related to fuel enrichment,f abrication and reprocessing operations and may be released to receiving waters. These effluentsare usually present in dilute concentrations such that only small amounts of dilution water arerequired to reach levels of concentration that are within established standards Table 5.5-10specifies the flow of dilution water required f or spec"ic constituents. Additionally, allliquid discharges into the navigable waters of the United States from plants associated withthe fuel cycle operations will be subject to requirements and limitations set forth in an P.PDESpermit issued by an appropriate state or Federal regulatory agency.
Tailings solutions and solids are generated during the milling process. These solutions andsolids are not released in significant quantities to create an impact upon the environment.
Radioactive effluents released to the environment estinated to result f rom reprocessing and wastemanagetrent activities and other phases of the fuel cycle process are set forth in Table 5.5-10.It is estimated that the overall gaseous dose comitment to the U.S. population from the totalfuel cycle for a 1000 MWe reference reactor would be approxiNtely 370 man-rem per year. Thisdose is less than .002I of the average natural background dose of approximately 20,000,000 man-remto the U.S. population. Based on Table 5.5-10 values, the additional dose corsnitment to the U.S.population fron radioactive liquid effluents due to all fuel cycle operations would be approx-imately 100 man-rem per year for a 1000 MWe reference reactor. Thus, the overall estimatedannual involuntary dose commitment to the U.S. population from radioactive gaseous and liquidreleases due to these portions of the fuel cycle for a 1000 MWe LWR is approximately 470 man-rem.The occupational dose attributable to the reprocessing and waste management portions of thefuel cycle is 22.6 man-rem per reference reactor year. This represents approximately 5% of theoccupational dose associated with operation and maintenance of the reactor.
The quani.i'ies of buried radioactive waste material (low level, high level and transuranic wastes)are specified in Table 5.5-10. For low level wastes, which are buried at land burial facilities, theComnission notes in Table S-3 of 10 CFR 51.20 that there will be no significant effluent to theenvironment. For high level and transuranic wastes, the Commission notes that these are to beburied at a Federal Repository and, in accordance with Table S-3 of 10 CFR 51.20, no release tothe environment is associatec with such disposal- NUREG-Oll6 which provides background andcontext for the new values established by the Conmission, indicates that these buried wastes,which are placed in the geosphere, are not released to the biosphere and no radiological environ-mental impact is anticipated from them.
.
"The Seventh Annual Report of the Council on Environmental Quality," September 1976,figures 11-27 and 11-28, pp. 238-239,
1561 143

5-36
The transportation dose to workers and the public is specified in Table 5.5-10. This dose issmall and is not considered significant in comparison to the ratural background dose.
The use of a fuel cycle entailing no recycle (neither plutonium nor uranium) would not affect thediscussion above, since as described in footnote 1 of Table 5.5-10, the Corrnission has consideredsuch a cycle in developing the values given in Table 5.5-10 with respect to reprocessing, wastemanagement, and transportation of wastes.2/
In a September 21, 1977 memorandun to J3nes Yore, Chaiman, Atonic Safety and Licensing BoardPanel ( ASLBP), Dr. Walter H. Jordan, a r;gnber of the ASLBP, indicated that Table S-3 of 10 CFR 51presents a value of 74.5 curies per RRYH of Radon-222 released to the atmosphere which does notaccurately represent all sources of radon releases from the uranium fuel cycle.
A number of staf f af fidavits have been prepared which identify the basi, for the value of74.5 curies per RRY set forth in Table S-3 and which provide current staff assessmen;s of radonrelease, including releases from mining and from stabilized mill tailings piles, (two sources notcovered by the 74.5 curies per RRY entry set forth in Table S-3), as well as a consideration ofthe radioloqical impact from such radon releases.
The staff estinates of Radon-222 releases from mininq and milling operations for the uranium fuelcycle in tems of Ci/RRY are 74.5 from active millinq operations only, 4060 from nining operations,780 from active mill tailings stabilization pile, 350 f ron interin tailings pile (inactive mills;drying prior to stabilization),1-10 from stabilized tailings pile (f or several hundred years) and110 from stabilized tailings pile (beyond several hundred years).
Current staff estimates of projected population doses attributable to Radon-222 releases associatedwith the uranium fuel cycle to support the operation of one RRY considers the 4060 Cf /RRY fromnininq, the 1130 Ci/RRY from nill operations at an active pile and subsequent dryinq of the pileprior to stabilization, and the 1-110 Ci/yr/RRY f rom the stabilized pile. The population dcse fromall radon releases associated with the uraniun fuel cycle is not distinguishable from the normaland expected variations in natural backaround.4/
5.6 SOCIO-ECONOMIC IMPACTS
The staff considered the environmental effects of station construction in the community in theFES-CP.1 It was concluded th3t the City of Baxley and several nearby comnunities would bear thebrunt of an influx of 1300 to 1500 construction workers. The staff noted that schools andrecreation facilities in particular would be stressed but provisions by the applicant to supple-nent local resources would ease the impact.
During the operation phase, the staff concludes that the small size of the additional operatingstaff for Hatch Unit No. 2--estimated to be 45--will have an insignificant effect on regionalhousing resources and comunity facilities. Taxes on the plant will greatly benefit the schooldistrict and the County.2 As well, the annual payroll for 275 pernanent operating personnel ofapproximately $3.2 million is expected to have a significant impact on the regional grossproduct.' It is expected that these components of long-term economic impact will ircrease thepotential for future residential and industrial growth.
*/' As noted in Table 5.5-10 the entry for radon 222 excludes the contribution f rom mining. Foot-note 5 to Table 5.5-10 indicates a naximum release of about 4800 Ci of radon 222 when contribu-tions from nining are considered. This in turn, would increase the estimated dose committentfor the total f uel cycle by scre 600 man-ren per reference reactor year, maximized for the norecycle case. Although this is larger than the dose cornitment due to other elements of thefuel cycle, it is still small compared to the natural background exposure level of some20,000,000 man-rem per year.
3/RRY - Peference Reactor Year (a 1000 Ne light water reactor operatinq at 80r capacity factorfor one year). Synonymous with ove annual fuel requirenent (AFR) with the same capacityfactor.
/This evaluation of the environmental ef fects is based on the staf f's more recent estinates ofthe Padon release. The Atomic Sa fety and Licensinq Appeal Board in Met ropoli_ tan _E_di_ son _ Coppany
(Three Mile Island Nuc ear Station, Unit No.2), ALAB-456 (1978) ru' led that the staff as alet alnatt'er of law was bound to accept the value of 74.5 curies of Radon-222 released to the atmosphereper PRY as set forth in revised Table S-3. Thus, the principal portion of section 5.5.3 discussesenvironmental impe ts on the basis of 74.5 Ci/RRY contained in Table 5-3.
1561 144
. . . - . -.
5-37
REFERENCES FOR SECTION 5
References for Section 5.2
1. Georgia Power Company, Supplement 1 to Edwin I. Hatch Nuclear Plant Unit No. 2,Environmental Report-Operating License Stage, January 1976, Question 5.1-5.
2. H. N. Scherer, Jr., D. J. Ware C. H. Shih, " Gaseous Effluents Due to EHV TransmissionLine Corona," 1.E.E.E., " Transmissions on Power Apparatus and Systems." Vol. Pas. 92(3),Pages 1043-1049 (1973).
3. M. Frydman, A. Levy, and S. E. Miller, Ibid., Pages 1141-1148.
4. F. A. Jenkins L. W. Long, "EHV Transmission Lines-Fences and Things." Paper presentedto Southeastern Electric Exchange Meeting. September 22, 1972.
5. " Biological Effects of High Voltage Electric Fields: State-of-the-Art Review andProgram Plan." Prepared by !!T Research Institute for Electric Power Pesearch Institute,November 1975.
References for Section 5.3
1. Georgia Power Company, Edwin I. Hatch Nuclear Plant Unit No.1, Annual Environmental_ _
Surveillance Report No. 2 January 1 - December 31, 1975.
2. Georgia Power Company, Edwin I. Hatch Nuclear Plant Unit No. 2, Environmental Report -Operating License Stage, JJ1y 1975, p. 3.7-1.
3. Ibid, p. 5.1-1.
4. Ibid, Table 5.4-1.
5. U.S. Atomic Energy Comission Final Environmental Statement for Edwin I. Hatch NuclearPlant Unit I and Unit 2, Docket Nos. 50-321 and 50-366, October 1972, p. III-18.
6. Op. cit. , Reference 2, p. 5.4-2.
7. Op. cit., Reference 2, p. 3.6-1.
8. Op. cit. , Reference 2. Tables 2.5-3 and 2.5-4.
9. Op. cit., Reference 2, p. 5.1-1.
10. W. A. Brungs, " Effects of Residual Chlorine on Aquatic Life," Journal, Water PollutionControl Federation, Vol. 45, No.10, pages 2180-2193, October 1973.
11. " Water Quality Criteria 1972 " A Report of the Comittee on Water Quality Criteria,Environmental Studies Board, National Academy of Sciences National Academy ofEngineering, Washington, D.C. ,1972. (Published by the Environmental Protection Agencyas EPA-R3-73-033, March 1973.)
References for Section 5.51. NRC Staff's Brief in Support of Exception and Motion to Supplement the Record; Before
the Atonic Safety and Licensing Board - In the Matter of Northern States Power Company(Minnesota) and Northern States Power Company (Wisconsin) - Tyrone Energy Park, Unit 1,Docket No. 50-484, January 23, 1978.
1561 145
r .-- -

5-38
References for Section 5.4
1. Georgia Power Company, Edwin I. Hetch Nuclear Plant Unit No.1, Annual EnvironmentalSurveillance Report No. 2. January 1 - December 31. 1775.
2. Georgia Power Company, Ju plement I to Edwin I. Hatch Nuclear Plant Unit No. 2S
Environmental Report - Operating License Stage, January 1976, Question 5.1-5.
3. Georgia Power Company, Edwin I. Hatch Nuclear Plant Unit No. 2, Environmental Peport -Operating License Stage, July 1975.
4. U.S. Atomic Energy Comission, Final Environmental Statement for Edwin I. HatchNuclear Plant Unit 1 and Unit 2 Docket Nos. 50-321 and 50-366, October 1972.
5. Georgia Power Company, Edwin I. Hatch Nuclear Plant - Unit 1 Semi-Annual EnvironmentalSurveillance Report No.1, Period Ending December 31, 1974.
6. Georgia Power Company, suyp1_ement 2 to Edwin I. Hatch Nuclear Plant Unit No. 2,Environmental Report - Operadng License Stage, April 1976.
_
7. Storr, John F.,1974, Plankton Entrainment by Condenser Systems of Nuclear PowerStations on Lake Ontario, In: Symposium on Thermal Ecology, J. W. Gibbons andR. R. Sharitz (Eds.), Technical Information Center, Oak Ridge, Tennessee, 291-295.
8. Op. cit., Reference 3, Figures 5.1-1 to 5.1-6.
References for Section 5.5
1. Braun Safety Analysis Report. Docket No. STN 50-532, p.12.1-56 (June 27,1975).
2. 10 CFR Part 20, Standards For Protection Against Radiation.
3. NUREG 75/032, Occupational Radiation Exposure to Light Water Cooled Reactors, 1969-1974(June 1975).
4. FES, Numerical Guides for Design Objectives and Limiting Conditions for Operation toMeet the Criterion "As Low As Practicable" for Radioactive Material in Light-Water-Cooled Nuclear Power Reactor Ef fluents, WAS'i-1258, July 1973.
5. S. T. Auerbach. " Ecological Considerations in Siting Nuclear Power Plants. The LongTerm Biota Effects Problems," Nucl. Safety 12:25 (1971).
6. "The Ef fects on Population of Exposure to Low Levels of lonizing Radiation," NAS-NRC,1972. ("BEIR" Report)
References for Section 5.6
1. U.S. Atomic Energy Commission, Final Environrental Statement for Edwin I. HatchNuclear Plant Unit I and Unit 2. Docket Nos. 50-321 and 50-366, October 1972,Section IV.B.3.
2. ceorgia Power Company, Edwin I. Hatch Nuclear Plant Environmental Report - ConstructionPemit Stage, Amendment 1, April 27,7972, pp. ll.14-18F - ll .14-19F.
-
3. Georgia Power Company, Supplepent 2 to Edwin I. Hatch Nuclear Plant Unit No. 2,Environmental Report - Operating _ License Stage. AprW 1976, p.13.
1561 146
6. ENVIRONMENTAL MONITORING
- .
6.1 RESUME
A survey of the background levels of various chemical, radiological, thermal and biologicalparameters for the Hatch site and the adjacent Altamaha River was initiated in 1968. Since thattime, the study has been modified appropriately to reflect program objectives. Certain aspectsof the preoperational monitoring program may be modified or deleted if analyses of collecteddata show no adverse environmental impacts. The operational monitoring program is essentiallyidentical to the preoperational study except the scope includes measurement and assessment ofimpacts upon the environment due to two-unit operation.
6.2 PRE 0PERATIONAL MONITORING PROGRAMS
6.2.1 Onsite Meteorological Program
The onsite meteorological program has been in operation since 19701 in conjunction with the UnitNo. I licensing process. The meteorological data is collected on a 150 tower southeast of theplant structures about 1000 feet away.
Wind speed and direction are collected at the 75 and 150 foot levels while delta-T for atmos-pheric stability is determined between 150 and 33 feet. Some deterioration of the datarttrieval rate has been observed during the course of the four years of data acquisition, buta program to insure retrieval greater than 90 percent has been instituted by the applicant.
6.2.2 Water Quality Monitoring
The preoperational monitoring studies were in progress at the time of the issuance of theFES-CP. These studies are discussed in the ER0L2, and results of the studies have been reportedas part of the annual environmental surveillance reports for Hatch Nuclear Plant Unit No.1. 3d.5Since Unit No.1 is in operation, the preoperational program currently in progress for Unit No. 2addresses potential impacts which also include the influence of Unit No.1 operation.
6.2.3 Croundwater Monitoring
Samples of well water were collected from the two deep onsite wells and from the onsite sub-surface drainage ditch for the purpose of establishing preoperational levels of radioactivity.An offsite sample was collected about 2 miles upstream near the Altamaha River in order toestablish an unaf fected background level. Samples were analyzed for gross beta, gross alpha,and tritium levels. Quarterly or yearly analyses of tritium were performed using enrichmentteshniques, since the levelf in the unconcentrated samples were undetectable.t
6.2.4 Radiological Environmental Monitoring
The preoper3tional phase of the monitoring program provides for the measurement of backgroundlevels and their variations along the anticipated important pathways in the area surrounding theplant, the training of personnel and the evaluation of procedures, equipment, and techniques.This is discussed in greater detail in NRC Regulatory Guide 4.1, Rev.1, " Programs for Monitor-ing Radioactivity in the Environs of Nuclear Power Plants."
The applicant has proposed a radinlogical environmental monitoring program to meet the needsdiscussed above. It is based on a continuation of the operational program for Unit No. 1. Adescription of the applicant's proposed preoperational program (as described in the TechnicalSpecifications for Unit No.1) is summarized in Tables 6.2-1 and 6.2-2. Detailed information onthe applicant's preoperational radiological environmental monitoring program for Unit No. 2 ispresented in the applicant's environmental technical specifications for Unit No.1.
1561 1476-1

..___ _ _
6-2
TABLE 6.2-1
ENVIRONMENTAL RADIOLOGICAL MONITORING PROGRAM
Number of Stations Regime *
Phase Sample Medium Indicator Ba c kground !!! II I Analysis **_
Airborne Dust 8 6 C-1 C-2 S-4 B. N-13, S-13
Airborne lodine 8 6 C-1 C-2 5-4 I
Discharge Precipitation 8 6 C-4 C-4 5-4 B, N-13, 5-13
to the External Radiation 30 6 R-13 R-13 R-13 R
Atmosphere Milk 1 2 G-1 G-4 - 1SVegetation 2 2 G-1 G-4 - !
Water 2 1 G-4 G-4 S-4 B. N-13, T-13
Discharge Benthos 2 1 G-13 G-26 - N, 5
to the Fish 2 1 G-13 G-26 - N. S
River Vegetation Not Available - - - -
Sediment 2 1 G-13 G-52 - N, 5
Discharge Ground Water 1 1 U-13 U-52 - T, N
to the
Ground
NOTES:
*The symbols under Regime mean:
C - sample continuouslyR - expose thermoluminescent dostmeter continuouslyG - grab sampleS - sample and discard without analysisU - take grab sample in the event of accident or unusual circumstances
The number following each of the letters defined above indicates the duration in weeks, of thesampling period. For example, the number 13 means 13 weeks or a calendar quarter which mayactually be i2 to 16 weeks depending on weather, availability, and the schedule demands ofassociated samples.
**The symbols under analysis mean:
B - gross beta countN - gamma spectrum analysisI - analysis for iodine-131R - read the radiation dose accumulated by the dosimeterT - analysis for tritium5 - analysis for strontium-89 and/or -90 if discharge to that phase of the environment is
measurable.
The numbers which follow some of these symbols indicate the interval in weeks over which thesamples are composited for analysis. The absence of a number indicates that each sample isanalyzed.
1 fiti1 14 {3

6-3
TABLE 6.2-2
ANALYTICAL SENSITIVITIES
Lower Limit of Collection SampleSample Media Analysis Detection Sample Size Efficiency Sensitivity
3 3Airborne Dust Gross e 1.0 pCi/ sample 600 m 100% 2 x 10⁻³ pCi/m3 3Airborne Dust y-Spec 40 pCi/ sample 600 m 100% 7 x 10⁻² pC1/m3 3Airborne Dust Sr-89, 90 1.0 pCi/ sample 600 m 100% 2 x 10⁻³ pC1/m
Charcoal Filter I-131 20 pCi/ sample 600 m 75% 5 x 10⁻² pC1/m3 3
precipitation Gross e 1.0 pC1/ sample 1 liter 100% 1.0 pCi/l
Precipitation y-Spec 40 pCi/ sample I liter 1001 40 pCi/lPrecipitation Sr-90 1.0 pC1/ sample 1 liter 100% 1.0 pCi/l
External Radiation Read-out <10 mrem / period 4 weeks 100: <10 mrem /4 weeks
Milk I-131 0.5 pCi/ sample 2 liters 100% .25 pC1/1
Milk Sr-89, 90 1.0 pCl/ sample 1 liter 100% l.0 pC1/1#Vegetation I-131 1.0 pCi/ sample 25 g 100% 4 x 10 pCi/gm
River Water Gross e 1.0 pCi/ sample 1 liter 100% l.0 pCi/l
River Water y-Spec 40 pC1/ sample i liter 100% 40 pC1/13River Water H-3 5.0 pCi/ sample .005 liter 100% 1.0 x 10 pCf/1
Aquatic Life y-Spec 40 pCi/ sample 500 g 100% .08 pC1/g wet
Aquatic Life Sr-89, 90 1.0 pCi/ sample 1 g (ashed) 100% 1.0 pCi/g (ashed)
Sediment y-Spec 40 pC1/ sample 500 g 100: .08 pCi/gSediment Sr-89, 90 1.0 pC1/ sample 10 g 100% 0.1 pC1/g
3Ground Water H-3 5.0 pC1/ sample .005 liter 100% 1.0 x 10 pC1/1Ground Water y-Spec 40 pCi/ sample 1 liter 100% 40 pCi/l
The Staff concludes that the Regime III preoperational monitoring program proposed by theapplicant for Unit No. 2 is generally acceptable. However, consistent with Regulatory Guide 4.8," Environmental Technical Specifications for Nuclear Power Plants," the following changes arerecommended to improve the effectiveness of the program:
1. Precipitation sampling is not needed to comply with Regulatory Guide 4.8.
2. Surface water samples should be collected using equipment which is capable ofcollecting an aliquot at time intervals which are very short (e.g., hourly) relativeto the compositing period. Gross beta measurement is no longer necessary for surfaceand ground water samples.
3. Bottom sediments should be analyzed for Sr-90 semiannually.
4. One semiannual sample of shoreline sediment (from nearest downstream area of existingor potential recreational value) should be analyzed for gama isotopic and Sr-90content.
5. The vegetation sampling program should include fruits, tuberous and root vegetableswhere available at the time of harvest. Where harvest is continuous, samples shouldbe analyzed monthly. Radiciodine analyses need only be performed on green leafyvegetables.
6. The soil sampling should be carried out once every three years to determine long-termbuildup of Sr-90 only.
7. The applicant should institute semiannual sampling of meat, poultry and eggs within 10miles downwind with gamma isotopic analyses and sample one major game species wherethese may provide an important source of dietary protein.
8. The " lower levels of detection" (LLD) should be comparable to Regulatory Guide 4.8.The applicant must provide the basis for assumed collection efficiencies.
1561 149

6-4
6.2.5 Aquatic Biological Monitoring
The preoperational aquatic monitoring program for Hatch Unit No. 2 is in essence the programdescribed in the Environmental Technical Specifications issued for the Unit No. I plant. Initialpreoperational biological surveys of macroinvertebrate fauna of the Altamaha River began in 1971,and the program was later expanded to include studies of periphyton, drif t, benthic organismsud fishes. The operational phase of the biological monitoring program for Unit No. I wasinitiated in the f all of 1974. Data from this study will be compared to Unit No. 2 operationaldata to assess two-unit impacts upon the aquatic environment.
6.3 OPERATIONAL MONITORING PROGRAMS
6.3.1 Onsite Meteorological Program
The meteorological monitoring program for the operational phase will be identical to thatdescribed in the preoperational stage (Section 6.2.1). Meteorological monitoring shall continueduring the operational lifetime of the plant.
6.3.2 Water Quality Monitnring
The monitoring of water quality changes due to plant operation is required by the NPDES permitissued by 'he State of Georgia and will be included in the NRC environmental technical specifi-cations. Since it was concluded that water quality ef fects will be negligible, extensive sitemeasurenents in the Altamaha River will not ce needed to follow ef fects of plant operation.
The one possible exception to the above would result li corrosion were more significant thananticipated by the applicant. Any release of corrosion products or use of corrosion inhibitorscould justify measurements of concentration in the river water and sediments below the station.Such studies need not be included in the initial monitoring program.
Certain eter quality data must be collected to aid in interpreting observations of aquaticb io ta . Proposed studies of temperature and dissolved oxygen distribution are included in theapplicant's proposed prcjram. Samples for other water quality parameters including pH, turbidity,dissolved solids, hardness, phosphate, and nitrogen should also be collected at the time ofbiological sampling.
6.3.3 Groundwater Monitoring
No discharge of radioactivity to the groundwater is planned. Environmental surveillance of thegrouWster will be conducted on a routine basis. Monitoring will be conducted only at thetmckground well two miles upstream from the site near the Altamaha River.
6.3.4 Chemical Effluents Monitoring
Specifications within the NPDES permit and the environmental technical specificationsrequire that a monitoring program will include at the minimum, the determination of pH and totalresidual chlorine in the cooling system blowdown and monitoring of pH in the low volume wastestreams.
The applicant has proposed extensive chlorine monitoring during initial operation to establish arelationship between chlorine usage and discharge concentration. Thereafter, usage will be con-trolled to assure compliance with discharge limits. The relationship between usage and concen-tration will be checked periodically. It has been the usual practice of the regional EPA officeand the Georgia DEP to require multiple grab samples once per week. The initial study programwill also include observations of cooling tower cleanliness. This study could verify if thetotal residual chlorine level in the combined discharge was less than the 0.2 mg/l value judgednecessary to protect aquatic biota. The difference in tower designs between Unit No. 1 andUnit No. 2 results in dif ferent chlorination requirements. The initial period of two-unitoperation should provide a good comparison of actual chlorination requirements.
1561 150

6-5
The applicant has proposed a monitoring program for cooling tower blowdown.1 The parameters tobe monitored are affected by the concentrating effect of the closed cycle evaporative coolingsystem rather than by direct addition of chemicals. Theref 3re, they reflect make-up waterquality and cycles of concentration in the cooling system. Interpretation of the significanceof any of the substances would require knowledge of receiving water quality. The proposed datawould be more valuable in the interpretation of the results of biological studies if an indica-tion of cycles of concentration could be recorded simultaneously so that rrake-up water quality(and thus receiving water quality) could be estimated by calculation. However, it is thegeneral conclasion of the staff analysis that the maximum concentrations indicated for theproposed parameters will not result in an environmental impact.
The Georgia Power Company does not anticipate any corrosion within the cooling system. However,because of the potential toxic effect of corrosion products, it is recomended that monitoringbe included to confirm the anticipated result. The monitoring should be scheduled to coincidewith occurrence of water quality conditions most conducive to corrosion. The details related j
to the corrosion monitoring program shall be presented in the environcmtal technical I
. specifications.
6.3.5 A_quatic B_iological Monitoring
The applicant's proposed operational monitoring program for Unit No. 2 is substantially different Ifrom the Unit No. 1 operational studies which also served as the Unit No. 2 preoperation studies.Based on the results of two years of operational data, the applicant has requested, and the NRCstaf f has granted, the temnation of the majority of the aquatic biological monitoring studies.
Aquatic biological monitoring that has been proposed by the applicant after Unit No. 2 beginsconmercial operation includes studies designed to detect and quantify any effect that the thermalplume may have on benthic organisms in the Altamaha River, and studies to quantify impingementand entrainment associated with the intake structure.
Sampling stations, frequency and type of gear are indicated in Table 6.3-1 and locations are shownin Figure 6.3-1.
Benthos
Samples for benthic organisms will be collected using both Dendy multi-plate samplers and thePetersen dredge. Samples will be taken quarterly at three stations, RM 116.6, RM 115.9, andRM 115.5. Six Dendy multi-plate samplers will be located at each sampling station, five Petersendredge samples will be obtained in a transect between the north and south banks at each station.Organisms collected will be identified to the lowest practicable taxon and enumerated. Qualita-tive and quantitative comparisons of the taxa will be made at each station. Comunity struc-ture will be characterized by a diversity index.
Impingement
The applicant has proposed * monthly sampling for impingement at the intake structure. Each sampleshall be of twenty-four hours duration and all fish collected during the sample shall be identi-fled to the lowest possible taxon, enumerated, weighed and total length determined. The staffrequires that impingement sampling be conducted on a frequency of once per week rather than onceper month. Impingement sampling for Unit No. I was conducted once a week. Consistency betweenstudies will allow a comparative analyses of the incremental effects on the fish populationsassociated with the operation of Unit No. 2.
Entrainment
The applicant has proposed monthly diel sampling for entrainment of ichthyoplankton at the intakestructure commencing in March and continuing until late summer until densities warrant termina-cant plans to evaluate the efficiency of the large net used in the past to obtain ichthyoplanktonsamples in the Altamaha River, a smaller net, a pump sampler, and possibly an in-plant samplingpoint. The staff requires that weekly diel entrainment samples be taken at the intake structureduring the months of February through May. Monthly sampling, as proposed by the applicant, istoo infrequent to detect peak spawning periods which for some species are as short as two weeksduration. Replicate samples shall be collected imediately in front of the intake structureduring both day and night sampling periods. Gear employed for sampling ichthyoplankton will bespecified in the environmental technical specifications. Fish eggs and larvae will be identifiedto the lowest possible taxon and enumerated.
1561 151

6-6
TABLE 6.3-1
A0 VATIC SAMPLING FREQUENCIES ON THE ALTAMAHA RIVER ,
RIVERfi!LEAND SHORE STATION DESCRIPTION SAMPLE
ProposedPreoperational Post-operationali
117.8NS North and South shore Altamaha River, 1.4 rivermiles 2a, 2b, 4a -
upstream from intake structure
117.65 South shore Altamaha River,1.2 rivermiles upstream lb -
from intake structure
117.45 South shore Altamaha River,1.0 rivermiles upstream la -
from intake structure
116.7 Altamaha River, .3 rivermiles upstream from intake Ic, 3a -
structure
ll6.6NS North and South shore Altamaha River, .2 rivermiles 2a, 2b, 4a 2a, 2bupstream from intake structure
116.5 Altamaha River, .1 rivermiles upstream from intake Ic, 3a -
structure
116.4 Intake Structure Sa Sa, ta
116.4 Altamaha River, just downstream f rom intake structure ic, 3a -
116.3 Altamaha River, .1 rivermiles downstream from intake Ic, 3a -
structure and just upstream of discharge structure
116.2 Altamaha River. .2 rivermiles downstream from intake Ic, 3a -
structure and .1 rivermiles downstream of dischargestructure
116.1 Altamaha River, .3 rivermiles downstream from intake ic, 3a -
structure and .2 rivermiles drwnstream of dischargestructure
115.9NS North and South shore Altamaha River, .4 rivermiles 2a, 2b, 4a 2a, 2bdownstream of discharge structure
115.5N5 North and South chore Altamaha River, .8 rivermiles - 2a, 2bdownstream of discharge structure
ll5.4NS North and South shore Altamaha River, .9 rivermiles 2a, 2b, 4a -
downstream of discharge structure
ll4.2N North shore Altamaha River, 2.1 rivermiles downstream lb -
from discharge structure
ll3.8N North shore Altamaha River, in oxbow 3.1 rivermiles 2a*, 2b* -
downstream fron discharge structure
ll3.4N North shore Altamaha River, 2.9 rivermiles downstream 2a*, 2b* -
from discharge structure
113.45 South shore Altamaha River, 2.9 rivermiles downstream la, 2a*, 2b* -
from discharge structure

6-7
TABLE 6.3-1 (Cont'd)
AQUATIC SAMPLING FREQUENCIES ON THE ALTAMAHA RIVER
Sample and Frequency Code i
1. Fishes,
a. Adult - gill net - quarterlyb. Juvenile - seine - monthly, May - Septemberc. Ichthyopl6nkton - Plankton net - weekly February - June
2. Benthosa. Dendy multi-plate samplers - quarterly, 6 week immersionb. Petersen dredge - quarterly
3. Macroinvertebrate Drifta. Plankton net - quarterly
4. Periphytona. Artificial substrates - quarterly, 6 week imersion
5. Impingementa. Actual count - 1-24 hr sample / week
6. Entrainmenta. See text - replicate diel samples, weekly, February - May
s
ilscontinueMris) preoperational sampling period.
Density will be calculated and statistical confidence applied to the resulting values for eachweekly sample.
6.3.6 Terrestrial Monitoring Program
The environmental technical specifications for Unit No.1 (Section 3.1.5) describe a program ofaerial photography coupled with ground investigations that is adequately monitoring the terres-trial environment. The photographs will provide historical information that can be referred toat any time to assess changes. The duration for the progam is specified as fo.:r years for UnitNo . 1. The staff recommends the specification as stated be applied to Unit No. 2 with the fouryear period to begin with commercial operation of Unit No. 2. Termination of the vegetativesampling program at the end of this period will be contingent on review and approval by thestaff. It is anticipated that the aerial photography program will be reduced to once a year atthe time of termination of the sampling program.
Periodic maintenance activities or severe weather conditions may cause minor instances along thetransmission line corridors where re-seeding will be necessary. The staf f recomends that fora four (4) year period or until the Hatch-Bonnsire corridor is certified as stabilized that asurveillance program be conducted to determine any evidences of erosion and/or vegetationaldamage or other environmental degradation and that reasonable steps be taken to stabilize suchoccurrences.
6.3.7 Radiological Environmental Monitorin3
Radiological environmental monitoring programs are established to provide data on measurablelevels of radietion and radioactive materials in the site environs. Appendix I to 10 CFRPart 50 requires that the relationship between quantities of radioactive material released ineffluents during nonna1' operation be evaluated, including anticipated operational occurrencesand resultant radioactive doses to individuals from principal pathways of exposure. Monitoringprograms are conducted to verify the in-plant controls csed for controlling the release ofradioactive materials and to provide public reassurance that ur. detected radioactivity will notbuild up in the environment. Surveillance is establiched to identify changes in the use ofunrestricted areas to provide a basis for mod *fications of the monitoring programs.
1561 153

I
,
STA. ll3.8N
qA. Il7.BN
/*,
/ STA. STA. Il6.6N {(117,6SSTA. Il7.8S . IntAu stastu MA . Il3.4N
* DistnAAct staJCitat
STA. Il5.9N STA.115.5N If STA.STA. 11 *16 . 1117.4S STA .116 . 7 7 SYA . g
m ~ STA .f STA. 116.6S 11,6 . 5 116 . 4116 3 STA. STA.q 116 . 2 114.5N
,
IDostAt * * 4F%| [/ STA. 115.9S *'
$\gg STA.115.5S STA, 113.4S I1 STA. 115.4S )
stat is rtti
i 1300 0 ins 26:3 r.n] &_=
'a
U"I@ l GFC PAOPta!! LIME
-
Figure 6.31 Edwin I. Hatch Nuclear Plant, Altamaha River Aquatic Sampling Stations."
LT14
-
Source: Edwin 1. Hatch Nuclear Plant, Unit No. 2 Environmental Report. Or vating LicenseStage, Appendix A. Figure 5.51.
6-9
The operational offsite radiological monitoring program is conducted to measure radiationlevels and radioactivity in the plant environs. It assists and provides backup support to thedetailed effluent monitoring (as recorraended in NRC Regulatory Guide 1.21. " Measuring, Evalua-ting and Reporting Radioactivity in Solid Wastes and Releases of Radioactive fiaterials inLiquid and Gaseous Effluents from Light-Water Cooled Nuclear Power Plan *'") which is needed toevaluate individual and population exposures and verify prcjected or ar .icipated radioactivityconc.itrations.
The applicant plans essentially to continue the proposed preoperational progran during theoperating period. However, refinenents may be riade in the program to reflect changes in landuse or preoperational monitoring experience.
An evaluation of the applicant's proposed operational monitoring program will be performedduring the operating license review, and the details of the required monitoring program will beincorporated into the environmental technical specifications for the operating license. !!RCRegulatory Guide 4.8 also provides detailed infomation on operational programs for nuclearpower plants.
1561 155

6-10
REFERENCES FOR SECTION 6
References for Section 6.2
1. Georgia Power Company, Edwin I. Hatch Nuclear Plant Unit No. 2, Environmental Report -Operating License Stage, July 1975, p. 2.6-5.
2. Ibid., Volume 1 - Section 6.1, Volume 2 - Appendix A.
3. Op cit., Reference 1. Volume 2 - fppendix A.
4. Georgia Power Comoany, Edwin I. Hatch Nuclear Plant Unit No.1, Semiannual EwironmentalSurveillance Report No.1. Period ending December 31. 1974
5. Georgia Power Company, Edwin I. Hatch Nuclear Plant Unit No.1, Annual EnvironmentalSurveillance Report No. 2. January 1 - December 31, 1975.
6. Op cit. , Reference 3.
References for Section 6.3
1. Georgia Power Company, Edwin I. Hatch Nuclear Plant Unit No. 2 Environmental Report -Ooerating License Stage, July 1975, Table 6.2-2.
1561 156
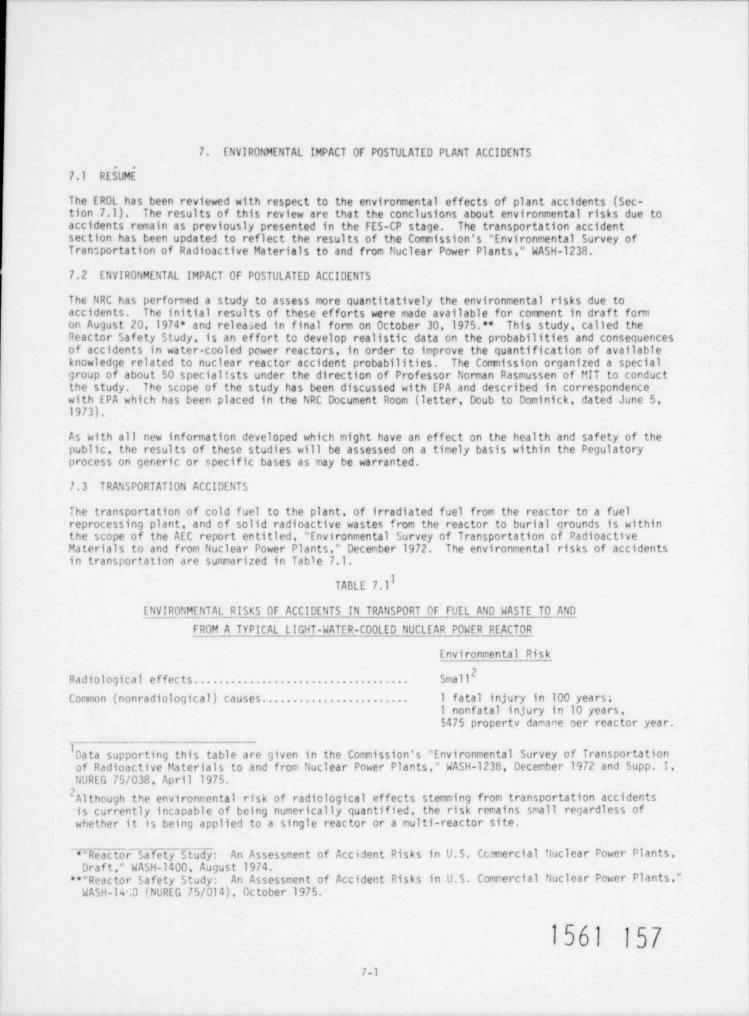
7. ENVIRONMENTAL IMPACT OF POSTULATED PLANT ACCIDENTS. .
7.1 RESUME
The ER0L has been reviewed with respect to the environmental effects of plant accidents (Sec-tion 7.1). The results of this review are that the conclusions about environmental risks due toaccidents remain as previously presented in the FES-CP stage. The transportation accidentsection has been updated to reflect the results of the Connission's " Environmental Survey ofTransportation of Radioactive Materials to and from Nuclear Power Plants," WASH-1238.
7.2 ENVIRONMENTAL IMPACT OF POSTULATED ACCIDENTS
The NRC has performed a study to assess more quantitatively the environmental risks due toaccidents. The initial results of these efforts were made available for corrent in draft fomon August 20, 1974* and released in final fom on October 30, 1975.** This study, called theReactor Safety Study, is an effort to develop realistic data on the probabilities and consequencesof accidents in water-cooled power reactors, in order to improve the quantification of availableknowledge related to nuclear reactor accident probabilities. The Cornission organized a specialgroup of about 50 specialists under the direction of Professor Noman Rasmussen of MIT to conductthe study. The scope of the study has been discussed with EPA and described in correspondencewith EPA which has been placed in the NRC Document Room (letter Doub to Dominick, dated June 5,1973).
As with all new infomation developed which might have an effect on the health and safety of thepublic, the results of these studies will be assessed on a timely basis within the Pegulatoryprocess on generic or specific bases as may be warranted.
1.3 TRANSPORTATION ACCIDENTS
The transportation of cold fuel to the plant, of irradiated fuel from the reactor to a fuelreprocessing plant, and of solid radioactive wastes from the reactor to burial arounds is withinthe scope of the AEC report entitled, " Environmental Survey of Transportation of RadioactiveMaterials to and from Nuclear Power Plants," December 1972. The environmental risks of accidentsin transportation are suncarized in Table 7.1.
lTABLE 7.l
ENVIRONMENTAL RISKS OF ACCIDENTS IN TRANSPORT OF FUEL AND WASTE TO AND
FROM A TYPICAL LIGHT-WATER-COOLED NUCLEAR POWER REACTOR
Environmental Risk
2Radiological effects. Small. ..
Conmon (nonradiological) causes. 1 fatal injury in 100 years;...
1 nonfatal injury in 10 years,$475 propertv damane oer reactor year.
I Data supporting this table are given in the Commission's " Environmental Survey of Transportationof Radioactive Materials to and from Nuclear Power Plants," WASH-1238 December 1972 and Supp. I,NUREG 75/038, April 1975.
2Although the environmental risk of radiological effects stenming from transportation accidentsis currently incapable of being numerically quantified, the risk remains small regardless ofwhether it is being applied to a single reactor or a multi-reactor site.
*" Reactor Safety Study: An Assessment of Accident Risks in U.S. Ccmercial Nuclear Power Plants,Draf t," WASH-1400, August 1974.
**" Reactor Safety Study: An Assessment of Accident Risks in U.S. Commercial Nuclear Power Plants,"WASH-LED (NUREG 75/014), October 1975.
1561 1577-1

8. f.EED FOR PLANT
8.1 RESUME
Subsequent tu the issuance of the FES-CP in July 1972, the nation experienced extensive increasesin fuel prices and a period of economic recession. The original Georgia Power Company (GPC) loadforecasts have thus been revised to reflect these energy changes within the GPC service area.Edwin I. Hatch Nuclear Plant Unit No. 2 is scheduled to begin commercial operation in 1978 and willprovide approximately 803 MWe net electrical energy capacity to the Georgia Power distributionsystem. The Hatch Nuclear Plant. Unit No. 2, is owned jointly by the GPC (50.1%), the OglethorpeElectric Membership Corporation (30.0%), the Municipal Electric Authority of Georgia, an instru-mentality of the State (17.7%), and the City of Dalton (2.2%).
8.2 APPLICANT'S SERVICE AREA AND REGIONAL RELATIONSHIPS
8.2.1 Applicant's Service Area
The Georgia Power Company supplies retail and wholesale electricity to 1.1 million residential,commercial, industrial, and other customers throughout the State of Georgia (see Figure 8.2-1).Its service area includes 153 counties 50 municipalities, and 39 rural electric corporations.GPC estimates that their system currently serves nearly 95! of the State's population and that,by 1980, GPC will serve an additional 570,000 people.1
Data in Table 8.2-1 indicate the total sales of electricity, the number of customers covered, andaverage consumption figures for the past 13 years. It should be ncted from the data that theincrease in energy sales was due primarily to increased consumption; the long term rate of salesper customer was considerably greater than the increase in customers.
TABLE 8.2-1
ENERGY CONSUMPTION IN THE GEORGIA POWER
COMPANY SERVICE AREA: 1963-1975
1963 1975 Change
Total Sales (Millions of kWh) 13,565 39,010 188Customers served 782.440 1,083.646 38Average Energy Sales
Per Customer (kWh) 17,000 36,000 112
SOURCE: Data for 1963 from E. I. Hatch Unit No. 2 Environmental Report - OperatingLicense Stage July 1975, Table 1.1-2; 1975 data from the Southern Company,Annual Report 1975 (Atlanta: The Southern Company, 1976), p. 13.
8.2.2 Pegional Relationships
The Applicant's service area is within the Federal Power Comission (FPC) Southeastern PowerSurvey Region (SPSR) and is located entirely within FPC's power supply area, PSA 23 (see Figure8.2-2). The Applicant is a party to the Southeastern Electric Reliability Council (SERC), whichis one of the Nation's nine regional reliability councils. SERC encompasses the same areas as theSPSR, and is divided into four subregions: Florida (PSA 24), Southern Companies (PSA 22 and 23),Tennessee Valley (PSA 20), and the Virginia - Carolinas (PSA 18 and 21). Areas of load concentra-tion within SERC are showr. in Figure 8.2-2. This figure indicates that within PSA 23, the loadconcentration is within the Applicant's service.
GPC is also one of the four producing affiliates of the Southern Company System, an integrated andfully coordinated generation and transmission system serving most of Georgia, Alabama, the north-western portion of Florida, and southeastern Mississippi.
1561 1588-1
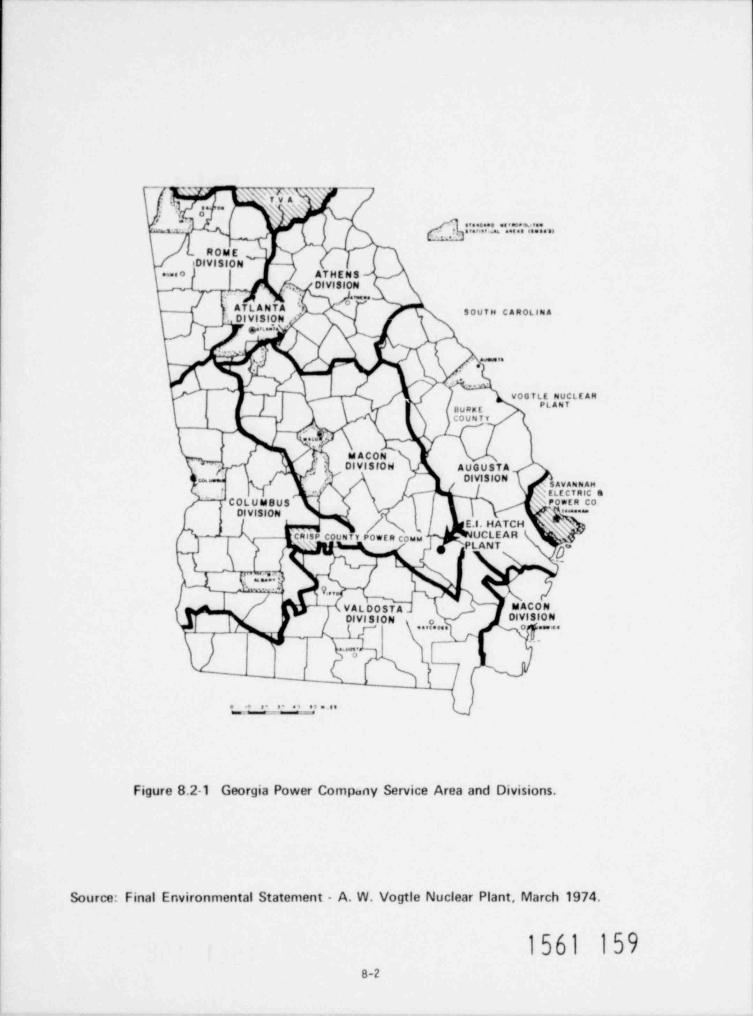
' yyg. . ee .\. N \'
". .. o..o ew. ..o.e.g . gm . . . . . . . . . . .
ROMEiDivlSION
m. o ATHENSDIVISION,
'iATLANTA SOUTH C AROLIN AOlVISION
g,. i ;
. -
*,
V0GTLE NUCLE AR#
B u Rat ECOUNTV
. . . .
MACON,
DIVISION AUGUSTA-4,
- / OlVISION ,,,," ' ELECTRIC e
', COLU MBUS PonER Coi
OlVISION s"*"
E.I. HATCHcResp count v power couw UCLEAR
j PLANT ='"
_ C ' .~. * ,'.y_ A m. . , q,,
VALDOSTA MACONDIVI SION OlvlS10 N
...o... o . . . .r~m r .
6 peo ,
[~_
. . .g.g. . . .
Figure 8.2-1 Georgia Power Company Service Area and Divisions.
Source: Final Environmental Statement - A. W. Vogtle Nuclear Plant, March 1974.
1561 1598-2

.Ns , s s' " g' xss sys
s
,'o - \ \ \ fj( ,, t uo,,s ,7's, L; ., **F= ' pj g
.\.x ;' , 4 's s s 1
'
- [;'' .' s .W.
. .
\ 's.'=o,,,, . . .. ,. e si 1 'I(., . s.Lttaio,3
3 - 7- - ,'s s
.9 * *t ii 'N '
' g' . > 6 .1) U-,
] ,g. s' *
.
5' d i ,* e~. v e e s i. . . g.'\'
"'5,'I D , sh i . g '' $' .j'.
s- p, is\\' N
;
'( '\'[ e'E'' f'
'
19 A , ,, , , , - J,
34' % 's ,
.
,{'
=, , , , , , s. wd,j \\ I' ".5
O K '\g-s ,
N \s\ ' N ' . \" :a?
-+ ,
-4--|s s' ~ ~ ~ ~\ ' , \
. ,
* d ,.,, .j, , ,\. , - Qq*
$. , . , , . _ , - ._
. ,.j, ,r jdN ,.yf' D :r re
s i\g,\\sysg+- /M. -
i's ,s s
y"= sea jjif g ..h'#m*Tw.=* ~ *cei=a- )\\h} \\' [N' ~
s
\ ... canN' SD ,< .,szur w ;s,. ,
# f*, . . , |.s.
~~ %,.
e* es --- -_ _~ '
.s s i str :ihi 31|
| !i t
#m'' ri %|r ,w
N %sx:''s 1
., s\e 0r
g3 , M13 soutw c a n oten.s
s "?MNgs\ s s
%Mp22gjjgi.i -N .'xx x, sx c
,]s N \ s's[' .*s'i s f f , N* s ,
g-
o a
\s \\'.' i
-
0+s .
NY SYSTEMg3 @
OMPA'
[N '-
SOUTH M [Eseone,,
gNs
4 '.AN s\ si s' ' ' ' ' ' O
J ' ' g. *E.f. HATCH
\\ ('' .pNUCLEAR
)Yi f'N' ','s' ' r PLANT
{*s
4Q., x:~.&:- f3 7tQ - -- -_ _
.
,t. g),*a .c-
Tyg\ L - w 22. o ([\ n'.
D-.\ k. . ~< p,T'gj
e, 4 8L0maoaO , - 54j..e
,
W
c es! ""v b"-r,e"
4,y9r'.Jx
' -h)
&|n"
,,,,,, m . . . . . . . .\.
CD ":::.:: ':."'* ji_v.. : ?: . .: e ~c
Q %. XT.'.:.7 hg; . . . . . . . . . < . . . . .
,7
1561 Igo
Figure 8.2-2 Federal Power Commission's Southeast Regional Advisory Committee -Region til - Load Cor* centration Areas.
8-3
8-4
8.3 BENEFITS OF OPERATING THE PLANT
Hatch Unit No. 2 is being constructed by the Applicant to provide an economic source of baseloadgeneration energy for 1979 and following years, and will be utilized to provide power for theservice area described above.
8.3.1 Minimization of Production Costs
Capital expenditures for Hatch Unit No. 2, for the most part, are considered sunk costs and arenot a relevant factor in determining whether or not the plant should operate. The importantdecision variables are fuel, operating, and maintenance costs because these expenses can beavoided if the Applicant chooses not to operate the plant. The decision criterion is to operateHatch Unit No. 2 if system production expenses are reduced by doing so.
Production cost of Hatch Unit No. 2 in 1979 is estimated by the Applicant to be 5.99 mills /kWh ata 47% capacity factor. The lowest cost baseload plant in the Georgia Power generation systenis anticipated to be the Hatch Unit No.1 plant with 1979 procuction costs of 3.98 mills /kWh.2As Hatch Unit No. 2 is one of the least expensive baseload plants in the Georgia Power Systemto operate, significant cost savings will be realized by bringing Hatch Unit No. 2 on line asscheduled. The staff, af ter reviewing the applicant's data finds the estimated increase in systemproduction costs to be $37.9 million if Hatch Unit No. 2 is not available in 1979. Incr easedproduction costs would result from the increased use of available coal-fired units which havesubstantially higher production costs to meet load requirements. Table 8.3-1 shows a samplecalculation of output and production costs using the applicant's 1979 estimate of energy required.Should the plant not be operated, these production cost savings would be lost. In the unlikelyevent that demand should fall drastically from the 1975 level, the savings realized by operatingHatch Unit No. 2 instead of other fossil-fired plants would be substantial. Moreover, the staffassessment concludes that overriding external social and environmental impacts would not be afactor in delaying or denying the operation of Hatch Unit No. 2.
In examining the issue of operating the plant, the staff has considered other energy sources notpreviously evaluated, particularly solar and geothermal energy. Nei ther energy source is comer-cially available and cannot, +herefore, be reasonably considered as a replacement for Hatch UnitNo. 2 generation.
8.3.2 Energy Demand
Although cost savings in system production costs alone are a sufficient basis to justify operationof Hatch Unit No. 2, the plant will also be required to meet the expected growth in energy demand.In addition, the plant will provide important benefits in terns of increased system reliability.Since the issuance of the FES-CP, load forecasts have been updated and revised to reflect changesin the overall energy situation. In line with these changes, peak load forecasts for the late1970's have been rcvised downward twice, once by 10.6% and once by 12%, and Hatch Unit No. 2scheduled for 1978 was rescheduled accordingly.
T1ble 8.3-2 shows the most recent load forecasts for the Georgia Power generation system, andTable 8.3-3 shows system capability, reserves, and reserve nargins assuming Hatch Unit No. 2comes on line as scheduled. Reserve margins increased dramatically in 1976 reflecting theaddition of 2,195 MW to the system. If Hatch Unit No. 2 is delayed beyond the 1979 sumerpeak, reserve margins for the Georgia Power would be reduced from 13.41 to 6.57 It should benoted that the projected reserve margin is below the acceptable standard of 15-251 recommendedby the Federal Power Comission. '
Projections of the demand for electricity are both technically difficult to make and subject torapidly changing and often indeterminate factors. However, recent long-tern projections aspresented in Table 8.3-4 indicate that the State of Georgia will experience a growth rate whichis higher than the rate expected in the United States and higher than all states except Floridain the southeastern part of the Nation.
1561 161

TABLE 8.3-1
,COMPARISON OF SELECTED SYSTEM PRODUCTION COSTS FOR 1979,
WITH AND WITHOUT HATCH UNIT i;0. 2
Total Production Variable Fuel Variable 0&M Fixed CAM Total Operating Costs
(Millions of MW) (Mills /kWh) ,ttills/kWh) (Mills /kWh) (Millions of Dollars)( (_ ffills/kWh)With HNP 2 105.4 11.32 0.65 0.81 1,347.0 12.78Without HNP 2 105.4 11.69 0.67 0.78 1,385.0 13.14 y
SOURCE: Supplement 2 to E. I. Hatch Unit No. 2 Environmental Report - Operating License Stage, April 13, 1976, p. 17.
m
&-
M
N

8-6
TABLE 8.3-2
FORECASTED BASE, INTERMEDIATE, AND PEAKING LOADS FOR
GEORGIA POWER SERVICE AREA, 1975-1981
(IN MEGAWATTS)Total Demand
M Base Intermediate Peakinj At Peak
1975 3,782 2,744 2,269 8,7951976 4,214 3,058 2.528 9.8001977 4,558 3,307 2,735 10,6001978 4,902 3,557 2.941 11,4001979 5.332 3,869 3,199 12,4001980 5,805 4 ,21 2 3,483 13,5001981 6,235 4,524 3,741 14,500
SOURCE: Supplement 2 to E. I. Hatch Unit f:0. 2 Environmental Report - OperatingLicense Stage April 13, 1976 Figs. 8.0-9A, 8.0-98
TABLE 8.3-3
SYSTEM CAPABILITY, RESERVES, AND RESERVE MARGINS
.c0R GEORGIA POWER SERVICE AREA, 1975-1981
System Capability Reserves Peserve MarginsYear (PW) (PW) (%)
1975 10,222 1,427 16.21976 12.417 2,617 26.71977 12,350 1,750 16.51978 13,210 1,81 0 15.91979 14,064 1,664 13.41980 14,676 1,176 8.71981 15,926 1,426 9.8
SOURCE: Supplement t'o. 2 to E. I. Hatch Unit No. 2 Environmental Peport - OperatingLicense Stage, April 13,1976, Table 1.1-5.
TABLE 8.3-4
POPULATION PROJECTIONS FOR GEOPGIA, SOUTHEASTERN
U.S. , AND THE UNITED STATES, 1970-2020
-
1970 2020 Chang
Georgia 4.6 7.5 62.8
Southeastern U.S.* 32.4 53.0 63.6
United States 203.9 297.1 45.8
bRCE: U.S. Water Resources Council,1972 OBERS Projections, Regional EconomicActivity in the U.S. , Vol 4, States (Washington, D.C. GovernmentPrVthgOffice,1974T.
* Composed of the following states: Alabama, Florida, Georgia, Louisiana,filssissippi. North Carolina, South Carolina, and Tennessee.
1561 163

8-7
REFEPENCES FOR SECTION 8
1. Georgia Power Company. Supplement 2 to Edwin I . Hatch Unit No. 2 Environmental Pep ~ ort-OperatingLicense Staje. April 13.19 76. p.16-~~
~ ~ ~ ~ ~ ~ ~ ~ ~ ~ ~ ~ ~ ~ " ~ ~~
2. Ibid., Table 8.0-10.
3. Federal Power Conrnission. The 1970 National Power Survey. Part 1 (Washington, D.C.Government Printing Office.'ll?lT. p. UlS-7.
~~
1561 164

9. EVALUATION OF THE PROPOSED ACTION
9.1 ADVERSE EFFECTS WHICH CANNOT BE AVOIDED
The staff has re-assessed the physical, social and economic impacts that can be attributed to theoperation of Hatch Unit No. 2. Inasmuch as the Unit is currently under construction, many of thepredicted and expected adverse impacts of the construction phase are evident. The Applicant hascomitted to a program of restoration and redress of the plant site that will begin at the termi-nation of the construction period. The staff has not identified any additional adverse effectsf rom that presented in the FES-CP that will be caused by the operation of the Unit. Consequently,the operation phase of Hatch Unit No. 2 will include restoration, reparation and maintenance withthe possibility of enhancing the environs as they existed prior to construction.
9.2 SHORT-TERM USES AND L0hG-TERM PRODUCTIVITY
lhe staff's evaluation of the use of land for the site of the Hatch Nuclear Power Plant andassociated transmission lines has not changed since the preconstruction environmental review. Thepresence of this plant in Appling County will continue to influence the future use of other landin its immediate environs as well as the continued removal of county land from agricultural andtimber use as the result of any increased industrialization.
9.3 IRREVERSIBLE AND IRRETRIEVAELE COMMITMENTS OF RESOURCES
There has been no change in the staff's assessment of this impact since the earlier review exceptthat the continuing escalation of costs has increosed the dollar values of the materials used forconstruction and fueling of the plant.
9.4 DECOMit!SSIONING AND LAND USE
In the long term, beyond the useful life of the proposed generating station, this site may continueto be used for the generation of electrical energy. At the termination of such use, the landareas occupied by the nuclear facilities would be removed from productive use, unless decommission-ing measures included removal of all radioactive equipment. Although the details of decomission-ing may not be finalized for several years, such actions should not negatively affect the proposedlicensing of the plant. The range of beneficial uses of the site by future generations will notbe curtailed, provided the Applicant has the capability for removing all radioactively contaminatedequipment if and when that step may be desirable.
NRC regulations prescribe procedures whereby a licensee may voluntarily surrender a license andobtain authority to dismantle a facility and dispose of its component parts.1 Such authorizationwould normally be sought near the end of the nuclear plant's useful life. In any event, theCommission requires that a qualified licensee maintain valid licenses appropriate to the type offacility and materials involved. Under current regulations, the Comission generally requiresthat all quantities of source, special nuclear, and byproduct materials not exempt from licensingunder Parts 30, 40, and 70 of Title 10. Code of Federal Regulations, either be removed from thesite or secured and kept under surveillance.
Unit No. 2 of the Hatch Nuclear Power Plant is desianed to operate for a0 years, and theoperating license for Unit No. 2 will be issued for no more than a0 years from the date ofissuance of the construction permit, thus teminating in aporoximately the year 2012. Theapplicant has made no firm plans for decomissioninq but assumes that the followinq steps wouldbe taken as minimum precautions for maintaining a safe condition:
A. Removing spent feel from the site.B. Decontaminating acxiliary systems.C. Disposing of chemical cleaning and flushing water and other radioactive waste water.D. Disposing of resins and filters by offsite burial.E. Sealing containment and other buildings containing contaminated process piping and
components.F. Performing a radiatior survey to determine the level of decontamination achieved.G. Isolating the area wita a security fence and alarms.2
1561 1659-1

9-2
A decision as to whether the facility would be further dismantled would require an economic studyinvolving the value of the lano and scrap value versus the cost of complete demolition and removalof the complex. However, no additional work would be done unless it is in accordance with NRCrules and regulations in ef fect at the tinte.
In addition to personnel required to guard and secure the facility, concrete and steel would beused to prevent ingress into any building, particularly the radioactive areas.
The estimated cost of decommissioning either unit of the Hatch Plsnt, excluding comon or snaredfacilities, is $4.7 million/ unit; subsequent annual maintenance is estimated to be $188,000/ unit.Decomissioning of the comon f acilities, which would occur with the decommissioning of th( secondunit, is estimated to cost an additional $1.5 million. Subsequent annual maintenance for taecomon facilities is estimated to cost an additional $11,000. 3 Although these costs are estimates,the actual costs of deconmissioning which would be borne at the end of the plant's economic liferepresent an insignificant factor in the production cost of ener gy when discounted to its pr ?sentvalue.
All of the site, t:xcept the area within the security perimeter, could be made available for otheruses, including further power generation development, following decomissioning. However, thespecific use of the site will depend upon various factors which Cannot be determined at this time.
1561 166

. . . . - - . - -
9-3
REFERENCES FOR SECTION 9
1. Title 10. " Atomic inergy," Code of Federal Regulations, Part 50, Licensing ofProduction and Utilliation Facilities, Section 50.82, "Applicatioiis Tor Teminationso Q cense U
2. Edwin I. Hatch Nuclear Plant Unit No. 2 Environmental Peport - Operating License Stage,JuVTDF,-~P'. D~l . - ~~
3. ; bid.
1561 167
'
- . ,

10. EENEFIT-COST ANALYSIS
10.1 RESUME
flinor changes in the cost-benefit ratio have occurred since the issurance of the FES-CP,However, these changes do not alter the staff's findings of a positive benefit-cost ratio.
10.2 BENEFITS
The direct benefits of Hatch Unit No. 2 include the 4.9 billion kWh the plant will produceannually at a 69; capacity factor, the addition of 803 fGe to the ;/ stem generation capacity andthe favorable effect on reserve margins, the saving of $37.9 million in production costs in 1979f f the unit comes on line as scheduled, and cost savings in subsequent years.
The economic benefits to the community include the tax revenues which during the operationperiod will amount to more than $2.2 million annually. These taxes have already parmittedimprovements in the school system, county police equipment and other county services.
Other secondary benefits include the employment of 45 operating personnel at Unit No. 2. Theirsalaries will amount to approximately $520,000 annually. A portion of the annual operation andmaintenance budget (excluding payroll) will be spent within the State of Georgia.
10.3 ECONOMIC COSTS
The total capital cost of Hatch Unit No. 2 is presently estimated at $512.6 million. Table 10.3-1summarizes the major cost categories of the plant. These cost estimates include provisions forescalation and contingencies incurred during the construction phase.
TABLE 10.3-1
CAPITAL COST OF HATCH UNIT NO. 2(Millions of Dollars)
Land and Land Rights 0.0
Structures and Improvements 125.0
Peactor Plant Equipment 236.6
Turbogenerator 104.0
Accessory Electrical Equipment 42.0
Miscellaneous Power Plant Equipment 50.0
Total Nuclear Production Plant 512.6
SOURCE: U.S. Energy Research and Development Administration, " QuarterlyProgrtss Report on Status of Reactor Construction" (Mimeo Fonn HC-254).December 8, 1975.
1561 16810.1

10-2
The operation and maintenance budget has been estimated by the staff to be $4,410,000 per yearfor Unit No. 2, or approximately .90 mills /kWh. Fuel costs for Unit No. 2 are expected to be4.00 mills /kWh in 1980. An additional cost of Unit No. 2 operation is the cost of decommission-ing, ihe applicant has estimated this cost to be $4.7 million for Unit No. 2 with an annualmaintenance cost of $188,000. However, because this cost is not borne until 2009, its presentvalue is insignificant as a cost factor.
10.4 ENVIRONMENTAL COSTS
There have been no significant changes to the evaluation presented in the FES-CP with regard tothe environmental costs of land use, water use and biological effects. Table 10.4-1 presents asunnary of the benefits and costs associated with the operation of the E. I. Hatch Nuclear PlantUnit No. 2.
10.5 SOCIETAL C05TS
No significant economic or social costs are expected from either Unit No. 2 operation or fromoperating personnel living in the area.
10.6 ENVIRONMENTAL COSTS OF THE URANIUM FUEL CYCLE
The contribution of environmental effects associated with the uranium fuel cycle is indicated inTable 5.5-10 and described in Section 5.5.3. The staff has evaluated the environmental impactsof the f uel cycle releases presented in Table 5.5-10 as well as those due to the increment in |Radon-222 releases and has found these impacts to be sufficiently small so that, when they are isuperimposed upon the other environmental impacts assessed with respect to the operation of theplant, they would not alter the cost-benefit balance against issuance of the operating license.
10.7 ENVIRONMENTAL COSTS OF URANIUM FUEL TRANSPORTATION
The contribution of environmental effects associated with the transportation of fuel and wasteto and from the f acility are surmarized in Section 5.5.1.4 and Table 5.5-6. These effects aresufficiently small as not to affect significantly the conclusion of the Benefit-Cost Balance.
10.8 SUMMARY OF BENEFIT-COST
As the result of this second review of potential environmental, economic, and social impacts,the staf f has been able to forecast more accurately the ef fects of operating Unit No. 2. No newinformation has been acquired that would alter the staf f's previous position related to theoverall balancing of the benefits of Unit No. 2 versus the enviroruental costs. Consequently,it is the staff's belief that Unit No. 2 can be operated with only minimal environmental impacts.The staff finds that the primary benefits of minimiling system production costs and/or theaddition to baseload generating capacity greatly outweigh the environmental and social costs.
1561 169

10-3
TABLE 10.4-1
BENEFIT-COST SUMMARY *
'' ., mary impact & populationor resource affected Unit of measure Magnitude of impact
Direct Benefits
Energy kWh/yr 4850x106Capacity kW 803x103
Economic Costs
OperatingFuel $/yr 19,600,000Operations & Maintenance $/yr 4,410,000Decomissioning $ 4,700,000Maintenance following
Decomissioning $/yr 188,000
Environmental Costs
1. Impact on water1.1 Water consumption
1.1.1 People gal /yr 172x10''l.1.2 Property acre-ft/yr 16,773
1.2 Thennal discharges toAltamaha River
1.2.1 Plant thermal discharge BTU /hr 5.71x1091.2.2 Aquatic biota Insignificant
1.3 Chemical discharges toAltamaha River
1.3.1 People Negligible1.3.2 fquatic biota Negligible1.3.3 Chemical sischarges
and water quality Consistent withNPDES Permit andState water qualitystandards
1.4 Radionuclide dischargesto Altamaha River pCi/yr Total except tritium-
3.2x10⁵, tritium-32x10''
l.5 Changes in groundwater levels Negligible
1.5 Chemical discharges tog roundwa ter Negligible
1.7 Hadionuclide discharges togroundwater Negligible
1.8 Biological effects from coolingsystem and intake / dischargestructures Insignificant
1.9 Natural water drainage1.9.1 Flood control Acceptable1.9.2 Erosion control Acceptable
2. Impact on air2.1 Chemical discharges to ambient air
2.1.1 Air quality Negligible
1561 170
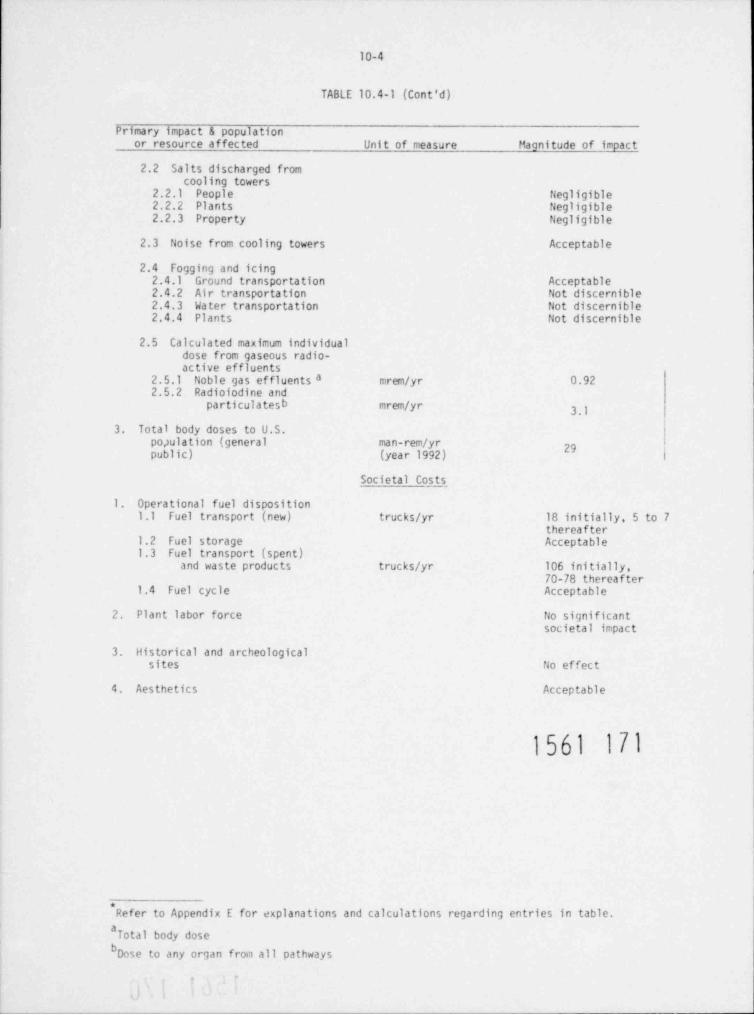
10-4
TABLE 10.4-1 (Cont'd)
Primary impact & populationor resource affected Unit of measure Magnitude of impact
2.2 Salts discharged fromcooling towers
2.2.1 People Negligible2.2.2 Plants Negligible2.2.3 Property Negligible
2.3 Noise from cooling towers Acceptable
2.4 Fogging and icing2.4.1 Ground transportation Acceptable2.4.2 Air transportation Not discernible2.4.3 Water transportation Not discernible2.4.4 Plants Not discernible
2.5 Calculated maximum individualdose from gaseous radio-active effluents
a2.5.1 Noble gas effluents mrem /yr 0.922.5.2 Radiofodine and
particulatesb mrem /yr 3.1
3. Total body doses to U.S.population (general man-rem /yr
29public) (year 1992) |
Societal Costs
1. Operational fuel disposition1.1 Fuel transport (new) trucks /yr 18 initially, 5 to 7
thereafter1.2 Fuel storage Acceptable1.3 Fuel transport (spent)
and waste products trucks /yr 106 initially,70-78 thereafter
1.4 Fuel cycle Acceptable
2. Plant labor force No significantsocietal impact
3. Historical and archeologicalsites No effect
4 Aesthetics Acceptable
1561 171
*Refer to Appendix E for explanations and calculations regarding entries in table.
" Total body dose
Dose to any organ from all pathways
-.
It

11. DISCUSSION OF COMMENTS RECEIVED ON THE DRAFT ENVIRONMENTAL STATEMENT
Pursuant to 10 CFR Part 51, the Draft Environmental Statement for the Edwin 1. Hatch NuclearPlant, Unit No. 2, was transmitted, with a request for comments, to:
Advisory Council on Historic PreservationDepartment of AgricultureSoll Conservation Service, USDAForest Service, USDADepartment of the Army, Corps of Engineers - Savannah DistrictDepartment of CommerceDepartment of Health, Education and WelfareDepartment of Housing and Urban DevelopmentDepartment of the InteriorDepartment of TransportationDepartment of Transportation - Regional Of ficeEnergy Research and Development AdministrationEnvironmental Protection AgencyEnvironmental Protection Agency - Regional OfficeFederal Energy AdministrationFederal Power CommissionGeorgia Public Service CommissionGeorgia Department of Natural Resources - Game and Fish DivisionGeorgia Department of Natural Resources - Environmental Protection DivisionOffice of the Attorney General, State of GeorgiaOffice of Planning and Budget, St. ate of GeorgiaAltamaha Georgia Southern Area Planning and Development CommissionAppling County CommissionersAppling County Chamber of CommerceAppling County Police DepartmentAppling County School SuperintendentThe Mayor, City of Baxley, GeorgiaCity Manager, City of Baxley, Georgia
In addition, the NRC requested comments on the Draft Environmental Statement from interestedpersons by a notice published in the Federal Register on May 6, 1977 (42 FR 23189). Inresponse to the request referred to above, comments were received from:
U.S. Department of Agriculture, Agricultural Research Service (USDA/ARS)U.S. Department of Agriculture, Forest Service (USDA/FS)U.S. Department of Agriculture, Soil Conservation Service (USDA/SCS)U.S. Department of Commerce, National Oceanic and Atmospheric Administration (USDOC/NOAA)U.S. Energy Research and Development Administration (USERDA)U.S. Environmental Protection Agency, Region IV (USEPA)U.S. Department of Health, Education and Welfare (USHEW)U.S. Department of Housing and Urban Development, Region IV (USHUD)U.S. Department of Housing and Urban Development, Atlanta A.ea Office (USHUDA)U.S. Department of the Interior (USD01)Altamaha Georgia Southern Area Planning and Development Commission (AGSAPDC)Appling County Chamber of Commerce (ACOC)State of Georgia, Office of Planning and Budget (GOPB)Georgia Power Company (GPC)
The comments are reproduced in this statement as Appendix A. The staff's consideration ofthe comments received and its disposition of the issues involved are reflected in part byrevised text in the pertinent sections of this Final Environmental Statement (changes to thetext are noted by lines in the margin) and in part by the discussion in Section 11. Thecomments are categorized by subject and are referenced by the use of the abbreviationsindicated above. The organization of Section 11 corresponds to the ordering of sections inthe' body of the FES; e.g. , discussion pertinent to Section 5.2 would be presented in
"''i fiti1 17;?
Section 11.5.2. The pages in Appendix A on which copies of the respective comments appearare indicated by each subject title comment within Section 11 and in the index to Appendix A.
11.1.1 and Summary and Conclusions: Subject of Comment: Construction Status (GPC, A-16)
These sections have been revised to reflect the NRC estimate of the January 1978 status ofconstruction of Hatch Unit No. 2.
11.1.1 Subject of Comment: Ownership Interests (GPC, A-17)
In Amendment No. 1 to the ER (November 1976), the applicant updated information on theownership of Hatch Unit No. 2. This information was not included in the DES text but hasbeen included in Section 8 of the FES.
11.2.0 Subject of Comment: Misspellings (GPC, A-17)
The appropriate spelling corrections have been made in the FES.
11.2.2.2 Subject of Comment: Changes in Land-Use (USDA/FS, A-2)
Section 2.2.2 of the FES has been revised to reflect this comment.
11.2.2.3 Subject of Comment: Local Economy and Population Changes Related to Constructionof Hatch Unit No. 2 (USHEW, A-ll)
After reviewing data on economic growth for Appling County, the staff concluded in the DESthat "the data in Table 2.?-4 suggest that the economic impact of the Hatch nuclear powerplant on Appling County and the City of Baxley has been substantial" (DES, page 2-3). Thestaff reached this conclusion because other generators of growth in the region were notevident. However, the task of establishing a causal relationship between Unit No. 2--thesubject of the staff's analysis--and indicators of economic growth would involve in-depthstudies of the individual permits, licenses, and water connections granted. Because suchstudies would be costly to undertake and would not provide information central to the deci-sions being made by NRC at the operating license stage, the staff cannot justify the effortand finds the assessment regarding local economic effects and population changes to beadequate as developed in the DES.
11.2.5.1 Subject of Comment: Soils Description (USDA/SCS, A-3)
Section 2.5.1 has been revised to reflect this comment.
11.2.5.2 Subject of Comment: Reference (GPC, A-16)
Reference 19 has been modified to reference the paper, " Invasion of the Asiatic Clam in theAltamaha River, Georgia.'
11.2.5.2 Subject of Comment: Location of Hawkinsville (GPC, A-16)
The text of Section 2.5.2 has been revised to reflect the staff's agreement with the comment.
11.3.2.1 Subject of Comment: Cooling Tower Water Use (GPC, A-17)
The average water withdrawal rate given in Section 3.2.1 has been revised from 22,600 to22,550.
11.3.2.2 Subject of Comment: Typonraphical Error (GPC, A-17)
IFigure 3.2-1 has been revised to correct the typographical error. j )f) ]11-2

11.3.2.3 Subject of Comment: Various Comments on Radioactive Waste Treatment Systems(GPC, A-17)
Section 3.2.3 has been apnropriately revised to reflect the correct ventilation system flows andthe fact that the liquid radwaste system is not a shared system except for laundry wastes.
11.5.2.2 Subject of Comment: Transmission Line Inspection Program (GPC, A-17)
Section 5.2.2 has been revised to include a limiation on the duration of monitoring along theHatch-Bonnaire corridor as well as a specific reporting requirement.
11.5.3.1.1 Subject of Comment: Mixing Zone Definition in NPDES Permit (GPC, A-18)
Subsequent to the issuance of the DES, the NPDES permit was issued for the Hatch plant bythe State of Georgia. Section 5.3.1.1 of the DES has been revised to reflect the defini-tion of the mixing zone given in the NPDES permit.
11.5.3.4 Subject of Comment: Cleanup Wastes (GPC, A-18)
The applicant has selected one of the two alternative methods recommended by the staff inthe DES to dispose of cleanup wastes. Since such wastes will be disposed of offsite therewill be no requirement to route them through the radwaste system.
11.5.3.4 Subject of Comment: Corrosion Inhibitors (GPC, A-18)
It is the policy of NRC to review impacts, including those due to chemical releases, wherechanges in operating procedures are made at operating stations. Where NPDES permit changesare required to allow changes in chemical discharge, NRC approval is not needed. Pursuant tothe environmental technical specifications any changes in the NPDES proposed by the applicantshall be provided to the NRC. The NRC staff will provide the results of their review to thepermitting authority (i.e., State of Georgia, Department of Natural Resources, EnvironmentalProtection Division).
11.5.3.4 Subject of Comment: Langelier Index (GPC, A-18)
The concentrating effect of the evaporative cooling system will reduce the corrosive tendencyof the circulating water. Close attention to the Langelier Index of the circulating waterwill " minimize the potential for scaling or corrosion of the condenser."
A monitoring program shall be established to assure NRC that proper control is being achieved.The NPDES permit does not address copper monitoring. Although NRC policy is to require thatinformation be made available to indicate the nature and extent of environmental impacts,imposition of any effluent limitations would be the responsibility of the State of Georgia.
11.5.3.5 Subject of Comment: Corrosion Products (USDOC/NOAA, A-4)
The NRC staff has not found any problems associated with products from corrosion withincooling towers at other sites. Furthermore, cooling towers for the most part are fabricatedfrom non-corrodible materials. The applicant has provided a response which describes thematerial used in the construction of cooling towers at the Hatch Nuclear Plant, Unit No. 2.This response is reproduced below to provide the reader with a better understanding ofcooling tower construction.
"The amount of corrosion in the Hatch 2 cooling towers is expected to be negligible.The cooling tower basins are concrete; the structures are concrete with stainless steelhardware; the tower fill and drift eliminators are polyvinyl chloride (PVC); the fillsupport hangers are PVC-coated; the tower water distribution system components areeither fiber glass, stainless steel, or polypropylene-lined; the steel drift eliminatorsupports are cold-tar epoxy-coated; and the fan blades are fiber glass. The only towercomponents considered to be subject to corrosion are the fan motor, gear box, andsupports; however, these constitute a very small amount of surface arca and are locatedin the upper portion of towers and are not in contact with the circulating water. Thecooling tower manufacturer is not aware of any problems due to corrosion products intowers of similar design and construction."
11-3

11.5.3.5 Subject of Comment: Review of Chemicals for Corrosion Protection (GPC, A-18)
Following licensing, the NRC will continue to review any changes in operating practices whichhave the potential for increasing environmental impact at the station. This will includereview of usage of chemicals different from those reviewed in the EIS. Any such review willbe coordinated with the U.S. EPA and the State.
11.5.4.1 Subject of Comment: Duration of Aerial Surveillance Program (GPC, A-18)Based upon staff evaluation of the monitoring program data for Hatch Unit No.1, the monitoringprogram for Unit No. 2 shall continue for a period of at least four years.
11.5.4.2.1 Subject of Comment: Entrainment Versus River Flow (CPC, A-18)
Table 5.4-1 has been revised to reflect the staff's agreement with the comment.
11.5.4.2.2 Subject of Comment: Location of Discharge Pipes (GPC, A-18)
The text of Section 5.4.2.2 has been revised to reflect the staff's agreement with thecomment.
11.5.5.1.2 Subject of Comment: Thyroid Dose (GPC, A-18)
The apparent inconsistency in thyroid doses in Tables 5.5-2, 5.5-7 and 5.5-8 was due totypographical errors in Table 5.5-2. This has been corrected in the FES.
11.5.5.1.4 Subject of Comment: Direct Radiation (USEPA, A-10)
The staf f believes that its discussion in the DES with regard to direct radiation f rom thefacility is adequate. The applicant has provided a response to this comment which is givenbelow. F urthermore, the staf f has reviewed TLD data presented in Annual Operating Reports(1975 and 1976) for Hatch Unit No. I and is in agreement with the conclusions reached by theapplicant regarding direct radiation.
"The radiological environmental monitoring program for Hatch Nuclear Plant described insubsection 6.2.1 of the Hatch Unit No. 2 ER0L includes measurements of external radiation bymeans of thermoluminescent dosimeters (TLDs). An evaluation of the results of the monitor-inq program is submitted to the NRC annually. Analysis of TLD data has not shown a measurabledose in the plant environs due to operation of Hatch Nuclear Plant.
Furthermore, subsection 12.4.3 of the Hatch Unit No. 2 FSAR indicates that, with both unitsoperating at 100% plant capacity, the maximum annual dose to an individual at the siteboundary would not be more than a few millirem due to direct radiation and skyshine."
11.5.5.2.2 Subject of Comment: Dose to Muskrat (GPC, A-18)
The Hatch site may or may not contain muskrats since the region is considered to be withinthe range of these mammals and certainly provides a suitable habitat. The staff noted that,although the University of Georgia did not capture any muskrats in their survey, beaverswere identified, and these two rodents often occupy the same immediate habitat.
The purpose of the muskrat dose calculation was merely to demonstrate a range of doses forpotential biota in the Hatch area. Certainly the potential dose to muskrats is trivial butserves to upperbound the dose to mammals due to their omnivorous behavior.
11.5.6 Subject of Comment: Recreation Effects (U500I, A-13)
Recreation facilities within 10 miles of the plant include the Altamaha River, the BullardWildlife Management Area, Grays Landing, and miscellaneous sports facilities operated by theCity of Baxley. With respect to the Altamaha River, a sport fishing resource that is usedextensively, the staf f has determined tnt no major ef fects related to construction were
1561 175"-'
determined and that, if such effects did occur as a result of construction, they were of atemporary nature (Section 4.3.2). Further, whatever impacts the construction of Hatch UnitNo. 2, principally the construction of intake and discharge structures, had on accessibilitywere also temporary in nature. As the attractiveness of the Altamaha River for sport fishinghas not been changed except for those periods of intensive construction, the staf f concludesthat the impact of sport fishing in the vicinity of the plant was negligible.
The staff has also concluded in Section 5.4.2.1 (Intake Effects), Section 5.4.2.2 (DischargeEffects), and Section 5.5.2.4 (Evaluation of the Radiological Impacts on Biota) that theoperation of Hatch Unit No. 2 should not change the fish life in the Altamaha River. There-fore, the staf f concludes that Hatch Unit No. 2 will not alter the value of the Altamaha
River as a recreational resource.
With respect to the use of land-based recreational facilities, those impacts which may haveoccurred during the construction period have diminished as the peak of activities has passed.Based on experiences with other plants, the staff believes that such impacts would haveresulted from traffic congestion caused by construction workers travelling through Baxley;such impacts would be temporary in nature, would occur during peak travel periods, and wouldaffect a relatively small number of people.
During the operating period, the external impacts of the plant due to traffic generation andvisibility will be negligible. Moreover, in-house staf f evaluations of attendance data forstate recreation facilities proximately located to nuclear power stations indicate no discern-ible, adverse change after those stations began operation. Therefore, the staff concludesthat outdoor recreation should not be impacted by the operation of Hatch Unit No. 2.
Since the construction impacts on water and land-based recreational areas in the vicinity ofthe Hatch plant were shown to be negligible and no adverse changes are expected at such areasduring the operation of the facility, inclusion of a map highlighting such unaffected recrea-tion areas would not serve any useful purpose.
11.6.2.3 and 11.6.3.3 Subject of Comment: Groundwater Monitoring (US001, A-13)
Section 6.3.3 has been revised to reflect this comment. The applicant has provided aresponse to comments regarding permeability data presented in the Environmental Report andthe detection of accidental releases to aquifers. This response has been reviewed andverified by independent calculations performed by the staff. It was found to be bothaccurate and responsive to the comment and as such is reproduced below.
.The invert elevation of the onsite subsurface drainage ditch is at about 104 feet,"
MSL. Groundwater which collects in the drainage ditch is derived from the shallowunconfined aquifer, which has a bottom elevation that ranges from 100 feet to 200 feet,MSL. Therefore, the shallow unconfined aquifer is the source of samples taken from theonsite subsurface drainage ditch.
The water quality of groundwater in the minor shallow confined aquifer has not beenmonitored.
A portion of the unconfined aquifer was removed during construction where excavationswere made for plant structures, such as the reactor and radwaste buildings. Conse-quently, the base of these buildings is below the bottom of the unconfined aquiferwhich is adjacent to the plant. In the event of an accidental spill, the contaminantswould move downward and eventually enter the minor confined aquifer. The contaminantswould not migrate upward into the unconfined aquifer; therefore, computations were madeto define the movement of contaminants only in the minor confined aquifer.
A map showing the water level contours of the unconfined aquifer is shown inFigure 2.5-13 of the Hatch Unit 2 EROL. A water level contour map of the unconfinedaquifer, which shows the location of plant structures, is shown in Figure 2.4-39 of theHatch Unit 2 Final Safety Analysis Report (FSAR). This figure was prepared usinggroundwater level data collected in 1968; however, a new water level contour map of theunconfined aquifer is being prepared using data collected in 1977.
A water level (potentiometric surface) contour map of the minor shallow confined aquiferwas not included in the Hatch Unit 2 ER0L. The contours of the potentiometric surfacaof the minor shallow confined aquifer are shown in Figure 2.4-40 of the Hatch Unit 2
,
1561 176"-'
FSAR. This figure was used to determine the hydraulic gradient of 0.0043, which wasused in computing the movement of contaminants in the minor shallow confined aquifer.
The hydraulic properties of the unconfined and confined aquifers are listed as follows:
Permeability Hydraulic Effective(ft/ min) Gradient Porosity
-
Unconfined Aquifer 1.4 x 10 3 0.0026 to0.015
~
Confined Aquifer 2.5 x 10 * 0.0043 0.10(131 ft/yr)
. Georgia Power Company pag sampling quarterly aroundwater in the nnsitesubsurface drainage ditch, but this sampling was discontinued at the end of 1977.
With regard to the detection of accidental releases to the groundwater, an accidental(or unplanned) release occurs at an unexpected time and place, but it is known to haveoccurred during or shortly after the event. The installation of plant monitors virtu-ally eliminates the possibility that any plant release can go undetected. Therefore,reliance is placed on plant monitors, rather than environmental monitors, to dettctplant releases for two reasons:
(1) Concentrations will be higher and nearer the point of release than they will be atan environmental mcaitor. As a consequence, plant monitors will be more sensitiveto and would detect smaller releases than would environmental monitors.
(2) Plant monitors will indicate where and when a release occurs, thus allowing theplant operator to correct the situation much more quickly than if he were to relyon environmental monitors.
Georgia Power Company has placed in plant monitors at strategic locations such that allaccidental releases are expected to be detected. As a result, GPC contends that theuse of in plant monitors will indicate any possible need to monitor for accidentalreleases in the environment."
11.6.2.4 Subject of Comment: Inclusion of Fowl Game Species in Radiological EnvironmentalMonitoring Program (USHEW, A-ll)
Game species, which will be considered when the environmental technical specifications forHatch Unit No. 2 are developed, include deer, rabbit, squirrel, oppossum, dove and mallard.The radiation doses for ingestion of game species may be somewhat higher than domesticanimals on a per Kg basis. However, due to the relative short duration of the huntingseason and limitations on the number of game species taken per day, generally much smallerquantities of game would be ingested year-round than would be the case for domestic animals.Therefore, the annual doses from ingestion of game species would not be expected to exceedthose from domestic animals. As a result, the staff feels the judicious selection andmonitoring of a single game species is adequate to assure the public health and safety.
11.6.a.2 Subject of Comment: Water Quality Monitoring (GPC, A-18)
It is the NRC position that monitoring should be performed to the extent necessary to docu-ment environmental impacts associated with licensed stations. The requirements of the NPDESpermit may satisfy some of this need,
11.6.3.3 Subject of Comment: Well Water Monitoring (GPC, A-18)
Section 6.3.3 has been revised to exclude monitoring at two onsite wells.
11.6.3.4 and Summary and Conclusions: Subject of Comment: Monitoring of Corrosion Products(GPC, A-18)
The applicant has not argued against the need f or monitoring of corrosion products but hasinstead noted that such monitoring should be a conditicn of the NPDES permit issued by the
1561 17711-6

State of Georgia. The permit issued by the State on June 6,1977 does not specificallyrequire such monitoring. For any potential issue identified during NRC's NEPA review whichis not resolved at the issuance of the FES, it is the policy of NRC to require such addi-tional data during station operation as may be necessary to provide resolution. Where suchdata is collected by the utility as a requirement of tha NPDES permit, then NRC will notrequire collection of duplicate data. However, where the NPDES permit does not rtquire thecollection of information necessary for the resolution of an NEPA issue, then NRC may requiresuch information.
If experience indicates that the corrosion rate is exceeding design objectives, then measure-ments of copper in the receiving water may be warranted. Should this be the case, then NRCwould discuss with the State the need for subsequent information and the possible need formitigative actions.
11.6.3.5 and Summary and Conclusions: Subject of Comment: Aquatic Monitoring Program(GPC, A-18)
The staff has reviewed the information presented in the applicant's response to questions aswell as the information given in the 1976 Annual Environmental Surveillance Report No. 3 andthe September 13, 1977 submittal attempting to justify in part a reduced impingement samplingeffort. The staff maintains its position that impingement sampling be conducted on a fre-quency of one 24-hour sample per week. The basis for this decision is as follows:
A. As stated in Section 5.4.2.1, incremental impingement losses at the Hatch Nuclear Plantdue to the operation of Unit No. 2 cannot be accurately made. The staff anticipatesthat the losses sustained by the fishery due to two unit operation would not be signifi-cant; however, this prediction can only be verified through monitoring.
B. Comparison of impingement data collected during two-unit operation to data that hasbeen collected during one-unit operation would allow the determination of the incre-mental impingement loss associated with the operation of the second unit. Valid compari-sons of the data can only be made if the data are collected in a similar manner and atthe same frequency.
The statistical basis for the reduced sampling effort proposed by the applicant is detailedin their September 13, 1977 submittal. The staff has reviewed the statistical approachtaken by the applicant and has found it to be inaporopriate. The test used is valid onlyfor a normally distributed variable, and the number of fish impinged at the Hatch Station isn;t normally distributed. Furthermore, the assumption that the data is independent isfalse, since seasonal variation in impingement is found.
The staff, therefore, concludes that the statistical basis for a reduced sampling effort isunfounded and that the uncertainty of our prediction as well as the obvious merits of contin-uing a study using the same sample frequency will require impingement sampling on a weeklybasis.
Section 6.3.5 of the DES has been revised in part to reflect these comments. The staff hasreviewed the State of Georgia NPDES permit requirements and the explanation provided in theSeptember 13, 1977 submittal from GPC to the NRC for the proposed ichthyoplankton entrainmentmonitoring program and has found the program to be acceptable in part. The staff requirestnat monitoring at the intake be conducted weekly from February through May rather thanmonthly as proposed by the applicant. Monthly sampling is too infrequent to detect peakspawning periods which for some species are as short as two weeks duration. All priorentrainment sampling has been designed to determine ichthyoplankton densities and distribu-tion in the river, and mortality due to entrainment was determined by simple volumetriccomparisons. The proposed study would not determine ichthyoplankton densities and distribu-tions in the Altamaha River but would provide a more accurate estimation of the actuallosses due to entrainment. If after one complete season of data collection the estimatednumber of organisms being entrained through the plant is significantly greater than thecalculated volumetric densities based on the data from the two previous years, then addi-tional riverine sampling may be required to determine if the increase was due to higherdensities of organisms in the river during that year, or due to selective entrainment of agreater number of organisms than can be explained by simple volumetric proportions.
11.6.3.5 Subject of Comment: Reference to Main Channel in Altamaha River (GPC, A-18)
The text in Table 6.3-1 has been revised to reflect the staff's agreement with the comment.
11-7
1 fi6ii 17(3

11.6.3.6 Subject of Comment: Duration of Terrestrial Monitoring Program (GPC, A-18)
Section 6.3.6 has been revised to reflect'the staf f's findings with regard to this comment.
11.7.0 Subject of Comment: Environmental Impact of Postulated Plant Accidents (USHEW, A-ll)
The iES-CP for Hatch Unit No. 2, published in October 1972, provided an assessment of theenvironmental impacts of postulated accidents which dealt specifically with the Hatch site,e.g., population distribution. The DES-OL for Hatch Unit No. 2 states in Section 7.1, Resumd,that the conclusions about environmental risks due to accidents remain as previously presented
in the FES-CP stage.
The Reactor Safety Study (WASH-1400) is a generic study and it was not used to reach anyconclusions regarding the environmental risk from postulated accidents from the operation ofHatch Unit No. 2. Therefore, its conclusions do not alter the staf f findings presented inthe FES-CP nor this FES-OL with regard to environmental impacts at the Hatch site due topostulated accidents.
11.8.2.2 Subject of Comment: Location of Hatch Nuclear Plant (GPC, A-19)
Due to a graphical error, the location of the plant was incorrectly shown on Figure 8.2-1 inthe DES. This has been corrected in the FES.
11.9.4 Subject of Comment: Designed Operational Lifetime for Hatch Unit No. 2 (GPC, A-19)
Section 9.4 has been revised to reflect a 40 year designed operational lifetime for HatchUnit No. 2.
11.10.8 Subject of Comment: Radiological Dose (GPC, A-19)
The radiological dose values presented in item 2.5 of Table 10.4-1 have been revised toreflect the calculated values.
1561 179
11-8

REFERENCES FOR SECTION 11
1. Georgia Power Company, Review of Comments on Draft Environmental Statement,Letter to G. W. Knighton, NRC, f rom C. F . Whitman, Georgia Power Company, datedSeptember 7, 1977, Docket No. 50-366.
1561 180
11-9

A P P E !! D 1 X A
COMMENTS ON
DRAFT ENVIRONMENTAL STATEMENT
PAGE
U. S. Department of Agriculture, Agricultural Research Service,A-2letter dated June 8, 1977 ... . . . .. .. . .
U. S. Department of Agriculture, Forest Service, letter datedA-2May 12, 1977 ... .. ...... . .... .... .... .
U. S. Department of Agriculture, Soil Conservation Service,A-3letter dated June 10, 1977. . . . . . . . . . .
U. S. Department of Commerce letter dated June 16, 1977 with enclosurememorandum from National Oceanic and Atmospheric Administration
A-4dated June 3, 1977. . . . . . ... . ..... . .
U. S. Energy Research and Development Administration letterdated June 28, 1977 . ... . . . A-5
U. S. Environmental Protection Agency, Region IV, letter. . . . A-6dated June 16, 1977 . .
U. S. Environmental Protect.on Agency, Region IV, letterdated June 20, 1977 forwarding letter dated June 3,1977from U. S. Department of the Interior, Fish and WildlifeService . . . A-7. .. . . ... .
U. S. Environn.antal Protection Agency, Region IV, letterd ated July lb,1977 . . . . . . . . A-8
U. S. Environmental Protection Agency, Region IV, letterdated July 26, 1377 A-10..... ..... .... . ..
U. S. Department of Health, Education, and Welfareletter dated June 16, 1977 A-11. ... .
U. S. Department of Housing and Urban Development, Region IV,A-12letter dated May 3,1977 . . . . ..
U. 5. Department of Housing and Urban Development, AtlantaArea Office, letter dated June 3,1977 A-12
. . . ..
U. S. Department of the Interior letter dated June 28, 1977. .. A-13
Altamaha Georgia Southern Area Planning & Development Commission,. . . A-14letter dated June 13, 1977 . .. .
Appling County Chamber of Connerce letter dated June 13, 1977 A-14....
State of Georgia, Office of Planning and Budget, letterdated May 3,1977 A-15
,,,,, , , ,,,,,, ,,,,
State of Georgia Office of Planning and Budget, letterdated June 30, 1977. . . . . , ,
A-15
Georgia Power Company letter dated June 17, 1977. . . A-16... .
A-11561 181

U.S. Department Agricultural Research U.S. Department Forest Serviceof Agriculture Service of Agriculture
,- , .gt. m
a,cg,yy = ;g~cm~ o c n-v'. .,, a ,,c , . e.. s D. .. - e, . a ._
- sys...-tJo .TIO sf 471s OF8sCE OF AD*4tNisTa * TOae
OfpasTMENT O' I?2C Peachtree Goad. %.W. ' j. [~ACalCutTLEE Atlanta. Georgia 3C309 p ;.e
,
y .dD / ,c- '/ >Y<~8400 /
June 6.1977 '- May 12.
Mr. George W. Esighten
'' M'I 3 37p 3Mr. Geor eh Knighton. Chief
Inviston or site s.tery u.s.nuc$ ear. n gaatte; Cem+tssioneand Environmental Analysts a a Division of $tte Safety & Environeent Analysis.5,#8' W o ,wNuclear Regulatory Cocaission D lea s h i e g te n . C.C. 2C555Washington, D.C . 20$$5 * * ' " 4//
NDaar Mr. Knighton: 4 E
-
s
We have reviewed the Craf t Environmental statement relatedto e,e operation cf the Edwin I. Hatch helear Plane ,, Unit e have revte.ed the Draft Environmeatal StatementNo. 2. and have no con =ent s. for the Ed.in 1. Matcn hsclear Plant. L' P i t No. 2.Georgta Pceer Cor;any and have one area of Concern.We appreciate having the opportunity to review this statement.
Regarding c ommen ts rade in Section 2.2.2 - ChancesSincerely,
M" b''' "
Iatively m i c o r' . we would suggest tPat land a' 'r e a 'sno longer needed fer terporary constr ction uses tereturned to treir forrer land use in so fa as pessible,unless lard uses reeting hig*er needs are necessary.?s ca;.._ - . , Sectica 2.2.2 first paragrach, sentences five aed
y, y,,,,, sia irdicate that the areas Cleared for ConstructionDeputy Assistant Administ rat or purposes have been revegetated alth grasses. Aneffort should be made to return as owch of these landsto tieter probction as possible. Guidance in theselection of prc:er see:ies and revegetation technicaesCan be obtained from the Georgia Forestry Comaission,5156 Riggins Mill Road, risaon. Georgia.Sin /erely. .
mIm.k!. v. . -THE000RE R. KIUFMAsiArea Envircemee.tal Coordinator
Copy: State Forester - GeorgiaWON
amm ie
C771650253N "3 ND
A-2-..n-

U.S. Department Soil Conservationof Agriculture Service
_
,
UNITED STATES DEPARTMENT OF AGRICULTURE
''torL coNsr%aT'cN stav:ctP.O. Box 332 Athens, Georgia 3GeJ3 Telephone: 404 540 .275
June 10,197?
Mr. George W. Kn ight :n , ChiefEnviron:nental Proj ect s Branch No. 1Divistan of S1te Safety
and Environmental Ana a sisU.S. Nuclear Regalatory Coesissionhashingt an D. C. 20555
Dear Mr. Kn i g h t on :
Subj ec t Craft EIS. FJ.in !. March Nuclear P11nt, Unit No. 2Georgia Power C.npany , Doc ket No. 5d- 3 %
After reviewing the subject draf t environmental impact statement, heare enclosing a copy cf the sail survey of Appling and Jef f OasisCount ies , Georg ia, f or your use along with the following reco-senda-tions:
We recomenJ that yea include a description of the soils of t5e pro.iectarea in accardance with this soll survey, and include a statement thatthis area does hase soee prime farmlands. In order for you to make adetermination of the pr1*e f areland, we have placed a rej check markby the mappind anit s that qualify as pr19e f armlanJ. These esppingunits are locat ed on the gu1Je to mapping units which follows page 65.
If you have any questions concerning this information and our reummenda-tions, please call Frank Lowery at; 404-546-2216.
Sincerely,
M,
=1ght : . T realm.sy %. , ,7State Conservat tnist
@, - /
@gEnclosure 3 f2 IIT 71
-
, e 4. :s G 7 80ip -w ;,a .,
W. M *a s NS Q
w k' pDW
A-3
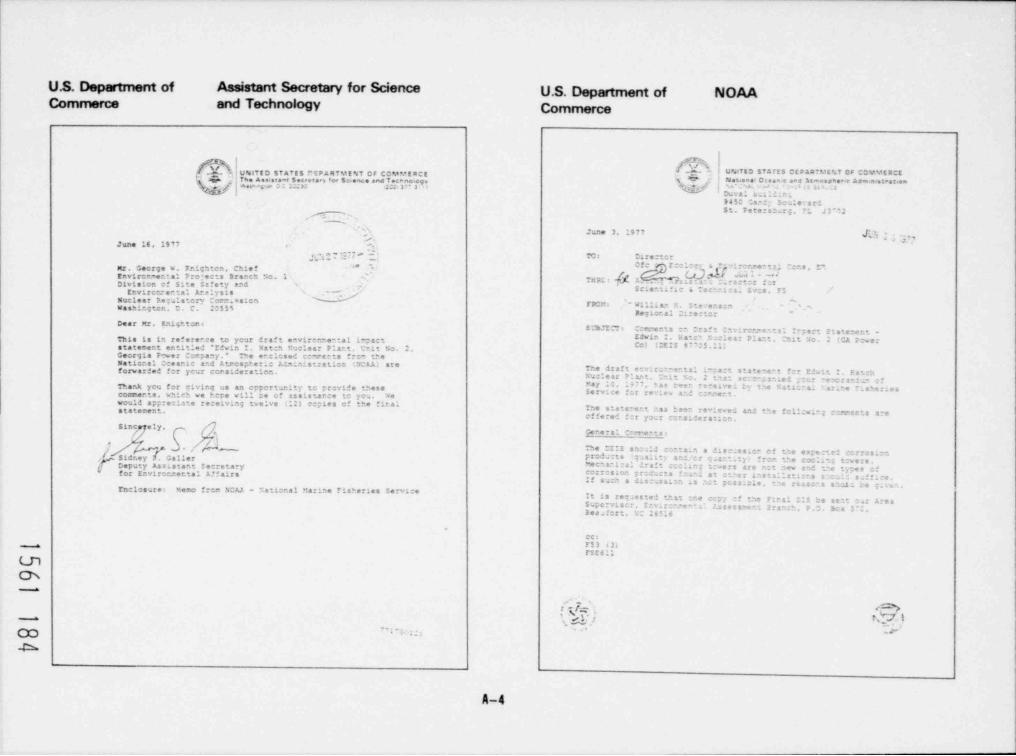
U.S. Department of Assistant Secretary for Science U.S. Department of NOAACommerce and Technology Commerce
[.md1h UNert3 STA TIS CEpaarMENT CF COYYE RCE/,T1T.N..ITE.D. .S..T A.T E S P,E P A,R T, Y t.%T C F.,e Teo, o.enU COV*?ERCE
b.. s N at ea.s' C.: e = a see, Staesp%ee'e Aem.m.strateen7 . s,., . A a se< e a , e sc. ~ e a gyf a.r .s .ir g ;.;x na 3 r 3 't p3.xF -- - -
u aNva; 6.1;. ,
9450 Osr. 5 + .l e .'a r dSt. Peterst.r; TL J32, C .'
s
n June 3 1977%. *I?i. , * ,
June 15, 19'7 %,.-7.-" " * ' -'
To *1re: 0-", ' C*: E c o . 7. 6
!pv' cr-er*. - . .1 ns, E*nr. Gecrge w. Frighten, Chiefs
THR;: .
a .nuc- ; re:*:r .*:rEnviren ental Pro:e:ts Branch ?:o . 1 W Mt ..,
Division ef site Safety and" . -
''
Scie- .*.c 6 Tee :a. Sves, r5Er.virc.reeta; Are;ysisNuclear Pe laterv O m .esien FRCL W11.la- * Stevens a - s
Regional - re: :- - ' . +washir. sten, r. C. 2255%
Dear Mr. Knightens 5 '. b?I * t 0:r: ent s - ra * * I-' i rerre .t a ; . ;ae* State r * -Edwin : hair ' N clear P;an* .1 No. . (OA P0kerThis is in refererce to your drafa eavirer. er.tal i pa:-
, Col (CE:S #7'05. 1)statement entit;e * *Edwin I. Mat:s1 ;; ear Plant, ~.t No. .*'e ere.'csed c0-rertsGeorgia Pawer Corpany.
*ro' w areOe
National Oceante a.d Atresprer e A.: ministration NThe d aft e xir;r e tal i cart state .e-* *-- E l'a - * Pat:"forwarded f:r ycur ccrsideration.Na 7;e ar ?;&;t, - t '. o . mat a c r- : n .;e d , t ' e cra : *way .* - ras ree- rertivei t . r.e Nati;ra; a .re ; she r:e sThank you for civing us an cyper*. * yt
provide these,de 5ery;ee Mr rev.e. an: --.er-corsments, s'P.leh we here wi;; te cf assistarce ' e youwould appre:.'te re:elvini svelve (12) ec;tes c* the * ira,.
Tne statere-t n a s t e -. re newed and *Me fcl; d y c:'re ent s arestatement..
e*ferei *:r you- re r s i de r a!. .,-sinc ely,
Cerera; cmrs2
,[F-I9 Ma The II:5 s. 2 - t a.n a *1ac sel:- ef tne exre:ted e ras 10-51dr.ey [. Oa11er pro 3a:ts 2a;1t- a. c - an*. y> * ce the coc;.ag t:sers.Deputy Assastant secretary **cn a 1 :a; r a f * w.. , :-e r s are m. naw and .r e ges *for EnvirerJental Af * airs e - : s ter, e - . cts * .n. at .re r 1 r.s t a;; a t i: ns s- - .a. * re..* s .ch a cas:.sai as r- ;csa =;e. ne reaso s sn.12 e ; eEnclosurer Memo *rce NOAA - ?:stional Mar.no fisheries Serv 1:e
;t 3, ,,, ; , , g , 3 .y, , t _ . , , e= p , *he r rs; ::s be sen- ..- Area.,
Supervis:- Env r .. e - . ;.ssess e* 'ran-" P.; Bcx 5 .Bes;':rt 0 265;6
ce sw T53 (31
TSE61.
Ch-
-
,Ad. tf t/c.. .
x. .A.~ .1_ %
;,
b
A-4

U.S. Energy Research andDevelopment Administration
utif tB sTaYgs
..4, EMHGY RESE ARCH A8e9 DEVELOWENT ACMI455TR AT|04[1., s easmosfee o c. rosas7 :Alp &
a
Jt#1 ! 81977
nr. George W. Knighton. ChiefEnvironmental Frejects Branch Mo.1Civision of Site Safety
and Environrwetal AcalysisNuclear Rer.lat:ry CarsnissionWashington, D.C. 20555
Dear Mr. Knighton:
This is in response to your transmittal dated April 23, 1977,in which you invited the Ecergy Research and CevelopreatAdministratton (ERCA) to review and comeet on the NuclearRegulatory Comission's draft environmental imcact statementrelated to the operation of Edwin 1. Patch Nuclear Plant,Unit No. 2, Georgia Power Company.
We have reviewed the statement and have determined that theproposed action will not confitet with current or known futureERCA programs. We have no Corinents to of fer on the statementitself.
Thank you for the opportunity to review and cornnent on thedraf t stateient.
Sincerely.
' ~ W'/ Of ffft".' par %4
f. H. Pennington, QrectorOffice of NEPA Ccordination
cc: Council on EnvirorsnentalQuality ($) 4. 3.,s
Ritit d0
w 'faa*4 $)*$'W -
D: n-2. e~n,-
e
$ hM
co,, : - 2, . .uw
A-5
U.S. Environmental Region IVProtection Agency
-%.W' UNITED STATES ENv1RONMENT AL PROTECTICN AGENCYq ms seose av
aThearT4 GaOsPGee'*383'6gas couer'LAa o s Efs
8
June 16.1977
..
.\ .
3Mr. George W. Knightoe .- . . ,Gief. Environmental Projects %Branch No. L
W [('Division of Site Safety.sand Envirormental Analysis '
gjU. S. Nuclear Ra. .atory CassionWashington, D. C. 20 555
-
Dear Mr. Knighton;
We have received the Draf t Envirorumental Lopect Statewet onthe Edwto 1. Hatch Nuclear Plant. Unit No. 2 in Appling County, Georgia.Although cammente from our Agency are due back to you by Joe 20, 1977,we regret that we shall not be able to respond within that time.
This letter is to Lafor:n you that our detailed comments willbe forthcasning on or before July 5.1977.
Sincerely yours.
*3 U H C,
ja ; Frank M. Reemond "/jReview SectionIIS Branch
%
Cha
*au a
Ch
77173%15
A-6

U.S. Environmental Region IV- Protecdon Agency
_
~
M. v.D'. United States Depart:nent of the Interior[2%,umTED STATES ENwaOWENT AL PROTECTION AGENCY 'I FISH AND WILOLIFE SERklCEj
.e.%.e .. e.e. -e .. .s. -s - . .amo couevkasse efess? .
.C AYLANT4. Ga,oAG4A 3C329avt.astra, escunosa sesee p -
' t'[ JUN 3 1977Jun z e sn *
;ur. caerse v. mai sto.. a ter -
. _ ,Environ.ematal Projecta Branch 1 ' - -
-
Diviaime of site safety and ' ' = . Q Mr. J. L. LedbetterRevironmental Anatysta J Director. Enviror.eental Protection Division
Buclear Regulatory counteetonWashington D.C. 20555
, Georgia Departrent of Natural Resources210 Washingtas Street. 5.2.
*ta s E.1. Estch Nuclear Plant
pm Permit No. 64120 Dear Mr. Ledtetter:
Dear Mr. Enightos The Fish and Wildif fe service has reviewed the preecsed NationalPollutant Discharge Elimtration System (?.FCE5) Permit t3 the
Attached are causeate f rom the U.S. Fish and Wildlife Service relatt" Georgie Power Co oeny for its Eun I. hatc9 Nuclear Powr Plant.Permit nurter GA 0%W3. Car co . ents see sutritted in accorcance
to the above ref erenced f actitty.witti provtsions of tee Fis'i and Wildif fe Cocedination Act (48 ' tat.ssei, as amended; 16 u.s.C. 661 et seq.).
Ns pmposed pemit states that this r.omer generation station isSincerely yours. C4 '3 sed of two units (1633 eegswatts) a'id ocerates en cooling- '_ . - towers with water being withdrawn from and s.bsequertly discharged
'. - * into the Altamaha A1ver.'J'
diaries E. Kaplancoor dina tor The Service has recently reviewed the Nuclear Pegulatc*y Cemptssion's
hermal analysis Unit Draft Envi rcr''tental 15act State ~ tent for the hatcft Plant. Unit 2dated April 1977, which contains traing- ent. (Section 5.4.2.1
Inclosure Pages 5-7) a9d entrain"Wnt (SeCtion 5.4.2.1 pages 5-8 tercug'i5-10) data. It aneers t*at wicer the present ande cf eserationswith Cffstresa caelt*1 t"s tes, t%1s statien is not Cawsing sub-stantial dage to incigencas acuatic biota. The 5ernca cercluoesthat this permit gives acewate ceristderatics to assure t%e protec-tion and pr~angatio c' talameu, ino192 ness populati:ns ofshellfish, fish, and wilditfe in the receiving waters.
The above views constitute the report of the Departrent of theInterior,
$1ncerely yours,mr ..e/
T'' .%.'byOJTf04, D* putt
.
4 / egional Director@ R,9
K.,h,e% cc: %ard r ner. En. atic.a. cic,caar . e-
e%e- rn-6 D'
77174U131 2.
%.#wN
A-7

U.S. Environmental Region IVProtection Agency
, . ,
iO iF] UMTED ST ATES ENymcwgNT AL *90TECTICN AGENCY
e 2g ec c.,o . e
:=~e; e;e ,wamify ne r1.ts a.smimed wta urt, ate,-cool.4 .ucl.m -erplan ts. The EF4's reviee of this decament tacluded in-house and
Cg contractual ef forte, and cialainated La the release of final Adency
JUL 18 $77 co-e.t. on ne er.f t re,.rt c. August 15. lors. :.ittal ca .te
p'... *-- 4. were 1seued en Move mer 27.19'6.
%wr. coorte e. raies,o
h'p * a , N, . -2 EPA completed Lte review of the final Reactor Safett Studt ce JunegChief. Envirassental Project s
west of ourg%''* % %, - ''
L1,1974. and Lasued a puolte report o f sto findtags.?A*granch so. Iconcerna have been resolved La cur diseass tone with the NRC regardingDietaics o f lite Saf ety and %
Enviressental Asa.este Y,.' be focused on two tect.aical pointe ~ a f actor of 6 is latect cancer
the comments. Our concerne vita the Reactov $4f ety Stude may now
b''. _ C\U. 5. suclear Requisure Cenn.1 asian
N' - health ef fects and a nazima f actor of 13 La tre presatility of 371Washin gtan , 3. C.1)i35acram f ailure. ee also believe that the methodology of the Reactor
Dear Mr. Enigstae Safety St4dy enould be used as a tool is the evaluettom of soclearerstees that varv free the models chcses for the study and that ageneric analvole should be ende of the acceptability of the presenttagios IT o f sne L 5. Envir?r.nental Pre e :tica Acuev has reviewe e
the Draf t Envirse.=es t al imp ac t at a t anen t related te ene jeratio- risks and the necessity f ar tacreased levele o f safety.
of the Edvta 1. Hat ca Nuclear F.a=t '.'.a t t No . ; of tae Georgte FnerComepany. Fuel Cytle end to- e-to 3 Ocee Asseesse g
We sete that the ap:11 cant has mo dified a liquid, gaseous and EPA is e .Oponsible f ar establishing generally applicable enviroo-
oolad radu actise was e t reat ent svste 2s since :P.e F.!5 was Los.ed *****1 **.11ation p rote ct ion s t anaaras to limit unnecessere radiation
far the const raties ie::n i.a :ll Se plant sw.;d se | a:ab;e af esposures and radioactive asteriale La two geteral e . rirossent re-
being ope: a :ed by the soplic ant i s such a manner to red. e radia., culting free aersal operettene of f acilities that are part of theutentum f uel Cvcle. Se EPA has ccccluded that env1. sasental radiaticescrive ef fluents to meet ;] crt 30 A:pe a ,.e s t (9 00 f er Ave C ' .
teria and .0 CTR IM, Eavironmental Radiatian Standar:e f ar Nuclear standards for nuclear power Ladustrv operations shau. ! taae intsPower Ope rattees. account the total radiat10m dese to population, the stings Ladividual
dose. the risk o f haait.h e f f ects attributable to the . doses (includingThe following radialequ a asse, a are a;plicas ,e ta t*.e e-erat ima the future rians at:st g f rom the release of laag-li ved radionue.lidesof the Bat a Csit W. I su, ear powe r plant: to the enet reament s , and the ef fectiveness and costs of ef flueet con-
trol technologo EPr o Crania Fuel Cycle Standards are aspressed toee: Mr A:: ecs terms of daea litits ts individual seteers of the genersi puelic ads
LLaits es quantities of certala long-11ved radioactive materials re--e have emaaland the N PC's ana vees o f accidents and t*ett act ent t a; leased to the gene ral environment.rissa. The anacses were deveio :ed by s; La e cow se af itsengtmeer ted eva;.at tcs ef rea r safetv s tr e est an af na; ear A document entitled "Envirmsental Survev of the Urania Twel Cycle'pl an t s . 51u e tnese s s ue s are r e mo t o a; *., s ear plants a a WASE-126 8) was issued bv AEC is :tajuractics w*.th a regulation (13 CT1s
gives tyl e . we c en e.r vita W C e ge er;: up ro. s ca ac;tcent ev a. a. 30. Append 1.s 31 f ar app;Lcattoe is complet tad the cost-benefit analvataatlan. The MO t o ez cred t a cvnt a e e ef f orts !attia :es hv AEc for indiviaaal lightwater reactar environ ental reviews (39 F.R. la180)..
to Laaure saf ety tarne p; ant eesign .44 a :cident ana; eses is tr.a This document is used Ff NRC la draf t environmatal statements tolicensing process on a case-ov-:ase easts. assess the incroneatai environmental Wacts that can be attributed to
f uel cycle coopcoast s .hich suppart nuclear power plante. Bis ap-In 19 77, tSe AIC init t eted an ef f:rt t o e samin e reactor safety an d presch appears to be edequate f or plants currectly under cocaideration,the resal taOt 4Cvir0*Anett al Ccnseq Je ,es a.7 4 ri s ta M a sc re g 4 anti- 404 ettiaatet Of the 13cremental impacts of the Hatch huClear Plantt etive has e me cct t i? we t o e a: |rt t *: 14 e'' ort. h Aw(ast |1 Unit Fe. 2 are reasesable. gawever, se
aan.ar,1,,1,suggest ed La our geoment s oglea, tse m , e .e d ur ,e me. : ue u. : me am, sgo f sat e.s i.e e ,a f e t e ne , ,r .e4 r.:e,as us m if aa a., roach is to be
st udy 4.As a-l.m . ~ w.e ene ,roesc r: to us.s f f ut ure ,;an t., it t o is,e t t an t fo,.3,C te ,e,1.di,a :y revie,m -d cate ne aur=auo. a.d assese.em tuhat,ues used.
-
772C wC:s%
CD
A-R

3 '
la response ta a 19 7s court .e : t s ica , t*.e NRC issued a sappiesentto WA5H-12 34 (T/3.IM1;+) w'L1;n eated the impas e f r:# re p r:ces e ;* g The EFA will saae acewn Lt a views os an, envirissentally macceptableof opent f uel and L=pa< e ras radiesetive weste sacasennt. EPA candic1Jes related to transDott at aara. dB Che basta Of present LA *
has connented os tne supplement. format ion , EP A believes t*.at there le no undue riA ef t rasseert ation
accidents associated with tne Haten Nac' ear Plant Unit No. .gt s5-| e ve ; West e " s e -me-t
Dee +seti s s ' e lasThe techniques and procedure w ed t a sanage bian-level radisactivewastes will have sa tapact ce the en ei ronzes t . *a a certa.a est ent . Upon coupletion 'f it s 6.t a f ul life, a cossnercial light-water aueleerthese impaets cao : e 11 re etly related to 1sta vidua. nude a r ;cwe r power piscs itae.' hecomes a f arm of radioactive was e This vasteplaats be:aae the rep roce ss ar. : sf e ent f .e , f res esca no. am .. y possesses caaracteristics 1. ate dif f erent f ree those generated darlags111 cont ribute ta the t at a; eas e te AZC. on S ep r esoe : - a operaties but sometheaese represents a consideraale volume at.d raata=ise ase f ar ecscreet a ers' s at e=est ent it ;e * "Se 7.anace ee : of active toventerv. v -esent reg alat tens ao set require considerationCommerc:a1 kigw eve. an raas. rana .=:r-Ostaa: sated 1441 s e of a decommaiasionL=g plan s.ntti near the end af the reactor's use!ulWeste* U.455-:5M*. a :nis recar s. ;P h provi sed en ese rve "a=es t a li f e.en WA35-1319 oo *.o ee=cer . 19 7a Ar sa:ar cr: Las was taa edraf t s t at emen t | a med a prsgram f ar arriving at a satts f actsr r setnod While EP A and other Teseral agenctee are actively addresstag the issuesof "ulttmate" ni h-level wasta dis po sal . involved la waste sa.ageser.c. decomissiasing and the dis >ceal wasted
resulting f ree exa activi se Mave received ;1ttle et tention. Ca a.I.PA is cooperatist eitt 43th NE and ICA to develop an envir:n esta;;y sidertog the site ;oepiexity an d nuur.ner of tot =.orcial icwor reactorsacceptan's progras f ar rs ' a :t ive vast e :acasene,1 a t. a reg a rs, that are or will be incenset. 15 wou.d appear prudent to oegin planair.4EP A will estasliar epirer.et. 76 ral:.atian Pt:tentian er1 erta far for decon=lesiant.:.g as es 't in plant :if e as possible, var ezaspie.
radioactive vaste -ar.44ereet : 6 147' ar.4 envir:n=estal rad:a ton tre. it aa, be necesserv t a L: :ute esign c:anges t o f acilit ate eventual
tection standards f ar Migv: e el bast e is 19 79. e have cr ;;uded dismantling. Is aaditian. . aiuatica o f social 1spects and res3urcethat the coastsued deve b Te, ' at t3e Natlan 's nac. ear PNe ;scust ry coEEhitsent s on present ane . 4 tare generat ;.:n3 shcuid be censiderea soF
is acceptable f rom an env'.rcr: s t a; s t and;c ia t d.: '::4 the ; L:d re. that those receir.ng the be e fits are these reopensisle f:r pa ring the.
quired ta satista: tori.ly resa) e the waste man 4gement q.es e necessary costs of plant re t. resent. We belteve en order;w dec e s-eissioning p rocedure nould ae caveloped f or esca sata containing a
Trene-o r ar on light-water suc; ear power re actor we'l bef are its retirement.
Is its earlier reviews of Ene environ =estal impacta of transportation In accordance with our eraalisned procedure we have assigned a ratingof radioactive materia;, EP A agreed eitt AIC 14st aanf aspects s * of 14 {Laca of Ob;ections) to tce project and 1 (Adeqaate) to thethis program coulf best he trea .e4 m a seneric b asis. Se :iRC has Impact Statement.codified thia ger.ori: a pp roa c h d .J F. A. ^ MS) by aiding a tanie tsits regulatisse (D CTR Par ; 31 wnics summartane .e enviro . esta; We appreciate the opportunity to review this draf t environmental impacttapacts resulting f rca the | r an s po r t a ;sn of radt:act ;we 34te r:4.s t a statement.and f rca 11gnt-wece r reacters. This re gul at ion teruts : e se of theimpac t values list ed in the ta e is : au of assessics tae t r an s po rt a- Sincerely yoution 1spect f ar individ.41 reactor i :er.stes acti one 18 :ert a ts e n- -#"
[ #[*dic ions are set. 51sce the ? a::h %. clear Plant tatt No. . a ears to ,
meet these conditians and s t ue EP A agrees that tse tr ar s tartat taa
tap ac t values in tse t aale a e reasonasle, the generic apptoach appears John A. Littleadequate f or this plan t . Acting Regional AdsLaist rator
*he tap ac t value f ar rautire tra.ieport attan of radiasetive satoria;a
has been set at a leve '. wM a ch . ove rs 93 per:er ; of tse reacto rs or-.
restly ope rating or under cres r a t a go. The basis f or the L:; 4ct.er risa. of trans crtatt:n a ::i ssats 11 nc t as e ear e de eJ. Atp re sen t , EPA. EUA. ao s N2C are es 2 a t t emp t is d ta so re f.1; as ses s
a the radialegic al irpact of t ransportat t 3s i sa s
CV-
M
@A-9

01 Environmental Region IVProtection Agency
r ~%*1tes"1 J UNITED STATES ENvipONMENT AL P8PCTECT*0N AGENCY.j og soose sv
m a wevawe, eaansa se me
,m-
July 26,19 77.
2
-1 ,,di M ,, 1* 1be potential for high doses et L1 eaclear power plaste can beftr. George W. E tightos ,
b' reduced if necessarv throup the provistas of etther restrictedChief. Eaviraesental Pro jectastanca no. 1 sivistos of site safee, and - % ; gg' -R access or additional salea. w se appropriate.
Emeironmental Analyste * ? Sincerely yo%0. S. 541est Regulaterv Cosedseios TWashington, D. C. 2015 5' s'' & #\'
f,g.f-,Dear ?tr. Enighton:
John A. Litt;
acting testanal adalaistratorla eur couments of July 19. 1977 on the Draft tavironmental ImpactStatement related to the operation of the Edwia | , Bat:h Nuc eetFleat tait 50. 2 of the Georgia Power Company we tsadvertentir es.ittedcoments relative to section S.5.1.4 Please inc. to the followi gwith our original comentes
Direct Rad is t i an
EFA to pleased to este that the I|EIS does discuse t e direct radia-tion and sa' yenine dose rates related to operation et boiling waterreactere (E1'e) . EPA has been cencerned for oc a time about thedirect and scattered gamma radiation resulting f r:= primary cociantactivity during trenoport to tuttime building componente. "he TII$ahould provise additistal Laformattaa se direct radiation from theEatch evelear plant ette.
Is a==.eh se the operettag Eacch Plant No. 1 is os the same genericclass of b1 design and power level, the current radiological enviroe-mental scaitorias progran should provide inforastion to place t%edirect radiatioe of intenseJ operation of Natch Flert No. 2 in theproper perspective as it relates to the potential exposure to eeneersof the pubite beyend the site boundary.
Resulta of an EFA field study of a 2600 MW, g El power plant ind le at ethat it should be possible to restrict t he se from direct radiat tenand skyshine to real individuale located at reasonable distances f reethe turbine building for realistic cccupacey times to a few aremper year.
w
0%=a
w
7720eo3=y
CD
A-10
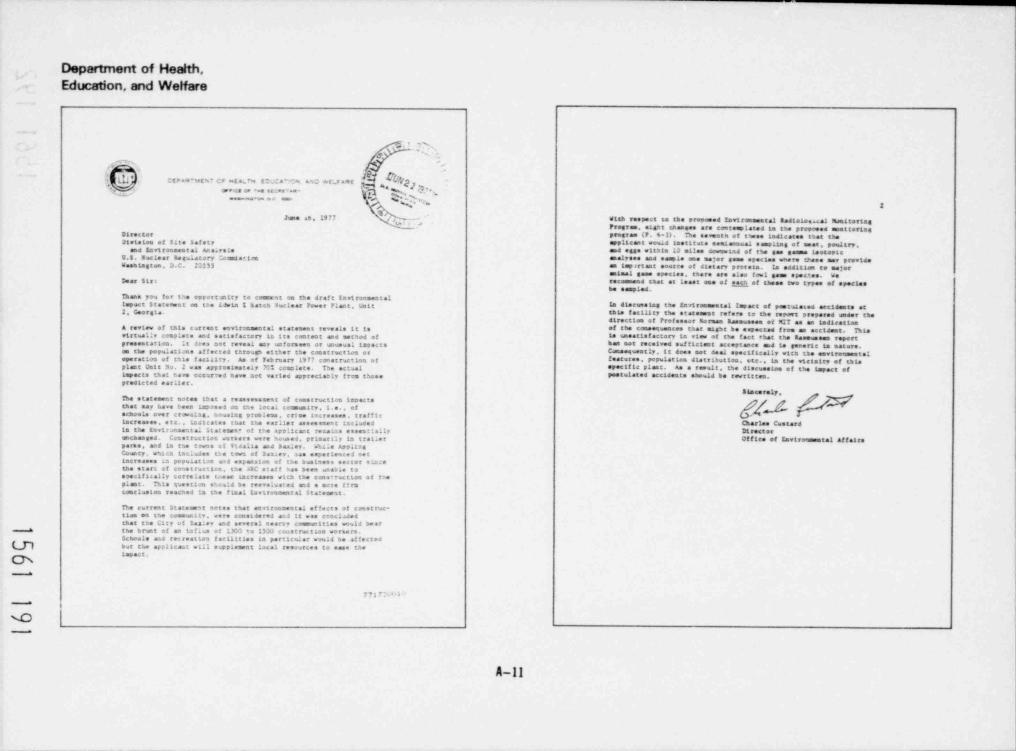
Department of Health,Education, and Welfare
,
*,,..W's-g
m G
d ';tese vtw?ces.E4 % Et.ca o ac *t.faet 7a E
.s_ sls. eseo se . e c.r .e, nv qq,c_ ee .e. %
,
3Joe se.19 77 ,"' - with respect to the preposed Environneetal Radiotas. sal phamstorias'
Progree, siset emanese are centempleted s.e the prepceed emet terlagDirec tor progree (P. e-3). The sevemen of tsese indicates that t hegivisies of Site Safety applicant wenid Laetituta semiannual esepilog of eest , pensi try ,
and Iavironeestal Ane.co te and egge within 10 e11 s dennestad of the gas games 14eteetc9.5. Buclear Requistory Cma er ton analyses and emeple one major gene spectee emere these es, provideWasatasten. D.C. 23:53 as sep artant oeerce of dietary protets. la addition to ester
emiest game species. there are else fowl sees spec.tes WeDear $1rt r*eemesad saat at least one of eac3, of tasse two types of spectee
he esopled.Thank you for the oppert anity to ceament en the draf t En vi ronmen t altapact Statenest en the IJuta 1 hates Nuclear Fewer Plant. Om i t la discons tas the tevtreameetal !apact of poot1 slated accidents at2. Georgia, tale f acility the stateenst ref ers to the report prepared under the
directies of Prof essor Korean Rasmussee el M27 as an indicattae& review of tale carrect environesotal stateneet reveale it is of the conseguances that might he espected f ree as accisent. Thisvirtually cesplete and satisf actory La t re centent and setned of is uneatisf acterv Le view of the f act that the Rasmussem reportpresost at t en. It sees oss reveal an, un forsees or unueuel 1spects has set rece1**d suf ficient acceptance and is generis la ascere.em the popsist14e af f ected threven either the constructies or Canaequently. Et does met deal specifically with tae envireemesteloperettee of this f ac111tv. As of Feb ruary 19 77 constructica et features, populatiet diettibettes, etc.. La the vietetty of thisplant Unit No. 2 was appresteatele 7C1 complete. The octaal eFecif18 plant. As a result, the diocesates of the impact ofLepects that aave accur-ed have act verted apprecisely f ree these poetslated octadente should be rewrittes.predicted earlier.
Stacerely.The statement metes that a resseesseest of constructies 1seactsthat say have bees tapeset en the local cocmunarv.1.e. , ofscheels over creweist. housing proeless, crsee increases , t raf fic *
increases , e t c. ,, Ladicat.se t hat taa earlier assessment ineladed Charles CooterdLa the Eevirsneestal 5 tat esse * of tre Applicant remaine esses *1 ally Di rect orunchan ged . Cemet ruction versers were housed. primarily le trailer Office of Enviroquestal Affaireparta, and La the towne of Vie 4114 and 54miev. ~ hile Aspilogm
County, whics Lac iudes ene tow'n of Roa ev. saa seperience s mettacreasee la populat tos and espensten of the businees sector e 2.nce
the start o f cons t ruc t ion . the 4RC staf f has been unasle tospecifically correlate tasse tacreases with the cemetructten of tuplant. This question e euld be reeva usted and a sete f t ra
concluelee reacned is the final Envareseent al Statessot.
The current statenest notes that emetteneestal ef fecto et const ruc-ties on the cenmuot tv. were coesidered ar.d it was concladedthat the City of Bas;ev and several nearty communittee would Deer
a t he b run t o f an tafius of 1300 to 15N coastruc tien vermere.Scheele and rec reatten f acilitiee la particular would be af fected
@ but the applicant will supplement local resources te ease theispec t .
-
7717 ? ' ! >-
-
A-Il
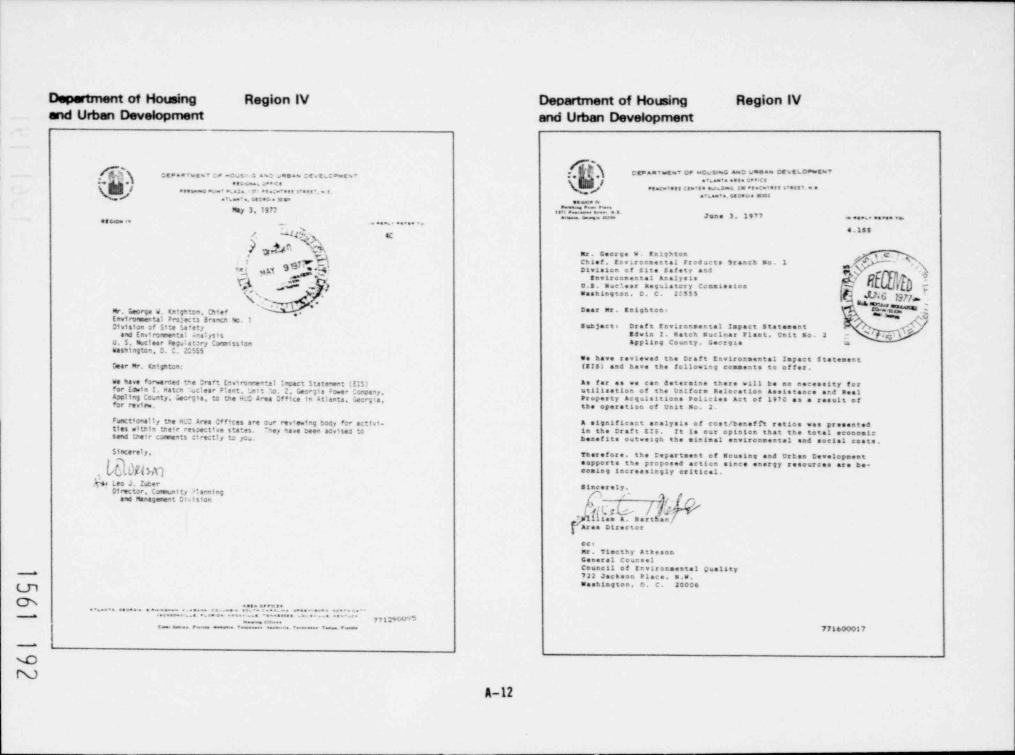
Department of Housing Region IV Department of Housing Region IVand Urban Development and Urban Development
*h.$Ac <~ a ~< < or -o *-a ---- c'' ' * *":ec,e.e ~.- ;, c.s o e,:,, _ ... , e . , : . a a e . . , .........o....
...i . . . . . . . . . .... ....c...~.. / - - ~ . - - - - ~ ~ - - - -
/ '-'a-==.. . me, . e e. .
=, s . i g 77 ..m. . .J. . e. . - .,... s . 1, n ~ . - . . .
es s o. iv _
s a.1ss...%... .. .
/ elD 'k 4CU
2' 2M 'n ... .oor,e .. .. ,ht.a ,x.,
Chief, tav aronmental Prod ucts Sranch 30. 1 -t 9gv**. sivision of site safety ans ,,..e i 4 .# g g* ,tavironmental Analyste$4 j;y $ p.v.s. see..ar sesolatory comete.t.. ~ 4
V , Washington, D. C. 2c555 4*, g g'w' a.h w, ...
Mr. George w. Kntgates, cMef D'** "** 8818ht**' D4== [j, ,Envirtpunertal Pes;ects Brancn %o.1Division of Site Sa et, sanjacte Draft tavironmental Impact statement
5 ,,
''4and Environreatal ealysis navin I. match muelmer riant. Umst so. 2 rU. 5. auclear Replatsey Carpission Appling County. Georgas amas 91agton. D. C. 2:555
se have reviewed the craft tavironmental Ispact statementDear Mr. Knigntos: (IIs) and have the following comments to offer,
we have forwarded t*e Ora't Environreatal I*cact 5 tate wat (E!5) As far es we een determine there will be me necessity forfor Edwie I. Maten uc: ear Plant. ',at t '.o. 2. Gecrgia *Mr Comcaar. **AIA***I** *f 'h* **AI*** **l******* ********** **8 "**1App 1 tag County. Georgia, to the W.0 Area Cf fice in Atlanta Georg'a. Pf*perty Aegassitione Pe1&ctes Act of 1970 as a resslt of'or review. the operation of Unit No. 2.
Functionally the HC0 Area Offices are o.ar rev e.4eg body for activt. a significact analysis of cost /neaef ft ratios was presentedd
ties ettnin trair respective states. Sey Mave teen advised to in the craft IIs. It is our opteloa that the total oceacetesend toetr caserats cirectly to sca. benefits entweigh the sintesi envireemental end social ceste.
Sirmerely, Therefore. the reporteemt of moneing one erkee covelopeest, espports the proposed actica since energy resources are be.p coming tacreasingly critical.
h Leo J. Zweer slacerely.Of rector. Constnt ty al anning
and Management Ot.1ston q f-
6c.zG.. ../ ,/r/ r Oy
7 1 e ruanfArea Director
ectMr. Timothy Atkoso.General Counselcosac11 of tettroneestal Gue11tya 732 Jackson Place. E.W.Washington. 4. C. 20004
& . . . . . . . . . . , , ....-..::'"..".... " . . . . . . . .*. . . . .
..e. . . . . .. .v .e yee..
e e e- -.,_ ,-r- 771600017
w
NA-12

.__ _ _.___
U.S. Departmentof the Interior
#"% United States Department of the Interior-# OFFICE OF THE set RET 4R)
MSHINGTON. D C 2ma This apparent statsg of properties ekseid be esplatsed erIE 77/416 d __ . alarified becaese ceseiderably lenger travel times for ces.
JUN I' N -" ''', tesissats result. site well 2 appesca te be located paradient
'S from effsite desestic wells to the sewth and southwest. Theflaal statenest should include properly identified water-level'r'Nr. George W. Kaightescoateurs en a map s how in g the locattene of redweste bu11 dings,
Chief, tavireneestal Frejects : s
Divistaa of $1te Safety atd 4'
or any other potential sources of accidental costastaattoa ofBrasch No. 1gravadwater and should taclode er least the aest important
Envires= ental Analysis 'O. ,hydreolic properties of the aquifere tavelved. The drafterstesent, page 6-4 states that fa the future se seatteringNuclear Segulatory Cesesseien .
af groundwater will be done salees sa accidental release occure.Usekinsten, 3. C. 20555 . . . -The statement ekosle indicate how eene types of accidentaly releases will be detected La a timely esamer. particularly ifDear Nr. Enightestthey are free sederground facilities, if asetterlag does set
Thank you for your letter of April 28 1977, tressaittlag teptes occur periodically at intervale is se cstd anc e with the hydre-
of the Euclear Regulatory Cesatssten's draft envirensestal logic properties and hydras 11ce of the aqstfore affected.
Sepact statement en the Edwta 1. Batch Euclear Flest, Unit No.2,{Decket No. 50-366], Appling County, Georgia. Fish and Wildlife
Our cessents are sebmitted occardtag to the format of the is general, the oevironeestal statement adequately describesthe fish and wildlife resources of the project ares and thestatenest er by enbject.probable tapatte thereto associated with project cesstructies
Gre endwate r and operatten. Should the Georgia pesar Ceepany er the BeclearRegulatory Cesalestem find through f urther recenaatssence.
We mete f rom pages 4-1 and 6-4 that past groundwater moniter- maattettsg. er surveillance the presence of endangered er
ing has bees restricted to water frse the deep regional confined threatened species, the Fish and Wildlife Service enceuragesclose ceaseltatten to insure the protecties of these species.steif er an ' from an easite " subsurface drainage ditch." It is
set clear whether the ditch easple would represest the shallow The Cessission eheuld scatter the Federal Beatster for currestesconftsed agaifer sad /or the shallow einer confined equiferi listing er delisting of endangered or threatened species and
this eheeld be clarified. Past monitoring, it appears, say have the desigsattaa of critical habitat. The Consissies steeldslee censult with the Fish and Wildlife Service. Office ofseglected *ie miser shallow ceaftsed aqstfer, which to recogaired
as very eas eptible to accidental contastaaties, because it lies Indangered Species. Washington, D. C., en the status of species
less than five feet below the foundattaa of the Unit 2 radweste which are betag reviewed for listing se endangered er threat-
building, as Radicated es page 2.5-6 of the environmental report. emed species or whose critical habitat to betag evaluated fordesignattoa.The envire: estal report. Figure 2.5-13, presents centeurs on
the water table is the unceofined staifer, according to thelegend of the figare and the test 13 section 2.5.2 The hydrau- Cotdeer tecreatieslic gradiest obtstaed free this map is used in computing thesevement of coatsainants free any accidensal sp111, es discussed We recessend that sa smalyste of any tapacts spea the
a es page 2.5-6 ef the envirensertal report. However, the per- recreaties areas within a lo-mile radtwe of the project ette
meability ssed (2.5 s 10** ft. sia.*1) to that gives for the be included is the statement along with a may depicting these
@ silty sandstone of the steer shallow confined aquifer, which is areas,
sa ses11er than the perseabilityalmost sa 9rder ofsis. gottedeb (1.4 a 10*J ft. ) of the ascentined aquifer, as acted es We hope these ceaseste will be helpfel to yes.
pages 2.5-5 and 2.5-4 of the envirossental report.$1acerely,
co.m.se os I!u as
- re. N %g 0r-.+; Ast * s15 EC RET ARY-
Sase herfy ard You Smr Awwa''
A-13
-
_

Altamaha Georgia Appling County ChamberSouthem of Commerce
e-
Altamaha Georgia Southern~
4
\ Area Planning & Desclopment Commission .AP,.P.U N G .C_O U N.o Y. s~ W.,.e e..M B.E R.e.O F..C.O M M.,ER.C ET iA"i . CH A
. .
\ .e . .e.. .. .e 4 . s.
%' .i .
s) e .. o <. 1. .e... c. _. . . -... ._ ..7<
..o....
e....." Jun.1 s. 1 en ..- *w .- ..p.. f, ,
nuley. coorgt. - * Mr. George W. Knight m '
June 13.1977 , Eavironmental Pre;ects, Br anch No.1 .
3 Division of St.e Saftev and Environmental A*siveis 7.
Environmental Pro;ecte arasca No. 1.
- U.S. Selear Reg 41 story Commiestoa-
.-Mr. George W. Kaighton Chief *NWashangton, D. C. 20555 Y %*.N-Civistoe of 54te Safety and Enviroarneatal #
Analy si s-
Dear Mr. Knighton: -
U.S. Nuclear R eg%4 tory Commisstoa ,
,
Washington. D.C. Z355 5 .- , Th* app 1 Lag County Chamber of Commerce, as requested bv you, ha s reviewedthe Nuclear Regalatory Commteolone Draft Environmental Statement for the Edwta
Dear Mr. Kaighton: 1. Hatch Plant. Umst 2 of the Georgia Power Compaay. NUREG Decket No. 53 366
The Altamaha Georgia Southern Area Planning and Development Commission *I" * * * * ' * * 'I * * * " * * ** * " * " " " " * * *""*has reviewed the Nulsar Regdatory Commission's Draft Enviroc. mental Statement * ** " * * * "'" * * * " ' " " " " " ' * ' " ## ** *'" *for the Edwia 1. Match Plant. Unit 2 cf the Georgia Power Compacy. NUREG Docket c *8' e * 5enerah MebM W.No. 50.306
we appreciate the opportuotty for making comments on this Draft EnvironmentalSophleticated methods of analysis and evaluation of this statement were not Statement and respectf ally request that you proceed with the issuance of an operation
coseid red at the local leeel. However, it has been generally determised that license for the startup and operation of Umst 2..
the preposed action subject to the condattons for the protection of the environmentlisted in sections 9. o. and 7 of the report. Le La accord with regional and local If we can be of f arther asetetance, please contact me.plans, programs had objectives as of this date,
Stacerely.The Altimaha Georgia Southern AFDC also made this document available to
the geners' jublic and to cary and couary offactals in the area. No adverse commentehave bee . made known.
'
e
Ed SaleIf we may be of any further assistance. please let us know. " "'
S Loc e r ely.ES:s s
/N'w l' i '$e s.#
Ralford G. MorganEnvironmental Special;st
RGM ee-.a
771710072Os.__a ete en e-
771740177
.--a
.t:: A-14

State Cleadnghouse Office of Planning and BudgetOffice of Planning and Budget State Clearinghouse
. tbOffice of }Jlsnning sub Lbget
- r. coor,e e. ini.hton, Chie,Eaarusie. F.emem eEnvireveental Protects Branch so. 3
Dirtsten of 5ite Safety andEavironmental Analysts h==Y==***=>,
Ihacleer Regulatory Cornission heashington, D.C. 20555
G L E! Eli 11111 g t tigigg g g git g g g g g gg 0 g g
TO: Mr. Gecrge W. Knig* ton, chief"'Fa34: state CLEAR!a3+0t:5E Enviscreen ta l P r c; ec t s 3 r anch La . 1
0FFICE OF FLAW 1NG AND BUDGET U.S. helear Pegulat;ry Oc.FrassionIWTERGmER.VENTAL RELATIONS C1415f 0N washington, D. C. aC555 ,270 4ASHI%CTON 5*REET, 5.e. - 4
h- Qj _.ATLANTA, CE0er".I A 3G3 34
c 'p~
DA71: May 5,1977 g ( -- ;/ '45ULIECT: RECEIPT hECA?Ii! DFCLARAT!ah/EWIRONFENTAL A55E55kE1T OR FROM - N ,es h. Badger, Aasan1strator 'N .*6/
DRATT/FIuL EWIRCNMENT AL 1@ ACT STATDENT C**rsta State Clearinghouse V,, *
Cf fice of Pla .ntr.g and taget
APPLICANT: Nuclear Regulatory CommissionDATE : Jane 30, 1977
PMCT: Draft EIS - Edwis ! Hatch - Unit 2 - Appling CountyApp lic ant : NLPE -0257 : af* EIS
STATE CLEARINCHOUSE CChTROL htHBIR: 77-05-03-03# ** ~
OFFICE OF PLAw!NG AND BUDCET CONTACT: C. Sadger/5. stiltaes
The environmental informatton for the above project was received by the State Clear- State Clearing $ouse Control Amt.or: 77-05-03-03inghouse on wav 3 19*'
The State-level review on this project has been instisted aw e-Ory effort is being The State-level rewte. of the shove.referewed document has been coepleted. As a result rfmade to insure prompt action. The document =111 be carefully evoluted relattwo to the environmental rewteu proc e ss , the a ttitty t9ss document was prepared fer t.as been foundits consistency utth State econoste, social, phystcal goals, policies, plans, ob;ec- to be consistent atta those State social, econostc physical goals, poltetes, plans, andtives and programs. You may espect to be informed by the State Cleartnghouse of the programs =tth watch the state is concerned.results of the laittal rewtow by Jure ** '9"
Additional Ceneents: "orieIn future correspondance regarding this document, please include the State Clearing-house Control Number shown steve. I f You have any questions ConCerntSg this Pro;ec t, The follestag 5 tate Agencies have been offered the cpport-nity to reviewpaease es11 vs at (a 04 ) 656-3855 or (aoa) 656- 3a 29. and concent on this project:
Bureaa of Indastry and Trade3-reaa cf C rwunity Af f airs
- - - - * Department cf H an PesourcesDepartrent of Nat ;ral Researces
C State Seal 6 Water Conservata n Com atteeCffice of Planning and Budget, Exe:utive Dept.
b Cata idhcca Ray Stewert, DNR
""' f[3'Leias"* 6' 5 E * M*** b '8
"#'FOPM SC-E!5 1 S 30333 '' #
July 1975 #"If-
LT1
A-15

Georgia Power Company
Gronma Ponn CormmTAttachsieet
.e-,. s vo es ac-tase * **ur~ :.7,*. ::** gn~**, Cowwats oa hatc9 MS
AT3.A*f 7A
StreSRT A33 CONCLUSDh5Am* 17 l'77 e ,
Q 51. Page 111. item 3. As of Febesary 1977. coastruction of Hatchy . g#~
J ,p .3'% Unit 2 was 80 percoat cceplete. not 73 percent as inetcated.O / 11 2. Page v. t tee 6.b. (3). Aay retutrwient that a monitoring progenepj' Qty '. F63
be conosctes for/ corressea prodacts smo.le be imposed by tre3. s. Nuclear Regu;atory commisetas g *y5 tate af Georgia's Envirce ental Protection 01stston tnrougn theOmuset af s:te safet, ama Environmenta; Analysta a terms of tM ratch hPM5 Hreit.am- nr. caerse w. Katasron- chuf ,
Y *'tartronesotal Pto' ects stanch 1w..htast on, 3. c. ::555.
3. Page v. f tee 6.b. (4). Accorateg to the "Second Meeccande ofUndersta9 ding ReSaecirq !* Die'entatfo9 of Certain tot and (74aespenstatit ties.* review my t*e state of Georg's of t*e ef*ectsof non-radiolog' cal l'au1 etsc*arges free t%e eatcm tuclear Plant
consr''C N "*' and subseoweet reawtre eats aca ltat tattons tmposed ey tne temisaccTm P!Pt! C??t-90EDWI4 1. MATcn r.cizas rm; cNti I ef tre ,laa. tch %P35 ce~ t see act to be suce-ceeed ey hac recutrements.gg,, y
tryIFV CF !RC ! ' % "NTY. si'IN. Appendia A to Pe 'second Menora9dA Cf Uacerstanding*,,,,,, , scally states teat "ct f*ervat liet tations er recst ree=*ts (from,,,,,, japog,4 p ,,arg g3 gm, p pCA) etII not be faccsed by iRCGent lemen tpursweat to SEPA as a coadition to any peret t a- itcense.. *
Ceorsia P3**r ca pany herewsta suht e sts comments ( see a t t ***** * )The Hatc% ttES peMt speci*tcally requiree t'a t ** ce-Net s biof aqtcalon the D* a f i Icvtroesental Staterent related to the operation of !Jwin ,,,,,y (sp;ES Peemit ':o. MIC4123. * art 1 B.2) and a 3:6in) deccestratten1. natch n ear Plant enit 2. 13 accere.ance with instruettoes f rom (MPM5 Pef''Pi 40. MC4123. Part ! 8.a). GPC ha seemHtted for statenr. citif od 4=upt. ve h.ve ese;e.ed ten (13) .Jaittar.a1 ceries of th'** m 1n hs, as reosw h me M5 pe.s. wit, for eets t*ecommente f er scar f restew.bietogical s vey and the 316(b) ocamestratton. Ueon anoroval ef theseplans ey t%e Geore,$a Emetremental Protection 01 vision. GPC will swomitYours my truly, Anweeneet no. 2 te tseDL This amenorent will revise t*e as aticbiologica) neattertag progran for wata tenit 2 as discussed in the (20L.so as to co**ere to t*e rewtrements cf tse Matc*i MPN5 permit soecificallythe biological survey and t%e 316(t) seecns tra t t on.
Thws. the ameaced E4JL& Y 0,aup/;c ey w util incloce only tse aswatic biological monttoring programs reostree bythe Itatch %CES perett.11 t. threnepnger
GPC ftrety belteves taat *enitoriag data co11ected since the CROL wasCLS/Fcs/ebsw* 'tted two years ago devstrate the fatignificant effects of unit Is
ops.atton ce the acsatic Dicta in the Alta=isme Rtwer. The RRC staff'sAt ta chmen tC analyst * presentes te tre w
ac : Mr. 1. 5. "ite$ ell. III due to bntt 2 operetton ta be as follcos;atc9 wit 2 OES fosne the esattional e**ectsh Mr. s . A. Thm * g, Lepg ,.t , .tven a tea *old inc-ease (to fisn losses eue ts" coorge P. Trmeidge. Esquire
legingedni). de entre"ely Copservative esttea*.e. ocu td not signiff *cantly af'ect tre...fisi populations te the Altacama River."(X5. Section 5.4.2.1.)
s
7' 17* '
A-16

2
3
B. Entraiaevat.WD3(1) P%teplaaktoa. "The regenerative ability (of phytoolanataa)
would raciais of fset.. . losses even during estre-e low fic= 1. Page 3-1. Sect'en 3.2.1. The figure 22.600 c:va gives in cara;ra:n ocecondi tient. (DES. Section 5.4.2.1.) as the average et ts:ca.a1 rate sec.id ne cnanged to 22.550 gom.
(2) Pertph on . *(Pericayton) losses will be instgnificaat." * Rive' Osme $tructure" should be chaege3 toPage 3-3,.,Fi gure 3.2-1.2.
GE5 ction 5.4.2.1.) ., j ,,, ; ,. a e St r.ct.re.*
(3) pacretave +edette de+ rt. The rectality rate encected to 3. Page 3-4. Section 3.2.3.1. The 11ou14 rad.aste system f:e Uaits 1 ardewlt from t-o-unit operation is *tnsignificant." GES. 2 is no.l a s*and sys*em, encept for la.ed y and ~*ot* smowee mastes.
section 5.4.2.1.)
Furtne**ere. F t g.re 3.2-2 saavid be ti t ed ,3.2-2 and 3.2-3 are reve se s.Pages 3-5 and 3-7 The ti tles 7 - Figa-es4. 3
(4) Fish eens sad Taevee. The*e should be "no significaat ref.ctf onm t vs . I ea s je,5f s t rae 3was recl aeasecus
In the scatnyos.aantan populations.* Losses to the smac : .lati:," itch m. clear plant, tait so 2 no t *
due to entrainevnt of eggs and f arvae will be " instant f tcen evenduring the histort;; average low flow., * (OES. Section5.4.2.1. ) 5. Page 3-5. Figure 3.2-2. The fsur butiding venttiatien systeas secuid te
corrected as follows:Thus. GPC asserts that cer'pliance wit % 9POE$ permit requireawats f*coledpursuant to statatory autncrity delegated ey EPA to twe State of te:rgia
filter /adsarece patas saould be is.The fine rate fo* t*e ti=0A. Reacter Su11dieg Pef.ef tag Floor
will assure adecaate protection of t$e souatic biota ichatittag tae, ro c's eacn (or a total ofAltamaha River. Further nore. data collected daring tPe cceration a 30.000 W. not D.CM di eaa as f acuated.Unit 1 and the staff's analysts presseted in t9e CES 1rdtcate 19at t*eentensive monitoring reautrements proposed in the CES are unnecessarf. B. Reactor 8atiding 2cae Coatrol. Only cae filter /adsectee pat * with
a 6500 cf3 flow rate s%eutd te saown, net two paths.
MOM 1 C. Radweste Suildias. Each of t*e two filtee/acsorter catPs has a tiewrate of 12.2 ch. not Za.E c*m eac9 as tadicated.
1. Page 1-1. Section 1.1. As of February 1977, construction of MatchUnit 2 was 80 percent corvete, not 73 percent as stated. D. Tuftine 8a11dir2 Each of t*e two filter /adsorber cat *s has a flow
I8E' 8 II * C . not M.E CN .ad as inmatet2. No mentton is made of the ownership interests of CEMC and mea 3 in
Match unit 2. 6. Pa ge 3-6, section 3.2.3.2. The tarbtne buildtag veettiation atr enha stI 'E 8 D1 2.500 c*i filter trains. not ey "one cf two 25.X3 c'*
''1te"r t'raies .t o5ECTION 2 ft .
1. Pages 2-13,14.15.15 ams 19 contain various misspelltags of s:ecies 7. Page 3-6. Sect w 3.2.3 3 The EFL otves tae estimatednames . These misspellings have been brougnt to the attention of quantity of wet .olid wastes as 23.000 cutic 'eet, nct 13.000 catic feet.Mr. Clifford Haupt.
8. Fage 3-8. Table 3.2-1. The reactor oc=ce level sModd be ~537 " t , actw 2. Pa 2-14 The personal consaunication with Dr. W. R. Woodall (reference 2570 Mst. Also, the system flow rate should be 1.35 a 10~ lb/%r , act7
lg sentioned in para 1raph five can be replaced by re'erencing *.*e pacer 1.05 a 10*! evasion of the Asiatic Clam in the Altamaha Af ver. Georgia," 4 Ccpy of -5 lb/hr.y which has been provided recently to the MC sta'*
SECTION 5a 3. Page 2-19. paragraph 2. Hawkinville is 25; miles from the mcut9 of the
Altamaha River, not 300 miles as stes=4. 1. Page 5-2, Section 5.2.2. T5e staff's reconewadation t*at erestae aloegtransmissica I tae rig *tts-of-way be re9Crtes sPould be lietted 13 a pe**cdof 4 years. Alsc. tae rec 3arwadation caes act state to whom this resor1should be transmitted.
Y
A-17

4
1
2. Pa..e 5-2. SeC tion 5.3.1.1. ** nas teen f ss.ed an VCE5 pe *i t =*f Ch . 5-ee?ines a WC foct stalag 20ae.
3. Pages 5-4 tad 5-5. =a-arars 423 ;29. T*e sta'f reCrreads tastJeet cal C eaa*.o =estes e' t'ee De r%te2 ?*'ouga t*e rammas te s <ste* The e=tra wreat "o= for bets uat es Caaaet te estim ates s"wi, tv!
eowal tag t*e ,a t t i ataae rate eeCause t*e "tase "ete,' ae i;a a t 2ar be disposed e# C Fs t te. Dowttaq C*e**Cai tieaau2 wastes t**Nc*f(W C's) is less t'aa t e ra*e *>* e' t 1 L 56. 3 t ' . *.s . :*ethe ra&sas!# sys tese w%'S res ' t e f m. ' mg 08 **e s vi teC s Se** *f'a l t f e'spercent c' ve * I Ole f*!'a'eed t f dCt3 an t 's mas w*'** *es t ' *a te d byand .nnecesiaci ty t se:es ,e ae3 ene iwe ea ;ei C' t-e u Cfs4.T."re5.4-tduminers|12er Pes * *s . Imeee*C'e. PC *ee ls t9st GnIf t*e C##stte 49s:csal
optton snow?d be recorre*ced.9. Page 5-11. Se:t'em I.a 2 2. pa-a ge s:* :* **e . i'* ' s;* a *;* - : *1*
a re' * **ae
apprCa tr a te ' y ? 7 *et * * *'wt **e ri efe t e -a nC t IX *eet. 4*d t*ee4 Page 5-5. sarava:9 423. ? M I ) . If late- operettag eceeit'Ce ee ces- 'Msthe need for Core 05* 39 s *C1 *e'es ' C9* ) ' PM D* tC"s . a9y C V 3' ti gps I " Tacates 4 feet tet e. !*e s.-*a:e e' t*e et w e% act 1 'Get. *** c:'-ette :stipelr*1oas assoc'a ted =1!9 t*e use c' corres '3* '*** 3 t t0's *C ' a M 4-f act Ce;ti ao.sia t*e9 te C? sis te*t w' t* 3a'4Va} Fe C* Da;e 3*4taposeo on rwcq l t et ta ti ea t%e "atC't V;El Ce'"at t.T, s. en.,,G7C t a.re-tai ,. e. s o i,s s per 't ed t * 10. Page 5-22, Tas'e 5. 5-? * * * aw ee* < a * st ie 5. 5 7Environmental PrcieClion 21st stan, not By t.%e %%. o .e. 2.as e, ,e at t e ,=ea,s t :.t* ,-e * 1 cese ,se CruCiet , t e State of se=-vo
-ce, ,at nai : 2t vi >not Coesiste- .* t9 t*e :Ost va !.e ''3= raa'3 4* se a% O a-t' C. a tes
5. Page 5-5. saca;-a?*i 423.13(1). N sta'' bet + eves teet, tase - given im ?a2'e 5 5-| ' 4. 2 *rea yr * r .a t ts . sea 2) aad Tas;e 5 5-8(3.1 aren y- * ar .a : 2 oaly s.deterwiettion cf tae Lam;el'ee Ince s t t'e', will te a strea; ts e c
for Cer'os toa. 791s telted ts ! aged og am a cereat ed s.P$e*1ta 4 *) 11, Pege $ 32, Taste 5.5-9. 'here are ac m se-ets 19 t*e = 1 C * * ' ty c' "V .af the La9geite" !adet's relad sn 13 c; test *J* 28 t9e COM * mg the*s. u
AS state $ to t*e EC t9e CoCltag !:me-s will te cDerate3 at te*ete* 2and 5 Cycles of Coa cea tea t t osi . ' i thift tat s rar;e, t=e Cf-tes c* co-:ea-traliam will be Coat *Clled. o' a:;.sta 3. so as to me18ta9 n a f a r0'a le SECT 134 6Langelier D'tde u . m* e et 2 * mg t*e pc' eat' ai "or sC al t*] Or C "** s ' 39 C#
1. Page 6 4, $ecti on 6.3.2. ?Ae acni tar *eg of C*4e RS t e mate * cua '' *vthe Conde*see. Fue:NeN*e. i' CC**Cs t C9 *e'e 13 oC bP. ** * 1 *C*N"II I3904?d be S.: lect oe?y to tme rehlevarats Of t*te hatC9 V A 5 Ge''*11Feview and apo*Cor9 ate CCP'eCt9te 4Ct'0"5 woneld Se t"Ircse3 Df t*e S tate
of Georgia t*irew7t t*e tee'".s Cf t*e Mat:1 V0E5 per511. (See Correathe. 4 a3cre.) 2. Pese 6-4. Sett'ea 6.3. 3. PC t oooses to m-a+ ts' at sat i t=c ? :at ' ors :
the haCagehr3 mell rstreae f -ca t*e s e te a-3 the ers * te si.ts.r'are4. Page 5-6. Sect'en 5. 3.5. any progrew f.,r twe use of Co- es* :n 1** 'titrs
graf sage $1 :04 t".e taso em 10a41 ces t *e we'Is seat Leet were 9Ct1=Clwee1 as a se-t o' ,,n- t ; s t.c es.would be swtjeCI onif to liss tattCes a*a coaeitt ees taceses *y tae S tate
Of Georg*e Pr%gM t*e te**s o' t*e Pa tt'l '. %{5 pe*et t. Slee pre ** hsCourtent nos. 4 and 5 aeove.) 3. Page 6-5. Secti on (. 3 4. Mon t t :rie* f e "Sr*C14?9 occf.Ct1 s%ed d terem,lres caty if reste. to t'.e State cencest ates test s C* nea tor'a,
7. Page 5-7. SeCtica 5.4.1. ?>e use e' se** at pa teges:sf as a %-Me-* '
CheCh on $rt f t e**ects* saowl d be 5.3;eCr to a de'i nt te t"e l'C * at'or .GPC seag;ests that swCN a prograil of acetal phctoyapey be limited 13 4 4. Page 6-$ thr%q% (.9, SeC t ee9 6.3.5. s .at* c t + c' ogic al ae- * -- aaeyears, esquireagets sm:4 'e te <| Me sce r * *ed i s t*e $ ta!*- ar : a* **1 4 * : 4 'C al
survey aas 3'.f t i ce cas t*a t a ca eas i ee : *v t*e ~a tCi * ;El co-m ta
8. Page 5-8. Tamle 5.a . The cafortty of ;eeCentage figures given in (See Correat P.o. 3 .90er SEM Y ANC CC'eQ Z >h - )" " " " *this table should be Coreected as f:!1o=s '
5. Page 6-6. 'af e 6.1-1 T%e C*eas e "=am C*carel* Shes/! De SeletetkN fran StaU ce Ces;r ;* t aas teCa ne t*e ICCaU e C# t%e Ta!8 C*a P''t ?PerCest Flo,w Entrat9ed By PerCeat FTom Ertea med I'm c .e. n, erande's 'rwn acet9 c are o sx*9 te scre-s p ea * ?w - 3e at- -8 - - a ns
6. Pa;e 6-9. Sect * 3n 6. 3. 6. PC beiseves taat t*e reard-teesia; rent re ents.m==h CalCalated eiptsve 5.5% 11.2%% served elmim m 4. 2't 8.9% of paea;-a:a t.o seos.is be l'ai tes to 4 yeaes .uAverage flow . 38% .83aleatmum flood .322% .06%ea
00
A-18
. . . . _ _ - .
C- .e. e4" O M9 O*3 e"' q;
O**e y
aggA # qA $8 0
i e.4W O e t
f % 68esf& W bep
1. Vi - my-k kl
L es - gh' b b 4 e eb* O O ryC ') % y uO'e
+' .=.-(pg
E $ .W w goU L
68 4 thEP 4. L ymK G G
es ea k{e CA (: e@* U e te
%,E L u. 664 f) g t,& est
*. sa@ ** ge,g t ,
4J*6e*1 g L g eg@ O ;
' 5 .% gk .4,, .-e., %
C ~ 4ft 1
S.n.G.3
%99 3fI Of 7 g |v 42 Ts g.
C. ,: OwO 438 *= n . ,,, g
W O*@ "e ^
e4 g wpI g e. ;
Y 19 f N y . qpg m -- .cGP CD
o.e.9** fL
e-*e
w68b e y nP- # P- p. p - MJ as g-
O 1 U AJ CU.J
g es eW 4*J ) 4 : mee m. ese a
ett* **
% W9 ertsn
N L . -7 g-
8 *f W 9 a-s eW e t) = s? g
tr" U N 9O SP C-go 'e -=43 ,
3l
% f efGF3 O
+ne-.es tv 3gp
L sbw-6' 4
en so1 3or
o .,,., es46*8*C" vt &
eN, n% 4
sJ g g@ We 6- 4 e2
N sa*45
ygen -*11b W **
e.e y e ya 4 ei wi e s ,,@ (J (pm
esN es uOa g- q
& *- @ @ m<* * * * * m tp e e* @ 4 0 g ELKdb a ek C e6 g cm os
N & &
1561 199
_ ..
APPENDIX B
FINAL ENVIRONMENTAL STATEMENT
for the
Edwin I. Hatch Nuclear Plant Unit I and Unit 2
Docket Nos. 50-321 and 50-366
October 1972
(See NUREG-0257 published April 1977)
1561 200
B-1

APPENDIX C
U.S. EPA STEAM ELECTRIC POWER GENERATING POINT SOURCE CATEGORY
EFFLUENT GUIDELINES AND STANDARDS
1561 201
C-1

U. S. EPA STEAM ELECTRIC POWER GENERATING POINT SOURCE CATEGORY
EFFLUENT GUIDELINES AND STANDEDS
Wee le suedd ** ae e , . i.ui . a- sectre.laned coonns water befon a is3 433.13represemaang the derete of e8Be'*ene ,smo.=swume e===.==se eses restreulated to um main condensers.re =s asemissue se enen a casemm==me e C
emp eme esy
eedues,se,ss setee.ssable by.me me ,e appesea- r' ,.:: ,,-- * * -e- *' -e-th amme ent eemme ( Bes
s, . be ,a. , ih.4.)wner t may be discharged whereerat- pf a urat ou=rsi=e,- .s% ariah.; afe
ces ans use..aus eet.. .. es eet anbject to th;s hmitauon era demon-
dree . . .. an est.. .._._. is sisA*!*.e foCos trg t:m.t.Wons e=tabitJt tne <D he quanute of pollutants dis- strate that su 1cletzt land for the cor-etructaan and operation of enechanncalquanuty or quauty os pouutants or pol- charged frnm conlms tourer blowdnen
lutant propernes controbed by this see- fd> he quantity of pollutants dis- shan not exceed the quanuty determined draft evap-stave hw uwers u nottsort thsch may 15e d.scharged by a point charged in bo*Lom ash transport water seansble safter consademuon pg r-by mu;t'plymg the Cow of crums towersource sub'e:S to tre prov:sions of uus shall not exceed the quanuty determmed blowdown umes the concentrauon listed "*88I*"d"*'***"""""'*"u'dsubpa*t after applatlin of the best by muluglying the f ow of bottom ash I* *#*" the
o"w'ership or contin the follewing table:eccDomicany transport water I mes the concentratton n of omner or
achievable. technolegy heted n the followmg table and divid:ng operstor as of Mare . .
eval'ableg w,,,,, ,,,,. seereme
eas ne pH of a;I discharges. except the product by 12 5. cuarenervise conc ==ismi e as anernate rectrchia e snuenre through coolmg w ater, shrll be la pracurable.
we same _ + ta d ,5) Heat may be discharged thereetthin the rur.ge of 6 0-9 9 ,8,",,s,*y* rg, , , , , . _ , ,
polychlortnated bip'tenot compounds ,,,,,,,,**""s*e"s" ear *=*="e the owne,r or operator of a unit other-(b) There sha:1 de no d.scharge ofu
an= wise sub) ct to this limitauon can deta-euch as those commonly used foe trans- meeres er$ enstrate that the total dissolved solada
ne quanuty of poilutants disq]' Tesou end os=== . ._ in est._... m m-.t ==s e=ss=e=am*m*veeencentrauon in blowdown eucceds 30.-aus eme dor uformer cu.d . ..._. ins ent... .. sn ase . en e 900 ms '1 and land not owned or con-set
charged from low volurr.e waste sourree4 r.,,,,,. _ _ . .i o tr ya owner or crator as ofon ..,,.,,,,,4
j ten he quantity of pollutants dis- ....se,,,, . . **"t' Martjt 4. 1974, hB located titr?la ISOshad not esteed the quantity determmed.. mters feeti In the prevat:ang down-by muluplung the f|cm of low volume; charged in f*y ash slu2carr shall not es- ,,,."rw *r****** wtnd direction of every pracurab.e loca-
wash m>urces times the cancentrauon|i reed the quanuty dete.mmed by multi-sime-
tion for mechanical draft cootmg towers
* [,y,C',,f,[,F 7,h j7,3, fo$"listed in the fonowing table: N hE ' " *M*.
tot'a"l rac'laal ch"in a'e rnay b'h"sc"har"ged' *"g sys* tem"*as pr'a'cticabW* 8 th * *d " * * * ' ' ' ' ' ' " ' * " " ' * *o i
e d; In' * *from any unst for itsore than tso hours in its Heat may be discharged there theany one day and a.ot mo~e uan one unit owner or operstor of a urat otherwis
E E'unes as he nas in any piarat may disharge free ata.1- Subject to this larnatauon can demonemero anness ear e== emy ema-we e* able or total resadual chlortne at any strate to the regional admir.:strator o
***'88****'*** one time unless the utal.ty can demon- State. If the State has NPDFs permistrate to the rettunal admir.nstrator or lasums authunty, that the plume shaci
Tes . . . . _ see mist _ ap ue t state if the state has PrPDES permit must necessarily emit troen a coolinevu eue useins. . m ee.. ... an selasums authority. that the units in a tower would cace a substantaal hazareparticular los atson cannot operate mL or tocommercial svtauon and that no alter.(f) %e quantity of pollutants cas* belos thts level c! chloriz.ataenn. Bate rertreulated cool.ns wa'er syntais
charged in metal clearaa saates sha,3 ski In the event that saate atreams as practicable In maams .ur% demon,not exceed the quanute determined by from various acurces are combaued for stratton to t*te regnor.al adnunistrator ormulupt> ng the flow of metal c:cantr.g treaunent or diacharge the quanuty of State the cener or onerator of wh unitwa.<tes umes the concentrauon listed in each pollutant or pollutant property con- must include a findmg by the Federalthe following table; troned m paragraphs 'at throurh sp of Avtauon Administrauon that the vla.b;e
this secuen attributable to each con- plume ematted fr3m a well-cteersted comba arer* *8 *a84 tro!!cd maste source shs:1 not exceed the Ing toner sould tn f act cause e subst n-,,,',)',,,,,,, ,,, [ L'*,,,"[,"N', spectfe<1 limitanon for that waste source. tial hazard to commerical amuon in the
'"*
emen en enroe (15 nere shall be no discharge of heat vicinity of a major commercial airtiort.from the mala c.indensers e nrept: ims he limitation of g.aragrtph eis
Tss . . . .. te ,e t. .. ... so set til itent may be discharged in blow- of this section shan become e!*ecuve one . .e4 .re=_ . an na i . ..p*-' down f-om rertreu ated coolms mater July 3,1931.$rEn.I ~' $D.; ;I*M systems provided the temperature at in) In the e*ent that a resional re.@ which the bhudown is discharged does liebility counct.. or when rao f unettonmg
not '"c''d ** "c"r'cu";a=u'ng'n'oo" ling''m''ater 's'tality or' 2**"'uum o +''u*'1 ties.2** =- sta"*2 r caunc2 * = =*>o r%, ne quanut, of poi:= tank da.
perature of re i c conscr f u1 cancharvec tn bratier blowdown shau nst em,ceed the quantity determmed by mu:u- prte.r to the addtuon of the make-up demonstrate to the regions. administra-
t alef-plyms the Dow of botter blowdoma Un.cs tor or Etate. if the Ftate has NPDFJ5* H st unay be dierherged in blow- permit issuing authof"t7 L' tat the systemthe concentrauon 1&sted in the follo#uis
' down from rerittulated coolms water reliability would be seriously imparted
O,
systems which have teen designed to dis- by cor'tplying math the eferme cate actaverecoef SEPT charge blowdoW forth in paragraph (mt abote. the re.
N y ,8*g*g', ttire above the 1,3 mater at a tempera *mest temperature of re- stonal adnun:strator may a-cept an al-ehem ent enw ctrru!sted cooling mater prnor to the ternatave proposed scheduie of compb-
adrtItaon of make-up mater providinS ance on the part of all the utilaues3b st.e4. such rei treta atirg coo]mg systems hage concerted providing. hoMeVer. that suchT.M . . . . . . ~_
lde me t.._4 . ec4 (seema . Je me a .. O me s been Disced M CDeratton or are Urtder schedale of compliance %tal require thatZU,'*' 7 [Q;.:"~" ; [ g construction t'nor to the efertae date tinits represenung riot less than 30 per.
the he quantity of pollutant.5 - - - - Of th18 F'Ed*DO"be discharted s here thedis- (39 Hest may - eent of the E!'ected generstmg capWttyshall meet the compisance date, thatcharged in once through condenaer s ater owner or cretator of a unit otherwise units represenung not less than an adda-
;ha;] not enceed the quanuty delerstned suhyect to this limitation can demon- thonal 30 percent of the generatingby mu;uply1La the f!ow of once through strate that a coc!ma por d or cooling lake es pacity shall comply not later thancondenser water sources times the eon- la used or is under construruoan as of the Julv R.1951 and the Dalance of uruts shallcentrauen Dated In the following tabl*: eSecuve date of this regulauon to cool comply not later than July 1. 3943.
Source: Federal Register, October 8, 1974 (39 FR 36200-36201).
C-2

APPENDIX D
NEPA POPULATION DOSE ASSESSMENT
Population dose corrnitments are calculated for all individuals living within 50 miles of thefacility employing the same models used for individual doses (see Draf t Regulatory Guide 1.109).In addition, population doses associated with the export of food crops produced with the 50-mileregion and the atmospheric and hydrospheric transport of the more mobile ef fluent species suchas noble gases, tritium, and carbon-14 have been considered.
D-1 Noble Gas Effluents
for locations within 50 miles of the reactor facility, exposure to these effluents are calcu-lated using the atmospheric dispersion models in Draft Regulatory Guide 1.111 and the dosemodels described in Section 5.1 and Draf t Regulatory Guide 1.109. Ceyond 50 miles, and until theeffluent reaches the northeastern corner of the United States, it is assumed that all the noblegases are dispersed uniformly in the lowest 1,000 meters of the atmosphere. Decay in transitwas also considered. Ceyond this point, noble gases having a half-life greater than one (e.g.,Kr-85) were assumed to completely mix in the troposphere of the world with no removal mechanismsoperating. Transfer of tropospheric air between the northern and southern hemispheres, althoughinhibited by wind patterns in the equatorial region, is considered to yield a hemisphere averagetropospheric residence time of about two years with respect to hemispheric mixing. Since thistime constant is quite short with respect to the expected mid-point of plant life (15 yrs),mixing in both hemispheres can be assumed for evaluations over the life of the nuclear facility.This additional population dose comitment to the U.S. population was also evaluated.
D-2 lodines and Particulates Released to the Atmosphere
Effluent nuclides in this category deposit onto the ground as the effluent moves downwind, whichcontinuously reduces the concentration remaining in the plume. Within 50 miles of the facility,the deposition model in Draft Regulatory Guide 1.111 was used in conjunction with the dosemodels in Draft Regulatory Guide 1.109. Site specific data concerninq production, transport andconsumption of foods within 50 miles of the reactor were used. Beyond 50 miles, the depositionmodel was extended until no effluent remained in the plume. Excess food not consumed within the50-mile distance was accounted for, and additional food production and consumption representativeof the eastern half of the country was assumed. Doses obtained in this manner were then assumedto be received by the number of individuals living within the direction sector and distancedescribed above. The population density in this sector is taken to be representative of theEastern United States, which is about 160 people per square mile.
D-3 Carbon-14 and Tritium Released to the Atmosphere
Carbon-14 and tritium were assumed to disperse without deposition in the same manner askrypton-85 over land. However, they do interact with the oceans. This causes the carbon-14to be removed with an atmospheric residence time of 4 to 6 years with the oceans being a majorsink. From this, the equilibrium ratio of the carbon-14 to natural carbon in the atmosphere wasdetennined. This same ratio was then assumed to exist in man 50 that the dose received by theentire population of the U.S. could be estimated. Tritium was assumed to mix uniformly in theworld's hydrosphere, which was assumed to include all the water in the atmosphere and in theupper 70 meters of the oceans. With this model, the equilibrium ratio of tritium to hydrogen inthe environment can be calculated. The same ratio was assumed to exist in man, and was used toCalculate the population dose, in the same manner as with carbon-14.
D-4 Liould Effluents
Concentrations of effluents in the receiving water within 50 miles of the facility were calcu-lated in the same manner as described above for the Appendix I calculations. No depletion ofthe nuclides present in the receiving water by deposition on the bottom of the Altamaha Riverwas assumed. It was also assumed that aquatic biota concentrate radioactivity in the samemanner as was assumed for the Appendix ! evaluation. However, food consumption values appro-priate for the average individual, rather than the maximum, were used. It was assumed that allthe sport and comercial fish and shell fish caught within the 50 mile area were eaten by theU.S. population.
Beycnd 50 miles, it was assumed that all the liquid effluent nuclides except tritium havedeposited on the sediments so they make no further contribution to population exposures. Thetritium was assumed to mix unifonnly in the world's hydrosphere and to result in an exposure tothe U.S. population in the same manner as discussed for tritium in gaseous effluents.
1561 203D.,

APPENDIX E
REFERENCES AND EXPLANATION OF BENEFIT-COSTSUMMARY IN TABLE 10.4-1
Economic Impact of Plant Operation
Direct Benefits - Energy: 803 MWe x 8760 hr/yr x 0.69 Plant factor =94.85 x 10 kWh/yr
Capacity: Refer to Section 10.2
Economic Costs - Fuel:
Operation and ttaintenance: Refer to Section 10.3
Decomissioning:
Environmental Impact of Plant Operation
The index numbers used in this section correspond to those shown in
Table ',0.4-1.
1.1 - Water Consumption
1.1.1 People: Refer to Sections 2.3.1.1, 2.3.1.2 and 2.3.3
1.1.2 Property: 34,000 gpm - 22,600 gpm = 10,400 gpm consumption
= 16,773 acre f t/yr
1.2 - Thermal discharges to Altamaha River
1.2.1 Plant thermal discharge: Refer to Section 3.2.2
1.2.2 Aquatic biota: Refer to EROL, Section 5.1.3.1
1.3 - Chemical discharges to Altamaha River
1.3.1 People: Refer to FES-CP, p. V-4
1.3.2 Aquatic biota: Refer to Section 5.3.5
1.3.3 Chemical discharges and water quality: Refer to Sections 3.2.4, 5.3.2 and 5.3.5
1.4 - Radionuclide discharges to Altamaha River
Refer to Section 3.2.3.4
1561 204
E-1

_
,
1.5 - Changes in groundwater level
Refer to Section 5.3.7
1.6 - Chemical discharges to groundwater
Refer to FES-CP, p. V-4
1.7 - Radionuclide discharges to groundwater
Refer to FES-CP, p. V-4
1.8 - Biological effects from cooling system & intake / discharge structures
Refer to Section 5.1.3 of EROL, pp V-5 to V-10 of FES-CP
1.9 - Natural water drainage
1.9.1 Flood control: Refer to FES-CP, p. 11-12
1.9.2 Erosion control: Refer to FES-CP, pp. IV-1 and IV-4
.
2.1 - Chemical discharges to ambient air
2.1.1 Air quality: Refer to ER0L, p. 3.7-1. FES-CP, p. VII-2
2.2 - Salts discharged from cooling towers
2.2.1 People: Refer to EROL, p. 5.1-6, FES-CP, pp. V-1, V-3, V-5, VII-2
2.2.2 Plants: Refer to ER0L, p. 5.1-6, FES-CP, pp V-3, V-5, V-6
2.2.3 Property: Refer to EROL, p. 5.1-6, FES-CP, pp V-3
2.3 - Noise from cooling towers
Refer to FES-CP, p. V-5
2.4 - Fogging and icing
2.4.1 Ground transportation: Refer to FES-CP, p. V-3 & ER0L, p. 5.1-4,
2.4.2 Air transportation: Refer to FES-CP, p. V-3 & ER0L, p. 5.1-4
2.4.3 Water transportation: Refer to ER0L, p. 5.1-4
2.4.4 Plants: Refer to ER0L, p. 5.1-4
1561 205
E-2
.'

2.5 - Calculated maximum individual dose from gaseous radioactive
effluents
2.5.1 Noble gas effluents: Refer to Table 5.5-8
2.5.2 Radiciodine and particulates: Refer to Table 5.5-8
3- Total body doses to U.S. population
Refer to Table 5.5-3
Societal Costs
1- Operational fuel disposition
1.1 fuel transport (new): Refer to FES-CP, p. V-25. V-27 & LROL, Section 3.8
1.2 fuel storage: Refer to EROL, Section 3.8
1.3 fuel transport (spent) & waste products: Refer to FES-CP, p. V-25 to
V-29 and EROL, Section 3.8
1.4 Tuel cycle: Refer to Table 5.5-10
2- Plant labor force
Refer to Section 10.2 and FES-CP, p. IV-4
3- Historical and archaeological sites
Refer to FES-CP, p. !!-7, !!-12
4- Aesthetics
Refer to FES-CP, p. !!I-l
1561 206
E-3

t%0lX F: EO%IA EES E*IT RP MTG flX1EM Pm PLtAT, INT TS.1 AT 2rESprfSE TO fE CMDTS ON T.7T 'FDES ER"IT
^ N.R.C., Washington. D.C.p]c htpIIrtlTIrlti d allIIll hts 011 rec 5 June 21.1977
Page 2aNvinowtNT ALPROTECDON Div'Siospc wAs-.c*o= smrt? s w
, , ,ATLA ='A GE O*G A 3c334
a tro=Apo Leoemsa June 21.1977demand in the receiving stream and any unchlorinated river water used for
*j diluting the station discharge prior to return to the river. Considermg the<3
k various EPA recommended criteria for evaluating toxicity levels of totalq residual chlorine in receivmg streams, one can arrive at varying values for,
F 'F . 1 maximum total residual chlorine that should be permitted in the stationMr. Voss A. Moonf ' ey,@/2p yf . ~ discharge. The latest criterion recommended by EPA is contamed in theirAssistant Director-Environmental Projects document entitled. " Quality Criterta for Water" which recommended aDivision of Site Safety & Environ- W/A total residual chlorine level of 10.0 micrograms per liter for fresh watermental Analysis
,
\ and marine organisms. The 1975 annual environmental surveillance reportOffice of Nuclear Reactor Regulataan, , for Hatch Nuclear Plant. Unit 1. in Chapter 7 described the results of theNuclear Regulatory Commission T q* ':' * ,' ' Company's chlorination praettees with the tunimum, maximum, and
Washington, D.C. 20555 -
average total chlorine residuals discharged to the Altamaha River for 1975.The average total chlortne residual reported was less than 0.1 minigramsRe: NPDES Permit No. Ga 0004120 per liter with a single maximum instance lasting for approximate!y 20
Georgia Power Company minutes of 0.65 mtDigrams per liter. If this had occurred simultaneouslyPlant Edwin L Hatch with the 7-day,10-year low flow occurrence, the resultant total residualDocket Nos. 50-321 & 50-366 chlortne concentration in the receiving stream would still have been within
Dear Mr. Moore: the order of magnitude of the recommended criteria. It is not anticipatedthat the Hatch Nuclear Plant station diseharge will contain suffsetent
This will acknowledge receipt of your June 15, 1977, letter enclosing com- residual chlorine to result in receiving stream concentrations exceedingments on the draft NPDES permit for the above plant. Unfortunately your this criteria.comments did not arrive before conclusion of the public notice period andissuance of the final permit and therefore could not be considered in formulatmg 3. We will look forward to reviewing and commenting tg>on the unified tech-final permit conditions. nical specifications for both Unit I and Unit 2 to determme consistency
with any proposed e previously approved 316(b) study submitted by theEnclosed for your information and reference is a copy of the final permit a* permittee in compliance with requirements on page 11 of 19 of t!'a permit.issued to the Georgia Power Company. In reviewing the N.R.C. staff commentson the draft NPDES permit we would respond in the same order as follows: If you teve any further questions or comments, please do not hesitate to
1. The limit of 0.2 mg/l free available chlocine has been made applicable tothe average over.a given chlorination period and not the monthly everage Sincerely,as stated in the draft. The frequency of sampling has been changed from asingle grab sample to multiple grab samples during periods of chlormation. ; /
y y, .f ( 4Both these changes are reflected on page 3 of 19 in the permit.a
G ne B. Welsh. ChiefW 2. As referenced. the Rules and Regulations for Water Quality Control, m- ,
Water Protection Branch@ vised June 1974, in Chapter 391-3-6 .03(6XeM. include the prohibition of
any toxic waste "-. in concentrations that would harm man, fish and game." or other beneficial equatie life". It should also be noted that the Rules and GBW;mg
Regt.lations in Chapter 391-3-6 .03(9) stipulates that specifie criteria apply Enclosuresto all stream flows equal to or exceeding 7-day.10-year minimum flow onN unregulated streams. The Altamaha R2ver in the vicinity of the GeorgiaO Power Company. Hatch Plant, would be considered unregulated. The
dilution factor for the station discharge, at the 7-day.10-year low flow.would be about 38.5. This is without considering the effects of the chlorine
771750045Aft AFFI@MAflWE ACTION EoVAL EMPLoVMf ueT orromTWTV EMPtovt a
F-1
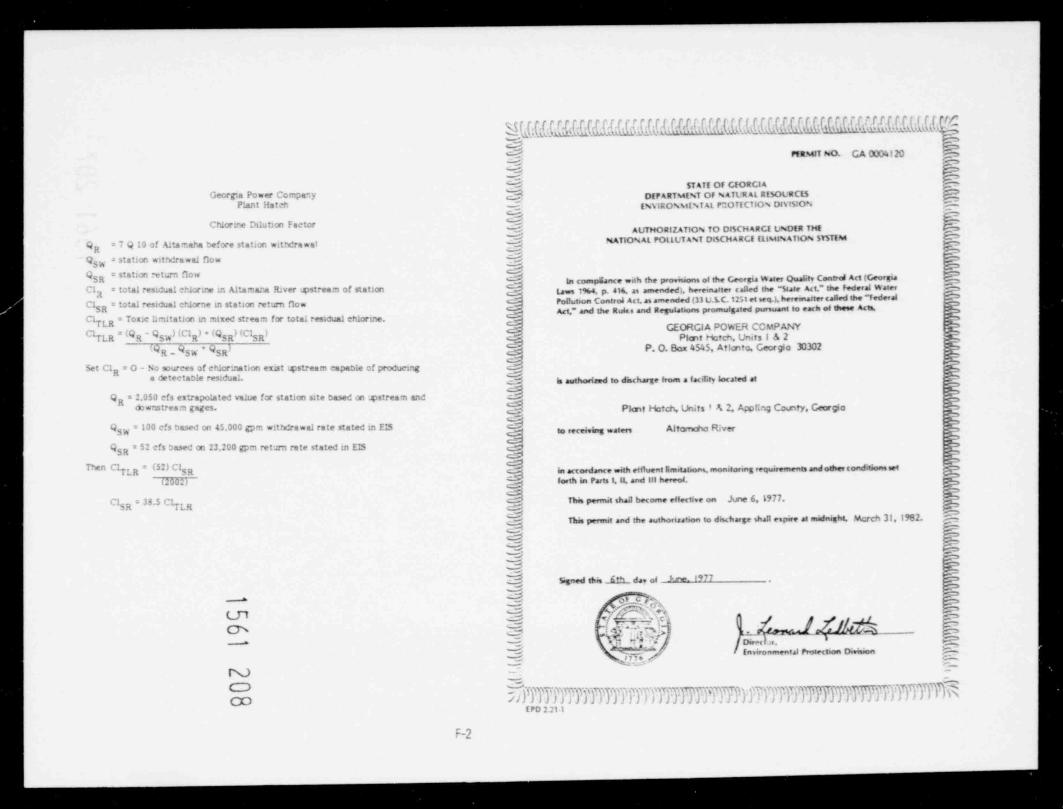
_ _ _
' i 1 U. 11 LJ.li .d 3 d
.ISIs PtRMIT p 0L CA 0304120 6g%M
I P DEPARTMENT F%4TL 4 RESOL;RCESP' t t IN51RONMENT AL P*tOTICTION Dl% t510N%
Ch;orme Dilation FactorM AUTHORtLATION TO Dr5CH ARCE UNDER THE3 NATIONAL POLLUT4NT DISCH ARCE ELIMIN ATION SYSTEMQ * 7 Q 10 of Altamaha before station w:thdranal bR
Q * station nitNta waf flow hSW
QSR = station eturn flow **" ' ' * F # ''' " *" bCl = total resicaal chlorme m Altamar.a R;ver testream of station Lawn 1%a. p."44, as asnendedL heeeenarter called the " State Act.* the f+deval Waves.-@
A Pollution Controi Act, as amended (13 UAC. t251 et seq.L hereinaster cared the " federal OC15R = total resi<2ual chlorne m station return flow ras and Regutet.ons pawnulgated pursuant to each M h Acw yCkLR = Toxic lamitation m mixed stream for total residual chlorme.
g^
~9 I ICkLR R 5W R* *
E SR Plmt Hctch. Units I & 2 g, 9 ]R P. O. Box 4545, Atlmto, Georgia 30302 6(qRESW SR A
6Set C1 = 0 - No was of eMormation ust wstream capable of pcoduemg
,
Nga detectable residual. is authorind to dacharge from a facility located at be
bQ = 2.050 efs extrapolated value for station site based on @ stream andR S" "'W''' Piet Hatch, Units 8 & 2, Appt:ng Comty, Georgia
@Q = 100 efs based on 45.000 gpm withdrawal rate stated m EIS so receiving water, Altamcha River a3g
Q = 52 efs based cri 23,200 gpm return rate stated in EISSR
4 "AThen C1TLR = (52) C1,R
'
in actordance with effluent Ern.tates, monitoring require,nents and other conditions see
U2J forth in Parts I,11. and ill heveed.
CI = 38.5 CkLR T This pemut ihait become effective on Jme 6, 5977.SR M,
Tu. it a,d the authonueion to dwha, e sha e,p.,e at idni.hi. Scrch ai, irez. g
E.-%
g4 Siened ihi, ses da, os n- i 77
a g
f ,$h N-
Ln:. i' / -.44.,
I
!@& O,L,Nv& J @A1
:
?! 06,,, mQ m."Environmental Proiection Division
y y p-
3 . I7 D 7[ 3 }}'[ 8 Ii7 3 3 ) M N )[II[7)3 D H D }} 3 [7[ F [7 0 N'CD LNCD
EPD 2.211
F-2
_. .
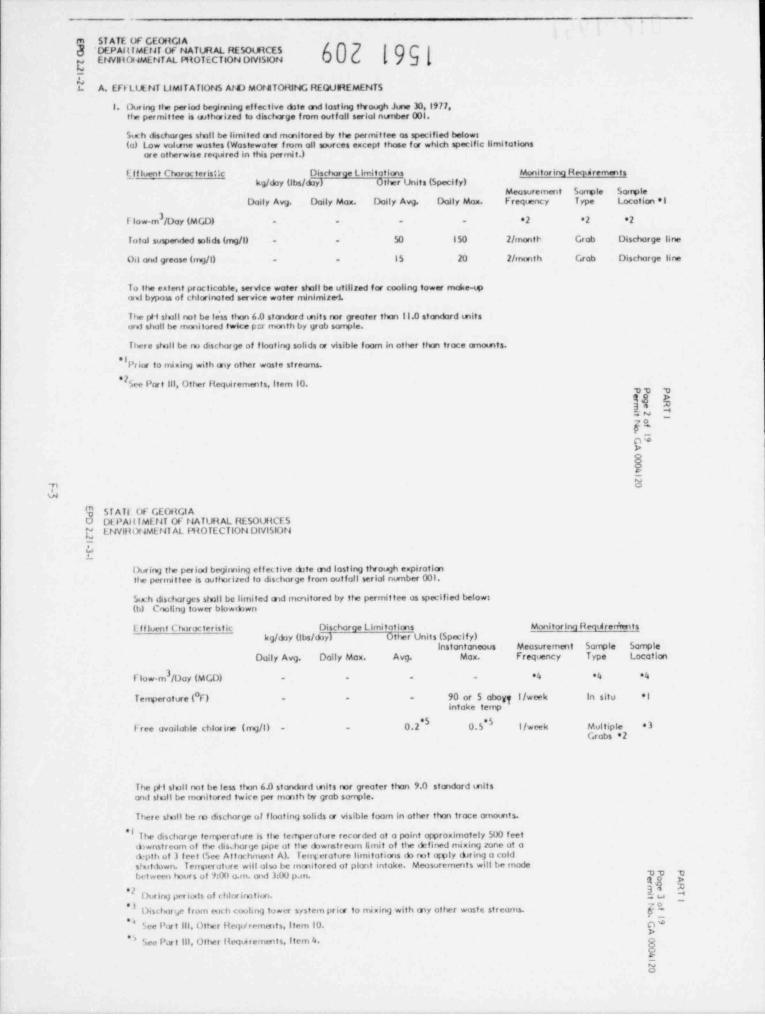
.
rn STATE OF GEOltGIA3 'DEPAllIMEtil OF NATURAL RESOURCES
EtNatONMEt4TAL PitOTECilON DIVISIOr4u
bA. Eft LUtref LIMITATIOt45 Ato MOraTORING REQUETEMENTS
1. During ste period begirming elf ective date md lasting ttrough June 30, 1971,tte permittee is wthorized to discturge from outfall serial nurter 004.
Sin h dscharges doll be limited md mmitored by tte permittee os specified belowt(a) Law vohsne wastes (Wostewater f rom all sources except those for whidi specific limitotions
are otherwise reqtated in ftis permit.)
E f f luent Choroc terisGe Dischar ge limit ations Monitor 6na Reqiarements~
kg/ day (lbs/ dry) Oiiir Units (Specify)Measurement Sanple Sanple
Daily Avg. Daily Max. Dolly Avg. Daily Max. Frequency Type Locationel
3I low-m /Doy (MCD) - . . - *2 *2 *2
Total suspended solids (mg/l) - - 50 150 2/montt Grab Discharge line
Oil and grease (ng/l) - . 15 20 2/nunt h Grob Discharge line
To the catent practicable, service water stoll be utilized for cooling towee rrwhe-wamt bypois of chlorinatal service water minimized.
The get stoll not be le'ss stun 6.0 simdurd mits for greater thm 11.0 standard mitsaest shall be erwnitored twice p r month by grab sortple.
There simil be rn dischorge of floatiruj solids or visible foam in other ttun trace omomts.
*IPrior to mixing with my other waste streams.
See l'or t til, Other llequirements, item 10.77 7%8i.l * $.. . ~ -~* 1 _V -o4>
sm&
9 STAit OF GEORGIAO Di PAlt IME t3T OF F4ATUlt AL RESOURCES[ ttNiltOr 4ML t4f AL IHOTECTIOt4 DIVl510t4OL
Durirmj tie perlod begiroing ef f et five dite md lostIng ttwough expiratimHe pernittee is autterleed to disomrge f rom outfall ser101 number 001.
Six h disciurges stoll be limited md mcnitored by tte permittee os specified belows(t >) Cooling tower blowd2wn
i f fluent Ctwworteristic Dischar ge limitotims Manitorinq Reqidren%ntskg/tby (Ibs/o yl Otter Units (Specify)
-
Instontoneous Measurement Sample SampleDaily Avg. Dolly Max. A vg. Max, Frequency Type Locotlan
I low-m /Doy (MCD) - - - - *4 *4 *4
Tenperature ( F) . - - 90 or 5 aboy 1/ week in sito 'l
intoke tenp
F ree available dilorine (ng/l) - - 0.2 0.5 1/ week Multiple *3Grabs *2
The pti slull not be less tten 6.0 staruliwd mits rur greater than 9.0 standard mitsand stull be mmitored twice per mmth by grab sompte.
There stoil be rn disdurge of floating solids or visible foam in other than trace amomts.*I The disdurge tenperature is the tertveroture recorded at a point approximately 500 feet
&wnstream of tte disshorge pipe at tie d2wratreom limit of the defined mining tone ut a+pth of 3 feet (See Attot tunmt A). Teng croture hmitations & rnt agply darirw) a coldstutslu*n. Tenseroture will aho be m<nutored at phrit intoke. Meusurements will be modet+ tween hours of 'h00 a.m. anit 3:00 p.m.
Ouriruj per hits of < blor imtion. h b ~-4
thsthurg f rom ein h (sm21erw) town system priis to risimiruj with my other waste streams. [1-'
e,See Pir t 111. Otter Heytiremmts, item 10. O '*
>.,' $ce P6r t lll, Otter lleqsiremmis, ltem 4.
eO
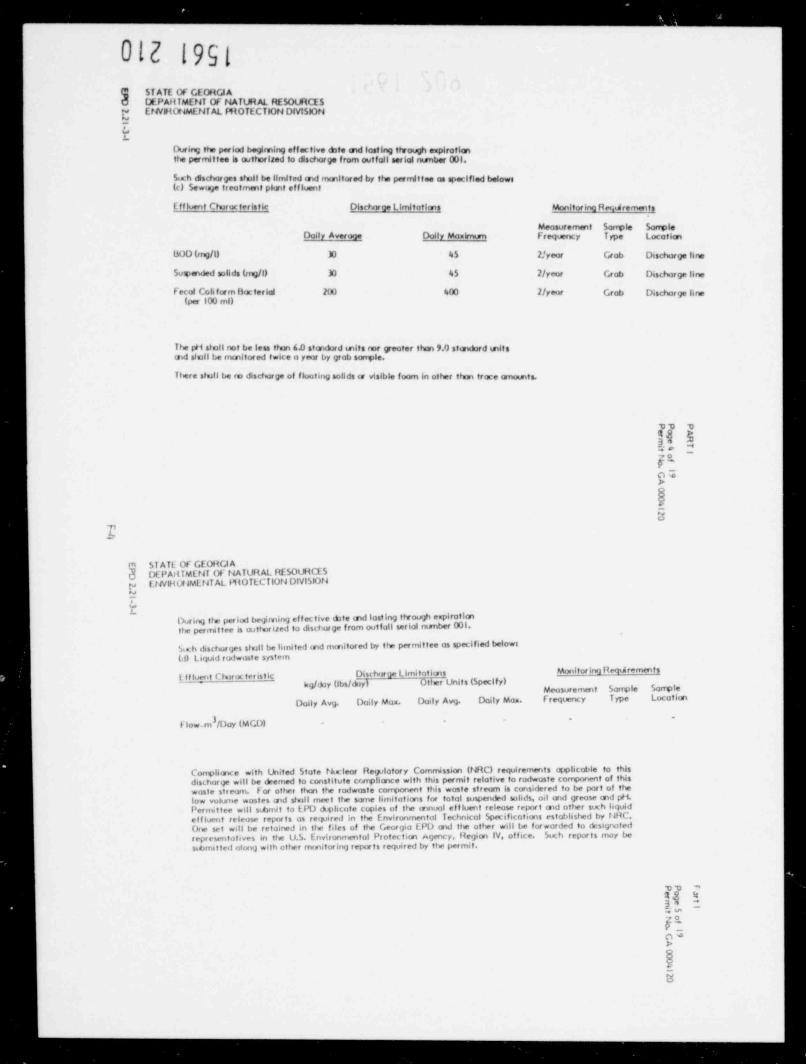
. ___.__ _ .
012 199[Q STATE OF GEOHCI AO DE PARTMEt4T OF F4ATURAL RESOURGSy Er#1 hor 4 met 4T AL FHOTECTlON DIVISION2
$Durity Stu period begiming effective &te end lostIng ttrough expirotlanits permittee is mettorized to discharge from outfall serial rusnbar 001.
Sah dsderges shall be limlfed md mmitored by the permlttee os spectfled belows(c) Sew <sje treatmmt plant ef fluent
E f fluent CFuror teristic Dischnroe limitotles Monitorina Revdrements
Measuremmt Sanple SorrpleDoily Average Daily Momirnern Freqiency Type Location
DOD (rng/l) 30 45 2/ year Grob Descharge hne
Supeded sullds (mg/l) 30 45 2/ year Grob Discharge line
fecol Coli form B4x ternal 200 400 2/ year Grob Discharge line(pu 100 ml)
Tre pti simil not be leu ttum 6D stcrxind mits ror greater than 9.0 stmdord mitscrid sloll be trusiltored twice a year by grob sortple.
Itere stull be to discharge of fluoting solids a visible foom in other ttum trace anomts.
tt 7
%S 53e=c e 2
os->
sA
19 ST ATL OF GEOHGI Ad DEPAHIMLt4T Of f 4ATUR AL RESOURCES
LtWlHOf JMLt4T AL FROTLCTIOt1 DIVISIONpMi,L
During t?e periM begiming ef fective ete md lostIng ttrough expirationthe perrruttee is osttuwlied to disctorge from outfull serial rusnber 00f.
Sith disctiorges stull be limited md nusiitored by the permittee as specified belows(J) Liquid rodwoste system
i illuent Cturor teristic Disdvirge Limitoti.sq Monitorinq Reqid rements- kg/doy (Ibs/doy) 01ler Units (Specify)
Measurement Sonple SorrpleDuely Avg. Daily Max. Duily Avg. Daily Mox. Frequency T ype Location
f low m /Doy (MCD) -' ~
Conpliance with Wited State tkalear Rery lotory Commission (NRC) requirements (wlicable to thisdesderge will be deemed to constitute creplimce with this permit relative to rodwoste corrponent of thiswaste stream. For other ttan the rodwoste component this waste streum is considered to be part of thelow volume wastes ed stcll meet tte some limitations for total suspended solids, oil und grease md pH.Pernuf tee will sihmit to LPD dplicate copies of the mnual ef fluent release report md otter such liquidef fluent release reports as re<pred in the Environmental Teomical Specifications established by t 4HC.One set will be retained in tie files of ite Georgio LPD und the otter will be forwarded to designatedrepresentatives in the U.S. Environnental Protection egency, Hegion IV, office. Such reports moy bess6 matted along with otter monitoring repor ts required by tte permit.
T7 *3$ k3e 2a,wo
_
o->
aeO
_ . _ . . . . .
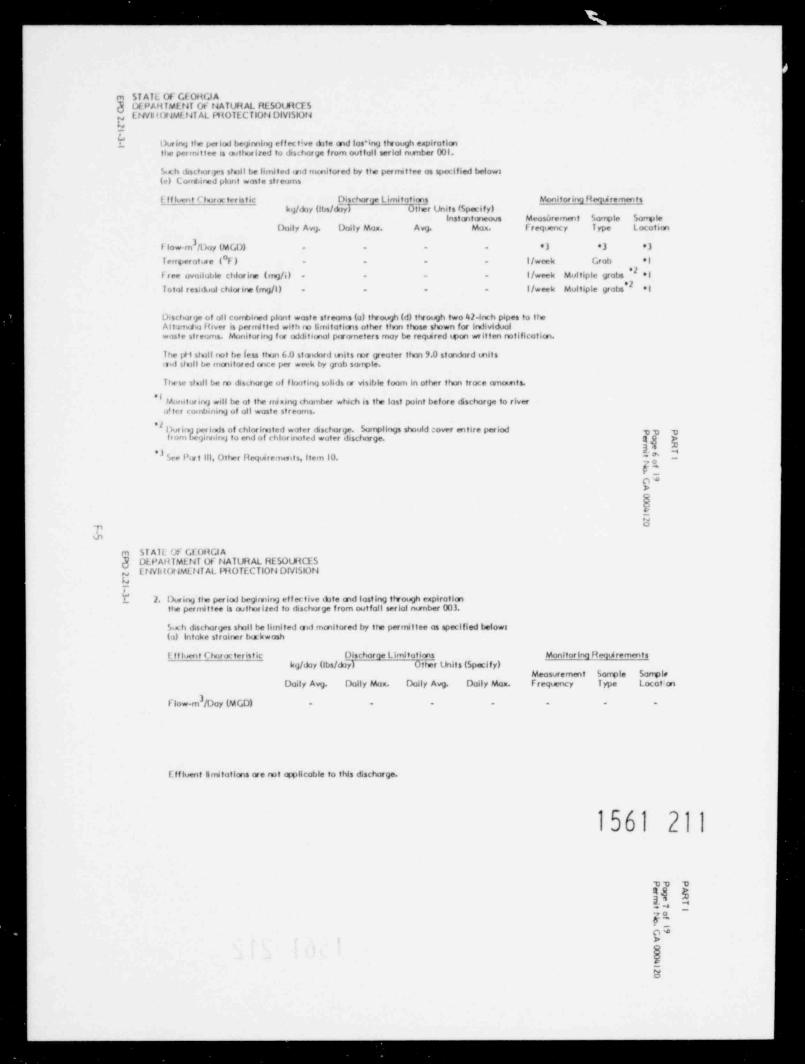
:
m ST ATL Of Gf OttGIA} IX PAttTMEr4T Of t4ATUHAL RESOURCES
LtNiltOf 4MLf 41 AL HtOTECTION DIVISR)r4u
bDur irw; ff e per lod termirwJ ef f ec tive ete wwf los'irw] ttrough expirationtte pervruttee as attavised to disetwwge from outtall serial runnber 001.
Sea.h ths(tuwges $Psall be limited md enmitored by tie pertruttee os sper.lfied belows(c) Cond> ired pliant waste streorns
i f f kent rt.irar teristic Dischorae limitatims Monitorina Hequiremmts~
kg/&y (lbs/dirl Otier Umts f5paify)Instontsmous Measuremmt Sormle Sormte
Dusly Avg. () oily Mom. A vg. Max. Freqienc y Type Locotion
3f low-m /Doy (MGD) - - - . *) '3 '3
Ienceratine ("f) - - - - l/ week Grob 'l
F ree ovenlut,le chlorire (truga - - - - 1/ week Multiple grots *2 .g
Totoi residuul chiarire (rywgl) - - - - 1/ week Multiple grabs *l'
Disctunge of oil corrbined pimt waste streoms (o) ttwough (d) through two 42-irth pipes to tPeAlt mmdio Hiver is perrrdtted with to limitaties other ttvn those stown for irstividualwaste streams. Muniforing for <x).htimal perorneters enoy be reqtired tgxin written rutification.
The Idt st.;il set be less stun 6.0 stasukud mits ruw greater ttun 9.0 sfcswkud mitsised sisdl be erwnstored uw e per week ty grub sortple.
Itese st ill be to distnurge of flmting solids or visible foam in other thun troce amomts.*I IA nator arvj will be of the mining dmmter which is tte lost point before dischorge to river
o'ler (oubmirwJ of oil wuste streams.
periiuls of thintimted water disderge. Surrplings should cover entire periodIbrera[egirworw; to end of chlorimtcJ wuter discharge. mi mf r om 3S >
3. * 3*I $ce P.s lit, Other Reqairemmts, f tem 10. 7 o* -
I:o->
eo
Tw
m ST AIL Of GFOHGI A@ DEPAHTMLf 4T Of f 4ATURAL RESOURCES
L f NIHuf 4MLt4TAL fHOTECTIOr4 DIVl510rl~
N2. Duriruj the period begimirw; ef ferlive ete ed losting ttrough expiration
tte permittee is attuwlied to dischurge from outfall serial rusnber 00).
Sin.h disderges stelt be limited runt mmitored by sne permittee as specified belows(o) intoke strairer txa kwonh
I f fluent C#wirorteristic Dist+mroe L imitatims Monitorinq Heqiirements
kg/ dor (Ibs/&y) Otter Units (Specify)Measuremmt Sorrple Sortple
Daily Avg. Dolly Max. Duily Avg. Daily Max. Frequency Type Locat on
3flow-m /Doy (MCD) - - - - - - -
Effluent Errutations are rot ogplicable to this discharge.
1561 211
mm m
2-*,o
I2o-D
U
...._ _ _---

_ __ _ _ _ __
rn $r Ait of Cf OttGI Ah OLPAltIMLt4T Of IJATURAL RESOUPCLSe EtNitt ol 4ME f 4T AL PHOTECTION DIVISIOrdMLL 3. ()uring tte period begiming effective dite ed lasting tNougli expiraticri
the permittee is mttorized to dischorne from outfall serloi rnanber 002.
Sm h esduarges staill be limited said monitored by its permittee os specified belows(.3) intoke sc reen but kwash
t Illoent Cteiror teristic Dischorge limitotims ~ Monitor 6ng HMid rements'
kg/diy (Ibs/dIy) 6tI7r Units (Specify)Measurement Sormie Sanple
Duity Avg. Daily Mon. Doily Avg. Daily Mon. Freqwrw y T ype Location3F low-m / Day (MGD) - - - - - - -
L ffluent limitotions are ret qplicable to ins discharge.
There stoll be re discharge of floating solids a visible foam in other tturi troce omcnets.
TT T
__ _*O
V :-ow>
f.
Uri
cb
M ST All. Of GEOHGa Ad DLPARIMLI4T Of t4ATUHAL RE50UltCESM EtNIHOt4 MENTAL PROTECTION DIVISIONtO 4. Ibring tie period begirviing July 1,1977, and losting ttrough expirationL tre permittee is mttorized to discharge from outfall serial number 001.
Sin h dictuarges sinal be hmited md mmitored by the perrnittee os specified belows(o) Low vol(ane wontes (Wostewater from all sources except those for wNch specific limitations
ore otherwise required in this permit.)I ffluent Cturat teristic Discharge t imitofims Monitorino Heedrementskg/doy (Ita/asy OiiFr Units (Specify)
Measurement Sorrvie Sortple ,Dualy Avg. Daily Max. Daily Avg. Daily Mou. f regia ncy Type Locatim ,3flow-m /Doy MGD - - . . 7 7 7
Total suspeided solids (mg/l) '3 '3 30 100 2/nunth Grob Discharge lineOil armi greuse (mg/l) *3 '3 15 20 2/rrwsith Grob Descharge line
The l i simil ret be less ttwn 6.0 stcridird units ror greater thm 9.0 st%dh
mits ed simil be trvnitored twice per mmth by grab sorwie.
There sinll be no discharge of floating solids or visible foom in other thcri froce amounts.*1 Prks to mining with my other waste streams.*2
See Pat lil, Other Reqdrements, item 10.')
Limitations may be rruide gplicable m mass basis once discharge flows ore estabilsted.
77 T
u$.i.l * _V,.
-
-
o<
156i 212 ie
__ ..

_ _ _ _ _ _
ST ATE OF GEORCI A PARTIMDEPARTMENT OF NATURAL RESOURCES STATE OF GEORGIA PARTI
Et4VIROtWE*4T AL PROTECTICN DIVI 5!ON Page 10 of 19Permit No. CA 000:6120 DEPARTMENT OF NATURAL RESOURCES -
ENVIRONMENTAL ROTECT.ON DIVISION Page it of 19 gPermit No. GA 0004120
B. SCtEDULE OF COMPLIANCEm
1. The permittee shcIl ochieve compliance with the effivent limitationsspecified for disci *arges in accordence with the following sche &le: g
4. (i) Within 90 &ys cf ter the promulgation of the 3|6(b) gaidelines, or not @Preliminary Engineering Report - 60 tys of ter permit is issued later than six (6) months prior to anticipated commercial @eration -
date of Unit 2, whichever occurs first, o proposed 316(b) demonstratimStart Construction - Dates to be prc<ided 30 days of ter pim of study and completion schedule will be s@mitted to theReport on Construction - Preliminary Engineering Report is Environmental Protection Division.Achieve Operational Level - opproved but in no event is Achieve
Operational Level to exceed July 1, (ii) The Georgio Environmental Protection Division will provide con-1977. currence or submit comments ed objections to the proposed plan
within 60 days of receipt.2. In order to ecument that the mixing zone will not create e objectionable
or domoging poitut:an condition, o biological survey should be completed of: (iii) The Georgio Power Cormey will initiate work m the study not later(1) o station upstream of tne discharge, G) o station in the mixing zone ed than six (6) months following the commercio! gerotion date for43) o station of the downstream edge of tte mixing zone, Unit 2.
The study will be completed in accordance with the following schedule: 5. No later than 14 calendor days following a date identified in the aboveschedule of compliance, the permittee shall submit either o report of
(i) A proposed plan ed schedule for completing the study will be sub. progress or, in the case of specific actions being required by identifiedmitted to the Georgio Environmento: Protection Division by dates, a written notice of compliance or noncompliance. h the lotter case,September I,1977. the notice sboll include the cause of noncortpliance, any remedici acticos
taken, and tbe pronobility of meeting ene nent scheduled requirement.(ii) The Georgio Environmento! Protection Division will provide con-
currence or submit comments and objections to the proposed plan byNovember I,1977.
(iii) The Georgio Power Compmy will initiate work on the study not laterthan six (6) montns following the commercial creration date forUnit 2.
(iv) The Georgio Environmental Protec' ion Division will review edcomment on the study data within 60 Wys of ter it is submitted.
If the study dato shows that the delineated mixing zone will not crecteon objectMcDie or domoging pollution condition there will be nochange in tne permit; however,if in the opinion of the Director of fneGeorgio Environmento! Protection Division the study snows that thedelineated mixing zone will crecte e objectionable or domogingpollution condition, tne permit will be revoked and reissued.
3. The Georg;o Power Company vill alw initiate work on a study to fieldverify and/or fine tune their thermal plurner predictive model not later thansix (6) months following the commercial operation date for Unit 2. Asummary report on ite results with my modifications to the model will besubmitted to the Georgio Environmantal Protection Division not later then15 months of ter initiation of the study.
EPO 2.2141 EPO 2.21 4-l
F-7
__

...
PART ISTATE OF CECaCI APART ISTATI or '7r*Cla T
D(P%RM NT OF NAT"eAL REU"!PCIS E.NV!AChNENTAL PRCTICTION DIVISION Page 13of I? -
ENv!RonM nTAL PRCECTICN Dh!SION Para 120f I? Permit A O NW \yPeret t A . GA 000ul20
IPn as used herein mean the rivision of Envirouestal Protection of d. The " daily maaimum" concentration means the daily determination ofNote:the Department of hatural Resources. concentration for any calendar day.
DC. eONITfiRING AhD REFCRTING e. Detghted by flow value" means the sumation of each sample con-
centration times its respective flow in convenient units divided1. Ayresentative SMing by the sum of the respective flows. w---
S. ples and measurements taken as required herein shall be representative f. For the ;vrpose of this pemit, a calendar day is defined as anyof the volume and nature of the monitored discharge. consecutive 24-hotr* period.
4, r,,e pwe,Ar,,2. A ,rting7
Monitorirs results obtained durits the previous senths snall be Test procedures for the analv is of pollutants shall conform to regulationsmusmarized for each month and re;crted on an Operation 143nitorirg Report published pursuant to Sectica 304(g) of the Federal Act.(Fors W 1.a$), postmarked no later than the 15th day cf the montafollowirg the completed reportirg period. The first report is d.e on S. hearding of ham!rs
Octooer 15,1977 The EPD may require reporting ofFor each measurement or sample taken pursuant to the requirements ofadJitional monitori g results by written notification. Signed copies
of these, and all other reports required herei.n, anall be autaitte3 to this permit, the penittee shall record the following information:the followird address: De exact place, date, and time of sampling;a.
Ceorgia Environmental Protection Division b. De dates the analyses were performed;unter Quality Control Section270 Washington St reet . SW c. The person (s) who performed the analyses 1Atlanta, Georgia 30334
d. The analytical techniques or met eds used; andt
3. Definitiemse. The results of all required analyses,
1he " daily average" discharge means the total discharge by weighta.during a calendar sonth divided by the ntsober of days in the menth
Where less 6. AFiticnal At'nitoring by Per==itteethat the production or comunercial facility was operating.than daily sarpling is required by this permit, the daily average If the permittee mnitors any pollutant at the location (s) designateddischarge shall be determined by the susumation of all the oc asured herein ere freqs.ently than required by this permit, using approveddaily discharges by weight divided by the number of days sampled analytical methods as specified above, the results of such monitoringduring the calendar sonth when the seasurements were made. shall be included in the esiculation and reperting of the values required
in the Dis::harge %nitoring Report Foru (EPA he. 3320-1). Such increasedb. The " daily manism.se" discharge means the total discharge by weight monitoring frequency shall also be indicated. The EPD may require more
during any calendar day. frequent unitoring or the monitoring of other pollutants not requiredin this permit by written notification.
c. The " daily average" concentration means the arithmetic average(weighted by flow valua) of a!! the daily deterwanations of c:ncen- E U N Pd8 h t*"fiO4tration made during a calendar month. Daily determinations o fconcentratt,on vede using a composite sample shall be the concentratien All records and,infstmation resulting from the monitoring activitiesof the composite sample. ahen grab samples are used. the daaly required be this permit including all records of analyses perforweddetermination of concentration shall be the arithmetic averate and calibration a,J amintenance of inst rtamentation and recordings from(weighted by fico value) of all the sarple collected durant that contanwus an>natarird instr.smentation shall be retained bv the per-atteecalendar day, for a minimum of three (3) years, or longer if requested by the State
Environmental Protection Division.-
,EPD 2.21 5.T '*21-6-!eer/74-
F-8 _
-

PART IIsert CT (MCMDLPARTT.XT CF aTJAL IISOCCESC A IEC:.% IAL I W ILCTION CIVISICN
Page 14 of 19 Pant IIPermit No. CA 0004120 TaTr or croacrgpfpapWT OF NATUut RESOURCES Page 15 of 19
A. MAMCC"3T REQUICCTS f w1RONNENial PRCTECTION DIV151om Permit %o. CA 000M 20
1. C7. W e in Nse q r*
*A!! discharges authorised herein shall be consistent with the tem a-d any diversion (roe or bypass of facalaties covered liv 'his pcret t 15conditions of this permit. The discharge of any pollutant identtfica inthis prit rcre fr-Mently th:n cr at a 1cvel in etcess of that av hari:ed prohibited. encept (t) where unavoidat te to prevent loss of life or N
severe property damag*, or (ii) where racesuve ston dratnage, runoff.shall co:tstitute a violation of the perlit. Any anticipated f1ciltty or infiltration would damage any f acilities necessary for comrlimee =ithexpansicas, production increases, er process rodifications eich willresult in new, dificrcnt, or increased discharges cr pollutants rest bg the effluent limitatiops and prohtbattons of this permat. The permittee dit t -
reported by suhission of a new NpCES a;plicatien or, if such ch:nges will operate the treatment works. inciating the t reatment plant and total sewe
DI of this
not violate the ef fluent limitations specified in this pet 91t, by notice system to mantmire discharge of the pollutants Insted in Partto the EPD of such ct:anges. Following such notice, the Termit ray be peret t from combaned sewer overflows or bvpas,es. The permittee shall Q
monitor all overflows and bvvasses in the sewer and treatment system. Naodified to specify and limit any pollutants not previously limited. a recort of each overflow and bypass shall be kept enth information on the
location, cause duration, and peak flow rate. Upon =rttten net t f tcation2. NonocrapZierce Notification by EPD, the permittee m.my be required to subatt a plan and schedule for reducing
If, for any-reason, the perr ttee does not comply mith or will be unable bypasses, overflows, and infiltration in the system.8
to comply with any daily r asimu:s effluent limitatien specified in this h. Fe"waf Sdst.mapermit, the permittee shall protide the 9ater Quality Control Se:tien ofEPD with the following information, in writing, within five (5) days Solids, sludges. filter backwash, or other pollutant s removed in the courwof becoming aware of such condition: of treatment or control of wastewaters shall be disposed of an a maner
such as to prevent any pollutant from such materials from entering matersA description of the discharge and cause of noncocp11ance; and of the State.s.
ifb. The period of noncompliance, includicg exact dates and times; or, 7, pc,,, 7,g g,,,,,
not corrected, the anticipated tir.e the nonco=pliance is expected tocontinue, and steps being taken to reduce, eliminate and Frevent In order to maintain compliance with the ef fluent Itattations and proh@ t io%recurrence of the noncc= plying discharge, of this permit the peruttree shall etther:
In accordance with the Schedule of Compliance contained in hrt 1a.3. Facilities Opet=ction provsde an alternative power source suff tetent to operate the =aste-The permittee shall at a!! times mairrtain in good working order and eperate water control facilities;
es efficiently as possible all treatment or control facilities or systees or if such alternative power source is not in existence, and no date forinstalled or used by the permittee to actieve compliance w. h the ter ns its implementation appears in Part I,and conditions of this permit.
Halt, reduce or otherwise cont rol production anJ/or all disdarge*b.4. Adverse ITc.it from wastemater control facilities upon the reduct ton, loss. or
failure of the primary source of po.er to said =aste=ater contrulThe permittee sha!! take all reasonable steps to minicize any adverse facilit ies.impact to navigabic waters resulting from noncompliance with any ef fluentlimitations specified in this per it, including such accelerated or S. R G W RILITIESadditional conitorinC as necessary to determine the natura and impactof the noncomplying dtscharge. 3. Pipt of Detry
The peretttee shall allow the Director of EPD. the Regtonal adstu st ratorof epa. and/or their authortred representatives, agents, er egloyees,upon the presentation of credenttals;
To enter upon the perusttee's premises where an effluent scurce isa. under thelocated or an which any recards are required to be kept
terms and conditions of tht s permt; andEPD 2.01 7
EPD 2 21 8
F-9

_ . _ _ _ . .
C-
N
A -
DLD
ST&H Of Ceca 014 P427 El3, mMPtRMN* OF %4TLS.4L RESOURCES'f o litysat sT4 f t '.TE: TION Pste M of O
rece6t w. CA 0004l20
D. At reasonable times to have access to and copy any records re:aus redto be kept under t*e terus and condit soas of thi s permit. to taspectany monttoring ertulpeent or mmtatoring met %nd requared in tha s peren t ;and to saapit any discharge of pollutants,
: Msfir of Me* ship ct Cmtr*'lfa. in the event of any change an coetrol er ownership of facilittes fmep =%ich t he aut hori zed discharges emanate. *he persattee sh.all not ify theQ succedtag eeer or controller of the esistence of this permit by letter,~
a corv of which shall be forwarded to the mater Quality Contro! Section, of EPD.
I 3. Aemi:,1N:iry of Feperta,
Eacept for data deterstned be the Director cf EPO to be confidentialy'- under Section 16 of the State Act er the Regional Adstnistrstor of they u.5. Environments! Protection agency under Section 3:t of the Federal
<5 ,
h3 Act, att reports prepared an accordance with the terus of this pernatep de shall be availadle for public inspection at the attaita efface of the EPD.*
h5 MJ e *, Effluent data shall not be considered confidential. Knowogly making anyg,i ,4 v false statement on any such report may result in the ingv ss tion of_<,g y .. ,o
k*b 3 [ o% criminal penalttes as provided for in Section ::(b) of tme State Act.**i dE(< 1 _ a. Fer="ix nedificatLm
*
tJ "
After written notice and opport stity for a hearsng, thts permit may be.
;p 8 modified, suspended, or revched la whole or in part daing its tere fory cause ancidimg, but not liasted to, the following:g e~ ~
* I a. Violation of any conditions of this permit;
| .1b. Obtainirg this permit be misrepresentation or failure to disclose
e E| fully all relewant facts; or'I
c. A change in any condition that restuires eit%er a temperary er[ permanent reduction or elimination of the permitted d*' . . . . .s --
et O.
a w" 5. brw Pe!!=tata5o 3
C L j S=Notwithstanding Part !!. B-a above, if a tonic efflueet standard orEE .
"i prohibition (including any schedule of compliance specified in suchE t c
* h"3 efflueit standard or prontbatton) as established under Section 30'ra),
h # *w
! k * of the Federal Act for a tonic pollutant which is present an the dac%arge"
5 * "k and such stam4ard or prc,htbat ton is more striegent than any llatta' on fer$8) such re!!wtant in t4as perett, this perwit s%all be revised of Wan ted"
in accordance =1th the tonic ef fluent standard or pechabit ten and the(peraattee so notified.
,
1
Ein : :19
F-D
. _ _

.
%Ta Ti 89 M k(.la PneT ITss P4afic aff rn %A T1J ka l Na bntfuG v1 %vinnrae vist. ritorictioN olvistoM rage 17 of 19
Perm i t so. CA 0004120 STATE OF CEORCI A PART 111
DEPARTvENT Of tat"9AL RESOURCES NGl / a,=s t w.im / # t.a t/ifv ENviROtWD.T AL PRO TECT ION J.1510N Page IS of I'
.. "Permt re. GA 000412040t hirig in this perett shall he construed to relieve t%e cere nt? e - t rcwa Ncivil or criminal penalties for noncompliance. OTrCR REQUREVENTS
There s v211 be no o schcr;e of polve**lorimted tapwnvl corroomes sucm os t*me ,---7 State L2ve 1. a
commonly use i for trmsf ar-er fivis. Admen str:tive proce@res N1 be insh ts?cd tohothing in this permie shall be construed to preclude the estitut ion cf (I) mo.ntain a octaued ir ventory of PCB vve, (2) assare erspneering oes ;n ed Dany legal action or relieve the permittee from any re=ponst*111t tes, cons *ruction to preclude re4ecse of PC3's to the environr,ent, ed W) et t ee t ,ve , gliabilities, or penalties established pursuant to any app 1Lca51e State detect the loss of PCB's f om equipr erit. Deto,1 of such proce*res st! C+
las or regulatton under authority preserved by Section $10 of the Federal s4.bmitted ro Icter than 130 cs:vs prior to receipt of PCB cantaning eqepment or af '"""
Act. ofready on s4te, not later than 60 cs2vs of fer permit cs issued.
S. Water Gim2Zity Sta' surds 2. Any metsi clean ig westes genercted will be cmtsired far fse+5er trectment ordisposd in a manner to permt compliance of teme of dischar;e = ti requirements
Nothing in this perett shall be construed to preclude the modificatson listed be6ow. This accues to my pre.operatianot chemcol cleaning of rne'ol processof any condition of this persit when it is deteruleed that the ef f Lent equipment also.limitations specified herein fatt to achieve the applicable State mater
3. Effective Jury 1,1977, the want.ty of pouwtets d:schargal .in me oi c'ean ng was*,quality standards. sist!) not exceed the qumtity artermined by multiplying aun f bw of rnetet cicanang
wastes times the concentrations listed below. The pr1 is to be in ft e range of 64-949, ,g gg, standard units.
The issuance of this permit does not coevey any property rights an either Effiv at Chcract** st:e Dischorne tJm.t, tim f M)
rea t or personal property, or any exclusive privileges, nor does it Och Ave yr Om *v ve. -authorite any injury to private property or any invasion of personal Tomi e Mids 30 100rights, nor any infringement of Federal, State or local !a or regulation' 04f ed greose 15 20
10. Erpira+ist of Pet =visPhosphorus * - 4.0
Permittee shall not discharge after the expiration date. In order tor-ceive authoritation to discharge beyond the expiration date, th, * Appliccble to pre-operatianc! cleeing wastes may.permittee shall submit such information, forms, and fees as are required A Neither free avcilab e chlor;ne nor total resideal chlorine may be discharged from myby the agency authorited to issue permits no later than 180 days priorto the expiration date. unit f ar more the two hours in ey one d2y and not more the one un.t in my pict
may discharge free availace or total res. dual chiarire at ey one fee miess the11. Cortested Bezrings utility em demonstrate to t*e State pr.or to July 1,1978, that tv units cannot
operate at or below this level of chlorinction.Any person who is aggrieved or adversely strected by any action of theDirector vf EFD shall petition the Director for a hearing within thirty 5. The cornpey s%Il not;f r the Director in wr; ting rot Icter t*w sixtv 100) acvs peer to(30) days of notice of such action, instituting use of my odditional b.ocide or chemical vsed in cool,rg sy3? cms, o*er
the chiarine, which mcv be toxic to aquotic life other t*m t'ese prev.ovs:v repor ted12. Severubility to the Environmental Protect.on Division. Such not,f;cction shcJi incivae:
The provisions of this permit are severable, and if any provision of t%:s (c) rer,e md generci correositian of biocide ar cremcolpermit, or the application of any provision of this permit to any (b) Frequency of usecircumstance, is held invalid, the application of such provt s ton to ot 5er (c) Qumt ties usedcircumstances, arkt the remainder of this persat, shall not be affected (d) Proposed effluent concentrationsthereby. (e) EPA reg.stration number, if applacable.
6. In *he event that asta streoms f-om veris awrees are combined for t'ectecet ofe s chcr 7, +N= q e t * v of coc% poh ,tri or po%tr* proper *v cm*- A1 tv tw s
permit stil not e=ceed the specif ed hmatat ans f ar fict source.
EPO 2.21 10EPO 2 21-13
F-ll

___
-
a
f
ST ATE OF GEORGI A PART 111DEPART. VENT OF NATURAL RESOURCES
I ENVIROrWENTAL PROTECTION DIVISION Page 19 of 19Permit No. GA 0004120
7. If the permittee, of fer monitoring for ct least six months, determines that he is| consistently rrecting the effluent limits contained herein, the permittee may requestj of the Director of the Georgia Environmental Protection Division that tne monitoring
requirements be reduced to a lesser frequency or be elimincred.W
8. All effluent limitations mmtimed herein shc!! be cpplied on a gross basis cs of July 1~1977, unless the permittee cm cemonstrate prior to July 1,1977, that such effluent
limitctions for my parameter should be c; plied on a net basis. However, credit for bpollutants in intake water will not be given where these ore in f act removed by thepermittee either for process water purity reasons or cs a consequence of treatment _for pollutants which are, m fact, added by the permittee.
V9. In addition to compliance with ef fluent i mitations t5e compmy is to continue to Lf)
evoluote appliccble methods md cvailaJle technology to reduce total residuol ,
chlorine levels. The compmy is to also continue to evolucte appliccble methods edavailable technology to reduce discharge of blowdown from cooling towers withinlimits established by best egineering practices. The compmy is to nrovide m annuctstctus report on its evoluotions with the first report to be semitted on March 1,1978.
10. Not later than June I,1977, o plan for determining the flow of the vcrious w utestreams will have been developed by the Georgio Power Company and sutmittee forreview ed approval by the Georgio Environmental Protection Division. The plan is tobe implemented within 30 days of EPD's approval of tne plan.
Bl. In the interim, pending promulgation by the Environmental Protection Agency ofeffluent guidelines fcr this waste category, construction practices ed control of siterunoff shcll be consistent with sound engineering practices such cs, but not restrictedto, those contained in " Guidelines for Eros'on and Sediment Control Planning andImplementation *, EPA-R2-72-015 (August, 1972) or " Processes, Procedures edMethods to Control Pollution Resulting from oil Construction Activity" EPA-430/9-73-007. (October, 1973). Becoming a co-operator with tne So;l ed watecConservation District serving the locci oreo ed installing facilities and measuresconforming to minimum design stedards ed specifications of the Soil ConservationService would otso be an acceptoele cpprooch. Within 90 days of repromulgation ofappliccble guidelines the practices being employed will be reevaluated by thepermittee and a proposed implementation schedule for modification or constructionof any necesscry control facilities shcIl be submitted to the Georgio EnvironmentalProtection Division.
PREVIOUS PERMITS
All previous State water quality permits issued to this f scility, whether for constructionor operation, are hereby revoked by the issuance of this permit. Ihis action is taken toassure complimce wit 5 the Georgia Water Quality Control Act, as amended, and theFederci Water PWtion Contro! Act, as c:ne,ded. Rece;pt of the permit con titutess
notice of such action. The conditions, requirements, terms md provisions of this permitca;thorizing discharge under the National Pollutant Discharge Elimination system governdischcrges from this facility.
con 71i .1
F-12
__

2 LT M : FTW CT!PiS % }.7T T13 FM'IT FFW O 'lCIA; Ry.T U'di 'IS. I ?O 2
Ch. . .
* Ufe. RID ST 6f ES-,8mVCLE AR RE GULATOHV COMuissiO8u b. ,
t (.' _uwmctoes D c 2ous*
-
,. ,2, A ~, ,
p c ~ .: rF t ~: Z s . . ' A r? ' r 5 w;;. .~ *""""*...*
QD-12;Dock =t s
M4.n d M- M 1. Pr g .,ca Erf1 cert L ttit at ters, out t all serial neer 421 Chlorinee====
liutatica i n c oc ! r g t owe r blowdown.
vr Rnc 3. Welsh. rhief e treatrett et chlorice in c x 113 t oser b l* . wn frage 3 of 19).a t t r F rct e sticn Bran.Iepartwnt ' Natural Researces ap ca -to te 1' ( ,13 tem sitk the N C staff's understanding ofEnvir M. mental Protection Divisicc
273 ktdtnxion Street. S. W. k .- 1 n IV cy. .t o f 0. . rg / l f r ee available ( 51or t e.e/tlanta, i+crd!4 3d 3 3'*
' # "I d L' 'UI1"3 '* h' '#' rage over a g nen dierinat ion per iod andDear '*r. Welsh:
not the s a. 5;y a verage stated in the draft ?.f;f3 Permit. The proposedav have revi wed Public Notice No. 77-) f o r t he draft NF:E5 Permit
An1Nring by single grab sagle woi,ld not be adeqt. ate to determinein conn < s t ien wit h t:.e Geot tia Power Ctepany's Edwin I . Hat ch Suclear
ave W e m entration during a chlorination period ner would it beFlant, and offer the at t aaeed c aent s for your consideratien.
ad e p t s- to av3ure t h.s t the t.n i t does rep discharge either total ocSincerels,
f ree residul f or rne then two h:sur s in any day (Other kequirementa No. 4
g).. g
[f t ta /d ', h .^ t I page 18 e f 19). Multiple grab samples are necessary for enforcement of
Voss A. % cre. Assistar.t Director these provisions.for Environmertal ProjectsDivision cf Site Safety and
Environmental Analysis
Office of Nuclear Peactor Regulation . Preposed Effluert L1=itatio,s. outfall serial etc.ber 001: Evaluation
of t otal residual c hlerine in combineJ hast e st ream.Atta hvnt;
Cerment. on NPD b Permit
The t e rm i t t e e is t a tenitor t ot si residoal c'ilorine in the ceabiced
plant waste s t r e a:ns (page 6 of 19). The permit can be modified if
r.ccessary to assare co=pliance hith State water qaality standards
(ite= 9 rage 17 of 19). App!! cable standarda in c lude the prohibitiots
of am toxic wast e in "%nc ent rat ions t hat vos.ld haraa man, fish and g ame
er etter bene t ic .al a l aa t ic li f e'' (Rules cf Georgia DNR. FT2
H

_ . _
-2-
- 3-
T J )i- 3+6 . C 3 (6) (c)6. ) . ~he | ;XC staff wvuld like to br.e4 .hether
measured values cf t e ral resid 2al t hlarine in t he wr.a i" < d p lan t waste
strea.n will be evalt.ated f or wmplia:.:e wi t h t he toxicity prohibition. req.est of t t.e ut ili t y. In Febru.ary of 19 7 7 the NRJ staf f recor== codedC
If so, it may be appropriate to ir11cate the criterion whh h would t,ethat the studica be diswat ir.ued Jee to the insignificaat losses
sustained to the fi.;.ery from wpiegement and entrainment. In Nused for this wab..ation.
Marc % of 1977 the a.mu al Fav tro vental Surveillance Report for -
W crq ared its s t a t ea.e n t for E.atJ t'n i t 2 cperativa at was t '.e 1970 ha+ received. The data were similar to that collected in 1975. Qf eeling of the stat! that t he wat er q aality s t.:ndard s should rewit Lf)
The GPC data f or bot h t he 1975 and 1976 studies and the NRC impact
in a r. ore strin cnt lir.;tation en chiarine conceat rat ton than thea apprai.+41 resulting in t he determination cf the st udtes are available.technalvgy based limit ations which appear in the draft permit.
3. P r.' posed Sc t.e.lule of Compit.snce: Ceordination of 316(b) Denon,trationbe adopted to cover both units when Unit 2 comes on line. At that
On pa',e 11 of 19 the permittee is reliired tu submit a 316(b) t irte it is anricipated that at least ene additional year of impingement
decenstration to the Georgia favironmental Protection Livision. and entrainment monitoring will be required to assess the combined
The Georgia Fower Cuep4ny (uPC) perf ormed both an fepingement and impact of both units on the aquatic resources.
entrainment monitoring progra f or Unit I during the years 1975
and 1976 as specified in t he t'nvironmental Technical Specif icat ions.
The results of these studies are summarized in the annual Favironmental
S urv e illanc e Reporta for 1975 and 1976. During the spring of 1977
the 20 reviewed and su=marized the results of the 1975 data at theutility. It is suggested that when the utility requests the %C
review of th? unified technical specif ications f or both units, members
of the State staff would evaluate and suggest appropriate changes to
these ocmitoring pregra=4 required for a 31o(b) study.
G-2
-

UNITED STATES INUCLE AR RE GULATORY COMMISSION
w ASN Norou o. c. 2osss ,,,,,,, ,,,,,,,,,,,u s NucLEma arGutatony
OFFICI AL SUSINFSSPE N ALTY FOR PRIV ATE USE, $300 ECO " "'''' "
L J
l561 221