ML20093N172.pdf - Nuclear Regulatory Commission
224
_ .__ _ _ _ __ ._. - _ _ _ _ _ _ _ _ . . _ . _ . _ < I. U l ex - [ , , I I Once-Through Integral System Test Program OTIS Loop Functional Specification i < RDD:84:4091-24-01:01 ; ! ] Prepared By: 0 The Babcock & Wilcox Company Research and Development Division g Alliance Research Center 3 ICT r r L UNITED STATES NUCLEAR REGULATORY COMMISSION Office of Nuclear Regulatory Research LI O 7915 Eastern Avenue |. Silver Spring, Maryland 20910 . September 1984 h and . B&W OWNERS GROUP and ELECTRIC POWER RESEARCH INSTITUTE, INC. P.O. Box 10412 3412 Hillview Avenue Palo Alto, California 94304 Principle Investigators: ARC DP Binningham MT Childerson GC Rush 8410310437 841022 ,/ PDR ADOCK 05000302 P PDR (% 0 | - . . __ __ __._.. _ ..__ ____ _.._ ______
-
Upload
khangminh22 -
Category
Documents
-
view
2 -
download
0
Transcript of ML20093N172.pdf - Nuclear Regulatory Commission

_ .__ _ _ _ __ ._. - _ _ _ _ _ _ _ _ . . _ . _ . _
<
I.U
lex-
.
[ ,,
I
I Once-Through Integral System Test Program
OTIS Loop Functional Specificationi <
RDD:84:4091-24-01:01 ;
!
] Prepared By:0
The Babcock & Wilcox CompanyResearch and Development Division
g Alliance Research Center3
ICTr r
L UNITED STATES NUCLEAR REGULATORY COMMISSIONOffice of Nuclear Regulatory Research
LI O7915 Eastern Avenue
|. Silver Spring, Maryland 20910 .
September 1984
h and
. B&W OWNERS GROUP
and
ELECTRIC POWER RESEARCH INSTITUTE, INC.P.O. Box 104123412 Hillview AvenuePalo Alto, California 94304
Principle Investigators:
ARC
DP BinninghamMT ChildersonGC Rush
8410310437 841022,/ PDR ADOCK 05000302
P PDR(%0
|
- . . __ __ __._.. _ ..__ ____ _.._ ______

1
QUALITY ASSURANCE STATEMENT
r
| To the best of my knowledge and belief, the material presented in this reportwas conducted in accordance with the following Quality Assurance Plan:
Once-Through Integral Test Program (OTIS), 8/2/83 QA 83014
!,
George W. RobertsManager, Quality AssuranceAlliance Research Center
O
I
o
O-
i
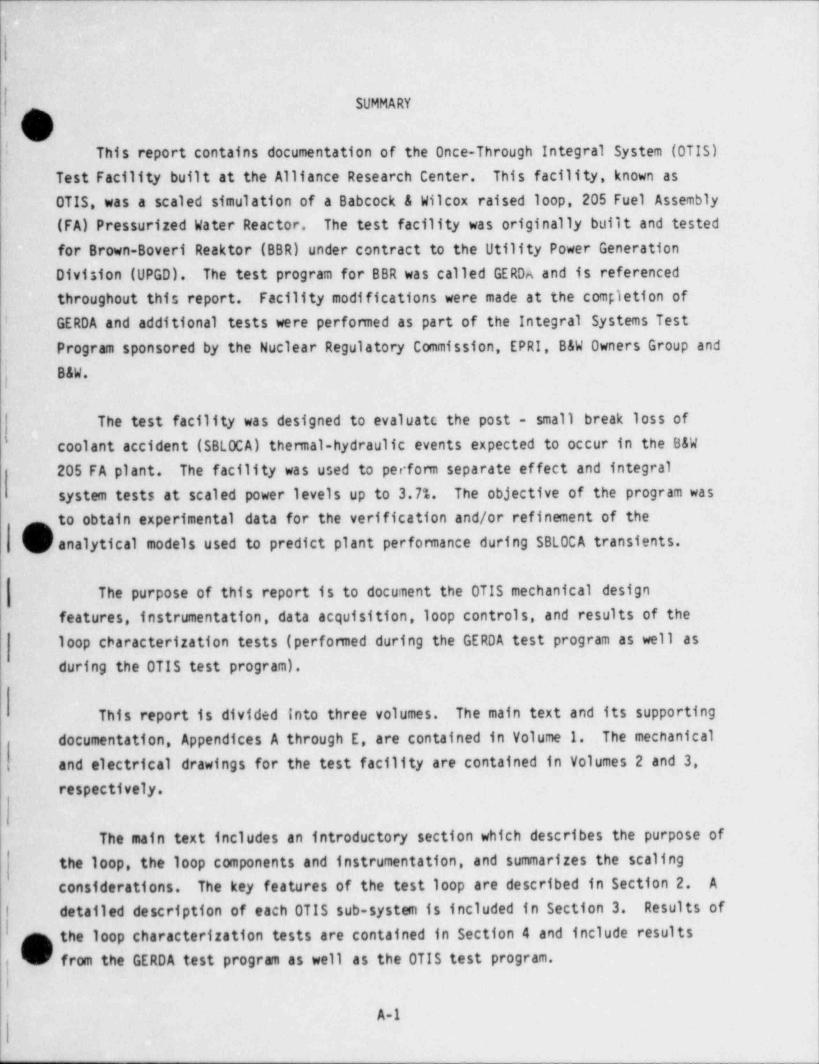
SUMMARY,I
! This report contains documentation of the Once-Through Integral System (OTIS)Tcst Facility built at the Alliance Research Center. This facility, known asOTIS, was a scaled simulation of a Babcock & Wilcox raised loop, 205 Fuel Assembly(FA) Pressurized Water Reactor. The test facility was originally built and testedfor Brown-Boveri Reaktor (BBR) under contract to the Utility Power GenerationDivision (UPGD). The test program for BBR was called GERDA and is referencedthroughout this report. Facility modifications were made at the completion of
i GERDA and additional tests were performed as part of the Integral Systems Test
Program sponsored by the Nuclear Regulatory Commission, EPRI, B&W Owners Group and
f B&W.
The test facility was designed to evaluatt the post - small break loss ofcoolant accident (SBLOCA) thermal-hydraulic events expected to occur in the B&W
205 FA plant. The facility was used to perfom separate effect and integralsystem tests at scaled power levels up to 3.7%. The objective of the program was
to obtain experimental data for the verification and/or refinement of thegVanalytical models used to predict plant perfomance during SBLOCA transients.
The purpose of this report is to document the OTIS mechanical designfeatures, instrumentation, data acquisition, loop controls, and results of theloop characterization tests (performed during the GERDA test program as well asduring the OTIS test program).
This report is divided into three volumes. The main text and its supportingdocumentation, Appendices A through E, are contained in Volume 1. The mechanical
1 and electrical drawings for the test facility are contained in Volumes 2 and 3,respectively.
The main text includes an introductory section which describes the purpose ofthe loop, the loop components and instrumentation, and summarizes the scalingconsiderations. The key features of the test loop are described in Section 2. A
1 detailed description of each OTIS sub-system is included in Section 3. Results ofI
p the loop characterization tests are contained in Section 4 and include results| (_/ from the GERDA test program as well as the OTIS test program.I
A-1

;
TABLE OF CONTENTS
Section Page
1.0 INTRODUCTION ------------------------------------------ 1-1
2.0 KEY FEATURES OF TEST LOOP ----------------------------- 2-1
3.0 OTIS SUB-SYSTEMS -------------------------------------- 3-1
3.1 Reactor Yessel and Downcomer -------------------- 3-3
3.2 H o t L e g P i p i n g ---------------------------------- 3-14
3.3 Steam Generator --------------------------------- 3-19
3.4 Cold Leg Piping and Primary Forced CirculationSy s t e m - - - - - - - - - - - - - - - - - - - - - - - - - - - - - - - - - - - - - - - - - - 3-29
3.5 P re s s u r i z e r - --- -- -- -- -- - - ------- -- - -- -- -- - - -- --- 3-36
3.6 High Pressure Injection and Facility WaterS upply and Cl e a n-Up Sy stem ---------------------- 3-43
3.7 P rima ry Ye nti ng Sy stems ------------------------- 3-48
3.8 Secondary Forced Circulation System and Feed-
Wa te r H e a te r s ------------------- ---- ------------ 3-55
3.9 Feedwater Piping -------------------------------- 3-60
3.10 Steam Piping ------------------------------------ 3-60
3.11 Secondary Low-Pressure Cleanup System (SLPCUS) -- 3-67
3.12 Noncondensibl e Gas Addi tion -------------------- 3-67
3.13 Data Acqui sition Sy stem (DAS) ------------------- 3-72
3.13.1 Initial Data File Processing ------------ 3-76
3.13.2 Post Processing of the Data File -------- 3-80
3.13.3 User Input for Definition of the OTISYT ABL E D a ta b a s e ------------------------- 3-83
| @
.

TABLE OF CONTENTS (Cont'd)
Section Page
4.0 LOOP CHARACTERIZATION TESTS --------------------------- 4-1
4.1 Hel i um L e ak Te s t -------------------------------- 4-1
4.2 Discharge Orifices - Vapor and Liquid Region ---- 4-3,
|- 4.3 Two-Phase Venting System - Checkout Test -------- 4-8
4.4 Irrecoverable Pressure Loss Characterization -Fo rwa rd and Reverse Fl ow ------------------------ 4-9
4.5 Heat Loss --------------------------------------- 4-10
4.6 Guard Heater Characterization ------------------- 4-17
4.7 Stored Metal E nergy Ef fec ts --------------------- 4-21
4.8 Calibration of Primary Flow Elements ------------ 4-29
4.9 Calibration of Feedwater and Steam Flowmeters --- 4-34
4.10 Filled Noncondensible Gas Test ----------------- 4-36
4.11 Temp e ra tu re C al i b ra ti o n s ------------------------ 4-39
4.12 Loop Volume Measurements Versus Elevation ------- 4-40
V
:!
i
!-
i
| oiUl|
|. _ . ._.___ _ _ , _ _ _ . _ _ _ _ . _ . . . _ . . _ _ _ _ ______,_._____.,__m.__________.___._______ ..

-
i
LIST OF APPENDICES
OAppendices Page
A OTIS FACILITY DRAWING $ L' W A-1 ,.
B INSTRUMENTATION AND VALVE DESIGNATION B-1
C OTIS INSTRUMENT LIST C-1
D VTAB DATA CARDS-PARAMETERS AND FORMAT D-1
E L QT OF PHAS_E_0,ANS CHARACTERIZATION TESTS E-1(GERDA AND OTIS)
O
,
I
O

.- - -
,
I l
i 1
|
7-LIST OF TABLES _
'
VTable Page
,.
3-1 Comparison of Key Elevations -- OTIS,vs 3-2-
Mulheim Karlich (MK)
3-2 GERDA Volume Checks 3-3
3-3 Reactor Vessel Vent . Valve Flow-AP Measurements 3-7(
-
t 3-4 Reactor Vesse'l< Vent Valve Response Time 3-9
3-5 Manufacturers' Specified Flow Coefficients 3-14for Valves in Reactor Vessel
i
3-6 Elevation of Hot Leg Guard Heater 3-19Zones and Control Thermocouples
n 3-7 Elevation of Multi-Junction Thermocouple Junctions 3-26,
' '
3 '8 Manufacturers' Specified Flow Codfficients 3-39*
for Valves in the Pressurizer
3-9 Feedwater Valve Position for 3' Feet Per Minute 3-58%
ID Level, IncreaseV
3-10 Feedwater Valve Positions for Simulating the 2-58Davis-Bessee AFW Head-Flow * Curve -
p 3-11 Steam Control Valves' Response Time 3-64.
3-12 Gas Addition Reservoir Volumes 3-70
3-13 Accuracy and Resolution of the Analogic ANDS 5400 3-72
Comand Procedures for Enhineering Data Files 3-803-14
3-15 QA Documents for Source Codes and Comand Procedures 3-84
4-1 Loop Characterization Test Categorfes 4-2'
\a
,
*
/m
.. !.;
y.t N
e;. ,,
y _i ei,*.
t -- , ~ , , , _ . ~ . _ , _ . , , , , . , , . ,,,,g , , _ _

LIST OF TABLES (Cont'd)
Table Page
4-2 Calibration Results for GERDA Leak Flow Orifices 4-(O'
4-3 Comparison of Gas Removed With Initial 4-8Gas Volume In Loop
4-4 Comparison of GERDA Measured and SAVER 4-10Predicted .1Ps
j 4-5 Effect of Steaming Rate on Stored Energy 4-28i Release
4-6 Superheat Produced by Stored Energy Release 4-28.
l 4-7 Total Gas Content Prior To Voided Primary OTIS 4-39Tests ' rte tc 'nc4uded-1+ter4--
O
i
f
I
O..
I

LIST OF ILLUSTRATIONS
UFigure Page
1-1 OTIS Test Facility 1-3
1-2 Comparison of Full-Size 205 Fuel Assembly 1-5Plant OTSG to 19-Tube OSTG in OTIS
1-3 Plant and Model HLUB 1-7
1-4 Comparison of Full-Size 205 Fuel Assembly Plant 1-8
| Reactor Yessti to OTIS Reactor Simulationi
1-5 Comparison of Full-Size 205 Fuel Assembly 1-10Plant Cold Leg to OTIS Cold Leg
1-6 OTIS Instrumentation 1-13
1-7 OTIS Differential Pressure Measurements 1-14
2-1 OTIS General Arrangement 2-2
2-2 Leak Flow Control Orifice Assembly 2-3
O 2-3 Leak Flow Control Orifice 2-4
(d2-4 Guard Heater Concept 2-6
3-1 Reactor Vessel and Downcomer General Arrangement 3-5
3-2 RVVV Arrangement and Flow Characteristics 3-8
3-3 Reactor Vessel Heater Response to a 60 KW Power Increase 3-11
3-4 Reactor Yessel and Downcomer Instrumentation -- 3-12Thermocouples, RTDs and Conductivity Probes
3-5 Reactor Vessel and Downcomer Instrumentation 3-13-- Pressure and Differential Pressure Measurements
3-6 Hot Leg Piping General Arrangement 3-15
3-7 Hot Leg Instrumentation - Thermocouples, RTDs, 3-17Conductivity Probes and Viewports
3-8 Hot Leg Instrumentation -- Differential 3-18Pressure Measurements
j 3-9 19-Tube Once-Through Steam Generator 3-20
Oiv
4
$. . . - . . - - __ ._- _ - _- _. - . . . - --

LIST OF ILLUSTRATIONS (Cont'd)
OFigure Page
3-10 Comparison of 19-Tube and Prototypical 3-21OTSG Tube Support Plates
3-11 OTSG Temperature Measurements and Tube 3-23Support Plate Elevations
3-12 OTSG Pressure and Differential 3-24Pressure Measurements
3-13 Radial and Circumferential Location of Primary 3-25Fluid and Primary Metal Thermocouples
3-14 Radial and Circumferential Location of 3-27Secondary Fluid Thermocouples
3-15 Location of Multi-Junction Thermocouples, Pitot 3-28Tubes and AFW Nozzles
3-16 Cold Leg Piping-General Arrangement 3-31
3-17 Cold Leg Piping-Temperature and Flow Measurements, 3-32Location of High Pressure Injection and Cold Leg Leaks
3-18 Cold Leg Piping-Differential Pressure Measurements 3-34
| 3-19 Primary Forced Circulation Loop 3-35
3-20 Pressurizer-General Arrangement 3-37
3-21 Surge Line Layout 3-38
3-22 Pressurizer Guard Heater Bias for Adiabatic 3-41Pressurizer for Tests Prior for April 3,1984
3-23 Pressurizer Instrumentation 3-42
3-24 High Pressure Injection System 3-44
3-25 GERDA 4 Pump HPI Head-Flow Curve 3-46
3-26 OTIS " Nominal" HPI/LPI Head-Flow Characteristic 3-47
3-27 Facility Water Supply and Cleanup System 3-49
O

~.
|
|
LIST OF ILLUSTRATIONS (Cont'd),,-)
%) ~
j- Figure Page
3-28 Single-Phase Venting System-General 3-51
j Arrangement and Instrumentation
3-29 Two-Phase Venting System-General 3-52Arrangement and Instrumentation
3-30 Two-Phase Venting System -- Differential 3-54Pressure Measurements
,
I, 3-31 Secondary Forced Circulation System-General 3-56Arrangement and Test Instrumentation
3-32 Auxiliary Feedwater (AFW) Scaled 3-59Head-Flow for Davis Bessee Plant
[ 3-33 Feedwater Piping System-General 3-61'
Arrangement and Instrumentation
j 3-34 Steam Piping-General Arrangement 3-62L' 3-35 Location of Steam Exit Pipe on OTSG 3-63
3-36 Steam Piping Instrumentation 3-65'
3-37 Secondary Low Pressure Clean-Up System General 3-68
| Arrangement and Instrumentation
3-38 Gas Addition System-General 3-69Arrangement and Instrumentation
3-39 Gas Addition Locations 3-71
3-40 OTIS Data Acquisition System 3-73
3-41 Initial Processing of OTIS Raw Data File 3-77
3-42 Follow-Up Processing of OTIS Raw Data File 3-82
1 4-1 Measured and Predicted Critical Flows 4-61 2
4-2 Critical Water Flow for a Scaled 9.8 CM Leak 4-7
.4-3 - GERDA Loop Heat Loss 4-12
4-4 GERDA Steam Generator Heat Loss 4-13g ,
i.
.
, - ,er~-,.--- c- s we,-v-ve-,-m,-r,,,,--.- s, m e ,m o .v w e. w o e w m-w or~ , , , -,n-- , v.---s----,-------.,,, ,, er,--.v--ew-,,--v.e, r--mr.-,--,--,,-,-
LIST OF ILLUSTRATIONS (Cont'd)
Figure Page
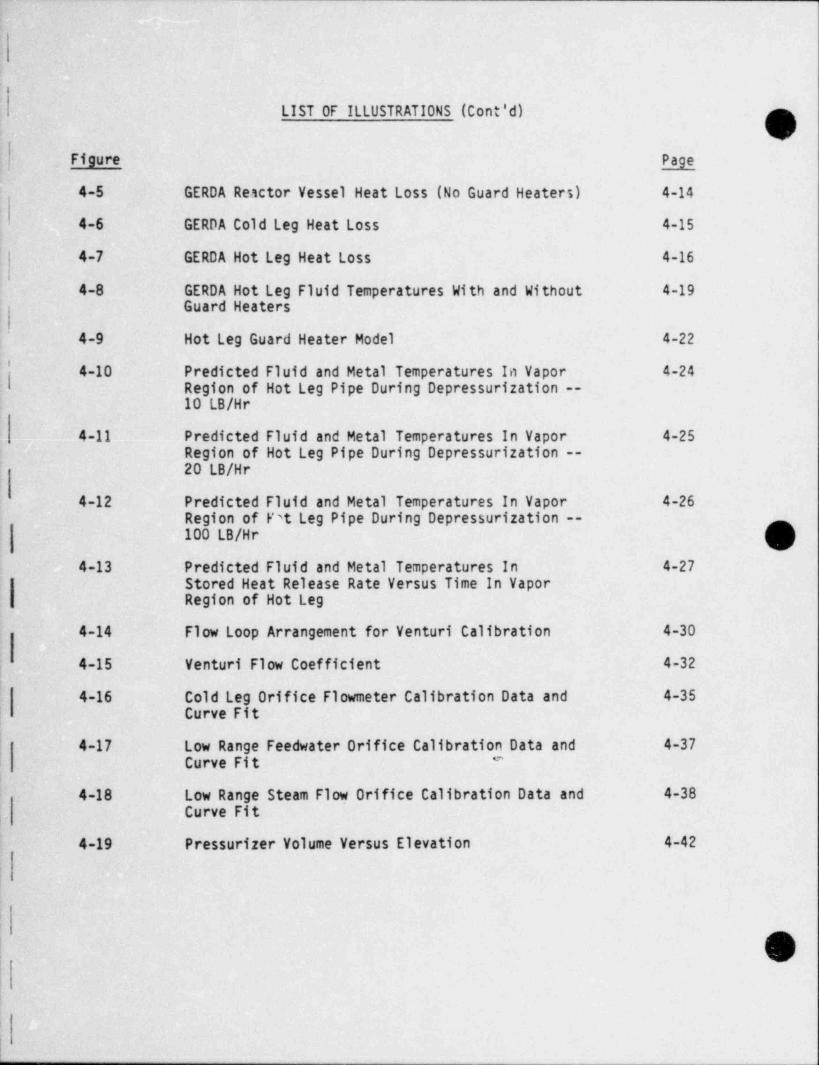
4-5 GERDA Reactor Vessel Heat Loss (No Guard Heaters) 4-14
4-6 .GERDA Cold Leg Heat Loss 4-15
4-7 GERDA Hot Leg Heat loss 4-16
4-8 GERDA Hot Leg Fluid Temperatures With and Without 4-19Guard Heaters
4-9 Hot Leg Guard Heater Model 4-22'
4-10 Predicted Fluid and Metal Temperatures In Vapor 4-24I Region of Hot Leg Pipe During Depressurization --
10 LB/Hr
4-11 Predicted Fluid and Metal Temperatures In Vapor 4-25Region of Hot Leg Pipe During Depressurization --20 LB/Hr
4-12 Predicted Fluid and Metal Temperatures In Vapor 4-26Region of F't Leg Pipe During Depressurization --100 LB/Hr
4-13 Predicted Fluid and Metal Temperatures In 4-27Stored Heat Release Rate Versus Time In VaporRegion of Hot Leg
4-14 Flow Loop Arrangement for Venturi Calibration 4-30
4-15 Venturi Flow Coefficient 4-32
4-16 Cold Leg Orifice Flowmeter Calibration Data and 4-35Curve Fit
4-17 Low Range Feedwater Orifice Calibration Data and 4-37#Curve Fit
4-18 Low Range Steam Flow Orifice Calibration Data and 4-38Curve Fit
4-19 Pressurizer Volume Versus Elevation 4-42
|
O
r

I
| LIST OF ILLUSTRATIONS (Cont'd)
.'Figure Page
i |
4-20- Reactor Vessel Volume Versus Elevation 4-43 )1
4-21 Hot Leg Active Region Volume Versus Elevation 4-44
4-22 Cold Leg and Downcomer Active Region 4-45,
Volume Versus Elevation
4-23 Steam Generator Primary, Hot Leg and Cold Leg In- 4-46Active Region Volume Versus Elevation
|
4-24 Steam Generator Secondary Volume Versus Elevation 4-47
|
|r
O,
I'
-- -. ... . - , . . . . _ . . - , . . _ _ , . - . _ _ . _ _ - _ _ _ _ , _ . _ , _ . _ - - _ - _ _ _ _ _ _ _.

TABLE OF ABBREVIATION
Of Abbreviation Definition
177FA 177 Fuel Assembly
205FA 205 Fuel Assembly
J AFW Auxiliary Feedwateri
ARC Alliance Research Center
B&W Babcock & Wilcox
BBR Brown Boveri Reaktor
CDC Control Data Corporation
i CLD Cold Leg DischargeI
CLS Cold Leg Suction
-DAS Data Acquisition System
DB Davis-Bessee
DC Direct Current
DEC Digital Equipment Corporation
DP Differential Pressure
GERDA Geradrohr D_ampfergeuger A_nlage meaning straight-tubesteam generator (test)
HLUB Hot Leg U-Bend
HPI High Pressure Injection
HPV High Point Vent
ID Inside Diameter
KW Kilowatt
LPI Low Pressure Injection
LTS Lower Tubesheet
! MK Mulheim Karlich
MWT Mega-Watt Themal

i-
t
/ ,T. TABLE OF ABBREVIATION (Cont'd)
,k)j- Abbreviation Definition
NCG Noncondensible Gas'
OD Outside Diameter
OTIS Once-Through Integral System (Test):1.
OTSG Once-Through Steam Generator.
PORY Power Operated Relief Valvej
QA Quality Assurance
II QQLP Quick-Quick Look Plots
RCP- Reactor Coolant Pump
RTD_ Resistance Temperature Detector
RVVV Reactor Vessel Vent Valve
SBLOCA Small Break Loss of Coolant Accident
- SFLTS Secondary Face of the Steam Generator Lower Tubesheet
TC Thermocouple
TSP Tube Support Plate
TVA Tennessee Valley Authority
UPGD Utility Power Generator Division -
UTS Upper Tubesheet
VTAB Variable Table Entry
,
O

r
i
1.0 INTRODUCTION
OPhase 1 of a contract between the NRC, owners of B&W nuclear steam supply
systems, B&W, and EPRI, involved modifications to and testing of the GERDA
| facility at B&W's Alliance Research Center. This experimental test facility wasdesigned to evaluate the thermal / hydraulic conditions in the reactor coolantsystem and steam generator of the Mulheim Karlich (MK) plant, a raised-loop B&We
|I 205 fuel assembly, pressurized water reactor during the natural circulation phasesOf a small break loss-of-coolant accident (SBLOCA). The test facility was a 1 x 1
| (one hot leg, one cold leg) electrically heated loop specifically simulating theimportant featuras of a raised loop plant. The facility was used to perfonn
,i
| separate effect and integral system tests at simulated scale power levels of aboutI to 5%.
Modifications were made to GERDA to support the subject Phase 1 workscope of
the renamed facility, OTIS. Specifically, the OTIS facility modificationsconsisted of the following items:
e Addition of a reactor vessel head vent and flow restrictor betweenthe upper plenum and upper head of the reactor vessel
,'
e Addition of guard heaters to the upper plenum and upper head ofthe reactor vessel
e Addition of a guard heater to the pressurizer surge line
e Relocation of the cold leg flow measurement orifice by adding aflanged section in the cold leg near the steam generator outlet
e Installation of a branched leak of the cold leg suction pipingwith a thermocouple for fluid temperature measurement
e Installation of a string thermocouple in one of the steamgenerator tubes (a string thermocouple was added to a second tubebut experienced early failure) and pitot tubes at the outlet ofthree steam generator tubes
e Installation of control valve limit switches for the high and lowi- flow feedwater and steam circuits to indicate valve closure
e Relocation of the lower tap for the cold leg suction pipingdifferential pressure measurement.
O
1-1
. . . .

!
.
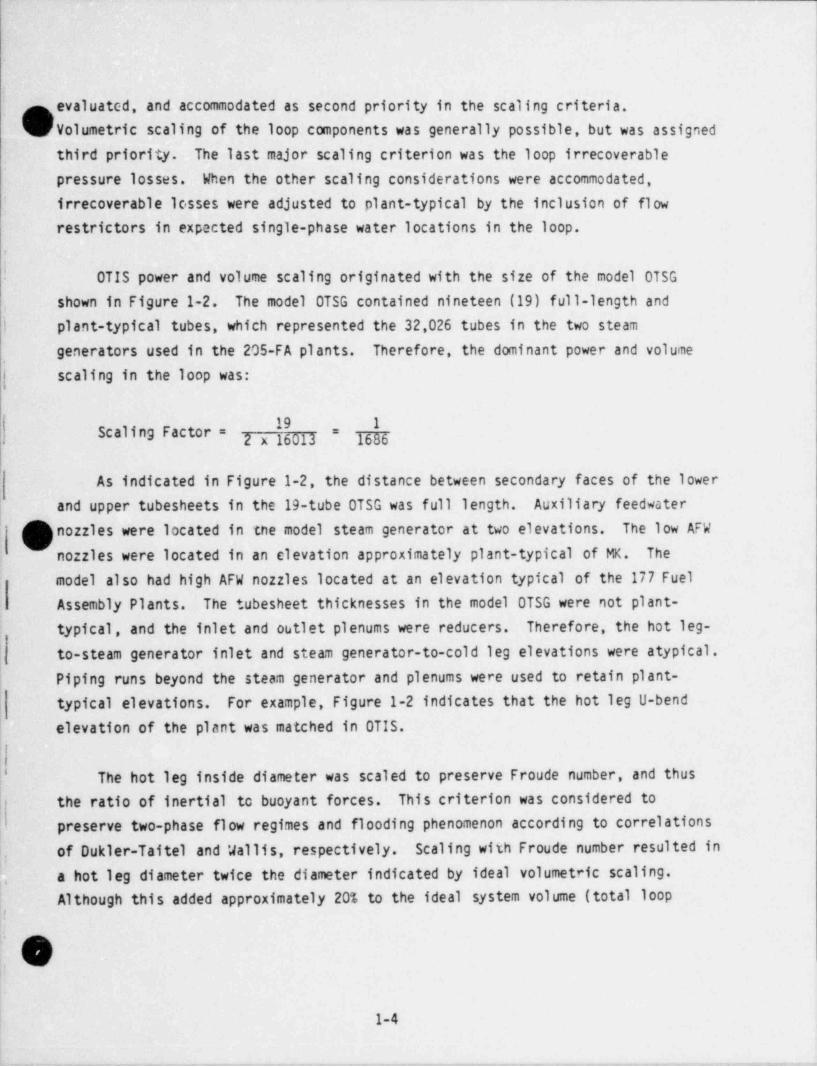
The general arrangement of the major components and systems of the OTIS Test
(,
j Facility is shown in Figure 1-1. The loop consisted of one 19-tube Once-Through
j Steam Generator (OTSG), a simulated reactor, a pressurizer, a single hot leg, anda single cold leg. Reactor decay heat, following a scram, was simulated in thetest loop by electrical heaters in the reactor vessel. No pump was included in'
the main primary loop, but a pump in an isolatable cold leg bypass line wasavailable to provide forced primary flow. The test loop was full raised-loop.
! plant elevation, approximately 95 feet high, and shortened in the horizontal plane(to approximately 6 feet) to maintain approximate volumetric scaling.
!Other primary loop components included a reactor vessel vent valve (RVVV),
|pressurizer pilot-operated relief valve (PORV) or safeties, and a hot leg highpoint vent (HPV). Auxiliary systems were available for scaled high pressu einjection (HPI), controlled primary leaks in both the two-phase and single-phaseregion, a secondary forced circulation system for providing auxiliary feedwater(AFW) to the OTSG, steam piping and pressure control, a cleanup system for the
' secondary loop, and gas addition for the primary loop,
o1
The configuration of the test loop was dictated by scaling considerations ,The four scaling criteria used to configure OTIS, in order of priority, were:
e Elevationse Post-SBLOCA Flow Phenonenae Volumese Irrecoverable Pressure Loss Characteristics
SBLOCA fluid behavior is typically buoyancy driven; therefore, full elevationmodeling was assigned first priority. To obtain flow phenomena in the test loop
| as close to plant-typical as possible, the governing phenomena were determined,
IDetails of scaling considerations are presented in Design Requirements Specifica-U tion for GERDA, b * Document No. 12-1123163-01, July 1981, and in the OTIS Design
Requirements, B&W Docu...ent No. 51-1149127-00, February 1984.!
:/O
:
1-24
,
, , - . , ,. . , _ _ _ - . . - - , , , , - - _ , - - - - . . _ - .,- . . . , , - - - - - - , , , - , . , , , - . . . - . - - --

,
,
I
l
iI
, . . . . . _ . . _ . . _ _ _ _ . _ _ _ _ _ . _ _ _ . . _ _ . . . .
1 . =Ms g~A __ --| - -
.' ;>-- i i
,
o v}/3" g-.-,.t. :: ; v' <6.A , e ::.,
4 ,
=-
, __, ~_i ..- -
,
!, ,.. ,
, . . . . . . . , __
- - ,
1,I i .e 1
0 , i j
%x' Q.. u ,i ,.. . . . . . . , ;
'| |,...........---e .......... 3 ,-_
; , ;. y .i = m._..__,
, z - II, , ' i
. A, 1i . '-- i .:-| .,j i, -- ii_, , ,_ .
, . , ,
;_
["" ~",':::::::::::.'.. , | ,'.'--------:-=;;.,.---------'. . . i' e e gI g' >|. GP 6 3 g< gI
i i 1
't,i D e8 e i gL......'T..e 6 m,p , g
* * ~ ~ ~**-~~1 -
g i er*-*--**t 4 8 1
1 I g'
0 4 .
i I I8 % v8 t = 1 i i.
,- -[t ,,- - - ,|
'8
e *"" |i ,
.. ..
;. .. , _ -
,L- ,;; ;,., J f~ | ;.,
-- "- -
| ; | ||- ;=, -
, , ,,8 N g i I
I Ie |e ee ', _am
| t i1
s * = i iI 4I ^ ; g0
|8. . " " . " " 1 E''.""..,.*" i
*..........g . . ._,; 1
i is. .a i3 iM-- ,i L............._..,_=, 4*
r------------------------' ":::"'s ' ' 't _ ** C, * W' ' . | [hk |
***,
qL.-| s s ;. . . . . . i| ,
n ::: .- e' * ,_ e gv IB a ,'
s. '-"
! | D ":|'.""." | a,, _
| r' ,a> " " " " " " ' -
i
I .- g i. F..8. a - -- i) g
*
: .a- - -
__| p....g g y -.. ,| = g.=.---, . . , , , , , , ,
-- .. ,= _, ,.R | i i.
| g W =
| ||. w i
!,~~
|' = =-a ,
. = . _ .. --e--- . . i ,ch i ,
|^ - :r- ..
| . El i i
.,.....; |.6......... m. m. m ..... ,. . , ,
4 m.re. g. --
., t........,
~/.
.i
{
Figure 1-1 OTIS Test Facility
0,.
!
1- 3
fqcvaluated, and accommodated as second priority in the scaling criteria.VVolumetric scaling of the loop components was generally possible, but was assigned
third priority. The last major scaling criterion was the loop irrecoverablepressure losses. When the other scaling considerations were accommodated,
' irrecoverable losses were adjusted to plant-typical by the inclusion of flowrestrictors in expected single-phase water locations in the loop.
t
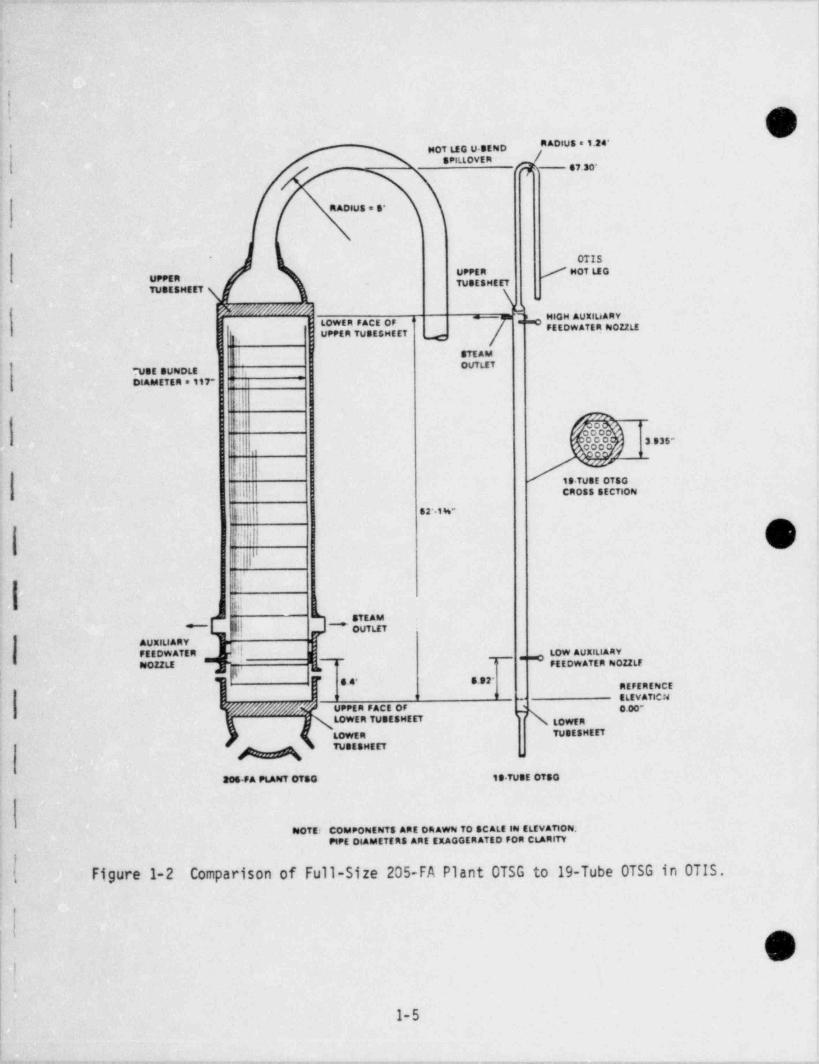
OTIS power and volume scaling originated with the size of the model OTSGshown in Figure 1-2. The model OTSG contained nineteen (19) full-length and,
i plant-typical tubes, which represented the 32,026 tubes in the two steamgenerators used in the 205-FA plants. Therefore, the dominant power and volume
j scaling in the loop was:
Scaling Factor = "2 x 1 013
fAs indicated in Figure 1-2, the distance between secondary faces of the lower
| and upper tubesheets in the 19-tube OTSG was full length. Auxiliary feedwaternozzles were located in tne model steam generator at two elevations. The low AFWnozzles were located in an elevation approximately plant-typical of MK. The
model also had high AFW nozzles located at an elevation typical of the 177 FuelAssembly Plants. The tubesheet thicknesses in the model 0TSG were not plant-typical, and the inlet and outlet plenums were reducers. Therefore, the hot leg-
L to-steam generator inlet and steam generator-to-cold leg elevations were atypical.Piping runs beyond the steam generator and plenums were used to retain plant-typical elevations. For example, Figure 1-2 indicates that the hot leg U-bendelevation of the plant was matched in OTIS.
The hot leg inside diameter was scaled to preserve Froude number, and thusthe ratio of inertial to buoyant forces. This criterion was considered topreserve two-phase flow regimes and flooding phenomenon according to correlationsof Dukler-Taitel and Wallis, respectively. Scaling with Froude number resulted ing
!c a hot leg diameter twice the diameter indicated by ideal volumetric scaling.Although this added approximately 20% to the ideal system volume (total loop
3
I (O'
1-4!
. , - - . - _ - _ . - - . - . . - _ . . _ - _ _ , - _ . - -- . - - - - - - - . _
||
|
|'
i
(.
O'
R ADIUS e 1.24'4 HOT LEG U BENDSPILLOVER ,
RADIUS = S'
|
OTISUPPER / HOT LEGUPPER TUDESMEET
TUSESHEET
f&G9&?&#?A?%& 'JIQ HIOM AUXIUARYd' -
.| LOWER FACE OF FEEDWATER NOZ2LEUPPER TUDESMEET
! STEAMOMT
'U9E SUNDLE ij_
.
DRAMETER e 117" r i
Nil -
, so
3 H5"h ,, o
19. TUBE OTSG
h N!h CROSS SECTION
|Ulm uw
IMil $||.t.L..
l 
:
i Ovolume), this choice of hot leg inside diameter was considered most likely to2
avoid the whole-pipe slugging behavior observed in the SRI Reflux Boiler Tests ,,
(The hot leg U-bend in OTIS is shown overlayed on the plant hot leg U-bend in
{ Figure 1-3. As indicated in the figure, the plant spillover elevation is obtainedin OTIS by matching the elevations of the bottom (inside) of the plant and OTIShot leg U-bend pipes. The hot leg U-bend in OTIS is exactly volumetrically scaled'
j.(1/1686). The inside diameter of the hot leg U-bend pipe was set by the2
phenomenological scaling of the hot leg. The radius of the U-bend was chosen toachieve exact volumetric scaling.
The pressurizer in OTIS was volume and elevation scaled. With this scaling,the OTIS pressurizer was approximately 20 inches shorter than plant-typical. The
) olevation of the bottom of the pressurizer was plant typical as was the spillunderelevation of the pressurizer surge line. The centerline elevation of the hot leg-to-pressurizer surge connection matched the plant hot leg-to-surge centerlineelevation.
O An electrically heated reactor vessel provided heat input to the primaryfluid to simulate reactor decay heat levels to 3.7% scaled power. Based on aptwer rating for the Tennessee Valley Authority (TVA) Plant (a domestic B&W 205fuel assembly, raised loop plant) of 3600 MWt, 3.7% scaled power in OTISccrresponded to 79KW (3600/1686 x 0.037 x 1000). The OTIS reactor vessel heat
input capacity was 180KW.
,
The design of the OTIS reactor vessel compared to the 205-FA plant reactorvessel is shown in Figure 1-4. The annular downcomer of the reactor vessel was'
simulated by a single external downcomer in OTIS. The sp111under elevation in theh:rizontal run at the bottom of the downcomer corresponded to the elevation of the
uppermost flow hole in the lower plenum cylinder. The OTIS reactor vessel con-
" Reflux Boiling Heat Removal in a Scaled TMI-2 System Test Facility," R.T.i Fernandez, et. al., paper presented at Thermal Reactor Safety Meeting, Knoxville,, (April,1980).lO
as,
1-6
L.

i-1
(-.
i
/ i e.
/ N
I y
|
A'3/ ., . *, 2% 2- t.
6 OE
'T TD E"
V> o 2
Q.
mb
Ee
I E $E .R
\ , wN
o--.
| * O1s
N I: .
e.
| NI
.
9
i
.
I
'
O!
,'!
1-7'
'

- . _ _ _ . . _ _ _ _ _ _ _ _ . _ _ -._ ._ ___ ___ _ __
,... ,. . . ,
, _ ,
) (Dv xJ v)t
4
4
,
' vorMfNutt .
.
/'
,,
- . .eactosi / tre.eacton -
f/4 ve sseti vesset
7/4 vant watve' ve=T .
aman'Q 7,,",,,N -paiamEi * * * "_ ,
/oo o g,o os. .c.o. v.. t . _. _ . ._ _ ,
cu . . . , _ ,__
ELivatto4L" Fr|coto tre To atacH388 vt99ft esor2tf cfarftetlut
-: alsoi. abo.rvishrio orua oirtiawiiatmay . .mmm m x _
L vo neuves- g : _ _ _ _ _| \rottrocoto tee y :______
( ofISoo co ..-
/ cone w.wt, ..* +) i
s,
m~ ,- y
' v~~
k 5 I
& - 5 wineoitii5fn - g |.:g~
-ts r 3= ce=vre oe
,,,,,c,,,,
3 g'! vesset s
; aoo==consen s; > , g
~ ' -
.
$ IC~ -@
-
t+ _ _ _ _ _ _ _ _ _ _ _ _ _ _ _ _ _
A
' '
x
# "" "".! Qllllllllllllll! k . aa="co='_" '? =_a are *'uua'a P
. __ _ _ _ . , , ,
e move; ec-o==vs aar oma== to scate = stewarions;, 88 ano non OTIS m acrose
to-ea - . **=====,e ruv snameisas,oa cua,,irouvat osstaascee angiwantnooo.aano ,
,
Ptt ssuet '
t
206 f a Ptaarf ataCTodt vf 35ft
figure 1-4 Comparison of Full-Size 205 Fuel Assembly PlantReactor Vessel to OTIS Reactor Simulation
-

~||
' sisted of three regions: a lower plenum, a heated section (core vessel), and anupper and top plenum. The center of the heated length of the core vesselcorresponded to the center of the active fuel length in the plant core. The corevessel, portion of the reactor vessel contained excess volume due to construction
{ constraints; therefore, to maintain the total reactor vessel model scaled volume,the reactor vessel was shorter than plant-typical. Non-flow lengths were
. sacrificed to maintain reactor vessel scaled volume, that is, the lower plenum was,1
shortened below the downcomer spillunder point, and the upper and top plenum was. shortened above the reactor vessel vent valve spillover point.
k.Cold primary fluid entered the downcomer from the cold leg, and heated
primary fluid exited the upper plenum to enter the hot leg. The center of thecold leg to downcomer connection in OTIS corresponded to the cold leg-to-reactorvessel nozzle centerline in the plant. Similarly, the center of the hot leg-to-upper and top plenum connection in OTIS corresponded to the reactor vessel-to-hotleg nozzle centerline in the plant.
The cold leg in OTIS is compared to the 205-FA Plant cold leg in Figure 1-5.As indicated in the figure, the OTIS cold leg did not contain a pump, since OTISwas designed to simulate the natural circulation phases of a SBLOCA. A flange wasprovided in the OTIS cold leg just upstream of the reactor coolant pump spilloverpoint so that a flow restrictor could be inserted to simulate the irrecoverablepressure loss characteristic of a stalled reactor coolant pump rotor. This flange
| was not used in OTIS to provide simulated locked pump rotor resistance. Rather,
the resistance was positioned at the flange assembly downstream from the OTSG'
cutlet for flow rate treasurement.i
The OTIS cold leg originated at the lower plenum of the 19-tube OTSG and
cxtended downward in order that the elevation of the horizontal run of the OTIScold leg matched the spillunder elevation of the plant cold leg. The highestpoint in the cold leg, that is, the spillover into the sloping cold leg discharge
|f line, matched the reactor coolant pump spillover elevation in the plant. Becausei horizontal distances were shortened in OTIS, the slope of the cold leg discharge
,
line was atypical in order that the cold leg to downcomer connection elevation was
| plant typical.f
1-9.
|
_ _ __ . _ .

, - --~ __~ J~ , , . . .~ - .- -- - -~~ -_._
O p+ fM\ )v,
i
REACTOR3
COOLANT
/PueseFULL SEtt
i OTSO t 19 TUSE' ' OTSO
j
COto LEO' DeSCHARGE
! J
C -" ' ' * " * ~ " ' ~ ' ' ' " " " =* - t R=** a'''c=
|~ ELEVAllOft,
"COLD LEO 70 REACTOR VESSEL NO22tE| L 1
~ i
I CE NTE nLN8E . ~g ~ ~ "I'I'w
-t'COLD LEO SUCTION SPtt1UseOEn !Lio j_ ,, 4, _
i
COLD LEO
COLD LEO N pgaggnqVESSri
DOUuseCOe8ER
,
206-FA PLAfff OTIS COLO LEO*! COto tao.
, NOTE: COtePO88ENTS ARE 08tAwes TO SCALE les ELEVATION:! PtPE DeAnsETTRS AND HOnt20NTAL DISTANCES ARE1 ExAcoEnAno eon CtAn TV
>!
i
!
! Figure 1-5 Comparison of Full-Size 205-FA Plant Cold Leg to OTIS Cold legi
! ,
!'
i;
|,
j_ _ _ _ . _ _ _ _ __ _

The diameters of the cold leg suction and cold leg discharge lines werechosen to preserve Froude number. Because of the she tened horizontal distances
; in OTIS, the cold leg volume was within 1% of the ideal volumetrically scaledvolume.
!
Atypicalf ties in the OTIS test loop are summarized as follows:
t
e OTIS was predominantly a vertical system, due to the shortenedhorizontal distances and small cross sections of the variouscomponents such as steam generator and reactor vessel. There fore,-
! OTIS was inherently a one-dimensional model.
, e Because of the small size of the piping used in OTIS, the ratio ofj loop wall surface to fluid volume was approximately 20 times that' of the plant. Therefore, the fluid and wall-surface temperatures
were much more closely coupled than those of a plant.
e In high-pressure models, the ratio of metal volume to fluid volumeincreases as the model is made smaller. In OTIS, the ratio ofmetal volume to fluid volume was approximately twice that of theplant.
Little can be done to eliminate the one-dimensionality and the excess metalvolume atypicalities of scaled integral-system facilities unless the scale factorapproaches one. However, data from scaled integral test facilities is importantfor benchmarking computer codes if the facility is shown to display the expectedsystem phenomenon. Data obtained from a scaled facility can be used to benchmarkthe computer code which in turn, can be used to predict the performance of thepl ant.
The pipe surface to fluid volume ratio atypicality of scaled facilitiesresults in higher heat losses in the scaled facilities than in the plants. Thisatypicality can be minimized by using both active (guard heaters) and passive
r insulation on the model piping in critical regions. Guard heaters were used for! OTIS on the hot leg, pressurizer, reactor vessel upper and top plenums, and the
pressurizer surge line.;
|
The secondary side of OTIS provided the steam generator secondary inventoryIj and those fluid boundary conditions which impact SBLOCA phenomenon. This included
O!
1-11
. . . _ -
1
izmthe steam generator level and auxiliary feedwater control, auxiliary feedwater!
(m) inlet elevation, and the cooldown valves. These controls are discussed further inSection 2.0..;
q Figure 1-6 is a schematic of the test loop, indicating the types and loca-tions of instrumentation installed in OTIS. The OTIS instrumentation includedpressure and differential-pressure measurements; thertnocouple (TC) and resistance.
.I' temperature detector (RTD) measurements of fluid, metal, and insulation tempera-
.tures; level and phase indications by optical-ports, heated RTD, and conductivityprobes as well as by differential pressures; and pitot tubes and head flowmetersfor measurements of flow rates in the loop. Figure 1-7 is provided to indicatethe differential-pressure (DP) measurements in OTIS. In addition to theseceasurements, loop boundary conditions were metered; HPI, hot leg HPV, controlledleak (cold leg suction, cold leg discharge, RV lower plenum or RV upper headvent), PORY relief, and secondary steam and feed flow and energy transport were
,
measured; noncondensible gas (NCG) injections are controlled and metered; NCG
discharges with the two-phase primary effluent streams were measured; and the
paggregate primary effluent were cooled and collected for integrated metering.V
In total, OTIS instrumentation consisted of approximately 250 channels ofdata which were acquired and stored by a high-speed data acquisition system. Atthe base of the data acquisition system was a dedicated Digital Equipment
[ Corporation (DEC) PDP 11/34 minicomputer which converted raw voltages tocngineering values on-line to provide the operators with visual displays andprintouts of the loop conditions as testing was proceeding. The acquisition ratecould be event-actuated or adjusted by the loop operator to acquire and store afull set of data as often as every 5 seconds.
f
-!
.O .
i
1-12
. - _ __ .- _ _ - - _ _ _ _ _ . _ _ _ _ _ . . _ _ _ _ . . _ _ _ _ _ _ _

, - - _ _ _ _ - _ - - - - _ _ __. . _ _ _ . . ___ _ ._
-- - - . - _ - - _ ~
HPV r- - - -ee
e_ _ - _ _ VENTING SYSTEM- =-=W 4H y a
SECONDARY FW g HOT yy I,, ,p_ g ,AND EAM CIMM A MG. gg. o+A , ,_
I "'' N ~l -O |o,
- ES' 7 -- 5' > ', ,
_ g
d I5 -, STEAM o+>- *6 I I Io 400-, -,3
k Io= -v e 4 I_g co- ~ GENERATOR- *
28 (PRIMARY) k- i,_ I400- -aA+>- -o 1 -e ico =ceI'ao-
- t : -o go ~*d
~
_$'__ __..-_ -_ -s"W "-
,
' '"', a+- --PRESSURIZERx , o- -e
M-o_w I ao- o o-m- D o- g, o -. a-
7 + _, -+ REACTORo- J ok+--
~ - o- 4 6" *# 1 lii y _o 8: VESSELg ;; 9 PRESSUREo-
o_ q COLD LEG , g,_ 4T %a i D RTD.T ,o- || -o I o- .d , , ,
'||@ o TC (FLUID)-
"E " 'l '~ b' I $ => a TC (METAL), STEAM OENERATOR 824YO -.
-' ,gjo- O PITOT TUBESISECONDARY) if~ de % e PRIMARY STRING TC~~ -
N ERggAgg/ m- fi D CONDUCTIVITY PROSE
_ t ' f-A-- -x O WATWETER,_ ,_
~~y a -o 4 HEATED RTD* HPl + AT (TEMP. DIFF.)I
og o X FLOWMETER (RATE)e..y - :'; -e- FLOWMETER
e LIMIT SWITCH
1. aT's used for guard heating RY Leaks v DIFFERENTIAL PRESSUREcontrol and sionitoring ofguard heating perforinance.
Figure 1-6 OTIS Instrumentation
O O O

- _ . . -- ._. . ._. - - ._
t
/
E :y
- m oPO3 4:HOT
STEAM GENERATOR LEG($ECONDARY) oy
/ -"
1-
i =_ STEAM GENERATOR
8 ,-
g y /1. MIMARY) g
*'
I h PROPO1
G- ! !-|
REACTOR VESSELN
!I I f n
en v gRVDPO1' - --
_j' j{ y
.
_
a
,1.g- RVDPOS"
RVDPO2'"
pCLDPO2,04 CLDPOj
DOWNCOMERi
/ t "_
"OCDPO1,03
OCDPO2 (OOWNCOMER ORIFICE)
/ *|
ii
Figure 1-7 OTIS Differential Pressure Measurements
i |
|| ,
O1-14
.-. . . - . .-. -. .-. - -_ _-.- ,---. - - -... --. -..-. -. - - -- - -. _ . - _ . - .
I|
2.0 KEY FEATURES OF TEST LOOP.q
OOTIS consisted of a closed primary loop, closed secondary loop, and several
auxiliary systems. A general arrangement showing the relationship of the key1( components of these systems is shown in Figure 2-1. In this section the key1
Ifeatures of these systems will be discussed. The key features are:'
!
I e Multiple leak location,e Gas addition capability,e Guard heating,e Scaled high pressure injection (HPI),a Simulated reactor vessel vent valve (RVVV), !e OTSG 1evel control,
,
o Automatic cooldown,'
e High and low auxiliary feedwater addition.
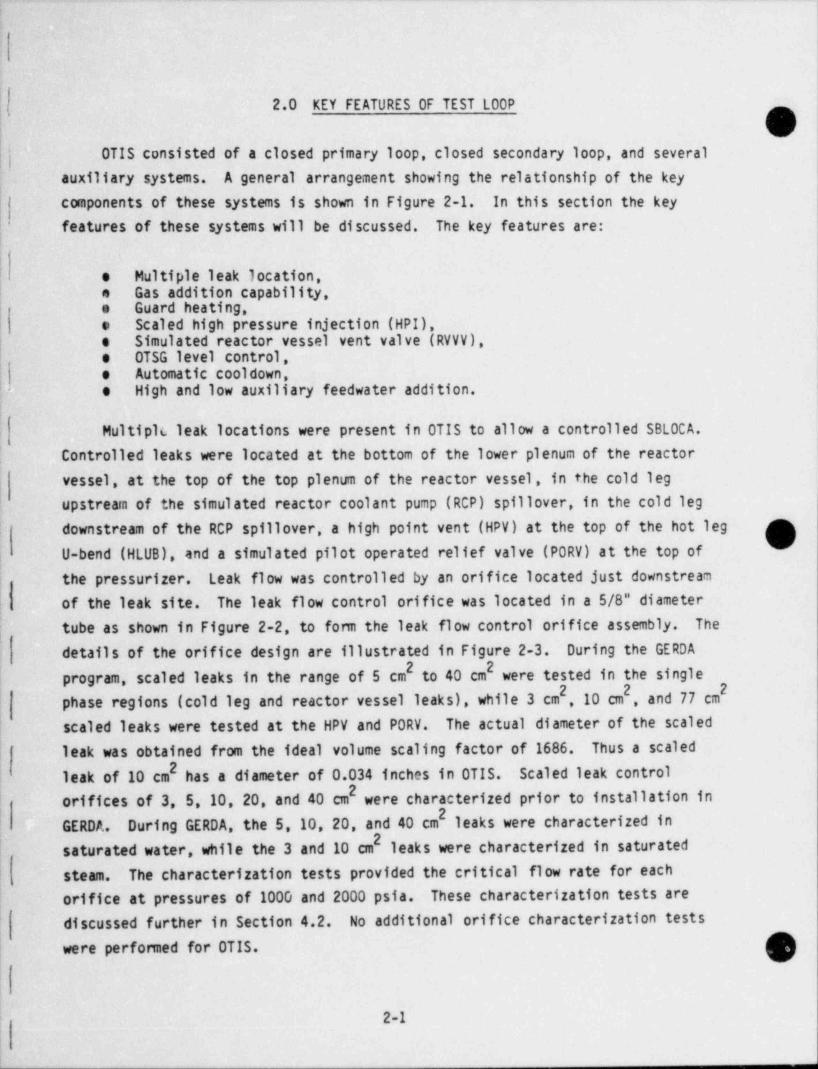
Multipli leak locations were present in OTIS to allow a controlled SBLOCA.Controlled leaks were located at the bottom of the lower plenum of the reactor
; vessel, at the top of the top plenum of the reactor vessel, in the cold legupstream of the simulated reactor coolant pump (RCP) spillover, in the cold legdownstream of the RCP spillover, a high point vent (HPV) at the top of the hot legU-bend (HLUB), and a simulated pilot operated relief valve (PORV) at the top ofI
;
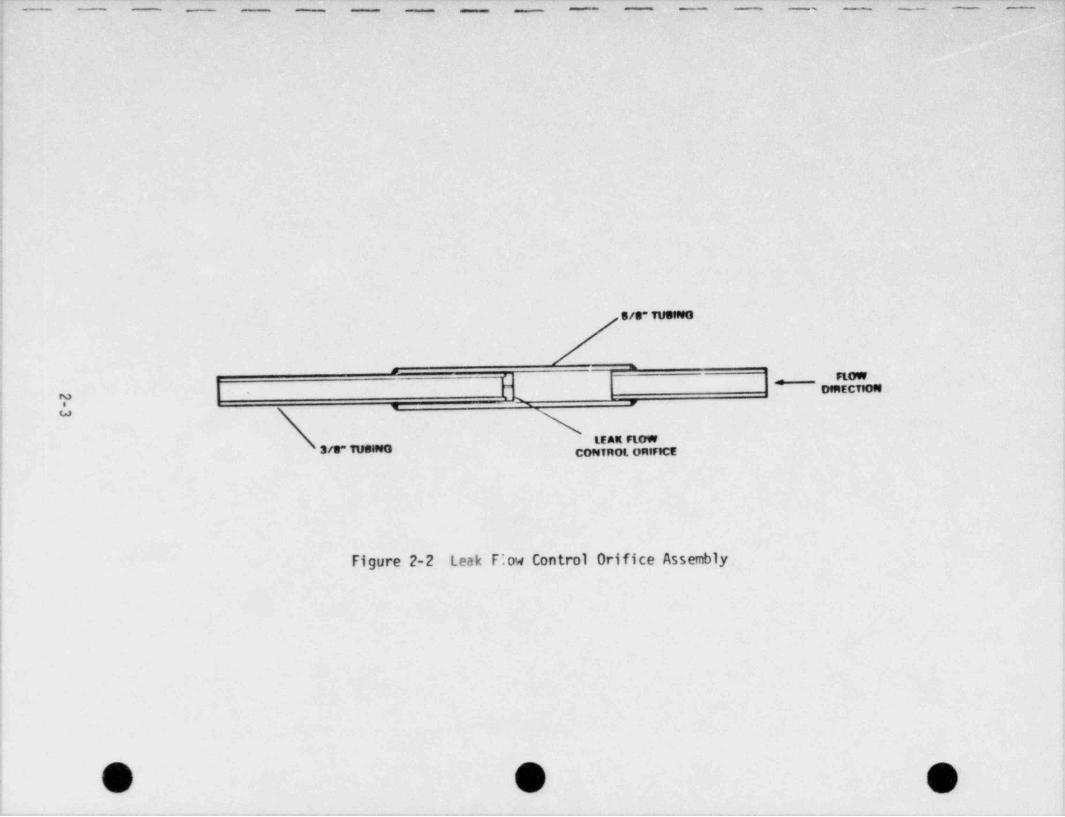
the pressurizer. Leak flow was controlled by an orifice located just downstream| of the leak site. The leak flow control orifice was located in a 5/8" diameter
tube as shown in Figure 2-2, to fonn the leak flow control orifice assembly. Thedetails of the orifice design are illustrated in Figure 2-3. During the GERDA
2 2program, scaled leaks in the range of 5 cm to 40 cm were tested in the single2 2 2
phase regions (cold leg and reactor vessel leaks), while 3 cm ,10 cm , and 77 cmscaled leaks were tested at the HPV and PORV. The actual diameter of the scaledleak was obtained from the ideal volume scaling factor of 1686. Thus a scaled
2leak of 10 cm has a diameter of 0.034 inches in OTIS. Scaled leak control2orifices of 3, 5, 10, 20, and 40 cm were characterized prior to installation in
,
2GERDA. During GERDA, the 5, 10, 20, and 40 cm leaks were characterized in
2saturated water, while the 3 and 10 cm leaks were characterized in saturatedsteam. The characterization tests provided the critical flow rate for each
,
orifice at pressures of 1000 and 2000 psia. These characterization tests arediscussed further in Section 4.2. No additional orifice characterization testswere performed for OTIS. g
2-1

I ,! ; ; !' I
,,,
,
,
,,
O,
,
,
,
._
.
,,
P.
MT UO PH NY .
- R ORE I
ATSN DALE N UD O C ,
_
N C R_
EIO g_ SCC
R <E|T
A R t_ WE n -DTE A - eE E 0 m
&F FH8 eg
_
- nK a
O Orr
am A_
_ R lE atZ rI
R eU nS eS GER R SP O I
T T-( OA
MRA E'
NE N % x 1-
-TEh SG 2
2' eay rug,
P iI
M F
PhU;_ 2'
-
* g -
-
I
P- V H
RO p 4' '
' I
VR VOL !
oTECSa 1= 1
AS.
EERV $
,
,
-;
-
O_
_
or
; ;! , ;$Ii | , |f| 1 f1 |? - : 1?
-__-____ _ _ _ - _ _ _ _ _ _ _ - _ _ _ _ .
-- _ _ _ __ _____-
i4
\
ses TUomo
;-
. Ftow-
F_
-
omtCTion> y N -.
\";; trax now'
3/9" TUOMG CONTROL ORIFICE.
!
l<
1
1
i
! Figure 2-2 Leak Flow Control Orifice Assembly
4
Ii
a
O O O'

!
O
.
N;
ORIFICEDIAMETER
/h
=- -. - .
D FLOWDIRECTION
|I
|.
_
1I
. I
Figure 2-3 Leak Flow Control Orifice
i
O'
2-4
|-_ . . . _ _ _ . _ . _ _ _ _ _ _ _ . _ _ _ - _ _ _ _ _ . , _ _ _ . , . .

\t
i
i Batch addition of noncondensible gases (NCG) could be made to the primaryloop to study the effect of NCGs on system performance. Tha NCGs could be addedat four locations around the loop. These locations included:
e lower plenum of reactor vessel! e cold leg piping downstream of RCP spillover
e top of steam generatore top of hot leg at HLUB
To preclude leakage of NCGs from the loop, sealed stem valves were used,where possible, throughout the loop. Additionally, all instrument fittings in thereactor coolant system, above the top of the core heaters were seal welded. Tocharacterize the leak tightness of the loop, a helium leak check was performedduring the GERDA program. The results of this test are discussed in Section 4.1.
As a result of the large surface area to fluid volume ratio, heat loss in theOTIS loop was proportionally greater than that in the plant. To minimize thisGffect, guard heaters were used along the hot leg piping, pressurizer, pressurizersurge line, and the reactor vessel upper and top plenums. The objective of theguard heating system was to provide heat to the components in an amount equal toheat loss of that component to ambient. The concept used for guard heating isillustrated in Figure 2-4. A layer of control insulation, approximately 1/2"thick, enclosed by a thin shell of stainless steel lagging, was placed over thepipe sections to be guard heated. The heater tapes were spirally wrapped over thelagging material, covering nearly 100". of the pipe section. Two layers of passive
| insulation then covered the guard heaters. The heaters were controlled based onthennocouples located on the pipe OD and at a point mid-way into the controlinsulation. Tests were performed to evaluate the heat loss from the OTIS loop andto characterize the operation of the guard heaters. The heat loss tests are
! described in Section 4.5 and the performance of the hot leg guard heaters isdiscussed in Section 4.6.
;
Two high pressure injection (HPI) locations were provided on OTIS - one atthe cold leg low point, upstream of the simulated RCP spillover, the other in thedownward sloping cold leg, downstream of the simulated RCP spillover. A scaled
;'
O.
2-5
__

ym , ;.19
w it t. , \,G,
-?f%. . ,4
o b |s*
4 }'^ ,
a s :qu >
;f,
e.' % ;i.$ t
.
, .
Sf ff'A \ % g_, .c-
..,
i& .A. ,. .m s
d ( ..'
,,#r k<%
1. 'k '
.g *#
,} . 15a .
4 ., ,
.; i KAOWOOL FIBERGLASSt ( |'
je ' y y 7 ;ts | s g\ g g y ) po8 )h
a
:'\ ;"^ j h' r :
/.
' ? )
|.s p h.e ue/ sy
fdhhf 8 %I '~,\
6 ss \ s\$ ggggg%,
Titi/';
nsss s q s$s9{; /.N :.F
c
/g!? gy,pp?s.t&.
'
i s.
g.:,. .;-m .
W: iM C a( q u).
a e.Mvt.ew :-Q* \ \ {%8 %
/6',8 i -
*. ')) )/
} &<.y4
SM.fGW|%!Qh *: '*,~ u. ,:i
h.'*.s,' nils'ly5 $$$$Y b Sh \Sy'
*s~d,f ,_ Siy f
~-
PIPE h) A A---
hf M.kfsfi$$ S $ >$ S \ d
p, ' K ' L j j/d^
WALLr$5$$$5'
qsp|.$.,j,g4
'g1: :
% hh%% >
rfga,yk{M5$$$$$$$$si,
/ a-...:!<
[A..,
,934gg,gl4 h9 s:," j:i@ g.
'
y,e ..
f ' ,i $ q (( (q((. y CONTR L ,
gN (&~ M:g'*rsi, 4 )THERMOCOUPLES /3'!i4 #3. 0 )
:|/ y/M-a (?x. D.m, ;,pj .,..v ..
) .ffbf,'j}' f('
/ p. ,
) _
.- -
{ (0 i5,TAINLESS|_
.
HEATERS9|. .i
| $ |. LAGGING > ,-
. . .
' . .. t'
-
,% ). bt ,
n.
y ? < ,...y
.' !) \ 1e:,'
..J !*.+ d.'
3Figurd24 Guard Heater Concept' ' . . E' ~ ' L /Q |,r *
:4 ( s, f( ;i '. ,
f ,4
_
' '''
**| ',-
-\,
\ '\ ua \, , ,
' ' ,; ,<,t is *, .,. ,
'l ! 2-6';,
. . t,: .
I s' s s .1
.
,g L
e I . - _ _ _ _ .- ,, _
' '. - . , - - . , , - _v'_r, , ,-,,-,,-,,..y- ,--,e-.-%.,,.,_- . _ -.

HPI flow was provided by a positive displacement pump. The flow into the loop wascontrolled to simulate the plant scaled head-flow curve. HPI flow could be
_|directed to either one or both of the HPI injection locations.
The reactor vessel vent valve (RVVV) was simulated in OTIS by a single pipe
rixtending from the upper and top plenum of the reactor vessel to the externaldowncomer. The elevation at which the pipe was located matched the spilloverelevation of the plant RVVV. This is illustrated in Figure 1-4. A pneumatically-
cperated, automatically-controlled valve was located in the pipe. The valve wascontrolled to open and close when the differential pressure between the reactorvessel and downcomer reached preset values. An orifice in the pipe, downstream ofthe valve was used to control the flow through the simulated vent valve. Thesimulation was for the plant vent valves in the full open position.
The secondary loop consisted of the 19-tube OTSG, steam piping, a watercooled condenser, hot well, feedwater pump, feedwater heater, and feedwaterpiping. The relationship between these components is shown in Figure 2-1. The
secondary side simulation of the modeled plant was limited to the steam generatorand the elevation of the auxiliary feedwater ( AFW) inlets. Additionally, severalcontrol functions were used to simulate plant performance. These included:
e continuous level (inventory) controle band level controle steam pressure controle automatic cooldown
Two modes of steam generator level control were available on OTIS, continuouslevel control and " band" level control. With continuous level control, theoperator set the desired steam generator level from 0 to 100%. The controller
maintained the collapsed water level at this set point by adjusting the feedwaterflow rate. A second mode of steam generator level control was tenned band levelcontrol. With this mode of level control the steam generator collapsed water
|level was maintained between specified elevations relative to the secondary face
I of the lower tubesheet (SFLTS). When the collapsed level reached the upper level,the feedwater valve was cycled closed. When the collapsed level reached the lowerlevel, the feedwater valve opened. The feedwater flow rate obtained during thismode of level control was determined by the position of several control valves in
l
2-7

i
l the feedwater piping. These valves could be positioned to supply the required AFW'D
t flow rate for a single fixed steam generator pressure or adjusted to simulate the
3 AFW head-flow curve of interest. The signal for the collapsed level, for both'
modes of level control, was based on a differential pressure measurement.
d ll The secondary loop could operate at steam pressures of approximately 100 to
1200 psia. Steam pressure was automatically controlled by a steam control valve,,
abased on a signal from the steam pressure transmitter. In addition to automaticl
steam pressure control, the steam pressure could be controlled to decrease at apre-programmed rate. This feature allowed simulation of the plant operatorinitiated " automatic cooldown mode", where the steam generator is depressurized to
| obtain a fixed cooldown rate. In OTIS, the desired cooldown rate was keyed into'
the controller as a series of linear segments of pressure and time. When
activated, the steam pressure control valve modulated to maintain the set pointpressure versus time.
Auxiliary feedwater addition could be made at one of two locations in thesteam generator - a high feed elevation, typical of the B&W domestic 177 FAplants, and a low feed elevation, typical of the MK plant. The configuration ofthe AFW nozzle at each elevation could be for maximum wetting or minimum wettingof the steam generator tubes. The two configurations, maximum or minimum wettingof the tubes, allows comparison of the effects of a spray pattern on heat transfer(typical of the outer rows of tubes near the AFW nozzles in the plant), with theeffects of pool heat transfer (typical of the large majority of tubes that areaway from the AFW nozzles in the plant).;
i|
|
|;
'
|qv
2-8
_ _ _ _ _ _ - _ - _ _ _ . - _ _ _ _ _ _ _ _ . _ _ _ . _ __ _ _ _ _ _ _ _ _ _ _ . _ _ _

3.0 OTIS SUB-SYSTEMS
O| The major primary, secondary, and auxiliary components of the OTIS loop have' been sub-divided into systems. Each of these systems will be discussed in detail
r in the following sections.|
The primary loop was fabricated from stainless steel and was designed for2500 psi at 650*F. The secondary loop was fabricated from carbon steel and wasdesigned for 1500 psi at 600"F. The test loop was hydro-static tested to 3750 and2250 psi at ambient temperatures, on the primary and secondary respectively, inaccordance with the pressure piping and boiler codes.
Prior to discussing the details of each system, a reference comparison of thekey elevations and volumes for OTIS and the MK plant will be made. Full elevationmodeling was assigned first priority in the OTIS scaling criteria. OTIS pipinggenerally models the MK spillover and spillunder elevations. Additionally, anumber of other key elevations are preserved in the OTIS model. These keyelevations for OTIS and MK are compared in Table 3-1.
O
i
i
'
O
3-1

,
It
Table 3-1,,
'
-COMPARISON OF KEY ELEVATIONS -- OTIS VS MULHEIM KARLICH (MK),
,i -
Elevation-Inches Relative to theSecondary Face of the SteamGenerator Lower Tubehseet
OTIS MK (1)
Bottom of Reactor Vessel -287-1/2 -336Downcomer to Lower Plenum- -283-1/4 -283-1/4Bottom of Heated Section -196-1/4 -230-1/2Center of Heated Section -157-1/2 -158-1/2 *
Top of Heated Section -119 - 86-1/2Hot Leg Nozzle-Reactor Vessel Centerline - 23 - 23Reactor Vessel Vent Valve Spillover + 6-1/2 + 6-3/4Top of Reactor Vessel Upper Plenum + 15-7/8 + 61Top of Reactor Vessel + 91-1/4 +134-1/2Hot Leg U-bend (HLUB) Spillover +807-1/2 +807-1/2Primary Face of Upper Tubesheet (UTS) +628-3/8 +646-3/4Secondary Face of UTS +625-3/8 +625-1/4Secondary Face 'of Lower Tubesheet (UTS) 0 0
Primary Face of LTS - 24 - 21-1/2Steam Generator Outlet / Cold Leg Interface - 30-1/2 - 79-1/4
() Cold Leg Low Point (Top of Pipe ID) - 76-7/8 - 76-3/4C/ Pump Spillover + 30 (2) + 30
i
Cold Leg to Downcomer Interface - 23 - 23-1/4:g- Top of Downcomer + 25-1/4 43-1/4
:[ Pressurizer Bottom + 79-1/4 + 79-1/4Pressurizer Top +566-1/2 +585-1/2Hot Leg-To-Surge Line Connection (Centerline) +103-1/4 +103-1/4Surge Line Sloping-to-Vertical Interface + 94-3/4 + 94-3/4Surge Line Low Point, Top of Pipe + 30 + 30Auxiliary Feedwater (AFW) InjectionElevation -- Low Injection Point + 71 + 77
Auxiliary Feedwater (AFW) InjectionElevation -- High Injection PointUsed on Some 177FA Plants +610-3/8 +610-3/8
:
| (1) MK elevations are rounded to nearest 1/4"'
(2) Simulated RCP spillover
Volumetric. scaling of the loop components was generally adhered to. As part
!- of the Phase 0 -- GERDA Loop Characterization Tests, the volume versus elevationwas obtained for four (4) primary-side regions and for the secondary side of the:
()/ steam generator. These primary regions included the pressurizer, the reactorjw
3-2
|
_ _ , . . . _ . _ , _ _ _ _ . . _ _ . _ . _ _ _ .. _ _ _ _ _ _ . , __

vessel (excluding the downcomer), the active region, and the inactive region. The,
active region included the volume in the cold leg piping between the cold legspillover and the downcomer, the downcomer piping, reactor vessel, and the hot legpiping between the reactor vessel outlet and the HLUB spillover. The inactiveregion included the volume in the hot leg between the HLUB and the steam generatoroutlet, and the cold leg between the outlet of the steam generator and the coldleg spillover. The volume versus elevation results are presented in Section 4.12.In Table 3-2, the volume checks are summarized for these regions and compared with
the ideal volume scaled loop.
Table 3-2
GERDA VOLUME CHECKS
Ideal Scaled GERDA3 3Loop Volume, f t Volumes, ft
Primary
Pressurizer 1.61 1.58
Reactor Vessel (excluding downcomer) 2.21 2.23
Active Region 4.06 5.74
Inactive Region 2.78 2.82
I TOTAL Primary Volume 8.48 10.14
Secondary
Steam Generator 2.45 2.58t
|!
3.1 REACTOR VESSEL AND DOWNCOMER
An electrically heated reactor vessel provided the heat input to the primaryfluid to simulate decay heat levels up to 3.7% simulated full power (neglectingheat losses). Based on the TVA plant power rating of 3600 MWt and on the ratio ofthe number of tubes in the model steam generator to the plant OTSG's (19/32,026),3.7% simulated full power corresponds to 79 KW. The OTIS reactor vessel heatinput capacity was 180 KW.
1 0:|
3-3,

The stainless steel reactor vessel and downcomer design was similar to that
shown in Figure 3-1. The reactor vessel was composed of three (3) regions; a
lower plenum, a heated section, and an upper and top plenum. The downcomeri
consisted of a single pipe external to the reactor vessel. The overall length of3
- the reactor vessel was about 31 feet with a net fluid volume of about 3850 in(excluding the downcomer). A single line with a pneumatically operated controlvalve connected the upper and top plenum of the reactor vessel to the upper
f downcomer simulating the reactor vessel vent valve (RVVV).
The cold leg pipe connected with the downcomer at elevation -23"3 The.
external downcomer connected the lower plenum at elevation -283-1/4". The lower
plenum consisted of a straight vertical section of 2" Schedule 160 pipe, and a six(6) pipe header arrangement consisting of four (4) 1" Schedule XXS pipes and two(2) 1-1/4" Schedule 160 pipes. This header supplied the heated section, which wasenclosed in a 6" Schedule 160 pipe. The four (4) 1" Schedule XXS pipes werespaced 90* apart around the bottom flange while the 1-1/4" Schedule 160 pipeswere 180* apart. All six (6) inlets were normal to the heater rods. The details ,
of the downcomer piping and lower plenum are shown on B&W drawings 9510E, 9542E,
and 9560E. A complete list of the facility drawings is contained in Appendix A.The mechanical and electrical drawings are contained in Volumes 2 and 3 of this
report, respectively.
The heated section of the reactor vessel started at elevation -196-1/4". The
four (4) 1" Schedule XXS inlets were approximately 2-1/2" below the start of theheated section, and the two (2) 1-1/4" Schedule 160 inlets were approximately6-3/4" above the start of the heated section. The top of the heated section wasat elevation -119", for a heated length of about 77-1/4". The upper and topplenums extended from the top of the heated section, elevation -119", to the topof the reactor vessel, elevation +91-1/4". An orifice plate (1/8" thick andhaving 7 holes of 0.469" diameter each) at elevation +15-7/8" separated the upperand top plenums. The pipe sections consisted of a short section of 6" Schedule
3All dimensions are relative to the secondary face of the steam generatorO lower tubesheet. The horizontal dimensions are from the centerline of theO pipe unless otherwise noted.
3-4
_ - - - . _ .__ _ ,_ __ _____ _ _ _ _ . _ _ _ _ _ _ . _ _ _ . _ _ _ . _ .

7_ _
ORVHIGHPOINT VENTg
+91 1/4"
NTOPPLENUM
'7'I'4~DOWNCOMER\
MVCVO1j; 23"
... .,_
~~
HOT LEG" ' REACTORVIEW "B B" VESSEL
ppPLENUM
DOWNCOMERs
.
- 119"
|'
N HEATEDSECTION
g. y__ .
(,[ " D "A" "A".- -
d J b-) 196-1/4"i
' 7. 2" ' ,
VIEW "A A" 'j!.
'
'd :11
J=: ._-
L .
=NOTE: ALL DIMENSIONS ARE IN INCHES
RELATIVE TO THE SECONDARY NLOWERFACE LOWER TUBESHEET PLENUMgygy
-283 1/4"-
HRVHVO3RV LEAK ;ggygyo4
Figure 3-1 Reactor Vessel and Downcomer General Arrangement
O3-5
_

,
i
$3 160 pipe, a 6" x 4" concentric reducer, and about 200" of 4" Schedule 160 pipe.
i (V At elevation -23", the fluid leaves the reactor vessel through a 4" x 4" x 3" tee,;
l where it entered the hot leg. A 1-1/2" Schedule 160 pipe, with the centerlinelocated at elevation +7-1/4" connected the reactor vessel top plenum with thedowncomer, through the RVVV simulation. A single-phase leak site was located atthe bottom of the lower plenum of the reactor vessel. A nigh point vent (HPV), ascaled 3 square centimeter orifice for OTIS testing, was located at the top of thereactor vessel as shown on Figure 3-1. The details of the heated section, upperand top plenums, and RVVV connection are shown in B&W drawings 9505E, 9506E, and
95520.
Reactor vessel decay heat was simulated using three (3) 60 KW Watlow rodheaters. The 1-1/4" OD heaters were spaced 120* apart on an ~3" bolt circle. The
heaters were seal welded to the flanged head of the reactor vessel. There were
three (3) flow distributor / rod spacer plates along the length of the heaters --located at elevations -186-3/4", -159-3/4", and -123-1/4". Details of the reactor
: vessel heaters and plate design are shown on B&W drawings 9524C and 9512E. The
reactor vessel power could be controlled to either a constant power or to a powerramp. Decay heat was controlled using a Leeds & Northrup 1300 Process Programmer.
;g This programmer allowed the operator to key-in the desired power level and timeI intervals to approximate the decay heat curve.
.
The reactor vessel upper plenum and top plenum were guard heated. The guardheaters were divided into two (2) control zones, one each for the upper plenum andthe top plenum. The upper plenum guard heater zone covered from -23" to +15-7/8"with the control AT, RVDT01, at -4". The top plenum guard heater zone covered the
remainder of the top of the reactor vessel, extending from +15-7/8" up to 91-1/4".The control AT, RVDT02, was located at 58". The operation of the guard heaters is
discussed in Section 4.6.
The RVVV simulation consisted of a single 1-1/2" Schedule 160 pipe connecting
the top and upper plenum with the downcomer, with a 1-1/2" Rockwell Edwards
Hennavalve and an orifice (downstream of the valve) for RVVV flow control. Thispneumatically actuated valve was controlled to open and close at specified
O differential pressures betweer. the upper plenum and the downcomer. The opening
and closing APs were adjustable, but typically the RVVV was set to full open at a
3-6
.- - . . _ - . . ., - . ___ - - - - . - . - - _ - -

!I
AP greater than +.25 psid and to close at a AP less than +.125 psid. A (vertical) g,slotted orifice was located just downstream of the Hermavalve to control the Wamount of flow through the RVVV. A test was performed during GERDA to determine |
the pressure drop -- flow characteristics of the RVVV. The RVVV flow rate was I
measured using three independent measurements -- weight-time, accumulating
flowmeter, and a turbine meter. Pressure drop was measured using the APtransmitter across the vent valve, RVDP03, and a water over oil manometer. The
results of this test are summarized in Table 3-3.
Table 3-3
REACTOR VESSEL VENT VALVE FLOW-AP MEASUREMENTS
Flow Measurement AP Measurement
AccumulatingNominal Flow Weight / Time Flowmeter Turbine RVDP03 Manometer
Ibm /hr lbm/hr lbm/hr lbm/hr i n. H 0_ i n. H 0_2 2
500 419.2 387.7 433.6 .23 .11
750 745.5 750.7 778.9 .55 .45
1000 993.9 1047.0 1023.5 .83 .75
1250 1244.2 1259.3 1269.1 (2) 1.01
1500 1437.1 (1) (1) (2) 1.42
1800 1837.0 (1) (1) (2) 2.33
(1) Flowmeters out of range
(2) Zero shift on transmitter -- unit taken out of service
The predicted and measured pressure drop-flow characteristics are shown inTheFigure 3-2, as is the calculated loss coefficient versus Reynolds number.
loss coefficient approached a constant value of about 17.6 for Reynolds numbers
above 10,000.
The response time for the vent, valve (a Rockwell Edwards Herniavalve) wasmeasured during the GERDA program. The data is recorded on Table 3-4. The delay
time in going from close-to-open was the time from valve actuation to the firstindication of valve movement (time required to vent air out of actuator). The
ramp time was the total elapsed time from valve actuation to 100% or 50% travel.
3-7

. - _..,.
O O O-
4
i
!
i
'
i
2.50 23
i / - - + - - ) .---* VENT VALVE ff DOUMcCOMER ! RES TRICTION 2.25 - %/ 22I
.
i I
) [ 2.00 - 1 21-
A A I l /
j - = c; e s ,,.25 ,-
\, / M'#i
- ., . 1.50 - \ f
- 19 2+ + ,300**
~ y y''2
j , g fD \ '/ - 18 . 9:
Ew'
| SECTION "A-A** w 1.25 - PREDICTED> / %=m oL
MEASURED / o a{ { j ----
I#'
Y 1.00 - --- CALCULATED # - 17m ; / SS*
/ "i w
> / 2,' .75 - / - 1s -
A /
/ p'ISOLATION .50 - ,/ DESIGN POINT -- 15
VALVE /j #! #i .25 - f'
- 14
| s'|4 ' ' ' ' ' ' '
| / k 0250 500 700 1000 1250 1500 1750 2000 2250
TOP PLENUte VENT FLOW, L8M/HR
\| t i I | | 1 i i I i
: - - 4. - - | 23e8 are0 7:40 es20f
| REYNOLDS NUMBER
(BASED ON l.D. = 1.34")
ii
i Figure 3-2 RVVV Arrangement and Flow Characteristics j
l |; I
4
l1

I.i
Table 3-4
REACTOR VESSEL VENT VALVE RESPONSE TIME
Close Open Del ay Ramp
to to Time Time Percent Temperature PressureOpen Close (Seconds) (Seconds) Travel *F osia
j X 1.3 18.7 100 520 1951
! X 1.2 19.3 100 520 1951
X 1.2 18.6 100 520 1951
X 0 13.2 100 520 1951'
X 0 12.7 100 520 1951,
:! X 0 13.3 100 520 1951
X 1.1 4.9 50 512 2023'
X 1.3 5.1 50 512 2023
X 0 4.0 50 512 2023
X 0 3.8 50 512 2023
X 0 13.5 100 512 2023
X 0 12.9 100 512 2023
O
NOTE: Instrument air pressure is 46.5 psi
i
i
3-9
-
l
1
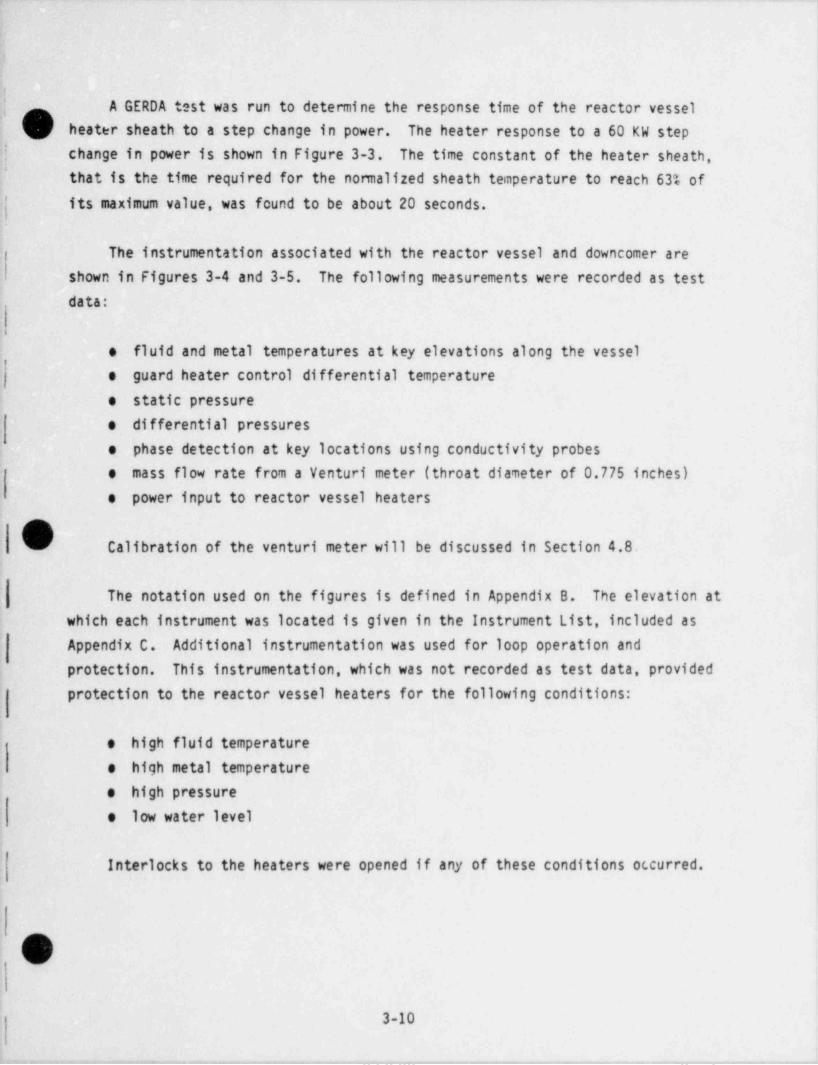
g A GERDA test was run to determine the response time of the reactor vessel!j heater sheath to a step change in power. The heater response to a 60 KW step
j change in power is shown in Figure 3-3. The time constant of the heater sheath,|'
that is the time required for the normalized sheath temperature to reach 63% of |
its maximum value, was found to be about 20 seconds.
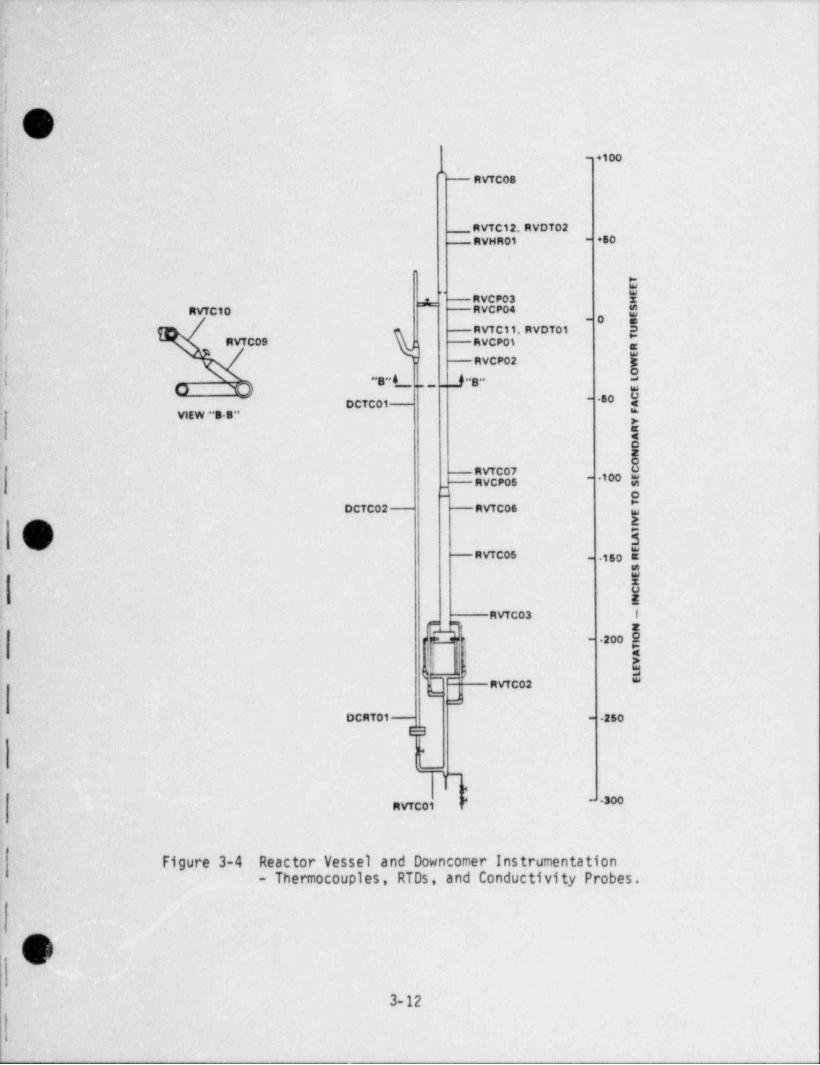
The instrumentation associated with the reactor vessel and downcomer areshown in Figures 3-4 and 3-5. The following measurements were recorded as test
data:
e fluid and metal temperatures at key elevations along the vessele guard heater control differential temperaturee static pressure
e differential pressures
e phase detection at key locations using conductivity probese mass flow rate from a Venturi meter (throat diameter of 0.775 inches)e power input to reactor vessel heaters
[\ Calibration of the venturi meter will be discussed in Section 4.8.
The notation used on the figures is defined in Appendix B. The elevation atwhich each instrument was located is given in the Instrument List, included asAppendix C. Additional instrumentation was used for loop operation andprotection. This instrumentation, which was not recorded as test data, providedprotection to the reactor vessel heaters for the following conditions:
e high fluid temperaturee high metal temperaturee high pressuree low water level
Interlocks to the heaters were opened if any of these conditions occurred.
O3-10
_ . _ _ _ - _ _ _ - _ . _ _ , _ _ _ . _ . _ _ . _ _ _ _ _ __._ _ _ . . - . . _ . - - -

O'
.p#
.<- -
.. ,
F 'lg 7 = 20 SEC.p
'u.*" eN .s -
>R-e
k"io .6 -
Em
e.4 -
E.ON
k.2 -
IE
k!
I I I I I I I l0( 0 20 40 SO SO 100 120 140 160 180
TIME, SEC
||
!
|, Figure 3-3 Reactor Vessel Heater Response to a 60KW Power Increaset
(
|
O3-11
:l
_ _ . _ _ . _
,
,
l'
:l 7.V
iff <- .100
RVTC08
f1
RVTC12. RVDT02+50RVHRO1 -
,IIl
'
C[ RVCP03 E
f. RVTC10 RVCPO4 $O e-
g RVTC11, RVDT01 gRVTC09 ; RVCP01 g
"
RVCP02
s- L _f a- -- o y, ,_ _ _
'
DCTC01- 50 $
*VIEW "S B"N%5
RVTC07 u_ RvCP0s **-
- o"
DCTC02 RVTC06EO) ' -
(V 2.
RvTCOs - 30men
f
URVTC03 i
Id. 200I-
4' g:
ti . .
w "*RVTC02{
DCRT01 260-
l_: s~**
RVTC01
Figure 3-4 Reactor Vessel and Downcomer Instrumentation- Thermocouples, RTDs, and Conductivity Probes.
n-\_,)f
3-12

O
f RVPR01, ,, ,,
}
+50-
RVDP03 - *RVDP01
ww
..S: tt)- 0 E
E
I $o e
- <>
sw
50 $-RVDP05
RVDP02
sE8
,,- 100 $''
''
2
5w8RVDPO4 - 150DCDP 02 ,
EE1
~, 200, -
DCDP 01 * ' ' <DCDN3 ;| g
,y' _o dL.
e250-
4
l_; s;p 300
w i
Figure 3-5 Reactor Vessel and DowncomerInstrumentation - Pressure andDif#erential Pressure Measurements
3-13
L

!! )l
;
I, A valve was located in the bottom of the downcomer to satisfy pressure vessel
Q code requirements. The manufacturers' specified flow coefficient (Cv) for this'q valve being fully opened and for a fully opened reactor vessel vent valve are
shown in Table 3-5..
Table 3-5
MANUFACTURERS' SPECIFIED FLOW COEFFICIENTSFOR VALVES IN REACTOR VESSEL
Flow Coefficient, CvValve Full Open Valve
RVHV01 (downcomer) 120a
RVCV01 (RVVV) 32
A safety relief valve and rupture disc assembly was located just above theheated section.
3.2 HOT LEG PIPING
GThis system consisted of the piping and associated hardware and
instrumentation from the junction of the hot leg-reactor vessel outlet to the;
primary inlet at the upper head of the steam generator. The piping was comprisedof sections of 3" Schedule 160 stainless steel and Inconel 600 pipe.
A general arrangement of the hot leg piping is shown in Figure 3-6. From the
hot leg-reactor vessel outlet at elevation -23", the hot leg extended horizontallyabout 17", then made a vertical upturn through a special pipe section with aradius of curvature of 14-7/8". The hot leg extended vertically to an elevation
of about 794". The piping then started a bend to form the hot leg U-bend (HLUB),
with a radius of curvature of 14-7/8". The HLUB spillover was located at
807-1/2". The HLUB radius of curvature was selected to scale the HLUB volumewhile maintaining the same hot leg pipe inside diameter of 2.626". From the HLUB
the piping ran vertically downward to the steam generator. A high point vent(HPV) was located on the top of the HLUB. The details of the hot leg pipingdesign are shown on B&W drawing 9553E.
-
3-14
. - .. _ .. . _ - , - - _ , . . -_ __ - --

}
!
.I:i
HIGH POINTVENT
I +507 1/2" - 800+79 4 ~
- 700
+428 :1 'i - .r5- 600
STEAM pe
iGENERATOR
,
- 600 o>-
5E
- 400 gHOT LEGp5E
i 9- 300 4
.
| dc
|
- 200
SURGE UNE+103-1/4" ~- 100
<| -o! q
23"
% ' m REACTORVESSEL
,
Ficare 3-6 Hot Leg Piping General Arrangement
O3-15
.

.
I1
1
1 Hot leg instrumentation is identified on Figures 3-7 and 3-8. Resistance7( temperature detectors (RTDs) were located near each end of the hot leg piping.
l Fluid temperatures from thennocouples were measured just above and below the surgeline connection on the hot leg, and at approximately 10' intervals along the hot
j leg. Conductivity probes, for phase detection, were located at approximately 4'intervals between the 444" elevation and the inlet to the steam generator. Below
this elevation, the probes were placed further apart. There were three APmeasurements along the hot leg -- from the hot leg-reactor vessel nozzle to theHLUB, from the HLUB to the steam generator inlet, and from the hot leg-reactorvessel nozzle to the steam generator inlet. These measurements are identified in
Figure 3-8. There were two viewports located on the hot leg that allowed visualobservation of the fluid inside the pipa. One viewport was located in the
vertical hot leg, approximately at elevation +420", while the other was located atthe HLUB. A video camera was located at each viewport. The cameras wereconnected to a video recorder through a special effects generator that allowed theflow visualization data at each viewport to be recorded simultaneously,
n The hot leg was guard heated over its entire length. Guard heaters wereU divided into eight (8) control zones, each approximately 132" long. In each zone
.
there was a AT measurement used for controlling the guard heaters and a ATmeasurement that was recorded on the data base for monitoring the performance of
the guard heaters. The two AT measurements were at the same axial location, 180*apart. The elevation of the hot leg guard heater zones and control thermocouplesare given in Table 3-6. The operation of the guard heaters is discussed inSection 4.6.
3-16
- .___. _ - - _ , _ _ _ _ - - - - _ _ _ _ _ _ _ _ _ _ _ . _ _ . _ _ . _ . _ . _ _ _ - _ _ -

:
!
: 9I
HLHR01
HLUBVIEWPORTHLTC11
HLCP12HLTC08
- 800
HLCP13 - -HLCP11 HLDT07
HLCP14 - - HLCP10
HLTC09 HLTC07
HLCP15 - - HLCP09 HLDT08 HLTC14HLDT06~'
HLTC17
HLCP16 - - HLCP08
r> rh
- HLCP07 HLTC06 - 6C0
- HLCP06 HLTC1%HLDT05 g
fA A
- HLCP05- 500 g
HLTC05 m?g- HLCPO4
- HLCP03 []% HOT LEO EE12T04 VIEWPORT 400 in_
HLTC04 --Gi
E
H 10~
HLTC14.H1DID 3d
HLTC03
- 200
HLCP02 -
ELTC13,HLDT02
HLTCO2
% HLTC01 \ 100-
HLTC12, HLDT01HLCP01- 4
HLRT01 -0HLCP17L
,'
x A
Figure 3-7 Hot Leg Instrumentation - Thermocouples, RTDs,Conductivity Probes and Viewports
O3-17

. _ _ _ _. -_ _ _ . _ _ . .--
,
I
'
J!
n ,, - .00,,
HLDP03- 700
o or%
- 600
0A d
MLDP02- 500 o
>-
T''
5| . y
HLDP01 - 400 m
O I.
I- 3o0 ,
tt
- 200l
i \ - 100o
.
|
|' m-0
L o:.
,
i1e
x|
|'
Figure 3-8 Hot Leg Instrumentation - DifferentialPressure Measurements
| 3-181
. _ . _ . . _ . _ _ _ _ , - . . . - _ _ _ . _ _ _ _ . . _ _ _ . _ _ _ _ _ _ _ _ _ , _ . _ _ _ . _ _ ._.._.,_ ,__._ _ _ _ , . . __ _,. . , . . _ _ -

.
fi Table 3-6
ELEVATION OF HOT LEG GUARD HEATER ZONES AND CONTROL THERM 0 COUPLES
! Elevation Covered Elevation ofZone by Zone Heater Control TCs Control TCsNo, (Inches Relative to SFLTS) Designation for Zone (Inches Relative to SFLTS)
1 - 23 to + 86 HLDT01 + 26
2 + 86 to +218 HLDT02 +157-1/2
3 +218 to +350 HLDT03 +295
4 +350 to +482 HLDT04 +408
5 +482 to +612 HLDT05 +559
6 +612 to +746 HLDT06 +695
III +746 to +734 HLDT07 +78674
8 +734 to +635 HLDT08 +692
(1) This zone crosses over HLUB (elevation +807-1/2)
3.3 STEAM GENERATOR
An existing 19-tube Once-Through Steam Generator (OTSG) was used in OTIS.
The OTSG was a single pass, counterflow, tube and shell heat exchanger. It
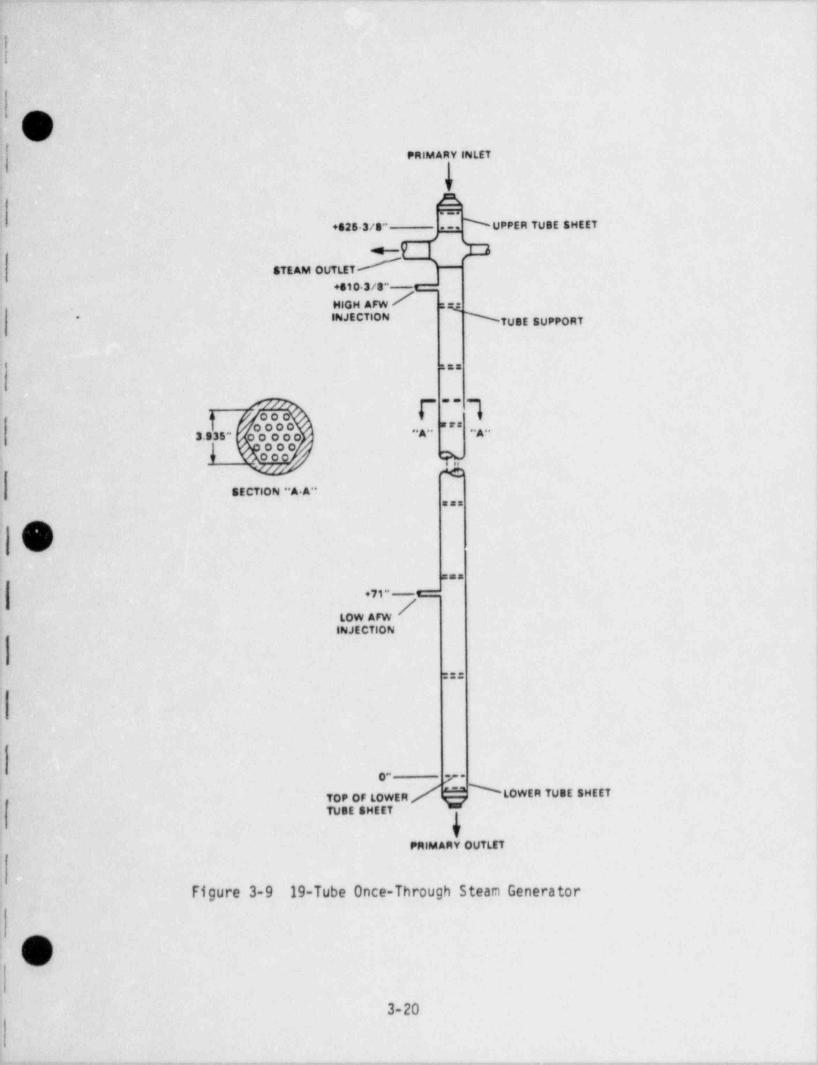
consists *of 19 Alloy 600 tubes with an outside diameter of 5/8 inch spaced on atriangular pitch of 7/8 inch on centers. The tube bundle was enclosed in ahexagonal shell 3.935 inches across flats and was held in place by 16 carbon steeltube support plates (TSPs) spaced at approximately 3 foot intervals. The distancebetween the secondary face of the lower and upper tubesheets was full length,approximately 52 '-1-3/8". The 19-tube OTSG is illustrated in Figure 3-9. The
TSPs were 1-1/2" thick and were drilled in a manner to simulate the broachedpattern of a full-size OTSG TSP. This is illustrated in Figure 3-10.
ad eiIn the OTSG primary flow entert at the top, flows' dopward through the
tubes,andexit/gat the bottom. The main feedwater enterp the steam generator atdthe bottom, boils'on the outside of the tubes, and exits at the top. For OTIS.
both a high and a low auxiliary feedwater (AFW) injection location were available.The high AFW injection location was selected so that the distance from the nozzle
to the first TSP below the nozzle in the model was the same as in the Oconee III
3-19
.. .- - . . . _ . .. . . _ - . . _~ ... _._- . . _ _ _ .
-. 4
PRIMARY INLET
'IfOewy
NUPPER TUSE SHEET+425 3/8" m
*STEAM OUTLET
+410- 3 / 8 "-HIGH AFW sqINJECTION NTUBE SUPPORT'
ass
f '"3.935" | "A" ''A"
00
mSECTION "A A"
eas
O...
+71"-C::
LOW AFWINJECTION
===>
|
D
o" 7-
TOP OF LOWER LOWER TUBE SHEET
TUSE SHEET
IfPRIMARY OUTLET
Figure 3-9 19-Tube Once-Through Steam Generator
O-
3-20
.-.. . - . . - - . _ - . . - . - . - , . _ . . - - - - - - -. . ..--._- - _ . - - - - . . - . . . - . - .

18. TUBE OTSG TUBE SUPPORT PLATE (DRILLED)
_ _
'
h 1 0,
i .
/""\[ 10 ,3 p3
h20,31
--# Rg (IN 1 R2 (IN l R3 (IN ) ARE A (IN 1
\. 0.32031 0 250 0 1907 0 051518,
FULL SIZE OTSG TUBE SUPPORT PLATE (BROACHED)
11' "" 29
T 7Ot
thI t f sI, Og,[ "2 N
I2
Rg (IN ) R2 (IN ) ARE A (IN 1
0.323 0.430 0 0518550.320 0.430 0 0530750.320 0 427 0.0514850.323 0.42/ 005C233
| 120'
Figure 3-10 Comparison of 19-Tube and PrototypicalOTSG Tube Support Plates
i
! 3-21!
!
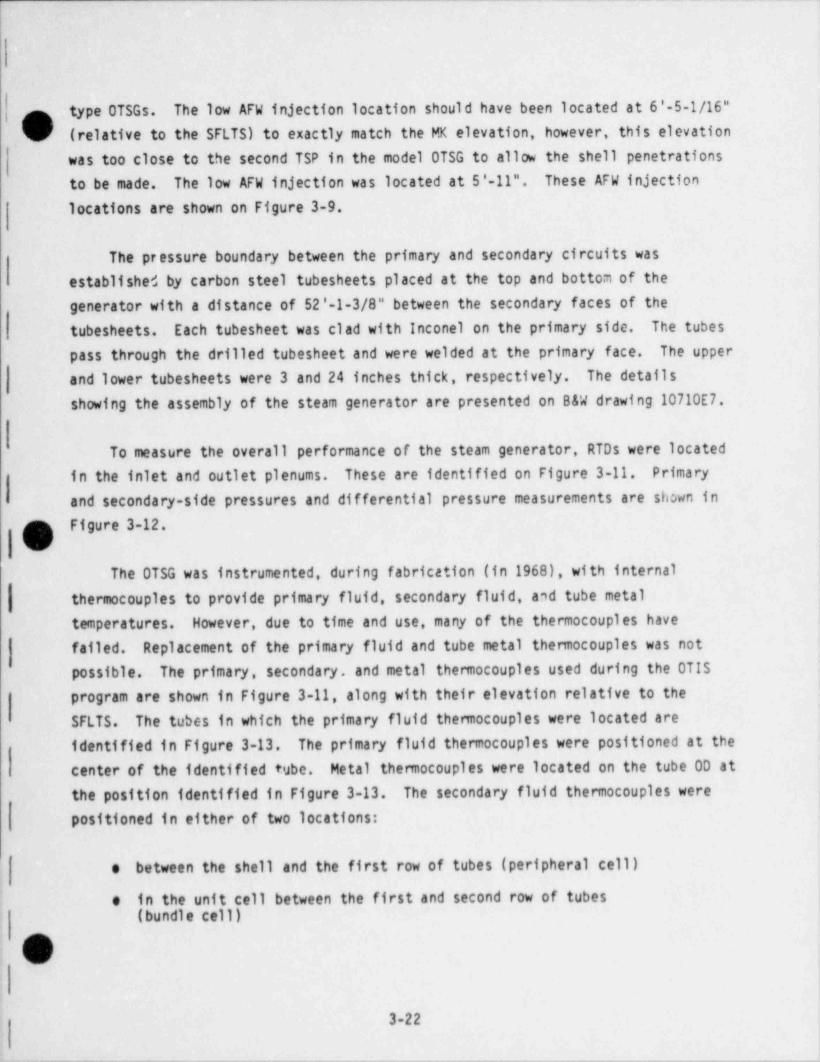
g] type OTSGs. The low AFW injection location should have been located at 6'-5-1/16"C' (relative to the SFLTS) to exactly match the MK elevation, however, this elevation j
was too close to the second TSP in the model OTSG to allow the shell penetrations )
to be made. The low AFW injection was located at 5'-11". These AFW injection
locations are shown on Figure 3-9.
The pressure boundary between the primary and secondary circuits wasestablished by carbon steel tubesheets placed at the top and bottom of thegenerator with a distance of 52'-1-3/8" between the secondary faces of thetubesheets. Each tubesheet was clad with Inconel on the primary side. The tubes
pass through the drilled tubesheet and were welded at the primary face. The upperand lower tubesheets were 3 and 24 inches thick, respectively. The details
showing the assembly of the steam generator are presented on B&W drawing 10710E7.
To measure the overall performance of the steam generator, RTDs were locatedin the inlet and outlet plenums. These are identified on Figure 3-11. Prima ryand secondary-side pressures and differential pressure measurements are shown in
G Figure 3-12.O
The OTSG was instrumented, during fabrication (in 1968), with internal
| thermocouples to provide primary fluid, secondary fluid, and tube metaltemperatures. However, due to time and use, many of the thermocouples have
failed. Replacement of the primary fluid and tube metal thermocouples was notpossible. The primary, secondary, and metal thermocouples used during the OTISprogram are shown in Figure 3-11, along with their elevation relative to theSFLTS. The tubes in which the primary fluid thermocouples were located areidentified in Figure 3-13. The primary fluid thermocouples were positioned at thecenter of the identified tube. Metal thermocouples were located on the tube OD at
the position identified in Figure 3-13. The secondary fluid thermocouples werepositioned in either of two locations:
o between the shell and the first row of tubes (peripheral cell)
e in the unit cell between the first and second row of tubes(bundle cell)
Ov
3-22
- _ _ _ _ _ - _ _ _ _ _ _ _ - _ _ _ _ _ _ _ _ _ _ _ - _ _ - - _ _ _ - _ _ - - - _ _ _ _ _ _ - _ - - _ _ _ _ - _ _ _ ___ _

.
' PRIM ARY INLET
.
1f
SPAT 01. SPRT02
,23 puPPER TUSESHEET'JTUSESUPPORT 4
\ 49'.9" - SSTC25- #8'*I~ 47'.0"- SSTC23. SSTC24-
4 8 '.8" 44'.2"- SSTC21, SSTC22---
42 '.0 " 41 3"- SSTC19, SSTC20.--
8 ' '' ' ~ 3s'.2" - SPTC01, SSTC17, SSTC18. SMTCOS---
38'.0" 36'.4"- SPTC02. SSTC16, $$TC16---
33*.10" 32'.4 - SSTC13, SSTC14---
0'.10"29'.3"- SSTC11. SSTC12. SMTC03---
27*.9" 28'.4"- SSTC09 SSTC10, SMTCO2---
24'.10" '-"- 23'.2" - SSTC00
21 '.8 "20'.2" - SPTC03 SSTC07, SMTC01---
18 *.8 *17.4"- SPTC04. SSTCOS---
18'.10"~~* 14*.2" - $ $7C06
12 *.8"--* 11*.1" - 8 STC04
3'.7"~~* s'.1" - SPTCOS SSTCO3
8 '.7 *--- 4*.11" - $$7C02
3 *.S " ,,,
1*.8" - S STC010.mEFERENQ1 DNE
747 TOP OF LOWER TUeESHEET
!q[ ~:SPRT03.SPRT04LOWERSFTC16. SPTC17. SPTC18TUSESHEET
m
1 f
PRIMARY OUTLET
Figure 3-11 OTSG Temperature Measurements andTube Support Plate Elevations
O3-23
_ _ . - _._ _ -. .

.
i%/
l
PRIMARYjpINLET4
SPPR01 - 836 3/4"i l _
k
UPPER WyTUSFSHEET PSPRoi ,ggg,
- 423 3/4"
| SSDPO4- 387 3/4"
"SSDPOS
SSDP03 - 360 1/2"
SPDP01 ggg,P02" - 277 1'2'
OSSDP01
LOWER '' "TuSESHEET N === - 0"lREFERENCE)
-
'
) 5FFT01, 02, 03' ' - .331/4"
m
Figure 3-12 OTSG Pressure and DifferentialPressure Measurements
.
b3-24

OAN
%
iou I T j j s |sMTC02
0, 1
'"'c*'
"1
H | B A { E | P|v| v1
nn|J jj C | D ( N|SMTC03
AI K j l L ( M
VsMTC04
PRIMARY FLUID TUBETHERMOCOUPLES IDENTIFICATION
SPTC01 E
SPTCO2 B
SPTC03 F
SPTC04 R
SPTC06 U
Figure 3-13 Radial and Circumferential Location of Primary Fluidand Metal Thermocouples
t
|
O3-25

. [ ;''
(' ,
i'y ,;,
/ T'
$ ,.
A mS,p showing the circumfere6tial and radial location of the secondary fluid- sn 73( ) thermocouples is given in Figure 3-14.v
: .
s\ .,
,,
Additional instrumentatim was added to the steam generator for the GERDA andA
,', OTIS program. A speciallycfabriceted piti-junction themocouple was installed ,
.- ,,
W' b into one tube. This tube is idettified in Figure 3-15. The multi-junction )thermocouple had ten (1Gi'th)rm'occuple junctionr. in a single 1/8" diameter sheath.
i;,k The tharmocouples were positioned at an elevation to measure the effect of high
9 ' ' , elevatfor. AFW injection on thd tiest transfer process. These elevations, alongf~
with the thermocouple designation are givcr.'in Table 3-7. Pitot tubes wereinstalled at the exit plane of the lower tubesheet in three selected tubes. The^
pitot tubes were used to provide a relative flow indication between the tube'! \>, f r.strumented with the multi-junction,thermxouples and one uninstrumented tube.
,- is s
,i Each pitot tube was equipped with a thermocouple for measuring temperature at the'' same point as differential pressure in the fluid stream. The steam generator
l' tubes instrumented with a pitot tube are identified in Figure 3-15. The details'of the additional instrumentation e arrangement in the existing steam generator
,
[ W, is shown on B&W drawing 9527E..
Table 3-7-
_
. ELEVATION OF MULTI-JUNCTION THERMOCOUPLE JUNCTIONS
!VTAB Designation Elevation of TC Junctio-
~ SPTC** Relative to SFLTS'
06 23 ' - 1-3/8"- 07 30' - 1-3/8",
k 08 35' - 1-3/8"- 09 39' - 1-3/8"
10 43 ' - 1-3/8"[
>
.
11 47 ' - 1-3/8"L' '
12 49' - 1-3/8"m
f 13 50' - 1-3/8"14 50' - 7-3/8"
> ' 15 51 ' - 1-3/8"
ow ./ ,
(
- ,
'
3-26"
r .
. - - - _ _

._
-
!
,
!,i
b
N,
N NUMBERS REFER TO SSTC".FOR EXAMPLE. 24 REFERS TO SSTC24
I U | | T } | S |
L v ! G I | F | R |'
4
19 11
I"| 1s 2s
I H | ! B l { A I E | P
zi
Y |n Y|J C | D i N || \
I K j L j { M l
9 17
|Figure 3-14 Radial and Circumferential Location
j of Secondary Fluid Thermocouples
||
|
93-27
. . .. _ ._.

]Q
nN AFW NOZZLE
FOR MAXIMUMN / WETilNG
t
U T S
V G F R
H B A E P
J C D N
\K L MAFW NOZZLE AFW NOZZLEFOR MAXIMUM & FOR MAXIMUMMINIMUM WETTING WETTING
INSTRUMENT TUBE
I (VTAB DESIGNATION) IDENTIFICATION
MULTI-JUNCTION TC #1 (SPTCOS SPTC15) J
llPITOT TUBE #1 (SPPT01) . TC SPTC16 J
,,
f PITOT TUBE #2 (SPPT02) . TC SPTC17 R
f- PITOT TURE #3 (SPPT03) . TC SPTC18 N
|
Figure 3-15 Location of Multi-Junction Thermocouples,Pitot Tubes, and AFW Nozzles
|
||||x
3,-28
L-

i
i
Conductivity probes were installed in the steam generator to measure thesecondary level swell anticipated during some transients. The thirteen (13)active conductivity probes were concentrated between the 29' to 36' elevation inthe generator (the normal GERDA test operating level in the steam generator was
about 26'). These probes were spaced approximately 6" apart. and were staggeredaround the circumference of the generator. The steam generator reference probewas located at the 20' elevation. The details showing the location andinstallation of the steam generator conductivity probes are given on B&W drawing9548E.
Auxiliary feedwater injection in OTIS could simulate either a high or lowelevation AFW injection plant. Additionally, nozzles for AFW were used thatallowed either maximum or minimum wetting of the tubes in the model OTSG. These
maximum and minimum wetting nozzles were used during the GERDA secondary heat
transfer and natural circulation tests to evaluate the importance of spray patternon the heat transfer process and natural circulation.
The configuration of the AFW nozzles for maximum and minimum wetting wasdetermined using a plastic model of the 19-tube OTSG ,5 The maximum wetting4
configuration consisted of a 0.187 inch ID tube with a 0.063 inch OD cross insert
| located on three sides of the hexagonal shell. The minimum wetting configurationconsisted of a single 0.430 inch ID tube located on one side of the hexagonalshell. The circumferential location where the maximum or minimum wetting nozzleswere installed is identified on Figure 3-15.
3.4 COLD LEG PIPING AND PRIMARY FORCED CIRCULATION SYSTEM
The cold leg piping was scaled based on phenomena and elevation..
Phenomenological scgling set the pipe size to a 3" Schedule 160 pipe. The cold#
leg piping extend / from the 5" x 3" concentric reducer at the outlet of the steam /
4Auxiliary Feedwater Benchscale Tests, LR:81:5168-05:01, D. P. Birmingham andA. L. Miller to Distribution, March 15, 1981.
Auxiliary Feedwater Benchscale Tests-Effects of Tube Material on WettingCharacteristics, LR:81:5168-05:02, D. P. Birmingham and A. L. Miller toDistribution, April 15, 1981.
3-29
-. ..

1
1'
I
generator, through a flanged orifice assembly (bore diameter is 1.110 inches), to( the cold leg low point (spillunder) at elevation -76-7/8". The pipe turned 90" to
a short horizontal run prior to the upbend. The horizontal run was at a 45' angleto the reactor vessel / steam generator centerline. The cold leg then ranvertically for about 24", where it was reduced from 3" Schedule 160 pipe to 1-1/2" i
Schedule 160 pipe. The 1-1/2" pipe then turned 90* to the horizontal, then 90*again to a vertical run. This vertical run of 1-1/2" Schedule 160 pipe, ofapproximately 39 inches, was included for the cold leg ultrasonic flowmeter. Theultrasonic flowmeter was found to be an unacceptable technique for measuring flowrates in GERDA and was not used for GERDA and 0 TIS test data. However, the
associated piping did remain as part of the cold leg piping. After passingthrough this section of pipe, the cold leg returned to a 3" Schedule 160 pipe,
ad continued vertically upward to the simulated reactor coolant pump (RCP) spillover -
resistance. From the RCP spillover the cold leg sloped downward and connected
with the downcomer at elevation -23". The routing of the cold leg piping and thekey elevations are illustrated in Figure 3-16. Details of the cold leg piping are
shown on B&W drawing 9542E.
Iv There were two high pressure injection (HPI) locations in the cold leg -- oneat the cold leg low point on the upstream side of the cold leg spillover, and theother in the sloping section on the downstream side of the cold leg spillover.HPI fluid was injected on the bottom side of the pipe normal to the axis of thepipe. Thc HPI nozzle was sized to preserve the ratio of cold leg to HPI momentumfor one HPI pump discharging to one injection location. Details showing the HPIconnections to the loop are illustrated on B&W drawing 9572E.
There were two simulated leak sites in the cold leg -- one at the cold leglow point on the upstream side of the cold leg spillover, and the other in thesloping section on the downstream side of the cold leg spillover. The leak siteswere located on the bottom side of the pipe. These leak sites are shown in Figure
3-17. Effluent from the leaks was directed to the single-phase venting system /
(discussed in Section 3.7).
The instrumentation associated with the cold leg is elso shown in Figure
3-17. There were five (5) thennocouples located in the cold leg, three (3) on the
V upstream side and two (2) on the downstream side of the cold leg spillover. An'
3-30i
!... .__., - _ . . - - - - - - , _ . -,. . . , . .-, , - - - . ---

!!\
O
+30"(BOTTOM ID OF PIPE)
-23".
9 STEAMGENERATOR
DOWNCOMER
6630-1/2"
FLANGED-66" " ORIFICE ,
l
-76-7/8"' (TOP ID OF PIPE) )
Figure 3-16 Cold Leg Piping - General Arrangement
.
O'3-31
w . _ . . . . . - - . . _ . . - . - - _ . . _ . - _ _ _ - . . - . - . - , . - . - . . - - - _ . _ ...

-_ _ -
|
|
I<
.
- +50
DE
+25 g-
CLTC04 eW S5t9w
HPl5
CLD LEAK O g-
<g
CLTCO3- C8CLTC05 <n
ea0 -25 5-
, 5T
55ao1
5P
50-
-
\r..,a*
-CLTC01 -CLTCO2
I't
CLOR02CLOR04 ~
-75
I I'
| HPI CLS LEAK|
Figure 3-17 Cold Leg Piping - Temperature and Flow MeasurementsLocation of High Pressure Injection and Cold Leg Leaks
i
i O3-32
||
, - .--- .. . . _ . - .- . , _ . . - - . . _ . - . . , - . . , - . - - - - _ _ - - , - . . - , - , - , - , . - .

9
:
orifice was located near the bottom of vertical run from the steam generator tothe spillunder. A high range and low range AP transmitter was used to calculatethe flow rate from this orifice. The calibration of this orifice is discussed inSection 4.8. The differential pressure measurements arcand the cold leg are shownin Figure 3-18.
A Chempump Model GET was used in OTIS for providing forced circulation. TheChempump was a canned-rotor pump with a design head of 250 feet at a flow of 250GPM. The pump was cooled using city water. The circulating pump was used duringfacility start-up. The pump was located in a loop parallel to the " naturalcirculation" flow path through the cold leg. Its location is illustrated in
Figure 3-19.
The Primary Forced Circulation Loop started at the tee connection in the coldleg low point just before the vertical upturn. A 2-1/2" isolation valve wasdownstream of the tee section and just upstream of a 4" Schedule 160 straightsection to the suction side of the pump. The straight section contained a flangedstrainer assembly. The pump discharged vertically upwards through a 3" pipe.After passing through a concentric reducer, the flow passed through an isolationvalve located in a 2-1/2" pipe downstream of the pump. The Primary Circulation
Loop connected back into the cold leg piping at approximately an elevation of
-58-3/4".
| The pump-by-pass valve, CLCV01, was full open during natural circulation
| tests. During forced circulation operation, the isolation valves around the pumpwere opened and CLCV01 was throttled to give the desired flow rate. As CLCV01 was
! closed down, more flow was forced through the primary loop. With CLCV01 full open(flow coefficient, Cv, of 110) and the isolation valve on the discharge side ofthe pump, PCHV02, opened 3-1/2 turns, a flow rate of about 7500 lb/hr was obtainedwith cold water. This was the normal alignment during loop start-up. The pump
| was interlocked so it could not be started unless the pump by-pass valve was full
open. This was to prevent forcing a large amount of flow through the loop andpossibly damaging instrumentation. Pressure gages and thermocouples were located
upstream and downstream of the pump. This instrumentation was not recorded astest data, but used for loop operation. Details of the forced circulation system
|' are shown on B&W drawing 9542E._
| 3-33

--. _ - . _
t-
1
.t
jb
W
u
E9u
STEAMGENERATOR DOWNCOMER --
o
o
,
IEEa
tCLDP02CLDPO4
Figure 3-18 Cold Leg Piping - Differential Pressure Measurements
Cy v.)'l
3-34,
1;1
. . _ . _ _ . . _ _ _ . . . . _ . _ _ _ _ _ . . _ . _ . . . _ . _ - . _ _ _ _ _ _ _ _ . _ _ . . . _ . _ . _ . __ . _ _ _ . -___.

$i
ei
|
c
o
PCHV02 PCHV05
k bE cLCv01
STRAINER FELTMETALFILTER
H 01CHEMPUMP
PCHV06
,
: Figure 3-19 Primary Forced Circulation Loopi
|
:
O~
3-35
-
---. -. _. - _ . - --

The forced circulation pump in OTIS was not intended to match the head / flow,.,
V or coastdown performance of the plant RCP, but only to provide forced circulation.The coastdown time for the OTIS forced circulation pump was determined duringGERDA testing to be about 5 seconds based on flow measurements before and after
pump trip. |
During facility startup and when the suspended solids in the primary fluidexceeded the desired level, a portion of the primary fluid was directed through a
0.6 micron Feltmetal filter. The Feltmetal filter consisted of interlocked metalfibers which were sintered to produce metallic bonds at all points where thefibers touch each other. This porous structure enabled filtration to 0.6 microns.The filter was tubed into a by-pas- loop around the Chempump, and is shown in
Figure 3-19. Instrumentation w s provided around the filter to measure the
! pressure drop across the filter, flew rate, and pressure. These measurements were
used for loop operation and not for test data.
3.5 PRESSURIZER
: n
k The pressurizer vessel was fabricated from a 3" Schedule 160 stainless steelpipe. The volume of the pressurizer was scaled to that of MK, as was the
| elevation of the bottom of the vessel. The length of the pressurizer wasapproximately 20" shorter than that of the MK plant to preserve the volumescaling. The surge line was fabricated from 1" Schedule 80 stainless steel pipe.'
Surge line volume was approximately scaled to MK as were the elevations of the hotleg-to-surge line connection the surge line sloping-to-vertical interface, andthe surge line low point. These elevations and volumes for OTIS are compared toMK scaled parameters in Section 3.0.
A schematic illustrating the pressurizer and surge line is shown in Figure3-20. A layout of the surge line is shown in Figure 3-21. The pressurizer could
be isolated from the hot leg by two (2) manually operated valves, PRHV01 andPRHV02. A simulated pilot operated relief valve (PORV) was located at the top ofthe pressurizer. A spray connection to the pressurizer (from the cold leg) wasprovided through a remotely operated valve, PRCV01. The facility water supplysystem was connected to the pressurizer through PRCV02. Provisions for degassingg(during heat-up operation) the pressurizer and for providing a gas blanket on the
.
3-36.
. . - - - - , . - . - , , , - , _ , - - . - , . ,,.- ----.,m ,. - - , , .,-- - - - - -

I1 |
Of FACILITY
WATER SUPPLY
, if
{~ PRHVO4 SIMULATED* Q PORVn * TO PRIMARYM y VENTING SYSTEM
PRHVOS , g ,,PRCV02%
*
SPRAY UNE + MFROM COLD LEG PRCV01
hi
|
PRSVO1
OPRESSURIZER %
''HOT LEG %
PRHV01
PRHV02
i 9 +79 1/4"!
II
SURGE 'LINE PRHV03
!
l
Figure 3-20 Pressurizer - General Arrangement;
|
I I
13-37
t
,
ee

|'
|
.
.
! = 32" :
PRESSURIZER
*a
30"
= 29 3/4" r
1
30' u;
STEAM HOT LEGGENERATOR (VERTICAL RUN)
T
i |N
HOT LEG %,
' ' +103-1/4"
A +94 3/4"
|N( PRESSURIZER # s; ,79,3f4-
+30"| (TOP OF PIPE)!
Figure 3-21 Surge Line Layout:1
O,
i!, 3-38
|
. ._..-_.. ._ __ __.,,-, ,.__ .._-._....._.,-,._ , .___. _ _..__ _ ___ _ . _ _ . . _ _ _ _ _ _- -

pressurizer (used during fill operation) were provided through PRHV04 and PRHV05.A drain valve, PRHV03, was located at the bottom of the surge line. A safety
valve and rupture disc assembly was located near the middle of the vessel. Thedetails of the pressurizer and surge line design are contained in B&W drawing9518E and 9549D.
All the valves on the pressurizer (except the code safety valve and drainvalve) were sealed stem valves to preclude leakage of NCGs. The safetyvalve / rupture disk assembly and drain valve had a water trap upstream of the valveto isolate NCGs from the potential leak path. The flow coefficient, Cv, for thevalves in the flow path are given in Table 3-8.
Table 3-8
MANUFACTURERS' SPECIFIED FLOW COEFFICIENTl FOR VALVES IN THE PRESSURIZER
Valve Flow Coefficient, Cv
Designation Full Open Valve
PRHV01 1.2
PRHV02 1.2
PRCV01 1.0l
The simulated PORY was located at the top of the pressurizer in a section of3/8" tubing. This simulation consisted of two (2) sealed stem automaticallyactuated valves, and a flow control orifice upstream of these valves The flow
control orifice was sized to provide the desired relieving capacity of the PORV.The valves in the PORY simulation were controlled to open at a set point pressureof 2300 psia and then to close at 2250 psia. These dual set point pressures wereadjustable. The valves could also be opened manually. The operation of the PORVis discussed further in Section 3.7, Primary Venting Systems.
The pressurizer was heated externally using band heaters. The main heatershad an installed capacity of about 1.4 KW (MK scaled power was 1.12 KW) and were
located over the lower 18" of the vessel. Pressure was controlled with the mainheaters during steady-state operation. The heaters were tripped at the start ofthe SBLOCA transient, and remained off during the entire test. In addition to the
,,
3-39
_ _ - _ _ _ _ - - _ _ _ _ _ _ _ _ _ _
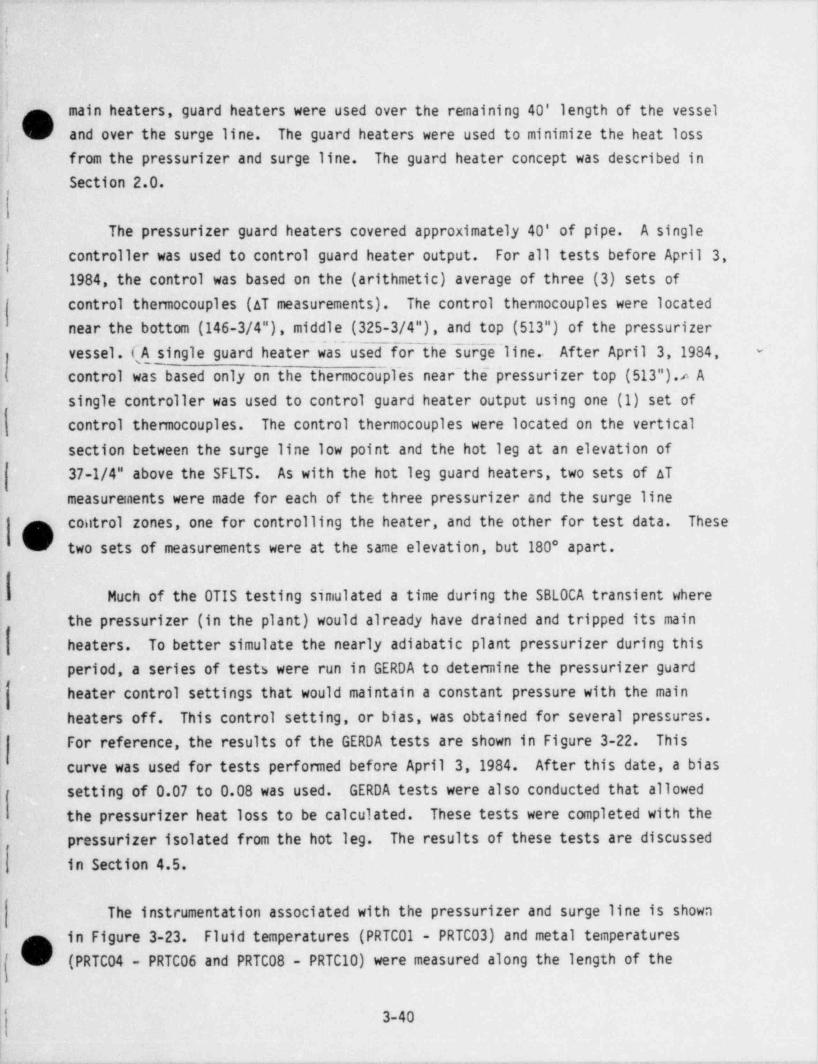
!l
,o main heaters, guard heaters were used over the remaining 40' length of the vesselU and over the surge line. The guard heaters were used to minimize the heat loss.
d -from the pressurizer and surge line. The guard heater concept was described inSection 2.0.
The pressurizer guard heaters covered approximately 40' of pipe. A singlecontroller was used to control guard heater output. For all tests before April 3,
1984, the control was based on the (arithmetic) average of three (3) sets ofcontrol thennocouples (AT measurements). The control thermocouples were locatednear the bottom (146-3/4"), middle (325-3/4"), and top (513") of the pressurizer
~~
vessel. (A single guard heater wa's used for the surge 'line. After April 3, 1984, -i
_
control was based only on the thermocoupl'es near the pressurizer top (513").e A~
single controller was used to control guard heater output using one (1) set ofcontrol thermocouples. The control thermocouples were located on the vertical
.,
section between the surge line low point and the hot leg at an elevation of37-1/4" above the SFLTS. As with the hot leg guard heaters, two sets of ATmeasurenents were made for each of the three pressurizer and the surge line
,o control zones, one for controlling the heater, and the other for test data. Thesetwo sets of measurements were at the same elevation, but 180' apart.
.
Much of the OTIS testing simulated a time during the SBLOCA transient where
the pressurizer (in the plant) would already have drained and tripped its mainheaters. To better simulate the nearly adiabatic plant pressurizer during thisperiod, a series of tests were run in GERDA to detennine the pressurizer guard
'
heater control settings that would maintain a constant pressure with the mainheaters off. This control setting, or bias, was obtained for several pressures.For reference, the results of the GERDA tests are shown in Figure 3-22. This
curve was used for tests performed before April 3,1984. After this date, a bias
| setting of 0.07 to 0.08 was used. GERDA tests were also conducted that allowedthe pressurizer heat loss to be calculated. These tests were completed with thepressurizer isolated from the hot leg. The results of these tests are discussedin Section 4.5.
The instrumentation associated with the pressurizer and surge line is shown
n in Figure 3-23. Fluid temperatures (PRTC01 - PRTC03) and metal temperatures
j' U '(PRTC04 - PRTC06 and PRTC08 - PRTC10) were measured along the length of thea
L 3-40
. _. _ . - _ - - _ . _ . _ _ _ _ _ _ . _ _ _ _ - _ _ _ _ .

!t1
4
;
O!
1
1!
!
...e
e.es .
|e.44 .
' sc'|| a e.4a .- s
|s e,4 .
' E! TI I e.as .
OM=
. . . .
. . .
e.2 _|
l 5 5 g g g g g g
2ge des GBe 888 1988 1298 14ee tage 1880 2eSe 220e
N PSTA
Figure 3-22 Pressurizer Guard Heater Bias for Adiabatic Pressurizer'
for Tests Prior to April 3,1984.
1
|
|
O.
-
!
3-41
. -

I
? |
|.t
F
'l |-
,1 '
! -
_f. |
- . 00
;
' PRTC06 - - PRTCO3
PP.TC10-PR DT03
,
b| 4,PRPROI y
ehE
IPRTC05- - +400- PR CO2
WI S
E
-PRDT02 $PRESSURIZER PRTC09 2
\ 8w
- +300 #O
'[dw*gPRDP01
- PRTC01 wPRTC04- -PR HR01 m
1 r-
+200gi
E
-PRDT01
N PRTCOB gBOT LEG
- +100
''PRTC11
-PRDT04o
IPRTC07 -0
Figure 3-23 Pressurizer Instrumentation
I,
u\
3-42
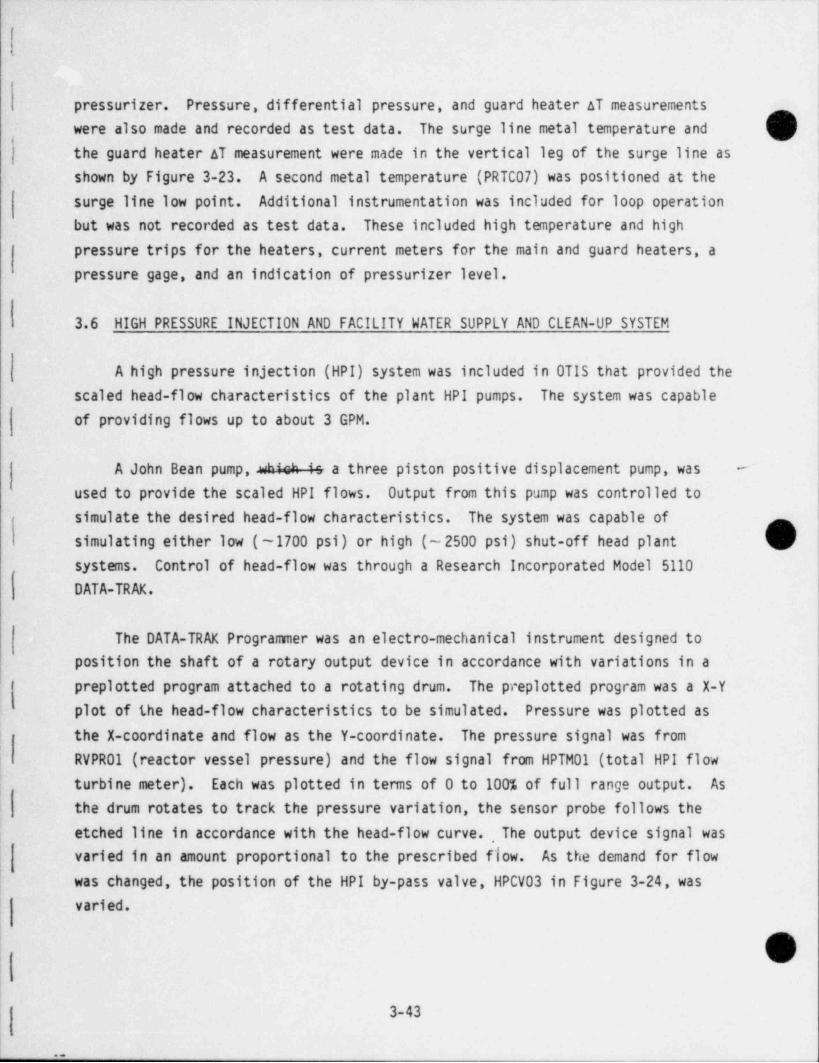
pressurizer. Pressure, differential pressure, and guard heater AT measurementswere also made and recorded as test data. The surge line metal temperature and
| the guard heater AT measurement were made in the vertical leg of the surge line asshown by Figure 3-23. A second metal temperature (PRTC07) was positioned at the
surge line low point. Additional instrumentation was included for loop operationbut was not recorded as test data. These included high temperature and highpressure trips for the heaters, current meters for the main and guard heaters, apressure gage, and an indication of pressurizer level.
3.6 HIGH PRESSURE INJECTION AND FACILITY WATER SUPPLY AND CLEAN-UP SYSTEM
A high pressure injection (HPI) system was included in OTIS that provided thescaled head-flow characteristics of the plant HPI pumps. The system was capableof providing flows up to about 3 GPM.
A John Bean pump, 4 MS B a three piston positive displacement pump, was -
used to provide the scaled HPI flows. Output from this pump was controlled tosimulate the desired head-flow characteristics. The system was capable ofsimulating either low (~1700 psi) or high (~ 2500 psi) shut-off head plantsystems. Control of head-flow was through a Research Incorporated Model 5110DATA-TRAX.
The DATA-TRAK Programmer was an electro-mechanical instrument designed toposition the shaft of a rotary output device in accordance with variations in apreplotted program attached to a rotating drum. The preplotted program was a X-Yplot of the head-flow characteristics to be simulated. Pressure was plotted asthe X-coordinate and flow as the Y-coordinate. The pressure signal was from
iRVPR01 (reactor vessel pressure) and the flow signal from HPTM01 (total HPI flow
; turbine meter). Each was plotted in terms of 0 to 100% of full range output. As
the drum rotates to track the pressure variation, the sensor probe follows theetched line in accordance with the head-flow curve. , The output device signal wasvaried in an amount proportional to the prescribed fiow. As the demand for flowwas changed, the position of the HPI by-pass valve, HPCV03 in Figure 3-24, wasvaried.
e3-43
o ..

- - _ _ ___ - ,_. _ . _ m ._ ..
_. .._
. ),
4
!
i;
i
i
iTO COLD LEO TO COLD LEODISCHARGE SUCTION
'
Ait
,
ynPHvas %HPNV45
: 3_3. 3_.0|i R : TO PRESSURIZER SPRAY
HeHv4e;)(HPTM021 w HPI PUMP; .
| $ x X )'_ rnoM rAcet Tv
1 HPTM03 HPTM01 ~ WATER SUPPLY,
HPTC01
$| HPCv03
:
!|
1!
|
!!:
i:
Figure 3-24 High Pressure Injection System,
i
i
!
!_ -________
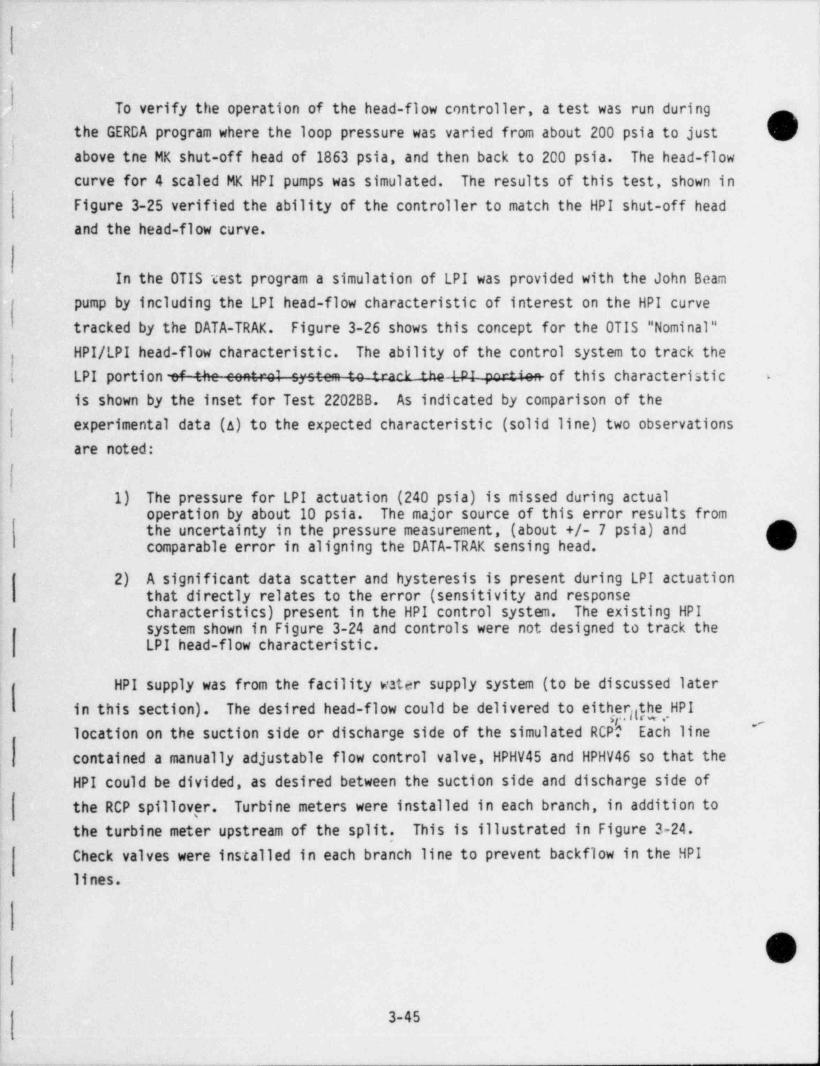
To verify the operation of the head-flow controller, a test was run duringthe GERDA program where the loop pressure was varied from about 200 psia to just,
above tne MK shut-off head of 1863 psia, and then back to 200 psia. The head-flowcurve for 4 scaled MK HPI pumps was simulated. The results of this test, shown inFigure 3-25 verified the ability of the controller to match the HPI shut-off headand the head-flow curve.
In the OTIS test program a simulation of LPI was provided with the John Beampump by including the LPI head-flow characteristic of interest on the HPI curvetracked by the DATA-TRAK. Figure 3-26 shows this concept for the OTIS " Nominal"HPI/LPI head-flow characteristic. The ability of the control system to track the
;
i LPI portion tf the centrol syste- te track the LPI pertica of this characteristic -
is shown by the inset for Test 2202BB. As indicated by comparison of theI
| experimental data (a) to the expected characteristic (solid line) two observationsare noted:
1) The pressure for LPI actuation (240 psia) is missed during actualoperation by about 10 psia. The major source of this error results fromthe uncertainty in the pressure measurement, (about +/- 7 psia) andcomparable error in aligning the DATA-TRAK sensing head.
2) A significant data scatter and hysteresis is present during LPI actuationthat directly relates to the error (sensitivity and responsecharacteristics) present in the HPI control system. The existing HPIsystem shown in Figure 3-24 and controls were not designed to track theLPI head-flow characteristic.
HPI supply was from the facility water supply system (to be discussed later|
in this section). The desired head-flow could be delivered to eitherge,HPIlocation on the suction side or discharge side of the simulated RCPh Each line '
contained a manually adjustable flow control valve, HPHV45 and HPHV46 so that theHPI could be divided, as desired between the suction side and discharge side of
the RCP spillov,er. Turbine meters were installed in each branch, in addition tothe turbine meter upstream of the split. This is illustrated in Figure 3-24.
Check valves were installed in each branch line to prevent backflow in the HPI
| lines.
,
O,
3-45

- - m- -
rw
0N %') U
P (BAR)13 48 100 128.5
I I I i
1400 SNN
A----A MEASURED---- SCALED MK
*(1200 -
,
%.'
! 1000 -
! c- k} S
. 800 - -
Y b A'
a .a wI
gSa- **,
400 -
s
!
i
; m -
1
! AI I I | 1 I I l Y1 0i 0 250 500 750 1000 1250 1500 1750 20004 DISCHARGE PRESSURE (PSIA)i
'
)
)' Figure 3-25 GERDA 4 Pump HPI Head-Flow Curve
!
- -_ _ _ _ _ - _ _ _ _ _ _ _ _ _ _ _ _ _ _ _

2282BS.0 NO ClMRD HEf.TERS TEST18-APR-84
\2w
J \ e,,.
#1996 A
e8#3 _ ,
M A/H 888 *
"
R g ,,
79$ A
a
600 s#A, 86 A,
s,- -
A'500 a n
b*A
* ** s'kl _ _ _ _ -g
, - l_ L.__4g _ _ _ . . , ,
a
228 225 230 235 244 245 250
~ THEORETICAL HEAD-FLOW PSIA<
'
A'"A EXPERIMENTAL EAD-FLOW
1400 < -
h (230 psia 1332 lbm/hr)
1200. .
1000 --
043e a00 .
!Ie
600 **
"0 TIS Nominal"
(Tull Capacity, high shetoff h.ad)' ''
(240 p.ia. 443 lba/hr)
gno . .
- - 2400 psia. 176 lbm/hr)
LP1 EFI
O ~
2500560 1600 15'00 2000 e....r.. ....Figure 3-26 OTIS " Nominal" HPI/LPI Head-Flow Characteristic
3-47
| 1
The HPI system was supplied by the Facility Water Supply and Clean-Up System. ),
This system, illustrated in Figure 3-27, provided high-purity deaerated water forinitial filling of the primary and secondary loops, for leakage makeup, forremoval of NCGs from the loop, and for HPI supply.
Demineralized water from the plant reverse osmosis system was passed througha Continental demineralizer, then to an Epicor vacuum deaerator. The deaeratorwas operated at a fluid temperature of 110*F and a pressure of 3 inches mercury toprovide deaerated water (<10 ppb oxygen) at flows up to 3 GPM. Flow from the
deaerator could be supplied directly to the loop, either through the HPI system orthrough a Sprague pump. The Sprague pump, which is a single piston air drivenpump, was primarily used for making chemical additions to the loop and for smallamounts of makeup water. Water from the deaerator could also be stored in a 1000gallon storage tank. In this storage tank, the demineralized water was kept atambient temperature with a small gas overpressure. The conductivity of the waterin the tank was adjusted to that in the loop to minimize the (conductivity)dilution effect during high pressure injection. Also, the gas overpressure wasselected to be either nitrogen or helium depending on which species was being usedg3in the loop. Water stored in this tank could be routed back to the deaerator sothat degassed water could be supplied to the loop. Upon completing a NCG test,the water in the loop was routed back to the Facility Water Supply and Clean-UpSystem, where it was degassed, and then returned to the loop using the HPI system.
3.7 PRIMARY VENTING SYSTEMS
The function of the primary venting system was to provide a controlled le.'kfor the release of primary fluid, and to provide a means of measuring the rate andtotal mass of fluid exiting the loop through the leak site. In OTIS there were
six (6) leak sites - four (4) defined as single-phase region leaks, and two (2)defined as two-phase region leaks. Independent systems were used to control and
meter the fluid from the single-phase and two-phase leak regions. The single-phase venting system will be discussed first.
There were four controlled leak sites in the single-phase region - two (2) inthe cold leg, one on the suction side of the simulated RCP spillover and one onthe discharge side of the RCP spillover, one controlled leak at the bottom of the
.
3-48
- _ _ - _ _ _ - _ _ - -- . _ . . - - _ - . _ -- -

i
e
_ . _ ... ~ u-
...-. -I I
W.T.. .ufMT
t - ,3 -
H- " .-,
R ..
"'"~h3-,
3-,. 3- M- =p 3 ,,,, , --- .. . _ ,
-- e .n -#F' , _ _ _ _ _ _ _ _ _ _ _ _ _ _ _ _ _ _ _ ,* *- u ():'"" . ; 2_ |
,,.rWW2, 8 3
= ="~-A- ! | -ch- -
|; |" " ~
C88EM =" 0
. o- . , - ,$
',,,,,yg y
. so.. | ...|"a 2 =@, ,o
m._ _ _ .
L8CW. To g.-, , _P. woe
|
~
M ,, *''" --
X+='a,, , , , ' " . " *' '| f
-a,
: e :-_,
-~-o-~e | ...r = . =uo.c rie,=-y t.____________.,,
. ..
PWW.3
-
Figure 3-27 Facility Water Supply and Clean-Up System
O3-49
1-

_
|-
f _ lower plenum of the reactor vessel, and one controlled leak at the top of the top
( plenum of the reactor vessel. These four leak sites tied into a common point,I' after which they shared a heat exchanger and a leak measuring system. The cold
leg suction leak site was branched into four lines, each having a leak orifice.This arrangement avoided loop cooldowns for cold leg suction (CLS) leak orifice
;
changes. This system is illustrated in Figure 3-28. '
Remotely actuated leak control valves were located just downstream of theleak control orifice. (The orifice assembly was discussed in Section 2.0.) The
f- cnntrol valves and control orifice were located in 3/8" tubing. The controlvalves were 3/8" NUPRO "U" series sealed stem valves, which have a flowcoefficient, Cv, of 1.0. After passing through the control valve, the fluid wascooled using a single pass, tube-in-shell heat exchanger. The heat exchanger had
2sufficient cooling capacity to handle single-phase leaks up to a scaled 50 cmbreak. Downstream of the cooler the effluent could be sampled to determine theamount of dissolved gas prior to being collected in a collection tank. Anaccumulating flowmeter, Y1AC01, was used to measure the mass of fluid exitingthrough the leak site. Leak rate was computed (by the data acquisition system)based on the accumulating flowm'eter reading and the time interval between data'
[ acquisition scans. Fluid temperature was measured downstream of the meter. The| collection tank was mounted on a weigh scale to allow cross checks on total
inventory leaked from the loop. Details of the single-phase leak system are givenon B&W drawings 9574E and 9539D.
I There were two (2) leak sites in the two-phase region of the loop - a highpoint vent (HPV), located on top of the HLUB, and a simulated pilot operated
| relief valve (PORV), located on the top of the pressurizer. The effluent from
| these leaks was cooled, stripped of NCGs (if present), then the liquid and NCG
| mass flows were measured. A schematic illustrating the two-phase venting systemis shown in Figure 3-29. Details of the two-phase venting system are given on B&W
drawings 9559D, 9562D, 9563D, 9564D, and 9565D.
j The HPV leak control valves, which were two 3/8" NUPRO "U" series sealed stem
[ valves, were located upstream of the leak control orifice assembly, After passing /
k through the orifice the steam-water-NCG mixture was condensed, cooled, and the| gases were separated from the condensate. A centrifugal separator was used to
3-50
_. . .. _ _ . _ _ . _ _ _ _ _ _ _ . _ _ , _ . _ _ _ . _ . _ _ _ _ _ . _ . - . - -

ORV TOP PLENLH
LEAK SITE
v1Cv12em
SACVOS
SACVW vitCD38 $ TEAM# GENERATORg
CLD
# v1 cn2 R E ACTORSITE
h.v1Cv03 .. .. .
CLS LEAK SITE
4 __V1MV00 VICV04 VICVM g
VICV05 VICV07
-so-V1HV07
OACVOS GACV07
~ ~
RV INER PLINLHLEAK SITE
hv1Cv01
*__ V1MV06
COOLER~
__
V1MV01
TO DEAERATOR
}(e vinv0.b""
V1HV03
V1HV04
TO COLLECTION7TAhK
Figure 3-28 Single-Phase Venting System - GeneralArrangement and Instrumentation
O3-51
|

._ . . _ _ . . . _ - _ _ _ -
(~1 V2TC03
| VENT | ,
MO diirWNVet V3CV02 OneFeCE
f30 OALLON h
WTCM_ $4PV gggg i
_SEPARATOR
f 3V2HV07i V2HVOS%
SURCETANK
|V3CV93 V2CVOS
WITC01WUTM
"" "" NORTHd''' TANE TANK
.
v ACOi Q .__ch_dih_ _ . - _'
V3CVO3 V2CV04
-_-""
PORvLEAK
cop,o' ~-
-~ _ _
PORv*E'^a^Toa yy musTsAm
J "'"' # v3Cv10 vzCvii
TO U.
ORAINV2HV01
''"'''PRessumiramg
WaCvosh Vawvor {To AIN
I
, -1P V3MV04
TO CousenowTANE V3MVes
t vtTC02
'''o>0| W-3)
vTO COLLECnowTANE
.
'
Figure 3-29 Two-Phase Venting System - GeneralArrangement and Instrumentation
O'
3-52
| 1
. . . - . . , _ . _ _ . , _ _ _ _ _ _ _ . _ . _ _ _ __ _______ _ _- _.._. _. _. ___ _ _ _ -- - - -

separate the liquid and the gases. The liquid level in the separator wasmaintained at a nearly constant level using a flow control valve, V2CV05, and theseparator differential pressure. The differential pressure measurementsassociated with this system are shown in Figure 3-30. An accumulating flowmeter,
Y2AC01, was used to meter the mass of steam-water removed through the HPV. TheNCGs flowed from the top of the separator to the two 250 gallon tanks. When theinternal pressure of the separator was sufficient to raise the water level in anoverflow leg to its discharge elevation, water from the 250 gallon tank wouldspill over into either the North or South accumulator tank (whichever one wasselected by the operator). The level in the accumulator tank was calculated fromthe differential pressure measurement, V2DP03 or V20P04. The volume of gasreleased through the HPV was then computed from this level change.
The PORY leak control valves were located downstream of the leak controlorifice assembly. As with the HPV a double isolation valve was used. After themixture from the PORY was cooled and the gases were separated from the condensate,
the liquid mass and gas volume were measured in a manner similar to the HPV.
A Surge tank was used in parallel with the two accumulator tanks (North andSouth tanks). The purpose of the Surge tank was to provide a means of pressurerelief for the system as well as to measure water displaced from the tanks. In
the event a large quantity of gas was released, the lines to the North and Southtanks may not be able to handle the resulting water flow rate without building upa backpressure. The large line to the Surge tank would provide a path to relievethe pressure and a means to measure this large gas release.
The instrumentation associated with the two-phase venting system are shown on
Figures 3-29 and 3-30. Included are limit switches on the HPV and PORY flowcontrol valves; accumulating flowmeters to measure steam-water removed throughboth the HPV and PORV; thermocouples located in each separator, on the water side
of the 250 gallon tanks, and at the Surge tank, a pressure transmitter, and the"differential pressure measurements shown in Figure 3 All these measurements.
were recorded as test data. 30
A test to verify the ability of the two-phase venting system to accuratelymeter gas removed through the HPV and PORV was performed as part of the GERDA
3-53

_
' T.t; ;y . .. g g|~ '
,. .. , , ,.- A,
3..
. % :. & s.- 3i g
* <s" 3-
. ,,..
, > ..
Og ') .\ *
+ f .1-e,
|h . .\
t .
L?. -
.,. -
..s. -9
<_.
.e i .' /,
.
s e ,
-?*
,.
-t. .
Ow.,
,
.
y ,_ o a o
'
I [j %)'
~_.
,
~4 o'1
t
4'
V2DP02' V2DP01 -
)V2DP03 V2DPO4 V2DP05
,
,
*o ;-_
'( .
HPV , 'f
-- SEPARATOM=s- PORY'o' U 'I
- SEPAR ATOR ' 5.\ s5
>* ,
*
! /..,' 3.,,
n a
'i lf 1I lE*
8,
ee'.
ACCUMULATOR ACCUMULATOR TANK, SOUTH NORTH SURGE''
. ~ ,
'-A*
4' TANK TANK+-
, , . ,,,
M. t
dV,.. Figure 3-30 Two-Phase Venting System-Differential
, .
;;1 Pressure Measurements'M-a
- g,4-:p
'j .~9,ri 'jj
*
I?-(-... -t;,
i'
' *_
}-' -) f?
.**
l- ?$ 34x
0.t =44
'\
L .a..,,
,,,
9
3-54-
< >,
- s+ s
,.( ) d' .*k
_ _ |!- .r=.

.1
program. This will be discussed in Section 4.3. The response time for the HPVand PORY flow control valves, V2CV01 through V2CV04 on Figure 3-78, was measured. .
The total time required for the valve to move close-to-open or open-to-close wasless than one second,
i
I3.8 SECONDARY FORCED CIRCULATION SYSTEM AND FEEDWATER HEATERS
The purpose of the secondary forced circulation system was to provide feedflow to the 19-tube OTSG at flow rates from approximately 0.2 to 2.5 gpm(represents plant scaled flow rate of 340 to 4210 gpm) and at supply pressuresfrom approximately 100 to 1300 psia. To supply the desired flow rates andpressures, an existing Sundyne LMV-311 centrifugal pump was used. The Sundyne
pump was rated at 27 gpm at a developed head of 1600 psia. The arrangement of thepump in the secondary forced circulation system is shown in Figure 3-31. This
arrangement allowed proper operation of the pump by returning most of the flowback to the hot well while passing the desired flow to the steam generator. The
flow split between the steam generator and the hot well was varied by positioningthe pump discharge valve, SFCV01, the by-pass valve, SFCV02, and the flow controlvalve, SFCV03 or SFCV04.
The hot well was used as an accumulator tank for the secondary side of theloop. The hot well was located to provide the required net positive suction head(NPSH) for the Sundyne pump and was used to collect condensate from the condenser.
Since most of the pump flow was by-passed back to the hot well, a system wasrequired to remove the pump heat from the fluid in the hot well. This system willbe discussed in Section 3.11. Chemical additions to the secondary loop were made
into the hot well. A slight nitrogen overpressure was maintained on the hot wellat all times.
i
A feedwater heater was included in the OTIS loop. This vessel wasconstructed using six (6) parallel and interconnecting 4" diameter pipes. A 20 KW
electrical heater, Chromalox Model MTS3180AXX, was located in each of the
interconnecting pipes. With the installed capacity of 120 KW, it would bepossible to heat the feedwater from 100* to 500*F for flows up to 1.5 gpm. In the
O.3-55
-- _ _ _ _ _ _ _ _ -

-_ _ _ _ -_ __ _ - _ _ _ _ , . _ , - - - , . _ __..._
/"' '
(x .
e.een .,,a.s
-
ir
.~
N.. n
STLSO2 *== -- --->,
* @ X.,3 .[ u
Y . . . ..
"7[ @ X M . . .:,
= :: .:, = .co'h- _" rm sei
. . , _ . .
m .. ,
--,.M 8j.co.
- I78 - 5 E-9., W W )(+"~. , - , .
,
k--J_gg_g gg g g'.
g.. ..E"
. , ,
2. , - ,
Figure 3-31 Secondary Forced Circulation System- General Arrangement and TestInstrumentation

!!
| OTIS test matrix, feedwater temperature was specified as about 100 F for alltests; consequently, the feedwater heaters were not used. Hand isolation valves
i were provided that allowed by-passing the feedwater heater.
Parallel flow control and flow measurement circuits provided for a highfeedwater flow path and a low feedwater flow path. Each path contained a flow
| control valve and a flow orifice. The flow control valves were Annin Series 94' valves with flow coefficients, Cv, of 0.075 and 0.55 for the low and high flow
path, respectively. These valves are identified in Figure 3-31 as SFCV03 and,
I SFCV04. Each of these control valves was instrumented with a limit switch (SFLS01and SFLS02) for positive indication of a closed valve. The flow orifices,
| manufactured by Fluidic Techniques Incorporated were installed downstream of theflow control valves in a flanged spool piece. The orifices had a bore diameter of0.207 and 0.312 for the low and high flow orifices, respectively. The meters hadcorner taps for the differential pressure measurement. The calibration of thesemeters is discussed in Section 4.9.
High and low range turbine meters were installed in parallel flow paths,upstream of the feedwater heaters. These turbine meters were used as the standardfor calibrating the steam and feedwater flowmeters. The details of this systemare shown on BaW drawings 9501E, 9502E, and 9503E.
The test data instrumentation associated with the secondary forcedcirculation system included the APs across the flow orifices. A high (0 - 100"H 0) and low (0 - 20" H 0) range AP was used on each orifice. The remaining
2 2instrumentation in this system was for loop operation and protection and was notrecorded as test data.
For the domestic raised loop plants considered, i.e., Davis-Bessee (DB) andTennessee Valley Authority (TVA), AFW flow is injected at a rate such that thesteam generator secondary water level increases at a rate of not more than 3 feet
| per minute. In OTIS, the feedwater valve positions were determined so that the 3feet per minute level increase was obtained at about 1000 psia. These valvepositions are given in Table 3-9.
O3-57'
1
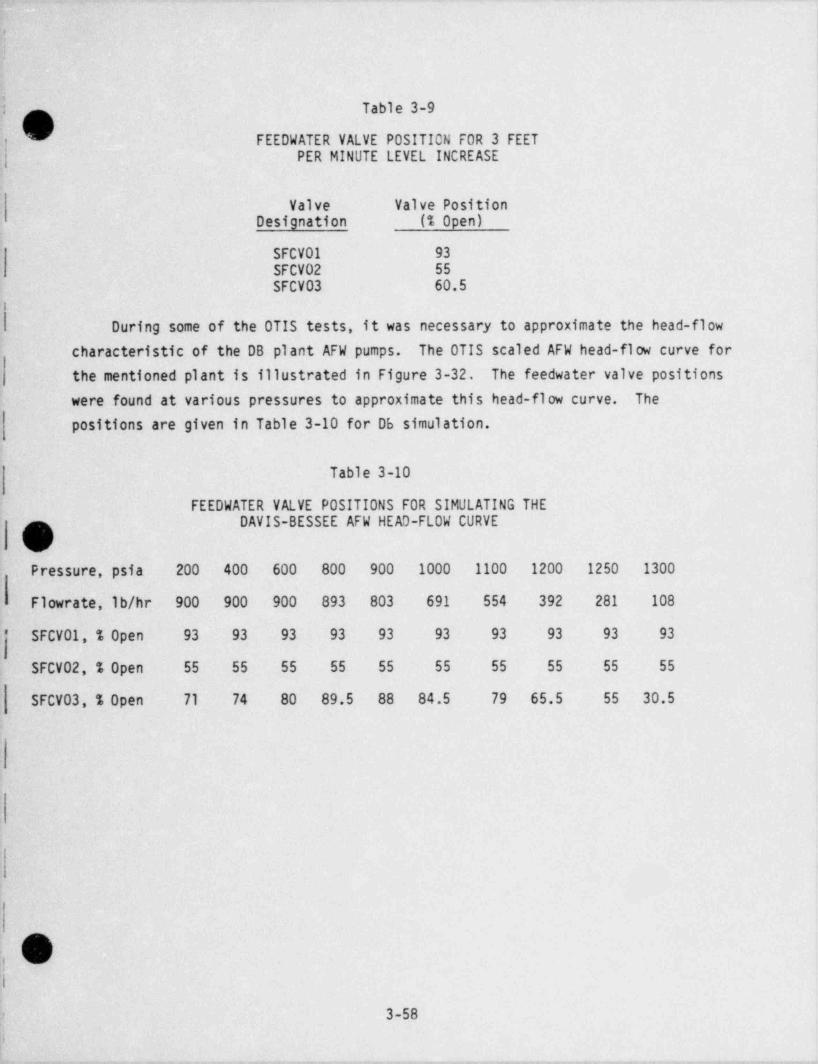
. .
,
!
i! Table 3-9
FEEDWATER VALVE POSITION FOR 3 FEETPER MINUTE LEVEL INCREASE
Valve Valve PositionDesignation (% Open)
-SFCV01 93SFCV02 55SFCV03 60.5
During some of the OTIS tests, it was necessary to approximate the head-flowcharacteristic of the DB plant AFW pumps. The OTIS scaled AFW head-flow curve forthe mentioned plant is illustrated in Figure 3-32. The feedwater valve positions
were found at various pressures to approximate this head-flow curve. Thepositions are giken in Table 3-10 for Db simulation.
| Table 3-10
FEEDWATER VALVE POSITIONS FOR SIMULATING THEDAVIS-BESSEE AFW HEAD-FLOW CURVE
'
:%
Pressure, psia 200 400~ 600 800 900 1000 1100 1200 1250 1300
Flowrate,lb/hr 900 900 900 893 803- 691 554 392 281 108
:'| SFCV01,. % Open 93 93 93 93 93 93 93 93 93 93-
SFCV02, % Open 55 55 55 55 55- 55 55 55 55 55
SFCV03, % Open 71 74 80 89.5 88 84.5 79 65.5 55 30.5
Ita'l
3-58'
i'-
._ ._ - _ . . __ _ , _ _ _ - , . _ . _ . . _ _ _ . _ . _ . . _ _ . ~ , - - - . ~ . _ _ _ . _ _ _-
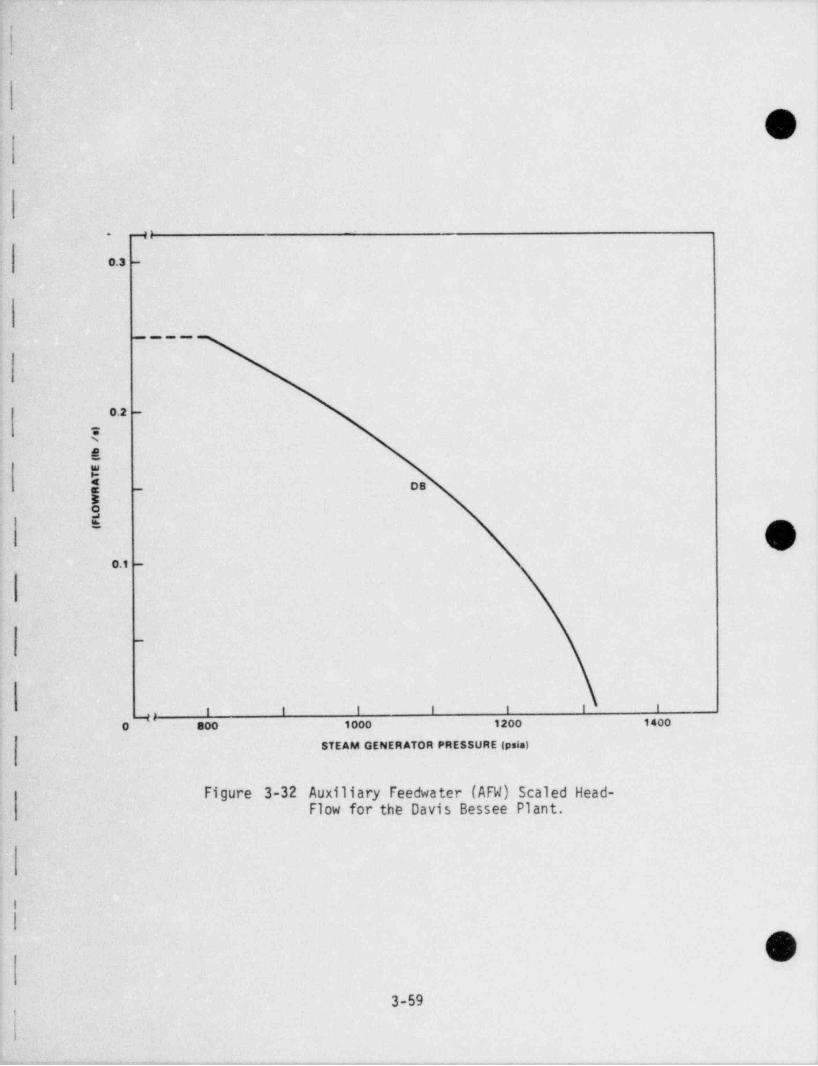
t
.
O
-4:-
0.3 -
_ - -
0.2 -
7s
8*g - DB
3' O
0.1 -
_
1 I I I I I Iq ,.O 800 1000 1200 1400
STEAM GENERATOR PRESSURE (psia)
Figure 3-32 Auxiliary Feedwater (AFW) Scaled Head-Flow for the Davis Bessee Plant.
I
I
O3-59
,
i
k.
- --. _ . - . - . _ _ _ _ .

)..
3.9 FEEDWATER PIPINGy
b)'i
This system extended from just downstream of the feedwater flow measurements(in the secondary forced circulation system) to the feedwater injection locationson the steam generator. This is illustrated in Figure 3-33.
There were three (3) feedwater injection locations on the 19-tube OTSG; ahigh AFW location typical of that used on some 177FA OTSGs a low AFW locationtypical of that used on 205FA OTSGs, and an injection location just above thelower tubesheet. The two locations that simulated AFW injection were discussed inSection 3.3. These locations were used for testing. The inlet just above thetubesheet was used periodically to flush out the " dead leg" below the low AFWsite. This inlet also served as a drain point for the steam generator.
The instrumentation associated with the feedwater piping included aResistance Temperature Detector (RTD) in each line and a thermocouple upstream ofthe split (to the three locations). The feedwater lines were arranged so that one
. feed path could be selected while the other paths were isolated. A remotelyactuated control valve, with a response time less than 1 second, and a manuallyoperated valve were located in each line. The two lines simulating AFW injectionsupplied a header arrangement that allowed either maximum or minimum wetting ofthe steam generator tubes. This was discussed in Section 3.3. The details of thefeedwater piping and this header are shown in B&W drawing 9550E.
3.10 STEAM PIPING
The steam piping system extended from the outlet of the steam generator tothe piping upstream of the hot well. A schematic illustrating this system isshown in Figure 3-34.
-Steam exited the steam generator at elevation 619-3/8" centered on a pointon the hexagonal generator adjacent to tube "H". A cross-section of the generatorat this elevation is illustrated in Figure 3-35. After leaving the steamgenerator, steam passed through either a low flow or high flow path for steampressure control and flow measurement, through a water cooled condenser, through
v
, 3-60
b
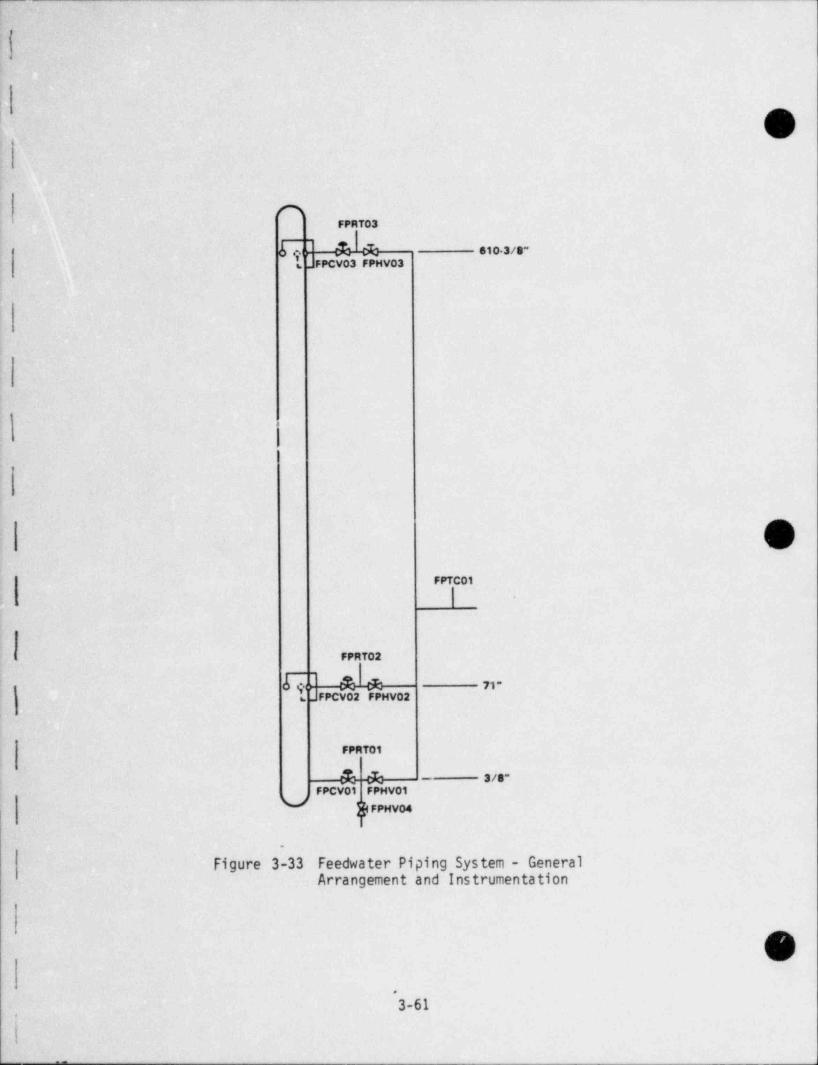
|
1
O
nFPRT03
610 3/s"
6 _ FPCV03 FPHV03
1
1
OFPTC01
. >
FPRT02
b-CIO 71"i t
6 .FPCV02 FPHV02
FPRT01
4& - 3/s-FPCV01 FPHV01
FPHVO4
Figure 3-33 Feedwater Piping System - GeneralArrangement and Instrumentation
O.
3-61,
k_

1,
)
\,s
;
PSCV01
PSSV01h k'
PSHV01q.a *- -
PSHV04 PSCV03
i
1- STEAM GENERATOR>
CONDENSER
O LJPSHVO3 PSCV04
k
HOT ELLPSHV02 PSCV05
Figure 3-34 Steam Piping - General Arrangement.
O3-62,
!
. - _ - - - _ _ _ _ - . - - . - - . _ - _ . . _ . _ . . - - - -.

,
)
!4
0
f'
uN
K
u l | T | { s j
j nnnni I I I |STEAM EXIT
n m| |ononv u |v u |vH B l A j l E l P lI
,t
A>|n |n |nJ C 1 D | N |1
A A} n:'{ K j { L { M j
l
|
>
Figure 3-35 Location of Steam Exit Pipe on OTSG
|
|
93-63;,
I,
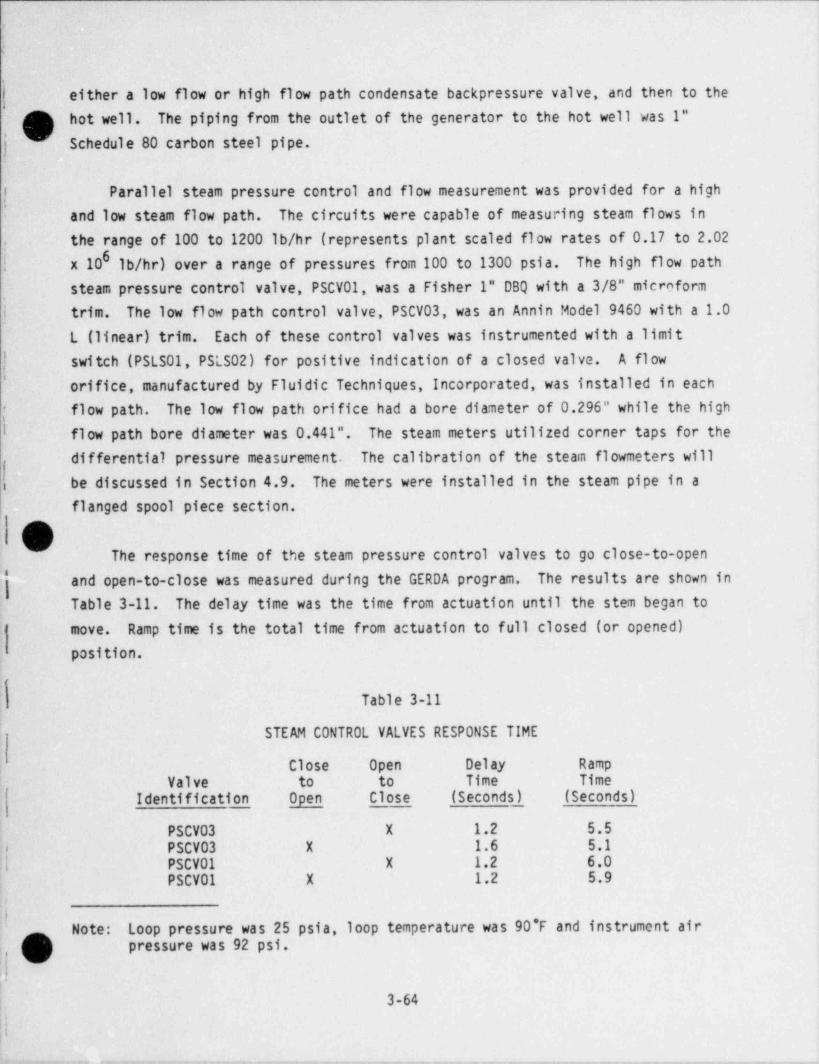
',
|
f either a low flow or high flow path condensate backpressure valve, and then to the( 7 , hot well. The piping from the outlet of the generator to the hot well was 1"s ,
j Schedule 80 carbon steel pipe."t
{Parallel steam pressure control and flow measurement was provided for a high
and low steam flow path. The circuits were capable of measuring steam flows inthe range of 100 to 1200 lb/hr (represents plant scaled flow rates of 0.17 to 2.02
7
6! x 10 lb/hr) over a range of pressures from 100 to 1300 psia. The high flow path
steam pressure control valve, PSCV01, was a Fisher 1" DBQ with a 3/8" microform,
i trim. The low flow path control valve, PSCV03, was an Annin Model 9460 with a 1.0
L (linear) trim. Each of these control valves was instrumented with a limitj switch (PSLS01, PSLS02) for positive indication of a closed valve. A fl ow
orifice, manufactured by Fluidic Techniques, Incorporated, was installed in eachflow path. The low flow path orifice had a bore diameter of 0.296" while the high'
flow path bore diameter was 0.441". The steam meters utilized corner taps for thedifferential pressure measurement. The calibration of the steam flowmeters will
i be discussed in Section 4.9. The meters were installed in the steam pipe in a
flanged spool piece section.
The response time of the steam pressure control valves to go close-to-openand open-to-close was measured during the GERDA program. The results are shown inTable 3-11. The delay time was the time from actuation until the stem began tomove. Ramp time is the total time from actuation to full closed (or opened)position.
<
| Table 3-11
STEAM CONTROL VALVES RESPONSE TIME
Close Open Delay Ramp,
Valve to to Time Time'
Identification Open Close (Seconds _)_ (Seconds)_
PSCV03 X 1.2 5.5# PSCV03 X 1.6 5.1
|| PSCV01 X 1.2 6.0PSCV01 X 1.2 5.9
a
]' Note: Loop pressure was 25 psia, loop temperature was 90*F and instrument air) pressure was 92 psi.,,
:'
3-64
d-|
_ ,_ _ , _ _ _ _ . _ _ _ _ . _ _ , _ _ . . . _ _ _ _ _ . , . . . . ,. ._ _ ..___ _ _ _ _ _ _____ ___ _

!
j
i! The steam condenser was a single pass, tube in shell, counterflow heat
exchanger. Steam was on the tube side, inside a 1-1/2" Schedule 80 pipe, while,
i shell side coolant was enclosed in a 3" Schedule 40 pipe. The heat exchanger was2about 78' long with about 30 ft of cooling surface available. The condenser was
[ capable of removing about 335 kw of heat input. Tower water from the plant's maintower provided cooling water for the condenser. Downstream of the condenser were
j two Micropak 1" control valves (one for the high flow circuit and one for the low' flow circuit). These valves were intended to backpressure the steam control valve
and thereby extend the range for steam pressure control. The valves had a trim of0.25 L and 0.04 L for the high and low flow circuits, respectively. Details ofthe steam piping system are shown on B&W drawings 9513E, 9514E, 9515E, and 951GE.,
|The instrumentation associated with the steam piping is shown in Figure 3-36.
The measurements recorded as test data included the thermocouple and RTD just
outside the steam generator, and the thermocouple in each flow measuring branch,steam pressure, and the differential pressure across the steam flowmeter. Dual
l range APs were used for each steam flowmeter, a low range (0 - 125" H 0) and a2
high range (0 - 500" H 0). The other instrumentation shown in Figure 3-36 was2
used for loop operation and not recorded as test data.
Automatic control of steam pressure was available for either constantpressure control or pressure ramp control. For constant pressure control, theoutput from a pressure transmitter provided the signal to modulate the steampressure control valve to the desired set point. The process line for steampressure was located near the steam exit from the generator at elevation 619-3/8".During the course of a SBLOCA, the plant operator initiates loop cooldown bydecreasing steam pressure at some rate. In OTIS, this steam pressure ramp controlwas simulated using a Leeds & Northrup 1300 Process Programmer. The cooldown rate
was keyed into the programmer as a series of linear segments of pressure(saturation)andtime. A test was conducted during the GERDA program that,
verified the operation of this controller for a 50 F per hour ramp from 700 to 200psia.
f
O
j 3-6[

._ _ _ . _ _ _ _ _ _ _ _ . . _ . _ _ _ _ _ . . _ . ..
I
TO:)
-i,
i
SDM1PSLS01PSDP02
PSPR1M % PSTC04' ''
01PSRT01 ' pstgo2
'
.
O Gk '*
^.
PSDP03 PSPR101PSTC01 PSTC05 PSDPO4
PSTC100
AO V'
PSTC101
h*
h m- Sc
Figure 3-36 Steam Piping Instrumentation
!|
,
|I -
li|'
|
| O3-65
\
!
.. ._. . . --_..__ - -.. - . - _ ._ - - -. .. . - , - . . .

.
S
3.11 SECONDARY LOW PRESSURE CLEAN-UP SYSTEM (SLPCUS)
The purpose of the Secondary Low Pressure Clean-up System (SLPCUS) was
two-fold. One was to remove heat added to the secondary-side fluid by the mainsecondary forced circulation pump and the second was to remove suspended anddissolved contaminants from the secondary-side fluid. This was accomplished using
the hardware and instrumentation shown on Figure 3-37.
The subsystem hardware was arranged so that a Worthington D512 pump takessuction from the hot well to provide a flow of approximately 20 gpm through acounterflow heat exchanger. The counterflow heat exchanger was sized to removeheat from the secondary fluid added by the secondary forced circulation pump. Theheat exchanger was used to maintain the feedwater temperature less than or equal
to 120*F.
?| Downstream of the heat exchanger the flow was split by valves SCHV04 andSCHV05 and either returned to the hot well or passed through the clean-up system.L
Approximately 4 gpm was passed on to the clean-up system while the remaining flowwas returned to the hot well. The 4 gpm flow was directed through a CUNO 5 CD1filter with a 5 micron filter cartridge to remove suspended contaminants andthrough a CUB S-300 demineralizer with NH 0H resin to remove soluble contaminants.4
Af ter passing through the demineralizer the flow was returned to the hot well.
All of the instrumentation shown on Figure 3-37 was required for loopoperation. As such, the output from these instruments was monitored to insureproper operation of the system but was not recorded as test data.
3.12 NONCONDENSIBLE GAS ADDITION
L The function of the noncondensible gas (NCG) addition system was to add a
known quantity of NCG into the primary loop. The NCG was added as a batch
addition.
Batch addition of a known quantity of NCG was performed by expanding the gasj
at an initial pressure and temperature from a known volume into the primary loop.-
A schematic of the NCG addition system is shown in Figure 3-38. The source of NCG
3-67
-

!
I'
,
h
SCMV14HEAT EXCMANGER
I
I
|
PSIAII
FLOWMETER
SCMV04
%I
,~ SCMV02
SCSV01
SCCV01
SCMV12
O 1m*
hSCMVOSFLOWMETER fROMFLPCUS
HOT 7mu )*
D", ,vaPSIA "
O "
-# #,,,,E , SCMVOS SCMV07d PSIA P8'A
SCMV01 SCMVII CUNO
OF8LT.aCIRCULATING"' T otMia RAU2ER
.
SCMVt3
*s
:| Figure 3-37 Secondary Low Pressure Clean-Up System GeneralArrangement and Instrumentation
Ii
!
O,
4
4
3-68c
L~.-

r
,
$<
OGATC02
* GACV02HOT LEG
GACV01 UBEND
GATC03
. GACV04
* UPP R HEAD
GATC04L
_ACV06
GACVO COLD LEG
GATC01 GAPR01
i
REGULATOR GAHV02 GATC06
GACV08GAHV01 _
_ REACTORVESSELGACV07
CYUNDER1t'
() FILTER-
CYUNDER 2 _
| | CYUNDER 3 _
l FROM GASl SUPPLY
Figure 3-38 Gas Addition System - GeneralArrangement and Instrumentation
,
! e,
|i 3-69
.

1
was a standard size 2500 psia gas bottle. Nitrogen (N ) was used during OTIS2
Q testing. There were three reservoirs available for gas addition. One or more,
h reservoirs were selected based on the quantity of gas to be added and the looppressure. A computer program, GASADD, was used to select the appropriate
f reservoir (s) and/or tubing volumes and the initial pressure to which this volumeshould be pressurized to make the desired addition. The volume of the reservoirsand tubing is included in Table 3-12.
Table 3-12
GAS ADDITION RESERV0IR VOLUMES
3Reservoir Volume. in
J Tubing (T) only 40.141 T + cylinder 1 107.81
T + cylinder 2 177.24
3 T + cylinders 1 and 2 244.91
T + cylinder 3 394.92
T + cylinders 1 and 3 462.59
T + cylinders 2 and 3 532.02
T + cylinders 1, 2, and 3 599.69
Prior to adding gas to the loop, the gas supply was isolated, the active volumesand gas pressure were checked, then the gas was added through the appropriate '
isolation valves. There were two isolation valves, NUPRO "U" Series sealed stembellows valves, at each gas addition location. These valves were remotelyoperated from the control room.
There were four locations in the primary loop where NCG could be added. Theywere:
e Lower plenum of the reactor vessele Cold leg piping, downstream of RCP spillovere Top of steam generatoro Top of HLUB
These locations are illustrated in Figure 3-39, ,
l' 3-70
l
-- . _ . - _ ___ , _ . _ _ _ . _ . _ _ _ _ _ _ _ _ _ . _ _ _ _ . _ _ _ _ _ _ _ _ _ _ _ _ _ _ _ . _ . . _ . _ _ _

i
%
Oi
i4
I<
<
a.S
%U
8
e}- 2
l
* \'
$C . -
is,m
;, -5 e ,u,
hN : r
E p' OK g! :=
0XRN 4 -X+g4 3rDG-i, sWh#
[.r
j% F'X'
*X<'
m _
|@s .tfg~ja -
' M_< n F-4,E>
1
|
|.
i e3-7L
|
. - _ . - _ _ _ _ _ . _ . _ . - _ - _ . - . . - . . . _ . - - . - - _ .

ik-
("% 3.13 DATA ACQUISITION SYSTEM (DAS)y6The OTIS facility had a Digital Equipment Corporation (DEC) PDP 11/34-
Einicomputer and Analogic ANDS 5400 data acquisition system dedicated to theo
facility for data acquisition and on-line data processing. A number ofinput / output devices were attached to the PDP 11/34 for user communication to the
7DAS and prompting of data display options. In addition, a DECnet link from the
6 ~
PDP 11/34 to the existing VAX PDP 11/780 computer at the Alliance Research Centerwas used for direct communications with this computer. The system architecturethat make the OTIS DAS is shown in Figure 3-40.
!
An Analogic ANDS 5400 was used to acquire analog voltage, digital, andfrequency data from the test instrumentation. The architecture of the Analogicwas such that analog voltages were input to one of three card types depending onthe full scale range of the input. Analog inputs in the millivolt range to amaximum of 10.0 volts were digitized by the Analogic system. Sixteen bit, bipolar
D (hence,15 bits plus sign) data acquisition rates of about 10,000 readings per'
second were obtained. Table 3-13 sumarizes the Analogic's resolution and
accuracy for three full scale DC voltage inputs.
Table 3-13,
ACCURACY AND RESOLUTION OF THE ANALOGIC ANDS 5400
Full Scale Resolution TypicalInput (yv) Accuracy Inputs
+/-40 av 1.2 0.05%/20 uv Thermocouple
. +/-1.25 V 38 0.05%/625 uv RTD
+/-10.0 V 305 0.05%/5.0 my Pressure and differential pressuretransmitters, watt transducer, con-ductivity probe (analog)
q- 6PDP and VAX are trade names for families of DEC minicomputers.
7DECnet is a hardware / software communication link for interconnecting compatiblecomputers.
3-72
(

-
-
---
. O)
NC RI T E
DYE. S I RPCN H RO
- E C NT CUI OST
I .E| QW T RPM
Dass SJE S TR OV R_ B 5 F T D AM M M LM H
I
6 0 0 AL C -I
7
Cw% 1 C {1 I S.1 T
G*| I PD C7r (
::: ': -
4t)
.
T R CE E L T m
T E NE eN C0 R N t I P t.
C I 0E G4 E A G s
O5 V C P 1
X ,D'
PM t - O . Sy
D# ' LSN "r A L
A , '
PI ADO M H A DC Tt .NV I NNC T R nAA D A A . oP C/ i
- A T t(it ,s
-
i
u_- q
cAa
_ taD
OSI;
: -' TO
S 08C 1 L SL 4I 9
HL R A 0 A R CA -L
E 0 N I NPAAN N I TOHI 3
R I TI I 1M DLPMOA R e-
M RM T I|
RGO R WR V CR E rE-
E C E T GT uR T T gT E
i_
. E D
.
R F__
___
_
- ___ _ _-_
_
_.
.
_. X
I
RN O E. OEI__
_ RDP.
TI O__ KV C__ E__ T_
-.
..._ ,._ ..
. O__
____
__
.
_
_
Yd_
_
_
--
-I

- . - - _. _ _ _ __. _ ._.
f The filter on each of the Analogic voltage input channels attenuated the
amplitude of an analog voltage input such that an additional 0.05% full-scale
{input error was present at a frequency of 0.12 Hz. For analog voltage inputs with |
frequency contents greater than 0.12 Hz, the error caused by the filter increased!
i
j to approximately 30% at 5 Hz.&
Raw signal data from a thermoc]uple (NLTC08), a differential pressuretransmitter (HLDP01), and a pressure transmitter (RVPR01) were recorded on
magnetic tape as well as by the OTIS DAS for the first 1.5 hours of an OTIS test. ;
The magnetic tape data was analyzed to: ;
!determine frequency content from OTIS instrumentation raw signale
|data,e estimate the effect of the Analogic input filters on data
acquisition, and ,
}] e evaluate the ability of the OTIS DAS sampling method to recordSBLOCA phenomena of interest.
-
The dctatied .e-Wt h givd. The analysis * showed that the transient data was f'
tracked well by the OTIS DAS. Spectral analysis of the raw signal fluctuationsshowed that fluctuations were less than 5 to 10 Hz, and typically of low
'
|magnitude. Errors introduced through the filter characteristics of the Analogic
; and by sampling at OTIS DAS rates (0.2 Hz) were found to be negligibly small in
most cases. It .W$ncluded that the application o the acquired OTIS data forcode benchmarking exercises on a macro scale does^r${ot warrent reducing the scanfrequency to more accurately acquire the data on a micro scale. |
'
'
jMeasurement accuracy of a frequency input (such as from a turbine meter) was
fconservatively set at +/-0.1 Hz for frequency inputs from 1 to 100 Hz and +/-0.1% |
,
of the reading for inputs of 100 to 5000 Hz. No error was associated with theinput and handling of a digital input. Digital inputs resulted from limit fswitches and from the conductivity probes when first processed by the Creare
it
I
!1
'
8"0 TIS Signal Analysis," ROD:84:4091-30-01:01, H.R. Carter to Distribution,September,1984.'
3-74
!
_ . _ _ _ _ . . . . _ _ . - _ _ . _ . . . _ _ _ _ _ _. . _. - _ . _ . - _ _ . . ,-

i electronics and microprocessor Similarly, no error was associated with measuring
the counts obtained from the output of the accumulating flogmeters at their -
output frequency during ,peration.
Calibration checks of the Analogic ANDS 5400 were achieved by substituting a
specf ally configured MAC patch panel in place of the panel used during test dataacquisition. This panel wired all analog voltage input cards of the same fullscale input in parallel so that a single connection of a calibration standardallowed the whole series of channels to be simultaneously checked. Thecalibration check was performed periodically, depending upon past history andstability of the Analogic.
Control of the Analogic DAS and data processing was through the PDP 11/34
minicomputer controlled under a real time (RSX-11M, Version 4) operating system.
User software was written in Fortran IV Plus with software instructions stored inthe 11/34 memory (256 K bytes) and/or on disk. Data in raw and/or engineeringunits was transferred to one of the two 10 mega-byte disks for temporary storage
,
during data acquisition.
Between tests when data acquisition was not required. the PDP 11/34 diskrecords were transferred over the DECnet to much larger disk drives (176
mega-bytes) on the VAX 11/780 computer for conversion to engineering unit data and
permanent archival on tape. In addition, the VAX computer was connected to the
computer center at UPGD via a telephone link and thereby provided a data transfer
means to UPGD. The flow of data from the PDP 11/34 to UPGD will be discussedlater in this section.
A MAC patch panel was used to provide a flexible interface between transducerinputs to the DAS and the Analogic and PDP 11/34. The MAC panel could interfaceup to 1088 3-wire connections. Because of the desired flexibility when routing
input channels to the Analogic and the parallel capability to route any inputi channel to a secondary data acquisition device (such as a magnetic tape recorder,I pen-type strip chart recorder, digital voltmeter, etc.), the actual capacity of
the MAC panel was reduced to about 350 input channels.
9,
3-75
2

._
i:
User communications with the PDP 11/34 and 11/780 computers were through theOQ four terminal devices as shown on Figure 3-40. A DECWRITER III terminal was
,
j available for hardcopy listings of data, source listings, or system error messagesfrom either the PDP 11/34 or the VAX 11/780. A VT-100 DEC terminal with the
RETR 0 GRAPHIC option was connected to the PDP.11/34 and VAX 11/780 computers and
was used for software development and display of test data in graphical formatduring data acquisition. A second VT-100 DEC tenninal was used to display testdata and/or loop operating parameters. An Industrial Data Terminals (IDT) Model2000 color graphics tenninal was available for color graphic display of the OTIStest loop and selected test parameters during the test program. Color graphicaldisplays of loop parameters such as the water level . temperatures, pressures, flowrates, etc., provided important real-time visual feedback of the loop behaviorduring transient tests. The graphical displays of the RETR 0 GRAPHICS terminalcould be recorded in black and white hardcopy form using a TEKTRONIX Model 4632
video copier with enhanced grey scale.
'|
Data acquired on the OTIS data acquisition system resided on the PDP 11/34disk until the test engineer down-loaded the file to the VAX 11/780 computer for
,
!| data processing and long term archival. Once on the VAX, additional manualoperations were required to ultimately transfer the converted engineering datafile to UPGD, Lynchburg, and to archive the data to magnetic tape. In Section
3.13.1 the commands necessary to trace the path of data processing from the PDP
! 11/34 to the VAX 11/780 with u'Itimate data transfer to UPGD and data archival totape will be described. In addition, the routines available for data filerevisions or updates and subsequent data processing are defined.
3.13.1 Initial Data File Processirig
The initial flow of the data file strictly involved its acquisition andprocessing to transmit a condensed part of the engineering data file to UPG0 forissuance of the Initial Report plots. Once processed at Alliance, the raw and
fconverted engineering data files were archived to magnetic tape for long termstorage.
;I A flowchart illustrating the processing steps for a raw data file is shown ono~ C Figure 3-41. A discussion of this flowchart and the routines available at ARC are{
3-76
L

b
O-
PDP 11/34Data File(ASC2! orII"**WI Convert Raw no
to' m" "
III EngineeringgrData File?
VAX DataFile (ASCIIor 31 nary) es (5)
ir
Engineering
Ves ASCII Data File,
I'7 .E00'
'
no (2)
> y "8
.HDR File ,
.5CN Fileges (6)
ir(3)
Tape Filesif
,' g gASCII Raw; Data File .CMD
.R00
CD nom
@O ."O Tap /et-
..t. "
ransWes (7)
ir
yes (4)Mail Tape
ifto UPCD,
Engineering LynchburgData File.E00
gr
q,CondensedE00 File > > CDC r xfor Plots ( STOP f
(#1 0 entleseJ in parentheses refers to VAX command procedures thatare discussed in the accompanying test.
7
Figure 3-41 Initial Processing of OTIS Raw Data Fike
\
O3-77

r
defined below. Numbers enclosed by parentheses on the flowchart correspond to VAXcommand procedure data processing routines and are referenced in the followingtext using the same nomenclature, i.e., the number enclosed in parentheses.
(1) The data acquired on the PDP 11/34 was transferred to the VAX 11/780using a Digital Equipment Corporation (DEC) file transfer routine calledDECnet. The PDP user manually installed the DECnet transfer routines onthe PDP by issuing the command 0[1,2]NETSTART. Once loaded, the datafile could either be sent to VAX while logged on the VAX or logged on
the PDP. If logged on the VAX the following command resulted in
transfer of the data file:
COPY SBLOCA" SYSTEM SYSTEM"::DL1:[PDP ACC'NT] PDP EXT VAX. EXT
If the user was logged on the PDP and wished to perform the transfer tothe VAX from the PDP, the following command was required:
NFT>VAX/USERNAME/ PASSWORD //::VAX. EXT =PDP. EXT
OV
The transferred raw data file could be either in binary or ASCII format
(2) at this time. depending upon how data save took place as defined by thetest engineer. If the file was saved in binary, then two operationsmust have taken place to convert it to an ASCII format. First, the file
was operated on using either the VAX command procedure DAYASC or NITASC
j depending upon whether day batch or night batch processing, respect-I ively, was required. These routiaes translated the binary file to ASCII
and " split" the r n data file into two parts -- a header sectionconsisting of the legend and VTAB list, and the data portion for eachtime scan. In so doing, any additional comments to the legend that needto be included to document the completed test prior to its distribution
to UPGD could be included at this time. The header section was smalll enough that the VAX editor can easily be used to add any comments. This
was important because with large files it was not possible to edit theheader without first separating the header from the remaining data
1 (3) scans. The second step combined the ASCII header and data scan partsinto a single file. Execution of either the command procedure DAYCOP or
3
:
3-78
(

i
\
! NITCOP (depending upon whether day or night batch processing was
desired) merged the two files,into the single ASCII raw data file. As{ indicated on the Figure 3-46' flowchart, this raw data file was denoted -
".R00", the "R" denoting the " raw" data file and the "00" indicatingrevision 0 of the file.
(4) To begin the process of making plots for the Initial Reports, the usermanually invoked the execution of the command procedure, DATRNS or
NITRNS, once again depending upon whether day or night batch dataprocessing was required. This command procedure caused the conversionof selected raw data file scans to their corresponding engineering data
file (denoted ".E00" on the flowchart) scans. Raw data scans to be
converted to engineering unit scans were selected based upon a userpredefined list of significant events during the test transient andcorresponding data conversion time steps for each event. If this sorted
engineering data file contained more than 250 time scans (the maximumallowed for UPGD plots). then an additional sort took place prior to,
data transnission to UPGD that limited the data file to 260 scans, In
addition, this data file contained only those VTABs previously definedby UPGD as needed for the Initial Report data analysis and presentation.Hence, the data file contained only a portion of the data base VTABs and
a maximum of 260 time scans.
I
In the event that electronic data transfer to UPGD was not desired butthe converted engineering data file was still required at ARC, a
(5) number of conversion routines were available at ARC to create theengineering data file and provided additional listings of the legendpart of the data file and/or a listing of the entire header (legend plusVTAB listing). This conversion was accomplished by executing a VAXcommand procedure depending upon the information desired and the mode of
data processing -- real time, day batch, or night batch. In Table 3-14
these command procedures and their options are summarized.
.
O3-79
..

\
|
('
' Table 3-14O.O COMMAND PROCEDURES FOR ENGINEERING DATA FILES
Command Legend and Data toProcedure Batch Chrono Files UPGD
CNVRE no - real time no no
CNVRT no - real time yes no
BCNVRT yes - day batch yes no
NCNYRT yes - night batch yes no
DATRNS yes - day batch yes yes
NITRNS yes - night batch yes yes
At this time, two data files were resident on the VAX computer, a rawdata file, ".R00", and an engineering data file, ".E00". These files
were stored to tape using command procedures on the VAX. The original
(6) raw data file, ".R00", was saved to tape by executing the commandprocedure ORIGIN. A backup copy of the raw data file was created byrunning procedure BACKUP. Finally, the raw data file and engineering
' data file were saved as pairs on a tape by executing the command
procedure COMBIN. These three steps created the data tapes ".0RG",".BCK", and ".CMB", respectively, as shown on the flowchart. Asindicated, three copies existed of the original version of the raw data
c
file, ".R00".
In the follow-up to the electronic data transfer for the Initial Report(7) the complete engineering data file created at ARC was copied to a CDC
compatible tape at ARC and mailed to UPGD, Lynchburg. This tape wascreated using the VAX command procedure ENGR.
,
3.13.2 Post Processing of the Data File
f;! After processing and transmitting the data file for the Initial Report,
modifications to the data base were needed to remove or correct deficiencies toq the data base files. Additional comments to the data file legend and corrections
O to the data file VTAB listing were required. After implementing these corrections,
j v
' 3-80?-
(-

_
|
the revised raw data file was converted to engineering units and the engineeringdata tape mailed to UPGD. The flowchart shown by Figure 3-42 traces the steps
I required for file handling and the VAX command procedures needed to implement
each.
The original raw data file (or most recent revision) was migrated fromtape back to the VAX disk. If the raw data file was too large for useof the VAX editor and available user disk space, the user executed the
(1) command procedure DSPLIT or NSPLIT (day or night batch, respectively).These routines operated on the ASCII raw data file and split it into aheader portion and a data scan portion. The user could then easily
i operate on the header portion with the VAX editor -- making the neededadditions to the legend and corrections to the VTAB parameters. After
(2) completing the revision to the header file the two were combined to asingle revised raw data file by executing the command procedure DAYCOPor NITCOP, described previously. The resulting raw data file is denotedon the flowchart as ".RO#", where the # symbol refers to the raw data'
file revision number.
OWith the revised row data file complete, conversion to the corresponding
(3) engineering data file, ".E0#", was achieved using one of the commandprocedures previously defined -- CNVRE, CNVRT, BCNVRT, or NCNVRT. Note
that neither DATRNS nor NITRNS were used since electronic transfer ofdata to UPGD was not performed for the revised data files.
(4) The revised raw and engineering data files were archived to tape using
j the command procedure COMBIN. Backup of the revised data files were
periodically performad using VAX system commands to duplicate the
magnetic tape.
(5) The complete engineering data file could then be copied to a CDC,
compatible tape at ARC and mailed to UPGD, Lynchburg, Virginia. Thi s
tape was created using the VAX command procedure ENGR.
G:.
3-81
1
I

/ I',,
; <[ j
t (
|t7,
I
\ J .~,
' onvert Raw no
} Engineering -
f3, Data File?,s y
no argeI Raw Date
sle* ges (3)}
'
.; ,
,t 1rj''
iges (1) EngineeringData File
ir E0t*
.HDR File g
.SCN Filei Tape no
Storage * ?' ,
gr
i .'' '
Perform ges (4)
I Editing 37Functions
- Tape Files
'
'I23 CMDJ ; *
'' gr
- [D Raw Data
,8 CD0 nom' ,,'
'" Y.. .
.
ges (5)-
ir
'e '
.[:, Mail Tape,,
to UPGD,,
] Lynchburg>t,-t:
b*f
<('
gr
%STOP 7
e denotes the revision number of the file.e
(#) G enclosed in parentheses refers to VAX command procedures thatare discussed in the accompanying test *
i ri ''i
.
^
Figure 3-42 Follow-Up Processing of OTIS Raw Data File
; -
,
-.
1
+
3-82, ,-
e~
- . . _ ~ _ _ . _ _ _ , . . , _ _ _ . _ _ . . . _ _ _ _ _ _ _ _ _ . _ _ . _ _ _ _ _ _ . _ _ _ , . _ . _ _ , _. _ _ , . ,, ,
|: Additional infomation and listings of the command procedures and Fortran
Isource code defining the routines referenced in this document can be found in the$ QA documents listed in Table 3-15.
3.13.3 User Input For Definition of the OTIS VTABLE Database
The database for the OTIS data acquisition system was designed so the usercould define all parameters needed to couple each of the user defined tableentries (VTABs) to the available options in the data acquisition software. Thisinformation was stored on disk in account DLO: [201,10] with the file name,
VTABLE.DAT.
The VTAB generally corresponded to an instrument such as a thermocouple
pressure transmitter, conductivity probe, etc. However, the VTAB may havereferred to a "non-instrument entry" desired t" the user to more appropriatelydefine the output of the inst dment. For examp an orifice used for flowmeasurement was monitored by a differential pressure transmitter that measures the
pressure differential across the orifice. It was necessary for the data
acquisition system to measure and record this differential pressure but it wasalso convenient for the operator to have an on-line indication of the flow ratebased on this measured differential pressure. The OTIS data acquisition sof twareallowed the user to define a second VTAB which contained the necessary conversionconstants and reference VTABs (or instruments) to compute the flow rate throughthe orifice. This flow rate remained in memory until the next data acquisitioncycle. Hence, any on-line calculation for the current data acquisition cyclewould have this flow rate available without the need to recompute the flow. Thisflow rate was also present in the off-line data base for distribution to usersoutside of ARC.
|.
9
O,
1
3-83
__ . . _ .

^ " " '=="'E a -,a A :.m. a _ m _ __ _-
e
!. Table 3-15s
QA DOCUMENTS FOR SOURCE CODES AND COMMAND PROCEDURES,
!2
QA
|-{.Routine Document
DAYASC QA0102.000
f NITASC
DAYCOP
NITCOP
||| ~:
!
[ DSPLIT QA0103.000
N I NSPLIT|
W
(. CNVRE QA0100.000
CNVRT
BCNVRT'
NCNVRT
.(~' DATRNS
|'' NITRNS
Details Defining the Conversion. QA0097.001from Raw to Engineering Units'
||
ORIGIN QA0101.000
l BACKUP
|- COMBIN
ENGR
b-
!.
'
?,
Il.
:
3-84
,
-
--%-w-,- -,r,-,.m.,,,.e -w---.-,--,y-,---,+..---,--e,,--- re-- - - - - - .-- -----,,=,--,-.-..-----.7 - . . ,,

':
l
i
i With this introduction, the following options required user input for each'
VTAB and are summarized below.
I
e Global definition to the data acquisition software regarding thestatus of a VTAB, i.e., in or out of service, use for loop alannindications to the operator, or use for control of the timeinterval between data acquisition scans.
e Identification of a VTAB for alarm monitiring and the parametersrequired to define the low and high alurm values, and alarmdeadband.
e Identification of a VTAB for rate control of the data acquisitionhardware, i.e., based on the rate of change of a VTAB raw datasignal or engineering value, the time interval between dataacquisition scans is either increased or decreased.
e Definition of the ANALOGIC ANDS 5400 " card" (analog, counter-timer,or digital input) and ANALOGIC channel associated with the VTAB.
e Conversion of the raw data signal (voltage, frequency, digitalinput, count, etc.) to the appropriate value in engineering formator units. This operation requires the following user definedinformation:
- Calibration constants and material or test loop geometryconstants needed to perform the raw data signal to engineeringformat conversion.
- Reference VTABs (or instrument readings in this case) needed toperfonn the raw data signal to engineering format conversion.
e Definition of the " units descriptor" tex., DEG F, PSI, LBM/HR)associated with th: converted engineering value for each VTAB.
e Definition of the number of significant decimal places that willbe associated with the converted raw data signal to engineeringvalue.
e Descriptor associated with each VTAB for user ease inidentification of the VTAB.
I
I The parameter order and fonnat for each of the VTAB data cards is containedin Appendix D.
!
O|
3-85
-,

__
i
4.0 LOOP CHARACTERIZATION TESTS
!f
The purpose of the loop characterization tests was to debug the mechanical andelectrical components, to characterize the operation of important loop systems (suchas high pressure injection, guard heaters, etc.) and to calibrate in-place selectedinstrumentation. For reference, the results of the GERDA Phase O tests aredocumented here as well as in the final revision of the GERDA Loop Functional
Specification (RDD:84:5168-01-01:01). The six (6) major test categories, along withthe section of this report in which the results are contained, are identified inTable 4-1. A list of the test runs recorded during GERDA and OTIS Phase 0 is
included as Appendix E. .
4.1 HELIUM LEAK TEST
Tests were completed during the GERDA program to determine the extent of
noncondensible gas (NCG) leakage from the primary natural circulation loop. The- loop was drained under a helium blanket until the water level was about 72" above
|the secondary face of the lower tubesheet (SFLTS). This is approximately the
- elevation of the top of the reactor vessel. The helium pressure was increased to,
about 1000 psia. Based on the pressure decay with time, a leak rate of about 10-2
cc/sec was calculated.
A Matheson gas detector was used to " sniff" around the gas region of the loopto identify where the leakage was occurring. Leakage that produced a full scaledeflection of the gas detector, 8 x 10⁻⁴ cc/sec (~1 x 10⁻⁴FT /HR) or greater, was3
;' noted at the following locations:
hot leg U-bend (HLUB) view port windows both on the north andesouth side
conductivity probes, HLCP12 and HLCPO4, at the Conax fittinge
9i. e hot leg isolation valve, RVHV02
IThis valve was not present for OTIS testing.
OV
4-1,
!
!.

,
k
Table 4-1
LOOP CHARACTERIZATION TEST CATEGORIES
REPORTSECTION CONTAINING
CATEGORY RESULTS
1. DEBUG AND CHECK 0UT
I.1 Component, Instrument, and Control Operation Not applicable
II. COMPONENT TESTS
II.1 Feedwater and Steam Flowmeter Calibration 4.911.2 Steam Generator Volume 3.0, 4.12II.3.A Discharge Orifices - Vapor and Liquid Region 4.2II.3.B Venting with Noncondensible Gas (NCG) - 4.3
Pilot-Operated Relief Valve (PORV) Site
III. COLD LOOP
III.1 Leakage 4.1III.2 Primary Volume 3.0, 4.12III.3. A Filled NCG 4.10III.3.B Yalve Response - Colo 3.1,3.9,3.10III.4 Primary Flow - Cold 4.8
IV. HEATED LOOP
IV.2.A Primary Flow - Hot, Low Flow 4.8IV.2.B Heat Loss, Guard Heating, Stored Energy 4.5, 4.6, 4.7
IV.3 Temperatures 4.11
V. STEAMING (FORCED FLOW)
V.1 Cooldown 3.10
VI. ABNORMAL CONFIGURATIONS
VI.1.B HPI Head-Flow Curve, LPI Simulation 3.6VI.2 Reactor Vessel Vent Valve (RVVV) Head-Flow Curve 3.1VI.3 Reversed Primary Flow 4.4VI.4.A Level Indication with Condensation and 4.7
Guard Heating in a Vapor RegionVI.4.B Venting with NCG - High Point Vent (HPV) 4.3
p
i
J
O4-2
!
'l
- _ _ - . . . - . _ - - . . - - . _ . . _ - . - , . _ _ - . . , _ _ , -, . - , . , . - - -

e reactor vessel vent valve, RVCV01
To get a feel how leak tight the loop was, consider how long it would take I
lfor helium to escape assuming that:
e The measured leakage all occurred in the hot leg U-bend (HLUB) andthe hot leg stub
3(Volume = .65 FT )
c The HLUB and hot leg stub was filled with a 4% volumetric |
single tube test {hote, a 4% concentration was required in theconcentration.
,
to elevate the primary pressure to greater than2000 psia from an injttal pressure of about 900 psia.)(Volume He .026 FT = 736.32 cc)
The time required for the helium to escape would be 66,938 seconds (18.6hours) at 1000 psi system pressure. Based on these results it was concluded thatthe loop was leak tight enough to allow testing with NCG's, including helium.
4.2 DISCHARGE ORIFICES - VAPOR AND LIQUID REGION
2Scaled leaks up to 77 cm were tested in GERDA. Leaks of 5,10, 20 and 40cm were tested in the liquid region (cold leg suction, cold leg discharge, bottom
2of reactor vessel), and 3,10, and 77 cm were tested in the vapor region (Hot Leg
HPV and PORV).
2To characterize the flow for each orifice size up to 40 cm , the criticalflow rate was measured at pressures of approximately 1000 and 2000 psia for both
2the liquid and vapor region orifices. Two 5,10, 20, and 40 cm orifices were2calibrated at these pressures in saturated water, and two 3, and 10 cm orifices
were calibrated at the same pressures in saturated vapor. These calibrations
[ 10Condensation Heat Transfer Inside An Alloy 600 Once-Through Steam Generator(OTSG) Tube, LR:81:2987-07:01, G. C. Rush to J. R. Gloudemans, November 9,1983.3
ba
4-3
< ..

'
s
l
were perfonned in the Steam Generator Test Facility (SGTF) pressurizer.ti
The-
detailed-test-dete-4or-these 1:alibrat%ns is -containedM.
The calibration test results are summarized on Figure 4-1 and Table 4-2. As
shown by Figure 4-1, the steam phase critical flows compared well with thepredictions of Fauske, Moody, and HEM. For the liquid phase orifices, themeasured critical flows were approximately 1-3*. greater than predicted by Fauske.
Figure 4-2 illustrates that as subcooling is reduced the critical flow isreduced until the fluid temperature reaches saturation. The flow measured at thisplateau was taken as the saturated water critical flow and presented on Figure 4-1and Table 4-2. The remaining data on Figure 4-2 was generated by increasing the
pressure loss upstream of the leak orifice. The increased pressure drop causedthe fluid at the orifice inlet to become two-phase. This resulted in a step-change reduction in the measured flow. The flow change (as noted during severalorifice tests) was reversible and repeatable.
2The critical flow rate for a 77 cm steam phase orifice installed at thei
$ 1.-
GERDA PORV site was also measured. The PORY was opened for about 15 seconds at
pressures of 1900,1700, and 1550 psia, and the vented vapor was measured. Thecritical flow rate measured compared well with Moody predictions. The-detaHed- -
resuits vi 44+-test-are_tacTuded 184
2For the OTIS testing, a scaled 15 cm leak control orifice was also used. Nocharacterization tests were performed for this orifice. Interpolation of GERDA
leak orifice data was sufficient to characterize this orifice.
11 Letter from H.R. Carter to J.R. Gloudemans, Calibration of Leak Flow Orifices,SBLOCA-794, September 27, 1982.
Letter from G.C. Rush to H.R. Carter and J.R. Gloudemans, Test 009910, VentingThrough the Pressurizer Relief Valve Without Noncondensibles, SBLOCA-810,October 14, 1982.
4-5:t

, _ _ _ - _ _ _ _ _ _ _ - _ _ - _ _ _ _ - _ _ - ___ -____-____ _ __ . . .
O O OTable 4-2
CALIBRATION RESULTS FOR GERDA LEAK FLOW ORIFICES
Orifice Test Normalized Test NormalizedOrifice Diameter Arga Pressure Leak Rate Leak Rate Pressure Leak Rate Leak Rate,
2 2'
Serial No. (in.) (cm ) (psia) (1bm/he) (1bm/hr-cm )_ (psia) (1bm/hr) (1bm/hr-cm )
: 52 0.0237 4.80 1060 155.3 32.4 2050 162.1 33.853 0.0241 4.96 1060 163.6 33.0 2020 173.1 34.9-
'
12 0.0338 9.76 1055 294.7 30.2 2055 302.5 31.0| 13 0.0339 8.82 1070 292.5 29.8 2050 300.8 30.6.
! 56 0.u47 18.87 1045 580.6 30.8 1995 634.6 33.657 0.041 18.95 1050 572.3 30.2 2010 656.9 34.7
! 58 0.0667 39.16 1000 1145 29.2 2060 1232 31.5) ? 59 0.0675 38.92 1005 1090 2R.0 2036 1115 28.7i
*
{ SATURATED STEAM
! 4 0.0178 2.71 1050 14.2 5.2 1980 27.8 10.35 0.0180 2.77 1055 14.1 5.1 1990 27.8 10.3
! 54 0.0319 8.69 1095 45.9 5.3 1985 87.5 10.1
-| 55 0.0338 9.76 1000 42.0 4.3 1980 88.8 9.1-
,
i
!
i1
i
I
IJ

.
I
O
P(BAR)
48 79 100 150
1 I I I
' - - - 30 g4.1 - I[A s
aI , |4- 4.0 - a g10I I 20 -
\ il3.9 <MOODY \ 15 W-"#
3.8 SATURATED LIQUID"# "gFAUSKE
3 ~t 3.7 -^
"[ 5 x 10 E HEM # {-
*10-
C 3.6 a og \ ~ '
h! ''3.5 -
SATURATED VAPOR n- - 6 <b 3.4 -
oA ~z
g" 2 x 10³ - 3.3 -
s
2- d
3.2 -e 3 CM
5 CM3.1
- 3 gA 10 CM 8
)23- 3.0 - $ 20 CM10g2 - 2m 40 rM
|. o| 1 I I I I I i 1
|800 1000 1200 1400 1600 1800 2000 2200 2400
'
P (PSIA)
FAUSKE, MOODY, AND HEM (HOMOGENLDUS EQUILIBRIUM MODEL) CRITICAL FLOW2
AT SATURATED CONDITIONS. GERDA CRITICAL FLOW is FOR A SCALED 1 CM LEAK.
.
Figure 4-1 Measured and Predicted Critical Flows
O4-6
.,

._
li i
i
1 ('')xL
.
g340 -
E' e
320 N O
! *N.9a 300 - e
% ..e e 9 e--e e e4gE= 2so --
3 .>.26o
TIME INTERVAL
4o
0
A-A.g.o
d %
g 20 - ',\
| 10- I3, s.,
ti, _ A -. A...A A A * A-A A.A.A. A.A.4-4 4- A
-10
TIME INTERVAL
2Figure 4-2 Critical Water Flow for a Scaled 9.8 CM Leak
4-7
L.._ . . __ _. __ . . . . _ , . . , - . . . . . . . - . . , . _ , - _ . _ _ _ .

|
: t'
\
|
4.3 TWO-PHASE VENTING SYSTEM - CHECK 0UT TEST
t A GERDA test was completed to verify the ability of the two-phase ventingj
system to effectively separate and meter the NCG's removed through the HPV and f
PORY. This test was performed at the conclusion of GERDA Test 100145.
1
During GERDA Test 100145, a total of 37.19 SCF of nitrogen was added to |
GERDA. Upon completing this test, the two-phase venting system checkout test wasperformed. The HPV was opened, allowing the NCGs to be vented out as the loop wasslowly refilled. Periodically the PORY was cycled to vent any gases present inthe pressurizer. The HPV remained open until the loop was refilled and theaccumulator tanks indicated no more NCGs were being removed. The primary
circulation pump was run after the loop was refilled to help release any trappedgases. After the free gas was removed, several grab samples were taken from thecold leg suction leak site for total gas analysis. The amount of gas removed fromthe loop was compared with the initial amount of gas in the loop. This is shownbelow in Table 4-3.
Table 4-3
COMPARISON OF GAS REMOVED WITH INITI AL GAS VOLUME IN LOOP
Initial Gas Volume Removed,Volume, SCF SCF
NCG Added 37.19 ---
35.36NCG Vented ---
NCG Dissolved 0.045 2.86
Total 37.24 38.22
The amount of NCGs removed from the loop compare well with the initial gas
content'.' its "+='' d = "1 + e =nd-cakulations- for-this -test are included 4
13 Letter from J.E. Blake to H.R. Carter, Two Phase Vent Exercise, Run #009981,|
| SBLOCA-1009, March 11, 1983..
4-8'
i
. _ . _ . . . _ _ _ _ . _ , _ _ . _ _ . _ . _ _ _ .

,
\
4.4 IRRECOVERABLE PRESSURE LOSS CHARACTERIZATION - FORWARD AND REVERSE FLOW
v|
The GERDA loop irrecoverable pressure drop characteristics must approximatethose of the MK plant to obtain similar natural circulation performance. SAVER'
Code calculations indicated that the GERDA primary loop piping was lessrestrictive than that of MK. To better match the irrecoverable pressure dropcharacteristics, orifice plates were added in GERDA. An orifice plate was added
f near the reactor coolan'c pump (RCP) site to model the missing stalled RCP, and a
venturi for flow measurement in the lower downcomer to match the loss coefficient
f in the RVVV loop. During OTIS testing the orifice at the pump spillover elevation(used for flow rate measurement) was relocated in the cold leg to the steamgenerator outlet as shown by Figure 3-16.
GERDA tests were conducted that allow calculation of the irrecoverable. pressure drop (Euler number) around the primary loop. These Euler numbers were:
then compared with the predicted values from the SAVER Code. Since natural
I circulation pressure drops were too small for comparing measured and predictedEuler numbers, the tests were run with (nearly) isothermal, forced forward flow
s
( ) conditions. GERDA Test 0401CC, with a primary flow rate of about 20,000 lb/hr wasused for comparison with the SAVER calculations # The measured APs are given in '
.
Table 4-4. Note that CLDP03, from the outlet of the steam generator to the RCP
spillover, (including the cold leg orifice) was not recorded. The calibratedrange of this transmitter precluded its use while in forced circulation.'
The fractional differences between the SAVER predicted and the adjusted
measured APs ranged from -64% to +14%. The differences decrease with increasing
AP. The sum around the loop of measured APs obtains a fractional difference of
only -0.5%. h t:!'e af tha cat eu1 =+ 4ea- :.d the Len re d t: are 4acluded-ttth;-
.+
d
14 GERDA Forced Flow AP Prediction," B&W Document No. 32-1127192-00, 2/2/83.
a4-9
m . _ __ _ _ _ __ _ _ _ _ _ . _ _ _ _ . _ _ _ _ _

,
i
A test was also perfonned to obtain loss coefficients for reverse flow in theprimary piping loop. With a reverse flow of about 1600 lb/hr (~1.67% of fullflow) the measured differential pressures were nearly identical (withintransmitter accuracy) to the no-flow condition. The conclusion from this test wasthat for the expected reverse flows, irrecoverable loss was negligible incomparison with the gravity head.
Table 4-4
COMPARISON OF GERDA MEASURED AND SAVER PREDICTED APs
.
GERDA SAVER| " Corrected" Measured Predicted
AP Transmitted AP, psi AP, psi
HLDP01 0.762 0.426HLDP02 0.785 0.482HLDP03 0.156 0.056SPDP01 1.572 1.682CLDP01 0.260 0.143CLDP03 10.556--
f DCDP 02 2.092 2.390RVDP02 0.090 0.038RVDP04 0.205 0.243
Total 5.004 4.978
j (excludingCLDP03)i
4.5 HEAT LOSS
To determine the heat loss characteristics of the GERDA loop, a series of
|heat loss tests were conducted during GERDA Phase O Characterization Testing.
From these tests the total loop heat loss and the heat loss from the major'
components (reactor vessel, hot leg, steam generator, and cold leg) wasdetermined. The heat loss was measured during steady-state conditions undernatural circulation flow rates. To assure steady-state conditions, the loop was
,
f allowed to soak at least 24 hours prior to taking the heat loss data. Data weretaken both with and without the hot leg guard heaters activated (no surgeline or
|\
b e,.
4-10'
.
'._

t
k
reactor vessel guard heaters were available during these GERDA heat loss tests).Pressurizer heat loss was determined during a separate test in which it wasisolated from the loop.
The overall loop heat loss (excluding the pressurizer) equals the core power3I required to sustain the loop temperature. Thus, loop heat loss was measured
direc*ly by the core wattmeter. Heat loss for the major components was calculated,
- based on the fluid enthalpy change between the inlet and outlet of each component.Enthalpy change was based on Resistance Temperature Detector (RTD) measurementslocated at the inlet and outlet of each component, and on the mass flow rate asindicated by the Venturi meter in the downcomer. The reactor vessel vent valve(RVVV) wae closed during all the heat loss tests. During these tests thesecondary side of the steam generator was isolated. The water level in the steamgenerator varied from 0 to 67% during these tests.
The overall loop heat loss, in terms of percent (%) full power versus steamgenerator inlet temperature, is shown in Figure 4-3. At 500*F with the hot leg
guard heaters activated and with a wet steam generator, loop heat loss was about0.55% of full power (1% of full power equals 22.4KW for GERDA tests). Thecomponent heat losses are shown in Figures 4-4 through 4-7 for the steamgenerator, reactor vessel, cold leg, and hot leg respectively. Steam generator
heat loss, shown in Figure 4-4, was insensitive to the secondary-side water level,
]as long as a level was present. The one data point taken for a dry steam
t generator shows a lower heat loss than for a wet steam generator at the sametemperature.
|
Hot leg heat loss, shown in Figure 4-7, was taken both with and without guardI' ~ heaters activated. With the guard heaters activated (bias setting at 0.1), the
hot leg was nearly adiabatic up to about 500*F. Above this temperature, the dataindicates a net heat loss along the hot leg. At 535'F, the heat loss was about
0.045%.
Pressurizer heat loss was determined while the pressurizer was isolated from
the loop. Initially, the pressurizer was at a steady-state condition with the
M;
4-11
'_. _ - _ . . _ . . _ _ _ _ -._--.-_ _ _ . _ . - - - _ . . _ . . . - .

F
f
i
e?
|
[d1
i
I
| e.8
%
G- o
.u ... .
*L a go*
PO
DW e.4 '
EDR
';* a
8.2I B--G SG ET - WITH GUNG EATERS *
*--+ SG DFU - WITH GDHD WATIRS *| +-+ SG uct - NO CUED HAERS
see ase 4ee 4se see sse see'
SG IM.ET TDMRATURE DEG FI
.
* Hot leg guard heaters only, bias setting +0.1.|
fFigure 4-3 GERDA Loop Heat Loss
!I
i
G,
i4-12
,
- - . - - . - .

q
..
ONJ
i(
)
- 0.3<
0.250
%D*/."
e.2 mF o o
- ULL
6.15 g
OW -
E[ 81R u
%'
.95|
f- e= - 300 m 400 450 500 550 600'
i e-- e SG IET 17-67% LEVEL M SG TDf9EATURE DEG F'
*--* sG Im.
I!Figure 4-4 GERDA Steam Generator Heat Loss! '
; 1
LO. 4-13
, ,
.
I [
|'
L

r--
i*
|\.
l'
G
e.2
e. isa
U De.15
Dv. O U D
[ e.12s
LL
e.1 ow
P0
$ .es*
R
.es
.e25
e
m ase 400 4se see sse m
AVENE RV TDPERATtK DEG F
Figure 4-5 GERDA Reactor Vessel Heat Loss(No Guard Heaters)
!
i,
f4-14
'[J

)'b
I,gs'd
l, ..,
!
I i.
a
fe.2
' ' e.17s
a o%e.is o,
J [ e.12s aD
1 L'
e.1..
PL
O
y .e75 -
TN Rt
U, .es
.eas
e
see ase 4ee 4se see ese 600
m c. TDPERATURE DEG F
i Figure 4-6 GERDA Cold Leg Heat Loss,
i
i
LO4-15
.
1*
L ..

,
O
e.2
e.15 u
x0
Fu e,1LL
POw .es *
GER
,
oe .
,
.
.05
* * * e see 550 ceet M EF
~* W ATERS ias Set ,}
Figure 4-7 GERDA Hot Leg Heat loss
;
i
,
94-16
. _

|' I
!
! main heaters controlling to a set pressure (~2000 psia) and the guard heaters
Q making up for heat loss. The main and guard heaters were tripped and the vessel
{was allowed to depressurize (due to heat loss). Based on the temperature,
pressure, and collapsed water level data, the heat loss was calculated as thevessel depressurized from 2000 to 1650 psia, and again from 1250 to 500 psia. The
heat loss during these tests was 0.047 and 0.042% of full power at 622' and 530*F,
respectively.
.
For,0 TIS testing, guard h, eaters were added at the,p'tssuriz line anfat the reactor fessel upper'and top plenums. ' Guard heater contr/er 9gei - /-
ol bias settings'
were determined to minimize heat loss from these regions. ,4haracteriza' tion test''/'
L results for these OTIS components will be added to this fext when test results are''
available. L L c' --
_ .
4.6 GUARD HEATER CHARACTERI6HOS EATie43
A Pressurized Water Reactor (PWR) at operating temperature typically loses15less than 0.1% of full power to ambient OTIS, with its larger surface area to.g
volume ratio, will lose a larger percentage of the heat being generated to thesurroundings. To minimize the undesirable effects of heat loss in the hot leg,p s, hpressurizer surge line, and reactor vessel upper and top plenums, a guard heatingsystem was used on these components. The guard heating system (discussed inSection 2.0) was designed to provide heat to the components in an amount equal tothat components heat loss to ambient.
During the GERDA Phase 0 Loop Characterization Tests, the performance of thehot leg guard heaters was characterized. The hot leg guard heaters are dividedjinto eight (8) control zones, each zone covering about eleven feet of pipe. Heat.i
input to the zone was controlled based on a AT measurement between the pipe OD and,
.I
!6
15" Scaling Criteria and an Assessment of Semiscale Mod-3 Scaling for Small Breakp Loss of Coolant Transients", T. K. Larson, J. L. Anderson, and D. J. Shimeck,
| *)s
EGG-SEMI-ST21, March, 1980.
4-17'
l

|
|
| a point approximately mid-way into the 1/2" layer of control insulation. Theguard heater concept is illustrated on Figure 2-4. The proposed method to
minimize the heat loss was to control the guard heater so that the AT between thepipe OD and the control insulation was zero. With the AT being zero, an adiabaticcondition would exist at the pipe wall, thus the heat loss would be zero. Duringthe heat loss tests it was found that with the guard heaters maintaining a zeroAT, there was a net heat loss along the hot leg. The temperature at the steamgenerator inlet was about 2*F less than the reactor vessel outlet temperature.This represented a heat loss along the hot leg of about 0.045% (at 500*F). Thisnet heat loss was due to a higher heat loss through instrument penetrations(thennocouples, conductivity probes, viewports, etc.) than through the insulatedsections of the pipe where the control signal was located. To minimize theoverall heat loss from the hot leg, that is making the steam generator inlettemperature equal to the reactor vessel outlet temperature, the heater controlsetpoint was increased (biased to +0.1). With the higher control setpoint there'
was a net heat addition over the insulated section of the control zone to| compensate for the higher heat loss through the instrument penetrations in that
zone. The result is illustrated in Figure 4-8. Between the reactor vessel outlet
and steam generator inlet, the net heat loss was approximately zero with the guard hheaters on (and biased to +0.10). The fluid temperatures along the hot leg varied
by +1* F. This guard heater control setpoint (bias +0.10) was used for all GERDAPhase 1 tests. The fluid temperature profile with the guard heaters off is alsoillustrated on Figure 4-8. There was about a 5'F temperature difference from theoutlet of the reactor vessel to the steam generator inlet with the hot leg guard
heaters off.|
As part of the OTIS characterization testing, a run was perfomed to!
determine the control settings for the eight hot leg guard heaters for a steami
environment at 500*F. The effects of slightly overpowered guard heaters are most1,
apparent in a steam environment due to the relatively small volumetric heatcapacity of the fluid. This guard heater characterization test showed that thecontrol settings for the eight hot leg zones, established during the GERDAprogram, were too high. An estimate of the excess heat addition to the hot leg
I
4-18

| \
Ni
|
l
,
I
..LOCATIONS
1 2 | !yMOT LEG-
|.
WITH HEATERS | |
2i|,i. . g a._a_6._6._o A _. __
^'% |"
~ 5'F "' ".
"g %g STEAM r''"#*O GENERATOR 3*
*
5 gi* 6%g n-|s .e8
WITHOUT HEATERS |3
s * i
O
;. [' b L;coLoLEO \.98 - GRTD ,('
6TC j
IRE ACTORVEssE L
^'|-
e e t e a
37 , "
0 40 80 120 ,
DISTANCE, FT
.
L Figure 4-8 GERDA Hot Leg Fluid Temperatures Withand Without Guard Heaters
$:
1 .
!O
!4-19
;
;
L

16was made and totalled 324 watts The control settings were reduced to +0.09'
.
for zone 4 (see Table 3-6 for zone elevations), +0.08 for zones 1 and 5, +0.07 for gI zones 2, 6, 7 and 8, and +0.06 for zone 3. Finally, the loop was refilled and the l
Iadequacy of the reduced hot leg guard heater control settings was verified undernatural circulation conditions. The natural circulation hot leg fluid
j' temperatures were within 1.5*F of those in a steam environment.
The control settings for the reactor vessel upper and top plenum guard heater 5were also detarmined in a steam environment at 500*F. A control setting of
+0.23 the upper plenum and +0.135 for the top plenum (see Section 3.1 for -
zone elevations) were required so that the top plenum fluid temperature (RVTC08)was within l'F of the core outlet fluid temperature (RVTC07). The heat loss fromthe reactor vessel was reduced from 3.36 KW to 2.26 KW at 500*F using these guard
heaters. The total loop heat loss was decreased from 12.1 KW (or 0.57% of fullpower where 1% of full power equals 21.4 KW for OTIS) to 11.0 KW (0.51% of fullpower). These same reactor vessel guard heater control settings resulted in a
! 14*F temperature gradient between the core outlet and the top plenum for a waterfilled reactor vessel and natural circulation conditions in the loop. The heatloss from the reactor vessel upper and top plenums under these conditions was only
29W.
The pressurizer surge line guard heater control setting was set at +0.0 for
( OTIS testing. A larger bias setting was not required due to the absence of localheat sinks (instrument stand-offs, pipe supports, viewports, etc.) in the surge
line piping.'
As mentioned in Section 3.5, the pressurizer guard heater control was basedon the arithmetic average of three sets of control thermocouples for all testsperfonned before April 3,1984. On that date, one of the three sets of control
I thermocouples failed and control was switched to a single set of control|
;
i
|
Letter from D.P. Binningham to H.R. Carter, "0 TIS Guard Heater CharacterizationTest Results,0 TIS-158", April 17,1984.
4-20:

themocouples. New characterization of the guard heaters was required. Thecharacterizations were performed at pressures of 500 psia and 1600 psia with ahalf-full pressurizer. The new controller bias was determined to be 0.07 to 0.08'
and was used for. the remainder of the OTIS testing.
4.7 STORED METAL ENERGY EFFECTS-
f During a depressurization transient, the water gives up its energy byflashing to steam. The metal, which was initi. illy at the fluid temperature,dissipates its stored energy by convecting hear to the fluid. During thisdepressurization the guard heater will shut off, only when the temperature of thepipe OD begins decreasing.(to follow the temperature of the depressurizing fluid).During the GERDA refill and composite tests (Tests 14 and 16), the hot leg fluidtemperature in the steam region of the hot leg remained hot (became superheated)as _the loop depressurized. An analyses was conducted to determine if thisr
superheating was a. result of an overpowering guard heater or from stored energy.
The effects of stored energy was determined using a computer code (TRUMP)qV model of the hot leg. The fluid, pipe wall, control insulation, heater, and
passive insulation were modeled. One axial layer of the model represented thewater region, and the other layer represented the steam region. Each region wasof unit (1 foot) length. Axial conduction in the pipe was not included. Themodel is illustrated in Figure 4-9.
..
The temperature of the water region was prescribed to follow the primarysaturation temperature during the first 50 minutes of GERDA Run 140301. Duringthis depressurization, the fluid temperature decreased from 518'F (initially) to392*F (at 50 minutes into the transient test). The rate at which the fluidtemperature changed was varied according to the saturation temperature for thisrun. The initial steady-state temperature distribution for the hot leg model was
. determined based on a fluid temperature of 518'F. All thermal properties in the
j model were temperature dependent. The water was assumed to make perfect contactwith the pipe (infinite heat transfer coefficient), while the steam heat transfer'i
L
i
4-21;
. .w. - - _ _ . - _ _ - . __ ._. - - . . . . _ . _ , . . _ . .,._ ,. - - . - ... - _ .. .- , _ _ ~ , . - . _ _ _ . _ - - - - . _ . .

O
2 2
d a9 9< on w>a ESFLOW 3 E$ w
E3 E ESOUT w9: CE W 4za a. u- 1 a. -
__
STEAMREGION
__
b
aTFORFLOW gHEATER CONTROL--
IN/
WATER __
REGION
|
9.!|
Figure 4-9 Hot Leg Guard Heater Model
i'
Ii,I I
I
O4.42
|1
- -- - -- - - - - - - _ _ _ . _ - .- _ _

17to the pipe was based on the Dittus and Boelter equation Heat transfer from.
the passive insulation to the ambient was based on a natural convection heattransfer coefficient. The guard heater was off during this depressurization.
Saturated steam, at the temperature of the water control volume, enters the'
steam control volume. The temperature of the steam control volume was calculatedbased on the heat convected to the steam region from the pipe wall. The steaming
f- rate up the hot leg was varied. The minimum steaming rate considered was the highpoint vent (HPV) capacity of 10 lb/hr. This is approximately the HPV capacity at900 psia. The steaming rate could be greater than the HPV capacity since steammay be condensing in the steam generator. To investigate this, steaming rates of
f' 10, 20,100, and 500 lb/hr were considered.
Using the initial temperature distribution calculated for GERDA Test 140301,the transient calculation was initiated to follow the depressurization rate from
|this run. The steam temperature, metal temperature (at inside diameter of pipe),
| and fluid temperature (saturation) are presented for hot leg steaming rates of 10,20, and 100 lb/hr in Figures 4-10 to 4-12, respectively. The stored energyrelease rate, heat flow from the pipe to the steam control volume, for hot legsteaming rates of 20,100, and 500 lb/hr are shown in Figure 4-13.
The analysis shows that even at 50 minutes into the test, stored energy wasstill being released from the pipe. At a steaming rate of 20 lb/hr, the heatrelease rate was about 25 watt / foot (of hot leg) at 50 minutes. Based or a stored
energy capacity of 220 BTU / foot for a 3" Schedule 160 pipe, which cools from 518'Fto 392*F, the pipe only released about 26". of its stored energy during the first
(
!
Pr .30Dittus-Boelter equation is: Nu = 0.023 Re .8
017
where: Nu = Nusselt Number
f . (q- Re = Reynolds NumberPr = Prandtl Number
|
4-23
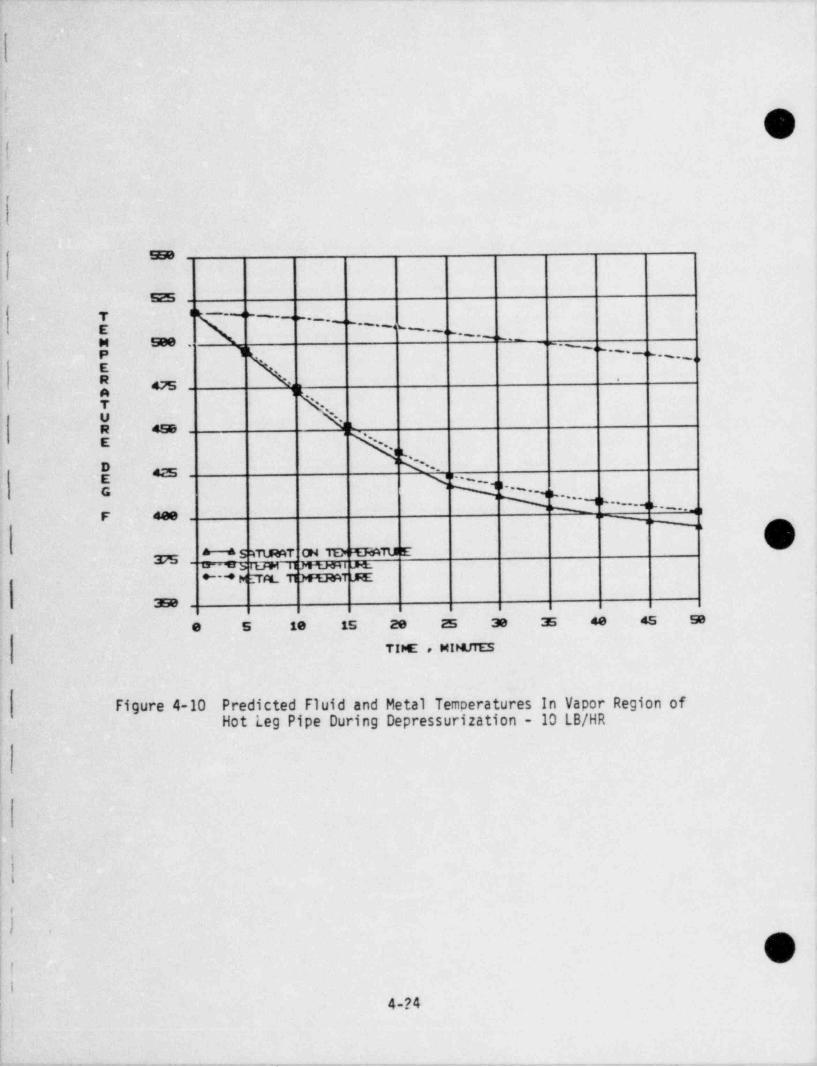
i
! O<
~1
EEiB
525
7 I -~ w- .- _,_~ *E - - ~ ~ ~ ~ '*-w .._M 9ee .P 1
' -- m._," "-- -o'
E '
$ 43 'g..
-
T N,,
'.-U 'LR 4EiB
''
E ' . ,,'-
nk.! ' --425
M%'a ..
,D, "~'----o- - .m .
F 4es ~ _'.
%$
S4TUMT ON TDPEFATUE375 =diCMwi une_
*---* ML'TM TIM UMTURE
.EB
e 5 10 15 20 25 30 ~E de 45 50
TIME , MD41TES
Figure 4-10 Predicted Fluid and Metal Temperatures In Vapor Region ofHot leg Pipe During Depressurization - 30 LB/HR
t
|
!
!! 1
(
s
9no.
4-?4'
- -- . _ _ _ _ _ . "* ' " -. , , - _ _

_
%
ff'
,t
y't.
A JL,
!
'/ ;. ,
, !!'
.
} -
| 525' --
% T %., ,'' ~E ~ ~ ' '/.
AM See '
P 1 % '' -E ', m '''
m
'" ~ ~ --~
475 ',-R,
'.T -
U N,-LR 4EiB .
. D _g
k~m9,___*
* *'-- di|
| F 468 A, -'
__
%6'
/; (,/
| g WS4TtJMT. oN TDrERATUE"bIW ilM tNH I JHt.
*---* M T/4 TIMEMTJRE
35B
9 5 19 15 29 25 30 |E 40 45 SB
TIME , MINUTES
Figure 4-11 Predicted Fluid and Metal Temperatures In Vapor Region ofHot Leg Pipe During Depressurization - 20 LB/HR
|
l
!'
l<
v
.
!nvi
i
4-25
o >,
b

- -- -- _
+
i
,
'l
9'
-
i,,
EEiB
525
7 8 %E . ,' %
~'M Seep 1 ,'
4 s,'wE s475 ', g,4 ,
T '
'',- s', N,,,'U -
'R 4EiB '
, ,, ,,'E ' ',~.,
-
D -w,,,'',
' 'g
G -
. . . ,gQ-1p~_
F 4ee .w (-
WS4TtJMT ON TEPPERATUEg=druwe nMwi uHt;.
*---* MJAL. T1MERATL5 E
"EiB
e 5 le is 29 25 3e "Ei de 45 W
TIE , MIMJTES
Figure 4-12 Predicted Fluid and Metal Temperatures In Vapor Region ofHot Leg During Depressurization - 100 LB/HR
,
I
~
i
i
O4-26
-, . . .--_. .-. . .- . _ . . .. .- --

O.
- s.
125
''sH *
/E r' '\,gA W N LB M,'j )g G-- C 11e t R Ad?T 19e
.- -* 9e LB Ms,s%,
R /*.E / '\.L '
j 's[ :s \,[ a - -- <a. . , '-,.... go ..- ,,,:~ .
. %s.. . '50 ;|
a
.l l .,''-, Nu -' ''., s.1
, ,.- w :.s-- T
. g' '
~.v - 2s c - : TF
e
e le 20 30 ** "
TitC M!t4JTES
Figure 4-13 Stored Heat Release Rate Versus Time; In Vapor Region of Hot Leg.g
f
,
'Ia.
'
s
4||
4-27
t -m

..
t50 minutes of the transient (with 20 lb/hr steaming rate). The percent of stored'
energy released at 50 minutes, and the average heat release rate for 20,100, and
] 500 lb/hr steaming rate is shown in Table 4-5.
Table 4-5
EFFECT OF STEAMING RATE ON STORED ENERGY RELEASE
|I
Steam Stored Heat Average Release'
Flowrate Removed 0 Ratei lb/hr 50 min. (%) watt / foot
20 26.3 20.4100 65.5 50.65
1 500 90.9 70.3
Based on these average release rates, the amount of superheat produced in a 10foot section of pipe is shown in Table 4-6. These temperatures are based on the
inlet fluid being saturated vapor at 900 psia.
Table 4-6 OSUPERHEAT PRODUCED BY STORED ENERGY RELEASE
Flowrate Average Release Amount ofRate Superheat Produced
lb/hr watt / foot *F
20 20.4 35100 50.6 16
500 70.3 2
As a result, it is concluded that stored energy release from the pipe to thefluid, can add heat at a rate to produce the superheated steam temperaturesobserved during the first hour of some of the refill tests.
A GERDA test was performed to determine if'significant condensation occur,ed
| in the voided hot leg with and without guard heaters on. To void the hot leg, thereactor vessel leak was opened allowing the primary to saturate at approximately'
|t 1000 psia. The leak remained opened until the hot leg level was below the hot leg|
OI
4-28i
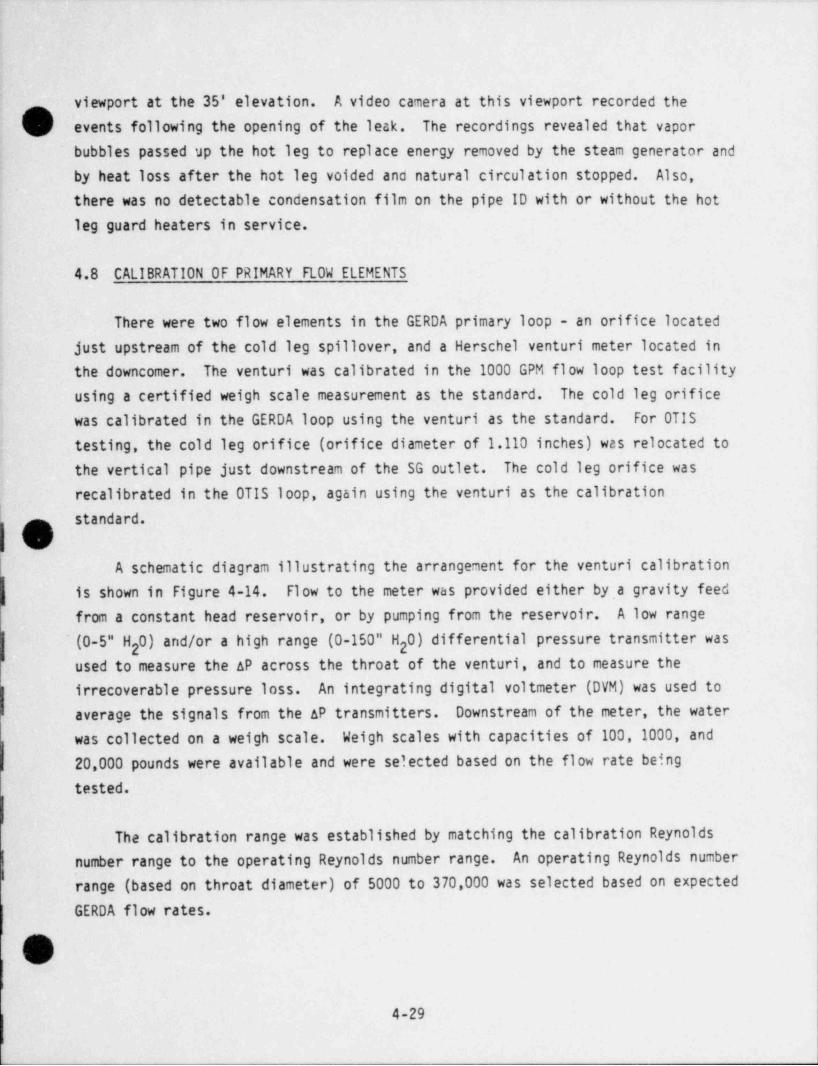
viewport at the 35' elevation. A video camera at this viewport recorded the
V events following the opening of the leak. The recordings revealed that vaporbubbles passed up the hot leg to replace energy removed by the steam generator andby heat loss after the hot leg voided and natural circulation stopped. Also,there was no detectable condensation film on the pipe ID with or without the hotleg guard heaters in service. ;
1
4.8 CALIBRATION OF PRIMARY FLOW ELEMENTS'
There were two flow elements in the GERDA primary loop - an orifice located
just upstream of the cold leg spillover, and a Herschel venturi meter located inthe downcomer. The venturi was calibrated in the 1000 GPM flow loop test facility
using a certified weigh scale measurement as the standard. The cold leg orificewas calibrated in the GERDA loop using the venturi as the standard. For OTIS
testing, the cold leg orifice (orifice diameter of 1.110 inches) was relocated tothe vertical pipe just downstream of the SG outlet. The cold leg orifice wasrecalibrated in the OTIS loop, again using the venturi as the calibration
k standard.
UA schematic diagram illustrating the arrangement for the venturi calibration
is shown in Figure 4-14. Flow to the meter was provided either by,a gravity feedfrom a constant head reservoir, or by pumping from the reservoir. A low range
'(0-5" H 0) and/or a high range (0-150" H 0) differential pressure transmitter was2 2
used to measure the AP across the throat of the venturi, and to measure theirrecoverable pressure . loss. An integrating digital voltmeter (DVM) was used toaverage the signals from the AP transmitters. Downstream of the meter, the waterwas collected on a weigh scale. Weigh scales with capacities of 100, 1000, and20,000 pounds were available and were selected based on the flow rate being
tested.
The calibration range was established by matching the calibration Reynoldsnumber range to the operating Reynolds number range. An operating Reynolds number
range (based on throat diameter) of 5000 to 370,000 was selected based on expected
GERDA flow rates.
4-29
L

I
|
i
O'
mV
- u.u-m . . , .
S,uppt?- .
%s /em.COwiaas'J
" = *** cia..y' / ,/
,,,
p3 b('i= ' '
y ,. .. ..
| "g'' |m uu"8 r 5, , , , ,
a v-
3..________.| r %| v
KH -
/ }} f fn-n
iso poim ICAPACffturo D4M . coo novano,,, ,,g gg
T&8sE EA'ACIY' 'I'0"TAhRTakt
Figure 4-14 Flow Loop Arrangement for Venturi Calibration
|
|!t
|
O4-30
!t
4

The expression for mass flow rate through a venturi is:
'(G\
2g p AP,.eCam = 41-8
Defining a flow coefficient, K, as:
CK=41-8
and solving for K in terms of the measurable parameters yields:
.
"K=2g p AP a
c m
where,
m = mass flow rate, lb /secm
3= fluid density, 1b,/ftj (3 p2'. V a = throat area, ft
2AP, = differential pressure across throat, lb /ftf
2- g = gravitational constant, 32.174 lb,-ft/sec -lbfc
'
C = coefficient of discharge
f a = throat to pipe diameter ratio, d_D
The flow coefficient, K, was computed using the above expression, andt
j correlated with the parameter 1000/gRe where Reynolds number is based on theD
1 2-1/2" Schedule 160 pipe diameter. A plot showing this correlation is shown in ,
i Figure 4-15.-
The data were curve fitted (using a linear fit) for use in the GERDA and OTIS|
'
data bases,
i
'
p,-]
4-31'
t
-.. ,._,- , .. . . _ _ _ . _ . . . . _ _ _ _ . _ , _ . _ _ _ . , . , . . _ _ _ - . . , _ . _ _ . _ _ _ _ _ _ - , - - _ _ _ , _ , . .. -

I
l|
1.1
1.875 .
1.f5 n a-
u
w 1.E5'*
.
5t; o
i.-
$.s7s .
E.v oo ., e M B no O n2 N] a O 5aN O
D u' e.95 - n -
oo a a
e.555 n a.
a
I s I I i 8*
9 5 1. 15 29 25 38 3!i de
POLY 14A curwe fit 1 N aytUteD)h 4 DATA
|
I Figure 4-15 Venturi Flow Coefficient|
|r!
(
O4-32
,
|
.. . _ . . . _ - . _. - . _ _ - - - - - _ _ . _ _. .--

~1
lI'
|'
During the venturi (throat diameter of 0.775 inches) calibration, data were
V also taken to determine the Euler number for the assembly to be installed in th;loop. An Euler number, based on a 3" Schedule 160 pipe, of 14.2 was experi-mentally determined for the assembly to be installed in the downcomer. This valueagreed well with the predicted Euler number of 16.7.b
IThe ;cntri caldbration-data
-e=d the suppyti g aq"aHaas develep=ent is includepN.
The cold leg orifice (1.110 inch bore diameter) just downstream of the SGoutlet was calibrated in the OTIS loop because of the non-standard installationrequired by the loop piping. The downcomer venturi was used as the standard forthis calibration. Calibration data were recorded using the OTIS data acquisitionsystem. The AP across the orifice was recorded using a low range (0-7" H 0) and a
2
high range (0-25" H 0) differential pressure transmitter. Calibration data were2
taken under natural circulation conditions. The flow coefficient, K, was
calculated from the measured parameters using:
.
*K=20.525 d 3p
(v~}where
lh = mass flow rate indicated by downcomer venturi, lb /secm
d = orifice bore diameter, inches3
p = fluid density, 1b /ftm
AP = orifice differential pressure, psid
This flow coefficient was correlated with the parameter 1000/gRe , whereD
Reynolds number is based on the 3" Schedule 160 pipe diameter. These calibration
|I
tii
i
lm18 Letter from J.E. Blake to H.R. Carter, "GERDA Downcomer Venturi Calibration",
SBLOCA-932, January 11, 1983.
4-33
..

r-
ifdata are plotted in Figure 4-16. The data were curve fitted (using a linear fit)for use in the OTIS database. ht4ondata-and-suppor-ting celttdathns
.ere incl aoa @i
4.9 CALIBRATION OF FEE 0 WATER AND STEAM FLOWMETERS
The feedwater and steam orifices were calibrated in the GERDA loop. The
feedwater orifices and the high range steam orifice were calibrated using theturb.ine meters upstream of the feedwater heaters as the standard. The low range
j
i steam orifice was calibrated using the low range feedwater orifice as thestandard.
The flow coefficient, K, for each feedwater and steam orifice was calculatedfrom:
.
*K=20.525 d 3p
,
wheredi = mass flow rate from the flow standard, lb /sec
morifice bore diameter, inchesd =
3fluid density, lb,/ft=p
AP = differential pressure, psid
Fcr each flowmeter the flow coefficient was correlated with the parameter 1000/
YRe , where the Reynolds number was based on the pipe diameter (1" Schedule 80D
for steam and 3/4" Schedule 80 for feedwater). A curve fit of flow coefficientversus the Reynolds number parameter was developed for each meter for use in theGERDA and OTIS data bases.
19'
Letter from J.E. Paxson to D.P. Birmingham, " Cold Leg Spillover OrificeCalibration", OTIS-103, February 21, 1984.
,
|
4-34

!l
C>) -
t/ ; eI
Eh 00 go O
9m
,,
] |. -
t
? m :I h
"I 'e'
=I .
I. on 9 yoe8
o 58?c$' c8a ;I 2
$ k -4 aa co- - . cm m:
( -
a! - s' c
-'| a o
I gi
in..Em<
@
c!!III @U DD jGl 13 0 y
I 7)uDa a gte u ~
w5%,El5V 0$ 4,
b *I
i 5$ E
$'
W |8, s'~
| 1 on"
s s o ss e a g! 4 4 d m. e 59* *
. .
o e e o
kJO3 UOWkk-UWZF
Ol 4-351
. - _ . _ _ . _ _ . _ _ _ _ _ _ _ _ _ _ _ - . - _ - . . _ - . _ _ _ . _ _ _ - - _ _ . . . . _ . _ _ _ . _ . _ _ _ _ _ _ . , _ _ _ _ . ___ . _ . . . _ _ _ . --
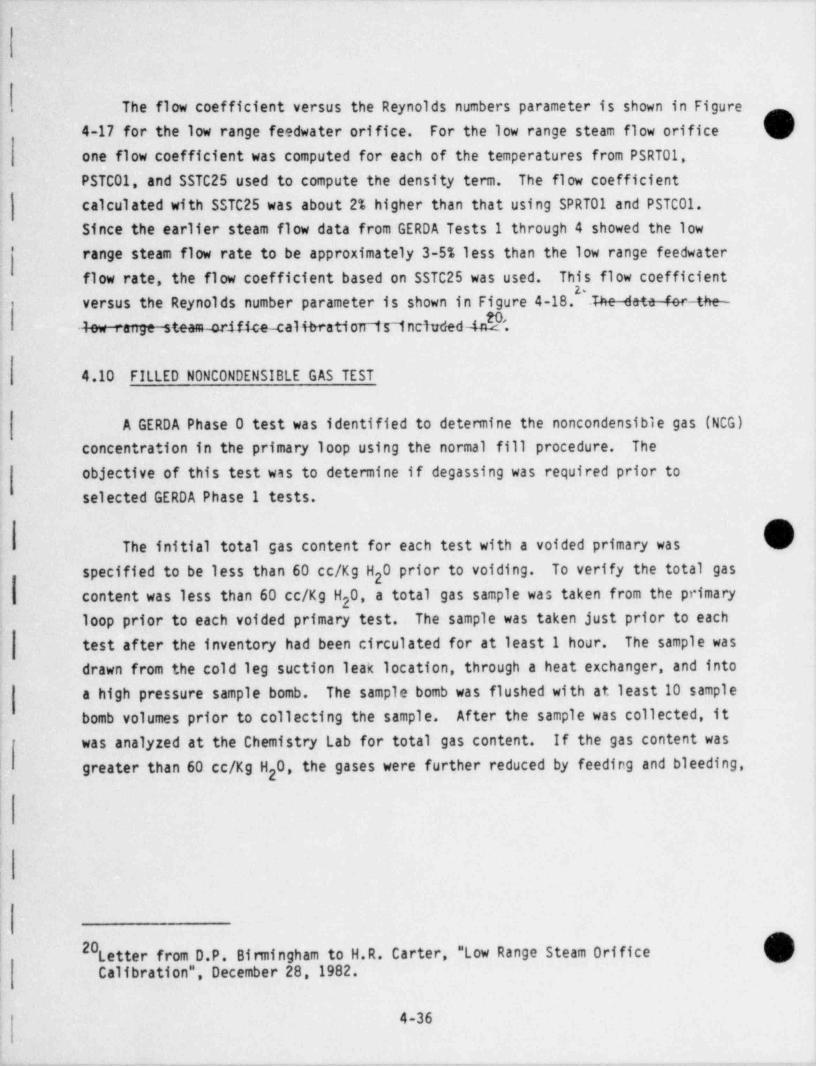
The flow coefficient versus the Reynolds numbers parameter is shown in Figure4-17 for the low range feedwater orifice. For the low range steam flow orificeone flow coefficient was computed for each of the temperatures from PSRT01,PSTC01, and SSTC25 used to compute the density term. The flow coefficientcalculated with SSTC25 was about 2% higher than that using SPRT01 and PSTC01.Since the earlier steam flow data from GERDA Tests 1 through 4 showed the low
range steam flow rate to be approximately 3-5% less than the low range feedwaterflow rate, the flow coefficient based on SSTC25 was used. This flow coefficient
z-versus the Reynolds number parameter is shown in Figure 4-18. The-date-for-the---k.; reiige steam-ordf4ce-calkratioTr15-inciuded48'.
4.10 FILLED NONCONDENSIBLE GAS TEST
A GERDA Phase O test was identified to determine the noncondensible gas (NCG)
concentration in the primary loop using the normal fill procedure. Theobjective of this test was to determine if degassing was required prior toselected GERDA Phase 1 tests.
The initial total gas content for each test with a voided primary wasspecified to be less than 60 cc/Kg H O prior to voiding. To verify the total gas
2content was less than 60 cc/Kg H 0, a total gas sample was taken from the primary
2loop prior to each voided primary test. The sample was taken just prior to eachtest after the inventory had been circulated for at least I hour. The sample wasdrawn from the cold leg suction leak location, through a heat exchanger, and intoa high pressure sample bomb. The sample bomb was flushed with at least 10 samplebomb volumes prior to collecting the sample. After the sample was collected, it
was analyzed at the Chemistry Lab for total gas content. If the gas content was
greater than 60 cc/Kg H 0, the gases were further reduced by feeding and bleeding,2
0Letter from D.P. Binningham to H.R. Carter, " Low Range Steam OrificeCalibration". December 28, 1982.
,
4-36
.-
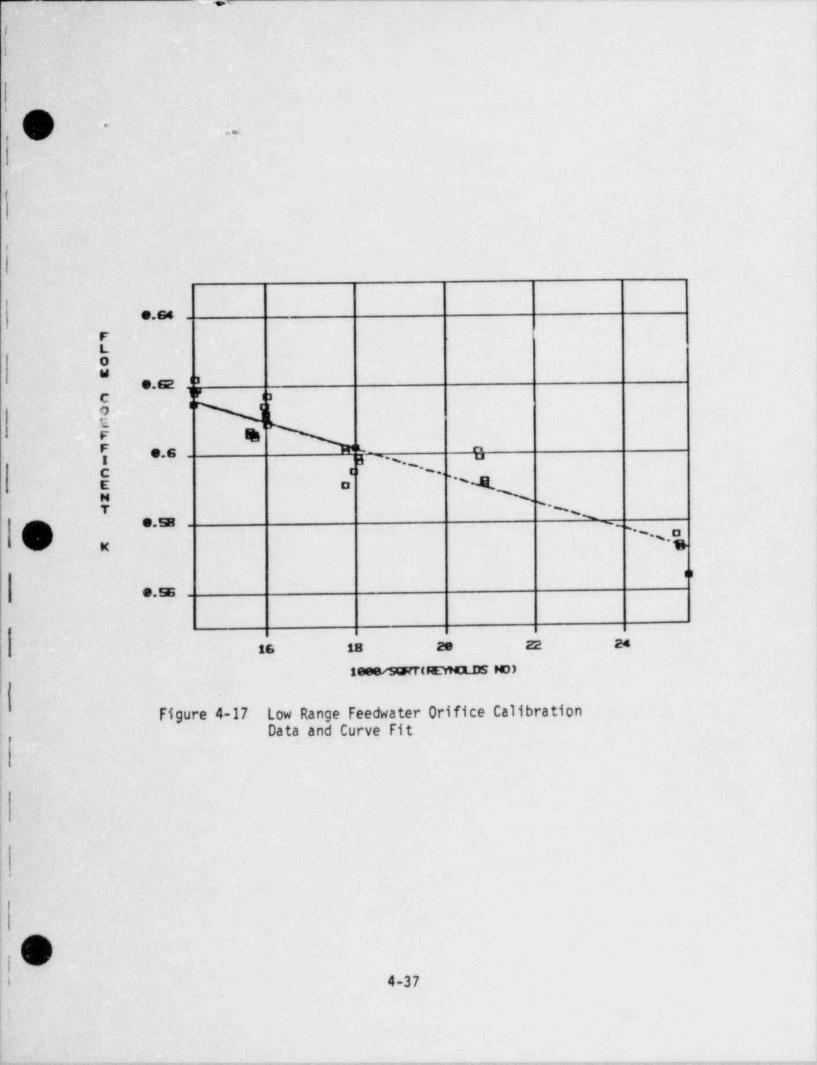
. _ _ _ _ .
!^
)
I
' (vh -
..
f
i
i
!
..
FL0W e.se ' 8
i P v 3C
$
| *< _... ", s '' "' *-'
C 'E o ~4g NT '
~sm e.se ^
(V3 ._,,ox s
oe.ss
is is ze 22 a
IN(8CrNOLIE PO)
Figure 4-17 Low Range feedwater Orf fice CalibrationData and Curve Fit
!
|
|
t
|:.
t
, 4-37
. -. . . -._ - _ . - - .- - -. _ _.. _ . . . . . - - - . _ . - - . - , . - . . . - - . _ _ -

I
|
9!
|
I|
.
1-
e.7
I
I ..se
,
!...,
O
d o"
i 5 ..s4 .o o'
,,~
| U 3 D a" aC e gb e.se .. . . _,
uoU o
"! ...
Ou.
. . .
9.EE
l <
3.2 3.4 3.6 3.3 4 4.2 4.4 4.6 4.8
f 19N(ED)| i
Figure 4-18 Low Range Steam Flow Orifice Calibration| Data and Curve Fit
i
i
!l
,
l|
1 OP.i 4-38
!
l i
.
. . _ - . _ . _ _ - _ __

!!
passing through the vacuum deaerator, until the content was less than 60cc/Kg H 0.2
A compilation of the initial gas contents prior to each OTIS test is included in,
]' Table 4-7.
4.11 TEMPERATURE CALIBRATIONS
The objective of these GERDA tests was to calibrate the thermocouples (TCs)-
!! in the primary natural circulation loop, the pressurizer, and tne secondary sideof the steam generator. The pressurizer TCs were calibrated by isolating the
1 pressurizer from the loop, and then establishing a saturated condition in thepressurizer. Nine (9) pressure plateaus, ranging from 200 to 1900 psia wereestablished for the temperature calibration points. The TCs were calibrated tothe saturation temperature corresponding to the measured pressure. The measured
saturation pressure was corrected to correspond to the saturation pressure at theelevation of the TC.
Table 4-7
TOTAL GAS CONTENT PRIOR TO VOIDEO PRIMARY OTIS TESTS.
i
Total Gas ContentTest cc/Kg H,,0
210100 2.7220100 11.0220201 17.9
f 2202AA 15.52202BB 15.5220304 18.3220402 17.9
; 220503 3.5220604 11.0220756 11.7
i 220899 7.4220999 16.4221099 15.7
|
230199 13.4230299 14.0
Oh 4-39
< ..

_
t
The primary-side TCs in the hot leg, steam generator, colo leg, anddowncomer, and the secondary-side TCs in the steam generator were calibrated with
f forced circulation conditions in the primary loop, with the steam generatorisolated. Heater power was adjusted to establish the desired steam generator
( inlet temperature. Using four (4) Resistance Temperature Detectors (RTDs) aroundl the primary loop as standards, most of the primary-side TCs were calibrated to a
temperature based on a linear interpolation between the RTDs. A total of thirteen
(13) temperature plateaus, ranging from 350* to 575*F were established.
,
The calibration data (voltage and temperature standard) for each TC wasI
recorded on a file. The data was then curve fit to a second-order polynomialequation using the POLYAA Comupter program. The coefficients for the polynomialequations were then entered into the database for each TC.
The reactor vessel thermocouples (except RVTC01) were not calibrated due to
their close proximity to the heat source and/or due to their being located in anon-flow region. The thennocouple voltage versus temperature data used for thenon-calibrated thermocouples were traceable to the National Bureau of Standards(NBS) Monograph 125. This is discussed further in the uncertainty analysis
20report .
4.12 LOOP VOLUME MEASUREMENTS VERSUS ELEVATION
The volume versus elevation for the four (4) primary regions - pressurizer,
Jreactor vessel, active region, and in-active region, and for the secondary side ofthe steam generator was determined during GERDA Phase 0 testing. These volumesI
were obtained by filling the loop, isolating the component to be measured, then,
draining the cold water from the component into a weigh tank, periodicallyAstopping the drain to record the weight drained and the differential pressure.
t
f.
:
|
.
Uncertainties for OTIS Instrumentation and Derived Calculations, &20
1 RDD:85:4091-30:01:01, R.P. Ferron, August,1984. Wt
4-40

,
water level was calculated from the differential pressure and fluid temperaturemeasurements. The detailed procedure and valve alignments for these volume checksare contained in the technical procedures ARC-TP-500 and ARC-TP-502.
The volume versus elevation for the pressurizer and reactor vessel are shown
in Figures 4-19 and 4-20, respectively. Volume versus elevation for the activeregions of the hot leg and the cold leg and downcomer are shown in Figures 4-21and 4-22, respectively. The in-active regions of the hot leg, cold leg and thesteam generator (primary) are shown in Figure 4-23. The OTSG secondary-side
volume versus elevation is shown in Figure 4-24.
N['
,
I
I
I
i
:
|
O4-41

i
i
.
O
asse
,, .s_ -...*
.*
.,
.Jv p'-O m
/u .-H .AE '
*
1500.
I_'*'
3 1900 ,
,s*L',
,
**See 1
, , *
A
''e .
i
e les ase see e see m(
ELEVATION FROM SFLTS - INCM:S
Figure 4-19 Pressurizer Volume Versus Elevation
O
4-42'
. _ _ _ .
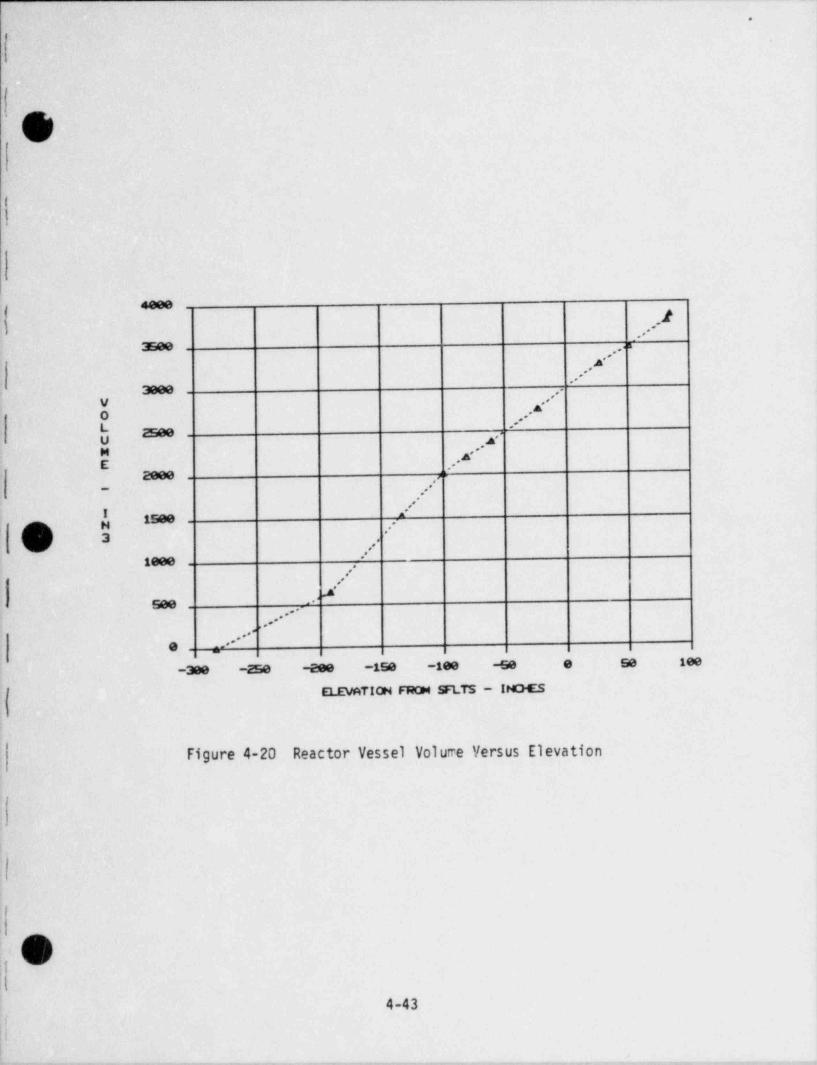
_
.
s.
|
|
,n- iI, /'ss
I
4ees2
t .. -:mee ,....a
.*..-
asse .-'
V a''o ,..-L ,
asee ,
u ^,.-M
t ,. d'asse
/-.I A1Eliest .-,
-- 3 'g /w/
itse -
i.-
see , A...-
..-
_.. *..-e
-ase -ase -ene _gse _g., , , 6e lee
. I ELEVATION N SFLTS - INCESI .
I
Figure 4-20 Reactor Vessel Volume Versus Elevation
-t
'
Oo,
!l
4-43|||lr
, . . _ . __ - - - . . _ _ _ _ . . , _ . . - _ , - _ . , . _ - _ _ . . . , . . . - _ . . , _ - _ - . _ . , _ . _ , . . . . _ _ . . , _ _ _ . _ , , , . _ _ - . . - - - - _ - . _ _ . - . - . , . - ,

-
.
I
!,
hI
}
sees
** 2, . .
_.-" .-
.. '*V .Co *.. -L .gu aeee
-
u,.4E
,g
.. -_
x 2eee . . s'H .A'3
..**/
.-seee....
.. -**
_-,,.
ie
e 100 20e 300 W W,
E1EVATION FROM SFLTS - IMS
Figure 4-21 Hot Leg Active Region Volume Versus Elevation
iI
l
| |
i4, '
4-44,
G

. . _ _. _
l
i
,
ni 4
'%)
idee .-. . -
.-.
12ee .-ib
'
.-v . . -
19eeO .A'L .
U .,***u ***E
J',.*..a'.--,
***s . . * 'H
. *. -3n, ,...-.Se _
,
t-.. ..-
..aee, , ' . . . -
e : **,,-ase -zee -sse -tee _se e 5,
NTION N SFLTS - INGES
Figure 4-22 Cold Leg and Downcomer Active RegionVolume Versus Elevation
.
>
't
t
av ,
I: 4-45
:l
- s-. - _. . - _ - - . . . - _ - - - - _ _ _ . -__ . - . - . _ . _ _ . . - . . . . - .

9
.
seee. .a"
, . -, . , *
seee. . * '
-
...".*..a.yO 4000 ''L .-
U ,-.u '
E . . -3000 '
..,.. '-
,..*'" .'
3 2000 ,-,~
.-'#seee .
a-:'
:*.
e -
, y m M *
E11VATION FROM SFLTS - IHOES
Figure 4-23 Steam Generator Primary, Hot Leg and ColdLeg In-Active Region Volume Versus Elevation
|
<
| '
i
|
94-46
| I,
I
k_
_ _ _ _ _ _ - - - - - - - -
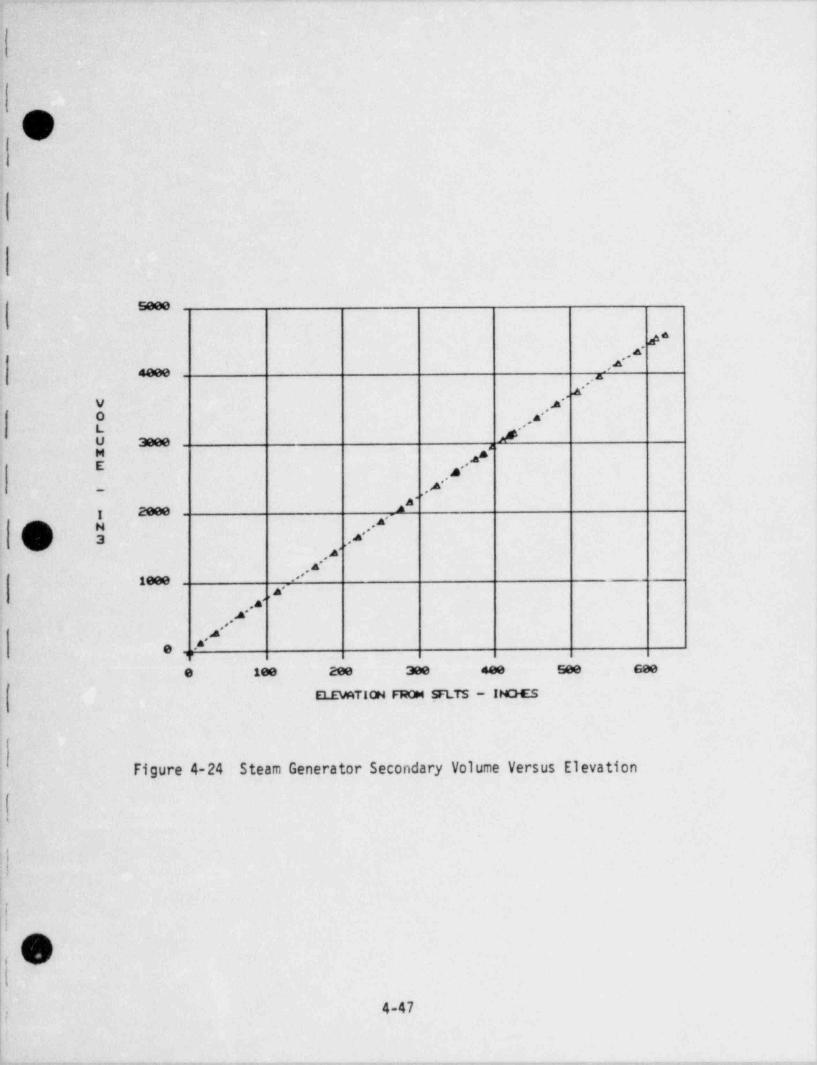
. - - - _ . - .. -. - .
rmi \
\,_ji
l
)l
seee
'* e', . .
neee .=-
gv y
*o *4L p*y 3eee 'jE .''- .A
fI 2eee
,4-N *
3 s*%j ,
. ' ''
. . ''
neee
.s''s's-, . ~
*'e,
e see aos see 5,, ,
MTION N SFLTS - INGES
Figure 4-24 Steam Generator Secondary Volume Versus Elevation
lil
O4-47
I
i
, - - - . - - , , - - . - , . . . , - . . , - - - - , - . . _ - - . - - , ,,an...----n.- , , - - - , . . - - - - - ~ ,,-,_nn ,.---,----,--,,n--, - - - -

- -- . -. _ _ _ - . . ._
( -
Appendix A
OTIS Facility Drawings List
'
O
4
|
|
L|
O'
,
l
i1
-e--e - m.._,.- _+e,. ,- .w, _.w. _ _ _ , _ ,..__ _ , , , _ __
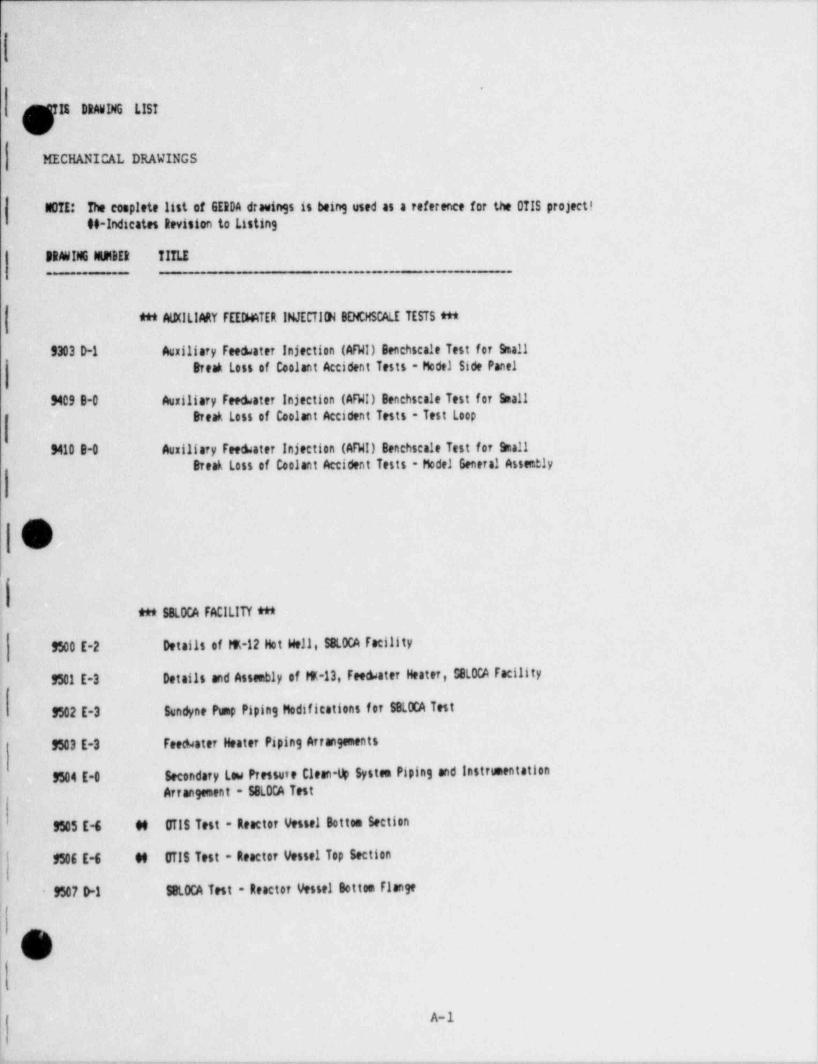
.
/ MIS DRMING LISTC
MECHANICAL DRAWINGS
NOTE: The complete list of GERDA drawings is being used as a reference for the 071S project!M -Indicates Revision to Listing
3RMING IGMBER TITLE. _ . . . -
*** AUKILIARY FEEDMTER INJECT 191 BENCHSCALE TESTS ***
9303 D-1 Auxiliary Fee &ater Injection (AFWI) Benchscale Test for kalltred Less of Coolant Accident Tests - Model Side Panel
MCS B-0 Auxiliary Fee &ater injection (AFWI) Benthscale Test for hallDreak Loss of Coolant Accident Tests - Test Loop
M10 B-0 Auxiliary Fee &ater injection (AFWI) Benthscale Test for kallBreak Loss of Coolant Accident Tests - Model General Assstly
iv
*** SOLOCA FACILITY ***
9500 E-2 Details of E-12 Hot Well, $8LOCA Facility
9501 E-3 Deta!!s and Assembly of E-13, Fee &ater Heater, COLOCA Facility
9502 E-3 Sundyne Pop Piping Modifications for $8LOCA Test
9503 E-3 Fee &ater Heater Piping Arrangements
9504 E-0 Secondary Law Pressure Clean up Systen Piping and InstrumentationArrangement - SSLOCA Test
9505E-6 M UTIS Test - Reactor Vessel Botten Section
9506 E-6 M UTIS Test - Reactor Vessel Top Section
9507 > 1 SOLOCA Test - Reactor Vessel Settes Flange!
,
O
A-1
|
._ _-_ -_ _ .. . . - _ - . .- - - __ - - _. - -._- - .- - .

9508 D-1 $8LOCA Test - Reactor Vessel Bottom Head
9509 D-1 Ste m Condensing Reservoir
9510 E-2 SJLOCA Test - Lower Plenum
9511 C-0 Special Nuts for Botton Head
9512 E-1 $8LOCA Test - Reactor Vessel Heater Support
9513 E-0 Ste m condenser - S8LOCA
9514 E-0 Installation Assembly of Secondary Stem Condenser and LPCUS Heat Exchanger in
Bay 919, Building 'A'
9515 E-0 Arrangement of Condenser and Stem Piping Systee - SBLOCA
9516E-4 M Arrangement of Condenser and Stem Piping System - OT!S Facility
9517 E-1 Tower Water Hook-Up Stem Condenser - 58LOCA
9518 E-2 S8LOCA Test - Pressurizer Vessel*
9523E-0 $8LOCA Reactor Vessel Connection Box
9524 C-1 S8LOCA Test - Reactor Vessel Heater MK-2-A-13
9526 D-0 HK-47 Stem Mixer Detail - SBLOCA <ter Piping
9527 E-4 M 'A' 6enerator Modifications - OTIS
9528 E-1 Installation Assembly of 19-Tube 'A' 6enerator - SBLOCA
9529 D-2 Generator Vessel Support Stand - SBLOCA
9530 D-1 'A' 6enerator Modification Details - SBLOCA
9531 E-0 Arrangement and Details of Wireways S8LOCA Centrol Room - Bay 19 Extension Building 'A' High Bay
9533 E-0 Arrangement 8 Details of Censole Writing 8 Work Top - SBLOCA Control Room -Bay 19 Extension, Building 'A', High Bay
|
! 9534 E-1 Arrangement and Details of Control Panel Equipment Support - SBLOCA ControlRoom - Bay 19 Extension - Building 'A' - High Bay
9535E-0 $8LOCA Test - Rea: tor Vessel Support
9536E-0 $8LOCA Test - Reactor Vessel Suppert
9539 D-0 Primary Venting (Single-Phase) Heat Exchanger - SBLOCA
A-2
|t v

9541 0-1 90 Degree Pipe Bends for Hot Leg Piping - S8LOCA
2 E-5 M UTIS Test - Primary Forced Circulation Loop and Primary Cold Les Piping
9543 D-2 M 0715 Test - Primary Cold Leg Piping Penetration Details
9544 D-2 S8LOCA Test - Primary Cold Leg Piping Penetration Details
9545 D-0 Hot Leg View Port Section WHigh Point Vent
9546 E-1 Building 'A' Bay 19 Extension Wireway Installation - $8LOCA Test
9547E-1 Pressurizer Vessel Installation Arrangement - SBLOCA
M4B E-4 'A' 6enerator Penetrations for Conductivity Probesi
9549 D-4 M OTIS Test - Surge Line
9550 E-0 Fre&ater Piping System - 6eneral Arrangment
9552 D-1 SBLOCA Test - RVW Piping
9553E-4 Primary Hot Leg Piping - SBLOCA
' ,_ 9554 D-9 Primary Hot Leg Piping - Details - SBLOCA
(v 9555 D-0 Support Stand for Hot Leg and Cold Leg Paping - SBLOCA
9556E-0 SBLOCA Test - Primary Forced Circulation Loop and Cold Leg Piping Supports
9557 D-0 S8LOCA Test - Primary Forced Circulation Locp and Cold Leg Piping Supports
9558 D-0 SBLOCA Test - Downcomer Support Detail
9559 D-0 2 Phase Primary Venting and Sepling System Scheeatic - SBLOCA
9560 E-0 $8LOCA Test - Lower Plenum Bypass Lines
9561 0-0 High Point Vent - Separator - SBLOCA
9562 D-0 P.O.R.V. - Separator 2 Phase Primary Venting and Sampling System - SBLOCA
95630-0 Dverflow Stack Detail - SBLOCA - 2 Phase Primary Venting and Sepling Systee
9564D-0 WV - Separatter Installation and Piping - 58LOCA
9565 D-3 Displacement Tanks and P.O.RN. Installation Assembly - SBLOCA - Primary Venting a*.d $mpling Systee
9566 E-2 SBLOCA Test - Ultrsonic Flometer
OGI
A-3
. . _ _ _ . __ _ _ - - _ _ _ _ _ _ _ _ - - . - - _ . _ __. ._ _ ____
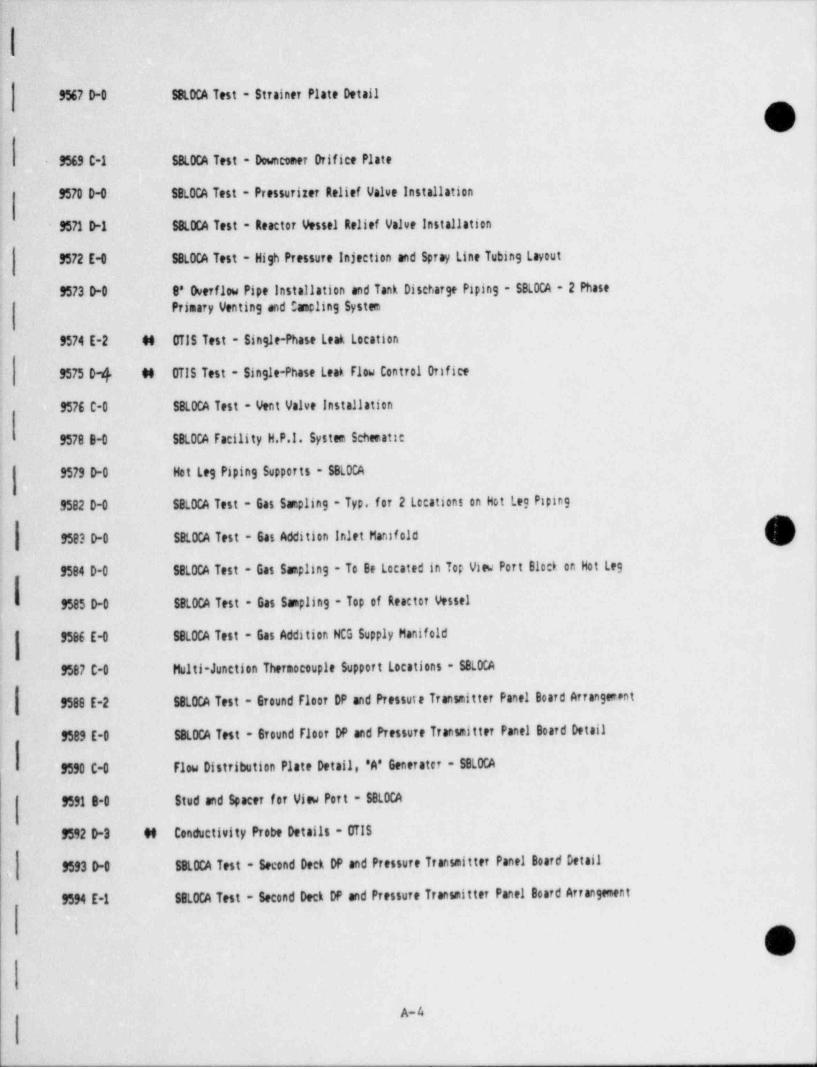
9567 D-0 $8LOCA Test - Strainer Plate Detail
O$569 C-1 58LOCA Test - Dwncomer Drifice Plate
9570 D-0 SBLOCA Test - Pressurizer Relief Valve Installation
9571 0-1 $8LOCA Test - Reactor Vessel Relief Valve Installation
9572 E-0 $8LOCA Test - High Pressure Injection and Spray Line Tubing Layout
9573 D-0 8' Overf1w Pipe Installation and Tank Discharge Piping - SBLOCA - 2 PhasePrimary Venting end C ocling System
9574 E-2 M OTIS Test - Single-Phase Leak Location
9575D-4 M OTIS Test - Single-Phase Leak F1w Control Orifice
9576 C-0 SBLOCA Test - Vent Valve Installatien
9578 B-0 SBLOCA Facility H.P.I. System Scheratic
| 9579 D-0 Het Leg Piping Supperts - SBLOCA
9582 D-0 $8LOCA Test - Gas Supling - Typ. for 2 Lccationi on Hot Leg Paping
9523 D-0 SBLOCA Test - 6as Addition Inlet Manifold
9584 D-0 $8LOCA Test - Gas Supling - To 8e Located in Tc; V w Port Bloc 6 on Hot Leg
9585 D-0 SBLOCA Test - Gas S upling - Top of Reactor Vessel
9566 E-0 S8LOCA Test - Gas Addition HCG Supply Manifold
9567 C-0 Multi-Junction Thermoccuple Suppert Locations - SBLOCA
9588 E-2 $8LOCA Test - Ground Floor DP and Pressure Transmitter Panel Board Arrangepnt
9589 E-0 SBLOCA Test - 67cund Floor DP and Pressure Tranmitter Panel Boatd Detail
9590 C-0 F1w Distribution Plate Detail, 'A' Generater - $8LOCA
9591 8-0 Stud and Spacer for Viw Port - SBLOCA
9592 D-3 M Conductivity Probe Details - OTIS
9593 0-0 $8LOCA Test - Second Deck DP and Pressure Transmitter Panel Board Detail,
9594 E-1 SOLOCA Test - Second Deck DP and Pressure Transmitter Panel Board Arrangement
O
A-4

. ,
Ste m Orifice Plate - SBLOCAp )f595 0-1\' " 9596 B-0 1' - 60004 Threadolet for SBLOCA Steam Generator
i :
9597B-0 1-1/4' - 60004 Sockolet and Plug for S8LOCA Stem Generator
9599D-0 $8LOCA Test - Bulkhead Fitting Support Panel Detail
10009 D-1 SOLOCA Test - Pit DP and Pressure Transitter Panel Board Arrangement
10010 D-0 $8LOCA Test - Pit DP and Pressure Transmitter Panel Board Detail
10012E-0 SBLOCA Test - Gas Addition Tube Routing Diagra
10051 B-1 Instrument Air Sy' stem - S8LOCA
20052 B-0 Bau 19, Building 'A' City Water Supply System - SBLOCA,
Sheet 16.2
16053 B-0 Bay 19, Building 'A' Filtered and Unfiltered Tower Water Supply and Return System
Sheet 16.1
';,10185C-0 S8LOCA Test - Orifice Plate
10237 C-0 S8LOCA Test - Orifice Plate
/ 10297 li-? Downeocer Venturi Flom eter Asseebly - set 0CA
V10298D-0 Downcomer Venturi Flcmeter Details - i4LOCAt
10299 D-0 Downeomer Venturi Flometer Details - S8LOCA
10300 D-0 Dcwncomer Venturi Flometer Details - $8LOCA
10313 C-1 M UTIS Cold Les Orifice Plate.,
10314 C-0 $8LOCA Test - Downconer Orifice Plate1
19697 C-0 M OTIS Test - /Witional Cold Leg Drifice Flange Detail
l1-
19706 6- 0 W UTIS Preject - Cold Leg Drifice Location
10710 E-7 M Assembly 6 Details of 19 Tube 'A' Gen.
10857 D-6 # OTIS Test - Branch Leak Connection
19968 C-6 M OTIS Tes: 7 Reactor Vessel Vent Valvef
SK 1996~ Neater, Pressurizer for Babcock & Wilcox Co. - Watlow Electric Mfg. Co.
501-070-04 High Temperature Ultrasonic Flometer'
I.
A-5
-
_ _ - . _ . . . _ . _ . _ _ . _ _ . . _ _ . _ . . _ _ _ _ _ , _ . _ _ _ _ _ _ _ _ _ _ _ - . _ _ - _ -

4-5236-1 H Proposed Hot Leg Probe Assembly
4-5236-5 C-0 Conductivity Probe Holders
C-SK-2200-611 Special Multipak Assembly
706125, Rev. 6 Ass'y: Level Sensor, Miniature B & W Simulated Reactor Test Systee - Single Switch PointSheet 1 of 3
706125, Rev. 6 Level Sensor Miniature B 4 W Simulated Reactor Test Systee - Dual and Single Switch PointSheet 2 of 3
706125 Rev. 6 Ass'y Level Sensor, Miniature B & W Simulated Reactor Test System - Single Switch PointSheet 3 of 3
0-489190 Rockwell E6ards Forged Steel Univalve Globe Stop Valve - Class 1690
ei
ELECTRICAL DRAWINGS
9519 B-10 M OTIS Test General Panel Layout Looking North - Panel
( Sheet 1
9519 B-6 M OTIS Test General Panel Layout Looking West - Panel
Sheet 2
9519 B-3 M OTIS Tes'. Power Distribution Center Layout - PanelSheet 3
O|
A-6
[. _ _ _ _ _ _ _ _ _ _ _

f
9519B-3 M OTIS Test - Motor Control Center Arrangement - Panel
et 4
9519B-1 SBLOCA Test - Power Distribution Center Panel Door Layout - Panel
ilheet 5 |
9519B-2 M OTIS Test - Power Dicributien Ceter Panel Door Layout - Panel
Sheet 6
9519 B 1 S8LOCA Test Lead Control Center Panel - Feekater Heater SCR's - PanelSheet 7
9519 B-1 SBLOCA Test Lead Control Center Panel - Reactor Vessel & Pressurizer - PanelSheetB
9519B-2 H OTIS Test Lead Center Panel - Hot Leg - Panel
Sheet 9
9519B-2 S8LOCA - Fee &ater Heater Connection Box - Panel
Sheet 10
9519 B-0 SBl.CCA - FeeSater Heater Connection Box Cover Drwing - Panel
Sheet 11
9519 B-0 SILOCA Test - First and Second Pit Levels Down - Floor Plari - PanelSheet 12
19B-1 M UTIS Test - Ground Fleer - Floor Plan - Fanel-
Sheet 13~
SBLOCA Test - First Deck Elevation - Floor Plan - Panel9519B-0- Sheet 14
~
9519 B-0 S$t0CA Test - Sacend Deck Elevation - Floor Plan - Panel
. Sheet 15
9519B-0 $8LOCA Test - Third Deck Clevation - Floor Plen - PanelSheet 16
9519 B-0 SBLOCA Test - Penthouse Level 41 - Floor Plan - PanelSheet 17
| 9519 B-O SBLOCA Test - Penthouse Levels 42 and 43 - Floor Plan - PanelSheet 1B
9519 B-1 SBLOCA Test - Multipoint Temperature Recorder - Panel,
(. Sheet 191'
9519B-3 M 071S Test - Steam Ramp Prograseer - Panel
Sheet 20
oUr
L

9519 B-1 $8LOCA Test - Secondary Piping Controls - Panel
Sheet 21
9519 B-2 $8LOCA Test - Secondary Loop Temperature Limits - Panel
Sheet 22
9519 B-1 $8LOCA Test - Secondary Circulation Pump and FeeSater Heater Controls- Panel
Sheet 23
9519 B-2 SBLOCA Test - Secondary Low Pressure Clean-Up System (SLPCUS) - Panel
Sheet 24
9519 B-1 $8LOCA Test - Reactor Vessel Temperature Limit - Panel
Sheet 25
9519 B-2 $8LOCA Test - Pressurizer and Reactor Vessel Level Recorder - PanelSheet 26
9519 B-1 SBLOCA Test - Reactor Vessel Controls - PanelSheet 27
9519 B-2 SBLOCA Test - Pressuriter Temperature Limit - Panel
Sheet 2B
9519 B-1 58LOCA Test - Pressurizer Heater Controls - PanelSheet 29
9519 B-1 SBLOCA Test - Pressurizer Vent Valve and Fee @ater Puep Controls - Panel
Sheet 30
9519 B-3 58LOCA Test - High Pressure injectio,. (HPI) Controls - PanelSheet 31
9519 B-2 SB'.00A Test - Primary Circulation Pur+ - Panel
| Sheet 32l
| 9519 B-1 S8LOCA Test - Dissolved Oxygen Analyzer - Panel
Sheet 33
f519 B-2 S8LOCA Test - Conductivity Monitor and High Pressure Alarm - Puel
| Sheet 341
9519 B-1 S8LOCA Test - Hot Leg Zone Heater Controls - Panel
| Sheet 35|| 9519 B-1 $8LOCA Test - Patch Panel Cutout - Panel
Sheet 361
9519 B-1 SBLOCA Test - Patch Panel Layout Upper Case - Panel
Sheet 37'I
I
O
A-8
-- --

s
f
M19 B-5 SBLOCA Test - Patch Panel Layout - Lower Case - Panel'
et 3B,
k 9519 B-0 58LOCA Test - Installation of Bailey Controls Module Racks - Panel
i Sheet 39
9519 B-1 S8LOCA Test - Bailey Conditioner Rack 41 Layout - Panel
Sheet 40
9519 B-2 $8LOCA Test - Bailey Conditioner Rack 42 Layout - Panel
Sheet 41 )
l
M19 8-2 $8LOCA Test - Bailey Conditioner Rack 43 Layeut - Panel l
Sheet 42t
9519 B-1 SBLOCA Test - Utility Outlet Panel - Panel
Sheet 43
9519 B-2 $8LOCA Test - Relay Panel il - Fanel
Sheet 44
9519 B-1 SBLOCA Test - Relay Panel 42 - Panel
Sheet 45
9519 B-1 $8LOCA Test - Relay Panel 43 - Panel
; Sheet 46
9 B4 SBLOCA Test - Assembly for Color Monitor Keytcard Storage - Panel
9519 B-2 SBLOCA Test - Bailey Rack 41 Equipment Location - Panel
Sheet 48
9519 E-2 SBLOCA Test - Bailey Rack 42 Equipment Location - Panel
Sheet 49
9519 B-0 S8LOCA Test - Reference Junction Enclosure SBLOCA Panel Board - Pant!.
Sheet 50
9519 B-1 SBLOCA Test - Hot Les Temperature Controller Zones 1 Thru 4 - Panel
Sheet 51
9519 B-1 S8LOCA Test - Hot Leg Temperature Controller Zones 5 Thru 8 - Panel
Sheet 52
9519 B-1 SBLOCA Test - Annunciator Centrols and Room Temperature Monitor Panel - Panel
Sheet 53
9519 B-0 S8LOCA Test - Ground Floor Layout - South Side - Panel
Sheet 54
,s
w
A-9

i
9519 B-0 S8LOCA Test - Protective Cover for Analogic DAS - Patel
Sheet 55
9519 B-3 $8LOCA Test - Annunciator - Panel1
Sheet 56
9519 B-0 $8LOCA Test - 6as Sample - Panel 'Sheet 57
9519 B-1 SBLOCA Test - 2-Phase Vent - PanelSheet 50
9519 B-0 SBLOCA Test - Relay Panel 6 - Panel
Sheet 59
9519 B-1 S8LOCA Test - Primary and Hot Well Pressure 64uge Layout - Panel| Sheet 60
9519 B-1 SBLOCA Test - Secondary Pressure Gwge Layout - Panel
Sheet 61
9519 B-1 SBLOCA Test - Differential Pressure 6auge Layout - Panel
Sheet 62
9519 B-1 S8LOCA Test - Differential Pressure 6nge Layout - Panel
Sheet 63
9519 B-1 M OTIS Test - Pananetries Ultrasonic Flomete' Conditioner Mounting Panel
Sheet 64
9519 B-1 M OTIS Test - Guard Heater CentrolsSheet 65
I 9519 B-2 M OTIS Test - 1-Phase Vent Systee
Sheet 66
| 9519 B-0 SBLOCA Test - 6as Addition Sy5 tem - Panel
'. Sheet 67
9519 B-1 $8LOCA Test - Vent and Spray Valves - Panel
Sheet 68
9519 B-0 S8LOCA Test - Turbine Flometer Layout - Panel
Sheet 69
9519 B-0 $8LOCA Test - Terminal Strip Layout - Panel
Sheet 70
9519 B-0 $8LOCA Test - Digital Input Power Supply - Panel.
Sheet 71
O.
A-10[
-- - - ,. . .. . - -

19 B-0 S8LOCA Test - Digital input Terminal Strip - Panelt 72
9519 B-1 SBLOCA Test - Heated RTD Electronics - PanelSheet 73
9519 B-0 $8LOCA Test - Power Supply - A*alog Device Mounting - Panel
Sheet 74
9520 b-4 N UTIS Test - 480 V Power Circuits Reactor Vessel Heaters - ElectricalSheet A
9520 B-1 SBLOCA Test - 480 V Power Secondary FeeSater Heaters - Electrical
Sheet B
9520 B-2 $8LOCA Test - 480 V Power Secondary FetSater Heaters, Primary Circulation Pump,
Sheet C Deserator - Electrical
9520 B-2 M UTIS Test 480 V Power SLPCUP System - Electrical
Sheet D
9520 B-3 M OTIS Test - 480/240 V Power Hot Leg and Pressurizer Heaters - Electrical
Sheet E
9520 B-3 M OTIS Test - Heater Power Control Pressurizer and Hot Leg - Electrical
Sheet F,
20 B-1 SBLOCA Test - Heater Power Control Pressurizer and Hot Leg - Electrical
Sheet G
9520 B-1 SBLOCA Yest - Heater Power Control Pressurizer and Hot Leg - Electrical
Sheet H
9520 B-0 $8LOCA Test - 120 V AC Power - ElectricalSheet !
9520 B-0 S8LOCA Test - Reactor Vessel Controls - ElectricalSheet J
l 9520 B-1 S8LOCA Test - Reactor Vessel Controls - Electrical' Sheet K
| 9520 B-2 SBLOCA Test - Reactor Vessel and Pressurizer Level - ElectricalSheet L
9520 B-4 M OTIS Test - Reactor Vessel Controls - ElectricalSheet M
,
9520 B-3 SSLOCA Test - Reactor Vessel Controls - ElectricalSheet N
OG
A-ll,
,
b
_ . . _ _ __ ._- .,_ , , _ - - .. . _ . , _ . - . _-
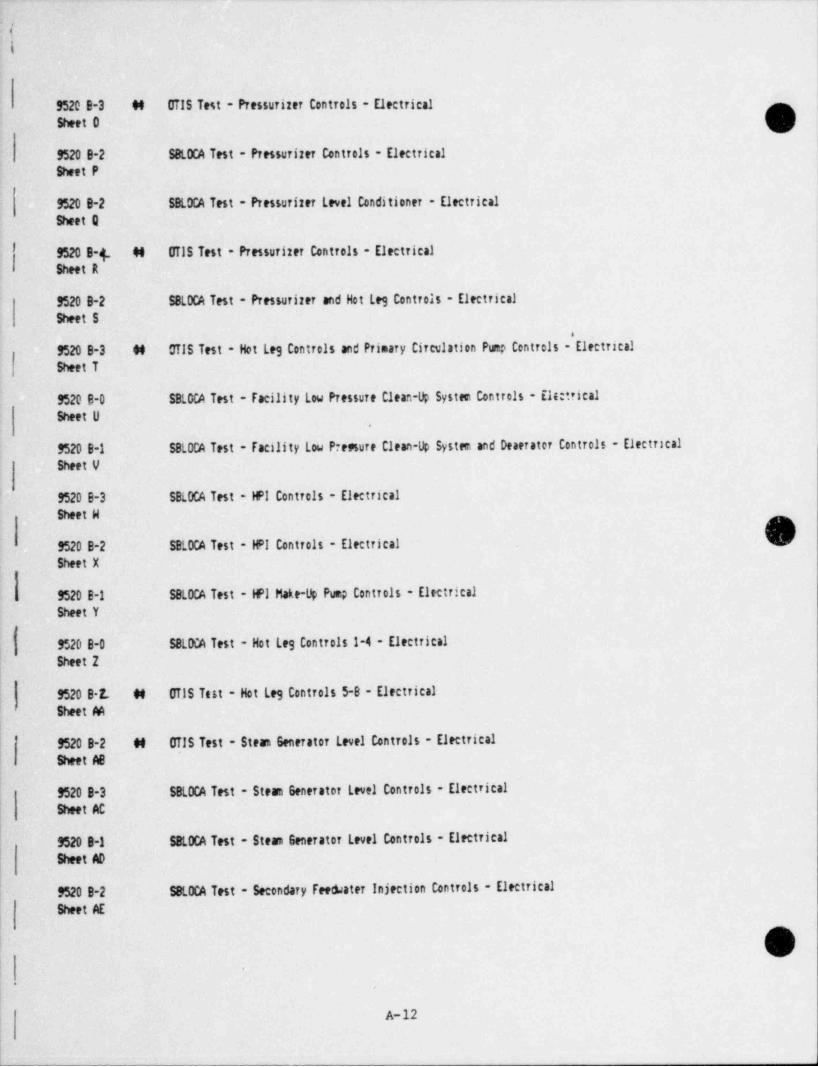
i|
9520 B-3 M OTIS Test - Pressurizer Controls - ElectricalSheet 0
9520 B-2 SBLOCA Test - Pressurizer Controls - ElectricalSheet P
9520 B-2 SBLOCA Test - Pressurizer Level Conditioner - ElectricalSheetQ
I9520B-4 M OTIS Test - Pressurizer Controls - Electrical
| Sheet R
9520 B-2 SBLOCA Test - Pressurizer and Hot Leg Controls - Electrical
Sheet S
9520 B-3 M UTIS Test - Hot Leg Controls and Primary Circulation Pump Controls - ElectricalSheetT
9520 B-0 SBLOCA Test - Facility Low Pressure Clean-Up System Controls - Ele:trical
Sheet U,
M20 B-1 SBLOCA Test - Facility Low Preesure Clean-Up System and Deaerater Controls - Electrical
Sheet V
M20 B-3 SBLOCA Test - Hol Controls - ElectricalSheet H
M20 B-2 SBLOCA Test - HDI Controls - ElectricalSheet X
|,
i M20 B-1 SBLOCA Test - HPI Make-L5 Pump Controls - Electrical
Sheet Y
9520 B-0 $8LDCA Test - Hot Les Controls 1-4 - Electrical| Sheet 2!
9520 B Z. M OTIS Test - Hot Les Controls 5-B - Electricall ' Sheet AA
9520 B-2 M OTIS Test - Steam Generator Level Controls - Electrical
| Sheet AB
i 9520 B-3 SBLOCA Test - Steam Generator Level Controls - Electrical
( Sheet AC
f 9520 B-1 $8LOCA Test - Steam Generator Level Controls - Electrical
| Sheet AD
9520 B-2 $8LOCA Test - Secondary Fee @ater Injection Controls - Electrical
SheetAE
O.
.
A-12

-
f 20 B-3 M OTIS Test - Secondary Stem Pressure Controls - Electricalet AF
9520 B-1 SBLOCA Test - Stem Generator Secondary Pressure Controls - Electrical
SheetAG l
9520 B-3 58LOCA Test - Secondary Circulation Pop Centrols - DectricalSheetAH
9520 B-2 $8LOCA Test - Secondary Circulation Pump Controls and Hot Well Controls - DectricalSheetAl
9520 B-2 S8LOCA Test - SLPCUS and Fee &ater Controls - DectricalSheet AJ
9520 B-0 $8LOCA Test - Fee &ater Temperature Controls - Electrical
SheetAK
9520 B-2 $8LOCA Test - Secondary Circulation Controls - DectricalSheetAL
9520 B-3 S8LOCA Test - Feewater Pop Speed Control and GA'RDI - Electrical
Sheet M
9520 B-2 SBLOCA Test - 6eneral Instrumentation Power Connections - DectricalSheet Mg
0 B-3 SBLOCA Test - 6eneral Instrumentation Powr Connections - DectricalSheet A0
952C B-2 SBLOCA Test - Reference Junction P,wer Connections - Dectrical
Sheet AP
9520 B-2 $8LOCA Test - Flometers - ElectricalSheet AQ
9520 B-5 S8LOCA Test - 6eneral Instrumentation - DectricalSheetAR
9520 B-3 S8LOCA Test - Heated RTD Connections - DectricalSheetAS
9520 B-1 SBLOCA Test - 120 V AC Outlets - DectricalSheet AT
9520 B-1 SBLOCA Test - Annunciator - ElectricalSheet (U
9520 B-2 SBLOCA Test - Annunciator - DectricalSheetAV
(p
A-13
-. . _. . - - -
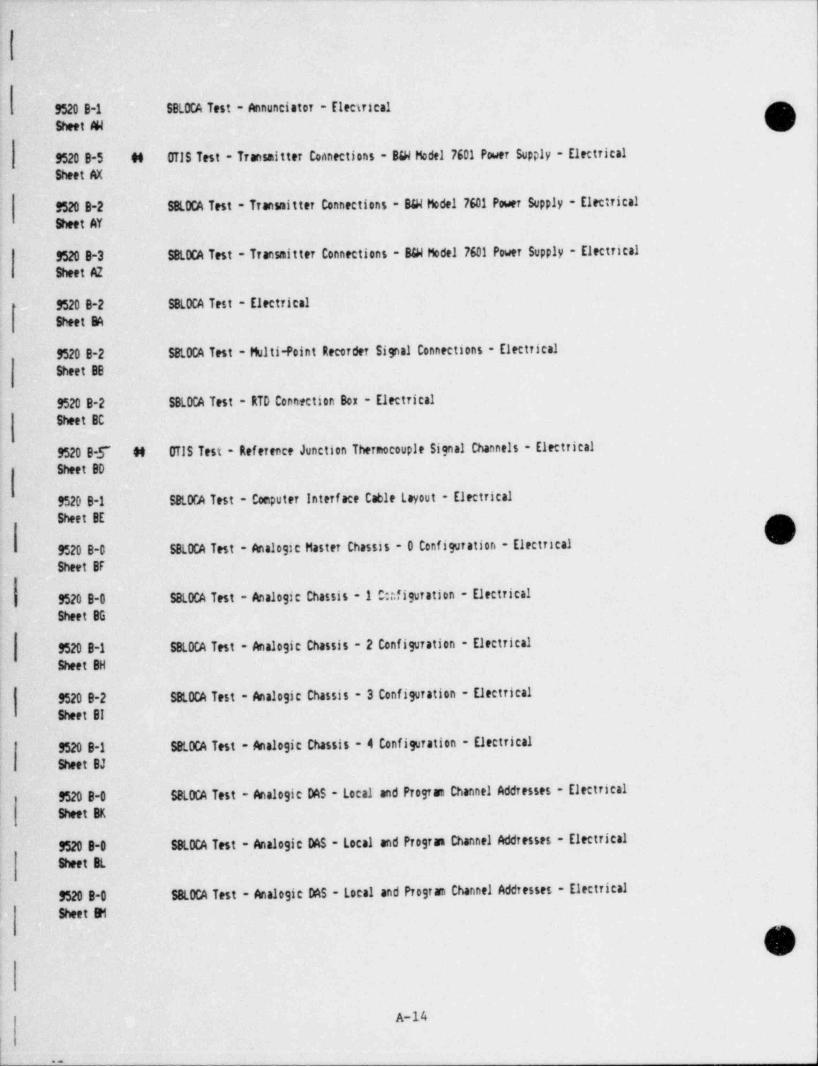
t
9520 B-1 SBLOCA Test - Annunciator - ElectricalSheet #1
9520 B-5 M OTIS Test - Transmitter Connections - BGl Model 7601 Power Supply - Dectrical
Sheet AX
9520 B-2 SBLOCA Test - Transmitter Connections - BGi Model 7601 Power Supply - Electrical
SheetAY
9520 B-3 SBLOCA Test - Transmitter Connections - Bei Model 7601 Power Supply - Dectrical
Sheet AZ
9520 B-2 SBLOCA Test - ElectricalSheet BA
9520 B-2 SBLOCA Test - Multi-Point Recorder Signal Connections - Dectrical
Sheet BB
9520 B-2 SBLOCA Test - RTD Connection Box - Electrical
Sheet BC
9520B.T M OTIS Test - Reference Junction Thermocouple Signal Channels - Electrical
Sheet BD
9520 B-1 SBLOCA Test - Computer Interf ace Cable Layout - Dectrical
Sheet BE
9520 B-D SBLOCA Test - Analogic Master Chassis - 0 Configuration - Electrical
Sheet BF
9520 B-0 SBLOCA Test - Analogic Chassis - 1 C:rfiguration - Dectrical
Sheet BG
9520 B-1 SBLOCA Test - Analogic Chassis - 2 Configuration - Dectrical
Sheet BH
9520 B-2 SBLOCA Test - Analogic Chassis - 3 Configuration - Dectrical
SheetBI
9520 B-1 SBLOCA Test - Analogic Chassis - 4 Configuration - Dectrical
Sheet BJ
9520 B-0 SBLOCA Test - Analogic DAS - Local and Program Channel Addresses - Dectrical
Sheet BK
$520 B-0 SBLOCA Test - Analogie DAS - Local and Program Channel Addresses - Dectrical
Sheet BL
9520 B-0 SBLOCA Test - Analogic DAS - Local and Progra Channel Addresses - Electrical
Sheet Ri
O
A-14
..

9520 B-0 SBLOCA Test - Analogic DAS - Local and Progra channel Addresses - Electricalet 94
9520 B-0 SBLOCA Test - Analogic DAS - Local and Progra Channel Addresses - ElectricalSheet 90
9520 B-0 SBLOCA Test - Analogic DAS - Local and Prosta Channel Addresses (Future) - Electrical
Sheet BP
$520 B-0 SBLOCA Test - Analogic DAS - Local and Progra Channel Adcresses (Future) - Electrical
Sheet 90
9520 B-0 SBLOCA Test - Patch Panel Connections - ElectricalSheet BR
9520 B-0 SBLOCA Test - Patch Panel Connections - ElectricalSheet BS
9520 B-1 SBLOCA Test - Patch Panel Connections - ElectricalSheet BT
9520 B-1 SBLOCA Test - Patch Panel Connections - ElectricalSheet BU
-
9520 B-1 SBLOCA Test - Patch Panel Connections - ElectricalSheet BV
,
B SBLOCA Test - Patch Panel Connections - Electrical
9520 B-1 SBLOCA Test - Patch Panel Connections - Eltetrical
| Sheet BX
9520 B-1 SBLCCA Test - Patch Panel Connections - ElectricalSheet BY
9520 B-2 SBLOCA Test - Patch Panel Connections - ElectricalSheet BZ
9520 B-4 SBLOCA Test - Patch Panel Connections - ElectricalSheet CA
*
9520 B-1 SBLOCA Test - Patch Panel Connections - ElectricalSheet CB
9520 B-2 SBLOCA Test - Patch Panel Connections - ElectricalSheet CC
9520 B-1 SBLOCA Test - Patch Panel Connections - ElectricalSheet CD
m
v,
i
i A-15i
_ , _ - . . . - . . . . . _ _ . . . _ _ - . , . . . - . _ _ ..

)I
'
\
!9520 B-3 SBLOCA Test - Patch Panel Connections - ElectricalSheetCE |
1
9520 B-1 S8LOCA Test - Patch Panel Connections - Electrical l
SheetCF |1
9520 B-2 SBLOCA Test - Patch Panel Cennections - ElectricalSheet C6
9520 B-1 S8LOCA Test - Patch Panel Connections - Electrical i
SheetCH
9520 0 2 SBLOCA Test - Patch Panel Connections - Electricall
Sheet Cl
9520 B-1 SBLOCA Test - Patch Panel Connections - ElectricalSheet CJ
9520 B-0 $8LOCA Test - Patch Panel Connections - ElectricalSheet CK
9520 B-1 $8t0CA Test - Gas S uple: Hot Leg (U-Bend) Controls - ElectricalSheet CL
9520 B-2 M OTIS Test - 6as Saple: Het Leg (Main) Controls - ElectricalSheetCM
9520 B-1 SBLOCA Test - 6as Seple: Stem 6en. Prir.. Outlet Controls - ElectricalSheet (H
9520 B-2 M OTIS Test - 6as Seple: Reactor Vessel Controls - ElectricalSheet C0
9520 B-3 M OTIS Test - 2-Phase Vent System Centrols - Electrical
SheetCP
9520 B-4 $8LOCA Test - 2-Phase Vent System Controls - Electrical,
Sheet CQ|
9520 B-4 S8LOCA Test - 2-Phase Vent System Controls - Electrical
Sheet CR
9520 B-3 S8LOCA Test - 2-Phase Vent System
Sheet CS
9520 B-2 SBLOCA Test - 6as Addition Systee - Electrical
Sheet CT
9520 B-2 $8LOCA Test - Bas Addition System Valve Switch Connections - Electrical
Sheet CU
O
A-16
i -.

|
M20 B-4 M OTIS Test - 1-Phase Vent Systee - ElectricaltCV
9520B-(- M OTIS Test - 1-Phase Vent System Valve Switch Connections - ElectricalSheet 04
1
9520B-3 M UTIS Test - Vent and Spray valves - Electrical l
SheetCX
9520 B-2 M OTIS Test - Digital input Chart - Electrical |SheetCY
9520 B-6 M OTIS Test - Digital input Chart - ElectricalSheet CZ
9520 B 3 M UTIS Test - Wire Number Listing - ElectricalSheet DA
9520 B-7 M OTIS lest - Wire Number Listing - ElectricalSheet DB
9520 B-0 Number List'ing - S8LOCA - Electrical
Sheet DC
9520 B-1 Cable Number Listing - SBLOCA - Electrical
Sheet DD
20 B-4 M Cable Number Listing - OTIS - Electrical'
Sheet DE
(1 of 2)
9520 B-1 M OTIS Test - Cable Number Listing - DietricalSheet DE
(2of2)
9520 B-0 S8LOCA Test - Conductivity Probe Connections
F SheetDF
9520 B-0 S8LOCA Test - Conductivity Probe Connections
Sheet DG
9520 B-0 SBLOCA Test - Conductivity Level Probe Connections - Electrical
Sheet DH
! 9520 B-0 M OTIS Test - Reactor Vessel Guard Heater Controllers - Electrical! Sheet 01
9520B-1 M OTIS Test - Heater Power Control Reactor Vessel & Surge Line - Electrical-
SheetDJ
| 9520 B-0 # OTIS Test - Reactor Vessel & Surge Line Guard Heater Controls - Electrical
9520Bl M OTIS Test - 1 Phase Vent Systen Valve Switch Connections - ElectricalSheet DL
A-17
, ~ - , - _ _ _ _ _ _ _ - - _ - - __ _ _ _ _ - - _ _ ._ _. - -

|'
9'
,
I
,
|
\
Appendix B
Instrumentation and Valve Designation
- 01
'
l.I'
,
/
O,
i

_
\
The instrumentation and valves in OTIS are identified by a six or seven,r]- (./ character string. The first two letters identify the system of which the
j instrument or valve is a part, the second two letters identify the instrument orvalve type, and the last two or three numbers are a unique number for theparticular instrument or valve. Numbert. between 01 and 99 are used to identify" test data instruments". Three digit numbers,100 or greater, are used toidentify " loop operation instruments". For example, SSDP02 stands for Steam
Generator S_econdary (SS), Differential Pressure (DP), instrument 02. RVCV03stands for Reactor Vessel (RV) Control Valve (CV), number 03. A complete listing
of the abbreviations used are contained in Tables B-1 and B-2.
[
GI O
,
|?| |
'
! o|
;
B-1
. _ . - - --. . . _ . . - - - - - . - _ . . . . . .- - - - - . - - - , . .
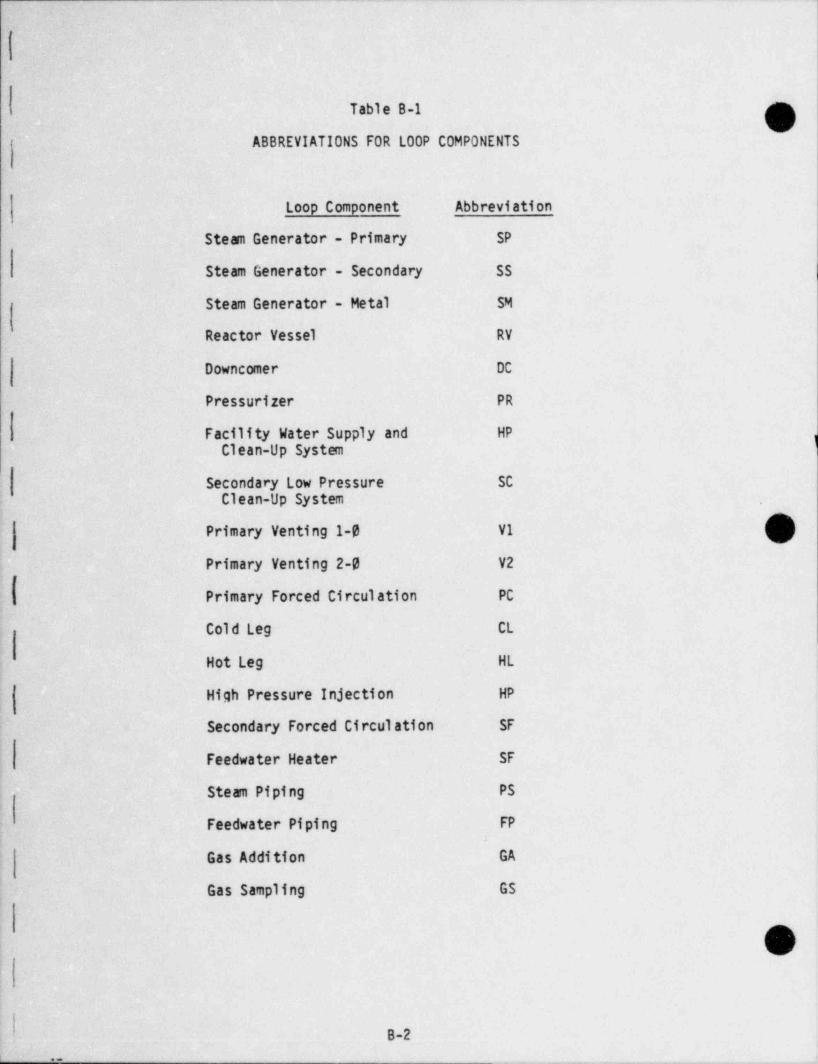
Table B-1I
ABBREVIATIONS FOR LOOP COMPONENTS
Loop Component Abbreviation
Steam Generator - Primary SP
Steam Generator - Secondary SS |
Steam Generator - Metal SM
Reactor Vessel RV
- Downcomer DC
Pressurizer PR
Facility Water Supply and HP
Clean-Up System 5
Secondary Low Pressure SC
Clean-Up System
Primary Venting 1-0 V1
Primary Venting 2-0 V2
Primary Forced Circulation PC
Cold Leg CL
Hot Leg HL
High Pressure Injection HP
Secondary Forced Circulation SF
Feedwater Heater SF
Steam Piping PS
Feedwater Piping FP
Gas Addition GA
Gas Sampling GS
O
B-2e m.
_ . _ _ _ __

. -_ -
Table B-2
ABBREVIATION FOR INSTRUMENTS AND YALVES
. Instrument or Hardware Abbreviation
Themocouple TC
Resistance Temperature Detector RT
Differential Temperature DTt
? Themometer TH
Pressure PR
Differential Pressure DP
Flow Rator FR
Turbine Heter TM
Orifice OR
''
- Conductivity Probe CP
Watt Meter WM
Control Valve CV
Hand Yalve HV'
Safety Valve SV
Limit Switch LS. .
Accumulating F1ow Meter AC
0xygen Monitor OX
O,
B-3. - - - - _ _ - _ . - . . . _ . . - _ . - _ , _ - . . _ . . . . - - . . _ - - - _ . - . - . . _ - . ._

O
:
|
6
Appendix C
OTIS Instruraent List
O
O,
_ , - , . _ . . . _ ...--- ,_ __,-,-._,._____.--,-...-.,n...-,. ,_ . - . _ . - ._, ..,_...- , . _ , . . _ _... -.

_ INSTDUMENT LIST ******
__
TODAYS DATE: 16-JULY-94
- - - - - -. . . _ . -
COMPONENT: STEAM GENERATOR
REFEREh CE D R AWINGS: 9 52 7 E 4,9 5 4B E4,9 553 E4,9 587 CO
INSTRUMFNT IDENT ELEV ATION REL ATIVE TO SF LTS CO W.U E N T
(RVSD) (NEW) PROP 0 FED (1) DE SI GhE D INSTALLED
S FP901 5 3 '-1 -1/ 2" 53*-1 3/4" 9553E4- S FRT 01 53'-1" 53'-2 1/2" 53*-1 3/4" 9 553 E 4S PRT02 53'-1" 53'-1 1/2" 53'-3/4" 9 553E4SSTC25 49'-10" 4 9 *-9 " 49*-9 1/2"
03/23/83 SPTC01 47'-1/4" THE INSTALLED ELEVATI]NS STC23 47'-o" 47'-0" 47'-1/4" F0F ALL SMTC & SFTC'SS STC24 4 7 '-0 " 47*-0" 47'-1/4" WAS DETEE"INED FFOMSSTC21 44'-2" 44'-2" 44'-2 1/4" PEh?Th ATION "E ASURE"ENTS,
23/83 SSTC22 44' 7" 44'-2" 44'-2 " MI5US 3" BASED ON DR AWTNG' SMTC06 44'-2" 44*-2" 44'-2 1/2" r.L-13 6 6 4 9-6
S STC19 41*-2" 41 '-3 " 41'-3"SSTC20 41'-2" 41 '-3 " 41'-3"SFTCO2 38'-2"S STC17 38'-?" 3 9 '-2 " 38'-2"S STC19 38"-2" 38'-2" 38'-2"S MICOS 3 8 '- 2 " 38*-2" 38'-2"SPTCO3 35'-3 3/4"S STC15 3 5 '- 5 " 3 5 '-4 " 35'-4"S STC16 35' E" 35'-4" 35'-4"S STC11 29*-?" 2 9 *-3 " 29'-2 3/4"S STC12 29'-2" 29'-3" 29'-2 3/4"SFTC03 2 9 '- 2 " 2 9 '-3 " 29'-3"SSTC09 25'-4" 26'-4" 26'-3 1/2"
|
S SIC 10 - 25'-4" 2 6 '-4 " -- 26*-3 1/2" -
|| SMTCO2 25'-4" 26'-4" 26'-3 1/2"SSTCOB 23'-2" 23'-2" 23'-1 1/2",i
| S STC07 20'-2" 20'-2" 20'-1 1/2" -
SNTC01 20'-2" 20'-2" 20'-1 1/2"S PTC04 17 '-4 " 17'-3 1/2"
-S STC06 17'-4" 17 '-4 " - - 17 '-3 1/2" --S STC05 14'-2" 14'-2" 14'-1 1/2"SSTC04 11'-1" 11'-1" 11'-3/4"73
'( i S PTCOS 8'-1" 8 '- 7 / 8 " ---'
| kJ S STCO3 8 '- 1 " 8'-1" 9 '- 7 / 8 "| S STCO2 4 '-11" 4 '-11 " 4'-10 7/8"
S STC01 l'-6" 1*-6" l'-6"S FRT03 -2'-1" - 2 '-9 1/ 4" -2'-9 3/4" 9542E5
, _
C-1

SPRT04 -2*=2" -2 *-11 1/ 4" -2 *-11 1/4" 9542E5SPPT01 -24" 9527E4 PTe3 (DN N0Z)
01/30/84 SPTC16 - - - - - -- - 0 . 5 " - -- 9 527 E4 (ON NOZ TC)SPPT02 -24" 9527E4 PT#1 (OFF NOZ)
01/30/84 SPTC18 -0.5" 9 527 E 4 (OFF NOZ TC)-- SPPT03 -24" 9 527 E4 PT#2 (OPP N32)
01/30/84 S PTC17 -0.5" 9 527E 4 (OPP NO2 TC)SPTC06 23'-1-3/8" 9 587 C O ,9 527 E 4
.
-- SPTC07 30'-1-3/8" SPTC06 TO SPTC15SPTCOB 35'-1-3/8" IN "NW" TUPE(PLANT "SW")SPTC09 39'-1-3/8" M.1 TC "0N N0ZZLE"
--- S PTC10 43'-1-3/6" C5 GORCON TCf 3SPTC11 4 7 '-1 -3 / 8" .
SPTC12 49'-1-3/8" -
SPTC13 5 0 '-1 -3 / 8"SPTC14 5 0 '-7 -3 / 8"SPTC15 51'-1-3/8"S SCP14 21'-1" 21'-1/2" 9548E4 REF P:0FES SCP01 35'-5" 3 5 '-7 " 35'-6 1/2" 9549E4SSCP02 34*-6" 3 4 '-6 " 34'-5 1/2"SSCP03 3 4 '- 0 " 34'-0" 33'-11 1/2"SSCPO4 33'-6" 33'-6" 33'-5 1/2"S SCP05 3 3 '- 0 " 3 3 '-0 " 32*-11 1/2"SSCP06 32'-8" 32 * -7 " 32'-6 1/2"S SCP07 32*-0" 32*-0" 31'-11 1/2"S SCP08 31' '" 31*-6" 31'-5 1/2"S SCP09 31 '- 0 " 31'-0" 30'-11 3/4"S SCP10 30*-6" 30 '-6 " 30*-5 1/2"SSCP11 30'-0" 30'-0" 29'-11 1/2"S SCP12 29'-6" 2 9 '-6 " 29'-5 3/4"S SCP13 2 9 '- 0 " 29'-0" 28'-11 1/2"S SDP01 32'-0" 32*-3 3/4" P.EF0VEC SSTC14SSDP01 00*-0" 0*-0" SFLTSS SDP02 51 '-7 -1/ 4" 51'-4" STEAM LINES SDP02 00'-0" 0'-0" SFLTSS SDP03 35'-4" 35'-3 3/4"S SDP03 2 3 '-2 " 23'-1 1/2" 9548E4S SDPO4 3 5 '-4 " 35'-3 3/4"S SDPO4 32'-0" 32'-3 3/4"SSDP05 32'-0" 32'-3 3/4"S SDP05 2 9 '-3 " 29'-2 1/2" 9548E4S PDP01 53'-1-1/2" 52*-11 3/4" 9553E4 SG INLET
03/23/83 S PDP01 -2 '-9 -1/ 4" -2'-9 1/4" 9542E3 SG OUTLETS SDP100 SG LEVEL IN-CONTROL R009
'03/31/03 S S D P 0 2 -- --- - - -- -- - --- -- 51 '-3 " HOT DIRENSION ETkN TAPS@ SSTC01:501.4F
SSTC25=508.9F
03/31/83 S PDP01 --- -- ---- - --- 55'-10 1/2" HOT DIFENSION ETFN TAPSS SPRT01:510.5F
SPPT03:500.2F. . . . . _ . . . _ . . __ _.. . . _ _ . . .
m .emw6m -
O.. . .
C-2
- _ . . _

C MPONENT: REACTOR VESSEL --
N ERENCE DRAKINGS: 950 5 E6,95 06 E6,9 510 E2. _ . .
IN STRUMEN T IDENT ELEV ATION REL ATIVE TO SF LTS COM u EN T
(RVSD) (NEW) P ROP OS ED DESIGNED INSTALLED. - - . - . . . . . . . -
RVTC01 -23'-8" -23 '- 9 3 /4" -23 *-8 3 / 4" FLUID, BOTTOM PIPE- --- RVTCO2 -19'-2" -19'-1" -19 *-1 1/2" FLUID
R Vkv01RVTC03 -15'-6" -16'- 3/8" -16'-1/2" SFIh
04/05/83 RVTC100 - 14 '- 6" HE ATEF TCRVTC103 -14'-4" -13 '-11 5/ 8"-13 '-11 3/ 4"H I SF I A TEMF (K A S RVT C0 4)
04/05/83 RVTC101 - 12 '- 2" HEATER TCRVTC05 -12*-10" -11'-10 7/8"-11'-11" SKINRVTC06 -11'-2" -9 '-10 1/3 " -9 *-10 1/4" S KINRVTC102 - 8 ' -7 1/2" -8'-8" HI FLUID TEu?RVTC07 -8'-10" -8*-3 1/2" -d'-3 7/6" FLUIDRVTC10 0'-8" 0*-7 1/2" 9552D1 RVVV LINE,0C SInF
R VTC09 0 *-10 " O'-7 1/2" 9552D1 RVVV LINE,RV SIDE
RVTC104 HEATEP TCR VTC105 HE ATER TCRVTC106 HEATER TCRVTC107 HEATEh TCR VTC108 -23 '-5-1/4" FLUID,TCP CRCSF0VEF PIPE
(~' R VPP01 7 '- 2 " 7'-1 3/8" 7'-5/8"(s,$/ RVTCOB 7'-2" 6'-10 3/8" 6'-9 3/4" FLUID
RVCP02 -2' 4" - 2 '-5 " -2'-5" RV-ELR VCP01 -l'-6" -1 '-4 e / 8" -1'-5" PV-HLRVCPO4 0'-6 19/32" O'-6 5/8" RVVV
RVCP03 0*-7 29/32" O'-8" RVVV
RVCP05 -9 '-1 1/ 2" -8'-11" 9506E6 REF P9095R VDP01 7 '- 5 /6" 7'-5/8" RV TOPR VDP01 - l '-1 1" -1'-11" RV-HLRVDP02 -1'-11" -l'-11" RV-HLRVDP02 -8*-1/2" -8'-3/4" COFE TCPRVDP03 0*-7 1/4" 0*-7 1/2" RVVV
RVDP03 0'-7 1/4" O'-7 1/2" RVVV
R VDPO4 -8 '-1/2 " -8'-3/4" COPE TCP
RVDPO4 -16"-1/2" -16 '- 3 / 4" C OPE PCTTou.
RVDPOS 7'-5/8" 7' 5/8" RV TDFRVDP05 -16'-1/2" -16'-3/4" CORE BOTTOM
RVLS01 RVVV LIMIT SKITCFRVRF01 3'-11 3/4" 3*-11 1/2" SVID HTP VOLTAGER VRT01 3'-11 3/4" 3'-11 1/2" SWID PEF FTDRVLS02 3'-11 3/4" 3'-11 1/2" SWID S/W INDRVLS03 3'-11 3/4" 3'-11 1/2" SWID F AILURE IND
- -RVHR01 -- 3'-11 3/4" 3'-11 1/2" H RTD -DT- --R VHR02 -17 '-5 1/2" STD HRTD DTRVRF02 - 17 '- 5 1/2" STD HTR VOLTAGE
r3 RVRT02 -17'-5 1/2" STD REF PTD! ! RVLSO4 -17'-5 1/2" STD S/h IND'
'' R VLS05 -17 '-5 1/2" STD F AILURE IND
c-3,
* * --

(I R VRT03 -17'-5 1/2" STD SAT TEMP
R VPR100 RV PRESSURE-CONTFDL E00"03/23/83 R VLS06 -- ----- ---- RVVV CLOSED INDICATIO403/31/83 R VDP05 23'-2 7/16" HOT DIPENSION ETVN T AF
@ DCRT01:497.6F--- -- R VT C07 : 515. 2F
RVTC09=479.IF04/13/84 R VD701 -4.0" D AT A
04/13/84 -R VDT101 -4.0" LOGP-
04/13/84 RVDT02 4*-103 DATA04/13/84 R VDT102 4'-10" L OCP
04/13/84 R VTC11 -4.0" METAL (9506E6)04/13/84 RVTC12 4'-10" METAL (9506E6)
' '
COMPONENT: PRESSURIZER ANJ SURGE LINE
REFERENCE D R AWINGS: 9 518 E2,95 49D 4
INSTRUMENT TDENT ELFVATION REL ATIVE TO SF LTS COMMENT(RVSD) (NEW) P 90POS ED DESIGNED INSTALLED
PFTC101 7'-11 1/2" 7'-11 1/2" SYINPFTC100 9'-7 1/4" 9 '-7 1/ 4" HI FLUID TEMPPFDT01 12'-2 3/4" DATAPRDT101 12'-3 3/4" LOCPPPTC01 11'-0" 21*-10 3/4" 21'-10 1/2" FLUIDPPTC04 11'-0" 17'-5 1/2" 17 '-11 1/2" SKINPRDT02 27'-1 3/4" DATAP RDT102 27'-1 3/4" LOCPP RTCO2 23'-6" 34'-2 1/4" 34*-2" FLUIDPRTC05 23'-6" 36'-5 1/2" 36'-9 1/2" SFINPETC102 26'-11 1/2" 27'-1 3/4" SKIN (FECORDER)PRDT03 42*-9" DATA (EEFORE 4/3/64 ONLY)PRDT103 42'-9" LOOPPPTC03 42'-10" 46'-5 3/4" 46'-5 3/4" FLUIDPETC06 42'-10" 45'-11 1/2" 46'-5 3/4" SKINPRPR01 46'-10" 40'-5 3/4" 40'-5 3/4"PRDP01 46'-10" 40'-5 3/4" 40'-5 3/4" TOP OF PPPRDP01 2'-5 1/2" 2'-5 3/4" 9549D4 SUPGE LINEP RHP 01 21'-4 3/4" 21'-5 1/2" SWID DTP P RF01 - - - -- - - -- -- 21'-5 1/2" SWID HTR VOLTAGE
| PRRT01 21'-5 1/2" SWID REF PTD,
P RLS01 21'-5 1/2" SWID S/h IND-- PRLS02 -- - - - - - - -- 21*-5 1/2" SWID F AILURE IND
PRPR100 PRESSURIZER FRES. CONTFDL01/30/84 PFDT04 3'-1 1/4" SUFGE LINE DT (DATA)01/30/84 - P RDT104 - - - - - - - -- 3 '- 1 1/ 4" SUFGE -LINE D T (LCOP)04/05/83 PPTC07 2'-6 3/8" S KIN, D AT A
03/31/83 PRDP01 38'-1 1/8" HOT DIPENSION PTVN TAPS- 0 PRTC01:58E.7F
hPRTCO3:586.0F04/13/84 PRTC08 12'-2 3/4" METAL
04/13/84 PPTC09 - -- 27'-1 3/4" METAL
04/13/84 PFTC10 42'-9" METAL04/13/84 PFTC11 3'-1" METAL (SURGE LINE)
. . . _-
-
_ _ _ _ _ _ _ . _ _ . _ _ _ _ _ .

P~70NENT: HPI AND FLPCUS -- - - -
- (.)'
INSTRUMENT IDENT ELEVATION RELATIVE TO SF LTS COM W.EN T --
(RVSD) (NEW) PROPOSED DESIGNED INSTALLED
RPPR101 - - - - - - - - - -
HPPR100HPTH100
- - - - - H PCP100H FCP101HPPS100HPPR105HPPR105H PPR107HPPR108 - -- - --
H PTM01HPTC01 FLUID TEMPHPTC101 - - - - ELLIOT TANKHPTC102 DEAERATORHPTM02HPTM03H PTH101H PPP102H PPR103HPTC100r ,c3H P AC100
1(-
H PPP134HPAC01 TOTALING FLOF
COMPONENT: PRIMARY CIRCUL ATION LGOP
REFERENC3 D R AWING: 9542E5
INSTRUMENT IDENT ELEV ATI ON REL ATIVE TO SF LTS COMVENT(RVSD) (NEh) PROPOSFD DESIGNED INSTALLED
,
P CTC100 -78" UPSTRM PUMPi PCTC101 -58 3/4" DWNSTPP. PUMP
. - - - P CTC10 2 -- - -- - - - - - - - - - - - - - - - - - - - -COCLING h ATER OUTLETP CDP 100P CGR100P CPR10 2 - - -- -- - - - - - - --
P CDP 101PCPS100
,
' - - P CP R 10 0 - - -- -78" - UPSTRM PUMP -
! PCPR100
( C)PCPR101 -98 3/4" DWNSTRP. PUMP
{|
. - - - - . . . . .
-. - - - .

COMPONENT: COLD LEG PIPING
REFERENCE DR AWING: 95 42 E 5,954 3D 2,95 443 2,10697 CO ,10706D 0
INSTRUMENT IDENT ELEV ATION REL ATIVE TO SF LTS COM M EN T --
'(RVSD) (NEh) P ROP OS ED DESIGNED INSTALLED'
6/8/84 CLTC01 -4'-10" - 4 '-9 " -4'-8 5/8" FLUIDCLTCO2 -4'-10" -4*-E" -4'-6" FLUID
- CLUS01 -1'-10" - 4 '-3 /4"CLTC03 -0*-10" -O'-3 1/2" -O'-1 3/4" FLUIDCLTC04 1 '- 10 ' l'-9" l'-9" FLUIDC LTC05 -O'-6" -O'-6" - -O'-5 3/4" FLUIDCLDP01 2'-7 5/16" 2 '-7 3 / 4" CL-50
I CLDP01 - 8 '-3 " -8'-3" DC
l. 6/ 8/84 CLDP02 -5'-4 1/2" -5'-4 1/2" CLC LO RANGE (UPPEF TAD)
6/ 8/84 CLDP02 -5'-7 1/16" -5'-7 1/16" CLC LO FANGE (LOkER TAP)CLDP03 2'-7 5/16" 2'-7 3/4" CL-SO
6/ 8/84 C LDP03 -- -4 '-5 3 / 8" -4*-5 3/8" CL US LOWER DRAIN
04/05/83 CLDPO4 -5'-4 1/2" -5'-4 1/2" CLC HI RANGE (UPFER TAP)
04/05/83 CLDPO4 -5'-7 1/16" -5'-7 1/16" CLG HI R ANGE (L0kER T AP)CLLS101 - CLCV01 OPEN
CLLS102 CLCV01 MAXD CTC01 -3'-7" - 3 '-3 " -3'-3" FLUIDD CTCO2 -10*-0" - 9 '- 9 " -10*-0" FLUIDD CRT01 -20'- 1/4" -2 0 *- 0 "
05/09/83 D CDP 01 -2 0 *- 91/ 2" -12*-8" RV DC VENTURI LO RANGr
05/09/83 D CDP 01 -2 0 '- 11 1/ 2"-13 '-2" RV DC VENTURT LO FENG:D CDP 02 -8 -3" -8'-3" DC
DCDP 02 -16*-5" -16'-3/4" 9505E6 CORE EDTTCM
05/09/83 DCDP 03 -12 *- 8 " RV DC VENTUDI HI RANGE
05/09/83 D CDP 03 -13'-2" RV DC VENTURI HI RANGE
COMPONENT: SECONDARY LOW P9 ESSURE CLEAN-UP SYSTEM
REFEREN CE D R AWING: 9504E0
INSTRUMENT IDENT ELEVATION REL ATIVE TO SF LTS COMuENT
(RVSD) (NEW) PPOPOSED DESIGNED INSTALLED
S CPP104S CPR105S CFR102S CTS 100S CTC100S CTH102 ---- - - - -- - -
S CFS100S CPR102S CPR103 - -
S CFR101i S CTH100
S CTH101 - - --
|
S CFR100i S CPR100! S CPP101 -
C-6
__

COMPONENT: SINGLE-PHASE VENTING SYSTEM
REN CE D R AWING: 9574 E2,108 57 D O,1066 8C O
INSTRUMENT IDENT ELEVATION REL ATIVE TO SF LTS COMuENT -(RVSD) (NEW) PROPOSED DESIGNED INSTALLED
VITC01 FLUID TEMP DbNSTFu CO3LER01/30/84 VITCO2 CLS LEAK TEv.PEFATUFE01/30/84 VITCO3 CLD LE AK TEMFEF LTUDE
VILS01 RV LOWEP PLENUU LEAK
03/23/83 V1LS03 CLD LE AT
01/30/84 V1LSO4 10 CM2 CLS LEAK SITE01/30/84 VILS05 10 CF2 CLS LEAF SITE01/30/84 V1LS06 15 CM2 CLS LEAF SITE01/30/84 VILS07 -- 15 C42 CLS LEAK SITE*
01/30/84 VILS08 RV TOP PLENUY LE AK SITEVIAC01
_.
COMPONENT: TWO-PHASE VENTING SY ST EM
REFERENCE D F AWING: 9559D o,956 503
g'' "3NSTRUMENT IDENT ELEVATION RELATIVE TO SF LTS COPMENT
' ,jV SD ) (NEn') PRODOSED DESIGNED INST ALLED
V 2TC01 HPV SEFARATOFV 2TCO2 PDFV SEPARATCPV2TC03 NCG TEMP (250 G AL T ANK)V2TC04 SUEGE hATEP TEMPV2DP01 HPV SEFAFATOF 1V2DP02 PDFV SEP AR ATCR 2
03/23/83 V2DP03 19'-11 11/16"0VEFFLOW T ANK 1( SOUTH)03/23/83 V 2DPO4 19'-10 7/16" OVEPFLCW TAN 8 2(f.0?TE)03/23/83 V 2DP05 19'-11 11/16"0VER FLCW T ANK 3( SUPGE)
V 2LS01 HPV
V 2LS02 HPV
V2LS03 PDFV- V2LSO4 -- - - - - POPV
V 2PR01 TWO PHASE VENT SYSTEF PREV2AC01 HPV ACCUM FLOkV2ACO2 PDFV ACCUp FLOW
._ _ . . . . _ . . . _ . . _ _. . . ..
|
j't
I N.,)
c-7!.
. -. _. .- , _ -

&
COMPONENT: HOT. LEG PIPING
REFERENCE D P AWING: 9553E4
INSTRUMEN T IDENT ELEV ATION REL ATIVE TO SF LTS COMWENT(RVSD) (NEW) PROPOSED DESIGNED INSTALLED
. - . . ... . .. _ . . _
HLRT01 0 '- 0 " 0'-0" O'-0"HLCP01 1*-0" l'-0" 1 "- 0"
..- - - -fi L D T 01 4'-0" 2 '- 9" D AT A
H LDT101 2'-9" CONTPOLH LTC01 8 '- 0 " 8'-0" 8'-1" PELO) SURGEHLTCO2 9'-0" 9'-0" 9 '- 1 3 / 4" ABCVE SURGEHLDT02 15'-0" 12'-9" D AT A
H LDT102 12*-9" CONTROLHLCP02 15'-0" 15 '-0 " 15'-0"HLTCO3 20'-0" 20'-0" 19'-11 3/4" FLUIDHLDT03 25'-0" 23*-9" D AT A
HLDTIO3 -- 23'-9" COhTROLH LTC04 30'-0" 30'-0" 29'-11 3/4" FLUIDHLCP03 35'-0" 35'-0" 34'-11 1/2"HLDT04 35'-0" 34'-6" SATAHLDT104 34*-6" CONTPOLHLCPO4 37*-0" 37'-0" 36'-11 3/4"HLCP05 41'-0" 41'-0" 41'-0"HLTC05 40*-0" 40'-0" 39'-11 3/4" FLUIDHLCP06 45'-0" 45'-0" 44'-11 1/2"HLDTOS 45'-0" 46'-3" D AT A
HLDT105 46*-?" C0hTROLHLCP07 49'-0" 4 9 '-0 " 49'-11 1/2"HLCP08 5 3 '-0 " 53'-0" 52'-11 1/2"HLDT06 55'-0" 57 '-3 " DATAHLDT106 57*-3" CONTROLHLCP09 57'-0" 57'-0" 56'-11 1/2"H LCP10 61'-0" 61'-0" 60'-11 1/2"H LTC07 60'-0" 60'-0" 59'-11 1/2" FLUID
,
| HLDT07 65'-o" 65'-0" 65'-11" DATAHLDT107 65'-11" CONTROLHLCP11 65'-0" 6 5 '-0 " 64'-11 1/2"
03/23/83 HLCP12. 67'-R" 67'-6 1/8" 9545DO,
03/23/83 HLTC08 67'-3 1/2" 9545DO, FLUIDHLCP13 65'-0" 65'-0" 64'-11 1/4"H LCP14 61 '- 0 " -61*-0" 60'-11 3/8"!
HLTC09 60'-0" 60'-0" 59 '-11 1/4" FLUIDHLDT08 60'-0" 57'-2" D AT A
ilLDT108 - - 57'-2" CONTROLH LCP15 57'-0" 57'-0" 56'-11 1/4"
03/23/83 HLCP16 53'-1" 53'-2 1/2" 53'-0 3/ 4"|
|i LCP 17 - --- - - - O '- 6 " - - O '-6 1/ 4" R E F- P R GB E --
HLVP01 35'-0" 35'-0" 9545D0H LVP02 67'-6" 954500HLDP01 -1 '-11" -1'-11" 9506E6,PV-HL
03/31/83 HLDP01 67 '-4-3 / 4" 67 '-5 5 /16 " 9 5 45D O,P.LUp (DSTNC PTiTAPS ADDED TO LWP ELV)
i
e
C-8
. ..

HLDP02 - --- - - 1 *-1 1" - - -l'-11" 9 506 E 6,R V-HL
, f""73/83 HLDP02 53'-1-1/2" 53'-1 3/4" SC INLET-l ,31/83 HLDP03. 67'-4-3/4" 67*-5 5/16" 9545DO,HLUB (SAVE AS
- HLDP01-HLUB)HLDP03 53 '-1-1/ 2" 52'-11 3/4" SG INLET
03/23/83 H LHP01 66'-11 3/4" SWID DT" SWID HTR VOLTAGE-- -" HLRF01" SWID REF RTDH LRT02" SWID S/W INDHLLS01" SWID F AILURE IND-- HLLS02
HLPR100 HL PPESSURE(!!LDP01-HIGH)-CONTFCL ROOM
03/31/83 HLDP01 69'-9 3/4" HOT DINENSION ETkN T APS@ HLTC08:513.0F
HLPT01:512.3F03/31/83 HLDP03 14*-5 15/16" HOT DIkENSION BTkN T AFF
@ SFPT01:510.5F04/13/84- HLTC10 34'-6" METAL (DATA)04/13/84 HLTC11 65'-11" METAL (DATA)04/13/E4 HLTC12 2*-8 1/2" METAL (D AT A)
04/13/84 H LTC13 12'-8 1/2" METAL (DATA)04/13/84 H LTC14 23'-8 1/2" METAL (DATA)04/13/84 HLTC15 46'-2 3/8" METAL (D AT A)
04/13/84 HLTC16 57'-2 3/E" METAL (DATA)04/13/84 H LTC17 57'-2 3/8" METAL (D ATA)
I
:
|
;._ .
..
|
,
-h
, -
!;
fC-9
- . .- - . - - - - . - . _ . . - - . - . .-.

COMPONENT: SECOND ARY FORCED CIRCULATION AND FEEDk ATER HE ATERS
REFERENCE D P AWINGs: 9500 F 2,95 02 E3,9 503 E3
INSTRI5 MENT IDENT ELEVATION REL ATIVE TO SF LTS COMMENT
(RVSD) (NEW) P ROP OS ED DESIG NED INSTALLED
SFOR01 LO FL0k- -SFDP01 LO,LO FLCW
SFDP02 HI,LO FLOW
'~SFOR02 HI FLOkS FDP03 LO,HI FLOk
SFDPO4 HI,HI FLOW
SFTM01 LO FLOkSFTu02 HI FLOk
01/30/84 SFLS01 FEED LC FLOF CV01/30/84 SFLS02 FEED HI FLOW CV
S F AM100 SUNDYNE STARTERS F AV101 FW HTR 1SFAM102 FW HTR 2S F AM103 FW HTF 3S F AV104 FW HTR 4SFAM105 Ek HTP 5S FAM106 FW HTR 6SFTC100 S UNDY N E ,
S FTC101 FW HTR(LIMIT)SFTC102 FW HEATER (?ECCFDERSFTC103 FW HTR(CONTPCL)S FTC104 FLUID, HOT WELLSFPR101 DWhSTRF FISHER PY-PAS 3,
CONTROL P00vSFPR102 FEEDWATER HTR-CONTROL
ROCM
SFPR103 HOT WELL-CONTFDL ROOVSFDP101 LEVEL GAGE & CONTE 0L, HOT
WELL-CCNTROL ROO"SFFS100 SUNDYNE CO3 LING kATEFSFHM100S FFD.100 DWNSTRM'SUNDYNF.-CONTFDL
RODY! SFOR100 DWhSTRM SUNDYNE
SFDP100 - - - DWNSTRM SUNDYNE-CONTPOLROOM
SFPS100 FW HTR PERMISSIVE. . ..
f
. - .-
hw-see,. g..,s.
O
C-10
~. _

-_
C3MPONENT: STEAM PIPING
RENCE DRAWINGS: 9 515 F0,9516 E4,9 517 El,.
NSTRUMEN T IDENT ELEVATION RELATIVE TO SF LTS COMMENT-
(RVSD) (NFW) PROPOSED DESIGNED INST ALLED
P SPP100 STM OUTLET-CONTRCL ROOMP SPR01 STM OUTLET (DATA)P STC01 FLUID,UPSTRV 0F PIXERP SRT01 FLUID,0WNSTRV 0F PSTC01P SOR01 LO FLOkP SDP01 LO,LG FLOWP SDP02 HI,LO FLOk<
P SOP 02 HI FLOkP SDP03 -- --- --- - LO,HI FLOWPSDPO4 HI,HI FLOWP STC04 FLUID,LO FLOk SITEP SPR101 - DWNSTRP STM CV CCNT. ROGVP STC101 FLUID,UFSTRM CONDENSERP STC102 FLUID,0WNSTRP CONDEhSEFP STC05 FLUID,HI FLOk SIDEP STC100 STEAV CUTLET (TO FECOPDER)
01/30/84 P SLS01 STEAM LO FLOW CV01/30/64 P SLS02 STEAP HI FLOk CV
rs%.
C3MPONENT: FEEDWATER PIPING
REFEPENCE D R AWING: 9550E0
INSTRUMEN T IDENT ELEVATION REL ATIVE TO SF LTS COMMEN1
(RVSD) (NEW) PROPOSFD DES IG NED INSTALLED
F PRT03 50'-10 3/8" 177FA AFhIFFRT02 5'-11" 205FA AFWIF PRT01 0'-3/8" AFWI AT SFLTS
h FFTC01 DkNSTPP FW HEATEF5
} FPPR100. . . _ . . _ _
* 4 e p W e' -e
M1
m
'
C-ll

COMPONENI: GAS ADDITION SYSTEM
hINSTRUMENT IDENT ELEV ATION REL ATIVE TO SF LTS COMMENT(RVSD) -- (NEW) PROPOSED DESIGNED INSTALLED --
REFERENCE DRAWING: 9583D0
G ATC01GAPR01
- - - -GALS 01 - HLUBG ATCO2 HLUBG ALS02 UPSTRM OTSGGATCO3 - UPSTRM OTSGGALS 03 COLD LEGG ATC04 COLD LEGGALSO4 RV-LPGATC05 RV-LP
__.
C3MPONENT: MISCELLANEOUS
MSRF01 - RTD REFERENCE VOLTAGEM SRF02 STD CELL VOLT AGE-D AS 40h.MSTC01 REFENENCE OVEN TEMPM STCO2 REFEREhCE OVEN TEMP
i M STCO3 ANALOG 1C DAS TEMP
(1) ELEVATIONS TO THE NE AREST INCH
ocoo**************************************************************************The following instruments were used for dimensional inspections duringf acility construction and testing, and are included in this list tocomplete the scone of instrumentation used during the project.
REVISED B&W ID DESCRIPTION
20-JUN-83 -780363 - - -- - - Micrometer, Cutside
20-JUN-93 780364 Micrometer, Cutside
20-JUN-83 610062 Conparator, Cptical-20-JUN-83 750160 Caliper, Verrier20-JUN-83 780355 Caliper, Vernier
___ .. __ . . . _ _ _ _ _ _ . . _ . _ _ _ _ . _ . . _ . _ _ . . .
A
. . .
O
C-12
._. ._. _ __ _ _ _

. . ..
O
Appendix D
VTAB Data Cards - Parameters and Format4
O
!l
!~1
!,
!
O-
-. __ - -_ - - - _ _ _ _ _

VTABLE Structure
The data base for the SBLOCA data acouisition swstem isdesigned so the user can define all parameters needed to coupleeach of the user defined table entries (VTAB's) to the availabicoptions in the data acouisition software. This information isstored on disk in account E201,103 with the file ncoe, VTABLE.DAT.
The VTAB senerailw corresponds to an instrun.ent such as cthermocouple, Pressure transmitter, Conductivitw Probe, etc. However,
the VTAB maw refer to a 'non-instrument entrw' desired bw the user tomore areropriatelv define the output of the instrument. For example,
an orifice used for flow me a su r e merit is monitored bw a differenticiPressure transa.itter that measures the Pressure differential cetossthe orifice. It is necessarv for the data acovisition tuttera tomeasute and record this differential Pressure but it is also convenientfor the osoiator to have an on-line indication of the flow rate bcsedori this measured dif f erential Presture. The SBLOCA data accuisitiorisoftware allows the user to define a second VTAB which contains thenecessarv conversion conttants and reference VTAP's (or instruments)to compute the flow rate through the orifice. This flow rate t e ra s i n sin men. ors uritil the ne;:t data accuisition cycle. Hence, any on-line
calculation for the current data scoussition cucle would have thisflow rate available without the neEd to recomPate the flow. This fiorate is also present in the off-line data base for distribution tousers outside of ARC.
With this intoduction, the followins ortions reouire userinput for each VTAB and are summarized below.
Globel definition to the data acouisition software recardinsthe status of a VTAB, ie., in or out of service, use forloop alarm indications to the operator, or use for controlof the time interval between dets scouisition scans.Identification of a VTAB for alarm monitoring and theParameters ruouired to define the low and high alarm values,arid alarm desdband.
Identification of a VTAB for rate control of the data'
acouisition hardware, ie., based on the rate of chance ofa VTAB raw data signal or engineering value, the time 'ntervalbetween data acouisition scans is either increased ordecreased.
Definition of the ANALOGIC ANDS 5400 'cerd' (analos,counter-timer, or diditol input) and ANALOGIC channelessociated with the VTAB.
O
D-1
. _ _

. . _ -
l'hi i
\_/
Conversion of the raw data signal (voltase, frecuenev,digital input, count, etc.) to the aFFroFriate valuein engineerins format or units. Thi: operation teovires the
followins user defined information*
Calibration constants and material or test loorgeometrv constants needed to perform the raw datasignal to engineerins format conversion.
Reference VTAB's (or instrunient readings in this case)needed to Perform the raw data sisnal to ensineeriorformat conversion.
,
Definition of the ' units descriptor' ( e:: . , DEG F, PSIA, LEM/HR)
associated with the converted ensineerin vclue for each VTAB.
Definition of the number of sisnificant decimc1 Fisce thatwill be associated with the converted r:w data signc1 toengineerins value.
Descrietor associated with each VTAB for user ecse inidentificction of the UTAB.
nt 4
(_/ The followins discussion defines the parameter order and formttfor each of the VTAB date cards. All VTAB's reouire the same F aramEter
. . entries on cards 41 and 42. Cards 43 and 44 a re or-tional de r-E ndiris on; the data reduction twFe needed to convert from the raw input sicnal to
-the engineerins formatted value.
,
i
D-2l. -
l|
|'
t.

r- -
c000000000000o00000000000000000oooooooooooooooooooooooooooooooooooo*******o***++
Card 01 definan the percmater list for global alctming and ratespecifications, set up of the data acquisition system prior to a date .
scan, definition of the data reduction routine, and VTAB units anddescriptor. ;
000e*..**........*........*.....................*..**.*...*.....................coo CARD #1 *** FORMAT (2X,3A2,1X,913,4X,40A1) ;
*********** CARD COLUMN AND ENTRIES ********** !
1 2 3 4 5 6 7 8 j
12345678901234567890123456789012345678901234567890123456789012345678901234567890A1A2A3 BBBCCCDDDEEEFFFGGGHHHIIIJJJ KKKKKKKKKKKKKKKKKKKKKKKKKKKKKKKKKKKKKKKKk ;
'CARD SOFTWAREENTRY PARAMETER DESCRIPTOR VALUE(S) FORMAT
******* ********* ************************ **************** ***++***
A1A2A3 VTAB Name of VTABLE.DAT entry A1 - Subsystem A2(Instrument or " dummy" A2 - Instrument A2name) A3 - Number A2
BBB KEYS Read, Rate, Alarm, and 13Ref Channel Code Wcrd VALUE PARAM O/1
1 VREAD Read /No Read 1
2 AWORD Alarm Out/In!4 RWORD Rate Out/In
8 VREF None/Ref VTABBBB = Summation of CVALUE*(O or 1)] '
CCC ALARMW Alarm Code Word 13VALUE PARAM O/1
1 AVTAB No Alarm /Yes2 ADEAD Delta /%Deadband4 ALSTAT No/Yes Alarm
State(User Should Set This tc'
O Initially -- Systemi Will Then Modify)'
8 ALVTAB Lo/Hi AlarmState
| |
CCC = Summation of CVALUE*(O or 1)]
| DDD RATEW Rate Option Code I3
Word VALUE PARAM O/11 RVTAB No/Yes Rate
Change2 RDUM **Not Used**4 RVOLTS Not Used/Eng
Units8 RLIMIT Limit / Rate of
Change
DDD = Summation of CVALUE*(O or 1)3|
|| EEE REDUC Reduction Equation I
TYPE DESCRIPTION1 Engineering Value = Raw
*1"'D-3!
|'
1,

.
Pcge 4
2 RTDl3 C1+C2a(V-VV)+C3e(V-VV)**2
4 C1+C2*V+...+C5*V**45 Type J TC
[ ') 6-8 Not Used\- 9 Uncalibtsted 100 chm
Platinum RTD10-20 Not Used
21 Turbine Flow Meter22 DP Transmitter (W/O H2O
Correction)23 Orifice Flow Meter With
Flange or Corner Taps24 DP From TYPE 22 to Actual
(H2O & Thermal ExpansionCorrected)
And Vertical OrificeDP in Upflow and Downflow
25 Correct Pressure Trans-mitter Reading to UpperTap
26 Not Used27 Volume of Gas Discharged
into the Two-PhaseVenting System
28 Composite Steam Flow Ratein GERDA Steam Circuit
29 Composite Feed Flow Ratein GERDA Feed Circuit
30 Pressurizer Collapsedf'"N Water Level'j-
I- 31 OTSG Primary CollapsedWater Level
32 OTSG Secondary Collapsed
I Water Level|
33 Hot Leg Collapsed WaterLevel
34 Hot Leg Stub CollapsedWater Level
35 Reactor Vessel CollapsedWater Level
36 OTSG Secondary Wetted CP37 Hot Leg Stub Wetted CP38 Hot Leg Wetted CP39 Reactor Vessel Wetted CP40 Feedwater Temperature41 RVVV Mass Flow Rate42 HPV & PORV Composite Mass
Flow Rate43 Single Phase Leak Mass
Flow Rate44 Pitot Tube Mass Flow Rate45 RV Downcomer Composite
Venturi Mass Flow Rate46 Cold Leg Orifice Composite
O Mass Flow Rate47 Not Used48 Integrate Turbine Meter
Flow Rate with Time toGet Accumulated Total
D-4 49 RVVV Limit Switch (Open,
- - . - --

7
Pege 5
Naither, Closed)50 Cold Log Co11cpsed Water
Level51 RV Downtomer Collapsed
Water Level52 Cold Leg Orifice Mass F >
Rate w/ Level t-: Sat Checks** Called from Type 23 **
53 RV Downtomer Venturi MassFlow Ratee
}** Called from Type 23 **
54 Saturation temperaturefrom pressure
55 Auctioneered cold legsuction leak for OTIS
FFF DEC # of Significant 13Digits After theDecimal Places in theConverted ENG Value
GGG UNIT CODE FOR UNITS CODd UNITS 131 Volts2 Deg F3 PSIA4 PSIG5 GPM6 LBM/HR7 PSI8 KWATT9 BTU /HR
10 DRY / WET11 OPN/CL12 LBM13 FT14 SCF15 GAL
I3HHH CHAN Analogic Channel
13III GAIN Gain Code Word
For ANALOGIC Cards GAIN DESCRIPTIONI O " DUMMY" Channel--Not
Instrument VTAB| Or Accumulating Flow Meter|
1 Gain of 1 for ADTYPE's 1-3" " "
2 Gain of 2" " "
4 Gain of 4" " "
8 Gain of 8# # = Bit for Digital Input
Card (1-16, 16 bit)## ## = Gate Time for Frequencs
Input## GATE TIME (SEC)
4 6005 36006 607 100E 109 1
10 0. 1D-5

- A . . . . .
IPage 6!
11 0.01 i
12 0.001 l
13 0.0001 )/~' 14 0.00001
~
bg 15 O.000001 |l
JJJ ADTYPE ANALOGIC Card Type 13CODE CARD
0 " DUMMY" Channel1 Analog +/- 40 mv2 Analog +/- 1.25 v3 Analog +/- 10.0 v4 Digital Input5 Counter6 Frequency
KKK..KKK DESCR VTAB Descriptor 40A1-
000 END CARD #1 ***ooooo*************************************************************************++0o0o0*******************************************##*#***##***********************
(_\i
/
.
O
D-6.-. -.. . - . . . . - - , . . - . - ._...- ,.. - - - . . . . . . . - . . . ... -.- __ - .-

Page 7
Data input to card #2 is specific to the data reduction typecode, REDUC, defined above. The input parameters for eachreduction type are defined below.
coco ************************************************************************** *
oooo****************************************************************************coo CARD #2 *** FORMAT (10X,5(E13.7,1X))
FORMAT (10X,4(E13.7,1X),2(13,2X),4X) <--- TYPE 23 ONLY
*********** CARD COLUMN AND ENTRIES **********
1 2 3 4 5 6 7 8
12345678901234567890123456789012345678901234567890123456789012345678901234567890AAAAAAAAAAAAA BBBBDDDDDBBBB CCCCCCCCCCCCC DDDDDDDDDDDDD EEEEEEEEEEEEEAAAAAAAAAAAAA BBBBBBBBBBDDB CCCCCCCCCCCCC DDDDDDDDDDDDD EEE eee !'!
!!! Type 23 only|
CARD REDUCTION VALUE
ENTRY FORMAT TYPE DESCRIPTOR (IF CONSTANT)oo***** ******** ********* ************************<**** *************
AAAAAAA E13.7 1 Engineering = Raw Input 0.00
2 RTD Resistance (OHM) e 0. 0 (C)3 C1 of C1+C2*(V-VV)+C3*(V-VV)**34 C1 of C1+C2*V+C3*V**2+.. +CS*V**45 TYPE J TC (Coefficients Hardwired) 0.00
6-8 Not Used 0.00
9 RTD Resistance (OHM) at O (C)10-20 Not Used 0.00
21 C1 of C1 + C2*K + C3*K*K + C4*K**322 C1 of (C1+C2*EE+C3*DE**2)(1-C4* PRES)23 Pipe Inside Dia. (inches)24 Distance (FT) Between DP Taps25 Elevation (FT) of Pressure Tap Above
Transmitter26 Reduction Type Not Used27 Not Used 0.00
28 Not Used 0.00
29 Not Used 0.00
30-43 Not Used 0.00l
44 Flow Cross Sectional Area (FT**2)45 Minimum Transmitter Voltage
!46 Minimum Transmitter Voltage47 Reduction Type Not Used
0.0048-55 Not Used
1.00BBBBBBB E13.7 1 Engineering = Raw Input
2 RTD Temp Coeff e 0.0 (C) -- Alpha3 C2 OF C1+C2*(V-VV)+C3*(V-VV)**34 C2 OF C1+C2*V+C3*V**2+....+C5*V**45 TYPE J TC (Coefficients Hardwired) 0.00
0.006-8 Not Used
9 Temperature Coefficient at O (C)0. 010-20 Not Used
21 C2 of C1 + C2*K + C3*K*K + C4*K**3 |
22 C2 of (C1+C2*DE+C3*DE**2)(1-C4* PRES)23 Orifice Dia (FT) ,
'
24 Coefficient of Thermal Expansion (1/F)0.00
25 Not UsedD-7

_
Page 8
26 Reducticn Typo Not Usod27 Not Used 0.0028 Max Voltage for Over-Range29 Max Voltage for Over-Range--.,,
( 30-44 Not Used 0.00\- ' 45 Max Voltage for Over-Range
46 Max Voltage for Over-Range-
47 Reduction Type Not Used '
48-55 Not Used 0.00 i
-CCCCCCC E13.7 1 Engineering = Raw Input 0.002 RTD Constant -- DELTA3 C3 OF C1+C2*(V-VV)+C3*(V-VV)**34 C3 OF C1+C2*V+C3*V**2+....+C5*V**45 TYPE J TC (Coefficients Hardwired) 0.00
6-8 Not Used 0.009 RTD Constant -- Typically About 1.49
10-20 Not Used 0.0021 C3 of C1 + C2*K + C3*K*K + C4*K**322 C3 of (C1+C2*DE+C3*DE**2)(1-C4* PRES)23 C3 +C3 ==> K=C3(1+C4/ red) Flange
-C3 ==> K=-C3+C4*1000/SGRT(RE) Corner24 C 1=0. 0 ==> Invert DP with Ref Leg
C1=1.0 ==> Orifice DP for DownflowC1=2.0 ==> Orifice DP for Upflow
25 Not Used26 Reduction Type Not Used
27-46 Not Used 0.0047 Reduction Type Not Used
'
/~'\ 48-55 Not Used 0.00V
.
.DDDDDDD E13.7 1 Engineering = Raw Input 0.002 Resistance (OHM) of Precision Resister'
3 C4 of C1+C2*(V-VV)+C3*(V-VV)**34 C4 of C1+C2*V+C3*V**2+....+C5*V**4,
5 TYPE J TC (Coefficients Hardwired) 0.006-8 Not Used 0.00
[ 9 Current (AMPS) Through RTD!, 10-20 Not Used 0.00
21 C4 of C1 + C2*K + C3*K*K + C4*K**322 C4 of (C1+C2*DE+C3*DE**2)(1-C4* PRES)
Static Pressure Span Error (TypicallyL'
1% per 1000 PSI or +1.E-05)23 C4 of K=C3(1+C4/ red) Flange
L -or K=-C3+C4*1000/SGRT(RE) Corner| 24 Not Used 0.00| 25 Not Used; 26 Reduction Type Not Used| 27-46 Not Used 0. 00| 47 Reduction Type Not Used
| 48-55 Not Used 0.00
r'' E13.7 1 Engineering = Raw Input 0.00
(s)3EEEEEE13.7 2 Not Used 0.00'
E13.7 3 VV of C1+C2*(V-VV)+C3*(V-VV)**3E13.7 4 C5 of C1+C2*V+C3*V**2+....+C5*V**4;
| E13.7 5 TYPE J TC (Coefficients Hardwired) 0.006-20 Not Used 0.00
| E13.7 21 Not Used 0.00
| D-8

Pago 9
E13.7 22 'Zoro' VoltegoEEE 13 23 Pipo Mat'l O=Steinless, 1=Cerbon
ooe 13 Orifice Mat'l O= Stainless. 1= CarbonE13.7 24 Not Used 0.00E13.7 25 Not Used 0.00
26 Reduction Type Not UsedE13.7 27-46 Not Used 0. 0C
47 Reduction Type Not UsedE13.7 48-55 Not Used 0.00
000 END CARD #2 ***ocooe***************************************************************************0000C*************************************************************************te
O9
!
!
!
ii
|
Oi
D-9|
-_ _ _ _

_ Wage B@
Cerd C3 centcins the reforonco VTAD's (when used) forconverting the input of the VTAB to engineering format. For example,
an RTD requires the voltage drop across a precision resistor todetermine the current flow in the circuit. Hence, the reference
s_/ voltage drop across this resistor appears as a reference VTAB for the8 RTD.in location A1A2A3.I Note that unused reference VTAB entries must be set to blanks
by the user since the read is for 4 entries.
' ooooce**************************************************************************.ooooce**************************************************************************Coo CARD #3 *** FORMAT (8X,4(2X,3A2),40X)
*********** CARD COLUMN AND ENTRICS **********
1 2 3 4 5 6 7 E
12345678901234567890123456789012345678901 EJ456789012345678901234567890123456789 ;A1A2A3 B192B3 C1C2C3 D1D2D3
Where,A1A2A3, B1B2B3, C1C2C3, D1D2D3 are the reference VTAD's
CARD E N T R Y ------------------------REDUCTION --------------------
TYPE A1A2A3 B1B2B3 C1C2C3 D1D2D3
oooo***** ************* *************** ************** **********
()1 Card Not Required
2 Voltage Drop Across '6 Blanks' '6 Blanks' '6 Blank s '
Precision Resistor
3 Card Not Required
4 Card Not Required
5 Card Not Required
6-8 Not Used
9 Card Not Required
10-20 Not Used
21 Fluid Pressure Fluid Temperature '6 Blanks' '6 Blanks'
22 Fluid Pressure '6 Blanks' '6 Blanks' '6 Blanks'
23 Fluid Pressure Fluid Temperature Orifice Diff '6 Blanks'Pressure
24 Fluid Pressure Ref Leg Temp Diff Pressure Fluid Temp
O 25 Fluid Pressure Ref Leg Temp '6 Blanks' '6 Blanks'.
.
26 Not Used
27 Vent Sys Press Vent Sys Temp '6 Blanks' '6 Blank s ',
D-10-. - _ . . .. .~ -_ _ - . - - - . - _ . , - - . _ . _ . - - - _ - . - - - . - . - . . - --
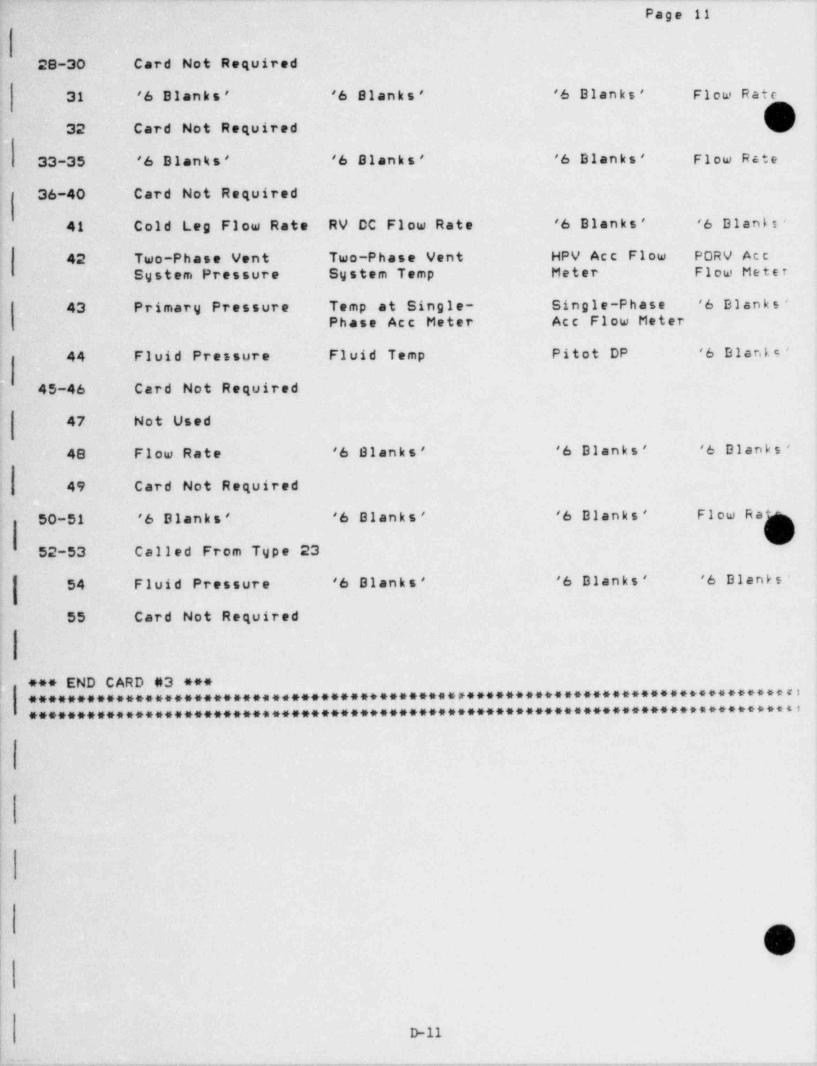
Page 11
'22-30 Ccrd Not Roquirod
31 '6 Blanks' '6 Blanks' '6 Blanks' Flow Rate
32 Card Not Required
33-35 '6 Blanks' '6 Blanks' '6 Blanks' Flow Rete
36-40 Card Not Required
41 Cold Leg Flow Rate RV DC Flow Rate '6 Blanks' '6 Blenis-
42' Two-Phase Vent Two-Phase Vent HPV Acc Flow PORV AccSystem Pressure System Temp Meter Flow Meter
43 Primary Pressure Temp at Single- Single-Phase '6 Blanks'Phase Acc Meter Ace Flow Meter
44 Fluid Pressure Fluid Temp Pitot DP '6 Blants'
45-46 Card Not Required
47 Not Used
48 Flow Rate '6 Blanks' '6 Blanks' '6 Dlanks'
49 Card Not Required
50-51 '6 Blanks' '6 Blanks' '6 Blanks' Flow Ra
52-53 Called From Type 23
54 Fluid Pressure '6 Blanks' '6 Blanks' '6 Blanks
55 Card Not Required
000 END CARD #3 ***|' ocoo****************************************e*********************************<
0000****************************************************************************
|
i
|
|!
D-11
- - _ -. - - . - .___ _ - _ _

_____
f
Card #4 definoe the porcmaters ossocieted with clorm messagescnd rato control stim 2 betw2Gn dato acquisition scons) of the dataacquisition system. This card is therefore used only when the VTABis selected for alarming or rate control. In all other instances thiscard should not be part of the VTAB identity. The ' KEYS' parcmeter onefg
'' ') card #1 should be switched to include the presence of rate and/ore
alarm control for the subject VTAB.
ocooo***************************************************************************ocooo************************************************************************s<.ooo CARD #4 *** FORMAT (10X,4(E13.7,1X))
*********** CARD COLUMN AND ENTRIES **********
1 2 3 4 5 6 7 E
123456789012345o7890123456789012345678901234567890123456789012345678901234567E;;AAAAAAAAAAAAA BBBBBBBBBBBBB CCCCCCCCCCCCC DDDDDDDDDDDDD EEEEEEEEEEEEE
CARD SOFTWAREENTRY PARAMETER DESCR IPT ION FORMAT
******* ********* ****************************************** ******++
AAAAAAA ALARMH Hi Alarm Value E13.7BBBBBBB ALARML Low Alarm Value E13.7CCCCCCC ALARMD Alarm Deadband E13.7DDDDDDD RVALUE Maximum Change of VTAB Engineering Value E13.7
Between Successive Data Acquisitions orMaximum Engineering Value Allowed Before
O EEEEEEE'Pe gging ' DAS Sp eed
RATOLD Previously Calculated Value for Rate E13.7
' 000 END CARD #4 ***occoo**************************************************************************>ooooo***********************************************************************<-**u
This concludes the definition of the VTABLE.DAT file. The in-
formation in VTABLE.DAT is used to define swstem cocmon dcta for eachof the VTAB's. This information is then available to all othet SBLOCADAS routines. The ne::t section lists and desc ribes all of these SBLOCADAS routines.
O
D-12

O
.
>
Appendix E
List of GERDA and OTIS Phase O Characterization Tests
O.
(
i
O
1
- . - . . _ _ _ - . _ _ _ _ _ _ _ _ . - . - _ . - _ . _ _ . _ _ . - _ _ _ _ _ _ . _ _ _ . _ _ _ _ . _____. . _ _ . _ . . _ _ _ . . - _ . ._

GERDA PHASE O TESTS
I
Run Number Description
000100 TC Calibration - Pressurizer at 382*F000200 TC Calibration - Pressurizer at 432*F000300 TC Calibration - Pressurizer at 486*F000400 TC Calibration - Pressurizer at 532*F000500 TC Calibration - Steam Generator at 350*F
~000600 TC Calibration - Steam Generator at 375'F000700 TC Calibration - Steam Generator at 400'T000800 TC Calibration - Steam Generator at 425'F000900 TC Calibration - Steam Generator at 450*F001000 TC Calibration - Steam Generator at 450*F001100 TC Calibration - Steam Generator at 475'F001200 TC Calibration - Steam Generator at 475'T001300 TC Calibration - Steam Generator at 500*F001400 TC Calibration - Steam Generator at 500*F001500 TC Calibration - Pressurizer at 587'F001600 TC Calibration - Steam Generator at 525'F001700 TC Calibration - Steam Generator at 525*F001800 TC Calibration - Steam Generator at 550'F001900 TC Calibration - Steam Generator at 550*F002000 TC Calibration - Steam Generator at 575'F002100 TC Calibration - Steam Generator at 575*F
, 002200 TC Calibration - Pressurizer at 629'F.(''T 002300 TC Calibration - Steam Generator at 500*F(_ / 002400 TC Calibration - Steam Generator at 500*F
002500 TC Calibration - Pressurizer at 587'F002600 TC Calibration - Steam Generator at 425'F
-002700 TC Calibration - Steam Generator at 425'F: 002800 Steam Ramp Cooldown
002900 Steam Ramp Cooldown.
I) 003000 Steam Ramp Cooldown'j- 003100 VOID
| 003200 TC Calibration - Steam Generator at 350'F; 003300' TC Calibration - Steam Generator at 350*F| 003400 TC Calibration - Pressurizer at 486*F| 003500 TC Calibration - Pressurizer at 382*F! 003600 TC Calibration - Reactor Vessel at 382*F
003700 TC Calibration - Reactor Vessel at 432*F! 003800 TC Calibration - Reactor Vessel at 488'F| 003900 TC Calibration - Reactor vessel at 531'F| 004000 TC Calibration - Reactor vessel at 587'F
004100 void004200 TC Calibration - Reactor Vessel at 629'F
,
004300 TC Catteration - Reactor Vessel at 587'F| 004400 TC Cal 1Lca61on - Reactor Vessel at 527'F
004500 TC Calibration - Reactor Vessel at 486'F| 004600 TC Calibration - Reactor Vessel at 382*F| 004700 VOID'
(}004800 VOID
li
|- E-1
.I'_ _ _ __ _ ..__. _ ._ _ ___. _ _ _ . _ . ._. _ _ _ _ _ . _ . _ _ _

PHASE O TESTS (cont'd.)
Run Number Description.
004900 Steam /Feedwater Orifice Calibration - 200 lb/hr005000 Steam /Feedwater Orifice Calibration - 250 lb/hr005100 Steam /Feedwater Orifice Calibration - 300 lb/hr005200 Steam /Feedwater Orifice Calibration - 350 lb/hr005300 Steam /Feedwater Orifice Calibration - 200 lb/hr005400 Steam /Feedwater Orifice Calibration - 300 lb/hr005500 Steam /Feedwater Orifice Calibration - 400 lb/hr005600 VOID005700 Steam /Feedwater Orifice Calibration - 250 lb/hr005800 Steam /Feedwater Orifice Calibration - 300 lb/hr005900 Steam /Feedwater Orifice Calibration - 350 lb/hr006000 Steam /Feedwater Orifice Calibration - 200 lb/hr006100 Steam 7Feedwater Orifice Calibration - 120 lb/hr006200 Steam /Feedwater Orifice Calibration - 200 lb/hr006300 Steam /Feedwater Orifice Calibration - 250 lb/hr006400 Steam /Feedwater Orifice Calibration - 300 lb/hr006500 Steam /Feedwater Orifice Calibration - 200 lb/hr006600 Steam /Feedwater Orifice Calibration - 250 lb/hr006700 Steam /Feedwater Orifice Calibration - 285 lb/hr
| 006800 Steam /Feedwater Orifice Calibration - 100 lb/hri 006900 4 HPI Pump Head-Flow Control
007000 4 HPI Pump Head-Flow Control007100 2 HPI Pump Head-Flow Control007200 2 HPI Pump Head-Flow Control007300 Primary Flow Calibration at 9450 lb/hr007400 Primary Flow Calibration at 12000 lb/hr007500 Primary Flow Calibration at 2300 lb/hr007600 Primary Flow Calibration at 2300 lb/hr007700 Primary Flow Calibration at 1600 lb/hr007800 Primary Flow Calibration at 2000 lb/hr007900 Primary Flow Calibration at 2400 lb/hr00S000 Primary Flow Calibration at 2900 lb/hr008100 Primary Flow Calibration at 3350 lb/hr008200 Primary Flow Calibration at 3600 lb/hr
| 008300 Primary Flow Calibration at 1100 lb/hr008400 Heat Loss - No Guard Heaters - 505'F
! 008500 Heat Loss - Zone / On - 505'F008600 Heat Loss - Zone 1 and 2 On - 512*F008700 Heat Loss - Zones 1-6 On - 553*F008800 Heat Loss - Guard Heaters On - 561*F
.
008900 Surge Line Special TestI 009000 Heat Loss - No Guard Heaters - 566*Fl 009100 Heat loss - Zones 2-6 On - 536*Fi 009200 Heat Loss - Guard Heaters on - 502*F
009300 Heat loss - Bias + 0.1009400 Heat Loss - Bias 0.0
| 009500 Heat loss - Zones 2-6 on - 492*F009600 Condensation and Guard Heating Vapor Region009700 Heat Loss - No Guard Heaters - 490*F
,
E-2
v. _ _ _ _ _ _ _ _ _ _ _ _ _ _ _ _ _

F l
PHASE O TESTS (cont 'd.)
~
'Run Number Deseription
009800 Heat Loss - No Guard Heaters - 490'F |
009900 Heat - Loss - No Guard Heaters - 490*F )009901 63-Bar Interception
009902 Conductivity Probe Checkout009903 NPV w/o NCG009904 RPV w/o NCG009905 HPV w/o NCGC09906 HPV w/o NCG009907 Gas Sample HLUB009908 Gas Sample with NCG009909 Gas Sample HLUB with NCG009910 PORV w/o NCG009911 PORV with NCG009912 PORV with NCG009913 Heat Loss - No Guard Heaters - 497'F00991l. Heat Loss - No Guard Heaters - 451*F009915 Heat Loss - Guard Heaters on - 494*F009916 Ultrasonics - No Flow009917 Ultrasonics - Intermodulations009918 Ultrasonics - Pulse Echo w/o NCG009919 Ultrasonics - Pressure = 1266 psia
009920 Ultrasonics - Pressure = 1541 psia
009921 Ultrasonics - Pressure = 1908 psia
("')S 009922 Ultrasonics - Pressure = 2100 psias,009923 Ultrasonics - Pressure = 928 psia
009924 Ultrasonics - Pressure = 790 psia- 009925 Ultrasonics - Water Injected at CLS
: 009926 Ultrasonics - Pressure = 840 psia with NCG009927 Ultrasonics - Pressure = 1425 psia009928 Heat Loss - SG Level 32%, 554*F009929 Ultrasonics - Spectrum Analysis009930 Heat Loss - SG Dry, 550*F009931 Ultrasonics - Pressure = 1200 psia009932 Ultrasonics - Density Layering
009933 Ultrasonics - Pressure = 1200 psia009934 Conductivity Probes009935 Steam /Feedwater Orifice Calibration - 120 lb/hr
,
.
009936 Steam /Feedwater Orifice Calibration - 200 lb/hr,
| 009937 Steam /Feedwater Orifice Calibration - 250 lb/hr009938 Steam /Feedwater Orifice Calibration - 300 lb/hr
; 009939 Steam /Feedwater Orifice Calibration - 250 lb/hr! 009940 Steam /Feedwater Orifice Calibration - 200 lb/hr
009941- Steam /Feedvater Orifice Calibration - 150 lb/hr009942 Steam /Feedwater Orifice Calibration - 110 lb/hr009943 DCUS, Pressure = 1200 psi (no disk file)009944 DCUS, with Guard Heaters, 460*F009945 DCUS, with Guard Heaters, 513*F,
'
| C 009946 VOID\ 009947 Energy Balance at 520'F
;
l| E-3
_ _ _ _ . _ _ _ _ _ . _ . _ _ , _ . _ , . _.- _ . _ _ . _ _ _ . _ _ . . _ _ _ _ . . _ _ _ . . _ _ _ _ _

PHASE O TESTS (cont'd.)
Run Number Description
009948 Pitot Tubes (Renamed 010302)009949 Heat Loss at 515'F009950 Cold Leg Orifice Calibration 0 1% Power009951 Cold Leg Orifice Calibration 01.5% Power009952 Cold Leg Or.ifice Calibration 0 2% Power009953 Cold Leg or.fice Calibration @ 2.5% Power009954 Cold Leg Orifice Calibration 0 3.0% Power009955 Cold Leg Orifice Calibration 0 3.5% Power009956 Cold Leg C-ifice Calibration 0 4.0% Power009957 Cold Leg Orifice Calibration 0 4.5% Power009958 Cold Leg Orifice Calibration 0 5.0% Power009959 Cold }.eg Orifice Calibration @ 5.5% Power009960 Cold Leg Orifice Calibration 0 0.3% Power009961 Cold Leg Orifice Calibration 0 0.54% Power-
009962 Euler Number Test - Stalled Flow009963 Euler Number Test - Minimum Forced Flow009964 Euler Number Test - Repeat of 9963009965 Cold Leg Calibration 0 8.6 KW009966 Euler Number Test - 15000 lb/hr009967 Euler Number Test - Stalled Flow009968 Euler Number Test - 20,000 lb/hr009969 Euler Number Test - Stalled Flow009970 Data Storage Qieck009971 Heat Loss at 465'T009972 Heat Loss, Guard Heaters on, 519'F009973 Heat Loss, Guard Her.ters on, 526*F009974 Heat Loss, Guard Heaters On, 420*F009975 Heat loss, Guard Heaters on, 330*F009976 Conductivity Probe Check at 30 pmho/cm009977 Conductivity Probe Check at 24.5 teho/cm
;
009978 Conductivity Probe Check at 44.5 vmho/cm009979 Leak - HPI Equilibrium for 070602009980 Heat Loss at 537'F, SC Dry009981 Two-Phase Vent Exercise
| 009982 Heat Loss, SG Level 30%, G.H. On009983 Heat loss, SG Level 67%, No G.H.
2 2 HPV - 2 HPI009984 Equilibrium Pressure for 10 cm CLS and 3 cm
Pumps2 2 HPV - 4 HPI
009985 Equilibrium Pressure for 10 cm CLS and 3 cm,
Pumps2
! 009986 Equilibrium Pressure for 10 cm CLS - 2 and 4 HPI Pumps,
009987 Heat Loss, SG IAvel 35%, No G.H.009988 Equilibrium Pressure for 070301009989 Equilibrium Pressure for 071112009990 Equilibrium Pressure for 070801
i
009991 HK(2) AFW Head-Flow, Part 2009992 NK(2) AFW Head-Flow, Part 1009993 Equilibrium Pressure for 070401
1 009994 Heat Loss, 433*F009995 Equilibrium Pressure for 070201009996 Equilibrium Pressure for 071224
E-4
.
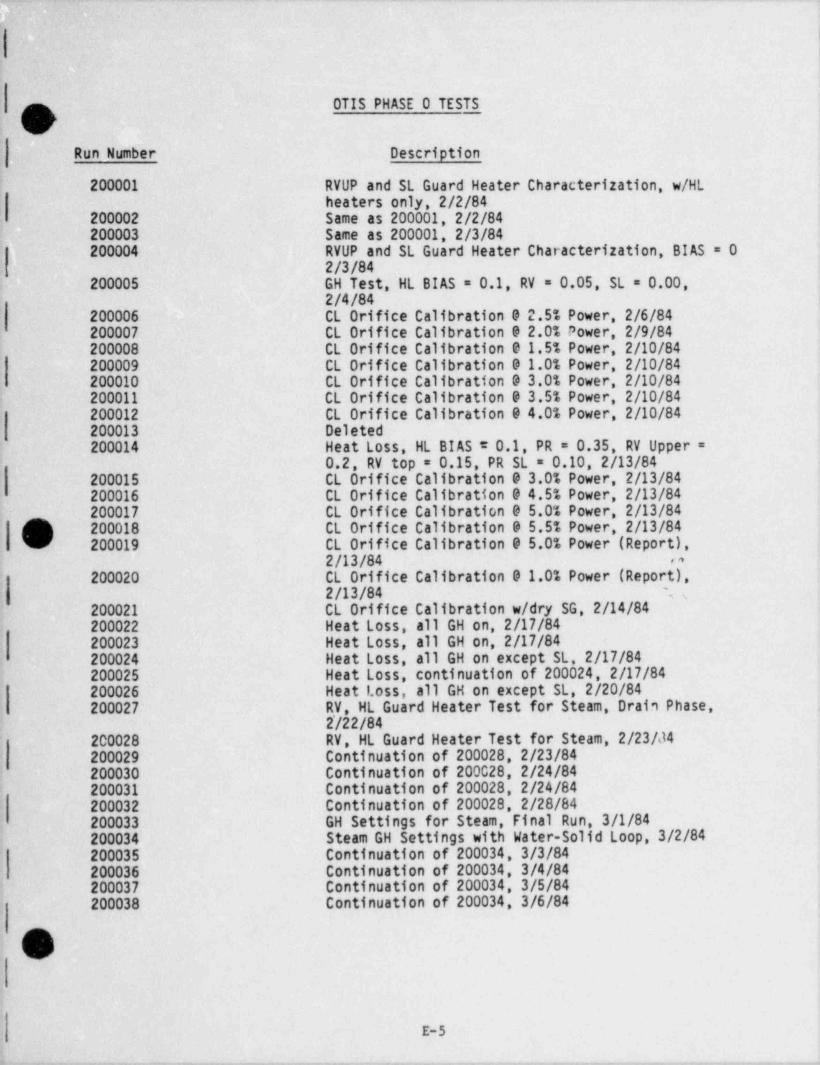
. _ _ _ .__ ._. - _. ._ _ _ _ _ _ . . . _ _
y 1
OTIS PHASE O TESTS
G |
Run Number Description
_200001- RVUP and SL Guard Heater Characterization, w/HL,
heaters only, 2/2/841 - 200002 Same as 200001,2/2/84-
200003 Same as 200001,2/3/84200004 RVUP and SL Guard Heater Characterization, BI AS = 0
'
2/3/84200005 GH Test, HL BIAS = 0.1, RV = 0.05, SL = 0.00, ,
2/4/84200006 CL Orifice Calibration 0 2.5% Power, 2/6/84200007 CL Orifice Calibration 9 2.0% Power, 2/9/84200008 CL Orifice Calibration 01.5% Power, 2/10/84200009 CL Orifice Calibration 91.0% Power, 2/10/84200010 CL Orifice Calibration 9 3.0% Power, 2/10/84200011 CL Orifice Calibration 9 3.5% Power, 2/10/844
200012 CL Orifice Calibration 9 4.0% Power, 2/10/84200013 Deleted200014 Heat Loss, HL BI AS * 0.1, PR = 0.35, RV Upper =
,
O.2, RV top = 0.15, PR SL = 0.10, 2/13/84 i'
200015 CL Orifice Calibration 9 3.0% Power, 2/13/84200016 CL Orifice Calibration 9 4.5% Power, 2/13/84200017 CL Orifice Calibration 9 5.0% Power, 2/13/84
O' 200018 CL Orifice Calibration 9 5.5% Power, 2/13/84' U 200019 CL Orifice Calibration 9 5.0% Power (Report), '
2/13/84 o
: 200020 CL Orifice Calibration 91.0% Power (Report),2/13/84
'
200021 CL Orifice Calibration w/ dry SG, 2/14/84 i
200022 Heat Loss, all GH on, 2/17/84-200023 Heat Loss, all GH on, 2/17/84200024 Heat Loss, all GH on except SL, 2/17/84200025 Heat Loss, continuation of 200024, 2/17/84200026 Heat loss, all GH on except SL, 2/20/84200027 RV, HL Guard Heater Test for Steam, Drain Phase, ,
2'/22/84200028 RV, HL Guard Heater Test for Steam, 2/23/d4200029 Continuation of 200028,2/23/84200030 Continuation of 200028,2/24/84 4
200031 Continuation of 200028,2/24/84*
200032 Continuation of 200028,2/28/84- 200033 GH Settings for Steam, Final Run, 3/1/84
200034 Steam GH ' Settings with Water-Solid Loop, 3/2/84200035 Continuation of 200034,3/3/84'
200036 Continuation of 200034, 3/4/84200037 Continuation of 200034,3/5/84''
200038 Continuation of 200034,3/6/84 ;
O.
E-5
_ _ _ _ _ . _ - ,_ ._.. _ . _ _ _ _., . _ _ . _ , .__ _ . _ . _ . _ . _ ._ _.__ _ __._ _ _. _

OTIS PHASE O TESTS (Continued)
Run Number Description
200039 Pressurizer GH Re Characterization, BIAS = 0.07,4/3/84
200040 Continuation of 200039,4/4/84'
200041 Continuation of 200039,4/4/84,
l
O:
.I; -
,
[t ,
i
|'
O
E-6
-