ML090690738.pdf - Nuclear Regulatory Commission
329
-
Upload
khangminh22 -
Category
Documents
-
view
1 -
download
0
Transcript of ML090690738.pdf - Nuclear Regulatory Commission


Table of ContentsExecutive Summary ..................................................... ........Introduction: A Bright Outlook for the South ............................................................ 3.. .... .............
The Scope of Nuclear Power in the South - . ...
Nuclear Power Fulfills a Need for Electricity ............................ .... .... .Nuclear Power Plants Operating in the South ......... ................ ..* . .. ..'7Nuclear Energy is a Stable, Reliable Power Supply in the South .......................... .................Price Stability Relative to Other Fuel Types ......... 9"............................................... 7':
Economic Impact of Nuclear Power Plants .....................
New Nuclear Plants- an Energy Imperative?Improved Financial Climate for Nuclear Power 3................ . . ... ............. -Implications on Nuclear Power of Energy Policy Acts of 1992 and 2005 ................... 13
Energy Policy Act of 1992 ................................................................................. 13.Energy Policy Act of 2005 ................................................................................... 14
New Nuclear Plant Licensing- Plant Design Certification, Early Site Permits,and Combined Operating License ...................... ........................ 5.
Early Site Permits (ESP)............................... ......................... ..... 15Combined Construction and Operating Licenses (COL) --------. 16
History of Nuclear EnergyThe Early Days of Nuclear Power in the United States ...................................... 1 .7............... 17Nuclear Power Grows in the South ...................................... ...................................... 18...
Continued Improvements in Nuclear Plant Operations..Safety Emphasis in the Aftermath of Three Mile Island .......................................... 19Nuclear Plant Challenges of the Mid-1980s to Mid-1990s .......................... 2................. .. .... 0Maximizing Existing Assets: License Renewal, Unit Capacity Uprates and
Capacity Factor Increases ..........................................................License Renew al ................................................................................................ ... ............ 21Unit Capacity Uprates ............................................. ...................................... ... 22,Increased Capacity Factors and other Operating Parameters .................... 22.................. ..
Nuclear Energy on the World Stage ....................................................................... ....... 2 ... ..... 23
Policy IssuesN on-Proliferation Issues ........................................................................................................... 2-Energy Diversity and Energy Security..................................................................................... ...... ............."-. • .'.• .' .'.Clean Air/ Climate Change/ Environmental Footprint -............-.--...-..-... .. 26•.. .• .............. ......................................... ' '. :•> •- •;.•, :')--:..:- :;•••:•Used Fuel Management 7................... ... ....
Scientific Consensus on Deep Geologic Disposal 27........ ......... .............Scientific Justification of Yucca Mountain Site ....................................... 28Policy Statements in Support of Yucca Mountain .............................. 2o............ • 9Nuclear Waste Fund (NWF) Payments/Interim Storage Inventory .......... .,........ 29
Reactors of the Future . .Advanced Reactor Technology for the Next Wave of Nuclear Plants ................. . .Generation IV Technology......................................................Other Potential Benefits of Nuclear Energy ........................................................ ,. .. .32
Spurring Transition to a Hydrogen Economy ................................................. 2! 3-2Seawater Desalinization ........................................................................ ................. 32

..... I.. 33
,-" ..................................................... .................................................................. "........ 34
egional Reliability Councils .................................................................................. 4ý' Demand Forecast Through 2030 ........................................................................... 5ving Current Nuclear Units in SSEB States ..................................................... 6mnit Capacity Factors Over Time ........................................................................ 9q Costs of Various Generating Options ........................................................... 10I Capacity from Nuclear Unit Uprates ........................ .................................. 22Liclear Countries in the World ............................................................................. 23•missions of C02 from Various Generating Options ......................... 27
ehnerating Units in the Southern States................................ 7gneration by State and Percentage of State Generation - 2005 ................... 8e4r Generation from SSEB Member States - Selected Years ........................ 19ins by SSEB Member States to the Nuclear Waste Fund ............................... 30ge Sites in the SSEB Member States ................................................................ 30

Executive SummaryThe United States and the South must have a diversified energy policy that fuelsenvironmental preservation and reduces our dependence on foreign sources of ener30 years, the U.S. economy has grown three times faster than our energy consumpsame period of time, more than 55 million jobs have been created while air polluti&oby about 50 percent. Historically, the United States has put policies in place that emgrowth, make the nation more dependent on domestic energy sources and protect itis imperative that states enact policies to further address these urgent issues over diElectricity demand is projected to increase by nearly 50 percent by 2030, accordingInformation Administration. In the Southeast and across America, policymakers xiimplementing a strategy to meet that demand from a diverse portfolio of electric g&iwhile maximizing other energy resources such as renewable power, along with con,efficiency measures.
Nuclear power plays a vital role in this diverse energy portfolio. Uranium fuel is taffordable, and nuclear power plants already generate 20 percent of U.S. electricityemitting any greenhouse gases or controlled air pollutants.
More than 100 nuclear power plants operate in 31 states, including 44 reactors in Sýstates. They are the nation's second-leading source of electricity, after coal, with 4Vcosts that are cheaper than coal or natural gas for electricity production. Nuclear Istates meet Clean Air Act goals as well as reduce carbon. Without nuclear energy, 4emissions would have been 28 percent greater in the electricity industry in 2004, aiimillion tons of carbon dioxide would have been emitted each year-about the samecemissions from 136 million passenger cars.
In order to fuel regional economic growth and enhance national security, our regicorconstruction of advanced-design nuclear power plants. Electric companies from U-have announced their intention to develop license applications for as many as 20 neThese new reactors are needed to meet rising electricity demand in fast-growing SSand they are economic drivers for communities and states where they are located.
Provisions in the Energy Policy Act of 2005 are jumpstarting interest in new reactoiincludes limited investment incentives, such as loan guaramtees for carbon-free enyduction tax credits for new nuclear power plants and federal insurance to protect cxavoidable delay in the government's reactor licensing process. Moreover, the Nucfi.Initiative is a $1.1 billion partnership between the federal government and the indusconstruction of advanced reactor designs. Some state legislatures have followed thtare considering energy policy legislation to remove impediments to building energy.,ýincluding nuclear power plants.
Public support for nuclear energy also is growing, including many environmentalistleaders across the political spectrum. Public support for nuclear energy in the Unitgrown steadily as a result of excellent plant safety and performance, as well as grownuclear energy's benefits. A March 2006 survey revealed that 86 percent of the geiithat nuclear energy will play an important role in meeting our nation's electricity neahead. In addition, 73 percent found it acceptable to add a new reactor at the neareplant site. Overall, 68 percent of Americans surveyed support nuclear energy, whihit (Bisconti Research 2006).

the benefits of conservation, efficiency and renewable sources of energy, opinionlitical blogger Matt Yglesias, who wrote that "it's simply not feasible to meet
nand through these routes, much less meet current demand plus the additionalconomic growth plus the additional demand imposed by the need to move awayieans looking at nuclear power"(neinucleamotes.blogspot).
of nuclear waste disposal must move in tandem with new plant construction.I Congress in 2002 approved a repository site at Yucca Mountain, Nevada, toised nuclear fuel disposal center. The Department of Energy must make

Introduction: A Bright Outlookfor the SouthThe key to the economic prosperity we are witnessing in the South is a stable, reli•i1inexpensive supply of electricity. The role of nuclear power has become more signilimproved efficiency and life extension at existing reactors and because of the prosp eproduction at new reactors that could begin to operate within the next decade.
As we have seen, the latest era of base-load natural gas plants presents challenges mand as the environmental consequences of some aging fossil-fired power plants conipower is on the brink of a remarkable return to prominence. Existing nuclear planiStates and in the South are operating at record-high capacity factors, ushering in thseriously additional reactors in the South. With booming population growth and ecothe outlook for increased demand for electricity is evident. While some electricity jicome from renewable power supply, such as biomass and wind sources, and new ncombined cycle plants, the South's thirst for electricity will require unprecedentedpower supply from nuclear and coal.
The outlook for nuclear power has grown recently due to several other factors, inciapprehension about global warming, fluctuating fuel prices for other electric generarenewed emphasis on new-generation nuclear technology. Rising world temperaturon greater use of fossil fuels for power generation, makes atomic power more attraicsupply option that does not generate greenhouse gases, such as carbon dioxide (CO.pollutants such as sulfur dioxide (SO2) and nitrogen oxides (NOx), is attractive froiperspective. While the capital costs of nuclear power plants are not expected to be cgreater than other emerging new baseload technologies, the fuel costs of nuclear angeneration of nuclear power plants will be safer, notwithstanding the high levels of sreactors (Francis 2005).
The Bush Administration and Congress have signaled their continued support of nmhelp reduce our dependence on foreign sources of energy and contribute to environisolutions to electricity generation. President George W. Bush stated, when signing tAct of 2005, that "nuclear power is another of America's most important sources ofour nation's energy sources, only nuclear power can generate massive amounts of eemitting an ounce of air pollution or greenhouse gases, and because of advances in.-nology, nuclear plants are far safer than ever before" (NEI 2005).
Challenges remain on key issues such as waste storage and disposal; nuclear non-p0overall safety perceptions in some circles. Nonetheless, nuclear power seems pois'ephase of prominence in the U. S. and globally as part of a diverse electricity supply
The Scope of Nuclear Power in the
Nuclear Power Fulfills a Need for ElectricityMany states in the South are confronted with increasing electricity demand and the'new baseload electricity generation. In Texas, high temperatures in April 2006 crealouts, and future electricity demand has state planners concerned. Electric utilities t)routine power plant maintenance in the 'off-peak' months during the spring and fall,weather event created a real capacity shortage and rolling blackouts throughout the

,COT), affecting over 600,000 residences and businesses in the north Texas areale's surplus of electricity-about 20% in 2000-is expected to be no more thanof population growth, retirements of older power plants and a slowdown in thelectric generation.
ent was partially blamed on abnormal temperature patterns for the spring, the,ctrical generating capacity in the South is clear. According to the North Ameri-y Council (NERC), electricity growth for the summer peak demand for the pastias been around 2.4% per year, while the forecast for the next 10 years is slightlyIn the South, peak demand is expected to grow at a slightly faster pace - 2.1%
beast Electric Reliability Council (SERC) states; 2.7% per year for Florida; 1.8%and 1.3% to 1.5% per year for the Southwest Power Pool (SPP). Energy use is
Figure 1: NERC Regional, Reliability Councils
tNERC REGIONS
-1NOTE: The Southern States Energy Board consists of member states represented, in the mostpart, by the following reliability organizations of the North American Electric Reliability Council(NERC): SERC (Southeast Electric Reliability Council)- most of the SSEB states; ERCOT (ElectricReliability Council of Texas) - majority of Texas; SPP (Southwest Power Pool) - Oklahoma,Missouri, portions of 7X, LA, AR; FRCC (Flordia Regional Coordinating Council) - Florida.
.imilar pattern with nationwide growth expected to be around 1.8 % per years energy to grow at 1.7% per year. (Figure I shows the regional reliability organi.NERC).

44',-Part of the increased use of electricity is due to the increased population in the regicand 2000, the region's population grew by 17%, and eight of the states in the regio4percentage than the national average of 13.1%. Between 2000 and 2004, the natioiowhile the South grew by 5.6%. This trend is expected to continue in the future. Withe South representing some 38% of the total U.S. population in 2004, the expectedthe South will be significant.
In the NERC regions that serve the SSEB states, the following peak loads are e:
IISoutheast Electric Reliabil Council 163.0 178.8Electric Reliability Council of Texas 61.0 65.0Florida Regional Coordinating Council 41.9 46.8Southwest Power Pool 41.2 44.3
Most regions maintain a capacity reserve margin - a measure of installed capacit!11% to 15%. As electric demand grows, supply must grow in order to maintain acto reliably supply energy requirements. Nationally by 2010, the peak electric loac807.4 GW in 2010 up from an expected peak of 743.9 GW in 2006. Figure 2 showsin electrical energy requirements, in billions of Kwh, over the next 25 years.
Figure 2: Electricity Demand Forecast Through 2030
Over the past dozen years, the majority of the capacity additions to meet additional,been natural gas-fired combined cycle capacity (for intermediate load service) or 60for peaking needs. From 1998-2004, 132.4 GW of combined cycle capacity was addtion mix and 73.5 GW of combustion turbines of the total 216.1 G-W added. The f6o,
GW of combined cycle additions; 6.5 GW of combustion turbines; 19.4 GW of coal;ine•s; and 2.9 GW of nuclear uprates and the refurbishment of Tennessee Valley••Ferry I nuclear plant.
S'. Energy Information Administration, all regions will need additional generatingl the greatest need in the Southeast and the West. In 2025, the Southeast will -
130 percent of projected total demand due to the size of the electricity market andgrwth in the region, as described earlier. The EIA report expects coal-fired gener-,able capacity to be among the capacity additions in the Southeast (EIA Annual05). Electricity demand over the next 25 years will be 45% greater than it is today.
i rrent electric fuel supply mix would require building the equivalent of 50 nuclear1W each, 261 coal plants at 600 MW each, 279 natural gas plants at 400 MW each,ower supply sources at 100 MW each (a total of some 328 thousand MW).
ient by the public and private sectors for the construction of new nuclear plants hasnitinterest on Wall Street. Fitch Ratings is one of the Wall Street firns bullish onv nuclear plants in the near term:
matter of debate whether there will be new nuclear plants in the industry's future.in has shifted to predictions of how many, where and when. New nuclear plants
wer plants using new coal technologies are least likely to appear in the populous andV'Jtheast or in California, regions that already have significantly higher energySoutheast and Midwest. For political or geological reasons, these regions are likely tos-fired powerfacilities or costly investments for other resources, such as wind orfreences will tend to favor lower energy prices in the Southeast and Midwest to thethe Northeast and California (Fitch Ratings 2006).
n ew electrical load of the next 20 years will be met by wind power and otherptions, including small-hydro, the bulk of the requirements will have to fall to a,n power supply option. Limitations to the amount of energy that can be generatedexample, include the fact that there are certain periods of the day when the windlequate or sustained speed to ensure•Jk Typically wind genera- Figure 3: Map Showing Currentýcity factors ranging Nuclear Units in Member SSEB States'nL Windre.large'Pically located
es from thegificant
ýgses. Solar16': are stillractive andifiity to storee, upply.[4nt technol-;tissions-kj' is expectediathe next
SWer, with its@!.and recent,lency ,
ible, eco-11 those .'yVneeds.

Nuclear Power Plants Operating in the SoulSince they first started to come on line in the early 1970s, the 44 nuclear generaticregion have been a reliable, efficient source of electricity for a growing economy a'Nuclear plants in the South have a combined electrical generating capacity of appGigawatts (GW). In 2005, these reactors contributed about 341 billion Kwh of eleAbillion Kwh of total generation in 2004. The operating capacity factor of those unithree years is 90.3% (excluding Browns Ferry 1, which is not currently operating).nuclear plants is also located in the South at the Tennessee Valley Authority's WalMW reactor that began commercial operation in 1996. Figure 3 is a map of the nuunits in the South while Table I lists the nuclear generating units in the SSEB mewith their capacities and license expiration dates. Table 2 shows recent state-by-stnuclear capacity along with the percentage of generation in each state that comes
Table 1 - Nuclear Generating Units in the Southern States
I Browns Ferry 2-I.I Browns Ferry 3 1 NC.1 Brunsvwick I
i Brunswick 2Farley I
AR: Arkansas Nuclear IArkansas Nuclear 2
FL-* Crystal River 3St Lucie 1
2016201420212023
_r _JMcGuire 1 1 IMcGuire 2 1100
2014 1 Shearon-Harris 900 20262018
SC Catawba 1 1129 20242016 Catawba 2 1129 20262016 Oconee 1 846 2033
St Lucie 2 839 2023 Oconee 2 846 I 2033Turkey Point 3 693 2012 Oconee 3 846 2034Turke Point 4 693 2013 Robinson 2 710 2010
o al 3 Summer 966 2022GA: Hatch 1 869 2034
Hatch 2 883 2038 -TN Sequoyah 1 1150 2020Voatlf I 1152 2027 1127 2021
o .gte 2 1149 2029 W
LA;.- River Bend 968 2025 IX -. C(Waterford 3 1087 2024 Ct
MD: ICalvert Cliffs 1 873 2034 S10Calvert Cliffs 2 862 2036
1171
IJAuunvu rclfA I Iomanche Peak 2nth Texas I
2035
2030203320272027
.2018202020122013
rtb Anna I 2orth Anna 2 1MS: -.. Grand Gulf 1 1270 2024 IN
SurryQ__"1I
Generation by State and Percentage of State Generation - 2005
Alabama 1 __- 08 1 31.7 23 JArkansas 1,837 13.7 29Florida 3,902 28.8 13Georgia 4,053 31.5 24Louisiana 2,055 15.7 17Maryland 1,735 14.7 28
73.590.488.592.590.294.893.6Mississippi 1,270 10.1 22
Missouri 1,137 8.0 9 85.5North Carolina 4,938 40.0 31 94.2South Carolina 6,472 53.1 52 90.8Tennessee 3,398 27.8 29 90.2Texas 4,860 38.2 10 88.5Virginia 3,440 27.9 35 89.4
Total 44,105 340.4 88.1(90.3 without
Browns Ferry 1)
iergy is a Stable, Reliable Power Supply
its supply electricity around the clock and help ensure the stability of the nation-Jy. Since the fuel costs and other operational costs of nuclear plants are relativelyer options (except hydro and other renewables), nuclear generating capacity
S, base load' generation operating at full output every hour of the day.
.p.lants typically operate for long periods of time between either scheduled refueling•al outages due to unplanned maintenance. Originally the operation of nucleared so that refueling outages were planned for every 12 months, but the industryed over time to 18 months to 24 months. As a point of reference, the longest.. U.S. light water reactor is LaSalle 1, which completed a 739 day run in February
have been steadily reducing the period of time it takes to refuel reactors, therebythat they are producing electricity. In 2005, the average refueling outage was 38104 days in 1990. The shortest refueling outage by a U.S. nuclear power plant isn-.ied by TVA's Browns Ferry Unit 3 in 2002 (NEI 2006). Industry-wide im-!rg outage duration is due to "significant improvements to processes; planning;pections of equipment; simultaneous performance of more work; and the use oferform routine tests more efficiently" (Power 2005).
,re of overall reactor performance is capacity factor. In the past three years, the•tor - the amount of energy actually produced divided by the maximum energyime - was 89.2% for U.S. nuclear plants. This includes plant down time due to-and unplanned maintenance shutdowns.
Inuclear plant capacity factors have grown steadily over time from the first sixi_ factors ranged between 54% and 58% to the most recent five years (2001-2005),ws were at an all-time high of 87%to 90.3%. During that time, the median capacityincrements has steadily climbed from 56.6% in 1980-1985 to 70.9% (1991-1995) and
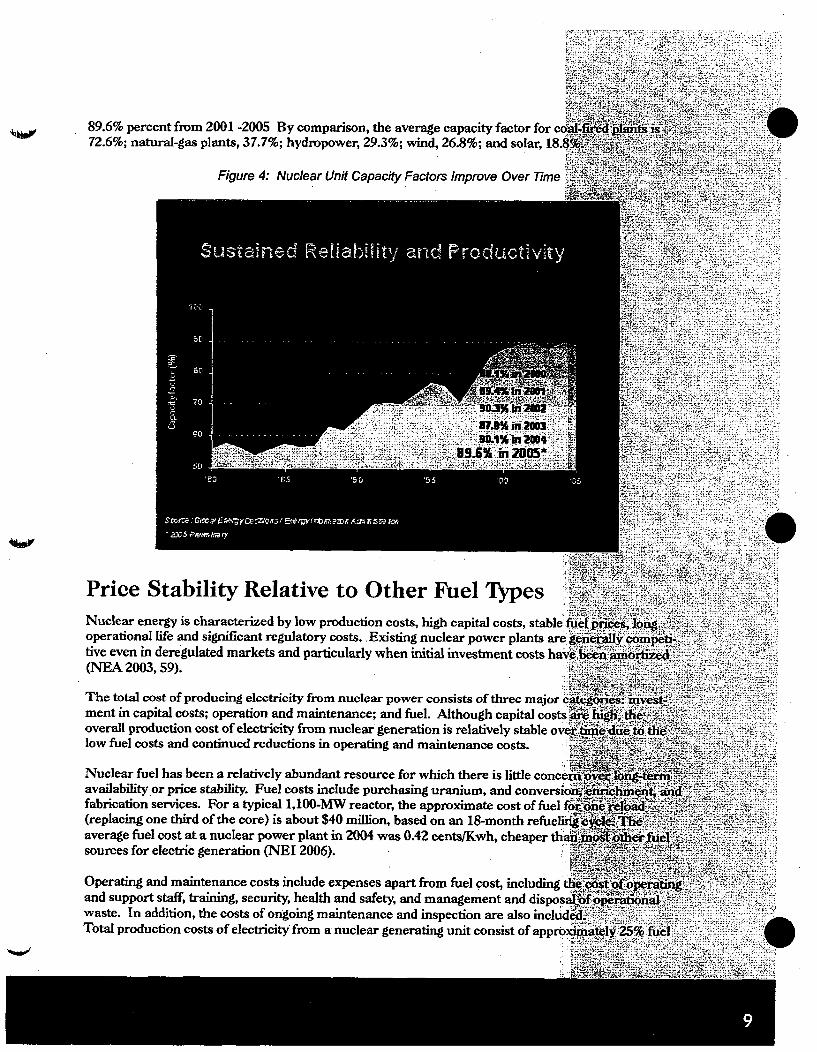
89.6% percent from 2001 -2005 By comparison, the average capacity factor for c72.6%; natural-gas plants, 37.7%; hydropower, 29.3%; wind, 26.8%; and solar, 18
Figure 4: Nuclear Unit Capacity Factors Improve Over Time
Price Stability Relative to Other Fuel TlypesNuclear energy is characterized by low production costs, high capital costs, stableoperational life and significant regulatory costs.. Existing nuclear power plants aretive even in deregulated markets and particularly when initial investment costs ha(NEA 2003,59).
The total cost of producing electricity from nuclear power consists of three major 6ment in capital costs; operation and maintenance; and fuel. Although capital costsoverall production cost of electricity from nuclear generation is relatively stable ovelow fuel costs and continued reductions in operating and maintenance costs.
Nuclear fuel has been a relatively abundant resource for which there is little conce,availability or price stability. Fuel costs include purchasing uranium, and conversicfabrication services. For a typical 1,100-MW reactor, the approximate cost of fuel f1(replacing one third of the core) is about $40 million, based on an 18-month refueliraverage fuel cost at a nuclear power plant in 2004 was 0.42 cents/Kwh, cheaper thasources for electric generation (NEI 2006).
Operating and maintenance costs include expenses apart from fuel cost, including tand support staff, training, security, health and safety, and management and disposewaste. In addition, the costs of ongoing maintenance and inspection are also includTotal production costs of electricity from a nuclear generating unit consist of appro)
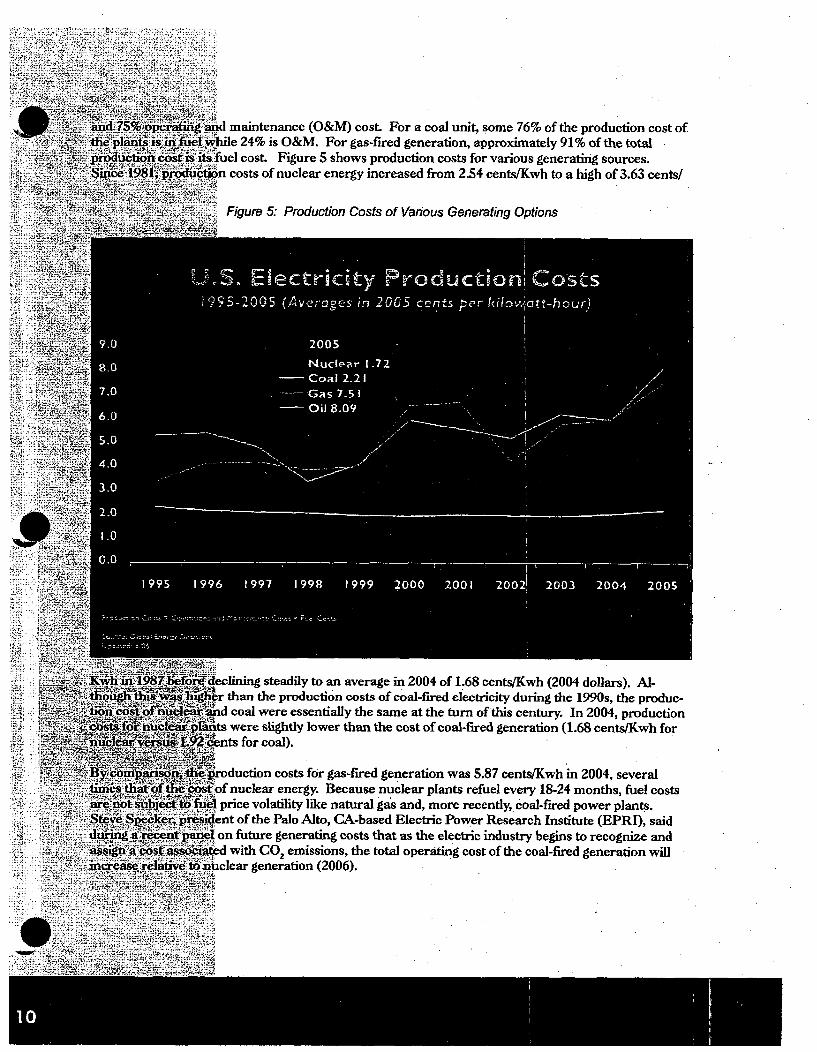
I maintenance (O&M) cost. For a coal unit, some 76% of the production cost ofile 24% is O&M. For gas-fired generation, approximately 91% of the totaliel cost. Figure 5 shows production costs for various generating sources.i costs of nuclear energy increased from 2.54 cents/Kwh to a high of 3.63 cents/
Figure 5: Production Costs of Various Generating Options
wclining steadily to an average in 2004 of 1.68 cents/Kwh (2004 dollars). Al-r than the production costs of coal-fired electricity during the 1990s, the produc-id coal were essentially the same at the turn of this century. In 2004, productionts were slightly lower than the cost of coal-fired generation (1.68 cents/Kwh for-nts for coal).
roduction costs for gas-fired generation was 5.87 cents/Kwh in 2004, severalof nuclear energy. Because nuclear plants refuel every 18-24 months, fuel costsprice volatility like natural gas and, more recently, coal-fired power plants.ent of the Palo Alto, CA-based Electric Power Research Institute (EPRI), saidon future generating costs that as the electric industry begins to recognize andd with CO. emissions, the total operating cost of the coal-fired generation willLclear generation (2006).

Economic Impact of Nuclear Power PlantsThe average U.S. nuclear plant employs approximately 500 employees in the local-jobs typically pay salaries that are 40 percent higher than the average salaries in tlnomic activity by the plant also generates 500 additional jobs in the local area, accdseveral nuclear power plants by the Nuclear Energy Institute.
A nuclear plant generates approximately $350 million in total output for the local 0roughly $60 million in total labor income. These figures include both direct and se'The direct effects reflect expenditures for goods, services, and labor made directly Isecondary effects include subsequent spending effects and reflect how plant expenddown" through the local economy.
Another way of measuring the secondary effects of a plant is by using multipliers,iratio of the plant's "total economic impact" to its "direct economic impact" and careach geographic region. Multipliers essentially measure how many dollars are creifor every dollar spent by the plant. The local output multiplier for the average nuciproximately 1.13. That means that every dollar spent by a nuclear plant results in,-$1.13 in the local community.
Nuclear plants also account for a significant amount of tax revenue to their state a]ties. The tax impacts from a nuclear plant extend beyond the tax revenue generateplant. Spending from the plants has direct impacts on income and value creation, Naffects taxes paid on that income and value. Similarly, the secondary effects of plaxother products and services, in addition to the increased economic activity itself, leEincome and value creation, as well as additional tax revenues. The average nuclea,total state and local tax revenue of over $20 million. These tax dollars benefit scho,state and local infrastructure needs.
A specific example of the benefits of nuclear plants is found in a 2004 report on theto local communities and the states of Duke Power's nuclear power plants. In thisestimated that theeconomic impacton the countiessurrounding thenuclear plants atMcGuire andCatawba are morethan $1.5 billion,and those sur-rounding Oconeeplant at $791million.
In a 2004 economicimpact study of"Progress Energy'sBrunswickNuclear PowerStation, Universityof North Carolina-Wilmington econo-mists Claude

L 'Hall Jr. found that the Brunswick facility has significant positive impacts on thexýunties of North Carolina. The facility has impacts on gross output or income,ll' self-employment income, property income, indirect business taxes, and local6: facility's impact on gross output or income in the four counties was almost $901pkrcent of the value of total regional output in the four-county area.
Oity supported 2,030 jobs (1.3 percent of total employment) and $88.4 million iniii in 2003, with an annual average salary per job of $43,500. "Prior to this report,own about the faciliiy's economic impact inside or outside of Brunswick County. It,wn and, perhaps, at times, misunderstood and unappreciated, major asset to theý"economy," the analysis found. 'Also, not to be overlooked are Progress Energy's
Mirce contributions associated with the nuclear facility."

New Nuclear Plants - An EnergyImperative?
Improved Financial Climate for Nuclear Power iiIndependent analyses by the University of Chicago and the Massachusetts Institu. 4Tch'bi69'• in"-,2003 and 2004, respectively, found that the first few new nuclear power plants wou 9ii n1.u... i•eeconomic and financing hurdles. The Energy Policy Act of 2005 addressed these hdl whsvfinancial incentives for the construction of a limited number of new nuclear plantsi` i...Un.....States. A production tax credit, similar to the credit for wind and solar generation•i,1&A•4da longaatee program, available to all low- or zero-emission generation, were designed to " the oicof and to facilitate financing for the first few new nuclear power plants. The legisl iti ' vzd-standby support, a form of insurance, to help protect private companies against dela ca)u blicensing or litigation owing to factors beyond their control. -• ..i
The electric utility industry has a much shorter focus than in the past. Avoiding n6ar-term .e.on6.crisk will sometimes outweigh long-term needs resulting in the increased reliance on•n•e•• iel'so•_'urcesuch as the over-reliance on natural gas in the electricity sector over the past dozes&Ayprs.,Oinýý eissue that will impact the future of nuclear energy is the ability to finance new nuclear. po! ' r plantIn that regard, recent key financial institutions have bolstered the outlook fornew nuc`lear power plant.....construction. , . ...
Merrill Lynch, discussing the need for environmental controls on coal plants, seesaifa _npclear.utilities as "beneficiaries of the rising cost profile of coal generation and since the cossof nuclearpower are relatively stable, these higher prices lead to higher margins for the nuclear p]ants- I n _-addition, nuclear utilities represent a free option on potential future carbon-reduction leisatb. ..n. andthis should be an added margin for a nuclear plant" (December 2005). Moody's s~ay-gs ;"tieif ab•e,trend of [nuclear] plant performance is partly duo to the sector's proactive responsem meeting gmuchstricter inspection requirements imposed by the NRC" (February 2004).
Finally, Prudential Equity sees a convergence of "powerful economic and political for-eis at sho ldlead to a renaissance of nuclear power," with momentum for new nuclear constructionil•eiigsustained by industry and federal officials who see nuclear as emission-free, secure soýrce`bf electric•ity(Prudential Equity Group, January 2005). 7
Of course, the first investors to gain access to funds for a new nuclear plant will be c'HiinI aneWcourse-or at least one that has not been navigated with the current market, policY..variables. Uncertainty will continue to create some investment angst until the new 'e& 6ifeiic1power expansion is well underway. The Energy Policy Act of 2005 will also play a 'rlo iiim iiir-goratinvestor confidence and enabling new nuclear power plants to come on line. A -,
Implications on Nuclear Power of Energy Pol .1992 and 2005 cy• !tsofEnergy Policy Act of 1992.... .......-Although this law had energy-efficiency and conservation as its key features, sever " As f the;actdeal specifically with nuclear power and the role it plays in the electricity mix of the I SaesThe act codified the framework for the licensing process for new nuclear plants, give..p'.'rced: ...-rUdelays and ensuing financial difficulties posed by the former process. The revisedlicen6sgpress
V

ut early, so that energy companies can resolve issues before they make a largeit to build a new reactor.
gy companies are now pursuing license applications for new reactors using ap-under the framework provided by the 1992 law. These include the early site-h allows a company to gain pre-approval of a site for a new reactor in advance ofnd combined operating process, which allows a company to pursue a construction
license for a new reactor simultaneously. The law established the UnitedLorporation (USEC) for the purpose of managing uranium and uranium enrich-0omestically and to foreign entities. USEC today is a $1.6 billion corporation thatamum enrichment facility in the United States, a gaseous-diffusion plant, at
ith uranium supply and processing, including the establishment of the Nationalleserve; and health, safety and environmental issues associated with uranium
In addition there was a focus on the commercialization of advanced nuclearn particular the advanced light-water technology and the modular high tempera-tbr technology, along with the liquid metal reactor technology. The act set in placehing a company to gain certification for a new plant design, paving the way for-s - an approach not applied on a large scale with the construction of today's
Nct of 2005figust 2005, this law includes a range of measures supporting both currentlythe construction of new nuclear plants. The act provides limited incentives for*s, including loan guarantees, production tax credits, and investment protection forjilder's control; extends the Price-Anderson Act framework for industry-fundedtrance; and provides added nuclear energy research and development funding.
iredit provides a credit of 1.8 cents/Kwh for the first 6,000 Mwh of generation from6r its first eight years of operation for units in service before 2021. The loanit of the act provides loan guarantees up to 80 percent of the zero-emission or low-ts, while the standby insurance provision protects for financial impacts of delayscontrol for the first six reactors. These delays could be due to delays in NRCOn.
ýatural Resources Chair Pete Domenici of New Mexico, in hearings in May 2006,h delays is an essential part of the act and believes new nuclear generation of upbe in place between 2015 and 2020. "It's important that this risk insurance beft seen a new nuclear power plant ordered in three decades. I consider an effec-un to help utilities cover the cost of delays caused by law suits or regulatoryi, making those proposed plans a reality" (Energy Senate Press Release 2006).

New Nuclear Plant Licensing - Plant DesignCertification, Early Site Permits, and Combii eOperating LicenseInterest in one-step nuclear power plant licensing was accentuated following lengltydures for the Shoreham Nuclear Plant in New York and the Seabrook plant in M#i1980s. According to the NRC, it was "apparent that the complicated licensing probedeterrent to utilities who might consider building nuclear plants." The NRC propT-Aýlicensing procedures by replacing the traditional two-step process with a one-step sysystem, the NRC established a graded approach that applied to the systems, struct:iunents and their relationship to plant safety, thus ensuring safety while providing fle•iIment of new designs (NRC 2003).
NRC Chairman Nils Diaz suggested the use of a revamped 10 CFR Part 52 for li•lplants depends on numerous factors, including the quality of the application submit•icompany. "The primary purpose for establishing the new Part 52 process for licenal]facilities was to encourage early resolution of issues to increase regulatory predicbibmajor financial commitments while maintaining the requisite safety reviews."
Recognizing the number of potential applications for new plants that are expected. tthe economic simplified boiling water reactor (ESBWR) and the economic pressurizý"there is much appeal in an approach that resolves specific design details for all imipcin the process - early resolution of environmental issues and emergency preparednestal of the combined construction and operating license (COL) application, could bcibtimely completion of the COL reviews." Standardization in both industry planningition review is the key to making this approach work for potentially scores of licens',ethe three reactor designs (Diaz Febiruary 13, 2006).
The certification of new standard reactor designs resolves all safety issues with the!doordered for a particular site. The design certification process is a lengthy process buicessfully completed for four advanced reactor designs: the Westinghouse AP-600 (Pr4Reactor or PWR); the Westinghouse AP-1000; Combustion Engineering System 80-GE Advanced Boiling Water Reactor (BWR). The GE ESBWR is currently under -itAREVA intends to pursue certification of its EPR design.
Early Site Permits (ESP)
The early site permit (ESP) process allows an applicant to address site-related issueismental impacts, for possible future construction and operation of a nuclear power p1NRC's review process requires both a technical review of safety issues and an envirfor each application. If approved, an ESP gives the applicant up to 20 years to decid4one or more nuclear plants on the site and to file an application with the NRC for' a]jconstruction.
To date, three ESP applications have been submitted, all at sites where nuclear powecurrently operating. Dominion, Entergy and Exelon have submitted applications, a.nhave taken place within Duke Energy to consider application for ESP for a new reacDiaz 2004, 83). The NRC issued a final environmental impact statement on the projGrand Gulf nuclear plant site near Vicksburg, Mississippi. The Grand Gulf ESP apjin 2003 by System Energy Resources, a subsidiary of Entergy Nuclear.

fnies, including Southern Company, are either preparing or considering filingie NRC has recently held public meetings in Georgia, for example, to discussly site permit application for the Southern Nuclear Operating Company's Vogtles two reactors generating electricity (NRC April 25, 2006).
struction and Operating Licenses (COL)
required to obtain an operating license is another important licensing changeentire process more efficient and manageable. Instead of filing separate applica-on permit and then an operating license, a prospective nuclear plant operatoried construction and operating license (COL), during which time contentiousiublic participation in the project are vetted prior to construction. "The intent isig issues that may be raised after the plant is built are those relating to adherenceto the design specifications and any new safety issues that may have emergedsued" (Travieso-Diaz 2004, 84).
mar plant activity is focused in the Mid-Atlantic and Southern states. ThreeI to the U.S. Department of Energy for matching grants to pursue COLs includ-TVA-led group, and a Dominion Energy-led group. NuStart, which consists ofDuke Energy, EDF International North America, Entergy, Exelon, Florida
ess Energy, Southern Company, TVA, General Electric and Westinghouse, haswhich it plans to file an application for COL. At TVNs Bellefonte site, a
)0 reactor plan will be submitted; and at Entergy's Grand Gulf site, a GEESBWR plant will be submitted. NuStartEnergy's mission is to keep the nuclear optionopen by demonstrating the NRC application andapproval process for COL.
Progress Energy is preparing to file COL applica-tions for possible new nuclear plants, one in theCarolinas and one in Florida, with an applicationdate for both COLs to the NRC by 2008. If planscontinue on track, construction of these unitscould begin as early as 2010 with power genera-tion by 2015. According to company officials,variables that will impact decisions regardingwhich future generating options to pursue includethe power market conditions; projections of otherproposed plants in the area; fuel prices; regula-tory environment; and the ability to obtainfinancing. "Nuclear power may prove to be ourbest option to provide reliably affordable andemissions-free energy and it will provide anopportunity to maintain a diverse fuel mix inmeeting future demand" (Progress Energy 2005).
In addition, Duke Power plans to submit a COLwithin 24-30 months for the Westinghouse AP-1000. Southern Nuclear Operating Co. plans tosubmit a COL for a new reactor at its Vogtieplant while Entergy likewise has submitted plansfor its River Bend plant.
History of Nuclear Energy
The Early Days of Nuclear Power in the United tfttes.,
After World War II, the U.S. government encouraged the development of nuclear nac-e-civilian purposes. Congress created the Atomic Energy Commission (AEC) in 1946 T AE uhrized the construction of Experimental Breeder Reactor I in Idaho, where electricity ":fs:ti" ene
ated from nuclear energy on Dec. 20, 1951 (DOE 1994).To stimulate the private development of nuclear power, the Atomic Energy Commissiin
myriad supports to U.S. firms engaged in building and operating nuclear power stations-.'•ngunderwriting reactor construction costs, providingfreefuelfor reactors..fundingnerdevelopment activities, and committing the federal government to the development of uTcar4waste•:•disposal facilities (Rodobnik 2006, 105). i*.*. * -
In 1953, President Dwight Eisenhower delivered his 'Atoms for Peace" speech at th ed 14a
declaring that the United States was intent on fostering international cooperation of ani energy tec•h•nology "to solve humanity's energy difficulties by the end of the century." The Eis&how"erAdmis1tration also supported congressional enactment of the Price-Anderson Act of 19573'-h'li the'liability of utilities operating nuclear reactors to a maximum of $560 million in the ,yev aycdent (Rodobnik 2006,105). Today, the U.S. nuclear power industry has an umbre0liia6finore han-$102billion in liability insurance protection to be used in the event of a reactor incident.ilitie, not thepublic or the federal government, pay for this insurance.
A major goal of nuclear research in the -.---
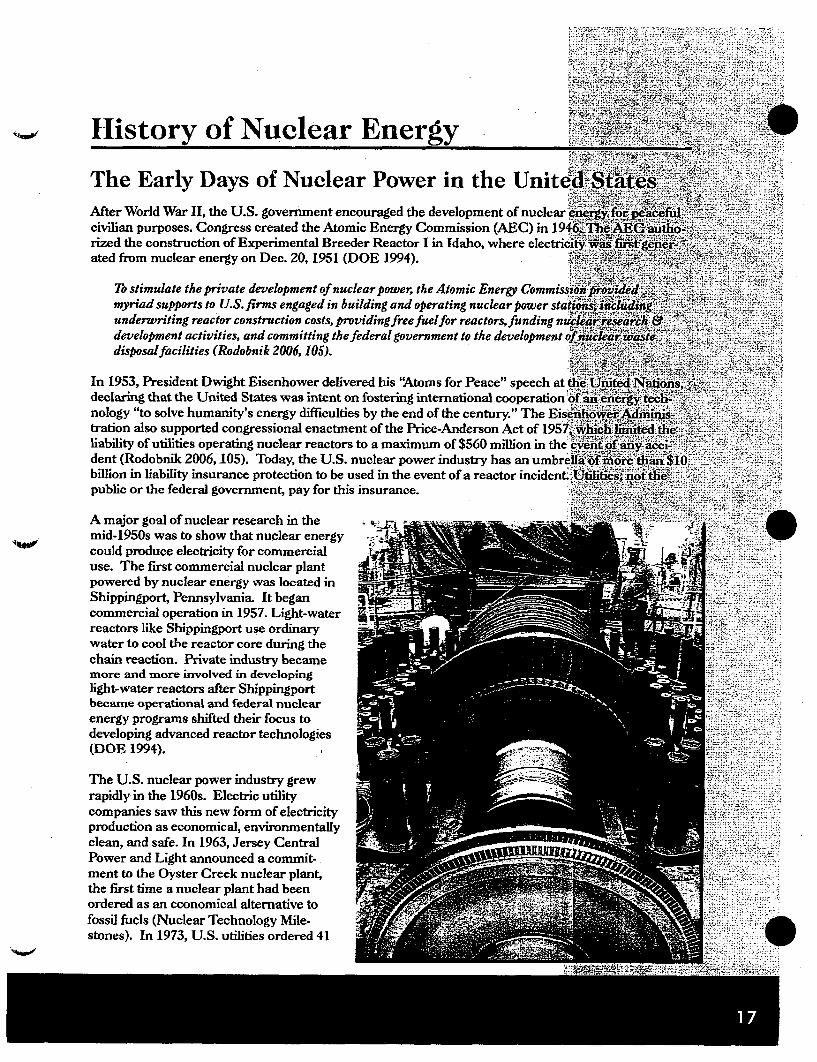
mid-1950s was to show that nuclear energy , .could produce electricity for commercialuse. The first commercial nuclear plantpowered by nuclear energy was located M'Shippingport, Pennsylvania. It begancommercial operation in 1957. Light-water -reactors like Shippingport use ordinary -
water to cool the reactor core during thechain reaction. Private industry becamemore and more involved in developinglight-water reactors after Shippingport -became operational and federal nuclearenergy programs shifted their focus todeveloping advanced reactor technologies(DOE 1994).
The U.S. nuclear power industry grewrapidly in the 1960s. Electric utilitycompanies saw this new form of electricityproduction as economical, environmentallyclean, and safe. In 1963, Jersey CentralPower and Light announced a commit-.ment to the Oyster Creek nuclear plant,the first time a nuclear plant had beenordered as an economical alternative tofossil fuels (Nuclear Technology Mile-stones). In 1973, U.S. utilities ordered 41

.l4, the first reactor of 1,000-MW size came online with Commonwealth Edison'sis(DOE 1994).
ower Grows in the Southplants in the South in the early 1970s were Carolina Power & Light's H. B.V. lin Virginia, Turkey Point 3 in Florida, Duke's Oconee I and 2, TVA's Brownsns ,s Nuclear 1. From an electricity dream in the sixties to large-scale power genera-40arge boost of nuclear energy was beginning to make a major mark in the elec-the economy in the South.
utilear power policy created by the Southern Governors' Conference in 1969 investi-,su•s, opportunities, and environmental effects related to the increased use of nucleard •in the development of state and regional nuclear power policies for the public'[oiice (1) identified and evaluated relevant information on the role of nuclear powerand regional electric energy requirements; (2) studied public issues and problems-power operations, plant safety, radiation control, waste disposal, cooling water
icrienvironmental considerations; and (3) prepared recommendations for state orio•er policies for consideration by governors and other state officials (Southern'rne 1970).
ýslof the report included a statement of support for the development of nuclear power;gram; regulatory responsibility review and sharing with the federal government;
numerous aspects of nuclear power; and cooperation and coordination amongLgncies, among others. The Southern States Energy Board, originally formed inthe Southern Interstate Nuclear Board, has continued to be involved with nuclear
me'.
i'aieraged about 7 percent per year for a number of years, doubling every 12 years,ýarly 1970s when nuclear power plants were being planned. In addition, projectionsra costs were relatively optimistic so that new nuclear units were being orderedpntry at a rapid pace. In the late 1970s and 1980s, however, growth slowed. Demandricity decreased and concern grew over nuclear issues, such as reactor safety, waster environmental considerations (DOE 1994). The oil embargo of the early 1970sýrqwth, while delays and cost increases were occurring at nuclear power plante, #esc factors resulted in a number of utilities canceling baseload power projects,lea, that were either under consideration or already under construction.
ies6 past 30 years, nuclear power in the South has been a key factor leading to stabledAi.dequate, reliable supply of power. With generation topping 341 billion Kwh in
states, nuclear energy provides approximately one-fifth of the electricity needs of'Witt South Carolina receives 52% of its electricity from nuclear power, while MVr-_ad North Carolina 31%. All but three SSEB states host nuclear power plants.
&r&wer generation has tripled in the past 25 years-from 251 billion Kwh in 1980 to'Kwh in 2005. The South's annual generation from nuclear power over select years2 :nd has averaged 342 billion Kwh in the past four years. As a point of reference,prOximately 44% of the nation's total electricity. Note that in 2005, the environmen-lear energy resulted in the~prevention of 305 million tons of carbon dioxide (CO,)iliin ton reduction in sulfur dioxide (SO2) emissions; and a 500,000-ton reduction inQk emissions.
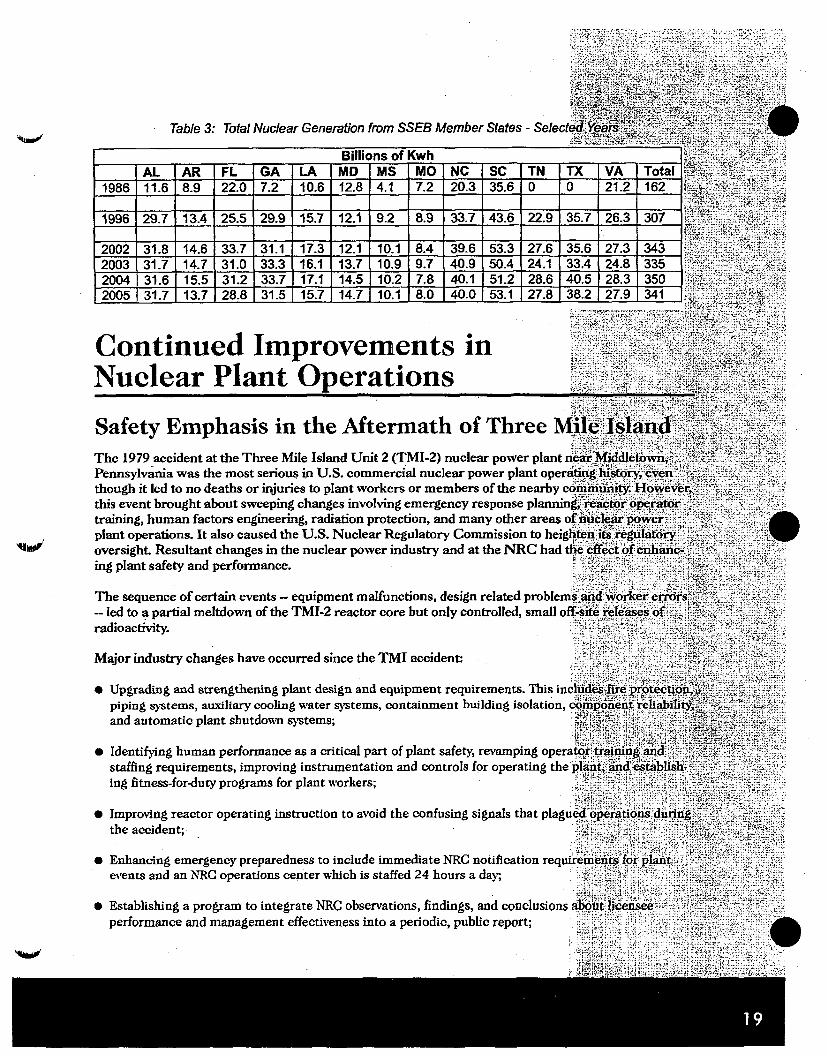
Table 3: Total Nuclear Generation from SSEB Member States - Selecý
Billions of KwhAL. AR FL GA LA MD M'S MO• NC ISC- TN TX VA ... Total
1986 11.6 8.9 22.0 7.2 10.6 12.8 4.1 7.2 20.3 35.6 0 0 21.2 162
1996 29.7 13.4 25.5 29.9 15.7 12.1 9.2 8.9 33.7 43.6 22.9 35.7 26.3 307
2002 31.8 14.6 33.7 31.1 17.3 12.1 10.1 8.4 39.6 53.3 27.6 35.6 27.3 3432003 31.7 14.7 31.0 33.3 16.1 13.7 10.9 9.7 40.9 50.4 24. 33.4 24.8 3352004 31.6 15.5 31.2 33.7 17.1 14.5 10.2 7.8 40.1 51.2 28.6 40.5 28.3 3502005 31.7 13.7 28.8 31.5 15.7 14.7 10.1 8.0 40.0 53.1 27.8 38.2 27.9 341
Continued Improvements inNuclear Plant Operations
Safety Emphasis in the Aftermath of Three MThe 1979 accident at the Three Mile Island Unit 2 (TMI-2) nuclear power plant 6Pennsylvania was the most serious in U.S. commercial nuclear power plant operathough it led to no deaths or injuries to plant workers or members of the nearby ccthis event brought about sweeping changes involving emergency response planninitraining, human factors engineering, radiation protection, and many other areas olplant operations. It also caused the U.S. Nuclear Regulatory Commission to heiglioversight. Resultant changes in the nuclear power industry and at the NRC had tling plant safety and performance.
The sequence of certain events - equipment malfunctions, design related problems-- led to a partial meltdown of the TMI-2 reactor core but only controlled, small offradioactivity.
Major industry changes have occurred since the TMI accident:
" Upgrading and strengthening plant design and equipment requirements. This incpiping systems, auxiliary cooling water systems, containment building isolation, cand automatic plant shutdown systems;
" Identifying human performance as a critical part of plant safety, revamping opera'staffing requirements, improving instrumentation and controls for operating theIIng fitness-for-duty programs for plant workers;
* Improving reactor operating instruction to avoid the confusing signals that plaguithe accident;
• Enhancing emergency preparedness to include immediate NRC notification requiievents and an NRC operations center which is staffed 24 hours a day;
" Establishing a program to integrate NRC observations, findings, and conclusionsperformance and management effectiveness into a periodic, public report;

esident inspector program, first authorized in 1977, whereby at least two inspectorsrk exclusively at each plant in the U.S to provide daily surveillance of licenseer'egulations;
tlanta-based Institute of Nuclear Power Operations (INPO), the industry's ownnd formation of what is now the Nuclear Energy Institute to provide a unifiedto generic nuclear policy and regulatory issues.
oved toward a new reactor oversight process for the nation's nuclear plants, aintitative performance indicators and safety significance. Today's reactor over-ned to focus industry and NRC resources on equipment, components and opera-ýe the greatest importance to, and impact on, safety. The agency and the industry1erience with this revised reactor oversight process and the approach is successfulisparency, objectivity and efficiency of regulatory oversight.
& process combines the results of performance indicators in 18 key, areas and2,500 hours of NRC inspections per reactor to determine the appropriate alloca-ources across all operating plants. The most recent results, after the fourthas follows:
[l green (best level) performance indicators and inspection findings and will receive)f NRC inspection (approximately 2,500 hours per year);angle white (second-best level) performance indicator or inspection finding and illidl inspection beyond the baseline effort;re than one single white indicator or finding in a performance area or had whiteIgs in different performance areas and wIll receive more in-depth inspection.
nht Challenges of the Mid-1980s to Mid-
,,mbarked on ambitious nuclear programs during a period of high load growth andthe 1960s and early 1970s, but that growth pattern evaporated following the Arabd, the nuclear industry experienced skyrocketing construction costs, partly due toýat grew out of the lessons learned from the accident at Three Mile Island. Many
dramatically as new, large generating units came into service in the mid-1980s,ess capacity as a result of units prudently started but not currently needed togrowth in demand for electricity (Baliles 1987, 111-3).
Lice, "there is little doubt that one major factor in halting nuclear power expan-p in demand growth, beginning in 1973." Demand growth averaged 7.1 percent aF2, then dropped to 2.6 percent a year during 1973-1982. During 1982-1988, loadpercent a year. Several other factors in addition to this sharp decline in demandrV's expansion. Chief among these are: (1) loss of confidence by the financiali•lity of utility management; (2) increasingly complex and burdensome regulationte level; and (3) erosion of the historic cost advantage that nuclear power enjoyedir option for large-scale electricity generation in the United States. Nuclear
also have been affected by a sharp increase during the mid-1970s in the public'siservation was preferable to the construction of more power plants. In addition,ictive waste disposal played a role in the decline of nuclear power (Nealy 1990, 3).
nding the Energy Stalemate: A Bipartisan Strategy to Meet America's Energyional Commission on Energy Policy said that "government policies to improve

the prospects for expansion of nuclear energy are warranted by the interests of sod i Wa,going beyond the private interests that are reflected in the marketplace-in abatin c n ate Crisks by expanding the share of no-carbon and low-carbon energy options in the efi 'mix. The policies that the commission judges to be warranted at this time are similaim.i-•espeetto those of the recent MIT study of the future of nuclear energy: they relate to (a) t-adiifty/.security, considered together; (b) radioactive waste management; and (c) proliferation" rik 'Ener•yNCommission 2004).
Critics of nuclear power, such as the Natural Resources Defense Council (NRDC) et r'e':-are still perceived risks of the accidental release of radioactivity and that there areon dpublic health risks with uranium mining and milling. An NRDC position paper in!W 20,sttd1''fortunately, in terms of helping solve the problems of global warming, the nuclear p ttu.......present state suffers from too many security, safety and environmental exposure pfb.sive costs to qualify as a leading means to combat global warming pollution" (Cochria•nR tbla 0 2 )However, other organizations, such as the Pew Center for Global Climate Change_ e roessivePolicy Institute, the Earth Institute at Columbia University and Princeton Univer;ittbe eh'J .nuclear energy is one way to meet the dual challenge of meeting our growing electricitAy dem and ndreducing carbon emissions. ...
A May 13, 2006 editorial in The New York Times reiterated the challenges and beefits o n--learpower, including the abundant and inexpensive fuel supply diversity offered by nuclear power-..ability of nuclear energy to reduce carbon dioxide emissions that contribute to globa',w g a .the-fuel diversity that gives growing economies in China and India alternatives to heavy". eedn- oburning large quantities of coal and oil. However, making any real dent in carbon:c einrequire building many hundreds or even thousands of new nuclear plants around tewin ingi-decades" which, most importantly, begs the question of the long-term solution for wasie disposa(2006). ..... . .- .
Maximizing Existing Assets: License Renewa, iJn"tCapacity Uprates and CapacityFactor IncreasesThere are several methods available to increase the valueof today's nuclear generating assets, including extension ofthe license of the nuclear reactor; increasing the operationof the reactor; and changes to the unit that increase thepower rating, which results in increased capacity andenergy output.
License Renewal
While some utilities were closing reactors before their 40-year operating licenses expired, others were weighing thepotential of extending the lives of plants beyond 40 years.Following a detailed analysis of license renewal in 1985 and.further study, the NRC determined that plants would be -7 'able to apply for a maximum of a 20-year extension to theirlicenses. Baltimore Gas and Electric received the firstlicense extension at its Calvert Cliffs plants in 1998 withDuke Energy obtaining extensions for its Oconee nuclearunits in South Carolina. Forty two reactors have had theirlicenses extended for 20 years while nine others haveapplied for license renewal.

Tprates
ael and operating cost of nuclear facilities, nuclear operating companies have notense renewal but have also continued to upgrade the operation of the units asa] generating capacity to the units already in service. Since the 1970s, utilitiesr uprates as a way to increase the power output of their nuclear facilities. The
Figure 6: Additional Capacity from Nuclear Unit Uprates
esve
WRs. Extended power uprates are greater than stretch power uprates and have-reases up to 20 percent. Extended power uprates usually require significantor pieces of plant equipment such as the high pressure turbines, condensateiain generators, and transformers. From the first uprate in 1977 at Calvertýd capacity some 5.5 percent, there have been over 4,200 MW of nuclear uprates.i the South have occurred at Southern Nuclear Operating Companies Plant.ent) and at Progress Energy's Brunswick plant with a 15 percent uprate in 2002.
MW of nuclear plant uprates are under consideration by the NRC to be in placears. Figure 6 shows the megawatts of nuclear generating capacity added throughthe period 1977 to 2006.
Factors and other Operating Parameters
;plants has increased substantially with operating capacity factors now hoveringear cycles. In addition, the frequency of unplanned reactor shutdowns has•e than 7 per 7,000 critical operating hours 20 years ago to less than 1 per 7,000Lprovement can be attributed to the maturation of operating practices. Thetit in nuclear plant operating and maintenance (O&M) practices is reflected by theruns that continue to break records. In September 2005, Exelon Nuclear'sworld record for the longest continuous run by a BWR by operating for 707 days
g outage in 2003 (Pettier 2005).
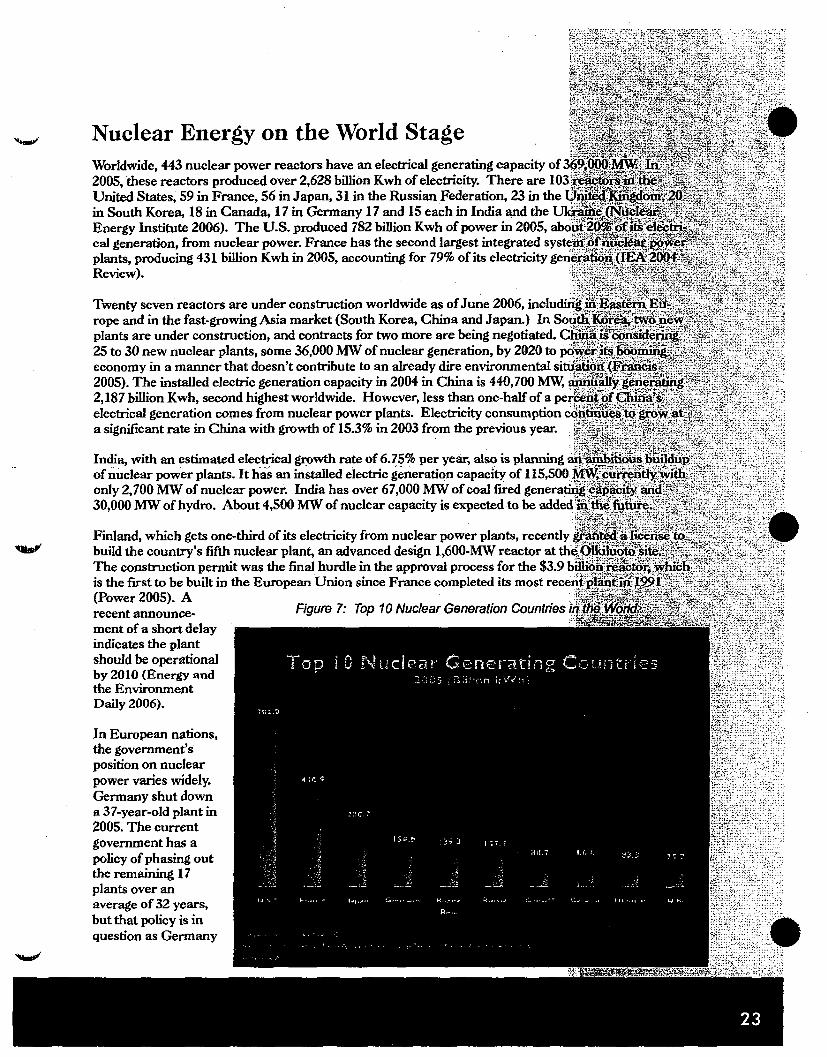
Nuclear Energy on the World StageWorldwide, 443 nuclear power reactors have an electrical generating capacity of 3602005, 'these reactors produced over 2,628 billion Kwh of electricity. There are 103 rUnited States, 59 in France, 56 in Japan, 31 in the Russian Federation, 23 in the Uiin South Korea, 18 in Canada, 17 in Germany 17 and 15 each in India and the UkrEnergy Institute 2006). The U.S. produced 782 billion Kwh of power in 2005, abo ucal generation, from nuclear power. France has the second largest integrated systebplants, producing 431 billion Kwh in 2005, accounting for 79% of its electricity geneiReview).
Twenty seven reactors are under construction worldwide as of June 2006, includir4rope and in the fast-growing Asia market (South Korea, China and Japan.) In Soulplants are under construction, and contracts for two more are being negotiated. Ch25 to 30 new nuclear plants, some 36,000 MW of nuclear generation, by 2020 to p1yeconomy in a manner that doesn't contribute to an already dire environmental situi2005). The installed electric generation capacity in 2004 in China is 440,700 MW, Or2,187 billion Kwh, second highest worldwide. However, less than one-half of a perdelectrical generation comes from nuclear power plants. Electricity consumption coia significant rate in China with growth of 15.3% in 2003 from the previous year.
India, with an estimated electrical growth rate of 6.75% per year, also is planning asof nuclear power plants. Itha an installed electric generation capacity of 115,500`1Aonly 2,700 MW of nuclear power. India has over 67,000 MW of coal fired generatin,30,000 MW of hydro. About 4,500 MW of nuclear capacity is expected to be addedi
Finland, which gets one-third of its electricity from nuclear power plants, recentlygbuild the country's fifth nuclear plant, an advanced design 1,600-MW reactor at theThe construction pernmit was the final hurdle in the approval process for the $3.9 bilis the first to be built in the European Union since France completed its most recen(Power 2005). Arecent announce- Figure 7: Top 10 Nuclear Generation Countries inment of a short delayindicates the plantshould be operationalby 2010 (Energy andthe EnvironmentDaily 2006).
In European nations,the government'sposition on nuclearpower varies widely.Germany shut downa 37-year-old plant in2005. The currentgovernment has apolicy of phasing outthe remaining 17plants over anaverage of 32 years,but that policy is inquestion as Germany
ith its commitments under the Kyoto Protocol. Sweden voted in 1982 to phase out'its 12 plants was recently closed, but now Swedish public opinion strongly favors
policy will continue as it replaces some of its aging nuclear plants with newBritain, there is speculation the Labour government may switch to a pro-
1-2006, the United Kingdom was reviewing its energy policy, including the role ofMinister Tony Blair has said the country should build more nuclear plants.
31 outlooks toward nuclear energy, it provides 16 percent of the world's electric-as it did in 1986 despite two decades of continued electrification around theclear power output has grown on average 9.2 percent a year (FRANCIS 2005).kergy. production from the nuclear units in those countries with the largestineration.
Policy Issues
Non-Proliferation IssuesThe need to prevent the spread of nuclear weapons was evident from the first days cBy the mid sixties, there were five declared nuclear weapon states - the United S64Union, the United Kingdom, France and China. Many predicted that the nuclear •20-30 countries within two decades. It rapidly became clear that if the many peacefttechnology were to be developed, states needed credible assurances that nuclear pnibe diverted to military applications. Along these lines the United States has redefnetion policy on nuclear energy through various aspects of its Global Nuclear Energy'-
" Upgrading and strengthening plant design and equipment requirements. This incliipiping systems, auxiliary cooling water systems, containment building isolation, coand automatic plant shutdowna systems;
" Reclcling nuclear fuel using new proliferation-resistant technologies to recoveer moreduce waste ill dramatically reduce the amount of waste requiring permanent dand its international partners will work together to develop commercial recycling';do not produce separated plutonium, thereby reducing proliferation concerns.
" Utilize the latest technologies to reduce the risk of nuclear proliferation worldide
* By developing new proliferation-resistant recycling technologies and increasing th7of nuclear energy worldwide by providing fuel services to developing nations, GNEP?tion risks and keep nuclear technology and materials out of the hands of rogue stat
" A Fuel Services program will enable nations to acquire nuclear energy economicalhproliferation risks. Under GNEP, a consortium of nations with advanced nuclear teiensure that countries who agreeto forgo their own investments in enrichment and'technologies will have reliable access to nuclear fuel. Once the advanced recycling'demonstrated, the spent fuel would be returned to fuel supplier countries for recy"c:ultimate disposition. This concept builds on the moratorium on the sale of enrichiiing technologies that has been in place over the past two years among G-8 nationis.
" Improve nuclear safeguards to enhance the proliferation-resistance and safety ofe.ýpower. Under GNBP, an international safeguards program is an integral part of t64nuclear energy and the development of future proliferation-resistant fuel cycle techgoal of GNEP is to make it nearly impossible to divert nuclear materials or modify' qimmediate detection. In order for the IAEA to effectively and efficiently monitor an4materials, GNEP will design advanced safeguards approaches directly into the plankthe expanding base of nuclear energy systems and fuel cycle facilities. The U.S. V-i Hclosely with the IAEA and our international partners to ensure that civilian nuclearonly for peaceful purposes (Global Nuclear Energy Partnership 2006).
Energy Diversity and Energy SecurityWhen President Bush signed the Energy Policy Act of 2005, he specifically mention(nuclear energy regarding its security as a domestic fuel supply. In his 2006 State of.he also decried America's addiction to oil and proposed increasing domestic energy snuclear power, to reduce U.S. reliance on imported oil. In addition, as described e-a
ificant additional sources of electricity production in the next two decades asogrow and as significant amounts of aging power plants are retired.
,htitled Securing America's Energy Future from the U.S. House of Representa-her issue is as central to the continued well-being of the United States as is energy!rnment Reform Subcommittee on Energy and Resources summarized nineri energy-related issues in 2005 with recommendations that will assure continuedd insulate U.S. foreign policy from coercion by producers of oil and natural gas.cific recommendations, the committee said that "the solution is not an 'either or'noting production and promoting conservation. The U.S. must pursue bothiittee recommended that to enhance competitiveness and protect American jobs,ot be used for baseload electricity generation or new generating capacity. Instead,q reserved for industries that use it as a feedstock or for primary energy whichI for by fuel-switching. "Nuclear energy must become the primary generator ofthereby relieving the pressure on natural gas prices and dramatically improvingiis" (2006).
ural gas in the electricity sector has resulted in supply and price volatility as well.itants such as S02, NOx, mercury and C02 also could limit coal use. While•:tly accounts for about 20% of the electricity generated in the United States and,ercentages will decline over time without additional nuclear reactors as electricity
isting nuclear plants are decommissioned. The regional economy could bea scenario in which there is inadequate power supply to fuel the region's economicino where higher than necessary cost of new generations are incurred.
Ailimate Change/Environmental Footprintreport entitled Agenda for Climate Action, the Pew Center on Global Climateic "continued use of nuclear power generation, pending resolution of issues such
0torage" as one of a number of key actions the U.S. should take to address emis-gases. Specifically, it recommends actions to drive the energy system towardker-carbon energy sources. "Because nuclear power is one of the few options for,,production, efforts should be made to preserve this option, which depends on the'industry to start expanding nuclear generating capacity in the next 10-15 years,olution of cost, safety and waste storage issues".
f suggest that:
ýuld enact legislation to encourage new fast-mover nuclear plants usingbhnologies, contingent on the resolution of these issues. Finance incen-a production tax credit, an investment tax credit, loan guarantees, and
nisms including those in the Energy Policy Act of 2005 will increase:for these new plants. Congress should restructure DOE's nuclear R&Dbus on the once-through fuel cycle (Pew Center 2006, 9).
ctric utilities to develop and promote the use of resources that do not createill be critical in the decades ahead as countries struggle to meet growing electricityig more environmentally sustainable energy solutions. Nuclear wastes continue'there is considerable effort being expended to develop solutions to those issues.•Research Initiative (NERI), a program sponsored by the Department of Energy,lutions to help reduce and ameliorate civilian reactor waste.

Figure 8 shows a relative picture of the lifecycle emissions of C02 from various sgenerating capacity. Nuclear power's lifecycle emissions are significantly lower tgenerating options. In fact, nuclear power emissions are even lower than the masources of energy.
Figure 8:. Carbon Dioxide Emissions from Various Generating Soi
Comario of W - lEm ssin
am-
Itti#r ony t !ff-Ioe emisioas of aft dioida ure amonr Ike loes! of avy e* Fy
Used Fuel ManagementScientific Consensus on Deep Geologic DisposalIt has been the scientific and technical consensus of the National Academy of Scieri(Nmost nuclear fuel management specialists for several decades that geological diso ungof engineered and natural barriers, is the preferred means of disposal for high-Ieve.1R9This strategy would securely isolate the byproducts from the biosphere for extremely-lng per.time, and ensure that residual radioactive substances reaching the biosphere after Ai• o
years would be at concentrations insignificant compared to natural background levels orSuch a final disposal solution would be permanent, but would be monitored for ongoiAn s.ientresearch and confirmation that it is performing as modeled, and the used fuel containers"c-onretrieved if needed.
Prior to the decision to dispose of nuclear waste in a geologic repository, other optioqWrecered. These options included dropping the waste into the Arctic shelf, blasting it in't'o-• s.pacto a remote Pacific island already contaminated by nuclear weapons tests; and burying I sesediments (SSEB Spent Fuel Handbook 1995).

ification of Yucca Mountain Site
ýs that led to the selection of Yucca Mountain for characterization started in 1977nnent decided to investigate the Nevada Test Site (NTS). Yucca Mountain is a,it ridge in the Nevada desert some 90 miles northwest of Las Vegas. The NTS•stigation because it was used for nuclear weapons testing; its land was withdrawnit was subject to long-term institutional control. Furthermore there were many,asons:
a, groundwater does not discharge into rivers that flow to major bodies of surface
hav'e geochemical characteristics that would retard the migration of radionuclides ifIi the specialb, designed containers;idwater flow between potential sites for a repository and the points of ground-water
educes the rate at which groundwater is recharged and therefore the amount of'er is very low, especially in the unsaturated rocks.
Ventually limited to three locations on the southwestern part of the NTS, of whichs eventually selected as the site (Yucca Mountain Site Overview 1988).
.,:Secretary of Energy made the formal decision to recommend to the Presidentitain site be developed as the nation's repository for commercial reactor fuel andeý waste from the nation's defense programs. His decision started the final siteie law that created the Yucca Mountain program is very specific about the process•approval. Once DOE has determined that the site is suitable, it notifies thed state legislature, then 30 days later DOE notifies the President. The Secretary.:his recommendation to the President on Feb. 14 2002. On July 23, 2002, Presi-juse Joint Resolution 87, allowing the DOE to take the next step in establishing aich to store our nation's nuclear waste. Nevada vetoed the President's approval,tity of Congress overrode the state's veto as allowed by the Nuclear Waste Policy
ukocess of preparing an application to obtain the Nuclear Regulatory Commissioniih construction and operation of the repository.
ýense from the NRC to build and operate a repository at Yucca Mountain, Ne-ipping nuclear waste from commercial and government-owned sites to the reposi-
rent must transport used nuclear fuel according to strict federal regulations. The•d in heavily shielded casks certified by the NRC along approved transportation"the department will provide technical assistance and funding to states and Nativerng emergency response personnel. Over the last 40 years, the nuclear energy
6ansported 3,000 shipments of spent nuclear fuel over 1.7 million miles of U.S.ids. Fuel containers were involved in just eight accidents, only four with fuelir. No radiation was released in any of the accidents.
aplementation of a multipurpose container to shield spent fuel during transport,SThis container system will address transportation, at-reactor storage, and
id disposal of commercial spent nuclear fuel, and will be consistent with DOE'ssigns.

Policy Statements in Support of Yucca Mountain *,. '
An international committee of the National Academy of Sciences' National ResearciCsoned rssle ,'*'2001 report supporting centralized disposal of used nuclear fuel, preferably in an undergroundrepotory. 'After four decades of study, the geological repository option remains the only so-entifcllycredible, long-term solution for safely isolating waste without having to rely on activ ..... nt,."'.:NAS said. 'Although there are still some significant technical challenges, the brodo.the scientific and technical communities is that enough is known for countries togeological disposal." This approach is sound, the committee said, as long as it invo6 '4-
reversible decision-making process that takes advantage of technological advances ibl particpation. "For example, geological repositories, such as Yucca Mountain in Nevada• •.•t.iitded,controlled and monitored for many decades throughout and some time beyond their- oprationa pbas-e`during which retrieval of waste would be possible if required." 1'. i
The leadership of the National Association of Regulatory Utility Commissioners e xp s en-,6d th"support to Secretary of Energy Samuel Bodman for the civilian radioactive waste mangemeintprogram. The commissioners also expressed their concern about the need to refor• the NuclearWaste Fund and bring financial stability to the program, the need for comprehensivei'and riscprogram schedules, and the importance that a solution to the waste disposal problenm' ti avemsustaining or expanding nuclear generation. .
The Southern Governors Association, in its 2005 policy priorities for energy, urged tliat full flndngiibemade available for all past and present commitments to cleanup operations at nuc•opr,ýnergy facilities
Nuclear Waste Fund (NWF) Payments/ Interim Storage Inventory..
Funding for the federal government's nuclear waste management program, includ~ing the YutccaMountain project, comes from collecting a one-tenth of a cent per Kwh fee from c0ohu" me hSelectricity generated at nuclear power plants. This fee is collected into a special tnsrfriid '6nled he,ý.Nuclear Waste Fund, which has collected approximately $27.9 billion since 1983. Soins sou therniates,have paid more than $500 million into the fund since 1983, including more than $Lbi l÷ri.ii:i SoutCarolina alone. Through 2005, DOE spent approximately $9.1 billion on repository! sibe'-crcteriz aý,tion research. Even though the fee is collected specifically for this program, Congr tsi ust r:ppropriate money each year for DOE's work. '. ,.-7i,
The nuclear industry believes Congress has consistently failed to provide the programith, adequatefunding which is one reason the program is behind schedule. In 2006, DOEpropo0d Ie isl!iiin Thatwill allow funding for the project directly from the Nuclear Waste Fund rather tha i ...... witother programs to remain within congressional budget caps. Clearly, DOE must di 6 >ithod toensure that it has appropriate funding as the project moves to the constructionpaT'- . 3--.
The Southern Legislative Council, in 2005, urged federal policymakers to support regul• e.ory, legislative and fiscal policies that would "reform the Nuclear Waste Fund by restoring thelfi••id& `-:ý-ts origuialbudgetary status; thus ensuring that fees paid by electricity consumers are used Isolelyto pa for theused fuel management program." The SLC also endorsed investment stimulus for p l••a•t pl ....a.'
construction and mitigation of regulatory risks associated with new plants.
Table 4 shows the contributions each state's consumers have made to the Nuclear Wthrough the first quarter of 2006. ": "-.

4: Contributions by SSEB Member States to Nuclear Waste Fund
State Nuclear Fuel Contribution to Waste Fund
Nuclear Waste Fund ContributionsState ($ Millions)Alabama 647.7Arkansas 253.9Florida 679.5Georgia 585W8Kentucky 0Louisiana 274.7Maryland 313.3MIA$.Iaappl 172.5Mlasoulri 166.4North Carolina 716.9Oklahoma 0South Carolina 1086.7Tennessee 383.1Texas 492.0Virginia 612.9Walt Virginia 0
TOTAL 6386.4Fued $awe is paoaNt olcecy geraaltd wft*4n Vmt bwfdala of af wWa*
FuW Sr-.. So . GOIatb E-a9y D..efakn I Erna-y 1.lfrn,-b0- AdO466SS.flNuds, Wa.aM F-d Co o - Of Mar- 31. 2006 fon. DOnraMS of Er-Wy
-stored at 83 locations throughout the United States, including reactor storageýent fuel storage facilities, national laboratories, university research and trainingweapons sites. The 103 commercial nuclear generating units licensed to operatemore than 2,000metric tons of spent fuel annually, a relatively small amount
kilowatt-hours of electricity generated at the plants. The total inventory was• metric tons at the end of 2004 (Energy Information Administration 2004). Table
-ar fuel assemblies are stored in the U.S.
Table 5: Fuel Storage Sites in the United States
ttaftoo. - :-: a
52 241.4 Shearon Harris Nu"eari NC P 3814 964.5Power Plant
Browns Ferry Nuclear Plan AL_ P 6696 1230.2 Catawba Nuclear Station SC P 1780 782.43. M. Farley Nuclear Plant.- AL P 2011 903.8 H.B.Robinson Steam SC P 344 147.9
___'. "__'Electric PlantCrystal River Nuclear Power FL P 824 382-3 I 56 24.1Plant .. .• . •
St. LuckeNuclear Power FL P 2278 870.7 Oconee Nuclear Station,:. SC P 1419 665.8Plant .____.._. .___....___..___-____'___ __.__'__" ___'___.Turkey Point Station:. : FL P 1862 851.7 -. - 1 1726 800.4
A. W. Vogue Electric. GA P 1639 720.8 Savannah River Defense SC F 9657 28.9GeneratimgPlant _ _"__ ___SiteE. L. Hatch Nuclear Plant GA P 5019 909-3 V. C. Summer Nuclear SC P 812 353.9
Station •_.. . .. _"•- 816 151.2 Sequoyah.Nuclear Power TN P 1699 742.6
____i__ Plant __"_.__""_River Bend Station. LA P 2148 383.9 Watts BarNuclear Power TN P 297 136.6
"".__.__.._ ."_".__ Plant-Waterford Generating LA P 960 396.4 Comanche Peak Steam s TX P 1273 540.7Station Electric Station __."__"i_
Calvert Cliffs Nuclear Power MD P 1348 518.0 South Texas Project TX P 1254 677.8Plant _______..__ _,._ __ ....__ ,___ :___ ._...
-. 1 960 368.1 North Anna Power Station VA P 1410 652.7CallawayNudearPlant:... MO P 1118 479.0 I 480 220.8
Grand Guff Nuclear Station NMS P 3160 560.2 Sony Power Station VA P 794 365.4
Brunswick Steam Electric NC P 2227 477.4 1 1150 524.2Plant -
v, t'ulre N•uclJe.ar: NC. 1P 22.32 1001.1 TOTALS in SSEB -
Membeir States65,492 18,809.5
Reactors of the Future
Advanced Reactor Technology for the Next WNuclear PlantsWestinghouse has earned NRC approval for its 1,000-megawatt Advanced Pressursurized water reactor that has one-third fewer pumps, half as many valves, and mcfewer pipes than current reactors. It can be built using modular units manufactuntransported to the nuclear plant site, cutting construction time to three years. The•
largely passive safety system in which cooling water is above the reactor core andnatural circulation for emergency cooling. In today's reactor designs, cooling wateinto the reactor core. Duke Power, Progress Energy and Southern Company havein applying for COL applications. Duke Power plans to prepare applications to th4bined COLs for two of these designs to be submitted within the next 24 to 30 mont]selected the Harris Nuclear Plant site in North Carolina and an unnamed site in Ffor possible nuclear expansion. Meanwhile, Southern Nuclear announced plans tcfor an early site permit in 2006, along with a combined COL in 2008 for Plant Vogithe AP1OOD.
In 2005, GE formally submitted a design certification application to the NRC for itdesign - the economic simplified boiling water, reactor (ESBWRY - which is a "Geidesign for a 1,500 megawatt reactor. According to GE, it has a simple design and pfeatures, depending on fewer active mechanical systems, with associated pumps ainstead on more reliable passive systems that utilize natural forces such as naturalgravity. It also occupies a smaller footprint which will result in reduced constructi4ule. The ESBWR evolved from GE's Advanced Boiling Water Reactor design thatin 1997. That design has more than 18 reactor years of operating experience from'Japan. Plans are underway to prepare license applications for the ESBWR at Grasippi) and River Bend (Louisiana) (Petrochemical News 2005).
Three manufacturers are currently involved in the "Generation III Plus" reactor rAREVA is developing information to submit a design certification license to the NIversion of its newest reactor, one of which is already being built in Finland. The 1,Economic Pressurized Reactor (EPR) is an evolutionary design based on the Frenreactors designed by Framatoxne and Siemens. It is a simplified design using existiwith fewer parts. While maintaining an active rather than passive safety system, tIdesign improvements, including a double-wall concrete containment dome for gre aagainst terrorist attacks using an aircraft. The design also extends the dome overtand two of the four safety buildings. In case of a severe accident and meltdown, thdesigned to capture the fuel in a cavity below the containment building.
Generation IV Technology"Generation IV" reactors are intended to be safer, more efficient, and proliferationreactors reflect a revolutionary step from the Generation III reactors and earlier li,but development of these designs is not expected before 2030. The goal of the Geriiis to draw the international community together to develop long-term technologicalneeds. Generation IV systems are projected as prototypes in the next decade, withtion before 2030 (NEI). One unique characteristic of Generation IV reactors is thito produce more heat and less spent fuel, with a different cooling mechanism than,reactors. These reactors could produce hydrogen as a replacement for fossil fuels i

mn automobiles to electric lamps. International efforts are underway examiningthat would use gases, such as H20, or liquid metal or molten salt for cooling the
tor known as the "pebble bed modular reactor" is being developed in SouthDepartment is planning on a $1.25 billion program for a gas-cooled Generation IVin Idaho that would also produce hydrogen (AP 2005).
,the administration envisions a hydrogen-based economy to reduce U.S. depen--ces of energy and to provide a clean, abundant source of energy. This initiative isg six of the most promising new reactor technologies, including the gas-cooled fastast reactor; molten salt reactor; sodium-cooled fast reactor; supercritical water-ie very high temperature reactor.
itial Benefits of Nuclear Energy
ransition to a Hydrogen Economy
reactors, DOE's hydrogen initiative will demonstrate that commercial quantitieslanufactured economically without greenhouse gas emissions. Hydrogen isindustrial commodity, with an annual world consumption of some 45 million.n the production of chemicals, fertilizer, and in oil refining. Demand for hydro-rease significantly as high quality oil stocks diminish and cleaner fuels are man--esearch into replacing carbon fuels with hydrogen in automobiles. However, thisnomical methods forIirectly from waterfuels. Nuclear energy
ortant source ofeither through the
essary high-tempera-electricity (NEA 2003,
uinization
'or fresh water inrid, particularly inMiddle East, areAit to meet. Thesericulture, industry,nd growing popula-seawater is one5hortage. In thiss, considerable heat isowered desalinization-rating in Japan andants currently provideuses rather than large-tey are successfullyuelear energy is a)ssil fuels as the heat(NEA 2003, 83).

SummaryThe history of nuclear power in the South has been one of reliable, relatively inexjelectrical energy. As the South continues to grow, outpacing growth in the remairidthe electrical energy needed to fuel a strong and healthy economy in the South musThe region requires a diversity of new supplies and nuclear power is a leading contpower supply, along with renewables, new clean-coal technology, and natural gas.z
While there are challenges for the nuclear industry, particularly as new nuclear urnconstructed and licensed for the first time in over 30 years, there are major efforts!iissues such as waste disposal. Features of the Energy Policy Act of 2005 should bein the South so that these utilities can take advantage of early nuclear commitmentguarantees, production tax credits, stand-by support insurance and the re-authorizAnderson Act - all benefits provided to those who lead the way to a new era of nueiUnited States.
With early site permitting, COL and new nuclear designs being reviewed and readsof construction, states have a legitimate role in ensuring unnecessary barriers to n•removed.
Through the Southern Governors' Association Policy Priorities in Energy issues, iI2005 issued a statement "recognizing the re-emerging interest in nuclear energy aniing of various activities such as those regarding environmental sampling and analys'complexes".
Some specific steps that can be taken by various participants in the new nuclear vii
* Utilities should study and consider capacity uprates as appropriate for existing nul
* Utilities should study and consider life extensions as appropriate;
" Utilities and state energy offices, as well as state public service commissions, shotpublic outreach efforts to increase the public's awareness and understanding of enirole of nuclear power in those concerns;
" State officials should continue to coordinate waste transport efforts, emergency p1inter-state activities that are critical to the ongoing safety concerns of nuclear elel
* Utilities can take advantage of provisions of the Energy PolicyAct of 2005, which'pties for the resurgence of nuclear energy;
* State energy plans should consider methods to facilitate and ease the process forrties to be built within their states;
* States should review their permitting, siting and other regulatory processes to ensa barrier to full process efficiency when studying nuclear applications;
* The nuclear industry should continue to prioritize its endorsement of safety throujNuclear Energy Institute and other means of promotion of the safe and efficient us
aphyr Is Offer Evolutionary Change". 13 June. Washington: The Associated Press.
Path to Recovery- Report of the Advisory Committee on the Tennessee Valley Authority". Atlanta, GA:
66. Survey of 1,000 U.S. Adults. March. NOP World.
['Nuclear Energy Partnership". 13 February Washington, DC: Platt's Nuclear Energy Conference. Coin-
1.2005. Position Paper. Commercial Nuclear Power. October. New York: Natural Resources Defense
twDesign, Certification and Licensing". 13 February. Wshington, DC: Platt's Nuclear Energy Conference.Lan of Nuclear Regulatory Commission.
4gy) 1994. The History of Nuclear Euergy. •kshington, DC. US Department of Energy.
Administration). 2006. Annual Energy Outlook 2006. Department of Energy: Energy Information
lent Daily. 2006. 'Finnish Reactor Construction Behind Schedule". 24 April. E&E Daily.
gL.:Office. 2006. "Domenici Congratulates DOE for Releasing Interim Rules for Standby Nuclear SupportWashington, DC. wwwenergysenate.gov.
000. "Electricity Production Costs". Green Paper. obwards a European Strategy for Energy Supply.fission.
and Economics: Nuclear Industry Plans Ad Push for New Plants". 6 February New York. Wall Street
r.Energy: lreling the South's Economic Promise". EnerLy and the South. Atlanta, Gk: Southern States
n1• A Light Shines on Nuclear Power". 19 May. Christian Science Monitor.
irtnership. 2006. http://--,-w.gnep.energy)gov/.
Pblicies of IFA Countries: 2004 Review. International Energy Agency. Paris: Organization for Economicipent-
lennilg the Next Generation of Nuclear Power Plants". Progress in Nuclear Energy. Great Britain: Else~ierl- 4pp- 10.
[uclear". 16 April- Washington, DC: Washington Post.
Energy Policy. 2004. Ending the Energy Stalemate: A Bipartisan Strategy to Meet America's Energyaergy Commission. vwu.energyoommission.org.Mr Development: Prospects in the 1990s. Columbus, OH: Battelle Press.
Larotes.blogapot.com/200S/02/nuclear-energ-not-leftright-issue.hbtml.
ectric Reliability Council). 2005. 2005 Long-Term Reliability Assessment: The Reliability of Bulk Electrici, September. North American Electric Reliability Council.
ass Browns Ferry Nuclear Plant Unit 1 Restart and 2005 Performance on Units 2 and 3". 21 April.Aear Regulatory Commission. Vol. 26. No. 16.
aw Significant Emironmental Impacts from Proposed Grand Gulf Early Site Permit".7 April. Washington,or- Commission. Vol. 26. No. 14.

Is-RC News. 2006. "NRC to Hold Public Meetings in Georgia to Discuss Review of Possible Early Site Permit.Wa.hshington, DC: U.S. Nuclear Regulatory Commission. No. 06-058.
NRC. 2003. "NRC: Short History". 23 June. Nuclear Regulatory Commission, www.nro.gov/who-ýe-are/sl&'
Nuclear EnergyAgency. 2003. Nuclear Energy Today. Paris: Organization for Economic Cooperation and
Nuclear Plant Journal. 2006. "Need for Nuclear". March-April. V7ol. 24 No. 2.
Nuclear Regulatory Commission. 2006. "Fact Sheet on the Accident at Three Mile Island". NRC website. litreading-rm/doc-collectlons/fact-sheets/3mile-isle.html.
Nustartenergy.com. 2006. ,,,•,ustartenergy corm.
Petrochemical News. 2005. "GE Energy Seeks NRC Approval for ESBnW. 28 September. m w:petrochemi6
Pettier, R. 2005. "U.S. Utilities Driving for a License'. November/December. Power. VoL 149. Issue 9. a
PEW Center on Global Climate Change. 2006. Agenda for Climate Action. February, Arlington, A: Pew C
Piller, D. 2006. "Power Outages Show Shrinking Surplus, Prompt Questions". 19 April. Fort Worth: Fort Wo
Podobnik, B. 2006. Global Energy Shifts: Fostering Sustainability in a Turbulent Age. Philadelphia, PA. "16b
Power. 2005. "Asians Craving Nukes, Fuel Cells". October. Power Magazine. Vol. 149. Issue 8.
Power. 2005. "Demand for Nukes Rising". April. Power Magazine. V1o. 149. Issue 3.
Power. 2005. "Shortage Outage Ever". May. Power Magazine. Vol. 149. Issue 4.
Progress Energy. 2005. "Application Process for Second COL". 1 November. www.progress-energy.com.
Prudential Equity Group. 2005. "Back on Line: U.S. Nuclear Power Generation Ste for Resurgence". Janua
Southern Governors' Conference. 1970. Nuclear Power in the South: A Report of the Southern GovernorsPower Policy. 22 September. Atlanta, GA. Southern Interstate Nuclear Board.
Specker, S. 2006. "Generation Technologies in a Carbon-Constrained World". 30 March. Washington, DC: IPolicy Leadership Forum.
Technology Marketing Corporation (TMC). 2006. "Pakistan holding talks with China on nuclear power planC11 Technology Marketing Corporation.
Travieso-Diaz, M. and R. Haemer. 2004. "The Outlook for U.S. Nuclear Power in the 21st Century". OctobeiJournal.
Wholesale Power Market Update.2006. "Vl/l Street Outlook for Nuclear". 13 March. www.nei.org/doc.asýp'
Wholesale Power Market Update. 2006. Fitch Ratings Ltd. 13 March.
Wiu, F and S. Fu. 2005. "China's Future in Electric Energy". July/August. IEEE Power and Energy Magazinie
Yadav, R., A. Roy, et al. 2005. 'India's Fast-Growing Power Sector". July/August. IEEE Power and Energy Mat3, No. 4.


AlabamaArkansas
FloridaGeorgiaKentuckyLouisianaMarylandMississippiMissouri
North CarolinaOklahomaPuerto Rico
South CarolinaTennessee
TexasU.S. Virgin Islands
Virginia
West Virginia
6325 Amherst Court, Norcross, Georgia [email protected] * www.sseb.org
(770) 242-7712 . (770) 242-9956 fox] e (770) 242-0421 fax2
toi)rN d on recydod paper

4-alc 1ý,q 7YI3
THE ECONOMIC FUTURE OFNUCLEAR POWER
A Study Conducted at The University of Chicago
August 2004

THE ECONOMIC FUTURE OF NUCLEAR POWER
A Study Conducted at The University of Chicago
August 2004
0

TABLE OF CONTENTS
PART ONE: ECONOMIC COMPETITIVENESS OF NUCLEAR ENERGY1. Levelized Costs of Baseload Alternatives ..............................................................2. International Comparisons .....................................................................................3. Capital Costs...................... ......... ..............4. Learning by D oing .................................................................................................5. Financing Issues .....................................................................................................
PART TWO: OUTLOOK FOR NUCLEAR ENERGY'S COMPETITORS6. Gas and Coal Technologies ....................................................................................7. Fuel Prices ......................................................................................................8. Environm ental Policies ..........................................................................................
PART THREE: NUCLEAR ENERGY IN THE YEARS AHEAD9. Nuclear Energy Scenarios: 2015 ..................................... .10. Nuclear Energy Scenarios: Beyond 2015 ................................ ; ..............................
APPENDIX: MAJOR ISSUES AFFECTING THE NUCLEAR POWER INDUSTRYIN THE U.S. ECONOMY
Al. Purpose and Organization of Study ...............................................................A2. Electricity Futures: A Review of Previous Studies ........................A3. Need for New Generating Capacity in the United States ..............................A4. Technologies for New Nuclear Facilities ......................................................A5. Nuclear Fuel Cycle and Waste Disposal .......................................................A6. Nuclear Regulation ....................................................................................A7. Nonproliferation Goals .................................................................................A 8. H ydrogen ......................................................................................................A 9. Energy Security .............................................................................................
1-12-13-14-15-1
6-17-18-1
9-110-1
Al-iA2-1A3-1A4-1A5-1A6-IA7-1A8-1A9-1
A CRON YM S .............. ; ......................................................................................................... A CM -i
TABLESTable 1-1: Summary Worksheet for Busbar Cost Comparisons, $ per MWh,
with Capital Costs in $ per kW, 2003 Prices ..................................Table 2-1: Percent Distribution of 1998 Electricity Generation Capacity
by C ountry ............................................................................................Table 2-2: Number of Generation Sources Providing over 5 Percent
of Total Electricity in 1998 ..................................................................Table 2-3: Projected Percent Distribution of 2010 Electricity Generation
by Country .........................................................................................Table 2-4: Deutsche Bank Busbar Costs, 75 Percent Capacity Factor,
40-Year Plant Life, $ per MWh, 2003 Prices .......................................Table 2-5: OECD Busbar Costs, 75 Percent Capacity Factor,
40-Year Plant Life, $ per MWh, 2003 Prices .......................................
1-8
2-5
2-6
2-7
2-9
2-10
iii

TABLES(contd.)Table 5-7: The Impact of Construction Delays on the First-Plant LCOE of a
$1,500 per kW Plant, $ per MWh, 2003 Prices .....................Table 6-1: Cost Expectations for New Coal Plants in 2003......................Table 6-2: Thermal Efficiency Effect on Fuel Cost of GTCC, $ per MWh,
2003 Prices ......................................Table 6-3: Cost Estimates for New Gas Plants ................................................... 0..Table 6-4: Effect of Fuel Price on Gas LCOE, $ per MWh ..................................Table 6-5: Effect of Environmental Controls on 2020 Gas-Fired LCOE ..............Table 6-6: Cost Characteristics of Fossil-Fired Electricity Generation .................Table 7-1: Coal Price Projections .....................................Table 7-2: Natural Gas Price Projections ........................................... ....Table 7-3: Year When Production Centers Become Cost Justified.......................Table 7-4: Estimates of Uranium Resources ...........................................Table 7-5: MESSAGE Forecasts of North American Gas Production ..................Table 8-1: Average Costs Across Studies: IGCC, PCC, and GTCC
(D avid 2000) .......................................................................................Table 8-2: Ground Transportation Cost Estimates, by Plant Type, $ per MWh ...Table 8-3: Injection and Storage Cost Estimates, by Plant Type, $ per MWh ......Table 8-4: Summary of Components of Carbon Sequestration Cost,
$ per MWh ......................................Table 8-5: Costs of Carbon Control, $ per MWh .................................................Table 9-1: LCOEs for a First Nuclear Plant, with No Policy Assistance,
7-Year Construction Time, 10 Percent Interest Rate on Debt,15 Percent Rate on Equity, 2003 Prices ...............................................
Table 9-2: LCOEs for Coal and Gas Generation, 7 Percent Interest Rate onDebt, 12 Percent Rate on Equity, 2003 Prices .....................................
Table 9-3: Nuclear LCOEs with Loan Guarantees, $ per MIWh, 2003 Prices .......Table 9-4: Nuclear LCOEs with Accelerated Depreciation Allowances,
$ per M WW h, 2003 Prices ......................................................................Table 9-5: Nuclear LCOEs with Investment Tax Credits, $ per MWh,
2003 Prices ...........................................................................................Table 9-6: Nuclear LCOEs with Production Tax Credits, $18 per MWh,
8-Year Duration, $ per MWh, 2003 Prices ..................Table 9-7: Effects of Combined $18 per MWh 8-Year Production Tax Credits
and 20 Percent Investment Tax Credits on Nuclear Plants' LCOEs,$ per MWh, 2003 Prices ..................................
Table 9-8: LCOE for Successive Nuclear Plants, First to Eighth Plants,Learning Effects and Payment of FOAKE Costs Only, $ per MWh,2003 Prices ...........................................................................................
Table 9-9: LCOE for Successive Nuclear Plants, First to Eighth Plants,$ per M W h, 2003 Prices .......................................................................
Table 9-10: LCOE for Successive Nuclear Plant First to Eighth Plants, withDebt Share Responding to Reduced Risk, $ per MWh, 2003 Prices...
Table 9-11: Contributors to LCOE Cost Reduction for Fifth Plant: Learning,Reduced Construction Time, and Elimination of Risk Premium,$ per M W h, 2003 Prices .......................................................................
15-28
6-6
6-86-9
6-106-116-12
7-5.7-107-117-137-15
8-68-78-8
8-98-10
9-5
9-6
9-7
9-7
9-8
9-9
9-11
9-13
9-15
9-15
9-16
VW
0V

FIGURES (contd.)Figure A3-3:
Figure A3-4:
Figure A5-1:Figure A9-1:Figure A9-2:
Figure A9-3:
Figure A9-4:
Figure A9-5:
Ratio of Manufacturing Electricity Consumption to ManufacturingOutput over Tim e, in Logs ............. ......................................................Ratio of Industry Electricity Usage to Industry Quantity Index(1987= 100) ...........................................................................................The Nuclear Fuel Cycle ...................................................................U.S. Natural Gas Production and Imports, 1970-2003 ........................Electric Utility Sector Gas Prices in the United States, OECDEurope, Japan, and Taiwan, 1994-2002, in 2003 Dollars ....................Industrial Sector Gas Prices in the United States, OECDEurope, Japan, and Taiwan, 1994-2002, in 2003 Dollars ....................Household Sector Gas Prices in the United States, OECDEurope, Japan, and Taiwan, 1994-2002, in 2003 Dollars ....................Determination of Additions to Nuclear Capacity ...................
A3-7
A3-7A5-4
A9-10
A9-12
A9-13
A9-13A9-19
vii

Part One: Economic Competitiveness of Nuclear Energy
Any policies concerned with the future of nuclear power must funnel through theprice at which nuclear power will enter the marketplace, if nuclear power is to be viable. Thelevelized cost of electricity (LCOE), as the price at the busbar needed to cover the operatingplus annualized capital costs of nuclear power, must be competitive with prices of otherbaseload electricity. Part One attempts to develop the most reliable estimates possible of thefuture busbar cost of nuclear electricity.
A starting point is estimates of nuclear generator costs from previous studies. Theseestimates for the United States are reviewed in Chapter 1. Chapter 2 is a parallelinternational review.
In light of the importance of capital costs and the role they have played incontributing to differences in LCOE estimates, Chapter 3 is devoted to the anatomy of theestimation of capital costs. An aim is to narrow the range of uncertainty in estimates offuture capital costs. Chapter 4 proceeds to another major reason for uncertainty aboutnuclear costs, which is learning from experience in constructing facilities. Drawing onanalyses of earlier nuclear experience and innovations in manufacturing more generally,estimates are developed of the extent to which costs can be expected to fall between thebuilding of the first and n plants of a given technology.
Chapter 5 develops the financial model used in this study to evaluate the prospects fornuclear power. The complications of the tax system and of private sector financing asinfluenced by risk are introduced. No-policy estimates of nuclear LCOEs are estimated to setthe stage for the later policy analysis.

Chapter 1. LEVELIZED COSTS OF BASELOAD ALTERNATIVES
Summary
In Chapter 1, differences in the magnitude of levelized cost of electricity (LCOE)estimates from previous studies are compared. These differences illustrate the challenge ofestimating a reasonable range on future LCOEs.
Reasons for differences in LCOE estimates include differences in assumptions aboutnuclear technology chosen, differences in the degree of experience with a technology,differences in equity and debt financing terms, differences in construction time, and less welldefined differences in the degree of optimism or pessimism about costs.
Delaying the complication of taxes until Chapter 5, the present chapter develops apre-tax LCOE model and uses it to calculate LCOEs of nuclear, coal and gas turbinecombined cycle generation based on values from recent plant models. The models comparedare GenSim, the SAIC industry model, the Scully Capital financial model, and an EnergyInformation Administration (EIA) model. The results illustrate how differences inassumptions influence estimated LCOEs.
GenSim does not specify a particular nuclear technology, but rather takes EIA'sspecifications from the agency's 2001 AnnualEnergy Outlook (AEG 2001). At a basecapital cost of $1,853 per kW, increasing the discount rate from 10 to 15 percent raises theGenSim busbar nuclear cost from $51 to $83 per megawatt-hour (MWh). GenSim estimatesfor competitors to nuclear are: $37 to $48 per MWh for coal, $35 to $40 per MWh for gascombined cycle, and $56 to $68 per MWh for gas combustion turbines. Solar photovoltaicand solar thermal are far more costly, while wind's cost, in some areas, is comparable to gascombustion turbine.
The SAIC model considers several nuclear technologies, with cost estimates rangingfrom $39 per MWh for the Gas Turbine Modular Helium Reactor (GT-MJR) to $77 perMWh for existing nuclear technology. Coal-fired costs are on a par with Pebble Bed cost, at$43 to $49 per MWh. Gas combined cycle with lower capital costs is $38 to $40 per MWh.
The Scully model compares alternative financing plans for a technology that broadlycorresponds to the AP1000. The busbar cost range is $36 to $44 per MWh.
EIA's AEO 2004 nuclear capital cost and interest rate assumptions keep previouslybuilt nuclear generation's busbar cost relatively high among these estimates at $63 to $68 perMWh and considerably lower for coal generation at $38 per MWh.
1-1

1.1. Introduction
Direct comparison of busbar costs frequently is hampered by different assumptionsused in their calculation: discount rates, borrowing and equity shares and interest rates,construction time, plant life, treatment of taxes and depreciation, and quite importantly, themagnitude of overnight capital cost. This chapter reports on recent estimates of LCOE forbaseload generation technologies. The estimates differ considerably among sources, despitethe basic uniformity in the methodology of LCOE calculation. Accounting for thesedifferences is the primary goal of this chapter.
Section 1.2 identifies several estimates of LCOE for nuclear, coal, and gas baseloadgeneration. Section 1.3 describes a pre-tax LCOE model developed to provide a commoncalculation framework for comparing estimates. Section 1.4 reports the LCOE calculationsmade with the model of Section 1.3.
1.2. Representative Studies of Baseload Generation Costs
This chapter focuses on studies by Science Applications International Corporation(SAIC) (Reis and Crozat 2002), Scully Capital (Scully Capital 2003), a LCOE simulationmodel developed at Sandia National Laboratory (Drennan et al. 2002), and calculations usingvalues from EIA's Annual Energy Outlook 2004 (AEO 2004), which itself does not reportLCOE estimates but which is an influential source of cost component estimates for othersand provides the cost inputs for the National Energy Modeling System (NEMS).
Each of the calculations uses the basic LCOE methodology which amortizes capitalcosts and adds current operating costs to calculate a price in cents per kilowatt hour (kWh) ordollars per megawatt hour (MWh) that will cover costs. Stated alternatively, the calculationsolves for the constant electricity price, in real terms, which if charged over the life of theplant, would give investors the rate of return they require on their capital in the plant.
1.3. The LCOE Concept
The LCOE, or busbar cost, is used for comparing the cost of energy production bydifferent generation methods. As introduced in Chapter 2, a problem solved by the LCOE isthe annualization of the up-front capital costs of a power plant so the total cost per kWh ofgenerating electricity, including both fixed and variable costs, can be identified.
Capital costs are incurred during the construction period, when the actual outlays forequipment and construction and engineering labor are expended. Overnight costs areexclusive of interest and include engineer-procure-construct (EPC) costs, owner's costs, andcontingencies, as explained in more detail in Chapter 3 on capital costs. These expendituresaccrue interest charges during the construction period. Once electricity sales begin, theplant's owner begins to repay the sum of the overnight and interest costs. The price chargedfor electricity generated by the plant must cover these costs as well as yearly recurring fueland operation and maintenance (O&M) costs.
1-3

1.4.1. Capital Cost, K
To obtain K, the total capital cost including financing is calculated by compoundingthe cost plus interest from the beginning of the construction until the plant is completed,using
K Pt
where
n years required for constructionC = total overnight cost before financingP1 = percentage of overnight cost outlay in year tr = weighted average of debt and equity interest rates.
1.4.2. Insurance Cost, I
Insurance cost is entered as an insurance rate that is a fraction of the capital cost.I =C • Insurance rate.
1.43. Fixed O&M Cost, Mf
Fixed O&M cost includes items from rent to workers' wages. This cost is dependenton the size, rather than the output, of the plant. It is given as $ per kW. Fixed O&M cost iscalculated as
Mf= Fixed cost in $ per kW - plant size in kW • plant life.
1.4.4. Variable O&M Cost, M,
Variable O&M is given in the form $ per kWh and is entered directly into the LCOEformula as M,.
1.4.5. Fuel Cost, F
Fuel cost is calculated using the formula F •BHR, where
F = Fuel cost in $ per MMBtuMR = Heat Rate in MMBtu.
1.4.6. Additional Factors
While this model incorporates the basic components of LCOE, it is not allencompassing, as it omits taxes and decommissioning and decontamination (D&D) cost.
1-5

interest rates. SAIC's coal-fired capital costs are on a par with Pebble Bed Modular Reactor(PBMR) capital cost, giving similar busbar costs, $43 to $49 per MWh. Gas turbinecombined cycle capital costs are projected much lower, and busbar costs are correspondinglylower, at $38 to $40 per MWh.
The latest Annual Energy Outlook (EIA 2004, pp. 5-58) reduces nuclear capital costassumptions below those in previous AEOs (EIA 2003, p. 73, Table 40). The two right-handcolumns of Table 1-1 use the new EIA nuclear capital cost estimates. The nuclear base casecapital cost estimate makes new nuclear generation's busbar cost relatively high among theestimates in this table, at $63 to $68 per MWh for the nuclear base case, but lower for theadvanced nuclear case, at $43 to $53 per MWh. EIA's estimate is considerably lower forcoal generation, at $38, and for gas generation, at $41.
1-7
References
Drennan, Thomas E., Arnold B. Baker, and William Kamery. (2002) Electricity GenerationCost Simulation Model (GenSim). SAND2002-3376. Albuquerque, N.M.: Sandia NationalLaboratories, November.
Energy Information Administration (EIA). (2004). Annual Energy Outlook 2004 WithProjections to 2025. DOE/EIA-0383(2004). Washington, D.C.: Energy InformationAdministration, January.
Energy Information Administration (EIA). (2003). Assumptions for the Annual EnergyOutlook 2003 With Projections to 2025. DOE/EIA-0554(2003). Washington, D.C.: EnergyInformation Administration, January.
Reis, Victor H., and Matthew P. Crozat. (2002) "A Strategy for U.S. Nuclear Power. TheRole of Government." Mimeo. San Diego: Science Applications International Corporation,June.
Scully Capital. (2002) "Business Case for New Nuclear Power Plants." Final Draft.Washington, D.C., July.
1-9
Chapter 2. INTERNATIONAL COMPARISONS
Summary
Chapter 2 extends the analysis of Chapter 1 to other countries' energy systems andelectricity costs to broaden the understanding of what factors may be particular to the U.S.electricity system and what factors are more general.
Due to its relatively low coal and natural gas prices, the United States has largershares of electricity from coal and gas than many other countries. On the other hand, Indiaand China stand out as coal users, with coal share of power generation at around 75 percentversus 52 percent in the United States. Also, Russia is a natural gas generator, with naturalgas share of power generation at 43 percent versus 15 percent in the United States. The U.S.nuclear share of power generation is very close to the world average, 19 percent versus theworld average of 17 percent. France has the world's largest nuclear generation share, 76percent, while Japan and Korea have 32 and 37 percent shares, respectively. Italy standsalone in the world with its oil generation share of 41 percent, compared to the world averageof 9 percent.
Busbar cost estimates are quite variable across countries, depending on assumptionsabout discount rate, plant life, and capacity factor, in addition to differences in underlyingfuel prices and construction costs. Nonetheless, several studies permitting inter-country costcomparisons are available. These place U.S. natural gas combined cycle costs near the lowend of a worldwide range of $30 to $101 per MWh. Similarly for coal, U.S. costs are nearthe low end of a worldwide range of $31 to $84 per MWh.
U.S. nuclear busbar costs are estimated somewhat below the middle of the worldwiderange for countries not reprocessing spent fuel, of $36 to $65 per MWh. LCOEs on newnuclear plants in the United States are not projected to be higher than those elsewhere in theworld, comparing favorably even with the prospective French costs. Nuclear power's largeshare of electricity generation in France appears to be due at least partially to the fact thatgeneration costs from alternative sources in France are higher than for nuclear power. Totalcapital cost shares of LCOEs for new nuclear plants projected in the United States andFrance are similar.
Historically, France has experienced shorter and less variable construction times forits nuclear plants than has the United States. Meanwhile, nuclear plants built around theworld since 1993, mostly in Asia, have been built in shorter times, and with lesser variability,than even the French experience, offering some basis for optimism regarding future nuclearconstruction in the United States.
2-1

2.1. Introduction
This chapter places the U.S. electric power industry in an international perspective.What similarities and differences are there between the U.S. sector's characteristics and thoseof other countries? How do U.S. LCOEs, or busbar costs, compare with those of othercountries, and what can account for differences? How does the distribution of capacity andgeneration compare across countries, and again, what can account for the differences? Ofparticular interest are comparisons with the Organization for Economic Cooperation andDevelopment (OECD) countries and other large power-producing countries such as Russiaand China. The two primary areas of discussion are the distribution of generation types andbusbar costs for different plant types, Busbar cost information for the U.K. and Germany hasbeen omitted for lack of data stemming from the recent privatization of the power industry inthose two countries.
The remainder of the introduction covers similar previous studies and the data sourcesused in this study. Section 2.2 discusses the distribution of generation sources. Section 2.3discusses the busbar cost figures for each country. Section 2.4 takes a closer look at nuclearpower. Section 2.5 summarizes the results of this study and presents an overall picture of theU.S. power industry in comparison with the rest of the world. Section 2.6 is an appendixwhich details the methodology used in the LCOE calculations in this chapter.
2.1.1. Previous Studies
Although reliable data for an international comparison of the power industry are oftenhard to come by, there have been a number of previous studies that are useful for orientationand comparison. OECD (1998) is an update of a 1992 study. It uses a levelized costmethodology to project busbar costs for new power plants in fourteen OECD countries andfive other nations. The original cost information for this study was gathered by a group ofexperts drawn from the relevant countries. The recent study by MIT (2003) calculates costsfor several generation technologies in a number of countries. Although the focus is onnuclear power, other technologies are mentioned for purposes of comparison.
Tarjanne and Kari Luostarinen (2002), discuss the economics of nuclear power inFinland. This study includes LCOEs for new plants as well as historical data on plantsoperated by Teollisuuden Voima Oy. Although the study focuses on nuclear power, itreports cost information for other technologies as well.
Feretic and Tomnsic (2003) estimate busbar costs for new power plants in Croatia.The study provides a slightly different approach to levelized cost calculations. Instead ofpoint estimates for costs and other model inputs, each parameter is given a probabilitydistribution, and busbar costs are then calculated as a probability distribution as well.
Smith and Hove's (2003) Deutsche Bank report covers coal, gas, and nuclear powergeneration, discussing busbar costs as well as new technology options. That study's
2-3
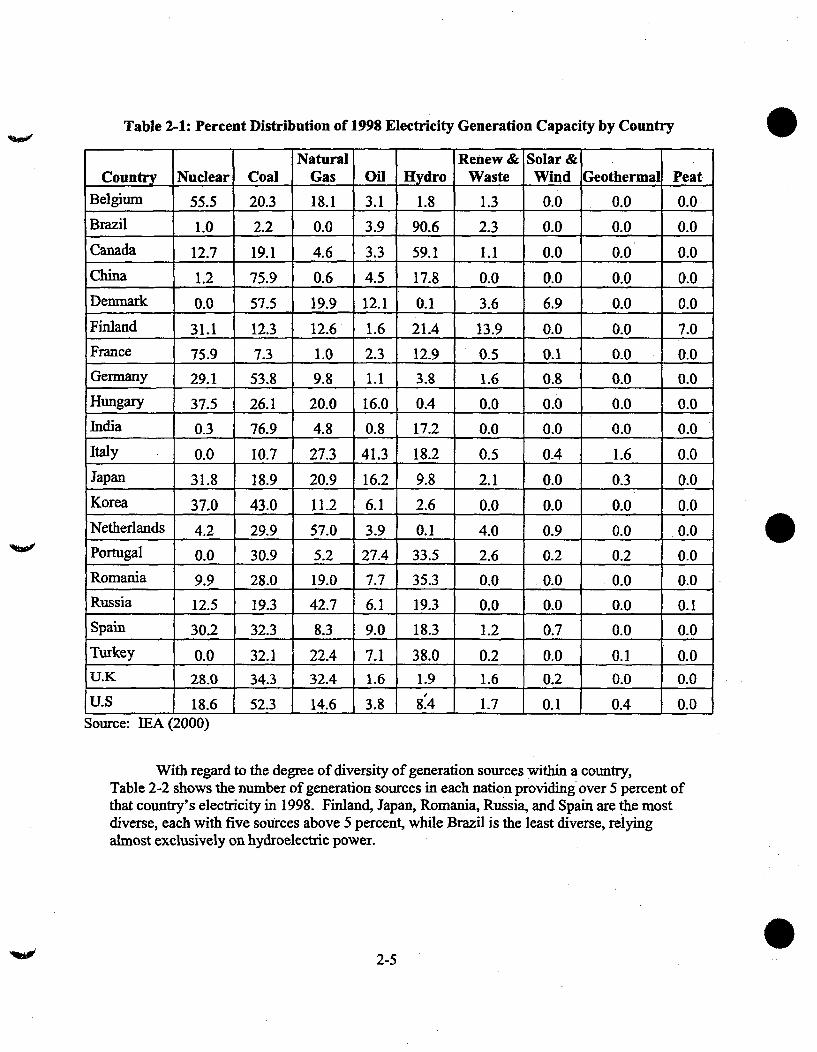
Table 2-1: Percent Distribution of 1998 Electricity Generation Capacity by Country
Natural Renew& Solar&Country Nuclear Coal Gas Oil Hydro Waste Wind Geothermal Peat
Belgium 55.5 20.3 18.1 3.1 1.8 1.3 0.0 0.0 0.0
Brazil 1.0 1 2.2 0.0 3.9 1 90.6 2.3 0.0 0.0 0.0
Canada 12.7 1 19.1 4.6 3.3 59.1 1.1 0.0 0.0 0.0
China 1.2 75.9 0.6 4.5 17.8 0.0 0.0 0.0 0.0
Denmark 0.0 57.5 19.9 12.1 0.1 3.6 6.9 0.0 0.0
Finland 31.1 12.3 12.6 1.6 1 21.4 13.9 0.0 0.0 7.0
France 75.9 7.3 1.0 2.3 12.9 0.5 0.1 0.0 0.0
Germany 29.1 53.8 9.8 1.1 3.9 1.6 0.8 0.0 0.0
Hungary 37.5 26.1 20.0 16.0 OA 0.0 0.0 0.0 0.0
India 0.3 76.9 4.8 0.8 17.2 0.0 0.0 0.0 0.0
Italy 0.0 10.7 27.3 41.3 18.2 0.5 0.4 1.6 0.0
Japan 31.8 18.9 20.9 16.2 9.8 2.1 0.0 0.3 0.0
Korea 37.0 43.0 11.2 6.1 -2.6 0.0 0.0 0.0 0.0
Netherlands 4.2 29.9 57.0 3.9 0.1 4.0 0.9 0.0 0.0
Portugal 0.0 1 30.9 5.2 27.4 1 33.5 2.6 0.2 0.2 0.0
Romania 9.9 28.0 19-0 7.7 35.3 0.0 .0.0 0.0 0.0
Russia 12.5 19.3 42.7 6.1 19.3 0.0 0.0 0.0 0.1
Spain 30.2 32.3 8.3 9.0 18.3 1.2 1 0.7 0.0 0.0
Turkey 0.0 32.1 22.4 7.1 38.0 0.2 0.0 0.1 0.0UX 28.0 34.3 1 32.4 1 1.6 1.9 1.6 0.2 0.0 0.0
US 18.6 52.3 1 14.6 1 3.8_ 8.4 1 1.7 0.1 1 0.4 0.0Source: EEA (2000)
With regard to the degree of diversity of generation sources within a country,Table 2-2 shows the number of generation sources in each nation providing over 5 percent ofthat country's electricity in 1998. Finland, Japan, Romania, Russia, and Spain are the mostdiverse, each with five sources above 5 percent, while Brazil is the least diverse, relyingalmost exclusively on hydroelectric power.
2-5

Table 2-3: Projected Percent Distribution of 2010 Electricity Generation by Country
Natural Renew & Solar &Country Nuclear Coal Gas Oil Hydro Waste Wind Geothermal
Belgium 55.5 8.7 29.6 2.3 0.4 3.5 0.0 0.0Canada 11.2 13.6 15.8 0.7 58.3 0.2 0.0 0.1Denmark 0.0 42.3 26.2 8.8 0.1 7.7 14.9 0.0Finland 22.4 39.7 13.5 1.5 14.3 8.6 0.1 0.0France 69.8 1.5 16.3 0.2 12.3 0.0 0.0 0.0
Germany 25.1 50.5 14.5 0.8 3.6 2.7 2.9 0.0Hungary 35.8 19.9 33.7 9.5 0.5 0.6 0.0 0.0
Italy 0.0 9.2 43.6 22.0 12.2 7.6 4.3 1.1Japan 40.7 15.2 20.2 11.2 8.9 2.3 0.5 1.11Netherlands 0.0 14.9 70.5 8.1 0.2 4.6 1.7 0.0Portugal 0.0 23.0 41.0 11.1 20.4 2.9 1.5 0.1
Spain 24.4 11.0 27.0 8.0 14.7 6.4 8.6 0.0Turkey 4.7 35.3 35.9 0.3 23.7 0.0 0.0 0.0
U.K 13.7 19.7 49.3 15.2 1.1 0.9 0.1 0.0U.S. 15.2 48.6 24.4 1.3 7.0 2.8 0.3 0.4
Source: lEA (2000).
2.3. Cost Comparisons of New Plants
International comparison of costs is subject to several difficulties. In many cases,accurate cost information for various countries and technologies is not available. When costinformation is available, it is not always clear what factors are included in the quoted figures.Deregulation in the U.K. and Germany complicated the comparability for those countries sogreatly that cost figures are omitted for them.
Busbar cost data are taken from OECD (1998), Tarjanne and Luostarinen (2002), andSmith and Hove (2003). An effort has been made to keep costs used in calculationsconsistent across sources. For example, overnight capital costs for OECD countries arecalculated with and without contingency costs, the largest difference being 5.6 percent.Thus, an actual quantitative comparison of costs between the sources has the potential to bemisleading, although discrepancies in costs included should change the total busbar cost lessthan 10 percent.
2-7
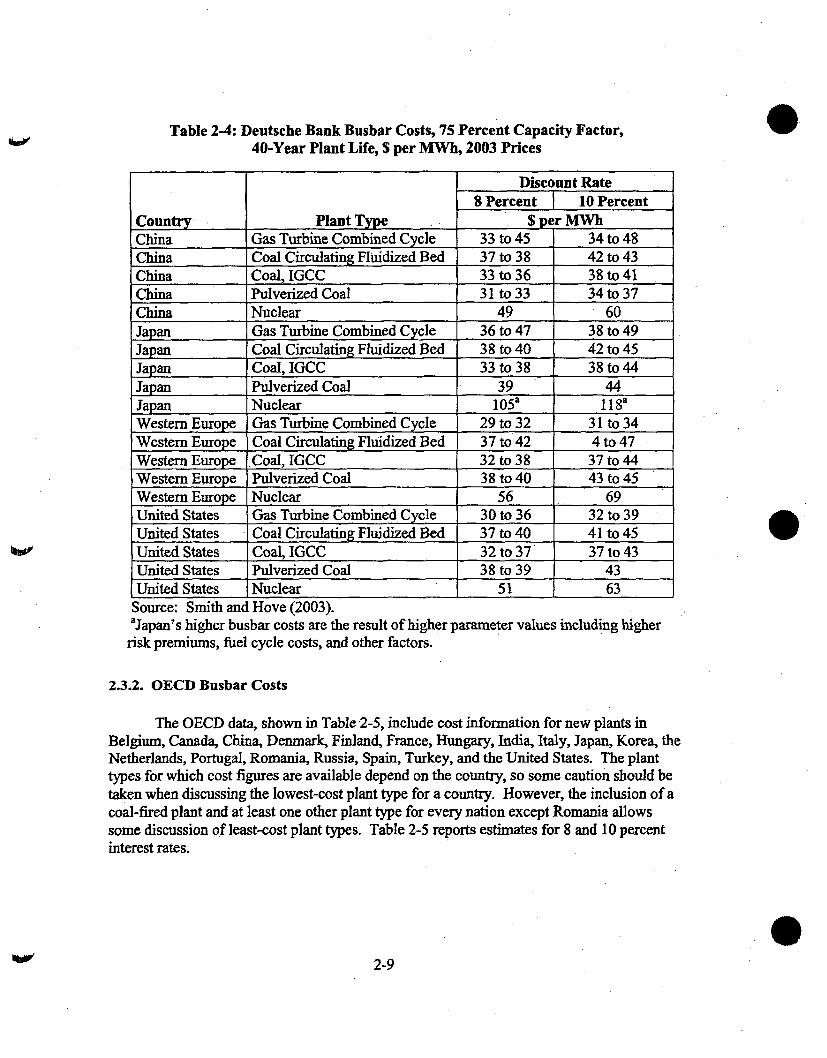
Table 2-4: Deutsche Bank Busbar Costs, 75 Percent Capacity Factor,40-Year Plant Life, $ per MWh, 2003 Prices
Discount Rate8 Percent 10 Percent
Country Plant Type $ per MWhChina Gas Turbine Combined Cycle 33 to 45 34 to 48China Coal Circulating Fluidized Bed 37 to 38 42 to 43China Coal, IGCC 33 to 36 38 to 41China Pulverized Coal 31 to 33 34to37China Nuclear 49 60Japan Gas Turbine Combined Cycle 36 to 47 38 to 49Japan Coal Circulating Fluidized Bed 38 to 40 42 to 45Japan Coal, IGCC 33 to 38 38 to 44Japan Pulverized Coal 39 44Japan Nuclear 105a 118aWestern Europe Gas Turbine Combined Cycle 29 to 32 31 to 34Western Europe Coal Circulating Fluidized Bed 37 to 42 4 to 47Western Europe Coal, IGCC 32 to 38 37 to 44Western Europe Pulverized Coal 38 to 40 43 to 45Western Europe Nuclear 56 69United States Gas Turbine Combined Cycle 30 to 36 32 to 39United States Coal Circulating Fluidized Bed 37 to 40 41 to 45United States Coal, IGCC 32 to 37 37 to 43United States Pulverized Coal 38 to 39 43United States Nuclear 51 63
Source: Smith and Hove (2003).aJapan's higher busbar costs are the result of higher parameter values including higher
risk premiums, fuel cycle costs, and other factors.
2.3.2. OECD Busbar Costs
The OECD data, shown in Table 2-5, include cost information for new plants inBelgium, Canada, China, Denmark, Finland, France, Hungary, India, Italy, Japan, Korea, theNetherlands, Portugal, Romania, Russia, Spain, Turkey, and the United States. The planttypes for which cost figures are available depend on the country, so some caution should betaken when discussing the lowest-cost plant type for a country. However, the inclusion of acoal-fired plant and at least one other plant type for every nation except Romania allowssome discussion of least-cost plant types. Table 2-5 reports estimates for 8 and 10 percentinterest rates.
2-9
Given configurations of plant life, capacity factor and discount rate in Table 2-5,nuclear power is the least-cost generating alternative for two countries, although it is close toits nearest competitor in several countries. In France, nuclear power is less costly than eithercoal- or gas-fired power, and the low range of once-through nuclear costs in China is belowthe Chinese pulverized cost. In Canada, nuclear is close in cost to the low end of pulverizedcoal and well below the cost of circulating fluidized bed coal combustion. In Russia, theonce-through nuclear cost is close to the cost of gas-fired generation and well below that ofpulverized coal. In Turkey, nuclear power is competitive with pulverized coal, butconsiderably more costly than natural gas-fired generation. France is the country wherenuclear power has by far the greatest advantage over other plant types; only at the highestdiscount rate is nuclear power not the least-cost option. For most other countries, the highcapital costs of nuclear power prohibit it from being cost-competitive with coal and naturalgas-fired technologies.
Gas-fired power is most often the least-cost option. In addition to its competitivenessat the higher discount rate, gas-fired power is the least-cost option for a number of countriesat lower discount rates as well. In Canada, Hungary, Russia, and Turkey, gas is least-cost atdiscount rates as low as 8 percent. For Belgium, the Netherlands, Portugal, and the UnitedStates, gas-fired power is the least-cost option with both discount rates.
Coal is most often the least-cost plant type at lower discount rates, although for anumber of countries with higher natural gas prices, coal is competitive at the higher discountrate as well. In China, Denmark, Finland, India, and Japan, coal is the least-cost option athigh discount rates. It is the least-cost option at lower discount rates in Denmark, Finland,Hungary, Italy, Japan, and Spain.
2.3.3. Other Recent European Assessments
Several European assessments of the busbar costs of new nuclear plants have beenconducted recently, in addition to the 1998 OECD study reported above: the 1997 Directiondu gaz, de l'61ectricit6 et du charbon (DIGEC) study, of the French Ministry of Energy;, aFrench Parliament report of 1999; a report requested by the French Prime Minister, preparedby Charpin et al. (2000); a 2000 report from the Belgian AMPERE commission; and a 2003report by the French Ministry of Industry. These studies have calculated LCOEs in the rangeof $26 to $38 per MWh for nuclear and $31 to $69 for the combined cycle gas turbine(CCGT), to which are added $7 to $42 for costs of environmental impacts, using discountrates between 5 and 10 percent, as summarized in Bouchard (2003, Attachment 1, p. 5). Thereactor designs assumed are the European Pressurized Reactor (EPR), available immediately;the RHRl which is similar to the GT-MHR, available after 2015; and the RHR2, a secondgeneration high-temperature reactor available after 2040. The overnight costs range from$1,620 to $2,040 per kW (Charpin et al. 2000, pp. 111-114). The range of gas generationcosts of these studies is wider than that calculated in the previous sections, but that for thenew nuclear plants is considerably lower.
2-11

lengthier and more variable than the French experience. The U.S. average has been 9.3 years Wagainst 6.7 for the French; and the relative variability of U.S. construction time (the standarddeviation as a percent of the mean) has been 40 percent of the average, while theFrenchrelative variability has been 30 percent.
Table 2-7: Years Elapsed from Construction Start to Commercial Operationas of December 31, 2001
Average Minimum Maximum Standard Last PlantDeviation Begun
U.S nuclear plantsconnected to grid 9.3 3.4 23.4 3.8 1977French nuclear plantsconnected to grid 6.7 4.3 16.3. 2.0 1985Plants under constructionbeginning later than 1993a 5.3 4.5 7.2 0.75 2001
Source: IAEA (2002).'China, India, Japan, and Korea.
The U.S. construction period in Table 2-7 was achieved under regulatory conditionsthat have been revised, and the French construction period may be a better estimate of futureU.S. construction times, but the recent Asian experience, an average of 5.3 years with avariability of only 14 percent, may suggest that even further reductions are possible.
Total capital costs are strongly influenced by the length of construction period. Whileconstruction time may be influenced by the size of plant, there is no clear relationshipbetween overnight cost per kW and construction time. Table 2-8 shows the recent record inovernight cost for some of the plants included in Table 2-7 as built after 1993, although thesample of plants in the former table is broader than that in the latter table. The costs in Table2-8 have been converted to 2003 prices with the CPI-U (BLS 2003).
02-13

composition of coal-fired generation reflects the U.S. advantage in coal costs, which hasbeena major impetus to the French concentration in nuclear generation capacity.
Table 2-9: Comparison of French and U.S. Busbar Costs, 25-Year Plant Life,Technology-Specific Capacity Factors, 10 Percent Discount Rate,
$ per MWh, 2003 Prices
Capacity Shares of Busbar Cost, Percent BusbarCountry Plant Type Factor,
Percent Capital O&M Fuel Cost
France Nuclear Closed-Cycle 70 71 13 16 55United States Nuclear Once-Through 70 68 19 13 53
Gas Turbine CombinedFrance Cycle 80 25 7 68 60
Gas Turbine CombinedUnited States Cycle 80 28 9 63 32
Pulverized CoalFrance Combustion 80 46 15 40 67
Pulverized CoalUnited States Combustion 80 60 14 26 42Source: OECD (1998), lten (2003, Table 39).Source: MIT (2003, pp. 141-142).
2.5. Conclusion
The United States is in many ways typical when it comes to electricity. Theabundance of both natural gas and coal resources in the United States is reflected in therelatively low cost of coal-fired and gas-fired power, yielding some of the lowest busbarcosts in the world, despite the fact that U.S. nuclear busbar costs are comparable to or lowerthan nuclear busbar costs in most other nations. The one country where nuclear power isboth least-cost and highly utilized, France, does so not because of the absolutely low cost ofits nuclear power but because of the high costs of gas and coal.
When it comes to distribution of generation shares, the United States is in themainstream of countries around the world. Its reliance on nuclear power is close to theworld's average. Its high reliance on coal is also in no way unusual. The diversity of itsgeneration sources is also a common experience. Thus the United States is in fact rathertypical, with the usual reliance on fossil fuels and additional generation provided by nuclearand hydroelectric.
LCOEs on new nuclear plants in the United States are not projected to be higher thanthose elsewhere in the world, comparing favorably even with the prospective French costs.Nuclear power's large share of electricity generation in France appears to be due at leastpartially to the fact that generation costs from alternative sources in France are higher than
2-15

where:
I = Total capital expenditures discounted to year 1C = Contingency costsK = Overnight capital cost (excluding contingency costs)St = Percentage of overnight capital costs incurred in the tth year of constructionc = Length of construction period.
K, overnight capital cost (less contingency costs), is the dollar amount that would bepaid out if all capital expenses occurred simultaneously; no interest payments are included.OECD (1998) reports contingency costs separately from overnight costs, although the U.S.definition of overnight cost includes contingency costs and owner's costs, as described ingreater detail in Chapter 3. This data reporting difference is responsible for the separateaccounting of contingency costs in the equation for capital costs above, which treatscontingencies as being expended in the final year of construction. E, yearly electricitygeneration is simply total nameplate capacity times capacity factor. F, the fuel cost, and M,the yearly operation and maintenance expenditures, were taken directly from each of the datasources.
All costs are reported in June 2003 U.S. mills per kWh. Costs from each data sourcewere first converted to dollars with the Federal Reserve exchange rates (Federal ReserveBoard 2001) if necessary, and then converted to June 2003 mills using the CPI-U (BLS2003).
2.6.2. Relationship to OECD Cost Formula
A significant portion of the cost data used in this study was drawn from OECD(1998). Thus it may be helpful to see the relationship between the cost formula used here andthe formula used in that study.
The OECD formula is a standard levelized cost formula, looking at the ratio betweenthe total sum of discounted costs and the total sum of discounted generation:
EGC= (I [(Ii+Mt+Ft)( l+r)-t])IG
t
G= [, [Et(l+r)-t ]t
where:
EGC= Average lifetime levelized electricity generation cost per kWh
It =Capital expenditures in the year t
02-17
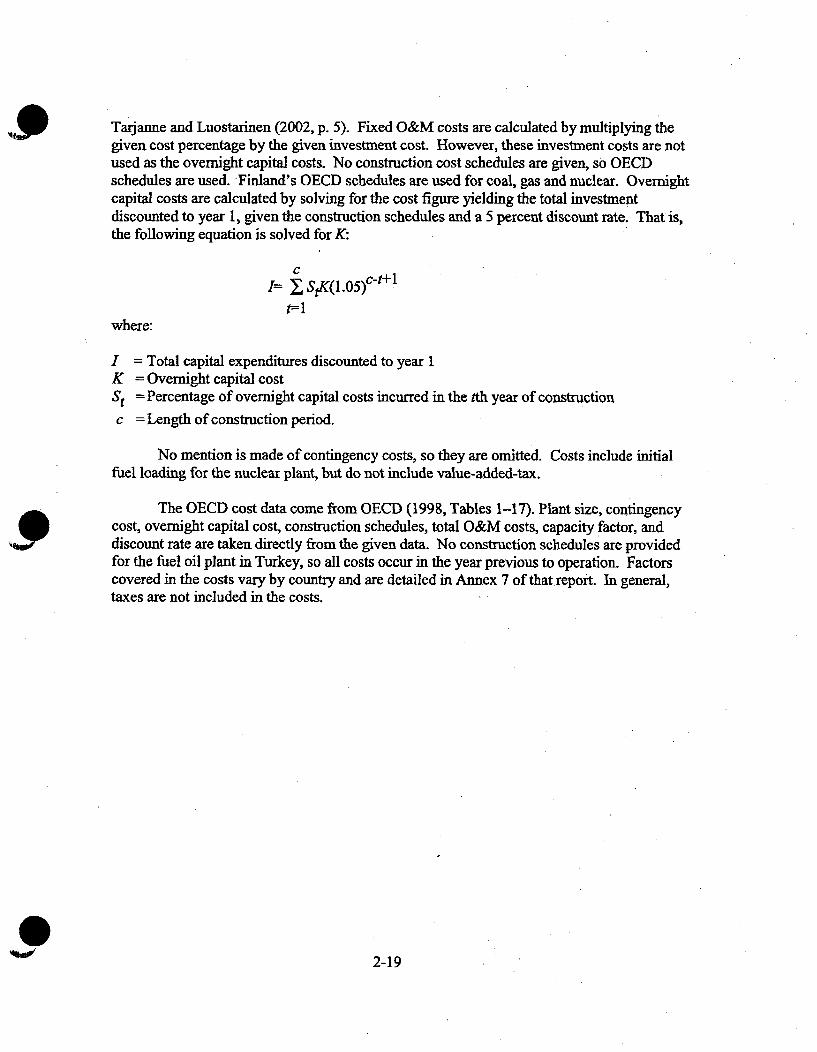
Tarjanne and Luostarinen (2002, p. 5). Fixed O&M costs are calculated by multiplying thegiven cost percentage by the given investment cost. However, these investment costs are notused as the overnight capital costs. No construction cost schedules are given, so OECDschedules are used. Finland's OECD schedules are used for coal, gas and nuclear. Overnightcapital costs are calculated by solving for the cost figure yielding the total investmentdiscounted to year 1, given the construction schedules and a 5 percent discount rate. That is,the following equation is solved for K:
c
I= StK(1.05)c-t+1t~=l
where:
I = Total capital expenditures discounted to year 1K = Overnight capital costSt = Percentage of overnight capital costs incurred in the tth year of construction
c = Length of construction period.
No mention is made of contingency costs, so they are omitted. Costs include initialfuel loading for the nuclear plant, but do not include value-added-tax.
The OECD cost data come from OECD (1998, Tables 1-17). Plant size, contingencycost, overnight capital cost, construction schedules, total O&M costs, capacity factor, anddiscount rate are taken directly from the given data. No construction schedules are providedfor the fuel oil plant in Turkey, so all costs occur in the year previous to operation. Factorscovered in the costs vary by country and are detailed in Annex 7 of that report. In general,taxes are not included in the costs.
2-19

Organization for Economic Co-operation and Development (OECD). (1998) ProjectedCosts of Generating Electricity. Update 1998. Paris: OECD.
Smith, R., and A. Hove. (2003) "The Old Reliables: Coal, Nuclear and Gas in 2003."Report. New York: Deutsche Bank AG.
Tarjanne, Risto, and Kari Luostarinen. (2002) Economics of Nuclear Power in Finland.Lappeenranta, Finland: Lappeenranta University of Technology, June.
2
.02-21

Chapter 3. CAPITAL COSTS
Summary
Capital costs are the single most important component of the costs of providingnuclear power, as is illustrated by figures from one of the major technologies considered indetail in this chapter. For the Advanced Boiling Water Reactor (ABWR), already built inAsia, the overnight capital costs, or undiscounted capital outlays, account for over one-thirdof LCOE, and the interest costs on the overnight costs account for another quarter of theLCOE.
Overnight Costs
Overnight cost estimates from different sources have ranged from less than $1,000per kW to as much as $2,300 per kW. This chapter examines reasons for differences inestimates, with the aim of reaching a smaller range.
The first major component of overnight costs consists of engineer-procure-construct,or EPC, costs, amounting to around 85 percent of total overnight costs paid. EPC costs are inturn separated into direct and indirect costs. The direct costs are for physical plant equipmentand the labor and materials to assemble them, while the indirect costs involve supervisoryengineering and support labor costs, with some materials. Direct costs account for roughly70 percent of EPC costs. About 60 percent of EPC costs are for factory equipment, 25percent for labor, and 15 percent for materials. About 50 percent of EPC costs are for reactorplant and turbine equipment. These figures include equipment, labor, and materials costs ofinstalling them. R&D targeted at these components could have a substantial impact onovernight cost.
Overnight costs include three additional categories of costs, one for contingencies,one for the owner's costs of infrastructure and training incurred to get the plant runningsafely when it is built, and one for first-of-a-kind engineering, or FOAKE, costs.
Contingencies and owner's costs can add 15 to 20 percent to overnight costs. Beforea reactor of a particular design has been built, several hundred million dollars must beexpended to complete its engineering design specifications. These are FOAKE costs. Theyare incurred only once for any type of reactor-although building a reactor of a particulardesign in one country may not transfer all the preliminary engineering necessary to satisfysafety regulations in another country, so some FOAKE costs may still be incurred for the firstconstruction in any given country. Nonetheless, when a U.S. firm builds a new designoverseas, much of the engineering experience may be transferable to the home country,making it possible for routine engineering and home office services to cover those remainingcosts.
FOAKE costs are a fixed cost of a particular reactor design. How a vendor allocatesFOAKE costs across all the reactors it sells can affect the overnight cost of early reactors
3-1

%apeConsideration of the foregoing reactor types contributes to the choice of $1,200,
$1,500, and $1,800 per kW overnight costs in the sensitivity scenarios used in the economicviability analysis in Chapters 5 and 9. The range is consistent with allowance for uncertaintyin the cost estimates in view of the scope for variation in overnight costs due to the otherfactors reviewed in this chapter.
3-3

3.1. Introduction
Capital costs are especially important to the competitiveness of nuclear power, sincethey account for a major share of the levelized cost of electricity (LCOE). The literature onnuclear power plant costs reports a wide array of capital costs. In analyzing why theestimates differ, Section 3.2 of this chapter deals with the overnight cost component ofcapital costs. Section 3.3 deals with the interest component. Section 3.4 uses the results ofthe chapter to narrow the range of capital costs to be used in the economic analysis of thepresent study, proposing to limit the analysis to three near-term reactors as the most realisticpossibility and to allow for remaining uncertainty based on analysis of the individualcomponents of capital costs.
3.2. Overnight Costs
3.2.1. Why Overnight Costs Differ
Estimates of overnight capital costs of nuclear plants have ranged from as high as$2,300 per kW and to as low as $1,100 per kW. The reasons for the differences are diverse.At the simplest explanation, the numbers refer to different reactor technologies. Estimatesfor the same technology can differ as well, however. At different times, the cost estimatesfor reactor components may differ, and of course, different price levels prevail at differentdates, so cost estimates produced at different dates should be adjusted for price-leveldifferences for comparability.
A further important source of cost difference, for identical as well as differenttechnologies is the allowance for contingencies. Reactor cost quotes are firm-fixed-priceoffers (even if they may be subject to negotiation between vendor and buyer), and vendorsinclude allowances for construction costing more than their most optimistic estimate. Thesecosts are included in an account explicitly referred to as contingencies and are charged to thebuyer whether the contingent events occur or not. Depending on how much of thecontingency costs actually get expended-which can be more or less than 100 percent-avendor's profits on a project will vary.
Cost numbers sometimes refer to expected costs in different countries, and marketcosts of inputs may differ across countries, for which purchasing power parity adjustmentsare imperfect. When considering cost numbers of technologies of firms from differentcountries, the possibility should be considered that governments are offering subventions forsome proportion of costs.
Some cost numbers refer to actual construction costs where others are expected costsof plants not yet built. For reactors that have not been built, some estimates may includeFOAKE costs while others may exclude them. Frequently costs are expressed in terms ofntb-of-a-kind and possibly combined with twin plant assumptions. The ne-of-a-kind cost hasreduced the first-plant cost by some presumed learning efficiency
3-5
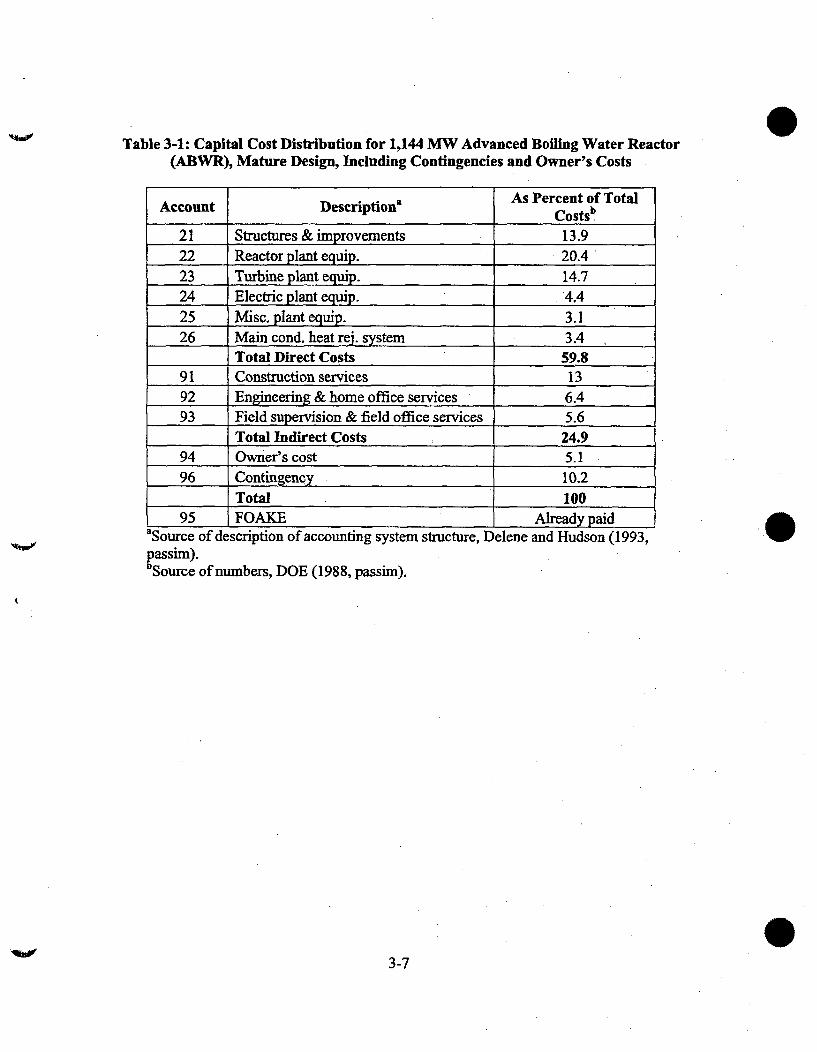
Table 3-1: Capital Cost Distribution for 1,144 MW Advanced Boiling Water Reactor(ABWR), Mature Design, Including Contingencies and Owner's Costs
As Percent of TotalAccount Descriptiona CoStSb
21 Structures & improvements 13.922 Reactor plant equip. 20.423 Turbine plant equip. 14.724 Electric plant equip. 4.425 Misc. plant equip. 3.126 Main cond. heat rej. system 3.4
Total Direct Costs 59.891 Construction services 1392 Engineering_& home office services 6.493 Field supervision & field office services 5.6
Total Indirect Costs 24.994 Owner's cost 5.196 Contingency 10.2
Total 10095 FOAKE Already paid
aSource of description of accounting system structure, Delene and Hudson (1993,assim).Source of numbers, DOE (1988, passim).
3-7

3.2.2.1.2. Contingencies
To these direct and indirect costs, vendors add a percentage referred to ascontingencies (account 96). They will need to justify these contingency costs to a buyer, andthey may be negotiated. Sometimes a government will agree to pay contingency costs.These may range from 9 to 12 percent of total direct and. indirect costs, or be as low as zero.
3.2.2.1.3. Owner's Costs
Another category of costs, owner's cost (account 94), is paid directly by the buyer.These are costs of testing systems within the plant, training a staff (which may take severalyears while the plant is being built), various inspections, etc. These range from 5 to 10percent of direct and indirect costs.
3.2.2.1.4. FOAKE Costs
Accounting practices for nuclear power plant costs have evolved in recent years, andthe identification of the costs of working out the initial engineering design of a new type ofreactor as a distinct type of cost is an important product of that development When a newtype of reactor is developed, taking that design from relatively simple conceptual stages todetailed engineering specifications that will make all the necessary components cometogether successfully is a massive undertaking. These costs can range from $300 million to$600 million, adding as much as 30 percent to the cost of a first reactor. However, oncethese design efforts are completed, they never have to be repeated for this reactor design.Further engineering design work will have to be undertaken to place this type of reactor intoa particular site, with its particular geographical and geological setting, but those engineeringcosts are contained in account 92, engineering and home office services.
FOAKE costs are specific to each reactor design. For example, two new reactordesigns, say the AP 1000 and the ABWR would have completely separate FOAKE costs.However, if one of these designs were to be built in, say, China, a considerable portion, butnot all, of the FOAKE costs of building it in the United States would be covered by thedesign work for the Chinese installation. This reduction, if not elimination, of FOAKE costsby building a new reactor in any particular country, is motivation for more aggressive initialpricing in overseas markets.
How a vendor accounts for these FOAKE costs can make a substantial difference inthe capital cost estimate. The effects of accounting for FOAKE costs are discussed further inSection 3.4 below.
3.2.2.2. The Account Structureof Capital Costs
Table 3-1 shows the largest component of overnight capital costs to be the reactorequipment. This account amounts to 20 percent of total costs, including owner's costs and
3-9
3.2.2.5. Possible Effect of Strategic Considerations
Several reasons exist why overnight cost estimates are not entirely hard engineeringestimates. For example, if a vendor finds some indirect value to building a plant (especially afirst plant or a first plant in a particular market), it may depress its contingency costcomponent, possibly eliminating it altogether, in order to obtain the sale. If some of thecontingent events do occur, the vendor may well have to take the associated costs out of itsprofits. In some instances in which national governments have particularly close associationswith their countries' nuclear vendors, the governments may agree to help with contingencies,although these actions may be limited by international trade agreements. A vendor might beable to get a variance agreement with the buyer to reimburse additional costs, particularly butnot exclusively, inforce majeure cases.
Cost estimates may be influenced by marketing goals. When comparing costestimates for different types of reactors, produced by different vendors, it is even possiblethat one cost estimate is a strategic marketing reaction to another cost estimate. Account 96,contingencies, is available to assist a vendor in strategic marketing goals, with or withoutgovernment subventions.
3.2.3. FOAKE Costs and Capital Cost Estimates
Section 3.2.1 introduced FOAKE costs, and noted that they can add 30 percent tototal overnight costs. FOAKE costs are a fixed cost of a reactor design. If a lengthyproduction run reasonably could be assured, comparable to, say, a new model of automobile,the costs can be amortized over the anticipated future production. and have little effect on theunit price. Conditions have not proven as simple for nuclear reactors.
How a vendor chooses to account for FOAKE costs may affect price and even itsability to sell a reactor. The preferred method, of course, is to have the vendor's governmentpay for these costs, but the practicality of that alternative depends on the priorities ofdifferent countries' governments. An agreement with a utility or consortium of utilities forthe purchase of multiple reactors, possibly eight or ten, spread out over a relatively short timeperiod, would be an alternative that would permit the spread of these fixed costs overmultiple units. However, any utility or consortium accepting such a cost agreement wouldeffectively subsidize subsequent buyers of this design, which reduces the likelihood of suchan arrangement being reached in practice.
No a priori solution to this problem is apparent. Vendors may deal with the pricingproblem by either (1) quoting ntb-of-a-kind costs, which exclude FOAKE costs and includecost reductions due to learning over the construction of the first n- I reactors or (2) quotingcapital cost for a first plant in S per kW terms and placing the FOAKE cost alongside as acover charge.
3-11

overnight cost of a single-unit construction (NEA 2000, pp. 12-13, 65-70). This effect isindependent of learning effects, which themselves may be enhanced by building multiplereactors at a single station, as reported in Chapter 4.
Significant cost reduction also may derive from standardization of plant design.Much of this cost saving is thought to lie in reduction of overnight costs by eliminatingduplication in FOAKE costs. Reductions in construction time from standardization alsoreduce interest costs (NEA 2000, pp. 12, 55-65). Again, these cost savings are distinct fromthe effect of standardization on learning by doing.
3.2.6. Near-Term Reactor Designs
Table 3-3 gives dollar figures underlying the percentages in Table 3-1.
Table 3-3: Capital Cost Estimates: Advanced Boiling Water Reactor (ABWR),Mature Design, in Mflfions of 2001 Dollars
Account Description ABWR21 Structures & improvements 19822 Reactor plant equip 290
23 Turbine plant equip 21024 Electric plant equip 6225 Misc. plant equip 4526 Main cond. ht rej. system 48
Total Direct Costs 85391 Construction services 18692 Engineering & home office services 9193 Field supervision & field office services 79
Total Indirect Costs 35694 Owner's cost 7396 Contingency 145
Total 1,426Source: ABWR, DOE (2001, Tables 1-4) and consultation with internationaltechnical nuclear expert.
For comparison, a published Westinghouse estimate for total costs of an AP1000reactor, without FOAKE costs, is $1,100 to $1,200 per kW (Poulson 2002, p. 22). This figureis slightly below the $1,246 F er kW for the ABWR in Table 3-3 (as implied by dividing thetotal cost in Table 3-3 by 10 to obtain dollars and 1,144, which is the capacity in megawattsof the ABWR). However, the AP1000 has not yet been built. Assigning a FOAKE cost of
3-13

Including the three accounts additional to EPC in the Scully numbers, the resultingovernight costs are slightly higher than in the estimates reported above. FOAKE costs areslightly lower than the 30 percent estimate noted above. The Scully report presumes thatlearning in construction would reduce the overnight costs of the second plant by 3.8 percent.Learning would reduce the fourth plant's overnight cost by 23 percent below that of the firstplant (Scully Capital 2003, p. 1-8). Altogether, the Scully capital cost composition is roughlysimilar to the two compositions reported above.
3.2.7. Cost Implications of Opportunities for Siting New Nuclear Plants
Nth-of-a-kind cost estimates sometimes assume a full 5 percent cost reduction witheach doubling of units installed. The discussion in Section 3.2.2 of the components oflearning by doing suggests that realizing the full 5 percent reduction could be optimistic.Availability of demand will limit opportunities to build multiple 1,000 MW units at a singlesite, either simultaneously or in rapid sequence, reducing the scope for on-site replicationlearning. Limitations on the ability to build multiple units at a single site would also reducethe ability to obtain the additional 5 to 7 percent cost reduction attainable from simultaneousconstruction. The practicality of building multiple units at more remote sites, away frommajor demand centers, is limited by the availability of transmission capacity and could beconstrained as well by availability of cooling water.
Whether siting limitations such as these constrain new nuclear power plantconstruction is an open question, but the issues point to the importance of developing aspecific strategy for a program of nuclear expansion. Capital costs would be sensitive, withina range of nearly 10 percent, to sites selected, timing patterns, and opportunities for multipleunits.
3.3. The Shares of Overnight Capital Costs and Interest Costs in LCOE
The total capital cost shares in the LCOEs of nuclear plants are only slightly higherthan those of a large coal plant,. as Table 3-5 shows. The overnight cost estimates for theABWR differ somewhat from those in Tables 3-3 and 3-4 above, deriving from differentsources. These sources were taken from calculations of LCOEs, which included interestcosts and the major component cost shares of the LCOEs. The principal demonstrationpoints are not affected greatly by the overnight cost variations.
The ABWR capital cost share is 64 percent and that of an AP 1000 is 61 percent,while that of a large, pulverized coal plant is nearly 61 percent as well. The cost share of agas plant is only about 32 percent, which goes some way to explaining the popularity of gasplants in recent years.
The similarity of the cost shares of the AP1000 and the coal plant is largely explainedby their similar overnight costs, $1,365 per kW versus $1,350 per kW. The ABWR
3-15

5-year construction period, but the increments in interest costs are from 27 to 30 percent,depending on the interest rate.
Construction interest costs are clearly an important component of total capital costs.The magnitude of the interest component over a 7-year construction period at a 13.5 percentWACC is impressive: nearly 42 percent of total capital cost. Even over a 5-yearconstruction period, the interest costs account for nearly one-third of the total capital cost.The 13.5 percent WACC reflects a risk premium of about 4 percentage points overconventional utility financing in recent years, which has averaged around 11.5 percent onequity and 7.5 percent on debt for a WACC of 9.3 percent. These figures show nonethelessthe importance of keeping construction delays under control and offering assurances thatwould reduce the risk premium investors require. Chapter 5 below goes into detail on choiceof construction time and WACC in the energy scenarios to be analyzed.
Table 3-6: Sensitivity of Overnight and Interest Cost Contributions to Total CapitalCost: Varying Construction Time and Weighted Average Cost of Capital
(WACC), for Advanced Boiling Water Reactor (ABWR)
Construction Time: 5 YearsWACC 0.080 0.115 0.135Interest share 0.211 0.287 0.327Overnight capital cost share 0.789 0.713 0.673
Construction Time: 7 YearsWACC 0.080 0.115 0.135Interest share 0.274 0.368 0.416Overnight capital cost share 0.726 0.632 0.584
3.4. Reactor Designs and Capital Cost Scenarios for Economic Analysis
A considerable narrowing of overnight costs estimates is accomplished byconsidering near-term reactor types. Choosing realistic near-term alternatives allows foruncertainty while anchoring estimates in reality. The resulting range also allows for someplay in estimate in view of the various sources of latitude reviewed in this chapter.
Appendix A4 identifies current reactor designs and discusses their prospects for near-term commercialization. Four reactors appear to be particularly good candidates fordeployment in the United States by the 2010 to 2015 period of concern in this study. Onecandidate is General Electric's ABWR, which has been built in Asia, jointly with Toshiba.Its prior construction by a U.S. vendor could simplify transferring it to the United States.Full FOAKE costs should not be incurred on a first unit in the United States since the U.S.firm's engineers would be able to transfer much of their experience with the Japanese
3-17

The EPR's overnight cost has been estimated between $1,600 per kW and a little over$1,900 per kW. Applying this cost to the SWR 1000, this range overlaps the range ofovernight costs experienced recently in Asia, and thus may represent other reactor designsthat could be considered. This third design's cost is taken to be $1,800 per kW.
3.5. Uncertainty in Overnight Cost Estimates
Overnight costs for each of these reactors are subject to some degree of uncertainty.Light is thrown on the uncertainty range by comparing the account compositions of theABWR in Table 3-1 with the corresponding account composition for the ABWR reported inRothwell (2004, p. 50, Table 1). The comparison of the two sources for same technologymay give some idea of the scope for variation in total cost per kW for any particular designof reactor.
Accounts 21, 22, 23, and 91--structures and improvements, reactor plant equipment,turbine plant equipment, and construction services (indirect costs in Rothwell)---comprise60 percent of the cost in Table 3-1 and 70 percent in Rothwell (2004). The differencebetween the two cost shares for a particular account, as a percent of the mean cost share forboth designs, may be a reasonable scope for variation of costs in that account for eitherreactor. Multiplying this percent by the mean cost share of that account yields the percentvariation in the total reactor cost that could be expected from variations in the costs in thisaccount. Performing the same calculation for each of these four accounts and summing overthose four accounts yields a variability of 21.5 percent of the total overnight cost.
Table 3-7 reports the range of overnight costs for each of the three reactor costsposited here, allowing for 10 percent variability in either direction from the midpoint. Thecost ranges overlap only slightly between the upper range of a lower-cost design and thelower range of a higher-cost design.
Table 3-7: Uncertainties in Overnight Capital Costs, $ per kW, 2003 Prices
Characterization of Reactor Lower Range Midpoint Upper RangeAverage of Mature Designs 1,080 1,200 1,320New Designs, FOAKE Costs Not Paid 1,350 1,500 1,650Advanced New Design, FOAKE Costs 1,620 1,800 1,980Not Paid 1,620 _ ,800_1,98
As another source of uncertainty, of the four designs considered likely candidates forconstruction by 2015, only the ABWR has had its proof of concept established. Theconstruction costs of plants whose prototypes have never been built have to be consideredless certain.
3-19

References
Cushing, Jack. (2002) "Memorandum: Summary of Meeting with Framatome ANPRegarding the Design Certification Process for the SWR 1000." New Reactor LicensingProject Office, Office of Nuclear Reactor Regulation, U.S. Nuclear Reactor Regulation.Rockville, Md, April 4. Retrieved December 2003 from World Wide Web:http://www.nrc.gov/reactors/new-licensing/new-licensing-files/mI020940471.pdf.
Delene, J. G., and C. R. Hudson II. (1993) Cost Estimate Guidelinesfor Advanced NuclearPower Technologies. ORNI/TM-10071-R3. Oak Ridge, Tenn.: Oak Ridge NationalLaboratory, May.
Electric Power Research Institute (EPRI). (2003) Nuclear Power's Role in MeetingEnvironmental Requirements: Evaluation of E-EPIC Economic Analyses, EPRI 1007618.Palo Alto, CA: EPRI, January.
Energy Information Administration (EIA). (2004) Annual Energy Outlook 2004 (AEO2004). Washington, D.C.: U.S. Department of Energy, January. DOE/EIA-0383(2004).
Energy Information Administration (EIA). (2001) Assumptions to the Annual EnergyOutlook 2002 (AEO 2002). Washington, D.C.: U.S. Department of Energy, December.DOE/EIA-0554(2002).
Framatome ANP. (2003) "Framatome ANP Submits its Tender to Build a New NuclearUnit in Finland," March 31. Retrieved December 2003 from World Wide Web:http://www.framatech.com/newsreleases/newsrelease.sap?NewsNumber= 190.
Mallay, James F. (2002) Letter to Samuel J. Collins, Office of Nuclear Reactor Regulation,U.S. Nuclear Regulatory Commission. Lynchburg, Va, May 31. Retrieved December 2003from the World Wide Web: http://www.nrc.gov/reactors/new-licensing/new-licensing-files/2002-6-6-6027622 l.pdf.
Massachusetts Institute of Technology (MIT). (2003) The Future of Nuclear Power: AnInterdisciplinary MITStudy. Cambridge, Mass.: Massachusetts Institute of Technology,July.
Nuclear Energy Agency, Organization for Economic Co-Operation and Development (NEA).(2000) Reduction of Capital Costs of Nuclear Power Plants. Paris: OECD.
Paulson, C. Keith. (2002) "AP1000: Set to Compete," Nuclear Engineering International47, Issue 579 (October): 20-22.
Reis, Victor H., and Matthew P. Crozat. (2002) "A Strategy for U.S. Nuclear Power: TheRole of Government." Mimeo. Washington, D.C.: SAIC.
3-21

Chapter 4. LEARNING BY DOING
Summa
Reductions in capital costs between a first new nuclear plant and some nb plant of thesame design can be of critical importance to eventual commercial viability. In building theearly units of a new reactor design, engineers and construction workers learn how to buildnew nuclear plants more efficiently with each plant they build. This chapter examines theevidence of cost reductions for nuclear power plants contributed by learning. The findings ofthis chapter are used in Chapter 9 to estimate the reduction in LCOEs due to learning effectsthat would take place after construction of early nuclear plants, lessening and possiblyeliminating the need for government policies aimed at the nuclear power industry afterbuilding the first few plants.
A case can be made that the nuclear industry will start near the bottom of its learningcurve when new nuclear construction occurs. The paucity of any new nuclear construction inthe past twenty years in the United States, together with the entry of new technologies and anew regulatory system, has eliminated much of the applicable experience of the U.S. craftworkforce. Participation in overseas construction may have given some U.S. engineersexperience that is transferable to construction in the United States, but the internationalmobility of craftsmen is much less. Consequently, considerable learning is to be expectedduring the construction of the first few new plants.
Studies of nuclear plants built in the 1960s and 1970s report evidence of learningrates of 5 to 7 percent with doubling of plants constructed. Extending the sample of plants tothose built in the 1980s weakens the ability to identify construction learning effects. Studieshave found lower costs on plants built in-house by a utility itself rather than by a contractor,as much as 25 percent; but an earlier study found a 30 percent higher cost on in-houseconstruction. It is possible that the in-house effect is the result of contractors in a marketwith limited competition.
A plausible range for future learning rates in the U. S. nuclear construction industry isbetween 3 and 10 percent. Tbree percent is conservative. It is consistent with a scenarioinvolving low capacity growth, reactor orders of a variety of designs spaced widely enoughapart in time that engineering and construction personnel cannot maintain continuity, some'construction delays, and a construction industry that can retain internally a considerableproportion of learning benefits. A medium learning rate of 5 percent is. appropriate for ascenario with more or less continuous construction, with occasional but not frequent cases ofsequential units built at a single facility, a narrower range of reactor designs built by a morecompetitive construction industry, with delays uncommon. A 10 percent learning rate isaggressive. It would necessitate a continuous stream of orders that keep ineering teamand construction crews intact, a highly competitive construction industry, and streamlinedregulation largely eliminating construction delays.
4-1

4.1. Introduction
The purpose of this chapter is to draw lessons for the future from the historicalexperience of learning by doing. Section 4.2 defines learning by doing. Section 4.3 reportslearning rates in industries other than nuclear plant construction. Section 4.4 describesobstacles that hinder measuring learning by doing. Section 4.5 reviews the research on firmlearning rates: Section 4.5.1 considers the standard approach studies that sought only tomeasure learning by doing; Section 4.5.2 analyzes the later studies that sought to characterizelearning by doing in greater detail; and Section 4.5.3 looks at research comparing firmlearning in the United States with f= learning overseas. Section 4.6 evaluates the researchon industry learning by doing. Section 4.7 examines factors other than learning by doing thatseven studies found to be significantly related to nuclear power plant capital costs: regulation(4.7. 1), in-house management (4.7.2), multiple-unit sites (4.7.3), economies of scale andconstruction-time effects (4.7.4), and region (4.7.5). Finally, Section 4.8 discussesknowledge depreciation, and Section 4.9 concludes'by summarizing the factors influencingalternative learning rates.
4.2. What is Learning by Doing?
As a product is produced over and over, the marginal cost of producing it oftendecreases. When this decrease is not a result of economies of scale or a drop in input prices,it may be a result of learning by doing. Learning by doing occurs when the human beingsinvolved in a production process gain experience performing their tasks and, over time, findmore efficient ways to do them. Costs of production decrease until potential gains inefficiency from learning are exhausted, at which point the costs level off toward anasymptote.
Learning by doing is an observed phenomenon; theories exist about where in theproduction process the learning occurs, but they remain theories. Epple et al. (199 1, p. 59)offer a list of factors contributing to learning by doing:
"Factors suggested as being responsible for organizational learning include:increased proficiency of individuals, including direct labor, management andengineering staff; greater standardization of procedures; improvements inscheduling; improvements in the flow of materials; improvements in productdesign; improvements in tooling, layout, materials, and equipment; bettercoordination; division of labor and specialization; incentives; leadership; andlearning by firms outside the focal firm, including suppliers and other firms in theindustry."
Moreover, learning rates probably capture the learning effects from multiple, differentagents within a firm: "The learning curve should be thought of as an aggregate model in thesense that it includes learning from all sources within the firm" (Yelle 1979, p. 309).Joskow and Rose (19 85, p. 8) write:
4-3
were approximately two times as large (25.6 percent versus 14.1 percent)" (Yelle 1979, p.306). The implication is that the more processes performed by human beings, the greater theopportunities to learn. Irwin and Klenow (1994) found in the semiconductor industry thatfirms learn three times more from their own cumulative production than from cumulativeproduction of other finms and that learning spills over as much between firms in the samecountry as between firms in different countries.
In the research on learning by doing in the nuclear plant construction industry,nuclear learning rates are generally lower than the 20 percent average of other industries.There are many possible reasons for this phenomenon. First, and most significantly, eachnuclear power plant is a unique project, making experience from previous projects lessrelevant. As McCabe writes, "Homogeneity maximizes the usefulness of past productionexperience... In contrast, power plant D&C involved designs that exhibited considerableheterogeneity, reducing the usefulness of past experience" (McCabe 1996, p. 357-358).Second, cost uncertainty (as a result of both regulation and heterogeneous plant designs) andcost-plus contracting may have reduced construction firm's incentives to reduce costs. Third,experienced construction firms may have been realizing decreasing costs but charging thehigher market price (rent-capturing).
4.4. Estimation Problems
Long construction times and complex accounting practices are hindrances toestimating learning by doing. Because power plant construction projects last a number ofyears, complicated calculations are necessary to remove inflation and interest duringconstruction (IDC) from the nominal cost numbers reported by utilities. Zimmerman,Komanoff, and Paik and Schriver use previous research on the typical cash flow for a nuclearpower plant construction project to estimate the proportion of the reported nominal costsspent each year of construction (Zimmerman 1982, p. 301; Komanoff 1982, p. 316). Oncethe costs are broken down year-by-year, they use average interest rates to subtract theappropriate interest and inflation.
Cantor and Hewlett, however, are critical of the use of both the typical cash flowmodel and average interest rates. They claim that the cash flow model is inaccurate andintroduces a bias correlated with time, leading "one to question the results of the otherresearch, since all the variables of interest are correlated with time" (Cantor and Hewlett1988, p. 323). Cantor and Hewlett claim to solve both problems by collecting accurateallowance for funds used during construction (AFUDC) and IDC rates from form FERC-1:"reported AFUDC rates collected from Form FERC-1 and supplemented by informationfrom various State public utility commissions to incorporate important accountingconventions are used to derive effects AFUDC rates" (Cantor and Hewlett 1988, p. 334).
Accounting practices present another barrier to calculating costs precisely: whenmultiple units are built at one site, utilities often allot a disproportionate fraction of sharedcosts to one of the units (Komanoff 1981, p.201; McCabe 1996, p. 365). Various methods
4-5

A
Table 4-1: Summary of Regression Analyses of Learning by Doing in Nuclear Power Plant Construction
Paper/Database Size Cost Size Date/Viltage Experience' Espertence2 Multiple Cooung Tower In-Ilouse Regions Other VariablesMoon 1979 In (c per kW) SIZE CPIS LN TOWER LOCI BW TIRSID and T2RSID
54 plants issued IDC included inuignificant Date construction Natural log of dummy; Dumny; I if Babcock-Wilcox .residuals from anotherpermits through permit issued cumulative insignificant Northeat, 0 if manufactured the regression; insignificantDecember 1972; z- number of LWR other NSSS; insignificant0.67; teamning rate - power plants byI 1.2 percent architect
Paik and Schriver In C in (MW) tN D0I.D4 RI RI^2197965 plants issued IDC included cumulative dummy was of four regions, "Regulation Impact used algorithm to estimatepermits between 1967 number of LWR included in only two Index:? Each impact ofregulations duringand 1974 and which plants built by regression, but (unspecified) - regulation was constructionwere complated or design firm results were regional dummies assigned an impactexpected to be insignificant wear asgnificas t rating (1.4); Sum ofcompleted by 198);
t regulations in year
-0.78; leamning rate -ofcoustr=nioa
21.9 •percentKornanoff 1981 capital cost, K MW CUMULATIVE A.E MULTIPLE COOLING NORTHEAST DANGLING
NUCLEAR TOWERCAPACITY
mote: only staristically $ per KW, captures effect of [anber of dummy; I if dummy ran separate only tortelsut Succe• oruitgnflcant vartables without regulation reactors built by unit is part of a regression to region had incomplete at timegiven In atudy; 46 estimated IDC; architect. multiple-unit test for inhousa significant cost of study; K. unablereactors completed used costs engineer site, 0 if unit is effects difference to average costsbetween December from data stAnd-alone across reactors at1971 and December reported "year site1978; r- 0.923; followingadjusted r- .908; commerciallearning rate - 7 operation"percent (p. 198)Zinumerman 1982 log actual cost, SIZE YEARI (l/(I+EXPF) (i/(I+EXPI) FIRST T SELFCO R7-RI I LETIME LUTIME
kw41 planta completed per kilowatt in in MW in which nuclear experience cumulative durmmy; I if dummy; I if dummy; I if 5 regions Ilog of the number log of the diff. betweenbetween 1968 and 1979S. decision was (completed industry first unit at mechanical conatruction of years orig. actual and anticipated time to1990; r' = 0.85; removed announced reactors) of experience; sire, 0 if cooling tower was done by anticipated between operationlearning rate in estimated IDC; construction eateratlity otherwise utility announctcement andTable 3 firm; measures associated with operation
private learning constructionaclivity
Cantor and Hewlett In (c per kW) In(SIZE) CONSTRT CSTI FIRST COOL BUILD IPRICE In (construction INTER1988 time)67 plants with "use actual number ofdays (I/I+EXPF) dummy; I if d umiy dummy. i if construction labor ran separate interactive term betweenscheduled commercial AFUDC rates between date of where EXPF is unit is a first utility was wage rate in the regression to BUILD s CSTIoperation before 1986; and cash construction start number of or single unit construction planui state capture "indirect"adjusted ?"0.85; profiles" to and 111/1960 completed plant manager effects of variableslearning rate I remove IDC reactors by through changes inlearning coefficient "cemntructor" construction timeinsignificant I _ _ I
4-7

Komanoff (198 1) studies capital costs of both nuclear and coal power plants.Employing a nuclear data base of 46 reactors completed between December 1971 andDecember 1978, Komanoff estimates a regression using variables for architect-engineerexperience, size, cumulative nuclear industry capacity, and dummy variables for multi-unitsite, dangling status, region, and use of a cooling tower (Kornanoff 1981, p. 198). Utilitiesoften allocate costs for plants at multi-unit sites unevenly. Komanoff solves this byaveraging total costs over the number of units at a site; dangling status means not all the unitsat a multi-unit site were complete at the time of the study, making averaging impossible(Komanoff 1981, p. 201). Komanoff's study is a departure from the previous two studies inseveral respects. First, he controls for multi-unit sites, while Mooz and Paik and Schriver donot, and found significant cost reductions for reactors at such sites. By controlling fordangling status, Komanoff prevents disproportionate cost allocations at multi-unit sites frombiasing the results against incomplete multi-unit sites.
Second, Komanoff's cost numbers better represent the overnight capital costs ofbuilding a plant: he removed estimated interest during construction from reported costs, andused costs reported in the year after the plant came online to capture substantial first-yearcapital costs (Komanoff 1981, p. 198). These techniques, together with Komanoff's highadjusted r2 of 0.908 and-high significance of the learning coefficient (> 99.9 percent), givehis estimated firm learning rate of 7 percent appear statistically reliable. He also finds that"the 95 percent confidence interval ranges from between a 5 and 9 percent cost reduction foreach doubling of experience" (Komanoff 1981, p. 200). However, Zimmerman's 1982 studyand Cantor and Hewlett's 1988 studies (below) give reason to question these results.
Zimmerman studies 41 plants finished between 1968 and 1980 "for which completedcost figures are available" (Zimmerman 1982, p. 301). He uses variables for size, vintage,anticipated construction time, difference between anticipated and actual construction times,construction firm experience, industry experience, and dummy variables for use of a coolingtower, first-unit status, region, and in-house construction (Zimmerman 1981, p. 299).Zimmerman's study is most comparable with Komanoff's, mainly because both use a cash-flow model to remove estimated IDC from reported costs (Mooz and Paik and Schriver donot remove JDC, while Cantor and Hewlett use actual cash-flow data).
Although Zimmerman's study is most similar to Komanoff's, Zimmerman'sregression differs from Komanoff's in several respects. First, while Komanoff usescumulative nuclear industry capacity to capture the effects of regulation, Zimmerman uses atime variable. Second, Zimmerman includes regression variables for anticipated and actualconstruction time, in-house construction, and industry learning effects, while Komanoff doesnot. Third, Zimmerman uses an alternate form of the experience variable, 1/(1 + experience),instead of simple experience (Zimmerman 1982, p. 300). The effects of these threedifferences on the accuracy of results are ambiguous; most of Zimmerman's additionalvariables are statistically significant. Zimmerman's use of the 1/(l + experience) form of theexperience variable makes calculating a constant learning rate impossible. While thelearning rate is a constant percent reduction for each doubling of experience, Zimmerman's
4-9

by the utility is accurately reflected in the estimated learning coefficient. Zimmerman notesthat including a regression parameter for in-house construction can help determine the extentof this bias: if utilities that manage their own construction realize lower costs than those thatoutsource to a construction firm, it may be evidence that construction firms are chargingprices significantly above costs. He finds that on average, in-house construction resulted in22 percent lower costs (Zimmerman 1982, p. 303). This saving may indicate thatconstruction firms were capturing rents (in which case, calculated learning rates are biaseddownward, but still accurately indicate utilities' cost savings), or it may simply indicate thatutilities run construction projects better. Zimmerman says of the lower costs for in-houseconstruction: "This could reflect savings due to a better managerial arrangement, or it couldindicate that in these cases the utility captured the entire rent" (Zimmerman 1982, pp. 304-305). In sum, rent-capturing maybe pushing calculated learning rates downward, but thatcannot be certain.
This consideration suggests a first reason to question the reliability of Komanoff'sresults: whereas Komanoff finds that in-house construction led to 30 percent higher capitalcosts, Zimmerman finds that in-house constructionrresulted in 22 percent lower costs.(Komanoff 198 1, p.200; Zimmerman 1982, p. 303). Komanoff does not include a variablefor in-house construction in his main regression. However, he estimates a separateregression to test for in-house effects: "The result was -a 30 percent higher cost for self-A-E,with a 95 percent confidence interval of 13 to 50 percent and a 99.9 percent significancelevel" (Komanoff 1981, p. 200). Furthermore, Cantor and Hewlett's results agree withZimmerman's (Cantor and Hewlett 1988, p. 332). This may be a result of different databases, although Zimmerman's (1968-1980) brackets Komanoffs (1971-1978) in time.
Alternatively, it may be a result of regression techniques or cost deflation data - it isdifficult to tell without access to Zimmerman's data (Komanoff provides his). The pointworth noting, however, is that the two authors examining similar time periods can findwidely disparate cost effects from a given factor. Moreover, Komanoff's in-house effectcoefficient is significant at the 99.9 percent level - the same high significance level of thelearning effects he finds. This must be taken into account when considering Komanoff's7 percent learning rate.
Cantor and Hewlett's study includes 67 nuclear plants "with scheduled commercialoperation before 1986" (Cantor and Hewlett 1988, p. 322). Their regression includesvariables for size, construction labor wage rate in the plant's state (a proxy for regional costdifferences), construction time, vintage, constructor experience, and dummy variables for useof a cooling tower, first-plant (at a multi-unit site) or single-plant status, and in-houseconstruction. They also include an interactive term between constructor experience and in-house construction. This study is a departure from the previous studies mainly in itsmethodology for estimating overnight costs. Where Komanoff and Zimmerman uses averagedebt rates and cash-flow models, Cantor and Hewlett use "actual AFUDC rates and cashprofiles" (Cantor and Hewlett 1988, p. 319). In a regression with an adjusted r2 of 0.85,Cantor and Hewlett find no learning effects for construction firms; they find "someevidence" of learning effects for utilities that managed construction themselves (Cantor and
4-11

4.5.2. Principal-Agent Framework and Firm Learning
McCabe studies 90 nuclear units finished by the end of 1988 (McCabe 1996, p. 368)*His study differs from the standard approach studies, in that he used a model of learning thatrelies on a principal-agent framework (McCabe 1996, p. 357). The principals (the utilities)outsource construction projects to the agents (the design and construction firms), except inthe case of in-house construction. McCabe recognizes a trend in the results of the standardapproach studies: in-house construction projects were generally cheaper than their agent-managed counterparts, and in-house construction exhibited greater learning effects (McCabecites Cantor and Hewlett's 1988 study). Consequently, McCabe separates projects intoutility-managed and agent-managed groups to test whether utility- and agent -managers faceddifferent incentives (McCabe 1996, p. 358). He hypothesizes that cost-plus contracts andcost uncertainty (mainly as a result of an unstable regulatory environment) reduced theincentives to learn for agent-managers. He does not deal with Zimmerman's rent-capturinghypothesis, that construction firms; had profit as an incentive to reduce costs. McCabe furtherclassifies the agent-managed projects by length of the principal-agent relationship to testwhether longer relationships provide greater learning opportunities by allowing agents tobetter understand a utility's unique design preferences. Additionally, McCabe notes that-because a utility that repeatedly manages -construction in-house is essentially in a long-termrelationship with itself, "In-house utilities building a series of plants should also experiencerelatively larger learning benefits" (McCabe 1996, p. 361).
McCabe's results generally conform to those of the standard-approach studies. In hisfirst regression, McCabe uses the standard approach: one experience coefficient representedthe experience of the unit's architect-engineer. This regression shows no significant learningeffects. In his second regression, McCabe separates the experience variable into agentexperience (which takes a value of I if the agent managed construction), principal experience(which takes a value of I if construction was managed in-house), and specific-relationshipexperience (which takes a value of I if an agent had previously contracted with the utility).With an adjusted r2 of 0.87, the results indicate that in-house construction experience had alarger impact on in-house construction costs than agent experience had on agent-managedprojects (McCabe 1996, p. 372). In fact, McCabe finds that for utilities, each in-houseproject reduced the cost of the subsequent in-house project by 11.6 percent, while forarchitect-engineers, that number is 2 percent (McCabe 1996, p. 371). These percentages arereductions after every project, and therefore not learning rates for doubling; roughlycomparable leanjing rates would be about 30 percent for in-house and 6 percent for agent-managed. McCabe's approximation of learning effects assumes constant returns fromlearning, but nearly all the research on learning by doing finds diminishing returns. Hisregression results, however, advance the understanding of learning as they reveal evidence ofconsiderably greater learning effects for utilities that manage projects in house. McCabe alsofinds specific-relationship experience insignificant, implying that "poor incentives rather than.design variation account for the difference between agent and in-house procuremenf)
(McCabe 1996, p. 372). That is, if design variation were responsible for the differencebetween in-house and agent-managed project costs, significant cost effects should be
4-13

learning (both within and among firms) is observed only when reactors of the same class areinvolved," implying that learning effects are more significant when plants are similar oridentical. Examining construction times of French reactors, Thomas noted that althoughconstruction times did not decrease from 1971 to 1980, "Even more striking... is the fact thatconstruction times have not risen over time" (Thomas 1988, p. 229). That is, in contrast tothe U.S. and German experiences, and despite the fact that the French industry wasundergoing "very rapid expansion," French construction times remained relatively constant"There is little evidence of learning leading to reduction in construction times but this is atleast in part explained by the rather short schedules that the French programme establishedfrom the beginning" (Thomas 1988, p. 232). Furthermore, a 1984 article in Nucleonics Weekcites a study by the Electric Power Research Institute (EPRI), which found that French plantsrequired "50 percent or less of the electric and mechanical (craft) labor consumed by the U.S.plants studied" (MacLachlan 1984, p. 2). In summary, Lester and McCabe found that theFrench industry realized greater learning effects in operation and maintenance, while Thomasfound that France was able to avoid significant construction delays; the EPRI study foundthat French plants required significantly less labor to construct. All the studies explicitlyattribute their findings to France"s standardization and single-utility industry structure.
Japan's nuclear industry has also been characterized as-successful. In a 1988 article,Navarro attributes Japan's success to standardization and a unique anti-trust policy. TheJapanese Ministry of International Trade and Industry (MITI) guided Japan into a two-designreactor program. The program was designed to reap the benefits of both standardization(reduced costs, greater learning effects) and competition (pressure to keep costs down). Ofstandardization, Navarro writes, "Besides the benefits associated with construction timereductions, these programs are generally credited with helping Japanese utilities raise theaggregate nuclear capacity factor from a low of 37 percent in 1977 to close to 80 percenttoday" (Navarro 1988, p. 9). However, Navarro notes that in a statistical analysis, he wasunable to find any firm-specific learning effects in Japan. Navarro attributes this lack of firmlearning to the prevalence of industry learning: "This important result suggests that thevarious Japanese consortia have been able very quickly to assimilate and share thetechnological stock of knowledge necessary to build nuclear plants" (Navarro 1988, p. 7).Navarro goes on to describe Japan's unique anti-trust policy, writing that the Japanesegovernment "encourages cooperation and concentration within industries and views resultantconsortia as warriors in the international arena" (Navarro 1988, p. 9). Lastly, Navarro notesthat Japan's "open and shut" licensing process allows Japanese utilities to pay lowerinsurance premiums on their capital (Navarro 1988, p. 10).
Although both the French and Japanese nuclear industries were relatively successful,a direct link between their success and their efforts to standardize remains unproven.Nonetheless, there is evidence implying that standardization leads to greater learning effects.A study by Kouvaritakis et al. (2002) estimates a 5.8 percent learning rate for OECD nuclearconstruction over the period 1975-1993 (reported in McDonald and Schrattenholzer 2001,Table 1, p. 257).
4-15

four-year span, from March 1967 to March 1971" (Komanoff 1981, p. 205). Second, notePaik and Schriver's use of a regulatory index. The index was created by assigning anumerical weight based on "impact" to each piece of U.S. Nuclear Regulatory Commission(NRC) regulation. The authors cite Bennett and Kettler (1978) who "evaluated the impact ofeach issuance on investment requirements with respect to both schedule and direct costs andclassified their impact ranging from minor to most significant" (Paik and Schriver 1979, p.231). Paik and Schriver used an algorithm to assign each plant a valuerepresenting thequantity and quality of regulation its designers had to face, taking into account regulationpassed during the plant's construction. They found that regulation caused a 69.2 percentincrease in plant cost from 1967 to 1974 (Paik and Schriver 1979, p. 235). Subsequentstudies did not use Paik and Schriver's regulatory index because a vintage variableperformed just as well. Komanoff used cumulative sector size to measure the effects ofregulation "because it appears to capture more of the societal processes that give rise to newstandards' and because it resulted in a higher r2 value (Komanoff 1981, p. 204). However,later studies did not use cumulative sector size because, as with Paik and Schriver'sregulatory index, a vintage variable performed just as well. Cantor and Hewlett write,"neither Komanoff's cumulative sector size measure nor Paik and Schriver's regulatoryindex performed any better than a simple time trend variable. This is because any measure ofNRC regulatory activity is highly correlated with time" (Cantor and Hewlett 1988, p. 325).Cantor and Hewlett attribute-their relatively low percentage to their unique deflation methods(Cantor and Hewlett 1988, pp. 327-328).
Table 4-3: Regulatory Effects
Study Time Independent Variable Percent Change NotesStudy Period IndependentVariable in Costs NotesMooz (1979) 1965-1972 Vintage (permit issue date) 24.0, per year
Paik and Schriver 1967-1974 Regulatory Index 15.6, per year (compound(1979) annual)Komanoff (1981) 1971-1978 Cumulative Sector Size 49.0, per doubling of sector
size
Vintage (permit issue date) 23.6, per year (average)Vintage (plant completion) 13.1, per year (average)
Zimmerman (1982) 1968-1980 Vintage (nuclear decision 11.0, per year Included Industryannounced) Experience Variable -
completed reactors18.0, per year Included Industry
Experience Variable -reactor years
Cantor and Hewlett 1966-1986 Vintage (construction start) 10.6, per year(1988)McCabe (1996) 1971-1988 Vintage (permit issue date) 17.3, per year Included higher order
terms (date, date2, date3)Canterbery et al. 1966-1987 Cumulative number of 11.1, per 10 percent increase(1996) regulations in number of regulations
4-17

Cantor and Hewlett point out: "It should be recognized that the use of a binaryvariable to measure the cost differences between the two types of management regimes isdone by necessity. In fact, there may be a range of utility involvement in the constructionmanagement, suggesting that a continuous variable, if one could be derived, would be apreferable measure" (Cantor and Hewlett 1988, p. 329).
In summary, in-house construction management yields lower costs and greaterlearning rates. The cause may be rent-capturing or greater incentives to reduce costs.
4.7.3. Multiple-Unit Sites
Most of the studies include a variable in their regressions to control for first-unitstatus. As noted, utilities often allot a disproportionate fraction of total costs at multi-unitsites to the first unit. By including a variable for first-unit status, the studies ensure that thisdisproportionate allocation does not bias their results. However, the coefficient associatedwith first-unit status tells nothing about whether reactors at multi-unit sites cost more or lessthan stand-alone reactors, but indicates only that the first unit costs more than subsequentunits at a multi-unit site. Only Komanoff seeks to determine whether reactors at multi-unitsites cost less than stand-alones. To control for first-unit bias, Komanoff averages total costsfor a multi-unit site over all the reactors at the site, so that all the reactors at a multi-unitsiteare assigned the same cost. He then includes a dummy variable in his regression for multi-unit status, and finds that "multiple units averaged 9.7 percent lower costs than otherreactors" (Komanoff 1981, p. 201).
4.7.4. Economies of Scale and Construction-Time Effects
Because the standard approach studies use overnight costs as the dependent variable,identifying economies of scale correctly is a three-step process. The first step is to calculatewhat effects, if any, scaling up plant size has on overnight costs, "the quantities of land, laborand materials needed to construct a nuclear power plant" (Cantor and Hewlett 1988, p. 318).However, overnight costs, by definition, do not take into account time-related costs likeinterest and inflation. The second step is to determine how scaling-up plant size affectsconstruction time, and the third step is to determine how an increase in construction timeaffects costs. Construction time affects real costs in two ways: an increase in constructiontime results .in greater interest and inflation as well as greater overnight costs. Although therelationship between construction time and overnight costs is not immediately clear, Cantorand Hewlett's evidence of such a relationship is described below. Table 4-4 lists the studies'estimated scale effects. As a reference point, Komanoff wrote in 1981 that "capital costprojections of the U.S. Atomic Energy Commission (AEC), its successor agencies, and thepower industry assume that nuclear costs per kW decline by 20 to 30 percent when reactorsize is doubled" (Komanoff 1981, p. 200).
4-19
off and then re-hired). They find overnight costs correlated with construction time beyondthe 95 percent significance level. Using just overnight costs and no construction-timeeffects, Cantor and Hewlett find that a doubling of unit size resulted in a 36 percent decreasein costs per kW. However, when the construction time-overnight cost relationship is takeninto account, the longer construction time necessary to build larger plants makes a doublingin plant size 9 percent more expensive, in costs per kW. "Thus, there appears to be someevidence supporting the claims that the industry has attempted to build units that are too largeto be efficiently managed by the constructors" (Cantor and Hewlett 1988, p. 318). Theconstruction time-overnight cost relationship excludes the construction time-interest costrelationship which affects LCOE.
Marshall and Navarro (1991) deal with the measurement rather than the concept ofovernight costs. They observe that the calculation of overnight costs as the sum ofexpenditures over the construction period must be placed on a correct time basis to satisfy therequirements of capital theory. They point out that overnight costs as commonly calculatedcannot accurately represent economies of scale because they leave out construction-timeeffects. The summation of construction expenditures must be dated to the completion date ofthe plant, which requires the proper correction for price-level change in the calculation ofovernight costs. In their test for economies of scale in Japanese nuclear plants usingovernight costs dated to plant completion dates, they find that when overnight costs are usedas the dependent variable, economies of scale seem to exist, but when opening-date overnightcosts are used, the size coefficient is insignificant, implying no economies of scale exist(Marshall and Navarro 1991, p. 153). Although Marshall and Navarro are critical of theprevious studies' calculation of overnight costs, they come to the same conclusion - ifeconomies of scale exist, they are minimal. McCabe (1996) uses Marshall and Navarro'sopening-date cost and finds the size coefficient insignificant (McCabe 1996, p. 370).Canterbery et al. (1996, p. 558, n. 4) note that Marshall and Navarro's contention that thedefinition of overnight costs exclude inflation is incorrect.
The results on size effects are diverse. In Mooz's regression, the size coefficient isinsignificant. Paik and Schriver do not use costs per kW, so their results cannot be used totest for economies of scale. Komanoff finds evidence of slight economies of scale, takinginto account construction time-interest effects but not construction time-overnight costeffects. Cantor and Hewlett find evidence of slight diseconomies of scale, taking intoaccount construction time-overnight cost effects, but not construction time interest effects.Zimmerman finds evidence of modest economies of scale, but the coefficient is onlymarginally significant. Using opening-date overnight costs, both Marshall and Navarro(1991) and McCabe (1996) find no evidence of economies of scale, but Canterbery et al.(1996) find a strong size effect reducing cost. It seems reasonable to conclude that few if anyscale economies existed in nuclear plant construction in the 1970s and 1980s to confound theidentification of learning effects.
4-21

Table 4-5: Regional Cost Differences
Numberof Regions Independent
Study Controlled Variable FindingsFor
Mooz (1979) 5 Dummy Northeast 38.8 percent moreexpensive than other regions
Paik and 4 Dummy South 21.3 percent cheaper, Mountain 23Schriver (1979) percent cheaper than Northeast and CentralKomanoff 3 Dummy Northeast 28 percent more(1981) expensive than other regionsZimmerman 5 Dummy Midwest 28.1 percent, South 30.2 percent,(1982) Mountain/Texas 39.3 percent, Pacific 14.8
percent less expensive than NortheastCantor and 50 Construction Labor wage rate by state correlated withHewlett (1988) labor wage rate plant costs per kW at 95 percent
in state where significanceplant is located
McCabe (1996) 4 Average union Average wage rate by region correlated withwage rate in costs per kW plant at 95 percentBLS region significance
4.8. Forgetting and Knowledge Depreciation
Organizational forgetting (or alternatively, knowledge depreciation) occurs whenknowledge is lost during a break in production. Argote and Epple (1990) note: "Knowledgecould depreciate because individual employees forget how to perform their tasks or becauseindividuals leave the organization and are replaced by others with less experience" (Argoteand Epple 1990, p. 922). The concept of organizational forgetting is relevant to the presentstudy because of both the long-term hiatus in nuclear construction in the United States andthe potential for short-term interruptions should construction resume.
Argote and Epple summarize the literature on knowledge depreciation inmanufacturing; none specific to construction was found. They cite one study in which unitcosts were higher after a break such as a strike, and another study that found "recent outputrates may be a more important predictor of current production than cumulative output"(Argote and Epple 1990, p. 921). Argote and Epple also cite Lockheed's experience with theL- 01 1 Tri-Star as an example of knowledge depreciation: after a period of low productionof the Tri-Star, Lockheed's costs were higher than when production first began.
Knowledge depreciation is relevant to near-term nuclear construction in the UnitedStates in so far as recent experience from overseas plant construction is not perfectly
4-23

deployed, but each in sufficient numbers to obtain maximal learning among all parties, frommanufacturing through engineering and construction. Regulation would streamlineconstruction times, and delays would be largely eliminated.
Table 4-6 summarizes the conditions associated with different learning. rates.
Table 4-6: Conditions Associated With Alternative Learning Rates
LearningRate Pace of Number of
(Percent for Reactor Reactors Built Construction Reactor Design RegulationDoubling Orders at a Single Site Market Standardization Impacts
Plants Built)3 Spread apart Capacity Not highly Not highly Some
I year or saturated, no competitive; can standardized constructionmore multiple units retain savings from delays
learning5 Somewhat Somewhat More competitive; Narrower arTay of Delays
more greater demand most cost reductions designs uncommoncontinuous for new capacity; from learning passedconstruction multiple units on to buyers
still uncommon10 Continuous High capacity 11ijh-iy competitive; Several designs; Construction
construction demqnd growth; all cost reductions sufficient orders for time reducedmultiple units passed on each to achieve and delayscommon standardization largely
learning effects eliminated
4-25

MacLachlan, Ann. (1984) "Key to Cheaper French Nuclear Plants is Labor Use, StudyShows," Nucleonics Week 25: 9-10.
McDonald, Alan, and Leo Schrattenholzer. (2001). "Learning rates for energy technologies,"Energy Policy 29: 255-261.
Marshall, John M., and Peter Navarro. (1991) "Costs of Nuclear Power Plant Construction:Theory and New Evidence," RAND Journal of Economics 22: 148-154.
McCabe, Mark J. (1996) "Principals, Agents, and the Learning Curve: The Case of Steam-Electric Power Plant Design and Construction," The Journal ofIndustrial Economics 44:357-375.
Mooz, William E. (1979) A Second Cost Analysis ofLight Water Reactor Power Plants.Santa Monica: The Rand Corporation, R-2504-RC.
Navarro, Peter. (1988) "Comparative Energy Policy: The Economics of Nuclear Power inJapan and the United States," The Energy Journal 9, No. 4: 1-15.
Paik, Soon, and William R. Schriver. (1979) "The Effect of Increased Regulation on CapitalCosts and Manual Labor Requirements of Nuclear Power Plants," The EngineeringEconomist 26: 223-244.
Thomas, S.D. (1988). The Realities of Nuclear Power: International Economic andRegulatory Experience. New York: Cambridge University Press.
Wright, T.P. (1936). "Factors Affecting the Cost of Airplanes," Journal ofAeronauticalScience 3: 122-128.
Yelle, Louis E. (1979). "The Learning Curve: Historical Review and ComprehensiveSurvey," Decision Sciences 10: 302-328.
Zimmerman, Martin B. (1982) "Learning Effects and the Commercialization of New EnergyTechnologies: The Case of Nuclear Power," Bell Journal of Economics 13: 297-310.
4-27
Chapter 5. FINANCING ISSUES
Summary
As a prelude to considering energy scenarios for the future, which will be thecapstone of the study in Chapters 9 and 10, this chapter develops the basic financial modelused to analyze nuclear energy economic viability. Features of the U.S. tax system areintroduced. Risk is considered in some depth. To provide a benchmark for the energyscenarios for the future that will contemplate alternative nuclear energy policies, the model isused to estimate the sensitivity of economic viability to uncertainties in the no-policy case.
Taxes
Recognition that nuclear energy plants will be owned and operated by utilities orother private providers requires introducing tax treatment of debt and equity, deduction ofdepreciation from taxable income with effects of different allowed depreciation schedules,effects of special tax provisions, and effects of inflation on taxes.
Risk
The perceived risk of investments in new nuclear facilities is widely appreciated tocontribute to the risk premium on any new nuclear construction. Principal sources of risk arethe possibilities that new plants will exceed original cost estimates and that constructiondelays will escalate costs. In this chapter guidelines from the corporate finance literature areused to specify likely relationships between project risk and risk premiums for corporatebonds and equity capital. Risk premiums have an important influence on the economiccompetitiveness of nuclear energy. A 3 percent risk premium is used for the first few plants.
No-Policy Scenarios
In using the financial model to study sensitivity to uncertainties, an overnight costrange for new nuclear plants of $1,200 to $1,800 per kW is used, based partly on the threetechnologies discussed as being realistic in Chapter 3. Given the capital cost range, theLCOE of new nuclear plants in the absence of policies is from $53 to $71 per MWh, with a7-year construction time. The range is lower at $47 to $62 per MWh with a 5-yearconstruction time. Costs remain outside the range of competitiveness with coal and gas,which have LCOEs of $33 to $41 per MWh and $35 to $45 per MWh, respectively.
The nuclear LCOE for the most favorable case, $47 per MWh, is close but still abovethe highest coal cost of $41 per MWh and gas cost of $45 per MWh. Longer debt terms andlonger plant life span reduce nuclear LCOEs, but still do not bring them into the competitiverange. The impact of construction delays is large, particularly if a 2-year delay occurs afterall outlays have been made--capable of making the nuclear LCOE range from $61 to over$76 per MWh. These no-policy results provide benchmarks indicating the extent to whichpolicies to be considered in Chapters 9 and 10 are needed to reduce nuclear LCOEs.
5-1
5.1. Introduction
To ascertain the conditions under which nuclear power will be competitive in themarketplace requires a financial model of private sector decisions. The required model ismore elaborate than the LCOE model of Chapter 1 used to compare LCOEs in previousstudies, because of tax considerations omitted there. Within the required financial model,careful attention is paid to rates of return on debt and equity that investors will demand inview of market perceptions of the riskiness of nuclear power investments. Introducing theseconsiderations permits estimation of the cost of electricity that will have to be covered byrevenues of operators of new nuclear facilities if these facilities are to be viewed by theprivate sector as warranted investments. These costs in the no-policy case are the startingpoint for considering policies that would make nuclear power competitive.
Section 5.2 develops the financial model that will be used for policy analysis in thepresent study. Section 5.3 reviews the finance literature for guides to risk premia and 'capitalstructure to be expected for new nuclear facilities. Section 5.4 lays out baseline assumptionsin the absence of policies aimed at the nuclear power industry and applies the financial modelto arrive at LCOEs in the no-policy case. Sensitivities to the baseline assumptions areexplored.
5.2. The Financial LCOE Model
5.2.1. Basic Equation
The levelized cost of electricity, or LCOE, is defined as the constant real price ofelectricity over the life of the plant that compensates debt and equity investors at theirrequired rates of return. Interest on debt accrues during the construction period and debtholders are repaid with equal annual payments over the debt term. Equity holders investduring the construction period and receive profits after tax and debt payment over the plantlife. The LCOE is the electricity price that yields the internal rate of return required byequity holders on the returns accruing to them.
Equity is considered, with debt as an expense, rather than treating them symmetricallyas in the pre-tax LCOE model, because of the different tax treatment of debt and equityreturns. LCOE is the electricity price that solves the following equation:
PRESENT VALUE OF EQUITY INVESTMENT DURING THE CONSTRUCTION PERIOD
- PRESENT VALUE OF NET REVENUE EARNED BY EQUITY OVER THE LIFE OF THE PLANT
where
NET REVENUE = EARNINGS FROM LCOE REVENUE BEFORE INTEREST AND TAXES (EBIT)
- INTEREST EXPENSE - TAX EXPENSE + DEPRECIATION - REPAYMENT OF DEBT
5-3
5.2.5. Depreciation
Depreciation only becomes effective in an LCOE calculation when taxes areconsidered, because it is an allowance in the tax code that permits subtraction of an amountof capital expense from a year's taxable income. With no taxes, the only requirement is torecover the capital cost over the life of the plant. The life of the plant matters, but the timepath at which the plant is assumed to depreciate is irrelevant.
A percent of the depreciable asset base can be deducted from gross income each year.Depreciation begins as the plant starts to operate. Two schedules are employed in the model,the Modified Accelerated Cost Recovery System (MACRS) and Straight Line, to examinethe impact of different depreciation methods on LCOE. The Modified Accelerated CostRecovery System (MACRS) schedule is a 1986 modification of the Accelerated CostRecovery System (ACRS), which was established by the Economic Recovery Tax Act of198 1. Both ACRS and MACRS represent a departure from previous depreciation ruleswhich were closely allied to financial depreciation concepts that attempt to depreciate anasset over its economic lifetime. The federal tax code assigns a 15-year depreciation periodto electric utility plants under MACRS (IRS 2002, p. 93). MACRS allows declining balanceor straight-line depreciation for classes of assets that include power plants. Decliningbalance is used here.
The depreciable asset base is measured in nominal dollars at the time ofdisbursement. Consequently a lengthier construction period, or a delay at the end of aconstruction period, would reduce the depreciable asset base relative to overnight costsbecause inflation has more time to raise other prices. This effect reduces the real value of theallowable deduction from revenues and hence would reduce the value of the depreciationallowance. VVhile inflation has offsetting effects on revenues from electricity sales and pricesof fuels and O&M outlays, the effect on the depreciation is not neutral.
During the construction period, part of the financing comes from debt investors andthe other from equity holders. According to accounting rules, interest on debt outstanding iscapitalized and added to the depreciable asset base, so the total asset base consists of nominaldebt investment equity investment and interest expenses during the construction period.The depreciable asset base excludes equity appreciation.
5.3. Theory and Evidence of Risk Premiums and Capital Structure
This section is concerned with risk associated with new nuclear plants. The purposeis to develop guidelines for returns on equity, returns on debt and debt-equity ratios, to beused in the financial modeling of the present study. Section 5.3.1 characterizes the risksfacing investments in new nuclear plants. Section 5.3.2 reviews studies of effects of -uncertainty on decisions to build nuclear plants. Section 5.3.3 deals with required return onequity, 5.3.4 with required returns on debt, and 5.3.5 with debt-equity ratios. Section 5.3.6addresses the choice of debt maturity.
5-5

Investment is assumed to go forward as long as expected capital costs do not exceed thesevalues.
Pindyck's study assumes a price of electricity and, using a risk-free interest rate,determines the threshold price of capital above which an investor would not buy a nuclearpower plant. In contrast, the approach of the present study assumes a required price forcapital, and using a weighted average cost of capital that includes an interest premium,determines the price of electricity.
Sommers (1980), using a logit regression analysis of 113 utilities, found that greateruncertainties about nuclear capital costs and construction times lowered the probability that autility would invest in a nuclear plant rather than a coal plant. Capital cost uncertainty had astronger dampening effect on the likelihood of a utility's investing in a nuclear plant than didthe relative capital cost of nuclear and coal investments.
While the Sommers study corroborates the importance of risk factors this study hasidentified, it focuses on the probability that an investor would undertake construction of anuclear plant. In contrast, the present study addresses the incentives that would be requiredto induce investors to undertake construction.
5.3.3. Required Rates of Return on Equity
5.3.3.1. Traditional CAPM and Its Irrelevance to the Present Study
The most widely used model of equilibrium equity asset pricing remains the capitalasset pricing model (CAPM) of Sharpe (1964), Lintner (1965) and Black (1972) and Mossin(1966). The central implication of the CAPM is that expected returns for each asset (let thisbe ri for asset i) should bear a linear relationship with the expected returns of the market as awhole. The CAPM equation is ri = rf + P3i (rm - rf), where Pi is a measure of co-movementof each firm with the market. Expected stock returns are higher for firms with highcorrelations with the market return. Investors demand a premium for holding stocks whichare highly correlated with the market, that is, for holding non-diversifiable or systematic risk.A model very similar to the CAPM is a consumption-based capital asset pricing model(CCAPM). This model suggests that expected asset returns have a linear relationship withoverall marginal utility of consumption as determined by performance of the economy atlarge. Though there have been other theories of equilibrium asset pricing, CAPM andCCAPM are still most prevalently used. CAPM has become a central tool of financialanalysis in the finance industry (see for example Graham and Harvey (2001) who find thatfirms rely heavily upon CAPM techniques).
CAPM and CCAPM do not include an effect of own variance of asset returns, aproperty often considered to be counter-intuitive. The reason for lack of effect of ownvariance is brought out in the Markowitz (1959) portfolio selection model (a building blockof CAPM). Investors can completely rid themselves of any assets' idiosyncratic risk bydiversifying, through the holding of a market basket containing essentially an infinite number
5-7

not yet built or for regulatory uncertainty surrounding the decision to build a plant, which arerisks of concern the present study. Farber (1991) studied the effect of adopting nucleartechnology on equity costs of electric utilities prior to the Three Mile Island (TMI) accident.Farber studied the effects on equity returns of thirty-six nuclear power adopters and twenty-five non-nuclear firms. He concluded that adoption of a nuclear plant increases a firm'sCAPM equity beta. In addition, he concluded that the leniency of regulators may moderatethe risk-increasing effect of nuclear power. Brooks and D'Souza (1982), Bowen et al.(1983), and Fraser and Kolari (1983) found that the TMI accident appeared to increase theexpected beta risks of four utilities owning nuclear capacity, although Uselton et al. (1986)subsequently found the effect to be transitory.
Hearth et al. (1990) examine the effect on stock prices of cancellations of nuclearpower plants. The authors found that decisions to cancel nuclear power plants underconstruction appeared to result in significant negative excess stock returns. This loss wasfound to be bigger with the ratio of the sunk costs relative to the utility's market value. Kalraet al. (1993) measure the U.S. stock market reaction to the April 1986 nuclear Chernobylpower plant accident. The authors found that after the Chernobyl event the betas for allpower utilities (conventional, mixed and nuclear) rose.
Fuller et al. (1990) studied the reaction of financing environment of three specialevents: Three Mile Island accident, the Chernobyl catastrophe and the Washington PublicPower Supply System bond default. Based upon the authors' cross-sectional analysis it wasestimated that a 3 percent increase in the allowed rate of return for nuclear utilities wouldhave been required to offset the discount associated with nuclear power.
Hill and Schneeweis (1983) use stock price data to study the effect on the stockreturns of public utility firms of the TMI nuclear accident. The authors find that impact ofthe Three Mile Island accident on non-nuclear electrical utility firms was less than that onnuclear based utilities. Hewlett (1984) found that investors in nuclear firms required a I to 2percent risk premium.
As noted, since these studies refer to utilities that already had nuclear plants, refer to apast regulatory environment, and in some cases rely on estimates of beta no longer acceptedin the literature, they are at best suggestive and in any case give little if any help in choosinga required rate of return applicable to a firm that will build a new nuclear plant in the future.
5-3.4. Required Rates of Returns on Corporate Bonds
The academic literature generally assumes (see Elton et al., 2001) corporate debtcarries the same rate of return as U.S. Treasury Bonds plus a premium. The premium iscomprised of three parts 1) a premium for expected default risk, 2) a state tax premium (asincome from corporate bonds is taxed and Treasuries are not), and 3) a premium forattracting risk-averse investors.
5-9
Much of the empirical work of an academic nature related to debt-equity ratios doesnot focus on risk. Work which does speak to risk generally finds a small role for risk incapital structure. See for example, Marsh (1982), Ghosh et al. (2000), Kale et al. (1991) andFama and French (2003).
There is an on-going debate on whether industry-specific effects on debt-equity ratiosexist. Schwartz and Aronson (1967), Scott (1972), Scott and Martin (1975), Bowen et al.(1982), Martin and Henderson (1984) and Bradley et al. (1984), Hull (1999), and Sibley(1999) find inter-industry differences in debt equity ratios. Remmers et al. (1974), Belkaoui(1975), and Sekely and Collins (1988) all fail to find evidence of differences in debt-equityacross industries. Graham and Harvey (2001) surveyed 392 CFOs regarding their use offinancial tools and targets. The responses indicated that if firms do have leverage targets,those targets are quite soft.
5.3.6. Debt Maturity
Multiple factors influence corporate borrowers' and lenders' choice of debtmaturities. Moreover, debt maturity, debt-equity ratio and risk premium are interrelated. Anumber of models relate risk and capital structure to maturity choice, but no comprehensivemodel of all three choices has been found. The first sub-section (5.3.6.1) places maturiWchoice within the general context of the term structure of interest rates. The second sub-section (5.3.6.2) addresses informational asymmetry problems that may pose important risksin financing new nuclear power plants. The third sub-section (5.3.6.3) deals with theinfluence of other risks on maturity choice, and the fourth (5.3.6.4) discusses the influencesof transaction costs and taxes. The fifth sub-section (5.3.6.5) addresses interactions betweenchoices of debt maturity and capital structure. The sixth sub-section (5.3.6.6) reviewsempirical evidence on risk and debt maturity. The final sub-section (5.3.6.7) summarizes.
5.3.6.1. Term Structure
The term structure of interest rates underlies debt maturity choices. An importantconsideration is the slope of the term structure, i.e., rate of rise of interest rates that must bepaid as maturity length increases. Empirical evidence has shown that firms take into accountthe relative cost of short- and long-maturity bonds when issuing debt (Barclay and Smith1995, Guedes and Opler 1996, Stohs and Mauer 1996, Graham and Harvey 2001). Otherthings being equal, firms gravitate to shorter maturity instruments when term structure slopesare steep, and toward long term instruments when slopes are shallow or negative. However,the slope of the term structure is clearly not the only determinant of maturity choice as thefollowing sub-sections bring out.
5.3.6.2. Influences of Asymmetric Information on Debt Maturity Choice
When a lender either cannot assess the accuracy of a borrower's informationregarding a project, or when a lender cannot easily monitor the actions that a borrower agreesto undertake as part of a loan contract, asymmetric information problems exist. One problem
5-11

5.3.6.3. Effects of Non-Informational Risks on Debt Maturity Choice
Liquidity risks tend to push debt maturities to the long end of the spectrum. Atemporary problem could force issuers to refinance at unattractive rates. If bad news about aborrower arrives near the refinancing date, investors would raise the default premium on newdebt. Firms with projects that could experience temporary problems will be motivated tohold longer-term debt, so as to face the debt renewal less frequently (Johnson 1967, Flannery1986, Diamond 1991).
Some firms will want to match maturities of their liabilities and their assets. Thismotivation would be stronger when transactions costs and liquidity risks are higher (Mitchell1991, Sarkar 1999). A bond would mature at the date an asset is to be sold or begingenerating positive cash flow, avoiding both the need to roll over shorter maturity bonds andthe higher cost of longer term bonds. Morris (1976) finds that financing long-lived assetswith short-maturity debt could decrease the uncertainty of net income if interest rates arepositively correlated with net operating income.
5.3.6.4. Transactions Costs and Taxes
Small debt issues have proportionally higher transactions costs than large issues.Large firms, such as those likely to build new nuclear power plants, would tend to chooseshorter term debt to take advantage of lower market rates at the shorter end of the termstructure (Fisher et al. 1989). In general, long-term debt allows its holders greater flexibilityin timing of capital gain and loss declarations, and this flexibility is an option having value.Firms can sell long-term bonds for relatively more than short term bonds if this tax-timingoption is highly valued (Brick and Palmon 1992).
Interest rate volatility reduces the present value of debt tax shields from short-termfinancing, making long-term debt attractive when interest rates are volatile (Guedes andOpler 1996, Brick and Ravid 1985, 1991; Kim et al. 1995). If new nuclear plants reachedfinancing stages during a period of volatile interest rates, borrowers could be expected towant longer debt maturities. Kane et al. (1985) model the tax advantage to debt, net of amarket premium for added bankruptcy risk, adjusting maturity and the debt-equity ratio tomaximize firm value including the tax shield, with the result that optimal maturity is
negatively associated with the tax advantage of debt. As the value of a tax shield falls, thedebt-equity ratio falls and maturity lengthens. Policies that reduced tax obligations on newnuclear plants could increase the value of longer maturities.
5.3.6.5. Interactions between Choices of Debt Maturity and Capital Structure
To the extent that risks are affected by both debt-equity ratios and debt maturity, thetwo choices will be made simultaneously. For example, in a world of agency problems,should the debt-equity ratio be so low that bankruptcy is almost impossible, the incentive tolower debt maturity as a signal would disappear and the firm would move to a longer
05-13

and market variables used in the LCOE calculations in the benchmark no-policy case.Sections 5.4.3 and 5.4.4 discuss the use of these variables in sensitivity and scenario analysis.
5.4.1. Nuclear versus Fossil Plants: Economic Advantages and Disadvantages
Nuclear power has several advantageous economic characteristics, but also suffersfrom a number of disadvantageous characteristics as perceived by investors, as summarizedby LaBar (2002). Advantageous economic characteristics are as follows:
Low and predictable fuel and operation and maintenance (O&M) production costs.Nuclear production costs exhibit low volatility over both the short and long termbecause the primary energy source, uranium ore, represents a very small fraction ofthe total production cost. On the other hand, the cost of the primary energy source infossil-fired plants is a large fraction of the production cost.
" High capacity factors. The operating nuclear plants in the United States nowconsistently achieve fleet-average capacity factors in the 90 percent range. Theprojected lifetime averaged capacity factors for competing baseload gas-firedcombined cycle plants are in the range of 80 to 85 percent.
" Long Operating Lifetime. Operating lifetime licensing extensions have been obtainedfor several U.S. nuclear plants and more are expected in the future. New nuclearplants are being designed for a 60-year life. On the other hand, there is littleexperience in the long-term operation of competing baseload gas-fired combinedcycle plants. Nominal gas-fired combined cycle plant lifetimes are not expected toexceed 25 years.
Disadvantageous economic characteristics of nuclear power are:
* Large plant size. Most new nuclear power plants are designed in the size range of1,000 to 1,350 MW to gain economy of scale benefits and reduce the capital costsper kW. A drawback of this size range is high potential for exceeding demandgrowth. Widely used baseload gas-fired combined cycle plants are in the range of500 to 600 MW.
" Large capital outlay. Total overnight capital costs of new nuclear plants are estimatedto be in the $1,000 to $1,800 per kW cost range. For a 1,350 MW plant at $1,600 perkW, an investment of $2.16 billion can be required, excluding interest costs. Thecompeting baseload gas-fired combined cycle plant capital cost is in the $450 to $650per kW range. A 600 MW combined cycle plant at $650 per kW would require aninvestment of less than $0.4 billion.
" Long construction time. The construction time for new nuclear plants, even ifoptimized to achieve short construction times, is in the range of 3 to 4 years. Theconstruction period for competing gas-fired combined cycle plant is about 2 years.
5-15
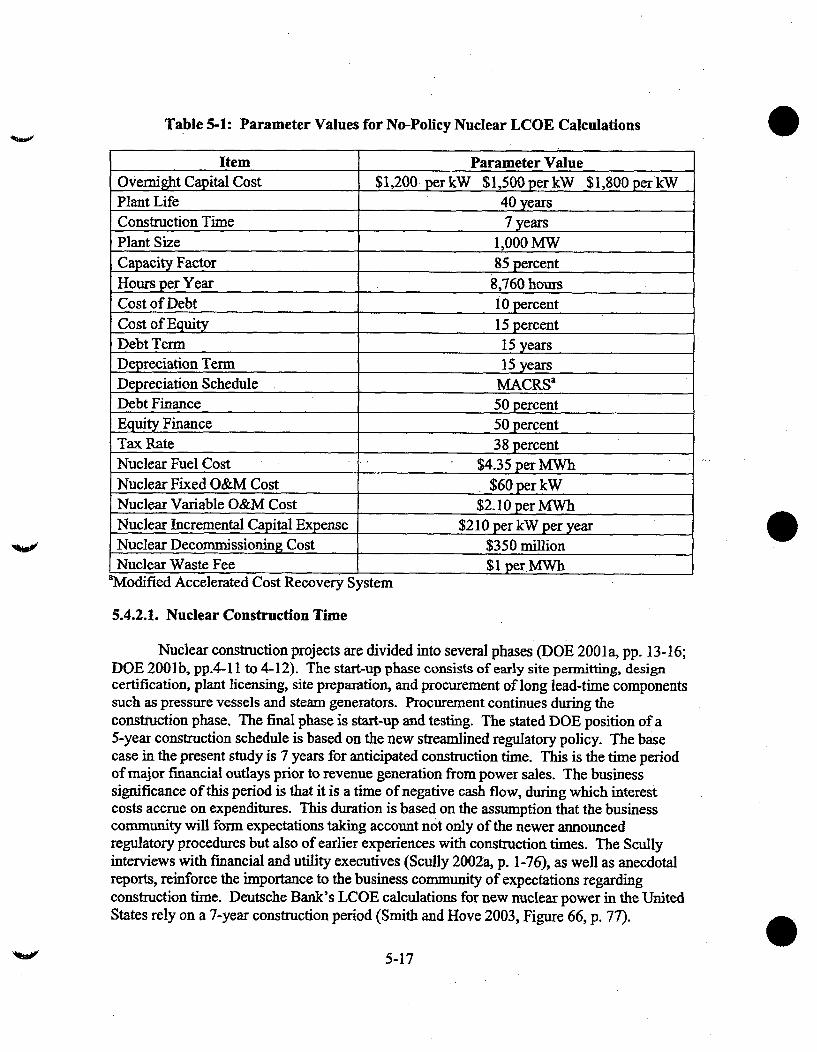
Table 5-1: Parameter Values for No-Policy Nuclear LCOE Calculations
Item Parameter ValueOvernight Capital Cost $1,200 per kW $1,500 per kW $1,800 per kWPlant Life 40 yearsConstruction Time 7 yearsPlant Size 1,000 MWCapacity Factor 85 percentHours per Year 8,760 hoursCost of Debt 1 0 percentCost of Equity 15 percentDebt Term 15 yearsDepreciation Term 15 yearsDepreciation Schedule MACRSa
Debt Finance 50 percentEquity Finance 50 percentTax Rate 38 percentNuclear Fuel Cost $4.35 per MWhNuclear Fixed O&M Cost _ $60 per kWNuclear Variable O&M Cost $2. 10 per MWhNuclear Incremental Capital Expense $2 10 per kW per yearNuclear Decommissioning Cost $350 millionNuclear Waste Fee $1 per. MWh
aModified Accelerated Cost Recovery System
5.4.2.1. Nuclear Construction Time
Nuclear construction projects are divided into several phases (DOE 2001a, pp. 13-16;DOE 2001b, pp.4 -11 to 4-12). The start-up phase consists of early site permitting, designcertification, plant licensing, site preparation, and procurement of long lead-time componentssuch as pressure vessels and steam generators. Procurement continues during theconstruction phase. The final phase is start-up and testing. The stated DOE position of a5-year construction schedule is based on the new streamlined regulatory policy. The basecase in the present study is 7 years for anticipated construction time. This is the time periodof major financial outlays prior to revenue generation from power sales. The businesssignificance of this period is that it is a time of negative cash flow, during which interestcosts accrue on expenditures. This duration is based on the assumption that the businesscommunity will form expectations taking account not only of the newer announcedregulatory procedures but also of earlier experiences with construction times. The Scullyinterviews with financial and utility executives (Scully 2002a, p. 1-76), as well as anecdotalreports, reinforce the importance to the business community of expectations regardingconstruction time. Deutsche Bank's LCOE calculations for new nuclear power in the UnitedStates rely on a 7-year construction period (Smith and Hove 2003, Figure 66, p. 77).
5-17

Using a 300-day moving average to smooth out the fluctuations in the yield on the generic30-year government gives a return about 50 basis points above the current yield.
Thus the total adjustment to the base rates reported in Bloomberg, to account forterm-structure and the currently low rates, is between 1 and 1.5 percentage points. Theseadjustments give a cost of equity between 9.64 and 10.13 percent and a cost of debt between6.35 and 6.84 percent. For purposes of the present study, these capital cost estimates arerounded to 10 percent for equity and 7 percent for debt.
5.4.2.3. Risk Premium
While the finance literature has much to say about risk and bond and equity rates, itdoes not provide clear, quantitative guidance on the relationship between risk and interestrates, as the above review brings out. Many factors influence the relationship, and thesubject is actively researched. Financial terms in recent nuclear construction overseas are nota satisfactory guide to a risk premium in the United States because of differences amongcountries in business practices, differences in business climate, varying degrees ofinvolvement of governments in nuclear projects, and differences in regulatory regimes.
Themes in the above review are that nuclear plant risk is idiosyncratic (plant specific)rather than beta (market related) and that agreement is lacking on the effect of idiosyncraticrisk on required returns. These considerations hinder estimation of the effect idiosyncraticrisk as a variance concept. However, another and quite direct effect of nuclear plant risk isits effect on expected return. While risk leading to dispersion in possible future returns addsto variance, it also affects the expected returns if it is asymmetrical, as it is in the case of newnuclear plants. For the outcome where all goes according to plan, a normal projection ofreturns can be made. But the upside risk of favorable surprises is less than the downside riskfrom unforeseen delays and the like.
The investor maximizing expected returns will be indifferent between a security withnormal market risk yielding a return of r and an investment with noticeable asymmetricdownside. risk yielding some higher return rR, is needed to induce investors to hold the riskiersecurity. The expected gross return for a security with normal market risk is l+r, whichprovides for paying back the original dollar invested. Through security pricing, investorswill make l+r equal to the expected return on a security with asymmetric downside risk. Theexpected gross return on the security with asymmetric downside risk is the gross return on adollar invested l+rR times the probability that the investment will be successful, plus theprobability that it will be unsuccessful times the fraction of the dollar that will be recovered ifunsuccessful, or [ps + (1 - ps)fL](1 + rR) where ps is the probability of a normal or successfuloutcome andfL is the fraction of the dollar that will be recovered in the event of anunsuccessful outcome. Setting l+r equal to [ps + (1 - ps)fL](1 + rR) and re-arranging gives
l+rR = (l+r)/ [ps + (1-ps)fL].
5-19
probabilities used by investors in assessing risks of equity and debt holding. These arepossible losses, not actual losses.
Assuming that investors form consortia to spread their risks, the LCOE calculationsin the present study use a risk premium of 3 percent. Such a risk premium is consistent witha 5.3 percent probability of the 50 percent loss (column 1 of Table 5-2), a 3.5 percentprobability of the 75 percent loss (column 2), a 2.5 percent probability of the complete loss(column 3), and 2.1 and 1.8 percent probabilities of the losses to affiliated assets (columns 4and 5). Informal conversations with a number of Wall Street analysts corroborated thereasonable magnitude of the 3 percent premium as a lower bound estimate.
5.4.2.4. Debt-to-Equity Ratio
Allowing for differences between market capitalization and book value, debt-equityratios for the larger utilities in the United States currently average in the neighborhood of 50-50 (Bloomberg, Inc. 2004).
5.4.2.5. Utility Regulatory Status and Financial Risk
Regulation of electric utilities in the United States, which has included both rate-of-return and retail price regulation, has tended to shield utilities from market price risks, thusreducing their costs of capital (Joskow 1997; Hogan 2002). The Energy Policy Act of 1992,implemented with FERC Orders 888 and 889 in 1996, deregulated electricity wholesalemarkets. Presently 18 states and the District of Columbia are actively preparing to deregulateretail markets, and 10 other states have passed legislation to do so or are studying how to doso (PNNL 2004).
Evidence from both the United States and the U.K. suggests that the deregulation ofthe 1990s placed more of this risk on the firms, removing it from direct payment byconsumers (Nwaeze 2000; Buckland and Fraser 2001). Whether the direct placement of riskon consumers or producers has a net negative or positive effect on retail prices appears toremain an open question. In the continued movement to further restructuring and retailderegulation, political and regulatory risks exist that tend to raise the hurdle rates for newgeneration investments in currently regulated states (Ishii and Yan 2004).
Under regulation, utilities occasionally faced the risk of having some portion ofconstruction costs disallowed from their rate base. While rate-of-return regulation mightprevent capital markets from charging risk premiums appropriate to such risks in newgeneration projects, both lenders and equity holders might decline to supply funds forprojects with such risks without such compensation. It is not clear that the financial strengthof a firm would have more influence than the characteristics of a project in the financialmarket's assessment of risk. While issuance of project bonds for a project perceived as riskyby financial markets would incur a risk premium that senior debt for firm financing mightavoid, the latter strategy could result in a general downgrading of the firm's debt, whichcould be more costly than the isolated project financing.
5-21

Table 5-3: First-Plant LCOEs for Three Reactor Costs, 5- and 7-Year ConstructionPeriods, $ per MWh, 2003 Prices
Mature Design, New Design,. Advanced New Design,Construction Foake Costs. Paid, Foake Costs Not Yet Foake Costs Not Yet
Period $1,200 per kW Paid, $1,500 per kW Paid, $1,800 per kWOvernight Cost Overnight Cost Overnight Cost
5 years 47 54 627 years 53 62 71
A question for the LCOEs of Table 5-3 is how close they are to the LCOEs ofcompeting fossil generation. Tables 5-4 and 5-5 report the LCOEs for coal and gasgeneration, for alternative capital costs, fuel prices, and construction periods.
In Table 5-4, the coal plant's overnight cost ranges from $1,182 per kW to $1,430 perkW. The low overnight cost is an average of costs used in Drennan at al. (2002), originatingfrom EIA and 2002 Platt's data. The mid-range of $1,300 per kW was used by Reis andCrozat (2002), and the high cost is an average of recently announced pulverized coalgeneration projects. See Section 6.2.4 for further discussion regarding new coal plants.Projected construction times for recently announced pulverized coal plants in the 1000 MWsize range have varied from 2 to 4 years. The coal price of $1.02 per MMBtu is an averageof prices used in Drennan at al. (2002), also originating from EIA and 2002 Platt's data; theprice of $1.23 per MMBtu corresponds to 2003 delivered coal prices; and the price of $1.15per MMBtu is EIA's 2004 forecast for 2015, with subsequently declining real prices. Coalplants are assumed to be financed at interest rates of 7 percent on debt and 12 percent onequity. Considering different capital costs, coal prices and construction times, the range fromthe scenarios is $33 to $41 per MWh.
5-23

Table 5-5: LCOEs for Gas Turbine Combined Cycle Plants, 85 Percent CapacityFactors, Alternative Overnight Costs, Gas Prices and Construction Periods,
$ per MWh, 2003 Prices
Overnight Cost$500 per kW $588 per kW $700 per kW
Gas price, $ per MMBtu4.25 & 4.25 & 4.25 &
3.39 4.30 Varying 3.39 4.30 Vary'ig 3.39 4-30 Varyingover over over
Forecast' Forecast" Forecast'Cost per NMWh
1-3 construction 35 41 42 136 42 43 137 44 442-yr construction 35 41 42 36 43 43 38 44 45
aFrom a price forecast of $4.25 per MMBtu in 2015, a peak of $4.51 is reached in 2021, fromwhich the forecast falls to $4.48 by 2025, at which level it remains for the remainder of theplant life.
Comparison of the $47 per MWh LCOE of the $1,200 per kW built in 5 years, inTable 5-3, with either of the fossil LCOEs in Tables 5-4 and 5-5, shows no surprise. Noobservers have expected the first new nuclear plants to be competitive with mature fossilpower generation without some sort of temporary assistance during the new technology'sshake-down period of the first several plants. However, the comparison of the LCOEs inthese three tables shows the magnitude of the competitive gap that any policies would haveto bridge.
5.4.4. Sensitivity Analysis for First Nuclear Plants
Before proceeding tothe analysis of such policies in Chapter 9, sensitivities of the no-policy case to several parameters are considered. Table 5-6 reports the effects of a longerplant life than the 40 years used in the LCOEs reported in Table 5-3, as well as alternativecapacity factors and construction periods. As Table 5-6 shows for the $1,200 per kW ABWRor ACR-700 reactor, a 60-year plant life has a minimal impact on the LCOE, because of thediscounting of the additional 20 years of life span beginning 40 years from the present,regardless of capacity factor or length of construction period.
5-25

The lower line of Figure 5-1 supposes that each cost and performance parameter is atits most optimistic value and examines the effect of changing the debt term. This calculationis for a plant built in 5 years, at $1,200 per kW overnight cost, with 60 percent debt and40 percent equity, and expecting a 60-year operating life. Debt and equity interest ratesremain at 10 and 15 percent. The LCOE with a 25-year debt term is $40 per MWh, andextending the debt term to 40 years by only another $1.50 per MWh, to $39 per MWh. Thisis close to the range of gas-fired power, but the combination of cost and performanceassumptions is probably too optimistic for a first plant. Nonetheless, the ability of shiftingthe basic cost and performance parameters within a range of values that may be realistic for alater plant offers promise for the commercial viability of some nh plant in the future.
Figure 5-1: The Effect of Debt Term: First-Plant LCOEs for a $1,500 per kW,AP1000, and $1,200 per kW Plant with Reduced Construction Time and Higher Debt
Ratio, $ per MWh, 2003 Prices
$65
$60
$55
$50
$45
$40
$3510 15 20 25
De bt Te rm, ye ars30 35 40
u-Base . -- *- ptimitstic
The impact of construction delays is addressed in Table 5-7. The $1,500 per kWreactor design is chosen for illustration. Two cases are considered in a 7-year constructionperiod. The first row of the table reports the LCOE with no construction delays. The secondrow reports the impact of a 2-year hiatus in construction coming in the middle of theconstruction period, and the bottom row places the delay after 7 years, when all constructionoutlays have been expended but power sales from the plant have not been allowed to begin.
A 2-year delay in the middle of the construction would increase the interestcomponent of total capital costs enough to raise the LCOE 12 percent above what it would bein the absence of delays-from $62 to $69 per MWh. A comparable period of delay after all
5-27
References
Alliant Energy. (2004) "Power Iowa - Emery Generating Station." Newsroom, CurrentIssues. Retrieved May 2004, from the World Wide Web:http://www.alliantenergy.com/stellent/groups/public/documents/pub/news-ci-pi_011130.hcsp.
Altman, Edward I., and Vellore M. Kishore. (1998) "Defaults and Returns on High YieldBonds: Analysis Through 1997." Working Paper. New York: NYU Salomon Center.
Antoniou, Antonios, Yilmaz Guney, and Krishna Paudyal. (2002) "The Determinants ofCorporate Debt Maturity Structure." Working paper, Centre for Empirical Research inFinance, Department of Economics and Finance, University of Durham, version 1.4,December 12.
Armistead, Thomas F., and Jonathan Barnes. (2002) "Coal Gets New Respect," November18. Retrieved May 2004 from the World Wide Web: http://enr.construction.com.
Bali, Geetanjali, and Frank S. Skinner. (2003) "The At-Issue Maturity of Corporate Bonds:The Influence of Credit Rating, Security Level, Duration and Macroeconomic Conditions."ISMA Discussion Papers in Finance 2003-01, International Securities Market Association,University of Reading.
Banz, Rolf W. (1981) "The Relationship Between Return and Market Value of CommonStocks," Journal of Financial Economics 9: 3-18.
Barclay, M.J., and Clifford W. Smith, Jr. (1995) "The Maturity Structure of Corporate Debt,"Journal of Finance 50: 609-631.
Barrett, W. Brian, Andrea J. Heuson, and Robert W. Kolb. (1986) "The Effect of Three MileIsland on Utility Bond Risk Premia: A Note," Journal of Finance 41: 255-261.
Belkaoui, Ahmed. (1975) "A Canadian Survey of Financial Structure," FinancialManagement 4: 74-79.
Benmelech, Efraim. (2003) "Asset Salability and Debt Maturity: Evidence from 19thCentury American Railroads." Working paper, Graduate School of Business, University ofChicago, October.
Berger, Allen N., Marco Espinosa-Vega, W. Scott Frame, Nathan H. Miller. (2003) "DebtMaturity, Risk, and Asymmetric Information." Mimeo, preliminary draft, Federal ReserveBoard and International Monetary Fund, January.
Black, Fischer and Myron S. Scholes. (1973) "The Pricing of Options and CorporateLiabilities," Journal of Political Economy 81: 637-654.
5-29

Chen, Chao, Philp Fanara, Jr., and Raymond F. Gorman. (1987) "Abandonment Decisionsand the Market Value of the Firm: The Case of Nuclear Power Project Abandonment,"Journal ofAccounting and Public Policy 6: 285-297.
Das, S. and P. Tufano. (1996) "Pricing Credit Sensitive Debt when Interest Rates and CreditSpreads are Stochastic," Journal of Financial Engineering 5: 161-198.
Diamond, Douglas W. (1991) "Debt Maturity Structure and Liquidity Risk," QuarterlyJournal of Economics 106: 709-738.
Diamond, Douglas W. (1993) "Seniority and Maturity of Debt Contracts," Journal ofFinancial Economics 33: 341-368.
Diamond, Douglas W., and Raghuram G. Rajan. (2001) "Banks, Short-term Debt andFinancial Crises: Theory, Policy Implications and Applications," Carnegie-RochesterConference Series on Policy 54: 37-71.
Dominion Energy. (2001) "Dominion Plans $600 Million Power Station in Person County."News release, September 28. Retrieved May 2004, from the World Wide Web:http://www.dom.com/news/dom2O01/pr0928.jsp.
Dominion Energy. (2004) Personal communication. Corporate CommunicationsDepartment, Richmond, Va., May 26.
Douglas, George W. (1969) "Risk in the Equity Markets: An Empirical Appraisal of MarketEfficiency," Yale Economic Essays 9: 2-45.
Drennan, Thomas E., Arnold B. Baker, and William Kamery. (2002) Electricity GenerationCost Simulation Model (GenSim). SAND2002-3376. Albuquerque, N.M.: Sandia NationalLaboratories, November.
Duffie, D., and K. Singleton. (1997) "Modeling Term Structures of Defaultable Bonds,"Review of Financial Studies 12: 687-720.
Duffee, G. (1998) "The Relation Between Treasury Yields and Corporate Bond YieldSpreads," Journal of Finance 53: 2225-2241.
Elyasiani, Elyas, Lin Guo, and Liang Tang. (2002) "The Determinants of Debt Maturity atIssuance: A System-Based Model," Review of Quantitative Finance and Accounting 19:351-377.
Elton, Edwin J., Martin J. Gruber, Deepak Agrawal, and Christopher Mann. (2001)"Explaining the Rate Spread on Corporate Bonds," Journal of Finance 56: 247-277.
5-31

Generation Markets Week. (2002) "Mississippi Merchant Plant Generation," Power Daily,September 3. Retrieved May 2004, from the World Wide Web:
www.aengblom.com/docs/GMW02-09-03Miss.pdf.
Ghosh, Arvin, Francis Cai, and Wenhui Li. (2000) "The Determinants of Capital Structure,"American Business Review 29: 129-132.
Graham, John R., and Campbell R. Harvey. (2001) "The Theory and Practice of CorporateFinance: Evidence from the Field," Journal of Financial Economics 60: 187-243.
Guedes, Jose, and Tim Opler. (1996) "The Determinants of the Maturity of Corporate DebtIssues," Journal of Finance 51: 1809-1833.
Hamilton, David T. (1999) "August Default Report," Moody " Risk Management ServicesSeptember, p. 3.
Hearth, Douglas, Ronald W. Melichor, and Darryl E. J. Gurley. (1990) "Nuclear Power PlantCancellations: Sunk Costs and Utility Stock Returns," Quarterly Journal of Business andEconomics 29, no. 1:102-116
Hewlett, J. (1984) "Investor Perceptions of Nuclear Power." Washington, D.C.: DOE/EIA-0446. Energy Information Agency, U.S. Department of Energy, May.
Hill, Joanne, and Thomas Schneeweis. (1983) "The Effect of Three Mile Island on ElectricUtility Stock Prices: A Note," Journal of Finance 38: 1285-1292.
Hogan, William W. (2002) "Electricity Market Restructuring: Reform of Reforms,"Journal of Regulatory Economics 21: 103-132.
Houston Business Journal. (2001) "Reliant Starts Miss. Power Plant Construction," October8. Retrieved May 2004, from the World Wide Web:http://www.bizjournals.com/houston/stories/2001/I 0/08/daily4.html.
Hull, Robert M. (1999) "Leverage Ratios, Industry Norms, and Stock Price Reaction: AnEmpirical Investigation of Stock-for-Debt Transactions," Financial Management 28: 32-45.
Ishii, Jun, and Jingming Yan. (2004) "Investment under Regulatory Uncertainty: U.S.Electricity Generation Investment since 1996." Working Paper, Center for the Study ofEnergy Markets. Berkeley: University of California Energy Institute, March.
Jarrow, R., D. Lando, and S. Tumbull (1997) "A Markov Model for the Term Structure ofCredit Spreads," Review of Financial Studies 10: 481-523.
Jensen, Michael, and William Meckling. (1976) "Theory of the Firm: Managerial Behavior,Agency Costs, and Capital Structure," Journal of Financial Economics 3: 305-360.
5-33

Lescoeur, Bruno, and Philippe Penz. (1999) La probl6matique du financement duinvestissements 0lectronucl6aires," Revue de iconomiefinancitre 51: 167-182.
Lignite Energy Council. (2004). "Energy Success Story, King Plant Readies for NewEmissions Control Technology," February. Retrieved May 2004, from the World WideWeb: http://www.lignite.com/ess/feb_04.html.
Lintner, John. (1965) "The Valuation of Risk Assets and the Selection of Risky Investmentsin Stock Portfolios and Capital Budgets," Review of Economics and Statistics 47: 13-37.
Longstaff, Francis, and E. Schwartz. (1995) "A Simple Approach to Valuing Risky Fixedand Floating Rate Debt," Journal of Finance 50: 789-819.
Madan, D. B., and H. Unal (1998) "Pricing the Risks of Default," Review of DerivativesResearch 2: 121-160.
Markowitz, Harry M. (1959) Portfolio Selection: Efficient Diversification of Investments.New York: Wiley.
Marsh, Paul. (1982) "The Choice Between Equity and Debt: An Empirical Study," Journal ofFinance 37: 121-144.
Martin, Linda J., and Glenn V. Henderson. (1984) "Industry Influence on FinancialStructure: A Matter of Interpretation," Review of Business and Economic Research 19: 57-67.
Mazur, Frank. (2003), commentary, "Nature's Power: Blowing in the Wind," RepresentativeFrank Mazur's (Vermont) Home Page. Retrieved May 2004, from the World Wide Web:http://home.adelphia.net/-frankmazur/windmills_10_03.htm.
Merchant Power Monthly. (2004a) "As Natural Gas Surges, Illinois Utilities Turn to Coal toFuel Power Plants," Vol. 19, no. 4 (April), pp. 2-3.
Merchant Power Monthly. (2004b) "Boston-Based Firm Delays Building Natural-Gas-FiredPlant in North Carolina," Vol. 19, no. 4 (April), p. 9.
Merton, Robert. (1997) "On the Pricing of Corporate Debt: The Risk Structure of InterestRates," Journal of Finance 29: 449-470.
Midwest Generation. (2004) Personal communication. Government Affairs Department,Chicago, May 26.
Miller, Merton, and Myron Scholes. (1972) "Rates of Return in Relation to Risk: A Re-Examination of Some Recent Findings," in Michael Jensen, editor, Studies in the Theory ofCapital Markets. New York: Praeger, pp. 47-78.
5-35

Pacific Northwest National Laboratory (PNNL). (2004) State Electricity RestructuringStatus. Retrieved March 2004 from the World Wide Web: http://pnnl-utilityrestructuring.pnl.gov/Electric/electric.htm.
Pindyck, Robert S. (1993) "Investments of Uncertain Cost," Journal of Financial Economics34: 53-76.
Peabody Energy. (2004) Personal communication. Public Relations Department, St. Louis,May 25.
Ravid, Abraham. (1996) "Debt Maturity: A Survey," Financial Markets, Institutions andInstruments 5: 1-68.
Realdon, Marco. (2003) "About Debt and the Option to Extend Debt Maturity." DiscussionPapers in Economics, No. 2003/20, Department of Economics and Related Studies,University of York.
Remmers, Lee, Arthur Stonehill, Richard Wright, and Theo Beekhuisen. (1974) "Industryand Size as Debt Ratio Determinants in Manufacturing Internationally," FinancialManagement 3: 24-32.
Reuters. (2001) "Record Gas Prices Breathe Life Into Nuclear Power," January 25.Retrieved May 2004 from the World Wide Web:https://www.pbmr.co.za/press-archive/record_gas-prices.htm.
Reuters (2004) "Reliant to Mothball Miss. Power Plant," News for RRI.N., May 4. RetrievedMay 2004 from the World Wide Web: http://biz.yahoo.com/prnews/040504/datuO4l- .html.
Roll, Richard, and Stephen A. Ross. (1980) "An Empirical Investigation of the ArbitragePricing Theory," Journal of Finance 35: 1073-1103.
Rosenberg, B., K. Reid, and R. Lanstein. (1985) "Persuasive Evidence of MarketInefficiency," Journal of Portfolio Management 11: 9-17.
Rousseau, Fabrice. (1999) "Signaling with Debt Maturity Choice." Working paper,National University of Ireland, Maynooth, November.
Sargent & Lundy. (2004) Personal communication. Fossil Power Department, Chicago,May 24.
Sarkar, Sudipto. (1999) "Illiquidity Risk, Project Characteristics, and the Optimal Maturityof Corporate Debt," Journal of Financial Research 22: 353-370.
Schwartz, Eli, and J. Richard Aronson. (1967) "Some Surrogate Evidence in Support of theConcept of Optimal Financial Structure," Journal of Finance 22:10-18.
5-37

Titman, Sheridan, and R_ Wessels. (1988) "The Determinants of Capital Structure Choice,"Journal of Finance 43: 1-19.
Tolley, George, and Mark Nielson. (1992) "Asset Pricing with Investigation Costs." Mimeo.University of Chicago, March.
Tolley, George, and Mark Nielson. (2003) "Asset Pricing with Information Costs." Mimeo,University of Chicago and MacroEcon Global Advisors, working paper, July.
Tyler Morning Telegram. (2004) "Clean-Air Efforts Threatened, Environmentalists Say,"March 2. From Typerpaper.com. Retrieved May 2004, from the World Wide Web:http://www.zwire.conmsite/news.cfin?newsid= 11055212&BRD= 1994&PAG=46 1 &dept.
U.S. Department of Energy (DOE). (2001 a) "A Roadmap to Deploy New Nuclear PowerPlants in the United States by 2010, Volume I." Summary Report. Washington, D.C.: Officeof Nuclear Energy, Science and Technology, October.
U.S. Department of Energy (DOE). (2001b) "A Roadmap to Deploy New Nuclear PowerPlants in the United States by 2010, Volume II." Main Report. Washington, D.C.: Office ofNuclear Energy, Science and Technology, October.
U.S. Department of the Treasury, Internal Revenue Service (IRS). (2002) "How toDepreciate Property." Publication 946. Washington, D.C.: IRS.
Uselton, Gene C., James W. Kolari, and Donald R. Fraser. (1986) "Long-Term Trends in theRiskiness of Electric Utility Shares," Journal of Business Finance and Accounting 13: 453-459.
Wiggins, James B. (1990) "The Relation Between Risk and Optimal Debt Maturity and theValue of Leverage," Journal of Financial and Quantitative Analysis 25: 377-386.
Wisconsin Public Service Corporation. (2002) "'WPS Resources Corporation DiscussesFinancial Details of Wisconsin Public Service Corporation Building a 500-Megawatt Coal-Fired Electric Generator." WPS Resources Corporation, September 25. Retrieved May 2004from the World Wide Web: http://www.wpsr.com/cfin/smwpsr.gif.
Xcel Energy. (2004) Personal communication. Capital Projects, Engineering andConstruction Department, Minneapolis. May 24.
5-39
Part Two: Outlook for Nuclear Enerev's Competitors
Part Two considers the prospects for gas and coal as the major baseload competitorsto nuclear generation. Consideration is given to technologies that could reduce costs of gas-and coal-fired electricity, fuel price changes that could affect relative competitiveness, and.the potential effect of greenhouse gas controls on costs of fossil-fuel generation.

Chapter 6. GAS AND COAL TECHNOLOGIES
Summary
This chapter examines the near-term prospects for improvements in gas- and coal-fired electricity generation that would affect their costs relative to nuclear power. Somemodest efficiency improvements are foreseen in the near term for gas technologies, but theprospects for coal technologies appear to be farther in the future.
The most common combustion technology used in recently constructed coal plants inthe United States is pulverized coal combustion (PCC). The thermal efficiency of mostfluidized beds used for power generation is similar to that of conventional PCC plants.Interest in the use of this technology has been stimulated by its better environmentalperformance even when utilizing lower grade fuels. However, its cost competitivenessremains in question. Integrated coal gasification combined cycle (IGCC), while attractivefrom a thermal efficiency and emissions perspectives, is likely to be too expensive to enterthe U.S. market in the near term.
More advanced coal-fired technologies are still in early R&D stages. Since little canbe said about their near-term commercialization potentials, they are not included as realisticpossibilities for reducing coal-fired generation costs within the time scope of the presentstudy.
The primary gas-fired technology for new baseload electricity generation is gasturbine combined cycle. Modem gas turbine plants with a triple-pressure heat recoverysteam generation (HRSG) system with steam reheat can reach thermal efficiencies above55 percent. A gas turbine, with steam cooling of the turbine blades and nozzles, combinedwith an advanced HRSG is expected to operate at an efficiency level of 60 percent in the nearfuture. The goal of most world manufacturers is to reach overall thermal efficiencies of thecombined plant of 60 percent in the short term, primarily by increasing firing temperatures.Other cycle improvements could lead to thermal efficiencies nearing 65 percent.
Since fuel costs are generally two-thirds of the levelized cost of gas-generated power,a 5 percentage-point increase in efficiency could result in an approximate by 8 percent costdecrease, which although small, could affect competitive margins across generation types.
6-1

6.1. Introduction
Fossil fuel technology continues to be the primary source for electric powergeneration. Moreover, it appears that its market dominance will continue for the foreseeablefuture. Concerns over its environmental impacts have spurred efforts to find alternatives aswell as improve the current technology. The purpose of this chapter is to describe the currentand near future fossil-fired power generation technologies, noting prognoses forimprovements in efficiency and emissions control. Finally, an assessment of the costs for anew coal-fired or gas-fired plant incorporating all necessary emissions control is provided.
6.2. Coal-Fired Power Plant Technology
Since the early 1900s, coal power has provided the bulk of electricity generated in theUnited States because of its low price (Gillenwater 1996, p. 19). Since 1965, the thermalefficiency of steam turbines increased steadily and then plateaued (Gillenwater 1996, p. 21).There has been a general trend toward larger plants to take advantage of scale economies, butthere is a threshold beyond which reliability becomes difficult to ensure in these large units(Gillenwater 1996, p. 21).
6.2.1. Current and Future Technology
6.2.1.1. Pulverized Coal Combustion (PCC)
Pulverized coal combustion (PCC) is the most widely used method for burning coalfor power generation. Older PCC plants offer efficiencies around 30 percent while newersub-critical steam units with high quality coal can reach 35 to 36 percent efficiencies. Newerunits employing supercritical steam may reach efficiencies of 45 percent. However,supercritical boilers are more highly integrated than the simpler sub-critical PCC designs andrequire advanced steel materials. As materials advance, government R&D programs hope toreach efficiencies as high as 50 percent. Further technological improvements depend on thedevelopment of new materials capable of withstanding higher temperatures and pressures(Smith and Hove 2003, p. 39).
6.2.1.2. Fluidized Bed Combustion (FBC)
Fluidized bed boilers were developed in the 1990s and can utilize waste coal thatcould not be burned for power in other boilers (Smith and Hove 2003, p. 41). The advantageof fluidized bed combustion (FBC) is that it encourages complete combustion at a lowertemperature than that of PCC. While the units are cleaner than a corresponding PCC plant,its efficiencies only range from 30 to 35 percent. The most current technology utilizes thepressurized circulating fluidized bed boiler (PCFB) in which the entire combustion chamberis placed under pressure and may deliver higher efficiencies.
6-3
coal-fired power plants can be met through extending the life, increasing the utilization ofexisting capital, or both (Gillenwater 1996, p. 3). Additionally, investors generally seelimited opportunities for new baseload capacity in the United States over the next 10 years(EIA 2003, p. 3). Moreover, given the uncertainty over environmental regulation and theneed to minimize long-term capital risk, private companies are unwilling to invest in long-term R&D to improve technology without government support (DOE 1999b, p. 2).
6.2.4. Cost Estimates
6.2.4.1. Mining and Transportation Costs
Continued technological developments for extracting and hauling large volumes ofcoal in both surface and underground mining suggest that further reduction in mining costs islikely. However, EIA expects improvements in labor productivity to remain the key elementto lower coal-mining costs (EIA 2003, p. 87).
In 1997, transportation costs averaged 41 percent of the delivered price of contractcoal shipments to electric utilities. With an increase in the Western market share, an increasein the average shipping distance may lead to increased transportation costs. Rail costs andtransportation bottlenecks lead to regional differences because coal is now being shippedover longer distances (Smith and Hove 2003, p. 13). However, EIA projects that rail rates forWestern coal will decline gradually over the next two years with improvements to railroadinfrastructure (Smith and Hove 2003, p. 34).
6.2.4.2. Fuel Supply and Price
Coal is stored in substantial quantities at power plants, and most utility companieshave long-term supply contracts to stabilize coal prices. Consequently most utilities havecontinued to pay low and stable prices for their coal, thereby limiting exposure to the higherprices experienced in 2002. Western coal costs are lower than Eastern costs because of thethickness of the coal seams and high productivity associated with large-scale surface mining,but Western coal tends to have a lower energy content per unit weight than Eastern coal(Smith and Hove 2003, p. 34). Coal supply and price projections are reported in Section 7.2.
6.2.4.3. Capital Costs
Capital costs for new PCC plants range from $1,100 to $1,200 per kW depending ontheir location, and supercritical PCC plants tend to cost closer to $1,200. per kW. PCFBcapital costs are around $1,200 per kW, with somewhat lower gas cleanup costs as part ofthis figure (Smith and Hove 2003, p. 38). DOE estimates the future cost of IGCC units atjust over $1,300 per kW and projects that its price will come down to $1,000 per kW by 2008(Smith and Hove 2003, p. 42).
6-5

technologies: the gas turbine and the steam turbine. In a gas turbine, natural gas is burned incombination with a steady stream of high velocity compressed air. The hot combustion gasis then passed through an array of rotating and stationary airfoils that turn a generator toproduce electricity. For the second or bottoming cycle, a heat recovery steam generationsystem (HRSG) and steam turbine are added to take advantage of the thermal energyproduced from the first combustion cycle.
Modem gas turbine plants with a triple-pressure HRSG with steam reheat can reachefficiencies above 55 percent. ABB-Alstom claims 58 percent efficiency of a combinedcycle plant built around its GT24/26 reheat gas turbines; the same efficiency is cited-bySiemens, for the Westinghouse steam-cooled W501G/701G gas turbine or V94.3 a gasturbine, combined with a triple pressure HRSG. A gas turbine, with steam cooling of theturbine blades and nozzles, combined with an advanced HRSG is expected to operate at anefficiency level of 60 percent in the near future. The goal of most world manufacturers is toreach overall thermal efficiencies of the combined plant of 60 percent in the short term,generally by increasing firing temperatures (Franco 2002, p. 1504).
DOE has recently cited the General Electric (GE) "H" class GTCC system for itsperformance promise. The new system is claimed to reach an overall thermal efficiency of60 percent through its increased gas turbine firing temperature of 1430 degrees C with apressure ratio of 23:1 (Corman 1996, p. 1).
In spite of manufacturer claims of 60 percent efficiency, most industry expertssuggest efficiencies in the range of 55 to 58 percent would be a preferable range to accountfor plant-to-plant variation such as ambient air differences and other environmental factors(Claeson Colpier 2002, p. 313).
6.3.2. The Future of Gas Turbine Combined Cycle Technology
Research into increasing the efficiency of combined-cycle technology is proceedingwith several developments that allow higher firing temperatures, better turbine performance,and more efficient recovery of heat. The engineering literature has paid considerableattention to the optimization of HRSG. Two basic exhaust heat recovery processes can beused to increase efficiency: (1) recuperation, in which the recovered heat is used in the samegas turbine cycle; and (2) bottoming cycle, in which the exhaust is used as a heat source for asecond and essentially independent power producing cycle (Heppenstall 1998, p. 838). Inaddition, basic optimization of HRSG parameters such as mass flow rates and heat exchangerefficiencies can produce substantial increases in overall efficiency. The efficiency increasecan vary from 2 percent for HRSG optimization alone, to 6 to 7 percent using postcombustion reheating, inter-cooling, and gas-to-gas recuperation (Franco 2002, p. 1515).
While significant increases in efficiencies are technically feasible, increasedcomponent and plant complexity could result in increased cost. The thermodynamicperformance of a plant is usually reflected in the fuel cost. The fuel cost savings as a resultof increases in thermal efficiency are shown in Table 6-2, which suggests that, on average, a
06-7

Claeson Colpier et al.'s (2002) analysis suggests that the great reduction in gas-firedelectricity costs through the 1990s was the result of a worldwide increase in installedcapacity and attendant experience with combined cycle technology in electricity generation.If GTCCs become the generation technology of choice, the trend would likely continue,moderated by declining marginal returns to learning, discussed in Chapter 4. According toClaeson Colpier et al., holding the fuel price constant, the stable progress ratio for the cost ofgenerating electricity is approximately 94 percent. That is, at the next point where installedcapacity doubles, the capital cost should fall by 6 percent, or a 6 percent learning effect in theterminology of Chapter 4. The likelihood, however, of a further doubling of capacity in theshort term is small, and therefore its effect on the overall cost of electricity minor comparedto gains in thermal efficiency and fuel cost.
Table 6-3: Cost Estimates for New Gas Plants
2003 Long TermpPlant Size CoMs 300 300A uCapital Cost ($ per 590 450Lead Time (Year) ...3 3Fuel Price ($ per MMN~tu) b 3.75 3.15Fuel Cost ($ per MfWh) 23.6 19.9Total O&M Cost ($ per M4Wh) 2.6 2.6Annual Capital Cost ($ per
MWh) 10.2 7.8Levelized Cost ($ per MWhe 36.4 30.3
Source: Smith and Hove (2003).aLong term is the length of time required for fuel prices to reach an equilibrium, approximately
2006 (p. 77).bFuel price based on 2003 EIA estimate, plant efficiency set at 54 percent; price does not
include post-combustion emissions control.cLevelized cost is the sum of fuel, O&M, and annuitized capital costs.
6.3.4. Natural Gas Emissions, Control Technology, and Costs
When compared with emissions from coal-fired plants, combined cycle plantsproduce significantly less of the six criteria pollutants established by the 1990 Clean Air Act.Natural gas produces no sulfur dioxide or ash, and smaller quantities of volatile organics,C0 2, and NOx gases. However, for the purposes of this report, only nitrogen oxides (NOx)will be considered. NOx gas emissions are formed during the combustion of natural gas andother fossil fuels by high temperature oxidation of atmospheric nitrogen. CO2 is a naturalbyproduct of fossil fuel combustion and is currently not a federally regulated gas.
6-9

Table 6-5: Effect of Environmental Controls on 2020 Gas-Fired LCOE'
2020 w/ 2.5 ppm 2020 w/ 2.5 ppm2020 2020w/2. ppm NOx + CO2NOx Limit Captur0Capture
Plant Size AW) 300 300 300Capital Cost ($ per MW) 450,000 450,000 450,000Lead Time (Years) 3 3 3Fuel Price ($ per MMBtu) 3.78 3.78 3.78Fuel Cost ($ per MWh) 20.3 20.3 20.3Total O&M Cost ($ per MWh)b 2.6 4.0c 6.3b'd
Capital Cost ($ per MWh)e 7.8 7.8 7.8Levelized Cost ($ per MWh) 30.7 4 32.1 44.4
a 2020 Thermal efficiency set at 63 percent, estimated fuel cost taken from Table 6-4, capitalcost and O&M cost values taken from Smith and Hove (2003).b Incremental emissions control costs include cost of capital and O&M but are reflected intotal O&M cost.C Additional SCR unit for NO, control adds $1.4 per MWh (Onsite Syscom Energy Corp.,
1999, p. 4).d Additional monoethanolamine (MEA) unit for CO2 capture adds $2.3 per MWh (David2000a, p. 3).'Annual capital cost = depreciation cost/depreciation term. Depreciation cost is determined
using a weighted average cost of capital (WACC) of 11.3 percent. Depreciation term is25 years. (Smith and Hove 2003a, p. 75.)
6.4. Summary of Future Coal and Gas Technologies
The near-future coal- and gas-fired power generation technologies look much thesame as the current technologies. There is some prospect of modest efficiency improvementsin gas technology, but significant advances in coal technology appear further in the future.Integrated gasification combined cycle plants would have an advantage over currentpulverized coal plants if reduction of carbon emissions became a priority. Capital costs in allof these technologies are well understood, but the fuel price prognoses for coal and gastechnologies differ, the former universally considered to be stable, the latter much morevolatile and subject to uncertainties.
Table 6-6 summarizes the cost characteristics of the current and near-futuretechnologies.
06-li

References
Agrawal R.K., and Wood, S.C. (2001) "Cost-Effective NOx Reduction," ChemicalEngineering 108: 78-82.
Alvey, J. (2003) "The Carbon Conundrum: Technology Exists to Sequester Carbon - ButWill Utilities Ever Buy It?" Public Utilities Fortnightly August: 20-24.
Basu, A., Wainwright, J. (2001) "DME as a Power Generation Fuel: Performance in GasTurbines." PETROTECH-2001 Conference, New Delhi, India.
Chase, D.L. (2000) "Combined-Cycle. Development, Evolution and Future." TechnicalReport GER-4206. GE Power Systems.
Claeson Colpier, U., and D. Comland. (2002) "Economics of the Combined Cycle GasTurbine -An Experience Curve Analysis," Energy Policy 30: 309-316.
Corman, J. (1996) "Gas Turbine Combined Cycle." Report. GE Power Systems.
David, J. and H. Herzog. (2000) "The Cost of Carbon Capture." Paper presented at the FifthInternational Conference on Greenhouse Gas Control Technologies, Cairns, Australia,August 13 to 16.
Energy Information Administration (EIA). (1997) "The Effects of Title IV of the Clean AirAct Amendments of 1990 on Electric Utilities: An Update." USDOE/EIA-0582(97).Washington D.C.: EIA, March.
Energy Information Administration (EIA). (2001) "Annual Coal Report 2001."USDOE/EIA-0584. Washington D.C.: EIA.
Energy Information Administration (EIA). (2002a) "Inventory of Electric Utility PowerPlants in the United States 2000." USDOE/EIA-0095(2002). Washington D.C.: ElA,March.
Energy Information Administration (EIA). (2002b) "U.S. Coal Supply and Demand: 2002Review." Washington, D.C.: EJA.
Energy Information Administration (EIA). (2003a) Annual Energy Outlook 2003 WithProjections to 2025. USDOE/EIA-0383(2003). Washington D.C.: EIA, January.
Energy Information Administration (EJA). (2003b) "Electric Power Monthly April 2003."USDOE/EIA-0226(2003/04). Washington D.C.: EIA.
Franco, A., and C. Casarosa. (2002) "On Some Perspectives for Increasing the Efficiency ofCombined Cycle Power Plants," Applied Thermal Engineering 22: 1501-1518.
6-13

Northwest Power Planning Council. (2002) Natural Gas Combined Cycle Gas TurbinePower Plants. Retrieved December 2003 from the World Wide Web:http://www.westgov.org/wieb/electric/Transmission%2ýOProtocol/SSG-WI/pnw- 5ppj-2.pdf.
Onsite Sycom Energy Corporation. (1999) Cost Analysis ofNOx Control Alternatives forStationary Gas Turbines. Retrieved December 2003 from the World Wide Web:http://www.eere.energy.gov/der/industrial-turbines/pdfs/noxcntlcost.pdf.
Phillips, J. N. (2000) "Hydrogen-Enriched Natural Gas Offers Economic NO. ReductionAlternative," Power Engineering 104: 36-39.
Schmoke, James W., and Thaddeus S. Dyman. (2001) Changing Perceptions of US.Natural Gas Resources as Shown by Successive Department of Interior Assessments. U.S.Geological Survey Bulletin 2172-B. Washington, D.C.: U.S. Geological Survey.
Retrieved December 2003 from the World Wide Web: http://pubs.usgs.gov/bul/b2l72-b.
Simmons, Matthew R. (2003) "Future Energy Resources: Are We Asking the RightQuestions?" Presentation to the National Defense University Workshop. Houston:Simmons International, Inc., May, 9.
Smith, Richard, and Anders Hove. (2003) "The Old Reliables: Coal, Nuclear and Gas in2003." New York: Deutsche Bank AG.
Spath, P.L, and M.K. Mann. (2000) Life Cycle Assessment of a Natural Gas Combined-Cycle Power Generation System. Retrieved December 2003 from the World Wide Web:http://bioproducts-bioenergy.gov/pdfs/bcota/abstracts/13/99.pdf.
U.S. Department of Energy (DOE). (I999a) "Clean Coal Technology: The Investment PaysOff." Washington, D.C.: U.S. Department of Energy, November.
U.S. Department of Energy (DOE). (1999b) "Coal and Power Systems Strategic and Multi-Year Program Plans." Washington, D.C.: U.S. Department of Energy, January.
U.S. Department of Energy (DOE). (2000) "Coal and Power Systems Strategic and Multi-Year Program Plans: Ensuring Clean, Affordable Power for the 2lIt Century." Washington,D.C.: U.S. Department of Energy, March.
U.S. Department of Energy (DOE). (2003) "Draft Environmental Assessment ToxeconRetrofit for Mercury and Multi-Pollutant Control." USDOEIEA-1476. Washington, D.C.:U.S. Department of Energy, June.
U.S. Environmental Protection Agency (EPA). (2002a) "Technical Addendum:Methodologies for the Benefit Analysis of the Clear Skies Initiative, September 2002,"Washington, D.C.: EPA.
6-15

Chapter 7. FUEL PRICES
Summa
This chapter examines forecasts for the three fuels of concern: coal, natural gas, anduranium. Coal prices in the United States are not expected to increase. Forecasts for naturalgas prices are mixed, although EIA forecasts a 20 to 30 percent increase over 2002 levels by2020. The supply elasticity of uranium is estimated by several sources to be between 2.3 and3.3, which should keep uranium prices down in the near term.
Some uncertainty surrounds projections of fuel price changes, which can alter relativecompetitiveness between gas and coal, and can also affect competitiveness of both withnuclear. This chapter sums up the significant similarities and differences in the underlyingmethodologies of the various models for coal, natural gas, and uranium supply.
Coal supplies worldwide are expected to be sufficiently elastic that even a doublingof demand is not expected to increase price appreciably. Much of the work on coal prices isshort-term in nature and hence is of limited usefulness for the projections needed for thepresent study. Long-term changes in past decades that have affected coal prices haveincluded dramatic increases in coal mining efficiency, the past trajectory of which may be ofsome help in predicting the future. Among the model forecasts, there is general agreementthat coal production will increase over the next 20 to 30 years (35 to 50 percent). Theinternational forecasts foresee a rise in the international coal price (25 to 30 percent), whilethe forecasts for the U.S. coal price to utilities uniformly predict a decline (10 percent).
EIA's 2003 gas price predictions are for a 10 percent dip from the 2003 level,followed by a 38 percent increase by 2025. Its 2003 supply prediction is for a relativelysmooth 34 percent increase over the 2003 level by 2025, reduced in the 2004 prediction to15 percent. EIA's 2004 forecast projects less of a price dip in 2005, followed by a larger riserelative to 2000 levels by 2025.
The International Energy Agency (IF-A) and EIA have uranium market models, butthey are limited. IMe International Atomic Energy Agency (IAEA) offers an outlook onpotential uranium market trends, but it does not incorporate a model of investment inexploration. Since the fuel cost share of nuclearpower generation is less than 10 percent,variation in uranium prices will have only a limited effect on the overaH cost of nucleargeneration of electricity.
7-1

7.1. Introduction
This chapter reviews and evaluates fuel price forecasts to be used in the analysis ofnuclear power's competitiveness with coal and gas. The chapter examines major modelingsystems of coal, natural gas, and uranium supply currently in use by government andinternational agencies, focusing on their supply functions for these fuels and thesophistication of the price forecasts.
A focus on current levels of known reserves of a resource, in terms of a certainnumber of years' consumption remaining, can prompt alarm at the prospect of running out ofa critical mineral such as natural gas from North America. Short-term price fluctuationsextrapolated to the future can yield intermediate-term forecasts that could cause majorchanges in the electricity sector were they to materialize.
Sections 7.2, 7.3, and 7.4 review models of coal, natural gas, and uranium supply.Models of oil supply are excluded from this analysis since the use of oil for electricitygeneration is not widespread in the United States. Section 7.5 examines modeling systemsthat deal with the fuels in a generic manner. Section 7.6 summarizes the price and supplyprojections.
7.2. Coal
Three economic models of coal are reviewed in this section, the EIA's NationalEnergy Modeling System (NEMS), the European Union's Prospective Outlook on Long-Term Energy Systems (POLES), and the International Energy Agency's World EnergyModel (WEM).
7.2.1. The Forecasting Models: NEMS, POLES, and WEM
NEMS and POLES include different specifications to forecast coal production andprices. The Coal Production Submodule (CPS) of NEMS is responsible for the constructionof annual supply curves for each combination of region, mine type, and coal type found inthe United States. Using two-stage least squares regression methodology, a supply functionis created that relates price to mine capacity utilization (EIA 2003c, p.8). It is then calibratedto the most recent data (EIA 2003c, p. 17).
The POLES model evaluates future coal supply from a global perspective. Itestimates production for each of thirty-two national and regional markets. National andregional supplies are modeled as a function of the previous year's coal production, a short-term price effect, a long-term price effect with a distributed lag and asymmetric responsefactor, coal consumption in the current and previous year, and an autonomous technologicaltrend, differentiating between exporting and non-exporting areas in its supply specifications(Criqui et al. 2003, 2.3). For countries that are large producers or exporters of coal, alsocalled swing producers, which includes the United States, POLES models a national coal
7-3

productivity and predicts a price of $11.43 per ton in 2030. This represents an increase of15 to 35 percent from current price levels, depending on the market considered (EuropeanCommission 2003, p. 23).
WEM calculates a constant steam coal price of $40.92 per ton for the period of 2002to 2010, which is the average price for the years 1997 to 2001. Between 2010 and 2030, theprice is assumed to increase linearly, reaching $46.16 per ton in 2030 (lEA 2002, p. 52).WEM projects increases in demand, and in transportation costs (international, via sea) due tohigher oil prices, to exert upward pressure on the world coal price (lEA 2002, p. 52). At thesame time, the drop in costs of mining coal resulting from production relocation andproductivity gains are projected to push the price down (lEA 2002, p. 52). The transportationcost in the 2003 NEMS applies to domestic transportation in the United States from mines toelectric utilities. This difference could explain the divergent trends of coal transportationcosts between NEMS and WEM.
Tables 7-1 summarizes these models' projections of coal price as well a privateforecast. Year 2000 values of all projections have been normalized to a base value of 100,and subsequent year prices are relative to 2000 prices.
Table 7-1: Coal Price Projections'
Year 2000 2005 2010 2015 2020 2025 2030NEMS, AEO 2004 100b 100 99 96 94 94 N/APOLES IOOC N/A N/A N/A N/A N/A 133WEM 100d N/A 111 N/A 117 N/A 125Hill & Associates,U.S. Price toUtilities 1 0 0 b N/A N/A 84 89 N/A N/A
'Year 2000=100.b $25.47 per short ton.' $8.57 per barrel oil equivalent (BOE), average of markets.d $36.72 per ton.
The U.S. projections are in agreement with one another. NEMS and Hill &Associates both predict declining coal price trends from 2000 through 2015; after that dateNEMS' projection continues to decline while Hill's rises somewhat. This reflects EIA'sexpectation of continued improvements in labor productivity and the expansion of productionto the more productive Western U.S. coal mines (EIA 2003a, p. 104). Both POLES andWEM project rising trends while the U.S. forecasts project declining trends.
7-5

0Figure 7-2: U.S. Lower 48 Average Natural Gas Wellhead Price.
6
5
C>)
C.,
o304
2 -1 1 1 I -
2001 2003 2005 2007 2009 2011 2013 2015 2017 2019 2021 2023 2025
Year
Source: EIA (2004).
Figure 7-3 shows NEMS' forecast errors of gas prices from two years' forecasts.Only 7 years are available to compare forecasting performance, but the 1995 forecast maybesuperior to the 1989 forecast since it cycles around zero instead of trending off, although theyare predicting for different calendar years. It seems that NEMS' gas price forecasts, even ifthey are off by 25 percent, are improving with experience.
Figure 7-3: Natural Gas Wellhead Price: Difference between Actual and Forecast
C
Ci
C0
175
150125
100
75
50
25
0
-25
-50
-/ zr--\
AL
0 2 4 6 8Years into future
10 12
--*-Years Ahead From 1989 -*---Years Ahead From 1995
Source: Holte (2001, Table 8).
7-7
7.3.3. World Energy Model (WEM)
The gas supply module in WEM estimates production field by field to determineshort-term production profiles, while in the long term production is limited by ultimatelyrecoverable resources and a depletion rate estimated through historical data. Ultimatelyrecoverable resources depend on a recovery factor, which reflects technological
improvements in drilling, exploration, and production. The trend in the recovery rate is afunction of the gas price, which is set exogenously, and a technological improvement factor(lEA 2002, pp. 510-511).
WEM considers three regional gas markets, North America, Europe, and Asia. InNorth America, natural gas prices are projected to average around $2.62 per MM3tu in 2002and to remain at that level until 2005. Prices will then start to rise as rising demand causesthe region to become increasingly reliant on more costly sources, such as LNG,unconventional gas, and Alaskan gas (LEA 2002, p. 50). Prices reach $3.15 per MMBtu by2010 and continue to rise in line with oil prices (lEA 2002, p. 50). lEA's 2002 World EnergyOutlook predicts rising import dependence for the OECD North America region. In 2000,this region's net gas imports amounted to only 1 percent of the total primary gas supply, butby 2030, imports are expected to rise to 26 percent of the total primary gas supply (LEA2002, p. 117).
7.3.4. Current Issues in Natural Gas Supply
The recent increases in natural gas prices have led to divergent opinions on the futureof natural gas in the United States. In one view these price increases represent fundamentalshifts in supply and demand that have long-term implications for the natural gas market andwill only worsen in the future because of dwindling gas reserves (Simmons 2003). Currie(2003) emphasizes longer-term deterioration of gas pipeline and storage infrastructure, post-deregulation, as a major problem facing the gas industry, but in the long-run time period ofthe current study, capital markets will supply that infrastructure.
A recent study by the National Petroleum Council (NPC) also blames the higher gasprices in recent years on a fundamental shift in the supply-demand balance (NPC 2003, p.23). However, the NPC believes the tight market situation "can be moderated" (NPC 2003,p. 23) by allowing exploration and production in currently restricted areas offshore and in theRocky Mountains, using new technologies that can protect sensitive environmental resources(NPC 2003, pp. 76-77).
7.3.5. Summary of Gas Price Projections
Table 7-2 reports NEMS, POLES, and WEM projections of natural gas prices through2020, and two private forecasts reported by the AEO 2003, those of Global Insights, Inc.(GIl) and Energy Ventures Analysis, Inc. (EVA). The NEMS forecasts from the AEO 2003and AEO 2004 are reported in the first two rows of the table, showing a sharp increase inEIA's gas price forecast between these two years. Prices are expressed relative to a base of
7-9

grouped into categories. The categories range from highest to lowest on a scale ofconfidence in the future availability of each type of resource. Production centers and theirassociated resources are also ranked by projected production costs. The order in whichproduction centers fill market-based production requirements is based on availabilityconfidence level and cost. It is assumed that the lowest-cost producer in the highest-confidence category will satisfy the first increment of demand, followed by progressivelyhigher-cost, lower-confidence producers until annual demand is filled (IAEA 2001, pp. 2-3).
The IAEA study does not include an explicit projection of uranium prices, but it doesproject the years when production centers of various cost ranges and confidence levels willbe cost-justified to begin operations. These projections, contained in Table 7-3, should beinterpreted as "an indirect indication of market price trends" (IAEA 2001, p. 4). Forexample, in the first row, in the medium demand case, using only reasonably assuredresources (RAR), production costs will fall in the range of $55 to $82 per kilogram (kg) ofuranium by 2019, and will not jump to the higher range of $82 to $136 per kg until 2024.Accepting the stock of resources described by RAR plus estimated additional resources ofconfidence level I (EAR-I), those two years would be pushed back to 2021 and 2027, andadding estimated resources of confidence level 11 (EAR-il), these two years would be 2021and 2029.
Table 7-3: Year When Production Centers Become Cost Justified
Confidence Level Regarding Price of UraniumResource Availability: Adding $55 to $82 >$82 to $136
Resources of Decreasing per kgU per kg U . >$136 per kg UCertainty Medium Demand Case Price of Uranium
RARa 2019 2024 2028RAR + EAR-Ib 2021 2027 2034RAR + EAR-I + EAR-EI 2021 2029 2041
High Demand Case Price of Uranium
RAR 2013 2019 2023RAR + EAR-I 2015 2022 2026RAR + EAR-I + EAR-I! RAR +EAR-I + EAR-ll 2015 2023 2031
Source: IAEA (2001, p. 4).a Reasonably assured resourcesb Estimated additional resources of confidence level I
Estimated resources of confidence level HI
Figure 7-4 shows recent uranium prices in the United States. These prices correspondto production in the cost categories below $36 per kg U and $36 to $55 per kg U (IAEA2001, p. 33).
7-11
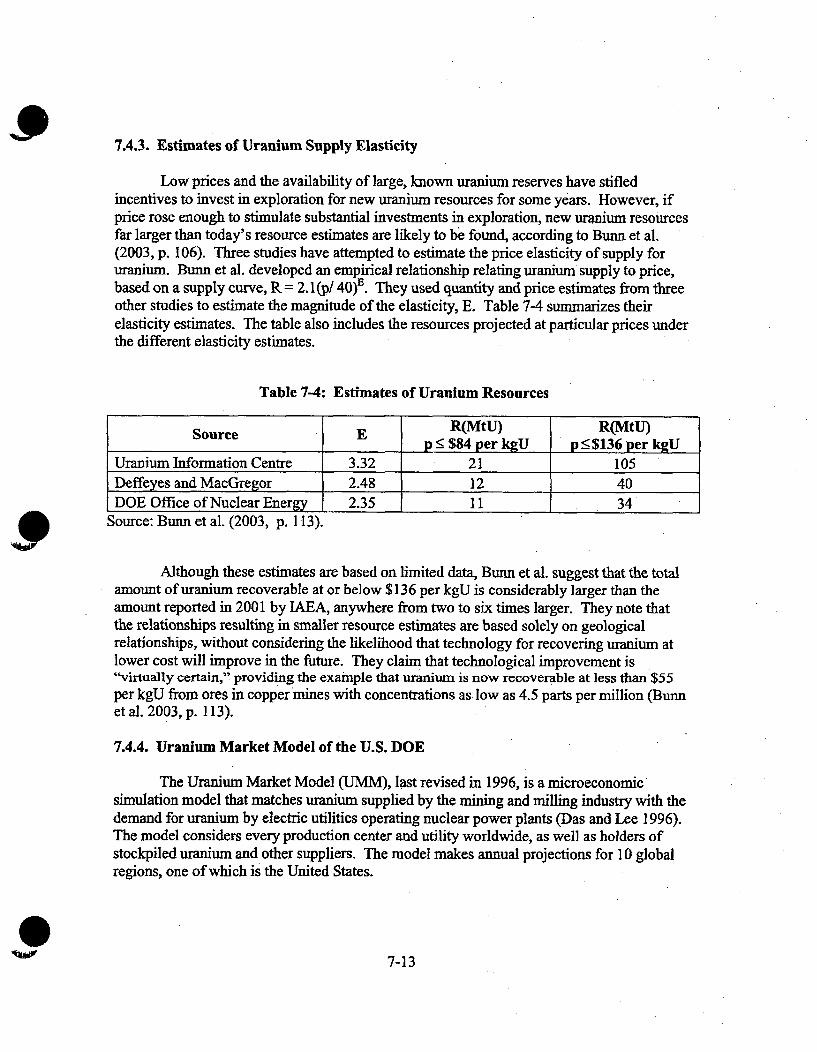
7.4.3. Estimates of Uranium Supply Elasticity
Low prices and the availability of large, known uranium reserves have stifledincentives to invest in exploration for new uranium resources for some years. However, ifprice rose enough to stimulate substantial investments in exploration, new uranium resourcesfar larger than today's resource estimates are likely to be found, according to Bunn et al.(2003, p. 106). Three studies have attempted to estimate the price elasticity of supply foruranium. Bunn et al. developed an empirical relationship relating uranium supply to price,based on a supply curve, R = 2.1 (p/ 4 0 )E. They used quantity and price estimates from threeother studies to estimate the magnitude of the elasticity, E. Table 7-4 summarizes theirelasticity estimates. The table also includes the resources projected at particular prices underthe different elasticity estimates.
Table 7-4: Estimates of Uranium Resources
Source E R(MtU) R(MtU)pUn $84 per kgU pCnr$136 per kgU
Uranium Information Centre 3.32 21 105Deffeyes and MacGregor 2.48 12 40DOE Office of Nuclear Energy 2.35 11 34
Source: Bunn et al. (2003, p. 113).
Although these estimates are based on limited data, Bunn et al. suggest that the totalamount of uranium recoverable at or below $136 per kgU is considerably larger than theamount reported in 2001 by IAEA, anywhere from two to six times larger. They note thatthe relationships resulting in smaller resource estimates are based solely on geologicalrelationships, without considering the likelihood that technology for recovering uranium atlower cost will improve in the future. They claim that technological improvement is"virtually certain," providing the example that uranium is now recoverable at less than $55per kgU from ores in copper mines with concentrations as low as 4.5 parts per million (Bunnet al. 2003, p. 113).
7.4.4. Uranium Market Model of the U.S. DOE
The Uranium Market Model (UMM), last revised in 1996, is a microeconomicsimulation model that matches uranium supplied by the mining and milling industry with thedemand for uranium by electric utilities operating nuclear power plants (Das and Lee 1996).The model considers every production center and utility worldwide, as well as holders ofstockpiled uranium and other suppliers. The model makes annual projections for 10 globalregions, one of which is the United States.
7-13

7.5.2. Model for Energy Supply Strategy Alternatives and their General EnvironmentalImpact (MESSAGE)
7.5.2.1. The Model
The Model for Energy Supply Strategy Alternatives and their General EnvironmentalImpact (MESSAGE) was developed by HASA. MESSAGE models fuel supply throughdetailed domestic resource extraction constraints and elasticity definitions, in addition toconstraints on imports and exports.
MESSAGE calculates a supply elasticity as the change in price relative to a referenceprice level that results from a change in supply over a reference supply level (Messner andStrubegger 2001, p. 47). The model contains an equation that balances production andimport of primary energy with central conversion, transport, and export requirements(Messner and Strubegger 2001, p. 28). This equation takes into account the level oftechnology involved in the extraction a given resource (Messner and Strubegger 2001, p. 29).
MESSAGE was used for the projections in Global Energy Perspectives, publishedjointly by HASA and the World Energy Council (WEC) in 1998. Although this publicationdoes not include projections of fuel prices, it does include projections of fuel production byregion. The projections for North American (U.S. and Canadian) gas production under sixdifferent scenarios are shown in Table 7-5. The timing and extent of new discoveries ofreserves and resources are incorporated as assumptions in the scenarios (IHASA and WEC1998, p. xiii). The numbers indicate that the scenarios represent distinctly different futures,even within a period of only three decades.
All the scenarios in MESSAGE project increasing North American natural gasproduction from 2000 through 2020, although scenarios B, Cl and C2 see production fallingoff from 2010 to 2020.
Table 7-5: MESSAGE Forecasts of North American Gas Production
North America Natural Gas Production (Mtoe)Scenario 2000 2010 2020Al: high growth, ample oil and gas 587 727 806A2: high growth, return to coal 580 716 734A3: high growth, fossil phaseout 620 794 997B: middle course 583 712 690CI: ecologically driven, new renewableswith nuclear phaseout 506 569 545C2: renewables and new nuclear 507 593 562
7-15

References
Adica Consulting, LLC. (2002) "Description of the ENPEP Model." Retrieved September10, 2003 from the World Wide Web:http://www.adica.com/main/media/demos/ENPEP-summary.pdf.
Bunn, Matthew, Steve Fetter, John P. Holdren, and Bob van der Zwaan. (2003) "TheEconomics of Reprocessing vs. Direct Disposal of Spent Nuclear Fuel." Cambridge, Mass.:President and Fellows of Harvard University.
Criqui, Patrick, Silvana Mima, and A. Tuan Nguyen. (2003) 'POLES 4: ProspectiveOutlook on Long-term Energy Systems." Grenoble, France: Institute of Economy andEnergy Policy.
Currie, Jeffrey R. (2003) "Natural Gas Supply and Demand Issues." Testimonybefore the Full Committee on Energy and Commerce, U.S. House of Representatives,Washington, D.C. New York: Goldman, Sachs & Co., June 10.
Das, Sujit, and Russell Lee. (1996) "Model Documentation of the Uranium MarketModel (UMM)." Washington, D.C.: Energy Information Administration.
Deffeyes, Kenneth, and Ian D. MacGregor. (1980) "World Uranium Resources,,Scientific American 242, No. 1: 50-60.
Energy Information Administration (EIA). (2003a) Annual Energy Outlook 2003with Projection to 2025. Washington D.C.: Energy Information Administration.Supplemental Tables retrieved from the World Wide Web December 2003:http://www.eia.doe.gov/oiaf/archive/aeo2003/supplement/sup-ogc.pdf.
Energy Information Administration (EIA). (2003b) Assumptions for the AnnualEnergy Outlook 2003 with Projection to 2025. Washington D.C.: Energy InformationAdministration.
Energy Information Administration (EIA). (2003c) "Model Documentation: CoalMarket Module." Washington, D.C.: Energy Information Administration.
Energy Information Administration (EIA). (2003d) "Model Documentation: NaturalGas Transmission and Distribution Module." Washington, D.C.: Energy InformationAdministration.
Energy Information Administration (EIA). (2003e) "Oil and Gas Supply ModuleDocumentation." Washington, D.C.: Energy Information Administration.
7-17

Simmons, Matthew. (2003) "Future Energy Resources: Are We Asking The RightQuestions?" Houston: Simmons & Co. International. Retrieved November 20, 2003 fromthe World Wide Web:http://www.simmonscointl.com/files/Natl%20Defense%2OUniv%20(B&W).pdf.
7-19

Chapter 8. ENVIRONMENTAL POLICIES
Summary
The future costs per MWh of the major competitors to nuclear energy, not just thepresent costs, need to be considered. In addition to process technology advances andpossible fuel price changes that could reduce coal- and gas-fired costs, environmentalconsiderations could serve to raise the cost of these competitor sources in view of theirsignificance as a source of air poUution. This chapter assesses the potential magnitudes ofthese cost increases on coal- and gas-generated electricity.
In view of global climate concerns, an important emission that remains largelyuncontrolled but could be subject to controls in the future is carbon. Carbon emissions canbe reduced only by thermal efficiency improvements, which have rather tight limits. Captureand sequestration therefore are the longer-term environmental control possibilities forcarbon.
Despite a recent application of capture and sequestration in a gas-fired plant inNorway and an innovative example of sale and re-use between a gas-fired utility in NorthDakota and an-oil company in Canada, the technology and likely costs of carbonsequestration are in pre-commercial stages.
While the technologies of carbon capture, transport, injection, and sequestrationcannot be said to be commercialized yet, some cost estimates are available. On a per-megawatt hour basis, assuming 100 km transportation by pipeline, a summary is:
$36 to $65 per MWh for pulverized coal combustion (PCC), including anenergy penalty of 16 to 34 percent
$17 to $29 per MWh for gas turbine combined cycle (GTCC), includingan energy penalty of 10 to 16 percent
$20 to $44 per MWh for integrated gasification combined cycle (IGCC),including an energy penalty of 6 to 21 percent.
An alternative. measurement of the future costs of carbon control is through the use ofpermit markets similar to those used by the Acid Rain Program and Federal NOx Budget.Prices generated through permit market trading are interpreted as the approximate future costof reducing present emissions. Thus the prices can be used to estimate the mean cost ofmeeting current emissions standards on a per MWh basis. Partly because of the present lackof a carbon emission standard, the results of models estimating the future price of potentialgreenhouse gas permits that have been reviewed have varied greatly. A carbon price range($50 to $250 per metric ton) has been used to construct upper and lower bounds to theelectricity cost impact. For coal, the cost impact is likely to be between $15 and $75 per
8-1

Outline
8.1. Introduction
8.2. Present Situation and Future Projections
8.3. Carbon Sequestration Technology and Costs
8.3.1. Separation and Capture8.3.2. Cost Estimates8.3.3. Transport and Injection8.3.4. Summary of Carbon Mitigation Costs
8.4. Carbon Tax and Emissions Permit Trading
8.4.1. Review of Carbon Price Estimates8.4.2. Estimated Effect of Carbon Control
8.5. The Effect of Tradable Emission Permit Programs on Electricity Prices
8.5.1. The SO2 Case8.5.2. The NOx Budget Program8.5.3. Conclusion
References
8-3

8.3. Carbon Sequestration Technology and Costs
One of the most widely discussed means of reducing CO2 emissions is carbon captureand sequestration. The basic method is to capture CO2 and inject it into secure geologicformations or into the deep ocean for long-term storage. This method holds much promise,and in a 1997 report, the President's Committee of Advisors on Science and Technology(PCAST) recommended that funding within DOE's fossil-energy R&D program bereformulated, emphasizing new technologies such as carbon capture and sequestration(PCAST 1997, p. 5).
Two current projects are being studied to better understand the feasibility of this typeof solution in the reduction of global CO 2 emissions. These are the Weyburn project inSaskatchewan, Canada and the Sleipner project in the North Sea off the coast of Norway.The motivations behind these two projects differ.
The Weyburn oil field, located in southeastern Saskatchewan, was discovered in1954, containing approximately 1.4 billion barrels of oil. As production rates declined in thefield, CO2 flooding (injection of CO2 into the field to increase production) was used torecover an additional 130 million barrels of oil and permanently sequester approximately15.4 million net tons of CO2 for a total of 19.8 million tons of CO2. CO2 is captured at theGreat Plains Synfuels Plant in North Dakota (coal-fired power plant) and transported in asupercritical state (2,100 pounds per square inch (psi)) via 323-km pipeline to the Weyburnsite. Approximately2,756 tons of CO2 per day have been injected into the reservoir sinceSeptember 22, 2000 (Brown et al. 2001).
The CO2 sequestered at the North Sea Sleipner gas fields is not the result of burningfossil fuels, but is an impurity that is removed to prepare the gas for market. Formerly, theCO2 was vented to the atmosphere. When Norway instituted a tax on offshore carbonemissions of U.S. $50 per tonne, it became economically viable to capture and sequester theseparated CO2 (the tax was later lowered to $38 per tonne). By avoiding this tax on onemillion tonnes of CO2 annually (3 percent of Norway's total CO2 emissions), Statoil was ableto recover its investment of $80 million in two years (Adam 2001).
Since, 1996 Statoil has been injecting the separated CO2 into a sandstone layer,known as the Utsira formation, 800 to 1,000 meters below the seabed (IEA 2003). Afterseparation, the CO2 must be compressed to a supercritical state and injected into the rockyreservoir.
A seismic survey done by the British Geological Survey (BGS) in 1999 showed thatthe CO2 injected into the reservoir is likely to remain in place. The potential for storage islarge. One percent of this reservoir would hold three years' emissions from all the powerplants in Europe (Adam 2001). A BGS report indicated that the North Sea has the potentialto hold all of the CO2 from European power stations for 800 years (800 billion tonnes) (LEA2003). One concern is that the CO2 may begin to compress, rather than dissipate throughoutthe formation, making future injection more difficult (Adam 2001).
8-5
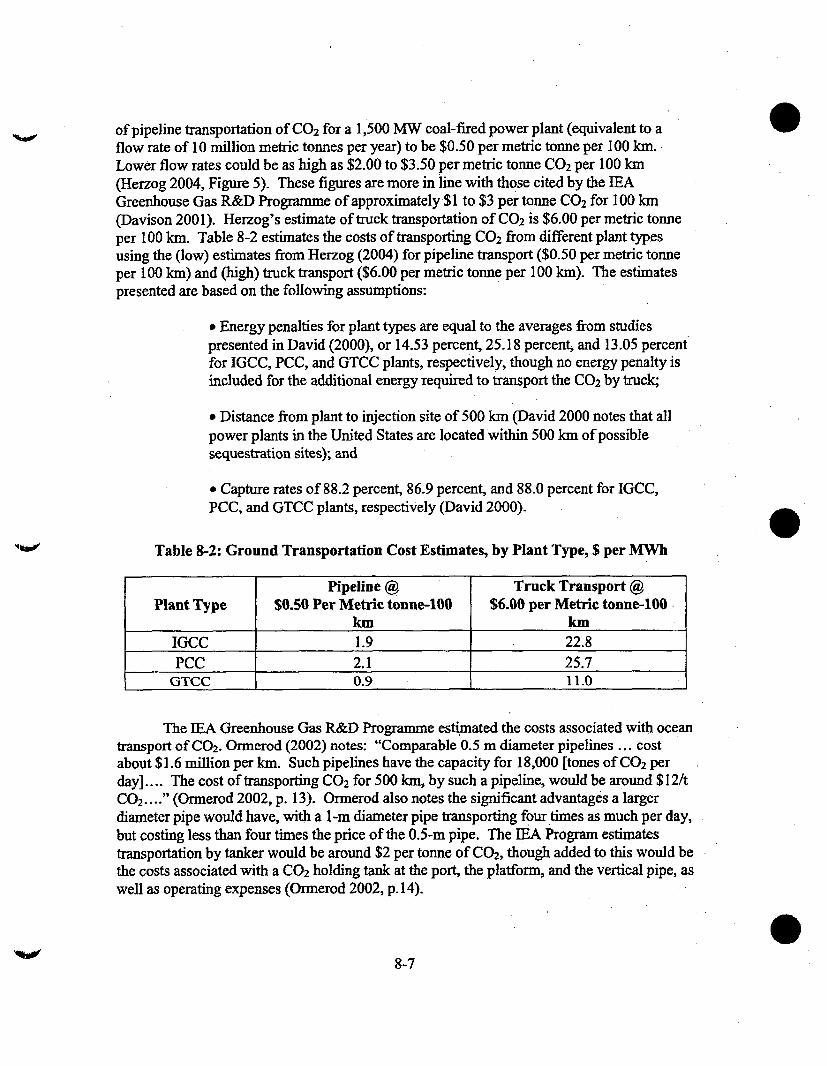
of pipeline transportation of CO2 for a 1,500 MW coal-fired power plant (equivalent to aflow rate of 10 million metric tonnes per year) to be $0.50 per metric tonne per 100 km.Lower flow rates could be as high as $2.00 to $3.50 per metric tonne CO 2 per 100 km(Herzog 2004, Figure 5). These figures are more in line with those cited by the lEAGreenhouse Gas R&D Programme of approximately $1 to $3 per tonne CO2 for 100 km(Davison 2001). Herzog's estimate of truck transportation of CO2 is $6.00 per metric tonneper 100 km. Table 8-2 estimates the costs of transporting CO2 from different plant typesusing the (low) estimates from Herzog (2004) for pipeline transport ($0.50 per metric tonneper 100 kin) and (high) truck transport ($6.00 per metric tonne per 100 kin). The estimatespresented are based on the following assumptions:
* Energy penalties for plant types are equal to the averages from studiespresented in David (2000), or 14.53 percent, 25.18 percent, and 13.05 percentfor IGCC, PCC, and GTCC plants, respectively, though no energy penalty isincluded for the additional energy required to transport the CO2 by truck;
* Distance from plant to injection site of 500 krn (David 2000 notes that allpower plants in the United States are located within 500 km of possiblesequestration sites); and
• Capture rates of 88.2 percent, 86.9 percent, and 88.0 percent for IGCC,PCC, and GTCC plants, respectively (David 2000).
Table 8-2: Ground Transportation Cost Estimates, by Plant Type, $ per MWh
Pipeline @ Truck Transport @Plant Type $0.50 Per Metric tonne-100 $6.00 per Metric tonne-100
km kmIGCC 1.9 22.8PCC 2.1 25.7
GTCC 0.9 11.0
The IEA Greenhouse Gas R&D Programme estimated the costs associated with oceantransport of CO2. Ormerod (2002) notes: "Comparable 0.5 m diameter pipelines ... costabout $1.6 million per km. Such pipelines have the capacity for 18,000 [tones of CO2 perday].... The cost of transporting CO2 for 500 kin, by such a pipeline, would be around $12/tCO2.... " (Ormerod 2002, p. 13). Ormerod also notes the significant advantages a largerdiameter pipe would have, with a 1 -m diameter pipe transporting four times as much per day,but costing less than four times the price of the 0.5-m pipe. The LEA Program estimatestransportation by tanker would be around $2 per tonne of CO2, though added to this would bethe costs associated with a CO2 holding tank at the port, the platform, and the vertical pipe, aswell as operating expenses (Ormerod 2002, p. 14).
8-7

Using this formulation, Table 8-4 summarizes the cost components of the full cycle ofcarbon sequestration, including capture, transport, and injection and storage. The transportcosts assume a 100-km pipeline as an average across plants. The capture costs are the largestcomponent, injection, and storage the smallest, and transport the most variable. Coal plantswould face the greatest expense, although IGCC technology is better adapted to capture carbonthan is pulverized coal, and gas the least.
Table 8-4: Summary of Components of Carbon Sequestration Cost, $ per MNWh
Plant Type Capture Transport Injection and Storage TotalIGCC 17 2 to 23 1 to 4 20 to 44
PCC 34 2 to 26 1 to 5 34 to 65GTCC 16 1 to 11 .5 to2 17to 29
8.4. Carbon Tax and Emissions Permit Trading
A cap-and-trade program similar to the current SO 2 abatement program may beimplemented in the future. Like carbon taxes, carbon permit markets are intended to equalizemarginal costs of abatement, only a permit price is set by a market rather than by a regulator.Thus, these prices are likely to be closer to the true cost of abatement than a carbon tax.
Predicting the actual price of carbon emissions the market will bear is complicated bynumerous uncertainties relating to supply and demand, the introduction of the KyotoProtocol, and other factors. Ultimately, the carbon price will rise or fall as a function of theamount to be abated and the number of buyers and sellers participating in the market. Asabatement targets become more stringent, the cost of carbon abatement will increase and withit the viability of low-carbon-generation options (WWF 2003, p. 8).
The availability of more economic substitutes could contribute to lower allowanceprices. While carbon sequestration technology continues to improve, fuel switching betweenhigh-carbon-content coals to natural gas is currently the most accessible method for loweringcarbon emissions. Natural gas plants emit less CO 2 and other pollutants than coal plants.Depending on the future price of natural gas, large-scale substitution away from coal couldoccur in response to a carbon control program.
8.4.1. Review of Carbon Price Estimates
Despite an already large and growing demand for information upon which toformulate reasonable price expectations, little reliable information is available (Springer2003, p. 1). Numerous models simulate a global market for carbon dioxide (C0 2) orgreenhouse gas (GHG) emission permits. For example, Burtraw et al. (2002) have shown
8-9

08.5. The Effect of Tradable Emission Permit Programs on Electricity Prices
The purpose of examining current tradable emission permit programs is two-fold.First, analysis of the permit allowance prices provides an indication of the future costs toelectricity generators of reducing present emissions. Second, examining the performanceover time of current permit programs may provide insight into the potential cost of a carbonprogram.
8.5.1. The SO 2 Case
The U.S. SO2 cap-and-trade program was established as a result of the 1990 CleanAir Act Amendments under the authority granted by Title IV, which included severalmeasures to reduce precursor emissions of acid deposition. The SO 2 component consisted ofa two-phase cap-and-trade program for reducing SO2 emissions from fossil-fuel-burningpower plants located in the lower 48 states of the United States. Beginning in 2000, thePhase II cap equivalent to an average emission rate of 1.2 lbs. of S0 2 per MMBtu wasinstituted for all electric generating units greater than 25 MW (Burtraw et al. 2003a, pp. 2-6)
Since allowances are readily substitutable for abatement, this single price provides acommon reference point and a coordinating mechanism for all owners of affected sources indeciding whether to abate more or less at any one time and thereby to equalize the marginalcost of abatement. The cap-and-trade system generally has been regarded as efficient asevidenced by its high volume of trading since its inception in 1994.
Allowance prices have varied greatly, from a low of $64 in 1996 to a high of $212 in1999. The average price since Phase II of the Acid Rain Program is $164, with a low of$125 and a high of $208. In spite of the wide variation, there appears to be a general upwardtrend in allowance prices, as shown in Figure 8-1.
08-11

Plan (SIP) regional program is expected to begin adding states to the original OzoneTransport region to a total of 20 states. One hundred eighty-six gas (300 MW or larger) andcoal (600 MW or larger) plants from the NOx SIP call region were selected to determine theaverage incremental cost of electricity (EPA 2002a). The calculation of incremental cost isthe same as the SO 2 calculation above, but the data are adjusted for the ozone season, whichrefers to the summer months when emissions limits apply. The average cost for the 126 coalplants above the limit was $1.3 per MWh and the average cost of the 15 gas plants above thelimit was $0.4 per MWh.
8.5.3. Conclusion
Analysis of the SO 2 allowance market suggests that coal-fired electricity generatorscan expect an average cost of $0.50 per MWh to meet current emissions standards.However, older less efficient plants can expect costs closer to $1.20 per MWh and newermore efficient plants closer to $0.10 per MWh. TheNOx allowance market indicates thatcoal plants can expect an average cost of $1.3 per MWh to meet Phase mI emission limits,whereas gas plants were rarely over the limit, and those that were had an average cost of$0.40 per MWh. Allowance prices could change, however, should the NOx budget programbecome annual or federalized to include all 48 states.
8-13
Energy Information Administration (EIA). (2003b) "Analysis of S. 139 the ClimateStewardship Act of 2003: Highlights and Summary." Washington, D.C.: EIA.
Energy Information Administration (EIA), Office of Integrated Analysis & Forecasting.(2003c) Annual Energy Outlook 2003 with Projections to 2025. Washington, D.C.: EIA.Retrieved from the World Wide Web: www.eia.doe.gov/oiaf/aeo/aeotab_l 9.htm.
Farrell, A. (2000) "The NOx Budget: A Look at the First Year," The Electricity Journal 1:83-93.
Federal Energy Regulatory Commission (FERC). (2002) "Remedying Undue DiscriminationThrough Open Access Transmission and Standard Electricity Market Design." Notice ofProposed Regulation released August 2002.
Herzog, H. and D. Golomb. (2004) "Carbon Capture and Storage from Fossil Fuel Use,"forthcoming in Encyclopedia of Energy. C. Cleveland, ed., Amsterdam: Elsevier.
Herzog, H. (1999) "The Economics of CO2 Separation and Capture." Second Dixie Lee RayMemorial Symposium. Washington, D.C., August.
International Energy Agency (IEA). (2003) "SACS Project." Retrieved from lEAGreenhouse Gas R&D Programme Website. Retrieved from World Wide Web:http://www.ieagreen.org.uk.
Newell, R., and R. Stavins. (1999) "Climate Change and Forest Sinks: Factors Affecting theCosts of Carbon Sequestration." Discussion Paper. Washington, D.C.: Resources for theFuture.
Ormerod, W.G., P. Freund, A. Smith, and J. Davison. (2002) "Ocean Storage of CO 2."Cheltenham, UK: lEA Greenhouse Gas R&D Programme. Retrieved from the World WideWeb: http://www.ieagreen.org.uk/.
Ozone Transport Commission (OTC). (2002) "The NOx Budget Program: Progress Report1999-2002." Report. Washington D.C.: Ozone Transport Commission.
Panel on Energy Research & Development. (1997) "Report to the President on FederalEnergy Research & Development for the Challenges of the Twenty-First Century."Washington, D.C.: PCAST, November, Retrieved from the World Wide Web:http://www.ostp.gov/Energy.
Palmer, K. (1997) "Electricity Restructuring: Environmental Impacts," Forum for AppliedResearch and Public Policy 12: 28-33.
Pizer, W., and R. Kopp. "Summary and Analysis of McCain-Leiberman Climate StewardshipAct of 2003." Issue Brief. Washington, D.C.: Resources for the Future.
8-15

Part Three: Nuclear Enerev In The Years Ahead
Part One considered the cost of new nuclear electric power and Part Two consideredthe cost of electricity from coal and gas that nuclear power will have to meet if it is to becompetitive. Parts One and Two are used here in Part Three to estimate what policies orcombination of policies are needed to make nuclear power competitive in 2015. Lookingfarther to the future, prospects for 2025 and beyond are considered.

Chapter 9. NUCLEAR ENERGY SCENARIOS: 2015
Summary
No-Policy Benchmark
As indicated in Chapter 3, capital cost ranges are patterned on reactors taken to berealistic possibilities for deployment by 2015: (1) the General Electric ABWR such as isalready built in Japan, and the ACR-700, the CANDU 6 version which has been built inChina and Romania, on which first-of-a-kind engineering (FOAKE) costs have been paid,with overnight cost for either reactor of $1,200 per kW, (2) a Westinghouse AP1000, whosesister reactor the AP600 has been certified by NRC but on which FOAKE costs have yet tobe paid, with overnight cost of $1,500 per kW and (3) the Framatome SWR 1000, similar to alarger version in advanced planning stages in Finland, with overnight cost of $1,800 per kW.
As noted in Chapter 5, the financial model developed there gives no-policy LCOEson first new nuclear plants of $53, $62, and $71 per MWh respectively. This range assumesbusiness expectations of construction times as long as 7 years and a 3 percent additional riskpremium. None of these new nuclear LCOEs are as low as the $33 to $45 per MWh range ofLCOEs for coal-fired and gas-fired generation.
Individual Financial Policies
Starting from the no-policy benchmark, the financial model has been used to estimatethe effects of various financial policies. According to the financial model, a loan guaranteeof 50 percent of construction costs would reduce nuclear LCOE for the lowest cost reactor to$49 per MWh under likely business expectations. Accelerated depreciation, whose mostliberal terms would extend to immediate expensing, could reduce the LCOE for the lowestcost reactor in this case to $47 per MWh. An investment tax credit as high as 20 percent,refundable so as to be useable as an offset to nonnuclear activities of a utility, would reducethis number to $44 per MWh. None of the foregoing policies alone would achievecompetitiveness even for the lowest cost reactor under likely business expectations of a7-year construction period and added debt and equity risk premiums of 3 percent for nuclearpower. A production tax credit of $18 per MWh for the first 8 years would reduce the LCOEof the lowest cost reactor under likely business expectations to $38 per MWh, which iswithin the range of competing coal and gas LCOEs. This tax credit is what has beenconsidered in legislation proposed in 2004. It would however achieve competitiveness onlyfor the most optimistic cost outcome. Moreover, it is a back-end policy that permitsincreased revenue only in later years when power is being produced, not in the more crucialnear-term front-end construction period. A conclusion is that no single financial policy alonecan definitely be counted on to bring about nuclear competitiveness by 2015.
9-1
fourth and fifth plants. These costs are within the upper end of the range of coal- and gas-fired LCOEs.
Robustness of Conclusions
The results are sensitive to assumptions about overnight costs and plant constructiontimes, but both of these are included in the analysis. The results are not very sensitive toplant life. Competitor prices deserve mention. Rising gas prices would disadvantageelectricity generated by gas, but coal prices appear unlikely to rise. The major effect couldbe substitution of coal for gas, with nuclear still competing against coal generation atessentially the same cost per MWh as in the analysis here. Stringent measures to controlgreenhouse gases would disadvantage both gas and coal, making nuclear energy easilycompetitive in the marketplace. While this contingency provides a policy reason for havingnuclear capability in place, it conservatively is not included in the 2015 outlook assumedhere for nuclear energy.
9-3

9.1. Introduction
Three nuclear plant costs were considered in the no-policy scenario, introduced inChapter 5. To recapitulate, they are patterned after three candidate reactors: (1) a matureplant such as the ABWR and ACR-700, the FOAKE costs on which have already been paid,with an overnight cost of $1,200 per kW; (2) a design not yet built, such as the AP 1000, theFOAKE costs on which are yet to be paid, with an overnight cost of $1,500 per kW; and(3) the Framatome SWR 1000, similar to a larger version in advanced planning stages inFinland, whose overnight cost is estimated at $1,800 per kW. The cost range also allows foruncertainty in cost estimates for reasons other than reactor type.
This study investigates what would be necessary to allow nuclear power to come intothe marketplace in the event that first plants were found to be not competitive with fossilpower generation. Accordingly, this chapter focuses on potential federal policies for earlyplants.
Section 9.2 recapitulates the no-policy starting point, giving first-plant LCOEs for thethree nuclear reactor designs and for the current fossil generation alternatives, applying thefinancial model developed in Chapter 5. The remainder of the chapter applies the model topolicy alternatives. Section 9.3 examines the effects of several policies that might beimplemented to offer support to new nuclear plants. To examine the viability of nuclearpower after learning by doing has reduced costs during construction of the first few plants,Section 9.4 calculates the busbar costs that new nuclear plants could deliver without anypolicy support. Section 9.5 calculates LCOEs of fossil generation under alternative fuel-price and environmental-policy scenarios. Section 9.6 summarizes the findings of thechapter.
9.2. First-Plant Nuclear and Fossil LCOEs
Table 9-1 summarizes from Chapter 5 the LCOEs of a first nuclear plant, for each ofthe three reactor costs being considered, assuming a 7-year construction period. Accordingto the financial models, a $1,200 per kW reactor could deliver power at $53 per MWh. The$1,500 per kW reactor could deliver power at $62 per MWh. The $1,800 per kW reactorcould deliver power at $71 per MWh.
Table 9-1: LCOEs for a First Nuclear Plant, with No Policy Assistance, 7-YearConstruction Time, 10 Percent Interest Rate on Debt, 15 Percent Rate on Equity,
2003 Prices
Overnight Cost, $ per kW 1,200 __ 1,500 1,800LCOE, $ per MWh 53 62 71
9-5
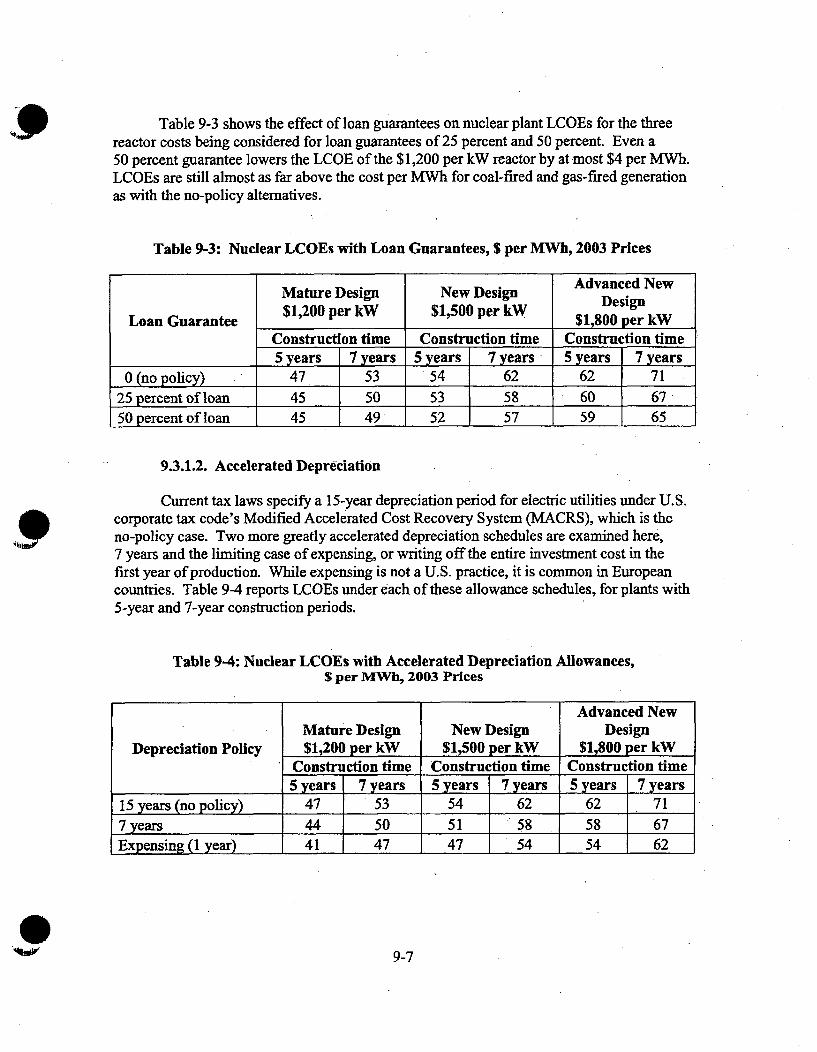
Table 9-3 shows the effect of loan guarantees on nuclear plant LCOEs for the threereactor costs being considered for loan guarantees of 25 percent and 50 percent. Even a50 percent guarantee lowers the LCOE of the $1,200 per kW reactor by at most $4 per MWh.LCOEs are still almost as far above the cost per MWh for coal-fired and gas-fired generationas with the no-policy alternatives.
Table 9-3: Nuclear LCOEs with Loan Guarantees, $ per MWh, 2003 Prices
Mature Design New Design Advanced New
Loan Guarantee $1,200 per kW $1,500 per kW DesignLaGurne $1,800 per kW
Construction time Construction time Construction time5 years 7 years 5 years 7 years 5 years 7 years
0 (no policy) 47 53 54 62 62 7125 percent of loan 45 50 53 58 60 6750 percent of loan 45 49 52 57 59 65
9.3.1.2. Accelerated Depreciation
Current tax laws specify a 15-year depreciation period for electric utilities under U.S.corporate tax code's Modified Accelerated Cost Recovery System (MACRS), which is theno-policy case. Two more greatly accelerated depreciation schedules are examined here,7 years and the limiting case of expensing, or writing off the entire investment cost in thefirst year of production. While expensing is not a U.S. practice, it is common in Europeancountries. Table 9-4 reports LCOEs under each of these allowance schedules, for plants with5-year and 7-year construction periods.
Table 9-4: Nuclear LCOEs with Accelerated Depreciation Allowances,$ per MWh, 2003 Prices
Advanced NewMature Design New Design Design
Depreciation Policy $1,200 per kW $1,500 per kW $1,800 per kWConstruction time Construction time Construction time5 years 7 years 5 years 7 years 5 years 7 years
15 years (no policy) 47 53 54 62 62 717 years 44 50 51 58 58 67Expensing (1 year) 41 47 47 54 54 62
9-7
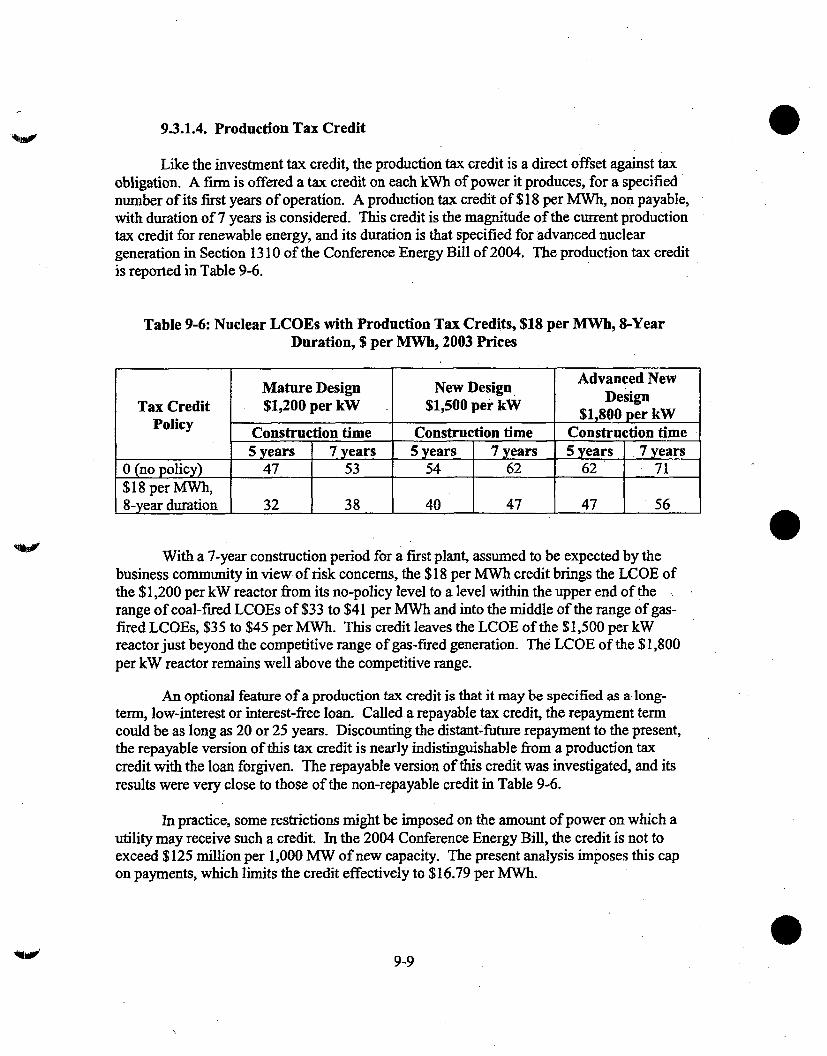
9.3.1.4. Production Tax Credit
Like the investment tax credit, the production tax credit is a direct offset against taxobligation. A firm is offered atax credit on each kWh of power it produces, for a specifiednumber of its first years of operation. A production tax credit of $18 per MWh, non payable,with duration of 7 years is considered. This credit is the magnitude of the current productiontax credit for renewable energy, and its duration is that specified for advanced nucleargeneration in Section 1310 of the Conference Energy Bill of 2004. The production tax creditis reported in Table 9-6.
Table 9-6: Nuclear LCOEs with Production Tax Credits, $18 per MWh, 8-YearDuration, $ per MWh, 2003 Prices
Advanced NewMature Design New Design DesignTax Credit $1,200 per kW $1,500 per kW D$1800 per kW
Policy Construction time Construction time Construction time
5 years 7 years 5 years 7 years 5 years 7 years0 (no policy) 47 53 54 62 62 71$18 per MWh,8-year duration 32 38 40 47 47 56
With a 7-year construction period for a first plant, assumed to be expected by thebusiness community in view of risk concerns, the $18 per MWh credit brings the LCOE ofthe $1,200 per kW reactor from its no-policy level to a level within the upper end of therange of coal-fired LCOEs of $33 to $41 per MWh and into the middle of the range of gas-fired LCOEs, $35 to $45 per MWh. This credit leaves the LCOE of the $1,500 per kWreactor just beyond the competitive range of gas-fired generation. The LCOE of the $1,800per kW reactor remains well above the competitive range.
An optional feature of a production tax credit is that it may be specified as a long-term, low-interest or interest-free loan. Called a repayable tax credit, the repayment termcould be as long as 20 or 25 years. Discounting the distant-future repayment to the present,the repayable version of this tax credit is nearly indistinguishable from a production taxcredit with the loan forgiven. The repayable version of this credit was investigated, and itsresults were very close to those of the non-repayable credit in Table 9-6.
In practice, some restrictions might be imposed on the amount of power on which autility may receive such a credit. In the 2004 Conference Energy Bill, the credit is not toexceed $125 million per 1,000 MW of new capacity. The present analysis imposes this capon payments, which limits the credit effectively to $16.79 per MWh.
9-9

Table 9-7: Effects of Combined $18 per MWh 8-Year Production Tax Credits and 20Percent Investment Tax Credits on Nuclear Plants' LCOEs, $ per MWh, 2003 Prices
Mature Design New Design Advanced New Design$1,200 per kW $1,500 per kW $1,800 per kW
Construction Time Construction Time Construction Time5 years 7 years 5 years 1 7 years 5 years 7 years
No policies:.47 53 54 1 62 62 71
With combination of policies:26 31 31 38 37 46
With an expected 7-year construction period, the combination of the $18 per MWla 8-year production tax credit and the 20 percent investment tax credit would bring the LCOE ofthe $1,200 per kW reactor below the range of fossil LCOEs and that of the $1,500 per kWreactor into the upper half of the range of coal-fired LCOEs. The LCOE of the $1,800 perkW reactor would remain above the range of fossil LCOEs.
If it were possible to lower construction times expected by the business communityfor first nuclear plants to 5 years, nuclear LCOEs would be in the competitive range even forthe highest cost reactor, and would be well below it for the others
9.4. The Competitive Status of Nth Plant New Nuclear Facilities without FinancialPolicy Support
Section 9.4.1 addresses the LCOEs of sequential plants under various scenariosinvolving learning rates, construction time, and financing. Section 9.4.2 summarizes thefindings of Section 9.4. 1.
9.4.1. Ne-Plant Nuclear LCOEs: Learning, Streamlined Regulation, and RiskReduction
A critical question for new nuclear power is whether, after the initial plants have beensupported, nuclear power can be produced at prices competitive with coal and gas generation.During the construction of early plants, learning can be expected to take place inmanufacturing and construction, lowering overnight cost. As an additional consideration, ifthe construction and cost uncertainties thatlead to high risk premiums on early financingrates are resolved, debt and equity rates can be expected to fall to levels closer to those oncoal and gas generation.
This section examines the effects of three rates of cost reduction from learning: 3, 5,and 10 percent for each doubling of the number of completed plants. As noted in Chapter 3,
9-11

Table 9-8: LCOE for Successive Nuclear Plants, First to Eighth Plants, LearningEffects and Payment of FOAKE Costs Only, $ per MWh, 2003 Prices
Scenario Initial Overnight Cost
Plant Debt $1,200_per W I $1,50P pe kW I $1,800 per kWFOAKE Construction Risk De ,2 LeanSI0 Rate
Costs Time Premium Share of 3% 1 5% 10% 3% 50/6, 10%Financing ( pe MW1)
Already
paidon 7years 3% 50% 53 53 53 62 62 62 71 71 71$1,200plant IAllpaid,
2 no 7years 3% 50%0 53 53 53 53. 53 53 62 62 62learning .....Allpaid.
2 with 7years 3% 50% 51 51 49 51 51 49 60 59 57learning ..All paid,
3 with 7years 3% 500 51 50 47 51 50 47 59 58 55learning_All paid,
4 with 7years 3% 50% 50 49 45 50 49 45 59 57 53learning IAll paid,
5 with 7years 3% 50% 50 48 44 50 48 44. 58 56 52learning _All paid,
6 with 7years 3% 50% 50 48 44 50 48 44 58 56 51learningAll paid,
7 with 7years 3% 50% 49 48 43 49 48 43 58 55 50learning IAll paid.,4
with 7 years 3% 50% 49 47 42 49 42 58 55 49_ _ learning I
Table 9-9 shows the LCOEs of each plant, from the first through the eighth, as costand construction time uncertainties are resolved, in addition to the payment of FOAKE costsand the effects of learning. Table 9-10, in addition to the effects shown in Table 9-9, allowsthe debt share of financing to respond to the resolution of uncertainties. The LCOEs of thefirst four plants are the same in Tables 9-9 and 9-10, but those of plants five through eight inTable 9-9 include the influence of increasing debt shares.
Each row in those tables refers to a plant, in order of its construction, identified in theleft-most column. The four columns under "Scenario" describe important conditions ofconstruction and financing that can be anticipated to change as construction progresses:FOAKE costs are paid, construction time is reduced, and the risk premium on nuclearconstruction is eliminated.
The time patterns of changes in Tables 9-9 and 9-10 are judgmental since no dataexist to offer unambiguous guidance, and other sequences of events may be reasonable. 0
9-13

Table 9-9: LCOE for Successive Nuclear Plants, First to Eighth Plants,$ per MWh, 2003 Prices
Scenario Initial Overnight Cost
Plant Debt $1,200 per kW $1,500 Mr kW SI 800 per kWFOAKE Construction Risk Share of Learning Rate
costs Time Premium Fo3% 5% 1 10% 1 3% 1 5% 1 10% 1 3% 1 5% 1 10%LC,,OE (S per MW-)
Already
1 pad 7years 3% 50% 53 53 53 62 62 62 71 71 71$1,2001plantI1
2 Allpaid 7years 3% 1 50% 51 51 49 51 51 49 60 59 573 Allpaid 5years 3% 50016 45 44 42 45 44 42 52 51 484 Allpaid 5years Gone 50% 36 35 33 36 35 33 41 40 375 Allpaid 5years Gone 50% 35 34 32 35 34 32 40 39 366 Allpaid 5years Gone 50%16 35 34 32 35 34 32 40 39 367 Allpaid 5years Gone 50% 35 34 31 35 34 31 40 39 358 1Allpaid 5 years Gone 50% 35 34 31 35 34 31 40 38 35
In Table 9-10, the debt share of financing responds to the reduced uncertainties dispelled bythe successful construction of the first four plants. Financing of the fifth and sixth plants can beaccomplished with a greater proportion of debt, 60 rather than the 50 percent of the first four plants.The debt share rises to 70 percent for plants seven and eight, reducing LCOEs for those plants by a. further 5 to 10 percent.
Table 9-10: LCOE for Successive Nuclear Plants, First to Eighth Plants, with DebtShare Responding to Reduced Risk, $ per MWh, 2003 Prices'
Scenasio "_Initial Overnight CostF$1,00 r kW I$1500 per kW $1,800 per kW
Plant FOAKE Construction Risk Debt Share Learning Ratestatus Time Premium Financing 3% 5% 10% 3% 1 5% 10% 1 3% 5% 10%
LCOE ($per NVh)
Already
1 paid on 7years 3% 50% 53 53 53 62 62 62 71 71 71$1,200plant.
2 Allpaid 7 years 3% 50% 51 51 49 51 51 49 60 59 573 Allpaid 5years 3% 50% 45 44 42 45 44 42 52 51 484 Allpaid Syears Gone 50% 36 35 33 36 35 33 41 40 375 Allpaid 5years Gone 60% 34 33 31 34 33 31 38 37 356 Allpaid 5 years Gone 60%16 34 33 30 34 33 30 38 37 347 Allpaid 5 years Gone 70% 32 31 29 32 31 29 36 35 328 Allpaid 5 years Gone 70% 32 31 29 32 31 29 36 35 32
9-15

9.5.1. Higher Natural Gas Prices
EIA's projection for natural gas prices sees a one-third increase in real price by 2020.The gas price used in the low end of the LCOE calculations of Table 9-2 is $3.39 perMMBtu. A gas price of $4.25 to $4.30 per MMBtu would yield an LCOE of $42 to $43 perMWh. New gas plants might not be built at expected prices of this level, in view of thelower cost of coal generation under these circumstances.
9.5.2. Environmental Policies for Fossil Generation
Some tightening of NO, and S0 2 emissions for coal-fired and gas-fired power plantscould occur in the future, but the cost impacts of plausible further restrictions are not great.The larger unknown in future environmental policy concerns the possibility of carbonemission restrictions. Considering the complexity of grandfathering allowances in currentenvironmental regulations, a myriad of scenarios could be constructed for a policy of carbonemission limitations.
This analysis considers a system of limitations with emission permit trading butsimplifies the institutional detail. Because of the potentially high cost of transportingcaptured CO2, it is assumed that plants located immediately adjacent to suitable sequestrationsites will be the only plants to restrict their CO2 emissions, and they will sell their emissionpermits to plants that would have to transport their captured CO 2. After trades, the marginalemission reduction costs will be those of carbon capture and of injection and storage. In thisway, transportation costs could be avoided.
The costs used to represent carbon capture, injection, transportation, and storage costsare taken from Table 8-4, as averages of the individual ranges for pulverized coal-combustion and gas turbine combined cycle plants. These costs are on a per-megawatt-hourbasis, so they are added to the LCOEs calculated on the basis of other cost and performanceparameters. Table 9-12 compares the coal-fired and gas-fired LCOEs with currentenvironmental regulations with LCOEs under greenhouse policy of the character describedhere. The coal-fired plant LCOE would be increased two and one-half times, while the gas-fired plant LCOE would rise by one-half.
Table 9-12: Fossil Fuel Generation LCOEs with and without Greenhouse Policies,$ per MWh, 2003 Prices
Under Current Environmental Under GreenhousePolicies Policy
Coal-fired 33 to 41 83 to 91Gas-fired 35 to 45 58 to 68
09-17
Consider finally the competitiveness of later nuclear plants. Learning effects can beexpected to reduce overnight capital costs.. Successful construction and operationexperience, aided by streamlined regulation, should reduce expected construction time andalso permit a reduction of risk premiums. With leammig rates of 3 to 5 percent, constructionperiods of 5 years, and financing rates comparable to those of fossil plants, the $1,200 and$1,500 per kW reactors would be competitive with fossil power by the fifth plant. Ifsuccessfal contractor and operator experience with early plants permitted the reduction ofrisk premiums on debt and equity finance for fifth plants, both of these reactors wouldoperate well within the competitive range, and the $1,800 per kW reactor would reach theupper end of the competitive range. The results suggest that nuclear power could becomecompetitive on its own after a fairly brief period of policy assistance.
9-19
Fisher, William L. (1994) "How Technology Has Confounded U.S. Gas Resource WEstimators," Oil & Gas Journal 92, October 24: 100-107.
Greenspan, Alan. (2003) "Natural Gas Supply." Testimony before Senate Committee onEnergy and Natural Resources, Federal Reserve Board.
Guillerminet, Maire-Laure. (2001) "La dicision d'investissement en 61ectricit6 et sonfinancement dans un environmennement institutionnel en mutation." Mimeo. Paperpresented at Colloque international "La n6cessit6 de nouvelles r6gulations internationalesface aux mutations 6nerg6tiques et environmennementales," Paris, June 10-13. Downloadedfrom Worldwide Web December 2003: http://www.sceco.utiv-montpl.fr/creden/Reseau/DOCS%20COLLOQUE/IM_LGuillerminet. pdf.
Hamilton, James D. (1983) "Oil and the Macroeconomy since World War 11," Journal ofPolitical Economy 91: 228-248.
Jensen, James T. (2003) "The LNG Revolution," The Energy Journal 24, No. 2: 1-45.
Jones, Donald W., Inja K. Paik, and Paul N. Leiby. (2004) "Oil Price Shocks and theMacroeconomy: What Has Been Learned Since 1996," forthcoming in The Energy Journal25, No. 2: 1-32.
National Energy Policy Development Group (NEPDG). (2001) National Energy Policy:Abso Reliable, Affordable, and Environmentally Sound Energy for America 's Future. Report of
the National Energy Policy Development Group. Washington, D.C.: U.S. GovernmentPrinting Office, May.
National Petroleum Council (NPC). (1999) "Meeting the Challenges of the Nation'sGrowing Natural Gas Demands." Washington, D.C., December 1999.
National Petroleum Council (NPC). (2003) "Balancing Natural Gas Policy - Fueling theDemands of a Growing Economy." Washington, D.C., September 2003.
Pindyck, Robert S. (1991) "Irreversibility, Uncertainty, and Investment," Journal ofEconomic Literature 29:1110-1148.
Schimmelpfennig, D. (1995) "The Option Value of Renewable Energy: The Case ofClimate Change," Energy Economics 17: 311-317.
Schmoker, James W., and Thaddeus S. Dyman. (2001) Changing Perceptions of UnitedStates Natural Gas Resources as Shown by Successive US. Department of the InteriorAssessments. U.S.Geological Survey Bulletin 2172-B. Washington, D.C.: U.S. GeologicalSurvey.
0~9-21

Chapter 10. NUCLEAR ENERGY SCENARIOS: BEYOND 2015
Summary
The long gestation periods involved in nuclear research, the long lags entailed ingearing up the nuclear industry for production, to say nothing of the long-term nature ofsecurity and environmental problems bearing on nuclear energy, make it prudent to attemptto look several decades ahead in making decisions about nuclear energy policy.
Uncertainties of virtually every kind increase as a longer time horizon is considered.While achieving precision becomes increasingly difficult as one attempts to look out fartherto the future, the direction of some events has been persistent over the past few decades andshows every sign of continuing. These include perhaps most clearly the continued growth indemand for electricity and continued growth in severity of environmental problems. Beyondthese, all the policy concerns addressed in Part Two above seem likely to continue. Thelikelihood that they will become more serious seems great.
Exhaustive consideration is not feasible here. The present study closes byconsidering three matters of particular importance for 2025 and beyond, having implicationsfor nuclear energy strategies now.
First is nuclear energy technology. Much is already known about the momentum ofnuclear cost reductions using existing technology. Much is also known about nuclear energyR&D on new technologies that will come to fruition after 2025. The R&D is ongoing andmust be planned years ahead.
The importance of cost reductions from first-of-a-kind-engineering (FOAKE) costsand learning by doing beyond FOAKE has been verified above in Part Three. There is everyreason to believe that this type of experience will continue. If presently available GenerationIlI technologies are deployed for several years beginning in 2015, as contemplated in thisstudy, cost reductions from their replication could extend to 2025 and beyond.
New designs from R&D work on Generations 1I1+ and IV reactors, with manyspecifics now already in motion, may be commercialized soon after 2025. R&D in generalhas the potential to reduce costs. Cost reduction will be a prerequisite to commercialization.
The Pebble Bed Modular Reactor (PBMR), a relatively near-term technology, couldmake a particular contribution to reducing costs in view of its modularity. With independentunits of 110 MW, an 1,100 MW power plant could be constructed in a sequence permittingunits begun earlier to be brought on line earlier. Interest during construction, which hasnormally accounted for one quarter of nuclear LCOE, could be greatly reduced, perhaps evento minor proportions. Furthermore, once proof-of-principle was established, the smalleramounts of capital at risk in a single project--viewing the individual units as separateprojects-would reduce the risk premium that larger projects now have to pay. The
10-1

Outline
10.1 Introduction
10.2. Reactor Costs
10.2.1. Nb -of-a-Kind Costs10.2.2. New Reactor Designs
10.3. Environmental Policies
10.4. New Demands for Electricity: The Hydrogen Economy
10.5. Conclusion
10-3

designs, and its modularity could confer cost advantages. With independent units of 110MW, an 1,100 MW power plant could be constructed in a sequence that permitted unitsbegun earlier to be brought on line earlier, reducing construction interest. Beyond thatadvantage, once its proof-of-principle was established, the smaller amounts of capital at riskin a single project-viewing the individual units as separate projects-could reduce the riskpremium that larger projects might have to pay.
10.3. Environmental Policies
The longer the time horizon in the future that is considered, the more likely it is thatglobal warming will become a pre-eminent concern, leading to urgent need to replace coal-and gas-fired electricity generation. In view of the time it takes to gear up the nuclearindustry, this eventuality is one of the reasons for national concern with maintaining anuclear energy capability.
The LCOEs calculated in Chapter 9 for coal and gas generation under potentialgreenhouse policies may be high compared to the technology that actually emerges in thenext several decades, but indicate that even with major cost reductions in meetingenvironmental goals from fossil electricity generation, nuclear power would be the morecompetitive electricity source.
10.4. New Demands for Electricity: The Hydrogen Economy
If hydrogen were to make a major inroad on oil in transportation fuels, how toproduce the hydrogen could prove to be a major issue. As reported in Appendix A8,production of hydrogen using steam methane reforming is capable of reducing carbonemissions on balance, although production by electrolysis at coal plants would increase thoseemissions. Producing hydrogen with nuclear power by thermo-chemical processes wouldemit no carbon, offering a 100 percent reduction in carbon emissions with no take-backeffect through the hydrogen production.
Of the currently available methods of producing hydrogen, electrolysis, which wouldrequire considerable electricity, has not been tried at large scales of production. Steammethane reforming, the current production method of choice, needs process heat that couldbe supplied by either gas or nuclear reactors, but its economic viability is subject to the priceof its feedstock, and its production emits carbon unless steps are taken to capture it. Thermalwater-splitting is an alternative, non-carbon-emitting chemical process, and it can bepowered by nuclear energy.
Nuclear reactors produce large amounts of heat that can be used for a variety ofapplications. The addition of a gas or steam turbine would allow production of electricity.Adding a thermo-chemical water splitting unit would permit hydrogen production. Lookingto the post-2025 future, variations on modular helium reactors such as the GT-MHR
10-5

References
Forsberg, Charles W. (2003) "Hydrogen, Nuclear Energy, and the Advanced High-Temperature Reactor," International Journal of Hydrogen Energy 28: 1073-1081.
Schultz, K.R. (2003) "Use of the Modular Helium Reactor for Hydrogen Production." SanDiego: General Atomics. Retrieved December 2003 from the World Wide Web:http://www.world-nuclear.org/sym/2003/pdf/schultz.pdf.
Southworth, Finis. (2002) "Very High Temperature Gas Cooled Reactor Systems."Presentation to American Nuclear Society (ANS) Winter Meeting, Washington, D.C. IdahoNational Engineering & Environmental Laboratory, November.
010-7

Appendix: Major Issues Affecting the Nuclear Power Industry inthe U.S. Economy

NAppendix Al. PURPOSE AND ORGANIZATION OF STUDY
The focus of the study is on technologies for supplying baseload electricity-nuclear,coal-fired, and gas-fired technologies. Renewables technologies are not considered sincethey are not baseload. While hydroelectric facilities supply baseload generation in someparts of the United States, the major opportunities for hydro projects have been taken already,and significant new construction of hydroelectric facilities is not expected. Table Al-1presents the shares of generation furnished by different technologies in the United States.
Table Al-I: Shares of Total U.S. Electricity Generation, by Type of Generation
Net Generation,Energy Source Percent
Coal 50.1Nuclear 20.2Natural Gas 17.9Hydroelectric 6.6Petroleum 2.5Non-hydro Renewables 2.3Other Sources 0.4
Total 100Source: EIA (2003), Electric Power Monthly.
This study aims to synthesize what is known about the factors affecting the viabilityof nuclear power and to make the best possible estimates of a range of future possibilities.The organization of the study is as follows.
Appendix A2 assesses the state of knowledge about future demands for electricgenerating capacity, as revealed by market and plant models. The date at which newcapacity will need to be built in the United States is estimated in Appendix A3.
Appendices 4 through 10 consider other major factors that affect the nuclear powerindustry. The subjects include new nuclear power technology, waste disposal, nuclearregulation, nonproliferation goals, hydrogen, and energy security.
Part One of the body of the report is concerned with the market competitiveness ofnuclear power. Subjects include levelized costs, comparisons with international nuclearcosts, capital costs, the effect of learning by doing, and financing issues.
Part Two of the body of the report deals with fossil-fired generation, which is themajor competitor to nuclear power. Subjects include gas- and coal-fired technology, fuelprices, and major environmental policies.
Al-I

Appendix A2. ELECTRICITY FUTURES: A REVIEW OF PREVIOUS STUDIES
Summary
Two principal types of models have been used to investigate electricity futures: plantmodels and market models. Plant models calculate the cost of electricity generation from aspecific type of power plant. Costs are calculated on a levelized basis (LCOE), combiningoperating and capital costs to arrive at a cost per kWh, which if charged will recoup the costof supplying electricity. Costs are calculated at the busbar level in order to focus onelectricity generation costs abstracting from locally varying distribution costs.
Market models forecast the demand for electricity and the mix of electricitygenerating capacity that will come online to meet future levels of expected demand.Aggregate demand and supply functions are estimated and brought together simulatingmarket behavior, often at the regional level.
By presenting cost per kWh figures, plant studies provide a useable commondenominator. If nuclear energy can enter the marketplace at a cost per kWh equal to or lessthan other baseload electric power sources, it can hope to find a niche as a major powersource. Cost per kWh is not a perfect measure inasmuch as it will be an average of actualmagnitudes that depend on local conditions.
Focusing on cost per kWh simplifies analysis by eliminating the need for elaborateprojections of the precise share of nuclear in the nation's energy mix. The essential questionbecomes: Will nuclear power enter the marketplace as a viable baseload option? It may doso with greater or less robustness, which may vary from place to place, and if the niche is tobe expanded, will enter at a rate influenced by how fast other baseload sources are retired. Itis not necessary to consider these details, at least in the first instance. There is little point inproceeding to these details unless the prerequisite cost per kWh is achieved that is necessaryfor a viable niche.
Within each category of model, different underlying numerical assumptionscontribute to the principal differences in projections. The most significant of these aredifferences in overnight costs and interest rates for nuclear capacity, overnight costs for coalgeneration, and fuel costs for gas generation. Among the plant models, the most importantstructural difference is the inclusion or exclusion of taxes. The market models aresufficiently complex that reasons for differences in their projections frequently are difficult topinpoint. The results depend on black box calculations that the reader cannot replicate, witha resulting lack of intuition as to what is driving the results.
Plant models appear better suited to the present investigation concerned with theviability of nuclear power. Their structures are straight forward enough to permitcalculations to be transparent. Plant models however are far from being totally transparent.Frequently, plant calculations are made whose documentation is insufficient to permit
A2-1

Outline
A2.1. Introduction
A2.2. Plant Models
A2.2.1. LCOE Estimation Using Plant ModelsA2.2.2. "'Business Case for New Nuclear Power Plants" by Scully CapitalA2.2.3. GenSimA2.2.4. The MNT Nuclear Power Study
A2.3. Market Models
A2.3. 1. Basics of Market ModelsA2.3.2. The National Energy Modeling System (NEMS)A2.3.3. The All Modular Industry Growth Assessment (AMIGA) Modeling
SystemA2.3.4. Integrated Planning Model, U.S. Environmental Protection Agency
A2.4. A Hybrid Model: SAIC's Power Choice Model
A2.5. Conclusion
References
A2-3
A2.2.1.1. Capital Cost
Capital costs are treated in detail in Chapter 3, so only a brief guide to the contents ofthe capital cost component of the LCOE equation is offered here. The base for the capitalcost portion is the overnight cost for a generating plant. Overnight cost is construction costswithout interest charges. It is generally quoted in terms of dollars per kilowatt of capacity.As plants are not in fact built overnight, the total capital cost per kilowatt can vary dependingon the construction time and financing terms.
Overnight costs are not firm quotations from generating plant suppliers, but rather areestimates of the cost to build a new plant of a given type. In the case of fossil fuel plants,where plant construction occurs at a relatively steady pace, the overnight cost estimates arebased on historical costs, and variation in cost is expected to be minimal. However, becauseno new nuclear plants have been built in the United States recently, the margin of error inestimating overnight construction costs for nuclear plants is larger.
Estimates of overnight costs sometimes assume an nth-of-a-kind plant, a plant whosedesign has been built frequently enough in the past that there is little potential for furtherreductions in cost due to improvements in construction experience. Most fossil plants fallinto this category. By contrast, when a completely new type of power plant is built, it incursfirst-of-a-kind-engineering or FOAKE costs, which represent the pre-constructionengineering work required for implementing a prototype technology. Inclusion or exclusionof FOAKE costs for newer, advanced nuclear reactor designs and the lack of recent historicalexperience has contributed to considerable variability in overnight construction costestimates for new nuclear power plants. There may, in addition, be learning effects for thefirst few plants beyond the first one.
A power plant's capacity factor, the percentage of total rated power that is used,reflects the effect of scheduled and unscheduled downtime on the total amount of power thatthe plant is able to generate in a given year. Variations in the expected capacity factor canmake a significant difference to the busbar cost of electricity, as an increase in the expectedcapacity factor has the same effect as lowering capital costs per kilowatt. Historically, U.S.nuclear power plants suffered from initially low capacity factors, but these have improved inrecent years to levels approaching 90 percent.
The expected lifespan of the plant also affects the cost of electricity, as capital costsare typically recovered over the lifespan of the plant. While power plants are designed forspecific operating lifetimes, many fossil plants are operating beyond their original designlives, and a number of nuclear plants are currently requesting license extensions andundergoing refurbishing to extend their lifespan. A longer plant life lets the capital in a plantgenerate more electricity and consequently lowers capital cost per kilowatt, but because ofdiscounting, beyond a certain point (40 years or so), increasing the expected lifespan of theplant has only a small effect on the present-value cost represented by the LCOE. Most of thecapital costs are recovered in the first 20 years of operation.
A2-5
Scully Capital report first qualitatively examines the risk factors that are critical to thenuclear plant decision, such as nuclear waste disposal, the public perception of nuclear risk,and government support. Scully Capital includes a model for calculating the economics ofnuclear power from a project financing perspective. The model is used to analyze theeconomics of investing in nuclear power, under alternative assumptions about capital costsand financing structure.
The Scully Capital model's focus is on investors' perceptions of profitability. Themodel solves for the internal rate of return (IRR) on equity in the investment, assuming awholesale price of baseload electricity, which is the implied LCOE received (Scully Capital2002, p.101). The results can be re-arranged to express LCOE as a function of investorrequired rate of return, which is done in Chapter 1.
The Scully Model uses EPC or Engineer-Procure-Construct costs as the base for thecapital cost of nuclear power. These costs are based on the APIOO reactor by Westinghouseand appear to come directly from Westinghouse estimates (Scully Capital 2002, p.90). As acomponent of overnight costs, EPC costs do not contain any financing charges, but owner'scosts, contingency costs and other development costs are added to the EPC cost, addingabout 10 percent to arrive at full overnight costs before financing. A range of EPC costsfrom $1.6 billion to $1.0 billion for a 1,100 MW reactor is used, the range reflectingimprovements in technology and construction experience that could eventually reduce thecost of construction. Translated into per kW terms, the resulting cost range is $909 to $1,454per kW.
A2.2.3. GenSim
The GenSim model from Sandia National Laboratories (Drennan et al. 2002) is ageneric LCOE model. The LCOE calculation is (Drennan et al. 2002, p. 10)
LCOE I(CRF) + O&M E
Q Q
where I is capital investment, including finance costs; CRF is the capital recovery factor,r( + r)n
specified as CRF -1 , in which r is the real discount rate and n is the plant life; QQ1 +r)n -1I
is annual plant output in kilowatt hours; O&M is fixed and variable operation andmaintenance costs; and E is externality costs. The report identifies F as fuel costs, but theterm does not appear in the published version of the report on the model. Presumably a term+F/Q is omitted from the reported equation rather than from the actual model. The model iswritten in the software package Powersimn Constructor (Drennan et al. 2002, p. 7).
The technologies for which the model has calculated LCOEs include nuclear, coal,gas combined cycle, solar photovoltaic, solar thermal, and wind. The published report uses anuclear capital cost (presumably an overnight cost) of $1,853 per kW.
MA2-7

reliability premium to ensure a margin for unexpected outages, assuming that market forcesensure specific plants are built where they are most cost efficient.
A23.1.1. Modeling Issues
Over the long term, electricity consumption increases with population growth and thelevel of economic activity or development in a region. Most electricity demand modelscontain economic and population growth models that produce an estimate of electricitydemand growth as an output. The historical record of electricity use, and assumptions aboutthe growth rates of the economy, population, and energy intensity, are major inputs toelectricity demand models.
Supply-side models need to represent how electricity capacity evolves over time,response to changing capital and fuel costs, and demand. Supply models depict the powergenerating industry's decisions in response to changing electrical demand and input costs.Crew and Kleindorfer (19 86, Chapter 3) shows the structure of the short- and long-termdecisions that the forecasting models implement in considerable detail.
Capacity models begin with the existing U.S stock of electrical generation capacityas the reference point. Additional capacity is added by the model to provide for projectedincreases in electrical demand and to replace existing power plants which have to be retireddue to age, environmental, or other cost reasons.
Market models use a plant LCOE model to choose a least-cost generation alternative,but market models do not build only the plants with the lowest projected LCOE. LCOEs areonly generic estimates for a particular region, and, if two.technologies are close in ternis ofprojected costs, the market as a whole may in fact build plants of both types because oflocation-specific cost differences that are too fine-grained to reflect in the LCOE calculationsbased on average characteristics for a region. Various market-sharing algorithms are used toallocate new capacity among technologies with similar costs.
A2.3.1.2. Market Models and Electricity Market Deregulation
Electricity market deregulation has been the most significant change affecting energymarkets in recent years (Joskow 2000,2001a, 2001b, 2003; Joskow and Kahn 2002). Almostall the market models reviewed here assume either that the market is still regulated, or thatthe market is deregulated and perfectly competitive. Market models typically split demandand supply between regulated and deregulated regions to compensate for the fact thatdifferent regions of the United States are undergoing varying degrees of electricity marketderegulation.
Differences in model specifications of regulated and deregulated electricity marketscenter on price formation. Regulated markets have regulated prices that will follow costswith some time lags. In unregulated markets, price is determined by supply and demand withmarket price being set at any given time by the marginal producer's cost. The specification
A2-9

Pricing Model (CAPM), which adds a risk premium reflecting a project's specific volatilitycompared to that of the market to the risk-free rate of return (EIA 2003a, pp. 167-168). TheEFP submodule appears to assume uniform risk for all electricity generation projects.
A2.3.2.2. Complexity, Accuracy, and Transparency in the NEMS ModelStructure
NEMS is the most complex and detailed electricity model currently in widespreaduse. It incorporates many realistic factors, such as regional demand differences, transmissionconstraints, and individual plant characteristics. Its detail contributes to its ability to closelyreplicate market outcomes in individual regions. At the same time, the complexity added bythe additional detail reduces the model's transparency, reducing the ability to pinpointreasons for some of its results. A more aggregated model may not lose a significant degreeof accuracy compared to NEMS at the national level. Some reduced accuracy could becompensated by greater transparency compared to NEMS.
A2.3.2.3. Studies using NEMS -Annual Energy Outlook Series
The Annual Energy Outlook (AEO) annual series provides comprehensive twenty-year projections of U.S. energy markets. AEO defines a base case that "focuses on... long-term fundamentals, including the availability of energy resources, developments in U.S.electricity markets, technology improvement, and the impact of economic growth onprojected energy demand and prices through 2025" (EIA 2003a).
AEO projects the prospects of nuclear power conservatively, primarily because asignificantly higher capital cost is projected for nuclear power compared to coal and gas.Even though natural gas prices are expected to rise over the medium term, from the $3 rangeto $3.50 per thousand cubic feet in 2025, natural gas is still expected to be the most costcompetitive standard generating technology through 2025. The rise in natural gas pricescauses some shift in construction of new power plants to coal-fired plants, but not to nuclearplants, identified as the reference case in AEO 2004. Unless the underlying assumptions aremodified so as to change the relative cost characteristics of the three main generatingtechnologies, or impose some systemic constraints on the cost-minimizing power plantselection procedure, AEO will likely continue to make projections of significantly increasednatural gas-fired generating capacity, some new coal-fired capacity in the medium term, andno new nuclear capacity.
A2.3.2.4. Studies Using NEMS- EPRI
The Electric Power Research Institute (EPRI) produced a study in 2003 using NEMSto support its "Vision 2020" goal of 50,000 MW of new nuclear generating capacity by 2020(EPRI 2003a, p. vi). Because NEMS did not project any new nuclear generating capacity by2025, EPRI created several scenarios that allowed the growth of significant nucleargenerating capacity.
A2-11
In the "Turbulent World" scenario, confidence in nuclear power erodes, leading thegovernment to let the Price-Anderson Act lapse in 2010. Without the insurance provisions ofPrice-Anderson, new reactor construction is not undertaken after 2010, although a few arebuilt prior to that date (Mintzer et al. 2003, p. 21).
Within each scenario, the Pew study simulates policies designed to constrain carbonemissions, increase energy efficiency, and spur R&D on distributed generation, renewables,and hydrogen technologies. These policies increase the shares of these new technologies, andall three scenarios see major increases in renewable electricity supply and distributedgeneration, while natural gas consumption is moderated (Mintzer et al. 2003, Tables 12, 14-15, pp. 52-54).
The Pew study uses an overnight cost for nuclear plants of $2,645 and $2,835 per kW(Mintzer et al. 2003, Table 6, p. 34). These costs help to explain the reduced role of nuclearpower in favor of power from advanced renewables technologies.
A2.3.4. Integrated Planning Model, U.S. Environmental Protection Agency
The Integrated Planning Model, or IPM, is a proprietary model developed by ICFResources, Inc. and used by the U.S. Environmental Protection Agency (EPA). IPM isdesigned to characterize deregulated wholesale electric markets (EPA 2002, p. 2-7). EPAlinks the IPM with its own National Electric Energy Database System (NEEDS) to assess theeffects of environmental regulations on the U.S. electricity industry.
IPM structure is similar to NEMS but emphasizes environmental constraints andemission trading systems. NEEDS aggregates the plant data from EIA's yearly survey ofpower plants into model plants that represent a number of actual plants on the basis ofcharacteristics such as region, technology type, capacity, and heat rate. The 103 nuclearplants are aggregated into 47 model plants (EPA 2002, pp. 2-4, 2-5).
Electricity demand and generation are modeled internally for each NERC region, withregions linked by inter-regional transmission. New power plants are selected forconstruction to meet new demand and replace retiring plants on a cost-minimizing basis.(EPA 2002, sect. 2-2). IPM examines the impact of current emissions regulations on theelectric power industry using a 20-year forecast horizon.
All additional capacity growth from the present to 2020 is projected to come fromnatural gas-fired combustion turbine and combined cycle units. No nuclear or coal units areselected for construction (EPA 2002, p. 9-5). In fact, some nuclear units are retired becausethe model finds that life-extension retrofits are uneconomic. EPA takes data for advancednuclear plants' cost and performance characteristics from EIA's AEO 2001, assuming a costof $2,465 per kW for a 600 MW advanced nuclear plant that is built between 2005 and 2009,dropping to $2,276 per kW for plants built from 2015 onwards. The high capital cost
A2-13

AP 1000 or GT-M]HR reactors from being built once Yucca Mountain limits are reached(Reis andCrozat 2002, p. 11).
A final action considered by SAIC is an introduction of an advanced fuel cycle thatrecycles spent fuel via advanced fast reactors (AFRs), which are estimated to cost $2,000 perkW. This plan removes the nuclear waste limitation since the AFRs recycle the majority ofwaste produced by the APl1000 and GT-MHR reactors. Once AFRs are built, starting aroundyear 25, growth of AP1OOO and GT-MIHR reactors rises to more than 375 GW of capacity inyear 80. AFR growth reaches more than 150 GW in year 80 (Reis and Crozat 2002, p. 14).Nuclear waste, meanwhile, declines from a high of nearly 1.5 Yucca Mountain Equivalents(YME) in year 25 to less than 0.25 YME in year 80.
A2.5. Conclusions
Table A2-1 summarizes the characteristics of the different plant and market modelsthat have been reviewed in this appendix. The table brings out the varieties of plant type,forecast horizons, treatment of environmental costs, and nuclear power data sources that havebeen used. Cost assumptions from the four plant models identified in bold font-the Scullymodel, the GenSim model, NEMS, and SAIC's Power Choice model-are used in Chapter 1a pre-tax LCOE model developed in this study to examine sources of differences in LCOEestimates.
Plant and market models are constructed for different purposes, although marketmodels generally contain plant cost calculations as well as market interactions. Thecomplexity of market models, even though soundly constructed, makes it difficult tounderstand the reasons for forecast results or to calculate how different assumptions wouldchange them.
The plant models that calculate LCOE are simpler in structure, and the basic structureis well accepted. Nevertheless, reported versions differ considerably in assumptions thataffect costs and in degree of documentation and financial detail, rendering comparison ofresults difficult. Results for nuclear LCOEs are heavily influenced by two assumptions,overnight capital costs and interest rates, and the choices of these values typically are notdiscussed in great detail.
A2-15

References
Crew, Michael J. and Kleindorfer, Paul R. (1986) The Economics of Public UtilityRegulation. Cambridge, Mass.: MIT Press.
Drennan, Thomas E., Arnold B. Baker, and William Kamery. (2002) Electricity GenerationCost Simulation Model (GenSim). SAND2002-3376. Albuquerque, N.M.: Sandia NationalLaboratories, November.
Electric Power Research Institute (EPRI). (2003 a) Nuclear Power's Role in MeetingEnvironmental Requirements: Evaluation of E-EPIC Economic Analyses, EPRI 1007618.Palo Alto, Calif.: EPRI, January.
Energy Information Administration (EIA). (2003a) Annual Energy Outlook 2003 withProjections to 2025, DOE/EIA-0383. Washington, DC: U.S. Department of Energy, January9. Retrieved December 2003 from the World Wide Web:http:/Iwww.eia.doe.gov/oiaf/archive/aeoO3/index.html.
Energy Information Administration (EIA). (2003b) Assumptions to Annual Energy Outlook2003. Washington, DC: U.S. Department of Energy. Retrieved December 2003 from theWorld Wide Web:http://www.eia.doe.gov/oiaf/archive/aeo03/index.html,http://www.eia.doe.gov/oiaf/aeo/assumption/electricity.html,http://www.eia.doe.gov/oiaf/aeo/assumption/tbl39.html,http://www.eia.doe.gov/oiaf/aeo/assumption/tbl40.html.
Energy Information Administration (EIA). (2003c) The Electricity Market Module of theNational Energy Modeling System: Model Documentation Report. Washington, DC: U.S.Department of Energy, July 2003. Retrieved December 2003 from the World Wide Web:http://tonto.eia-doe.gov/FTPROOT/modeldoc/m068(2003).pdf.
Environmental Protection Agency (EPA). (2002) Documentation of EPA ModelingApplications (V2.1) Using the Integrated Planning Model, EPA 430/R-02-004. Washington,DC: U.S. Environmental Protection Agency, March. Retrieved December 2003 from theWorld Wide Web: http://www.epa.gov/airmarkt/epa-ipm/.
Hanson, D.A. (1999) A Framework for Economic Impact Analysis and Industry GrowthAssessment: Description of the AMIGA System. ANL/DIS draft TM. Argonne, Ill.:Argonne National Laboratory, April.
Joskow, Paul. (2000) "Deregulation and Regulatory Reform in the U.S. Electric PowerSector." Revised Discussion Draft. Cambridge, Mass.: MIT Center for Energy andEnvironmental Policy Research, February 17. Retrieved December 2003 from the WorldWide Web: http://econ-www.mit.edu/faculty/download__pdf.php?id=561.
A2-17

Appendix A3. NEED FOR NEW GENERATING CAPACITY IN THE UNITED 0STATES
Summary
This appendix assesses future electricity demand and compares it with existingcapacity to estimate a range on the time in the future when added capacity building will needto start. Projections by the Energy Information Administration (EIA) and the NorthAmerican Electric Reliability Council (NERC) are compared with projections based onhistorical relationships between demand growth and GDP growth. The historicalrelationships yield growth rates roughly 1 percentage point higher than EIA's forecasts and.5 percentage-points above NERC's.
From a national perspective, even with an annual growth rate in electricity demand of2.7 percent, new capacity will not be needed before 2011. The aggregate view obscuressome NERC regions in which capacity additions will be needed before that date. Even underlow demand growth, new capacity is needed in 5 of the 11 NERC regions by 2010. It is safeto say that demands for new electricity generating capacity will be sufficient to justifysignificant amounts of new capacity by 2015, which is the year of new plant constructionused in the analysis of viability of nuclear power in the present study.
A3-M

A3.1. Introduction
This appendix compares future electricity demand with existing capacity to estimatewhen new electricity generation capacity will be needed. Sections A3.2, A33, and A3.4 ,examine the three main sectors of electricity demand, residential, commercial, and industrial.Section A3.5 reviews the literature on the effects of price on electricity demand. SectionA3.6 assesses several other potential influences on future demand. Section A3.7 provides anational projection of demand growth and reports forecasts of additions to generationcapacity. Section A3.8 gives a regional breakdown of forecasted demand and capacitygrowth in the United States. Section A3.9 summarizes and draws conclusions on bothnational and regional demand.
A3.2. Major Types of Electricity Demand
The three major sectors of electricity consumers-residential, commercial, andindustrial-each claims about one-third of national consumption, and they all respond toprice changes, at least in the long nuL However, their long-term growth rates have differed,the predictability of their demands differ, and they are subject to some different influences.
A3.2.1. Residential Demand
Over the 20 years 1982 to 2002, residential electricity demand has increased anaverage of 2.8 percent annually, while GDP has advanced 3.3 percent per year. ThisV40001 relationship appears to have remained fairly steady over the entire period. Figure A3-1shows that while residential electricity demand growth is uneven, its moving average is about40-50 basis points below GDP growth in recent years. The average ratio of residentialelectricity demand growth to GDP growth is about 0.9, with most of the deviation due toweather fluctuations. Therefore, based on purely historical trends, residential electricitydemand could be expected to grow around 2.6 to 2.8 percent per year, given GDP growth of3.1 percent per year.
The major influences on residential energy consumption during the next two decadesare likely to be changes in the energy efficiency of existing appliances, the emergence of newappliances, and the continued movement of the population to the South and West
For several decades, energy conservation policies have aimed at reducing the energy-efficiency gap, a phenomenon in which consumers invest less in energy-efficicnt appliancesthan would be expected, given interest rates, appliance costs, and electricity prices, withlimited success. There is little agreement to date on the cause of this phenomenon, but theseappliances currently account for roughly half of residential energy consumption (EIA 2003a,Table A.4), so a substantial reduction in the load they draw could be important. EIA's high-technology forecast assumes greater market penetration of higher-efficiency appliances,which reduce the growth rate of residential electricity consumption by nearly 30 basis points.
A3-3

improvements may be responsible for a large proportion of the AEO's consistent under-forecasts of residential electricity consumption growth. Of the three major influences onresidential electricity demand growth for the next two decades, two have considerableuncertainty, so looking to the historical growth rate for guidance may be useful. Over the lastthree decades, annual residential electricity demand growth has been around 90 percent thatof GDP growth. Using EIA's assumption of a 3.1 percent GDP growth rate for 2001 to 2010(referencing Global Insight) would yield a 2.8 percent annual growth in residential electricitydemand. Dampening that growth by 20 to 30 basis points EIA predicts for improvedelectricity efficiency would cut that growth rate to 2.5 percent. Allowing for populationgrowth and its continued regional redistribution could add another 10 basis points, bringingan overall residential electricity consumption growth rate to 2.6 percent. A GDP growth rateof 3.2 percent from 2010 to 2020 would raise the residential demand growth rate to 2.7percent during that decade.
A3.2.2. Commercial Demand
Historically, commercial electricity demand growth has somewhat outpaced GDPgrowth. As Figure A3-2 shows, commercial demand growth has averaged about 1.2 timesthe rate of GDP growth, the corresponding gap between commercial demand growth andGDP growth being about 50 basis points.
Figure A3-2: 10-Year Moving Average of Commercial Demand Growth/GDP Growth Gap
1.40%
1.20% .
1.00%0.80%0.60%
0.40%-0.20%-0.00% .. . . . . . ..
-0.20%nX LOO CO) C3O' U) 1- 0)oo 0 0 co c 0) M 0M 0) 0) 0o0) 0D 0) 0) 0) 0) 0) M) 0) CD
---- CAGR of Residential Electricity Demand Less CAGR of Real GDP
Sources: EIA (2003b), BEA (2003).
A3-5

Figure A3-3: Ratio of Manufacturing Electricity Consumption to ManufacturingOutput over Time, in Logs
21.8
1.61.4
1.2 -
0.8-0.6-0.4
0.2-
V- (0 CD 0 04 w~ CD C1 N C'J ~ O coNý t% t- 0) 0 ) OD co co co 0) 0) 0) )0) 0) 0) 0) 0) 0) 0) 0) ) 0) ) 0 )
Sources: EIA (1998), U.S. Census Bureau (ASM, CM).
Figure A3-4: Ratio of Industry Electricity Usage to Industry Quantity Index(1987=100)
140,
120
110
100
90
80Nl co M) M to COJ t-- C ) 03 Cn V' W W~ W CO 0
--n--20. Food and Kindred Products - 26: Paper and Allied Products
---,---28: Chemicals and Allied Products -- 33. Primary Metal Industries
Sources: EIA (1998), U.S. Census Bureau (ASM, CM), BEA (2003).
A3-7
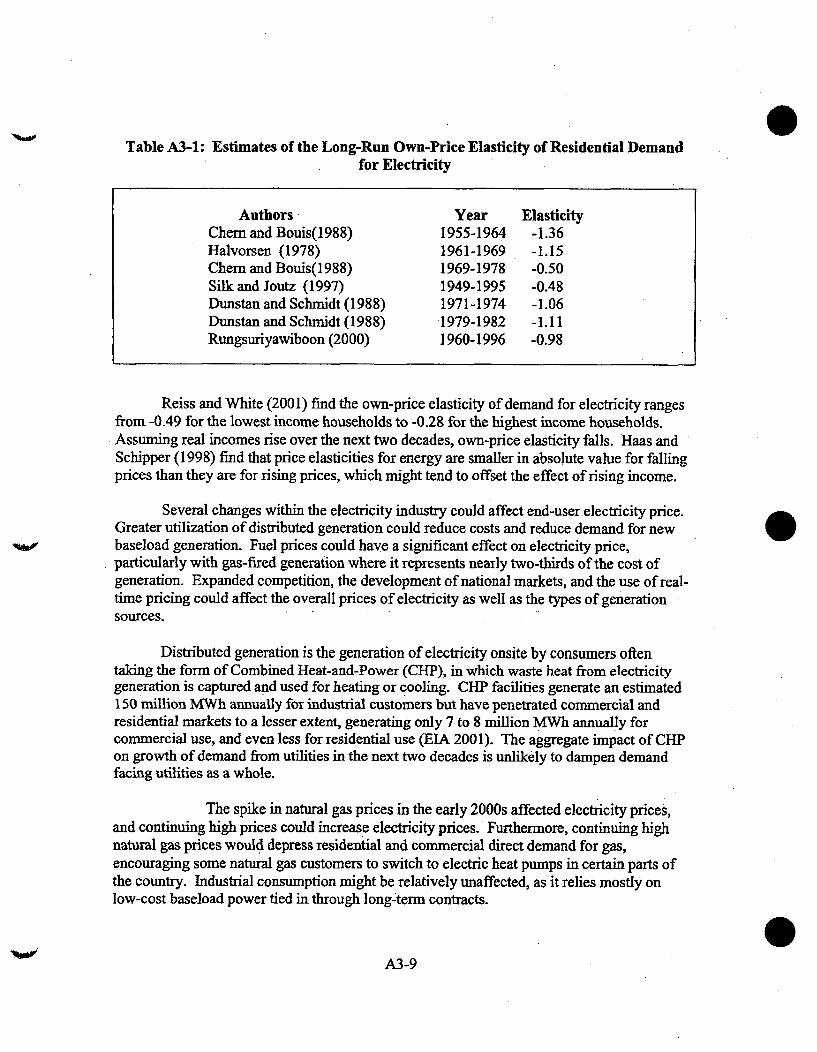
Table A3-1: Estimates of the Long-Run Own-Price Elasticity of Residential Demandfor Electricity
Authors Year ElasticityChem and Bouis(1988) 1955-1964 -1.36Halvorsen (1978) 1961-1969 -1.15Chern and Bouis(1988) 1969-1978 -0.50Silk and Joutz (1997) 1949-1995 -0.48Dunstan and Schmidt (1988) 1971-1974 -1.06Dunstan and Schmidt (1988) 1979-1982 -1.11Rungsuriyawiboon (2000) 1960-1996 -0.98
Reiss and White (2001) find the own-price elasticity of demand for electricity rangesfrom -0.49 for the lowest income households to -0.28 for the highest income households.Assuming real incomes rise over the next two decades, own-price elasticity falls. Haas andSchipper (1998) find that price elasticities for energy are smaller in absolute value for fallingprices than they are for rising prices, which might tend to offset the effect of rising income.
Several changes within the electricity industry could affect end-user electricity price.Greater utilization of distributed generation could reduce costs and reduce demand for newbaseload generation. Fuel prices could have a significant effect on electricity price,particularly with gas-fired generation where it represents nearly two-thirds of the cost ofgeneration. Expanded competition, the development of national markets, and the use of real-time pricing could affect the overall prices of electricity as well as the types of generationsources.
Distributed generation is the generation of electricity onsite by consumers oftentaking the form of Combined Heat-and-Power (CHP), in which waste heat from electricitygeneration is captured and used for heating or cooling. CIP facilities generate an estimated150 million MWh annually for industrial customers but have penetrated commercial andresidential markets to a lesser extent, generating only 7 to 8 million MWh annually forcommercial use, and even less for residential use (EIA 2001). The aggregate impact of CHPon growth of demand from utilities in the next two decades is unlikely to dampen demandfacing utilities as a whole.
The spike in natural gas prices in the early 2000s affected electricity prices,and continuing high prices could increase electricity prices. Furthermore, continuing highnatural gas prices would depress residential and commercial direct demand for gas,encouraging some natural gas customers to switch to electric heat pumps in certain parts ofthe country. Industrial consumption might be relatively unaffected, as it relies mostly onlow-cost baseload power tied in through long-term contracts.
A3-9

However, although natural gas has been the fuel of choice for new generation in the past,some new coal capacity announcements have been made recently. Several factors are likelyat work in the renewed interest in coal, including rising natural gas prices, looser federalregulations regarding environmental retrofits to coal plants, and the proposed new energybill, which offers incentives for coal as well as nuclear power.
A3.4.2. Current Generating Capacity and Demand
Currently, the United States has an over supply of generating capacity. As of October31, 2003, total national supply equaled 964,469 MW (Smith 2003). Using projections for netinternal demand for electricity during the summer of 2003 of 695,672 MW according to aJuly 2003 A.G. Edwards report (Fischer et al. 2003), and 716,728 MW according to the June2003 Merrill Lynch. report, yields a calculated reserve margin between 28 percent and 29percent in 2003. Given the current amount of capacity, this will probably rise greater than30 percent in 2004. This is already far in excess of suggested reserve margins necessary forinvestment and operation: Fischer et al. (2003) report 18 percent as ideal for investment, andMerrill Lynch (2003a) supports 15 percent to be an equilibrium level. In addition to theselarge reserves, there is between 25,000 Týff (Merrill Lynch 2003a estimate) and 36,000 MW(Fischer et al. 2003 estimate) of new capacity that is under construction now and will comeonline between 2004 and 2005. This brings the total generating capacity of the United Statesto approximately 950,000 MW by summer of 2005.
A3.4.3. Plant Retirements
Plant retirements may speed the need for new capacity, but the extent of possiblefuture retirements is difficult to discern. EIA, in the AEO 2003, estimates that 66,800 MWof capacity will be retired by 2010, with only 13,000 MW being retired by 2005, andvirtually all of the retired capacity coming from older oil and gas fired plants. Furthermore,environmental regulations may be enacted between now and 2020 which force older, morepolluting coal plants to shut down.
A3.4.4. Projections-
Based on projections of electricity demand growth by sector presented earlier, thisappendix estimates a total annual demand growth rate of 2.6 percent, nearly 70 basis pointshigher than that projected by the EIA, and 80 basis points higher than that projected byGlobal Insight (Table A3-2).
A3-11

nation is over-supplied. Since, power currently cannot be easily shared across regions due tosignificant transmission constraints, projections of future capacity needs should bedifferentiated by region. This section analyzes the country by region, in order to get a bettersense of when capacity will be needed, how much, and where.
This section presents an analysis that applies projections of plant retirements anddifferent demand growth rates to figures for the amount of current stock in order to gaugefuture capacity needs by region. The date at which new capacity would be needed by eachregion is estimated given two different future demand scenarios, based on high and lowdemand growth rates estimates.
Capacity figures come partially from the equity research reports prepared by A.G.Edwards (Fischer et al. 2003), Morgan Stanley (2002, 2003a, 2001b), and Merrill Lynch(2003a, 2003b). Their projected reserve margins are based on the available resources ascalculated by the North American Electric Reliability Council (NERC) and found in Fischeret al. (2003), which concerns itself primarily with plant reliability. Therefore there is asignificant amount of capacity that does not get included, because it is not committed.Merrill Lynch makes an estimate of the actual capacity in several regions, where the actualcapacity is significantly higher than the reported capacity. Every effort has been made to usethe highest estimate of capacity, in order to most accurately reflect the amount of capacityactually in existence going forward, as that determines what more will be built.
The timing and location of plant retirements ar e primarily based on the NEMS, model..NEMS tries to capture. some of the various factors that contribute to decision for plantretirement, including environmental regulations, projected future electricity prices, andprojected future operating costs, and outputs an estimated timetable of type, timing, size,.andlocation of retirements. Along with NEMS, A.G. Edwards' table of gas/oil fired plants withheat rates of 12,000 BTUs and above (44,000 MW) is also used (Fischer et al. 2003). At thislevel of heat generation, it is impossible to operate a plant while still making a profit(Morgan Stanley 2003a, 2003b).
Region-specific demand growth rates are based on projections from NERC, EIA, andthose presented earlier in this appendix. The third set of growth rates is calculated byapplyimg the growth rates of demand estimated earlier in this paper to the shares of electricitydemanded by the residential, commercial, and industrial sectors in each region. From thisrange of estimates, two specific growth rates are chosen to model a high and a low demandgrowth scenario.
The model assumes a minimum capacity reserve margin of 15 percent This is basedon historical observations: before the boom in new capacity starting in 2000-2001, reservemargins were in the 14 to 15 percent range in the United States during 1998-2000.
The effect of population shifts from region to region is not accounted for, though itcan implicitly be assumed that regions to the south and west will experience higher growththan those to the north and east.
A3-13
A3.6. Conclusion
The United States, in the aggregate, has a large stock of excess power capacity, but itis, distributed unevenly among regions. This appendix presents some projections of futureelectricity capacity needs given a variety of demand and supply scenarios at the aggregatenational level and by region. For the nation as a whole, new capacity is not needed until2015 for low and high demand growth rate scenarios. However, most excess capacity islocated in the South, West, and Northeast, while other regions have much lower excesscapacities available presently. Five out of the eleven NERC regions would require newcapacity by 2010 even under projections of low demand growth. These areas include thefollowing states: Florida, New Jersey, Maryland, Delaware, Pennsylvania, Illinois, NewYork, and parts of Wisconsin and Montana. The last region to need new capacity will beSERC, the Southeastern Electric Reliability Council, which includes Virginia, Georgia,Louisiana, Arkansas, Mississippi, and Tennessee. SERC will not need to MiCrease its currentcapacity until 2015 under a high demand growth scenario and 2017 under a low demandgrowth scenario.
A3-15
Energy Information Administration (ETA). (2001) Annual Energy Review 2001.Washington, D.C.: U.S. Department of Energy.
Energy Information Administration (EIA). (1999) Annual Energy Outlook 2000 withProjections to 2020. DOE/EIA-0383(2000). Washington, D.C.: U.S. Department of Energy,December 17, 1999.
Energy Information Administration (EJA). (1998) Manufacturing Energy ConsumptionSurvey 1998 (MECS). Washington, D.C.: U.S. Department of Energy, 1998.
Energy Information Administration (EIA). (1997) Residential Energy Consumption Survey1997 (RECS 1997). Washington, D.C.: U.S. Department of Energy.
Fischer, Douglas A., Timothy M. Winter, Charles J. Fishman, Michael Doyle, Neil A.Kalton, and Jose Ramon. (2003) Energy Power Supply/Demand Study. New York:A.G. Edwards, July 9.
Haas, Reinhard, and Lee Schipper. (1998) "Residential Energy Demand in OECD-Countries and the Role of Irreversible Efficiency Improvements," Energy Economics 20:443-461.
Halvorsen, Robert. (1978) Econometric Models of U.S. Energy Demand. Lexington: D.C.Heath and Company.
Koomey, Jonathan G., Richard E. Brown, Robert Richey, Francis X. Johnson, Alan H.Sanstad, and Leslie Shown. (1995) Residential Sector End-Use Forecasting with EPRI-REEPS 2.1: Summary Input Assumptions andResults. LBNL-34044. Berkeley. LawrenceBerkeley National Laboratory, December. Retrieved December 13, 2003 from the WorldWide Web: http://enduse.Ibl.gov/Info/LBNL-34044.pdf.
Koopmans, Carl C., and Dirk Willem te Velde. (2001) "Bridging the Energy EfficiencyGap: Using Bottom-Up Information in a Top-Down Energy Demand Model," EnergyEconomics 23: 57-75.
Merrill Lynch. (2003a) "Electric Utilities & IPPs." New York: Merrill Lynch, June 12.
Merrill Lynch. (2003b) "Paper and Forest Products. Money can Grow on Trees." NewYork: Merrill Lynch, July 14.
Merrill Lynch. (2002) "The Four Comers." New York: Merrill Lynch, May 9.
Morgan Stanley. (2003a) The Power Meter-Unregulated Power Update. August 12.
Morgan Stanley. (2003b) The Power Meter-Unregulated Power Update, October 1.
A3-17
Appendix A4. TECHNOLOGIES FOR NEW NUCLEAR FACILITIES
Summary
The nuclear reactors currently in use in the United States, denoted as Generation II,were deployed in the 1970s and 1980s. These include boiling water reactors and pressurizedwater reactors. Advanced reactor designs, Generation III, have been developed in order to bemore cost competitive with natural gas. Generation III includes the advanced boiling waterreactor (ABWR) and the AP600 (pressurized water) passive-design reactor. The nuclearindustry has continued to develop yet more innovative designs designated Generation III+.Generation mH+ includes a gas cooled reactor, the Pebble Bed Module (PBMR), as well as acapacity upgrade from AP600 to AP1000. Generation 111+ may have even lower generatingcosts, however, the U.S. Nuclear Regulatory Commission (NRC) has not certified thesedesigns, and their cost estimates have greater uncertainty. The nuclear industry also hasplans for Generation IV technologies, but these reactor designs may not be available foranother two decades, and their cost estimates are even more uncertain.
The U.S. Department of Energy (DOE) has organized the Near Term DeploymentGroup (NTDG) to examine prospects for the deployment of new nuclear power plants in theUnited States over the next 10 years. Nuclear suppliers submitted eight plant designs forassessment. General Electric submitted designs for the ABWR as well as the EuropeanSimplified Boiling Water Reactor (ESBWR), and Westinghouse submitted designs for theAP600, AP1000, and the International Reactor Innovative and Secure Design (IRIS). TheIRIS is a modular light water reactor. Framatome ANP submitted a design for the SWR1000, a boiling water reactor (BWR) incorporating passive safety features. Eskom submitteda design for its PBMR design, and General Atomics provided NTDG its design for a GasTurbine Modular Helium Reactor (GT-MHR). The PBMR and GT-MTIR are based on gasreactors built in Germany.
The ABWR is the only reactor type that has been built. Although never built, theAP600 has obtained design certification and boasts extensive verification of its costestimates. Like the ALBWR it faces concerns with economic competitiveness. As a scaled-upversion of the AP600, the AP1000 should be more economically competitive, but is stillseeking design certification. Despite offering larger potential economic savings, the PBMRand GT-MIHR are only in very preliminary stages, and major uncertainties are to be resolved.The IRIS project has perhaps the largest upside of the reactor types, but is not considered tobe a realistic option for near-term deployment. Framatome has opened discussion with NRCto obtain certification for the SWR 1000 in the United States. GE wants to commercializethe ABWR domestically prior to introducing the ESBWR to the U.S. market.
The best near-term candidates are the ABWR, the AP1000, the SWR 1000, and theCANDU ACR-700. The first three are ALWR designs, based on the PWR and BWR designsin operation in the United States. These PWR and BWR designs account for the greatmajority of reactors in operation throughout the world. The ALWR designs have acquireddesign certification. Unlike the gas cooled reactors, the ALWR designs have no design or
A4-1

Outline
A4. 1. Introduction
A4.2. Overview of Nuclear Power Plant Designs
A4.2. 1. Functions and Design Choices in Nuclear ReactorsA4.2.2. Nuclear Plant GenerationsA4.2.3. Nuclear Plant Types in OperationA4.2.4. Worldwide Nuclear Plant OperationA4.2.5. Nuclear Plants Under Construction
A4.3. Near-Term Deployment Design Criteria
A4.3.1. Regulatory AcceptanceA4.3.2. Industrial InfrastructureA4.3.3. Commercialization PlanA4.3.4. Cost Sharing PlanA4.3.5. Economic CompetitivenessA4.3.6. Fuel Cycle Industrial Structure
A4.4. Near-Term Candidates
A4.4.1. ABWRA4.4.2. AP1000A4.4.3. SWR 1000A4.4.4. CANDU, ACR-700A4.1.5. AP600A4.4.6. ESBWRA4.4.7. PBMRA4.4.8. GT-MHRA4.4.9. IRISA4.4.10. Other Candidates (not evaluated by NTDG)
A4.5. Evaluation of Near-Term Candidates
A4.5.1. ABWRA4.5.2. AP1000A4.5.3. SWR 1000A4.5.4. CANDU, ACR-700A4.5.5. AP600A4.5.6. ESBWRA4.5.7. PBMRA4.5.8. GT-MHRA4.5.9. IRISA4.5. 10. Conclusion
References
A4-3

In addition to material and construction differences among reactor vessels andcontainment structures, reactor designs differ in (1) the type of fuel they use, (2) how theymoderate neutron flow, and (3) how they manage the heat generated from the reaction. Fueltypes include natural unenriched uranium, enriched uranium, mixed thorium-uranium, andmixed-oxide fuels (MOX). Enrichment or fuel processing increases the overall cost of fuel,which leaves natural uranium the cheapest fuel. While neutron moderation is generallyrequired to increase the likelihood of neutron absorption by a U-235 atom, fuels that areenriched or have higher concentrations increase the probability of absorption, andconsequently require less moderation than other fuel types. Because of the processing costsinvolved in making them, moderators such as heavy water and graphite are considerablymore expensive than light water.
Several options exist for transforming the heat generated from nuclear reactions intoelectricity. In pressurized water reactors (PWRs), water is heated under pressure and sent toa heat exchanger to produce steam for the turbine. Alternatively, boiling water reactors(BWRs) utilize existing coolant water to generate steam, thereby reducing the chance for heatloss during its transfer. Reactors such as the CANDU use heavy water to transfer heatbecause it does not reduce the efficiency of the chain reaction by absorbing neutrons. Whileprevious CANDUs (CANDU-3, 6, and 9) used heavy water to transfer heat, the ACR-700uses light water to transfer heat and heavy water for moderation. Gas-cooled reactors utilizestable gases such as helium or carbon dioxide to act as a coolant because they have betterheat transfer properties than water. Finally, gas-cooled reactors such as the GT-MHIR andPBMR employ a Brayton power cycle, which is the thermal expansion of gas to power a gasturbine, when they are used to generate electricity.
As with the relationship between fuel and moderator, there are trade-offs among heatmanagement techniques that result in differing costs and electricity production efficiencies.For example, a PWR requires that its coolant water be pressurized to 150 times atmosphericpressure to prevent it from boiling as it transfers heat to the power cycle, adding an extracost. Conversely, a BWR is a low-pressure design that directly produces steam for powergeneration, using its coolant water. However, its steam is contaminated with radionuclidesfrom contact with the reactor core, and these must be removed or shielded from the powercycle, reducing the cost savings from its low-pressure design. In another heat managementtechnique, gas turbines are more efficient producers of electricity than steam turbines,however their costs are higher and they require the use of helium, which is more expensivethan water. In sum, the array of current and future reactor designs (some of which aredescribed in Section A4.4) are essentially alternative combinations of fuel types, moderators,and the coolants and heat utilization techniques of heat management systems that attempt tomaximize the efficiency of electricity production while minimizing its cost.
The review of individual reactors in Section A4.4 emphasizes how each designrepresents a combination of these functions, as design choices trade off various physical andeconomic efficiencies.
A4-5
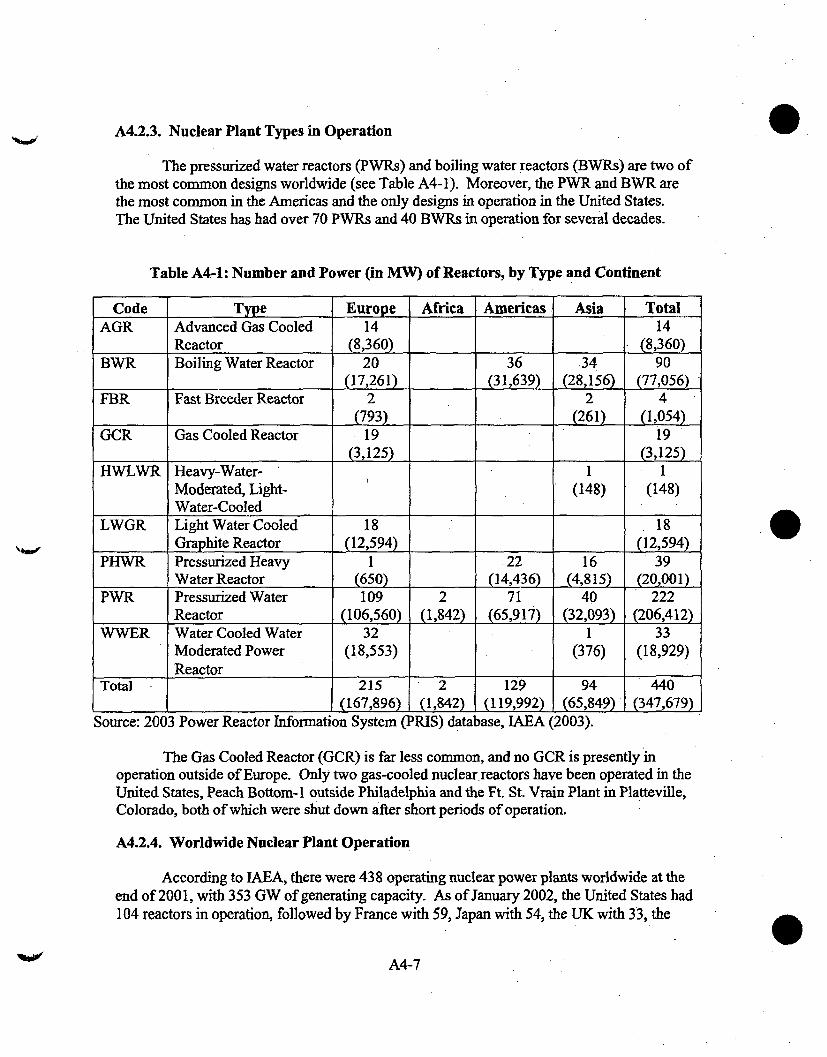
A4.2.3. Nuclear Plant Types in Operation
The pressurized water reactors (PWRs) and boiling water reactors (BWRs) are two ofthe most common designs worldwide (see Table A4-1). Moreover, the PWR and BWR arethe most common in the Americas and the only designs in operation in the United States.The United States has had over 70 PWRs and 40 BWRs in operation for several decades.
Table A4-1: Number and Power (in MW) of Reactors, by Type and Continent
Code Type Europe Africa Americas Asia TotalAGR Advanced Gas Cooled 14 14
Reactor (8,360) (8,360)BWR Boiling Water Reactor 20 36 34 90
(17,261) (31,639) (28,156) (77,056)FBR Fast Breeder Reactor 2 2 4
(793) (261) (1,054)GCR Gas Cooled Reactor 19 19
(3,125) (3,125)HWLWR Heavy-Water- 1 1
Moderated, Light- (148) (148)Water-Cooled
LWGR Light Water Cooled 18 18Graphite Reactor (12,594) (12,594)
PHWR Pressurized Heavy 1 22 16 39Water Reactor (650) (14,436) (4,815) (20,001)
PWR Pressurized Water 109 2 71 40 222Reactor (106,560) (1,842) (65,917) (32,093) (206,412)
WW)ER Water Cooled Water 32 1 33Moderated Power (18,553) (376) (18,929)Reactor
Total - 215 2 129 94 440_(167,896) (1,842) (119,992) (65,849) (347,679)
Source: 2003 Power Reactor Information System (PIUS) database, IAEA (2003).
The Gas Cooled Reactor (GCR) is far less common, and no GCR is presently inoperation outside of Europe. Only two gas-cooled nuclearreactors have been operated in theUnited States, Peach Bottom-I outside Philadelphia and the Ft. St. Vramin Plant in Platteville,Colorado, both of which were shut down after short periods of operation.
A4.2.4. Worldwide Nuclear Plant Operation
According to IAEA, there were 438 operating nuclear power plants worldwide at theend of 2001, with 353 GW of generating capacity. As of January 2002, the United States had104 reactors in operation, followed by France with 59, Japan with 54, the UK with 33, the
A4-7

" Kudankulam 2, a 905 MW WWER in India" LWR -Project Unit 1, a 1040 MW PWR in Dem. P. R. Korea.
A4.3. Near -Term Deployment Design Criteria
DOE has been working with the nuclear industry to establish a technical andregulatory foundation for the next generation of nuclear plants. DOE has organized a NearTerm Deployment Group (NTDG) to examine prospects for the deployment of new nuclearpower plants in the United States over the next 10 years. The NTDG established thefollowing six evaluation criteria as a basis for near-term deployment (DOE 2001).
A4.3.1. Regulatory Acceptance
Candidate technologies must show how they will be able to receive either aconstruction permit for a demonstration plant or a design certification by the U.S. NuclearRegulatory Commission (NRC) within the time frame required to permit plant operation by2010 or earlier.
A4.3.2. Industrial Infrastructure
Candidate technologies must be able to demonstrate that a credible set of componentsuppliers and engineering resources exist today, or that a credible plan exists to assemblethem, which would have the ability and the desire to supply the technology to a commercialmarket in the time frame leading to plant operation by 2010 or earlier.
A4.3.3. Commercialization Plan
A credible plan must be prepared which clearly shows how the technology would becommercialized by 2010 or earlier, including market projections, supplier arrangements, fuelsupply arrangements and industrial manufacturing capacity.
A4.3.4. Cost Sharing Plan
Technology plans must include a clear delineation of the cost categories to be fundedby government and the categories to be funded by private industry. The private/governmentfunding split for each of these categories must be shown, along with rationale for theproposed split.
A43.5. Economic Competitiveness
The economic competitiveness of candidate technologies must be clearlydemonstrable. The expected all-in cost of power produced is to be determined and comparedto existing competing technologies along with all relevant assumptions (includes plant capitalcost, first plant deployment cost, and other plant costs). Advanced passive designs are
A4-9

Table A4-2: Summary of New Reactor Designs
U.S. DeploymentDesign Supplier Size and Type Prospects and Overseas NRC Certification Status
DeploymentABWR General Electric 1,350 MW BWR Operating in Japan, under Certified in 1996.
construction in Taiwan.AP1000 Westinghouse 1,090 MW PWR Additional design work to Design certification
be done before plant ready expected September 2005.for construction.
SWR 1000 Framatome Advanced 1,013 MW BWR Under consideration for Submission of materials forNuclear Power (ANP) construction in Finland, pre-application review to
designed to meet European begin in mid-2004. Pre-requirements. application review
completion expected 2005.CANDU Atomic Energy 753 MW HWR Deployed outside Canada in Pre-application reviewACR-700 Company, Limited Argentina, Romania, South scheduled to be completed
(AECL)Technologies Korea, China and India. by NRC, June 2004.Inc., U.S. subsidiary ofCanadian AECL
AP600 Westinghouse 610 MW PWR Additional design work to Design is certified, butbe done before plant ready actual construction will befor construction, superseded by AP 1000.
Simplified General Electric 1,380 MW BWR Commercialization plan not Pre-application reviewBoiling Water likely to support completion expected in earlyReactor deployment by 2010. 2004. Application for design(ESBWR) certification to be submitted
mid-2005.Pebble Bed British Nuclear Fuels I 10 MW Modular No plan beyond completion Pre-application reviewModular (BNFL) pebble bed of South African project closed September, 2002 withReactor, departure of Exelon.(PBMR)Gas Turbine General Atomics 288 MW Licensed for construction in Design certificationModular Prismatic graphite Russia. application would begin byHelium Reactor end of 2005., LGT-MHR)International Westinghouse 100 to 300 MW Plans to deploy between Design certification reviewReactor PWR 2012 and 2015. to begin 2006.Innovative andSecure (IRIS)European Framatome-ANP 1,545 to 1,750 MW No decision on U.S. Ordered for deployment inPressurized PWR market Finland.Water Reactor(EPR)
System 80+ Westinghouse 1,300 MW PWR Plants built in Korea. Certified May 1997.Design not planned to bemarketed in United States.
Advanced Fast General Electric, 300 to 600 MW, Began certification in the No action taken.Reactor Power Argonne National sodium-cooled 1990s.Reactor LaboratoryinnovativeSmall Module(AIR PRISM)
0A4-11

than that for LWRs. The ACR-700 uses light water for cooling and heavy Water formoderation. The ACR-700 uses 75 percent less heavy water than the earlier CANDU 3, 6,and 9 nuclear units. The ACR-700 reactor assembly is 30 percent smaller than that of theCANDU 3, 6, and 9 nuclear units. Combined with significant previous constructionexperience, simplification of the design and extensive use of modular construction arethought to greatly improve the ACR-700's economic competitiveness in electric powergeneration.
CANDU reactors have been deployed outside Canada in Argentina, India, Romania,and South Korea, which opted in 2001 to continue its nuclear power expansion with1,000 MW units from Combustion Engineering rather than with CANDUs (NuclearEngineering International 2001). A 728 MW CANDU 6 unit was brought to full power atChina's Qinshan site in November 2002, and a second unit was brought on line in July 2003,with a construction period of 51 months from the first pouring of concrete to criticality(AECL 2002, AECL 2003b, Hedges 2002, p. 8). AECL began construction on a second 710MW CANDU 6 unit at Cernavoda, Romania in April 2003, projecting a 48-monthconstruction period and an overnight cost of U.S. $700 million (AECL 2003a). AtomicEnergy of Canada, Limited (AECL), the CANDU's vendor, requested pre-application reviewby NRC of its 700-MW ACR-700 design in June 2002, and NRC expects to complete its pre-application review in mid-2004 (Van Adel 2002; AECL Technologies 2002, p. 14; NRC2004, p. 2).
A4.4.5. AP600
The AP600 is a 610 MW PWR. The core, reactor vessel, internals, and fuel areessentially the same design as for presently operating Westinghouse PWRs. Fuel powerdensity has been decreased to provide more thermal margin. Canned rotor primary pumps,proven in the U.S. Navy's reactor program and in fossil boiler circulation systems, have beenadopted to improve reliability and maintenance requirements.
The innovative aspect of the AP600 design is its reliance on passive features foremergency cooling of the reactor and .containment, provided by natural forces such asgravity, natural circulation, convection, evaporation, and condensation, rather than on ACpower supplies and motor-driven components. Extensive testing of the AP600 passivecooling systems has been completed and supported by independent confirmatory testing byNRC to verify the design and analyses of the passive emergency cooling features. NRC hascertified the AP600 design. Additional detailed design work would be needed before theplant would be ready for construction. However, the thermal economics of the AP1000 aresuperior to those of the AP600, and it is considered unlikely that the AP600 will actually bedeployed, although its design certification may speed certification of the AP1000.
A4.4.6. ESBWR
The European Simplified Boiling Water Reactor (ESBWR) is a 1,380 MW, naturalcirculation, passively safe boiling water reactor developed by GE, in concert with
A4-13

A4.4.8. GT-MHR
The Gas Turbine Modular Helium Reactor (GT-MHR) is a graphite-moderatedhelium cooled reactor. Each unit generates 288 MW, with up to four units comprising acomplete plant. Heat generated by nuclear fission in the reactor is transferred to the coolantgas (helium) and converted into electrical energy in a gas turbine generator. The fuelconsists of spherical fuel particles, each encapsulated in multiple coating layers, formed intocylindrical fuel compacts and loaded into fuel channels in graphite blocks.
The GT-MI-R design offers very high thermal efficiency (approximately 48 percent)and outstanding nuclear safety. The GT-MHR is being developed under an internationalprogram in Russia for the disposition of surplus weapons plutonium. Government andprivate sector organizations from the United States, Russia, France, and Japan are sponsoringthe development work.
General Atomics (GA) has the lead responsibility for providing U.S. technicalsupport. The Russian GT-MHR demonstration plant is planned to be operational in 2009. Aparallel GT-MHR commercial plan has been assembled and could lead to adaptation of thedesign to utilize uranium fuel. The detailed design produced in Russia would be converted toU.S. standards and revised as necessary for the U.S. application. At this point, GA is activelyseeking a U.S. owner/operator. Although the United States has limited experience with GCR'technology, much was learned from the 330 MW Fort St. Vrain Plant that has proven usefulin the continued development of the GT-MHR. Built by General Atomics (GA) as a DOEdemonstration plant in 1973, Fort St. Vrain was transferred in 1979 to Public ServiceCompany of Colorado and operated for several years before being shut down in 1989, afterexperiencing technical problems, particularly intrusion of moisture from water-cooledbearings. The GA-built helium-cooled reactor operated at 1,400 degrees Fahrenheit andproduced 330 MW of electricity. Despite operation and maintenance difficulties, the hightemperature plant demonstrated enhanced safety characteristics, including significantlyreduced radiation exposure to its workforce, and the use of hexagonal prismatic fuel blocks,which have continued to be used in the GT-MHR (Margolis 2003). Moreover, the plant waslauded as the first successfully decommissioned nuclear plant in 1996 (Nuclear EnergyInsight 1997, p. 4). The plant has since been repowered as a combined-cycle gas turbineplant producing near 720 MW of electricity.
A4.4.9. IRIS
IRIS is an innovative small (100 to 300 MW) pressurized water reactor underdevelopment by Westinghouse. The key feature of the IRIS design is the integrated primarysystem, that is, all primary system components, including the steam generators, coolantpumps and pressurizer, are housed along with the nuclear fuel in a single, large pressurevessel. As such, IRIS offers potential safety advantages, primarily related to the eliminationof any potential for large-break loss of coolant accident. Its small size and modular designmay simplify on-site construction and make it deployable in areas not suitable for largenuclear plants.
A4-15

A4.4.103. AFR and the PRISM
The Advanced Fast Reactor (AFR) and the Power Reactor Innovative Small Module(PRISM) are two Generation IV designs that utilize a fast neutron spectrum and sodiumcooling for the purpose of creating a more closed fuel cycle. The use of the fast neutronspectrum allows the reactor to consume plutonium and other transuranic elements, therebyeliminating the need for additional disposal methods. The AFR is being developed toincorporate pyroprocessing that separates the fission products and re-fabricates fuel with theremaining uranium and transuranic products. The reactors range in size from 300 to 465MW per module. Argonne National Laboratory and General Electric are working on thisdesign (Roglans-Ribas et al. 2003; Boardman et al. 2000; Boardman, Dubberley, and Hui2000).
A4.5. Evaluation of Near -Term Candidates
The following sections summarize the NTDG evaluation of the eight-candidatereactor designs (DOE 2001). These include assessment of each candidate's compliance withthe six criteria established by the NTDG, identified design-specific gaps, projected costperformance, schedule considerations, and overall potential for deployment by 2010. In eachof these evaluation categories, the NTDG conclusions for all eight candidates aresummarized in tabular form. The NTDG did not evaluate the ACR-700, so the summary forthat reactor is derived from the present study.
Tabular summaries are intended to provide a concise comparison of the relativemerits and demerits of the reactor designs evaluated. The NTDG evaluation of the degree towhich each of the candidate reactor designs meets the intent of the six criteria for near-termdeployment is summarized below. The NTDG judgments in each case were based on theinformation submitted by the respondent, on additional information provided (includingpresentations at NTDG meetings) and on the experience and judgment of the NTDG teammembers.
A4.5.1. ABWR
" Regulatory Acceptance: Meets criterion. Design is NRC certified." Industrial Infrastructure: Meets criterion. International infrastructure exists and
has been demonstrated on Asian ABWR projects.* Commercialization Plan: Can meet criterion. ABWR has been successfully
commercialized in Japan and Taiwan." Cost Sharing Plan: Meets criterion. No design-specific government funding
requested.9 Economic Competitiveness: Can meet criterion. ABWR costs have high certainty
(based on actual experience), but U.S. economic competitiveness is uncertain becauseof relatively high capital cost; ABWR may be competitive in some market scenarios.
A4-17

" Commercialization Plan: Can meet criterion. The ACR-700 is an evolution of theproven CANDU-6 units, of which the last six have been built on or ahead of scheduleand on budget.
* Cost Sharing Plan: Meets criterion. The AECL plan does not request any specificfunding for design certification, only for NRC fees.
" Economic Competitiveness: AECL reports short lead times and low capital costs fortwin 700 MW units.
* Fuel Cycle Industrial Structure: Utilizes slightly enriched uranium (SEU) and aonce through fuel cycle.
" Design Specific Gaps: Achieving Design Certification; meeting all U.S.requirements.
A4.5.5. AP600
* Regulatory Acceptance: Meets criterion. Design is NRC certified.* Industrial Infrastructure: Meets criterion. Strong infrastructure is in place." Commercialization Plan: Can meet criterion, but require substantial financial
investment to complete the detailed design.* Cost Sharing Plan: Meets criterion. The Westinghouse plan proposes cost sharing
and supporting rationale for design certification and detailed design.* Economic Competitiveness: Can meet criterion. Because of smaller capacity, has
higher capital and operating costs than AP1000. Based on Westinghouse projectedcosts, AP-600 may be competitive in some U.S. market scenarios.
* Fuel Cycle Industrial Structure: Meets criterion. AP600 will utilize conventionalnuclear fuel.
* Design Specific Gaps: Financial support for completion of detailed design; economiccompetitiveness under some scenarios.
A4.5.6. ESBWR
* Regulatory Acceptance: Can meet criterion. ESBWR design incorporates ABWRand SBWR design features, both previously reviewed by NRC.
* Industrial Infrastructure: Meets criterion. Same international infrastructure asdemonstrated on Asian ABWR projects would support ESBWR.
* Commercialization Plan: Does not meet criterion. ESBWR commercialization planis predicated on prior successful commercialization of ABWR. Therefore it is notlikely to support deployment by 2010.
* Cost Sharing Plan: Meets criterion. Cost sharing requested for design certificationand detailed design.
e Economic Competitiveness: Can meet criterion. GE did not provide costprojections; however, based on GE design economic targets and GE preliminaryestimates of material quantities, ESBWR would likely be economically competitive.
A4-19

" Cost Sharing Plan: Meets criterion. Cost share proposal is predicated on continuedU.S. Government support to Russian project and presumes substantial private sectorparticipation for commercialization.
" Economic Competitiveness: Can meet criterion. However, projected GT MHReconomics are preliminary and have high uncertainty. Satisfactory economics rely ondeployment of multiple modules and successful development of the design.
" Fuel Cycle Industrial Structure: Can meet criterion. GT MHR safety andreliability hinge on successful fuel development and high quality fuel manufacture.Current plan includes ambitious program to develop, test, license and produce GTMHR fuel.
" Design Specific Gaps: Conversion of Russian prototype information and analyses,into documentation suitable for U.S. application; successful continuation of Russianproject; fuel development, characterization, manufacture, testing and regulatoryacceptance; performance of in-reactor high temperature materials; power conversionsystem uncertainties with respect to component5, materials and reliability.
A4.5.9. IRIS
" Regulatory Acceptance: Does not meet criterion. Design certification in time for2010 deployment is unlikely, because of extensive analysis and testing required.
" Industrial Infrastructure: Can meet criterion. International IRIS design team,which includes manufacturing capability, has been assembled.
" Commercialization Plan: Does not meet criterion. Commercialization plan (in timeto support 2010 deployment) is unrealistic.
• Cost Sharing Plan: Meets criterion. Identified cost sharing would support IRISengineering, testing and licensing.
* Economic Competitiveness: Indeterminate. Westinghouse projections on IRIS costsare highly conjectural; if true, IRIS would be economically competitive, but there isnot yet a sufficient basis for confidence.
* Fuel Cycle Industrial Structure: Meets criterion, for initial fuel loads. However,more highly enriched fuel loads, intended for later years, would require newmanufacturing capability.
" Design Specific Gaps: Steam generator design, control, and accessibility forinspection as well as maintenance; integrated system safety performance, includingtransient response as well as primary system/containment interaction; internal controlrod drive mechanism (CRDM) development (and/or adequacy of conventiona.lCRDMs with long drive trains).
A4.5.10. Conclusion
The ABWR, the AP600, the AP1000, ACR-700 and the SWR. 1000 are the onlyreactor types where the vendors appear willing and potentially able to meet the NTDGcriteria. The ABWR has design certification and is the only reactor type that has been built,
A4-21

References
AECL Technologies, Inc. (AECL Technologies). (2002) "A Plan for the Pre-ApplicationReview of the Advanced CANDU Reactor (ACR) (September 26, 2002). Mimeo, issued fordiscussion with NRC. Gaithersburg, Md.: AECL Technologies, Inc., September 26.
Atomic Energy of Canada, Ltd. (AECL). (2002) News release: "AECL's CANDU 6Reactor Achieves First Criticality in China." Mississauga, Ontario, September 22.Retrieved from the World Wide Web:http://www.aecltechnologies.com/Content/News/2002/NR-020922.
Atomic Energy of Canada, Ltd. (AECL). (2003a) News release: "AECL Builds SecondCANDU® in Romania." Mississauga, Ontario, April 17. Retrieved from the World WideWeb: http://www.aecltechnologies.com/Content/News/2003/NR-030417.htm.
Atomic Energy of Canada, Ltd. (AECL). (2003b) News release: "AECL Sets Record withChina Project." Mississauga, Ontario, July 23. Retrieved from the World Wide Webhttp://www.aecltechnologies.com/Content/News/2003/NR-030723.htm.
Agence France Presse (AFP). (2003) "France Mulls New Nuclear Reactor to PreserveEnergy Options." Paris: AFP, November 7. Retrieved from the World Wide Web January24, 2003: http://www.spacewar.com/2003/031107164621.vqx5zynq.htm1.
Bennett, Geraldine. (2003) "48 Hours & Counting for Nuclear Reactor." Moneyweb.Retrieved January 2004 from World Wide Web:https://www.pbmr.com/making-headlines/48/%20Hours%20&%20Counting%2Ofor%/o2ONuclear0/620Reactor.htm.
Boardman, Charles E., Allen E. Dubberley, Douglas G. Carroll, Marvin Hui, Alan W.Fanning, and Walter Kwant. (2000) "A Description of the S-Prism Plant." ICONE-8168.Proceedings of the 8h International Conference on Nuclear Engineering, Baltimore, April 2-6. San Jose, Calif.: General Electric.
Boardman, Charles E., Allen E. Dubberley, and Marvin Hui. (2000) "Optimizing the Size ofthe Super Prism Reactor." ICONE-8003. Proceedings of the 8th International Conference onNuclear Engineering, Baltimore, April 2-6. San Jose, Calif.: General Electric.
Chalmers, Robyn. (2002) "Exelon deals SA Nuclear Energy Plan a Major Blow." BusinessDay. April 17,2002. Retrieved January 2004 from World Wide Web:https://www.pbmr.com/making-headlines/Exelon-dealsSA-nuclear.,htm.
Cushing, Jack. (2002) "Memorandum: Summary of Meeting with Framatome ANPRegarding the Design Certification Process for the SWR 1000." New Reactor LicensingProject Office, Office of Nuclear Reactor Regulation, U.S. Nuclear Reactor Regulation.Rockville, Md., April 4. Retrieved December 2003 from Word Wide Web:
A4-23

U. S. Department of Energy (DOE). (2001) "A Roadmap to Deploy New Nuclear PowerPlants in the United States by 2010 Volume I Summary Report." U.S. Department of Energy,Office of Nuclear Energy, Science, and Technology, October.
U.S. Nuclear Regulatory Commission (NRC). (2004) Fact Sheet. Next-GenerationReactors. Washington, D.C., NRC, Office of Public Affairs, January.
U.S. Nuclear Regulatory Commission (NRC). (2002) Website: "Design Certification Pre-Application Review-SWR 1000." Retrieved December 13, 2003 from World Wide Web:http://www.nre.gov/reactors/new-licensing/license-reviews/design-cert/SWR 1000.html.
U.S. Nuclear Regulatory Commission (NRC). (2003) Website: "Design CertificationApplication Review-AP 1000." Retrieved December 13, 2003 from World Wide Web:http://www.nrc.gov/reactors/new-licensing/license-reviews/design-cert/ap 1 000.html.
Van Adel, Robert. (2002). Letter to Samuel J. Collins, Director, Office of Nuclear RectorRegulation, U.S. Nuclear Regulatory Commission. Mississauga, Ontario, June 19.
A4-25

Appendix A5. NUCLEAR FUEL CYCLE AND WASTE DISPOSAL
Summary
The front-end costs of nuclear fuel consist of the cost of raw ore, its conversion, itsenrichment, and its fabrication. Total front-end costs amount to $3.50 to $5.50 per MWh.
In the United States, direct disposal from a once-through fuel cycle has been used,without reprocessing of spent fuel. The costs of disposal in this case consist of short-termon-site storage costs prior to permanent storage, plus a charge levied to pay for permanentstorage at a central facility such as Yucca Mountain. The back-end costs are $1.09 perMWIh. The total fuel cycle cost is, therefore, between $4.65 to $6.62 per MWh, or less than10 percent of the LCOE new nuclear generation.
Reprocessing traditionally has been conducted using the PUREX process forrecovering uranium and plutonium. DOE's R&D program is developing techniques designedto be still more proliferation-resistant.
Reprocessing and eventual recycle of the fissile material for reuse as a fuel in futurenuclear reactors would not materially affect the economic competitiveness of nuclear energy.
A5-1

A5.1. Introduction
The purpose of this appendix is to provide estimates of the contribution of fuel coststo total nuclear power costs. Section A5.2 gives background on the structure of nuclear fuelcosts, of which storage, disposal, and possibly reprocessing are components. Section A5.3describes some of these costs. DOE R&D currently underway or planned to improve theefficiency of nuclear fuel and the safety involved in its disposition is described in SectionA5.4.
Section A5.5 develops estimates of the costs of waste disposal, without reprocessingand with reprocessing. Section A5.6 compares total fuel cycle costs under these alternatives.Section A5.7 concludes.
A5.2. Composition of Fuel Costs
Nuclear fuel costs consist of front-end and back-end costs. Figure A5-1 shows thestages in the nuclear fuel cycle, from the front-end mining and processing stages, through thefuel's use in a reactor, to its back- end phases of either disposal or reprocessing, followed byrecycle of the fissile material.
The front-end costs consist of the cost of raw uranium, its conversion to uraniumhexafluoride, the enrichment to 5 percent U235, and fabrication into fuel rods, pellets or otherform. Table A5-1 shows the composition of these cost components. The low and highranges of the costs shown in the table are from alternative sources (NEA 1994, Ch. 4; NAC2000, session 2, slide 15). These costs are incurred over a period of up to five years prior tothe use of the fuel in the reactor, and the outlays incur interest costs during this period.Consequently, there is an overnight component to the cost, in the second column of the table,and a time-related component in the third column. The right-most column reports the sharesof these components in the front-end fuel cost. The dominant cost component is enrichment,followed by ore purchase and fabrication.
The remaining costs can take one of two forms, direct disposal or reprocessingfollowed by recycle of the fissile material for reuse in a future nuclear reactor. The costs ofdirect disposal, as presently borne by utilities, consist of the cost of on-site storage plus thefederal charge of 1 mill per kWh.
A5-3
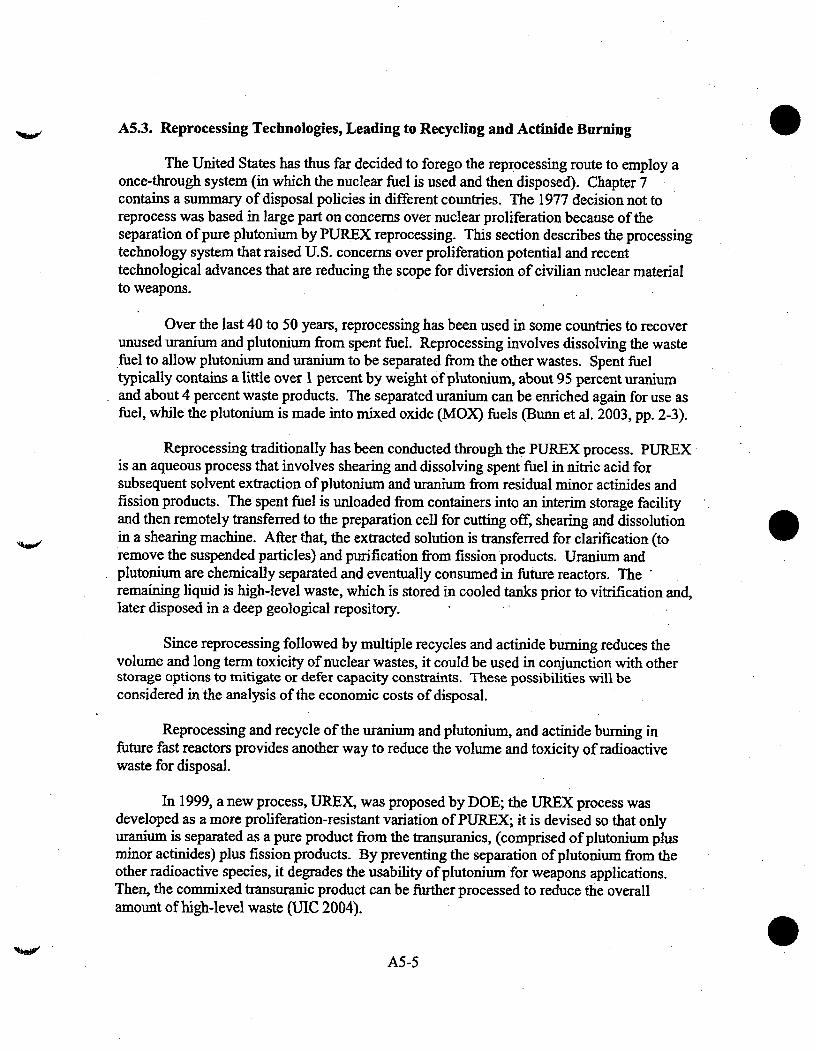
A5.3. Reprocessing Technologies, Leading to Recycling and Actinide Burning
The United States has thus far decided to forego the reprocessing route to employ aonce-through system (in which the nuclear fuel is used and then disposed). Chapter 7contains a summary of disposal policies in different countries. The 1977 decision not toreprocess was based in large part on concerns over nuclear proliferation because of theseparation of pure plutonium by PUREX reprocessing. This section describes the processingtechnology system that raised U.S. concerns over proliferation potential and recenttechnological advances that are reducing the scope for diversion of civilian nuclear materialto weapons.
Over the last 40 to 50 years, reprocessing has been used in some countries to recoverunused uranium and plutonium from spent fuel. Reprocessing involves dissolving the wastefuel to allow plutonium and uranium to be separated from the other wastes. Spent fueltypically contains a little over 1 percent by weight of plutonium, about 95 percent uraniumand about 4 percent waste products. The separated uranium can be enriched again for use asfuel, while the plutonium is made into mixed oxide (MOX) fuels (Bunn et al. 2003, pp. 2-3).
Reprocessing traditionally has been conducted through the PUREX process. PUREXis an aqueous process that involves shearing and dissolving spent fuel in nitric acid forsubsequent solvent extraction of plutonium and uranium from residual minor actinides andfission products. The spent fuel is unloaded from containers into an interim storage facilityand then remotely transferred to the preparation cell for cutting off, shearing and dissolutionin a shearing machine. After that, the extracted solution is transferred for clarification (toremove the suspended particles) and purification from fission products. Uranium andplutonium are chemically separated and eventually consumed in future reactors. Theremaining liquid is high-level waste, which is stored in cooled tanks prior to vitrification and,later disposed in a deep geological repository.
Since reprocessing followed by multiple recycles and actinide burning reduces thevolume and long term toxicity of nuclear wastes, it could be used in conjunction with otherstorage options to mitigate or defer capacity constraints. These possibilities will beconsidered in the analysis of the economic costs of disposal.
Reprocessing and recycle of the uranium and plutonium, and actinide burning infuture fast reactors provides another way to reduce the volume and toxicity of radioactivewaste for disposal.
In 1999, a new process, UREX, was proposed by DOE; the UREX process wasdeveloped as a more proliferation-resistant variation of PUREX; it is devised so that onlyuranium is separated as a pure product from the transuranics, (comprised of plutonium plusminor actinides) plus fission products. By preventing the separation of plutonium from theother radioactive species, it degrades the usability of plutonium for weapons applications.Then, the commixed transuranic product can be further processed to reduce the overallamount of high-level waste ("IC 2004).
A5-5

casks to increase the available on-site storage capacity. Wet and dry on-site storage,however, are considered temporary solutions, as they are intended to allow. fresh SNF to coolbefore its final disposal (Bunn et al. 2001, p. 10).
Since the early 1980s, Yucca Mountain, Nevada, has been the site proposed by DOEfor the construction of a centralized high-level radioactive waste storage facility. The planscall for a permanent underground storage complex intended to house all of the high-levelradioactive waste that currently exists in the United States and that will be produced in thiscountry through the year,2041. The Yucca Mountain project is projected to proceed instages: development (1983 to 2003), licensing (2003 to 2006), construction (2006 to 20 10),emplacement (2010 to 2041), monitoring (2041 to 2110), and closure (2110 to 2119) (DOE2002).
The Yucca Mountain project has been finided in two main ways. Congress has madeappropriations to cover the disposal of defense-related nuclear wastes, while a tax of one Imill (one-tenth of a cent) per kWh since 1983 has been levied on power produced at nuclearpower plants in order to fimd the disposal of commercially produced wastes. As of this date,the fund totals almost $18 billion. The money from this fund, along with the proceeds fromits investment income over the coming decades, has been projected to be sufficient to pay forthe Yucca Mountain project.
While Yucca Mountain's currently legislated capacity is 70,000 metric tons, DOE'sEnvironmental Impact Statement suggests that the site could safely accommodate more than120,000 metric tons (DOE 2002). Other sources suggest 150,000 to 200,000 metric tons maybe possible (Peterson 2003, p. 28; NEI 2003).
With regard to estimation of disposal costs, for the temporary on-site storage phasetotal capital cost to establish new dry storage facilities at a reactor site is estimated to rangefrom $8 to $12 million regardless of the amount of waste to be generated (Bunn et al. 2001,p. 13). Costs to purchase and load dry casks range from $60 to $80 per kilogram of heavywaste (kglIM). Operating costs are modest since there is little to be done after loading,except security and safety monitoring, maintaining its NRC license. For a-reactor thatgenerates 1,000 metric tons of heavy metal waste over a 40-year lifetime, the total cost for
.5 years of dry cask storage would be approximately $120 million. Assuming the plantgenerates 0.006 lbs. of spent nuclear waste per MWh (DOE 2003b), the cost to a 1,000 MWreactor would be 0.09 mills per kWh, or $0.09 per MWh.
For permanent disposal, the estimated total cost for disposal at Yucca Mountain isapproximately $56 billion. This includes an estimated $49.3 billion in future costs and$6.7 billion in past costs (DOE 2001 a, p. 1 - 1). This cost estimate covers every stage of theYucca project, from development to permanent closure. DOE's (2001b) recent investigationof the current fee system determined that the charge of -1 mill per kWh is sufficient to coverthe costs of storing all high-level wastes generated through 2041. Calculations belowcorroborate this assessment.
A5-7
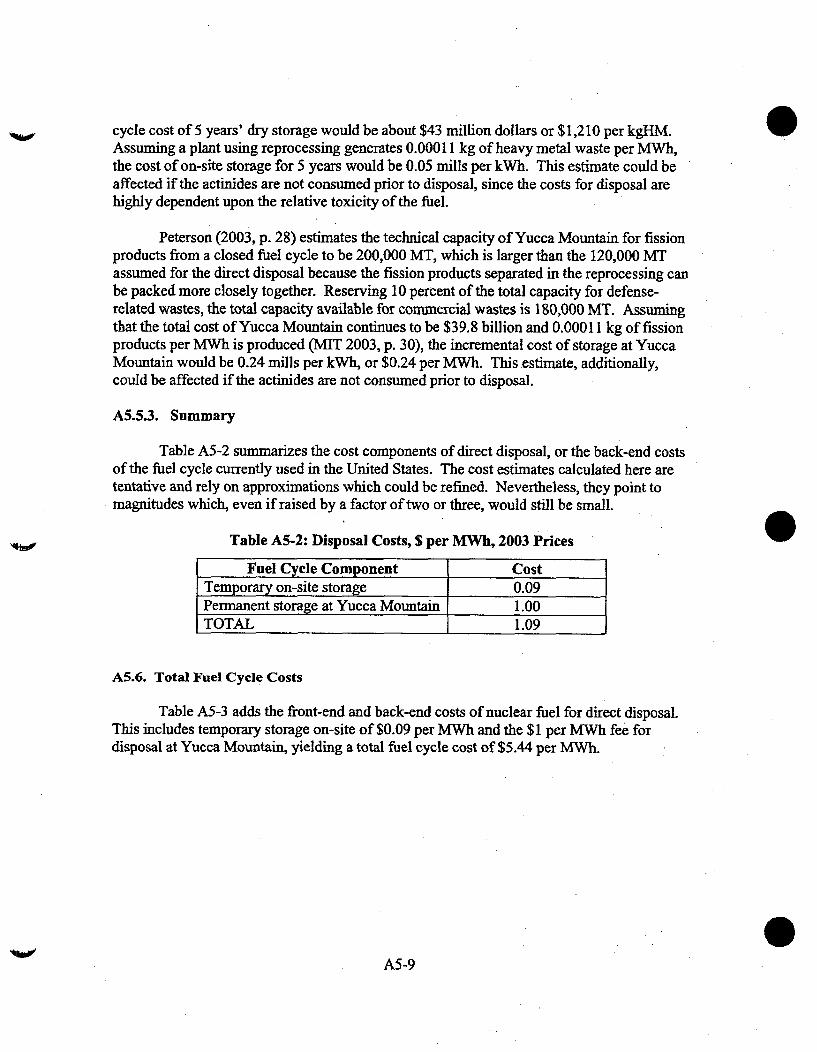
cycle cost of 5 years' dry storage would be about $43 million dollars or $1,210 per kgHM.Assuming a plant using reprocessing generates 0.00011 kg of heavy metal waste per MWh,the cost of on-site storage for 5 years would be 0.05 mills per kWh. This estimate could beaffected if the actinides are not consumed prior to disposal, since the costs for disposal arehighly dependent upon the relative toxicity of the fuel.
Peterson (2003, p. 28) estimates the technical capacity of Yucca Mountain for fissionproducts from a closed fuel cycle to be 200,000 MT, which is larger than the 120,000 MTassumed for the direct disposal because the fission products separated in the reprocessing canbe packed more closely together. Reserving 10 percent of the total capacity for defense-related wastes, the total capacity available for commercial wastes is 180,000 MT. Assumingthat the total cost of Yucca Mountain continues to be $39.8 billion and 0.00011 kg of fissionproducts per MWh is produced (MIT 2003, p. 30), the incremental cost of storage at YuccaMountain would be 0.24 mills per kWh,,or $0.24 per MWh. This estimate, additionally,could be affected if the actinides are not consumed prior to disposal.
A5.5.3. Summary
Table A5-2 summarizes the cost components of direct disposal, or the back-end costsof the fuel cycle currently used in the United States. The cost estimates calculated here aretentative and rely on approximations which could be refined. Nevertheless, they point tomagnitudes which, even if raised by a factor of two or three, would still be small.
Table A5-2: Disposal Costs, $ per MIWh, 2003 Prices
Fuel Cycle Component CostTemporary on-site storage 0.09Permanent storage at Yucca Mountain 1.00TOTAL 1.09
A5.6. Total Fuel Cycle Costs
Table A5-3 adds the front-end and back-end costs of nuclear fuel for direct disposal.This includes temporary storage on-site of $0.09 per MWh and the $1 per MWh fee fordisposal at Yucca Mountain, yielding a total fuel cycle cost of $5.44 per MWh.
A5-9

References •
Bunn, Mathew, John P. Holdren, Allison Macfarlane, Susan E. Pickett, Atsuyuki Suzuki,Tatsujiro Suzuki, and Jennifer Weeks. (2001) "Interim Storage of Spent Nuclear Fuel."Cambridge, Mass.: Joint report, Harvard University and Tokyo University.
Bunn, Matthew and Steve Fedder, John P. Holdren, Bob van der Zwaan. (2003) "TheEconomics of Reprocessing vs. Direct Disposal of Spent Nuclear Fuel." Cambridge, Mass.:Harvard University, Project on Managing the Atom.
Lobdell, Simon. (2002) "The Yucca Mountain Repository and the Future of Reprocessing."Mimeo. Washington, D.C.: Washington Internship for Students of Engineering.
Macfarlane, Allison. (2001) "Interim Storage of Spent Fuel in the United States," AnnualReview of Energy and the Environment 26: 201-35.
Massachusetts Institute of Technology (MIT). (2003) The Future of Nuclear Power: AnInterdisciplinary MIT Study. Cambridge, Mass.: Massachusetts Institute of Technology,July.
Nuclear Assurance Corporation (NAC). (2000) Nuclear Fuel Management Seminar. PowerPoint slides. November.
Nuclear Energy Institute (NEI). (2003) "Common Objections to the Yucca MountainProject, and What the Science Really Says." Retrieved August 15, 2003 from the WorldWide Web: http:/Iwww.nei.org/index.asp?catnum=2&catid=197.
Nuclear Energy Agency (NEA). (1994) The Economics of the Nuclear Fuel Cycle. Paris:OECD.
Peterson, Per F. (2003) "Will the United States Need a Second Geologic Repository?" TheBridge 33, No. 3: 26-32.
Uranium Information Centre (UIC). (2004) "Waste Management in the Nuclear FuelCycle." Nuclear Issues Briefing Paper 9. Melbourne, January.
U.S. Department of Energy (DOE). (2001 a) "Analysis of the Total System Life Cycle Costof the Civilian Radioactive Waste Management Program." Washington, D.C., May 2001.
U.S. Department of Energy (DOE). (2001 b) "Nuclear Waste Fund Fee Adequacy."Washington, D.C.
U.S. Department of Energy (DOE). (2002) "Yucca Mountain: Commonly Raised Topics."Pamphet Washington, D.C.
A5-11
Appendix A6. NUCLEAR REGULATION
Summary
The U.S. Nuclear Regulatory Commission (NRC) was created to conduct all licensingand regulatory functions for the nuclear power industry. It is involved in the regulation ofactivities from mining uranium to plant decommissioning. Historically, the construction andoperation permitting process has been at the center of many delays and cost increases for newnuclear power plants.
An amendment to the Code of Federal Regulations (10 CFR Part 52) provides forcombined construction and operation permitting and is aimed at streamlining the permittingprocess. The combined Part 52 license is designed to allow investors the opportunity toresolve many uncertainty issues before committing large amounts of money to an investmentin a nuclear facility.
Reducing construction delays and lowering the risk premium to investors necessary tocompensate for the possibility of delays or cancellations due to regulatory activities couldlower the cost of power from a nuclear plant significantly. Table A6-2, derived from thefinancial model of Chapter 5, compares levelized cost of power (LCOE) for nuclear plantsunder different regulatory regimes. The first regime, reflecting the older procedure, assumes7-year construction time, 12 percent interest rate on debt, 15 percent required return onequity, and a reduction in construction costs of 3 percent for doubling the number of plants.The second regime, reflecting the new regulatory procedures, assumes a 5-year constructiontime, 7 percent interest rate on debt, 12 percent required return on equity, and 5 percentreduction in construction costs for double the number of plants. The electricity costreduction for lower cost plants is 31 percent and 53 percent for higher cost plants.
0A6-1

A6.1. Introduction
This appendix examines the impacts of regulation on the future construction andoperation costs of nuclear power facilities. Section A6.2 reviews the current regulatoryframework. Section A6.3 presents estimates of costs of delay and uncertainty that may bereduced by streamlined regulation. Section A6.4 concludes that benefits of reducingconstruction delays and investor uncertainties are substantial.
A6.2. Current Regulatory Framework
Regulation of nuclear energy in the United States originates with the Atomic EnergyAct (AEA) of 1954 (42 USC 2011 et seq.) and is enumerated in the relevant sections of theCode of Federal Regulations (CFR). The federal government has assumed most regulatoryresponsibilities in this area; in fact, courts have struck down many state efforts to regulatenuclear energy more independently (Hillegas 1983). While states can still regulate thoseareas the federal government has chosen not to address, federal preemption has ensured theregulatory supremacy of the federal government in nuclear energy. The U.S. NuclearRegulatory Commission (NRC) was created to conduct all licensing and regulatory functions(Schoenbaum 1988).
A6.2.1. Mining Regulations
Although the AEA does not set forth detailed provisions regarding the mining ofuranium or thorium, NRC is responsible for issuing licenses for the extraction of thesematerials. In recent years, several U.S. facilities have been licensed to recover uranium(OECD 1999). DOE can also issue permits for uranium exploration on federal lands.
A6.2.2. Regulations for Importing and Exporting Nuclear Fuels and Equipment
In 1995, NRC issued rules making regulations on the import or export of nuclearfuels and equipment conform to the International Atomic Energy Agency's (IAEA)principles of transboundary movement. The new standards, much like the old regulations,focus on issues of nuclear proliferation and require licenses to export or import nuclearwastes and mixed wastes. Separate categories and requirements exist for materials thatbecome incidentally radioactive. NRC consults with other federal agencies regarding exportsof radioactive materials and must receive explicit approval prior to transit from all affectedcountries.
A6.2.3. Nuclear Facilities: Construction and Operation Licenses
All nuclear power plants in the United States are licensed by NRC pursuant to theprovisions of the AEA. NRC's Office of Nuclear Material Safety and Safeguards licensesfuel cycle facilities, and the Office of Nuclear Reactor Regulation issues reactor licenses(42 USC 5801-5844).
A6-3

Table A6-1: Comparison of One-Step and Two-Step Licensing
Old Two-Step Construction PermitLicense Procedure Preliminary Safety Analyses
* Environmental Review* Financial and Anti-Trust Statement* Public comment on each section
Operating License* Submission of Final Design* Final Environmental and Safety AnalysisFurther public comment on each section
New One-Step Pre-Application ActivitiesLicense Procedure Early Site Permit (includes environmental review)
Standard Reactor Design Certification• Public comment
Combined License- License Authorizes Construction and Operation* Includes same information as two-step procedure* Can reference early application activities* Public comment within 180 days of reactor start-up
A6.2.4. Inspections and Reporting Requirements
The operating license contains detailed provisions regarding periodic inspections(NEA 1999). NRC conducts regular safety inspections in conjunction with full-time reactorsite inspectors. The results of these inspections are published. Moreover, nuclear powerplants are periodically reviewed for other operational characteristics (called the SystematicAssessment of License Performance, or SALP). Throughout its operational life,. the reactorfacility is also required to report specific types of information to NRC on a regular basis.
A6.2.5. Regulating the Protection of Workers from Radiation
Regulations applicable to worker safety at nuclear facilities attempt to (1) informworkers about the health problems from radiological exposure, (2) educate workers aboutmethods to reduce exposure, and (3) encourage workers to report problems to NRC (NEA1999). Some of the specific regulations include setting an annual limit for radiation doses,monitoring personnel for exposure, providing radiation protection equipment and the trainingto use it, informing workers about exposure hazards, and providing training regardingapplicable warning labels, instructions, and signs. In addition, nuclear plants are still subjectto all the requirements of the Occupational Safety and Health Act (OSHA).
A6-5

regulatory costs have been due to unanticipated delays and uncertainty that can contribute tothe riskiness of investing in nuclear facilities
A6.3.1. Costs of Delay
Capital costs contribute 60 to 64 percent of the LCOE of nuclear power (see Table3-5). Interest costs over a 7-year construction period can be nearly 30 percent higher thanthey would be for the same overnight cost over a 5-year construction period (Table 3-6). Theresulting LCOE can be about $5 to $6 per MWh, or roughly 13 to 15 percent, higher as aconsequence. Expressed as a saving that could be obtained by reducing a construction periodfrom 7 years to 5, this amounts to a 12 to 13 percent saving.
Similarly, a two-year halt in the middle of construction could increase the LCOE of anuclear power plant by over $7 per MWh, and a two-year delay between the completion ofconstruction and bringing a nuclear plant on-line can add nearly $15 per MWh to its LCOE(Table 5-7). This is a possible additional cost that could be avoided, beyond the basic no-policy LCOE.
A6.3.2. Costs of Uncertainty
The risk that a plant, once begun, will not be completed or if completed will not beallowed to operate, makes investors skittish. Either they will require a higher risk premium,which will lead to a higher cost per megawatt hour of the power that eventually does getproduced from the plant, or they will decline to invest at all. Calculations in Chapter 9indicate that reducing the required risk premium on investment in a nuclear plant to levelscomparable to those for coal- and gas-fired plants would reduce the LCOE of the nuclearplant by $9 to $14 per MWh. This amounts to a reduction of roughly 26 to 32 percent foreighth plants, depending on the initial capital cost and the ability of learning by doing toreduce overnight costs (Tables 9-8 to 9-10). This combines the effect of the shortenedconstruction period, noted in the previous sub-section, at a given interest rate, and lowerinterest rates over the shorter construction period, resulting in a total reduction in LCOE of$14 to $21 per MWh.
A6.3.3. Potential Benefits of Improved Regulation
This section pulls together the construction-time and risk-reduction benefits thatimproved regulation could confer and takes into further consideration the expectation that asmoother regulatory procedure could enhance learning by doing. Table A6-2 compares theLCOE of an eighth plant under the previous regulatory regime with that of an eighth plantunder an improved regime. This comparison assumes that the former circumstances allow a3 percent learning rate-that is a 3 percent reduction in overnight costs with each plantdoubling-and that the improved circumstances permit a 5 percent learning rate. The firstrow of the table reports the LCOEs of the eighth plant of each design built in 7 years, atinterest rates of 12 percent on debt and 15 percent on equity, and with a 3 percent learningrate on overnight cost reductions. The $1,200 or $1,500 design would have an LCOE of
A6-7

References
Center for Strategic and International Studies. (1999) The Regulatory Process for NuclearPower Reactors. Washington, D.C.: CSIS Press.
Hillegas, Joe. (1983) "Pacific Gas and Electric Co. v. State Energy Resources Conservationand Development Commission: Preemption of State Regulation of Nuclear Power," Journalof Energy Law and Policy 5: 135-46.
Goldsmith, Richard. (199 1) "Regulatory Reform and the Revival of Nuclear Power," HofstraLaw Review 20:159-208.
Goxem, Karen. (1988) "Emergency Offsite Planning for Nuclear Power Plants; FederalVersus State and Local Control," American University Law Review 37: 417-51.
Moeller, James. (1992) "State Regulation of Nuclear Power and National Energy Policy,"Journal of Energy, Natural Resources, and Environmental Law 12: 1-61.
Nuclear Energy Agency (NEA). (1998) Future Nuclear Regulatory Challenges. Paris:OECD.
Nuclear Energy Agency (NEA). (1999) Regulatory and Institutional Framework for NuclearActivities. Paris: OECD.
The Nuclear Tourist. Retrieved December 20, 2003 from the World Wide Web:http://www.nucleartourist.com/.
Reitze, Arnold. (1987) "The Price-Anderson Act - Limited Liability for the NuclearIndustry," Environmental Law Reporter 17: 10185-114.
Schoenbaum, Thomas. (1988) The Regulation of Nuclear Power in Three Countries: TheUnited States, France, and Japan. Athens, Ga: The Dean Rusk Center.
U.S. Nuclear Regulatory Commission (NRC). (1978) Preliminary Statement on GeneralPolicy for Rulemaking to Improve Nuclear Power Plant Licensing. Washington, D.C.
A6-9

Appendix A7. NONPROLIEFERATION GOALS
Summary
Countries that have chosen reprocessing include Belgium, China, France, Germany,India, Japan, Russia, Switzerland, and the U.K_ These countries engage in reprocessing toseparate plutonium and uranium from fission products for ffirther use as fuel for reactors.Countries that have chosen direct disposal without reprocessing include the United States,Canada, Finland, South Korea, Spain, and Sweden. A chief concern with reprocessing is thatthe plutonium could be diverted to develop nuclear weapons. Several industrial countrieshave, in the past, provided reprocessing as well as enrichment technology and services toothers, purportedly increasing the opportunities for theft or transfer of technology,equipment or products.
International regulation of nuclear energy takes the form of a combination of treaties,international organizations and multilateral ' and bilateral agreements. The key componentsare the Treaty on the Non-Proliferation of Nuclear Weapons, the International AtomicEnergy Agency, whose safeguards system verifies compliance, informal international groupsand the Convention on Physical Security for Nuclear Materials, which sets internationalsecurity standards for storing, using and transporting nuclear material. Implementation of thePresident's February 11, 2004, speech would provide added safeguards preventingreprocessing and enrichment technology spreading to rogue countries or terrorists.
Res olution of these issues involves broader policy considerations beyond the scope ofthe present study. The future economic viability of nuclear power, however, does not dependon their resolution. As Appendix A6 shows, the difference in the cost of nuclear wastehandling, as between once-through disposal and reprocessing, is too small to materially affectthe economic viability of nuclear power.
A7-1

AM. Introduction
This appendix reviews practices in different countries (Section A7.2), andsummarizes international arrangements aimed at preventing proliferation (Section A7.3).Section A7.4 provides information on the current Administration policy regarding thespreading of enrichment and reprocessing technology outside a set of countries considered tobe reliable fuel suppliers who in compliance with international nonproliferationrequirements. The concluding section assesses the implications of proliferationconsiderations for the present study.
A7.2 International Comparison of Nuclear Fuel Disposal Policies
Technological considerations in direct disposal and reprocessing were discussed inAppendix A5. Attention was given to the traditional PUREX method of reprocessing and thenewer UREX method, along with ftu-ther DOE developmental efforts. Countries havereacted differently to the technological alternatives. Table A7-1 provides a comparison offuel cycle and nuclear waste disposal policies.
Reprocessing separates plutonium and uranium from fission products and recoversthem for use as new fuel for reactors while reducing the volume of high-level waste and theradioactivity life of low-level waste. The recovered plutonium is stored in facilitiescontrolled by the International Atomic Energy Agency (IAEA) or is combined with uraniumand manufactured into mixed oxide (MOX) fuel used to feed certain type of nuclear reactors.The remaining radioactive liquid fission products are mixed with other materials, vitrified,and placed in metal canisters for storage. Among the countries conducting re processing thatwere mentioned above, France, the U.K., and Russia have large-scale reprocessing facilitiesand provide reprocessing services commercially to a number of other countries. Belgium andItaly have reprocessing facilities for research, and Japan is building a commercial -reprocessing facility. Also, enrichment technology is located in several Western countries,Russia, and the Far East.
In the United States, reexamination of the U.S. choice of once-through policy isoccurring, in order to consider proliferation resistance characteristics of the newer UREX andPYRO methods of reprocessing and finther DOE development of disposal technologiesdiscussed in Appendix A5. These techniques may be able to meet nonproliferation goalssince they do not require plutonium to be separated from higher actinides or transported sincethey are recycled together in the reactor. As a consequence, proliferation risks are lowered,mainly through a substantial reduction in the risk of theft or misuse of plutonium.
A7-3

A7.3. The Nonproliferation Regulatory Framework
The nuclear nonproliferation regime consists of a combination of treaties,international organizations, and multilateral and bilateral agreements complemented byseveral unilateral actions intended to deter further spread of nuclear weapons. Keycomponents of the regime are the Treaty on the Non-Proliferation of Nuclear Weapons(NPT), the International Atomic Energy Agency (LAEA), whose safeguards system verifiesNPT compliance, informal international groups, and the Convention on Physical Security forNuclear Materials, which sets international security standards for storing, using andtransporting nuclear material. This section describes the extent of the NPT, the role of IAEAas well as its mission and safeguards system, and the responsibility of other organizationsand arrangements.
A7.3.1. The Treaty on the Non-Proliferation of Nuclear Weapons
The Nuclear Nonproliferation Treaty (NPT) was concluded in 1968, came into forcein 1970, and was indefinitely extended in 1995. Its main goals are to prevent the spread ofnuclear weapons, to make sure that peaceful nuclear technology is not diverted, to facilitateaccess to peaceful nuclear technology, and to promote disarmament. It provides the legal andinstitutional basis for nonproliferation internationally and depends for its success oncountries not violating their commitments. In particular, it establishes the framework for aninspection system based on an agreement between each participating state and IAEA.Currently, 187 nations are party to the NPT.
A7.3.2. Role of the International Atomic Energy Agency (IAEA)
IAEA was created in 1957 to help nations develop nuclear energy for peacefulpurposes. It has the role of establishing and administering nuclear safeguards arrangements,which are designed to deter diversion of nuclear material.
One of IAEA's missions is to verify through its inspection system that states complywith their commitments under the NPT and other nonproliferation agreements, to use nuclearmaterial and facilities only for peaceful purposes.
Article II of the basic Statute of IAEA specifies the role of IAEA in terms ofpreventing nuclear proliferation: "the Agency shall seek to accelerate and enlarge thecontribution of atomic energy to peace, health and prosperity throughout the world. It shallensure, so far as it is able, that assistance provided by it or at its request or under itssupervision or control is not used in such way as to further any military purpose" (IAEA1997).
Part B of Article III indicates that "in carrying out its functions, the Agency shallconduct its activities in accordance with the purposes and principles of the United Nations topromote peace and international co-operation, and in conformity with policies of the United
A7-5

A7.4. Current Administration Policy Regarding Nonproliferation Applicable to theNuclear Fuel Cycle
In a recent speech at the National Defense University, President Bush said, "The 40nations of the Nuclear Suppliers Group should refuse to sell enrichment and reprocessingequipment and technologies to any state that does not already possess full-scale, functioningenrichment and reprocessing plants. This step will prevent new states from developing themeans to produce fissile material for nuclear bombs. Proliferators must not be allowed to.cynically manipulate the NPT to acquire the material and infrastructure necessary formanufacturing illegal weapons!' (Bush 2004).
A7.5 Conclusion
There is a lack of agreement about whether or not the availability of currentreprocessing and enrichment technology under current regulatory mechanisms are increasingnonproliferation risk. Pursuing proliferation-resistant fuel cycle technology will clearly allaythese concerns. Also, implementation of the President's policy of capping the spread of
enrichment and reprocessing technology would provide added safeguards to preventreprocessing or enrichment technology spreading to rogue countries or terrorists.
Resolution of these issues involves broader policy considerations beyond the scope ofthe present study. The future economic viability of nuclear power, however, does not dependon their resolution. As Appendix A6 shows, however, the difference in the cost of nuclearwaste handling, as between once-through disposal and reprocessing,, is too small to materiallyaffect the economic viability of nuclear power.
40A7-7

Appendix A8. HYDROGEN
Summary
Success in the current efforts to make the hydrogen car an economic reality wouldreduce U.S. dependence on foreign oil and could have potentially large environmentalbenefits. Intensive R&D efforts are underway to reduce fuel cell costs. Mass productioncosts need to be reduced on the order of one-half to two-thirds to achieve widespreadadoption.
Combining hydrogen with oxygen creates essentially no pollution since the by-product of this type of energy conversion is water. The environmental benefits of hydrogenwould however be tempered if fossil fuels with their attendant carbon emissions are used toproduce the hydrogen, simply replacing carbon emissions from oil with emissions from fossilpower generation or steam methane reforming. Nuclear energy may provide a pollution-freeinput for production of hydrogen. Hydrogen could be produced using electricity fromnuclear power in an electrolysis process, or it could be produced using thermo-chemicalprocesses with nuclear reactors as the energy source. A hydrogen economy accompanied bymore stringent efforts to control carbon emissions could greatly expand the demand fornuclear power.
A8-1

A8.1. Introduction
If the hydrogen fuel cell vehicle makes a significant market penetration, the demandfor hydrogen will increase dramatically, and new sources for its production must be found.One promising possibility would use high-temperature nuclear reactors -to provide the heatsource for steam medme reforming or thermal cracking. This appendix considers the'prospects for a hydrogen economy to provide additional benefits from nuclear powergeneration. First, the hydrogen fuel cell vehicle (FCV) is considered: the near-term prospectsfor its market penetration and the demand for hydrogen that would derive from itswidespread adoption. Following the consideration of the FCV, the prospects for generationof hydrogen from nuclear power are examined.
A8.2. Hydrogen-Fueled Vehicles
The motivation to reduce air pollution and greenhouse gases caused by vehicleemissions, coupled with the need to reduce dependency on foreign oil, has speeded the raceto produce commercially viable vehicles that use gasoline-altemative fuel such as batteryhybrid vehicles and fuel cell vehicles. The hydrogen FCV has been given much attention inrecent years as an alternative to current gasoline-powered internal combustion engine (ICE)vehicles. The hydrogen FCV fits the category of zero-emission vehicle (ZEV) as itsbyproduct is water.
A8.2.1. Challenges to the Creation of a Hydrogen Vehicle Fleet
The successful introduction of hydrogen cars requires a hydro gen fuel cell capable ofpowering an automobile in a manner comparable to the internal combustion engine. On theinfrastructure side is the need for a distribution system to deliver the hydrogen fuel to thedriving consumer. The rest of this section will be primarily concerned with these two majorissues.
A8.2.2. Hydrogen Fuel Cells
A hydrogen fuel cell converts hydrogen and oxygen (or air) into water, producingelectricity and heat in the process. As hydrogen flows into the fuel cell on the anode side, aplatinum catalyst facilitates the separation of the hydrogen gas into electrons and protons(hydrogen ions). The hydrogen ions pass through a membrane (the center of the fuel cell)which acts as the electrolyte and, with the help of the platinum catalyst, combine withoxygen and electrons on the cathode side, producing water. The hydrogen electrons at thebeginning of the anode side which cannot pass through the membrane will flow from theanode to the cathode side through an internal circuit containing a motor or other electric load,which consumes the power generated by the cell.
A8-3

quick bursts of power during acceleration, providing instantaneous response and higher fuelefficiency (Honda 2002).
The GM Hy-Wire has 80 horsepower with 159 lb-ft of torque, a maximum speed of96 mph, and a 1i 0-mile range. The absence of booster batteries onboard conserves weightand space and demonstrates that the fuel cell can produce sufficient electricity on demand.GM hopes that between 2010 and 2020 it will become the first company to sell one millionfuel-cell vehicles (GM 2002).
The Toyota fuel cell hybrid vehicle (FCHV) has 109 horsepower with 194 lb-ft oftorque, a maximum speed of 96 mph, and an 80-mile range. It has undergone 18 months oftesting in California and Japan, but there are still many product, operational, and logisticalissues to address. Toyota does not expect that commercialized fuel cell-powered vehicleswill achieve any great market significance until at least 2010 (Toyota 2002).
A8.2.2.4. Projected Costs of the PEM fuel.ceU and Hydrogen FCV
Fuel cell cost estimates vary and are difficult to interpret. Several estimates arereported in this section. Ogden (2002, p. 70) indicates that the cost of fuel cell stacks mustbe reduced to the neighborhood of $50 to $100 per kW as compared to the current $1,500 perkW for the hydrogen FCV to be economically viable.
A report conducted by TIAX in May 2003 for a Hydrogen and Fuel Cells MeritReview Meeting estimates that the cost of a 50 kW fuel cell system based on 2001 near-termtechnology and a production rate at a high volume of 500,000 units per year was $324 perkW, where 67 percent of that cost was for the fuel cell, 24 percent for the fuel processor,6 percent for the assembly and indirect, and 3 percent for balance-of-plant.
A hydrogen fuel cell with fuel processor converts other hydrogen carriers such asmethanol or various hydrocarbons into hydrogen. According to A.D. Little (2001), a 50 kWfuel cell fuel processor system is estimated to cost $14,700, of which 60 percent goes toproducing the fuel cell, 29 percent to the fuel processor, 8 percent to assembly and indirectcosts and 3 percent to the balance of plant. This makes the cost of the fuel cell $8,820 or$176 per kW as compared to $8,850 or $177 per kW in a non-fuel processor system fuel cellthat does not convert hydrogen carriers into hydrogen.
In a report on the comparative assessment of fuel cell cars produced by MIT'sLaboratory for Energy and the Environment (LFEE), the cost for hydrogen and gasoline-fuelcell hybrids is projected to be $22,140 to $23,400, or 23 to 30 percent higher than the 2020baseline vehicle costs of $18,000 (Weiss et al. 2003). Analysis by A.D. Little (2001) concursthat even with optimistic assumptions about performance and cost, factory costs would likelybe 40 to 60 percent higher than for ICE vehicles. Moreover, ownership cost would be $1,200to $1,800 higher than for conventional ICE vehicles (Weiss et al. 2003, p. 7). The existingFCV models are currently too expensive to put on the market; for instance, the Honda FCXcosts $2 million, or $100,000 if mass produced. The General Motors Hy-Wire costs
A8-5.
levels is to construct the catalyst layer with the highest possible surface area. The LosAlamos National Laboratory (LANL) has developed a fabrication process for fuel cellmembrane electrode assemblies with reduced platinum loading that decreases the cost of thecatalyst by 90 percent (LANL 2000).
Danish Power Systems has developed a PEM fuel cell stack system that meetsautomaker requirements for an operating temperature that runs at up to 200 degrees C and iseasier to cool than the low-operating ones that run below 100 degrees C. The membrane ofeach PEM fuel cell is made of PBI, a thermally high resistant material that possesses uniqueproperties that increase efficiency and costs less than the traditional Nafion (Bjerrum 2003).
Hydrogen technology research is also heavily funded to overcome the technicalbarriers of storage capacity and cost, along with improving life cycle cost and energyefficiency and improving methods of hydrogen production (Rose 2003a). For example, DOEhas funded projects to develop methods to safely store hydrogen to enable at least a 300-milevehicle range, which it considers a critical requirement for successful vehiclecommercialization.
A8.2.2.5.2. Federal FCV Pilot Study
The federal government is currently involved in a ten-year program to help facilitatethe commercialization of fuel cell technology (Rose 2003b). It has been proposed that theSecretary of Energy lead a cooperative effort among federal agency fleet operators andprivate-sector FCV companies.in a cost-shared program to purchase, operate and evaluateFCVs in integrated service for federal fleets to demonstrate their commercial viability in arange of climates, duty cycles, and operating environments.
This $495 million program includes two phases to reach the goals of this pilot-fleetdemonstration. Phase I runs from 2004-2007, and includes the purchase of 500 passengervehicles, 500 Department of Defense (DOD) vehicles, 100 transit buses, 100 school busesand 20 fueling stations, demonstrating a range of fuels and fueling strategies. Phase II runsfrom 2008 to 2011, when the federal government would meet 50 percent of its civilianvehicle fleet needs with fuel cell vehicles, or purchase 5,000 passenger vehicles annually.During this phase, the DOD and the Cabinet secretaries would set their own targets on thenumber of military vehicles or mobile equipment and specialty vehicles needed.
A8.2.2.5.3. Proposed Tax Incentives
The Breakthrough Technologies Institute, Inc. recently published a report thatincluded a FCV ten-year market entry support plan (Rose 2003b). The report recommendeda short-term consumer-based tax incentive that would reduce the incremental cost for earlyadopters and help the FCV industry build production capacities to reach economies of scale.It suggested that Congress continue the existing $4,000 tax credit system for qualifying fuelFCVs.
A8-7

At the other end of the spectrum, the National Hydrogen Energy Roadmap and othersources suggest that the Bush administration has been working to ensure that hydrogenproduction will remain fossil fuel-dependent and dirty, as 90 percent of all hydrogen wouldbe refined from oil, coal and natural gas while the remaining 10 percent will be cracked fromwater using nuclear energy. The process of producing the fuel cells from hydrocarbons willcontinue America's dependence on fossil fuels and still emit carbon dioxide, the, primarycause of global warming (CNN 2003; Lynn 2003; ITS 2002; Kolber 2003; Hunt 2002).
In between are those who think that given the major scientific and economicimprovements necessary to be successful, funds could be better used to focus on more viableoptions (Popely 2001; Tromp et al. 2003). David Cole warns that fuel cells may notultimately be the solution to reducing fossil-fuel dependence, since hybrid electric vehicles,diesels, or a new technology could prove more cost-effective (Flint 2003). The NaturalResources Defense Council contends that funding of the hydrogen car cuts the budget forother federal research into clean energy by $47 million (Rosenbaum 2003).
A8.3. Considerations for Large-Scale Hydrogen Production
Should natural gas prices rise, electrolysis of water may become the primaryhydrogen production method to meet the needs of a growing FCV market. Kruger's (2000)analysis of electric power requirements suggests that by 2010, 165 GW of additional capacitywould be needed to meet increased hydrogen demand from the use of 20,000 fuel cellvehicles, beyond the requirements to meet other sources of demand growth. This wouldamount to a 20 percent increase over current capacity.
While renewable energy sources can be used to produce hydrogen, those fail to meetthe scale demanded by industry: using wind power would require as many as 640,000windmills occupying 71,000 square miles (about the size of Indiana and Ohio); powergeneration using biomass would require four times as much plant material as U.S. farmerscurrently grow; the solar option would require $4.8 trillion worth of solar panels andequipment occupying 3,000 square miles (NEI 2003). Reducing these estimates by one-halfwould not materially relax the limitations to renewables supplying hydrogen at an industrialscale.
Sufficient domestic coal exists to fire electrical plants to provide both the electricityand the hydrogen needed for several hundred years. Building new power plants required tomeet this demand would be a large-but not infeasible-task, but coal-fired power plantsgenerate carbon dioxide and other emissions. Without expensive emission control methods,coal plants would simply discharge these substances into the atmosphere at a differentlocation from automobiles, increasing carbon emissions on balance. Such a strategy woulddo little to combat pollution and global warming or harness the environmental benefits ofhydrogen. Production of hydrogen using steam methane reforming is capable of reducing.carbon emissions on balance, but only modestly. Substituting hydrogen for gasoline invehicular transportation would reduce carbon emissions from the gasoline but would involve
A8-9
steam reforming in combination with a nuclear reactor. The institute hasdeveloped a heatexchanger type of nuclear reactor for the reforming process that has minimized many of theoperational issues. Since this uses standard hydrogen production technology it represents theonly near-term nuclear-hydrogen technology (Forsberg 2003, p. 1075).
A8.4.2. Electrolysis
Electrolysis, while a mature technology, has been used historically to produce purehydrogen only in small quantities. Electrolysis is essentially the splitting of water moleculesby electricity. Electrodes, a cathode and an anode, placed in an alkaline solution drive themovement of electrons. Hydrogen forms at the cathode and oxygen at the anode.
While current electrolyzers have efficiencies approaching 85 percent or better,electrolysis is not competitive for large-scale production of hydrogen, given its capital costand electricity consumption. Current capital costs are estimated to be near $600 per kW(Forsberg 2003, p. 1075). Average electricity consumption is 4.5 kWh per cubic metres ofhydrogen, (Kruger 2000, p. 128).
A possibility for improving the economic conditions for electrolysis would be forelectricity generators and hydrogen production facilities to agree to use off-peak electricityfor the electrolysis production (Crosbie and Chapin 2003, p. 3). Several studies have shownthat when electricity is cheap enough, for example at off-peak rates of $2 to $3 permegawatt-hour, hydrogen might be produced at a price competitive with the price of gasolineor diesel fuel. NRC (2004, p. 5-16) concludes that electricity prices will be critical to the useof electrolysis for hydrogen production.
A8.4.3. Thermo-Chemical Cycles
Thermo-chemical cycle water-splitting processes offer the potential for makinghydrogen at temperatures in the range of 700 to 900'C. This process is considered to be theleading long-term option for hydrogen production (Crosbie and Chapin 2003, p. 9). Thebasic cycle involves the thermal decomposition of water into hydrogen and oxygen using anionic solution to mediate the reaction.
The most promising of these cycles are the calcium-bromine process and the sulfur-iodine process. Currently, neither of these thermo-chemical processes has progressed to thepoint of commercial viability, perhaps partly because there has not been the economicincentive to do so. Recently, however, interest in environmental benefits and energyindependence has increased attention to these methods. Recent estimates indicate thatthermo-chemical production costs could be 60 percent of current electrolysis costs usingnuclear reactors dedicated to hydrogen production (Forsberg 2003, p. 1075).
Thermo-chemical processes would be conducted from nuclear reactors dedicated tohydrogen production. The greater proportion of the heat generated by the reactor would beused for the hydrogen production, but the waste heat could be used to power a steam turbinewhich would generate electricity that could be sold outside the hydrogen production facility.
A8-11

References
Arthur D. Little, Inc. (2001) "Cost Analysis of Fuel Cell System for Transportation: 2001System Cost Estimate." Report to U.S. Department of Energy. Cambridge, Mass.: ArthurD. Little, Inc., August.
Argonne National Laboratory (ANL). (2003) "Meeting U.S. Transportation Needs in theHydrogen Economy." Retrieved December 13, 2003 from the World Wide Web:http://hydrogen.anl.gov/pdfs/meeting-transportationlneeds.pdf.
British Broadcasting Corporation (BBC). (2003) "An Overview of the GM Hy-Wire Car"Retrieved from the World Wide Web: http://www.bbc.co.uk/dna/place-london/Al 143505.
Business Week (BW). (2002) "Commentary: Fuel Cells: Japan's Carmakers Are FlooringIt". Retrieved from the World Wide Web:http://www.businessweek-com/magazine/content/02_511b3813084.htm.
Bjerrum, N.J. (2003) "Danish Breakthrough for the Next Generation of PEM Fuel Cells."Retrieved December 13, 2003 from the World Wide Web:http://www.fuelcellsworks.com/Supppage247.html.
Cable News Network (CNN). (2003) "Bush Hydrogen Initiative Furls Debate." RetrievedAugust 2003 from the World Wide Web:http://www.cnn.com/2003/ALLPOLITICS/02/O7/hydrogen.vision.ap/.
Crosbie, L. and D. Chapin. (2003) "Hydrogen Production by Nuclear Heat." MPRAssociates, Inc., Alexandria, Va.
Davis, C., B. Edelstein, B. Evenson, A. Brecher, and D. Cox. (2003) "Hydrogen Fuel CellVehicle Study," Panel of Public Affairs & American Physical Society, June 12. RetrievedSeptember 2003 from the World Wide Web:http://www.aps.org/public-affairs/popa/reports/fuelcell.pdf.
Doctor, Richard D. (2002) "STAR-H2: A Calcium-Bromine Hydrogen Cycle Using NuclearHeat." Argonne National Laboratory. Retrieved from the World Wide Web:http://hydrogen.anl.gov/pdfs/doctor-0302.pdf.
Edmunds.com. (2003). "Honda's Pollution-Free Car". Retrieved from the World WideWeb: http://www.edmunds.com/advice/specialreports/articles/100335/article.html, July 2003.
Flint, J. (2003) "The Hydrogen Car?" Ward's Auto World. Retrieved August 2003 from theWorld Wide Web:http://www.wardsauto.com/magazinearticle.asp?magazinearticleid= 170599&magazineid=50&sitelD=26&sitelD=26&releaseid= 111 07&mode=print.
A8-13

Retrieved August 2003 from the World Wide Web:http://msl1.mit.edu/msl/meeting-04192001/prz2.pdf/ibaron.pdf.
Melaina, Marc W. (2003) "Initiating Hydrogen Infrastructures: Preliminary Analysis of aSufficient Number of Initial Hydrogen Stations in the U.S," International Journal ofHydrogen Energy 28: 743-755.
Molburg, John C., and Richard D. Doctor. (2003) "Steam Methane Reforming-CO 2 LifeCycle Analysis." Draf, FWP 00FE49497. Argonne, IM1.: Argonne National Laboratory,February 1.
Morita, Y. (2003) "Development and Diffusion of Fuel Cell Powered Automotive Vehiclesand Its Impact." Tokyo: The Energy Data and Modeling Center, The Institute of EnergyEconomics.
National Research Council (NRC). (2004) The Hydrogen Economy: Opportunities, Costs,Barriers, and R&D Needs. Washington, D.C.: National Academies Press.
Nice, K. (2003) "How Fuel Cells Work." Retrieved December 2003 from the World WideWeb: http://auto.howstuffworks.com/fuel-cell.htm/printable.
Nuclear Energy Institute (NED). (2003) "The Hydrogen Economy and Nuclear Energy."Retrieved December 2003 from the World Wide Web:http://www.nei.org/index.asp?catnum=2&catid=265.
Oak Ridge National Laboratory (ORNL). (2003) Carbon Dioxide Information AnalysisCenter. Oak Ridge, Tenn.: Environmental Sciences Division, Oak Ridge NationalLaboratory. Retrieved December 2003 from World Wide Web:http://cdiac.esd.oml.gov/pns/faq.html.
Ogden, Joan. (1999) "Prospects for Building a Hydrogen Energy Infrastructure," AnnualReview of Energy and Environment 24: 227-280.
Ogden, Joan. (2002) "Hydrogen: The Fuel of the Future?" Physics Today 55: 69-76.
Popely, R. (2001) "H2 Oh: Carmakers Move Toward Hydrogen Fuel Cells." ChicagoTribune. August 12.
Rose, R. (2003a) "FY 2004 Budget Proposals for Fuel Cells and Hydrogen." U.S. Fuel CellCouncil. Retrieved from the World Wide Web: http://fuelcells.org.
Rose, R. (2003b) "Fuel Cells and Hydrogen: The Path Forward." Washington, D.C.:Breakthrough Technologies Institute, Inc.
A8-15

Wengroff, J. (2003) "Fuel Cell Vehicles to Number 800,000 by 2012, According to ABL"Allied Business Intelligence. Retrieved July 2003 from the World Wide Web:http://www.abiresearch.com/pdfs/afc02pr3.pdf.
A8-17

Appendix A9. ENERGY SECURITY
Summa
Nuclear power could provide energy security benefits as a potential source ofhydrogen to replace oil in the transportation sector and more generally as a substitute for gas-generated electricity.
Energy security has been discussed primaril y in connection with oil and the politicalinstability of the Middle East. A direct link to electricity is limited by the small amount ofelectricity produced using oil. One way by which nuclear electricity generation could berelated to oil security is via cogeneration of hydrogen for widespread use in transportation. Ifcogeneration with nuclear power is the least expensive source of hydrogen, it wouldcontribute to speeding the adoption of hydrogen vehicles, reducing dependence on oil.
Currently the United States imports about 4 percent of its natural gas in the form ofLNG, but this percentage could grow if substantial new capacity is devoted to gas-firedproduction and if North American gas production expands only very sluggishly. Asinternational trade in LNG becomes more extensive and the United States participates in itmore deeply, this energy security linkage could become more important.
The effect of foreign dependence on gas is influenced by differences between worldoil and gas markets. The world natural gas market is less unified than the world oil market.Price increases in one part of the world are not as quickly and completely transferred to othercountries as with oil, as shown by analysis of natural gas prices for over thirty countries.Results show high correlations of gas price movements within Europe, but low correlationsbetween European countries and non-European countries. Canadian, Mexican and U.S. gasprices are highly correlated with one another, but none of these North American countries'prices is highly correlated with either European or Asian prices. Gas prices in Taiwan. andJapan, both of which import considerable amounts of LNG from Indonesia and Malaysia, arehighly correlated, as would be expected in that regional market. However, their gas priceswere essentially uncorrelated with gas prices in North America or Europe.
This balkanization of natural gas prices around the world suggests that whilecountries may be subject to economic repercussions from gas supply shocks in their ownregions, they tend to be insulated from supply shocks in other re igions.
Gas does not pose as great an energy security threat as oil, but, still, nuclear powergeneration capacity could become a significant defense against regional gas supplyinterruptions. Interruptions could extend increasingly to offshore sources, given thelikelihood of only limited additional imports from Canada and Mexico.
Projections of gas prices are reported in Chapter 7. Recent projections from a numberof models have forecast gas prices in 2020 to be slightly below their levels in 2000, inconstant dollars. However, in the recent period of gas price volatility and uncertainty about
A9-1

Outline
A9.1. Introduction: What Energy Security Is
A9.2. Oil and Energy Security
A9.2.1. The Track Record with OilA9.2.2. A Unified World Oil MarketA9.2.3. Concentration of Oil ReservesA9.2.4. Oil Price Shocks and Gas-Fired Electricity Generation
A9.3. The Present and Future of Natural Gas
A9.3. 1. The Recent Price Increases and Forecasts for the FutureA9.3.2. U.S. Natural Gas Consumption and Longer-Term Gas Supplies in the
Continental United States and CanadaA9.3.3. Gas Imports-LNGA9.3.4. Vulnerability of Gas to Price ShocksA9.3.5. The World Gas MarketA9.3.6. Implications for Natural Gas as an Energy Security Issue
A9.4. Energy Security Implications for Nuclear Power
A9.4.1. Sources of UncertaintyA9.4.2. Toward Modeling UncertaintyA9.4.3. Appendix
References
A9-3

The 1979 to 1980 events began with supply interruptions from Iran during theKhomeini revolution and were supplemented with further interruptions when Iraq took theopportunity to attac * k Iran in 1980. Both events fortuitously interrupted oil production andshipments from both Iran and Iraq, and the slack was not picked up by the OPEC swingproducer, Saudi Arabia. Both the Iranian Revolution and the beginning of the Iran-Iraq Wartook the world by surprise, and the political and military consequences were uncertain forwell over a year. By 1982, the United States was well into recession. The politicaluncertainties of the Persian Gulf disturbances were resolved over the next few years, and theenergy R&D and oil exploration sparked by the OPEC embargo's price shock reachedfi-aition. By 1985, the world supplies of oil had greatly increased, and at the same time oilintensities of all types of industrial production had begun to fall si nificantly. The result wasthe 1985 oil price collapse.
Iraq's inv asion of Kuwait in August 1990 cut off Kuwaiti oil supplies, and for overtwo months the integrity of Saudi supplies was in question. .After some negotiation, SaudiArabia compensated for much of the lost production, but Iraq's military action had caught theworld by surprise and the military uncertainty lasted until the allied invasion began in mid-January 199 1. Prices rose by 5 0 percent overnight and remained near that level until thebeginning of the allied attack- The economic uncertainties of the situation were resolvedrapidly, but the United States, which had been on the brink of recession prior to August 1990,fell into a full-scale recession with the push from the oil price shock.
OPEC has demonstrated some cartel power in recent years, but it has been temperedby the reserve army of fringe producers that has emerged as a consequence of the earlier oilprice shocks. While Saudi Arabia remains the swing producer-the cartel leader-its pricepower appears to be weaker, although a few random events around the world could put itback in the driver's seat for a time.
Oil has clearly been an economic problem. Hamilton (1983) presented evidence thatthe post-1973 relationship between oil prices and U.S. recessions went back to the late 1940s.Despite occasional suggestions that these oil price shocks were only fortuitously associatedwith the ensuing recessions, the preponderance of the evidence indicates that the oil supplyshocks have indeed had major recessionary impacts (Jones et a]. 2004).
A9.2.2. A Unified World Oil Market
While the dynamics of oil prices, with its storability, are interesting, it is sufficient forpresent purposes to emphasize the relative unity of the world oil market. Oil can be shiftedaround the world at relatively low cost by tankers and low-pressure pipelines in response torelatively small differentials in price. Price differentials will always exist according to thephysical qualities of oil and the expense of refining them at particular facilities, but changesin the price of one grade of oil in one location in the world are invariably followed closely bynearly parallel changes in the prices of all other grades of oil all over the world.
A9-5

The extent of actual substitutions between oil and gas in industrial uses, which wouldbe the driver of cost increases for gas-fired electricity generation, would probably depend onthe character of the oil price increase. A short, sharp price shock such as the industrial worldhas experienced several times since the early 1970s, could fail to motivate industrial oilconsumers to switch to gas if the oil price is expected to fall rapidly and the switch-over costswere high relative to the cost of curtailing production for an expected short period.Nonetheless, a two- or three-year-long period of elevated oil prices would see natural gasprices rise in response,.to keep their prices per MMBtu roughly equal. A longer-term,probably slower, oil price increase such as would be associated with dwindling worldwidereserves rather than a cartel action, would certainly be matched with parallel gas priceincreases.
A9.3. The Present and Future of Natural Gas
The potential link between natural gas and nuclear power requires an examination ofthe place of natural gas in the U.S. energy system, both currently and prospectively. The twomost critical questions are (1) is the United States rapidly depleting North American gasreserves, permanently driving up the price of natural gas? and (2) could the United States besubject to a natural gas price shock, comparable to an oil price shock, from an overseassupply disruption, whether or not it becomes dependent on imports? This section considersthe present situation to set the stage to address these two questions.
A9.3.1. The Recent Price Increases and Forecasts for the Future
In recent years, the spot price for natural gas has displayed volatility and becomeincreasingly unpredictable. As more gas powered electric plants have come online, thehistorical difference between winter and summer gas demand has diminished. EIA has had toreadjust its price forecasts repeatedly due to the changes in the natural gas market Accordingto a Deutsche Bank report, EIA's long-term gas price forecasts have been off by an averageof $1.20 per MMBtu over the last 15 years, while the 3-year forecast has been off by $0.70per MMBtu (Smith and Hove 2003, p. 10). Table A9-1 shows the current EIA forecastpredicting the average wellhead price for the lower 48 states to vary from $3.62 per MMBtuin 2005 to $4.51 per MMBtu by 2025 (in 2003 dollars).
Table A9-1: Natural Gas Prices, Recent and Forecasts, $ per MMBtu, in 2003 Prices
EIA Price Forecast 2000 2001 2005 2010 2015 2020 2025-Average Wellhead Price 3.92 4.24 3.62 3.48 4.29 4.38 4.51Average Import Price 4.14 4.59 3.76 3.87 4.69 4.69 4.77
Average Price 4.03 4.30 3.65 3.57 4.39 4.45 4.57Source: EIA (2004).
A9-7

although this calculation does not 'allow for new discoveries or an acceleration of theexploration rate. Some observers believe that Canada would be hard pressed to find newreserves if consumption of gas increased dramatically. Canadian companies would need tofind an alternative to the Western Canada Sedimentary Basin, which currently accounts for95 percent of the Canadian reserves and is considered one of the most productive in NorthAmerica.
Opinions exist in the gas industry that recent technological advances in explorationand drilling will revitalize the discovery of new reserves, particularly in previously littleexplored areas. Fisher (1994) discussed how technological improvements have continuallyoverridden estimates of reserves, and technology has continued to advance in the decadesince his article was written. An assessment that the continental United States and Canadawill be largely depleted of their natural gas resources in the next decade may be anoverstatement.
A93.3. Gas Imports-LNG
Worldwide reserves of natural gas continue to be immense and relatively untapped.For gas fields that are remote from their ultimate consumers, long haul pipelinetransportation is prohibitively expensive. Alternatively, the market flexibility offered byLNG represents a new opportunity to increase supply. Growth in LNG trade has beensubstantial since the early 1990s in response to increased world gas demand and reduction inproduction costs. hnports of LNG by the United States make up a small percentage of thetotal supply of natural gas. Figure A9-1 shows the history of U.S. natural gas consumptionand imports.
A9-9

precisely at present. Additional.ly, a rule of thumb in the gas business is that over the longerterm, the natural gas price will be equivalent in NBOtu terms to the price of oil, so forecastsfor continuing gas price increases that take no account of real oil prices may be inadequate.
Until the past few years, almost aH LNG trade took place under committed long-termcontracts, but recently short-term contracts-but not quite a spot market-have become morecommon-rising from 1.5 percent of all LNG transaction in 1997 to 7.8 percent in 2001(Jensen, 2003, p. 8). With the large capital investments required in LNG liquefaction,transportation, and regasification, investors have been reluctant to build LNG facilitieswithout long-term contracts, typically as long as 20 years. It is not clear that this linkagebetween long-term contracts and capital investment in LNG will change significantly in thefuture.
The United States presently has four LNG terminals, only two of which are currentlyopen. Numerous sites have been suggested for additional terminals, but most haveencountered envir ' onmental problems in siting. Significant expansion of LNG imports wouldrequire new termials.
A9.3.4. Vulnerability of Gas to Price Shocks
Weather anomalies are a primary source of natural gas demand shock. The pricespikes they cause should not precipitate any pause in economic activity that would lead torecession. Unusually bad weather, despite the temporary hardships it causes, is neverexpected to last very long and produces no long term economic uncertainties. A longer-term,gradual warming trend such as would be associated with global climate change, mightincrease or decrease the demand for electricity between cooling and heating seasons, buteven a net increase would produce a gradual gas price increase that markets should be able toabsorb without temporary dislocations.
Infrastructure problems and wellhead supply interruptions are possible sources ofsupply interruptions. The former could cause localized supply disruptions, but probably notgeneralized price increases. With regard to wellhead supply interruptions, some of the majorgas-producing regions of the world have problems with potential political instability:Indonesia, Central Asia, Nigeria, Algeria, and Saudi Arabia with its significant natural gasreserves in addition to its oil reserves. Political turbulence in any of these regions couldinterrupt its gas exports, such as occurred with Iranian oil in 1979. However, gas reservesare distributed more evenly around the world than are oil reserves, which lowers and possiblyeliminates, any particular producer's market power. This low degree of market power alsowould imply a smaller proportional disruption of world supply if any one producerexperienced a production shut-down from political disruption.
The question remains, however, whether a disruption in any particular world regionwould cause parallel price movements in gas prices throughout the world. The next sectionaddresses that issue.
A9-11

Figure A9-3: Industrial Sector Gas Prices in the United States, OECD Europe, Japan,and Taiwan, 1994-2002, in 2003 Dollars
600-
5 500-
.2
0 400 -C
W00 -E
CL
0.
10009S1994 1995 1996 1997 1998 1999 2000 2001 2002
-I--OECD Europe -A--Taiwan -- &--Japan *.USAI
Source: EIA (2003c).
Figure A9-4: Household Sector Gas Prices in the United States, OECD Europe, Japan,and Taiwan, 1994-2002, in 2003 Dollars
1600
1400-
.21200-
C 10000
800E
600
0. 400
m 200
01994 1995 1996 1997 1998 1999 2000 2001 2002
.-- OECD Europe - Taiwan a--Japan -.-- USA
Source: EIA (2003d).
A9-13

market as well. Information is not available to assess the extent to which South Americangas markets are integrated with North American gas markets. Columbia was disturbedpolitically in 2003 by the possibility of exporting its abundant natural gas reserves to NorthAmerica, while Peru has been making explicit investment plans to export its gas (Webber2003). Thus, it appears that closer integration of North and South American gas markets is apossibility in the relatively near term.
The correlation coefficients between the United States and OECD Europe arenegative and small for both utility and industrial gas prices. Japanese and OECD Europeindustrial and utility gas prices have small, negative correlation coefficients. From Table 9-2,the Japanese utility sector gas price has a statistically insignificant correlation with U.S.utility gas prices but the two countries" industrial sector gas prices are negatively correlated.
These data suggest the existence of at least three major world markets in natural gasthat are not particularly well integrated. The East Asian market is largely an LNG market,but the North American and European markets are primarily pipeline markets, with LNGsupplies at the fringes. It is not clear why the Japanese and U.S. utility and industrial sectorgas prices have their pattern of correlations. The greater part of the U.S. small LNG importsare from the Atlantic Basin LNG market rather than the Pacific Basin market.
A9.16. Implications for Natural Gas as an Energy Security Issue
Wide distribution of natural gas reserves prevents the world natural gas markets frombeing cartelized. As a result of substantially greater transportation costs than oil, there doesnot appear to be a unified world market for natural gas, which has both benefits anddrawbacks from the energy security perspective. The benefit is that supply disturbancesoriginating overseas are difficult to transmit directly to U.S. gas prices. The drawback is thatwhen a sharp supply-demand shift occurs in the United States, sending gas prices skyward, itwould be difficult to alleviate the problem quickly with imports. This is the classic energysecurity problem. It would exist if domestic (or North American) gas supply shocksemerged, but probably would be little affected by overseas shocks.
The prognosis for dwindling natural gas reserves in the continental United States andCanada is subject to a wide range of opinion. New exploration and drilling technology mayfind and extract vast new quantities of natural gas in North America at prices eventuallyaround $3 per mcf in 2003 prices. The energy-content price parity with oil should keep gasprices down, regardless of the progress of recoverable reserves. However, should reservesnot expand, or expand only modestly, the supply of gas to gas-fired utilities would not growrapidly enough to match electricity demand growth. Currently operating gas plants wouldhave quasi-rents in view of their existing capacity that could make them affordable using gaspriced significantly above the oil energy equivalent, at least for a while. The extent to whichLNG imports could supplement dwindling domestic gas supplies is subject to fin-therestimation. Capital cost and financmig issues, contract-term issues, and environmental issuesin siting terminals are all involved. If a low-reserve scenario emerged, and it could not beeliminated by LNG imports, capacity expansions would be in coal and nuclear technologies
A9-15
Another source of uncertainty concerns the environment: it is possible that theexternal cost of fossil electricity generation will become unacceptably high, reversing thepresent relative costs of nuclear and fossil generation. Retaining nuclear power on thatoption would reduce high adjustment costs of gearing up a moribund nuclear capacity in thefuture.
A third source of uncertainty concerns the possible emergence of a hydrogeneconomy, with a greatly increased demand for production of hydrogen from non-fossil heatsources such as those supplied by nuclear power. A longer-term link between oil securityand electricity revolves around the possibility of the widespread adoption of hydrogenvehicles, replacing oil-fueled vehicles. If hydrogen vehicles were adopted on a massivescale, the demand for electricity to generate hydrogen would expand several-fold, andnuclear power would offer a non-emissive option for expanding generation capacity.
A9.4.2. Toward Modeling Uncertainty
If the future were known with certainty, there would be no reason to try to beprepared for events that might happen when more than one outcome is possible. The futurecost of fossil power generation may or may not be greater than the cost of nuclear powergeneration. For example, stricter greenhouse gas controls could raise the future cost of fossilgeneration substantially above the cost of nuclear generation. While it is not known for surewhether and when the controls might be introduced, the risk motivates building nuclearcapacity in order to be prepared for the possibility that the price of fossil generation will rise.
How to react to risk requires comparing the costs of being prepared with the expectedbenefits. If nuclear power capacity could be expanded instantaneously, there would be noreason to add to nuclear capacity-unless and until fossil capacity actually becomes moreexpensive. However, if time is required to expand nuclear capacity once a decision is madeto do so, it will pay to have nuclear capacity on hand in advance. How much to have on handdepends on the probability of the environmental occurrence and the costs of building upnuclear capacity. In the model below, fossil power plants are subject to the possibility ofhigher cost in the future, but they can be built without driving up their construction cost.Nuclear plants are not subject to similar future price uncertainties, but a rapid build-up ofnuclear capacity would drive up their construction costs. A rule for optimizing additions tonuclear capacity is to equate expected cost, as the probability-weighted average of costs offossil generation with and without the environmental occurrence, to the short-run marginalcost of adding nuclear capacity.
Let CF be the cost of fossil generation if the present situation of very few controls ongreenhouse emissions is continued. Letp be the probability of an undesirable environmentalor other event increasing the cost of fossil generation to c;, so that I-p is the probability of acontinuation of cF. Then the expected cost of electricity generation from the capacity thatwill be added in the economy in any year is
EC = (1 -p)[CF.(k_- kN)+ f(kN)] + p[cF(-k)+ f(kN)],
A9-17
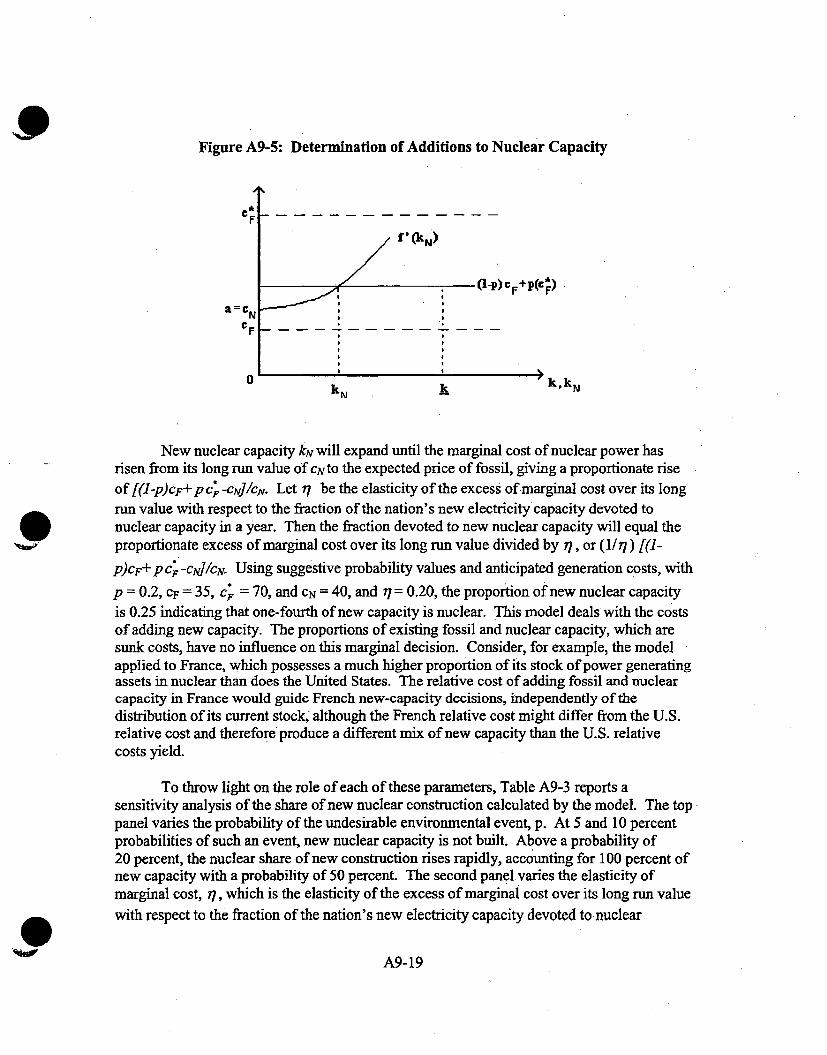
Figure A9-5: Determination of Additions to Nuclear Capacity
_ kN k - kkN
New nuclear capacity kN will expand until the marginal cost of nuclear power hasrisen from its long run value of cN to the expected price of fossil, giving a proportionate riseof[(1-p)cF+pc7-cNr]/cN. Let r be the elasticity of the excess of marginal cost over its longrun value with respect to the fraction of the nation's new electricity capacity devoted tonuclear capacity in a year. Then the fraction devoted to new nuclear capacity will equal theproportionate excess of marginal cost over its long run value divided by 77, or (l/r1) [(1-p)CF+ p C -CN]/CN. Using suggestive probability values and anticipated generation costs, withp = 0.2 , CF = 3 5 , cF = 70, and CN = 40, and 17= 0.20, the proportion of new nuclear capacityis 0.25 indicating that one-fourth of new capacity is nuclear. This model deals with the costsof adding new capacity. The proportions of existing fossil and nuclear capacity, which aresunk costs, have no influence on this marginal decision. Consider, for example, the modelapplied to France, which possesses a much higher proportion of its stock of power generatingassets in nuclear than does the United States. The relative cost of adding fossil and nuclearcapacity in France would guide French new-capacity decisions, independently of thedistribution of its current stock, although the French relative cost might differ from the U.S.relative cost and therefore produce a different mix of new capacity than the U.S. relativecosts yield.
To throw light on the role of each of these parameters, Table A9-3 reports asensitivity analysis of the share of new nuclear construction calculated by the model. The toppanel varies the probability of the undesirable environmental event, p. At 5 and 10 percentprobabilities of such an event, new nuclear capacity is not built. Above a probability of20 percent, the nuclear share of new construction rises rapidly, accounting for 100 percent ofnew capacity with a probability of 50 percent. The second panelvaries the elasticity ofmarginal cost, q/, which is the elasticity of the excess of marginal cost over its long run valuewith respect to the fraction of the nation's new electricity capacity devoted to nuclear
A9-19
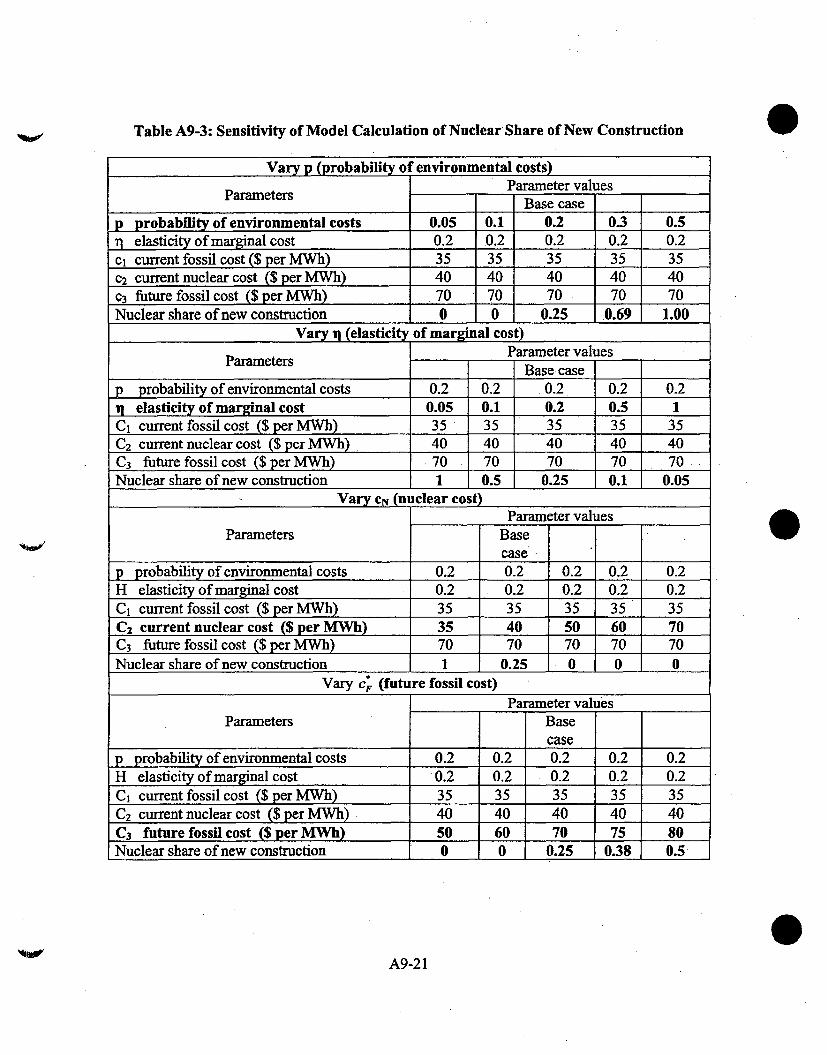
Table A9-3: Sensitivity of Model Calculation of Nuclear Share of New Construction
Vary p (probability of environmental costs)
Parameters Parameter valuesBase case
p probability of environmental costs 0.05 0.1 0.2 0.3 0.5I1 elasticity of marginal cost 0.2 .0.2 0.2 0.2 0.2c, current fossil cost ($ per MWh) 35 35 35 35 35c2 current nuclear cost ($ per MWh) 40 40 40 40 40c3 future fossil cost ($ per MWh) 70 70 70 70 70Nuclear share of new construction 0 0 0.25 0.69 1.00
Vary 11 (elasticity of marginal cost)
Parameters Parameter valuesParameters Base case
p probability of environmental costs 0.2 0.2 0.2 0.2 0.21q elasticity of marginal cost 0.05 0.1 0.2 0.5 1C1 current fossil cost ($ per MWh) 35 35 35 35 35C2 current nuclear cost ($ per MWh) 40 40 40 40 40C3 future fossil cost ($ per MWh) 70 70 70 70 70Nuclear share of new construction 1 0.5 0.25 0.1 0.05
Vary CN.(nuclear cost)Parameter values
Parameters Basecase
p probability of environmental costs 0.2 0.2 0.2 0.2 0.2H elasticity of marginal cost 0.2 0.2 0.2 0.2 0.2C1 current fossil cost ($ per MWh) 35 35 35 35 35C2 current nuclear cost ($ per MWh) 35 40 50 60 70C3 future fossil cost ($ per MWh) 70 70 70 70 70Nuclear share of new construction 1 0.25 0 0 0
Vary cF (future fossil cost)
Parameter valuesParameters Base
casep probability of environmental costs 0.2 0.2 0.2 0.2 0.2H elasticity of marginal cost 0.2 0.2 0.2 0.2 0.2C1 current fossil cost ($ per MWh) 35 35 35 35 35C2 current nuclear cost ($ per MWh) 40 40 40 40 40C3 future fossil cost ($ per MWh) 50 60 70 75 80Nuclear share of new construction 0 0 0.25 0.38 0.5
A9-21

Assumption 2: The consumer decides what fraction of the resource will be used with eachgeneration technology before the state of the world is known.
Assumption 3: There are no environmental externalities.
In this case, the consumer solves
max,# (f[qR- + (1- q,)R z (3){q, ) t=0
where z = {p, w}, E, is the conditional expectation operator, and q, is the fraction of theresource that will be used with the nuclear technology in period t. Since there is nointertemporal decision in this case, the above problem is equivalent to
max E,U(f[qR7 + (I- q,)R S.(z)]) (4)
(0•q1 -IJ
The first order condition for program (4) is
),r U[f(e(p))]f'[e(p)][R" - Rg (p)] +
(I -ct)U'[f(e(w))]f'[e(w)][RR - Rf (w)] +p -A, 0 (5)
where e(z) is the amount of electricity generated in state z, ;r, is the conditional probability
of peace, and u, and A, are Lagrange multipliers on the constraints q, Ž0 and 1 - q, 0respectively. It thus follows that
U[f(e(w)]f [e(w)] ' [Rf(p)-R] IU'[f(e(p))f p)] < I-= i )[R- Rf(w)] (6)
as q, I and q, 0 respectively, while (4) holds with equality for any interior value of q,-Evaluating expression (6) at equality and using the particular functional forms for U(.) andf(.) we obtain
[e(P)]_.) (i [R (p) -R("7
e') "I -;r, [R" - Rff'(w)] f7
A9-23
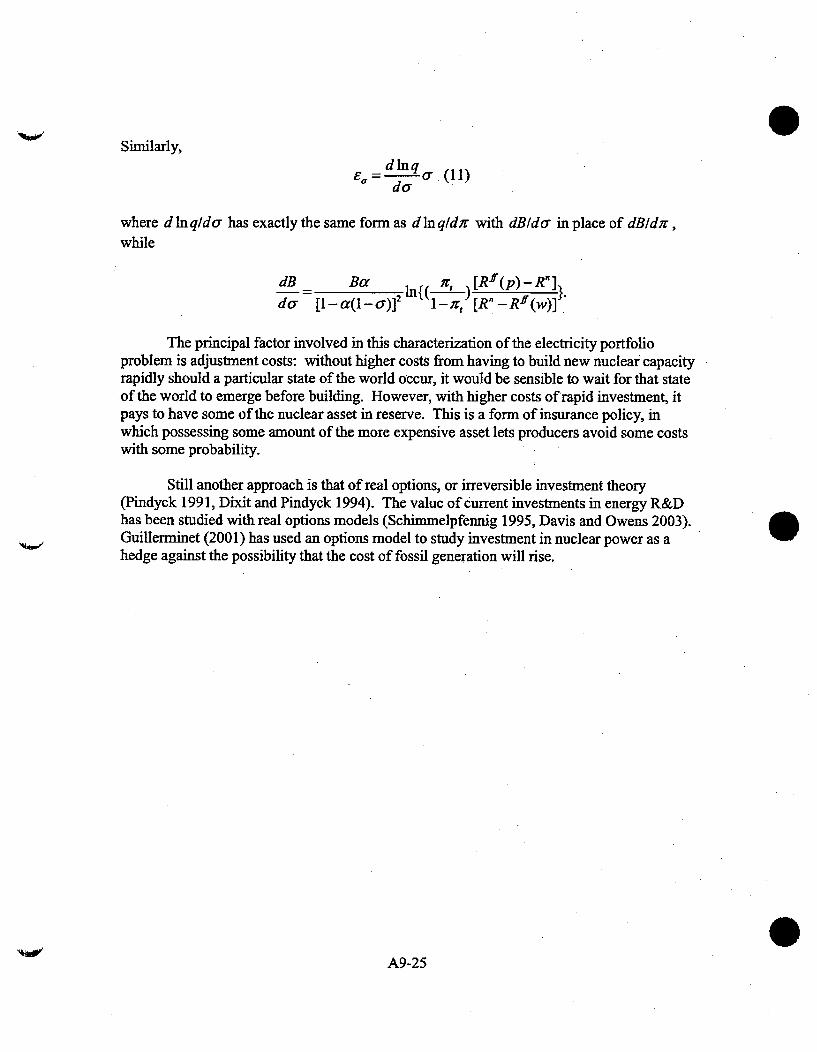
Similarly,d inq
do-
where d In qid" has exactly the same form as d In qldyr with dB/dc" in place of dB/dir ,while
dB Ba )r [R [ (P)R- n]a-- [I [1a(1 -) In( ---•,) [R. --Rf (w)]}"
The principal factor involved in this characterization of the electricity portfolioproblem is adjustment costs: without higher costs from having to build new nuclear capacityrapidly should a particular state of the world occur, it would be sensible to wait for that stateof the world to emerge before building. However, with higher costs of rapid investment, itpays to have some of the nuclear asset in reserve. This is a form of insurance policy, inwhich possessing some amount of the more expensive asset lets producers avoid some costswith some probability.
Still another approach is that of real options, or irreversible investment theory(Pindyck 1991, Dixit and Pindyck 1994). The value of current investments in energy R&Dhas been studied with real options models (Schimmelpfennig 1995, Davis and Owens 2003).Guillerminet (2001) has used an options model to study investment in nuclear power as ahedge against the possibility that the cost of fossil generation will rise.
A9-25

Hamilton, James D. (1983) "Oil and the Macroeconomy since World War II," Journal ofPolitical Economy 91: 228-248.
Jensen, James T. (2003) "The LNG Revolution," The Energy Journal 24, No. 2: 1-45.
Jones, Donald W., Inja K. Paik, and Paul N. Leiby. (2004) "Oil Price Shocks and theMacroeconomy: What Has Been Learned Since 1996," forthcoming in The Energy Journal25, No. 2: 1-32.
National Energy Policy Development Group (NEPDG). (2001) National Energy Policy:Reliable, Affordable, and Environmentally Sound Energy for America 's Future. Report ofthe National Energy Policy Development Group. Washington, D.C.: U.S. GovernmentPrinting Office, May.
National Petroleum Council (NPC). (1999) "Meeting the Challenges of the Nation'sGrowing Natural Gas Demands." Washington, D.C., December 1999.
National Petroleum Council (NPC). (2003) "Balancing Natural Gas Policy - Fueling theDemands of a Growing Economy." Washington, D.C., September 2003.
Pindyck, Robert S. (1991) "Irreversibility, Uncertainty, and Investment," Journal ofEconomic Literature 29: 1110-1148.
Schimmelpfennig, D. (1995) "The Option Value of Renewable Energy: The Case ofClimate Change," Energy Economics 17: 311-317.
Schmoker, James W., and Thaddeus S. Dyman. (2001) Changing Perceptions of UnitedStates Natural Gas Resources as Shown by Successive U.S. Department of the InteriorAssessments. U.S. Geological Survey Bulletin 2172-B. Washington, D.C.: U.S. GeologicalSurvey.
Simmons, M.R. (2003) "Future Energy Resources: Are We Asking the Right Questions."National Defense University Workshop, Simmons International.
Smith, R1, and A. Hove. (2003) "Utilities: The Old Reliables." Deutsche Bank AG.
Stokey, Nancy L., and Robert E. Lucas, Jr., with Edward C. Prescott. (1989) RecursiveMethods in Economic Dynamics. Cambridge, Mass.: Harvard University Press.
U.S. Department of Energy (DOE) and Nuclear Power Industry. (2004). Strategic Plan forLight Water Reactor Research and Development. First Edition. Washington, D.C.: Officeof Nuclear Energy, Science and Technology; Nuclear Energy Institute, and Electric PowerResearch Institute, February.
A9-27

ACRONYMS
Acronym DefinitionABB-CE Asea Brown Boveri - Combusion EngineeringABI Allied Business IntelligenceABWR Advanced Boiling Water ReactorACR Advanced CANDU ReactorACRS Accelerated Cost Recovery SystemAEA Atomic Energy ActAEC Atomic Energy CommissionAECL Atomic Energy Canada, LimitedAEO Annual Energy OutlookAFR Advanced Fast ReactorAFP Agence France PresseAFUDC Allowance for funds used during constructionAGR Advanced Gas Cooled ReactorAHTR Advanced High Temperature ReactorALWR Advanced Light Water ReactorAMIGA All Modular Industry Growth Assessment Modeling SystemANL Argonne National LaboratoryANP Advanced Nuclear PowerAPWR Advanced Pressurized Water ReactorASM Annual Survey of ManufacturesBALANCE Energy network module from ENPEPBBC British Broadcasting CorporationBBL. BarrelsBEA Bureau of Economic AnalysisBGS British Geological SurveyBLS Bureau of Labor StatisticsB/M Book to marketBNFL British Nuclear Fuels, Ltd.BOE Barrel of oil equivalentBtu British thermal unitBW Business WeekBWR Boiling Water ReactorCAAA Clean Air Act AmendmentsCANDU Canada Deuterium UraniumCAPM Capital asset pricing modelCCAPM Consumption-based capital asset pricing modelCCGT Combined cycle gas turbineCF Capacity factor,CFB Circulating fluidized bedCFR Code of Federal Regulations
0
ACM-1

Acronym DefinitionFCHV Fuel cell hybrid vehicleFCV Fuel cell vehicleFCX Honda FCX fuel cell vehicleFEMA Federal Emergency Management AgencyFERC Federal Energy Regulatory CommissionFOAKE First-of-a-kind-engineeringFOB Free on board, shipper pays shipping costsFRCC Florida Reliability Coordinating CouncilGA General AtomicsGCR Gas Cooled ReactorGDP Gross Domestic ProductGE General ElectricGenSim Electricity Generation Cost Simulation ModelGHG Greenhouse gas_GII Global Insights, Inc.GM General MotorsGt GigatonnesGTCC Gas Turbine Combined Cycle.GT-MIBR Gas-Turbine Modular Helium ReactorGW GigawattHg MercuryHLW High-level wasteHTGR High-Temperature Gas-Cooled ReactorHRSG Heat recovery steam generationHWLWR Heavy-Water-Moderated, Light-Water-CooledIAEA International Atomic Energy AgencyICE Internal combustion engineIDC Interest during constructionIHASA International Institute for Applied Systems Analysis1EA International Energy AgencyIGCC Integrated gasification combined cycleILW Intermediate level wasteIPM Integrated Planning Model.IPP Independent Power PlantIRIS International Reactor Innovative and SecureIRR Internal rate of returnITS Institute of Transportation StudiesJAERI Japan Atomic Energy Research Institutekg KilogramkgHM Kilograms of heavy metalKgU Kilogram of uraniumkW KilowattkWh Kilowatt hour
ACM-3
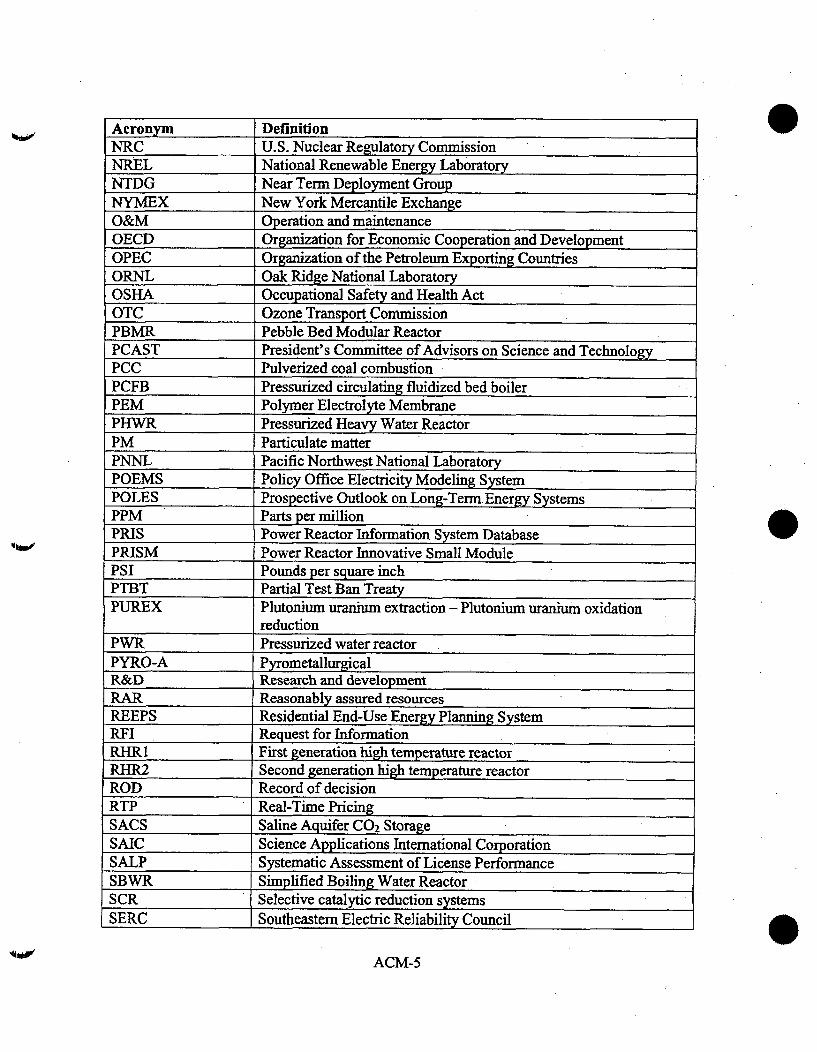
Acronym DefinitionNRC U.S. Nuclear Regulatory CommissionNREL National Renewable Energy LaboratoryNTDG Near Term Deployment GroupNYMEX New York Mercantile ExchangeO&M Operation and maintenanceOECD Organization for Economic Cooperation and DevelopmentOPEC Organization of the Petroleum Exporting CountriesORNL Oak Ridge National LaboratoryOSHA Occupational Safety and Health ActOTC Ozone Transport CommissionPBMR Pebble Bed Modular ReactorPCAST President's Committee of Advisors on Science and TechnologyPCC Pulverized coal combustionPCFB Pressurized circulating fluidized bed boilerPEM Polymer Electrolyte MembranePHWR Pressurized Heavy Water ReactorPM Particulate matterPNNL Pacific Northwest National LaboratoryPOEMS Policy Office Electricity Modeling SystemPOLES Prospective Outlook on Long-Term. Energy SystemsPPM Parts per millionPRIS Power Reactor Information System DatabasePRISM Power Reactor Innovative Small ModulePSI Pounds per square inchPTBT Partial Test Ban TreatyPUREX Plutonium uranium extraction - Plutonium uranium oxidation
reductionPWR Pressurized water reactorPYRO-A PyrometallurgicalR&D Research and developmentRAR Reasonably assured resourcesREEPS Residential End-Use Energy Planning SystemRFI Request for InformationRHR1 First generation high temperature reactorRHR2 Second generation high temperature reactorROD Record of decisionRTP Real-Time PricingSACS Saline Aquifer CO 2 StorageSAIC Science Applications International CorporationSALP S stematic Assessment of License PerformanceSBWR Simplified Boiling Water ReactorSCR Selective catalytic reduction systemsSERC Southeastern Electric Reliability Council
ACM-5

Q:l14I ~C.. ~
0.PDFComplete
Click Here & Upgrade IExpanded Features'
Unlimited Pages
:;7 /6./il
1P #
SECURING AMERICA'SENERGY FUTURE
Majority Staff Report
To
Committee on Government ReformChairman Tom Davis
And
Subcommittee on Energy and ResourcesChairman Darrell E. Issa
Committee on Government ReformUS House of Representatives
May 8, 2006
Click Here & Upgrade0-1 Expanded Features
PDF Unlimited Pages
Complete
Findings
No other issue is as central to the continued well-being of the United States as is energysecurity. During 2005 the Subcommittee on Energy and Resources held nine oversighthearings on energy-related issues. We feel it is imperative to issue this report to advancethe discussion on energy policy and craft govenunent policies that will assure ourcontinued economic growth and insulate US foreign policy from coercion by producersof oil and natural gas. President George W. Bush's Advanced Energy Initiative, outlinedin the 2006 State of the Union, will be one of a number of steps in reducing ourdependence on petroleum and ensuring our energy security.
At the same time we reassess our energy security, we must take note that we are in thebeginning stages of a clean energy revolution. Alternative and renewable sources ofenergy are becoming more mature and economically viable. We have realized themistake of the dejacto moratorium on the construction of new nuclear generating plants,with the "rediscovery" that nuclear reactors provide an incredible amount of power that isultraclean. Clean coal plants are moving forward. The automobile market is currentlyundergoing a renaissance with the market penetration of gasoline-hybrid cars andalternatively- fueled vehicles gaining popularity. Highly efficient and clean diesel carswill also soon come to market. In addition, hydrogen power is steadily advancing withgreat promise.
We urge that the report and its findings be read in the context of a dramatically alteredworld energy supply and demand situation, as well as a fundamentally changedgeopolitical environment. To fully realize energy security for the long-term, the cleanenergy revolution must come to fruition over the next several decades. This will requirea greater level of coordination between policyrnakers, businesses, public-privatepartnerships, and American consumers. We acknowledge that some will suggest that"market forces" will correct the current situation and further government intervention isnot necessary. Indeed, private investment in the energy sector must be encouraged notonly in the US but in other countries. However, in our view the energy crisis ispotentially an economic and national security threat of such magnitude that governmentalaction is necessary to "provide for the common defense" and the "general welfare" of theUnited States.
The findings of the report are:
1. Unlike previous periods of high prices and price volatility in petroleum markets,this one is demand-driven and not caused by supply restrictions instituted byproducers or political upheaval.
2
Click Here & Upgrade I00, Expanded Features I
PDF Unlimited Pages iComplete
2. Because tight global market conditions are demand-driven with little or no spareproduction capacity, the US is more vulnerable to a catastrophic supply shock,especially considering the current geopolitical environment.
3. The solution is not an "either or" choice between promoting production andpromoting conservation. The US must pursue both options.
4. More than two-thirds of oil consumed in the US is consumed by the transportationsector, mainly cars and trucks. To reduce US dependency on oil, effectivedemand-reduction policies must focus on this sector.
5. Corporate Average Fuel Economy standards must be strengthened to reduce oildemand and assure the competitiveness of domestic manufacturers. It is thefederal government's responsibility to set adequate standards, yet fuel economyhas stagnated for the last 20 years. By not upgrading standards, the governmenthas contributed to American manufacturers losing the competitive edge againstforeign competition.
6. Alternative transportation fuels, renewable energy, and advanced technologiessuch as clean coal and next generation nuclear must be 'aggressively pursued.
7. To enhance competitiveness and protect American jobs, natural gas must not beused for baseload electricity generation, nor for new generating capacity. Naturalgas should be reserved for industries that use it as a feedstock or for primaryenergy-and cannot substitute for it by fuel-switching.
8. Nuclear energy must become the primary generator of baseload electricity,thereby relieving the pressure on natural gas prices and dramatically improvingatmospheric emissions.
3

Click Here & Upgrade
Expanded Features
PDF Unlimited Pages
Complete
Table of Contents
1. Findings
Table of Contents
11. Energy Security in Transition
Introduction
Energy Security
The US Economy, Oil Intensity, and Prices
Hurricanes Katrina and Rita
Global Markets and Geopolitics
A New Competition for Energy
The Resurgence of State-owned Companies
Developments in Russia
Tight Global Refining Markets
Targeting Foreign Oil Dependency
Policy Options: Revising CAFE
Policy Options: Revisiting Strategic Reserves
111. Nuclear Power and Electricity
Introduction: Nuclear Must be the Primary Source ofBaseload
4

Click Here & Upgrade
Expanded Features
' PDF Unlimited Pages
Complete
The US Electricity Outlook
Natural Gas and Power - Negative Effects
Global Confidence in Nuclear Power is Growing
Nuclear Power and the US
A Record of Reliable and Efficient Power
Nuclear Power's Environmental Benefits
Nuclear Power:. The Financial Challenge
Nuclear Waste and Closing the Fuel Cycle
IV. Conclusion
Appendix - Subcommittee on Energy and Resources Hearingson Energy -1st Session, 1 0 9th Congress
5

Click Here & UpgradeExpanded FeaturesI
PDF Unlimited Pagesi
Complete
Energy Security in Transition
1.1 Introduction
In the same year that the landmark, omnibus Energy Policy Act of 2005 was enacted,increased imports of oil and gasoline, tight energy markets, high fuel prices, and theeffects of Hurricanes Katrina and Rita spurred policymakers to reassess what energysecurity means for America in the 21t Century.
Economic growth in the US is the driving force in the global economy. The US economyis much more efficient in using energy than in years past, due in large part to energyconservation and fuel-switching actions in the 1970s and early 1980s. Despite theseimprovements, the US is more dependent on increasingly expensive oil than ever before.Demand continues to inexorably increase. In addition, the US price of natural gas hasbeen at record levels to meet record demand, in large part due to natural gas fuelingvirtually all new electricity generation plants constructed since the mid-1990s.
The volume and proportion of imported oil and gasoline also continues to rise in the US.Similarly, the volume of imports to meet demand is escalating for other countriesexperiencing robust economic growth, particularly in Asia. With increasing globalcompetition for oil and natural gas at a time when there is very little spare worldproduction capacity, countries such as China and India are becoming increasinglyaggressive in pursuing bilateral agreements to lock in supplies over the long-term. Manyof these agreements involve national producers that are not friendly to US interests.Alarmingly, producer nations such as Russia, Iran, and Venezuela have used threats-andin Russia's case has followed-through on them-of withholding essential supplies toinfluence geopolitics.
Hurricanes Katrina and Rita demonstrated the vulnerability of US supplies anddistribution systems for oil and natural gas. In the immediate aftermath, the US withdrewcrude oil from the Strategic Petroleum Reserve, and had to rely on releases fromEuropean reserves in the form of finished gasoline and gasoline blending components.Furthermore, the crisis had global implications because production capacity for the globaloil and refined products market is razor-thin and specialized. Cascading effects were feltthroughout oil consuming nations.
To ensure US energy security, dependence on oil and refi'ed petroleum products must bereduced. While oil products are used for services such as heating, steam generation,electricity generation, and as industrial feedstocks, the major use of petroleum products isfor transportation---68.4 percent of oil consumed in the US is consumed by the .mbl
6

Click Here & UpgradeExpanded Features
PDF Unlimited PagesComplete
9 transportation sector, mainly cars and trucks.1 Globally, demand for transportationservices is the key-driver for oil demand.2 By increasing the average fuel economy forthe US surface transportation fleet, oil demand can be reduced. Domestic automanufacturers can increase their competitiveness in the US and world markets bymanufacturing more fuel efficient vehicles, particularly as governments look to reduce oilconsumption through mandatory increases in fuel economy standards or through higherfuel taxes.
1.2 Energy Security.
Let us set as our national goal, in the spirit of Apollo, with the determination of the ManhattanProject, that by the end of this decade we will have developed the potential to meet our ownenergy needs without depending on any foreign energy sources.
-President Nixon, November 1973, announcing "Project Independence"3
Energy security is in a state of transition for the United States and the rest of the world.Having energy security means having a diversity of energy supplies at reasonable pricesto keep the economy growing, while ensuring that the nation is not overly dependent onspecific elements of supply and distribution-whether nations, geographical regions, typeof fuel, or infrastructure. The greater the level of dependence, the greater the opportunityfor supply shocks to cause economic crisis, and for suppliers to exert political andstrategic influence over consuming nations. Recent events have caused a reassessment ofenergy security. Energy security in practice must now assure the integrity of the wholesupply chain and infrastructure, from production to consumer, which will involve morecoordination between the private sector and government.4
The US has reached a tipping point in finally acknowledging that it is inherentlycontradictory to pay lip-service to a goal of energy independence while acting under anassumption that crude oil and refined petroleum products will remain perpetuallyinexpensive.5 This point was driven home by one witness testifying before theSubcommittee.
'Energy Information Administration, Annual Energy Outlook 2006, Year-by-Year Reference Case Tables
(2003-2030), Table 2.
-Energy Information Administration, Annual Energy Outlook 2005, p. 41.
3 Quoted from In Search of Reasonable Certainty: Oil and Gas Reserves Disclosure, Cambridge EnergyResearch Associates, February 2005, p. 37.
4 Daniel Yergin, "The Katrina Crisis," Wall Street Journal, September 3, 2005.
5 Many invoke "energy independence" as meeting domestic demand with 100 percent domestically-sourcedfuels or resources., The ability of the US or almost any industrialized country to meet 100 percent ofdomestic energy needs without imports is unrealistic. The utility of such a policy is questionableconsidering the marginal benefits of moving from a high proportion of domestic sourcing to an absolute
7

Click Here & Upgrade
Expanded Features
'PDF Unlimited Pages~Complete
The current situation in US oil and gas can be seen in the context of a fulcrum point. The 0 "
2 eh Century was one in which the US economy was driven by abundant cheap domestic oiland gas. The 21st Century will be driven by scarcer, more expensive, imported oil. The
current priori'ties of US consumers and politicians are lagging the realities of the future,
which are all too visible in the present energy crisis.
-Mr. Paul Sankey, Sr. Energy Analyst, Deutsche Bank6
There must be a change in the energy policy outlook. Policymakers in the US mustconsider energy security in terms of balancing risk across an energy portfolio. No longercan energy security solely involve ensuring a diversity of foreign supplies ofoil whiletaking precautions to deal with interruptions in crude oil production. The US mustpursue a diversity of energy resources, and both supply-side and demand-side measuresmust be pursued in order to achieve a balance.
Policymakers and the public must also acknowledge that conservation and "fuelswitching" to renewable energy sources alone cannot begin to meet US energy needs, justas opening up the Arctic National Wildlife Refuge and other areas to oil developmentwill not satisfy demand increases in the future nor noticeably lower prices. By framingenergy policy in terms of an "either or" choice between petroleum and renewables, welose sight of the fact that these demand and supply-side policies can decrease USvulnerability, and should be pursued as part of the portfolio. 7 However, even taking intoaccount these potential improvements, the current energy mix does not meet long-termUS needs and minimum requirements for energy security.
Industries, consumers, policymakers, and public-private partnerships must consider avariety of factors in energy portfolio allocations, including: cost, efficiency,environmental burden, domestic production capacity, and geographic source. Not allsources will be economical in the short or medium-term. The US must learn from theexperience of the 1970s and early 1980s that the eventual abandonment of government-backed investment for new technologies in the face of lower prices-while it made sense
level-e.g. escalating from 60 to 85 percent to 100 percent without consideration of cost, efficiency, orsource emissions. Furthermore, some imports of fuel, such as from the US-Russia Megatons to Megawattsprogram, are clearly beneficial and enhance US and world security. Under the program, uranium fuel fromrecycled former-Soviet nuclear weapons is used to generate electricity, powering one in ten US homes. Todate almost 10,750 nuclear warheads have been eliminated. All things considered, the energy situationmust be viewed as a continuum between total energy dependence on one end and 100 percent independenceon the other.
6 Written testimony of Mr. Paul Sankey, Deutsche Bank, for the House Government Reform Subcommittee
on Energy and Resources Hearing, Petroleum Refining: Will Record Profits Spur Investment in NewCapacity? October 19, 2005.
7 While not reducing oil intensity, drilling in ANWR would contribute substantially to correcting the USforeign trade deficit; Ian Parry W.H. Parry and I.W. Anderson, "Petroleum: Energy Independence isUnrealistic," Resources Winter 2005, p. 15. Also, the US has substantial natural gas reserves that are off-limits to exploitation on the Outer Continental Shelf, in the Rocky Mountain region from Montana to NewMexico, and Alaska.
8
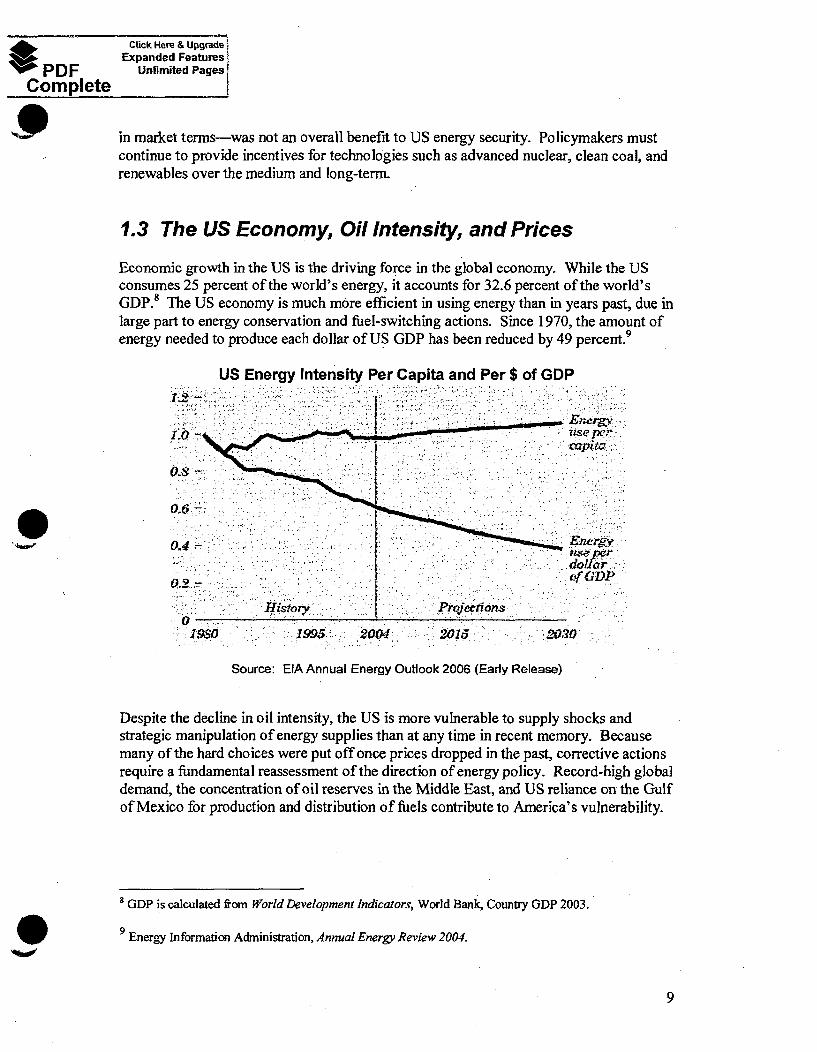
Completep!Crick Here & Upgrade !
Expanded Features!Unlimited Pages'
in market terms-was not an overall benefit to US energy security. Policymakers mustcontinue to provide incentives for technologies such as advanced nuclear, clean coal, andrenewables over the medium and long-term.
1.3 The US Economy, Oil Intensity, and Prices
Economic growth in the US is the driving force in the global economy. While the USconsumes 25 percent of the world's energy, it accounts for 32.6 percent of the world'sGDP.8 The US economy is much more efficient in using energy than in years past, due inlarge part to energy conservation and fuel-switching actions. Since 1970, the amount ofenergy needed to produce each dollar of US GDP has been reduced by 49 percent. 9
U 11
04.2
0o
Energy Intensity Per Capita and Per $ of GDPS:ill :. :fr
us. pet -
GDf PDP
. 1995,-.: .2004 . 201.5 12030
Source: EIA Annual Energy Outlook 2006 (Early Release)
Despite the decline in oil intensity, the US is more vulnerable to supply shocks andstrategic manipulation of energy supplies than at any time in recent memory. Becausemany of the hard choices were put off once prices dropped in the past, corrective actionsrequire a fundamental reassessment of the direction of energy policy. Record-high globaldemand, the concentration of oil reserves in the Middle East, and US reliance on the Gulfof Mexico for production and distribution of fuels contribute to America's vulnerability.
s GDP is calculated friom World Development Indicators, World Bank, Country GDP 2003.
9 Energy Information Administration, AnnualEnergy Review 2004.
9

Click Here & Upgrade
Expanded Features
'oPDF Unlimited PagesComplete
1.3.1 Hurricanes Katrina and Rita
Prices for crude oil, gasoline, and natural gas were at or close to historic highs beforeHurricane Katrina made landfall on August 29, 2005. On the spot markets, US wellheadprices for natural gas were quintuple what they were just ten years earlier, and both crudeoil and gasoline prices were 3.6 times higher for the same period.' 0
Hurricanes Katrina and Rita delivered a devastating blow to the nation's energyinfrastructure because of the Gulf of Mexico's central role in production and refining.According to the Federal Reserve Bank of Dallas' Houston Branch, 26.4 percent of thenation's domestic crude oil production and 21.3 percent of natural gas production takesplace in the Gulf of Mexico. Almost 40 percent of the nation's crude oil refiningcapacity is located on the Gulf Coast.
The Gulf Coast had only just recovered from the effects of 2004's Hurricane Ivan, whichheavily damaged underwater pipeline infrastructure. According to the Department ofInterior's Minerals Management Service's last 2005 report on hurricane-damaged energyinfrastructure in the Gulf of Mexico, shut-in oil production on December 29, 2005, wasequivalent to 27.4 percent of the daily oil production in the Gulf of Mexico. Thecumulative shut-in oil production for the August 26-December 29 period was equivalentto 19.9 percent of the yearly production of oil in the region. Shut-in gas production wasequivalent to 19.5 percent of the daily gas production in the Gulf of Mexico. Thecumulative shut-in gas production for the August 26-December 29 period equaled 15.4percent of the yearly production of gas in the region."
Immediately after Katrina struck, the Secretary of Energy approved loans of crude oilfrom the domestic Strategic Petroleum Reserve (SPR). However, only about one-third ofSPR crude that was offered was in fact loaned, because there was not enough undamagedrefining capacity to process it. Furthermore, following Rita one-third of the nation's oilrefining capacity was offline. As of November 1, almost 5 percent of the nation'srefining capacity was still shut-down. Because the refineries were already operating atfull tilt, gasoline prices hit record levels. According to the Congressional ResearchService, refined product supplies were replaced by the release of 30 million barrels ofgasoline, middle distillate and other products from the strategic reserves of membernations of the Organization for Economic Cooperation and Development who areInternational Energy Agency members.1 2 To facilitate the refined product response, theEnvironmental Protection Agency temporarily waived Clean Air Act requirements so thatany available gasoline could be used in any regional market.
10 Crude oil prices refer to West Texas Intermediate and gasoline prices are for New York Harbor
conventional gasoline.
" MMS measures from August 26 as infrastructure and equipment were taken offline and shutdown priorto the hurricanes as part of emergency protection procedures. "Shut-in" refers to production that is offline.
12 CRS Report for Congress, Oil and Gas Disruption from Hurricanes Katrina and Rita, October 21, 2005.
10

Click Here & Upgrade fExpanded Features!
P PDF Unlimited Pagesf
Complete9The hurricanes' ongoing impacts have made already tight markets worse, contributing topersistent high prices. Sustained high prices for oil and natural gas may prove to be adrag on productivity and economic growth in the US. Slowed productivity growthdecreases wage growth and increases the unemployment rate. Businesses and consumerssave less and borrow more, resulting in higher interest rates and increased inflation.Higher utility bills result in less discretionary spending at the household level.
1.4 Global Markets and Geopolitics
Today the United States faces very different markets for natural gas, crude oil, andrefined petroleum products than those of the preceding two decades. In regard to naturalgas, a tightening of the balance between supply and demand, first evidenced in 2000, hasled to higher and more volatile prices. Hurricane Katrina has only added to this picture bydelivering a real shock, driving prices further up and creating considerable anxiety aboutthe immediate and future supply. The run-up in natural gas prices, which has been underway for several years and has occasioned much anxiety in the US, was predictable in thesense that its underlying cause--the inability of continental production to keep pace withdemand-has been recognized for many years. Since 2003, Cambridge Energy ResearchAssociates has routinely warned that higher and more volatile natural gas prices willbecome the norm for the North American market.' 3
Just as sustained higher prices were predictable, so has been the industry response tothose prices. A surge in investment by companies seeking to bring new supplies, bothfrom continental sources and imported in the form of liquefied natural gas (LNG), is wellunder way. However, meaningful growth in supply, mostly from LNG, will not berealized for a few more years. As a result, significant, sustained price relief will not cometo the United States before 2008 at the earliest, and only then if LNG development issubstantial considering it currently supplies less than 3 percent of natural gas consumedby the US.
Unlike the market for crude oil, natural gas markets are fragmented according to thelimited number of LNG terminals or pipeline connectivity-hence Russia's recent gambitto exert pressure on the former Soviet bloc countries that depend on it for their criticalnatural gas needs. Although progress is being made, there is not yet a truly global spotmarket for LNG although more consuming countries are seeking to build regasificationterminals to receive LNG. In 2004 almost 12 percent of a nearly 20 billion cubic feet perday global LNG market was sold on a spot basis; the rest of the market is dominated bylong-term contracts.' 4 To illustrate, the prices paid for natural gas in different regionsvary widely depending on government subsidization, usage, and availability.
13 Written Testimony of Mr. Michael Zenker, Cambridge Energy Research Associates, for the September
14, 2005 hearing, Meeting America's Natural Gas Demand: Are We in a Crisis?
14 Written response from Mr. Michael Zenker, to Chairman Issa's followup question from the September
14, 2005 hearing, Meeting America's Natural Gas Demand: Are We in a Crisis?
11

Click Here & Upgrade !Expanded Features i
PDF Unlimited Pages;
Complete
Natural Gas Costs around the World, 2005($US per million BTUs)
UK: $SBeIgi
Source: American Chemistry Council
Unfortunately, many consumers in the US feel the bum of high natural gas prices twice.Not only do they shoulder escalated costs through their natural gas bills, but they are hitagain through higher electricity bills due to natural gas-fired intermediate and baseloadproduction. Domestic production can no longer satisfy demand to the point where pricestability is anywhere in the near future.
In contrast to natural gas markets, crude oil and gasoline are tradable commodities in ahighly integrated global market. High demand growth for oil and refined petroleumproducts has led to a tightening of supplies and high prices. Market fundamentals arelikely to change little in the next few years, with a lack of spare production capacity androbust commercial inventories. Unlike previous periods of price volatility, this one isdemand-driven and not caused by supply restrictions instituted by OPEC or politicalupheaval. With the additional complication of the hurricanes' supply shock feltthroughout the world, global markets have been knocked off an already precariousbalance between supply and demand.
Demand projections for China alone are staggering. It was the source of 40 percent ofworld oil demand growth from 2001 to 2005. China's annual electricity consumption has
12

Click Here & Upgrade IExpanded Features:
PDF Unlimited Pages
Complete
recently been climbing at a more than 15 percent rate.s5 In addition, using moreconservative estimates than Western analysts, the Chinese government predicts thenumber of cars and trucks in China to reach 130 million by 2020, rising from less than 20million in 2000.16 The amount of gasoline or diesel fuel required to meet these estimateswill be enormous. China is now the second largest oil consumer and importer in theworld.
(O00s bbls/d)12,000 Consumption
CNna's oil consurnption has10,000 been growing and is expected
to grow at a much faster rate >
8,000 than production, leading toburgeoning net imports
6,000
4,000 jF Production*4,000 ., . . . . . . . . . .
200-CNna has been a net2,000 importer of crue oil
since 1993
0 . . IiO 0 UO 0 U) 0 it) 0 UO C L 0 U
Co fl- Nl- Co C 0) M) 0 0 C4~-N0D M M) 0o 0) 0M M) C> 0 (D C> C0 0- -.- T- - - " C4 N C- C4 N
Source: Goldman Sachs International17
India is expected to follow closely in the footsteps of China in regard to energy use.India, with a current population of 1. 1 billion, will experience strong annual increases indemand for oil and natural gas. Oil consumption is forecast to increase 24 percent by2010, and Indian demand for natural gas will increase 5.1 percent annually. According tothe US Energy Information Administration (EIA), Asian developing countries will leadthe world in energy consumption growth as their economies become more advanced andpopulations continue to rise; EIA forecasts the region will account for 45 percent of thetotal increase in world oil consumption through 2025.18
1.4.1 A New Competition for Energy
In a post-Cold War world, these factors have led to new strategies, the pursuit of newalliances, and aggressive tactics by both petroleum producing and consuming nations.
1 5Energy Information Administration, Country Analysis Brief. China, August 2005.
16 China Daily, "Vehicle Market Growth Imposes Challenges," May 11, 2004.
'7 Written Testimony from Ambassador Robert Hormats, Vice Chairman Goldman Sachs International.
Testimony before the House Government Reform Subcommittee on Energy and Resources Hearing,America's Energy Needs as Our National Security Policy. April 6, 2005, p. 3.
'8 Energy Information Administration, International Energy Outlook 2005.
13

Click Here & Upgrade1PDF Expanded Features
ComPDF Unlimited Pages.Complete L
Competition for resources can certainly be extended to other fuels besides those that arepetroleum-based. The global supply network and players are shifting, indicating achange in the world energy map and geopolitics.
Furthermore, producer countries are using control of petroleum supplies as a tool--orweapon-to coerce other nations or to advance their strategic interests. Venezuela hasthreatened to withhold crude oil from the American market and then sold home heatingoil at cut-rates to some US cities in an attempt to undermine Administration foreignpolicy. President Chavez has also pressured international petroleum Companies intorenegotiating existing agreements for production in Venezuela, with the implication thatcompanies that will not cooperate may have oil or gas concessions voided orexpropriated. Russia jailed the CEO of privately-owned energy giant Yukos, broke thecompany up, and sold off its oil subsidiary to state-run company Rosneft. Iran hasrepeatedly threatened to withhold oil from the world market should sanctions be imposedas a result of Iran's ill-advised program to enrich uranium. In addition to grave securityconcerns, using energy supplies as a threat provides a powerful disincentive to privateinvestment. This is already being witnessed in Venezuela and Russia, where necessaryupgrades and maintenance of equipment are not occurring due to a lack of investment.
China is using increasingly aggressive tactics to secure long-term access to oil andnatural gas. Chinese state-owned companies have sought to strengthen China's hand in anew and extended "great game" of geopolitics through regional agreements andacquisitions.1 9 The China National Petroleum Company has acquired petroleumconcessions in Kazakhstan, Venezuela, Sudan, Iraq, Iran, Peru, Ecuador, and Azerbaijan.The China Petroleum Corporation is seeking to purchase overseas upstream assets. State-run oil companies from China, the Philippines, and Vietnam have signed an agreement tojointly conduct a seismic survey in the South China Sea to systematically determineenergy potential in the area. China and Canada are promoting cooperation in oil sandsproduction. In October 2005, China National Petroleum Corporation successfully sealeda deal for PetroKazakhstan. The first fuel has already been delivered through the 1,800-mile Atasu-Alashankou pipeline between Kazakhstan and China. The pipeline will alsotransit Russian oil to China from western Siberia. Finally, China recently completed anumber of energy agreements with Russia, including a joint venture between state-ownedcompanies.2 °
China has also not hesitated to seek out sources controlled by governments hostile to USinterests. In addition to expansion of Chinese influence, it is an issue of great importancebecause these states may view China as a "buffer" against what they perceive as USaggression.21 China receives almost 15 percent of its oil from Iran and is the largestbuyer of oil from Sudan. In December 2004 Venezuelan President Hugo Chavez signed
19 The first "great game" refers to the conflicts and maneuvering to control the resources of Central Asiaduring the 19"' Century.
20 Stratfor Situation Reports, 3/22/06, 8/26/05, 8/22/05, 3/14/05.
21 Stratfor, "China's Overseas Expansion Strategy," 4/17/03.
14

Click Here & Upgrade!Expanded Features !
PDF Unlimited Pages
Complete
9 eight agreements in Beijing that prepared the foundation for granting Chinese oilcompanies preferential access to oil and gas projects in Venezuela, including explorationand production, and the construction of new pipelines, refineries, and petrochemicalplants. Both China and India have entered long-term agreements with Iran for natural gassupply, and both countries have taken equity stakes in Iranian natural gas production.Chinese and Indian companies recently submitted a joint bid to obtain a 38 percent shareof a Syrian petroleum company.22
1.4.2 The Resurgence of State-owned Companies
National or state-owned oil companies are pursuing global contracting and partnershipopportunities that were previously the reserve of international oil companies. Thisdevelopment is of particular concern since government-controlled companies alreadymanage 72 percent of the world's oil reserves, 55 percent of gas reserves, and more thanhalf of current world oil production.2 3 These agreements demonstrate how national oilcompanies are turning away from their traditionally insular roles and are pursuingcontracting opportunities that were previously the reserve of international oil companies.The lack of transparency in state-owned operations and bids for contracting vis-a-visprivate international oil companies is a concern. By having state treasuries behind them,state-owned companies may operate at a loss while private corporations do not have thatoption. With much of the world's proven oil reserves in countries with access controlledby national ministries or national oil companies, international oil companies are at adecided disadvantage.
1.4.3 Developments in Russia
Nowhere has the wielding of political power in energy markets by governments andstate-owned companies been more in evidence than in Russia. Besides the well-knownYukos affair, Gazprom has used its supply of natural gas in an attempt to subvertUkrainian autonomy from Russian influence. Unlike crude oil, there is a very limitedinternational spot market for natural gas, and supplies are not easy to come by. Russiangovernment officials and Gazprom executives acted in concert to pressure the Ukraineinto paying exorbitant prices for natural gas. A compromise agreement to phase-in a lessdamaging but still high price was reached, but only after Russia reduced the flow ofnatural gas to the Ukraine, affecting greater Europe. More than one-quarter of natural gasconsumed by European Union countries is imported from Russia-almost 40 percent inall European countries-and 80 percent of that transits Ukraine. 24 Since then, a numberof Russia's neighbors have scrambled to negotiate new agreements with Russia or to seekalternative arrangements, most likely with varying rates of success. In essence, they have
22 Stratfor Situation Reports, 11/29/05, 1-2/2704.
23 Testimony of Mr. Frank Verrastro, Director of the Energy Program, Center for Strategic and
International Studies, before the Senate Committee on Energy and Natural Resources, February 3, 2005.
24 Stratfor, "EU: Exploring Its Energy Options," 1/03/06.
15

Click Here & Upgrade
Expanded FeaturesPDF Unlimited Pages,
Complete
been forced to make a choice between being firmly in Russia's sphere of influence or 9 -moving closer to greater Europe with doubtful prospects for a near-term solution to theirenergy problems.
Also of concern is the "Atlantic Basin" or "Russian Cascade" in the global petroleumrefining balance. As the members of the European Union have transitioned from apredominantly gasoline-fueled surface transportation fleet to one that is diesel-powered,European refiners have not met the diesel, or middle distillate, demand. Instead, theserefiners have lagged the transition and, rather than rapidly converting refinery productionto meet European demand, they have chosen to capitalize on more advantageous profitopportunities by producing and exporting gasoline to the US. More than 10 percent ofgasoline consumed in the US comes from imports, and Europe supplies most of theshipments. The Northeast is particularly dependent on imports to meet demand,accounting for almost 90 percent of US gasoline imports.25
What makes this arrangement work are Russian exports of diesel fuel to meet WesternEurope's demand. Should events lead to Russia reconsidering this arrangement, orrender it unable to export diesel to Europe in the needed quantities, a shock would"cascade" through the system to US gasoline markets, resulting in tumultuous globalmarkets until the structural disequilibrium was corrected.
Lo Trom intemauTonai inergy Agency aata
25 Energy Information Administration, Short-Term Energy Outlook: Summer 2005 Motor GasolineOutlook, April 2005, p. 11.
16

Click Here & Upgrade
Expanded Features1
PDF Unlimited Pages
Complete
Fortunately, a negative cascade has not reverberated through the system. In fact, theimbalance helped the US cope with the short-term aftershock of Hurricanes Katrina andRita because Europe had enough gasoline through increased production and reserves tohelp meet US demand. This will surely not be the case for the long-term, however.
1.5 Tight Global Refining Markets
The complex balance in refined products trade is of concern because of very tight globalrefining markets. There is very little spare refining capacity in the world system-approximately 3 to 4 percent at present according to one Subcommittee witness.26 Inother words, existing refineries are operating flat-out, and are taken offline only forabsolutely necessary maintenance. Sudden or even incremental increases in demandresult in an outsize impact on prices because there is little or no surplus capacity to meetthe demand surge. Record profits have been the result, but the last two years earningshave not been the norm for the industry. The situation, however, must be changed ifrecord profits due to a dangerous lack of spare capacity are not to become the rule ratherthan the exception.
Excess capacity has been wrung out of the system since the 1980s. Record profits in thelate 1970s and early 1980s led to vast overexpansion in the global oil industry. In 1986there was 100 percent spare capacity in the industry. 27 The refining industry followedwith years of below-average earnings and lost money as recently as 2002. Globally,return on investment for the oil industry was often below the cost of capital for much ofthat period.
26 Written testimony of Mr. Thomas O'Connor at the Subcommittee's October 19, 2005 hearing.
27 Written testimony from Mr. Paul Sankey at the Subcommittee's October 19,2005 hearing.
17

Click Here & UpgradeExpanded Features I
PDF Unlimited Pages
Complete
50.0
45.0
40.0
35.0
20.0
15.0
10.0
5.0
0.0
1989 1990 1991 1992 1993 1994 1995 1996 1997 1998 1999 2000 2001 2002 2003 2004 2005
Cash return on cash invested, US energy
- Global Cost of Capital - WTI (RHS)
Source: Written testimony of Mr. Paul Sankey, Deutsche Bank, for the October 19, 2005 SubcommitteeHearing, Petroleum Refineries: Will Record Profits Spur Investment in New Capacity?
To that end, the US refining industry has increased the average size of existing refineries,closed smaller inefficient operations, and stepped-up production levels from theirconsolidated capacity. Consequently, US refineries now do more with less. No newrefineries have been built since 1976, and additions in capacity are done throughexpansions of existing refineries because of environmental regulations and because it ischeaper. A large new refinery built in the US would cost between $5 and $7 billiondollars and more than five years to build-all before a dollar is earned.2 8 Refiningcompanies are reluctant to upset the current balance between supply and demand nowthat profits seem assured for the future.
29 Testimony of Mr. Thomas O'Connor at the Subcommittee's October 19,2005 hearing, Exhibit 16.
18

Click Here & Upgrade
Expanded FeaturesPDF Unlimited Pagest
Complete
Change in US Refinery Capacity Relative to Number of Refineries
20 400
.- 350
L -250 z_
YEAE
LU
10- 20DLL
= ....- 150 aS OPERABLE CAPACITY OPERAhV RENRIES Cam
Souce Feder0 TrdDomsio.Jl05
gz
,50
0 J .. { ,!01950 195 1960 1965 19'70 1975 1980 1;85 190 19'95 2000
YEARSource: Federal Trade Commission, July 2005.
The global situation is much the same. New refineries are planned but new capacity isnot expected to provide much of a cushion versus increased global demand. Industryexperts forecast that most of the new refining capacity will be built overseas and co-located with petrochemical manufacturers to achieve cost-savings and economies ofscale.
1.6 Targeting Foreign Oil Dependency
US oil demand is steadily growing while domestic supplies are dwindling, forcing the USto rely on imports for almost 60 percent of our consumption. Fifty years ago the USproduced half of the world's oil, and today we do not produce even half of our own needs.Domestic crude oil production continues to decrease, from a projected 5.5 million barrelsin 2006 to 4.57 million barrels in 2030.29 EIA forecasts dependence on petroleumimports will increase to 68 percent by 2025.30 By 2030, forecasts indicate thetransportation sector will comprise 74 percent of US petroleum consumption.31
Dependency on imported oil has a number of decidedly negative effects. It makes the USmore vulnerable because many of the countries that hold the greatest reserves are notfriendly to US interests. The greater Middle East will continue to be the low-cost and
29 Energy Information Administration, Annual Energy Outlook 2006, Reference Table 11.
3 0 Energy Information Administration, Annual Energy Outlook 2006, p. 101.
3 1 Energy Information Administration, Annual Energy Outlook 2006, p. 95.
19

Click Here & UpgradeExpanded Features i
PDF Unlimited Pagesi
Complete
dominant petroleum producer for the foreseeable future, ensuring its geopoliticalimportance. While usually willing to sell to the highest bidder, suppliers such asincreasingly belligerent Venezuela and Iran have threatened to curtail sales or cut offsupplies.
Reliance on imported oil has important implications for the balance of payments and theUS trade deficit. At $50 per barrel--the price of crude when the Subcommittee had itsfirst hearing in March 2005--the US sends nearly $600 million each day to foreignsources, which are often to state-owned oil companies in countries that are hostile to us.Some of the funds are likely to be used to fund activities counter to US interests or evento fund terrorism. The US "oil bill" accounts for more than a third of the annual tradedeficit the US currently runs. 32
The US is more dependent on imported oil than in the past, despite periodic calls fornational initiatives to wean our appetite for foreign crude in the wake of the 1973 ArabOil Embargo, the 1979 Iranian Revolution, and the Iraqi invasion of Kuwait and thePersian Gulf War in 1990-1991. These crises were supply shocks to the US economythat caused a rapid reassessment of energy policies and consumer behavior. The patternhas been for policymakers and consumers to make progress in reducing demand---ordemand growth--through conservation, efficiency, and fuel-switching measures. Theresponse lasts only as long as prices are high or changes remain mandatory. The sameeffect can also be seen in Corporate Average Fuel Economy Standards. After a period ofsteady improvement, continually falling gasoline prices resulted in a flat-lining of fueleconomy due to relaxations of standards and manufacturers responding to consumer 9preferences for purchasing large new vehicles.33 This recurring pattern must be broken.
32 Written testimony of Mr. Paul Portney, President of Resources for the Future, March 16, 2005
Subcommittee Hearing, p. 3.
3 3 The Department of Transportation announced new CAFt standards for light trucks and the heaviest
SUVs on March 29, 2006. The light truck targets will increase from 21.6 to 24 miles per gallon by 2011.
20

Click Here & Upgrade 1Expanded Features
PDF Unlimited Pages1
Complete
pSales-Weighted On-Road Fuel Economy by Vehicle Type, 1975-2004 Model Years
26~24-
2016. 18
10
1975 1980 1985 1990 1995 2000
. Passenger Cars --0-Vans--- SUVs -*-Pickups
Source: Energy Information Administration, Household Vehicles Energy Use: Latest Data &Trends, November 2005. EIA used the US EPA's Fuel Economy Trends 2004 as the data
source.
1.6.1 Policy Options: Revising CAFE
The US has three primary options for reducing demand in the transportation sector:widespread development of alternative fuels, increasing gasoline taxes, and aggressivelyrevising CAFE standards. Alternative fuels and ethanol are undergoing welcome andrapid development, but their gasoline-reduction impact will not be realized on a nationalscale until well into the future. Sufficiently raising gasoline taxes to greatly reducedemand would harm the economy, disproportionately impact rural areas, and is notpolitically feasible. 34
Policymakers and regulators need to aggressively revise CAFE standards and the designof the program. Fuel economy has stagnated since 1985, greatly contributing to US oildependence since the transportation sector consumes the bulk of oil. US industry found iteasier to lobby against CAFE increases as an impediment to business operations than tokeep making strides in fuel efficiency. This was a strategic mistake; CAFE is about UScompetitiveness, and the government must reassess its role in preventing shocks to USindustry by enhancing efficiency rather than pursuing myopic policies protecting thestatus quo.
Advances in automotive technologies in the domestic market have gone to increasedhorsepower and vehicle size. While short-term profits were realized by concentrating onsport utility vehicles and minivans during times of cheap gasoline, US automakers are
34 If increases in gasoline taxes at these levels ($1.25 to $2.25 per gallon) were not to harm the economy, atthe minimum accompanying tax cuts at equivalent levels would need to be made to counteract the negativeeffects on consumers and business.
21

Click Here & UpgradeExpanded Features
PDF Unlimited Pages,Complete
poorly positioned because global oil markets dictate that consumers will not value these 9vehicles as highly for the foreseeable future. Higher mileage requirements are achievableand cost-effective. Increases in CAFE standards will ultimately make US automakersmore-not less--competitive.
One of the most attractive options for revising CAFE is a market system of tradablecredits across the automobile manufacturing industry.35 Under the current system, thesales-weighted average fuel economy of an individual manufacturer's fleet of passengercars or light trucks for a given model year must be equal to, or greater than, the standard.By allowing a system of tradable credits, car manufacturers have the freedom to designand build the types of vehicles that will bring the most profit, taking into account themarket for CAFE credits. Greater efficiencies in the overall domestic market will bereached without requiring each manufacturer to build, market, and sell all types ofvehicles. Rather, each manufacturer can focus on its core competencies and designexpertise.
1.6.2 Policy Options: Revisiting Strategic Reserves
The effects of Hurricanes Katrina and Rita and forecasts for tight refining markets wellinto the future require investigating additional options to protect the US economy. Toensure crucial fuel supplies and to avoid economic catastrophe in the event of a supplyshock, the National Academies of Science (NAS) should carry out a study on thefeasibility and utility of creating strategic reserves for fuels other than crude oil. TheChairman of the Subcommittee has introduced a bill, HR 4043, to charge the NAS withsuch a study.
The situation for gasoline was especially tenuous following the hurricanes. Although theinternational strategic reserve system worked, there is no doubt that the US was heavilydependent on imported gasoline for an extended period. It is possible that a worsecatastrophe could affect global refining markets, causing a shortfall in supplies ofgasoline and gasoline blendstock. Building a reserve could provide the cushion needed tocombat skyrocketing prices-and their devastating effects-for a period of time untilemergency imports arrive and critical production and distribution infrastructure resumeoperations.
Designing a working reserve for refined products is much more complicated thandesigning a crude oil reserve, and would have an effect on the structure of the SPR.Refined products degrade over time and storage is an important consideration. A newreserve's effect on markets and the behavior of the private sector is also of utmostimportance. Finally, a gasoline reserve should not be promoted as a way to lowereveryday gas prices. The likely effect is that gasoline prices would rise at least a fewcents per gallon if a reserve were to be instituted. This increase can be viewed as an
3 Tis option has been popularized by the non-governmental, bipartisan National Commission on EnergyPolicy.
22

Alto!PDF
Complete
".9
Click Here & UpgradeExpanded Features
Unlimited Pages
insurance cost against a crushing blow to the US economy caused by a supply shock.The question is then whether a strategic reserve would be worth the cost and who, in fact,ultimately pays for the additional measure of security.
23

Click Here & UpgradeExpanded Features
PDF Unlimited PagesComplete
Nuclear Power andElectricity
2.1 Introduction: Nuclear Must be the PrimarySource of Generation
I believe the majority of environmental activists.., have now become so blinded by their extremistpolicies that they fail to consider the enormous and obvious benefits of harnessing nuclear powerto meet and secure America's growing energy needs. These benefits far outweigh the risks.There is now a great deal of scientific evidence showing nuclear power to be an environmentallysound and safe choice.
Mr. Patrick Moore, Co-Founder of Greenpeace3 6
The early release of the Energy Information Administration's 2006 Annual EnergyOutlook provides that the percentage of electricity generated by coal-fired plants willdecline slightly by 2020-to 49 from 50 percent-and then increase to 57 percent by2030. Natural gas will increase to 22 percent by 2020 before falling to 18 percent by2030 as a result of new coal plants being constructed. Nuclear generation will fall fromtoday's level of 20 percent to 15 percent by 2030. This lopsided ratio will generatehigher prices, increase dependency upon LNG imports to supplement domestic naturalgas depletion, and perpetuate the release of more harmful emissions produced by coalplants. Realigning policies to ensure nuclear power is the primary supplier of baseloadelectricity is the only sensible path forward. In addition, a revived nuclear programshould revisit the "once through" fuel cycle. Instead, the US should consider recyclingnuclear materials with the goal of achieving an innovative "closed loop" fuel cycle. Thiswill make for more efficient use of nuclear fuel, less volume of waste, and less harmfulnuclear waste that must ultimately be disposed of in a long-term waste facility.
As nuclear power's share of electricity is forecast to decline in the US, nuclear power isexperiencing a resurgence around the world. Nuclear power already supplies a largerpercentage of electricity in 17 countries than it does in the US, and the number isexpected to grow. As of April 2005, 30 nuclear reactors were being constructed in 11
36 Written testimony of Mr. Patrick Moore, prepared for the April 28, 2005 Subcommittee Hearing, The
Role of Nuclear Power Generation in a Comprehensive National Energy Policy.
24

Click Here & UpgradeExpanded Features,
PDF Unlimited Pages
Complete
countries, notably China, South Korea, Japan, and Russia. None are under constructionin the US. 3 7 The United Kingdom, Sweden, and Germany are reviewing their energypolicies that unwisely assumed intermittent renewable sources are capable of meetingeveryday electricity needs without nuclear power.38 Still other countries in Europe areconsidering increasing the scope of their own nuclear programs in response to the recentcrisis brought on by Russia's willingness to withhold natural gas from dependentconsumers.
Increased nuclear electricity production has several critical advantages over the statusquo. It will, among other things, free natural gas supplies for critical uses inmanufacturing processes, reduce electricity costs to the consumer, be emission-free, andpave the way for drastically reduced petroleum dependency should next generationnuclear technology be used to produce hydrogen in sufficient quantities to power acritical mass of emissions-free automobiles. Nuclear technology has steadily advancedand companies have designed standard reactor models that can be constructed anywherein the world, in stark contrast to the existing fleet of aging US nuclear plants that werecustomized according to each location and permitting process. The switch to nuclearpower as the primary source of baseload electricity will not come without a cost; it willnecessitate tremendous political support and financial investment from privateinstitutions and the federal government alike. This process will also require time andpatience. The federal government has begun to realize this, albeit to a limited extent.
On August 8, 2005, President Bush signed into law the Energy Policy Act of 2005(EPACT05). EPACT05 calls for novel incentives for private institutions to build andoperate nuclear facilities. These benefits include an amendment to the Price-AndersonAct to extend liability protection for private institutions, tax credits for megawatts, anexpedited review of reliable and affordable nuclear waste storage, and financialprotection for costs incurred due to licensing delays. Congress intends that theseincentives spur renewed interest in reactor production.
Despite these new incentives, and notwithstanding the President's Nuclear Power 201039initiative, the United States is no closer to energy security because the scope of energy
37 World Nuclear Association, Plans for New Reactors Worldwide, April 2005.
38 Maturing renewable power sources such as solar and wind are important to US energy security and mustbe developed. However, most renewables are intermittent in nature and cannot meet baseload demandbecause there is no way to store this energy. For example, the US National Academies of Science predictsfuture improvements will only increase the utilization capacity of wind turbines from 30 to 40 percent-meaning they cannot be relied upon to always deliver power when and where it is needed. In the US, EIAforecasts that renewables will not exceed 10 percent of the energy portfolio in the next 25 years.
39 The Nuclear 2010 program will pay up to half of the nuclear industry's costs of seeking regulatoryapproval for new reactor sites, applying for new reactor licenses, and preparing detailed plant designs. Theprogram is intended to provide assistance for advanced versions of existing commercial nuclear plants thatcould be ordered within the next few years. The applications under the Nuclear Power 2010 program areintended to test the "one step," combined construction permit and operation licensing process establishedby the Energy Policy Act of 1992. Previously it was a two-step, sequential process that did not assure that
25

Click Here & UpgradeExpanded Features I
PDF Unlimited Pages
Complete
policy has been too narrow. Congress drafted EPACT05 to help clear the hurdles 0 .impeding new reactor construction. Assuming the 6,000 megawatt increase contemplatedby EPACT05 is realized, by 2019 nuclear power's share of electricity generation wouldactually shrink to only three-quarters that of today--down to 15 percent.40 For nuclearpower to maintain its 20 percent share of the nation's electricity generation, 41 new 1,000megawatt plants would be needed by 2025. Thus, the incentives do nothing more than topromote reactor construction without stopping the decline of nuclear power's central rolein US electricity generation. Similarly, the President's 2010 initiative, referenced in the2005 State of the Union address, carries only the hope of granting construction permitsand operating licenses. It places no obligation upon petitioners to actually build reactorsonce they receive licenses. In this light, Congress and the Administration must be bolder.
2.2 The US Electricity Outlook
Recent trends suggest that, given current and projected consumption rates, energydemand in the United States will increase at an average rate of 1.2 percent per annum,from 99.7 quadrillion Btu in 2004 to 127 quadrillion Btu in 2025. Likewise, totalelectricity demand will increase from 3,729 billion kilowatthours (kwh) in 2004, to 5,619billion kwh by 2030. Coal-fired plants will provide 57 percent of the electricitygenerated, while natural gas-fired plants and nuclear plants will shoulder 17 percent and15 percent, respectively. 4' Under present conditions, however, fossil fuels will not allowthe United States to satisfy this growing demand in a safe and affordable manner.Natural gas prices are presently at an all-time high, and there is no guarantee of relief assupplies continue to dwindle and expensive, unreliable Liquefied Natural Gas (LNG)imports fill the void.
The electricity outlook is heavily influenced by the 1992 Energy Policy Act (EPACT92),which has had far-reaching consequences. EPACT92 opened access for interstatewholesale bulk power transactions. Simultaneously, it greatly increased the scope of theFederal Energy Regulatory Commission's jurisdiction. While access to wholesale bulkpower markets was opened, EPACT92 left it to individual states to determine whetherretail access would be opened to competition. New entities were formed to takeadvantage of industry transformation under EPACT92. New generation companies notsubject to price regulation were created and separated from ownership of the grid, whichis still regulated in terms of prices.
constructed plants were granted operating licenses. CRS Issue Brief for Congress, Nuclear Energy Policy,updated December 13, 2005.40 Energy Information Administration, AEO 2006 Early Release.
41 Energy Information Administration, AEO 2006 Early Release.
26
Click Here & Upgrade
Expanded Features
I PDF Unlimited PagesComplete
2.2.1 Natural Gas and Power- Negative Effects
An important consequence of EPACT92 is the boom in electricity produced by naturalgas-fired units. In fact, it has become the preferred fuel choice for new electricitygeneration facilities. This includes both baseload and intermediate power. The NorthAmerican Electric Reliability Council defines baseload as the minimum amount ofelectric power delivered or required over a given period at a constant rate. EIA appliesthis concept to generating units, equating baseload to units that produce electricity at aconstant rate and run continuously. Broken down further, baseload can be expressed as apercentage of capacity factor--the electricity actually produced compared to the potentialelectricity that the plant is capable of producing. Baseload is then the power supplied byunits with a capacity factor of 70 percent or more, intermediate load refers to electricitysupplied by units between plants used for only "peak" power needs-a capacity factor of20 percent or less-and baseload at 70 percent.
The Subcommittee staff is unaware of any comprehensive, US government analysis ofbaseload and intermediate power supplied by natural gas. According to EIA's definitionand Subcommittee majority staff discussions with EIA, baseload can be assumed to beelectricity that is supplied by nuclear and coal power plants.42 This assumption is clearlyflawed and discounts the largest source of new capacity. Natural gas clearly plays a largerole in the country's intermediate and baseload power needs. Since the 1990s, almost allnew plants are powered by natural gas, and the 5-year period from 1999 saw the largestincrease in generating capacity in the electricity industry's history. From 1996 to 2000,the use of natural gas for electricity grew 11 percent per year. According to EIA, of the94,000 megawatts of planned additions in electricity generating capacity through 2009,80 percent will be fueled primarily by natural gas, 14 percent by coal, and no newnameplate additions will be nuclear.
A capacity factor analysis initiated by the Subcommittee majority staff and completed byCambridge Energy Research Associates for the November 2005-October 2006 periodindicates that more than two-thirds of electricity generated by natural gas was
intermediate power, and up to 5 percent was baseload power (see figure below). 43 Theanalysis examined a period when natural gas prices were at extremely high historicallevels, which provided a strong disincentive for generators to burn natural gas forelectricity. In fact, price incentives have never been higher to utilize existing coal andnuclear power plants to the maximum extent possible. For other years, such as 2002, the
42 EIA generally defines baseload according to plants that run continuously. According to EIA,baseload capacity is defined as "the generating equipment normally operated to serve loads on anaround-the-clock basis." A baseload plant is "a plant.. .which is normally operated to take all orpart of the minimum load of a system, and which consequently produces electricity at anessentially constant rate and runs continuously."
41 The analysis performed by Cambridge Energy Research Associates used data from EIA Form 906, whichprovides monthly and annual data on generation and fuel consumption at the individual power plant andprime mover level.
27

1-1Click Here & UpgradeExpanded Featuresl
PDF Unlimited PagestComplete . I
0t-"natural gas capacity factors were much higher-and baseload a larger share of natural gassupplied electricity-because the cost of natural gas was lower.44 It is also important tonote that the role of intermediate load has become more prominent since the bulk powermarkets were created by EPACT92. The significant swings in natural gas capacityfactors and the cost of natural gas have a clear effect on the nation's electricity reliability,as well as the ability of households to meet their electricity bills.
US Electric Sector Gas Use vs. Plant Duty Cycle(1112005-1012006)
D
0
0
0
100%
75%
50%
25% tP10% W
0% 25% 50% 75%
Plant Duty Cycle (Average Annual Capacity Factor)
Courtesy of Cambridge Energy Research Associates
100%
Source: EJA Form 906
Natural gas has been especially attractive for use in electricity generation because naturalgas plants are generally cleaner, less costly and faster to construct, easier to site andlicense, require less manpower to operate, and are fuel-efficient compared to alternatives.Rather than being a seasonal product with use spiking in the colder months, as was thecase 25 years ago, natural gas demand is greater year-round because it has become thefavorite choice for electricity generation. In addition to its use for electricity, natural gasheats more than half of American homes, and the number is increasing. In 2003, 70percent of new homes built had heating systems fueled by natural gas.
At the same time as natural gas has become the preferred fuel for electricity generation-and prices have reached a new and more expensive floor-industries that use natural gasas a feedstock or for primary energy have experienced grave consequences. Many
4In 2002, the average wellhead price was $2.95 per tct and the price was $7.51 per tcf for 2005.45 American Gas Association, Snapshot of US Natural Gas Consumption (2005).
28

allPDF
Complete
A
Click Here & Upgrade
Expanded Features
Unlimited Pages It
industrial users do not have the option of switching to other sources of fuel when naturalgas prices rise. A 2001 price spike caused some industrial users to shut down productionand sell their long-term natural gas contracts to make a profA, and it is likely that theprice spike beginning in August 2005 has had the same effect. According to the Societyof the Plastics Industry, as a direct result of a three-fold increase in natural gas prices theplastics sector lost more than 150,000 jobs and $14.6 billion in business to other countriesfrom 2000 to 2002. As a result of high prices, America is no longer the world's toplocation for making chemicals; the US is now a net importer of chemicals. Ongoing highprices have also helped to shutter 21 nitrogen fertilizer production facilities, andproduction has moved overseas.46 Natural gas should be exploited for the uses for whichit is best suited. Profligate use of natural gas for electricity generation and otherprocesses that can use other fuels will ultimately lead to the US being less competitive.Natural gas must not be squandered on baseload and new electricity generation.
2.3 Global Confidence in Nuclear Power is Growing
While the US struggles with these issues, nuclear power is moving ahead in other regionsof the world. A March 2005 ministerial conference convened by the Organization forEconomic Cooperation and Development concluded that nuclear power is a proventechnology that contributes to the security of energy supply and the stability of energyprices by reducing exposure to fluctuations in the price of fossil fuels. In that regard,countries that once rejected nuclear power-such as Germany and Italy-are beginningto revise their policies. Even in Sweden-where a referendum in the 1980s placed amoratorium on nuclear power-public opinion polls indicate that 77 percent favorcontinued nuclear generation. 47
46 Testimony of Mr. Ford B West, President of the Fertilizer Institute, before the Senate AppropriationsInterior and Related Agencies Subcommittee, October 25, 2005.
47 The Analysis Group, November 2005 telephone poll of 2062 Swedes.
29

Click Here & UpgradeExpanded Features'
PDF Unlimited PagesComplete
Percent of Electricity Generated by Nuclear Energy -Selected Countries 2004
9078
807060- 55 52 "
20-4029 27
30-0 22 20
10 _ 70
Source: Compiled from World Nuclear Association tables, June 2005.
Moreover, as China and India develop, their energy demand is projected to skyrocket. Inlight of serious air quality problems and challenges transporting coal to its populationcenters, industry observers report that China plans to commission 21 new plants betweennow and 2020, increasing the number of reactors in operation from 9 to 30. Furthermore,the World Nuclear Association recently reported that India's national energy policy callsfor increasing the country's 2.5 gigawatt nuclear generating capacity one hundred-fold by2050.
France's heavy investment in nuclear power has positioned the country's state-ownedpower groups to reap significant benefits from marketing new nuclear technologies. TheFinancial Times reported in late March 2005 that corporate forecasts estimate that some$261 billion will be spent between 2010 and 2030 on building and updating reactors inEurope alone. The French government estimates that nuclear power not only saves thecountry about $13.3 billion annually when compared with the costs of generatingelectricity from natural gas, but that the industry's annual exports are worth $33 billion.48
France is the world's largest net electricity exporter, and nuclear generated electricity isFrance's fourth largest export.49 In addition, France recently announced that it aims tohave a new generation of reactors constructed and operating by 2020. Finland alsofinalized a contract with one of France's two power groups to build the first of a newgeneration of nuclear power plants, the European Pressurized Water Reactor, and Chinais considering the same reactor type for its electricity needs.
48 Peggy Hollinger, "France Wins Support as Showcase for Nuclear Power," Financial Times, 3/21/05, p. 3.US dollar figures are converted from Euros based on the exchange rate on the date of publication.
49 World Nuclear Association, French Nuclear Power Program Issue Brief, February 2006.
30

Click Here & Upgrade
Expanded Features' PDF Unlimited PagesiComplete
P2.4 Nuclear Power and the US
Nuclear power plants currently generate a significant amount of the nation's electricitybaseload. Projected growth in electricity demand, volatile fossil fuel prices, andenvironmental concerns have revitalized interest in nuclear generation in the US andelsewhere in the world. Nuclear power is a proven, emission-free source of electricitythat can contribute to the security of energy supplies and the stability of prices.
Today's operating nuclear power plants are consistent high performers in the USelectricity generation system, accounting for 20 percent of the nation's electricity. TheUS nuclear power industry comprises 103 licensed reactors at 65 plant sites in 31 states.50
Electricity production from US nuclear power plants is greater than that from oil, naturalgas, and hydropower, and behind only coal, which accounts for more than half of USelectricity generation. Nuclear plants generate more than half the electricity in six states.The record 824 billion kilowatt-hours of nuclear electricity generated in the United Statesduring 2004 was more than the nation's entire electrical output in the early 1960s, whenthe first large-scale commercial reactors were being ordered.5' Nuclear plants haveproven to be extremely reliable and clean.
2.4.1 A Record Of Reliable and Efficient Power
Since the early 1990s, US nuclear generators have dramatically increased their capacityfactor from about 70 percent to over 90 percent in 2004-the equivalent of gaining theoutput of about 25 nuclear power plants without building a single new facility. 52 Nuclearplants have also produced power with stable, predictable operating costs that arerelatively insulated from price fluctuations. Now that they are fully depreciated, theaverage US nuclear power plant now generates electricity at about 1.5 cents per kWh-far below the average US retail price for electricity, slightly less than coal, and much lessthan natural gas (2.5 cents/kWh before the record increase in prices in 2005)."Electricity production costs are a function of the costs for fuel, operations andmaintenance, and capital. Fuel costs make up most of the operating costs for fossil-firedunits.54 To illustrate the impact of high natural gas prices, fuel costs for the US power
50 This excludes TVA's Browns Ferry 1, which has not operated since 1985; the TVA Board decided May
16, 2002, to spend about $1.8 billion to restart the reactor by 2007.
51 Congressional Research Service, Nuclear Energy Policy, updated April 15, 2005, p. 2.
52 Statement of the Honorable Clay Sell, Deputy Secretary, Department of Energy, before the SenateCommittee on Energy and Natural Resources, April 26, 2005.
53 Paul Portney, "Nuclear Power: Clean, Costly and Controversial," Resources, Winter 2005, p. 29.According to the Nuclear Energy Institute, the cost of electricity produced from natural gas in February2005 was 5.8 cents/kWh.94 Even with waste disposal costs accounted for, the total fuel costs of a nuclear power plant in OECDcountries are typically about one-third of those for a coal-fired plant, and between 20 and 25 percent of
31

Click Here & Upgradekpý Expanded Features
X PDF Unfirrifted Pagesl,Complete
industry. 56 By substituting for fossil fuel plants, nuclear energy prevented the emission
of an estimated 1.11 million tons of nitrogen oxide, 3.43 million tons of sulfur dioxide,
and 696.6 million metric tons of carbon dioxide in 2004 alone.57
Furthermore, any discussion of policy options to deal with global warming and climate
change must acknowledge the centrality of nuclear power's role as a solution. ' A few
renowned environmentalists like James Lovelock have exposed the hypocrisy of ffinge
groups that claim climate change is the greatest threat to civilization and must be
addressed now, but steadfastly refuse to admit nuclear energy must be part of the
solution. The American public is belatedly recognizing this fact. According to a March
2006 Gallup poll, 55 percent of the public supports expanding the use of nuclear power,
including a majority of Democrats.
2.4.3 Nuclear Power: The Financial Challenge
Despite nuclear power's advantages, including competitive operating costs, financial
challenges stand in the way of new plant construction. According to the Congressional
Research Service, construction costs for reactors completed since the mid-1980s ranged
from $2 to $6 billion, averaging more than $3,000 per kilowatt of electric generating
capacity (in 1997 dollars). The nuclear industry predicts that new plant designs could be
built for less than half that amount if many identical plants were built in a series, but such
economies of scale have yet to be demonstrated. 58
In addition, building the first new nuclear power plant in the US in decades is regarded as
a high-risk effort by both the nuclear power industry and the financial community. These
reservations exist despite the fact that reactor designs have been standardized, and these
uniform designs have been constructed and are in operation around the world. The
industry's reluctance is largely based on past experience in the US. Several of the
nation's currently operating nuclear plants experienced delays due to changing
regulations, lengthy litigation (often brought by groups whose opposition to any nuclear
power is absolute), and significant cost overruns that seriously impacted the financial
health of the utilities and investors engaged in the projects.
Nuclear power's checkered financial history means that both debt and equity investors
will be extremely cautious before undertaking the financing of new nuclear construction.
The major risk for lenders is a delay in operations-hence revenues-by factors such as
those experienced in the past. Unless this risk is mitigated, sufficient debt financing to
support new nuclear plant construction will likely not be made available. Equity
investors also look to the predictability of a company's projected earnings and cash flows
56 Written testimony of Mr. Patrick Moore for the April 28, 2005, Subcommittee hearing entitled, "TheRole of Nuclear Power Generation in a Comprehensive National Energy Policy," P. 4.
57 Nuclear Energy Institute briefing, March 2006.
58 Congressional Research Service, Nuclear Energy Policy, Updated March 15, 2006, p. 2.
33
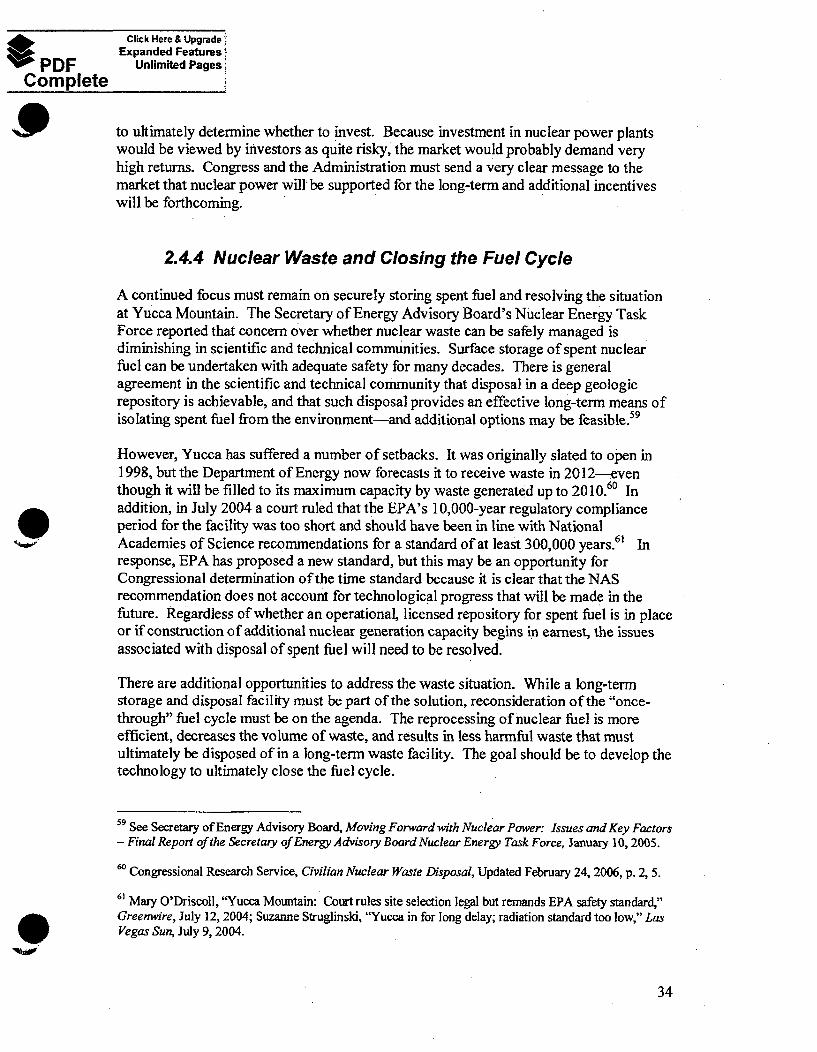
Click Here & Upgrade!6
Expanded Features !
PDF Unlimited Pages
Complete
P to ultimately determine whether to invest. Because investment in nuclear power plantswould be viewed by investors as quite risky, the market would probably demand veryhigh returns. Congress and the Administration must send a very clear message to themarket that nuclear power will be supported for the long-term and additional incentiveswill be forthcoming.
2.4.4 Nuclear Waste and Closing the Fuel Cycle
A continued focus must remain on securely storing spent fuel and resolving the situationat Yucca Mountain. The Secretary of Energy Advisory Board's Nuclear Energy TaskForce reported that concern over whether nuclear waste can be safely managed isdiminishing in scientific and technical communities. Surface storage of spent nuclearfuel can be undertaken with adequate safety for many decades. There is generalagreement in the scientific and technical community that disposal in a deep geologicrepository is achievable, and that such disposal provides an effective long-term means ofisolating spent fuel from the environment-and additional options may be feasible. 59
However, Yucca has suffered a number of setbacks. It was originally slated to open in1998, but the Department of Energy now forecasts it to receive waste in 2012-eventhough it will be filled to its maximum capacity by waste generated up to 2010.60 Inaddition, in July 2004 a court ruled that the EPA's 10,000-year regulatory complianceperiod for the facility was too short and should have been in line with NationalAcademies of Science recommendations for a standard of at least 300,000 years. Inresponse, EPA has proposed a new standard, but this may be an opportunity forCongressional determination of the time standard because it is clear that the NASrecommendation does not account for technological progress that will be made in thefuture. Regardless of whether an operational, licensed repository for spent fuel is in placeor if construction of additional nuclear generation capacity begins in earnest, the issuesassociated with disposal of spent fuel will need to be resolved.
There are additional opportunities to address the waste situation. While a long-termstorage and disposal facility must be part of the solution, reconsideration of the "once-through" fuel cycle must be on the agenda. The reprocessing of nuclear fuel is moreefficient, decreases the volume of waste, and results in less harmful waste that mustultimately be disposed of in a long-term waste facility. The goal should be to develop thetechnology to ultimately close the fuel cycle.
59 See Secretary of Energy Advisory Board, Moving Forward with Nuclear Power: Issues and Key Factors- Final Report of the Secretary of Energy Advisory Board Nuclear Energy Task Force, January 10, 2005.
60 Congressional Research Service, Civilian Nuclear Waste Disposal, Updated February 24, 2006, p. 2, 5.
61 Mary O'Driscoll, "Yucca Mountain: Court rules site selection legal but remands EPA safety standard,"
Greenwire, July 12, 2004; Suzanne Struglinskd, "Yucca in for long delay; radiation standard too low," LasVegas Sun, July 9, 2004.
34
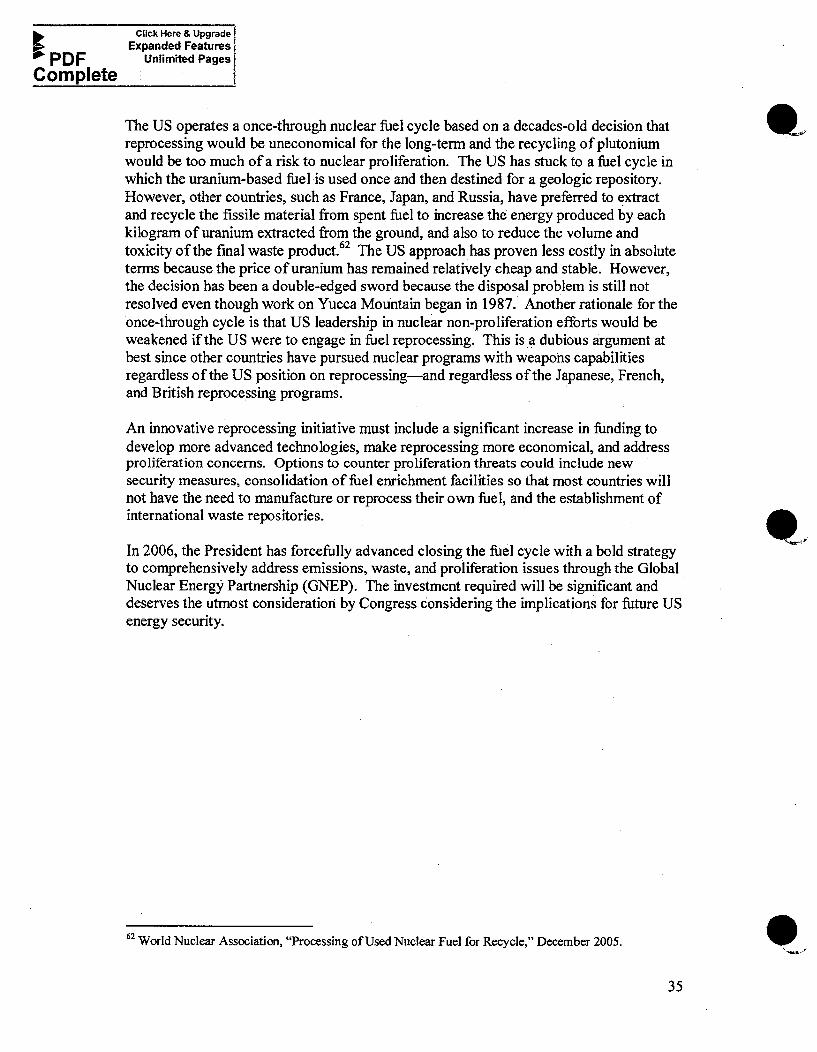
Click Here & Upgrade1-01 Expanded Features
Ow" PDF Unlimited Pages
Complete
The US operates a once-through nuclear fuel cycle based on a decades-old decision that W o.reprocessing would be uneconomical for the long-term and the recycling of plutoniumwould be too much of a risk to nuclear proliferation. The US has stuck to a fuel cycle inwhich the uranium-based fuel is used once and then destined for a geologic repository.However, other countries, such as France, Japan, and Russia, have preferred to extractand recycle the fissile material from spent fuel to increase the energy produced by eachkilogram of uranium extracted from the ground, and also to reduce the volume andtoxicity of the final waste produCt.62 The US approach has proven less costly in absoluteterms because the price of uranium has remained relatively cheap and stable. However,the decision has been a double-edged sword because the disposal problem is still notresolved even though work on Yucca Mountain began in 1987. Another rationale for theonce-through cycle is that US leadership in nuclear non-proliferation efforts would beweakened if the US were to engage in fuel reprocessing. This is.a dubious argument atbest since other countries have pursued nuclear programs with weapons capabilitiesregardless of the US position on reprocessing-and regardless of the Japanese, French,and British reprocessing programs.
An innovative reprocessing initiative must include a significant increase in funding todevelop more advanced technologies, make reprocessing more economical, and addressproliferation concerns. Options to counter proliferation threats could include newsecurity measures, consolidation of fuel enrichment facilities so that most countries willDot have the need to manufacture or reprocess their own fuel, and the establishment ofinternational waste repositories.
In 2006, the President has forcefully advanced closing the fuel cycle with a bold strategyto comprehensively address emissions, waste, and proliferation issues through the GlobalNuclear Energy Partnership (GNEP). The investment required will be significant anddeserves the utmost consideration by Congress considering the implications for future USenergy security.
62 World Nuclear Association, "Processing of Used Nuclear Fuel for Recycle," December 2005.
35

Click Here & Upgrade;4001 Expanded FeaturesM MW
PDF Unlimited Pages
Complete
Conclusion
US policymakers must rise to the challenge of breaking the chains of energy dependenceby first acknowledging that the global energy situation has fundamentally andirreversibly changed. Unlike previous episodes of high energy prices, the currentsituation is fundamentally different because it is demand-driven. We must face the fact
that no matter what we do to secure sources of supply for petroleum, the US can dorelatively little in terms of lowering oil prices over the long haul because oil is boughtand sold on a world market. It is possible that oil and energy prices will decrease if arecession were to occur in the US and Asia, or as a result of a spike in new exploration
and production of oil and natural gas.
However, the price effect would be temporary because the structural issues for demand
will remain the same. Over the long-term, energy demand will continue to rise from boththe developed and developing world, particularly Asia. Additionally, the geopoliticalissues that surround the availability of oil and natural gas imports to consuming countriesfrom producing countries-Iran, Russia, Venezuela, Saudi Arabia, Nigeria, or others-have the potential for catastrophic consequences for the US economy and vital nationalsecurity interests.
There is only one way to guarantee the national security and economic well-being of theAmerican people. A comprehensive plan must be developed to reach increasing levels ofenergy independence, and we must not waver in our commitment to seeing it realized
even if prices are to temporarily drop. As witnessed fi7om events of the last 35 years,energy dependence and the effects of comparatively rare supply shocks made us moredependent on imported petroleum resources because policymakers put the priority onlowering prices of suddenly scarce commodities to avoid abrupt economic hardship.Once the price of oil and gasoline dropped, the impetus for a profound and long-lastingchange in US energy supply and consumption patterns was lost. This is demonstrated bythe fact that the US is more dependent on imported oil than in the past despite theperiodic calls for national initiatives to wean our appetite for foreign crude in the wake ofthe 1973 Arab Oil Embargo, the 1979 Iranian Revolution, and the Iraqi invasion ofKuwait and the Persian Gulf War in 1990-1991. We must ensure that the currentgeopolitical situation and the lessons of Hurricanes Katrina and Rita are not added to thisignominious list of opportunities lost.
To set foot down the path of energy independence, the US must first address thetransportation sector because it is the predominant user of crude oil and refined petroleum
products. Implementing a market-based system of stronger CAFE standards will helpachieve this goal while making American industry more competitive in the global
36
Click Here & Upgrade
Expanded Features
PDF Unlimited Pages
Complete
marketplace. Second, emissions-free nuclear power must become the primary source of tbaseload electricity and the choice for new units to generate electricity. Our reliance onnatural gas as the preferred source of fuel for new electricity generation has put us in aprecarious position both economically and geopolitically.
Policymakers must be realistic about our ability to break the chains of energydependence, the actions required, and the consequences if those actions are not taken.Energy consumption in the US must be viewed in terms of an energy portfolio, whichincludes not just choices of fuels but the full gamut of measures to be taken. We cannotignore empirical reality by engaging in dangerous wishful thinking. We cannot conserveour way to energy independence, nor domestically produce enough oil and natural gas tomake the geopolitical importance of the Middle East a distant memory. It is timepolicymakers make these difficult choices.
37

Click Here & UpgradeExpanded Featuresi
PDF Unlimited Pages!
Complete
Appendix
Subcommittee on Energy and Resources, Hearings on Energy- 1stSession, 1091h Congress
March 16, 2005 - Energy Demand in the 21" Century: Are Congress and the ExecutiveBranch Meeting the Challenge?
Witnesses: Mr. Jim Wells, Director, Natural Resources and Environment,Government Accountability Office
Mr. Guy Caruso, Administrator, Energy InformationAdministration, Department of Energy
Mr. Paul Portney, President, Resources for the Future
April 6, 2005 - America's Energy Needs as Our National Security Policy
Witnesses: The Honorable Jeffrey Clay Sell, Deputy Secretary, Department ofEnergy
The Honorable R. James Woolsey, former Director of the CentralIntelligence Agency
Ambassador Robert Hormats, Vice Chairman, Goldman SachsInternational
Mr. Robert E. Ebel, Chairman, Energy Program, Center forStrategic and International Studies
April 28, 2005 - The Role of Nuclear Power Generation in a Comprehensive NationalEnergy Policy
Witnesses: Mr. Donald Jones, Vice President and Senior Economist,RCF Economic and Financial Consulting, Inc.
Mr. Marvin Fertel, Senior Vice President for Business Operations,Nuclear Energy Institute
Mr. Patrick Moore, Chairman and Chief Scientist, Greenspirit____ Strategies Ltd.
38
Click Here & UpgradeExpanded Features
PDF Unlimited PagesComplete
a,.May 9, 2005 - Field Hearing, Long Beach, CA - What's Causing Record Prices at thePump?
Witnesses: Mr. John Cook, Director of the Petroleum Division, Office of Oiland Gas, Energy Information Administration, Department ofEnergy
Mr. Jim Wells, Director, Natural Resources and Environment,Government Accountability Office
Mr. Pat Perez, Transportation Energy Division, California EnergyCommission
Ms. Rayola Dougher, Manager, Energy Market Issues, AmericanPetroleum Institute
June 8, 2005 - Ensuring the Reliability of the Nation's Electricity System
Witnesses: The Honorable Pat Wood III, Chairman, Federal EnergyRegulatory Commission
Mr. Michehl R. Gent, President and CEO, North American ElectricReliability Councilt
Mr. David Owens, Executive Vice President, Edison ElectricInstituteDr. Mark Cooper, Director of Research, Consumer Federation of
America
June 29, 2005 - The Next Generation of Nuclear Power
Witnesses: Mr. Robert Shane Johnson, Acting Director, Nuclear Energy,Science and Technology, Department of Energy
Dr. David Baldwin, Senior Vice President, General Atomics
Dr. Rowan Rowntree, Independent Scientist
Mr. Dave Lochbaum, Nuclear Safety Engineer, Union ofConcerned Scientists
39

ftMW* PDF
Complete
'*A
Click Here & UpgradeExpanded Features
Unlimited Pages
July 27, 2005 - The Hydrogen Economy: Is it Attainable? "en?
Witnesses: The Honorable Douglas L. Faulkner, Acting Assistant Secretaryfor Energy Efficiency and Renewable Energy, Department ofEnergy
The Honorable Richard M. Russell, Associate Director forTechnology, Office of Science and Technology Policy, ExecutiveOffice of the President
The Honorable Alan Lloyd, Secretary, California EnvironmentalProtection Agency
Mr. Dennis Campbell, CEO, Ballard Power Systems
Lawrence D. Burns, Vice President of Research and Development,General Motors Corporation
Mr. Mujid KazimL Director, Center for Advanced Nuclear EnergySystems, Massachusetts Institute of Technology
Týft. Daniel Sperling, Director, Institute of Transportation Studies,University of California at Davis
September 14, 2005 - Meeting America's Natural Gas Deman& Are We in a Crisis?
Witnesses: The Honorable Rebecca Watson, Assistant Secretary for Land andMinerals Management, Department of Interior
The Honorable Guy Caruso, Administrator, Energy InformationAdministration, Department of Energy
Mr. Michael Zenker, Senior Director, North American NaturalGas, Cambridge Energy Research Associates
Mr. Logan Magruder, President, Independent PetroleumAssociation of Mountain States
Mr. Tyson Slocum, Research Director - Energy Program, PublicCitizen
40
Click Here & UpgradeExpanded Features
PDF Unlimited Pages
Complete
October 19, 2005 - Petroleum Refineries: Will Record Profits Spur Investment in NewCapacity?
Witnesses: Mr. Bob Slaughter, President, National Petrochemical & Refiners
Association
Mr. Paul Sankey, Senior Energy Analyst, Deutsche Bank AG
Mr. Tom O'Connor, Project Manager, ICF Consulting
Mr. Eric Schaeffer, Director, Environmental Integrity Project
Additional information and hearing testimony are available on the Subcommittee's websitehttp://reform.house.-Rov/ER/.
41

Transportation
. (scattering by material contents), cloudshine (scattering by air), and groundshine (scattering by theground). Credit for potential shielding between the shipment and the receptor was not considered.
The RISKIND code was also used to provide a scenario-specific assessment of radiological consequencesof severe transportation-related accidents. Whereas the RADTRAN 5 risk assessment considers theentire range of accident severities and their related probabilities, the RISKIND consequence assessmentfocuses on accident scenarios that result in the largest releases of radioactive material to the environmentthat are reasonably foreseeable. The consequence assessment was intended to provide an estimate of thepotential impacts posed by a severe, but highly unlikely, transportation-related accident scenario.
The dose to each maximally exposed individual considered was calculated with RISKIND for anexposure scenario defined by a given distance, duration, and frequency of exposure specific to thatreceptor. The distances and durations were similar to those given in previous transportation riskassessments. The scenarios were not meant to be exhaustive but were selected to provide a range ofpotential exposure situations.
J.1.2 NUMBER AND ROUTING OF SHIPMENTS
This section discusses the number of shipments and routing information used to analyze potential impactsthat would result from preparation for and conduct of transportation operations to ship spent nuclear fueland high-level radioactive waste to the Yucca Mountain site. Table J-1 summarizes the estimatednumbers of shipments for the various inventory and national shipment scenario combinations.
J.1.2.1 Number of Shipments
DOE used two analysis scenarios-mostly legal-weight truck and mostly train (rail)-as bases forestimating the number of shipments of spent nuclear fuel and high-level radioactive waste from 72commercial and 5 DOE sites. The number of shipments for the scenarios was used in analyzingtransportation impacts for the Proposed Action and Inventory Modules 1 and 2. DOE selected thescenarios because, more than 10 years before the projected start of operations at the repository, it cannotaccurately predict the actual mix of rail and legal-weight truck transportation that would occur from the77 sites to the repository. Therefore, the selected scenarios enable the analysis to bound (or bracket) theranges of legal-weight truck and rail shipments that could occur.
The analysis estimated the number of shipments from commercial sites where spent nuclear fuel would beloaded and shipped and from DOE sites where spent nuclear fuel, naval spent nuclear fuel, and high-levelradioactive waste would be loaded and shipped.
For the mostly legal-weight truck scenario, with one exception, shipments were assumed to use legal-weight trucks. Overweight, overdimensional trucks weighing between about 36,300 and 52,200kilograms (80,000 and 115,000 pounds) but otherwise similar to legal-weight trucks could be used forsome spent nuclear fuel and high-level radioactive waste (for example, spent nuclear fuel from the SouthTexas reactors). The exception that gives the scenario its name-mostly legal-weight truck-was forshipments of naval spent nuclear fuel. Under this scenario, naval spent nuclear fuel would be shipped byrail, as decided in the Record of Decision for a Dry Storage Container System for the Management ofNaval Spent Nuclear Fuel (62 FR 1095; January 8, 1997).
For the mostly rail scenario, the analysis assumed that all sites would ship by rail, with the exception ofthose with physical limitations that would make rail shipment impractical. The exception would be forshipments by legal-weight trucks from six commercial sites that do not have the capability to load railcasks. However, the analysis also assumed that these six sites would be upgraded to handle a rail caskafter the reactors were shut down and would ship either by direct rail or by heavy-haul truck or barge to
J-10
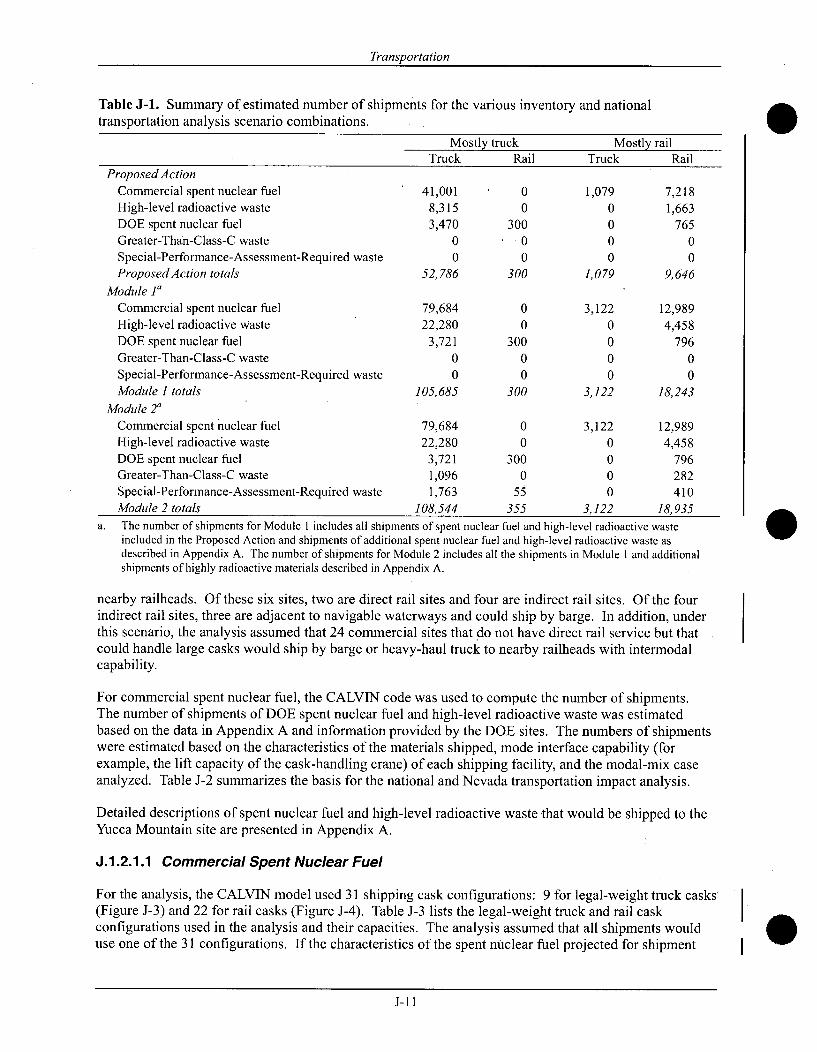
Transportation
Table J-1. Summary of estimated number of shipments for the various inventory and nationaltransportation analysis scenario combinations.
Mostly truck Mostly railTruck Rail Truck Rail
Proposed ActionCommercial spent nuclear fuel 41,001 0 1,079 7,218High-level radioactive waste 8,315 0 0 1,663DOE spent nuclear fuel 3,470 300 0 765Greater-Than-Class-C waste 0 0 0 0Special-Performance-Assessment-Required waste 0 0 0 0Proposed Action totals 52,786 300 1,079 9,646
Module 1a
Commercial spent nuclear fuel 79,684 0 3,122 12,989High-level radioactive waste 22,280 0 0 4,458DOE spent nuclear fuel 3,721 300 0 796Greater-Than-Class-C waste 0 0 0 0Special-Performance-Assessment-Required waste 0 0 0 0Module I totals 105,685 300 3,122 18,243
Module 2aCommercial spent nuclear fuel 79,684 0 3,122 12,989High-level radioactive waste 22,280 0 0 4,458DOE spent nuclear fuel 3,721 300 0 796Greater-Than-Class-C waste 1,096 0 0 282Special-Performance-Assessment-Required waste 1,763 55 0 410Module 2 totals 108,544 355 3,122 18,935
a. The number of shipments for Module 1 includes all shipments of spent nuclear fuel and high-level radioactive wasteincluded in the Proposed Action and shipments of additional spent nuclear fuel and high-level radioactive waste asdescribed in Appendix A. The number of shipments for Module 2 includes all the shipments in Module 1 and additionalshipments of highly radioactive materials described in Appendix A.
nearby railheads. Of these six sites, two are direct rail sites and four are indirect rail sites. Of the fourindirect rail sites, three are adjacent to navigable waterways and could ship by barge. In addition, underthis scenario, the analysis assumed that 24 commercial sites that do not have direct rail service but thatcould handle large casks would ship by barge or heavy-haul truck to nearby railheads with intermodalcapability.
For commercial spent nuclear fuel, the CALVIN code was used to compute the number of shipments.The number of shipments of DOE spent nuclear fuel and high-level radioactive waste was estimatedbased on the data in Appendix A and information provided by the DOE sites. The numbers of shipmentswere estimated based on the characteristics of the materials shipped, mode interface capability (forexample, the lift capacity of the cask-handling crane) of each shipping facility, and the modal-mix caseanalyzed. Table J-2 summarizes the basis for the national and Nevada transportation impact analysis.
Detailed descriptions of spent nuclear fuel and high-level radioactive waste that would be shipped to theYucca Mountain site are presented in Appendix A.
J.1.2.1.1 Commercial Spent Nuclear Fuel
For the analysis, the CALVIN model used 31 shipping cask configurations: 9 for legal-weight truck casks(Figure J-3).and 22 for rail casks (Figure J-4). Table J-3 lists the legal-weight truck and rail caskconfigurations used in the analysis and their capacities. The analysis assumed that all shipments woulduse one of the 31 configurations. If the characteristics of the spent nuclear fuel projected for shipment
J-1 1

Transportation
Table J-2. Analysis basis-national and Nevada transportation scenarios.a,b
Mostly legal-weight truck National mostly rail scenarioMaterial scenario national and Nevada Nevada rail scenario Nevada heavy-haul truck scenario
CasksCommercial SNF
DOE HLW and DOESNF, except navalSNF
Naval SNF
Transportation modes
Commercial SNF
DOE HLW and DOESNF, except navalSNF
Naval SNF
Truck casks - about 1.8MTHM per cask
Truck casks - 1 SNF orHLW canister per cask
Disposal canisters in largerail casks for shipment fromINEEL
Legal-weight trucks
Legal-weight trucks
Rail from INEEL tointermodal transfer station inNevada, then heavy-haultrucks to retositorv
Rail casks - 6 to 12 MTHMper cask for shipments from66 sites
Truck casks - about 1.8MTHM per cask forshipments from 6 sitesc
Rail casks - four to nineSNF or HLW canisters percask
Disposable canisters in largerail casks for shipments fromINEEL
Direct rail from 49 sitesserved by railroads torepository
Heavy-haul trucks from 7sites to railhead, then rail torepository
Heavy-haul trucks or bargesd
from 17 sites to railhead,then rail to repository
Legal-weight trucks from6 sites to repositoryc
Rail from DOE sitese torepository
Rail from INEEL torepository
Rail casks - 6 to 12 MTHM percask for shipments from 66 sites
Truck casks - about 1.8 MTHMper cask for shipments from 6 sites
Rail casks - four to nine SNF orHLW canisters per cask
Disposable canisters in large railcasks for shipments from INEEL
Rail from 49 sites served byrailroads to intermodal transferstation in Nevada, then heavy-haultrucks to repository
Heavy-haul trucks from 7 sites torailheads, then rail to intermodaltransfer station in Nevada, thenheavy-haul trucks to repository
Heavy-haul trucks or bargesd from17 sites to railheads, then rail toiniermodal transfer station inNevada, then heavy-haul trucks torepository
Legal-weight trucks from 6 sites torepositoryc
Rail from DOE sitese to intermodaltransfer station in Nevada, thenheavy-haul trucks to repository
Rail from INEEL to intermodaltransfer station in Nevada, thenheavy-haul trucks to repository
a. Abbreviations: SNF = spent nuclear fuel; MTHM = metric tons of heavy metal; HLW = high-level radioactive waste;INEEL = Idaho National Engineering and Environmental Laboratory.
b. G. E. Morris facility is included with the Dresden reactor facilities in the 72 commercial sites.c. The analysis assumed that the six legal-weight truck sites would upgrade their crane capacity upon reactor shutdown and
would ship all remaining spent nuclear fuel by rail. Of those six sites, four are heavy-haul sites and two are direct rail sites.Three of the heavy-haul sites have barge capability (Pilgrim, St. Lucie 1, and Indian Point).
d. Seventeen of 24 commercial sites not served by a railroad are on or near a navigable waterway. Some of these 17 sites couldship by barge rather than by heavy-haul truck to a nearby railhead. Salem/Hope Creek treated as two sites for heavy-haul orbarge analysis.
e. Hanford Site, Savannah River Site, Idaho National Engineering and Environmental Laboratory, West Valley DemonstrationProject, and Ft. St. Vrain.
J-12

18 meters (56 feet) J
Soum~e: DIRS 1O4782-Kelderhouse (1999. p. 7).
Figure J-3. Artist's conception of a truck cask on a legal-weight tractor-trailer truck.
Z
21 meters (66 feet)
Souce:DIR 1478-Kederoue
(999 p.81
Source: DI RS 1O4782-Kelderhouse (1999. p. 8).
Figure J-4. Artist's conception of a large rail cask on a railcar.
0

Transportation
Table J-3. Shipping cask configurations.
Capacity (number of spentShipping cask nuclear fuel assemblies) Description"ab
RailB-R-32-SP 32 BWR single-purpose shipping containerB-R-32,SP-HHI 32 BWR single-purpose high-heat-capacity shipping containerB-R-44-SP 44 Medium BWR single-purpose shipping containerB-R-68-OV 68 Large BWR overpack shipping containerB-R-68-SP 68 Large BWR single-purpose shipping containerB-R-BP64-OV 64 Plant-unique overpack shipping containerB-R-H168-OV 68 BWR HISTAR overpack shipping containerB-R-NAC56-OV 56 BWR NAC UMS overpack shipping containerP-R-12-SP 12 Small PWR single-purpose shipping containerP-R-12-SP-HH 12 Small PWR single-purpose high-heat-capacity shipping containerP-R-21-SP 21 Medium PWR single-purpose shipping containerP-R-24-OV 24 Large PWR overpack shipping containerP-R-24-SP 24 Large PWR single-purpose shipping containerP-R-7-SP-HH 7 PWR high heat shipping containerP-R-9-OV-MOX 9 PWR mixed-oxide overpack shipping containerP-R-9-SP-MOX 9 PWR mixed-oxide single-purpose shipping containerP-R-MP24-OV 24 PWR MP-1 87 (large) overpack shipping containerP-R-NAC26-OV 26 PWR NAC UMS overpack shipping containerP-R-ST I 7-SP 17 PWR plant-unique single-purpose shipping containerP-R-VSC24-OV 24 PWR Transtor ventilated storage cask overpack shipping containerP-R-WES2 1 -OV 21 PWR WESFLEX overpack shipping containerP-R-YR36-OV 36 PWR plant-unique overpack shipping container
TruckB-T-9/9-SP 9 BWR single-purpose shipping containerB-T-9/7-SP 7 Derated BWR single-purpose shipping containerP-T-4/4-SP 4 Primary PWR single-purpose shipping containerP-T-4/3-SP 3 Derated PWR single-purpose shipping containerP-T-4/2-SP 2 Derated PWR single-purpose shipping containerP-T-4/4-SP-ST 4 PWR plant-unique single-purpose shipping containerP-T-4/3-SP-ST 3 PWR Derated plant-unique single-purpose shipping containerP-T-4/4-SP-MOX 4 PWR Mixed-oxide single-purpose shipping containerP-T-4/4-SP-BP I PWR plant-unique.single-purpose shipping container
a. Source: DIRS 157206-CRWMS M&O (2000, all).b. BWR = boiling-water reactor; PWR = pressurized-water reactor; SNF = spent nuclear fuel.
exceeded the capabilities of one of the casks, the model reduced the cask's capacity for the affectedshipments. The reduction, which is sometimes referred to as cask derating, was needed to satisfy nuclearcriticality, shielding, and thermal constraints. For shipments that DOE would make using specific casks,derating would be accomplished by partially filling the assigned casks in compliance with provisions ofapplicable Nuclear Regulatory Commission certificates of compliance. An example of derating isdiscussed in Section 5 of the GA-4 legal-weight truck shipping cask design report (DIRS 101831-GeneralAtomics 1993, p. 5.5-1). The analysis addresses transport of two high-bumup or short cooling timepressurized-water reactor assemblies rather than four design basis assemblies.
RAIL SHIPMENTS
This appendix assumes that rail shipments of spent nuclear fuel would use large rail shipping casks,one per railcar. DOE anticipates that as many as five railcars with casks containing spent nuclearfuel or high-level radioactive waste would move together in individual trains with buffer cars andescort cars. For general freight service, a train would include other railcars with other materials. Indedicated (or special) service, trains would move only railcars containing spent nuclear fuel or high-level radioactive waste and the buffer and escort cars.
J-14

Transportation
For the mostly rail scenario, six sites without sufficient crane capacity to lift a rail cask or without otherfactors such as sufficient floor loading capacity or ceiling height were assumed to ship by legal-weighttruck. However, the analysis assumed that these sites would be upgraded to handle rail casks once thereactors were shut down, and all remaining spent nuclear fuel would ship by rail. Of these six sites, twoare direct rail and four are indirect rail sites. Of the four with indirect rail access, three have access to anavigable waterway. The 24 sites with sufficient crane capacity but without direct rail access wereassumed to ship by heavy-haul truck to the nearest railhead. Of these 24 sites, 17 with access tonavigable water-ways were analyzed for shipping by barge to a railhead (see Section J.2.4). The numberof rail shipments (direct or indirect) was estimated based on each site using the largest cask size feasiblebased on the load capacity of its cask handling crane. In calculating the number of shipments from thesites, the model used the Acceptance, Priority Ranking & Annual Capacity Report (DIRS 104382-DOE1995, all). Using CALVIN, the number of shipments of legal-weight truck casks (Figure J-3) ofcommercial spent nuclear fuel estimated for the Proposed Action (63,000 MTHM of commercial spentnuclear fuel) for the mostly legal-weight truck scenario, would be about 15,000 containing boiling-waterreactor assemblies and 26,000 containing pressurized-water reactor assemblies. Under InventoryModules I and 2, for which approximately 105,000 MTHM of commercial spent nuclear fuel would beshipped to the repository (see Appendix A), the estimated number of shipments for the mostly legal-weight truck scenario would be 29,000 for boiling-water reactor spent nuclear fuel and 5 1,000 forpressurized-water reactor spent nuclear fuel. Table J-4 lists the number of shipments of commercial spentnuclear fuel for the mostly legal-weight truck scenario. Specifically, it lists the site, plant, and statewhere shipments would originate, the total number of shipments from each site, and the type of spentnuclear fuel that would be shipped. A total of 72 commercial sites with 104 plants (or facilities) are listedin the table.
The number of shipments of truck and rail casks (Figure J-4) of commercial spent nuclear fuel estimatedfor the Proposed Action for the mostly rail scenario would be approximately 2,700 for boiling-waterreactor spent nuclear fuel and 5,600 for pressurized-water reactor spent nuclear fuel. Under Modules Iand 2, the estimated number of shipments for the mostly rail scenario would be approximately 5,400containing boiling-water reactor spent nuclear fuel and 10,700 containing pressurized-water reactor spentnuclear fuel. Table J-5 lists the number of shipments for the mostly rail scenario. It also lists the site andstate where shipments would originate, the total number of shipments from each site, the size of rail caskassumed for each site, and the type of spent nuclear fuel that would be shipped. In addition, it lists the 24sites not served by a railroad that would ship rail casks by barge or heavy-haul trucks to a nearby railheadand the 6 commercial sites without capability to load a rail cask.
J.1.2.1.2 DOE Soent Nuclear Fuel and High-Level Radioactive Waste
To estimate the number of DOE spent nuclear fuel and high-level radioactive waste shipments, theanalysis used the number of handling units or number of canisters and the number of canisters pershipment reported by the DOE sites in 1998 (see Appendix A, p. A-34; DIRS 104778-Jensen 1998, all).To determine the number of shipments of DOE spent nuclear fuel and high-level radioactive waste, theanalysis assumed one canister would be shipped in a legal-weight truck cask. For rail shipments, theanalysis assumed that five 6 1 -centimeter (24-inch)-diameter high-level radioactive waste canisters wouldbe shipped in a rail cask. For rail shipments of DOE spent nuclear fuel, the analysis assumed that railcasks would contain nine approximately 46-centimeter (18-inch) canisters or four approximately6 1 -centimeter canisters. The number of DOEspent nuclear fuel canisters of each size is presented inAppendix A.
Under the mostly legal-weight truck scenario for the Proposed Action, DOE would transport a total of11,785 truck shipments of DOE spent nuclear fuel and high-level radioactive waste (one high-level wastecanister per shipment) to the repository. In addition, DOE would transport 300 shipments of naval spentnuclear fuel by rail from the Idaho National Engineering and Environmental Laboratory to the repository
J-15

Transportation
Table J-4. Shipments of commercial spent nuclear fuel, mostly legal-weight truck scenarioa
(page 1 of 2).
Site Reactor
Browns Ferry
Joseph M. Farley
Arkansas Nuclear One
Palo Verde
Diablo Canyon
Humboldt BayRancho SecoSan Onofre
Haddam NeckMillstone
Crystal RiverSt. Lucie
Turkey Point
Edwin I. HatchVogtleDuane ArnoldBraidwoodByronClintonDresden/Morris
LaSalleQuad CitiesZionWolf CreekRiver BendWaterfordPilgrimYankee-RoweCalvert CliffsMaine YankeeBig Rock PointD. C. CookFermiPalisadesMonticelloPrairie IslandCallawayGrand GulfBrunswick
Browns Ferry IBrowns Ferry 3Joseph M. Farley IJoseph M. Farley 2.Arkansas Nuclear One, Unit IArkansas Nuclear One, Unit 2Palo Verde 1Palo Verde 2Palo Verde 3Diablo Canyon IDiablo Canyon 2Humboldt BayRancho Seco 1San Onofre ISan Onofre 2San Onofre 3Haddam NeckMillstone IMillstone 2Millstone 3Crystal River 3St. Lucie 1St. Lucie 2Turkey Point 3Turkey Point 4Edwin I. Hatch IVogtle 1Duane ArnoldBraidwood 1Byron IClinton IDresden IDresden 2Dresden 3
MorrisdMorrisdLaSalle IQuad Cities IZion IWolf Creek IRiver Bend 1Waterford 3Pilgrim 1Yankee-Rowe ICalvert Cliffs IMaine YankeeBig Rock PointD. C. Cook IFermi 2PalisadesMonticelloPrairie Island ICallaway IGrand Gulf IBrunswick IBrunswick 2Brunswick IBrunswick 2
State
ALALALALARARAZAZAZCACACACACACACACTCTCTCTFLFLFLFLFLGAGAIAILILILILILIL
ILILILILILKSLALAMAMAMDMEMIMIMIMI
MNMNMOMSNCNCNCNC
Fuel type
BbBpC
PPPPPPPPBPPPPPBPPPPPPPBPBPPBBBB
BPBBPPBPBPPPBPBPBPPBPPBB
Proposed Action(2010-2033)
738324363330362432383375360359370
4412452
408393255321361310277426380291292939725324565617363
76459514
31988
769979557396353374322134867356110832377409257665435592
4036
281282
Modules 1 and 2(2010-2048)
1,550807779843645905694691716971
1,13044
12452
817829255321694
1,008621849987574570
1,8201,379
5761,1421,136
63676
726760
31988
2,0801,567
557678636607575134
1,612356111
1,759662660435
1,109701
1,3834036
702657
J-16

Transportation
Table J-4. Shipments of commercial spent nuclear fuel, mostly legal-weight truck scenarioa
(page 2 of 2).
SiteShearon Harris
McGuire
Cooper StationFort CalhounSeabrookOyster CreekSalem/Hope Creek
James A. FitzPatrick/Nine Mile Point
GinnaIndian Point
Davis-BessePerryTrojanBeaver Valley
LimerickPeach Bottom
SusquehannaThree Mile IslandCatawba
Oconee
H. B. RobinsonSummerSequoyahWatts BarComanche PeakSouth Texas
ReactorShearon Harris IShearon HarrisMcGuire IMcGuire 2Cooper StationFort CalhounSeabrook 1Oyster Creek 1Salem ISalem 2Hope CreekJames A. FitzPatrickNine Mile Point INine Mile Point 2GinnaIndian Point IIndian Point 2Indian Point 3Davis-Besse IPerry 1TrojanBeaver Valley IBeaver Valley 2Limerick 1Peach Bottom 2Peach Bottom 3Susquehanna IThree Mile Island ICatawba 1Catawba 2Oconee IOconee 3H. B. Robinson 2Summer ISequoyahWatts Bar IComanche Peak ISouth Texas ISouth Texas 2North Anna ISurry 1Vermont Yankee IColumbia Generating Station
StateNCNCNCNCNENENHNJNJNJNJ
Fuel typePBPPBPPBPPB
NY BNYNYNYNYNYNYOHOHORPAPAPAPAPAPAPASCSCSCSCSCSCTNTNTXTXTX
Proposed Action(2010-2033)
289152372419272260277451329304444413426387320
40400285343293195309248740567575
1,044320327310970324249281644158665271257675863380415
Modules I and 2(2010-2048)
549152932
1,069621457590658725826796732628722472
40805694786528195649472
1,3541,0231,0352,482
654555574
1,668666470713
1,768552
1,409614590
1,5881,457
6131,006
51637
1,05128,71950.965
North AnnaSurryVermont YankeeColumbia Generating
VA PVA PVT B
WA BStation
Kewaunee Kewaunee WI PLaCrosse LaCrosse WI BPoint Beach Point Beach WI PTotal BWRbTotal PWRc
a. Source: DIRS 157206-CRWMS M&O (2000, all).b. B = boiling-water reactor (BWR).c. P = pressurized-water reactor (PWR).d. Morris is a storage facility located close to the three Dresden reactors.
30637
65315,22925.772
J-17

Transportation
Table J-5. Shipments of commercial spent nuclear fuel, mostly rail scenarioa (page 1 of 2).
Proposed ModulesAction I and 2
Site Reactor State Fuel type Cask 2010 -2033 2010-2048Browns Ferry
Joseph M. Farley
Arkansas Nuclear One
Palo Verde
Diablo Canyon
Humboldt BayRancho SecoSan Onofre
Haddam NeckMillstone
Crystal RiverCrystal RiverSt LucieSt. Lucie
Turkey Point
Edwin I. HatchVogtleDuane ArnoldBraidwoodByronClintonDresden/Morris
LaSalleQuad CitiesZionWolf CreekRiver BendWaterfordPilgrimPilgrimYankee-RoweCalvert CliffsMaine YankeeBig Rock PointD. C. CookFermiPalisadesMonticelloMonticelloPrairie IslandCallawayGrand Gulf
Browns Ferry IBrowns Ferry 3Joseph M. Farley 1Joseph M. Farley 2Arkansas Nuclear One, Unit IArkansas Nuclear One, Unit 2Palo Verde IPalo Verde 2Palo Verde 3Diablo Canyon 1Diablo Canyon 2Humboldt BayRancho Seco ISan Onofre ISan Onofre 2San Onofre 3Haddam NeckMillstone IMillstone 2Millstone 3Crystal River 3Crystal River 3St. Lucie ISt. Lucie ISt. Lucie 2Turkey Point 3Turkey Point 4Edwin I. Hatch IVogtle IDuane ArnoldBraidwood IByron 1Clinton 1Dresden IDresden 2Dresden 3MorrisMorrisLaSalle 1Quad Cities IZion 1Wolf Creek IRiver Bend ]Waterford 3Pilgrim IPilgrim IYankee-Rowe ICalvert Cliffs IMaine YankeeBig Rock PointD. C. Cook IFermi 2PalisadesMonticelloMonticelloPrairie Island ICallaway IGrand Gulf ]
ALALALALARARAZAZAZCACACACACACACACTCTCTCTFLFLFLFLFLFLFL
GAGAIAILILILILILILILILILILIL
KSLALAMAMAMAMDMEMIMIMIMIMNMNMNMOMS
BbBpC
PPPPPPPPBPPPPPBPPPPPPPPPBPBPPBBBBBPBBPPBPBBPPPBPBPBBPPB
RailRailRailRailRailRailRailRailRailRailRailRailRailRailRailRailRailRailRailRailRail
TruckRail
TruckRailRailRailRailRailRailRailRailRailRailRailRailRailRailRailRailRailRailRailRailRail
TruckRailRailRailRailRailRailRailRail
TruckRailRailRail
122515753576465626660616
219
65644091
1154925
13312
358615252
116205
5794
101.5911
83894315
101172
9363576624
15415
169557
1496170328
1037180
2471201321311081499794
102148160
6219
1311374091
19913817
43713
7511478586
2882831291621598711
1581604315
305329
9397879318
39415
320557
26891
12219
250205101215
J-18
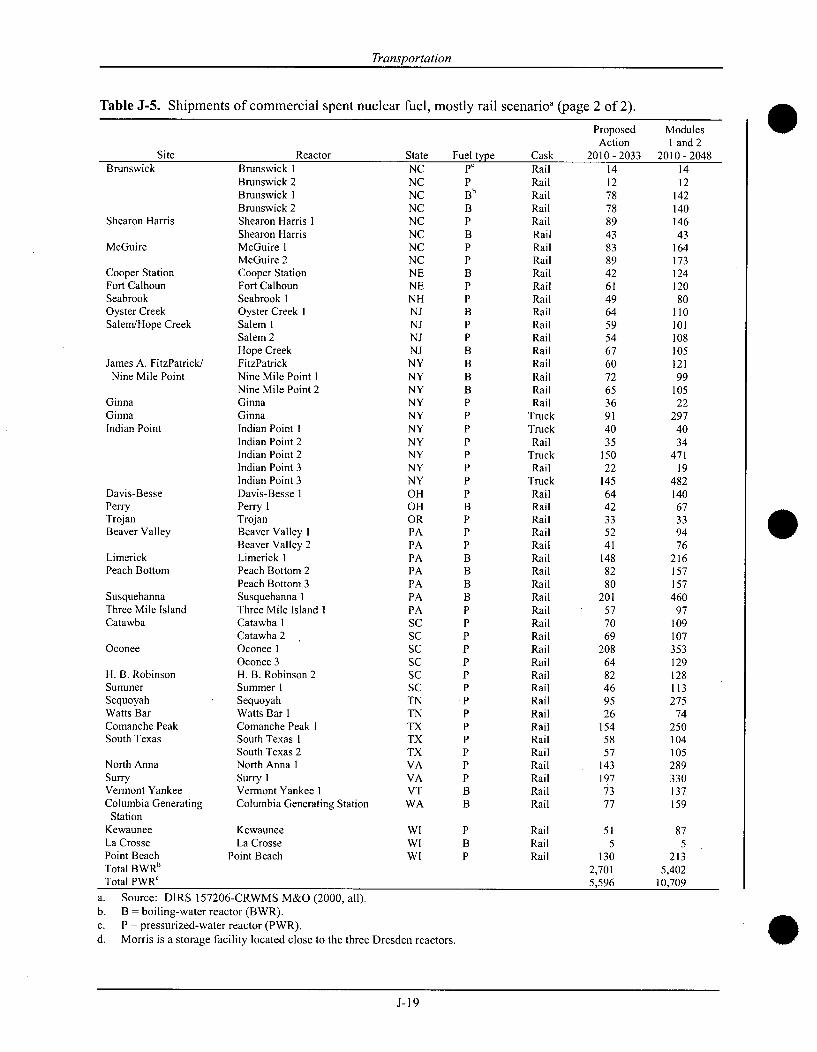
Transportation
Table J-5. Shipments of commercial spent nuclear fuel, mostly rail scenarioa (page 2 of 2).
Site ReactorBrunswick
Shearon Harris
McGuire
Cooper StationFort CalhounSeabrookOyster CreekSalem/Hope Creek
James A. FitzPatrick/Nine Mile Point
GinnaGinnaIndian Point
Davis-BessePerryTrojanBeaver Valley
LimerickPeach Bottom
SusquehannaThree Mile IslandCatawba
Oconee
H. B. RobinsonSummerSequoyahWatts BarComanche PeakSouth Texas
North AnnaSurryVermont YankeeColumbia Generating
StationKewauneeLa CrossePoint BeachTotal BWRbTotal PWRc
Brunswick IBrunswick 2Brunswick 1Brunswick 2Shearon Harris 1Shearon HarrisMcGuire 1McGuire 2Cooper StationFort CalhounSeabrook 1Oyster Creek ISalem 1Salem 2Hope CreekFitzPatrickNine Mile Point INine Mile Point 2GinnaGinnaIndian Point IIndian Point 2Indian Point 2Indian Point 3Indian Point 3Davis-Besse IPerry 1TrojanBeaver Valley IBeaver Valley 2Limerick IPeach Bottom 2Peach Bottom 3Susquehanna IThree Mile Island ICatawba ICatawba 2Oconee IOconee 3H. B. Robinson 2Summer ISequoyahWatts Bar IComanche Peak ISouth Texas ISouth Texas 2North Anna ISurry IVermont Yankee IColumbia Generating Station
StateNCNCNCNCNCNCNCNCNENENHNJNJNJNJNYNYNYNYNYNYNYNYNYNYOHOHORPAPAPAPAPAPAPASCSCSCSCSCSCTNTNTXTXTXVAVAVTWA
Fuel typepC
PBbBPBPPBPPBPPBBBBPPPPPPPPBPPPBBBBPPPPPPPPPPPPPPBB
PBP
CaskRailRailRailRailRailRailRailRailRailRailRailRailRailRailRailRailRailRailRail
TruckTruckRail
TruckRail
TruckRailRailRailRailRailRailRailRailRailRailRailRailRailRailRailRailRailRailRailRailRailRailRailRailRail
ProposedAction
2010-203314127878894383894261496459546760726536914035
15022
1456442335241
1488280
201577069
2086482469526
1545857
1431977377
515
1302,7015,596
Modules1 and 2
2010-20481412
14214014643
16417312412080
11010110810512199
10522
2974034
47119
482140
67339476
216157157460
97109107353129128113275
74250104105289330137159
875
2135,402
10,709
KewauneeLa Crosse
Point Beach
WIWIWI
RailRailRail
a. Source: DIRS 157206-CRWMS M&O (2000, all).b. B = boiling-water reactor (BWR).c. P = pressurized-water reactor (PWR).d. Morris is a storage facility located close to the three Dresden reactors.
J-19

Transportation
(one naval spent nuclear fuel canister per rail cask). For Modules 1 and 2 under the mostly legal-weighttruck scenario, the analysis estimated 26,001 DOE spent nuclear fuel and high-level radioactive wastetruck shipments, as well as the 300 naval spent nuclear fuel shipments by rail.
Under the mostly rail scenario for the Proposed Action, the analysis estimated that DOE would transport2,128 railcar shipments of DOE spent nuclear fuel and high-level radioactive waste (five high-level wastecanisters per shipment), as well as the 300 shipments of naval spent nuclear fuel. For Modules 1 and 2under this scenario, DOE would transport 4,954 railcar shipments of DOE spent nuclear fuel and high-level radioactive waste, as well as the 300 shipments of naval spent nuclear fuel. Table J-6 lists theestimated number of shipments of DOE and naval spent nuclear fuel from each of the sites for both theProposed Action and Modules 1 and 2. Table J-7 lists the number of shipments of high-level radioactivewaste for the Proposed Action and for Modules 1 and 2.
Table J-6. DOE and naval spent nuclear fuel shipments by site.
Proposed Action Module 1 or 2
Site Mostly truck Mostly rail Mostly truck Mostly rail
INEELa 1,388b 433 1,467 442Savannah River Site 1,316 149 1,411 159Hanford 754 147 809 157Fort St. Vrain 312 36 334 38Totals 3,770 765 4,021 796
a. INEEL = Idaho National Engineering and Environmental Laboratory.b. Includes 1,088 truck shipments of DOE spent nuclear fuel and 300 railcar shipments of naval spent nuclear fuel.c. Includes 1,167 truck shipments of DOE spent nuclear fuel and 300 railcar shipments of naval spent nuclear fuel.
Table J-7. High-level radioactive waste shipments by site.a
Proposed Action Module 1 or 2
Site Mostly truckb Mostly railc Mostly truckb Mostly railc
INEELd 0 0 1,292 260eHanford 1,960 392 14,500 2,900Savannah River Site 6,055 1,211 6,188 1,238West Valleyf 300 60 300 60Totals 8,315 1,663 22,280 4,458
a. The total U.S. inventory of high-level radioactive waste at the time of shipment would be 22,280 canisters. Under theProposed Action, DOE would only ship 8,315 canisters. Under Inventory Module I or 2, DOE would ship the entireinventory.
b. One canister per shipment.c. Five canisters per shipment.d. INEEL = Idaho National Engineering and Environmental Laboratory.e. 238 shipments of Idaho Nuclear Technology and Engineering Center glass form waste, 20 shipments of Argonne National
Laboratory-West ceramic form waste, and 2 shipments of Argonne National Laboratory-West metallic form waste (seeAppendix A, Section A.2.3.5.1).
f. High-level radioactive waste at West Valley is commercial rather than DOE waste.
J.1.2.1.3 Greater-Than-Class-C and Special-Performance-Assessment-Required WasteShipments
Reasonably foreseeable future actions could include shipment of Greater-Than-Class-C and Special-Performance-Assessment-Required waste to the Yucca Mountain Repository (Appendix A describesGreater-Than-Class-C and Special-Performance-Assessment-Required wastes). Commercial nuclear
J-20

Transportation
powerplants, research reactors, radioisotope manufacturers, and other manufacturing and researchinstitutions generate low-level radioactive waste that exceeds the Nuclear Regulatory Commission ClassC shallow-land-burial disposal limits. In addition to DOE-held material, there are three other sources orcategories of Greater-Than-Class-C low-level radioactive waste:
" Nuclear utilities" Sealed sources* Other generators
The activities of nuclear electric utilities and other radioactive waste generators to date have producedrelatively small quantities of Greater-Than-Class-C low-level radioactive waste. As the utilities take theirreactors out of service and decommission them, they could generate more waste of this type.
DOE Special-Performance-Assessment-Required low-level radioactive waste could include the followingmaterials:
* Production reactor operating wastes* Production and research reactor decommissioning wastes* Non-fuel-bearing components of naval reactors* Sealed radioisotope sources that exceed Class C limits for waste classification" DOE isotope production-related wastes* Research reactor fuel assembly hardware
The analysis estimated the number of shipments of Greater-Than-Class-C and Special-Performance-Assessment-Required waste by assuming that 10 cubic meters (about 350 cubic feet) would be shipped ina rail cask and 2 cubic meters (about 71 cubic feet) would be shipped in a truck cask. Table J-8 lists theresulting number of commercial Greater-Than-Class-C shipments in Inventory Module 2 for both truckand rail shipments. The shipments of Greater-Than-Class-C waste from commercial utilities wouldoriginate among the commercial reactor sites. Typically, boiling-water reactors would ship a total ofabout 9 cubic meters (about 318 cubic feet) of Greater-Than-Class-C waste per site, while pressurized-water reactors would ship about 20 cubic meters (about 710 cubic feet) per site (see Appendix A). Theimpacts of transporting this waste were examined for each reactor site. The analysis assumed that sealedsources and Greater-Than-Class-C waste identified as "other" would be shipped from the DOE SavannahRiver Site (see Table J-8).
Table J-8. Commercial Greater-Than-Class-Cwaste shipments.a
Category Truck Rail
Commercial utilities 742 210Sealed sources 121 25Other 233 47Totals 1,096 282
a. Source: Appendix A.
The analysis assumed DOE Special-Performance-Assessment-Required waste would be shipped fromfour DOE sites listed in Table J-9. Naval reactor and Argonne East Special-Performance-Assessment-Required waste is assumed to be shipped from the Idaho National Engineering and EnvironmentalLaboratory.
J-21
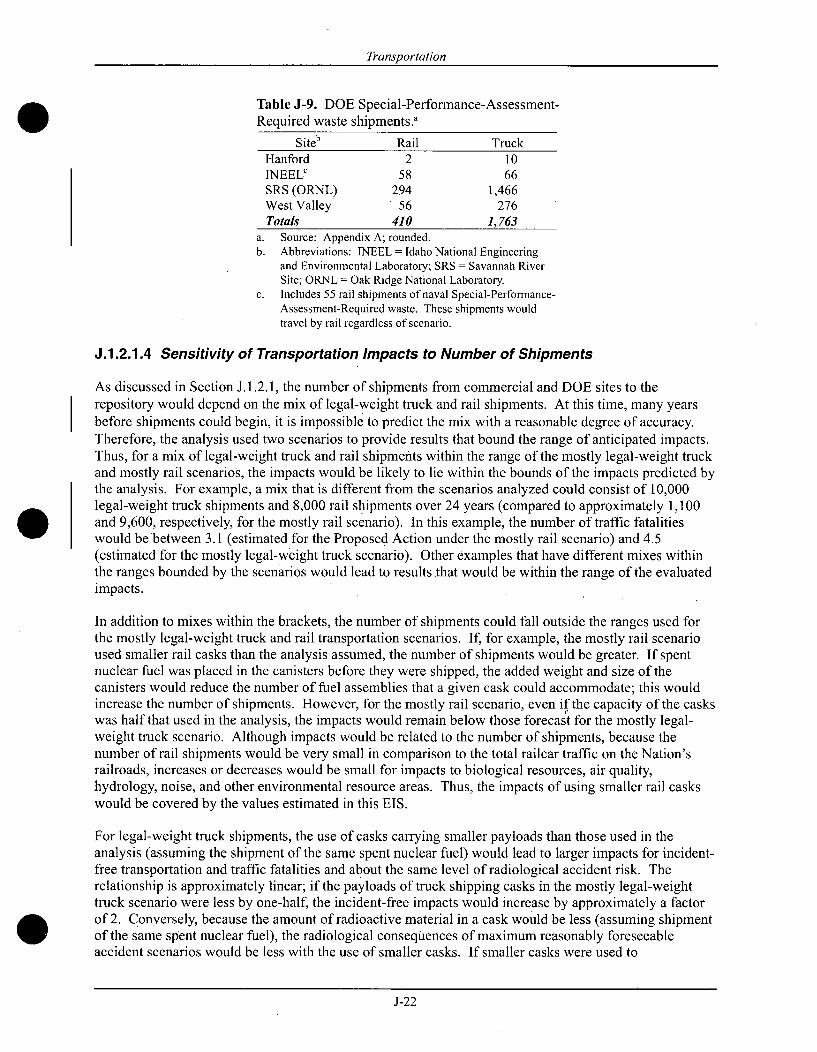
Transportation
Table J-9. DOE Special-Performance-Assessment-Required waste shipments a
Siteb Rail TruckHanford 2 10INEELc 58 66SRS (ORNL) 294 1,466West Valley 56 276Totals 410 1,763
a. Source: Appendix A; rounded.b. Abbreviations: INEEL = Idaho National Engineering
and Environmental Laboratory; SRS = Savannah RiverSite; ORNL = Oak Ridge National Laboratory.
c. Includes 55 rail shipments of naval Special-Performance-Assessment-Required waste. These shipments wouldtravel by rail regardless of scenario.
J.1.2.1.4 Sensitivity of Transportation Impacts to Number of Shipments
As discussed in Section J. 1.2.1, the number of shipments from commercial and DOE sites to therepository would depend on the mix of legal-weight truck and rail shipments. At this time, many yearsbefore shipments could begin, it is impossible to predict the mix with a reasonable degree of accuracy.Therefore, the analysis used two scenarios to provide results that bound the range of anticipated impacts.Thus, for a mix of legal-weight truck and rail shipments within the range of the mostly legal-weight truckand mostly rail scenarios, the impacts would be likely to lie within the bounds of the impacts predicted bythe analysis. For example, a mix that is different from the scenarios analyzed could consist of 10,000legal-weight truck shipments and 8,000 rail shipments over 24 years (compared to approximately 1,100and 9,600, respectively, for the mostly rail scenario). In this example, the number of traffic fatalitieswould be between 3.1 (estimated for the Proposed Action under the mostly rail scenario) and 4.5(estimated for the mostly legal-weight truck scenario). Other examples that have different mixes withinthe ranges bounded by the scenarios would lead to results that would be within the range of the evaluatedimpacts.
In addition to mixes within the brackets, the number of shipments could fall outside the ranges used forthe mostly legal-weight truck and rail transportation scenarios. If, for example, the mostly rail scenarioused-smaller rail casks than the analysis assumed, the number of shipments would be greater. If spentnuclear fuel was placed in the canisters before they were shipped, the added weight and size of thecanisters would reduce the number of fuel assemblies that a given cask could accommodate; this wouldincrease the number of shipments. However, for the mostly rail scenario, even if the capacity of the caskswas half that used in the analysis, the impacts would remain below those forecast for the mostly legal-weight truck scenario. Although impacts would be related to the number of shipments, because thenumber of rail shipments would be very small in comparison to the total railcar traffic on the Nation'srailroads, increases or decreases would be small for impacts to biological resources, air quality,hydrology, noise, and other environmental resource areas. Thus, the impacts of using smaller rail caskswould be covered by the values estimated in this EIS.
For legal-weight truck shipments, the use of casks carrying smaller payloads than those used in theanalysis (assuming the shipment of the same spent nuclear fuel) would lead to larger impacts for incident-free transportation and traffic fatalities and about the same level of radiological accident risk. Therelationship is approximately linear; if the payloads of truck shipping casks in the mostly legal-weighttruck scenario were less by one-half, the incident-free impacts would increase by approximately a factorof 2. Conversely, because the amount of radioactive material in a cask would be less (assuming shipmentof the same spent nuclear fuel), the radiological consequences of maximum reasonably foreseeableaccident scenarios would be less with the use of smaller casks. If smaller casks were used to
J-22
Transportation
accommodate shipments of spent nuclear fuel with shorter cooling time and higher bumup, theradiological consequences of maximum reasonably foreseeable accident scenarios would be about thesame.
J.1.2.2 Transportation Routes
At this time, about 10 years before shipments could begin, DOE has not deten-nined the specific routes itwould use to ship spent nuclear fuel and high-level radioactive waste to the proposed repository.Nonetheless, this analysis used current regulations governing highway shipments and historic railindustry practices to select existing highway and rail routes to estimate potential environmental impactsof national transportation. Routing for shipments of spent nuclear fuel and high-level radioactive wasteto the proposed repository would comply with applicable regulations of the U.S. Department ofTransportation and the Nuclear Regulatory Commission in effect at the time the shipments occurred, asstated in the proposed DOE revised policy and procedures (DIRS 10474 1 -DOE 1998, all) forimplementing Section 180(c) of the Nuclear Waste Policy Act, as amended (NWPA).
Approximately 4 years before shipments to the proposed repository began, the Office of CivilianRadioactive Waste Management plans to identify the preliminary routes that DOE anticipates using instate and tribal jurisdictions so it can notify governors and tribal leaders of their eligibility for assistanceunder the provisions of Section 180(c) of the NWPA. DOE has published a revised proposed policystatement that sets forth its revised plan for implementing a program of technical and financial assistanceto states and Native American tribes for training public safety officials of appropriate units of localgovernment and tribes through whose jurisdictions the Department plans to transport spent nuclear fuel orhigh-level radioactive waste (63 FR 23756, January 2, 1998) (see Appendix M, Section M.8).
The analysis of impacts of the Proposed Action and Modules I and 2 used characteristics of routes thatshipments of spent nuclear fuel and high-level radioactive waste could travel from the originating siteslisted in Tables J-4 through J-7. Existing routes that could be used were identified for the mostly legal-weight truck and mostly rail transportation scenarios and included the 10 rail and heavy-haul truckimplementing alternatives evaluated in the EIS for transportation in Nevada. The route characteristicsused were the transportation mode (highway, railroad, or navigable waterway) and, for each of the modes,the total distance between an originating site and the repository. In addition, the analysis estimated thefraction of travel that would occur in rural, suburban, and urban areas for each route. The fraction oftravel in each population zone was determined using 1990 Census data (see Section J. 1. 1.2 and J. 1. 1.3) toidentify population-zone impacts for route segments. The highway routes were selected for the analysisusing the HIGHWAY computer program and routing requirements of the U.S. Department ofTransportation for shipments of Highway Route-Controlled Quantities of Radioactive Materials (49 CFR397.101). Shipments of spent nuclear ftiel and high-level radioactive waste would contain HighwayRoute-Controlled Quantities of Radioactive Materials.
J.1.2.2.1 Routes Used in the Analysis
Routes used in the analysis of transportation impacts of the Proposed Action and Inventory Modules Iand 2 are highways and rail lines that DOE anticipates it could use for legal-weight truck or railshipments from each origin to Nevada. For rail shipments that would originate at sites not served byrailroads, routes used for analysis include highway routes for heavy7haul trucks or barge routes from thesites to railheads. Figures J-5 and J-6 show the truck and rail routes, respectively, analyzed for theProposed Action and Inventory Modules I and 2. Tables J- 10 and J- 11 list the lengths of trips and thedistances of the highway and rail routes, respectively, in rural, suburban, and urban population zones.Sites that would be capable of loading rail casks, but that do not have direct rail access, are listed inTable J- 11. The analysis used six ending rail nodes in Nevada (Beowawe,. Caliente, Dry Lake, Eccles,
J-23

Hanford ' -
Trojan. its.. Columebia Ireneratiog '-J .... l M-,station Fl3 T.A ' i
q- ~..r VermontIdaho National MT ND [] Nine Mile Point & Yonkee MaineEngi g and James A. itzPatrick YankeeEnviomntal iMN
!rator (-'---- • ". '•"-'-• West ValleyNY ,-Monticllo w Demonstration r\• N H
Praisde eoe inet Project Yankee- SeabrookSD Island K---he.waune•gri
Point Ginna todian
L aCrosse FMillstoneZionPa•iade m Per Ssqehaa
onopossae Rb B.rn.••PAson Haddamý:" .Ful EM ' IA - J Neck
NE Fort Beaver
: e NS a•nalhois Cudei vl ia e Valley watSalem &n h e Stt of N Y w Hope Creek
National ht. Vrain CorTrk
Federall re Calvert Cliffs
Figure KS Rereenatv trcCoterrmcmmrilaneOi es toYCcal M unaiwaalye for the PrpsdActo anSurntr
D M o d ule 1; a 2onanyon Shearon
= OK auirr on aArkansasBr own It-:
.S'AZ ,ucea onee. mr- Rbj B kiv r nSmite ..
Oofre NM SL1 •
,re ý2M FerryAnA]gt'Cl-
I• AL •"Savannah
•'"-- •Peak LA Gl Jose M. Hatc
TX '°ar ley
South Texas tr
FL t. Lucie
Legend I
S Commercial sites TurkeyNote: The E IS analysis considered three commercial site pairs -- Salem and Symbols do not reflect precise locations. P, oint
Hope Creek, Nine Mile Point and FitzPatrick, and Dresden and Morris --to be single sites due to their proximity to each other.
•) DOE sitesNote: The EIS analysis included the high-level radioactive waste at West Valley.
The State of New York owns the high-level radioactive waste and the site.Under the West Valley Demonstration Project Act, DOE is responsible for These routes represent the routes analyzed in Chapter 6 and might not be thesolidifying and transporting the high-level radioactive waste to a repository. routes actually used for shipments to the proposed repository at Yucca Mountain.
-- National highways analyzed Truck routes comply with U.S. Department of Transportation routing regulations.States or tribes can designate alternative preferred routes (40 CFR 397.103).
[• Federally recognized Native American lands Source: Modified from DIPS 101779-DOE (1998, Overview, p. 5),
Figure J-5. Representative truck routes from commercial and DOE sites to Yucca Mountain analyzed for the Proposed Action and Inventory11 Modules I and 2.

~ A WA4ZTrojarn ' ° ____o'
"• Site olmi, ratng
tainMT o tý Nine Mile Point & Yankee 0
ElJames A. FiOPatnck YankeeEngineering and MN 01JmsA iz~tikyank
OREnvironmental •) .. /• • MOR abratory '2_j• -- '-[ "'-' : " West Vle Y V
Villcll ", Wlg Demonstration Yne-N falro
p Point Project Ra St.a
D and ~ na [ilgri
By •o PPoint - Millstone
A'ru1n! - " ' '-Bya- W V .Ca vermi ,, Hdfa
CO I, aVA Nec
NE Calhoun-QMa .iOystereCreek
NV I;Pl AZ C=J ' •Pf [r ' " * -', RN ear- Ln . . all nri 'Bruswic Tr.
Ono,,oo Veran Salem,.Rach \SavannaheS. n HM~ flHoeCre
S hxco ý Pech Botto
St D E sites I A
.CAe The EI UTlyi cosdee thre ILmrca INt pair N- Sale CavndC
Note: The EIS analysis included the high-level radioactive waste at Weat Valley.The State ot New York owns the high-level radioactive waste and the site.Under the Weat Valley Demonstration Project Act, DOE is responsible forsolidifying and transporting the high-level radioactive waste to a repository.Teerue ersn h otsaaye nCatr6adwgtntb h
DNational rail lines anaylzed routes actually used for shipments to the proposed repository at Yucca Mountain..4-44-4I-H-Nevda ril orriorsRail routes are based on maximizing the distance on mainline track and minimizing+-H-F• evaa ral crriorsthe overall distance and number of interchanges between railroads.
----]Federally recognized Native American lands source: Modified from Of nS 101779-DOE (1998. Overview, p. 5).
Figure J-6. Representative rail routes from commercial and DOE sites to Yucca Mountain analyzed for the Proposed Action and Inventory] Modules 1 and 2.

Transportation
Table J-10. Highway distances for legal-weight truck shipments from commercial and DOE sites toYucca Mountain, mostly legal-weight truck transportation (kilometers)ab (page 1 of 2).
Origin State Totalc Rural Suburban Urban
Browns Ferry AL 3,798 3,344 393 61Joseph M. Farley AL 4,149 - 3,617 463 69Arkansas Nuclear One AR 2,810 2,588 191 30Palo Verde AZ 1,007 886 100 21Diablo Canyon CA 1,015 828 119 68Humboldt Bay CA 1,749 1,465 192 92.Rancho Seco CA 1,228 1,028 124 76San Onofre CA 694 517 89 87Haddam Neck CT 4,519 3,708 736 75Millstone CT 4,527 3,673 746 109Crystal River FL 4,675 3,928 672 75St. Lucie FL 4,944 4,115 748 80Turkey Point FL 5,198 4,210 840 148Edwin I. Hatch GA 4,342 3,695 572 74Vogtle GA 4,294 3,623 592 79Duane Arnold IA 2,773 2,544 189 40Braidwood IL 3,063 2,796 231 36Byron IL 3,032 2,773 223 36Clinton IL 3,104 2,814 252 38Dresden/Morris IL 3,059 2,798 225 36La Salle IL 3,017 2,766 215 36Quad Cities IL 2,877 2,631 211 36Zion IL 3,167 2,834 284 50Wolf Creek KS 2,686 2,474 173 38River Bend LA 3,479 3,097 322 60Waterford LA 3,565 3,159 346 59Pilgrim MA 4,722 3,697 930 94Yankee-Rowe MA 4,615 3,692 831 92Calvert Cliffs MD 4,278 3,511 684 82Maine Yankee ME 4,894 3,733 1,052 108Big Rock Point MI 3,866 3,266 547 52D. C. Cook MI 3,196. 2,827 318 51Fermi MI 3,524 3,014 449 61Palisades Ml 3,244 2,855 338 51Monticello MN. 3,003 2,702 261 41Prairie Island MN 2,993 2,720 232 41Callaway MO 2,988 2,721 225 43Grand Gulf MS 3,354 2,989 311 54Brunswick NC 4,773 3,994 696 82Shearon Harris NC 4,543 3,815 649 79McGuire NC 4,347 3,737 535 74Cooper Station NE 2,523 2,328 160 36Fort Calhoun NE 2,348 2,165 148 35Seabrook NH 4,725 3,675 942 107Oyster Creek NJ 4,424 3,530 825 69Salem/Hope Creek NJ 4,350 3,531 739 79Ginna NY 4,089 3,356 642 91Indian Point NY 4,382 3,695 620 67 •James A. FitzPatrick/Nine NY 4,234 3,461 688 85Mile Point
J-26

Transportation
Table J-10. Highway distances for legal-weight truck shipments from commercial and DOE sites toYucca Mountain, mostly legal-weight truck transportation (kilometers)a b (page 2 of 2).
Origin State Totalc Rural Suburban UrbanDavis-Besse OH 3,520 3,106 358 55Perry OH 3,693 3,157 464 73Trojan OR 2,137 1,865 236 36Beaver Valley PA 3,779 3,214 500 64Limerick PA 4,287 3,484 741 62Peach Bottom PA 4,205 3,479 662 63Susquehanna PA 4,126 3,539 528 59Three Mile Island PA 4,147 3,443 643 60Catawba SC 4,350 3,686 594 70Oconee SC 4,208 3,586 551 71H. B. Robinson SC 4,467 3,739 647 81Summer SC 4,352 3,704 576 71Sequoyah TN 3,856 3,361 433 61Watts Bar TN 3,933 3,460 413 61Comanche Peak TX 2,794 2,547 213 34South Texas TX 3,011 2,652 295 64North Anna VA 4,437 3,825 533 79Surry VA 4,611 3,898 629 83Vermont Yankee VT 4,615 3,675 846 94Colombia Generating WA 1,880 1,669 178 32
StationKewaunee WI 3,347 2,978 314 55La Crosse WI 3,014 2,773 198 43Point Beach WI 3,341 2,972 314 55Ft. St. Vraind CO 1,637 1,501 108 28INEELe ID 1,201 1,044 129 27West Valleyf NY 3,959 3,322 562 75Savannah Rivere SC 4,294 3,622 593 79Hanforde WA 1,881 1,671 178 32
a. To convert kilometers to miles, multiply by 0.62137.b. Distances determined for purposes of analysis using HIGHWAY computer program.c. Totals might differ from sums due to method of calculation and rounding.d. DOE spent nuclear fuel site.e. DOE spent nuclear fuel and high-level radioactive waste site.f. High-level radioactive waste site.
Jean, and Apex) to select rail routes from the 77 sites. These rail nodes would be starting points for therail and heavy-haul truck implementing alternatives analyzed for transportation in Nevada.
Selection of Highway Routes. The analysis of national transportation impacts used routecharacteristics of existing highways, such as distances, population densities, and state-level accidentstatistics. The analysis of highway shipments of spent nuclear fuel and high-level radioactive waste usedthe HIGHWAY computer model (DIRS 104780-Johnson et al. 1993, all) to determine highway routesusing regulations of the U.S. Department of Transportation (49 CFR 397.10 1) that specify how routes areselected. The selection of "preferred routes" is required for shipment of these materials. DOE hasdetermined that the HIGHWAY program is appropriate for calculating highway routes and relatedinformation (DIRS 101845-Maheras and Pippen 1995, pp. 2 to 5). HIGHWAY is a routing tool that DOEhas used in previous EISs [for example, the programmatic EIS on spent nuclear fuel (DIRS 101802-DOE1995, Volume 1, p. 1-6) and the Waste Isolation Pilot Plant Supplement II EIS (DIRS 101814-DOE 1997,pp. 5 to 13)] to determine highway routes for impact analysis.
J-27

Transportation
Table J-11. Rail transportation distances from commercial and DOE sites to Nevada ending rail nodesa
(kilometers)bc (page 1 of 3).
Site Totald Rural Suburban UrbanCommercial sites with direct rail access
Arkansas Nuclear OneBeaver ValleyBraidwoodBrunswickByronCatawbaClintonColumbia Generating StationComanche PeakCrystal RiverD. C. CookDavis BesseDresden/MorrisDuane ArnoldEdwin I. HatchFermiH. B. RobinsonHumboldt BayJames A. FitzPatrick/Nine Mile PointJoseph M. FarleyLa CrosseLa SalleLimerickMaine YankeeMcGuireMillstoneMonticelloNorth AnnaPalo VerdePerryPrairie IslandQuad CitiesRancho SecoRiver BendSan OnofreSeabrookSequoyahShearon HarrisSouth TexasSummerSusquehannaThree Mile IslandTrojanVermont YankeeVogtleWaterfordWatts Bar
Wolf CreekZion
2,593 - 2,9303,242 - 3,5792,586 - 2,9234,145 - 4,4822,403 - 2,7403,819-4,1562,595 - 2,9321,369- 1,7062,492 - 2,6784,175 - 4,6532,632 - 2,9692,917 - 3,2542,510 - 2,8472,168 - 2,5053,929 - 4,2663,072 - 3,4093,889 - 4,226
724- 1,4123,632 - 3,9694,021 - 4,3582,851 - 3,5792,653 - 3,3813,934 - 4,2714,435 - 4,7713,916 - 4,2534,139 - 4,4762,655 - 2,8223,944 - 4,281
872- 1,4663,222 - 3,5582,344 - 2,6812,595 - 3,323
263 - 8823,266 - 3,405
472- 1,1334,282 - 4,6193,366 - 3,7034,046 - 4,3832,815 - 3,2773,755 - 4,0923,827 - 4,1643,828 - 4,1651,326 - 2,0484,078 - 4,4153,985 - 4,3223,408 - 3,5403,310 - 3,6472,108 - 2,4452,542 - 2,879
2,427 - 2,7202,675 - 2,9682,260 - 2,5533,363 - 3,6562,207 - 2,5003,265 - 3,5592,358 - 2,6511,274- 1,5672,218 - 2,4013,481 - 3,9602,261 - 2,5552,452 - 2,7452,253 - 2,5462,014 - 2,3073,396 - 3,6892,513 - 2,8063,137 - 3,430
550- 1,0932,848 - 3,1413,438 - 3,7312,578 - 3,3612,396 - 3,1793,148 - 3,4413,245 - 3,5383,170 - 3,4633,078 - 3,3712,347 - 2,5433,132 - 3,425
778 - 1,1132,836 - 3,1292,100 - 2,3932,324 - 3,108
178 - 6942,966 - 3,027
322 - 7563,183 - 3,4773,044 - 3,3373,301 - 3,5952,539 - 2,7703,291 - 3,5842,883 - 3,1763,129 - 3,4221,040- 1,8363,135 - 3,4293,443 - 3,7362,878 - 3,0863,011 - 3,3041,995 - 2,288
2,231 - 2,525
149- 181452 - 484253 - 286721 -753172-204495-527196-22884- 116
213-236587-672277-309356-389222-255135-167480-513437-469685-717137-239631 -663529-561196-234181 -220
664-6961,008-1,040
679-712893-925241 -265
639-67277-252
317-349223-255194-23361 - 139
268-35893-264
920-952277-309686-718234-434414-446771 -803588-620172-346778-811489-522293-453254-28698-130
247-279
17- 29115- 12773- 8560-7224-3559-7041 -5311 -22
37-4355- 10694-105
109- 12135-4620-3153-64
123 - 13568-7936-80
154- 16554-6622-3920-37
123- 135182- 19366-78
168- 17938-44
172-18418- 10169-8022-3321 -38
24-4828-6858- 112
179- 19046-5759-7042-7350-62
173-185111-12340- 108
164- 17653- 6463-7646-5715-27
64-75
J-28

Transportation
Table J-11. Rail transportation distances from commercial and DOE sites to Nevada ending rail nodesa
(kilometers)b'c (page 2 of 3).
Site Totald Rural Suburban UrbanCommercial sites with indirect rail access
Big Rock PointHHe-20.0 kilometers
Browns FerryHH-55.4 kilometers
CallawayHH- 18.5 kilometers
Calvert CliffsHH-41.9 kilometers
Cooper StationHH-53.8 kilometers
Diablo CanyonHH-43.5 kilometers
Fort CalhounHH-6.0 kilometers
GinnaHH-35.1 kilometers
Grand GulfHH-47.8 kilometers
Haddam NeckHH- 16.6 kilometers
Hope CreekHH-5 1.0 kilometers
Indian PointHH-14.2 kilometers
KewaneeHH-9.7 kilometers
OconeeHH- 17.5 kilometers
Oyster CreekHH-28.5 kilometers
PalisadesHH-41.9 kilometers
Peach BottomHH-58.9 kilometers
PilgrimHH-8.7 kilometers
Point BeachHH-36.4 kilometers
SalemHH-5 1.0 kilometers
St. LucieHH-23.5 kilometers
SurryHH-75.2 kilometers
Turkey PointHH-17.4 kilometers
Yankee-RoweHH- 10.1 kilometers
3,258 - 3,595
3,118 - 3,455
2,230 - 2,567
3,829 - 4,166
1,852 - 2,189
715-789
1,736 - 2,073
3,532 - 3,869
3,108 - 3,445
4,105 - 4,442
3,978 - 4,315
3,981 -4,318
2,867 - 3,204
3,738 - 4,075
4,061 - 4,398
2,680- 3,017
3,849 - 4,186
4,263 - 4,600
2,820- 3,157
3,950 - 4,287
4,315 - 4,840
4,065 - 4,402
4,662 - 5,140
3,998 - 4,335
2,766 - 3,059
2,723 - 3,016
2,103 - 2,396
3,024 - 3,317
1,719 - 2,012
461 - 522
1,656- 1,949
2,792 - 3,086
2,817- 3,115
3,070 - 3,363
2,842 - 3,135
3,034 - 3,327
2,421 - 2,714
3,221 - 3,514
2,862 - 3,155
2,279 - 2,572
3,134 - 3,427
3,103 - 3,396
2,405 - 2,698
2,868 - 3,161
3,464 - 3,984
3,468 - 3,761
3,696 - 4,175
3,083 - 3,376
399-431
353-386
108- 140
631 -663
109- 141
162- 181
70- 102
604-636
259-373
868-901
912-944
781 -813
363-395
464-496
957-989
306-338
604- 637
986- 1,018
338-370
864- 896
732-809
523-555
785- 870
752-784
93- 105
42-53
20-32
174- 185
25-36
73- 105
10-21
136- 147
28-67
167 - 178
225-236
166- 177
84-95
54- 65
242-254
96-107
111- 122
174- 185
78- 89
219-230
74-125
74-85
127- 179
164- 175
J-29

Transportation
Table J-11. Rail transportation distances from commercial and DOE sites to Nevada ending rail nodesa(kilometers)b'c (page 3 of 3).
Site Totald Rural Suburban UrbanDOE spent nuclear fuel and high-level
radioactive wasteFt. St. Vrainf 1,039 - 1,321 1,011 - 1,214 24-93 3 - 13Hanford Site' 1,356 - 1,693 1,262 - 1,555 84- 116 11 -22INEELg 482-819 445-738 34-66 4- 15Savannah River Siteg 3,751 - 4,088 3,081 - 3,374 605-638 65-76West Valleyh 3,447 - 3,784 2,774 - 3,067 538 - 570 135 - 146
a. The ending rail nodes (INTERLINE comnuter proeram designations) are Anex-14763: Caliente-14770: Beowawe-14791:
b.C.
d.e.f.g.h.
and Jean-16328.To convert kilometers to miles, multiply by 0.62137.This analysis used the INTERLINE computer program to estimate distances.Totals might differ from sums due to method of calculation and rounding.HI-I = heavy-haul truck distance.DOE spent nuclear fuel.DOE spent nuclear fuel and high-level radioactive waste.High-level radioactive waste.
Because the regulations require that the preferred routes result in reduced time in transit, changingconditions, weather, and other factors could result in the use of more than one route at different times forshipments between the same origin and destination. However, for this analysis the program selected onlyone route for travel from each site to the Yucca Mountain site. Section J.4 describes the highway routesused in the analysis along with estimated impacts of legal-weight truck shipments for each state.
Although shipments could use more than one preferred route in national highway transportation tocomply with U.S. Department of Transportation regulations (49 CFR 3 97.101), under current U.S.Department of Transportation regulations all preferred routes would ultimately enter Nevada onInterstate 15 and travel to the repository on U.S. Highway 95. States or tribes can designate alternative oradditional preferred routes for highway shipments (49 CFR 397.103). At this time the State of Nevadahas not identified any alternative or additional preferred routes that DOE could use for shipments to therepository.
STATE-DESIGNATED PREFERRED ROUTES
U.S. Department of Transportation regulations specify that states and tribes can designate preferredroutes that are alternatives, or in addition to, Interstate System highways including bypasses orbeltways for the transportation of Highway Route-Controlled Quantities of Radioactive Materials.Highway Route-Controlled of Radioactive Materials include spent nuclear fuel and high-levelradioactive waste in quantities that would be shipped on a truck or railcar to the repository. If a stateor tribe designated such a route, highway shipments of spent nuclear fuel and high-level radioactivewaste would use the preferred route if (1) it was an alternative preferred route, (2) it would result inreduced time in transit, or (3) it would replace pickup or delivery routes. Fourteen states havedesignated alternative or additional preferred routes (65 FR 75771; December 4, 2000). AlthoughNevada has designated a State routing agency to the Department of Transportation (NevadaRevised Statutes, Chapter 408.141), the State has not yet designated alternative or preferred routesfor Highway Route-Controlled Quantities of Radioactive Materials. State route designations in thefuture could require changes in highway routes that would be used for shipments of spent nuclearfuel and high-level radioactive waste from 77 sites to Yucca Mountain. As an example of recentchanges, two states notified the U.S. Department of Transportation of state-designated preferredroutes (65 FR 75771; December 4, 2000) near or following publication of the Draft EIS.
J-30

Transportation
Selection of Rail Routes. Rail transportation routing of spent nuclear fuel and high-level radioactivewaste shipments is not regulated by the U.S. Department of Transportation. As a consequence, therouting rules used by the INTERLINE computer program (DIRS 104781-Johnson et al. 1993, all)assumed that railroads would select routes using historic practices. DOE has determined that theINTERLINE program is appropriate for calculating routes and related information for use intransportation analyses (DIRS 10 1 845-Maheras and Pippen 1995, pp. 2 to 5). Because the routing of railshipments would be subject to future, possibly different practices of the involved railroads, DOE coulduse other rail routes. Section JA contains maps of the rail routes used in the analysis along withestimated impacts of rail shipments for each state.
For the 24 commercial sites that have the capability to handle and load rail casks but do not have directrail service, DOE used the HIGHWAY computer program to identify routes for heavy-haul transportationto nearby railheads. For such routes, routing agencies in affected states would need to approve thetransport and routing of overweight and overdimensional shipments.
J.1.2.2.2 Routes for Shipping Rail Casks from Sites Not Served by a Railroad
In addition to routes for legal-weight trucks and rail shipments, 24 commercial sites that are not served bya railroad, but that have the capability to load rail casks, could ship spent nuclear fuel to nearby railheadsusing heavy-haul trucks (see Table J- 11). In addition, six of the sites that initially are legal-weight trucksites would be indirect rail sites after plant shutdown.
J.1.2.2.3 Sensitivity of Analysis Results to Routing Assumptions
Routing for shipments of spent nuclear fuel and high-level radioactive waste to the proposed repositorywould comply with regulations of the U.S. Department of Transportation and the Nuclear RegulatoryCommission in effect at the time shipments would occur. Unless the State of Nevada designatesalternative or additional preferred routes, to comply with U.S. Department of Transportation regulationsall preferred routes would ultimately enter Nevada on Interstate 15 and travel to the repository on U.S.Highway 95. States can designate alternative or additional preferred routes for highway shipments. Atthis time the State of Nevada has not identified any alternative or additional preferred routes DOE coulduse for shipments to the repository. Section J.3.1.3 examines the sensitivity of transportation impactsboth nationally and regionally (within Nevada) to changes in routing assumptions within Nevada.
J.1.3 ANALYSIS OF IMPACTS FROM INCIDENT-FREE TRANSPORTATION
DOE analyzed the impacts of incident-free transportation for shipments of commercial and DOE spentnuclear fuel and DOE high-level radioactive waste that would be shipped under the Proposed Action andInventory Modules I and 2 from 77 sites to the repository. The analysis estimated impacts to the publicand workers and included impacts of loading shipping casks at commercial and DOE sites and otherpreparations for shipment as well as intermodal transfers of casks from heavy-haul trucks or barges to railcars.
J.1.3.1 Methods and Approach for Analysis of Impacts for Loading Operations
The analysis used methods and assessments. developed for spent nuclear fuel loading operations atcommercial sites to estimate radiological impacts to involved workers at commercial and DOE sites.Previously developed conceptual radiation shield designs for shipping casks (DIRS 101747-Schneider etal. 1987, Sections 4 and 5), rail and truck shipping cask dimensions, and estimated radiation dose rates atlocations where workers would load and prepare casks (DIRS 104791 -DOE 1992, p. 4.2) for shipmentwere the analysis bases for loading operations. In addition, tasks and time-motion evaluations from thesestudies were used to describe spent nuclear fuel handling and loading. These earlier evaluations were
J-31

South Carolina Electric & GasCOL Application
Part 3 - Environmental Report
Section 10.5 References
1. Duke Energy 2007a, First Quarter Earnings Review, May 8, Available at http://www.duke-energy.com/pdfs/1Q07_Slides.pdf. Accessed May 31, 2007.
2. Duke Energy 2007b, Water Quantity Model for the Upper Broad River Basinand Appendix A, Water Quantity Model for the Lower Broad River Basin,March 5, 2007.
3. SCE&G 2002, Environmental Report for V C. Summer Nuclear Station.Available at http://www.nrc.gov/reactors/operating/licensing/renewal/applications/summer.html.
4. The State 2007, "Legislators Slam Door to Nuclear Waste Site," March 29,Available at http://hps.org/govtrelations/documents/barnwellbillvoteddownnewsarticle.pdf. Accessed May 21, 2007.
5. U.S DOE 2002, Final Environmental Impact Statement for a GeologicRepository for the Disposal of Spent Nuclear Fuel and High-LevelRadioactive Waste at Yucca Mountain, Nye County, Nevada. Page 6-40 andTable J-1. DOE/EIS-0250, February. Available at http://www.eh.doe.gov/nepa/eis/eis0250/eis0250index.html.
6. U.S. NRC 2007, Expected New Nuclear Power Plant Applications, UpdatedApril 27, 2007, Available at http://www.nrc.gov/reactors/new-licensing/new-licensing-files/expected-new-rx-applications.pdf. Accessed May 21, 2007.
10.5-7 Revision 0
10.5-7 Revision 0
'DDukefffEnergy®
Water Quantity Model for the Upper Broad River Basin
Scope of Work - Phase I
1.0 Introduction
Duke Energy (Duke) is developing a water supply capacity model of the Upper Broad RiverBasin from its headwaters in North Carolina extending downstream to Duke's Ninety-NineIslands Dam near Blacksburg, SC. Phase I of this Study is intended to explore the water supplycapacity associated with the proposed expansion of Duke's Cliffside Steam Station, located nearCliffside, North Carolina and Duke's proposed construction of the Lee Nuclear Station (LNS),located near Blacksburg, South Carolina. Phase I of the Study will help Duke ensure a clearunderstanding of the total, long-term water supply picture at these power plant sites. The Studywill determine the water supply capacity in the Upper Broad River Basin during low-flow, ordrought, conditions and provide tools and analysis that will be used to support the applicationprocess for both proposed facilities.
This Study will incorporate eight existing reservoirs, beginning at Lake Lure and Lake Summitto the Northwest, Moss Lake to the Northeast, and ending at Ninety-Nine Islands, as well asrouting of flows in identified riverine sections upstream of the proposed LNS. In addition to thewater quantity model, this proposal includes performing a water supply Study to inventorycurrent water withdrawals and returns, and project future water withdrawals and returns for theUpper Broad River Basin. The results of the water supply Study will be used to support thedevelopment of a dynamic water budget model (CHEOPS'). Subsequently, the information andmodel will be used to conduct safe yield analyses for the Upper Broad River Basin in support ofDuke Energy's proposed power plant expansions.
A second phase (Phase II) of this Study is also planned and is described in Appendix A. Figure 1depicts the geographical extent of the Phase I and Phase II study areas. The Phase I drainagearea is approximately 1,550 square miles and the Phase II drainage area adds an additional 3,745square miles, for a total drainage area of 5,295 square miles at the confluence of the Broad Riverand the Saluda River near Columbia, South Carolina.
2.0 Approach
Devine Tarbell & Associates (DTA) has teamed with HDR, Inc. (both firms have businessoffices in Charlotte, NC) to provide the water quantity and water supply services outlined in thisproposal. DTA and HDR worked together successfully in the past on the Duke Energy Catawba-Wateree Hydro Project relicensing, providing similar services to those outlined below. HDRwill provide expertise in water supply analysis and projections of future water demand in theUpper Broad River Basin. DTA will develop a computer based water quantity model andprovide expertise in performing scenario modeling and basin specific water budget projectionsbased on results of the water supply Study combined with the CHEOPS model.
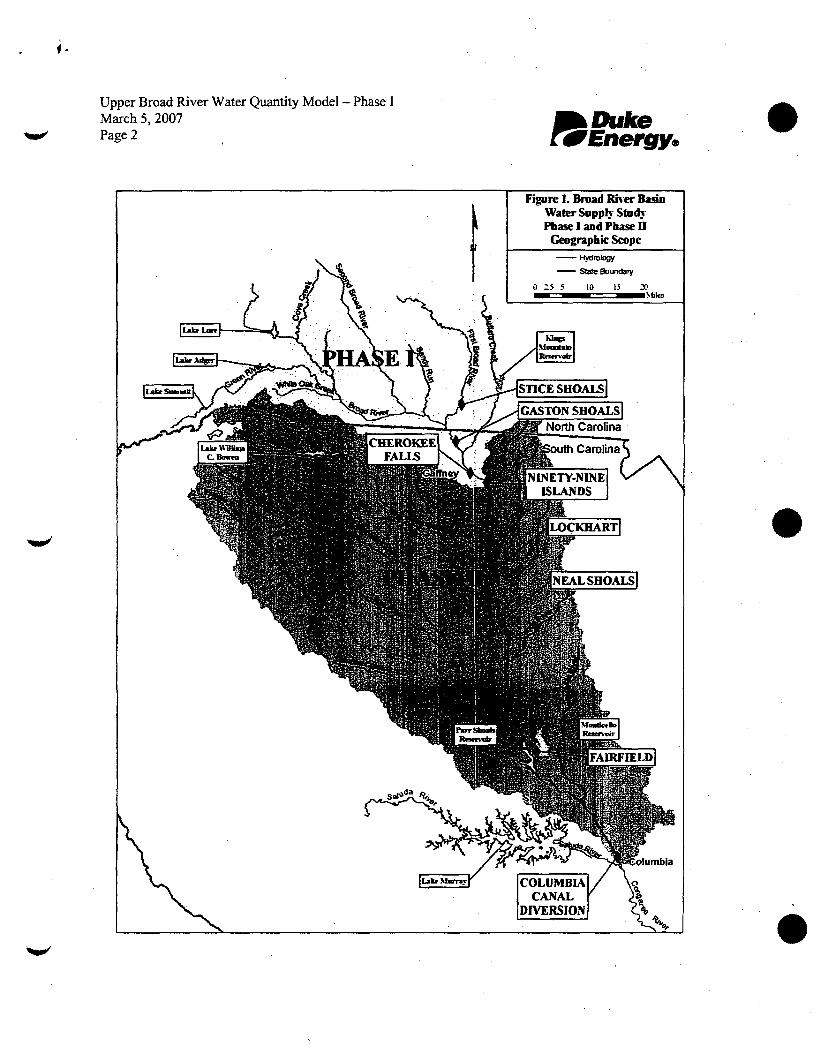
Upper Broad River Water Quantity Model - Phase IMarch 5, 2007Page 2 P DukeDEnergye

Upper Broad River Water Quantity Model - Phase IMarch 5, 2007 DukePa(ye 3 EneMye
Water Quantity Model
The water quantity modeling phase of the project will encompass the upstream constraints in theUpper Broad River Basin down to the Ninety-Nine Islands Hydroelectric facility in CherokeeCounty, South Carolina. The water quantity model of the Upper Broad River Basin will allowfor the evaluation of the cooling water supply potential of the study area while taking intoconsideration the restrictions that are in place on the river system. The restrictions andcharacteristics to be modeled include daily hydrology of both direct inflows to the reservoirs andlateral inflows, reservoir operations, hydro unit performance and generation capacity for thefacilities to be modeled as hydroelectric generation projects, water (consumptive and non-consumptive use) withdrawals and returns, and operating restrictions. The model willincorporate known withdrawal and return points and characterization of flow travel time betweennodes either by a direct time lag or the U.S. Army Corps of Engineers HEC- I program's NormalDepth routing scheme. The routing characteristics of the reaches will be derived from acombination of field measurement and topographic estimations for representative reaches in thestudy area.
The majority of the Upper Broad River Basin information to be used in the development of t heCHEOPS model will be acquired from the existing HEC-1 model developed for the calculationof the 1997 Ninety-Nine Islands Probable Maximum Flood (PMF) Study. This work wasdeveloped by current DTA engineering staff.
The headwaters of the Broad River originate in the Blue Ridge Mountains through the foothillsto the Piedmont. The major tributaries to the Broad River above the Ninety-Nine Islands facilityare the Green River, the Hungry River, the Second Broad River, and the First Broad River.These tributaries incorporate the two proposed public water system reservoirs in ClevelandCounty, North Carolina, on the First Broad River and Buffalo Creek. The Ninety-Nine IslandsHydroelectric Station is -on the Broad River in Cherokee County, South Carolina and has adrainage area of approximately 1,550 square miles. The dam is located approximately 6 milessouth of Blacksburg, South Carolina, and approximately 9 miles southeast of Gafffiey, SouthCarolina. It is approximately 90 miles north of the confluence of the Broad River and SaludaRiver near Columbia, South Carolina. The Ninety-Nine Islands project will be modeled as apeaking facility. There are a number of existing dams upstream of Ninety-Nine Islands:
Tuxedo (Lake Summit) on the Green River
Turner Shoals (Lake Adger) on the Green River
Lake Lure on the Broad RiverStice Shoals on the First Broad River
Gaston Shoals on the Broad River
Cherokee Falls on the Broad River
Kings Mountain Reservoir (Moss Lake) on Buffalo Creek

Upper Broad River Water Quantity Model - Phase IMarch 5, 2007 l DukkePage 4 tFEnergy.
Tuxedo Dam (Lake Summit)The Tuxedo Hydroelectric Project is located on the Green River in Henderson County, NorthCarolina, approximately 2 miles west of the Town of Saluda, NC. Tuxedo Dam impounds LakeSummit. Lake Summit has a surface area of approximately 300 acres and a shoreline of about 10miles at full pond elevation of 2,012.6 ft msl. The project will be modeled as a generatingmodified run-of-river facility.
Turner Shoals Dam (Lake Adger)The Turner Shoals Hydroelectric Project is located on the Green River in Polk County, NorthCarolina, approximately 3 miles northwest of the Town of Mill Springs, NC. Turner ShoalsDam impounds Lake Adger, which has a surface area of approximately 438 acres and a shorelineof about 15 miles at full pond elevation of 911.6 ft msl. The project will be modeled as agenerating modified run-of-river facility.
Lake Lure DamThe Federal Energy Regulatory Commission (FERC) licensed Lake Lure Hydroelectric Projectis located on the Broad River in Rutherford County, North Carolina, on the eastern side of theTown of Lake Lure, NC. Lake Lure has a surface area of approximately 900 acres at full pondelevation of 991 ft ms], which makes it the largest reservoir upstream of Ninety-Nine Islands.The project will be modeled as a fill-and-spill reservoir due to the availability of projectinformation.
Stice Shoals DamThe Stice Shoals Hydroelectric Project is located on the First Broad River in Cleveland County,North Carolina, approximately 4 miles upstream of the confluence with the Broad River and isapproximately 5.5 miles southwest of the City of Shelby, NC. The project will be modeled as afill-and-spill reservoir due to the availability of project information and negligible storagecapacity.
Gaston Shoals DamThe FERC-licensed Gaston Shoals Hydroelectric Project is located on the Broad River inCherokee County, South Carolina, approximately 7 miles upstream of Ninety-Nine IslandsReservoir. Gaston Shoals has a drainage area of approximately 1,300 square miles, including theGreen River, the Hungry River, the Second Broad River, and the First Broad River. Thereservoir volume is estimated to be 2,500 acre-feet, based on the 1997 Ninety-Nine Islands PMFStudy. The project will be modeled as a peaking facility.
Cherokee Falls DamThe FERC-licensed Cherokee Falls Hydroelectric Project is a Federal Energy RegulatoryCommission (FERC) licensed project located approximately 4.5 miles upstream of the Ninety-Nine Islands development on the Broad River in Cherokee County, South Carolina. The projectwill be modeled as a fill-and-spill reservoir due to the availability of project information andnegligible storage capacity.
Upper Broad River Water Quantity Model - Phase IMarch 5, 2007 k kePage 5 f Energy.
Kinas Mountain Dam (Moss Lake)Kings Mountain Dam (Moss Lake) is located in Cleveland County, North Carolina, on BuffaloCreek, approximately 5 miles northwest of the City of Kings Mountain, NC. The project will bemodeled as a fill-and-spill reservoir due to the availability of project information.
There are also two reservoirs in the Upper Broad River Basin that are in the early planningstages:
" Cleveland County Sanitary District's proposed reservoir is to be located on the FirstBroad River in Cleveland County, North Carolina. This facility will be modeled as astorage facility.
" Kings Mountain's proposed reservoir is to be located on Muddy Fork Creek inCleveland County, North Carolina. Currently, there are no plans to model this facilitydue to limited available preliminary design information.
There are also number of ponds and small lakes in the Ninety-Nine Islands watershed. Thesefeatures will not be modeled as reservoirs. However, depending on the location of the routingreaches and the water withdrawals, a small pond or reservoir may have to be included in therouting calculations. The CHEOPS model will be used to route the water between each of thefacilities to analyze the travel time of releases from existing or proposed storage projects. Thefocus of the modeling is to analyze streamflow and water quantity at specific points along theBroad River during low river flow (drought) conditions. Therefore, calibration of the model willbe performed over a range of "in-bank" river flows. To facilitate calibration of the routing of theriver flows between points of interest along the river (nodes), DTA is proposing to install levellogger instrumentation that will record stage and timing of flows. DTA is also proposing todevelop four point stage-flow rating curves at approximately 10 locations in the basin aboveNinety-Nine Islands. This data is essential in the calibration of parameters used in the CHEOPSmodel for performing river routing between nodes.
As part of the Broad River Water Quantity Model Project, a Water Supply Study will becompleted for the Ninety-Nine Islands Reservoir and drainage basin. The initial phase of theWater Supply Study will be completed by HDR and consist of data compilation and developmentof future projected water withdrawals and returns within the Upper Broad River Basin. TheWater Quantity Model will be used for a series of scenario runs, which apply the future projectedwithdrawals developed by HDR to determine the safe yield for the Ninety-Nine IslandsReservoir. The future projected withdrawals will be incrementally applied to drought hydrologyto determine the safe yield.
Water Supply Study
The objective of the Broad River Basin Water Supply Study is to inventory current waterwithdrawals and returns, and project future water withdrawals and returns for the Broad RiverBasin that begins in western North Carolina and extends into western South Carolina. Theresults of this Study will be used (by others) to support the development of a dynamic water

Upper Broad River Water Quantity Model - Phase IMarch 5, 2007 Ift [ukePage 6 -Energy.
budget model (CHEOPS). Subsequently, the information and model will be used to conduct safeyield analyses for the Upper Broad River Basin in support of Duke Energy's proposed LNSproject, as well as other interests.
The Study will produce the following information:
A listing of all significant water users (power, agricultural/irrigation, public watersuppliers, and industrial) withdrawing and/or returning water to/from the surfacewaters of the Broad River Basin.
" Current water withdrawal and return rates, on an annual average basis, with monthlyvariability factors, where available, for each significant user identified.
" Projected water withdrawal and return rates, on an annual average basis, withmonthly variability factors, where available, for each significant entity identified.Projections will be provided every year for 60 years beyond the base year (assumedas 2015).
Geographic and Temporal Scope
The Study will cover all water withdrawals and returns greater than 100,000 gallons per day(gpd) to/from the Broad River and its surface water tributaries within the Upper Broad RiverBasin. Additionally, existing and potential future inter-basin transfers (IBTs) into or out of theUpper Broad River Basin will be estimated and included.
Summary of Existing Data
The following is a list of existing available data that may be useful in the development of thisStudy:
1. Local Water Supply Plans (LWSPs) of North Carolina public water suppliers (updatedevery five years)
2. Withdrawals in South Carolina registered in compliance with the South Carolina SurfaceWater Withdrawal and Reporting Act
3. South Carolina Water Plan (1998 or latest)4. National Pollutant Discharge Elimination System (NPDES) permit information for
wastewater treatment facilities5. Public domain Geographic Information Systems (GIS) information

Upper Broad River Water Quantity Model - Phase IMarch 5, 2007 P k 1,kePage 7 4WEnergy.
3.0 Scope of Project
Water Quantity Model
1. Acquire System InformationThis task includes collecting, compiling, reviewing, and organizing project operatingcharacteristics data. It is assumed that the majority of the necessary Basin information isavailable in the existing HEC-1 model developed in 1997 for the calculation of theNinety-Nine Islands PMF Study.
Necessary information:a. Hydro Facilities
i. Physical Features1. Reservoir Storage Curve2. Tailwater Curve3. Spillway Curve4. Reservoir Area Curve5. Turbine Curves - For generating facilities6. Generator Curves - For generating facilities7. Head loss Coefficients - For generating facilities
8. Flashboards - If anyii. Operations
1. Withdrawals and Returns2. Bypass Flows and Return Points3. Operation Type - Peaking vs. run-of-river4. Operating Band - Minimum, maximum, and target5. Historic Operations
a. Lake Elevationsb. Generation - Preferably monthlyc. Withdrawals and Returns
b. Non-Generating Facilitiesi. Physical Features
1. Reservoir Storage Curve2. Spillway Curve3. Reservoir Area Curve
4. Flashboards - If anyii. Operations
1. Withdrawals and Returns2. Bypass Flows and Return Points3. Operating Band - Minimum, maximum, and target
c. Routing Reachesi. Channel Geometry
ii. Stage/Flow Relationshipsiii. Inflow and Outflow Points

Upper Broad River Water Quantity Model - Phase IMarch 5, 2007 PhOukePage 8 drEneyWe
1. Lateral Inflows2. Withdrawals and Returns
2. Develop HydrologyThis task includes the development of unimpaired hydrology at each of the nodelocations using available USGS gage records and historic plant information.
3. Develop ModelThis task includes the development of the CHEOPS model for reservoir interactions andflow regimes. This will require custom coding for the routing and withdrawal sections aswell as the specific reservoir operations for water supply support.
a. Incorporate Withdrawal Pointsi. River Reaches
ii. Reservoirsb. Develop Routing
i. HEC-1 Set-upii. HEC-1 Calibration
iii. Incorporate into CHEOPSc. Develop existing conditions scenario and interactions between reservoirs
4. Model CalibrationThis task includes model calibration runs for representative wet, dry, and normalhydrology years for which historical operating data is available. Additional model runswill be made for current operation constraints for the hydrology period of record toestablish a long-term data set of existing operation as a baseline. The routing routineswill be calibrated for a range of normal operating flows.
5. Scenario Runs and AnalysisThis task includes a series of runs necessary to define the water supply capacity of theUpper Broad River Basin in reference to the proposed LNS project. This process will beperformed in conjunction with HDR for the development of the safe yield at the Ninety-Nine Islands Reservoir. DTA assumes 30 runs will be needed to quantify the watersupply capacity for specific drought periods, and 5 runs for a long-term record.
6. Report and SummaryThis task includes compiling the modeling scenario results, summary preparation, andpreparing a technical report for the Study participants.
7. DeliverablesHydrology Report
Calibration Report
Summary Report
Compiled Model

Upper Broad River Water Quantity Model - Phase IMarch 5, 2007 DukePage 9 -Energy.
8. ScheduleTo support the Nuclear Regulatory Commission (NRC) combined construction andoperating license application process for the proposed LNS project, the CHEOPS toolwill be calibrated by the end of May 2007 and available to run simulations from Junethrough August 2007.
Water Supply Study
1. Document Current and Projected Water Withdrawals and Returns" Compile current permitted surface water withdrawals and returns greater than
100,000 gpd or more in the Upper Broad River Basin, including any identified IBTs." Review and reconcile the information presented in the LWSPs of North Carolina
communities and in the Water Plan of South Carolina for South Carolinacommunities.
" Arrange and conduct interviews with entities that produce significant withdrawalsand/or returns to obtain current data that is more accurate and discuss, in more detail,future projections.
" Compile future population and growth projections from various sources within theUpper Broad River Basin.
" Review current and future industrial growth trends by industry type in the UpperBroad River Basin (including power production facilitieS).
" Review USGS information associated with current and future agricultural/irrigationwater demands.
" Develop a set of 60-year future water withdrawal and return projections for allentities identified in the Study. Projections will utilize population and growth ratesestimated based on an evaluation of local and regional factors, trends, and influences.
* Review any available information on population projections, etc.* Provide technical memorandum summarizing the water withdrawal and return
projections.
2. Assemble and Coordinate Data for Use in the CHEOPS Model" Compile water withdrawal and return information into spreadsheets usable for
loading into the CHEOPS model." Coordinate with DTA staff on modeling issues related to the withdrawal and return
projections.
3. GIS Mapping" Develop a GIS map and database that documents. the water withdrawal and return
entities included in the Study." Load relevant data for each entity into the GIS system including name, phone
number, current water withdrawals and returns, and future water withdrawal andreturns.

Upper Broad River Water Quantity Model - Phase IMarch 5, 2007 DWukePage 10 U Energy.
4. Safe Yield Analysis" Evaluate preliminary safe yields for water withdrawal interests in the Upper Broad
River Basin." Evaluate impacts of future water supply modifications (e.g. new reservoirs, intake
modifications) on safe yields." Provide technical memorandum on safe yield results and potential impacts of future
water supply modifications.

Upper Broad River Water Quantity Model - Phase 11March 5, 2007 DukePage I I lftdrEnetW.
APPENDIX A
Water Quantity Model for the Lower Broad River Basin
Proposed Scope of Work - Phase 11
1.0 Introduction to Phase 11
Duke Energy (Duke) recognizes that other organizations rely on the Broad River as well fordrinking water-, industrial and agricultural water needs, and other uses and Duke wants to ensurethat all the major water quantity interests are considered in the Study. Therefore, in addition todeveloping a water quantity model for the Upper Broad River Basin, as described above, Duke isalso considering a future second phase of this Study. Phase 11 would extend the geographicscope of the water quantity model and water supply Study from Ninety-Nine Islands Damdownstream to the Broad River's confluence with the Saluda River near the Columbia CanalDiversion Dam in Columbia, South Carolina. This would more than double the scope of theoriginal Phase I Study by adding an additional 90 miles of river making up the Lower BroadRiver Basin. Note that the Phase I drainage area is approximately 1,550 square miles and thePhase 11 drainage area adds an additional 3,745 square miles, for a total drainage area of 5,295square miles at the confluence of the Broad River and the Saluda River near Columbia, SouthCarolina.
2.0 Phase 11 Approach
The approach for the proposed Phase 11 Study would replicate that of the Phase I Study describedabove, only it would be applied to the Lower Broad River Basin. The result would be a singlemodel and water supply Study covering the entire Broad River watershed from the headwaters inwestern North Carolina to the confluence with the Saluda River near Columbia, South Carolina.Phase II will require the development of hydrology downstream of the Nmiety-Nine Islandsfacility and the acquisition of the physical and operational characteristics of the Lockhart facility,Neal Shoals facility, Fairfield facility, Monticello Reservoir, Parr Shoals facility, and theColumbia Canal facility near Columbia, South Carolina.
The majority of the Lower Basin inforination necessary for the development of the CHEOPSmodel would be acquired from publicly available data, Modeling of the hydroelectric facilitieswould be limited to the availability of operational and physical data for the facilities.
Lockhart DamThe FERC-licensed Lockhart Dam is located in Chester and Union counties, South Carolina, onthe Broad River. This project would be modeled as a peaking facility.
Upper Broad River Water Quantity Model - Phase IIMarch 5. 2007 %DukePage 12 •E- eg ®
Neal Shoals DamThe FERC-licensed Neal Shoals Dam is located in Chester and Union counties, South Carolina,on the Broad River, approximately 10 miles south of Lockhart Dam. This project would bemodeled as a peaking facility.
Fairfield DamThe FERC-licensed Fairfield Dam is located in Fairfield County, South Carolina, on the BroadRiver. Fairfield Dam is a pump-storage facility for the Monticello Reservoir. This project couldbe modeled as either a storage facility or a pump-storage facility, in tandem with the MonticelloReservoir, depending on data availability and participation of stakeholders.
Parr Shoals DamThe FERC-licensed Parr Shoals Dam is located in Newberry and Fairfield counties, SouthCarolina, on the Broad River. This project would be modeled as a run-of-river reservoir due tothe availability of project information, negligible storage capacity, and current run-of-riveroperations.
Columbia Canal Diversion DamThe FERC-licensed Columbia Canal Diversion Dam is located in Richland County, SouthCarolina, on the Broad River. This project would be modeled as a run-of-river reservoir due tothe availability of project information and negligible storage capacity.
3.0 Determination to Proceed with Phase II
Because Duke is concerned with water supply capacity as it pertains to the proposed expansionof Cliffside Steam Station and the proposed construction of LNS (Lee Nuclear Station), theUpper Broad River Basin Study, as outlined in Phase I above, is Duke's primary interest.However, Duke also recognizes that its facilities are part of a larger watershed with a growingpopulation that has many diverse water interests and needs. Therefore, Duke is planning topursue Phase II of this Study with the following criteria:
" A Broad River Water Supply Study Advisory Group (SAG - see Appendix B for adescription) is established during the Phase I Study with representatives from Duke,South Carolina Electric & Gas (SCE&G), state resource agencies, and arepresentative cross-section of public water system owners, industrial and agriculturalwater users from both North Carolina and South Carolina.
" The SAG works collaboratively during Phase I of the Study to use the resulting tools,analysis, and information for sound decision making purposes.
" Duke's interests are met with respect to filing an application for a LNS combinedconstruction and operating license with the NRC by October 2007.
E The SAG makes a recommendation that Phase II of the Study be pursued, identifiesthe deliverables of such a Study, and as part of that decision, considers a cost-sharingapproach to Phase II.

Upper Broad River Water Quantity Model - Phase IIMarch 5, 2007Page 13
DukeFEnergye
Note: Duke will make the final decision regarding whether or not it proceeds with PhaseII of the Study.
It is anticipated that a final decision as to whether to proceed with Phase II of the.Study wouldneed to occur by July 31, 2007, near the end of the Phase I Study. If a decision to proceed withPhase II is made, the expected completion date of the Phase II Study would be near the end ofNovember 2007.

Upper Broad River Water Quantity Model - Phase IIMarch 5, 2007 JWL kePage 14 Energy.
APPENDIX B
Broad River Water Supply Study Advisory Group
BackgroundDuke Energy (Duke) is planning to expand its coal-fired power plant located at Cliffside, NC andto develop a new nuclear power plant (the Lee Nuclear Station), just east of Gaffney, SC. Bothof these power plant sites are located in the Broad River Basin (Basin) that begins in the foothillsand mountains of North Carolina and extends into the piedmont region to Columbia, SC. As partof the planning effort, Duke is conducting a Phase I Water Supply Study that includes both ananalysis of water supply needs and the development of a water quantity model for the portion ofthe Basin upstream from the Ninety-Nine Islands Hydroelectric Project (located near Gafffiey,SC). Phase I of the Study will help Duke ensure a clear understanding of the total, long-termwater supply picture at its Broad River power plant sites. Duke recognizes other organizationsrely on the Broad River as well for drinking water, industrial and agricultural water needs, andother uses and Duke wants to ensure that all the major water quantity interests are considered inthe Study.
Broad River Water Supply Study Advisory Group DescriptionDuke believes that the quality and usefulness of the Study can be substantially enhanced by theformation of a Broad River Water Supply Study Advisory Group (SAG). The SAG wouldconsist of representatives from the two large power producers in the Basin (i.e., Duke and SouthCarolina Electric & Gas (SCE&G)), state resource agencies, and a representative cross-section ofpublic water system owners, industrial and agricultural water users from both North Carolina andSouth Carolina. The SAG would review and provide technical input for the development ofwater use projections and the water quantity model, in addition to guiding the development offuture water use scenarios. Participation on the SAG shall be entirely advisory in nature and inno way represents approval or endorsement of either the methodology or results of the Study orof the development plans at Duke's power plants. Once the products from Phase I are nearingcompletion, the SAG would also provide Duke with additional input so a final decision can bemade as to whether to proceed with Phase II of the Study. This would extend the data collection,water use projections, and modeling efforts from Ninety-Nine Islands Dam to the mouth of theBroad River in Columbia, SC.
Proposed SAG MembershipThe following is a proposed list of 9-13 potential members of the SAG {Note: "large" inreference to water intakes means intakes that typically withdraw 1 Million Gallons per Day(MGD) or more}:
Large Power Producers (One representative each)* Duke - Ed Bruce
* SCE&G - Bill Argentieri

Upper Broad River Water Quantity Model - Phase IIMarch 5, 2007 DukePage 15 '-EnerDgy.
State Resource Agencies (One representative each)" North Carolina - Department of Environment and Natural Resources (NC-DENR-
DWR) - Tom Fransen" South Carolina - Department of Health and Environmental Control (SC-DHEC) -
Larry Turner and Chuck Gorman" South Carolina - Department of Natural Resources (SC-DNR) - Andy Wachob
Public Water Suppliers* A representative from each of 1-2 large NC public water system owners
* A representative from each of 1-2 large SC public water system owners
Industrial/Agricultural Users" A representative from each of 1-2 large NC industrial or agricultural water intake
owners" A representative from each of 1-2 large SC industrial or agricultural water intake
owners
Water intake owners interested in being on the SAG can notify Duke or its consultant within oneweek following the regional Study kick-off meetings. SAG members from the power companiesand state agencies will meet within two weeks following the regional kick-off meetings to decideon the remaining SAG membership. Every effort will be made to include representation fromthe proposed Phase II Study region, as well as the Phase I Study region.
The consulting company conducting the Study for Duke will facilitate the meetings and provideall logistical support for the SAG. Duke will also ensure that communications mechanisms arein place to keep other water supply interests (in addition to those that are on the SAG) informedabout the Study.

Final
Environmental Impact Statementfor a
Geologic Repository for the Disposal ofSpent Nuclear Fuel and High-Level
Radioactive Waste at Yucca Mountain,Nye County, Nevada
Volume I - Impact AnalysesChapters 1 through 15
U.S. Department of EnergyOffice of Civilian Radioactive Waste Management
DOE/EIS-0250
Februam 2002

COVER SHEET
RESPONSIBLE AGENCY: U.S. Department of Energy (DOE)
TITLE: Final Environmental Impact Statement for a Geologic Repository for the Disposal of SpentNuclear Fuel and High-Level Radioactive Waste at Yucca Mountain, Nye Count)- Nevada(DOE/EIS-0250)
CONTACT: For more information on this Final Environmental Impact Statement (EIS), write or call:
Jane R. Summerson. EIS Document ManagerYucca Mountain Site Characterization OfficeOffice of Civilian Radioactive Waste ManagementU.S. Department of EnergyP.O. Box 30307, M/S 010North Las Vegas, NV 89036-0307Telephone: (800) 967-3477
Information on this EIS is available on the Internet at the Yucca Mountain Project web site athttp://wury'mp.gov and on the DOE National Environmental Policy Act (NEPA) web site athttp://tis. eh.doe.gov/nepa/.
For general information on the DOE NEPA process, write or call:
Carol M. Borgstrom, DirectorOffice of NEPA Policy and Compliance (EH-42)U.S. Department of Energy1000 Independence Avenue, S.W.Washington, D.C. 20585Telephone: (202) 586-4600, or leave a message at (800) 472-2756
ABSTRACT: The Proposed Action addressed in this Final EIS is to construct, operate and monitor, andeventually close a geologic repository at Yucca Mountain in southern Nevada for the disposal of spentnuclear fuel and high-level radioactive waste currently in storage or projected to be generated at 72commercial and 5 DOE sites across the United States. The EIS evaluates (I) projected impacts on theYucca Mountain environment of the construction, operation and monitoring, and eventual closure of thegeologic repository; (2) the potential long-term impacts of repository disposal of spent nuclear fuel andhigh-level radioactive waste; (3) the potential impacts of transporting these materials nationally and in theState of Nevada; and (4) the potential impacts of not proceeding with the Proposed Action. The preferredalternative is to proceed with the Proposed Action and to use mostly rail, both nationally and in Nevada,to transport spent nuclear fuel and high-level radioactive waste.
PUBLIC COMMENTS: In preparing this EIS, DOE considered comments received by letter, electronicmail, facsimile transmission, and oral and written comments given at public hearings at 21 locationsacross the United States on the Draft EIS, and at 3 locations in Nevada for the Supplement to the DraftEIS.
iii

Environmental Impacts of Transportation
supplies would be 50 tons per year during the construction phase and 67 tons per year during theoperations and monitoring phase; emissions would contribute a maximum of an additional 0.07 percent tothe estimated 2000 daily carbon-monoxide levels in the nonattainment area (DIRS 156706-Clark County2000, Appendix A, Table 1-3).
Impacts in other environmental resource areas would be unlikely to occur.
6.2 National Transportation
This section describes the estimated national transportation impacts from shipping spent nuclear fuel andhigh-level radioactive waste from 72 commercial and 5 DOE sites throughout the United States to theproposed Yucca Mountain Repository. This section includes the following:
0 Definition and an overview of the analysis scenarios (Section 6.2.1)
* Impacts to workers and the public from spent nuclear fuel and high-level radioactive wasteloading operations at commercial and DOE sites (Section 6.2.2)
* Potential incident-free (routine) radiological impacts and vehicle emission impacts(Section 6.2.3)
0 Potential accident scenario impacts (Section 6.2.4).
National transportation of spent nuclear fuel and high-level radioactive waste, which would use existinghighways and railroads, would average 7.8 million truck kilometers (4.9 million miles) per year for themostly truck case and 1.6 million railcar kilometers (1 million miles) per year for the mostly rail case.Barges used to ship rail casks to nearby railheads from commercial sites not served by a railroad couldaverage as much as 6,500 kilometers (4,000 miles) per year. The national yearly average for totalhighway and railroad traffic is 186 billion truck kilometers (116 billion miles) and 49 billion railcarkilometers (30 billion miles) (DIRS 150989-BTS 1998, pp. 5 and 6)]. Spent nuclear fuel and high-levelradioactive waste transportation would represent a very small fraction of the total national highway andrailroad traffic (0.004 percent of truck kilometers and 0.003 percent of railcar kilometers). Domesticwaterbome trade in 1995 accounted for about 1 billion metric tons (910 million tons) (DIRS 148158-MARAD 1998, all). This represents about I million barge shipments per year. Thus, shipments of spentnuclear fuel by barge would only be a very small fraction of the total annual domestic waterbomecommerce.
With the exception of occupational and public health and safety impacts, which are evaluated in thissection, the environmental impacts of this small fraction of all national transportation would be verysmall in comparison to the impacts of other nationwide transportation activities. Thus, the nationaltransportation of spent nuclear fuel and high-level radioactive waste would have very small impacts onland use and ownership; hydrology; biological resources and soils; cultural resources; socioeconomics;noise and vibration; aesthetics; utilities, energy, and materials; or waste management.
To determine if pollutants of concern from national transportation vehicles (truck and rail) would degradeair quality in nonattainment areas, DOE reviewed traffic volumes in these areas. This review determinedthat the numbers of shipments of Yucca Mountain-destined vehicles through these areas would be verysmall in relation to normal traffic volumes. Therefore, the impact to air quality in these areas, exceptNevada (see Section 6.1.3), would be very small.
Radiological impacts of accidents on biological resources would be extremely unlikely. The analysisfocused the impacts from accidents on human health and safety. A severe accident scenario, such as the
6-32

Environmenfal Inipacts of Transponation
maximum reasonably foreseeable accident scenarios discussed in Section 6.2.4.2, that would cause arelease of contaminated materials would be very unlikely. The probabilities of the severe accidentscenarios discussed in Section 6.2.4.2 are less than 3 in 10 million per year for both the mostly legal-weight truck and mostly rail transportation scenarios. Because of the low probability of occurrence, anaccident scenario during the transport of spent nuclear fuel and high-level radioactive waste would beunlikely to cause adverse impacts to any endangered or threatened species, and impacts to other plantsand animals would be small. Therefore, the analysis did not evaluate the impacts for these environmentalparameters for national transportation activities further.
This chapter does not evaluate the risks of economic loss or resultant environmental consequences frompotential transportation accidents that could cause releases of radioactive materials. DOE did not performthese analyses because estimating economic risks, and environmental consequences would depend onmany factors associated with accidents that cannot be known in advance. Therefore, the information thatwould be needed for such an analysis is not available. Section J.1.4.2.5 of Appendix J presents a reviewand analysis of studies by the U.S. Nuclear Regulatory Commission, the National Aeronautics and SpaceAdministration, DOE, and others that discusses cost factors and provides estimates of the range of costsand environmental consequences of cleaning up contamination following hypothetical accidental releasesof radioactive materials.
6.2.1 ANALYSIS SCENARIOS AND METHODS
Under the mostly legal-weight truck scenario for national transportation, DOE would transport shipments(with the exception of naval spent nuclear fuel and possibly some DOE high-level radioactive waste) bylegal-weight truck to Nevada. Naval spent nuclear fuel would be shipped by rail from the Idaho NationalEngineering and Environmental Laboratory. Under the mostly-legal weight truck scenario, DOE assumedthat some shipments of DOE high-level radioactive waste would use overweight trucks. With theexception of permit requirements and operating restrictions, the vehicles for these shipments would besimilar to legal-weight truck shipments but might weigh as much as 52,200 kilograms (115,000 poun ds).States routinely issue special permits for trucks weighing up to 58,500 kilograms (129,000 pounds).
Figure 6-11 shows the highway routes (mostly Interstate ffighways) that the analysis used to estimatetransportation-related impacts, along with the locations of the commercial and DOE'sites and YuccaMountain. The routes selected for analysis are representative of routes that DOE could use for truckshipments if the Yucca Mountain site was approved. In addition, the highway routes shown wouldconform to the. routing requirements in 40 CFR 397. 101 (see Appendix J, Section J. 1.2).
Although DOE cannot be certain of the actual mix of rail and truck shipments that would occur, it expectsthat the mostly rail scenario best represents the mix of modes it would use. This belief is based onanalyses the Department has done to assess generator site capabilities to handle larger (rail) casks,distances to suitable railheads, and historic experience in actual shipments of fuel, waste, or large reactor-related components. In addition, DOE considered relevant information published by knowledgeablesources such as the Nuclear Energy Institute, which provided information on capabilities of generatorsites to handle large rail casks (DIRS 155777-McCuUum 2000, all). Although DOE believes the mostlyrail scenario best represents what would be likely for the transportation of spent nuclear fuel and high-level radioactive waste to a Yucca Mountain Repository, Appendix J, Section J. 1.2.1.4 describes ananalysis that illustrates how changes in the mix of rail and truck modes would change estimated healthand safety impacts for national transportation. The results of the analysis indicated how a mix betweenthe limits represented by the mostly legal-weight truck and mostly rail scenarios would result in healthand safety impacts that would be between those estimated for the two scenarios and would not be greaterthan the impacts from either scenario.
6-33

I
OR ......... .............. .*j t., Dr . " "N•W s ale a oA O~s5I
Ito ''b
E~NV. caambi Asrse
Idaho National MT No .. Mr. mile PointS .. teiW.nEn ionMnNOlI Laborator .y .1 MNs
Vale Nt soMoCUOOIO . ' / I Demonstration I
1. 53 Prjct A nt
...... u, 5A i
' " La - an o
Ohor -eI'.w
I AL LGA
LL Nodee* IA . *
k'
* co r site seteHo pe Creek. Nine M.le
..o..nt and Simon Clnd
DIede and Mori
FL a" IL•
L c arelif
to e s ngle ite due to thi pr)ft o ahoh
K Doael sites
Note Wall cree Mnaysi KYsdrdtreSmosd otrfetrcs os ls
Note: The EIS analysis Included the high-level radioactive waste at West Valley.The State ot New York owns the high-level radioactve waste and the site.Under Ihe West Valley Demonstration Project Act, DOE is reslbonsibte for
These routes represent the routes analyzed in Chapter 6 and might not ba thesotidifying and transporting the high-level radioactive waste to a repository,
routes actually used for shipments to the proposed repository at Yucca Mountain.Nati nal high ays anal zedTruck
routes comply with U .S. Department o1 Transportation routing regulations.NatinalhighaysanalzedStates
or tribes can designate alternative preterred routesa (40 CFR1 397.103).*Federally recognized Native American lands
s~;Mdfe rmOR 0•7-XE{96 •nkw ,5
OUte M.It~O tra ...... .. ? 5O EI 5,O oven .
Figure 6-11. Representative truck routes from commercial and DOE sites to Yucca Mountain analyzed for the Proposed Action.

'I •
Environmental Impacts of Transportation
MOSTLY LEGAL-WEIGHT TRUCK AND MOSTLY RAIL SCENARIOS
The Department would prefer most shipments to a Yucca Mountain repository be made using railtransportation. It also expects that the mostly rail scenario described in this EIS best represents themix of rail and truck transportation that would be used. However, it cannot be certain of the actualmix of rail and truck transportation that would occur over the 24 years of the Proposed Action.Consequently, DOE used the mostly legal-weight truck and mostly rail scenarios as a basis for theanalysis of potential impacts to ensure the analysis addressed the range of possible transportationimpacts. The estimated number of shipments for the mostly legal-weight truck and mostly railscenarios represents the two extremes in the possible mix of transportation modes, thereby coveringthe range of potential impacts to human health and safety and to the environment for thetransportation modes DOE could use for the Proposed Action.
Under the national transportation mostly rail scenario, DOE would transport shipments (with theexception of commercial spent nuclear fuel at six sites that do not have the capability to load a rail cask)by rail to Nevada. In addition, this scenario assumes that 24 commercial sites that have the capability tohandle and load rail casks, but that do not have railroad service, would make shipments to nearbyrailheads by barge or heavy-haul truck. Barge shipments of rail casks containing spent nuclear fuel couldbe possible from 17 commercial sites that are on or near navigable waterways. Figure 6-12 shows theraiload routes that the analysis used to estimate transportation-related impacts, along with the locationsof the commercial and DOE sites and Yucca Mountain. The routes selected for analysis arerepresentative of routes that could be used for rail shipments if the Yucca Mountain site was approved.The analysis estimated that these routes would most closely follow current railroad industry practices andthe system-wide capability to ship hazardous materials safely. These routes would reduce time in transit,reduce the number of interchanges between railroads, and use mainline tracks to the maximum practicalextent.
The railroad routes shown in Figure 6-12 could also be used by generators to transport spent nuclear fuelto a proposed Private Fuel Storage facility near Skull Valley in northwestern Utah (DIRS 152001-NRC2000, all). Rail routes from that facility to connections with potential branch rail lines or to an intermodaltransfer station in Nevada would be essentially the same as the western sections of rail routes analyzed inthis chapter. Thus, impacts presented in this chapter for five candidate routes for heavy-haul trucks andfive candidate rail corridors in Nevada would be about the same whether shipments were directly from 72commercial and 5 DOE generator sites to a Yucca Mountain Repository or from a Private Fuel Storagefacility in Skull Valley, Utah. Chapter 8, Section 8.4, discusses potential cumulative impacts oftransporting commercial spent nuclear fuel to a Private Fuel Storage facility and then to a YuccaMountain Repository (see Appendix J, Section J.1.2).
This section evaluates radiological and nonradiological impacts to workers and the public from routinetransportation operations and from accidents. DOE used a number of computer models and programs toestimate these impacts; Appendix J describes the analysis assumptions and models.
The CALVIN model (DIRS 155644-CRWMS M&O 1999, pp. 2 to 22) was used to estimate the numberof shipments of commercial spent nuclear fuel for both the mostly legal-weight truck and mostly railscenarios. The CALVIN program used commercial spent nuclear fuel inventories and characteristicsfrom the Report on the Status of the Final 1995 R W-859 Data Set (DIRS 104848-CRWMS M&O 1996,all) and the Calculation Method for the Projection of Future SNF Discharges (DIRS 156305-CRWMSM&O 2001, all) (see Appendix A) to estimate the number of shipments. For DOE spent nuclear fuel andhigh-level radioactive waste, the analysis used inventories and characteristics for materials to be shippedunder the Proposed Action that were reported by the DOE sites in 1998 (see Appendix A) to estimate thenumber of shipments. Chapter 2, Section 2.1.3, and Appendix J discuss the number of shipments.
6-35

( (
> ... • "i ..........
MNTf Idaho National DeoTm,,,rt o , i '.,G ). -, n n a n d ...... J amLA . F li a lrhc k< - ......... - _ . M.. +. "W 1 ... .... , -l f r
...... .. .. ......a l e
.. .. .. • ........ • : +...0ýM Q B " Iý lIA AD= nP d. Pun
Ci- io. N P N.k
Fort Vol ... •.o- & •
Rsdf s -oa)HHp~~
St Van C +• MD "C• ~KS W-11 ook +VA + +Yu a .+ .................
ShotalNon5,
C.ro ..... .. --.... ... :m\ anna
...... .. .. ... A Z NM ,c i .... ..t FolkS.
Legend +''
* Commercial sites, ""
Note; The EIS anaiysis considered three commercial site pairs -- Salem and5Hope Creek, Nie Mile Point and FitzPatrick,. and Dr•esden and Morris -- Symbols do not reflect precise laceatlrts.to be single sites due to their proximity to eacli other.
H DOE sitesNote: The EIS analysis included the high-level radioactive waste at West Valley.
The State of New York owns the hiph-tevel radioactive waste and the site.Under the West Valley Demonstration Prolect Act, DOE Is responsible forsolidilying and transporting the high-level radioactive waste;lo a repository, These routes represent the roumtes analyzed In Chapter 6 and might not beNational rail lines anaylzed the aoutes actually used for shipments to the proposed repository at Yucca
Mountain. Rail routes are based on maximizing the distance on mainline+'--'-- Nevada rail corridors track and minimizing the overalt distance and number at interchangesbetween railroads.Federally recognized Native Amencan lands Source: Modilad from DIRS 101779-DOE te998s Overview, p. 5).
Figure 6-12. Representative rail ioutes from commercial and DOE sites to Yucca Mountain analyzed for the Proposed Action.
* 0

Environmental Impacts of Transportation
The transportation analyses used the following computer programs:
" HIGHWAY (DIRS 104780-Johnson et al. 1993, all) to identify the highway routes that it could use totransport spent nuclear fuel and high-level radioactive waste. All of the routes would satisfy U.S.Department of Transportation route selection regulations.
" INTERLINE (DIRS 104781-Johnson et al. 1993, all) to identify rail and barge routes for the analysis.
* RADTRAN 5 (DIRS 150898-Neuhauser and Kanipe 2000, all; DIRS 155430 Neuhauser, Kanipe, andWeiner 2000, all) to estimate radiological dose risk to populations and transportation workers duringroutine operations. The analyses also used this program to estimate radiological dose risks topopulations and transportation workers from accidents.
" RISKIND (DIRS 101483-Yuan et al. 1995, all) to estimate radiological doses to the maximallyexposed individuals and to the population during routine transportation. This program also estimatedradiological doses to the maximally exposed individuals and to the population from transportationaccidents.
6.2.2 IMPACTS FROM LOADING OPERATIONS
This section describes potential impacts from loading spent nuclear fuel and high-level radioactive wastein transportation casks and on transportation vehicles at the 72 commercial and 5 DOE sites. It alsodescribes methods for estimating radiological and industrial hazard impacts from routine loadingoperations and radiological impacts of loading accidents to workers and members of the public. Duringloading operations, radiological impacts to workers could occur from normal operations and accidents. Inaddition, workers could experience impacts from industrial hazards. Members of the public couldexperience radiological impacts if a loading accident occurred but would not experience impacts fromindustrial hazards, including hazards associated with nonradioactive hazardous materials. Nonradioactivehazardous materials would be used only in small quantities, if at all, in loading operations. Chapter 4addresses impacts from unloading operations at the repository.
6.2.2.1 Radiological Impacts of Routine Operations
Radiological impacts to members of the public from routine operations would be very small. An earlierDOE analysis estimated that public dose from loading operations (primarily due to atmospheric effluents)would be less than 0.001 person-rem per metric ton of uranium loaded (DIRS 104731-DOE 1986, Volume2, p. E.6) (see Appendix I for more information)- Therefore, to be conservative this analysis estimatedthe dose to the public from loading operations by multiplying the value of 0.001 person-rem per metricton of uranium by the 70,000metric tons (77,000 tons) of spent nuclear fuel and high-level radioactivewaste DOE would transport under the Proposed Action. [DIRS 104731-DOE (1986, Volume 2, all) usesthe term "metric ton uranium," which is essentially the same as metric tons of heavy metal forcommercial spent nuclear fuel.] The resulting population dose would be 70 person-rem, which, based onconversion factors recommended by the International Commission on Radiological Protection, wouldresult in 0.04 latent cancer fatality. The Commission recommends 0.0004 and 0.0005 latent cancerfatality per person-rem for involved worker populations and the general public, respectively (DIRS101836-ICRP 1991, p. 22).
Table 6-6 lists estimated involved worker impacts from loading spent nuclear fuel at commercial sites andloading DOE spent nuclear fuel and high-level radioactive waste at DOE facilities for shipment to theYucca Mountain site under the Proposed Action. The impacts assume worker rotation and otheradministrative actions at commercial sites would follow guidance similar to that in DOE Standard -Radiological Control Manual (DIRS 156764-DOE 1999, Article 211). Although the guidance that the
6-37

• J !L 1
Environmental Impacts of Transportation
annual dose received by an individual worker could be as high as 2 rem per year, DOE policy is to limitdoses to individual workers to no more than 500 millirem per year. The maximum individual dose would*00.1
1
Table 6-6. Estimated radiological impacts toinvolved workers from loading operations.,
!I
Mostly Mostly legal-Impact rail weight truck
Maximally exposed individualDose (rem) 12' 12"Probability of LCF' 0.005 0.005
Involved worker population"
Dose (person-rem) 4,200 15,000Number of LCFs 1.7 6.1
a. Numbers are rounded.b. Based on 500-millirem-per-year administrative dose
limit.c. LCF = latent cancer fatality.d. All involved workers at all facilities, preparing about
11,000 shipments under the mostly rail scenario andabout 53,000 shipments under the mostly legal-weighttruck scenario over 24 years.
be 12 rem over the 24 years of loading operationsfor individuals who worked the entire duration ofrepository operations. The estimated probability ofa latent cancer fatality for an involved worker fromthis dose would be about 0.005 (5 chances in1,000).
As many as 2 latent cancer fatalities from themostly rail scenario and about 6 latent cancerfatalities from the legal-weight truck scenario couldresult in the involved worker population over24 years. The mostly legal-weight truck scenariowould result in more potential impacts than themostly rail scenario because of the increasedexposure time needed to load more transportationcasks.
To assess potential radiological impacts at generatorfacilities, the EIS analysis assumed that
I
noninvolved workers would have no direct involvement with handling spent nuclear fuel or high-levelradioactive waste.. DOE expects radiological impacts to noninvolved workers to be even smaller thanthose to involved workers.
6.2.2.2 Impacts from Industrial Hazards
Table 6-7 lists estimated impacts to involved workers from industrial hazards over 24 years of loadingoperations at the 77 sites. Fatalities from industrial hazards would be unlikely from loading activitiesunder either national transportation scenario. The mostly legal-weight truck scenario would have aboutthree times the estimated number of total recordable cases and lost workday cases of the mostly railscenario because there would be more shipments and more work time (full-time equivalent worker years).Using the assumption that the noninvolved workforce wouldbe 25 percent of the number of involvedworkers, the analysis determined that impacts to noninvolved workers would be about 25 percent of thoselisted in Table 6-7.
Table 6-7. Impacts to involved workersa from industrial hazards during loading operations.bImpact Mostly rail Mostly legal-weight truck
Total recordable cases' 130 380Lost workday casesd 67 200Fa
a.
atalities' 0.29 0.9Includes all involved workers at all facilities during 24 years of repository operations. During the 24 years of shipments tothe proposed repository, these workers would put in 1,300 worker years (2,080 hours per worker year) preparing about11,000 shipments under the mostly rail scenario and 3,700 worker years preparing about 53,000 legal-weight truckshipments and 300 naval spent nuclear fuel rail shipments under the mostly legal-weight truck scenario. Industrial safetyimpacts in the noninvolved workforce would be about 25 percent of those listed.Numbers are rounded to two significant digits.Total recordable cases (injury and illness) based on a 1998 loss incident rate of 0.08.Lost workday cases based on a 1998 loss incident rate of 0.05.Fatalities based on a 1998 loss incident rate of 0.000218.
b.C.d.e.
6-38

Environmental Impacts of Transportation
D To assess potential industrial safety impacts at generator facilities, the EIS analysis assumed thatnoninvolved workers would be persons with office-based administrative duties associated with loadingoperations. In addition to industrial safety impacts, traffic fatality and vehicle emissions impacts as aresult of commuting workers associated with loading operations were estimated. Traffic involvingcommuting workers could result in 0.4 fatality under the mostly legal-weight truck scenario and 0.2fatality under the mostly rail scenario. Estimated vehicle emissions impacts from commuting could resultin 0.06 latent fatalities for the mostly legal-weight truck scenario and 0.02 for the mostly rail scenario.
6.2.3 NATIONAL TRANSPORTATION IMPACTS
The following sections discuss the impacts of transporting spent nuclear fuel and high-level radioactivewaste to the proposed Yucca Mountain Repository under the mostly legal-weight truck and mostly railscenarios. The analysis in this section addresses the impacts of incident-free transportation. Section6.2.4 discusses accidents, and Appendix J contains the details of the analysis and its assumptions.
6.2.3.1 Impacts from Incident-Free Transportation - National Mostly Legal-Weight TruckTransportation Scenario
This section addresses radiological and nonradiological impacts to populations and maximally exposedindividuals for incident-free transportation of spent nuclear fuel and high-level radioactive waste for themostly-legal weight truck scenario.
Incident-Free Radiological Impacts to Populations. Table 6-8 lists the incident-free population doseand latent cancer fatalities to workers and the public for the mostly legal-weight truck scenario. Theimpacts include those for the shipment of naval spent nuclear fuel by rail to Nevada, intermodal transferDof rail casks to heavy-haul trucks, and subsequent heavy-haul transportation to the proposed repository.Section 6.3.3 and Appendix I contain additional information on worker impacts from intermodal transferoperations. Worker impacts would include radiological exposures of security escorts for legal-weighttruck, rail, and heavy-haul truck shipments and from the transfer of naval spent nuclear fuel shipmentsfrom rail to heavy-haul truck. The collective dose to the security escorts traveling in separate vehicleswould be about 6 person-rem for legal-weight truck shipments. Doses to escorts of rail shipments ofnaval spent nuclear fuel, who would travel in railcars in sight of but separated from the cask cars,followed by escorted heavy-haul truck shipments in Nevada would be about 0.4 person-rem.
Table 6-8. Population doses and impacts from incident-free transportation for national mostly legal-weight truck scenario.,
Legal-weight truck Rail shipments of navalCategory shipments spent nuclear fuelb Totalsd
Involved workersCollective dose (person-rem) 14,000 29 14,000Estimated LCFsH 5.6 0.01 5.6
PublicCollective dose (person-rem) 5,000 20 5,000Estimated LCFs 2.5 0.01 2.5
a. Impacts are totals for shipments over 24 years.b. Includes impacts from intermodal transfer operations (see Section 6.3.3.1).c. LCF = latent cancer fatality.d. Totals might differ from sums of values due to rounding.
If escorts accompanied legal-weight truck shipments over the full length of their shipment routes, ratherthan only in highly populated urban areas as required by Federal regulations (10 CFR 73.37), theestimated doses to escorts over 24 years would be 360 person-rem (a 0.14 probability of a latent cancerfatality in the population of escorts).
6-39

Environmental Impacts of Transportation
In addition, as is recommended by the Commercial Vehicle Safety Alliance (DIRS 155863-CVSA 2000,all), the analysis assumed state safety inspections of shipments would occur only in originating anddestination states. If inspections were conducted for every shipment in each state through which theshipment would pass, inspectors would receive an additional dose of 7,000 person-rem (about 2.8 latentcancer fatalities) over 24 years.
Appendix J, Section J. 1.3.2.2.2 contains additional information about the analysis of impacts to escortsand inspectors.
The estimated radiological impacts would be 6 (5.6) latent cancer fatalities for workers and 3 (2.5) latentcancer fatalities for members of the public for the 24 years of operation. The population within 800meters (0.5 mile) of routes would be about 10 million based on projections to 2035. About 2.3 millionmembers of this population would be likely to incur fatal cancers from all other causes not associatedwith the Proposed Action (DIRS 153066-Murphy 2000, p. 5).
Incident-Free Radiological Impacts to Maximally Exposed Individuals. Table 6-9 lists estimates ofdoses and radiological impacts for maximally exposed individuals for the legal-weight truck scenario(which considers drivers and security escorts). The risks are calculated for the 24 years of shipmentactivities. Appendix J discusses analysis methods and assumptions. State inspectors who conductedfrequent inspections of shipments of spent nuclear fuel and high-level radioactive waste andtransportation vehicle operating crews would receive the highest annual radiation doses.
Table 6-9. Estimated doses and radiological impacts to maximally exposed individuals for nationalmostly legal-weight truck scenario. ab
w
Individual Dose (rem) Probability of latent fatal cancerInvolved workersCrew member (including driver) 48e 0.02Inspector 48' 0.02Railyard crew member 0.13 0.00005
PublicResident along route 0.006 0.000003Person in traffic jam 0 .0 16 d 0.000008Person at service station 2.4c 0.0012Resident near rail stop 0.009 0.000005
a. The assumed external dose rate is 10 millirem per hour at 2 meters (6.6 feet) from the vehicle for all shipments.b. Totals for 24 years of operations.c. Based on 2-rem-per-year administrative dose limit. If a lower dose limit, for example 500 millirem per year, was imposed
for transportation workers or state inspectors, maximally exposed individual doses would be lower. See DIRS 156764-DOE(1999, Article 211) for DOE guidance on occupational dose limits.
d. Person in a traffic jam is assumed to be exposed one time only.e. Assumes the person works at the service station for all 24 years of operations. Mitigation would be required to reduce
impacts to members of the public to below 100 millirem per year.
Impacts to the maximally exposed individuals in the general public would be very low. The highestimpacts would be to a service station employee who worked at a station where the analysis assumed alltruck shipments would stop under the mostly legal-weight truck scenario (Table 6-9). The analysisestimated that this employee would receive a dose of 2.4 rem over 24 years, which corresponds to themaximum that would be allowed (100 millirem per year) for a member of the general public underregulations in 10 CFR Part 20. The estimate assumes that measures would be taken by DOE to reduce thedose to the employee from 130 millirem per year (3.2 rem over 24 years)-the dose estimated by theanalysis if dose reduction measures were not implemented. The estimate of 3.2 rem over 24 yearsconservatively assumed the person would be exposed to 450 truck shipments each year for 24 years. Forperspective, under the mostly legal-weight truck scenario, which assumes an average of 2,200
6-40

Environmental Impacts of Transportation
Plegal-weight truck shipments per year, about 450 truck shipments would pass through the Mercury,Nevada, gate to the Nevada Test Site in 1,800 hours. A worker at a truck stop along the route to Mercurywould work about 1,800 hours per year. Thus, if every shipment stopped at that truck stop, the maximumnumber of shipments the worker would be exposed to in a year would be 450.
Impacts from Vehicle Emissions. Using data published by DIRS 151198-Biwer and Butler (1999, p.1165 to 1166), DIRS 155786-EPA (1997, all), and DIRS 155780-EPA (1993, Section 13.2.13) (seeAppendix J, Section J. 1.3.2.3), DOE estimated the number of fatalities that vehicle emissions fromshipments to Yucca Mountain could cause (Table 6-10). These potential impacts would result principallyfrom exposure to increases in levels of pollutants, where the additional pollutants would come fromvehicles transporting spent nuclear fuel and high-level radioactive waste and the accompanying escortvehicles. In the context of the number of vehicle kilometers from shipments to the Yucca Mountain site,these emissions would be very small in comparison to the emissions from other vehicles.
Table 6-10. Population health impacts from vehicle emissions during incident-free transportation fornational mostly legal-weight truck scenario.'
Legal-weight tiruck Rail shipments of navalCategory shipments spent nuclear fuel Totalb
Estimated vehicle emission-related fatalities 0.93 0.01 0.95a. Impacts are totals for shipments over 24 years.b. Total differs from sums of values due to rounding.
This section addresses radiological and nonradiological impacts to populations and maximally exposedindividuals from the incident-free transportation of spent nuclear fuel and high-level radioactive waste forthe mostly rail national transportation scenario. In addition, it identifies impacts of legal-weight truckshipments that would occur under the mostly rail scenario for the six commercial sites that do not havethe capability to load rail casks (about 1,079 legal-weight truck shipments over 24 years). Of these sixsites, two have direct rail access and four have indirect access. Of the four sites with indirect access,three have barge access. The analysis assumed that the six legal-weight truck sites would upgrade theircrane capacities and ship by rail after reactor shutdown.
6.2.3.2 Impacts from Incident-Free Transportation - National Mostly Rail TransportationScenario
For this analysis, DOE assumed that it would use either a branch rail line or heavy-haul trucks in Nevadato transport rail casks to and from the repository. Accordingly; the results indicate the range of impactsfor the rail and heavy-haul truck implementing alternatives that DOE could use for transportation to therepository after rail shipments arrived in Nevada. Section 6.3 and Appendix J present more informationon the analysis of the environmental impacts of the Nevada rail and heavy-haul implementingalternatives. Appendix J, Section J.2, also presents a comparison of the effects of using dedicated trainsor general freight services for rail shipments.
The mostly rail scenario assumes that the 24 commercial sites not served by a railroad but with thecapability to handle rail casks would use heavy-haul trucks to transport the casks to railbeads for transferto railcars. In addition, 17 of the 24 sites are adjacent to navigable waterways. At some of the 17 sites onnavigable waterways, barges could be used for the initial trip segments (see Appendix J, Section J.2. 1).The impacts estimated by the analysis include the impacts of heavy-haul truck or barge shipments of railcasks from the 24 sites to nearby railheads.
The analysis assumed that the truck shipments of spent nuclear fuel and high-level radioactive wastewould make periodic stops for state inspections, changes of drivers, rest, and fuel. Rail shipments would
6-41

Environmental Impacts of Transportation
VEHICLE EMISSION UNIT RISK FACTORS
DIRS 151198-Biwer and Butler (1999, all) presents unit risk factors for estimating vehicle emissionsand the resulting health effects (fatalities) from truck and rail transportation. Changes to informationused in the Biwer and Butler analysis resulted in revised factors used in the analyses in this EIS.DOE made four changes:
Fugitive dust emission factor. Biwer and Butler used the paved road fugitive dust emission factorequation from DIRS 155786-EPA (1997, Volume 1, Supplement D, Section 13.2.1) to estimatefugitive dust emission factors for individual vehicle weight classes. The emission factor used inthe Final EIS analysis is based on the fleet average weight, as recommended in the reference.
" Diesel exhaust emission factor. Biwer and Butler used diesel exhaust emission factors for trucksoperating in 1995. The Final EIS analysis used information presented in the Motor Vehicle-Related Air Toxics Study (DIRS 155780-EPA 1993, all) to> estimate diesel exhaust emissionfactors projected for the fleet of trucks operating in 2010.
* Mortality rate used to estimate health effects. The PM10 risk factor used in Biwer and Butler wascalculated using a baseline mortality rate of 0.008. This is the crude rate, which is influenced byage differences in population composition. The analysis for the Final EIS used an age-adjustedmortality rate of 0.005.
" PM10 risk factor. The PM10 health risk factor used by Biwer and Butler was based on an upperbound reported by DIRS 152600-Ostro and Chestnut (1998, all), who also presented lower-bound and central estimates. To avoid compounding conservative assumptions, the Final EISanalysis uses the central estimate.
These changes resulted in values for vehicle emission health effect (fatality) unit risk factors that areabout a factor of 30 smaller that those estimated by DIRS 151198-Biwer and Butler (1999, all).
also make periodic stops. However, the assumed frequency of the stops and the numbers of peoplenearby would be different from those for truck shipments and would result in a lower dose.
Incident-Free Radiological Impacts to Populations. Table 6-11 lists incident-free radiologicalimpacts that would occur during the routine transportation of spent nuclear fuel and high-level radioactivewaste under the mostly rail national transportation scenario. Because national impacts would result fromtransportation from the commercial and DOE sites to the repository, they include impacts from a Nevadarail or heavy-haul truck implementing alternative. For the case in which rail shipments would continue inNevada, total impacts to members of the general public would differ depending on the implementingalternative (see Section 6.3.2 for additional details). The range of values listed in Table 6-11 includes therange of impacts from the Nevada implementing alternatives.
About I latent cancer fatality could result from shipments of spent nuclear fuel and high-level radioactivewaste under the mostly rail scenario over 24 years. The latent cancer fatality would occur over thelifetime of an individual in the exposed population. The population within 800 meters (0.5 mile) ofroutes in which this fatality would occur would be approximately 16.4 million. Approximately 3.8 millionmembers of this population would incur fatal cancers from all other causes not associated with theProposed Action (DIRS 153066-Murphy 2000, p. 5).
Incident-Free Radiological Impacts to Maximally Exposed Individuals. Table 6-12 lists the resultsof risk calculations for maximally exposed individuals for the mostly rail transportation scenario over 24years. Truck and rail crew members would receive the highest doses. The mostly rail scenario wouldrequire transport crews for legal-weight trucks (1,079 total shipments over 24 years) and for rail
6-42
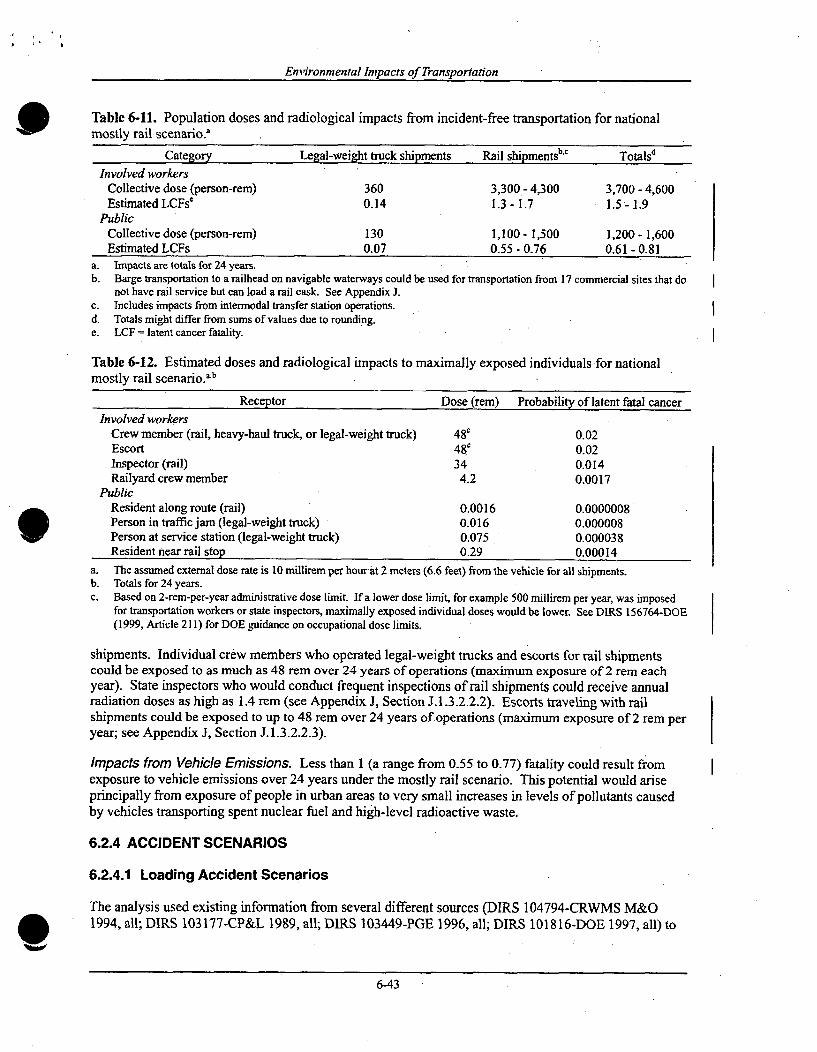
Environmental Impacts of Transportation
Table 6-11. Population doses and radiological impacts from incident-free transportation for nationalmostly rail scenario.a
Category Legal-weight truck shipments Rail shipmentsb,, TotalsdInvolved workers
Collective dose (person-rem) 360 3,300- 4,300 3,700 - 4,600Estimated LCFs' 0.14 1.3-1.7 1.5,-1.9
PublicCollective dose (person-rem) 130 1,100 - 1,500 1,200 - 1,600Estimated LCFs 0.07 0.55 - 0.76 0.61 - 0.81
a. Impacts are totals for 24 years.b. Barge transportation to a railhead on navigable waterways could be used for transportation from 17 commercial sites that do
not have rail service but can load a rail cask. See Appendix J.c. Includes impacts from intermodal transfer station operations.d. Totals might differ from sums of values due to rounding.e. LCF = latent cancer fatality.
Table 6-12. Estimated doses and radiological impacts to maximally exposed individuals for nationalmostly rail scenario.a3b
Receptor Dose (rem) Probability of latent fatal cancer
Involved workersCrew member (rail, heavy-haul truck, or legal-weight truck) 48c 0.02Escort 48c 0.02Inspector (rail) 34 0.014Railyard crew member 4.2 0.0017
PublicResident along route (rail) 0.0016 0.0000008Person in traffic jam (legal-weight truck) 0.016 0.000008Person at service station (legal-weight truck) 0.075 0.000038Resident near rail stop 0.29 0.00014
a.b.C.
The assumed external dose rate is 10 millirem per hourat 2 meters (6.6 feet) from the vehicle for all shipments.Totals for 24 years.Based on 2-rem-per-year administrative dose limit. If a lower dose limit, for example 500 millirem per year, was imposedfor transportation workers or state inspectors, maximally exposed individual doses would be lower. See DIRS 156764-DOE(1999, Article 211) for DOE guidance on occupational dose limits.
shipments. Individual crew members who operated legal-weight trucks and escorts for rail shipmentscould be exposed to as much as 48 rem over 24 years of operations (maximum exposure of 2 rem eachyear). State inspectors who would conduct frequent inspections of rail shipments could receive annualradiation doses as high as 1.4 rem (see Appendix J, Section J.1.3.2.2.2). Escorts traveling with railshipments could be exposed to up to 48 rem over 24 years of operations (maximum exposure of 2 rem peryear; see Appendix J, Section J. 1.3.2.2.3).
Impacts from Vehicle Emissions. Less than 1 (a range from 0.55 to 0.77) fatality could result fromexposure to vehicle emissions over 24 years under the mostly rail scenario. This potential would ariseprincipally from exposure of people in urban areas to very small increases in levels of pollutants causedby vehicles transporting spent nuclear fuel and high-level radioactive waste.
6.2.4 ACCIDENT SCENARIOS
6.2.4.1 Loading Accident Scenarios
The analysis used existing information from several different sources (DIRS 104794-CRWMS M&O1994, all; DIRS 103177-CP&L 1989, all; DIRS 103449-PGE 1996, all; DIRS 101816-DOE 1997, all) to
6-43
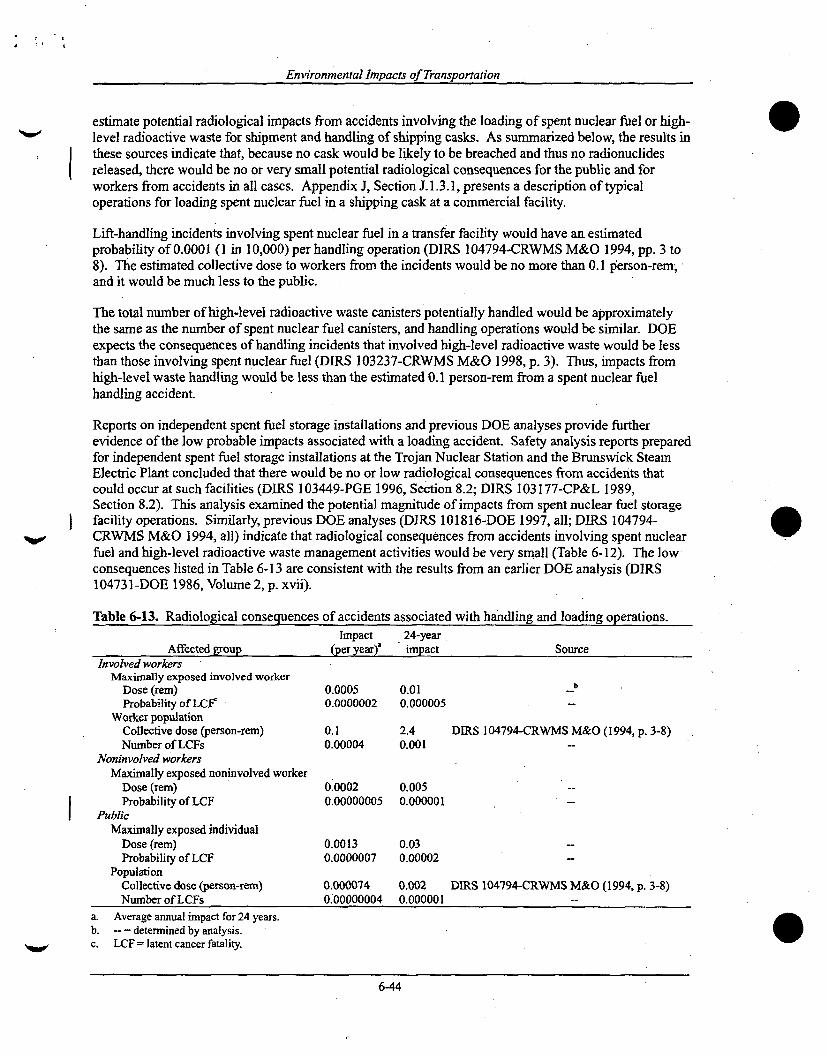
Environmental Impacts of Transportation
estimate potential radiological impacts from accidents involving the loading of spent nuclear fuel or high-level radioactive waste for shipment and handling of shipping casks. As summarized below, the results inthese sources indicate that, because no cask would be likely to be breached and thus no radionuclidesreleased, there would be no or very small potential radiological consequences for the public and forworkers from accidents in all cases. Appendix J, Section J. 1.3.1, presents a description of typicaloperations for loading spent nuclear fuel in a shipping cask at a commercial facility.
Lift-handling incidents involving spent nuclear fuel in a transfer facility would have an estimatedprobability of 0.0001 (1 in 10,000) per handling operation (DIRS 104794-CRWMS M&O 1994, pp. 3 to8). The estimated collective dose to workers from the incidents would be no more than 0.1 person-rem,and it would be much less to the public.
The total number of high-level radioactive waste canisters potentially handled would be approximatelythe same as the number of spent nuclear fuel canisters, and handling operations would be similar. DOEexpects the consequences of handling incidents that involved high-level radioactive waste would be lessthan those involving spent nuclear fuel (DIRS 103237-CRWMS M&O 1998, p. 3). Thus, impacts fromhigh-level waste handling would be less than the estimated 0.1 person-rem from a spent nuclear fuelhandling accident.
Reports on independent spent fuel storage installations and previous DOE analyses provide furtherevidence of the low probable impacts associated with a loading accident. Safety analysis reports preparedfor independent spent fuel storage installations at the Trojan Nuclear Station and the Brunswick SteamElectric Plant concluded that there would be no or low radiological consequences from accidents thatcould occur at such facilities (DIRS 103449-PGE 1996, Section 8.2; DIRS 103177-CP&L 1989,Section 8.2). This analysis examined the potential magnitude of impacts from spent nuclear fuel storagefacility operations. Similarly, previous DOE analyses (DIRS 101816-DOE 1997, all; DIRS 104794-CRWMS M&O 1994, all) indicate that radiological. consequences from accidents involving spent nuclearfuel and high-level radioactive waste management activities would be very small (Table 6-12). The lowconsequences listed in Table 6-13 are consistent with the results from an earlier DOE analysis (DIRS104731-DOE 1986, Volume 2, p. xvii).
I
Table 6-13. Radiological consequences of accidents associated with handling and loading operations.Impact 24-year
Affected group (per year)' impact SourceInvolved workers
Maximally exposed involved workerDose (rem) 0.0005 0.01 _b
Probability of LC1r 0.0000002 0.000005Worker population
Collective dose (person-rem) 0.1 2.4 DIRS 104794-CRWMS M&O (1994, p. 3-8)Number of LCFs 0.00004 0.001
Noninvolved workersMaximally exposed noninvolved worker
Dose (rem) 0.0002 0.005Probability of LCF 0.00000005 0.000001
PublicMaximally exposed individual
Dose (rem) 0.0013 0.03Probability of LCF 0.0000007 0.00002
PopulationCollective dose (person-rem) 0.000074 0.002 DIRS 104794-CRWMS M&O (1994, p. 3-8)Number of LCFs 0.00000004 0.000001
a Average annual impact for 24 years.b. -- = determined by analysis.c. LCF = latent cancer fatality.
6-44

Environmental Impacts of Transportation
6.2.4.2 Transportation Accident Scenarios
Accidents could occur during the transportation of spent nuclear fuel and high-level radioactive waste.This section describes the risks and impacts to the public and workers for a range of accident scenariosincluding those that are highly unlikely but that could have high consequences (called maximumreasonablyforeseeable accident scenarios) and those that are more likely but that would have less severeconsequences. The impacts would include those to the population and to hypothetical maximally exposedindividuals. The following paragraphs describe the analysis approach. Appendix J, Section J.1.4,contains more details.
The analysis did not address accident impacts to workers apart from impacts to the public. For example,fatalities from train and truck accident scenarios would include fatalities for vehicle operators. Thecollective radiological risk ftorn accidents to highway vehicle and train crews would be much less thanfor the public because of the large difference in the numbers of individuals that could be affected, Inaddition, based on national accident statistics, motor carrier and train operators are much less likely to befatalities in nonradiological accidents than operators of other vehicles (DIRS 1034 1 O-DOT 1998, p. 30).
MAXIMUM REASONABLY FORESEEABLE ACCIDENT SCENARIOS
'Maximum reasonably foreseeable impacts from accident scenarios for the transportation of spentnuclear fuel and high-level radioactive waste would be characterized by extremes of mechanical(impact) forces, heat (fire), and other conditions that would lead to the highest reasonablyforeseeable consequences. For postulated accident scenarios such as these, the forces and heatwould exceed the regulatory design limits of transportation cask structures and materials. (Theperformance of transportation casks was demonstrated through a combination of tests andanalyses.) In addition, these forces and heat would be applied to the structures and surfaces of acask in a way that would cause the greatest damage and bring about releases of radioactivematerials to the environment. The most severe accident scenarios analyzed in this chapter wouldrelease radioactive material. These accident scenarios. correspond to those in the highest accidentseverity category, which represent events that would be very unlikely but, if they occurred, wouldresult in human health effect consequences.
In general, this EIS considers accidents with conditions that have a chance of occurring more oftenthan 1 in 10 million times in a year to be reasonably foreseeable. Accidents and conditions lesslikely than this are not considered to be reasonably foreseeable.
The specific number, location, and severity of an accident can be predicted only in general terms of thelikelihood of occurrence (the probability). Similarly, the weather conditions at the time an accidentoccurs cannot be precisely predicted. Therefore, the EIS analysis evaluated a variety of accidentscenarios and conditions to understand the influence of various conditions on environmental impacts.The analysis of impacts to populations along routes assumed that an accident could occur at any locationalong a route.
The EIS analysis considered accident scenarios based on the 19 truck and 21 rail accident cases presentedby DIRS 152476-Sprung et a]. (2000, all). Appendix J, Section J. 1.4.2. 1, describes those cases and theirderivations. In addition, the analysis estimated impacts of postulated releases from accident scenarios inthree population zones-urban, suburban, and rural-under a set of meteorological (weather) conditionsthat represent the national average meteorology. The analysis used state-specific accident data, thelengths of routes in the population zones in s ' tates through which the shipments would pass, and thenumber of shipments that would use the routes to determine accident scenario probabilities.
6-45

a i
Environmental Impacts of Transportation
The EIS analysis used the properties of a representative commercial spent nuclear fuel along with theproperties for the 15 categories of DOE spent nuclear fuel and high-level radioactive waste described inAppendix A. Since the publication of the Draft EIS, DOE has reevaluated the properties of commercialspent nuclear fuel that it used in analyses of transportation accidents and determined that therepresentative spent nuclear fuel described in Appendix A is more appropriate for analysis of suchaccidents. Representative commercial spent nuclear fuel would be (1) fuel discharged after 14 years froma boiling-water reactor with a bumup of 40,000 megawatt-days per MTHM and (2) fuel discharged froma pressurized-water reactor after 15 years with a burnup of 50,000 megawatt-days per MTHM. Becauserepresentative spent nuclear fuel would be younger and have higher burnup than typical spent nuclearfuel, its relative health and safety hazard would be greater. In fact, the hazard is about 2 times greater. Asa consequence, estimates of impacts of transportation accidents involving casks containing representativespent nuclear fuel would be about 2 times greater than if the casks contained typical spent nuclear fuel.
TRANSPORTATION EMERGENCIES
Under Section 180(c) of the Nuclear Waste Policy Act, as amended, the Department would providetechnical assistance and funding for training of local and American Indian public safety officials ofeligible states and tribes in relation to transportation under the Proposed Action. The training wouldcover safe routine transportation and emergency response procedures. DOE would also require itstransportation contractors to comply with Carrier and Shipper Responsibilities and EmergencyResponse Procedures for Highway Transportation Accidents Involving Truckload Quantities ofRadioactive Materials (DIRS 156289-ANSI 1987, Section 5.2). This standard requires thepreparation of an emergency response plan and describes appropriate provisions of informationand assistance to emergency responders- The standard also requires the carrier to provideappropriate resources for dealing with the consequences of the accident including isolating andcleaning up spills, and to maintain working contact with the responsible governmental authority until
Nave the latter has declared the incident to be satisfactorily resolved and closed. DOE would, asrequested, assist state, tribal, and local governments in several ways to reduce the consequencesof accidents related to the transportation of spent nuclear fuel and high-level radioactive waste. Inaddition, DOE maintains an emergency response program through eight Regional CoordinatingOffices across the United States. These offices are capable of responding to transportationradiological emergencies and are on call 24 hours a day. They respond to requests for radiological
F assistance from state or tribal authorities. Other DOE, Federal Emergency Management Agency,and U.S. Department of Transportation programs have provided training for transportationemergencies for many areas (for example, Colorado and South Carolina to support preparation fortransportation for the Foreign Research Reactor and Waste Isolation Pilot Plant programs).Appendix M contains additional detail.
In addition to the risk due to accidents involving a release of radioactive material, the analysis examinedthe impacts of loss-of-shielding accidents. The loss-of-shielding scenarios range from an accident withno loss of shielding to a low-probability severe accident involving both a loss of shielding (and anyincreased direct exposure) and a release of some of the contents of the cask.
The EIS analysis also estimated impacts from an unlikely but severe accident scenario called a maximumreasonably foreseeable accident to provide perspective about the consequences for a population thatmight live nearby. For maximum reasonably foreseeable accident scenarios, the consequences wereestimated for each of the accident scenarios and for both truck and rail casks from the spectrum ofaccidents presented in DIRS 152476-Sprung et al. (2000, all). For each accident scenario, possiblecombinations of weather conditions, population zones, and transportation modes were considered. Thescenarios were then ranked according to those that would have a likelihood greater than 1 in 10 millionper year and would have the greatest consequences (see Appendix J).
6-46

Environmental Impacts of Transportation
REEXAMINATION OF SPENT FUEL SHIPMENT RISK ESTIMATES
Factors other than the environment can cause uncertainties in the prediction of accident impacts.Uncertainty can result from both limited data and the limitations of computer models used to predictaccident impacts. The first comprehensive study that developed estimates of the impacts of severeaccidents was the Shipping Container Response to Severe Highway and Railway AccidentConditions (DIRS 101828-Fischer et al. 1987, all; also called the Modal Study) for fractions ofshipping cask contents (spent nuclear fuel or high-level radioactive waste) that such accidentscenarios could release to the environment. The estimates of severe accident impacts developed inthe Modal Study were reexamined by Sandia National Laboratories in Re-Examination of Spent FuelShipment Risk Estimates (DIRS 152476-Sprung et al. 2000, all) published in April 2000. TheNuclear Regulatory Commission staff, in a memorandum to the Commissioners, concluded "the bestestimate spent-fuel shipment risks from the reexamination appear to be less than the 'Modal Study'-based estimates by as much as 2 orders of magnitude" (DIRS 155562-NRC 2000, all). Although theCommission staff offered this positive finding, it also observed that several questions on the Sandiamethodology require resolution before the best-estimate results can be completed. Even though itexpressed caution regarding its findings, on the basis of the results presented the Commission staffconcluded "the transportation risk studies provide a technical basis for determining that currentregulations are sufficient to prevent releases of radioactive material during transport" (DIRS 155562-NRC 2000, all).
6.2.4.2.1 Impacts from Accidents - National Mostly Legal-Weight Truck Scenario
This section summarizes the potential impacts and risks associated with accidents under the legal-weighttruck scenario. The impacts and risks include those associated with the legal-weight truck and railshipments to Nevada plus the transfer of the spent nuclear fuel and high-level waste to heavy-haul trucksand its transportation in Nevada. The section summarizes radiological impacts for six accident scenariocategories, under two types of weather conditions, and in three population densities (urban, suburban, andrural), in terms of a collective dose risk and consequence (latent cancer fatalities). It describes thepotential impacts from the maximum reasonably foreseeable accident scenario separately. It alsodescribes nonradiological impacts in terms of accident fatalities.
Radiological Impacts to Populations from Accidents. Based on state-specific accident rates, the totalestimated number of traffic accidents under the Proposed Action for the mostly legal-weight truckscenario would be 66, or 2.8 per year. The collective radiological accident dose risk, as described inAppendix J, Section J. 1.4.2.1, would be less than 1 (0.5) person-rem for the population within 80kilometers (50 miles) along routes for the national mostly legal-weight truck scenario. This calculatedrisk would be the total for 24 years of shipment operations. The radiological dose risk of accidents is thesum of the products of the probabilities (dimensionless) and consequences (in person-rem) of all potentialtransportation accidents. A radiological dose risk of 0.5 person-rem would be likely to cause much lessthan 1 (0.0002) latent cancer fatality, or approximately 2 chances in 10,000 of 1 latent cancer fatalityamong the more than 10 million persons within 80 kilometers of the routes that the shipments would use.The 0.5 person-rem risk includes the dose risk associated with loss-of-shielding events. The accident riskfor legal-weight truck shipments dominates the total risk, contributing more than 99.9 percent of thepopulation dose and risk in comparison to the risk associated with the 300 proposed shipments of navalspent nuclear fuel.
Consequences of Maximum Reasonably Foreseeable Accident Scenario. The analysis evaluatedthe impacts of a maximum reasonably foreseeable accident scenario in urbanized and rural populationzones for both legal-weight truck and rail shipments under the mostly legal-weight truck scenario. Themaximum reasonably foreseeable transportation accident scenario that would have the greatestconsequences for the mostly legal-weight truck scenario (a probability of approximately 3 in 10 million
6-47

Environmental Impacts of Transportation
per year) would be a long-duration severe fire accident in which the transportation cask was fullyengulfed by the fire. This accident is further described by DIRS 152476-Sprung et al. (2000, p. 7-25) ascase 18 in accidents evaluated for legal-weight truck casks (see Appendix J, Section J. 1.4.2. 1). Theanalysis assumed that the accident would occur under stable (slowly dispersing atmospheric conditionsthat would not be exceeded 95 percent of the time) meteorological conditions in an urban area. Severeaccidents in other population zones under stable or neutral weather conditions (atmospheric conditionsthat would not be exceeded 50 percent of the time) would have smaller consequences. The accidentscenario assumes a breach of the shipping cask and the release of a portion of its contents to the air. Thisaccident in combination with stable atmospheric conditions would be very unlikely (2.3 in 10 million peryear). Table 6-14 summarizes the impacts of the accident scenario. This accident scenario could cause0.55 latent cancer fatality; in comparison, a population of 5 million within 80 kilometers (50 miles) of thecenter of a large U.S. metropolitan area such as that assumed in the analysis would be likely to experiencemore than 1.1 million lifetime cancer fatalities from other causes not related to the Proposed Action(DIRS 153066-Murphy 2000, p. 5). For this accident scenario, the analysis projected that most of thedose to a population would come from inhalation, cloudshine, and groundshine sources. The maximallyexposed individual, assumed to be about 150 meters (490 feet) from the accident where particles heatedby the accident would fall after cooling, would receive a dose of about 0.8 rem (Table 6-14). A firstresponder to this accident would receive a small dose (2.6 millirem).
Table 6-14. Estimated radiological impacts of maximum reasonably foreseeable accident scenario fornational mostly legal-weight truck scenario.
Urbanized areaImpact (stable atmospheric conditions)
Accident scenario probability (annual) 0.00000023 per year (about 2.3 in 10 million)Impacts to populations
Population dose (person-rem) 1,100Latent cancer fatalities 0.55
Impacts to maximally exposed individualsMaximally exposed individual dose (rein) 3Probability of a latent cancer fatality 0.0015
Impacts to first responderMaximally exposed responder dose (rem) 0.26Probability of latent cancer fatality 0.0000013
In addition to a maximum reasonably foreseeable accident, DOE evaluated other severe accidents.Appendix J, Section J. 1.4.2.1, describes these accidents and their potential impacts. The accidentconditions for one truck accident (Case 11) could be similar to those from a crash of a commercial jetairliner into a legal-weight truck cask (DIRS 15721 0-BSC 2001, all). The consequences of this accident(1,100 person-rem or 0.55 latent cancer fatality) would be about the same as those for the maximumreasonably foreseeable truck accident described above.
Section J. 1.4.2.5 in Appendix J summarizes studies of potential economic and environmental impacts ofhypothetical severe transportation accidents that would releaseradioactive materials from transportationcasks.
Impacts from Traffic Accidents. Approximately 5 (4.9) traffic fatalities could occur in the course oftransporting spent nuclear fuel and high-level radioactive waste under the mostly legal-weight trucknational transportation scenario during the 24 years of operations for the Proposed Action. Essentially allof these fatalities would be from truck operations; none would occur from the 300 railcar shipments ofnaval spent nuclear fuel. The fatalities would be principally from traffic accidents; half would involvetrucks transporting loaded casks to the repository and half would involve returning shipments of emptycasks. The fatalities would occur over 24 years and approximately 380 million kilometers (240 millionmiles) of highway travel. Based on information extrapolated from the U.S. Department of Transportation
6-48

Environmental Impacts of Transportation. Bureau of Transportation Statistics (DIRS 150989-BTS 1998, p. 20), during the same 24-year period
about 1 million deaths would be likely to occur in traffic accidents on U.S. highways.
6.2.4.2.2 Impacts from Accidents - National Mostly Rail Transportation Scenario
This section discusses the results of the analysis of radiological impacts to populations and maximallyexposed individuals and of traffic fatalities that would arise from accidents during the transportation ofspent nuclear fuel and high-level radioactive waste for the national mostly rail transportation scenario.
DOE used the models and calculations described in Appendix J, Section J. 1.4.2.1, to estimate the impactsfrom rail accidents, and included impacts postulated to occur during the transportation of commercialspent nuclear fuel by legal-weight trucks from six commercial sites that do not have the capability tohandle or load large rail casks. The analysis also included the impacts from accidents for heavy-haultruck or barge shipments to nearby railheads from 24 commercial sites that have the capability to load arail cask but are not served by a railroad. DOE used the models and calculations described in Appendix Jto estimate the impacts. Appendix J, Section J.2.4, presents additional information on heavy-haul truckand barge transportation from the 24 commercial sites.
Accident Radiological Impacts for Populations. Based on state-specific accident rates, the totalestimated number of rail and truck traffic accidents under the Proposed Action for the mostly rail scenariowould be about 10, or about 0.4 per year. The collective radiological dose risk of accidents would beapproximately 1 (0.89) person-rem for the population within 80 kilometers (50 miles) along routes for thenational mostly rail transportation scenario. This calculated dose risk would be the total for 24 years ofshipment operations. The radiological dose risk of accidents is the sum of the products of theprobabilities (dimensionless) and consequences (in person-rem) of all potential transportation accidents.A radiological dose risk of 1 person-rem would be likely to cause much less than 1 (0.00045) latent.cancer fatality.
Radiological risks from accidents for the mostly rail scenario would include impacts associated withabout 9,646 railcar shipments (one cask to a railcar) and 1,079 legal-weight truck shipments. Nationalrail transportation of spent nuclear fuel and high-level radioactive waste would account for most of thepopulation dose and risk to the public.
Impacts of Maximum Reasonably Foreseeable Accident Scenario. The analysis evaluated the impactsof a maximum reasonably foreseeable accident scenario in urbanized areas or rural population zones andunder stable and neutral atmospheric conditions. The maximum reasonably foreseeable accident scenariounder the mostly rail scenario would involve a release of a fraction of the contents of a rail cask in an urbanarea under stable meteorological conditions (slowly dispersing atmospheric conditions that would not beexceeded 95 percent of the time), where atmospheric dispersion of contaminants would occur more slowlyonly 5 percent of the time. This accident scenario would have a likelihood of about 2.8 in 10 million peryear, and would result in about 5 latent cancer fatalities in the population (Table 6-15). The maximallyexposed individual, assumed to be about 330 meters (1,080 feet) from the accident, would receive a dose ofabout 29 rem. An accident that involved high impact forces or a long-duration fire could reduce theeffectiveness of the radiation shielding in a shipping cask. A first responder to this accident could receive adose of as much as 0.83 rem.
Actual transportation accidents involve collisions of many kinds, such as with other vehicles and roadsideobjects, involvement in fires and explosions, inundation, and burial. These accidents are caused by avariety of initiating events including human error, mechanical failure, and natural causes such asearthquakes. Accidents occur in many different kinds of places including mountain passes and urban. areas, rural freeways in open landscapes, and rail switching yards. Thus, there are as many differentkinds of unique initiating events and accident conditions as there are accidents. DOE could not
6-49

* I
Environmental Impacts of Transportation
,' j Table 6-15. Estimated impacts from maximum reasonably foreseeable accident scenario for nationalmostly rail transportation scenario.
Impact Urbanized area (stable atmospheric conditions)
Accidentprobability 0.00000028 per year (about 2.8 in 10 million)Impacts to populations
Population dose (person-rem) 9,900Latent cancer fatalities 5
Impacts to maximally exposed individualsMaximally exposed individual dose (rem) 29Probability of a latent cancer fatality 0.01
Impacts to first responderMaximally exposed responder dose (rem) 0.83Probability of latent cancer fatality 0.0004
practicably attempt to analyze every possible accident that could occur. Instead, DOE analyzed a broadrange of accidents, each of which represents a grouping of initiating events and conditions having similarcharacteristics. For example, the EIS analyzes the impacts of a collection of collision accidents in whicha cask would be exposed to impact velocities in the range of 60 to 90 miles per hour (see Appendix J,Section J. 1.4.2.1).
In addition, the EIS analyzes a maximum reasonably foreseeable accident in which a collision would notoccur but the temperature of a rail cask containing spent nuclear fuel would rise to between 750'C and1,000°C (between 1,400'F and 1,800'F) (Section 6.2.4.2). The conditions of the maximum reasonablyforeseeable accident analyzed in the EIS envelop conditions reported in newspapers for the BaltimoreTunnel fire (a train derailment and fire that occurred in July 2001 in a tunnel in Baltimore, Maryland).Temperatures in that fire were reported to be as high as 820°C (1,500'F) and the fire was reported to haveburned for up to 5 days (DIRS 156753-Ettlin 2001, all; DIRS 156754-Rascovar 2001, all).
DOE evaluated other severe accidents. Appendix J, Section J. 1.4.2. 1, describes these accidents and theirpotential impacts. The accident conditions for one rail accident (Case 4) could be similar to those from acrash of a commercial jet airliner into a rail cask (DIRS 157210-BSC 2001, all). The consequences ofthis accident (1,300 person-rem or 0.65 latent cancer fatality) would be less than those for the maximumreasonably foreseeable rail accident described above.
Impacts From Traffic Accidents. The analysis estimated that across the United States approximately
3 (3.1) traffic and train accident fatalities could occur during transportation of spent nuclear fuel andhigh-level radioactive waste under the national mostly rail transportation scenario. Half of the fatalitieswould occur during the return of empty casks to commercial and DOE sites. Essentially all of thefatalities would involve train operations; about half would involve highway vehicles hit by trains. Therewould be about a 12-percent chance of 1 fatality from the 1,079 legal-weight truck shipments ofcommercial spent nuclear fuel. This fatality could happen during the 24 years of transportationoperations involving approximately 77 million kilometers (48 million miles) of railcar travel and10 million kilometers (6 million miles) of highway travel. On the basis of data presented by the Bureauof Transportation Statistics (DIRS 150989-BTS 1998, p. 20), during the same 24-year period aboutI million people will die in traffic accidents on U.S. highways.
6.2.4.2.3 Impacts of Acts of Sabotage
The Nuclear Regulatory Commission has developed a set of rules specifically aimed at protecting thepublic from harm that could result from sabotage of spent nuclear fuel casks. Known as physicalprotection and safeguards regulations (10 CFR 73.37), these security rules are distinguished from other
6-50

Environmental Impacts of Transportation
regulations that deal with issues of safety affecting the environment and public health. The objectives ofthe physical protection and safeguard regulations are to:
" Minimize the possibility of sabotage
* Facilitate recovery of spent nuclear fuel shipments that could come under control of unauthorizedpersons
To achieve these objectives, the Nuclear Regulatory Commission physical protection and safeguard rulesrequire:
* Advance notification of each shipment to the Nuclear Regulatory Commission, the states, and NativeAmerican governments [proposed rulemaking 10 CFR Parts 71 and 73 (64 FR 7133 1, December 21,1999)]
• The licensee to have current procedures to cope with safeguards emergencies
* Instructions for escorts on how to determine if a threat exists and how to deal with it
" Maintenance of a communications center to monitor continually the progress of each shipment
* A written log describing the shipment and significant events during the shipment
* Advance arrangements with law enforcement agencies along the route
" Advance route approval by the Nuclear Regulatory Commission
9 Avoidance of intermediate stops to the extent practicable
* At least one escort to maintain visual surveillance of the shipment during stops
• Shipment escorts to report status periodically
* Armed escorts in heavily populated areas
" Onboard communications equipment
• Protection of specific shipment information
The cask safety features that provide containment, shielding and thermal protection also provideprotection against sabotage. The casks would be massive. The spent nuclear fuel in a cask wouldtypically be only about 10 percent of the gross weight; the remaining 90 percent would be shielding andstructure.
It is not possible to predict whether sabotage events would occur and, if they did, the nature of suchevents. Nevertheless, DOE examined various accidents, including an aircraft crash into a transportationcask. The consequences of both the maximum reasonably foreseeable accident and the aircraft crash arepresented above for the mostly truck and mostly rail transportation scenarios and can provide anapproximation of the types of consequences that could occur from a sabotage event. DOE alsoconsidered the consequences of a potential successful sabotage attempt on a cask. A study conducted bySandia National Laboratories (DIRS 104918-Luna, Neuhauser, and Vigil 1999, all) estimated the amountsand characteristics of releases of radioactive materials from rail and truck casks subjected to the effects oftwo different devices.
6-51

Environmental Impacts of Transportation
Devices considered in the Sandia study (DIRS 104918-Luna, Neuhauser, and Vigil 1999, all) includedpossible devices that might be used in acts of sabotage against shipping casks. (Note: The shield walls ofshipping casks for spent nuclear fuel and high-level radioactive waste are similar to the massive layeredconstruction used in armored vehicles such as tanks.) These kinds of devices were demonstrated by thestudy to be capable of penetrating a cask's shield wall, leading to the dispersal of contaminants to theenvironment.
The truck cask design selected for analysis was the General Atomics GA-4 Legal-Weight Truck Cask.This cask, which uses uranium for shielding, is a state-of-the-art design recently certified by the NuclearRegulatory Commission to ship four pressurized-water reactor nuclear fuel assemblies (DIRS 148184-NRC 1998, all). The rail cask design used was based on the conceptual design developed by DOE for thedual-purpose canister system. This design is representative of large rail casks that could be certified forshipping spent nuclear fuel and high-level radioactive waste.
DOE used the RISKIND code (DIRS 101483-Yuan et al. 1995, all) to evaluate the radiological health andsafety impacts of the estimated releases of radioactive materials. The analysis used assumptions aboutthe concentrations of radioisotopes in spent nuclear fuel, population densities, and atmospheric conditions(weather) used to evaluate the maximum reasonably foreseeable accidents.
Because it is not possible to forecast the location or the environmental conditions that might exist for actsof sabotage, the analysis determined consequences for urbanized areas (see Appendix J, Section J. 1.4.2.1)under neutral (average) weather conditions.
For legal-weight truck shipments, the analysis estimated that a sabotage event ocacuring in an urbanizedarea could result in a population dose of 96,000 person-rem. This dose would cause an estimated 48 fatalcancers among the population of exposed individuals. A maximally exposed individual could receive alifetime committed dose of 110 rem, which would increase the risk of a fatal cancer from about 23percent from all other causes, to about 29 percent.
These estimates exceed those presented in the Draft EIS for two reasons. The analysis for this sectionassumed that the cask would contain representative (or average hazard) spent nuclear fuel. The analysisin the Draft EIS assumed that the cask would contain typical (or average age) spent nuclear fuel. Theamount of radioactivity in representative'spent nuclear fuel is about twice that in typical spent nuclearfuel. In addition, the analysis in the Draft EIS used urban area populations reported in the 1990 Census,whereas the analysis for this section used populations projected to 2035. The population estimates usedfor 2035 are about 40 percent greater than those reported by the 1990 Census. The combined result ofthese changes is that the estimated consequences of an act of sabotage against a transportation cask in thissection are about 3 times those estimated in the Draft EIS.
The consequences estimated for an act of sabotage involvinga rail shipment would be less than thoseestimated for a legal-weight truck shipment. The smaller consequence for the rail shipment would bebecause less of the radionuclides would be released from a rail transportation cask than from a legal-weight truck transportation cask (DIRS 104918-Luna, Neuhauser, and Vigil 1999, all). For railshipments, the analysis estimated that a sabotage event in an urbanized area could result in a populationdose of 17,000 person-rem. This dose would be likely to cause an estimated 9 fatal cancers among thepopulation of exposed individuals. A maximally exposed individual could receive a lifetime committeddose of 40 rem, which would increase the risk of a fatal cancer from about 23 percent from all othercauses to about 25 percent.
Because of the attacks on September 11, 2001, the Department and other agencies are reexamining theprotections built into our physical security and safeguards systems for transportation shipments. Asdictated by results of this reexamination, DOE would modify its methods and systems as appropriate.
6-52

EnWronmental Impacts of Transportation
6.2.5 ENVIRONMENTAL JUSTICE
Shipments of spent nuclear fuel and high-level radioactive waste would use the Nation's existingrailroads and highways. DOE expects that transportation-related impacts to land use; air quality;hydrology; biological resources and soils; cultural resources; socioeconomics; noise and vibration;aesthetics; utilities, energy, and materials; and waste management would be small. In addition, asdescribed in the preceding sections, incident-free transportation.and the risks from transportationaccidents (the maximum reasonably foreseeable accident scenario would have about 3 chances in 10million of occurring per year) would not present a large health or safety risk to the population as a whole,or to workers or individuals along national transportation routes. The low effect on the population as awhole also would be likely for any segment of the population, including minorities, low-income groups,and members of Native American tribes.
A previous DOE analysis of the potential for environmental justice concerns from the transportation ofDOE spent nuclear fuel to the Idaho National Engineering and Envirorimental Laboratory (DIRS 10 1802-DOE 1995, Volume 1, pp. L-2 and L-36) also concluded that impacts to minority and low7incomepopulations and to populations of American Indians in Idaho would not be disproportionately high andadverse. As part of that analysis, DOE consulted with the Shoshone Bannock Tribe to analyze impacts totribe members because the shipments in question would cross the Fort Hall Reservation. The analysis(DIRS 101802-DOE 1995, Volume 3, Part A, p. 3-32) concluded that risks to the health and safety of thepotentially affected tribal population in Idaho from incident-free transportation and from accidents wouldbe very low.
The EIS analyzes potential public health effects of both routine (incident-free) transportation ofradioactive materials and transportation accidents involving radioactive materials. First, regardingroutine transportation, the EIS considers air emissions and doses from exposure to radioactive materialsduring transport. The EIS estimates the impact from air emissions to be 1 emissions-related fatality. TheEIS also estimates that the 24-year national transportation campaign would cause fewer than about 3latent cancer fatalities among the public under the mostly legal-weight truck scenario and fewer under thepreferred mostly rail scenario. Although many people would be exposed nationwide over a longcampaign, the radiation dose to any exposed individual would be very low. In this context, DOE does notconsider such impacts to be high. Because DOE does not know of a plausible mechanism under thesecircumstances whereby low-income or minority populations could incur high and adverse impacts whenthe general public would not, the Department believes there could be no disproportionately high andadverse impacts on low-income or minority populations.
The EIS estimates the number of people in the general public'who could be killed by accidents involvingtransportation of spent fuel and high-level radioactive waste. The two mechanisms for such impacts arebodily trauma from collisions or exposure to radioactivity that would be released if a sufficiently severeaccident occurred. The analysis estimated that the 24-year national campaign would cause fewer than 5fatalities among the general public from trauma sustained in collisions with vehicles carrying spentnuclear fael or high-level radioactive waste. In this context, DOE does not consider such impacts to behigh. Again, DOE does not know of a plausible mechanism under these circumstances whereby low-income or minority populations could incur high and adverse impacts when the general public would not.
Only a severe accident that resulted in a considerable release of radioactive material could cause high andadverse health effects to the affected population. Because the risk of these high and adverseconsequences applies to the entire population along all transportation routes, it would not applydisproportionately to any minority or low-income population.
Based on the analysis of incident-free transportation and transportation accidents in this EIS and theresults of a transportation analysis conducted by DOE 'in a previous programmatic EIS, and the fact that
6-53

Environmental Inipacis of Transportatioii
DOE has identified no subsection of the population that would be disproportionately affected by'transportation related to the Proposed Action, DOE has concluded that no disproportionately high andadverse impacts would be likely on minority or low-income populations from the national transportationof spent nuclear fuel and high-level radioactive waste to Yucca Mountain.
Section 6.3.4 discusses environmental justice in relation to transportation in Nevada. Chapter 4, Section4.1.13.4, contains a discussion of a Native American perspective on the Proposed Action.
6.3 Nevada Transportation
The analysis of impacts from national transportation includes those from transportation activities in theState of Nevada. This section discusses Nevada transportation impacts separately to ensure that theimpacts of alternative transportation modes in Nevada are apparent. Spent nuclear fuel and high-levelradioactive waste shipped to the repository by legaI-weight truck would continue in the same vehicles tothe Yucca Mountain site. Material that traveled by rail would either continue to the repository on a newlyconstructed branch rail line or transfer to beavy-haul trucks at an intermodal transfer station that DOEwould build in Nevada for shipment on existing highways that could require upgrades. Selection of aspecific rail alignment within a corridor, or the specific location of an intermodal transfer station or theneed to upgrade the associated heavy-haul truck routes, would require additional field surveys,environmental and engineering analysis, state, local, and Native American Tribal governmentconsultation, and National Environmental Policy Act reviews.
The transportation analysis in the EIS treats the candidate legal-weight truck routes, rail corridors, andheavy-haul truck routes as current analysis tools and refers to them in the present tense. The EIS refers toimpacts associated with these alternatives in the conditional voice (would) because they would not occurunless DOE proceeded with the Proposed Action. This convention is applied whenever the EIS discussesthe transportation implementing alternatives.
This section describes potential impacts of three transportation scenarios and their respectiveimplementing alternatives. The three transportation scenarios are (1) mostly legal-weight truck(corresponding to that portion of the national impacts that would occur in Nevada), (2) mostly rail, and(3) mostly heavy-haul truck.
The mostly legal-weight truck scenario does not include implementing alternatives. Under this scenario,highway shipments would be restricted to specific routes that satisfy the regulations of the U.S. 'Department of Transportation (49 CFR Part 397). Because the State of Nevada has not designatedalternative preferred routes, only one combination of routes for legal-weight truck shipments wouldsatisfy U.S. Department of Transportation routing regulations (1-15 to U.S. Highway 95 to YuccaMountain). This scenario assumes that over 24 years approximately 300 shipments of naval spent nuclearfuel would arrive in Nevada by rail from the Idaho National Engineering and Environmental Laboratoryand that heavy-haul trucks would transport them to the repository from a railhead.
The mostly rail scenario has five implementing alternatives, each of which includes a corridor withvariations for a branch rail line in Nevada. Each implementing alternative includes the construction andoperation of a rail line. These alternatives would include about 1,079 legal-weight truck shipments (about45 per year) from 6 commercial sites that, while operational, would not have the capability to load railcasks.
The mostly heavy-haul truck scenario has implementing alternatives for five different routes on e .xistmgNevada highways. The highways would have to be upgraded to enable beavy-haul trucks routinely totransport rail casks containing spent nuclear fuel and high-level radioactive waste from an intermodaltransfer station to the repository. Each heavy-haul truck implementing alternative includes the
6-54

w
t~u, ~
200 Aplctos
I l)uke At-UUU Wlzllam Lee Nuclear Staflonu SI N(2 units)
NuStart Energy API 000 Bellefonte (2 units) AL N
Progress Energy AP1000 Harris (2 units) NC Y
Dominion ESBWR North Anna (I unit) VA Y
NuStart Energy ESBWR Grand Gulf (1 unit) MS Y
South Carolina Electric AP1000 Summer (2 units) SC Y& Gas
NRG Energy ABWR South Texas Project (2 units) TX Y
2007 TOTAL NUMBER OF APPLICATIONS =7TOTAL NUMBER OF UNI[TS = 12--. ": -" *
Progress Energy AP1000 Levy County (2 units) FL NSouthern Nuclear AP- 1000 Vogtle (2 units) GA Y
Operating Co.
Entergy ESBWR River Bend (I unit) LA Y
UNISTAR EPR Calvert Cliffs (I unit) MD• Y
UNISTAR EPR TBD (1 unit) TBD UKN
AmerenUE EPR Callaway (I unit) MO Y
UNISTAR EPR Nine Mile Point (1 unit) NY Y
TXU Power US APWR Comanche Peak (2 units) TX Y
Exelon TBD TBD (1 unit) TBD UNK
Detroit Edison TBD Fermi (1 unit) Ml Y
Amarillo Power EPR Vicinity of Amarillo (2 units) TX UKA'J
I
-s2WTOT'AL NUMBER OF AUINTS=1S 11,- - ~ ~ ~ V4I2009hpp~icaiitiosiiLI - -Florida Power & Light J TD TBD (I unit) U~NK UNK
2009 TOTAL NUMBER OF APPUCATIONS =I OTANUBRO NS=1
.0 at 6. .
0 v'20 H
I

OViCr 5lsdc £001
SOUTH CAROLINA'S HOME PAGEThwaday, Mar S 2007=
Posted on Thu. Mar. 29. 200
Legislators slam door to nuclear waste siteBy SAMMY FRETWSLLA Utah company's push to dump more nuclear waste in Barnwell County suffered a crippling defeat Wednesdaythat some legislators called historic in its message to the nation:
South Carosa wants out of the nudearwaste disposal business after three decades of owning a landfill for thecountry's radioactive garbage.
Wednesday's surprising 16-0 House committee vote effectively Ifls legislation to keep the landfil open to thecountry after 2008, although the tandfi's operator could try other legislative means to accomplish its goaL
Energy Solutions of Utah, a rapidly expanding nuclear services company, could get help from lawmakers whocould attach an amendment to another bill.
The company, which has hired 10 lobbyists through its Barnwell division, is expected to push similar legidationnext year.
But lawmakers who voted against the landfill said the nation needs to find another place to bury tow-level nuclearwaste. The overwhelming vote by the House Agriculture, Natural Resources and Environmental AffairsCommittee underscores that belief, some said.
South Carolina has been taken for granted as a disposal site by other states, said Rep. David Umphlett,R-Berkeley.
The big allowed power plants across the nation to continue using the site through 2023, instead of reserving thelandfill for only South Carolina, New Jersey and Connecticut after next year.
'These other states in the United States need to get up off of their backsides and start doing what's right," saidUmphliett, who Initially supported keeping the site open. "They want to stomp us in the ground and beat us up andsay 'You bunch oa country hicks.'
"I'm just getting tired of it."
The landfil is used as a disposal site mostly by nuclear power plants for low-level radioactive waste. Since 1971,it has taken about 28 milon cubic feet of waste. Its closure would mean plants in most states would have to storesome of their most potent nuclear waste on site. Past attempts in the Leoslature to shutter the site have failedafter Intense lobbying by tme landfilrs operator and utilities.
Energy Solutions, which last month took lawmakers on a bus tour of the landfill, issued a statement saying thelegislation helped the state and county economies.
-MW are of course disappointed with today's committee vote on what Energy Solutions, the uttes. BarnwellCounty and others consider a sensible and needed piece of legistion," the statement said.Wednesday's voteshocked people familiar with the 18-member House agriculture committee.
The panel. which hears most environmental bills, in recent years has been sympathetic to industries that sought.law changes. But the Conservation Voters of South Carolina. an umbrella group for environmental organizations,intensely lobbied to close the dump to the nation.
For many legislators, the decision hinged on South Carolina's obligations. Under a 2000 law, the Palmetto Stateagreed to reserve landfill space after 2008 for only New Jersey, Connecticut and South Carolina companies thatgenerate nuclear waste.
Keeping the site open to everyone after 2008 could take up much of that space and create legal problems, many
legislators said.
'We've set the rules. The game is over," said Rep. Kenneth Hodges, D-Colleton. -The dock has expired."
The landfill has Mitle more than I million cubic feet of space left 100,000 has been committed to New Jersey andConnecticut and much of the rest to South Carolina. That's particularly precious space If South Carolina utilitiesadd new nuclear power plaint that would eaate more waste, some lawmakers said.
Rep. W.D. "Bill* Witherspoon, who sponsored the bill, abstained from voting. Another member was absent.Witherspoon. said the space question sank the billThe dump opened as a disposal site for lightly contaminatedradioactive material, such as hospital gloves and gowns. Today, it's the only commercial tandfill in the U.S. thattakes the most potent forms of low-level nuclear waste, such as old reactor parts.
If the landfill remains open to every state after 2008. the state "could be home to some 30 dead decommissionednuclear reactors," the Sierra Club's Susan Corbett said of power plants that will dose.
Barnwell County's landf has had two spits or leaks of tritium, records show. Environmental groups say the site isa long-term threat to Lowcountiy dlnng water. State officlails say the site doesn't pose a health threat.
Bamwell-area leaders were disappointed and angry about Wednesday's vote. The landfill contriutes more than$2 million a year to the county for schools and government services - and many tomi residents said they wantthe facility to remain open.
"This is an embarrassment," Barnwell-area industrial recruiter Danny Black heatedly told Wterspoon.
Black said the landfill has been unfairly charactedzed as a dump and Barnwell County must pay the price. Thecounty has had dilfioulty recruiting industry because of what he called the negative image portryed by the mediaand landfill opponents.
'How do you expect us to have Industrial recwutment down there when we get this kind of negative response fromour elected leaders and people that are supposed to be covering it in a not biased way? Black told Witherspoon.
Witherspoon and Rep. Lonnie Hosey, a Bamwell Democrat who is not a member of the committee, said SouthCarolina must now consider how it will replace money lost from the landfill. Fees and other money from the dumpcontribute about $12 million to the state and county.. 6Envimnmentalists who worked to defeat the till said the economic argument is poor. South Carolina has amplerevenue growth and can make up for any lost money from the landfill, said Cary Chamblee, a lobbyist for the S.C.Sierra Club and the S.C. Wildlife Federation.
"It could be made up very easily. It is a drop In the bucket"
Reach Fretwel at (803) 771-8537.
INSIDE BARNWELL
Bamwell County's tow-level nuclear waste dump will close to the nation as scheduled In 2008, a House committeeagreed Wednesday.