ML042330385.pdf - Nuclear Regulatory Commission
639
NUREG-1496 Vol. 3 ¶ Generic Environmental Impact - Statement in Support of Rulemaking on Radiological Criteria for License Termination of NRC-Licensed Nuclear Facilities Appendices C-H Final Report U.S. Nuclear Regulatory Commission Office of Nuclear Regulatory Research
-
Upload
khangminh22 -
Category
Documents
-
view
1 -
download
0
Transcript of ML042330385.pdf - Nuclear Regulatory Commission

NUREG-1496Vol. 3
¶ Generic Environmental Impact-Statement in Support ofRulemaking on RadiologicalCriteria for License Termination ofNRC-Licensed Nuclear FacilitiesAppendices C-H
Final Report
U.S. Nuclear Regulatory Commission
Office of Nuclear Regulatory Research
AVAILABILITY NOTICE
Availability of Reference Materials Cited in NRC Publications
Most documents cited In NRC publications will be available from one of the following sources:
1. The NRC Public Document Room, 2120 L Street, NW., Lower Level, Washington, DC20555-0001
2. The Superintendent of Documents, U.S. Government Printing Office, P. 0. Box 37082.Washington, DC 20402-9328
3. The National Technical Information Service, Springfield, VA 22161-0002
Although the listing that follows represents the majority of documents cited In NRC publica-tions, it is not intended to be exhaustive.
Referenced documents available for inspection and copying for a fee from the NRC PublicDocument Room include NRC correspondence and intemal NRC memoranda; NRC bulletins,circulars, information notices, inspection and investigation notices; licensee event reports;vendor reports and correspondence; Commission papers; and applicant and licensee docu-ments and correspondence.
The following documents in the NUREG series are available for purchase from the GovernmentPrinting Office: formal NRC staff and contractor reports, NRC-sponsored conference pro-ceedings, international agreement reports, grantee reports, and NRC booklets and bro-chures. Also available are regulatory guides, NRC regulations in the Code of Federal Regula-tions, and Nuclear Regulatory Commission Issuances.
Documents available from the National Technical Information Service include NUREG-seriesreports and technical reports prepared by other Federal agencies and reports prepared by theAtomic Energy Commission, forerunner agency to the Nuclear Regulatory Commission.
Documents available from public and special technical libraries Include all open literatureitems, such as books, journal articles, and transactions. Federal Register notices, Federaland State legislation, and congressional reports can usually be obtained from these libraries.
Documents such as theses, dissertations, foreign reports and translations, and non-NRC con-ference proceedings are available for purchase from the organization sponsoring the publica-tion cited.
Single copies of NRC draft reports are available free, to the extent of supply, upon writtenrequest to the Office of Administration, Distribution and Mail Services Section, U.S. NuclearRegulatory Commission, Washington DC 20555-0001.
Copies of industry codes and standards used in a substantive manner in the NRC regulatoryprocess are maintained at the NRC Ubrary, Two White Flint North,11545 Rockville Pike, Rock-ville, MD 20852-2738, for use by the public. Codes and standards are usually copyrightedand may be purchased from the originating organization or, if they are American NationalStandards, from the American National Standards Institute, 1430 Broadway, New York, NY10018-3308.

NUREG-1496Vol. 3
I
Genenc Environmental impactStatement in Support ofRulemaldng on RadiologicalCliteria for License Termination ofNRC-Licensed Nuclear Facilities
Appendices C-H
Final Report
Manuscript Completed: July 1997Date Published July 1997
Division of Regulatory ApplicationsOffice of Nuclear Regulatory ResearchU.S. Nuclear Regulatory CommissionWashington, DC 20555-0001
ABSTRACT
.The action being considered in this Final Generic Environmental Impact Statement (GEIS) isan amendment to the Nuclear Regulatory Commission's (NRC) regulations in 10 CFRPart 20 to include radiological criteria for decommissioning of lands and structures at nuclearfacilities. Under the National Environmental Policy Act (NEPA), all Federal agencies mustconsider the effect of their actions on the environment. To fulfill NRC's responsibilitiesunder NEPA, the Commission is preparing this GEIS which analyzes alternative courses ofaction and the costs and impacts associated with those alternatives.
44
In preparing the final GEIS, the following approach was taken: (1) a listing was developedof regulatory alternatives for establishing radiological criteria for decommissioning; (2) foreach alternative, a detailed analysis and comparison of incremental impacts, both radiologicaland nonradiological, to workers, members of the public, and the environment, and costswere performed; and (3) based on the analysis of impacts and costs, conclusions onradiological criteria for decommissioning were provided. Contained in the GEIS are resultsand conclusions related to achieving, as an objective of decommissioning ALARA, reductionto preexisting background, the radiological criterion for unrestricted use, decommissioningALARA analysis for soils and structures containing contamination, restricted use andalternative analysis for special site-specific situations and groundwater cleanup. In itsanalyses, the final GEIS includes consideration of comments made on the draft GEIS(NUREG-1496, August 1994) during the public comment period.
.. *
iii

Table of Contents
Volume 3 - Supporting Appendices
Page
Abstract ....................................... iii
Appendix C: Estimated Costs for Decontamination as a Function of Residual Radiation DoseRate for Facilities and Soils
C.1 Introduction . . .C.1-1C.1.1 GEIS Scope .. C.1-1
C.1.1.1 Reference Facilities .C.l-1C. 1.1.2 Decommissioning/Remediation Alternatives .... C. 1-2
C.1.2 Purpose of This Appendix .. C.1-2C.1.3 Analytical Approach .. C.1-2C.1.4 Appendix Organization .. C.1-4
C.2 Summary Of Results ....................................... C.2-1C.2.1 Reference Nuclear Power Plant ........... .................. C.2-2C.2.2 Reference Uranium Fuel Fabrication Plant ...... ............... C.2-4C.2.3 Reference Sealed Source Manufacturer ....... ................ C.2-5C.2.4 Reference Rare Metal Extraction Plant ........ ................ C.2-6
C.3 Modifications to Analyses In Response To Public Comments . . .C.3-1C.3.1 Reference Nuclear Power Plant . . .C.3-1
C.3.1.1 Summary of Public Comments .C.3-1C.3.1.2 Analyses Conducted in Response to Public Comments .. C.3-2C.3.1.3 Analysis Modifications Made in Response to Public
Comments .C.3-4C.3.2 Reference Uranium Fuel Fabrication Plant .C.3-4
C.3.2.1 Summary of Public Comments .C.34C.3.2.2 Analyses Conducted in Response to Public Comments .. C3-5C.3.2.3 Analysis Modifications Made in Response to Public
Comments .C.3-6C.3.3 Reference Sealed Source Manufacturer .. C.3-6
C.3.3.1 Summary of Public Comments .C.3-6C.3.3.2 Analyses Conducted in Response to Public Comments .. C.3-7C.3.3.3 Analysis Modification Made in Response to Public
Comments ........................... C.3-7C.3.4 Reference Rare Metal Extraction Facility ..................... C.3-8
C.3.4. I Summary of Public Comments .C.3-8C.3.4.2 Analyses Conducted in Response to Public Comments . . C.3-8
NUREG-1496v

C.3.4.3 Analysis Modifications Made in Response to PublicComments ...................... C.3-9
CA Characterization of Reference Facility Contamination ........ ........... C.4-1C.4.1 Reference Nuclear Power Reactor Station ...................... C.4-1
C.4.1.1 Description of Building Contamination .... ........ C.4-1C.4. 1.2 Description of Soil Contamination ..... .......... C.4-4
C.4.2 Reference Uranium Fuel Fabrication Plant ..................... C.4-6C.4.2. 1 Description of Building Contamination .... ........ C.4-6C.4.2.2 Description of Soil Contamination ..... .......... C.4-8
C.4.3 Reference Sealed Source Manufacturer ....................... C.4-9C.4.3.1 Description of Building Contamination . C.4-10C.4.3.2 Description of Soil Contamination ........... ... C.4-10
C.4.4 Reference Rare Metal Extraction Facility .C.4-11C.4.4.1 Description of Building Contamination. C.4-11C.4.4.2 Description of Soil Contamination. C.4-11
C.5 Methodology for Estimating Contamination Levels .. C.5-1C.5.1 Cobalt- and Cesium-Contaminated Soil ........................ C.5-1C.5.2 Uranium-Contaminated Soil .C.5-3C.5.3 Thorium-Contaminated Soil .C.5-4
C.6 Cost Methodology for Remediation of Concrete and Soils ............... C.6-1C.6.1 Concrete Surface Decontamination Cost Calculation Methodology ... C.6- IC.6.2 Concrete Surface Decontamination Technology and Cost . . . C.6-2
C.6.2.1 Rates of Floor and Wall Surface Removal .. . C.6-2C.6.2.2 Unit Costs for Removing Contaminated Concrete Surfaces C.6-2C.6.2.3 Crack and Wet Spot Removal .. . C.6-3
C.6.3 Removal of Activated Concrete From the Reactor Bioshield . . . C.6-4C.6.4 Soil Decontamination Cost Methodology .. . . C.6-4C.6.5 Soil Treatment Technologies .. . C.6-5
C.6.5.1 Soil Washing - General Description .. . C.6-6C.6.5.2 Other Soil Cleanup Technologies .. . C.6-6
C.6.6 Cost and Labor Estimating Bases for Soil Remediation/Treatment ... C.6-7C.6.6. 1 Excavation ... C.6-7C.6.6.2 Removal of Contaminated Soil Beneath Concrete Floor
"Wet Spots" ... C.6-7C.6.6.3C.6.6.4C.6.6.5C.6.6.6C.6.6.7C.6.6.8
Soil Washing .Packaging.Transportation.Burial Costs .Tailings Pile Stabilization and Capping Costs .Occupational Radiation Dose Estimates.
.C.6-7
.C.6-8.C.6-8. C.6-8.C.6-8.C.6-9
NUREG41496 Vl

C.7 Presentation of Analytical Results .............. .................. .........C.7-1C.7.1C.7.2C.7.3C.7.4C.7.5C.7.6
Analysis Bases ......................................Analytical Results ......................................Reference Nuclear Power Plant .............................Reference Uranium Fuel Fabrication Plant .....................Reference Sealed Source Manufacturer .......................Reference Rare Metal Extraction Plant I........................
C.7-1C.7-3C.7-4C.7-7C.7-9
C.7-11
C.8 Analysis of Groundwater Remediation ..............C.8.1 Groundwater Remediation Reference Cases.
C.8.1.1 Reference Case 1............C.8.1.2 Reference Cases 2 and 3
. .. .. .. .
. .. .. .. .
. .. .. .. .
. .. .. .. .
... C.8-1
... C.8-1
... C.8-2
... C.8-2
C.9 References ....... . ...... C.9-1
Attachment A:
Attachment B:
Calculated Dose Factors for Three Land-Use Scenarios ... ... C.A-I
Dose Rate Spreadsheets for Contaminated Soils ... ........ C.B-1
Attachment C:
Attachment D:
Attachment E:
Detailed Spreadsheets - Calculated Costs and Other Parameters forRemediation of Contaminated Soil at Nuclear Facilities .. C.C-1
Reproduced Appendix C of Draft Generic Environmental ImpactStatement (Draft GEIS) ......... C.D-1
Detailed Groundwater Information .. C.E-1
Appendix D: Termination Survey Considerations and Detailed Analysis of Costs ofTermination Surveys
D. 1 Introduction .............................................
D.2 Modifications Made in Response to Public Comments ................
. D-1
-. D-l
D.3 Overall Survey Methodology ApproachD.3.1 Bases of Survey Techniques ....D.3.2 Dose Conversion Factors ......D.3.3 Instrumentation ............
. . .. .. ...
. . .. .. ...
. . .. .. ...
. . .. .. ...
... . .. .. .:
. . .. ...
.. .4. ...
. . .. ...
.,D-1. D-1. D-1. D-1
D.4 Survey Costs ...............D.4.1 Labor Cost ...........D.4.2 Analytical Cost ........D.4.3 Special Services ........
....
....
....
....
.........
.........
.........
.........
........
........
........
........
. D-2
. D-2
. D-2
. D-2
..i NUREG-1496

D.5 Detailed Survey Analysis for Reference Facilities .......D.5.1 Survey Cost Estimate Introduction and AssumptionsD.5.2 Power Reactor ..........................
D.5.2.1 Survey Cost Estimate for 100 mrem/y ...D.5.2.2 Survey Cost Estimate for 60 mrem/y ....D.5.2.3 Survey Cost Estimate for 25 mrem/y ....D.5.2.4 Survey Cost Estimate for 15 mrem/y ....D.5.2.5 Survey Cost Estimate for 3 mrem/y .....
D.5.3 Sealed Source Manufacturer Facility ...........D.5.3.1 Survey Cost Estimate for 100 mrem/y . . .D.5.3.2 Survey Cost Estimate for 60 mrem/y ....D.5.3.3 Survey Cost Estimate for 25 mrem/y ....D.5.3.4 Survey Cost Estimate for 15 mrem/y ....D.5.3.5 Survey Cost Estimate for 3 mrem/y .....
D.5.4 Uranium Fuel Fabrication Facility .............D.5.4.1 Survey Cost Estimate for 100 mrem/y ...D.5.4.2 Survey Cost Estimate for 60 mremly ....D.5.4.3 Survey Cost Estimate for 25 mrem/y ....D.5.4.4 Survey Cost Estimate for 15 mrem/y ....D.5.4.5 Survey Cost Estimate for 3 mrem/y .....
D.5.5 Rare Metal Extraction Facility ...............D.5.5.1 Survey Cost Estimate for 100 mrem/y ...D.5.5.2 Survey Cost Estimate for 60 mrem/y ....D.5.5.3 Survey Cost Estimate for 25 mrem/y ....D.5.5.4 Survey Cost Estimate for 15 mrem/y ....D.5.5.5 Survey Cost Estimate for 3 mremly .....
.. D-2
.. D-2
.. D-4
.. D-4
.. D-6
.. D-8
.. D-10
.. D-14
.. D-16
.. D-16
.. D-18
.. D-20
.. D-22
.. D-25
.. D-27
.. D-27.. D-29.. D-31.. D-33.. D-36.. D-39.. D-39.. D-41.. D-43.. D-45.. D-48
D.6 Results ................................. D-50
D.7 Relative Costs of Conducting Other Radiological Surveys forDecommissioning. D-50
D.8 References. ...................................
Appendix E: Summary of Draft GEIS Scoping Process
E.1 Basis for Scoping Process .........................
E.2 Scoping Activities Conducted .......................
E.3 Scoping Comments Received .......................
............ D -51
... E-1
... E-1
... E-1
E.4 Nature of Scoping Process ........................
E.5 Summary of Conclusions of the Scoping Process ........
.............. E-2
.............. E-2
NUREG-1496 viii

Appendix F: Access Restrictions for Restricted Use of Facilities That Have Had TheirLicenses Terminated by NRC
F.l Perimeter Fence ................................. F-I
F.2 Paving and Surfacing .............. ................... F-1
F.3 Landscaping ................................. F-2
F.4 Access Restriction Costs for Reference Facilities ......... .............. F-2
F.5 References ................................. F-4
Appendix G: Evaluation of the Planned Disposal Capacity for DecommissioningOperation Waste
G.1 Introduction and Background ..............................
and Normal
...... .G-1
G.2 Approach and Method ........................... .............. G-1
G.3 Waste Generator Profiles and Population .............
G.4 Estimated Quantities of Low-Level Waste Generated .G.4.1 Normal Operations Waste ..... ............-G.4.2 Estimated Waste Volumes from
Decommissioning of Structures and Lands atReference Facilities ..................
............... G-2
.............. G-12
.............. G-12
.............. G-12G.4.2.1 Nuclear Power Plants .....G.4.2.2 Test and Research Reactors .G.4.2.3 Fuel Cycle Facilities.G.4.2.4 Non-Fuel Cycle Materials FaciG.4.2.5 Dry Spent Fuel Storage ....
G.4.3 Sites in the Site DecommissioningManagement Plan (SDMP) ...
........................ G-15
........................ 0-15
... .................... G-15ilies ................... G-15........................ G-15
......................... G-19
G.5 WasteG.5.1G.5.2G.5.3G.5.4G.5.5G.5.6G.5.7G.5.8G.5.9G.5.10G.5.11G.5.12G.5.13
Capacity Projections .......Appalachian States CompactCentral Interstate Compact ...Central Midwest Compact . . .Midwest Interstate CompactNortheast Compact ........Northwest Compact .......Rocky Mountain Compact ...Southeast Compact ........Southwestern Compact .....
New Hampshire .....Massachusetts ......Rhode Island .......New York .
, . ...
, . ...
. . ...
, . ...
, . ...
, . ...
. ....
, . ...
, . ...
, . ...
, . ...
, . ...
, . ...
, . ...
. .. .. .. .... .
. . .. .. .. ...
. . .. .. .. ...
. . .. .. .. ...
. . .. .. .. ...
. . .. .. .. ...
. . .. .. .. ...
. . .. .. .. ...
. . .. .. .. ...
. . .. .. .. ...
. . .. .. .. ...
. . .. .. .. ...
.. . .. .
. .... .
. .... .
. .... .
.. . . . .
,.. .. .
. .... .
,.. .. .
,.. .. .
, . ...
, ... .
, . ...
, . . .
, . ...
, ... .
, . ...
, ... .
, ... .
, ... .
, . ...
, ... .
, . ...
, ... .
.0.G-20
.0. -22
.0.G-23
.. G-23
.. G-23
.0.G-23
.0.G-25
.0.G-26
.0.G-26
.0.G-26
.0.G-27
.0.G-27
.0.G-27
.0.G-27
lX NUREG-1496

G.5. 14 Texas Compact - Pending ........................... G-27G.5.15 Michigan ............... G-28G.5.16 District of Columbia ............... G-28G.5.17 Puerto Rico ............... G-28
G.6 Onsite Waste Disposal ............... G-29
G.7 Discussion and Summary ............... G-29
G.8 References ............... G-34
Appendix H: Summary of Comments on Draft Generic Environmental Impact Statement
H.1 Regulatory Alternatives and Approach ............... H-1
H.2 Analysis of Impacts and Costs ............... H-2H.2.1 Reference Facilities ............... H-2H.2.2 Human Health Impacts; Dose/Mortality Modeling ............... H-2
11.2.2.1 Dose Modeling Approach ....... ........ H-2H.2.2.2 Use of the Linear Nonthreshold Hypothesis in Analysis . . H-3H.2.2.3 Time Period for Analysis ....... ........ H4H.2.2.4 Transfer of Risk -- Nonradiological Impacts and Waste
Disposal Impacts ....... ........ H-4H.2.2.5 Effect of Chemicals ....................... : .. H-5H.2.2.6 Radon ............... H-6
H.2.3 Nonhuman Impacts ...... ......... H-6H.2.4 Impacts on Waste Disposal/Capacity ..... .. ........ H-7
11.2.4.1 Limits on Capacity ............... H-7H.2.4.2 NORM Waste ............... H-7
H.2.5 Methods and Costs for Decommissioning ....... ........ H-8H.2.5.1 Inaccuracy in Costs ............... H-8H.2.5.2 Cost of Compliance, Social Costs, and Other Costs .. H-8
H.3 Results of Analysis .. H-9H.3.1 Completeness/Validity of Analysis and Suggested Alternative
Cost-Benefit Analysis Approaches .... H-9H.3.2 Comparison of Costs and Benefits .. H-10H.3.3 Restricted Use .. H-llH.3.4 Need for Groundwater Analysis .. H-14
NUREG-1496 x

Tables Paue
C.2.1 GEIS Scenario Matrix ................................... C.2-8C.2.1.1 Incremental Costs and Occupational Dose for Decontamination of
the Reference Nuclear Power Plant Bioshield . C.2-9C.2.1.2 Summary of Costs and Occupational Dose for Decontamination of the
Reference Nuclear Power Plant Floors/Walls .. C.2-10C.2.1.3 Incremental Costs and Occupational Dose for Remediation of Contaminated
Soil at the Reference Nuclear Power Plant (Unrestricted Land Use,Deposition on Soil Surface, with Soil Washing) .. C.2-11
C.2.1.4 Incremental Costs and Occupational Dose for Remediation of ContaminatedSoil at the Reference Nuclear Power Plant (Unrestricted Land Use,Deposition on Soil Surface, Direct Disposal of Soil) .. C.2-12
C.2.1.5 Incremental Costs and Occupational Dose for Remediation of ContaminatedSoil at the Reference Nuclear Power Plant (Restricted Land Use,Deposition on Soil Surface, with Soil Washing) .. C.2-13
C.2.1.6 Incremental Costs and Occupational Dose for Remediation of ContaminatedSoil at the Reference Nuclear Power Plant (Restricted Land Use,Deposition on Soil Surface, Direct Disposal of Soil) . C.2-14
C.2.1.7 Incremental Costs and Occupational Dose for Remediation of ContaminatedSoil at the Reference Nuclear Power Plant (Unrestricted Land Use,Deposition on Soil Surface, with Soil Washing, 50-Year SAFSTOR) .. C.2-15
C.2.1.8 Incremental Costs and Occupational Dose for Remediation of ContaminatedSoil at the Reference Nuclear Power Plant (Unrestricted Land Use,Deposition on Soil Surface, Direct Disposal of Soil, 50-Year SAFSTOR)C.2-16
C.2.1.9 Incremental Costs and Occupational Dose for Remediation of ContaminatedSoil at the Reference Nuclear Power Plant (Restricted Land Use,Deposition on Soil Surface, with Soil Washing, 50-Year SAFSTOR) .. C.2-17
C.2. 1.10 Incremental Costs and Occupational Dose for Remediation of ContaminatedSoil at the Reference Nuclear Power Plant (Restricted Land Use,Deposition on Soil Surface, Direct Disposal of Soil, 50-Year SAFSTOR)C.2-18
C.2. 1.11 Incremental Costs and Occupational Dose for Remediation of ContaminatedSoil at the Reference Nuclear Power Plant (Unrestricted Land Use,Spill/Leak, With Soil Washing) ............................ C.2-19
C.2.1.12 Incremental Costs and Occupational Dose for Remediation of ContaminatedSoil at the Reference Nuclear Power Plant (Unrestricted Land Use,Spill/Leak, Direct Disposal of Soil) .. C.2-20
C.2.1.13 Incremental Costs and Occupational Dose for Remediation of ContaminatedSoil at the Reference Nuclear Power Plant (Restricted Land Use,Spill/Leak, With Soil Washing) ........... . C.2-21
C.2.1.14 Incremental Costs and Occupational Dose for Remediation of ContaminatedSoil at the Reference Nuclear Power Plant (Restricted Land Use,Spill/Leak, Direct Disposal of Soil) .......................... C.2-22
xi xi NUREG-1496
C.2.1.15 Incremental Costs and Occupational Dose for Remediation of ContaminatedSoil at the Reference Nuclear Power Plant (Unrestricted Land Use,Spill/Leak, with Soil Washing, 50-Year SAFSTOR) .... ......... C.2-23
C.2.1.16 Incremental Costs and Occupational Dose for Remediation of ContaminatedSoil at the Reference Nuclear Power Plant (Unrestricted Land Use,Spill/Leak, Direct Disposal of Soil, 50-Year SAFSTOR) .... ...... C.2-24
C.2.1.17 Incremental Costs and Occupational Dose for Remediation of ContaminatedSoil at the Reference Nuclear Power Plant (Restricted Land Use,Spill/Leak, with Soil Washing, 50-Year SAFSTOR) ............. C.2-25
C.2. 1.18 Incremental Costs and Occupational Dose for Remediation of ContaminatedSoil at the Reference Nuclear Power Plant (Restricted Land Use,Spill/Leak, Direct Disposal of Soil, 50-Year SAFSTOR) .... ...... C.2-26
C.2.2.1 Incremental Costs and Occupational Dose for Remediation of ContaminatedSoil at the Reference Uranium Fuel Fabrication Plant (Unrestricted Land Use,Deposition on Soil Surface, with Soil Washing) ..... ........... C.2-27
C.L2.2.2 Incremental Costs and Occupational Dose for Remediation of ContaminatedSoil at the Reference Uranium Fuel Fabrication Plant (Unrestricted Land Use,Deposition on Soil Surface, Direct Disposal of Soil) ..... ........ C.2-28
C.2.2.3 Incremental Costs and Occupational Dose for Remediation of ContaminatedSoil at the Reference Uranium Fuel Fabrication Plant (Restricted Land Use,Deposition on Soil Surface, with Soil Washing) ..... ........... C.2-29
C.2.2.4 Incremental Costs and Occupational Dose for Remediation of ContaminatedSoil at the Reference Uranium Fuel Fabrication Plant (Restricted Land Use,Deposition on Soil Surface, Direct Disposal of Soil) .... ......... C.2-30
C.2.2.5 Incremental Costs and Occupational Dose for Remediation of ContaminatedSoil at the Reference Uranium Fuel Fabrication Plant (Unrestricted Land Use,Mixing/Landfilling, with Soil Washing) . ..................... C.2-31
C.2.2.6 Incremental Costs and Occupational Dose for Remediation of ContaminatedSoil at the Reference Uranium Fuel Fabrication Plant (Unrestricted Land Use,Mixing/Landfilling, Direct Disposal of Soil) ....... ............ C.2-32
C.2.2.7 Incremental Costs and Occupational Dose for Remediation of ContaminatedSoil at the Reference Uranium Fuel Fabrication Plant (Restricted Land Use,Mixing/Landfilling, with Soil Washing) . ..................... C.2-33
C.2.2.8 Incremental Costs and Occupational Dose for Remediation of ContaminatedSoil at the Reference Uranium Fuel Fabrication Plant (Restricted Land Use,Mixing/Landfilling, Direct Disposal of Soil) ....... ............ C.2-34
C.2.3.1 Summary of Costs and Occupational Dose for Decontamination of theReference Sealed Source Manufacturer Floors/Walls .... ......... C.2-35
C.2.3.2 Incremental Costs and Occupational Dose for Remediation of ContaminatedSoil at the Reference Sealed Source Manufacturer Site (Unrestricted Land Use,Deposition on Soil Surface, With Soil Washing) ..... ........... C.2-36
C.2.3.3 Incremental Costs and Occupational Dose for Remediation of ContaminatedSoil at the Reference Sealed Source Manufacturer Site (Unrestricted Land Use,Deposition on Soil Surface, Direct Deposit of Soil) .......... .... C.2-37
NUREG-1496 xii
C.2.3.4 Incremental Costs and Occupational Dose for Remediation of ContaminatedSoil at the Reference Sealed Source Manufacturer Site (Restricted Land Use,Deposition on Soil Surface, With Soil Washing) ...... .......... C.2-38
C.2.3.5 Incremental Costs and Occupational Dose for Remediation of ContaminatedSoil at the Reference Sealed Source Manufacturer Site (Restricted Land Use,Deposition on Soil Surface, Direct Deposit of Soil) ..... ......... C.2-39
C.2.3.6 Incremental Costs and Occupational Dose for Remediation of ContaminatedSoil at the Reference Sealed Source Manufacturer Site (Unrestricted Land Use,Spill/Leak, With Soil Washing) .... . . . . C.2-40
C.2.3.7 Incremental Costs and Occupational Dose for Remediation of ContaminatedSoil at the Reference Sealed Source Manufacturer Site (Unrestricted Land Use,Spill/Leak, Direct Disposal of Soil) ....................... C.2-41
C.2.3.8 Incremental Costs and Occupational Dose for Remediation of ContaminatedSoil at the Reference Sealed Source Manufacturer Site (Restricted Land Use,Spill/Leak, With Soil Washing) .......... .......... C.2-42
C.2.3.9 Incremental Costs and Occupational Dose for Remediation of ContaminatedSoil at the Reference Sealed Source Manufacturer Site (Restricted Land Use,Spill/Leak, Direct Disposal of Soil) ......................... C.2-43
C.2.4.1 Incremental Costs and Occupational Dose for Remediation of ContaminatedSoil at the Reference Rare Metal Extraction Plant (Unrestricted Land Use,Deposition on Soil Surface, With Soil Washing) ...... .......... C.2-44
C.2.4.2 Incremental Costs and Occupational Dose for Remediation of ContaminatedSoil at the Reference Rare Metal Extraction Plant (Unrestricted Land Use,Deposition on Soil Surface, Direct Disposal of Soil) ..... ........ C.2-45
C.2.4.3 Incremental Costs and Occupational Dose for Remediation of ContaminatedSoil at the Reference Rare Metal Extraction Plant (Restricted Land Use,Deposition on Soil Surface, With Soil Washing) ........ C.2-46
C.2A.4 Incremental Costs and Occupational Dose for Remediation of ContaminatedSoil at the Reference Rare Metal Extraction Plant (Restricted Land Use,Deposition on Soil Surface, Direct Disposal of Soil) ..... ........ C.2-47
C.2.4.5 Incremental Costs and Occupational Dose for Remediation of ContaminatedSoil at the Reference Rare Metal Extraction Plant (Unrestricted Land Use,Mixing/Landfilling, With Soil Washing) ............ ......... C.2-48
C.2.4.6 Incremental Costs and Occupational Dose for Rernediation of ContaminatedSoil at the Reference Rare Metal Extraction Plant (Unrestricted Land Use,.Mixing/Landfilling, Direct Disposal of Soil) ........ ........... C.2-49
C.2.4.7 Incremental Costs and Occupational Dose for Remediation of ContaminatedSoil at the Reference Rare Metal Extraction Plant (Restricted Land Use,Mixing/Landfilling, With Soil Washing) ...... i ............... C.2-50
C.2.4.8 Incremental Costs and Occupational Dose for Reemediation of ContaminatedSoil at the Reference Rare Metal Extraction Plant (Restricted Land Use,Mixing/Landfilling, Direct Disposal of Soil) ........ ........... C.2-51
C.2.5.1 Incremental Costs and Occupational Dose for Remediation of ContaminatedSoil at the Reference Uranium Mill (Unrestricted Land Use,Deposition on Soil Surface, With Soil Washing) ................ C.2-52
... NUREG-1496
C.2.5.2 Incremental Costs and Occupational Dose for Remediation of ContaminatedSoil at the Reference Uranium Mill (Unrestricted Land Use,Deposition on Soil Surface, Direct Disposal of Soil) .... ......... C.2-53
C.2.5.3 Incremental Costs and Occupational Dose for Remediation of ContaminatedSoil at the Reference Uranium Mill (Restricted Land Use,Deposition on Soil Surface, With Soil Washing) ..... ........... C.2-54
C.2.5.4 Incremental Costs and Occupational Dose for Remediation of ContaminatedSoil at the Reference Uranium Mill (Restricted Land Use,Deposition on Soil Surface, Direct Disposal of Soil) ..... ........ C.2-55
C.4. 1.1 Extent of Surface Radionuclide Contamination in the Reference PWR NuclearPower Station .C.4-2
C.4.1.2 Gamma-Emitting Radionuclide Distributions in Dry Active Waste . C.4-4C.4.1.3 Concentration Ranges of Radionuclides in Contaminated Surface Soils (0-4 cm)
from Radiation Controlled Areas . ....................... C.4-5C.4.2.1 Distribution of Contaminated Concrete Floor Area in the Reference Uranium
Fuel Fabrication Facility .C.4-7C.5.1.1 Concentration of 'Co and 137Cs in Soil at Humboldt Bay .C.5-7C.5.1.2 Value for Parameters in the C(x) Model for '"Co and `Cs ..C.5-7C.5.2.1 Estimated Contaminated Soil Volume Ratio at Different Cleanup Levels for
the Ventron Corporation Plant ......... ............ C.5-8C.7.1.1 Total and Contaminated Surface Areas for Structures and Soils at
Each of the Reference Facilities . ...................... C.7-14C.7.1.2 Ranges of Soil Surface Activities for the Radionuclides of Interest . . . C.7-14C.7.2.1 GEIS Scenario Matrix. C.7-15C.7.3. 1 Calculated Costs and Other Parameters for Decontamination of Reactor
Bioshield Concrete ............ C.7-16C.7.3.2 Calculated Costs and Other Parameters for Decontamination of Reactor
Wall/Floor Concrete ............. C.7-16C.7.3.3 Summary of Costs and Occupational Dose for Remediation of Contaminated
Soil at the Reference Nuclear Power Plant Unrestricted Land Use .... C.7-17C.7.3.4 Summary of Costs and Occupational Dose for Remediation of Contaminated
Soil at the Reference Nuclear Power Plant Restricted Land Use ..... C.7-18C.7.3.5 Calculated Costs and Other Parameters for Decontamination of Reactor
Bioshield Concrete (50-Year SAFSTOR) .......... ........... C.7-19C.7.3.6 Calculated Costs and Other Parameters for Decontamination of Reactor
Wall/Floor Concrete (50-Year SAFSTOR) ........ ............ C.7-19C.7.3.7 Summary of Costs and Occupational Dose for Remediation of Contaminated
Soil at the Reference Nuclear Power Plant Unrestricted Land Use,50-Year SAFSTOR ............ C.7-20
C.7.3.8 Summary of Costs and Occupational Dose for Remediation of ContaminatedSoil at the Reference Nuclear Power Plant Restricted Land Use,50-Year SAFSTOR ............ C.7-21
C.7.3.9 Summary of Costs and Occupational Dose for Remediation of ContaminatedSoil at the Reference Nuclear Power Plant Unrestricted Land Use,Spill/Leak ..... C.7-22
NUREG- 1496 xiv
C.7.3.10 Summary of Costs and Occupational Dose for Remediation of ContaminatedSoil at the Reference Nuclear Power Plant Restricted Land Use,Spill/Leak ............................ C.7-23
C.7.3.11 Summary of Costs and Occupational Dose for Remediation of ContaminatedSoil at the Reference Nuclear Power Plant Unrestricted Land Use,Spill/Leak, 50-Year SAFSTOR .......... .. ................ C.7-24
C.7.3.12 Summary of Costs and Occupational Dose for Remediation of ContaminatedSoil at the Reference Nuclear Power Plant Restricted Land Use,Spill/Leak, 50-Year SAFSTOR ........ ............ C.7-25
C.7.4.1 Calculated Costs and Other Parameters for Decontamination of UraniumFuel Fabrication Plant Wall/Floor Concrete ........ ........... C.7-26
C.7.4.2 Summary of Costs and Occupational Dose for Remediation of ContaminatedSoil at the Reference Uranium Fuel Fabrication Plant UnrestrictedLand Use .... C.7-27
C.7.4.3 Summary of Costs and Occupational Dose for Remediation of ContaminatedSoil at the Reference Uranium Fuel Fabrication Plant RestrictedLand Use .... C.7-28
C.7.4.4 Summary of Costs and Occupational Dose for Remediation of ContaminatedSoil at the Reference Uranium Fuel Fabrication Plant UnrestrictedLand Use, Mixing/Landfilling ....... ............ C.7-29
C.7.4.5 Summary of Costs and Occupational Dose for Remediation of ContaminatedSoil at the Reference Uranium Fuel Fabrication Plant RestrictedLand Use, MixinglLandfilling ....... ............ C.7-30
C.7.5.1 Calculated Costs and Other Parameters for Decontamination of SealedSource Manufacturer Facility Wall/Floor Concrete ..... .......... C.7-31
C.7.5.2 Summary of Costs and Occupational Dose for Remediation of ContaminatedSoil at the Reference Sealed Source Manufacturer Site UnrestrictedLand Use .... C.7-32
C.7.5.3 Summary of Costs and Occupational Dose for Remediation of ContaminatedSoil at the Reference Sealed Source Manufacturer Site RestrictedLand Use .... C.7-33
C.7.5.4 Summary of Costs and Occupational Dose for Remediation of ContaminatedSoil at the Reference Sealed Source Manufacturer Site UnrestrictedLand Use, Spill/Leak ....................... C.7-34
C.7.5.5 Summary of Costs and Occupational Dose for Remediation of ContaminatedSoil at the Reference Sealed Source Manufacturer Site RestrictedLand Use, Spill/Leak ............. C.7-35
C.7.6. 1 Calculated Costs and Other Parameters for Decontamination of RareMetal Extraction Plant Wall/Floor Concrete .C.7-36
C.7.6.2 Summary of Costs and Occupational Dose for Remediation of ContaminatedSoil at the Reference Rare Metal Extraction Plant UnrestrictedLand Use .... C.7-37
C.7.6.3 Summary of Costs and Occupational Dose for Remediation of ContaminatedSoil at the Reference Rare Metal Extraction Plant RestrictedLand Use .... C.7-38
XV NUREG-1496

C.7.6.4
C.7.6.5
C.7.7.1
C.7.7.2
C.8.1
C.8.2
C.8.3
C.8.4
Summary of Costs and Occupational Dose for Remediation of ContaminatedSoil at the Reference Rare Metal Extraction Plant UnrestrictedLand Use, Mixing/Landfilling ............................ C.7-39Summary of Costs and Occupational Dose for Remediation of ContaminatedSoil at the Reference Rare Metal Extraction Plant RestrictedLand Use, Mixing/Landfilling ............................ C.7-40Summary of Costs and Occupational Dose for Remediation of ContaminatedSoil at the Reference Uranium Mill Unrestricted Land Use .... ..... C.7-41Summary of Costs and Occupational Dose for Remediation of ContaminatedSoil at the Reference Uranium Mill Restricted Land Use .... ...... C.7-42Soil Removal to Control Prospective Uranium Contamination,Incremental Costs & Impacts, from 25 mrem/y Based on Usageby 25 Persons ........................................ C.8-5Sr-90 Remediation by Pump and Treat, Incremental Costs and Impactsfrom 25 mrem/y Based on Usage by 25 Persons ................. C.8-6Uranium Remediation by Pump and Treat, Incremental Costs and Impactsfrom 25 mrem/y Based on Usage by 25 Persons ................. C.8-7Remediation by Restricting Use & Providing Replacement Water for anSr-90 and Uranium Site, Incremental Costs and Impacts from 25 mrem/yBased on Usage by 25 Persons ............................. C.8-8
D.I.lD.2.1D.3.1D.4.1
Power Reactor . ................................ D-52Sealed Source Facility ................................ D-59U Fuel Fabrication ................................. D-66Rare Metal Extraction Facility ............................. D-73
Calculated Costs for Site Access Restrictions ....... ............. F-3F. 1
G.3-1G.3-2G.3-3G.3-4
G.3-5
G.3-6G.4-1
G.4-2
G.4-3
G.44
Nuclear Power Plants in Commercial Operation .................Formerly Licensed Commercial Nuclear Power Plants .............Location and Types of Research and Test Nuclear Reactors.Research and Test Nuclear Reactors Preparing for orUndergoing Decommissioning; Possession Only License ...........Location of Fuel Fabrication, Uranium HexafluorideProduction, and Uranium Enrichment Facilities ..................Dry Spent Fuel Storage Facilities ...........................Compacts and Non-Member States Low-Level NormalOperations Waste Generation Rates ..........................Yearly Activity (Ci) and Waste Volumes (ft3 ) of AllWaste Shipped for Disposal ...............................Estimates of Low-Specific Activity Decommissioning WasteVolumes for Nuclear Power Plants ..........................Estimates of Low-Specific Activity Decommissioning WasteVolumes for Test and Research Reactors ......................
. G-4
. G-6
. G-7
. G-9
-G-10G-1l
G-13
G-14
G-16
G-17
NUREG-1496 XVI
G.4-5
G.4-6
G.4-7
G.4-8
G.4-9G.5-1
G.7-1
G;7-2
Estimates of Low-Specific Activity Decommissioning WasteVolumes for Fuel Cycle Facilities ...........................Estimates of Low-Specific Activity Decommissioning WasteVolumes for Materials Facilities ............................Estimates of Low-Specific Activity Decommissioning WasteVolumes for Dry Spent Fuel Storage Facilities ..................Summary Estimates of Low-Specific Activity DecommissioningWaste Volumes From NRC SDMP Sites ......................Estimated Waste Volume From Selected SDMP Facilities ..........Estimated Low-Level Waste Disposal Capacity byCompacts and Non-Member States ..........................Total Waste Volume Summary from Decommissioning ofLands and Structures for Reference FacilityCategories by Compacts and Non-Member States ................Estimated Low-Level Waste Disposal Capacity byCompacts and Non-Member States ..........................
G-17
G-18
G-19
G-20G-21
G-24
G-32
G-33
xvii NUREG-1496

Figures
Page
Figure C.5.1.1
Figure C.5.1.2
Figure C.5.1.3
Figure C.5.1.4
Figure C.5.1.5
Figure C.5.1.6
Figure C.5.1.7
Figure C.5.1.8
Figure C.5.1.9
Figure C.5.1.10
Figure C.5. 1.11
Figure C.5.1.12
Figure C.5.2.1
Figure C.5.2.2
Figure C.5 3.1
Calculated Residual 'Co Radiation Dose Rate as a Function ofSoil Depth Removed (Spill/Leak Model, Unrestricted Land Use) C.5-9Calculated Residual 'Co Radiation Dose Rate as a Function ofSoil Depth Removed (Spill/Leak Model, Restricted Land Use) . . C.5-9Calculated Residual "'Cs Radiation Dose Rate as a Function ofSoil Depth Removed (Spill/Leak Model, Unrestricted Land Use) C.5-10Calculated Residual ... Cs Radiation Dose Rate as a Function ofSoil Depth Removed (Spill/Leak Model, Restricted Land Use) . C.5-10Calculated Residual Composite 60Co and "'Cs Radiation DoseRate as a Function of Soil Depth Removed (Spill/Leak Model,Unrestricted Land Use) ............................. C.5-11Calculated Residual Composite 6OCo and 137CS Radiation DoseRate as a Function of Soil Depth Removed (Spill/Leak Model,Restricted Land Use) .............................. C.5-11Calculated Residual Composite 'Co Radiation Dose Rate as aFunction of Soil Depth Removed (Spill/Leak Model, UnrestrictedLand Use, 50-Year SAFSTOR) ......... ............. C.5-12Calculated Residual Composite 60Co Radiation Dose Rate as aFunction of Soil Depth Removed (Spill/Leak Model, RestrictedLand Use, 50-Year SAFSTOR) ......... ............. C.5-12Calculated Residual Composite "'Cs Radiation Dose Rate as aFunction of Soil Depth Removed (Spill/Leak Model, UnrestrictedLand Use, 50-Year SAFSTOR) ......... ............. C.5-13Calculated Residual Composite '37Cs Radiation Dose Rate as aFunction of Soil Depth Removed (Spill/Leak Model, RestrictedLand Use, 50-Year SAFSTOR) ......... ............. C.5-13Calculated Residual Composite 'Co and 137Cs Radiation DoseRate as a Function of Soil Depth Removed (Spill/Leak Model,Unrestricted Land Use, 50-Year SAFSTOR) ..... ......... C.5-14Calculated Residual Composite 60Co and 137CS Radiation DoseRate as a Function of Soil Depth Removed (Spill/Leak Model,Restricted Land Use, 50-Year SAFSTOR) ..... .......... C.5-14Calculated Residual Uranium Radiation Dose Rate as a Functionof Soil Depth Removed (Mixing/Landfilling Model, UnrestrictedLand Use) ................................ C.5-15Calculated Residual Uranium Radiation Dose Rate as a Functionof Soil Depth Removed (MixingJLandfilling Model, RestrictedLand Use) ................................ C.5-15Calculated Residual Thorium Radiation Dose Rate as a Functionof Soil Depth Removed (Mixing/Landfilling Model, UnrestrictedLand Use) ................................ C.5-16
NUREG-1496 xviii

Figure C.5.3.2
Figure D.1Figure D.2Figure D.3Figure D.4
Calculated Residual Thorium Radiation Dose Rate as a Functionof Soil Depth Removed (Mixing/Landfilling Model, RestrictedLand Use) . ................................. C.5-16
Power Reactor ............ ....................... D-58Sealed Source Facility ........ ...................... D-65U Fuel Fabrication .......... ...................... D-72Rare Metal Extraction Facility ...... ................... D-79
X1X NUREG-1496

APPENDIX C
ESTIMATED COSTS FOR DECONTAMINATIONAS A FUNCTION OF RESIDUAL RADIATION DOSE RATE
FOR FACILITIES AND SOILS
APPENDIX C
C.1 Introduction
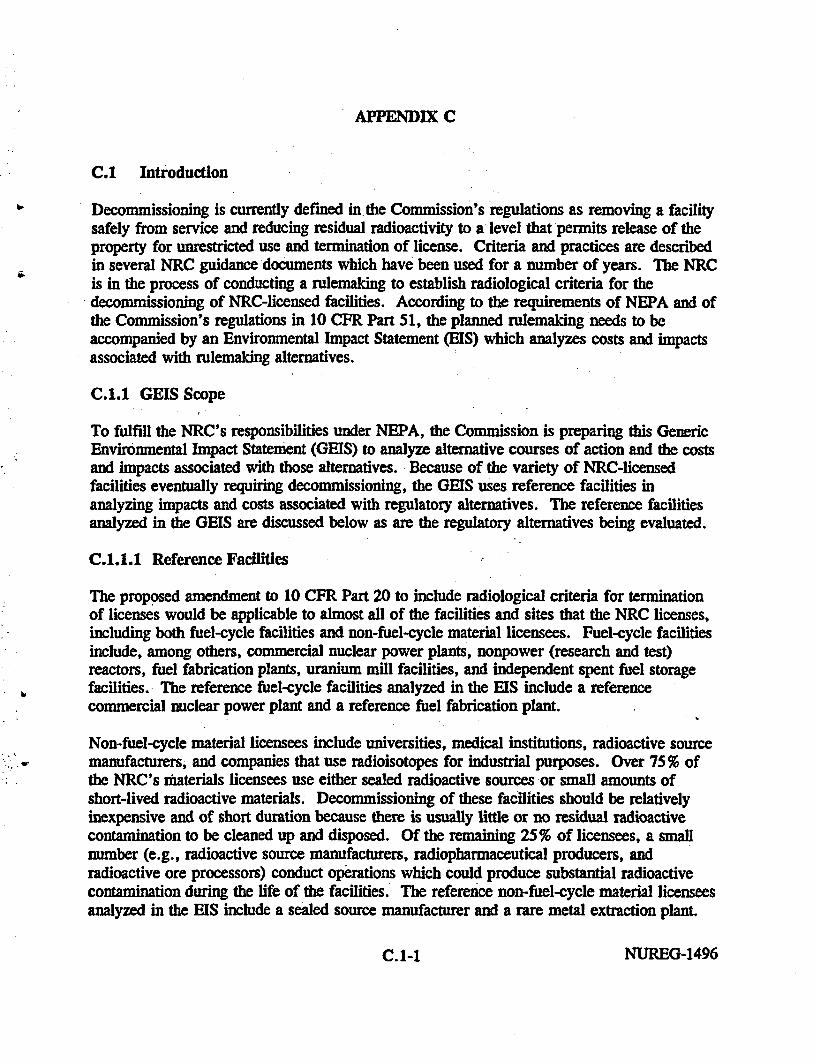
Decommissioning is currently defined in the Commission's regulations as removing a facilitysafely from service and reducing residual radioactivity to a level that permits release of theproperty for unrestricted use and termination of license. Criteria and practices are describedin several NRC guidance documents which have been used for a number of years. The NRCis in the process of conducting a rulemaking to establish radiological criteria for thedecommissioning of NRC-licensed facilities. According to the requirements of NEPA and ofthe Commission's regulations in 10 CFR Part 51, the planned rulemaldng needs to beaccompanied by an Environmental Impact Statement (EIS) which analyzes costs and impactsassociated with rulemaking alternatives.
C.l.l GEIS Scope
To fulfill the NRC's responsibilities under NEPA, the Commission is preparing this GenericEnvironmental Impact Statement (GEIS) to analyze alternative courses of action and the costsand impacts associated with those alternatives. Because of the variety of NRC-licensedfacilities eventually requiring decommissioning, the GEIS uses reference facilities inanalyzing impacts and costs associated with regulatory alternatives. The reference facilitiesanalyzed in the GEIS are discussed below as are the regulatory alternatives being evaluated.
C.l.l.l Reference Facilities
The proposed amendment to 10 CFR Part 20 to include radiological criteria for terminationof licenses would be applicable to almost all of the facilities and sites that the NRC licenses,including both fuel-cycle facilities and non-fuel-cycle material licensees. Fuel-cycle facilitiesinclude, among others, commercial nuclear power plants, nonpower (research and test)reactors, fuel fabrication plants, uranium mill facilities, and independent spent fuel storagefacilities.- The reference fuel-cycle facilities analyzed in the EIS include a referencecommercial nuclear power plant and a reference fuel fabrication plant.
Non-fuel-cycle material licensees include universities, medical institutions, radioactive sourcemanufacturers, and companies that use radioisotopes for industrial purposes. Over 75% ofthe NRC's materials licensees use either sealed radioactive sources or small amounts ofshort-lived radioactive materials. Decommissioning of these facilities should be relativelyinexpensive and of short duration because there is usually little or no residual radioactivecontamination to be cleaned up and disposed. Of the remaining 25% of licensees, a smallnumber (e.g., radioactive source manufacturers, radiopharmaceutical producers, andradioactive ore processors) conduct operations which could produce substantial radioactivecontamination during the life of the facilities. The reference non-fuel-cycle material licenseesanalyzed in the EIS include a sealed source manufacturer and a rare metal extraction plant.
C.1-1 NUREG-1496

C. 1.1.2 Decommissioning/Remediation Alternatives
The costs and impacts of decommissioning NRC-licensed facilities will be heavily dependentupon the residual radioactivity criteria that the licensee must meet to allow release of thefacility for other uses. Additionally, these criteria will be dependent upon how the facilitywill be used after decommissioning is complete and the facility is released for reuse. Whilethe GEIS is evaluating five different regulatory alternatives (Chapter 2 of Volume 1) forestablishing radiological criteria for decommissioning, the two alternative land-use scenariosdistinguishing the analyses reported in this appendix are as follows:
Unrestricted Land-Use: No restrictions are placed on the use of the facility after it isreleased. This scenario assumes that a family takes up residence on the site andfarms the land. Analytically what this means is that the residential farm family isexposed to residual radioactivity via all potential pathways (i.e., external, inhalation,soil, drinking water, agriculture (irrigation), and aquatic).
* Restricted Land-Use: Use of the facility after decommissioning is restricted toindustrial uses. This scenario assumes that decontaminated buildings are reoccupiedby workers and that a farm family would take up residence outside the site boundary.Analytically what this means is that the occupational worker can be exposed toresidual radioactivity from the following pathways: external, inhalation, soil, andaquatic.
Each of the reference facilities described previously is evaluated for each of thesealternatives. In addition, the reference commercial nuclear power plant is evaluated for eachalternative under two scenarios: 1) decommissioning activities commence immediately afterreactor shutdown and 2) decommissioning activities begin after a 50-year SAFSTOR period.Other sensitivity analyses are also performed for the various reference facilities.
C.1.2 Purpose of This Appendix
An assessment of the life-cycle costs and impacts (environmental, ecological, and humanhealth effects) of alternatives is required for any EIS. The purpose of this appendix is todescribe only the methodology developed for estimating the costs associated with cleaning,removal, and disposal of contaminated concrete and soil for each of the EIS alternatives.The methodologies for estimating costs associated with other decommissioning activities,including radiation surveys before, during, and after decommissioning, are discussed inAppendix D. Also, the methodologies used to estimate the environmental, ecological, andhuman health effects associated with each of the alternatives are discussed in Appendix B.
C.1.3 Analytical Approach
The major high-cost decommissioning activities include cleaning, removal, and disposal ofcontaminated concrete and soil (and potentially groundwater). However, the cost of these
NUREG-1496 C. 1-2

activities is very sensitive to regulation-based residual cleanup levels, or residual radioactivitycriteria, that must be met. Estimating decommissioning costs for alternate residualradioactivity criteria is difficult because of problems in making a generic evaluation ofcontamination levels on and within concrete and soil surfaces (including accounting forcontamination within cracks in the concrete and hot spots) and because of uncertaintiesregarding the amount of dose reduction achieved by concrete and soil removal techniques.
The approach taken in this study was to develop generic models for estimating the following:
* the volume of contaminated concrete requiring removal from building interior floorsand walls for alternate residual dose levels to the building occupants after completionof decommissioning,
* the volume of contaminated soil requiring excavation for alternative residual doselevels to the residential farmer after completion of decommissioning, and
* the labor requirements, occupational doses, and costs associated withremoval/excavation of contaminated concrete/soil and treatment, transportation, anddisposal of the resulting waste volume.
The models, originally developed for the GEIS, were based on technical work previouslyperformed by PNNL for the NRC and documented in a series of reports on the technology,safety, and costs of decommissioning fuel-cycle and non-fuel-cycle nuclear facilities (Smith1978; Konzek 1982a, 1982b, 1995; Murphy 1981; Elder 1980a, 1980b, 1981; Short 1989).Also utilized in the development of the methodology was PNNL technical expertise onresidual radionuclide contamination within and around nuclear power plants (Abel 1986;Robertson 1989, 1991). These models are discussed in Appendix C of the draft GEIS (NRC1994) (for completeness, Appendix C of the draft GEIS is included here as Attachment D).
Subsequently, the NRC received a number of public comments questioning the soilcontaminant distribution methodology utilized in the draft GEIS. The essence of thesecomments was that the draft GEIS methodology, in some instances, significantlyunderestimates the "real world" volume of contaminated soil requiring remediation duringdecommissioning of nuclear facilities. In response to these comments, NRC and PNNL staffreviewed data on contamination submitted by the commenters, compared it with availabledata on radionuclide distributions in contaminated soil including that in the draft GEIS, andverified and/or modified, as appropriate, the analyses of the reference facilities. This finalGEIS thus considers additional soil contamination data. In response to these comments andthe results of the data review, the analyses of the reference facilities were modified to include"real world" scenarios for the nuclear power plant, uranium fuel fabrication plant, sealedsource manufacturer, and rare metal extraction plant. It should be noted that these "realworld" scenarios represent extreme contamination cases and not the typical situation but arevaluable in providing an upper bound to the problem.
C. 1-3 NUREG-1496

C.1.4 Appendix Organization
The remainder of this appendix is organized as follows:
* Section 2: provides a brief summary of the results of thedecominissioning/remediation analyses,
* Section 3: provides a discussion of the public comments received on the draft GEIS,response to those comments, and modifications made to the analyses for the finalGEIS,
* Section 4: provides a description of each of the reference facilities being evaluated inthe GEIS,
* Section 5: provides a description of the methodology developed to estimateradionuclide contamination levels in contaminated soil at the reference facilities,
* Section 6: provides a description of the methodology developed for estimating thecosts of removal/excavation of contaminated concrete/soil, treatment, transportation,and disposal of resulting low-level radioactive waste volumes,
* Section 7: provides the results of the decommissioning analyses,
* Section 8: provides a cursory examination of possible groundwater remediation,
* Section 9: provides a list of references utilized in developing the analyticalmethodologies.
Attachments A, B, C, and D provide additional information on assumptions and detailedresults of the decommissioning analysis, and Attachment E provides detailed groundwaterinformation.
NUREG-1496 C. 1-4

C.2 Summary of Results
The intent of this section of the appendix is to provide a brief summary and overview of thecosts, labor requirements, and occupational doses associated with decontaminatingcontaminated facilities to alternate residual dose criteria. The purpose of these analyses hasnot been to estimate the total magnitude of each of these figures-of-merit, but to estimateonly those portions of each parameter that are sensitive to different residual cleanup levels.Therefore, the results presented here show the incremental/differential remediation costs andoccupational doses between alternate residual cleanup levels, not totaldecommissioning/remediation costs at each residual cleanup level.
Table 2.1 provides a matrix identifying each of the baseline and sensitivity cases evaluated inthe GEIS. As the table indicates, both an unrestricted and a restricted land-use scenario, asdescribed in Section 1.1.2, are evaluated for each reference facility. The Baselinedecommissioning scenario assumes that D&D begins immediately after shutdown while the50-Year SAFSTOR scenario assumes that D&D begins 50 years after shutdown. In order toassess the potential benefits/costs associated with minimizing the generation of LLWrequiring disposal, both a Soil Wash scenario, that assumes that soil is cleaned via immersionand agitation within an aqueous decontamination solution, and a Direct Disposal scenario,that assumes any excavated contaminated soil is sent directly to disposal without anydecontamination, are evaluated for each case.
Each of these scenarios is, in turn, evaluated for different assumed average levels ofcontamination in the soil. These different levels are labeled H for high, M for medium, andL for low. Depending upon the type of contamination, the medium level assumes an averageconcentration of contaminant in the soil that is three to six times greater than theconcentration assumed for the low contamination level. The high level assumes an averageconcentration of contaminant in the soil that is two to five times greater than theconcentration assumed for the medium contamination level.
Finally, the reference nuclear power reactor site, uranium fuel fabrication plant, sealedsource manufacturer, and rare metals extraction plant are each evaluated assuming twodifferent sources of contamination in the soil. Each reference facility is evaluated assumingcontamination is deposited upon the surface of the soil, such as via windblown contaminateddust. This analysis assumes that the primary mechanism driving contaminant migrationdeeper into the soil column is diffusion. The methodology for this analysis was originallydeveloped for the draft GEIS and is discussed in NRC, 1994.
The second scenario for the reference nuclear power reactor site and the sealed sourcemanufacturer assumes that soil contamination was primarily the result of a spill and/or leakof contaminated solution into the soil column that provided a gravitational-driven source ofcontamination. The second scenario for the reference uranium fuel fabrication plant and raremetals extraction plant assumes that soil contamination is primarily the result of mixing cleansoil with contaminated soil and also potentially using this mixture as landfill material on the
C.2-1 NUREG-1496

site. These "real world" scenarios were developed for the final GEIS based on publiccomments received on the draft GEIS analyses (see Sections 1.3 and 3). A discussion of themethodology developed for these "real world" scenarios is provided in Section 5.
A summary of the results for each of the identified scenarios follows. For a discussion andpresentation of the detailed results, refer to Section 7 and Attachment C.
C.2.1 Reference Nuclear Power Plant
The baseline decommissioning evaluation of the reference nuclear power plant includeddecontamination of the reactor bioshield concrete and other contaminated concrete surfacesand remediation of soil on the site contaminated by infrequent surface deposition where thereis no mechanism other than diffusion downward into the soil column over time. Thecontaminated soil was evaluated two different ways: 1) the contaminated soil was disposedof directly into a disposal facility and 2) the contaminated soil was first treated with a soil-cleaning technology to remove contaminants followed by disposal of the contaminated soilremaining after cleaning. These cases were evaluated for both the restricted and unrestrictedland-use scenarios. Each of these scenarios was also reevaluated assuming the power reactoris not decommissioned until 50 years after shutdown (i.e., 50-Year SAFSTOR). A secondset of scenarios was evaluated that assumed that soil was contaminated as a result of leaksand/or spills of contaminated liquids where the contamination is driven into the soil at afaster rate than diffusion and percolates downward into the soil column over time.
A summary of the analyses evaluating the decontamination of the reactor bioshield and othercontaminated floors and walls is provided in Tables 2.1.1 and 2.1.2 for the bioshield (viadrill and blast) and other concrete surfaces (via scabbling), respectively. Both of these tablesshow that there is a definite occupational dose advantage to waiting 50 years prior todecommissioning a nuclear power plant (although doses incurred during the long-termsurveillance and maintenance period of the plant have not been estimated in these analyses).
The incremental costs of decommissioning the bioshield are not dependent upon whendecommissioning occurs. However, there is a significant total decommissioning costadvantage to waiting 50 years before beginning decommissioning (since the bioshield isprimarily contaminated with the relatively short-lived activation product Co-60). While thisconclusion is not obvious from just looking at the incremental costs reported in Table 2. 1. 1,it can be reached by comparing the total costs reported in Tables 7.3.1 and 7.3.5 in Section7.3.
Finally, the cost advantage of waiting 50 years to decommission the bioshield is somewhatoffset by the increased costs of waiting 50 years to decontaminate other contaminated wallsand surfaces. As Table 2.1.2 indicates, immediate decontamination of the walls and floors to
NUREG-1496 C.2-2

a residual dose rate of 10.4 mrem/y will cost about $3 million (assuming a disposal cost of$3501ft3) while waiting 50 years to decontaminate will increase this cost to about $4 million(residual dose rate of 9.5 mrem/y). These costs increase in this case due to the fact that thecontamination in the walls/floors is assumed to include Cs-137 in addition to Co-60 (so a50-year decay period does not provide the same benefit as if just Co-60 were present), andthe longer time period provides an opportunity for deeper penetration of the radionuclidesinto the concrete.
A summary of the results of remediating the contaminated soil at the reference nuclear powerplant, assuming deposition of contamination on the soil surface, is provided in Tables 2.1.3through 2.1.6 for the immediate D&D scenario and Tables 2.1.7 through 2.1.10 for the 50-Year SAFSTOR scenario. Similar results are provided in Tables 2.1.11 through 2.1.18 forthe same scenarios but assuming that soil contamination is the result of a spill and/or leak ofcontaminated liquids.
The results in each of these tables are provided for three different assumed contaminationlevels (high, medium, and low) in the soil and for three different soil disposal costs ($10,$50, and $350 per ft). A general observation of the results presented in these tables is that,depending upon what the regulatory requirement is for radioactive exposure from residualcontamination left in the soil, remediation may or may not be required. This is demonstratedin the low contamination case in Table 2.1.3 where soil remediation would not be requiredunless the residual dose rate were set at a level of 3 mrem/y or lower.
Another general observation supported by the results in these tables is that the incrementalcost of soil remediation increases with each unit (I mremly) reduction in the requiredresidual dose level. In other words, the cost of reducing the residual contamination in thesoil by 1 mrem/y is significantly higher if the reduction is from 10 to 9 mrem/y than it is ifthe reduction is from 100 to 99 nrem/y. This is due to the general nature of howcontaminants are distributed in the soil column where the majority of the contaminant is nearthe surface of the soil column and which trails off significantly with depth (i.e., significantlymore soil volume requires remediation to remove the last one curie of activity than it takes toremove the first one curie of activity).
A comparison of the results of the soil washing scenarios with the corresponding directdisposal of soil scenarios, such as Tables 2.1.3 and 2.1.4, indicates that the higher thedisposal cost, the greater the incentive to clean the soil to reduce the volume requiringdisposal. At a disposal cost of $350 per ft3 , the results indicate that it is always more costeffective (both total and incremental) to clean the soil to reduce the volume requiringdisposal. On the other hand, at a disposal cost of only $10 per ft3 , it is generally more costeffective to ship the excavated soil directly to disposal.
C.2-3 C3NUREG-1496

Another conclusion drawn from the results provided in the tables is that remediationrequirements are reduced in the restricted land-use scenario when compared to theunrestricted land-use scenario (i.e., the residual dose level at which remediation would berequired is lower, as are generally the total and incremental costs of remediation, under arestricted land-use scenario); compare Tables 2.1.3 and 2.1.5 as an example. This is to beexpected since there are fewer exposure pathways assumed in the restricted land-usescenarios (i.e., there are restrictions and controls on the use of the land) than are assumed inthe unrestricted land-use scenarios.
By delaying decommissioning of the reference nuclear power plant for 50 years (i.e.,allowing radionuclide decay and contaminant dispersion in the soil to "naturally" remediatethe soil), the total cost of decommissioning can potentially be significantly reduced. As withthe restricted and unrestricted land-use comparison discussed above, a 50-year delay inremediation can significantly lower the residual dose level where remediation would even berequired (compare Tables 2.1.3 and 2.1.7 as an example). Again, these analyses did notinclude the costs associated with long-term monitoring and surveillance. However, if therequired residual dose level were set sufficiently low (i.e., at 3 mrem/y in Table 2.1.7, highcontamination case, as an example), the cost of soil remediation under the 50-YearSAFSTOR scenario would be considerably higher than if the reactor site were immediatelydecommissioned. This is due to giving the contaminant plume an additional 50 years tomigrate deeper into the soil column, thereby requiring greater soil volumes to be remediated.
Finally, the above conclusions are also consistent with the results of the "real world"scenarios provided in Tables 2.1.11 through 2.1.18. The difference in the results in thesetables and those for the "baseline" scenarios in Tables 2.1.3 through 2.1.10 is that theincremental and total costs, soil volumes being remediated, and occupational doses toworkers are higher across the board in the "real world" scenarios. This is because the "realworld" scenarios were developed, in response to public comments on the draft GEIS, to be abounding representation of the extent of contamination that might be expected to requireremediation during decommissioning of a nuclear power plant.
C.2.2 Reference Uranium Fuel Fabrication Plant
The baseline decommissioning evaluation of the reference uranium fuel fabrication plantincluded decontamination of contaminated concrete surfaces and remediation of soilcontaminated by infrequent surface deposition where there is no mechanism other thandiffusion downward into the soil column over time on the site. The contaminated soil wasevaluated two different ways: 1) the contaminated soil was disposed of directly into adisposal facility and 2) the contaminated soil was first treated with a soil-cleaning technologyto remove contaminants followed by disposal of the contaminated soil remaining aftercleaning. These cases were evaluated for both the restricted and unrestricted land-usescenarios. Also, the second set of scenarios was evaluated assuming the soil contaminationon the site was the result of mixing/landfilling with contaminated soil and/or slag.
NUREG-1496 C.2-4

Decontamination of the concrete surfaces was deternmined to require only one layer (0.3175cm) of concrete be removed due to the very slow diffusion of uranium through concrete.This translates into a total concrete volume requiring disposal of 288 in, a concrete disposalcost of $1.89 million, a total occupational dose of 7 person-rem, and a residual dose rate ofjust 1.4x10' 0 mrem/y.
A summary of the results of remediating the contaminated soil at the reference uranium fuelfabrication plant is provided in Tables 2.2.1 through 2.2.4 for the windblown deposition ofcontamination scenarios and Tables 2.2.5 through 2.2.8 for the mixing/landfilling scenarios.The same general trends and conclusions discussed previously for remediation ofcontaminated soil at the reference nuclear power plant apply to the results for the referenceuranium fuel fabrication plant and therefore will not be repeated here. Soil remediation costsand occupational doses incurred during remediation of the soil are shown to be significantlyhigher across the board for the uranium fuel fabrication plant than for the nuclear powerplant due to the much larger volumes of soil requiring remediation at these types of facilities.
C.2.3 Reference Sealed Source Manufacturer
The baseline decommissioning evaluation of the reference sealed source manufacturer, inwhich the soil is assumed to be contaminated by infrequent surface deposition where there isno mechanism other than diffusion downward into the soil column over time, is the same asthat described for the two reference facilities already discussed previously. Specifically, theanalyses included scenarios where contaminated soil was both treated via soil washing anddirect disposed without treatment and scenarios in which both the restricted and unrestrictedland-use scenarios were evaluated. A second set of "real world" scenarios was evaluatedthat assumed that the soil contamination at the site was the result of a leak and/or spill ofcontaminated liquids where the contamination is driven into the soil at a faster rate thandiffusion. Finally, as with the previous facilities, contaminated concrete on structures wasremoved in 0.3175 cm layers via scabbling.
The estimated requirements for decontamination of the concrete surfaces of this referencefacility are summarized in Table 2.3.1. Minimal concrete removal is assumed to be requiredat these types of facilities.
A summary of the results of remediating the contaminated soil at the reference sealed sourcemanufacturer is provided in Tables 2.3.2 through 2.3.5 for the "baseline" scenarios andTables 2.3.6 through 2.3.9 for the leak/spill scenarios. The same general trends andconclusions discussed previously for remediation of contaminated soil at the reference nuclearpower plant apply to the results for the reference sealed source manufacturer and thereforewill not be repeated here. Soil remediation costs and occupational doses incurred duringremediation of the soil are shown to be lower across the board than for either the uraniumfuel fabrication plant or the nuclear power plant. These types of facilities are assumed to nothave significant volumes of contaminated soil requiring remediation during decommissioning.
C.2-5 INUREG-1496

C.2.4 Reference Rare Metal Extraction Plant
The scenarios evaluated for the reference rare metal extraction plant are the same as thoseevaluated for the reference uranium fuel fabrication plant, although the radionuclidecontaminants and other specific data used in the analyses were obviously different.Specifically, both soil washing and direct disposal of contaminated soil were evaluated forboth the restricted and unrestricted land-use scenarios. Also, each of these scenarios wasevaluated for both a "baseline" scenario, where soil is assumed to be contaminated byinfrequent surface deposition where there is no mechanism other than diffusion downwardinto the soil column over time and a "real world" scenario, where soil contamination isassumed to be the result of landfilling with contaminated soil and/or slag.
Decontamination of the concrete surfaces was determined to require just two layers (0.635cm) of concrete be removed due to the very slow diffusion of thorium through concrete.This translates into a total concrete volume requiring disposal of 176 in3, a concrete disposalcost of $2.28 million, a total occupational dose of 8.6 person-rem, and a residual dose rateof 0.023 mremly.
A major difference between this reference facility and the others is that this site is assumedto have a 7,000-m3 slag pile requiring remediation. The slag pile, therefore, is the majorsource of contaminated soil requiring remediation at this site. Since the slag cannot beeffectively washed, it requires direct disposal.
A summary of the results of remediating the contaminated soil at the reference rare metalextraction plant is provided in Tables 2.4.1 through 2.4.4 for the baseline scenarios andTables 2.4.5 through 2.4.8 for the mixing/landfilling scenarios. The same general trends andconclusions discussed previously for remediation of contaminated soil at the reference nuclearpower plant apply to the results for the reference rare metal extraction plant and thereforewill not be repeated here. It should be noted that the total costs of remediating this siteinclude those costs associated with remediating the slag pile (which is significant and isreported in Tables 7.6.2 through 7.6.5 in Section 7.6). However, since the requirements forremediation of the slag pile do not vary by residual dose level or contamination level, andsince Tables 2.4.1 through 2.4.8 only report incremental soil volumes, occupational doses,and costs for remediating soil, these tables do not reflect the remediation requirementsassociated with the slag pile.
Also, the definition of the restricted land-use scenario for this reference site is different thanfor any of the other reference sites. Restricted land-use for the other reference facilities wasbased on limitation/controls that affectively eliminated some potential pathways for exposure.While this is also true for the reference rare metal extraction plant, restricted land-use alsomeans the slag pile will not be remediated and disposed of offsite but will be left onsite andused as a disposal facility for other contaminated soil produced during remediation.Therefore, for the restricted land-use scenarios, there is no cost associated with the disposalof the slag pile or contaminated soil. However, costs are estimated for stabilizing the slag
NUREG-1496C2- C.2-6

pile in place (although costs associated with long-term monitoring and surveillance are notincluded). Since there are no disposal costs in the results of the restricted land-use scenarios,the estimated costs for these scenarios are considerably less than for the correspondingunrestricted land-use scenarios.
C.2-7 NUREG-1496

z
9
00
;v
roi
Table C.2.1. GEIS Scenario Matrix
Unrestricted Land-Use Restricted Land-Use
Baseline 50-Year SAFSTOR Baseline 50-Year SAFSTOR
Direct Direct Direct Direct
Reference Facility Soil Wash Disposal Soil Wash Disposal Soil Wash Disposal Soil Wash DisposalH M L H M L H M L H M L H M L H M L H M L H M L
PWR Power Reactor Site- Deposition on Soil Surface X X X X X X X X X X X X X X X X X X X X X X X X- Spill/Leak X X X X X X X X X X X X X X X X X X X X X X X X
Uranium Fuel Fabrication Plant- Deposition on Soil Surface X X X X X X X X X X X X- Mixing/Landfilling X X X X X X X X X X X X
Sealed Source Manufacturer- Deposition on Soil Surface X X X X X X X X X X X X- Spill/Leak X X X X X X X X X X X X
Rare Metals Extraction Plant- Deposition on Soil Surface X X X X X X X X X X X X- Mixing/Landfilling X X X X X X X X X XXX

f I t
Table 2.1.1. Incremental Costs and Occupational Dose for Decontaminationof the Reference Nuclear Power Plant Bioshield
Decommissioning Soon After Shutdown
z
'oPh.
0tDisposal Cost $350/fe Disposal CostCost per Cost per
Reduction i Incremental Cumulative Incremental Cumulative Reduction in Incremental Cumulative Reduction inResidual Incremental Cumulative O=Wational Occupational Concrete Concrete Residual Dose Concrete Concrete Residual DostDose Rate Concrete Concrete Dose Dose Disposal Cos Disposal Cos Rate Disposal Cos Disposal Cosl Rate -(mremlyr) Volume (m3 Volume (in3 (person-rem) (person-rem) (S millions) (S millions) (SKlmremlyr) (S millions) (S millions) (SKhnmrem/yr
100-60 16 16 6.3 6.3 0.14 0.14 4 0.32 0.32 860-30 22 38 0.1 6.4 0.05 0.19 2 0.28 0.60 930-25 5 43 0.0 6A 0.01 0.20 2 0.07 0.67 1425-15 16 60 0.3 6.7 0.04 0.25 4 0.21 0.88 2115-10 16 76 0.0 6.7 0.03 0.28 7 0.21 1.09 4110-3 41 117 6.7 13.4 0.21 0.49 29 0.64 1.72 913-0.3 87 204 7.4 20.8 0.32 0.80 117 1.24 2.96 458
0.3-0.03 90 294 7.7 28.4 0.33 1.13 1,204 1.28 4.24 4,726
i_ 50-Year SAFSTOR
50 Disposal Cost $35 Disposal CostCost per Cost per
Reduction Incremental Cumulative Incremental Cumulative Reduction in Incremental Cumulative Reduction inResidual Incremental Cumulative Occupational Occupational Concrete Concrete Residual Do Concrete Concrete Residual Do.
Dose Rate Concrete Concrete Dose Dose Disposal Cosl Disposal Cosl Rate Disposal Cost Disposal Cost Rate(mrem/yr) Volume (in3 Volume (m3 (person-rem) (person-remn) (S millions) (S millions) (SK/mrem/yr) (S millions) (S millions) |(SK/mne/yr)
100-60 14 14 0.00 0.00 0.03 0.03 1 0.17 0.17 460-30 22 35 0.00 0.00 0.05 0.08 2 0.28 0.45 930-25 3 38 000 0.00 0.01 0.08 1 0.04 0.49 725-15 16 54 0.00 0.00 0.04 0.12 4 0.21 0.70 2115-10 11 65 0.01 0.01 0.13 0.25 25 0.24 0.94 4810-3 35 101 0.00 0.01 0.08 0.33 1 1 0.45 1.39 653-0.3 73 174 0.00 0.01 0.27 0.59 100 1.05 2.44 387
0.3-0.03 79 253 0.01 0.02 0.29 0.88 1,056 1.12 3.56 4,148

zC9
Table C.2. 1.2. Summary of Costs and Occupational Dose for Decontaminationof the Reference Nuclear Power Plant Floors/Walls
l
0
Decommissioning Soon ter Shutdown 50-Year SAFSTOR
$50/ft3 $350/ft3 $50/ft3 $350/ft3
Concrete Disposal Dismosal Concrete Disposal DisposalConcrete Volume VolumeThickness Residual Requiring Occupational Building Building Residual Requiring Occupational Building BuildingRemoved Dose Rate Disposal Dose D&D Cost D&D Cost Dose Rate Disposal Dose D&D Cost D&D Cost
(cm) (mremly) (MI) (person-rem) (S millions) (S millions) (mrem/yr) (m3) (person-rem) ($ millions) (S millions)
0.3175 36,000 90 2.4 0.6 1.5 535 90 0.003 0.6 1.5
0.6350 4,100 104 3.8 1.0 2.1 376 104 0.005 1.0 2.1
0.9525 220 116 5.2 1.3 2.6 210 116 0.007 1.3 2.6
1.2700 10.4 129 6.6 1.7 3.1 94 129 0.009 1.7 3.1
1.5875 0.28 142 8.0 2.1 3.6 33 142 0.011 2.1 3.6
1.9050 0.0035 155 9.4 2.4 4.1 9.5 155 0.013 2.4 4.1
2.2225 <0.003 168 10.8 2.8 4.6 2.2 168 0.015 2.8 4.6
2.5400 <0.003 181 12.2 3.2 5.1 0.39 181 0.017 3.2 5.1
2,8575 --- ... --- --- --- 0.056 194 0.056 3.5 5.6
3.1750 --- --- --- --- --- 0.006 207 0.006 3.9 6.1

r A;
Table 2.1.3. Incremental Costs and Occupational Dose for Remediation ofContaminated Soil at the Reference Nuclear Power Plant(Unrestricted Land Use, Deposition on Soil Surface, with Soil Washing)
slwio Itoul CAMst S50S DiSPeOn Colt S3503L Diwosl CastC Pet rCas PeM Cas"e
Rdudi 1r 1 C l n Redi h ReO o in Redutim ihiReil Inanul Cmlat O t l Optlesml Residwl Dose Reddal Doew Rsidwl DosDe Rate Soll VoNM Sol Voet Dose DO"e Inew ltul Citdatifs Rate I kcremetal Ci"0120t Rate baemeut coA e pR(ow"Onlw (ffl) (in')~ (paso-wl in frisu-w"cmos ) we Cos (3M (SlhmnWenYr) Costm (1) Ceas () 3 un, cost (3K) cat (SK)
ffig10040 10 10 2 2 6.6 7 0.16 14.4 14 036 56.6 57 1.4260W30 10 20 2 4 6.3 13 0.21 12.6 27 0.42 53.5 110 -1.7t30-25 2 22 0 4 1.6 1 0.32 3.2 30 0.65 13.7 124 2.7325-15 6 2t I 5 3.9 Is 039 7.3 31 0.71 32.3 157 3.2315.10 5 33 1 6 3.6 22 0.72 3.5 47 1.70 31.t 1i 6.3510-3 23 61 5 1 5 1.4 40 2.63 33.0 Is 5.43 156.6 343 22.31
3.0.3 66 128 12 23 43.6 t4 16.14 89.5 174 33.16 370.5 715 137.210.30.03 33 161 6 29 25.3 110 95.64 44h 219 163.26 184.6 900 633.76
100460 13 3t 3 3 50.2 50 1.26 59.4 59 1.49 137.2 137 3.4360.30 15 34 3 6 102 60 0.34 21.6 at 0.72 37.0 224 2.9030-7' 3 36 0 7 1.7 62 0.35 3.4 34 0.69 14.6 239 2.9125-14 7 43 3 4.5 67 0.45 9.0 93 0.90 33.1 277 3.11s15-1 5 48 1 9 3.3 70 0.65 6.5 100 1.30 27.6 304 5.5210-3 13 61 2 I1 .5 7t 1.22 13.3 its 262 73.3 371 10.433.0.3 61 123 11 22 40.3 119 14.94 33.0 201 30.75 343.0 721 127.02
0.3-0.03 44 167 a 30 29.0 143 10732 60.4 262 223.71 247.1 96s 915.31
1000 ., . . . .60.30 - . . . .30-25 - - . . . .25-15 . . . . . . . .
10.3 27 27 S 5 56.0 56 t.00 71.0 71 10.14 135.9 186 26.563.3 35 62 6 11 23.0 79 3.52 43.5 119 17.97 196.3 333 72.91
0.30.03 77 139 14 25 50.5 130 117.03 104.6 224 337.50 430.1 13 1
C-;4
U:0Ak'0ON

zc
rxi
9
I
r)
Table 2. 1.4. Incremental Costs and Occupational Dose for Remediation ofContaminated Soil at the Reference Nuclear Power Plant(Unrestricted Land Use, Deposition on Soil Surface, Direct Disposal of Soil)
SI10/fl' Diosl Cost SSO/fl' Dispsal Cost 5350/fl' Dispsl CostCoat per Cot per Cost pes
Reduction in I _I9MGA1 Ciulalive Reduction in Reduction in Reduction in
Residual b cv tl Cumulative OCCupational OCcupation Residual Dose Residual Doe Residual Dose
Dose Rate Soil Volune Soil Volume Dose Dowe 1nmmel Cumulative Rate Inemental Cumulative Rate IncEmeMtal Cumulative Rate
(nem/Wl) (i) (mn') (par-1-mm") (Perpo---) Cost (SK) Cost (SK) ($Kln1 'YI_) Cost (SK) Cost (SK) (SKm ') Cott(SK) CostK(3K) SK/ r)
Eugh100-60 tO to 2 2 5.9 6 0.15 23.5 23 0.59 129.0 129 3.23
60-30 10 20 2 3 5.7 12 0.19 22.7 46 0.76 124.9 254 4.16
30-25 2 22 0 4 1.4 13 0.29 5.5 52 1.09 31.5 285 6.31
25-15 6 21 1 5 3.5 16 0.35 13.1 65 1.31 75.S 361 7.58
15-10 5 33 1 5 3.2 20 0.65 13.5 78 2.70 71.6 433 14.33
10-3 28 61 5 10 20.6 40 2.94 64.1 143 9.26 361.4 794 51.62
3-0.3 66 123 11 21 43.1 83 15.96 155.2 298 57.47 S57.5 1,652 317.59
0.3-0.03 33 161 5 26 19.4 103 71.96 78.7 377 291.34 428.6 2,080 1,587.58
Mediun100-60 It I 3 3 14.9 15 0.37 43.4 43 1.0O 237.7 238 5.94
60-30 15 34 3 5 9.1 24 0.30 37.0 S0 1.23 200.6 433 6.69
30-25 3 36 0 6 1.5 26 0.31 5.8 S6 1.17 33.6 472 6.73
25-15 7 43 1 7 4.0 30 0.40 15.2 101 1.52 87.9 560 1.79
1I-10 5 4S I 8 2.9 32 0.59 12.4 114 2.48 65.1 625 13.02
10-3 13 61 2 10 7.6 40 1.09 30.2 144 4.31 167.7 793 23.95
3-i.3 61 123 10 20 40.2 S0 14.88 144.2 288 53.39 794.0 1,517 294.06
0.3-0.03 44 167 7 27 30.0 110 111.17 103.2 391 382.06 570.0 2,157 2,111.01
100-60 .- - -
60-30 - - . .
30-25 - - . .
25-15
15-10 - .. . . . .
10.3 27 27 4 4 20.1 20 2.36 64.2 64 9.17 351.5 352 50.22
3-0.3 35 62 6 10 20.6 41 7.62 S1.7 146 30.26 452.5 804 167.60
_0.03 77 139 12 23 49.3 90 182.47 179.8 326 666.00 993.4 1,798 3,679.40

Table 2.1.5. Incremental Costs and Occupational Dose for Remediation ofContaminated Soil at the Referece Nuclear Power Plant(Restricted Land Use, Deposition on Soil Surface, with Soil Washing)
f
S.10V'Dhpo1CM SW D 1 Cos s330M Dsm tOalc Ct.fCM per C I
Redttoi ba" maft d gigA" Rteduet in Redti" in Reductj inResdIl bI C Ow u Oo_1 0 1 Reidul Dos RdsIN Don Residl Dos
DmKe% SolVem SoVon Dow Dai SAftl cuImrai Rst hesensetu Cwwnflu Mt hbmemenl C;ul RPA., M=kL L~k~ Cmt(M GoMMS (Mi"MA), Cod(S M CM, Cd(M CM=
W300660-30 . .-30-25 - - - -. . .25-15 . . . .15-10 12 12 2 2 46.0 46 9.21 51.1 51 10.21 101.7 102 20.3410-3 27 5 7 17.6 64 2.51 36.3 87 5.19 149.6 231 21.37
3403 23 62 4 11 13.2 79 5.63 31.6 119 11.72 129.6 331 4tOI03-0.03 i3 79 3 14 11.6 90 43.01 23.1 142 83.73 9t.0 479 36291
300-0 * 2 . . .60-30 . . . . . .
30.2 25 . . . .
25-15 - - - -* -
15.10 . . . . .-
103 21 21 5 3 56.4 56 3.05 72.9 73 140 190.1 190 27.153.0.3 21 56 5 10 1M6 73 6.90 3.4 ti1 14.24 153.4 348 3361
03-0.03 I1 74 3 13 11.6 n7 43.11 23.2 135 05.93 9t.2 447 363.77
100-40 '. -, , . . . . . .-
60.30 . - . -30-25 . . . . . .25-15. .... .....15-10 . . . . . . .
10-3 . . . . . . . . .-
340.3 17 17 3 3 49.4 49 -It31 51.3 33 21.43 130.4 130 43.300.30.03 35 52_ 6 9 22.3 72 14.23 46.7 Jos 172n 193.3 324 716.00
A94.00%
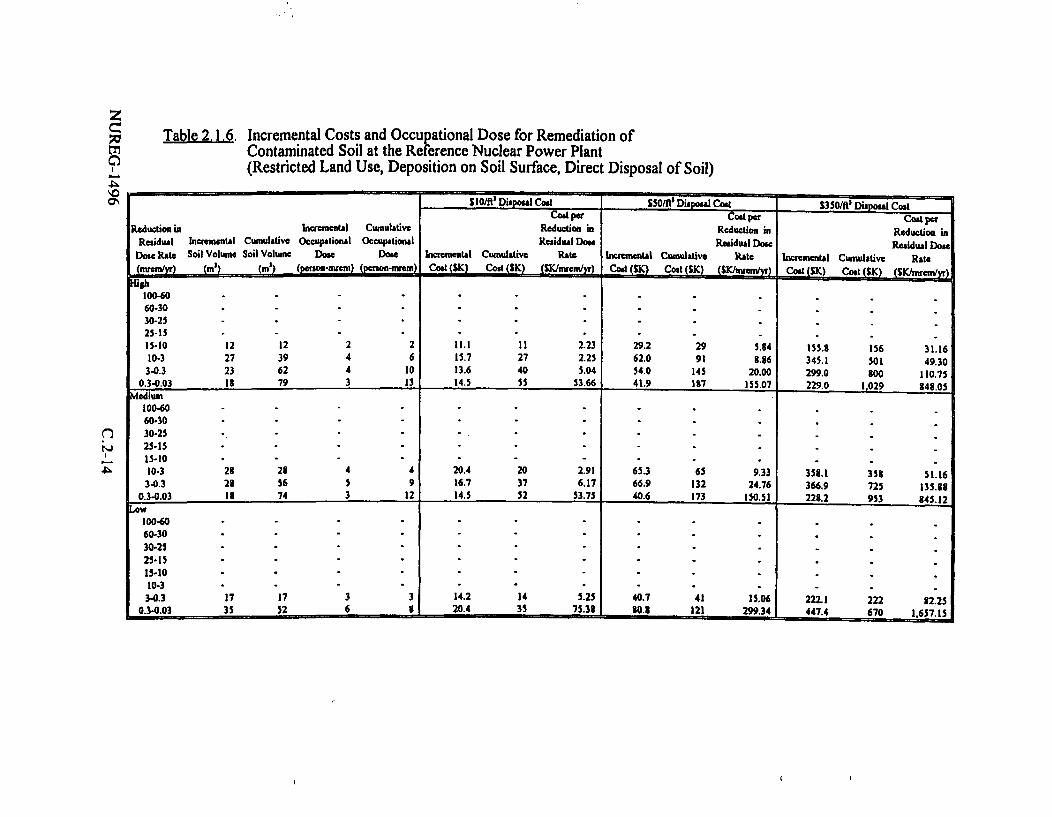
z
C
;V
-P
4k
Table 2.1.6. Incremental Costs and Occupational Dose for Remediation ofContaminated Soil at the Reference Nuclear Power Plant(Restricted Land Use, Deposition on Soil Surface, Direct Disposal of Soil)
SW/Rl Disposl Cost 550/fl' Disposal Cost 30/f Disposal CostCost per Cot per cost
Reduction in Incremental Cumulative Reduction in Reduction in Reduction inResidual Incremental Cumultive Occupational Occulltio l Residual Dose Residual Dose Residual Dose
Dose Rate Soil Volume Soil Volume Dose Dose Incemental Cumulative Rate Ircunul Cumulative Rate Incremental Cumulative Rate(mxem/yr) (i) (m) (personmrem) (peonn-rem) Cost 5K ost (SK) (SK/mrem/yr) C ) Cost (5K) (SLCln ) Cost (SK) Cost (SK) (SK/mrem/w)
100-60 . . , . . .
60.30 , . . . . .30-25 . , , . . . .
25-15 , , . . . . .15-10 12 12 2 2 11.1 11 2.23 29.2 29 5.84 155.8 156 31.1610-3 27 39 4 6 15.7 27 2.25 62.0 91 3.86 345.1 501 49.30
3-0.3 23 62 4 10 13.6 40 5.04 54.0 145 20.00 299.0 300 110.750.3-0.03 18 79 3 13 14.5 55 53.66 41.9 137 155.07 229.0 1,029 348.05
Medium10060 . . . . . . . .6030 - - - . . . . . .30-25 . , . . . . . .25-15 . . . , . . . .15-10 - - - .10-3 29 23 4 4 20.4 20 2.91 65.3 65 9.33 358.1 3S5 51.16
340.3 23 56 5 9 16.7 37 6.17 66.9 132 24.76 366.9 725 135.880.3.0.03 18 74 3 12 14.5 52 53.75 40.6 173 150.51 228.2 953 845.12
LOw100-60 . , . . . . .60.30 , , . . . .30-25 . , , , . .25-15 . . . , . . .15-10 . , , , . . .10-3 . . . . . .
3-0.3 17 17 3 3 14.2 14 5.25 40.7 41 15.06 222.1 222 32.250.3-0.03 35 52 6 5 20.4 3S 75.31 10.3 121 299.34 447.4 670 1,657.15

Table 2.17. Incremental Costs and Occupational Dose for Remediation ofContaminated Soil at the Reference Nuclear Power Plant(Unrestricted Land Use, Deposition on Soil Surface, with Soil Washing, 50-Year SAFSTOR)
slo' Dispoal cod Stff' DisICposalCat 350 'Dimol CostCodt per Cst per Costper
R inuett blanbue Ol Ca iw Reduction in Reduction in Reduetiou inRaidl Incrm ental Cubtlas Oopetiond 0eTo1 ReridualDos RedualDos RidualDoe
DwRate Soil WoN. Soil Volume Does Dovs bwernectol Cant"ive Rate hommental OWuAtive Rft Inclrn... Cimalati,( (i 3 Ln) (C Coost(SOt (SAReedw) cot () Costm(S) (
10040 ' . . . _ . . .
60-30 -** -.-
30-25 . . . . . . . .25-IS -* . _ . . ..
15-10 . . . _ . _-
10-3 21 21 4 4 519 52 t41 67L7 63 3.96 151.0 151 21.573-03 m 413 70 74 265.9 31t 91.43 533.5 59 197.59 2.194.2 2.345 *12.6t
03-'.03 75 4N 13 37 49.1 367 111.96 100.6 67 372.49 417.2 2?762 1545.16
10040 . . .6030 . . _30-25 . . . .25-IS . _ , -
15-?10 . _ , -
10-3 - - -".3 106 106 19 19 MOt.0 lo 39.n 171.5 17 66.09 621. 62 232.65
0.3-0.03 342 441 61 1O 232.9 341 162.7 465.1 644 1,722.46 1,913.1 2541 7,015.65
60-30 * - - -.30-25 * * * -_ . . _ _25-15 . . . . . .15-10 . . . . .
10-3 . _ . _ _ _ .3.03 - _ . . . . .-
0.3-0.03 373 373 67 67 291.6 292 1,0".1 541.4 541 2,005.33 2.122.0 2O122 7,t59.14
l.A
zC:
9
0.
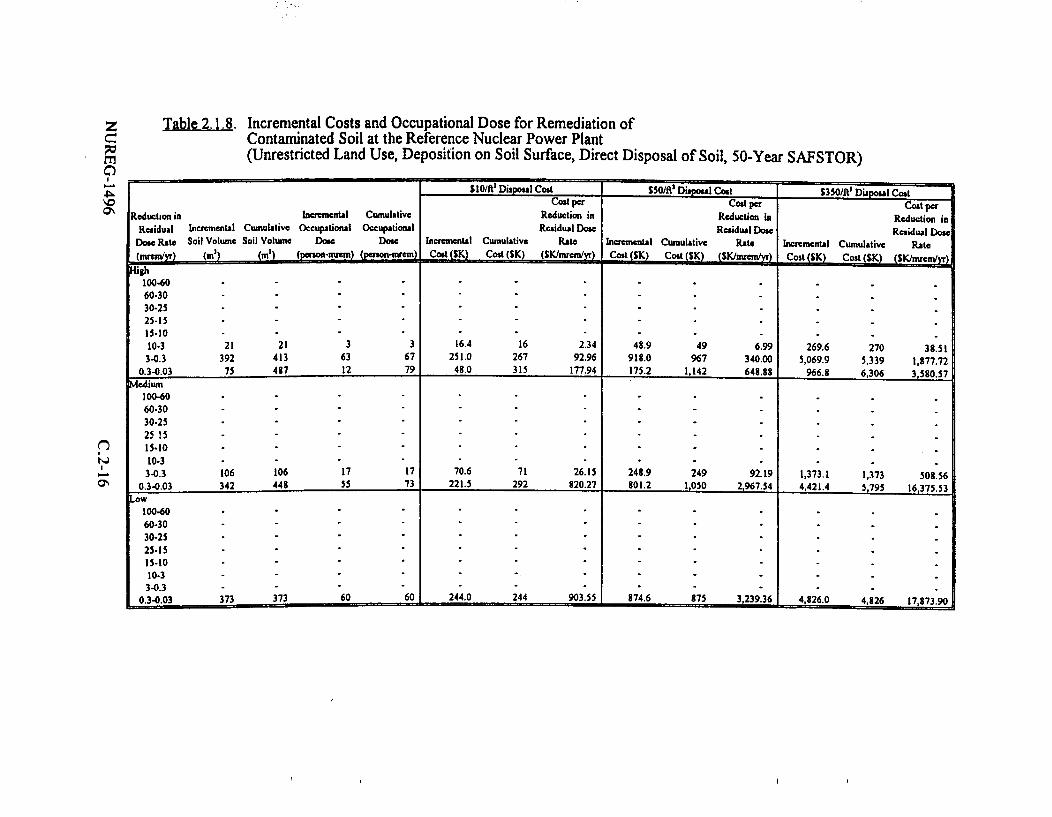
zCx7
4~-
0c
Table 2.1.8. Incremental Costs and Occupational Dose for Remediation ofContaminated Soil at the Reference Nuclear Power Plant(Unrestricted Land Use, Deposition on Soil Surface, Direct Disposal of Soil, 50-Year SAFSTOR)
S0/ft' Dispoal Coat 550/ft' Disposal Cost 5330/fl' Disposal CoatCost per Cost per Coat per
Reduction in Inctmfental Cumulative Reduction in Reduction in Reduction inResidual netemental Cumulative Occupational Occupational Residual Dose Residual Dose Residual Dose
Dose Rate Soil Volume Soil Volume Dose Dose Incremental Cumulative Rate Incremental Cumulative Rate Incremental Cumulative Rate(mteiy, (i') (in') (pEon-ircm) (teson-arvem) Cost(SK) Coat (SK) (SK/mrem/yr) Cost (SK) Co (SK) (SK/Ema CotSK) Cos t(K) (tK/mt mlyr)
ffigh100-60 . . . . . .60-30 - - - - . . .
30.25 , . . .25-15 - - - - .15-10 - - - -10-3 21 21 3 3 16.4 16 2.34 48.9 49 6.99 269.6 270 33.513-0.3 392 413 63 67 251.0 267 92.96 918.0 967 340.00 5,069.9 5,339 1,877.72
0.3-0.03 75 487 12 79 43.0 315 177.94 175.2 1,142 648.88 966.3 6,306 3,580.57Medium
100-60 - , . . .60-30 - - - -. . .30-25 - - - - .255 - - - - . .13-10 . . , . . . .10-3 - - - - . . .
3-0.3 106 106 17 17 70.6 71 26.15 248.9 249 92.19 1,373.1 1,373 508.560.3-0.03 342 448 55 73 221.5 292 820.27 801.2 1,050 2,967.54 4,421.4 5,795 16,375.53
ow100-60 . . . . . . . .60.30 - -. . .. .30-25 * ' ' . .25-15 - - -' .15-10 . . .10-3 , . . . .
3-0.3 - - * - . . .0.3-0.03 373 373 60 60 244.0 244 903.55 874.6 875 3,239.36 4,326,0 4,326 17,173.90
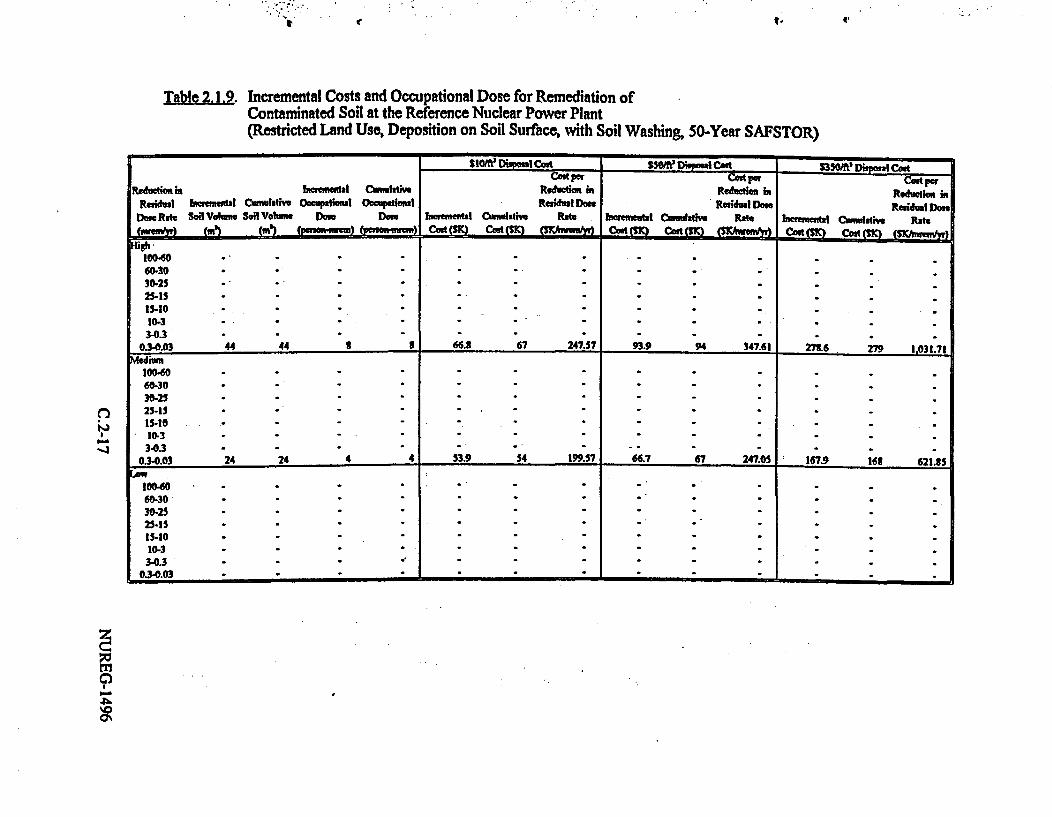
t V I-if t'
Table 2.J2. Incremental Costs and Occupational Dose for Remnediation ofContaminated Soil at the Reference Nuclear Power Plant(Restricted Land Use, Deposition on Soil Surface, with Soil Washing, 50-Year SAFSTOR)
SIOft' Dispsl Cod - 501' DiS m1 Cut 3501' Dispoul CstCost Pe Coil r Cost PMr
dutint ImMrel C ltW Redt m Redctio in Rg inReiul b Iftm:M*l CumIlti" OOUPutMI O "tioml Red~ual Den Reridual Dose Residual D
DM Rite S0tl Volue Soil Volue DMe Dm Incremenut Cwsultiv RPa bW91 ftal CItw 'bRiM PM bw. lbt Cumulative RateuC CodS (,K)
10040 .- . . . .. .
60410 . . . -
30.25 - ' -. . .. .
2515 . . .. . .
103 - -' ' . ..3-0.3 . . . . . .
0.34.03 44 44 t I 66.3 67 247.57 93.9 94 347.61 273.6 279 1,031.71
100 60 - -' ' .
60.30 - . . . .30-25 - . . . . . . . .
25-15 - . . .15.10 . - . . . . . . .10-3 - - .-
304.3 . . . . . . . . .03-0.03 24 24 4 4 53.9 54 199.57 66.7 67 247.05 167.9 163 621.35
10040 - . . . , . . -
60.30 - . - . .30-25 - . . - .25-1 . . .15-10 . . . . . . . . .10-3 - - . .3-0.3 . . . . .
0.340.03 - _ . . . .
-3
WM93A-

zri-PO
Table 2.1.1 0. Incremental Costs and Occupational Dose for Remediation ofContaminated Soil at the Reference Nuclear Power Plant(Restricted Land Use, Deposition on Soil Surface, Direct Disposal of Soil, 50-Year SAFSTOR)
S10/ft Disposl Cost 550/f1' Dihpel Cost 5350/ftl' Disposal CostCoot per Cost per Cost per
Reduction in IncrmentAl Cumulative Reduction in Reduction in Reduction inResiduAl Incremental Cumulbtive OccuPational OccupAtional ResiduAl Dose Residual Dose ResiduAl Dose
Dos RAte Soil Volume Soil Volume Dose Dose Incremental Cumulative Rate Incremental Cumulative Rate Incremental Cumulative Rate(nueanyr) (Ms)m l)mn'- -)peSOnm (pon-_e_ Ct_) Cost_(SKI (SK/mrantyr) ___ Coat (Ko Cost (SK) (SK/mrem/yr)
8igh100-60 - - - . .60-30 - ' '30-25 - - . . .25-15 , . , .15-10 .10-3 - - - .
3-0.3 , . .0.3-0.03 44 44 7 7 29.7 30 61710 5170 4 2O3.13 003 5652 565 2,093.26
Medium100-60 - -- -60-30 - - - . .30-25 - - ,25-15 - - - . . .15-10 - - . .10-3 - - . . . I
3403 .0.34003 24 24 4 4 IS. I Id 67.20 57.0 57 211-13 310.0 310 1,14U 12
Low100-60 - - .60-30 - - - .30-2525-15-.....15 10,10-3'''..
3-0.3--0.3-0.03-.'''
X
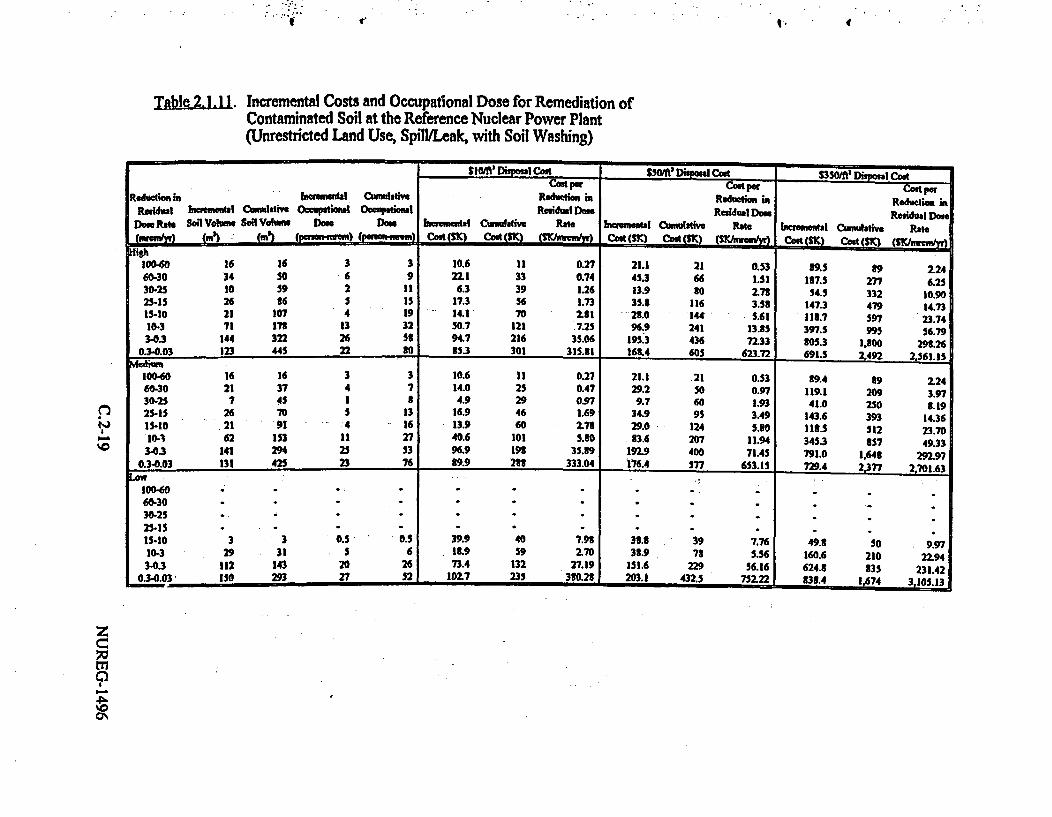
* f *
Tble 2.I.. Incremental Costs and Occupational Dose for Remediation ofContaminated Soil at the Reference Nuclear Power Plant(Unrestricted Land Use, Spill/Leak, with Soil Washing)
320/fl Disposal Codt 551' Mipsl C4st S330/ft Disposal CostCotpe osf Cost PeM
Reduction in bleroIdal Cuinmlati Reducton m Reduction in Reduction inResidual hrmemental Cosnulative Ocuetonal OCeuvatidm Residsal Doe Residual Does Residual Cose
DowRaft Svoiohxre Soil Vobien DaMe DCkn isrm l Csunalaie Rate bnmvmftal CNMulaie Rate bwmement Crnutative Ratem= =)(C0st(5 Cot (SK) (StJMMW,) cost (SK) cost () (s
High10040 16 16 3 3 10.6 11 0.27 21.1 21 0.53 89.5 89 2.2460.30 34 so 6 9 22.1 33 0.74 45.3 66 1.51 137.5 m 6.2530.25 10 59 2 11 6.3 39 1.26 13.9 30 2.7S 54.5 332 10.9025-15 26 t6 5 is 17.3 56 1.73 35.8 116 3.58 147.3 479 14.7315-10 21 107 4 19 14.1 70 2.8 -28.0 144 5.61 118.7 597 -23.7410-3 71 173 13 32 50.7 121 .7.25 96.9 241 13.35 397.5 995 56.79
3-0.3 144 322 26 St 94.7 216 35.06 195.3 436 72.33 805.3 1.300 292.260.3-0.03 123 44 22 S0 35.3 301 31S.3I 16S.4 605 623.72 691.5 2.492 2,561.15
10040 16 16 3 3 10.6 11 0.27 21.1 21 0.53 39.4 19 2.2460-30 21 37 4 7 14.0 25 0.47 29.2 50 0.97 119.1 209 3.9730-25 7 45 1 a 4.9 29 0.97 9.7 60 1.93 41.0 2S0 8.192S-15 26 70 5 13 16.9 46 1.69 34.9 95 3.49 143.6 393 14.3615-10 21 '91 4 16 13.9 60 2.73 29.0 124 5.30 t13.5 512 23.7010-1 62 153 11 27 40.6 101 5.30 83.6 207 11.94 345.3 837 49.33
340.3 141 294 25 53 96.9 19S 35.39 192.9 400 71.45 791.0 1,643 292.970.3-0.03 131 425 23 76 19.9 233 333.04 176.4 577 653.15 729.4 2,377 2,701.63
100.60 . . . . . . . .60-30 - * - - . . .30-25 . . . . .25-1S - - - . . . .15-10 3 3 0s 0.3 39.9 40 7.9 33.1 39 7.76 49.3 50 9.9710.3 29 31 S 6 18.9 S9 2.70 33.9 78 5.56 160.6 210 22.94
3-0.3 112 143 20 26 73.4 132 27.29 151.6 229 56.16 624.8 835 231.4203S.03 1S0 293 27 52 102.7 235 330.28 203.1 432. 75222 33.4 1.674 3.105.13
i4I
4D
zc)
AI-P.r~'0(7s

z
C);0
A
0
Table 2.1.12. Incremental Costs and Occupational Dose for Remediation ofContaminated Soil at the Reference Nuclear Power Plant(Unrestricted Land Use, Spill/Leak, Direct Disposal of Soil)
S10/fl DisEosal Cost _50/ft' Disposal Cod t350/ft' Disposal CostCost per Cost per Cost per
Reductinin mtal Cunulative Reduction in Reduction in Reduction inResidual Incremental Cwnuulativw Occupational Occupational Rcsidual Dose Rcsidual Dose Residual Dose
Dose Rate Soil Volume Soil Volume Dos" Doe Incremental Cwuulative Rate Incremental Cumulative Rate Incremental Cumulative Rate[fii) n (P-- ) (Peo_-f =) Coat (SK) Cost (SK) (SK/nrnu/yr) Cost (SK) Cost ($K) (SK/mranmyr) Cost (SK) Co t (5K) (SK/nurcm/
100-60 16 16 3 3 9.5 9 0.24 38.5 33 0.96 209.4 209 5.2360-30 34 50 5 a 23.3 33 0.79 73.5 117 2.62 434.1 643 14.4730-25 10 59 2 10 5.6 39 1.13 21.3 13S 4.26 122.3 766 24.5525-15 26 96 4 14 15.5 54 1.55 62.4 201 6.24 341.1 1,107 34.1115-10 21 107 3 17 12.6 67 2.52 50.2 251 10.03 276.8 1,384 55.3510-3 71 173 11 29 45.3 113 6.55 165.5 416 23.64 917.0 2,301 131.003-0.3 144 322 23 52 92.9 206 34.39 338.2 755 125.27 1,S63.3 4,164 690.I1
0.3-0.03 123 445 20 72 10.3 286 299.26 288.7 1,043 1,069.26 1,596.5 5,761 5,912.83Medium
100-60 16 16 3 3 9.5 9 0.24 37.1 37 0.93 207.9 208 5.2060-30 21 37 3 6 12.5 22 0.42 49.S 37 1.66 274.8 483 9.1630-25 7 45 1 7 4.3 26 0.S7 17.7 105 3.54 95.9 579 19.1S25-15 26 70 4 11 19.2 45 1.92 59.6 164 5.96 331.2 910 33.1215-10 21 91 3 15 12.4 5S 2.48 49.5 214 9.91 273.3 1,183 54.6510.3 62 153 10 25 40.4 93 5.73 145.1 359 20.73 799.4 1,932 114.21
3-0.3 141 294 23 43 91.2 190 33.78 330.6 690 122.46 1,325.9 3,308 676.250.340.03 131 425 21 69 85.0 275 314.67 305.7 995 1,132.36 1,633.5 5,497 6,253.54
LAw100-60 . . . . . . . .60-30 , . . . . .30-25 - - . . . . . .25.15 . . . , . . . . . .15-10 3 3 0.4 0.4 5.6 6 1.13 7.1 7 1.42 34.6 35 6.9310-3 29 31 5 5 16.9 23 2.41 66.4 73 9.43 370.5 405 52.933-0.3 112 143 18 23 73.9 96 27.36 262.5 336 97.24 1,445.5 1,351 535.37
0.3-.03 IS0 293 24 47 96.4 193 356.93 350.1 6S6 1,296.81 1,933.4 3,739 7,179.09
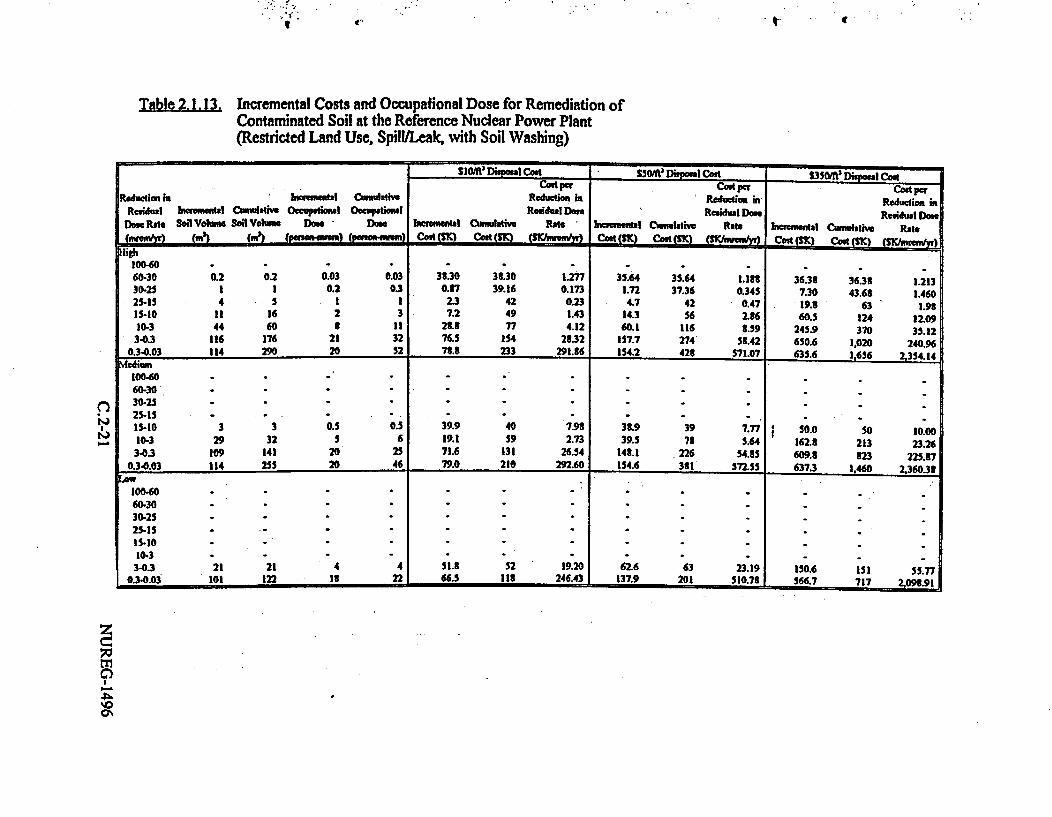
Table 2.1.13. Incremental Costs and Occupational Dose for Remediation ofContaminated Soil at the Reference Nuclear Power Plant(Restricted Land Use, SpilVLeak, with Soil Washing)
slwit Disposl Cut 350fl Disposal Cost S350/ft Disposal CodtCotptCotptCost pet
Reduction in honemntal Cumulative Reduction in RePSWion mi Reduction imResidual 11MVIMMI&Itii CI SiIW Occupa1tional Occpatioal Residual Do" Residual Dose Residual Dose
DoseRate oVONM SoilVolmus Doe Dowss IJmemeal Cumlstive atoe hcenrmntal Cumulative Rat Inemntal aulatiw Rate__anr (pnnmm (VtaMm Cod(= Cs5Z) o~StC S hHie/r in) (n) (ISwVm poh Vf) Ol(i) Cod=(i) SCwenw COMM(SC Cost SKC SC~vi~) gCut Si) Cost (Si) SCussw
100-60 . . . . .-60-30 0.2 0.2 0.03 0.03 33.30 33.30 1.277 35.64 35.64 1.133 36.33 36.38 1.21330.25 1 1 0.2 0.3 0.7 39.16 0.173 1.72 37.36 0.345 7.30 43.68 1.46025-15 4 5 I I 2.3 42 0.23 4.7 42 0.47 19.8 63 1.9S15-10 11 16 2 3 7.2 49 1.43 14.3 56 2.86 60.5 124 12.0910-3 44 60 3 it 2t.3 77 4.12 60.1 116 8.59 245.9 370 33.12
3-0.3 116 176 21 32 76.5 154 23.32 157.7 274 53.42 650.6 13020 240.960.3-0.03 114 290 20 52 73.3 233 291.36 154.2 428 571.07 635.6 1,656 2,354.14
Medium100-60 -. .60-30 * - -. . . . .30-25 - - -
15.10 3 3 0.5 0.5 39.9 40 7.98 38.9 39 7.77 50.0 50 10.0010-3 29 32 5 6 19.1 59 2.73 39.5 73 5.64 162.3 213 23.26
3-0.3 109 141 20 25 71.6 131 26.54 148. 226 54.85 609.3 323 225.370.340.03 114 255 20 46 79.0 210 292.60 154.6 331 572.55 6373 1,460 2,360.33
10060 - . . . . .60.30 . . . . . . .30.25 - . . . . . .25-15 . . . . . . .15-10 * - - . . . . .
3-0.3 21 21 4 4 51.3 52 19.20 62.6 63 23.19 150.6 151 55.770.34.03 30i 122 Is 22 66 37.9 201 510.73 566.7 717 2,09.9
t~4
M3
'0-A
%OaM

Z Table 2.1.14. Incremental Costs and Occupational Dose for Remediation ofContaminated Soil at the Reference Nuclear Power Plant(Restricted Land Use, Spill/Leak, Direct Disposal of Soil)
S10/fl Disposal Cost $50/ft' Dipoul Cost S350/ft' Dispooul CodCod per Cod pe Cog per
Reduction in In"ental CQ'ulative Reduction in Reduwtion in Reduction inResidul Inerencl Cumulative Occupational Occupational Residual Dos Residual Dose Recidual Dose
Doe Rats Soil Volume Soil Vohmc Dos Dos" hcelahl Cwmulative Rate Imsmental Cuinublaivc Rate Incremental Cumulative Rate
(.M/ra ) (ml) (MI) (Pasaawem) (Peroo-mcm) Cos (8K) Cod (SK) (sK-mnrem/?) £ (S) a*(SKLSIWwerem/) Cost (SK) Cod (SK) (SK/mrem/wr)
100-60 - - - -
60-30 0.2 0.2 0.03 0.03 4.20 4.20 0.140 1.71 1.71 0.057 3.53 3.58 0.11930-25 1 1 0.2 0.2 0.77 4.98 0.15 2.92 4.64 0.58 16.86 20.44 3.3725.15 4 5 1 1 2.1 7 0.21 7.9 13 0.79 45.6 66 4.5615.10 11 16 2 3 6.4 13 1.28 25.5 33 5.10 141.0 207 23.1910-3 44 60 7 10 25.3 39 3.63 102.6 141 14.66 567.0 774 81l0l
3-0.3 116 176 19 29 76.6 116 28.37 272.9 414 101.06 1,505.0 2,279 557.410.3-0.03 114 290 IS 47 75.0 191 277.84 265.5 679 933.46 1.469.1 3,748 5,441.12
100-60 - , . - -
60-30 - - - . . .. .30-25 - . . . .
^ 25-15 - - . . .15-10 3 3 0.4 0.4 5.6 6 1.13 7.2 7 1.43 35.0 35 7.00
bj 10.3 29 32 5 5 17.1 23 2.45 67.3 74 9.61 375.7 411 53.67I 3-0.3 109 141 13 23 63.2 91 25.25 255.2 330 94.53 1,409.6 1,820 522.07
0.3-0.03 114 255 13 41 75.2 166 278.50 267,5 97 9 7 1474.3 3,295 5,460.45Low
100460 . . .. . .60-30 - - - . . . . .30-25 - . .25-15 - . . . . .15.10 . . . . . . . . .10-3 - . . . . .
3-0.3 21 21 3 3 16.3 16 6.04 48.7 49 18.06 268.7 269 99,510.3-0.03 101 122 16 20 63.6 s0 235.60 238.0 237 333.31 3,309.9 1,579 4,3

Table 2.1.15. Incremental Costs and Occupational Dose for Remediation ofContaminated Soil at the Reference Nuclear Power Plant(Unrestricted Land Use, Spill/Leak, with Soil Washing, 50-Year SAFSTOR)
t.
slo/f im ic Cg _ /, Diq.aI Cad _ 350 D Iosa CostCotptCut pet Cod per
Recretial Cumalati" Reductio in Reducion irk Reducion in
Ridal JI boemotl Ceaut Ovesuatl O _1i"I Residual Dow Residal Don Rftjul DonDesRte Soil Volume Sol VOMe DoMe Doe bwaeebt Cumulatiwe Rate Increnental Cumlative Rate iftorenmta Ciomulativ Rate(nWe ,) n (MI pe) ("M". Cost (M) Cut(SK) OlCAu y) Cu( C CCut (SIC) Cost (SK) (s.
304 . - . , . -,
60-30 . . . ,30-25 *. . .25-15 . : , , . _ . .
15-10 19 19 3 3 50.6 51 10.13 60.23 60 1105 140.49 140 21.1010.3 36 55 6 10 23.8 74 3.39 50.0 110 7.14 203.2 344 2902
3-0.3 173 22m 31 41 117.9 192 43.63 234.8 345 H6.91 963.5 1,312 318.690.3-0.03 224 453 40 -31 151.6 344 561.66 304.7 650 1,121.45 1,255.6 2,568 4,650.30
Meflium10040 - - -.60-30 - . . . .30-25 - - - . . . .25.35 _ . , , . .
35-10 . . . . . -
10-3 14 14 2 2 47.18 47 6.74 53.35 53 7.62 111.36 ;1 15.913-0.3 91 112 I 20 64.4 112 23.87 133.73 17 49.53 549.02 660 203.34
03.0.03 213 329 39 59 147.1 259 544.90 295.66 433 1.095.04 1,217.39 1,373 4,508.85
100460 . . . .60-30 - . . . .30-25 - - . . . .25-IS , , . . . . . .Is-to . ,. . . . . . . .10-3 - - - -. . . . .3-0.3 33 33 6 6 60.0 60 22.22 30.21 30 29.71 220.79 221 81.77
0.3-0.03 124 157 22 2t 31.6 142 302.19 167.92 248 621.92 693.74 93 2.
pj
z
0
q.C)

z
C.,
Table 2.1.16. Incremental Costs and Occupational Dose for Remediation ofContaminated Soil at the Reference Nuclear Power Plant(Unrestricted Land Use, Spill/Leak, Direct Disposal of Soil, 50-Year SAFSTOR)
S .xDposl Cost S50/0' Disposal Cost £350/ft' Disposal CostCost per Coat per Cost per
Reduction un IkcMentAl CumuhAtivc Reduction in Reduction in Reduction in
Residual 1acmc~tal Cumulstivc Occuationil Occuptional Residual Dose Residual Dose Residual Dose
Dose RIte Soil Volume Soil Volume Dose Dos Incremental Cumulative Rate Incremental Cumulative Rate Inucemental Cumulative Rate
(mrcm/y) Cm' (MIn) (person-nie)(esnme) Cost (SK)_ Cost (SK) (SKhzuzm/r)_ Cost (SK) _ Cost (SK) (SKlavem/yr) Cost ($K) Cost (SK) (W/vmrcwjy)
thh100-60 . . , . .60-30 - - . .. . .
30-25 -'25-15 . , , . . . .
15-10 19 19 3 3 15.2 15 3.05 44.7 45 8.94 245.4 245 49.07
10-3 36 55 6 9 21.3 36 3.04 15.6 130 12.22 461.4 714 66.92
3-0.3 173 228 28 37 114.1 151 42.27 404.3 535 149.75 2,23S.4 2,952 129.03
0.3-0.03 224 453 36 73 144.3 295 534.34 526.1 1,061 1,948.63 2,903.4 5,856 10,753.24
Medium100-60 . . ,60.30 - -
30-2S -
25-15 - --
15-10 - - - - -
10-3 14 14 2 2 12.2 12 1.74 33.0 33 4.72 171.1 171 25.44
3-0.3 98 112 16 18 61.7 74 22.87 229.5 263 S5.02 1,267.8 1,446 469.54
0.3-4.03 21S 329 35 53 140.2 214 519.35 509.5 772 1,887.10 2,S13.8 4,260 10,421.63
Lw
100-60 ,- -
60-30 . . . .
30-25 - - ' ' . . . .
25-15 . . . . . . .
15-10 -
10-3 .- - -. . .3-0.3 33 33 5 5 23.6 24 1.74 79.0 79 29.25 430.4 430 159.42
0.3-.03 124 157 20 25 81.2 105 300.66 290.1 369 1,074.53 1,604.7 2,035 5,943.24
'2

I -.. ;,. -. . 11 I, tr r
Table 2.1.17. Incremental Costs and Occupational Dose for Remediation ofContaminated Soil at the Reference Nuclear Power Plant(Restricted Land Use, Spill/Leak with Soil Washing, 50-Year SAFSTOR)
D550 I isIo Cst S35I _o oslCostCot e Cs pet Cast pe
RehI b bi COmdfw Redatlo ih Redao in Red&io inResWal bc'm Il Cdnlal 0ceu au Oee"pi"el Reidul Dos Residul Don Riddin Doss
DoR SdlVl Soil Volon Doss Dos ber"WI C lWWd Rad Inrmenta Cumuative Rate 1nohMbIn1 CUMlstiVe Raf(wfvemk" t(m er 2 Cst C Cost 5:K) (5S,) Coimt(MK) Cotd (S5gh100-60 . . _- . ....-
60-30 . . . . .30-25 * . .25-15 . . . _15-10 . . . . . . . .
10-3 - -. .3.0.3 41 41 7 7 64.37 64.t7 24.026 39.92 39.92 33.305 261.92 261.92 97.006
0.3-.03 142 133 25 33 97.3 162 361.09 192.8 2t3 713.97 7 1057 L943.22imed
10060. - - -. .
60.30 . . . . . .30.25 . . . . . .25.15 . . - - . . . . . .3.30~l . - . , . - - .
10.3 _ . . . . . .34.3 - - - .. . .
0.3-0.03 37 3 16 16 95.49 95.49 353.634 153.61 153.61 56t933 522.97 522.97 3936.916
10040 ' ' ' ' .60-30 - _ _30-25 - -.25-15 . .15-10 . . . .- .
10-3 - . . . . . .
0.34.03 20 20 4 4 51.06 51.06 139.100 61.07 61.07 226.176 144.04 144.04 533.476
l.A
zC
C)
'.0%OON

z
ri9
Table 2.118. Incremental Costs and Occupational Dose for Remediation ofContaminated Soil at the Reference Nuclear Power Plant(Restricted Land Use, Spill/Leak, Direct Disposal of Soil, 50-Year SAFSTOR)
_S0/ft Disposal Codt S50/ft'Dia I Co}t S350/flS Dispoul CostCodt Pee Cost per od tf
Reduction in aoIemental Cumulative Reducti uction in Reduction inResidual Incmntal Cumulative Oceational Occupautional Residual Dose Residual Do"u
Doe Rate Soil Volume Soil Volume Do Do"s Incremenal Cumulative Rate In-emntl Cumulative Rate scmnul Curubtive Rate(M=Vcy) () Cm') -(Perh-m ) (Pergon-Mtem) Cost (SK) Cost (sd _ (SKhnrcm/W) Coot (SK) Cost (SK) (SK/mremyr Coat (SIC) Cost (SIC) (SK)/mnemr)
ih100-60 - .60-30 ' ' ' . . .30-25 - . . . .25-15 - - . . . .15-10 - - - . . . . ..10-3 ' ' . .. . .
3-0.3 41 41 7 7 27.97 27.97 10.359 95.43 95.43 35.345 525.41 525.41 194.5970.3-0.03 142 1t3 23 30 91.7 120 339.76 332.6 423 1,232.00 1,837.4 2.363 6,805.13
Mcdium100-60 - - - . . . . . .60-30 ' ' ' . . . .30-25 ' ' ' . . . . .25-15 - ' . . . ..15-10 * - ' . .IC-3 ' ' ' . . . .3-0.3 - . . . . .
0.3-0.03 87 37 14 14 59.46 59.46 220.229 205.48 205.43 761.038 1,128.87 1.128.87 4.110.995
100-60 - .60-30 ' . . .30-25 ' . . . .25-15 . . . .15-10 . - . . . .10-3 - . . . . .
3-0.3 _ - 1 5 - - - -5.3003 20 20 3 3 15.62 15.62 57.334 41.3 46.13 370.350, 253.56 253.56 939.099

1, � . ! :-I.. .. . -
ar) () V I
Table-2.21. Incremental Costs and Occupational Dose for Remediation ofContaminated Soil at the Reference Uranium Fuel Fabrication Plant(unrestricted Land Use, Deposition on Soil Surface, with Soil Washing)
SloW'Dispnl Cot SSOm MDiml Cos S35/W Dipl CotCoM per CIt Fer Coet -p
in hmemeuI C dwa RedICe io | Roheo In Reductim inResidual bmeInsl OM I 0 a O Pubon e 0atlpIa Resdul Doe RedulDos RIlDoe
DoRa S lVoNe SolVolmuss Ds Dos 11mental CdAnR ulal Rat hhes blt C wMho RPAe hb lfta Cunulaj Rate("M ))0) (PCuauI ) Cot(3,) CMst (SKMweak) COa (K CostA(M (SWJMMuyw3 Cottm Cost I3t)
10060 133 133 24 24 87.2 87 2.18 130.5 1S0 4.51 742.7 743 13.5760-30 156 239 21 52 107.0 194 3.57 213.0 393 7.10 373.9 1,619 29.2030-25 37 327 7 so 24.6 219 4.92 30.4 444 30.0O 209.1 It21 41.3225-11 100 426 Is 76 69.7 2tl 6.97 136.0 330 13.60 331.4 2.336 53.34IS-IO 76 302 14 90 49.7 331 9.93 102.9 633 20.39 422.9 2,309 84.5910.3 201 703 36 126 340.5 479 20.0 273.0 956 39.01 1,123.9 3,935 160.1S
3-0.3 326 1,029 11 334 21t.2 697 3O.10 442. 1.39t 163.91 1,. 5,757 674.tS0.34.03 239 1,317 52 236 19t.0 m 733.41 392.9 1.791 1,455.37 1,616.4 7,373 j5,96.67
100-60 341 541 97 97 367.9 368 9.20 735.2 735 11.38 3,026.3 3.027 75.6760-30 2U4 324 51 141 194.3 563 6.49 3t6.4 1,122 12.33 1,53t3 4,616 52.9630.25 59 m it 133 31.6 601 7.72 79. 1,201 33.91 321.2 4,944 65.6325-13 142 1,025 25 113 97.2 691 9.72 192.2 1,393 19.22 792.1 5,736 79.2115-10 99 1,124 I1 201 69.2 763 13.35 135.1 1,52t 27.02 554.8 6,291 110.97
10.1 251 .75 45 246 169.3 937 24.19 341.2 1,370 43.74 1,405.3 7,696 200.t33-0.3 312 1,757 63 313 259.5 1,196 96.11 319.4 2,339 192.37 2,133.9 9,335 792.19
0.3.03 332 2,069 36 370 213.4 1,410 790.46 424.9 2114 1,573.34 1,747.5 1.533 6.4 3
100440 , , , . 4.60-30 - ' -30-25 - - - .253-15 40 340 IS0 3I0 607.0 607 60.70 1,176.3 1,176 117.63 4,736.6 4,737 473.66i5s-0 479 1,320 36 236 327.6 933 63.51 6522 1,321 130.44 2,634.0 7,421 536.8110-3 469 1,719 U4 320 320.9 1,236 45.3 637.6 2,466 91.0 2,626.3 10,047 375.19
3.0.3 502 2,29l 90 410 338.1 1,S94 125.23 6321 3,149 2S2.37 2,309.0 12,156 1,040.3t0.34.03 364 2,655 65 475 251.9 1,34 932.78 494.7 3.644 1,332.13 2033.5 14,395 7549.95
n,t%
-~1
za

z
C9-4
00
toj
Table 2.2.2. Incremental Costs and Occupational Dose for Remediation ofContaminated Soil at the Reference Uranium Fuel Fabrication Plant(Unrestricted Land Use, Deposition on Soil Surface, Direct Disposal of Soil)
S100/f ' Disposal Cost tS05f/f Disposal Cost S350/ft' DCol
Cost per Cad per Co Par
Roduction in bwenitental CunuisIive Reduction in Rc in Reduction in
Residual abiemntl Cum ulative Occupational Occupstional Residual Dose Residual Dose Residual Dose
Dose Rate Soil Volume Soil Volume DO Dose Do c h en l Cumulative R a te icremental Cumulative Rate Incmental Cumulative Rate
(mr e /yr) ( )m l(i) (p( pnr ) (p e on-mrew Cost (SK) Cost (SK) (SK/mnrem yr) Co sd (SK) Co s (q) ( SK/inv Em ) C ost (S C) Cost- (SK) (S
ll gh 8 . 62 1100-60 133 133 21 21 86.2 S6 2.16 310.5 311 7.76 1,716.0 1,716 42.90
60.30 156 289 25 47 100.2 1 6 3.34 367.3 678 12.24 2,024.7 3,741 67.49
30-25 37 327 6 53 22.0 208 4.40 87.1 765 17.43 483.8 4,224 96.77
253-15 100 426 16 69 66.8 275 6.68 233.3 998 23.33 1,289.5 5,514 128.95
15-10 76 502 12 31 48.5 324 9.70 177.0 1,175 35.39 976.9 6,491 195.39
10-3 201 703 33 114 130.7 454 38.67 472.1 1,647 67.45 2,604.4 9,095 372.05
3-0.3 326 1,029 53 167 207.9 662 76.99 762.7 2,410 232.47 4,211.6 13,307 1,559S83
0.3-0.03 289 1,317 47 213 186.2 849 689.63 6756_ 3,086 2,502.16 3,734.2 17,041 13.830Q43
Medium100460 541 541 88 88 350.8 351 8.77 1,265.8 1,266 31,64 6,994.7 6,995 174.87
60.30 284 824 46 134 133.3 534 6.11 665.9 1,932 22.20 3,671.7 10,666 122.39
30-25 59 883 10 143 38.6 573 7.72 136.9 2,069 27.38 758.5 11,425 151.70
25-13 142 1,025 23 166 91.5 664 9.15 331.6 2,400 33.16 1,331.5 13,256 183.15
15.10 99 3,124 16 182 62.4 727 12.47 231.9 2,632 46.38 1,281.2 14,538 256.24
10-3 251 1,375 41 223 164.2 891 23.45 5S8.4 3,220 24.05 3,249.9 17,788 464.28
3-0.3 382 1,57 62 285 245.3 1,136 90.84 895.1 4,115 331.50 4,943.8 22,731 1,S31.05
0.3-0.03 312 2,069 SI 335 204.1 1,340 755.73 73!.5 4,847 2,709.31 4,038.0 26,769 14,955.59
100-60 - - - -. . . .
60-30 . . , . . . .30-25 ' ' . . . . . .
25-15 840 840 136 136 543.3 543 54.33 1,969.1 1,969 196.91 10,870.1 30,870 1,087.01
15-30 479 1,320 78 214 310.7 854 62.14 1,123.0 3,092 224.61 6,202.6 17,073 1,240.52
10-3 469 1,789 76 290 304.7 1,159 43.53 1,099.1 4,191 157.02 6,071.0 23,144 867.28
3-0.3 502 2,291 83 371 323.3 1,483 119.93 1,175.2 5,366 435.26 6,490.9 29,635 2,404.03
0.3.0.03 364 2,655 59 430 234.8 1,717 869.49 6221 3,163.19 4,713.6 34,348 17,457.75

I) 0
Table 2.2.3. Incremental Costs and Occupational Dose for Remediation ofContaminated Soil at the Reference Uranium Fuel Fabrication Plant(Restricted Land Use, Deposition on Soil Surface, with Soil Washing)
S.O. DimlCost C501 Diswo1Cot 3350 Disosl CostCAMt PK Cost R -e Cost PM
Rediction h el CAuWtivO Redution in Redudion in Redutim inResdal eIentl C ltdive Occaptioul Occuptiol Raidu Dow Reidul Don Redl De
DoeRs SoilVoeh Sol Volew Doen Don binmntl Ctdnsw Rate Inrena Cimulwstiu Rate l Cnlutive Rate
(MiM d ('go) (') -VW) (P 1 -j Cot(S) t( ) ( Costd(SIc) costTSic vm)M Cal (S(S) Cost sic
300460 . . . . . . . ..
6030 - - . - -.
30-25 - * * . .25-15 3,056 1M056 It9 139 753.1 753 75.31 1,469.3 1,470 146.9 5,944.9 5,945 594.4915-10 323 1,379 51 247 220.7 974 44.13 439.4 - 1.99 37.31 1,301.7 7,754 361.7310-3 431 13.17 78 325 300.2 1,274 42.39 595.1 2,504 35.01 2,450.3 10,204 350.11
3-0.3 491 2,301 tt 413 335.2 1,609 124.13 6C7.4 3,172 247.17 2,743.1 12,952 1,017.310.3.0.03 363 2.671 65 471 247.1 1,356 935.28 494.3 3,666 1,33242 2,034.5 14,917 7,535.31
Mledium100C0 . . .60.30 . . . . . . - .
30-25 - * - . . .2S-35 . . . .
10-3 1,056 1,056 139 139 753.1 753 107.58 1,469.3 1,470 209.97 5,944.9 5,945 349.273-0.3 933 1,919 167 356 6332 1,391 236.36 1,269.3 2,739 470.10 5,223.5 11,163 1,934.61
0.30.03 434 2,423 71 434 293.4 1,6t5 1,036.30 539.7 3,329 2,184.09 2,427.9 13,596 3,992.36
100o4 . . .. . . , . .60.30 * ' . . . . .
30-25 *- .. . .25-15 . . . . . .
15-10. - ' ' - . . , . . .10-3 . . . . . .. .3-0.3 1,379 3,379 247 247 973.7 974 360.65 1,909.3 1,909 707.09 7.753.5 7,754 2,371.63
0.3.0.03 691 2,077 125 372 475.5 16449 170.99 949.4 2,359 3,5316.37 314
'0
zC
A40
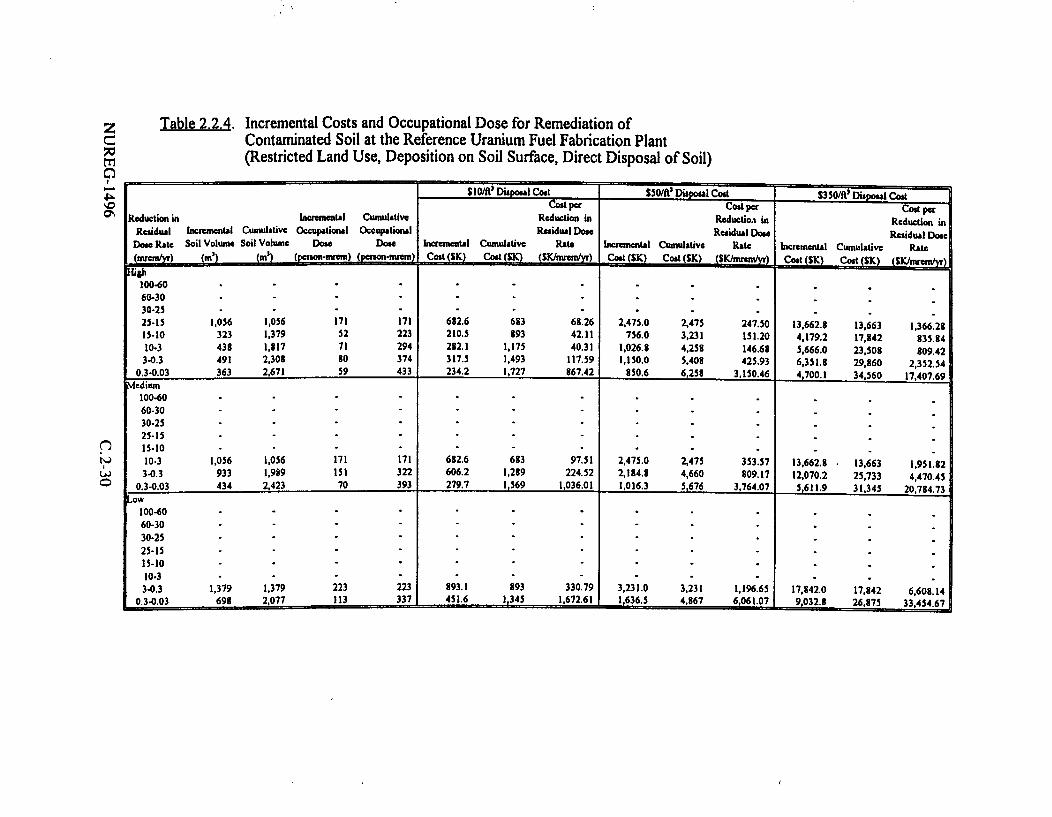
z
M
0
Table 2.2.4. Incremental Costs and Occupational Dose for Remediation ofContaminated Soil at the Reference Uranium Fuel Fabrication Plant(Restricted Land Use, Deposition on Soil Surface, Direct Disposal of Soil)
. 10/fl' Disposal Cosl 550/fl' Disposal Cost S350/ft' Disposal CostCost per Cost per Cost per
Reduction in Incremental Cumulatiwe Reduction in Reductio. an Reduction inResidual Incremental Cumulative Occupational Occupational Risidual Dose Residual Dos" Residual Dose
Dose Rate Soil Volume Soil Volume Dose Dos Incremental Cumulative Rate Incremental Cumulative Rate Incremental Cumulative Rate(iwremlyr) (MI) (MI) (peson-mrem) (Peenon-mrem) Coit ($K) Cost (SK) (SK/mremlyr) Coat (5SK) Cost (SK) (SK/mrem/yr) Cost (SK) Cost (SK) (SK/mremlyr)
100-60 . . . .60-30 - - - . . . .30-25 - - . . . . .25-15 1,056 1,056 171 171 682.6 683 68.26 2,475.0 2,475 247,50 13,662.8 13,663 1,366.2815-10 323 1,379 52 223 210.5 893 42.11 756.0 3,231 151.20 4,179.2 17,842 835.S410-3 438 1,817 71 294 232.1 1,175 40.31 1,026.8 4,258 146.68 5,666.0 23,508 809.42
340.3 491 2,30S S0 374 317.5 1,493 117.59 1,150.0 5,408 425.93 6,351.8 29,360 2,352.540.3-0.03 363 2,671 59 433 234.2 1,727 867.42 850.6 6,258 3,150.46 4,700.1 34,560 17,407.69
Medium100-60 .- .60-30 - . . . .30-25 - - - . . .25-15 . . .15-10 - - - . . . . .10.3 1,056 1,056 171 171 682.6 633 97.51 2,475.0 2,475 353.57 13,662.8 13,663 1,951.82
3-0.3 933 1,989 151 322 606.2 1,289 224.52 2,184.8 4,660 809.17 12,070.2 25,733 4,470.450.3-0.03 434 2,423 70 393 279.7 1,569 1,036.01 1,016.3 5,676 3,764.07 5,611.9 31,345 20,784.73
Lw100-60 - . .. . .60-30 - - - . . .30-25 - - . . .25-15 . . . . . .15-10 . . , , . . . . . .10.3 - - - - . .-
3-0.3 1,379 1,379 223 223 S93.1 993 330.79 3,231.0 3,231 1,196.65 17,342.0 17,842 6,608.140.3-0.03 698 2,077 113 337 451.6 1,345 1,672.61 1,636.S 4,867 6,061.07 9,032.8 26,875 33,454.67

f
Incremental Costs and Occupational Dose for Rem ediation ofContaminated Soil at the Reference Uranium Fuel Fabrication plant(Unrestricted Land Use, Mixnglandfilling, with Soil Washing)
_1lOV I Cost 10C' ' Di COPM Cod per Cot per
bw bse l ftl OmmWsve Reductim in W Wom In Redow . in
Rashd ul lw-si-bl COSItin O 04O"IR O=T il Resida s ReDtl ReddualDs
Den psd Sehtoi m Soil Vlkne Dse Ds himein Its CoSm istMe Rift hMTC~flSIca"WI Rats baItl CaCwlath Rate
u(IN) Cost=K Co m W ) Coat(K C (1 * e C ) Cod )Co (S
0060 96 96 171 176 679.8 630 16.9 1353.6 1,354 33.34 5,576.0 5.576 139.40
630 3.492 4.4tt 625 103 L311.3 2,491 6036 0 1.3 3 4 13935 It 977. 4 24,53 632 .
30.25 765 ,SI3 137 940 423.3 2 915 34.76 943.3 6.471 Itt 7 4,183.8 23737 t 36.7
25 -1 5 1,91 7,231 35 9 1.26 1,102. 9 4,013 110.29 2, 450.9 1929 245 .09 10,363.6 39.601 1,036.36
1 5-10 1.16 4 9,102 334 1, 629 1, 033.3 5 ,056 207 .67 2,300.6 11 ,229 460.13 0,2O. 0. 49.1 01 2,040.02
30.3 5,2 21 1 4,330 936 2 565 2, 904.4 7,960 414.91 6,495.0 17, 634 92M M34 21,60M1 78,409 4,0t 6 .11
3.0. 3 9. 492 23,321 1, 699 4 ,24 ,579.0 13,240 1 , 5.20 11,713.9 29,403 4 ,4020 59 42.6 130, 352 1 9,23 .00
0.3-0.03 9,66 3 33,414 1, 730 5 S.4 5,370.2 13,61 0 199.56 1,929.4 4 332 44, 132.O 52,7 3.3 133,230 1 9s, 345 .61
10045 0 25 2 4 4 163 16 0.41 33.3 34 0.14 133.7 139 3.47
60.30 1,149 1,174 331 335 1,57.2 1.2m 41.91 2,514.0 2,541 33.30 10,351.7 10,490 345.06
30.25 767 2,641 137 473 524.7 1,71 104.94 1,0420 3,590 20.40 4,291.4 14,712 153.27
¢ 25 -15 2,147 4,7tt 334 857 1,461.2 3,259 1 46 .12 2,91 3.9 6,309 291.8 9 12,01 3.4 26.300 1 ,201 .14
is 15-10 1,704 6,49 305 1,162 1,157.2 4,417 231.45 2,316.4 ,t25 463.28 9,5363 36,337 1,907.31
qj 10-3 5,057 IIS 49 905 - 2,067 2514.5 6,931 359.21 5,944.5 14.770 349.21 27,375.3 63,712 3,910.75
3-03 9,667 21,216 1,730 3,791 5,376.6 12,301 1.9132 11,934.4 26704 4,420.16 52,9I.5 16,614 19,593.16
0.3 4.03 96 4 30 3 0 1.730 5,521 9,370.3 17,67t 19,t91.67 11t932.0 31.636 44,19141 52,315.3 169,499 195,3.M 04
30046 0 - * . . . - -.
-
60.30 * - - * . *30-25 . . . . .. . -25.19 31 31 7 7 63.5 63 6.35 t 7.2 t 7 82 250.2 250 25 .02
135-10 22 60 4 11 14.4 73 2.19 30.1 117 6.02 123.2 373 24.63
10-3 3,557 3,613 637 643 2,421.0 2,499 345.86 4,139.5 4.953 690.79 19,909.7 20,213 2,144.24
340.3 9.673 1320 1,731 Z 379 5,443.7 7,943 2,016.19 IZ 005 .2 16,953 4,44636 52 995.5 7327 9 19,627.9 5
034.03 9.666 22957 1.730 4109 ,372.0 13,315 19,96.39 11,934.8 2 1,393 44; 20L91 SL391.4 126,177 19 5920.07
z9
P.0ORI
I
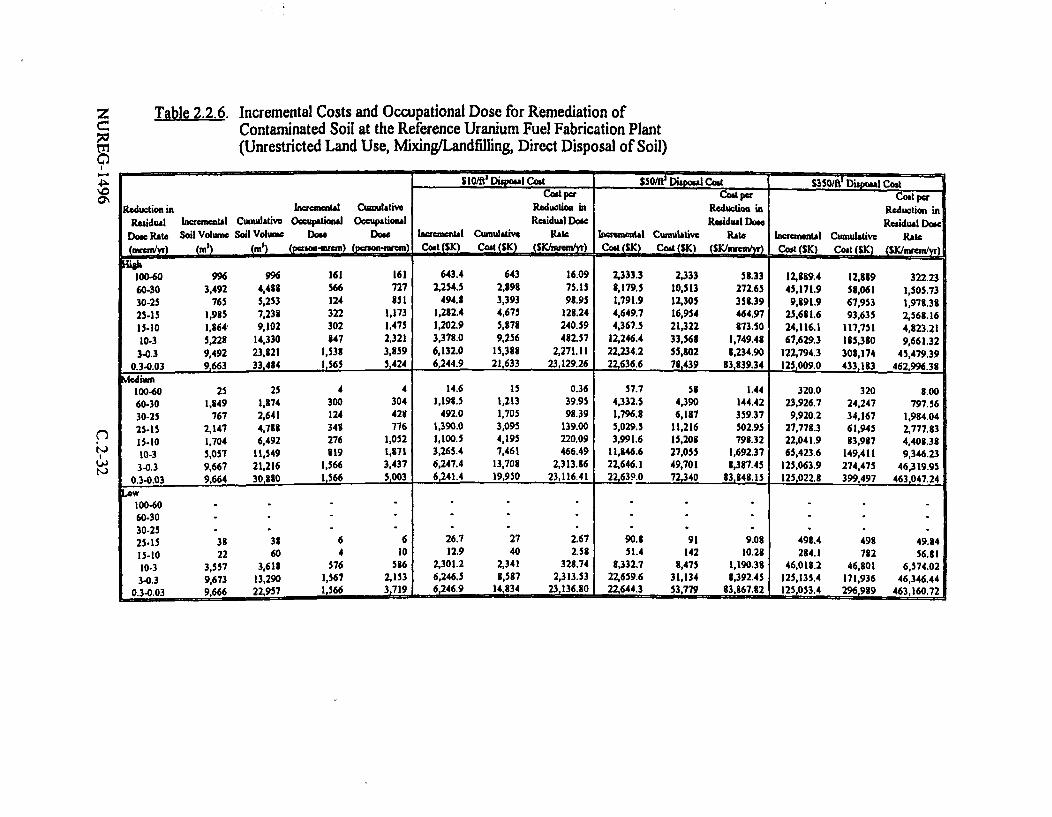
z
I.-I
'IOCh
Table 2.2.6. Incremental Costs and Occupational Dose for Remediation ofContaminated Soil at the Reference Uranium Fuel Fabrication Plant(Unrestricted Land Use, Mixing/Landfiluing, Direct Disposal of Soil)
S10/fltDisposal Cost S50; Dis COM' Disposal CodCost pe Cod per Cst
Rduction in Incrmntal Cumltive Reduction in Reduction in Reduction inResidual hwomenul cumulative Occuptio"l Occupation l Residual Dose Residual 00e Re idual Doec
Doe Rate Soil Volume Soil Volume Dows Do"c Incrmenall Cwuuluative Rate I ncremeubl CWumulItive Rate Incrneatal Cumulative Rate
LnviLv .LMe (me) (pason-wem) (paron-num) Cost (SK) Cost (SKIe (SK/mwo/yr) Cost (SK) Cod (SK) (W w) Jcost (SK) Cost (SK)
100-60 996 996 161 161 643.4 643 16.09 2,333.3 2,333 53.33 12,319.4 12,389 322.2360-30 3,492 4,481 566 727 2,254.5 2,898 75.15 3,179.5 10,513 272.65 45,171.9 58,061 1,505.7330-25 765 5,253 124 351 494.8 3,393 98.95 1,791.9 12,305 353.39 9,891.9 67,953 1,97S.3S25-15 1,985 7,233 322 1,173 1,232.4 4,675 123.24 4,649.7 16,954 464.97 25,681.6 93,635 2,563.1615-10 1,864 9,102 302 1,475 1,202.9 5,873 240.59 4,367.5 21,322 373.50 24,116.1 117,751 4,323.2110-3 5,223 14,330 847 2,321 3,373.0 9,256 432.57 12,246.4 33,563 1,749.43 67,629.3 135,380 9,661.32
3-0.3 9,492 23,321 1,533 3,S59 6,132.0 15,333 2,271.11 22,234.2 55,102 8,234.90 122,794.3 301,174 45,479.390.3-0.03 9,663 33,434 1,565 5,424 6,244.9 21,633 23,129.26 22,636.6 78,439 83,339.34 125,009.0 433183 4623996.38
Mediwn100-60 25 25 4 4 14.6 15 0.36 57.7 58 1.44 320.0 320 3.00
60-30 1,349 1,374 300 304 1,198.5 1,213 39.95 4,332.5 4,390 144.42 23,926.7 24,247 797.5630-25 767 2,641 124 423 492.0 1,705 93.39 1,796.3 6,137 359.37 9,920.2 34,167 1,934.04
25-15 2,147 4,733 348 776 1,390.0 3,095 139.00 5,029.5 11,216 502.95 27,773.3 61,945 2,777.83
15-10 1,704 6,492 276 1,052 1,100.5 4,195 220.09 3,991.6 15,203 793.32 22,041.9 13,987 4,403.33
10-3 5,057 11,549 319 1,871 3,265.4 7,461 466.49 11,146.6 27,055 1,692.37 65,423.6 149,411 9,346.23
3-0.3 9,667 21,216 1,566 3,437 6,247.4 13,703 2,313.36 22,646.1 49,701 3,387.45 125,063.9 274,475 46,319.950.3-0.03 9,664 30,380 1,566 5,003 6,241.4 19,950 23,116.41 22,639.0 72,340 83,S48.15 125,022.8 399497 463,047.24
LOW100-60 - . . . . ..60-30 - . -. . . . . ..30-25 - * . . . .25-15 33 38 6 6 26.7 27 2.67 90.3 91 9.03 491.4 491 49.84
15-10 22 60 4 10 12.9 40 2.53 51.4 142 10.23 234.1 732 56.S1
10-3 3,557 3,613 576 516 2,301.2 2,341 323.74 3,332.7 8,475 1,190.38 46,018.2 46,101 6,574.02
3-0.3 9,673 13,290 1,567 2,153 6,246.5 3,517 2,313.53 22,659.6 31,134 3,392.45 125,135.4 171,936 46,346.44
0.3-0.03 9,666 22,957 1,566 3,719 6,246.9 14,834 23,136.80 22,644.3 53,779 13,S67.12 125,053.4 296,989 463,160.72
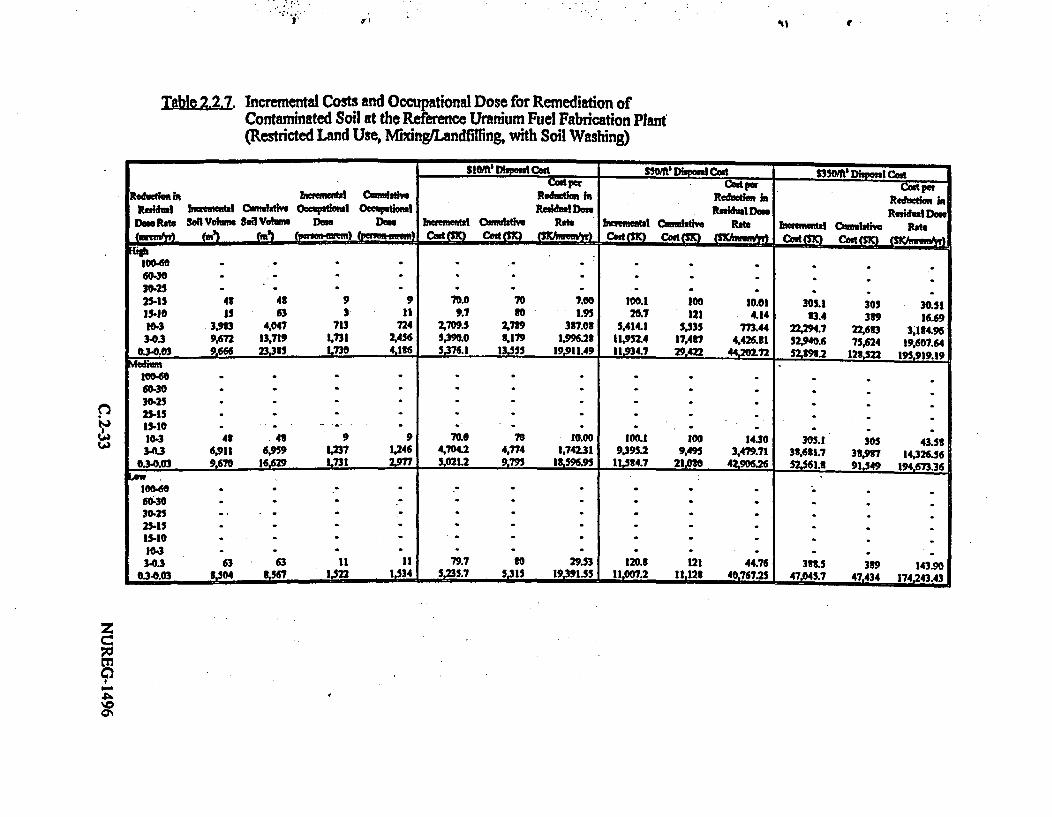
Table 2.2.7. Incremental Costs and Occupational Dose for Remediation ofContaminated Soil at the Referenmc Uranium Fuel Fabrication Plant(Restricted Land Use MxingLandfilling, with Soil Washing)
Sl0we Dbposcad SVfDisoCst $350/t DilC
Rdilt h lr Clos R pet in Cot pIn
ResIl bwmmetl Cwtldh Oesdwl o0 1&Ml ReslDogs ReuI Doss RidulDDmPb Sil Vehm Soil Vehw Dos Dvas bweal CuM I_ Ras I "rMenl Oinlath' Rs bnuwstl Cofflutive PS"
(aenU. (n) a) (pumuonnfum) (p-r-w.. Cot (SM cest(SIC (Invi) Coato(mC CaostSI M!S = =s~Fw CRUM (Sc) ast aSC (SICjsuunJ*)
30040 , ,,,,.,6WO 3.0 - -.30.25 - **- . . . .
25-15 41 4t 9 9 70.0 70 7.00 300.1 100 10.01 305.1 305 30.3115-10 i5 63 3 11 9.7 tO 1.95 20.7 121 4.14 33.4 339 16.6910-3 3,913 4.047 713 724 2,709.5 2,7t9 387.03 5,414.1 5,535 773.44 22,24.7 22,633 3,14.96
3-0.3 9,672 13,719 1,731 2,456 5,393.0 8,19 1,996.23 11,952.4 17,417 4,426.81 52,90.6 75,624 19,607.6403-0.03 9,666 23,335 ,730 4.1t 5,376.1 13,35551 9911.49 11,934.7 29.422 440272 52,3"2 1222 39 19
10040 . . .
60-30 - * - * . .
30-25 . , , , .
25-15 . . . . . .
15-10 . , , .- .
10-3 43 4S 9 9 70.0 70 10.00 100.1 tO0 1430 305.1 305 43.533n0.3 6,911 6,5 L237 1,246 4,704.2 4,774 1,742.31 9,3952 9,495 3,479.71 33,681.7 38,917 14,326.56
03-0.03 9,670 16,629 1731 2,97 5,021.2 9,795 13596.95 11,584.7 21.0M 42,906216 5%1.: 914 1394,673.36
100-60 - -
6030 . ,30.25 - - - .
25-15 . . . . . . .
15-10 . . . . .10-3 ' . . . . . .
3-0.3 63 63 11 11 79.7 tO 29.53 120.8 121 44.76 33.5 339 143.9003-0.03 tS04 3567 I,522 13534 5,235.7 5,315 19.391.55 11,007.2 11,121 40,767.25 47,045.7 47,434 174243.43
Q
wk4
za
90%

z
C
Table 2.2.8. Incremental Costs and Occupational Dose for Remediation ofContaminated Soil at the Reference Uranium Fuel Fabrication Plant(Restricted Land Use, Mixing/Landfilling, Direct Disposal of Soil)
31f'_Disposal Co 50I /fi'Disposal Cost S350/fl' Disposal CogtCost pet Cost per Cost per
Reduction in Incremental Cunulative Reduction in Reduction in Reduction in
Residu l IncemMnta Cumulative Occupational Occupational Residual Dose Residual Dose Residual DoseDw Rate Soil Volrune Soil Volume Dowc Dose Incremental Cumulative Rate Icrmental Cumulative Rate Incremenaul Cumulative Rate(Inrean/lr) (mn (01 ') (renn-mmz) (pon.-mm) Cost(SK) Cost(K) (Mauroow) JCos (5K) Cost ($K) (SK/nren/) Cost coSt (5K) (SKEL/Mam/yrj
100-60 - - . .60-30. .........30-25 -- -.25-15 48 48 S 8 32.5 33 3.25 114.0 114 11.40 626.5 626 62.6515-10 15 63 2 10 8.7 41 1.74 34.2 148 6.84 191.0 817 3S.2010.3 3,983 4,047 645 656 2,576.5 2,613 363.07 9,332.3 9,481 1,333.19 51,533.9 52,351 7,361.95
3-0.3 9,672 135719 1,567 2,222 6,246.2 8,864 2,313.43 22,657.2 32,138 8,391.55 125,127.3 177,479 46,343.610.3-0.03 9,666 23.38S 1,566 3.79 6,246.9 15,111 23,136.71 22,644.2 54,782 83,367.46 125,052.3 302,532 463,158.65
Medium100-60 - -. . . -.60-30 - - -. . .30-25 - - - . . . .25-15 . . . . . . .15-10 ' . . . .10-3 48 48 8 8 32.5 33 4.65 114.0 114 16.29 626.5 626 89.49
3-0.3 6,911 6,959 1,120 1,127 4,466.4 4,499 1,654.22 16,189.8 16,304 5,996.24 39,406.1 90,033 33,113.350.3S0.03 9,670 16,629 1,566 2,694 6,244.7 10,744 23,128.55 22.651.4 3L,955 S3,S93.99 125,094.2 215,127 463,311.75
Low100-60 - -* - . . . .60-30 - - -. . . . .30-25 - - - - . . .. .25-15 - - - . . . . .15-10 . . . . . .. . .10-3 - - - . . . . .3-0.3 63 63 10 10 41.3 41 15.28 148.2 148 54.90 817.4 817 302.75
0.3-0.03 8,599 8,663 1,393 1,403 5,557.9 5,599 20,584.66 20,144.8 20,293 74,610.51 111,249.2 112,067 412,034.18

Table C.2.3.I. Summary of Costs and Occupational Dose for Decontaminationof the Reference Sealed Source Manufacturer Floors/Walls
Concrete ConcreteDepth Residual Volume Building Occupational
Removed Dose Rate Requiring D&D Cost Dose(cm) (mra/y) Disposal (m3) millions) (peson-rem)
0.3175 485 2.7 0.048 0.081
0.6350 56 3.0 0.061 0.12
0.9525 3.0 3.3 0.075 0.16
1.2700 0.50 3.7 0.089 0.20
1.5875 0.004 4.0 0.103 0.25
C.2-35 NUREG-1496

z
0e
C
VE
Table 2.3.2. Incremental Costs and Occupational Dose for Remediation ofContaminated Soil at the Reference Sealed Source Manufacturer Site(Unrestricted Land Use, Deposition on Soil Surface, with Soil Washing)
SIM' Disposal Cad £50/11' iposal Coa MOP Disposal Coal'Coad per Cost per Cost per
Rcductionin kwanetIrl Cumulative Reduction in Reduction in Reduction inResidual Incremental CUmulative Occuaftio1Al OcCUational Residual Dose Residual Dos Residual Dose
Dose Rate Soil Volume Soil Volne Dose Dowe L=CWmttl Cumulative Rate hIem1olal Cumulative Rate lacmenteal& Cumulative Rate(Peon-nein) (Peon=nx CtnK) C S) SKfnrnm/ j Cost (SK) Cost (SK) (SK/nmem/yr) Cost ($K) Cost (SK) (SK/mret/yr
*1io100-60 6 6 1 1 4.2 4 0.10 8.4 3 0.21 35.4 35 0.8860-30 6 13 1 2 4.1 8 0.14 9.4 is 0.31 35.6 71 1.1930-25 2 14 0 3 1,0 9 0.21 2.1 20 0.41 8.7 80 1.752S-15 4 IY I 3 2.5 12 0.25 S.0 25 0.50 21.0 101 2.1015-10 4 21 1 4 2.3 14 0.46 4.6 29 0.92 19.5 120 3.9010-3 I8 39 3 7 1 1.3 26 1.68 24.8 54 3.54 100.7 221 14.39
3-0.3 42 82 a 15 27.9 54 10.33 56.9 III 21.08 236.7 451 17.670.3-0.03 21 103 4 Is 13.9 68 51.49 29.0 140 107.53 118.6 576 439.37
Modium100-60 12 12 2 2 45.9 46 1.15 50.8 51 1.27 100.5 101 2.5160-30 10 22 2 4 6.5 52 0.22 13.0 64 0.43 54.9 155 1.8330-25 2 23 0 4 1.1 54 0.22 2.2 66 0.44 9.3 165 1.8625-15 4 23 1 5 2.9 56 0.29 7.1 73 0.71 25.7 190 2.5715-10 3 31 1 6 2.1 58 0.42 4.2 77 0.83 17.7 208 3,5310-3 Y 39 1 7 5.5 64 0.78 10.9 38 1.56 46.1 254 6.58
3-0.3 39 73 7 14 25.8 90 9.56 521 141 19.55 219.1 473 81.160.3-0.03 23 107 5 19 18.5 101 68.68 38.3 179 141.30 157.8 631 584.43
LAw100-60 . . . . .60-30 * . . .30-25 . . . .25-15 * . . . . .15-10 - - . . . .10-3 17 17 3 3 49.6 50 7.09 51.2 58 8.31 131.7 132 11.82
3.0.3 22 40 4 7 14.7 64 5.46 30.7 89 11.36 125.6 257 46.520.3-0.03 49 *9 9 16 32.3 97 119.70 67.1 156 248.39 275.4 533_ 1,019.82

P Id .;q ,
4) 3. 4') t
Table M2l. Incremental Costs and Occupational Dose for Remediation ofContaminated Soil at the Reference Sealed Source Manufacturer Site(Unrestricted Land Use, Deposition on Soil Surface, Direct Disposal of Soil)
._somf Disposl cad . S . DisposD l CotCodpm Costr m CostRed in Inherudl CO W Reduction in Reduction m Reduction in
Raidual hmumb 0latdw OoeupsloP OCCutoWna ResualDow ResidulDose Residual DosDow Rbe Soi VoI.nI Sol Vonie DoMe Dano bnoeenwal C>uuAstive Rate buxsemendl Cirn tiwv Rate IIc ,l Cmnuative Raft( _V7 ) (Pe-mmm) bo-"m) C-t (SK) Cost 1fJnu d Cud(=) Cad (SIC) _ fjm yr) Cinad=Si Consm) (Hgh
10040 6 6 I 1 3.3 4 0.09 15.5 is 0.39 83.0 83 lee60-30 6 13 1 2 3.6 7 0.12 13.7 29 0.46 79.1 IQ 2.6430-23 2 .14 0 2 0.9 3 0.19 3.3 33 0.70 20.2 182 4.0425-13 4 IS I 3 2.2 11 0.22 9.7 42 0.97 49.8 232 4.9g15-10 4 21 1 3 2l 13 0.41 7.t S0 1.56 45.0 277 9.0010-3 1I 39 3 6 I0.5 23 1.51 42.4 93 6.06 232.2 509 33.173-0.3 42 32 7 13 29.1 52 10.76 912 191 36.37 547.7 1.057 202.4
0.34.03 21 103 3 17 32.4 63 46.05 49.6 240 13.71 273.6 I3j31 1,013.30ion'10040 12 12 2 2 11.0 11 0.21 2t.7 29 0.72 133.1 153 3.0360,30 10 22 2 4 5.3 17 0.19 22.0 31 0.73 12.7 no 4.2230-23 2 23 .0 4 1.0 Is 0.20 5.1 56 1.01 22.9 303 4.5725-15 .4 21 1 4 2.6 20 0.26 9.3 65 0.91 56.3 359 5.6315-10 3 31 1 5 1.9 22 0.37 7.1 73 1.41 40.3 400 3.3610.3 3 39 I 6 4.9 27 0.70 19.3 92 2. 107. 307 1.4030.3 39 71 6 13 27.2 54 10.07 92.5 It 34.25 303.3 1,016 I13.29
0.3-0.03 2t 307 5 17 16.6 71 61.43 65.3 250 241.77 364.1 1P3o0 1,343.34
10 06 0 .-. . . .6 0-30 - - -.30-25 - - -.23-15 - - . . . . .15-10 - - - . . . . . . . -10-3 17 17 3 3 14.3 14 2.04 41.2 41 3.39 225.1 223 32.163-0.3 22 40 4 6 13.2 27 4.83 52.4 94 19.41 2s9.7 313 107.30034.03 49 39 3 14 33.0 60 122.25 115.3 209 423.79 636.5 13.51 2,37.37
w-4
3
9.1k.'0

z
i1jt'3
00
Table 2.3.4. Incremental Costs and Occupational Dose for Remediation ofContaminated Soil at the Reference Sealed Source Manufacturer Site(Restricted Land Use, Deposition on Soil Surface, with Soil Washing)
so ips cs 5 0DsoaCd 3 SO _ipa Cost
Codt per cosdpe Cost per
Rcduction in Imerungstl Cumnultive Reduction in Reductio in Reduction in
Residual i n-ntal Cumulativf OcWaptioual Occupatioawl Residual Dos" Residual Dose Residual Dose
Dose Rate Soil Volume Soil Volume Dose Doe Incremntal Cumulative Rats hIctnentAl Cumubltiv Rate hIcremental Cumulative Rate
(vemhyr) () (h) (paunmrem) (panmrcm) Cost (SlQ Cost (SK) (SKIInen/) Cost (SK) Cost (SKI) (SEm ) Coat (SK) Cost (SK) (SKmrelyr)
100-60'''......60.30.--......30-25.,,.....25-15--.......15510 S 8 I 1 43.2 43 11.64 45.4 45 9.09 77.11 78 15.S7
lO-3 17 25 3 4 11.2 54 1.61 22.4 61 3.20 94.9 173 13.56
3-0.3 is 40 3 7 9.7 64 3.60 20.7 99 7.68 83.4 256 30.91
0.3-0.03 1 1 51I 2 _ 9 7.4 72 27.53 14. 101_8 62.7 319 232.27
100 60 -' '60-30''......30 25--''......25-1515-10-.........10-3 is is 3 3 49,9 50 7.12 5S.6 59 8.37 133.5 134 19.09
340.3 11 36 3 6 11.9 62 4.41L 25.1 94 9.29 101.9 23S 37.71
0.3-0.03 11 47 2 8 7.4 69 27.59 14.8 99 54.99 62.9 298[ 232.81
100-60---......60-30-''......30.25
15-10.,,......10-3-''......
3-0.3 11 11 2 2 45 .4 45 16.81 49.9 so 18.43 96.2 96 35.63
0.340.03 22 33 _ 4 6 14.6 60 53.9 30.4 so 112.41 124.2 220 460.0
- . xD APO AI F = N' NC oswS 35 /fl' Dis osal C os

i) t
Tale 2.3.5. Incremental Costs and Occupational Dose for Remediation ofContaminated Soil at the Reference Sealed Source Manufacturer Site(Restricted Land Use, Deposition on Soil Surface, Direct Disposal of Soil)
S.OW DispIosalst CM SSW1 Diposl CMs S350V Dipol CtCost pe CMsprCs e
Rduo Iincinbt Cuilab Redut ion Redti RidniunRsiail _ ctal Cnlaiw OcIal Occlioml ResidulDos | ResidulDo Residwl DoD Rate Sll Va SilVew Dos Do FlReMAta C|IRlOi Ra cfflAWt Rit 1bXI "I Clwolat Rst
_ ()=e. Codt(1K). CwSt (S) (SKA've CM=K ct(S (SNM" Cc, Cot () (1Kh:weinHig
10040 * . . ., . . - - .
60.30 . .30-25 . . . .
25-15 - - - - - - .15-10 3 3 t I 3.6 9 02 1.3 Is993 9 19.t710-3 17 25 3 4 10.1 19 1.44 40.6 59 5.30 221.3 321 31.69
3.0.3 15 40 2 6 3.7 27 3.22 34.2 93 12.66 191.0 512 70.740.3-0.03 11 51 2 t 6.6 34 24.62 26.4 120 97.17 146.2 653 541.37
Medim,10060 , , . , , , , , ,60-30 . . . . . .30-25 . . . . . .25-15 . . . . . -15.10 . . . . . . .
10-3 13 Is 3 3 14.5 15 2.07 41.9 42 5.99 229.3 229 32.763-0.3 Is 36 3 6 10.7 25 3.95 4..9 35 15.39 234.9 464 t7.00
0.30.03 11 47 2 3 6.7 32 24.68 26.5 III 95.09 146.5 611 542.64
10040 - - - - -
60-30 * * . . .
30-25 - . . . - .25-15 - . . . . .15-10 - 2 U D 1 4 7 D 2 9 9 110-3 ----
3-0.3 11 it 2 2 10.5 1I 3.91 27.0 27 9.99 143.1 143 52.990.340.03 22 33 4 S 13.0 24 41.24 51.3 79 191.97 216.5 430 1.009
0
.06

z
0
Table 2.3.6. Incremental Costs and Occupational Dose for Remediation ofContaminated Soil at the Reference Sealed Source Manufacturer Site(Unrestricted Land Use, Spill/Leak, with Soil Washing)
S10/fil Disposal Coal 50/f' Dispoul Cogt S350/fI Disposal CostCost per Coat per Cost por
Reductiona i hcremn41al CainUwtive Reduction in Reduction in Reduction in
Residual loamental Cumulative Occupational Occupational Residual Dose Residual Dose Residual Dose
Do" Rate Soil Volue Soil Volumoe Dose Do" lncrtmaenll Cwuulative Rate Incremental Cumulative RAte Incremental Cumulative Rate
;m/vmr) (m) (m) (M2 = ) (person-mam) Cost (SK) Cost (SK) (SK/mrem/yr) Coat (SK) Coit (SK) (SK/mrem/yr) Codt (SK) Cost (SK) (SIC/mremlyr)
100-60 17 17 3 3 11.0 I1 0.27 23.2 23 0.53 93.7 94 2.34
60-30 46 63 3 11 30.3 41 1,01 63.0 S6 2.10 258.1 352 8.60
30-25 13 76 2 14 8.8 50 1.77 17.6 104 3.52 74.6 426 14.91
25-15 3g 114 7 20 24.S 75 2.48 50.8 155 5.08 210.9 637 21.09
15-10 30 144 5 26 19.7 95 3.95 42.0 197 8.40 169.2 806 33.84
10-3 89 233 16 42 62.9 15S 8.99 121.3 313 17.32 500.5 1,307 71.50
3-0.3 172 405 31 73 117.1 275 43.37 233.2 551 86.37 961.5 2,268 356.10
0.3-0.03 172 577 31 103 117.1 392 433.63 234.5 735 36S.36 962.6 3,231 3,565.09
Modium
100-60 3 I I 3 5.3 5 0.13 10.5 11 0.26 44.6 45 1.12
60-30 20 21 3 5 12.8 Is 0.43 26.9 37 0.90 109.7 154 3.66
30-25 10 37 2 7 6.3 24 1.26 12.6 50 2.52 53.3 203 10.66
25-15 36 73 6 13 23.5 48 2.35 43.1 98 4.81 199.3 407 19.93
15-10 30 103 S IS 19.8 68 3.96 42.1 140 8.42 169.6 576 33.91
10-3 90 193 16 34 63.0 131 9.00 121.4 262 17.35 501.2 1,078 71.59
3-0.3 172 365 31 65 117.4 243 43.47 233.1 495 86.56 963.7 2,041 356.91
0.3-0.03 172 537 31 96 117.4 365 434.77 235.1 730 870.63 965.2 3,006 3,574.70
100-60 - - - .. . .60-30 * - . . .30-25 - - ' ' . . . . . .25-15 - - ' . . . .15-10 4 4 1 1 41.0 41 3.21 41.1 41 3.22 59.4 59 13.39
10-3 20 24 4 4 13.1 54 3.38 26.2 67 3.74 110.9 170 15.85
3-0.3 ISO 174 27 31 98.7 153 36.57 204.8 272 75.34 841.1 1,011 311.52
0.30.03 171 345 31 62 116.5 269 431.66 232.1 504 859.52 956.3 1,968 3,543.54

A6
Tabl 32.3. Incremental Costs and Occupational Dose for Remediation ofContaminated Soil at the Reference Sealed Source Manufacturer Site(Unrestricted Land Use, SpilYLeak, Direct Disposal of Soil)
slow .mDIoal Cat 1350O' DilCst * 350mtDisMl ContCst p Copfr Cos .pe
Redution h IroI C lw Redation ltection is Reduction m
Rosidual h aeomonl Cntive O atm Owptional Reswl Dos R csil Do Resetl Dm
DosRs SoilaV oh Sol Vad D. Dos umnil Cumauile Rst bwanbul caIatlv Ratc JIerementl Cu tiv Ra
( _ 1 . ) Cost(K Ca() ?(1Kn u Cost (1K) Cost (SK) 0Knwsmw)High -
100460 17 17 3 3 9.3 10 0.24 39.6 40 0.99 216.1 216 5.4060.30 46 63 7 10 31-2 41 1.04 107.5 147 3.53 595.3 oil 19.84
30-25 13 76 2 12 7.9 49 1. 31.2 17t 6.23 173.6 9t5 34.7125-15 3t 114 6 Is 22.2 71 222 t9.2 26t 8.92 439.3 1.474 43.93
15-10 30 144 S 23 21.1 -93 4.35 70.6 333 14.13 33.7 163 77.7310-3 39 233 14 3t 56.7 1*0 t.10 209.3 547 29.90 1,157.4 3,020 165.34
3-0.3 172 401 21 66 113.4 263 41.99 402.9 950 149.20 2223.6 5.244 323.55
0.3-0.03 172 577 21 93 109.3 372 404.64 402. 1353 1,491.70 2223.0 7,467 3.233.51
10040 t t I 1 4.7 5 0.12 19.2 19 0.41 104.4 104 2.61
60-30 20 23 3 4 11.5 16 0.38 46.0 65 1.53 252.9 357 8.43
30.25 10 37 2 6 5.7 22 1.13 22.7 It 4.53 124.S 432 24.39
25-15 36 73 6 12 25.1 47 2.51 33.2 171 3.32 461.3 943 46.131j5-10-t 30 103 S 17 17.7 65 3.54 70.3 242 14.16 339.5 1,333 77.90
10-3 90 193 15 31 56.3 121 3I. 209.6 451 29.94 1,159.0 2,491 165.57
_ 3-03 172 365 5 9 113.6 235 42.0t 403.7 155 149.53 222t.6 4,720 325.42
0.340.03 172 537 2t 37 109.5 345 405.66 403.8 1.2S9 1,495.55 2,229.0 6,949 3,255.72
10040 . . .60-30 . . . . . . . .30-25 - - . . .25-15 . . . . .15-I0 4 4 I I 6.6 7 1.33 10.9 11 2.19 56.3 57 11.37
10.3 20 24 3 4 11.3 It 1.63 47.1 53 6.72 253.9 316 36.91
3-0.3 150 174 24 21 96.5 115 35.75 352.0 410 130.33 1,9419 2259 719.600.3-0.03 171 345 21 .56 301.3 224 402.31 399.6 30 1,430.13 !4 9=
6914h-
9

zC;0M0I.P.zON
Table 2.3.8. Incremental Costs and Occupational Dose for Remediation ofContaminated Soil at the Reference Sealed Source Manufacturer Site(Restricted Land Use, Spill/Leak, with Soil Washing)
SI 01t 3 ~ lc d 0/It' Disposal Cost SSO50' Divousl Cost f'Di IC LCot per Cos per Coat per
Reductiuni Iicraial Cumulative Reduction in Reduction in Reduction in
Residual Iucincntal Cumulative Ocwuational Occupatiosal Residual Dose Residual Do"e Residual DoseDoge Rate Soil Volume Soil Volume Doac Do"e loctemental Cumubative Rate basental Cumulative Rate Increrental Cumulative Rate(mremn'r) (mg) (m') (paemn) (paltrem) Cost (SK) Cost (SK) (SK/Wrem/yr) Cot (SK) Cost (SK) (SK/mrEn/yr) Codt (SK) Cost (SK) (SKlrnrnyr)luh
10040 .- - - .
60-30 0.3 0,3 0.1 0.1 38.37 38.37 1.279 35.79 35.79 1.193 37.03 37 1.23430-25 2 2 0.4 0.4 1.44 39.82 0.28 2.87 39 0.575 12.17 49 2.43325-15 6 8 1 2 3.9 44 0.39 7.8 46 0.73 32.9 82 3.2915-10 6 14 1 3 3.9 48 0.77 7.7 54 1.54 32.7 115 6.5410-3 46 60 8 II 30.0 78 4.29 62.4 117 8.92 255.8 371 36.54
3.0.3 170 230 30 41 115.9 194 42.94 230.9 347 85.51 951.7 1.322 352.430.3-0.03 171 401 31 72 116.7 310 432.15 232.3 5S0 360.50 957.9 2,230 3,547.70
Mcdium100-60 , , , , . . .60.30 - * - . . . . . .30-25 .25-lS . , . . . .15-10 4 4 1 1 41.1 41 3.21 41.1 41 3.23 59.7 60 11.9410 3 20 25 4 4 13.2 54 1.S9 26.4 68 3.77 113.8 171 15.96
3.0.3 153 177 27 32 104.4 159 38.67 207.9 2?5 76.98 854.2 1,026 316.380.3-0.03 172 349 31 62 112.9 272 418.09 232.9 508 862.75 960.4 1,986 3,557.22
Low100-60 . . . . -60-30 * * -. . . .30-25 - - . .25-15 , . . .15-10 , . . .10-3 ' . . -
3-0.3 17 17 3 3 49.4 49 18.29 57.7 58 21.37 129.8 130 43,090.3-0.03 133 ISO 24 27 87.5 137 324.19 183.1 239 670.68 745.2 875 2,759.94

able22.9. Incremenal Costs and Occupational Dose for Remediation ofContaminated Soil at the Reference Sealed Source Manufacturer Site(Restricted Land Use, Spill/Leak Direct Disposal of Soil)
0C
5Slow Dhs ClCd Cssom Di l CAst S35 Diss Ca
Cast Pe Cost pr CAst Pe
Redin -wo al COmmd" R e&w~m in Redm in Redution in
Rsidwl _wunmtl Cmutive Owcuptlh Ocamtoml Reidul Dose Real Dam RsddlDODlnV_ SNIVGie sIVluOm Dan Dm wawemuI Cmativ e PAN R m"Wat Comfdatiw Re l abmemeIrl Cmwmlatve w Rat
bla~l (.) (? (pnnee) vrmy Cadt (SC Cost (Sic (SlCmwdyr) Cedst ~s C cst(sic (SKMvesn'w) Cost (Si Cost (W) (S1Cweemf)
10-60 . , . ,
60-30 03 .03 0.05 0.05 4.27 4.27 0.14Q 1.97 1.97 0.066 5.01 S 0.169
30-25 2 2 0.4 0.4 1.29 5.56 0.251 4.7 6.t4 0.974 21.10 33 SA
25-15 6 a I 1 3.5 9 0.35 13.2 20 1.32 76.1 109 7.61
15-10 6 14 1 2 3.5 13 0.69 14.4 34 2 tS 76.8 186 15.37
10-3 46 60 7 to 26.1 39 3.13 106.6 141 15.23 519.9 776 84.28
340.3 170 230 21 37 t12.3 152 41.61 391.9 540 147.75 2,201.0 2.977 115.19
0.34.03 171 401 22 65 103.9 261 403.32 400.1 940 1,431.79 2,213.9 5,191 8.199.71
1000 0 . . . . .
60-30 - . . . . .
30-25 . . . . . .
25-1S- --
tW 1510 - 4 4 I 1 6.7 7 .- 1.34 - 1.0 11 2.21 57.4 57 11.49
10-3 20 25 3 4 11.S 19 1.69 47.4 5t 6.77 260.8 31t 37.25
W 3-1.3 3 377 25 29 97.9 116 36.26 357.3 416 132.32 1,973.2 2,291 730.t1
0.34.03 172 349 21 36 109.2 226 404.33 402.4 gig 1,490.51 2,221.2 4,513- ,226.6
10040 - -' ' .. .
60-30 . . , , . . . .
30-25 - " , ' *
10-3 - - --
3-0.3 17 17 3 3 14.1 14 5.23 40.4 40 14.91 220.7 221 81.76
0.30.03 133 150 22 24 36S 101 320.33 311.5 352 1,153.74 1,721.1 1,943 6,376.3
3
9 .I-
'C0'

z
rri171,
Table 2.4.1. Incremental Costs and Occupational Dose for Remediation ofContaminated Soil at the Reference Rare Metal Extraction Plant(Unrestricted Land Use, Deposition on Soil Surface, with Soil Washing)
S 10/fl' Disposal Cost 5SC50/fl' Disposal Co tCost per Cod pet Cost per
Redcioin Increm al Cumultiveduti Reduction in Reduction in
Residual Incremental Cumulativc Occupatioal OccuPtional Residual Dose Residual Dose Residual Dose
Dose Rate Soil Volume Soil Voluen Doe" Dose Incremental Cumulative Rate Incemontal Cumulative Rate Inc1eumntal Cummulative Rate
_n) _ *=em = Cos (SK) Cot (SK 5 ncmlyr) J Cost (SK) Cost (SKI (SKmC (SK) Cost (K (SK/nuem/yr
100-60 35 35 6 6 27.2 27 0.65 47.3 47 1.15 196.0 196 4,90
60-30 26 61 5 11 17.3 44 0.5S 35.3 83 1.19 147.3 343 4.91
30-25 4 66 1 12 2.9 47 0.58 5.7 39 1.15 24.3 361 4.87
25-15 9 75 2 13 5.8 53 0.53 12.8 102 1.28 50.0 413 5.00
15-10 4 79 1 14 2.9 56 0.58 5.7 107 1.15 24.3 442 4.37
10-3 63 142 11 25 41.4 97 5.92 85.2 193 12.17 352.1 794 50.30
3-0.3 34 176 6 32 22.5 120 3.33 46.2 239 17.09 191.1 935 70.77
0.3-0.03 17 263 16 47 61.5 ISI 227.94 119.8 359 443.68 490.0 1,475 1,814.S3
Medium10040 . - . . . .
60-30 50 50 9 9 71.0 71 2.37 102.2 102 3.41 313,8 314 10.46
30-2S 9 59 2 11 5.3 77 1.15 11.5 114 2.30 48.7 362 9.73
25-15 1I 76 3 14 11.5 18 1.15 24.3 138 2.43 98.6 461 9.86
15-10 9 85 2 15 5.3 94 1.15 11.5 149 2.30 48.7 510 9.73
10-3 34 119 6 21 22.2 116 3.17 46.9 196 6.70 189.9 700 27.13
3-0.3 63 137 12 34 45.0 161 16.66 92.3 239 34.19 332.2 1,082 141.55
0.3-0.03 S0 267 14 48 56.3 218 210.45 109.1 398 403.91 448.3 1,531 1,662.31
Low100-60 - . . . . . .60-30 * * * * . . .30-25 ' ' ' - , . .25-15 15 15 3 3 43.3 44 4.33 54.9 55 5.49 117.S IIS 11.7S
15-10 29 44 5 3 23.3 67 4.66 39.6 95 7.93 163.5 231 32.70
10-3 41 S5 7 15 26,9 94 3.84 55.0 149 7.85 228.4 510 32.63
3-0.3 34 169 15 30 55.5 ISO 20.56 115.9 265 42.94 473.7 983 175.44
0.3-0.03 47 216 S 39 34.8 184 121.81 62.5 323 231.38 260.2 1,244 963.65

Table 2.4.2. Incremental Costs and Occupational Dose for Remediation ofContaminated Soil at the Reference Rare Metal Extraction Plant(Unrestricted Land Use, Deposition on Soil Surface, Direct Disposal of Soil)
S.ft Digoual Cut S5W Diveal Coat S3__V Diop Costcut pm Cust PM Cut per
Redation Iii Incwmetat curlatiw Reduction In Reduction in Reduction inReldul Iabwiitatl ONT02tivO Occatiol OcculatiOnal Reddul Doe Reidual Dan Residual D
DMw Rate 301 Vhl- Sell Volure Do" Due InaMe Cimulatiw Rta hesuiwtal oAmmatiwe Rate bcemental Qmladv. Rate
L=(m Cutt0) Cust a) gEtm(ug Cot 0K) Cutt(K) (SKAwur'w) Coat, codCtK) )Hih
M00 35 35 6 6 20.6 21 0.52 8139 2 2.05 453.5 454 11.3460-30 26 61 4 30 15.$ 36 0.52 61.1 143 2.04 339.8 793 11.33
30-25 4 66 1 11 6.7 43 134 I3.L 154 2.21 57.5 351 11.50
25-Is 9 7n 1 12 5.2 41 0.52 19.3 173 L95 112.4 963 11.24
15-10 4 79 1 13 2.6 5 0.52 11.1 185 221 57.5 1,021 31.50
13 63 142 10 23 41.1 92 5.31 147.3 332 21.12 315.1 1,336 116.443-0.3 34 176 6 29 20.1 112 '7.45 79.9 412 29.60 4423 2,271 163.31
0.34.03 7 263 14 43 55.5 161 205.48 204.6 617 757.79 1,130.1 3,401 4,185.66Medint
30040 , , , -
60.30 so so I 3 33.5 33 1.12 117.5 lie 3.92 646.5 646 21.5530-25 9 59 1 10 5.2 39 1.03 20.3 138 4.16 113.7 760 22.7425-15 It 76 3 12 10.3 49 1.03 40.3 179 4.03 226.1 916 22.6135-10 9 IS 1 14 9.3 s1 1.85 20.3 199 4.16 113.7 1.100 22.74103 34 119 5 19 19.9 7 284 S.9 271 11.28 436.5 1.536 62.36
3-0.3 61 1m7 11 30 44.3 122 16.42 159.9 433 59.21 314.6 2.421 327.620.3.03 tO 267 13 43 51.3 174 139.34 31t.7 627 691.71 1,031.3 3.459 3,44.13
1000 ..030 , , . , - .
30-25 - - . . . .25-15 15 15 2 2 12.3 13 1.21 33.6 36 3.56 193.0 193 19.3015-10 29 44 5 7 17.2 30 3.44 67.6 103 13.51 377.3 570 75.4510-3 41 i5 7 14 21.2 5t 4.02 96.2 199 13.74 529.1 1,100 73.63
3-0.3 34 169 14 2 53.3 112 39.91 191.3 397 73.36 1,092.5 2,192 404.6103-0.03 47 216 3 35 27.4 139 101.63 108.9 506 403.37 603.2 2.796 2.234.06
LA
N-0
%00N
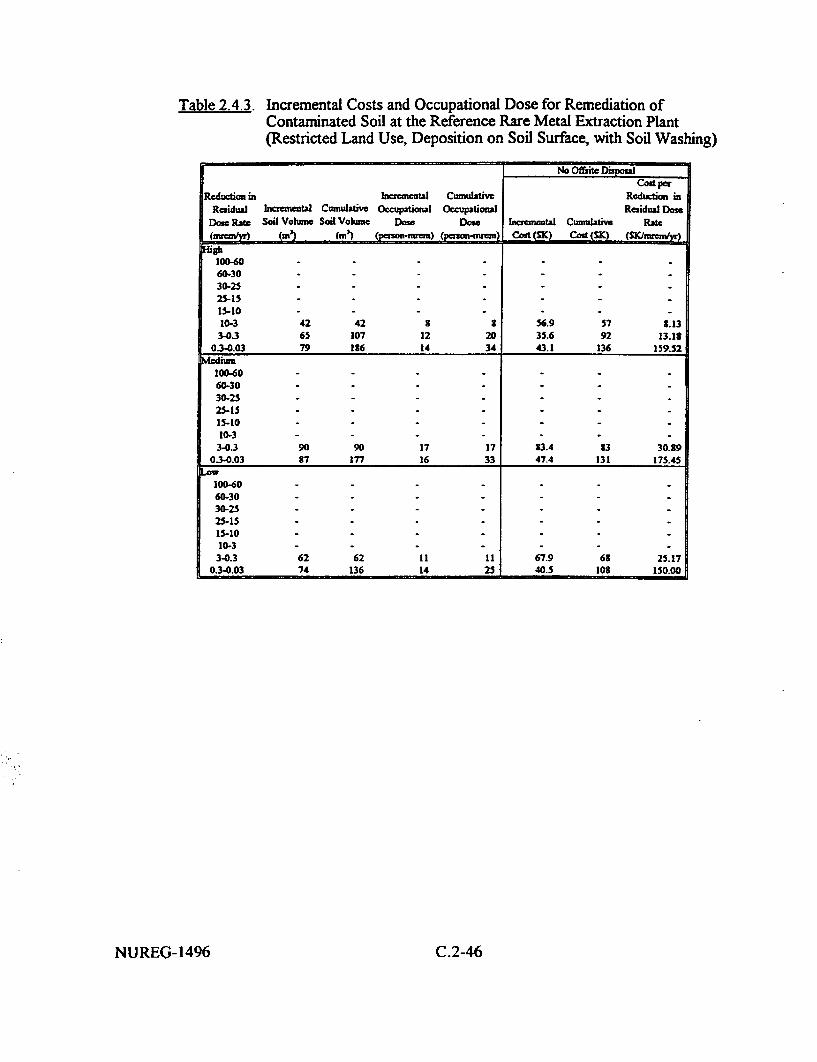
Table 2.4.3. Incremental Costs and Occupational Dose for Remediation ofContaminated Soil at the Reference Rare Metal Extraction Plant(Restricted Land Use, Deposition on Soil Surface, with Soil Washing)
No Offite DisposalCosiperI
Reduction in bIneintal Cumulative Reduction inResidual Inrmental Cunmlative Occupational Occupational Residual Dowe
Dos Rate Soil Volume Soil Volume Dows Dose Incmctal Cumulativ Rate( r) (in) () n) Cost (SK) Csn (SK) (SK/m:sn unw)
100-60 - . ,
60-30 - - - -30-25 - - - -25-15 - - _ _
15-10 - - _ -10-3 42 42 S 3 56.9 57 8.13
3-0.3 65 107 12 20 35.6 92 13.130.34.03 79 1I6 14 34 43.1 136 159.52
ium100-60 - - - -60-30 - - - -
30-25 - - - -25-15 - -15-10 - -10-3 - -
340.3 90 90 17 17 83.4 33 30.390.3-0.03 37 177 16 33 47.4 131 175.45
100-60 - - -60-30 - - - -30-25 - - - -
25-15 - . _ , -
15-10 - _10-3 - - - - -
3-0.3 62 62 11 11 67.9 68 25.170.3-0.03 14 136 14 25 40.5 108 150.00
NUREG- 1496 C.2-46

Table 2.4.4. Incremental Costs and Occupational Dose for Remediation ofContaminated Soil at the Reference Rare Metal Extraction Plant(Restricted Land Use, Deposition on Soil Surface, Direct Disposal of Soil)
No Offsite Disposa
R bCost perReauctim in kcreMenl CuwMlative Reduction in
Rmidual h 1Menlal C=nati" 0 Ton1 O pational Resida DosDose Rite Soil Volum So Voume Dose Dose kccuantal Cmulative RaC(inres (') (an' (o-m)j m Cst(SI) Cost (SKC) ( p p mnv1=
100-60 . ,60-30 - - -
30-25 - -2S-151510 . . .,10.3 42 42 7 7 12.9 13 1.14
340.3 65 107 11 11 20.1 33 7.45034.03 79 16 13 31 24.3 57 90.15
10040 . .60-0 -30-25 - ' ' '25-15 . . .15-1010-3 ' ' '343 90 90 15 15 279 28 10.32
0.34.03 17 177 15 30 26.8 55 99.15
10060 -
60.30 - - -
30-25 -
25-15 . . . .15-10 - - .
10-3 '3.0.3 62 62 10 10 19.1 19 7.09
0.30.03 74 136 13 23 22.9 42 g
C.2-47 NUREG-1496

z
A
W
c
.4x0
Table 2.4.5. Incremental Costs and Occupational Dose for Remediation ofContaminated Soil at the Reference Rare Metal Extraction Plant(Unrestricted Land Use, Mixing/Landfilling, with Soil Washing)
s l0/Rw' Dip l Cost S5W Disposal Coad 350/flDispal CostCod per Codt p Coe per
Rsdactmin IinuinCSI* Cumulative Reduction in Reduction in Reduction in
Rsidual hen-tl Cumulative OccWq ticml Occupatioal Residual Does Residual Dose Residual Dose
Dos Rate Soil Volume Soil Voluw Dose Dose Inb utal Cunulative Rate Incmeneal Cunulative Rate hIcremntal Cumulative Rate
( em vr (i) (n) (er nmrn)(Person-mrei) Cost (SK) Cost (5K) (SK/anro yr) Cost (SK) Cost (SK) (W~imrut/y) Cost (SK) Cost (SK) (SK/msem/yr)
WA_IW0-60 402 402 72 72 272.3 273 6.32 547.3 547 13.61 2,252.9 2,253 56.32
60-30 545 948 98 170 371.0 644 12.37 741.4 1,219 24.71 3.053.1 5,306 101.77
30-25 143 1,091 26 195 98.4 742 19.6S 195.9 1,435 39.18 103.6 6,110 160.73
25-15 402 1,493 72 267 272.3 1,015 27.23 545.0 2,030 54.50 2,247.3 3,357 224.73
15-10 319 1,112 57 324 217.8 1,232 43.56 433.7 2,463 86.74 1,784.5 10,141 356.91
10-3 941 2,760 170 494 643.9 1,176 91.98 1,283.1 3,752 184.12 5,306.2 15,443 758.03
3-0.3 1,311 4,570 324 a13 1,231.5 3,108 456.12 2,461.6 6.214 911.72 10,134.2 25,532 3,753.40
0.3-0.03 1,S12 6,352 324 1,142 819.7 3,928 3,036.02 2,045.4 8,259 7,575.62 9,724.5 35,306 36,016.76
100-60 401 401 72 72 276.3 276 6.91 546.0 546 13.65 2,247.2 2,247 56.18
60-30 546 948 93 170 371.4 643 12.33 742.3 1,2SS 24.74 3,056.9 5,304 101.90
30-25 I44 1,091 26 195 93.5 746 19.70 196.1 1,4S4 39.21 104.3 6,108 160.87
25-15 402 1,493 72 267 272.5 1,019 27.25 545.3 2,030 54,53 2,248.7 1,357 224.87
15-10 319 1,312 57 324 217.9 1,237 43.53 433.3 2,464 16.77 1,735.3 10,142 357.05
10-3 947 2,759 170 494 643.3 1,550 91.90 1,237.7 3,751 113.96 5,301.5 15,444 757.35
3-0.3 1,312 4,571 324 813 1,232.2 3,112 456.37 2,462.9 6.214 912.20 10,139.7 25,514 3,755.45
0.34.03 1,312 6,383 324 1,142 1,236.5 4,349 4,579.63 2,462.1 8,676 9,113.78 10,140.3 35,724 37.556.64
100-60 3 3 1 I 36.1 36 0.90 33.2 33 0.95 51.5 51 1.29
60-30 545 548 95 9S 370.5 407 12.35 740.4 779 24.63 3,048.3 3,100 101.63
30-25 143 691 26 124 91.3 505 19.66 195.7 974 39.15 S02.9 3,903 160.58
25-15 402 1,093 72 196 276.6 7S2 27.66 545.2 1,520 54.52 2,243.3 6,152 224.S3
15-10 319 1,413 57 253 214.2 996 42.84 434.6 1,954 36.93 1,738.6 7,940 357.71
10-3 947 2,360 170 422 647.5 1,643 92.51 1,238.0 3,242 184.00 5,302.6 13,243 757.52
3-0.3 1,S12 4,172 324 747 1,232.5 2,376 456.43 2,463.6 5,706 912.43 10,142.3 23,335 3,756.41
3 1.11 5,93 324 1,07 1,231.3 4,103 4,562.12 2,460.3 3,167 9,114.04 10,134.9 33,520 37,536.57

... 'i'- - *I
Table 2.4.6. Incremental Costs and Occupational Dose for Remediation ofContaminated Soil at the Reference Rare Metal Extraction Plant(Unrestricted Land Use, MixdngALandfilling, Direct Disposal of Soil)
.1S011' DioI Cod $501' Dil Cas S350f1e Dial CostCops Cast pri
Redoeic in ba"Mot calatvR Redcdiotn in Reduttion inRsidal bMfCl COmblat Oceptioena OeapthI Reil D Reidul D Reddual DosDow Rte Soil Vhm Sol Vohsm Doss Dosw Imremntl 0 adi. Rate b bl C d Rae b l OI Ve Rd
i) ( (vevu22c) (Ve"S"MM) Cas M Cast () ($Khwm:y Cost C 01-Ot M Mvn1 Cod(St I Ccot (SK) Gld(SOK/
60"o 402 402 65 65 2613 261 6.53 942.3 943 23.57 5,206.6 5.207 130.1760.30 545 94s t 154 349.5 611 11.65 1,277. 2,220 429 7,056.7 12,263 235.2230.25 143 1,091 23 177 92.5 703 13.51 335.7 2,556 67.14 1,S55.0 14,113 371.0025-15 402 1,493 65 242 260.9 964 26.09 941.1 3,497 94.11 5,196.3 19,3135 519.6815-10 319 1,312 52 294 203.9 1,163 40.73 746.3 4,244 149.27 4,123.5 23,439 824.7010.3 943 2,760 154 447 615.0 ,7M 37.35 2,221.3 6,465 317.41 12,265.3 35,704 1,752.1t
340.3 1,311 4,570 293 740 1,167.4 2,950 432.35 4,240.6 10,106 1,570.61 23,422.0 59,126 3,674.8103-0.03 1,312 6,332 294 1,034 1,172.4 4,123 4.34209 4,245.4 14,951 15.723.69 23,43.2 32,569 t6,t26.5
100-0 401 401 65 65 260.7 261 6.52 940.5 941 23.51 3,193.- 5.194 129.3460-30 546 943 3t 154 354.0 615 1I.30 I.2792 2,220 42.64 7,065.6 12,259 235.5230-25 144 1,091 23 177 92.6 707 13.52 336.0 2,556 67.20 1,356.7 14,116 371.3325-15 402 1I493 65 242 256.9 964 25.69 941.7 3,497 94.17 5,200.1 19,316 520.0115-10 319 1,312 52 294 20.3 1,172 41.61 746.6 4,244 149.32 4,125.1 23,441 325.0330-3 947 2,759 153 447 610.4 .733 37.19 2,213.6 6,463 316.95 12,253.1 35,694 1,750.44
3.0.3 1,312 4,571 293 740 1,172.0 2.955 434.09 4,244.2 10,707 1,571.92 23,436.1 59,130 3,630.030.34.03 1,t12 6,333 294 1,034 1,16t1 4,123 4,326.45 4,244.9 14,952 15,721.97 23.440.5 2,571 36,316.61
I0040 3 3 1 1 1.3 2 0.05 3.3 3 0.21 41.5 4i 1.0460-30 545 543 tt 39 353.2 355 11.77 1,275.9 1,234 42.53 7,046.9 7.031 234.9030-25 143 691 23 112 92.5 447 M1349 335.4 1,620 67.01 1,353.4 3,942 370.6325-15 402 I.93 65 177 261.0 703 26.10 941.5 2,561 - 94.15 5,199.1 14.141 519.91
5.-10 319 1,413 52 229 204.3 913 40.6 747.9 3,309 149.59 4,132. 33,274 326.5510-3 97 2,360 153 312 614.6 1,527 37.30 2219.1 5,521 317.0 12,255.7 30,529 1,750.32
3.0.3 3,332 4,172 294 676 1,163.2 2,696 432.67 4,245.2 9.773 1,572.30 23,442.1 53,971 3,632.250.3-003 3.33 5,933 293 969 1,171.7 3,367 4,339.50 4,241.4 14.015 15,709.04 23,426.6 77,391 3676536
4.0
3
9

Table 2.4.7. Incremental Costs and Occupational Dose for Remediation ofContaminated Soil at the Reference Rare Metal Extraction Plant(Restricted Land Use, Mixing/Landfilling, with Soil Washing)
No Offisite ICost per
Reductionin Incrmnxtal Cumulative Reduction inResidual Incrental Cumulative Occupational Occupational Residual Dowe
Dosw Rate Soil Volume Soil Volume Dose Dose Incremcutal Cumulative Rate(mraww) (m') (m) (Person-uwrm) (p nem) Cat (SK) Cost (SK) (SKl/n=e=yr)
100-60 _ , .60-30 . , ,30-25 - - - -25-S1 117 117 21 21 97.S 9° 9.7815-10 319 435 5S S0 173.9 272 34.7710-3 947 1,323 174 254 516.9 739 73.25
3-0.3 1,311 3,194 333 526 9S2.4 1,777 366.07034-.03 1,12 5,006 333 919 922.6 2,766 3,661.52
Mcdim100-60 - - - - -
60-30 -
30-25 -
25-15 - - - .15-10 - - - - -
10-3 237 337 154 154 490.7 491 70.093-0.3 1.312 2,649 333 4S6 932.2 1,479 366.22
0.3-0.03 1.312 4,461 333 S19 988.7 2,463 3,661.99
10040 - - .
60-30 - - - - - -
30-25 - - - - - -
25-15 - - - - . -
15-10 - - - - - -
10-3 - - - - -
3-0.3 1.702 1.702 312 312 962.7 963 356.570.3-0.03 1.312 3,514 333 645 938.5 1.951 3,661.24
NUREG-1496 C.2-50

Table 2.4.8. Incremental Costs and Occupational Dose for Remediation ofContaminated Soil at the Reference Rare Metal Extraction Plant(Restricted Land Use, Mixing/Landfilling, Direct Disposal of Soil)
No 05sitA D iy.C stper
Reduction th al Cumtiv Rductio inRidual b =e W CmdW Occ=uptial Occupation Residual Dae
Dm Rawe Sa Velume So Vehm De Dm hcael Cumulaiv Rate(J) (' (cm (p =a ) (peWn. ) Cast (M) Cat(SM (S IUm
10040 *60-30 . . .30.25 - -
25.15 I17 117 20 20 36.0 36 3.6015-10 319 435 54 73 98.3 134 19.610-3 947 1,3S3 160 233 292.1 426 4L73340.3 JIM 3194 305 538 5513 985 206.37
0.30.03 1 12 S,006 305 144 355.7 1544 2,069.15him10060 - -
60-30 - -
30-25 - *25-15 , ,15-1010-3 U37 137 141 141 25L.0 253 36.16
3-0.3 1 12 2649 305 446 5581 317 206.950.34.03 1,312 4,461 305 752 553.7 1376 2.069.41
100460 -
60-30 - -
30-25 -25-15 - ' ' '15-10 - - -10-3 . , , ,3-03 1.702 1,702 2S7 -27 324.t 525 19437
0.3.0.03 1.12 3.514 305 592 355.6 1.00 2,062.99
C.2-51 - NUREG-1496

Table 2.5.1. Incremental Costs and Occupational Dose for Remediation ofContaminated Soil at the Reference Uranium Mill(Unrestricted Land Use, Deposition on Soil Surface, with Soil Washing)
No Ofrsite DisposalCost per
Redactionin Incremental Cwnulative Reduction inResidual Incutal Cumulative Occupational Occuational Residual Dose
Dow Rate Soil Volume Soil Volume Dose Doa Incremnbtal Cumulative Rate(nmTyr) (in') (1w) (penon-nrem) (peron-mem) Cot (SK) Cost (SK) (SK/mrrn/wr)
100-60 11,594 11.594 2.075 2,075 4,555 4.555 11460-30 13.672 25,265 2,447 4.522 5,372 9,927 17930-25 3.272 28,538 S86 5,103 1,236 11,213 25725-15 3.712 37,250 1,559 6,668 3.423 14,636 34215-10 6,599 43,349 1.11 7,49 2,593 17,229 51910-3 17.5S9 61,437 3,148 10,997 6,911 24,140 937
3-0.3 28.450 89,337 5.092 16,090 11,173 35,318 4.1400.3-0.03 25,230 115.118 4,516 20,606 9,914 45,232 36.717
Modiwn100-60 47,257 47,257 8,459 3.459 18,563 11,563 46460-30 24,795 72,053 4,433 12,397 9.743 28,311 32530-25 5.127 77.130 913 13.315 2,015 30,326 40325-15 12.372 39,552 2,215 16,030 4,361 35,137 43615-10 3.656 93,208 1,549 17,579 3,401 33,533 63010-3 21,955 120.163 3,930 21.509 8,627 47,214 1,232
3-0.3 33,393 153.561 5.978 27.437 13.123 60,337 4.3600.3-0.03 27,275 130,36 4,832 32,370 10,717 71,054 39.692
100-60 - - - -60-30 - - -30-25 - - - -25-15 73,423 73.423 13,143 13,143 29,399 29,399 294015-10 41.901 115.324 7,500 20.643 16.464 45,S63 3.29310-3 41,012 156,337 7,341 27,934 16.115 61.977 2,302
3-0.3 43,349 200,136 7.849 35,333 17.229 79,206 6,3310.3-0.03 31,337 232,023 5,699 41,532 12,509 91,716 46,331
NUREG-1496 C.2-52

Tab1e 2 52. incremental Costs and Occupational Dose for Remediation ofContaminated Soil at the Reference Uranium Mill(Unrestricted Land Use, Deposition on Soil Surface, Direct Disposal of Soil)
Noc Offifte DisvonCost per
Rdcion &==ermeta CuMulative Reduction imResidual keemnk!l CumulAtive O0cuptiou! ecupdatins Rcsidual Dose
Dose Rafte WlVolume Soil Volume Do Doe hcmu C uaiv Rc(MrMMNi) (in') (in') (pronor m)(eo vm=) Cas (1K) cost (SMC (9K/==iNJ)y
100-60 114594 114594 I'M7 1,17 2,763 2,763 6960.30 13,672 25,26 2,2t5 4,093 3.259 6.022 10930-25 3,27 2M3.3 530 4,623 730 6,302 15625-15 2,712 37.25 1,411 6,034 2,077 2,872 20315-10 6,599 43,149 1,069 7,104 1.57 10.451 31510-3 174389 61.437 2,249 9.953 4,192 14,643 599
3-0.3 28.450 219,387 4,609 14.562 6,731 21.424 2,5110.3-.03 25.230 115,111 4,037 124649 6,014 27,432 22,273
100-60 47,27 47,27 7.656 7,656 11,264 11,24 232260.30 24,795 72,053 4,017 11.673 5.910 17,173 19730-25 5,127 77.120 131 1253 1,22 12,96 24425-1S 12,372 2952 2004 14,507 2,949 21,344 29515-10 2,656 98.202 1,402 15,910 2,063 23,407 41310-3 21,955 120.163 3,557 19,466 5,233 21,640 743
3-0.3 33,39 1534361 5,410 24,277 7,960 36,601 2,9403.04.03 27,275 110.336 4,41) 29,295 ,51 43,102 24,077
100460 .
6"0-330-25-.25-15 73,423 73,423 11.295 11.29 174500 17400 1,75015-10 41,90 115,324 6,738 12,63 9,987 27,437 1,99710-3 41.012 156,337 6,644 25,327 9,775 37,262 1,396
3-0.3 43,1149 200,136 7.104 32,430 10,451 47,713 3,2710340.03 31,27 232,023 5,152 37.52t 7,583 55.302 22,105
NUREG-1496C.2-53

Table 2.5.3. Incremental Costs and Occupational Dose for Remediation ofContaminated Soil at the Reference Uranium Mill(Restricted Land Use, Deposition on Soil Surface, with Soil Washing)
No Offsitc DisposaCost pe~r
Reduction in b=ncental Cumulative Reduction inResidual Incremental Cumulative Occupational Occuptional Residual Dose
Dose Rate Soil Volume Soil Volume Dose Dow Incremental Cnmulative Rate(m=uP/Yr) (mn) (M') (pcno-mem) (pcn-mrenc) Cost (SI) Cost (Sp) (Siren/y)
gh100-60 - - - - _60-30 _30-25 - - - -25-15 92,2S7 92,237 16,519 16,519 36,311 36,81I 3,68115-10 28,233 120,525 5,055 21,574 11,095 47,906 2.21910-3 32,263 153,794 6.350 23.424 15,036 62,943 2.148
3-0.3 42X910 201,704 7.681 36,105 16,860 79.803 6.24403-0.03 31,754 233,4538 5,6J4 41,789 12,477 92,279 46,210
Medium100-60 -60-30 - - - -30-25 - - - .25-1515-10 - -10-3 92,287 92,237 16.519 16,519 36,S11 36.311 5,259
3-0.3 31.545 173.U32 14,596 31,116 32,040 63,851 11,8670.3-0.03 37.909 211.741 6,736 37,902 14,895 33,746 55,167
Low100-60 - -60-30 - - - - .30-25 - - - - .25-15 - - - - _15-10 - _10-3 - _ -
3-0.3 120,525 120,525 21,574 21,574 47.906 47,906 17,7430.3-0.03 61,011 131.537 10,921 32,495 23,973 71,379 33,737
NUREG- 1496 C.2-54

Table 2.5.4, Incremental Costs and Occupational Dose for Remediation ofContaminated Soil at the Reference Uranium Mill(Restricted Land Use, Deposition on Soil Surface, Direct Disposal of Soil)
No Offaite DiapoWa
Reduclin in InCraw=Ula Onulatiw R.cdution inRaidul kctio Canutive Occ fiana Ocpat ioC Readuami Di
De= Rat Soa Vat Soni Volum Dm DM hcrzena Cwltive Me(mium*) (Mn) (MIn) (Pcnnm=-==) (Peuc-inie) ccat (SIC) Cost (SIC (Sl Anrzy)
1000 -i6CL30 ,30-25 .,25-15 92,287 92287 14,951 14,951 212.9 21,996 2,20025-10 28,238 120f,25 4,575 19,525 6,730 2727 1.34610-3 3S.26t 15t.794 6,199 25,725 9.121 37,348 130334.3 42,910 201,704 6,951 32676 10,227 4,075 3,783
0.34.03 31,754 233,453 5,24 37,32 7,56S 55,644 28,031
10040 . .6C-30 - -30-2525-15 . . .15-10 . ,10-3 92,287 92,27 14051 14,951 21,96 21.996 3,142
3.0.3 31,545 173,332 13,210 23,161 19.436 41,432 7,1980.34.03 37,909 211,741 6,141 34,302 9,035 50,467 33,464
10040 . . , .60-30 . . .30-25 - . .25-I5 . . ,15-10 . ,10-3 - -
3-0.3 120,52 120,525 19,525 19,525 28,727 28,727 10,6400.340.03 61,011 131,537 9,334 29,409 14,542 43,269 53,5
IC.2-55 NUREG-1496

C.3 Modifications to Analyses In Response to Public Comments
The NRC received a number of public comments questioning the soil contaminantdistribution methodology utilized in the draft GEIS. The essence of these comments was thatthe draft GEIS methodology, in some instances, significantly underestimates the volume ofcontaminated soil requiring remediation during decommissioning of nuclear facilities. Inresponse to these comments, NRC and PNNL staff reviewed data on contamination submittedby the commenters, compared it with available data on radionuclide distributions incontaminated soil including that in the draft GEIS, and verified and/or modified, asappropriate, the analyses of the reference facilities. This final GEIS thus considers additionalsoil contamination data. The following sections discuss specific public comments receivedrelative to each of the draft GEIS reference facilities and any modifications to the referencefacilities made in response to these comments.
C.3.1 Reference Nuclear Power Plant
C.3.1.1 Summary of Public Comments
Public comments received on the analysis of the reference nuclear power plant suggest thatthe diffusion, or "surface deposition," model utilized in the draft GEIS for estimatingradioactively-contaminated soil volumes is not representative of "real world" situations.Specifically, it is suggested that the "surface deposition" model used for predictingradionuclide distributions in the soil column is too simple to adequately represent "realworld" situations. Noted "real world" situations that the "surface deposition" model doesnot adequately represent were as follows:
* radionuclide deposition from airborne effluents released over the life of the plant,
* breaks that occur in underground pipelines that extend between buildings, betweenoutdoor tanks and buildings, or between tanks and discharge points; furthermore,these leaks can occur several feet underground,
* seepage of slightly contaminated routine effluents from drain lines, from tankoverflows, and from natural buildup of permitted effluent releases over years ofoperation, and
* mixing of contaminated and uncontaminated soil that occurs during remediation.
These possible sources of contamination suggest that areal variability can be much morepronounced than the uniformly-spread contamination assumed in the "surface deposition"model, contamination can be much deeper than predicted with the "surface deposition"model, and contaminated soil volumes predicted by the "surface deposition" model are toolow compared to 'real world" situations. Furthermore, a number of commenters indicated
C.3-1 NUREG-1496

that soil volumes requiring removal can increase exponentially with decreasing dose criteriaat levels below about 30 mrem/y.
One commenter acknowledged that the "surface deposition" model used in the draft GEISmay adequately represent situations where contamination results from discrete spills, such asaround perimeters of tanks. This same cominenter further indicated, however, that the othersources of contamination mentioned above would be more prevalent in the "real world."
Finally, with regard to building contamination, one commenter suggested that the volumes ofactivated and contaminated equipment and structures requiring D&D increase exponentiallywith decreasing dose rates below 500 mrem/y. More specifically, two commenterssuggested that the costs of decontaminating activated concrete, in particular for some reactordesigns where significant volumes of concrete (hundreds of thousands of cubic feet) becomeslightly activated, were not included in the draft GEIS.
C.3.1.2 Analyses Conducted in Response to Public Comments
The simple diffusion model developed to predict radionuclide distributions in contaminatedsoil for the draft GEIS was originally chosen over other more complex models because of thescarcity of "real world" data on radionuclide profiles in the soil column at nuclear powerreactors from which to develop a generic, or composite, site description for analysis and thedesire to develop a generic site that could be representative of the broad class of NRClicensees.
However, in the final GEIS, in order to be responsive to public comments, further PNNLreview and analysis of available data (NRC, 1997), including that submitted by commenters,on the extent and depth of radioactive contamination in soil at commercial nuclear powerplants was conducted. The major results of this review and analysis are as follows:
* Based on general site data and specific site area information, which generally camefrom decommissioning plans for commercial nuclear power reactors, the majority ofthe environs surrounding a power plant have such low concentrations of radionuclidesthat the dose to an onsite resident would be in the range of a few mremfy (based onutilizing the dose conversion factors from the draft GEIS or this GEIS. However,there are isolated areas that appear to have higher levels of contamination. Thesehigher levels for Co-60 (10-12 pCi/g) and Cs-137 (9-30 pCi/g) are comparable to thesurface contamination levels assumed in the draft GEIS (i.e., 2-60 pCi/g and 1-20pCi/g, respectively). These isolated areas of higher contamination also have arealextents (225 to 300 m2) that are comparable to that assumed for the reference facilityin the draft GEIS (i.e., 185 m2 ).
Many commercial nuclear power plants have had documented events that resulted incontaminated soil and requests for onsite burial of this contaminated soil (formerly 10CFR Part 20.302 burials). Based on an analysis of data available on the contaminated
NUREG- 1496 C.3-2
soil from these events, the majority of the contaminated soil would result in doses inthe range of a few mrem/y to the onsite resident (based on utilizing the doseconversion factors reported in Kennedy, 1992). Several of these events resulted inhigher contamination levels which are comparable to the surface contamination levelsassumed in the draft GEIS (e.g., Co-60 levels between 2 and 25 pCi/g up to a levelof 200 pCi/g; Cs-137 levels between 4 and 15 pCi/g up to 80 pCi/g).
* .Information on the volume of contaminated soil associated with individual eventssuggests that there may be instances where contaminated soil volumes are larger thanpredicted in the draft GElS.
* Based on previous analyses performed for the NRC (Oak, 1980 and Tichlier, 1995),soil contamination resulting from airborne effluent deposition in general appears toresult in contamination levels ( < 0.1 mrem/y) that are significantly below proposedrelease criteria and.will not add noticeably to contamination levels resulting fromother causes such as spills.
* There is very limited information on the distribution of radionuclide contaminationwith depth.into the soil column or volume. Where data are available on radionuclideconcentration with depth into the soil column, they are generally only for a sampletaken from a single borehole (based on the limited data available and in Abel, 1986).
With regard to the building contamination model utilized in the draft GEIS, a simplediffusion model combined with "real world' data on measured radionuclide distributions inconcrete at commercial nuclear power plants was developed for predicting the spread ofradionuclides into concrete walls and floors and the reactor bioshield. In response to publiccomments received on this methodology, further PNNL review and analysis of available data(NRC, 1997), including that presented by the commenters on the extent and depth ofradioactive contamination in concrete at commercial nuclear power plants, were conducted.The major results of the review and analysis are as follows:
* Based upon these new analyses and the analyses originally conducted for the draftGEIS (refer to Appendix C in NRC, 1994), measured radionuclide concentrations(between 10' and 105 pCilcm3 for C-60 and between 1012 and 106 pCilcm3 for Cs-117)in concrete are comparable to the geometric mean (data from 7 nuclear powerreactors) radionuclide distribution profiles assumed in the draft GEIS (between 10°and 104 pCi/cm3 for.C-60 and between 100 and 104 pCi/cm3 for Cs-137).
* Based on data available in decommissioning plans and previous analyses done for theNRC (Konzek, 1990 and Konzek, 1995, Appendix M), the contaminated concretevolumes removed during D&D assumed in the draft GEIS (900-1,800 n3) are in goodagreement with the volumes generated or estimated by the commercial industry (800-1,500 my). Furthermore, comments received by industry experts on earlier NRC
IC.3-3 NUREG-1496
studies of the reference nuclear power plant indicate general agreement with theextent of radioactive contamination in concrete assumed in the draft GEIS.
Analysis of recent data from the Trojan Nuclear Plant decommissioning projectindicates higher than expected tritium contamination levels in the walls of the reactorcontainment building (Robertson, 1996). While the tritium levels are 2 to 3 orders ofmagnitude above background levels, the levels are still well below acceptable residualcontamination criteria and therefore do not require aggressive decontamination usingsurface removal techniques. This is consistent with the assumptions in the draft GEISregarding the extent of contamination in containment building walls/floors.
C.3.1.3 Analysis Modifications Made in Response to Public Comments
Based on the analysis of available "real world" data made in response to public commentsreceived on the reference nuclear power station D&D analysis methodology in the draftGEIS, the following modifications were made to the analysis methodology for the finalGEIS:
* The size of the contaminated soil site requiring remediation was increased from 185m2 (2,000 ft2) in the draft GEIS to 280 m2 (3,000 ft2).
* A "real world" radionuclide profile with depth in soil model was developed based ondata available on contaminated soil from Robertson (1986) at the Humboldt Bay Unit3 Nuclear Power Plant. This contamination profile was taken from a soil core thatwas taken near a condensate storage tank where either a spill or underground leak ofradioactive water had occurred.
The analysis methodology for the final GEIS included scenarios that evaluated remediation ofa 280-m2 (3,000-ft 2 ) contaminated soil site using both the "surface deposition" model fromthe draft GEIS and the new "spill/leak" model.
C.3.2 Reference Uranium Fuel Fabrication Plant
C.3.2.1 Summary of Public Comments
Public comments received on the analysis of the reference uranium fuel fabrication plantsuggest that the diffusion, or "surface deposition," model utilized in the draft GEIS forestimating radioactively-contaminated soil volumes is not representative of "real world"situations. Specifically, comments suggested that
* the "surface deposition" model used for predicting radionuclide distributions in thesoil column is too simple to adequately represent "real world" situations,
NUREG-1496 C.3-4

that the volumes of contaminated soil estimated using the "surface deposition" modelin the draft GEIS are too low and that volumes requiring removal in reality increaserapidly (even geometrically) with decreasing dose criteria; figures, without supportingdata, submitted by commenters indicated that the volume of contaminated soilrequiring remediation increased by a factor of 3 to 6 when the residual dose criteriaare decreased from 100 to 15 mrem/y, and
* that the "surface deposition" model only results in significant levels of surfacecontamination, which is only representative of situations where contamination hasresulted from windblown contaminated dust or spreading of contaminated topsoil;actual experience indicates that depths of contamination are considerably deeper dueto a variety of site-specific waste management practices such as onsite burials ofradioactive materials, leaks in underground radioactive liquid effluent systems, andmixing of contaminated soil with clean soil from previous site activities such asexcavations for new building foundations.
No public comments were received on the building contamination model for the referenceuranium fuel fabrication plant.
C.3.2.2 Analyses Conducted In Response to Public Comments
A review of available data on areal extent, depth, and volume of contaminated soil aturanium fuel fabrication plants was originally conducted for the draft GEIS. However, aswith the reference nuclear power station discussed above, a simple diffusion model wasdeveloped to predict radionuclide distributions in contaminated soil for the draft GEIS ratherthan a more complex model, because of the scarcity of "real world" data on radionuclideprofiles in the soil column at uranium fuel fabrication plants from which to develop ageneric, or composite, site description for analysis. In response to public commentsreceived, however, PNNL and NRC staff conducted a further review and analysis ofavailable data (NRC, 1997), including that presented by the commenters, on the extent anddepth of radioactive contamination in soil at uranium fuel fabrication plants. The majorresults of this review and analysis are as follows:
* Based on site-specific data for several uranium fuel fabrication plants, which generallycame from decommissioning plans for NRC licensees, contaminated soil volumes andthe areal extent of contaminated sites requiring remediation can be considerably
:' higher than predicted in the draft GEIS. Specifically, the decommissioning of theBabcock and Wilcox fuel conversion plant in Apollo, Pennsylvania, resulted in 18,800m3 (665,000 ft3) of contaminated soil having greater than 30 pCi/g of radioactivecontamination being disposed of offsite (Carlson, 1994). The total area ofcontamination was estimated to be about 13,900 ml (150,000 fe).
C.3-5 NUREG-1496

* Leakage from liquid effluent systems (i.e., sewers) can substantially increase thedepth of contamination into the soil column and the resulting volume of contaminatedsoil requiring remediation.
* There is very limited information on the distribution of radionuclide contaminationwith depth into the soil column or volume at uranium fuel fabrication plants. Dataavailable on three DOE Formerly Utilized Sites Remedial Action Program (FUSRAP)uranium facilities indicate that the volume of contaminated soil requiring remediationincreases by a factor of 3.4 to 14 when the residual criteria are decreased from 130 to13 pCi/g (DOE, 1994a).
While no public comments were received specific to the building contamination model usedfor the reference uranium fuel fabrication plant, PNNL review and analysis of available data(NRC, 1997) were conducted. The results were that there are very few data available onradionuclide contamination levels and are much less sufficiently detailed to allow acomparison with the results of the model used in the draft GEIS.
C.3.2.3 Analysis Modifications Made in Response to Public Comments
Based on the analysis of available "real world" data made in response to public commentsreceived on the reference uranium fuel fabrication plant D&D analysis methodology in thedraft GEIS, the following modifications were made to the analysis methodology for the finalGEIS:
* The size of the contaminated soil site requiring remediation was increased from 4,650In2 (50,000 ft2) in the draft GEIS to 9,300 M2 (100,000 ft2 ).
* A "real world" radionuclide distribution in soil model was developed based on dataavailable on contaminated soil at the Babcock and Wilcox Apollo Plant and the DOEFUSRAP uranium sites. This contamination profile was based on a DOE site whereextensive landfilling and site grading occurred resulting in significant mixing ofcontaminated soil with clean soil.
The analysis methodology for the final GEIS included scenarios that evaluated remediation ofa 9,300-m2 (100,000-ft2 ) contaminated soil site using both the "surface deposition" modelfrom the draft GEIS and the "mixing/landfilling" model developed based on the publiccomments.
C.3.3 Reference Sealed Source Manufacturer
C.3.3.1 Summary of Public Comments
Only one specific public comment was received on the draft GEIS analysis of the referencesealed source manufacturer, which also used a diffusion, or "surface deposition," model for
NUREG-1496 C.3-6
estimating radioactively-contaminated soil volumes. This commenter did not specificallyquestion the "surface deposition" or building contamination models but rather made thegeneral note that the selection of the reference facility (i.e., a sealed source manufacturer)does not adequately represent other types of non-fuel-cycle facilities, such as radiochemicaland radiopharmaceutical manufacturing facilities. The commenter suggested that the impactof decommissioning on these types of facilities to the level of the proposed standard would besignificant, yet was not considered as part of the impact analysis.
C.3.3.2 Analyses Conducted in Response to Public Comments
An analysis of NRC licensees classified as non-fuel-cycle facilities indicated that of theapproximately 1,400 non-fuel-cycle licensees, 295 are sealed source manufacturers, 1,101 arebroadly classified as R&D facilities (of which over 800 are academic, medical, and privatelaboratory-type facilities), and the remaining are rare earth extraction facilities. Generally,academic and medical facilities are issued licenses for the possession and use of radionuclidesfor teaching, training, and research. Previous NRC analyses of the D&D of these broadR&D types of facilities have not indicated significant soil contamination problems and thecontaminated laboratories are generally relatively small, on the same order as the size of thereference sealed source manufacturer assumed in the draft GEIS (Murphy, 1981 and Short,1989). The draft GEIS results for decontamination of the reference sealed sourcemanufacturer building can easily be scaled to determine comparable results for largerbuildings.
A review was made by PNNL and NRC staff of available literature on non-fuel-cycle nuclearfacilities to identify available data (NRC, 1997) on areal extent, depth, and volume ofcontaminated soil at these types of facilities (Murphy, 1981; Short, 1989; NRC, 1993).While there were references to contaminated soil in a couple of instances, a site havingcontaminated soil was clearly the exception rather than the rule (in general, contamination isconfined to localized areas inside the building). And even in those cases where contaminatedsoil was indicated to be present, there were no estimates of the areal extent, depth, orvolume of contamination in the soil from which to base an analysis upon.
C.3.3.3 Analysis Modification Made In Response to Public Comments
The indication in the public comment that remediation requirements are significantly greaterat other types of non-fuel-cycle nuclear facilities than sealed source manufacturers is notsubstantiated by the data available to NRC and PNNL staff. It therefore appears reasonableto conclude that the reference sealed source manufacturer facility assumed in the draft GEISbe retained as the reference facility.
However, as a sensitivity case, a "spill/leak" model was developed to represent potentiallydeeper contamination than would result from the "surface deposition" model used in the draftGEIS. The model used to represent this scenario was the same as was developed for thereference nuclear power plant "real world" scenario. The analysis methodology for the final
C.3-7 NUREG-1496

GEIS therefore included scenarios that evaluated remediation of a 465 m2 (5,000 ft2)contaminated soil site using both the "surface deposition" model from the draft GEIS and the"spill/leak" model developed based on public comments.
C.3.4 Reference Rare Metal Extraction Facility
C.3.4.1 Summary of Public Comments
Only one specific public comment was received on the draft GEIS analysis of the referencerare metal extraction facility, which also used a diffusion, or "surface deposition," model forestimating radioactively-contaminated soil volumes. The essence of the comment receivedwas that the volumes of contaminated soil estimated as requiring remediation using the"surface deposition" model are underestimated and, consequently, the calculated soilremediation costs are underestimated. The commenter also suggested that soil volumesrequiring remediation would increase appreciably as the residual dose criteria decrease,especially at low dose criteria.
C.3.4.2 Analyses Conducted in Response to Public Comments
A review of available data on areal extent, depth, and volume of contaminated soil at raremetal extraction facilities was originally conducted for the draft GEIS. However, as with thereference nuclear power station and uranium fuel fabrication plant discussed previously, asimple diffusion model was developed to predict radionuclide distributions in contaminatedsoil for the draft GEIS rather than a more complex model because of the scarcity of "realworld" data on radionuclide profiles in the soil column at rare metal extraction facilities fromwhich to develop a generic, or composite, site description for analysis.
Also, as discussed in the draft GEIS, the reference rare metal extraction facility is assumedto have a large 7,000-m3 (250,000-ft3) contaminated slag pile. However, this slag pile wasnot included in the draft GEIS analyses because the relatively high contamination levelsassociated with the slag pile (an average activity level of 1,250 pCi/g) meant that there wouldbe no difference in remediation requirements for the alternative residual dose levels beingconsidered in the GEIS (i.e., those less than 100 mrem/y). In other words, the impacts ofremediating the slag pile would just subtract out when comparing the differences inremediation costs between two residual dose levels. Since the purpose of the GEIS analysesis to determine the differences in impacts between different residual dose levels and not toestimate the total costs of remediation, remediation of the slag pile was not included in theGEIS analyses (even though it would have added substantially to the total volume ofcontaminated soil requiring remediation).
In response to public comments received, however, PNNL and NRC staff conducted afurther review and analysis of available data (NRC, 1997), including that submitted bycommenters, on the extent and depth of radioactive contamination in soil at rare metalextraction facilities. The major results of this review and analysis are as follows:
NUREG-1496 C.3-8

* Based on site-specific data for several rare metal extraction facilities, which generallycame from decommissioning plans for NRC licensees and from NRC, 1993, there aregenerally large volumes of contaminated slag piles associated with these types offacilities. Much of the contamination data available on these types of sites is for theslag piles, with very little contamination data, or estimates of contaminated volumesand/or areal extent, available on the soil.
* There is very limited information on the distribution of radionuclide contaminationwith depth into the soil column or volume at rare metal extraction facilities. Limitedinformation on the Molycorp, Inc., rare metal ore processing facility in York,Pennsylvania, indicates that a total of 510 m3 (18,000 ft3) of Th-232-contaminatedsoil, with concentrations as high as 700 pCi/g, is estimated to require excavation andremoval from the site during remediation. Approximately 100 m3 (3,600 ft3) of thisvolume is contaminated with Th-232 to levels greater than 70 pCi/g (NRC, 1993).
* Information from several of the sites evaluated indicated that thorium does not leachappreciably from the slag into the soil and that soil contamination is generally limitedto the upper one to two feet of soil.
While no public comments were received specific to the building contamination model usedfor the reference rare metal extraction facility, PNNL review and analysis of available data(NRC, 1997) were conducted. The results were that there are very few data available onradionuclide contamination levels and are much less sufficiently detailed to allow acomparison with the results of the model used in the draft GElS.
C.3.4.3 Analysis Modifications Made in Response to Public Comments
Based on the analysis of available "real world" data made in response to public commentsreceived on the reference rare metal extraction facility D&D analysis methodology in thedraft GEIS, the following modifications were made to the analysis methodology for the finalGETS:
* A 7,000-m3 (250,000-ft3) slag pile was included in the soil remediation analyses.
* A "real world" radionuclide distribution in soil model was developed based on dataavailable on contaminated soil at the Molycorp, Inc., rare metal ore processingfacility in York, Pennsylvania. This contamination profile was based on a verylimited data set that required a number of "best engineering judgement" assumptionsbefore the data could be developed into a model sufficient for analysis. The soilcontamination was assumed to be the result of utilizing the slag as landfill, similar topast practices at the Molycorp, Inc., rare metal ore processing facility in Washington,Pennsylvania.
C.3-9 NUREG-1496

The analysis methodology for the final GEIS included scenarios that evaluated remediation ofa 7,000-m3 (250,000-ft3 ) slag pile and a 9,300-m 2 (100,000-ft2 ) contaminated soil site usingboth the "surface deposition" model from the draft GEIS and the new "mixing/landfilling"model developed based on public comments.
NUREG-1496 C .3-10
C.4 Characterization of Reference Facility Contamination
The NRC received a number of public comments questioning the soil contaminantdistribution methodology utilized in the draft GEIS (refer to Section 3). The essence of thesecomments was that the draft GEIS methodology, in some instances, significantlyunderestimates the volume of contaminated soil requiring remediation duringdecommissioning of nuclear facilities. In response to these comments, NRC and PNNL staffreviewed information submitted and also conducted a literature search for informationdocumenting the extent and depth of radioactive contamination at both NRC-licensed andDOE nuclear facilities. This literature search identified a number of "real world' situationswhere, as suggested by public comment, radioactively-contaminated soil volumes weresignificantly greater than had been estimated by the draft GEIS methodology. These "realworld" data were subsequently analyzed and used to form the basis for modified referencefacilities.
This chapter provides a brief physical description of the reference facilities being evaluated inthe final GEIS. The descriptions include information such as the size of buildings and totalsite area, the extent and penetration of radioactive contamination on building surfaces fromactual radiation surveys when available, and the extent and depth of radioactivecontamination in the environment where "real world" data were available.
The descriptions of each of the reference facilities are based upon actual facilities licensed bythe NRC or owned and regulated by the DOE. In some cases, insufficient information wasavailable on any one facility to provide an adequate description for evaluation. In thesecases, the reference facility description is actually a composite description of multiplefacilities. While much of the reference facility descriptions include information originallypresented in the draft GEIS (NRC, 1994), it is repeated here for completeness and clarity.
C.4.1 Reference Nuclear Power Reactor Station
The Trojan Nuclear Power Plant, located in Rainier, Oregon, was used as the representative1095-MWe pressurized water reactor plant that is preparing for decontamination anddecommissioning. Conceptual decommissioning of this plant has been reported in previousstudies for the NRC (Smith et al., 1978; Konzek et al., 1995).
C.4.1.1 Description of Building Contamination
The extent of surface radionuclide contamination on floors of the various buildings of thereference PWR nuclear power station was estimated by reviewing detailed contaminationsurvey maps supplied by the utility for contaminated areas of the station. The contaminationsurveys were conducted by taking smears of removable radioactive material from 100 cm2
areas of floor surfaces. In a number of locations in the reactor containment building,contaminated walls were also surveyed for removable radioactive contamination. A summaryof the contaminated surface areas is given in Table 4.1.1. As shown in the table, all of the
C.4-1 INUREG-1496

floor surfaces in the reactor containment building (estimated area of about 1900 m2 ) areassumed to be contaminated at levels which would require scabbling to reduce thecontamination levels to acceptable residual concentrations.
Contamination penetrated into concrete below-grade floors in the Sodium Reactor ExperimentFacility approximately 1/8 to 3/8 inches on the average and up to the full thickness of wallsand floors where cracks and joints existed (Brengle, 1979). Angus et al. (1990) found that137 CS penetrated deeply into areas of surface porosity and cracks. Information on surfacecontamination of concrete in the Japan Power Demonstration Reactor (Yasunaka et al., 1987)indicated that most of the contamination penetrated less than 2 cm and only 15% penetratedup to 3 cm. In the liquid waste treatment building, the deepest penetration was up to 11 cmin the vicinity of cracks, but elsewhere it was less than 2 cm. Therefore, complete removalof concrete will likely be required in the vicinity of contaminated cracks. The perimeter ofthe concrete floors is assumed to contain 1500 m of cracks. Because contamination tends topenetrate rapidly into cracks, contaminated crack regions are expected to require completeremoval.
The interior walls of certain locations within the reactor containment building also containsignificant radionuclide contamination, particularly the upper and lower cavity areassurrounding the pressure vessel. Although summaries of wall contamination are not includedin Table C.4. 1. 1, it is estimated that approximately 400 to 600 m2 of wall area from theselocations have been contaminated at levels ranging from about 1,000 to 60,000 pCi/100 cm2.Other portions of the interior wall surfaces in the containment building may also becontaminated and require some type of decontamination.
Table C.4. 1.1. Extent of Surface Radionuclide Contaminationin the Reference PWR Nuclear Power Station(a)
Approximate Estimated % of Estimated AreaFloor Surface Floor Area Needing
Buildina Area, ft2 Contaminated Cleanup. ft2
Reactor 20,400 100 20,400Containment
Auxiliary 43,000 1-5 430 - 2,200(6 levels)
Fuel Building 53,800 1-5 540 - 2,690(5 levels)
Turbine Building 61,300 per level 0 0
Control Building 7,500 per level 0 0
(a) From Smith et al. 1978.
NUREG-1496 C.4-2

In addition to the widespread surface contamination of concrete and patchy areas ofcontamination associated with spills or high radiation areas where maintenance work wasconducted, radioactive contamination is produced in-situ by neutron activation of concreteshields. Concrete areas subjected to neutron exposure within the plant are limited primarilyto the bioshield and the sump area directly beneath the reactor vessel. Concrete core samplescollected directly beneath the pressure vessel show the effects of both surface contaminationand subsurface neutron activation of stable elements present in the concrete (Abel et al.,1986). The concentration of radionuclides, such as 'Co, decreases rapidly (byapproximately four orders of magnitude) with depth from the surface to about 2 cm beneaththe surface. This concentration profile is attributed to diffusion of surface contamination.The radioisotopes produced by neutron activation extend much deeper (even feet) in nuclearreactors (Abel et al., 1986; Irving, 1980). The concentration may peak at depths where theneutron energy spectrum coincides with peaks in the capture cross section for the parentisotope. The subsurface contamination produced by neutron activation is too deep to beremoved by surface scabbling and must be removed by procedures for concrete demolition.
The auxiliary and fuel buildings also have some areas of floor contamination but not nearlyto the extent of that observed in the reactor containment building. It has been estimated,based on survey reports (Smith et al., 1978), that about 1 to 5% of the floor area(representing about 430 to 2,200 ft2) in the auxiliary building has radioactive contaminationlevels in the range of 500 to 3,600 pCi/100 cm2. The fuel handling building also has a smallamount of floor contamination, estimated at approximately 540 to 2,690 ft2 , withcontamination levels ranging from about 500 to 2,300 pCi/100 cm2.
The other buildings, including the turbine building, the control building, radwaste handlingwarehouse, and the condenser building, generally do not have any measurable radioactivecontamination on any surfaces.
Within the common variabilities of contamination levels in nuclear power plants, the analysisfor a PWR reasonably estimates the contaminants and contamination levels for a BWR.Within these variabilities and considering the information shown in Table 4.1.2, theradioactive contamination in the various types of reactors appears to be similar. The primarydifference is in the areas and volumes of the structures. Dry active waste (DAW) is amixture of radioactively contaminated items typically generated at nuclear power stations(e.g., trash, protective clothing, gloves, equipment, tape, plastic sheeting and bags, etc.),and the radioactive material associated with DAW would be expected to be reasonablyrepresentative of that found on surface contaminated concrete. These measurements weremade on over 100 DAW samples during a recent study conducted by Battelle for the ElectricPower Research Institute to determine the industry-wide variability in the radionuclidecomposition of very low-level wastes generated at nuclear power stations (Robertson, et al.1989).
C.4-3 NUREG-1496

C.4.1.2 Description of Soil Contamination
Available information on radionuclide contamination in soils at nuclear power plant sitesindicates that this contamination is generally located in small patches of very lowconcentrations, that these patches are generally located within the security fences, and thatthey are generally at known spill sites. These locations were generally close to condensateor borated water storage tanks, effluent sampling points, or equipment maintenance and/orcleaning areas. Small areas of contaminated soils at most plants would require remedialaction, such as excavation and disposal as low-level waste. Contaminated soil volumes arerelatively low, generally in the tens of cubic meters (Abel et al., 1986). Additional volumesof contaminated soil might occur during decontamination and/or dismantling, as additionalspills occur or covered areas (e.g., underneath spent fuel storage pools) are found to becontaminated.
Abel, et al. (1986) reported concentration ranges of a number of radionuclides measured insurface soils (to a depth of 4 cm) at six different nuclear power reactor plants. Thesereported radionuclide concentration ranges are reproduced in Table 4.1.3. Cobalt-60 was thelargest contributor to radiation dose from radionuclides in soils at these plants. The highestlevels of radionuclides found in "hot spots" (soil samples and holding pond sediments)consisted of 'Co (up to 377 pCi/g) and '37Cs (up to 91 pCi/g) (Abel et al., 1986).
Table C.4. 1.2. Gamma-Emitting Radionuclide Distributions in Dry Active Waste(Robertson et al. 1989, 1991)
Average % Composition of Y-Emitting Radionuclides
All StationsRadionuclide All PWR Stations4) All BWR Stationst1' Combined(c)
"Co 49 340) 78 ±2.6 61 30
13 7 Cs 27 22 11 ±2.2 20 18
'34Cs 8.6 ± 7.3 2.5 + 1.2 6.1 ± 6.3
58co 9.8 ± 9.8 0.59 ± 0.43 6.7 + 9.0
mMn 0.7 ± 0.5 6.4 + 3.6 3.0 ± 3.6
06Ru 2.4 ± 2.1 1.8 i 0.4 2.1 + 1.4
'25Sb 0.6 + 0.3 0.69 ± 0.47 0.6 ± 0.4
"Nb 2.4 ± 3.2 0.2 + 0.09 1.8 ± 2.8
95Zr 0.7 ± 0.5 0.7 ± 0.5
11mAg 0.3 + 0.5 0.12 0.3 + 0.4
(a) Includes 6 stations and 60 samples.(b) Includes 4 stations and 42 samples.(c) Includes 10 stations and 102 samples.(d) ± values are the standard deviation (la).
NUREG- 1496 C.4-4
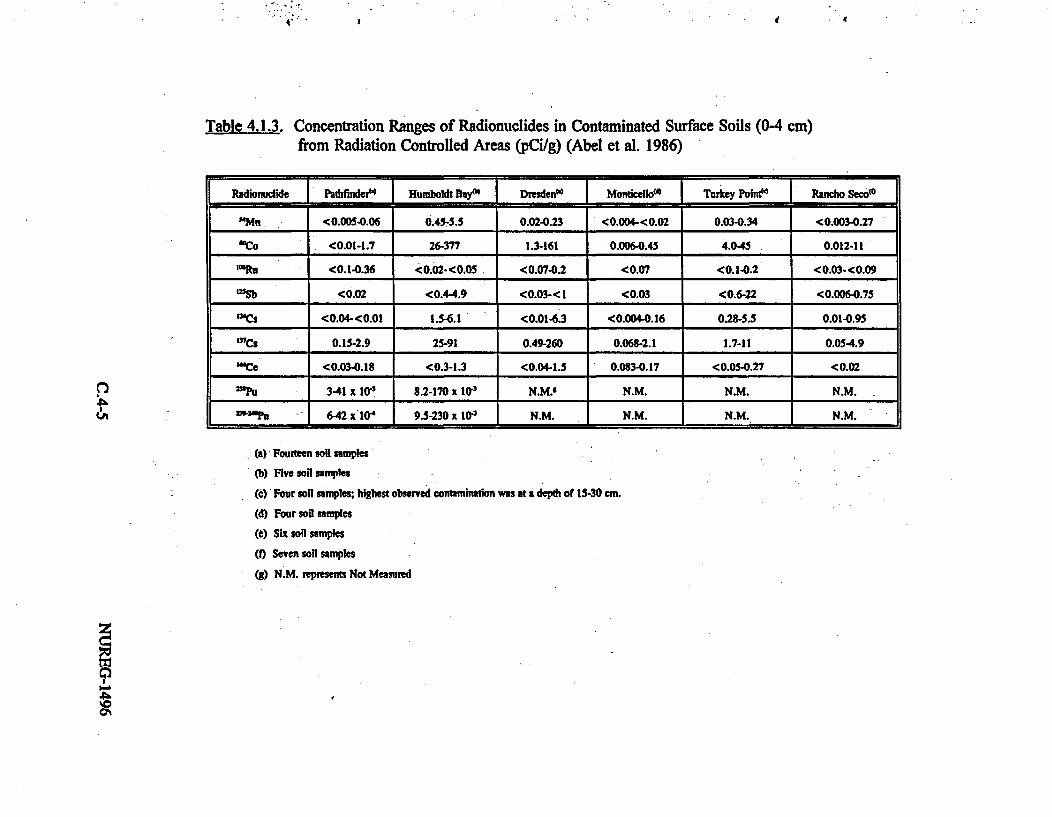
. ' :
:4 1 .
Table 4.1.3. Concentration Ranges of Radionuclides in Contaminated Surface Soils (0-4 cm)from Radiation Controlled Areas (pCi/g) (Abel et al. 1986)
Radionuclide Pathfnder [ Humboldt Bay°' DresdenW Monticello(' I Turkey Pointe' Rancho Seco<°
"'Mn - <0.005-0.06 0.45-S.S 0.02-0.23 <0.004-<0.02 0.03-0.34 <0.00340.27
loco <0.01-1.7 26-377 1.3-161 0.006-0.45 4.0-45 0.012-11
wRu <O.l-0.36 <0.02-<0.05 <0.07-0.2 <0.07 <0.1-0.2 <0.03-<0.09
12Sb <0.02 <0.4-4.9 <0.03-< 1 <0.03 <0.6-22 <0.006-0.75
,'Cs <0.04-<0.01 1.5-6.1 <0.01-6.3 <0.004-0.16 0.28-5.5 0.01-0.95
'3'Cs 0.15-2.9 25-91 0.49-260 0.068-2.1 1.7-11 0.05-4.9
MCC <0.03-0.18 <0.3-1.3 <0.04-1.5 0.083-0.17 <0.05.27 <0.02
3-41 x 10 8.2-170 x 10-' N.M.$ N.M. N.M. N.M.
"""Pu 6-42 xtO' 9.5-230 x 10' N.M. N.M. N.M. N.M.
O,
(a) Fourteen sol samples
(b) Five soil samples
(c) Four soil samples; highest observed contamination was at a depth of 15-30 cm.(d) Four soil samples
(a) Six son samples
(f) Seven soil samples
(g) N.M. represents Not Measured
I4%0

C.4.2 Reference Uranium Fuel Fabrication Plant
The reference uranium fuel fabrication plant is based upon General Electric Company'sFacility located in Wilmington, North Carolina, which processes an average of 1,000MTU/y. Conceptual decommissioning of this plant has been reported in a previous study forthe NRC (Elder and Blahnik, 1980a). Buildings or site areas associated with the referenceuranium fuel fabrication plant include:
* Processing buildings, which are typically two-story windowless structures of concreteand steel. Interior walls, typically of concrete block, divide the buildings intodiscrete operations areas that house each of the production steps.
* Onsite waste ponds containing calcium fluoride; calcium fluoride is a waste productthat is produced by treating the fluoride wastes with Ca(OH)2. The calcium fluorideis stored in waste ponds on the site.
* A total site area of 4.7 x 106 ft2 .
The reference facility is licensed by the NRC, is a major fabricator of nuclear fuel forcommercial nuclear power plants, and is considered to have characteristics similar to otherexisting commercial uranium fabrication plants. Contamination of equipment and floorsresults during normal operations and, on at least one occasion, from a spill that causeduranium to penetrate through cracks in the concrete floor into soil beneath the fuel processingbuilding.
The feed to the plant is slightly enriched uranium in the chemical form of UF6. The plantuses two chemical processes for converting the UF6 to U0 2. The primary method is achemical process that reacts UF6 with ammonia to form ammonium diuranate (ADU)precipitate and reduces and calcines the ADU to dry U0 2 powder. The second methodinvolves direct conversion of the UF6 to U30, to U0 2 powder in a reduction calciner. TheU02 powder from each process is subsequently milled and pressed into pellets that aresintered and ground to size. The pellets are loaded into rods and sealed. The rods areassembled into fuel bundles ready for use in light water reactors.
Liquid waste streams containing uranium are kept separate to facilitate uranium recoveryoperations. They are classified as nitrate wastes, fluoride wastes, and radwastes. Uranium-bearing nitrate sludge is sent to an offsite contractor for uranium recovery. Calcium fluoridesolids entrap uranium residuals in the waste from the UF6 to U02 conversion process. CaF2solids are stored onsite for eventual reprocessing to recover the uranium residuals.
C.4.2.1 Description of Building Contamination
The reference fuel fabrication plant consists of five potentially contaminated buildings (Elderand Blahnik, 1980b). There are an average of two floors per building with a total floor
NUREG-1496 C.4-6

space of approximately 235,000 ft2 (about 22,000 m2). Contamination incidents, as well asreleases during normal operations, are assumed to have affected 50% of the surface of theprocess areas. The principal contaminant is uranium, and its concentration at the exposedsurface after removal of the covering and after surface washing is 1 g U/m2 (33 pCi/g ofconcrete). Therefore, approximately 11,000 ir2 are assumed to be contaminated to a level of1 g U/m2 (33 pCi/g of concrete) and require decontamination by surface removal.
Floor tiles cover 100% of the process area floors. Replacement of the floor tiles andlinoleum coverings removes significant contamination. However, recontamination duringoperation requires floor tiles to be replaced annually for ALARA considerations. The tilesare also removed during normal decommissioning operations. Because of contaminantpenetration through seams between tiles, it is assumed in Table 4.2.1 that 50% of theconcrete floor has become contaminated'. The chemical area has a sealed concrete floor. Itis assumed that 50% of the concrete floor surface under the seal is contaminated. Officesand change rooms have tiled or painted floors (Elder and Blahnik 1980a); it is assumed thatthe concrete surfaces below these surface coverings are not contaminated.
Table C.4.2. 1. Distribution of Contaminated Concrete Floor Area in theReference Uranium Fuel Fabrication Facility(')
EstimatedSurface Area, Estimated Area Contamination Level,
Location fe Contaminated. % gCVcm 3
Fuel Manufacturing Building 208,000 SO 73
Chemical Metallurgical 8,300 40 73Laboratory
Uranium Scrap Recovery Room 3,700 90 73
U0 Powder Warehouse 8,700 30 73
Contaminated Waste incinerator 2,400 100 73
Fluoride and Nitrate Waste 2,500 100 73Treatment Plant
Boiler Steam House 1,100 0 0
Total 234,700 SO
(a) (Elder and Blahnik 1980b)
Note: this assumption deviates from that made by Elder and Blahnik (1980) in that they assumed theconcrete was not contaminated. Penetration and spread of contamination through seams between tiles isassumed in Table 4.2.1 to result in approximately 502 of the concrete floor becoming contaminated.
C.4-7 NUREG-1496

Elder and Blahnilc (1980a) estimated the surface concentration of uranium on horizontalsurfaces to be approximately 1 g U/m2 (33 pCi U/g of concrete)'. Approximately 700samples were taken from the main building block and brick walls at the Babcock and Wilcoxplant located in Apollo, Pennsylvania. The majority of the wall contamination was <30 pCiU/g with some selective areas containing up to 2,000 pCi U/g (Haase et al. 1992). Thecharacterization of surface contamination was complicated by the heterogeneous nature of thecontamination and, in some areas, the number of overlying pours of concrete that were madeto cover contaminated floor areas.
Measurements at the DOE Fernald facility have shown some floor regions with extremeuranium contamination approaching 10,000,000 dpm/100 cm2 with an average maximum of2,220,000 dpm/100 cm2 (DOE 1992). These high levels are believed to be an upper bound.
The three uranium fuel fabrication facilities provide information on three levels ofcontamination: an estimated 33 pCi U/g for Wilmington, up to 2,000 pCi U/g measured forApollo, and a maximum beta-gamma of nearly 16,000 pCi U/g for Fernald. These datawere converted to dpm/100 cm2 and resulted in values of 18,000 dpm/100 cm2 (low);1,100,000 dpm/100 cm2 (medium); and 10,000,000 dprn/l00 cm2 (high). Based on theabove discussion, the level of surface contamination after surface washing assumed for thereference uranium fuel fabrication facility is 18,000 dpml100 cm2.
Considerable documentation was reviewed (Elder and Blahnik, 1980a, 1980b; Babcock andWilcox, 1992a, 1992b; Haase et al., 1992; and DOE, 1992) to locate information on thedepth of penetration of uranium into concrete for use in the analyses. However, noexperimental data were found.
C.4.2.2 Description of Soil Contamination
Although the General Electric Wilmington Plant is the reference nuclear fuel fabricationfacility, more information on the condition of the soils at this type of facility was found forthe Babcock and Wilcox Apollo plant. Also, considerable information on soil contaminationwas available for the Ventron Corporation plant located in Beverly, Massachusetts, which isa DOE Formerly Utilized Site Remedial Action Program (FUSRAP) site (DOE, 1994a).
The Babcock and Wilcox Apollo plant is a former nuclear fuel manufacturing site currentlyundergoing decontamination (Babcock and Wilcox, 1992a, 1992b). The fuel manufacturingoperations were performed in one part of the facility, owned by Babcock and Wilcox, andlocated on the east side of the site in approximately one acre of roofed two-story buildings.Other parts of the complex included a parking lot (2.5 acres) and an "offsite area" (3 acres)which included a metals-processing complex, laundry, railroad spur, and equipment storagebuilding.
1 g U/m2 - 0.7 x 10⁶ pCi/m 2 x 0.472 pCi/g per pCi/cm2 x 10-' u?/cn? - 33 pCi/g
NUREG-1496 C.4-8
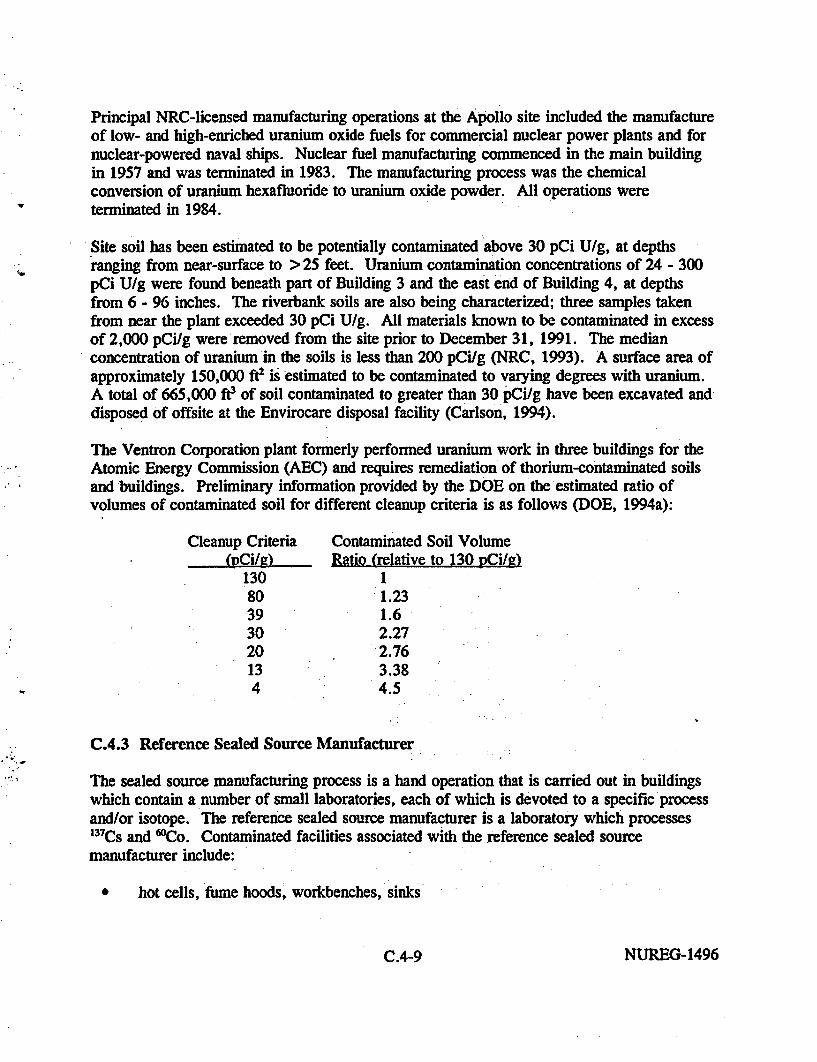
Principal NRC-licensed manufacturing operations at the Apollo site included the manufactureof low- and high-enriched uranium oxide fuels for commercial nuclear power plants and fornuclear-powered naval ships. Nuclear fuel manufacturing commenced in the main buildingin 1957 and was terminated in 1983. The manufacturing process was the chemicalconversion of uranium hexafluoride to uranium oxide powder. All operations wereterminated in 1984.
Site soil has been estimated to be potentially contaminated above 30 pCi U/g, at depthsranging from near-surface to >25 feet. Uranium contamination concentrations of 24 - 300pCi U/g were found beneath part of Building 3 and the east end of Building 4, at depthsfrom 6 - 96 inches. The riverbank soils are also being characterized; three samples takenfrom near the plant exceeded 30 pCi U/g. All materials known to be contaminated in excessof 2,000 pCi/g were removed from the site prior to December 31, 1991. The medianconcentration of uranium 'in the soils is less than 200 pCilg (NRC, 1993). A surface area ofapproximately 150,000 ft2 is estimated to be contaminated to varying degrees with uranium.A total of 665,000 ft3 of soil contaminated to greater than 30 pCi/g have been excavated anddisposed of offsite at the Envirocare disposal facility (Carlson, 1994).
The Ventron Corporation plant formerly performed uranium work in three buildings for theAtomic Energy Commission (AEC) and requires remediation of thorium-contaminated soilsand buildings. Preliminary information provided by the DOE on the estimated ratio ofvolumes of contaminated soil for different cleanup criteria is as follows (DOE, 1994a):
Cleanup Criteria Contaminated Soil Volume(VCi/g) Ratio (relative to 130 pCi/g)
130 180 1.2339 1.630 2.2720 2.7613 3.384 4.5
C.4.3 Reference Sealed Source Manufacturer
The sealed source manufacturing process is a hand operation that is carried out in buildingswhich contain a number of small laboratories, each of which is devoted to a specific processand/or isotope. The reference sealed source manufacturer is a laboratory which processes13 7 Cs and 6WCo. Contaminated facilities associated with the reference sealed sourcemanufacturer include:
* hot cells, fume hoods, workbenches, sinks
C.4-9 NUREG-1496

* laboratory floor and wall areas
* building areas used for storage of waste drums.
The situation for radiochemical and radiopharmaceutical manufacturers would be very similarto that of the sealed source manufacturer and is not examined further in this report.
Advanced Medical Systems, Inc. (AMS) is used as the reference sealed source manufacturer.It is a licensed non-fuel-cycle plant in Cleveland, Ohio, that manufactures '"Cs and 'Cocapsule sources for use in medical teletherapy devices and radiography machines (NRC,1993).
The AMS operations occupy about one quarter of an 8,000-ft2 (ground floor) warehousebuilding. The remainder of the building is unused. The facility occupies portions of threefloors in the warehouse. The first floor consists of an office area, an isotope shop area, ahot cell, a shielded work room, and a storage area. The second floor area houses amechanical equipment room and an exhaust ventilation equipment room. A liquid wastehandling room and the former liquid waste holdup tank room and dry waste storage area arelocated in the basement. Waste is stored in a locked room with roped areas on the south sideof the warehouse area. The floor surface areas are estimated to be 6,000 ft2 (assuming threefloors). The indoor surface area of the walls (estimated at 10 ft high) is estimated to be4,600 ft2.
C.4.3.1 Description of Building Contamination
A 1985 survey by Oak Ridge Associated Universities (ORAU) found surface contaminationin a hot cell, the ventilation system, the dry waste storage area, the liquid waste area, andthe holding tank and its piping. No offsite contamination was found. However, somedetectable activity (attributed to stack effluent releases) was found in sediments, soil, andvegetation in the southern portion of the AMS property. The ORAU survey showedcontamination up to 1.51 x 10⁶ dpm/100 cm2 in the hot cell access port in the isotope shoparea, an area normally expected to be highly contaminated. A water sample from the liquidwaste room floor contained 1.75 x 10⁵ pCi 6WCo/L. Sediment from the loading dock drainshowed low but detectable levels of activity.
C.4.3.2 Description of Soil Contamination
The site area of the reference facility is estimated to be 40,000 ft2. The contaminated area isestimated to be 5,000 ft2, based on assumed stack effluent releases. Advanced MedicalSystems, Inc., manufactures 6OCo and 137CS sources for medical use. A small amount ofdetectable activity has been found in site soil and was assumed to be due to stack effluentreleases. Apart from this, the major route to soil contamination would be via liquid wastespills on building floors running off through floor-wall seams in the concrete. However,
NUREG-1496 C.4-10

apart from some activity in sanitary sludges, there is no evidence of contamination outsidethe buildings from this source (NRC, 1993).
C.4.4 Reference Rare Metal Extraction Facility
Rare metal extraction facilities refine raw ore materials for the recovery of rare metals suchas tantalum and niobium. The raw ores processed by these facilities can contain appreciablequantities of uranium and thorium that can then end up in waste tailings produced during therefining process.
The reference rare metal ore processor is the Molycorp, Inc., facility located in Washington,Pennsylvania. This plant occupies a 17-acre (740,000-ft2) site and was used to produce aferro-columbium alloy from a Brazilian ore from 1964 to 1970 (Martin, 1985). The orecontained licensable concentrations of thorium (1-1.5%), consequently a byproduct of theoperation was a thorium-bearing slag. Contaminated facilities and areas associated with thereference rare metal extraction facility include:
* Buildings in which slag is processed and the rare metals are extracted. Significantbuilding contamination from these operations is not expected.
* Settling ponds containing the tailings from the metal extraction process, includingessentially all of the thorium and uranium present in the original raw ore. The pondis assumed to be unlined at the reference rare metal ore processor, although it may belined at newer facilities.
* A 7,000-m3 slag pile containing solid wastes from the extraction process.
C.4.4.1 Description of Building Contamination
The site contains a number of buildings, eight holding ponds, and a large slag pile. Building34 has up to 90 dpm/100 cm2 fixed alpha contamination, up to 8,680 dpm/100 cm2 fixed betacontamination, and direct radiation levels up to 169 uR/hr. The source of direct radiation issuspected to be below the floor. The total area of floors is estimated to be 150,000 fW; 40%of this surface is estimated to be contaminated with thorium. The surface area of the walls Isestimated to be 180,000 ft2 , of which 10% is estimated to be contaminated with thorium.
C.4.4.2 Description of Soil Contamination
Thorium-bearing slag and contaminated soil was previously collected and segregated in 1972.Some of this material was removed offsite at the time while the remainder was placed in aclay-capped pile on the property. Some of the slag was used as fill over portions of the site.The large slag pile is located on the southern part of the property and has an average activitylevel of 1,250 pCi/g (NRC, 1993). The slag pile is in a stabilized configuration in that it iscovered with vegetation.
C.4-11 NUREG-1496

Thorium contaminant concentrations in the soil, throughout the site, range between 10 and2,650 pCi/g and average 100-200 pCi/g. The area of contaminated soil is estimated to be100,000 ft2 based on the extensive handling and storing of ore and slag at the site. It isestimated that there is 1. lx1O kg of thorium onsite in the form of contaminated soils andslags.
While more detailed information on soil contamination at this facility is not available, anotherMolycorp, Inc., rare metal ore processing facility located in York, Pennsylvania, does havesome specific information on thorium contamination in the soil. During remediation of thissite, it is anticipated that a total of 18,000 ft3 of soil contaminated primarily with thorium-232 will be excavated and removed offsite. Of this volume, approximately 3,600 ft? willcontain up to 70 pCi/g of contamination. In addition, prior to soil excavation and removalactivities in 1987, the site had soil with contamination levels up to 700 pCilg of Th-232(NRC, 1993).
NUREG-1496 C.4-12

C.5 Methodology for Estimating Contamination Levels
Evaluating the costs and impacts associated with remediating contaminated buildings and soilsto different residual cleanup levels requires information on the level, extent, and depth ofcontaminants within the concrete structures requiring decontamination and in the soil column,respectively. Baseline models were developed for the draft GEIS (NRC, 1994) to providethe required contamination profiles needed for estimating the volume of contaminated soilrequiring excavation and/or treatment for alternative residual dose levels. These baselinemodels were described in the draft GEIS and are not repeated here.
Public comments received on the draft GEIS expressed concern that the calculatedcontamination profiles considerably underestimated the depth of contamination penetrationinto the soil column as compared to "real world" data. This difference is to be expectedgiven that the model used in the draft GETS to calculate the radionuclide contaminationprofiles in the soil is a simple diffusion model most appropriately representative ofcontamination deposition on the surface of the soil from a thin blowing contaminated dust ora thin spreading of contaminated material. The "real world" data, on the other hand, reflectextreme conditions of spills and leaks of contaminated aqueous solutions and/or mixing andburial of contaminated material in soil that result in deeper zones of contamination than arepredicted by the diffusion model where contaminant transport is assumed to be via diffusiononly.
In response to these comments, contaminant distribution models for O0Co, 137Cs, uranium, andthorium were developed to represent available "real world" data. The models developed torepresent these scenarios are discussed below. No new models were developed to estimatecontaminant distributions in concrete for the final GEIS based on the discussion in SectionC.3.1.2.
C.5.1 Cobalt- and Cesium-Contaminated Soil'
Data available on the extent of radionuclide contamination in soil around nuclear powerplants are sparse and generally not readily available. However, the NRC did conduct a studyin the early 1980s in which a comprehensive sampling program was conducted at severaloperating and shutdown nuclear power plants for the purpose of assessing residualradionuclide compositions, distributions, and quantities (Abel, 1986). Data obtained fromsampling and analyses conducted for this study were used to develop a "real world" model ofsoil contamination at nuclear power plants.
While considerable data were obtained on the levels of contamination in soil around thenuclear power plants investigated, very limited data on soil profiles were developed. Of thatlimited information, core samples taken near a condensate storage tank at the Humboldt BayNuclear Unit provided sufficient data to derive a concentration profile as a function of depthinto the soil column representative of soil behavior at the facilities studied. These data areprovided in Table 5.1.1 for Co-60 and Cs-137, the primary long-lived radionuclides of
- C.5-1 NUREG-1496

interest. As that table shows, the concentrations (pCi/g) of 'Co and "3Cs generally decreasewith soil depth until a depth of 30 to 38 cm, at which point the concentrations begin toincrease with depth. These increases are presumably caused by local conditions at thisparticular site or possibly by faulty sampling procedures. To do any kind of reasonablemodeling, an assumption had to be made regarding the behavior of the concentration profileat depths beneath the available data. Three possibilities were identified:
* The concentration rises as indicated by the data until a depth around 44 cm (the limitof the data) is reached. The concentration then remains at this level until someunknown depth, at which point the concentration drops at some unknown rate.
* The concentration rises as indicated by the data until about 44 cm and then dropseffectively to zero for depths greater than 44 cm.
* The rise in concentration below the 30 to 38 cm interval is peculiar to this soil. Inthe general case, for a "typical" soil, the concentration should fall monotonically withdepth.
There are other possibilities, of course, but it was decided that the third option would beused in this study. In the development of the "real world" model, it was assumed that theupper 36 cm of the concentration data is representative of a 'typical" soil and that beyond 36cm the data would be extrapolated.
Upon examination of the general shape of the data in Table C.5. 1.1, it was found that thedecreasing portion of the concentration curves for OCo and 137Cs could be fit rather well to afunction, C(x), having units of pCi/g, consisting of the sum of two decaying exponentials,i.e.,
C(x) = Ale -AIX + A2e-2X
where C(x) is the 'Co or 137 Cs concentration (in pCilg of soil) at a depth of x centimetersbelow the surface, and Al, XI, A2, and X2 are constants determined by a least squares curve-fitting procedure. The value for the constants derived from the least squares analysis isprovided in Table C.5.1.2 for both 6 'Co and 137Cs.
The CQx) functions for 'Co and 137Cs are assumed to represent the soil concentrationdistribution profiles at the time of reactor shutdown. Since exposure is primarily viabeta/gamma radiation, the contact dose to individuals from this contamination is due to morethan just the contamination in the layer of surface soil to which they are in contact. In orderto compensate for this, it is conservatively assumed that all of the inventory of contaminantremaining in the soil column is evenly distributed in the top 15 cm of soil and that the doserate from each layer of soil removed is from 1/15th of the total inventory. The residual doserate after removal of x cm of soil is therefore calculated by integrating CQx) over all x and
NUREG-1496 C.5-2

dividing by 15 to obtain an average adjusted concentration in the soil, and then multiplyingby the appropriate dose conversion factor (refer to Attachment A) as follows:
D(x) =- dCf(l -1IX+ _ e2
where D(x) is the residual dose rate (in mrem/y) after x centimeters of soil have beenremoved, and dcf is the dose conversion factor (in mrem/y per pCi/g) for either ZCo or137Cs.
The model developed for the above data is assumed to be representative of a site having ahigh surface contamination level since the data from the Humboldt Bay Nuclear Unit was atthe high end of the data obtained from all of the nuclear power plants evaluated in the studyreferred to above (compare to data in Table C.4.1.3). Medium and low surfacecontamination level models were developed by assuming the same scaling relationships aswere assumed for the baseline, or diffusion model, scenarios (i.e., contaminantconcentrations in the medium case are assumed to be 'A and 'A those in the high case for60Co and 137Cs, respectively, and in the low case are assumed to be 1/30th and 1/20th that ofthe high case for w0Co and 13'Cs, respectively). The model results for the unrestricted andrestricted land-use scenarios are shown in Figures C.5.1.1 and C.5.1.2, respectively, for6wCo and in Figures C.5.1.3 and C.5.1.4, respectively, for '37Cs.
A composite case is presented for the same scenarios in Figures C.5.1.5 and C.5.1.6. Thecomposite case is just the summation of the results for 6wCo and 13'Cs and are the resultsactually used in the analyses conducted for this study.
Figures C.5.1.7 through C.5.1.12 present the same results as discussed above for thescenarios where decommissioning is delayed for 50 years (i.e., SAFSTOR). In these cases,the results from the models above were input into the diffusion model, which is discussed inNRC, 1994. The diffusion model was used to simulate the 50-year SAFSTOR period byassuming that existing contamination migrated deeper into the soil column via diffusion only.
The calculated data underlying Figures C.5. 1.1 through C.5.1.12 are provided in AttachmentB.
C.5.2 Uranium-Contaminated Soil
The "real world" model for uranium-contaminated soil was developed from data available onthe extent of soil contamination at the former Ventron Corporation plant located in Beverly,Massachusetts (refer to Section C.3.2). The volume of soil that would be expected to beexcavated at this site for different residual cleanup levels is provided in Table 5.2.1 (DOE,1994a). These data were extrapolated to the reference uranium fuel fabrication plant bynormalizing to contaminated soil volume data available on the Babcock & Wilcox Apollo fuel
IC.5-3 NUREG-1496

fabrication plant. During remediation of this site, a total of 665,000 ft3 of soil contaminatedto greater than 30 pCi/g was excavated and disposed (Kingsley, 1994).
The total estimated soil volume requiring remediation was then calculated for each of thecleanup criteria shown in Table C.5.2. 1. These volumes were converted to an estimateddepth of contamination penetration into the soil column by assuming that the contaminationwas uniformly spread throughout an approximate contaminated surface area at the Apolloplant estimated at 200,000 ft2. The residual dose rate corresponding to each of these soildepths was then determined by converting the cleanup criteria (pCi/g) in Table C.5.2.1 todose rate (mrem/y) using the appropriate Dose Conversion Factor for uranium (refer toAttachment A).
A model to estimate residual dose rate as a function of the depth of contaminated soilremediated was developed by curve-fitting an exponential function to the above data, whichis as follows:
D(x) = 232.5 e(4 1221 x) (unrestricted land-use), and
D(x) = 8.694 e(#-0 l7X) (restricted land-use),
where D(x) is the residual dose rate (in mrem/y) and x is the soil depth remediated (in cm).The model results are shown in Figures C.5.2.1 and C.5.2.2 for the unrestricted andrestricted land-use scenarios, respectively.
The models developed for the above data are assumed to be representative of a site having ahigh surface contamination level since data available on the Apollo plant suggest that themedian concentration of uranium throughout the entire contaminated soil volume is less than200 pCi/g (NRC, 1993). Medium and low surface contamination level models weredeveloped by assuming the same scaling relationships as were assumed for the baseline, ordiffusion model, scenarios (i.e., contaminant concentrations in the medium case are assumedto be 1/5th those in the high case, and in the low case are assumed to be 3/100th that of thehigh case). The calculated data underlying Figures C.5.2.1 and C.5.2.2 are provided inAttachment B. For purposes of soil removal calculations in Attachment C (and in particularfor Tables C.25 and C.26), the depth of soil removal necessary to attain the lower alternativedose criteria (30-0.03 mrem/y) was based on Attachment B. The depth of soil removalnecessary to achieve the higher alternative dose criteria (100 and 60 mrem/y) was based onthe data available rather than a calculated curve fit because they were a better representation.
C.5.3 Thorium-Contaminated Soil
Limited information was available relating to soil contamination profiles in terms of thoriumconcentrations as a function of depth of soil for rare metal extraction plants. Based on thevery limited data available, however, the following broad conclusions can be made:
NUREG-1496 C.5-4
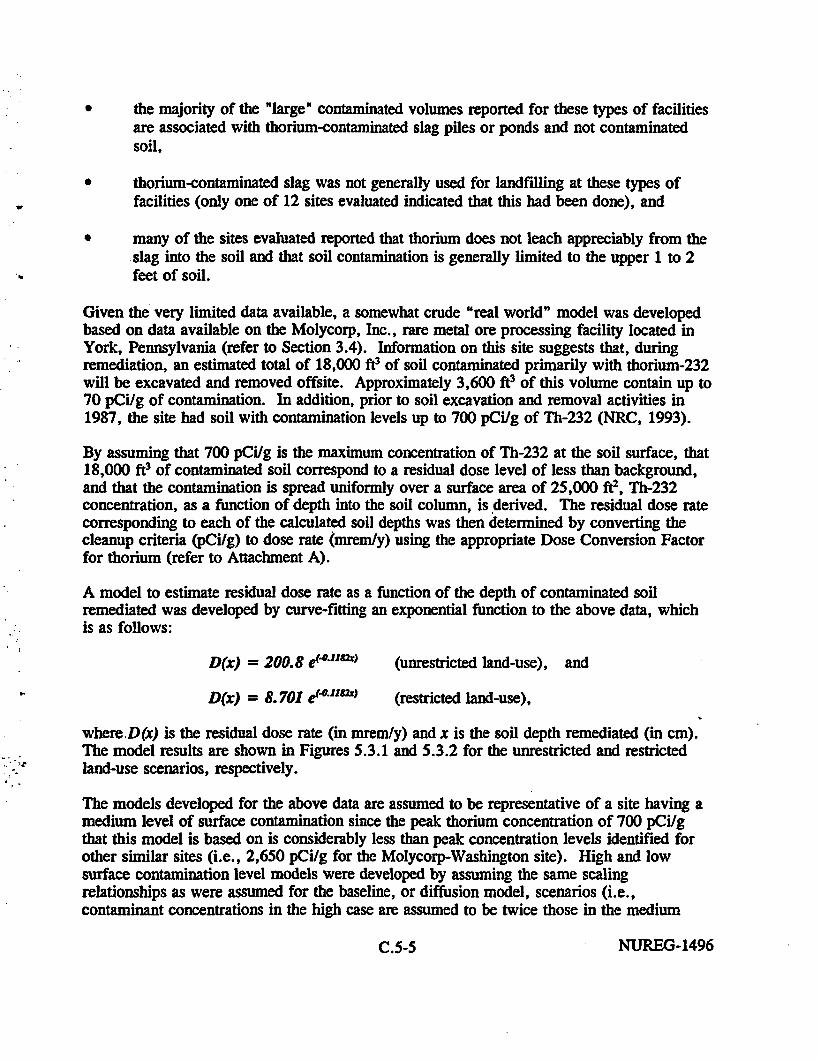
* the majority of the "large" contaminated volumes reported for these types of facilitiesare associated with thorium-contaminated slag piles or ponds and not contaminatedsoil,
* thorium-contaminated slag was not generally used for landfilling at these types offacilities (only one of 12 sites evaluated indicated that this had been done), and
* many of the sites evaluated reported that thorium does not leach appreciably from theslag into the soil and that soil contamination is generally limited to the upper 1 to 2feet of soil.
Given the very limited data available, a somewhat crude "real world" model was developedbased on data available on the Molycorp, Inc., rare metal ore processing facility located inYork, Pennsylvania (refer to Section 3.4). Information on this site suggests that, duringremediation, an estimated total of 18,000 ft3 of soil contaminated primarily with thorium-232will be excavated and removed offsite. Approximately 3,600 ft3 of this volume contain up to70 pCi/g of contamination. In addition, prior to soil excavation and removal activities in1987, the site had soil with contamination levels up to 700 pCi/g of Th-232 (NRC, 1993).
By assuming that 700 pCi/g is the maximum concentration of Th-232 at the soil surface, that18,000 ft3 of contaminated soil correspond to a residual dose level of less than background,and that the contamination is spread uniformly over a surface area of 25,000 ft2, Th-232concentration, as a function of depth into the soil column, is derived. The residual dose ratecorresponding to each of the calculated soil depths was then determined by converting thecleanup criteria (pCi/g) to dose rate (mrem/y) using the appropriate Dose Conversion Factorfor thorium (refer to Attachment A).
A model to estimate residual dose rate as a function of the depth of contaminated soilremediated was developed by curve-fitting an exponential function to the above data, whichis as follows:
D(x) = 200.8 ' (unrestricted land-use), and
D(x) = 8.701 ceft) (restricted land-use),
where D(x) is the residual dose rate (in mrem/y) and x is the soil depth remediated (in cm).The model results are shown in Figures 5.3.1 and 5.3.2 for the unrestricted and restrictedland-use scenarios, respectively.
The models developed for the above data are assumed to be representative of a site having amedium level of surface contamination since the peak thorium concentration of 700 pCi/gthat this model is based on is considerably less than peak concentration levels identified forother similar sites (i.e., 2,650 pCi/g for the Molycorp-Washington site). High and lowsurface contamination level models were developed by assuming the same scalingrelationships as were assumed for the baseline, or diffusion model, scenarios (i.e.,contaminant concentrations in the high case are assumed to be twice those in the medium
C.5-5 NUREG-1496

case, and in the low case are assumed to be 3/10th that of the medium case). The calculateddata underlying Figures C.5.3.1 and C.5.3.2 are provided in Attachment B.
- 'A
NUREG-1496 C.5-6
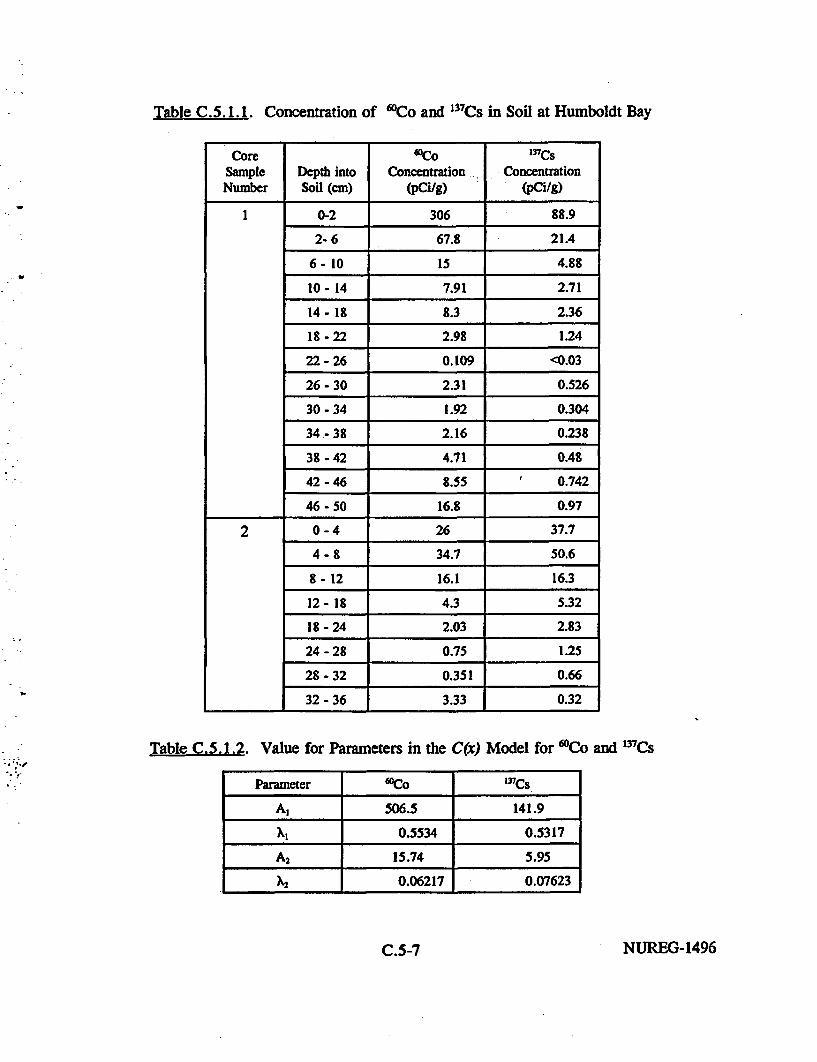
Table C.5. 1.1. Concentration of TCo and 137Cs in Soil at Humboldt Bay
Core COCo "CsSample Depth into Concentration ConcentrationNumber Soil (cm) (pCilg) (pCi/g)
0-2 306 88.9
2- 6 67.8 21.4
6- 10 15 4.88
10 - 14 7.91 2.71
14 - 18 8.3 2.36
18 - 22 2.98 1.24
22 - 26 0.109 <0.03
26 -30 2.31 0.526
30 - 34 1.92 0.304
34.- 38 2.16 0.238
38 - 42 4.71 0.48
42 - 46 8.55 0.742
46 - 50 16.8 0.97
2 0 - 4 26 37.7
4 - 8 34.7 50.6
8- 12 16.1 16.3
12 - 18 4.3 5.32
18 - 24 2.03 2.83
24 - 28 0.75 1.25
28 - 32 0.351 0.66
32 - 36 3.33 0.32
Table C.5.1.2. Value for Parameters in the C(x) Model for 6OCo and 13'Cs
Parameter CCo "Cs
Al 506.5 141.9
XI 0.5534 0.5317
A2 15.74 5.95
1 0.06217 0.07623
C.5-7 NUREG-1496

Table C.5.2. 1. Estimated Contaminated Soil Volume Ratio at DifferentCleanup Levels for the Ventron Corporation Plant
Cleanup Criteria
13080393020134
Contaminated Soil VolumeRatio (relative to 130 pCi/g)
1.231.62.272.763.384.5
NUREG-1496 C.5-8

Dose Rate(mzem/yr)
20 40 60 80
Soil Depth Removed (cm)
100 120 140
Figure C.5.1.1.
1. OE+03
1. OE+02
1.OE+01
Dose Rate 2.0E+0 -(mrem/yr)
Calculated Residual '0Co Radiation Dose Rate as a Function ofSoil Depth Removed (Spill/Leak Model, Unrestricted Land Use)
0 20 40 60 80 100
Soil Depth Removed (cm)
120 140
Figure C.5.1.2. Calculated Residual OCo Radiation Dose Rate as a Function of-Soil Depth Removed (Spill/Leak Model, Restricted Land Use)
C.5-9 NUREG-1496

Dose Rate
(mxem/yr)
0 20 40 60 80 100
Soil Depth Removed (cm)
120 140
Figure C.5.1.3. Calculated Residual '"Cs Radiation Dose Rate as a Function ofSoil Depth Removed (Spill/Leak Model, Unrestricted Land Use)
1. oz+02
1. o0+0l
Postulated Surface Concentration
High Contan. Level
--- Hed Contan. Level
-. . . . .Low Contam. Level
1.OE+C
Dose Rate(mrem/yr)
1. OE*
1.03--
00i=
., Is_. .. - I
1. ON- uJ
0 20 40 60 80 100 120 140
Soil Depth Removed (cm)
Figure C.5.1.4. Calculated Residual 137Cs Radiation Dose Rate as a Function ofSoil Depth Removed (Spill/Leak Model, Restricted Land Use)
NUREG-1496 C.5-10

Dose Rate I.OE*00 -(m=em/yz)
I.OE-0 _
I. OE-02 _
1.OE-O
0
Figure C.5.1.5.
1.O0+03
1.03+02
1.03+01
Dose Rate 1.0OE+00-(mrem/yz)
20 40 60 80 100 120 140
soil Depth Removed (cm)
Calculated Residual Composite OCo and 137Cs Radiation DoseRate as a Function of Soil Depth Removed (Spill/Leak Model,Unrestricted Land Use)
0 20 40 60 SO 100 120 140
Soil Depth Removed (cm)
Calculated Residual Composite WfCo and 137Cs Radiation DoseRate as a Function of Soil Depth Removed (Spill/Leak Model,Restricted Land Use)
C.5-1 1 NUREG-1496

Dose Rate
(nzem/yr)
0 10 20 30 40 50 60 70 so 90 100
Soil Depth Removed (cm)
1 7. Calculated Residual 'Co Radiation Dose Rate as a Function ofSoil Depth Removed (Spill/Leak Model, Unrestricted Land Use,50-Year SAFSTOR)
1
1
Dose Rate
(mrem/yr)
1.
1 .
I1.
0 10 20 30 40 50 60 70 80 90 100
Soil Depth Removed (cm)
Figure C.5.1.8. Calculated Residual W0Co Radiation Dose Rate as a Function ofSoil Depth Removed (Spill/Leak Model, Restricted Land Use,50-Year SAFSTOR)
NUREG-1496 C.5-12

Dose Rate
Cmzem/yz)
0 10 20 30 40 so 60 70 80 90 100
Soil Depth Removed (cm)
Figure C.5.1.9.
1.OE+02
1, OE.01_
1.OE+00_
Dose Rate N(mzem/yr)
i I Calculated Residual 137Cs Radiation Dose Rate as a Function ofSoil Depth Removed (Spill/Leak Model, Unrestricted Land Use,50-Year SAFSTOR)
0 10 20 30 40 SO 60 70 so 90 100
Soil Depth Removed (cm)
Figure C.5.1.10. Calculated Residual 137Cs Radiation Dose Rate as a Function ofSoil Depth Removed (Spill/Leak Model, Restricted Land Use,50-Year SAFSTOR)
C.5-13 NUREG-1496

Dose Rate(mrem/yr)
0 10 20 30 40 50 60
Soil Depth Removed (cm)
70 SO 90 100
Figure C.5.1.11.
1. O+02
1. O0+01 _
1. O+00 E
Dose Rate N(mrel/yr) Ad
Calculated Residual Composite w0Co and '"Cs Radiation DoseRate as a Function of Soil Depth Removed (Spill/Leak Model,Unrestricted Land Use, 50-Year SAFSTOR)
0 10 20 30 40 50 60 70 80 90 100
Soil Depth Removed (cm)
Figure C.5.1.12. Calculated Residual Composite 'Co and '"Cs Radiation DoseRate as a Function of Soil Depth Removed (Spill/Leak Model,Restricted Land Use, 50-Year SAFSTOR)
NUREG-1496 C.5-14

1. OE+03 _ _ _
Postulated Surface Concentration
' High Contam. Level1.OE+02 - _
Med Contam. Level
Low Contam. Level
l.OE+01 _ -7 _ _| _
1 .03OC =
-~ - k-_,^
1.OE-0O ' _ _ __ ,_|_ _____ - _ _
l.OE-0_ _
Dose Rate(mrem/yr)
+ 4- 4 4
l.OE-OV
0 50 100 150 200 250 300
Soil Depth Removed (cm)
Figgre C.5.2.1. Calculated Residual Uranium Radiation Dose Rate as a Functionof Soil Depth Removed (MixingLandfilling Model, UnrestrictedLand Use)
1. OE+031 i I II I i
i I__ _I Postulated surface tnntentrationn
-Ric 3 I - h Contam. Level_
I --- Ned Contam Level =
Dose Rate
(mrem/yr)
_.OE____'_' Low Contam. Level
1. OE+001 3 0 _ _ _ _ _ _ _ ___ _ _ _ _ __ _ _ _ _
l.OE-0O. - _ 3* O-0-2_
E
4 4 4 -=--=---------- + -
1 0E- 1 4 4 4 -- 4.Uj
0 50 100 150 200 250 300
Soil Depth Removed (cm)
Calculated Residual Uranium Radiation Dose Rate as a Functionof Soil Depth Removed (Mixing/Landfilling Model, RestrictedLand Use)
C.5-15 NUREG-1496
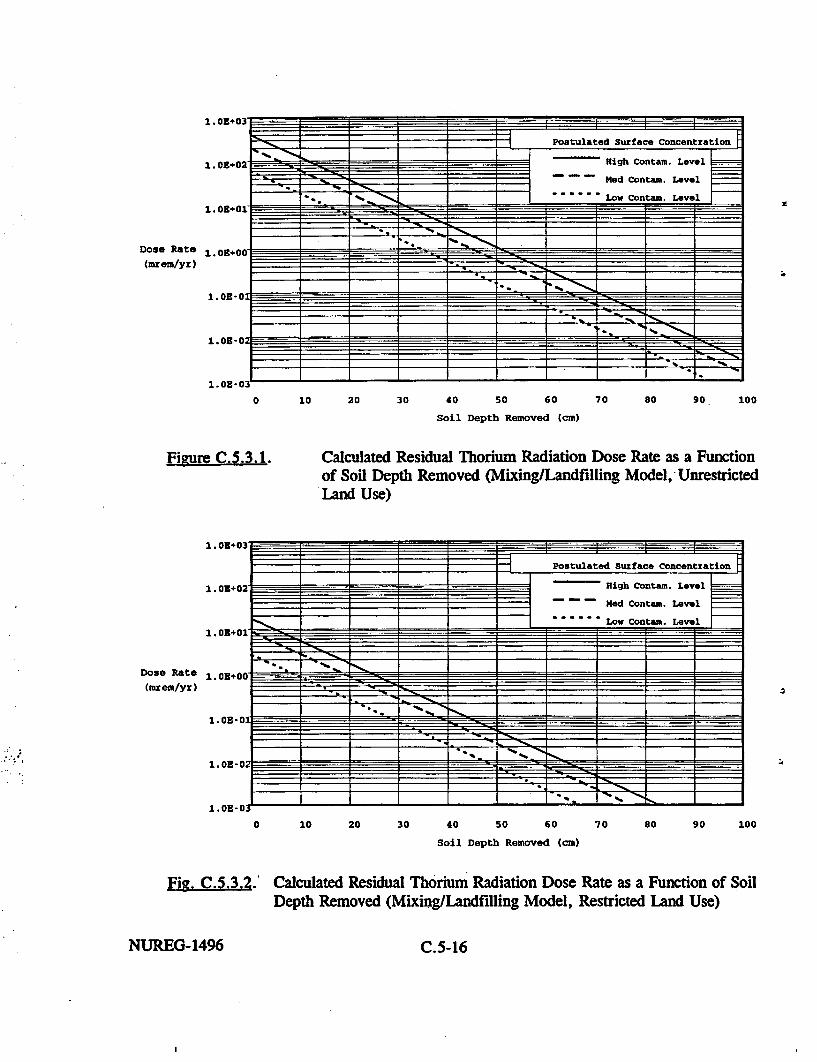
Dose Rate
(mrem/yr)
0 10 20 30 40 50 60 70 80 90 100
Soil Depth Removed (cm)
Figure C.5.3.1.
1. O+03
1. OE+02
1.OB3+021-
Dose Rate 1. 03+00
(mrem/yr)
Calculated Residual Thorium Radiation Dose Rate as a Functionof Soil Depth Removed (Mixing/Landfilling Model, UnrestrictedLand Use)
0 10 20 30 40 50 60 70 80 90 100
Soil Depth Removed (cm)
Fig. C.5.3.2. Calculated Residual Thorium Radiation Dose Rate as a Function of SoilDepth Removed (Mixing/Landfilling Model, Restricted Land Use)
NUREG-1496 C.5-16

C.6 Cost Methodology for Remediation of Concrete and Soils
The methods of calculating costs for removal and disposition of contaminated concrete and soilsfrom decommissioned nuclear facilities are described in this chapter. The methodology forcosting the removal and disposal of contaminated concrete surfaces is described first, followedby the methodology for costing removal and disposal of contaminated soils.
C.6.1 Concrete Surface Decontamination Cost Calculation Methodology
The approach used to calculate the costs of removal and disposition of contaminated concretefrom facility surfaces is as follows:
* The area of contaminated surface is defined (facility-specific).
* The length of perimeter crack is defined (nominally the perimeter of thestructure).
* The area of the "wet spots" is defined (nominally 2% of the ground floorarea).
* The volume of concrete to be removed is determined, based on the dosecalculations described in Section 6.2.3 of this report.
* The unit cost factors for removal of contaminated concrete from surfaces,cracks, and wet spots are defined. The removal cost for each of thecontaminant situations (floors, walls, cracks, and wet spots) is calculated as theproduct of the area x the appropriate unit cost factor.
* The resulting volumes of removed material are expanded by a rubbleexpansion factor of 1.56 (Westinghouse Hanford Co., 1989), and thecontaminated rubble is drummed. The cost of drums is calculated by theproduct of the number of drums x the unit cost of a drum.
* The cost of transport is calculated assuming a one-way shipment of 500 milesfrom the waste generator to the disposal site, for a legal-weight truckshipment, by dividing the number of drums of rubble generated by the numberof drums per truck shipment x the cost per shipment.
* The cost of disposal is calculated assuming very low activity waste disposed ata licensed LLW disposal site: the number of cubic feet of waste x theappropriate disposal charge rate per cubic foot.
* The duration of the concrete removal period is based upon the number ofperson-hours required to remove the material, assuming two crews/shift and
C.6-1 NUREG-1496

two shifts/day, and specified removal rates (floors or walls) in square feet percrew-hour. On each shift, one crew works on floors and one crew works onwalls. The total (floor or wall) area treated is divided by the appropriateremoval rate in square feet per crew-hour to determine the number of crew-hours required to remove the material; i.e., the duration of the removalperiod. The overhead labor costs are determined by the size and makeup ofthe overhead staff and their salaries and the length of the removal period.
* The total cost for contaminated concrete removal is the sum of the costs forremoval of surface layers on floors and walls, and the cost for removal ofcracks and wet spots, plus the costs for packaging, transport, and disposal ofthe packaged material, plus the cost of project overhead staff during theremoval period. As each successive layer of concrete is removed from floorsand walls, these removal costs increase, together with packaging, transport anddisposal costs. The cost elements for the cracks and wet spots are independentof the number of layers of floor and wall removed.
C.6.2 Concrete Surface Decontamination Technology and Cost
Decontamination of concrete surfaces of floors and walls is postulated to be accomplishedusing commercial equipment presently available. The equipment postulated to be used inthese analyses is a pneumatically operated surface removal system (scabbler) manufacturedby Pentex, Inc. (The Mooseil and associated smaller units). This device can chip awayapproximately 0.125 in. of surface depth per pass and has a skirted' scabbling unit with avacuum system which collects the dust and chips from the operation and deposits the wastematerial into a waste drum. Filters on the vacuum system discharge removed suspended dustparticles from the air to prevent recontamination of the cleaned surfaces. Successive passesare required to remove deeper layers of contaminated concrete.
C.6.2.1 Rates of Floor and Wall Surface Removal
The removal rates for the scabbler devices are functions of the depth to be removed.Because the depth of cut for the scabbler is adjustable, different depths can be removed witha single pass. However, the deeper the cut, the slower the rate of removal in terms ofsurface area. For these analyses, a depth per cut of 0.125 in. is postulated, somewhere nearoptimum for maximizing the effectiveness of the equipment, which results in a removal rateof about 115 ft2 per hour for a single pass of the equipment. The smaller units utilized forthe edges of floors and for walls have a removal rate of about 30 ft2 per hour for a singlepass.
C.6.2.2 Unit Costs for Removing Contaminated Concrete Surfaces
The cost per square foot of surface removed is calculated based on the postulated crewmakeup and size. For this type of operation, a crew consisting of 3 laborers, 0.25 of a
NUREG-1496 C.6-2

health physics technician, and 0.25 of a crew-leader was postulated, which resulted in a costper square foot, removed to a depth of 0.125 in., of $2.20 for the floors and $8.61 for thewalls.
To compute the cost of removal and disposition of each layer of contaminated concrete in afacility, the estimated contaminated area of floors and walls is multiplied by the appropriateunit cost factors, and the results summed. Added to these removal costs are the costs ofpackaging (cost per drum), transport (legal-weight truck one-way for 500 miles), anddisposal at a licensed LLW facility (disposal charge rates are based on the rates at the U.S.Ecology site at Richland, Washington [$50/ft3] and at the Chem-Nuclear site at Barnwell,South Carolina [$3501ft3]). The cost of the project overhead staff during the removal periodis computed based on the duration of the removal period and added to the other costs of theeffort.
C.6.2.3 Crack and Wet Spot Removal
Decontamination of cracks in the floor that contain contamination is accomplished byremoval of the concrete surrounding the crack, using ordinary pneumatic hammers andvacuum systems for dust and particle collection. The cost of this operation is computed in amanner similar to the floor removal operations, using a unit cost factor for crack cleanoutand the linear length of crack requiring removal. A crew is defined, labor rates areassigned, the rate of crack length removal is estimated, and the cost per linear foot of crackis calculated. This unit cost factor is multiplied by the number of linear feet of crackrequiring removal to obtain the removal cost. The costs of packaging, transport, anddisposal are calculated and added.
Decontamination of a crack is postulated to require removal of approximately 1 in. ofconcrete on either side of the crack, to an average depth of 6 in., resulting in a waste volumegenerated of about 0.13 ft3 of contaminated rubble per linear foot of crack, including the1.56 volume expansion for rubblizing. The removal rate is assumed to be 20 linear feet ofcrack per operating crew-hour, with a resulting cost per linear foot of crack of about $7.40,including equipment costs. The length of crack for each facility was postulated to be equalto the perimeter of the structure, derived from the building footprint surface area, assuming asquare structure:
perimeter 4 x (number of floors) x (footprint area)'.
For the analyses presented in this report, a single story structure is assumed for all facilities.
For "wet spots"; i.e., areas that had been exposed to liquid contaminants for extendedperiods of time, the penetration of contaminants is considerably deeper than for drycontaminants, as discussed in Chapter 4 of the draft GEIS (NRC, 1994). Therefore, theentire thickness of a concrete floor is postulated to be removed for the area of the wet spot"(2% of the area of the ground floor), using equipment similar to that described for crack
C.6-3 NUREG-1496

removal. For these analyses, the floor thicknesses removed were assumed to be 6 in. thick.It is also postulated that the contamination will extend downward into the soil beneath the"wet spot" thereby requiring corresponding soil removal.
The removal rates, crew sizes, and costs for removal of the "wet spot" areas of concretewere obtained from Means (1993).
C.6.3 Removal of Activated Concrete From the Reactor Bioshield
Removal of the activated concrete from the reactor bioshield is accomplished using a drillingand blasting technology. Vertical holes are bored into the shield concrete at selecteddistances from the shield inner surface. Explosives are inserted into the holes and detonated,breaking up the inner segments of the shield. This operation is repeated as necessary toremove the required amount of the shield to reduce the surface radiation dose rate inside theshield cavity to acceptable levels.
Calculations of the activation of materials in the concrete biological shield that surrounds thereactor pressure vessel were reported in NUREG/CR-0130 (Smith et al., 1978) for thereference PWR (Trojan), for an assumed operating lifetime of 30 effective full-power years(i.e., 75% operating efficiency). These calculations did not include any '"Eu because noinformation was available about the likely concentration of 152Eu in the natural materials ofthe Trojan bioshield. However, measurements made at the Elk River Reactordecommissioning suggested that the Ci/m' attributable to "lEu was about the same as theCi/m3 associated with 'Co. Thus, the total bioshield activity is postulated to beapproximately twice the calculated activity of 'Co, due to the anticipated E52u activity.
Examination of the original calculations of activations in the bioshield suggests that at about7 years following reactor shutdown, the residual activity levels in the bioshield will be suchthat removing 3.49 ft from the inner surface of the shield would result in a surface radiationdose rate of about 100 mrem/y; 3.92 ft removed for 25 mrem/y; 4.60 ft removed for 3mremly; and 5.36 ft removed for 0.3 mrem/y. The costs associated with removal anddisposal of that activated material were calculated using the unit cost factor algorithm foractivated bioshield concrete removal presented in Section C.2.17 of Appendix C inNUREG/CR-5884, (Konzek et al., 1995) and the cost estimating computer program (CECP).The duration of the decontamination effort was calculated to be controlled by the shieldremoval initially, but after one pass of the floor-removal equipment, the floor removalduration controlled the duration of the effort, for the purpose of calculating project overheadcosts to be added to the direct labor costs.
C.6.4 Soil Decontamination Cost Methodology
The costs for removal and disposition of contaminated soils are calculated in a somewhatsimilar manner. The area of contaminated soil is defined. The unit cost factors for soilremoval, treatment (if any), packaging, transport, and disposition are defined. The depth of
NUREG-1496 C.6-4

contaminant penetration into the soil is defined. Then, the total cost for contaminated soilremoval is the sum of the individual cost elements, which are calculated using theappropriate unit cost factors. The cost calculation is based upon removing all of the soil tothe depth necessary to achieve each of the alternate residual radiation dose rates. In addition,the soil volume removed from beneath 2% of the ground floor surface of each facility isadded to the volume of exterior soil removed, for purposes of calculating the total removal,packaging, transport, and disposal cost for soils.
Subsequently, choices are made between treating the contaminated soil prior to disposition,or transporting the untreated contaminated soil to a regulated disposal facility for very lowactivity materials. In the treatment scenario, the cleaned soil is retained onsite for backfill,with the more contaminated residues removed by the treatment process being packaged andtransported to an LLW disposal facility.
At the reference rare metal extraction facility, an alternate method of disposal ofcontaminated soils was also analyzed whereby the contaminated soil is not disposed of at anoffsite disposal facility but is placed in a nearby or onsite tailings pile and then finally cappedaccording to existing regulatory criteria. Appropriate costs of stabilization and capping thetailings pile are also included. The capped tailings pile site would necessarily be considereda form of restricted land use and would likely require continual monitoring. The costsassociated with this required monitoring are not estimated since they are not fixed in arestricted land-use scenario.
In any actual situation, selection of one alternative over another would most likely begoverned by the total cost for each choice.
Information on additional methods for restricting access to facilities is contained in AppendixF.
C.6.5 Soil Treatment Technologies
The various forms of soil washing represent the only commercially-demonstrated soil-cleaning techniques for radioactively-contaminated soils. Innovative techniques beingdeveloped (at present in the pilot plant or demonstration stage) include electrokinetics and'magnetic separation. These latter two techniques offer some potential for cost-reduction butare likely to be applied as a polishing step after soil classification and washing rather than asstand-alone soil cleaning methods. In addition, biosorptionlbioleaching technology, currentlybeing used for metals extraction from ores in the mining industry (particularly uranium andcopper) may be applied to contaminated soil cleanup, but it is currently a developingtechnology.
C.6-5 NUREG-1496

C.6.5.1 Soil Washing - General Description
Contaminated soil is removed from the site, classified to remove large particles and rocks,and washed by immersion with agitation in an aqueous solution. Chemical additives may bepresent in the wash solution to dissolve contaminants bound to soil particles. Severaladditives are available to facilitate the solution process depending on soil and contaminanttype (Dennis et al., 1992; SEG, 1992; and Gerber et al., 1991). After washing, the soil isseparated according to particle size. Since most of the contaminants bind to the fine soilparticles (<250 micrometers) which account for between 10-40% of the total soil mass, thebulk of the soil can be returned to the original location. The remaining slurry ofcontaminated fines may have to be treated further to prepare for disposal (e.g., by dryingand placing in drums). Removal rates of contaminants are enhanced by high liquid to soilratios. Depending on the soil type and type of washing solution, this method may beeffective in the removal of radionuclides. This is a relatively new technology for soilremediation, although it has been used in the mining industry for many years. The processhas been commercially demonstrated in Europe and the U.S., mostly for organic-contaminated soils, although some data are available on its application to radiologicallycontaminated soil remediation.
C.6.5.2 Other Soil Cleanup Technologies
A DOE program is underway to evaluate innovative soil treatment technologies, includingfield testing at the Nevada Test Site (NTS), at the NTS Treatability Test Facility (operatedby Reynold's Electrical & Engineering Co.). The soil treatment technologies underexamination currently are restricted to plutonium removal but are likely to be equallyeffective for thorium and uranium (but not cesium or strontium), and include:
* Advanced Process Technologies, Salt Lake City, UT: Air-spargedhydrocyclone for removal of plutonium
* AWC/Lockheed, Las Vegas, NV: Mineral jig combination and shaker table
* Nuclear Remediation Technologies, San Diego, CA: Paramagnetic separationof plutonium from soil using Eriez Magnetics equipment
* Paramagnetics, Inc., Plant City, FL: Pretreatment washing, followed by KolmSeparator paramagnetic separation
* Scientific Ecology Group, Pittsburgh, PA: Multigravity separator; and high-gradient magnetic separator.
Site cleanup is expected to begin in 1996, using the selected successfil technologies (NuclearWaste News, 1993).
NUREG-1496 C.6-6

C.6.6 Cost and Labor Estimating Bases for Soil Remediation/Treatment
The information developed for cost and labor is based on unit cost and labor data presentedin this section. Categories for which basic unit factors were developed include: soilexcavation, both inside and outside the facility, soil washing, packaging, transportation, anddisposal. Estimates were developed using a spreadsheet that calculates the cost and laborrequirements as a function of volume removed for each site.
A soil washing option was considered for each site analyzed. The soil washing processwould separate the contaminated soil from the clean soil in order to reduce the volume of soilthat would be disposed of at a burial facility. In order to evaluate the cost effectiveness ofsoil washing, two scenarios were considered for each facility: one with soil washing and theother without soil washing.
C.6.6.1 Excavation
The unit cost and labor estimates for excavation of soil, or tailings pile, were obtained fromShort (1989). This analysis assumed that the soil was excavated and removed from an areacontaminated with radioactive residue resulting from facility operations. Radiologicalsurveys are performed before, during, and after the excavation activities. Whereappropriate, clean overburden was removed, contaminated soil excavated, and the cleanoverburden replaced. The unit cost of excavation was assumed to be $235/r 3 while laborrequirements were assumed to be 1.62 person-hours/r 3.
C.6.6.2 Removal of Contaminated Soil Beneath Concrete Floor "Wet Spots"
A unit cost and labor factor was developed for removal of soil from beneath the 2% of thefacility ground floor area that was considered a 'wet spot." The same unit cost and laborfactor for removal was used as for the exterior excavation activities.
C.6.6.3 Soil Washing
Soil washing is a water-based process for mechanically scrubbing and leaching wasteconstituents from a contaminated soil for recovery and treatment. It is an ex-situ toxicityreduction technology. The process removes contaminants from soils in one of two ways: bydissolving or suspending them in the wash solution, or by concentrating the contaminants intoa smaller volume of soil through simple particle size separation techniques.
The cost of soil washing contaminated soil that was removed was obtained from theENVEST Environmental Cost Engineering Model (ENVEST 1991) developed by the UnitedStates Air Force Environmental Restoration Program.- The soil volume generated at each sitewas used as the cost estimating basis for the ENVEST model. It was assumed that a
C.6-7 NUREG-1496
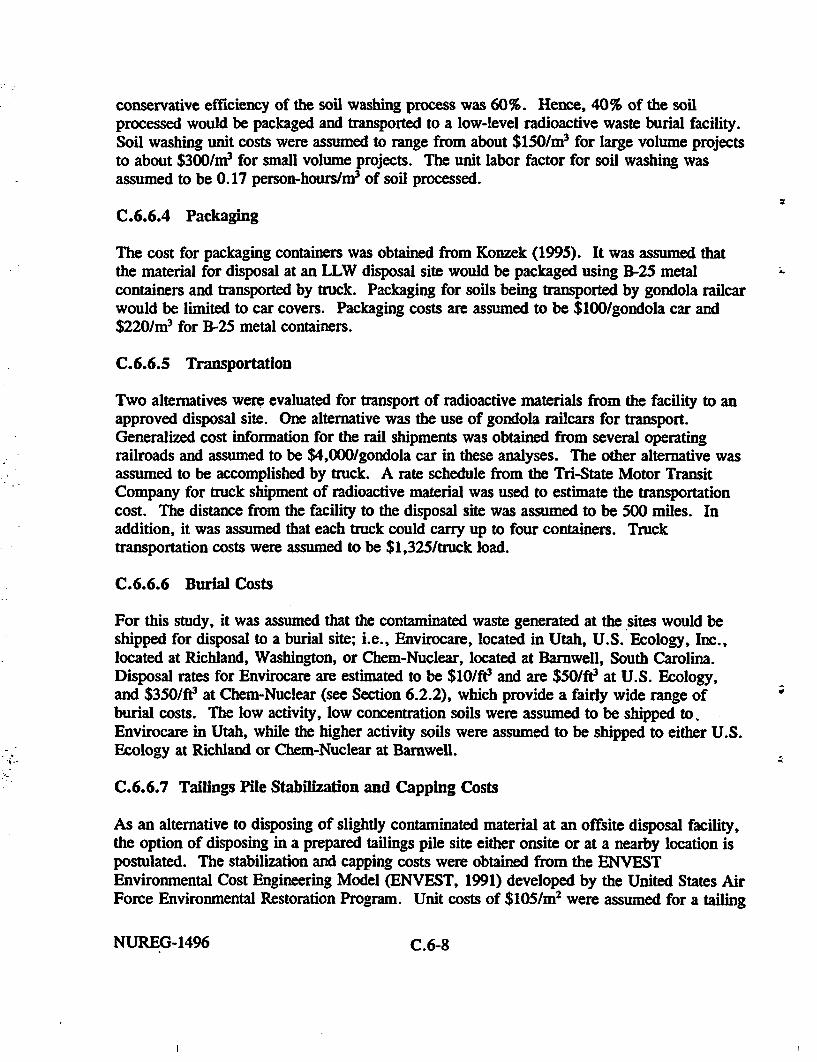
conservative efficiency of the soil washing process was 60%. Hence, 40% of the soilprocessed would be packaged and transported to a low-level radioactive waste burial facility.Soil washing unit costs were assumed to range from about $150/m 3 for large volume projectsto about $300/r 3 for small volume projects. The unit labor factor for soil washing wasassumed to be 0.17 person-hours/r 3 of soil processed.
C.6.6.4 Packaging
The cost for packaging containers was obtained from Konzek (1995). It was assumed thatthe material for disposal at an LLW disposal site would be packaged using B-25 metalcontainers and transported by truck. Packaging for soils being transported by gondola railcarwould be limited to car covers. Packaging costs are assumed to be $100/gondola car and$220/r 3 for B-25 metal containers.
C.6.6.5 Transportation
Two alternatives were evaluated for transport of radioactive materials from the facility to anapproved disposal site. One alternative was the use of gondola railcars for transport.Generalized cost information for the rail shipments was obtained from several operatingrailroads and assumed to be $4,000/gondola car in these analyses. The other alternative wasassumed to be accomplished by truck. A rate schedule from the Tri-State Motor TransitCompany for truck shipment of radioactive material was used to estimate the transportationcost. The distance from the facility to the disposal site was assumed to be 500 miles. Inaddition, it was assumed that each truck could carry up to four containers. Trucktransportation costs were assumed to be $1,325/truck load.
C.6.6.6 Burial Costs
For this study, it was assumed that the contaminated waste generated at the sites would beshipped for disposal to a burial site; i.e., Envirocare, located in Utah, U.S. Ecology, Inc.,located at Richland, Washington, or Chem-Nuclear, located at Barnwell, South Carolina.Disposal rates for Envirocare are estimated to be $10/ft3 and are $50/ft3 at U.S. Ecology,and $350/ft3 at Chem-Nuclear (see Section 6.2.2), which provide a fairly wide range ofburial costs. The low activity, low concentration soils were assumed to be shipped to.Envirocare in Utah, while the higher activity soils were assumed to be shipped to either U.S.Ecology at Richland or Chem-Nuclear at Barnwell.
C.6.6.7 Tailings Pile Stabilization and Capping Costs
As an alternative to disposing of slightly contaminated material at an offsite disposal facility,the option of disposing in a prepared tailings pile site either onsite or at a nearby location ispostulated. The stabilization and capping costs were obtained from the ENVESTEnvironmental Cost Engineering Model (ENVEST, 1991) developed by the United States AirForce Environmental Restoration Program. Unit costs of $105/m 2 were assumed for a tailing
NUREG-1496 C.6-8
pile of 1.5 meters depth. Area of the tailings pile and the resulting multi-layered cap wascalculated as a function of the respective contaminated soil volumes to be placed in the pile.
C.6.6.8 Occupational Radiation Dose Estimates
The occupational radiation dose estimates were derived from Short (1989) and Murphy(1981). Occupational radiation dose estimates are made by multiplying the person-hoursrequired to decommission a site by an average radiation dose rate. The actual worker doserate experienced during site decommissioning depends on several factors, including the typeof radioactive contamination on the site, the location and concentration of contamination, thesite parameters, and the work procedures and work schedules. Actual worker dose rates areexpected to be site- and worker-specific.
Some information exists on dose rates at typical contaminated sites. For example, data froman operating low-level waste burial ground indicate an average dose rate at the site of about 1rnrem per 24-hour day (0.042 mrem/hr). Exposure records of 23 workers engaged in theremoval of a contaminated industrial waste line showed that over a 3-month period, only fourdosimeters recorded doses in excess of 10 millirem. The maximum total exposure for oneworker for 1 month was 30 millirem. All of these dose rates refer to direct exposure and donot include contributions from inhalation of radioactive particles.
The inhalation of airborne radioactivity may make a significant contribution to occupationalexposure for some site decommissioning operations, depending on the nature of the site andthe decommissioning option. The inhalation dose would not normally be significant for sitestabilization or for waste removal operations at sites where soil contamination is minimal.This dose could be significant during the removal of a tailings pile because of the dustproblem. For site decommissioning operations, worker use of face masks or otherrespiratory equipment, the use of water sprays or foams to reduce dust concentrations, andpossible use of portable enclosures to confine fugitive dust, would limit the occupational dosefrom inhalation of airborne radioactivity.
For this study, an average worker dose rate of 0.1 mrem/hr is assumed for sitedecommissioning operations. This value is believed to be reasonably conservative, based onavailable information about real sites. Decommissioning workers at potentially dusty sites.are assumed to wear protective respiratory equipment to maintain occupational dose rates ator below this level.
C.6-9 NUREG-1496

C.7 Presentation of Analytical Results
The costs, labor requirements, and occupational dose associated with decontaminatingpreviously contaminated facilities to alternate residual dose criteria are presented in thischapter. The models, methodologies, and assumptions discussed in Chapters 4 through 7 arethe bases for these results. It needs to be emphasized that the purpose of these analyses wasto provide a framework for differentiating the costs and impacts of decontaminating anddecommissioning facilities to alternative residual cleanup levels, not to provide acomprehensive life-cycle estimate of these costs and impacts. These analyses thereforegenerally only assess those impacts that are a function of the alternative residual dose criteriaand not those that are considered to be fixed across all residual dose levels being evaluated.An example of costs not evaluated includes the costs and labor requirements associated withthe removal and disposal of contaminated equipment; e.g., steam generator (such analyseshave been previously done in NRC, 1988). The costs associated with final status ortermination surveys are presented in Appendix D of this report.
C.7.1 Analysis Bases
The analytical results provided in this chapter include analyses for the following alternativeuses for the reference sites and structures after decommissioning and license termination:
(1) Industrial use of the site, including occupational use of the structures, which assumesoccupation of the decontaminated buildings by workers during a normal work shiftand potential renovation of the buildings for eventual occupation (i.e.,walls/ceilings/floors are moved, replaced, etc.).
2) Residential use of the site, including use of groundwater for drinking, irrigation, andlivestock. Occupation of the structures is also assumed.
The bases for these scenarios are taken from Kennedy and Strenge (1992). Important initialconditions and other analytical bases assumed in the scenario evaluations for decontaminationof structures and remediation of soils and groundwater follow.
Facilities
Decontamination requirements of structures to allow for later rboccupation are estimatedusing the methodology presented in Chapter 4 of Appendix C of the draft GEIS (NRC, 1994)(see Appendix D). This methodology provides a tool for estimating the concentration ofradionuclides at different depths in concrete walls/floors resulting from past facilityoperations, assuming a surface contamination level. Calculated radionuclide concentrationsas a function of depth into the concrete are converted to dose rates using the DoseConversion Factors provided in Attachment A. The depth of concrete requiring removal isthen determined for the alternative residual dose rates being evaluated in the GEIS, which are100, 60, 30, 25, 15, 10, 3, 0.3, and 0.03 mrem/y. The same level of decontamination of
C.7-1 NUREG-1496

structures is required in both the unrestricted and restricted land-use scenarios sincereoccupation of structures after decontamination is assumed in both.
In general, other major assumptions are as follows (variations from these major assumptionsfor individual scenarios are discussed in the next section):
All in-process materials and products, major pieces of equipment, fixtures, floorcoverings, and contaminated utilities such as drain lines and HVAC have beenremoved for disposal.
* Preliminary washdown of the site structures has been performed.
* The majority of contaminated concrete surface areas are scabbled to depthscorresponding to the residual dose rate being evaluated, with the removed materialbeing packaged, transported, and disposed (layers of concrete are assumed to beremoved in 0.125-inch increments).
* The total thickness of contaminated concrete adjacent to contaminated cracks isremoved, packaged, transported, and disposed.
* The total thickness of contaminated concrete in areas exposed to "wet spots" isremoved, packaged, transported, and disposed.
Soils
Remediation requirements for soils for both the restricted and unrestricted land-use scenariosare estimated using the methodologies presented in Chapter 5 and in NRC, 1994. Thesemethodologies provide tools for estimating the concentration of radionuclides at differentdepths in the soil column resulting from past facility operations, assuming a surfacecontamination level. Calculated radionuclide concentrations as a function of depth into thesoil column are converted to dose rates using the Dose Conversion Factors provided inAttachment A. The depth of soil requiring remediation is then determined for the alternativeresidual dose rates being evaluated in the GEIS, which are 100, 60, 30, 25, 15, 10, 3, 0.3,and 0.03 mrem/y. The depth of soil contamination requiring remediation is different- for theunrestricted and restricted land-use scenarios since assumptions on the type of receptors,nearness of the receptors to the source of contamination, and possible pathways of receptorexposure differ between each of these scenarios.
In general, other major assumptions are as follows (variations from these major assumptionsfor individual scenarios are discussed in the next section):
* Soils beneath buildings are contaminated in localized areas where the concrete hasbeen exposed to "wet spots." These localized areas of contaminated soil areremediated by first removing the corresponding areas of contaminated concrete floor
NUREG-1496 C.7-2

(the structure is not assumed to be demolished). The contaminated soil is thenremoved and either 1) packaged and disposed as low-level waste (LLW) or 2) treatedvia soil washing, with only the residual contaminated soil packaged and disposed asLLW and the clean soil returned to the site.
Other "open-air" contaminated soils on the site are handled similarly in that it isremoved and either 1) packaged and disposed as low-level waste (LLW) or 2) treatedvia soil washing, with only the residual contaminated soil packaged and disposed asLLW and the clean soil returned to the site.
* In either location, the contaminated soil is removed to the depth corresponding to theresidual dose rate being evaluated. This depth is determined using the diffusionmodels described in NRC, 1994 for the "baseline" scenarios. The "real world'scenarios utilize the new models described in Section C.5 to determine the thicknessof soil requiring remediation. In both the "baseline" and "real world" scenarios, thedepth of contamination in soils beneath buildings is estimated using the diffusionmodels, which were believed to be a better representation of contaminant migrationbeneath buildings.
* For the "baseline" scenarios, contaminated soil in either location is the result ofcontaminant deposition on the surface of the soil followed by migration via diffusiondown through the -soil'column. For the "real world" scenarios, the analyses assumethat contaminant distribution in the soil column is'the result of either significantmixing/landfilling utilizing contaminated soil/slag or spills/leaks of contaminatedaqueous solutions.
A summary of the contaminated and total concrete and soil surface areas assumed for each ofthe reference facilities is provided in Table C.7.1.1. This table also shows the postulatedmaximum radioactivity on the concrete surface of structures for each reference facility priorto initiation of concrete removal activities. Table C.7.1.2 shows the range of postulatedactivities on the surface of contaminated soil sites for each of the radionuclides of interest.Lastly, the unit cost and dose factors, and values for other parameters, used in these analysesare summarized in Section C.6.
C.7.2 Analytical Results
The estimated costs of decontaminating contaminated concrete surfaces and remediatingcontaminated soils are presented in the following sections for each of the reference facilities.The indicated, costs include that for direct labor, packaging, transport, and disposal of all ofthe material removed to reach the contaminant concentration level associated with theresidual dose rate being evaluated. Also included in the costs are the project overhead staffcosts incurred during the period of removal operations. The scenarios (both 'baseline" and"real world" cases) evaluated for this study are identified in Table C.7.2.1; the results foreach are discussed in Sections C.7.3 through C.7.7.
C.7-3 NUREG-1496

C.7.3 Reference Nuclear Power Plant
The cost, labor requirement, and occupational exposure resulting from decontamination ofthe reactor bioshield and other walls/floors of structures at the reference nuclear power plantfor alternative residual dose levels are provided in Tables C.7.3. 1 and C.7.3.2, respectively.These results are subdivided into two categories - the reactor bioshield and other concretesurfaces - because different technologies are required to decontaminate each. Removal ofactivated concrete from the reactor bioshield is via drilling and blasting technology becauseof the large depths of contaminated concrete requiring removal. The results in Table C.7.3.1for decontamination of the reactor bioshield are shown for each of the different depths ofconcrete removal required to achieve the alternative residual dose rates being evaluated.
Radionuclide contamination in other concrete floors/walls is not nearly as deep as in thereactor bioshield and so is decontaminated using a pneumatically-operated concrete scabbler.Since the scabbler removes approximately 1/8-inch of concrete with each pass, the resultsshown in Table C.7.3.2 for other concrete surfaces are in 1/8-inch increments. However,the table also provides the calculated residual dose rate for each increment such that thedepth of concrete requiring removal can be determined for each of the residual dose levelsbeing evaluated. These are 0.5 inches for 100, 60, 30, 25, and 15 mremfy, 0.625 inches for10, 3, and 0.3 mrem/y, and 0.75 inches for 0.03 mrem/y.
The analysis results for remediation of contaminated soil at the reference nuclear power plantare provided in Tables C.7.3.3 and C.7.3.4 for the unrestricted and restricted land-usescenarios, respectively. Conclusions from these results include:
Unrestricted Land-Use Scenario
* As is to be expected, soil washing becomes increasingly more cost effective as soildisposal costs increase. In fact, soil washing is not worth the additional cost if thesoil disposal costs are as low as $10 per cubic foot, but well worth the cost if soildisposal costs are as high as $350 per cubic foot (total costs are reduced by over 50%when compared with the direct disposal scenario).
* Soil remediation is required for the low surface contamination level case only forresidual dose levels of less than 10 mrem/y.
* Since soil washing is a low labor-requirement operation, including soil washing in thesoil remediation technology mix contributes little to the total occupational doseincurred during remediation operations.
Restncted Land-Use Scenano
* Total soil remediation costs are, as expected, significantly less tanm for thecorresponding unrestricted land-use scenario.
NUREG-1496 C.74

* The general trends in costs and occupational dose are the same as describedpreviously for the unrestricted land-use scenario.
* For all three surface contamination levels (high, medium, and low), soil remediationis not required at all for certain residual dose levels. In fact, no soil remediation isrequired for any of the cases unless the required residual dose level is 10 mrem/y orless.
Sensitivity Analyses
Two types of sensitivity analyses were performed on the reference nuclear power plant: 1)SAFSTOR for a period of 50 years prior to D&D and 2) soil contamination resulting fromspills/leaks of contaminated aqueous solutions. The results of these analyses are discussedbelow.
SO-Year SAFSTOR Period
The cost, labor requirement, and occupational exposure resulting from decontamination ofthe reactor bioshield and other walls/floors of structures at the reference nuclear power plantfor different residual dose levels are provided in Tables C.7.3.5 and C.7.3.6, respectively.These analyses used the same diffusion model as was used in the previously described"baseline" scenarios, and which are described in NRC, 1994, to determine contaminantdistribution in the concrete. However, in these scenarios, the model was run to simulate anadditional 50 years of radionuclide migration and decay.
The required depth of concrete removal from the bioshield at any of the residual dose levelsis significantly less than that for the scenario where the reference nuclear power plant isdecommissioned soon after shutdown. This is due to the assumption that contamination inthe bioshield is primarily from the activation product Co-60, which has a half-life of only 5.2years. Cost savings are between 35 and 60% between the upper and lower residual doselevels, respectively (although the additional costs associated with monitoring and surveillanceduring the 50-year SAFSTOR period are not included in these estimates). The results aresimilar for decontamination of other concrete floors/walls.
The analysis results for remediation of contaminated soil at the reference nuclear power plantafter a 50-year SAFSTOR period are provided in Tables C.7.3.7 and C.7.3.8 for theunrestricted and restricted land-use scenarios, respectively. Again, these analyses used thesame diffusion model as was used in the "baseline" scenarios discussed previously, andwhich are described in NRC, 1994, to determine contaminant distribution in the soil column.However, in these scenarios, the model was run to simulate an additional 50 years ofradionuclide migration and decay. Noteworthy conclusions from these results include:
* The general trends in costs and occupational dose are the same for these scenarios asdescribed previously for those scenarios where decommissioning is initiated soon after
C.7-5 NUREG-1496

shutdown. The costs associated with monitoring and surveillance during the 50-yearSAFSTOR are not included in these analyses however.
* Because of the 50-year period allowing the radionuclide contaminants to decay, soilremediation is only required in those scenarios where the residual dose rate is reducedto less than 10 mrem/y for the unrestricted land-use scenarios or less than 0.3 mrem/yfor the restricted land-use scenarios).
* However, the residual radionuclide contamination after 50 years has also had anadditional 50 years to percolate deeper into the soil column. Because of this effect,soil remediation that is required at the low residual dose levels for these scenarios, ingeneral, costs significantly more than remediation to similar levels did for thosescenarios where decommissioning was initiated soon after shutdown (significantlygreater soil volumes require remediation). This effect is more pronounced in theunrestricted land-use scenarios than in the restricted land-use scenarios due to themuch higher Dose Conversion Factors associated with the unrestricted land-usescenario. Because of the relatively low Dose Conversion Factors used for therestricted land-use scenarios, very little soil volume requires remediation in any of thescenarios evaluated (whether D&D begins soon after shutdown or after a 50-yearSAFSTOR).
Soil Contamination Resulting from Spills/Leaks of Contaminated Aqueous Solutions
These scenarios assume that soil contamination at the reference nuclear power plant site isdue to leaks and/or spills of contaminated aqueous solutions resulting in much deeper zonesof contamination than are assumed in the "baseline" scenarios. The analysis results forremediation of contaminated soil at the reference nuclear power plant are provided in TablesC.7.3.9 and C.7.3.10 for the unrestricted and restricted land-use scenarios, respectively.Tables C.7.3.11 and C.7.3.12 provide the same results for scenarios that assume a 50-yearSAFSTOR period prior to remediation of the soil. For the 50-year SAFSTOR scenarios, the"real world" contaminant distribution profiles were input into the diffusion model, and 50years of additional migration via diffusion was simulated. Conclusions from these resultsinclude:
* The soil remediation costs and occupational exposure are considerably greater than forthe previously evaluated scenarios that assume only deposition of contamination on thesurface of the soil followed by migration via diffusion (up to 50% and higher forresidual dose rates less than 25 mrem/y). This is a direct result of the significantlygreater depths and, correspondingly, volumes of soil requiring remediation in thesescenarios.
* The general trends in costs and occupational dose are the same for these scenarios asdescribed previously for the scenarios where contamination is assumed to be depositedon the surface of the soil.
NUREG-1496 C.7-6

* Soil remediation is not likely to be required in restricted land-use cases or ifdecommissioning is delayed for 50 years (i.e., the results for these scenarios indicatethat, in the worst case, remediation would only be required for the residual dose ratesof 15 mrem/y or lower).
C.7.4 Reference Uranium Fuel Fabrication Plant
The cost, labor requirement, and occupational exposure resulting from decontamination ofthe walls/floors of structures at the reference uranium fuel fabrication plant for differentresidual dose levels are provided in Table C.7.4. 1. Radionuclide contamination in theconcrete floors/walls is decontaminated using a pneumatically-operated concrete scabbler.Since the scabbler removes approximately 1/8-inch of concrete with each pass, the resultsshown in Table C.7.4.1 for concrete surfaces is in 1/8-inch increments. However, the tablealso provides the calculated residual dose rate for each increment such that the depth ofconcrete requiring removal can be determined for each of the residual dose levels beingevaluated. Since the residual dose level after just one pass of the scabbler (1/8-inch) is1.4x 1010, only 1/8-inch of concrete requires removal to achieve any of the alternativeresidual dose levels being evaluated in the GElS (i.e., 100, 60, 30, 25, 15, 10, 3, 0.3, and0.03 mremly).
The analysis results for remediation of contaminated soil at the reference uranium fuelfabrication plant are provided in Tables C.7.4.2 and C.7.4.3 for the unrestricted andrestricted land-use scenarios, respectively. These scenarios assume that uranium is depositedon the surface of the soil during operation of the facility, which then migrates down throughthe soil column over time via diffusion. Noteworthy conclusions from these results include:
Unrestncted Land- Use Scenano
* As is to be expected, soil washing becomes increasingly more cost effective as soildisposal costs increase. In fact, soil washing is not worth the additional cost if thesoil disposal costs are as low as $10 per cubic foot, but well worth the cost if soildisposal costs are as high as $350 per cubic foot (total costs are reduced by over 50%when compared with the direct disposal scenario).
* No soil remediation is required for the low surface contamination level except forresidual dose levels of 15 mnrem/y or less.
* Since soil washing is a low labor-requirement operation, including soil washing in thesoil remediation technology mix contributes little to the total occupational doseincurred during remediation operations.
* Total costs for remediation of the contaminated soil at this site is significantly greaterthan that for the reference nuclear power plant due to the much larger volumes of soilrequiring remediation.
C.7-7 NUREG-1496
Restncted Land-Use Scenano
* Total soil remediation costs are, as expected, less than for the correspondingunrestricted land-use scenario.
* The general trends in costs and occupational dose are the same as describedpreviously for the unrestricted land-use scenario.
* For all three surface contamination levels (high, medium, and low), soil remediationis not necessary at all for certain residual dose levels. In fact, no soil remediation isrequired for residual dose levels of 15 mrem/y or less.
Sensitivity Analyses
Due to uncertainties of contaminant behavior in the "real world," an additional set ofscenarios was evaluated that assumed that significant soil contamination at the referenceuranium fuel fabrication plant was due to mixing/landfilling of uranium-contaminated soilthroughout the site. The analysis of these scenarios utilized the "real world" modeldiscussed in Section C.5.2 for estimating the depth of contamination in the soil throughoutthe site. However, the depth of contamination in soil underneath buildings continued to beestimated using the "baseline" diffusion model since it is assumed that this soil is onlycontaminated as a result of leakages through floors of buildings and not frommixing/landfilling (i.e., the soil is assumed to have been clean when the building wasconstructed).
The analysis results for remediation of contaminated soil at the reference uranium fuelfabrication plant are provided in Tables C.7.4.4 and C.7.4.5 for the unrestricted andrestricted land-use scenarios, respectively. Conclusions from these results include:
* The soil remediation costs and occupational exposure are significantly greater than forthe previously evaluated scenarios that assume only deposition of contamination on thesurface of the soil followed by migration via diffusion. This is a direct result of thesignificantly greater depths and, correspondingly, volumes of soil requiringremediation in these scenarios.
* The general trends in costs and occupational dose are the same for these scenarios asdescribed previously for the scenarios where contamination is assumed to be depositedon the surface of the soil.
* Soil remediation is not likely to be required, or at most minimally required, if futureuses of the site are restricted (i.e., the results for these scenarios indicate that, in theworst case, remediation would only be necessary for residual dose rates of 15 mrem/yor lower).
NUREG-1496 C.7-8

C.7.5 Reference Sealed Source Manufacturer
The cost, labor requirement, and occupational exposure resulting from decontamination ofthe walls/floors of structures at the reference sealed source manufacturer for differentresidual dose levels are provided in Table C.7.5.1. Radionuclide contamination in theconcrete floors/walls is decontaminated using a pneumatically-operated concrete scabbler.Since the scabbler removes approximately 1/8-inch of concrete with each pass, the resultsshown in Table C.7.5. 1 for concrete surfaces is in 1/8-inch increments. However, the tablealso provides the calculated residual dose rate for each increment such that the depth ofconcrete requiring removal can be determined for each of the alternative residual dose levelsbeing evaluated. These are 0.25 inches for 100 and 60 mirem/y, 0.375 inches for 30, 25,and 15 mrem/y, 0.5 inches for 3 and 0.3 mrem/y, and 0.625 inches for 0.03 mremly.
The analysis results for remediation of contaminated soil at the reference sealed sourcemanufacturer are provided in Tables C.7.5.2 and C.7.5.3 for the unrestricted and restrictedland-use scenarios, respectively. These scenarios assume that radionuclide contamination isdeposited on the surface of the soil during operation of the facility, which then migratesdown through the soil column via diffusion over time. Noteworthy conclusions from theseresults are much the same as identified in previous sections and include:
Unrestricted Land-Use Scenario
As is to be expected, soil washing becomes increasingly more cost effective as soildisposal costs increase. In fact, soil washing is not worth the additional cost if thesoil disposal costs are as low as $10 per cubic foot, but well worth the cost if soildisposal costs are as high as $350 per cubic foot (total costs are reduced by over 50%when compared with the direct disposal scenario). -At a disposal cost of $50 per cubicfoot, the differences in remediation costs between the soil washing and direct disposalscenarios are essentially a wash.
* Soil remediation is not required for the low surface contamination level except forresidual dose levels of 3 mrem/y or less.
* Since soil washing is a low labor-requirement operation, approximately 10% of the,total labor required, including soil washing in the soil remediation technology mixcontributes little to the total occupational dose incurred during remediation operations.
* Soil remediation costs are quite low when compared to the other reference sites.These types of manufacturing facilities, in general, are not expected to havesignificant soil remediation requirements during decommissioning because of thegenerally small quantities of radioisotopes handled and the well controlled nature withwhich they are handled.
C.7-9 NUREG-1496

Restricted Land-Use Scenario
* Total soil remediation costs are, as expected, considerably less than for thecorresponding unrestricted land-use scenario.
* The general trends in costs and occupational dose are the same as describedpreviously for the unrestricted land-use scenario.
* For all three surface contamination levels (high, medium, and low), soil remediationis not required at all for certain residual dose levels. In fact, soil remediation is notrequired for any of the cases except for residual dose levels of 10 mrem/y or less.
Sensitivity Analyses
Neither PNNL nor NRC staff were able to identify any actual real world situations wheresealed source manufacturing sites had any soil contamination. However, a set of sensitivitycases was evaluated in which the "real world" spill/leak model for 'Co and 137Cs discussedin Section C.5.1 was used to represent the possibility of sites having deeper contaminationthan estimated by the "baseline" diffusion model. The spill/leak model developed from dataavailable on soil contamination for the reference reactor (see Section C.5.1) was used inthese analyses due to the lack of any specific data on sealed source manufacturing sites andbecause the postulated source of contamination was assumed to be similar (i.e., spills/leaksof aqueous solutions containing radioisotopes such as WOCo and 137Cs).
The analysis results for remediation of contaminated soil at the reference sealed sourcemanufacturer are provided in Tables C.7.5.4 and C.7.5.5 for the unrestricted and restrictedland-use scenarios, respectively. Conclusions from these results include:
* The soil remediation costs and occupational exposure are considerably greater than forthe previously evaluated scenarios that assume only deposition of contamination on thesurface of the soil followed by migration via diffusion (up to 150% and higher forresidual dose rates less than 25 mrem/y). This is a direct result of the significantlygreater depths and, correspondingly, volumes of soil requiring remediation in thesescenarios.
* The general trends in costs and occupational dose are the same for these scenarios asdescribed previously for the scenarios where contamination is assumed to be depositedon the surface of the soil.
* Soil remediation is not likely to be required in restricted land-use cases (i.e., theresults for these scenarios indicate that, in the worst case, remediation would only benecessary for residual dose rates of 15 mrem/y or lower).
NUREG-1496 C.7-10

C.7.6 Reference Rare Metal Extraction Plant
The cost, labor requirement, and occupational exposure resulting from decontamination ofthe walls/floors of structures at the reference rare metal extraction plant for different residualdose levels are provided in Table C.7.6. 1. Radionuclide contamination in the concretefloors/walls is decontaminated using a pneumatically-operated concrete scabbler. Since thescabbler removes approximately 1/8-inch of concrete with each pass, the results shown inTable C.7.6.1 for concrete surfaces is in 1/8-inch increments. However, the table alsoprovides the calculated residual dose rate for each increment such that the depth of concreterequiring removal can be determined for each of the residual dose levels being evaluated.Since the residual dose level after just two passes of the scabbler (1/4-inch) is 0.023 mrem/y,only 1/4-inch of concrete requires removal to achieve any of the residual dose levels beingevaluated in the GEIS (i.e., 100, 60, 30, 25, 15, 10, 3, 0.3, and 0.03 mrem/y).
The analysis results for remediation of contaminated soil at the reference rare metalextraction plant are provided in Tables C.7.6.2 and C.7.6.3 for the unrestricted andrestricted land-use scenarios, respectively. These scenarios assume that thorium is depositedon the surface of the soil during operation of the facility, which then migrates down throughthe soil column via diffusion over time. Conclusions from these results include:
Unrestricted Land-Use Scenario
* Total soil volume (excluding the slag pile) requiring remediation is relatively small inthese scenarios due to the very slow diffusion rate of thorium through the soil column(total depth of penetration of the thorium into the soil was less than 3 cm at a residualdose level of 0.03 niremly).
* While the results do show that soil washing becomes increasingly more cost effectiveas soil disposal costs increase, the net benefit of doing so is small due to the verysmall volume of soil that actually requires treatment. In fact, the soil washing anddirect disposal scenarios are essentially a wash in terms of total costs when disposalcosts are in the range of $10 to $50 per cubic foot. However, if disposal costs are ashigh as $350 per cubic foot, there is a cost advantage to including soil washing in theremediation solution.
* Furthermore, because the 7,000-m3 slag pile is such a significant proportion of thetotal soil volune requiring remediation, and since this slag cannot be effectivelywashed to reduce the end volume requiring disposal, any benefit obtained fromwashing the little volume of soil available for treatment is masked by the cost ofdisposing of the very large volume associated with the slag pile.
* Soil remediation is not required for the low surface contamination level except forresidual dose levels of 15 mrem/y or. less, although remediation of the slag pile is stillrequired.
C.7-11 NUREG-1496

* Since soil washing is a low labor-requirement operation, less than 10% of the totallabor requirement, including soil washing in the soil remediation technology mixcontributes little to the total occupational dose incurred during remediation operations.
Restricted Lad- Use Scenano
* The restricted land-use scenario for the reference rare metal extraction plant wasevaluated differently than for the other reference facilities. It is assumed in thisscenario that contaminated soil is excavated and disposed of on the slag pile and thatthe slag pile as a whole is stabilized in place. Therefore, there are no costs associatedwith offsite disposal of the soil and slag pile. Only costs for excavation of thecontaminated soil and stabilization of the slag pile are considered, consequently thetotal costs for this scenario are significantly less than for the unrestricted land-usescenarios.
* The total costs of the soil washing scenario are greater than for the direct disposalscenario because there is little cost associated with disposal of the contaminated soilon the slag pile. The only additional cost is associated with stabilization of theslag/contaminated soil pile after remediation is completed, which is a smallincremental cost relative to the unit cost of disposal at an offsite disposal facility.However, the costs associated with long-term monitoring and surveillance of the sitehave not been accounted for in this analysis (although the incremental cost of theseactivities would be significantly less than the costs incurred from disposal at an offsitedisposal facility).
* Soil remediation is not likely to be required in restricted land-use cases (i.e., theresults for these scenarios indicate that, in the worst case, remediation would only benecessary for residual dose rates of 3 mrem/y or lower). However, stabilization ofthe slag pile is always required.
Sensitivity Analyses
Based on the uncertainties of slag/soil contamination behavior in the 'real world," anadditional set of scenarios was evaluated that assumed that significant soil contamination atthe reference rare metal extraction plant was due to mixing/landfilling of thorium-contaminated slag/soil throughout the site. The analysis of these scenarios utilized the "realworld" model developed in Section C.5.3 for estimating the depth of contamination in thesoil throughout the site. However, the depth of contamination in soil underneath buildingscontinued to be estimated using the "baseline" diffusion model since it is assumed that thissoil is only contaminated as a result of leakages through building floors and not frommixing/landfilling (i.e., the soil is assumed to have been clean when the building wasconstructed).
NUREG-1496 C.7-12
.N

The analysis results for remediation of contaminated soil at the reference rare metalextraction plant are provided in Tables C.7.6.4 and C.7.6.5 for the unrestricted andrestricted land-use scenarios, respectively. Principal conclusions from these results include:
The soil remediation costs and occupational exposure are considerably greater than forthe previously evaluated scenarios that assume only deposition of contamination on thesurface of the soil followed by migration via diffusion. This is a direct result of thegreater depths and, correspondingly, greater volumes of soil requiring remediation inthese scenarios.
* The general trends in costs and occupational dose are the same for these scenarios asdescribed previously for the scenarios where contamination is assumed to be depositedon the surface of the soil.
* Soil remediation is not likely to be required in restricted land-use cases (i.e., theresults for these scenarios indicate that, in the worst case, remediation would only benecessary for residual dose rates of 15 mrem/y or lower). However, the slag pilerequires remediation at all residual dose levels.
C.7-13 NUREG-1496

Table C.7. 1.1. Total and Contaminated Surface Areas for Structures and Soilsat Each of the Reference FacilitiesO
Radionuclide Surface Areas of StructuresActivity on Surface Areas of Soil
Wails/Floors of ft2 % Contaminated (f)Structures
Reference Facility (dpmloO cma) Floor Wall Floor Wall Total Site Contaminated
Nuclear Power 7.5 x 10Co 250,000 300,000 10 2 50 x 10' 3,000Plant 2.4 x 10' L'Cs
Uranium Fuel 18,000 U 240,000 240,000 50 5 4.7 x 10' 100,000Fabrication Plant
Sealed Source 102,000 to 6,000 4,600 10 5 40,000 5,000Manufacturer 33,300 '"Cs
Rare Metals 18,000 Th 150,000 180,000 40 10 740,000 100,000Extraction Plant
(a) The estimated surface areas are based on limited information and, in many cases, represent anengineering judgement estimate based on the total footprint of the structures and the types ofoperations. The estimates are believed to be conservatively large (i.e., probably overestimate actualsurface areas).
Table C.7. 1.2. Ranges of Soil Surface Activities for the Radionuclides of Interest
Contamination Surface ConcentrationRadionuclide Level (pCi/g)
Co-60 High 60
Medium 30Low 2
Sr-90 High 9.00x10 4
Medium 2.25x10⁻³Low 4.50xlOr
Cs-137 High 20Medium 5
Low IThorium High 200
Medium 100Low 30
Uranium High 1,000Medium 200
Low 30
NUREG-1496 C.7-14

I.
Table C.7.2.1. GEIS Scenario Matrix
Unrestricted Land-Use Restricted Land-Use
; Baseline 50-Year SAFSTOR Baseline 50-Year SAFSTOR
Direct Direct Direct Direct
Reference Facility Soil Wash Disposal Soil Wash Disposal Soil Wash Disposal Soil Wash Disposal. HTM L H ML H M L H M L H M L H ML H M L H M L
PWR Power Reactor Site- Deposition on Soil Surface X X X X X X X X X X X X X X X X X X X X X X X- Spill/Leak X X X X X X X X X X X X X X X X X X X X X X X X
Uranium Fuel Fabrication Plant- Deposition on Soil Surface X X X X X X X X X X X X- Mixing/Landfilling X X X X X X X X X X X X
Sealed Source Manufacturer- Deposition on Soil Surface X X X X X X X X X X X X- Spill/Leak X X X X X X X X X X X X
Rare Metals Extraction Plant- Deposition on Soil Surface X X X X X X X X X X X X- Mixing/Landfilling X X X X X X X X X X X
_-=-_ =- -= = -_ = .- = _ _ 2 = =
c-iU'
9t(ON

Table C.7.3.1. Calculated Costs and Other Parameters for Decontaminationof Reactor Bioshield Concrete
Volume of Concrete DisposalConcrete Concrete Number of Costs (S millions) Concrete Total
Depth Requiring Concrete Decontam- OccupationalDose Rate Removed Disposal Transportation ination Labor Dose(mrem/y) (inches) (MI) Shipments ($50/fl') (S350/ft3) (person-hours) (person-rem)
100 3.49 11,136 29 1.115 4.456 2,679 24.80
60 3.65 11,712 31 1.258 4.772 3,351 31.08
30 3.87 12,480 33 1.308 5.052 3,365 31.22
25 3.92 12,672 33 1.319 5.121 3,365 31.22
15 4.08 13,248 35 1.361 5.335 3,394 31.49
10 4.22 13,824 36 1.395 5.542 3,394 31.49
3 4.60 15,264 40 1.600 6.179 4,108 38.19
0.3 5.36 18,336 48 1.916 7.416 4,894 45.57
0.03 6.10 21,504 56 2.241 8.692 5,708 53.23
Table C.7.3.2. Calculated Costs and Other Parameters for Decontaminationof Reactor Wall/Floor Concrete
Volume of Concrete DisposalConcrete Concrete Number of Costs (S millions) Concrete Total
Depth Requiring Concrete Decontam- OccupationalRemoved Dose Rate Disposal Transportation ination Labor Dose(inches) (mrem/y) (I) Shipments ($50/fl) (S350/f 3) (person-hours) (person-rem)
0.125 36,000 3,173 9 0.592 1.544 4,130 2.38
0.250 4,100 3,663 10 0.958 2.048 6,572 3.79
0.375 220 4,093 11 1.324 2.552 9,013 5.19
0.500 10.4 4,554 12 1.690 3.056 11,454 6.60
0.625 0.282 5,013 14 2.057 3.561 13,895 8.00
0.750 0.0035 5,473 15 2.423 4.065 16,337 9.41
0.875 <0.003 5,934 16 2.789 4.569 18,778 10.82
1.000 <0.003 6,394 17 3.155 5.074 21,219 12.22
NUREG-1496 C.7-16

Table C.7.3.3 Summary of Costs and Occupational Dose for Remediation of ContaminatedSoil at the Reference Nuclear Power Plant Unrestricted Land Use
Reference Nuclear Po*er PtantUnrestricted Land Use
Raiddn So With So Washing-DirDose Vafe Teol Remelation Cost (SK) To21 Remedataion Cst (5K)Ram Sat dDo-at DM I _ cost Dopo Can 0/t3l
ty u t0 s0 330 (P*ro rin 10 so 330
100 24 4 S4 67 170 4 1i 58 31560 34 6 61 t2 227 6 24 81 44430 44 3 67 94 280 7 30 104 $6925 46 69 97 294 * 31 11O 601is 52 9 73 105 327 a 35 123 67610 So 10 76 114 359 9 38 136 7483 U6 15 95 152 515 14 59 201 1.109
0.3 132 27 138 241 886 25 102 3S6 1.9670.03 1I3 33 164 236 1.070 30 121 435 2396
100 0 0 0 0 0 0 0 0 060 Is 3 50 59 137 3 is 43 23830 34 6 60 81 224 S 24 tO 43825 36 7 62 14 239 6 26 86 47211 43 a 67 93 277 7 30 101 56010 48 9 70 100 304 £ 32 114 623 61 11 n7 It1 37m to 40 144 793
03 123 22 119 201 721 20 30 288 1.5870.03 167 30 148 262 968 27 110 391 2.157
100 0 0 0 0 0 0 0 0 060 0 0 0 0 0 0 0 0 030 0 0 0 0 0 0 0 0 025 0 0 0 0 0 0 0 0 0IS 0 0 0 0 0 0 0 0 010 0 0 0 0 0 0 0 0 .03 27 S 56 71 186 4 20 64 3S2
03 62 1U 79 119 383 10 41 146 S040.03 139 23 130 224 813 23 90 326 1.798
C.7-17 NUREG-1496

Table C.7.3.4 Summary of Costs and Occupational Dose for Rernediation ofContaminated Soil at the Reference Nuclear Power PlantRestricted Land Use
----- ower PmReference Nludear Power PlantResicted Land Use
Rgdda1 Soil Witb Soil Waswng Direct -posalDOr Vol=e* Total Reieanioo CoS (IX) Total Reredadon Cost (IS1Rate Remedate D Daps Cad (5 D DDiospe sCad (/f
(IS -50 356 (PenonrM)l to so 3SO
too 0 0 0 0 0 0 0 0 060 0 0 0 0 0 0 0 0 030 0 0 0 0 0 0 0 0 025 0 0 0 0 0 0 0 0 0is 0 0 0 0 0 0 0 0 010 12 2 46 SI 102 2 11 29 1563 39 7 64 17 251 6 27 91 501
0.3 62 1 1 79 119 3J1 10 40 145 8000.03 79 14 90 142 479 13 55 187 1.029
100 0 0 0 0 0 0 0 0 060 0 0 0 0 0 0 0 0 030 0 0 0 0 0 0 0 0 025 0 0 0 0 0 0 0 0 015 0 0 0 0 0 0 0 0 010 0 0 0 0 0 0 0 0 0
3 2S 5 56 73 190 4 20 65 3510.3 56 10 75 Ill 341 9 37 132 725
0.03 74 13 17 135 447 12 52 173 953
ew100 0 0 0 0 0 0 0 0 060 0 0 0 0 0 0 0 0 030 0 0 0 0 0 0 0 0 025 0 0 0 0 0 0 0 0 015 0 0 0 0 0 0 0 0 010 0 0 0 0 0 0 0 0 03 0 0 0 0 0 0 0 0 0
0.3 17 3 49 St 130 3 14 41 2220.03 52 9 72 105 324 J 35 121 670
NUREG- 1496 C.7-18

Table C.7.3.5. Calculated Costs and Other Parameters for Decontaminationof Reactor Bioshield Concrete (50-Year SAFSTOR)
Volume of Concrete DisposalConcrete Concrete Number of Costs (S millions) Concrete Total
Depth Requiring Concrete Decontam- OccupationalDose Rate Removed Disposal Transportation ination Labor Dose(mnrem/y) (inches) (0f) Shipments ($50/ft') ($350/ft') (person-hours) (person-rem)
100 1.36 3,936 I 1 0.453 1.634 1,321 0.02
60 1.52 4,416 12 0.483 1.808 1,321 - 0.02
30 1.74 5,184 14 0.530 2.085 1,321 0.02
25 1.79 5,280 14 0.536 2.120 1,321 0.02
15 1.95 5,856 16 0.573 2.329 1,321 0.02
10 2.09 6,240 17 0.699 2.571 1,965 0.03
3 2.47 7,488 20 0.778 3.025 1,979 0.03
0.3 3.22 10,080 27 1.047 4.071 2,651 0.03
0.03 3.97 12,864 34 1.332 5.191 3,365 0.04
Table C.7.3.6. Calculated Costs and Other Parameters for Decontaminationof Reactor Wall/Floor Concrete (50-Year SAFSTOR)
Volume of Concrete DisposalConcrete Concrete Number of Costs ($ millions) Concrete Total
Depth Requiring Concrete Decontam- OccupationalRemoved Dose Rate Disposal Transportation ination Labor Dose(inches) (mrem/y) (f Shipments ($50/R') ($350/f 3) (person-hours) (person-rem)
0.125 535 3,173 9 0.592 1.544 4,130 0.003
0.250 376 3,663 10 0.958 2.048 6,572 0.005
0.375 210 4,093 11 1.324 2.552 9,013 0.007
0.500 93.8 4,554 12 1.690 3.056 11,454 0.009
0.625 33.4 5,013 14 2.057 3.561 13,895 0.011
0.750 9.51 5,473 15 2.423 4.065 16,337 0.013
0.875 2.15 5,934 16 2.789 4.569 18,778 0.015
1.000 0.389 6,394 17 3.155 5.074 21,219 0.017
1.125 0.056 6,854 18 3.522 5.578 23,660 0.056
1.250 0.006 7,314 19 3.888 6.082 26,102 0.006
C.7-19 NUREG-1496

Table 7.I . Summary of Costs and Occupational Dose for Remediation ofContaminated Soil at the Reference Nuclear Power PlantUnrestricted Land Use, SO-Year SAFSTOR
Reference Nudear Power PlantUnrestricted Land Use - SO-Year SAFSTOR
Reidua son Wi So Washing Dirt _pweDM Vol=* ToW Remdlan Coa (SIK TOW Remedlado, Cost (3K)Rate Remedlated Do Cost Dons B s Cost (sif
(Mrem/yr) *M'r) 10 So 3SO I (pe___re__ laso __
too 0 O 0 O o O O o o60 0 0 0 0 0 0 0 0 030 0 0 0 0 0 0 0 0 025 0 0 0 0 0 0 0 0 O
10 0 O O O O -O O O O3 21 4 52 63 151 3 16 49 270
03 413 74 318 596 2.345 67 267 967 5,3390.03 4S7 87 367 697 2,762 79 313 1.142 6306
100 0 0 0 0 0 0 0 0 060 0 0 0 0 0 0 0 0 030 0 0 0 0 0 0 0 0 025 0 0 0 0 0 0 0 0 01s 0 0 0 0 0 0 0 0 010 0 0 0 0 0 0 0 0 03 0 0 0 0 0 0 0 0 0
03 106 19 108 178 623 17 71 249 1.3730.03 448 80 341 644 2.541 73 292 1.050 5.795
100 0 0 0 0 0 0 0 0 060 0 0 0 0 0 0 0 0 030 0 0 0 0 0 0 0 0 025 0 0 0 0 0 0 0 0 015 0 0 0 0 0 0 0 0 010 0 0 0 0 0 0 O 0 03 0 0 0 0 0 0 0 0 0
03 0 0 0 0 0 0 0 0 00.03 373 67 292 541 2,122 60 244 375 4,326
NUREG-1496 C.7-20

Table 7.3,8. Summary of Costs and Occupational Dose for Remediation ofContaminated Soil at the Reference Nuclear Power PlantRestricted Land Use, 50-Year SAFSTOR
Reference Nuclear Power PlantRestricted Land Use - 50-Year SAISTOR
leidual Son With SoD Washng Dit DpsaDose Vdume Tatal Remedblan Cos (3K) TOW Remedon Codt CS tRte Remedbted Dose MMI Cost 0sm Doe o lCost(
(mrm (i' (person-Irn) 10 SO 350 (person-.mrn) 10 SO 350
100 0 0 0 0 0. 0 0 0 040 0 0 0 0 0 0 0 0 030 0 0 0 0 0 0 0 0 023 0 0 0 0 0 0 0 0 015 0 0 o 0 0 o 0 0 010 0 0 0 0 0 0 0 0 03 0 0 0 0 0 0 0 0 0
0.3 0 0 0 0 0 0 0 0 00.03 44 S 67 94 279 7 30 103 56510
100 0 0 0 0 0 0 0 0 030 0 0 0 0 0 0 0 0 030 0 0 0 0 0 0 0 0 025 0 0 0 0 0 0 0 0 0is 0 0 0 0 0 0 0 0 010 0 0 0 0 0 0 0 0 03 0 0 0 0 0 0 0 0 0
0.3 0 0 0 0 0 0 0 0 00.03 24 4 54 67 168 4 IS 57 310
100 0 0 0 0 0 0 0 0 060 0 0 0 0 0 0 0 0 030 0 0 0 0 0 0 0 0 025 0 0 0 0 0 0 0 0 015 0 0 0 0 0 0 0 0 010 0 0 0 0 0 0 0 0 03 0 0 0 0 0 0 0 0 0
03 0 0 0 0 0 0 0 0 00.03 0 0 0 0 0 0 0 0 0
C.7-21 NURBG-1496

Table 7.3.9. Summary of Costs and Occupational Dose for Remediation ofContaminated Soil at the Reference Nuclear Power.PlantUnrestricted Land Use, SpiliLeak
Reference Nuclear Power PlantUnrestricted Land Use - SpMlLeak
Reddual son Wt Soil Wtsng Dre DisposalDose Vohmae Total Remedlaialo Cost (S14 =_ _.a n Cost (S)
Rate Redt Dose D Cost SJf Dose -(o i) ( n 10 SO 350 [(Peso- i -lo so 350
gh100 23 5 56 73 190 4 20 65 35760 44 3 67 94 279 7 30 104 56630 77 14 39 139 467 13 54 182 1.0002S 37 16 95 153 521 14 59 203 1,123iS 113 20 113 189 668 18 75 266 1.46410 135 24 127 217 7J7 22 87 316 1.741
3 205 37 177 314 1.1U5 33 133 431 2.65S0.3 349 63 272 509 1.990 57 224 320 4.521
0.03 473 as 357 673 2.6SI 77 307 1.103 6.118Meduiux
100 5 1 42 42 64 1 7 13 6660 21 4 52 63 153 3 17 50 27430 42 8 66 92 272 7 29 100 54925 50 9 71 102 313 8 33 117 64515 75 14 a3 137 457 12 53 177 97610 97 17 102 166 S75 16 65 226 1.249
3 158 23 142 250 920 26 105 371 2.0490.3 299 54 239 442 1.711 49 197 702 3,375
0.03 430 77 329 619 2.441 70 232 1,003 5.563L
100 0 0 0 0 0 0 0 0 060 0 0 0 0 0 0 0 0 030 0 0 0 0 0 0 0 0 025 0 0 0 0 0 0 0 0 015 0 0 0 0 0 0 0 0 010 3 0 40 39 50 0 6 7 353 31 6 59 73 210 5 23 73 405
0.3 143 26 132 229 835 23 96 336 L.a5s0.03 293 52 235 432 1.674 47 193 686 3.739
d
NUREG-1496 C.7-22
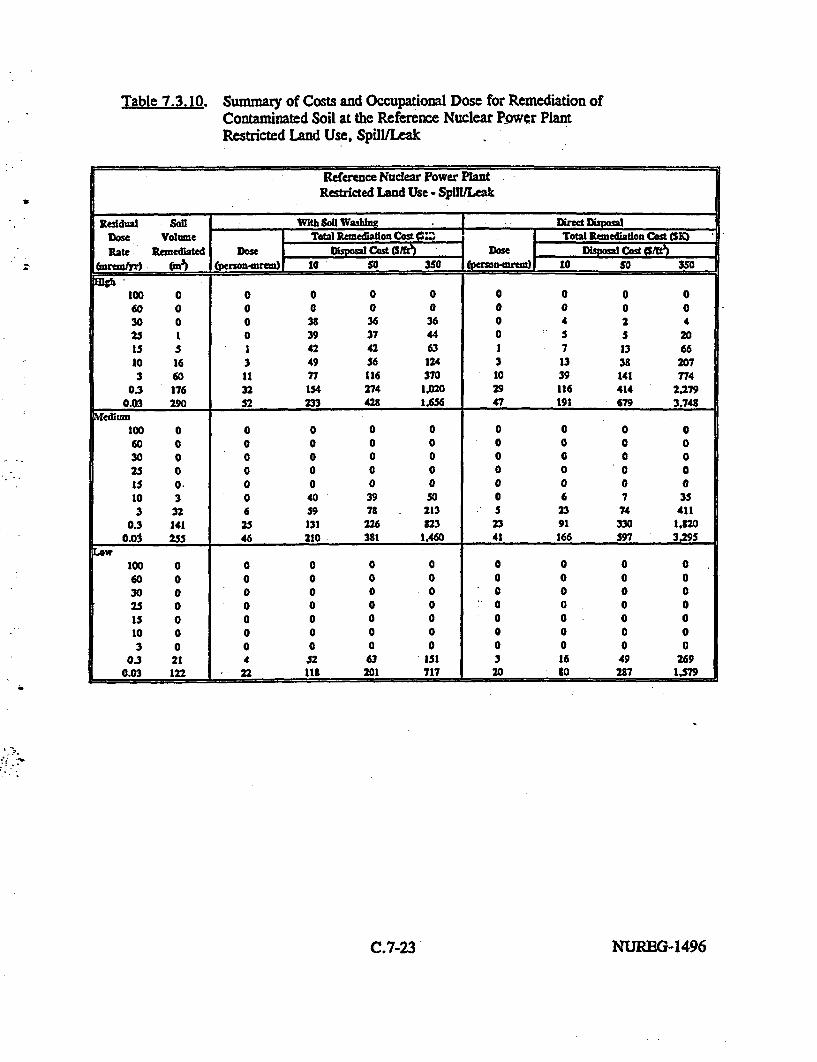
Table 7.3.10. Summary of Costs and Occupational Dose for Remediation ofContaminated Soil at the Reference Nuclear Power PlantRestricted Land Use, Spill/Leak
Reference Nuclear Power PLantRestricted Land Use - Spl/Leak
Residual Soil With Soll Washing Direct DisposalIDose Volue TOWal Cod t Total Remedliaon Cost (SKMRakte Renediated Don Cost ($) - Dose CMat Cdi
sonnnrts 10 So 3S0 (person-airen) 10 50 3S0
31gh100 0 0 0 0 0 0 0 0 060 0 0 0 0 0 0 0 0 0
30 0 0 38 36 36 0 4 2 425 1 0 39 37 44 0 5 5 2015 5 1 42 42 63 1 7 13 6610 16 3 49 56 124 3 13 38 2073 60 11 77 116 370 tO 39 141 774
0.3 176 32 154 274 1.020 29 116 414 2.2790.03 290 52 233 423 1.66 47 191 679 3,748
Mecdiumn100 0 0 0 0 0 0 0 0 0
60 0 0 0 0 0 0 0 0 030 0 0 0 0 0 0 0 0 025 0 0 0 0 0 0 0 0 01i 0. 0 0 0 0 0 0 0 010 3 0 40 39 50 0 6 7 353 32 6 59 72 213 5 23 74 411
0.3 141 25 131 226 823 23 91 330 1.8200.03 255 46 210 381 1.460 41 166 597 3,295
LAW100 0 0 0 0 0 0 0 0 0
60 0 0 0 0 0 0 0 0 030 0 0 0 a 0 0 0 0 025 0 0 0 0 0 0 0 0 015 0 0 0 0 0 0 0 0 010 0 0 0 0 0 0 0 0 0
3 0 0 0 0 0 0 0 0 003 21 4 52 63 151 3 16 49 269
0.03 122 22 119 201 717 20 80 287 1,579
C.7-23' NUREG-1496

Table 7.3.1 1. Summary of Costs and Occupational Dose for Remediation ofContaminated Soil at he Reference Nuclear Power PlantUnrestricted Land Use, Spill/Leak. 50-Year SAFSTOR
Reference Nuclear Power PlantUnrestricted Land Use - SpiM/Leak. SO-Year SAO OR
Rksidual Soin Wfth Soil Wamax Ded EMpoADose Volume TOW kemecszaffo4 OtD tOW Rmedladox Cod (SI)Rate Remedl Dan 1d DM DtS I o * CSW
(mrear ('') t(person.tmnw) le 50 350 (Perso-Cure=) 10 So 350th
100 0 0 0 0 0 0 0 0 060 0 0 0 0 0 0 0 0 030 0 0 0 0 0 0 0 0 025 0 0 0 0 0 0 0 0 0Is 0 0 0 0 0 0 0 0 010 19 3 51 60 140 3 is 45 2453 55 10 74 110 344 9 36 130 714
03 223 41 192 345 1,312 37 1!i 535 2.9520.03 453 Sl 3U 650 256S 73 295 1.061 5.356
'3m100 0 0 0 0 0 0 0 0 060 0 0 0 0 0 0 0 0 030 0 0 0 0 0 0 0 0 025 0 0 0 0 0 0 0 0 0
.15 0 0 0 0 0 0 0 0 010 0 0 0 0 0 0 0 0 03 14 2 47 53 III 2 12 33 17S
0.3 112 20 112 137 660 18 74 263 1.4460.03 329 59 259 4U3 1.17 53 214 772 4:260
100 0 0 0 0 0 0 0 0 060 0 0 0 0 0 0 0 0 030 0 0 0 0 0 0 0 0 025 0 0 0 0 0 0 0 0 0is 0 0 0 0 0 0 0 0 010 0 0 0 0 0 0 0 0 03 0 0 0 0 0 0 0 0 0
0.3 33 6 60 80 221 5 24 79 .4300.03 157 21 142 24U 915 25 10S 369 2.035
MMWD .
NUREG-1496 C.7-24
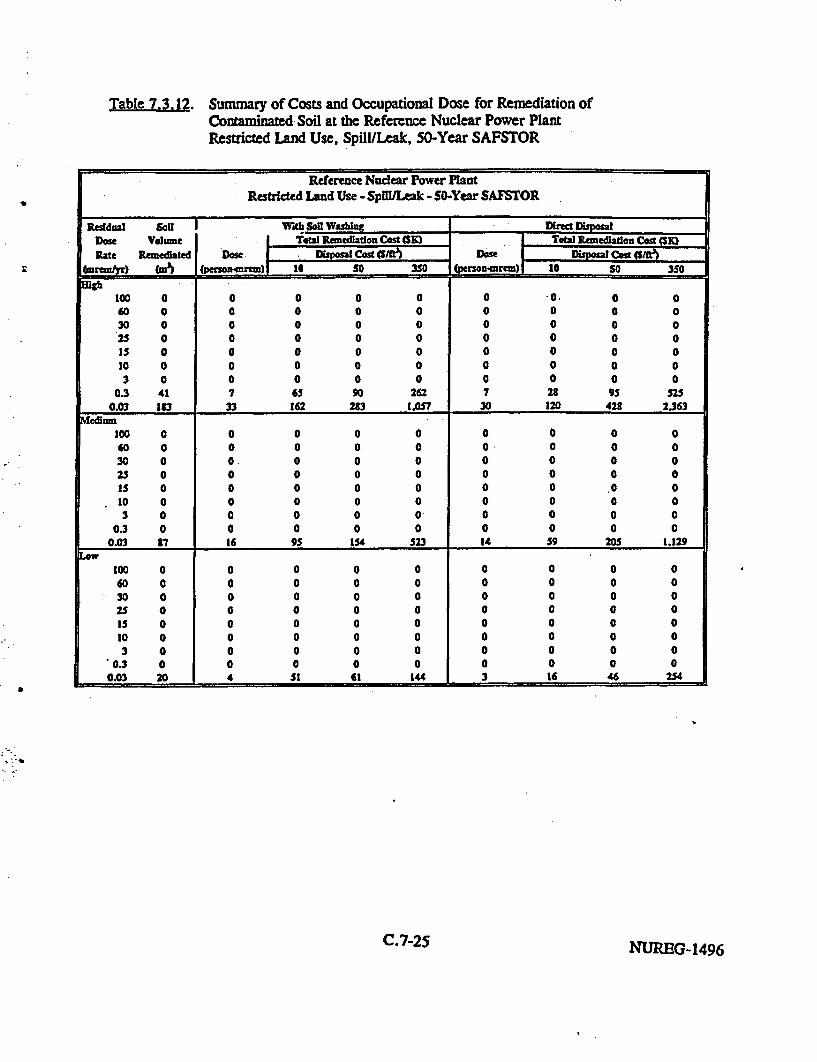
Table 7.3.12. Summary of Costs and Occupational Dose for Remediation ofContaminated Soil at the Reference Nuclear Power PlantRestricted Land Use, Spill/Leak, 50-Year SAFSTOR
Reference Nuclear Power PlantRestricted Land Use - SpMlLeak - 50-Year SAFSTOR
Rseddual Son With Soil Washlag Direct DispodDose Volme I TOW Remedlatfon Cost am TOWta meadaon cost (SMIRate RImediated Dome -I I tpocD Cost O.T)
) (m3M ( pebson-nwao 10 s 350 (ron-wrem)I 10 50 3S0
100 0 0 0 0 0 0 0. 0 060 0 0 0 0 0 0 0 0 030 0 0 0 0 0 0 0 0 025 0 0 0 0 0 0 0 0 OIS 0 0 0 0 0 0 0 0 010 0 0 0 0 0 0 0 0 0
3 0 0 0 0 0 0 0 0 00.3 41 7 65 90 262 7 28 95 5
0.03 183 33 162 283 1.0S 30 120 42 2,363
100 0 0 0 0 0 0 0 0 060 0 0 0 0 0 0- 0 0 030 0 0. 0 0 0 0 0 0 025 0 0 0 0 0 0 0 0 015 0 0 0 0 0 0 0 ,0 010 0 0 0 0 0 0 0 0 03 0 0 0 0 0 0 0 0 0
0.3 0 0 0 0 0 0 0 0 00.03 87 16 95 154 523 14 59 20S 1.129
100 0 0 0 0 0 0 0 0 060 0 0 0 0 0 0 0 0 030 0 0 0 0 0 0 0 0 025 0 0 0 0 0 0 0 0 0is 0 0 0 0 0 0 0 0 010 0 0 0 0 0 0 0 0 03 0 0 0 0 0 0 0 0 0
0.3 0 0 0 0 0 0 0 0 00.03 20 4 SI 61 144 3 16 46 254
C.7-25 NUREG-1496

Table 7.4.1. Calculated Costs and Other Parameters for Decontaminationof Uranium Fuel Fabrication Plant Wall/Floor Concrete
Volume of Concrete DisposalConcrete Concrete Number of Costs (S millions) Concrete Total
Depth Requiring Concrete Decontam- OccupationalRemoved Dose Rate Disposal Transportation inaion Labor Dose(inches) (mrem/yr) (f Shipments ( S 5/fe) ($3501R3) (person-hours) (person-rem)
0.125 1 .40x10-° 10,185 27 . 4.944 12,090 6.96
27
NUREG-1496 C.7-26

Table 7.4.2. Summary of Costs and Occupational Dose for Rernediation ofContaminated Soil at the Reference Uranium Fuel Fabrication PlantUnrestricted Land Use
Reference Uranium Fuel Fabrication PlantU ewtricted Land Use
Residual SOl With Soil Was. ng Direet DSposaDoe Volume |TO Remedition Cost (SK Total R)medlou Cost tSK)Rate Reemediated Dose Dispsat Cost (SD Dose cgm
_ _ _ _ _ _ _ _ _ _ _ _ _ _350_ _aol)10 _ 50 350(mrem/yr) (uma~ (persnwxmnm 0s 5 p *'M CsS~lh100 1,8 320 1.256 2.466 10.047 290 t1l59 4.191 23.14460 1.922 344 1.343 2.647 10,790 311 1.245 4.502 24.86030 2.071 372 1,430 2.S60 11,666 337 1.345 4.869 26.88425 2.115 379 1.474 2,910 11.t75 343 1.367 4.956 27,36S15 2.215 397 1.544 3.046 12,433 359 1.434 5,190 28.65810 2.291 410 1.594 3.149 122.56 371 1.483 5.366 29.6353 2.492 446 1.734 3.422 13.982 404 1.613 5,839 32,239
0.3 2.17 504 1.952 3.64 15.804 456 1.821 6.601 36,4500.03 3,106 556 2.150 4,257 17,420 503 2.007 7.M 40.1t5
Mediu100 840 150 607 1.176 4.737 136 543 1.969 10.87060 1.381 247 975 1.911 7.763 224 894 3.235 17.86530 1.665 298 1.170 2.298 9.352 270 1.077 3.901 21.53625 1,723 308 1.208 2,377 9.680 279 1.116 4.038 22,29515 1.865 334 105 2.570 10.472 302 1.208 4369 24.12610 1.964 352 1.375 2.705 11.027 318 1.270 4,601 25.4083 2.215 397 1,544 3.046 12.433 359 1.434 5.190 28,65S
0.3 2,597 465 1.803 3.565 14.572 421 1,679 6.085 33,6010.03 2.909 521 2.017 3,.90 16,320 471 1.883 6,t16 37.639
w 00 _100 0 0 0 0 0 0 O 0 060 0 0 0 0 0 0 0 0 030 0 0 0 0 0 0 0 0 025 0 0 0 0 0 0 a 0 015 840 150 607 1.176 4.737 136 543 1,969 10.87010 1.320 236 935 1.328 7.421 214 t54 3,092 17.073
3 1.789 320 1,256 2.466 10.047 290 1.159 4.191 23.14403 2.291 410 1.594 3.149 12,856 371 1.433 5,366 29,63S
0.03 2,655 475 1.845 3.644 _14.95 430 1.717 6.221 34,348
C.7-27 7NUREG-1496

Table 7.4.3. Summary of Costs and Occupational Dose for Remediation ofContaminated Soil at the Reference Uranium Fuel Fabrication PlantRestricted Land Use
Reference Uranium Fuel Fabrication PlantRestricted Land Use
Reidul soa With Soil Wa.hnx Ded DbposIDoss Volume Toa Rimediallm CoWt MSE| TOW RemedLdtes Cod (SI)inae Remedlated ptrsme | Dpd Cos dSI CDon S i
mjramotr It (So 35h0 (p"=n-mr4 I 0 so 350
100 0 0 0 0 0 0 0 0 060 0 0 0 0 0 0 0 0 030- 0 0 0 0 0 0 0 0 025 0 0 0 0 0 0 0 0 0IS 1.056 189 753 1,470 5.945 171 6S3 2.47S 13,66310 1.379 247 974 1.909 7,754 223 893 3,231 17.,23 1.317 325 1.274 2.S04 10,204 294 -1.17S 4.258 23.503
0.3 2.30S 413 1.609 3.172 12.932 374 1.493 3.403 29.8600.03 2.671 473 1.356 3.666 14.987 433 1.727 625 34.560
100 0 0 0 0 0 0 0 0 060 0 0 0 0 0 0 0 0 030 0 0 0 0 0 0 0 0 025 0 0 0 0 0 0 0 0 0IS 0 0 0 0 0 0 0 0 010 0 0 0 0 0 0 0 0 0
3 1.056 189 753 1.470 3.943 171 683 2.473 13.6630.3 1.989 356 1.391 2.739 11.163 322 1,2S9 4.660 25.733
0.03 2,423 434 1.635 3.329 13.596 393 1,569 S.676 31.34S
100 0 0 0 0 0 0 0 0 060 0 0 0 0 0 0 0 0 030 0 0 0 0 0 0 0 0 025 0 0 0 0 0 0 0 0 015 0 0 0 0 0 0 0 0 010 0 0 0 0 0 0 0 0 03 0 0 0 0 0 0 0 0 0
0.3 1,379 247 974 1.909 7.754 223 sn 3231 17,8420.03 2.077 372 1.449 2.359 11.661 337 1,345 4.867 26.87S
NUREG-1496 C.7-28

Table ?74.4. Summary of Costs and Occupational Dose for Remediation ofContaminated Soil at the Reference Uranium Fuel Fabrication PlantUnrestricted Land Use, Mixing/Landfilling
Reference Uranium Fuel Fabrication PlantUnrestricted Land Use -bdfnglAndfiing
Residal Soil Wth SoUl WasiWg .Di D1paIDos Volume jTota Remecdlatlon Cost (5K) Tota Remedlation Cost (5K)Rate Remedlated Doe cost Dose - cst D e s-
(rlyr) Cm' (pensonmrewn) 10 50 330 (person..rcr 10 So 350
igh100 4.1t8 750 2,386 5.728 23.477 678 2.709 9.812 54.11260 5,1S5 928 3566 ?7.2 29.053 540 3.353 12.14U 67.07230 1,676 2;553 5378 11.32 48.030 1.406 5.607 20.325 112.24425 9,441 1.690 5.101 12.26 S2.214 1.S29 6.102 22.117 122,13615 11.426 2.045 6,904 14.657 63.077 1t151 7.384 26.767 147.31710 13.290 2.379 7.943 16,958 73.277 2.153 a,587 31.134 171.9333 1.518 3.315 10.147 23.413 101.86 3.000 1.965 433S0 239.563
0.3 28,009 S.014 16,126 3S.131 153.128 4.538 12,097 65.615 362.3570.03 37.672 6.743 21,496 47.061 206.706 6.103 24.342 38.251 487,366
100 38 7 63 t7 250 6 27 91 49860 63 11 30 121 389i 10 41 14S 31330 1.913 342 1.337 2.635 10.741 310 1,240 4.4S1 24,74525 2,680 480 1i.62 3,677 15.032 434 1.732 6.275 34,66515 4,327 364 3,323 6.S96 27.050 732 3.122 11.307 62.44410 6,531 1.169 4,480 1,912 36537 1.0538 4222 15.299 34,4863 11.588 2.074 6.994 14.157 63.962 1.177 7.488 27.145 149,909
0.3 21,255 3.30S 12,371 26.791 116.164 3.443 13.735 49.792 274.9730.03 30.919 S.534 17.742 38.723 169.749 5.009 19,976 72.431 399.996
0eV100 0 0 0 0 0 0 0 0 060 0 0 0 0 0 0 0 0 030 0 0 0 0 0 0 0 0 025 0 0 0 0 0 0 0 0 015 38 7 63 17 250 6 27 91 49810 60 11 78 117 373 1o 40 142 7823 3.613 648 2.499 4.953 20.233 536 2,341 5.475 46".01
0.3 13.290 2.379 7.943 16.958 73M79 2.153 8.587 31.134 171.9360.03 22.9S7 4.109 _ 13315 28.393 126.177 3.719 14.134 53.779 296,989
C.7-29 NUREG-1496

Table 7.4,5. Summary of Costs and Occupational Dose for Remediation ofContaminated Soil at the Reference Uranium Fuel Fabrication PlantRestricted Land Use, Mixing/Landfilling
Reference Uranium Fuel Fabrication PlantRestricted Land Use - Mxbdng(landflilg
Residual s50; WiM Soo WaShlus M Dect DisposDo# VolU=* Total RemedOalon Cost (SK) Total Runedhldo Cost (SKIRate Rewedie Dane Di od Cost 0 Dose Disposa Cod $It W
(Zs Lpe r~O 10 so 3So (personumrem) is so 3*0
100 0 0 0 0 0 0 0 0 060 0 0 0 0 0 0 0 0 030 0 0 0 0 0 0 0 0 025 0 0 0 0 0 0 0 0 0Is 43 9 70 [O0 305 3 33 114 6261o 63 1 80 121 389 10 41 143 8173 4,047 724 2.789 5.535 22.683 656 2.613 9.481 52.351
0.3 13.719 2,456 8.179 17.437 75.624 2.222 8.864 32.13S 177.4790.03 23.3s5 4.1t6 13.555 29.422 123.522 3.7U 15.111 54.732 302.532
ewa I100 0 0 0 0 0 0 0 0 060 0 0 0 0 0 o 0 0 o30 0 0 0 0 0 0 0 0 025 0 0 0 0 0 0 0 0 015 0 0 0 0 0 0 0 0 010 0 0 0 0 0 0 0 0 03 4u 9 70 100 305 1 33 114 626
0.3 6C959 1.246 4,774 9.495 381.97 1.127 4,4o99 16.304 90,0330.03 16.629 2.977 9,795 21,080 91.549 2,694 10.74 38.955 215.127
.ow100 0 0 0 0 0 0 0 0 060 0 0 0 0 0 0 0 0 030 0 0 0 0 0 0 0 0 025 0 0 0 0 0 0 0 0 015 0 0 0 0 0 0 0 0 010 0 0 0 0 0 0 0 0 03 0 0 0 0 0 0 0 0 0
0.3 63 11 80 121 389 1o 41 143 8170.03 3.567 1,534 5.315 11.123 47,434 1,403 s5.99 20.293 112.067
NUREG-1496 C.7-30
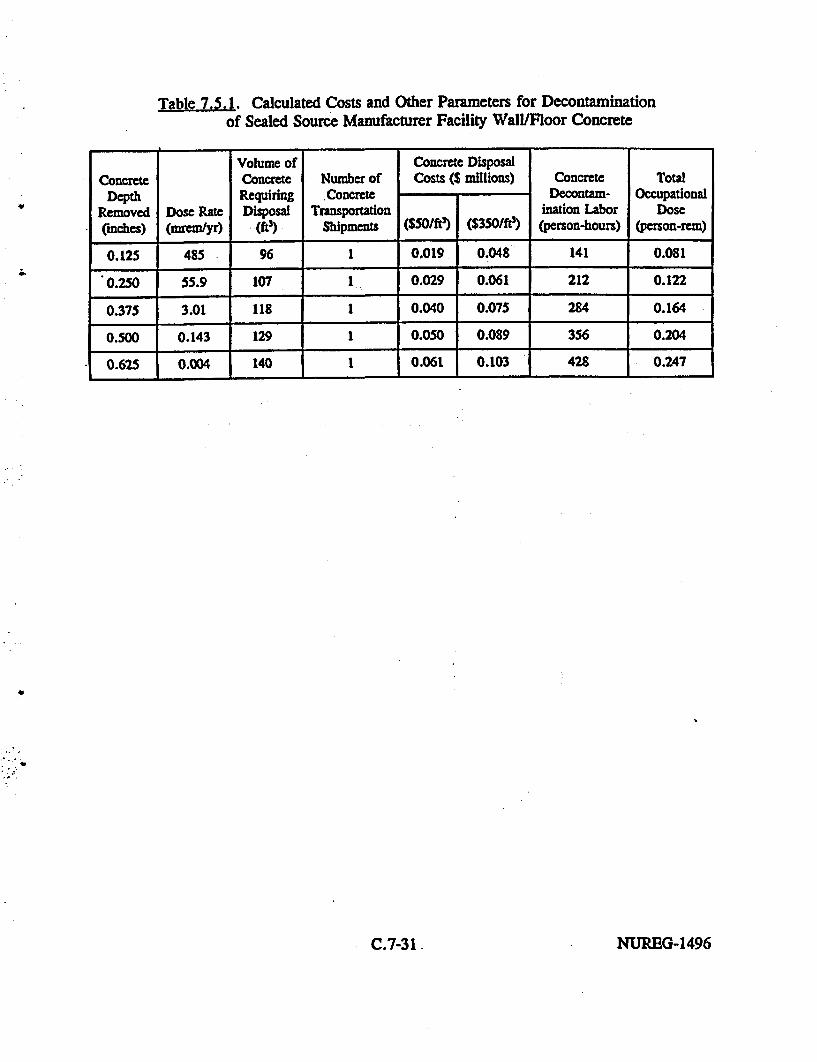
Table 7.5.1. Calculated Costs and Other Parameters for Decontaminationof Sealed Source Manufacturer Facility Wall/Floor Concrete
Volume of Concrete DisposalConcrete Concrete Number of Costs (S millions) Concrete Total
Depth Requiring Concrete Decontam- OccupationalRemoved Dose Rate Disposal Transportation ination Labor Dose(inches) (mremlyr) (ft) Shipments (SSOft) ($350/ft) (person-hours) (person-rem)
0.125 485 96 1 0.019 0.048 141 0.081
0.250 55.9 107 1 0.029 0.061 212 0.122
0.375 3.01 118 1 0.040 0.075 284 0.164
0.500 0.143 129 1 0.050 0.089 356 0.204
0.625 0.004 140 1 0.061 0.103 428 0.247
IC.7-31 . NUREG-1496

Table 7-.52. Summary of Costs and Occupational Dose for Remediation ofContaminated Soil at the Reference Sealed Source Manufacturer SiteUnrestricted Land Use
Reference Sealed Source Manufacturer SiteUnrestricted Land Use
Residual SoM T dh Son Washing Mee DipoaDoes Volume Total Remedladon Cost (SX) ToWl Remedladon Cost (SX)Rate PAmedlat Dom myow cost (st)oa I Cost (5jft))
reyr (M' (pne) 10 so _350 _pso_) 10 SO 350
Egh100 16 3 43 56 122 3 13 37 20260 22 4 53 64 157 4 17 53 2S530 2S 5 57 74 193 5 21 66 36425 30 5 5S 76 201 S 22 70 3S4i5 33 6 60 St 222 5 24 SO 43410 37 7 62 35 242 6 26 37 4793 S5 10 74 110 343 9 36 130 711
0.3 97 17 102 167 579 16 65 228 1.2590.03 ItS 21 116 196 693 -19 7S 273 1.532
100 0 0 0 0 0 0 060 12 2 46 51 101 2 11 29 15330 22 4 52 64 15s 4 17 51 28025 23 4 54 66 165 4 Is 56 303IS 28 S 56 73 190 4 20 65 359to 31 6 5S 77 203 5 22 73 4003 39 7 64 S8 254 6 27 92 507
0.3 73 14 90 141 473 13 54 IS5 1.0160.03 107 19 103 179 631 17 71 250 1.380
Low100 0 0 0 0 0 0 0 0 060 0 0 0 0 0 0 0 0 030 0 0 0 0 0 0 0 0 025 0 0 0 0 0 0 0 0 015 0 0 0 0 0 0 0 0 0t0 0 0 0 0 0 0 0 0 0
3 17 3 S0 58 132 3 14 41 2250.3 40 7 64 S9 -57 6 27 94 515
0.03 89 16 97 156 S33 14 60 209 1.151 t
NUREG-1496 C.7-32

Table 7.5.3. Summary of Costs and Occupational Dose for Remediation ofContaminated Soil at the Reference Sealed Source Manufacturer SiteRestricted Land Use
Reference Sealed Source Manufacturer SiteRestricted Land Use
Residual Sol WVth Soi2 Wwading DretDsosDkae Volume Tebd Ikseefdon Cod ($13 Tetd Remedoibff C;M5 CSKL}R2te Resedlated Dose ; cog Om) Dose . ost C I
t1)(yr) p tersona-mrn) I 10 S0 3S0 (person-nrm) 10 S0 350
100 0 0 0 0 0 0 0 0 060 0 0 0 0 0 0 0 0 030 0. 0 0 0 .0 0 0 0 025 0 0 0 0 0 0 0 0 015 0 0 0 0 0 0 0 0 010 t 1 43 45 7S 1 9 Is 993 25 4 54 68 173 4 19 59 321
0.3 40 7 64 39 256 6 27 93 5120.03 51 9 72 103 319 * 34 120 658
100 0 0 0 0 0 0 0 0 060 0 0 0 0 0 0 0 0 030 0 0 0 0 0 0 0 0 025 0 0 0 0 0 0 0 0 0iS 0 0 0- 0 0 0 0 0 010 0 0 0 0 0 0 0 0 03 is 3 50 59 134 3 15 42 229
0.3 36 6 62 W4 235 6 25 t5 4640.03 47 £ 69 99 298 8 32 111 611
100 0 0 0 0 0 0 0 0 060 0 0 0 0 0 0 0 0 030 0 0 0 0 0 0 0 0 025 0 0 0 0 0 0 0 0 0t5 0 0 0 0 0 0 0 0- 010 0O 0 0 0 0 0 0 0 0
3 0 0 0 0 0 0 0 0 00.3 1 2 45 50 96 2 11 27 143
0.03 33 6. 60 t0 224 S 24 79 430
C.7-33NUREG- 1496

Table 7.5.4. Summary of Costs and Occupational Dose for Remediation ofContaminated Soil at the Reference Sealed Source Manufacturer SiteUnrestricted Land Use, Spill/Leack
Reference Sealed Source Manufacturer SiteUnrestricted Land Use - Spil/Leak
Residubl soi Wlth Soil W!whsng Dfrect DkposaDose Volum Total Remedladou Cost (Sl) ToW 2. (S14Rate Remedatedd Dose D(n r CoA ($I Dose _ 1 oost0
(irm/rd (i) |(s IPC emn) 10 S0 3S0 I mr 50 35S0tooso
100 21 4 52 63 152 3 16 49 27160 38 7 63 S6 245 6 26 89 48730 84 15 93 149 504 14 57 196 1.08325 97 17 102 167 578 16 65 228 1.256Is 135 24 127 217 789 22 8s 317 1,74610 165 30 t47 259 953 27 109 387 2,1343 254 46 210 381 1.459 41 166 597 3.292
0.3 426 76 327 614 2.420 69 279 1,000 5.5150.03 598 107 444 848 3.383 97 3S9 1.402 7.73n
100 8 2 44 46 82 1 9 20 11060 16 3 49 57 127 3 14 39 21430 36 6 62 84 237 6 25 a5 46725 46 8 68 97 290 7 31 108 59115 81 15 92 145 489 13 56 191 1,05310 111 20 111 187 659 I8 74 -262 1,4423 201 36 174 308 1.160 33 131 472 2.601
0.3 373 67 292 542 2.124 60 244 875 4,8300.03 546 98 409 777 3.089 88 354 1.279 7.059
100 0 0 0 0 0 0 0 0 060 0 0 0 0 0 0 0 0 030 0 0 0 0 0 0 0 0 025 0 0 0 0 0 0 0 0 015 0 0 0 0 0 0 0 0 01e 4 4 41 4 1 59 1 7 158 573 24 4 54 67 170 4 185 58 316
0.3 174 3 1 153 272 1.011 28 115 410 2.2590.03 345 62 269 504 1.968 56 224 310 4,470
NUREG-1496 C.7-34

Table 7.5.5. Summary of Costs and Occupational Dose for Remediation ofContaminated Soil at the Reference Sealed Source Manufacturer SiteRestricted Land Use, Spill/Leak -
Reference Sealed Source Manufacturer SiteRestricted Land Use - SpillLeak
Residual Son 1Wrih Soil Washing Direct DisposalDose Volume TOtW Remediatlon Cost (SKM -& R 1tdmwedUlio Cost ($SKRate Remediated Dbse I L31 CoSt Dose Disposa Cog IW
(Wremn/r) One (person-rumn) 10 5O 3S0 (fpersown-aur) 10 50 3S0Dgh_
100. 0 0 0 0 0 0 0 0 060 0 0 0 0 0 0 0 0 030 0 0 38 36 37 0 4 2 525 2 0 40 39 49 0 6 7 33Is S 2 44 46 32 1 9 20 10910 14 3 4S 54 ItS 2 13 34 t16
3 60 1 7n 117 311 10 39 141 7760.3 230 41 194 347 1.322 37 152 540 2.977
0.03 401 72 310 530 2;250 65 261 940 5.191Mcdicrn
100 0 0 0 0 0 0 0 0 060 0 0 0 0 0 0 0 0 030 0 0 0 0 0 0 0 0 025 0 0 0 0 0 0 0 0 015 0 0 0 0 0 0 0 0 010 4 1 41 41 60 1 7 11 573 25 4 54 68 171 4 19 5S 318
0.3 177 32 159 275 1,026 29 116 416 2,2910.03 349 62 272 508 1.986 56 226 113 4,513
w100 0 0 0 0 0 0 0 0 060 0 0 0 0 0 0 0 0 030 0 0 0 0 0 0 0 0 025 0 0 0 0 0 0 0 0 0I5 0 0 0 0 0 0 0 0 0t0 0 0 0 0 0 0 0 0 0
3 0 0 0 a 0 0 0 0 00.3 11 3 49 SI 130 3 1,4 40 221
003 150 27 137 239 375 24 301 352 1.943
NUREG-1496C.7-35

Table 7.6.1. Calculated Costs and Other Parameters for Decontaminationof Rare Metal Etraction Plant Wall/Floor Concrete
Volumeof Concrete Disposal
Concrete Concrete Number of Costs (S millions) Concrete TotalDepth Requiring Concrete Decontam- Occupational
Removed Dose Rate Disposal Transportation ination Labor Dose(inches) (mrem/yr) (*3) Shipnb^ms i Mmo ($350/R3) (person-hours) (person-rem)
0.125 3,600 5,054 14 1.281 2.797 8,304 4.78
0.250 0.023 6,232 17 2.277 4.146 14,971 8.62
V
NUREG-1496 C.7-36

Table 7.6.2. Summary of Costs and Occupational Dose for Remediation ofContaminated Soil at the Reference Rare Metal Extraction PlantUnrestricted Land Use
Refrnce Rare Meal Ertion PintUrstricted Land Use
He
Residual Son With SolU Washing Dina DisposalDose Volume Aow Aemedlation Cost (SCK) Total Rezvedlatlon Cost (S)
Rbae Fkxnediated Dose DhgpeNA Cint av DoXse lipalit cgf/Sflt
(wE!! n) '(pe n en)m) erso-so35 (pe)non 10 so 330
E~h100 7,015 1.137 4.367 16,4S3 90.677 1.136 4.36 16,434 90.73260 7.050 1.143 4.594 16.501 90,M 1.142 4.556 16.316 91.20530 7,076 1,148 4.611 16,S36 91.020 1.146 4,572 16.577 91.54525 7,081 1.148 4.614 16.542 91.044 1.147 4J79 16,8S 91,60315 7.089 1.150 4.620 16,555 91.094 1.148 4,584 16.607 91.71510 7.094 1,151 4.623 16,561 91.119 1.149 4.586 16.619 91;7m3 7.157 1.162 4,664 16,646 91,471 1,159 4,627 16.766 92.583
0.3 7.191 1.168 4.687 16.692 91.662 1.165 4.648 16.,46 93.0300.03 7.278 1.184 4.74S 16.,12 92,152 1.179 4.703 17.051 94.160
adium100 7.000 1.134 4,523 16.398 90.559 1.134 4.S23 16,398 S0,55960 7.000 1,134 4523 16.398 90.559 1.134 4.523 16.39S 90.55930 7,050 1.143 4.594 16.501 90S,73 1.142 4.556 16.516 91.20525 7.059 1.145 4.600 16.512 90.921 1.144 4.562 16.537 91.31915 7.076 1.148 4.611 16.536 91,020 1,146 4,572 16.577 91.54S10 7,085 1.149 4.617 16.548 91.069 1.148 4.5S1 16.398 91.6593 7.119 1,155 4.639 16.595 91.258 1.153 4.601 16.677 92,095
03 7,187 1,16B 4.684 16.6B7 91,641 1.164 4.645 16,337 92.9800.03 7X,267 1.182 4,741 16.796 92.089 1.177 4.697 17.025 94,011
100 7,000 1.134 4,523 16,398 90.559 1.134 4.23 16.398 90,55960 7,000 1,134 4,523 16.391 90,559 1.134 452S3 16.398 90.55930 7.000 1.134 4.523 16,398 90.559 1.134 4,523 16,398 90.55925 7.=00 1.134 4,523 16.398 90.559 1.134 4.523 16.398 90,55915 7.015 1.137 4.567 16.453 90,677 1.136 4,536 16.434 90.7S210 7.044 1.142 4.590 16.493 90.840 1.141 4.,53 16.502 91.129
3 7.015 1.149 4.617 16.543 91.069 1,148 4.5S1 16,598 91,6590.3 7.169 1.164 4.673 16.664 91.542 1.161 4,635 16.796 92.751
0.03 7.216 1.173 4.707 16,726 91.t02 1.169 4.662 16.905 93,354
C.7-37 NUREG-1496

Table 7.6.3. Summary of Costs and Occupational Dose for Remediation ofContaminated Soil at the Reference Rare Metal Extraction PlantRestricted Land Use
Reference Rare Metal ExtractIon PlatRestrcted Land Use
Resd.ual soi Wib Sol Washing Mect Unp s
Rate Remedlated Dose Total Remedladon Cos (3K Dose Total Remedlaton Cost (SKmrd () (perso-nmM) N Ofslte Dispos (persoma r) No Of sMUl
100 7.000 23 490 23 49060 7.000 23 490 23 49030 7.000 23 490 23 49025 7.000 23 490 23 490iS 7.000 23 490 23 49010 7.000 23 490 23 4903 7.017 31 547 30 503
03 7.043 43 512 41 5230.03 7,074 57 626 S4 547
m702u3 2100 7.000 23 490 23 49060 7.000 23 490 23 49030 7.000 23 490 23 49025 7.000 23 490 23 49015 7,000 23 490 23 49010 7C000 23 490 23 4903 7.000 23 490 23 490
03 7,036 39 573 3S 51S0.03 7.071 Ss 621 53 5s
Lo243
100 7.000 23 490 23 49060 7.0C0 23 490 23 49030 7.000 23 490 23 49025 7.000 23 490 23 49015 7.000 23 490 23 490
10 XO 23 490 23 4903 7.000 23 490 23 490
03 7.025 34 553 33 5090.03 7.0SS 43 59S 46 532
NUREG-1496 C.7-38

Table 7.6.4. Summary of Costs and Occupational Dose for Remediation ofContaminated Soil at the Reference Rare Metal Extraction PlantUnrestricted Land Use, MixinglLandfilling
Reference Rare Metal Extraction PlantUnrestricted Land Use - Mxixng/Landfluing
Residual Soil WVth Soil Washng Direet D_ _ _S2
Zen Volume ToWt Remedlation Cod (SK) otal Remediation Cost (3K)Ratc Ranedaed Dose Dioa Cod PLOf Dose DipslCotOe
(___Ir) _ _ _ Person-==)J 10 5 (personmrC)o 10 (s 3S)
tO0 9.093 13310 5,304 17.919 96,710 1,311 5.231 It,959 104,70060 t,495 1,402 5,57 1t,465 9S,963 1,376 5,493 19,902 tO9,9630 9i041 1.499 5,948 I9.207 102I016 I,¢oS 5.842 21.1t0 116.9632S 9,184 1,52 6,047 19.403 102,S20 1,¢SS 5,935 21,516 ti8181t15 9,SS6 1,597 6,319 19.94t 10S,067 1,5S3 6,.96 22,¢S7 124,015to 9,905 1,654 6,537 20,381 106.952 1,60S 6,399 23,20 12S 1383 lO.t53 1.924 7,1tl 21,670 112.158 1,t58 7,014 25,425 140.404
0.3 12.663 2,148 t,412 24,132 122,292 2,0SI t,1t2 29,665 163.9260.03 14,475 2.472 9232 26.177 132.017 2.345 9,354 33,911 167.269
amn100 7.54S 1,232 4.930 17,177 93.659 1223 4.378 17,683 97.64760 7,949 1_304 5206 17.723 95.906 1,2tS 5,139 1.623 102,4130 1.495 1.402 5.577 13.465 98.963 1.376 5.493 19,902 109.90625 1.639 1.427 5,676 13.661 99.768 1.400 5,5S5 20.23 111.76315 9.041 1.499 5,943 19.207 102,016 1,465 5.842 21.130 116.963t0 9.360 1.556 6,166 19,641 103,302 1.516 6.050 21.927 121.0883 10,307 1.726 6.t09 20,928 109.103 1.670 6,661 24.145 133.341
0.3 12.119 2.050 8.042 23.391 119,243 1.963 7.333 28.389 156,7770.03 13.930 2375 9,278 25.353 129.383 - 2.257 9,001 32.634 130.213
100 7,000 1,134 4¢523 16.398 90,559 1,134 4.523 16.398 90.55960 7,003 1.135 4.559 16.437 90,610 1,135 4,525 t6.407 90,60030 7,548 1.232 4,930 17.177 93.659 1.223 4.871 17.683 97,64725 7.691 1,258 5,023 17,373 94,462 1.246 4.970 1,013 99.50115 3.093 1.330 5,304 17,91t 96,710 1.311 5.231 13.959 104.70010 1.413 1,387 5,519 13,353 98.499 1363 .5.436 19.707 108.,33
3 9,360 1,556 6.166 19,641 103,302 1,516 6.050 21.927 121.08S0.3 11,172 1,381 7,399 22.104 113,944 1.310 7,213 26,172 144,530
0.03 12.983 2,205 1.630 24,565 124.079 2.103 8390 30,413 167.957
C.7-39 9NUPG-1496
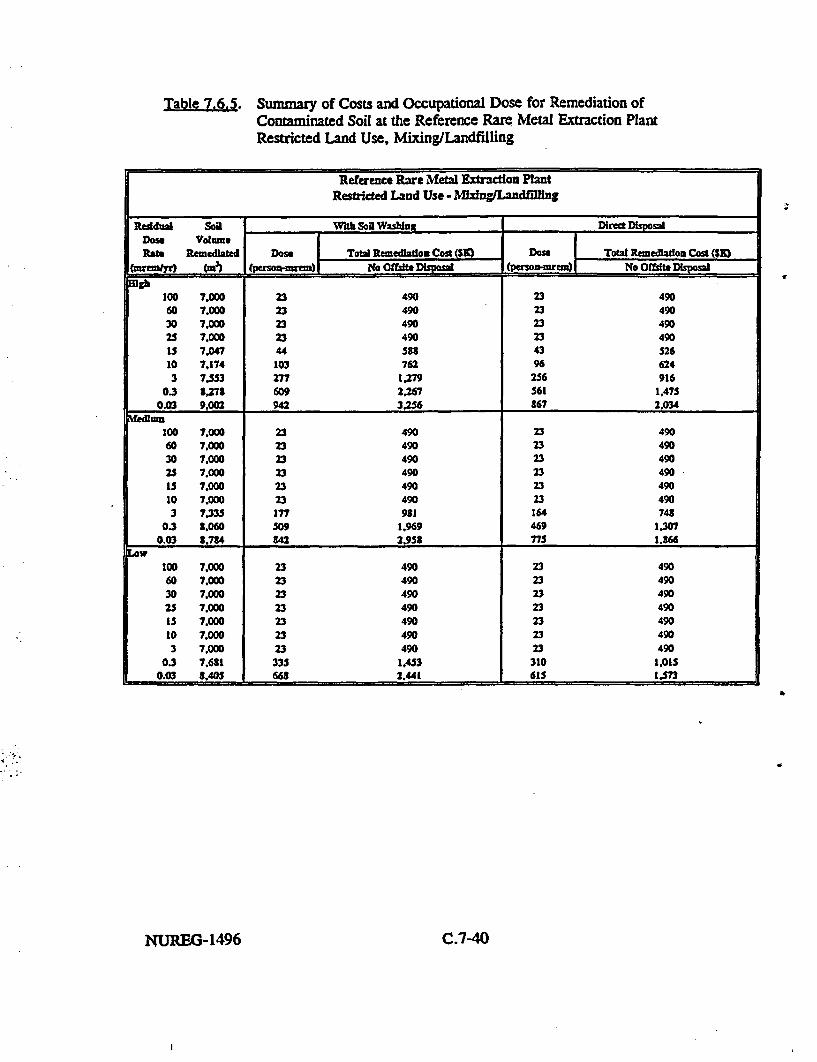
Table 7.6.5. Summary of Costs and Occupational Dose for Remediation ofContaminated Soil at the Reference Rare Metal Extraction PlantRestricted Land Use. Mixing/Landfilling
Refernce Rare Metal Extractlou PlantRestrided Land Use -MIngiLandfilling
Residiul Soil With Soil Wasbias Direct DisposalDose Volume I_Rat Remedlated Dose Total Remedlatlon Cost (SI) Dose Total Remedlado Cst S
() (persoo-zrm) m(e Offale Disposa (pesuwnazruo) NOo lsita ipoa
gh100 7.000 23 490 23 49060 7.000 23 490 23 49030 7.000 23 490 23 49025 7.000 23 490 23 49013 7.047 44 584 43 42610 7.174 103 762 96 6243 7.053 217 1.M 256 916
0.3 ,.273 609 2.267 561 1647S0.03 9.002 942 3.2 867 2.03406edi1m100 7,000 23 490 23 49060 7.000 23 490 23 49030 7.000 23 490 23 49023 7.000 23 490 23 49015 7.000 23 490 23 49010 7.000 23 490 23 4903 7.333 177 931 364 749
03 .060 509 1.969 469 1.3070.03 8.704 942 2.953 775 1.866
LOW100 7.000 23 490 23 49060 7.000 23 490 23 49030 7.000 23 490 23 49025 7.000 23 490 23 49015 7.000 23 490 23 49010 7,000 23 490 23 4903 7.000 23 490 23 490
0.3 7.681 335 1,453 310 1.0130.03 8.403 668 2.441 615 1.573
NUtEG-1496 C.7-40

Table 7.7.1. Summary of Costs and Occupational Dose for Remediation ofContaminated Soil at the Reference Uranium MillUnrestricted Land Use
Reference Uranium MillUnrestricted Land Use
Residual Soll With Sail Waiting DiretDispolDosc ValmneRate Remedlated Dose Total Remeio_ Cost OM Dose Total Rtmediation Cog (SE)
MMlY) (m j(person-aum= No Ole Disposl J(person-mrew) NO O t 1_
100 156,337 27.984 61,977 25.327 37.26260 167.931 30.060 66.533 27.205 40,02630 11.602 322507 71.904 29.420 43,2t425 184,174 33.093 73.190 29.950 44064IS 193.517 34.652 76.613 31.361 46.14110 200,186 35.133 79.206 32.430 47.7133 217.774 3S.982 36.117 35.279 51,
0.3 246.224 44.074 97.296 39.,8S 58.6860.03 271.454 48.590 107,209 43.976 64.700
100 73.423 13.143 29,399 11.895 17,50060 120.681 21.602 47.967 19.550 28.76430 145,476 26.040 57,710 23,567 34,67425 150.603 26,958 39.725 24,398 35.89615 162.976 29,173 64.586 26.402 38.84310 171.631 30.722 67,987 27.804 40,9083 193.587 34.652 76,613 3t.361 46,141
0.3 226.985 40.630 89,736 36.m 54.1010.03 24260 45.512 100.453 41.190 60.602
100 0 0 0 0 060 0 0 0 0 030 0 0 0 0 025 0 0 0 0 015 73,423 13.143 29,399 11,95 17.50010 215.324 20.643 45.163 18.683 27,4873 156.337 27.984 61.977 25.327 37,262
0.3 200.116 35,333 79.206 32.430 47.7130.03 232.023 41,532 91.716 3.5j8 55,302
C.7-41 NUREG-1496

Table 7.7.2. Summary of Costs and Occupational Dose for Remediation ofContaminated Soil at the Reference Uranium MillRestricted Land Use
Reference Uranim MillRestricted Land Use
Resdual Son With Sol Washwng MDrect DbsposalDosn YWumeRats Redlatdi DI Total Remedlatlo, Cost (SK Dose IYTotal Remedlato Cost (SJ4
(zna (persou-mru No OM* RtD af (Pmasoamren) No isk poaL
100 0 0 O60 0 0 0 0 030 0 0 0 0 025 0 0 0 0 015 92.287 16,519 36,811 14.951 21.99610 120,r2Z 21.S74 47.906 19.525 28,7273 158.794 28,424 62.943 25.725 37.843
0.3 201.704 36.105 79.803 32.676 48.0750.03 233.458 41.7S9 92.279 37.820 55.644
ifedlum100 0 0 0 0 060 0 0 0 0 030 0 0 0 0 025 0 0 0 0 015 0 0 0 0 010 0 0 0 0 03 92.287 16,519 36,811 14,9S1 21.996
0.3 173,832 31.116 68.851 28,161 41,4320.03 211.741 37.902 83,746 34.302 50.467
Low100 0 0 0 0 060 0 0 0 0 030 0 0 0 0 02S 0 0 0 0 0IS 0 0 0 0 010 0 0 0 0 03 0 0 0 0 0
0.3 120,525 21.574 47.906 19.525 28,7270.03 181.537 32.49S 71.879 29.409 43.269
NUREG-1496 C.7-42
C.8 Analysis of Groundwater Remediation
In Section 6.2 of Volume 1, it was concluded that, for unrestricted use, the cost-benefit ratiofor soil removal which would result in a dose of 25 mrem/y or less is generally unreasonablyhigh when compared to the range used in NRC's decisionmaking guidance of NUREG/BR-0058 and NUREG-1530 (see Section 6.1 of Volume 1). It was also concluded that site-specific situations can be a factor that permits doses to be reduced below 25 mrem/y usingALARA considerations. Such site-specific considerations are especially necessary whendealing with groundwater contamination. This section considers potential groundwatercontamination situations for NRC licensees (i.e., unlikely, possible, and likely (seeAttachment E to Appendix C for a list of groundwater contamination indicators)), andcorresponding Reference Cases 1, 2, and 3 are developed specifically for these potentialgroundwater contamination scenarios. For each of the reference cases, examples of site-specific situations are considered and analysis performed to estimate cost-benefit ratioincrements in reducing doses from 25 mrem/y to levels approaching background (onlyanalysis of remediation of groundwater to levels at or below 25 mrem/y is considered in thissection based on the results of Section 6.2 of Volume 1). The analysis includes cost-benefitconsideration of impacts for the dose levels associated with maximum contaminate levels inthe National Primary Drinking Water regulations in 40 CFR 141. The analysis presentedbelow illustrates potential ALARA considerations at levels below 25 mrem/y.
C.8.1 Groundwater Remediation Reference Cases
NRC facilities have been divided into the following possible reference cases based on theirlikelihood for significant soil/groundwater contamination (see Attachment E to Appendix Cfor more complete description and discussion):
1. Licensees with little contamination and therefore very low potential forsoil/groundwater contamination - certain sealed source manufacturers, short-livedradionuclide users, and other small licensees with little contamination (e.g., smallresearch reactors)
2. Licensees with low to medium indicators for soil/groundwater contamination -research reactors, certain sealed source manufacturers and broad R&D facilities, somepower reactors, etc.
3. Licensees with medium to high indicators for soil/groundwater contamination - SDMPsites, large uranium/thorium facilities, some power reactors
Based on a broad review of licensees, there are about 6000 NRC licensees in Reference Case1 and about 500-700 NRC licensees in Reference Cases 2 and 3.
The following is an analysis of Reference Cases 1 - 3.-
CQ8 1 NUREG-1496

C.8.1.1 Reference Case 1
Because it is unlikely that these facilities will have any soil contamination or groundwatercontamination, a screening analysis is likely to be sufficient to demonstrate that thesefacilities meet a 25 mrem/y all-pathways TEDE standard and do not have a significant dosecontribution from the drinking water pathway.
Therefore, implementation of ALARA levels below the dose standards is likely to involveminimal effort.
C.8.1.2 Reference Cases 2 and 3
While, generally, Reference Case 3 has a higher potential for groundwater contaminationthan Reference Case 2, they are discussed together in this section because some of the samesteps in considering further remediation would be similar.
Because there is generally some soil contamination at Reference Case 2 sites, but notanticipated current groundwater contamination, specific efforts at characterization ofgroundwater are not necessarily done routinely as part of normal operations ordecommissioning. Reference Case 3 sites have medium/high indicators for subsurface soiland groundwater contamination, and therefore would generally have to do groundwatercharacterization, either as part of their operations or as part of a decommissioning effort.
In situations where lower contamination levels are present, a screening analysis wouldgenerally be done to demonstrate compliance with an all-pathways TEDE dose. In theabsence of any evidence of existing groundwater contamination (see Attachment E toAppendix C), this would be an analysis of prospective future contamination. If screeningshows doses from the site are less than a 25 mrem/y all-pathways TEDE and doses are lowor nonexistent from the drinking water pathway based on groundwater sources, furtherALARA considerations would likely not result in the need for additional remediation toreduce doses from the drinking water pathway. If screening shows the site dose is less thana 25-mrem/y all-pathways TEDE but the dose from the drinking water pathway based ongroundwater sources makes up a large fraction of the all-pathways dose, a licensee mayperform more detailed site-specific evaluation or additional site characterization. Most siteswould be able to show that doses from the groundwater pathway are quite low without theneed for such site characterizations. If these additional analyses show the doses through thedrinking water pathway are low or nonexistent, no remediation would likely be needed.
In those cases where contamination is more extensive, groundwater characterization may bedone. If such characterization shows that groundwater contamination does not exist,licensees would still have to do prospective modeling of future groundwater contaminationbased on the soil contamination present at their site. If this evaluation shows that the sitedose is less than a 25-mrem/y all-pathways TEDE but that the dose through the drinkingwater pathway makes up a large fraction of that dose, the licensee could consider remediation
NUREG-1496 C.8-2

of the site to further reduce the dose to ALARA levels. Possible remediations in such caseswhere there is prospective contamination of the groundwater include soil removal, restrictingfuture water use while supplying replacement water, or source stabilization.
This evaluation of prospective contamination would consider radionuclides in the soil such asCo-60, Cs-137, Sr-90, H-3, thorium, and uranium. Because uranium is the most likelyradionuclide to move through soil to groundwater at a fast enough pace or have a longenough half-life to cause significant groundwater contamination, the scenario described belowconsiders uranium contamination. Similar analyses could be considered for Co-60, Cs-137,Sr-90, H-3, or thorium.
As noted above, a licensee would consider all the site-specific factors involved as part of anALARA analysis before undertaking remediations. For example, Tables 4.5.3 and 4.5.4 ofthe "Draft EIS Decommissioning of the Shieldalloy Metallurgical Corporation, Cambridge,Ohio, Facility," NUREG-1543, July 1996, describe site-specific considerations related toestimating doses from drinking water pathways. For the purposes of this generic analysis, itis conservatively assumed that uranium contamination in soil moves such that groundwatercontamination will occur over time and the resulting drinking water dose is 50% of theTEDE based on the models of NUREG/CR-5512 (NRC 1992), and that this dose occurs bothonsite and offsite. While an ALARA analysis will be highly dependent on site-specificfactors that affect both the transport of contaminants to the aquifer and the availableremediation options, there are two principal remediation methods that could be used ifnecessary: removal of soil and restricting site use. Soil could be removed from onsite toprevent further migration of uranium to groundwater resulting in costs of soil removal. Thecost benefit analysis for soil removal could be approximated by that in Table C.8.1 andwould likely not be cost effective unless the population served by the groundwater resourcewas large enough. Alternatively, there could be restrictions placed onsite and/or offsite.This alternative is discussed further below.
Another potential situation is that the characterization of groundwater may show that there isexisting groundwater contamination and that the dose through drinking water pathway is lessthan a 25 mrem/y all-pathways TEDE but that the dose through the groundwater pathwaymakes up a large fraction of that dose. For these cases, licensees might need to remediatetheir site depending on results of an ALARA analysis. Possible remediations include pumpand treat or restricting water use while providing replacement water. A review of currentlicensees in Attachment E of Appendix C ("Groundwater Contamination Detected at NRCLicensed Facilities") indicates that some sites have existing groundwater contaminated withSr-90, H-3, Tc-99, alpha emitting nuclides, or uranium. Such contamination generally takesplace because of a specific release event rather than a slow release from contaminated soil.Three potential scenarios are considered based on a review of the licensees in Attachment Eto Appendix C for certain materials facilities (Sr-90, Tc-99, alpha emitting nuclides), reactors(H-3), and uranium facilities and include:
C.8-3 NUREG-1496

1. A composite case of a materials facility with Sr-90 groundwater contamination suchthat the dose through the drinking water pathway is 20 mrem/y.
2. A composite case of a reactor with H-3 groundwater contamination at or slightly inexcess of 20,000 pCi/L.
3. A composite case of a uranium facility with uranium groundwater contamination.
An ALARA analysis of these cases would be highly dependent on site-specific factors thataffect both the transport of contaminants to the aquifer and the available remediation options,and a variety of outcomes is possible. The following are potential outcomes based on ageneric analysis of the composite cases:
a. The drinking water dose from groundwater is assumed conservatively to occur bothonsite and offsite.
b. In general, remediation of a site to reduce doses to below 25 mrem/y to meetALARA levels could be accomplished in the following manner:
1) The groundwater below the site could be remediated by pump and treat operationsto reduce the nuclide concentration levels. The incremental costs for pump andtreat are in Column 2 of Tables C.8.2 and C.8.3 for Sr-90 and uraniumcontamination, respectively. Costs and impacts are not analyzed for H-3contamination because groundwater below the site cannot be treated by pump andtreat operations to remove H-3. The benefits of reduced exposure to thecontaminated plume are estimated based on assuming 25 persons would take theirdrinking water from the contaminated plume. The cost-benefit analysis of such asituation is shown in Column 4 of Tables C.8.2 and C.8.3 and would not be cost-effective. This analysis is illustrative and demonstrates that for site-specificsituations where larger populations may exist, a cost-benefit analysis should bedone to indicate whether remediation is cost-effective.
2) There could be restrictions placed on the onsite and/or offsite use of the waterwhich would be applicable to the Sr-90, H-3, or uranium contamination cases.For onsite restrictions, it is assumed there would not be costs for replacementwater because the site could be zoned for industrial use. For offsite restrictions, itis assumed that replacement water supplies would have to be provided; the costbenefit analysis for replacement water assumes that 25 persons would take theirdrinking water from the contaminated plume. It is not assumed that the landwould be purchased as the costs of this are too indeterminate and uncertain for ageneric analysis. The costs of replacement water for 25 persons are shown inTable C.8.4, Column 2, and the cost benefit analysis is shown in Column 4.
NUREG-1496 C.8-4

Table C.8.1
Soil Removal to Control Prospective Uranium ContaminationIncremental Costs and Impacts from 25 mrem/y
Based on Usage by 25 Persons(Incremental Cost-benefit Results in $M/estimated mortality averted)
Dose Reduction Soil removal Soil removal Incremental Cost/benefit Cost/benefit(mrem/y) cost at $10/ft3 cost at $50/ft3 Estimated for $10/ft3 for $50/ft3
burial charge burial charge Morality burial charge($M) ($M)
25-15 7.8 27 0.12 12 38
15-3 13 44 0.15 45 130
3-background- >20 > 70 0.15 110 440
C.8-5 NUREG-1496

Table C.8.2
Strontium-90 Remediation by Pump and TreatIncremental Costs and Impacts from 25 mrem/y
Based on Usage by 25 Persons(Incremental Cost-benefit Results in $M/estimated mortality
averted)
Dose Reduction Incremental Incremental Incremental(mrem/y) cost ($M) estimated cost /benefit
mortality
25-15 . 1.7 0.0055 309
15-3 5.4 0.0116 466
3-background 32 0.0139 2300
w
NUREG- 1496 C.8-6

Table C.8.3
Uranium Remediation by Pump and TreatIncremental Costs and Impacts from 25 mrem/y
Based on Usage by 25 Persons(Incremental Cost-benefit Results in $M/estimated mortality
averted)
Dose Reduction Incremental Incremental Incremental(mrem/y) cost ($M) estimated cost /benefit
mortality
25-15 17 0.13 131
15-3 124 0.26 477
3-background 306 0.31 987
C.8-7 NUREG-1496

Table C.8.4
Remediation by Restricting Use & Providing ReplacementWater for a Strontium-90 and Uranium Site
Incremental Costs and Impacts from 25 mrem/yBased on Usage by 25 Persons
(Incremental Cost-benefit Results in $M/estimated mortality averted)
Dose Reduction Incremental Incremental Incremental(mrem/y) cost ($M) estimated cost/benefit
mortality
Sr-90 site: 25 3.3 0.0139 250mrem/y -
background
Uranium site: 25 11 0.31 36mrem/y -
background
NUREG-1496 C.8-8

C.9 References
Abel, K. H., D. E. Robertson, C. W. Thomas, E. A. Lepel, J. C. Evans, W. V. Thomas,L. C. Carrick, and M. W. Leale. 1986. Residual Radionuclide Contamination Within andAround Commercial Nuclear Power Plants. NUREGICR4289, U.S. Nuclear RegulatoryCommission, Washington, D.C.
Angus, M. J., S. R. Hunter, and J. Ketchen. 1990. 'Classification of Contaminated andNeutron-Activated Concretes from Nuclear Facilities Prior to their Decontamination orDecommissioning," pp. 229 to 234, Waste Management '90 Vol. 2- High Level Waste andLow Level Waste Technology. American Nuclear Society, LaGrange Park, Illinois.
Babcock and Wilcox. 1992a. 'Technical Progress Report, Apollo, Pennsylvania NuclearFuel Facility D&D Project. Quarterly Progress Report for the Period 1/1/92 - 3/31/92,"DOE/EW/40017-T2, June 8, 1992.
Babcock and Wilcox. 1992b. "Technical Progress Report, Apollo, Pennsylvania NuclearFuel Facility D&D Project. Quarterly Progress Report for the Period 4/1/92 - 6/30/92,"DOE/EW/40017-T3, August 25, 1992.
Brengle, R. G. 1979. "The Decontamination of Concrete," in proceedings of an AmericanNuclear Society Topical Meeting Decontamination and Decommissioning of NuclearFacilities, M. M. Osterhout, Editor, pp. 451-455, Sun Valley, Idaho, September 16-20,1979, Plenum Press, New York, New York.
Dennis, R., D. Dworkin, and W. Lowe. 1992. Evaluation of Commercially Available SoilWashing Processes for Site Remediation, HMC, May/June 1992, pp 47-57.
DOE. 1990. Final Remedial Investigation/Feasibility Study--Environmental Assessment forthe Monticello. Utah. Uranium Mill Tailings Site, Volume 1 Remedial Investigation,DOE/EA-0424, U.S. Department of Energy Surplus Facilities Management Program byUNC Geotech, Grand Junction, Colorado, January 1990.
DOE. 1992. Remedial Investigation and Feasibility Study: Operable Unit 3 Work PlantAddendum. Revision 2. Draft Final, Volume 1 of 2, Sections 1-8, Appendices A, B, and C,Fernald Environmental Management Project, U.S. Department of Energy Fernald FieldOffice, Fernald, Ohio.
DOE. 1994a. Letter from Andrew Wallo, U.S. Department of Energy, to Dr. Anthony B.Wolbarst, U.S. Environmental Protection Agency, February 24, 1994.
-C.9-1 NUREG-1496

DOE. 1994b. Monticello Mill Tailings Site Environmental Report for Calendar Year 1993,DOEIID/12584-171, U.S. Department of Energy Grand Junction Project Office, GrandJunction, CO. May 1994.
Elder, H. K. 1981. Technology. Safety and Costs of Decommissioning a ReferenceUranium Hexafluoride Conversion Plant, NUREGICR-1757, U.S. Nuclear RegulatoryCommission, Washington, D.C.
Elder, H. K. and D. E. Blahnik. 1980a. Technology. Safety and Costs of Decommissioninga Reference Uranium Fuel Fabrication Plant, NUREG/CR-1266, Vol. 1 Main Report, U.S. XNuclear Regulatory Commission, Washington, D.C.
Elder, H. K. and D. E. Blahnik. 1980b. Technology. Safety and Costs of Decommissioninga Reference Uranium Fuel Fabrication Plant, NUREG/CR-1266, Vol. 2 Appendices, U.S.Nuclear Regulatory Commission, Washington, D.C.
ENVEST. 1991. RACER Remedial Action Cost Engineering and Requirements System-ENVEST Environmental Cost Engineering. United States Air Force EnvironmentalRestoration Program. Tyndall AFB, Florida.
EPA. 1990. "Superfund Record of Decision: Monticello Mill Tailings (DOE), UT",EPA/ROD/R08-90/034, August, 1990.
Gerber, M., H. Freeman, E. Baker, and W. Riemath. 1991. Soil Washing: A PreliminaryAssessment of its Applicability to Hanford, PNL-7787, Battelle Pacific Northwest Laboratoryfor the U.S. Department of Energy.
Haase, A. E., R. S. Kingsley, L. P. Williams, and R. V. Carlson. 1992.'Decommissioning of B&W's Fuel Conversion Plant." pp. 717-721, Waste Management '92Vol. 1- Technology and Programs for Radioactive Waste Management and EnvironmentalRestoration, American Nuclear Society, LaGrange Park, Illinois.
Irving, B. A. 1980. "Three Mile Island Concrete Decontamination Experience."Proceedings of a Concrete Decontamination Workshop, Seattle, Washington, May 28-29,1980. pp. 169-178. CONF-800542, PNL-SA-8855, Pacific Northwest Laboratory,Richland, Washington.
Kennedy, W. E., Jr. and D. L. Strenge. 1992. Residual Radioactive Contamination FromDecommissioning, NUREG/CR-5512, Vol. 1, U.S. Nuclear Regulatory Commission,Washington, D.C.
Kingsley, R.S., 'Apollo Decommissioning Project, Decommissioning an LEU/HEU FuelFabrication Complex," Presentation to National Academy of Sciences, National ResearchCouncil, June 15-16, 1994.
NUREG-1496 C.9-2

Konzek, G. J., J. D. Ludwick, W. E. Kennedy, and R. I. Smith. 1982a. Technology.Safety and Costs of Decommissioning Reference Nuclear Research and Test Reactors. MainRport, NUREG/CR-1756, Vol. 1, U.S. Nuclear Regulatory Washingtonj DC.
Konzek, G. J., J. D. Ludwick, W. E. Kennedy, and R. I. Smith. 1982b. Technology.Safety and Costs of Decommissioning Reference Nuclear Research and Test Reactors.Appendices, NUREG/CR-1756, Vol. 2, U.S. Nuclear Regulatory Washington, DC.
Konzek, G.J. and R. I. Smith. 1990. Technology. Safety, and Costs of Decommissioning aReference Boiling Water Reactor Power Station - Comparison of Two Decommissioning CostEstimates Developed for the Same Commercial Nuclear Reactor Power Station.NUREG/CR-0672, Addendum 4. U.S. Nuclear Regulatory Commission, Washington, D.C.
Konzek, G. J., R. I. Smith, M. C. Bierschbach, and P. N. McDuffie. 1995. RevisedAnalyses of Decommissioning for the Reference Pressurized Water Reactor Power Station,NUREG/CR-5884, Vol. 1, U.S. Nuclear Regulatory Commission, Washington, DC.
Martin, K. L. 1985. "Radiological Survey of Molybdenum Corporation of America,Washington, Pennsylvania," Preliminary Report for U.S. NRC Region I Office, Oak RidgeAssociated Universities.
Means. 1993. Means Building Construction Cost Data. Kingston, Massachusetts.
Murphy, E. S. 1981. Technology. Safety and Costs of Decommissioning Reference Non-Fuel-Cycle Nuclear Facilities, NUREG/CR-1754, U.S. Nuclear Regulatory Commission,Washington, D.C.
NRC. 1980a. Final Generic Environmental Impact Statement on Uranium Milling,NUREG-0706 Volume I, U.S. Nuclear Regulatory Commission, Washington, D.C.
NRC. 1980b. Final Generic Environmental Impact Statement on Uranium Milling,NUREG-0706, Volume m, U.S. Nuclear Regulatory Commission, Washington, D.C.
NRC. 1992. Residual Radioactive Contamination From Decommissioning. Technical Basisfor Translating Contamination Levels to Annual Total Effective Dose Equivalent, FinalReport, NUREG/CR-5512, Vol.1. Battelle Memorial Institute, Pacific Northwest Laboratory.
NRC. 1993. Site Decommissioning Management Plan, NUREG-1444, U.S. NuclearRegulatory Commission, Washington, D.C.
NRC. 1994. Generic Environmental Impact Statement in Support of Rulemaking onRadiological Criteria for Decommissioning of- NRC-Licensed Nuclear Facilities. NUREG-1496, Volume 2, Draft GEIS Report for Comment, U.S. Nuclear Regulatory Commission,Washington, D.C.
.C.9-3 NUREG-1496

NRC. 1997. Memorandum from Carl Feldman, U.S. Nuclear Regulatory Commission, toFile, Information Given to PNNL by NRC in Support of PNNL Modeling for FGEIS, March1997. Placed in NRC Public Document Room under the proposed nrle Federal RegisterCitation reference 59 FR 43228; August 22, 1994.
Nuclear Waste News, March 25, 1993; p. 117
Oak, H.D., et.al. 1980. Technology. Safetl. and Costs of Decommissioning a ReferenceBoiling Water Reactor Power Station. NUREG/CR-0672, Vol. 2 Appendices. U.S. NuclearRegulatory Commission, Washington, D.C.
Robertson, D. E., et al. 1989. Below Regulatorv Concern Owners Group: RadionuclidesCharacterization of Potential BRC Waste Types from Nuclear Power Stations. EPRI NP-5677, Project B101-15 Final Report March 1989 by Pacific Northwest Laboratory, ElectricPower Research Institute, Palo Alto, California.
Robertson, D. E., C. W. Thomas, N. L. Wynhoff, and D. C. Hetzer. 1991. RadionuclideCharacterization of Reactor Decommissioning Wastes and Spent Fuel Assembly Hardware,NUREG/CR-5343, U.S. Nuclear Regulatory Commission, Washington, D.C.
Robertson, D.E. 1996. "Evaluation of the Residual Radionuclide Source Term at theTrojan Nuclear Power Plant at the Start of Decommissioning (1994)." Letter from StevenM. Short (Pacific Northwest National Laboratory) to Dr. Carl Feldman (U.S. NuclearRegulatory Commission).
SEG. 1992. Scientific Ecology Group Oualifications for Soil Washing Services, ScientificEcology Group, Pittsburgh, Pennsylvania.
Short, S. M. 1989. Technology. Safety and Costs of Decommissioning Reference Non-Fuel-Cycle Nuclear Facilities, NUREG/CR-1754, Addendum 1, U.S. Nuclear RegulatoryCommission, Washington, D.C.
Smith, R. I., G. J. Konzek, and W. E. Kennedy, Jr. 1978. Technology. Safety and Costsof Decommissioning a Reference Pressurized Water Reactor Power Station, NUREQ/CR-0130, Vol. 1 & 2, U.S. Nuclear Regulatory Washington, DC.
Tichlier, J., K. Lucadmao, and K. Doty. 1995. Radioactive Materials Released fromNuclear Power Plants. NUREG/CR-2907. U.S. Nuclear Regulatory Commission,Washington, D.C.
Westinghouse Hanford Company. 1989. Shipgingport Station Decommissioning Project -Contaminated Concrete Removal Topical Report, DOE/SSDP-0047, Westinghouse HanfordCompany, Richland, Washington.
NUREG-1496 C.9-4

Yasunaka, H., M. Shibamoto, T. Sukegawa, T. Yamate, and M. Tanaka. 1987."Microwave Decontaminator for Concrete Surface Decontamination in JPDR,"CONF-871018, Decommissioning. Vol. 2, pp. IV.109-IV.116, G.A. Tarcza, Editor,Proceedings of the 1987 International Symposium, Pittsburgh, PA.
C.9-5 NUREG-1496
ATTACHMENT A
CALCULATED DOSE FACTORS FOR THREE LAND-USE SCENARIOS
C.A-1 NUREG-1496

CALCULATED DOSE CONVERSION FACTORS
Table A-1 Building Occupancy Scenario
Dow Conversion Factor YearRadionuclide (mremly) per (dpmIlO0 cm) I Analyzed Controlling Pathway
'co 2.89E-3 e xternal (-91%)
"Sr 1.51E-3 1 ingestion (-84%)
ITS l.1lE-3 1 external (-59%)
Wh 2.63E-2 I inhalation (M 2n -67%,9h -14%)
U nat 1.61E-2 I inhalation (9J -69%).__ __I_ ingestion (9.1 -14%,291 -12%)
Table A-2 Unrestricted Land Use Scenario
Dose Conversion Factor
Radionuclide I (mrcm/y) per (pCitgx)
'Co 5.0562
'sr |1.3183
'"ts 1.4027
__b 1.754
U nat 0.76453
Table A-3 Restricted Land Use Scenario
Dose Conversion FactorRadionudide I- (Mem/y) per (pCi/gm)
'To 0.368
'sr 0.0015
"ts 0.0869
2"Ib 0.076
U nat 0.0254
NUREG-1496 C.A-2
ATTACHMENT B
DOSE RATE SPREADSHEETS FOR CONTAMINATED SOILS
C.B-1 NUREG-1496

ATTACHMENT B
DOSE RATE SPREADSHEETS FOR CONTAMINATED SOILS
This attachment provides the underlying data from which the dose rates versus depthof contamination in soil figures in Section 5 were generated. Section 5 provides adescription of the 'real world" models used to generate the tables in this attachment. TablesB. 1 and B.2 provide spreadsheets, for the unrestricted and restricted land-use scenarios,respectively, showing dose rate (and contaminant concentration) versus depth into the soilcolumn for the "real world" (OCo and 1'"Cs models discussed in Section 5.1. The profiles inthese tables represent the scenario in which the reference facility is assumed to bedecommissioned soon after permanent shutdown. Tables B.3 and B.4 represent the same setof scenarios with the exception that the reference facility is assumed to be decommissionedafter a 50-year SAFSTOR period.
The "real world" model for predicting the distribution of uranium in soil is providedin Table B.5 for both the unrestricted and restricted land-use scenarios. This distribution isbased on the "real world' model for uranium discussed in Section 5.2. Correspondingly,Table B.6 provides the spreadsheet for the distribution of thorium contamination in the soilcolumn for both the unrestricted and restricted land-use scenarios. The "real world" modelfor thorium from which this model was generated is discussed in Section 5.3.
NUREG-1496 C.132

. t . .
t..
Table B . Calculated Residual Radiation Dose Rates as a Function of Soil Depth Removed,(Unrestricted Land Use, Real World Model for Cobalt-60 and Cesium-137)
Co-60 Dose Rate, nwemly Cs-I 37 DO5e Rate, mrremwy-
tuf uam Cam.tm.Jiaw....4"I 1-t1_ i amrsonpc~lSoil DEpth
1 5.22E!02 1.44t%22 3.06P,+02 3M. 013 I.3IE102 5.41E 014 1.09M02 33311015 6.77101 Z131E4016 4.341101 1.40El017 Z921101 9.611+00e 2.0701 4.92E4009 1." 610 5.25E+10l0 .ME401 4.11140011 I .051E+01 3.47E 0012 9.101400 zne14013 3.134e00 2.62E4014 7.40E0 2.35E40015 6.1O400 Z13E1416 63214 5.f9540017 WE.91100 1.798100I3 5.55140 .65140019 5.171+00 5.52110020 4.114e00 1.40M0021 4.551400 1.30E 0022 4.27140 1.2011+0023 4.01110 1.11E40024 3.7711400 1.03E40025 3.541400 9.5514526 3.331E00 3.3514I27 3.13E1400 .2014121 2 4"4 7.56014129 2.761100 7.0491130 2.591100 6.52140131 2441 00 6.01OE4032 2.291100 .6014O
z 33 Lt51400 5.91144 34 .021400 4.31104135 1.90E400 4.46EOI36 1.791100 4.13E1O37 I.61E100 3.311143t 1.53140 3.55311
'. 39 1.411400 3.29110140 139E100 3.04014
0I C
234S673910It12'314i55617I3392021222324.252627212930353233343536
37
39
Sufac. CcfNIM6". Lqw. P0J2 30 60
131E1OI 1.971102 3.94E402.59E400 1.291402 2.5t1402
5.91E400 .D07140 1 .771024.32+100 6.411401 5.301+023.3414E00 5.021.05 l.OOE022.73400 4.101401 3.1911402.33E400 3.501140 6.991012.051100 3.01E401 6.161+101.35e400 2.711401 5.6E14011.701E00 .54E401 5.09E1401.57110O Z35E401 4.71E1401.46E400 2.191401 4.3tE3101.36E100 2.0411+01 4.09F.4011.2t11100 I.91V4+01 314011.2011+00 1.791401 3.59I4Oi1.12E400 1.61tE01 3.3E1O0I.OE500 1.51EO1I 3.16E+019.39R01 4 .41101 2.97E1419.1011 1.39"401 2.79E4051.73E1O 1.31B401 Z621E14*.21101 1.231E401 2.46E1407.7114501 5.51dE01 2.31E+107.25141 1.091401 2.171E016.tlE451 3.02401 2.04WE1O6.40E-01 9.60E400 1.92EO146.01E41 9.02E1400 5.3E4015.6E141 3.43400 1.7011O05.31E-01 7.971400 1.5914014.99E41 7.491E00 5.501E404.691451 7.04E+00 1.41EO1I4.41141 6.611400 1.3281fil4.14t145 6.21E400 1.24EO103.39101 5.34140O 1.171+013.661101 5.491!+00 1.1011403.441145 5.16E400 5.03E101323111 4.341100 9.69RE003.03U1 4.551100 9.102102.35E401 4.21400 t.55E1002.6141" 4.02E1400 3.041002.52E01 3.7 t400 7.551E00
5210
1.611140 3.07E100 3.2364011.071400 5.361400 2.541405I7.45E401 3.721400 1.4911015.44E14 2.72E100 3.0911e04.311E451 9100 O .36114003.37E1 45 .63400 6.74E1OO2.32141 1.411400 5.651.t02.44E141 1.221140 4.39E4OO21614 5.011o1400 4.3214001.94E41 9.71E141 3.111-O01.76E100 3.32141 3.538tO01.61141 8.07E141 3.23E400I.43145 7.42E401 2.9714001.372!-01 6.t4E41 273E4001.26E141 6.31E451 153E141.171141 5.34E141 2.341400I.03e14 5.401E41 2.16E5Ol.OE401 5.0010 2.001*ot9.271102 4.63E451 1.5R14001.53142 4.29P.41 1.7214007.95E42 3.9tE401 1.59je.n7.371142 3.63141 1.47F14006.t3F.42 3.41E-01 1.37E1006.3212 3.16.165 1.26ni0O5.361102 2.93P4 1.17E"O05.43E142 2.721-45 5.0910oo5.03E 02 2.52E114 OI 3.Oe04.66E142 2.33E OI 9.3211414.32E142 2.16E41 3.64E414.00E-02 2.00E1451 8.001413.71E-02 5.351E01 7.4211413.44E42 1.724.01 6.37013.31tE42 1.591141 6.3711012951142 1.47-01 5.490F.012.73E42 1371145 3.47F1.0O23142 I.2M741 5.07E412.35102 - 1.17E41 4.69B4012157E02 5.091141 4.35E1412.02E142 I.OIE41 4.03E141I.37E42 9J4E142 3.731143
I

Table B. 1. Calculated Residual Radiation Dose Rates as a Function of Soil Depth Removed,.. (Unrestricted Land Use, Real World Model for Cobalt-60 and Cesium- 137) (continued)
Co-6O Dose Rate, =ll y Cs-1 37 Dose Raft, nuemy
Ah _ .i
POaam~lAa pciI 0So Depath
41 133+OO 2.3224142 1.23Et00 2.61E4143 1.16E+00 2.42E24144 3.092*0 2.24t145 3.022+00 2.0324346 9.9g43 1.93E24147 9.02E40 1.79E2OI41 3.47E4OI I.6SE0I49 7.96E41 1.53E4150 7.48240 1.4224I51 7.03E41 1.32EI52 6.613-01 1.22E20153 6.21641 1.1334154 5.3E34 O .OSE OI55 5.48140 9.7E-0256 5.1 5241 3.99E40257 4.UE441 3.3324t51 4.55E41 7.7224259 4.28241 7.1SE260 4.02E01 6.6324261 173243 6.14E262 3 SSE41 5.6924263 3.33E41 5.2714264 3.1341 4.j9E26S 2 19441 4.53E40266 2.77E41 4.192467 2.60E01 33A95268 2.44241 3.24269 2.30E 0 3.34E4270 2.16£41 3.0WE4271 2.03E01 2.37PA272 1.91E01 2.66-0273 1.79240 2.4624274 I.6UE41 2.2204275 1 .52EO1 2.31IE0276 1.49E 01 1.96E40277 1.40641 I.IIE0271 1.31W1 1.63£-0279 1.23E201 1.56E42o 1.16E-41 1.44E42
AYUSn
4041424344454647484950SO
525354SS565751596061626364656667616970717273747576777879
SWfN COWA4604606on LveL PCi/i
2 30 60Lsg d b12.37E-3 3.552*0 7.10E+202.22243 3.34E200 6.672+002.09E01 3.132*00 6.272+*01.96E41 2.95E400 5.592+003.35E41 2.772400 5.542+001.73EOI 2.60E+00 5.20E+001.63241 2.442*00 4.Y924001.53E301 2.302400 4.592*001.44E301 2.162t00 4.3224001.35E41 2.032*00 4.06E4CO1.27E431 I93E400 3.813+001.19E201 1.79E*00 3.5E2+001.122 OI 1.6300 3.317E+001.05E41 1.581400 3.16E+009.91E02 1.49E 00 2.97E2009.31242 1.402*00 2.79E+00
.75242 1.311400 2.63E+00322242 1.232*00 2.47E+007.73242 1.16E+00 2.322+007.26242 1.092*00 2.1324006.3222 132200 2.052+006.41 202 9.622301 1.922+006.03202 9.04L43 3.3lztOO5.66E202 3.0E401 1.702400S.3242 7.982-01 1.60+005.00242 7.50203 3.S0+004.70242 7.0se201 3.41E2004.42242 6.63E43 O .332+004.13542 6.23241 1.25E4003.90E22 5.Y524I 1.172+003.66242 .SOE41 1.102+003.44E 02 .17E201 1.0324003.24242 4.3524 9.721-O13.04242 4.56E41 9.122432Y62402 4.29E401 3.S7E412.69E202 4.032401 3.0641OI2.52E-02 3.792401 7.57C412.37402 3.5624-3 7.11EO242.23E402 3.34E41 6.69E432.09E42 3.14E-01 6.2ue-o
- &Wraw coa�on Iwd. pcitjt --I
Law1.73E421.6024021.491W21.3142
1.13 02I.IOE0223.03249.402433.712433.074-037.45E236.934-036.422435.95E435.52E435.11E434.732034.39E4034.06E433.77243.4924033.23E2433.001432.7YE43Z572E03
2.33E403Z21E -032.05E403I.90E2031.76E2031.63E2031.51E4031.40E-031.30E2031.202403I.1E-031.03E2039.55E-04Y.YSE504
3 20
8.652428.022427.43U426.34E426.38E425.912425.424025.0724024.70E4024-3624224.04E4023.74Er023.4724023.21E422.98E422.7624022.562402
2.37E2022. 39422.03E42
1.74E-021.62e42I.5OE421.3924021.29E421.29E402M.1E-021.0212429.48E43879243Y.14E437.55E436.99R.036.480436.OOE435.56E413S.15E434.78E434.43E.03
20
3.46E2OI3.21E412.97I4
2.552432.36E412.19E412.031413.8324301.7424303.6124e1.50E411.39E2031.232411.19L OI1
1.02E4019.47E42Y.77E42
73111"07.S132426.932426.47F.425.99E42S.55L425.152424.77E424.422.024.09E 023.79E423.51E423.26E 023.021422.802422.59E422.40E-022.22E422.06C 021.9312021.77RE.
p.

t 0 t
Table B.1. Calculated Residual Radiation Dose Rates as a Function of Soil Depth Removed,(Unrestricted Land Use, Real World Model for Cobalt-60 and Cesium-1371 (continued)
CofontruOt.P cSoil Deph-
tl I.O9141 1.3414212 1.021A4 1.24E10213 962E02 1.1 3142t4 9.04W2 1.06E02Is 3.49E42 9.1504336 7.93102 9.1314387 7.30112 t.46e0331 7.01142 7.340319. 6.21402 7.26490 6.224 6.731-0391 5.13502 6.24e0392 530142 3.7E10393 5.96142 336143' ̂4 4.31.902 4.9614395 4.6E142 4.6014396 4.29E42 4.26E 397 4.03142 3E.14393 3.73142 36399 3.36E102 3.39E-03100 3.34142 3.14M101 3.14M2 .91B43102 2.91E02 2.71E03103 2.77142 130013104 2.61E02 132143105 2.41142 2.13E43206 2.30-02 2.991403107 2.16E02 I.34E4310 .03E102 I.71143109 1.911-02 1.531403110 1.79E42 1.478-03111 1.69E12 136143112 2.31102 1.26103113 1.49E42 I.0E103
;3114 1..02 I.OtEJ03t15 1.314-02 1.00403
116 1.24E-02 9.2t144-112 1.16E 02 t.59ge44
its ll.0912 7.96104119 1.03E-2 7.33E04120 9.64E103 6.4E44
I cmLay-
10t3t2
.3314is3697is
3990999293949396979199
100101102103104105106107M01
309110III112113114Its
.. 116116li7
119
Co.60 Dose Rate, nremly
swfac Coetuuq Levl, pCiIs2 30 60
Lo4 No Wz9.97E-2 2Z.9E41 5.901412.35142 2.7714-1 5.5E511.74Pe02 2.611401 5.2141W1.63142 2.4SE31 4.901411.533102 2.30E-01 4.601401.441e2 2.161101 4.334141.3612 103141 4.07"142.27142 I.9S114 3.32E11.20E42 1.30141 3.5914O1.12142 1.69s14 3371411.061-02 1.94 3.117E149.93e-03 1.49E014 2.93149.33143 1.40141 2.30e 01s.7743 3214-01 2.631E43.245.J3 1.241-01 2.4714107.74E43 1.216E1 2.32E417.2tE43 1.091E49 2.13016.34143 1.03141 10SE3146.43E03 9.64E102 1.931496.041403 9.06142 2.391495.67e43 3.2SIE42 1.701493J3E34 3.00o42 1.6014OI5.019403 7.521c-2 .35014I4.71E403 7.06142 1.41E414.43E103 6.6412 1.331-14.16143 6.24E42 1.2514983.99143 S.36E42 1.17E143.67403 5.31142 9.101413.45143 .31t42 IA.41I3.245-03 4.t6e42 9.731023.05E103 4s7e502 9.14122zt6w43 4.30E12 3.39122.691w 4.04E42 1107E422.53143 3.79142 7.59E422.3t143 3361E42 7.1331422.23143 335E402 6.01E022.10143 3.2314-2 6.301422.974 2.96E-2 5.92142L.3SE43 2.7M502 3.56542L.74e43 Z61E42 5.22E 02
Cs-I 37 Ddse Rate. mremJv
S_ ' .S Co'amihuim Level. pCVZtI ' 20
Lem Mu h8.20404 4.10543 1.6414027.604-04 3.10E43 1.321427.041E4 3.52143 1.41E4026.53144 3.261403 131E2026.0314 3.021 03 1.21M-025.601-04 2.30103 1.122145.29144 2.60143 2.0414024.314 04 2.40143 9.621434.46144 2.23143 L9lE2 14.139-04 2.06143 8.26143.3E304 1.99143 7.651.u3.55E14 1.77143 7.091433.21-04 1.64143 6.57E433041344 9.32543 6.091432321404 1.41543 3.64143Z61E44 1314 03 3.23E-032.42144 1.21E43 4.14E432.24E44 1.122103 4.4991432.0344 1.041E03 4.JME-31.93144 9.63144 3.35543L79E 4 1935 4 3.571031.65E104 1271404 3.iE343
.53E104 7.66E04 3.07-031.42144 7.10E44 2.3411431.32E54 6.3tE04 2.6314031.22E104 6.101404 2.444-03I.23544 .63504 2.26E.031.05E404 3.23e44 2.091039.70E45 4.35E 04 1.94E43.99103 4.49E44 9.mE-3
133145 4.16144 1.6714037.72145 3.36E404 1.541437.15145 3.5114 1.43W436.63145 3.31E-04 1.3315036.14E05 3.07144 1.23E433.69E45 2.6411E04 1.14E4035.27E.05 2.64144 1.054 034OE345 2.44504 9.77F.444.53315 2.26E504 9.05E444.19145 ZI-044 3.39E-04

z
eU
Table B.2. Calculated Residual Radiation Dose Rates as a Function of Soil Depth Removed,(Restricted Land Use, Real World Model for Cobalt-60 and Cesium-137)
Co-60 Dose Rate, nucmay CsAl 37 Dose Rate, nuemry
Conc"AfA60A. A~lkSoil Dqeh
1 5.222402 1.432+022 3.06E202 3.392+.03 I.IIE+02 S.411#014 1.09E402 35.E+015 6.774+01 2.1314016 4.342+01 1.40E*O07 2.92E+01 9.611+008 2.071+01 6.92E2009 1.56E+01 5.25+40010 1.251+01 4.181400II 1.051E01 3.471+0012 9.101400 2.91+40013 3.131400 2.62E+0014 7.40E+00 2.35E4002 5 6.SIE400 2.13+400
r 16 6.32E!00 1.95240017 5.19E+00 1.791+00I1 5.51E100 1.65E40019 5.172E00 I.521E4020 4.35E+00 1.40E+0021 4.552400 1.30240022 4.27Et00 1.202+0023 4.014OO 1.112+40024 3.771+00 1.03E40025 3.54E400 9.55E1E026 3.33E400 L85.E0127 3.131+00 L202.I28 2.94E100 7.60E.0129 2.76E400 7.04E-OI30 2.92t00 6.52EO1I31 2.44E+00 6.05PA132 2.292+00 5.602.0133 2.15E+00 5.19E40134 2.021E00 4.31141O35 1.90E200 4.46E4136 1.79E200 4.13E2OI37 1.63E400 3.83E O138 1.582E00 3.5514039 I.42E400 3.29E-OI40 1.39E+00 3.04242
I1cmlemye
0
23456739to2222314i516178329
202122232425262172829303213233343536373939
Surfa*c onuaminatlo LoudI. Peilg2 30 60
9.56E-01 1.432401 2.87E+206.25E-01 9.37E+00 1.372+404.30E201 6.46E400 1.29+4013.14E-01 4.71E+00 9.43Et002.43& 01 3.654+00 7.30E+001.99E40 2.98E+00 5.96E2001.70E201 2.54E+00 5.0914001.50E-01 2.24E+00 4.49E+Oo1.35E-01 2.02E+0O 4.05E+001.23E41 1.35E+00 3.70E+001.14E201 1.71E400 3.42E+OO1.06E41 1.592400 3.19E+009.92E42 1.49E400 2.98E4009.22E42 1.39t400 2.7924003.70242 1.31E+00 2.61Et003.17E42 1.222+00 2.452400
7.67E42 I.ISE200 2.3011*07.20E42 I.082+00 2.1614006.77E42 2.02+200 2.03+4006.36E42 9.53E201 1.91E4005.97E42 8.96E41 1.79E+005.61122 3.42E41 1.682t005.27E42 7.91E224 1.53E+004.96E42 7.43E41 1.49t4004.66E42 6.98E-01 .40E4004.38402 6.5C641 1.3124004. 1E242 6.17E41 1.23+4003.86E42 5.801401 1.16E+OO3.63E42 5.45E41 1.0924003.41E02 5.12E-01 1.0224003.21E42 4.31242 9.62E2OI3.01E-02 4.52E201 9.042412.83E02 4.25E.02 .49242.2.66E42 3.99E-01 7.98E2422.50E42 3.75241 7.50E2422.35E-02 3.52241 7.052412.21E02 3.31E.0 6.62E-I2.08342 3.11E401 6.23E411.95242 2.93E-01 5.8524E21.83E302 2.75E-01 5.50E1OI
!surface COAn Tamni aj n Laval m .i~r�-
9.99E2026.642E424.61E423.37E2Ol2.59E422.09E421.75E 021.51E2421.34E 021.20E421.09E202
9.19E-033.47E243
7.82E 037.232436.69E-036.20E435.74£43532E4034.93E 34.56£434.23e433.924033.63E 033362.033.12E-032.89E-032.68E4032.48E2032.30E4032.13E431.97E-03
1.69E-031.57E4031.45F,031.354031.25E2O31.16E-03
Msd5.002423.32&-012.311,011.684011.29E411.04EI8.75E4127.57E2026.69E426.02E4025.46E-025.00E-024.60E2024.23E-023.91E-023.62E4023.35E2423.10E-022.87E-022.662422.462E022.23E2Ol
2.122E02
1.96-021.82E 02
1.56E 021.44E 021.34E-021.2424021.152421.06E2029.86E439.142.03Y.47E-037.84E437.27E-036.74E.036.241.035.78E.0
20
Ukh2.00E4001.3324009.22E2016.714-015.28241I4.17E-OI3.50E4013.03E2OI2.6t1E-O2.41E-OI2.19E2OI2.00E O11.844101.69E OI11.56E-OI1.45E101.34F-OI1.24E 011.15E1OI1.06Fe419.85E-029.1 323.468 02
7.83327.26E4026.73F,026.23E 025.77E-025.35E 024.96"224.59E-024.26E-023.94E4023.65E-023.39E-023.14E-022.91E-022.69E-022.50F.022.31H-02
r IL

. i0 " C a I '4r
Table B.2. Calculated Residual Radiatibn Dose Rates as a Function of Soil Depth Removed,(Restricted Land Use, Real World Model for Cobalt-60 and Cesium-137) (continued)
Son DTpfh
4! 131E400 2.325I42 1.231400 2.61W1I43 1.165#0 2.42E144 1.0+00 22454345 1.02E500 2OIE-0146 9.5101 1.9310!47 9.02101 1.79E4141 3471 0 .655-0149 7.96501 1.53-0150 7.41"0 1.425-01SI 7.03r01 132 I0152 6.615F03 1.22E-0153 6.21WP1 1.13101S 4 J.t3"E4 1 I5E.OI
w 55 5.4tt1 9.70EM0256 5.155I-1 . 95257 O4H1 *3JS3 4.SSE1 7.720259 4.2W1 7.M5E0260 4.02N41 6.63135261 3.7.O1 6.14E0262 3.55E501 U9m263 3.33E-0 5.27S0264 3.13501 4.19E065 2.9V01 4331-066 2.77E01 4.195-267 160501 3.0263 2.44E01 3.60-269 230"1 3340270 2.16E41 3.095-0271 2.031-0 187E10272 1.91141 266E-02
U 73 1.91401 2.464274 31AI-01 2.21EA075 n .5114 2.11 0276 1.49-0 1.96E02
.b 77 1.40E91 1.t1E402% 71 1.31W-01 1.6tW42
79 1.231-91 I.56-02to 1.16E-01 1.44E-02
I t
40414243444546474149505!525354555657St596061626364656667616970717273747i7677
79
Co-60 Dose Rate, mmt
Swrfaee Cofmzhln Led. EMs2 30 60
1.72542 2.51E41 5.17-0!1.62E502 2.43E41 4.ue-01t.52E-02 2.2315-0 4.56E411.43E502 2.14E-01 4.29E-011.34E402 2.01E41 4.03E-091.26E02 1.t9E-01 3.79E-0I1.19802 1.71PAI 3.561-011.11E2 1.678-01 3.34541i.054 1.57-01 3.14E019.14-3 1.4tE.01 2.955-019.25E503 1.39E501 2.7754I3.69E.03 1.30E41 2.61E It.171-03 1.22-01 1451E417.67E-03 1.15E-1 2.30E OI7.21E503 I.OtE-01 2.165416.7tE.03 1.02E-01 2.03E5916.37E4o3 9.35E-02 1.91E-515.99B-03 8.9tE02 I.OEJJ15.62143 .44E02 1.694015.2t113 7.9350 1.5914I4.971-03 7.451-02 1A9E5914.675-03 7.00E42 1.40E5O14.39503 6.535-2 1.32E914.12E43 6.13E2 1.24-0!3.17103 5.1E-02 1.16E43.6403 .44-2 1.09&013.42E43 5.13E-02 1.03E413.21E503 4.t2E02 9.641.023.02E503 4.53302 9.0654213q45e3 4.26E42 L.525-22.67E43 4.eOE-02 .00-E022.5153 3.76542 1.525-22.35E03 3.53M42 7.0652.21E43 3.32E-02 6.64E422.01E43 3.12E42 6.244021.95E43 2.93E502 5.6E021.84E43 2.7552 5515.021.73E-03 2.59E-02 5.1E5421.62E43 2.43E-2 4.17E.921.52E-03 2.29E-42 .4.537-02
CS-I37 Dosm Rate, mmry
Comhme Leel p1,_I
1.07E5039.93E449.20E504t.52E-047.90-047325A46.71046.29E-04S.32E44S.40-E045.00-E044.63E-044.29W43.95043.69W43.421-043.175042.935A42.72E442.52E442.33E042.16-042.005E04I.t6-E041.72E-041.59E-041.4tE541.37E-041'27-041.17E-041.09E-04I.OIE-049.355-058.66E451.03E457.44W-S6.t9E-056.3tE4S5.92E455.4tE-5
S.36E-03 2.14E424.97E43 1.99E-024.60E43 1.t4C424.26E543 1.70E023.955-03 1.531023.66503 1.46E423.39E03 1.365-23.145-03 1.2622.91E53 1.16E422.70£43 1.015422.50543 1.00E.022.32E503 9.271-032.15E-03 1.59E-031.99E-03 7.95EJ 31.345-03 737Y-U11.71A 3 6.33543L.51-03 6.335-31.47103 S5.tEJ3136E-03 S.44E031.26-03 5.04E103
1.17E-03 4.67E43I.01E503 4.32E033.OOE53 4.01V-039.21-04 3.71E-038.60504 3.445037.975-04 3.19E 037.3t504 2.951-036.84E504 2.74E436.345E44 2.54E43It7E-04 235E-035.44E44 2.13E435.04E504 2.02E434.67£44 I.37E434.33E-04 1.73E5034.01E54 1.61E-033.72E-04 1.495433.44F.-04 1.3tE433. 19E-04 1.2tE-032.96E04 .lE4-032.74E-04 1.13E-03

z
9
Table B.2. Calculated Residual Radiation Dose Rates as a Function of Soil Depth Removed,(Restricted Land Use, Real World Model for Cobalt-60 and Cesium-137) (continued)
Co-60 Dose Rate, numremy Cs-137 Dose Rate, nuesm/
Isuffac Cnitmnimanal Level. ,~Soil Depth
(an)13283843586878s8990919293
2 94w 9500 96
97989910010110210310420510610710b109110.III11211311415
116117il8119120
Coocn&alonk pCUR
QOA2 C1371.09W41 1.34E-021.02E-01 1.24E-029.625-02 1.15-E029.04E-02 1.06E 028.49E-02 9.855E037.985-02 9.13E037.50-02 S.46037.05E-02 7.34-36.62E-02 7.265436.22E-02 6.73E-035.Y5E02 6.24E-035.50E 02 5.78-035.16E,02 5.36E-034.355-02 4.96E-034.56E 02 4.60E-034.29E-2 4.26W-34.03E.02 3.955E033.785-02 3.66E 033.56E.02 3.39W133.34E402 3.14E-33.149 02 2.91E-032.95ss02 2.70E-032.77502 2.50E032.61E-02 2.32E-032.45E02 2.15E032.30M-02 1.99-032.16E42 1.9451432.03542 1.71E-031.91542 I.SS8531.79E 02 1.47E431.69E02 1.36W432.584E02 1.26E 01.49E42 1.17£ 031.40E502 I.08aw31.31E02 L.OOE31.24W-2 9.28E041.16W42 8.59E-041.09E42 7.96E5041.03E-02 7.380449.64E-03 6.84E504
IcmLAyuS
Removed80go
8238435863788899091929394959697989910010110210310410510610710O109110III11211311411511611722g119
2
1.43E-031.35E43.1.26E-031.19E431.12E43.OSE-03
9.86E-049.27E-048.71E448.19E 047.69E447.23E446.79E-046.38E-046.00E-045.64E-045.30E5044.985-044.685-044.40E5044.13E-043.88a043.65E-043.43E443.225-43.03E42.84E442.67E-042.511-042.36E5042.22-042.0YE441.96-041.841-041.73E-041.63E441.53E-041.44E-041.35W41.27E-04
30
Ha2. 1 5E-022.02E-021.90E421.725421.68E421.57E-02I.43E-021.394-021.31E-021.234-021.15E402I.OE-021.02E4029.57E439.00E.03S.45W437.94e437.47E-037.02E I6.59E456.19E-U:5.322E035.47E-035.14W034.S3E-034.54E434.27E434.01E2433.774-033.54E433.33W-33.13E^032.94E432.76E-032.59E432.44£-032.29E-032.15E-032.02E431.90E-03
60
lih14.30E424.04E423.79E-023.57E-023.35E423. 1 55422396W22.78E-022.61E-22.464-022.3 12522.17E4022.04E421.91E4021.80E421.69E421.59E 021.494-021.40E 021.32E-021.24E4021.16E-021.09E4021.03E42
9.66E-039.0EMu32.535-038.024-037.54E-037.085436.65E436.25E435.881035.52E435.19E434.88E434.58E4034.31E-034.05E433.OE4-03
La5.081-054.71E-054.36E 054.04E-053.74E-053.47E5053.22E452.985452.76E4052.56C552.37e452.20E-052.03E0551.89E-051.75E5051.62E451.50E-051.39E451.29E5051.19E051.II1W51.02E459.49E O68.8or46S.15E4-67.55E-067.00E-066.49E-066.01E-065.57E-65.16E464.785464.43E4064.11WC63.80E063.52E-463.27M063.03E 062.80E462.60C46
_ _
S~wfac Conuinamiailon Level, pCi/g-
S
2.54E5042.35E442.185E042.02W41.87E-041.73E-041.61E-041.49E441.38541.2854
I.ISE44I.IOE0441.02E449.43E054S.74E5S.09E457.5011-056.95E456.44E-055.97E455.535405.122554.75E454.40E454.08E-053.78E-053.50E-053.24E-053.00-052.78S452.58E5052.39E452.22E-052.05E 051.90E451.76E451.63E-051.51-.051.40E-051.30E45
20
Hkh1.02E-039.415448.7251.04S.O8E-047.49E-046.94E-046.43E445.96E445.52E445.122-044.74E-044.39E44.07F-043.771 043.491 643.24E-043.00E-042.785442.58L 042.39E-042.21E-042.05E-041.90E-041.76E41.63E-041.51E41.40E-041.30E441.20E-04I.IIE441.03E449.56E-053.865458.2113057.61E457.05E.056.53E-056.05F.055.61E455.20E-05
4. 4,
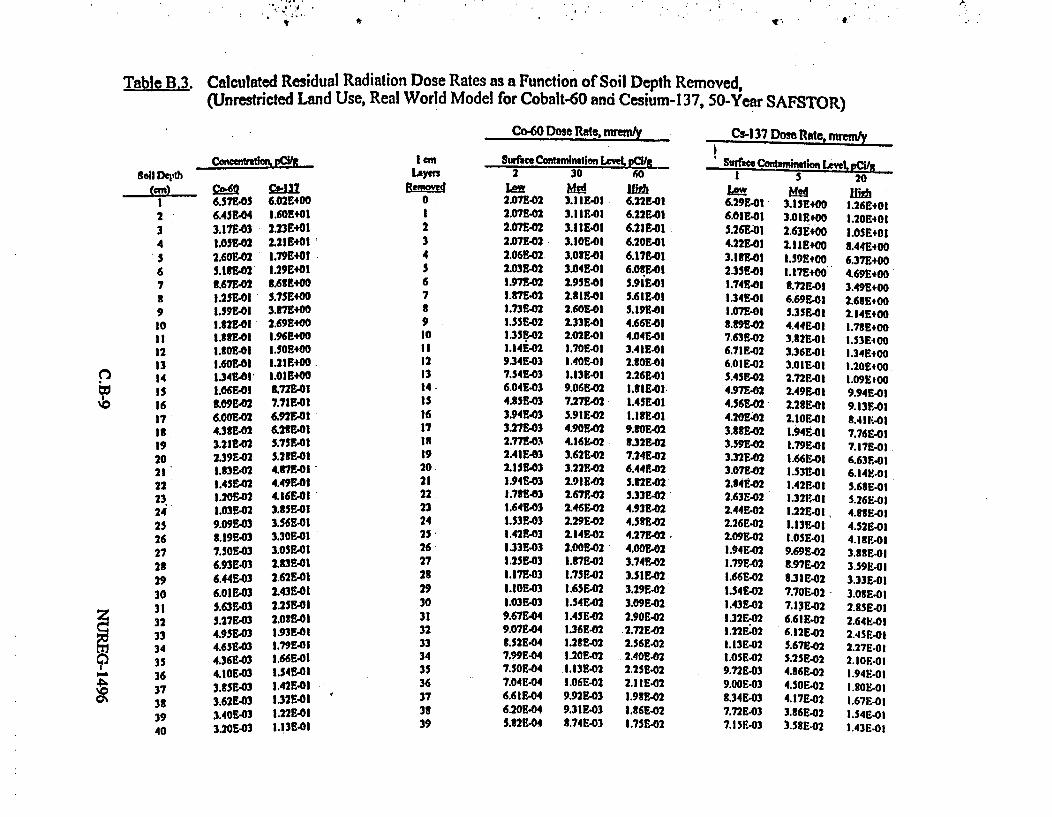
A~
t *
Table B.3. Calculated Residual Radiation Dose Rates as a Function of Soil Depth Removed,(Unrestricted Land Use, Real World Model for Cobalt-60 and Cesium-1 37, 50-Year SAFSTOR)
Co-60 Dose Rate, nuem/y
Su fiM C ofihumnallontLcv e m C~
Cs-I 37 Dose Rate. mnemlv
Soil Depth
1 6.57e4s 6.02E4002 6.455E04 1.60E+503 3.7E403 2.23E+504 I.051.2 2.21E+50S 2.60M2 1.795E016 5.33-02 2.29E+407 t.67E42 eA6eEooa 1.2SE-01 5.755+M09 2.5S41 3.t7E+00to 1.32541 2.69.400
I .nflS 0 3.965400i2 1.3051-03 I.50 40012 1.8OE.01 1.50E+OO
13 1.605.01 1.21 0oo14 I.34E41 L.OIE+00Is 1.06w-01 3.725-0I1 16 t.O9E42 7.71E4117 6.00E42 6.92eAIa 4.3#e-02 6.235-0
19 3.21W42 5.7154320 2.39sE2 5.2tE4121 1.3E.42 4.75E-0122 1.45E502 4.49501
23 1.20E-02 4.16E5-024 1.03B-02 3.355-025 9.090E3 3.56E126 3.19E-03 3.30EA127 7.30543 3.03E-01
23 6.93E403 2.33E-0129 6.445-3 2.625-0130 6.01E-03 2.43E-01
31 5.635.3 2.235.I32 5.27F,03 2.0354333 4.95E-03 1.93E-534 4.65E43 1.795E4
9 35 4.36E03 1.66E4136 4.10E43 1.545-I
'0 37 3.SS543 1.4254138 3.62E43 1.32E ol39 3.40543 1.22E-0440 3.20E503 1.13E41
I1cm1gyen
0
234S679910
121314Is1617la192021222324252627282930313233343536373339
2.07E-022.07E422.070422.07E422.06E422.03E-021.97E-21.87E42.73nE52
1.s5E421.35E.021.14&N029.34E-037.54E436.04E434.85E-033.94E-033.27£432.77E432.41E432.155431.94E5031.7tE-031.64E431.53E431.42E43IJ3335.25UE43
1.17E-031.10531.03E 39.67E449.07E44e.52e447.99E-047.50E447.04E.046.61E446.20E-045.t2F-04
30
Med3.1E-013.11F-0131IE-013.10E-013.035E43.04E542.95E032.tlE412.6011-02.33E412.02E-011.70E-011.405431.1313-019.065427.27E423.91E-024.90E424.16E42362E4023.24-022.91W422.67P422.46E4022.29E422.14E34422.00E-021.875421.755-021.65E421.54521.45E-021.36E421.23542
60
2IM6.22E416.22E516.21E4016.20E.016.17E-026.0tE415.9ie415.6 1415.19E414.66E414.045433.41E5-02.t0O412.26E41L.33E431.43E4013.21E301
9.301W2332E42
7.24E-026.445425.32E423.335424.9JE424.53E424.27E-024.00E423.74E423.51E423.29E423.09E422.90£422.72E422.56E02
I 5 20
6.29E41 3.35E+00 1.26E+OI6.05E41 3.01E+00 1.20E4015.26541 2.635+00 3.05E+014.22E41 2.15E+00 t.44E4003.1tE41 1.59E400 6.37E+002.35E41 1.17E+00 4.69E+001.74E41 3.72E401 3.49E+001.34E41 6.69E-01 2.63Ei001.07E541 5.35E41 2.145400t.t9E42 4.44E41 1.78E+oo7.63E42 3.82E41 1.53E1006.71E-02 3.36E41 1.34E4006.01E42 3.01E41 1.20E4OO5.45542 2.72P41 1.09E 004.97E42 2.49E-01 9.94E-014.56542 2.23E-01 9.13F.014.20E42 2.10541 .411.4-13.88E42 1.94E41 7.764-013.59E502 1.79F40 7.17E-0O3.32E42 1.66F41 6.63F.OI3.07542 1.534-01 6.14E-0I2.t4E42 1.42E401 5.68E-012.63E42 1.32141 5.26E-012.44E502 1.22E-01, 4.381-012.26E42 1.13E41 4.52E4012.09E-02 1.OSE01 4.18F-011.94E-02 9.69E42 3.83E411.79E42 3.97E42 3.59E-011.66E502 t31E342 3.33E411.54E-02 7.70E52- 3.0SE4 11.43E42 7.13E402 2.35E-0O1.32E-02 6.61E42 2.64M]021.22E.02 6.12E-02 2.45E-011.13E42 5.67E-02 2.27E-0I.OSE042 5.25E42 2.10E-0I
9.72E-03 4.86E42 1.94E-029.00E-03 4.50E42 1.80E-0O8.34E43 4.17E42 1.67F.-O7.72E43 3.86E42 1.54E-0I7.15E-03 3.53E-02 1.43E.0-
1.20E42 2.40E421.33E42 2.25E-02I.06E42 2.21E429.92E-03 1.9t5-29.31E343 I.t6E423.74143 1.75E42

2 Table B.3. Calculated Residual Radiation Dose Rates as a Function of Soil Depth Removed,(Unrestricted Land Use, Real World Model for Cobalt-60 and Cesium-137, 50-Yesr SAFSTOR) (continued)
* Co.60 Dose Rate, mremry Cs-I 37 Dose Rale, wremdy
0%COC9I an Suwfc Contamination Level. pCig Surface Contamination LewVl. CVuSoil D* h
4t4243444546474849505152535453
0 565758596061626364656667686970717273747576777879so
CAU Ck1333.00E43 1.05E-012.82243 9.73E422.65E43 9.0E4022.49E203 8.35E022.34E403 7.742422.20E43 7.17E22.07E43 6.64E421.94E43 6.16E42I.U3E43 5.70E421.72E43 5.29E421.61 203 4.90E421.52E43 4.54B421.42E43 4.21E421.34E43 3.90E421.26E203 3.61E421.32143 3.35E423.3I3E03 3.102421.04E43 2.37E429.SI.044 2.66429.21E244 2.47242
.662E04 2.29E42
.42E041 2.12E027.65E44 t.96E427.19E44 1.32E426.75E44 1.68E426.35E44 1.562425.96B44 1.452425.60E44 1.34E425.27244 1.242424.95B44 1.152424.65E44 I.072424.37E24 9.82E034.12E44 9.16E033.36W44 8.48E433.632404 7.86143 03.41E24 7.28A233.20244 6.7524033.012044 6.25E432.83E04 5.79E432.66E-04 5.37E-03
Layers
40414243444546474849505152535455565753596061626364656667636970717273747576777879
2Ldw5.46E445.13E-044.8YE-044.531E444.23E443.97W43.72E043.49E443.27E443.06E441/7E2442.69W042.52E3442.36E-042.21E22442.07E441.94E441.81E441.69B443.58E44I.482-04L.38E441.29F241.21 3041.12E441.052,049.772059.10E45L.472457.UE8057.332456.80E2056.31E-055.852E455.42E455.01E454.63E454.27E-953.93E453.61E-05
30
8.20E437.69E437.2132036.77J436.35E435.952E35.584035.23E434.90g434.60E43431E4034.04E433.784033.54E-033.3!E433.10E4032.90E432.72E432.54E2032.3eE432.22E032.07E431.941.-03I.S1E4031.69W431.57E4031.47E-031.37W431.272431.leE-03I.IOE101.02E439.47E448.78E44e.132447.52E446.94E446.40&2045.90E445.42E44
60
1.64E421.54E-021.44E421.35E421.27E421.19E4021.1212421.05E429.813439.19E433.6132438.072437.56E4037.08E436.63E 436.21E3 435.8V3435.43E435.082434.75E434.44U434.152433.37E.033.62F 033.37R-033.15 -032.93E432.73E4032.34E2032.36E432.202432.04E43I.89E431.76E431.63E431.50E031.39E431.28E 03I.IYE-03I.OE043
6.62E436.133435.67E2035.25E434.Y6E434.50E434.16W433.g5E4033.57E033.30E433.05E4032.32E4032.61E 032.41E-032.23W432.06E031.9132431.76W431.63E4321.50E431.39E431.28E-03I.I8E-031.09E03I.00439.26E443.532447.85247.22E-046.64E446.IIE-45.61E445.14E444.71E444.32E2043.95F.443.61E043.29PA043.OOE442.73E-04
5
3.31E3023.06£.022.841422.63E422.43"22.25E022.082421.93E421.781021.65E-021.53E-021.41E3021.3 1 E-021.213E021. 12E021.03E-029.53£038.81E-038.13E3437.51E436.94E4036.40E435.912435.454-035.02E-034.63E-034.26E433.93E2433.611E-033.322433.05E-032.YOE 032.57E432.36E 032.16E-031.98E-03I.OF.4031.65E431.50E-031.37E-03
20
1.32E411.23E411.13E3411.05E4019.72E 029.00E428.33E2027.71E2427.13E32426.60E-026.10"425.64E425.22E-024.13E3424.46E-024.12E423.81E-023.52E-023.25E-023.00E422.77"422.56E422.362422.1YE422.013 421.351 021.71F-021.57E421.4414021.33E421.222421.12E421.03E-029.43E438.64E437.90E-037.220436.59F-036.0012-035.46E43
4i

t S
4'
Al
Table B.3. Calculated Residual Radiation Dose Rates as a Function of Soil Depth Removed,(Unrestricted Land Use, Real World Model for Cobalt-60 and Cesium-1 37, 50-Year SAFSTOR) (continued)
Co-60 Dose Rate, MM"tvSufceCntnn~inLecA C/
Cs-1 37 Dose Rate, nmemly
Concentio S l.tSoil Dwh
tl 2.30E44 4.9tE-0352 2.35604 4.61E-03t3. 2.21E44 4.27E4334 2.07E44 3.96E43t5 1.95E44 3.67£4386 1.3E-04 3.40P43t7 1.72E44 3.15E4388 1.62E44 2.92£4339 1.52E 4 2.70W-0390 1.43E.04 2.31E4391 1.34W-04 2.32E43
o 92 1.26E-04 2.15E-3* 93 1.114 1.99-03
94 I.I1E44 1.t5E-0393 1.05£-44 1.71A0396 9.31-03 .359E4397 9.24t-05 1.47E439 a6tE-045 1.364-0399 t.16E-5 1.26W03100 7.66E.05 1.17-03
A
~00%
I ernLaym
ItO
328334'
3637
3990919293949596979899
!SUrf0c CArdnitminh ntzcnle, PCI'g2
3.31E45S3.03E4032.77E-052.32E452.29E6052.07E-05I.6E-051.674031.49E 051.32E.051.16E-05I.0E405.65E-06
7.3ne.066.07E-064.t9E.063.79E-062175£061.7tE.068.61E-07
30Med4.97EA44.SSE-044.1E-043.78E6043.43E-043.JOE-042.79£-042.51E 042.23E441.98E441.74E-041.516-041.30E-041.10-049.1 1E4-57.34E6055.69E6-O4.13E-052.67E4051.296-0
60
9.94E449.10E-04t.31E-047.366-046.t6E-046.21E-045.596-4S.O01E44.47W-043.95E.043.47E.043.02E-042.60W.42.205-041.t2E-041.47E-041.14£-04t.26E.053.33E -052.31E-05
I
2.4t£-042.25E 042.03E-041.83E6041.65E-041.4E-041.32E-041.17E-041.03E6049.06E4057.39E-056.81E 055.306-054.8tE7034.00-E053.206-052.46E-051.77E-031.14E-053.47E-06
SMed1.24E.031.12£-031.02E-039.16E.043.23E-047.3tE-046.5tE-045.t5E-445.16E-04
4.536-043.93E-043.40E-042.90£-042.43E-042.00E-041.60E-041.23E 041.75055.68E-032.73PA5
20
4.96E034.49E-034.064-033.66E-033.29E-032.95£-032.63F.-032.134-032.07E-03
t1116F031.56E-031.36E-031.16E4039.73E-048.OOF-046.401-044.92:--043.56E-042.27E-041.09F-04
I

Z Table B.4. Calculated Residual Radiation Dose Rates as a Function of Soil Depth Removed,(Restricted Land Use, Real World Model for Cobalt-60 and Cesium-137, 50-Year SAFSTOR)
CoW60 Dose Rate, tuanfy Csc137 Dose Rai LEmcy
_____________ I c Sudiace Conlamizutjo LE.vel Pci/s Surfac Contlan ion Lavel. pj/g
Soil Deph ion.ApCu 2 30 60 S S20
_" C>I Ro 137 R Hub L&V H
6.57e-05 6.02E+00 0. 1.s1203 2.26E02 4.52e-02 3.9O242 1.95E-01 7.792E01
2 6.45E04 1.60E+03 I 1.SIF-03 2.26E-02 4.52E-02 3.72E202 1.36-01 7.44"-I
3 3.17E.03 2.23E401 2 1.SE-03 2.26E-02 4.52E-02 3.26E202 1.63201 6.52E-01
4 1.05-02 2.21E+01 3 1SE2-03 2.262E02 4.52E-02 2.61E402 1.31E41 5.232-01
2.60E-02 '.79E+03 4 1.50-03 2.24E-02 4.49e-02 1.97E-02 9.s62-02 3.95E.01
6 5.19E202 @.292E01 5 1.422E03 2.21E02 4.43E202 1432.02 7.27E-02 2.912E017 1.67E42 ?.699a00 6 1.43PA3 2.1SE-02 4.30F,02 1.08F-02 5.40E-02 2.16E-01S 1.2-01 :.75E+00 7 1.36E403 2.04W-02 4.09E402 1.293 4.3SF202 1.66E-019 i.s5s9E- .S7E400 S 1.26E-03 1.59E42 3.71E42 6.63E403 3.31F402 1.33E201
0 1.82E201 L.69E200 9 1.13E43 1.69E-02 3.39E-02 s.soE-03 2.7SE-02 1.10E.013.3eo-01 .96.400 30 9.g2l-04 1.47E-02 2.94w-02 4.73W43 2.36E-02 9.4se-02
12 1.aoE001 1.50E+00 1 3.27E44 1.24E-02 2.48E42 4.16E-03 2.01E-02 8.32E202
13 1.60EA1 1.21E+00 12 6.20E204 1.02E-02 2.04E42 3.72E-03 1.26E-02 7.44E-02
14 1.34E-01 3 OE1+00 13 5.49E-04 3.23E-03 3.65E-02 337E203 1.69E202 6.74E402Is 1.06EO21 .72E-01 14 4.40E-04 6.59E-03 1.32E-02, 3.0SE-03 1.54202 6.16E42
_6 .09E-02 7.71-01 is 3.53E-04 5.29E23 1.06E2.0 2.83E-03 1.41E-02 s.65E40217 6.002E02 6.92F43 16 2.37E44 4.30E-3 8.60E-03 2.60E-03 1.30E42 5.212-02la 4.31E202 6.28201 37 2.3gE-04 3.57w-03 7.13E43 2.40E203 1.20E 02 4.21-o02
19 3.21E"2 5.73E-01 I3 2.022-04 3.03E-03 6.052-03 2.22F403 3.33E-02 4.442.42
20 2.39E42 5.28E201 9 1.76E44 2.63E-03 s.27E43 2.OSE-03 1.03E-02 4.11E42
21 1.8)E42 4W8720 20 1.56E204 2.34E-03 4.68E203 1.90E-03 9.53E203 3.8o0 2
22 1.45E402 4.49E-01 21 1.41E4 112E243 4.24243 1.76243 S.84)O23 3.s2e-02
23 1.20E42 4.162-1 22 1.29F44 1.942e03 3.332-3 1.63-03 .IsE5-03 3.26K-02
24 1.032-02 3.32-01 23 I.19F,04 1.79E-03 3.51E43 1.51E.03 7.55E203 3.02e42
25 9.09243 3.56E41 24 1. IE-04 1.67E-03 3.3343 1.40E203 6.99sF3 2.20-E02
26 191E903 3.30241 25 1.04E44 1.52E43 3.1 I2-03 1.3043 6.48243 2.i9E402
27 7.5003 3.05241 26 9.69E-05 1.45E43 2.93E-03 1.20E43 6.00E43 2.40FA2
28 6.93243 2.Y3E41 27 9.08E-05 1.36E43 2.72E43 1.11243 5.56E-03 2.222W02
29 6.44E43 2.62E-01 28 3.531-05 1.2E-03 2.55E43 1.03E-03 5.3SF43 2.06r.02
30 6.012-03 2.43241 29 7.99E45 1.20E-03 2.402-03 9.54E-04 4.772-03 1.91E-02
3 .63E203 2.25E41 30 7.50E-05 1.12243 2.252E03 8.4E244 4.422-03 1.77"2
32 5.27243 2.0824I 33 7.03E)05 1.06E43 2.31E203 8.19244 4.0243 1.64E-02
33 4.9543 1.932-0 32 6.60e.05 9.9E44 1.98243 7.532E44 3.79E403 1.52F40234 4.652E03 1.79E41 33 6.20E-05 9.30E44 1.86E43 7.02E44 3.SE2-03 1.40E-02
3 4.36E43 1.66E41 34 5.32245 3.73244 1.75E43 6.50E44 3.25243 1.30E-02
36 4.10643 1.541 35 5.46E2-o 1392E44 1.64E43 6.02E44 3.01E-03 1.20E-02
37 3.35E-03 1.42E41 36 5.13E-05 7.69E44 1s54P-3 5.58E404 2.79E43 1.12E-02
33 3.62EA3 1.32E41 37 4.83E45 7.22E-04 1.44E43 3.16E204 2.58E-03 3.033 (.239 3.402-03 1.22E-01 33 4.52E-05 6.77E-04 1.35243 4.78E-04 2.392.03 9.561 *
40 3.20E403 1.13E401 39 4.24E-05 6.36E-04 1.27E-03 4.43E04 2.216-03 8.861 * I
4.

. tle
I
Table B.4. Calculated Residual Radiation Dose Rates as a Function of Soil Depth Removed,(Restricted Land Use, Real World Model for Cobalt-60 and Cesium-137, 50-Year SAFSTOR) (continued)
Soil Depth
414243444546474149so5152
r 5354
w 5657St59.6061626364656667686970
2: 71e 72
73
7475
O" 76'0 77a% 78
7980
3.00e-03 1.05oe12.2E403 9.73E-022.65s.03 9.01E5022.49E-03 t.3sE422.34E.03 7.74E.022.20E-03 7.175022.07.03 6.645021.94E-03 6.165-21.83E53 S.70E-021.720) S.29E021.61303 4.90e-021.32E 03 4.34E421.42E-03 4.21 421.34E.03 3.soE-021.26E-03 3.61E-023.38E503 3.35e.021.AIE03 3.105-2
1.04E 03. 2.875-029.91E.04 2.66E-029.215-4 2.47E-028.66e-04 2.29E028.1404 2.12M27.6S354 1.96E-027.19E04 1.125-026.755-04 1.61E026.35E-04 1.56E-02S.6E-04 1.45502M.60504 134E-025.27E-04 1.24E-024.95E-04 1.3S-024.6SE-04 1.07E-024.37E-04 9.815-034.11E-04 9.16E-033.86E-04 1.415-033.63E504 7.16E5033.41E404 7.28sE33.20E-04 6.7sE-033.01E-04 6.2sE432.3E404 s.79E-032.66E-04 5.37-03
IcmLAYe
40
41
424344
4546
47
4849
505152
5354
355657
39
60
61
6263646566 -
67
68
69
7071727374
73
76777879
* Co-60 Dose Rate, nuem/y
Saco Contsmhilion ltvel, pCVg2 30 60
3.985OS 5.96E404 1.19E-033.73E-05 S60E.04 1.12E4033.305-S 5.25E-04 1.05E-033.2tE-03 4.93E-04 9.35E-043.011-05 4.62E404 9.23e-042.89E-O5 4.33E44 8.66E5042.7135-S 4.065-4 8.12E-042.54E-05 3.835-04 7.62E5042.3-0s 3.s7E404 7.14EM042.23W5-O 3.35-04 6.69E042.095-05 3.13E-04 6.27U041.96E45 2.94£-04 3.t7e-041.933S 2.75-4 S.SOE-041.72E-05 2.SE1-04 S.1SE441.61E-J5 2.41E-04 4.82541.SIE05S 2.26E504 4.32E5041.41545 2.115-0( 4.23E441.32eo55 1.91E504 3.s9s-041.23E-OS 1.35-,04 3.70504L.1SE05 1.73f-04 3.46E-04LON-OS 1.62E-04 3.23F.04
L.OE-05 I.S1-04 3.02E-049.405-06 1.41E-04 2.325A43.77506 1.32E504 2.63E-04.1E-06 1.23E-04 2.46E-04
7.635-06 1.14E-04 2.29E447.11E-06 1.07E404 2.13E-046.63E-06 9.94E-05 1.99E-046.17E-06 9.2E545 1.855-045.74E506 8.60505 1.72E-04s.33e506 t.OOEos 1.60E-044.9se56 7.43W-05 1.495044.59546 6t9E-045 13tE.044.26E46 6.39E45 1.28E-043.94E-6 5.91E-05 1.1E-043.6sE-06 3.475S 1.09E-043.375-6 S.05F.5 1.OIE-043.10E-06 4.66E5-O 9.315PS2.86E-06 4.29E-05 t.5E-052.63E-06 3.94E-05 7.88E-05
Cs-I37 Dose Rate, mreniy
S"ace Coamn"atimn Lavd, pCifqI 5 20
4.10-E04 2.05e03 8.20E433.79E504 1.90£43 7.954E33.51E-04 1.76E-03 7.03E-033.235-04 1.63£ 03 6.51R-033.01E-04 1.51E-03 6.02p-032.79504 1.39E-03 5.375E432.58E-04 1.29E 03 5.165-032.39E504 1.19E503 4.77E-032.21E04 1.104-03 4.42 1032.04E44 1.02E403 4.09E n1I.9£-04 9.45544 3.78L.a.1.75E-04 8.74E-04 3.50E-031.62E-04 8.08E44 3.23E-031.504-04 7.4tE-04 2.99F431.38E-04 6.91E504 2.76E431.28E504 6.395-04 2.56E-03I.lt5-04 5.90544 2.36E5031.09E-04 5.45E44 2.1tE43I.OIE 04 3.04E44 2.62E-039.31F-05 4A5E-4 1.16E438.39F.5- 4.30E504 1.72E4037.93E50 3.97E504 1.59F.-37.32E-05 3.66E-04 1.46E-036.75E45 3.37E44 1.35E-036.22E-05 3.11F-04 1.24E-035.73E45 2.87E5o4 1.ISE5035.2SF,43 2.64E504 1.06E-034.t6E5-0 2.43F 04 9.72E-044.47E-05 2.24E44 8.95E444.12E05 2.06E-04 8.23E-043.75-S05 1.t9E 4 7.56E-043.47E405 1.74E44 6.94E443.19E45 13.59E44 6.37E5042.92E05 1.46E44 5.84E442.68E-05 1.34£44 5.35E-042.45E-05 1.22E-04 4.89E-042.24E-03 1.12E-04 4.47E-042.04E45 1.02E-04 4.0SE.041.S6E-05 9.30&5-o 3.721;041.69E-05 8.46E45 3.38E-04

z Table B.4. Calculated Residual Radiation Dose Rates as a Function of Soil Depth Removed,(Restricted Land Use, Real World Model for Cobalt-60 and Cesium-I 37, 50-Year SAFSTOR) (continued)
_ Co-60 DosP RPi@ uIIWJy Cs-I 37 Dose M, nuieamly
0% ^ iifVe I cm SlUfa* COnUaiahfon LAVl. Mg' qk 1 -..- I
SoP Dplh(an)313283S4353637gS39909'92
P 93V 94- 95
96979399100
C"6Q2.50E042.35E.042.21E5042.07E041.95E.041.83E304.72E.04
1.62E 041.52E-041.43E-041.34E-041.26E-04I.18E44I.l 3.04IOSE-049.UE6459.24E-503.685-0
.N6E-07.C6E-05
4.986-034.61E4034.27e-33.966-033.676-033.400433.I5E-032.92E-032.70E-032.531P32.32E-032.15E431.99W-03I.35E431.71E-03
.59E-031.475-31.36E431.26E-031.17E-03
Lysu%
Rcmovd8031g2833435S687es8990919293949596979399
2
2.41E062.21E-062.01E 061.U3461.66E46
1.36E-061.22E-063.036-069.59E-078.425-077.33E 076.30E475.33E4074.42E-073.56E-072.76E472.00E-071.29E-076.27E-02
30
3.62E-053.31E-013.02E452.75e-052.50E452.26ce052.03E4051.a2E6451.62E-05L.44E5os1.26E-oS.IOE405
9.44E-067.99E-066.63E465.34E464.14E4063.00E4061.94E469.40E407
60
7.23E-05
6.C2E456.04E455.50"s54.99E454.52E454.07E453.65E453.25E452.83E-052.536-052.20W55
1.60E451.33E-451.97E4s8.2BE466.015-063.386-0I.SBE-06
.abus, 5A..vgI 5 20
1.54W-05 7.6BW-05 3.07E441.39E4-5 6.96W05 2.785E041.26E45 6.29-05 2.52E441.13E45 5.67W-05 2.27E-041.02E-05 5.10E45 2.04E-49.14E46 4.57E405 3.B3E-048.15-E06 4.0BE54O 1.63E447.24E06 3.62E-05 1.15E-046.40E-06 3.20E-05 1.23E-045.61E-06 2.J1E45 1.12E.044.39E56 2.44F505 9.771-054.22E46 2.1145 S8.43E.053.59E-06 I.8O0-05 7.18F,053.013-06 1.51E-05 6.03F-052.48E-06 1.24E45 4.96E051.98E-06 9.92E-06 3.97F.451.52E-06 7.62E-06 3.05::.051.101-06 5.49E46 2.20E-057.04E-07 3.52E46 1.41E5-03.39E-07 1.69E46 6.77E.06
U'
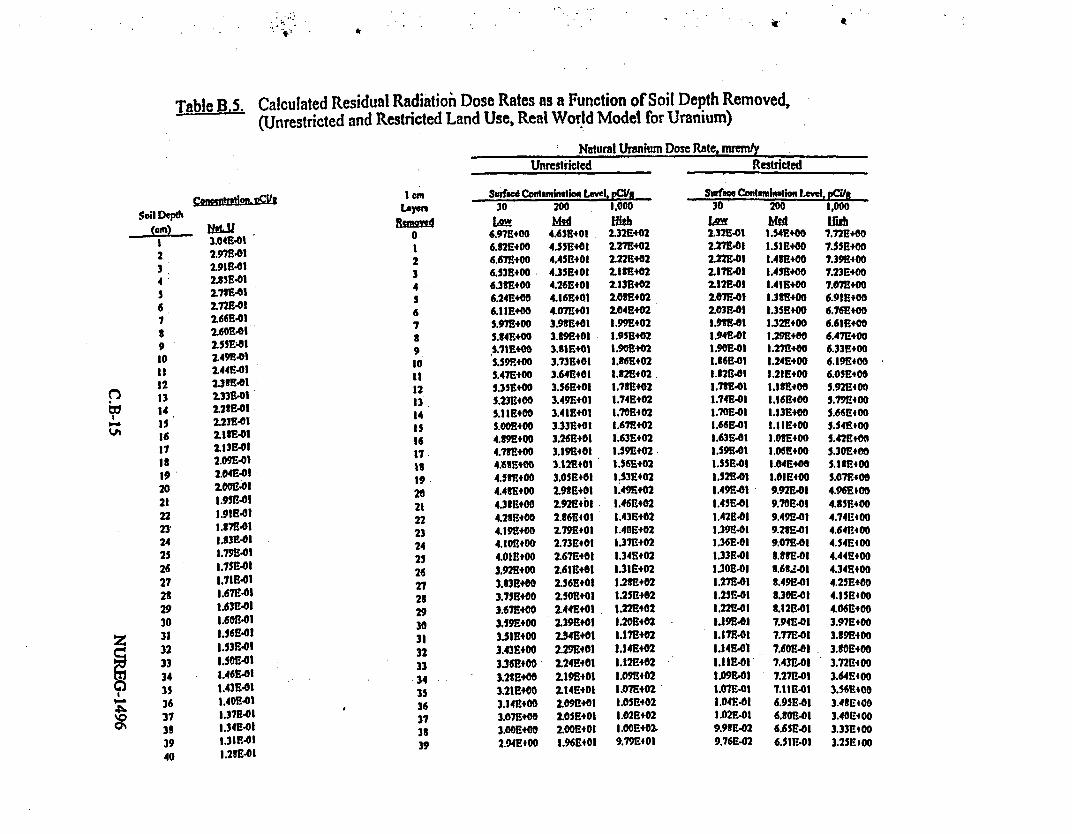
I
Table B.S. Calculated Residual Radiatioi Dose Rates as a Function of Soil Depth Removed,(Unrestricted and Restricted Land Use, Real World Model for Uranium)
Natural Uranium Dose Rate, mM!Unrestricted Restricted
Soil Depth
234,
67t910if12
P 14,_v 14- Is '
1617
192021222324252627222930
z 3132
t 339 34
9 35_- 36
6 '373'3940
2.97H.01
2.355401
2.725401216654012.6011402.55SOI2149E.012.44E-012.31E543
2.235.032.23E5412.1RE-01
2.09E.012.045431
3 .93 5.03
1.7954011.75E-01
1.67E5013.63B5433.60P.433.5654313.53H5433.508243
1.465431
1.3754311.3454313.33 54 I1.235401
I cm
0123
673930It121314is36'7.to392023222324252627232930313233
.34L3s36373339
SwfwA Co,,ianetioi Level, pCi,30 200 3,000
tLe MW IM6.97E*00 4.6SE401 2.32E4026.32E500 4.55E401 2.27E+026.675+00 4.45E#03 2.22E+026.53E400 4.35E403 2.33E5026.3tEt00 4.26E+01 2.13Et026.24E+00 4.365403 2.0354026.11EO00 4.07503 2.041+025.975E00 3."930l 1.99E4o25.U4Ft00 3.395403 1939E+02S.75E+OO 3.135401 3.9B+5025.595.400 3.73E540 1.365402S.47E400 3.644001 I.3254025.35E+00 3.565401 1.735t025.23E500 3.49E+01 1.74E502S.1E5400 3.41E+01 1.7054025.00E500 3.33E+03 3.67+4024.395+00 3.26E+01 1.63E5024.73E500 3.9E9501 3.5954024.:6Et00 3.125403 1.56E+024.53E500 3.055E01 1.53E4024.43E400 2.9tE401 1.49R4024.33E+00 2.92E+3l 1.4654024.2E5400 2.365-01 13.43etO24.395400 2.79E501 1.405#024.10Et00 2.73E401 .137t4024.0IEtOO 2.67E401 1.34+4023.92E5o4 2.61E+01 131E.O23.833+00 256E50+ 3.2354023.755400 2.505+40 1.25!4023.67E500 2.44E+01 1.22E4023.59E90O 2.392403 1.2054023.513400 2.34E+01 1.17E+023.432400 2.29E401 1.14E5023.36E00 2.24E401 1.12E4023.25E+00 2.19E+0 L.09E4023.21E+00 2.14E01 1.0754023.142!400 2.95401 I.0E54023.07E+00 2.0SE+03 1.025E023.00E+00 2.00OR401 .0OE402.2.94E500 .96E401 9.79E40
Swfme CoMIwinglie" Level, pCiIA30 200 3,000i Mid Ifh
2.32E41 1.54Et00 7.72Et002.27E01 1.514Et00 7.514002.22E-04 1.45+400 7.395400137E501 1.455+00 7.23E+001125.0 3A.435400 7.07e002.07541 1.33E+00 6.91E4002.03431 1.355400 6.76et001.9t5Eo 1.32t400 6.6135003.s4e4 3.295400 6.47E4001.904 1.27E+00 6.33E+00.36e-o1 1.24E400 6.3E5400
1.325.43 1.21E400 6.05E4001.7E431 I.l5400 5.24001.74e43 3.36E400 5.7954001.70E41 1.133500 5.66E400IME641 3.35E+00 5.4E+001.63E41 3.035400 5.42Et00.59E541 1.06Et00 5.304003.55E54 I.04E400 5.133400
1.52543 I.OIE400 5.07E1001.49E.0- 9.92E41 4.0651001.45E41 9.70E41 4.3514001.425E41 9.49540 4.74E4001.39EOI 9.21E41 4.64.4081.36E41 9.07E43 4.1454001.33E43 O S.3E-0 4.4454003.30531 3.6t.24 4.34E500
1.27E431 .49E41 4.25Et001.25E41 3.30E41 4.15OO1.2E2I 3.32E541 4.06E4001.19E501 7.94E41 3.97E5001.17E41 7.77E41 3.39E4001.14E41 7.60E41 3.3E0003.33543 7.43 401 3.72E400
1.09E501 7.27541 3.64E4001.07F.01 7.11F.41 3.56E5O01.04E301 6.95E41 3.4tE1001.02E41 6.t0E41 3.40E4009.9se02 6.65E41 3.335*OO9.76E 02 6.51E-01 3.25KI00

z; Table B.5. Calculated Residual Radiation Dose Rates as a Function of Soil Depth Removed,R (Unrestricted and Restricted Land Use, Real World Model for Uranium) (continued)
Natural Uraniun I )ose Rate, mrendy
Unrestricted
Surfsce Coataminalion Lel, pCi/p
Restricted
Conctalralion. DM&it
Soil Dcplh(em) VA"U
41 1.25E4142 1.234-0143 1.20E-O144 1.174-0145 1.15E4146 1.12E-0I47 I.IOE-0O41 1.07E4149 1.05E-01so 1.03E-01SI 1.00& 0152 9.U25-2
~ 53 9.60&4254 9.398-02
Ch 55 9.19&-0256 8.981-0257 2.79E1025i 8.59E50259 L.41-0260 5.22E4261 3.04E-0262 7.n7e-0263 7.694-0264 7.52E-0265 7.36E0266 7.20E-0267 7.04E50263 6.39E4269 6.73E40270 6.59E4271 6.44E4272 6.30E-0273 6.16E4274 6.03E4275 5.90E4276 5.77E4277 5.64E427? 5.52E10279 5.40E4210 5.29E102
I GMLayer.
40414243444546474849505252354555657is596061626364656667686970717273747576777379
SUrffW* CDOntaingima IAVGI. VCi/p30 200
2.375+00 1.925+012.51E400 1.3754012.75E+00 1.8334012.695400 1.79C40O2.63E+00 1.75t40I2.57E+00 1.71H+012.52E+00 1.631+022.46E+00 1.64E+502.41E400 1.60E4012.35E+00 1.57E+402.305+00 1.53E+402.255+00 1.50+4012.201+00 1.47E1012.155+00 1.44EtOI2.111400 1.40E4022.06E+00 1.375+012.02E+00 1.345+402.974E00 1.31E4011.93E400 1.29E2011.895400 I.2654011.341400 1.2314012.30E200 1.20Et0O1.76E+00 1.232+011.73E400 1.15&4011.69E400 1.13E+011.65E400 1.10E+011.61E+00 I.OE+ 02.535+00 1.051+021.54E+00 1.035+011.5215+00 I.0I4OI1.43U+00 9.35E+oo1.45E+00 9.64E+001.41E+00 9.4254001.354100 9.22Et001.355+00 9.0214001.32E 00 8.3224001.29E+00 3.635+001.27E+00 3.44E4001.24E+00 8.25+4001.221 +00 3.07E+00
*1,000
9.5354029.37E4019.16E+0I1.96E+0I
3.77E+021.571+028.39e+018.2054028.0254017.3540+07.6740+07.515+407.34Et017.2324017.02t40I6.871+0O6.72E4016.571+016.43540O( 2954016.55E4026.; :11025.58E+0I5.7514015.6354013.5011+05.335+015.2624CI5.1554025.045+404.93t40I4.82E+014.71E+I04.61E4024.5514+04.4114014.31254024.2214014.135FO04.031401
30Lw9.5fE029.34E429.13E428.93E4021.74E421.554-023.366421.17E402Y.OOE027.32E427.65E427.43E027.325427.16C427.OE0426.35E26.70E5026.55E426.41E426.27E426.13B-025.99E425.365425.734025.61E-025.490425365425.25E425.132425.02E424.91E424.C0E424.70E-024.59E4024.49F1424.39E4024.30E4024.204-024.111224.02E402
200
6.36E-016.23E4I6.09E545.96E-015.325425.70E415.57E415.45E2OI5.33E-OI5.21E2O45.10E414.9913424.885424.77E414.67e414.561414.461424.37E404.272414.123544.09L4I
3.91F.2OI3.822423.74E2OI3.66E413.5821OI3.50£4013.4251-3.35E413.27E-0I3.205.013.13E4013.06E413.00E5OI2.932422J87F-01
2.30E OI2.74E1OI2.6CC-01.4
1,000
U413.18+35003.11C4003.04t40012.98+002.91E4002.35E4002.79E4002.724 002.67+4002.6154001 2.55EOO2.49114 002.44+4002.3954002.335o0012.2E40012.2324002.1234002.14540012.0954002.04E4002.004 001.9554001.911#001.8572001.13354001.792+001.755+001.7154001.67+4001.64E+001.60E+001.57Et001.53E+001.50EfOO1 .4614001.4314OO1.40+500I .37E4 001.341E0o

el
Table B.5 Calculated Residual Radiation Dose Rates as a Function of Soil Depth Removed,(Unrestricted and Restricted Land Use, Real World Model for Uranium) (continued)
Natural Uranium Dose Rate. Mrm/yUnrestricted I Restricted
30 Co 200 nmion 0t.Soil DIPth
It 5.16E4212 5.053E42t3 4.94E-0214 4.8331.2t5 4.72130236 4.62E-02t7 4.521-02t3 4.42402
39 4.3210290 4.23E13291 4.14E-0292 4.04E-0293 3.96E-0294 3.07 295 3.731R32
_1 96 3.70E-n297 3.62E14291 3.54E-02
3.4&E402100 3J9E-02101 33142102 3.241382103 3.17m-02104 3.10E102105 3.03E-02106 2.97F132107 2.90E402lOt 2.14£-02109 2.717E02110 2.11E 02111 2.65E402
! 112 2.60E42113 2.54E-02114 24tE342
Q 115 2.43E-02116 2.3tE42
0 117 2.324-02lts 2.27E-02119 2.22E142120 2.17E142
I cm
Lsoe30tl32t334
3637
3990919293949596979399
100101102103104105106107too109110
112113114Its116117118119
Sufcw CotImi1one Lw, pCi/t30 200 1,000
L Md Wh1.11tEOO 7.9E+00 3.931+oI1.1611+00 7.721400 3.1613+011.131300 7.55EO0 3.711*011.l111t00 7.39E+00 3.691+011.03+300 7.223400 3.61+3011.06R+00 7.07E+00 3.53E+011.04E400 6.91E400 3.45sEoI1.0113OO 6.76E400 3.33E4019.92E141 6.61E+00 3.31P+019.70E01 6.47E+00 3.223E+o09.49E141 6.32E+00 3.16E4019.23141 6.191+00 3.09E+019.07E141 6.05E400 3.02E+013.3131P 5.921300 2.96E1013.63E41 5.791400 2.9E+018.491E41 S.66E+00 2.831+01t.30E341 S.54Et00 2.77E+018.12E141 5.411E00 2.7114017.941H41 5.3013400 2.65E+017.77E341 5.1340O 2.51E+o17.60E-41 .0713400 2 5313017.43E141 4.9614OO 2.4114017.27E41 4.3E5300 2.42E4017.11E341 4.74e400 2.37+3016.951E41 4,64E+00 13213o46.801-41 4.54E3400 2.27E+016.65E141 4.4413+00 2.2214016.511.01 4.34E+00 2.17E4016.363E1 4.24E+00 2.12E3016.23E141 4.15EQ400 2.07E3016.091E4! 4.063400 2.03E4015.96E341 3.971+00 .9E1015S.2141 3.831+00 1.94E+015.701301 3.10130 1.90134015.57141 3.713+00 1.86E4015.45E.01 3.63E1300 1.2E4015.33341 3.553400 1.7t1t015.21E41 3.4t300 1.74E14015.10E341 3.40Et00 1.70O4014.99s41 3.33134E00 1.66E401.
30
3.93E4023.151423.76E4.23.6313423.60E3423.s2E 023.5UE423.44113423.37£-023.291s423.22E3023.1513423.0tE423.01E1422.9113422.31tE02
2.76E1422.70E4216413422.51302
2.36E422.52E642
2.4213022.136E422.31E422.26E042
2021E42
1.911E421.941342
1.29ne421.81t421.311342
1.77E1421.73E1421.69sE021.66e-02
200 1,000-bMid mhb2.62E-01 1.3114002.56E-41 1.2ttO002.51E-14 1.2531+002451341 1.23£tOO2.40E131 1.20EO002.3sE41 1.17114002.30134 1. I1SE1002.251E34 1.12Et002.20E1OI l.lIOOO2.151E41 1.07E4002.101-01 1.05114002.05sE41 1.03E1tOQ2.01EOI1 1.OoE0oo1.971301 9.5313411.92E-31 9.61E3O11.313E01 9.40E 01
1.34E341 9.20E11.tOE0134 3.99131.16E-O1I 3.E041
1.72E341 t.6QE OI1.61H-11 1.4213-011.65H341 t.23E3411.61E31 3.0511341.713-01 7.a724i1.54E141 7.70E1411.51E-41 7.53E OI1.47E141 7.37E14I1.44E-0 7.21E1411.41E41 7.05E14r1.31E4! 6.891o41.31E341 6.741E11.321341 6.60134!1.29s4L1 6.45E34!1.26E-41 6.31E0131.23E41 6.17E-411.21E-01 6.04E1411.18tEO 5.90E-Cl1.15E141 5.77E 011.13E-01 5.65E4!1.10E41 5.52E-0

Table B.6. Calculated Residual Radiation Dose Rates as a Function of Soil Depth Remqved,(Unrestricted and Restricted Land Use, Real World Model for Thorium)
Uod , h_, wu Dose Rate, nwa ,UAI Rn.c~~~O~ .w~k -P . k
Cxoml*"ioa. PUR/Soil D.
1 3.414E022 1.021+023 9.04g+014 1.03E OI5 7.13 140O6 6.341+407 5.63E1OI3 5.0014019 4.45140110 3.95E401I1 3.51Et01
12 3.12140113 277?E0114 1.461401
00 2.I19EOI16 1.94100O17 1.731+01Is 1.53O14019 1.36E10120 1.21940121 1.0840122 9.56E10023 .50E*0024 7.55E40025 6.714+0026 5.9640O27 5.301E0028 4.71E0029 4.141+0030 3.714O0031 3.30E40032 2.93140033 2.61140034 2.31W0035 2.06EtOO36 1.23340037 1.62140038 1.44140039 1.25140040 1.14E00
laLayuam
234S67391033121314Is161713192021222324252627282930313233343536373839
Sad Cwaa bwan 1.iou l, pci/p30 300 200
L1 mwd WihC.02140O 2.014E02 4.02E4025.35E+01 1.71E+02 3.571E024.761401 1.592+02 3.1714024.231401 1.411402 2.214+023.751401 1.251402 2.50E4023.341+0 1.1IE1402 2.22E1022.96E01 9.381401 O .9511022.39+01 8.784e01 1.7614022.34E401 7.301401 1.5241022.0314+01 931401 13.39102L.3E401 6.161401 1.2314021.64140 5.471401 1.09E 021.461401 4.36E+01 9.721403.30114+0 4.321401 3.641401
1.15140I 3.34401 7.6724011.02E+01 3.431401 6.3214019.01+400 3.031E01 6.06E1403.071400 2.69E401 5.33E4017.171E00 2.39E401 4.791*806.37e400 2.121401 4.25E4015.661+00 1.699401 3.7814015.03E 00 1.681401 3.351404.471400 1.492401 9S9EO103.97g400 1.321E01 2.651+013.53E400 .1 3140 2.3514013.14EO00 1.05E+01 2.q9Fi.j02.79E400 9.291400 1.3141012.43E400 8.251400 .6114012.20E400 7.33E400 1.17E10I1.951400 6.521400 1.3011403.741o00 5.791400 1.1614031.541400 5.141400 1.0314031.371400 4.571E00 9.141o001.221400 4.061400 3.321o001.081400 3i61Eo00 7M221oO9.621.0 3.231400 6.41ECO3.54E01 2.385400 S.7014007.53914 2.531400 5.0614006.75ne4 2.251400 4.514OO5.99ss43 2.04E400 4.00OO40
Sad".. Caalamaaao L4WI,. PCi/i30 1 100 200
2.4194002.32+100106E4001.8334001.6314001.4514001.231o001.14114001.0314009.03143-3.0011437.3143-06.321015.61E2014.991.014.431E433.94143.50E1013.1 43AI2.761432.451412.143I1.94LOI1.72E411.531411.36E 41.21E431.0714I9.53E-023.4714027.521426.681425.941425.28124.691424.1714 23.701423.29SE22.921 022.60142
37014007.731+006.3714006.10E4005.4224004.21o4004.2814003.5011003J33o003.00Eo0016714+002.3711002.13 31E01.71E4003.614001.43O001.3141001.171+001.0411009.21&01
I 332017.27"46.4614-3S.741435.10E 04.53P4I4.021433.532413.1E412.32N12.51432.231431.98140O1.761.0131.56414.3s914
1.23143I.301A439.74102366I42
Uih1 .74140
1.554 01
1.22.401
9.6414008.5614007.61EOO6.76E4006.014+00
5.3414004.7414004.21Et00
3.7414w3.331400
2.9511*002.63E40O2.33e1 00
2.0714 003.31411401.64114003.4514001.292-100
3.02114009.0414313.-052:437.3514306.3511-35.6514305.02143O4.4614303.961433.5214303.1331432.7314312.4714 12.391433.9514301.73E243
W$v~
S.

Table B.6. Calculated Residual Radiatidn Dose Rates as a Function of Soil Depth Removed,(Unrestricted and Restricted Land Use, Real World Model for Thorium) (continued)
Thol m Dose Rate, mremny
Soil DWIth
42 3.9 013443 7.99-13444 7.101134345 6.313013446 S.60E43147 4.911-0141 4.42"I449 3.9313431so 3.4913-01SI 3.3011343352 2.761134333 2.4330"34 23313.03633 L.9313-O
10 6 3.72134357 1.5313-0
39 1.2t13-060 3.0713063 9313.0262 1.4513.263 7.31034264 6.6713463 3.9313.0 266 3.2713.267 .4.631-4263. 4.16134269 3.701-0270 3.231"-271 2.9214722.3013422
73 2.3011-0274 2.03"3279 1.321342
- ~ 76 3.62E302.h.77 1.4411.0273 1.23134279 1.313E42
to .03J302
I GM
404,424344454647
i 4S49*s
523345556
75
39
60616263646366676169
70717273747576777t79
UresrictedSwao ColmnfaknLvl '
30 100 200
$321343 1.77E1+O :.s313OO4.731341 1.313+00 3.U314004.20E401 1.40E+00 2.10tEOO3.741-0 1.25E00 2.49E4003.32e43 3.3114+00 2.21E#002.951141 9.8334 197E13002.621E41 J.73E41 3.7SE+002.331341 7.76E-01 I.3E3400
073e41 6.19E43 3.313E+003.34e-03 6.13E41 1.23E+001.630E41 3.44E43 3.09E1400t.45e-03 4.14E431 9.67E0131.29134 4.301E431 3.39431.31343 3.J2E341 7.64E1433.021O34 3.39se01 6.73E1419.0413-02 3.1OIE41 6.01E-413.03142 2.631401 3.3613437.141342 2.33143 4.7613416.34102 2.IIE-0 4.2313415.6313.2 3.3314 3.7614$.OI42 L.671O3M 3.3413414.4S142 1.41343 2.971343.931302 1.32E401 2.6313413.531E42 1.17E431 2.34143.13e-02 1.041343 2.0112.77E102 9.241342 1.331-02.461032 3.21342 1.64H3412.9E42 7.301 42 1.4613413.94142 6.4313.02 1.30E141E.731E42 5.76E142 3.1313011.341E42 5.12E102 1.02E1411.3642 4.331342 9.098s421.21e42 4.04e102 1.03E102L.031t42 3.39P342 7.130429.371343 3.191342 6.331-023.SO3143 2.233102 3.67E1427SSE.43 2.32E142 S.0413426.731034 2.241342 4.4713423.96E-03 1.9912 3.97E1423.30E143 1.771342 3.3E3142
ResWcled
30 100 200ZO Mid Mz
2.31342 7.691-42 1.3413402.03E142 6.13E142 1.37E34I.121342 6.071342 1.211431.62W342 3.39s42 -. O1-OI1.441E42 4.79P-12 9.39E9421.21342 4261302 B.32E421.14E4)23.03E1423.9610437.96E1437.07E1436.29E134
5.S91E434.s6E434.413433.92E1433.4,13403
3.0913*2.73e032.44E3432.17E1431.931-33
1.711E431.52E4031.331343
1.20E.031.07E1439.4tE344t.43E1447.49E1446.63E1443.913E045.25E 044.67E144
3.736102 67.7E242.913642 6.97E 02
2.6se42 S.3E1422.61E302 4.31E3422.30E142 4.3 91421.31E-02 4.72E102
631E42 3.33E1023.47E42 2.31E0421.471-02 2.64E34231613E42 2.610421.163 02 2.0613421.03.02 2.06131429J6F .1 03 .313M427.24333 1.63E3427.231343 1.423426.42E703 1.2413425.713433 1.143424.073143 .OIC4024.001343 3.03113434.003633 7.O3E1433.161343 7.1213433.163403 6.32E1032.30E103 4.62E9032SOE103 4.4313432.22E903 4.43E43
.731343 3.93E0431.731343 3.5034.31.56E 03 2.7 IE033
4.1SE44 1.33E1433.63E144 1.23E1433.27E34 1.093E.032.93 104 9.69E.042.S3E44 3.613.042.30E134 7.65E.04
2.461-34
.94E1431.72E-033.533.03

Table B.6. Calculated Residual Radiation Dose Rates as a Function of Soil DepthRemoved,z (Unrestricted and Restricted Land Use, Real World Model for Thonum) (continued)
5 Thorium Dosc Wale, nuem/y, Unresuicled i ResIricled
Soil DapthH IALU
n1 5.95E.0312 7.954E0323 7.068E314 6.251E03SS 5.578-03
Y6 4.95E.0387 4.40403Is 3.91SQ319 3.47E-0390 3.09E 0391 2.74E-0392 2.44W393 2.17E50394 1.922-039S 1.71E40396 1,5204397 1.35P391 1.20E 0399 1.075-03100 9.47244505 8.411-04102 7.47E.04103 6.641-04104 5.90244105 5.24E-04106 4.661-04107 4.15444l0o 3.61109 3.27WM110 2.90844111 2.58244112 2.291-04113 2.04E504114 1.815-04Il5 1.61)204116 1,432104111 1.27W4
1.132144119 I,0E.O 04120 8.90HE05
u.
Icm
Rany10Is1Y28384a516871899091929394959697989950010110210310410S106107108109110III112113114115116117
t1s119
Suwfaos Comalaainion LAWl PCIIk30
4.71E5034.1YE433.72E433.30E432.932-03L614-032.328432.06043I.U3E431.622431.442431.212e431.142-03I.0IE438.992447.99E 047.1015046.31E045.652-044.982444.431043.93E 043.490-043.10E-042.76E542.45-442.11I041.93E441.7229041.538-041.36E441.21E441.078049.52045S.A4057.51E2456.6804055.9354S5.27E454.6SE45
100
1.57E421392421.24E42M.G0M429.782433.698437.72E436.86436.09E 35.41E434.515434.27E433.802433.372433.00E432.66E432.37E432.10Y43I.S70431.66E431.4YE431.312431.16E4031.038-039.19E44
.17E 7047.261446.455445.73-445.09E-044.52E444.022443.57E443.17E442.820442.50E442.23E441.91E441.76E441.56144
200
3.142422.79e422.480422.20E421.96E421.74E421.542421.37U421.22PA2I.08429.62E403S.55E4037.60E436.75E436.100435.33E4034.73E434.2111033.74E433.32E.032.95E4032.62E4032.33E432.07E.03I.S4E431.63E431.4E0431.29£431.15Y03
.0224039.05E5041.0415047.14E446.35E445.64E445.01E444.45E-043.95E 043.51E443.12e44
Sufde Cooltaunalio Level, pCI/R30 100 200
LOUid bIl2.04E44 6.10244 1.36E41I.1IE44 6.04544 1.21E431.61E44 5.37E44 1.070431.43Y44 4.77E44 9.54E0441.27E44 4.24E44 .471441.13244 3.76E44 7.53E44I.OOE44 3.34E404 6.69E44*.92E45 2.97E44 5.94E447.92E45 2.64E44 5.2Y5447.04E45 2.3se04 4.69E446.25E45 2.0E44 4.17E445.56545 1.U1544 3.70E444.94E45 1.65E44 3.295-044.39E45 1.46E44 2.92E443.90E45 L30E804 2.60E443.46E45 1.15044 2.31E443.01E-05 1.03L44 2.05E442.73E45 9.11E045 5.32442.43E45 8.5E005 1.62E442.56E-45 7.19E45 1.44E441.92E45 6.39045 5.21E041.70E45 5.61E45 1.14E4J1.51L24S 5.05545 I.OIE441.35545 4.484 3 8.97L451.20E45 3.91E45 7.9754551.06E8O5 3.54E45 7.01E459.43E 6 3.14E45 6.29845S3.38146 2.79Us5 5.59E457.45546 2.41245 4.979.OS6.62246 2.21E45 4.41E 055.18E46 1.96E54 3.922455.22246 1.74E205 3.485454.64546 1.55E45 3.09E454.12E46 1.37E45 2.755453.66E-6 1.22245 2.441--053,26E46 1.09E845 2.174-052.19E46 9.64E46 1.93E452.5746- 1.572-06 1.71E452.21E46 7.61E46 1.52E452.03E46 6 76g.06 1.351-o05
0. 4.

ATTACHMENT C
DETAILED SPREADSHEETS
CALCULATED COSTS AND OTHER PARAMETERSFOR REMEDIATION OF CONTAMINATED SOIL
AT NUCLEAR FACILITIES
C.C-1 NUJREG-1496

ATTACHMENT C
DETAILED SPREADSHEETS
CALCULATED COSTS AND OTHER PARAMETERSFOR REMEDIATION OF CONTAMINATED SOIL
AT NUCLEAR FACILITIES
This attachment provides the detailed results for the analyses summarized in Sections 2and 7. A separate table, or spreadsheet, is provided for each scenario analyzed. Forcompleteness of basic information, detailed results are provided for the alternative residualdose levels evaluated (i.e., 100, 60, 30, 25, 15, 10, 3, 0.3, and 0.03 mreniy), includingestimates for 1) the volume of soil requiring remediation, 2) the costs associated withexcavating, treating, packaging, transporting, and disposing of the excavated soil, 3) thenumber of labor hours required to excavate and treat the soil, and 4) the total occupationaldose incurred during excavation and treatment of the soil. Each table reports these results forthe assumed high, medium, and low surface contamination levels.
Table C.1 provides an index to the results for each scenario presented in thisattachment. Identified in the table is the table, or spreadsheet, number, the reference facilityevaluated, the contaminant distribution profile (i.e., "baseline" or "real world'), the time ofdecommissioning (i.e., soon after shutdown or after a 50-year SAFSTOR period), the land-useassumed (i.e., restricted or unrestricted), and the soil treatment train (i.e., direct disposal of thesoil or washing of the soil to remove contaminants prior to its disposal).
NUREG-1496 C.C-2

Table C. 1. Index to Spreadsheets
Reference Facility Table Contaminant Distribution Time or Land-Use Contaminated SoiNumber Model Decommissionig Disposition
Nuclear Power Plant C.1.1 "Baseline" or Diffusion Soon After Unrestricted Washed Prior toShutdown Disposal
Nuclear Power Plant C.1.2 'Baseline' or Diffusion Soon After Unrestricted Direct DisposalShutdown
Nuclear Power Plant C.1.3 *Baseline or Diffusion Soon After Restricted Washed Prior toShutdown Disposal
Nuclear Power Plant C. 1.4 *Baseline' or Diffusion Soon After Restricted Direct DisposalShutdown
Nuclear Power Plant C tIS "Baseline" or Diffusion SAFS`OR Unrestricted Washed Prior toDisposal
Nuclear Power Plant C.1.6 *Baseline' or Diffusion SAFSTOR Unrestricted Direct Disposal
Nuclear Power Plant C.l.7 "Baseline' or Diffusion SAFSIOR Restricted Washed Prior toDisposal
Nuclear Power Plant C.1.8 "Baseline' or Diffusion SAFSTOR Restricted Direct Disposal
Nuclear Power Plant C.1.9 'Real World' or Spill/Leak Soon After Unrstricted Washed Prior toShutdown Disposal
Nuclear Power Plant C.1.10 'Real World" or Spill/Leak Soon After Unrestricted Direct DisposalShutdown
Nuclear Power Plant C.1.ll 'Real World" or Spill/Leak SoonAfter Restricted Washed Prior toShutdown Disposal
Nuclear Power Plant C.1.12 *Real World" or SpillLeak Soon After Restricted Direct DisposalShutdown
Nuclear Power Plant C.1.13 'Real World" or Spill/Leak SAFSTOR - Unrestricted Washed Prior toDisposal
Nuclear Power Plant C.1.14 *Real World' or Spill/Leak SAFSTOR Unrestricted Direct Disposal
Nuclear Power Plant C.1.IS *Real World' or Spill/Leak SAFSTOR Restricted Washed Prior toDisposal
Nuclear Power Plant C. 1 16 "Real World' or Spill/Leak SAFSTOR Restricted Direct Disposal
Uranium Fuel C.2.1 'Baseline' or Diffusion Soon After Unrestricted Washed Prior toFabrication Plant Shutdown Disposal
Uranium Fuel C.22 'Baseline' or Diffusion Soon After Unrestricted Direct DisposalFabrication Plant Shutdown
Uranium Fuel C.2.3 *Baseline" or Diffusion Soon After Restricted Washed Prior toFabrication Plant Shutdown Disposal -
Uranium Fuel C.2.4 "Baseline" or Diffusion Soon After Restricted Direct DisposalFabrication Plant Shutdown
C.C-3 C.C-3 NUREG-1496

.Table C1. Index to Spreadsheets
Reference Facility Table Contaminant Distribution Thne of Land-Use Contaminated SoilNumber Model Decommissioning Disposition
Uranium Fuel C.2.5 'Real World' or Soon After Unrestricted Washed Prior toFabrication Plant Mixmg/Landfilling Shutdown Disposal
Uranium Fuel C.2.6 'Real World' or Soon After Unrestricted Direct DisposalFabrication Plant Mixing/Landfilling Shutdown
Uranium Fuel C12.7 "Real World' or Soon After Restricted Washed Prior toFabrication Plant Mixing/Landfilling Shutdown Disposal
Uranium Fuel C.2.8 'Real World' or Soon After Restricted Direct DisposalFabrication Plant Mixing/Landfilling Shutdown
Sealed Source C.3.1 'Baseline' or Diffusion Soon After Unrestricted Washed Prior toManufacturer Shutdown Disposal
Sealed Source C.3.2 'Baseline' or Diffusion Soon After Unrestricted Direct DisposalManufacturer Shutdown
Sealed Source C.3.3 'Baseline' or Diffusion Soon After Restricted Washed Prior toManufacturer Shutdown Disposal
Sealed Source C.3.4 'Baseline' or Diffusion Soon After Restricted Direct DisposalManufacturer Shutdown
Sealed Source C.3.S 'Real World- or Spill/Leak Soon After Unrestricted Washed Prior toManufacturer Shutdown Disposal
Sealed Source C.3.6 'Real World- or Spill/Leak Soon After Unrestricted Direct DisposalManufacturer Shutdown
Sealed Source C.3.7 'Real World, or Spill/Leak Soon After Restricted Washed Prior toManufacturer Shutdown Disposal
Sealed Source C.3.8 'Real World' or Spill/Leak Soon After Restricted Direct DisposalManufacturer Shutdown
Rare Metal C.4.A 'Baseline' or Diffusion Soon After Unrestricted Washed Prior toExtraction Plant Shutdown Disposal
Rare Metal C.4.2 'Baseline' or Diffusion Soon After Unrestricted Direct DisposalExtraction Plant Shutdown
Rare Metal C.4.3 'Baseline' or Diffusion Soon After Restricted Washed Priox toExtraction Plant Shutdown Disposal
Rare Metal C.4.4 'Baseline' or Diffusion Soon After Restricted Direct DisposalExtraction Plant Shutdown
Rare Metal C.4.5 'Real World' or Spill/Leak Soon After Unrestricted Washed Prior toExtraction Plant Shutdown Disposal
Rare Metal C.4.6 "Real World" or Spill/Leak Soon After Unrestricted Direct DisposalExtraction Plant Shutdown
Rare Metal C.4.7 "Real World" or Spill/Leak Soon After Restricted Washed Prior toExtraction Plant Shutdown Disposal
U
NUREG-1496 C.C-4

Table C.1. Index to Spreadsheets
Reference Fadlity Table Contaminant Distribution Time of Land-Use Contaminated SollNumber Model m Disposition
Rare Metal C.4.8 'Real Word' or SpillLeak Soon After Restricted Direct DisposalExtraction Plant Shutdown
Uranium Mill C.5.1 'Baseline' or Diffusion Soon After Unrestricted Washed Prior toShutdown Disposal
Uranium Mill C.5.2 'Baseline' or Diffusion Soon Afer Unrestricted Direct DisposalShutdown
Uranium Mill C.5.3 'Baseline' or Diffusion Soon After Restricted Washed Prior toShutdown Disposal
Uranium Mill C.5.4 Baseline' or Diffusion Soon After Restricted Direct DisposalShutdown
i
C.C-S NUREG-1496

9
90%)
Table C.I.l. Calculated Costs aad Other Pameters for Remleaaton of Cotaminated SoU at the Reference Nudear Power Plant(Unrestridted Land Use, With SoUi Wsing)
Contmnb* Site Below. Below. Total Soil 4ito SeResidual Dose oled Site Soil SIte Soil Building uiling Soil Volume Excavaton
Rate Soil e Dcpth Volume Soil Oedh Volune Removed Costs_aww lVt2 cm m-3 cm m3 m-3
iIGH __100 3,000 3.3 9 3.3 15 24 6,70760 3,000 4.6 13 4.6 21 34 8,04930 3,000 6.9 16 6.9 27 44 10,31626 3,000 6.2 17 6.2 29 48 10,89315 3.000 7.0 20 7.0 33 52 12,28310 3,000 7.8 22 7.8 36 58 13,6733 3,000 11.6 32 11.5 54 06 20,161
0.3 3,000 20.6 57 .20.5 96 36,7290.03 3,000 24.9 69 24.9 116 186 435492
EDIUM 0 _ 0100 3,000 0.0 0 0 ._ _ 0 0 __ 0_060 3.000 2.6 7 2.6 11 18 4,31030 3.000 4.S 13 4.5 21 34 7,94026 3,000 4.9 14 4.9 23 36 8 8,5571 6 3.000 5.8 16 5.8 27 43 1 10O16910 3,000 6.5 18 6.5 30 48 - 11.3393 3,000 8.2 *23 8.2 38 61 14,389
0.3 3,000 16.6 45 16.5 77 123 -28,8030.03 3.000 22.4 62 22.4 104 167 39,168
LOW- ---
100 3,000 0.0 0 0.0 0 0 060 3,000 0.0 0 0.0 0 0 030 3 000 0.0 0 0.0 0 0 026 3,000 0.0 0 0.0 _ 0 0 016 3,000 0.0 0 0.0 0 0 010 3,000 0.0 0 0.0 0 0 0
3 3,000 3.6 10 3.6 17 27 6,3740.3 3,000 8.4 23 8.4 39 62 14.599
0.03 3,000 18.7 62 18.7 87 139 32,648Unit Ratles .d ... Dilbn -Otffus 2sA bitdON $23Bkn'3
imodl aI model aud tHO wasNotes ptOMs uid 1260.000
baIw It-'l
Page 1 of 3
A.X5
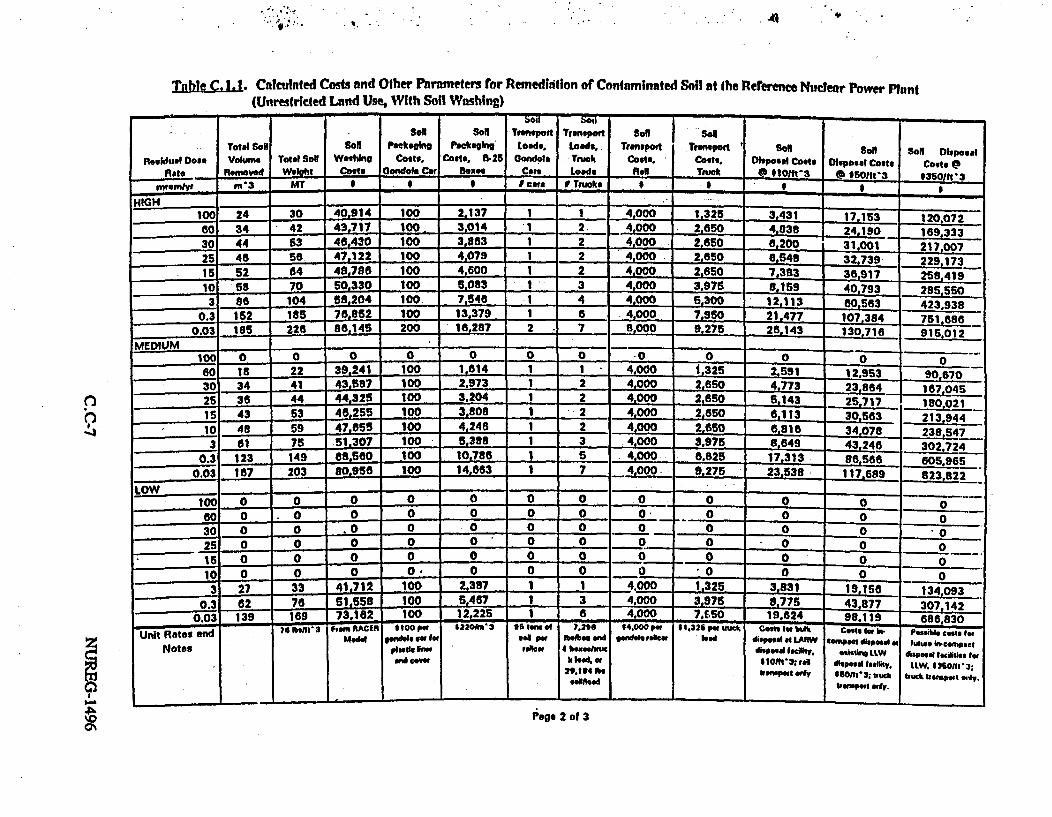
.. .1, -': -fI
0
I
Tnbe C.1.. Calcultied Costs and Other Parameters for Remedintion of Contaminated Soil at the Reference Nuclear Power Plant(Unrestricted Land Use, With Soil Washing)
.~f 561 _.
Sol Sol Tfatepont Tanpoft soll n sonTotal SON Son telthog Packagig Leads, Loads_ Tt nspott Transpor Soll Soi Son Diposal
Residual Dose Volume Total Sol Washing Costs. Coats, 825 Gondole Tnuck Cost. Costs. Diapoa*l Coots Disposal Costs Coots @not Removed Weibht Costs ondola Car Boxes Cas Loads RaOl Thuo @1 9o1t1 3 .som *aSOI3.3
mremlyf m 3 MT S I , * Jca Tuokas I--._ .
HIGH 24 30 40,9-4 100 2,-37 1 4,000 1,325 3,43t 17,153 1200724 0. 1 4 1 0 2 1 3 71170 0 _153_ _ _120__ _ _0 72_ _
60 34 42 43,7t7 100 . 3 1 2. 4 4,000 2 o650 4,838 24.180 _ 169,333
30 44 53 48430 100 3,863 1 2 4.000 2.650 6,200 3_ ool 217.00725 45 . 50 47.122 100 4.079 1 2 4,000 2,650 e,548 32.739 229.17315 -2 a4 48.786 100 4.600 1 2 4.000 2,650 7.383 36.917 259 4i .10 58 70 50,330 100 5,083 1 3 ., 1 15. 3.976 8.169 40.793 285 550
3 as 104 58,204 100 7,546 1 4 4,000 5.300 12,113 00553 423,9380.3 152 185 71.852 100 13,379 1 6 4,000 7.950 21.477 107.384 751,686
0.03 185 228 86,145 200 16,287 2 . 7 8,000 9.275 28.143 l130,716 915,012MEDIUM _ -
100 0 0 0 0 o 0 0 0 0 o -0 o 0
60 18 22 39,241 100 1,614 1 1 4.000 i,325 2,591 lZ,953 - 0o67030 34 _ 41- . 43.597 100 2.973 1 2 4.000 2,650 4."3 _3.864 _ 167,04525 36 44 44.32S 100 3.204 1 2 4.000 _2,650 5,143 25 717 150.0211 55 s 10o 3,808 - 2 4,000 2,650 6,113 J 30,563 213,94410 5 9 47555 100 4,246 1 2 4 2,6s0 6.816 34.078 238,5473 61 75 51.307 100 5,388 1 3 4.000 3.975 8,649 43.246_ 302.724
0.3 123 149 MMse too 10.786 1 5 4,00 6,825 17.313 _ ss1se 605 960.03 167 203 80,956 100 14,863 1 7 4 000 9,275 23,538 117,689 s23.822
Low -_- -o - - o0 ' -_
LOW L - --
10 0 0 0 0 0 0 0 0 0 0 - _ 0
- 0,03 1 0 0 0 0 _ J 0 1 0 0 030 0 0 0 0 0 0 0 0 __ 000
-25 0 , 0 e t 0 0 0 0 0 0 0
15 0 0 0 0 0 0 0 o_ _ 0_ _ _ _ _
_~ _ 011 --- 0t e
1 0 0 0 0 0.- 0 0 0 00 0003 27 _33 41.712 100 2.387 1 1 4.000 1.325 3,831 1.5 3.9
0.3 62 76 51.558 100 5,47 1 3 *4.000 3975 8775_ 437 3
0.03 139 169 73.12 100 12.225 - a 4.000 7.50 -19,624 98.119 688.830Unit Rates and - 615abt1 FiRACIER Ot00Pef 4220*Rn2 9 atwno o 1.256 114.04M~ Pa 1.32% perueqa Cs"uo btok ColsIM -Psil ot
Mbede~ O w~a " g u ~ dis ssa IL M Ca~ o l dispoald al IL*%#* n~cem ctINotes surita Wmg reacor 4 bell~hs"w dolsool ladlay. Oalf*lr LW dispossal Suilities fer
M d 5 W ie i. .010fl 3;,Ia l dl0sp 1 1taol1uY. I. W. M on t-~3:29.t54 f. W fW 95.t erdy *601at' . a2uc& 104 d 1AaM wp. IV.L
t'uruPort erd.
Pagei 2 of 3

Table C.].
3 Calculated Costs and Other Paraneers for Remediation of Contaminnated Soil at the Referee Nuclear Power Plant(Unresitricled Land Use, With Soil Washing)
I-0o
0n
I - - - 1 - m ----- -Tots i &Se Total 501 R0medl3toon l WCall Total
Residual Dose Vokw 0 010/1g-3 0 $6011t'3 0 1 lt-3 SoiiW a Sil SeallvXOV n Total Soim OUpaaiwalRot. Di3posed Disposal Costs Disposal Cost Disposal Costs Labor Labor qamedil8L0n Labor Dose
nwwwnr mn3 _ _ _ $ m__ br man-v h p"Solrnem
HIGH -
100 10 54,1S2 67,237 170,155 4 39 43 4
60 14 60,704 81.620 22B,7Bj __ 5S 61 6
30 a8 67,045 94.268 280.264 7 71 79 8
25 19 8.663 97,483 293,918 8 76 83 8
15 21 72,553 10523 326,738 9 85 94 9
10 23 76.161 113,763 358,510 10 94 103 10
3 34 94.67 151.763 515,13 15 139 153 16
0.3 1 138.158 241,294 885,596 26 246 272 27
0.03 74 183.980 285,914 1.070.211 31 300 331 33
MEDIUM.10 0 0 0 0 0 0 0
60C 7 50,242 59.443 137,160 3 30 33 _ _3
3C 14 60,400 81,014 224.195 6 55 60 6
26 15 62,125 84,453 238.757 6 59 65 7
1 6 68.637 93,446 278.827 7 70 77 _ _
1j 19 68.909 89.968 304.437 a 78 88 9 -
3 24 78-445 118,305 377,783 10 99 110 11
0.3 49 118.777 201,341 720,739 21 199 219 22
0.03 67 147.752 261,741 987.874 28 270 298 30
LOW , .LW0 0 0 0 0 .___
00 _° 0 0 0 0 0 ° 0
0 0 0 0 0 0 030 g . 000
26 0 0 0 0 0 0 0 0
15 -0 0 0 0 0 0 0 0
10 . 0 0 0 0 0 0 0
_6.017 70°94 lasS,891 G 44 49 G
0. 25 79.033 119,476 382.741 11 101 111 11
0.03 56 129,532 224,102 812.813 24 225 249 2S
.am la o.0t% em' m 3w tab"~sm
Notes 4.1 wdow I
VOI. OM .VOL.1 ias masad
Page 3 01 311A1

Table C.12
Calculated Costs and Other Parameters for Rernediation of Contaminated Soil nl the Reference Nuclear Power Plant(Unrestricted Land Use, Without Son Washing)
'0
Conhm Sit aow- el Totw S.! kh SonlFleldu Does Std Sit. Sol Site Sol Buii J ild Sl Voumen Excavat
Re Sol Are* Dh Sel l Dsowt Vdlume RNod C*ts*e , ftt2 em m3 e3 m' m3
HIGH ____ - - -
-100 3.3N 9 ._ 3.3 1 5 24 5,70760 3,000 4.8 1 3 4.6 21 304 ,4930 3 000 5.9 16a 5.9 27 44 10,316
25 3.000 8.2 17 .2 29 46 10.893
1_ 3__00_ 7.0 20 7.0 33 52 12,283
10 3.000 7.8 22 7.8 36 BE 13t5733 3,000 11.5 32 11.5 54 86 20.151
0.3 3,000 20.5 57 20.5 !85 152 35.729
0.03 a.ooo 24.9 89 24.9 1i1 185 43.492M!DUM- - - - -- _ _
100 3.000 0.0 0 0.0 0 0 060 3.000 2.5 7 2.7 5 t is 1 4.31030 3.000 4.5 13 4.5 21 34 7,94025 3,000 4.9 14 4.9 23 36 8;55715 3,000 5.8 le 5.8 27 43 10,16910 3,000 I 18 6.5 30 48 11.339
3 3,000 8.2 23 8.2 38 61 14,3890.3 3.000 16.8 46 16.5 77 123 28,803
0.03 3.000 22.4 62 22.4 104 167 39.158LOW -.
100 3 0.0 O 0.0 0 0 O60 3.000 0.0 0 0.0 0 0 030 3.000 0.0 0 0.0 0 0 025 3.000 0.0 0 0.0 0 0 0
15 300 0.0 0 0.0 0 0 010 3.000 0.0 0 0.0 0 0 0
3 3.000 3.6 10 3.6 17 27 6,3740.3 3.000- 2S 8.4j 23 14 599
0.03 3,000 18.7 52 18.7 87 139 32.646
Unitii Rte end OHIVSdfl O~thUId f 2S t Wb0Sflt. "11i ~tfotes proh fr~ d Mlhk°°
betw ft121
Pegs I of 3
z
ra0%

Table C. 1.2.
Calculated Costs and Other Parnmeters for Reinedialion of Contaminated Soil at the Reference Nuclear Power Plant(Unresricted Land Use, Without Soil Washing)
z
Q
0o
- - - .-- -ur-~Soi Soa Tianapoet Tranepoit Soil Soil
TOtal Sol Soo Naksoe Packaghring Load,. Loads, Tiansporut Tuspart SoN Soil Soi Disposal
Residual Dooe Volune Total Soil Woa~n Coast. Cost.. 8.26 Gondols Truck Costs. Cost. Disposal Costs Dispoal Costs Costs @
Rat* Removed Weight Costs Gondois Car Boxes cars Loads Rail Truk 0 01011t3 0 66 It'3 *36091t-3
_Wontt/w W-3 MT . I . cas ITtucke _ _ II __
HIGHI100 24 30 0 100 5,343 1 3 4,000 3,975 8,77 42,883 300,179
60 34 42 O 100 7,535 1 4 4,000 S,300 12.095 60,476 423,332
30 44 _ 53 100 9,6SB 1 5 4,000 B,625 16,500 77,S02 S42.517
25 4( se - . 100 10.198 1 _ 4.000 6.625 16,370 81.848 572.934
15 S' 64 0 100 11,499 1 5 4.000 8,625 10,4S9 92,293 646,04S
10 S e 70 0 100 12,706 1 6 4,000._ 7.950 20,396 141.902 713974
3 of 104 O 200 18.864 2 8 8a000 10,600 30,2861 J ]407 1,059,846
0.3 - 15 is 1S O 300 33,449 3 14 12,000 18,550 53,692 268.459 1,879,215
0.03 lSi_ 228 O 300 40.716 3 1S 12,000 23,860 65,3S8 326,790 2.287 530
MEDIUM ___
100 -O- O O O O O O O 0 060 -l18 22 O 100 4,03S 1 2 4,000 2.650 6,476 32.382 226,676
30 34 41 0 100 7 433 1 4 4,000 5,300 11_932 417_B12
2 36 44 0 100 8.011 1 4 .A4.000 S,300 12.859 64,293 4S0 052
15 .43 O3 100 9,S20 1 4 4.000 5,300 _ 15,282 76.409 534,860
10 48 S9 10,615S 1 5 4,000 6.625_ 17,039 85,195 - 596,367
3 1 7B 100 13,471 1 6 . 4,000 7.950 21,623 108,116 756;809
0.3 123 149 O 200 26.964 2 12 8 1B,900 43,283 216.416 JAI±914
0.03 167 203 0 300 36.659 3 16 12.000 21.200 58,844 294.222 2 9,55
LOW -° - -I ° 'I °-'2 2 2 °
100 0 0 0 0 0 0 0 0 0 0 0 0
__ - °-- - °60 0. 0 0 - 0 0 0 0 030 1 0. 0.. 0 0 0 0 0 0 0 0 -
25 0 0 0 0 0 0 0 0 0 0 0
10 0 0 0 0 0 0 0 0 0 0 0- _ _
27 33 0 100 967 1 3 4,000 39 9_578 47,890 335,233
0.3 62 76 0 100 13.667 1 6 4,000 7,9SO 21,939 109 693 767,854
8139 169 O 30,S63 2 13 8,000 17,22S 49,059 245.296 1,717.075_______ B.. A*100.,. *22201m2 ASI Id 5 7.2 f l4sxo* 511 IAU... .. = _
Unit Rates andNotes
I'm WWII .FeACLMeR" w - -.- ,golade iv le
NW cwaan OEr
sea W
roe"
aendoIa 'dew I lead
4 boEats
20.134 Peibid
G" srace r I b06 4loooa at 1fWdibeol bedity.
trimpoft wai
sulowg LLWdiaosi Ieitv
60111'3. StucWa00 Gy.
ressibe l cot .s
defsuul C"im4s ItelAW. $3601tt3;
truck tnortt #*.
-I --. I
Page 2 of 3

* E t* * t#
Tnjte C. 1.2. Calculated Costs and Other Paraneters for Remediation ot Contaminated Soil at the Referee Nuclea Power Plant(Unrestricted Land Use, Without Soll Washing)
Total SoM Totd S Reffdlit" Costs TotallevIdual De... Volme 0 Otm'3 0 160iot'3 0 eoW' * Solt W*f t ETmten Totd So! Occupatlonal
net. Dpotd Dhptio Costs Dlseld Cade DhpoEMS Costs Labor _ DnonLabor ones
gywetmy m-3 I I 9 mnhr man-hr Manhr _ ma f
HIGH100 24 1.8384 57,s0o 315.204 0 39 39 4G0 34 24.244 81,360 444.216 0 55 55 a30 44, 29,916 104.099 569,113 0 71 71 725 48 31.363 109.564 60.4 0 75 75 a
15 52 34,842 122,700 7e se 0 8 7ss a10 s 398,069 138.211 749,103 0 94 94 9
3 86 58.632 201.022 1.103.461 0 139 139 14
0.3 152 101,721 35e.187 1.966.943 0 246 246 25
0.03 135 8 121.150 434 149 2,395,589 0 300 300 _ 30
MEDIUM100 0 0 ....... 0 0 0. ____
j_ _ o_ 0 o0 * oo60 is 14s8 - 43.377 237.870 0 30 30 330 34 23,972 80, 32 438.286 0 55 55 _ _5
25 36 25.515 SUM 471.919 0 99a_ 5 e
15 43 29,51 101.398 559,849 0 70 7 71C 48 32,478 113,774 824,946 o 0 78 78 a
40112 143.925 792.619 0 99 10___112 jl.. 158810 199 199 1
0.3 123 80.28 288s8 1,5Bs6s5l o 199 199 200.03 1.7 110.302 391,239 2.156.572 0 270 270 27
LOW -_°°°°°°-_100 0. 0 .0 0 0 0 0 0
3a 0 0 0 0 0 0 0 030 0. 0 0 0 0 0 0 0
25 0 0- 0 0 0 0
15 0 0 0 0 0 0 0 0
10 0 0 0 0 0 0 0 0
3 27 20.052 64.206 351,549 0 44 44 4
0.3 e2 40,638 145.910 804.070 0 101 101 100.03 139 89,906 325,731 1,797,509 0 225 225 23
- 0Ot? MsnHv PM 1.82"an4w Ps"Unit Rates and_0 7ir * 2r _o mw n
Not". IMSsmPq
__ - -3-
zU9-p4
AR

Thie C.1.3.
Z Calculated Costs and Other Parameters for Remediatlon of Contaminated Soil at the Reference Nuclear Power Plant0 (Restricted Land Use, With Soal Washing)
0-6
-A
Cotamin- Site U blow. Below- TOWl W1; Is SWR& de DOe Mod Slte F u1 SiteU Sol BBUIdin Buidin Soil Voknel Ex~vatboo
Rale Soll Are D. nth Velum So Depth WU- Removed Coscatemit 1t'2 cGa 3- can m'3 _
HIGH .I=100 3.000 0.0 0 0.0 0 0 0
80 3.000 0.0 0 0.0 0 0 0
30 3.000 0.0 0 0.0 0 0 0
26 300 0.0 0 0.0 0 0 015 3.000 0.0 O 0.0 0 0 010 3,000 1.6 4 1.6 7 12 2,8083 3,000 6.2 5 I 5.2 24 39 9.089
0.3 3.000 8.3 23 8.3 39 S2 14,S23
0.03 3,000 10.7 30 10.7 50 79 18.673
MEDIUM _ _ _
100 3.000 0.0 0 0.0- 0 0 0
60 3,000 0.0 0 0.0 0 0 030 3.000 0.0 0 0.0 0 0 0
25 3,000 0.0 0 0.0 0 0 0
____16 0 .02 0 0.0 0 0 0106 3 .2 0.0 O 0.0 0 0 0
3 3,000 3.7 10 3.7 17 28 084940.3 300 7.5 21 .7.6 36 66 _13,14S
0.03 3,000 9.9 28 9.9 48 74 17.309
1 0 0 j Q . .2 Q .... . 0 _ 0 o60 3,000 0.0 0 0.0 0 0 030 3,000 0.0 0 0.0 0 _2E 3,000 0.0 0 0.0 0 0 0
16 3.000 0.0 0 0.0 0 0 0
1_ 3,000 0.0 0 0.0 0 0 03 3,000 0.0 0 0.0 0 0 _ 0 -
0.3 3,000 2.3 2.3- 11 17 4.024
0.03 3,000 7.0 19 7.0 32 62 12.166
Unit Rate and _ e Oblse 2 .i 62-Notee ssiE oooo
II-Iw lt21
Pege 1 o 3'I.

.54
Tabecu. 13Calculated Costs and Other Parameters for Remkiatlon of Contaminated Soil at the Referenee Nudear Power Plant(Restricted Land Use, With Soil Washing)
I.-so
D."
- -_ _-sr -r-s..N SoJ Trenspost Trento" lol 8e son
Total SOi SON PAkagn Packagh Loads, Loads. Transport Transport son S oN SON Disposal
Residual Doe Voluhm Total Soil Wiashi Costa. Costs. 825 Gondola Truck Coste. Coots. Disposal Covea isposal Costa Costs
note s "q- Wbt Cots GondsC Does Cue Loads 1n, Tftck 3 4350/ f #lO ft _ sonrt'3ftwMlyr m'3 MT , _ ow_ l e se Trukek _ _4_ ________,
HIGH - - - - - -
100 0 0 0 0 0 0 0 0 0 0
60 0 0 0 0 0 0 0 0 0 0 0 030 0 0 0 0 0 0 0 0 0000
- - O - - _ O -O O _
263.... .... 9. ... 9....0 0 0 0oo 027~~5 0 0. 0..., 0 0 __0 0 0. 0 0 0
'' "' 100 102 __-
I 10 1 2 .-5 37,444 AM_ _ I 4,000 1.325 ________ 8,440 59 0
3 39 47 44,962 100 .43 1 2 _ 000 2,650 5,463 27 9316 191,209
. 0.3: 75 51 49J82 103 484 1 3 4 t0)00O 3 9775 _ ,04 5.01 27,2
0.3 62 75 1.o 17 1O O5.438 1,_ 3825 °730 43.649 l3058545
0.03 79 97 6 4 33 5 100 4JbS2 1 3 4.000 350 11.225 5.123 6 392,860
100 0 0 0 0 0 0 0 0 0 0 0 0
60 0. 0 Q 0 0 0 0 0 0 0 0 030 Q.9 0. 0., 0 0 0 0 0 0 0 0 0
25 0 0 0 0 0 0 0 0 0 0 0 0
0 0 0 0 0 0 0 0 0 0 0 0
1 0 0 0 0 0 0 0 0 ____ ____
3 28 34 41.856 j99.. 2.432- 1 2 __!J0Q 2.850 3.903 19.517 136.621
o.3 5*i6 6ii 4-9.822 10 4.924 I 3 4 000 -375 7.904 39.518 276.6290.3 74 ___4__2__ 048 - - 3 .. 975 10.404 52.021 384,150
LOW - --- -_ _ _
0 ) 0 a_0 0 0 0 0 0 0 0 0
60 0 __ 0 f..... 0 0 0 09 0 0 0 030 ~ - 9... 9... 0 00 0 0 000
25030.... 9. 0 0 000 0 015 0 0 0 0 0 0 0 0____ ____
2 D, 00 010I 0 0 0 0 0 0 0 0 0 0 0
30 2 . 0.. 0. 0 0 0 0 - 0 0 0 0
0.3 17 ...2... 38,899 .j00.. 1I .I0I 1 4.000 -- 1.325 2.419 12.093 84,6540.3 5 -4~ ... J 1. 4.652 I 4000 2.650 7.307 364 ______
52 6 4963 ,0 14.0 5.3 255,738.~** ael'rm &atoom I 22Obm2 56 Iso. at 1.200 1 4.00 Pff Si$.326petnuk Ce jostata.hat I C~........i..
Unit Rates andNotes
IV 1l. J r- -as-
momh I.- baH-5- kV0 CrtlAdsor
SON P. fedaw a bymhw.
k Seed. so29.164 be
whead
Adal takr loa dieosl stittySuarpmt felly.
61001t-3:teltanupr W
-- - As1l
gernsechew1 ^@p
dispsal t fadit.1601n2;. Duckftanpalt sedn.
l-Awe im compactdisAposa fadades for
UW. $360I'3:idck tompazt IAd.I
l - I - I - . - . - K l l
Page 2 of 3

able C. 1.3.zCalculated Cosls and Other Parameters ror Reaiediation of ConIaininated Soil at the Reference Nuclear Power Plan,
(Restricted Land Use, With Soil Washing)
a-1
0~
q4-a1
Total S8 Tobl So a _ omedlation Cols TotalReSOu4 Doe Voumw 0 1etwira 0 $s0jir3 0 e35W0t-3 S Bl Washirg SGO Excavation Total Oacupaoona
Asia ___ Ois d Disposal Costs Dlwposa Costs Disposal costs Labor - tabor Rtndlisin Lbor DoR*Mnvr m- i _ -,us'4, m M~ Manrv
HIGH _100 0 0 0 0 0 0 0 os0 0 0 0 0 0 0 0 I30 0 0 0 0 0 0 0 026 0 0 0 0 0 o 0 015 0 0 0 0 0 0 0 0
'f O O 48,041 51,070 101,713 2 19 21 23 15 63,614 87,419 251.313 7 63 69 7
0.3 25 78,820 119.053 380.949 11 100 111 1_t0.03 .32 90.433 142M199 478,936 _ t129 _ 4Z 14 |- _ _ _ _ _1 9142 14
MEDIUM __ ___
10 0 0 0 0 0 0 0 0s0 0 0 0 0 0 0 0030 0O 0 0 0 0 025 0 0 O 0 0 0 0 0 _
15 0 0 0 0 0 0 010 0 0 0 0 0 0 O 03 11 56,353 72.949 190.053 S 45 49
0.3 22 74.974 111,388 348,499 10 91 100 100.03 29 8.6B15 134,689 446,717 13_ 119 132 13
LOW __ _ _ _ _
100 0 0 0 0 0 0 0 060 0 0 0 0 0 0 0 030 0 0 0 0 0 0 a __ _ _ _
26 O 0 0 0 0 0 0 0i5 0 0 0 0 0 0 0 010 0 0 0 0 0 0 0 03 0 ... L....0 0 0 0 0 _ _ _ _ _ _ _ _
0.3 7 49.442 57.848 130.408 3 283130.03 21 1 72.198 104,626 323,729 9 84 939
Nob.Rte m3 ~&4 % 3 O Ivsbal
v614 tmk*UvtIVOL Is folasaid
0. ~Pago 3 of 3lo

vj a
Tuhle C.I .4. Calculated Costs and Other Pnrameters for Renedlation of Contaminated Soll at the Reference Nudlear Power Plant(Restricled Land Use, Without Soil Washing)
p
'-A
.__ - _ __--
Contemin- She Below. 0e0w. TotMl Sell tStI SoolRflsidlut Do$* oted SWt SoNl Sh So0 BOln Bdg Soll Volumo Exoevetton
Ret.- SoN An* Dwh Vobm. 8d Drth Vobme Reowed co"t e3 m'3 eam m'3 m-3
HIGH100 3,000 0.0 0 0.0 0 0 060 3 000 0.0 0 0.0 0 0 0
30 3000 0.0 0 0.0 O 0 025 3.000 0.0 0 .0.0 0 0 0
I18 3.000 0.0 0 .0.0 0 0 0
10 3.000 IA6 4 1.6 7 1 2 2.808i_ _ 3 i.000 5.2 15 5.2 24 39 9.089
0.3 3.000 - 8.3 23 8.3 39 62 14.5230.03 3.000 10.7 30 10.7 50 79 18J 73
MEDIUM -.100 3.000 0.0 0 0.0 0 0 060 3.000 0.0 0 0.0 0 0 030 3 000 0.0 0 0.0 0 0 0
__ _25 ~ . 0.0 0 0.0 0 0 015 3000 0.0 0 0.0 0 0 0
10 3J000 0.0 0 0.0.- 0 0 0
3 3,00 3.7 10 3.7 17 28 6.494
0.3 3.000 7.5 21 25 56 13 149
0o02 3,000 9.9 28 9.9 46 74 17.309
LOW -_ _
100 3.000 0.0 0 0.0 0 0 0
60 3,0C20 0.0 0 0.0 0 0 0
30 3.000 0.0 0 0.0 0 0 025 3.000 0.0 0 0.0 0 0 0
1' 3.000 o.o o o.o Q_ _ 010 3a000 0.0 0 0.0 o 0 0
3 3000 0.0 0 0.0 0 0 00.3 3,000 2.3 a 2.3 11 17 4.024
0.0 3,000 7.0 19 7.0 32 52 12.156Urdt Rateo and w 3%SWl
Notes "oft ed MANhboo" h'21
Pu" 1 of 3
-o~h3

z
'.0
0~
0'~
Table-C. A1. Calculated Costs and Oiller Paramnelers for Remiediation of Contamilnaled Soil at the Reference Nuclear Power Plant(Restricted Land Use, Without Soil Washing)
So01 SON Transport Transpoft SON sonTotal So. Soil Packaging Packaging Loads, Loads. Tranapoit Traspolt Son Soi sOi Disposal
Rfbldual Dero Volume Total SOi W6hhn Coats. Costs. 8-26 Gondola Tnr-k Costs Coats. Dispolal Costs Diaposal Cost, tools @
Rats Xmowd Welaht Coal Gondola Ca Baoxes Care toads Rail Truck @ t10/t'3 @ $601 t3 360/lh3m'3 MT I I D cars I Trucks
HIGH O -__ -
100 0 0 0 0 0 0 0 0 0 0 00
600 0 0 0 0 0 0 0 0 0
3 00 .0 0 0 0 0 0 0 0 o
25 0 0 0 0 0 0 0 0 0 0
156 0 0 0 ... 0 0 0 I0 0 0 0 0 01 0 L.2 15 0 100 2,829 1 4,000 2.650 4.220 21.01 14770
3 39 47 O 100 8,S08 1 4 4.000 6,300 13,658 68,289 478.023
0.3 62 75 0 100 13,596 1 6 4,000 7,950 21,825 109,123 763,§83
0.03 79 9 0 0 200 17.482 2 8 8.000 10.600 28,061 140.307 982i4s
MEDIUM - - - Al -
28 0 0 0 0 0 0 0 0 0 0 0 0
60 0 0 0 0 0 0 0 0 0 0 0 0
30 74 90 0 0 0 0 0 0 0 0 10,5 91
25 0 0 0 0 0 0 0 0 0 0 .0 -
0is0 0 0 0 0 0 0 0 0
10 0 0 0 0 0 0 0 0 0 0 0 _ _
3 28 34 0 100 6 079 1 3 4 12 2- *759790009 . 2 J .
^ @kg- z Opr $2An oc79 ttr ,69$1.5733cwr ts ~e trh Cat1 ti" e
t0 100 1.2304 1 6 4 79 9 9 I It bdL oOW 0.3 04 2 7 8.000 9.276 26.0li 130.054 910r375
10, 0 0 0 r 0 0 0 0 0 0 0 00
60 0 0 0 0 0 0 0 0 0 0 0 ~30 0 0 0 0 0 0 0 0 0 0 0 _
25 0 0 0 0 0 0 0 0 0 0 0
16 0 0 0 0 0 0 0 0 000010 0 ___ _ _ _
0 0 0 0 0 0 0 0 0 0 03 0 0.. 0 0 0 .. 0 0 0 0 0 00
0.3 17j. 21 1 0 i... 9 3.767 1 2 4.000 2.650 6.047 30.233 211j6 40.03 52 63 1 0 100 11,380 1 6 4,000 6.825 18,287 91,335 639.34S
U rit R ates and -'~~8 t * . 8 e o o . l2 6 ii s d o t l Ij CeM a. . in.Not s Rl someals GMt ler SON Par b*A es an garmdd 164cow lo 4 a a0 I at uA~tW .sm Gac das"oa &I lta keu~No e Aadd pl"I gjpw iilcat 4 boxa5Auc cliposal 1acbty. esylatrv 11W dispaeI lacwikea Ome
wilcoeretd... *141h'3. tail disaoo es a~ls h. UK1W. 365oae3.29.1im VA Vt' 6a n, eaIady 960114'3; trusk trucke a~upwg wndy.
Pau. 2 of 3
&AIL

;q g'l. V
Tnhle C. 1.4. Calculated Costs and Other Parameters for Remid~ition of Contaminated Soil at the Reference Nuclear Power Plant(Restricted Land Use, Without SoNi Washing)
-a
Ao%0ON
Tot d o lhd emadis Oed Totalpeemdtu Dole Vohme @ 010/ft3 0 06ft'S3 0 93somti3 Soi W ,sin ol. Excavation Total So" OupationalRdt, p Dsped Obedl Cos Nl Labor Labot Ran-didlon I. oem|
nvamW w mn 3 I I S mn w na 4w men-WHIGH -
100 0 0 0 0 -- 0- 0 0 O60 0 0 0 0 0 0 0 030 O 0- 0 .0 0 0 0 025 0 0 0 0 0 0 0 O15 O 0 0 0 0 o o O10 2 11.129 29.189 155,798 0 19 19 23 39 28.846 91,186 500,921 0 63 63 -0.3 62 40,448 14S.193 .799,932 0 100 10t to0.03 79 64,935 187.062 1.028,904 0 129 129 _ 13
M EOIM -D.
100 0 .0 0 0 0 0 0so 0 0 0 0 0 o _ 030 O 0 0 0 0 0 o _ _ _ _O25 O0 0 0 0 0 0 015 0 0 0 0 0 0 0 010 0 0 0 0 0 0 0 0
3 2t . 20,353 O65341 35!101 0 45 45 40.3 56 I 37-008 132.204 724.91 . 0 91 - 91
0.03 74 51, 520 172,11 41 9 3 163O 0 . 119 12LOW -
100 0 0 0 0 0 0 0 0
30 00 0 0 0 0 0 0
25 0 0 0 0 0 0 0 015 0 -- 0 0 0 0 0 0 010 0 0 0 0 0 0 o 0
3 00 0 0 0 0 0 00.3 17 i 14 _ 40,674 7 222.075 0 28 28 30 .03 52 5 34,52334,S2 3 2 4 609.506 0 8484 8
4)s e - m u- - --.*~. 4'~~VtW .I lUBl man-UnitM nates and
Notes I
-..I F- on'3 D I l a b .,
_ I - I. I l
Page 3 of 3
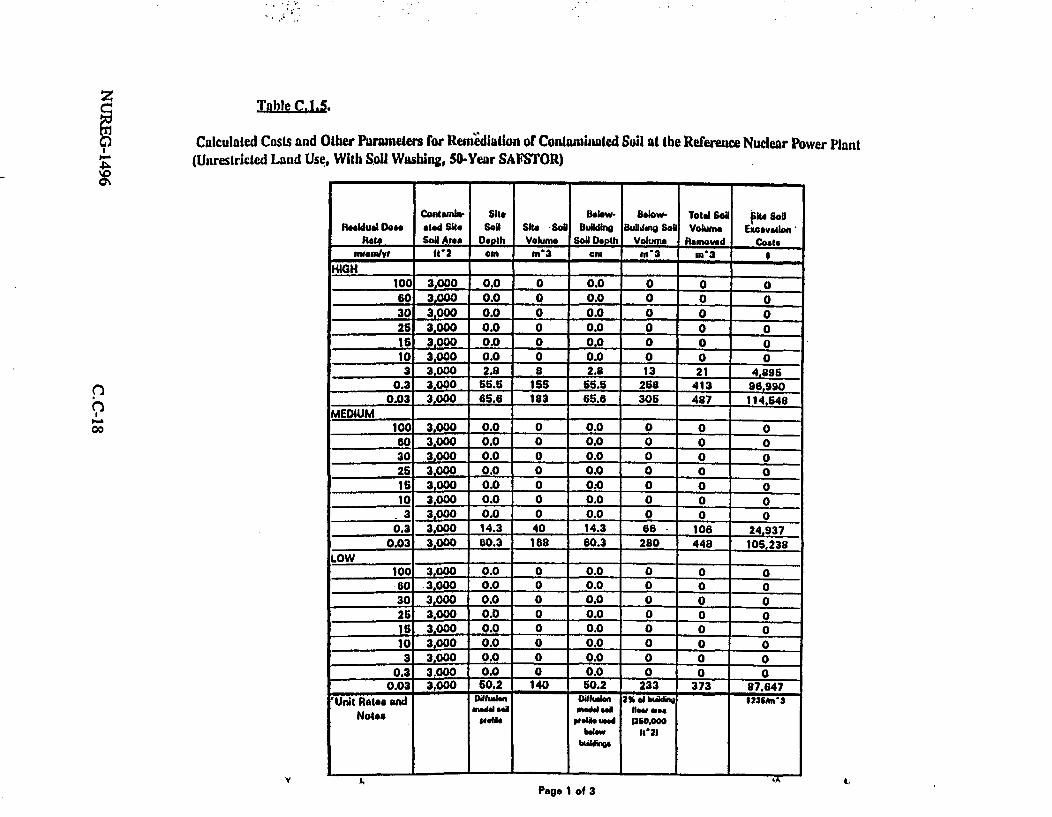
Tahle C. 1.5.
0 Calculated Costs and Other Purameters for Resnedialion of Conlaminaled Soil at the Reference Nuclear Power Plant. (Unrestricled Land Use, With Soil Washing, 50-Year SAMSTOR)_0
WN
x
00
ContsmIa Site Below- Below- Total S6l Pk. S.osloulDo d Site 5* Sa Site Soil Buildin Bidi Soa Voiwn Excavation
Ratm SoIl Ates Death Volme Sol Depth Volune Removed Costsvemnlyr l'2 cm m-3 cm m'3 m-3
HIGH I100 3,000 0.0 0 0.0 0 0 060 3,000 0.0 0 0.0 0 0 030 3,000 0.0 0 0.0 0 0 025 3,000 0.0 0 0.0 0 0 015 3.000 0.0 0 0.0 0 0 0
10 3.000 0.0 0 0.0 0 0 03 3.000 2.8 8 2.8 13 21 4,895
0.3 3.000 66.5 155 66.5 268 413 96 9900.03 3.000 65.6 183 65.6 305 487 114 648
MEDIUM __11__4
100 3.000 0.0 0 0. 0 00 0
60 3.000 0.0 0 0.0 0 0 030 3,000 0.0 0 0.0 0 0 026 3,000 0.0 0 0.0 0 0 016 3,000 0.0 0 0.0 0 0 010 3,000 0.0 0 0.0 0 0 03 3,000 0.0 0 0.0 0 0 0
0.3 3,000 14.3 40 14.3 66 106 24.9370.03 3,000 60.3 188 60.3 280 448 1OS,238
LOW__ _ __ _ _
100 3.000 0.0 0 0.0 0 0 060 -3.000 0.0 0 0.0 0 0 030 3.000 0.0 0 0.0 0 0 025 3.000 0.0 0 0.0 0 0 0
I6 3.000 0.0 0 0.0 0 0 010 3.000 0.0 0 0.0 0 0 0
3 3.000 0.0 0 0.0 0 0 00.3 3.000 0.0 0 0.0 0 0 0
0.03 3,000 50.2 140 50.2 233 373 87,647
'Unit Rates end - ahk - DJUiWI' 2% at kift $236/m'SNotes NW- -01"utd 12*0A*
betew" It21
K LAPage 1 of 3
V I,

Table C.1.S. Calculated Costs and Other Parameters for Remediation of Contaminated Soil at the Reference Nuclear Power Plant(Unrestricted Land Use, With Soil Washing, SO-Year SAFSTOR)
~0
I .'I.
1 MoA Traspoil Ta Spoit soa sonTotal SON . Sol Ps agne Pa i 1 L ads, Loads, Tianpot Tr spotf ! - so o o
IsInual Doe. V ohu e Total son Wa"n Cest,. Costs. 8-25 ondols Tnlot Codte. C ost. Disposl Cost, Dhpossi osalls cosot @Rste R Ewd Coots Gondoa Car lons. Caeq Load.e man Tnit 0 /Oitts _ 3 3501113
m',1 Iw3 MT * #Gm a DThwits S _._._ S _ -_ .=
-i ~ - - O - - - O_ __HIGH ---- _ _ _ --- _ _ _ _
100 0 9 0 0 0 0 0 0 0 0 0
60 0 0 0 0 0 0 0 0 0 0 0 030 0 0 0 0 0 0 0 0O o 0 0 025 0 0 0 0 . ........ 0 0 .0 0 0 0 0015 0 0 0 0 0 0 0 0 0 0- 0010 .0..... ... 0 0 0 0 0 0 0 O'0
_3 21 25 39,942 100 1,833 1 1 4.000 1.325 242 147_1. 2,9422 - 102,9820.3 413 503 150,183 300 36 320 3 16 12,000 21,200 58,301 291 503 2.040 519
0.03 4i87 594 171,201 300 42 895 3 18 12.000 23,850 as i55 344.273 2;409.912
MEDIUM -_ _ _ _ _ 00000 0 0 0 _ _ _
100 0 0 0 0 0 0 ~ 0 0 O 0 _ __ __ _ __ __
30 - - 'O 0 0- 0 0II _ _ _ O O _ O 0 0 0 0 0
30- 9.... 9...... 039.. . 0 -_ 0 O 0 4 00 0,o 04 f 04 0s- SZ ,3__ __ I 0 0 * 0 0 0 0 0 0 0 0 0
_ _ 348 56 te~s o 9,0 3- --7 1,0 255_ a 5 - - 1,9 22401|
LOW 0 0 0_ _ _0 _ _
10 0 0 0 0 0 0 0 0 0 0 0 0
JO 3 0 0 0 0 0 0 0 0 0 0 _ __
25i 10 129t 83 1 M
0. 0 2 393 100 9,338 1 4 -.300 14---__ __ __ _ -- -- . .0 0 .3 0 4. 9074,94 8 524f634
0.03 448 54i 160.056 300 39.408 3 17 12.000 2252 - 3216.4: 522 4.041
LOW 0 __a _ 0 0 0 0 0 0 0
s0 0 0 0 0 0 0 0 0 0 0 0 030 9..... 9 .... .. . .. . .9 . .. * 0 0 0 0 0 0 0 025 0 0 0 0 0 _ _ _ _ _ _ _ _ _ _ _ _ _0
___ 50 0 0 0 0 0 0 0 0 0 0 010 000 0 0 0 0 0 0 000
. fHSH w^chtoo 0w 2"- 0 6 0"i72 4 ,^_wScnt ~1::N-3 0 0 0 .o0 0 0 0 0 0 0 0
0.3 0 0 9 . 9...0 0 0 0 0 __ __ __
F0.03 373 454 138.999 300 32,821 3 1 14 I 12.000'. 18.550 52 4 I- 6--.2 0.4.5~n~rvt fitn m *20'Ma2 0a ta ofi n-29a1 1..000a - -. I -e
Unit Rates endNotes
F.l a.Mab.
O=w rW ddse,#pleata
Bsar
w--wn_ _ I4 Po
go%* 4 HWone
29.1a4 lbfols
,era*. tallow leadIllose d a tW
*10/3: tallIt emanp ##
"01106s" dplal a-h*V~ LLWaimi tin r tW
dItpevel ldpot.
950hu3p ut k,
tuqwae hcompate-futwe WCO&'I
doat4e lecosas gs11W. 626011,2;
Cluck tevwups.t sy.I
_________ I I I I
Page 2 of 3

z
.
%0CN
Table C. 1.5. Calculated Costs and Other Parameters for Remedialion of Contaminaled Soil at the Reference Nuclear Power Plant(Unrestricted Lund Use, With Soil Washing, SO-Year SAMOR)
Total Sol Tota Sol Ftemadlilon Casts Total
Roamusl Dors Volume @ S10/ft3 p s&n!if3 1 *35Q0/f3 Sol Washing Sol Exeoavaton Total SoN OccupationalRate Dlsposed Disposal Costs DOlpos I Costs Disposal Costs Labor Labor Re 4ndlatlon labor _Do.
nrvenyr m3 ._ , SS mhr man-hr men-hr pvson-m,.m
H IG H_ _ _ _ _ _ _ _ _
100 0 0 0 0 0 0 O O_°-____60 0 0 0 0 0 0 0 030 0 0 0 0 0 0 o25 0 0 0. 0 0 0 o O
15 0 0 0 0 0 o o10 0 0 0 0 0 O 0 0
3 8 51,879 - -6270 150.978 4 34 37 40.3 165 317,774 596.196 2,345.211 70 069 739 74
0.03 195 368,904 696.767 2.762.406 83 790 873 87
M EDIUM O OO _O _O _O O-10 0 0 0 0 0 0 0 0
60 0 0 0 0 0 -30 _0 O 0 .30 0 0 0 0 0 0 0-
25 00 0 0 0 0 015 0 0 0 0 0 0 0
_______ - °-°°°°°- _____1- o 010 0 0 0 0 0 0 0 --
3 0 0 0 0 0 0 0 00.3 42 107,969 178.456 628.142 18 172 190 19
0.03 179 340,852 643.519 2.641.268- 76 725 802 _ 80
LOW _100 00 0 0 0 0 0so .2... 0 0 0 0 0 0 030 0 0 0 0 0 1 0 0 025 0 0 0 0 0 1 0 0 ___
15 0 0 0 0 0 0 0 010 0 0 0 0 0 0 0.ooooooo._o- 01
3- 0 0 0 0. 0 0 0 o0 3 0 0 0 0 0 0 O
0,03 149 291.630 S41,439 2,121,969 63 604 668 67-4817 - 0.17m-tw paO 1.62 mmI per 0.1 eRn .e mu,-
,eMMUs40% 1 aoNotes of*6441 m
V8l4 *aliko
Pag3 of3 3,

I * '.3* 0a
Tnble C. 1.6. Calculated Costs and Other Parameters for Remedlaton of Contaminated Soil at the Reference Nuclear Power Plant(Unrestricted Land Use,.Without Sofl Washing, S0-Year SAMSTOR)
g(;i3
-Ol- -1 - -e - -w> b
Cantfflhi. Sie MOsW- Mow. Toal Sonl ~fte sofROeldual Dote ated Se son St. So"l uiO Muldig BOil Volume Excavaton
Rat Soil Area . th Voue Sol Vohme ffeflewd Co"ft4 cm-2 m'3 cm m'3 3 -
100 3,000 o.o o 0.0 0 0 060 3,000 0.0 0 0.0 0 0 03 0.0 0 0.0 0 0 025 3.000 0.0 0 0.0 0 0 015 3,000 0.0 0 0.0 0 0 010 3,000 0.0 0 0.0 0 0 0
3 3,000 2.8 8 2.8 13 21 4.8950.3 3.000 55.5 155 55.5 258 413 96,990
0.03 3.000 65.6 183 65.8 305 487 114548MEDIUM - - 0 -
100 3.000 0.0 O 0.0 0 0 O60 3,000 _ 0.0 0 0.0 0 0 030 3,000 _ ).0 0 0.0 0 0 025 3.000 0.0 0 0.0 0 0 01 5 3,000 0.0 0 0.0 0 0 010 3.000- 0.0 O 0.0 0 0 03 3,000 0. 0 0.0 _. ° O 0
0.3 3.000 14.3 140 14.3 66 106 24,9370.03 3.000 o0.3 168 60.3 _ 2800 448 10S,238
100 3,OOOL 0.0 0 2 0.0 0 &A.. 060 3,000 0.0 0 0.0 0 0 030 3.000 0.0 0 0.0 0_ 0 025 3.000 0.0 0 0.0 0 0 015 3.000 0.0 0 0.0 0 0 0
10 3.000 0.0 0 0.0 0 0 0: 3 3.000 0.0 0 0.0 0 0 0
0.3 3.000 0.0 0 .0.0 0 0 00.03 3,000 50.2 140 50.2 233 373 87.647
Unit Rates and Dalkkw 04kf eln 24At of$23e'3Notes fftiW . wd 120w
Peoe 1 of 3
F~
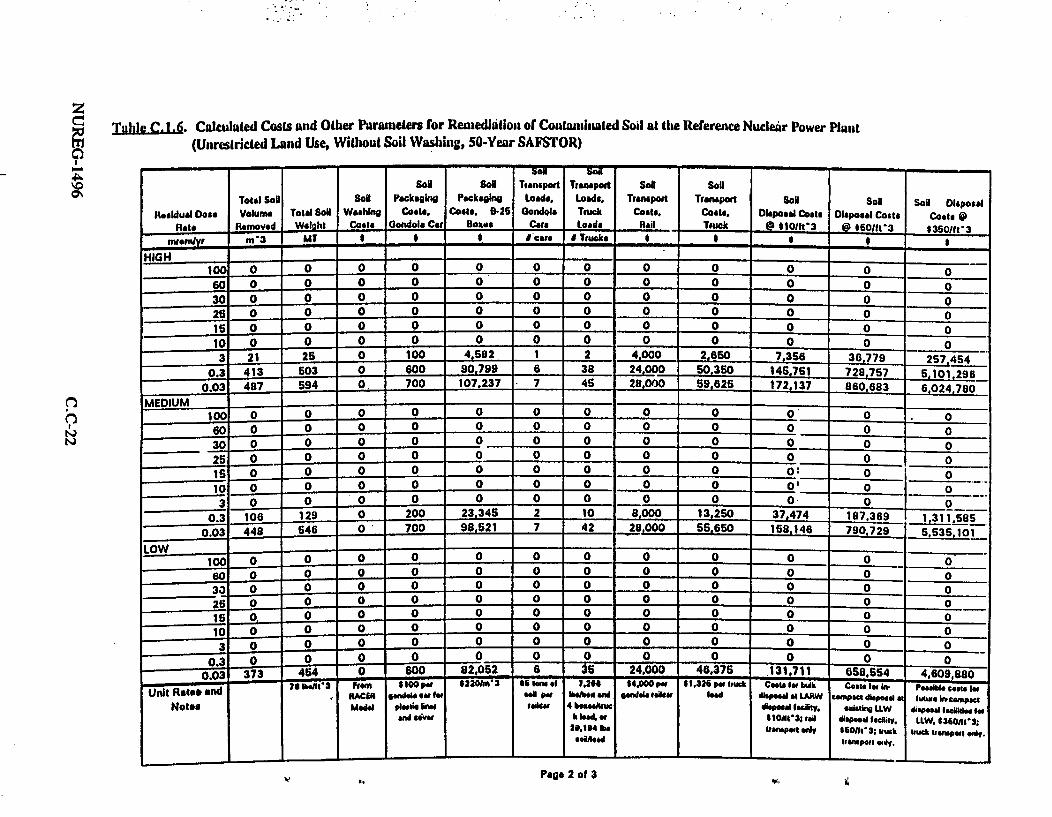
z
9LTahlC.1.6A. Calculated Costs and Other Paraueters for Remediition of Contaminaled Soil al the Reference Nuclear Power Plant
(Unresiricled Land Use, Without Soil Washing, 50-Year SAFSTOR)
Soil Sol Tianaport Transport Sol SoNl
Total Sol Sol Packaging Packaging Loads, Loads, Transpoit Transport Soll Sol Soil Disposal
reidual Dose Volume Total Sol Washing Costs. Costa. 9B25 GondeIa Thick Costs. Coats. Disposal Costs Disposal Costs Coats @
Rate lRmowed Welht Costs Gondola Car Boau Ceres Loads Rail Tiuck @ 6101/t-3 @ *60/1t3 1350*1tt3
nantlymr m- 3 MT #'cas s Tuucks . _ __ __. _ _
HIGH .- -
100 0 0 0 0 0 0 0 0 0 0 0 O60 0 .0. j 0 0 0 0 0 0 0 0 o30 0 0 0....0 0 0 0 0 0 0 0 0
26 0 0 0 0 0 0 0 0 0 1 0 0 -- o16 0 0 0 0 0 0 0 0 0 0 0 0
10 0 0 0 0 0 0 0 0 0 0 0 0
3 21 26 0 100 4,682 1 2 4- 2 , 5 7,356 36,779 2S7 454
0.3 413 503 0 600 90,799 6 38 24,000 50.360 14S,751 75 9 c_ _ _---__ _ _ _ _ -
1 4__ _ _ _ _7 51_ _ _ 7- 2 8 ,7 67 5 .1 0 . 2 9_ 0.03 487 594 0. 700 107,237 7 46 28,000 59.625 172,137 860,683 6.024,780
MEDIUM _ _100 0 0 0 0 0 0 0 0 0 O O 0
60 A...... 2....0 0 0 0 0 0- 0 ~ 0 0
03 0 0 O 0 0 2,4 0 0 0 0 0 0 0
25 0 0 0 0 0 0 0 0 0 0 0
is 0.. 0 0 0 0 0 0 0 - 00
10 0 0 0 0 0 0 0 0 0 0' _
3 _ O O O 0 0 0 0 0 0 O_ _-°_0
0.3 _106 129o . A 200 23.345 2 10 8.00 . 13,250 i 747 .. t t
0.03 448L.. ...46.. 0.~ 700... 98.521 7 42 28.000 66.650 158.146 2Z . ~ j 0
-O ~ ~~ ~ =- --9.2 ,3.0
100 0 0 0 0 0. 0 0 0 0 0 ____
-. -_ -_-__
60 0 0 0 0 0 0 3 0 0 0 0 0303 0 ... Ž. 0 0 0 0 0 0 0 0 0 0
26 0 .. 2.... 0 .. .2 .. .. . 0 0 0 0 0- 0 0 0
15 0. 0 0 0 0 0 0 0 0 0 0 0
10 0 0 0 0 0 0 0 0 0 0 0 0
3 0 0 0 0 0 0 0 0 0 0 0 0
0.3 0 0 0. 0 0 0 0 0 0 0... 0~
0.03 37 454 0 S00 82,052 6 -24,000 48.375 .131,711 858,654 4,609.880U n t et na in l l b d 's U -n=600 M *W 220knm 2 5 gB onem of .2 08 *4.O P." 11,326 5 tw1 u k C aI tb.d s sl n. P a b a,. 1 i
KACIA *earm 5 SW toM &A1 Wa ibaoas N SM oSraoIS failem had disposal 641LAW 901TPS9i diapead a Autd o knCampsAc
Notes Me"a plassi 6nat iailw 4 boxaalnm disposal losily. ealistie L1W disposal lackddm fa
eNW ew, h lead. a 1110014i3;tail alaaaal oClsy, U K. $36014'3;
25.154 lbs tumnpoug a6 y 660AIg ; Uauck tiuck uiampwi 0.rv
soalioad! Iffamponl mDvi.
Page 2 of 3fo

T CL6. Calculated Costs and Other Parameters for Reminlation of Contatninfed Soil at the Referenee Nueslr Power Plant(Unrestricted Land Use, Without Soil Washing, 50-Year SAVOR)
Total sn _ Told So Roe1 tlovn Co Totad
Resluds Does VoOWi 0 #11t'3 - * ISft3 0 13901t'3 SdO WOsin SoN Excwvaton Total Sol Ompationalg0fthpot omhroaad Cor. CDhoo co. Ct hpolCt costd tsbLt Rabor Laborb Do.
wmm m'3 Ru____ _ nwn4w mnntw anl4w b neyvm
HIGH -
100 0 0 0 ° 0 -Or 0 0 0 0 0 0 0
309 Q... 0 a 0 0 0 0 025 0 0 -0. 0 0 0 - 0 0
1 0 0 0 0 °0 0 -10 O O 0 0 0 0 0 0
3 21 _ 165351 48,907 269,681 0 34 34 3
0. 413 267,341 966.896 5,339.436 0 669 des_9 670.03 487 315.385 1.142.093 6.306.190 0 790 790 79
UM _Dt _
100 .9 0 0 0- 0 0 050 . 0 0 0 0 0 0
30 0 0 0 0 0 0 __ _25 0 0(___ 0 0 0 0
15 0 0 0 0 0 0 0 010 0 0 0 0 0 0 ____
3. 0 0 o 0 0 . __
0.3 010 70,811 248.902 1.373.113 _8 0 172 172 - 17
0.03 4 292.094 1.050.137 5.794.510 _ 0 725 725 -73
LCV _ --102 0~ 0 0 0 0 -
60 j.... 0 0 0 0 0 0___30 ..Q.... 025 000 0 0 -0
15 0 0 0 0 0 0 0 0
10 00 0 0 00000 0 0 0 0 0. 0 0
0.3 000 0 0 0 0
0.3 373 243958 874.629 4,825.954 0 6 004 604 O-- -I O.tIPmerft p"I 5.02 wan.w pee
A.\00\
Unit Rates andNotes
m I i- - If bI
I I. 1 . -.
Pee 3 of 3

z
Table C. 1.7. Calculated Cosis and Other Parameters for Reniediation of Contaminated St. il at lhe Reference Nuclear Power Plant(Restricted Land Use, With Soil Washing, S0-Year SAMSTOR)
+6
WA
Contanlnir Sit Wblow Below. Total Soil Silt Sololsoel Do" Mad Uito Soil Sit. Soil Buldi uild Soll Vaium Eoavation
Plto Soil Area Depth Voeb n. Soil Deoth Voh. PAumnowd Costsaw1C ft2 cm m-3 cGn mt3 m-3
HIGH _100 3 000 0.0 0 0.0 0 0 0
_0 3 3000 0.0 O 0.0 O 0 O
30 3,000 0.0 0 0.0 0 0 025 3,000 0.0 0 0.0 0 0 016 3,000 0.0 0 0.0 0 0 0
3 3,000 0.0 0 0.0 0 0 0
0.3 3,000 0.0 0 0.0 0 0 0
0.03 3.000 5.9 16 5.9 27 44 10.243
MEDIUM . ._.____100 3,000 0.0 0 0.0 0 0 0
60 3.000 0.0 0 0.0 0 _ 03 M 0.0 0 0.0 0 0 0
23 3.000 0.0 0 0.0 0 0 015 3.000 0.0 0 0.0 0 0 0
. 0 0.0 0 0 03 3.000 0.0 0 0.0 0 0 0
0.3 3,000 0.0 0 0.0 0 0 0
0.03 3,00 3.2 9 3.2 15 24 6.612
LOW -
10I 3 O . 0 0.0 0 0 0so 3,0C10 0.0 0 0.0 0 0 030 3,000 0.0 0 0.0 0 0 0
25 3.000 o0.0 0 0.0 -0 0 0I E 3,000 0.0 0 0.0 0 0 010 3,000 0.0 0 0.0 0 0 0
0.0 0 0.0 0 0 00.3 3,000 0.0 0 0.0 0 0 - .
0.03 3.000 0.0 0 0.0 0 0 0
- - - - to " - "Notes plow ild tc0wo
L 'a..,h.1 o 34
Page I of 3 #4

v-9
Tnhte C. .7. Calculated Costs and Other Parameters for Remidintlon of Contaniinated Soil at the Reference Nuclear Power Plant(Restrited Land Uses With Soil Washing, 50-Year SAFSTOR)
r
tA
z
10(A
Soil sow TrsWpolt Transport SON Son
Total Son Sd r NalSUIP Paokagll Le ads, Loads. Trunspo.t Transport Soi Soi SON Disposal
Residual Do$* Volume Tol of WesKMn Costs. Costs, 5.25 Gondola, Thue k Colt. Casti. Disposal Costs Disposal Costs Cost.s
___ght coot3s G.ondola Car Dowde Care Loads T n.l Trulc _@ @3 SO/ '3- *35011tO3ft'J
HIGH n3IAT er hie 4
100 0 0 0 0 0 0 0 0 0 0 0 0
60 0 0 0 0 0 0 0 0 0 0 0
30 0 0 0 0 0 0 0 0 0 0 0 o
25 00 0 0 0 0 0 0 0 0 0 O
15 0 0 0 0 0 0 0 0 0 0 0 0
'10 0 0 0 0 0 0 0 0 0 0 0 0
3 0 0..... 0 0 0 0 0 0 000_ _ _
0.3 0 .0 0 0 0 00 0 0 0
0.03 44 53 4B,343 100 3,836 1 2 . 4,000 22.650 6.1.57 30784 15489
MEDIUM -0 - -
100 0 0 0 0 0 0 0 0 0 0 0 __ _
60 0 0 0 .. 0 0 0 0 0 0 0 0 0
30 0 000 0 0 0 0 0 0 0 __ _ __ _
25 0 0 0 0 0 0 0 oo o 0 o_-_.0
15 0 0 0 0 0 0 0 0 0 0 0
30 0 0 0 0 0 0 0 0 0 0 ~ 0 0
03 0 0 0 0 0 0 0 0 0
0.03 2°4 O2 40.800 100 2,101 I I 4,0°001 1,325 3.373 16.866
1 00w --- . 2 L . .. .. . . . . 0 0 00000060 00 0 0 0 00 0 0 0 0 0
30 0 0 0 0 0 0 0 _ 000
2 .. . 0 0 0 0 o _ 0 0 0 _ _ _ _ _
15 0 0 -10 0 0 0 0 0 0 0 0 0
10 0 0 0 0 0 0 0 0 0 0
3 0 0 0 0. 0 0 0 0 0 0 0 0
03 0 0 0 . 0 0 0 0 0 ___ __ __
0.03 0 0 0 0 0 0 0 0 00F er0 A C S t --
I- -0St FI M G MI 11O~pe 5220/M'3 9 a m wus 1.3SS $4.000ps. *1t.32liisqrstmuki C,.gowh. I ....-
DW fuX7ma IneseIpact
Unit Rates endNotes
me"~ gowaw eam forHubd 5mw_ son P".
md .wm4 bauseus
It eed. a,25.134 Mesastad
afte*a |os Ib00
BrPasal faclityrS 10rn3; galltrarapact s.*
64 -Idspsl ttW09111inq LLWdispssel facUiy,
160mp9'tO3t' Ateepeest ady
disposad tacigbisa iseI.W. $360nit3;
tUck tUinpat e..
I I- - .1 I
Page 2 of 3

z
a Tlble C. 1.7 Calculated COSlS sid Other Paameters [or Remediatlon of Conlaminated Soil at the Reference Nuclear Power Plant. (Restricted Land Use, With Soil Washing, SO-Year SAMSTOR)
4P.~0
o)0%j
Toeall &1 Total Soil ... m. dl.|ioL Costs Total
Rsdual Do"s Vokn 1 10ilo'3 nP 160/1f'3 .0 03601'3 SON Weala Soam Ecoavaot Total Sioam Ocutonal
Roe DlwPo4*d Disposal CoWt Disposl Costs Di4posal Costs Labob Labor Romedltlon Labol Dose
_ m'3 0 , 1mfwhr ft&hr mn"4w_ possonstmem
HIGH -
100 0 0 0 0 _ O0 0 0 0
so 0 0 0 0000025 0 0 0 0 o 0 0 0
6C-0 0 0 0 0 0 015 -6 1 OO
t0 0 0 0 °0 0 0 0 O3 0 0 0 0 0 0 0 0
0.3 0 0 0 0 0 0 0
0.03 17 66,843 93,856 278561 7 71 78 I
MEDIUM _ -- . .
100 0 0 0 0 0 0 0 0
30 _ 0_ O O 0 0 0 030 0 _ 0 0 0 0 0 oO 0 :25 0 0 0 0 0 0 0 0
15 0 0 0 0 0 0 0 O10 0 0 0 0 0 0 0 0
3 0 0 0 0 ci 0 0 0
0.3 0j. 0 0 0 0 0 0
0.03 10 63,885 66,704 167.899 4 39 43 4
LOWOOOOOOOO _100 0 _ _ 0 0 0 0 0 0 0
60 0 0 0 0 0 0 0 0
30 00 0 0 0 0 0 0
25 ~ .00 0 0 0 025 .. 2 000000010 0 0 0 0 0 0 0
03 0 0 0 0 0 0 0 0
0.3 .2.... 0 0 0 0 0 0 0
003 0 0 0 0 0 0 0 0t a. a i.1 _ 0.17 mm4s Me 1.62 nutv ii 0. mtom Pw mew
UriZitR0 Rutil voke Isn 40% m'3 m-3 b1i
Notes m3m3a. "I
Vol, ttf*uN-.1.-b--- -----d
Pago 3 of 3 N

I .40 a
Table C.1.8. Calculated Costs and Other Parameters for Remnediation of Contaninated Soil at the Reference Nuclear Power Plant(Restricted Land Use, Without Soil Washing, 50-Year SAFSTOR)
g
'3
.Contemi- Site Fbow blow- Total Sol St SonResidual 0ose sled Sith SOl SM Son quding fildIng Sd Vohnm Exoavallon
Rate Bell Area DOepth Vohme SoD Dpth Volnme leowd o _mmr ft2 em m'3 cm m3 m'3
HIGH - ___
100 3.000 0.0 0 0.0 0 0 Oe0 3.000 0.0 0 0.0 0 0 030 3.000 0.0 0 0.0 O 0 025 3.000 0.0 0 0.0 0 0 -15 3.000 0.0 0 0.0 O 0 010 3.000 0.0 0 0.0 0 0 03 3.000 0.0 0 0.0 0 0 0
0.3 3.000 0.0 0 0.0 0 O 00.03 3.000 5.9 16 5.9 27 44 to,24i3
MEDIUM - - 0 0.0 0 0 0100 3,000 0.0 O 0.0 O __ O30 3.000 0.0 0 0.0 0 0 030 3.000 0.0 0 0.0 ¢ 0 02! 3,000 0.0 0 0.0 0 0 0
_ 15 3,000 0.0 0 0.0 0 0 010 3.000 0.0 0 0.0 0- 0 0.3 3.000 0.0 0 0.0 0- 0-- 0
0.3 3.000f- 0.0 0 0.0 0- 0 00.03 3,000 3.2 9 3.2 15 24 5.612
LOW.100 3.000 0.0 0 0.0 0 0 060 3.000 0.0 0 0.0 0 0 030 3,000 0.0 0 0.0 0 0 025 3,000 0.0 0 0.0 0 0 015 3,000 0.0 0 0.0 0 0 010 3,000 0.0 0 0.0 0 0 0
3 300 0.0 0 0.0 0 0 00.3 3,000 0.0 0 0.0 0 0 0
0.03 3,000 0.0 0 0.0 0 0 0Unit Rates and 2 .ff b* d
NoteP fIS -0 M." "I fuu aft.Nata pr150 t.0 Wsed 6250.000
.t I w h'21
Page 1 of 3
z
9I-A
'.0
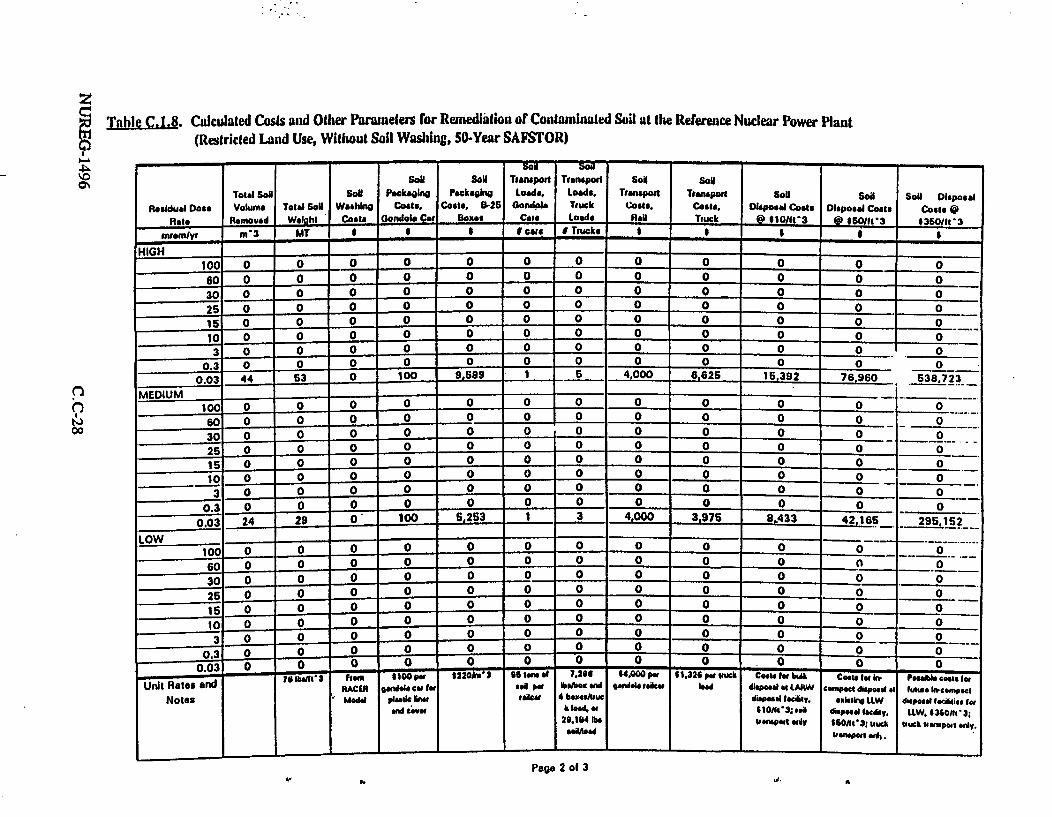
z
Table C.1. Calculated Costs and Other Parameters ror Remedialion of Contaminated Soil at the Reference Nuclear Power Plant
(Restricted Land Use, Without Soil Washing, 50-Year SAFSTOR)-PI
~0Ch
200
-st -- - - -!a- - -
Sod SOi Transport Tanatport Sol SOl
Total Sol SoN Packain PackanWg Loads. Loads. Transport Transpoit Sd SoN SoN Disposal
Residual Dose Volume Total Soll Wahhing Coats. Costs, 8-26 Gondpu Truck Costs, Coast. Disposal Costs Disposal Costs Costs @
Rate Removed weight Costs Gondola Car Boxe* Core Loads RAN Truck @ 010/11t3 @ $50s1oi3 *350/1tt3
M yernly' nm3 MT 0 6 Slea, ITiucks _ _ _ _ _ _
HIGH100 00 0 0 0 0 0 0
60 0 . 0 0 0 0 0 0 0 0 0 0
30 0 0 0 0 0 0 0 0 o 0 0 o
25 0 -0 0 0 0 0 0 0 0 0 0 0
15 0 0 0 0 0 0 0 0 0 0 0 0T O
10 0 0 0 0 0 0 0 0 0 0 0 0
3 0 0 0 00 0 0 0 0 0 0 -. 0
0.3 0 0 0 0 0 0 0 0 0 0 0 _ O-
0.03 44 53 O 100 9,589 1 6 - 4.000 8,625 15,392 78.960 538.723
MEDIUM - - - -
100 0 0 . j... 0 0 0 0 0 0 0 0 O
60 0 0 0 0 0 0 0 0 0 0 0 030 0 0 0 0 0 0 0 0 0 0 0 0-O.
25 0 0 0 0 0 o 0 0 0 0 0
15 0 0 0 0 0 0 0 0 0 0 0 0
10 0 0 0 0 0 0 0 0 0 0 0 _ 0
3 0 0 0 0 0 0 0 0 0 0 00
0.3 Q .. 0 0 0 0 0 0 0 -
0.03 24 29 0 100 5.253 1 3 4,000~ 3.975 8,433 42.165- 29i5 I2.-
LOW -1 0 00000 0 0 o 0 000
100 O O 0 O ° O O O- 0 ° - 0~
60 .. 9.. 0 0 0 0 0 0 0 0 1~0
30 0 . 0 . 0 0 0 0 0 0 0 0 - 0__ __ __
25 00 0 0 0 0 0 0 0 0 0
16 0 0 0 ...... 0 0 0 0 0 0 0
10 0 0 0 0 0 0 0 0 0 0 0 , 0
3 0 . ~ ..... 0 0 0 0 0 0 0 0
0.3 0 0.. . 0 0 0 0 00
0.03 0 0 0 0 0 0 0000 0 0
Urjit RatesRACER 5an M gl PM h x and Gondola drpssala td Itw CAW rpect disposalt hIiwtu wnconpo
Notes M pxdel #"Cr .l 4 be duce disosal teAitv. oxtik Ltw dieposa Isci l og gm
Wd &aVeo k ht dof, *0o6ilS;.coa dispee . dllity, LLW. 6360n.3;
23.14 lbe toompolt Idf i1O/tt'3; uIck "WA UsnopwI entv.
Pags 2 of 3

d VI
Tahle C.1.8. Calculated Costs and Other Parameters for Rentedintion of Contaminated Soil at the Reference Nuclear Power Plant(Restricted Land Use, Without Soil Washing, 50-Year SAFSTOR)
1%Oin0
- --
Total S .1 S Femedhetlen -C|ets Totdl
Reqwduel Does Vohome 0 3101o35-3 Soll W*h Soll Exvtin Total Sdl Occupetional
Rete Db9pored Dlepesel Coets Dh2poe Costv Dkpoghi Coats Lebor Labor Roedbatlon tebo* Doe
mtr in'3 _ * *_,___ men-hr menhr menh person-nwm
HIGH - o o100 0 0 0 0 0 o o _ o
80 o o 0 0 0 0 0 030 0 0 0 0 0 0 0 0
25 0 03 0 0 7 0 _ _7
1I 0 0 0 0 0 0 0 0
10 0 0 0 0 0 0 0 0
3 0 0 0 0 _0 , _ _ 0 0
0.3 ° . ° °0 0 0 0 0
0.03 44.. 29.735 110.5JL4.. 565.179 0 71 71 7
MEDIM - __n-J ___
10 0 0 0 0 o 0 0 0____
0 0. 0 0 0 0 0 0 ____
30 0 0 - 0 0 0 o 0 ____
25 . 0 ~0000 0
15 0 0 - 0 0 0 0 0 0
10 0 0 3 0 0 0 0 0
3 0. 0 0 0 0 0 0 0
Low e .
003 0 0 0 0 0 0 0 060O0W00 0 0 000
30 0. 0 0 0 0 0 0 0
25 0 0 0 0 0 0 0
15 0 0 0000 0 010 0 0 0 000 0 0
3 0 0 0 0 0 0 0 0
0.3 0.... 0 0 0 0 0 ____
0.03 0 0 0 0 0 00
-Unit -Rates and 0.11""mrow per 1.62o ut.I Per 0. I avem Per man.
Notes m
Paeg 3 of 3
z
UN9

Z Table C. 1.9. Calculated Costs and Other Parameters for Reidnlatlon of Contaminated Soil at the Reference Nuclear Power Plant
C. (Unrestricted Land Use, With Sol] Washing, Real World Sol] Profile)_ _ m
9\00%
0
Contain. Slbt Below. BWlow. Totel Soe Site SOBResidual Do&s sled Sil SoN Sit Soil Oudding Buiding Soil Volume Iaicvation
Rate Soi Atea npth Volume Sol Depth Volume Removed Costs
nustive 1_2 cm m'3 cm m-3 Mt3 1
HIGN __ _ _
100 3,000 4.4 12 3.3 15 28 6,471
60 3.000 8.0 22 4.6 21 44 10,261
30 3,000 17.9 50 6.9 27 77 18,149
26 3 000 20.8 68 6.2 29 87 20.400
15 3 000 28.9 80 7.0 33 113 26682
10 3000 3.3 9 7.8 38 136 31,609.
3 3.000 64.6 152 11.5 64 205 48,279
0.3 3.000 91.3 254 20.6 95 349 82,107
0.03 3.000 128.2 357 24.9 116 473 111.116
MEDIUM __
100 3,000 _ .8 6 0.0 0 6 1.191
60 30 3.6 10 2.5 11 21 4,980
30 3.000 7.8 21 4.5 21 42 9.69
26 _ 9.7 27 4.9 23 60 11.704
15 3,000 17.4 48 5.8 27 75 17.729
10 3,000 23.8 66 6.5 30 97 22.691
3 3,000 43.1 120 8.2 38 168 37,205
0.3 3,000 80.0 223 16.6 77 299 70,372
0.03 3,000 116.9 326 22.4 104 430 101,0i3
100 3,000 0.0 0 0.0 0 0 0
60 3,000 0.0 0 0.0 - 0 0
30 3,000 0.0 0 0.0 0 0 0
25 3,000 0.0 0 .. 0 00 0 0
15 3.000 0.0 0 0.0 0 -0- 0
10 33000 0.9 3 0.0 0 3 611
_ 3,000 6.1 14 3.6 17 31 7,356
0.3 3000 37.4 104 8.4 39 143 33 596
0.03 3.000 73.9 206 18.7 87 293 688.26
UNit Rates ViWd HoW -- I O lm 2% d236A - 3Bay"Imome sa" uo. at"
Notes Bew MI 1 b 260K
below 1to2t
-Page 1 of 3
I
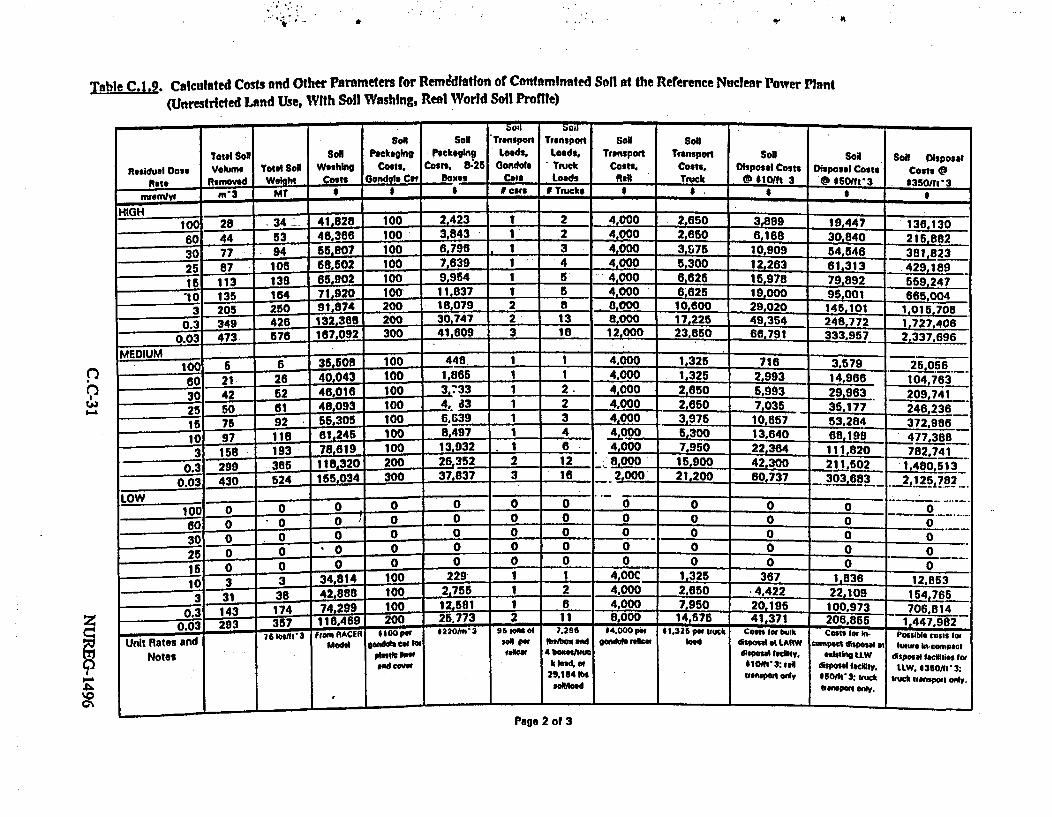
a
Table C.1.9. Calculated Costs and Other Parameters for Remn&diation of Contaminated Soil at the Reference Nuclear Power Plant
(Unrestricted Land Use, With Soil Washing, Real World Soil Profile)
I-A
z
0%~
Sol anspont Transpoit soi Sol
Total Sol Son aelkging Packealnp Loads. Loads, Transport Transport Soil son SO Disposal
Residual Dose Volhme Total SoN WashIng Costs. Cost. 0-25 Gondola ru*ck Costs. Costs, Disposal Costs Disposal Costs Costs n
note RWmovd ht Costs Gondola Car Box" Cats Loads RaI Tuck L @ *101ft 3 0 *601tt 3 $3so51r 3
mnvmlyr m 3 MT t Dcars U Trucks III $ . . - '_ .. _ _ $
HIGH-----100 28 34 41.828 100 2,423 1 2 4,000 2,650 3 889 19,447 136,130
0 44 53 46,366 100 3,843 1 2 4,000 2,650 6R168 30,840 215,882
30 77 -94 55.807 100 6.796 1 3 4,000 3,975 10,909 54,546 381D,23
25 87 10. 68,6 02 100 7,639 1 4 4 000 5,300 12,263 61.313 429,189
15 113 138 65,902 100 9,954 1 5 4,000 .625 15,978 79,892 559.247
10 135 164 71,920 100 11,837 t 6_ 4,000 8825 19,000 9i,001 665.004
3 205 2SO 91,874 200 18,079 2 8 8,000 10.600 29,020 145,101 1.015O708
0.3 349 426 132,368 200 30.747 2 13 8,000 17,225 49,34 246,772 - 1?2!0
-.03 473 76 187,092 300 41-. 3 18 12,000 23,850 66.791 333,957 2,337,696
100 5 j 35,508- 100 -__44 _ _ 1 1 4.000 1,325 716 3.579 2A5 6
60 21 2 40,043 100 1.865 1 _ 4,000 1.325 2,993 14,966 104,763
30 42 52 100 3,733 1 2 4,000 2,650 5.993 29,963 209,741
2 50 61 48,093 100 4, d3 1 2 4,000 2,60 735 246.236
15 75 92 55,305 100 6.,39 1 3 4,000 3,975 10,657 372,985
10 97 il18 61,245 100 8,497 1 4 4,000 5,300 13,640 688198 477.388
3 158 193 786 19 100 13,932 . 1 6 4,000 7,950 22,364 111,820 782,7410.A 1 . 2 Z 9... .~ 352 2 12 1__ __900___42.300_ __
0. 299 11,320 200 26 8,000 1900 42300 211L502 1,480.513
0.03 430 524 155,034 300 37,837 3 16 2,000 21,200 60,737 _303183 _
LOW - - - -
1 0 0000 0 0 0 _ _ _ _0 0 00-1 -8 ---- - ------
60 0 '0 0 0 0 0 0 00 00. 3 03 . 0 025 0 0 '00 0 0 0 0 0 0 0
- 00 __ 00 0 0 0
16 0 0 I__ _ _ _ _ 0 2 6 j 3
10 3 3 34. 4 229- 1 112.813253642 8 8 100 2 7 5 1 2 4000- 422 -..2 A2~..n 1 24,8653
3 31 ~ 38 -, 5 . 2 2 , 0 5 , 6
0,3 143 1174 742 9 022.. 12,5 1 14 00 9 020.1 5 10,973 706,814
0.03 293 ..... 6L. 4.9 ... 2 2.. .25.773 2 11 8.000 14,575 41,37120 , 514 79 2
FrarsAACEhi- 01Ooper I *220IM13 9S to"aof 7.296 *4.000 Per St .326pstuck costsaoffbulk I costsforin. Paz= .... n
Unit Rates andNotes
I - * 5 R l I " - - - -pub est
VW e"on
mi VWrtc r 4 bear
29.184 lbsNooad
gVA9 dcne I 1b14d ds**W at LAcRW.
l101ot3: raldI ansp1IM o*
exisposal L CLl
Wl0lspoi rigy.
cobtuv In-compmAdisposal lafghs foe
l.W. 0350111'3;truck *trisport only.
IPage 2ofI
Page 2 of 3

zc)9
O7
TableC19. Calculated Costs and Other Parameters for Remdlation of Contaminated Soil at Ebe Reference Nuclear Power Plant
(Unrestricted Land Use, With Soil Washng, Real World Soll Profile)
Total TotSl Sil edialon Costs Total
Residual Dos Volume @ 610d113 U 46091-3 Q 135011t-3 SOi Wshing Soil Excwvewon Total Sdl Occupatiorl
Rate Disposal Coats Dispocol Costs Disposal Costs Labor Labor Remodiauion Labor Dosewv m'3 1 $ $ . aw4w min4v h uh-w Pelson-nmum
HIGH -
10 . 11 56B288 72,819 189,502 6 45 49 5
60 89 93967279,001 71 78 8
30 31 88.966 139,274 466.561 13 126 138 14
25 35 96,266 153,164 521,030 1l5 141 166 16
15 45 ___.. 112,683 18 ,9566 668,311 19 183 202 20
10 54 128,829 216,991 788,994 23 218 241 24
3 B2 177.373 313.933 1.184.640 36 333 368 37
0.3 1 272,030 609.219 1l989.853 59 566 625 63
0.03 189 367,299 677,623 2.681,363 80 766 846 _6
MEDIUM - .-
100 2 41.516 42,050 63.626 1 8 9 I
60 64b._2.116 63.179 162,976 4 34 38 4
30 17 66.078 92.332 272,110 7 69 76 8
25 20 __70..2932 _ 100.006 313,066 8 81 89 9
15 30 87,790 13G.931 456,633 13 122 135 14
lt 3 101,676 166.931 676,121 16 166 173 17
3 63 1 42288 249,2B 920,448 _ 7 266 283 28
0.3 1i2 239,192 442,446 1.711,467 51 485 636 54
0.03 172 329,114 618.798 2.440.896 73 697 770 77
LOW _ _ ° ° °100 0 - 0 0 0 0 0 _ 0
60 0 0 0 0 0 0 0 0
30 .. 0 0 0 0 0 0 0
2 6 O 0.. . 0 0 O_ - O - 4 0
15 00 0 0 0 0 0 0
10o 39.892 38 .815 49.831 0 4 __ __ __ __ _
3 - 68.768 77.758 210,414 5 51 _ 68_
0. 67 132,190 229,399 836,240 24 232 266 26
0.03 117 234,866 432,497 1.673.626 50 474 1 624 52_ 0.1? w p_.1 wmwn man
U",-aUnit Rates andNotes I
vch Is 40sAof mat upl
vol. 1idMOiVLkI .....
m'3 m-3 IVlow
IIi a **
- -
Page 3 of 3

J~~ . I ~
Trble C.1.10. Calculated Costs and Other Parameters for Re Iedlatlon of Contaminated Sotl at the Reference Nuclear.Power Plant
(Unrestricted Land Use, Without Soil Washing, Real World Soil Profle)
i
ww
->" -~ Sh -e - -, -iFl
Cofie#W~n- Sit. Delow- below.- Total sonl ~lte soil
Residual Dose bted Sit Soi Sihe Sal Bun BusAding SoH Volhum ExceatdonRite Sil Are 2eath Voume Soi0 epth Volufe Removed Coati
wewemhw W'2 em m"3 conm m 3 m 3
HIGH -- _ _
1C0 3,000 4.4 12 3.3 15 28
a0 3,000 8.0 22 4.6 21 44 10.261
30 3,000 17.9 60 5.9 _ 27 77 18149
25 3,000 20.8 58 6.2.' 29 87 20,400
15 3.000 28.9 8o 7.0 33 113 26.582
10 3.000 13S.3- 91 7.8 35 135 .
3 3.000 C54.C 152 1 1.5 54 205 48.279
0.3 3,000 91.3 254 20.5 96 349 82.107
0.03 3.000 128.2 357 24.9 116 473 111,118
MEDIIUM_.--_100 3.CK0 1.8 5 0.0 0 5 1.191
60 3.000 3.5 10 2.5 11 21 4.980
30 3.000 7.6 21 4.5 21 42 9.969
25 3.660 9,7 27 4.9 23 50 11.704
115 3,000 17.4 48 5.8 27 75 17,729
10 3 2000 23.. as 6.5 30 97 22.691
3 3000 43.1 .120 8.2 38 158 37.205
0.3 3 000 80.0 223 . 18. - 77 - 29 70.372
0.0: 3'000 3l6j 326 22.4 104 430 101.043
LOW - - 0.
1 S 000 0.0 O , 0.0 0 - 0 O
60 3;000 0.0 0 0.0 0 0 0
30 3,000 0.0 0 0.0 0 _ 0 0
25 3.000 0.0 0 0.0 0 0 0
15 3,000 .0.0 0 0.0 _ 0
10 3,000 .9 3 0.0 _0 3 611
3 3.000 .5.1 14 3.65 1 7 31 7,356
0.3 3.000 3. ~.104 8.4 39 13 33,595
. 0. 3000 73.9 206 18.7 87 293 68,826
Unit Rates and - boyt - owI"N 2%eta -ee *23s-3
Notes POa* ae Rshol "00.baelow ft,2)
- _- - -
Pa ge 1 at 3
z
tOU

Table C.1,10. Calculated Costs and Other Parameters for Remedlatlon of Coutandnated Soll at the Reference Nuclear Power Plant
i (Unrestricted Land Use, Without Soll Washing, Real World Soil Profile)
9%0
p
Sol Sl Tuanspwot Transpot SoN Soa
Total SON SoQ Poianjag Packaolow Loads, Loads, Tifinvolt Tiaospot Sol Soil Soil Disposal
Hasiduit Dose Volam Total Soi Wash"g Costs. Coats. 326 Gondola Thuck Costs, Coats DISpoS Costs Disposal Costs Costs 0
Rate Reoed Weht Costs Gondola Cu' Boxes Cos Loads Rail Tnxk @l$011t3 @ 66Bnr3 $360/t 3
"wemlw m-3 MT , $ c as Ju TUc * * * * ____
H IG H- _ _ _ _ . 0 8_ _ _ _ __ _
34 0 100 6,058-- 1 3 4,0C0 3,97S 9,72410 10 0 002.66 349.24 48,618 340 26
60 44 53 0 100 9,60 1 6 4 4000 _ 625 15,420 77,101 39704
30 77 94 0 200 16.990 2 _8 8,000 10,600 27,273 136,3B5 964,58
25 87 106 0 200 19,098 2 a 8,000 10,600 30,656 153_2 2 1,072,972
16 113 138 - 0 200 24.85 2 11 8 14,576 39,946 199,731 1.398,117
10 135 164 0 200 29,591 2 13 8,000 17.226 47,600 237,501 1,6B2,510
3 205 260 0 300 45,197 3 19 _ 12,000 26,175 72.551 362,763 2.539,271
0.3 349 426 0 500 70,866 5 33 20,000 43.726 123.386 618.931 4,318,615
0.03 473 676 0 700 104,023 7 44 28,000 58,300 166.978 834,891 6,844.240
100 6 6 0 100 1.115 1 1 4,000 1,325 1.790 8,949 62.64
60 21 26 0 100 4,662 1 2 4,000 2.650 7,483 37,415 6 261.907
30 42 52 0 100 9,333 1 4 4,000 5.300 14.981 74.907 524,352
25 0 61 0 100 10,957 1 5 4,000 6.626 17,588 87,941 615.590
16 75 92 0 200 2ff597 2 . .. 8,000 9,276 26,642 13i,209 932.466
10 97 118 0 2 21,243 2 9 .9 8,000 11,925 34.099 170,496 1.193.470
168 193 0 300 34,831 3 16 12,000 19,876 55,910 279&51 -1956,854
0.3 299 365 0 500 65,880 5 28 20,000 37,100 16,761 528,75-
0.03 4 524 0 700 94,693 7 40 28,63, 0 000 151,842 7592 08 5314
0.03 430 __24 0 0 0__ . - -
0 0 0 0 0 0 0 00 __6000 0 - __00
- - __ __ _ __ _ 0 0 0 00o 00 00 000
-0 -.
00 00 -- . .. ...
15 0 0 0 0 0 0 0 0 0 0 0- 0
10 3 3 0 100 572 1 1 4.000 1,325 918 ° _ 13 .
3 31 38 0 100 f6,887 1 3 4,000 3,975 11,065 |566 273 38B,912
03 143 - 174 0 300 31,452 3 14 12,000 18.550 50.487 252.434 1_767,0350.0 357 0 500 64.432 5 27 20,000 36.775 103.427 617.136 3.619.956
- ,.0 **p* 29 3O 7.296 64 000 par 1 t325 per u s -- rbul 1 ;n i ~ c Po I mb Isoilpet bshm M godol tal.' oad dopsalLAH ComacS4opsetat ut~. n-c-ompact
Unit Rates andNotes
II- -RACSRMel
go doa cm to
aNW coval'
ea ONgalew
ibsfx 6144 boxalmuuc
k load. or29.154 ba
Sob~cl failcaload §tios fality.
weanap erdy
Cma cmpe at
ddioal facility.1501lo3: SDuck
nspowl Galy.
Auwe h neny esd eospo facilites lo
LLW. 035ol0 3;Stuck Stanspott wly.
____________ J - I - I - I - A - J - A I I I
Page 2 of 3h

*
A
A
Table C.1.10. Calculated Costs end Other Parameters for Reigedlatlon of Contaminated Soil at the Reference Nuclear Powter Plant(Unrestricted Land Use, Without Soil Washing, Iteat World Son Profile)
w
k-i%O
Told Son T allol Cm" Total
Rldua Dos V olu om'3 1 t'3 @ *M5ot2 Soi WaIMhhg Sonl Excavetion Totd SON OccupatInd1101 el oVA_________0Wh' _________ Labor M L b r D s
Rate t .hod_ iSo!d CWS Dhiosl CoSes Dposl Coats Labor -madatlon Labo DoseRm '3 a __ ____ ._ _ me w m PM
H~IGH _ _ _ _ _
100 28 20,294- 65.121 356e029 0 45 45 4
60 44 2 103.593 566.197 0 71 71 7
30 77 53,622 182.103 1 000 297 0 125 125 13
25 87 59.257 203.380 .1.123.070. 0 141141 14
Is 113 - 74,728 265.774 1.4R4.160. 0 183 183
1t 87,309 315.927 1.740.935 0 218 219 22
_ _ 05 3133,129 481.404 2.657,922 0 333 333 33
0.3 349 -225.993 819.629 4,521,214 0 6ee 5es 570.03 473 306.794 1,108.330 6.117.679 0 786 768 77
M DIUM ---
100 5 7.091 12 580 e66272 0 a 8 I __
60 21 1 ,563 49707 274.198 __ _ 334 34 3
30 42 29,051 994610 548.954 0 69 69 7
25 60 33.392 117.228 644.87 0 81 81 8
1 75 52.571 .176 810 97B6067 0 122 1210 9 49 0226.355 1,249 3 90 156S 158 16
3 158 105,415 371,461 2,048,764 0 256 2 _ _ 26
0.3 299 196,623 702.107 3,874,635 _ 0 485 - 485 49-
0.03 430 281.584 1.007.844 5,563,091 0 ..i97 _ 97 __ _ 70
LOW _0OOOOO°
10 0 0 0 0 0 0 0 _
so0 0 0 0 0 0 0 030 0 0 0 0 0 0 0 025 0 .2......0 0 0 0 0 __
15 0 0 0 0 o 0 0 0
10 3 5,2 7.098 34.640 0 4 4~ 1... . ! L .... 73.491 405,130 0 51 51_ _ _ _ _
0.3 143 -. . ,383 336.032 1.850,633 0 232 232 23
003 293_ 192753 619 3.788.968 0 474 474 47
Unit Rates and I* VW 0.; Il H pm men._Notes In I ov I .
_ _ .. ~ -~ 2 ~ _ _ I I__-IPage 3 of 3

Table C. 1.11. Calculated Costs and Other Panmetlers for Remedjation of Contaminated Soil at the Reference Nuclear Power Plant
P (Restricted Land Use, With Sol] Washing, Real World Soil Profile)
6
I.0%
0oh
Coneammh Site BeIow- Below. Total Soil S!ite SiReuSda Do" mtd Sit* Sai Silt Soi Buing Buildng Sal Voluw Enxvatuon
Rate Sol Area Deoth Volume Soil Deth Volume Removed Costsmworsw It2 cm m3 am m-3 m 3 S
HIGH - - 0 0 0-100 3,000 0.0 -O 0.0 0 0 0
60 3,000 0.0 0 0.0 0 0 0
3- 3,000 0.1 0 0.0 0 0 41
2 3,W0 0.6 1 0.0 0 1 350
6s 3,000 1.8 6 0.0 0 5 1.188
lo 3.000 3.0 8 1.6 7 16 3.748
3 3.000 12.8 36 6.2 24 60 14.050
0.3 3.000 49.3 137 8.3 39 176 41,381
0.03 3,000 06.1 240 10.7 50 290 68.078
MEDIUMCo 3,000 0.0 0 0.0 0 0 060 3.000 0.0 0 0.0 0 0 0
30 3000 0.0 0 0.0 0 0 025 - 300 0.0 0 0.0 0 0 0
16 3,000 0.0 0 0.0 0 0 0
13 3 000 0.9 3 0.0 0 3 617
3 3,000 5.2 14 3.7 17 32 7,458
.3 3,000 37.9 106 7.6 36 141 33,063.
0.03 3,000 74.0 209 9.9 46 256 69,832
LOW -
10 3,000 0.0 0 0.0 0 0 0
60 3,000 0.0 0 0.0 0 0 0
30 3,000 0.0 0 0.0 0 0 0
25 32000 0.0 0 0.0 0 _0 0
16 3,000 0.0 0 0.0 0 0 0
10 3,000 0.0 0 0.0 0 . . 0
3 3,000 0.0 0 0.0 0 0 0.
0.3 3 3.6 10 2.3 11 21 4,8780.03 3.000 32.2 90 7.0 32 122 28,667
U Rates VWI D 2% l *23Sh-
Notes swlo twused 1260.000blobw ol 3
Page 1 Of 3
I
..

t A
TableC.I. Calculated Costs and Other Parameters for Retiedration of Contaminated Soil at the Reference Nuclear Power Plant(Restricted Land Use, With Sofl Washing, Real World Son Profile)
z
c0
sonl SoN Tranport Tianhport Son Son
Total Sof son Packsg9If' PnItt Leods,. Loads, ttrnpott Tunsnpon SoO soN Soft Disposal
Residual Dose Vome Total Son W*stng Cotsa. Costs., .26 Gondol Tnml Cogt", Costs, Dhsponel Catt Disposal Costs Costs @
Rate Removed WVIght C09tLtt 68dd C ¢ e cmnt Loads Ralti - 1 _lont-3 * s0onft3 _3_0/ft'3
tnt tnlyt m '3 Mt S D^r D wn Tuucts S S
HIGH -
1000 0 0 0 0 0 0 . 0
60 0 0 0 0 0 0 0 0 0 0 o __._0 030 0 _ 34.132 100 15 1 - 4,000 1,32C 25 124 868
25 _ 2 34.502 100 131 I 4,000 _1,325 211 1,053 7373
15 5 6 35,604 100 445 1 1 4,000 1.325 714 3569 _ 24984
10 16 19 38,569 100 1,404 1 .1- 4,000 1,325 2,253 256 _ 7
3 fiO_ 73 60,900 100 5,2F1 1 3 4.000 3.975 8S446 42,226 295 582
0.3 176 215 83.517. 100 .,16.498 1 7 4,000 9,276 24,874 124,370 870.590
0.03 290 353. 116,574 200 25,t 93 2 11 iriOO 14.575 40.922 204,608 1,432,256
MEDIUM100 0 0 0 0 _ _ _ _ _ _ _ _
60 .2 . 0 U 0 0 0 0 -0 0 0
2 5 0 0 0 0 0 0 0 0 0 0-a 0
1 20 3 3 4 100 2s1 I I 4,000 1,325 371 i~ese3 32 39 43,010 100 2,793 1 2 4.000 2,650 4,483 22,414 156,997
0.3 141 171 73,661 -100 12,381 1 6 4.000 7,950 1t_874 _99 372 _695,002
_ _ _ _ _ _ __ _ _ _ -_ _ _ _ _ 1 7 9 9 3 26 9 5 .6 0 2
0.03 255 310 105.703 200 22,405 2 -110 8,000 13.250 3569F5 179,824 51,28,769
. 09 _ O O O O_ 0- o_100 0 0 0 000 0 0 0 0 0 0____0 - 0 0 0 0 0 0 0* 0 0
00_0 _ O O _ ,3 0 . 0... .. 0
25 0 0 ~. 0 0. 0 0 0 0 0 0 0 ...
15 0 0 0 0 0 0 0 0 0 0 0 0
103 0 0 0 0 0 0 0 0 0 0 0
03 2 25. 39,922 100 1.827 1 1 4.000. 1.325 O______002_102_-_fi310.03 122 149 68.386 100 10,731 1 6 4,000 6,625 17.225 86.127 602 889
00 7ifISI'3 from AACEGR mop" t220hM3 9S ton of 7.298 54,000 PK *1,.325 peirmuc Cohbtjk COtSIf torln POsSINS costs t
Unit Rates at .Mad O10. *N * tet t W4 oonde de raw itwd dspOAit at UflW compat impos tmPe
Notes pinst ttho V 4 box"M tt5S d Wllty. e**Vx LLW disposa tta iti.s Iat
c ndIetW ble4d, ot10/ :'Sei dlspos taciltty. LLW. 350/fsn 3;2S.1 114 lbs t o nl 5011 23; IUe truck thangpott only.
Sol.tced tansm oily.
Page 2 of 3

zTable C. I.11. Calculated Costs and Other Parametes forReniedlatlon oContaminated SofitheRefereneeNudearPowerplant
(Restricted Land Use, With Soil Washiing, Real World Soil Profile)a
IC0%
900
-|
,Totu Saol Total Soi l R emgd ioL CoSI3 tot d
Residual Dos Vtiam @ 61011t3 @ 66Wl13 Q36Cvh-l3 Sol Wshg Sol ESdavan Total So Occupatinal_ SDOsed Dsposal Coals D Dspoe. Costs Dizoosal Costs Leboa tabot _emedtllon Leb Does
Ret.r l D is n _ _ _$_. $ amme h embos a tlan lh tst$ofDo m
HIGH _ _ _ _ _
100 0 0 0* 0 0 0 0 __ _
60 0 0 0 0 0 0 0 °O_-_
30 0 _ 38,298 36,638 38,382 0 0 0 0
25 1 39,163 37,362 43.682 0 2 3 0
I 1. - ...... 41,606 42.030 63.445 1 8 9 I
a1 6 48,671 66,312 123,907 .3 26 29 3
3 77,495 116,412 369,768 10 97 107 11
0,3 70 163,972 274,139 1,020,359 30 285 315 32
0.03 116 232,774 428.329 1.655.976 49 469 219 52
MEDIUM-100 0 0 0 0 0 0 00
- -0--E 0
6 0 20_ 0 0 0 0 020 0 0 0 0 0 0 0 0
25 0 fl 0 0 0 0
10 1 39,910 38.861 498985 0 4 6 .__
3 13 69,060 78,324 212.807 | 51 57 6
0. 66 130,698 226,427 822,667 24 228 262 26
0.03 102 209,700 381,015 1.469,969 43 412 466 46
LOW -
100 0 0 0 0 0 0 0 0
60 0 0 0 0 0 0 0 0
30 .0 0 0 0 0 0 . 0 __ _ _ _
25 A.... 0 0 0 0 0 0 015 2...... 0 0 0 0 0 0 0
10 0 0 _ _ _ _ __ _ _ _ _0 03 .O 0 0 0 0 0 0 0
0.3 8 61.832 62,613 150.682 4 34 37
0.03 49 118,367 200,626 717.287 21 198 218 22
Uilt Rates *nd poub0 .01ms w .2|bp 0.1 nwwoam.
Notes n td"L: *wk~Val. Is mm"
Page 3 of 3of a.
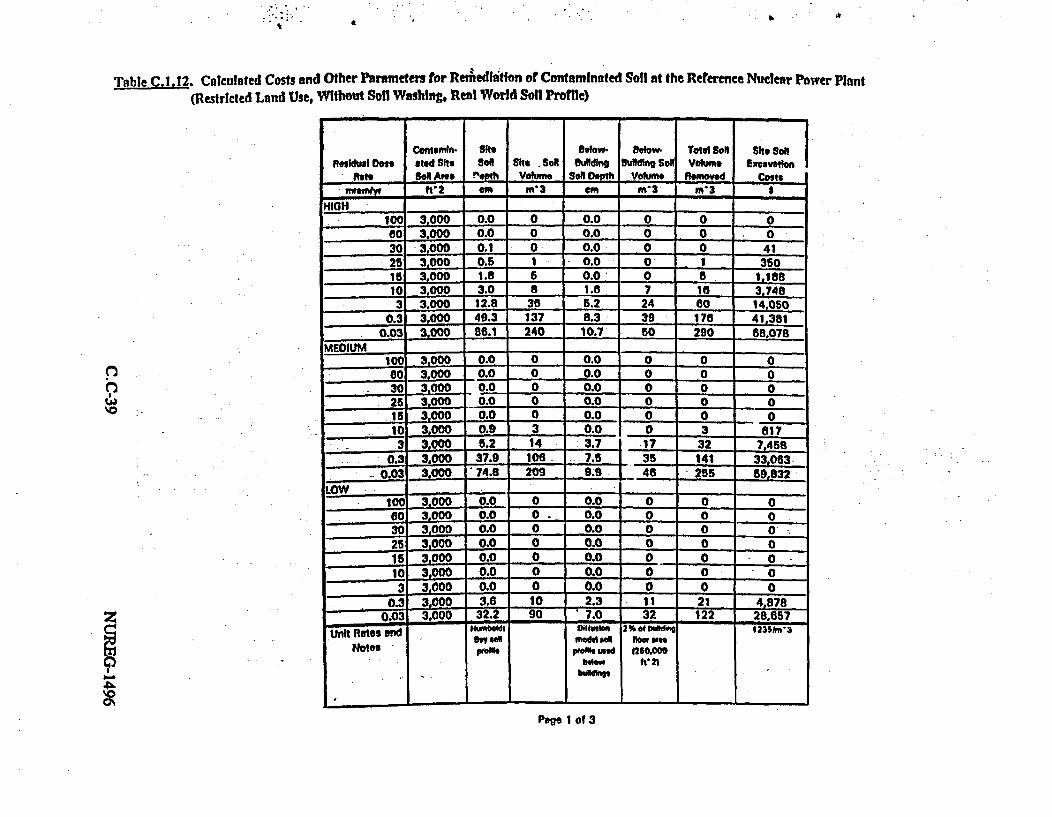
Table C.1.12. Calculated Costs and Other Parameters for Remiedliatlon of Contaminated Soll at the Reference Nuclear Power Plant(Restricted Land Use, Without Soll Washing, Real World Soll Proie)
'0
.__- -----
Contumn ste Below. 8elow. Total Sol She Soislekb Ose oed She Si She. Seol Building Bulding Soil Volume Excavation
Rate Si Ares Ž21!L Vohme Soil 0th VolMe Remvved Costs- ftn2 cm on'3 c m-3 mn'3
HIGH - -
100 3.000 0.0 0 0.0 0 0 0
60 3.000 0.0 0 0.0 0 0 0
30 3.O00 0.1 0 0.0 0 0 4125 3,0C0-0- 0.5 I 0.0 0 1 360
16 3.000 1.8 6 0.0 O 5 61s.810 3.000 3.0 8 1.8 7 16 3.748
3 3.000 12.8 36 5.2 24 6o 14050
0.3 3 000 49.3 137 8.3 39 176 41.381
0.03 3,000 86.1 240 10.7 50 290 68.078
MEDIUM 1 -
1 _ 3.000 0.0 0 _.0 0 0 0
60 3.000 _00 0 0.0 0 0 0
30 3.000 0.0 0 0.0 0 0 0
25 3.000 0.0 0 0.0 0 0 - 0is 3000 0.0 0 0.0 0 0 0
I 3,000 0.9 3 0.0 0 3 617
3 3,C00 5.2 14 3.7 -17 32 7 458
. 0.3 3,00 37.9 106f .- 7.5 _ 35 141 33 063.
0.0- 3,000 74.8 209 9.9 4 255 59.832
- . 00 0.0 0 0.0 0 0 0
60 3.000 0.0 0 . 0.0 - Q 0 030 3,000 0.0 0 0.0 0 0 0
22 5 3,000 0.0 0 0.0 _ 0_ 0
1 3.000 0.0 0 0.0 0 0 0
10 3,000 0.0 0 0.0 0 0 0
3 3.000 0 0 0 0.0 0 0 0
0 3 3. 1 0 2.3 1 1 21 4.878
0.03 -3 32.2 90 7.0 32 122 28,657
Unit Rates end t*,w't DilluMM 2%oDbUidie *236M'3Bay e11 wwdl uAc flow lie,
Notes pueW, pflh Und 250.00o
,e .. of 3
Page 1 of 3
i - . . -
z
9b
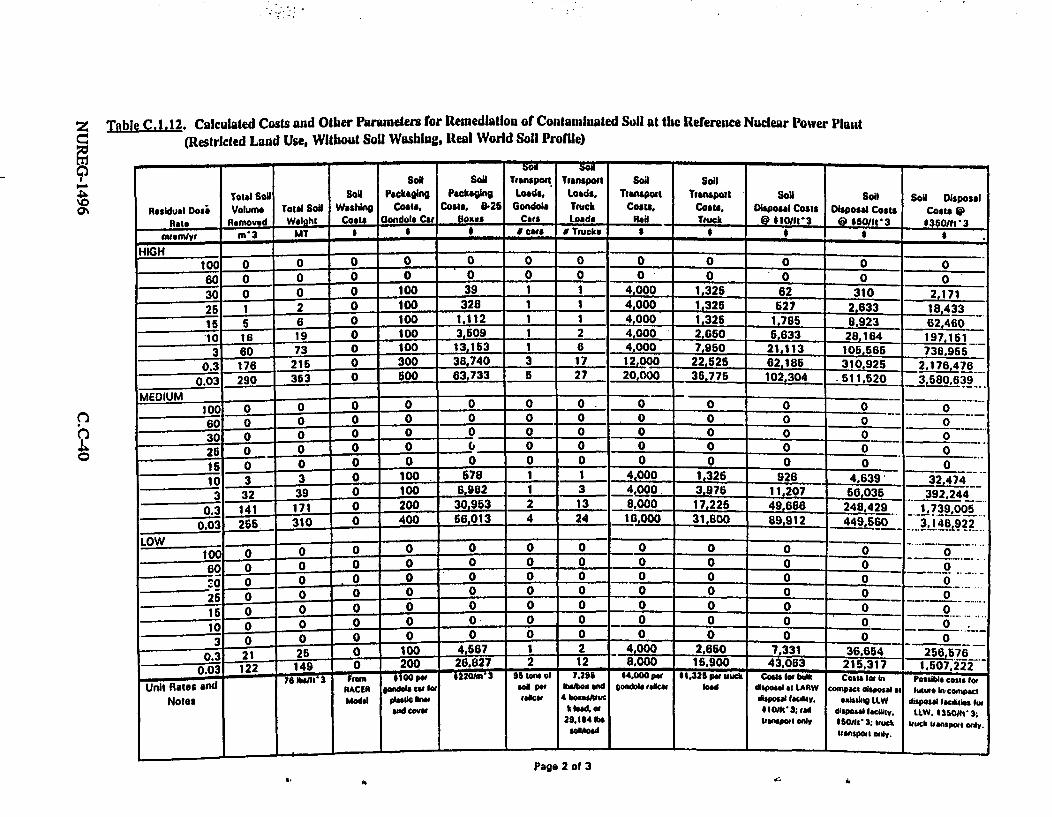
Z Table C. 1.12. Calculated Costs and Other Parameters for Remedlation of Contaminated Soil at the Reference Nuclear Power PlantCE (Restricted Land Use, Without Soil Washing, Real World Soil Profile)
- -_ __LI
0%
Sol Silm Transport Tiansport Soil Soil
Total Sag SoN Packagi Packaging Loads, Loads. Transport Transport SON Soil Sol Disposal
Residual Dose Volume Total SONl Wahing Costs, Costs, 025 Gondola Truck Costs. Costs, Disposal Coats Disposal Costs Costs @Rate Removed Walht Coats Gondola Car 3oxes Cars Loads ROa Truck 0 6101lt-3 @ 660111l3 *350mt 3
mrwgyr m-3 MT S , . cs Ae Trucks $ .______
HIGH - - - -
100 0 0 0 0 0 0 0 0 0 o - o __ _
60 0 0 0 0 0 o 0 0 0 o o __ __
30 O O o 100 39 1 4 000 2 310
25 1 2 0 100 328 1 1 .4,000 1.325 627 2,633 | 18,433
15 5 6 0 100 1,112 1 1 4,000 1,325 1,785 8923 02.460
-a 16 1 9 0 100 3,609 1 2 | 4,000 2,850 5,633 28,164 197,415
3 60 0 100 13,163 1 6 4.000 7,950 21,113 1056566 738.955
0.3 176 215 0 300 38,740 3 17 12.000 22,52S 62,185 310 925 2,176,476
0.03 290 353 O 600 63,733 5 27 20,000 365776 102,304 511,520_ 3,5,639
MEDIUM - I_ _ _ - _
100 0 ___ 0 0 0 . 0 0 0 0 0
6 3 0 0 0 0 0 0 0 0 0 0 0
6i° ._0 0 n i o0 0 0. 792O30 __I_.. 2.... L.. 00_ 0 0 0 - __
25 0 -.. 0. 0 __ _ 0 0 0 0 0 0
15 0 0 0 0 0 0 0 0 0 0 0 0
10 3 3 0 100. 578 1 1_ 4 000 -1.326 2 ,3 27J~~ I- fi f I .-
I 3 47
00J9I
=
U'
30.3
qft ,au To still 0.40019 I .7 .9.%Oww � .2.2010 I R.orA % FE n'10; -20-2 12A
A ^ e oe I a "I 3L- ~ |; n-u 1^ | J ^- I J7K| 77b 14o j. 7 I A Win AMMKI II A II-UUU 11-77h ,du Alta IbAC Aftn
4,QUU .low JoY ED.
bran hEi 01 1 1 U.U(N} :41 Rnn Ra nss Asa ear
i | 1 4 1 | 1 s I | w | . w § _ _, _ _ _ i A | q A I -g--- | w ,, _ | ^ A A ^ ^ I . _ _ _ _ _
- �?�205- - - I- --- ---0.03 255 31U oV .a . -v - -x 442L 3,145D922
-- - - -- X -
10 0 0 0 0 0 0 0 0 0 000
60 0 0 0 0 0 0 0 0 0 0 _ _
:0 0 0 00 0 0 0 0 0 0 0 0
25 0 0 0 0 0 0 0 0 0 0 0. _
15 0 0 0 0 0 0 0 0 0 000
10 0 0 0 0 0 0 0 .0 0 0 0_ _
lo _ _ _ _ _ _ _ 0
3 0 0 00 0 0 0 0 0 0 00.3 21 25 0 10_ 4,567 1 2 4,000 2,650 7,331 36.654 2565476
0 122 149 0 200 26,827 2 12 8.000 16,900 43,063 215.317 1-Vs menu4- 2a,1 1,5o075 .2225400-In--w - --- l ume os" ets eq
nt Rates andNotes
76I lt 1011 rium W.- r-
a w p l h .MCERModel
gionola Car fog
and covor
sol paS
rikar4 bosshsuc
k lod, of
29.t84 *s
eon~o *s load dsp"g at LARWisposl facility.
X 10113; cad
trDetit oOly
compct disposal *1
exisibli UVVdisposal facility.
o*s;01t ; uckIfenspo OI nly.
raumue osts for
disposal lacalligs to
ILUW. $n50poon.stuck lianspois adyl
I,
ii
Page 2 of 34, 4
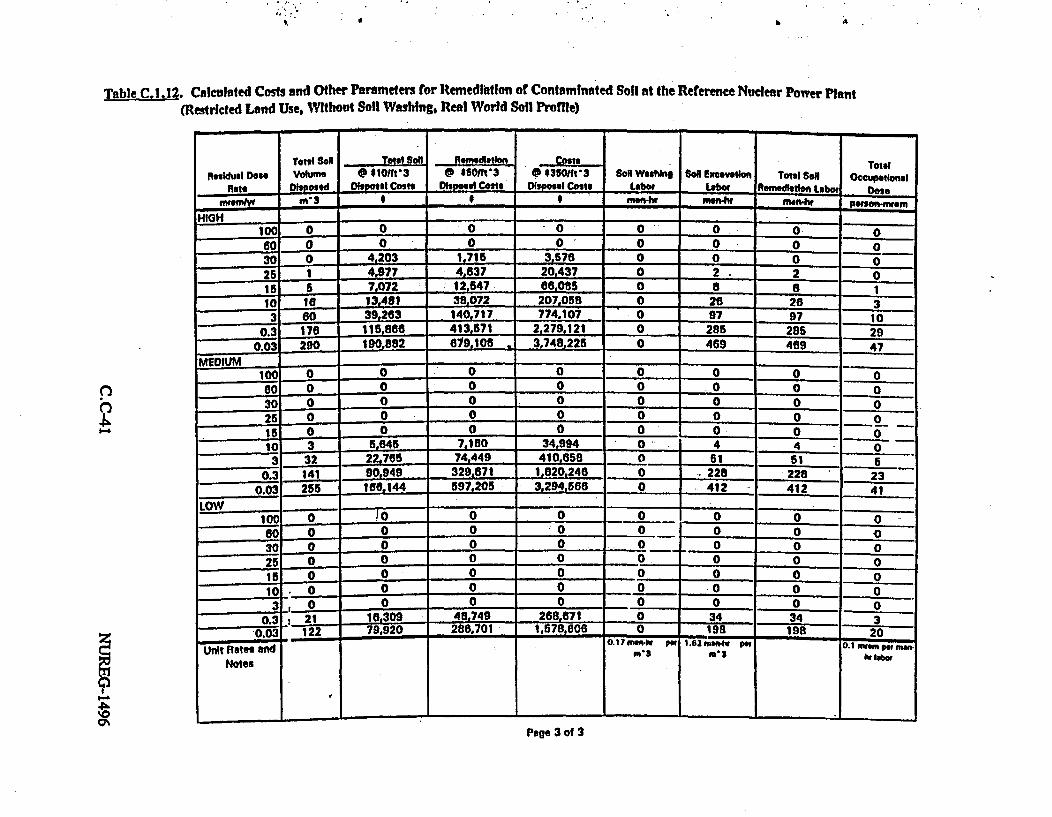
4
Table C.1.12. Calculated Costs and Other Parameters or Remedlitlon of Contaminated Soil at the Reference Nuclear Power Plant(Restricted Land Use, Without Soll Washing, Real World Sofl Profaie)
Total Son Toa So I~'wlaoonOatlieate
Rasidual Doe Volum @ O)Ift'3 @ t5011t-3 0 S3MI'tff SoN WashMn Sotl Excovathon Total SoNl Occupationalnote Diposed DPosal Cost Dishoal Coslt Disposal Costs Labo, Labor femeftlon Labor Dov.
"w m ____ """O m'ntht nWn4w Pefson-wsm
HIGH-100 0 0 0 0 0 0 0 06O 0 0 0 0 0 0 0 0
30 0 4.203 1,715 3.576 0 0 0 0
25 4.977 4.637 20,437 0 2 2 0
165 5 7.072 12,547 66.085 0 8 8 _ 1
1C i0 13,451 38,072 207.058 0 26 26 360 39,263 140.717 774.107 . 0 9797 10
0.3 17l 115,806 4131571 2,279.121 0 285 285 290.03 290 190.882 e19.108 * 3.748.225 0 469 469 47
MEDIUM -
100 0 0 0 0 0 0 00
60 0 0 0 0 0 0 0 0
30 0 0 0 0 0 0 0 0-
25 0 0 0 0 0 0 0 -
15 O 0 0 0 0 0 0 010 3 5,645 7,160 34,994 0 4 4 0
3 32 22,765 74,449 410,058 0 __ 51 51 _
0.3 141 90.949 329.671 1.820.246 228 22830.03 255 56,l44 597 ,205 3_294.6
L. 0 412 412 4 t
LOW .. _I10 0 lo 0 0 0 0 0 0
20 0 0 . 0 _0 - - °° - -0O60 0 0 0 0 0O 0 0 030 0 0 0 - 0 0° 02s 0 0 0 0 0 0 0 _____
-0 0 0 0 0 0 0 03 00 0 0 0 0 0 0
0.3 - l.- ?9920 48,749 268 671 0 34 34 230
0.03 2 79,920 286.701 1.578,606 0 9 1ee2O
Unit Rates and 0. t 7 rua;h p. ma i . . h bpm
Notes m
Page 3 of 3
I.
0%

zTable C.1.13. Calculated Costs and Other Parameters or Remedlatlo of Contamiated Soil at the Reference Nuclear Power Plant
C) (Unrestricted Land Use, With Soil Washing, Real World Data , 50-Year SAMFOR)
4-
D00\
C.')6
Contlmknl Si Below. Below. ToIl Soil ISi Soeldu Dose led She Sol. Steb Sol Buddg Buildng Sol Voluaw Excavation
Rate Soil A Depth Volume Soil Depth Volume Removed Costsawyr It-2 cm m'3 cm m-3 m-3
100 3,000 0.0 0 0.0 0 0 060 300 0.0 O 0.0 0 0 030 3,000 0.0 0 0.0 0 0 026 3,000 0.0 0 0.0 O O °15 3.000 0.0 0 0.0 0 0 010 3,000 2.5 7 2.5 12 19 4,4513 3,000 7.4 21 7.4 34 56 _12,943
0.3 3 30.7 8o 30.7 143 228 63.6260.03 3,000 60.9 170 60.9 283 453 108.367
MEDIUM - -
100 3,000 0.0 O 0.0 0 O60 3 000 0.0 0 0.0 0 0 030 3,000 0.0 0 0.0 O 0 025 3,000 0.0 0 0.0 0 0 O15 3.000 0.0 0 0.0 O O 0
3_ 1 3000 0.0 0.0 0 0 0323,000 1.8 a 1.8L9 14 3,217
0.3 3.000 16.0 42 16.0 70 112 26 2460.03 3,000 44.3 123 44.3 206 329 77.360
100 3-000 0.0 - 0 * 0.0 O60 3.000 0.0 0 0.0 0 0 _3 3 000 -0.0 0 0.0 0 0 026 , 0.0 0 0.0 0 0 016 3.000 0.0 0 0.0 0 0 010 3,000 0.0 0 0.0 0 0 03 3,000 0.0 0 0.0 0 0 0
0.3 3.000 4.6 12 4.6 21 33 7,7960.03 3.000 21.2 69 21.2 98 167 36,965
UntRates and OMIAl Difuson 23IiA i3m o de £05E m o de soi I__locSNotles plo prolld wed 1250.000
below WU21
- -- --W
Page 1 of 3 '4
..

Table C.1,13. Calulated Costs and Other Parameters for Remedfntlon of Contaminated Solt at the Reference Nuclear Power Plant(Unrestricted Land Use, Wlth Soll Washing, Real World Data , SO-Year SAMSTOR)
J-"
I~
- - --ou -s-l - _ _
SoN SoN Transport Trsport Sol Soil
Total Sol SoN Iackalng Packag"g Loads. Loeds, Transpont Transport Sol Sol Sol DisposalResidual Dose VoMe Total So6 Wash"g Costs, Costs, W-25 Gondol TIck Costs, Costs. Disposal Costs Dosposel Costs Costs 0
Itilts Atm d W9MT Com Gondola C r boxe Cars Ltds Ro T ruck 0 110/1h3 @ *$350t3St-
HIGH -- - - - - -100 0 0 0 0 0 0 0 0 0 0 o _ _
60 0C 0 0 O OO O O OO OO0o O O O O 0 0 0 0 0 0 a O
_ _ - - - -o -oOOOg _ -- _30 0 0 . .... 02 0 0 0 0 0 0 0 0
25 0 . .... 0, ..... 0 0 0 0 0
__ _15 0 0 0 0 0 0 0 0 0 0 00
10 C 23 39.410 100 1,667 1 1 4,000 1,325 2.675 13377 O_ _ _ _ _ 3, j . . ~1 0 4,84 7 - _ _ _ _3_ _77 _ 93_ _ _4 1
3 6 67 49,76 100 * 1 3 4,000 3,975 7,780 38 901 27i,30B
0.3 228 278 98,274 200 20,011 2 9 8,000 11,925 32.234 181.171 1 128 197
0.03 4 5t 1t,395 300 39,827 3 17 12,000 22.625 63.931 319.654 2.237.579
MEDIUM - ° - ° 0 - - ° °°-00 0 000 0 00000
1E O -0 _ 0_14_1760 0 3 ,30 0 0 0 0 0 0 0 9,86 °_ _ _
0.3 0 0 ,0 0 0 0 0 0 0 0 0 0011W 0 0 0 0 0 0 0-
1_ 15 0 O_ *0 0 0 0 0 0 0 0 0
_ ~~ -
10 0 0 0 0 0 0 0 0 0. 0 .. 0. 0
3 4 1 7 37 933 100 1.205 I . 0 . 2619 49 6
0.3 112 13116 65.500 100 98 5 4.000 6.6251578z____ - -2-
1_7 7
0.03 329 401 120,685 200 28969 2 13. 8.000 17254.0 0 i- 2 L217.25 W -32 -0 - -2 &2
100 0 0 0 0 0 0 0 0 0 00 0
60 ~0 0 0 0 0 0 0 0 0 0 0
30 0 0 0 0 0 0 0 0 0 0
25 000 0 0 0 0 0 0 0 0
16 0 0 0 0 0 0 0 p0 0 0 0
10 0 0 0 0 0 0 0 0 0 00_ _ _ _ _
3 0 0 0 0 0 0 0 0 0 0 ___ ___
0 3 340 43.414 100 2.919 1 2 4 0 02 6 04 6 82 . 3 6 . 1
0. 3 5 197207L a_ .0 07. 5 22.2131 1. 6-5 7KI#mn 3 i oFIO. AA ERI *lO0per $220O m3 9surnuom of 298 *4.O o- *.3 Sw i ck Co eaeW. 777,469.3h e n calf Ombad- -
Unit Rates a(oNotes
fumes zMg" es to
VW CoveritwtSct 4 bhIM
2S.164 rotsoft"
Ab101 eefv 00" -wW 0w -e.
V e n e e e t I 4tfieavt O*
.oats LL hpaepec #" l .
d~fo a ec lty.160#1r3: Suck
earKts n* .
P fossg cstes gor
11W. 1360St'3." ck eftsp s onldy,
_ _ _ _ _ _ _ I I I - . - -
Page 2 of 3

Table C. 1.13. Calculated Costs and Other Parameters for Remedlalton of Contaminated Soll at the Reference Nuclear Power Plant(Unrestricted Land Use, With Soil Washi Real World Data, 50-Year SAFSTOR)
;- - .-
48Tota SON Total Son Hlerndisdtn Costs TotalResidual Dose Voku" Q 61W11V3 . $60111 3 C o$s3i3 Soil Washkn Soil Excavaton Tota SoN Omwatanl
RaU sposd Disposal Costs Diposai Costs Dsposal Cest Labor Labor _iSmedlalion Laboi Dose
vna_ _ m-3 * * manhi man-l man-hr pOt o-miam
HIGH -
100 ; 0 0 0 0 0 0 0 0
60 0 0 0 0 0 0 0 0
30 0 0 0 0 0 0 0 0
25 00 0 0 0 0 o o15 0.... 0 0 0 0 0 0 010 a 50,637 60,230 140,494 3 31 34 3
3 22 74,400 110,242 343.647 9 89 99 10 i
0.3 91 192,334 345,077 1.312,103 39 370 408 41
0.03 li 343,983 649.7658 2.567,683 77 733 810 | 1
ioI 0 0 0 0 0 0 0 ___
60 0 ° 0 0 0 0 0 0
30 0 0 0 0 0 0 _______ -_
25 0 0 0 0 0 0 0 _0'
-5 0 0 0 0 0 0 0
010 0 0 °0 0 0.3 47,14 53348 111,739 2 22 25 -
0.3 45 141.623 187,02 610,3719 181 200 20
0 132 2684 482,7 2 1.877.766 so 433 589 59
LOW-100 0 I 00 0 0 0 0 _ _
60 0 0 0 0 0 0 __
30 0 0 0 0 0 0 30 0
25 0 0 0 0 0 0 0 0
15 0 0 0 0 0 0 0 010 0 0 0 .0 0 0 0 0
3 0 0 0 0 0. 0 __0
0.3 13.... 59.9968 80.210 220,791 8 54 ___ 9____
0.03 63 141.587 240.129 914,531 27 281 28_
Unit Rates and 0400516 .MinP e
Notes ofkw3
vol. Is I5a.
Page 3 of 3

A
Table C.1.14. Calculated Costs and Other Parameters ror Reniednition of Contaminated Sofl at the Reference Nuclear Power Plant(Unrestricted Land Use, WIthout Boll Washing, Real World Data, 50-Year SAFSTOR)
p
COntemin Site volow. -low- Total so" the SolRes"il Dos ated She Soil Site Soil 9ldhn Suilding Soil Vohme Excevedton
Ret Soil Am . h Volume Soil Vtolume Reved Costsvmlw tZ' em m3 cm m3 m3
HIGH100 3.000 0.0 0 0.0 0 0 060 3 000 0.0 0 0.0 0 0 030 3.ooo 0.0 0 0.0 0 0 025 3000 0.0 o o.o -0 0 01f 3,000 0.0 0 0.0 0 0 010 3.000 2.5 7 2.5 12 19 4,451
. 3 3,000 7.4 21 -7.4 34 s5 12 9430.3 3,000 30.7 8B 30.7 143 228 53.528
0.03 3000 6 B.9 170 60.9 283 453 106.367MEDIUM _ _ ___
100 3,000 .0 0 0.0 0 0 060 3.000 Jo.0 0 0.0 0 0 030 3.000 o .0 0 0.0 0 0 o25 3,000 o0.0 0 0.0 0 0 015 3,000 0.0 0 0.0 0 0 010 3,000 i._0 0 0.0 0o o-0 0
3 3.000 1.8 6 - 1.8 9 14 3.2170.3 3,000 16.0 42 15.0 70 112 26,24B
0.03 3.000 44.3 123 44.3 208 329 77,360Low - - .
100 3o000 0.0 0 0.0 0 0 060 3 000 0.0 0 0.0 0 o 030 3,000 0.0 0 0.0 0 0 025 3.000 0.0 0 0.0 0 0 015 3.000 0.0 0 0.0 0 0 010 3,000 0.0 - 0 j.0 0 0 0
3 3.000 0.0 0 0.0 0 0 00.3 3.000 4.6 12 4.5 21 33 7.796
0.03 3,000 21.2 59 21.2 98 157 36.965Unit Rates and WNW"lo o01lu 2%@o bu:dI ._ 4235/in'3
Notes . raft o .beg w 1I:"
Page 1 of 3
0~

IkTable C.1.14. Calculated Costs and Other Parameters for Reunediallon of Contaminated Soll at the Reference Nuclear Power Plant(Unrestricted Land Use, Without Soil Washing, Real World Data, 50-Year SAFSTOR)
'I.
00%
_oi 5 4 o4Sol Soil Transport Ttaspont Soil Soo
total So Sol Packaging Packaging Loads, Loads, Tiuapoet Tusapoit t Soil Sol Soil Disposal
Residual Dose Volume Total Soil Wasi Coats, Costs. 0-25 Gondola Tiuck Coats. Costs, Disposal Costs Disposal Costs Costs @
Rose Rsmowvd Weight Costa Gondots Cat 80o14S Cm5 Loads Rho Truck .01. @*' *_ 3 @ 16t'3 $35011-3
Vemly' on'3 %UT U c&'s Trucks __ _ _ _ _
_ _ - -o -~ - -- - -- °- ° -HIG H----
100 0 0 0 0 0 0 0 0 0 0 0 0
s0 0 2. .2 0~ 0 0 0 0 0 0 0
30O0 0 0 0 0 0 0 0 0oo
25 0 0 0 0 0 0 0 0 0 0 0
1 6 ....... 0.. 0.Q 0 ....... 2 _ 0 0 0 0 o 0 010 19 _ 23 O 100 4.167 1 2 4,000 2,950 6,689 3_ 443 234,102
3 66 6i7 0 100 12,117 1 6 4,000 7,950 19,450 97.262 680,765
0.3 228 278 0 400 50,203 4 21 16,000 27,826 80,585 402.927 _,492
0.03 463 551 0 700 99,560 7 42 28.000 55,650 159,827 799,135 8,693,946
MEDIUM - -O -O_ _O O-
100 0 0 0 0 0 0 0 0 0 0 0 0
60 _0 ° 0 0 0 0 0 0 0 0 0- ---
30 0 0 0 0 0 0 0 0 0 0 0 0
25 0 0 0 0 0 0 0 00000
16 0 0 0 0 0 0 0 0 0 ° -0 0
1 0 0 0 0 0-,,
31 14 17 0 100 3,012 1 2 - 4,000 2,660 4834 24171 169983438 31720 _ _12 _9_ _ _
0.3 112 1 O 200 24,571 2 11 8.000 14,676 39441 197,206
0.03 329 401 0 600 72,422 6 31 0 41,07 _19,.26 _ 8_ ____ __ _ 3 - 0- - L.. 20.000 411,075 116.262 __ L Poasi
LOW O O OOO° -_too 0 00 0 0_ 00 Z i 7 . i
60 0 0 0 00 0 0 0 0 0000 00 0 0
00 00 0 0 0 0 0 __0 0
_ _ _ _ _ _ 0 00 0 0 0 _ _ _ _ _ -- -s ..00 0 0 0000
~0 0 0 00 0 0 0 0 0 0 0
0. 33 40 O 1O 702098 4 4,000 5,300 110716 58,576 410 030
0.03 157 192 0 300 34,598 3 15 12.000 19.875 66,634 2-7.66 1,943,673__ _-________ .. A . 'i . s;Co 22O An3 5lso" oft 7.296 1 64.O0 Oe * 1.325 Psi uch Causlmbd* C-..,. - I A .. *
Unit Rates andNotes
la -... .
RACERmowa
gomadas Car to'
aNd cover
racar 4 boxeshiuck lo d
29.154 lMEONAd
omiAbbek I b
$ 1011t'3: faba utra i ol
Compact d"WalWWsalatis LLW
d5011 tsdkyc$50ft4-3; uuckuArppst oify.
Newsp citenas t
49LSLW. S i*t 3.
tgwb stanwpoag ons.
-- I -I
Page 2 of 3Al
.4

Table C.j.l4. Calculated Costs and Other Parameters for Remedatlon of Contaminated Soil at the Reference Nuclear Power plnt(Unrestricted Land Use, Without Soil Washing, Real World Data, S0-Year SAFSTOR)
0
-4
- -- 7 -
Total Sonl nII SONl s Rmedftn -- Res n Total
Residual Dose Volnm @P 011Ot'3 0 150ft3 @ *350Mt3 Sol Waing Soll ExcavatIon Total Soil OccupationalRatoe asPsd D0"aal Costs DIspos^ CmtS Disposl Costs Labor Labor L1emedlatin Labo Doe
HImH m-3 . * $ m_ n4w men-h. p _fon-nvvm
HIGH - .
100 0 0 0 0 0 o0s0o 0 0 0 0 0 0 030 .... 0 0 0 0 0 0 o26 0 0 00 0 0 0 0 ____
15 O... 9..... 0 o o 0 0 0
10 19... 15.240 44 711 245 359 0 31 31 33 5 368494 130.283 713,778 0 - 89 89 9
0.3 228 150,B11 534.581 2.952,145 0 370 370 37
0.03 453 294,884 1.060.710 5.855.521 0 733 733 -_73MDIUM - -
100 .0. 000o00 030 0 0 0 0 0 0 0
2 ... _____0 0 0 0 015 0 0 .0 0 0 0 0 0
10 0 0 0 0 0 0 ____
3 t4 1 2,151 33.050 178.07B 0 22 22 2
0. lt2 73.887 282,598 1,445,835 -_ 0 181 181
0.03 329 214.112 772.116 4,259,675 0 533 533 53-_ -
LW 100 j.0 0 0 0 0 0 0 ___
s0 0 0 0 0 0 0 0 0
30 0 0 0 0 0 0 0 025 o 0 0 0 0 - 0 0
15 0 0 0 0 0 0 0 0
I10 0 0 0 0 0 0 0 03 0j 0 0 0 0 0 ______ 0
0.3 a... k23.611 78,970 430.424 0 54 266_250b3 15 104. 38S,093 2.035,098 0 255 252
R a0.17 mf4 pa 1.62 man-# pw I.. _ O ' wmpw n.unit Rates and
Notes m
Page 3 of 3
zC-11
%0-0%

Table C.1.15. Calculated Costs and Other Parametersfor Reanediation ofContaminated Soialatthe Reference Nuclear Power PlantR- (Restricted Land Use, With Soil Washing, Real World Data, 50-Year SAFSTOR)
P-t0%
00
Conlianla- SMt Below. Below- Total Soil Isite SamlResidual Dqse sled SWt Soal Site Soil Building BIld" n Soal Volume Excavation
noate Soil Area Dapth Wolum Soil Depth Volume Renmved Costsamwavg It'2 cmt M3 cm m.3 n
100 3.000 0.0 0 0.0 0 0 060 3 0 0.0 0 0.0 0 0 030 3.000 0.0 0 0.0 0 0 025___ 300 0 0 0.0 0 0 016 3,000 0.0 0 0.0 0 0- 010 3.000 I0.0 0 0.0 0 0 o3 3.00 0.0 0 0.0 0 0 0
0.3 3.000. 5.8 I 5 5.5 26 411 9.5380.03 3.0 24.6 68 24.6 114 183 42 915
M DIUM __ _ _
10 3.000 0.0 0 0.0 0 0 060 3j... 0.0 0 0.0 0 0030 3. 0.0 0 0.0 0 0 0
_ _ _ 6 2 ~ ' .000 000 015 3,000 0.0 0 0.0 0 0 010 3'0 0 . 0 0. 0
3 3 0 0 0 0.0 -0 0 00.3 3 090L 0.0 0 0.0 0 0 0
0.03 3L000 11.7 33 11.7 -64 .A87... 20.482
100 3000 0.0 0 0.0 0 00.60 3,0 0.0 0 00 0 0 0
22 ,00 .0 0 .0 0 0 026 i 310 ..0 -0.0 0 0.0 - - _ ___ __
__ __5 3000 10.0 0 0.0 0 0 0i 30 0 -0 .0 0 0.0 0 0 - 0
_____ 0 0002 0.0 0 0.0 0 0 00. -300 0.0 0 0.0 0 0 0
0.03 3.000- 2.6 7 2.6 12 20 4.601Untoghwmn "" 'CUal 2% of WWIdo M2 gUMa
belaw 12
Page 1 of 3

t
Table C.1.15. Calculated Costs nnd Other Prmeters for Remedatfon of Contaminated Soll at the Reterence Nudear Power plant(Restricted Land Use, With Soll WashIng, Real World Data, 50-Year SAFSR)
Soil Soil Tronpon Transpot Soll SoNTatcl Son -5dl l PlRackag Loads, Loads, Twintpott TIVIort Son Sonl Sol Disposd;
Residual Doss Volume Total SoN Wsthth Costs. Costs, 8.25 Gondots Tmck Costs. Costs. DiOhpwod Costs Disposal Costs Coss @Rot Romnd W*t Costs Oondohs Cat Boxes Cats Loads Rail Teucwk 0 101ft3 0 *50tS 350m'3
m teiv M T . * * 3* s tT nickt 3 . S S
HIGH - - - _ -
100 0 0 0 0 0 0 0 0 0 0 1 0
60 0 0 0 0 0 0 0 0 , 0 0
30 0 0 0 0 0 0 o 0 00|
- - 0 o o __ ._ _ 0 0 0 0 -35 0 0 000 0 0
0.3 20 Lj .. j E 100 1,6723 O...L.. O 4,0C10 132.6--- _2,73 j 1,28.6 200°799
0 100 R s 0 0 0 a 0 0 0 0 _,eh
6 0 0 0 0 0 0 0 0 0 0 0
30 0 0 0 0 0 0 0_ _
25 0 0 0 00 0 0 0 00 00 0 0
153 01 .09 0549 10 3 7 00 020 0 ___733
4~2~-6 _ l _2b11 CI-g eal"|s 2006589
_____ - 0 0 -0 0 0_
10 0 0 0 0 0 0 0 0 0 0 0 -70
_ _ _30 0.~.. .L..~ . 0 0 0 0 0 00
0. .09.... j.. 0 0 0_ ____ _____
2OW - - 0 0 -
_____0 0 0 0 0 0 0 0 0 0
C0
60 0 Qs 0 0 0 0 0 0 0 o
30 0 0 ... j... 0 0 0 o _ 0 0 0... _____
153 0 0 0 0 0 0 0 0 0000 0 0 0
10 0 0 0 0 0 0 0 0 0___ 0 0___
_____30.. ... 0. 0.. 0 0 0 0 0 0 02_0 0 0 0 0 0_
z __ _0 0 0 0 .7230 0 ____
_______ - - - 10 0 1 I 400 1.2 2. 1382 9679- 20 24 90 - - 0-
atsadGOH' ~R-FIACER *IOOPW 022OWu3 9S WmDo 7.296 *4,000Per *t1.325 Per w# C$IfortafbLk Costs #ouln. PosiweCosts fo
Unit Rae envrdi ondoa cm fo mP gtxK Aooftt e FPO~sI at I.AW COVK d!So'd# lutt In.compeclNots' o~ttc nksr 4 bo"m 1oslt~ afumty, *Xbdlug LLW d~spqessi naukO;fo
N o esh1sd .*tope S ,u *a spos mtl oc nity. I.IW . 635O , ft3 :
29.184 His "$W mo* * soil- ; Ifuck mnKk t'anpon l
Page 2 of 3

3 Table C. 1.15. Calculated Costs and Other Parameters for Remedlatlon of Contaminated Soil at the Reference Nuclear Power Plant(Restricted Land Use, With Soil Washing, Real World Data, 50-Year SAFSTOR)
(4-
AI
10%
C
0
Total Soil T91l Soll Reomdbtion | Costs Total
Residual Dose Volua $ 61O/llt 3 *5011t'3 @ *36011t3 Soil Washing Solt Excavation Total Soil Occupational
Ra Disposed Disposal Cosls Disposal Costs Disposal Costs Labor Labor Remediation Labor Dose
mronivr m'3 ___ __ 1 - hr in -hr manlhr Parson-wnsm
HIGH -
100 0 0 0 0 0 0 o 060 0 0 0 0 o - o o30 0 0 0 0 0 0 0 o2- 0 0 0 0 0 0 0 0
15 0 0 0 0 0 0 0 0
10 0 0 0 0 0 o o 03 - 0 0 0 0 o 0 -
0.3 16 _ .. 64,870 - 89924 261,917 66 73 7
0.03 73 162,366 282.696 1.066,587 31 296 327 33
MEOIUMO100 0 0 0 0 -0 0 0 0
60 O 0 0 0 0O 0 O30 . . 0 0 0 . 0 0 0 °o
25 0 0 0 0 0 0°
16 - 0 0 0 0 0 0 012, 0 0 0 0 0 0 0 0
3 0 0 0 0 0 0 0 0-. 0 0 0 0 0 0
0.o3 35 95,496 153,612 522,967 15 141 1566 1
LOW 100 0 0 0 .0 0 0 0 0
60 0 0 0 0 0 0 0 03- 0 - __ __ 0
26 0 0 0 0 0 0 0 __O
25 0 0 0 0 0 0 0 0
16 0. 0 0 0 0 0 0 0
3 0 0 0 0 0 0 0 ~ 0- 0 0 0 0 00
0.3 0 0 _ __ _ __-__ _ __ _
0.03 a 51.057 61.08 144.038 3 1 32 35 4_____07 nsr pI I6 I, h _ D lB 12man1v DWe
Unit Rates andNotes
voans I 4 0%
01 toa avo.; 4Vol. isII"S
m-3 I rn2 he le,.
I I l.
Page 3 of 3
1* 41
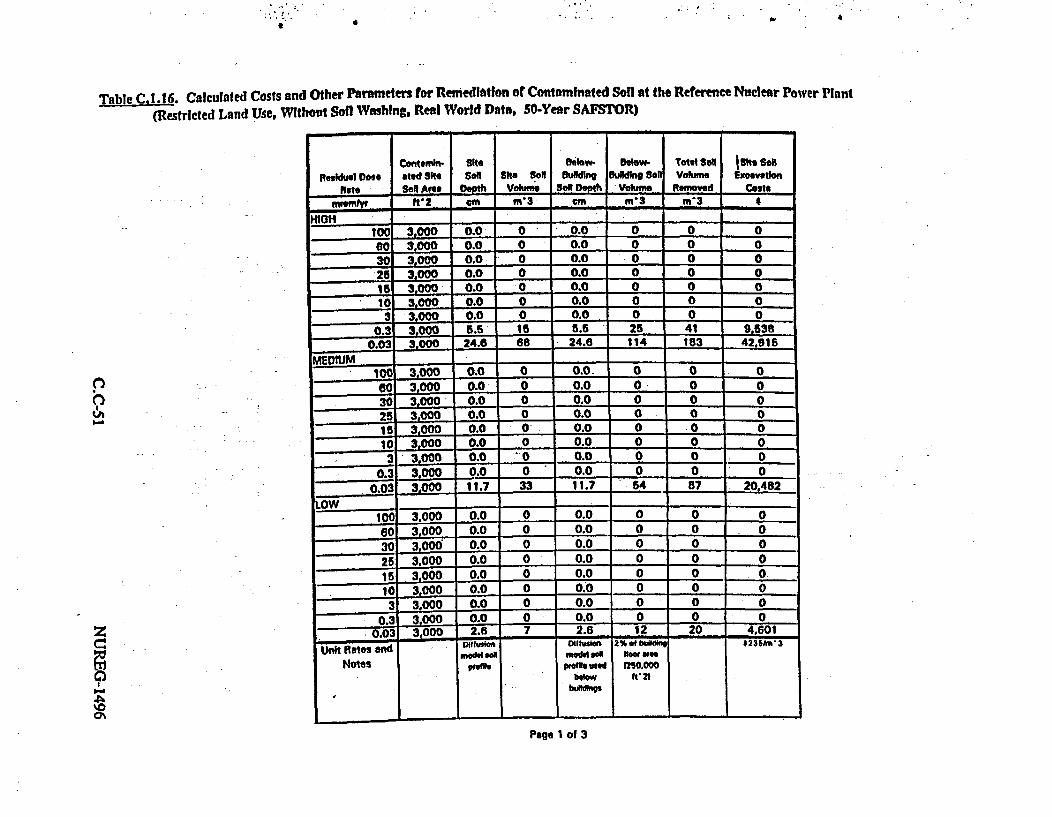
.: : I .... . ft A
a
Table C.1.16. Calculated Costs and Other Parameters for Remedlatfon of Contaminated SoN at the Reference Nuclear Power Plant
(Restricted Land Use, Without Soil Washing, Real World Data, 5Year SAFSTOR)
z
t'a
Cof" mn.- Shte Below Below. Total Sodl St Soe
Residual Dose *ted Slt So She SoN BuildMn Budg Soln Volmve ExcovotionO8l Afea Oeh Voehme dt Depth- Voeme Removed Ce
""mlr ft'2 cm m3 cm m'3 _ '3
IHIG H _ -.
100 3.000 0.0 0 0.0 0 0 0
80 3 000 0.0 0 0.0 0 0 0
30 3. 000 0.0 0 0.0 0 0 0
25 i000 0.0 0 0.0 0 0 0
300 0.0 0 0.0 0 0 0
10 3.000 0.0 0 0.0 0 0 0
3 3'000 0.0 0 0.0 0 0 0
0.3 3,00 5.5 15 5.6 25 41 98538
0.03 3.000 24.6 as 24.6 114 1i83 42.916
MEDIIJM _ ___ _____.
01 3.000 0.0 0 0.0. 0 0 0
60 3.000 SA-.0. 00.0 0 0 030 3'000 0.0 0 0.0 0 0 0
25 3.000 0.0 0 0.0 0 0 0
25 3 000 0.0 0 0.0 0 0 0
1 3'000 0.0 0 0.0 0 0 0
- 3 3.000 6A ZL.. 0.0 0 0 0
3 000 0.0 0 0.0 0 0 0
00 3.000 11.7 33 11.7 54 87 20,482
100 3.000 0.0 O 0.0 0 0 0
60 3,000 0.0 0 0.0 0 0 0
23 3.000 0.0 0 0.0 0 0 0
15 3,000 0.0 0 0.0 0 0 0
10 3'000 0.0 0 0;0 0 0 0
3 3.000 0.0 0 0.0 0 0 0
03 3.000 0.0 0 0.0 0 0 0
0.03 3.000 2.f6 7 2.8 12 20 4,601- - - - - - 1 - -VU- 1
Unit Rates and
Holesmcdd silPeft
medd uspetbf tni
WOW' bdop
ee wlee1250.000I t' 2)
I - � �
Page 1 of 3

Table C3.t16. Calculated Costs and Other Parameters for Remnedlatlion of Contaminated Soil at the Reference Nuclear Power PlantZ (Restricted Land Use, Without Soil Washing, Real World Data, SO-Year SAFSTOR)
- 9-~~_
Q
42-
2
soil Soil Ttanspoil Transport Soil SONl
TotsSoilo So* cg Packaging Loads, Loads, Transport Tranaport SON Soi Soi Disposal
Residual Dose Volume Total Sol Washing Costa, Costs, 8.26 Gondola Truck Costs, coats. Dispos Costs Disposal costa Costs @
Rats Rmed Win'3 t Coats Gondola Car Boxes Cars Loads Red Truck @ 610/1'3 esoa3 $ 350/1t 3
nvamlyr m'3 MT S S U cars' U Trucks S _ _
HIGH l -- -
10 0 0 0 0 0 0 0 0 0 0 0 0
60 0 0 0 0 0 0 0 0 01660 0
30 0 183 22 0 300 0 0 0 0 0 0 0 _
25 - 0 i 0 0 0 0 0 0 0 0 0
15 3C 0 0 0 0 0 0 0 0 0 0
10 0 0 0 0 0 0 0 0 o 0 0 o_3 0 0 0 0 0 0 0 0 0 0 0 0
0 100 ° 1 4 4,000 2 ,300 __14,333 7 664 501,646
0.03 183 223 0 300 40.176 3 1 7 12.000 22,626 64,491 322,454 2,257,181_
MEDIUM - - 000 0- 00 0 0 0 0 _ _ _ _ _ _ _ _ _
100 - - 0 _ _ _ _0 0 0 0
25 0 0 0 0 0 0 0 010 0 0 025 0 .... 0 0 0 0 o 0 0 010 0 0 0 0 0 0 0 0 0 o 0 0
30 0 0 0 0 0 00 0 0 0003 0 0 0 0 0 0 0 0 0 0 __ -_ _
_ _ _ _ _ - -_ _ _ _ 00
0.03 87 108 .2... 200 19,175 2 9 8,000 192 3078 153,898 1.7,8LOW
100 0 0 0 0 0 0 0 0 0 0 0- 0____60 0 - - 00 00 00 0
0 0 0 0 0 0 0 0 0 0 0
3005 0 _0 0 0 0 0 0 0 0Is__ - 0 0 0 0 0 0 0 0 0 025 0 0 0 ___ 0 0 0 0 0 0 ____
10 0 ... .2.. 0 0 0 00 0 0 0 0 -
3 S . 2 . .... j.. 00 0 0 0 0 0 00.3 0 . ~ ~ ~
0.0 20, 24 100 4,307 1 2 .0 2.650 6,914 34,571 '241,998Unt R te n 1100W F$0 220Wm3 95 tons of 7.296 1
4.0 0 pair *1.325 Pat Mck C slts or boikllo. P il csa o
UntR tsQRACER gondola CaM for Am per lb*hx and goadol a lacor load disposal at LARW compact dispos*,l at Ohaae in-Campo"e
Notes hModal plast1c kmarl~ 4 box"Artinc disposal lacdSy. existling LLW disposal le.Milas lorVWdCavar Itload. of 11111931t~alj disposallfacllit, LLW. 4250itti3;
29.%84 lb&I Aftaspork only $50,113: Tiuck ctuck t'anspowg only.somoad Sransport only.
Page 2 of 3
Jo

Table C.L.16. Calculated Costs and Other Parameters for Remedlatfon of Contaminated Soil at the Reference Nuldear Power Plant(Restricted Land Use, Without Soil Washing, Real World Data, 50-Year SAFSTOR)
l.0
Totdl Soi TotLd Sol Rledlatlon Costs TotalRasadual Dose Voluhm 0 $10/h'3 L 501ft'3 0 $35011'3 Soll Wasino Soil Excevatln totl Sol Occupational
flats Dispo Disposal Costs Dpoad Costs Labr Con Labor -tmedltlon Laboa Dose*rweS me3 n * * -mhr man-lw psrbon mVem
-~ a ° - -°-- °-=oHIGH- -
0.3 4_6_ a f60 000 0 0 0 0 0
30 0 0 0 0 00 0
-5 0 - 0 0 0 0 0
15 0 0 0 0 0 0 0 010 0 0 0 0 0 0 0 o3 O 0 0 0 O O 0 O
0.3 41 27.970 -9-5430 525 .412 0 66670.03 183. 119,706 42871 2.362.797 0 290 296 3
MEDIUM-. _
60 0 0 0 0 0 0 030 0... 0 .... J___ 0 0 0 0
25 0 0 U0 0 0 0 015 0000 0 0 0 0
10 0 0 4) 0 0 0 0 03 0 0 0 0 0 0 0
03 0 00o 0 0 0 0_,3 - 0 9 °l O _ O_
0.03 8, 59,462 205.400 1.128.869 0 - 141 141 14
LOW -OO100 0 0 0 0 0 0 0
60 0 0 -0 0 0 0 0 _____
30 00 0 0 0 0 03<_ - 0 0
25 0 0 0 0 0 0 0 _____
15 .9.......0 0 0 0 0 010 0 0 00 0 0 0 03 0 0 0 0 0 0 0 0
03 ...... 0000 0 0 00.03 20 1568 46.130 253.557 0 2 32 3
Unit Hts ond .o.7 man4 Pw 1.62 in4v p" O. n- P man.Notes .
Page 3 of 3
go4h00%

.. I
z Table C.2. 1. Calculated Costs and Other Parameters for Remedlation of Contaminated Soil at the Reference Uranium Fuel Fabrication Plant
(Unrestricted Land Use, With Soil Washing)
9%0
9D.-
Contamla- Site Below- Below- Total son Sig. So8RealJ oe. atod Site Sal Soil 6it Soo BuIldkng Buildh SoH Volume Excavation
Rait Are o22th Volume son Depth Volm e Coststwwmlyt h'2 GM m'3 cm m'3 m3
HIGH ._ __ -_ __ _
100 100,000 18.4 1,707 18.4 82 1,789 420,38480 100.000 19.7 1.834 19.7 88 1.922 4S1.S7030 100,000 21.3 1,983 21.3 85 2.078 488.33325 100.000 21.7 2,019 21.7 97 2,115 497.1321 100.000 22.8 2.114 22.8 101 2.21S 520,560
10 100.000 23.5 2,186 23.5 105 2,291 638.30S3 100.000 25.6 2,378 25.6 114 2.492 585,601
0.3 100.000 28.9 2,688 28.9 129 2,817 662.103
0.03 100.000 _31.9 2,964 31.9 142 3,108 729,948MEDIUM _.
10MD 100000 8.U 802 8.6 38 840 197.438
* 60 100.000 14.2 1,318 14.2 83 1,381 324,51430 100.000 17.1 1,588 17.1 76 1.685 391,1902E5 100.000 17.7 1,644 17.7 79 1.723 404,97715 00,000 19.2 1,779 19.2 8S 1.865 438,240
1t0 20.2 1.874 20.2 90 1.964 461,5223 100,000 22.8 2.114 22.8 101 2,215 520,560
0.3 100,000 26.7 2.478 26.7 119 2,597 61003680.03 100,000 29.9 2,776 29.9 133 2,909 683,711
LOW .100 1001000 0.0 0 0.0 0 ° 0
62 100,000 0.0 0 0.0 O O 030 100.000 0.0 0 0.0 _ 0 0 025 100.000 0.0 _ 0.0 0 ° 015 100.000 8.6 802 8.6 38 840 197.43810 100.000 13.6 1.259 13.6 60 1,320 310.110
3 100,000 18.4 1,707 18.4 _ 82 1,789 420.3940.3 100.000 23.5 2,186 23.5 105 2,291 538.305
0.03 100,000 27.3 2,533 27.3 122 2,655 823.915
ULit Rates NWd oplaw" Mlee 2% e hdng $236lnm3oesmodal adI m del sea waru uro
NowPbOW asoh. wad 1240,000 ftil
Page 1 of 3
v

& . a
Table C.2.1. Cnlctinted Costs and Other Parameters for Remetdlation of Contaminated Soil at the Reference Uranium Fuel Fabrication Plant(Unrestricted Land Use, With Soil Washing)
p
c]h
LA
z
tC%
Son son Transpof Transport SU UN
TotaldSoil Pkckteksorg Pa*cagnv Loads. Loads. Transport Transport Sol So Soln DisposalResidual Volume Total Soll oil Washing Costs. Costs. B-25 ondola Tnrk Costs. Coss. Dipos Costs Disposal Costs Coots
DoesRIt Rsmowvd Weight Costs Gonodola Car S 7a CatW Loads Rel Truck @1 *0Ora' @ 3SOt*3 J_________
mrsmlyr m3 MT II * can ITrksl S 0 _ 03_0/f-
HIGH -
100 1,789 2,180 537,310 1,100 157.424 11 66 44,000 J7,450 2 1.263.490 8.844.427
60 1,922 2,341 574.628 1,100 169.099 11 71 44.000 94,075 271.438 1.357.189 943008320
30 2,078 2,532 618,835 1,200 182,865 12 77 48,000 102,025 293.536 1,487,680 10-273I758
25 2.115 2,578 629.168 1.200 186.160 12 78 48,000 103,350 29825 1.494.126 1045884
15 2.215 2.699 1657.212 1,300 194,933 13 82 52.000 108.650 312.907 1.564,536 10.951,755
10 2.291 2.791 678 453 1,300 201,578 13 85 52,000 112.625 323.574 1.617,8s8 11.325.079
2.492 3.036 735069 1,500 219.289 15 92 _ 0000 121900 352,004 1,70,018 12;320 124
0.3 2.817 3,433 826.644 1,600 247,936 16 104 64,000 137.800 397,988 1.99.942 13,929,.597
0.03 3,106 3.785 907.857 1,800 273.342 18 1 5 7182,C00 152,375_ 43870 ,9 1535S959
MEDIUM 2_9,5 I53699
oa0 840 1,024 270,423 500 73,934 5 3 1 20,000 41,075 _ 593,397 415377A
60 1 38l 1.683 422,S38 803 121,520 8 51 3?,000 67,575 195,065 975,324
30 . 2,028 502,351 - 146 186 10 62 40,000 82.150 235.143 1.175.716 8.230,O1525 1,723 2,100 518.855 1.000 151.651 10 64 40.000 84,800 243,431 1,217,154 8.520 078
15 1,865 2,272 558.679 1,100 164.109 11 69 44,000 91,425 263.429 1,317,144 9.220.010
a0 1 964 2 393 586,541 1,200 172,825 12 73 -48000 961725 277,420 1.387,099- 709.692
3 215 2 9 657,212 1,300 194,933 13 82 _ 52,000 1037450 312.907 1,5847,38 10_951.7, 5
0.3 2 597 3,15. 764.716 1,500 228.563 15 96 _I ;°,°°° 127,200 361.891 1.834455 12 S4 ltl82
0.03 2 909 3 ,545 852,510 1 ,700 256,028 17 108 _ b.1,000 143.100 410,59 79.... __ _ 14,34 ,213._- O7- -O. IO- _ _1300 407 2.054,888 14_ 84.2L-
LOW ____ ___
100 ... 0 0 0 1. 0 0 0 0 .... 0 000 _ _
60 0 0 0 0 0 0 0 0 o 0 0 -
30 0 0 0 0 0 0 00 0 __ _ _ _ __ _ _ _
- -
2~5 0 ,.... 0 0 0 0 0 0 0 0 0 _
15 840 1 021 270,423 500 73,934 5 31 20,000 41,005 - 118679 593,397 4,153,778
1 320 1 6005 405,296 800 118,126 8 49 32,000 64925 186407 932,033 b4,2
21,789 18 537,310 1,100 157,424 tl 66 44,000 87,450 252,698 1.263.490 8.844,427
0.3 2,291 2,791 678453 1,300 201,578 13 85 52,000 1124625 323,574 1.617.868 11.325079
0,03 2.655 3.235 780.932 1,600 233636 16 98 4000 129850 32 9- ' - -ACf -1t -20'375.034 1.875,17 1 13.126.1949100.eI a Of Ut P2ess3i9bImloa1 2case4s0 0 o I to-sa2&i b parI
unit Ratesand Notes
II- --! I. "- I ad cm to
prd Coer
ricaF, 4 bowevAtut
& lead, ws.184 PissNAbed
gnl.e asw hd diPeaSS at LARWdAbasael lacy.
Iluel fight~
lrPeve wa
uufTorn IerIIc Nc disposad d o
*.lotI LLWdiaPeas lacligy.16001t3; Mrcklonspett ewd,.
10AW. bn emopact
diapeadi tacli., 6 ts.LLW. b3a0ton3a
truck tra upari ary.I
I -I - I -.L.____________ _____
Page 2 of 3

z Tntble C.2. I. Culculaled Costs sand Oither Parameters for Renedlatlon of Conlanidaled Soil at lile Reference Urailum Fuel Fabricatlio Plant
9 (Unrestricted Land Use, Whith Soil Washing)U.61I4�0C�
0*0vLa
Total Soi Total i Amadlation Costs Toal
Reidual Dos Volume 6 0101f-3 p *60/1-3 * 635011H3 Sola Wang Sel Excsvation Total Sal Occupaiol
Ra DMpooed Disposal Costs Disposal Codts Disposal Comte Labor Labor Rmedion Labor Dose
wW r m iinwb man-he mwtrhl petson-awom
HIGH 71 1,255,501 2.466.067 10.047.004 304 2.898 3.202 320
60 769 1,342,736 2,646,660 10.789,692 327 3.113 3.440 344
30 831 1.449,704 2 ,859A38 11.665.617 353 3,366 3,720 372
25 846 1.474.326 2,909,937 11.874.695 360 3,427 3.787 379
1i 886 1,S43.979 3.045,891 12,433,110 377 3.589 3,9B5 397
10 918 1,593.831 3,148,829 12 858.040 389 3.711 4,100 410
997 1,734,173 3,421,876 13.981.982 424 4 037 4,461 446 _0.3 1,127 1,892,336 3.884,425 15,804,080 479 4,564 5,043 504
0.03 1,242 2.160.376 4.257.374 17,420,482 E28 5,032 5,560 558
MEDIUM-100 33j 607,040 1,176,266 4.736,645 143 1,361 1,504 150
60 552 974,917 1,911,472 7.763,416 235 2,237 2,472 247
30 666 1,169.684 2,29?7895 9.352.194 283 2.697 2 980 298
25 689 .2. 2,3,7.437 9.680,361 293 2,792 3.08- 308 __
15 746 1,305,4S4 2,569,604 10.472.470 317 3.021 3,338 334
_0 786 1,374,683 2,704.712 11,027,305 334 3.182 3,515 352
- 3 888 1,643,979 3,045,891 12,433,110 377 3,589 3,96B 397
0.3 1.039 1.803.475 3.665.301 14.572.028 442 4,208 4,649 465
0 03.,164 2,016,899 3,990,238 16.319.563 495 4,713 5,208 521
LOW -O10 0 0 0 0 o 0 0 060 . .00 0 0 0 00
30 00 0 0 0 0 0 0
2 0 0 0 0 0 0 0 0
15 8 607040 131763266 4°73-645 143 31 504 1°50
10 528 934,613 1.828.490 7.420,688 224 2,138 2,362 236
3 716 1i,265501 2,466,067 10,047,004 304 2,89B 3,202 320
0.3 918 1593 31 3,148,29 12.856,040 389 3,711 4.100 410
0.03 1.082 1.845.481 3.643.504 14.894.528 451 4.301 4,762 475- - I.7mn~ .2m~ a,0......n..
Unit Rates and 4055IUVANmw Is 40%Notes oI" SialS
wsa ,5f kif lVal. is 9h.h"d
M-3 - I M-3 ' tv lbw
l _ . -
Page 3 of 3e
I I I ,

I .8 f :
6. .. I
Tnrbte C. 2.2. Calculated Costs and Other Parameters for Remedinflon of Contaminated Soil at the Reference Uranium Fude Fabrication Plant(Unrestricted Land Use, Without Sell Washing)
Contemin- Site MOW. Below. total Soi she. SonRe. Jdual Does ated Si* Soel Site SOl Bldng BuildinSo VoMe Elavetle,
Rete Soll Ae Deth VolwMe so" OEh Voume Remeved CostsMremw" ft2 cm m3 am m3 m3
HiGH = _ ____100 100,000 18.4 1.707 18.4 82 1 789 420,394
60 100,000 19.7 1.834 19.7 88 1 922 451,S7030 100,000 21.3 1.983 21.3 95 2.078 488,33325 100,000 21.7 2,019 21.7 97 2.115 497.13215 100.000 22.8 2,114 22.8 101 2.215 520,56010 10000,0 23.5 2.186 23.5 105 2,291 538,3053 100,000 25.6 2,378 25.6 114 2.492 585,601
0.3 100,000 28.9 2.688 28.9 129 2.817 682,1030.03 1002000 31.9 2,964 31.9 142 3.'06 729,948
MEDIUM -
100 100.000 8.6 802 8.6 38 840 197,4380 100,000 14:2 1,318 14.2 63 1,381 324,614
30 100l000 17.1 1.588 17.1 76 1.665 _ 39119025 100.000 17.7 1 644 17.7 79 1.723 404.97715 100.000 19.2 1,779 19.2 85 1.885 438.24610 100,000 210.2 1 874 20.2 90 1,964 461.522
3 100.000 22.8 2,114 22.8 101 2,215 520,5600.3 100,000 26.7 2.478 26.7 119 2,697 610,388
0.03 100.000 29.9 2.776 29.9 133 2.909 683.711
100 100,000 0.0 -0 0.0 0 0 060 100,000 0.0 0 0.0 0 0 030 100.00 0.0 0 0.0 0 0 025 100.000 0.0 0 0.0 0 0 01 100 000 8. 802 8.6 38 840 19743810 100.000 13.6 1,259 13.8 50 _1320 310,110
3 00.000 18.4 ,1,707 18.4 __ 82 1,789 420,3940.3 100.000 23.5 2.186 23.5 _ ~ lO _,21 53 0
o~o 100.000 27.3 -2.533 27.3 -122 2,565 _623,915Unit Rotes end Difluln DIltlen 2S C bldlW *2)S{mJ
medd so" medal r Now uasNotes e prbts pislif weE 1240.000 1h21
Page 1 of 3'.00%~

Z Tablc C.2.2. Calculated Costs and Other Paramieters for Resnedialloan of Contawuatated Soil ski tile Refercnce Uranium Fuel Fabrication plant
9 (Unrestricted Land Use, Without Sail Washing)
LU9
200
SONl SONl Tranapait Transport sail Soam
Total Soil Packaging Packagin Loads. Woads. Transport Tranapoeg Sol Soil Sam Disposal
Residual Volumne Total Soil SONl wWasn Costs. Coats. 8.-26 Gondola Truck Coste. Costa. Disposal Coats Disposal Costs Costs @Close Roe Ramnoved- Weight Costs Gondola Ca! Boxes Cars Loads Rail Truc 11r 1169111' *36011t -3
mwrsmlyr m'3 MT 11 1Uo ars I Truclt $ _ _ __ _ _ __ _ _ _
1100 1.789 2.190 0 2.500 393,560 26 165 104 000 218.625 631.745 3.158.724 2 2. 1 .0o6 7
60 1.922 2.341 0 2.800 422.748 28 177 112.000 234.525 6854 33291 2.5.0
30.2 2.078 2.532 0 3.000 457.163 30 192 120.000 25S4.,400 733.840 3.069,199 25.684,390
25 215 258 0 3.000 465.401 30 195 1120,000) 258.375 4703 .3536 2147,29
152.1 2 69- 0o.0 487.332 32 204 120.000 1270.300 782.268 3 911 341 27.379,389
I 0 2.291 2.7 0 .~.. 503.945 33 211 132 000 279.575 81089L34 4.044.671 28.,312.699
3 2 492 3.03t _ 0 3.600 548.222 36 230 144.000 304.750 8009 44004 2 *!K.
0.3 2.97 3LZ 43. ........... .0 819.841 40 20 1000 994.971 ~4974 .856 34.82~393
0.3,3108 3.70E 0 4.400 69.5 4 28 1800 3890 1.098,928 5.484,628 38.392.398
1002 - 1402 0 1,200 J84,835 12 78 4-8.000 103.350 298.6,98 1.-483.491_ 10 384, 440
60 1.381 1 683 0 2.000 303.801 20 127 .0...A&2. 168.275 487.662 2,4383.31~0 17.08 171
30 166S 2.028 02.400 368.220 24 154 96.000 204.050 587.858 2.921
25 _I723 2,100 -0 2.500 379.127 25 159 100.000 210.675 608.577 342 885 2.0.9
__....25 1.65 2.272 0 2.700 .410.273 27 172 108.00 227.900 ** . 2.0.9
10 -1.964 2,9 0 2.800 43 -6 28 1811 112.000 -239,825 658.542399.6 2423.05.025
3___ 2.215 2,699 0 3.200 487.332 32 24 128,000 270.300 782.268 391341 27 379 389
0.3. 2,597 3,165 0 3.700 571.408 37 239 148.000 316.675 I9117.227 4.56 3695
0.3 2,909 304 0 4.200 640.070 42 288 188,00 355.100 1.027.444 2LjLL. -
0 -5.137 219- 35 960 532-
100 0 00 00 0 00600 0. 0 0 0 0 0 0 0 0000
60 0 0. 0 0 0 0 0 0 0 0
25 0 0. 0 0 0 0 0 0 0 0 0
1 840 1,002420 184.835 1 2 78 48.000 103.350 296.698 1.483.491 10.384.440
10 ±1.320 1.608 0 100 290.316 1 9 122 78,000 -161.850 466.01 6 _2.330,082 1 6.31I0,575r
31789 2.180 0 2.0 393.S60 26165 14 04.00 218.6256317631,7593.17 242 22.III067
0.3 221 29 0 3.300 503.94S 33 211 1132.000 279.5$75 808.934 4i04!67 28.312.699
0.3 2.65 3,23 0 13.800 584.091 38 245--- 152.000 -324.62S 937,585 4.687 928 .32.8-15.484-9 RAI I 100w DO 220Om3 96 7o.. .2*8S 114.000r 11.326 per truck eoI.hA . .-
Unit Ratesand Notes
fw -1. -MO"e garndolsa m lei
metd caver
sagcPM4 heazslgruc
k lead, ar25,154 be
sellelod
Gorwols Wear load dtposal at bLAy
5 1011s3; laiItsrspotS wdt
aximling LLWdiSP011al tasity.S60AIsJ2 MtuckItarip el ordy.
diaposal Iscisilies for1LW. 5360ntc32;
Itiuck to nspaws o~y.
_____________ I - J. - . - - - - - - - L I.
Page 2 of 3
*1..
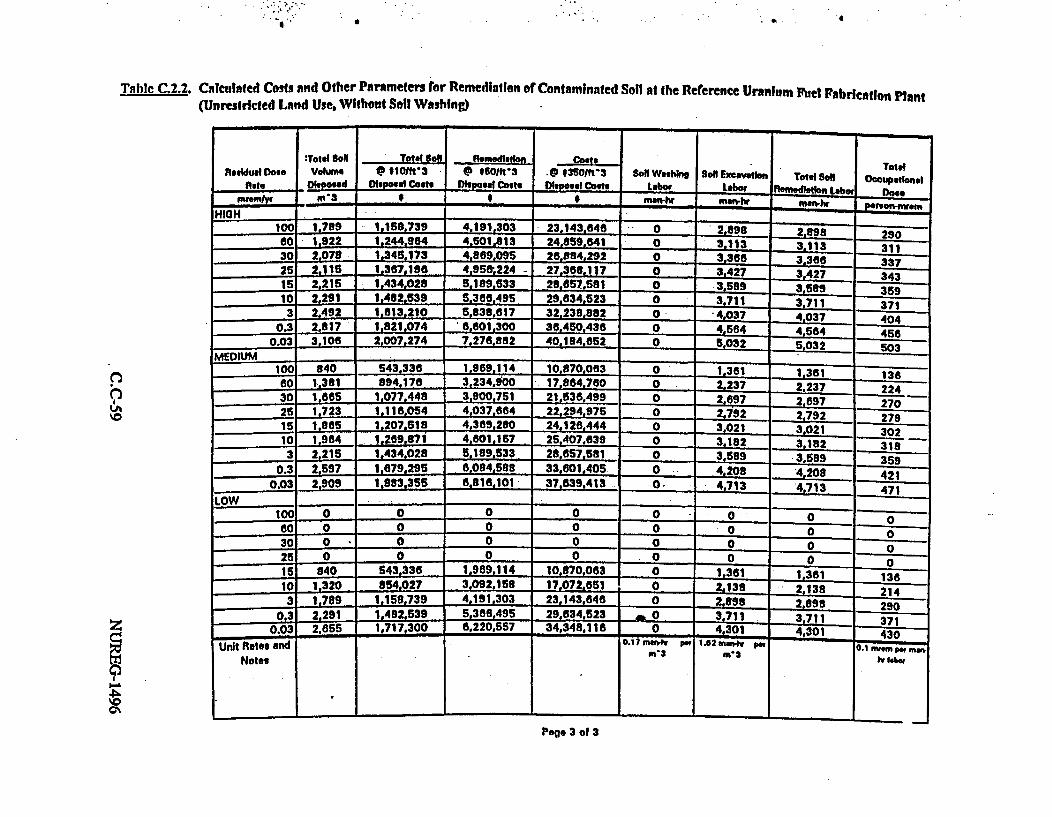
I , . I a
Tabl C2,2. Calculafed Costs and Other Parnmeters for Remedlinlion of Contaminated Soil at the Reference Uranhim Fuel Fabrication Plnt(Unrestricted Land Use, Without Soil Washing)
n7LAth
'Toal SON Total SoN pemedla co s TotalResidual Dose VknS @ *e011O3 @ 1h'3 . $350/ftS3 Son Washki Sol Excavation Total Son Ocupatlonel
Rate Dsposed Disposal Costs Disposal Costs Dihpoval Costs Lamor Labor femLIgvlgtb Lab,. Dosetnu -i3 R . 9 mmhwr man-lw
HIGH .5.2 4.9.3 _____ ____ ____
0 1 789 1,15,739 4,191,303 231434 0 2.898 2898 290so -1,922 _ 6244j954 4,501t813 24.859.641 0 3.113 31130 2 07 . 1.345,173 4,e89.09s 26.s4.292 0 3,368 3.63725 2.116 1.387,196 4.956.224 - 27,368,117 0 3.427 3.427 34315 2,215 1.434,028 56189.533 28.657.S61 0 3,589 3,59 359-10 J2L291 1.42_39 5.3866495 29.834.523 0 3,711 3.71 371
3 2.492 1,13,210 5.8389617 32.238.882 0 4,037 4,037 4040.3 2.917 1,821,074 6.6015300 38.450:435 0 4.564 4 564 456
0.03 3.106 2.007.274 7,276.982 40.184,652 0 5,032 5,032 503MEDIUM
100 840 543,338 1.969.114 10 870,063 0 1,361 1.361 13660 1,38L 994,170 3.234.900 17.864,700 0 2.237 2.237 22430 1 ,65 1,077.448 3.900.751 _ 21,53,499 0 2,697 297 270 -
25 10723 1.116.054 4,037.664 22.294.975 0 2.792 2.792 27915 1 $65 1,207,518 4.3e9.2s0 24.126.444 0 3.021 3.021 30210 1,964 1,269,871 4,601,157 25,-407639 0 3.182 3.192 318
2.215 1,434,028 5.189 533 28.657.591 0 3.589 3699 3590.3 2.597 1,679,295 6!084.599 33.601.405 0 4,208 4,204
0.03 2,909 1.83,3SS 6,816.101 37,639,413 0- 4,713 4_213 471LOW _.OO__O
100 - 0 0 ____________ ______
60 0 0 0 _______ ______
30 0 0 0 __ _ _ _ _25 0 0 0 __ __ _ __ _ _ __ ___ __ __ _
125 840 543,336 1_969,114 10,870,063 0 _1,3_ 1 1,36i 13610 1,320 854,027 3,092,158 17,0726551 0 2,138 2138 2143 1 789 1,158,739 4.191.303 23,143,646 0 2.898 2 898 290
0.3 2,291 1,482,539 5.368.495 29.634,523 .. ° . 3.711 3.711 3710.03 2,655 1,717,300 6,220,557 34,348.116 0 4.301 4,301_ _430
4- . 4n301 430z
U4Uni Ruats am
Notesa; - m-3 11r 0.1 101m Po m n.
IV laber
I .
Page 3 of 3

zZ Tnble C.2.3. Calculated Costs i nd Other Parameters for RewiedJlalion of Contanmnated Soil at the Reference Uranium Fuel Fabrication PlantM (Restricted Land Use, With Soil Washing)
'.00%
Q
Contalni Site Below. 6elaw- Total Soll s.e sonRealkduald *e ad Sue Sol sa Soa iBuiing Awulin S Volume Emavatlon
Rait So Ao Depth Volume Sol Depth Volume Removed Coast-vonityl, ft-2 cm a'3 cm m'3 m^3
HIGH I100 100,000 0.0 0 0.0 0 0 0
60 100,000 0.0 0 0.0 0 0 030 100.000 0.0 0 0.0 0 0 O26 100,000 0.0 0 0.0 0 0 015 100.000 10.8 1.008 10.8 48 1.056 248.16310 100.000 14.2 1.316 14.2 63 1,379 324,098
3 100,000 18.7 1,734 18.7 83 1,817 427,0010.3 100.000 23.7 2,202 23.7 106 2,308 542,387
0.03 100.000 27.4 2,549 27.4 122 2.,71 627,774MEDIUM
100 100,000 0.0 0 0.0 0 0 060 100.000 0.0 0 0.0 0 0 030 100.000 0.0 0 0.0 0 0 026 100,000 0.0 0 0.0 O 0 015 100.000 0.0 0 0.0 0 0 010 100,000 0.0 0 0.0 0 0 03 100,000 10.8 I,008 10.8 48 1,068 248,163
0.3 100,000 20.4 1.898 20.4 91 1,989 467,4390.03 100.000 24.9 2,312 24.9 111 2,423 569,376
LOW ____I
100 100.000 0.0 0 0.0 0 0 060 100.000 0.0 0 0.0. 0 0 030 100.000 0.0 0 0.0 0 0 025 100.000 0.0 0 0.0 0 0 0
16 100.000 0.0 0 0.0 0 0 010 100.000 0.0 0 0.0 0 0 0
3 100.000 0.0 0 0.0 0 0 0 O0.3 100,000 14.2 1.316 14.2 63 1,379 324,096
0.03 100,000 21.3 1,982 21.3 95 2,077 488,158Urit Rates and - iOfusion Diffusion 2 % el bWddv -
Note s " wpiele pet. usd 1240.000 1021
belw
Page 1 of 3a.

� I .. �, i ". .
Table C (.3. Calculated Costs and Other Parameters for Remediall," of Contamunated Soil at the Reference Uranium Iasi Fabrication plant([Restricted Land Use, With Soil Washing)
42
0~6 -&h
-oil - - -- - i;- _ - _
Son Solt' Transport Trensport Sonl so
Totd Sol Pakagoio Packagng toads. toads. Transport Transport Son so Soil Disposal
Residurl Dose Volwm Total Son SOl Washig Costs. Costs. R.25 Gondola Truck Cots. Costs. Disposal Costs Disposal Costs Costs @
Rate Removed Weight Costs Gondola Car oa Cr Load T rlNl TrUCk @SlO/fr3 @ 35011t?
mrsmlyr W3 MT S S eawe P inicls 9 _A-#_O____ 30/
HIG HH100 0 0 0 -_ -
0 0 0 0 0 -_-o - 0 °ooooo } - o
60 0 ..... 000 00 0 0 0 0 0
30 0 ~ 0 0 0 0 0 0 0 0 .~~
25 0 0 0 0 0 0 0 0 0 0
15 1,056 1.287 331.143 0oo 92,929 6 39 24,000 51,675 149.171 745 53 S29-L _5 220.968
10 1,379 1,680 422,038 800 121,364 8 51 . 32,000 67,575 194.814 974 a.8 6,818 47f6
31817 2,214 545,219 1,100 159.898 11 67 44,0000 88,775 256,870 1,283,34- 8983,436
0.3 2,308 2,812 883.339 1.400 203.10B 14 85 -56,000 112,625 32ff027 1.630.137 11 41096f11
0.0 3 2,671 3,255 785,551 1,600 235.081. 16 99 64,000 131,175 377,353 1 888 13.207.37 2
MEDIUM - -
100 0 0 0 0 _ 0 0 0 0 0 0 0 _
60 98 2,424 0 0 0 0 0 0 0 0 0 .0
30 0 0 0 0 2 0 0 - 0 0 0 0
25 0' 0 0 0 0 0 0 0 0 0 i---- ----0 0 0 0 0 0 - 0
0 _10 0 0 0 0 0 0 0 0 ________
3 1,056 1 287 331.143 600 92.929 6 39 24.000 51,875 14 07 745.853 2.6
0.3 1,989 2.424 593,624 1 200 175.041 ..12 74 4 98005 280,977 14483 9848
0.03 2,423 2.5 715.647 .12.40 21321 14 90 56,000 119.250 342.251 1,711 25S 1197.784
LOW- -
60 0 0 0 0 0 0. __ ___ ___ ___0 0.
__ 0 0 00 __z zz--0
_ _ _ _ 0 0 0
15 000 0 ~"- 00 ____ 0 0 __ __ _
10 0 0__ - -0010 0 0 0
3 0 0 0 0_ 0 0 0 0__
0.3 1 379 112..0 422.038 100 1,3§j4 8 51 32L000 67.575 1 94.14A 974,068 a 818,47606.032.07 .3 618,425 1.20 18.910..L.....2.. 422. ~2025 293~,431 1,6713 0_____
s.ioaA*10 1220hn'3 OI s..os44 1.258 64.000... *t2..,..k- 027.7Unit Rlte,
and NotesIVbu a- I at no
me"e! wv_ ramV
Ie~
I
I
sowpndlew 4 boxashnc
29.184 lbsolfted
v - av fake1004
4dead00 of tAodisabd pl cilty
I 10Atn3: vAbompoa Or
U"*@ la Wegret impa oaigg
6XlaOW" tLWdimposat la"Odr.3s1of13; wiucktronport oral
Posibe coes lo hIutus lreo.,ps,
Juspoad fadmies IloLLW. 1136Orn2'3It II oopa )Soilt-
_______________ - J. -.------ . -- -- . - . - . I I _______________________
Page 2 of 3

z Tablc C.2.3. Calculated Costs and Other Parameers [or Remnedlallon of Coliaminated Soil athe Reference Uranium Fuel Fabrication Plantt?1 (Restricted Land Use, With Soil Washing)
90%
0'
I owl
TotalS Total _ Rmedalalon Cot Total
Rjual Do. o VANm * 6Or3 @ .DO0lr3 @ $3g j3 Sol Washing 8d5 Excavation Total Sog Occupataonl
BAl Dkposed lsoael Costs Disposal Costs OsposlCosts Labor Labor Readladton Lsbot Doss
_evv m'3 11 1 4 awl-he an-hr nun-hr 006hfeFnm
HIGH -________ _100 ' 0 0 0 0 0 0 060 0 0 0 0 0 0 0 o30 O0 0 0 0 0 0 0
26 0 0 0 0 0 0 0 0
12- 422 753.077 1,469,764 5.944.879 18O 1.711 O1890 189
10 - 973,74S 1,S09,141 7.6.549 234 2.234 2,469 247
3 1.273,990 2,504,242 10,204,329 09 2944 3,252 325
0.3 923 1.609,164 3,171,S95 12,9S2,419 392 3.739 4,131 413
0.03 1 1069 1.866.278 3,66,349 14,986,953 454 4,328 4,782 _ 478
MEDIUM -
100 O 0 0 0 0 0 0 o _
60 0 .0 0 O 0 0 0 0
30 0 0 0 0 0 0 0 __
25 0 0 0 0 0 o 015 0 0 0 0 0 0 0
- 10 0 0 0 0 0 0 0 0
3 422 753,077 1,469,764 5.944.879 180 1.711 1,890 189
0.3 796 1,391,240 2 739 037 11,168,335 338 3,222 3.680 356
0.03 969 1.684.676 3.328.742 13,596.271 412 3,925 4,337 434
LOW_
10O -O 0 O 0 0 0 O60 0 . 0 0 0 0 0 0 0
30 B 0 0 0 3 2 0-4 02 6 9 0 0 000_ _ _ _0
00 0 0 0 0 0
10 0 0 0 0 0 0 0 03 00 0 0 0 0 0 0
0.3 .. 5L.. 973.748 1.909.141 7 753 649 234 2.234 249247
0.03 031 1,449.234 2.868.S61 11.661,478 353 3,365 3,718 3720.1,m& w S 2mage S. - "- ..
Un...._ . _.n0 F w tw~~b ~ s,
Unit Rates andNotes
umw
skmel ailmV914 #&i~MOJf
. ; .. I -_hi labor
a .
Page 3 of 3
I.

: ' A
Table C.2.4. Calculated Costs and Other Parameters for Remedlatlion of ContnminaLed Soil at the Reference Uranium PFel Fabarication Plant
(Restricted Land Use, Without Soil Washing)
Contanmn- Slte bekm- Below. Totel Soi S SoilreoldUfl Does *t S SlO SO! S Sl SONBOOM Buiing SON Volme E cvthn
Rnte Soil Area pth VoHme Sft Deph Vokme ftemoed Costsrwemfr h'2 cm '3 am m'3 m'3
HIGH100 100.000 0.0 0 0.0 0 0 060 100.000 0.0 0 0.0 0 0 0
30 100.000 .A 0.0 0 0 025 100.000 0.0 0 0.0 0 0 015 100,000 10.8 1,008 10.8 48 1.056 248.16310 100,000 14.2 1,318 14.2 63 1,379 324,096.
3 100.000 18.7 1.734 18.7 83 1.817 427,0010.3 100,000 23.7 2.202 23.7 106 2.308 542,387
0.03 100.000 27.4 2,549 27.4 122 2.671 627.774
100 100.000 0.0 0 0.0 0 0 060 100,000 0.0 0 0.0 0 0 030 100,000 3.0 0 0.0 0 0 025 100.000 0.0 0 0.0 0 0 015 100.000 Q ...0 0 0 00.0 0 010 100.000 0.0 0 0.0 0 0 0
3 100,000 10.8 1.008 10.8 48 1.056 248,1630.3 100,000 20.4 1.899 20.4 _ 91 1,989 467.439
0.03 100,000 24.9 2.312 24.9 _ 1 .I2.423 569,376LOW. _. . . . .. I
100 100.000 0.0 0 0.0 0 0 0S0 100.000 0.0 0 0.0 0 0 0
30 100,000 0.0 0 0.0 0 0 025 100,000 0.0 0 0.0 0 0 015 100.000 0.0 0 0.0 0 0 010 100.000 0.0 0 0.0 0 - 0
3 100,000 0.0 0 0.0 0 0 00.3 100.000 14.2 1.316 14.2 63 1379 4096
0.03 100.000 21.3 1,982 21.3 95 2,077 488,158
Unit Rates and 2,ilof hn t 23S ki-3moadel sol .Mos eoN nwI, Owe
Notes . pf bold w 1240.000 h21
belowbuldh.o:
Page 1 of 3
z
I~9DM-

Z Table C.2.4. Calculated Costs and Other Parameters for Rewediallon of ContaGnated Soil at the Reference Uranium Fuel nbaicailon plan,
i (Rcstrictcd Land Use, Without Soil Washing)
YI.".0b
i
, ~~ 50Sil____Son Soa Transport Tranport SoNl Sol
Total Sol Peckin acka Loads. Loads. Tiansport Transpon. SON So SON Disposal
Rsidual Doss Volume Total Sol Sol Washing Costs, Costs. 026 Gondola Tnuck Costs. Coabs, Disposal Coatl Disposal Costo Costs @
Rats Removed Weight Costs Gondola Car Boxes Ccar Load. Rah T ___k @ 1_01ht___ __3 __601____ __3__1__ 3
masmlyr m3 MT - oc -hak Irc 'S0t 6~3 *51
H IG H 1C°°°~-100 0 0 0 0 0 0 0 0 0 0 0 0
sa o 0 0 0 0 0 0 0 0 0 0 0
30 0 0 0 0 0 0 0 0 0 00025 O 0 0 0 0 0 0 0 0 0 0 0
15 1,056 1,287 0 1,500 232.323 15 98 . 60 000 129.850 372.926 1,864,831 13,052,420
1,379 1.680 0 2000 303409 20 127 000 168.275 487,034 2.436S170 17.046,191
3 1,817 2 214 0 2.600 399,746 26 168 104,000 222,6041 641,674 3,208,370
0.3 2,308 2.812 O 3.300 607,708 33 213 132,000 282.225 815,069 4,075 343 28,527.404
0.03 2,671 3,25S 0 3.800 587.703 3B 246 152,000 326,950 943,384 4,718.919 33 018,430
MlEDIUM - - -_
100 0 0 0 0 0 0 0 0 0 0 0 0
so 0 0 0 0 0 0 0 0 0 0 0 0
30 0 0 0 0 0 0 0 0 0 0 0 0
26 0 0 0 0 0 0 0 0 0 0 0 _
15 0_6 -0 0 0 0 0 0 0 A__ _ __ _ __
-___ _ 0 0 0 t 0 OO
0 0 0 0 0 0 0 0 0 000
79 1280 0 s00 232,323 125 92 80,000 1297850 372.920 134 64631 137052.420
0.3 1.989 2.424 0 2 900 4375602 29 183 1 42.476 702,441 3.612.207 2455851452
0.03 2,423 2 962 0 3.500 533.033 35 223 1295475 855.627 4.278.137 29.946 961
rf ram ,~_,____ ____a..____rwo
600 0 00 0 0 0 0 0 0 0 0 0300 00 0 0 0 0 0 0000
25 0 000 0 0 0 0 0
15 0 0- 0 0 0 0 0. 0 0 0 __ 0 0
10 0 0 0 0 0 0 0 0 0 0 00
3 0 00 0 0 0 0 0 0 0 0 0
0.3 1 39 19680- 0 2.000 I303.409 20 127 j0,000. 1875 487.034 2.3.70 17,046,1910.3207 2.531 0 3,000 456.999 30 192 1000 254,400 7376 3.667.882 25.675.176
I J2QA%'2 J 9 &G of1 7204 1P.-a a -LAi Ps&ii.golfo
Unit Ratesand Notes
7to -, .Ite"
Pistils ArwNW Camu
gsa paIsilga,
tW aAx sid4 bhssdmbw
kteed. of25.114 be$*MOW
dla ea I.- . -1
5 10M1o3; ralAVanapart ONYl
eitren cLip"
dis.psal eaccgy.r 6019t3. baugk
las oon .d r.
Fe-iw bcst fouitAW. ki~cgmpag4lseoaal lagighiais Is.
LLW. 1360ni'3;lauck ItApoat wd.
I ________________
Page 2 of 3I,

4
Table C.2.4. Calculated Costs and Other Parameters for Remediation of Contamlnated Soil at the Reference Uranium Fuel Fabrication Plant(Restricted Land Use, Without Soil Washing)
a
Total SONeTt Son pedlod Co., TotalResidual Does Voumw e ttomft' @ 601t3 3350/f'3 SON Wsng oil ExceveIton Total Son Ocoupatlond
" DispDsaood 09 Coest. DICpoa ts SCoost 1 Cost Labor Labor w..hlatlobn Labor Doe"Oem WS3 S t t mf men-r mwahr persoenw en
HIGH -
100 0 .0 0 0 0 0 0 060 ~. 0. 0 0 0 0 0 0 030 0 0 0 0 0 0 0 025 0 0 0 0 0 0 01s 1.056 682,590 2 47469 1392757 O0 : .11 1711 171
10 .1,7 893,130 3,230,951 17,841,971 0 2,234 2.234 2233 1.817 1,175,275 4,257,717 23.507.936 0 2,944 2944 284
0.3 2.308 1,492,755 5,407,721 29,859,782 0 3,739 3:739 3740.03 2 671 1,728,958 6.258,34 34,E59,857 0 4,328 4,328 433
MEDIUM-100 0 0 0 0 0 0 0 060 0. 0 0 0 0 0 0 030 0 0 0 0 0 0 02 0 0 0 0 0 0 6 ,is 0 0 0 0 0 0 00 _
10 0 0 0 0 0 0 0 ___
3 105 O 8202,5 20474.968 13.062.757 0 1,711 1,711 1710.3 1.989 1.,288,780 - 59,724 25,732,968 0 3,222 3,222 3220.03 .- ,423 1.569504 5.676.022 31.344.846 0 3,925 3,925 393
LOW -
100 0 0 0 0 0 0 0 060 0 0 0 0 0o 0 0 0
10 O 00 C O_ CI-30 0 .000 025 0 0 0 0 0 0 0 015 0... 0 0 0 0 0 0 010 0 0 0 0 0 0 003 0 0 0 0 0 -- 0 00
03 1379 893.130 3.230.981 178191 02.234 2.2340.3 2.077 1.344-.734 4 887.439 25.874.732 0 3,365 3,365 3
O.7wt .?OMsni PM 0 MOM Perpmmn.Unit Rates and%'
NoteS m
Page 3 of 3
z
94.00'.

Z Tabic C.2.5. Calculated Costs and Other Parameters for Remnedliation of Coaataminated Soil at the Refercnce Uraniumia Fuel Fabricatloa Plant
i (Unrestricted Land Use, With Soll Washing, Mizing/Landfiiilng)FA8-WWJV.XLS
11123195
%00%
9C1)0%
Contaomi- Se Below- Below. Tota So Sks Solflaklu De" dad Site Soa Sit Sol Oulinhg Buidkig Soi Volume Excavation
Rate Sg A& DePth Volume Sol DePth Volume Removed Cost.
twuwv 1 t'2 am m'3 cm m_ 3 m'3 IHIGH - -
100 100.000 44.2 4,106 18.4 82 4,188 984,20760 100.000 54.9 S.096 19.7 88 5 185 1 2189359
30 100loo 92.4 8.581 21.3 95 8.678 2.038.91125 100,000 100.6 9.344 21.7 97 9.441 2.218s58215 100,000 121.9 .11.325 22.8 101 11,426 2.685.10210 100.000 141.9 13,185 23.6 105 13.290 3M123S168
3 100.000 198,1 18.403 25.6 114 18.518 4.361.8420.3 100.000 300.1 27.880 28.9 129 28,009
0.03 100,000 404.0 37.530 31.9 142 37.672 8.953.017MEDIUM -
100 100,000 0.0 0 8.6 38 38 90 03
80 100,000 0.0 0 14.2 863 63 14.863
30 100.000 19.8 1,837 17.1 76 1.913 449,49526 100.000 28.0 2.601 17.7 79 2,680 629.68415 100,000 51.0 4.741 19.2-- 85 4.827 1.134.290
10 100,000 69.3 6,441 20.2 90 6,531 1,534,674
3 100.000 123.6 11.486 22.8 101 11.588 2.723,1000.3 100,000 227.5 21,136 26.7 119 21.255 4,994,893
0.03 100.000 331.4 30,786 29.9 133 30,919 7.265.932
LOW _100 .100,000 0.0 0 0.0 0 0 060 100,000 0.0 0 0.0 0 0 030 100,000 0.0 0 0.0 0 0 025100.000 0.0 0 0.0 0 0 015 100,000 0.0 0 8.6 38 38 9,04310 100.000 0.0 0 13.6 60 60 14.204
3 100.000 38.1 3,536 18.4 82 3,618 850.1290.3 100.000 141.9 t3195 23.5 106 13,290 3,123,209
0.03 100,000 245.8 22.835 27.3 122 22.957 5,394.810
Url Rates VVwa Ol" 2 w- i $23-3adwlatd aw"d &sol 110. Not
Notes NO poios wpedl uwoood 1 0 k2lbelow
Page 1 of 3I. C

. X*
aI~ I a
Table C.2.5. Calculated Costs andi Other Parameters for Remedii'tion of Contaminated Soil at the Reference Uranium Fuel Fabrication Plant(Unrestricted Land Use, With Soil Washing, Mixing/Landfilling)
*FAB-WIUV.XLS11123198
soil so4ilson SoN Tanpout Trenapott Sol son
Total Soil Pekai Packaging Loads. Loafds. TRnptt Tansport SoNl So1 SO8l Disposal
Residual Vohntm Total Soil SoNl Washig Cons. Conts. e-25 Gondola Tnwlt Costs, Dlposas costs Dhpoa Coats coats pDose Rate Ramved Wve ht C Gton*d 00ola Ca Soiee ca" Load* Flal Tnef $ 3ft3 @501 * 3
mremlyr mn3 MT _ cears DTmokS __t_ __ _
HIGH 4,1 88 5,103 1.21&2a2S 2,400 368,554 24 1. S 98,000 2 0S,375- 591,eos- 2.958.024 20,708 185
s6 S.Is .3.1i 1.492.503 3 000 456,238 30 191 120,000 253.075 732,353 3. .764 25.632.343
30 R878 1S72 1.908,044 5,000 763,507 50 320 200,000 424.000 10225.565 8.127.928 42,895.481
2S 9.441 11.504 -2027.759 5.400 830.788 54 348 21e000 481.100 1.333.585 6.667.924 46,675,486
t 11.426 13.922 2.339.602 6.500 1.005.485 6s 421 2 o0.000 557,825 164.005 8.070,046 56e490,324
1 13,290 12.194 2,630.480 7.600 1,169.523 76 489 304000 647,925 1.877.324 9386619 6506330
18 518 -22,e4 3,449,020 10,500 1.629.551 10s 682 420,000 903,050 265762 13,07,12 91,551.697
0.3 28.009 34.129 4,935264 1 2.464.835 _159 1.031 _ 3,000 1.386.075 3.956.584 19.782,821 138 479 746
0.03 -37 4-sso4 6.448.292 21.300 3,315.172 213 1.386 852,000 3 5.321.530 26.607.648 j!8 2S33
MEI - 3_ 47 44.907 100 3,386 1 2 4.000 2,850 5.436 27.178 1__,___100 38 ~ 5j..... - -________ 190.249
60 63 77 5 .874 100 s.s66 1 3 4,000 3 97S 8,934 44 .71 312.699
30 1.913 2,331 572.145 1,100 168.322 11 71 44,000 s4,079 270,190 ____________________
25 2,680 3.265 787838 1.0oo 235S797 16 99 64,000 131175 378.502 1 350.952 9.456,666,- 4,827 __ 2____00 424-______ .82.09 13.247 563
15 4,A.. 5 881 1,391,870 2,800 424755 28 178 112.000 235.850 _ 681,819 3.409 096 23863672
10 6.531 -7.9_57 1,s71,145 3,700 574.687 37 241 l4sooo 319 325 922,490 4__ 12 44_ 32_287,134
11ss 4t9 2,363,920 6,600 1,019,714 d 2 1 24.0 se,7 tiess ~ 4,4 ~ts,- 3 11.588 14.19 23390 ... 2. a6 427. i~2242. 56 7 1.636.850 8.184.248 728.3
0.23 21s255 899 3.877.819 12,100 1.870.420 121 782- 484.000 -1.036.150 3.002,420 15 012 098 105.084.687
0' 30919 -37 74 S.390.816 17,500 2.720,se0 tfs 1.138 1 7 W 507.850 4370536 2 1837 82 152700 __ 1
_.e 4 _sjes to st ,000 J97 J,5.38 21,83,02 298,820-7
LOW100 0 0 0 0 03 0 0 0 0 0 0
__ _00 0 060 0 000 00
30 0. 0 0 * . 0 0 o 0 0 0 0
.. i...400~858 42.689 298.8203 361 4 408 1.051.7181 2.100 -318,346 - 21 134 84.000 177,550 511.011 2.555 053 1.8.7
0.3- 13 29 27,942.6304404 7i600 26520 76 489 304000 647,925 1.877.354 9.386.772 65.707.4019
0. 2.5 1 f 0m 13,000 2.020.184 13I4 520.000 1 1119.86 3.242.809 16.214.044 113.498.307~ na-.a sta.. 220OW2 IClee tan .9 1.200 $4.000. iaO .i..ka -k
I%00't
Unit Rates.and Notes
7M Ia n
04ie oiwiNw -
tekist 4 bow"fleIt loaw. of
25.194 baFoumd
g r- a I-w d -7-bidso *kwl
X"d a LAW"B
Eiwsoad Iaeety.*t0512;3:#5
iMP ot
eaeaasn tOWdeasag dl.p.F N
160t00mt'h; bamPa& abt.
resbl "Is fori.lfutre Iscmpa
ct gtampa"m aa,.
I l
-
Page 2 of 3

z
co
10%
00
'1'nbll C. 2.5. Calculated Costs ad Other Parati eters for Rentedalalo of Contamalnated Soil at thec Reference Uranlul Fuel FIabraluilon Plant
(Unirstricted Land Use, Witli Soil Washing, Mling(landflhlng)
Total Soil Toal lesmedloalon Costs Toa
116s1clual Dose Voiw ( 011t'3 3 0 S1S0OV3 0 635015t3 So3lW W6#hkV SOR Exacaation Total soag Ooual
Hat. Disoo. d I DISPoSl Costs Disposal Costs Labor Labor RbomIdnutlot Labol Do ..
r mra/ rv t m.3 I __I_______Dose , r man~v alan-mr
HIGH ______
100 1.675 2.888,427 5.728,375 23.476.516 712 6_785 7.497 750
60 2.074 3,568.215 7,081937 29.052.52 881 8, 399 9D280 929
30 3,40 6,377.641 1, 1.282388 48.029.943 1,47S 14.055 15.530 1, 53
26 3,776 S,801,326 12.206,152 52.213.695 110 1 29 168899 1,690
1 5 4,570 6,904,214 14.657.061 63,077,339 1.942 18.510 2.462 2.045
10 6,31B 7,942,581 1B,957.704 73,277,416 2.259 - 2,379
3 7.407 10,8 46,924 23,412,675 101,885,549 3148 29.999 333147 3,315
0.3 11,204 16.125.957 35.131.224 153.828.149 4,762 45375 50137 5 01.-
0.03 165069 21.496.138 47060579 206,706,464 6.404 81,029 67 434 6.74. 4
MEDIUM100 1S 63,488 87.165 250,236 7 62 59
60 25 -79772 120,960 388,978 11 102 113 1 1
30 765 1,336.930 2.634.988 10,740,702 325 3,099 3,424 24 3
26 1.072 ,861824 7002 15032,068 458 4,341 4,796 480
15 1.931 3,322,779 8,595,861 27.0S0.437 821 7.819 8,640 864
10 2,612 4.480.009 8,912,279 36,586,965 1,110 10.579 11,690 ,163
_3 4635 6,994,470 14,8568768 83.982,246 1,970 18,772 2C,742 2 074
0.3 89502 12,371.032 268791.188 116.863.777 3,B 13 34,433 38046 3 805
0.03 12,368 17,741.784 38,723,139 169.749,229 5,256 50,089 65.345 S 34|
LOW -
100 0 0 0 0 0 0 0 O
o60 O 0 0 0 0 0 0 0
30 .. 0 0 0 0 o 0 0 -0
--L5 .A.... 0 0 0 0 0 0 0
---- --ie slb 63,488 87,165 250.236 7 62 69 7
10 24 --- 77.920 117,270 373,402 10 98 108 7
3 1,447 2.498.958 4,92,79 20,283116 15 5860 ,475 648
0.3 6.316 7.942.677 16.957.961 73,278,591 2,259 2i,530 23,790 2379
0.03 9,183 13,314.703 28,892,747 120.177.010 3.903 37,190 41,092 4.109
UNtRotes and _ _fA 0.51 OW M# 5.42 m pw mv p.
eLj vo Is m
esad
Page 3 of 3
FAI-WPV.XLS11123196
I.
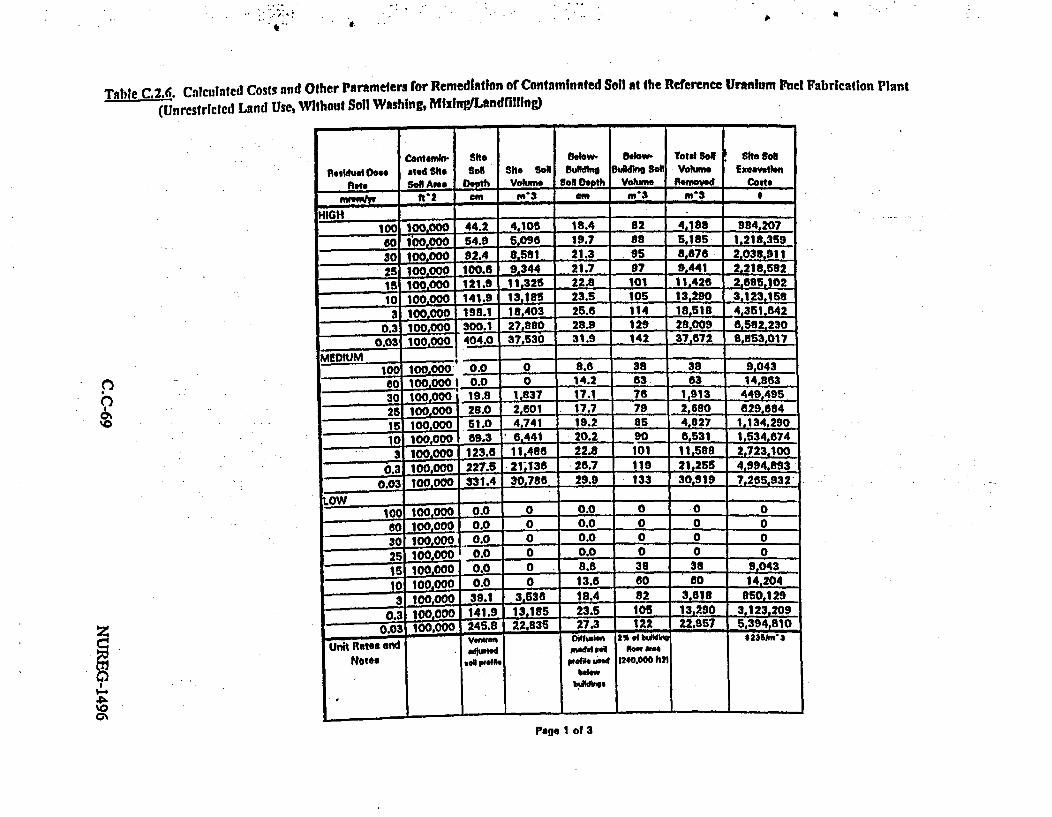
.. . - �. � IC
Table C.2.6. Calculated Costs and Other Parameters for Remedlation of Contaminated Soil at the Reference Uranium Fuel Fabrication Plant
(Unrestricted Land Use, Without Soil Washing, MixingLondfilllng)
S.
Contmlnm Site Below. aglow- Toid s.1 she Sol
a.,wlual fve uled Sit. SON Sht. So* aulldmlg aMIne Sell Volum Exesivellon
Fnle Soll Ana th VA~ Bell Depth Vome Ren d Coost
mfelyr fth2 em m'3 aw m'3 m'3
HIIGH - - -
100 1000o0 44.2 4 106 18.4 82 4,188 984,207
o I o 54.9 5098 19.7 i8 5 185- 1 218 359
30 100o000 92.4 a Sol 21.3 95 8,676 2.038.911
25 loo10oo l00.e 9,344 21.7 97 9.441 2.218.5821t -100.0 121.9 11,325 22.8 101 11,426 2.685.102
10 100.000 141.9 13.135 23.5 105 13,290 3,123,158
100,000 198.1 18,403 25.6 114 18,518 _4.351,642
0.3 100,000 300.1 27.880 28.9 129 28,009 6,582,230
- _ M 0.03 100 000 404.0 37.530 31.9 142 37.672 8.853.017
100 100.000 0.0 0 8.8 S8 39 9,043
600 100.000 on 0 14.2 63 63 14,863
3 100000 19.8 1.837 17.1 76 1 913 449,495
26 100.000 29.0 2,501 17.7 79 2.580 829.684
1 100.000 51.0 4,741 19.2 85 4.827 1.134.290
10 100.000 89.3 ' 1,441 20.2 90 6.S31 1,534.674
-3100000 123.6 11486 22.8 101 11.588 2.723,100
.:3 100 000 227.5 21-136 26.7 119 21,255 4.994.893
o.03 100 000 331.4 30786 29.9 133 30.919 7,26s.932
LOW- -
100 100.000 0..22. 0 0.0 0 0060- -10.W0.00 .A.. 0....... 0.0 0 0 0
30 1000 0.0 0 0.0 0 0 0
100,000 0.0 0 0.0 0 0 0
15100.0o00 0. 8.6 38 38 9.043
1000 .o o 1 3.6 60 6o 14'2043 0.0 9.1 3 536 18j.4 82 3.618 350.129
3 100000 105 13 .90 3 0123.209o 0.0 I lo o 4.9 13 195 23.5 105 13,.90 312,0
0.03 100.000 245.8 22.835 27.3 122 22.557 5.394,8100.0 5 2 S a4,8 1 .4h.Md 2u3
2%~~ ~~ of b"Mi62iRnp~0
Uniotates endNotes I
II
va S
0*ell 04., roo
ptodel ed
belowb-dis
flo ofnho0.oo h12
._____________ I - � J - � I - a
Page 1 of 3

F;t
Qh
Table C.2.6. Calculated Costs and Otlier Parameters for Remediallon of Contaminated Soil at the RLeference Uranium Fuel Fabrication plant(Unrestricted Laud Use, Without Soil Washing, MislAandfillng)
9-!10
SoN Saol Transport Tianaut Soil soDTotal Soil Packaging Packagin Loads. Loas. Tiapott Tapot S Sol soll S04 Disposal
Residual Volume Total SoN SOi Wshing Coats. Costs. 0-25 Gondo2 . Truck Costs. Costs. Di1posal Costs Olaposal Costs Costs 0Dosl Rat. Removed Weight Coals Gondola Car &is. Cott Loads Rag Tuk *111ft13 @ *$60t3 *350/ft'avrny e113 AMT 11 S Sor Z ~s 0 Ti___c______1___
HIGH __ __
100 4,188 5,103 0 8,000 921.385 60 386 240.000 511 450 1.479.012 7.395.059 51.785.413
60 5.1 6,317 0 7,400 1.140.591 74 477 296.000 632.026 1.830,882 9,154,410 84.080,871
30 8.678 10,572 0 12,300 1,908,768 123 798 492,000 1.057.350 3,0G3,D93 16.319.815 107.238,702
25 9.441 11.504 0 13,400 2.070.970 134 869 536,000 1,151,425 3.333982 69,6809 11.6688.664
15 11,426 13922 0 16,200 2.613.713 182 1.051 648.000 1.392.576 4.035.023 20.175 116 141.225.81110 13 190 is 194 0 18,800 2,923.808 188 1,223 752,30 1,620,475 4.693.309 23.46BS46 184,265,824
18 51 2,200 4.073,877 262 1,704 1,048,000 2,257,800 6,539,408 32.697,031 228T879,218
0.3 2B09 oos I129 0 39,600 6.162.087 396 2,576 1,584,000 3,413,200 3,891,410 49.457,052 3468199.36S0.03 37.372 45.904 0 53 300 8.287. 9 3 1 633 3.465 2,132,000 4.591,125 13,303.824 6.519,I 19 4685633,832
MEDIUM ___10 38 47 0 100 8,466 1 4 4,000 5300 13.589 67,946 475.823
60 10 77 0 100 13,915 1 6 4,000 .7.950 22.338 111678 781,748
30 1.913 0 L 0 I 2,800 420.804 28 176 112,000 233.200 676,476 3,377,381 2 3 , 6 41L66525 2680 3, 45- 0 3.800 5 8 5,49 2 38 247 152 000 327.275 946,254 4,731.,272 33,118o907
_1 _ _ _ 6o0 1_061_888 69 444 276,000 588,300 1.704.548 8,522.740 59,659,180
10 531 7,9(7 0 9,300 1,436,717 93 601 372,000 796,325 26308.224 31.119 B0,717.836
3 1588 144 1 9 1 6400 2.549.285 164 1,066 656,000 1.412.4S0 4,092,124 20.460620 143.22.34
0.3 21 255 25,899 0 30,100 4,676,070 301 1 9B5 1,204.000 2.690,375 7,508,04g 37,530,245 262,711 717
0.03 30.919 37,6t4 o 43.700 6.802.149 437 2,844 1.748,000 3,768,300 10,918.841 54.594 204 382,159.429
LOW - -o - - o _ ° o100 0 0 0 000 000000
80 0 0 0 0 0 0 0 0 0 0 0 0
30 0 0 0 0 0 0 0 0 0 o 0 0
... 25 0. 0. 0 0 0 0 0 0 0 0 015 38 47 .0 100 8.466 1 4 4.000 S,300 13,589 67,946 475.623
o 60 74 0 100 13,297 1 6 4.000 7.950 21.344 106,721 747.049
3 318 4408 0 5.200 795.865 52 333 208,000 441.225 1,277.527 6.387 633 44,713.431
0i.3 13 29 6 14 Ia0 18,800 2,923.855 188 26 3,7 450400 22.957 2797 0 32.500 5.050,460 325 2.112 1.300.000 2.798.400 _8.107.022 40.535,109 283.745,766
- 1 -25 - -,97 -i* - -peiAIUA ~I tIo~ $22O1fml3 O 06tons of 1.208 6400W *.326 b buck I C.".~ 1,.* .-.------- gol.re
Unit Ratesand Notes
1.-wand -
MO"a sorandaacMlas01i oart tns
"n cowerI
a" Porailcar 4 lbseualtuc
k load. or29.104 Ars
*ifldals idCNo I lead disiraal ai LAAWdisosaul facility.
* 10111l3; astrasmport std
4"40C disposal elouiatlrV LLW
6IO09'3. truckIasnspw ordy.
lhaws imcampactdisposal lacihiglas lot
ILW. $36011s-3;truck trar~ort a4t.
I I i -- -. . -- -- I I
Page 2 of 3
a-.

* -. . il.
%.:|. 4r" lb : II
Tnble C.2.6. Caculated Costs and Other Parameters for Remedlatlon of Contaminated Soet at the Reference Uranium Nuel Fabrication Plant(Unrestricted Land Use, Without Soil Washing, MizinglLandrlling)
Total S o lS sn tbn Costs TotalAsalduat Doae Volum 1101ft'3 @ *501ft3 @ t350/lt3 Son Wehhne Soll EreavtiIon Total Son ocupational
note Diposed Disposh l Coots OpoIA Costs DisPOesl Costs \Labor !Madlan Labelor Doesm'3 ___Men_ _ S S ,w manj man w effswn
HIGH -
100 4,1* 2,709,219 9.812.101 54.182.458 0 6.785 6_,785 078T0 3.352,641 12.145.3e5 67.071.846 0 8,399 8.399 840
30 80 _ 5607174 20,324,844 112,243,731 0 14,065 14.055 1.40025 3.441 8.101.944 22.116.786 122.135.641 0 15,294 1£ 294 1.52915 .426 7.384,325 26 7668506 147.817.201 0 1 18,510 1,95110 38290 9.687,267 31,133,987 171,933,265 0 21,530 211503
3 8,t518 11198%248 43,380,350 239.562,s37 0 29,999 29,999 3.000 |0.3 8 ,097,240 65.614.569 362,356,882 0 45.375 45,375 4,538
0.03 37Za72 24,342,140 88.251.191 487.365.904 0 61,029 61,029 6,103ME~DIM
10 38 20.732 90,755 , 0 62 62 660 ec .3 41,299 148.406 818,476 0 102 102 1030 .2J! 1,239,771 4.48 ,8s 24.745.164 0 3,099 3.099 310 ' _
25 1 1,731,739 6.2712723 34,665,358 0 4,341 4,341 43415 3 ,121,738 11,307,218 62.443.658 0 7,819 7,819 78210 e ,531 4,22219i. 16.299.835 04,48S.552 _ 0 10, 579 1.0583 1588 7,487,e24 27,145456_ 149.909,178 _ 0 18 772 18.772 _ 18770.3 21,255 13.735.042 49.791.584 274,973.056 _ 0 __,__3 34.433 3.443
0.03 30,919 19,976,473 72,430,5ss 399,995,810 0 50.08 50,089 5
LOW -10 00 0 0 0 0 00100 O . _ OO
60 0 0 0 0 0 0 0 030 0. 0 0 0 0 0 0 02 0 0 0 0 0 0 015 30 26,732 90.755 498.432 0 2_1C - 39648 142172 782,500 0 98 9s 103 8.474.852 46.80065so 0 5.86o 5-- s586 |
0.3 13.290 8.587.395 31.134.468 171,936,043 0 21,630 21,530 2 1530.03 22.957 14,834.332 53,7780780 296.989.437 0 37.190 37.190 3.719.332 53 29.9.47 3~ .71PWa __0.1 7 Uf4 MOVI SM 1-8 AM.4..-Act -rawpe me
I-'
Fcr0
uNot fotes andINotes
rn-a mnt #W Ia~.
I
- -I - - _________________________ - _________________________ - ____________________ - I �
Page 3 of 3

Z Tahie C.2,7. Calculalud Costs and Olier Parameters for Reaiialion of Conamiuated Soil at lle Reference Uranium Fuel Fabrication Plant4 (Restricted Land Use, With Soil Washing, Mixing/Landillilng)
'00%
Cowtamnb- SaO Below- Below. ToIl SW Sie Sao
Resiual Dos aled Sit So4U Sle So Buigld baWdk SO Volum Ex"veilon
Rate Sol Aes. Depth Vokume SoM Depth Volume Removed CostaMOWyr It2 m m'3 am m'3 m'3 t
HIGH I100 100.000 0.0 O 0.0 0 0 0
60 100,000 0.0 0 0.0 O0 030 100,000 0.0 0 0.0 0 O 0_ 0.0 0 0.0 0 0 015 J100 0.0 0 10.8 48 48 11.38610 10,09000 I.20 O I 0 14.2 63 63 14.8443 00,000 1 42.7 3.963 18.7 83 4.047 950,944
0.3 1iOOOO 148.5 13,613 23.7 108 13,719 3,223,9080.03 100,000 20.4 23,283 27.4 122 23.385 5,495,499
MEDDJUM000 100,000 0.0 O 0.0 0 0 0
so .100,000 0.0 0 0.0 0 0 030 100,000 0.0 0 0.0 0 0 0
2 -600 I0.0 0 0.0 0 0 0is 100,000 0.0 0 0.0 0 0 010 100.22. 0.0 0 0.0 0 0 0
3 100L222 0.0 0 10.8 49 48 11,366
0.3 1 *0 73.9 6,868 20.4 91 6,959 1, 34210.03 100,000 -177. 16,518 24.9 111 _ 10.629 3 907,770
LOW80 100,000 0.0 0 0.0 0 0 060100.000 0.0 0 0.0 0 O 030 10,00 00 0 0.0 0 0025 100,000 0 00 O 0.0 O 0 0-16 100000 0.0 0 0.0 O 0 0
l1 100.000 0.0 0 0.0 0 O 010 0.0 0 0.0 0 0 0
0.3 100,00O 0.0 0 14.2 63 83 14,8440.03 100,004 92.2 8,567 21.3 8.567 2,013,330
Unit Rab2V- *n _wwn 2% e kbg $23ll3
,e Notde p-ld w a .1 4 240.000 Itt,6*Wl" bew
- -
Pug. 1 of 3
I
.. I,a,

.3~ * I l It . .0.1 . a
Taive C2.2 Calculated Costsan n-Other Parameters For Remediltlon of Contaminated Soil a Ithe Reference Uranium Iuel Pabricationplant(Restricted Lnnd Use, With Soil Washing, Mlling/Landflhling)
- ~~ - -oi - S::- - __j
Soll Son Tra.pa TrYnstpe Sell Sol
Totd Sell Peealme Packtalno Leod., toed*. Traenwo r ft I son son 801 Di spol
oilldual Doo* Volume Total SOl Sell WeeM Orts.e Colts. &28 Gondol Tuick Coets. Costs. Dspoa Css Dhposd Con CotRlate Ratmow Weigh Cewe Ootdole Cam Bo%*s Co"~ Leads Pollk p"±W flr. (9poa cos~ts3 Cos ft
HIGH m3 MT I I I * * s Thak rk T e 3 3s S
HIGH100 0 0 0 O 0 0 0 0 0 0 0 O
60 0 0 0 0 0 0 *0 0 0
30 0 0 0 0 0 0 0 0 0 0 00
25 0 0 0 0 0 0 0 0 0
25 O 59 47,100 4256° 1 2 OA0" 2 6.832 34,161 239128
10 63 77 51,851 100 5,559 1 3. 4, S,97 ._ _ _239_1 _ 312,297-'4-0-0 3.975 8,923 44______ 7_____4464 31 2.297
3 4.047L j931 1,172,397 2.300 356,098 23 149 92.000 1, 5 571,810 2.858,0S1 20.006.IbS0.3 13.719 18,71j 2,697,610 7,800 7.207.251 78 - 505 312.000 9125_ 1,937.884 9.689,422 782594
0.03 23,3S 28.495 4.211.173 13,300 2,057,889 133 861 532.000 1.140.826 3,303,333 1d,183 - 15.816.644
-EIM - -=I8~63- .5,1,4
100 _ 0 0 0 0 0 0 -O___OO_ 0_ 1
60 0 0 0 0 0 0 0 0 0 00
- - - -O - 0 030 0 0 0 0 0 0 00 0 0
25 0 0 0 0 O 0 0 0 I 01- - - - 0 ° _ -
16 0 0 0 0 0 0 0 0 0 0 _____
48 59so 47.0 100 4.256 I 2 4,000 2.650 6.832 34 ja - 239 28
0.3 6,959 8,480 1 4,000 612.413 .40 257 I1eoooo 340.525- 983.048 34406690
0.03 16,629 20,262 3 153.268 9.400 1,463,335 4 IL . 376,000 !109 2,348,952 11744.761 82 213 327_
-7OW 1°°°-- -- -8-- --
6.0 0 0 0 0 -_.0 0 O 0 0 0 0 __ _0
G.o e3 3 0 0 0 0 0 0 0 0 4 312,297390... Q.... 00
.3 0 0 0 0 0 1 0 0 0 t - 0--
15 0 0 0 0 0 0 0 0 00i0 0 0 0 0 0 0 0 0 0 _____
0 0 0___ 0
- - - 0 0. 0 0 0 0 0 0
0. .63.. 772... 51,1851 j1... 5.559 1 3 4&2.000 3.975 B.92 4461 32.0...03..22 ..2L557. 102 439 1.891,000 4..900.. 753&.922L .49.. 316 196.000 ..±!4 22.. i000 1.051042 12 37297
7AIN 2'2 1h2 From, RACER *100 p5? *2201iii3 95 ism Of 1.290 1 4.000po *1j.32625 mc ku 42,35. 47**3 ..294s oss oIa-a
-01eo
Unit Ratesand Notes
is Amp -
Modl $wtolUivSWt
saderasGideokNM
s41corecall ,4 boassxlIu
2s,.t4 I41~had
gAnds left" - a." -- O4pled et LARWdispescI twbhy.
$1001'3; *m. vrot1 O*
Compact dU595ld .4
dhis it LLWdispoag lacjtay.
butrwaort *d,.
hOGO cldlttune lncompoctdsedIcitift Is
LtW. a 21xnt'2;Iuta Uwup"I It ly.I .
�- I I - .1. - I -. - - - - - - I - I I I
Page 2 of 3

Z Tnhic C2.7. Calculated Costs anid Other Parameters for Remidlallon of Contanllnated Sail at the Reference Uraniun Fued Fabrickaio Planti (Restricted Land Use, With Sall Washing, Mlxing/Landflilong)
4
,0
-1
Total SOD Tota lop RaatIn Totds
Pdstuda Do". Voklu 0 01011V3 0 150/ft3 0 1360W/1'3 SON Weahkn So ExasmiIn TOtW Soa OwalanoaiRa. 0D.posd Disposal Costs D1aposal Costs Lpoaal Coot Labor Lbor Rmadistion LaboW Do.e
nw mV/W to -_3 ,_____ _ ____ _r _uu hr pesson an mHIGH -
10 0 0 o 0 0 0 0 0__ _ __ _ - 0 0 0 0 0 0
30 0 . 0 0 0 0 0 0 0
26 0 0 0 0 0 0 0 016 19.... 69.987 100.122 .306089 a 7 97910 26 79,718 120.843 388,626 11 102 113 113 1.619 2,789,261 5.534,91S 22,t83,222 688 6.566 7.243 724
0.3 6.488 8,179.202 17.48-7.316 76.623,848 2,332 22,224 _24,557 2.456
0.03 9,354 13,556,306 2,452,060 128 622 030 3,975 37.884 41_8I 9 4 186
MEDIUM ______ - -
100 0 0 0 0 0 0 0 0
60 0 0 _ 0 0 0 0 0- 0 0 U 0 0 B0 0
25 0 0 0 0 0 0 0 015 0 0 0 0 0 0 0 010 0 0 CI 0 0 0 0 03 19I 69.987 100.122 306.089 8a7 87 9
0.3 2,784 4.774.212 9,495,343 38.980.792 1,183 11.274 12_457 1 246
0.03 6 9,795,390 21.080.034 91.548.600 2,827 26.939 29,766 2,977
LOW-1 0 0 0 0 0 0 0 0
60 0 0 1 20 840 0 0 0 0 030 . . . .... ,., ...... 0 0 0 0 025 0 i 0 - ~0 0 0 0 015 0 0 0 0 0 0 010 0 0 0. 0 0 0 0 03 0 0 0 0 0 0 0 0
0.3 ....2i... 79.718 120,843 388.528 1 1 102 113 1 __ __
0.03 3,427 6.315,438 11,128,000 47,434.252 1.456 13,879 15.338 1,534
U0it Rat. and i .1O mwbk M 1.2 manly pe 0.1 wm p mn
Notls of Wit Oa
vol. _le Mad
Page 3 ol 3
l}I,

Table C,2.8. Calculated Costs and Other Parameters for Remedlatlon of Contaminated Soil at the Reference Uranium Fuel Fabrication Plant(Restricted Land Use, Without SeN Washing, Mizing/Landfilling)
2tA
COntmMn Site Below- Below. Total Son Isite SlRelsdual Dos ated She. r..N Site SON Building Building Soll VolMe Exceavaton
Rote Soll Area D.pth Volulme UR VohUM nemn v cost.ft'2 cm rn3 cm m'3 m'3
-tG - - -_
-I 10 100,000 0.0 0 0.0 0 - 000 10(y.000 0.0 0 0.0 0 0 0
30 100.0001 0.0 0 0.0 0 0 025 100.000 0.0 0 0.0 0 ^ 015 100,000 0.0 0 10.8 48 48 11 3610 100.000 0.0 0 14.2 63 3 3 148443 100.000 42.7 3,983 18.7 83 4.047 950,944
0.3 100.000 146.5 13.613 23.7 106 13,719 J,223,9080.03 100.000 250.4 23,2R3 27.4 122 23,385 5,495,499
MEDIUM -
100 100.000 0.0 0 0.0 0 ' -~ olo~o oo o-~ - o-- oco800 00 0.0 0 0.0 0 0- 0
30 100.000 0.0 0 0.0 0 0 025 100.000 _n.0 0 0.0 0 0 015_0000 0.0 0 0 0.0 010 100000 0.0 0 '0.0 0 0 03 100,000 0.0 0 10. OB 4 48 _ 11,308
0.3 100000 -73.9 - 6 888 20.4 91 0,959- 1 635 4210.03 100.000 177.8 18B5,18 ?4-9 III 18,29 3.907.770
QOW100 100,000 0.0 0 0.0 0 - 0 0.
_0 100,000 0.0 0 0.0 0 0 o30 100,000 0.0 0 0.0 0 0 025 100,000 0.0 0 0.0 0 0 0
5 100.0500 0.0 0 0.0 0 0 010 100.000 0.0 0 0.0 0 0 03 100.000 0.0 0 0.0 0 0 0
0.3 100.000 0.0 0 14.2 83 63 14.8440.03 100,000 92.2 8,567 21.3 95 8,663 240H5.88y
un ntes. and O11kWfn 2% *Ib;=O - 235ft'
eOtus uolft squld, Wed £240,000 h2l
Page I of 3
z
3
0%C7,

z Table C.2.8. Calculated Costs and Other Parameters for Remediallon of Contaminated Soil al the Reference Urauiuni Fuel Vabricafion Plant
;3 (Rcstrictcd Land Use, Without Soil Washing, MixingILandIlillnge
a0%
o0%
Sam So Tanspotd Tanspont Sol Sol
Total SON Packaging Packaging Loads, Loads, Transpot Trnsport Sol Sol Soil Disposal
Residual Doss VoLum Total SoN SOH Washing Cowtt. Costs, 826 Gondola Truck Costa, Costs Disposal Costs Diosposa Coste Costs 0
Rale Removed Weight Costs Gondola Car C xee Cars Loads Rano Thuck @ $1*iIt'3 @ $50/13 0350/tt 3
m'3 MT S S S J cos I Thcks _ _ _ I
HIGH100 0 0 0 0 0 0 0 0 0 0 0 0
60 0 0 0 0 o o 0 0 0 0 0 0
30 0 0 0 0 0 0 0 0 0 0 ___ __ __
25...90... 0 0 0 0 0 0 1 0 0 0 o15 48 59 O 100 10,°641 1 e 4,0000. 6.625 17,081 85.403 597°821
1C0 63 _ 77 0 100 13,897 1 6 4,000 7,960 22.307 111,535 780,742
3 4.047_ 4,931 O 5,800 890.245 59 373 232000 494,225 1.429,026 7,145,128 50S015,S96
0.3 13 719 18,716 O 19,400 3,018B127 194 1.282 778,000 1,672,150 -4-4,71 24.223,555 169,664 86
0.03 23,385 28,495 0 33,100 5,144,722 331 2.1S1 1.324.000 2.850.075 8.258.332 41,291,658 2899041.609
MEDIUMO100 0 0 0 0 0 0 0000 0 0
80 0 0 0. . ...... 0 0 0 0 0 0 0
30 0 0 0 0 0 0 0 _0 0 0 0
3 48 59 0 100 10.641 1 5 4,000 6,625 17.081 85,403 S
0.31 6,959 8,480 0 9.900 1.531.033 99 641 396,000 849,326 --.i457.821 12,288,103 SO.0l6L724
0.03 16,629 20,262 0 23.500 3,6S8,338 235 I ,530 I140,000 2,027,250 5.872,381 29,361,903 205.533.318
LOW 2 -O O O O 0 0 0 0
00 0 0 0 0 0 0 0 _____________ _ _ 0 0 00
3 0 0 0 0 0 0 0 0 o 0 0 0
25 0 10.640 0 0 0 400 0,2 170 1 S4039 ,2
_ 3 47 100 797 64 392.000 9O2 36,019,724150 0 0 0 0 0 0 ~00_ 0 0 0 0
06 000 0 0 0 0 0 0 0 0
3 0 0 0 0 0 0 0 0 0 0 0 0
0.5 0!.. 0 1 0 1 . 9716 .. A 2 ... . 502 .07 .5 57 0 74
ri- -o
0 03 8 6 10.5 50 12 30 1. 05, 5 , , 7 7 420 0 0 1, 580 25 3 059 1 0 1 , 9 . 0 0 7.06 , 9
KE tfl.l a7f'A " 122OAm3 9C two o1 7.280 54.000 po 141.126s p. o k Coatsfteb t Costsf h. Pnso~s. alk. M sadal i~t~. lead ipsla tW 'les d eo 54 utsine oi
Unit Ratesand Notes
7$. ^11 Modal ~ONAO Car to.w w goe-ien.l
b~6V
Ai Po4 bosooluuc
k lad.. o28.114 164
earmialstoker load aeal IofLAyW
grow""t -di
s *lig t.Lwcomooma disposal
tworl Hedr.
s~toat swum
;uAuo Weornibetdisposal Iscilit fes
UW. 1360#ti' 3;luok trnspwt ords.
I I 1� .. �. - - - �-.- 6 &-
Page 2 of 3
4,I.

*X
Table C.2.8 Calculated Costs and Other Parameters for Rentedlation of Contaminnted Soil at the Reference Uranium ftel Vabrication Plant(Restricted Land Use, Without Soil Washing, MixingfLandflling)
p
- -
Total Sonl - son 110rnadlab stle TotalResidual Dole Volude @ 11oifs3 e *60m1t3 M sOWS Son Wahig Soll Ewaevtlon Totdl so Oupational
Rate Dispose Dlapoesl Co n l.Po 9M C Ogti POp C tM PaLeb erLtr R o t b 0 (Jol
13 ' 0 . - man4wr m hr _ mhr
HIGHI - .. I,100 0 0 0 0 0 0 0 060 0 0 0 0 0 0 0 030 O O O O 0 0 0 0 0 0 025 00 0 0 0 0 0 0
15 8 32547 114,035 626 453 0 78 0 8
I _3_ 41.2,5 148,225 817.432 0 102 102 103 4,047 2.617,769 9,480,542 52,351,310 0 6.555 6,555 656
0.3 13.719 8,864,019 32,137,740 177.479.070 a 22.224 22.224 2.2220.03 23,385 15.110.931 54.781.955 302.531,905 0 37,884 37,884 3.788
100 0 0 0 0 0 0 0 0
60 0 0 0 0 0 0 0 0
30, 0 0 0 0 0 0 0 0ec5 0 0 - 0 0 0 0 - -- -
15 0 0 0 0 0 0 0 010 0 0 0 0 0 0 0
- 48 32___547_ 114.035 626.453 0 78, 780
0. ~ 4,498,942 _16.303.863 -90.032.503 0 11.274 1.7 .2
1C9 ___O O. o-- °127 ° 12
16.2 10.7.650 38.955.260 215,1228676 0 25.939 -20
100 0 0 0 0 0 0 3 0 __10 3 , 0
s0 R.to .9.__ t 0 0 0 0 0 0 030 0 0 0 0 0 0 0 025 0..Q... 0 0 0 0 0 0 015 0 0 0 0 0 0 0 010 0- 0 0 0 0 0 0 0
- 0 0 0 0 ~ 0
0.3 83 41.251 148=2=25= 817.432 0 102 102 10.3 863 5.599.108 -20.293.064 -112.066.662 0 1403 140 1,403
U~nit RFates and 0.?mal3aq16 lyt ~ . lne aborm
Notes
Page 3 of 3
9
-A
a00%

z3 Table C.3.1. Calculated Costs and Olter Paraneters for Remedlation of Coniamlinated Soll at tlie Reference Sealed Source Manufacturer Site
(Unrcstrictcd Land Use, With Soil Washing)._
4~.%O
o%
00
COeM&I Sote Below. eokw.l etlw Som Sl sonResidual Dose Med Site Sag Sits SoR Oulidig Build&W Sol Volmw Emwuvk
note Soil Are& Depth Voleh Sall Oepth Volume Rmovd Costrvumyr It-2 arm r"- cm m'3 m'3
HIGH100 SO 3. 15 1 3.3 ° 10 3.65360 5,090 4.j 21 4.8 ! 22 .6151
30 5)0 5.9 27 .9 1 28 8,60125 65000 8.2 29 6.2 1 30 8,972I i 5,000 7.0 33 7.0 1 33 7.88110 5.000 7.8 38 7.8 1 37 8a6873 5,0 110.5 S4 11.5 1 55 12i896
0.3 5.000 20.5 95 20.5 2 97 22,867o03 S4 24.a 116 24.9 3 118 27.83S
MEDIUM - - 01000 0s0 o -o--o. o __60 5,000 2.S 11 2.5 0 1 2 2,76830 SOOO 4.S 21 4.5 1 22 5.08225 ,000 _4.9 23 4.9 1 23 5.47815 O. 0 6.8 27 5.8 1 28 8650810 5000 6.B 30 _ .B t 31 i7.257
3 8.2 38 8.2 I 39 9.2090.3 5.000 16.5 77 18.5 2 78 18,434
0.03 _5.000 22.4 104 22.4 2 107 25.081
LOW''_.._,60w -~SOO-0. - -. Q__100 SOO 0.0 0 0.0 0 0 0
00 SOO OA O 0.0 Q0 o30 5,000 0.0 0 0.0 0 0' 0
- 5 5,000 0.0 0 0.0 O _ O15A2020 -0.0 0 0.0 -0 - 010 5000 I0.0 0 0.0 O --
.SOOO 3.6 17 0 17 4.079
0.3 B 000 8.4 39 8.4 1 40 9,3430.03 . 18.7 87 18.7 2 a9 20,894
Umt RAt and DOmus liftwle 2% of e $236m-$ml " m" l" Ve "
Notes P~e" eiad 80 12
.ow
-a- -- - -Page 1 of 3t
..

.: -5a I
TahIeCA3J. Calcuiated Costs and Other Parameters for Remediation of Contaminated Soil at the Reference Sealed Source Manufacturer Site(Unrestricted Land Use, With SoN Washing)
'0
z
-AED
0o
Soil Soll Transpon TraneP"of SoNl soinTotal SOa SoNl PaIce" Paekaalng Leeds. toads. Trnspoet Trmnoportt SoN SOi son Disposal
Reildual Wres Volume Total SoN Watting Costs,. COts. 0-25 Gonole TTIck Coats. Costs. D1apossi Costs lspoesal Coots Coot a on noe _ enei wem code Gondola Car Boxes Cna toads flmal Tnm 1 @ $101t3 @ 060/ ____ _3_'3
mran yw g-3 MT I 0 S a #am o Tniolck s t _ _ _ _ .0
HIGH - 3-,4 1.368 1 - t- -- 132 2 196 10.97 746
e0 22 -27 40,249 100 1,929 1 . 4,000 1.325 3.096 15.482 108.373
30 28= 34 41,985 100 2,472- 1 2 4,000 2,eo 3,968 19841 125 30 36 42.428 100 2,611 1. 2 4.000 2.850 4.191 20.953 146 671
_ _2_15 3 , 43,49S 100 Z,944 1 2 4,000 2,650 4,72 231727,lC 10 -45 44.481 100 3.253 1 2 4.000 2,650 5.221 26.107 182.752
___ 3 5 49 ,S20 100 4 829 1 3 4,000 3.975 7.752 38 760 271,320
0.3 7__ 61.455 0oo 8.563 1 4 4.000 5,300 13.745 6s.72- 481.o79
0.03 1_I 144 e7,402 100 10,423 _ 5 4.000 6.625 15732 836s S88
MEDIUM - - - - O O O _ O _ . .
100 0 0 0 0 0 0 0 0 __ __ __ __ __ __
eol60 12 14 37,384 100 1,033 1 1 4,000 1,325 1,658 _8,290 029
-30 -. 22 .-2! 40.165 100 1,903 1 1 4,000 1.325 3,055 15 273 106 9092sl 23 _-28 40.638 100 2,051 1 1 _ 4,000 1,325 3.292 ess1 l! ..-34 41873 100 2.437 1 2 4,000 - 2,eso ,_1_ _sse_ 1 __E_ _ _ _ _-_ _ _ _ _ _ _ _ _ _ _ _ -. 5 3 .9 1 2 1 9 5 11 3 6 .9 2 4
lC 31 3_ 4 _2__70 22,717 1 2 4.000 2,050 4,352 21,810 152.6703 3 9 4 82 1 2
. 0 062_ _ _ _ _ _ _ 0_ _ _ 5_ _ _ _ _ _ 5 3 5_ _ _ _ _ _ _
__._ - 45,105 - - 3-44- 1 2 4,000 2 , eso 5536 27.678_ 193,743
0 .3 56148 .. s2,2s 6.903 1 3 4,000 3.975 i1081 _ 55 403
0.03 10. I 64,082 100 9.3W5 1 4 -4,000 5,300 15,064 75 321 527,246
LOW l ---- - ° ° ° - -- 0 ° -_°-_-o - -- _ 0_ _ _ _ _ _ _ 0 0 00 0 0 _ _ _ _ _
32___° -° ° - - - °°-O' o - _. 060 0 0 0 0 0 0. 0 0 0 0 0 030 Q... . .. 0 0 0 o 0 0 0 0025 0 0 - .O _ O O______ o 0 0 025 - -- 0 0 0___ __ 0 0 0 0 0 __ _ _ _
10 0 0 0 0 0 0 0 0 _ _ _ _ _
- -00 0 0 0 00 00 03 17 21 38.965 100 1,528 1 1 4.000 1,325 2,452 -- 12 --
0. 340 48 45 2 .7 1 349 2 40 0 2.650 5.616 2.8 9.70.0 9 108 59093 100 73824 4 4.000 -5.300 12.559
-.03 -, flf 21 9 1 20h43 9 071 t 14 oo nw .3 9 cUnit Rates end
Notesto Iww5
Me"d&.;;Pt= ~ earfaplaiu. In.
toitoha?.. ar
4 beas eh v4 tied15.154 fa
ismot..
antllas gaS,. . Io -c - lz h
iAnd shdlARWtdHwpe led".v1 0ilh- t 10
9trpo wa
165I 019 o Ii.1eampan disaoseg au
-htinB ttw&%Pfad fadk i4
$600bunt an.
Poni~bla casts t arhwi. bIgamPac
d spoad ladliss laiLW. 1360MI13.
bC u "OWpN., a t.y.
l - | J L - l
Page 2 of 3

z
toC%
0~
h00
TWble C.3. 1. Calculated Costs and Other Parameters for Rfectmiitlo of Contawinated Soil at the Reference Sealed Source Manufacturer Site
(Unrestricted Land lse, With Sill Washing)
Total Sog ToW SSol l Ttmcdigi Co sttsR esidual D o ss V o lum e 0 ll SiW3 0 1 501W 3 @ 53 50/13 So1iSa W aslik g " o E xc oavation Total S alt O c u a tion a
Rate Disposed- Dia osl Costs Disposal Cos Disposal Costs Labor Labor Roor ooodiabn n Labot Do"
mfter nvyr n 3 S S S t m an - Mn4 v o an- h Pa sononom
HIGH -
100 a 484403 . 55,778 121.646 3 25 28 3
60 9 526696 64B136 1 7.027 4 3_ 39 4
30 11 6S,64 737649 19921592 S 46 60 5
2 5 12 57.690 7 5.613 201,331 5 48 53 5
15 - 13 60,17- 80,575 222,330 6 64 60 _
10 15 82,489 896177 241,822 6 60 6G
3 74,268 109,981 342,541 9 89 s 10
0.3 39_ 102,167 166,910 579,263_ 17 1 58 174 17
0.03 47 116.069 195,944 697,893 20 192 212 21
MEDIUM O O10 0 0 0 0 0 000
60 5 45,900 S 0,790 100,629 2 19 21 2 _
30 9 52,401 63,748 1565,384 4 35 39 _ _4_-
25 9 53,508 65,949 164,703 4 38 42 4
16 11 68,394 73,029 190.393 5 45 60 5
10 12 58,488 77,203 208.083 5 60 68 6
3 B B 83,951 B8.091 254;167 7 63 70 7
0. 331 89.763 140,863 473.278 13 127 .140 _
0.03 43 108,307 179,148 631.073 18 _ 173 191 9
LOW 100 0 0 0 0 0 0 0 _ _O
60 0 0 0 0 0 0 0 0
30 0 0 0 0 0 0 01
25 0 0 0 0 0 0 0 0
15 000 0 0 0 0
10 0 0 0 0 0 0 0
3 7 -. 49,597 59.157 131 717 3 28 31 3
0.3 I 14,327 88,841 257,330 7 64 71 7
0.03 36 96.64 6 155.907 532,682 15 144 169 16I -
WN oacts andNotes
L .a4WW 'U-.
Io 40% 61t44.l
.msu*.g VOL IIb g l a41
M'SU- .,U. . ar w PM
W3-.t main Pa m w
IV Isbe
_pageI 3 IPails 3 of 3
4 , V

. I . 1k ' a, so a
Table C3.2. Calculated Costs and Other Parameters for Remidlation of Contaminated Soil at the Reference Sealed Source Manuracturer Site(Unrestricted Land Use, Without Soll Washing)
200
- - h - - - - -rol - 1n
ContarMI, Site Below- Below. Towel So4I SIte sonResiduat Doe. sled Sht Sonl She Sonl Biding Budin So Voleb etlc~,,
Rete Sonl A ** D th VebuM son Depth Vomeh "semmd Costsn^2 cm e 3 am m 3 mt'S
HIGH -_ _
100 56000 3.3 15 3.3 0 16 3A65360 S OOO 4.6 21 4.6 1 22 5.15130 56000 5.9 27 S.9 1 26 6.60125 5.000 6 2 29 6.2 1 30 6.97216 S.000 7.0 33 7.0 1 33 7386110 6.000. 7.6 36 7.8 1 37 8.8373 5.000 11.5 54 11.5 1 55 12.896
0.3 5.000 20.5 95 20.5 2 97 22.8670.03 5.000 24.9 Ila 24.9 3 118 27,835
MEDltIU --
100 5.000 0.0 0 0.0 0 0 060 5.000 2.5 11 2.5_ 0 12_ 2,75830 5.000 4.5 21 4.5 1 22 5.0S225 5.000 4.9 23 4.9 1 23 5.476185 5000 5.8 27 5.8 1 28 6.50810 5000 6.5 30 ..5 1 3 1 7.257
3 5.000 8.2 38 8.2 1 39 9.2090.3 5000 16.5 77 16.5 - 2 .78 18.434
0.03 5,000, 22.4 -104 22.4 ;2 107 25&61
100 500 0.0 _° 0.0 0 0 0
1o 5.000 _0.0 0 0.0 0 0 030 _5000 0.0 0 0.0 0 0 025 5 000 0.0 0 0.0 0 0 015 5.000 0.0 0 0.0 0 0 015 0 5000 0.0 0 0.0 0 0 010 _5000 0.0 0 0.0 0 003 5S000 3.6 17 3.6 0 17 4.079
0.3 £.000 8.4 39 8.4 1 40 9,3430.03 - 000 18.7 87 18.7 2 89 20.894
Undt Retes and CMfute 01Veln 2% of _a m *2$236h -
Notes prom pfft unod 18.000 It21
Page 1 of 3
'
0%08

Z Tahle C.3.2. CalculaeId Costs and Other Paraieters for Rcanedlaflon of Contaminated Soil at (lie Reference Sealed Source Manufacturer Site
R (Unrestricceld Land Use, Without Soil Washing) -
6I.-14�-�C)C�
- -o -o- - _ -
SoN SoH Transport Transport Son SoUl
Total Soil Sol PackagIna Packag1n Loads. Loads, Transport Transport Sol Sonl SON Disposal
Residual Dose Volume Total Soil WahiN Costs. Costs. 826 Gondola Truck Costs, Costs, Disoposal Cots Disposal Costs Costs @Rate Removed Weight Costs Gondola Cot Boxes Cots Loads RAbl Truck @ *1j0/S3 $601lt'3 *36011t3
mrom/vr m'3 MT S S , 0a STruCkA S 5 If _
HIGH __100 16 19 0 100 3.419 1 2 4L000 2.650 5,489 27.445 192,115
60 22 27 0 100 4,822 1 3 4,000 3.97B 7,741 38.705 270,93330 28 34 0 100 6.180 1 3 4,000 3,975 9,920 49.602 347 211
25 30 38 0 100 6.527 1 3 4.000 3,97B 10.476 52 382 368 677
15 33 41 0 100 7,359 1 4 4,000 S,30u 11,813 59,067 413,47110 37 45 0 100 8,132 1 4 4,uO0 5.300 13,054 65.268 456,879
3 55 67 0 100 12,073 1 6 1 4,000 7.950 19,380 96,900 .. 783018 . 2uf 21f47 2 9 8000 I11925 3A 3B3 17t DI A I -
_ _0 Ab 7D % .__I u.~uu41.H!5 AAAflI
0.03 990 tAA a 200 Zb., so I I1I OAuuu 1-4.01b 41.8129 209 I4aR I AAA n lI **- .L v-_ _ - I . _.'4- . -_ .
IMEVIUM i M. _ _ I
2100
UN
LOni
10060
012
0 0 0_._
a 100 2.,
4.'
.J I D 0 0 I I I 4m2 i.0 2.0, IA .,n *li=-- .0 n
;A2 2 4.W0EV Z.6S01 4. 4SK -30 7-21
n%
I sC -^.s
t~ ~ t -_ -i i - i -' I- ---- I ' - 4 - - I.,g,1j I 1A' 100 '57 2 4.000 1 2,650 7.6363 38182 IR 24;7? 272i
naz u IC It C._ ., _ . _ ., _ -*,___ , 4_.. _ . .25 23 _'28 0 100 s!27 1 3 4,000 3,975 8,230 41 148 288-033
28 34 O 100 6,093 1 3 4,000 3,975 9,780 48,902 342 11
10 31 38 Q 1 3 4,000 3,975 10.905 54,525 38 1.6753 39 _4 0 100 8,621 1 4 4,000 5,300 13,839 69,194 -_484 358
0.3 78 96 0 200 17,267 2 8 8,000 10.600 27.701 138,506 969,545
0.03 107 130 0 200 23.461 2 10 8,000 13,250 37.660 188.302 _,318,115
100 0 0 0 0 0 0 0 0 0 0 0 0
60 0 0 0 0 0 0 0 0 0 0 0 0
30 0 0 0 0 0 0 0 0 0 0 0 00 0 o 0 0 0 0
25_ _ _ _ _ __- - A __ _ _00-0__ _ _
3 1 21 0 1o 3.819 1 2 4.000 2650 O3 30,_650 214.549
0. 0 48 0 10 8.747 1 4 4.A,0..... 5,#3-00 14.0-411 70.204 491 4270.03 89 108 200 1 -.000 11.925 - 311398 5 ,990 1,098,928
_ ._ nf20 sa 1721 1 ,.e^00D- C1.326t I c ln ia.
t Rates andNotes.
75 lbs1Ia rel ;Utmom
*%Iwa -v~
cnd cmfo
Sol per
fallw
111111110 end4 besallaut
k; lead a.20.194 bsso;Ued
gondde aila lead disposal 4t LAtWdisposal fairy.
It~aawpat ordy
90"afct disposl at*xhblk UW
diaposal 1ocility.
*50/t'2; Isucktranspot orty.
lutwe lacoempau
duspoeal laclitds fet11W. 13S1OIt-3;
tuuck tiampat ondy.
II1 __ _ _ _ _ _ _ _ I
-
Page 2 of 34. 1
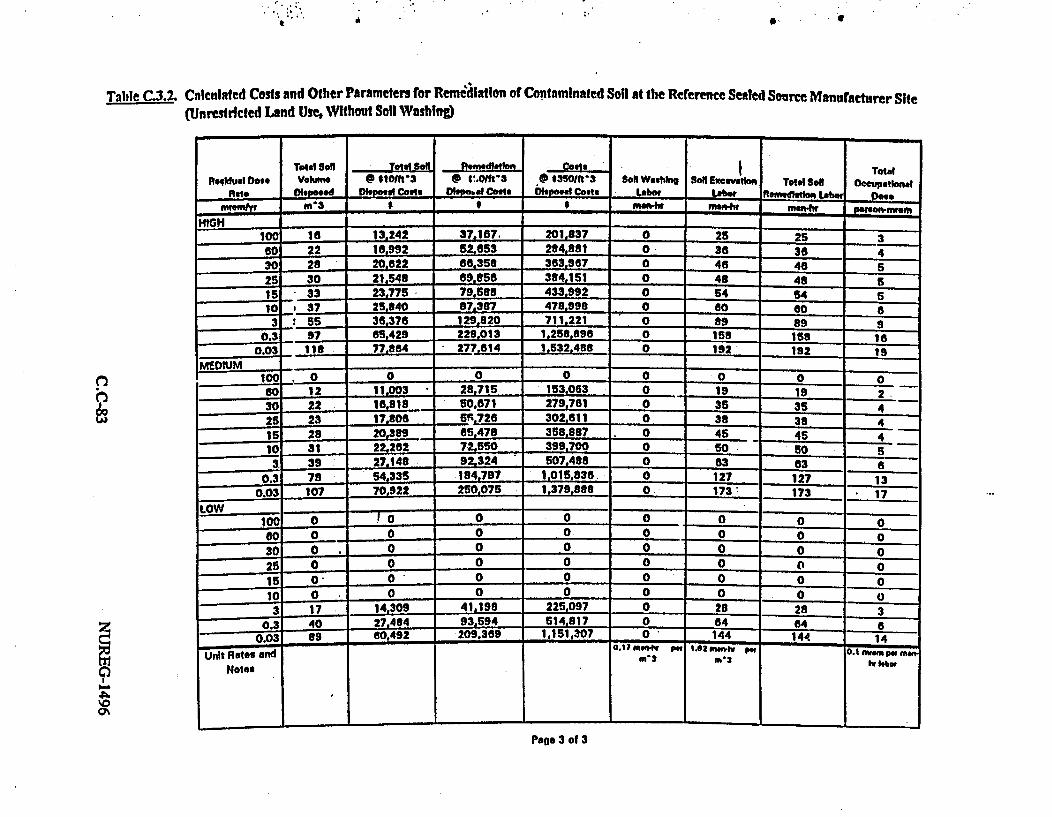
-I l* is*tB
.
Table C.3.2 CnIculated Costs and Other Parameters for Remeilatlon of Contaminated Soel at the Reterence Seated Source Manufacturer Site(Unrestricted Land Use, Without Soll Washing)
0
Toteol Total Sell -011 "a Coate Total
Rnell Do Volue _ 9lits DU e.om 0 ,3501ft Sell WshIn Soil Exeavation Total Son Ocw~tlobnalet. _ Co Dstpssa Coss Olcbw COttS Dp _ _t_ _ eettern L Dolenwnmyr3 S $ m ______ Kflwfw iwen4w ef"m
HIGH___ _
100 16 13,242 37,167. 201,837 0 25 25 360 22 183992 52,053 204,8DI 0 36 36 430 28 . _ 20,e22 66,358 363.967 0 46 48 525 30 21,549 69.856 394,151 0 48 48 51 5 33 23,775 79 ss8 433,992 0 64 54 S10 _37 25,840 87,397 478.999 0 so 60 6
3 55 36,376 129.920 711,221 0 89 89 g
0.3 97 05,429 228.013 1,258,898 0 158 158 10.03 - 1le 77.854 277,614 1.532.48S 0 192 192 19
MEDIUM _ -
100 0 0 0 0 0 ° 0 0 06o 12 11,003 28,715 153,063 0 19 19 2 -
30 22 16.818 - 50.671 279,61 0 35 35 425 23 17,806 5'726 302.61e1 0 38 38 415 28 203Bg 65.478 358.887 0. 45 45 4lt 31 2&252 72,550 399,70 50 0 -sos
- 39 27.148 92.324 507.488 0 63 63 a0. 78 54,335 184,797 1.015,836| 0 127 127 13
003 107 70,922 250.075 1,379.8s8 0 173 173 17
IOW0 0 0 0 0100 0 O O O_ _O0
60 0 0 0 0 0 0 0 0
15 0 0 0 0 0 0 0 0
10 0 0 0 0 0 0 0 03 17 14.309 41.198 225.097 0 28 298
0.3 40 27.484 93594 514.817 0 64 64003 89 60.492 20936 1,151,307 o 144 14 ; :
Ungt Rates and - 170 "' P [email protected] .
Notes m2hb
Pago 3 of 3
go-PCam

zc Table C.3.3. Calculatcd Costs and Other Parameters for Remediallon of Conltadinated Soil at the Reference Sealed Source Manufacturer Site
9 (Restricted Land Use, With Soil Washing)
a Contsmirn Site Belw Below. Total m L Slte SolResiual Do$e *tod Site Sell Site Soil Buidha Budbv Sol!| Vola x"v44tn
Rate Soil Area Depth Volume Soil De1th Volume Removed Coats
nvm/r 1I12 cm m-3 cm m-3 m-3HIGH I
100 5,000 0.0 0 0.0 0 0 060 5,000 0.0 0 0.0 0 0 030 5,000 0.0 0 0.0 0 0 025 5,000 I 0.0 0 0.0 0 0 0iS 5,000 0.0 0 0.0 0 0 01 S,000 1.6 7 1.6 0 a 1,7973 S,000 6.2 24 5.2 1 25 5B817
0.3 S,000 8.3 39 8.3 1 40 9,2950.03 5,000 10.7 S0 10.7 1 51 11,9S1
MEDIUM100 5,000 0.0 0 0.0 0 0 060 S,000 0.0 0 0.0 0 0 030 5,000 0.0 0 0.0 0 0 025 S,000 _0.0 0 0.0 0 0 _ 010 5.000 0.0 0 0.0 0 0 010 SOOO 0.0 . 0.0 O 03 S,000 3.7 17 3.7 0 1i 4,156
0.3 S,000 7.6 36 7.5 1 36 8,4150.03 5.000 9.9 48 1 47 11.078
100 5,000 0.0 0 0.0 0 0 060600 0.0 0 0.0 0 0 030 5,000 0.0 0 0.0 0 0 025 5,0 0.0 0 0.0 0 0 016 6,000 0.0 0 0.0 0 0 01 ,000 0.0 0 0.0 0 0 03 0.0 0 0.0 0 0 0
0.3 5.000 2.3 1 1 2.3 0 1 1 2,5750.03 5,000 7.0 32 7.0 1 33 7.7i0
Unit Rates NWd oil" pulus - 2% of bidkq *236/n'3
Notes pet pdibdwed t8.I0100h21below
. ae1o3
I . Paeo I of 3

Q` a *
Table C.3.3. Calculated Costs and Other Parameters for Remediation of Contaminated Soil at the Rtcerence Sealed Source Manufacturer Site(Restricted Land I se, With Soil Washing)
9~
-00
IOI-'
-o i - - - - -r ---Sonl So Tranpeort Transport SeHl sol
Total son ol Pa-kan Packain Leads. Leads, Transport Transport Sonl Soil So ll Disposal
Residual Dose Voem Total Soil Washin Cts. Costs. 8-25 Ondo Thck Costs. Cots., Diposal costs Di.p..l Cost Cota
Rato Costs dO ndeeol Car B oxes Cate L eads R oal _ T n* .1 l @ # 0/lt' *3 5rj t-3-M-II -- I_
HIGH - - __*____
100 0 - 0 0 0 0 0 0 0 0 0 o60 0 0 0 0 0 0 0 0 0 0_0 0
30 0 0 .0 0 0 0 0 0 0 -00
25 0 0..... .9.... 0 0 0 0 0 0 0
15 0 0 ~ 00 0 0 0. 0 0 000
10 a 9 36.234 100 673 1 1 4.000 1.325 1.080 5.402 378913
3 25 30 41,045 100 2,178 1 1 4.000 1,325 3.496 1.452 12i.374
0.3 40 48 45,209 100 3.481 1 2 4 p00 2.650 5.087 27936 -195.549
0.03 I 62 48.388 100 4,475 1 2 4.000 2,650 7.184 35,919 - 251,430
MEDIUM _- -- _100 0 0 0 0 0 0 0 0 0 0 0 0
--- 0000 060 0 0 0 0 0 0 0 2. 400 __ 0 __3,4- 2 06
30 . 0 0 0 0 0 0 O 0 0 0°
25 0 0...... 2 . 0 0 0 0 0 0 0
15 0 0 0 0 0 0 0 0°0 0 0 Ob
10 0 0 0 0 0 0 0 -0 0 000
_____3 is 22L0 100 1.556 I 1 4.000 1.325 2,498 12.491 7 7
UntR"e n 0.st3 44,155r w w 100^ 3,151 % 7 2d 4,0 ,2 i"t-z
0. e. 2.650 54058 25.292 177t043
0.03 47... S7.... 47.343 100 4.148 12 4.000 2.650 86-,59 3.9 3.5
LOW .9 3,5
100 0 0 0 0 0 0 0 00000
c0o 0 0 0 0 0 0 0 0 0 0: 0 00 0 0 0 0 _ _ _ _ _ _ _ _ _ _
25 0 0 0 0 0 0 0 0 0 0 0__ _ _ _ _ _ _ _
1 5 0 0 0 0 0 0 0 0 0 0 _ _ _ _ _ _ _ _ _ _
10 0 Q.... 0 Q .. 0 0 0 0 0 0 __ _ __ _
3 0 0 0 0 0 0 0 0 0 0
0.13 .l... 37.165 100 9 64 1 1 4.000 ~1 5 8 .. 2 Z 2...5 7
0. I I __1325 1,54
0.3 33 40 433 5 0 2.9 13 1 2 4,000 54 4.8llSboflt-3 hrs MA UR~ SlO0 Pat 6220hn'3 elsTm of 1.250 $4.000pa 5"-1.3255P., f k ucic .I MsW a chi a ,.k . oab.otf
Unit Rates and Coal ~. a~ 5 p J qL n di1 ag as Ogsw ~a p~
Notes plods;:"s tak 4 bovesIOahm aia~ L disposal #scalla taq
ifcv %k .o SS MI' tooII dlapasaul Jc~ijy. LLW. 03601h'3.
25.114 Ibe ww " say 1601hg3. wuiwk snac Ivampat .~
Peae 2 of 3

z
g Table C.3.3. Calculated Costs and Other Parameters for Remediation of Contaminated Soil at the Rererence Sealed Source Manufacturer Site9] (Restricted Land Use, With Soil Washing)
49
0h
TotaSol Total S oal Romodiation_ Costs TotalResidual Dome Volume @1 OtOIlt*3@3 1601Wt3 0 03601t3 Soa Washia SoiN Exavation Total SoN Ocatonal
Rat Dimposad Disoeal Costs Disposall osts Loabor Labor Rantodiaklon Lab1o Dose"wnimw m3'3 SnnAr " man- "MO-IV petson-ftwom
HIGH _ _ _100 0 0 0 0 0 0 ° o
60 0 0 0 0 0 0 0 030 0 0 0 0 0 0 0 025 0 . ° 0 0 0 0 0 o 0
15 . 0 0 0 0 0 0 0o10 - 3 43,212 45,431 77.843 1 12 14 13 10 64,458 67,847 172,739 4 40 44 4
0.3 16 84,191 98,670 256.183 7 64 71 7 7 70.03 20 71,623 103.393 318,895 9 82 si 91 - __ __
MEDIUM .___|100 0 0 0 0 0 0 0 0
60 0 0 0 0 0 0 0 030 0 0 0. 0 0 0 0 0
25 0 0 0 0 0 0 0
15 00 0 0 0 0 0 010 0 0 0 0 0 0 0 -
7 49,812 68,586. 133 532 3 09
0.3 14 61,729 83,664 235,416 6 58 64 6
-0.03 19 69,179 98.512 298.27 S _ 8 76 94 |
LOW - O 0 0 0 0 0 0
10 0 0 0 0 _ ° - °-30 0 0 0 0 o 0 0 0
30 0., 0 0 0 0 0 0 0
5 O 0 0 0 _ 0 0 -0 010 0 0 0 0 0 0 0 0
3 Q.... 0 0- 0 0 0 0 0
0.3 4 .j -. - 4 S 388 49.759 96.208 2 19 20 20.03 59,961 -o80,120 220,410 64 S9 6
UIt Rates and WIPsasi WPM" 0.170NO* p.62=1 w 0.1 m Pa m MawNot s l40*AlSofItI m 23M' m2hlobw
Notes oc V ol.:,gmdaN Vol. Is
istussad
4-Pa e 3 f
4GPage 3 of 3 0

Table C.3,4. Calculated Costs and Other Parameters for Remediation of Contaminated Soil at the Reference Sealed Source Mannfacturer Site(Restricted Land Use, Without Soil Washing)
00-4
Conem in. Site Below. Below. Toild o SIt SdIlResdual DOe etd Site Sol Sit So Buildins BdUN" Sol VounM Excavation
Rate soil Area Depth Voume SoN Depth Volune Reoved Coall-fti elm m3 cm m'3 n 03
HIGH1- l 000 0.0 0 0.0 0 0 060 5,000 0.0 . O 0.0 0 0 030 5.000 0.0 0 0.0 0 0 025 BOOO 0,0 0 0.0 O 0 0I1 5.000 0.0 0 0.0 0 0 010 6.000 1.6 7 1.6 0 8 1.797
3 5.000 5.2 24 5.2 1 25 5,8170.3 5.000 8.3 39 8.3 1 40 9.295
0.03 5000 10.7 0 10.7 _ 51 11.951MEDIUM -- - _ .
100 5,000 0.0 0 0.0 0 0 0-0 5.000 0.0 0 0.0 0 0 030 5.000 0.0 0 0.0 0 0 025 5.000 0.0 0 0.0 .0 0 015 5,000- 0.0 0 0.0 0 0 010 5.000 0.0 0 0.0 0 0 03 5,000 3.7-..- -17 3.7 O 18 4.156
0.3 5,000 7.5 35 7.5 1 36. 8.4150.03 5,000 9.9 46 9.9 1 47 11.078
100 5,000 0.0 0 0.0 O 0 0e0 5.000 0.0 0 0.0 0 0 030 5,000 0.0 0 0.0 0 0 025 5,000 0.0 0 0.0 0 0 01 5.000 0.0 0 0.0 0 0 010 5,000 0.0 0 0.0 0 O 0
5000 0.0 0 0.0 0 0 00.3 5.000 2.3 11 2.3 0 11 2.575
0.03 5,000 7.0 32 7.0 1 33 7.780- DI#Um"U DiftWien 2% at #236/hn3
Unit Rntes end _ fl ea "on areaNotes proI wofti wed .000 h'21
Maw
Pegs 1 of 3
z
0%

lo:
z Table C.3.4. Calculated Costs and Other Parameters for Reinedlation of Contaminated Soil at the Reference Scaled Source Manufacturer Site(Restricted Land Use, Without Soil Washing)-C] - -~--uu
It."
4�00�
n
6000
Sam son Transport Transport Soil SoNlTotal Soil Soll Packaging Packsng Loads. Loads. Transport Transpott Sonl SoN SoNl DIsposalResidual Dose Volume Total Soll Waahing Costs. Costa. 8 25 Gondola Truck Costs. Costs, Disposal Costs Disposal Costs Costa PRate Removed Weght Costs Gondola Car Boxes Calf Loada Real Truck @ 1tO/tt3 4@ 601ft'3 *350t-3
nvm yr/v m '3 M T t I t ar s STrCar u _ntck t t
HIGH -I100 0 0 0 0 0 0 0 0 o o 0 060 0 0 0 0 0 0 0 0 0 0 0 030 . 0. 0. 0 0 0 0 0 0 0 0 025 0 0 0 0 0 0 0 0 0 0 0 0i s 0000000 0 0 0 0 015 a1,.83
O 0 000 1, 1325 2.701 13.505 94.534'10 a 9 0 100 1 8 31_ _ _ _ _ _ _ _ _ _ _ _ _ _ _ _ _ _ _ _
30 0 100 5.445 1 3 4,000 3,975 8.741 43.705 305,9350.3 0 100 8,702 1 4 4.000 5.300 13,968 488.872
0.03 51 62 0 100 11. 1 S8 1 5 4 ,000 625 17 ,9 9 _ 89 .797 628 ,5 7 _
MEDIUM- -100 0 0 0 0 0 0 0 0 __ _ 0 0
60 0 0 0 0 0 0 0 0 0 0 0. 0
30 0 0 0 0 0 0 c 0 0 0 '0 0 --25 0 0 0 0 0 0 0 0 0 *o 0 0
15 0 0 0 00 0 0 0 0 0 010 0 0 0 0 0 0 _________ ___
-0 - - -0 - 0 0 0 03 18 22 0 100_ 3,891 1 2 4,000 2,650 6,246 312228 18-594
0.3 36 -44 O 100 7,878 1 4 4.000 5.300 12,646 63,230 442,6070.03 47 57 0 100 10,371 1 5 4,000 6.625 16,647 83,234 582.640
LOW - - - - 0 -O ___1 000 0 0 0 0 0 0 0 0 0 060 ° - ° 0 0 0 0 0 0 0 0
30 0 0 0 0 0 0 0 0 0 0 00
30 O 0 0 0 0 0 0 0 o 0 0 0
- -10 0 0 0 0 0 0 0 0 o 0 0 0
3 0 ~0 0 0 0 0 0 0 0 __ __ 0 00.3 11 13 0 100 2,411 1 2 4,000 2,650 3,870 19.349 135.446
003 33 40 0 100 7,283 1 4 4,000 5,300 11,691 58,454 409.181__-0-k-I- -X--~~~*~~~.jit ~ ~ ~ ~ I~b DaA-N*Op 2Om ~ee .0 SO~ t35tI& Caaut otl~n au~.ma.
CeileadAW opctdeeaia hw n~epc@da*a |M h6Unit Rates and
NotesModel
plasla muand Cover
*aa PM 4 boxosutmuk lead, ar
25.tS4 bead ioad
owwols r4kw I load disapoal JsCikyt.wS Npis,aampa.Io I; V
go~ate disoal atOxultipt tLwelapesal laility.
$soIllt 2; Clucktlaap..g sayt.
dispsal ftacilities OmLLW, $36011s';
Cluck lowupout mmlv.
I .1 - .1 - I - a . . -. a
Page 2 of 311'

' I I. . of -
Table C.3.4. Calculated Costs and Other Parameters for Remedlation of Contaminated Soft at the Retcrence Sealed Source Manufacturer Site(Restricted Landi Use, Without SolH Washing)
0
ch
'.0
'0C,
Total Soil Ta 49 medlthlon Cobts Totl
fsslmuel Dole Vobna e loto-3 1601fV3 @ 350S'ls son Wash"n sol Excavation Total soN Occupation
new Disposed Disposal Costs DIsElCa st Decots Labor Labor Rs"malsion Labo Does
mn m man h3S mIt anr p eonmnwem
HIGH - _100 0 0 0 0 o O O__O
60 0 0 0 0 0 0 0 0
30 .0 0 0 0 0 0 0 025 0 0 0 0 0 0 0 0
15 0 0 0 0 0- 0 0o
10 8,598 18,310 99.339 0 12 12 1
3 25 18.858 588942 321.172 0 40 40 4
0.3 40 27.363 93.135 512 169 0 64 64 |0.03 51 34.010 119.561 8658340 0 82 82 _
MEDIUM _ ____
an 0 0 0 000
000 0 0 0 0
30 0 0 0 0 0 __ __ _ 0 -
25 0 0 0 0 0 0 0
is5 0 0 0 0 0 0 0
10 O0 0 0 0 0 0 0 __
3 18 14,502 41.925 229.291 0 29
0.3 36 25,181 84,823 464,200 0 59 5B 6
0.03 47 31.824 111,307 610,713 0 78 76 8
LOW __ _ _ O___ ____
000 0 0 O 060 0 _ __ __ _
so 000 0, 0 0 0 0
30 0 0 0 0 0 025 0 0 0 0 0 0 0 0
15 0 0 0 0 0 0 0 0
10 0 0 0 0 0 0 0 0
3__ _ _ - 0 0 0 000
0.3 11 10.545 26,985 143.082 0 _____ 10.03 -- - 23.571 78,817 429.544 0 54 . 4 2I~~~. 0.e In =Mmenw1-
UNot meael amNotes
m3-m*2- I.- .;~. 0.1 Mmes vae manOw Isber
_ -- II L _ I.
Page 3 of 3

Z Table C.3.5. Calculated Costs and Other Parameters for Remedialaon of Contaminated Soil at the Reference Sealed Source Manufacturer Site
:¢ - (Unrestricted Land Use, With Soil Washing, Real World Data)Pm6.L.46�O0%
Ih
ConD osa Site Balow- Below. Total Sol jaste SoiResiM& Dou" sted Site Sol Site Soa "ding Dading Soi Voluin Exavation
Sat SOl Auis Depth Voluin Sol Depth Volume Removed Costs
mtvnww lt-2 em WI3 cm m-? m-3 4
HIGH100 5,000 4.4 21 3.3 0 21 4,925
60 S 000 8.0 37 4.6 1 38 8.839
30 6,000 * 17.9 83 6.9 1 84 19,668
25 5.000 20.8 96 6.2 1 97 22,817
16 56000 28.9 134 7.0 1 135 31.693
10 6,000 35.3 164 7.8 1 165 38,747
3 6.Ot0 64.5 263 11.5 1 264 59,777
0.3 5 000 91.3 424 20.5 2 426 100.163
0.03 .000 1 '8.2 696 24.9 3 598 140.640-
MEDIUM _
100 60 8 ° . -- a 1,98
60 _5.000 3.56 1 2.5 0 16 3,876
3 6000 7.6 36 4.6 1 36 8.464
25 6,000 _9.7 45 4.9 1 46 10.722
16 6,000 _17.4 81 6.8 1 81 19,108
10 5,000 3.8 111 6.6 1 111 26.178
3 6,000 43.1 200 8.2 1 201 47.236
0.3 6,000 90.0 371 16.6 2 373 87,716
0.03 5,000 116.9 643 22.4 2 548 120.203
100 6 000 0.0 0 0.0 0 0 0
60 5000 0.0 0 0.0 0 0 00
30 56000 0.0 0 0.0 0 0 0
25 65000 0.0 0 0.0 0 0 0
15 6.000 0.0 0 0.0 0 0 0
10 _ 000 0.9 4 0.0 0 4 1.018
3 5 000 5.1 24 3.6 0 24 5.717
0.3 6'000 37.4 174 8.4 1 174 41,006
0.03 5.000 73.9 343 18.7 2 345 81,192
UIt Rae and HCuhId Ollfwn 2%I *2of w-3oes"a matdoo e owt use
NotesPOO* POWMeead 1..00 It 21below
Page 1 of 3.. I
I
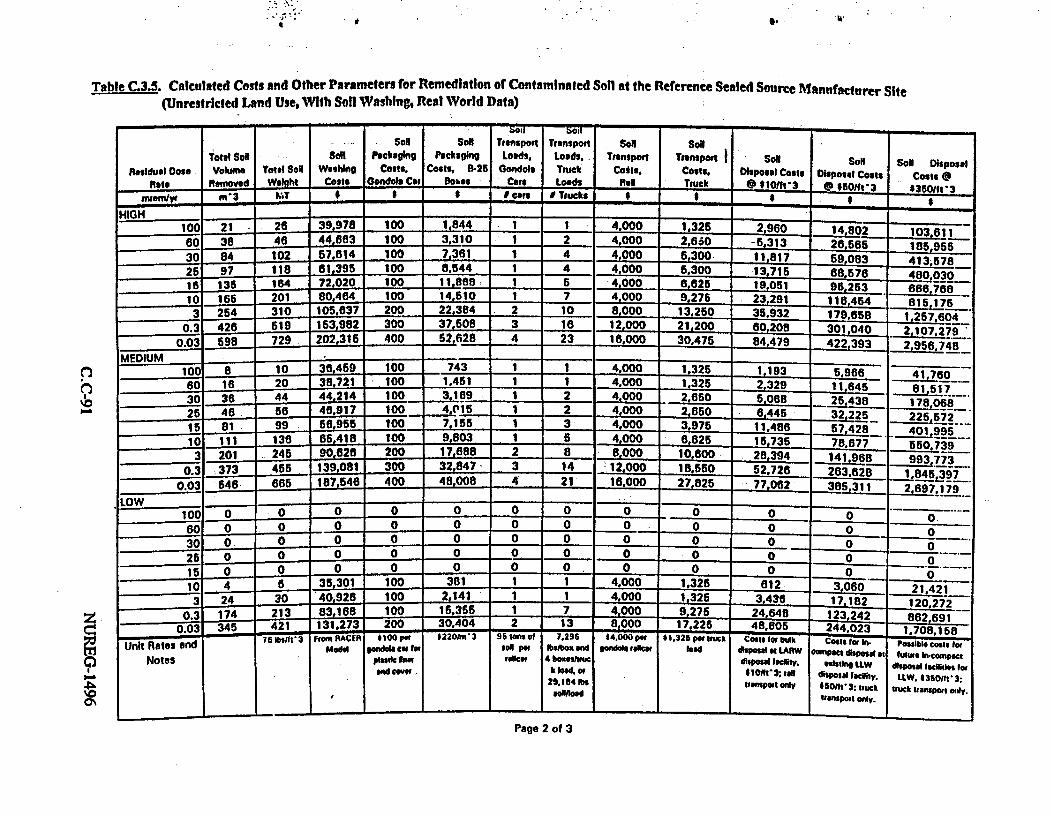
I'' ' .
,
. -. ) .1 .*9
Table C3.5. Calculated Costs and Other Parameters for Remediation of Contaminated Soil at the Reference Sealed Source Manufacturer Site(Unrestricted Land Use, With Soil Washing, Real World Data)
0h
Soil - - - -_Sonl SON Trenspo tt Transport Soil Soin
Totel Sol saw Packaging Packaging Loads. Loads. Transport Tsn nport son Soil SoiN DisposalResidual Dose Volune Total Sol Washing Costa. Costs, 8-25 Gondola Truck Coi ns. Coots. Disposal Costs Disposal Costs Costs 0note Rilmoond We sht Costs Gondola C ot Doke $ Cars Loads R om TIJcIC @ 21011it3 0 S 5if ___0/h_3 _350_ntn/va m 3 WT I _ F cars I Trucls *3..11. _HIGH
- ~__-100 21 26 39,978 100 1,844 1 1 4,000 1,325 2 960 14.802 103.61160 38 44 ,R83 100 3,310 1 2 4,000 2,6 0 -- 5,313 26 ,s565 185,95530 102 57,814 100 7.361 1 4 4.000 5.300 11.817 5 9,0 8-3 413;578_25 97 18 e 1,395 100 8,544 1 4 4,000 6 5.300 O 13715 -- 88e676 i80015 135 164 72,020 - 100 1 1888 1 5 4,000 6,625 19.051 9G,253 868,7as10 166 -2 01 804 854 100 il4,10 1 7 4 ,000 9.276 23.291 11 8 6454 8 15.1 7
_ 254__ _1 310 105.637 200 22,384 2 10 8,000 13.250 35,932 179f658 1I257-640.3 426 619 163,982 300 37,508 3 16 12,000 21,200 e0,208 301.040 2.107.2790.03 698 729 202.315 400 62,R28 4 23 18.000 30,475 84479 422 ,393 2s956, 48
-DU -1 38.e4s59 100 o 1 4 7u4,00_ 1,32 5 569
60 16 20 38.721 100 1.461 1 1 4,000 1,325 2 _329 11845 81.5130 3 6 44 44, 214 100 3 1 69 1 2 4, 000 2,e60 _ 78 ,06-8_________ - -5.088 25,38 178.06825 56 4.4.917 1o. 4.015 1 2 . 4,000 2,650 6,44515 81 99 68.955 1oo _ 7,l 55 __ 3 4,000 3197 511, 486 5 _7 4_ __ ,99510 111 136 65,418 100 9,803 1 - 4,000 295 7s,42 4019953 TO 1 -245 90,628 200 17,688 _ 2 4 8, D' 0 2 8,3945 141,9 78 993,7730.3 373 455 139.081 300 32,847 3 14 712 2,000 150.600 28.394 119 37_______ - - 8754 400- 1218550263,628 .4.90.03 SW 545 ees _ 54__ 400 48, 008 4 1 .100 27.825 - _1_
LOW - - -
100 0 0 0 0 0 0 0 0 -0 0 ___ _ __60 0 2.... ~ 00 00_ 0 0 0 030 0 0 0 0 0 0 0 __ _ 0 __ _
25 2..... 0 0 0 0 0 0 0 0 0 0 01 5 0 0 0 0 0 0 0 0 0 0
10....±.........L. 35,301 100 31 1 1 4.000 1.326 612 3,060 21.4213 3 0 _ 4 ,2 e 40925 100 2141 1 1 44 000 1.32 I 3.436 1718 1202720.3 17 1.3j~ 83.168 100 1935 1 7276Z... 24,648 123.22 86.90.03 345 421 131.273 200 30.404 2 13 8.000 17.225 48 805 244 023 _ __-. 7 QAVIR I 31 0t3 s t I 296 94 mm a 7296 *4 J2w at0 C tt 1. 70 8 ,1 5
LOwt to n osbl ol o~ g..P.hfb Al~. 20Unit Rates end
NotesModdl gondole cmlIN
olnt.c ewsVW cow.s
tioll p.'rIdes 4 bmou~hh~
It load orml14 o
aalndf
sandol als a load
dampor a1 0
Gmrpact dispoal atexistb t LW
dDitol lacly.50n 50- 3: tnuek*t satspors oly.
tuustwa Inrompac,Possibl cohtst fatdisposal lacaltill, lot
ULW. 4350/Il'3)truck transport Doily.
I I, I -- * .
Page 2 of 3

z
U'.0bc~0
(7h
Table C.3,5. Calculated Costs and Other Parameters for Renediation of Contaminated Soll at the Reference Sealed Source Manufacturer Site(Unrestricted Land Use, With Soll Washing, Real World Data)
Total Sol Total o Rmedltion TotlResidual Doss Volum @ *10/11'3 0 *60/t3 0 $350/1t3 Soil Washing Soil Excavation TotJ Soil Occuplaoal
Rate Disnosed Disposal Coast Disposal Costs Disposal Costs Labor Labor Ramedalslon Labor DoseHlnif m-3 II . 11 man-h maf-hr n-ht
HIGH__ _ _ _ _
100 a 51,963 62,873 161,682 4 34 3a 4
60 i5 62,916 866026 246,416 6 81 67 7
30 33 93,189 149,016 603,612 14 136 150 16
26 39 102.027 166.632 578.088 17 167 174 17t6 64 126,863 217.458 788,974 23 218 241 2410 66 146,602 269,449 956i171 28 267 295 30
3 102 209,645 380,706 1,458.652 43 412 4bS__ _ 4i60.3 170 326,663 613.893 2,420,132 *72 690 763 76
0.03 239 443,733 848,350 3.382.7083 102 969 1,070 107 _
MEDIUM100 3 43,737 46,478 82,272 1 14 152
6B 7 49024 6 126,888 3 27 30 330 14 61.866 8- 936 236.B66 6 58 6426 18 68,184 _9u1.628 289,876 8 74 82 816 33 91,648 144,621 489.187 14 132 214
10 45 111,431 186,701 668,762 19 180 199 203 80 174,465 308 118 1.169.923 34 326 3603
0.3 1 92 1 8 24 . 222 23 9163 606 668 6
0.03 218 409,210 776,892 3,088,760 9 - 3 884 977 98
LOW ..10 0 0 0 0 0 000
60 0 0 0 0 0 o 0 060 O 030 0 0 0 0 0 0 0 025 .2.. 0 0 0 0 0 001 5 0 0 *0 0 0 0 0 0
2 41032 41086 59 447 1 7 8
3 10 54.179- 67.290 170.381 4 39 44 40.3 ' 70 162,921 272,045 1,011,496 30 283 312 31
0.03 138 269,469 504,116 1,968.252 69 560 618 62
Unit Rates ud wl 7. p 1.62 M par mo po ma 40% eIWl M.1ul M
Notes a tval.
arnaltab d. &a
Page 3 of 30 . $4 v

.. .. . s ".. �. I � - 4 ' . . ' U . i
Table C,3.6. Calculated Costs and Other Parameters for Remediiation of Contaminated Soil at the Reference Sealed Somrce Manufacturer Site(Unrestricted Land Use, Without Soft Washing, Real World Data)
Contemin- Sie snelow. Below. Total Soil SeSoiResidual Doee ated Site Soil Site So Buildig Bulidng Sell Vonue Emxcevatimr
bate_ Sel Ate. Depth Volme Vokue Removed Costsnwev ntI2 cm mn'3 cm _m'3 S '3 _1
HIGH100 5.000 4.4 21 3.3 0 21 4,926so 05000 8.0 37 4.6 1 38 - 8,83930 5.000 17.9 83 5.9 1 R4 1965826 5.000 20.8 96 8.2 1 97 22;81715 56,000 - 28.9 134 7.0 1 135 31,69310 5.000 35.3 164 7.8 1 165 38.7473 5,000 54.6 263 11.5 1 254 69.777
0.3 5,000 91.3 424 20.5 2 426 100 1630.03 6,000 128.2 695 24.9 3 598 140,640
MEDIUM _100 5,000 1.8 8 0.0 0 8 198560 5,000 3.6 16 2.5 0 16 3,87530 5,000 '.6 36 4.5 1 36 8 464
_ 26 5.000 'u.7 45 4.9 1 46 10,722165 5.000 17.4 81 6.8 I e 81 19,10810 5.000 23.8 111 6.5 I 111 26,178
3 5.000 43.1 200 8.2 1 201 47.2360.3 6,000 8o.0 371 16.5 2 * 373 87.716
0,03 5,000 110.9 543 22.4 2 546 128,203LOW
100 65000 0.0 0 0.0 0 0 060 5.000 0.0 0 0.0 0 0 030 5,000 0.0 0 0.0 0 0 0
25 5,000 0.0 0 0.0 0 _ 010 5.000 0.9 4 0.0 0 4 1.0183 5,000 5.1 24 3.6 0 24 6,717
0.3 6,000 37.4 174 8.4 1 174 41.0060.03 5.000 73.9 343 18.7 2 345 81.192
Unit Rates nd Hmwnbo Difuinin 2%o1ki;; -72I35M'3day meN sol now neNotes ponr po e used 16.000 ft21
belowbuPgIof
Page 1 of 3
I4
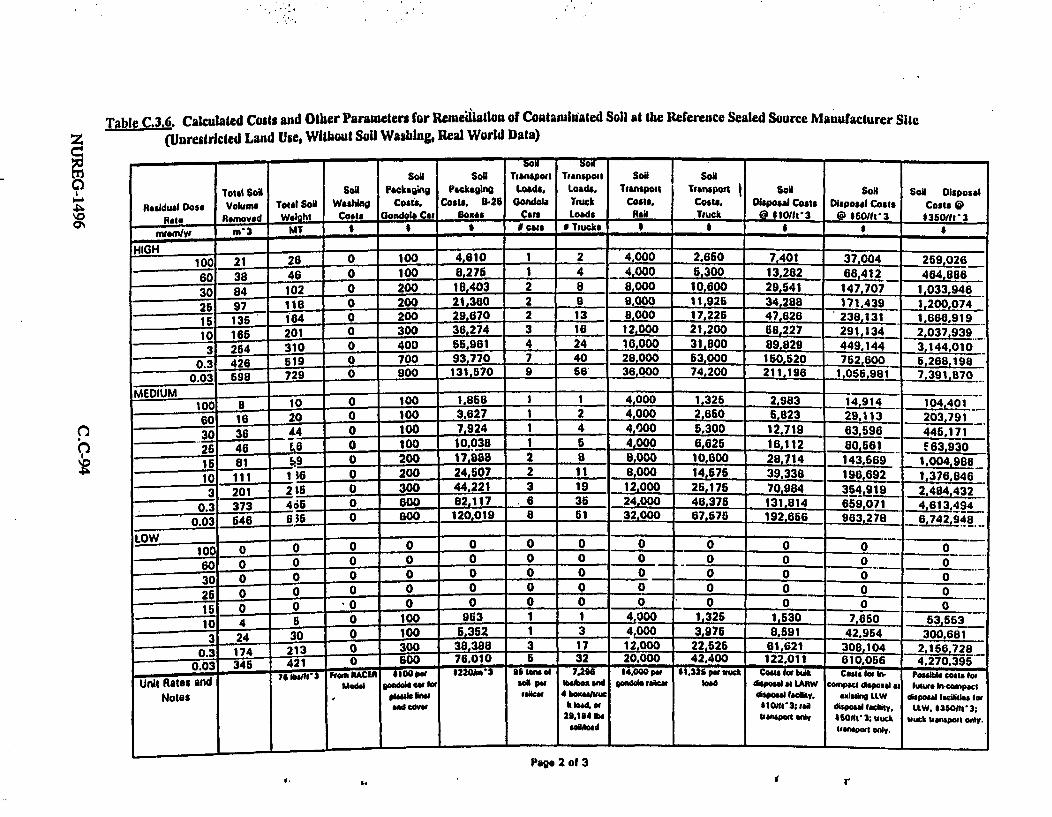
Table C.3.6. Calculated Costs and Other Parameters for Rmedilatlon of Contaminated Soil at the Reference Sealed Source Manufacturer SIe
Z (Unrestricted Land Use, Without Soil Washing, Real World Data)-
3 *!C
9I%00%
____boo SoilSOi Soil TIanspoul Transpoit Sol SoN
TOW SON SOa Packagng Packaing Loads. Loads. Twanspoit Transport SoOl Soi Sog Disposal
Residual Dose Volume Total Sol W On Costs. Cos., B.26 Gondola Truck Coats, Costs. D1sposal Costs Disposal Costs Costs 0
Rate Reoved Weight Costs Gondoat Co Boxes Cars Loads Rau Truck Q ,IO/it3 @ *6witr3 $350/tr3
mrvm/vl m 3 MT , S S Cam S Trucks S _ _ _ $ _
~HIGH- - -- --
100 21 26 0 100 4,610 1 2 4,000 2.650 7,401 37.004 259.026
60 38 46 O 100 8.275 1 4 4,000 6,300 13.282 68,412 464,8BB
30 84 102 0 200 10,403 2 a 8.000 10,600 29,541 147,707 1,033,946
25 97 118 0 200 21.380 2 9 8,000 11.926 34.288 171,439 1,200.074
15 135 164 0 200 29,670 2 13 8,000 17,226 47,626 238,131 1,666i919
10 i 166 0 300 36.274 3 Its 1200 21,200 68,227 291..!2 037 939
3 310 O 400 55,961 4 24 1.6,00J 0 31,800 89,029 __449.144 3 144.010
0.3 426 519 0 700 93,770 7 40 28,000 63,000 1501520 752,800 5.268,198
0.03 598 729 0 900 131,570 9 66 36,000 74.200 211.190 1,055,981- 7 i_,870.0 59 72 __.o.5.... _._7 3911.8'
100 a 10 0 100 1.868 I 1 4,000 1,326 2,983 14914 104L4 01
60 16 20 0 100 3,627 1 2 4,000 2,660 6,823 29,113 203,791
-30 38 4.4 0 100 7.924 1 4 .4..00 5.300 12,719 63 596_ 445,171
25 46 _ _. 0 tOO 10,038 1 6 , 4,000 6,625 16,112 80;661 E63,930
15 81 59 0 200 17.888 2 8 8,000 10,600 28,714 143 669 1,004 986
1t III 16 _ 200 24,-07 2 11 8,000 14.676 39_338 196 692 1,376.846
3 201 2 l6 - - O 300 44.221 3 19 12.000 26,176 70.984 364,19 2.484,432
0.3 373 4o65 0 600 82,117 . 6 36 24,000 46,375 131.814 659.071 14,613494
0.03 546 635 0 800 120,019 8 51 32000 77 1926 B6 9735278 6.74-948
°.0 O Bo 19O6 9633 278_K°° _ _O _10 0 0 0 0 0 0 0 0 0 0 0 0
60 0 0 0 0 0 0 0 0 0 0 0 0
0 0 0 0 0 0 000 0 -- i-.___0
0 0 0
15 0 0 0 0 0 0 - 0
101 4 j... .122... 963 1. ... j 4 000 - 1.325 1.530 7605.5
3340.2..... 0 ...... 2.... 5.352 1 3 4.t ....A00.. a.7 .9 jA 0.8
03 17 213 300 38.388 3 1 7 1..2,OGO ..2~L. 61.621 308.104 2.166,728
0.03 345 421 0 500 76.010 6 32 20,000 42.400 122.011 610,056 4,270.395-P..C -l. - pe IAC12 *241k3 9i toS d 7.2S6 $4.000 P 8 $1.326 pa. u Ceu* t btk rsI P0 com i0dHpsa 1 eI compar tisppea ii luura Incoinpac:
p
Unit Rates andNotes
- MO"a
ANd Cove
railcarWils"W4
4 boxeaaruek IoAd eq
29.184 IaSolAoad
godt rakatbead
d~SPosa faciliy.SIOUS.3; imaVanspowt Wd
oxsising LLWdisposal olacity.
tSfipon 3;t luckItort eatOry.
disposal lacildes fiorLLW. $3500tV3;
t tuc e tnmpol only.
I I1 -- l
Page 2 of3a l r

Table C.3,6. Calculated Costs and Other Parameters for RemelTatlon of Contaminated Soil at the Reference Sealed Source Manufacturer Site(Unrestricted Land Use, Without Soll Washing, Real World Data)
'0'-'
Total SoNl ots _ Total
Residual Dosn Volule 4 @lOlfh' 0 $GOfft'3 @ 1350n'3 Soil Washing Soil Excavation Total Soil Occupational
Ree Disposed DIpsal Costs DilPosal Coa Disnof costs Labor Labor Rfmedlatlon Latior Dos
rnet lyr m 3 0 tS man-hr manhi manelw pnsonrFMrm
HltH .-100 21 16,425 49.189 271.212 0 34 34 3
60 38 - 26,221 ss.82B 487.300 o e1 6130 84 57.400 1 96.308 1.082.508 0 136 136
25 97 65.305 227.541 1.256.175 0 157 157 16
15 1 87,619 316.719 1.745.507 0 218 218 22
10 __.16 109,274 387,355 2.134.159 0 267 267 27
23 -52 166,005 569682 3.291.647 0 412 412 41
0.3 _. .... 279.383 999,533 5.515.132 0 6 90 60 69
0.03 _ 698 3886,37 1,402,291 7 738.180 0 969 969 97MEDIUM -
1oo a 8 9.08 20,083 109,559 0 1 4 14 I
60 _I 13.797 39.205 213.943 0 27 27 3.
30 -.2 3 25 283 85,284 466.859 0 58 58 6
25 46 30,934 107.945 591.314 0 74 74 |-15 81 66.022 191,165 1.052,582 .O 132 132 13
10 111 73,718 261.952 1.442.106 0 180 180 I83 1 130,520 471.551 2.601,054 -O 328 325 33
0.3 373 244,130 875.278 4,829.701 0 oos C05 60
0.03 353,850 1.279.075 7.o58.744 0 884 884 as
10 O O 0 0 0 0 060 0 0 0 0 0 0 0 0
30 0 0 0 0 0 0 0 0o
25 0 0 0 0 0 0 0 0
15 00 0 0 0 0 .0 ~ 0
10 4 8.848 10,947 56.849 0 7 7_ _
3 . 24 18,408 57,998 31725 0 0 39 39 4
0.3 174 114.926 410,023 2.258,647 0 283 283 28
0.03 345 223,704 809.5.8 4,469.997 0 seo.. .. 56O3.17ma-tw pwa 1.2iunerv1 per 0.) memnupw Mon
Unit Ret.' and m'3 Vz IV tam
NotMs
Page 3 of 3
z
'0ON

Table C.3.7. Calculated Costs andl Other Parametern for Remealatlon of Contaminated Soil at the Reference Sealed Source Manufacturer Site
(Restricted Land Use, With Soil Washing, Real Woild Data)L,
cr0~
h
Contanun- Site Below' Below. Total So ile SoiResidual De" &led Site Soi Site Soi Builig Bulding Sol Volum Excavatan
Rate So A Depth Volume Soil Depth Volume Removed Cost#t 2_ cm m'3_ cm m'3 m'3
HIGH ______
100 6,000 0.0 0 0.0 0 0 0
60 6,000 0.0 0 0.0 0 0 0
30 5,000 0.1 0 0.0 0 0 69
2 5,6000 0.6 2 0.0 0 2 684
1 6,000 1 .8 8 0.0 0 a 1,979
10 ,000 3.0 14 1.8 0 14 3.384
3 6,000 t2.8 69 5.2 1 60 14,086
0.3 65000 49.3 229 U.3 1 230 64,058
0.03 6 000 86.1 400 10.7 1 401 94.292
MEDIUM -100 6,000 0.0 0 0.0 0 0 0
60 6,000 0.0 0 0.0 0 0 0
30 0.0 0 0.0 0 0 0
25 5,000 0.0 0 0.0 0 0 0
155000 0.0 0 0.0 0 0 0
1 6,000 0 9 4 0.0 0 4 1.029
3 6,000 6.2 24 3.7 0 26 65762
0.3 6.000 37.9 176 7.5 1 177 41,608
0.03 5.000 74.8 348 9.9 1 349 81.949
100 5B000 0.0 0 0.0 0 0 0
30 6.000 0.0 0 0.0 0 0 0
30 5 000 0.0 0 0.0 0 0 0
25 6,000 0.0 0 _ 0.0 0 0 0
15 6,000 0.0 0 0.0 0 0 0
1 6000 0.0 0 0.0 0 0 0
0.3 '6000 3.8 17 2.3 0 17 3,9990.03 5,000 32 .2 149 7.0 1 150 35,281
- ~ -8 8 -- - - W Xd$3Zuniat Rat"s WW HaB& I No MG" to flool WesAnNots Prom poli we ud tS.000 t'21
bWowr
Page 1 of 3..
A.VP
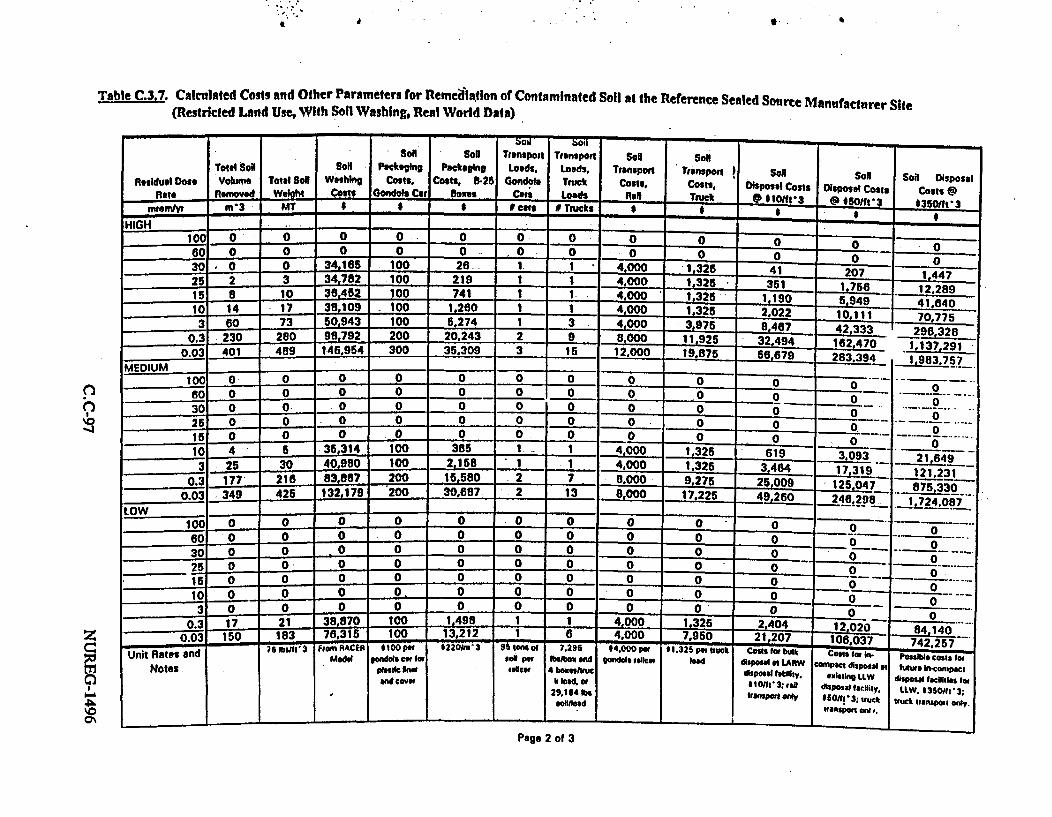
A
Table C.3.7. Calculated Costs and Other Parameters for Remedlatlion of Contaminated Soil at the Reference Sealed Source Manufacturer Site(Restricted Land Use, With Soil Washing, Real World Data)
'0
]0~
. - Si -S ---- - -r- -- -son Sol Transpon Trunspout SeO Son
Total Sdl Son Packaging Packaging Loads. Loads. Transpon Tianspont SoI s Sol Soi DisposalResiduul Dose Volume Total SoN W"hhn Costs. Costs, 8-25 Gondola Tructk Costs, Costs. Disposl Costs posalCosts Cos @
note Removed Wiq ht Costs Glando Car Boxes Cafs Loads C Totruc sont3 _@ *51'3 *36Its3mtemht m'3 MT C ars# Tfuck5 . S ._
HIGH - _ - __
100 0 0 0 0 0 0 0 o _____
60 0 0 0 0 0 0 0 0 0 0 --- - -BO _ 0 0-- O o9__
30 0 34,16S 100 2ff 1 I 4, 1,325 41 207 1,44725 2 3 34.782 10 219 1 I I_ 4-000 192 351 1,756 12.28915 a 30 36.452 100 741 1 1 4,000 1 325 I190 5 949 41.
10 14 17 38,109 100 1,260 1 1 4,000 1,325 2.022 10.111 70.7753 630 73 50.943 100 5.274 1 3 4,000 3,975 8,467 42 333 296,328
0.3 1230.. 2 .9.72 20 0.4 9 8.00925 32.494 162,470 1,137.2910.03 401 489 146.964 300 35.309 3 15 12,000 19.875 56.679 283 394 1_98_75_
MEDIUM = ° 1.983O7_7100 0 00 0 0 _ __ -___
6 0 0 0 00 0 0 0 U 0
26 - O O - - O -O O__ O___O. O ~le30 ° ° 0 0 0 0 0 - 0 ,---°-25 0. 0 0 0 0 0 0 0 ____
15 0 0 0 0 ~ 0 0 0 0000010 4 5 35,314 100 385 1 1 4,000 1,325 619 3 023 25 30 40.980 100 2,158 1 1 4,000 0,325 17,319
-_17 -_,8 1.8 .2 __3.464 127.3310-31 349 216 93,SS73 200 1_ __ 25,. 7 8.000 9.275 2509 1.7 8,0
0.03 - 34 425 132179 200 30.687 2 13 -,000 17.225 9 .A.9 .. 2.5
LOW 4_26 4629 .74.8
_ _- - - -o --.. 1_'--
100 0 0 0 0 0 0 o 0 0
30 . . t 7 0 0 3 0 0 0-----____ 2 0 00 0 0 0----
15 0 0 0 0 0 0 0 0 0-5 - 0 0 0 0
__ _10 0 0 0 0 0 0 0 0 0 0_0__ _ - - - 0 0. 0 0 0 0 00-
-____ - 880 10 .9 1 400 j 204 ______ ____
0.3 17 21 ,98 1 1 400 25 244 12.020 84.140.0 L10 18 635 100 13.212 1 6 4.000 7.950 2120 10603
0.03rnSlear RAER - 0 0-; 742.257-Ic-. O .. d _1.n.4omRAE $looper 6220hum3 IOS tonbof 7.296 1 54.0opm t~l.32s5pe'jwuca ~C9Slulbulk
Notes .Mod&l lotdola car foe
Nrd cover
sol par1,lcCr
?beoA and4 bz"hiAuc
kb louer
Om dd sall I load disgosal in LAFtwdipedal ftawly.
slofsi t3 n anlarneporl only
Canpact disposal uIexistki LLW
disposal adity.,850103: sttuckItbalport Ora P.
rosslis costs lothur h In-comp. cl
disposal faclities laIl.W. 350Oi t-3 ;
tfuck 1afnspia only.29.104 to
stoad
- -. - ~ - I - J.J. -.- I I
Page 2 of 3
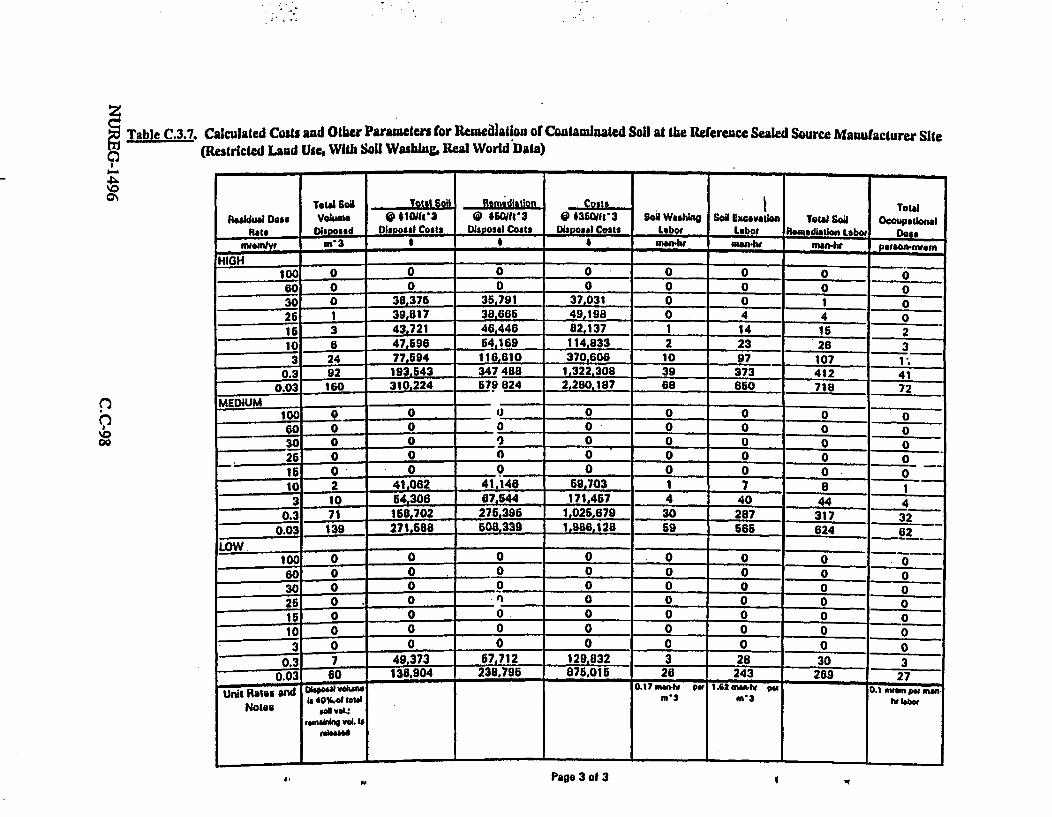
z2 Table C.3.7. Calculated Costs and Other Parameten for Rmezalloa of Contamiaated Soi al Ibe ReferenceScaledSourceManufacturerSite9 (Restricted Land Use, With Soil Wshing, Real World Data)
4_'.0CN
T000
Total SW TOW sil _Remod0lel TotalR eiduai Do&e Voiwu @ 41011&1 0 40IrS3 0 $35Jt 3 Soll Wehlg SON Eixialti Total Sod Occuputlonal
at Disoosed Dsposal Costs Disposal Costs Disposal Costs Lbo Labot Riomedit iLbor Do0sI laHma m' 3 an4w an-Irir _ An
HIGH100 0 0 0 0 0 .o .60 0 0 0 0 0 0 o30 0 38,376 35,791 37.031 0 0 1 0
26 1 39.817 38,666 49.198 0 4 4 0
16 3 43,721 46.446 82,137 1 14 15 210 6 47,696 64,169 114,833 2 23 26 33 24 77,594 116,610 370.606 10 97 _ 107 1_;
0.3 92 193.543 347 4B8 1,322,308 39 373 412 410.03 160 310.Z24 579 824 2.280.187 68 650 718 72
MEDIUM _
160 0 0 0 0 0 0 0 0- 0 - - OO ' -
30 .0 0 0 a 0 026 0 0 0 0 0 0 015 0 0 0 0 0 0 0. 0
10 2 41,052 41.140 69.703 1 7 03 10 4.30E 67,6444 171467 40 _ _44 4 4
0.3 71 168,702 276,396 1,026,679 30 287 317 320.03 139 271,6BB 608.339 1,986,128 69 665 624 62
LOW -
100 0 0 0 0 0 0 0 _.
60 0 0 0 0 0 0 _____ 0
30 0 0 0 0 0 0 0 025 0..... 0 0 0 015 0 0 0. O O 0 I
10 0 0 0 0 0 0 0 03 9... 0 0 0 0 0 0 0
0.3 7 49,373 67,712 129.832 3 28 30 3003 60 136.904 238.795 876,016 26 243 269 27
0.17 mtiIat S 1.62 m eahikpu0.1 avam Pat man .Ufit Rats and W Oad_ _mv .2 u lp - on me¢m
Ia 40%.OE toal m 3m 3ta aoNotes $a VOW
rwnbIkq vol. Itlaha~i
Page 3 of 3go -1

a k S0,
Table C.3.8. Calculated Costs and Other Parameters for Remedlatton of Contaminated Soil at the Reference Sealed Source Manuracturer Site(Restricted Land Use, Without Soll Washing, Real World Data)
(7
Contmin- Site felow. ftlow- Total SoN ISh SonlRidua'l Site SoN Building Dui Soi Vohn e ~xctln
Rhte _ Setl Are D. pth Vohme SON Depth Vohkme Removed CostmryrV ft'2 em mc' m'3 .m'3
HIGH -_
100 5.000 0.0 0 0.0 0 0 06o 5.000 0.0 0 0.0 0 0 030 6,000 0.1 0 0.0 0 0 6925 5,000 0.6 2 0.0 0 2 58415 6,000 1.8 8 0.0 0 8 _1_979
10 5.000 3.0 14_ 1.5 0 14 3.3643 6,000 12.8 59 6.2 1 6o 14085
0.3 6.000 49.3 229 8.3 1 230 64.0580.03 6.000 86.1 400 10.7 1_ 401 94.292
MEDIUM100 5 000 0.0 0 0.0 0 0 0
6o 060Q0 0.0 0 0.0 O O-_O30 5,000 0.0 0 0.0 0 0 025 5.000 0.0 0 0.0 0 0 015 5,000 0.0 0 0.0 0 0 O10 5,000 0.9 4 0.0 0 4 1,029
3 6,000 5.2 24 _7 0 26 567620.3 6,000 37.9 176 7.6 1 177- 47.6
0.03 6,000 74.8 348 9.9 349 81 949-
100 5,000 0.0 0 0.0 - 0 O60 6,000 0.0 0 0.0 0 0 030 5.000 0.0 0 0.0 0 0 025 6,000 0.0 0 0.0 0 0 015 6.000 0.0 0 0.0 0 0 010 6,000 0.0 0 0.0 0 0 0
3 C,0O0 0.0 0 0.0 0 0 0* 0.3 6.QOO 3.6 17 * 2.3 0 17 3.999
0.03 -6000 32.2 149 7.0 1 150 35.281Unit Rates and - t3umbS - ehnkn 2%.f hlg -W;
Notes pb pr d t5s.ooo nt2
Page 1 of 3
zUI9
-P

Table C,3.8. Calculated Costs and Other Parameters for Reme'dlatlon of Contaminated Soil at the Reference Sealed Source Maufacturer Site(Restricted Land Use, Without Soil Washing, Real World Data)
~0
h
So- -a - ll
Son Soi Transport Transport Soi SoNTotal Sao Sol Packagio Pfckgng Loads. Loads, Transport Transport So Soil soi Disposal
Residual Dose Volume Total Soi Washing Costs, Costs, 0.25 Gondola Truck Costs, Costs, Disposal Coits Disposal Costs Costs 0Rat Removed Weliht Costs Gondola Car 8o.s Ccars Loads Rai Truck _ @*O/ll3 @ *60/i3 $350/t'3
m an lyrv m '3 M T S $ Ica's M rucks S _ _ _ _ _ _ _ _ _ _ _ _ _ _ _-tte - - - - - -
HIGH 0 0100 O 0 0 0 0 0 O__ _ O_ _ O O
60 0 0 0 0 0 0 0 0 0 0 0
30 ..0 0 100 04 1 1 4,000 1,32S 103 617 3,618
25 2 3 0 100 547 1 1 4,000 1.32S 8.78 4,389 30,722
1S a 10 0 100 1,863 1 1 4,000 1,326 2,974 14,872 104,101
10 _14 17 0.. . 100 3,149 1 2 4,000 2,650 5,055 25,277 176,937
3 60 73 0 100 13,186 1 6 4,000 7,950 21,166 105,832 740,821
0.3 230 280 0 400 80,607 4 22 16,000 29.160 81.235 406,176 2,643.i27
0.03 401 489 0 600 88,273 6 37 24,000 49.025 141,697 708 5_ 4.59,3_92
MEDIUM- - -
100 0 0 0 0 0 0 0 0 - 0 00_ _ _
60 0 0 0 0 0 0 0 0 0 ° -- 0 0
__ _ _ _ 30 0 - .0 ... 0 0 __ _r _ 0 0 0 0 0 0 0 -
25 ° - - 0 0 0 0 0 0 O 0
15 0 0 0 0 0 0 0 0 0 0 0 0
10 4 6 0 100 963 1 _ 1 4,000 1,326 1,546 7.732 54.123- __ - - -, 1 2
3 26 30 0 100 5,395 1 3 4,000 _ 3,975 8,659 43,297- 30i0i9
0.3j 177 .16 -0_ 300 38,951 3 17 12,000 22.525 62,624 31261 2,188 326
0.03 349 426 0 0 76,719 5 33 _20000 43,726 123.149 615 746 a
LOW ____ --. °-.100 0 0 0 0 0 0 0 ____ ___ ____ ___
0 0 - - -O _-o - 0 _ 0 0 -O ___ Tj0...
lC _ _O __O °___ 0 O_____ _ O .____
6 0 0 _ _ _ _ _ _ _ _ _ _ _ _
03 0 0 0 0 0 0 0 4,000 ,60 6 0 -20.350
30 0 0 0 0 0 0 0 0 0 0 0 0.0 0 0 SS ____ 0 0
2 6 z Z i : Z0 000 - - -
15 0 ~ . 0 _ _ _ _ 0 0 0 0 0 0
10 0 0 0 0 0 0 0 0 0 0 0 0
0.3 1L..7 0 ..... 100 3 7~4 4 1 2 4 0 2.660 __ _ __ _ 0_ _ __ __0_ _
0.3 15 2 ,1.--- 3 4 1,00 1850 600 30.050 -210.350
- -3.2 31 1,5 5Ai201 a 265.092 1.8665.64215b '3)~ an V RM ACERA 0100par 122OWii3 95 go"r oI 7.206 44.000 par 01,326 par lu= k - C=OS$a hrbk - ~ o~ a
Unit Rates sandai cat for ShOEwMd San d M Wl bakw. foo ,d d1po11 &I LARVW comoact dsposal futuaowa Incampact
Notes P plastic s raw ar 4 bouxhruc xla 2 ztv. exisin uw dsoa facziu ICKNW lvo ad664or 0 1011k 3. red dibpoaal faceity. I.IW. 63600i1C3;
29.1.4 fbU 4p1ttOIlV SS0WI3;. truck sotuc U WaporI ony.so " 2ip Ol 3nly.
Page 2 of 3
9, A IV
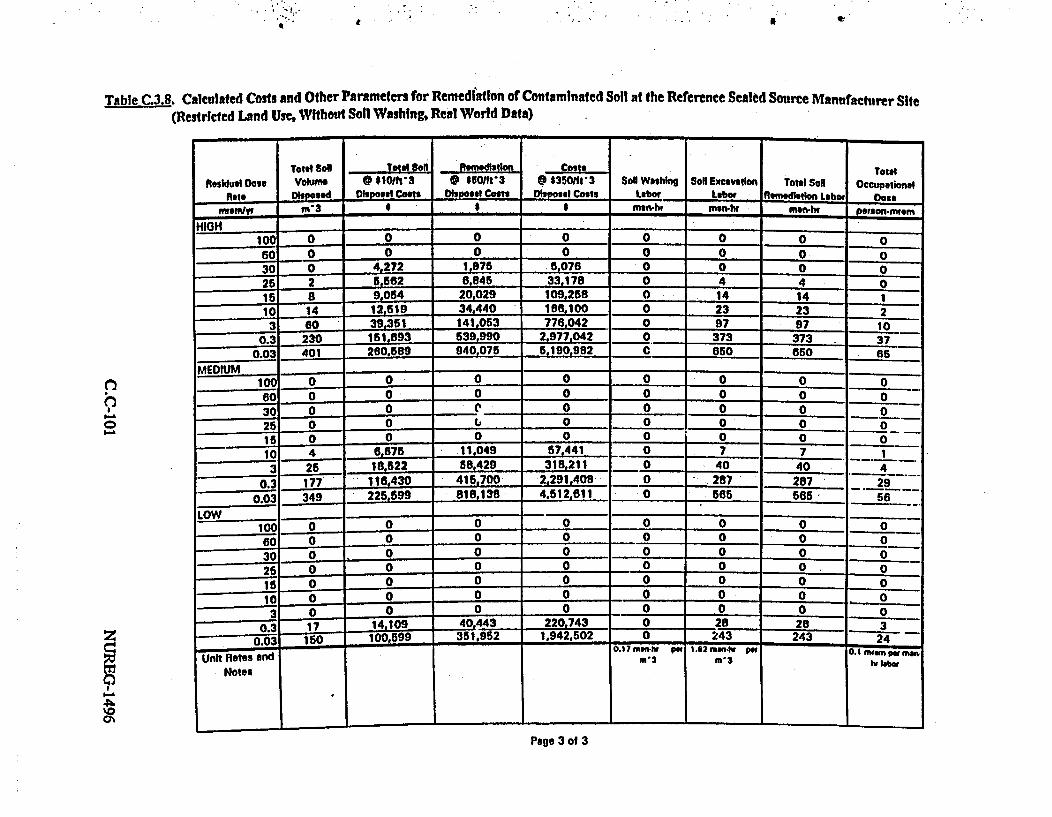
. . 4 .. !,. -
ft C ~t :a *
Table C3.8. Calculated Costs and Other Parameters for Remedfatton of Contaminated Soll at the Reference Sealtd Source Manufacturer Site(Restricted Land Use, Without Soll Washing, Real World Data)
0
0
Total SoN Tot.1 n Reedlatlon Cols Total
Residual Dose voumw @ S/ft'3 S $50/St'3 @ $35011-3 Son W$n Son Excavation Total So 0ccuptII * Diped Dhsposl Costs Dposal Cost Disposal Costs Labor Labor Runmedlaion Labr ose
nwenw m 3 $ .an-ht men-1r mn-l person-inwern
HIGH102 0 0 0 0 0 0 0 o60 __0. 0 0 0 0 0 0 o30 O 4.272 1976 5076 0 0 0 O25 2 556e2 6.845 33.178 0 4 4 -15 8 9.054 20,029 109 258 0 14 141
0 14 12.619 34.440 186,100 0 23 23eo 39.351 141,053 776.042 0 97 97 1_ 0
0.3 230 1651.093 539.990 2.977.042 0 373 373 37
0.03 401 200.589 940.075 5.190.982 C = 650 650 65
MEDIUM -
100 0 0 0 0 0 0 0 * 0
60 ...... 0 0 0 0 0 030 s.. .-- - ' 0 0 0 0 0
25 0 0 ___ __ __0 0 0 0
15 0 0 0 0 0 0 0 0O1- -4 6,575 11,049 _ 7,441 0 7 _ 7 '
3 25 18,522 58,429 318.211 0 40 40 4
0.3 1L. 116,430 415.700 2,291,408 =0 ° 287 287 _ 29 --
0.03 349 225,599 818.138 4.512.611 0 565 565 56
LOW 10
60 0 0oOOO - o 0Low -
260 0 0 0 0 0 0 0 0
265 0 0 0 0 0 0 0
15 0 0 0 0 0 0 0 O
3 00 0 0 0 -0 0 0
0.3 171. 0443 220 743 0 28 283 -
0.3 10 1059 31952 1.942,502 0 243...5...... 243 24- 0O.17 mawt-w aw- 1.02 mmi4v onw I.pf~
-NIUnit Rates and
Notesm-1 j m-3
I.v m.oo pV maI"oo
I
- . . . 1 J
Page 3 of 3

z
R Table C.4. I. Calculated Costs and Oller Parameters fot Recdiallon otContaminated Soll at the Reference Rare Metla Extraciln Plant. (Unrestricted Land Use, With Soil Washing)
0%
Cntsadn Below. Below. Totl La SAt. sewedM b Site Site ol Ste SW Buidi So BldngS Sbag PilN Vonew Exoveion
Residual 0Dae Rate UPA Afe DeDtD Voluume Voum VOlum O Ronmiod Costs
mrnetm t 2 cm m-3 cm n 3 m-3 m-3s
HIGH -
1 100,000 0.10 14 0.10 0 7,000 7,015 1.048.49000 100,000 0.52 40 0.52 1 7,000 7,060 1,050,73330 100.000 0.80 74 0.80 2 7.000 7.070 1682,9180
25 100,000 0.84 78 0.84 2 7.,00 7.081 1.663.9481i S100,000 0.93 87 0.93 3 7,000 7,0B9 1.68,007
10 100.000 0.98 91 0.98 3 7,000 7.094 1,007,0373 100.000 1.04 162 1.04 5 7 °°° 7,157 1,681,839
0.3 100.000 2.00 185 2.00 8 7,000 7191 1,089.070
0.03 100,000 2.91 270 2.91 8 7,000 7,278 1.710.408MEDIUM
1 o100,000 0 0 0 0 7.000 7.000 1,645,00000 100.000 0 0 0 0 7.000 7,00030 100,000 0.52 48 0.52 1 7.000 7.050 0 .100073325 100.000 0.01 57 0.01 2 7.000 7,069 1.058,79415 100.000 0.00 74 0.00 2 7 7.070 1,082,91810 100,000 0.89 03 0.09 2 7,000 7.085 1.804.977
3 100,000 1.24 115 1.24 3 7000 7119 1072.9080.3 100,000 1.90 182 1.98 5 7.000 7.107 1.588.983
0.03 100.000 2.79 200 2.79 B 7,0t0 7.207 1.707.025
LOW -. _ -
1o IG.O000 0 0 0 U 7000 7,000 1,045,00000 100,000 0 0 0 0 7,000 7,000 1.045.000.31 100.000 0 0 0 0 7000 7.000 1.045,00026 100.000 0 0 0 0 _.7.0U0 7.000 1.645,0001S 100.000 0.10 14 0.16 0 _ 7,016 1.648.49010 100,000 0.40 43 0.40 1_ 7,000 7.044 1,065,3593 100,000 0.09 03 0.89 2 7,000 7.085 1.884.977
0.3 looOoO 1.77 104 1.77 S .7.000 7.189 1.684.8150.03 100.000 2.28 210 2.20 0 7000 7,210 1.895,779
Undt bt. And Ouilulm 2i3oh 2 1 hIdhe - *263
mooteld ,elle fAsed 1110,000
Pau) 1 o 3.,

r ..
. 0 . S t -. a'
Table C .alclted Cmdonof Contaminated Soil at the Reference Rare Metal Extracton Plant
(Unrestricted Land Use, With Sell Washing) I
Soil sonl
soaw son Ttempoet Timnipert son I
Tot.I Son VAR111,s of ~.tn P*A*.gln§ L644d. Load.. Transport TraI poet sonl son Sol Diepoesi
Riolduel Vokiume Togil Soll SoN Sot Weahno Cost. Coale. 8.26 Gandot Teual coot.. Coat,. 0101600s Coost Disposal Coot. cost.s
Gov. Rate nornoved wwh MdIwd Coot. q~fiodtfeC s Some.. cats Load. Touok $ * tRn-S J9. 30
mrMA 3 MT W3 I j, 0 o. DTuetwi ___jRj,,'
HIGH __ _ ___ _ _ _
10 7,1 ,4 15 39.200 9.900 1.541.307 99 045 .398.000 5954.825 2,474,113 12.376,583 8653,4
8 2950 4.2 1000 15434 100 848 400,000 055.950 2.479.088 12.395.339 90.787.372
30 7.7 8.822 78 55.528 10.000 1.548.709 100 847 ~ 877 .8.8 24390 ~ 4
25 7.01BL 8.828 8i. 58.782 10.000 1.547.095 100 847 4000 857.275 24303 12.417.017 -88.919.12
15 7 8 80 89 59.229 __10.000 1.47.888 100 848 4002 50000 2.4482 1.2.1 8.8.7
~ ~ j 4 0042 1000 .4.22 10 48 4000 5880 2.485.282 12.428.308 88.984.1158
3 7.157 8,2 157 78.180 10 0002.. 1.553.795 100 850 40-0.00-0 881.250 2.494.159 12,470,73 8.9.5
0.3 7.191 ,L .. 1L 781 000 15085 100 851 4000 8275 2.498.990 12.494.950 07,464 48
, 0' 7,7 0,6 278L 112.378 10.100 1.564~.49 101 8055 04887.87 2.511.330 112.558.851 8.9~8
MEDIUM -7 - -56
I 1 7,02.. 0,52 0 0 9.900 1.540.000 99 844Ai. 39 8500 .7205 1.8.05A0.2
0p 7..L000.. 0 .52 .. 0 9 o I.540.000 99 044 395.000 1353.300 2.472.015 12.380.075 88.520.525
30 705 8,9 50 48.127 10.000 1,544.394 100 848 400.000 8590 ~ 23539 8 8.7
25 7.5 0,0 59 150.694 10.000 1.545.1815 100 I048 400.000 ~ .8.0 24153 .A!.2
1 .Z.... 55.528 10.000 1.S48,709 100 847 400.9 057.275 2.482.784 12.413.920 88.897.443
10 7 8 0,3 as 57.,995 10.000 1.547.481 100 847 40.0 57.275 2,48 .023 12.420.114 8 40
3 7 119 8.A074. li 87.489 10.000 1.550,451 100 849 400.000 859.92 2.49.90 1244.92 7 . 0?f
0. 167 .~lL..J . 8673 10.00-0 1.558.470 100 851 40-00 8267 =124 228 87,445.85
0.03 7287. 85 287L. 109.2808 10.100 1.503,528 101 854 404.0000 888.550 2.609.779 12.548.054 _;87 842 _2
110 7 000 8,1 0 0 9.900 1 4,0 99 844 3980,00 9330 24205 123005 8.2.2
80 _ 00 1.U 4 2 9 4 9 . 0 8 3 3 0 . 47Z20 15 - 12 .3 800 075 881.520.525
607 000 8.529 0 0 9.900 1.540.000 99 844 390.000 8300 2,472.015 12.380.075 86S012
25j 7 0 8.529 00 9.900 1.540.000 99 44 398.000 853.300 2.472.015 12.3075 85255
156 7 015 8 548' .. JL. 39.200 9.900- 1.541.307 99 845 398.000 054.025 2.4413 1.7,8
10 7.044 0,5. 44j. 48.493 10,000 1.543.879 100 848 400.000 855.950 -2.4-79.24-2 12.391.210 88.738.407
3 7.0 8533 a I789 0.000 1.547.481 100 847 400.000 857.275 2.484.023 12.420.114 88.940.801
E0. 718 jf - 19 81.743 1000 154.1 0 51 400.000 882.575 2.495 940 12.470.740 87.358 179
003 7 218- 0,793' 218 9487 1.0100 1.559.015 101 852 404.000 883,900 2.502 5-390 1.289 87.588,845
Ut at.76tlbe.ll OvillIol R~iit~AM 'de' I100 P"i 1220*a3 31, to" of 7.236 14.000ps 6 1.321 pout uek Citti Mg. bulk Cat ** ... I.
Iff" G -020 n I ~ N P *Gtx W OrAk Cllee lad 11efeal at LARW iOMepact dIkioul Cut. kicw.pasct
'0 and Note's O'as. oe les W ale 4 berAi dkIhPOf #-MY. St em SielO LLW dipagai taeMils. for
14 Withd. end -Ne k Mad,-Ov *t0ht2-33ui dispesal 16alutv. LLW. 4350111':~
NW otow29 10 ls tnaspeut.. *0 t501 3; tnuch titpek 1,afipOm imy.
Pon w........! 2 of 3 06111ead __ __ __ __ __ __ _ __ __ __ _ __ __ __ _

ZTAle C.1 Calculated Costs and Other Paraznelen for Rensedlalbon of Conlatninled Soil at Ii.e Reference Rare Metal Extractin Pla
(Unrestricted Land Use, With SoUl Washing)
TOW S.ea Total Sol 8011 isIobtlon Costs Tow
Vohan 0 011011ll Q 650t113 0 $36011i3 se Eueavdou, To e OawvmResidual Doas RatD. spesed 00 2s D tl Costs_ Disposal Coast Soll WasNne L- Lsbou lte2dIstlon Lgbor Dt
nu-n6r m 9 __ m mon4u nur.4i manhr penrut
HGH -
1 7,008 4.6680702 16,453.245 90.870,624 3 11,384 11,307 1.13780 7,020 4.693,928 10,6006543 90.572,578 a 11.421 11,429 1,14330 7,030 4.011.228 10.630.348 91.019.171 13 11.404 11.470U_ 1,14821 7.032 4.014,111 10.542.095 91.044.199 14 11,471 11.484 1,14U15 7,030 4.019.870 10554;913 91 094 101 1S 11.485 1it5s0c 115010 7,030 4.022,701 10.580.000 91.110,510 10 11,492 11.50 1,1513 7,083 4,084,177 18,045,858 91.470.013 27 11,594 11,021 1.102
0.3 7,070 4.680.087 10,092.008 91.681.704 32 11,849 11,682 1.108
0.03 7.111 4.749,212 18,811,800 92,151,708 47 11,791 11.938 1.184
IMEDIUM |_____
101 7,000 4,522,915 10,398,375 90.558.826 0 11.340 11.340 1 ,134I8 1,000 4.522,915 10.398,375 90,558,825 0 11,340 3 1.134
30 7.020 4,593.928 1,500543 90,872.570 0 11,421 11,429 1,14325 7,023 4,599,695 10.512.037 90,921 233 10 11,435 11.445 1,14515 7,030 4,011,228 10.538.348 91.019.871 13 11,484 11.470 1,148
10 7,034 4.010,995 10,547,842 91.088,528 14 11,478 11.492 1,1493 7.048 4.039.188 10,594,725 91.258.430 20 11.532 11,553 1,16S
0.3. 7.075 4.884.10O 18,07,020 91,U40,019 32 11,843 1"075 1,1680.03 7:107 4.740.989 10,798.080 92,089.444 45 11,773 1 1,919 1.182
LOWG1O 7.000 4,522,915 10,399,375 90.558.825 0 11.340 11,340 1,134
00o 7,000 4.522.915 10,398,375 905580,25 0_ 11,340 11.340 1,13430 7.000 4,522,915 10 390 376 90 558.825 0 11,340 11,340 1,13425 7.000 4,522.915 10.398.375 90,558.825 0 11,340 11.340 1,13416 7,000 4,680.702 10,453,245 90.6706.24 3 11.384 11,307 11'g3710 7.018 4,590,084 100.492.881 90,840,138 7 11.411 11.419 1,1423 7,034 4,010,995 10.547.842 91.089.528 14 11,478 11.492 1.149
0.3 7,088 4,072,508 100883.783 91,542,222 29 11.014 11.043 1111040.03 7,098 4,707,285 10,720,254 91,802,408 37 11.090 11,727 1.173
i~l ~z d t- P~7w ~Unit Raw NW and i.. LI 0.17Wfw pwz e .6 i.u 0.1I nusm pot WA"oNot"isle tl m-3 sa labor
w~eu 601A ofweek" esib
b Palah Vol.if musels d Il__ __ _ __ __ _ _s__ __3__ _ __ _ _ ___3_
6 , 9A#

it
Table C.4,2. Calcul:ted Costs and Other Parameters for Remediation of Contaminated Soil at the Reference Rare Metal Extraction Plant(Unrestricted Land Use, Without Soil Washing)
0
15A1
Cntaom- Shte eo. Blw Totd Sl Sb 8t Bollleoldu1e f. otedS te Sell She Sol Buiding uM So SlOg Mie Voume Efoeovtion
R t. SoN Area DeVpo Vooblu VolMe Vol.. Removd Coot.Omn 2 em '3 _ m'3 m-3 m_3
HIGHI ooG~.. 1OO ol 4 -l 0 7.000 7.016 1.648.490100 100.000 0.16 1 0.16 0 7_000 1___40_490
60 ioo.ooo 0.52 48 0.52 1 7,000 7.050 1I656 73330 100.000 0.80 74 0.80 2 7.000 7,07B 1.662.916
25 100.000 0.84 78 0.84 2 7.000 7.081. 1-te3,94615 100.000 0.93 87 0.93 3 7 7089 .1eee6.0071o 100.000 0.98 91 0.98 3 7.000 7.094 1,667.0373 100,000 1.64 152 1.64 5 7,000 7,157 1 681.839
0.3 100,000 2.00 185 2.00 a 7,000 7.191 .1689s8760.03 100.000 2.91 270 2.91 7,000 7,278 1.710.40
M4EDIUM - -_ .100 100.000 0 0 0 0 7,000 7,000 1.645.00060 100.000 0 0 0 0 7 7.007 1.645.00030 100.000 0.52 48 0.52 1 7.000 7.050 1.656.73325 100,00 0.61 57 0.61 2 7,000 7,059 1658,794I 5 100.000 0.80 74 0.80 2 7,00U 7,076 1,662,816o 10 100.000 0.89 83 0.89 2 7o000 -7085 1.664,977
3 100,000 1.24 ..124_ 3 --7.000 7.119 1,672,908
0.3 100,000 1j* 182 1.9L S 7.000 7.187 1.688.983
0.03 100,000 2.79 260 2.79 a 70o00 7.267 1.707.825
100 100.000 0 0 0 0_ 7o000 7o000 1.645,00060 J9o 0 oo 0 o o 0 7.000 7o000 1,645,00030 100.00 0 0 o 0 0 7.000 7.000 1.645,00025 100.000 I 0 0 0 0 7.000 7.000 1.64so00016 100.000 ole 14 0.1 o 7.000 7.015 1.64849010 100.000 0.46 43 0.46 1 7.000 7,044 1.655.3593 100,000 0.89 83 0.89 2 7.000 7,085 1.864.977
0.3 100,000 1.77 164 1.77 5 7.000 - 7.169 1684,8150.03 joo0o 2.26 210 2.26 6 7000 L7216 1,695.779
f
I I
N-
Unit Rotle andNotes
-lg o
jodbow
t.b
bukv
0ri - wswwq
4110.000
ht21
52361m-3
-
a - - - . - I - a I - I
Page 1 of 3

Z Table C.4.2. Calculated Costs and Other Paramneers for Remeilatloma of Conltainiated Soil at the Reference Rare Metal Extraction Plant(Unrestricted Land Use, Without Soil Washing)
I-1b.."
4�-�0ON
00%
SOI Sol Transport Transport SoIl Sol
Total SOa SO Packaging Packagn Loads. Loads, TranSpot Transport Soll Sol Soi DlsposalResidual Dose Volume Total Soil Washing Costs, Costl. B-26 Gondola TIuck Cots. CGsts. Olapoasl Costs Disposal Costs Costs O
Rete -Removed Weight Costs Gondola Clr Boxes Cue tOede LRoa Truck @ I ONte*3a @ 160iit-'3 *3503t6t'3mramlyr m '3 MT S 0 S S Dcog. _ _Tucks _ 1 _ _ _ .__ __
HIGH100H 7,015 8s548 0 10,000 1,643,267 100 646 400,000 855,950 2.477,269 12,386,296 86.704 070
60 7,050 8,590 o 10,000 1,5650,984 100 649 400 000 859,925 .4647 12.448.235 87.137,842
30 7,07G 8,622 0 10,000 1,556,772 100 651 400,000 862.576 2,498.938 12.494.689 87,462,82125 7,081 8.023 0 10.100 1.557.737 101 652 404.000 883.900 2.500,488 12.502.431- 87,517,01715 7,089 8-638 0 10.100 1.559,666 101 6S2 404.000 863,900 2.503.583 12.517.918 87.625.410
- 10 7,094 8,604 0 10,100 1,560.631 101 653 404,000 8652225 2,so6,i32 12,525,658 87.679.6073 7,157 8,7;0 0 10,200 1,574,487 102 659 408.000 873,175 2.527.374 127636,870 ss , 45s,08t
0.3 7,191 9712_ 0 10,200 1.S82,012 102 662 408.000 877.150 2.539,462 126972 8280.8320.03 7.278 s.aes 0 10.300 1.601,2? _ 103 670 412,000 887.750 2.570.303 12,.851,516 89.960.612
MEDIUM _.___
100 7,000 8,529 0 9.900 1.540A '0 99 844 396 000 853.300 2,472,015 12,380,075 .~e2O525
60 7,000 8.529 0 ssoo 1.540.000 99 644 396,000 853.300 2.472.015 _2J360 076 86 520 525
30 7.050 85 0 10.000. lo 550,94 100 649 400.000 859,925 2,489,647 12,448.235 87,137.64225 7.059 - L8,601 -o.. 10.000 1.552.914 100 650 400.000 861,250 2.492.744 12.463 719 87-246,035
5 7076 , o 10000 1.558.7/2 100 651 400.000 862.575 2.498,938 12.494 689 87.462 821
_ _ 7,085 8,633 0 10.100 1,558,701 101 652 404 000 __0_2_03_ 12 510,173 87.571,2143 7,119 8,674 o 10,100 1,566,127 101 655s 404,000 867.875 2,513,953 12.569.767 87988,370
0.3 7.197 7 -o 10.200 .581.178 102 661 408.000 875.825 2,538,110 12.690.551 88 833 8600.03 7,267 8D55 o 10.300 1.598,815 103 669 412.000 886.425 2,560,424 12,S832.122 89.824.855
009 7000 8,529 0 9.9oo 1.540,000 99 644 396,000 853.300 2,472.015 12,360,075 86,520,s2560 7,000 ooo 99 o ssoo 1,540,000 . . 64 000,000 853,300 2.472.015 12 360,075 868520.52530 7.000 8,529 0 0 15,40.000 9s 6 _44_ 396,000 8_53,300 945 12 360 07 5_85_20_52_ 5
25 7o000 8,929 o sso 1.540.0o3 1.240..99 644 396,000 853.300 2.472.015 12,380.075 86,520,525
15 7,015 .AL,548 o . 10.O 1,543,267 100 646 400,000 855.950 2.477.259 12.306.296 8 6704,07010 7,044 8.583 _ 10,000 1.549.698 100 648 400.000 sss,600 2.487.582 12.437,911 87.0655380
37085 8 633 0 10.100 1,558,701 101 652 404,000 863.900 2.502,035 12510,173 87,571,2140.3 7.169 8.738 0 10.200 1.577,274 102 660 408,000 874,500 2,531,847 12.659.237 88,614,659
0.03 7 .216 8,793 0 10,200 1.587,538 102 664 408.000 879,800 2.548.324 12.741 618 89 191.326is *tG Q -er 62201"m Ii tenwo o .200 $4,000 W $1.32l6 puuuuk Costsl ltb CostslI n Pfossi s cecu lo
Unit Rates RACER gOWb s ca 16 ea pMI Ibaex6 wd 5bd51 IdM fod diseil 1t LARW ceom ct dspeosi 4i luti, bcmepemand Notes 61110 blado kw *slcr 4 behAuanc disposa 1ecwty. &xitbv ttW disposs facilities for
c k fleod.. ot11 1 '3: 1 dbspos failtV. ttW. 0360or'a.t ttu2 5.154 lbs Iianep., ar4* 66011t 2l t w& teomtout wayI.
.WOW _oropon wig.
Page 2 of 3
Al 11

t ; a : e
Table C.4.2. CAlculnted Costs and Other Parameters for Remediatfon of Contaminated Soil at the Reference Rare Metal Extraction Plant
(Unrestricted Land Use, Without Soil Washing)
0
^-
T'1al Sol Tota Son _flos~, Colts Totdoklw. $ 5101ft3 J tW-t3 0 135011'3 Son We"n SON EXCavt9 . Totel SON Owuational
Rlldual Dole Rate C S Ihpoeal Coats O hie. coat Lp Ct Lr labor Reidltatn b4. Dolemrevnlrr rn' _______ 9 9 man-lw man-lw m______
HIGH _ - .
10C 1.015 4,535,749 16.434.002 s90,751777 0 . 1.364 11,36u 1,13B60 7,050 4,556,380 165615.877 91.205.294 0 11.421 11.421 1.14230 *b2w 4.571,853 16.578.952 91.545,084 o 0 11,464 11.464 1,146
_ _ 25 7.081 4,578,532 16.588.014 91,602,600 0 11,471 11,471 1.14715 7.089 4,583,690 16.807.409 91.714.983 0 11,485 11,485 1.14810 7,094 4,586,269 16.618.551 91.772.500 0 __ 11,492 11,492 1,149
3 7,157 4,627,412 16.766.370 92.587.588 0 11.594 11.594 1,1590.3 7,191 4,847,528 16.846.299 93.029.870 0 11.649 11.649 1,165
0.03 7.278 4.703.009 17.050,903 94.159.998 0 11.791 11.791MEDIUM
100 .0L0 4,522,915 18.398.375 90.558.825 0 11.340 1 , 1340So -7000 4,522,915 16.398.375 90.558.825 0 -11,340 j1,1340 1,134
30 7.050 4,556.3eO 16,515,877 91.205,284 0 11.421 11.421 |_ 142
25 7 059 4,561.538 16.53 7 1 3893 0 145 AL!. 114_2e_709^4sl3R 155 ,7 l318,993 o1 1 435 1 1 ,435 1,144
15 7.078 4,57,853 16.576.952 91.545.084 0 114444 | 114B10 7.085 4,581,111 16.597.751 91.658.792 0 11.478 11.474 1,148
3 7,119 4,600,961 16.676.677 92.095.280 0 11,532 ' 11,32__1611.532- 1.53o.3 7,187 4,645,293 1e.836.535 92,979,844 0 11,643 11,643 1I164
0.03 7,267 4,698,549 17.025.186 94.017 920 0 _ 11.773 11.773 1.177
100 7,0C!0 4.522.916 16,398,375 90.558.825 0 11,340 11.340
O0 7,0 o o 4,622,915 16.398.375 90.558.825 0 _ 11340 1i,340 1.13430 7.000 --, 4,522.91S5 16.398.375 90,558,825 0 11.340 11,340
25 7,000 4,522,915 16,398.375 90.558.825 0 11,340 11.340 1134
15 7,015 4,535,749 16.434.002 90.751.777 0 11,364 11.384 1,136
1 7,044 4.552.942 _16,501.669 91,129,037 0 11,411 11.411
-3 7.085 4.681.111 16,597.751 91.658.792 0 11,478 11,478 1,148
0.3 7,189 4,634,863 15,795,826 92,751.248 0 11,614 11,814 1,1810.03 J 4.662.303 16-904.736 93,364 444 0 11.690 11119
UIt Rates and .. IIwFv Ps 2 0.1 Owtpn" m"
Notes n' J
Pode 3 of 3
z
UaA

3 Table C.4.3. Calculated Costs and Other Paraeiters for Reinedillon ot Contamtinated SoiI at the Reference Rare Metal Extraction PlantC". - (Restricted Land Use, With Soll Washing)
- -
oX
r000
CA"tamnn Site Below- Below. Total SoN Lke SonResidual DIe bed Site Soil eall Set Soil uidIng Building V aolum Excavation
Rate Atea 001h Volwne Soil O*Pth Soil Volue Ramoved Coha2 era2 cm m-3 cm m'3 m-3 S
HIGH100 100,000 * 0.00 0 0.00 0 0 060 100,000 0.00 0 0.00 0 0 030 100,000 0.00 0 0.00 0 0 025 100000 0.00 0 00 0 0 0 015 100000 000 0 0.00 0 0 0
0 100.000 0.00 0 0.00 0 0 03 100,000 0.44 41 1 "42 9-830
0.3 100,000 1.12 104 1.12 3 107 261690.03 100,000 1.94 181 1.94 5 186 43,708
MEDIUM __ _ _ __ _ __ _ _ _
100 100,000 0.00 0 0.00 0 0 0G0 100,000 C00 0 0.00 0 0 0 130 100 0 0 0.00 0 0 025 100 000 0.00 0 0.00 0 0 0is 100.000 0.00 0 -0.00 0 0 _______
1C 100.000 0.00 0 0.00 0 0 0. 100,000 0.00 0 0.00 0 0 0
0.3 100,000 0-94 .81 0.94 -_ 90 21.2450.03 100.000 1.85 172 1.88 _5 __ 177 41,047
LOW -
100 100.000 0.00 0 0.00 0 0 060 100.000 0.00 0 0.00 0 0 030 100._QO 0.00 0 0.00 0 0 025 100.000 0.00 0 0.00 0 016 100.000 0.00 0 0.00 0 0 0
10 100,000 0.00 0 0.00 0 0 03 100,000 0.00 0 0.00 0 0 0
0.3 100 000 0.05 60 0.65 2 62 14.5860.03 1.000 1.42 132 1.42 4 136 32.029
Ufint" -t cm 2i0 n 2% t of iudA $23u=3medal O elS Me l ad bkiding Gem 7000 m.3
Notes pif Ialol used We slag Pl.
belew H60.b.ddh o U.I becoma es o-Cap td
Pole
ti

Tithle C.4.3. Calculnted Costs and Other Parnmeters for Remeilmlion of Contaminated Soil at Ihe Reference Rare Metal ExtrationPlant(Restricted Land Use, With Soll Washing)
_- - -
Sol Trans- Soin
poet Loads. Transport SonlTotRl Soll Volume of Rall towds, Tranpot SOlN Transport On.Sho SonVolhme Total Soll Sonl son Washih oudoos Tnwo Off Cast. PnRll Cost*. TMk Stabfllttlon a
Rasludl Does Rat- Rsnovd Woght Washed Cost Off-Site Shto Off-Sit On-sto Cappirg CostsW3 nt'J MT m ? . , Tri ,_t
HtGH _ __.100 0 0 0 0 0 0 0 0 490,000
so o -. o o o _o o 4,0.000
30 0 0 0 0 0 0 0 490.000
25 0 0 0 0 0 -0 0 - 490.00018 0 0 0 0 0 0 0 0 49000010 0 0 0 0 0 0 0 0 490.000
. 3 42 51 42 45,849 0 0 0 56 491,171
0.3 107 130 107 64,198 0_ 0 0 143 492.9980.03 186 227 186 89.403 0 0 _ 0 249 495.208
MDIUM -
100 0 0 0 0 0 0 0 0 490,00080 0 0 0 0 0 0 0 0 490.000
-_30 0 -0 0 0 0 0 0 0 490_00025 0 0 0 0 0 0 0 490,000
25 0 0 0 0 0 0 0 0 490.00010 0 0 0 0 0 0 0 _ 490.00031 0 0 0 0 0 0 0 490000
0.3 90 110 90 59,513 0 _0 0 121 492.531- 0.03 177 216 177 83.935 0 0 0 237 494.9G2
LOW -
100 0 90 0 _ 0 0 0 . 490.000
60 *0 0 0 0 0 0 0 09000030 0 0 0 0 0 00 0 490,000
26 0 0 0 0 0 0 0 0 490.000iS 0 - 0 0 0 0 0 0 490.10 0 0 0 0 0 0 0 . 490'00010 0 Q.. * 0 0 0 0 0. 4A9_0000
0.3 e2 75 62 1542 0 0 0 83 _491 380.03 136 l 136 _ 72.422 0 0 0 182 493.810
Unit Rates and - 70 1bftS O3 odt t0W h4 fusM AACER Not ad for Isttd 0 4.00055 Rom Wie 2 tSitl6 hedl alsit siteh d Mel new M1451 Asi Moto ie sl ,sdde . ISee 120 rd31 JlO e .IP cats gt
Notes t wh*ad Faclty Faclty Not used for tncka* aissita tAkoe pipe
NeW nat AM Rot. MmttM 100.6e011. 11 m dee e7.000 M' Facdity DAs casts $10W2
$11 Pko $2S514. Tiuci PlACra Madan)
it_ -b - - _ _ per day.
ON9oo0

Taboe CA3. Calculated Costs and Other Parameters for Rediadatlon of Contamlnated Soil at the Reerence Rare Metal Extraction Pluntd(Restricted Land Use, With Soil Washing)
0%
0
- - -
TotaI On S e Sam S" Sol D sposal To l 5.1 Soi E 'vstioan Tot 5a1 TotaDisposal DispoSal Costs D&IMSpoI Costs Costs Q Rmudlabtn Sol Wauln StAation Romaedslon Occupatioal
Residual Date Rate voin_ @ 101#113 @ S601t'3 M3GM1 3 Costs Loabr Labor Lobor Dossuu mvir m*'3 . , . , 6 Peaan-( p nsonlw p10n-tw person-m n m
HIGH100 7,000 0 0 0 490,000 0 229 229 2360 7,000 0 0 0 490,000 0 229 229 233 0 7000 O O 0 490.000 0 229 229 2325 0 70000 O O 490,000 0 229 229 2315 7 000 0 0 0 490,000 0 229 229--- 231C 7 000 0 0 0 490,000 0 229 229 233 7.017 0 0 0 °48.900 7 299 306 31
0.3 7,043 0 0 0 582,497 18 407 425 430.03 7.074 0 0 0 626.567 32 539 570 57
MDIUMIM£ M 7,000 0 0 0 490,000 0 229 229 23
660 7,000 o 0 0 490,000 0 229 229 237 C0-0 0 0 490,000 0 229 229 23
25 7. Q0 0 0 490,000 0 229 229 2315 7_ 0 0 0 490,000 0 229 229 2310 7b000 O 0 0 490,000 0 229 229 230.3 ___00 Go 0 0 0 490.000 1 229 229 23
0..3 __7O3O 0 0 .0 573.410 is _ __ 379 395 ____ ___
0.03 7.071 0 0 0 620,782 30 524 554 55_|
LOW :- -10C 7,0 O_ 0 490,000 0 229 _ 229_ 23
G0 7,000 0 0 0 490.000 0 229 229 23
30 7.000 0 0 0 490,000 0 229 229 2326 7,000 A 0 0 0 490,000 0 229 229 23I0 70000 O O O 490,000 0 _ 229 229 23
0 0 0 4907000 0 229 229 23 7000 0 0 490.000 0 229 229 23
0.3 7,025 0 0 0 557,949 11 332 343 340.03 7,065 0 0 0 698,449 23 4568 479 48
_ew mu"^zt-fi;1;i sz 1iW"wh 0.17rn PO"O 1.42>S7=4bh 0. ma Per;;{;Unit Raw 1nd Aam Aw l 10* 41 o essW m_ 1 1ww 0.3TI t ".Notes gat. swuM la0 diaeo 5ILA5IW 55jo LLW IOWa bi45U#Mw I Z * UW Eus Men v 1 n O.S
seoti lwh *om *.L4.used dps*alhd6iM. leuwI UK 10 Vd'31 taa e p. i 1. V"e Mets 4WOAVS. e 660 . lbt Oans"" IS on-Wm
in mamli 640 e d Pauk sr Eathia* 01-ttal mod I aRu b-alaI 0.5 aend" I'tla"s - UauA "taS s "M bucki led lg aow.
- -- V-sasC I tUF"" t3-~"X1"

II aA
Table _C.4.4. Calculated Costs and Other Parameters for Remedlaton of Contaminated Soll at the Reference Rare Metal Extraction Plant(Restricted Land Use, Without Soil Washing)
.
- - - - - -
CotmInt Slhe Below. Belw. Totl Sodl tSh. Seit4 Sit. SoN Site SON tIldIrm BIldIng Vlmeh Excavatbo
RetWal DoMe Rat Soil Ameu Depth Vohnue Soll Depth S Volue R.modme Coatstwofi It 2 am m'3 am m-3 m'3 S
HIGH100 100,000 0.00 0 0.00 0 0 0s0 100.000 0.00 0 0.0 0 030 100.000 0.00 0 0.00 0 0 025 100t000 0.00 0 0.00 0 0 015 100.000 0.00 0 0.00 0 0 010 100.000 0.00 0 0.00 0 0 03 100.000 0.44- 41 0.44 1 42 9,830
0.3 100.000 1.12 104 1.12 3 1070.03 1.94 I 181 1.94 5 18 43708
MED1UM - _ __ ___
10 100,000 0.00 0 0 .00 C ' 06010000 0.00 0 0.00 0 0. 030 100.000 0.00 0 0.00 0 0 025 100.000 0.00 0 0.00 0 0 025 100.000 0.00 0 0.00 0 0 010 100.000 0.00 0 0.00 0 . 0
3 100.000 0.00 0 0.00 0 0 0-0.3 100,000 0.94 88 0.94- 3 90 21.245
0.03 100,000 1.85 - 172 1.85- 5 177 41.,47
i100 100.000 0.00 0 0.00 0 0 0s0 100.000 0.00 0 0.00 0 030 100,000 0.00 0 0.00 0 0 025 100.000 0.00 0 10.00 0 0 01I s 0,000 0.00 0 0.00 .9 010 100'000 0.00 0 - 0.00 0 03 100.000 0.00 O 0.00 0 0 0
0.3 100.000 0.65 60 0.65 2 62 14.5060.03 100,000 1.42 132 1.42 4 136 32.029
Unit notes and Diffugion Diftwow 2% t OfbEi" * $236jh'3Note. mOM mad4adl bV NtlOW 7000 m-3Notes . p pllomted w " slag Pk
A .be 1150.000 WWI
.p .
Pug. t of 3
I0%'C

zC4
9
Tnbllc C.4.4. Calculated Costs and Other Parameters for Remediltion of Contaminated Soll at the Reference Rare Metal Extraction Plant(Restricted Land Use, Without Soil Washing)
Sai Tran.- Soilponi Loads, Transpot Soi
Total Soil SON Ra Loads, Transponr Soil 1aaon on-Sit. SoilVoluma Total Soi Washbin Gondolas Trnck Off Cost., Ral Cost. Tnrk StabWigtl^on &
Rasidiasl Do. Rat* Removed Wolpht Cost Off-Slt Sit Off-Site On-Site Capplng Costs. nyr m'3 MrT .$n M#$ uc Tnk S
HIG. ___ _ _ -- _ _ _
100 0 0 0 0 0 0 0 490,00060 0 0 0 0 0 0 0 490 0003_ 0 0 0 0 0 0 0 480.000
25 0 0 0 0 O 0 _ 490.000is 0 0 0 0 0 0 0 490,00010 0 0 0 0 0 0 0 490.000
3. 42 61 0 0 0 0 140 492'9280.3 107 130 0 0 0 0 358 497,494
0.03 198 227 0 0 0 0 622 S03,019MEDIUM _ _
100 0 0 0 0 O ° 0 490.00060 0 0 0 0 0 0 0 490,00030 0 0 0 0 0 0 0 490,00025 0 0 0 0 -0 0 0 490.00015 0 0 0 0 O O 0 49000010 O 0 0 0 O _ 0 490,000
3 0 0 0 0 0 0 0 490,0000.3 90 110 0 0 0 0 302 496.328
0.03 177 210 0 0 0 0 593 602.405LOW
-
100 0 0 0 0 0 0 0 490,00080 0 0 0 0 0 0 0 490,00030 0 0 0 0 0 0 0 490,00025 0 0 0 0 0 0 _ 0 490.00035 0 0 0 0 0 0 0 490,000IQ 0 0 0 0 0 0 0 0 490.0003 0 0 0 0 0 0 0 490,000
0.3 62 76 0 0 0 208 494,3450.03 138 168 0 0. 0 0 466 499.540
Uit RateW Nd If 70 T. l h uA t u No uat 1.. to' t 4.O0 PM tA INe 26-ton Stsabi 8.NM" ousut . ais Rte Metals ondal a dlak . 120 Vd31 da ca i uls.w c a .
Notes FcMV 'Aisv lit uwd to bwks 0 makea staiigaRue Metal. 4650AM Gtivw pile 1.6 in
F1`6 v G.6. $236I. 41*0760&uht 220 MwauZ2
d'3 w dat. .*I1ACIR M 4q
Page 2 of 3
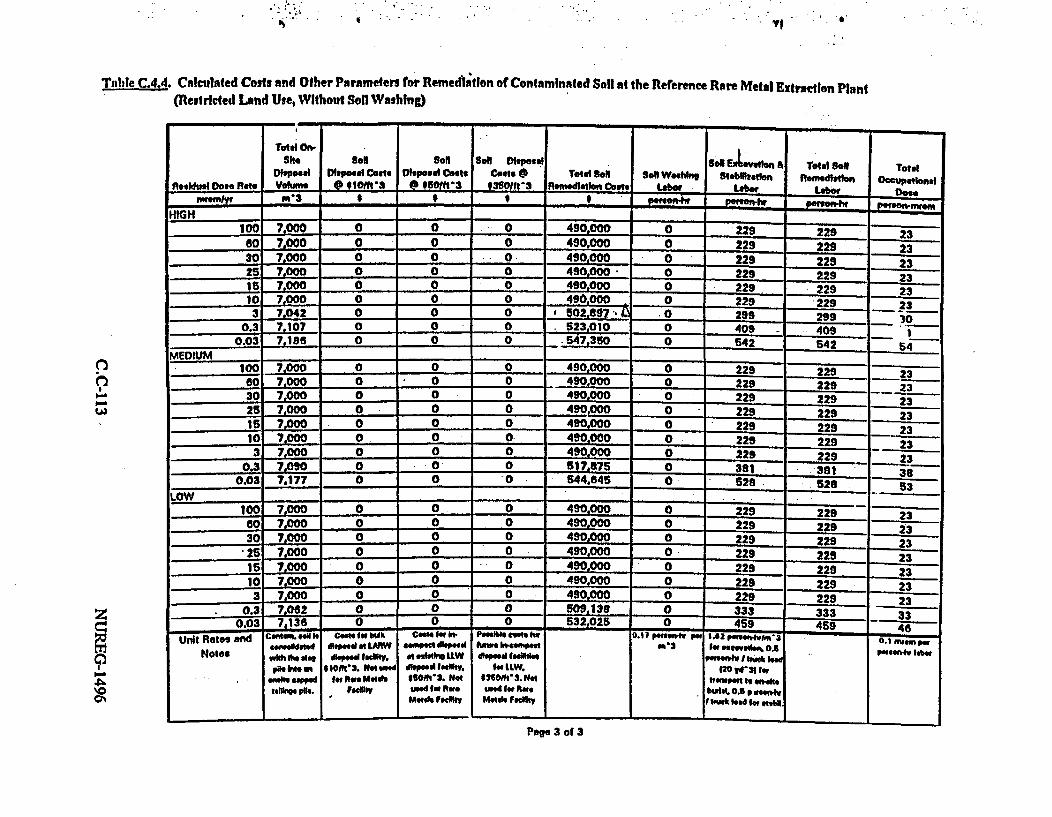
*. I. I S 7. .
Tpble C.4.4. Calculated Costs and Other Parameters for Remed);tlon of Contaminated Solt at the Reference Rare Metal Extraction Plant(Restricted Land Use, Without Soil Washing)
w
son son Dsosa So _5 ylvoIn - ' Total Soil TotalDisposal Ditposal Costa 01sposal cDo costs Q Totd Sol Soi Wood" Stabhttaon Ramwdltlo Mcalonl
R.,esdua Dole nat Volume @ I9O1t3 @ 0560193 -3So/t-3 Rfmd*ton Costs Labor Labor Labor DoenwmIvy _ __3 _ t t_ p__n_ _ potso-w p~tr pCrgo!w°
HIGH 0 0_S0022 __100 7.000 0 0 0 490,000 0 229 229
60 7.000 0 0 0 490.000 0 229 229 2330 7.000 0 0 0 -40000 229 229 225 7.000 0 I 0 0 490.000 0 229 229 2315 7,000 0 229 229310 7,000 0 0 0 490.000 0 229 229 233 7,042 0 Q 0 1 -s02.07 - 0 299 299 70 30
0.3 7,107 0 0 . 523,010 0 409 _ 4090.03 7.186 0 0 0 .547,30 0 542 542 54
MEDIUM100 7,000 0 0 0 490,000 0 229 229 23
60 7,000 0 0 0 490,000 0 229 229 2330 7,000 0 0 0 490,000 0 229 229 23-25 7.000 0 0 0 490.0-0 0 229 229 2315 7.000 0 0 0 490,000 0 229 - 229 _ 3
0, 00 0 0 -0 S4iS - 589 28 . 5010 7,00 0 0 . 0 490,00 0 229 229 ___23
3 7000 0 0 0 490.000 0 229 229 230.3 7.090 0 0 0 5174875 0 381 -381 380.03 7.177 00044450 528 528 53
100 7.000 0 0 0 490,000 0 229 2 2360 7,000 0 0 0 490,000 0 229 229 -_23-
_____30 7.000 0 0 0 490.000 0 229 23~2_____~700 0 0 0 490.000 0 229 22923
15 7.000 0 0 0 490.000 0 229 * 229 23_____10 7.000 0 0 0 490.000 0 229 229 -
3 7 000 0 0 0 490.000 0 229 229 20.3 7.082 0 0009160333 333 33
0.03 7.13_ 0 0 ±. 532.025 0 453 459 4_-_33-U Raisn Cenlti. I* CeakS 9W blaw CWl 9w k p. oiblo ie w .11 pO 0 In.2 pw.e.... _ . I Z.1 46U~ ae W toye ii~ tLAMW SOMMV*C 01OPellkd IFOiCO *0 m, got onewotm% 0.6 -peug e
Notes atlo .. I.naw sol". s L dsd . w I sPh htan I IOft'3. Netusad dIIpo6d1S. tlW. 120 ydSs for
WWI 41".ed IN Rom Metals 0O5f'3. Nat *SSOZ'3. NH Is ettalem 90e. P"tUSY mod 1w Ato wood for 9t1e 0.6I 0.t ,
Msds ftdlt Msole Fcut . tpk food fw oto"
Page 3 of 3
aNoof

zZ Table C.4.5. Calculated Costs and Other Parameters for Rewe4lallon of Conaminated Soll at the Reference Rare Metals Eziractlon PlantR (UnrestrIctedl Laud Use, With Saol Wadsn. MlxiznLandflUilag)
.J
If
2P-&
.i4
Coftamiu- Below. Below- Towl W site Solet Ste Site Sl Site SW suildiSo So Buadin 51 slog Pio Volme Excavation
.ResidJua Doe Rate _SullAL Deah Volume -Depth _ VoLyj_ Volumel Removed Costs"Wntr s W2 cm m-3 cm m *3 m-3 m-3
HIGH -
10C 100,000 11.76 1,093 0.1 0 7,000 .8,093 1.901,86960 100,000 16.08 1.494 0.52 1 7,000 8.496 1.998,43830 100,000 21.96 2,039 0.80 2 7,000 9.041 2.124,62826 100.000 23.49 2.182 0.84 2 7.000 9,184 2,158.32916 100,000 27.81 2.583 0.93 3 7,0_ 9.586 2,262.72810 100,000 31.24 2.902 0.98 3 7,000 9.906 2.327.6393 100,000 41.4? 3.848 1.64 5 7.000 10.863 2.660.419
0.3 100.000 60.90 6,B68 2.00 6 7,000 12.683 2.976,8930.03 100,000 80.1 7.467 2.91 8 7,000 14.476 3,401,731
MEDIUM _
1 100,000 5.9C 548 0 0 7,000 7,548 1,773,74760 100,000 10.2' 949 0 0 7,000 7.949 1.88.08030 100.000 .I8.0 1494 0.62 1 7,000 8,496 1,986,43825 100,000 17.62 1.037 0.61 2 _ 0.639 2.030.16916 100,000 21.96 2,039 0.80 2 7,000 9.041 2124,62810 100,000 25.38 2,3t7 0.89 2 7.000 9.360 2,199,6693 100,000 36.66 3.304 1.24 3 7,000 10.307 2.422.149
0.3 100,000 55.04 6.113 1.96 6 7,000 12.119 2,847,8670.03 100,000 74.52 6,923 2.79 8- 79,000 13.930 273,646
LOW . -_.-1 0C 0 0 0 0 7.000 7.000 1,646,00060 100.000 0.03 3 0 0 7,000 7.003 1,B46,73730 100,000 5.90 648 0 0 7.000 7,648 1.773.74726 100,000 7.44 691 0 0 7.000 7,691 1.807,41816 100,000 11.76 1.093 0.16 0 7,000 8.093 1.901,86910 100.000 16.19 1,411 0.46 1 7.000 8.413 1.976.9403 100.000 26.38 2.367 0.89 2 7,000 9.360 2,199,69
0.3 100,000 44.05 4.167 1.77 5 7,000 11,172 2,626,387003 100,000 64.33 S,97B 2.26 6 7000 12.983 .3,060.946
Uni Rates Nd .. fu .ioe 2% o Idm3n3
Notes 0es 00vle mwedl "I amwo
lwle 11h21
Page do 3

.* :
Table C.4.5. Calculated Costs and Other Paramefers tor Remedlatlon of Contaminated Sol at the Reference Rare Metals Extractlon Plant
(Unrestricted Land Use, With Soil Washing, MkxingLrandtltIng)
ISONl SoilSoNl Sol Tramport Tieapon Sol Soi
Totld SoN Volum el Pocirl Palghg tLod. Loods, 'ls.pTont Tatpot Sol SOl Soin Diopelesidwul Voume Total So Soil SON Wo" Cos, Costs. 6.25 Gonddol Twit Costs. Costs. Dthpo Costs Dsposel Costs Costs e
Notl.- Remve Wdt _We_ Coe__ CGn dl Rail Box"d R @N *0 3 @01o"t-3
HIGHv~ n 3 -MT a 3 0 _ Co 0 T n * - 4 .
19 .8o53 1 10 1,093 341,52 1_ t.,e636.186 106 684 424,000 908.300 2.626,412 3.132.061 91.924.430
60 8.495 10.352 1.495 464.767 10.800 1.671.602 108 699 432,000 926.175 2,s83.2e4 13.416.31a 93.914.224
30 9.041 11,016 2,041 609.215 11,100 1.719.605 III 719 444,000 952,675 2,7eo,31s 13,801.592 96.61 ,141.
25 9 184 _11.191 2,_14 e48.566 11.200 *1.732.225 112 725 448.000 960.825 2.780,576 21±!2,e~o 97.320.158
15 9.sse 11,681 2.861 761 565 11.400- 1.767.575 114 739 466.000 979.175 2,837.319 14.186.595 s, 164
Slow5 12_059 2,905 851.227 11.600 1.795.627 le 751 464.000 995.075 2,8n2,348 14.411,739 100,8B2 174
3 10.853 13,224 3.053 1, 117.93 12,100 1.879.0Sl 121 780 484.000 1.041,460 3,016t200 15.080.302 1-oss9.1is
.3 12 ee3 15,430 ,6683 1.627.211 13.100 2,038,377 131 853 524,000 1.130.225 3.272.012 16.360.060_ 114520.415
0.03 141475 17.38 7,47s 1.720.027 14,200 2.197.840 142 919 568o000 1.217.675 3,527,982 17.639.911 123.479.377
..... C.L. 7.548 9,197 e48 189,198 10.200 1,688.212 102 e64 408,000 879,800 2,549,405 t2,747, 23 89,22. 1864
a9 7,949 9.6a j4 301,125 10.600 1.623,539 105 879 420.000 899 675 2.606.112 13,030.658 91.213.907
30 8.495 10.352 1,495 44.7167 10,800 2Ai62 108 699 432.000 926,175 2,es3,264 13 1893.914.224
251 8539 10,527 1,839 495.144 10.900 1.694,233 1 769 2.703.539 13.517.L96 94.623.873
15 9.041 11,016 2,041 608.216 11,100 1.719.eo5 111 719 444,000 952,675 27B0.318 13,801592 9 ll41
10 9.360 11,405 2,360 097,922 11,300 1.747.668 113 731 452.000 9s88,575 2,805,365 4,82e s8.187783
10,307 12.559 3,307 964,359 11.800 1,831,017 118 786 472,000 1.014.950 2.939.158 14_e.6 188 102.870514
0.3 12.119 14.766 5,119 1,473,947 12.800 1.O9,432 128 833 512,000 1.103,725 3.195.00o 5 897258249 1! s2e.7430.03 13.930 16,974 6.930 1.983,632 13,900 2.149.876 139 899 566,000 1,191,175 3.450.990 17 _54,__ 784_;7 67
LOW-. 7,000 8,529 0 o 9,M 8,90 lUoo 99 644 395,000 853,300 2.472;015 23 0 8620.52s
6 7,0 03 8,533 3 * 34.965 9.900 1.540.276 99 644 396.000 853.300 2,472,4se 1243528291 se.5_6.0
30 7,548 9.197 548 188,198 10,200 1.588.212 102 664 408.000 879.800 2.549.405 23 89.229.164
25 7 91 9.372 - 91 228.603 10.300 1,600,820 103 670 412.000 887.750 2.569.644 12,848.221 89,937.549-
15 I 9,861 , 341.552 10,600 1,638.185 108 684 424,000 906,300 2.626,412 13,132.061 91,924,4301z 0 10,251 1.413 431.427 10,700 1,684,301 107 696 428.000 922.200 2,671,543 13.357.717 93,504,019
9.3eo 11.405 2 300 697,922 11,300 1.747.66S 113 731 462,000 988.575 2.805.36 14.o2s26 98,187.783__!_3_o__2_80
3_ 1402__82 9810771431
0.3 11,172 13.813 4.172 1,207.842 12.300 1.907.124 123 798 492.000 1.057,350 3.061.323 15.300.617 1 4631
0.03 12.983 15.819 5.983 1 717.052 13.300 2.066,482 133 864 532.000 1.144.800 3.317.126 16.685.631 116.099.415- 1UtWiit Rt3 e o ro , Min.aF P CSt oopar *3201m3 9bi Wmof 1.2S0 $4.opw 11.321e p l ulk Costslor Clstu f In. P-osalcoiin
Unit Rte #a, eadl a I.iWP~~ i' O tOWs et LARWEcmadbsa tueuibl lcosts fo
.p and Notes contamm. se plastic In" fecr 4 be u dtoos0l9 firgty, I eiting *LW ftlapo t acatblos Io
Is W*at". and eoer kIt d., or* ;31: ad tkwspal IlwAly. tLW. 135WOtl 3
"A ntM tte 2t.1U4 Ms traospion only *5Ofl 1: "S.truck Sck transport only.?.ooo m3 IJold __ l _ __ __ a ns t
Paoe 2 of 3

Table C4.5. Calculated Costs and Other Parameters for Remedlalin of Conlamilnated Soll at mte Reference iare Metals Extract Plant
9 (Unrestricted Land Use, With Soll WashIng, MlxIng/L~andffllng)
0.LP.�D0�
0\
Total Sol Totel Soil _ =_i _liL. C TotalVolmwn 01 01oa3 0 16011ti 3 43501At3 Sal Excavation Total Soil Occupaional
Residual Dosg RFte Di osed Disnoi Cost Osal Costs OlDosal Costs Soil Washinm Laboa Labor R madation Labor Dos
m 3 . _ _ _ 'mnhr ,_mn4w rsnh h mpernn-nemHIGH ____
10C 7.437 60304,423 17,917,958 90,710,327 196 13.111 13,296 1.330
60 7,598 6,577,268 18.465,300 98.963,208 254 13,763 14.017 _ 1.402
30 7,816 6,948,261 19,206,715 102,016,264 347 14.648 14,993 1.499
251 7.874 6.0480661 19,402.615 102.819.894 371 14,879 16,260 1.526
151 8.034 6,319,002 19,947,628 105,087,197 440 15.529 15.969 1.597
10 8.162 ,6538,813 20,381.306 106.851,741 494 16,046 16.640 _ 1.654
3 8,541 7.180,682 21,670,124 112,157.937 055 17.682 18,237 1.824
0.3 9,265 8.412.216 24,131,76B 122.292.124 963 20,615 21,477 2.148
0.03 9.990 9,231.940 26,177.184 132,016,650 1.271 23.450 24,721 2,472
MEDIUM____1 7.219 4,929,560 17,176,980 93,659,120 93 12,228 12.321 I1. 32
60 7,380 5,206,823 17,. !2,983 95,908.331 161 12.878 13,039 1,304
30 7,S98 65677,268 18,465,300 98.963.208 254 13.763 14,01. _ 1.402
_ 7,666 6.676.752 18,661.367 99,767,644 279 13,996 14,274 1.427
15 7,816 S,948,261 19,206,716 102,016.264 347 14,646 14.993 1,4_9
10 7,944 B,16d,166 19,040,501 103.801.518 _ 401 15.163 16,564 1,556
3 8,323 6,809,465 20,928,2B3 109,102,989 562 16.697 17,260 I,7260.3 9,047 8,041,064 23,391,210 119,242.704 870 19.632 20,02 26050
0.03 9.772 9,278,168 26,863,281 129,382,996 1.178 22.567 23,745 2,375
LOW .__ _I
10C 7,000 4,522.915 16,398,375 905658,826 0 11.340 11,340 1,134
6 7,001 4,669,060 16,436,669 90610,314 1 11,345 11,346 1,135
30 7,219 4.929.550 17.176,980 93,065,120 93 _ 12.228 12,321 1,232
25 7,278 6.027.860 17,372,713 94.462,041 117 12.460 12,577 1,258
1 7437 6,304,423 17,917,958 96,710.327 186 13.111 13,296 1.330
7,565 56518,610 8 352 585_ 981498.887 240 13,628 13,868 11387
7.944 6,168.166 19.640.561 103,801,518 401 16.163 16.364 1.856
0.3 8 7.398,662 22,104,119 113.943.820 709 18,098 18,808 1.881
0.03 9.393 8.630?424 24,564,911 124,078.695 1.017 21.032 22,049 2.205
Urdt Rates and Ui .Ois.4 0.1 7 Inn k per 1' Ien pu VWLIM Rates a tiotal sat ,o.a.3M' aNotes w 60% ol
washe el:
is relea sed _ _ _ _ _ _ _ _ _ _ _ _ _ _ _ _ _ _
I il
Page 3 of 3

; m n
S., :|: I a-0t
Table C.4.6. Calculated Costs and Other Parameters for Remedfintlon of Contaminated Sell at the Reference Rare Metals Extraction Plant(Unrestrictd Land Use, Without Sol] Washing, Mlxing/Landftlilng)
'-A
-4
Conte"nl She Below- Below- Totel S1i Sit s*aRneidual Doe* uted Shi Soil Sihe SONl Building B on 8oi6 No Volta. Excvt,
Rt , Sell Are Depth Volhme SOi Depth VoluM .Vkyme Removwd Costsfm"t 2 cm '3 con m'3 W3 ma'3
HIGH I
100 100.0o 11.7J 1,093 0.16 0 _ 7.000 8,093 ,90ss85960 100,000 18.08 1,494 0.52 1 7,000 8 495 1.998.43830 100o000 21.95 2.039 0.80 2 7,000 9.041 2.124.62825 100.000 23.49 2.182 0.84 2 7.000 9.184 2.15,.32915 100,000 27.81 2.583 0.93 3 7.000 9.586 2.252.72810 10.000 31.24 2,902 0.98 3 7.000 9,905 2.327.6393 100.000 41.42 3 848 1.64 5 7 oo - 853 2,550 41
0.3 100.000 60.90 5se5 2.00 6 7,000 12 663 2,975.8930.03 100.000 80.38 7 467 2.91 a 7.000 14.475 340731
MEDIUM -0
1 C 000 0 S.90 48 o o 7,000 7,548 1.773,74760 100.000 10.22 949 0 0 7.000 7,949 1.808.08630 100.000 16.08 1,494 0.52 1 _ 7,000 8,49s 1.996.43825 100.000 17.62 1.637 0.01 2 7,000 8,839 2.030.16915 100,000 21.95 2,039 0.80 2 7.000 9.041 2.124.62a
10 100,000 25.38 2.357 0.89 2 7,000 9s360 2199,5693 100l000 35.56 3.304 1.24 3 7,000 10,307 2,422149
0.3 100.000 55.04 5.113 1.96 5 7.000 12,119 2.8s70.03 100.000 74.52 6.923 2.79 . a 7.000 13,930 3,273.a46
LOW_ _
1o0 202o22o 0 0 0 0 7o000 7.000 1,645,00080 100,000 0.03 3 o0 0 7,000 7.003 1 .645.73730 100,000s 5.90 548 0 0 7.000 7,548 1.773.74725 10oo0oo 7.44 891 0 o._ 7.000 7.691 1!807,418
15 100.000 11.76 1.093 0.16 0 7.000 8,093 1,901.85910 lOOO00 15.1 1,411 0.46 1 7 000 8.413 1,97ss940
3 loOOOO 25.38 2.357 0.89 . 2 7.000 9.360 2.199.589
0.3 °100000 44.85 4.167 1.77 5 7.000 11.172 262623870.03 100,000 64.33 5,978 2.26 6 7000 12.983 3.050.948-
Unit Rates and M4yCeI D111uslen' 2%el.i n238got IOnbS M" VA 140ae
Notes 9 two 1oobelow thf
Page 1 of 3
ED
TO-aI
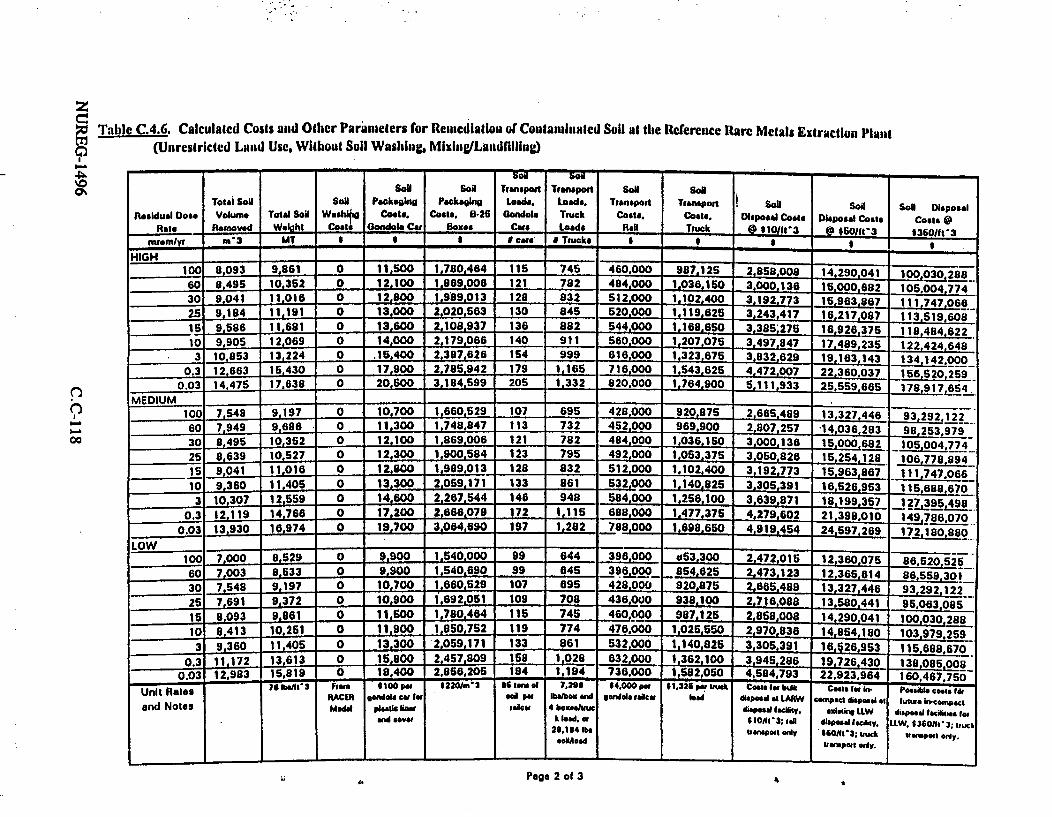
z
Table C.4.6. Calcuaited Coils ai d Other Parameters for Reineiation of Coutanaled Soil at the Reference Rare Metals Extraction PlantI? (Unrestricted Laud Use, Without Soil Washing, MixingILandflhling)
0%
9
00
sa sot
So" Soil Transport Transport Soil SolTotai Soal Soll Packaugin Packaging Loads. Loads. Transport Transport So9 soad Sol Disposal
Residual Dose Volume Total SoiI Whs Coits. Costs. B-26 Gondol Truck Costs. Costs. Disposal Caste Disposal Costs Costs @Rats Removed Welaht Coats Gondola Car Boxes Cats Loads Rai Tiuck @ 101Oit3 @ 160/1it3 1360/it'3
irn/r m3 MT II I Ic_ n * Tnucke 4 _
HIGH I100 8,093 9,861 0 11,500 1,780,464 115 745 460.000 987,125 2,858,00S 14,290,041 100.030.288
60 8,495 10,352 0 12,100 1,969,006 121 782 484,000 1,036,150 3,000,136 15,000.682 105.004.774
30 9,041 11.016 0 12.800 1.989,013 128 832 512.000 1.102,400 3.192.773 15,963,867 111.747,066
25 9,184 11,191 0 13,000 2.020,563 130 845 520,000 1,119.625 3,243.417 16,217,087 113,519,608
15 9,586 11.681 0 13,600 2.108.937 136 882 544.000 1,168.650 3.385,275 16.926.375 118,484.622
0 9,905 12.069 0 14,000 2,179,066 140 911 560,000 1.207,07S 3,497,847 17,489,235 122,424,648-
3 10,853 .13,224 0 .15,400 2.387,626 154 999 616,000 1.323,675 3,832,629 19.163 143 134,142,000
0.3 12.663 15,430 0 17,900 2.785.942 179 1,165 716,000 1.543,625 4,472.007 22,360.037 156,520,259
0.03 14.475 iL63 0 20,600 3,184,sg9 205 1,332 820,000 1.764,900 5.111.933 25.559.665 178 54
MEDIUM
100 7,548 9,197 0 10.700 1,660,S29 107 695 428,000 9.2i0,875Q 2,665,489 13,327.446 _93,292 122
60 7,949 9,688 0 11,300 1,748,847 113 732 452,000 969,900 2,807,257 14,036,283 98,253 79
30 8.495 10,352 0 12,100 1,869.006 121 782 484,000 1,036,150 3,000,136 15.000,682 105.004.774
25 8639 1027 0 12,300 1,900,584 123 795 492,000 1.053.375 3.050,826 15 254 128 106.778.89-4
15 9.041 11,016 0 12,800 1,989,013 128 832 512,000 1.102,400 3,192.773 15.963;867 111.747.066
1 9.360 11,405 13,300 2.059.171 133 861 532,000 1,140,825 3.305.391 16,S26,953 115.6S88.670
3 10,307 12,559 0 14,600 2,267,544 146 948 584,000 1,256,100 .639,871 18199357 127,395,498
0.3 12,119 14,766 0 17,200 2,68,079 172 1,115 | 1,477,375 4.2702 2 3 1 4786070
0.03 13,930 16,974 0 19,700 3.054.690 197 1,282 788.000 1.698.650 4.919.454 24,597 269 172,1980880
LOW 7 000 8,529 0 9.900 1,540,000 99 644 396,000 u53,300 2,472,015 12.360.075 8B,520,52
60 7.003 8,533 0 9,0 1.540.690 99 645 396,Q00 854,625 2,473,123 12,365,B14 86,559 30!
30 7,548 9,197 ° 10,700 1,660,529 107 695 428.000 920,875 2,665.489 13,37,44 93,292,122
25 7.691 9,372 0 10,900 1,692,051 109 708 436.000 938,100 2.716,088 13.580.441 95,063,085
15 8.093 9861 1S0 1.780,464 11S 745 460,000 907128 2 ,858,008 10 0,0300288
10 413 10.251 0 11,900 1,850,7S2 119 774 476,000 1.025.550 2,970.83B 14.854.180 103.979.259
3 9,360 11,405 0 13,300 2.059.171 133 861 532,000 1,140,825 3,305,391 6526953 115 688.670
0.3 11,172 13,613 0 15,800 2.457.809 158 1,028 632,000 1.362.100 3,945,286 19.726.430 138,085.008
0.03 12.983 15.819 0 18.400 2,856.205 184 1.194 736.000 1,582.050 4,84,793 22.923.964 160.467.750
Usats5./t . ma 7d 00 *' $F r 66 t22wo 2 * of 7.s t 0 72 4.00 Peur $1.326 5p- truck Costslotbi* Coastsgot IW peu scs., -suUnIt RReAs ACER geda car tor eil per Ib ox nd 5oW015 riWCA load disposel at LAt W cmP"act ispesot at lutue lCompact
and Notes Model pjiatic &M a 4il 4 bw x zhlc dis *e ld t Vi. exldine ttW disposal t diligs lo;
N W 'ever t lead. ot $t1001'3; tall dstrspel "A tyr LLW, $360ft*3, truck
29,1S4 1b5 trorepout *r.w 0650t1 ; truck trarMpe ordy.
so*itd trp srdy.
.a P a g 2_fIi Paoo 2 of 3

a, 5 ~ *
Tnile C.4.6. Calcuoatcd Costs and Other Parameters for Remeditalon of Contaminated Soil at the Reference Rare Metals Extracilon Plant(Unrestricted Lnnd Use, Without Soll Washing, Mixing/Landfilhing)
'.0
Total Soll Total SOel lmefdlfl, Caltl TotalVolhme @ $1011t3 *50/1t-3 6350/-t3 Sol Waht Soll Eaetton Total Sotl Occuuptonal
Residua Dtoe Rate Ol!!!46d 0isposal Costs sOsalMw Cost* Dl psA Coots Iabor Labor _ sdlstln Labo Dosemre ___-3 , _ _ t man-tw man-hr menohr Ir s
HG 8,093 5.231.367 18959.489 104.699.736 0 13,111 1-_i3l I.3I00 8.495 5.492.674 19.902.275 109,906,367 0 13.763 13 763 1 376
30 9.041 5,842201 21,179,908 118.963.107 0 14347 314.646 1.46525 9.184 5,934.746 21.515.604 118.818.125 0 - 14,879 14.879 1 4815 9.586 6,195,603 22.456.889 124.014.936 0 1,- 5.529 15.529 165310 9.905 8,399,486 23.203.016 128.138.428 0 16.046 16.046 1.6053 10,853 7,014,448 -25.424.863 140.403.720 0 17,582 _ 17.582 1,758
0.3 12.663 8,181,800 29,665,497 163.825,719 0 20,515 20.515 2,0510.03 14.475 9,354.164 33.910.895 187.268.884 0 23,450 23.450 2.345
MEDIUM100 7.549 4.877.936 17.682.597 97.647.273 0 12,228 12.228 1.22360 7949 5.138.643 18.823.115 102.840,812 0 12.878 12.878 1,28830 a,495 5,492,674 19.902.275 109.906.367 0 13.763 _ 13763 1.37825 8.639 5.585.294 20.238.255 111.7j3.022 0 13,995 13,995 1.40016 9,041 5,842,201 21.179.908 1 6963107 0 14,646 1446,410 9.360 6,050,260 21,926,518 L21.098.235 0 15.163 15,1633 10 307 .,ee0,620 24.145.149 133.341.291 0 16,697 16.697 _
0.3 12,119 7.832,859 28,389e321 1567,7,381 0 19,632 19.632 1.9630.0o 13.930 9.000.799 32,34,254 180.217.865 O 22.567 22,567 2,257
LO O 7.000 4,522.915 16.398.375 90,558,825 0 11,340 11,340 1,1341-134- 11.II340 1.13460 7.003 . 4.524.760 16.406.667 9O.600.354 0 11,345 11,345 1 13530 7.548 4,877,936 17,682,597 97.647.273 0 12.2228 122325 7.691 ,4970.406 18.018.010 99.500,655 0 12,460 12.460228 1215 8,093 5.231.367 18,959,489 104 699.736 0 13.111 3I111 1,31110 8,413 5.435.676 19.707.422 108:832.502 0 132 628 1.363_ 9,360 6,050,260 21,920,518 121,088,235 0 15.163 15,163 1,616
0.3 11.172 7,218,473 26.171,725 144,530.303 0 18,098 18,098 18100.03 12.983 8,390.139 30.413,165 167.956.950 0 21,032 21.032 2.103
urit Rates and . o.t menht Poe 1.62 MnW per _ I _Notes tv l ""
Page 3 of 3
I~

zg Table C.4.7. Calculalcd Cosls and Outer Parameters fort Remedialloa of Contaminated Soil at thte Reference Rare Metal EIxtraction Plant
(Restricted Land Use, With Soil Washing, Mhing/Landilling)
I!0~0
90
Contsmin- site Below. Below. Total So LSReakiual Dose ed Site So i SWtts 9 S Bm Buwd Buidhig Velm Excoavaon
Rate Au.. Depth Volume SoU Deeth Sotl Volune Removed Costsism/yr ft2 to M'3 am m'3 M'3
HIGH __ _
100 100 000 0.00 0 0.00 0 0 060 10,0 0.00 0 0.00 0 0 030 100 000 0.00 0 0.00 0 0 025 100,000 0.00 0 0.00 0 0 015 100.000 1.28 117 0.00 0 117 27 42210 100 000 4.69 436 0.00 0 435 102l3033 100,000 14.87 1.381 0.44 1 1.383 324,938
0.3 100.000 34.35 3.191 1.12 3 3.194 750,6250.03 100 000 53.93 5.001 1.94 5 5.006 1,176.40S
MED1UM100 100.000 0.00 0 0.00 0 0 060 100.000 0.00 0 0.00 0 0 030 100,000 0.00 0 0.00 0 0 025 100.000 0.00 0 0.00 0 0 0is 100,000 0.00 ° 0.00 0 0 010 100 000 0.00 0.003 100.000 9.01 837 0.00 0 837 196,842
0.3 100,000 28.49 2.646 0.94 3 2,649 022,5010.03 100,000 47.96 4,456 1.85 S 4.461 1.048.335
LOW l. .100 100.000 0.00 0 0.00 I 0 0 0h° 100,000 0.00 0 0.00 0 0 _O
30 100.000 0.00 0 0.00 0 0 025 10000 0 0.00 0 0 016 100.000 0.00 0 0.00 0 0 010 100,000 0.00 0 0.00 0 0 03 100.000 0.00 0 0.00 0 0 0
0.3 100.000 18.30 1.700 0.65 2 1.702 399.9S80.03 100.000 37.78 3,510 1.42 4 3.514 825.706
Unrt Rate. and Oi4i owha 2o GW- . $23"'3sta wes w8me"W 6b" New 7000 n-3
, Nol td "" we was de P&.bdw 1160 0 WOO
pc- e__ -~ ~ -f - P e a 3 8
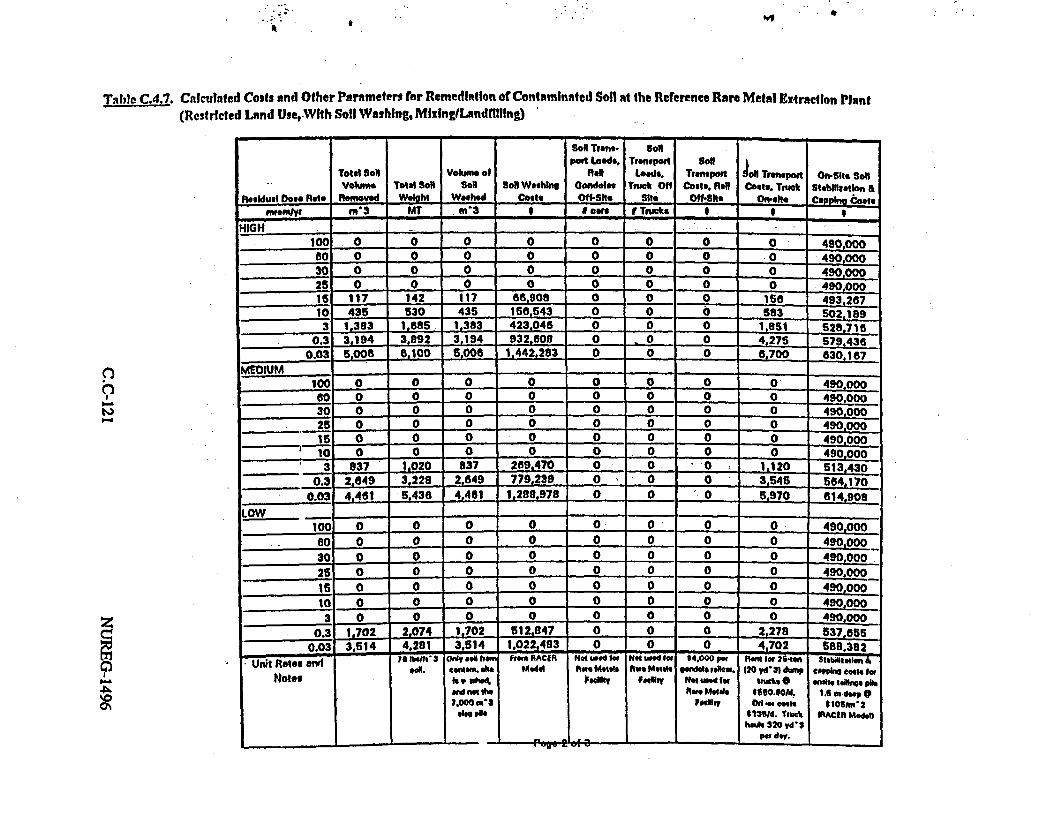
* l
TahleC4.7. Csicutnted Costs end Other Partmeters for Remedlattlon of Contaminated Soli at the Reference Rare Metal xtrlaction Plant(Restricted Land Use, With Soil Washing, MlxinglLandftling)
Soil Twatm SOiNpast Loads, Tranvpit So0
Told Sol Voh of Rf*lail Lowsp. "Tans ranvpi Onlsit. SonVoN"m Total $S SoN Sol' Wash Oon"ds Tnuk Off Cost. ,R&a Cbsts. Tnmk Stabiritatlon &
Ael.dijal Dose RFte Removed Weight Washe Cost Oft-Site Site Off-Site On-sit* Ppi a_l m'3 MT m^3 I coan I TnCs S g
HIGH __. _ -100 . 0 0 0 0 0 0 0 -490,000go O 0 0 0 0 0 0 - 490.00030 0 0 0 0 0 0 0 0 490,00025 ° O0 0 0 0 0 490.00015 117 142 117 68,908 0 0 0 1lO 493,26710 435 530 435 166,543 0 0 0 583 502.1993 1,383 It 1,383 423,046 0 0 0 1.851 528.716
0.3 3.194 3.892 3,194 932,608 0 O 0 4,276 579.436
0.03 5.00C I 100 5.006 1.442.283 0 0 0 6.700 630.167
100 0 0 0 0 0 0 0 0 490,00060 0 0 0 0 0 0 0 0 490.00030 0 0 0 0 0 0 0 490.000
25 0 0 0 0 0 0 0 0 490.000I 1 0 0 0 0 0 0 0 490,000
* 10 0 0 0 0 0 0 0 0. 490.0003 837 1-020 837 289,470 0 0 0 1.120 513O430
- 03 2,649 3,228 2,649 779,239 0 0 0 3,545 564,1700-03 4.461 5.436 4,461 1.289.978 0 0 0 5.970 614.908
LOW ._ - _
100 0 0 0 O0 0 0 0 490,00060 0 0 0 0 0 0 0 0 490.00030 O _ 0 0 0 0 0 0 _490,000
25 O O O ..... 0 0 0 090000
16 0 0 0 0 0 0 0 0 490.000
10 0 0 0 0 0 0 0 0 490.0003 O 0 0 0 0 0 0 0 490,000
0.3 1.702 2.074 1,702 512,847 0 0 0 _ 2.278 537.6550.03 3.514 4.281 3,514 1.022,483 0 0 0 4.702 589,382
QI
'0lN
7 Unit Rates andNotes
*Oi. tiltas de.h. iad.
,.000 m'dst piO
MW' "aln It MatsVW I I`s.. MatsWM iO H ICKS Zm c" eo"
Irmpl * w*""o
V,000 Pt
Ndmds tdet
Notsw MftorRu molds
120 vd'31 Ox"
11190.0Cm.Dd oer Cots
6?362. Tiuechoti 320 vd2'
per day.
coeph caen Is.hnht affines Pik
1.6 II sl p P$0oahn do
YtACItNMods
-______________________________ I - * - - - [�. -
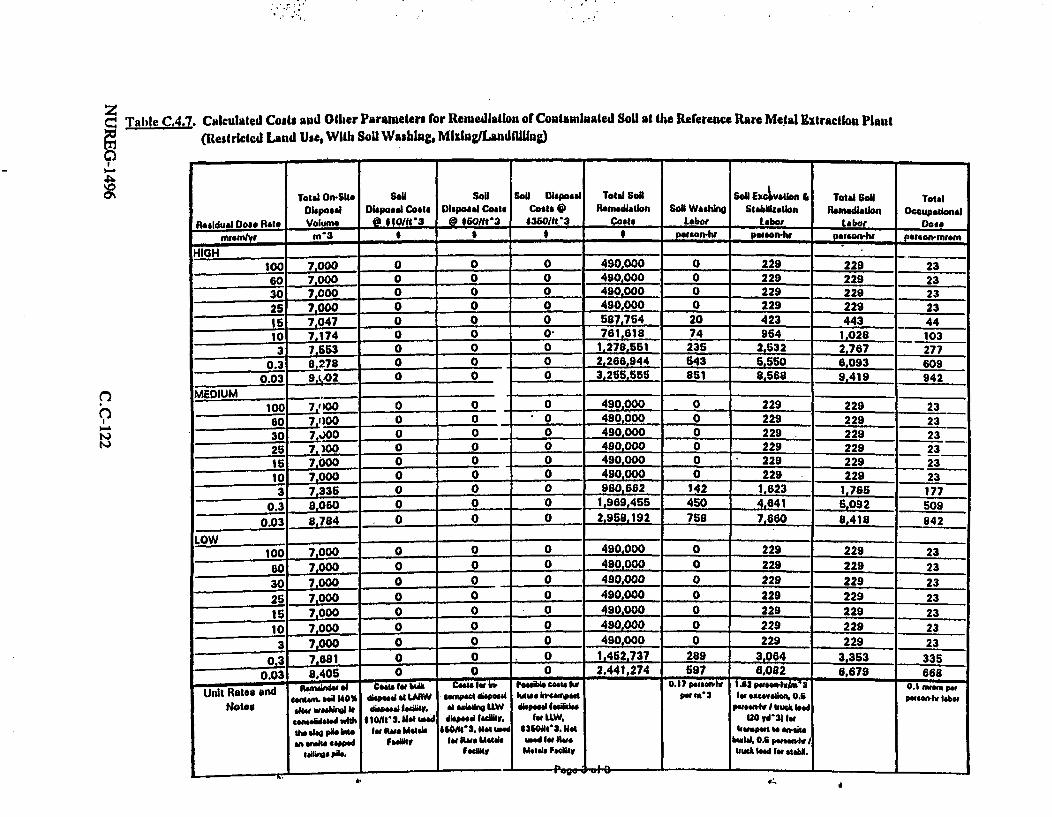
zC: Table C.4.7A Calculated Cost and Otlier Parameten for R enidlatlon otContaminated SoUi at he Reference Rare Metal Extracito Plant
(Restricted Land Use, With Soil Washing, MlzinglLandflUlng)*
I-.
40D~
29)
Toteb On-Slt Soil Sao Sol Dieposal Total Sao Sol EXt 4 tlon & Total Soil Total
Disposal Disposal Coat. DI&poIal Coult Costs 0 Reowdiatlon Sol WashkV StabilIzation PAm"dbatzon Occupational
Rasidual Do Rate Volume 0 10/1t'3 @ S601t3 *360/t'3 Costs Loba L abor Labor ______
mfsmlvt m'3 S S I S Poisnh ___ ___ __ honrwi i *1oem¢o"
HIGH _ ___
1-0 ,00 0 0 0 0 490.000 0 229 229 23
60 7 000 0 0 0 490.000 0 229 229 23
30 7 000 0 0 0 490,000 0 229 229 23
25 7000 O0 0 490,000 0 229 229 23
_ 7,047 0 0 0 587,764 20 423 443 44
10 7,174 0 0 0 761,618 74 964 1,028 103
3 7,553 0 0 0 1.278.551 235 2,532 2.767 277
0.3 8,278 0 0 0 2.266.944 643 6,550 6,093 609
0.03 9. 02 0 0 0 3,255,555 851 8,568 9,419 942
MAEDIUM. I
100 72100 0 0 0 490,000 _ 0 229 229 23
so 7I000 0 0 0 490,000 0 229 229 2330 7JOO- 0 0 0 490,000 0 229 229 23
25 7,)00 0 0 0 490,000 0 229 229 23
0 0 0 490.000 0 229 229 = 23
10 7.000 0 0 0 -490.000 0 229 229 23
7 33S 0 0 0 980,662 142 1,623 1.765 177
0.3 ,60 0 0 1,9B9,455 450 4,641 6092 509
0.03 8,784 0 0 0 2,958,192 758 7,660 8,418 842
LOW ___._._I
100 7,000 0 0 0 490,000 0 229 229 23
00 70000 O0 0 490,000 0 229 229 23
30 7,000 0 0 0 490,000 0 229 229 23
25 7.000 0 0 0 490,000 0 229 229 23
1 7,000 0 _ 0 490.000 0 229 229 23
10 7 000 -O0 0 490,000 0 229 229 23
3 7000 0 0 0 490,000 0 229 229 23
0.3 7*681 0 0 0 1.462.737 289 3.084 3.353 335
0.03 8,405 0 0 0 2,441,274 597 6,0B2 6,679 668URnt Ratsen Cts IsihtAk Costsls Iw Pts t4snsiu Ol 0t17 etW 1 *1 nt pe
Ul t Raes a cmdit *ad 10% diaa a- ULARW 6emPWt &VISa. kAWs WC 6 PM on' f o. Piusen- labwNoaes t wedwiul diead I s db . at eAia4i w diae"ed la"1 P"" f I WA
4wta eWm I *i0 , S. ht NimiaeU dt a * 'l "Uvtl (lWU , 1 v dO y l U
Mma galg p4 bite tO Staltme Moea *6" M2.u $e ~ 350M 3. Not 16wo et W. arnus.
ea aam eaed FaeIer lz Rue UPe wet d #W RVa fbla OeW 0.s p nz v I
ti pb. Foelli Metal Focky Utwl bd lot mtabs.
__ave w - - -Ai

TAle CG4.S. Calculatced Costs and Other Parameters for Remedlailon of Contaminated Soil at the Reference Rare Metal Extraction Plant(Restricted Land Use, Without Soll Washing, MilntILandfllIng)
tl Sl Below. Below Total Soil I. Sollnted Shte son Sh*t SoN BuIldi BuildIng Volme Excavetion
Redal Ddoe. Rat So9 Ame tlepth Vewh Sd Oeth BoN Vohlme Removed Coatsrz2 am m3 cm m,3 m-3 I
HIGH I II_. -- - 1o 100.00 0.00 0 0.00 0 0 0
60 100,000 0.00 0 0.00 0 0 030 100000 0.00 0 0.00 0 0 025 100,000 0.00 0 0.00 0 -0 015 100,000 1.26 117 0.00 0 117 27,42210 .100,000 4.69 435- 0.00 0 435 102.303
3 100.000 14.87 1,381 0.44 1 1.383 _24,9380.3 100.000 34.35 3,191 1.12 3 3.194
0.03 100,000 53.83 .5 001 1.94 5 5.00. 1.176,405MEDtUM
100 100.000 0.00 0 0.00 , 0 O60 100,000 0.00 0 0.00 0 0 030 100,000 0.00 0 0.00 0 o- 0 025100.000 0:00 0 0.Oo 0 0 025 100,000 0.00 -0 0.00 0 0 0
: 10 lwOw00-0 0.00 ' 0.00 o 0 Oi 0 lw,000 9.01 837- 0.00 0 837 190.642
0.3 1000O0o 28.49 2,464 0.94 _3 _2e49 622,5010.03 100,000 47.96 4,456 1.85 5 4.461 1,048.335
LOW - -
p
4'0
1W11 lW.JU1U 13.11J (I n0.0 n U' A'UIW. - _, _ _. _. __vv
L.......6 100.000y 0.00 0 0.00 0 -0 030 100,000 0.00 0 0.00 0 0 025 100.000 0.00 0 0.00 0 0 015 100.000 0.00 0 0.00 0 0 010 100.000 0.00 0 0.00 0 0 . o3 100.000 0.00 0 Om 0 0 0
0.3 100,000 18.30 1.700 0.65 2 1.702 3999580.03 100.000 37.78 3,610 - 1.42 4 3 514 825.706
Unit Rates and MeIyeerp Dif ewe. 2% ft Eaed ihe"
pteft toe gee flog Poe.belew 1.60.OOO wMlod
Wbea s t beemee theop-d Isilkwe
-- -- -p*
Pgo 1 of 3

3 Table C.4.8. Calculated CoFi and Ollier Parameler for Rewiedlillon otColtaminated Soll at tli. Reference Rare Metal Extraction Plant(Restricted Land Use, Without Soil Washing, Mixlng/LAndfiling)
S. Trans. Sooport Loads, Transport Sol
Total SoB S Rl Loads. Trnsport Sov Trnapots On-Site SolVokwwa Total SW Washing Gondolas Truck Off Costa. Rail Costl, Truck StlbItaain &
Residua Does Ratw R d ww Waight Coal. Oflms sit Oil-Sit On-SIto CaPPing Costs, wuwv n mn3 IT S cars D Trucks I _
HIGH
100 0 0 0 0 0 0 0 490,00060 0 0 0 0 0 0 0 490,00030 0 0 0 0 0 0 0 490,00025 0 0 0 0 0 0 0 490.00015 117 142 0 0 0 0 39d 49S.16810 436 530 0 0 0 0 1,457 520.4733 1,3B3 1,86 0 0 0 0 4.026 5836790
0.3 3,194 3,892 0 0 0 0 10,687 713 5900.03 6,008 6.100 0 0 0 0 18,749 840.419
MEDIUM _
100 0 0 0 0 0 0 0 490,000- 60 0 0 0 0 0 0 0 490.000
30 0 0 0 0 0 0 _ 0 490,00025 0 0 0 0 0 0 0 490.00015 0 0 - 0 0 0 0 0 490.00010 0 0 0 0 l -_ 0 0 490,0003 837 1,020 0 0 0 0 2,800 548,574
0.3 2,649 3,228 0 0 0 0 8.863 67S,4260.03 4.481 5.436 0 0 0 _ 14,925 802,270
LOW | - -100 0 0 0 0 0 0 0 490,00060 0 0 0 0 0 0 0 490.00030 0 0 0 _ 0 0 0 0 490,00025 0 0 0 0 0 0 0 490,0001 0 0 0 0 _ ° 0 490.00010 0 0 0 0 0 0 0 490,0003 0 0 0 0 0 0 O 490,000
0.3 1 702 2,074 0 0 0 0 5,694 609,1360.03 3 614 4.281 0 0 0 0 11,758 735,955
Uni Raes nd emCL1 Nimused he Nota. sd er 64.00w '=laosh 26 S-hisaah1.6Unil Rae* 3 * k as iasa gMdasl at. b2 d3ldump gsppkq cor". .
Nolas Uachv Facj Not used la W" 0 am" t
RLaue Meais $650A. t*.w pile 1.5mPetiy eeu1 $23S6. deep 0
Teuckbarod 320 *loum 3Vd'3 pw isv. ISACIA Usd4
- -, -
Page 2 of 3Al

C 0 I. S)
TahTe C.4.8. Calculated Costs and Other Parameters for Rentedfatlon of Contaminated Soil at the Reference Rare Metal Extraction Plant(Restricted Land Use, Without Soil Washing, MkxingILandfllling)
l
TotalO Sl Sd Soll Soa Elatia Son TotelSiteosonSONoSonDisposa
Disposal Disposal Costs Disposal Costs Costs @ Total Sol Sodl Washing Stablliatlon Ramedlotion OccupationalResidual Doe Rate Volume @ t10/t'3 1 t60/h'3 350/' Remnwdleton Costs te o Labor Labor Do
mromyr m'3 t S S S _ on-r p___onhr person-hr p
HIGHHIG 7,000 0 0 0 04so,000 o 229 =229 2360 7.000 0 0 0 042290229 230 7 000 0 0 0 490.000 0 229 229 2325 7-000 0 0 0 490,000 0 229 229 2315 7,117 0 0 0 525,981 0 426 428 4310 7.435 0 0 0 824,233 0 983 983 963 8 383 0 0 0 918,355 0 2,559 2,559 2se
0.3 10,194 0 o 0 1,474,902 ° 5,612 5,612 5610.03 12.006 0 0 0 , 2,033,572 0 ° .A!.. s es666 _67
MEDIUM 1 __700 ______49 _0000 _22 _9_229_210 7 000 0 0 0 490,000 0 229 229 23
80 7.000 0 0 0 490,000 0 229 229 2330 7.000. 0 0 0 49o0co0 0 229 1 2- 2325 70000 0 0 0 490,000 0 229 22915 7.000 0 0 0 490,000 0 229 229 2310 7i000 0 0 0 490.000 0 229 229 233 7L837 0 0 0 748,016 0 1.639 1,e39 164
0.3 988 0 0 0 1.306.789 0 4.893 , 4.693 469.0.03 11.461 0 0 0 18805.531 0 7747 774775
Low _ _ _ _ _ _ _ _ _
100 7,000 0 0 0 49000229 229 23o 7,000 0 0 0 490,000 0 229 229 23
30 7 000 0 0 0 490.000 0 229 229 2325 7,000 0 0 0 o490.000 0 229 229 23
s5 7,000 - 0 0 0 490,000 0 229 229 23o 7 ooo 0 0 0 490,000 0 229 229 23
7o000 0 0 0 490,000 0 229 _ 229 230.3 8702 0 0 0 1,014,789 0 3.097 3 097 310
0.03 10.514 0 0 0 1.573.417 0 8,151 6.151 _______sRatets for bwh coe leStar C . II prvo17w hpe 1 6 paseeoo/v3 o. I "mmo615
unit Rtsa eoatod apd at LMW Ce-#t desd luau,. iha-caqnO ter qw tbn, 0 6 me"t lpaNotes With tw sl 1dis"d ladliy,. *a owhbln LLW allosal Itllfbo pornt I wwekk ta
plekIte an I10/h'1. Notused d1$Vedld clity fo LUW. 20 o le31frsmile Copp" le ReV Mlel SSO1t1. Not *0soma. w1t buurort to wsktetr.e pile P .Pdty m1dI etie Wad lo. et AI pus vason-aw
Meal Pechitt meta, hPeaty 3Sck lead ow 3v&W.
Pige 3 of 3
zC-'
'0
ATTACHMENT D
REPRODUCED APPENDIX C OF DRAFT GEIS
C.D-1 NUREG-1496

ATTACHMENT D
REPRODUCED APPENDIX C OF DRAFT GEIS
In several places in this final GEIS, reference is made to analysis and results fromAppendix C of the draft GEIS. To assist the user of this report and to provide completeness,Appendix C of the draft GEIS is reproduced here as Attachment D. The section numberingsystem indicating that this was Appendix C has been retained.
NUREG-1496 C.D-2

REPRODUCED APPENDIX C OF DRAFT GEIS
C.1 INTRODUCTION
Decommissioning is currently defined in the Commission's regulations as removing a facilitysafely from service and reducing residual radioactivity to a level that permits release of theproperty for unrestricted use and termination of license. Criteria and practices are describedin several NRC guidance documents which have been used for a number of years. The NRCis conducting a rulemaking to establish radiological criteria for the decommissioning of NRC-licensed facilities. The facilities that would be covered by such a rulemaking include nuclearpower plants, non-power reactors, fuel fabrication plants, uranium hexafluoride productionplants, uranium mills, independent spent fuel installations, and non-fuel-cycle facilities.
According to the requirements of NEPA and of the Commission's regulations in 10 CFR 51,the planned rulemaking needs to be accompanied by an environmental impact statement (EIS)which analyzes costs and impacts associated with rulemaking alternatives.
In preparing the EIS, one of the principal decommissioning activities expected to be sensitiveto residual radioactivity criteria is the cost of cleaning, removal, and disposal ofcontaminated concrete and soil. Assessment of the differential in decommissioning costsrelated to alternate residual radioactivity criteria is difficult because of problems in making ageneric evaluation of contamination levels on and within concrete and soil surfaces, includingconcrete cracks and hot spots, and because of questions regarding the amount of radioactivedose reduction achieved by concrete and soil removal techniques.
The proposed amendment to 10 CFR Part 20 to include radiological criteria for terminationof licenses would be applicable to almost all of the facilities and sites that the NRC licenses.The nuclear facilities that will require decommissioning and would be affected by this actionincludes the following facilities involved in the nuclear fuel cycle:
* nuclear power plants* non-power (research and test) reactors* fuel fabrication plants* uranium hexafluoride production plants* uranium mill facilities* independent spent fuel storage installations,* non-fuel-cycle nuclear material facilities.
The materials licensees include universities, medical institutions, radioactive sourcemanufacturers, and companies that use radioisotopes for industrial purposes. Over 75% ofthe NRC's materials licensees use either sealed radioactive sources or small amounts ofshort-lived radioactive materials. Decommissioning of these facilities should be relativelyeasy because there is usually little or no residual radioactive contamination to be cleaned upand disposed of.
C.D-3 NUREG-1496

Of the remaining 25%, a small number (e.g., radioactive source manufacturers,radiopharmaceutical producers, and radioactive ore processors) conduct operations whichcould produce substantial radioactive contamination in portions of their facilities.
The amended Part 20 would not apply to the disposition of uranium mill tailings, low-levelwaste disposal facilities, or high-level waste repositories because these have already beenaddressed in separate regulatory actions.
This Appendix provides supportable technical models for estimating facility concretecontaminant penetration and soil contaminant penetration, realistic technical methods forfacility and soil decontamination during decommissioning, and a generic analysis of thedifferentials in decommissioning costs associated with decontaminating the facility and its siteto.alternate residual contamination levels.
NUREG-1496 C.D4
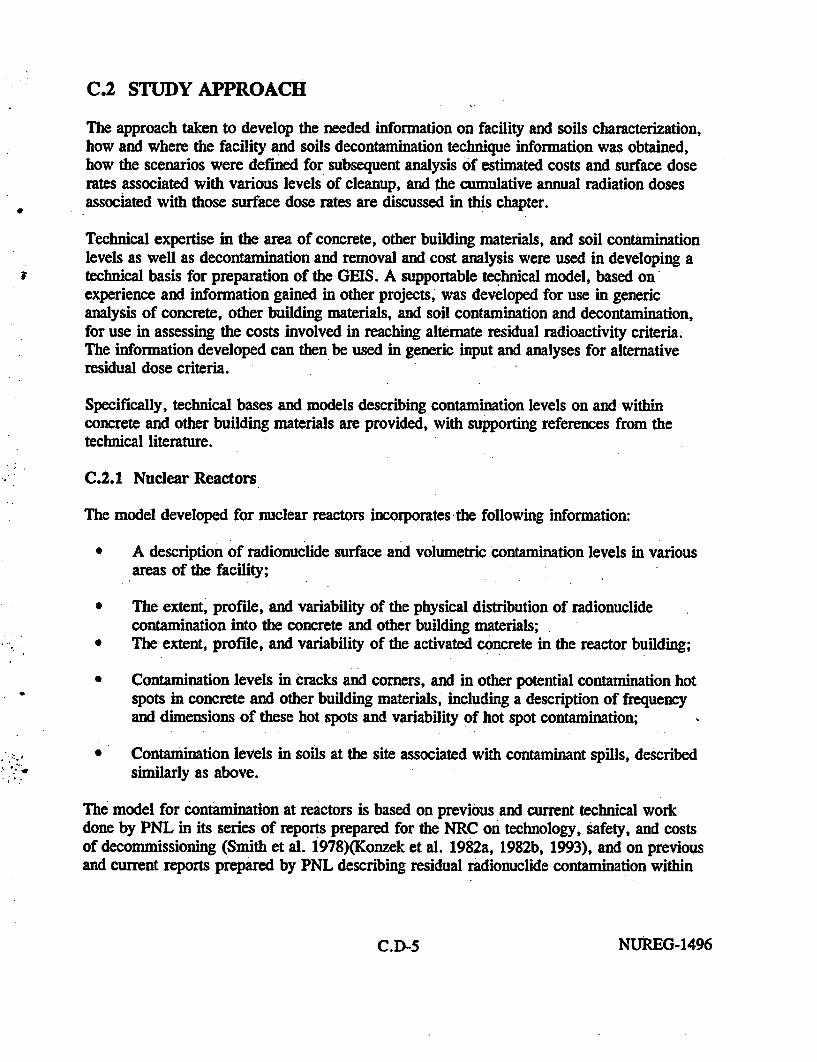
C.2 STUDY APPROACH
The approach taken to develop the needed information on facility and soils characterization,how and where the facility and soils decontamination technique information was obtained,how the scenarios were defined for subsequent analysis of estimated costs and surface doserates associated with various levels of cleanup, and the cumulative annual radiation dosesassociated with those surface dose rates are discussed in this chapter.
Technical expertise in the area of concrete, other building materials, and soil contaminationlevels as well as decontamination and removal and cost analysis were used in developing atechnical basis for preparation of the GEIS. A supportable technical model, based onexperience and information gained in other projects, was developed for use in genericanalysis of concrete, other building materials, and soil contamination and decontamination,for use in assessing the costs involved in reaching alternate residual radioactivity criteria.The information developed can then be used in generic input and analyses for alternativeresidual dose criteria.
Specifically, technical bases and models describing contamination levels on and withinconcrete and other building materials are provided, with supporting references from thetechnical literature.
C.2.1 Nuclear Reactors
The model developed for nuclear reactors incorporates the following information:
* A description of radionuclide surface and volumetric contamination levels in variousareas of the facility;
* The extent, profile, and variability of the physical distribution of radionuclidecontamination into the concrete and other building materials;
* The extent, profile, and variability of the activated concrete in the reactor building;
* Contamination levels in cracks and corners, and in other potential contamination hotspots in concrete and other building materials, including a description of frequencyand dimensions of these hot spots and variability of hot spot contamination;
* Contamination levels in soils at the site associated with contaminant spills, describedsimilarly as above.
The model for contamination at reactors is based on previous and current technical workdone by PNL in its series of reports prepared for the NRC on technology, safety, and costsof decommissioning (Smith et al. 1978)(Konzek et al. 1982a, 1982b, 1993), and on previousand current reports prepared by PNL describing residual radionuclide contamination within
C.D-5 NUREG-1496
and around nuclear power plants (Abel et al. 1986; Robertson et al. 1989). Whereappropriate, existing literature was reviewed to determine if the conclusions of the previousPNL reports remain valid.
C.2.2 Fuel Cycle and Non-Fuel Cycle Facilities
Facilities in these categories include fuel fabrication plants, uranium hexafluoride plants,uranium mills, sealed source manufacturers, broad R&D facilities, ISFSIs, and rare metalextraction processors.
Information presented on these facilities includes:
* A description of radionuclide surface and volumetric contamination levels in variousareas of the facility;
* The extent, profile, and variability of the physical distribution of radionuclidecontamination into the concrete and other building materials;
* Contamination levels in cracks and corners, and in other potential contamination hotspots in concrete and other building materials, including a description of frequencyand dimensions of these hot spots and variability of hot spot contamination;
* Contamination levels in soils at the site were described similarly as above, withspecific attention to special contamination features and their variability.
The model for contamination at fuel cycle and non-fuel cycle facilities was developed usingtechnical bases similar to those noted in Section 2.1 above (Elder and Blahnik 1980a, 1980b;Elder 1981; and Murphy 1981). The amount of recent and relevant technical data for thesefacilities was more limited than that which exists for reactors. However, a generic modelwas developed based on extrapolating information developed for reactors, or based on otherPNL data on uranium facilities and non-fuel cycle facilities, or by obtaining availableinformation on these other facilities from other sources such as DOE or NRC.
C.2.3 Decontamination Methods and Costs
Realistic descriptive summaries are provided, including cost and decontaminationeffectiveness, of cleanup and removal techniques anticipated to be used in decommissioningthe nuclear facilities listed in Sections 2.1 and 2.2.
Likely practical methods of concrete decontamination/removal for use in a large-scaleindustrial process like decommissioning of a facility are described. For example, thisAppendix addresses whether it is practical or likely that a licensee would remove layers ofconcrete during a decommissioning to achieve alternate contamination criteria and how thiswould be accomplished.
NUREG-1496 C.D-6

For decontamination of soil, practical soil cleanup and removal methods likely to be used inthe decommissioning of nuclear facilities are described.
This analysis was based on the information sources indicated above, on information whichhas been obtained from recent decommissioning experience at Shippingport, etc., and onrecent technical information obtained regarding decontamination methods.
Based on the results of the analyses described in Sections 2.1 and 2.2, generic analyses ofconcrete, other building material, and soil cleanup procedures and associated costs to reachalternate residual contamination levels for decommissioning for the facilities are provided.The analyses in the report assume that the contaminated equipment has been removed and thenondestructive decontamination has been completed. For building areas requiring destructivedecontamination of concrete and other building materials, the following information ispresented:
* The estimated contamination levels in those areas;
* The extent of contamination removal by realistic removal techniques (includingstepwise removal and the need for removal of hot spots and contamination in cracks)to reach alternate contamination levels;
* The costs associated with these removal techniques, including waste disposal costs.
Analyses have resulted in estimates of the amounts of concrete and other building materialswhich are necessary to be cleaned or removed in order to meet alternate residualradioactivity contamination levels. The analyses are quantitative in nature to the extentfeasible, quantifying the amount of contamination removed and the amount of contaminationremaining, and the associated costs required to achieve that contamination level.
For land areas, the following information is presented:
* The method of cleanup or removal that would be used in various site areas having* contamination;
* The estimated contamination levels in those areas;
,r*, * The extent of contamination reduction by soil cleanup or removal, if necessary, toreach alternate contamination levels;
* The costs associated with such removal.
C.D-7 NUREG-1496

C.3 RESULTS OF THE ANALYSES
Based on the models of radionuclide surface contamination and penetration profiles and thecosts of remedial actions, an assessment was made of decommissioning costs for referencenuclear facilities. Models were developed for use in calculating contaminant penetration profilesand associated residual radiation dose rates as successive amounts of the contaminated materialare removed. Based on the depths of materials removed, decommissioning costs were calculatedas a function of residual radioactivity and associated annual radiation dose criteria. The resultsof these analyses are summarized in Chapter 7, with additional details given in Attachments Aand B.
NUREG-1496 C.D-8

C.4 CHARACTERIZATION OF REFERENCE FACILITY BUILDINGCONTAMINATION
This chapter includes information on the types and concentrations of radionuclides and thequantities of surface areas contaminated for each of several reference facility types. Actualconcentration profiles for penetration of radionuclides into concrete surfaces are provided,where possible. Theoretical concentration profiles are developed for SpeCs, '6Co, uranium,and thorium, using diffusivity coefficients where actual data are not available. Sections 4.1 -4.7 present information on the areal extent and level of contamination on building surfacesfor reference facilities. Section 4.8 presents summary information on surface contaminationlevels and information on contamination profiles with depth below the surface. Similarinformation for soils is presented in Chapter 5.
C.4.1 Reference Nuclear Power Reactor Station
A representative 1095-MWe pressurized water reactor plant that is preparing for D&D is thereference plant for this analysis. Conceptual decommissioning of this plant has been reportedpreviously (Smith et al. 1978, Konzek et al. 1993).
Extent of Surface Contamination in Nuclear Plants
The extent of surface radionuclide contamination on floors of the various buildings of thereference PWR nuclear power station was estimated by reviewing detailed contaminationsurvey maps supplied by the utility for contaminated areas of the station. The contaminationsurveys were conducted by taking smears of removable radioactive material from 100 cm2
areas of floor surfaces. In a number of locations in the reactor containment building,contaminated walls were also surveyed for removable radioactive contamination. A summaryof the contaminated surface areas is given in Table 4.1.1. As shown in the table, all of thefloor surfaces in the reactor containment building (estimated area of about 1900 m2) areassumed to be contaminated at levels which would require scabbling to reduce thecontamination levels to acceptable residual concentrations.
Contamination penetrated into concrete below-grade floors in the Sodium Reactor ExperimentFacility approximately 1/8 to 3/8 inches on the average and up to the full thickness of wallsand floors where cracks and joints existed (Brengle 1979). Angus et al. (1990) found that137Cs penetrated deeply into areas of surface porosity and cracks. Information on surfacecontamination of concrete in the Japan Power Demonstration Reactor (Yasunaka et al. 1987)indicated that most of the contamination penetrated less than 2 cm and only 15 % penetratedup to 3 cm. In the liquid waste treatment building, the deepest penetration was up to 11 cmin the vicinity of cracks, but elsewhere it was less than 2 cm. Therefore, complete removalof concrete will likely be required in the vicinity of contaminated cracks. The perimeter ofthe concrete floors is assumed to contain 1500 m of cracks. Because contamination tends topenetrate rapidly into cracks, contaminated crack regions are expected to require completeremoval.
C.D-9 CNUREG-1496

The interior walls of certain locations within the reactor containment building also containsignificant radionuclide contamination, particularly the upper and lower cavity areassurrounding the pressure vessel. Although summaries of wall contamination are not includedin Table 4.1.1, it is estimated that approximately 400 to 600 m2 of wall area from theselocations have been contaminated at levels ranging from about 1000 to 60,000 pCil100 cm2.Other portions of the interior wall surfaces in the containment building may also becontaminated and require some type of decontamination.
TABLE 4.1.1. Extent of Surface Radionuclide Contamination in theReferencePWR Nuclear Power Stationw
Approximate Estimated % of Estimated NeedingBuildine Floor Surface F Floor Area Cleanup. ftR
Area. fti Contaminated
Reactor 20,400 100 20,400Containment
Auxiliary (6 43,000 1-5 430 - 2,200levels)
Fuel Building 53,800 1-5 540 - 2,690(5 levels)
Turbine 61,300 per level 0 0Building
Control 7,500 per level 0 0Building
(a) From Smith et al. 1978.
In addition to the widespread surface contamination of concrete and patchy areas ofcontamination associated with spills or high radiation areas where maintenance work wasconducted, radioactive contamination is produced in-situ by neutron activation of concreteshields. Concrete areas subjected to neutron exposure within the plant are limited primarilyto the bioshield and the sump area directly beneath the reactor vessel. Concrete core' samplescollected directly beneath the pressure vessel show the effects of both surface contaminationand subsurface neutron activation of stable elements present in the concrete (Abel et al.1986). The concentration of radionuclides, such as 'Co, decreases rapidly (byapproximately four orders of magnitude) with depth from the surface to about 2 cm beneaththe surface. This concentration profile is attributed to diffusion of surface contamination.The radioisotopes produced by neutron activation extend much deeper (even feet) in nuclearreactors (Abel et al. 1986; Irving 1980). The concentration may peak at depths where theneutron energy spectrum coincides with peaks in the capture cross section for the parentisotope. The subsurface contamination produced by neutron activation is too deep to beremoved by surface scabbling, and must be removed by procedures for concrete demolition.
NUREG-1496 C.D-10
The auxiliary and fuel buildings also have some areas of floor contamination, but not nearlyto the extent of that observed in the reactor containment building. It has been estimated,based on survey reports (Smith et al. 1978), that about I to 5% of the floor area(representing about 430 to 2,200 ft) in the auxiliary building has radioactive contaminationlevels in the range of 500 to 3600 pCi/100 cm2. The fuel handling building also has a smallamount of floor contamination, estimated at approximately 540 to 2,690 ft2, withcontamination levels ranging from about 500 to 2300 pCi/100 cm2.
The other buildings, including the turbine building, the control building, radwaste handlingwarehouse, and the condenser building, generally do not have any measurable radioactivecontamination on any surfaces.
Within the common variabilities of contamination levels in nuclear power plants, the analysisfor a PWR reasonably estimates the contaminants and contamination levels for a BWR.Within these variabilities and considering the information shown in Table 4.1.2, theradioactive contamination in the various types of reactors appears to be similar. The primarydifference is in the areas and volumes of the structures. Dry active waste (DAW) is amixture of radioactively contaminated items typically generated at nuclear power stations,(e.g., trash, protective clothing, gloves, equipment, tape, plastic sheeting and bags, etc.) andthe radioactive material associated with DAW would be expected to be reasonablyrepresentative of that found on surface contaminated concrete. These measurements weremade on over 100 DAW samples during a recent study conducted by Battelle, PacificNorthwest Laboratories for the Electric Power Research Institute to determine the industry-wide variability in the radionuclide composition of very low-level wastes generated at nuclearpower stations (Robertson et al. 1989).
Section 4.8 provides a summary assessment of the level of surface and shallow subsurfacebuilding contamination. Based on the information in that section and data obtained oncontamination at power reactors, the level of surface contamination assumed for the referencepower reactor is the high contamination level in Table 4.8.1. The shallow subsurfacecontamination depth profile is described in Section 4.8.3. The information on the buildingsurface contamination levels and areal extents are summarized in Table 7.1.1.
C.4.2 Radionuclide Source Term for Nonpower Reactors - Test and Research Reactors
Nonpower reactors generally are divided into two classes: research reactors and test reactors.A test reactor is defined in 10 CFR 50.2 as a nuclear reactor licensed for operation at athermal power level in excess of 10 MW or a thermal power level in excess of 1 MW if thereactor contains a circulating loop through the core to conduct fuel experiments, or a liquidfuel loading, or an experimental facility in the core in excess of 16 in2 in cross section. Aresearch reactor is defined in 10 CFR 170.3(h) as a nuclear reactor licensed for operation ata thermal power level of 10 MW or less and which is not a testing facility.
C.D-1 1 NUREG-1496

TABLE 4.1.2. Gamma-Emitting Radionucide Distributions In Dry Active Waste(Robertson et al. 1989,1991)
Average % Composition of 'v-Emitting Radionuclides
Radlonuclide
lCo
"Co
All PWR Statlonst'
49 ± 34'd
27 ± 22
8.6 ± 7.3
9.8 ± 9.8
0.7 ± 0.5
2.4 ± 2.1
0.6 ± 0.3
2.4 ± 3.2
All BWR StationsO
78 ± 2.6
11 ± 2.2
2.5 ± 1.2
0.59 ± 0.43
6.4 ± 3.6
1.8 ± 0.4
0.69 ± 0.47
0.2 ± 0.09
All StationsCombined"
61 ±30
20 ± 18
6.1 ± 6.3
6.7 ± 9.0
3.0 ± 3.6
2.1 ± 1.4
0.6 ± 0.4
1.8 ± 2.8
0.7 ± 0.5
0.3 ± 0.4
"4Mn
5Nb
"Zr 0.7 ± 0.5
0.3 ± 0.5 0.12
(a) Includes 6 stations and 60 samples,(b) Includes 4 stations and 42 samples.(c) Includes 10 stations and 102 samples.(d) ± values are the standard deviation (to).
C.4.2.1 Description of Reference Facility Structures and Lands
The reference test reactor is the Plum Brook Reactor at Sandusky, Ohio (Konzek et al. 1982a,b). It is a 60 MWt test reactor formerly operated by the National Aeronautics and SpaceAdministration and is located on a site approximately 50 x 106 ft2. It is a light water-moderatedand cooled plant, used in testing materials for specific applications. The testing system of thePlum Brook reactor is made up principally of the test reactor vessel (containing the nuclear coreand experimental beam tubes) and the reactor water recirculation system. Major structurescomprising the reference test reactor include:
* reactor building (housing the test reactor)
* hot laboratory building with seven hot cells
* a primary pump house
* an office and laboratory building (housing radiochemistry laboratories)
NUREG-1496 C.D-12

* a fan house (ventilation systems and waste ion exchanger and filters)
* a hot retention area (holding waste tanks)
* a cold retention area and an emergency retention basin
* a waste handling building.
The reference research reactor for this analysis is the Oregon State University 1 MWt TRIGAreactor. This reference facility is described by Konzek et al. (1982a, b) and Chapter 7 of NRC(1988). It is located on a site of approximately 150,000 ft2. It is an open-pool nuclear trainingand research facility. It is made up of a reactor tank and a core structure and a TRIGA typecontrol system. Major structures comprising the reference research reactor that are likely to becontaminated include a reactor building (housing the TRIGA reactor and support area), a coolingtower, an annex (housing a hot laboratory area and hot cell), a heat exchanger building (housinga water purification system, water pumping systems, and air compressor systems), and a pumphouse.
C.4.2.2 Contamination Data
Information on the extent and nature of contamination in the structures, and in surrounding on-site lands for the reference research and test reactors, is taken from Konzek et al. (1982a, b) andAbel et al. (1986). The locations and sizes of the contaminated areas are summarized in Tables4.2.1 and 4.2.2. The crack lengths, assumed to approximate the perimeter of the reference testreactor and the reference research reactor, are estimated to be 2,900 and 1,300 ft. respectively.Section 4.8 provides a summary assessment of the level of surface and shallow subsurfacebuilding contamination. Based on that information and on data obtained on contamination atresearch and test reactors, the levels of surface contamination assumed for the reference test andresearch reactors are the high contamination level and the medium contamination levels,respectively, from Table 4.8.1. The shallow subsurface contamination depth profile is describedin Section 4.8.3. The information on the building surface contamination levels and areal extentsis summarized in Table 7.1.1.
C.4.3 Reference Uranium Fuel Fabrication Plant
The reference uranium fuel fabrication plant processes an average of1000 MTfy. Buildings or site areas associated with the reference uranium fuel fabrication plantinclude:
* Processing buildings, which are typically two-story windowless structures of concrete andsteel. Interior walls, typically of concrete block, divide the buildings into discreteoperations areas that house each of the production steps.
C.D-13 NUREG-1496

* On-site waste ponds containing calcium fluoride; calcium fluoride is a waste product thatis produced by treating the fluoride wastes with Ca(OH)2. The calcium fluoride is storedin waste ponds on the site.
* A site area of 4.7 x 106 ft2 .
TABLE 4.2.1. Distribution of Contaminated Concrete Surface Areas within the Reference TestReactorsbl
EstimatedSurface Area,
Location - fl
Reactor Building and 61,000Containment Vessel
Hot Laboratory Building 24,000
Fan House 750
Waste Handling Building 4,230
Primary Pump House 2,500
Hot Retention Area 450
Cold Retention Area 13,470
Office and Laboratory 1,100Building and Sumps
Total 107,500
(a) (Konzek ct al. 1982a, b)(b) Estimates of percent of surface area contaminated given in Konzek 1982 are considered to be too high for an operating plant. An
average value of 10% is used in Table 7.1.1 based on operating data from power reactors.
C.4.3.1 Description of Reference Facility
The General Electric Company's Wilmington facility has previously been evaluated as areference plant for conceptual decommissioning activities (Elder and Blahnik 1980a). It islicensed, a major fabricator of commercial nuclear fuel, and considered to havecharacteristics similar to other existing commercial uranium fabrication plants.Contamination of equipment and floors results during normal operations and, on at least oneoccasion, from a spill that caused uranium to penetrate through cracks in the concrete floorinto soil beneath the fuel processing building.
NUREG-1496 C.D-14

The feed to the plant is slightly enriched uranium in the chemical form of UF6. The plantuses two chemical processes for converting the UF6 to U0 2. The primary method is achemical process that reacts UF6 with ammonia to form ammonium diuranate (ADU)precipitate and reduces and calcines the ADU to dry U02 powder. The second methodinvolves direct conversion of the UF6 to U308 to U0 2 powder in a reduction calciner. TheU0 2 powder from each process is subsequently milled and pressed into pellets that aresinterid and ground to size. The pellets are loaded into rods and sealed. The rods areassembled into fuel bundles ready for use in light water reactors.
TABLE 4.2.2. Distribution of Contaminated Concrete Surface Areas within theReference Research Reactor"
Estimated Surface Area, Estimated Area Contaminated,Location ft2 %
Reactor BuildingSurfaces 1050 100Reactor Top 100 20Fuel Storage Pits 5 100
AnnexHot Cell 145 100Hot Lab 430 10Hot Lab Sump 160 100
HX BuildingFloor 580 10Sump 160 100
Pump HouseConcrete Floor 645 10Sump 160 100
Waste Storage RoomConcrete Floor 410 10Sump 160 100
Radiation Center Building 30,000 4
Total 35,005 10
(a) (Konzek et *1. 1982a, b)
Liquid waste streams containing uranium are kept separate to facilitate uranium recoveryoperations. They are classified as nitrate wastes, fluoride wastes, and radwastes. Uranium-bearing nitrate sludge is sent to an offsite contractor for uranium recovery. Calcium fluoridesolids entrap uranium residuals in the waste from the UF6 to U0 2 conversion process. CaF2solids are stored onsite for eventual reprocessing to recover the uranium residuals.
C.D-15 NUREG-1496

C.4.3.2 Contamination Data
The reference fuel fabrication plant consists of five potentially contaminated buildings (Elderand Blahnik 1980b, p. A-18). There are an average of two floors per building with a totalfloor space of approximately 235,000 ft2 (about 22,000 m2). Contamination incidents, aswell as releases during normal operations, are assumed to have affected 50% of the surfaceof the process areas. The principal contaminant is uranium, and its concentration at theexposed surface after removal of the covering and after surface washing is I g Urm2n(33 pCi/g of concrete). Therefore, approximately 11,000 m2 are assumed to be contaminatedto a level of 1 g U/r2 (33 pCi/g of concrete) and require decontamination by surfaceremoval.
Floor tiles cover 100% of the process area floors. Replacement of the floor tiles andlinoleum coverings removes significant contamination. However, recontamination duringoperation requires floor tiles to be replaced annually for ALARA considerations. The tilesare also removed during normal decommissioning operations. Because of contaminantpenetration through seams between tiles, it is assumed in Table 4.3.1 that 50% of theconcrete floor has become contaminated'. The chemical area has a sealed concrete floor.It is assumed that 50% of the concrete floor surface under the seal is contaminated. Officesand change rooms have tiled or painted floors (Elder and Blahnik 1980a, p. 7-17); it isassumed that the concrete surfaces below these surface coverings are not contaminated
TABLE 4.3.1. Distribution of Contaminated Concrete Floor Area in the ReferenceUranium Fuel Fabrication Facilityw
EstimatedSurface Estimated Area Contamination
Location Area, Contaminated. % Level, pCicm3
Fuel Manufacturing Building 208,000 50 73
Chemical Metallurgical 8,300 40 73Laboratory
Uranium Scrap Recovery Room 3,700 90 73
U0 2 Powder Warehouse 8,700 30 73
Contaminated Waste Incinerator 2,400 100 73
Fluoride and Nitrate Waste 2,500 100 73Treatment Plant
Boiler Steam House 1,100 0 0
Total 234,700 50
(a) (Elder and Blahnik 1980b, p. A-18)
Note: this assumption deviates from that made by Elder and Blahnik (1 980) in that they assumed the concrete was not contaminated.Penetration and spread of contamination through seams between tiles is assumed in Table 4.3.1 to result in approximately 50% ofthe concrete floor becoming contaminated.
NUREG-1496 C.D-16

For an assumed average wall height of 10 ft. the total interior wall surface area isapproximately 236,700 ft2 (22,000 in2 ). Most of this wall area is cleaned by washing duringnormal decommissioning operations. The estimated remaining distribution of contaminationfor walls is indicated in Table 7.1.1.
The crack length in the concrete floors is taken to be equal to the sum of the buildingperimeter, i.e., approximately 3,000 ft. Uranium from contamination incidents haspenetrated through the concrete in regions of cracks, crevices, porosity, and unsealed joints.The contamination in cracks is assumed to have penetrated through the complete 6-in.thickness of the floor.
Elder and Blahnik (1980a) estimated the surface concentration of uranium on horizontalsurfaces to be approximately 1 g U/m2 (33 pCi U/g of concrete)2. Approximately 700samples were taken from the main building block and brick walls at the Babcock and WilcoxApollo plant in Pennsylvania. The majority of the wall contamination was < 30 pCi U/gwith some selective areas containing up to 2,000 pCi U/g (Haase, et al. 1992). Thecharacterization of surface contamination was complicated by the heterogeneous nature of thecontamination and, in some areas, the number of overlying pours of concrete that were madeto cover contaminated floor areas.
Measurements at the DOE Fernald facility have shown some floor regions with extremeuranium contamination approaching 10,000,000 dpmf100 cm2 with an average maximum of2,220,000 dpm/l00 cm2 (DOE 1992). These high levels are believed to be an upper boundand are used only in calculation of the penetration profiles in Section 4.8.
The three uranium fuel fabrication facilities provide information on three levels ofcontamination: an estimated 33 pCi U/g from Wilmington, up to 2,000 pCi U/g measured forApollo, and a maximum beta-gamma of nearly 16,000 pCi U/g for Fernald. These datawere converted to dpm/100 cm2 and resulted in values of 18,000 dpm/100 cm2 (low);
1,100,000 dpm/100 cm2 (medium); and 10,000,000 dpm/100 cm2 (high). Based on theabove discussion, the level of surface contamination after surface washing assumed for thereference uranium fuel fabrication facility is 18,000 dpm/l00 cm2. The information on thebuilding surface contamination levels and areal extents are summarized in Table 7.1.1
C.43.3 Reference Depth Contamination Data
Documentation was reviewed (Elder and Blahnik 1980a, b; Babcock and Wilcox 1992a, b;Haase et al. 1992; DOE 1992) for the penetration of uranium into concrete; however, noexperimental data were found. Two methods of theoretical calculations provide independentmethods for calculating penetration profiles. These two methods involve: I) the use of thediffusivity for uranium in concrete; and 2) data for the distribution coefficients from leaching
2 1 g U/rn2 - 0.7 x 10O pCi/m x 0.472 pCi/g per pCicn x 104 kn2 crn - 33 pCi/g
C.D-17 C1NUREG-1496

studies with uranium and concrete and cement. The relative values for the distributioncoefficients for uranium were compared to cesium for which there are also data fordiffusivity in concrete as well as penetration profiles. These relationships permit thedevelopment of a cohesive presentation of penetration profiles for uranium. Section 4.8.5contains information regarding an assessment of the depth profile for uranium.
C.4.4 Uranium Hexafluorlde Plant
The reference uranium hexafluoride facility processes 10,000 MT/y of natural uranium. TheKerr McGee plant was used as the reference facility(Elder 1981).
C.4.4.1 Description of Reference Uranium Hlexafluorlde Facility
Buildings or site areas associated with the reference uranium hexafluoride plant include:
* the total buildings, including the warehouse and storage areas, contain approximately120,000 ft2 of floor area. The floor area of the main processing areas in twobuildings is approximately 84,000 ft2. Some of the main processing rooms aredescribed in Table 4.4.1 to provide an estimate of the average radionuclide surfaceconcentration. The buildings are of normal industrial construction with heavyconcrete floors to support equipment. The wall surface area is estimated to be130,000 ft2.
* a series of on-site retention ponds for storage of process raffinates and sanitary wastes
* lagoon areas for neutralized liquid effluents* a burial area for disposal of defunct equipment
* a site area of 20 x 106 ft2 .
C.4.4.2 Surface Contamination Data
The extent of contamination in these structures, and in surrounding on-site lands, is takenfrom Elder (1981). The reference uranium hexafluoride plant includes at least twelveseparate rooms, several in the main building and several in small adjacent buildings, inwhich various steps related to the process were carried out. The primary contamination inthe plant is assumed to be in these process rooms, which are listed in Table 4.4.1. Thecontamination estimated to be on the process equipment after decontamination is then used asthe basis for estimating the amount of contamination remaining in the room after removal ofthe equipment. For these estimates, the following assumptions are made:
* The amount of contamination on the floor and walls is 15% of the amount listed forthe equipment itself, as a worst case.
NUREG-1496 C.D-18
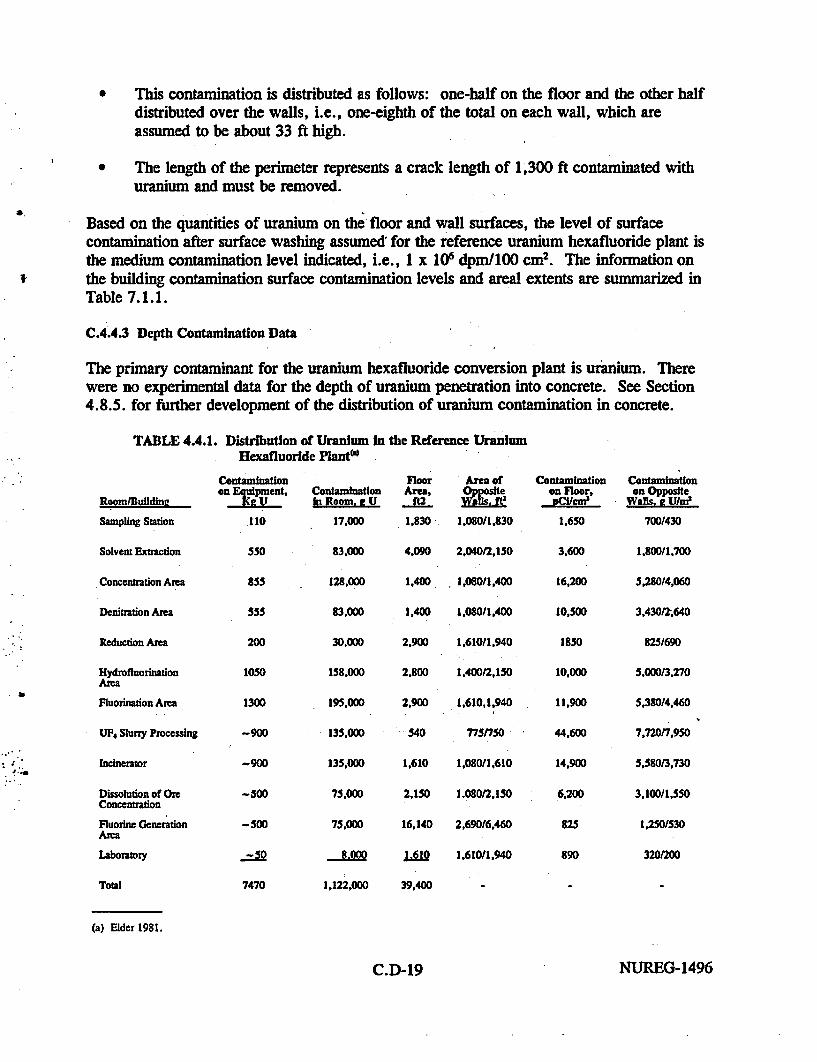
* This contamination is distributed as follows: one-half on the floor and the other halfdistributed over the walls, i.e., one-eighth of the total on each wall, which areassumed to be about 33 ft high.
* The length of the perimeter represents a crack length of 1,300 ft contaminated withuranium and must be removed.
Based on the quantities of uranium on the floor and wall surfaces, the level of surfacecontamination after surface washing assumed for the reference uranium hexafluoride plant isthe medium contamination level indicated, i.e., 1 x 10⁶ dpm/100 cm2. The information onthe building contamination surface contamination levels and areal extents are summarized inTable 7.1. 1.
C.4.4.3 Depth Contamination Data
The primary contaminant for the uranium hexafluoride conversion plant is uranium. Therewere no experimental data for the depth of uranium penetration into concrete. See Section4.8.5. for further development of the distribution of uranium contamination in concrete.
TABLE 4.4.1. Distribution of Uranium In the Reference UraniumHexafluoride PlantCm
RoomDulldine
Sampling Station
Contamination1n Equipment,
.110
ContaminationIn Room. l U
17,000
FloorArea,
02
1,830
Area of
1,0al/,8 f3
1,osou1,s30
confmitaionon Floor,
1,650
Centaminationon Opposite
Walls. e U/U?
700/430
Solvent Extraction
Concentration Area
Denitration Area
Reduction Area
HydrofluorinationArea
Fluorination Area
UF, Slurry Processing
Incinerator
Dissolution of OreConcentration
Fluorine GenerationArea
lUboratory
550
855
555
200
1050
1300
-900
-900
-500
-S50
83,000
128,000
83,000
4,090 2,040/2,150
1.400 1j,080/1400
1,400 1,080/1,400
30,000 2,900 1,610/1.940
158,000 2,800 1,400/2,150
195.000 2.900 1,610,1,940
135.000 540 77snso
3,600
16,200
10s500
1850
10,000
11,900
44,600
14,900
6,200
825
1,80D/1,700
5,280/4,060
3,430/2;640
825/690
5,000/3,270
5,380/4,460
7,720n,930
5,580/3,730
3,100/1,550
1.250S530
320nc0
135,000
75,000
1,610 1,080/1,610
2,150 1.080/2.150
75,000 16.140 2,69016,460
S.000
1,122,000
1.610 1,610/1,940
39,400 -
890
Total 7470
(a) Elder 1981.
C.D-19 NUREG-1496

C.4.5 Reference Non-Fuel-Cycle Plants
Non-fuel-cycle facilities are those facilities which handle byproduct, source, and/or specialnuclear materials but are not involved in the production of nuclear power.
Non-fuel-cycle facilities make up a wide variety of different facilities with widely varyinglevels of contamination. For the purposes of developing reference facilities for analysis, thewide variety of facilities are broken down into the following general types:
* material manufacturers, including (1) radioactive sealed source manufacturers, and (2)radiochemical and radiopharmaceutical manufacturers
* broad research and development program facilities including academic and medicalinstitutions, and companies using, distributing, or handling radioisotopes for industrialpurposes, etc.
* ore processors
* licensees who use either sealed radioactive sources or small amounts of short-livedradioactive materials, including sealed gauges, well loggers, sealed radiographersources, sealed irradiator sources, sealed special nuclear material sources, and leak-test sources.
These latter types of facilities are not examined in the analyses presented in this reportbecause, unless there has been an unusual occurrence, the sealed sources can be removedwith no remaining contamination. In the event of an unusual occurrence that leads tocontamination, the common practice is to immediately remove the contamination and restorethe facility to normal conditions for unrestricted use. Reference facilities are analyzed foreach of the above categories, as described in the following subsections.
C.45.1 Reference Sealed Source Manufacturer
The sealed source manufacturing process is a hand operation that is carried out in buildingswhich contain a number of small laboratories, each of which is devoted to a specific processand/or isotope. The reference sealed source manufacturer is a laboratory which processes'13Cs and 'Co. Contaminated facilities associated with the reference sealed sourcemanufacturer include:
* hot cells, fume hoods, workbenches, sinks
* laboratory floor and wall areas
* building areas used for storage of waste drums.
NUREG-1496 C.D-20

The situation for radiochemical and radiopharmaceutical manufacturers would be very similarto that of the sealed source manufacturer, and is not examined further in this report.
Advanced Medical Systems, Inc. (AMS) is used as the reference sealed source manufacturer.It is a licensed non-fuel-cycle plant in Cleveland, Ohio, that manufactures cobalt-60 andcesium-137 capsule sources for use in medical teletherapy devices and radiography machines(NRC 1993).
The AMS operations occupy about one quarter of an 8,000-ft2 (ground floor) warehousebuilding. The remainder of the building is unused. The facility occupies portions of threefloors in the warehouse. The first floor consists of an office area, an isotope shop area, ahot cell, a shielded work room, and a storage area. The second floor area houses amechanical equipment room and an exhaust ventilation equipment room. A liquid wastehandling room and the former liquid waste holdup tank room and dry waste storage area arelocated in the basement. Waste is stored in a locked room with roped areas on the south sideof the warehouse area.
The floor surface areas are estimated to be 6,000 ft2 (assuming three floors). The indoorsurface area of the walls (estimated at 10-ft high) is estimated to be 4,600 ft2. The perimetercrack length is estimated to be approximately 300 ft.
A 1985 survey by Oak Ridge Associated Universities (ORAU) found surface contaminationin a hot cell, the ventilation system, the dry waste storage area, the liquid waste area, andthe holding tank and its piping. No offsite contamination was found. However, somedetectable activity (attributed to stack effluent releases) was found in sediments, soil, andvegetation in the southern portion of the AMS property. The ORAU survey showedcontamination up to 1.51 x 10⁶ dpm/100 cm2 in the hot cell access port in the isotope shoparea, an area normally expected to be highly contaminated. A water sample -from the liquidwaste room floor contained 1.75 x IV0 pCi 'Co/L. Sediment from the loading dock drainshowed low, but detectable levels of activity.
About one-tenth of the concrete surface area is assumed to be contaminated with 6'Co, whichwas the principal contaminant measured by ORAU. Section 4.8 provides a summaryassessment of the level of surface and shallow subsurface building contamination. Based onthe information in that section and the data obtained on contamination at the non-fuel-cyclefacilities, the level of surface contamination after surface washing assumed for the referencesealed source manufacturer is the medium contamination level in Table 4.8.1. The shallowsubsurface contamination depth profile is described in Section 4.8.3. The information on thebuilding surface contamination levels and areal extents are summarized in Table 7.1.1.
C.4.5.2 Reference Rare Metal Extraction Faclity
The reference rare metal ore processor is a plant that refines raw ore materials for therecovery of rare metals such as tantalum and niobium. The raw ores can contain appreciablequantities of uranium and thorium, which are waste tailings of the refining process.
C.D-21 NUREG-1496

Contaminated facilities and areas associated with the reference rare metal ore processorinclude:
* Buildings in which slag is processed and the rare metals are extracted. Significantbuilding contamination is not expected.
* Settling ponds on-site containing the tailings from the metal extraction process, andcontaining essentially all of the thorium and uranium. The pond is assumed to beunlined at the reference rare metal ore processor, although it may be lined at newerfacilities.
* A site area of 7.4 x 105 ft2
* Slag Pile containing solid wastes from the extraction process.
The reference rare metal extraction facility is the Molybdenum Corporation of Americafacility (NRC 1993), which occupies a 17 acre (740,000 ft2) site, and produced a ferro-columbium alloy from a Brazilian ore from 1964 to 1970 (Martin 1985). The ore containedlicensable concentrations of thorium (1-1.5%), and so the operation produced thorium-bearing slag and contaminated soil. The material was collected and segregated in 1972, andsome of it was removed off-site. The remainder was placed in a clay-capped pile on theproperty.
The site contains a number of buildings, eight holding ponds and a large slag pile. Building34 has up to 90 dpm/100 cm2 fixed alpha contamination, up to 8680 dpmllO0 cm2 fixed betacontamination, and direct radiation levels up to 169 1&R/h. The source of the direct radiationlevel is suspected to be below the floor. The total area of floors is estimated from Figure 7in Martin (1985) to be 150,000 ft2; 40% of this surface is estimated to be contaminated withthorium. The surface area of the walls is estimated to be 180,000 ft2 and 10% is estimatedto be contaminated with thorium. Thorium contamination levels and extent for the referencefacility are given in Table 7.1.1.
C.4.5.3 Reference Broad Research and Development Facility
Research and development facilities using radioactive materials cover a broad range ofactivities including the use of laboratories or health treatment facilities that use radioisotopes.Both short-lived eH) and long-lived isotopes (14C) may be used. The reference facilityincludes rooms for synthesis of labeled compounds and for preparing radioactive samples, alaboratory, a counting room, and a storage room. Only long-lived nuclides are included inthis analysis. Contaminated facilities associated with the reference broad research anddevelopment facility include:
* glove boxes, fume hoods, sinks, workbenches;
* laboratory floor and wall areas;
* a storage area.
NUREG-1496 C.D-22

A generic single building facility is used in the analyses for a reference broad R&D facility,because such facilities vary widely in size. However, for an R&D facility comprised ofseveral buildings, the waste volumes, costs, etc. can be reasonably approximated bymultiplying the results for a single building by the number of buildings in the facility.
The floor area of the facility is estimated to be approximately 6,000 ft2. Approximately 10%of this area is estimated to be contaminated with '"Cs and I Co. The crack length isestimated to be approximately 320 ft. The wall area is estimated to be approximately 4,600ft2. Approximately 5% of this area is estimated to be contaminated. Section 4.8 provides asummary assessment of the level of surface and shallow subsurface building contamination.Based on the information in that section and the data obtained on contamination at the non-fuel cycle facilities, the level of surface contamination after surface washing assumed for thereference broad R&D facility is the medium contamination level in Table 4.8.1. The shallowsubsurface contamination depth profile is described in Section 4.8.3. The information on thebuilding surface contamination levels and areal extents are summarized in Table 7.1.1.
C.4.6 Reference Uranium Mills
Milling of uranium ores involves the following basic steps: 1) ore handling and preparation,which may include blending, crushing, grinding, and pretreatment; 2) chemical processingand concentration, and 3) product recovery, in which the product is recovered by chemicalprecipitation and dried and packaged for shipment.
Conventional uranium mills licensed by the NRC, and currently or previously operating,ranged from a capacity of about 500 MT/day to 6000 MT/day with most in the range of1000 to 2500 MT/day. Uranium tailings represent the bulk of the wastes generated duringthe milling process. When discharged from the mill, the tailings material is pumped to animpoundment (tailings pond). Tailings pond areas ranged from 50 acres to 300 acres withmost in the range of 100 to 250 acres (NRC 1980, Vol. III, Table T. 1).
The Monticello mill site is used as the reference uranium mill site as it provides an exampleof a contaminated site undergoing cleanup. Originally owned by the Vanadium Corporationof America, the site was used as a vanadium mill from 1942-1943, and a vanadium/uraniummill from 1943-1944 (EPA 1990). In 1948 the site was purchased by the Atomic Energy'Commission and used for uranium milling from 1949-1960, when it was closed permanently.Numerous milling operations were used during the site's history, including raw ore carbonateleach, low-temperature roast/hot carbonate leach, salt roast/hot carbonate leach, acid leachresin-in-pulp with raw ore carbonate leach, and carbonate pressure leach resin-in-pulpprocesses. Tailings piles were regraded, stabilized, and vegetated by the AEC from 1961-1964. In 1972, additional radiation surveys conducted for the AEC indicated uncoveredresidual surface contamination in soil, which was removed and dumped on top of thepreviously covered tailings piles. The Monticello millsite (78 acres) was included as a partof DOE's Surplus Facilities Management Program in 1980, and contaminated vicinityproperties (240 acres) designated as a separate remedial action project in 1983.
~C.D-23 NUREG-1496
Based on photographs of a model mill shown in NRC (1980 Vol. I), the area of the floors(assumed to be concrete) and walls are estimated to be 100,000 and 130,000 ft2 , respectively.The perimeter crack length is estimated to be 2,000 ft. Based on the apparent nature of theoperations they are assumed to be contaminated over 100% of the surfaces. Thecontamination level is assumed to be the medium level from Section 4.8.1.
With regard to the tailings impoundment, a general license is issued under 10 CFR 40.28 forthe custody and long-term care of the tailings to comply with standards for uranium milltailings sites reclaimed under the Uranium Mill Tailings Radiation Control Act of 1978. Thelicensee for the tailings impoundment will be the DOE, other Federal agencies, or States.Hence, long-term management of the tailings impoundment is outside the scope of this reportand is not discussed further.
C.4.7 Reference Dry Independent Spent Fuel Storage Installation
The large majority of ISFSIs in the U.S. use some form of dry storage. The reference ISFSIis a dry ISFSI with capacity of 811 MT of fuel.
Potentially contaminated facilities and areas associated with the reference dry ISFSI varywith the type of design, but the only dry ISFSIs now licensed are collocated at reactor sites.The reference dry ISFSI is collocated at the Virginia Power Company's Surry Reactor Plant(McKay et al. 1989). The fully implemented ISFSI facility will consist of three reinforcedopen air concrete pads on which the vertical sealed metal casks are placed. The concretepads are 70 m by 10 m by approximately 1 m thick. The total surface area of the three padsis about 23,000 ft2. Each pad is designed to accommodate 28 casks. There are no hot cells;the fuel is loaded into sealed casks and/or canisters at the reactor fuel handling facility. Thecasks arrive free of contamination at the storage site.
Although the dry storage ISFSI cask is designed and sealed to prevent release ofradionuclides and contamination is not expected, it is assumed that 10% of the concretesurface becomes contaminated. The basis for this estimate is release of undetectedcontamination carried on the external surfaces of the storage cask to the storage pad. Thedry storage casks will be removed prior to site decommissioning.
Section 4.8 provides a summary assessment of the level of surface and shallow subsurfacebuilding contamination. Based on the information in that section and the data obtained oncontamination at ISFSIs, the level of surface contamination after surface washing assumedfor the reference broad R&D facility is the low contamination level in Table 4.8.1. Theshallow subsurface contamination depth profile is described in Section 4.8.3. Theinformation on the building surface contamination levels and areal extents are summarized inTable 7.1.1.
NUREG-1496 C.D-24
C.4.8 Contaminant Surface Levels and Penetration Profiles
An important part of the analyses is the definition of the radionuclide surface contaminationand the concentration profiles of contaminants that have penetrated the surfaces. Surfacecontaminant and concentration profiles were based on actual data, when available, and ontheoretical estimates based on calculated diffusivity coefficients for the various radionuclidespecies of interest in these analyses when actual data were not available.
C.4.8.1 Empirically Measured Radionuclide Source Term and Depth Distribution In Concrete
Radionuclide contamination of concrete surfaces at nuclear power stations is of two types: 1)surface and shallow subsurface contamination resulting from both spills/leakage ofradioactive materials and/or deposition of radioactive aerosols, and 2) contaminationproduced in situ by neutron activation of concrete located near the pressure vessel by thesmall flux of neutrons escaping from the vessel. Contamination produced by neutronactivation is discussed in Sections 4.1 and 6.3. The following sections address surface andshallow subsurface contamination, and include an estimation of the isotopic composition,quantities, extent of contaminated surfaces, and depth of penetration of the radionuclides inthe concrete. Since this assessment will ultimately lead to an estimation of the amount ofconcrete that must be removed to comply with alternative dose criteria associated withresidual levels of contamination, only those gamma-emitting radionuclides of significantabundance have been considered. Although typical residual radionuclide compositions fromnuclear power plants do contain significant amounts of several pure beta or low-energyphoton emitters (e.g., 55Fe, 63Ni), their contribution to the total gamma dose rate would betrivial.
C.4.8.2 Radionudide Source Term for Surface Concrete Contamination
Approximately 100 concrete cores from seven nuclear power stations were collected andanalyzed for radionuclide constituents during an earlier investigation (Abel et al. 1986). Thisdata base has been reassessed to provide a range and geometric mean of the radioactivitylevels observed in contaminated concrete from many different areas within a nuclear powerplant, as shown in Table 4.8.1. These core samples were collected approximately 20 yearsafter the plant operations were begun. Therefore, the value of 20 years was used for timedependent calculations. These radioactivity levels would be lower after a longer time periodbecause of radionuclide decay. The 'Co and '"Cs concentrations found in the surfaceconcrete (pCi/cm3) for all the concrete cores obtained during the earlier study are shown inFigures 4.8.1 and 4.8.2 respectively. The three numbers labeled on the graph are thegeometric means of each group from Table 4.8.1. Concrete cores were from areas affectedby both wet and dry contaminants. These figures show the surface concentration on thevertical axis versus percentile ranking. The relatively straight line semi-log percentile plotsindicate the data are log-normally distributed and can therefore be best represented by ageometric mean.
C.D-25 CI2NUREG-1496

Three radioactivity concentration ranges were selected for conveniently describing thequantities of the most abundant gamma-emitting radionuclides (6OCo and '13Cs) observed inthe concrete:
* Low contamination = <100 pCi/cm3
* Moderate contamination = 100 to 10,000 pCi/cm3
* High contamination = > 10,000 pCi/cm3 .
The log-normal distributions demonstrated in Figures 4.8.1 and 4.8.2 provide the justificationfor selecting the geometric mean to represent the contamination level for each of the threegroupings. For definition of the three levels of contaminated core samples, contaminationwas defined as low when both 'Co and 137Cs were below 100 pCi/cm3 , as moderate wheneither 6wCo or "7Cs were above 100 pCi/cm3 and both were below 10,000 pCi/cm3 , and ashigh when either 6OCo or 137Cs exceeded 10,000 pCi/cm3. Therefore, the geometric mean forcesium identified by the arrow in the high range in Figure 4.8.2 is located near the mediumto high boundary and was influenced by samples that were highly contaminated with 'Cowhile the same samples contained less than 10,000 pCi/cm3 '37Cs at the surface.
TABLE 4.8.1. Radionuclide Contamination Calculated for Surface-Contaminated Concrete fromSeven Nuclear Power Stations
Geometric Mean Concentration.( pCi/cm 3
.4
Radionuclide
WCo
'37Cs
"_UCs
'aCo
54Mn
'IwRu/Rh
"5Zr/Nb
'ssb
LowContamination
4.4
1.4
0.45
0.49
0.22
0.15
0.18
0.04
0.22
ModerateContamination
460
150
46
50
23
16
19
4.5
2.3
HighContamination
34,000
11,000
3400
3700
1700
1200
1400
330
170
(a) I pCi/cm' is equivalent to 222 dpm/100 cm2.
NUREG-1496 C.D-26

" to aE
10
- 4C 1020
L 3I 10
C
4,
C 2
a 10C
o_
0
*o 10
0.4-
= -IO 10
V . I0 20 40 60 80 100
Percentile Ranking
FIGURE 4.8.1.
V)E 17
E l
EL .
C\ I 0.N 6
- 100.q- 30
C 10
Q
r- 2
O 10 -
C
C 10I.12a
oCI02a lC0 2
* 4 .FIUE4a 2
Concentrations of '0Co In pCI/cm3 Measured on Surface Concrete fromSeven Nuclear Power Stations
20 40 60 s0
Percentile Ranking100
Concentrations of L'Cs In pCikcm3 Measured on Surface Concretefrom Seven Nuclear Power Stations
C.D-27 NUREG-1496
In general, the gamma-emitting radionuclide composition at commercial nuclear powerstations is reasonably uniform throughout the nuclear power industry. Table 4.1.2, shownpreviously, lists the average percent composition of gamma-emitting radionuclides in dryactive waste (a good analog for contaminated concrete surfaces) for six PWR stations andfour BWR stations, and the average percent composition for all ten stations combined. Dryactive waste (DAW) is a mixture of radioactively contaminated items typically generated atnuclear power stations, (e.g., trash, protective clothing, gloves, equipment, tape, plasticsheeting and bags, etc.) and the radioactive material associated with DAW would be expectedto be reasonably representative of that found on surface contaminated concrete. Thesemeasurements were made on over 100 DAW samples during a recent study conducted byBattelle, Pacific Northwest Laboratories for the Electric Power Research Institute todetermine the industry-wide variability in the radionuclide composition of very low-levelwastes generated at nuclear power stations (Robertson et al. 1989).
6OCo plus 137Ce comprise 81 % of the total gamma-emitting radionuclides for the averagecomposition of DAW for all stations. The geometric mean concentrations for these twonuclides were then divided by 0.81 to obtain the geometric mean concentrations for the totalof all of the significant gamma-emitting radionuclides measured. The total geometric meanvalues were then broken down into the individual isotopic geometric means for each gamma-emitting radionuclide in surface-contaminated concrete using the average percentagecomposition for all stations given in Table 4.8.1. The individual isotopic geometric meanvalues, given in Table 4.8.1, represent the source term for gamma-emitting radionuclideconcentrations for the three levels of contamination (low, moderate, and high) observed on
'the concrete surfaces. A similar analysis for uranium-contaminated facilities was given inSection 4.3.2
Sections 4.1, 4.2, 4.5, and 4.7 use the information in Table 4.8.1 for the level of buildingsurface contamination for the different reference facilities. The level of contaminationassumed depends on the type of facility.
C.4.8.3 Depth Distribution of Radionuclides in Concrete
Estimation of the concentration of radionuclide contamination with concrete depth isnecessary to estimate the amount of contaminated concrete which must be removed to attainan acceptable surface gamma dose rate following decommissioning. This assessment isdifficult because of the many factors which affect the penetration rates of radionuclides inconcrete (e.g., the use and integrity of protective coatings on the concrete, the degree andfrequency of wetting of the concrete surfaces, the existence of cracks in the concrete, themineralogy of the concrete, etc.). However, a conservative estimate of the depth ofpenetration of the radionuclides has been made which will allow for reasonable estimates ofthe costs for concrete remediation during decommissioning. This estimate was made in themanner described below. Analyses considering both empirical and theoretical assessmentsare discussed in the sections below.
NUREG-1496 C.D-28

C.4.8.4 Use of Empirical Data
First, the depth distributions of 'Co and '13Cs (the two most abundant gamma-emittingradionuclides in contaminated concrete) in a number of concrete cores from retired nuclearpower stations measured in an earlier study (Abel et al. 1986) were examined to select themost conservative (fastest) penetration rates. Several cores collected from the sump floor ofthe reactor containment building of the Indian Point Unit I nuclear power station wereselected because the surface of this concrete was bare (not painted) and wet, and representedthe most favorable conditions for penetration into the concrete. This reactor, a 285 MWePWR, had operated from 1962 until 1974, and the concrete cores were collected in 1982,some 8 years after reactor operations ceased.
Concrete core IP-15 from the condensate and condensate return area was selected as the corerepresenting the most rapid penetration of 60Co and 1"7Cs into the concrete, and the depthdistribution of these radionuclides to 3 cm into the concrete is presented in Figure 4.8.3. Asshown in the figure, the 137Cs concentration decreased by over four orders of magnitude inthe first 1 cm of concrete and much less thereafter. The 137Cs observed below a depth of 1cm may possibly be due to cross-contamination of the lower sections resulting from thecoring and sectioning operations. The 'Co concentrations decreased only two orders ofmagnitude over the first 1 cm of concrete and appeared to penetrate much deeper into theconcrete. This indicates that the 'Co penetrates into the concrete at a faster rate comparedto the 137Cs, under wetted surface conditions.
V0E._
0
c
I-1
0C)
0
C,0
._
C)
00
1E+07
1 E+06
1 E+05
1 Et04
1 E+03
1 E+02
1 E+O 1
IE+000
MCs-1 37ALCo-50
5 10 15 20 25 30 35
Concrete Depth, mm
FIGURE 4.8.3. Depth Distribution of 'Co and "iCs in Indian Point Unit 1 Concrete Core IP-15
C.D-29 2NUREG-1496
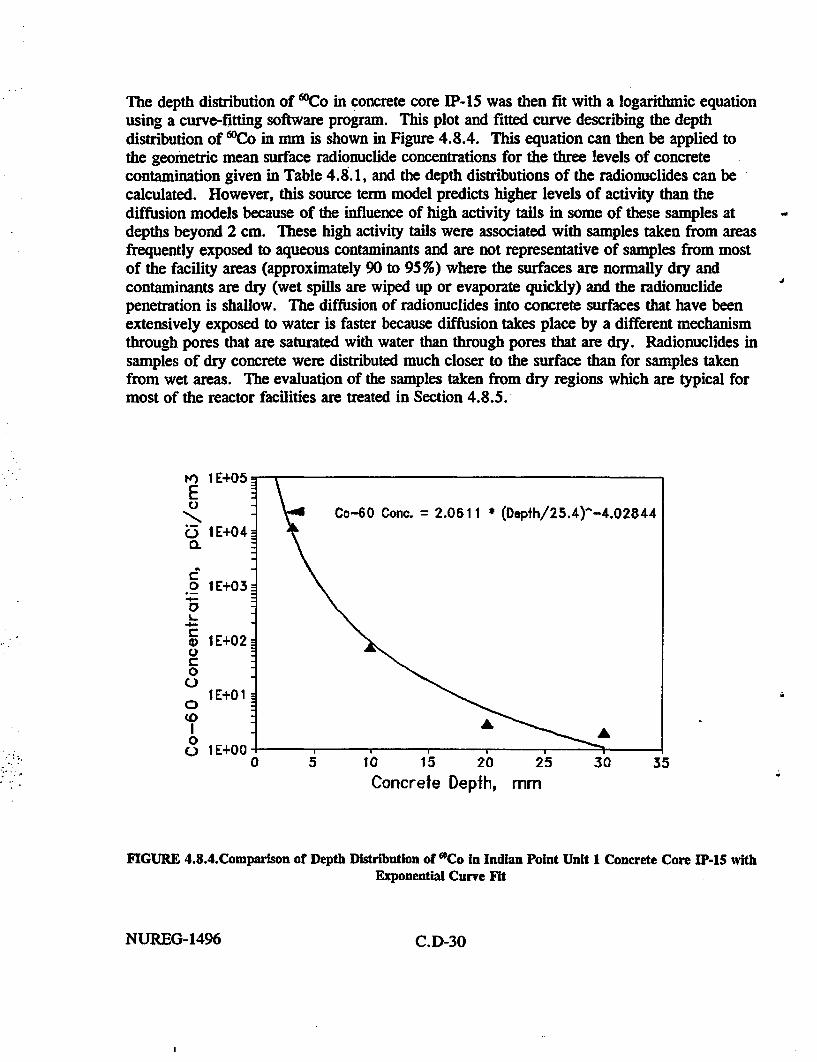
The depth distribution of 'Co in concrete core IP-15 was then fit with a logarithmic equationusing a curve-fitting software program. This plot and fitted curve describing the depthdistribution of 'Co in mm is shown in Figure 4.8.4. This equation can then be applied tothe geometric mean surface radionuclide concentrations for the three levels of concretecontamination given in Table 4.8.1, and the depth distributions of the radionuclides can becalculated. However, this source term model predicts higher levels of activity than thediffusion models because of the influence of high activity tails in some of these samples atdepths beyond 2 cm. These high activity tails were associated with samples taken from areasfrequently exposed to aqueous contaminants and are not representative of samples from mostof the facility areas (approximately 90 to 95%) where the surfaces are normally dry andcontaminants are dry (wet spills are wiped up or evaporate quickly) and the radionuclidepenetration is shallow. The diffusion of radionuclides into concrete surfaces that have beenextensively exposed to water is faster because diffusion takes place by a different mechanismthrough pores that are saturated with water than through pores that are dry. Radionuclides insamples of dry concrete were distributed much closer to the surface than for samples takenfrom wet areas. The evaluation of the samples taken from dry regions which are typical formost of the reactor facilities are treated in Section 4.8.5.
i) 1E+05EU
N'c3 1E+04
o 1E+03
L.-4--C1 1E+020C0
I E+0 1(0
0() IE+00
0 5 to 15
Concrete Dep20 25 30 35
Th, mm
FIGURE 4.8.4.Comparison of Depth Distribution of 'Co in Indian Point Unit 1 Concrete Core IP-1S withExponential Curve Fit
NUREG-1496 C.D-30
The concrete core samples taken at nuclear power stations during an earlier study weregenerally taken in areas of known or suspected contamination. Many of the cores were takenin areas where spills occurred occasionally to frequently. It would appear that penetrationhas occurred in many of the cores which exceeds the depth predicted from diffusion theory.There are several possible explanations for the observed versus predicted concentrationprofiles.
First, there exists the possibility that the lower segments of cores could have been cross-contaminated during the sample preparation process. The core sectioning was accomplishedusing a lapidary saw with recycling water for blade coolant. This coolant could possiblyhave introduced contamination onto the surface of the lower section of the core during thecutting process. This does not appear to be the most likely explanation, since not all coresappear to have been affected. Additionally, core segments were well rinsed with distilledwater after segmentation.
To verify that the radionuclide concentration tails were not originally contained in theconcrete prior to contamination, it is noted that core samples of concrete taken fromPathfinder that had been coated with epoxy, clear sealer, and gray paint prior to becomingcontaminated were below the limits of detectibility for both "'Cs and 6'Co below a depth of 1cm (Abel et al. 1986). For these samples, most of the contamination was removed with thecoating and little contamination remained to contaminate the concrete core samples.
The most plausible explanation appears to be that those cores where deeper penetration ofradioisotopes has occurred were frequently in locations that were wet to damp such as arounddrains, sumps, and pits. In such cases, deeper penetration than expected from diffusion ofdry contaminants has been reported by Angus et al. (1990). Additional credibility is addedto this hypothesis by the fact that more cores at Indian Point Unit 1 appear to have deeperpenetration. This facility had a history of spills and leaks. Finally, one core taken atDresden Unit 1 over a chemical spill which occurred during the Dow Chemicaldecontamination of the coolant system showed very enhanced penetration for both 6OCo and"'Cs. This core definitely illustrates that chemical parameters can influence and enhanceradionuclide migration into the concrete.
Angus et al. (1990) reported that '"Cs in an aqueous solution continuously in contact with.concrete penetrates deeper than from a dry surface contaminant. Soluble '"Cs in contactwith an unprotected concrete surface migrates through the water-filled pore network andcontaminates the concrete to a depth dependent on the rate of liquid diffusion and the extentto which that isotope is sorbed in the concrete. The pore network of dry concrete is driedout close to the surface; the aqueous transport mechanisms required for transport of theactivity into the concrete are therefore limited. This effect is illustrated inFigure 4.8.5 as the 1 x 10⁵ pCi/g (0.1 pCilg) cesium-137 tail that extends to a depth of atleast 15 cm. The lower-level concentration tails shown in Figure 4.8.5 are attributed toeffects of exposure of the concrete to wet contamination and cross contamination of samples.A minor contribution to these tails may be attributable to neutron-induced fission of uranium
C.D-31 NUREG-1496

that occurs naturally in concrete at levels of approximately 2 ppm3 in concrete core samplesremoved from areas located near reactor cores.
C.4.5.5 Calculation of Concrete Radionuclide Penetration by Diffsion
The penetration of diffusing radioisotopes into a semi-infinite medium of concrete wascalculated using the solution given in Crank (1956 Equation 2.7), for linear flow from aplanar source deposited initially at the surface of a semi-infinite cylinder (singlecontamination event). The solution is shown as Equation 1. Other solutions are available incases where the planar source varies with time (multiple contamination events). If the valueof the diffusivity for the isotope is assumed to be constant and the concrete is free ofsignificant porosity or cracks, then the concentration penetrated at the end of a specificexposure period is
C(xt) = [C(x,O)/(;rDt)0 -]exp(-x2/4Dt) [1]where
C(xt) = concentration of the isotope at distance "xm beneath the surface
at time t
C(xO) = concentration of the isotope deposited initiallyx = distance beneath the surfaceD = diffusivityt = exposure period.
The surface concentration at time t is
C(O,t) = C(x,O)/(rDt)05 exp(-x 2/4Dt) [2]= C(x,O)/(TDt)0'
If C(xO) is unknown, then C(x,O)/(TrDt)0l can be replaced with C(O,t) which is the morecommonly available surface concentration after exposure period t.
ThenC(x,t) = C(O,t)exp(-x2/4Dt) [3]
Difflusivity for '37Cs
The value selected for this diffusivity for '37Cs is:
D = 1 to 10 x i-'1 cm2/s (Muurinen, Penttilae, and Rantanen 1986)
3 Abel. K. H. 1993. Personal Communication, Pacific Northwest Laboratory. Richland. Washington.
NUREG-1496 C.D-32
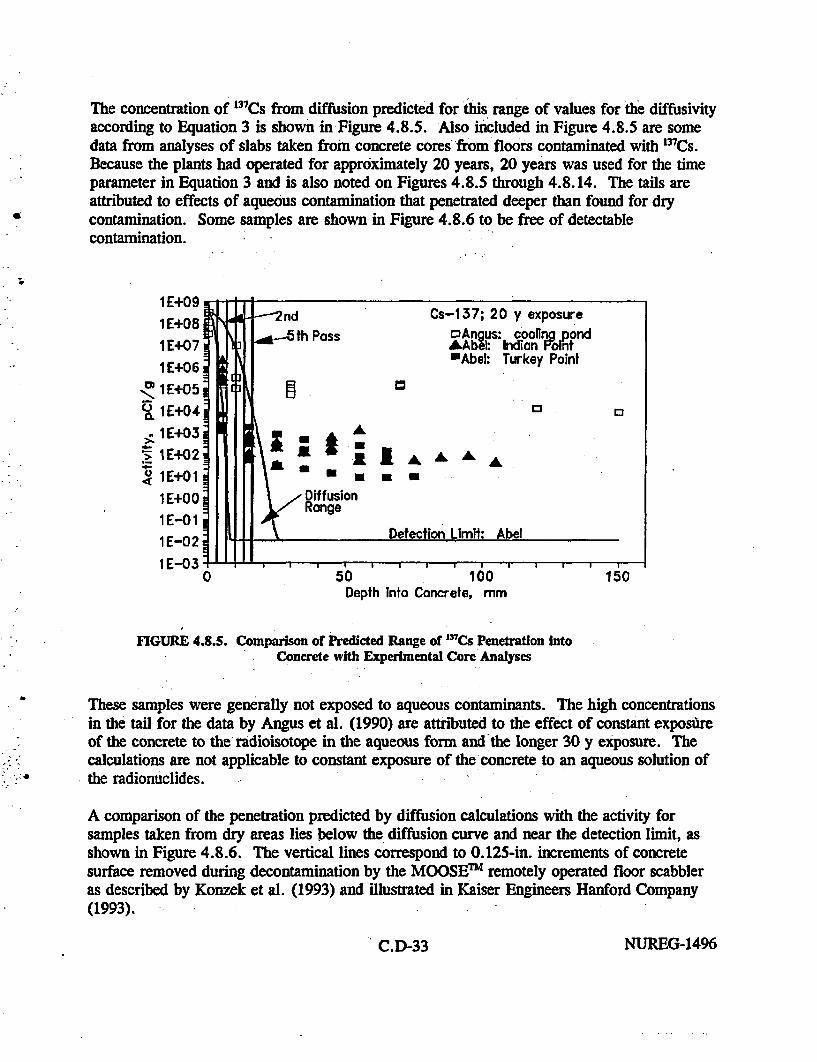
The concentration of "37Cs from diffusion predicted for this range of values for the diffusivityaccording to Equation 3 is shown in Figure 4.8.5. Also included in Figure 4.8.5 are somedata from analyses of slabs taken from concrete cores from floors contaminated with 137CS.Because the plants had operated for approximately 20 years, 20 years was used for the timeparameter in Equation 3 and is also noted on Figures 4.8.5 through 4.8.14. The tails areattributed to effects of aqueous contamination that penetrated deeper than found for drycontamination. Some samples are shown in Figure 4.8.6 to be free of detectablecontamination.
1 E+09
1E+08 nd Cs-137; 20 y exposureth Pass DAn us: colpondI E+07 AkAbl kidian oint
1 E+06 BAbel: Turkey Point1E+05.lE+04 3 0
1 E+03 Z n AL
1E+02 E A, A, AL<Z1 E+01 ALa u.
1E+00 Riffusion1 E-0 1 ag1 E-02 Detection Limit: Abel1E-03 . .I a A
Depth Into Concrete, mm
FIGURE 4.8.5. Comparison of Predicted Range of "'Cs Penetration into; Concrete with Experimental Core Analyses
These samples were generally not exposed to aqueous contaminants. The high concentrationsin the tail for the data by Angus et al. (1990) are attributed to the effect of constant exposureof the concrete to the radioisotope in the aqueous form and the longer 30 y exposure. Thecalculations are not applicable to constant exposure of the concrete to an aqueous solution ofthe radionuclides.
A comparison of the penetration predicted by diffusion calculations with the activity forsamples taken from dry areas lies below the diffusion curve and near the detection limit, asshown in Figure 4.8.6. The vertical lines correspond to 0.125-in. increments of concretesurface removed during decontamination by the MOOSE' remotely operated floor scabbleras described by Konzek et al. (1993) and illustrated in Kaiser Engineers Hanford Company(1993).
C.D-33 NUREG-1496

The profile corresponding to the maximum value of the diffusivity provided the mostconservative agreement with the data and is considered to be applicable to migration of drycontaminants. Therefore the maximum diffusivity will be used for further evaluations of1"7Cs concentrations in concrete.
I1E+09.iE
I E+08 iI E+07 II1E+06 i
*"T I E+0 5
. 1E+04 iI E+03~
`> I E+02 u
1 E+O0 I
I E-01 IIE-02jI E-03:
I *4 I 1I
II
Ki2nd.&--5th Pass
Diffusion
Cs-1 37; 20 y exposureAbgus: cooling pond
,&A hi: MonticellobAbes Pathfinder
Defection Limnit: AbeLU
U0 0
I .~ . . .
0 50 100Depth into Concrete, mm
150
FIGURE 4.8.6. Comparison of Predicted Maximum '3Cs Penetration Into Concrete withExperimental Core Analyses
Serne4 indicated that the values for diffusivity of "3Cs (approximately 5 to 10 x 10-9 cm 2s)for grout and cement from Matsuzuru and Ito (1977) and by Dayal, Arora, and Morcos(1983) may be higher than that found for concrete because 1) the high salt content of thegrout samples may reduce the potential for chemical reaction of 137Cs with the base groutconsistency and thereby increase the mobility of the 137Cs and 2) the aggregate and otherconstituents in concrete that are not present in the cement grout compounds may chemicallyreact with 137Cs and retard its mobility. Because the range of values reported by Muurinen,Penttilae, and Rantanen (1986), are preferred for concrete and provide the best consistencywith the penetration profiles for surface contaminated concrete, as presented in Figure 4.8.6,they are used in this analysis.
4 Personal Communication by R. J. Seme to E. R. Gilbert, June 1993, Pacific Northwest Laboratory, Richland, Washington.
NUREG-1496 C.D-34
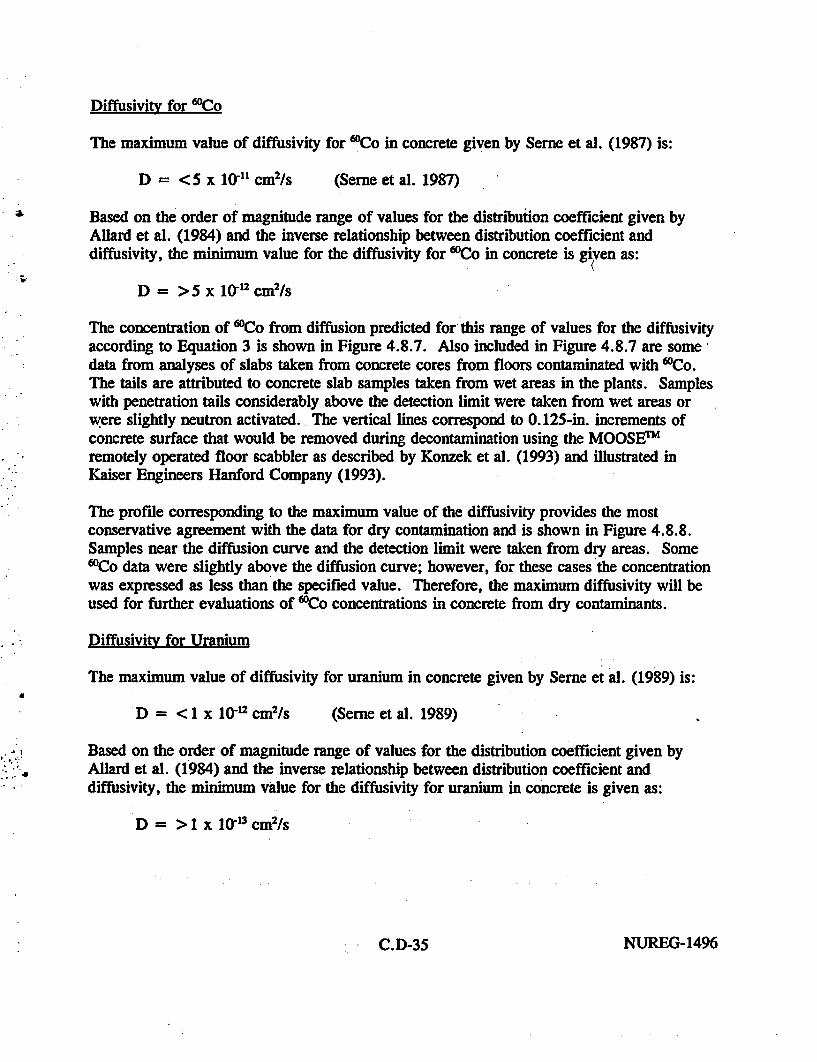
Diffusivitv for 6ECo
The maximum value of diffusivity for IOCo in concrete given by Serne et al. (1987) is:
D = <5 x 10P cm2ls (Serne et al. 1987)
Based on the order of magnitude range of values for the distribution coefficient given byAllard et al. (1984) and the inverse relationship between distribution coefficient anddiffusivity, the minimum value for the diffusivity for '"Co in concrete is given as:
D= > 5 x 102 cm2C s
The concentration of 'Co from diffusion predicted for this range of values for the diffusivityaccording to Equation 3 is shown in Figure 4.8.7. Also included in Figure 4.8.7 are somedata from analyses of slabs taken from concrete cores from floors contaminated with 6WCo.The tails are attributed to concrete slab samples taken from wet areas in the plants. Sampleswith penetration tails considerably above the detection limit were taken from wet areas orwere slightly neutron activated. The vertical lines correspond to 0.125-in. increments ofconcrete surface that would be removed during decontamination using the MOOSF'remotely operated floor scabbler as described by Konzek et al. (1993) and illustrated inKaiser Engineers Hanford Company (1993).
The profile corresponding to the maximum value of the diffusivity provides the mostconservative agreement with the data for dry contamination and is shown in Figure 4.8.8.Samples near the diffusion curve and the detection limit were taken from dry areas. Some60Co data were slightly above the diffusion curve; however, for these cases the concentrationwas expressed as less than the specified value. Therefore, the maximum diffusivity will beused for further evaluations of 'Co concentrations in concrete from dry contaminants.
Diffusivity for Uranium
The maximum value of diffusivity for uranium in concrete given by Serne et al. (1989) is:
D = < X 10x12 cm2/s (Serne et al. 1989)
Based on the order of magnitude range of values for the distribution coefficient given byAllard et al. (1984) and the inverse relationship between distribution coefficient anddiffusivity, the minimum value for the diffusivity for uranium in concrete is given as:
D = > 1 x 101 cm2/s
-. C.D-35 NUREG-1496
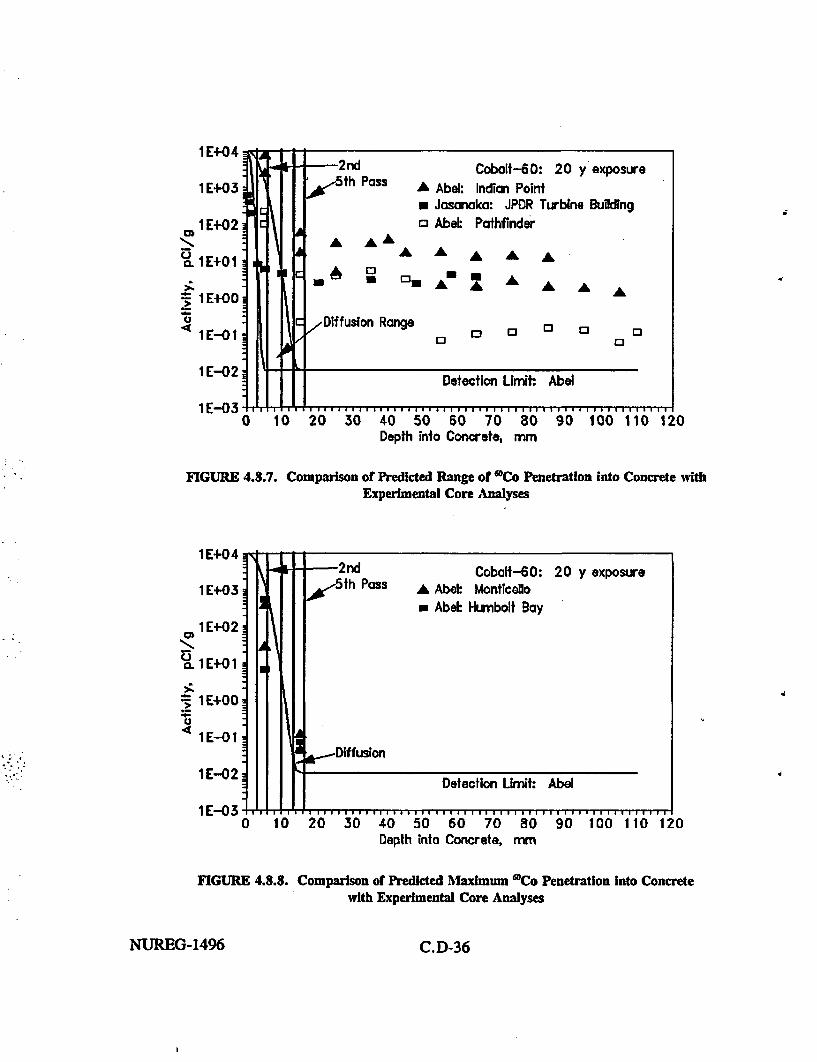
1 E+04
1 E+03
~-N
a
1 E+02
1 E+0 1
1 E+00
1 E-0 1
1 E-02
1 E-030
- 2nd Cobaltf-O: 20 y exposure5th Pass A Abel: Indian Point
* Jasancka: JPDR Turbine Buildingo Abek Pathfinder
A AA
A A A A A A
,Diffuslon Range D O 0 O0 0
Detection Lmit: Abel
4
.. 0 . I. . I..
D i t II ... e.e ..................... . . . .102 30 40 50 60 70 80Depth into Concrete, mmr
I... ......90 100 110 120
FIGURE 4.8.7. Comparison of Predicted Range of 'Co Penetration into Concrete withExperimental Core Analyses
1 E+04 .-2nd Cobalc-60: 20 y exposure
1 E+03 Ah Pass A Abel Monticello* Abel Hunbolt Bay
> 1E02
. 1E+ 1
I IE+00
l E-0 IDiffusion
1 E-02 Detection Llmit Abel
1 E-03 I T _ _ .I I I I I I0 10 20 30 40 50 60 70 80 90 100 110 120
Depth into Concrete, mrn
FIGURE 4.8.8. Comparison of Predicted Maximum '0Co Penetration Into Concretewith Experimental Core Analyses
NUREG-1496 C.D-36

The concentration profile for uranium from diffusion predicted for this range of values forthe diffusivity according to Equation 3 is shown in Figure 4.8.9.
The vertical lines correspond to 0.125-in. increments of concrete surface that would beremoved during decontamination using the MOOSE' remotely operated floor scabbler asdescribed by Konzek et al. (1993) and illustrated in Kaiser Engineers Hanford Company(1993). Tails in the concentration profiles are shown in Figure 4.8.9. This tail in theconcentration profile for uranium in concrete is predicted because of the natural occurrenceof uranium in concrete. Typical levels are approximately 2 to 3 ppm5. The profilecorresponding to the maximum value of the diffusivity provides the most conservativepredictions for dry contaminant. Therefore, the maximum diffusivity will be used for furtherevaluations of uranium concentrations in concrete from diffusion of dry surface contaminant.Uranium from wet contaminants would be expected to penetrate much deeper, similar to thecases for 137Cs and 6"Co, shown in Figures 4.8.5 and 4.8.7.
Diffusivity for Thorium
The maximum value of diffusivity for thorium in concrete is based on estimates by Serne andWood (1990) that are based on thorium solubility in cement (Ewart et al. 1992):
D = <I x 10.11 cm2/s.
A value of 1 x 10Y cm2/s is considered more reasonable. Both values are plotted in Figure4.8.10, but for conservatism the value of 1 x 10r" cm2 /s is used in this analysis.
Sunmmarv of Values Used in Analvses for Radionuclide Diffusivities=,
Diffusivity for 137Cs
Diffusivity for 'Co
Diffusivity for Uranium
D = I to 10 x 10." cm2%s(Muurinen, Penttilae, and Rantanen 1986)
D = 5 x 1011 cm2/(Serne et al. 1987)
D = < I x 1012 cm2/s(Serne et al. 1989)
Diffusivity for Thorium D = <lxl '" cm2 ls(Serne and Wood 1990)
5 Uranium occurs naturally in concrete at e concentration of approximately 2.7 Fg U/g(2.7 pg U/g x 0.7 pCi/tg U - 1.9 pCi U/g; 1.9 pCi U/g + 7.06 x 10' pCi/g U - 2.69 ppm).
- I C.D-37 NUREG-1496

. 1E+04
,- IE+03
4 1E+02
1 E+O 1
IEl-O0
Depth into Concrete, mm
FIGURE 4.8.9. Predicted Range of Uraniun Penetration into Concrete
1EI07
1 E+06
co 1 E+05
a. 1E+04
, 1E+03
< 1E+02
1 E+O 1
1 E000 2 4 6 8
Depth tnta Concrete, mm10
FIGURE 4.8.10. Predicted Range of Thorium Penetration Into Concrete
NUREG-1496 C.D-38

Materials Other than Concrete
Concrete is the major construction material in volume and surface area. Materials other thanconcrete, including concrete block, may be absorbent, unless coated with a sealer. Theeffectiveness of the seal depends on the paint quality. Because there are lower volumes ofthese materials and most of the contamination can be removed by washing, they are generallywashed, surveyed, and disposed according to the residual level of radioactivity.
C.4.8.6 Dose Calculation Methodology
The methodology employed in this study to calculate the radiation dose rates at the surface ofcontaminated concrete as successive layers of that concrete are removed is described in thissection.
The contaminant profile data of Abel et al. (1986) was obtained by counting each 1 cm layerof a core of contaminated concrete and plotting the measured value (pCi/cm3) at the depth ofthe midplane of the layer. This approach gives an inherently incorrect depth distribution,because the contaminant concentration is dropping rapidly with increasing depth, such thatthe depth-averaged average contaminant concentration is actually located closer to the surfaceof the layer than to the midplane, with the actual location being dependent upon the slope ofthe contaminant concentration curve.
The value of the contaminant concentration (CO) at the surface of the concrete is calculated,using the measured data of Abel (Co) and the equation for diffusion of contaminants intosolid materials, Equation 3 of Section 4.8.5 with some redefinition of terms:
Co = CO exp (-X42/4Djt) (4)
where XIj is the depth beneath the original surface at which the concentration of the jIradionuclide is to be calculated, D3 is the diffusivity of concrete for the P radionuclide, and tis the time that the diffusion process has proceeded (assumed to be 20 years in theseanalyses).
By integrating this equation over successive 1 cm layers, the depth-averaged contaminantconcentrations are calculated for each successive layer, Li, of concrete beneath the original.surface. The location of that average value is determined on the curve originally definedwhen the measured data were plotted at the mid-plane of each layer, thus defining the actualpositions where those average values should exist. Using the locations of the average valuesof the contaminants for the first 1-cm layer, given in Table 4.8.2, the values of CO for thediffusion equation are determined by evaluating the equation at the appropriate depth andsolving for C0.
C.D-39 NUREG-1496

TABLE 4.8.2. Depth Beneath the Upper Surface at Which the Average Value ExLsts
1-am Layer Number Calculated Depth. cm
Co Cs Uranium Thorium
1 0.3846 0.4538 0.1154 0.22
2 0.1692 0.2462 - -
3 0.1000 0.1538 -
4 0.0769 0.1385 -
5 0.0769 0.1154 -
6 0.0769 0.1154 -
7 - 0.0846 -
These values of C0 are then used in the diffusion equation to calculate the values of thecontaminant concentrations at the surface of the exposed concrete as each successive 0.125in. (0.3175 cm) layer of concrete is removed by the scabbling process. These averageconcentrations are converted into annual radiation dose rates at the surfaces of the successivelayers using the conversion for pCi/cm3 to dpmnlO0 cm2:
1 pCi/cm3 = 222 dpm/100 cm2
and the concentration-to-dose conversion factors (see Appendix A) developed using themethodology presented in NUREG/CR-5512 (Kennedy and Strenge 1992) for the buildingoccupancy scenario,
Fj [mremlyr]/[dpmlO0 cm2]
the appropriate factor for the jI radionuclide. Thus, the resulting dose rate is:
DR(Xij) = C{XuI[pCi/cm 3 ] x 222 [dpm/100 cm 2)/(pCi/cm 3 )] (5)x Fj [(mrem/yr)/(dpml100 cm2e]
where the argument of the variables DR and C is the depth of the average concentrationlocation for the jI radionuclide beneath the surface of layer Lo1 ,. The resulting values ofresidual annual radiation dose rate as a function of depth of concrete removed are given inTable 4.8.3, and illustrated in Figures 4.8.11, 4.8.12, 4.8.13 and 4.8.14.
For locations that are contaminated by more than one radioisotope, the total surface radiationdose rate is the sum of the individual dose rates calculated by the methodology given above.
NUREG-1496 C.D 40
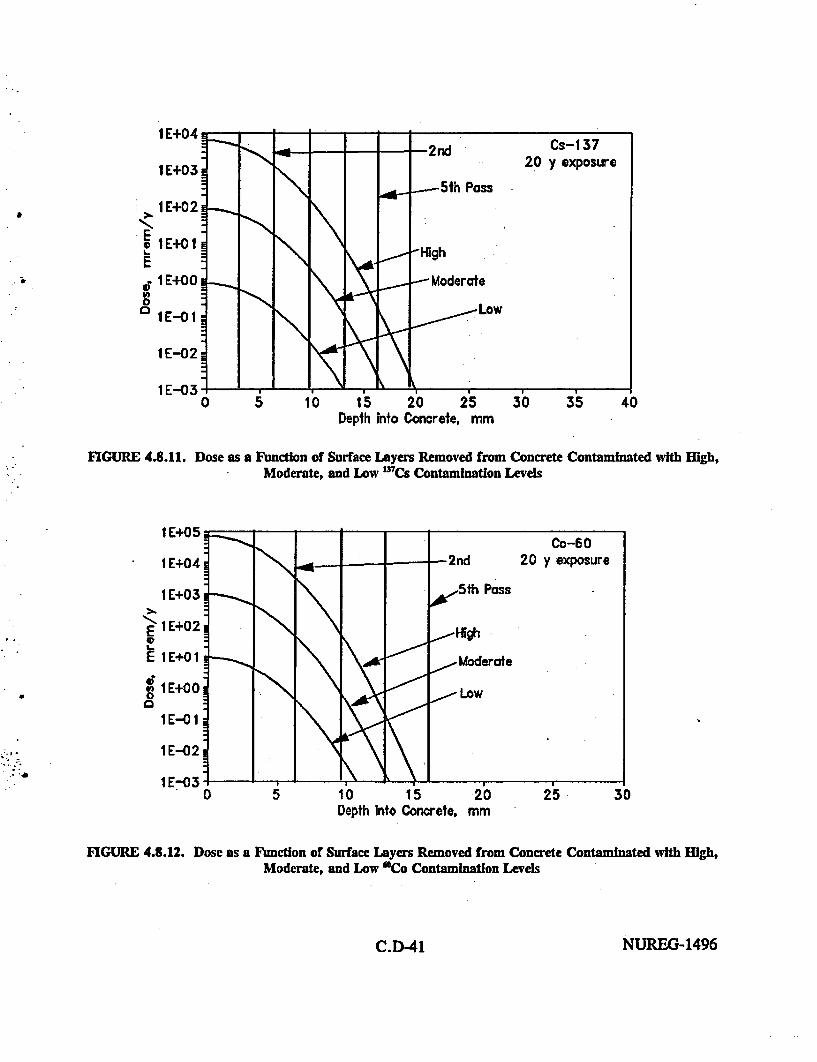
LE I s o \ \ -HighI IE+01E
1E+00 Moderate0
I IE-0OILo
I E-02
0 5 10 15 20 25 30 35 40Depth into Concrete, mm
FIGURE 4.8.11. Dose as a Function of Surface Layers Removed from Concrete Contaminated with High,Moderate, and Low .3'Cs Contamination Levels
I E+05Co-SO
1E+04 \ _ = - 2nd 20 y exposure
1 E+03 th Pass
E I E+0 I M )boderateI 1E+001E0 0Low
1 E-0 1
1 E-02
0 5 1 a 1 S20 25 30Depth Into Concrete, mm
FIGURE 4.8.12. Dose as a Function of Surface Layers Removed from Concrete Contaminated with High,Moderate, and Low 'Co Contamination Levels
C.D-41 NUREG-1496
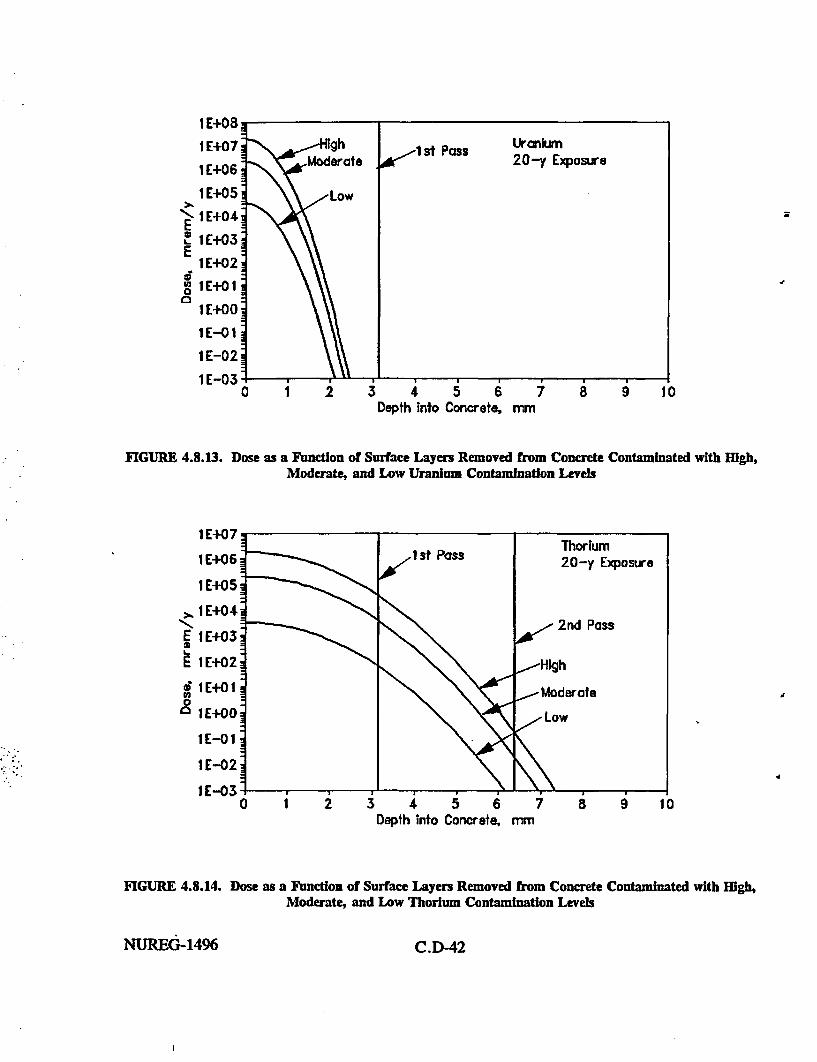
1 E+08!1 E+07
1 E+06
I E+05E IE+04E* 1E+03!
1 E+02]g lIE+01.0
1 E+00
1 E-0 I1
IE-02!
1 E-03
;a
Depth into Concrete, mm
FIGURE 4.8.13. Dose as a Function of Surface Layers Removed from Concrete Contaminated with High,Moderate, and Low Uranium Contamination Levels
1 E+07
1 E+06
1 E+05
,. 1 E+04
E IE+03
t 1E+02
61 E+O I0
o 1E+OO
1 E-0 1
I E-02
I E-03.d
0 1 2 3 4 5 6 7 8 9 10Depth into Concrete, mn
FIGURE 4.8.14. Dose as a Function of Surface Layers Removed from Concrete Contaminated with High,Moderate, and Low Thorium Contamination Levels
NUREG-1496 C.D-42
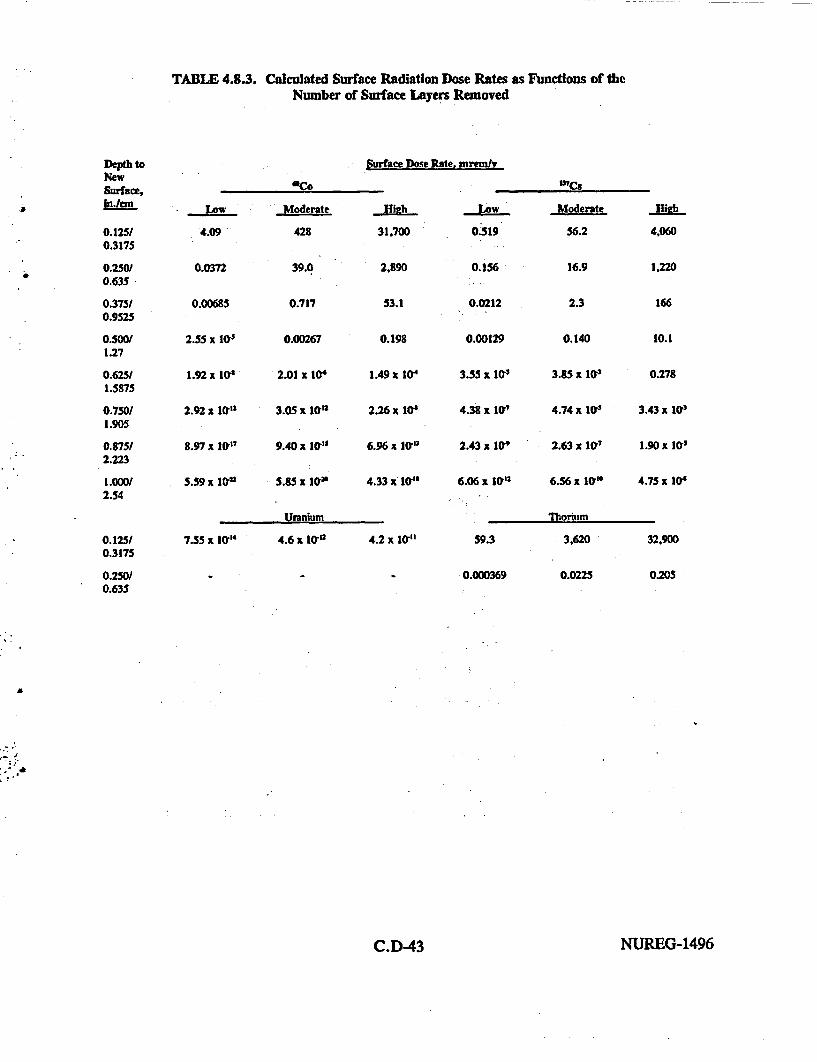
TABLE 4.8.3. Calculated Surface Radiation Dose Rates as Functions of theNumber of Surface Layers Removed
Depth to Surface Dose Rate. mretmlNewSurface, &co 7CSIn./cm Low Moderate Mgph Low Moderate idk
0.125/ 4.09 428 31.700 0.519 56.2 4.0600.3175
0.250/ 0.0372 39.0 2.890 0.156 16.9 1,2200.635
0.375/ 0.00685 0.717 53.1 0.0212 2.3 1660.9525
0.5OO 2.55 x 10' 0.00267 0.198 0.00129 0.140 10.11.27
0.6251 1.92 x 10' 2.01 x 10' 1.49 x 10' 3.55 x 10' 3.85 x 10r 0.2781.5875
0.750/ 2.92 x 10f't 3.05 x 10" 2.26 x 10' 4.38 x 10' 4.74 x 10'- 3.43 x 1'31.905
0.875/ 8.97x 10" 9.40x 10" 6.96 x 10lO 2.43 x 10' 2.63 x 10 1.90 x1'2.223
I.OOW 5.59 x 10" 5.85 s 102 4.33 x 10" 6.06 x 101 6.56 x 10 " 4.75 x 10'2.54
Ufanium 1horium
0.125/ 7.55 x 10⁴ 4.6 x WO2 4.2 x 10 59.3 3,620 32,9000.3175
0.250/ - - 0.000369 0.0225 0.2050.635
C.D-43 NUREG-1496

C.S CHARACTERIZATION OF REFERENCE FACILITY SOILCONTAMINATION
Soil contamination information from several facilities that have significant levels of soilcontamination is contained in this chapter. Facilities other than those selected as thereference for building contamination are described as the reference facility for soilcontamination if the data were more relevant. For example, the General Electric uraniumfuel fabrication plant was described as the reference facility for characterization of buildingcontamination, but the reference facility selected for characterization of soil contamination isthe Babcock and Wilcox nuclear fuel manufacturing plant in Apollo, Pennsylvania.
The following information related to contaminant penetration into soils was derived fromAmes and Rai (1978), unless otherwise referenced.
C.5.1 Parameters Affecting Radionuclide Penetration Into Soil
Unlike concrete, soil is a widely variable medium and the penetration of individualradionuclides through this medium is highly individual and complex. Prediction ofcontamination profiles in soils from a knowledge of the surface source term and penetrationtime is not possible without considerable additional information on soil composition (clay,sand, humus), particle size distribution, pH, ion-exchange capacity, etc., and cumulativerainfall on the surface. In addition, most sites are not placed on top of a homogeneous soil,but on top of several layers, which may contain varying amounts of sand, gravel, clay, rocks(all of varying thicknesses). Other factors must be considered for each site, such as thegradient of the contaminated area, the amount of runoff, whether cracks or channels mayarise in the soil, depth of groundwater, and so on. Models exist for calculation of profilesgiven all of this data, as described below, but model developers consistently caution ofproblems regarding results from non-expert use of the models. The science of profilecalculation using surface source data and computer models is in its infancy and currently theonly reliable way of determining radionuclide profiles in soil is to measure them. Given thiscaveat, once site soil and other parameters have been completely characterized,contamination profiles can be calculated. The following subsections provide information onsoil variability and its effect on radionuclide mobility useful to understanding the problems inmaking these calculations.
C.S.1.1 Soil Cation Exchange Capacity
There is considerable variability in the cation exchange capacity of various soil components,as shown in Table 5.1.1. Cation exchange capacity varies with particle size and pH, amongother factors.
NUREG-1496 C.D-44

TABLE 5.1.1. Cation Exchange Capacities of Soil Components"
Mineral Cation Exchanee Canacity. meallOO e
Kaolinite 3-15Smectites 36-100Vermiculite 100-150Zeolites 100-300Organic matter in soils (humus) 130-350Feldspar <1Quartz < 1
(a) Ames and Rai 1978
C.S.1.2 Diffusion
The transport of matter in the absence of bulk flow is known as diffusion. A surface spillwill move downwards through the soil, but there may also be some movement laterally andradially outward away from the spill point by the diffusion process. Under most conditions,to a first approximation, this is a relatively small correction to the model and may beneglected. Most models assume a cylindrical downwards flow of contaminant and will tendto slightly overestimate concentrations and underestimate contaminated soil volumes. Theaqueous diffusion coefficient in a binary electrolyte (contaminant salt in solution) is given bythe equation:
D= (2u1u2RT)/(uj + u2)F
where ul and u2 are the mobilities of the cation and anion, respectively, RT is the gasconstant times temperature in Kelvin, and F is a Faraday. The dimensions of D. are incm2/sec. Factors tending to reduce the diffusion rate are combined into a 'retardation factor"(Rd), given by:
d= 1 + (ple)Kd
where p is the soil bulk density, e is the pore fraction (volume occupied by the solutionphase), and Kd is the equilibrium distribution coefficient (mLJg). Ed is itself a complexparameter which is affected by a number of soil variables and must be determinedexperimentally for each site.
C.S.1.3 Hydraulic conductivity
In migration of radionuclides, hydraulic conductivity is of primary importance.Hydraulic conduction is the ratio of the flux density (volume of water flowing through across-sectional area per unit time) to the hydraulic gradient (head drop per unit distance inthe flow direction). If the soil water does not move, then radionuclide contaminants only
C.D-45 NUREG-1496
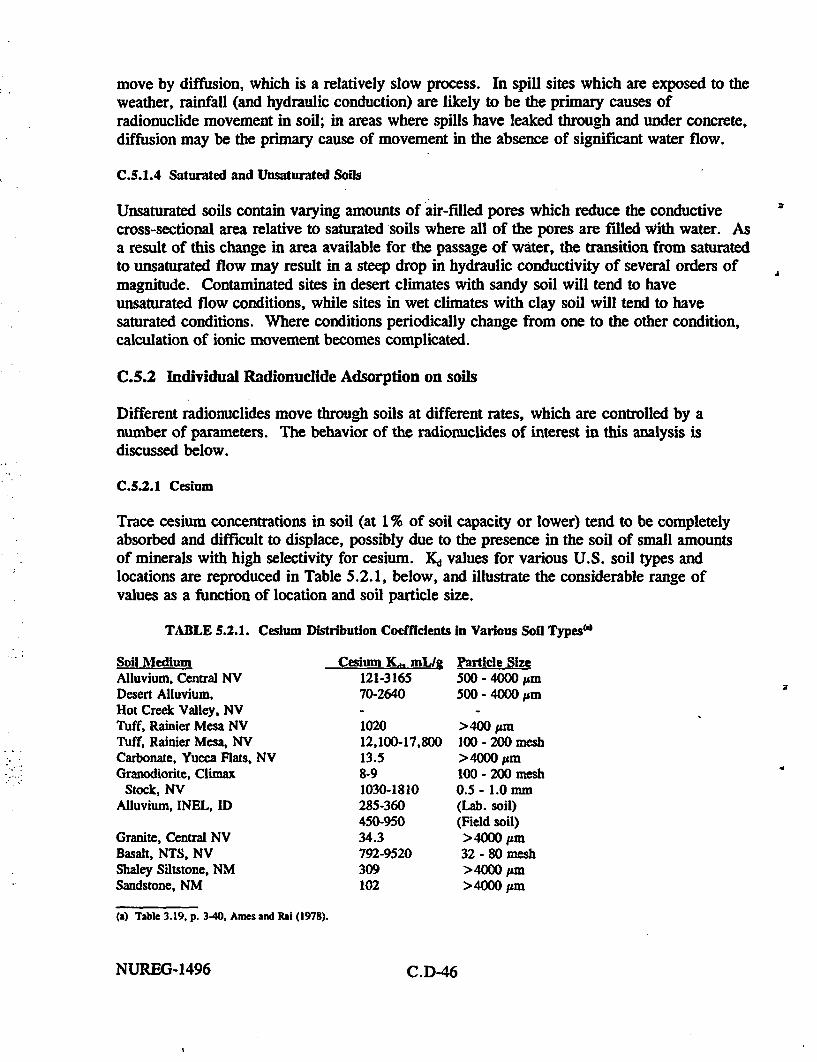
move by diffusion, which is a relatively slow process. In spill sites which are exposed to theweather, rainfall (and hydraulic conduction) are likely to be the primary causes ofradionuclide movement in soil; in areas where spills have leaked through and under concrete,diffusion may be the primary cause of movement in the absence of significant water flow.
C.5.1.4 Saturated and Unsaturated Soils
Unsaturated soils contain varying amounts of air-filled pores which reduce the conductivecross-sectional area relative to saturated soils where all of the pores are filled with water. Asa result of this change in area available for the passage of water, the transition from saturatedto unsaturated flow may result in a steep drop in hydraulic conductivity of several orders ofmagnitude. Contaminated sites in desert climates with sandy soil will tend to haveunsaturated flow conditions, while sites in wet climates with clay soil will tend to havesaturated conditions. Where conditions periodically change from one to the other condition,calculation of ionic movement becomes complicated.
C.5.2 Individual Radionuclide Adsorption on soils
Different radionuclides move through soils at different rates, which are controlled by anumber of parameters. The behavior of the radionuclides of interest in this analysis isdiscussed below.
C.S.2.1 Cesium
Trace cesium concentrations in soil (at 1% of soil capacity or lower) tend to be completelyabsorbed and difficult to displace, possibly due to the presence in the soil of small amountsof minerals with high selectivity for cesium. Kd values for various U.S. soil types andlocations are reproduced in Table 5.2.1, below, and illustrate the considerable range ofvalues as a function of location and soil particle size.
TABLE 5.2.1. Cesium Distribution Coefficients In Various Soil Typesw
Soil Medium Cesium K, mL/S Particle SizeAlluvium, Central NV 121-3165 500 - 4000 pmDesert Alluvium, 70-2640 500 - 4000 amHot Creek Valley, NVTuff, Rainier Mesa NV 1020 >400 pmTuff, Rainier Mesa, NV 12,100-17,800 100 - 200 meshCarbonate, Yucca Flats, NV 13.5 >4000 pmGranodiorite, Climax 8-9 100 - 200 mesh
Stock, NV 1030-1810 0.5 - 1.0mmAlluvium, INEL, ID 285-360 (Lab. soil)
450-950 (Field soil)Granite, Central NV 34.3 >4000 pmBasalt, NTS, NV 792-9520 32 - 80 meshShaley Siltstone, NM 309 >4000 pmSandstone, NM 102 >4000 pm
(a) Table 3.19, p. 3-40, Ames and Rai (1978).
NUREG-1496 C.D-46

C.5.2.2 Cobalt
The major soil contaminant observed at nuclear power plant sites is OCo. Cobalt chemistryin soil is a highly complex function of soil pH and the oxidation-reduction environment.Cobalt can be present in soil as Co-II and Co-Il oxidation states and as solution complexeswith hydroxide, chloride, sulfate, and nitrate, as well as insoluble phosphate and carbonate.Cobalt is relatively easily complexed with natural organics and is adsorbed by ferric oxideand illite. In one reported case (Ames and Rai 1978, p. 3-74), leakage of 'Co from theNuclear Fuel Services plant in western New York State comprised < 0. 1% of the betaactivity in surface drainage, but was all migrating as a complexed, soluble species. In astudy of Hanford trench wastes (Ames and Rai, 1978, p. 3-74), complexed cobalt passedfreely through the soil column to the groundwater at a depth of 68 m in a period of 12 years.
C.5.2.3 Strontium
Strontium in solution exists as Sr-IT, is exchangeable on soils, and is mobilized mostly bycalcium ions. Low pH and a high calcium content in soils results in high mobility of 90Sr.Secondary minerals such as clays and zeolites absorb strontium more strongly and selectivelythan primary minerals such as quartz, feldspars, and pyroxenes. Table 5.2.2 shows selectedKd data for strontium on various soil types:
TABLE 5.2.2. Strontium Distribution Coefficients in Various Soil TypesWs
Material Strontium A. InL/ Particle Size
Alluvium, Central NVSandstone, fineShaley siltstone
(carbonaceous)Shaley limestone, NMSandstone, NMAlluvium, INEL, II)
Tuff, Rainier Mesa, NVTuff, NTS, NVLimestone, Yucca
Flats, NVGranodiorite, Climax
stockGranite, Central NVBasalt, Buckboard
Mesa, NV
48 - 24541.26- 1.888.32 - 9.56
8.321.377.2 - 10.54026040000.19
4 - 911 - 231.716- 135
500 - 4000 pum4000 - <62 pm4000 - <62 Im
>4000 pm> 4 0 0 0 pm(Lab. soil)(Field soil)>400 pm
>4000 pmn
100 - 200 mesh0.5 - 1.0 mm>4000 pm32 - 80 mesh
(a) Ames and Rai 1978, p. 3-17415.
C.D-47 NUREG-1496

C.5.2.4 Thorium
Thorium contamination in soils may occur from metal ore tailings piles. Thorium is stronglyadsorbed by clay particles and tends to precipitate as thorium hydroxide and hydratedthorium oxide in soils. Low pH and high humic acid content in soils tends to cause morerapid migration of thorium. Typical measured Kd values ranged from 40 - 130 mnIg(medium sand), 310 - 470 (fine sand), and 2700 - 10,000 (silt-clay), respectively (Ames andRai 1978, p. 3-215).
C.5.2.5 Uranium
Uranium is of primary importance in decommissioning and disposal of contaminated soils,and is present in soils mostly as U-1V and U-VI, depending on soil pH and the oxidation-reduction environment. Uranium retention by oxidizing (low humus) alkaline soils is poorbecause the uranium is present mostly in anionic form. Uranium is solubilized and highlymobile in carbonate-containing waters. Uranyl ion can be adsorbed by clay and humicsubstances, especially at low pH. Typical Kd values obtained for uranium in various soiltypes are shown in Table 5.2.3.
TABLE 5.2.3. Uranium Distribution Coefficients In Various Soil Types(*
Material LmL/u
River sediment (clay, CaCO3) 39River peat (humic) 33Sediment (clay, CaCO3) 16Altered schist (clay) 270Quartz 0Calcite 7Itlite 139
(a) Ames and Ral M78, p. 3-23M
C.5.3 Issues Relating to Soil Radionuclide Profile Determination
Transport of radionuclides in soil is based on the concept of solution flow driven bydownward movement of water, opposed by various physical and chemical processes whichretard the radionuclide movement, summarized in a 'retardation factor'. Adsorptionprocesses are known to increase travel times for some radionuclides by 103 - 106 timesrelative to groundwater. The net effect is captured in the distribution coefficient for theparticular radionuclide and soil conditions. Furthermore, some adsorption processes areessentially irreversible and permanently remove radionuclides from the groundwater (Serne,1992). Use of the distribution coefficient approach to calculation of specific radionuclidemovement is universal in soil transport models.
NUREG-1496 C.D-48

C.S.3.1 Distribution Ratios
Each of the conceptual adsorption models relies on the experimental determination ofdistribution ratios (ratio of radionuclide on solid:radionuclide in solution). Because theseratios are themselves dependent on a large number of variables, the more complete theexperimental determination of these variables, the better the accuracy of the profilecalculation. However, more complete experimental determination of variables costs more intime, effort, and expense.
C.S.3.2 Constancy of Retardation Factor (Rig
Transport model calculations depend on the constant value for retardation of eachradionuclide. The retardation factor is itself dependent on other variables and requires acomplete knowledge of the soil profile. For example, if several types of soil underlie acontaminant spill location, the retardation factors will be different in each layer (topsoil, silt,sand, gravel, for example).
C.S.3.3 Unexplained Variability of Rd
Unexplained variability of retardation factors may be due to solubility-controlled retardationreactions (precipitation), which are highly dependent on radionuclide concentration at aspecific depth and hence on the initial concentration of the radionuclide at the surface, sincethese are equilibrium-controlled reactions. That is, the amount of radionuclide absorbed isdependent on the initial mass present.
C.5.4 Calculation of Radionuclide Contaminant Profiles In Soils
Models and computer codes for calculation of radionuclide contaminant profiles in soils frominitial surface loadings, elapsed time, and soil, climate, and geographic parameters are at anearly stage of development and are evolving rapidly. The approach taken in this analysis isbased upon that described in NUREG-5512 (Kennedy and Strenge 1992), although for thepurposes of estimating residual radionuclide concentrations in soils, the simple model hasbeen modified and expanded to give a more realistic result. The following descriptionexplains the basic NUREG-5512 model assumptions and the modifications made to it. Themajor difference is the thickness of the initial contaminated soil layer (1 cm instead of 1 m)and the number of consecutive layers (100 instead of 1) into which the 1 m near-surface soilcolumn is divided.
In the reference scenario, the contaminant of interest was deposited at the top of the soilcolumn (the vadose zone) at time zero and has penetrated the soil for a known period oftime. A contaminant plume has spread within the vadose zone but has not yet reached thegroundwater table. Lateral diffusion is assumed to be zero (a simplification discussedpreviously) and the profile is assumed to be within a vertical cylinder of contaminated soil.The required outputs of the model are the amounts of the contaminant that have reachedspecific depths.
C.D-49 .NUREG-1496

Assumptions for the Simplified Diffusion Analysis
* One-dimensional transport (down)* Darcy water flux density (through the entire vadose zone) is constant in time* the chemistry is described by linear sorption coefficients, Kds* only aqueous solute transport is considered* single radionuclide at a time, not the entire decay chain* assume a homogeneous vadose zone (only one layer)* numerical solution to the differential equations preferred.
Input Parameters Required
For using the code for calculating radionuclide concentration profiles, the followingnumerical input data are required (values used in parenthesis):
* number of years (20)* number of steps per year (120)* number of layers desired (100)* number of layers for which initial concentration is given (1)* initial concentration of radionuclide (1.0 pCi/cm3 in first box)* contamination rate (pCi/yr)(1.0 or 0.0)* integration time step, days (365/120)* total soil thickness, m (1)* infiltration rate, m/yr (0.18)* saturation ratio, dimensionless (1.0)* total porosity, dimensionless (0.3)* bulk density, g/cm3 (1.625)* sorption, mUg (various)* radionuclide half-life, years (various).
For simplicity, a given inventory of a given radionuclide is postulated to be present in theinitial surface layer of soil, arbitrarily set at 1 cm thick. The dispersion of that inventorydownward into the soil over time is calculated using a modification of the computer codeinitially developed by C.G. Cole of PNL in support of the methodology presented inNUREG/CR-5512. This code calculates the dispersion of the initial inventory as a functionof time and annual rainfall, taking into account the specific Kd value of the radionuclide forthis soil, and the soil porosity. In the calculations performed for these porosities the numberof successive layers of soil was arbitrarily set to be 100, the period of infiltration of thecontaminant was set at 20 years, and the annual rainfall was assumed to be 0.18 m/yr. TheKd values for each radionuclide were taken from the set presented in NUREG/CR-5512, thesoil density was set at 1.625 g/cmn, and the soil porosity was set to be 0.3 for all layers ofsoil (i.e., the soil was assumed to be homogeneous over the total depth). An initialdeposition of I pCi/cmn3 of the radionuclide in question was assumed to be deposited into theinitial 1 cm soil layer at time zero.
NUREG-1496 C.D-50

By selecting the soil layer thickness to be 1 cm, the inventory in each layer can be expressedas a concentration in pCi/cm3 , as can the calculated inventory in each layer at the end of the20-year infiltration period. Dividing the soil concentration in pCi/cm3 by the soil density ing/cm3 gave the concentration in each layer in terms of pCi/g of soil, the same units whichare needed for use with the dose factors developed for the residential scenario inNUREGICR-5512.
Because the dose factors are designed to be applied to the average concentration of.contaminant remaining in the soil, it was necessary to calculate the average concentration ofcontaminant as each successive layer was removed, starting at the surface. The procedureused is described in the next section.
C.5.5 Methodology for Calculating Soil Residual Dose Rates
The differential equation for the diffusion of material through a solid medium is solved andevaluated for an assumed initial deposition of 1 pCi/cm3 in the first 1-cm thickness of soil,using the parameters described above, for each radionuclide of interest. The basic procedurefor determining the radiation dose rate from radionuclides remaining in the soil at the end ofthe 20-year period is described below.
The concentration profile for each radionuclide 0) is calculated, using the method describedabove. The average concentration in each 1 cm thick layer of soil is calculated, and includesthe effects of radioactive decay over the 20-year period.
The average concentration over the uppermost 5 cm of soil is calculated, using the layer bylayer concentrations calculated above.
CMz, = (Cj)IS
The concentration profile is normalized by dividing each layer value by CA5, to obtain aprofile wherein the average value over the top 5 cm is1 pCi/cm3 , i.e.,
5.
CNI =CIICand CN= 1
The total normalized inventory over the 100-cm depth of soil is simply the sum over alllayers, of the normalized concentration in each layer, i.e.,
100
I = CN,
C.D-51 NUREG-1496
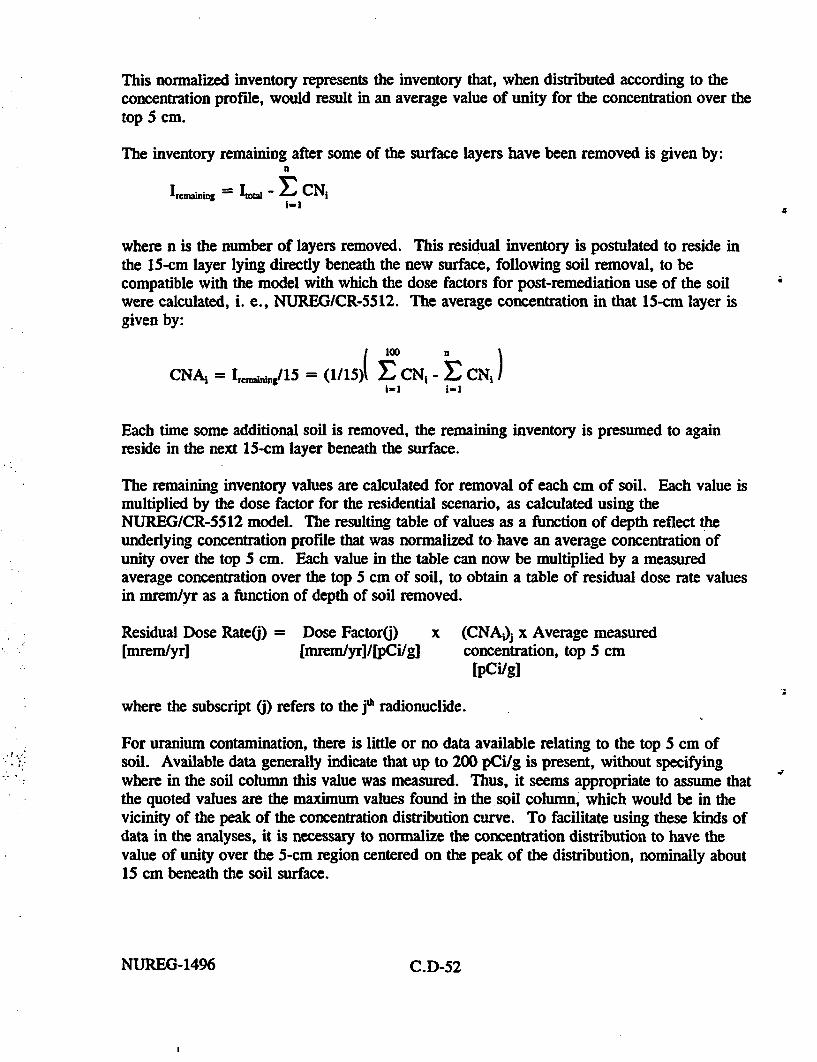
This normalized inventory represents the inventory that, when distributed according to theconcentration profile, would result in an average value of unity for the concentration over thetop 5 cm.
The inventory remaining after some of the surface layers have been removed is given by:n
Ire,,aXq= I - S CNj
where n is the number of layers removed. This residual inventory is postulated to reside inthe 15-cm layer lying directly beneath the new surface, following soil removal, to becompatible with the model with which the dose factors for post-remediation use of the soilwere calculated, i. e., NUREGICR-5512. The average concentration in that 15-cm layer isgiven by:
I 100 n
CNA, = .. 15 = (1/1i)1 CN, - S CNJ1
Each time some additional soil is removed, the remaining inventory is presumed to againreside in the next 15-cm layer beneath the surface.
The remaining inventory values are calculated for removal of each cm of soil. Each value ismultiplied by the dose factor for the residential scenario, as calculated using theNUREG/CR-5512 model. The resulting table of values as a function of depth reflect theunderlying concentration profile that was normalized to have an average concentration ofunity over the top 5 cm. Each value in the table can now be multiplied by a measuredaverage concentration over the top 5 cm of soil, to obtain a table of residual dose rate valuesin mrem/yr as a function of depth of soil removed.
Residual Dose Rate(j) = Dose Factor(j) x (CNA-)j x Average measured[mrem/yr] [mrem/yr]/[pCi/gJ concentration, top 5 cm
[pCi/g]
where the subscript (j) refers to the jI radionuclide.
For uranium contamination, there is little or no data available relating to the top 5 cm ofsoil. Available data generally indicate that up to 200 pCi/g is present, without specifyingwhere in the soil column this value was measured. Thus, it seems appropriate to assume thatthe quoted values are the maximum values found in the soil column, which would be in thevicinity of the peak of the concentration distribution curve. To facilitate using these kinds ofdata in the analyses, it is necessary to normalize the concentration distribution to have thevalue of unity over the 5-cm region centered on the peak of the distribution, nominally about15 cm beneath the soil surface.
NUREG-1496 C.D-52

17
CPS = (CQiS1-13
The new normalized concentration profile for uranium is given by:
CNI = C1ICps,17
and S CN1 = 11-13
The rest of the analysis is identical with the original analysis for the other radionuclides,using the modified CN1.
Results
Some typical output results of the calculations for several radionuclides commonlyencountered in soils at nuclear facilities are presented in Figures 5.5.1 through 5.5.6 as afunction of several different surface contamination levels. Section 5.7 provides a discussionof the bases for the surface contamination levels used for the reference facilities. Thecalculated data underlying the figures are given in Table 5.5.1.
= = 1 M i iI0 i
IOE.C2
1Ice+ci
IMe.O
V...Rg% 1~I41
I1MW2
IMEM
1.CE04=EEI --- -
--- I IiI1.OEMC
o a 4 5 I 10 12 14 It 1 30 AZ 24 26 28 80 tMePMs em
$4 SO 88 40
FIGURE S.S.I. Calculated Residual '0Co Radiation Dose Rates as a Function ofSoil Depth Removed, with the Surface Contamination Level as aParameter
C.D-53 C.D-53NUREG-1496
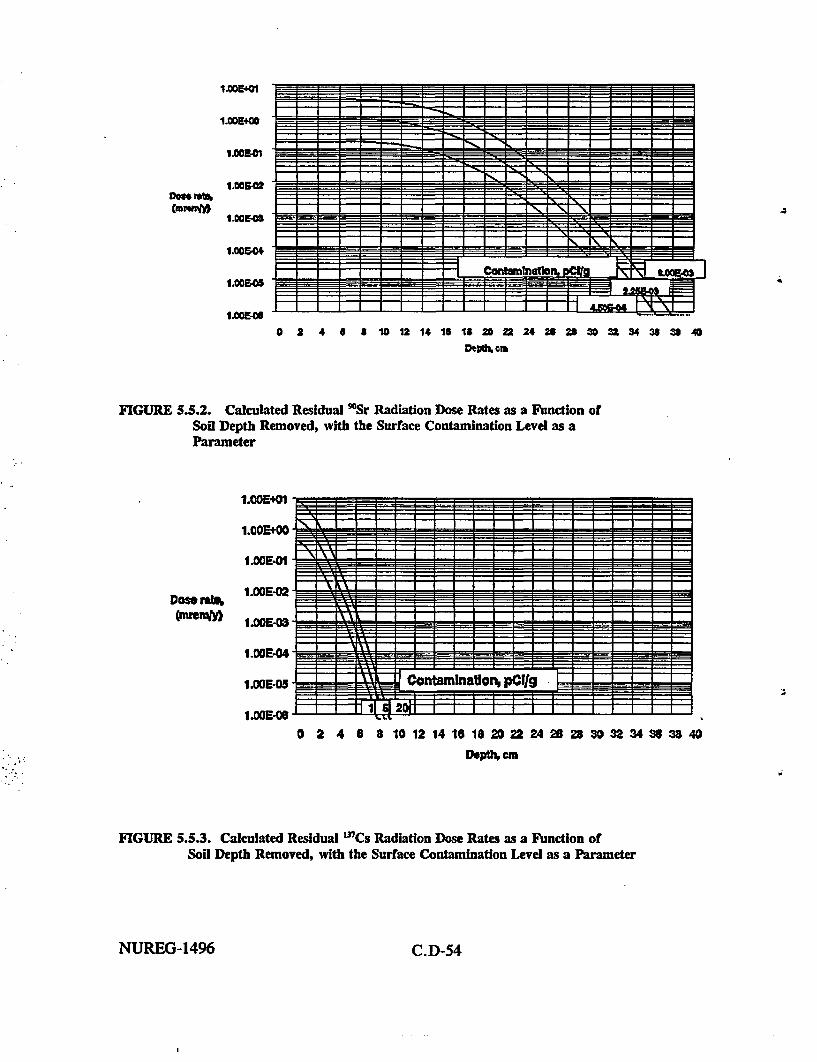
1MEO0
DO* .-
(mmar
1.00400
1.eo01
1.00ME2
1.COOEM
1.00504
1A.5N
I1OOE4
-r-�
N
_
ennstn~lan W.t . II I 1L. -'
I &E I a 1
0 2 4 6 * 10 12 14 18 18 20 2 24 26 24 30 32 34 38 38 40
DeV 1 enc
FIGURE 5.5.2. Calculated Residual 90Sr Radiation Dose Rates as a Function ofSoil Depth Removed, with the Surface Contamination Level as aParameter
1.005401
1.OOEO00
IMSE.0
Wms re%"mm
1.OOE-02
1.0E-03
I OOEE04
1.0XE-05
1aOOE-06
Contaminatfor, pClIg II -- -: w 1id
S
0 2 4 B 8 10 12 14 10 14 20 22 24 28 28 30 32 34 36 38 40
Depo^ cm
FIGURE 5.5.3. Calculated Residual '37Cs Radiation Dose Rates as a Function ofSoil Depth Removed, with the Surface Contamination Level as a Parameter
NUREG-1496 C.D-54

1IME404
1A0!400D af19
1J0EMM1OOEc.
1.054
ConrmAmhin.. man-nM Y = ff 53
1.0EMO A 4 1 * 10 t2 14 16 18 20 12 2A 28 18
De604CM
20 32 84 18 40
FIGURE S.S.4. Calculated Residual =Th Radiation Dose Rates as a Function ofSoil Depth Removed, with the Surface Contamination Level as a Parameter
1hA+02
It OE
IAWE41
1UA01Do.. n,
1A0EMOS
Conlpamlrlo& aCIo'coo
210.OOE.05
O 2 4 6 & 10 12 U 16 1 20 2 PA 28 2030 82 84 2888 40 42 44
FIGURE 5.5.5. Calculated Residual 2mU Radiation Dose Rates as a Function ofSoil Depth Removed, with the Surface Contamination Level as a Parameter
C.D-55 NUREG-1496

1.00014+0
10E401
Dose Rat 1.000400
1.OOO-01
1.OOCE-Oo4MC2
I I I I I I I I I l I I 1 1 I r L
- -_
o 2 4 S 8 10 12 14 15 I8 20 22 24 20 2* 30 32 34 30 35 40
Depifi Reamved, cm
FIGURE 5.5.6. Calculated Composite 'Co, 'Sr, and 'Cs Residual RadiationDose Rates as a Function of Soil Depth Removed, with the SurfaceContamination Level as a Parameter
10
NUREG-1496 C.D-56
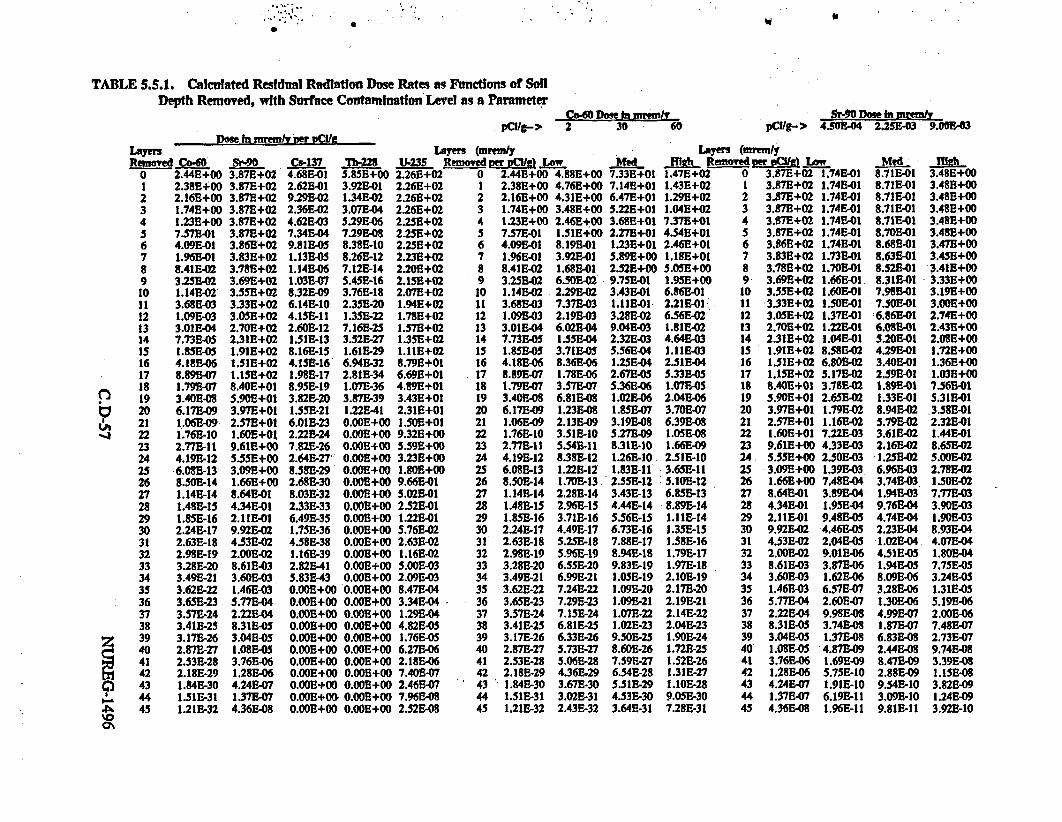
,.1
TABLE 5.5.1. Calculated Resfdual Radlation Dose Rates as Functions of SoilDepth Removed, with Surface Contamination Level as a Parameter
pCm/g-> 2 30 60Sr90DMsean reMnIv
pCllg- > 4.505-04 2.25E-03 9.005-63Do" fn mremlv per vCIe
--==L--
Remed 0 Sr, C 1370 2.44E+00 3.87E+02 4.68E-011 2.38B+00 3.87E+02 2.62E-012 2.16E+00 3.87E+02 9.29E-023 1.74E+00 3.87E+02 2.36E-024 1.23B+00 3.87E+02 4.62E-035 7.57B-01 3.87E+02 7.34E446 4.09E-01 3.86E+02 9.81E-057 1.96E01 3.83E+02 1.13E-058 8.41E-02 3.78E+02 1.14E-069 3.25E-02 3.69E+02 1.03E07
10 1.14B-02 3.55E+02 8.32E-09II 3.68E-03 3.33E+02 6.14E-1012 1.09E-03 3.05E+02 4.1E-1113 3.01E-04 2.70E+02 2.60E-1214 7.73B-05 2.31E+02 1.SIE-13IS 1.85E-05 1.91E+02 8.16E-1516 4.18E-06 1.51E+02 4.15E-1617 8.89E-07 1.15E+02 1.98B-1718 1.79E-07 8.40E+01 8.95E-1919 3.40E-08 5.90E+01 3.825-20b 20 6.17B49 3.97E+01 1.55-2121 1.06E-9 2.57E+01 6.01E-23
j 22 1.76E-10 1.60E+01 2.22E-2423 2.77E-11 9.61E+00 7.82B-2624 4.19E-12 5.55E+00 2.64E-2725 6.08E-13 3.09E+00 8.58E-2926 8.505-14 1.66E+00 2.68E-3027 1.14E-14 8.64B-01 8.03E-3228 1,48E-15 4.34B-01 2.33E-3329 1.85E-16 2.11E-01 6.49E-3530 2.24E-17 9.925-02 1.7SE-3631 2.63E-18 4.53E-02 4.5853832 2.98E-19 2.00-E02 1.16E-3933 3.28E-20 8.61E-03 2.82E-4134 3.49E-21 3.60E-03 5.83E-4335 3.62E-22 1.46E-03 O.OOE+036 3.65E-23 5.77W-04 O.0E+O037 3.57E-24 2.22E-04 O.OOE+O38 3.41E-25 8.31E-05 O.OOE+O39 3.17E-26 3.04E-05 O.OOE+O
e 40 2.87E-27 1.08E-05 O.OOE+O41 2.53E-28 3.76E-06 O.E+O42 2.18-E29 1.28E-06 O.OOE+O
2 43 1.84E-30 4.245-07 O.OE+044 1.51E-31 1.37W-07 O.OO+O
- 45 1.21E-32 4.36E-08 O.OOE+O0%
00000000000
Layes (mrem/y Layers (mrem/b228 U-235 R M nt PM) L4W Med f Reoved Mer PnUM L Med JMht
5.85E+00 2.26E+02 0 2.44E+00 4.88E+00 7.33E+01 1.47E+02 0 3.87E+02 1.74E-01 8.71E-01 3.48E+003.92E-01 2.26E+02 1 2.38E+00 4.76E+00 7.145+01 1.43E+02 1 3.87E+02 1.745-01 8.71E-01 3.48B+001.34E-02 2.26E+02 2 2.16E+00 4.31E+00 6.47E+01 1.29E+02 2 3.87E+02 1.74E-01 8.71E-01 3.48E+003.07E-04 2.26E+02 3 1.74E+00 3.48E+00 5.22E+01 1.04E+02 3 3.875+02 1.74E-01 8.715-01 3.48E+005.29E-06 2.25E+02 4 1.23E+00 2.46E+00 3.68E+01 7.37E+01 4 3.87E+02 1.745-01 8.71E-01 3A8E+007.29E-08 2.25E+02 5 7.575-01 1.51E+00 2.27E+01 4.54E+01 5 3.87E+02 1.74541 8.705-01 3.48E+008.38E-10 2.25E+02 6 4.095-01 8.19E-01 1.23E+01 2.46E+01 6 3.865+02 1.745-01 8.68E-01 3.47E+008.26E-12 2.23E+02 7 1.96E-01 3.925-01 5.89E+00 1.18E+01 7 3.83E+02 1.73E-01 8.63E-01 3.45E+007.125-14 2.20E+02 8 8.41E-02 1.685-01 2.52E+00 5.05E+00 8 3.78E+02 1.70E41 8.52E-01 3.41E+005.45E-16 2.15E+02 9 3.255E02 6.50502 9.75SE01 1.95E+00 9 3.69E+02 1.665-01 8.31541 3.33E+003.765-18 2.075+02 10 1.14B502 2.29E-02 3.43E501 6.865-01 10 3.55E+02 1.60E41 7.98E-1 3.19E+002.35E-20 1.94E+02 11 3.68E-03 7.37E43 111E501 2.21E-01 11 3.33E+02 1.505-01 7.505-1 3.0OE+001.35E-22 1.78E+02 12 1.09E03 2.19E-03 3.28E-02 6.56B-02 12 3.05E+02 1.37E-51 6.86541 2.74E+007.16E-25 1.575+02 13 3.01E-04 6.02544 9.045-03 1.81E42 13 2.70E+02 1.22E501 6.08E-01 2.43E+003.525-27 1.35E+02 14 7.735-05 1.55E-04 2.32E-03 4.64E-3 14 2.31E+02 1.04E-01 5.20E501 2.085+001.61E-29 I.IIE+02 15 1.855-05 3.71EO- 5.56E44 1.1IE-03 15 1.91E+02 8.58542 4.295-01 1.t2E+OO6.94B-32 8.79E+01 16 4.18E46 8.365-06 1.25504 2.51E44 16 1.51E+02 6.805-02 3.405-01 1.36E+002.815-34 6.69E+01 17 8.89E-07 1.78E-06 2.67E-05 5.335-05 17 1.15E+02 5.17E-02 2.59E-01 1.03E+001.07E-36 4.89E+01 18 1.79E-07 3.57E-07 5.36E-06 1.07E45 18 8.40E+01 3.78E42 1.89E-01 7.565-013.87E-39 3.43E+01 19 3.40E48 6.81548 1.02E-06 2.045-06 19 5.905+01 2.65E42 1.33E-1 5.315-011.22E-41 2.31E+01 20 6.17E49 1.23E48 1.85E-07 3.70E-07 20 3.97E+01 1.79E-02 8.94E42 3.58E41O.OOE+00 1.50E+01 21 1.06E-09 2.13E-09 3.195-08 6.39E-8 21 2.57E+01 1.16E-02 5.79E-02 2.32E41O.QOE+00 9.32E+00 22 1.765-10 3.51E-10 5.27E509 1.05E48 22 1.60E+01 7.22E-03 3.61E-02 1.445-41O.OE+00 5.59E+00 23 2.77E-11 5.54E-11 8.315-10 1.66E549 23 9.61E+00 4.33E43 2.16E-02 8.655420.00+00 3.23E+00 24 4.195-12 8.385-12 1.265-10 2.51E-10 24 5.S5E+00 2.50E43 1.25542 5.00E42O.OOE+00 1.80E+00 25 6.08E-13 1.22B-12 1.83E-11 3.65E-11 25 3.09E+00 1.39E-03 6.965-03 2.785-02O.0OE+00 9.66E541 26 8.50E-14 1.70E-13 2.55E-12 5.10E-12 26 1.66E+Q0 7.48E44 3.74E43 1.50542O.OOE+00 5.02E41 27 1.14E-14 2.28E-14 3.43E-13 6.855-13 27 8.64E41 3.89E44 1.94E43 7.77E43O.OOE+00 2.52E41 28 1.48E-15 2.965-15 4.44E-14 8.89E-14 28 4.34E41 1.95E44 9.76E-04 3.90E43O.OOE+00 1.22541 29 1.85E-16 3.71E-16 5.56E-15 1.11E-14 29 2.11E-01 9.485W5 4.74E-04 1.90E-03O.QOE+00 5.76E42 30 2.24E517 4.49E-17 6.73E-16 1.35E-15 30 9.92E-02 4.46545 2.235-04 8.93E-040.00E+00 2.63E42 31 2.63E-18 5.25E-18 7.885-17 1.58E-16 31 4.53E-02 2.0454W 1.02E44 4.07E504O.OOE+00 1.16542 32 2.98E-19 5.96E-19 8.94E-18 1.795-17 32 2.0OE42 9.01E-06 4.515EM 1.80E5040.00E+00 5.005-3 33 3.28E-20 6.55E-20 9.835-19 1.97E-18 33 8.61E43 3.87E-06 1.94545 7.75W55O.OO5+00 2.095-3 34 3.49E521 6.99E-21 1.05E-19 2.10E-19 34 3.60E43 1.62E-06 8.09E46 3.24E-05O.OOE+00 8.47E44 35 3.62E-22 7.245-22 1.09E-20 2.17E-20 35 1.46E43 6.57E47 3.28E-06 1.31E45O.OOE+00 3.34E44 36 3.65E-23 7.29E-23 1.095-21 2.19E-21 36 5.77E504 2.60E47 1.30E-06 5.19E46O.OOE+00 1.29E-04 37 3.57E-24 7.15E-24 1.07E-22 2.14E-22 37 2.22-44 9.98E48 4.99E47 2.00E-06O.00E+00 4.82E45 38 3.41E-25 6.81E-25 1.02E-23 2.045-23 38 8.315-05 3.74E-08 1.87E-07 7.48E407O.OOE+00 1.76E45 39 3.175-26 6.33E-26 9.50E-25 1.90524 39 3.04E-05 1.37E-08 6.835-08 2.73E-07o.OOE+00 6.27E46 40 2.87E-27 5.73E-27 8.60E-26 1.72E-25 40 1.085-0 4.87509 2.44E-08 9.74E48O.OOE+00 2.18E46 41 2.53E-28 5.06E-28 7.59E-27 t.52E-26 41 3.76E46 1.69E09 8.47E-09 3.39E-080.005+00 7.40E47 42 2.18E-29 4.36E-29 6.54528 1.31E-27 42 1.28E46 5.75E-10 2.88E-09 1.155-08O.OOE+00 2.465-7 43 1.84E-30 3.675-30 5.51E-29 1.10E-28 43 4.24E-07 1.91-10 9.54E-10 3.82E490.OOB+00 7.96E48 44 1.51E-31 3.02E-31 4.53E-30 9.05E-30 44 1.37E-07 6.19E-11 3.09E-10 1.24E-09O.OOE+00 2.52E48 45 1.21E-32 2.43E-32 3.64E-31 7.285-31 45 4.36E48 1.96E-11 9.81E-11 3.92E-10

TABLE 5.5.1. Calated Reiddual Radiation Dose Rates as Functi of SoilDepth Removed, with Surface Coaniamlbion Level as a Parameter (continued)
zCi Cs-137 Dose in mrem/v
pCl/g-> I 5 20Th-228 Dose In mremlv U-235 Dose In mrem/v
pc/Ug-> 30 200 1000pCi/g-> 30 100 200
7' Layers (nwemlyRemoved rEL/gi Low
0 0 4.68E-01 4.68E-0II 2.62E-01 2.62E-012 9.29E-02 9.29B-023 2.36E-02 2.36E-024 4.62E-03 4.62B-035 7.34E 04 7.34E-046 9.81E-05 9.81E-057 1.13E-05 1.13E-058 1.14E-06 1.14E-069 1.03E-07 1.03E-07
10 8.32E-09 8.32E-0911 6.14E-10 6.14E-1012 4.15B-11 4.15E-1113 2.60E-12 2.60E-1214 1.51E-13 1.51E-1315 8.16E-15 8.16E-1516 4.15S-16 4.15E-1617 1.98E-17 1.98E-17
( 18 8.952-19 8.95E-19O 19 3.82E-20 3.82E-20
20 1.55E-21 1.55E-2100 21 6.01E-23 6.01E-23
22 2.22E-24 2.22E-2423 7.82E-26 7.82E-2624 2.64B-27 2.642-2725 8.58E-29 8.58E-2926 2.68E-30 2.68E-3027 8.03E-32 8.03E-3228 2.33E-33 2.33E-3329 6.49E-35 6.49E-3530 1.752-36 1.75E-3631 4.58E-38 4.58E-3832 1.16E-39 1.16E-3933 2.82E-41 2.82E-4134 5.83E-43 5.83E-4335 0.00E+00 O.OOE+0036 O.OOE+00 O.OOE+0037 O.OOE+00 O.OOE+0038 O.OOE+00 O.OOE+0039 O.OOE+00 O.OOE+0040 O.OOE+00 O.OOE+0041 0.00E+00 O.OOE+0042 O.OOE+00 O.OOE+0043 O.OOE+00 O.OOE+0044 O.OOE+00 O.OOE+0045 O.OOE+00 O.OOE+00
Med2.34E+001.31E+004.65E-011.18E-012.31E-023.67E-034.90E-045.64E-055.702-065.13E-074.16E-083.072-092.08E-101.30E-117.53E-134.08E-142.07E-159.91E-174.47E-181.91E-197.77E-213.00E-22I.IIE-233.91E-251.32E-264.29E-281.34E-294.02E-311.16E-323.25E-348.76E-362.29E-375.79E-391.41E-402.92E-42O.OOE+00O.OOE+00O.OOE+00O.OOE+00O.OOE+00O.OOE+00O.OOE+00O.OOE+00O.OOE+00O.OOE+00O.OOE+00
Layers (mnre/yHMph Removedri)Cie) Low
9.37E+00 0 5.85E+00 1.76E+025.24E+00 1 3.922-01 1.17E+011.86B+00 2 1.34E-02 4.02E-014.712-01 3 3.07E-04 9.212-039.232-02 4 5.29E-06 1.59E-041.47E-02 5 7.29EW08 2.19E-061.96E-03 6 8.382-10 2.512E082.26B-04 7 8.26E-12 2.48E-102.28B-05 8 7.12E-14 2.14E-122.0SE-06 9 5.45E-16 1.64E-141.66E-07 10 3.76E-18 1.13E-161.23E-08 11 2.35E-20 7.06E-198.31E-10 12 1.35E-22 4.05E-215.19E-11 13 7.16E-25 2.15E-233.012-12 14 3.52E-27 1.06E-251.63E-13 15 1.612-29 4.84E-288.29E-15 16 6.94E-32 2.08E-303.96E-16 17 2.81E-34 8.42E-331.79E-17 18 1.07E-36 3.21E-357.65E-19 19 3.87E-39 1.16E-373.11E-20 20 1.22E241 3.65E-401.20E-21 21 0.00E+00 O.OO+004.43E-23 22 O.OOE+00 O.OOE+001.56E-24 23 O.OOE+00 O.COE+005.29E-26 24 O.OOE+00 0.00E+001.722-27 25 O.OOE+00 O.OOE+005.35-29 26 O.OOE+00 O.OOE+001.61E-30 27 O.OOE+00 O.OO+004.65E-32 28 0.00E+00 0.00E+001.30E-33 29 O.00E+00 0.00E+003.51-35 30 0.00E+00 0.00E+009.15E-37 31 0.00E+00 O.00E+002.31E-38 32 0.00E+00 O.00E+005.64E40 33 0.002+00 0.00E+001.17E-41 34 0.00E+00 0.00E+000.00E+00 35 0.00E+00 0.00E+000.00E+00 36 0.00E+00 0.00E+000.00E+00 37 0.00E+00 0.00E+000.00E+00 38 0.00E+00 0.00E+00O.OOE+00 39 0.00E+00 0.00E+000.00E+00 40 0.00E+00 O.OOE+000.00E+00 41 O.OOE+00 0.00E+000.00E+00 42 0.00E+00 0.00E+000.00E+00 43 0.00E+00 0.00E+000.00E+00 44 0.00E+00 0.00E+000.00E+00 45 0.00E+00 0.00E+00
Layers (nremyMed Mh Removed DOW _I&_L
5.85E+02 1.17E+03 0 5.23E-01 1.57E+013.92E+01 7.83E+01 1 5.23E-01 1.57E+011.34E+00 2.68E+00 2 5.23E-01 1.57E+013.072-02 6.14f-02 3 5.23E-01 1.57E+015.29E-04 1.06E-03 4 5.23E-01 1.57E+017.29E-06 1.46W-05 5 5.22E-01 1S72+018.38E-08 1.682-07 6 5.21E-01 1.56E+018.262-10 1.6SE-09 7 5.18E-01 1.55E+017.12E-12 1.42E-11 8 5.11E-01 1.53E+015.45E-14 1.09E-13 9 4.99E-01 1.50E+013.76E-16 7.52E-16 10 4.79E-01 1.44E+012.35E-18 4.71E-18 11 4.502-01 1.35E+011.35E-20 2.70E-20 12 4.12E-01 1.23E+017.162-23 1.43E-22 13 3.65E-01 1.09E+013.52E-25 7.04E-25 14 3.12E-01 9.36E+001.61E-27 3.23E-27 15 2.57E-01 7.72E+006.94E-30 1.39E-29 16 2.042-01 6.11E+002.81E-32 5.61E-32 17 1.55-E01 4.65E+001.07E-34 2.14E-34 18 1.13E-01 3.40E+003.87E-37 7.752-37 19 7.95E-02 2.392+001.22E-39 2.43E-39 20 5.36E-02 1.61E+00O.OOE+00 O.OOE+00 21 3.47E-02 1.04E+000.00E+00 O.OOE+00 22 2.162-02 6.48E-01O.OOB+00 O.OOE+00 23 1.302-02 3.89E-010.00E+00 O.OOE+00 24 7.48E-03 2.25E-010.002+00 0.00E+00 25 4.17E-03 1.25E-01O.00E+00 O.OOE+00 26 2.24E-03 6.72E-02O.OOE+00 0.00E+00 27 1.16E-03 3.49E-02O.OOE+00 0.00E+00 28 5.84E-04 1.752-02O.OOE+00 O.OOE+00 29 2.84E-04 8.51E-030.OOE+00 O.OOE+00 30 1.33E-04 4.012-030.OOE+00 O.OOE+00 31 6.092-05 1.832-03O.OOE+00 O.OOE+00 32 2.70E-05 8.09E-04O.OOE+00 O.OOE+00 33 1.16E-05 3.47E-04O.OOE+00 O.OOE+00 34 4.84E-06 1.45E-04O.OOE+00 0.00E+00 35 1.96E-06 5.89E-05O.OE+00 O.OOE+00 36 7.75E-07 2.33E-05O.OOE+00 O.00E+00 37 2.98E-07 8.952-060.00E+00 0.00E+00 38 1.12E-07 3.35E-060.00E+00 O.OOE+00 39 4.082-08 1.22E-060.OOE+00 0.00E+00 40 1.45E-08 4.36E-070.00E+00 0.00E+00 41 5.0SE-09 1.52E-070.00E+00 0.00E+00 42 1.72E-09 5.15E-080.00E+00 0.00E+00 43 5.69E-10 1.71E-080.00E+00 0.00E+00 44 1.85E-10 5.54E-090.00E+00 0.00E+00 45 5.85E-11 1.76E-09
Med1.05E+021.05E+021.05E+021.05E+021.0E+021.04E+021.04E+021.04E+021.02E+029.98E+019.58E+O09.00E+018.23E+017.30E+016.24E+015.14E+014.08E+013.10E+012.27E+011.59E+011.07E+016.94E+004.32E+oo2.59E+001.50E+008.34E-014.48E-012.33E-011.17E-015.67E-022.67E-021.22E-025.39E-032.32E-039.67E-043.93E-041.55B-045.96E-052.23E-058.16E-062.91E-061.OIE-063.43E-071.14E-073.69E-081.17E-08
52+h5.23E+025.23E+025.23E+025.23E+025.23E+025.22E+025.21E+025.18E+02S.IIE+024.99E+024.79E+024.50E+024.12E+023.65E+023.12E+022.57E+022.04E+021.55E+021.13E+027.95E+015.36E+013.47E+012.16E+011.30E+O07.48E+004.17E+002.24E+001.16E+005.842-012.842-011.33E-016.09E-022.70E-021.16E-024.84E-031.96E-037.75E-042.98E-041.12E-044.08B-051.45E-055.05E-061.72E-065.69E-071.85E-075.85E-08
U. 1. I,

C.5.6 Reference Facility Soil Contamination
Soil contamination information from 10 reference facilities is contained in this section. Alsocontained in this section are the surface areas of contaminated soil at the reference facilities,which are summarized in Table 7.1.1. Volumes of contaminated soil are calculated as afunction of thickness removed and are summarized in Tables 7.2.2 and 7.2.3. Facilitiesother than those selected as the reference for building contamination may be described as thereference facility for soil contamination if the data were more relevant. For example, theGeneral Electric uranium fuel fabrication plant was described as the reference facility forcharacterization of building contamination, but the reference facility selected forcharacterization of soil contamination is the Babcock and Wilcox nuclear fuel manufacturingplant in Apollo, Pennsylvania.
The data on the level of soil contamination presented in the following sections is limited andalso shows considerable variability. Such contamination would be expected to vary forspecific sites. Therefore, three sets of reference soil contamination levels have beendeveloped for each of the reference facilities, called "high, "medium," and 'low,' toprovide some bounding of the situation and to provide a range of the possible contaminationlevels that may be present. The soil surfaces are assumed to be contaminated at thesenominal contamination levels, for purposes of these analyses.
C.5.6.1 Reference Power Reactor
A reference facility based on the Trojan Reactor Plant has been described in Section 4.1.The concentration ranges of radionuclides in contaminated surface soils (to a depth of 4 cm)has also been reported by Abel et. al. (1986, Table 4.7, p. 27) for six other reactor plantsand are reproduced in Table 5.6.1. Cobalt-60 was the largest contributor to radiation dosefrom radionuclides in soils at those plants.
Geographic Profile
Radionuclide concentrations in soils at nuclear power plant sites were located in smallpatches of very low concentrations located within the security fences and were mostly atknown spill sites. These locations were generally close to condensate or borated waterstorage tanks, effluent sampling points, or equipment maintenance and/or cleaning areas.Small areas of contaminated soils at most plants would require remedial action, such asexcavation and disposal as low-level waste. Volumes are relatively low - tens of cubicmeters (Abel et al. 1986) Additional volumes of contaminated soil might occur duringdecontamination and/or dismantling, as additional spills occur or covered areas (e.g.,underneath spent fuel storage pools) are found to be contaminated. The highest levels ofradionuclides found in "hot spots" (soil samples and holding pond sediments) consisted of60Co (up to 377 pCi/g) and 37Cs (up to 91 pCi/g) (Abel et al. 1986).
C.D-59 NUREG-1496
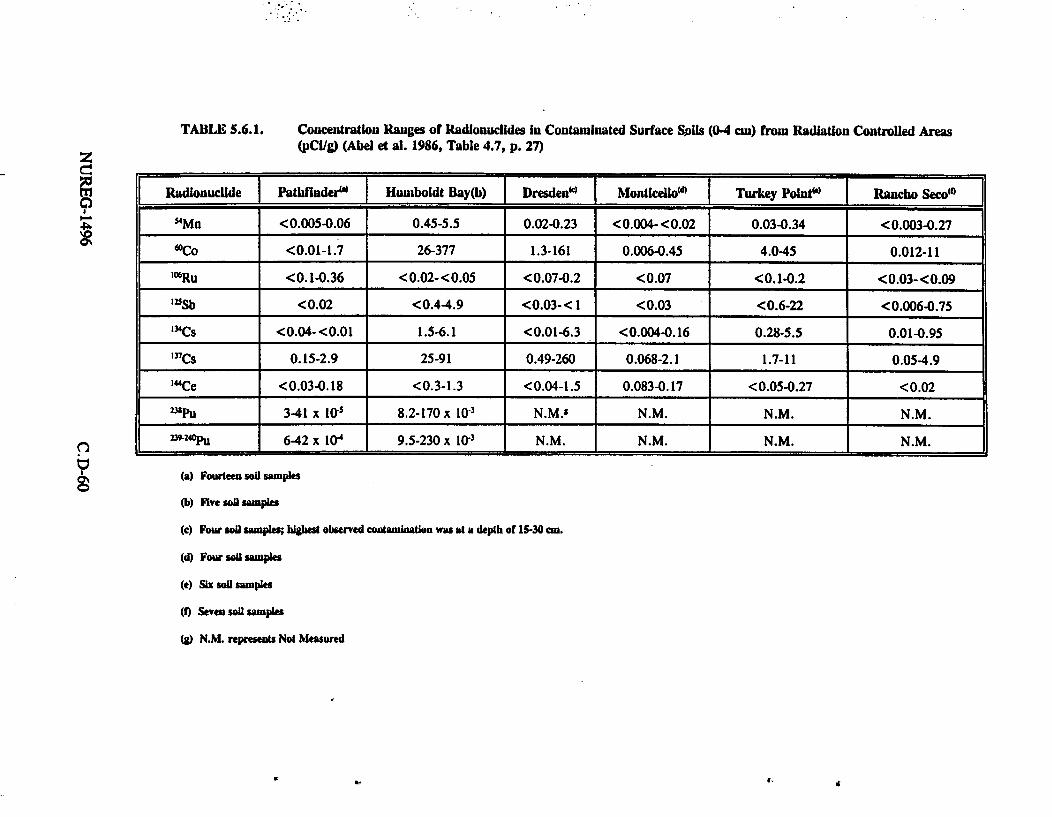
TABLE 5.6.I. Concentration Ranges of Radionuclides In Contaminated Surface SAils (04 cm) from Radiation Controlled Areas(pCi/g) (Abel et al. 1986, Table 4.7, p. 27)
o00~
Radionuclide Pathfinder" Humboldt Bay(b) Dresdenw Monticellom Turkey Point") Rancho Seco'°
14Mn <0.005-0.06 0.45-5.5 0.02-0.23 <0.004- <0.02 0.03-0.34 <0.003-0.27
loco <0.01-1.7 26-377 1.3-161 0.006-0.45 4.0-45 0.012-11
'06Ru <0.14.36 <0.02-<0.05 <0.07-0.2 <0.07 <0.1-0.2 <0.03-<0.09
123Sb <0.02 <0.4-4.9 <0.03-< 1 <0.03 <0.6-22 <0.006-0.75
134Cs <0.04-<0.01 1.5-6.1 <0.01-6.3 <0.004-0.16 0.28-5.5 0.014.95
'37 Cs 0.15-2.9 25-91 0.49-260 0.068-2.1 1.7-11 0.054.9
1ICe <0.03-0.18 <0.3-1.3 <0.04-1.5 0.083-0.17 <0.05-0.27 <0.02
3pU 341 x 105 8.2-170 x 10-3 N.M.' N.M. N.M. N.M.
D31-40pU 642 x 0r4 9.5-230 x 103 N.M. N.M. N.M. N.M.
(a) Fourteen soil sampks
(b) Five soi sampes
(c) Four soil samples; higest observed contamination was at a depth of 15-30 on.
(d) Four soil samples
(e) Six soD samples
(f) Seven son samples
(g) N.M. represents Not Measured
O0
W ..
Reference Scenario - Nuclear Power Plant
For the reference nuclear power plant decommissioning scenario, it is estimated thatapproximately 2000 ft3 of soil contaminated with 'Co and "37Cs may be identified from (a)known and recorded spills, (b) spills of solutions and sludges during surface cleaning anddecommissioning operations, and (c) spills into soil which are discovered during the post-decommissioning, pre-release radiological survey. The high, medium, and low values aregiven in Table 5.5.1 and Figures 5.5.1 - 5.5.3 for 60Co, "3Cs, and 'Sr and are used inestimating surface soil contamination at the reference power reactor. Since this soil will beof relatively low activity and contain no alpha-emitting radionuclides above release limits, itcan be treated as low-level waste, placed in drums, and transported to a LLW repository.
C.S.6.2 Reference Test Reactor and Research Reactor
The site area of the reference Plum Brook test reactor is estimated at 50 x 106 ft2. There areapproximately 3,400 linear feet of asphalt-lined drainage ditches at the reference test reactorfacility (Konzek et al.' 1982b). Before concrete pipes were laid on the asphalt lining, it isassumed that there was potential leakage of contaminated water into the soil beneath theasphalt. If the ditches were approximately 1.5 ft wide, the area of the contaminated soil isestimated to be approximately 5,000 ft2. Radioactivity released to the soil from the retentionbasins is assumed to be negligible.
The site area of the reference Oregon State University (OSU) TRIGA research reactor isestimated to be 150,000 ft2. No specific data on contaminated soil areas were found for theOSU reactor site. Therefore, the area of contaminated soil is estimated to be 500 fte, scaledfrom the contaminated area estimated for the test reactor, reflecting the reduced scale ofoperations at a research reactor.
The high, medium, and low values for surface contamination are given in Table 5.5.1 andFigures 5.5.1, 5.5.2, and 5.5.3, for 6WCo, 37Cs, and 'Sr, and are used to estimate the surfacesoil contamination at the reference test and research reactors.
C.5.6.3 Reference Nuclear Fuel Fabrication Facility
Although the General Electric Wilmington Plant is the reference nuclear fuel fabricationfacility, more information on the condition of the soils at the site were found for the Apollbplant. Therefore, soils at the Apollo plant are described in this section.
The plant is a former nuclear fuel manufacturing site in Apollo, PA, which is currentlyundergoing decontamination (Babcock and Wilcox 1992a, 1992b). The fuel manufacturingoperations were performed in one part of the facility, owned by Babcock and Wilcox, andlocated on the east side of the site in approximately one acre of roofed two-story buildings.Other parts of the complex included a parking lot (2.5 acre) and an "off-site area" (3 acres)which included a metals-processing complex, laundry, railroad spur, and equipment storagebuilding.
C.D-61 NUREG-1496

Principal NRC-licensed manufacturing operations at the Apollo site included the manufactureof low- and high-enriched uranium oxide fuels for commercial nuclear power plants and fornuclear-powered naval ships. Nuclear fuel manufacturing commenced in the main buildingin 1957 and was terminated in 1983. The manufacturing process was the chemicalconversion of uranium hexafluoride to uranium oxide powder. All operations wereterminated in 1984.
Contamination Information
Site soil has been estimated to be potentially contaminated above30 pCi U/g, at depths ranging from near-surface to >25 feet. Uranium contaminationconcentrations of 24 - 300 pCi U/g were found beneath part of Building 3 and the east end ofBuilding 4, at depths from 6 -96 inches. The riverbank soils are also being characterized;three samples taken from near the plant exceeded 30 pCi U/g. A surface area ofapproximately 50,000 ft2 is estimated to be contaminated to varying degrees with uranium.Based on the available information, high, medium, and low levels of surface contaminationare estimated. The values for uranium contamination at the surface for the referenceuranium fuel fabrication facility are given in Table 5.5.1 and Figure 5.5.5.
C.5.6.4 Reference Uranium Hexafluoride Plant
The uranium hexafluoride gaseous diffusion plant Portsmouth, Ohio, was selected as areference plant for the contaminated soils portion of this report because it provides someinformation on the extent of contamination. The Portsmouth Gaseous Diffusion Plant islocated on a government-owned reservation 126 km from Columbus, Ohio and 32 km northof Portsmouth, OH, next to the Scioto River and at an elevation of 650 - 700 feet above sealevel. The plant is operated for the U.S. Department of Energy (DOE) by Martin MariettaEnergy Systems, Ltd., and provides enriched uranium fuel to the nuclear power industryfrom isotope separation via gaseous diffusion.
Radioactive contamination in the soil at this site is currently being investigated as part of acomprehensive RCRA (Resource Conservation and Recovery Act) Facility Investigation(RFI). The site has been divided into four quadrants. [Complete data are currently availablefor only one of these - Quadrant I (Geraghty and Miller, Inc., 1990a, 1990b), but a generalsite overview has been included in these references].
Based on the available information, the high, medium, and low levels of surfacecontamination given in Table 5.5.1 and Figure 5.5.5 are used in estimating surface soilcontamination at the reference uranium hexafluoride plant. The estimated site area is 200 x106 ft2. The contaminated area is estimated to be 100,000 ft2.
C.5.63. Reference Non-Fuel-Cycle Plants
The reference non-fuel-cycle plants evaluated for soils contamination are a sealed sourcemanufacturing facility, a generic broad research and development facility, and a rare metalextraction facility.
NUREG-1496 C.D-62

C.S.6.S.1 Reference Sealed Source Manufacturing Facility
The reference sealed source manufacturer is the Advanced Medical Systems facility. Thesite area is estimated to be 40,000 ft2. The contaminated area is estimated to be 5,6W ftO,based on assumed stack effluent releases. Advanced Medical Systems, Inc. manufactures40Co and "7Cs sources for medical use. A small amount of detectable activity has beenfound in site soil, and was assumed to be due to stack effluent releases. Apart from this, themajor route to soil contamination would be via liquid waste spills on building floors runningoff through floor-wall seams in the concrete (NRC 1993).
For purposes of estimating soil contamination, the high, medium, and low values given inTable 5.5.1 and figures 5.5.1 and 5.5.3 for 'Co and "7Cs are used in estimating surface soilcontamination at the reference sealed source manufacturer. It is likely that the low value isappropriate in most situations for these facilities.
C.S.6.5.2 Rare Metal Extraction Facility
The reference rare metal extraction facility is the Molybdenum Corporation of Americafacility in Washington, PA, which occupies a 17 acre (740,000 ft2) site, and produced aferrocolumbium alloy from a Brazilian ore from 1964 to 1970. The ore contained licensableconcentrations of thorium (1-1.5% by weight), and so the operation produced thorium-bearing slag and contaminated soil. Some of the slag was used as fill over portions of thesite, which includes a number of buildings, eight holding ponds, and a large (7,000 mn') slagpile with an average activity of 1,250 pCi/g on the southern part of the property (NRC 1993,p. A-65). Average concentrations over most of the site ranged between 100-200 pCi/g.Therefore, 200 pCi/g was used for-the high value in Figure 5.5.4. The area of contaminatedsoil is estimated to be 100,000 ft2 based on extensive handling and storing of ore and slag atthe site. It is estimated that there is 1.1 x 10⁵ kg of thorium on-site in the form ofcontaminated soils and slags.
C.5.6.5.3 Broad Research and Development Facility
The reference broad R&D facility is a generic, single-building facility on a 40,000 ft2 site.Licensed nuclear fuels R&D was performed on the site. A site-wide radiological surveyindicated contamination in several areas of soil, with subsurface cesium contamination froni20-48 pCi/g at two locations, and with contaminated septic tank sludge and contaminated soilunder a downspout. Sediment samples from the site contained 137CS (up to 9.9 pCi/g) (NRC1993). Although radioactivity levels in soil were generally quite low, contamination in "hotspots" appeared to be quite widespread; therefore, the area of contaminated soil is assumedto be 5000 ft2.
The high, medium, and low values given in Table 5.5.1 and Figure 5.5.3 for 137Cs are usedin estimating surface soil contamination at the reference broad R&D facility.
C.D-63 INUREG-1496

C.5.6.6 Reference Conventional Uranium Mill
The scope of this document is limited to the uranium mill buildings and the immediate landssurrounding the mill buildings, and specifically the residual radioactivity criteria forcontamination which may be present in those buildings or lands. With regard to the tailingsimpoundment, a general license is issued under 10 CFR 40.28 for the custody and long-termcare of the tailings to comply with standards for uranium mill tailings sites closed under theUranium Mill Tailings Radiation Control Act of 1978. The licensee for the tailingsimpoundment will be the DOE, other Federal agency, or State. Therefore, long-termmanagement of the tailings impoundment is outside the scope of this document and is notdiscussed further.
Apart from the tailings piles, contaminated soil is assumed to be present in the former millarea and on the vicinity properties, which is believed to have originated from storage of orein open piles, roaster stack emissions, tailings pond overflow, and erosion of tailings piles bywind and water. The average contamination (given as "6Ra activity, which is a characteristicmeasurement for these sites) is 20 pCi/g of soil for the former millsite, with possiblecontamination of the subsurface to a depth of up to 6.5 ft.
The NRC (Sections 8.5 and 9.5 and Appendix K of NUREG-0706) has analyzed thedecommissioning of the model mill. Concrete floors, foundations, and sumps from the millbuildings would be broken up, removed, and buried in the tailings impoundment.Contaminated soil beneath foundations of the mill building would be excavated and also takento the tailings impoundment. Contaminated areas outside the mill buildings, such as ore padsand collection ponds, would be excavated and the soil removed to the tailings impoundment.All excavated areas would be backfilled, graded, and revegetated. It was estimated, basedon the areas of the leaching and countercurrent decontamination tanks, that 35,000 ft2 ofconcrete and underlying soil would be removed to a depth of six feet and placed into thetailings pile. It was also estimated that the ore pad and other more highly contaminated areashave an area of 20 acres and would be sent to the tailings piles and that for other mill siteareas, 300 acres of soil with a removal depth of 6 inches would be sent to the tailings pile.Estimates were based on residual contamination criteria existing or proposed at the time ofpublication of NUREG-0706 (Table 9-14 of NUREG-0706). Costs and impacts associatedwith decommissioning of the model mill are included in Sections 8.5 and 9.5 and AppendixK of NUREG-0706.
Based on Appendix K, and on recent NRC experience regarding the conduct ofdecommissioning operations by the currently licensed uranium mills, decommissioning of thereference conventional mill is assumed as follows. For the reference conventional uraniummill, the mill structure (including concrete floors and foundations) would be demolished,removed, and buried in the tailings impoundment, contaminated earth beneath removedfoundations and contaminated areas outside the buildings, such as ore pads and collectionponds and other areas in the vicinity of the mill structure, would be excavated and the soilremoved to the tailings impoundment. Foundations and portions of the mill buildings may be
NUREG-1496 C.D-64

disposed in place and covered with soil and erosion protection layers as part of the tailingsreclamation plan. As indicated above, the tailings impoundment would remain under generallicense by the DOE. For the reference conventional uranium mill, because of the proximityof the mill building area to the tailings impoundment, the area at the mill building and itsvicinity would become part of the DOE-licensed area under the general license for long-termcare of the tailings pile and would not be released for unrestricted use. Therefore,decommissioning of the reference conventional uranium mill facility would not be impactedby the alternatives under consideration in this report.
Uncertainty Analysis of Decommissioning Analysis of Reference Conventional Uranium Mill
Decommissioning of a conventional mill in which the owner made a decision to release all orpart of the mill area for unrestricted use would be evaluated on a case-by-case basis. Asnoted above, it has been estimated (Appendix K of NUREG-0706) that 35,000 square feet ofconcrete and underlying soil would be removed to a depth of six feet and placed into thetailings pile. It was also estimated that the ore pad has an area of 20 acres and an excavationdepth of 3 feet (100,000 yd3), and that for other mill site areas, 300 acres of soil with aremoval depth of 6 in. are sent to the tailings pile. If a reference case is postulated for acomplete or partial release of a site based on the volumes estimated, the quantities ofcontaminated material estimated for removal and disposal is less than that for a uranium fuelfabrication plant or uranium hexafluoride plant analyzed in Sections 4.3 and 4.4 of thisreport. Hence the evaluation of alternatives and release criteria estimated for those facilitiescould be applicable to the reference uranium mill case where there is release of some or allof the site for unrestricted use.
C.5.6.7 Reference Independent Spent Fuel Storage Installation
The reference dry ISFSI collocated at the Surry Reactor Plant has a site area of of 500,000ft2. The area of contaminated soil is postulated to be 500 ft2. The high, medium, and lowvalues given in Table 5.5.1 and Figures 5.5.1-5.5.3 for 'Co, 'MCs, and '0Sr are used inestimating surface soil contamination at the reference ISFSI. It is likely that the low value isappropriate in most situations for these facilities.
C.D-65 NUREG-1496

C.6. COST METHODOLOGY FOR DECONTAMINATION OFCONCRETE AND SOILS
The methods of calculating costs for removal and disposition of contaminated concrete andsoils from decommissioned nuclear facilities are described in this chapter. The methodologyfor costing the removal and disposal of contaminated concrete surfaces is described first,followed by the methodology for costing removal and disposal of contaminated soils.
C.6.1 Concrete Surface Decontamination Cost Calculation Methodology
The approach used to calculate the costs of removal and disposition of contaminated concretefrom facility surfaces is as follows:
* The area of contaminated surface is defined.
* The length of perimeter crack is defined.
* The area of the "wet spots" is defined.
* The volume of concrete to be removed is determined, based on the dosecalculations described in Sections 4.8.6 and 6.2.3 of this report.
* The unit cost factors for removal of contaminated concrete from surfaces,cracks, and wet spots are defined. The removal cost for each of thecontaminant situations (floors, walls, cracks, and wet spots) is calculated as theproduct of the area x the appropriate unit cost factor.
* The resulting volumes of removed material are expanded by a rubbleexpansion factor of 1.56 (Westinghouse Hanford Co. 1989) and thecontaminated rubble is drummed. The cost of drums is calculated by theproduct of the number of drums x the unit cost of a drum.
* The cost of transport is calculated assuming a one-way shipment of 500 milesfrom the waste generator to the disposal site, for a legal-weight truck -shipment, by dividing the number of drums of rubble generated by the numberof drums per truck shipment x the cost per shipment.
* The cost of disposal is calculated assuming very low activity waste disposed ata licensed LLW disposal site: the number of cubic feet of waste x theappropriate disposal charge rate per cubic foot.
NUREG-1496 C.D-66

The duration of the concrete removal period is based upon the number ofperson-hours required to remove the material, assuming two crews/shift andtwo shifts/day, and specified removal rates (floors or walls) in square feet percrew-hour. On each shift, one crew works on floors and one crew works onwalls. The total (floor or wall) area treated is divided by the appropriateremoval rate in square feet per crew-hour to determine the number of crew-hours required to remove the material, i.e., the duration of the removalperiod. The overhead labor costs are determined by the size and makeup ofthe overhead staff and their salaries, and the length of the removal period.
* The total cost for contaminated concrete removal is the sum of the costs forremoval of surface layers on floors and walls, and the cost for removal ofcracks and wet spots, plus the costs for packaging, transport, and disposal ofthe packaged material, plus the cost of project overhead staff during theremoval period. As each successive layer of concrete is removed from floorsand walls, these removal costs increase, together with packaging, transport anddisposal costs. The cost elements for the cracks and wet spots are independentof the number of layers of floor and wall removed.
C.6.2. Concrete Surface Decontamination Technology and Cost
Decontamination of concrete surfaces of floors and walls is postulated to be accomplishedusing commercial equipment presently available. The equipment postulated to be used inthese analyses is a pneumatically operated surface removal system (scabbler) manufacturedby Pentex, Inc. (The Moose~ and associated smaller units). This device can chip awayapproximately 0.125 in. of surface depth per pass, and has a skirted scabbling unit with avacuum system which collects the dust and chips from the operation and deposits the wastematerial into a waste drum. Filters on the vacuum system discharge remove suspended dustparticles from the air to prevent recontamination of the cleaned surfaces. Successive passesare required to remove deeper layers of contaminated concrete.
C.6.2.1 Rates of Floor and Wall Surface Removal
The removal rates for the scabbler devices are functions of the depth to be removed.Because the depth of cut for the scabbler is adjustable, different depths can be removed witha single pass. However, the deeper the cut, the slower the rate of removal in terms ofsurface area. For these analyses, a depth per cut of 0.125 in. is postulated, somewhere nearoptimum for maximizing the effectiveness of the equipment, which results in a removal rateof about 115 ft2 per hour for a single pass of the equipment. The smaller units utilized forthe edges of floors and for walls have a removal rate of about 30 ft2 per hour for a singlepass.
C.D-67 NUREG-1496
C.6.2.2 Unit Costs for Removing Contaminated Concrete Surfaces
The cost per square foot of surface removed is calculated based on the postulated crewmakeup and size. For this type of operation, a crew consisting of 3 laborers, 0.25 of ahealth physics technician, and 0.25 of a crew-leader was postulated, which resulted in a costper square foot removed to a depth of 0.125 in. of $2.20 for the floors and $8.61 for thewalls.
To compute the cost of removal and disposition of each layer of contaminated concrete in afacility, the estimated contaminated area of floors and walls is multiplied by the appropriateunit cost factors, and the results summed. Added to these removal costs are the costs ofpackaging (cost per drum), transport (legal-weight truck one-way for 500 miles), anddisposal at a licensed LLW facility (disposal charge rates are based on an average of therates at the U.S. Ecology site at Hanford and the within Compact and outside of Compactrates at the Chem-Nuclear site at Barnwell, about $148/ft3). The cost of the project overheadstaff during the removal period is computed based on the duration of the removal period andadded to the other costs of the effort.
C.6.2.3 Crack and Wet Spot Removal
Decontamination of cracks in the floor that contain contamination is accomplished byremoval of the concrete surrounding the crack, using ordinary pneumatic hammers andvacuum systems for dust and particle collection. The cost of this operation is computed in amanner similar to the floor removal operations, using a unit cost factor for crack cleanoutand the linear length of crack requiring removal. A crew is defined, labor rates areassigned, the rate of crack length removal is estimated, and the cost per linear foot of crackis calculated. This unit cost factor is multiplied by the number of linear feet of crackrequiring removal to obtain the removal cost. The costs of packaging, transport, anddisposal are calculated and added.
Decontamination of a crack is postulated to require removal of approximately 1 in. ofconcrete on either side of the crack, to an average depth of 6 in., resulting in a waste volumegenerated of about 0.13 ft3 of contaminated rubble per linear foot of crack, including the1.56 volume expansion for rubblizing. The removal rate is assumed to be 20 linear feet ofcrack per operating crew-hour, with a resulting cost per linear foot of crack of about $7.40,including equipment costs. The length of crack for each facility was postulated to be equalto the perimeter of the structure, derived from the building footprint surface area, assuming asquare structure:
perimeter = 4 x (number of floors) x (footprint area)y.
For the analyses presented in this report, a single story structure is assumed for all facilities.
NUREG-1496 C.D-68

For "wet spots", i.e., areas that had been exposed to liquid contaminants for extendedperiods of time, the penetration of contaminants is considerably deeper than for drycontaminants, as discussed in Chapter 4. Therefore, the entire thickness of a concrete flooris postulated to be removed for the area of the "wet spot", using equipment similar to thatdescribed for crack removal. For these analyses, the floor thicknesses removed wereassumed to be 6 in. thick. It is also postulated that the contamination will extend downwardinto the soil beneath the "wet spot" such that, on the average, about 5 ft. of soil must beremoved. The costs of removing and disposing of the "wet spot" concrete and the associatedsoil are summarized and included with the soils removal and disposal costs in Tables 7.2.3and 7.2.4 of Chapter 7.
The removal rates, crew sizes, and costs for removal of the "wet spot" areas of concretewere obtained from Means (1993).
The results of the calculations for the cost of removal, packaging, transport, and disposal aresummarized in Chapter 7 in Table 7.2.1 for the volumes of contaminated concrete removedfrom cracks, and in Tables 7.2.2 and 7.2.3 for the "wet spots".
C.6.3Removal of Activated Concrete From the Reactor Bioshield
Removal of the activated concrete from the reactor bioshield is accomplished using a drillingand blasting technology. Vertical holes are bored into the shield concrete at selecteddistances from the shield inner surface. Explosives are inserted into the holes and detonated,breaking up the inner segments of the shield. This operation is repeated as necessary toremove the required amount of the shield, to reduce the surface radiation dose rate inside theshield cavity to acceptable levels.
Calculations of the activation of materials in the concrete biological shield that surrounds thereactor pressure vessel were reported in NUREG/CR-0130 (Smith et al. 1978) for thereference PWR (Trojan), for an assumed operating lifetime of 30 effective full-power years(i.e., 75% operating efficiency). These calculations did not include any I52I because noinformation was available about the likely concentration of "2Eu in the natural materials ofthe Trojan bioshield. However, measurements made at the Elk River Reactordecommissioning suggested that the Ci/m3 attributable to IIEu was about the same as theCOim 3 associated with 'Co. Thus, the total bioshield activity is postulated to beapproximately twice the calculated activity of ' 0Co, due to the anticipated "lEu activity.
Examination of the original calculations of activations in the bioshield suggests that at about7 years following reactor shutdown, the residual activity levels in the bioshield will be suchthat removing 3.97 ft from the inner surface of the shield would result in a surface radiationdose rate of about 10 mrem/yr; 4.78 ft removed for 1 mrem/yr; and 5.57 ft removed for 0.1mren/yr. The costs associated with removal and disposal of that activated material werecalculated using the unit cost factor algorithm for activated bioshield concrete removal
C.D-69 NUREG-1496

presented in Section C.2.15 of Appendix C in NUREG/CR-5884, (Konzek et al. 1993) andthe cost estimating computer program (CECP). The length of the decontamination effort wascalculated to be controlled by the shield removal initially, but after one pass of the floor-removal equipment, the floor removal duration controlled the duration of the effort, for thepurpose of calculating project overhead costs to be added to the direct labor costs.
C.6.4. Soil Decontamination Cost Methodology
The costs for removal and disposition of contaminated soils are calculated in a somewhatsimilar manner. The area of contaminated soil is defined. The unit cost factors for soilremoval, treatment (if any), packaging, transport, and disposition are defined. The depth ofcontaminant penetration into the soil is defined. Then, the total cost for contaminated soilremoval is the sum of the individual cost elements, which are calculated using theappropriate unit cost factors. The cost calculation is based upon removing all of the soil tothe depth necessary to achieve each of the alternate residual radiation dose rates.Subsequently, choices are made between treating the contaminated soil prior to disposition,or transporting the untreated contaminated soil to a regulated disposal facility for very lowactivity materials. In the treatment scenario, the cleaned soil is retained on-site for backfill,with the more contaminated residues removed by the treatment process being packaged andtransported to a LLW disposal facility. In any actual situation, selection of one path overanother would most likely be governed by the total cost for each choice.
C.6.5 Soil Treatment Technologies
The various forms of soil washing represent the only commercially-demonstrated soil-cleaning techniques for radioactively-contaminated soils. Innovative techniques beingdeveloped (at present in the pilot plant or demonstration stage) include electrokinetics, andmagnetic separation. These latter two techniques offer some potential for cost-reduction, butare likely to be applied as a polishing step after soil classification and washing rather than asstand-alone soil cleaning methods. In addition, biosorption/bioleaching technology, currentlybeing used for metals extraction from ores in the mining industry (particularly uranium andcopper) may be applied to contaminated soil cleanup, but it is currently a developingtechnology.
C.6.5.1 Soil Washing - General Description
Contaminated soil is removed from the site, classified to remove large particles and rocks,and washed by immersion with agitation in an aqueous solution. Chemical additives may bepresent in the wash solution to dissolve contaminants bound to soil particles. Severaladditives are available to facilitate the solution process depending on soil and contaminanttype (Dennis et al. 1992, SEG 1992, and Gerber et al. 1991). After washing, the soil isseparated according to particle size. Since most of the contaminants bind to the fine soilparticles (<250 micrometers) which account for between 1040% of the total soil mass, thebulk of the soil can be returned to the original location. The remaining slurry of
NUREG-1496 C.D-70

contaminated fines may have to be treated further to prepare for disposal (e.g., by dryingand placing in drums). Removal rates of contaminants are enhanced by high liquid to soilratios. Depending on the soil type and type of washing solution, this method may beeffective in the removal of radionuclides. This is a relatively new technology for soilremediation, although it has been used in the mining industry for many years. The processhas been commercially demonstrated in Europe and the U.S., mostly for organic-contaminated soils, although some data are available on its application to radiologicallycontaminated soil remediation.
C.6.S.2 Other Soil Cleanup Technologies
A DOE program is under way to evaluate innovative soil treatment technologies, includingfield testing at the Nevada Test Site (NTS), at the NTS Treatability Test Facility (operatedby Reynold's Electrical & Engineering Co.). The soil treatment technologies underexamination currently are restricted to plutonium removal, but are likely to be equallyeffective for thorium and uranium (but not cesium or strontium), and include:
Advanced Process Technologies, Salt Lake City, UT: Air-sparged hydrocyclone for removalof plutonium
0
AWC/Lockheed, Las Vegas, NV: Mineral jig combination and shaker table
Nuclear Remediation Technologies, San Diego, CA: Paramagnetic separation of plutoniumfrom soil using Eriez Magnetics equipment
0
Paramagnetics, Inc., Plant City, FL: Pretreatment washing, followed by Kolm Separatorparamagnetic separation
Scientific Ecology Group, Pittsburgh, PA: Multigravity separator; and high-gradientmagnetic separator.
Site cleanup is expected to begin in 1996, using the selected successful technologies (NuclearWaste News, 1993).
C.6.6Cost and Labor Estimating Bases for Soil Remediation/Treatment
The information developed for cost and labor is based on unit cost and labor data presentedin this section. Categories for which basic unit factors were developed include: excavation,demolition of foundations, soil washing, packaging, transportation, and disposal. Estimateswere developed using a spreadsheet that calculates the cost and labor requirements as a
C.D-71 C-NUREG-1496

function of volume removed for each site.
A soil washing option was considered for each site analyzed. The soil washing processwould separate the contaminated soil from the clean soil in order to reduce the volume of soilthat would be disposed of at a burial facility. In order to evaluate the cost effectiveness ofsoil washing, two scenarios were considered for each facility, one with soil washing and theother without soil washing.
C.6.6.1 Excavation
The unit cost and labor estimates for excavation of soil were obtained from Short (1988).The unit factors were then escalated to 1992 dollars. This analysis assumed that the soil wasexcavated and removed from an area contaminated with radioactive residue resulting fromfacility operations. Radiological surveys are performed by a work crew consisting of aforeman and three health physics technicians from the site owner's organization. Thecontractor's work crew for removal and handling of contaminated soil includes a foreman,two equipment operators, and two laborers. This crew is assisted by a health physicstechnician. Backfilling and grading of the site is accomplished by a work crew that includesa foreman, two equipment operators, and a laborer.
C.6.6.2 Removal of Concrete Floor and Underlying Soil
A unit cost and labor factor was developed for removal of portions of the facility floor areaand about 5 ft. of soil beneath the removed portion of the floor. The unit cost and laborfactor was based on the previous excavation cost, the cost for demolition of concrete footingsand foundations, and placement of the demolished material into packages for transport to adisposal facility. The cost and labor factors for demolition of concrete foundations wereobtained from Means (1993). It was assumed that the foundations contained reinforced steeland were demolished using pneumatic equipment, a backhoe, and crawler. The rubble wasthen loaded onto trucks. It was assumed that the concrete had been decontaminated, but a15% work difficultly factor was applied to ensure that proper personnel protective equipment(similar to asbestos removal) was used during demolition.
C.6.6.3 Soil Washing
Soil washing is a water-based process for mechanically scrubbing and leaching wasteconstituents from a contaminated soil for recovery and treatment. It is an ex-situ toxicityreduction technology. The process removes contaminants from soils in one of two ways: bydissolving or suspending them in the wash solution, or by concentrating the contaminants intoa smaller volume of soil through simple particle size separation techniques.
The cost of soil washing contaminated soil that was removed was obtained from theENVEST Environmental Cost Engineering Model (ENVEST 1991) developed by the UnitedStates Air Force Environmental Restoration Program. The soil volume generated at each site
NUREG-1496 C.D-72

was used as the cost estimating basis for the ENVEST model. It was assumed that aconservative efficiency of the soil washing process was 60%. Hence, 40% of the soilprocessed would be packaged and transported to a low-level radioactive waste burial facility.
C.6.6.4 Packaging
The cost for packaging containers was obtained from Konzek (1993). It was assumed thatthe material would be packaged for shallow-land burial using B-25 metal containers.
C.6.6.S Transportation
Transport of radioactive materials from the facility to an approved disposal site was assumedto be accomplished by truck. A rate schedule from the Tri-State Motor Transit Company fortruck shipment of radioactive material was used to estimate the transportation cost. Thedistance from the facility to the disposal site was assumed to be 500 miles. In addition, itwas assumed that each truck could carry up to four containers.
C.6.6.6 Burial Costs
For this study, it was assumed that the waste generated at the sites would be shipped fordisposal to a burial site, i.e., U.S. Ecology, Inc. located in Richland, Washington, or ChemNuclear located in Barnwell, South Carolina. These sites were chosen due to the availabilityof cost information. Due to the uncertainty of the final disposition of the waste, an averageof the U.S. Ecology (US Ecology) disposal rates and the Chem Nuclear (Chem Nuclear)disposal for both in-the-Southeast Compact and out-of-the-South Compact was used, about$148/ft3.
The Vitro Chemical Plant located in Utah has accepted large quantities (2.16 million cubicmeters) of radium-contaminated soil for shallow land burial. However, no current data couldbe obtained for the cost of disposal at this facility.
C.6.6.7 Occupational Radiation Dose Estimates
The occupational radiation dose estimates were obtained from Short (1988). Occupationalradiation dose estimates are made by multiplying the person-hours required to decommissiona site by an average radiation dose rate. The actual worker dose rate experienced during sitedecommissioning depends on several factors, including the type of radioactive contaminationon the site, the location and concentration of contamination, the site parameters, and thework procedures and work schedules. Actual worker dose rates are expected to be site- andworker-specific.
Some information exists on dose rates at typical contaminated sites. For example, data froman operating low-level waste burial ground indicate an average dose rate at the site of about 1mrem per 24-hour day (0.042 mrem/hr). Exposure records of 23 workers engaged in theremoval of a contaminated industrial waste line showed that over a 3-month period, only four
C.D-73 NUREG-1496

dosimeters recorded doses in excess of 10 millirem. The maximum total exposure for oneworker for 1 month was 30 millirem. Background values of gamma radiation at the inactiveuranium mill tailings site at Tuba City, Arizona, have been measured at 0.01 mR/hr. All ofthese dose rates refer to direct exposure and do not include contributions from inhalation ofradioactive particles.
The inhalation of airborne radioactivity may make a significant contribution to occupationalexposure for some site decommissioning operations, depending on the nature of the site andthe decommissioning option. The inhalation dose would not normally be significant for sitestabilization or for waste removal operations at sites where soil contamination is minimal.This dose could be significant during the removal of a tailings pile because of the dustproblem. For site decommissioning operations, worker use of face masks or otherrespiratory equipment or the use of water sprays to reduce dust concentrations would limitthe occupational dose from inhalation of airborne radioactivity.
For this study, an average worker dose rate of 0.1 mrem/hr is assumed for sitedecommissioning operations. This value is believed to be reasonably conservative, based onavailable information about real sites. Decommissioning workers at potentially dusty sitesare assumed to wear protective respiratory equipment to maintain occupational dose rates ator below this level.
The results of calculations of the costs of treating contaminated soils are summarized inTables 7.2.2 and 7.2.3 of Chapter 7. The detailed spreadsheets for these calculations arepresented in Appendix B of this report.
NUREG-1496 C.D-74

C.7 ANALYSES RESULTS
The costs of decontaminating previously contaminated facilities and their surrounding sites tomeet alternate residual radiation criteria at those facilities are presented in this chapter. Forconcrete decontamination, the cost for satisfying a predetermined residual allowable levelwas not calculated, because the concrete surface removal process tends to be a series ofremovals of discrete thicknesses. Instead, the postulated decontamination process removed adefined thickness of the contaminated material surface, and the resulting cost (which includedremoval, packaging, transport, and disposal) and the resulting residual radiation dose rate atthe new surface were calculated. For soils decontamination, it was possible to define thedepth of removal required to achieve the desired residual radiation dose rate level, and theremoval process was generally accomplished with a single removal operation, down to thedesired depth. The cost for soils decontamination included removal, treatment (ifappropriate), packaging, transport, and disposal. The volumes of waste requiring disposal,total labor hours, the occupational radiation doses to workers, and the number of shipmentsbetween the site and the LLW disposal facility were also calculated for each residualradiation dose rate level considered.
The methodologies for calculating the residual radiation dose rates at the various depths ofsurface removal are presented in Chapters 4 and 5. The methodologies for calculating thecosts of concrete surface removal and of soil surface removal are presented in Chapter 6.The results of these calculations are summarized in this chapter.
The following potential situations regarding the post-decommissioning and post-licensetermination use of the site are evaluated:
(1) Occupational use of the facility in which the facility buildings are occupied by aworker during a normal 8-hour shift.
(2) Renovation of the facility in which workers occupy the facility buildings during anormal work day, for the purpose of moving/removing walls, ceilings, etc.
(3) Residential use of the site in which persons live on the site and obtain drinking waterfrom the site.
The bases for these scenarios are taken from Kennedy and Strenge (1992). The first twosituations are evaluated in the same manner, i.e., using the methodology presented in Section4.8.6 for radiation dose rate calculation, where the residual concentrations of contaminantsare transformed into surface contamination levels, and the dose rates are calculated fromthose surface contamination levels using the surface contamination conversion factorscontained in Appendix A.
The third situation listed above (residential and drinking water) is evaluated using themethodology developed in Sections 5.4 and 5.5 for estimating the residual radiation dose
C.D-75 NUREG-1496

rates as a function of the depth of soil removal, for the contaminants of interest, i.e., 'Co,90Sr, 13"Cs, uranium, and thorium. Based on the postulated initial contamination levels andthe calculated contaminant penetration profiles, the residual radiation dose rates followingremoval of successive layers of soil were calculated, and the depths of removal necessary toachieve the selected residual dose rates were determined from the data. The cost ofremoving, possibly treating, packaging, transport, and disposal of the removed soil wascalculated for each removal depth selected. Two estimates were developed for soils removal,one with treatment of the soil by washing, and one without treatment of the soil.
The initial conditions and the analysis bases for decontamination of floors and walls forfacilities and of soils on the surrounding sites are as follows:
Facilities
* All in-process materials and products, major pieces of equipment, fixtures, floorcoverings, and contaminated utilities such as drain lines and HVAC have beenremoved for disposal.
* Preliminary washdown of the facilities has been completed
* The neutron-activated concrete in the reactor bioshields is removed to depthscorresponding to the alternate residual dose rates, i.e., 100, 10, 3, 1, 0.1, and 0.01mremlyr.
* The total thickness of concrete adjacent to contaminated cracks is removed.
* The total thickness of concrete in areas exposed to wet contaminants is removed.
* The surface of concrete areas exposed to dry contaminants are scabbled to depthscorresponding to the alternate residual dose rates.
Soils
* Localized contaminated soil beneath structures is removed by removing local sectionsof the floor, without demolition of the structures. The removed concrete is disposedas LLW, the removed soils are either packaged and disposed as LLW, or treated,with the residual contaminated soils packaged and disposed as LLW, and the cleanedsoil restored to the site.
* Other contaminated soils on the site are handled in the same manner as thosecontaminated soils removed from beneath the floor, i.e., contaminated soil external tostructures is either removed and disposed as LLW, or treated, with the cleaned soilsrestored to the site, and residual contaminated soil disposed as LLW.
NUREG-1496 C.D-76

C.7.1 Analysis Bases
A summary of the total and contaminated surface areas of the reference structures and soilsfor the reference sites is presented in Table 7.1.1, together with the postulated maximumsurface activity levels at those facilities and sites prior to surface removal efforts.
TABLE 7.1.1. Total and Contaminated Surface Areas for Structures and Soils atReference Sitest"
Structur Structures Surface ArmsRadionucide
Activity, f Soil Surface Area, ft'Reference dpmJI00 cm' _ _ Contaminated
lFaciity Toor Wall or nWal Total Site Contanlnatedm
Power Reactor 7.5 x 10' MCo 250,000 300,000 10 2 S0 x 10' 2,0002.4 x 10' "'Cs
Test Reactor 7.5 x 10' "Co 100,000 120,000 10 2 50 x 10 5,0002.4 x 10'".Cs_
Research Reactor 102,000 "Co 35,000 40,000 10 2 150,000 50033,300 "Cs
Uranium Fuel Fab 18,000 U 240,000 '240,000 50 5 4.7 x 10' 50.000
Hexafluoride 1.1 x 10' U 120,000 130.000 50 45 200 x 10' 100,000
Sealed Source 102,000 "Co 6,000 4,600 10 5 40,000 5,000Manufacturer 33,300 17Cs
Rare Metal Extraction 18,000 Tb 150,000 180,000 40 10 740,000 100,000
Broad R&D Facility 102,000 "Co 6,000 4,600 10 5 40,009 5,000(Generic) 33,300 '"Cs
UraniumMill 11 X Iff U 100,000 130,000 100 100 1.4 x 10' 8. x 10
DryIFSM 980 "Co 23,000 0 10 - 500,000 500310 "'Cs
(1) The estimated surface areas listed above are based on very limited information, and in many cases represent an engineeringjudgment estimate based an the asze of dte building stnuctural facilities and types of operations. The estimates are believed to beconservatively large, Le., probably overestimate the actual areas involved.
(2) Radionuclide activity shown is for building surfaces. Radionuclide activity for soil surfaces is based on Figures 5.5.1 - 5.5.5.
C.D-77 NUREG-1496

C.7.2 Analyses Results
The estimated costs of removing the layers of contaminated concrete surface and cracks (andactivated concrete, for the power reactor) from the reference facilities are presented in thischapter. The indicated costs include the direct labor, packaging, transport, and disposalcosts for all of the material removed to reach the indicated depth, and the project overheadstaff costs during the period of removal operations.
Facility Decontamination
The residual surface radiation dose rates from the contaminated (not activated) floors andwalls as functions of the depth of surface removed are given in Table 7.2.1 for the referencefacilities considered in this analysis. The required depth of removal and the costs todecontaminate those surfaces to alternate dose criteria can be inferred from the results givenin Table 7.2.1.
The removal of the activated concrete from the bioshield in the reactor analysis creates aseparate set of values, independent of the normal contaminated surface removal analyses. Asnoted in Section 6.3, removal of activated concrete from the bioshield is accomplished usinga drilling and blasting technology. Vertical holes are bored into the shield concrete andexplosives are inserted into the holes and detonated, breaking up the inner segments of theshield. In actual situations, there would likely be a tendency to attempt to accomplish theremoval in one step because of the difficulty and tedious nature of the drilling and blastingefforts. Also, because of the nature of the blasting operation it is difficult to be preciseregarding the amount of depth removed. Therefore, a relatively simple analysis is performedwith regard to the depths of shield removed and residual criteria, resulting in residualradiation dose rates at the inner surfaces of the bioshield of 100, 10, 3, 1, 0.1, and 0.01mrem/yr, for the removal of 3.49 ft. 4.22 ft. 4.60 ft. 4.95 ft, 5.68 ft, and 6.5 ft.respectively. These results are also presented in Table 7.2.1. The lower values are intendedto demonstrate general behavior as criteria approximating a removal of all radioactivityattributable to licensed operations and return to background are investigated.
Additional information in Table 7.2.1 includes the volume of LLW generated for eachremoval depth, the occupational radiation dose accumulated by the workers in performing theremoval operations, the labor hours required to accomplish the removal effort, and thenumber of shipments of LLW from the site to the LLW disposal facility.
Soils Decontamination
The costs of decontaminating the soil surfaces at each site are summarized in Tables 7.2.2and 7.2.3, for the alternatives of 1) soil treatment (washing), and 2) no soil treatment. Thecosts of removing the thickness of contaminated concrete floor that was in a wetenvironment, and the soil beneath the "wet spot", are also included. Using the methodologypresented in Section 5.5, the depths of soil removal required to achieve residual radiationdose rates of 100, 60, 30, 15, 10, 3, 0.3 and 0.03 mrem/yr were determined for each of thereference facilities, for the low, medium, and high contamination levels discussed in Chapter5. The costs for removal, treatment (if applicable), packaging, transport, and disposal are
NUREG-1496 C.D-78
calculated for the volumes of LLW resulting from these operations to achieve the alternateresidual radiation dose rates. Also presented in Tables 7.2.2 and 7.2.3 are LLW disposalvolumes, the number of truck shipments from the reference site to the LLW disposal facility,the labor hours required to accomplish the effort, and the occupational radiation dose toworkers performing the tasks.
The resultant total cost for decontaminating a facility and site to a residual radiation dose ratelevel of less than some prescribed value is estimated by summing the appropriate value fromTable 7.2.1 for a given facility, and Table 7.2.2 or Table 7.2.3 for the associated soil forthat facility.
C.D-79 NUREG-1496

Table 7.2.1 Calculated Costs for Decontamination of Nuclear Facilitiesby Removing Different Depths of Concrete Surfaces
Facilty Tvue Parameter Value of Parameter to Remove Concrete to the Depth Indicated
Reactor Bioshield (depth, ft) 3.49 4.22 4.60 4.95 5.68 6.50Cost (1993 $M) W 1.922 2.391 2.661 2.895 3.415 4.027Volume (ft3) l.lE+04 1.4E+04 1.5E+04 1.7E+04 1.9E+04 2.3E+04Shipments 29 36 40 44 52 61Person-rem 20.979 21.315 21.541 21.773 22.298 22.811Labor Hours 2.7E+03 3.4E+03 4.1E+03 4.2E+03 5.OE+03 5.8E+03mrem/yr 100 10 3 1 0.1 0.01
Surface Removal (depth, in.) 0.125 0.250 0.375 0.500 0.625 0.750 0.875 L1Q0
Reactor Surface RemovalP Cost (1993 $M) ) 0.421 0.766 1.110 1.455 1.799 2.144 2.488 2.833
Volume (ft3) ° 764 1,268 1,772 2,276 2,780 3,284 3,788 4,292Shipments 2 4 5 6 8 9 10 11Person-rem 1.670 3.140 4.610 6.080 7.550 9.020 10.490 11.960Labor Hours 2,553 4,758 6,963 9,168 11,373 13,578 15,783 17,988mnem/yr 3.6E+04 4.1E+03 2.2E+02 10.29 0.278 0.0034 <0.003 <0.003
Test ReactorCost (1993 $M) W 0.388 0.726 1.065 1.404 1.743 2.082 2.421 2.760Volume (ft3) ° 522 880 1,238 1,595 1,953 2,311 2,668 3,026Shipments 2 3 4 5 5 6 7 8Person-rem 1.866 3.606 5.346 7.086 8.826 10.566 12.306 14.046Labor Hours 2,830 5,440 8,050 10,660 13,270 15,880 18,490 21,100mremlyr 3.6E+04 4.1E+03 2.2E+02 10.29 0.278 0.0034 <0.003 <0.003
k ao

a) %IO
Table 7.2.1 Calculated Costs for Decontamination of Nuclear Facilities by Removing Different Depths of Concrete Surfaces (continued)
Fa9l9ty Tvue Parameter Value of Parameter to Remove Concrete to the Deyth Indicated
Surface Removal (depth, in.) 0.125 0.250 0.375 Q.5Q0 0.625 0.750 0.875 1Q00
Sealed Source ManufacturerCost (1993 $M) ( 0.022 0.032 0.042 0.052 0.062 0.072 0.082 0.092Volume (A') O) 54 67 81 94 108 121 135 148Shipments 1 1 1 1 1 1 1 1Person-rem 0.077 0.122 0.168 0.213 0.259 0.305 0.350 0.396Labor Hours 122 191 259 328 396 464 533 601mrem/yr 4.8E +02 55.9 3.017 0.143 0.0037 <0.0037 <0.0037 <0.0037
0
Rare Mea ProcessorCost (1993 $M) 0'Volume (O) 0)Shipments
! Person-remnLabor HoursIrem/yr
Research and Development Facility ((
0.962 1.864 2.766 3.668 4.570 5.472 6.374 7.2761,470 2,738 4,006 5,275 6,543 7,811 9,079 10,3484 7 11 14 17 20 24 274.115 8.075 12.035 15.995 19.955 23.915 27.875 31.8356,210 12,150 18,090 24,030 29,970 35,910 41,850 47,7904.6E-12 <4.6E-12 <4.6E-12 <4.6E-12 <4.6E-12 <4.6E&12 <4.6E-12 <4.6E-12
;weric)Cost (1993 $M) (O 0.022 0.032Volume (ft) ° 54 67Shipments 1 1Person-rem 0.077 0.122Labor Hours 122 191mrem/yr 4.8E1+02 55.9
0.042 0.052 0.062 0.072 0.082 0.09281 94 108 121 135 148I I 1 1 1 10.168 0.213 0.259 0.305 0.350 0.396259 328 396 464 533 6013.017 0.143 0.0037 <0.0037 <0.0037 <0.0037
'00'0C.D-81

;t; Facility Tvpe Parametero0 Surface Removal (depth, in.)
Table 7.2.1. Calculated Costs for Decontamination of Nuclear Facilities byRemoving Different Depths of Concrete Surfaces (continued)
Value of Parameter to Remove Concrete to the Depth Indicated0.125 0X250 0.375 0.500 0625 0.750 0.875 1.000
Research ReactorCost (1993 $M) w 0.076 0.124Volume (ft3 ° 167 237Shipments 1 1Person-rem 0.276 0.477Labor Hours 432 733mrem/yr 4.8E+02 55.9
0.17130710.6781,0353.017
0.21837710.8791,3360.143
0.26644721.0801,6380.0037
0.313 0.360 0.408517 587 6572 2 21.281 1.482 1.6831,939 2,241 2,542<0.0037 <0.0037 <0.0037
00
Uranium Fuel Fabrication PlantCost (1993 $M) If 1.377 ---(4Volume (ft) °b) 2,401Shipments 7Person-rem 5.236 ---Labor Hours 7,901mrem/yr 4.2E-I 1---
UF& Conversion PlantCost (1993 $M) As 1.804 --- (
Volume (ftb) ( 2,,107Shipments 6 ...Person-rem 8.959Labor Hours 13,471mrem/yr 4.2E-1l ---
_ _ _ _ _
_ _ ._ _
_ _ _ _
_ _ _ _
_ _
_ _ _ _ . .
_ _ _ _ ._
_ _
_ _ _ _ _
_ _ _ _
C.D-82
I

Table 7.2.1. Calculated Costs for Decontamination of Nuclear Facilities byRemoving Different Depths of Concrete Surfaces (continued)
Faeility I ParameterSurface Removal (depth, In.)
Uranium Mill c) --
Value of Parameter to Remove Concrete to theDeyth Indicated0.125 0.250 0.375 O.SOO 0.625 0.750 0.875 1.000 .
Cost (1993 $M) (). 6.404 -0Volume (f) -( -
Shipments 0 -.
Person-rem . 29.072 -Labor Hours 5.OE+04 -
nremlyr -° -
00b
Drv ISFSI FacilitvCost (1993 $M) (Volume (ft) OShipmentsPerson-remLabor Hoursmrem/yr
0.0203710.0691044.609
0.040 0.06075 1121 1.0.138 0.207207 3110.193 0.022
0.081150I0.2764140.001
0.101 0.121187 2241 10.345 0.414518 621<0.001 <0.001
0.14126210.483725<0.001
0.16129910.552828.<0.001
(a) All disposal costs aim based on disposal charge rates, which are an average for the U.S. Ecology siteat Richland, Washington and dte Chem-Nuclear site at Barnwenll South Carolina.
(b) Wet Spot concrete volumes and costs inchided with soils decontamination in Tables 7.2.2 and 7.2.3.(c) All Uranium Mill concrete removed and placed into tailings pile on-site.(d) - indicates that for the uranium facilities, a single remol action was sufficint.(e) No volumes for shipment off-site.(f No residual dose rate calculated. since all of the material was removed.(g) No cracks are assumed to be present in the ISFSI pads. -
C.D-83

z
\00%
0
TABLE 7.2.2 Summary of Costs and Other Parameters for Remedlation Activities With Soil Washing for Sites Contaminated with Co and Cs
FACILiTY Manufacturer of Sealed Sources
Contaminated Soil Area. ft2 5000
Facility Area, ft2 _ 6000
Residual Conc. in Soil, Soil Depth Disposal Total Soil Decon Labor Occupationalmremhvr Removed Vocume Cost Requirements Dose
cm m3 $ man-hrs person-mrem
HIGH
100 3.00 14 $92.838 73 7
60 4.30 16 $108,636 84 8
30 5.50 19 $123,110 94 9
15 7.00 21 $139.954 106 11
10 7.30 22 $144,922 109 11
3 8.60 24 $160.720 120 12
0.3 11.00 29 $191.095 140 14
0.03 12.70 32 $211.684 154 15
MEDIUM
60 2.50 13 $85.498 69 7
30 4.50 17 $110.981 86 9
15 6.00 20 $127,825 98 10
10 6.40 20 $134.016 101 10
3 7.70 23 $149.814 112 11
0.3 10.20 27 $181,411 133 13
0.03 12.00 31 $203.224 148 15
LOW - _ _ . ._
.3 3.60 15 S100.075 J 78 8
0.3 7.30 22 $144,922 1 109 11
0.03 9.70 26 $174,072 129 13
sIt 9,

TABLE 7.2.2 Smnmary of Cost and Other Parameters for Remnediatfon Activities With SoN Washing for SitesContaminated with Co, Sr, and Cs
FACILITY Power Reader Test Reader
| Contamind Soi Ara. e 2000 S000
Facllit Area. ft _ -- 250000 100000
Residual Conc. Soil Depvt Cost Di~saVol Labor Dose Cost Disvosal Vol LAbor Dosein Soil, mtem/yr
cm SD m mfh ron-mrMM I f Immi r hr VewslmlemM
HIGH -
100 3.00 2.279.032 352 2019 202 943.318 145 829 83
60 4.5 2.286.769 353 2024 202 961.461 148 841 84
30 6.2 2.295.730 354 2030 203 983.37 151 855 86
15 7 2.29.323 355 2032 203 992.559 153 862 86
10 7.8 303.916 3S5 2035 203 15002.742 154 868 87
3 11.5 2.321.535 358 2047 205 611047489161 899 90
0.3 20.4 2.364.510 365 2077 2081.17.9 178 - 973 97
0.03 24.9 2.388.048 368 2092 209 1.212.507 186 1011 o101
100 0 2.264.557 349 2009 201 907.031 140 804 80
60 2.5 2.27G786 351 2017 202 .LZ937203 " 144 824 82
-30 4. 5 2.286.769 353 2024 202 960,660 148 841 84
15 6 2.294.832 354 2029 203 978.930 151 853 85
10 6.4 2.296.628 354 2030 203 985,621 152 857 86
3 8.2 2.305.713 356 2036 204 155 872 87
0.3 16.4 2.344.544 362 2064 206 1.108.1 170 940 94
0.03 22.3 t2.374.044 366 2083 208 1.181.012 181 989 99
LOW
100.60.30.10 0 || 2.264.557 349 2009 201 || 7,0..11 140 804 80
3 3.6 H 2281.727 352 2021 202 9SOSS 146 . 834 2 83
0.3 8.3 .2.306.162 356 2037 204 1.008.756 155 873 87
18.6 L6 2-354A426 3 363 m 2l07 . 207 ... 1-34-40 174 9 9 __ 96
0
U-941.

Z TABLE 7.2.2 Sumary of Cost and Other Parameters for Remediatlon Activities With Soil Washing for SitesC Contaminated with Co. Sr. andi Cs
'00%
o0%
FACILITY Research Reactor Generic R & D Facility
Contaminated Soil Area. ft 500 5000
Facility Ara, fP 35000 6000Soil Ct DiosI Lbr Dose cost Diosa LbrDsResidual Conc. SO Cost Di jsal L iosal Labor Dos
in Soil, mfecm/gr Depth Vol o ol
_ cm Jm' mrs P erson-mrem n _ _ ___ man-hrs verson-mrem
HIGH
100 3.00 321,509 49 2844 288 110.768 14 73 7
60 4.5 323,393 50 2855 288 128,941 17 86 9
30 6.2 325,402 50 2866 299 149,551 20 1000 10
15 7 I 326301 So 2877 299 158,654 21 1066 11
10 7.8 327,299 50 2888 299 169,037 23 1133 11
3 11.5 331,854 51 2911 299 215.139 30 1444 14
0.3 20.4 342,647 53 2988 300 324,202 46 2188 22
0.03 24.9 348.000 54 3022 300 380,047 55 2555 26
MEDIUM
100 0 317.940 49 2811 288 73,026 8 48 5
60 2.5 320,948 49 2833 288 103.448 13 69 7
30 4.5 323,393 S0 2855 288 128,941 17 86 9
15 6 I 325,078 50 2866 299 145.925 20 98 10
10 6.4 325,627 50 2877 299 151,796 20 lOll 10
3 8.2 327,748 50 2888 299 173,909 24 1166 12
0.3 16.4 337,356 52 2955 299 274,541 39 1855 18
0.03 32.3 *34881 53 3000 300 347,247 50 1 2344 23
LOW ,, , . _ ,,_,_
100,60,30,10 0 317,940 49 2811 288 73,096 8 48 5
3 3.6 s 322,183 50 2844 2988 1 118,075 15 78 8
03 8.3 327,860 T 50 2888 299 175,031 24 1177 12
0.03 18.6 L 339,926 1 52 _ 2977 302,470 1 43 1 2033 20
AlA I..

* . .I ...
i'a..1J)
00
I4.
I.-
TABLE 7.2.2 Summary ot Cost and Other Parameters for Remediathon Activities With Soil Washhito forSftes Contaminated with Co, Sr, and Cs ,4
FACILITY l DRY ISFD I
Contaminated Soil A23a0 f 00Faclity A&t R ._300__
Residual Conw. in Soil, mrem/yr Soil Deoth Cost Disnosal Vol Labor D _
1(0_3n0- 213 192 .4 1 R7777 IQ
. .fO 4 5 2146 R 11 A ! (19999. n f 21 ,985 T3 12Mnn 19999
.15 7 217 9RI __ _ 191111 l1Q"
_a10 7. 21R 9R2 34 191111 19999
0 11L. 224 1036 -4 194444 19999
0 n 240 293 9-R 17 20.216fi 111
100 I n. . I...i.. ..... 209 6 1R s
60 2 5 217 510 33 1R7777 J*99":0 4 214 97 MM12222_ . 1999
10 fi64 . 217 110 12 9 J999
1 2 219 431 U4 19?2,2 I2Q9 .
O 3 1fi A4 2229439 3-5 12RRRR 2noo
001 2?3 3. 236 564 16 2nl33 20non
MlW
100 601 1 nL 20?9 fi23 2 ) R55N5 I Rags
- I 3 .j. 21 1; f f R6 l6~
03 R3-. 213 541 34 1MM222 19099
n1 1R 2 7'V U m a 19 - - lnfi

z
9
IC
0%00
TABLE 7.2.2 Summary of Costs and Other Parameters for Remediation Activities With SoU Washing of Soil SitesContaminated with Thorium
FACILITY Rare Metals Extrtion Rare Metals Extraction TaPI!nes Pile(a)
Contaminated Soil Area. fte 100000 60035
Facility Area. fP _ 0IS0000
ResidualConc. in soil, Soil I Cost 1 Di l Vol Labor Dose Cost I Disposal Vol |Labor DoseI Do
mnvyr cm * S * * | man-hrs Derson-inrem S j m' I man-hrs v rerson-mrem |
HIGH
100 0.80 1,558,020 239 1338 134 13,911 0 72 7
60 1.1 1.630.018 251 1388 139 17.843 0 99 10
30 1.2 1,654.676 254 1405 140 19.154 0 108 11
15 1.4 1,700,917 262 1438 144 21,775 0 126 13
10 1.5 1,728,375 265 1455 145 23,086 0 136 14
3 2 1,850,990 284 1538 154 29,639 0 181 18
0.3 2.6 1,998,387 306 1638 164 37,503 0 235 23
0.03 3.1 2.121,002 325 1721 172 44,056 0 280 28
LOW _ ' _ _ _ _ _
100 0.2 1,411,622 217 1239 124 6.047 0 18 2
60 0.4 11461,363 225 1272 127 8.669 0 36 4
30 0.6 1,516,404 232 1305 131 11,290 0 54 5
15 1.1 1,633,218 251 1388 139 17,843 0 99 10
10 1.1 1,633.218 251 1388 139 17,843 0 99 10
3 1.3 1,691,134 258 1422 142 20,464 0 117 12
0.3 2 1,860,990 284 1538 154 .29,639 0 181 18
_003 2.67 1L umw338 306 1638 164 11 37.S03 0 ---235 23
(a) Costs arm for consolidation of contamination into the tailings pile and capping the pile only ,h>
a 4._t

9
TABLE 7.2.2 Smmary of Costs and Other Parameters for Remediatlon Activities With Sonl Washing for Sites Contaminated With Uranium
00
%0
09
FACILITY Uraim Fald Fabratilon Faefit-Y Urawli M m
C m d Soil A 50000 880000
Facility Atea. fl_ 240000 _ 100000
Residual Conc. mi Soil So Det Cost Disoosl Vol L Dose Cost Disposal Vol L aborDosemww/yrcm S m an-hr ierson-mrom S m manhr ersoz-mem
H I G H_ _ _ _ _ _ _ _ _ _ _ _ _ _ __ _ _ _ _ _ _ _ _ __ _ _ _ _
100 18.40 4,435,576 677 3458 346 3 876,409 6128 27729 2773
60 18.7 4.473,588 683 3483 348 40,514,573 6227 28168 2817
30 21.2 4,780,287 729 3691 369 |45819,817 7044 31827 3183
15 23 4.986.383 763 3841 384 49,534,452 7633 34461 3446
10 23.3 5,038,070 768 3866 387 50,289,616 7731 34900 3490
3 25.5 309,082 809 4049 405 54,950,695 8450 38119 3812
0.3 29 5,739.721 874 4340 434 62,372,036 9595 43241 4324
0.03 32 6,107,F90 930 4589 459 68,725.328 10576 47631 4763
MEDIUM
100 10 3 403,768 521 2760 276 22.117,861 3382 15437 1544
60 14.3 1 3,932,564 601 3118 312 31.207,740 4788 21730 2173
30 17.2 4,289,504 655 3359 336 537.335,427 736 25973 2597
15 19 4,494,275 689 3508 351 41,09,062 6325 28607 2861
10 20.2 4,657,672 711 3608 361 43,708,719 6717 30363 3036
3 22.8 4,976,600 759 3824 382 49,225,567 7567 34168 3417
0.3 26.6 8,445,251 30 4140 414 57,268,072 8810 39729 3973
0.03 29.8 5,837,878 889 4406 441 64,048,249 9856 44412 4441
LOW . _ _ _
100,60.30 0 2,174,322 336 1929 193 749,887 111 804 80
15 7 3 095 599 466 2511 251 24,774,69 2401 11047 1105
10 13.8 3871.094. 592 3076 308 30,140.691 4624 20998 2100
3 18.4 4,43SS76 677 3458 346 39,876,409 6128 27729 2773
0.3 23.4 1 ,050,299 770 3874 387 50,481,896 7763 35046 3505
0.03 2 7 2_ 1 S .2 841 - 4190 419 11 S4.76 90 40 07 4061_

T o o aon . t
z! TABLE 7.2.2 Summary of Costs and Other Parameters for Remedlatiou Activities With Soil Washing for Sites Contaminated With Uranium
9
p
FACILITY Uranium Hexafluonde Facilitv
Contaminated Soil Area fte ___ __
Facility Area, fte - _ _ 120000
Raiu Cone. in Soil, mrcm/yr Soil Dj . C0st | DisalI Vol | aLhor T ose
cm __S___ manhr I_ _erson-m_
HIGH
100 18.40 5,611,009 827 4024 402
60 18.7 5,684,708 838 4074 407
30 21.2 6,299,431 931 4490 449
15 23 6,723,299 997 4789 479
10 23.3 7,087,672 1009 4839 484
3 25.5 7,357.022 1090 5205 520
0.3 29 8,216.974 1220 5787 579
0.03 32 8, 958.312 1332 6286 629
MEDIUM
100 10 3,546,068 514 2627 263
60 14.3 4 603 659 674 3342 334
30 17.2 5,316,539 782 3825 382
13 19 5,735,407 849 4124 412
10 20.2 6,053,877 893 4323 432
3 22.8 6,693,058 990 4756 476
0.3 26.6 7,628,034 1131 5388 539
0.03 29.8 8,413,288 1250 5920 592
LOW _
100,60,30 0 1,088,001 143 964 96
15 7 2,771,731 403 2128 213
10 13.8 4,481,045 656 3259 326
3 18.4 5,611,009 827 4024 402
0.3 23.4 6,831,455 1012 4856 486
0.03 27.2 7.774,107 1154 5487 549
£ ,

TABLE 7.2.3. Summary of Cost and Other Parameters for Remediation Activities Without Soil Washingfor Sites Contaminated with Co and Cs
FACILITY Manufacthrer f Sealed Sourms
Contaminated Soil Anma, 5000ft
2_ _ _ _ _ _ _ _ _ _ _ _ _ _ _ _ _ _ _ _
Facility Area, fIt 6000
Soil D-iposal Total Soil Labor OccupatDeptb Volume Remediation Requirement ional
. Cost s Dose
Residual Conc. in Soil, Cn $ man-hrs person-rcm/yr nurem
HIGH _
(mremlyr)
100 3.00 32 $188,723 68 7
60 4.30 38 $223,089 78 8
30 5.50 44 $256,136 87 9
15 7.00 51 $295,788 98 10
10 7.30 52 $303,719 100 10
3 8.60 58 $339,409 110 11
0.3 11.00 70 $404,178 128 13
0.03 12.70 77 $449,118 141 14
MEDIUM- _ _ _ _
100 0.00 18 $108,093 45 5
60 2.50 30 $175,506 64 6
30 4.50 39 S228,376 79 8
15 6.00 46 S269,353 91 9
10 6.40 48 $279,927 94 9
3 7.70 54 $314,293 103 10
0.3 10.20 66 $381,705 122 12
0.03 12.00 74 $430,613 136 14
LOW
100,60,30,10 0 18 S108,093 45 5
3 3.6 35 $204,584 72 7
0.3 7.3 52 S303,719 100 10
.0.03 9.7 63 S368.488 118 12
-C.D-91 NUREG-1496
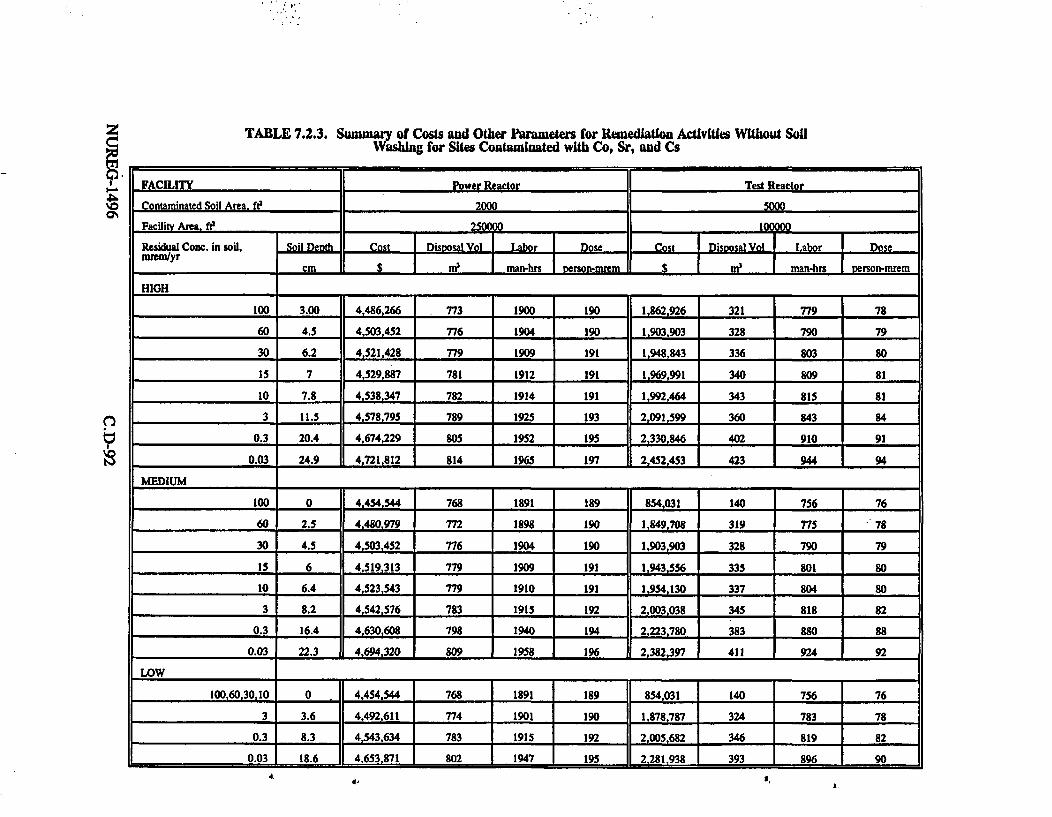
z
0%
TABLE 7.2.3. Summary of Costs and Other Parameters for Remediation Activities Without SoilWashing for Sltes Contaminated with Co, Sr, and Cs
FACILITY Power Reactor Test Reactor
Contaninated Soil Area. ft 2000 5000
Facility Area. ft' 2SOOC0 | 100000
Residiml Conc. in soil, Soil Denth Cost Dissal Vol Labor Dis al Vol Labor I Dose
m yr 'cm $ Snhs _ eoSan-hrs ____________
HIGH
100 3.00 4,486,266 773 1900 190 1,862,926 321 779 78
60 4.5 4,503,452 776 1904 190 1.903,903 328 790 79
30 6.2 4,521,428 779 1909 191 1.948,843 336 803 80
IS 7 4,529,887 781 1912 191 1.969.991 340 809 81
10 7.8 4S38,347 782 1914 191 1,992,464 343 815 81
3 11.5 4,78,795 789 1925 193 2.091.599 360 843 84
0.3 20.4 4,674,229 805 1952 195 2,330,846 402 910 91
0.03 24.9 4,721,812 814 1965 197 2| 2,453 423 944 94
MEDIUM _
10O 0 4,454,544 768 1891 189 854,031 140 756 76
60 2.5 4,480,979 772 1898 190 1 149,708 319 77S 78
30 4.5 |4,03,452 776 1904 190 1,903,903 328 790 79
15 6 4,519,313 I 779 1909 191 1,943,556 335 801 80
10 6.4 4523,543 779 1910 191 1,954,130 337 804 80
3 8.2 4,542,576 783 1915 192 2.003,038 345 818 82
0.3 16.4 i4,0,608 798 1940 194 2,223,780 383 880 88
0.03 22.3 4,694,320 809 1958 196 2,38,397 411 924 92
100,60,30,10 0 11 4,454,544 1 768 1891 189 II 854,031 140 1 756 76
3 3.6 4,492,611 4 774 1901 190 11 1,878,787 324 4 783 78
0.3 8.3 4,543,634 783 1915 192 2.005,682 346 819 82
0.03 18. 4,63,871 802 1947 195 21281 939 393 1 896 90
A S .

TABLE 7.23. Summarv of Costs and Other Parameters for Remediation Activities Without SoilWashing for Sites Contaminated with Co, Sr, and Cs
FACILrTy Research Reactor
Contaminated Soil Area. ft2 500
Facility Area, ft2 3500)0
Residual Conc. in Soil Cost Dispsal Labor Dosesoil, mrem/yr D.ffJ Vol _
cm $ m3n mn-hrs person-_mrem
HIGH.100 3.00 633.224 109 267 2760. 4.5 637.189 110D 268 27
30 6.2 641.683 264 27
10 7 643.798 III 270 2760 7.8 645.912 III 271 27
3 11.5 655.693 113 273 27
0.3. 2. 679.220 :117 280 2
0.03 24. 691.116 1 283 -28
MEDIUM
I 00 n 623.96i8 107 265 2660 fi0 .L J 630.577 109 267 27
30 4-.S. 637.189 110 268 27
15 6 641.154 110 269 27
10 64 642.211 110 269 27
3 8.2 1646-970 111 271 27
03 lfi4 16- 668.646 115 1 277 28
0.03 623 9 i4.24.3 .1281 28
0-l{ X L 0 623.468 107 265 2fi
3 3.6 1 634.810 109 267 27
0.3 8.3 647.234 III1 271 27
n 03 18 6 1i44)16 779 ?g
:IC.D-93 NUREG-1496
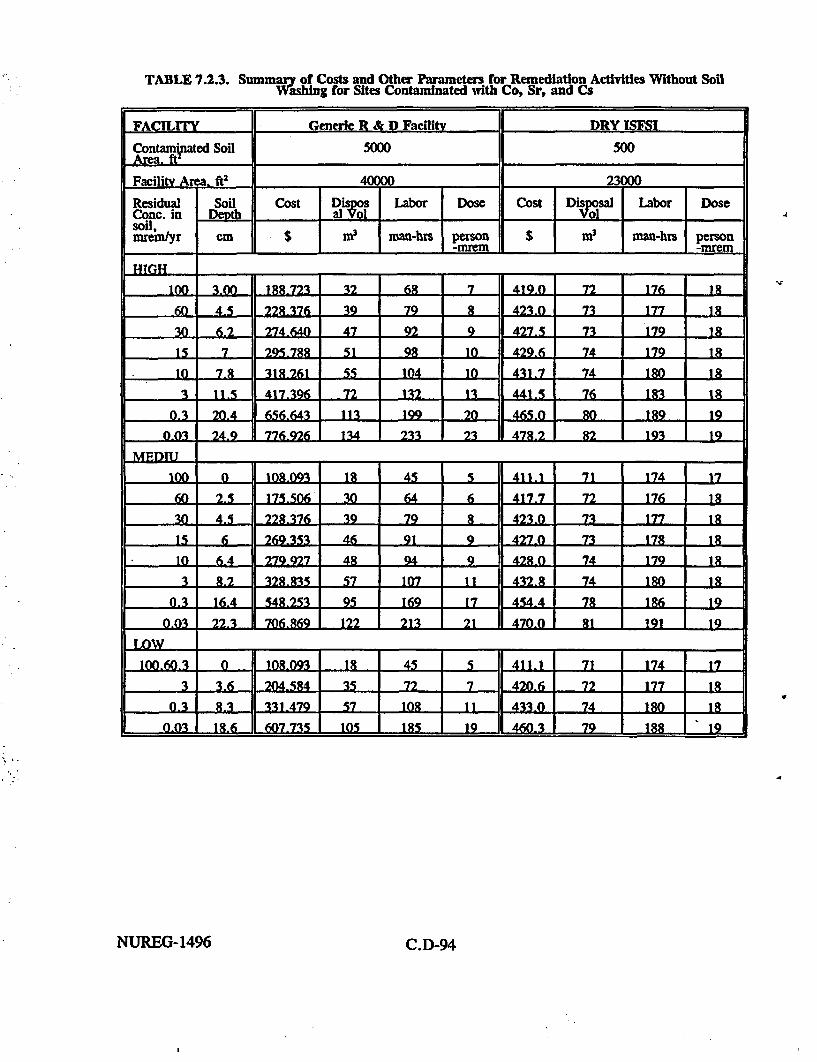
TABLE 7.2.3. Summary of Costs and Other Parameters for Remedlation Activities Without SoilWashing for Sites Contaminated with Co, Sr, and Cs
FACILITY Generic R & D Facility DRY ISFSI
Contaminated Soil 5000 500Area. ft"
Facilitv Area . t 40000 23000
Residual Soil Cost Di Labor Dose Cost Di- Posal Labor DoseConc. in Depth a] s, ___
Soil,inweinyr cm $ in3 man-hrs person $ in ian-hrs person
n_ _ _ __ _ __m__ _-mnrem
|HIGH100 3.00 188723 32 68 7 419.0 72 176 18
60 4.5 228.376 39 79 8 423.0 73 177 18
3 6.2 274.640 47 92 9 427.5 73 179 18
is 7 _ 295-7A 51 98 10 429.6 74 179 A18|. 10 7.8 318.261 55 104 10 431.7 74 180 18
3 1 1.s 417.396 72 132 13 441.5 76 183 18
0.3 20.4 65,6.643 113 199 20 465.0 80 189 19
10.03 24.9 776926 134 233 23 478.2 82 193 l9
100 X 1>.9 8 1 45 5 411.1 | 71 1 74 17_
60 2.5 17,0 30 64 6 417-71 72 T18
30 4.5 228.3 76 39 79 8 423.0 73 17 18
S 6 69353 46 91 9 427 0 73 1 7 8
10 6.4 279.927 48 94 9 72L. | 4 179 1L
3 R.2 32835 57 107 1 T 732. 4 180 18
0.3 16.4 .253 95 16f9 17 78 186 119
0.03 22.3 7fi.869 122 213 211 47,0 81 191 12
LOW,
100.60.3 Q | M093 18 | 4 5 71 174 17
3 3.6 204.-54 35 72 1 2 1 7 I t8
0.3 8.3 331.479 157 108 11 74 1 80 188.6 1I 607.735 5 185 19 460.3 79 188 19
NUREG-1496 C.D-94

TABLE 7.2.3. Summary of Costs and Other Parameters for Remedlation Activities Without SoilWashing for Sites Contaminated with Thorium
FACILITY Rare Metals Extraction Rar Metals Extraction Tailings_ _ _ _ _ _ _ _ _ _ _ _ _ _ _ _ _ _ _ _ _ _ _ _ _ _ _ _ _ _ _ _ _ _ _ _ _ _ _ _ _ _ _P il e (a )
Contaminated Soil 100000 60035Area, t2 _
Facility Area, ft2 150000 0
Residual Soil Cost Disposal Labor Dose Cost Disposal Labor DoseConc in Depth _ Vol VolSoil,mremSyr cm $ 3 man-hrs person $ m3 man- person
I -mrem hrs -mrem
HIGH
100 0.80 3,103,51 535 1255 125 13,911 0 72 7
60 1.1 3,264,77 563 1300 130 17,843 0 99 10
30 1.2 3,318.97 572 1315 131 'I1154I 0 108 11
15 1.4 3,426,03 591 1345 135 21,775 0 126 13
10 1.5 3 480 23 600 1360 136 2 0 136 14
3 2 3,748.55 646 1435 144 29,639 0 181 18
0.3 2.6 4,7.1,07 702 1526 153 37,503 0 235 23
. 0.03 3.1 4,340,72 749 1601 160 44,056 0 280 28
MLOW ._ _ ._ _ ._ _ -:_ _ __
100 0.2 2.780,99 479 1164 116 69047 0 18 2
60 0.4 2,888,05 498 1195 119 8,669 0 36 4
30 0.6 2,995Jl2 516 1225 122 11,290 0 .54 5
15 1.1 3 563 1300 130 1 0 99 10
10 1.1 3,264,77 563 1300 130 17,843 0 99 10
3 1.3 337184T 581 1330 133 120464 0 117 12
0.3 2 3,748,55 1 646 1435 144 129,639 0 181 18
-) 6 ̂ ]l A i n7 1 m 1i26 - A5 1 2 2 7 fl n n )3 -I
(a) Costs are for consolidadion of contamination into die tailings pile and capping the pile only
.I -
IC.D-95 -NUREG-1496
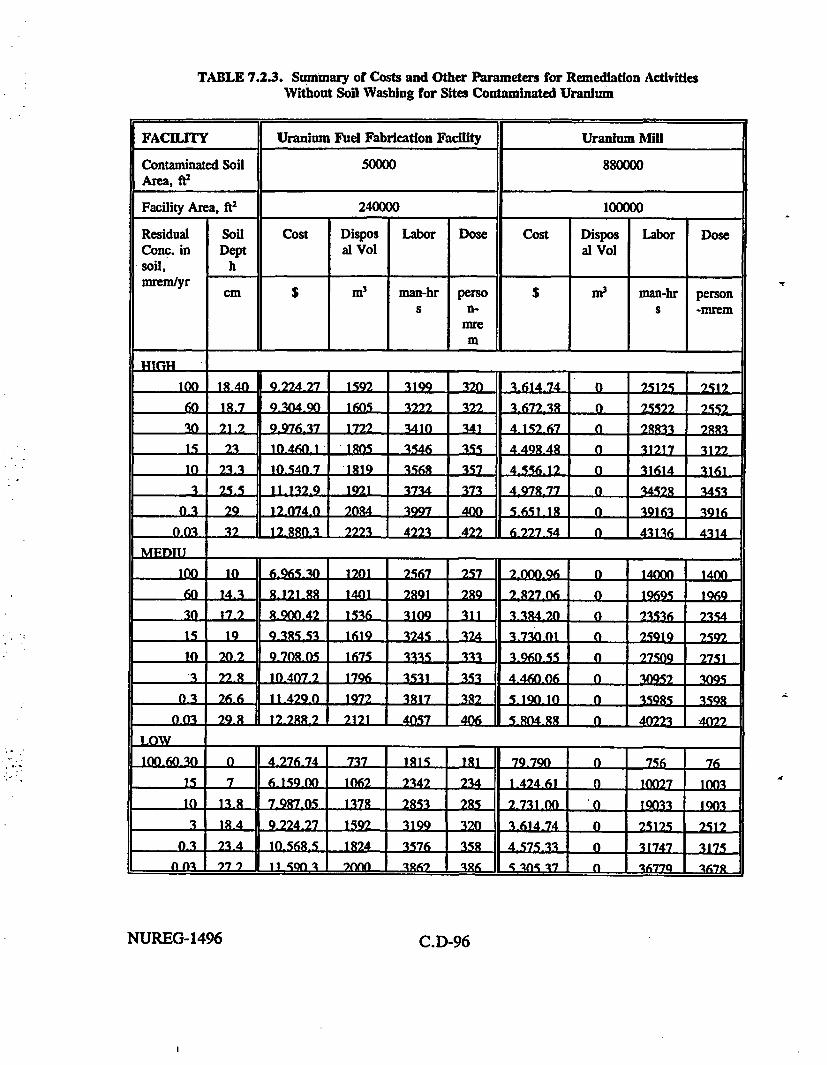
TABLE 7.2.3. Summary of Costs and Other Parameters for Remedlatlon ActivitiesWithout Soil Washing for Sites Contaminated Uranium
FACILITY Uranium Fuel Fabrication Facility Uranium Mill
Contaminated Soil 50000 880000Area, ft2
Facility Area, ft2 240000 100000
Residual Soil Cost Dispos Labor Dose Cost Dispos Labor DoseConc. in Dept al Vol al Volsoil, h
m em$yr an | S man-hr perso $ zn3 man-hr persons n- s -mrem
InfeIn
1 1Q0 201840 922427 152 3149 _732 3 4 0 2525 2512
60 1 4 1222 322 3,672-3L 0 2-5-5 25
30 212 -9726-37 1722 340 341 4- 15767 n 2833l 2B3
15 23 10-46;0-1 - M -846 35; 4A4AB4A 0 O 11217 3122
10n 23.3 10.540-7 1JB19 35fi8 357 4,S56-12 O 31fil4 34161
1 2iL5 1141?W29 1921 3734 373 4,978,77 0 34dZL 3453
1.3 29 12-0740 2084 3497 4(10 0i. O 39163 3916
0 J2 J12-9R1 22213 4223 422 6427 5 W Aa16 A314
METU__
lQ in -L96530 1201 2567 Z57 2 000-96 0 14n 1400
60 143 R 121-8R 141L 2891 289 2,S27fl0 W | 19695 |169
9-700-42 1536 3109 III 3-384 70 o 23536
15 L 43RS5-3 1619 324s 324 l73 lL o |2251. 2547
W e 2. S A 0n 1675 W3AS VAL 3960-5i5 f 2n50 275L
Z 2G 1796 J1 L I 53 4,460-06 W 3092L
n t & 12 0 112 59 0 3598 5
0-0i 29.L 12.B8LZ2 212L 4057 406 5AM -94 a n 402223 40-2
LOW
100-0-30 0 .2.i fL 8IRI JL 7979 W 756 761S 1 fi l 234M 234 1A424-61 0 10277 A anL
1n0 13.8 1 7-9R7-t2S 1372 2 l 225 2-7z11 W- n tn 1
3 JBA 2242 1592 3199 320 |3614.74 | n |712s 2|51
W o 23 Afl 6Li 1824 326 3f A8 5i31 0 312747 1217
- nn 03 - II | n -W ' R62 -M& s 3 - n _ 3622 - 362R
4
NUREG-1496 C.D-96

TABLE 7.2.3. Summary of Costs and Other Parameters for Remediatlon Activities Without SoilWashing for Sites Contaminated with Uranium
FACHLiTY Uranium Hexafluoride Facility
Contaminated Soil Area, ft2 100000
Facility Area, ft2 120000
Residual Conc. in soil, Soil Cost Disposal Labor Dose
cm $In man-hrs person-mrem
1lO 19.40 12-032-935 207L 3677 3f
60 127 12194-195 210fi 37.222 372
3 n 221 14-sn7-359 2505 4369 4371S . 3 |1353R.472 ?338 4098 410
1o TA2t | 14 466 .619 2533 4414 441
_. 25S | 15R51-636 2737 4745 47S
0.3 29 1 7 733-R89 30fi3 527? 2
0.03 32 19-346-492 3341 573 72
M EDllUM
100 10 7.Slfi 323 1297 2412 4
fiO 149-9g 28161 lfi47 306 sn30 17.2 11-3,Z7-994 196i6 350iss
-1S 19 12 355-455 2134 37fi7 377
10 20.2 13 O001RAN 2245 3948 '395
3 22.X 14-32&9qf9 ?4R7 4339 434
0.3 fi 16i 442-48) 2 X40 4911 9
0103 29 .g 1 .16f3 475 1137 5397 539
100-60-30 O 2-139-214 | 36iR | 90 9 1
1S5 7 2-139-214 36iR 9047 9 1
10 13.R 9.4549R36 | 1lfi0 |2984 | 298
3 1R.4 12-032 935 207 v 677 3fi8
n.3 t4 0 14-721 4Q-252M1742 443
n WA ?7 '7 14 7Ahq (M oq sonj n
C.D-97 NUREG-1496

C.8 REFERENCES
Abel, K. H., D. E. Robertson, C. W. Thomas, E. A. Lepel, J. C. Evans, W. V. Thomas, L.C. Carrick, and M. W. Leale. 1986. Residual Radionuclide Contamination Within and AroundCommercial Nuclear Power Plants. NUREG/CR4289, U.S. Nuclear Regulatory Commission,Washington, D.C.
Allard, B., L. Eliasson, S. Hoglund, and K. Andersson. 1984. "Sorption of Cs, I, andActinides in Concrete Systems," SKB Technical Report 84-15, Sweden.
Ames, L.L. and D. Rai, 1978. "Radionuclide Interactions With Soil and Rock Media. Vol.1. Processes Influencing Radionuclide Mobility and Retention; Element Chemistry andGeochemistry; Conclusions and Evaluation," EPA 520/6-78-007a. Pacific NorthwestLaboratories, Richland, WA.
Angus, M. J., S. R. Hunter, and J. Ketchen. 1990. 'Classification of Contaminated andNeutron-Activated Concretes from Nuclear Facilities Prior to their Decontamination orDecommissioning,' pp. 229 to 234, Waste Management '90 Vol. 2- High Level Waste and LowLevel Waste Technology. American Nuclear Society, LaGrange Park, Illinois.
Babcock and Wilcox. 1992a. 'Technical Progress Report, Apollo, Pennsylvania Nuclear FuelFacility D&D Project. Quarterly Progress Report for the Period 1/1/92 - 3/31/92,"DOEIEW/40017-T2, June 8, 1992.
Babcock and Wilcox. 1992b. "Technical Progress Report, Apollo, Pennsylvania Nuclear FuelFacility D&D Project. Quarterly Progress Report for the Period 4/1/92 - 6/30/92,"DOE/EW/40017-T3, August 25, 1992.
Brengle, R. G. 1979. "The Decontamination of Concrete," in proceedings of an AmericanNuclear Society Topical Meeting Decontamination and Decommissioning of Nuclear Facilities,M. M. Osterhout, Editor, pp. 451455, Sun Valley, Idaho, September 16-20, 1979, PlenumPress, New York, New York.
Crank, J. 1956. The Mathematics of Diffusion, Equation 2.7, p. 11, Oxford at the ClarendonPress, United Kingdom.
Dayal, R., H. Arora, N. Morcos. 1983. Estimation of Cesium-137 Release fromWaste/Cement Composites using Data from Small-Scale Specimens, NUREG/CR-3382, U.S.Nuclear Regulatory Commission, Washington D.C.
Dennis, R., Dworkin, D., and Lowe, W. 1992. Evaluation of Commercially Available SoilWashing Processes for Site Remediation, HMC, May/June 1992, pp 47-57.
DOE. 1992. Remedial Investigation and Feasibility Study: Operable Unit 3 Work Plant
NUREG-1496 C.D-98

Addendum. Revision 2. Draft Final, Volume 1 of 2, Sections 1-8, Appendices A, B, and C,Fernald Environmental Management Project, U.S. Department of Energy Fernald Field Office,Fernald, Ohio.
Elder, H. K. 1981. Technology. Safety and Costs of Decommissioning a Reference UraniumHexafluoride Conversion Plant, NUREG/CR-1757, U.S. Nuclear Regulatory Commission,Washington, D.C.
Elder, H. K. and D. E. Blahnik. 1980a. Technology. Safety and Costs of Decommissioninga Reference Uranium Fuel Fabrication Plant, NUREG/CR-1266, Vol. 1 Main Report, U.S.Nuclear Regulatory Commission, Washington, D.C.
Elder, H. K. and D. E. Blahnik. 1980b. Technology. Safety and Costs of Decommissioninga Reference Uranium Fuel Fabrication Plant, NUREG/CR-1266, Vol. 2 Appendices, U.S.Nuclear Regulatory Commission, Washington, D.C.
ENVEST. 1991. RACER Remedial Action Cost Engineering and Requirements System-ENVESTEnvironmental Cost Engineering. United States Air Force Environmental Restoration Program.Tyndall AFB, Florida.
EPA, 1990. "Superfund Record of Decision: Monticello Mill Tailings (DOE), UT",EPAIRODIR08-90/034, August, 1990.
Ewart, F. T., J. L. Smith-Briggs, H. P. Thomason, and S. J. Williams. 1992. "The Solubilityof Actinides in a Cementitious Near-Field Environment," Waste Management, 12:241-252.
Geraghty and Miller, Inc., 1990a. 'Portsmouth Gaseous Diffusion Plant. Quadrant I. RCRAFacility Investigation Work Plan," POEF/ER/Sub-88/4502/1. Revision 1, Geraghty and MillerEnvironmental Services, Dublin, OH, September 1990.
Geraghty and Miller, Inc., 1990b. 'Portsmouth Gaseous Diffusion Plant. Quadrant I.Description of Current Condition,' POEF/ER/Sub-88/4502/3. Revision 1,- Geraghty and MillerEnvironmental Services, Dublin, OH, September 1990.
Gerber, M., Freeman, H., Baker, E., and Riemath, W. 1991. Soil Washing: A PreliminaryAssessment of its Anplicability to Hanford, PNL-7787, Battelle Pacific Northwest Laboratoryfor the U.S. Department of Energy.
Haase, A. E., R. S. Kingsley, L. P. Williams, and R. V. Carlson. 1992. "Decommissioningof B&W's Fuel Conversion Plant." pp. 717-721, Waste Management '92 Vol. 1- Technologvand Programs for Radioactive Waste Management and Environmental Restoration, AmericanNuclear Society, LaGrange Park, Illinois.
C.D-99 DNUREG-1496

Irving, B. A. 1980. 'Three Mile Island Concrete Decontamination Experience." Proceedingsof a Concrete Decontamination Workshop, Seattle, Washington, May 28-29, 1980. pp. 169-178.CONF-800542, PNL-SA-8855, Pacific Northwest Laboratory, Richland, Washington.
Kaiser Engineers Hanford Company. May 1993. D&D Technologies. The Decommissioningand Decontamination Briefing, Vol. 1, Issue 1, S. T. Spence, Editor, Kaiser EngineersHanford Company, Richland, Washington.
Kennedy, W. E. Jr., D. L. Strenge. 1992. Residual Radioactive Contamination FromDecommissioning, NUREG/CR-5512, Vol. 1, U.S. Nuclear Regulatory Commission,Washington, D.C.
Konzek, G. J., J. D. Ludwick, W. E. Kennedy, and R. I. Smith. 1982a.Technology. Safety and Costs of Decommissioning Reference Nuclear Research and TestReactors. Main Report, NUREG/CR-1756, Vol. 1, U.S. Nuclear Regulatory Washington, DC.
Konzek, G. J., J. D. Ludwick, W. E. Kennedy, and R. I. Smith. 1982b.Technology. Safety and Costs of Decommissioning Reference Nuclear Research and TestReactors. Anpendices, NUREG/CR-1756, Vol. 2, U.S. Nuclear Regulatory Washington, DC.
Konzek. G. J., R. I. Smith, M. C. Bierschbach, and P. N. McDuffie. 1993. Revised Analysesof Decommissioning for the Reference Pressurized Water Reactor Power Station, NUREG/CR-5884, Vol. 1, U.S. Nuclear Regulatory Commission, Washington, DC.
Martin, K. L., 1985. "Radiological Survey of Molybdenum Corporation of America,Washington, Pennsylvania," Preliminary Report for U.S. NRC Region I Office, Oak RidgeAssociated Universities.
Matsuzuru, H., and A. Ito. 1977. Immobilization of Cesium-137 in Cement Waste Compositesby Addition of Mineral Zeolites, Health Physics, 34, pp. 643-648.
McKay, H. S., B. H. Wakeman, J. M. Pickworth, S. D. Routh, and W. C. Hopkins. 1989.An Independent Spent-Fuel Storage Installation at Surrv Station: Design and Operation, EPRIReport NP-6032, Electric Power Research Institute, Palo Alto, California.
Means. 1993. Means Building Construction Cost Data. Kingston, Massachusetts.
Murphy, E. S. 1981. Technology. Safety and Costs of Decommissioning Reference Non-Fuel-Cycle Nuclear Facilities, NUREG/CR-1754, U.S. Nuclear Regulatory Commission, Washington,D.C.
Muurinen, A., H. P. Penttilae, H. P., and J. Rantanen. 1986. Diffusivity of Cesium.Strontium. Carbon, and Nickel in Concrete and Mixtures of Sodium Bentonite and CrushedRock, DE87750404XSP, Helsinki, Finland.
NUREG-1496 C.D-100

NRC. 1980. Final Generic Environmental Impact Statement on Uranium Milling, NUREG-0706 Volume I, U.S. Nuclear Regulatory Commission, Washington, D.C.
NRC. 1980. Final Generic Environmental Impact Statement on Uranium Milling, NUREG-0706 Volume III, U.S. Nuclear Regulatory Commission, Washington, D.C.
NRC. 1993. Site Decommissioning Management Plan, NUREG-1444, U.S. Nuclear RegulatoryCommission, Washington, D.C.
Nuclear Waste News, March 25, 1993; p. 117
Robertson, D. E., et al. 1989. Below Regulator= Concern Owners Group: RadionuclidesCharacterization of Potential BRC Waste Types from Nuclear Power Stations. EPRI NP-5677,Project B101-15 Final Report March 1989 by Pacific Northwest Laboratory, Electric PowerResearch Institute, Palo Alto, California.
Robertson, D. E. C. W. Thomas, N. L. Wynhoff, and D. C. Hetzer. 1991. RadionuclideCharacterization of Reactor Decommissioning Wastes and Spent Fuel Assembly Hardware,NUREG/CR-5343, U.S. Nuclear Regulatory Commission, Washington, D.C.
SEG. 1992. Scientific Ecology Group Qualifications for Soil Washing Services, ScientificEcology Group, Pittsburgh, Pennsylvania.
Serne, R. J. et al. 1987. Laboratory Leach Tests of Phosphate/Sulfate Waste Grout andLeachate Adsorption Tests using Hanford Sediment, PNL-6019, Pacific Northwest Laboratory,Richland, Washington.
Semne, R. J. et al. 1989. Leach Tests on Grouts Made with Actual and Trace Metal-SpikedSynthetic Phosphate/Sulfate Waste, PNL-7121, Pacific Northwest Laboratory, Richland,Washington.
Serne, R. J. and M. I Wood. 1990. Hanford Waste-Form Release and Sediment Interaction,PNL-7297, Pacific Northwest Laboratory, Richland, Washington.
Serne, R. J., 1992. 'Current Adsorption Models and Open Issues Pertaining to PerformanceAssessment," in Proceedings. DOE/Yucca Mountain Site Characterization Project RadionuclideAdsorption Workshop. LA-12325C, Los Alamos National Laboratory, Los Alamos, NM, Sept.11-12, 1990.
Short, S. M. 1989. Technology. Safety and Costs of Decommissioning Reference Non-Fuel-Cycle Nuclear Facilities, NUREG/CR-1754, Addendum 1, U.S. Nuclear RegulatoryCommission, Washington, D.C.
C.D-101 NUREG-1496
Smith, R. I., G. J. Konzek, and W. E. Kennedy, Jr. 1978. Technology. Safet and Costs ofDecommissioning a Reference Pressurized Water Reactor Power Station, NUREG/CR-0130,Vol. 1 & 2, U.S. Nuclear Regulatory Washington, DC.
Westinghouse Hanford Company. 1989. Shippingport Station Decommissioning Project -Contaminated Concrete Removal Topical Report, DOE/SSDP-0047, Westinghouse HanfordCompany, Richland, Washington.
Yasunaka, H., M. Shibamoto, T. Sukegawa, T. Yamate, and M. Tanaka. 1987. 'MicrowaveDecontaminator for Concrete Surface Decontamination in JPDR," CONF-871018,Decommissioning. Vol. 2, pp. IV.109-IV.116, G.A. Tarcza, Editor, Proceedings of the 1987International Symposium, Pittsburgh, PA.
NUREG-4496 C.D-102

SUBAITACHMENT A TO ATTACHMENT D
CALCULATED DOSE FACTORS
FOR
THREE SCENARIOS
C.D.A-1 NUREG-1496

Building Occupancy Scenario
Radionuclide mremly per Year Controlling Pathwaydpml100 cm2 Analyzed
'Co 2.89E-3 1 external (-91 %)
90Sr 1.51E-3 1 ingestion (-84%)
"'Cs 1.11E-3 1 external (-59%)23q2 h 2.63E-2 1 inhalation (232Th -67%. 228Th
-14%)
U nat 9.07E-3 1 inhalation (238U -69%),
ingestion (23"U - 14%. 23OU
-12%)
Nuclide Initial Inventory Peak Year Total Dose(dpm/100 cm** 2) (mrem/yr per
dpm/100 cm' 21Co-60 1.00E+00 1 2.89E-03Sr-90 1.OOE+00 1 1.41E-03Y-90 O.OOE+OO 1.02E-04
1.51E-03Cs- 137 1.OOE + 00 1 4.49E-04Ba-1 37m O.OOE+0O 6.57E-04
1.11 E-03Th-232 1.OOE+00 1 2.02E-01Ra-228 1.0OE+00 1.35E-02Ac-228 1.OOE+00 1.17E-03Th-228 1 .OOE+00 4.05E-02Ra-224 1.OOE+OO 3.65E-03Rn-220 1.OOE+00 4.57E-07Po-216 1.OOE+OO 1.99E-08Pb-212 1.OOE +00 5.99E-04Bi-212 1 ;OOE +00 2.26E-04Po-212 6.41 E-01 O.OOE+00Tl-208 3.59E-41
U-Z33Th-234Pa-234rn
4.kSUI-01O.OOE+000.OOE+00
M 7.~3aE-03-m 1i
NUREG-1496 C.D.A-2

Pa-234U-234Th-230Ra-226Rn-222Po-218Pb-214Bi-214Po-214Pb-210Bi-210Po-210U-235Th-231Pa-231Ac-227Fr-223Th-227Ra-223Rn-219Po-215Pb-21 1Bi-211Po-21 1T1-207
0.00E +004.89E-01O.OOE +00O.OOE+00O.OOE +00O.OOE +00O.OOE+00O.OOE +00O.OOE+00O.OOE+00O.OOE- 00O.OOE + 002.25E-02O.OOE+00O.OOE+00O.OOE+00O.OOE +00O.OOE +00O.OOE +00O.OOE+00O.OOE +00O.OOE+000.OOE +006-O.OOE +00O.OOE+00
1 .26E-03M,
am Wm
....Xec i 4 .29£4957-0
17:1 SE-ti
..Building Renovation Scenario
Radionuclide mrem/y per Year Controlling Pathway| p CL I3 Analyzed
6°Co 7.72E-1 1 external (-100%)
90Sr 2.16E-3 1 externa 1(-61%)
137cs 1.75E-1 1 external (-100%)
232Th 9.19E-1 1 external ('3TI -41 %, 22GAc
-32%), Inhalation (232Th2 - 11 %)
I
C.D.A-3 NUREG-1496

-
inhalation (23SU -42%),external (234"Pa - 17%, 2
$5U
-11%) I, _ . |
Nuclide Initial Inventory4pCi/g)
Peak Year Total Dose(mremlyr perpci/g9
Co-60 1.OOE+0O 1 7.72E-01Sr-90 1.00E+00 1 8.23E-04Y-90 O.OOE+OO 1.3fE-3
2.16E-03Cs-137 1.OOE+00 1 2.93E-04Ba-137m O.OOE +00 1.75E-01
1.75E-01Th-232 1.OOE+00 1 1.12E-01Ra-228 1.OOE+00 7.46E-03Ac-228 1.OOE+00 2.98E-01Th-228 1.OOE + 00 2.29E-02Ra-224 1.OOE + 00 4.85E-03Rn-220 1.OOE+00 1.1 SE-04Po-216 1.OOE +00 5.27E-06Pb-212 1.OOE+00 3.94E-02Bi-212 1.OOE1+00 5.80E-02Po-212 6.41E-01 O.OOE+O0T1-208 3.5SE-01 3.76E-01
9.1 SE-01U-238 4.89E-01 4.10E-03Th-234Pa-234mPa-234U-234Th-230Ra-226Rn-222Po-218Pb-214Bi-214Po-214Pb-210B6-210Po-210
O.OOE+00O.OOE+OOO.OOE+004.89E-01O.OOE +00O.OOE +00O.OOE+0OO.OOE+00O.OOE + 00O.OOE +00O.OOE+OOO.OCE +00O.OOE+OOO.OOE +00
7.08E-04
IU 0
NUREG-1496 C.D.A-4

U-235Th-231Pa-231Ac-227Fr-223Th-227Ra-223Rn-219Po-215Pb-211Bi-211Po-211TI-207
2.25E-02O.OOE+00O.OOE+00O.OOE+O00.OOE+00O.OOE+O0O.OOE+00O.OOE+00O.OOE +00O.OOE +00O.OOE +00O.OOE +00O.OOE +00
1.t 1E-03
E-R
MB SE g
. B g.e ,.E
; XE9iF
Drinking Water Scenario
Radionuclide Max. TEDE Peak Year Max. HOCDE Max. Organmrem/y per pCi mrem/y per pCi
'Co 1.134E-11 9 2.103E-11 LLI wall
"7 Cs 6.554E-12 42 7.282E-12 adrenais
90Sr 3.095E-09 22 3.133E-08 b surface
"qTh 2.570E-09 9639 4.540E-08 b surface
U nat 5'.504E-09 47 7.91 8E-08 b surface
Nuclide Initial Inventory Peak Year Maximum TEDE-pCl) Irmremlyr)
Co-60 1.OOE+00 9 1.13E-11Sr-90 l1.OOE+00 22 3.10E-09Cs-137 1.OOE+00 42 6.55E-12Th-232 T1.00E+00 9639 2.57E-09U-238 4.89E-01 47 0ggU-235 2.25E-02 2*U-234 4.89E-01 47 2.83E-09
5.50E-09
C.D.A-S NUREG-1496

Residential Scenario
Primary micsiry P. Secondary mrem/y per Total DosePathway Nuclide pCilg parent Nuclide pCi/g mrem/y perparent pCilg parent
External °°Co 4.98058E+00 N/A N/A 4.98058E+00Inhalation 8°Co 1.37355E-04 N/A N/A 1.37355E-04Agricultural °Co 7.50995E-02 N/A N/A 7.50995E-02Soil 'Co 4.61020E-04 N/A N/A 4.61020E-04Water 'lCo 1.341 45E-05 N/A N/A 1.34145E-05Aquatic °°Co 4.84789E-05 N/A N/A 4.84789E-05
5.05634E+00
Primary mremly per Secondary mrenly per Total DosePathway Nuclide pCi/g parent Nuclide pCi/g parent mrem/y per
pCi/g parentExternal 9Y_ 8.53182E-03 90Sr 2.68957E-04 8.80078E-03Inhalation 90Sr 8.56971 E-04 4 Y 5.49233E-06 8.62463E-04Agricultural "Sr 1.21685E+O00 'Y 8.73595E-02 1.30421E+00Soil 90Sr 2.57067E-03 ?y 1.92277E-04 2.76295E03Water "Sr 1.0431 OE-03 90Y 7.54898E-05 1.11859E-03Aquatic 'Sr 6.53608E-04 90Y 2.38990E-05 6.77507E-04
1.31843E+OO
-
NUREG-1496C.D.A-6

Primary mrem/y per Secondary mrem/y per Total DosePathway Nuclide pCi/g parent Nuclide pCi/g parent mrem/y per
pCilg parent-External 37mBa 1.17358E+00 1'7Cs 2.84997E-04 1.17386E+0OInhalation *37C: -1 1 0787E-05 137-Ba O.OOOOOE-00 2.10787E-05Agricultural '17Cs 2.28090E-01 '37Ba O.OOOOOE-00 2.2809OE-01Soil 17Cs 9.01 794E-04 1311-Ba O.OOOOOE-00 9.01794E-04Water '37Cs 1.46349E-06 13'"Ba O.OOOOOE-00 1.46349E-06Aquatic Cs7CS 2.93688E-05 '3"'Ba O.OOOOOE-00 2.93688E-05
1.40290E -P00
Primary mrem/y per Secondary mrem/y per Total DosePathway Nuclide pCilg initial Nuclide pCi/g initial mrem/y per
conc. conc. initial conc.External 2WTi 2.54625E +00 22Ac 2.01751E+00 5.24482E + 00Inhalation 23qh 1.09367E +00 228Th 2.27869E-01 1.32716E+00Agricultural 23 Th 5.88653E+00 '2Ra 3.24762E + 00 1.08998E+01Soil 232Th 4.98676E-02 22ORa 2.62176E-02 9.08882E-02Water 2"Ra 9.23157E-06 2"'Th 1.09247E-06 1.19082E-05Aquatic 22BRa 8.32257E-06 2"Th 1.39534E-06 1.13579E-05
1.75627E +01
C.D.A-7 NUREG-1496

Primary mremly per Secondary mrem/y per Total DosePathway Nuclide pCO~g initial Nuclide pCi/g initial mremly per
.. conc. conc. initial conc.
External 2 3 "'Pa 2.29389E-03 235U 9.46140E-04 4.61744E-03
Inhalation 23OU 5.91468E-03 23sU 2.82353E-04 6.26693E-03
Agricultural 2 'U 4.96760E-02 23
8U 4.46176E-02 9.93776E-02
Soil Mu 3.87516E-04 238u 3.48056E-04 7.76070E-04
Water 234U 2.01181 E-01 2 3$U 1.80695E-01 3.99691 E-01
Aquatic 234U 1 .27402E-01 2 38u 1.1 4429E-01 2.5901 7E-01
7.69746E-01
NUREG-1496 C.D.A-8

- if SUBATTACHMENT B TO ATTACHMENT-D
SPREADSHEET RESULTS
FOR
SOIL CLEANUP
C.D.B-1 NUREG-1496

TABLE B. 1. Detail of Costs and Other Parameters for Renmediatlon of a Sealed Source Manufacturer Soil Site,Without Soil Washing
I
0%
Qpwov
Ez
Contaminated Soil Soil Soil Floor Floor Demo Total Soil Total Waste TranspornArea Depth Vol. Excavation Area & Excavation Volume Total Packaging Reqds
Costs Removed Concrete Cost
Units $235/m^3 S411/rn' $220/r_
Rates fle cm n' $ A S Ml RI' m' L trucks
HIGH _____
100 5000 3.00 14 3,275 I , 4.582 31 2 7.118 3
60 5000 4.3 20 4,694 1 1 4.582 37 2 8.447 3
30 5000 5.5 26 6.004 _ I 4.582 42 2 9,673 4
15 5000 7 33 7,641 11 4.582 49 2 11,206 4
.10 5000 7.3 34 7.968 II 4.382 Sl 2 11.512 4
3 5000 8.6 40 9,388 II 4.582 57 2 12.841 5
0.3 5000 II 51 12,007 I I 4.582 68 2 15.294 6
0.03 5000 12.7 59 13,863 1 1 4,582 76 2 17.031 6
MEDIUM
100 5000 0 0 0 O I 4.582 17 2 4.053 2
60 5000 2.5 12 2,729 I I 4,582 28 2 6,607 3
30 5000 4.5 21 4,912 I1 4,582 38 2 8.651 3
15 5000 6 28 6.549 1 1 4.582 45 2 10.14 4
10 5000 6.4 30 6.986 I , 4.582 46 2 10.593 4
3 5000 7.7 36 8.405 _ , 4,582 52 2 11.921 4
0.3 S000 10.2 47 11,134 1 , 4,582 64 2 14,476 5
0.03 5000 12 56 13,099 I I 4.582 72 2 16.315 6
LOW _ I I I __I___
100,60,30,10 5000 0 0 0 1 1 - 4.582 17 2 4,053 2
3 5000 16 17 3.930 I 1 4,582 33 2 7,731 3
0.3 5000 7.3 34 7.968 11 4,582 51 2 11.512 4
f f -- - 4I _ _ _ R _ _ . - - 21 4 .. .( 7 ... f... I s
1

TABLE B.l. Detail of Costs and Other Parameters for Remediatlon of a Sealed Source Manufacturer Soil Site,Without Soil Washing (continued)
Transport Dsposal Disposal Charges Average TOTAL Soil Floor Demo TOTAL Occup.Cost Volume Disposal COSTS Excavation Labor LABOR' Dose
_ _ _ _ _ _ _ _ _ _ _ _ _ _ _ _ _ _ _ C ost L abor _ _ _ _ _
Rates S132S/ Northwest Southeast Out-of-SE 1.62 4.07 manhr/mn 0.1._tmck . Compact Compact Compact . . r/m' . mrem/hr
S m S $ -S S S mnu-hr mran-hr man-hr Per-mm |
HIGH - _ ._ ._ . . .. . |
100 3,975 32 46.736 153,593 308.991 169,773 188.723 23 45 68 7
60 3.975 38 - 5,29 182,258 366.657 201,391 223,089 32 45 78 8
30 5S300 44 63.127 208,717 419,888 230.5m 256,136 41 45 87 9
15 5300 -1 72,961 24t,9 486,425 267.059 295.788 53 4S 98 tO
10 5,300 52 .74.928 248,407 499,733 274,356 303,719 55 45 100 10
3 6,625 58 83,452 277,071 557,399 30S,974 339.409 65 45 110 11
0.3 7.950 70 99,187 329,991 663.860 364,346 404,178 83 45 128 13
0.03 7950 77 191093363 367,474 739,269 4118 96 45 141 14
MEDIUM . __ -._
lo 2.650 18 27,066 87.444 175,915 96,809 108,093 0 45 45 5
60 3,975 30 43.457 142,568 286,812 157,612 175,506 19 45 64 6
30 3,975 39 56,570 186.667 375,529 206256 228,376 34 45 79 8
15 5.300 46 66,405 219.742 442.067 242,738 269.353 45 45 91 9
10 5.300 48 69,027 228,562 459,810 252,467 279,921 48 45 94___- 9
3 5,300 54 77,551 257, 2 517,476 284,085 314,293 58 45 103 10
0.3 6.625 66 93,942 312.351 628,373 344 8" 381,705 77 45 122 12
0.03 7,950 74 105,743 352,040 708,218 388,667 430,613 90 45 136 14
100,60,30,10 2,650 18 27,066 87,44 175915 96,809 108.093 0 45 45 5
3,975 3 0,669 166,823 33S,606 184,366 I 204,584 27 45 72 7
0.3 5,300 52 74,928 248,407 499,733 274,356 | 303.719 55 45 | 10
0.03 63 90,664 301,326 | 606,194 | 332,728 |3S48 73 45 118 12
pi:
I~0~
cN

z TABLE B.2. Detail of Costs and Other Parameters for Remedlatlon of a Generic R&D Facility Soil Sute,E Without Soil Washing
M
so
eb
- - -___ - _ * -_
Contaminated Soil Soil Soil Floor Floor Domo Total Total Waste TrnnsportArea Depth Volume Excavayon Area & Excavation Soil Concrete Pac-kaging Rcqds
Cost Removed Volume Volune Cost
Rates 235/m $411of __ $220/of
Units: fe cm S $ le oS tnmcks
HWH - _
100 5000 3.W 14 3.275 I 1 4.582 31 2 7,118 3
60 5000 4.5 21 4.912 11 4.S82 38 2 8 651 3
30 5000 6.2 29 6.768 11 4.582 46 2 10.388 4
15 5000 7 33 7.641 . 1 4.582 49 2 11.206 4
10 5000 7.8 36 8.S14 11 4.582 53 2 12.023 5
3 5000 11.5 53 12.S53 11 4.582 70 2 15804 6
0.3 5000 20.4 95 22.268 1 1 4.S82 III 2 24.899 9
0.03 5000 24.9 116 27 180 I I 4.582 132 2 29.498 10
MEDIUM -
100 5000 0 0 0 11 4,582 17 2 42053 2
60 5000 2.5 12 2.729 It 4.582 28 2 6.607 3
30 5000 4.5 21 4912 11 4.582 38 2 8.65 1 3
15 5000 6 28 6,S49 11 4.582 45 2 104184 4
0 300D 6.4 30 6,986 11 4 46 2 4
3 5000 8.2 38 8,951 4.582 55 2 12.432 5
0.3 5000 16.4 76 17.902 it 4.582 93 2 20.82 7
0.03 5O00 22.3 104 24.342 il 4,582 120 2 26,841 9
LOW I - I l_'_
100.60.30.1 0 0 0 11 4.582 17 2 2 053 2
3 5000 3.6 . 17 .. 3.930 . 11 4.582 33 2 37731 3
0.3 5000 8.3 39 060 11 4.582 55 2 12.S34 5
_ .3 5Q I1. 6 1 20.303 _ 11 4.582 1 In3 1 2 1 23,g60 | 8
.

Vi
TABLE B.2. Detail of Costs and Other Parameters for Remediation of a Generic R&D Facility Soil Site,Without Soil Washing (continued)
T_ _t Diyspe Disposal Charges Aerage TOTAL Excavation Floor TOTA Occup.Cost Volume Disposal COSTS Labor Demo L Dose
Cost Labor LABO
Rates S132S/ Northwest Southeast Out-of-SE 1.62 manhrl/fr 4.07 0.1tmck Compact Compact Compact manhrlnm mrem/hr
Units: $ r $ S S $ mrn-rhr marn-hr person-
mte
HIGH
100 3.975 32 46,736 1,53,593 3089.91 169,773 188.723 23 45 68 7
60 3,975 39 56.570 186,667 37.529 206.256 228.376 34 45 79 8
30 5.300 47 67.716 224,1S2 450.939 247,602 274.640 47 45 92 9
I5 5.300 51 72,961 241.792 486.42 267.059 295.788 53 45 98 10
10 6,625 55 78,206 259,431 S21,912 286.517 318.261 59 45 104 10
3 7.950 72 102,465 341015 686,039 376,507 417.3 87 45 132 13
0.3 11.925 113 160.817 ,537.28 1.080.830 592.969 1 656.643 154 45 199 20
0.03 13.250 ' .134 190.321 636,481 1.280.444 702.416 776.926 187 45 233 23
MEDIUM -
100 2.650 18 27.066 *.444 175,915 96,809 108.093 0 45 45 5
60 3.975 30 434.4S 142.568 286,812 157.612 175.506 19 .- 4S- . 64 j 6
30 3.975 39 56.S10 186,667 375.529 206.256 |228376 34 45 79 8
15 5.300 46 66,405 219.742 442,067 242.738 269,353 45 45 91 9
10 5,300 48 69,027 228,562 459,810 252,467 279,927 48 45 94 9
3 6.62S 57 80,829 268,251 S39,656 296.245 328,835 62 45 107 11
0.3 9.275 95 134,592 449,059 903,396 495,682 548,253 123 45 169 17
0.03 11.92S.- 122 173,275 S791S2 1,165,112 639.179 706,869 1 168 . 4S . 213 | 21
LOW _ _ _
100,60.30.1 26.60 | 18 27 0.66 | 87,444 1 175.915 96,809 108,093 0 4: 45 5
3 3.975 35 50669 166,823 335.606 184,366 204.584 27 | 4; 72 -1 7
0.3 6,625 57 ' 81485 270.456 5.02 298,68 331,479 62 | 4 108 11
0.03- 10199o 1 105 1 149.06 497-568--L~ 1 0 8 5 49-190 1- 607-73S51 140 A;r 185 _ 19
9'0I~

& TABLE B.3. Detai of Costs and Other Pmeters for Remediation of a Dry ISFSJ Soil Site,Withnut Soil Washinp-
014�0ON
Qb
ContAMinated so5 Soil Soil Floor Area Floor Demo TotW ToWa Waste TrmnsponDepth Volume Ecavation Removed & Excavation Soil Concrlee Packaging RcqdsCost __ _ _ _ _ _ _ _ _ Volume Volume Cost_ _ _ _ _
s$235mi' $4111ml' _2201' __
Units f cm Mln $ ml $ $ _ S of Trucks
-HIGH500 3.00 1 327 43 17.564 65 7 157842 6
_ 4.5 2 491 43 17 ,564 66 7 15 995 630 500 6.2 3 677 43 17.564 67 7 16.169 6IS Soo 7 3 764 43 17,564 67 7 16.2 50 6to S WO 7.8 4 8 51 43 17,564 68 7 16,332 63 500 11.5 5 1,255 43 17,5" 69 7 16,710 6
0.3 500 20A 9 24227 43 17,564 74 7 160.03 500 24.9 12 218 43 17,564 76 7 1 7
MEDIUM100 500 O 0 O 43 17,564 64 7 15.535 660 500 2.5 1 273 43 17,564 65 7 15.790 630 500 4.5 2 491 43 17.564 66 7 = 5 19 95 6I5 5OO 6 3 655 43 17,56467 7 tt '.148 610 500 6.4 3 699 43 17tS646 67 t. 1 .9 63 5 0 0 8 .2 4 8 9 5 4 3 1 7, S 6 46 8 7 1 ' .3 7 3 6
0.3 500 16 .4 8 1,79 43 17,564 72 7 1 2l 1 60.03 500 2 223 3 1 2, 434 43 17,564 74 7 I 814 6
LOW . ,,.____100, 60, 30,.10 500 . 0 0 4 3_O43. 17,564.6 4 7 156535 6
3 500 3.6 2 3 393 __17 5 43 66 7 15.9 03 17,564 6 60.3 500 8.3 4 906 43 17 564 68 7 16.383 6
0.03 500 18.6 9 2 3 43317, 564 1 73 17 77' 436 6
A

TABLE B.3. Detail of Costs and Other Parameters for Remlediation of a Dry ISFSI Soil Site,Without Soil Washing (continued)
: ,= . , . . ~ = - .______ . ______ _____-___
Transport Disposal Disposal chargs Average TOTAL Excavation Floor TOTAL Occup.Cost Volume Disposal COST Labor Demlo LABOR Dose
__ _ _ _ _ _ _ _ _ _ _ Cost _ __Labor _ _
Rames S1325Wm | Northwest Southeast Out-of-SE 1.62 4.07 0.1Compac Compact Compact ______ manbr/lm m ranhr/m' mm/hr
| MI n-hr manbhr mMM nh
HIGH _
100 7.950 72 102.3 34i,816 68t,650 377,390 0 _419 2 174 176 IS
60 7,950 73 103,687 345,124 694,304 3S1,038 423,038 3 174 177 18
30 7,950 73 104,801 348,872 701,S45 3SS.173 427,S32 5 174 179 18
is 7.950 74 105.326 350,636 705,394 3S7,119 429,647 5 174 179 18
10 7,950 74 105,850 352,400 708.942 3S9,064 431,761 6 174 180 18
3 7.950 76 108,276 360,558 725,355 398,063 441.542 9 174 183 18
0.3 7.950 80 114112 380.183 764.834 419.709 465,070 15 174 189 19
0.03 9275 82 117,062 390,105 784,795 430,654 478,290 19 17' 193 19
MEDIM - - -
100 7,g50 71 100,736 335,201 674,343 370,093 411,142 0 17- 17 17
60 7 950 72 102.375 340,714 685,432 376,174 417,751 2 I7: 176 i8
30 7.950 73 103.687 345,124 694.304 381.038 423,038 3 17. 177 18
15 7,950 73 104,670 348,431 700,958 384,686 427,003 5 _174 178 18
10 7,950 74 104,933 349,313 702,732 385,659 428,061 5 174 179 1 8
3 7.950 74 106,113 353,282 710.717 390,037 432,819 6 174 180 18
0.3 7,950 78 111,489 371.363 747,091 409,981 454.496 12 174 186 19
0.03 7.950 81 IIS,357 384,372 3,262 424.331 470,092 17 174 I 191 _ 19
LOW - - - -
100,60,30.10 7,950( 71 100,736 335,201 674.343 370,093 411142| 0 174 7174 1
3 7,950 2 103,097 343.139 690,312 |378,849 |420,6S9 3 174 | 177 | 18
0.3 7,9S0 j 74 106,178 353,503. 711,160 390,280 433,083 6 174 180 I 8
0^03_ 7 9M 72 ' , 12-931 1376.2141 756-850^ 411S.332 1 460-311 1 4 174 1 _ 8 19
n
z
0~

TABLE B.4. Details of Costs and Other Parameters for Remedlatlon of Test Reactor Sonl Site,Witliut Soil Washing
R10140I.I.0%
n
40
Contaminated Area so Sod Soil Floor Floor Demo & Total ToWl Waste TiunsponDepth Volume Excavation Area Excavation Soil Concrete Packaging Cost Reqds
Cost Removed Volume Volume _____ ____
Rates: $235/rd $41 I/m? S2101m'
llils ft cm [t S m' $ m11 $ Ntrucks
HIGH
tO0 S000 3.00 14 3,275 186 76,364 293 28 70,609 24
60 5000 4.5 21 4,912 186 76,364 300 28 72,142 2S
30 5000 6.2 29 6,768 186 76,364 307 28 732879 52
15 5000 7 33 7,641 186 76,364 311 28 74,t97 25
10 5000 7.8 36 186 76,364 315 28 75 14 26
3 5000 11.5 53 12,553 186 76.364 332 28 79,:.95 _
0.3 5000 20.4 95 22,268 186 76.364 373 28 8 30
0.03 5000 24.9 116 27,180 186 76,364 394 28 92,989 32
MEDIUM I
100 5000 0 0 0 186 76,364 279 28 30 755 11
60 5000 2.S 12 2,729 186 76,364 28 70.098 24
30 5000 4.5 21 4,912 186 76.364 300 28 72,142 25
15 5000 6 U 6,549 186 76,364 307 28 73.675 25
10 SO50 6.4 30 6,986 186 76,364 308 _ 28 _ 74,084 25
3 5000 8.2 38 8.951 186 76,364 317 28 75,923 26
0.3 5000 16.4 76 17 902 186 76,364 355 28 84303 29
0.03 5000 22.3 104 24.342 186 76,364 382 .28 90,332 31
LOW _ _ _ _ _ _ _ _
100,60,30, 5000 0 0 0 , 186 76,364 279 28 30,755 11
3 5000 3.6 17 3,930 186 76,364 295 28 | 71,222 24
0.3 5000 '.3 39 9 060 186 76,364 317 28 76,025 26
0.03 5000 18.6 86 20,303 .186 76,364 365 28 86,551 29

.. 9.7-,:
SABLE II4. Details of Costs and Other Parameters for Rem edlation of a Research Reactor Soil Site,Without SolN Washing (continued)
z
9
Transport Disposa Disposal Charges Average TOTAL Excavation Floor TOTAL Occu.
Costs Voo me Disposal COSTS Labor DeDo LABOR Dose
_ _ _ _ _- _ _ _ _ _ _ _ _ _ _ _ _ C o st _ _ _ _ _ _ _ _ L a bo r
Rates: S132 5n 2 Northwest Southeast Out-of-SE 1.62 4.07 0.1
Compact Compact Compact mapnn rlm' mnanloU m Imremth. r I
u fits S S . S S S S man-h r mat-hr man -hr person-
HIGH - -_ - - -
31.80 .321, 454,088 1,523,546 3,065.00 1.680.878 1,862.92 23 756 779 78
60 33.125 32t 463,923 1,56,621 3,131,538 1,717,360 1,903,90 34 756 790 79
30 33 125 336 475,069 1.594.105 3,206,948 1,758? 1948.84 47 756 803 to
15 33,125 340 480,314 1,611,745 3 ,242,434 1,778,164 1,969,99 53 756 809 81
10 34.450 343 485,559 1,629.385 3,277,921 1.797,622 1,992!46 S9 756 81S 81
3 35 775 360 S09 818 1,710,968 3,442,048 1,887,611 2,091,S9 87 756 843 84
0.3 39.750 402 568.170 1,907.211 3,836,839 2,104,073 2,330.84 154 756 910 91
0.03 42,400 423 597,674 2.006.434 4,03,453 2,213,520 2 2,45 187 7756 944 94
MEDUM -
100 14.575 140 19,387 663,608 1,335,016 732,337 *854,031 0 756 756 76
60 31,800 -4S0,810 t,12,S21 3,042,821 1668,717 1.849,70 19 756 775 78-
30 331S 38 4393 1556,621 3,131,538 1,717,360 1,903,90 34 1 76 1 70 1 7
30 33,125 46 .9 3 .. 3 31 38 . ! 34756 790 79
15 33,125 335 473,757 ,1,589,695 3,198,076 1,753,843 1,943.55 45 756 801 80
10 33,125 337 476,380 1,598,515 3,215,819 1,763,571 1,954,13 48 756 804 So
3 34.450 345 488,182 1,638,204 3,295,665 1,807,350 2,003,03 62 756 818 82
0.3 38,425 383 541,944 1,819,012 3,659,405 2,006,787 2,223.8 123 756 880 88
0.03 41,075 JjL. 580,627 1,949.105 3.921,121 2,150.284U 2,382,39 168 756 A 924 92
LOW ''''E._
100,60.30,10,10 14,575 34 198387 663,608 | 1,335.016 732,337 854,031 0 756 756 76
3 3180 324 438.022 1.536.776 3,091,615 1695.471 1 f78 7 27 756 783 748_3 10,03, 64 40
0.3 34 450 346 ' 4 3.300,101 1 109,782 2005,68 62 756 819 82
0.03 38,42S 393 556,368 1 867,521 3,756,994 20029 2,281,93 0756 896

z9
0
TABLE B.5. Detail of Costs and Other Parameters for Remediation of a Research Reactor Soil Site,Without Soil Washing
-~~ ~ ~ -. - - .__ _ _ _ _ _ _ _ _ ___ _ _ _ _ _ _ _ _
Contaminated Soil Soil Soil Floor Floor Demo Total Total Was TrAnsponAra Depth Volume Excavation Area t& Excavation son Concrete Pack ging Reqds
- - Cost Removed ______ Volume Volume Cost
Rates: __235_ _ _41_ _n_ _220__-
Units: m' cm m'$ Sf l $ 1D5 m S trucks
HIGH .- -
100 500 3.00 1 327 65 26,727 99 10 23,947 9
60 500 4.5 2 491 65 26.727 100 10 24.100 9
30 500 6.2 3 677 65 26,727 100 10 24,274 9
IS 500 7 3 764 65 26.727 101 10 24.356 9
t0 500 7.8 4 851 65 26.727 101 10 24,437 9
3 Soo 11.S 5 1,255 65 26,727 103 10 24,815 9
0.3 500 20.4 9 2,227 65 26,727 107 10 25,725 9
0.03 500 24.9 12 2,718 65 26,727 109 10 26.185 9
MEDIUM -
100 SW O O 0 65 26,m 98 10 23,640 8
60 SOO 2.5 I 273 65 26,727 99 10 23,896 8
30 500 4.5 2 491 65 26,727 100 10 24,100 9
1 5 -00 6 3 655 65 26,727 100 10 24.253 9
10 500 6.4 3 699 65 2o7 t 10 24,294 9
3 SOO 8.2 4 895 65 26.727 101 10 24,478 9
0.3 SOO 16.4 8 I 1,790 65 26,727 105 10 25,316 _ 9
0.03 500 22.3 10 2.434 65 26,727 108 10 25,919 9
LOW _ - . -
100,60,30,10 500 O .. O.0 65 26,727 98 10 23,640 8
3 500 3.6 2 393 65 26,727 99 10 24,008 9
0.3 500 | 8.3 | 4 | 906 65 26,727 101 10 24,488 9
0.03 500 18.6 9 2.030 65 26,727 106 10 925.41 9_____________ - ____I_
4

q
p
z
9
TABLE B.5. Detail of Costs snd Other Parameters for Remediation of a Research Reactor Soil Site,Without Soil Washing (continued)
Transpont Disposal Disposal Charges Average TOTAL Eicavntion Floor TOTAL Occup.Cost Volume Disposal COSTS Labor Demo LABOR Dose
_ _ _ _- _ _ _ _ _ _ _ _ _ _ _ _ c o st _ _ _ _ L ab o r
Rates: S1325/m' Northwest Southeast Out-of-SE 1.62 4.07 0.1Compata Compact Compact marthr/ni manrlWe mrem/hr
Units: S $ I I $ $ Smn-hr mnan-hr rman-hr person-: _ _ . . mrem
HIGH . - _ - -
00 11,925 109 154,706 516.704 1,039,481 570,297 633,224 2 265 267 27
60 11 925 110 155.689 520,011 1,046,135 573.945 637,189 3 265 268 27
30 11.925 120 156,804 523,760 1.053.676 578.080 641,683 5 265 269 27
15 - 11925 111 157.328 525,S24 1.057.225 580.026 643.798 5 265 270 27
10 11.925 III 157.853 527 288 1,060,773 581,971 645,912 6 265 271 27
* 3 1*q2 113 160,279 535,446 1,077,186 590,970 655,693 9 265 273 27
0.3 11.925 117 166.114 555,00 1.116,66S 612.616 679,220 I5 265 280 28
0.03 11,92S 119 169,06 564.m 1.136.626 6235,61 691,116 19 265 283 28
MEDIUM - -__
0 t0 2 10,600 107 L5,739. 510.089 1.026.174 563,000 623,968 0 265 265 26
60 1o0o6 109 154,378 51,601 0 1,037,263 569,081 630.577 2 265 267 27
30 11.925 110 155,689 520011 1.046135 573945 63 89 3 265 268 27
15 11.925 110 156.673 523.319 1.052.789 m7.593 64114, 5 265 269 27
10 11,925 110 156,935 524.201 1,054,563 578.566 642,211 5 265 269 27
3 11,92S III IS8,115 528,170 1,062,548 582.944 646.970 6 265 271 27
0.3 1,92S 115 163,491 546,250 1,098,922 602.888 668,646 12 265 277 28
0.03 11,92S _ 118 167,360 559,260 1,125,093 617,238 684,243 I 17 265 281 1 28
LOW I II-_II
100,60,30.10 10.600 107 152,739 S10,089 1,026 ,174 563,000 623,968 0 265 265_ 26
3 11,925 109 155.099 518.027 1.042.143 571-7S6 63481 3 265 27
0.3 11.92511. I I 158,181 528390 1.062.991 583.187 647.234 6 265 27
0.03 11925 16 164,934 S51.101 1 _1,108,680 1608,239 674462279 28

9
446'0
M
I-
TABLE B.6. Detail of Costs and Other Parameters for Remedlation of a Power Reactor Soil Site,Without Soil Washing
Containaed Soil SoOd Soil Floor Floor Demo Total Total Waste Trnsport
Arce Depth Volume Excavation Area I & Excavation Sool Concrete paCk uift Reqds.______ - - Cost Removed _ ____Volume volume cosg
Rates: S23512 I$411/nf __ __/_f_
Units: ft1 cm nL$ $ m $ Str__S__ucks
HIGH _
100 2000 3.00 6 1,310 465 190,910 702 71 170,085 57
60 200 4.5 8 1,965 465 190,910 705 71 170,698 58
30 2000 6.2 12 2,707 465 190,910 708 71 171,393 58
15 2000 7 13 3.056 465 190,910 710 71 1715728
10 2000 7.8 14 3,406 465 190,910 711 71 172,047 58
3 2000 11.5 21 5,021 465 190,910 718 71 173,559 59
0.3 2000 20.4. 38 8,907 465 190,910 735 71 177,197 60
0.03 2000 24.9 46 10,872 465 190,910 743 71 179,037 60
MEDIUM
100 2000 0 0 0 465 190.910 697 71 1685859 57
60 2000 2.5 S 1,092 465 190,910 701 71 169,881 57
30 2000 4.5 8 1,965 465 190,910 705 71 170,698 58
15 2000 6 11 2,620 465 190,910 708 7 1 , 171,311l 58
10 2000 6.4 12 2,794 465 190,910 709 71 171,475 58
3 2000 8.2 15 3,580 465 190,910 712 71 172,211 58
0.3 2000 16.4 30 7.161 465 190,910 727 71 175.,62 59
0.03 2000 22.3 41 9,737 465 190,910 738 71 177,974 60
100,60,30.10 2000 0 0 0 465 . 190,910 . 697 . 71t 168,859 57
3 2000 3.6 7 1 1,572 * * 465 * 190,910 ,703 , 71 170.330 57
0.3 2000 8.3 s15 1 3,624 465 190.910 712 71 172,251 58
0.03 2000 48.6 35 8 121 465 190.910 731 71 176,462 59

TABLE B.6. Detail of Costs and Other Parameters for Remediation of a Power Reactor Soil Site,Without Soil Washing (continued)
Transport Disposal Disposal Charges Average TOTAL Excavation Floor TOTAL LAROpRcost Volurme Disposal COSTS Labor Demo LABOR Dose
_ Cost Labor
Rates: $13251 NorthWest Soudieast Out-or-SE 1.62 4.07 0.1.Mick com - Cpaca Co____t Compmct nmnhrlm nInhrwt _ mrenmhr
Units: -S in' SS S $ S S m t man-brht nan-hr person-___ ___ ___ __ - .1I. __ ___ ___- _ mrem
HIGH _
100 75,525 7 1.092.317 3,669,952 7,383,041 404437 4486266 9 1891 1900 190
60 76.850 776 1,096,251 3,683,182 7,409,656 40330 4,503,452 14 1891 1904 190
30 76.850 779 1,100,710 3 698,176 7, 4.09.568 4,521,428 19 1891 1909 191
15 76.850 781 1.102.808 3,705.231 7.454.015 4.0St.351 4,529.887 21 1891 1912 191
10 76.850 782 1.104.906 3,712,287 7,468,210 4,095,134 4,538,347 23 1891_ 1914 _ 191
3 78.175 789 1,114,609 3,744,921 7,533.860 4,131,130 4.578,795 35 1891 192S 193
0.3 79.500 805 1.137.950 3,823,418 7,91,7 4,2177JS 4.674,229 61 1891 1952 195
Q.03 .500 814. 1.149752 3.863.107 7,771,622 4,261,494 4,721,812 75 1891 196 197
MEDIUM - -
100 75,525 768 1.084.450 3,643,492 7.329,811 4,019,251 4,454.544 0 1891 1891 189
60 7525 772 1,091.006 3,66S.542 7,374.170 4,043,57 4,480,979 8 1891 189 190
30 76.850 776 1.096.2S1 3.683.182 7409,6S6 4,063,030 4.503.452 14 1891 1904 190
15 76.8S0 779 1.100.185 3,696.412 7,436,272 4,077,623 4,519,313 18 1891 1909 191
10 76850 779 1,101,234 3,699,940 7.443,369 4,081,514 4.S23,543 19 1891 1910 191
3 76.850 783 1,105,955 3,71S,85 7.475.307 4,099,026 4,542,576 25 1891 1915 192
0.3 78,l75 79S 1,127,460 3.788,138 7,620,803 4,18,00 4.630.608 49 1891 1940 194
0.03 0 809 12 .933 3,840,176 7,725,499 4.236,199 4,694,320 67 1891 196
LOW100,60,30.10 75,525 768 1,084,450 3,643.492 | 7,329,811-__ 4,019.251 4 4,454544 0 1891 | 1891 189
3 75525 774 1,093,891 3,675244 7 393 687 4,054,27 4 4 449261 11 1891 1901 190
0.3 76,850 783 1 ,106,217 3,716,697 747,4",0tl 4,099,999 14,43,634 25 1891 1915 192
0.03 78.175 | 802 1.133.230 3.807,542 7,659, 839 4.200,203 | 4,653,871 56 19491 197 | 195
(1)bboIW
Q
0
Ch

I
0%
n
b
TABLE B.7. Detall of Costs and Other Parameters for Rewe ilton of a Rare Metals Extraction Sol] Site,Without Soil Washing
Contaminated Sod Deptb Soil Soil Floor Arca Floor Demo & Toal Soil Total Waste TransportVAra Volume Excavation Removed Excavaoon Volume concrete Packaging Roos
_ _ _ _ _ _ _ _ C ost _ _ _ _ _ _ _ _ _ _ _ _ _ _ _ V olu m eg C ont
Rates: S235/In $411/r S220/nt
| Uniut: ) cm $ Two $ S$ Suucks
HIGH _ .
| O 100000 0.80 74 17,465 279 114,546 492 42 117,666 40
60 100000 1.1 102 24,015 279 114.546 520 42 123.797 42
30 100000 1.2 111 26,198 279 114.546 530 42 125.841 43
15 100000 1.4 130 30.564 279 114,546 S48 42 129.928 -44
10 100000 1.5 139 32.747 279 114,S46 557 42 131.972 45
3 100000 2 186 43,663 279 114,546 604 42 48
0.3 100000 2.6 242 56,762 279 114,S46 660 42 154,454 52
o.03 100000 3.1 288 67.678 279 114,546 706 42 164,673 56
LOW .- - -
100 100000 0.2 19 4,366 279 114,S46 437 42 105,403 36
60 ID0000 0.4 37 8,733 279 114,546 455 42 109,490 37
30 100000 0.6 56 13,099 279 114,546 474 42 113,578 38
IS 100000 1.1 102 24.015 279 114.546 520 42 123.797 42
10 ID000o 1.1 102 24,015 279 114,546 520 42 123,797 42
3 100000 1.3 121 28,381 279 114,546 539 42 127,885 43
0.3 100000 2 186 43,663 279 114,546 604 42 142 191 48
0.03 10000 2.6 242 _ 56.762 279 114,546 660 42 15444 52

TABLE B.7. Detail of Costs and Other Parameters for Remedlation of a Rare Metals Extraction Soil Site,Without Soil Washing (continued)
Tianspoft Disposal Disposal Charges Avenge TOTAL Excavation Floor Demo TOTAL Occup.Cost Volume Disposal COSTS Labor Labor LABOR Dose
Rates: $1325/ Nonhwest Southeast Out-of-SE 1.62 4.07 0.1
tmack Compact Compact Compact manwtm' mnantr/ t -inrem/hr
Units: S $ S S $ $ nan-hr nun-hr man-hr perSon-
.G _ _
100 53.000 - 755,99 2.538,891 5,107,624 2,800,8 3,103,514 120 1134 1255 -125
60 SS,6S0 563 795.337 2,671,189 5,373,775 2,946.7 3,264.774 166 1134 1300 130
30 56,975 572 808,450 2.715.2RR 5.462,492 2.995,4 3.318,970 181 1134 1315 131
15-L 59.300 591 834.676 2.803.4S7 5,639,927 3.0.6 3,426,035 211 1134 1345 135
10 59,625 600 847,89 2,847,586 5,728,644 3 226 1134 1360 136
^ 3 63,600 646 913.353 3,068,083 6,172,230 3,384.5 3,748,555 301 1134 1435 144
0.3 68,900 702 992030 3,332,680 6,704,532 3.676.4 4.071,076 391 1134 1526 153
0.03 74,200 749 1.057.595 3,553,177 7,148,118 3,919.6 4,340,726 467 1134 1601 160
LOW _
100 47,700 479 677,322 2.274.294 4.575,321 2,508.9 2,780,994 30 1134 1164 116
60 49,025 498 703,547 2,362,493 4,752,755 2,606,2 2,888,059 60 1134 1195 119
30 50,350 516 729,773 2,450,692 4,930,189 2,703,5 2,95,124 90 1134 1225 122
15 55,.60 563 795,337 2,671,189 5.373.775 2.946,7 I 3.264.774 166 1134 1300 130
10 SS,650 563 795,337 2,671.189 5,373,775 2,946,7 3,264,774 166 1134 1300 130
3 56,975 581 821,563 2,759,388 5.551,210 3,044,0 3,371,840 196 1134 1330 133
0.3 63,600 646 913.353 3,068,083 6,172,230 3,384.5 13,748.555 301 1134 1435 144
_0.03 68900 702 9,030 3,332,680 6,67 41 625
Va
0
Cb

TABLE B.8. Details of Cost and Other Parameters for Remedlation of a Rare Metals Extraction Tailings Pile,Without Soil Washing (continued)
4'
0
01
Transport Disposal Disposal Charges Avenge TOTAL Excavatno Floor Son TOTAL Occup.
Costs Volume Disposal COST n Labor Demo Washing LABOR DoseCost Labor Labor
RatOs 2 wk rental Nolthwest Southeast Out-of-SE 1.62 4.07 0.17 0.1
Compact Compact Compact manhrm' mnh/m 1 ranrhr/' mrem/hrUnits: . m' ' I - S S S mn-hr man-hr man-hr nun-hr person-
- ~ ~~~ -_ 1-_ _ _ _ _ mrem
H IG H _ _ _ _ _ _ _ _ _ _ _ _
NIG 3,426 0 0 0 0 0 13 911 0 0 72 7
60 3.426 0 0 0 0 0 14,99 0 0 99 10
30 3,426 0 0 0 0 0 19,154 108 0 0 108 11
IS 3.426 0 0 0 0 0 21,775 126 0 0 126 13
10 3.426 0 0 0 0 0 23.086 136 0 0 136 14
3 3,426 0 O 0 0 0 29.639 181 0 0 181 18
0.3 3.426 0 0 0 0 3235 0 0 23 23
0.03 3 ,426 0 0 0 0 0 44,06 280 0 0 280 28
LOW , - - - - -
100 3,426 O 0 0 0 0 6,047 18 0 0 18 2
60 3,426 O 0 0 0 0 8,669 36 0 0 36 4
30 3,426 0 0 0 0 0 11.290 54 0 0 54 5
03426 0 O O 0 O 17843 99 0 0 99 10
10 3,426 0 0 0 0 0 17.843 99 0 0 99 10
3,426 0 0 0 0 0 20,464 117 0 0 117 12
0.3 3,426 0 0 0 0 29,639 181 0 0 181 18
0.03 3,426 0 0 0 0 0 37,503 235 0 - 0 235 23

9M0%
00
I
-P
oo
TO
TABLE B.9. Detail of Costs and Other Parameters for Remnediation of a Uranium Fuel Fabrication Facility
Soil Site, Without Soil Washing ._
Contaminated Soil Soil Soil Excavation Floor Area Floor Demo & Total Soi l Total Waste Transpon
Area Depth Volume Cost Removed Excavation Volume Volu ncrete Ct R Rs
_ _ _ _ _ _ _ _ _ _ _ _ _ _ _ _ _V olum e C ost
eRates - $235/= $41S23/m /l $220=n S
UnUtit f' _ cm ' m $ mfl $ Be $ _trucks
H HIGH1 0 0 50000 18.40 855 200,850 446 183.273 1524 68 350.134 118
60 50000 18.7 869 204,125 446 183.273 1537 68 3,3020 119
30 50000 21.2 985 231,414 446 183,273 1654 68 378,74 7 127
IS 50000 23 1068 251,062 446 183.273 1737 68 397,14 1 133
10 50000 23.3 1082 254,337 446 183,273 1751 68 400,207 134
3 50000 25.5 1118 278,352 446 183,273 1853 68 422,689 142
0.3 50000 29 1347 316,557 446 183,273 2016 68 458.455 154
0.03 o50X00 32 1486 349,304 446 j 183.273 2155 68 489.112 164
MEDIUM _____
MEIU 50000 10 4 109.158 446 183.273 1133 68 264 4 | 89
60 50000 14.3 664 156.095 446 183,273 1333 68 308,236 104
30 50000 1.72 799 187,751 446 183,273 1468 68 _337,71 113
15 50000 19 883 207,399 446 183,273 1551 68 356,265 120
tO 50000 20.2 938 220.498 446 183,273 1601 68 368,528 124
3 50000 22.8 1059 248,879 446 183,273 1728 68 395,098 133
0.3 50000 26.6 1236 290,359 446 183.273 1904 68 433.930 146
0.03 50000 2 1384 325,289 446 183,273 2053 68 466,631 156
LOW - -
-
100- 50000 0 0 0 446 183,273 669 68 1}2,104 55
IS _5000 7 325 76,410 446 183,273 994 68 243637 79
10 50000 13.8 641 150.637 446 183.273 1310 68 333,127 102
3 0000 184 8S 200,850 446 183.273 1524 1 68 350,134 118
0.3 50000 23.4 1087 255,429 446 1183273 11756 68 401,229 135
0.0__3 50000 2?.2 1163 _ 22§96.0 1 446A 1 X3.273 1 1932 1_68 1 440061 14
4

* ': 1.*..
:
TABLE B.9. Detail of Costs and Other Parameters for Remnediation of a Uranium Fuel Fabrication FacilitySoil Site, Without Soil Washing (continued)
Transport Di sal Disposal Charges Avrage TOTAL Excavation Floor Demo TOTAL Occup. Dose
Rates: S13251 Northwest Southeast Out-of-SE - 1.62 4.07 0h O rlmnlirtm~k 4Co a ct 4 ct 4 0"i fmb4 1ath/
Units: S -$ S SSS _ S nn-r man-hr man-hr erson-mrem
HIGH
tOO 156,350 1592 2,247,498 7,554,89 lS,198,59 8,333,6 9,224,271 1385 1SS 3199 320
60 157,o75 1605 2,267,167 7,621,04 15,331,67 8,406,628 9,304,901 1407 1815 3222 322
30 168,275 1722 2 431,078 8 172 28 16.440,63 9.014,8- 9,976,377 1595 1815 3410 341
15 176.225 0 2f49093 8.569,18 17,239.09 9,4S2.456 10,460,1S 1731 181S 3546 355
to 177,S0 1819 2,568,763 8,635,33 17,372.16 9,S25,421 10,S40,78 1753 181S 3S68 357
3 188,150 1921 2,713,004 9.120.42 1 10.060.49S 11,132,95 1919 1815 3134 373
0.3 204,00 2084 2.942,479 9. .16 19,900,60 10,911.750 12.074,08 2182 181i 3997 400
0.03 217,300 2223 3,139,172 10n553,6 21,231,36 11,641,397 12,880,38 2408 1815 4223 422
p MMEDUM...
IM10 117.925 1201 -' ,696 7S7' 5,702,n2 11,472,47 6,290,6S2 6,965,302 7S2 i 1815 i 2567 i 257
60 137.800 1401 1,978,684 6,650,86 13,379.89 7,336,479 8,121,884 1076 1815 2891 289
30 149,72S 1536 2,168,820 72.30 14,666,29 8.041,05 '8.900,425 1294 1815 3109 311
IS 159,000 1619 2,286,836 7,687.19 15.464,74 8.479593 ' 9.38S.S31 ' 1430 , 1815 324S 324
10 164,300 1675 2,365,513 7,951.79 15 997,05 8,771,452' 9,708,051 1520 Isis 3335 333
3 176,225 1796 2.535981 8.525.08 17,150,37 9.403.813 10.407,28 1716 s s81 3531 3S3
0.3 193,450 1972 2.78S,12S 9,362.97 18,836,00 10.328.032 11,429,04 2002 1815 3817 382
0.03 206.700 2121 2,994,931 10,068.5 20,255,47 11,106,323 12.288,21 2242 181S 4057 406
LOW _ - -
.87 737 1041.114 34977 7.036,619 3,858,495 4,276,748 0 181S 1815 181100.60.307287 ,, ,1
3 is 104.675 1062 1,500,064 5.041.23 10.141,71 S,S61,005 6,159,001 3815 2342 234
10 135,150 1378 61,94S902 6,540,61 13,158,10 7,214,872 7.987,059 1038 1815 2853 28S
3 , 6,350 1 592 52,247,498 7,54,89 8333664 9,224,271 1385 I 1815 3199 I 320
0.3 178.875 1824 62,577319 8,6S7.38 7 141652 9 549,742 10.568,54 1761 1813 3576 3580o -576

9
0
4-
10
C1%
TABLE B.10. Detalis of Costs and Other Parameters for Remedlatlon of a Uranium MIll Soil Site,Without Sol] Washing
Conuaminated Soil Soil Soil Floor Floor Dcno Total TOWu Waste TransportArca Depth Volumce Excavation Arcac Excavation soilua C onucrt PCkagin Reos
Rates: S235/fifl S4. _1 $220/n j _
Units: r'cm _ m!SiS ln S t #ucks,
HIGH
100 880000 18.40 I5042 . 3.534,956 186 76,364 15321 280 0
60 880000 18.70 15288 3,592,592 186 76,364 15566 28 0 0
30 880000 21.20 17331 4,072,885 186 76,364 17610 28 0 0
IS 880000 23.00 18803 4,418,696 186 76,364 19082 28 0 0
10 880000 23.30 19048 4,476,331 186 76,364 19327 28 0 0
3 880000 25.50 20847 4.898,989 186 76,364 21125 28 0 0
0.3 880000 29.00 23708 5,571,399 186 76,364 23987 28 0 0
0.03 880000 32.00 26161 6,147,750 186 76,364 26439 28 0 0
MEDIUM -
100 880000 10.00 8175 1,921.172 18 76.364 j8454 28 0_ 0 0
60 880000 14.30 11691 2,747,276 186 76.364 11969 28 .0 0
30 880000 17.20 14061 3,304,416 186 76,364 14340 28 3 0
15 880000 19.00 15533 3.656,227 186 76,364 15812 28 0 0
10 880000 20.20 16514 3,880,767 186 76,364 16793 28 0 0
3 880000 22.80 18639 4.380.272 186 76,364 18918 28 0 0
0.3 880000 26.60 21746 5,110,318 186 76.364 22025 28 0 0
0.03 880000 29.80 24362 5,725,093 186 76.364 24641 28 0 0
LOW
a,30 880000 .... . ° ° . 106 76,364 1 279 28 0 0
100,6_3is 880000 7...2 5723 1 344 820 186 76,36.4 60128 0 0
10 880000.V 13.80 11282 2,651.217- 186 7636 11560 28 0 0
3 880000 18.40 1042 3,534956 186 76,364 5321 28 0 0
0.3 880000 23.40 19130 4,495,S42 186 76364 19409 28 0 0
:.0 880000 !2.01 237 15 225.588 1 186 1 76.364 1255 1 2

. . 060 ' '
. * I I . e n
z
9%0'
TABLE B.10. Details of Costs and Other Parameters for Remediation of a Uranium Mill Soil Site,Without Soll Washing (continued)
Trnsport Disposal Disposal Charges Average Disposal TOTAL Excavation Floor Demo TOTAL Occup.Cost Vo me_ Costs COSTS Labor Labor LABOR Dose
Rates: $13251 Northwest Southeast Out-of-SE 1.62 4.07 O I-- ttuck Compact Compact Compact 0.m!rhrn mnhr/_ mfemhr
Units: S m' S S S$ man-hr mon-hr man-hr person
HIGH
-00 3.426 - 0 0 0 0 3.614.746 24369 756 25125 2S12
60 3.426 0 0 0 0 0 3.672,381 24766 756 25522 2552
30 3.426 0 - 0 0 0 0 4.152.674 - 28077 756 - 2833 2883
IS 3.426 0 0 0 0 0 4.498.485 30461 756 -31217 3122
10 3.426 IO. 0 0 0 0 4.556.121 30858 756 31614 3161
3 3.426 0 0 0 0 0 04978.77 33772 756 34528 3453
0.3 3.426 0 0 0 0 0 5.651.18 9 38407 756 39163 3916
0.03 3.426 0 0 0 0 0 6 42380 7S6 43136 4314
MEDIU . .. _._
10 3.426 0 0 0 0 0 2000.962 13244 756 14000 1400
60 3.426 0 0 0 0 0 2,827066 18939 756 19695 1969
3V 3.426 00 0 0 3,38U.206 22779 756 23536 2354
5 3.426 -0 0 0 0 0 3.730.017 25163- 756 25919 2592
10 3,426 --0 0 0 0 0 3.960.57 26753 756 27509 2751
3 3.426 0 _ 0 0 0 0 54460.062 30196 76 30952 3095
0.3 3,426 0 0 0 0 0 5,190.107 3S229 756 35985 3598
0.03 3.426 O O O O 0 5,804.882 39467 756 1 40223 | 4022
_LOW,,
1060 3,426 0 0 0 0 0 79,790 0 756 756 76
15 3,426 0 0 0 0 0 1.424,610 9271 7S6 10027 1003
10 3,426 | _ 0 | 0 | 0 0 0 2.731,007 18276 756 | 19033 1903
3 3.426 0 - 0 0 0 3,614,746 24369 756 25125 2512
0.3 3.426 0 0 0 0 0 4.575.332 30991 756 31747 3175
0.03 3 -2 f0 I _ IS3S381 62 - 13791 37

TABLE B."I. Detail of Costs and Other Parmeters for Remedlatlion of a UraniWum Heaafluoride Soil Site,Without soil wWasng
9.10
0%
p
'!.3
_ _ _ _ _ _ _ - -. -l - _ _ _ _ _ -_ _ _ _ _ -
Contaminated Sod Sod Sol Floor Floor Demo ToWa ToW Was TtpnArea Depth Volume Excavaton Area m Escavadon Soid Concrete Packaing
Cost Rlemoved Volume Volume Cost ed
_J___: $S2S/ni $41 I/n_ $220/n'
Unit: ft cm S $ no no S ftnucks
HIGH
100000 18.40 1709 401.700 223 91,637 2044 34 457, It 153
60 100000 _-18.7 1737 408.249 223 91,637 2072 34 463, :43 I55
30 100000 23 2137 502.125 223 91,637 2471 34 ,.jSI, 1 26 185
15 100000 21.2 199 462,828 223 91,637 2304 34 514,i38 172
10 100000 23.3 2165 508,674 223 91,637 2499 34 557.258 187
3 100000 25.5 2369 556,703 223 91,637 2703 34 602221 202
0.3 100000 29 2694 633,114 223 91,637 3029 34 673,754 226
0.03 100000 32 2973 698.608 223 91,637 3307 34 735,068 246
MEDIUM -
100 IO00oo 10 929 218,315 223 91.637 1263 34 285,432 96
60 100000 14.3 1328 312,190 223 91,637 1663 34 373,316 125
30 wOuooo 17.2 1598 375.502 223 91,637 1932 34 432,56 i45
IS 100000 19 1765 414,799 223 91.637 2100 34 469,374 157
10 100000 20.2 1877 440.996 223 91,637 2211 34 493,900 166
3 100000 22.8 2118 497,758 223 91,637 2453 34 547,039 183
0.3 100000 26.6 257I 80.718 223 91,637 2806 34 624,703 209
0.03 100000 29.8 2768 650,579 223 91,637 3103 34 2_______31
LOW
100,60,30 100000 O 0 0 223 91.637 334 34 81,052 28
Is 1ooo I°0 0 0 223 91.637 334 34 81,052 _ _28
________ 10_____ -_ 2
lo10 100000 13.8 1282 301,275 223 91,637 1616 34 363,097 122
3 100 0 18.4 1709 401,700 223 91,637 2044 34 1 457,111 . 153
0.3 100000 2174 10,857 223 91 637 2508 34 559.301 187
00 _ oo _ 27,2, 7 527 593 817 1 223 91.f3 2861 1 3 3 6 X
.4

TALE nll. Detail of Costs and Other Parameters for Remediation of a Uranium Hexafluoride Soil Site,-Without Soll Washine (continued)
nso
z
Is
th
Transport Disposal Disposal Charges AIerae TOTAL Elcavabon Foor De no TOTAL O
Costs Volume Disposal Cost COSTS Labor Labor ABOR Dose
Rates: S1325/ Northwest Southeast Out-of-SE 1.62 4.07: 0.1
truck Compact Compact Compact manhr/m manhrl,n mrem/
_ I _ __
n hh r
Units S m S S S S S annhr mannhr person-
HIGH - -
100) 202.725 2078 2,933,856 9,863,166 19.842.2 6S 10,j70.162 12,032,93 2769 907 3677 368
60 205.375 2106 2,99,995,464 20.108,416 M5,M 12,194,19 2814 907 3722 372
30 245,125 2S05 3,537,048 11,891,738 23,923,254 13,117,347 14,507.35 3461 907 4369 437
. 5 2790 238 33106 1.97.949 22.326.345 12.241.770 13.338.47 -3191 907 4095 410
10 2,775 2S33 3,576,386 12,024,036 24.189.405 13.263,276 14.668.61 3507 907 4414 441
3 267,650 27 3,864,869 12.994,223 26,141,183 14,333,425 1,8531.63 3838 907 4745 475
0.3 299.450 3063 4.323,820 14,537,702 29,246,283 16,035.935 17.733.88 4364 907 5272 527
0.03 325,950 3341 4,717.205 15,860,684 31,907,797 17,495,229 19.346.49 4816 907 23 572
M ED IUMt - --
100 127.200 1297 1.832.376 6.158,816, 12.390.024 6,793,739 7.516.323 1505 907 2412 241
60 165,625 1697 2,396,229 8,055.090 16,204,862 8,885,394 9,828.161 2152- 907 3060 306
-30 192,125 19C6 2,776,502 9,333,9n 18.777594 10.296,045 11,387,89 2bd9 907 3496 350
15 208,025 2134 3.012,533 10.127,762 20,374,S8 1121714621 23.4 259_ _ 67 - 377
10 219.950 2245 3,169,888 10,656,955 21,439,174 11,755,339 13,001,82 3040 907 3948 395
3 242,475 2487 3,510,822 11,803539 23,745,820 13,020,060 14,398,96 3431 907 4339 434
0.3 276,925 2840 4,009,111 13,479,316 27,117,071 14,868.500 16,44248 4003 907 4911 491
0.03 306,075 3137 4428723 14890497 29,956,020 16,425080 18,163,47 4485 907 5392 539
LOW
100,60,30 521,090 1 748876 3.51839 1.929.425 2,139.214 0 907 907 91
15 37,100 368 521, 1,748,876 3 518,309 1 929,425 2.139,214 _ 907 907 91
10 161,650 1650 2,330Q665 7,834,593 _ 15,761,276 8,642,178 9-559,836 2077 907 2984 298
- 202.725 2078 2,933,856 9,863,166 19.842,265 10,879762 1 12,032,93 1 2769 907 3677 368
0.3 247_775 2 3,589,499 12,068.136 24,278,122 13.311,919 14,721,48 3522 __907___4429_ 443
003 -24 5 3 _1L _2895 4429 _4
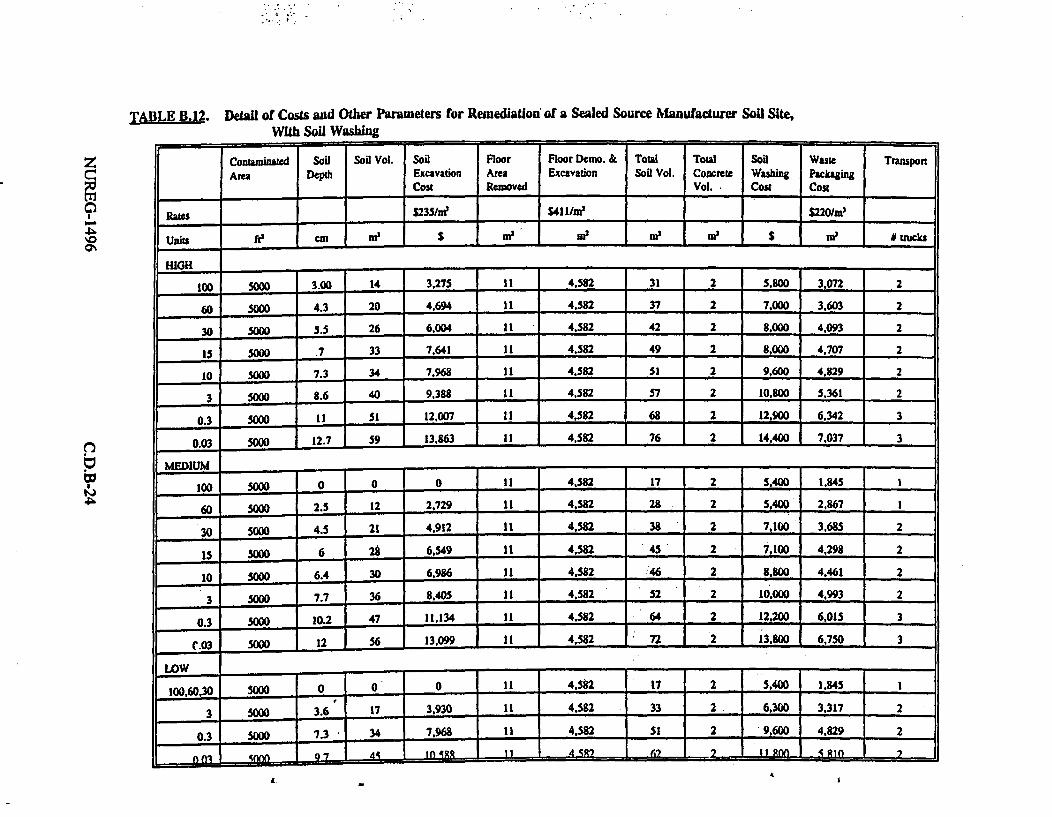
z
0%
Iw~
TABLE B.12. Delall of Costs and Other Parameters for Remediation of a Sealed Source Manufacturer Soil Site,With Soil Washing
_.___ .__,
Contaminated Soil Soil Vol. Soil Floor Floor Derno. & Total Total Soil Waste Transport
Area Depth Excavation Area Excavation Soil Vol. Concrete Washing PackagingCost Reoved Vol.. Cost Cos
Ra5s S235/rn _ $411/re2 S220/r'
Uniu fe -cm ni S m utrucks
HIGH
100 5000 3.00 14--- 3,275 11 4,582 31 2 5S800 3.072 2
60 SCCO 4.3 20 4,694 11 4.582 37 2 7,000 3,603 2
30 500D 5.5 26 6,004 1 I 4.582 42 2 8.000 4.093 2
IS 5000 7 33 7,641 1 1 4.582 49 2 8,000 4,707 2
10 S50O 7.3 34 7.968 1 1 4.582 51 2 9,600 4,829 2
3 5000 8.6 40 9,388 1 1 4,582 57 2 10,800 5.361 2
0.3 S000 1 51 12,007 11 4,582 68 2 12.900 6,342 3
0.03 5000 12.7 59 13,863 11 4,582 76 2 14.400 7,037 3
MEDIUM -
100 5000 0 0 0 11 4,S82 17 2 5,400 1845 1
60 5000 2.5 12 2,729 11 4,582 28 2 5,400 2,867 1
30 50o0 4.5 21 4,912 11 4,582 38 2 7,100 3.685 2
15 5000 6 28 6,549 11 4,582 45 2 7,100 4,298 2
10 500J 6.4 30 6.986 11 4,582 46 2 , 8,800 4,461 2
5000 7.7 36 8,405 II 4,582 52 2 10,000 4,993 2
0.3 5000 102 47 11,134 1 4.582 64 2 12,200 6,015 3
(O03 50 12 56 13,099 1 4,582 72 2 13,800 6,750 3
0100,60,30 S0 0 ° 1 1 4.582 17 2 5,400 1,845 1
- 500 3.6 17 3,930 11 4,52 33 2 63- _|3,317 | 2
0.3 50 7.3 34 7,968 11 4,582 51 2 9,600 4,829 2
n I r7 I Rin

i.. ,::. - l:a
TABLE B.12. Detail of Costs and Other Parameters for Reinediation of a Sealed Source Manufacturer Sofl Sfte,.With Soil Washing (continued)
~0
4N'.00'.
=F .-- = -
Transpot Disposal Disposal Charees Average TOTAL Soil Floor Demo SoDl TOTAL Occup.Cost Volume Disposal COSTS Excavation Labor Washing LABOR Dose
Cost Labor Labor
Ram S13251 Northwest Southeast Out-ofSE 1.62 4.07 0.17 0.1truck Compact Compact Compact -mrnht/mW manhrlm' marthr - mremlhr
1 -- - -
Units $ ni S S S S S man-hr man-hr man-hr manhr Person-- - mnrem
|HIGH
100 2,650 14 20,M 66,276 133,331 73,460 92.838 23 45 S 73 7
60 2.650 16 24,181 77,742 156,398 86.107 108,636 32 45 6 84 8
1930 2 19 7328 88,326 177.690 97,781 123,110 41 45 7 94 9
iS 2,6S0 21 31.262 101,SS6 204,305 112,374 139,954 53 4S 8 106 11
10 2.650 22 32.049 104,202 209.628 115,293 144.922 55 45 9 109 11
3 224 '3,,458 115, ,667 232,694 127,940 160.720 65 45 10 120 12
0.3 3,975 29 41.753 136.835 275,279 151.289 191.095 83 45 12 140 14
0.03 3975 32 4621 1 ISI ,82 305,443 -- 1367.827 211.684 96 45 13 154 15
MEDI S . . . .. ,i 1 8 12.904 39.816 80.101 44,274 57,426 0 °45 3 48 5
60 1,325 13 19,461 61.866 124,460 68,59S .A f 85,498 19 45 5 69 7
30 2,650 17 24,706 79,506 159,946 88,053 110,91 34 45 6 86 9
15 2.650 20 28,640 92.736 186,562 102.646 127,825 45 45 8 98 10
29689 264 193,659 106,537 134,016 48 45 8 101 10
3 2,650 23 33,098 107,730 216,725 119,184 149,814 9 58 4S , 9 . 112 1 1
0.3 3,975 27 39.655 19,7 261,084 143,S06 181.411l 77 45 1 11 133 1X3
0.03 3,975 31 44,375 45,655 2 ,022 161,017 203,224 90 45 12 1 148 1IS
LOW iir100,60- 1,325 8 12,904 39,816 80,101 44,274 57,426 0 45 3 48 5
3 2,0 1 22,346- 71,568 143.977 79,297 100,07S 27 45 6 78 1 8
0.3 2.650 22 32,049 104,202 209,628 115,293 144U922 SS- 45 9 109 1 1fi.0 260 6n 31L-343 1 ' 125.69 2S2.212 1 _13R 642_ L 174-072 1 73 1L.-i- 1, 1 129 1,3

TABLE B.13. Detail of Costs and Other Parameters for Remediatlion of a Generic R&D Facility Soil Site,With Soil Washing
z
-9'.0b
In
bhp:t'j
Conaminated Soil Soil Soil Floor Floor Demo TotaW Total Sod Waste TransportDepth Volume Excavation Area & Excavation Soil Conctew Washing Packaging
Cost Removed Volume Volumn Cost Cost
R$es $235/in S411/_ _ $220/mn
Units ft c I A $ . n S _ nt l I* d S S trucks
HIGH _ _ _ _ _ _ _
HIG 5000 3.00 14 3.275 11 4,582 31 2 23,730 3.072 2
60 500) 4.5 21 4,912 1 1 4,582 38 2 25,060 3,685 2
30 5000 6.2 29 6,768 1 1 4,582 46 2 26,580 4,380 2
Is 5000 7 33 7,641 II 4582 49 2 26,700 4,707 2
10 5000 7.8 36 8,514 11 4,582 53 2 28.100 5,034 2
3 5000 11.5 53 12.553 1 1 4.S82 70 2 31,330 6.546 3
0.3 5000 20.4 95 22,268 II 4,582 III 2 39.130 10,184 4
0.03 5000 24.9 116 27.180 11 4,582 132 2 43,120 12,023 5
MEDIU M _ __ _ _
100 5000 0 0 0 1 1 4,582 17 2 21.000 1,845 1 _
60 5000 2.5 12 2.729 1 1 4,582 28 2 23,350 2,867
30 5000 4.5 21 4,912 1 1 4,582 38 2 25,060 3,685 2
15 5000 6 28 6,549 1 1 4,582 45 2 25.200 4,298 2
1 5000 6.4 30 6,986 1 1 4,582 46 2 26,580 4,461 2
3 _ sm __ 8.2 38 8,951 1 1 4,582 -S 2 28,480 5,197 2
0.3 5000 16.4 76 17,902 1 1 4,582 93 2 35,710 8.549 3
0.03 5000 22.3 104 24,342 11 4,582 120 2 140840 10,961 4
LOW - - , - |. __ _ .. -
100,60,30,10 . so o 0 0 0 11 4,582 17 2 21.070 1,845 1
3 5000 3.6 17 3.930 11 4.582 33 2 24,300 3,317 2
0.3 so0o 8.3 39 9.060 11 4,582 55 2 28.480 5,238 2
0.03 5000 18.6 86 20.303 11 4.582 103 2 137610 9.448 4

S
pivbo
I9t0%
TABLE B.13. Detail of Costs and Other Parameters for Remediation of a Generic R&D Facility Soil Site,
With Soil Washing (continued)
Transport Disosal Disposal Charges Avenge TOTAL Excavation Floor Soil TOTAL Occup|Cost Vofumne Disposal COSTS Labor Domo Washing LABOR Dose
_ _ _ _ _ _ _ _ _ _ _ _ _ _ _ _ _ _ _ _ _ C o s t J L
Rats S1325/ Northwest Southeas Out-of-SE 1.62 4.07 0.17 0.1tmck Compact Compact Compact manhtthn manh}d manhr/m mremt/hr
-- - - -
Units . S man-hr man-hr fnan-hr man-hr person-_ _ _ _ _ _ _ _ _ _ _ _ _ _ _ _ _m re m
HIGH - -
100 2,650 14 20772 66,276 133,331 73.460 110.768 23 45 5 73 7
60 2,650 17 24,706 79,506 159.946 88,053 128.941 34 - 45 6 86 9
30 2,650 20 29,164 94.5M0 190,110 104,591 149,551 47 45 8 100 10
15 2,650 21 31,262 101.556 204.305 112,374 158,654 53 45 8 106 1
10 2,650 23 33,360 108,612 218.500 120,157 169,037 59 45 9 113 11
3 3,975 30 43,064 141,245 284.150 156,153 215,139 87 45 12 144 14
0.3 5.300 46 66,405 219.742 442,067 242,738 324.202 154 45 19 218 22
0.03 6,625 55 78,206 259,431 521,912 286.517 380,047 187 45 23 255 26
MEDIU I_,,,
100 1.325 8 12,904 39,816 80.101 44.274 73,026 0 45 3 48 5
60 1,325 13 19,461 61,866 124,460 68,595 103,448 19 45 ___S__ 69 7
30 2,650 17 24,706 79,506 159,946 88,053 128.941 34 45 6 86 9
15 2.650 20 28,640 92,736 186,562 102,646 145,925 45 1 45 8 98 10
10 2,650 20 29,689 96,264 193,659 106.537 151,796 48 45 8 101 10
3 2,650 24 34,409 112,139 225,597 124,049 173.909 62 45 9 116 12
0.3 3,975 39 55,915 184,462 371,093 203.823 274,S41 123 45 - 16 185 18
003 5,300 50 71 388 236,500 475,779 261,222 347.247 16S 45 20 234 23
LOW I__I_____
100,60, 1,325 8 12,904 39.816 80.101 44,274 73.096 0 45 3 48 _5
3 2,650 1 5 22,346 71,568 143,977 79.297 118,075 27 45 6 78 8
0.3 2,650 24 34,672 113,021 227.371 125,022 175031 62 45 9 117 12
n 1 LA- jtA tn t 161fs ,k 2wh 1?0 M 7 72h jm wQZ47 I 4n 1 4 R I Xm 1 2

A
4S-%0
00
ob
en
io0o
TA BLE .14. Details of Costs and Other Parameters for Rem edlatlon of a Dry JSFSI Soil Site,With Soil Washing
._ .. ..
_ _
Contaminated SOil Soo Soil Floor Ara Floor Dew Toaal Total Soil waste Transpor
Ara Depth Volume Excavation Removed & Excavation Sol Concrete Washing Packaging Reqds
Cost Cosi_ Volume Volum e C ost Costcos
R a t e s : - -2 -5/ d - -4
Units: fe cm tt t$ S UIe _ _ S _ Iu ii k
HIGH _ _ __
100 5D 3.00 1 327 43 17, 564 65 7 1 2.500 7.196 3
60 50 0 4.5 2 491 43 17.56 66 7 12,60 7722 8 3
30 500 6.2 3 677 43 17.564 67 7 12.700 7.327 3
15 SW 7 3 764 43 17.564 ,_767 7 12.80D 7.360 3
10 500 7.8 4 851 43 17,564 68 I 7 12.900 7.393 3
3 500 11.5 5 12 43 17,564 69 7 13.100 ,7*5 3
0.3 500 20.4 9 2,227 43 1 74 7 13.90 7 3
0.03 500 I.9 12 2,*18 43 76 7 14.400 17 3L
MEDIUM -
100 500 O 0 , , 43 1.564 | 64 7 | 12.300 73
60 500 2.5 1 273 43 17,564 65 7 12.400 7,176 3
30 500 4.S 2 491 43 17.564 66 7 12.600 7.258 3
IS 500 6 3 655 43 17,56A 67 7 12,700 7.319 3
10 500 6.4 3 699 43 17'564 -. 67 7 12,800 7,335 3
500 4 895 43 17,S64 68 7 12,900 7.409 3
03 500 .4 , 8 1,790 43 17,564 72 7 13.700 7.744 3
0.03 SOO 22.3 1 2,434 43 17,564 74 7 14.200 7.985 3
LOW __....___
10 D,60.30 , | _ _ 0 43 17,564 64 7 12.300 | 7,074 | 3
3 500 3.6 2' 393 43 66 7 12.500 7.221 3
0.3 500 j1 8.3 .- 4 906 L... 43 1 l ,56 ......... 68 .....7 . 12,900 7 .413 3
0.03 500 18.6 9 2,030 43 17.564 73 7 13.800 7 8341 3
- .0 Soo- -- *. * =
AL

S*t a
TABLE B.14. Details of Costs and Other Parameters for Remediation of a Dry ISFSI Soil Site,With Soil Washing (continued)
0mb.b0
0%
TIuNsp ipslDisposal Charges Average TOTAL Excavation Floor Soil TOTAL Occup.C0ot Vohme _Disposal COSTS Labor D Washing LABOR Dose_ _ _ _ _ _ _ _ C os _ _ _ _ a o L ab o r
Rates: S1325/truck Northwest Southeast Out or-SE 1.62 4.07 0.17 0.1Compact Compact Compact manhrlm' manhrl mnhr/rn mrem/hrUnits: $ $ $ $ S man-hr man-hr man-hr ma)hr Persn
HIOH - - - -100 3, 9754 33 4 7236 155.276 312.377 171.629 213 ,192 2 174 1 t 187 1960 3,975 33 47,629 15 6.599 315,038 173.089 214.976 3 174 1 t 189 1930 3,975 33 48.075 158,098 3183 055 174,743 216.9S 5 174 1I 190 19is 3 -975 33 48-285 1548 804 319.474 175.521 7,98 5 174 . 1 191 1910 31975 34 48,495 179629 320,893 1 , 218,99 2 6 174 12 191 193 3, 9 7 5 3 4 4 9. 4 6 5 1 6 2177 3 3 2 7 .45 9 1 7 9 .8 9 9 2 2 3 ,3 3 6 9 1 7 4 1 2 1 9 4 1 9
0.3 3, 975 36 5t,799 102 2o.6 3 188,557 234,130 15 174 13 202 20o0.03 3,97 5 37 S52.979 174, 591 3 .51235 192,935 239.683 19 174 13 206 21
MEDIUM10 0 3.975 32 46, 449 152.630 307,054 168,7116 7 2092 3623 0 ° I I u s 183, 393, 33 47.105 154,835 311,489 714 14 212. 530 2 | 174 | 1930-3 33 975 33 47.629 156.599 315.038 173, 08 214, 976 3 3 j 174 1 11 1 189 1915 3, 97 9733 483023 -1571 922 317.700 I 174 2548 2165761 S 174 1 190 1 910 33 975 3312 33 48,128 1741937 2177310 5 174 | 1 190 193 3,975 34 48,600 1 59.862 321.603 176.6 8 219.431 * 6 1 2 1 2 192 190. 3 3, 975 35 50.750 1 336, 153 184 666 229 439 12 174 12 198 20
0.03 3,7975 36 19029 1 236,564 17 174 1 3 020
LOW100,60,30 3.975 32 4 152.630 307.054 168,711 209,623 0 .174 1 11 1 185 l 13 3 3975 33 47 .393 15505 313,441 172, 213 213.866 3 174 1 188 19
0 3 3 975 34 483626 359.9503 321.781 176.786 2191543 6 174 12 192 19
0.3 3.975 36 51,327 169.035 340,056 -186,806 1232,009 _14 174 1 12 - 200 20
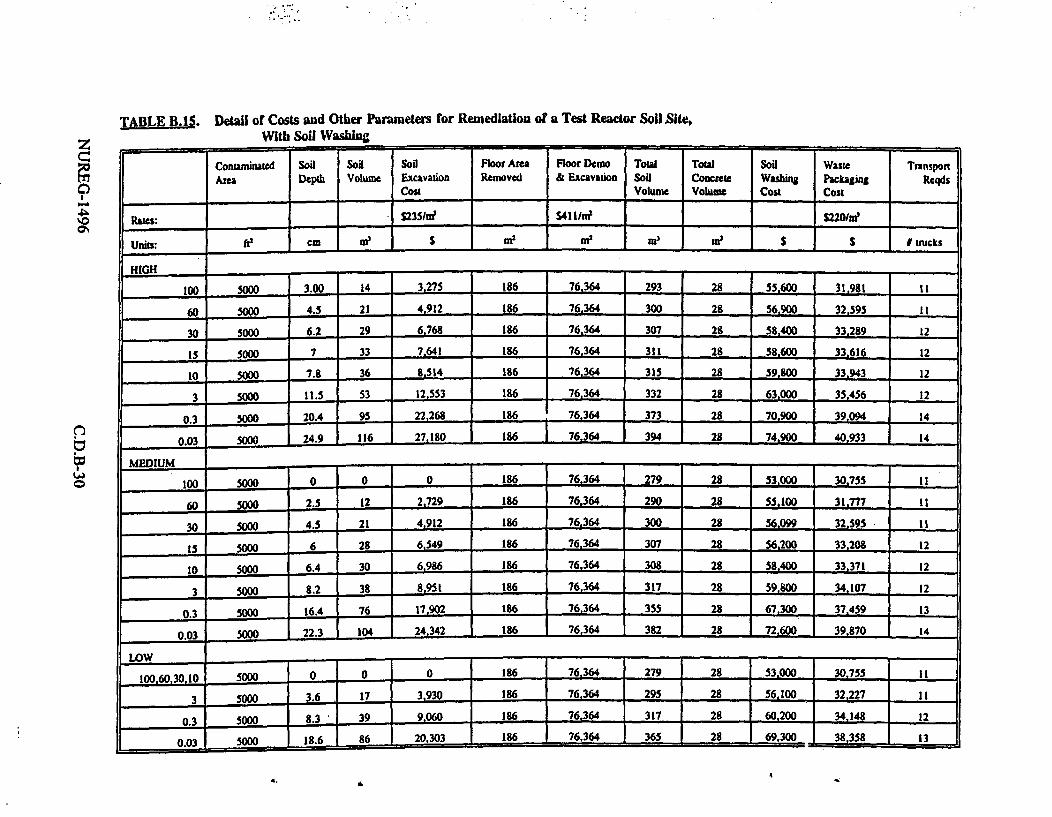
z
9l
0%
I
t.4.%0
TABLE B.1. Detail of Costs and Other Parameters for Remedlation of a Test Reactor Soil Site,With Soil Washing
Contaminated Sod Soil Soil Floor Area Floor Demo ToWal Total Soil Waste TransportArea Depth Volume Excavation Removed & Excavanon Soil Concrete Washing Packaging Reqds
Cost Volume Volume Cost Cost
Rates: $235/a? S$li 2201u _ _ __ _
Units: fP cm I Se 1t m$ 3333 S S Itiijcks
HIGH -
100 S000 3.00 14 3,275 186 76,364 293 28 55,600 31.98l I
60 5000 4.5 21 4.912 186 76,364 300 28 56.900 32,595 1
30 5000 6.2 29 6768 186 76,364 307 28 58,400 33,289 12
IS 7 33 7,641 186 76,364 311 28 8.600 33.616 12
10 500 7.8 36 8.514 186 76,364 315 28 59,800 33.943 12
3 5000 11.5 53 12553. 186 76,364 332 28 63.000 35 S456 12
0.3 5000 20.4 95 22.268 186 76,364 373 28 70,900 39.094 14
0.03 5000 24.9 116 27,180 186 76,364 394 28 74,900 40,933 14
MEDIUM
100 5000 0 0 0 186 76.364 279 28 53.000 30,755 11
60 5000 _2.S _ i 1 2 2,729 186 76.364 290 28 55.100 3l.777 11
30 S000 4.5 21 4,912 186 300 28 56.099 32.595 - _ _ 11
iS S000 6 28 6.549 186 76364 307 28 56.200 33.208 12
10 5000 6.4 30j 6,986 186 76,364_ 308 28 |58.400 33.371 12
3 5000 8.2 38 8,951 186 76,364 317 28 59.800 . 34.107L. 12
0.3 5000 16.4 76 17,902 16 76,364 355 28 67,300 | 374 13
0.03 5000 22.3 104 1 24,342 -- 186 76,364 382 28 -72,600 39.870 14
LOW ,__ _ ,_IIII__,_
100.60,30.10 Sooo 0 | 0 0 186 76.364 | 279 | 28 53| S000 | 30 755 | 11
3 S34___.3.6 17 _ 3,930 186 73295 28 .10 11
0.3 5000 | 39...86 . 9.060 | 186 1 317 28 6 200 34,3S8 12
0.03 5000 1.6. 86 20.303 186 76.364 365 28 69.300 38358 1
WI

. "
. I .4. . .. . - . . .
iv
I'.00'.
TABLE B.15. Detail of Costs and Other Parameters for Remediation of a Test Reactor Soil Site,With Soil Washing (continued)
Transport Disposal Disposal Charges Average TOTAL Excavation Floor Soil TOTAL Occup.Cost VolUe Disposal COSTS Labor Demo Washing LABOR DoseCost Labor Labor
Rates: S13251 Northwest Southeast Out-or.SE 1.62 4.07 0.17 0.1_trck - Compact Compac t mpact ,nanhrh' manrtm nnhr ' mM-/hrUnits: $ $ $ S $ S man-hr man-hr man-hr man-hr person._
- -m nremHIGH...
... ._ .too 14.575 145 206,255 69007 1,388.246 761,523 943,318 23 756 s8
60 14.575 148 - 210.l1s 703.297 1,414,t61 776,116 961,461 34 756 St -41 -30 15.900 ISI 214,647 118.2 9 1 7s2,6s4 9S3.375 47 7n6 S2 sss 86
15 15,900 153 216745 ns72,347 1.459.220 800,437 s2,.59 53 756 53 862 861o 1S4900 ISj 218,843 732.403 1,473.414 0.220 1, ,7 59 756 4 868 873 15.90 161 . ns8s47 76S1036 1 .53 9 06 5 8 ",216 . 047,4 8 7 756 56 899 900.3 18,5 50 17s 2s1.ss 843.533 1.696,982 930 .80 1 .1 57,9 154 756 63 973 970.03 18.550 186 263 689 s,3! 1.776.827 974.580 1,212.5 187 ISV .7 1011 lo
MEDIUM -
100 14 .S 75 140 I1, 387 6633 608 1.33S, 016 732.337 907.0 31 0 7S6 47 804 8060 14.575 144 204,944 6ss.6 57 _ 1.379374 4569658 | ..7,f .. | -.. 7i|4 | 824 . . 230 4575 48 210 703 297 1 414.861 776,116 960,660 34 i5 S | 84115 15,90 5 176527 1 4 790.709 978.930 45 756523
, 1. 15.900 . 2i.. 487652 857 83O 159900 155 2 91792 720.935 1.448s74 794,6M "S 621 62 756 52 85 87
- -= - -
3 3s~o 155 219t M 7s~ 35,3 1, 480,512 812,112 ,o, 10 72 62 75 546 8n 87| |0.3 17.225 170 24 .3 - M808254 , 6, .08 891 1 88e 1.108.1 1 123 756 0 940 94
0.03 1.550 .. 2 sL 256s 87 860.291 1,730,694 94s 5 1,1811 0 168 99 9
LOW - . - - . - - -100, 60.30, 14.57| 1405... 1 663, 608 1.335,016 732.337 907, 031 0 756 4 804 sQ
3 14.575 146 2 07, A29 695.359 | 1.3 .! | 767.360 955 55 27 756 so 7S6 | S | 3 | 80-3 15.900 736 , l 736.813 1, 482, 286 813, 085 1008.7 62 756 54 873 S7
0.03 7225 174 247167 827,658 1.665.043 I913289 1|134.8 | 756 62 9958 | 9 _
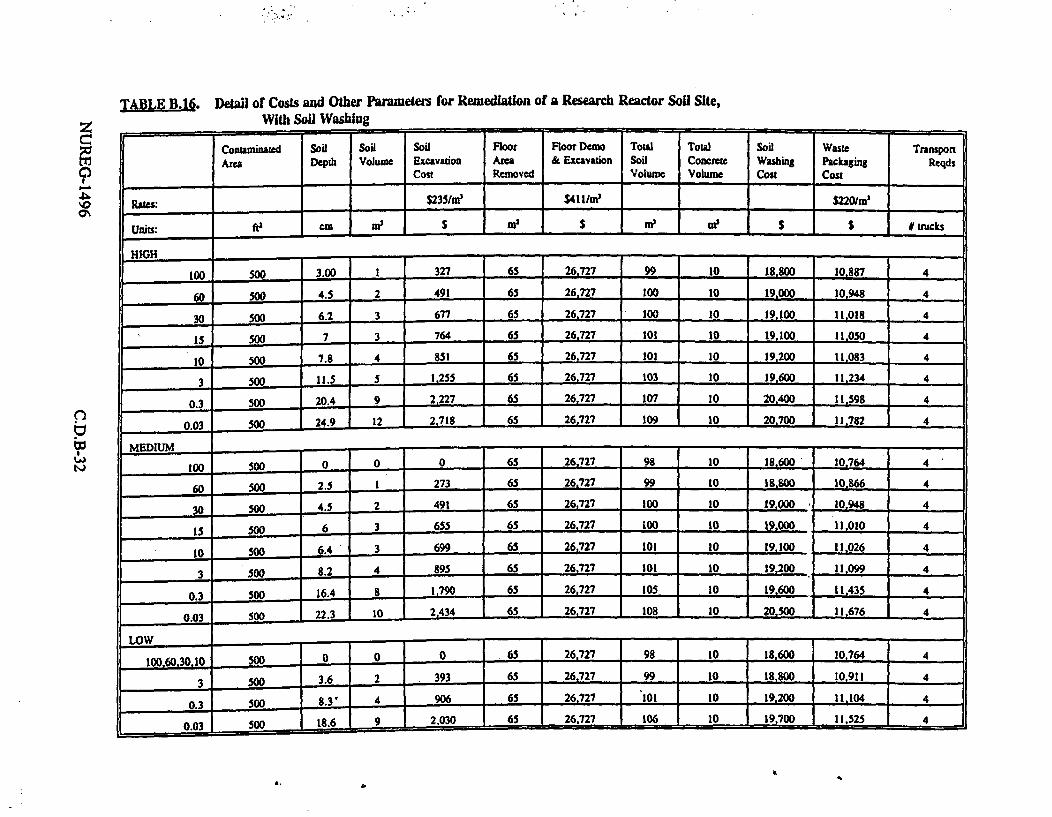
z
9
4Qw0
TABLE B.16. Detail of Costs and Other Parameters for Rewediallon of a Research Reactor Soil Site,With Soll Washing
. _ _ _ _ ___ - .-= . - .__ _ _
-_ _ _ _ _ _ _ _ _ _ _ _ _ _ _ _ _ _ _ _
Contaminated SoD SoD Soil Floor Floor Demo Total Total Soil Waste Transport
Ar Depth Volume Excavation Area & Excavaton Soil Concrete Washing Packaging Reqds
Cost Removed Volume Volume Cost Cost
lRtes: _ $235/m' $411/n- $220/1n
Units: ftP cm mn $ ml $ nI mn S S itrucks
HIGH -
100 500 3.00 j 327 65 26,727 99 10 18.800 10,887 4
60 500 ,4. 2 491 65 267.27 too 10 19.000 10,948 4
30 S00 6.2 3 677 65 26727to 100 10 19.100 I.018 4
IS 500 7 ,_3 764 65 26.727 101 10 19,100 II.O00 4
10 500 , 7.8 4 851 65 26,727 101 10 19.200 11,083 4
3 500 11.5 5 1.255 65 26.727 103 10 19,600_ 11234 4
0.3 500 20.4 9 2.227 65 26,727 107 10 20,400 I IS98 4
0.03 500S 24.9 124 2,718 65 26,727 109 10 20.700 11j7j 2 4
MEDIUM .___
too S00 , 0 0 0 6S 26,727 98 10 18,600 10.764 4
60 500 2.5 1 273 65 26,727 99 10 18 S 10,866 4
30 S00 4.5 2 491 65 26,727 100 10 1900010.948 4
15 SOO 6 3 655 65 26.727 100 1 | 19,000 | 11,010 4
10 500 , 6.4- 3 699 65 26.727 101 1O 19.100 11.026 4
3 500 8.2 4 895 65 26,727 101 10 19.200 11.099 4
0.3 500 , 16.4 8 1,790 6S 26,727 IOS 10 1 1 4,
0.03 500 22.3 2 10 4
LO W _ - - - _ _. ._,
100,60,30.10 Soo0 . ° . j° ° 0 65. 26,727 1 98 11. 10 1,, 10,764 4
3 500 3 6 2 393 65 26727 99 10 is Soo 10,911 4
0.3 500 8.3 4 906 65 26,727 101 I10 19,200 1 11 104 . 4
0.03 500 18.6 9 2,030 65 26,727 1 106 10 19,700 11,525 40 .03__ _ _ _ -. *.*
_ _ _ _ _ _
a, 4d.

TABLE B.16. Detail of Costs and Other Parameters for Remediation of a Research Reactor Soil Site,With Sofl Washing (continued)
Tnsport Disposal Disposal Charges Avenge TOTAL xcma on Floor soil TOAL OccupCost Volume Disposal COSTS Labor Demo Washing LABOR Dose
Rates: $1325/ Northwest Southeast Out-of-SE 1.62 4.07 0.17 0.1_ truk Compact Compact Compact -- nanhr/m3 niahrlm2 immr/ mrermhr
Uits: $ $ $ $ $ Sman-r man-hr inan-hr man-hr person-
100 5.300 -49 70.91S 234,909 472.59 259,467 321,509 2 265_ 17 284 28
60 5 300 So 71,308 236,232 475.240 260,927 323,393 3 265 17 285 28
30 5.300 so50 7,754 237.731 478.256 262.580 325S402 5 265 17 286 29
15 5.300 50 71,964 238.437 479,676 263.359 326.301 5 265 17 287 29
10 5.300 50 72173 239,142 481.095 264,137 327,299 6 265 17 288 29
3 5.300 Sl 73,144 242.406 487,660 267.737 331,854 9 j265 17 291 29
0.3 55300 53 I7547S 250.255 503.452 276,395 342.647 15 265 18 298 30
0.03 -5.300 54 76,68 24,224 511,437 280,773 348,000 19 -26 19 302 30
MED1U
100 5.300 49 7_0,128 232.263 ,467,25 256,549 17.940 0 265 1 7 281 28
60 5.300 49 70,783 234,468 471,691 258,981 |32094 2 265 17 283 28
30 5,300 50 71.308 236,232 475,240 260927 323,3 3 265 17 285 28
IS- 5.300 50 71.701 237.5 55 I 477,902 262,386 325.078 S 265 17 286 29
10 5.300 50 71 806 237.907 478,611 262,775 325,627 5 263 17 287 29
3 5.300 50 72,278 '239,495 481,80S 264,S26 327.748 6 265 17 288 29
.300 2 74.429 246.727 496 35 272,504 337.356 12 265 18 295 29
0.03 S.300 L 3 75976 251.931 I 506,823 344881 17 265 18 300 30
100.60,3 5,300 49 7,28 232.263 467.25 317.940 0 265 . 17 . 281 28
3 5,300 n0 7 23S-438 473,643 260,051 322,183 3 265 17 284 28
0.3 S 300 | 50 7,305 239-.S3 481,983 264,623 327,860 6 265 17 288 29
0.03 5,300 52 75,006 248,668 00,2S8 274644 339926 18 29 30
0
9~

TABLE: B. 1. Details of Costs and Other Parameters for Remedlatlon of a Power Reactor Soil Site,With Soil Washing
9'0
~0
pS
.gh
Contaminated SOil SoO SoOn Floor Floor Demo Total Toal Son Waste TransportAr Depdl Volume Excavadon Area & Soil Concrete Washig Packagwg Reqds
Cost Removed Excavaion Volume Volume Cost Cost
Ratos: _235/in S411/m _220/__
Uni fP cm $ In' $S nD S S mucks
HIGH ___
_ _ _ _ _ _
100 2000 3.00 6 1,310 46 , 190,910 702 71 133. 77.378 26
60 2000 4.5 8 1.965 465 190,910 705 71 134.000 7' 624 26
30 2000 6.2 12 2.707 465 190.910 708 71 134.000 7',901 27
15 2000 7 , 13 3,056 465 190.910 710 71 134.000 71,032 27
10 2000 7.8 14 3,406 46S 190,910 711 71 135.000 74 163 27
3 2000 11.S 21 5.021 46S 190,910 718 71 136.000 7 1 768 27
0.3 2000 20.4 38 8.907 465 l90.910 735 71 139.000 80,223 27
0.03 2000 29 46 10.872 465 190.910 743 71 141.000 80,959 28
MEDIU _ -_ _ __
100 2000 0 0 0 465 190.910 697 71 132.000 76.888 26
60 2000 2.5 5 1,092 465 190,910 70; 71 133.000 177297 26
30 2000 4.5 8 1,965 465 190.910 705 71 134.000 77,624 26
IS 2000 6 11 2.620 465 190,910 708 71 134.000 77.869 27
10 2000 6.4 12 2,794 465 190,910 709 71 134.000 77-934 27
3 2000 8.2 15 3.S80 465 190.910 712 71 135.000 78.228 27
0.3 2000 16.4 30 7161 465 190,910 727 71 137.000 79.569 27
0.03 2000 22.3 41 1 9,737 465 1 7 71 14.000 80.534 27
LOW ___,, __I,__,,_ -
100,60,3 2000 1 0 . 0 . 0 46 190.910 697 71 132.000 76.888 26
3 2000 j3.6 7 11,S72 465 .190.910 703 71 133,000 77.476 26
0 20 8.3 465 190,910 71278.24 27
0.03 2000 18.6 35 8,121 1 46 190.910 731 71 137.000 79,929 27
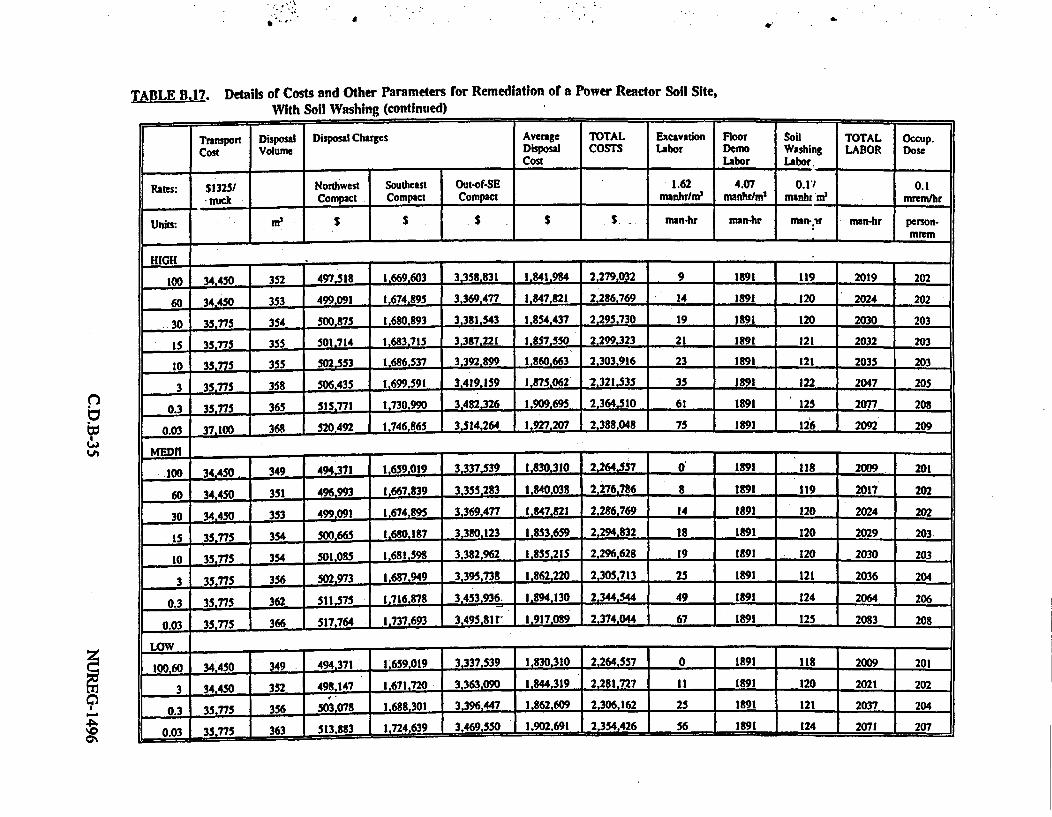
: s.. .i4.
TABLE B.17. Details of Costs and Other Parameters for Remediation of a Power Reactor Soil Site,With Soil Washing (continued)
.* ._ .= .
Transport Disposal Disposal Charges Averige TOTAL Excavation Floor Soil TOTAL Occup.
Cost Volume Disposal COSTS Labor Derno Washing LABOR DoseCost Labor Labor
Rates: $1325/ Northwest Southeast Out-of-SE 1.62 4.07 0.1' 0.1
trck Compact Compact Compact manhr/t' manhir' manh, -fi mrcmnhr
Units: m'$ $ $ $ S nmn-hr manu-r manfl r man-hr person-
HIGH
100 34.450 352 497.5 1,669,603 33588 .84.984 2,279.032 9 1891 119 2019 202
60 34.450 353 499,09 1,674,895 3 l3697477 2.286.769 14 1891 120 2024 202
30 35,775 354 500,7 1j680,93 3,381.543 1.854,437 2,295,730 19 191 120 2030 203
15 35.775 355 501.714 1.683.715 3.3S7.221 1.857.550 2.299.323 21 1891 121 2032 203
o0 35.775 355 3 1.686.537 3.392. A899 1860.663 2,303,916 23 1891 121 2035 203
3 35775 358 506.435 1.69.591 3.419.159 1.875,062 2.321.335 35 1891 122 2047 205
0.3 35.n7 365 515,771 1,730.990 3,482,326 1.909,695 2.364.510 61 1891 125 2077 208
0.03 37.100 368 50492 1,746,865 3.514.264 1.927.207 2.388s048 75 1891 126 2092 209
MEDI ,, . -
10 34.450 349 494,3171 1,659019. 3.33739 1|.830.310 2,264.557 0 1891 | 118 | 2009 201
60 34.450 351 496993 1.667.839 3,353283. 89840eee 2.276.786 8 1891 119 2017 202
30 34.450 353 499.09l 1.674,M 3.369.477| 1847.821l 2.286.769 14 1891 120 2024 202
15 35n s 354 SM.665 1.680.1.7 3,380,123 1,853,659 2,294.832 is 18 91 120 2029 203
10 35.775 354... a aaa 1 1 3382 ,s62 1 2 ,296,628 1 9 1 91 120 203
3.3s ns 35.775 356 L273 i,687, 3.395.738 1.862.220 2.30S.713 25 1891 121 2036 204
.3 3s. n , 362 l 511.575 1.716.878 3,453,936 1.894.130 2.344.544 49 1891 124 2064 206
03 35.7 5171764 .737603. 3.495.81t 1 . 2.374.044 67 1891 125 2083 208
LOW .- ._.
1,60 34.40 J349 -494371 1,659.019 3.337.539 1.83030 7 0 1891 1 L.8 2009 201
3 34540 352 498 147 1.671.720 3.363.090 1.844.319 2.281.727 II 1891 120 2021 202
0.3 35,775 356 03,079 1,688.301 2 1,862.609 2.306162 25 1891 121 2037 204
0.03 35s775 363 513,883 1.724.639 3-469 550 1 902,691 2,354,426 56 1 124 2071 207910~

z
0%
p10%
TABLE B.18. Detail of costs and Other Parameters for Remedlation of a Rare Metals Extraction Soil Site,With Soil Washing
... . , . .__. .. - .__ _ . - . _ _ _ _ _ -
Contaminated soil Soil Soi Floor Floor Demo Total Total Soil Name Transport
Area Depth Volume Excavation Area & Excavation Soil Concrete Washing ?ackaging ReqdsCost Removed Volume Volume Cost Cost
Raes: _ $235/t n' $41 I/n _ _220/mr . -
Units: ft cm Be S ne S m tn' S S _truchs
HIGH----
H oO 100000 0.80 74 17.465 279 114.546 492 42 95500 52.673 18
60 100000 1.1 102 24.015 29 114.S46 520 42 98.800 S5.125 19
30 100000 1.2 III 26,198 279 114.S46 530 42 101.000 S5.943 19
15 100000 1.4 130 30.564 279 114,S46 _ 5S48 42 101.000 57.S78 20
10 1wooo 1.5 139 32,747 279 114.546 557 42 106.000 58.395 20
3 100000 2 1L6 43,663 279 114.546 604 42 115.000 62483_ 21
0.3 100000 2.6 242 56.762 279 114,546 660 42 125.000 67.388 23
0.03 100000 3.1 288 67,678 279 114.546 706 42 134.000 71,476 24
LOW
100 100000 0.2 4366 279 114 437 42 |82-00 | 47-76 16
60 100000 0.4 37 8,733 279 114.546 455 42 86.500 49.403 17
30 100000 0.56 13,099 279 114.546 474 42 |90000 | 038 | 18
IS 100000 1.1 102 24,015 279 114.546 520 42 90-000 55.125 19
_ 100000 1.1 102 24.015_| 279 | 114.546 | 520 42 98.800 55.125 19
3 100000 1.3 121 28,381 279 114,46 539 42 102,000 56,760 19
0.3 100000 2 186 43,663 279 114,546 604 42 1IS.OOO 62.483 21
0.001 2L f 56.262 1 279 1 114-546 1Q 6|2 |=25 2 , &2
V,..

A a,
TAB 1. Detail of costs and Other Parameters for Remediation of a Rare Metals Extraction Soil Site,With Soil Washing (continued)
Transport Disposal Disposal Charges Average TOTAL Excavation Floor son TOTAL Occup.Cost Vtne Dispout COSTS Labor Demo Washing LABOR Dose
Rsns: $S13251 Northwest Southeast Out-of-SE 1.62 4.07 0.17 0.I
ujck Compact Compact Compact mlhlm n mnrth manhltrfm mem/h
Units: S S $ S mafhr m man-hr man-hr person-
HIGH - -
100 23850 239 339010 1,136,530 2,286,418 1,253,986 I158,020 120 1134 84 1338 1134
60 25,175 251 354,745 1.18J9,.49 2.392,879 1,312.358 1.630,018 -166 1134 88 1388 139
30 25.175 2S4 359,990 1 207.089 2,428,366 1.331,815 1,654,676 181 1134 90 1405
IS 26,500 262 370,481 1,242,368 2,499.340 1.370,729 1.700,917 211 1134 93 1438 144 _
10 26.500 265 m7,n 6 1.260.008 2,534,826 1,390,187 1,728,375 226 1134 95 1455 145
3 27,825 284 401,951 1,348,207 2,712,261 1,487,473 1,850,990 301 1134 103 1538 154
0.3 30,475 306 433.422 1,454,045 2,925SIS2 1,604,217 1.98.387 391 1134 112 1638 164
0.03 31.800 32 4 1,S42,2 U 3,102.616 1,701,503 2,121,002 467 1134 120 7 172
LOW
100 21,200 237 307,539 1,030.691. 2,073,497 1.137,242 11411,622 30 1134 74 1239 124
60 -22,5 225 318029 1,06.971 2,144,471 1,176,157 11461.363 60 . 1134 77 1272 127
30 23,8S0 232 328.519 1,101. 250 2.215,445 1,215,071 1,516,404 90 1134 81 130S 131
IS 25,175 251 3S4,745 1,1,9,449 2,392,87 11312,358 1,633,218 I 166 1134 88 38 1 139
10 25,175 251 354 745 1,189.449 2,392,879A! 1 312,358 1,633,218 166 1134 88 1388 139
3 25.175 258 365,235 2 224,728 2.463.853 1,351272 1 ,691,134 196 1134 92 1422 142
0.3 27,825 24 401.951 1,348207 1 1,487,473 1S60,990 301 134 103 3138 354
0 336U321 1 4S4 04, 2 925-182 1 1 6-2 17 1-1 23-387 1 91 1 1134-1 112 113 6
n
c
-J
'~0

690%
w0o
TABLE B.19. Details of Cost and Other Parameters for Remedlation of a Uranium Fud Fabrication Soil Site,With Soil Washing
Contaminated Soil Soil so Floor Floor Demo Toal Total Sod Wste TransportArta Depth Volumc Excavation Amea & Excavation soil Concrete Washing Packaging Reqds
__ _ _ _ _ _ _ -- Cost R emoved __ _ _ _ _ _ Volume Volum e Cost cost _ _ _ __ _ _
Rates: $235113' $4111.' _ $220/1.
Units: e cm no S 01' S i, Ml , S $ S trcks
|HIGH
100 50000 18.40 85S 200,8S0 446 183.273 1524 68 289,000 149,024 50
60 50000 18.7 869 204.12S 446 183,273 1537 68 292,000 150,250 51
30 50000 21.2 985 231,414 446 183 273 16S4 68 314000 160,469 54
IS 50000 23 1068 251,062 446 183.273 1737 68 314,000 1675727 57
10 50000 23.3 1082 254,337 446 183273 1751 68 332000 169,03 57
3 50000 25.5 1184 278,352 446 183,273 1853 68 ,352000 178.046 60
0.3 50000 29 1347 316,S57 446 183,273 68 3 192.3S3 65
0.03 50000 32 1 349.304 446 183,273 2155 68 C 204.615 69
MEDIUM _
100 50000 465 ,158 446 183.273 1133 68 215,000 114,688 39
60 50000 143 664 156,095 446 183,273 1333 68 253,000 132,26S 45
30 50000 17.2 799 187,751 446 183,273 1468 68 279,000 144,119 | 49
15 50000 , 19 8, 3 8 207,399 446 183,273 15SI 68 279,000 151,477 51
10 50000 20.2, 938 220,498 446 183,273 1607 68 30SOOO 156,382 53
3 50000 22.8 1059 248,879 446 183,273 1728 68 328,000 167,010 56
0.3 50000 3 26.6 1 1236 290,359 446 183,273 1904 68 3 000 182,542 62
0.03 50000 .29.8 1 1384 325289 446 183.273 2053 68 390,040 195.623 _ _ _66
LOW - - - ____ _
100,60,30 50000 . . 0 446 183,273_ 669 68 127,000 73,812 25
15 50000 7 325 76,410 446 183,273 994 68 3249000 102,425 35
10 50000 13.8 641 150,637 446 183,273 1310 68 24,000 130,221 44
3 50000 18.4 1 855 1 200,850 1 446 1 183,273 1 1524 I 68 1 289,000 1 149,024 so
0.3 50000 23.4 1 1087. 255,429 446 183,273 1756 68 333,000 1 169,462 57
_0.03_ 27.2L 126 296.908 446 1183.73 1 932 161 8995

TABLE B.19. Details of Cost and Other Parameters for Remedlatlon of a Uranium Fuel Fabrication Soil Site,With Soil Washing (continued)
a.
lrnpoit Disposal Disposal Charges Avenge TOTAL Excavantion Floor Soil TOTAL Occup.
Cost Volume Disposal COSTS Labor Demo Washing LABOR Dosecost Labor Labor
Rates: $1325S Nothwest Southeast Out-of-SE 1.62 4.07 0.17 0.1
Units: S MP S S S S S man-hr man-hr man-hr man-hr peron-
0 677 9S7.192 3,2151516 6.468.829 3.547.179 4.435,576 1385 18Si 259 3458 346
- 6768 3 965.060 3.241.976 6,522,059 3,576,365 4.473.588 1407 1815 261 3483 348
30 71.50 729 1, 624 3.462.473 6.965.645 3,819,581 4.780.287 1595 Isis 281 3691 369
1 7 ,52 763 1,077.830 3.621.231 7.285.027 3,994,696 4.986.383 1731 1815 295 3841 384
L .2 75.52S 76t 1.0O5.698 3.647.691 7.338.2S7 4,023,882 5,038,070 1753 1815 298 3866 387
3 79,0 809 1.143,395 3.841.728 7.728.612 4,237,912 5,309,082 1919 1815 315 4049 405
0.3 86.125 874 1,2S1 4,150.424 8.349.632 4.578,414 5.739.721 2182 1815 343 4340 434
0.03 91.425 930 1,313862 4,415,020 8,881,935 4.870,272 6.107,890 2408 1815 366 4589 459
100 51.675 | | 68 | 2,474,647 | 4,978-381 |2729,974 3-403,768 752 s815 193 2760 276
60 59,625 601 849666 2853901 5,741.348 3.148.305 3,932-564 1076 1815 227 3118 312
30 64.925 655 M 72 3.1968- 6.255.908- 3.436.436 4.289.504 1294 186 250 3359 336
is 1 689 3 268.436 6,S7S289 3,605,551 4.494.27S 1430 s185 264 - 351
10 .70Z225 711 1 .004398 3.374.274 6.7882211 3*722,294 4,657,672 1520 11i5 273 3603 361
3 5 79 1,072. 38S 3,603,591 7.249540 23,975239- 4.976.600 1716 181S 294 3824 382
0.3 8i.150 | 830 1,172243 | 3,938,747 7.923.790 4.344.927 5.445,251 2002 181S 324 4140 414
0.03 87,450 889 1.256.165 4,220,983 8.491.580 4,656,243 5,837,878 2242 181S 349 4406 441
LOW 33.125 336 474,639 1592,659 3,204,038 1 757112 2,174,322 0 1815 114 1929 193
iS 46,375 466 1658.219 12210 050- 4,446,078 12 438 116 3,09,5,99l 527 1 815 1- 69_ 2511 251
0 58.300 83654 2,809802 6S2.631 3 099662 3,871,094 1038 181S 223 3076 308
677 3,215516 6,468,829 3,547,179 4.435.576 138S 1815 259 3458
0 770 1 1,088,321 3,656,510 736.000 4,033,610 5.050.299 1761 1815 298 3874 387
-0ti 3241 4 -Il97! - L-666 8-030-251 4-40298 -517625 _204_ 115 _32 , 4190 419
~0'
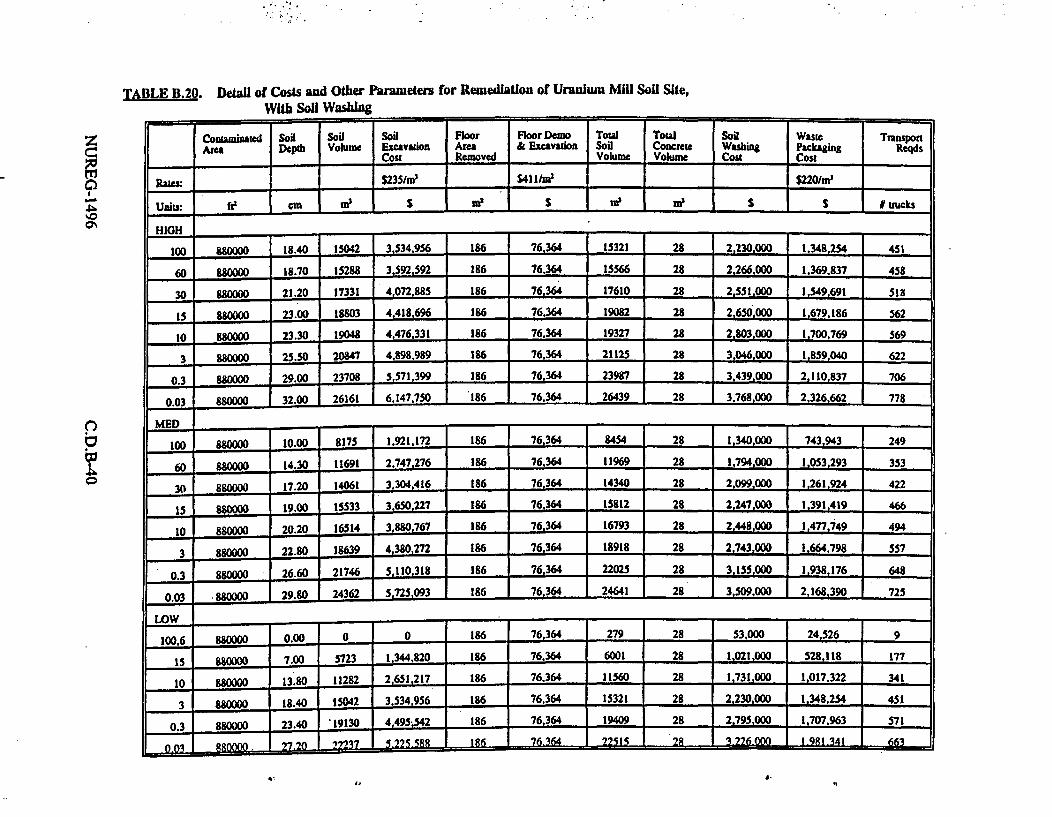
TABLE B.20. Detail of Costs and Other PArameters for Remediatlon of Uranium MIll Soil Site,With Soil Washin
pb
Contaminated son Soo Soo Floor Floor Demo ToWa TooJ Soo Waste Transport
Area Deptb Volume Excavaton Area & Excavaton Sod Concrete Washing Packaging Reqds_____-- - . Cost - Removed _ ____ volume Volume Cosn Cost
Pal/s: ='23__m_ $411/n S220/m_
Units: fte cm m1 S m' S m!' m S S N uucks
HIGH -
1_ 880000 18.40 15042 3,534,956 186 76,364 15321 28 2,230,000 1,348,254 451
60 880000 18.70 15288 3,592,592 186 76,364 15566 28 2,266,000 1,369.837 458
30 880000 2120 17331 4,072,88S 186 76,364 17610 28 2.551,000 1,549,691 Sig
15 880000 23.00 18803 4,418,696 186 76,364 19082 _ 28 2.650,000 1,679,186 562
10 880000 23.30 19048 4,476.331 186 76,364 19327 28 2,803,000 1,700,769 569
3 880040 25.50 20847 4,898,989 186 76,364 21125 28 3,046.000 1,859,040 622
0.3 880000 29.00 23708 5,571,399 186 76,364 23987 28 3,439,000 2,110,837 706
0.03 880000 32.00 26161 6,147,750 186 76.364 26439 28 376000 2,326,662 778__- -
MED _ ____
100 880000 10.00 8175 1,921.172 186 76,364 84S4 28 1 ,340,000 743,943 249
60 880000 14.30 11691 2,747,276 186 76,364 . 11969 28 1 794,000 1 053,293 353
30 880000 17.20 14061 3,304,416 186 76364 14340 28 2,099.000 1.261.924 422
15 880000 19.00 IS533 3,650,22n 196 76,364 1S812 28 2,247,000 1.391,419 466
10 880000 20.20 16514 3,880,767 186 76,364 16793 28 2.448,000 1,477,49 494
3 880000 22.80 18639 4,380,272 186 76,364 18918 28 2.743.000 1.664.798 557
0.3 880000 21746 5,110,318 186 76,364 22025 28 3,155.000 1,938.176 648
0.03 880000 . 24362 5,725,093 186 76,364 24641 28 3,S09,000 8 725
LOW ,__ _ - -,,,
100,6 880000 0.00 0 0 186 76,364 279 28 53,000 24,526 9
15 880000 7.00 5723 1,344,820 186 76,364 6001 28 1,021,000 528,118 177
10 880000 13.80 11282 2,651,217 186 76,364 11560 28 1,731,000 17,322 341
3 880000 1.40 15042 3,534,956 . 186 76.364 15321 28 2,230,000 1,34,25 451
0.3 880000 23.40 191S30 4,495,542 186 76,364 19409 28 2,795,000 1.707.963 571
0.03 88 7 I 27 5.225.588 6 76.364 1 22515 1 28 322 1981341 663
A-.1

Oh � -A
A.a
.
bo
z
90'%
TABLE B.20. Detail of Costs and Other Parameters for Remediatlon of a Uranium Mill Sol Site,With Soft Washing (continued)
Transport Disposl Di" Caurges Average TOTAL Excavation Floor Soil TOTAL Occup.Costs Vollme Disposal COSTS Labor Demo Washing LABOR Dose
_ _ _ _ _ _ _ _ _ Cost _ _ _ _ _ _ _ _ _ Labor Labor
Rs: 132 Northwest Southeast L 4.07 0170.1
Units: $ n' | S S | S S S nanhr anhr man-hr man-hr person-
HIGH . ..
00o 597.575 6123 8,651.358 29.091,491 58.524,930 32.089,260 39.876,409 24369 756 2605 27729 2773
60 60685so 6227 8,789.830 295SS7,181 S9.461.783 32,60,s3t 40.S14,73 24766 7S6 2646 2816i 2817
30 686-s 5 7044 9.943.761 33,437,928 67,268,892 36.883,527 4,81917 28077 756 2994 3L8
15 744 650 7633 10,774.59 36,232,066 *372,M.01 I 39.96s.ss6 49.534.4s2 30461 756
10 7s3,92s 7731 10,913.06 36.697,756 73,826,864 40,479,228 so,2ss,6t6 3085s 7ss 3286 34900 3490
3 .24.1s% 8450 11,928.S2 40.112,813 80.697.120 44,246,1S2 s4,sso,695 33772 7S6 3591 3819 3812
0.3 935,450 9595 13,544.02 4s5s 8ss 91,627,073 S0.238,9 62,m,036 3407 7 4078
0.03 1,3 ... 0 14.928,74 50,202,755 o s !Z, !2L 67, 42380 q 47631 4763
MED..,
100 329,2s 3382 4,n4,147 16052.11L 32,293,043, 17.706 4S7 22,117,361 13244 756' 1437 15437
60 467,725 4788 ,S 9 10 22,72.066 4s 211 25,069.082 31,207,740 IM99 76 203S 2 2173
30 59,150 736 8097,47 27,228 733 - 4,77SI7 30,034,574 37,335,427 2ms -7S6 2438 25973
5 61740 6325 8,928.301 30.022.871 60.398.636 33,1 KM 41,099,062 2s163 76 -2688 -607 -286
10 654550 6717 9 482 189 31,s88,629 64,146.048 35,171.289 43,70t,719 26753 756 285S 30363 3036
3 738,025 7567 30 682 27 35,921.606 72.265,442 39 623 109 49,225.567 30196 7S6 3216 34168 3417
0.3 858.600 88l0 12,436,25 41,820.342 84,132,248 46.129,615 S7,268,072 3s229 7S6 3744 39729 3973
0.03 960,625 9ss6 j,.913.. 46.787,6" 94,125.348 51.608,778 64,048,249 39467 756 4189 5 4443
100.60 11,925 III IS,1 52,9 1,064. 584,073 79870 7S 47.A 804 80
15 234X5 2401 3,389,429 11,395,285 1 22,924,S2 12,5697 42 15 774 569 9271 756 1020 11047 1105 I
10 451.825 4624 65813 21,950,91? 44,159,849 24,212.963 3010,9 18276 756 1965 298 2100
3 597. S7 6128 8,.6SI g 290919 241 93 32,089,260 39876409 1 24369 1 756 2605 1 27729 2773
0.3 756,S75 7763 10,959,22 36.852,985 -74L139L.48 40,650.452 50.481.896 30991 756 3299 35046 3S05
--0.03 A324 I W06 17 7 - _ _ - 471-9 - 33276_ 40 -

z
9.r0I'
p~
TABLE B.21. Detail of Costs and Other Parameters for Remnediation of Uranium Hexafluoride Facility Soil Site,With Soil Washing
Contaminated Soil Soil Soil Floor Floor Demo Total Total Soil Waste Transport
Rates: S23S/nd S411/d -$220/nt
Units: rPcm m$ re m$ S $m trucks
HIGH.
100 100000 18.40 1709 401,700 223 91,637 2044 34 388,000 187.330 63
60 100000 18.7 1737 408,249 223 91,637 2072 34 393,000 1899782 64
30 100000 21.2 1969 462,828 223 91.637 2304 34 437.000 210,220 71
15 100000 23 2137 502,125 223 91.637 2471 34 450.000 224.936 76
10 100000 23.3 2165 508,674 223 91.637 2499 34 747,000 227.388 76
3 100000 25. 2369 556703 223 91,637 2703 34 513,000 245,374 83
0.3 100000 29 2694 633.114 223 91,637 3029 34 575,00 273.987 _ 92
0.03 100000 32 2973 698,608 223 91,637 3307 34 632,000 298.513 100
MEDIUM
100 100000 10 929 218,315 223 91,637 1263 34 240,000 118,658 40
60 100000 14.3 1328 312,190 223 91,637 1663 34 316.000 153,811 52
30 100000 17.2 1S98 375,502 223 91.637 1912 34 367,000 177,520 60
15 100000 19 1765 414.799 223 91,637 . 2100 34 375,000 192,235 65
10 100000 20.2 1877 440,996 223 , 91,637 2211 34 420,000 202.045 _ 68
3 100000 22.8 2118 497,758 223 91,637 2453 34 466,000 223,301 75
0.3 100000 26.6 2471 580.718 223 1l637 2806 34 533,000- 254,366 86
0.03 100000 29.8 2768 650,579 223 91.637 3103 34 589.000 280,527 94
LOW , _ _ _ _ _,,
100,60,30 100000 0 o | 0 . 0 223 91,637 334 34 63.500 36,906 13
15 100000 7 650 152,821 223 91,637 985 34 150,000 94.133 32
10 100000 13.8 1282 301,275 223 91.637 1616 34 |307000 149,724 51
3 100000 18.4 1709 401,700 223 1 91,637 1 2044 _ 34 388,000 187,330 63
0.3 100000 2174 | 510,857 223 91,637 2508 | 34 467,000 228,206 77
IQOOOO I 27.2 2527 593817 1 223 2 2861 1 34 543-0 , _ _ 27. 59. 2

TABLE B.21. Detail of Costs and Other Parameters for Remediation of Uranium Hexafluoride Facility Soil Site,With Soil Washing (continued)
a.
w
-L
9
-Transport D b isposal Chan es 1Ave e TOTAL Excavation Floor Soil TOTAL OCCUR
Rates: S1325/ Northwest Southeast Out-of-SE 1.62 4.07 0.17 _ 0.1
Units: S N S $ $ S S man-hr man-hr nun-hr nmn-hr person
HIGH
m0 83.475 827 8,131,601 4,458.868 5,611,009 2769 907 347 4024 402
60 8480 838 1. 9 4,094.964 8,238,062 4,517,240 5.684.708 2814 907 352 4074 407
30 94,075 931 1,349 823 4535,958 9,125,233 5.003,671 6,299,431 3191 907 392 4490 449
15 100,700 997 1.444.235 4,853,474 9,763,997 5,353.902 6,723.299 3461 907 420 47F9 479
10 100 700 1009 1 459 971 4.906.393 9,870,457 5,412.274 7,087,672 3507 907 425 4839 484
3 109.975 1090 1 S75 364 5.294 468 10.651.168 5,840.333 7.3S7,022 3838 907 460 5205 520
_ 0.3 1219.m 1220 1,1758,944 18 l,93208 6.521,337 8.216.974 4364 907 515 5787 579
0.03 132400 1332 162 6.441.0S2 12,9S7,814 7.105,055 8,958,312 4816 907 562 6286 629
MED ,
I1m 53.000 514 762.366 2,560,305 5,150,705 2,824,459 3,546-068 1505 907 215 2627 263
60 6890 7 9790S 3,318,815 6,676,640 3,661,121 4,603,659 2152 907 283 3342 334
30 79 782 1 771404017 32 3830,368 ,81 ,316,539 2589 . 907 , 328 3825 382
S 86,125 49 | 1,234,429 4| 4147 84 8.344.522 4575.612 5.735.407 2859 907 357 4124 412
-o.. 0 M91 8 1,297.371 4,3561 7 4 6 3040 907 376 4323 432
3 99,375 990 1 ,433,745 4,818,194 9,693,023 5,314,987 6,693,058 3431 907 417 4756 476
0.3 950 1131 1633060 48 11.041524 6,054,363 7,628.034 4003 907 477 5388 539
0.03 124.550 1250 11800L905 6,052.978 12-177,103 6.676,995 S,413-288 4485 907 527 5920 592
LOW __ _
100,60 17,225 143 237,852 796,329 1,602,019 878,733 1, 001 0 907 57 964 96
15 42,400 403 05,012 2,031-112 4,086,099 2,240.741- 2,771.731 1053 907 167 2128 213
10 67.575 656 961,682 3.230,616 |6,49206 3.563.834 4,481,04 2077 907 | 275 3259 326
3 83,475 827 1,202.958 4,042,045 8131,601 4,458.868 5,611.009 2769 907 347 4024_
0.3 102,025 1012 1 465216 1 4,924,033 9905 944 5.431.731 6,831.455 3522 . 907 - 426 4856 486
003 7- 4 -91 - 12 L 611_ 7 19 MM 5487 549
ATTACE[MENT E
DETAIED GROUNDWATER INFORMATION
C.E-1 NlUREG-1496
ATTACHMENT E
DETAILED GROUNDWATER INFORMATION
Cost Analysis of Remediating Existing Groundwater Contaminationat NRC Licensed Sites
Introduction
The cost analysis was undertaken to estimate the total cost of reducing existing groundwatercontamination, at NRC licensed sites, to various dose objectives. The dose objectivesevaluated were: 1) 25 mrem/y total effective dose equivalent (TEDE), 2) 15 mrem/y TEDE,3) 3 mnrem/y TEDE, and background.
The goal of this cost analysis is to determine the costs associated with reducing theconcentration of radionuclides in groundwater, at a composite NRC-licensed site, toconcentrations that result in a dose of 25, 15, and 3 mrem/y TEDE to an individual whodrinks 2 liters of groundwater per day. The composite site contamination concentration (andother generic site variables) was based on an analysis of contaminated groundwater at NRC-licensed sites with existing groundwater contamination. The analysis also evaluated thedifferential cost of further reducing the concentration of radionuclides in groundwater at thecomposite NRC-licensed sites to background concentrations.
NRC-licensed sites with existing groundwater contamination (Table C.E.2) can be divided intotwo types; 1) sites where the groundwater is contaminated primarily with uranium, and 2)sites where the groundwater is contaminated primarily with man-made beta particleradioactivity (at NRC-licensed sites these are H-3, Sr-90, or Tc-99).
The analysis evaluates the costs of reducing the existing concentration of radionuclides ingroundwater at the composite NRC-licensed sites to the TEDE dose objectives and the totalcost of providing replacement water. The physical aspects of the composite sites evaluatedwere derived from a review of data from NRC-licensed sites known to have groundwatercontamination (Table C.E.2).
The analysis looked at the technical aspects of remediating the existing contamination, usingavailable technology, and estimating the total cost to reduce the contamination to eachidentified level.
NUREG-1496 C.E-2

Assumptions Used
The groundwater dose pathway is the only significant exposure pathway operating at each site.The groundwater contamination plume remains within a controlled area for the duration ofregulatory concern, and no offsite individual is affected by the plume.
Assumptions for composite Sr-90 site.
DoseReduction(mremn/y)
InitialPlumeSize'(ft)
InitialAve.Conc.(pci/i)
FinalAve.Conc.(pCi/i)
Years Generic Assumptions
25 to 15 75xl50 2625 2000 1
25 to 3 same 2625 500 12
Kd = 20
Hydraulic Cond. =100 ft/day
Porosity = 0.35
25 to back-ground2
same 2625 8 68
'Area of plume that. is at the initial average concentration or greater2MCL of 8 pCi/I
Assumptions for composite uranium site.
Dose Initial Initial Final Years Generic AssumptionsReduction Plume Ave. Ave.(mrem/y) Size' Conc. Conc. Kd= 15
(ft)(pCi/l) (pCi/l)Hydraulic Cond. =
25 to 15 500xlO00 1333 800 26 100 ft/day
25 to 3 same 1333 200 148 Porosity = 0.35
25 to back- same 1333 30 459ground2 _
AAm n--nam -47 ca hbinta ~sn n~nrtn tmraPropsa VM ofu 3l 0 pCI oUS,
'Proposed MCL of 30 pCi/lALLuCL aVUisCy,; %;UVLLiU6iUaUAI 9r r1~t%1
The values used in the tables in Chapter 6.4 and in Chapter 8 of Appendix C for the cases ingoing from 15-3 mrem/y were obtained by interpolation of the results presented in the tablesabove.
C.E-3 CNUREG-1496

Cost Estimate Modelinz
The cost estimates were done using the Cost of Remedial Action (CORA) model version 3.0(EPA). This code calculates the capital and first year operations and maintenance (O&M)costs for various remedial actions that could be taken at a contaminated site.
Explanation of Cost Categories
Capital Costs
One time costs for site development, technology design, and construction costs of building apump and treat remediation system. Value obtained from applying EPA's CORA model to acomposite NRC-licensed Sr-90 or uranium site.
O&M Costs
First year technology operation and maintenance costs for a pump and treat remediationsystem. Value obtained from applying EPA's CORA model to a composite NRC-licensed Sr-90 or uranium site. Value multiplied by number of years required to meet remediation goalin the groundwater. Out-year estimates were not discounted.
The remedial actions considered here were pump and treat of contaminated groundwater andsupplying water. The cost modules considered for the pump and treat remedial action were:
I) Removal (aggressive pumping)2) Treatment (ion exchange)3) Disposal of wastes4) Effluent release from the system5) Groundwater monitoring6) Site health & safety7) Site administration
Additional costs were incurred from:
1) Start-up (capital)2) Insurance (capital and O&M)3) Permitting (capital and O&M)4) Construction services (capital)5) Contingencies (capital and O&M)
NUREG-1496 C.E 4

The costs to supply water were based on a scenario of 25 people living above thecontaminated groundwater plume therefore having to install a 100-ft deep well outside theplume and distributing the water to 6 households. Capital costs included costs to install thesystem and operate and maintain it for 1000 years for uranium case. For Sr-90, operation isfor 286 years.
For background information, a list of indicators for potential subsurface soil groundwatercontamination used by the NRC as part of their groundwater contamination considerations isincluded in Table C.E.1.
C.E-5 NUREG-1496

Table C.E.1
List of Indicators for Potential Subsurface Soil Groundwater Contamination
Based on the experience gained from operational and decommissioning NRC-licensedfacilities, the following is a list of potential indicators for groundwater contamination atdecommissioning facilities:
High Potential - If a site has a history of or currently has:
* Unlined lagoons, pits, canals, or surface-drainage ways that receivedradioactively contaminated liquid effluent.
* Lined lagoons, pits, canals, or surface drainage ways that receivedradioactively contaminated liquid effluent, where the lining has leaked,ruptured, or where overflow has occurred.
* Septic systems, dry wells, or injection wells that received radioactivelycontaminated liquid effluent.
* Storage tanks, waste tanks, and/or piping (above or below ground) that held ortransported radioactively contaminated fluids and are known to have leaked.
* Liquid or wet radioactive waste buried onsite (i.e., burial under 10 CFR20.302 or 20.304 (or the current 10 CFR 20.2002)).
* An accident or spill onsite where radioactive material was released exterior toa building.
* Wet bulk waste (e.g., sludge or tailings) stored exterior to buildings or used asbackfill.
* Containerized-liquid waste, stored exterior to buildings, that has leaked.
Medium Potential - If a site has a history of or currently has:
* Surface water or atmospheric discharge of radioactive effluents.
* Radioactive contamination detected on the roof of a building.
* Radioactive contamination detected in the floor cracks or sump of a building.
NUREG-1496 C.E-6

Table C.E. 1 (continued)
* An accident or spill onsite, where liquid radioactive material was released tothe interior of a building.
* The presence of greater than 10-year-old underground storage tank orunderground piping that held radioactively contaminated fluids, not known tohave leaked, but never tested.
* A history of incineration of radioactive waste exterior to buildings onsite.
* Dry bulk waste (i.e., sludge or tailings) stored exterior to buildings or used asbackfill.
* Solid containerized waste, stored exterior to buildings, that has leaked.
Low Potential - If a site has a history of or currently has:
* Less than 10-year-old underground storage tanks or underground piping thathas held radioactively contaminated fluids and is known not to have leaked.
* Dry bulk waste stored inside of the buildings.
* A sealed-source-only license.
The potential for groundwater contamination at any of these sites is conditioned bycertain site characteristics such as depth to groundwater, amount of yearly precipitation andhydraulic conductivity, and by certain source characteristics such as half-life, solubility, anddistribution coefficient.
C.E-7 NUREG-1496
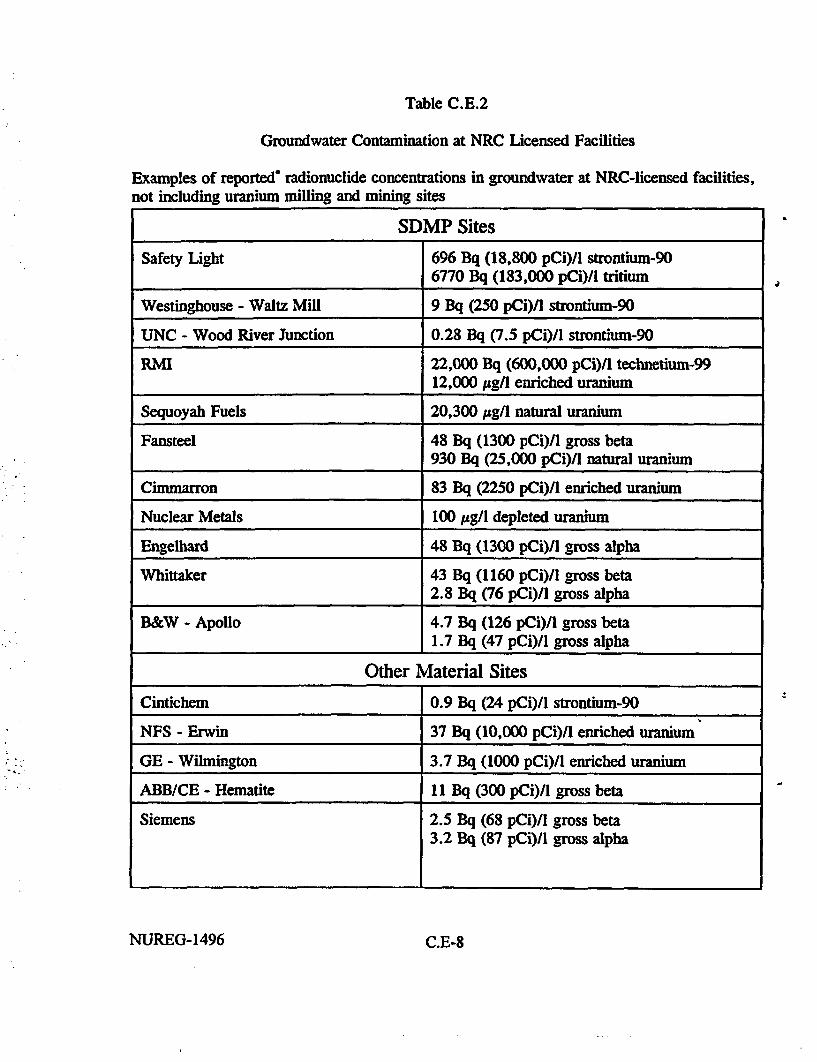
Table C.E.2
Groundwater Contamination at NRC Licensed Facilities
Examples of reported' radionuclide concentrations in groundwater at NRC-licensed facilities,not including uranium milling and mining sites
SDMP Sites
Safety Light 696 Bq (18,800 pCi)/l strontium-906770 Bq (183,000 pCi)/l tritium
Westinghouse - Waltz Mill 9 Bq (250 pCi)/I strontium-90
UNC - Wood River Junction 0.28 Bq (7.5 pCi)/l strontium-90
RMI 22,000 Bq (600,000 pCi)/I technetium-9912,000 pgil enriched uranium
Sequoyah Fuels 20,300 Ag/I natural uranium
Fansteel 48 Bq (1300 pCi)/l gross beta930 Bq (25,000 pCi)/l natural uranium
Cimmarron 83 Bq (2250 pCi)/l enriched uranium
Nuclear Metals 100 ,ug/l depleted uranium
Engelhard 48 Bq (1300 pCi)Il gross alpha
Whittaker 43 Bq (1160 pCi)/l gross beta2.8 Bq (76 pCi)/l gross alpha
B&W - Apollo 4.7 Bq (126 pCi)/l gross beta1.7 Bq (47 pCi)/l gross alpha
Other Material Sites
Cintichem 0.9 Bq (24 pCi)/l strontium-90
NFS - Erwin 37 Bq (10,000 pCi)/I enriched uranium
GE - Wilmington 3.7 Bq (1000 pCi)/l enriched uranium
ABB/CE - Hematite 11 Bq (300 pCi)/l gross beta
Siemens 2.5 Bq (68 pCi)/l gross beta3.2 Bq (87 pCi)Il gross alpha
NUREG-1496 C.E-8

Table C.E.2 (continued)
Reactor Sites
TM-2 18,500 Bq (500,000 pCi)/l tritium
Big Rock Point 1500 Bq (40,000 pCi)/l tritium
Dresden-I 850 Bq (23,000 pCi)/l tritium
Yankee-Rowe 300 Bq (8000 pCi)/l tritium
Humboldt Bay 96 Bq (2600 pCi)/l tritiumn
D.C. Cook 63 Bq (1700 pCi)fl tritiumDIjata were reportedi m units used here.
C.E-9 NUREG-1496

APPENDIX D
TERMINATION SURVEY CONSIDERATIONS ANDDETAILED ANALYSIS OF COSTS OF TERMINATION SURVEYS

APPENDIX D
D.1 Introduction
Survey cost estimates were developed for four reference facilities. The specific informationregarding each facility was obtained from the Pacific Northwest National Laboratory(PNNL), previous Environmental Survey and Site Assessment Program (ESSAP) surveyreports, or the corresponding NUREG documents describing each facility. For each facility,the 'affected" areas, as defined in NUREG/CR-5849 (NRC, 1992A), were estimated basedon reference facility descriptions. It should be noted that for the purpose of survey planning,the areas considered as affected were larger than the area actually decontaminated.
b
D.2 Modifications Made In Response to Public Comments
A number of public comments, noted in Appendix H, were received on survey methods andcosts. The estimates of survey costs at various alternative residual dose levels for the fourfacilities are presented in the following section based on survey methods described below.
D.3 Overall Survey Methodology Approach
D.3.1 Bases of Survey Techniques
The costs of radiological surveys for license termination are based on survey techniqueswhich a licensee would use in the decommissioning of its facility. Methodologies forconducting surveys are based on the approaches recommended in the Multi-AgencyRadiological Site Survey Manual (MARSSIM) (MARS, 1996) developed jointly by the NRC,EPA, DOE, and DOD and published for public comment in December 1996. Thesemethodologies are based on the analyses contained in NUREGs-1505, 1506, and 1507 (NRC,1995a, b, c). Based on this survey methodology, cost estimates for carrying out the surveysare estimated based on appropriate instrumentation and labor costs.
D.3.2 Dose Conversion Factors
Dose conversion factors are used in the determination of costs by converting theconcentration of the principal contaminant radionuclide to a dose that corresponds to thealternative residual dose levels being considered. Dose conversion factors for Co-60, Cs-137, Th-232, and natural uranium for several exposure scenarios (as described in
*. NUREG/CR-5512 (NRC, 1992b) are contained in Appendix C.
D.3.3 Instrumentation
The instruments considered for performing the final survey were standard commerciallyavailable instruments currently used by ESSAP. These instruments include large area gasproportional detectors, GM detectors, ZnS and Nal scintillation detectors coupled withratemeter-scalers.
D1 NUREG-1496

D.4 Survey Costs
D.4.1 Labor Cost
The labor costs for the decommissioning activities, including the overhead costs, wereprovided to the Oak Ridge Institute for Science and Education (ORISE) by the NRC.These hourly rates were $22.99, $36.82, $70.99, and $105.99 for secretarial support,health physics technician, supervisor, and project management, respectively. In estimatingman-hours necessary to complete the survey, time was also allowed for daily instrumentcheck-outs, QA activities, etc., based on ESSAP field survey experience. In estimatingtotal man-hours, project management and clerical times were also considered in theplanning and report preparation phases of activities.
D.4.2 Analytical Cost
In order to represent average costs of commercially available radiochemistry analyses, costtables from sources other than ESSAP were also considered. These included the Eberlineand the International Technology (IT) Corporation. Additional information was obtainedfrom M. H. Chew and Associates, Inc., which is compiling similar types of information forthe Department of Energy.
D.4.3 Special Services
The only item applicable to these cost estimates is the cost of land survey. The cost ofsuch contracts was estimated based on similar subcontracts by ESSAP and by contacting alocal engineering/land surveying firm.
D.5 Detailed Survey Analysis for Reference Facilities
D.5.1 Survey Cost Estimate Introduction and Assumptions
To facilitate survey design and assure that the number of survey data points for a specificsite is relatively uniformly distributed among areas of similar contamination potential, thereference site is divided into survey units which have a common history or othercharacteristics, or are naturally distinguishable from other portions of the site.
The limitation on survey unit size for Class 1 and Class 2 areas ensures that each area isassigned an adequate number of data points. Because the number of datapoints-determined by the nonparametric statistical tests-is independent of the survey unitsize, the survey coverage in an area is determined by dividing the fixed number of datapoints obtained from the statistical tests by the survey unit area.
Survey units are limited in size, based on classification and site-specific conditions. Oneimportant factor in assigning survey units is the relative homogeneity of the surveyed area.The suggested maximum areas for survey units, used for this cost estimate exercise, are
NUREG-1496 D-2

provided below. It should be stressed that these survey unit sizes may be altered based onsite conditions with reasonable justification.
Typical Maximum Survey Unit Sizes
Area Typical MaximumClass 1
Structures 200 m2 floor areaLand areas 10,000 e 2
Class 2Structures 200 to 1,000 m2
Land areas 10,000 e 2
Class 3Structures no limitLand areas no limit
The indoor and outdoor scan coverages for each of the survey unit classifications are 100%for Class 1, 50 to 100% for Class 2, and 10% for Class 3. For this cost estimate, it isassumed that 75% of Class 2 areas are scanned.
The number of samples for Class I areas is determined either by nonparametric statistics orbased on the hot spot potential. The number of samples for Class 2 and Class 3 areas aredetermined solely by nonparametric statistics. A reference area is needed for allradionuclides that are present in background and for radionuclides that are assessed usinggross measurement techniques-such as surface activity measurements using a gasproportional detector.
Survey costs are estimated for alternative residual dose levels of 100, 60, 25, 15, and 3mrem/y. These cost estimates are derived from methodology presented in MARSSIM(MARS, 1996) and NUREGs-1505, 1506, and 1507 (NRC, 1995a, b, c). An explanationof the methodology and parameters for each of the alternative residual dose criteria for thereference facilities are presented in the following sections.
In developing survey cost estimates for alternative residual dose levels of 100, 60, 25, 15,and 3 mrein/y, the only parameters that change at these dose levels are the DCGL andstandard deviation. The classification and number of survey units remain the same for thealternate residual dose levels, therefore the scan coverage will remain the same for eachdose level. The number of samples required at each dose level will likely change due tothe change in the DCGL relative to the scan MDC-the area factor will also get larger asthe DCGL is decreased, resulting in more samples to satisfy the potential for small areas ofelevated activity. Similarly, the area factor will also get smaller as the DCGL is increased,resulting in fewer samples necessary to satisfy the potential for small areas of elevatedactivity.
D-3 DNUREG-1496

The following discussion of cost estimates made for each of the alternative residual doselevels is somewhat repetitive for the various levels, but it is done so that the surveymethods and costs can be understood as each dose level is considered.
D.5.2 Power Reactor
Although the power reactor may be contaminated with many different fission and activationproduct radionuclides, the two contaminants that deliver greater than 95% of the dose areCo-60 and Cs-137. Based on Appendix C, these radionuclides are assumed to be present ata ratio of Co-60 to Cs-137 of approximately 3-to-1.
D.5.2.1 Survey Cost Estimate for 100 mremly
Surface Activity and Soil Concentration Dose Conversion Guideline Levels (DCGLs)
For the Appendix C concentration ratio for Co-60 to Cs-137, the gross activity DCGL forsurface activity is 40,900 dpm/100 cm2 total beta. Compliance with the surface activityDCGL will be demonstrated by measuring the total beta surface activity. Using the sameassumptions, the combined DCGL for Co-60 is 18.3 pCi/g. Compliance with the soilDCGL will be demonstrated based on the Co-60 concentration as measured by gammaspectrometry.
Surface Activity and Soil Concentration Backgrounds and Standard Deviations (efs)
Surface ActivityThe expected background for beta surface activity measurements is 2,000 ± 600 dpm/100cm2 (la).
Class 1 Standard deviation is 17,000 dpm/100 cm2
Class 2 Standard deviation is 10,000 dpml100 cm2
Class 3 Standard deviation is 600 dpmlOO cm2
Soil ConcentrationsCo-60 is not expected to be present in background.
Class I Standard deviation is 7.3 pCilgClass 2 Standard deviation is 7 pCi/gClass 3 Standard deviation is 0.2 pCi/g
Indoor Areas
Reference Area
It is assumed that all measurements are performed on concrete in a reference area. Thenumber of measurements equals 6 (from nonparametric statistics).
NTREG-1496 D-4

Instrumentation for Surface Activity Measurements and Scans
Surface activity measurements will be performed with a gas proportional detector; the MDCfor 1 minute measurements is 425 dpmlOO cm2.
The surfaces will be scanned with both a floor monitor (573 cm2) and a 126 cm2 gasproportional detector. The scan MDC for the floor monitor is 3600 dpm/100 cm2 and 2000dpm/100 cm2 for the gas proportional detector. Gamma scans will also be performed overapproximately 60% of the floor areas in the power reactor facility.
Number of Surface Activity Measurement:Indoor Areas and Exterior Paved Areas andStructures (based on nonparametnc stats or driven by hot spot potential)
Because the scan MDCs are sufficiently below the DCGL, the number of samples in ClassI areas will be determined by nonparametric statistics.
The number of surface activity measurements per survey unit based on nonparametricstatistics-considering both the Wilcoxon Rank Sum and Quantile tests-is 6250. It isassumed that an additional 2302 (includes 550 measurements from exterior surfaces)measurements are collected based on scan results for a total of 8552 direct surface activitymeasurements. The number of measurements based on scans will be assumed based on 1additional measurement per 10 ni2 of scanned area in Class 1, 1 additional measurementper 50 e of scanned area in Class 2 and Class 3 areas.
Outdoor Areas
It should be recognized that the outdoor areas include both soil areas and exterior buildingsurfaces and paved areas. It is general practice for surface activity measurements to beperformed on outdoor surfaces such as exterior structures and paved areas.
Reference Areas
It is assumed that all background soil samples, if necessary, are collected from an offsitereference area. Because Co-60 measurements will be used to demonstrate compliance withcriteria for outdoor areas, a reference area is not needed.
For exterior paved areas, it is assumed that all measurements are performed on asphalt in areference area. The number of measurements equals 6 (from nonparametric statistics).
Instrumentation for Surface Scans
Soil surfaces will be scanned with a Nal scintillation detector. The scan MDC for Co-60 isapproximately 5 pCilg.
D-5 NUREG-1496

Exterior paved surfaces and building surfaces will be scanned with both a floor monitor(573 cm2) and a 126-cm2 gas proportional detector. The scan MDC for the floor monitor is3600 dpm/100 cm2 and 2000 dpm/100 cm2 for the gas proportional detector. Gamma scanswill also be performed over approximately 40% of the exterior paved areas.
Number of Soil Samples
Because the Nal scan MDC is less than the DCGL (5 vs. 18.3 pCi/g), the number ofsamples in Class 1 areas will not be driven by the potential for small areas of elevatedactivity.
The number of soil samples per survey unit based on nonparametric statistics-consideringboth the Wilcoxon Rank Sum and Quantile tests-is 270. It is assumed that an additional117 samples are collected based on scan results for a total of 387 soil samples. The numberof samples based on scans will be assumed based on 1 additional sample per 50 m2 ofscanned area in Class 1, 1 additional sample per 200 m2 of scanned area in Class 2 areas,and 1 additional sample per 400 m2 of scanned area in Class 3 areas.
D.5.2.2 Survey Cost Estimate for 60 mrem/y
Surface Activity and Soil Concentration Dose Conversion Guideline Levels (DCGLs)
For the concentration ratio from Appendix C for Co-60 to Cs-137, the gross activity DCGLfor surface activity is 24,500 dpm/100 cm2 total beta. Compliance with the surface activityDCGL will be demonstrated by measuring the total beta surface activity. Under the sameassumptions, the combined DCGL for Co-60 is 11 pCi/g. Compliance with the soil DCGLwill be demonstrated based on the Co-60 concentration as measured by gammaspectrometry.
Surface Activity and Soil Concentration Backgrounds and Standard Deviations (e's)
Surface ActivityThe expected background for beta surface activity measurements is 2,000 i 600 dpml100cm2 (io).
Class 1 Standard deviation is 10,400 dpm/100 cmClass 2 Standard deviation is 7500 dpm/100 cm2
Class 3 Standard deviation is 600 dpm/100 cm2
Soil ConcentrationsCo-60 is not expected to be present in background.
Class I Standard deviation is 4.4 pCi/gClass 2 Standard deviation is 4 pCi/gClass 3 Standard deviation is 0.2 pCi/g
NUREG-1496 D-6

Indoor Areas
Reference Area
It is assumed that all measurements are performed on concrete in a reference area. Thenumber of measurements equals 6 (from nonparametric statistics).
Instrumentation for Surface Activity Measurements and Scans
Surface activity measurements will be performed with a gas proportional detector; the MDCfor 1 minute measurements is 425 dpmlOO cm2.
The surfaces will be scanned with both a floor monitor (573 cm2 ) and a 126-cm2 gasproportional detector. The scan MDC for the floor monitor is 3600 dpm/100 cm2 and 2000dpm/100 cm2 for the gas proportional detector. Gamma scans will also be performed overapproximately 60% of the floor areas in the power reactor facility.
Number of Surface Activity Measurement:Indoor Areas and Exterior Paved Areas andStructures(based on nonparametric stats or driven by hot spot potential)
Because the scan MDCs are sufficiently below the DCGL, the number of samples in Class1 areas will be determined by nonparametric statistics.
The number of surface activity measurements per survey unit based on nonparametricstatistics-considering both the Wilcoxon Rank Sum and Quantile tests-is 6484. It isassumed that an additional 2302 (includes 550 measurements from exterior surfaces)measurements are collected based on scan results for a total of 8786 direct surface activitymeasurements. The number of measurements based on scans will be assumed based on 1additional measurement per 10 m2 of scanned area in Class 1, 1 additional measurementper 50 i 2 of scanned area in Class 2 and Class 3 areas.
Outdoor Areas
It should be recognized that the outdoor areas include both soil areas and exterior buildingsurfaces and paved areas. It is general practice for surface activity measurements to beperformed on outdoor surfaces such as exterior structures and paved areas.
Reference Areas
It is assumed that all background soil samples, if necessary, are collected from an offsitereference area. Because Co-60 measurements will be used to demonstrate compliance withcriteria for outdoor areas, a reference area is not needed.
D-7 NUREG-1496

For exterior paved areas, it is assumed that all measurements are performed on asphalt in areference area. The number of measurements equals 6 (from nonparametric statistics).
Instrumentation for Surface Scans
Soil surfaces will be scanned with a NaI scintillation detector. The scan MDC for Co-60 isapproximately 5 pCi/g.
Exterior paved surfaces and building surfaces will be scanned with both a floor monitor(573 cm2) and a 126-cm2 gas proportional detector. The scan MDC for the floor monitor is3600 dpm/100 cm2 and 2000 dpm/100 cm2 for the gas proportional detector. Gamma scanswill also be performed over approximately 40% of the exterior paved areas.
Number of Soil Samples
Because the Nal scan MDC is less than the DCGL (5 vs. 11 pCi/g), the number of samplesin Class 1 areas will not be driven by the potential for small areas of elevated activity.
The number of soil samples per survey unit based on nonparametric statistics-consideringboth the Wilcoxon Rank Sum and Quantile tests-is 270. It is assumed that an additional117 samples are collected based on scan results for a total of 387 soil samples. The numberof samples based on scans will be assumed based on 1 additional sample per 50 zn2 ofscanned area in Class 1, 1 additional sample per 200 m2 of scanned area in Class 2 areas,and 1 additional sample per 400 m2 of scanned area in Class 3 areas.
D.5.2.3 Survey Cost Estimate for 25 mrem/y
Surface Activity and Soil Concentration Dose Conversion Guideline Levels (DCGLs)
For the Appendix C concentration ratio for Co-60 to Cs-137, the gross activity DCGL forsurface activity is 10,200 dpm/100 cm2 total beta. Compliance with the surface activityDCGL will be demonstrated by measuring the total beta surface activity. Under the sameassumptions, the combined DCGL for Co-60 is 4.6 pCi/g. Compliance with the soil DCGLwill be demonstrated based on the Co-60 concentration as measured by gammaspectrometry.
Surface Activity and Soil Concentration Backgrounds and Standard Deviations (e's)
Surface ActivityThe expected background for beta surface activity measurements is 2,0O0 ± 600 dpmlO0cm2 (la).
Class 1 Standard deviation is 6720 dpm/100 cm2
Class 2 Standard deviation is 5400 dpmlO0 cm2
Class 3 Standard deviation is 600 dpm/100 cm2
NUREG-1496 D-8

Soil ConcentrationsCo-60 is not expected to be present in background.
Class I Standard deviation is 2.3 pCi/gClass 2 Standard deviation is 2 pCi/gClass 3 Standard deviation is 0.2 pCi/g
Indoor Areas
Reference Area
It is assumed that all measurements are performed on concrete in a reference area. Thenumber of measurements equals 10 (from nonparametric statistics).
Instrumentation for Surface Activity Measurements and Scans
Surface activity measurements will be performed with a gas proportional detector; the MDCfor 1 minute measurements is 425 dpm/100 cm2.
The surfaces will be scanned with both a floor monitor (573 cm2) and a 126-cm2 gasproportional detector. The scan MDC for the floor monitor is 3600 dpm/100 cmr2 and 2000dpm/100 cm2 for the gas proportional detector. Gamma scans will also be performed overapproximately 60% of the floor areas in the power reactor facility.
Number of Surface Activity Measurement:Indoor Areas and Exterior Paved Areas andStructures(based on nonparametric stats or driven by hot spot potential)
Because the scan MDCs are sufficiently below the DCGL, the number of samples in Class1 areas will be determined by nonparametric statistics.
The number of surface activity measurements per survey unit based on nonparametricstatistics-considering both the Wilcoxon Rank Sum and Quantile tests-is 9355. It isassumed that an additional 2302 (includes 550 measurements from exterior surfaces)measurements are collected based on scan results for a total of 11,657 direct surfaceactivity measurements. The number of measurements based on scans will be assumedbased on 1 additional measurement per 10 in2 of scanned area in Class 1, 1 additionalmeasurement per 50 i 2 of scanned area in Class 2 and Class 3 areas.
Outdoor Areas
It should be recognized that the outdoor areas include both soil areas and exterior buildingsurfaces and paved areas. It is general practice for surface activity measurements to beperformed on outdoor surfaces such as exterior structures and paved areas.
D-9 NUREG-1496

Reference Areas
It is assumed that all background soil samples, if necessary, are collected from an off-sitereference area. Because Co-60 measurements will be used to demonstrate compliance withcriteria for outdoor areas, a reference area is not needed.
For exterior paved areas, it is assumed that all measurements are performed on asphalt in areference area. The number of measurements equals 10 (from nonparametric statistics).
Instrumentation for Surface Scans
Soil surfaces will be scanned with a NaI scintillation detector. The scan MDC for Co-60 isapproximately 5 pCi/g.
Exterior paved surfaces and building surfaces will be scanned with both a floor monitor(573 cm*) and a 126 cm2 gas proportional detector. The scan MDC for the floor monitor is3600 dpm/100 cm2 and 2000 dpm/100 cm2 for the gas proportional detector. Gamma scanswill also be performed over approximately 40% of the exterior paved areas.
Number of Soil Samples
Because the Nal scan MDC is just above the DCGL (5 vs. 4.6 pCilg), the number ofsamples in Class 1 areas may be determined based on the potential for small areas ofelevated activity. The area factor is 1.1 and corresponds to an area of approximately 300in2 . When this acceptable elevated area is divided into the survey unit area (2000 m2), thenumber of samples based on hot spot potential is 7. It is very unlikely that the number ofsamples necessary to satisfy the hot spot potential is going to be the driver because thenonparametric statistics should require more than 7 samples per survey unit.
The number of soil samples per survey unit based on nonparametric statistics-consideringboth the Wilcoxon Rank Sum and Quantile tests-is 270 (252 in Class 2 and 3 areas). It isassumed that an additional 117 samples are collected based on scan results for a total of 387soil samples. The number of samples based on scans will be assumed based on I additionalsample per 50 in2 of scanned area in Class 1, 1 additional sample per 200 mr of scannedarea in Class 2 areas, and 1 additional sample per 400 m2 of scanned area in Class 3 areas.
D.5.2.4 Survey Cost Estimate for 15 mrem/y
Surface Activity and Soil Concentration Dose Conversion Guideline Levels (DCGLs)
The DCGL for Co-60 is 5170 dpm100 cm2 and for Cs-137 is 13,600 dpm/100 cmn. Forthe concentration ratio from Appendix C for Co-60 to Cs-137, the gross activity DCGL forsurface activity is 6,130 dpm/100 cm2 total beta. Compliance with the surface activityDCGL will be demonstrated by measuring the total beta surface activity. The soilconcentration DCGL is 3.0 pCi/g for Co-60 and 10.7 pCi/g for Cs-137. For the
NUREG-1496D D-10

concentration ratio from Appendix C, the combined DCGL for Co-60 is 2.75 pCilg.Compliance with the soil DCGL will be demonstrated based on the Co-60 concentration asmeasured by gamma spectrometry.
Surface Activity and Soil Concentration Backgrounds and Standard Deviations (a's)
The estimated standard deviations for surface activity and soil concentrations in survey unitsare determined for each area classification. In large part, the estimated standard deviationswere based on results of past survey experience. A general guide for Class 1 areas, it wasassumed that the ratio of the standard deviation (a) to the DCGL (A) increased as theDCGL was lowered from 100 to 3 mrem/y. For example, for DCGLs at 100 and 60mrem/y, a/A is 40%; for DCGL at 25 mremly, a/, is 50%; for DCGL at 15 mrem/y, a/ais 60%; and for DCGL at 3 mrem/y, a/, is 70%. The standard deviations for Class 2areas were estimated to be approximately 50 to 95% of the Class 1 standard deviations.The standard deviations for Class 3 areas are assumed to be equal to the standard deviationof background-where the contaminant is not present in background and nuclide-specificmeasurements are performed, the standard deviation of background, and therefore thestandard deviation of the Class 3 area, is assumed to be near zero.
Surface ActivityThe expected background for beta surface activity measurements is 2,000 $ 600 dpm/100cm2 (lr).
Class 1 Standard deviation is 3700 dpm/100 cm2
Class 2 Standard deviation is 3000 dpm/100 cm2
Class 3 Standard deviation is 600 dpm/100 cm2
Soil ConcentrationsCo-60 is not expected to be present in background.
Class I Standard deviation is 1.7 pCi/gClass 2 Standard deviation is 1.3 pCi/gClass 3 Standard deviation is 0.2 pCilg
Indoor Areas
Survey Unit Classification
Reference Area
It is assumed that all measurements are performed on concrete in a reference area. Thenumber of measurements equals 9 (from nonparametric statistics).
D-11 NUREG-1496
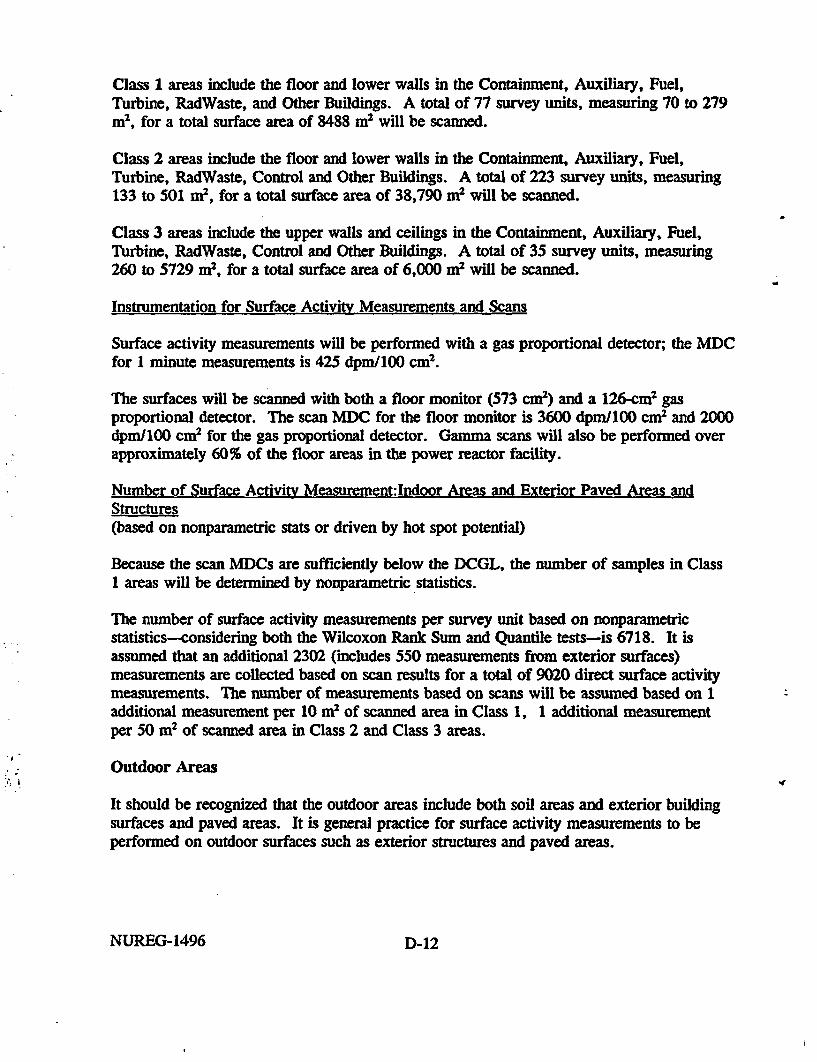
Class 1 areas include the floor and lower walls in the Containment, Auxiliary, Fuel,Turbine, RadWaste, and Other Buildings. A total of 77 survey units, measuring 70 to 279m2, for a total surface area of 8488 me will be scanned.
Class 2 areas include the floor and lower walls in the Containment, Auxiliary, Fuel,Turbine, RadWaste, Control and Other Buildings. A total of 223 survey units, measuring133 to 501 mn2 , for a total surface area of 38,790 *n2 will be scanned.
Class 3 areas include the upper walls and ceilings in the Containment, Auxiliary, Fuel,Turbine, RadWaste, Control and Other Buildings. A total of 35 survey units, measuring260 to 5729 in, for a total surface area of 6,000 m2 will be scanned.
Instrumentation for Surface Activity Measurements and Scans
Surface activity measurements will be performed with a gas proportional detector; the MDCfor 1 minute measurements is 425 dpm/100 cm2.
The surfaces will be scanned with both a floor monitor (573 cme) and a 126-cmi gasproportional detector. The scan MDC for the floor monitor is 3600 dpm/100 cm2 and 2000dpml100 cm2 for the gas proportional detector. Gamma scans will also be performed overapproximately 60% of the floor areas in the power reactor facility.
Number of Surface Activity Measurement:Indoor Areas and Exterior Paved Areas andStructures(based on nonparametric stats or driven by hot spot potential)
Because the scan MDCs are sufficiently below the DCGL, the number of samples in Class1 areas will be determined by nonparametric statistics.
The number of surface activity measurements per survey unit based on nonparametricstatistics-considering both the Wilcoxon Rank Sum and Quantile tests-is 6718. It isassumed that an additional 2302 (includes 550 measurements from exterior surfaces)measurements are collected based on scan results for a total of 9020 direct surface activitymeasurements. The number of measurements based on scan will be assumed based on 1additional measurement per 10 m2 of scanned area in Class 1, 1 additional measurementper 50 ti 2 of scanned area in Class 2 and Class 3 areas.
Outdoor Areas
It should be recognized that the outdoor areas include both soil areas and exterior buildingsurfaces and paved areas. It is general practice for surface activity measurements to beperformed on outdoor surfaces such as exterior structures and paved areas.
NUREG-1496 D-12

Survey Unit Classification -
Reference Areas
It is assumed that all background soil samples, if necessary, are collected from an offsitereference area. Because Co-60 measurements will be used to demonstrate compliance withcriteria for outdoor areas, a reference area is not needed.
For exterior paved areas, it is assumed that all measurements are performed on asphalt in areference area. The number of measurements equals 9 (from nonparametric statistics).
The Class 1 area includes 1 soil survey unit area of 2000 in, with a total soil scan area of2000 i 2 . No Class 1 areas have been identified for exterior paved surfaces or buildingexteriors.
Class 2 areas include 4 soil survey units, each measuring 4180 i 2, with a total scan surfacearea of 12,540 in2 . Class 2 areas for exterior paved surfaces or building exteriors include10 survey units, each measuring 1000 m2, with a total scan surface area of 7500 i 2 .
Class 3 areas include 10 soil survey units, each measuring 5574 n2, with a total scansurface area of 5574 i 2 . Class 3 areas for exterior paved surfaces or building exteriorsinclude 20 survey units, each measuring 10,000 m2, with a total scan surface area of 20,000m2
Instrumentation for Surface Scans
Soil surfaces will be scanned with a Nal scintillation detector. The scan MDC for Co-60 isapproximately 5 pCi/g.
Exterior paved surfaces and building surfaces will be scanned with both a floor monitor(573 cm2) and a 126-cm2 gas proportional detector. The scan MDC for the floor monitor is3600 dpml100 cm2 and 2000 dpm/100 cm2 for the gas proportional detector. Gamma scanswill also be performed over approximately 40% of the exterior paved areas.
Number of Soil Samples
Because the Nal scan MDC is greater than the DCGL (5 vs. 2.75 pCilg), the number ofsamples in Class 1 areas will be driven by the potential for small areas of elevated activity.The area factor is 1.8 and corresponds to an area of approximately 20 i 2. When thisacceptable elevated area is divided into the survey unit area (2000 m2), the number ofsamples based on hot spot potential is 100, which is going to be the driver for class 1 areasbecause the nonparametric statistics will require fewer than 100 samples per survey unit.
The number of soil samples per survey unit based on nonparametric statistics-consideringboth the Wilcoxon Rank Sum and Quantile tests-is 272 (252 in Class 2 and 3 areas). It is
D-13 NUREG-1496

assumed that an additional 117 samples are collected based on scan results for a total of 469soil samples. The number of samples based on scans will be assumed based on 1 additionalsample per 50 m2 of scanned area in Class 1, 1 additional sample per 200 m2 of scannedarea in Class 2 areas, and 1 additional sample per 400 e 2 of scanned area in Class 3 areas.
D.5.2.5 Survey Cost Estimate for 3 mrem./y
Surface Activity and Soil Concentration DCGLs (A's)
For the Appendix C concentration ratio for Co-60 to Cs-137, the gross activity DCGL forsurface activity is 1220 dpm/100 cm2 total beta. Compliance with the surface activityDCGL will be demonstrated by measuring the total beta surface activity. Under the sameassumptions, the combined DCGL for Co-60 is 0.55 pCilg. Compliance with the soilDCGL will be demonstrated based on the Co-60 concentration as measured by gammaspectrometry.
Surface Activity and Soil Concentration Backgrounds and Standard Deviations (e's)
Surface ActivityThe expected background for beta surface activity measurements is 2,000 i 600 dpmlO0cm2 (la).
Class 1 Standard deviation is 1400 dpm/100 cm2
Class 2 Standard deviation is 900 dpmJ100 cm2
Class 3 Standard deviation is 600 dpm/100 cm2
Soil ConcentrationsCo-60 is not expected to be present in background.
Class 1 Standard deviation is 0.39 pCi/gClass 2 Standard deviation is 0.27 pCi/gClass 3 Standard deviation is 0.2 pCilg
Indoor Areas
Reference Area
It is assumed that all measurements are performed on concrete in a reference area. Thenumber of measurements equals 45 (from nonparametric statistics).
Instrumentation for Surface Activity Measurements and Scans
Surface activity measurements will be performed with a gas proportional detector; the MDCfor 1 minute measurements is 425 dpm/100 cm2.
NUREG-1496 D-14

The surfaces will be scanned with both a floor monitor (573 cm2) and a 126-cm2 gasproportional detector. The scan MDC for the floor monitor is 3600 dpm/100 cm2 and 2000dpml100 cm2 for the gas proportional detector. Gamma scans will also be performed overapproximately 60% of the floor areas in the power reactor facility.
Number of Surface Activity Measurement:Indoor Areas and Exterior Paved Areas andStructures(based on nonparametric stats or driven by hot spot potential)
Because the scan MDC is greater than the DCGL (3600 vs 1220 dpm/100 cm2), the numberof samples in Class 1 areas may be determined based on the potential for small areas ofelevated activity. The area factor is 3.0 and corresponds to an area of approximately 4 i 2.When this acceptable elevated area is divided into each survey unit area, the total numberof samples based on hot spot potential is 2155.
The number of surface activity measurements per survey unit based on nonparametricstatistics-considering both the Wilcoxon Rank Sum and Quantile tests-is 6494 (3822 fromClass 2 and 3 areas). It is assumed that an additional 2302 (includes 550 measurementsfrom exterior surfaces) measurements are collected based on scan results for a total of 8796direct surface activity measurements. The number of measurements based on scans will beassumed based on 1 additional measurement per 10 i 2 of scanned area in Class 1, 1additional measurement per 50 m2 of scanned area in Class 2 and Class 3 areas.
Outdoor Areas
It should be recognized that the outdoor areas include both soil areas and exterior buildingsurfaces and paved areas. It is general practice for surface activity measurements to beperformed on outdoor surfaces such as exterior structures and paved areas.
Reference Areas
It is assumed that all background soil samples, if necessary, are collected from an offsitereference area. Because Co-60 measurements will be used to demonstrate compliance withcriteria for outdoor areas, a reference area is not needed.
For exterior paved areas, it is assumed that all measurements are performed on asphalt in areference area. The number of measurements equals 45 (from nonparametric statistics).
Instrumentation for Surface Scans
Soil surfaces will be scanned with a NaI scintillation detector. The scan MDC for Co-60 isapproximately 5 pCi/g.
Exterior paved surfaces and building surfaces will be scanned with both a floor monitor(573 cm2) and a 126-cm2 gas proportional detector. The scan MDC for the floor monitor is
D-5 NUREG-1496

3600 dpmllO0 cm2 and 2000 dpm/100 cm2 for the gas proportional detector. Gamma scanswill also be performed over approximately 40% of the exterior paved areas.
Number of Soil Samples
Because the NaI scan MDC is greater than the DCGL (5 vs. 0.55 pCi/g), the number ofsamples in Class 1 areas will be driven by the potential for small areas of elevated activity.The area factor is 9.1 and corresponds to an area of approximately 1 zn2 . When thisacceptable elevated area is divided into the survey unit area (2000 m2), the number ofsamples based on hot spot potential is 2000, which is going to be the driver for class 1areas because the nonparametric statistics will require fewer than 2000 samples per surveyunit.
The number of soil samples per survey unit based on nonparametric statistics-consideringboth the Wilcoxon Rank Sum and Quantile tests-is 273 (252 from Class 2 and 3 areas). Itis assumed that -an additional 77 samples are collected in Class 2 and 3 areas based on scanresults for a total of 2329 soil samples. Because of the close sample spacing due to thepotential small areas of elevated activity, it is assumed that no additional samples will becollected in Class 1 areas based on scan results. The number of samples based on scanswill be assumed based on 1 additional sample per 200 e 2 of scanned area in Class 2 areas,and 1 additional sample per 400 m2 of scanned area in Class 3 areas.
D.5.3 Sealed Source Manufacturer Facility
The contaminants include Co-60 and Cs-137; assume that the radionuclide ratio of Co-60 toCs-137 is 3:1.
D.5.3.1 Survey Cost Estimate for 100 mrem/y
Surface Activity and Soil Concentration DCGLs
For the concentration ratio of 3 to 1 presented in Appendix C for Co-60 to Cs-137, thegross activity DCGL for surface activity is 40,900 dpm/lO0 cm2 total beta. Compliancewith the surface activity DCGL will be demonstrated by measuring the total beta surfaceactivity. Under the same assumptions, the combined DCGL for Co-60 is 18.3 pCilg.Compliance with the soil DCGL will be demonstrated based on the Co-60 concentration asmeasured by gamma spectrometry.
Surface Activity and Soil Concentration Backgrounds and Standard Deviations (e's)
Surface ActivityThe expected background for beta surface activity measurements is 2,000 ± 600 dpm/100cm2 (la).
Class 1 Standard deviation is 17,000 dpm/100 cm2
NUREG-1496 D-16

Class 2 Standard deviation is 10,000 dpmlO0 cm2
Class 3 Standard deviation is 600 dpm/100 cm2
Soil ConcentrationsCo-60 is not expected to be present in background.
Class I Standard deviation is 7.3 pCi/gClass 2 Standard deviation is 7 pCi/gClass 3 Standard deviation is 0.2 pCi/g
Indoor Areas
Reference Area
It is assumed that all measurements are performed on concrete in a reference area. Thenumber of measurements equals 6 (from nonparametric statistics).
Instrumentation for Surface Activity Measurements and Scans
Surface activity measurements will be performed with a gas proportional detector; the MDCfor 1 minute measurements is 425 dpm/lO0 cm2.
The surfaces will be scanned with both a floor monitor (573 cm2) and a 126-cm2 gasproportional detector. The scan MDC for the floor monitor is 3600 dpm/100 cm2 and 2000dpm/100 cm2 for the gas proportional detector. Gamma scans will also be performed overapproximately 80% of the floor areas.
Number of Surface Activity Measurements(based on nonparametric stats or driven by hot spot potential)
Because the scan MDCs are sufficiently below the DCGL, the number of samples in ClassI areas will be determined by nonparametric statistics.
The number of surface activity measurements per survey unit based on nonparametricstatistics-considering both the Wilcoxon Rank Sum and Quantile tests-is 226. It isassumed that an additional 52 measurements are collected based on scan results for a totalof 278 direct surface activity measurements. The number of measurements based on scanswill be assumed based on 1 additional measurement per 10 m2 of scanned area in Class 1,1 additional measurement per 50 m2 of scanned area in Class 2 and Class 3 areas.
D-17 NUREG-1496
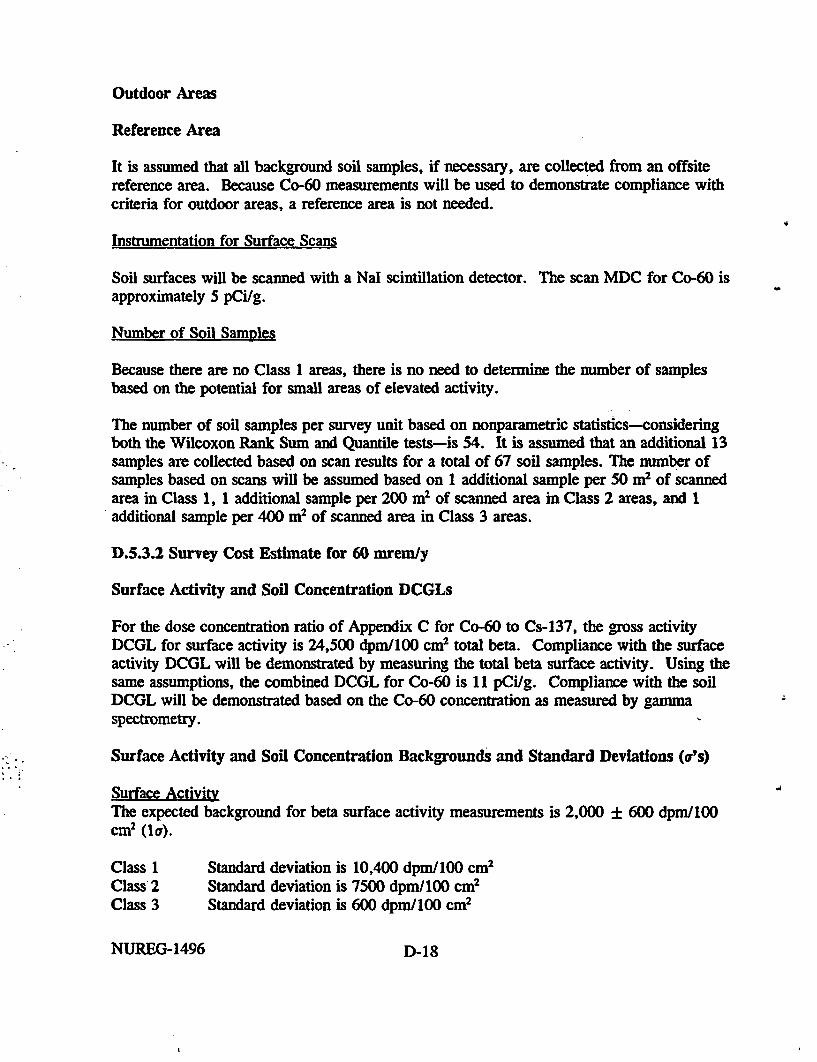
Outdoor Areas
Reference Area
It is assumed that all background soil samples, if necessary, are collected from an offsitereference area. Because Co-60 measurements will be used to demonstrate compliance withcriteria for outdoor areas, a reference area is not needed.
Instrumentation for Surface Scans
Soil surfaces will be scanned with a Nal scintillation detector. The scan MDC for Co-60 isapproximately 5 pCi/g.
Number of Soil Samples
Because there are no Class 1 areas, there is no need to determine the number of samplesbased on the potential for small areas of elevated activity.
The number of soil samples per survey unit based on nonparametric statistics-consideringboth the Wilcoxon Rank Sum and Quantile tests-is 54. It is assumed that an additional 13samples are collected based on scan results for a total of 67 soil samples. The number ofsamples based on scans will be assumed based on 1 additional sample per 50 m2 of scannedarea in Class 1, 1 additional sample per 200 m2 of scanned area in Class 2 areas, and Iadditional sample per 400 m2 of scanned area in Class 3 areas.
D.5.3.2 Survey Cost Estimate for 60 mrem/y
Surface Activity and Soil Concentration DCGLs
For the dose concentration ratio of Appendix C for Co-60 to Cs-137, the gross activityDCGL for surface activity is 24,500 dpm/100 cm2 total beta. Compliance with the surfaceactivity DCGL will be demonstrated by measuring the total beta surface activity. Using thesame assumptions, the combined DCGL for Co-60 is 11 pCi/g. Compliance with the soilDCGL will be demonstrated based on the Co-60 concentration as measured by gammaspectrometry.
Surface Activity and Soil Concentration Backgrounds and Standard Deviations (e's)
Surface ActivityThe expected background for beta surface activity measurements is 2,000 ± 600 dpmlOOcm2 (lo).
Class 1 Standard deviation is 10,400 dpm/lOO cm2
Class 2 Standard deviation is 7500 dpm/100 cm2
Class 3 Standard deviation is 600 dpm/100 cm2
NUREG-1496 D-18

Soil ConcentrationsCo-60 is not expected to be present in background.
Class 1 Standard deviation is 4.4 pCi/gClass 2 Standard deviation is 4 pCi/gClass 3 Standard deviation is 0.2 pCi/g
Indoor Areas
Reference Area
It is assumed that all measurements are performed on concrete in a reference area. Thenumber of measurements equals 6 (from nonparametric statistics).
Instrumentation for Surface Activity Measurements and Scans
Surface activity measurements will be performed with a gas proportional detector; the MDCfor 1 minute measurements is 425 dpm/100 cm2.
The surfaces will be scanned with both a floor monitor (573 cm2) and a 126-cm2 gasproportional detector. The scan MDC for the floor monitor is 3600 dpm/100 cm2 and 2000dpm/100 cm2 for the gas proportional detector. Gamma scans will also be performed overapproximately 80% of the floor areas.
Number of Surface Activity Measurements(based on nonparametric stats or driven by hot spot potential)
Because the scan MDCs are sufficiently below the DCGL, the number of samples in Class1 areas will be determined by nonparametric statistics.
The number of surface activity measurements per survey unit based on nonparametricstatistics-considering both the Wilcoxon Rank Sum and Quantile tests-is 234. It isassumed that an additional 52 measurements are collected based on scan results for a totalof 286 direct surface activity measurements. The number of measurements based on scanswill be assumed based on 1 additional measurement per 10 n2 of scanned area in Class 1,1 additional measurement per 50 e 2 of scanned area in Class 2 and Class 3 areas.
Outdoor Areas
Reference Area
It is assumed that all background soil samples, if necessary, are collected from an offsitereference area. Because Co-60 measurements will be used to demonstrate compliance withcriteria for outdoor areas, a reference area is not needed.
D-19 NUREG-1496

Instrumentation for Surface Scans
Soil surfaces will be scanned with a NaI scintillation detector. The scan MDC for Co-60 isapproximately 5 pCilg.
Number of Soil SaMnles
Because there are no Class 1 areas, there is no need to determine the number of samplesbased on the potential for small areas of elevated activity.
The number of soil samples per survey unit based on nonparametric statistics-consideringboth the Wilcoxon Rank Sum and Quantile tests-is 54. It is assumed that an additional 13samples'are collected based on scan results for a total of 67 soil samples. The number ofsamples based on scans will be assumed based on 1 additional sample per 50 rn2 of scannedarea in Class 1, 1 additional sample per 200 mn2 of scanned area in Class 2 areas, and Iadditional sample per 400 mn2 of scanned area in Class 3 areas.
D.5.3.3 Survey Cost Estimate for 25 mrem/y
Surface Activity and Soil Concentration DCGLs (41's)
For the dose concentration ratio in Appendix C for Co-60 to Cs-137, the gross activityDCGL for surface activity is 10,200 dprn/100 cm2 total beta. Compliance with the surfaceactivity DCGL will be demonstrated by measuring the total beta surface activity. Under thesame assumptions, the combined DCGL for Co-60 is 4.6 pCilg. Compliance with the soilDCGL will be demonstrated based on the Co-60 concentration as measured by gammaspectrometry.
Surface Activity and Soil Concentration Backgrounds and Standard Deviations (e's)
Surface ActivityThe expected background for beta surface activity measurements is 2,000 ±600 dpm/100cm2 (1r).
Class 1 Standard deviation is 6720 dpm/100 cm2~Class 2 Standard deviation is 5400 dpm/100 cm2~Class 3 Standard deviation is 600 dpmnl100 cm2
Soil ConcentrationsCo-60 is not expected to be present in background.
Class 1 Standard deviation is 2.3 pCi/gClass 2 Standard deviation is 2 pCi/gClass 3 Standard deviation is 0.2 pCi/g
NUREG- 1496 D2D-20

Indoor Areas
Reference Area
It is assumed that all measurements are performed on concrete in a reference area. Thenumber of measurements equals 10 (from nonparametric statistics).
Instrumentation for Surface Activity Measurements and Scans
Surface activity measurements will be performed with a gas proportional detector; the MDCfor 1 minute measurements is 425 dpm/100 cm2.
The surfaces will be scanned with both a floor monitor (573 cm2) and a 126-cm2 gasproportional detector. The scan MDC for the floor monitor is 3600 dpm/100 cm2 and 2000dpm/l00 cm2 for the gas proportional detector. Gamma scans will also be performed overapproximately 80% of the floor areas.
Number of Surface Activity Measurements(based on nonparametric stats or driven by hot spot potential)
Because the scan MDCs are sufficiently below the DCGL, the number of samples in Class1 areas will be determined by nonparametric statistics.
The number of surface activity measurements per survey unit based on nonparametricstatistics-considering both the Wilcoxon Rank Sum and Quantile tests-is 322. It isassumed that an additional 52 measurements are collected based on scan results for a totalof 374 direct surface activity measurements. The number of measurements based on scanswill be assumed based on 1 additional measurement per 1) n2 of scanned area in Class 1,1 additional measurement per 50 m2 of scanned area in Class 2 and Class 3 areas.
Outdoor Areas
Reference Area
It is assumed that all background soil samples, if necessary, are collected from an offsitereference area. Because Co-60 measurements will be used to demonstrate compliance withcriteria for outdoor areas, a reference area is not needed.
Instrumentation for Surface Scans
Soil surfaces will be scanned with a Nal scintillation detector. The scan MDC for Co-60 isapproximately 5 pCilg.
D-21 NUREG-1496

Number of Soil Samples
Because there are no Class 1 areas, there is no need to determine the number of samplesbased on the potential for small areas of elevated activity.
The number of soil samples per survey unit based on nonparametric statistics-consideringboth the Wilcoxon Rank Sum and Quantile tests-is 54. It is assumed that an additional 13samples are collected based on scan results for a total of 67 soil samples. The number ofsamples based on scans will be assumed based on 1 additional sample per 50 m2 of scannedarea in Class 1, 1 additional sample per 200 m* of scanned area in Class 2 areas, and 1additional sample per 400 rn2 of scanned area in Class 3 areas.
D.5.3.4 Survey Cost Estimate for 15 mrem/y
Surface Activity and Soil Concentration DCGLs
The DCGL for Co-60 is 5170 dpm/100 cm2 and for Cs-137 is 13,600 dpmlO0 cm2. Usingthe dose concentration ratio of Appendix C for Co-60 to Cs-137, the gross activity DCGLfor surface activity is 6,130 dpm/100 cm2 total beta. Compliance with the surface activityDCGL will be demonstrated by measuring the total beta surface activity. The soilconcentration DCGL is 3.0 pCi/g for Co-60 and 10.7 pCi/g for Cs-137. For the doseconcentration ratio of Appendix C, the combined DCGL for Co-60 is 2.75 pCi/g.Compliance with the soil DCGL will be demonstrated based on the Co-60 concentration asmeasured by gamma spectrometry.
Surface Activity and Soil Concentration Backgrounds and Standard Deviations (e's)
The estimated standard deviations for surface activity and soil concentrations in survey unitsare determined for each area classification. In large part, the estimated standard deviationswere based on results of past survey experience. A general guide for Class 1 areas, it wasassumed that the ratio of the standard deviation (a) to the DCGL (A) increased as theDCGL was lowered from 100 to 3 mrem/y. For example, for DCGLs at 100 and 60mrem/y, a/A is 40%; for DCGL at 25 mrem/y, a/A is 50%; for DCGL at 15 mrem/y, l/Ais 60%; and for DCGL at 3 mrem/y, a/A is 70%. The standard deviations for Class 2areas were estimated to be approximately 50 to 95 % of the Class 1 standard deviations.The standard deviations for Class 3 areas are assumed to be equal to the standard deviationof background-where the contaminant is not present in background and nuclide-specificmeasurements are performed, the standard deviation of background, and therefore thestandard deviation of the Class 3 area, is assumed to be near zero.
Surface ActivitVThe expected background for beta surface activity measurements is 2,000 ± 600 dpm/100cm2 (la).
NUREG-1496 D-22
Class 1 Standard deviation is 3700 dpm/100 cm2
Class 2 Standard deviation is 3000 dpmlOO cm2
Class 3 Standard deviation is 600 dpm/100 cm2
Soil ConcentrationsCo-60 is not expected to be present in background.
Class 1 Standard deviation is 1.7 pCi/gClass 2 Standard deviation is 1.3 pCi/gClass 3 Standard deviation is 0.2 pCi/g
Indoor Areas
Survey Unit Classification
Reference Area
It is assumed that all measurements are performed on concrete in a reference area. Thenumber of measurements equals 9 (from nonparametric statistics).
Class 1 areas include the Hot Cell and Hold-up Tank (HUT) room-all surfaces (floors,walls, and ceilings) in the Hot Cell and the HUT floor and lower walls are considered to beClass 1. It is assumed that the ventilation system has been removed from the facility. Atotal of 2 survey units, measuring 60 and 128 in2 , for a total surface area of 188 rn2 will bescanned.
Class 2 areas include the floor and lower walls in the loading dock, dry waste handlingarea, liquid waste handling area, Isotope Shop, Shielded Work room, and equipment area.The upper walls and ceiling in the HUT are considered to be Class 2. A total of 7 surveyunits, measuring 50 to 300 mn', for a total surface area of 736 in2 , will be scanned.
Class 3 areas consist of the remaining surfaces-floors, walls, and ceilings-on the groundlevel, basement, and second level. The upper walls and ceilings in the Class 2 rooms areclassified as Class 3 areas. A total of 4 survey units, measuring 803 to 1738 i 2, for a totalsurface area of 550 i 2 , will be scanned.
Instrumentation for Surface Activity Measurements and Scans
Surface activity measurements will be performed with a gas proportional detector; the MDCfor I minute measurements is 425 dpm/100 cm 2.
The surfaces will be scanned with both a floor monitor (573 cm2) and a 126-cm2 gasproportional detector. The scan MDC for the floor monitor is 3600 dpm/100 cm2 and 2000dpm/100 cm2 for the gas proportional detector. Gamma scans will also be performed overapproximately 80% of the floor areas.
D-23 NUREG-1496

Number of Surface Activity Measurements(based on nonparametric stats or driven by hot spot potential)
Because the scan MDCs are sufficiently below the DCGL, the number of samples in Class1 areas will be determined by nonparametric statistics.
The number of surface activity measurements per survey unit based on nonparametricstatistics-considering both the Wilcoxon Rank Sum and Quantile tests-is 299. It isassumed that an additional 52 measurements are collected based on scan results for a totalof 351 direct surface activity measurements. The number of measurements based on scanswill be assumed based on 1 additional measurement per 10 zn2 of scanned area in Class 1,1 additional measurement per 50 m2 of scanned area in Class 2 and Class 3 areas.
Outdoor Areas
Survey Unit Classification
Reference Area
It is assumed that all background soil samples, if necessary, are collected from an offsitereference area. Because Co-60 measurements will be used to demonstrate compliance withcriteria for outdoor areas, a reference area is not needed.
No Class 1 areas have been identified.
Class 2 areas include the Waste Storage Area and Stack Plume area. The stack plume areais calculated to cover the radial area 30 m from the stack and is biased toward the southernend of the facility. Class 2 areas include 2 survey units, measuring 270 and 2500 in2 , witha total scan surface area of 2078 in2 .
The Class 3 area consists of the immediate area around the perimeter of the building andincludes 1 survey unit measuring 300 in2 , with a total scan area of 30 i 2 .
Instrumentation for Surface Scans
Soil surfaces will be scanned with a Nal scintillation detector. The scan MDC for Co-60 isapproximately 5 pCilg.
Number of Soil SampIes
Because there are no Class 1 areas, there is no need to determine the number of samplesbased on the potential for small areas of elevated activity.
The number of soil samples per survey unit based on nonparametric statistics-consideringboth the Wilcoxon Rank Sum and Quantile tests-is 54. It is assumed that an additional 13
NUREG-1496 D-24

samples are collected based on scan results for a total of 67 soil samples. The number ofsamples based on scans will be assumed based on 1 additional sample per 50 m2 of scannedarea in Class 1, 1 additional sample per 200 m2 of scanned area in Class 2 areas, and 1additional sample per 400 m2 of scanned area in Class 3 areas.
D.5.3.5 Survey Cost Estimate for 3 mrem/y
Surface Activity and Soil Concentration DCGLs
Using the Appendix C dose concentration ratio for Co-60 to Cs-137, the gross activityDCGL for surface activity is 1220 dpm/100 cm2 total beta. -Compliance with the surfaceactivity DCGL will be demonstrated by measuring the total beta surface activity. Using thesame assumptions, the combined DCGL for Co-60 is 0.55 pCi/g. Compliance with the soilDCGL will be demonstrated based on the Co-60 concentration as measured by gammaspectrometry.
Surface Activity and Soil Concentration Backgrounds and Standard Deviations (a's)
Surface ActivityThe expected background for beta surface activity measurements is 2,000 i 600 dpmnl00cmn (la).
Class 1 Standard deviation is 1400 dpmlOO cm2
Class 2 Standard deviation is 900 dpm/100 cm2
Class 3 Standard deviation is 600 dpm/l00 cm2
Soil ConcentrationsCo-60 is not expected to be present in background.
Class I Standard deviation is 0.39 pCilgClass 2 Standard deviation is 0.27 pCilgClass 3 Standard deviation is 0.2 pCi/g
Indoor Areas
Reference Area
It is assumed that all measurements are performed on concrete in a reference area. Thenumber of measurements equals 23 (from nonparametric statistics).
Instrumentation for Surface Activity Measurements and Scans
Surface activity measurements will be performed with a gas proportional detector; the MDCfor 1 minute measurements is 425 dpm/100 cm2 .
ID-25 NUREG-1496

The surfaces will be scanned with both a floor monitor (573 cm2) and a 126 cm2 gasproportional detector. The scan MDC for the floor monitor is 3600 dpm/100 cm2 and 2000dpm/100 cm2 for the gas proportional detector. Gamma scans will also be performed overapproximately 80% of the floor areas.
Number of Surface Activity Measurements(based on nonparametric stats or driven by hot spot potential)
Because the scan MDC is greater than the DCGL (3600 vs 1220 dpm/100 cm2), the numberof samples in Class 1 areas may be determined based on the potential for small areas ofelevated activity. The area factor is 3.0 and corresponds to an area of approximately 4 m2.When this acceptable elevated area is divided into each survey unit area, the total numberof samples based on hot spot potential is 47.
The number of surface activity measurements per survey unit based on nonparametricstatistics-considering both the Wilcoxon Rank Sum and Quantile tests-is 407 (215 fromClass 2 and 3 areas). It is assumed that an additional 52 measurements are collected basedon scan results for a total of 459 direct surface activity measurements. The number ofmeasurements based on scans will be assumed based on 1 additional measurement per 10m2 of scanned area in Class 1, 1 additional measurement per 50 rn2 of scanned area inClass 2 and Class 3 areas.
Outdoor Areas
Reference Area
It is assumed that all background soil samples, if necessary, are collected from an offsitereference area. Because Co-60 measurements will be used to demonstrate compliance withcriteria for outdoor areas, a reference area is not needed.
Instrumentation for Surface Scans
Soil surfaces will be scanned with a Nal scintillation detector. The scan MDC for Co-60 isapproximately 5 pCi/g.
Number of Soil Samples
Because there are no Class 1 areas, there is no need to determine the number of samplesbased on the potential for small areas of elevated activity.
The number of soil samples per survey unit based on nonparametric statistics-consideringboth the Wilcoxon Rank Sum and Quantile tests-is 54. It is assumed that an additional 13samples are collected based on scan results for a total of 67 soil samples. The number ofsamples based on scans will be assumed based on 1 additional sample per 50 rn2 of scanned
NUREG-1496 D-26
area in Class 1, 1 additional sample per 200 m2 of scanned area in Class 2 areas, and 1additional sample per 400 n2 of scanned area in Class 3 areas.
D.5.4 Uranium Fuel Fabrication Facility
The contaminant is low enriched uranium (3% enriched U-235 by weight); theradionuclides of concern are U-238, U-235, and U-234.
D.5.4.1 Survey Cost Estimate for 100 mrem/y
Surface Activity and Soil Concentration DCGLs
The DCGL for 3% enriched uranium is 4,190 dpm/100 cm2 for total alpha and 1,500dpm/100 cm2 for total beta. Compliance with the surface activity DCGL will bedemonstrated by measuring the alpha surface activity. The soil concentration DCGL is18.9 pCi/g for U-238, 4.7 pCi/g for U-235, and 94.4 pCi/g for U-234-for a total UDCGL of 118 pCi/g. Compliance with the soil DCGL will be demonstrated based on theU-235 concentration as measured by gamma spectrometry.
Surface Activity and Soil Concentration Backgrounds and Standard Deviations (Ws)
Surface ActivitYThe expected background for alpha surface activity measurements is 63 ± 30 dpm/100 cm2
(la).
Class 1 Standard deviation is 1700 dpm/100 cm2
Class 2 Standard deviation is 1200 dpm/100 cm2
Class 3 Standard deviation is 30 dpm/100 cm2
Soil ConcentrationsThe expected background concentration for U-235 in soil is 0.05 ± 0.03 pCi/g (1ar).
Class 1 Standard deviation is 1.9 pCi/gClass 2 Standard deviation is 1.5 pCi/gClass 3 Standard deviation is 0.03 pCi/g
Indoor Areas
Reference Area
It is assumed that all measurements are performed on concrete in a reference area. Thenumber of measurements equals 6 (from nonparametric statistics).
D-27 NUREG-1496
l

Instrumentation for Surface Activity Measurements and Scans
Surface activity measurements will be performed with a gas proportional detector; the MDCfor 1 minute measurements for alpha activity is 130 dpm/100 cm2.
The surfaces will be scanned with both a floor monitor (573 cm2) and a 126-cm2 gasproportional detector. The scan MDC for the floor monitor for alpha is 400 dpm/100 cmand 260 dpm/100 cm2 for the gas proportional detector. Surface scans for beta activity willbe performed in the same areas as alpha scans, but beta scans will not be used forcorrelating the scan MDC and hot spot sampling design. Gamma scans will also beperformed over approximately 50% of the floor areas.
Number of Surface Activity Measurements(based on nonparametric stats or driven by hot spot potential)
Because the scan MDCs are sufficiently below the DCGL, the number of samples in Class1 areas is determined by nonparametric statistics.
The number of surface activity measurements per survey unit for each classification basedon nonparametric statistics-considering both the Wilcoxon Rank Sum and Quantile tests-is3684. It is assumed that an additional 1777 measurements are collected based on scanresults for a total of 5461 direct surface activity measurements. The number ofmeasurements based on scans will be assumed based on 1 additional measurement per 10n2 of scanned area in Class 1, 1 additional measurement per 50 m2 of scanned area inClass 2 and Class 3 areas.
Outdoor Areas
Reference Area
It is assumed that all background soil samples, if necessary, are collected from an offsitereference area. Since U-235 measurements will be used to demonstrate compliance withcriteria for outdoor areas, a reference area is needed. (It should be noted that to measureU-235 at background levels with a gamma spectrometer will require long counts, e.g.,greater than 4 hours). The number of measurements equals 6.
Instrumentation for Surface Scans
Soil surfaces will be scanned with a Nal scintillation detector. The scan MDC for lowenriched uranium is 75 pCi/g.
NUREG-1496 D-28

Number of Soil Samples
Because the Nal scan MDC is less than the DCGL (75 vs. 118 pCi/g), the number ofsamples in Class 1 areas will not be driven by the potential for small areas of elevatedactivity.
The number of soil samples per survey unit, for each classification, based on nonparametricstatistics-considering both the Wilcoxon Rank Sum and Quantile tests-is 475. It isassumed that an additional 574 samples are collected based on scan results for a total of1049 soil samples. The number of samples based on scans will be assumed based on 1additional sample per 50 rn2 of scanned area in Class 1, 1 additional sample per 200 rn2 ofscanned area in Class 2 areas, and 1 additional sample per 400 n2 of scanned area in Class3 areas.
D.5.4.2 Survey Cost Estimate for 60 mrem/y
Surface Activity and Soil Concentration DCGLs
The DCGL for 3% enriched uranium is 2,510 dpm/100 cin for total alpha and 900dpm/100 cm2 for total beta. Compliance with the surface activity DCGL will bedemonstrated by measuring the alpha surface activity. The soil concentration DCGL is11.3 pCilg for U-238, 2.8 pCi/g for U-235, and 56.6 pCi/g for U-234-for a total UDCGL of 70.8 pCi/g. Compliance with the soil DCGL will be demonstrated based on theU-235 concentration as measured by gamma spectrometry.
Surface Activity and Soil Concentration Backgrounds and Standard Deviations (ass)
Surface ActivityThe expected background for alpha surface activity measurements is 63 ± 30 dpm/100 cm2
(Go).
Class 1 Standard deviation is 1030 dpm/100 cm2
Class 2 Standard deviation is 800 dpm/100 cm2
Class 3 Standard deviation is 30 dpm/100 cm2
Soil ConcentrationsThe expected background concentration for U-235 in soil is 0.05 ± 0.03 pCi/g (la).
Class 1 Standard deviation is 1.1 pCi/gClass 2 Standard deviation is 1.0 pCi/gClass 3 Standard deviation is 0.03 pCi/g
D-29 NUREG-1496

Indoor Areas
Reference Area
It is assumed that all measurements are performed on concrete in a reference area. Thenumber of measurements equals 6 (from nonparametric statistics).
Instrumentation for Surface Activity Measurements and Scans
Surface activity measurements will be performed with a gas proportional detector; the MDCfor 1 minute measurements for alpha activity is 130 dpm/100 cm2.
The surfaces will be scanned with both a floor monitor (573 cm2) and a 126-cm2 gasproportional detector. The scan MDC for the floor monitor for alpha is 400 dpm/100 cm2
and 260 dpm100 cm2 for the gas proportional detector. Surface scans for beta activity willbe performed in the same areas as alpha scans, but beta scans will not be used forcorrelating the scan MDC and hot spot sampling design. Gamma scans will be performedover approximately 50% of floor areas.
Number of Surface Activity Measurements(based on nonparametric stats or driven by hot spot potential)
Because the scan MDCs are sufficiently below the DCGL, the number of samples in Class1 areas is determined by nonparametric statistics.
The number of surface activity measurements per survey unit for each classification basedon nonparametric statistics-considering both the Wilcoxon Rank Sum and Quantile tests-is3731. It is assumed that an additional 1777 measurements are collected based on scanresults for a total of 5508 direct surface activity measurements. The number ofmeasurements based on scans will be assumed based on I additional measurement per 10m2 of scanned area in Class 1, 1 additional measurement per 50 m2 of scanned area inClass 2 and Class 3 areas.
Outdoor Areas
Reference Area
It is assumed that all background soil samples, if necessary, are collected from an offsitereference area. Since U-235 measurements will be used to demonstrate compliance withcriteria for outdoor areas, a reference area is needed. (It should be noted that to measureU-235 at background levels with a gamma spectrometer will require long counts, e.g.,greater than 4 hours). The number of measurements equals 6.
NUREG-1496 D-30

Instrumentation for Surface Scans
Soil surfaces will be scanned with a Nal scintillation detector. The scan MDC for lowenriched uranium is 75 pCi/g.
Number of Soil Samples
Because the Nal scan MDC is slightly greater than the DCGL (75 vs. 70.8 pCi/g), thenumber of samples in Class 1 areas is likely not driven by the potential for small areas ofelevated activity. The area factor is 1.07 and corresponds to an area of approximately1,500 m2. When this acceptable elevated area is divided into each survey unit area (2,183m2), the number of samples based on hot spot potential is 2 per survey unit. It is veryunlikely that the number of samples necessary to satisfy the hot spot potential is going to bethe driver because the nonparametric statistics should require more than 2 samples persurvey unit. The total number of samples necessary to satisfy the potential for small areasof elevated activity is 12.
The number of soil samples per survey unit, for each classification, based on nonparametricstatistics-considering both the Wilcoxon Rank Sum and Quantile tests-is 490 (357 inClass 2 and 3 areas). It is assumed that an additional 574 samples are collected based onscan results for a total of 1064 soil samples. The number of samples based on scans willbe assumed based on 1 additional sample per 50 e 2 of scanned area in Class 1, 1 additionalsample per 200 i 2 of scanned area in Class 2 areas, and 1 additional sample per 400 m2 ofscanned area in Class 3 areas.
D.5.4.3 Survey Cost Estimate for 25 mrem/y
Surface Activity and Soil Concentration DCGLs
The DCGL for 3% enriched uranium is 1,050 dpmilO0 cm2 for total alpha and 375dpml100 cm2 for total beta. Compliance with the surface activity DCGL will bedemonstrated by measuring the alpha surface activity. The soil concentration DCGL is 4.7pCilg for U-238, 1.2 pCi/g for U-235, and 23.7 pCi/g for U-234-for a total U DCGL of29.6 pCi/g. Compliance with the soil DCGL will be demonstrated based on the U-235concentration as measured by gamma spectrometry.
Surface Activity and Soil Concentration Backgrounds and Standard Deviations (e's)
Surface ActivityThe expected background for alpha surface activity measurements is 63 ± 30 dpm/100 cm2
(10f).
Class 1 Standard deviation is 500 dpm/100 cm2
Class 2 Standard deviation is 400 dpm/100 cm2
Class 3 Standard deviation is 30 dpm/lO0 cm2
D-31 NUREG-1496
Soil ConcentrationsThe expected background concentration for U-235 in soil is 0.05 ± 0.03 pCi/g (la).
Class 1 Standard deviation is 0.6 pCi/gClass 2 Standard deviation is 0.5 pCi/gClass 3 Standard deviation is 0.03 pCi/g
Indoor Areas
Reference Area
It is assumed that all measurements are performed on concrete in a reference area. Thenumber of measurements equals 7 (from nonparametric statistics).
Instrumentation for Surface Activity Measurements and Scans
Surface activity measurements will be performed with a gas proportional detector; the MDCfor 1 minute measurements for alpha activity is 130 dpm/100 cm2.
The surfaces will be scanned with both a floor monitor (573 cm2) and a 126-cm2 gasproportional detector. The scan MDC for the floor monitor for alpha is 400 dpm/100 cm2
and 260 dpml100 cm2 for the gas proportional detector. Surface scans for beta activity willbe performed in the same areas as alpha scans, but beta scans will not be used forcorrelating the scan MDC and hot spot sampling design. Gamma scans will also beperformed over approximately 50% of the floor areas.
Number of Surface Actvitv Measurements(based on nonparametric stats or driven by hot spot potential)
Because the scan MDCs are sufficiently below the DCGL, the number of samples in Class1 areas is determined by nonparametric statistics.
The number of surface activity measurements per survey unit for each classification basedon nonparametric statistics-considering both the Wilcoxon Rank Sum and Quantile tests-is4177. It is assumed that an additional 1777 measurements are collected based on scanresults for a total of 5954 direct surface activity measurements. The number ofmeasurements based on scans will be assumed based on 1 additional measurement per 10m2 of scanned area in Class 1, 1 additional measurement per 50 m2 of scanned area inClass 2 and Class 3 areas.
NUREG-1496 D-32

Outdoor Areas
Reference Area.
It is assumed that all background soil samples, if necessary, are collected from an offsitereference area. Since U-235 measurements will be used to demonstrate compliance withcriteria for outdoor areas, a reference area is needed. (It should be noted that to measureU-235 at background levels with a gamma spectrometer will require long counts, e.g.,greater than 4 hours). The number of measurements equals 7.
Instrumentation for Surface Scans
Soil surfaces will be scanned with a Nal scintillation detector. The scan MDC for lowenriched uranium is 75 pCi/g.
Number of Soil Samples
Because the NaI scan MDC is greater than the DCGL (75 vs. 29.6 pCi/g), the number ofsamples in Class 1 areas is likely not driven by the potential for small areas of elevatedactivity. The area factor is 2.5 and corresponds to an area of approximately 500 in2.When this acceptable elevated area is divided into each survey unit area (2,183 m2), thenumber of samples based on hot spot potential is 5 per survey unit. It is very unlikely thatthe number of samples necessary to satisfy the hot spot potential is going to be the driverbecause the nonparametric statistics should require more than 5 samples per survey unit.The total number of samples necessary to satisfy the potential for small areas of elevatedactivity is 30.
The number of soil samples per survey unit, for each classification, based on nonparametricstatistics-considering both the Wilcoxon Rank Sum and Quantile tests-is 553 (388 inClass 2 and 3 areas). It is assumed that an additional 574 samples are collected based onscan results for a total of 1127 soil samples. The number of samples based on scans willbe assumed based on 1 additional sample per 50 in2 of scanned area in Class 1, 1 additionalsample per 200 m2 of scanned area in Class 2 areas, and 1 additional sample per 400 i 2 ofscanned area in Class 3 areas.
D.5.4.4 Survey Cost Estimate for 15 mrern/y
Surface Activity and Soil Concentration DCGLs
The DCGL for 3% enriched uranium is 630 dpm/100 cm2 for total alpha and 225 dpin/100ce for total beta. Compliance with the surface activity DCGL will be demonstrated bymeasuring the alpha surface activity. The Level 2 soil concentration DCGL is 2.8 pCi/gfor U-238, 0.71 pCi/g for U-235, and 14.2 pCilg for U-234-for a total U DCGL of 17.7pCi/g. Compliance with the soil DCGL will be demonstrated based on the U-235concentration as measured by gamma spectrometry.
D-33 NUREG-1496

Surface Activity and Soil Concentration Backgrounds and Standard Deviations (e's)
The estimated standard deviations for surface activity and soil concentrations in survey unitsare determined for each area classification. In large part, the estimated standard deviationswere based on results of past survey experience. A general guide for Class 1 areas, it wasassumed that the ratio of the standard deviation (or) to the DCGL (A) increased as theDCGL was lowered from 100 to 3 mrem/y. For example, for DCGLs at 100 and 60mrem/y, o/A is 40%; for DCGL at 25 mrem/y, a/A is 50%; for DCGL at 15 mrem/y, o/Ais 60%; and for DCGL at 3 mrem/y, aoA is 70%. The standard deviations for Class 2areas were estimated to be approximately 50 to 95% of the Class 1 standard deviations.The standard deviations for Class 3 areas are assumed to be equal to the standard deviationof background-where the contaminant is not present in background and nuclide-specificmeasurements are performed, the standard deviation of background, and therefore thestandard deviation of the Class 3 area, is assumed to be near zero.
Surface ActivityThe expected background for alpha surface activity measurements is 63 ± 30 dpm/100 cm2
(1o).
Class 1 Standard deviation is 410 dpml100 cm2
Class 2 Standard deviation is 300 dpm/100 cm2
Class 3 Standard deviation is 30 dpm/100 cm2
Soil ConcentrationsThe expected background concentration for U-235 in soil is 0.05 i 0.03 pCi/g (lar).
Class 1 Standard deviation is 0.45 pCi/gClass 2 Standard deviation is 0.35 pCilgClass 3 Standard deviation is 0.03 pCi/g
Indoor Areas
Survey Unit Classification
Reference Area
It is assumed that all measurements are performed on concrete in a reference area. Thenumber of measurements equals 10 (from nonparametric statistics).
Class 1 areas include the floors, walls, and ceilings in the process buildings. A total of133 survey units, each measuring 100 in2, for a total surface area of 13,300 m'2 will bescanned.
NUREG-1496 D-34

Class 2 areas include the floors, walls and ceilings in the process buildings. A total of 46survey units, 50% measuring 500 in2 , and 50% measuring 642 i 2, for a total surface areaof 19,843 i 2, will be scanned.
Class 3 areas consist of the upper walls and ceilings for the process buildings. A total of 5survey units, each measuring 5472 e 2 , for a total surface area of 2736 i 2 , will be scanned.
Instrumentation for Surface Activity Measurements and Scans
Surface activity measurements will be performed with a gas proportional detector; the MDCfor I minute measurements for alpha activity is 130 dpm/100 cm2.
The surfaces will be scanned with both a floor monitor (573 cm2) and a 126-cm2 gasproportional detector. The scan MDC for the floor monitor for alpha is 400 dpmlOO cm2
and 260 dpm/100 cm2 for the gas proportional detector. Surface scans for beta activity willbe performed in the same areas as alpha scans, but beta scans will not be used forcorrelating the scan MDC and hot spot sampling design. Gamma scans will also beperformed over approximately 50% of the floor areas.
Number of Surface Activity Measurements(based on nonparametric stats or driven by hot spot potential)
Because the scan MDCs are sufficiently below the DCGL, the number of samples in Class1 areas is determined by nonparametric statistics.
The number of surface activity measurements per survey unit for each classification basedon nonparametric statistics-considering both the Wilcoxon Rank Sum and Quantile tests-is5696. It is assumed that an additional 1777 measurements are collected based on scanresults for a total of 7473 direct surface activity measurements. The number ofmeasurements based on scans will be assumed based on 1 additional measurement per 10mn of scanned area in Class 1, 1 additional measurement per 50 m2 of scanned area inClass 2 and Class 3 areas.
Outdoor Areas
Survey Unit Classification
Reference Area
It is assumed that all background soil samples, if necessary, are collected from an offsitereference area. Since U-235 measurements will -be used to demonstrate compliance withcriteria for outdoor areas, a reference area is needed. (It should be noted that to measureU-235 at background levels with a gamma spectrometer will require long counts, e.g.,greater than 4 hours). The number of measurements equals 9.
D-35 NUREG-1496

Class 1 areas include a total of 6 survey units, each measuring 2183 2 , with a totalsurface area of 13,098 tn2 that will be scanned.
Class 2 areas include a total of 15 survey units, each measuring 4948 m2, with a total scansurface area of 55,665 in2 .
Class 3 areas include a total of 5 survey units, each measuring 26,196 i 2, with a total scansurface area of 13,098 mn.
Instrumentation for Surface Scans
Soil surfaces will be scanned with a NaI scintillation detector. The scan MDC for lowenriched uranium is 75 pCi/g.
Number of Soil Samples
Because the Nal scan MDC is greater than the DCGL (75 vs. 17.7 pCi/g), the number ofsamples in Class 1 areas may be driven by the potential for small areas of elevated activity.The area factor is 4.2 (considering the weighted area factor for the isotopic ratios of 3%enriched uranium) and corresponds to an area of approximately 300 rn2 . When thisacceptable elevated area is divided into each survey unit area (2183 in2), the number ofsamples based on hot spot potential is 8 (rounding up), which is likely not going to be thedriver because the nonparametric statistics should require more than 8 samples per surveyunit. The total number of samples necessary to satisfy the potential for small areas ofelevated activity is 48.
The number of soil samples per survey unit, for each classification, based on nonparametricstatistics-considering both the Wilcoxon Rank Sum and Quantile tests-is 643 (434 inClass 2 and 3 areas). It is assumed that an additional 574 samples are collected based onscan results for a total of 1217 soil samples. The number of samples based on scans willbe assumed based on 1 additional sample per 50 rn2 of scanned area in Class 1, 1 additionalsample per 200 rn2 of scanned area in Class 2 areas, and 1 additional sample per 400 mi2 ofscanned area in Class 3 areas.
D.5.4.5 Survey Cost Estimate for 3 mrem/y
Surface Activity and Soil Concentration DCGLs
The DCGL for 3% enriched uranium is 130 dpm/100 cm2 for total alpha and 50 dpm/100cm2 for total beta. Compliance with the surface activity DCGL will be demonstrated bymeasuring the alpha surface activity. The soil concentration DCGL is 0.57 pCi/g for U-238, 0.14 pCi/g for U-235, and 2.83 pCi/g for U-234-for a total U DCGL of 3.5 pCi/g.Compliance with the soil DCGL will be demonstrated based on the U-235 concentration asmeasured by gamma spectrometry.
NUREG-1496 D-36

Surface Activity and Soil Concentration Backgrounds and Standard Deviations (a's)
Surface ActivityThe expected background for alpha surface activity measurements is 63 ± 30 dpm/100 cm2
(1~).
Class 1 Standard deviation is 110 dpmlOO cm2
Class 2 Standard deviation is 80 dpmIIOO cm2
Class 3 Standard deviation is 30 dpm/100 cmn2
Soil ConcentrationsThe expected background concentration for U-235 in soil is 0.05 ± 0.03 pCilg (hir).
Class 1 Standard deviation is 0.1 pCi/gClass 2 Standard deviation is 0.07 pCi/gClass 3 Standard deviation is 0.03 pCi/g
Indoor Areas
Reference Area
It is assumed that all measurements are performed on concrete in a reference area. Thenumber of measurements equals 19 (from nonparametric statistics).
Instrumentation for Surface Activity Measurements and Scans
Surface activity measurements will be performed with a gas proportional detector; the MDCfor 5 minute measurements for alpha activity is 51 dpm/100 cm2.
The surfaces will be scanned with both a floor monitor (573 cm2) and a 126-cm2 gasproportional detector. The scan MDC for the floor monitor for alpha is 400 dpml100 cm2
and 260 dpm/100 cm2 for the gas proportional detector. Surface scans for beta activity willbe performed in the same areas as alpha scans, but beta scans win not be used forcorrelating the scan MDC and hot spot sampling design. Gamma scans wili also beperformed over approximately 50% of the floor areas.
Number of Surface Actvity Measurements(based on nonparametric stats or driven by hot spot potential)
Because the scan MDC is greater than the DCGL (400 vs 130 dpm/100 cme), the numberof samples in Class 1 areas may be determined based on the potential for- small areas ofelevated activity. The area factor is 3.1 and corresponds to an area of approximately 12m2. When this acceptable elevated area is divided into each survey unit area (100 M2 ), thenumber of samples based on hot spot potential is 8. It is very unlikely that the number ofsamples necessary to satisfy the hot spot potential is going to be the driver because the
1)-37 NUREG-1496

nonparametric statistics should require more than 8 samples per survey unit. The totalnumber of samples necessary to satisfy the potential for small areas of elevated activity is1064.
The number of surface activity measurements per survey unit for each classification basedon nonparametric statistics-considering both the Wilcoxon Rank Sum and Quantile tests-is4416 (802 from Class 2 and 3 areas). It is assumed that an additional 1777 measurementsare collected based on scan results for a total of 6193 direct surface activity measurements.The number of measurements based on scans will be assumed based on 1 additionalmeasurement per 10 in2 of scanned area in Class 1, 1 additional measurement per 50 m2 ofscanned area in Class 2 and Class 3 areas.
Outdoor Areas
Reference Area
It is assumed that all background soil samples, if necessary, are collected from an offsitereference area. Since U-235 measurements will be used to demonstrate compliance withcriteria for outdoor areas, a reference area is needed. (It should be noted that to measureU-235 at background levels with a gamma spectrometer will require long counts, e.g.,greater than 4 hours). The number of measurements equals 11.
Instrumentation for Surface Scans
Soil surfaces will be scanned with a NaI scintillation detector. The scan MDC for lowenriched uranium is 75 pCi/g.
Number of Soil Samples
Because the NaI scan MDC is significantly greater than the DCGL (75 vs. 3.5 pCi/g), thenumber of samples in Class 1 areas will be driven by the potential for small areas ofelevated activity. The area factor is 21.4 and corresponds to an area of approximately 8nin. When this acceptable elevated area is divided into each survey unit area (2,183 m2),the number of samples based on hot spot potential is 273 per survey unit. The total numberof samples necessary to satisfy the potential for small areas of elevated activity is 1638.-
The number of soil samples per survey unit, for each classification, based on nonparametricstatistics-considering both the Wilcoxon Rank Sum and Quantile tests-is 527 (286 inClass 2 and 3 areas). It is assumed that an additional 574 samples are collected based onscan results for a total of 2509 soil samples. The number of samples based on scans willbe assumed based on 1 additional sample per 50 rn2 of scanned area in Class 1, 1 additionalsample per 200 m2 of scanned area in Class 2 areas, and 1 additional sample per 400 ni2 ofscanned area in Class 3 areas.
NUREG-1496 D-38

D.5.5 Rare Metal Extraction Facility
The contaminants are Th-232 and Ra-226-both assumed to be in secular equilibrium withtheir progeny.
D.5.5.1 Survey Cost Estimate for 100 mrem/y
Surface Activity and Soil Concentration DCGLs
The DCGL for Th-232 is 2,320 dpm/100 cm2 for total alpha and 1550 dpm/100 cm2 fortotal beta. Compliance with the surface activity DCGL will be demonstrated by measuringthe alpha surface activity. The soil concentration DCGL is 5.7 pCi/g for Th-232 and 3.3pCi/g for Ra-226. Compliance with the soil DCGL will be demonstrated based on the Th-232 concentration as measured by gamma spectrometry.
Surface Activity and Soil Concentration Backgrounds and Standard Deviations (e's)
Surface ActivityThe expected background for alpha surface activity measurements is 63 ± 30 dpm/100 cm2
(la)-
Class 1 Standard deviation is 960 dpmllOO cm2
Class 2 Standard deviation is 800 dpm/100 cm2
Class 3 Standard deviation is 30 dprn/100 cm2
Soil ConcentrationsThe expected background concentration for Th-232 in soil is 1.0 i 0.4 pCi/g (la).
Class 1 Standard deviation is 2.7 pCi/gClass 2 Standard deviation is 2 pCi/gClass 3 Standard deviation is 0.4 pCi/g
Indoor Areas
Reference Area
It is assumed that all measurements are performed on concrete in a reference area. Thenumber of measurements equals 6 (from nonparametric statistics).
Instrumentation for Surface Activity Measurements and Scans
Surface activity measurements will be performed with a gas proportional detector; the MDCfor 1 minute measurements for alpha activity is 130 dpm/100 cm2 .
D-39 NUREG-1496

The surfaces will be scanned with both a floor monitor (573 cm2) and a 126-cm2 gasproportional detector. The scan MDC for the floor monitor for alpha is 400 dpm/100 cm2and 260 dpm/100 cm2 for the gas proportional detector. Surface scans for beta activity willbe performed in the same areas as alpha scans, but beta scans will not be used forcorrelating the scan MDC and hot spot sampling design. Gamma scans will also beperformed over approximately 50% of the floor areas.
Number of Surface Activity Measurements(based on nonparametric stats or driven by hot spot potential)
Because the scan MDC is less than the DCGL (400 vs 2320 dpm/100 cm2), the number ofsamples in Class 1 areas will not be determined based on the potential for small areas ofelevated activity.
The number of surface activity measurements per survey unit for each classification basedon nonparametric statistics-considering both the Wilcoxon Rank Sum and Quantile tests-is2929. It is assumed that an additional 1051 measurements are collected based on scanresults for a total of 3980 direct surface activity measurements. The number ofmeasurements based on scans will be assumed based on 1 additional measurement per 10mn2 of scanned area in Class 1, 1 additional measurement per 50 in2 of scanned area inClass 2 and Class 3 areas.
Outdoor Areas
Reference Area
It is assumed that all background soil samples, if necessary, are collected from an offsitereference area. Since Th-232 measurements will be used to demonstrate compliance withcriteria for outdoor areas, a reference area is needed. The number of measurements equals7.
Instrumentation for Surface Scans
Soil surfaces will be scanned with a NaI scintillation detector. The scan MDC for Th-232is 5 pCi/g.
Number of Soil Samples
Because the Nal scan MDC is less than the DCGL (5 vs. 5.7 pCi/g), the number ofsamples in Class 1 areas will not be driven by the potential for small areas of elevatedactivity.
The number of soil samples per survey unit based on nonparametric statistics-consideringboth the Wilcoxon Rank Sum and Quantile tests-is 173. It is assumed that an additional197 samples are collected based on scan results for a total of 370 soil samples. The
NUREG-1496 D-40

number of samples based on scans will be assumed based on 1 additional sample per 50 m2
of scanned area in Class 1 and Class 2 areas, and 1 additional sample per 400 m2 ofscanned area in Class 3 areas.
D.5.5.2 Survey Cost Estimate for 60 mrem/y
Surface Activity and Soil Concentration DCGLs
The DCGL for Th-232 is 1,390 dpm/100 cm2 for total alpha and 930 dpm100 cm2 for totalbeta. Compliance with the surface activity DCGL will be demonstrated by measuring thealpha surface activity. The soil concentration DCGL is 3.4 pCi/g for Th-232 and 2 pCi/gfor Ra-226. Compliance with the soil DCGL will be demonstrated based on the Th-232concentration as measured by gamma spectrometry.
Surface Activity and Soil Concentration Backgrounds and Standard Deviations (a's)
Surface ActivitVThe expected background for alpha surface activity measurements is 63 : 30 dpmf100 cm2
(lar).
Class 1 Standard deviation is 590 dpm/lOO cm2
Class 2 Standard deviation is 500 dpmlOO cm2
Class 3 Standard deviation is 30 dpm/100 cm2
Soil ConcentrationsThe expected background concentration for Th-232 in soil is 1.0 ± 0.4 pCi/g (la).
Class 1 Standard deviation is 1.8 pCi/gClass 2 Standard deviation is 1.5 pCi/gClass 3 Standard deviation is 0.4 pCi/g
Indoor Areas
Reference Area
It is assumed that all measurements are performed on concrete in a reference area. Thenumber of measurements equals 6 (from nonparametric statistics).
Instrumentation for Surface Activity Measurements and Scans
Surface activity measurements will be performed with a gas proportional detector; the MDCfor 1 minute measurements for alpha activity is 130 dpm/100 cm2.
The surfaces will be scanned with both a floor monitor (573 cm2) and a 126-cm2 gasproportional detector. The scan MDC for the floor monitor for alpha is 400 dpm/100 cm2
D41 NUREG-1496

and 260 dpm/100 cm2 for the gas proportional detector. Surface scans for beta activity willbe performed in the same areas as alpha scans, but beta scans will not be used forcorrelating the scan MDC and hot spot sampling design. Gamma scans will also beperformed over approximately 50% of the floor areas.
Number of Surface Activity Measurements(based on nonparametric stats or driven by hot spot potential)
Because the scan MDC is less than the DCGL (400 vs 1390 dpminlOO cm2), the number ofsamples in Class 1 areas will not be determined based on the potential for small areas ofelevated activity.
The number of surface activity measurements per survey unit for each classification basedon nonparametric statistics-considering both the Wilcoxon Rank Sum and Quantile tests-is2987. It is assumed that an additional 1051 measurements are collected based on scanresults for a total of 4038 direct surface activity measurements. The number ofmeasurements based on scans will be assumed based on I additional measurement per 10zn2 of scanned area in Class 1, 1 additional measurement per 50 mn of scanned area inClass 2 and Class 3 areas.
Outdoor Areas
Reference Area
It is assumed that all background soil samples, if necessary, are collected from an offsitereference area. Since Th-232 measurements will be used to demonstrate compliance withcriteria for outdoor areas, a reference area is needed. The number of measurements equals8.
Instrumentation for Surface Scans
Soil surfaces will be scanned with a Nal scintillation detector. The scan MDC for Th-232is 5 pCi/g.
Number of Soil Samples
Because the NaI scan MDC is greater than the DCGL (5 vs. 3.4 pCilg), the number ofsamples in Class 1 areas may be driven by the potential for small areas of elevated activity.The area factor is 1.5 and corresponds to an area of approximately 300 in2 . When thisacceptable elevated area is divided into each survey unit area (2324 m2), the number ofsamples based on hot spot potential is 8 per survey unit. It is very unlikely that the numberof samples necessary to satisfy the hot spot potential is going to be the driver because thenonparametric statistics should require more than 8 samples per survey unit. The totalnumber of samples necessary to satisfy the potential for small areas of elevated activity is32.
NUREG-1496 D-42

The number of soil samples per survey unit based on nonparametric statistics-consideringboth the Wilcoxon Rank Sum and Quantile tests-is 190 (73 in class 2 and 3 areas). It isassumed that an additional 197 samples are collected based on scan results for a total of 387soil samples. The number of samples based on scans will be assumed based on 1 additionalsample per 50 m2 of scanned area in Class 1 and Class 2 areas, and 1 additional sample per400 tn2 of scanned area in Class 3 areas.
D.5.5.3 Survey Cost Estimate for 25 mremly
Surface Activity and Soil Concentration DCGLs
The DCGL for Th-232 is 580 dpm/100 cm2 for total alpha and 390 dpm/100 cm2 for totalbeta. Compliance with the surface activity DCGL will be demonstrated by measuring thealpha surface activity. The soil concentration DCGL is 1.4 pCi/g for Th-232 and 0.84pCi/g for Ra-226. Compliance with the soil DCGL will be demonstrated based on the Th-232 concentration as measured by gamma spectrometry.
Surface Activity and Soil Concentration Backgrounds and Standard Deviations (ass)
Surface ActivityThe expected background for alpha surface activity measurements is 63 i 30 dpm/100 cm2
(lIo).
Class 1 Standard deviation is 320 dpmlO0 cm2
Class 2 Standard deviation is 300 dpm/100 cm2
Class 3 Standard deviation is 30 dpniIOO cm2 .
Soil ConcentrationsThe expected background concentration for Th-232 in soil is 1.0 ± 0.4 pCi/g (lo).
Class 1 Standard deviation is 1.1 pCi/gClass 2 Standard deviation is 1 pCi/gClass 3 Standard deviation is 0.4 pCi/g
Indoor Areas
Reference Area
It is assumed that all measurements are performed on concrete in a reference area. Thenumber of measurements equals 8 (from nonparametric statistics).
Instrumentation for Surface Activity Measurements and Scans
Surface activity measurements will be performed with a gas proportional detector; the MDCfor 1 minute measurements for alpha activity is 130 dpmlO0 cm2.
D-43 NUREG-1496

The surfaces will be scanned with both a floor monitor (573 cm2) and a 126-cm2 gasproportional detector. The scan MDC for the floor monitor for alpha is 400 dpm/100 cm2
and 260 dpm/100 cm2 for the gas proportional detector. Surface scans for beta activity willbe performed in the same areas as alpha scans, but beta scans will not be used forcorrelating the scan MDC and hot spot sampling design. Gamma scans will also beperformed over approximately 50% of the floor areas.
Number of Surface Activity Measurements(based on nonparametric stats or driven by hot spot potential)
Because the scan MDC is less than the DCGL (400 vs 580 dpm/100 cm2), the number ofsamples in Class 1 areas will not be determined based on the potential for small areas ofelevated activity.
The number of surface activity measurements per survey unit for each classification basedon nonparametric statistics-considering both the Wilcoxon Rank Sum and Quantile tests-is3865. It is assumed that an additional 1051 measurements are collected based on scanresults for a total of 4916 direct surface activity measurements. The number ofmeasurements based on scans will be assumed based on I additional measurement per 10mr of scanned area in Class 1, 1 additional measurement per 50 i 2 of scanned area inClass 2 and Class 3 areas.
Outdoor Areas
Reference Area
It is assumed that all background soil samples, if necessary, are collected from an offsitereference area. Since Th-232 measurements will be used to demonstrate compliance withcriteria for outdoor areas, a reference area is needed. The number of measurements equals13.
Instrumentation for Surface Scans
Soil surfaces will be scanned with a Nal scintillation detector. The scan MDC for Th-232is 5 pCi/g.
Number of Soil Samples
Because the Nal scan MDC is greater than the DCGL (5 vs. 1.4 pCi/g), the number ofsamples in Class 1 areas will be driven by the potential for small areas of elevated activity.The area factor is 3.6 and corresponds to an area of approximately 8 in2. When thisacceptable elevated area is divided into each survey unit area (2324 m2), the number ofsamples based on hot spot potential is 290 per survey unit. The total number of samplesnecessary to satisfy the potential for small areas of elevated activity is 1160.
NUREG-1496 D-44

The number of soil samples per survey unit based on nonparametric statistics-consideringboth the Wilcoxon Rank Sum and Quantile tests-is 288 (93 in Class 2 and 3 areas). It isassumed that an additional 197 samples are collected based on scan results for a total of1463 soil samples. The number of samples based on scans will be assumed based on 1additional sample per 50 m2 of scanned area in Class 1 and Class 2 areas, and 1 additionalsample per 400 xn2 of scanned area in Class 3 areas.
D.5.5.4 Survey Cost Estimate for IS mremn/y
Surface Activity and Soil Concentration DCGLs
The DCGL for Th-232 is 348 dpm/100 cm2 for total alpha and 232 dpm/100 cm2 for totalbeta. Compliance with the surface activity DCGL will be demonstrated by measuring thealpha surface activity. The soil concentration DCGL is 0.85 pCi/g for Th-232 and 0.5pCi/g for Ra-226. Compliance with the soil DCGL will be demonstrated based on the Th-232 concentration as measured by gamma spectrometry.
Surface Activity and Soil Concentration Backgrounds and Standard Deviations (¢'s)
The estimated standard deviations for surface activity and soil concentrations in survey unitsare determined for each area classification. In large part, the estimated standard deviationswere based on results of past survey experience. A general guide for Class 1 areas, it wasassumed that the ratio of the standard deviation (ar) to the DCGL (A) increased as theDCGL was lowered from 100 to 3 mremny. For example, for DCGLs at 100 and 60mrem/y, a/A is 40%; for DCGL at 25 mrem/y, u/A is 50%; for DCGL at 15 mrem/y, c/Ais 60%; and for DCGL at 3 mrem/y, or/A is 70%. The standard deviations for Class 2areas were estimated to be approximately 50 to 95% of the Class 1 standard deviations.The standard deviations for Class 3 areas are assumed to be equal to the standard deviationof background-where the contaminant is not present in background and nuclide-specificmeasurements are performed, the standard deviation of background, and therefore thestandard deviation of the Class 3 area, is assumed to be near zero.
Surface ActivityThe expected background for alpha surface activity measurements is 63 + 30 dpm/100 cm2
(la).
Class 1 Standard deviation is 240 dpm/100 cm2
Class 2 Standard deviation is 190 dpm/100 cm2
Class 3 Standard deviation is 30 dpm/100 cm2
Soil ConcentrationsThe expected background concentration for Th-232 in soil is 1.0 ± 0.4 pCi/g (la).
Class 1 Standard deviation is 0.91 pCi/gClass 2 Standard deviation is 0.82 pCi/g
- D-45 NUREG-1496

Class 3 Standard deviation is 0.4 pCi/g
Indoor Areas
Survey Unit Classification
Reference Area
It is assumed that all measurements are performed on concrete in a reference area. Thenumber of measurements equals 10 (from nonparametric statistics).
Class 1 areas include the floors and walls in the process and miscellaneous buildings. Atotal of 78 survey units, each measuring 62 to 93 in2, with a total surface area of 7161 mi,will be scanned.
Class 2 areas include the floors and lower walls in the process and miscellaneous buildings.A total of 58 survey units, each 62 to 517 mi, with a total surface area of 14,530 m2, willbe scanned.
Class 3 areas consist of the upper walls and ceilings for the process buildings and allsurfaces in the outbuildings. A total of 13 survey units, each measuring 496 to 4647 mi,with a total surface area of 1900 in2, will be scanned.
Instrumentation for Surface Activity Measurements and Scans
Surface activity measurements will be performed with a gas proportional detector; the MDCfor 1 minute measurements for alpha activity is 130 dpm/100 cm2.
The surfaces will be scanned with both a floor monitor (573 cm2) and a 126-cm 2 gasproportional detector. The scan MDC for the floor monitor for alpha is 400 dpm/100 cm2
and 260 dpm/100 cm2 for the gas proportional detector. Surface scans for beta activity willbe performed in the same areas as alpha scans, but beta scans will not be used forcorrelating the scan MDC and hot spot sampling design. Gamma scans will also beperformed over approximately 50% of the floor areas.
Number of Surface Activity Measurements(based on nonparametric stats or driven by hot spot potential)
Because the scan MDC is just above the DCGL (400 vs 348 dpm/100 cm2), the number ofsamples in Class 1 areas may be determined based on the potential for small areas ofelevated activity. The area factor is 1.2 and corresponds to an area of approximately 25m2 . When this acceptable elevated area is divided into each survey unit area, the totalnumber of samples based on hot spot potential is 319. It is very unlikely that the numberof samples necessary to satisfy the hot spot potential is going to be the driver because thenonparametric statistics should require more than 4 samples per survey unit.
NUREG-1496 D-46

The munber of surface activity measurements per survey unit for each classification basedon nonparametric. statistics-considering both the Wilcoxon Rank Sum and Quantile tests-is4491 (1671 in Class 2 and 3 areas). It is assumed that an additional 1051 measurementsare collected based on scan results for a total of 5542 direct surface activity measurements.The number of measurements based on scans will be assumed based on 1 additionalmeasurement per 10 e 2 of scanned area in Class 1, 1 additional measurement per 50 e 2 ofscanned area in Class 2 and Class 3 areas.
Outdoor Areas
Survey Unit Classification
Reference Area
It is assumed that all background soil samples, if necessary, are collected from an offsitereference area. Since Th-232 measurements will be used to demonstrate compliance withcriteria for outdoor areas, a reference area is needed. The number of measurements equals21.
Class 1 areas include a total of 4 survey units, each measuring 2324 xn2 , with a totalsurface area of 9,296 m2 that will be scanned.
Class 2 areas include 1 survey unit, measuring 929 in2 , with a total scan surface area of697 mn2 .
Class 3 areas include a total of 4 survey units, each measuring 3718 to 7435 in2, with atotal scan surface area of 2600 i 2.
Instrumentation for Surface Scans
Soil surfaces will be scanned with a Nal scintillation detector. The scan MDC for Th-232is 5 pCilg.
Number of Soil SamIles
Because the Nal scan MDC is greater than the DCGL (5 vs. 0.85 pCilg), the number ofsamples in Class 1 areas may be driven by the potential for small areas of elevated activity.The area factor is 5.9 and corresponds to an area of approximately 3 in. When thisacceptable elevated area is divided into each survey unit area (2324 m2), the number ofsamples based on hot spot potential is 775, which is going to be the driver for class I areasbecause the nonparametric statistics will require fewer than 775 samples per survey unit.The total number of samples necessary to satisfy the potential for small areas of elevatedactivity is 3100.
D-47 . NUREG-1496

The number of soil samples per survey unit based on nonparametric statistics-consideringboth the Wilcoxon Rank Sum and Quantile tests-is 422 (136 in Class 2 and 3 areas). It isassumed that an additional 197 samples are collected based on scan results for a total of3454 soil samples. The number of samples based on scans will be assumed based on 1additional sample per 50 m2 of scanned area in Class 1 and Class 2 areas, and 1 additionalsample per 400 zn2 of scanned area in Class 3 areas.
D.5.5.5 Survey Cost Estimate for 3 mremly
Surface Activity and Soil Concentration DCGLs
The DCGL for Th-232 is 70 dpm/100 cm2 for total alpha and 47 dpm/100 cm2 for totalbeta. Compliance with the surface activity DCGL will be demonstrated by measuring thealpha surface activity. The soil concentration DCGL is 0.17 pCi/g for Th-232 and 0.1pCilg for Ra-226. Compliance with the soil DCGL will be demonstrated based on the Th-232 concentration as measured by gamma spectrometry.
Surface Activity and Soil Concentration Backgrounds and Standard Deviations (O's)
Surface ActivityThe expected background for alpha surface activity measurements is 63 ± 30 dpm/100 cm2
(la).
Class I Standard deviation is 80 dpm/100 cm2
Class 2 Standard deviation is 50 dpm/100 cm2
Class 3 Standard deviation is 30 dpm/100 cm2
Soil ConcentrationsThe expected background concentration for Th-232 in soil is 1.0 ± 0.4 pCi/g (lo).
Class 1 Standard deviation is 0.52 pCi/gClass 2 Standard deviation is 0.48 pCilgClass 3 Standard deviation is 0.4 pCi/g
Indoor Areas
Reference Area
It is assumed that all measurements are performed on concrete in a reference area. Thenumber of measurements equals 38 (from nonparametric statistics).
Instrumentation for Surface Activity Measurements and Scans
Surface activity measurements will be performed with a gas proportional detector; the MDCfor 10 minute measurements for alpha activity is 35 dpm/100 cm2.
NUREG-1496 D-48

The surfaces will be scanned with both a floor monitor (573 cm2) and a 126-cm 2 gasproportional detector. The scan MDC for the floor monitor for alpha is 400 dpmzlOO cm2
and 260 dpmlOO cm2 for the gas proportional detector. Surface scans for beta activity willbe performed in the same areas as alpha scans, but beta scans will not be used forcorrelating the scan MDC and hot spot sampling design. Gamma scans will also beperformed over approximately 50% of the floor areas.
Number of Surface Activity Measurements(based on nonparametric stats or driven by hot spot potential)
Because the scan MDC is greater than the DCGL (400 vs 70 dpm/100 cm2), the number ofsamples in Class 1 areas may be determined based on the potential for small areas ofelevated activity. The area factor is 5.7 and corresponds to an area of approximately 6 in2 .When this acceptable elevated area is divided into each survey unit area, the total numberof samples based on hot spot potential is 1268.
The number of surface activity measurements per survey unit for each classification basedon nonparametric statistics-considering both the Wilcoxon Rank Sum and Quantile tests-is3907 (975 in Class 2 and 3). It is assumed that an additional 1051 measurements arecollected based on scan results for a total of 4958 direct surface activity measurements.The number of measurements based on scans will be assumed based on 1 additionalmeasurement per 10 m2 of scanned area in Class 1, 1 additional measurement per 50 m2 ofscanned area in Class 2 and Class 3 areas.
Outdoor Areas
Reference Area
It is assumed that all background soil samples, if necessary, are collected from an off-sitereference area. Since Th-232 measurements will be used to demonstrate compliance withcriteria for outdoor areas, a reference area is needed. The number of measurements equals236.
Instrumentation for Surface Scans
Soil surfaces will be scanned with a Nal scintillation detector. The scan MDC for Th-232is 5 pCi/g.
Number of Soil Samples
Because the Nal scan MDC is greater than the DCGL (5 vs. 0.17 pCi/g), the number ofsamples in Class I areas will be driven by the potential for small areas of elevated activity.The area factor is 29.4 and corresponds to an area less than 1 n2. When this acceptableelevated area is divided into each survey unit area (2324 m), the number of samples based
D-49 NUREG-1496

on hot spot potential is 2324 per survey unit. The total number of samples necessary tosatisfy the potential for small areas of elevated activity is 9296.
The number of soil samples per survey unit based on nonparametric statistics-consideringboth the Wilcoxon Rank Sum and Quantile tests-is 2404 (1161 in Class 2 and 3 areas). Itis assumed that an additional 197 samples are collected based on scan results for a total of10,890 soil samples. The number of samples based on scans will be assumed based on 1additional sample per 50 m2 of scanned area in Class 1 and Class 2 areas, and 1 additionalsample per 400 mn of scanned area in Class 3 areas.
D.6 Results
A breakdown of survey costs for each reference facility is provided in Tables D. 1.1through D.4.6. In Figures D.1 through 4, the increasing total cost is shown as a functionof decreasing residual dose criteria for each reference facility. For the reference facilities,the increase in cost becomes apparent at 3 mrem/y and below.
D.7 Relative Costs of Conducting Other Radiological Surveys for Decommissioning
As part of the decommissioning process, the cost of surveys other than that of the finalstatus survey should be considered; mainly, that associated with scoping, characterization,remediation control, and confirnatory surveys (MARS, 1996). The scoping surveyprovides preliminary data used in planning the next phases of the decommissioningactivities. It is typically a 1-5 % effort compared to that of a final survey.
The characterization survey may involve the greatest effort. In planning a characterizationsurvey, it should be remembered that some of the survey data that are below the guidelinevalues and are from unremediated areas may not have to be duplicated and could later beused as final survey results. However, without the specific condition of a given facility, itis difficult to estimate how much effort would be needed for a radiological characterizationof that site. If there is extensive subsurface soil contamination, the cost of sitecharacterization could be several times higher than that of a final survey. On the otherhand, if contamination is limited to indoor areas, or if the outdoor soil contamination isonly in the surface soil, the cost of radiological characterization could be less than orcomparable to that of the final survey. Therefore, the cost of characterization surveys canrange from 0.5 to 10 times that of the final survey or fall outside of this range. It shouldbe noted that a poor characterization of a facility could result in a much more costlyremediation effort.
The remediation control survey is intended to monitor the effectiveness of remediationefforts while they are in progress. It also assures that the workers, the public, and theenvironment are adequately protected against exposures to radiation and radioactivematerials arising from remediation activities. It is estimated that remediation controlsurveys involve a 10-20% effort compared to that of a final survey. A confirmatory survey
NUREG-1496 D-50

is performed to evaluate the adequacy and accuracy of the licensee's final survey and istypically a 5-15% effort compared to that of a final survey.
Although it is difficult to develop exact estimates, it is expected that the cost associatedwith each of these radiological surveys will increase at the low residual dose criteria. Thatincrease in cost as a function of decreasing residual dose criteria is expected to follow apattern similar to that of the final survey. Tables D.1.6, D.2.6, D.3.6, and D.4.6 illustratepossible costs of these surveys compared to that of the final survey.
D.8 References
MARS. 1996. Multi-Agency Radiation Survey and Site Investigation Manual (MARSSIM).Draft for Public Comment. December 1996.
NRC. 1992a. Manual for Conducting Radiological Surveys in Support of LicenseTermination, Draft Report. NUREG/CR-5849. Oak Ridge Associated Universities.
NRC. 1992b. Residual Radioactive Contamination From Decommissioning, TechnicalBasis for Translating Contamination Levels to Annual Total Effective Dose Equivalent,Final Report. NUREG/CR-5512, Vol. 1. Battelle Memorial Institute, Pacific NorthwestLaboratory.
NRC. 1995a. A Nonparametric Statistical Methodology for the Design and Analysis ofFinal Status Decommissioning Surveys. NUREG-1505. U.S. Nuclear RegulatoryCommission, Washington, D.C.
NRC. 1995b. Measurement Methods for Radiological Surveys in Support of NewDecommissioning Criteria. NUREG-1506. U.S. Nuclear Regulatory Commission,Washington, D.C.
NRC. 1995c. Minimum Detectable Concentrations with Typical Radiation SurveyInstruments for Various Contaminants and Field Conditions. NUREG-1507. U.S. NuclearRegulatory Commission, Washington, D.C.
D-51 NUREG-1496

Table D. .1
Reference Facillty Power Reactoq
Strucure Surveys Land Surveys
Residual Dose Lmit Ca I Cs 2 Cass 3 Clas * Class 2 Class 3100 mief" -1 Wffeewm luWe.d 4fed Aff*l*al wft MwShCk
Sit InformationTOW was (m .Outdo Oa na 42000 2000 1720 55740Totl amra (W22. FboadLow Wall U X8* 51723 0 "a n nTal area M2 U WSZC.Sftg 0 10000 264005 s nm na
Sca t% ANsl 100 75 10 100 75 10Sca aa (Mt) O.uor 0a na na 2000 12540 5574Scam amea (m - floo.ower Wall 848 3875z25 a AM n fiaScan area (PeZ. U.WanCedi, 0 7500 2e0.s ma noa na
Scanning Sut 4 te (Camma) Floom A O4Mow Pioa 5.31 3133 70.00 3.3333= 20.9 9.29
eWW Fkoom A L Waft 2.29 129.31 0.00 Dn na as(t) U. Wallt & C4ea O.0 Sa0o0 1T354 pa P5 pA
Direct MeasurementsNumber Measurements.tp nm nSsur- thq cm*27.55 25t.45 4tS0 no 81 As
SoU SamplingNo. of Samples 1a1 p paC cton Tow (h) no pa a 5 1.50 19.40
Srvey TimeSuT wbIhousm 181l 488 287 9 34 29
Adjubt A - 25S% 40 ,17 72 2 9 7qd* _" I _t bew PAdju at 8 -15% 24 70 43 1 5 4
TOWaNQ 228 a5s 402 13 45 40
Ai"Acl CCUt IS)Soi Saamples no .a np 4350 U1125 14550smearSaple. 94a 1898 323 no nP na
subto 9U 1898 2 4350 10125 14550
Final Survey Cost (SILabor
St~
Sup. Data Re mow Repeot Preparationlow Cod . Final Suft"
other Survey Costs ($SGnddng - hdoarGCidding - Otoor
SCPlep SU-Ve
Reined. Contrl SSwmytConlinlrm~ySu
8307944mel
241291898
14791325
.cnas
4714350A,*,
17731012541im
147914550ItOUVI. I- 1. .
2531108S516
1735446452
5426Io651a10o525425
3418.731I TOTAL SURVYM COSTS -
C -
NUREG-1496 D5D-52
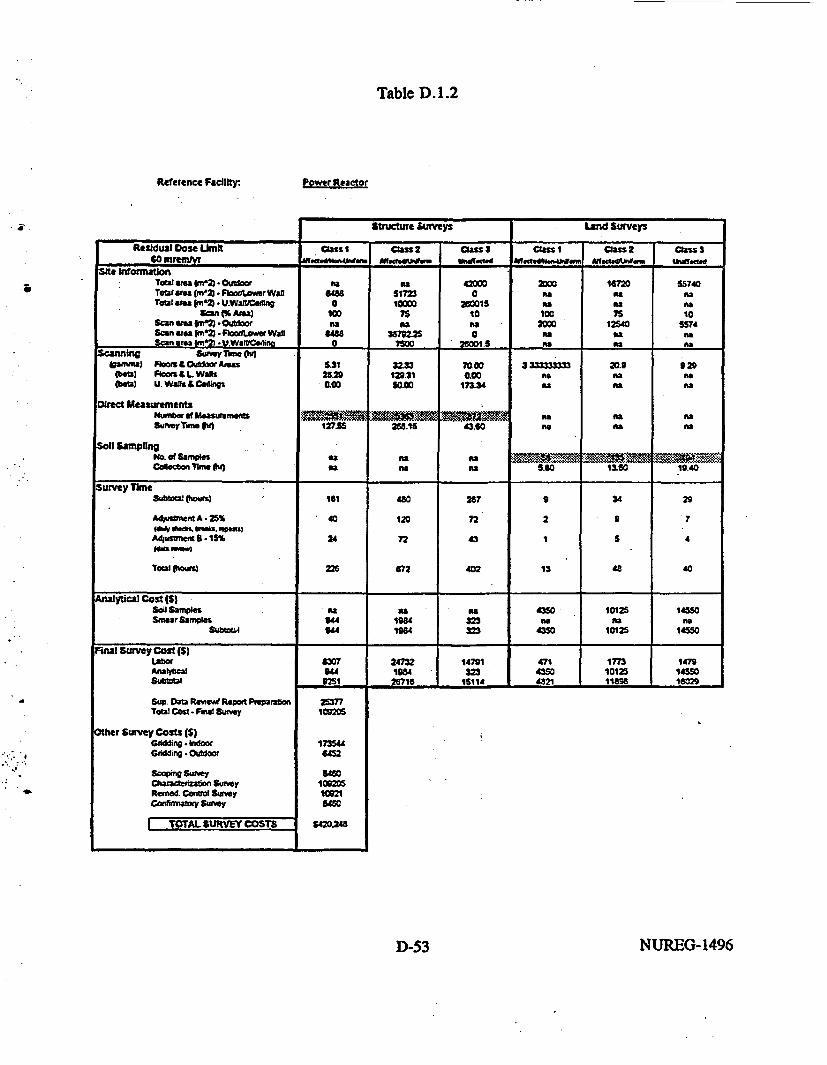
Table D. 1.2
Rderence Faclity: Power Reactor
'aStructure aurveys Lad Surveys
ResIdual Dose Lknft Class I Cass 2 class 3 Cuass CaSS 2 Class 3
Tebl am mZ * Ouww na ea 42000 2000 1620 55740Teot area mZ - FboPowv Wan 68 51723 a ma "a ma
Toot awte (ma* U.WaWCdt 0 l0000 260015 Ma "a faSan (%A al 100 75 tO 100 75 10
Scan aea "m' 2 OCuor ma m1 "a 2000 12540 5574Scan atea (m'2)-FlbodLwawWall "a 287925 0 ma ma naScan area Wm -V.WanlVmaCm 0 7500 2601.5 ma Oa a
Scaning Suwy Time (h.(a-a Flms &Outlaw Amas 5.I 3233 70.00 3333333 20.e 9
4b1) Flkor a L Wans 2 129.31 0.00 as na ma00bml U. Walls a Cadlngs t00 S0.00 17234 l m
Drect MeasurementsNrbgEtmoasremomtS . _ = . ma naSurge7uaO 127.55 268.1a 43.60 no ma
sn Sampflngmo. of Sampwes ma Na mCoelloThiem w ma Na Na 580 12.50 1940
Survey TimeSbalobJ ) 161 480 267 9 34 29
Adpmtm"nat A25% 40 120 72 2 9 7(d 0eM gWa. .3mA040entB i5% 24 72 43 1 5 4
Total Ocum) 225 672 402 13 48 40
Aalyt;cal Cost (s)SoilSamples ma ma Ra 4350 10125 1455Smear Samples 1"4 1984 323 Oa D a
Sub5to S4 1t84 323 4350 10125 14550
Fin Survey Cost ($)LawAnatSbl
6307s"
3251
24732IOU
26718
147s1223
16114
47143504821
7m10125118ss
14791455016029
.. - . - ______________________ _____________________
Sup. Data ev Reprt PmupmrboTeal Cost.- Fmal Sumey
Other Survey Costs ($3Gnidding lodroooCridding Outdoor
SocOpng Sur-yCharActencation Su'reyftemed. Contvl SumvyQV-ax SWWV
25377
1725446452
e-smS460
100205
84SO
642034I TOTAL SURVEY COSTS
D-53 NUREG-1496
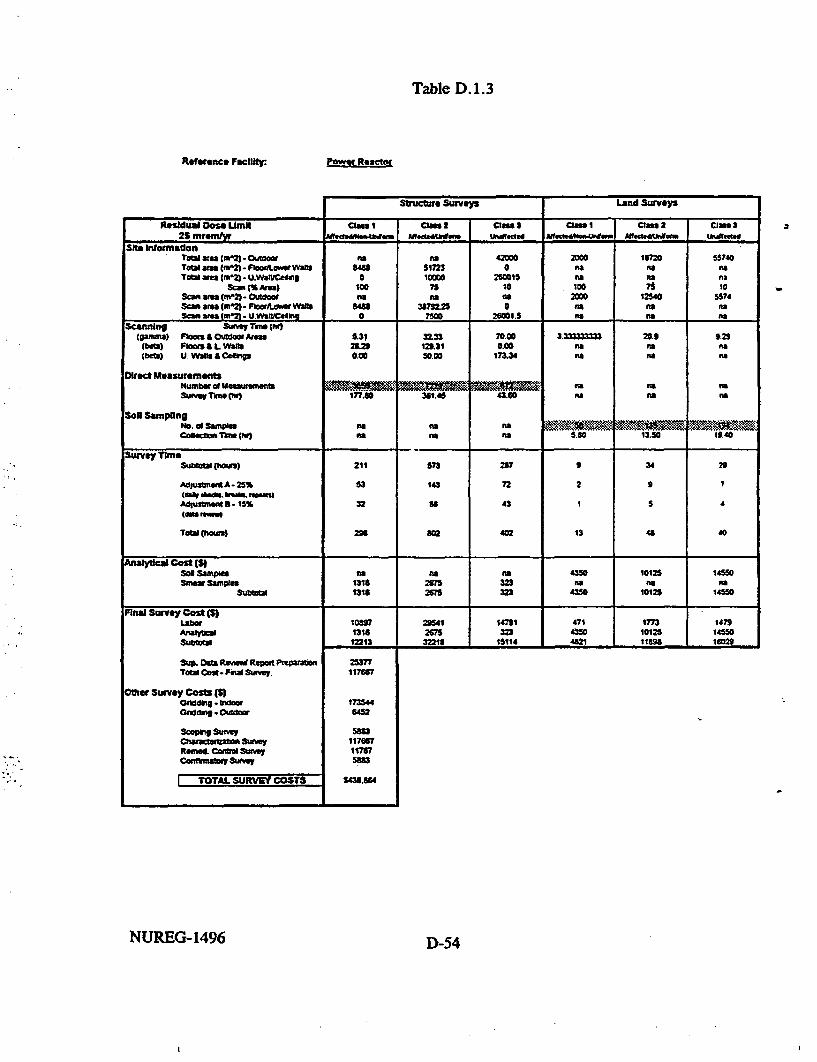
Table D.1.3
Reference Facluty: Power Reactor
I. - -
sructur 3ureys Land Survoy
Resdual Dose Umin cais I cm" 2 clas 3 Cs I clan 2 Cas 625 mroenw SAd9lgg,.AW_ ARdet&~... tMfedhd WuteMim4ME~em A .tkeSl "Oct"det
Slt Infoemalto_TOM ae (m^2). Oultoa ns a 42000 2000 16720 55740Totl are (m12) - Flog e~ Waft "a 51723 0 H a As naTO ala (fe - UWlliCutn g a t OGGO 250015 no na na
Scan (%A AtOa 100 75 10 100 T 10Scan ars (M2 - OCuoft no s no 2000 12540 5574Scan res (mO12)- Forkovet Wals 5488 3675225 0 an ns maScan ar tm'21) U.WsIZheikm 0 7500 2600t.5 na nS he
Scanning S-ef T- lltpmma) FIoos S OUtcocw Area 5.31 32.33 70.00 3.3333333 29.1 9.21(Mts) Fla= & L Was We2 12.3 0.00 a na nas(Mts) U Wal & Ceeliogc 000 500. 17234 no ns nA
Dored MeasurtemntNuMber of Ul _ Vs e sAs no no
S hi T Clv) 177.80 361.45 4360 na as na
SoN SampingNe. N Samps as nas n_Con Tkh) s as 5.n0 13.50 19.4t
Survey Tlmesubfx" Cho) 211 s73 237 34 29
AdstpanutA- 25% 53 143 72 2 9 7MOV * . WSAW Mean
Au1nt-. IS% 32 U 43 1 5 4
TOWtl(hous) 296 2 402 13 4U 40
AnaytycAl Cot(S)SWd Sam" a na a 4350 10125 1450Smw Saamps 1316 2675 323 na na na
Sub 1316 267S 323 450 10125 14550
Final Survey Cost(S
LaorI .
Suo OaM Rviwv Repoit PrepuarmbToW cost s Fta Samty.
MoUr Survey Cosas(S)Ort~asX. IfdoG Outdfr
I TOTAL SURVE COSTS
108713tt12212
295412675mt22
14791323
15114
471434821
7m1012511838
147914550
E02I 5 5
25377117667
17544S452
583311761711717538=
s3u4
5
NUREG-1496 D-54

Table D.1.4
Reference Facility: Power Reactor
Structure Surveys Land Surveys
Residual Do" Umnt C- 1 Cs aa 2 Cln 3 Class I Cloa 2 Clau 3IS mramlyr .s a rM Mffat re~w. wMamed M rd*&%fte"W zfedRwars uni1.d
SFR hIntormatlonTMarea (m^2) - Ouoor A ma 42000 2000 NM720 55740Tout ata (2 F Ploorj W walt 5&8 s1723 O no - naTOW area (MM4. uWanicaem 0 10000 26005 na ma na
San (%A Aa) 100. 75 10 100 75 10Scan aea (W!2). Oudr aa na ma 2000 12540 5574Scan 1ea (mA .p loadIower Wan t48U 372.25 0 na ma "a
Scan (arem2j- U.Waldceto 0 7500 2600t.5 no ma na
Scanning Surey Tons ME_(gaM) FRoMS & Otdoor Areas 531 32.33 70.00 33333333 20.9 2.29
(beta) FWoor9L L. Walne 28.29 129.31 0.00 - a na ma(beta U Vltl$ Ca taw 0.00 50.00 MN.24 ma mA
Oret MeasuromenteNumberarf Meaxuroents nma ma na
SwBy Tk- hr) 162M5 245.05 43.6 na ma na
Soll SamplingNo of Samples ma na ma __-_ _Calcwon Tin (r) a m Oa 4.00 13.50 19.40
Survey TimeSuM a(houl) 196 457- 287 17 34 29
AdtMnt A - 25% 49 114 72 4 9 7I*Ir d .1ks. looms)Adjustluent B t5% 29 09 43 3 5 4
Ka
TOW (hours) 274 639 402 24 45 40
ctal CostSal SaMpLes a a m 14000 13500 13400Samar Samples 1201 1813 323 "a na
sub_ _ _ 1201 1813 32J 14000 13350 19400
Final Survey CostrS)
Atatybra
SUP. Dat fiWf Repor PrepnrawnTot cog . Fusl sun"
Mer Survey Costs (S)Gnddkig WdoorGadding - Outdoor
Scop SuveyCharactomon SurveyItsied. Cdntot SurveyCenfrmaY Survey
TOTAL 5URVEY COSTS
10101 23541t201 1 13
11202 I' 355
"791
I I 10MA
9331400014A03
1773135001527
14791940020t79
4 -.---- I I. 4 - d
253771281t3
t73S564U2
6410128193
128196410
M22
D-55 NUREG-1496

Table D.1.5
Reference Facwlty: Power Reactor
Structure Surveys Land Surveys
Residual Dose Umit Cla I Class 2 Class 3 Class I Class 2 Clas3 mreml w ct.4wtm ~SIMUE A_ Afea. w uu a tOdbchd
Site Informationlotal area (m2) . Outdow ma na 42000 m i3Total area 1m42) -Flooiomr WaS na na RsToW ara twww4. U.WallF I 1Cadn * as ma mas
Scan ( Area)
Scam area (m'2) Outoov "a as "a 2O0 12540 5574Scan area .mw2) FIloorLmWaI W488 382.25 0 No ns naScan area (m^2) * U.WaWCedlwm 0 7500 26001 5 no a Iea
Scanning Suwsl Tr. (lt)p a Floos & Outdo Atom 5.31 3133 70C00 3.233333333 20.9 9.29
r Floorn A L. Waft 2129 129.31 0.00 Na N namew U. Walns&C eligs 0.00 50.00 173.34 na na na
Direct MeasurementsNumber of Measurements na PI SNSuey rtonweh) 176.bs 211.55 522D N Nn No
Soal SamplingNo. of Sample n naCollsoe row(hi) ma nma na 20000 1150 19.40
Survey TlmeSubtotl Ouru) 210 423 296 203 34 29
AdjustmenmtA . 25% 52 106 74 51 9 7
AdjustnentS - S% 31 63 44 31 S 4t4 -
Total (hours) 294 s92 414 265 48 40
knalytical cost (S)Sod Samples No Na Na 350=01 23625 33950Smear Samples 1303 1555 386 Na NA Na
SulltW 1303 IS"S 386 380000 2325 33950
Final Survey Cost (S)LabotAnatybcalSubtl
10807130312110
215141585
2380
t5235368
15621
10481
3804S
17732382525398
14793395035429
.5 0 4 a ____________
Sup. Data R ewd Report PreparabonTotal Cost . Final Survey
Dther Survey Costs (S)Gnddmg - Wl0oGrddid".- Outdoo
Scoping SuYChactenzabon SurveyRemed Cwwd SurveyComfnhatwy Survey
25377487796
1735448452
248804977n4878024890
S1.275.148| TOTAL SURVEY COSTS
NUREG-1496 D-56

Table D.1.6
Reference Faclity. Power Reactor
Residual Dose Umit (mt _myr). __
I 3 1 15 25 60 100__ __ . __
Scan tme(mrin 100 mA2)
Outdoor- gammaindoor - gammaloorl Lwalt - beta
u. wallf ceding - betafloor/ Lwall - betau. wall ceding - beta
101520402040
101520402040
101520402040
101520402040
Direct Measurements alpha/beta imam
(mine location)
Sol Sampin 10 10 10(samples/hr)
Anaysis Cost soil A
(Ssample) smear 0.37 0.37 0.37 0.37
Labor Rate H.P. Tecdician 36.82 36.82 36.82 36.82(SAWr) H.P. Spervisor 70.99 70.99 70.99 70.99
Costs of Other Surveys(as a % of final survey costs) Scopi Survey X i X X
Characterization SurveyReined. Controi Survey .
Confirmatory Survey
D-57 NUREG-1496

=__-_ Total Survey Costs _. _ . __ _.-
Power Reactor _ __.___ _
3 $1,275,146 _15_____ 3 $1,275,16 _Power Reactor
____ 15 - $462,02025 $438,884_ _ 60 $420,248 -1.400,000
100 _ $418,731 -tOAD
£5.00,00
W 5400.000
0 200,000
so3 Is 25 60 t_ -
Dose Criterion (mrem/yr)0
I a,

Table D.2.1
Rderence FacltMy: Sealed Source Facift
Structure Surveys Land Surveys
Residual Dose Umit Clts I class 2 Celss 3 Cass Chass 2 Class 2400 mremlvr . s w wd Ai . Mzds d
sSite Informatin.TOl at" (Mj. Outdor :a ma 0 27 Omo
Tral (m2 C .m lacFbwd er Wanl 153 8:3 2350 a m NTe ai ar" (mA U.UWa!LC&ng 25 128 2153 ma m Oa
Scan fi A-) 100 75 10 100 75 10Sonaus tm2)-Ouoo Oka ma ma 77.5 30Scan ama (m2*). Pl odAewer Wall 163 69.35 23S ma ma NmScan rea fmA2) U.WalCteriem 2* Os 3153 ms no Na
Icngin SeWnn* aw 4 ,(9amma) Floors & Outdoor Areas 0.10 O5 1.47 0 14825 0.05
Ebea) Floors L L Wa 0.54 2.13 0.78 na ma "a(bob) U. Walls & Cidlins 0.17 0.64 .10 ma nma m
Direct measurementsNwnbwar M"aUmemonb SoM M Z*~2 no ma masSumyTe w(h) 60 7.50 210 m ma ma
Soil SamplingNo. ofSamples ma H mConeco Time .00 4M (.V0
'urey TimeSu l xouts) 4 11 7 0 6 2
Adjustment A. 25% 1 3 2 0 2 0106 **d WOW. iweOsi
Adjusent B .151 1 2 1 0 1 0'a t
Tout 1O.t) 10 0 12 3
Analytical Cost(S)So Samples ma Oa ma 0 600 1425Smear Samples 27 68 21 ma ma ma
S L 27 $6 21 0 3600 14
Finat survey Cost():LSor
SUN=
22727
65768CI'
36921
SS9
0n0
42636004026
1011425t526A
- a -v . ,s'
Sup. Omat Re-i*f Repo PreparaonTotal Cost. FIn Survey
Other Survey Costs (S)Gnddmg . kdoorGliddirng Outdoor
Suogo SuteyChamdmiasbon -Remed. Camol SurweyC eyyatotus-
2537732164ms
U36
leow1092
15877I TOTAL SURVEY COSTS
D-59 NUREG-1496
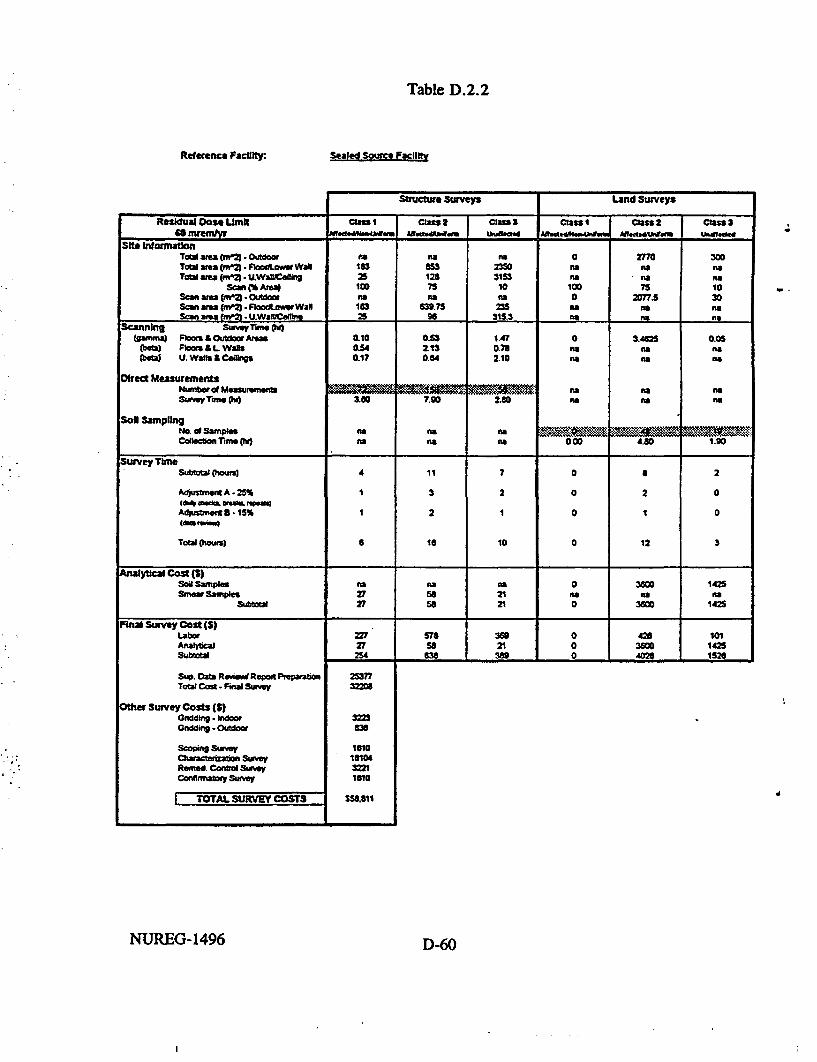
Table D.2.2
Reference Facdlty: Sealed Source Facility
Structure Surveys Land Surveys
Residual Oose Umn ela I Class 2 Class a Class I Class 2 Class 360 mrelw m0 _ u MId.U NonetMfafi e8bdS49mSW.&SE £fl Aecb4 sm IhdIodei
Site InformationTOWl aiea(AZ -Outdoor PA s n O 2o 300Toal aa (. FloodLuow Wal 163 853 2350 as Re noTo aWea (mA2) U.WaI.eUll" 25 128 3153 nos *S n
Scan 9I M4 100 75 10 100 75 10Sca ama (m*21 O'W n5o nAs ns 0 2077.5 30Scam area (WZ ).Flw sr Waif 1S3 69.75 235 Rs AS AsScan am( fM21 UWafllfefiff 2X 96 3153 "a nA no
Scanning suwry ra (_Wammal Fleoa A Outoor Atm 0.10 0S3 I.47 0 3.462S 0.06
Metl fbios & L Waft 0.54 Zt3 0.78 ns AS na(beaj U. WaftsA Cdlin 0.17 0.64 2.10 na no na
Direct MeasurementsNuaber d Mesatrsm U W'. 'o n1 As AssU-VT M &80 tSDO 2SO no no no
Sol SamplingNo. d Sampts no "a n a : 9 = oC alle ITo eSw) nA AS nA 000 4.80 1.90
Survey TiteSub9tal PummI 4 11 7 0 a 2
Adpasat A .251 1 3 2 0 2 0
Adlust m tS15% t 2 1 0 1 0C- n
Total (hours) 6 la 10 0 12 3
Aaycal Coat (S)Sad Samples nm nA as 0 3800 1425Snw Sanples 27 SS 21 nA as ns
Subtotal 27 S8 21 0 3800 112
FlaW Survey CCUt (S)LaborAnaliyOcalS.,ta
22727
s78so
36921
00A
42t3600Afl0
1011425Iq2Mb I S I I--
Sup.OatalRemwd ftepootlPrepwarionTotal Cost. Final5 Survey
Other Survey Costs (S)Gnddft - IndoorGnddinq Outdoo
Charactortnztanc SwrveyRerned Coneda SurveyConflmmtory Su-o
3223S3S
1610161043221t610
S58.811TOTAL SURVYE' COSTS
NUREG-1496 D-60

Table D.2.3
Reference Facility: I.af~d Source Facilit
-- - I . --5Uaru~wo bufV@ys Land Szwys
Resdual Dosm Unit C" I Conas 2 Oo 3 Class I C| a 2 Cas S25 mMlyT .adli.kwu A tq4~Mw UNRlSd . waotehfmin Mfct*~Nm thuM ueo
SIn fonnatonTotal area (m'4 2 Outdoor AS A ma 2Om7 300Tool ama (m^2) - RloorftA Walls 163 853 2350 na rAo naTotal am ((M2) - U WallMC*M 25 125 3153 N tA as
Scan ( Ana) tWC 75 10 tOO 75 0oSn a*t (m) - Outdoor no w - 0 2077.5 30Scn amas (m2) -Fbodaar Walls 163 639.75 235 n a NNScanarea Im2).UW VUA:M 25 96 315.3 l nA oA
Scanning Sulwy TWO 0(gama-) PlorA & Outdoor Aas 00 0.53 t47 3.&W 0 05
(DtM) PFOs & L WVfla 0.54 2.13 076 n5 :a "a(bela) U WallsaCeofgss 0.17 0U 2.10 AS ta NA
Direct Measuretments__Iumber of Mnem 'emna .NtAe AS naSuwey TIme (hr) 5.10 10 0 2J0 A ea "aS
son SamplinSoo.~ of Samples AS ASea1- ASMConecion Th(h) As MAS ra 0.00 4.60 1.10
Survey Time -
Su alMotas) 6 14 7 0 S 2
Adjuatrnent A - 25% 1 4 2 0 2 0(day E-s. Insk. mp.slAdpiaswWn - ?15% 1 2 1 0 1 0
TOWIncours) e 20 10 0 12 3
knalytical Cost (S)$Sosamples rA nA 11 0 3600 1425Smear Samples 3# to 21 nm As na
Subtobl 28 s0 21 0 3600 1425
Final survey COst (13
SubAna~csl
Sup. Oata Reoiw Raport PreparownTotal CMst * Foal Survey
Other Survey Costs (S)rnCdig . door
Cndong - Outdoor
SCOPrV SurveyChrafa*112nbon SurveyReied. Con SurveyCenotma-y Survey
TOTAL SURVEY COSTS
30538242
W
UX7
36921898
000
42636Q04M26
10114251526C - ___________ ___________ I
2537732467
36
1623
3247162t
SS9.252.Z,
D-61 NUREG-1496

Table D.2.4
Reference FacUIty: Sealed Source Factilt
Sultitur Surveys Land SUrVeyS
Reskdual Dose Umit Cas n ClM,2 Ciana class I ClAU Clas 315 mrenVyr At1a.c Md 41 lagileda Aftd004h.Eeiw ANfeeteu. t.cteg
St InformationToW as (m2) - OuCosq Va na na 0 2770 300Tot am's (m^2). Floorw Was 10 853 23fO na na NToOare (m2). U uW osmg 25 128 3153 na no na
S3a (mA) 100 75 10 100 75 10Soanm^sM2)M.Otdwoor a n na 0 20775 30San are (m^2) - FloadL Wall 163 63S.75 235 na n t nAScan* aUea b-Ual 25 96 315J3 m nr na
Scanning Surwvy Time (I)(gammann) Flome & 03gr km 0.10 0 53 1.47 O 3.25 e
(ela)S Flaas A L Walls 0.54 Z13 0.78 nAs no s(bM) U. WallsCedhp Q017 0.64 2.10 nA na nS
ofrecu MeasurementsNuber d Usauemt' _ n n '.. ". n SSurvyt raw ev 465 10.10 2t0 no ns na
Soil SamplingNM of Samples n na na _Ccton Thim (hl) nA na na 0.00 4.80 1.90
Survey TimeSuMP(hoeurls 5 13 7 0 8 2
AdpjusbY A -e25% 1 3 2 0 2 0(b4V dw i .s _Austnt B . 15$ 1 2 1 0 1 0lCSM_
tWol (hurs) S 19 10 0 12 3
Analytical Coitl(S)Sol Samples na no 0 480 1900Smear Sanples 34 75 21 no As nA
Subtal 34 75 21 0 4SW t900
lFlnql Survey cost S)Laber
Sup. Oa Asesif Report PreparatonTol Cost. Final Surey
21234%t2
691757N
36921
00Ai
42548005228O
TtO1SOO1900
I I.
2537734074
Other Survey Cosfs()G nx" - IdlroGncdsu - Outoor
ScDPeMI SureCharac -SuRact. Corol ftn"Caonfirm SuwY
3223836
17041703734071704
#61,.94I TOTAL SURVEY COSTS
NUREG-1496 D-62

Table D.2.5
Rderence Facilty: Seated SourEce Factlilt
- - I -
wructure surveys Land Surveys .
Residual Dose Umit Cass 1 Class 2 Clas a Cas I Cass2 Class 3am Mod*0404"mw Wfnoce*~Wr UIhldd M _d69.MwS wahe~M lhWVCdod
SineflfonmationTowlu"ma Lw. go . to .
Sonar ea ft-4-oor Me m a . 207tS 30Tealarea "n- FloodoweeWaill 13.TZI aseaaSna usa nA -Fleod~oerWaff 163 639.75 23s ma as aScan *rea 1) . U.Wd ino 25 56 3t5.3 no am
Scanning &u-YTunop4uwamml Flm&OutCoorksas 0.0o 0.53 1a 7 0425 005
Flolors & L Wafts 0.54 2113 0.78 Ha ma "a(betal U Wall f Cealls 0.17 0.64 Z10 na na as
Direct heasurementsnberf Me auremet as aSravey rNme 10.650 670 .65 as na ma
Soi Sampling -NmeSmampes m ea ma _
Mte ea ma COD 4.80 1s
Survey TimeSubt*W Os) 11 12 6 0 6 2
#justmeentA.25% 3 3 2 0 2 0
Aqusftmewt B . 15% 2 2 1 0 1 O
Tabtw Os) I6 17 11 0 12 S
AnalyUcal Cost (.0itSamples ma m 0 4UC 3325
SmearSamples 76 64 27 ma ma eaSubloa 76 64 27 0 gm0 3325
5U64- @UV. Igas .....
LOW&AnalyilcalSubtowa
Sup Data Ree-1 Rpoit PepartionTotal Cost. nal Su ey
Oher Surtey Cons ($OGdddi -hGadding Outdoor
&S l SurveyCharacteftxbo SurveyRemed. Colu SurveyCMatrySuMy
S887S187
61i64
eA"
41327
An
00
426UDO
1013325
2557739417
3223838
1O711970039421971
s71058I -. L- R)C=Tg _g otfn.lgcw Wo
I.
D-63 D-63 NUREG-1496

Table D.2.6
Reference Facility: Sealed Source Facility
Residual Dose Umit (mremnlyrI 15 25 80 100
_ _ 4 . .Scan time
(mW 100 mA2)outdoor - gammahdoor - gammafloor/ twal - betauL wail ceiling - betafloro Lwa1 - betau. wal ceiling-beta
101520402040
101520402040
101520402040
101520402040
Direct Measurements alphaibeta m go__(min location)
Soil sampling _ 10 10 10 10(samples/hr)
Analysis Co Sol(Ssample) smear 0.37 0.37 0.37 0.37
Labor Rate H.P. Tech nidan 38.82 36.82 38.82 38.82(Swhr) H.P. Spervisor 70.98 70.99 70.99 70.99
Costs of Other Surveys(as a % of final survey costs) Scoping Survey
Characterization Survey ~ ~ ~ ~Reined. Control Survey 4 .~
Confirmatory Swvey
NUREG-1496 D-64
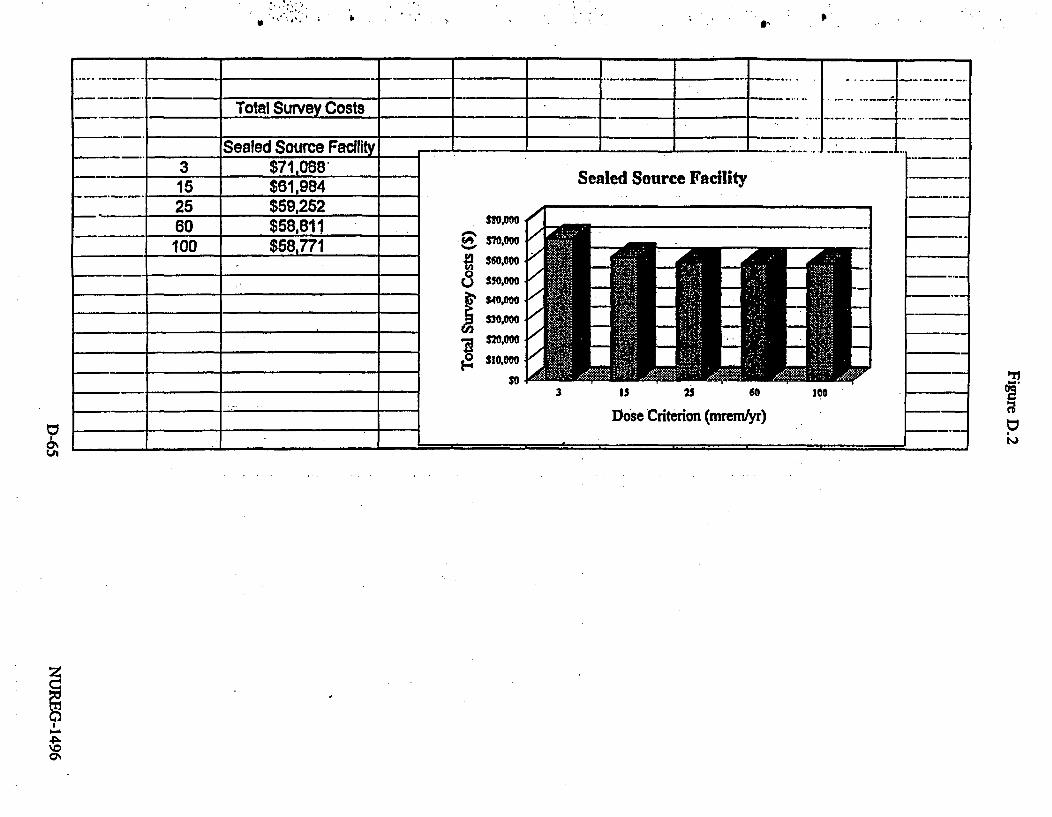
*: ".: ;: I -.
V V V *
4--
Total Survey Costs Iji11-i__ I I I . _ _.
... ... -
Sealed Source Faclity3 $71,068
___ 15 $61,98425 $59,252
o 60 $58,811100 $58,771
Sealed Source Facility
A--
0UF,
370,000
360,000
350,000
340,000
S30,000
3210,000
330.000
soX3 I5 25 60
Dose Criterion (mreniyr)100
of0%LtA
I ..

Table D.3.1
Reference P3uW. U Fuel FabrICatn
Strcture Surves Land Survey
Residual Dose Lmit Class I Cas 2 Class I Class 2 Cla$3
Site InformationTol area . - OiUoor no na a1309 74220 98Totl ae . Fbod~oww WaS 12300 25124 a as r naTotal amQ4 ULMMCe low lOw O tO 273 .3 na n
SM (% Ama) 10 75 10 100 75 10Scanasa(mW.*Outoon as a as 13098 6 130Sea a .(m PlooLmwrWaA 1230 1aw 0 as as IsSeas -a M .U.Wa$yeill" 1000 750 273 as ra TA
Scanning Swuve Time OhrFgamma o Rloorm hOM= Ars 7.69 1570 O0.0 21.U3 01775 21.13
(alpharbta) FbRors&L Waft a10 125B2 0 a O asn n(2p0abeta U. Wait A Cue;g 13.33 10.00) 5648 na a as
DIrect MeasurementsNumbw ofMeasuremuo Ns NasSuneyTeo 2M elm S25 rM s
Sol SamplingNo. d Samples la na s3Codiwcb= T ba "o na 710 8.30
Survey TimeSubo rs) 310 213 42 e 1SO 30
A4ustmertAA 25% 77 53 la Is 37 a
Adjusbtm 8.515% 46 32 6 9 22 5
ToWbPtM4 433 298 Se U 210 42
knalytical Cost(S)Soa Samples as as gas 2962. 42825 6225Smear Samples 1S28 454 39 na nas a
S9total 1528 454 30 2925 42825 62a5FinalSurvy Cot 4.
Fnal Survey Cost SLabot
Subt"t
Sup. Oa Rew Report PrationTotl Cost. Fal Sue
ethez Survey Costs IS)Gidddin - dwoorGdddg n .Ou
S-hbvSW SgesReind Contol SutrayCo6mtwySrvey
| TOTAL SURVEY COSTS
15sS5152sI7s=
10960454
-IIMAq
7728215139
316129W
1553625TM7
- I I. .....- -
25377147573
737938895221377379
S313.281
urvey costa using In situ gainCon"~ In-I doat5rvtycostASlituCosts TotalCost_.FMA
Dther Survey Csfts ES)
Reme& Conrol S
TOTAL SURVEY C
la spetromer31O87
71m5
8375228160
-135St?25065am55
S457=S
.r
NUREG-1496 D6D-66

Table D.3.2
Reference Faclitry: U Fuel FabrIcatlon
U.Structure Surveys Land Surveys
Residual Dose umit class I Class 2 cla 3 class I Cas2 Class ag0 anremhvr wku d*~GM MdIlded Warrosed,494Orm Mtdedk " lrutfdw
Site WormatlonT<wamn .0utdoor N a Na ma 13098 74220 13080Tatl area (m4n F.oodL r Wraf 12300 25124 0 ma maTol area OmQ2 .U.Waftiul 1000 1000 27W60 ma ma Na
Scan (% A1aa 100 75 la 100 75 10Scan ares' . Outdoor N N a. ma 1309 S5885 1309Sanawean* . FlowAwr Wral 1235 '1843 0 ma sa maScan area WZ - U.WaftIeffino 1000 750 2738 ma ma n
Scanning SiweyTow hjdfafn F Roas OLt-doorAwas 7.69 15?0 C.O 21.3 92775 21.3
(halbab) Flo L. Wals g00 1I=2 .00 nma a ma(atpharea) U. Waft & Ca"rmvs I3.33 10t00 W .4 a Na ma
Olrect Measurements .Numebw o asurermefts m ma masorvalm f 287f.J5 6365s 5.25 ma ma na
MMd CG 62 am SunI 8 JSoi SamplingNO. of Samples ma a As ___ __ ___ __
Collecton Tre uM ma na ea 39.50 6860 830
Survey TimeSubeclal OUMs) 310 215 42 e1 151 30
Adjusumm A - 25% 77 64 10 IS 38 5Adjusi¢Bcit S 15% 48 32 6 0 z 5jdata - -
Totaleu r) 433 30 58a 68 212 42
Analytcal Cost (S)So? Samnpls ma ma ma 29625 43950 6225SmearSamples 152l 471 39 na ma ea
Subtotal 152S 471 39 29625 43950 6275
Final Survey Cost S)LaborAnalytical
Sup. Dat Ravlel Report PmpatsdoTabl Cost . Fna Survy
Oher Survey Costs (S)G~dfn * bdoorChdddhg Outdoor
Sooping SuveyCharddrtafton SuleyReined. C&IM SuvyCon-awy Survey
I TOTAL SURVEY COSTS
15955152817453
11081 I 2151471 39
115S2 I 2190_
31C1296253273
7M034395061753
'553
777s- .. e . .- i ..-
2537714ts20
63752
7448111690
7448
2389.752
Curvey costs using hi situ amConventoral Indoortwueyenin tu Costs TOW Cost Fial
Other Survey Costs(S)GCldding - bdoorGdddfng . Outdoo
Sooping SureyCharatrza_Rened Cowtoa
TOTAL SURVEY C
sa xpectromet31226
167105
63752.28160
8355125329
6355
SA57J48
.-
D-67 NUREG-1496
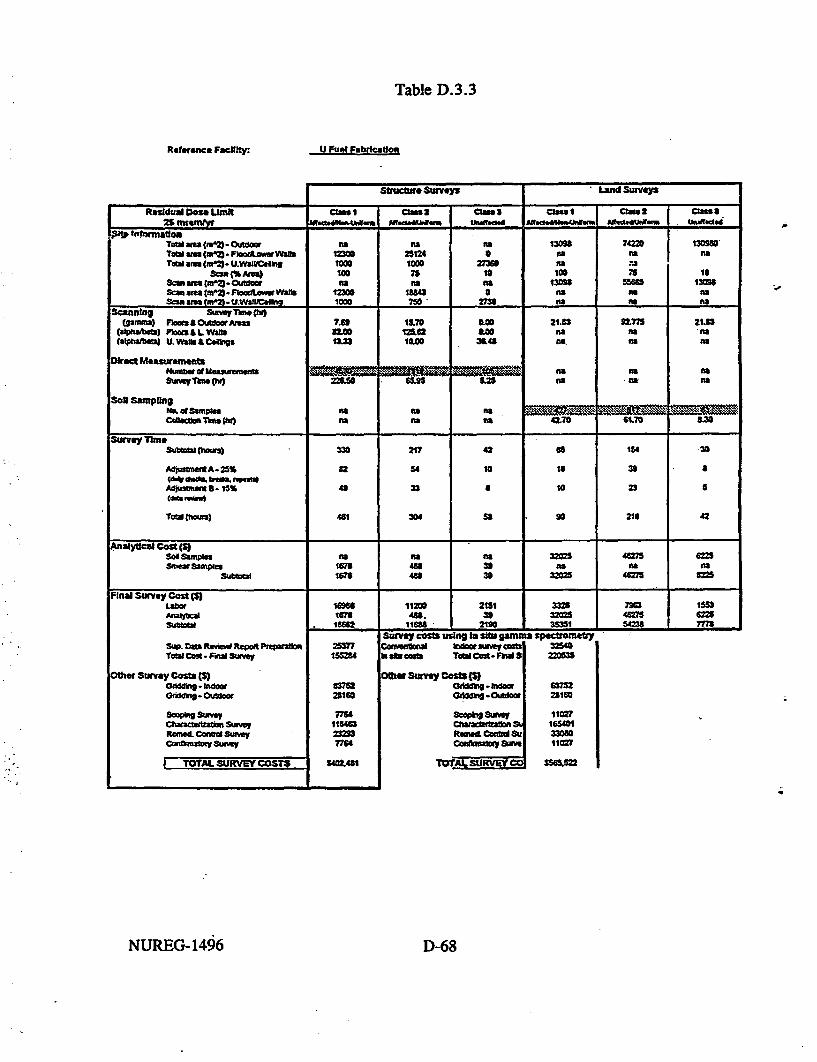
Table D.3.3
Reterence Facility: U Fuel Fabricadon
Strucfs" aurve Lane Survys
Residual Dom Limit Classll ClsS 2 Cma 3 Class I Casesa Clasal21 mramy I W.i"sWaM AffedsdtkMi Wdledw A4R~dt.s%8"tWu AfecedMkMSns iffldeS
ToWula a(m2). Ouldoa ASl no 13098 7422 13096Tota are (w.04).Fk~LooAwvWalls 12200 25124 0 as naSn
fOr3OU1ft0rAr*2) 7.6 1570 I*0 21.6 1077 21sSC a 2.0 u0orO t2o. 0.u 813 553 1A
Smpiibt)U Wawe £ Ce lkxigs w 13.33I InaS a4 rAs na as
Diec M aft reea Ob -UVw~h 00MV ' on
SoN amping srwkM
(aubeCPore & L WA as =a 830 43.7 n1o
SOrved Tmeaumef
NOd ubsag.15% 48 23 Re0 3
S SW hubM3) 150 288 38 225 5465 622
Finalyticaly CoAt(S)
Labor
subtota
169"1s6
, 1 6I.
112004U.
SIMS
21513,
2180
325_
15351
7904755415
155a
7775.4 __ __ ___ __--_-- _ _ _ _ __ _ _
aWAX 91~ KQ83W KePWIlowa Cog - Psi &al ue
Mete Survey Cosle (S)Go" kW.bdoor
0iharag. Ortoor we
Contimalmy Su-
x P.eSarzoon 2san1552U
6375228160
764
7764
t4"Al 1
Suavey C lS using Inl 5*0032111Conventional Indoor mury aslaIn Wm Coal ToWCO2-Frl~ds
Otbler Survey CObS)
Chtaractleriztin SiReined. CoraU SuCanwro~ysta%
TOAIUVYC
a spectrometry32540220535
25160
165401330601107
356&=23TOTAL SURVEY COSTS
b
NUREG-1496 D-68

Table D.3.4
Rafaranc Facility: iU Fuhl Fabrication
urucwur. umreys I Lands auays
Residual Dose imit Class I Class U Cuss a calas I Cl.as3 Class IIs Inramlyr Ait.0&.4k~em MK~e ekiUam W.Rdsd M~dd%.%Q4.M "~ A.ft.6¶AwM lMj!.ed
Site Information.-jTotal areat * Outdoor Ba ea VA 1309 7422'001w area (M-2).-flaod&eWwan 1230 25124 6 a aTotl mIm-4 II.Wa8Irling Wm Wm9-v
Scn wam (gnA2).Outdooe am low Ma10865 39
Scan ar"a fm^Z.fU.waltCse440 I05 760 0aaa
Scanning SurveyI (U)(gaMMa) Floora&OWW~taoass 769 16.70 am0 aim8 I277 21.8
(Ihalplbafte) FlocLl & L Waz 8.8 12362 .0 as ea m(alphafbte) U. Walls & C.U' 11.23 1.00 30.418 Ua Ba
Oirect MeasrementsNifaw of ~Meaaauemeft mas a vas
sa1 Sampling
CAeU.onTimp w a 710v= )
survey Time5b1(bOMzs) 396 397 42 a9 159 30
AMjuxbnenA-25% Is 67 10 17 40
Aontrlnerd l.-15% 39 34 6 10 24 6
Total Pixa) 6g5 217 6U 37 2342
kna3lytcal Cost(S)SalSampWe ea easa 00390 12450
Saamla2170 us 8 saSudft 217066S U=5 39490 12450
Fnal SurVey Cost(S)Law - 20424
217022594
116tM6G.
12233
215129
210
25537065074303
'9450to85 14503
* . . .
Sup. Om ewAimVReport Prepwarean7Towcost-Fea wsurm
Masurvey C"St(3
seopig suve
Rem.le Cw~ &W..CmhqSurvey
I mThAN vNIDUvI9Af-r-
9372
Sa
t:9
6s60413
wirvey costs Isang an s=u game
MUer Survey~otP
WTOTL SURVEY.C
'a upectromeuy
281960
6975228160
*29098'21|6470 -
U9
IZ PUMAS @wO=W a,
- C
D-69 NUREG-1496
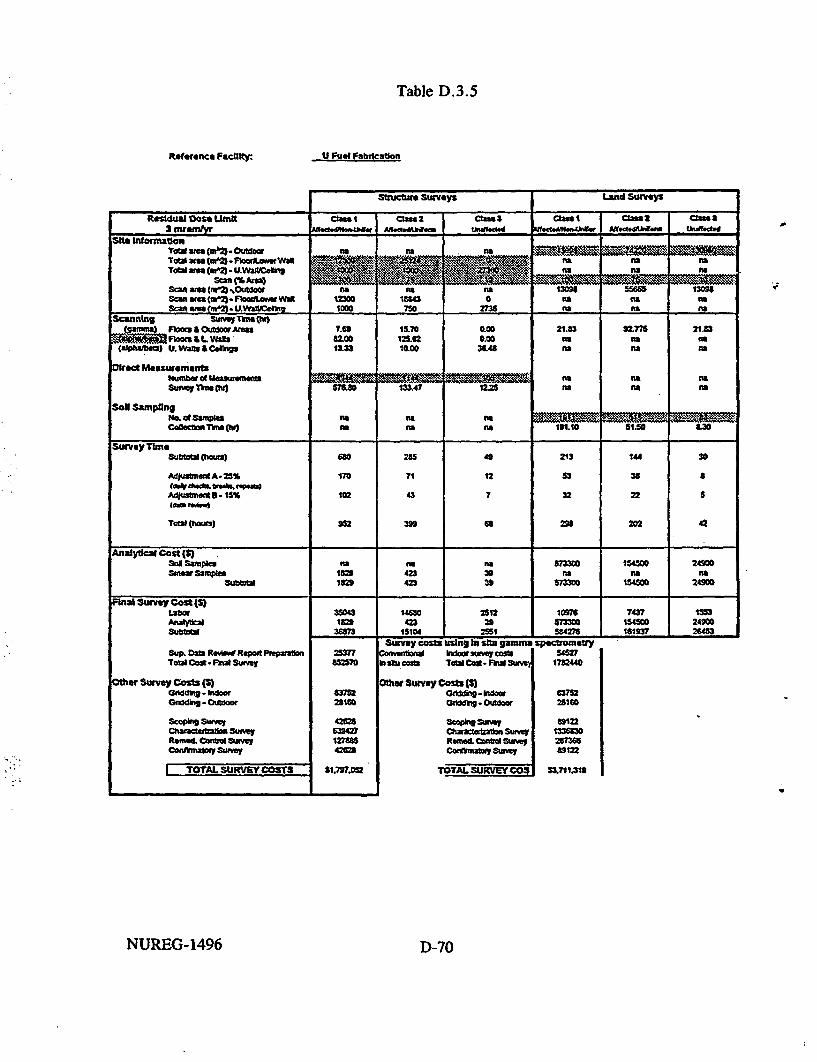
Table D.3.5
R*efrence Facilft: U Fuel Fabricaton
Structure Surveys I Land Surveys
Residual Doze Limi amus a. 22 Ones taft Iasst Cases3 mrwfwfyv Xd*"fU AN*CfdjA*l.,i ia~jv*ed 04&emAW AN~d9~ww m Lnrdhd~
Site Informatioa
Tota ame (m*2) - utdoarC to LU nano3O Se ( M oo~A-) M o Ia im -m
Sa ea(2.UNV21cleling 1000 78 2736 35s flU _____
ScanningSW sueTkme e(gamma) Floon;&OutmoorAeus 7.63 15.7 0.00 21833 Sim7NMx. i~aF~oxs&LVVAII 8am 125.62 0.0 alk c ut
(*Wghsbe*) U. Wails & Colkiga 1333 10.00 36461 no na no
Direct MeasurementsNumber of Meamemens "a na cisSurfve flue (l) 768 133.47 12.25 LU no LU
Soil SamplingNIL at samije as flU LUn"C~fOtletThft*(ft) Mako no11.0Sim5 830
Survey TimeSUbtoW MOWS) 680 285 40 213 144 30
AdpftsnenA.25% '170 71 12 53 36 8cdw dICI -OKfw
Adj~Uftl.LtS- U% 102 43 7 32 Z! 6C- -t
Total Momu) 962 39 Go 20320 42
Anailytical Cost (S)sa samplsm no em5730 15450 40
Sbmea samplee 1823 423 U3 na heSubtM 1I2 42 39 5730 18450 24M0
Final Survey Cost (S)Labor
Sup. Data RewwwoF Report preparationTOW COg. PFeSmavy
Oither Survey Cozls(S)Oaldd"Ig kifato
-fdfl - ww3-pin S-Charsameetaen SUN"Reined. CwiftL sLmW
3580182
3673
14684a8150
25123,
25ml
197657S320
58*276
743715450016133?
1s8324M00
_2UM- A - - __________ -
25W85337
83782
42M2
31.737.08
Survey costs using In s5O3 gammasonwntma k rycostl sb cort TOW Cos. Find Surey
DOther Survey Costs M5
Rem. Ccntai &SNey
T-OTL wy Survey
TOTAL SURVEYCOS
1782440
83128
3711.1Conftmzt s~umey
ITOTAL ISURVEY COSTS
NUREG-1496 D7D-70

Table D.3.6
Reference Facility: U Fuel Fabrication
I Residual Dose Umit (mnremhr)I s5 25 G0 100
t - 9 I -_ I
Scan time(mW* 100 mA2)
outdoor- gammahidoor - gammafood lwal - alphalbetau. waIV ceiling - alphalbetgood rwall - betau. waOI ceiling - beta
101540
:8020
;40
101540802040
101540s02040
101540802040
Drect Measurements alphahbeta t
(mint location)
Soil Sampring 10 10 10 10(samplesh
Anay~Cost son(Sisample) smear 0.37 0.37 0.37 0.37
aor Rate H.P. Techiidan . 36.82 36.82 36.82 36.82(SAh 1 .P. Spendsor . 70.09 70.99 70.99 70.99
Costs of Other Surveys -_(as a % of ka survey costs) Scop*g Survey
Characterization Survey TReined. Contol SurveyConfirmatory Survey --- ---
D-71 D NUREG-1496

0~
-4
___ - - " . - I _
Total Survey Costs.,_ _ _ _ _ _ _ _ _ _ _ _ _ _ _ _ _ -. . ... .. , -
._ __ _ __ _ _ _ _......_______ ._ ._ __ _ I. __ ,__ _____....
U Fuel Fabrcation _.__ .. .. _3 $1,797,052 U Fuel Fabrication
_315 $6082413__2 $402,481
-= ,_ .,00-00060 $389,752 -1 0000
____ 100 $313,281 -$1,400,000
$1,200,000
______ ____ 1.000,000
- $800,000____ ___ ~ $00,000
____ ____ _ __ ____ ____j~ 200,000
$0
Dose Criterion (mrem/yr)
h

Table D.4.1
Reference FacUlty: Rare Metal Etraction Facili
Structure Surveys Land Surveys
_ ,- I . ,
Reswauat pose Unmit48 Mrenthm chat I Class2 Chass S Cass 2 Casa 3
teIWonnationftiomTlOn w-ior'ewn 7161 19373 a amTareta am&2 .Ousonr aaa n 929 6 n2
Tota gmA2. fbowWdmwall mtl 133OS aTaI" area * u.wl 0 0 19a26 a i a
S1n0 VS 10 100 75 10Scat area (In-Z . Ou, u a .a gm296 696.75 262.3Scn ama OrrZ. FiUar Wa 7161 14=9.75 0 Oa A MScan- am2Z UWaduilo 0 1902.6 Rs maa
Scanning Srvey rime (ittR(gmMa) Flous & Odoor Areas 4.48 111 000 1549333 1.16125 4.337166667
takorfs) ROOM & L Wafs 47.74 08.67 0.00 "a sa ma1awarba3 U. Watts a Cawngs 0.00 0.00 2537 ma e ma
Direct MeasurementsNumbeUao m Me t mr ma N
Sey hn 123.15 70.05 60 ma m m
5oil Sampling -No. of sames m a o ma aCdoneunertTo ma "a ma 29.00 310 4.00
survey TlmeSubtoW phus) 174 179 32 44 A
Adjustment A .25 44 45 11 1 2
Adjuswmmn S.tI% 26 27 5 7 1 t
TOW Os) 244 251 45 62 6 13
Analyicl CostWSd Samptes ma ma Na 21750 2325 3675SmaSamp" O94 516 so m ma Ima
Subf ,9 S4 516 S0 21750 25 3675
Final Survey Cost (S)LaborMAnat~tcal
Sp. Data RenewS kepolt PrepraOnnTOtl Coat Final Suuwey
Other Survey Costs(S)Gridding * hdoorGnddg . Outoor
S'opkg "yCharactefitj SunyRened. ConbtW SurmyCormrmatotySurvey
| TOTAL SURVEY COSTS
6896
98s2
l22t 16a8SIG so
0747 _ 1709
3294217502434
2202325254S
47636754151
2537777483
43052345w
3873103661S4933873
916607
urvey costs using hi stu gami:onertfaal hwosilt Yew
TOW Cost . Fmal
Other Survey Costs (S)Gddd.mGSddft - Outdoor
. SUtycharactareaton aReied. ConOW S' & x C Sur
La spctomeil2134740156
430823458
2Xt
6032
TOTAL SURVEY C 1150.211
.1
D-73 NUREG-1496

Table D.4.2
Reteencet FaCilit. Rae Metal Extraction Facility
Structure Surveys Land Surveys
Residual Oos Limit Class I Clas 2 Class 3 Class I Class 2 Clas 360 mrenwyr ___________ Mrfdewn t*.dht^d *dedMW-VhE Aftoct.44&WO uIwiled
Site InformationTotal area (m12 -Outdo na a na g26 929 202Total area (m42) - FboAA~ WaS 7161 19373 0 na no naTotal area (m^2) U U.WaAICo 0 0 19026 No na
S (%tArea) 100 75 10 100 7S 10Scan area (mA2 - Outdow ma nma n 9296 696.75 26023Sc arnam (m, FbodLtw Wal 7161 t452975 0 nm ma mfScan area rn2i- U.WaWCedm9 0 0 1902.6 ma no n1
Scanning S3 s r e (hr)Wammal Floms & Outdoor Aram 4.48 1211 0.00 15 49333333 1.16125 4.3371666?t
palphx/tteta) Flom & L Wels 47.74 96.57 0.00 na mm ma(a*4Woew U. Waft & Codenp 0.00 000 25.37 a mn . -
Dired MeasurementsNumber of Measurement ' m NoS-weyTm(h) 122.15 72.95 .60 an nN no
Soil SampinNO. oSamples Nm no Ha _
C ollectonr TmeP" ma m n1 30.30 3.50 4.90
Survey Time5 (hOu-) 174 182 32 46 5 9
Adpatme A t 25% 44 45 8 tt 1 2
Adjutbmat8- 15% 26 27 5 7 I I
Total(haut) 244 255 45 64 7 13
knalycal Cost (S)Sdil Sampls5 no WA 22725 625 S367SSmr Samples 904 540 50 1W na mn
Subttal 904 540 50 22725 2625 3675
4
.alM SuWvey Cost (I1Lao
Slaytota
Sup. Date Remvd Repofl PeparatbonTotal Cst . Final Suwey
898904
9SR01
93785400013
165sso
17fl
236122725M0M
2402t252s5S
476375415s
a. .1 C
25377787
ANvey costs using In sait gamma speetrometro l kbdoor suivey cosl 21518
Tow Cos -Pia 401S5
Other Survey Costs (S)Gnddig - hIdoorGndding - Outdoof
0pi Su SyCharacteriaio weyRemed Contrl StoeyConnatoy Suey
430623458
3s50197491S7993900
$168.964
Other Surwvey Costa (S)Gd_*irs indoorGriding . Outdoo
Sc bco W-coaractorzabon tReited. Contrl SCoiSurv
TOTAL SURVEY C
43062S45S
8002
200a
1150.382| TOTAL SURVEY COSTS
a
NUREG- 1496 D-74
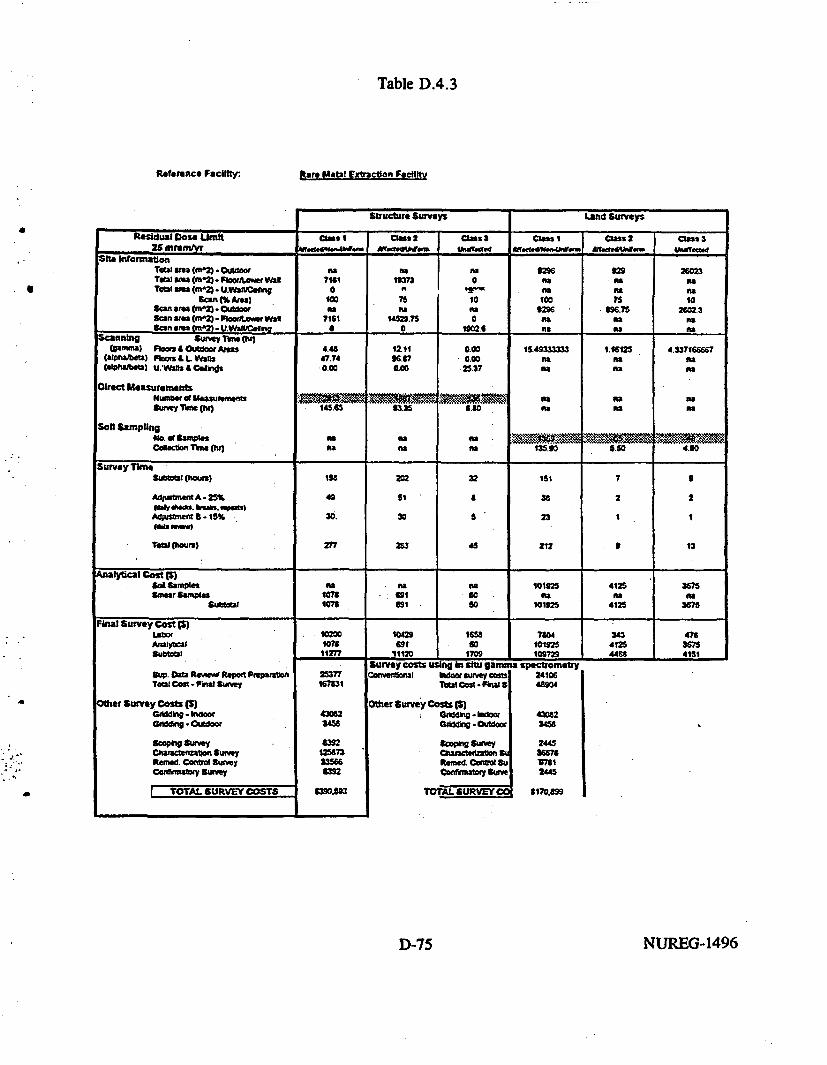
Table D.4.3
Reference Fadlwty: kare Metal Fetractiov Foelot
5.Structre surveys Land Surveys
. a
Residual Dose Umnit cls I cs 2 Class 3 CUsS 1 Cs 2 Clas 3
Sits InformationTetow area (m'2) . Outdoor m no a 62S6 229 26023TOW Oa (m3-. PloodLer WaN 7161 11373 0 M "a ouTOWt area (mn2) * U.WaWOeng 0 A As Mas
S1anCKAaa) 1w 75 10 too V5 10Sm a s(W2) - Outdoor Me ha f OM6 696.75 2602.3Scn aMa fM -.bLean WaT 1161 14529.a O l M RaSan s(m2 a UVAwMin0 0 1S02.6 s aa
Scanlnng Sumwy T.(gammal Rom 4SOutdoorAm 4.46 12.11 0.W0 15.493 1.16125 4.337166667
hariu) Ploa & L Wall 47.14 96*7 0.0 ma na "aalshaetf) U.Wafts Ces -0.00 0.O0 25.37 ma na a
Mirect asurementsN_ oe tessureeu 1 g m maSu&Tey Tlmrihc 145.65 3.35 6.60 ma rA
son Bampling .NM f saffzes.ea laceacf,,on raw *a ft ma 135.3 5.50 4.90
Survey TimeSucsi (phours) 19 202 32 151 7 9
Adjuatin.ntA.25% 49 51 36 2 2
Adptstent a 15% 30. 30 5 23 1 1
TOa(hous) 277 263 45 212 I 13
Pualytical Cost F)6d Samples Re Rs As 101925 4125 3675Smeargamples t7 6: s1 S O:a Re Ma
Subf 107o 691 so 101525 4125 3675
Fuial survey Cost 1S)
Anadmsl
Sup. Os= RCeamd Report PrepawnoTOWi Co. R Fa Surey
Outer Survey Costs (S)Cedohg .hoo011d119Ou~oor
c -Ren-d. Coruwol Surveycon"""y Survey
10200
1tm1
sto.911lIMf
16tsso
170
7S04t102510972
341254&
4763675
.1 & I .1 ________
25377167531
4=062am5
8307
33566a6m
t390=93
Survey csts using hi nu ganm
TOWs Cogt- Ftirm
o n uyCostsmS
GdkdV - OIdoor
Chalxradtedndon SRemed. Con~t Suc- sve
TOTAL -SURVEY CC
a Spectronetry241064B9Ot
3458
24453667I37 12445
X170.899
-
I TOTAL SURVEY COSTS
a
D-75 NUREG-1496

Table D.4.4
Reterence Facility Rare metal extactionm Lacdity
.1 - --
struuro Surveys Lanm ZutvKs
Residual Dose Umla Ccan 2 Classa Clae 1 clan 2 Clan aIS mramh/ w _ua >
SIt normatioTo am ( -Ouw na n"a M6 S 26023ToMWu a(m2. Floodjfwn V 7161 13737 a no rA naTow area Iw2) u.awa" 0 0 19W O no na
S100 7A) I o 100 75 10Sca am (nVW4 Odww nao na me9296 69675 260Z3scarea (mM FbomArWa 7161 1423.75 a no no naSca are (m1- U.Wacefti 0 0 1s9026 5nu na na
5ctnth9 Sure T1e (s)_ _Flo&OuWWerM 443 12.11 Q O 1S4333333 1.1t125 4337166661(3lphbd) Fl A L Wa 47.74 965.7 0.00 n. no ngt"Wbet) U. wall. £ Cekla 0.00 0.00 2y.37 ne na na
Dirtect Me="*urtHuffd ait Me"refo na noS16.W r t 95 X3.35 t60 na na na
Sol SamplingHe, oSamf6es Nn noC d h Nu e na 330.70 C.60 6CIO
Sutrvey TimSumt um 229 202 32 343 10 10
A4uMAA25% S7 51 S S7 2 3
AdpnMWK S. 15% 34 30 5 52 1 2
Tratm u) 321 283 45 45 14 s5
Aiatcal Cost (S)Sot Sampls n no na 4Jf50 12900 S150SmR Samples 130t 6E1 50 nA Na na
SuMt 1309 631 50 49605 12900 9150
4
maSuvyosub aai 11613130913122
10"t;S
11120
168350
17f0
173459M505t29M
503129001340
536St50
96U8- - - _______________
Sup. Data ftnwvw Reponi PrepearaigoTOW Cost Faix survey
Other Survey Coasg (SGM IMoM
Gnddmeg - C
Cnaracto~a~n Sr.
Reined Conw a S"aw
2537758714
4023453
2941U4412611766323416
31.252564
Survey costa using in 5ftt ganui-ovrm MKdaw veye
Dow~ Survey Cosft MIOad&"- ordoor
Reined Cmntrol Su,
TOTAL SURVEY CC
* Spactronle"25a 11
3456
25C237M3100002502
6175.081I TOTAL SURVEY COSTS
a
NUREG-1496 D-76

Table D.4.5
Reference Facility: Rare Metal ErtactIon Faclitty
q - --Smacture Surveys Lana Surveys
Residual Doss Untt Class I cas 2 CaseS Cleat I Clan 2 Clas 33 mremhyr | fte*nqseANr Mfsetesu WIMCd n1feaw Affe flht 48d.4li rdff iSd
Se Information n) -O1 door -
Tw ram (n2) - Otoore eaM VaNTa! eam (on22 - U.VVaWCadng fan 1
Scan C% Area) ,_ 1Scan at" (enS) Outdoor a r w a 996 t5 2SSana e ( Ftoo LwWal 7161 4529.75 0 ea as maScan Wms (62). -Wan UW n _ ° 1o 9020 M Oa #a
Scaning survy Tane (hi), unaem) lfb f& Orutdor ArUas 448 12.1 t00 15.49333333 1.16125 4.33716t67
3WMN o L waft 47.74 . ;.7 coo a N H
(alpheibena) U. allaSO Cags 4100 0600 25.37 "a
Cie Maurmenoffts 2rre UN =a aPNkeumbe V .earmn
Sur T () 730.20 228.2D 33.20 as n N
'SoI Sampling
econTom(M ea H .Oa.0 4.0 7010
Survey Tim*Sue T ue phours) 762 33? 59 87 47 . 75
AdjusrreitA-25% 196 54 15 247 12 19
Adjuatnal- 1 S % It7 61 I 148 7 II
Tot tnour) 1095 472 U2 132 6 10t
Analytical Cost(S)Sot Sples "a a 29U1540 3890 212700Smear Samples 1351 423 51 ma Me me
SUbel 135t 423 51 29184t0 138900 212700
/
Final Survey Cost ()Labor
nfreatso I
402M35t
4t68t
17381422
1780W
3019SI
s208
50933154003266293
244713t900141347
357821270021657£
' -.-- * -
Sup. OM tRcad Rep PrepambonTOe Cost- AFlat Survey
Other Survey Cost( )fnddAi - door
Gafdmg - Outdoor
Soopnot 5ubqSoapg SurWey eyRmw. CrSrvSwwy
COfntAL sur- C
I TOTAL SURVEY COSTS
253773412160
430234S8
17060825952062m32t708
V7.041.48
survey coss using in situ gammaCarne!ba arlw Sur," mc
Total Cot -Fta SUMn
Other Survey Costs (S)Onddg -Wiooamdo .Outdoor
0pgatg SayCR nf Survey
CarAfirl 5URy S tS
TOTAL SURVEY COS
cpecrmatry52566
-1475o
43082
3458
7ns
29516737'
P11i.65, ._.o_ __.^._. ___._
..
D-77 NUREG-1496
/

Table D.4.6
Reference Facility: Rare Metal Extraction Facility
. Residual Dose Limit (mrernyr)1 3 I 15 25 60 100
: 4
Scan bime(min/ 100 m^2)
outdoor - gammaindoor - gammaflood l.wafl - alphalbetau. waW ceiring - alphalbetflood l.wal - betau. wall ceiling - beta
101540802040
101540802040
101540802040
101540802040
N
Direct Measurements alphalbeta .
(min/ location)
Soil Sampling 10 10 10 10(samplesihr)
Analysis Cost sol A(S/sample) smear < 0.37 0.37 0.37 0.37
Labor Rate H.P. Technician 36.82 36.82 36.82 36.82(SIhr) H.P. Sperisor ? 7099 70.99 70.99 70.99
Costs of Other Surveys(as a 9% of final survy costsl Scot gi Suve
Characterization Survey ~*
RCmed.rCoatom SurveyCReine. C nw o Survey
a
NUREG-1496 D-78

p 0
- - - I I I I I I I I
- _ _ .|tt ._+ - _ _.-. - ...
Total Survey Costs_._ 4 -- I I _ ----- I _I . .
4 - .... 1Rare Metal Extraction Fac its11 . ., He-
3 704146815 125258425 39059360 168984100 166607
-I
Rare Metal Extraction Facility
I
I
8000000 e
7 0
6000000
5000000
4000000
3000000
2000000
1000000
0
I -- - I
, _.
._..
.....
,I__
-
3
-aIs 25 60
Dose Criterion (mrem/yr)
100 'In
1.
_I I. -. . ._ ,
z
oI
0%

APPENDIX E
SUMMARY OF DRAFT GEIS SCOPING PROCESS

APPENDIX E
E.1 Basis for Scoping Process
The Commission's regulations in 10 CFR Part 51 for complying with NEPA containrequirements for conducting a scoping process prior to preparation of an EnvironmentalImpact Statement (EIS). Section 51.26 indicates that, whenever the NRC determines that anEIS will be prepared by NRC in connection with a proposed action, the NRC will publish anotice of intent in the Federal Register stating that a Generic Environmental Impact Statement
a (GEIS) will be prepared, and conduct an appropriate scoping process. Section 51.26indicates that this scoping process may include the holding of a public scoping meeting aswell as opportunity for written comment.
Section 51.27 contains requirements regarding the content of the notice of intent, inparticular that it should describe the proposed action and, to the extent that sufficientinformation is available, also describe possible alternatives. In addition, the notice of intentis to describe the proposed scoping process, including the role of participants, whetherwritten comments will be accepted, and whether a public scoping meeting will be held.
E.2 Scoping Activities Conducted
In accord with 10 CFR 51.26 and 10 CFR 51.27, a notice of intent announcing the scopingprocess was published in the Federal Register on June 18, 1993 (58 FR 33570). The noticeof intent (referred to as an FRN) included a discussion of the proposed action, the bases forpreparation of the GEIS, and the scoping process. The FRN also invited comment on thescope of the GEIS by describing then-current preliminary NRC staff views on the scope andmajor topics to be dealt with in the GEIS including: (1) the facilities to be considered; (2) theaffected environment; (3) the regulatory alternatives to be considered; (4) the methods ofanalysis of regulatory alternatives; (5) impacts (both radiological and nonradiological) andcosts associated with the regulatory alternatives;' and (5) areas considered to be outside thescope of the GEIS. The FRN indicated that oral comment and discussion on the proposedaction and alternatives could be presented at any of eight public scoping meetings. The eightpublic scoping meetings were held in Washington DC, San Francisco, Oklahoma City, andCleveland during July 1993. In addition to the scoping meetings, the FRN also indicated thatwritten comments on the proposed action and alternatives could be submitted to NRC byAugust 15, 1993 (as a result of written requests, the written public comment period wassubsequently extended to September 20, 1993).
E.3 Scoping Comments Received
Oral comments presented at the scoping meetings and written comments submittedsubsequent to the scoping meetings were received from members of the general public,
E1 NUREG-1496

interest groups, Federal agencies, licensees, and industry organizations. Section E.5, below,summarizes the conclusions reached in the scoping process based on the comments received.
Transcripts of the Scoping Meetings and copies of related letters are available for inspectionor copying for a fee in the NRC Public Document Room, 2120 L Street, NW (Lower Level),Washington, DC.
E.4 Nature of Scoping Process
The Commission's regulations in 10 CFR Part 51.29(a) require that the scoping process willbe used to: (1) define the proposed action which is to be the subject of the statement;(2) determine the scope of the statement and identify the significant issues to be analyzed indepth; (3) identify and eliminate from detailed study issues which are peripheral or are notsignificant or which have been covered by prior environmental review (discussion of issuesin the EIS which are eliminated from detailed study would then include a brief presentationof why they are peripheral or will not have a significant effect on the quality of the humanenvironment or a reference to their coverage elsewhere); (4) identify any environmentalassessment and other environmental impact statements which are being or will be preparedthat are related to but are not part of the scope of the statement under consideration; (5)identify other environmental review and consultant requirements related to the proposedaction so that other required analyses and studies may be prepared concurrently andintegrated with the EIS; (6) indicate the relationship between the timing of the preparation ofenvironmental analyses and the Commission's tentative planning and decisionmakingschedule; (7) identify any cooperating agencies; (8) describe the means by which the EISwill be prepared, including any contractor assistance to be used.
The June 18, 1993, FRN (58 FR 33570) provided detailed description of the technical issuesassociated with Items (1) through (3), above, in Items (b) and (c) of the FRN on pages 33572and 33573 by providing a proposed outline of the sections of the GEIS and preliminary NRCstaff views on the scope and nature of the analyses to be conducted in those GEIS sections.These preliminary staff views were developed based on staff review of existing data andscientific information and also on the information presented in the seven public workshops onthe Enhanced Participatory Rulemaking held between January and May of 1993. It is thoseItems (1) through (3), above, where the large majority of public comment was receivedduring the scoping process, and it is those items where the principal determinations andconclusions regarding significant issues are discussed below in Section E.5. The FRN alsopresented infornation regarding Items (4) through (8), above, in items (d) through (g) onpages 33573 through 33574 of the FRN.
E.5 Summary of Conclusions of the Scoping Process
The Commission's regulations in 10 CFR 51.29(b) require that, at the conclusion of thescoping process used to perform the actions listed in 10 CFR 51.29(a) (listed in E.4 above),
NUREG-1496 E-2

the NRC prepare a concise summary of the determinations and conclusions reached as aresult of the scoping process, including the significant issues identified.
A number of public comments were received during the scoping process regarding the needfor, general form of, and procedural aspects of a rule. These comments were not, strictlyspeaking, part of the GElS scoping process and were not treated in the conclusions anddeterminations. These comments were treated more fully in the rulemaking development. Ingeneral, however, based on the comments received during the scoping process and as part ofthe rulemaking workshop process, most of which agreed that there should be a regulationwhich codifies residual radioactivity for decommissioning, the NRC is proceeding with arulemaking to establish radiological criteria for decommissioning. Based on the scopingprocess, a proposed rule was issued for public comment in August 1994. NRC plans to issuea final rule in 1997. In accordance with 10 CFR Part 51 and with the NationalEnvironmental Policy Act, this GEIS is being prepared as part of that rulemaking action.Based on the scoping process, the GEIS is analyzing regulatory alternatives for establishingradiological criteria for decommissioning structures and lands of licensed facilities.
The following is a summary of the conclusions reached as a result of the GEIS scopingprocess as it related to the-scope of this GEIS:
1. Regulatory Alternatives
Based on the comments received, the GEIS analyzes in detail the regulatory alternatives forestablishing residual dose criteria and considers the impacts and costs associated with thosealternatives. Chapter 2 indicates that the following regulatory alternatives are analyzed inthis GEIS: (1) "no regulatory change"; (2) abandonment of facilities; (3) risk-based limits orgoals; (4) use of best available technology; (5) return of the site to preexisting backgroundconditions; and (6) restrictions on future use of the site.
The analysis of the regulatory alternatives includes impacts on public health and theenvironment and costs associated with the regulatory alternatives. The analysis of impactsinclude radiological and nonradiological impacts to workers, the public, and the environment,as well as societal, economic, land use, and other impacts. Costs include the costs ofdecontamination of buildings and structures, waste disposal, and radiation surveys. Thedetails of the bases for the analyses and of how the analyses were performed are discussedbelow in Item 3. This includes the bases for the comparison of impacts and costs, the basesfor the risk levels evaluated, how worker and public impacts are calculated, collective risks,ALARA considerations, and development of the bases for costs, including aspects ofmeasurability at low dose levels.
2. Method of Approach
The scope of the facilities covered by the GEIS consists of licensed nuclear fuel cycle andnon-fuel cycle facilities listed in Chapter 1 of this GEIS and described more fully in Chapter
E-3 NUREG-1496

3. In the GEIS analysis, reference facilities are analyzed, and reference contamination at thebuildings and soils surrounding these facilities is estimated for a range of contaminationlevels to provide reasonable consideration of the incremental impacts and costs resulting fromthe regulatory alternatives.
The affected environment considered in Chapter 3 includes that affecting human health andsafety, and in particular radiation exposure pathways resulting from occupancy of sitebuildings and from residential, agricultural, and recreational use of site lands, and of affectedwater sources, both on an unrestricted use basis and a restricted use basis. In addition, theaffected environment includes consideration of waste disposal, nonradiological impacts onhumans, impacts on biota, economic impacts, societal impacts, and land use impacts.
With regard to the technical approach, Chapters 4-6 (and Appendices B, C, and D) analyzethe impacts on public health and the environment and costs associated with the regulatoryalternatives using data as available for a set of reference facilities for a modeled set ofreasonable pathways. The analysis of impacts includes radiological and nonradiologicalimpacts to workers, the public, and the environment, as well as societal, economic, land use,and other impacts. Costs include the costs of decontamination of buildings and structures,waste disposal, and radiation surveys. The details of how the analyses were performed arediscussed below in Item 3.
3. Analysis of Impacts. Costs. and Wastes
With regard to the bases for health risks from exposure to radioactive material, the NRC hasgenerally followed the basic radiation protection recommendations of the ICRP and its U.S.counterpart, the NCRP, in formulating basic radiation protection standards.
Recommendations of the ICRP and the NCRP were relied on in the revision of 10 CFR Part20, "Standards for Protection Against Radiation," which were implemented by licensees onor after January 1, 1994. The analysis in Chapter 4 with regard to impacts from exposure toradioactive materials continues this practice and bases the analysis on the estimates of theNCRP and ICRP. It is outside the scope of this GEIS to review other studies to establish anew basis for health effects from radiation exposure.
Risks specifically related to exposure to chemical hazards are outside the scope of this GEISalthough licensees would continue to be required to meet the applicable standards set byFederal, State, or local agencies with jurisdiction over these matters. Nevertheless, alicensee would be required to meet such standards before the NRC would terminate itslicense.
With regard to the analysis of impacts in this GEIS, incremental radiological andnonradiological impacts from the regulatory alternatives are considered. Chapter 4 considersimpacts to persons occupying the site following license termination based on several possibleexposure pathways. These pathways are based on scenario and pathway analyses developed
NUREG-1496 Em4

in NUREG/CR-5512 which was subject to significant public and peer technical review. Inaddition to these impacts, Chapter 4 of the GEIS also considers both radiological andnonradiological (e.g., industrial accidents) impacts to workers involved in thedecontamination activities, which occur during decommissioning, and considers theradiological and nonradiological (e.g., transportation accidents) impacts to workers and thepublic as a result of transport and disposal of decommissioning wastes, and issues related totransfer of the waste as opposed to keeping it on site. Consideration of the need to siteadded LLW facilities is included in Chapter 4 and in Appendix G. Chapter 4 of the GEISalso considers incremental impacts on biota and the environment, on society, and oneconomics which may result from the regulatory alternatives.
With regard to the analysis of the costs associated with the regulatory alternatives, Chapter 5of the GETS considers decontamination costs, waste transport and disposal costs, costs ofsurveys, and related issues. Incremental costs are assessed for the regulatory alternatives.ALARA issues are considered in Chapters 6 and 7.
Development of specific actions related to LLW disposal actions is outside the scope of thisGEIS and can be considered as part of issues related to 10 CFR Part 61.
4. Planning for, and Funding and Timing of Decommissioning
In considering whether these areas are in the scope of this GEIS, it is important to note theGEIS prepared in 1988 (NUREG-0586) to support the promulgation of rules on generaldecommissioning planning requirements considered these areas in detail and resulted ingeneral requirements for decommissioning in the Commission's regulations in 10 CFR Parts30, 40, 50, 70, and 72 for reactors, and for fuel cycle and non-fuel cycle facilities in theareas of planning, financial assurance, and timing.
Development of these requirements was based on an analysis in NUREG-0586 whichassessed the decommissioning activities for a number of reference nuclear facilities. Theanalysis in NUREG-0586 considered activities necessary to carry out decommissioning at thereference facilities, including the engineering and planning necessary for decommissioning,decontamination of facilities, the dismantling of equipment and structures, disposal ofradioactive wastes, and radiation surveys. Based on that analysis for each of the referencefacilities, NUREG-0586 assessed potential radiation exposures to workers and to the publicduring the decommissioning process, costs of decommissioning, the effect on planning andtiming of the half-lives of principal radionuclides, the waste volumes generated and disposedof, and other environmental consequences. The analysis considered both promptdecommissioning and decommissioning following a storage period. Based on the analysis inNUREG-0586, requirements for planning of decommissioning activities, establishment offunding methods, and timing for carrying out decommissioning were included in the 1988rulemaking. Specific timing and planning requirements for certain facilities were modified ina 1994 rulemaking (59 FR 36026; July 15, 1994) and a 1996 rulemaking (61 FR 39278; July
E-5 NUREG-1496

29, 1996), however, the analysis of NUREG-0586 remained valid for use in thesemodifications.
The incremental costs and impacts associated with the regulatory alternatives being treated inthis GEIS do not appear to significantly affect these above issues or to affect the nature ofthe requirements in the existing regulations. In any of the regulatory alternatives beingconsidered in this GEIS, licensees must continue to plan for, secure funding for, andcomplete decommissioning in a timely manner according to the current requirements.
An area that can be affected by the considerations of this GEIS, and which is thereforediscussed, is if significant additional funds beyond that considered in NUREG-0586 and theprevious rulemaking are necessary to accommodate a regulatory alternative, as for example ifsignificantly higher costs for survey measurements capability or waste disposal result from aparticular alternative. These costs are considered in Chapters 5 and 6 of this GEIS.
5. Continued Liability for Facilities
As discussed in Item 4, under existing regulations in 10 CFR Parts 30, 40, 50, 70, and 72,licensees are responsible for planning for and providing funding for decomnmissioning,including planning and funding for disposal of the wastes associated with decommissioning.Under existing regulations in 10 CFR Part 61, the licensee is responsible for packaging wastein a manner which protects public health and safety, but licensed waste disposal facilities areresponsible for safe handling and disposal of the wastes at the disposal site. Chapters 5, 6,and 7 discuss impacts and costs of different regulatory alternatives.
6. Recycle of Materials
In response, although the GEIS does not analyze recycle in detail, it does address thepotential for future inadvertent recycle of soils or structures following decommissioning of asite. With regard to proposed release of contaminated materials such as equipment,components, piping, etc., the Commission plans to consider separately impacts and costsrelated to potential recycle of these materials from nuclear facilities to deal with cases wherethe licensee proposes to intentionally release material containing residual radioactivity forreuse or recycle. In the interim, the Commission will continue to review such actions on acase-by-case basis. The costs and impacts associated with recycle of such materials can beaddressed on a separate basis without affecting the NEPA analysis of this GEIS.
7. Use of a GETS vs. the Need to Prepare a Site-Specific EIS
This GEIS does not attempt to analyze site-specific issues which may arise in the licensingprocess involved with the decommissioning of specific facilities, rather its principal intent isto provide a decision analysis leading to establishment of technical requirements regardingacceptable residual radioactive contamination levels for decommissioning. Theserequirements would establish a single set of radiological criteria which would apply to the
NUREG-1496 E-6

decommissioning of all sites, however they would also recognize the need for flexibility inapplying these criteria because of constraints posed by site-specific conditions (e.g. geology,hydrology, meteorology, demographics, and radiation background levels) and to provideopportunity for meaningful participation by local communities in individual decommissioningactions and, therefore, as discussed in Chapter 7, would provide for site-specificimplementation of the generic criteria.
8. Citizen Participation
Site-specific considerations arise in Chapters 4 and 5 of this GElS, when analyzing impactsand costs associated with reference facilities, and in Chapter 6 when evaluating theregulatory alternatives. Based on these considerations, comment from affected parties isdiscussed in Chapter 7.
9. Waste Minimization
Analysis of the waste quantities generated, of problems related to disposal of these wastequantities, and of associated costs in Chapters 4, 5, and 6 and Appendix G of this GEISillustrate the need for efforts to minimize waste generation at nuclear facilities. The need forprovisions in facility design and procedures for operation to minimize contamination of thefacility and the environment, to facilitate eventual decommissioning, and to minimize thegeneration of radioactive waste is discussed in Chapter 7.
E-7 NUREG-1496
APPENDIX F
ACCESS RESTRICTIONS FOR RESTRICTED USE OF FACILITIESTHAT HAVE HAD THEIR LICENSES TERMINATED BY NRC

APPENDIX F
ACCESS RESTRICTIONS FOR RESTRICTED USE OF FACILITIES THAT HAVEHAD THEIR LICENSES TERMINATED BY NRC
Licensees may choose to only remediate a contaminated site sufficiently to allow restrictedrelease of the site. Examples include situations where further remediation is determined tobe not cost effective for the benefit received and/or further remediation is determined tocause net public harm or to be unfeasible with existing technology. Site use can be restrictedby means of deed restrictions, simple access restrictions, and more complex engineeredbarriers. This Appendix discusses simple and relatively low cost access restrictions thatcould be used as part of a restricted use alternative. Deed restrictions, which can be verysite specific in their application, are not discussed here. Engineered barriers can be verycomplex and site specific although a general discussion of stabilization and capping iscontained in Section 6.6.7 of Appendix C. In order to show that a site has been remediatedto ALARA, a licensee could further reduce dose to individuals on the site by installinginexpensive but effective technologies to prevent inadvertent access to the site. This sectionprovides methods for representative low-cost technologies as well as cost estimates for thosemethods. The technologies evaluated in the section include installing a perimeter fencearound the contaminated site, paving the contaminated site, and landscaping the site in a wayto discourage access.
F.1 Perimeter Fence
One low cost but effective technology for restricting access to a site is a perimeterfence. For the purposes of this analysis, a cost estimate is developed for both a residentialfence and a low-security industrial fence that are intended to only prevent unintentionalaccess to the site. The residential chain link fence is six feet high, is made of 11-gauge wireand galvanized steel, and has 1-5/8" line posts every 10 feet, two-inch corner posts, and a 1-3/8" top rail. It is also assumed to have a six-foot high, four-foot wide gate every 1000 feetand to have a warning sign posted every 50 feet. The cost for installation of this fence isabout $12.20 per linear foot, or $40.00 per linear meter (Means, 1993).
The industrial chain link fence is six feet high, is made of 6-gauge wire andgalvanized steel, and has two-inch line posts every ten feet and a 1-5/8" top rail. It is alsoassumed that a set of double swing gates are in the fence every 1000 feet and that a warningsign is posted every 50 feet. The cost for installation of this fence is about $19.80 per linearfoot, or $64.90 per linear meter (Means, 1993).
F.2 Paving and Surfacing
Another technology that can be used to minimize exposure of individuals tocontaminated soil is to cover the contaminated land surface area with a material such asasphalt. This allows the possibility of reusing the site, such as for a parking area for
F-1 NUREG-1496

vehicles. Cost estimates for installation of this technology range from about $11.9/n 2 for aresidential driveway-grade paved surface to $19.7/m 2 for a highway-grade asphaltic concretepavement (Means, 1993). The cost estimate for the driveway-grade paved surface includesestimates for grading the surface in preparation for paving, the lay-down of a stabilization(polypropylene) fabric, and the lay-down of a 2½h-inch thick asphaltic concrete pavement.The cost estimate for the highway-grade paved surface includes for grading the surface inpreparation for paving, installation of a 4-inch thick granular (1 h-inch diameter stones) basecourse, lay-down of a 3-inch thick asphaltic concrete binder course, lay-down of astabilization (polypropylene) fabric, and the lay-down of a I ½-inch thick asphaltic concretewearing course.
In some cases, a more robust engineered barrier may be desired, such as to preventburrowing animals and vegetation from accessing the contaminated soil. Cost estimates forsuch an engineered barrier, or multi-layered cap, were provided in Section 6.6.7 ofAppendix C.
F.3 Landscaping
A low cost technology for preventing unintentional access to a site is to landscape thesite with plants that discourage access. For this analysis, it is assumed that a barberry shrubis planted around the perimeter of the site. The barberry shrub is a prickly shrub with sourgreen or red berries and yellow flowers and is often used for hedges. It grows to a height offour to five feet and a width of about four feet. The cost of landscaping with the barberryshrub is estimated to be $3.90/ft, or $12.90/m, and includes purchase and planting of theshrub and preparation of the bedding area with peat moss.
F.4 Access Restriction Costs for Reference Facilities
Table F. 1 provides estimates for the costs to implement site access restrictions for eachof the reference facilities described in Section 4 of Appendix C. The capital costs areestimated using the unit costs discussed above. The average annual cost of maintenance wasderived from the assumptions that the capital investment in the access restrictions depreciatedby 5% each year, that the maintenance cost for the first year is 1% of the capital investmentcost, and that maintenance costs increase by 10% each year thereafter. It is assumed thatessentially the only wear and tear on the access restrictions are from natural environmentalconditions. The assumed values for these parameters are, therefore, low relative to what theywould be for actual operating equipment. Based on these assumptions, the lifetime of theaccess restrictions is about 30 years, and the annual maintenance cost reported in Table F.1 isthe average annual maintenance cost over the 30-year period. If the paved surface were usedas a parking lot, then annual maintenance costs would be expected to be significantly higherthan shown in Table F. 1, and the lifetime of the surface would be expected to be considerablyless than 30 years.
NUREG-1496 F-2

Table F. 1. Calculated Costs for Site Access Restrictions
Perimeter Fence (SK) Paved Surface (SK) Landscaping ($K)
Reference Facility Annual Annual AnnualCapital Maintenance Capital Maintenance Capital Maintenance
Nuclear PowerPlant 2.7 - 4.3 0.15 - 0.24 3.3 - 5.5 0.18 - 0.30 0.90 0.05
Uranium FuelFabrication Plant 15.4 - 25.1 0.84 - 1.38 110 - 180 6.0 - 9.9 5.0 0.27
Sealed SourceManufacturer 3.4 - 5.6 0.19 - 0.31 5.5 - 9.2 0.30 - 0.50 1.1 0.06
Rare MetalsExtraction Plant 15.4 - 25.1 0.84 - 1.4 110 - 180 6.0 - 9.9 5.0 0.27
Uranium Mill 148 - 240 8.1 - 13.2 10,200-16,800 560 - 920 48 2.6
NUREG-1496

F.5 References
Means. 1993. Means Building Construction Cost Data. Kingston, Massachusetts.
NUREG-1496 P-4
APPENDIX G
EVALUATION OF THE PLANNED DISPOSAL CAPACITYFOR
DECOMMISSIONING AND NORMAL OPERATION WASTE

APPENDIX G
G.1 Introduction and Background
The cost analyses performed in Appendix C of the GEIS assumed that the waste generatedfrom the decommissioning of buildings and soils for most of the reference facilities wasplaced in low-level waste burial sites. Appendix G estimates the amount of available planneddisposal capacity by compact and noncompact states and compares this capacity to theincremental amount of waste generated by decontaminating the structures and soils for alllicensed facilities considering the regulatory alternatives and alternative residual dose criteriadiscussed in Chapter 2 of this GElS.
G.2 Approach and Method
For the purpose of this study, the focus is placed on low-specific-activity waste usuallypresent in large volumes. Such waste includes contaminated building rubble, soils, slag, ash,sands, etc., and tailings-like materials. For the lower alternative residual dose criteriaconsidered in Appendix C (i.e., approximately 3 - 0.03 mremly), larger waste volumeswould potentially occur and require disposal at approved disposal sites and could become aconsideration with regard to available and planned disposal capacity to accommodate theresulting waste volume. Conversely, for the higher alternative residual dose criteria(approximately 3 to 100 mrem/y), lesser waste volumes could potentially occur. Other riskand cost considerations are discussed in Chapters 4 and 5, and in Appendices B, C, and D.This Appendix factors waste disposal capacity considerations into the development ofacceptable residual dose criteria for decommissioning.
Inherent in this approach is the assumption that the total amount of activity (even whenassociated with very large waste volumes) is not expected to be a limiting factor for disposal.It is assumed that the total radioactivity present in such waste from decommissioning of landsand structures would be a small fraction of that contained in waste generated under routineand normal operations. In other words, it is assumed that the volume might be a limitingfactor, rather than total activity or radionuclide concentrations. Because the GEIS determinesthe incremental impact of alternative residual dose criteria for lands and structures, thisAppendix does not analyze waste volumes from disposal of metals and equipment. Thedecommissioning waste volume estimates of low specific activity waste are based on theinformation in Attachments C and D of Appendix C (to provide complete information onwaste volume estimates, Appendix C of the draft GEIS is reproduced in this final GEIS asAttachment D to Appendix C) and, where appropriate, information provided by the low-levelCompacts and unaffiliated States.
The estimated incremental waste volumes from decommissioning of lands and structures arecompared to the overall volume of waste generated under normal operations and are alsocompared to waste disposal capacity provisions by the Compact regions or States. Thiscomparison is performed for each of the nine Compacts and all unaffiliated States.
G-1 NUREG-1496

This Appendix also considers the Site Decommissioning Management Plan (SDMP) facilitiesidentified by the NRC. The facilities have contaminated buildings, soils, slag, andgroundwater and former waste disposal areas and tailing piles (NRC, 1993b).
G.3 Waste Generator Profiles and Population
Waste generators are grouped in this Appendix into five categories: nuclear power plants,test and research reactors, fuel cycle facilities, non-fuel cycle material facilities, and dryspent fuel storage facilities. Reference facilities for the categories of nuclear power plants,fuel cycle facilities, and non-fuel cycle facilities are described in Appendix C. As notedthere, the number of reference facilities analyzed in this final GEIS have been reduced fromthe draft GEIS, but because this Appendix G is summarizing total quantities of waste andcomparing it to waste compact capacities, it estimates volumes for all NRC-licensed facilitiesin the U.S. including those not analyzed in detail in Attachment C of Appendix C.However, a description of reference research and test reactors and spent fuel storagefacilities, including waste volumes, can be found in Attachment D to Appendix C. SiteDecommissioning Management Plan sites are discussed as a separate category. Low-levelradioactive waste produced by these categories of waste generators is generated in diversetypes of activities, including power production, fuel fabrication, materials testing, chemicalproduction, drug research and testing, mineral processing, and basic and applied research invarious scientific disciplines (e.g., physics, chemistry, medicine, and biology). Theradioactivity contained in the waste originates from various sources, such as reactors(research and power), industrial facilities, ore extraction and processing, etc. Wastegenerators are licensed under Nuclear Regulatory Commission and Agreement Stateregulations governing the possession and use of radioactive materials.
There are over 22,000 licensees (issued by the Nuclear Regulatory Commission andAgreement States) authorized to possess and use radioactive materials (NRC, 1993a). BothNRC and Agreement State licensees generate waste. The following sections describe theoperating and nonoperating nuclear power plants, fuel-cycle facilities, approved and pendingindependent spent fuel storage facilities, materials licensees, and operating and nonoperatingresearch and test reactors licensed by the NRC that are considered in this appendix.
Using the NRC license program code data, the distribution of licensees is estimated to be asfollows:
Category NRC Agreement-State
Academic 83 6,210Medical 2,260 1,120Industrial 4,060 7,880Source Materials 166 nlaSpecial Nuclear Materials 236 n/a
Sourcs NURME=M, VoL.5, NRC, 193a; NRC Bmese Nagement System outi dated 19193 (RIM OOSA).
NUREG-1496 G-2
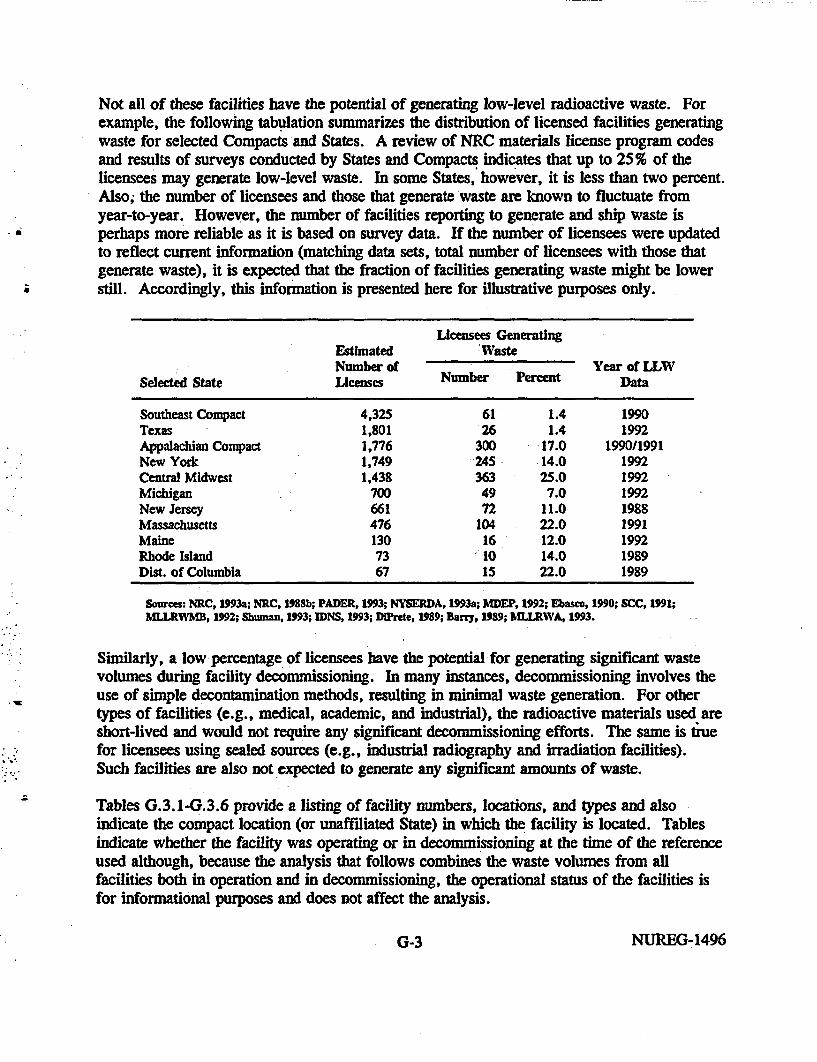
Not all of these facilities have the potential of generating low-level radioactive waste. Forexample, the following tabulation summarizes the distribution of licensed facilities generatingwaste for selected Compacts and States. A review of NRC materials license program codesand results of surveys conducted by States and Compacts indicates that up to 25 % of thelicensees may generate low-level waste. In some States, however, it is less than two percent.Also; the number of licensees and those that generate waste are known to fluctuate fromyear-to-year. However, the number of facilities reporting to generate and ship waste isperhaps more reliable as it is based on survey data. If the number of licensees were updatedto reflect current information (matching data sets, total number of licensees with those thatgenerate waste), it is expected that the fraction of facilities generating waste might be lowerstill. Accordingly, this information is presented here for illustrative purposes only.
Licensees GeneratingEstimated WasteNumber of Year of LLW
Selected State Licenses Number PercentData
Southeast Compact 4,325 61 1.4 1990Texas 1,801 26 1.4 1992Appalachian Compact 1,776 300 17.0 1990/1991New York 1,749 245 14.0 1992Central Midwest 1,438 363 25.0 1992Michigan 700 49 7.0 1992New Jersey 661 72 11.0 1988Massachusetts 476 104 22.0 1991Maine 130 16 12.0 1992Rhode Island 73 10 14.0 1989Dist. of Columbia 67 is 22.0 1989
Sources: NRC, 1993a; NRC, 1188b; PADER, 1993; NYSERDA, 1993a; MDEP, 1992; Ebasco, 1990; SCC, 191;WJLRAYMM, 1992; Shit, 1993; IDN, 1993; DiPr:te, 189; Barny, 1989; NMLLRWA, 1993.
Similarly, a low percentage of licensees have the potential for generating significant wastevolumes during facility decommissioning. In many instances, decommissioning involves theuse of simple decontamination methods, resulting in minimal waste generation. For othertypes of facilities (e.g., medical, academic, and industrial), the radioactive materials used areshort-lived and would not require any significant decommissioning efforts. The same is truefor licensees using sealed sources (e.g., industrial radiography and irradiation facilities).Such facilities are also not expected to generate any significant amounts of waste.
Tables G.3.1-G .3.6 provide a listing of facility numbers, locations, and types and alsoindicate the compact location (or unaffiliated State) in which the facility is located. Tablesindicate whether the facility was operating or in decommissioning at the time of the referenceused although, because the analysis that follows combines the waste volumes from allfacilities both in operation and in decommissioning, the operational status of the facilities isfor informational purposes and does not affect the analysis.
G-3 NUREG-1496

Table G.3-1 Nuclear Power Plants in Commercial Operation&
State and No. ofCompact Reglone) Plant Name Units Type Net MWe
Alabama/SE
Arizona/SWArkansas/CECalifornia/SW
Connecticut/NE
Florida/SE
Georgia/SE
Illinois/CM
Iowa/MWKansas/CELouisiana/CE
Maine/Unaf.Maryland/APMassachusetts/Unaf.Michigan/Unaf.
Minnesota/MW
Mississippi/SEMissouri/MW
Browns FerryJ.M. FarleyPalo VerdeArkansas NuclearDiablo CanyonSan OnofreHaddam NeckMillstone-1Millstone-2/3Crystal River-3St. LucieTurkey Point-3/4E.I. HatchA.W. VogtleByronClintonDresden-2/3LasalleQuad CitiesZionBraidwoodDuane ArnoldWolf CreekRiver BendWaterford-3Maine YankeeCalvert CliffsPilgrimBig Rock PointD.C.CookFermi-2PalisadesMonticelloPrairie IslandGrand GulfCallaway
BWRPWRPWRPWRPWRPWRPWRBWRPWRPWRPWRPWRBWRPWRPWRBWRBWRBWRBWRPWRPWRBWRPWRBWRPWRPWRPWRBWRBWRPWRBWRPWRBWRPWRBWRPWR
1065828122185810871080/436565654863/11428218396667661100110593077310367691040112053811359361075830825670671060107576853650311421125
NUREG-1496 G-4

Table G.3-1 Nuclear Power Plants in Commercial Operation"") (Continued)
State and No. ofCompact Region() Plant Name Units Type Net MWe
Nehrs%/F. I n 1 RW17ANW sa> %Lf4&%1A%-6
New Jersey/NE
New Hampshire/Unaf.New York/Unaf.
North Carolina/SE
Ohio/MW
Pennsylvania/AP
South Carolina/SE
Tennessee/SE
Texas/Unaf.
Vermont/Unaf.VirginiatSE
Washington/NW
Wisconsin/MW
Fort CalhounHope Creek
-Oyster CreekSalem
AA TV JL
PWRBWRBWRPWR
I *v*
47810316201106
SeabrookJ.A. FitzpatrickR.E. GinnaIndian Point-2/3Nine Mile PointBrunswickMcGuireShearon HarrisDavis BessePerryFermi-2Beaver ValleyLimerickPeach Bottom-2/3SusquehannaThree Mile IslandCatawbaOconeeRobinson-2V.C. SummerSequoyahWatts Bar-iSouth Texas ProjectComanche PeakVermont YankeeNorth AnnaSurryWashingtonProject-2
KewauneePoint Beach
PWRBWRPWRPWRBWRBWRPWRPWRPWRBWRBWRPWRBWRBWRBWRPWRPWRPWR'PWRPWRPWRPWRPWRPWRBWRPWRPWR
BWRPWRPWR
1150757470970610/107279011298608741141876810/83310551035/1051103880811298466658851148112512501150504915781
1095503485
(a) Commerdally operating plants by the end of 1995 (Nuclear News, 1993a, NRC, 1996a).(b) Key to hlw-level waste Compact regions: NW, Northwest,; MW, Midwest; NE, Northeast; AP, Appaladhian; CE, Central
Interstate; CM, Central Midwest; SE, Southeast; SW, Southwestern; and Unaf., unaffiated States.
G-S NUREG-1496

Table G.3-2 Formerly Operated Commercial Nuclear Power Plants"
Type & Power D&D Option State or CompactUnit & Location (MWt) Status"
CVTR, Parr, SC PTHW 65 SAFSTOR Southeast
Dresden 1, Morris, IL BWR 700 SAFSTOR Central Midwest
Fort St. Vrain, Platteville, CO HTGR 842 DECON Rocky Mountain
Trojan, Portland, OR PWR 3,411 Pending Northwest
Humbolt Bay, Humbolt Bay, CA BWR 200 SAFSTOR Southwestern
Rancho Seco, Herald, CA PWR 2,772 SAFSTOR Southwestern
GE VBWR, Pleasanton, CA BWR 50 SAFSTOR Southwestern
San Onofre-1, San Clemente, CA PWR 1,347 SAFSTOR Southwestern
Pathfinder, Sioux Falls, SD BWR 190 DECON Southwestern
Lacrosse, Genoa, WI BWR 165 SAFSTOR Midwest
Yankee Rowe, MA PWR 600 pending Massachusetts
Peach Bottom 1, Peach Bottom, PA HTGR 115 SAFSTOR Appalachian
Three Mile Island 2, Londonderry, PA PWR 2,772 DECON/SAFSTOR Appalachian
Fermi 1, Lagoona Beach, MI SCF 200 SAFSTOR Michigan
Shoreham, Wading River, NY BWR 2,436 DECON New York
Indian Point 1, Buchanan, NY PWR 615 SAFSTOR New York
(a) Extracted from NRC, 1993a. live plants under the custodial care of the AECIDOE are excluded from this listing.
(b) Key to D&D options: SAFSIOR, facility placed hi safe storage for decontamination at some future time; and DECON,facility, equipment, and site decontaminated for unrestricted release shortly after plant shutdown.
NUREG-1496 G-6

Table G.3-3 Location and Types of Research and Test Nuclear Reactors'
State & Type of Low-LevelLocation Licensee Reactor Waste Compact
WashingtonSeattle Univ. of Washing.Pullman Washington S. Univ.
OregonCorvallis Oregon State Univ.Portland Reed College
IdahoPocatello Idaho State Univ.
UtahSalt Lake City Univ. of Utah
CaliforniaSan Ramon AerotestSan Diego General AtomicsPleasanton General ElectricIrvine Univ. of Calif.
ArizonaTucson Univ. of Ariz.
ColoradoDenver U.S. Geological
SurveyNew MexicoAlbuquerque Univ. of New Mex.
TexasAustin Univ. of TexasCollege Station Texas A&M
IowaAmes Iowa S. University
MissouriRolla Univ. of MissouriColumbia Univ. of Missouri
WisconsinMadison Univ. of Wisconsin
IndianaWest Lafayette Purdue Univ.
OhioColumbus Ohio S. Univ.
NebraskaOmaha Veterans Admin.
KansasManhattan Kansas State Univ.
ArkansasRussellville Arkansas Tech, Univ.
Argonaut*>)Triga
Triga Mark IITriga Mark I
AGN-201
Triga Mark I
Triga (industrial)Triga Mark I & FNuclear TestTriga Mark I
Triga Mark I
Triga Mark I
AGN-201
Triga Mark IITriga/AGN-201
UTR-10
PoolTank
Triga
Lockheed
Pool
Triga
Triga
Triga
Northwest
Northwest
Northwest
Northwest
Southwestern
Southwestern
Rocky Mountain
Rocky Mountain
Texas
Midwest
Midwest
Midwest
Midwest
Midwest
Central Interstate
Central Interstate
Central Interstate
G-7 NUREG-1496

Table G.3-3 Location and Types of Research and Test Nuclear Reactors'o (Continued)
State & Type of Low-LevelLocation Licensee Reactor Waste Compact
IllinoisUrbana
MichiganAnn ArborMidland
PennsylvaniaUniv. Park
MassachusettsWorcesterLowellCambridge
Rhode IslandNarragansett
New YorkIthaca
BuffaloTroyBronx
MarylandBethesda
GaithersburgCollege Park
VirginiaCharlottesville
North CarolinaRaleigh
GeorgiaAtlanta
FloridaGainesville
Univ. of Illinois
Univ. of MichiganDow Chemical
Penn. State Univ.
Worcester Poly. Tech.Univ. of LowellMIT
RI AEC
Cornell Univ.
S. Univ. of NYRensselaer Poly Tech.Manhattan College
Armed Forces Radio-biology InstituteNISTUniv. of Maryland
Univ. of Virginia
NC State Univ.
Georgia Tech.
Univ. of Florida
TrigaLopra
PoolTriga
Triga
GEGE PoolHWR
Critical Assy.
Triga Mark II& Zero PowerPulstarCritical Assy.Tank
Triga
Nuclear testTriga
Pool
Pulstar
Heavy Water
Argonaut
Central Midwest
Michigan
Appalachian
Massachusetts
Rhode Island
New York
Appalachian
Southeast
Southeast
Southeast
Southeast
V
(a) Extracted from NRC, 1993a.(b) Facilities that are pending or undergoing decommissioning.
NUREG-1496 G-8

Table G.34 Research and Test Nuclear Reactors Preparing for orUndergoing Decommissioning; Possession Only License(a)
State & Type of Low-LevelLocation LUcensee Reactor Waste Compact
WashingtonSeattle
UtahProvoSalt LakeCity
CaliforniaLos AngelesPleasantonPleasanton
TexasAustin
District ofColumbia
OhioSanduskyPlum Brook
PennsylvaniaSaxton
Waltz MillVirginiaCharlottesvilleLynchburg
KansasLawrence
ArkansasStrickler
MassachusettsWatertown I
Univ. of Washing.
Brigham Young Univ.Univ. of Utah
Univ. of Calif.General ElectricGeneral Electric
Univ. of TexasCatholic Univ.
NASANASA
Saxton NuclearExperiment Corp.Westinghouse
Univ. of VirginiaBabcock & Wilcox
Univ. of Kansas
SEFOR
Watertown Arsenal
Argonaut
L-77AGN-201
ArgonautGETREVESR
PoolAGN-201
Mock-upTest
PWR
Test
PoolPool
Pool
Na-cooled
NorthwestNorthwest
Southwestern
Texas CompactDist. of Columbia
Midwest
Appalachian
Southeast
Central Interstate
Central Interstate
MassachusettsPool
(a) Obtained from the Office ot Nonpower Reactors and Decommissoning Directorate, November 1993, and NRC, 1993a.
G-9 G-9 NUREG- 1496

Location
Windsor, CT
Lynchburg, VA
Wilmington, NC
Columbia, SC
Hematite, MO
Erwin, TN
Richland, WA
San Diego, CA
Metropolis, IL
Gore, OK
Homer, LA
Table G.3-5 Location of Fuel Fabrication, Uranium HexafluorideProduction, and Uranium Enrichment Facilities'O
Uranium Low-LevelFuel Hexafluorlde Uranium WasteFabrication Production Enrichment Compact
ABB Combustion NortheastEngineering)
Babcock & SoutheastWilcox (2)
General SoutheastElectric
Westinghouse Southeast
ABB Combustion MidwestEngineering
Nuclear Fuel SoutheastServices
Siemens Nuclear NorthwestPower
General SouthwesternAtomics
Allied-Signal CentralMidwest
Sequoyah FuelsO) CentralInterstate
Louisiana CentralEnergy InterstateServicesw
(a) Extracted from NRC, 1993a.(b) Facility under decommIssIonIng.(c) Louisiana Energy Services, NRC Docket No. 70-3070, June 1993.
NUREG-1496 G-10

Table G.3-6 Dry Spent Fuel Storage FacdlitiesOO
- Licensing Low-LevelLicensee & State Status Waste Compact
.
PowerPlant/
Facility
Surry 1/2
H.B. Robinson
Oconee 1/2/3
Fort St. Vrain
Calvert Cliffs
Brunswick
Prairie Island
Rancho Seco
General Electric
Point Beach 1/2
Davis-Besse
Palisades
Virginia Electric& Power Co., VA
Carolina Power &Light Co., SC
Duke Power Co.,SC
Public Service Co.of Colorado, CO
Baltimore Gas &Electric Co., MD
Carolina Power& Light Co., NC
Northern StatesPower Co., MN
SacramentoMunicipal UtilityDistrict, CA
Morris, IL
Wisconsin Electricand Power Co., WI
Toledo EdisonCo., OH
Consumer PowerCo., MI
approved
approved
approved
approved
approved
pending
approved
pending
approved
general license
general license
general license
Southeast
Southeast
Southeast
Rocky Mountain
Appalachian
Southeast
Midwest
Southwestern
Central Midwest
Midwest
Midwest
Michigan
(a) Data extracted from NUREG-1350, VoLS (NRC, 1993a; 1996a) and DOE, 1990.
G-11 NUREG-1496

G.4 Estimated Quantities of Low-Level Waste Generated
For the population of waste generators discussed in Section G.3, this section providesestimates of the quantities of low-level waste generated from normal operations and fromdecommissioning of structures and lands.
G.4.1 Normal Operations Waste
Over the past recent years, the trend in normal operations waste generation rates has beengenerally downward (see tabulation below) in response to the volume allocations imposed bythe disposal sites and higher disposal costs (DOE, 1988; 1989; 1990; 1991; 1992a;Lockheed, 1996). Over the past 13 years, annual waste generation rates have variedsignificantly, ranging from a high of about 2.7 million ft3 to as low as 0.7 million ft3.
National Low-Level Waste Generation Rates (ft)
1983 1984 1985 1986 1987 1988 1989 19902.71E+6 2.62E+6 2.68E+6 1.80E+6 1.84E+6 1.43E+6 1.63+6 1.14E+6
1991 1992 1993 1994 19951.37E+6 1.74E+6 7.92E+5 8.58E+5 6.89E+5
Table G.-1 presents a breakdown of normal operation waste generation by Compact andnonmember states (unaffiliated). Table G.4-2 presents, for illustrative purposes, the totalvolume and total activity of all radioactive waste shipped for disposal by each of the fivecategories of waste generators from 1988 to 1992 (EG&G, 1989; 1990; 1991; 1992; 1993).This table captures all waste (i.e., Classes A, B, and C, brokered and nonbrokered).Typically, Class A waste constitutes over 95 percent of the volume but only about 3 to 13percent of the activity of the waste (NRC, 1990).
G.4.2 Estimated Waste Volumes from Decommissioning of Structures and Lands atReference Facilities
The estimates of total waste volume from decommissioning of structures and lands, givenbelow, are based on information in Attachments C and D of Appendix C for the fivecategories of facilities indicated in Section G.3, the estimated number of sites to bedecommissioned, and information provided by the low-level Compacts and unaffiliatedStates. The results presented here represent a broad estimate in that they are based on anumber of assumptions regarding contamination levels and extent discussed in Appendix C,and assuming similar behavior by the licensed facilities categorized by the referencefacilities.
NUREG-1496 G-12

Table G.4-1Compacts and Non-Member States Low-Level Normal Operations Waste Generation Rates&*
Waste Volumes (ft3)
Compact/State
Appalachian
Central Int.
Central Midwest
Midwest
Northeast
Northwest
Rocky Mountain
Southeast
Southwestern
District of Columbia
Maine
Massachusetts
New Hampshire
New York
Puerto Rico
Rhode Island
Texas
Vermont
Total
1988 1989 1990 1991
182,600
71,718
114,655
96,758
88,209
128,377
3,076
479,114
111,530
909
6,330
50,614
486
73,020
0
0 1,108
12,376
7,247
- 1.43E+6
171,212
85,244
143,353
157,820
102,439
115,016
10,215
497,208
149,909
925
15,634
56,526
27
96,642
0
1,419
22,101
172
1.63E+6
119,582
58,328
102,977
123,511
87,018
95,943'
4,481
336,474
84,910
539
6,865
40,750
1198
73,394
0
160
9,185
0
1.14E+6
244,930
56,774
104,302
112,800
106,207
137,935
4,783
285,828
100,599
1,206
5,209
34,425
4,324
99,254
0
361
53,087
17,138
5-Year1992 Average
112,083 166,000
80,116 70,500
287,219 150,500
88,793 116,000
91,064 95,000
235,620 143,000
37,481 12,000
369,951 390,000
133,758 116,000
1,598 1,000
8,789 8,500
56,734 48,000
48 1,200
70,272 82,000
0 0
374 700
162,844 26,000
6,090 7,700.
1.37E+6 1.74E+6
(a) Extracted from DOE, 1989; 1990; 1991; 1992a; and EG&G, 1993.
G-13 NUREG-1496
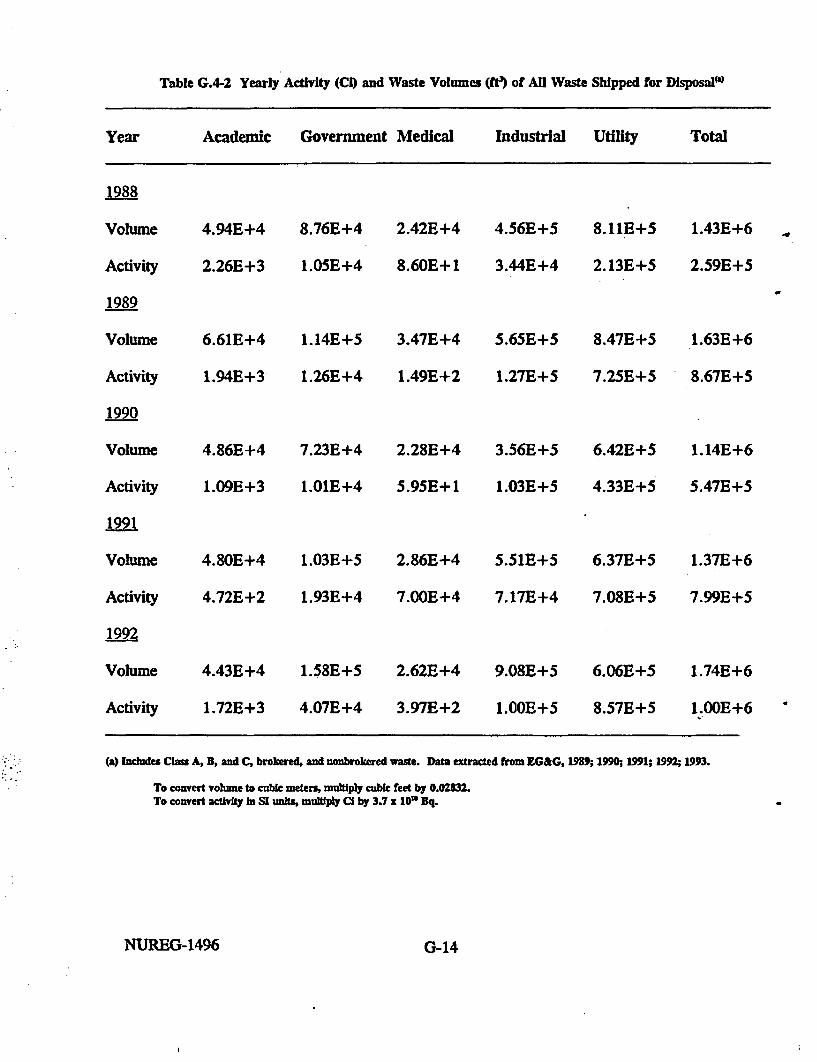
Table G.4-2 Yearly Activity (Ci) and Waste Volumes (ft) of ADl Waste Shipped for DisposalW
Year Academic Government Medical Industrial Utility Total
1988
Volume 4.94E+4 8.76E+4 2.42E+4 4.56E+5 8.11E+5 1.43E+6
Activity
1989
Volume
Activity
1990
Volume
Activity
1991
Volume
Activity
1992
Volume
Activity
2.26E+3 1.05E+4 8.60E+1 3.44E+4 2.13B+5
6.61E+4
1.94E+3
4.86E+4
1.09E+3
4.80E+4
4.72E+2
4.43E+4
1.72E+3
1.14E+5
1.26E+4
7.23E+4
1l.O1E+4
1.03E+5
1.93E+4
1.58E+5
4.07E+4
3.47E+4
1.49E+2
2.28E+4
5.95E+ 1
2.86E+4
7.00E+4
2.62E+4
3.97E+2
5.65E+5
1.27E+5
3.56E+5
1.03E+5
5.51E+5
7.17E+4
9.08E+5
l.OOE+5
8.47E+5
7.25E+5
6.42E+5
4.33E+5
6.37E+5
7.08E+5
6.06E+5
8.57E+5
2.59E+5
1.63E+6
8.67E+5
1.14E +6
5.47E+5
1.37E+6
7.99E+5
1.74E+6
1.OOE+6
(a) Incudes Class A, B, and C, brokered, and nonbrokered waste. Data extracted from EG&G, 1989; 1990; 1991; 1992; 1993.
To convert vohmle to cubic meters, multiply cubic feet by 0.02832.To convert activity to SI units, multiply a by 3.7 x 10¹⁰ Bq.
NUREG-1496 G-14

G.4.2.1 Nuclear Power Plants
Table G.4-3 presents estimates of low-specific activity waste volumes for nuclear powerplants. In making overall volume estimates, Table G.4-3 includes waste volumes from boththe operating and nonoperating power plants listed in Tables G.3-1 and G.3-2. Forcomparison purposes, the waste volumes are aggregated by Compact regions and unaffiliatedStates. Table G.4-3 estimates that nuclear power plants would produce approximatelyI million cubic feet of decommissioning waste.
G.4.2.2 Test and Research Reactors
The estimated amounts of low-specific activity waste for test and research reactors are shownin Table G.4-4. In making overall volume estimates, Table G.44 includes decommissioningwaste volumes from both the operating and nonoperating test and research reactors listed inTables G.3-3 and G.34. Table G.44 estimates that test and research reactors wouldproduce approximately 0. 15 million cubic feet of decommissioning waste.
G.4.2.3 Fuel Cycle Facilities
Table G.4-5 shows the estimated amounts of low-specific activity waste for the fuel cyclefacilities listed in Table G.3-5. These facilities are estimated to produce approximately0.66 million cubic feet of waste.
G.4.2.4 Non-Fuel Cycle Materials Facilities
Table G.4-6 presents the estimated volumes of low-specific activity waste resulting fromdecommissioning activities at non-fuel cycle materials facilities. For comparison, the wastevolumes are aggregated by Compact regions and unaffiliated States. In total, non-fuel cyclematerials facilities are estimated to produce about 5 million cubic feet of waste.
G.4.2.5 Dry Spent Fuel Storage
The amounts of low-specific activity waste generated during the decommissioning structuresand lands for dry spent fuel storage facilities are shown in Table G.4-7. Based on TableG.3-6, the overall waste volumes in this section are based on the presence of 12 storagefacilities. In total, this category is estimated to produce about 6E+3 ft of waste.
IG-15 NUREG-1496

Table G.4-3 Estimates of Low-Specific Activity Decommissioning Waste Volumesfor Nuclear Power Plants")
Operating Non- Total WasteCompact/State Plants Operating No. Vol. (Wt)
a
Appalachian 11 2 13 104,000Central Int. 7 7 56,000Central Midwest 13 1 14 112,000Midwest 11 1 12 96,000Northeast 8 8 64,000Northwest 1 1 2 16,000Rocky Mountain 1 1 8,000Southeast 34 1 35 280,000Southwestern 7 5 12 96,000Maine 1 1 8,000Massachusetts 1 1 2 16,000Michigan 5 1 6 48,000New Hampshire 1 1 8,000New York 6 2 8 64,000Texas 4 4 32,000Vermont 1_ 1 8.000Total 111 16 127 1.OE+6
(a) The n-ber of operating and shutdown power plants are based on data presented in Tables G-3-1 and G.32. Wastevolutnes for decommissioning of structures and lands were taken from Appendix C and rounded off to 3,000 fts per plant
NUREG-1496 Ga16

Table G.4-4 Estimates of Low-Specific Activity Decommissioning WasteVolumes for Test and Research Reactorso)
Operating D&D and Total WasteCompact/State Reactors Poss. Qnly No. Vol. (ft3)
Appalachian 4 2 6 15,000Central Int. 3 2 5 12,500Central Midwest 2 2 5,000Midwest 6 2 8 20,000Northwest 6 3 9 22,500Rocky Mountain 2 2 5,000Southeast 4 2 6 15,000Southwestern 5 3 8 20,000Massachusetts 3 1 4 10,000Michigan 2 2 5,000New York 4 4 10,000Texas 2 1 3 7,500Rhode Island 1 1 2,500District of 1 1 2,500ColumbiaTotal 44 17 61 1.5E+5
(a) The number of operating and shutdown reactors Is based on data presented in Tables G.3-3 and G3-4. Waste volumesfrom decommIssionIng structures and lands were based on Attachments C and D of Appendix C and rounded off to 2,500ft per plant.
Table G.4-5 Estimates of Low-Specific Activity Decommissioning Waste Volumesfor Fuel Cycle FaclitilesOO
No. ofProjected Waste
Compact/State Facilities Vol. (ft3)
Northeast 1 60,000Southeast 4 240,000Midwest 1 60,000Northwest 1 60,000Southwestern 1 60,000Central Midwest 1 60,000Central Int. 2 120.000Total 11 6.6E+5
(a) The number of facilities Is based on data presented in Table G.3-S. Waste volumes from decommIssioning of structuresand lands were based on Appendix C and rounded off to 60,000 ft' per site.
G-17 NUREG-1496
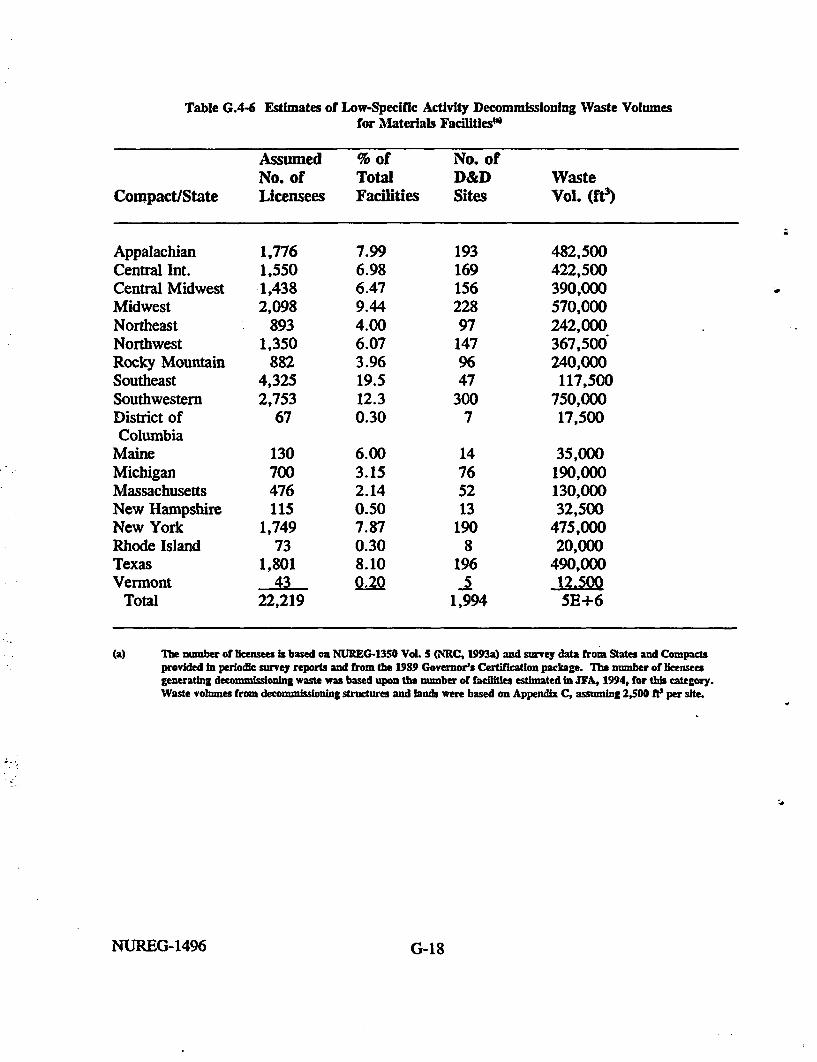
Table G.4-6 Estimates of Low-Specific Activity Decommissioning Waste Volumesfor Materials Facilities"
Assumed % of No. ofNo. of Total D&D Waste
Compact/State Licensees Facilities Sites Vol. (ft3)
Appalachian 1,776 7.99 193 482,500Central Int. 1,550 6.98 169 422,500Central Midwest 1,438 6.47 156 390,000Midwest 2,098 9.44 228 570,000Northeast 893 4.00 97 242,000Northwest 1,350 6.07 147 367,500Rocky Mountain 882 3.96 96 240,000Southeast 4,325 19.5 47 117,500Southwestern 2,753 12.3 300 750,000District of 67 0.30 7 17,500Columbia
Maine 130 6.00 14 35,000Michigan 700 3.15 76 190,000Massachusetts 476 2.14 52 130,000New Hampshire 115 0.50 13 32,500New York 1,749 7.87 190 475,000Rhode Island 73 0.30 8 20,000Texas 1,801 8.10 196 490,000Vermont 43 0.20 I 12.500
Total 22,219 1,994 5E+6
(a) The number of licensees is based on NUREG-13S0 VoL 5 (NRC, 1993a) and survey data from States and Compactsprovided in periodic survey reports and from the 1989 Governor's Certification package. The number of licenseesgenerating decommissioning waste was based upon the number of facilities estimated in JFA, 1994, for t1is category.Waste volumes from decommissioning structures and lands were based on Appendix C, assuming 2,500 ft3 per site.
NUREG-1496 G-18

Table GA-7 Estimates of Low-Specific Activity Decommissioning Waste Volumesfor Dry Spent Fuel Storage Fadlitiest o
No. ofProjected Waste
Compact/State Facilities Vol. (ft3)
Southeast 4 2,000Rocky Mountain 1 500Appalachian 1 -500Midwest 3 1,500Southwestern 1 500Michigan I 500Central Midwest 1 500
Total 12 6E+3
(a) The number of dry spent fuel storage facilities is based on DOE data, see Table 4-9 (DOE, 1990).Waste vohmles are 500 ft' per site (Appendix C).
G.4.3 Sites in the Site Decommissioning Management Plan (SDMP)
Under the Site Decommissioning Management Plan (SDMP), the NRC has identified anumber of facilities that warrant special attention. The SDMP program includes over 50sites, however, the actual number of sites varies depending upon licensing actions andprogress of clean up activities. The SDMP program classifies the sites into seven categories;
CategoryMetal ExtractioiFuel CycleResearchByproductU-CatalystMg-Th AlloyOthers
No. of Sitesan 14
669339
Some sites are known or suspected of having some groundwater contamination. The siteshave contaminated buildings, soils, slag, process waste, and former waste disposal areas andtailing piles (NRC, 1993b,c; NRC, 1995; NRC, 1996b).The contaminants include uranium(47%), thorium (34%), byproduct materials (14%), and plutonium (5%). The greater wastevolumes are associated with ore processors. Fourteen of the SDMP sites, contaminatedprimarily with thorium, are estimated to generate potentially large volumes of contaminatedsoil and rubble, ranging from 20,000 to 10 million ft.
G-19 NUREG-1496

Table G.4-8 presents the estimated waste volumes for the NRC's SDMP sites and Table G.4-9 presents waste volume estimates associated with the decontamination of specific SDMPsites (NRC, 1993b,c; NRC, 1995; NRC, 1996b). Based on these data, the SDMP sites areestimated to produce about 57 million cubic feet of waste.
It should be recognized that such facilities are in a class apart from the traditionalcategorization of waste generators. Essentially, most of the waste is associated with themovement and processing of large volumes of uranium- and thorium- bearing ores.
Table G.4-8 Summary Estimates of Low-Specific Activity Decommissioning Waste Volumesfrom NRC SDMP Sitesw
No. ofProjected Waste
Compact/State Facilities Vol. (fie)
Appalachian(') 13 5.4E+6Midwest 12 2.6E+7Northeast 3 4.7E+6Central Interstate 5 1.6E+7Massachusetts(c) 3 1.3E+5Michigan 4 4.4E+6Total 40 5.7E+7
(a) The number of 5DMP sites Is based on Information provided In Table G.4-9.(b) One site without data on waste volumes and characteristics omitted for the purpose of this estimate.(c) One site without data on waste volumes and characteristics omitted for the purpose of this estimate.
G.5 Waste Capacity Projections
This section discusses the estimated current or planned waste disposal capacities for theunaffiliated States and Low-Level Waste Compacts (LLW Forum, 1993; 1996). Table G.5-1summarizes this information, based on projections made by the Compacts or States.
-
NUREG-1496 G-20

Table G.4-9 Estimated Waste Volume From Selected SDMP Fadlities(O
EstimatedFacility/State Quantity Nuclide Material Compact
U.S. Army, AberdeenProving Ground, MD
Babcock & Wilcox,Parks Township, PA
BP Chemicals, Lima, OHCabot Comp.:- Boyertown, PA
- Reading, PA- Revere, PA
Chemetron Corp., NewburghHeights, OH:- Bert Ave.- Harvard Ave.
Dow Chemical:- Midland, MI- Bay City, MI
Fansteel, Muskogee, OKHartley & Hartley,Bay County, Ml:
- SCA- MDNRHeritage Minerals,Lakehurst, NJ
Kerr-McGee:- Crescent, OK- Cushing, OKU.S. Army, Lake CityIndependence, MO
Magnesium Elektron,Flemington, NJ
3M-Kerrick,Pine County, MN
Molycorp:- Washington, PA- York, PA
Nuclear Metals,Concord, MA
Metcoa, Pulaski, PARMI Titanium,Ashtabula, OH
1.3E+5 kg Dep.U Soils Appalachian
6.0E+5 ft3 U/Th2.8E+6 ft3 Dep.U
2.5E+5 f 3
1.3E+4 tons6.0E+4 f 3
8.2E+5 h3
urrmUrrhUrmhU/Th
4.8E+5 ft3 Dep.U1.6E+5 ft' Dep.U
3.2E+5 f 3
l.1E+6 ft3
8.1E+5 ft3
2.7E+6 R3
2.5E+5 ft3
2.8E+6 ft3
5.OE+5 ft3
4.4E+6 ft3
3.4E+6 ft3
ThThU/rh
ThThU/Th
UU/ThDcp.U
Soils/MetalsSoils/Sludge
SoilsTailingsSlagSlag/Soils
SoilsSoils
Slag/SoilsSlag/SoilsSludge/Soils
Slag/SoilsSlag/SoilsSands/Tailings
Soils/SludgeSoils/SludgeSoils/Sands
Sludge/Soils
Metals/Debris
Soil/SlagSoils/WasteSoils/Sludge
Soil/SlagSoils/Rubble
Midwest* U
W U
Michigan
Central
MichiganU U
Northeast
Central
Midwest
Northeast
Midwest
Appalachian* a
Massachusetts
AppalachianMidwest
AppalachianMidwest
AppalachianI, U
a
7.0E+5 ft3 U/Th
2.0E+4 ft3 U/Th
1.6E+6 ft3
3.3E+5 ft3
1.3E+5 R3
ThfUTh/U/RaDep.U
4.6E+4 ft3 Th1.4E+6 ft3 U/Tc/Dep.U
G-21 NUREG-1496

Table G.4-9 Estimated Waste Volume From Selected SDMP Facilitles~4 (Continued)
EstimatedFacility/State Quantity Nuclide Material Compact
Schott Glass Tech., 2.7E+5 ft3 U/Th Soils/Glass AppalachianDuryea, PA
Shieldalloy,- Cambridge, OH 1.0E+7 ft3 U/Th/Ra Soils/Slag Midwest- Newfield, NJ 1.2E+6 ft3 Th/U/Ra Soils/Slag NortheastGSA, Boston, MA 4.3E+2 ft3 U Soils MassachusettsWhittaker Corp., I.lE+6 ft3 U/Th/Ra Slag/Soils AppalachianGreenville, PA
Horizons, Inc., 2.2E+4 ft3 U/Th Soils/Rubble MidwestCleveland, OH
Jefferson Proving l.9E+6 ft3 Dep. U Soils MidwestGround, IN
Kaiser Aluminum 3.4E+6 ft3 Th Soils/Slag CentralSpecialty, Tulsa, OK
Advanced Med. Syst., 8.1E+4 ft3 Co/Dep.U Slag/Solids MidwestCleveland, OH
Elkem Metals, 8.1E+3 ft3 U/Th Soils MidwestMarietta, OH
Englehard Corp., Unknown U Sludge MassachusettsPlainville, MA
NE Ohio Reg. Sewer 5.3E+6 ft3 Co Soils/Sludge MidwestDist., Cleveland, OHPermagrain, 1.2E+4 ft3 Sr/Co Soils/Rubble AppalachianQuehanna, PA
Safety Light, Unknown H/la/Cs/Sr Soils/Rubble AppalachianBloomsburg, PA
Sequoyah Fuels, 7.0+6 ft3 U Soils/Rubble CentralGore, OK
Westinghouse, Unknown Sr/Co/Cs Soils AppalachianWaltz Mill,Madison, PA
IV
(a) Partial liing extracted from updated report on Site Decommissioning Management lan, SECY-93-179 (NRC, 1993b),NUREG-1444 (NRC, 1993e), Supplement I to NUREG-1444 (NRC, 1995, and SECY-96-207 (NRC, 199Mb). Ustingexcludes live sites expected to be removed from SDMP program by mid-1997 and nine others recently removed from theSDMP program from 1994 to mid-1996.
G.5.1 Appalachian States Compact
The Appalachian States Low-Level Radioactive Waste Compact (Appalachian Compact) iscomprised of four states, including Pennsylvania, Delaware, Maryland, and West Virginia.Pennsylvania is the host state for the disposal facility. The Appalachian Compact's disposalfacility is designed to accommodate an annual waste generation of 235,000 ft3. However,based on current waste generation rates, the annual average is lower, about 100,000 ft3
(PADER, 1993). The facility is designed to accommodate about 3.1 million ft3 over a 30-
NUREG-1496 G-22

year period. The design does not make special provisions for D&D waste. Based on a studyconducted by the Compact, it is thought that the design basis provides an ample margin tohandle future D&D waste. Most of the LWR D&D waste volume is assumed to be generatedbeyond the life of the planned LLW facility, assuming plant life extension.
G.5.2 Central Interstate Compact
The Central Interstate Low-Level Radioactive Waste Compact (Central Compact) consists offive states: Nebraska, Arkansas, Kansas, Louisiana, and Oklahoma. The State of Nebraskahas been designated as the host state. The Central Compact generates about 25,000 ft3 ofwaste per year. Initially, the disposal is planned to accommodate 500,000 ft3 , withauthorized expansions in 250,000 ft3 increments, up to the maximum design capacity. Thefacility will handle up to 2.5 million ft3 of waste, including.D&D waste. However, currentvolume estimates do not include provisions for D&D waste. The Compact requires that thedisposal of D&D waste be addressed on a case-by-case basis and get legislative approval.
G.5.3 Central Midwest Compact
The Central Midwest Interstate Compact Low-Level Radioactive Waste Compact (CentralMidwest Compact) is comprised of the States of Illinois and Kentucky. The State of Illinoishas been chosen to host the disposal facility. The Central Midwest Compact is projected togenerate about 50,000 ft3 per year on average. The facility will be designed to handle about5.5 million ft3 over its SO-year life span (Chem-Nuclear, 1991). For planning purposes,D&D waste volumes have been estimated for various scenarios, with a volume of about 3.0million ft3 for the most likely scenario.
G.5.4 Midwest Interstate Compact
The Midwest Interstate Low-Level Radioactive Waste Compact (Midwest Compact) consistsof six states: Indiana, Iowa, Minnesota, Missouri, Ohio, and Wisconsin. Ohio has beendesignated as the first alternate host state after Michigan left the Compact.
The Midwest Compact generates 125,000 fe? of waste per year, on average. The facility isdesigned for a capacity of 1.5 million ft3, averaging approximately 75,000 ft3 over the 20-year life of the facility (OLLRWAC, 1993). For planning purposes, D&D waste volumeshave been estimated for various scenarios and, depending upon the scenario, the D&D andunusual waste volumes are estimated to be up to 1.7 million fW (Baird, 1988).
G.5.5 Northeast Compact
The Northeast Interstate Compact Low-Level Radioactive Waste Compact (NortheastCompact) is comprised of the States of New Jersey and Connecticut. The Compact requiresthat each State develop the facilities needed to manage an equitable portion of the region'swaste.
G-23 NUREG-1496

Table G.5-1Estimated Low-Level Waste Disposal Capacity by Compacts
and Non-Member Statesi
Compact/State Assumed Facility Planned Provision Out-of- PlannedGenera- Life or Disposal/ for D&D Region Capacity
tion Projection Storage (10' ft3) Waste Waste(It3/y.) (y.) Capacity (10' ft') (10 ft3)
(10' ft)
Appalachianm 100,000 30 3.0 0.1 - 3.1
Central Interstate(a) 25,000 30 2.5 -- 2.5
Central Midwest 50,000 50 2.5 3.0 --- 5.5
Midwest Interstate 75,000 20 1.5 <1.7 -- 3.2
Northeast:
Connecticut 10,000 50 0.5 0.96 - 1.5
New Jersey() 37,000 50 1.0 1.7 - 2.7
Northwest 90,000 60 5.4 0.2 1.1 6.7
Rocky Mountain 16,000 60 0.96 0.14 - 1.1
Southeast 370,000 20 7.4 3.6 11.0
Southwestern 100,000 30 3.0 2.5 --- 5.5
District of Columbia 1,000 n/a -- -- -
Rhode Island(') 500 n/a -- ---
Massachusetts 20,000 30 0.6 0.45 - 1.1
Michigan(-) 18,000 20 0.36 0.97 - 1.3
New Hampshire 500 n/a -- - --
New York(") 72,000 60 4.3 (3.4) 4.3
Puerto Rico 0 n/a - -- -
Texas CompactO 26,000 50 1.3 1.5 - 2.8
Maine 6,300 50 0.11 0.10 --- 0.21
Vermont 5,900 50 0.11 0.18 - 0.29
(a) All values are rounded off. Footnotes continued on next page. See Section S.0 for details and sources Additional sourcesfor update: Lockheed, 1996; NYSERDA, 1996; MLLRWA, 1996; TLLRWDA, 1996; MLLRWMB, 1996; SWLLRWC,1996; WADOK, 1996; PADER, 1996; LADEQ, 1996; CTHWMS, 1996; NJLLRWDFSB, 1996; MDNS, 1996.
NUREG-1496 G-24

Table G.5-1 Footnotes:
() Adjusted from prior estimates based on recent trends. Most of the D&D waste vobmie for LWRs assumed to occur beyondlife of currently planned LLW disposal facility. All LWRs are assumed to obtain operatingife extensions.
(a) The assumed yearly generation rate is based on an analysis for 1989-1993 waste disposal practices. The planned disposalvolume is based on an "as-disposed" waste volume. For LWR D&D waste volumes, projections assume immediatedismantlement, inl recycling/reuse, and no access to low-activity and high-volume rubble disposal facilities.
(&) Planned capacity for disposal Is 500,000 ft. This initial capacity is expandable In 250,000 t3 Increments to a maximumcapacity of 2.SE+06 Wt3. Total capacity Includes provisions for D&D waste from LWRs.
C') Operational life span of LLW facility to be determined at discretion of volunteer community. Preliminary estimate forLWR D&D waste volume.
(+) No plans are being made for developing an LLW facility. State is planning to join a compact or unaffiliated state.(%) Based on the 'Expected Case." D&D waste volume from LWRs Included In the projected yearly waste generation rate.(e) Compact awaiting congressional ratification. Waste from Maine and Vermont will be disposed of at the planned Texas
LLW disposal facility. The assumed generation rate Is based on 50-year projections for "as-disposed" waste volumes.
The State of Connecticut is projected to generate annually about 10,000 ft3 of waste fordisposal. Based on 50-year projections, the total waste disposal volume is expected to be 0.5million ft0, assuming a 20-year life extension for the currently operating power plants(CTHWMS, 1993). For planning purposes, the anticipated D&D waste volume has beenestimated to be 0.96 million ft3. The total waste volume is expected to be 1.5 million ft3.
New Jersey is expected to generate about 37,000 Rf3 per year, based on a trend establishedover a five-year period (from 1989 to 1993). Over the projected operational life of theplanned New Jersey disposal facility, the total disposal volume is expected to be 2.7 millionft3. from all sources. For planning purposes, the D&D waste volume from LWRs isestimated to be about 1.7 million ft3. This estimate assumes immediate dismantlement,minimal recycling/reuse, and no access to low-activity and high volume rubble disposal sites.
G.5.6 Northwest Compact
The Northwest Interstate Compact on Low-Level Radioactive Waste Management (NorthwestCompact) consists of eight states: Alaska, Hawaii, Idaho,; Montana, Oregon, Utah,Washington, and Wyoming. The Northwest Compact is also accepting waste, undercontract, from the Rocky Mountain Compact, which- is addressed separately below.The Northwest Compact is one of the two remaining sited States, with its facility located inRichland, WA. The disposal site is slated to remain operational well into the next century(2063, based on DOE land-lease expiration date). The current license is due for renewal inMay 1997. The U.S. Ecology site lease with the State of Washington is due for renewal in2005. Assuming a waste generation rate of about 90,000 f3/y, it is deemed that the Compactwill have a sufficient disposal capacity to handle its waste and that of the Rocky MountainCompact. The Northwest Compact is expected to generate about 200,000 ft3 from D&Dactivities. The additional waste volume from the Rocky Mountain Compact is estimated tototal about 1.11 million f 3, which includes a provision of 140,000 ft3 for D&D (NuclearWaste News, 1993a). The site's total capacity has been estimated to be about 30 million f 3.
G-25 NUREG-1496

G.5.7 Rocky Mountain Compact
The Rocky Mountain Low-Level Radioactive Waste Compact (Rocky Mountain Compact) iscomprised of three states: Colorado, Nevada, and New Mexico. The Rocky MountainCompact was one of the three sited States with a facility located in Beatty, NV. However,the Beatty facility was closed at the end of 1992 (LLW Forum, 1993). The Rocky MountainCompact has since made arrangements with the Northwest Compact to dispose of its waste atthe Richland, WA, facility.
The Rocky Mountain Compact is expected to generate about 16,000 ft3l/y over the life of theagreement with the Northwest Compact. If the agreement with the Northwest Compactremains open for the life of the Richland facility, the Rocky Mountain Compact is expectedto generate about 1.11 million ft3 (Nuclear Waste News, 1993a).
G.5.8 Southeast Compact
The Southeast Interstate Low-Level Radioactive Waste Management Compact (SoutheastCompact) consist of eight states: Alabama, Florida, Georgia, Mississippi, North Carolina,South Carolina, Tennessee, and Virginia. The Southeast Compact is one of the currently twosited States, with its facility located in Barnwell, SC. Since July 1, 1995, the disposal sitehas been accepting waste from all Compacts and States. The alternate host State is NorthCarolina, with its new facility expected to become operational at the turn of the century.
On average, the Southeast Compact generates annually about 370,000 fi? of waste. TheCompact has estimated (under a base case analysis) that the new North Carolina site will berequired to handle at least 7.4 million ft3 over 20 years (Guichard, 1993). This volumeincludes a provision for 200,000 fi? to accommodate waste from nuclear power plant lifeextensions but does not include any D&D waste from power reactors. Other alternativesconsider waste volumes ranging from 7.5 to 10.6 million ft3. The facility design anddevelopment are based on 11 million ft3. This volume includes 3.42 million ft3 for D&D andexcludes waste due to plant life extension.
G.5.9 Southwestern Compact
The Southwestern Low-Level Radioactive Waste Compact (Southwestern Compact) consistsof four States: California, Arizona, North Dakota, and South Dakota. California is the hoststate for the disposal facility.
The Southwestern Compact generates annually about 100,000 ft3 of waste. The SouthwesternCompact is expected to generate about 5.5 million ft3 over 30 years. This waste volumeincludes D&D waste, about 2.5 million ft3.
NUREG-1496 G-26

G.5.10 New Hampshire
New Hampshire is an unaffiliated State. New Hampshire generators have produced varyingamounts of waste over the past five years, ranging from 9 to 235 ft3 annually, excluding thatgenerated by the Seabrook nuclear power plant (Lockheed, 1996). For planning purposes, theState is assumed to generate annually about 500 ft3 of waste.
G.5.11 Massachusetts
The State of Massachusetts is not affiliated with a low-level waste compact. Between 1988to 1991, Massachusetts waste generators produced annually about 46,000 ft3. The wastegenerated by the Yankee Rowe (shut down since 1991) and Pilgrim nuclear power station isbeing stored and, since July 1, 1995, has been shipped to Barnwell, SC, for disposal. TheState is expected to generate about 600,000 ft3 over the next 30 years, assuming a yearlygeneration rate of 20,000 ft3 (MLLRWMB, 1993; MLLRWMB, 1992). The State is alsoanticipating that an additional 450,000 ft3 will be generated by various D&D activities.
G.5.12 Rhode Island
Rhode Island is not affiliated with a low-level waste compact. Rhode Island generators haveproduced varying amounts of waste over the past five years, ranging from 6 to 374 ft3annually (Lockheed, 1996). For planning purposes, the State is assumed to generate annuallyabout 500 ft3 of waste. The State is not planning to build a disposal facility but is consideringjoining an LLW Compact or an unaffiliated State.
G.5.13 New York
The State of New York is not affiliated with a low-level waste compact. The State has beenconsidering various waste management options, including the need to establish long-termwaste storage capabilities, relying on a volunteer comnmunity to host a site, and using anexisting site for storage and/or disposal purposes (NYSERDA, 1993b).
The State of New York generates annually about 72,000 fte of waste (NYSLLRWSC, 1995).Current disposal plans are based on 30- and 60-year waste generation rates. It is anticipatedthat about 4.3 million ftl will be generated under the "expected-case' scenario. This wastevolume includes an estimated 3.4 million ft3 of D&D waste from LWRs.
G.5.14 Texas Compact - Pending
The State of Texas will operate a disposal facility for its own waste and that from the Statesof Maine and Vermont (Nuclear Waste News, 1993b). The Compact agreement has beenratified by all three States, however, the agreement has yet to be ratified by the U.S.Congress. A site has been located and a license application to design and operate the facilityhas been submitted to the appropriate State agency.
G-27 NUREG-1496
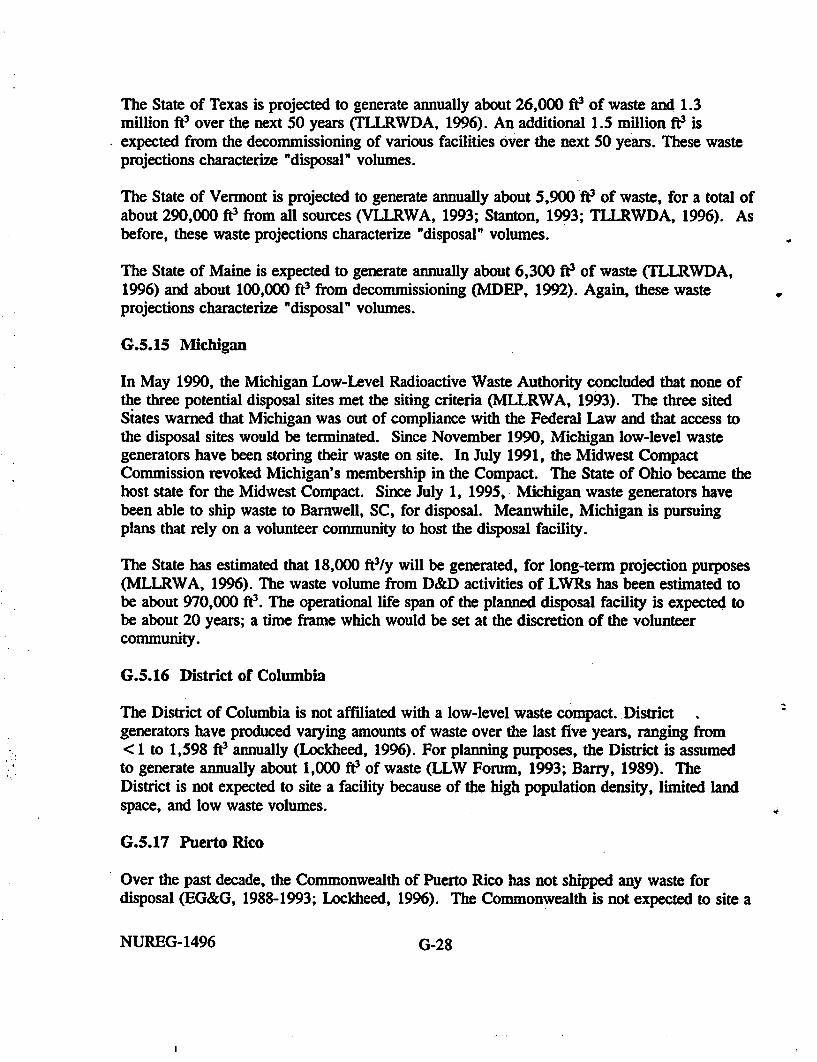
The State of Texas is projected to generate annually about 26,000 ft3 of waste and 1.3million ft3 over the next 50 years (TLLRWDA, 1996). An additional 1.5 million ft3 isexpected from the decommissioning of various facilities over the next 50 years. These wasteprojections characterize "disposal' volumes.
The State of Vermont is projected to generate annually about 5,900 fi? of waste, for a total ofabout 290,000 ft3 from all sources (VLLRWA, 1993; Stanton, 1993; TLLRWDA, 1996). Asbefore, these waste projections characterize "disposal" volumes.
The State of Maine is expected to generate annually about 6,300 ft3 of waste (TLLRWDA,1996) and about 100,000 ft3 from decommissioning (MDEP, 1992). Again, these wasteprojections characterize "disposal" volumes.
G.5.15 Michigan
In May 1990, the Michigan Low-Level Radioactive Waste Authority concluded that none ofthe three potential disposal sites met the siting criteria (MLLRWA, 1993). The three sitedStates warned that Michigan was out of compliance with the Federal Law and that access tothe disposal sites would be terminated. Since November 1990, Michigan low-level wastegenerators have been storing their waste on site. In July 1991, the Midwest CompactCommission revoked Michigan's membership in the Compact. The State of Ohio became thehost state for the Midwest Compact. Since July 1, 1995, Michigan waste generators havebeen able to ship waste to Barnwell, SC, for disposal. Meanwhile, Michigan is pursuingplans that rely on a volunteer community to host the disposal facility.
The State has estimated that 18,000 ft3/y will be generated, for long-term projection purposes(MLLRWA, 1996). The waste volume from D&D activities of LWRs has been estimated tobe about 970,000 ft3. The operational life span of the planned disposal facility is expected tobe about 20 years; a time frame which would be set at the discretion of the volunteercommunity.
G.5.16 District of Columbia
The District of Columbia is not affiliated with a low-level waste compact. Districtgenerators have produced varying amounts of waste over the last five years, ranging from< 1 to 1,598 ft3 annually (Lockheed, 1996). For planning purposes, the District is assumedto generate annually about 1,000 ft3 of waste (LLW Forum, 1993; Barry, 1989). TheDistrict is not expected to site a facility because of the high population density, limited landspace, and low waste volumes.
G.5.17 Puerto Rico
Over the past decade, the Commonwealth of Puerto Rico has not shipped any waste fordisposal (EG&G, 1988-1993; Lockheed, 1996). The Commonwealth is not expected to site a
NUREG-1496 G-28

disposal facility as waste volumes are very small (LLW Forum, 1993; CPR, 1990;Lockheed, 1996). The generators also rely on radioactive decay for short-livedradionuclides.
G.6 Onsite Waste Disposal
In the past, waste generators have disposed of certain waste on site under the provisions of10 CFR Part 20.304. This provision was rescinded by the NRC in 1980 and replaced byrequirements under 10 CFR 20.302 (45 FR 71761, October 30, 1980). Under Part 20.304, alicensee was authorized to dispose of low-specific activity waste not exceeding 1,000 timesthe amounts specified in Appendix C of 10 CFR 20.
It has been estimated by the NRC that about 100 licensees conducted burial under Part20.304 (45 FR 71761, October 30, 1980). Under the requirements of Part 20.302, thelicensees were required to obtain specific approval. Based on preliminary data, it isestimated that about 40 disposal requests have been authorized by the NRC (NMSS files,preliminary data). In addition, there are approximately another 30 pending applications invarious stages of review and evaluation, while some have been denied or are being held uppending the submission of additional information from the applicants.
Based on preliminary'NRC data, waste volumes have ranged from minimal (a few hundredcubic feet) to larger amounts (3 million ft3). Most of the burials, however, involve wastevolumes ranging from a few tens to several thousands of cubic feet. The waste materialsinclude contaminated soils, sand, animal carcasses, ash, sludge, rubble, hardware, etc. Suchmaterials were generated under normal operations, unusual occurrences, and decontaminationactivities initiated by the licensee. The radionuclides most often cited in applications includeH-3, C-14, P-32, S-35, Cr-S1, Mn-54, Fe-59, Co-58, Co-60, Zn-65, Ga-67, Tc-99m, I-125,I-131, Cs-134, and Cs-137. Radionuclide concentrations vary significantly, from a fractionto several hundreds of picocuries per gram.
If, under the implementation of a D&D Plan, a licensee were required to remove anymaterials buried on site, the total volume of excavated waste would be determined on a site-specific basis. The total volume would include the waste itself and some soil which hascommingled with the waste.
G.7 Discussion and Summary
Table G.7-1 gives the estimated waste volumes for decommissioning of lands and structuresat licensed facilities categorized by the reference facilities for all five waste sectors, acrossall States and Compacts. The total volume for these facilities is 6.8 million ft3 (Table G.7-1does not include the estimated waste volumes from SDMP sites).
IG-29 NUREG-1496

Table G.7-2 compares the results shown in Table G.7-1 against planned disposal capacities ofthe Compact regions and States. A review of this information indicates the following withregard to incremental impacts of alternate residual dose criteria:
* The estimated waste volumes from decommissioning of lands and structures make upabout 13% of the planned disposal capacity based on the assumptions of footnote (c)of Table G.7-2. As indicated in Attachments C and D of Appendix C, incrementalwaste volumes from decommissioning are estimated to vary by about a 40% decreasein going from 100-25 mrem/y and a 250% increase in going from 100-.03 mrem/y ascompared to a range of 100 to 3 mrem/y. However, as already noted based onAttachments C and D of Appendix C, a very large cost is associated with a verysmall dose reduction in reducing the dose below 3 mrem/y, and so such a reduction isextremely unlikely (see footnote (c) to Table G.7-2) and need not be consideredfurther. To simplify and bound this assessment, the analysis of waste disposalvolumes has focused on examination of incremental effects of moving from a residualdose criteria from 100 to 3 and to 0.03 mrem/y and does not consider the incrementaldifferences for the intermediate residual dose criteria examined in Chapters 4 through6 of this GEIS. Incremental volumes and effects related to these intermediate residualdose criteria would be lower than the bounding values presented here.
Therefore, the estimated incremental waste volumes from decommissioning of landsand structures corresponding to bounding alternative residual dose criteria beingconsidered here would not have a significant effect on the overall amount of disposalcapacity, making up about 13% of the total planned low-level waste disposal capacity,and making up approximately 25% or less of the planned disposal capacity for any ofthe regions.
* For four regions, the review in Section G.5 indicates that there are not definitiveplans for the disposal of the waste due to both normal operation anddecommissioning. The regions are the District of Columbia, New Hampshire, PuertoRico, and Rhode Island.
* Although not addressed here, it is assumed that since the waste is characterized bylow radionuclide concentrations, the total radioactivity is not expected to be a limitingfactor for disposal. It is assumed that such waste would produce a small fraction ofthe activity contained in normal operation waste (see Section G.4).
* In establishing disposal capacity needs, Compacts and States have adopted varyingapproaches. Some do not include any specific provisions for D&D waste. Rather,the design basis incorporates ample margin to handle such waste. In other cases, thedisposal of D&D waste will be addressed on a case-by-case basis. In otherCompacts, the assumption is that D&D waste will be placed into another disposalfacility. This is the case for waste that will be generated beyond the operational lifeof the currently planned disposal sites.
NUREG-1496 G-30

The disposition of wastes from SDMP sites is highly site-specific and consists mostlyof waste associated with movement and processing of larger volumes of uranium andthorium bearing ores and soil, and such wastes may not go to currently planneddisposal sites. For example, this type of waste may either be stabilized in place ormay be shipped to other disposal sites designed to handle large volumes of very lowlevel waste. One such facility is Envirocare of Utah, Inc., located in Tooele County,Utah (NRC, 1993d). The facility is authorized to handle large quantities of bulk low-level waste, NORM waste, and mixed waste under specific restrictions. Therestrictions include limits on nuclides, concentrations, and specifications on thephysical and chemical properties of the waste. In addition, some of these facilitiescould be placed into restricted use, and as described in Appendix C, this would resultin a reduction in soil volumes requiring disposal.
G-31 NUREG-1496

Table G.7-1Total Waste Volume Summary from Decommissioning of
Lands and Structures for Reference Facility Categories byCompacts and Non-Member States
Waste Volume (10' ftl)
DryPower Research Fuel Fuel Total
Compact/State Plants Reactors Cycle Materials Storage Volume
Appalachian 0.104 0.015 0.483 0.0005 0.602
Central Interstate 0.056 0.013 0.120 0.423 0.611
Central Midwest 0.112 0.005 0.060 0.390 0.0005 0.568
Midwest 0.096 0.020 0.060 0.570 0.0015 0.748
Northeast 0.064 0.060 0.243 0.367
Northwest 0.016 0.023 0.060 0.368 0.466
Rocky Mountain 0.008 0.005 0.240 0.0005 0.254
Southeast 0.280 0.015 0.240 0.118 0.002 0.655
Southwestern 0.096 0.020 0.060 0.750 0.0005 0.927
District of 0.003 0.018 0.020Columbia
Maine 0.008 0.035 0.043
Massachusetts 0.016 0.010 0.130 0.156
Michigan 0.048 0.005 0.190 0.0005 0.244
New Hampshire 0.008 0.033 0.041
New York 0.064 0.010 0.475 0.549
Puerto Rico 0.000 0.000
Rhode Island 0.003 0.020 0.023
Texas 0.032 0.008 0.490 0.530
Vermont 0.008 0.013 0.021
Total 1.02 0.153 0.660 4.99 0.006 6.8
V.p
a
NUREG-1496 G-32

Table G.7-2Estimated Low-Level Waste Disposal Capacity by
Compacts and Non-Member States
Waste Volume (10' ft. Ratio._ . Estimate
Total Reference Facility Categories Capacity(d)Compact/State Planned Total Waste Volume(e)
Capacity Estimates(c)
Appalachian 3.10 0.60 0.19
Central Interstate 2.5 0.61 0.24
Central Midwest 5.5 0.57 0.10
Midwest 3.2 0.75 0.23
Northeast 4.2 0.37 0.09
Northwest' 6.7 0.72 0.11
Rocky Mountain (a) --
Southeast 11.0 0.65 0.06
Southwestern 5.5 0.93 0.17
District of Columbia 0.02
Maine (b) -
Massachusetts 1.1 0.16 0.15
Michigan 1.3 0.24 0.18
New Hampshire - 0.04 --
New York 4.3 0.55 0.13
Puerto Rico --- 0.00 -
Rhode Island - 0.02
Texas 3.3 0.59 0.18
Vermont (b) -- -
Total 51.7 6.8 0.13
(a) Included In total for the Northwest Compact.(b) Included in total for the Texas Compact.(c) Numbers given are for total waste volume for decommissioning lands and structures at a residual dose criterion of 3
alrem/y. Incremental waste volumes woud be approximately 40% of these values for residual dose criteria of 100 to 25wremly and approximately 250% for the 100 - .03 mremly range. Because very large costs are Incurred with very smalldose reduction (Le.,3 - .03 mremly), this is extremely umliUly to occur.
(d) Refer to (c), above, for explanation of ratio estimates.(e) Does not Include waste vohlnes esthnated to be generated by NRC SDMP hites.
G-33 NUREG-1496

G.8 References
AIF 1985, Atomic Industrial Forum, Inc., The Environmental Consequence of Higher FuelBurn-up, AIF/NESP-032, June 1985, available from Nuclear Management and ResourcesCouncil, Inc., Washington, DC.
Baird, R.D., and Sutherland, A.A., 1988, Projections of Low-Level Radioactive WasteDisposal Needs Within the Midwest Compact, Rogers and Associates, Engineering Corp.,Salt Lake City, UT, December 1988.
Barry, M. Jr. 1989, Mayor's Certification Provisions of the Low-Level Radioactive WastePolicy Amendments Act of 1985, The District of Columbia, Washington, DC, December 29,1989.
Chem-Nuclear Systems, Inc. 1991, Volume, Make-up, & Source of LLRW, Illinois Low-Level Radioactive Waste Disposal Facility, Report to the Illinois Low-Level RadioactiveWaste Disposal Facility Siting Commission, May 15, 1993, Springfield, IL,
Cintichem 1991, Order Authorizing Dismantling of Facility and Disposition of ComponentParts, November 21, 1991, Nuclear Regulatory Commission, Cintichem Docket No. 50-54,Washington, DC.
CTHWMS 1993, Plan for Developing a Centralized Temporary Low-Level RadioactiveWaste Storage Facility in Connecticut, Connecticut Hazardous Waste Management andServices, January 1993, Hartford, CT.
CTHWMS 1996, Connecticut Hazardous Waste Management and Services, fax datatransmittal, Oct. 21, 1996, Hartford, CT.
CPR 1990, Commonwealth of Puerto Rico, Commonwealth of Puerto Rico Certification,Office of the Governor, January 29, 1990, San Juan, Puerto Rico.
Denero, J.V., et al., 1984, Decontamination and Decommissioning of the WestinghouseNuclear Fuel Facility at Cheswick, PA, report prepared for the U.S. Department of Energycontract No. DE-ACO6-82RL10363, Westinghouse Electric Corporation, Nuclear EnergySystems, Pittsburgh, PA, June, 1984.
DiPrete, E. D., 1989, Governor's Certification, Low-Level Radioactive Waste PolicyAmendments Act of 1985, State of Rhode Island, Providence RI, December 22, 1989.
DOE 1988, Department of Energy, 1987 Annual Report on Low-Level Radioactive WasteManagement Progress, Report to Congress in Response to Public Law 99-240, DOE/NE-0094, August 1988, Washington, DC.
NUREG-1496 G-34

DOE 1989, Departnent of Energy, 1988 Annual Report on Low-Level Radioactive WasteManagement Progress, Report to Congress in Response to Public Law 99-240, DOE/NE-0098, October 1989, Washington, DC.
DOE 1990, Department of Energy, 1989 Annual Report on Low-Level Radioactive WasteManagement Progress, Report to Congress in Response to Public Law 99-240, DOE/EM-0006P, October 1990, Washington, DC.
DOE 1991, Department of Energy, 1990 Annual Report on Low-Level Radioactive WasteManagement Progress, Report to Congress in Response to Public Law 99-240, DOEIEM-0059P, September 1991, Washington, DC.
DOE 1992a, Department of Energy, Annual Report on Low-Level Radioactive WasteManagement Progress - 1992, Report to Congress in Response to Public Law 99-240,DOEIEM-0091P, Washington, DC, November 1992.
DOE 1992b, Department of Energy, Integrated Data Base for 1992: U.S. Spent Fuel andRadioactive Waste Inventories, Projections, and Characteristics, Office of CivilianRadioactive Waste Management, DOE/RW-0006, Rev. 8, October 1992, Washington, DC.
Ebasco 1990, New Jersey Low-Level Radioactive Waste Disposal Plan, Task 2 Final Report,New Jersey Low-Level Radioactive Waste Disposal Facility Siting Board, Trenton. NJ, May3, 1990.
EG&G 1989, EG&G Idaho, Inc., 1988 State-by-State Assessment of Low-Level RadioactiveWastes Received at Commercial Disposal Sites, National Low-Level Waste ManagementProgram, Idaho Falls, ID, DOE/LLW-87, December 1989
EG&G 1990, EG&G Idaho, Inc., 1989 State-by-State Assessment of Low-Level RadioactiveWastes Received at Commercial Disposal Sites, National Low-Level Waste ManagementProgram, Idaho Falls, ID, DOE/LLW-107, December 1990
EG&G 1991, EG&G Idaho, Inc., 1990 State-by-State Assessment of Low-Level RadioactiveWastes Received at Commercial Disposal Sites, National Low-Level Waste ManagementProgram, Idaho Falls, ID, DOE/LLW-132, September 1991.
EG&G 1992, EG&G Idaho, Inc., 1991 State-by-State Assessment of Low-Level RadioactiveWastes Received at Commercial Disposal Sites, National Low-Level Waste ManagementProgram, Idaho Falls, ID, DOE/LLW-152, September 1992.
EG&G 1993, EG&G Idaho, Inc., 1992 State-by-State Assessment of Low-Level RadioactiveWastes Received at Commercial Disposal Sites, National Low-Level Waste ManagementProgram, Idaho Falls, ID, DOE/LLW-181, September 1993.
G-35 NUREG-1496

EPRI 1985, Electric Power Research Institute, Decontamination Waste Management, FinalReport, EPRI NP-4240, Palo Alto, CA, September 1985.
EPRI 1988, Electric Power Research Institute, Radwaste Generation Survey Update, FinalReport, Vol. 1: Boiling Water Reactors, Vol.2: Pressurized Water Reactors, EPRI NP-5526,Palo Alto, CA, February 1988.
EPRI 1989, Electric Power Research Institute, Proceedings: 1988 EPRI RadwasteWorkshop, EPRI NP-6453, Palo Alto, CA, June 1989.
Guichard, P.R., 1993, North Carolina Low-Level Radioactive Waste Management Authority,letter to J-C. Dehmel, SC&A, Inc., October 28, 1993.
IDNS 1993, Annual Survey Report - 1992, Illinois Department of Nuclear Safety,Springfield, IL, July 1993.
IDNS 1996, Illinois Department of Nuclear Safety, fax data transmittal, Nov. 7, 1996,Springfield, IL.
JFA 1994, Draft Regulatory Impact Analysis for Radiological Criteria for Decommissioningof Nuclear Facilities, July 1994, Jack Faucett Associates.
LADEQ 1996, Louisiana Department of Environmental Quality, fax data transmittal, Oct.24, 1996, Baton Rouge, LA.
LES 1993, Louisiana Energy Services, NRC Docket No. 70-3070, June 1993, NuclearRegulatory Commission, Washington, DC.
LLW Forum 1993, Low-Level Radioactive Waste Management Activities in the States andCompacts, Afton Associates, Inc., Washington, DC, August 1993.
LLW Forum 1996, Low-Level Radioactive Waste Management Activities in the States andCompacts, Afton Associates, Inc., Washington, DC, August 1996.
Lockheed 1996, Lockheed Martin Idaho Technologies, 1994 State-by-State Assessment ofLow-Level Radioactive Wastes Received at Commercial Disposal Sites, National Low-LevelWaste Management Program, Idaho Falls, ID, DOE/LLW-237, September 1996.
MDEP 1992, Maine Departnent of Environmental Protection, Low-Level Radioactive WasteActivity Report, Augusta, ME, 1992.
MLLRWA 1993, Michigan Low-Level Radioactive Waste Authority, Storage of LevelRadioactive Waste in Michigan, Lansing, MI, April 1993.
NUREG-1496 G-36

MLLRWA 1996, Michigan Low-Level Radioactive Waste Authority, fax data transmittal,Oct. 21, 1996, Lansing, MI.
MLLRWMB 1992, Massachusetts Low-Level Radioactive Waste Survey Report - 1991,Massachusetts Low-Level Radioactive Waste Management Board, Boston, MA, Nov. 1992.
MLLRWMB 1993, Directions for Low-Level Radioactive Waste Management inMassachusetts, Management Plan, Vols. I and II, Massachusetts Low-Level RadioactiveWaste Management Board, Boston, MA, January 1993.
MLLRWMB 1996, Massachusetts Low-Level Radioactive Waste Management Board, faxdata transmittal, Oct. 22, 1996, Boston, MA.
NJLLRWDFSB 1996, New Jersey Low-Level Radioactive Waste Disposal Facility SitingBoard, fax data transmittal, Oct. 30, 1996, Trenton, NJ.
Nuclear News 1993a, World List of Nuclear Power Plants, American Nuclear Society,March 1993, La Grange Park, IL.
Nuclear News 1993b, Storage Gets Tighter With Each Discharge, May 1993, p.51,American Nuclear Society, La Grange Park, IL.
Nuclear Waste News 1993a, Northwest, Southeast Compacts Only Regions with LLW Sites,Vol. 13, No. 1, p.2, January 7, 1993.
Nuclear Waste News 1993b, Vermont Authority Approves Texas LLW Disposal Site, Vol.13, No. 42, p.421, October 28, 1993.
NUMARC 1989, Nuclear Management and Resources Council, Inc., Report on NuclearPower Plant License Renewal, April 1990, Washington, DC.
NRC 1980, Nuclear Regulatory Commission, Technology, Safety, and Costs ofDecommissioning a Reference Uranium Fuel Fabrication Plant, NUREG/CR-1266, 2 Vol.,October 1980, Washington, DC.
NRC 1981, Nuclear Regulatory Commission, Technology, Safety and Costs ofDecommissioning Reference Non-Fuel Cycle Nuclear Facilities, NUREG/CR-1754, February1981, Washington, DC.
NRC 1983, Nuclear Regulatory Commission, Radiological Assessment of Steam GeneratorRepairs and Replacement, NUREG/CR-3540, December 1983, Washington, DC.
NRC 1986, Nuclear Regulatory Commission, Radiological Assessment of BWRRecirculatory Pipe Replacement, NUREG/CR-4494, February 1986, Washington, DC.
G-37 NUREG-1496

NRC 1988a, Nuclear Regulatory Commission, Assessment of the Use of Extended Bum-upFuel in Light Water Power Reactors, NUREG/CR-5009, February 1988, Washington, DC.
NRC 1988b, Nuclear Regulatory Commission, Final Generic Environmental ImpactStatement on Decommissioning of Nuclear Facilities, NUREG-0586, August 1988,Washington, DC.
NRC 1990, Nuclear Regulatory Commission, Characteristics of Low-Level Waste DisposedDuring 1987 Through 1989, Office of Nuclear Materials Safety and Safeguards, NUREG-1418, December 1990, Washington, DC.
NRC 1991, Nuclear Regulatory Commission, Generic Environmental Impact Statement forLicense Renewal of Nuclear Plants, NUREG-1437, August 1991, Washington, DC.
NRC 1992, Information Digest, 1992 Edition, NUREG-1350, Volume 4, Nuclear RegulatoryCommission, Washington, DC, March 1992.
NRC 1993a, Information Digest, 1993 Edition, NUREG-1350, Volume 5, NuclearRegulatory Commission, Washington, DC, March 1993.
NRC 1993b, Updated Report On Site Decommissioning Management Plan, SECY-93-179,June 24, 1993, Washington, DC.
NRC 1993c, Site Decommissioning Management Plan, NUREG-1444, Nuclear RegulatoryCommission, Washington, DC, October 1993.
NRC 1993d, Final Environmental Inpact Statement to Construct and Operate a Facility toReceive, Store, and Dispose of 11(e)(2) Byproduct Material Near Clive, Utah, NUREG-1476, Nuclear Regulatory Commission, Washington, DC, August 1993.
NRC 1995, Site Decommissioning Management Plan, NUREG-1444, Suppl. 1, issued underPolicy and Program Issues at Site Decommissioning Management Plan Sites, SECY-95-209,Aug. 11, 1995, Nuclear Regulatory Commission, Washington, DC.
NRC 1996a, Information Digest, 1996 Edition, NUREG-1350, Volume 8, NuclearRegulatory Commission, Washington, DC, July 1996.
NRC 1996b, Update of Policy and Program Issues at Site Decommissioning ManagementPlan Sites, SECY-96-207, Sept. 25, 1996, Washington, DC.
NYSERDA 1993a, New York State Low-Level Radioactive Waste Status Report for 1992,New York State Energy Research and Development Authority, Albany, NY, June 1993.
NUREG-1496 G-38

NYSERDA 1993b, Low-Level Radioactive Waste Storage Study, New York State EnergyResearch and Development Authority, Albany, NY, September 1993.
NYSERDA 1996, New York State Energy Research and Development Authority, excerptsfrom the 1994 Source Term Report, Vol. I, July 1995, letter of Oct. 23, 1996, Albany, NY.
OLLRWAC 1993, Ohio Low Level Radioactive Waste Advisory Committee, Report andRecommendations on the Development and Operation of a Regional Low Level RadioactiveWaste Disposal Facility, Columbus, OH, September 1993.
PADER 1993, Annual Low-Level Radioactive Waste Program Report to the GeneralAssembly, 1990-1991, Pennsylvania Department of Environmental Resources, Bureau ofRadiation Protection, Harrisburg, PA, January 1993.
PADER 1996, Pennsylvania Department of Environmental Resources, Bureau of RadiationProtection, fax data transmittal, Oct. 28, 1996, Harrisburg, PA.
TLLRWDA 1996, Texas Low-Level Radioactive Waste Disposal Authority, Excerpts fromthe license application to the Texas Water Commission for the States of Texas, Maine, andVermont, Texas Low-Level Radioactive Waste Disposal Authority, fax data transmittals,Oct. 18 and Nov. 5, 1996, Austin, TX.
SCC 1991, Southeast Compact Commission, File data, facilities generating 100 or more ft3per year, Raleigh, North Carolina, August 9, 1991.
Shunian, R., and Baird, R., 1993, Characterization of Waste to be Disposed of-at the TexasLow-Level Radioactive Waste Disposal Facility, Rogers & Associates Engineering Corp.,Salt Lake City, UT, October 1993.
Stanton 1993, Final Report on the Characterization of Low-Level Radioactive Waste in theState of Vermont, Vermont Low-Level Radioactive Waste Authority, Montpelier, VT,November 1991.
SWLLRWC 1996, Southwestern Low-Level Radioactive Waste Commission, fax datatransmittal, Oct. 19, 1996, Sacramento, CA.
VLLRWA, 1993, Vermont Low-Level Radioactive Waste Authority, Annual Report, July 1,1992 - June 30, 1993, Montpelier, VT, September 1993.
WADOE, Washington Department of Ecology, Nuclear Waste Program, fax data transmittal,Nov. 5, 1996, Olympia, WA.
G-39 NUREG-1496

ip APPENDIX H
SUMMARY OF COMMENTS ON DRAFTI* GENERIC ENVIRONMENTAL IMPACT STATEMENT
APPENDIX I
SUMMARY OF COMMENTS ON DRAFTGENERIC ENVIRONMENTAL IMPACT STATEMENT
H.1 Regulatory Mtematives and Approach
Comments
Some commenters agreed with the general content of the GEIS and stated that it sufficientlyaddressed all environmental, social, and economic impacts of the proposed rulemaking onradiological criteria for decommissioning and fulfilled NEPA requirements which eliminatedthe need for licensees' environmental reports or for site-specific NRC preliminaryenvironmental reviews for decommissioning to both unrestricted or restricted release. Othercorrmenters criticized the GEIS as being technically incomplete or inconsistent because thereis a lack of documentation, there are apparent discrepancies in the analysis, it is not clear whyexisting decommissioning criteria provide inadequate protection of public health, and theconclusions were derived from flawed bases and analyses. Some commenters indicated thatthe ALARA process is used inappropriately, that determining whether the proposeddecommissioning criteria will minimize overall public risk is impossible, and that the totalityof impact must be reviewed and included in decisionmaking. Some commenters questionedthe results of the GEIS regarding the costs, impacts, and conclusions reached as a result of theGEIS analysis and also questioned why Alternative 5a (maintenance of a license) wasexcluded from consideration in the GEIS.
Response
In response to the comment on the use of the results of the GEIS in site-specific licensingcases of either unrestricted or restricted use, Section 7.2.3 discusses the approach for such use.In response to comments criticizing the GEIS for the reasons noted, the responses containedin Section H.2.2 describe the modifications made to the GEIS to improve the analysis indetail and in clarity. It should be understood that this is a generic analysis which reviews alarge potential pool of facilities and sites and therefore, of necessity, is broad in its analysis ofcosts and impacts. Nevertheless, despite the range of possible parameters, scenarios, andsite-specific situations, Appendices B and C provide analysis of impacts and costs, andprovide results which can be helpful for gaining insight in making decisions regarding thedose criterion, ALARA, the decommissioning objective, and whether restricted use should bepermitted. The analyses of costs in Appendix C and the analysis of impacts in Appendix Bconsider a range of possible cases. Nevertheless, with the range of cases studied, it isbelieved that this GEIS provides sufficient supporting information for the issuance of a finalrule, in particular based on the rationale in Chapter 7.2.2.
H-1 NUREG-1496

Alternative 5a was not analyzed in detail in the GEIS because it is outside the scope of therulemaking supported by this rule which is intended to evaluate alternatives for establishingradiological criteria for decommissioning and license termination.
H.2 Analysis of Impacts and Costs
H.2.1 Reference Facilities
Comments
A number of comments were received that criticized the analysis of costs and risks asincomplete and inadequate and submitted information in support of those comments. Ingeneral, some of the major comments suggested, and provided data on, using additional datafrom actual decommissionings that should be included which would consider variations in sitecontamination characteristics, including the concentration and volume of contamination andthe profile of the contamination with depth. Specific comments were received suggestingsuch additional data for reactors, fuel fabrication facilities, uranium mills, rare-earth facilities,sealed source manufacturers, and independent spent fuel storage installations.
Response
In response to the comment, the NRC has reviewed additional data from a number ofoperating facilities. These facilities include power reactors, research reactors, uraniumfabrication plants, rare metal facilities, and sealed source manufacturers and broad R&Dfacilities. A discussion of that data, with the exception of uranium mills, is contained in thespecific facility discussions in Appendix C. The results of that review are incorporated intothe results of Appendix C. Because of the complexities associated with decommissioning millfacilities, they are excluded from the scope of this final GEIS (see Section 3.2.1).
H12.2 Human Health Impacts; DoselMortality Modeling
H.2.2.1 Dose Modeling Approach
Comments
Several commenters had specific criticism of the calculational method for estimating doses,including that it employed models that were inappropriately conservative and that morerealism was needed, that it did not take into account dose reduction by simple techniques suchas tearing down buildings, that it lacked supporting data for comparison of individual versuscollective dose, that it did not include alpha radiation, that it was inconsistent in its use ofdefault assumptions, that it omits evaluation above 100 mrem, that it does not considercompletely nonradiological impacts or collective dose, that using an average member of acritical group in calculations is inappropriate, or that the supporting technical basis had notbeen released for public review.
NUREG-1496 H-2

In particular, there were questions regarding the uranium dose modeling approach, includingconsistency in estimating doses to the bone and to the lung and in summing organ doses, theneed to take into account that, for many source-material wastes, uranium is insoluble,use of 1:1 concentration ratios for residual uranium and its long-lived decay products which istoo conservative because fuel cycle facilities process refined uranium (separated from itsprogeny), and ingrowth of daughter products from long-lived radionuclides.
Response
Based on examination of additional information for the facilities considered (see Appendix Cand by expanding the alternative uses for unrestricted release sites (see Appendix B), themodeling was refined to include a broader range of possible site-specific circumstances andimpacts than in the draft GEIS. While there can be other approaches to reducing residualdoses (such as tearing buildings down), or other approaches to dose modeling for specificcircumstances beyond that used in Appendix B, these are not considered typical and wouldrequire justification on a case-specific basis. Finally, doses above 100 mrem/y were includedin Appendices B and C evaluations. However, based on 10 CFR Part 20, 100 mrem/y wasused as the highest alternative dose criterion because it is the NRC's public dose limit in 10CFR Part 20.
H.2.2.2 Use of the Linear Nonthreshold Hypothesis In Analysis
Comments
Commenters stated that the use of the linear nonthreshold hypothesis was not appropriate inthe GEIS analysis as a decisionmaking tool for setting standards, for reasons ranging fromthat it overestimates to that it underestimates the risk.
Response
Use of the linear nonthreshold model for estimating incremental health effects per radiationdose incurred is considered a reasonable assumption for regulatory purposes by internationaland national scientific bodies such as ICRP and NCRP. The principal international andnational radiological protection criteria, including the NRC's, are based on this assumption, asa measure of conservatism. NRC's policy regarding use of the linear nonthreshold model wasstated in the preamble to the issuance of 10 CFR Part 20 (56 FR 23360; May 21, 1991)noting that the assumptions regarding a linear nonthreshold dose effect model are appropriatefor formulating radiation protection standards. Although this matter continues to be thesubject of further consideration at this time, there is not sufficient evidence to convince theNRC to alter its policy as part of this rulemaking.
A discussion of the basis for the analysis of dose and associated risk is contained in AppendixB.
H-3 NUREG-1496

H.2.23 Time Period for Analysis
Comments
Commenters were concerned that the time period for analysis in the GEIS was notappropriate. Some commenters objected to the time frame used for calculating dose andwanted it lengthened to better predict health effects over the hazardous life of each isotope.Other commenters wanted the time frame shortened. Other commenters questioned the 70-year time period as excessive when evaluating exposures of individuals living on site in that itexaggerates the real-world risks noting that the EPA uses a 30-year exposure period in itsparallel radiation site cleanup standards, and there is no justification for the NRC's assuming a70-year exposure period because it is highly unlikely that any person would, in fact, spend 70years working or living on site after a facility is decommissioned.
Response
The GEIS uses time periods following license termination of 1000 years for estimatingcollective doses from soil and 70 years for estimating collective exposures in buildings whichhave previously been used for licensed activities. Doses are calculated assuming radioactivedecay of principal radionuclides.
The use of 1000 years in estimating site exposures is reasonable based on the nature of thelevels of radioactivity at decommissioned sites and the potential for changes in the physicalcharacteristics at the site over long periods of time. Unlike analyses of situations where largequantities of long-lived radioactive material may be involved (e.g., a high-level wasterepository) and where distant future calculations may provide some insight into long termconsequences, in the analysis for decommissioning, where the consequences of exposure toresidual radioactivity at levels near background are small and peak doses for radionuclides ofinterest in decommissioning occur within 1000 years, long term modeling thousands of yearsinto the future of doses that are near background may be virtually meaningless. In 10 CFRPart 40, Appendix A makes reference to both a 200-year and 1000-year time frame. In10 CFR Part 61, references to the design of a physical barrier rather than a calculation ofexposure are made.
The use of a 70-year time period for calculating collective dose and risk following licensetermination for buildings that have been involved in licensed activities is a reasonable buildinglifetime. The use of these time periods is discussed in Appendix B.
H.2.2.4 Transfer of Risk - Nonradiological Impacts and-Waste Disposal Impacts
Comments
Commenters questioned the use of collective dose in the analysis indicating that the GEISincorrectly uses collective versus individual dose.
NUREG-1496 H-4

Several commenters questioned whether the net risk from decommissioning adequatelyconsiders all risks involved, including real risks to the worker and public risks associated withcleanup activities and waste handling and transport, compared to hypothetical risks fromradiation exposure, and also questioned whether transferring risk without minimizing total riskis appropriate; for example, risks incurred at offsite disposal sites cannot be used to offsetrisks at the site being decommissioned and whether transfer to another site can be justified asan option for adequate long-term protection of the public since there is no net reduction indose. Some commenters favored a risk-based approach that, in addition to radiologicalimpacts, considers other impacts, such as risks to remediation workers, risks, both radiologicaland nonradiological, from transportation and waste disposal, and risks of damage toecosystems and wildlife.
Response
The GEIS uses a risk-based approach to obtain comparisons for selecting alternative dose andassociated cost. It was recognized that various aspects of decommissioning risk, such astraffic accidents from shipping, radioactive waste, or industrial activities, are different fromrisks incurred from exposure to radiation. Nevertheless, to obtain some measure of overallrisk balance of major decommissioning activities and their respective costs, a measure of riskequivalency is permissible (see Appendix B for risk translation of decommissioning activities).In this way, the overall risk versus cost could be compared to obtain cost-benefit ratios for thealternative residual doses evaluated and the ratios compared with a range of acceptableassociated cost-benefit ratios (see Chapter 6 for such comparisons).
H.2.2.5 Effect of Chemicals
Comments
Commenters indicated that the GEIS fails to consider nonradioactive hazardous pollutants andthe adequacy of funding to deal with them, and in particular the synergistic effects ofnonradiation hazards and radiation hazards, and injuries and illnesses from exposures tochemicals and from conventional industrial hazards that might present the greatest risks toworkers' health and safety.
Response
This GEIS is concerned with the cost-benefit impacts resulting from considering alternativedose rate criteria. The impacts from other aspects of decommissioning have already beenconsidered in the FGEIS on the 1988 final rule (NUREG-0586). While there can be somesmall impacts resulting from nonradioactive (e.g., chemical decontamination) removal ofradioactive contamination from structures in achieving alternative dose rate levels, theirconsideration is covered by other Federal and State regulations (e.g., Department of Labor,Environmental Protection Agency, etc.).
H-5 NUREG-1496

11.2.2.6 Radon
Comments
Commenters questioned the approach to radon in the draft GEIS and in the proposed rule withsome indicating that the rule should specifically include reference to radon whereas othercommenters stated that the rule should not include standards for radon or expressed concernsabout the complications introduced by these considerations and the fact that background radonlevels are so high.
Response
As discussed in Appendix A, wide variations in local concentrations of naturally-occurringradon have been observed in all regions of the United States, including in soils and buildings.These variations make it very difficult to distinguish between naturally-occurring radon andradon resulting from licensed material. Because of these variations and the limitation ofmeasurement techniques, Sections 4.2.2 and 7.2.2 discuss the approach taken in the GEISanalysis and in conclusions regarding radon.
11.23 Nonhuman Impacts
Comments
Commenters indicated that all environmental impacts, not only risks to humans, need to beincorporated into the GEIS analysis and in site-specific decisions, and that because of thepaucity of our understanding of ecosystems, a fuill case-by-case consideration of allenvironmental and social "aspects" for each site or facility should be included. There aresituations whereby a slightly larger dose/risk of radiation exposure would be an acceptabletradeoff (i.e., major environmental disruption due to restoration efforts, safety risk to cleanupworkers).
Response
In general, the scientific literature concludes that protecting humans against radiological.exposure is sufficient to ensure protection of other flora and fauna, especially at the levels ofexposure being considered in this GEIS and rulemaking. Thus, both the draft and final GEISstate that the protection being provided to human populations by the standards imposed inthese regulations should be sufficient to protect environmental resources (see Attachment C toAppendix B and Section 4.3).
Other aspects of decommissioning, such as general disturbance of ground cover, use ofchemicals, etc., are either not related specifically to the level of the residual dose criteria andthus are outside the scope of the GEIS or the effects will be temporary and populations would
NUREG-1496 H-6

be reestablished to former levels as discussed in Section 5.3 of the draft GEIS (seeAttachment C to Appendix B).
H.2.4 Impacts on Waste Disposal/Capacity
H.2.4.1 Limits on Capacity'
Comments
Commenters were concerned about whether the analysis had appropriately considered theeffect on disposal capacity, whether the full scope of impacts of the cleanup criteria had beenconsidered, including the impact of future waste management regulations, and also that theGEIS analysis appears to be volume-based without any activity analysis.
Response
As noted in the response to Comment H.2.2.1, several of the'assumptions, models, andapproaches in Appendix C have been revised in response to public comments to includeadditional data and alternate waste disposal costs. A complete discussion of such revisions iscontained in Appendix C. Based on those revisions, an updated analysis of disposal capacityis contained in Appendix G, including considerations of waste regulations and activityanalysis.
H.2.4.2 NORM Waste
Comments
Commenters questioned the appropriateness of the GEIS analysis to NORM with regard toEPA and State and local government requirements, and with regard to the impact of highvolume NORM wastes, including impacts on available waste disposal capacity.
Response
The criteria of the rule supported by this final GEIS apply to residual radioactivity fromactivities under a licensee's control and not to background radiation (which includes radiationfrom NORM). 'Issues related to NRC-licensed sites containing materials which occur innature are discussed in more detail in Appendices A, C, and G. As noted in response toComment H.2.4.1, above, Appendices C and G have been modified as appropriate to considera range of waste volumes for remediation and disposal.
NRC's legislative and regulatory authority extends to those materials and facilities under theAtomic Energy Act of 1954, as amended, and not'to naturally-occurring radioactive material(sometimes referred to as NORM, except as it is defined as source material in Section 40.4of 10 CFR Part 40. The analysis of the GEIS applies to residual radioactivity from activities
H-7 NUREG-1496
under a licensee's control and not to background radiation (which includes radiation fromNORM). There is a wide variety of sites containing NORM subject to EPA jurisdiction andnot licensed by the NRC. The extent to which the analysis in this GEIS would apply to thesesites would be based on a separate evaluation. However, the considerations and analyses donein the GEIS regarding large fuel cycle and non-fuel-cycle facilities containing large quantitiesof naturally-occurring nuclides, such as uranium and thorium, are appropriate for certainNORM sites, and the broad provisions of Chapter 7 may be useful in considerations regardingNORM sites.
H.2.5 Methods and Costs for Decommissioning
H.2.5.1 Inaccuracy in Costs
Comments
Some commenters criticized the models used to estimate the costs and risks of waste handling(including soil washing), removal, and disposal, and in particular noted that the models for thereference facilities underestimated volumes of material and thus underestimated costs.Commenters also indicated that the costs for waste disposal should be reviewed in particularin recognition of uncertainty associated with various radioactive waste disposal options.Commenters also indicated that NRC should thoroughly reexamine the analysis of the surveycosts of demonstrating compliance at cleanup levels marginally above background radiation.
Response
As discussed in response to Comment H.2.1, the models used to estimate the waste volumesand resultant costs have been reevaluated. That reevaluation is contained in Appendix C. Itis recognized, as is discussed in Appendix G, that there is some uncertainty in waste disposalavailability and costs. For purposes of this GEIS, which attempts to provide a genericanalysis and illustration of trends in potential impacts and costs associated with alternativeresidual dose criteria, Appendix C contains waste disposal costs based on a review ofavailable information. A specific site in its licensing activities related to the decommissioningof that site would evaluate specific waste disposal charges. With regard to survey costs,Appendix D contains an updated evaluation of the methods and costs of surveys based oncurrent information regarding capabilities to measure residual radioactivity at the dose levelsevaluated in this GEIS.
H.2.5.2 Cost of Compliance, Social Costs, and Other Costs
Comments
Commenters indicated that the NRC needs to consider other costs not included in the costanalysis; e.g., costs owing to limited available disposal capacity, increased NRC and State andlocal regulatory costs, SSAB costs, costs of extensive public comment and hearing procedures.
NUREG-1496 H-8

Commenters also noted that the full social cost of radiological exposure was not considered,e.g., costs of decommissioning are emphasized but not costs of morbidity or mortality overthe full period of toxicity of residual radioactivity to both present and future members of thepublic.
Response:
Disposal capacity space in considering alternative dose levels is addressed in Appendix G andis evaluated based on current and planned waste disposal sites. The differences in cost fordecommissioning to alternative dose levels and the mortalities averted for various alternativeuses of the sites for the dose levels evaluated are also considered in Appendices B and C, andcost-benefit comparisons are presented in Appendix B. -Reasonable expectation of facilitybuildings lasting 70 years after license termination and sites requiring consideration for1000 years are included in these alternatives. While there are costs in terminating licenses tothe government, states, and affected populations, these are not necessarily increased costs andare likely to decrease because of licensing uniformity and inclusion of restricted releasealternatives and appropriate consideration of mitigation before terminating a license.
H.3 Results of Analysis
H.3.1 Completeness/Validity of Analysis and Suggested Alternative Cost-Benefit AnalysisApproaches
Comments
Some commenters criticized the inclusion of considerations of cost-effectiveness, objecting tousing cost in decisionmaking and that the completeness of decontamination or cleanup shouldbe decided by some criterion that does not include any consideration of the costs to achievethem, i.e., the health, public welfare, and environment must be NRC's priority without regardto costs associated with decommissioning. Other commenters criticized the GEIS because,although they favored use of cost-benefit analyses in decisiomnaking, they felt that the cost-benefit analysis was inadequate because it used an improper approach combining the buildingand soil analysis and that separate analyses of the cost-effectiveness of soil removal andbuilding removal should be performed. A commenter illustrated that such separate analyseswould clarify differences between costs and impacts of cleanup of soils and structures thatwere not obvious in the draft GEIS. Commenters also suggested deleting the "knee-in-curve"approach as not clearly illustrating the information regarding costs and impacts for cleanup ofboth soils and structures, and also suggested alternative values of the $/person-rem value usedor indicated that the cost per mortality averted was high compared to other costs per risk inFederal regulations. They also felt that the GEIS analysis underestimated the amount ofcontamination at reference facilities as well as the costs of remediation and final site closeoutsurveys.
H-9 NUREG-1496

Response
The rationale for establishing a dose criterion is explained in Section 7.2.2 of Chapter 7. Itindicates that considerations are given to health and safety issues and issues regardingexpenditure of resources compared to the benefits obtained. NRC methods and policyregarding cost considerations are stated in NUREG/BR-0058, Rev. 2, and call for preparationof an appropriate regulatory analysis in support of regulatory decisions. NUREG/BR-0058does note that costs cannot be considered for regulatory actions necessary to ensure adequateprotection of the health and safety of the public; however, it further notes that costs can be afactor in those cases where there may be more than one way to reach a level of adequateprotection. Thus, the analysis in the GEIS was prepared in support of the rulemaking to -
provide additional information to decisionmakers with regard to the rule criteria beingconsidered.
Based on the comments and information received, additional information has been added tothe GEIS. Data on contamination submitted by the commenters were reviewed, comparedwith other existing data, including that in the draft GEIS and incorporated into Appendix C,as appropriate. Appendix C thus considers additional soil contamination data as well as soiland building contamination levels comparable to those evaluated in the draft GEIS. It alsoconsiders the range of disposal costs and survey methods and costs presented in the draftGEIS as well as those suggested in the comments. The Commission agrees with thecommenters that consideration of soil and buildings separately can provide added information.Thus, Appendices B and C have used the analysis of the draft GEIS, which contained the datafor performing separate analyses, and has presented the data more clearly in its tables. Inaddition, the "knee-in-curve" figures, which provided general information about behavior ofcosts and impacts associated with cleanup, have been replaced with a set of tables inAppendix B and in Chapter 6.
With regard to comments on the $/person-rem value, the evaluation of regulatory alternativesin the GEIS has been done using the regulatory analysis framework presented in NUREG/BR-0058 and NUREG-1530. NUREG/BR-0058 provides a decisionmaking tool for decidingbetween regulatory alternatives. A value of $2000/person-rem is developed in NUREG-1530,which includes a review of costs of other Federal regulations, and used in NUREG-0058 aspart of that decisionmaking tool.
H.3.2 Comparison of Costs and Benefits
Comments
Some commenters agreed that the analysis of the GEIS supports a 15 mrem/y residual dosecriterion, which was recommended in Chapter 8 of the draft GEIS, and that such a level isattainable, provides a margin of safety, and isn't unjustifiably costly. However, mostcommenters did not agree that the analysis of the GEIS supports a 15 mrem/y criterion.Some opposed 15 mrem/y as being too high and indicated that the analysis supported
NUREG-1496 H-10

alternatives that reduced the contamination level to lower levels, including preexistingbackground. Others opposed 15 mrem/y as being too low and indicated that an appropriateanalysis would support alternatives which generally included increasing the limit to 25, 30,50, or 100 mrem/y with further reduction based on ALARA.
Response
As discussed in response to previous comments, modifications to the GEIS analysis have beenmade with regard to the reference facilities, the dose modeling approach, and the overall cost-benefit analysis approach. The results of these modifications and the effect on the cost-benefit analysis are discussed in Chapter 7. Also discussed in Section 7.2.2 of Chapter 7 isthe rationale for establishing a dose criterion for unrestricted use.
H.3.3 Restricted Use
Comments
Some commenters agreed with the concepts and analyses permitting restricted use ofdecommissioned sites because it may be financially impractical to reach unrestricted levels,especially if health and safety considerations do not warrant it and because restricted releaseallows realistic land uses to be considered. Some commenters opposed the concept of, andanalysis of, any planned restricted release of decommissioned sites because of concerns overthe durability and effectiveness of institutional controls to provide needed protection of publichealth and safety at decommissioned sites, and because licensees should accept responsibilityfor their actions and not place the' burden on other parties.
Commenters also noted that the cost analysis should take into account institutional andengineering controls,' including the costs of SSAB involvement in the restricted use process,that can be maintained to ensure that the costs of incremental reductions in residualradioactivity are truly proportional to the benefits achieved and should allow credit for soilcovers in meeting the criteria for restricted use.
Response
Current NRC regulations pertaining to decommissioning, promulgated on June 27, 1988 (53FR 24018), do not contain provisions for release of a facility for restricted use but limit alicensee's options in decommissioning to release of a facility for unrestricted use. Experiencewith decommissioning of facilities since 1988 has indicated that for certain facilities,achieving unrestricted use might not be appropriate because there may be net public orenvironmental harm in achieving unrestricted use, or because expected future use of the sitewould likely preclude unrestricted use, or because the cost of site cleanup and waste disposalto achieve unrestricted use is excessive compared to achieving the same dose criterion byrestricting use of the site and eliminating exposure pathways. The input received from therulemaking workshops held from January through May 1993 confirmed this experience and
'H-1 1 NUREG-1496
indicated that restricted use of a facility, if properly designed and if proper controls were inplace, was a reasonable means for terminating licenses at certain facilities.
Current NRC-licensed sites which might request restricted use are largely industrial sites. It isreasonable for them to remain industrial because of their locations and previous sitingconsiderations. Nevertheless, there may be instances where if a site had high cultural value,such considerations would be presented as part of the public process that is part of restricteduse and could be considered as a socioeconomic effect under the ALARA process.
The proposed rule, and the analysis of the draft GEIS of environmental impacts, thus providedfor both unrestricted and restricted use of sites. Appendix C and Appendix F provideadditional information with regard to impacts and costs related to restricted use. Based on theanalyses of Appendices B, C, F, and G, it would appear that release of certain facilities forrestricted use is an appropriate option assuming the presence of the specific provisionsdescribed below to ensure that appropriate controls are in place so that the restrictions on useremain in effect.
An important question raised in the public comments relates to the durability of institutionalcontrols, i.e., whether the controls provide reasonable assurance that the exposure will belimited to the dose criterion in the rule over the periods in question.
For many types of decommissioned sites released under restricted conditions where potentialdoses to an individual are caused by relatively short-lived nuclides, the radiation exposure thatcould potentially be received if controls were to fail will gradually decrease to below theunrestricted dose criterion so the restrictions on use would no longer be necessary. Examplesof facilities with nuclides of this type include reactors or materials facilities for which theprincipal dose contributing nuclides after decommissioning are Co-60 or Cs-137 (half-lives 5.3and 30 years, respectively), or other similarly short-lived nuclides. The Commission hasconsidered the effectiveness of institutional controls for up to 100 years in similar contextssuch as low-level waste disposal sites. Because decommissioned facilities will havecontamination at much lower levels than low-level disposal sites, the Commission believesthat institutional controls using relatively simple deed restrictions can provide reasonableassurance that the TEDE will be below the dose criterion in the rule with restrictions in place.
In a limited number of cases, in particular those involving large quantities of uranium andthorium contamination, the presence of long-lived nuclides at decommissioned sites willcontinue the potential for radiation exposure beyond the 100-year period. More stringentinstitutional controls should be required in these situations, such as legally enforceable deed
-restrictions and/or controls backed up by State and local government control or ownership,engineered barriers, and Federal ownership, as appropriate. Such Federal control is authorizedunder Section 151(b) of the National Waste Policy Act (NWPA). Requiring absolute proofthat such controls would endure over long periods of time would be difficult and should notbe required. Rather, institutional controls should be established by the licensee with the
NUREG-1496 H-12

objective of lasting 1000 years to be consistent with the time-frame used for calculations (anddiscussed in Section IV.F.7 of the Supplementary Information to the final rule). Having donethis, the licensee would be expected to demonstrate that the institutional controls couldreasonably be expected to be effective into the foreseeable future.
To provide added assurance that the public will be protected, there should be financialassurance to provide that the controls remain in place and are effective over the periodneeded. Given these provisions, the use of reliable institutional controls is appropriate, andsuch controls will provide a high level of assurance that doses will not exceed the dosecriterion for unrestricted use.
Although it is anticipated that failure of active and passive institutional controls with theappropriate provisions in place will be rare, it is recognized that it is not possible to precludethe failure of controls. Therefore, in the proposed rule, the Commission included arequirement that remediation be conducted so that there would be a maximum value ("cap")on the TEDE from residual radioactivity if the institutional controls were no longer effectivein limiting the possible scenarios or pathways of exposure. The cap included in the proposedrule was 1 mSv/y (100 mremn/y), which is the public dose limit codified in 10 CFR Part 20.Public comments on the proposed rule suggested other values for the cap, both higher thanand lower than the proposed value. The analysis of those comments, and their potential effecton the institutional controls used, is discussed in Section IV.B.3.4 of the SupplementaryInformation to the final rule.
Given the discussion above on the viability of controls and on the provisions for financialassurance and for a "cap", the provision for restricted use and institutional controls shouldprovide a high level of assurance that public health and safety will be protected. Licenseesseeking restricted use should be required to demonstrate, to NRC's satisfaction, that theinstitutional controls they propose are comparable to those discussed above, are legallyenforceable, and are backed by financial assurance. Licensees should also be required todemonstrate that the cap will be met.
With regard to responsibility for cleanup, the need to fix responsibility for decommissioningof licensed sites is appropriate. The planning and financial assurance requirements adoptedJune 27, 1988 (53 FR 24018) recognized the responsibility of licensees to plan for the cleanupof their sites and to provide adequate financial assurance for that cleanup. Similarly in theproposed rule and in the draft GEIS, it was indicated that licensees would not be permitted torelease a facility for unrestricted or restricted public use unless the dose criteria stipulated inthe rule had been satisfied. As noted in Chapter 7 and in Appendices B and C, furthercleanup to levels such as background is not generally reasonable because it results in verylittle additional health benefit with very large costs incurred and could result in an increase inthe overall risk associated with cleanup of a particular site when all factors (e.g., estimatedfatalities due to traffic accidents during transport of radioactive wastes) are considered.Therefore, for the reasons discussed in more detail in Chapter 7 and Appendices B and C,
H-13 NUREG-1496

potential use of restrictions is considered appropriate to protect public health and safety and topermit release of the sites and termination of license.
H.3.4 Need for Groundwater Analysis
Comments
The GEIS does not adequately analyze the technical basis or costs of applying the EPAdrinking-water standard as proposed and should provide a cost benefit analysis of imposingthe EPA's drinking-water standard as proposed.
Response
Chapter 6 and Appendix C have been modified to include an analysis of impacts and costsassociated with remediation of the site to reduce the dose from the groundwater pathway toalternative residual dose levels.
NUREG-1496 H-14

NRC FORM 335 U.S. NUCLEAREGULATORYCOMPASSION 1. REPORT NUMBER) t:oned=by NRCS Add VoL. Supp.,
NRCM 11w. e and m Numbs A mny3201,322 3BIBLIOGRAPHIC DATA SHEET
(ee 3Iucyora te reverse) NUREG-14962. mTLE AND SUBTITLE Vol. 3
3 DATE REPORT PUBLISHEDFinal Generic Environmental Impact Statement in Support of Rulemaking onRadiological Criteria for License Termination of NRC-Licensed Nuclear Facilities MONTH
July 1997Appendices C-H 4. FIN OR GRANT NUMBER
Final Report
S AUTHOR(S) 0. TYPE OF REPORT
Regulatory
7. PERIOD COVERED Vndusha Dates)
S. PERFORMING ORGANIZATION - NAME AND ADDRESS (if NRC, pro&de Divion, Office or Region, U.S. aktw RsegLatory CoriIwTlsskon mnd maein address; 1 cormtror,provIde name and melting address.)
Division of Regulatory ApplicationsOffice of Nuclear Regulatory ResearchU.S. Nuclear Regulatory CommissionWashington, DC 20555-0001
9. SPONSORING ORGANIZATION - NAME AND ADDRESS (if NRC. type 'Saze as boe; I coratector, provide NRC OMslon Office or Reglon, U.S. Nudes Regiistory Commssion.aid maling address.)
Same as 8. above.
10 SUPPLEMENTARY NOTES
11. ABSTRACT (2DO wor or Iess)
The action being considered in this Fmal Generic Environmental Impact Statement (GEIS) is an amendment to theNuclear Regulatory Commission's (NRC) regulations in 10 CFR Part 20 to include radiological criteria for decom-missioning of lands and structures at nuclear facilities. Under the National Environmental Policy Act (NEPA), allFederal agencies must consider the effect of their actions on the environment. To fulfill NRC's responsibilities underNEPA, the Commission is preparing this GEIS which analyzes alternative courses of action and the costs and impactsassociated with those alternatives.
In preparing the final GETS, the following approach was taken: (1) a listing was developed of regulatory alternativesfor establishing radiological criteria for decommissioning; (2) for each alternative, a detailed analysis and comparisonof incremental impacts, both radiological and nonradiological, to workers, members of the public, and the environ-ment, and costs were performed; and (3) based on the analysis of impacts and costs, conclusions on radiological crite-ria for decommissioning were provided. Contained in the GEIS are results and conclusions related to achieving, asan objective of decommissioning ALARA, reduction to preexisting background, the radiological criterion for unre-stricted use, decommissioning ALARA analysis for soils and structures containing contamination, restricted use andalternative analysis for special site-specific situations and groundwater cleanup.
12 KEY WROS/DESCRIPTORS (ist words or phrases that wI assit researchers in locabt ft report) la AVAILABILITY STATEMENT
Unlimited
Generic Environmental Impact StatementDecommissioning ('11o raep)Radiological Criteria UnclassifiedNuclear Reactors (rS Report)
Fuel Cycle Facilities UnclassifiedNon-Fuel Cycle Facilities 15 NUMBER OF PAGES
10 PRICE
NRC FORM 335 (2-")

Federal Recycling Program