oc"PA - Nuclear Regulatory Commission
217
. s ' * - ==a* -- ..-...,...we, --e e .e.-e -- hee g ,-p _e46 mee a*% F v r * , oc"PA ! eenrnca; oucoort oi p , . a . . - .- ,' c, :, : <~- *-) - .~ c . ,,- r w r; q*rn . . ~ .k-s n ut t . a G. :: * * ' .< ., . : ~ . , T;, 3, , ~ . 1 4j4 em. ,a e. ,e % - g a. ; ., ~ s o ,e,., r v.* ..-) . * ,n- , y . -- i, b 4 b.4 1 . . to . .# . 4 4 L s,.. .e . . , -! * <, s - . > - . .- , - . - > .e . i . 1 4 * % 1 -' h , , , j wm u h u e| \ ' is . '.4 * ;p . . ? . . . - . , , , /.:-;,., m. , . . . ,i ., .. A R . ',f . s - - . , . . , ; .m ; ' . : *, $ , ,,,.~; ~ k,;,' , ' f s . . , - + ~ , , # * r, 5 ||p*f :-i, O'...n' = - *_ g - '4 , < a ., .y .m o y ?v a,;f % . I - & , , , %,, 4. N. .$ . ;9 . ,.9 . 3 ,. ; ,o n '. n ; , . ' 3 , 4,. ' , . . , . : q r. -- p - 3, s { . : . Vy .s.; , ~ . - f.;, . . -y. g ,. s- r ., # ,s g,u,s , y m 6 . ,, y ; e. ;~ 3 p 6 { . ,. j ,f.' s '' f . , ? I. , -\ d j w . V ...m .e, h, . *.y y > in,.. r .e i . y. s 7 , , , , p **J. p . ;?. 4w Ma ,i .) < - '.y, g f . e i - .s .. . - . ,. . . . -- s. 7 s . . ;1 ;, 6 i ,g.- 51a.p .,'; d;',.,_-: q.* i - ; e ) ., : q .:3 , h ) ; ;v . ' , I J I . I. . :n,.' , . .* ,,60 s ' * , ' p. i . qQ' 5 Q ,q 7! * s- *1* '| p fsagg;n ;)t .}p'g. - .. .h }V ^., , t t> ~-{ . : , , , . . % y., d. ,1 * : , ' J :- . .. c. k .= ,+ < :.- r.- t. 1 ' x . s % .-. .m e ~ i 4 < - ; cf .* 'g .i,,f'~ #; . ! :.cn '.j,3% )r , . .h . ; , . . . M )I .4. - . . ..L (? ',s- ..' q - .f.- *,., c, m, . .'s . /, ' , 1 3, \ - ,. , , . q (- :s .e x . . * * ' * . .,v5 s i .[, i s1,z'_ *' ' .;:4 - ' .. '}( * v ' ; . _ , . 3 t. s s , 4. s, -< 7 ..* , '. **'4 ..,t.[f ~ e Y, : * '4. s* (,,.. ,. .. . c- , . ' T i', 4 . ig \ i, f.g * . g .n(. 's, ' * g ' %,-L a.3 ..:. - '- s . . . . w . .w' ~. , - u t, , t - e .. / , .- i , . . . , . .. . .- - -- ~, . s. , i | s , ,s . , ., .. .~ .: -- , l _ _ . _ . _ 80031 801 % .
-
Upload
khangminh22 -
Category
Documents
-
view
0 -
download
0
Transcript of oc"PA - Nuclear Regulatory Commission

.
s
' * - ==a* -- ..-...,...we, --e e .e.-e
-
- --
hee g ,-p _e46 meea*% F v r * ,oc"PA ! eenrnca; oucoort oip , .
a
.. - .-
,' c, :, : <~- *-) - .~ c . ,,- r w r; q*rn.
. ~.k-s n ut t . a G. :: * * '.<
., . : ~ . , T;, 3,,
~ .
1 4j4 em. ,a e. ,e % - g a. ; ., ~ s o ,e,., r v.* ..-). *,n- , y . --i, b 4 b.4 1 . . to ..# . 4 4 L s,.. .e . .
, -! * <, s - . > - . .-, - . - >.e .
i.1
4 * %
1
-'h
, , , j wm u h u e|\
'
is.
'.4*
;p. . ? . . . - . , , , /.:-;,., m. , . . .
,i
., ..
A R.
',f . s- - - . , . . , ; .m ; ' . : *,
$, ,,,.~; ~ k,;,' , ' f s
..
,- +
~ , ,# *
r, 5 ||p*f :-i, O'...n'= - *_g
-
'4,
< a ., .y .m o y ?v a,;f % .I -& ,
, ,%,, 4. N.
.$ . ;9 . ,.9 .
3 ,. ; ,o n '. n ; ,. '
3 , 4,.
' , . . , . : q r. -- p -
3, s{. : .Vy .s.;, ~
. - f.;, .
.
-y. g ,. s-r ., # ,s g,u,s , y
m6 . ,, y ; e. ;~
3
p 6
{ . ,. j ,f.' s '' f . , ? I. ,-\ d j
w . V ...m .e, h, . *.y y > in,.. r.e i. - y. s
7, , , ,
p **J. p . ;?. 4w Ma ,i.) < - '.y,g
f. e i-
.s .. . - . ,. . .. --. s. 7 s . .
;1 ;, 6i ,g.- 51a.p .,';d;',.,_-: q.* i - ; e
) ., : q .:3,
h ) ; ;v.' ,I J I. I. .
:n,.' , . .* ,,60s'
*, ' p. i .qQ' 5Q ,q 7!* s- *1* '| p fsagg;n ;)t.}p'g.- ..
.h}V ^.,
-
,
t t> ~-{ . : , , , . .%
y., d. ,1 * :,
' J :- . .. c.k .= ,+ < :.-
r.- t. 1 '
x . s % .-. .m e ~ i 4 <
- ; cf .* 'g .i,,f'~ #; . ! :.cn '.j,3% )r , . .h .; , . . .
M )I .4. -. .
..L (? ',s-..'q -
.f.- *,., c, m, . .'s. /, ',
1 3, \-
,., , . q (- :s .e x ..
* * ' * . .,v5 s i .[, i s1,z'_ *' ' .;:4 -'
..
'}(*v ';.
_ , .
3 t. s s , 4. s, -< 7 ..* , '. **'4 ..,t.[f~e
Y, : * '4. s* (,,..,.
.. . c- , .'T i', 4
. ig \ i, f.g*
.
g.n(. 's,
'
* g ' %,-L a.3 ..:. - '-s . . . . w . .w' ~. , - u t, , t -e .. / ,
.- i, . . .,
. .. ..- - --~, . s. , i |s , ,s . ,., .. .~ .: --
,
l
_ _ . _ . _
80031 801 %.
-,r: $ ;-
j_ t . --~ m.
_. -,;u-
hs~
3
'
.
C.;
// TECHNICAL SUPPC-T, OF STANDARDS FOR
HICH-LEVEL RADIOAC1. ' UASTE MANACEMENT
TASK C REPORT
ASSESSMENT OF HICRATION PATINAYS
EPA Contract No. 63-01-4470
Prepared by
Arthur D. Little, Inc.Cambridge, Massachusetts 02140
March-Jaly 1977
Rocch eJ!.. clear I:sgulator3 ( umm;-aies
hCV 2 3 i:!3 )IJLt.rv
%hhatun. U G. '%3's.
. . _ - . - -J
- ..... . . , .. , . . . .. .- . . .,,
4
t
DISCLAIMER
This report was prepared as an account of work sponsored by theEnviromental Protection Agency of the United States Government underContract No. 68-01-4470. Neither the United States nor the UnitedStates Environmental Protection Agency makes any warranty, express orimplied, or assumes any legal liability or responsibility for the accu-racy, completeness, or usefulness of any information, apparatus, produ:,t,or process disclosed, or represents that its use'would not infringeprivately owned rights.
|
,
>
11
.,.._ _. _, . . _ _ _ . , -_ .. _ ._
r__~ -
ACDioWLEDCHDrTS
Many individuals contributed to the work done under the directionof Arthur D. Little Inc. , for the U.S. Environmental Protection Agencyunder Contract No. 6S-01-4470. John L. Russell and Daniel Egan of theOffice of Radiation Programs at EPA served as constant staides in theprocess of our work. Dr. Bruce S. Old, James I. Stevens, and David 1.Hellstros of Arthur D. Little, Inc., were Program Director, ProgramHansger, and Assistant Program Manager, respectively, of the overallproj e ct. Key individuals involved in each of the reports preparedunder the four tasks were:
TASK A Donald KornArthur D. Little. Inc.Task Director
Robert McWhorter,Michael Raudenbush,and.Lester Goldstein
S.M. Stoller Corp.
TASK B Edwin L. FieldArthur D. Little Inc.Task Director
Robert McWhorter and i
Michael Raudenbush |S.M. Stoller Corp.
TASK C P.J. O'BrienArthur D. Little, Ing.
|Task Director
Dr. Ronald B. Lantz $
Intera Environmental ;
Consultants, Inc.
Dr. John GormleyD'Appolonia ConsultingEngineers Inc. |
TASK D Donald S. Allan j
Arthur D. Little, Inc.,
Task Director,
Ajit Bhattacharyya andCharles R. Hadlock i
Arthur D. Little Inc.|1
111 |
. _ _ .._.I
-- .. 3
|
|
FOltEWORD
A najor Federal offo o is underway to develop methods for disposal,
i of high-level radioactive vaste in deep geologic repositories. An Lapor-! tant element of this program is the development and promulgation by the
U.S. Environmental Protection Agency (EPA) of environmental standardsfor the management of these vastes.
1
In anticipation of its efforts to develop thes,e standards, EPArecognized that it would be necessary to estimate the expected andpotential environmental 1spacts from potential geologic repositories,
'
using modeling techniques based upon as thorough an understanding aspossible of the uncertainties involved in the quantities and charac-teristics of the vastes to be managed, the effectiveness of engineeringcontrols, and the potenti&1 cigration and accidental pathways that mightresult in radioactive materials entering the biosphere. Consequently,in March 1977, the CPA contracted with Arthur D. Little, Inc.,for a studyto provide technical support for its development of environmental regula-tions for high-level radioactive vastes. This study was divided intothe following four tasks:
Task A - Source Term Characterization / Definition
Tcsk B - Ef fectiveness of Engineering Controls
Task C - Assessment of Higration Pathways
Task D - Assessment'of Accidental Pathways'
The information presented in the reports on these tasks was developedprincipally during the period March 1977 to February 1978. In the case ofthis report, Task C , the information contained in it was prepared duringthe period March-July 1977. There are many national and internationalprograms underway to develop additional data, especially in the fieldsof waste forms, knowledge of geology and geohydrology, and risk assess-ment. The information presented in these reports has been developedon cenceptual bases and is not intended to be specific to particularconditions at geologic repositories,
iv
| |
n--
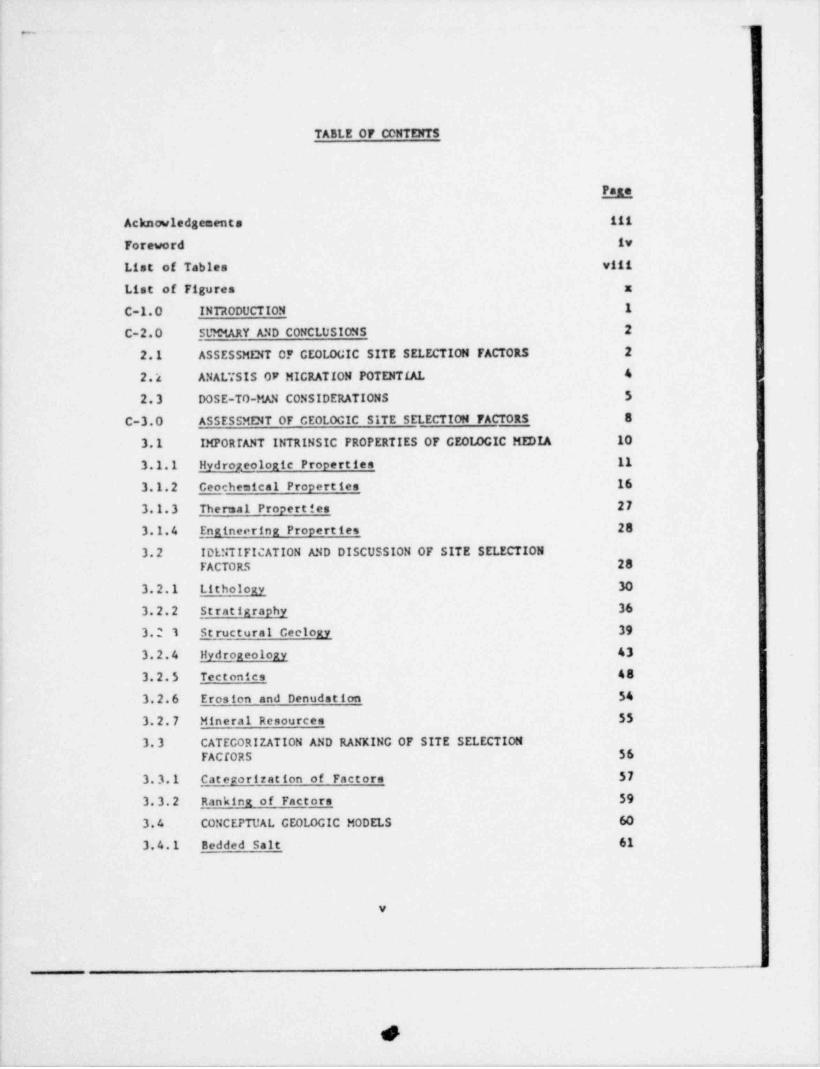
TABLE OF CONTENTS
MAcknowledgements iii |
Foreword iv
List of Tables v111 |
|List of Figures x
C-1.0 INTRODUCTION 1
C-2.0 SUMMARY AND CONCLUSIONS 2
2.1 ASSESSMENT OF CE0 LOGIC SITE SELECTION FACTORS 2
2.1 ANAL *.* SIS OF MICRATION POTENTIAL 4 |
2.3 DOSE-TO-MAN CONSIDERATIONS 5
C-3.0 ASSESSMENT OF CE0 LOGIC SITE SELECTION FACTORS 8
3.1 IMPORTANT INTRINSIC PROPERTIES OF CE0 LOGIC MEDIA 10
3.1.1 Hydropeol_o_gic Propertien 11
3.1.2 Ceochemical Properties 16
3.1.3 Thermal Properties 27,
3.1.4 Engineering Propert ies 28
3.2 IDENTIFICATION AND DISCUSSION OF SITE SELECTION {FACTORS 28 i
3.2.1 Lithology 30
3.2.2 Stratigraphy 36
3.2 1 St ructural Ceclogy 39
3.2.4 Hydrogeology 43
3.2.5 Tectonics 48
3.2.6 Erosion and Denudstion 54
3.2.7 Mineral Resources 55
3. 3 CATECORIZATION AND RANKING OF SITE SELECTIONFACf0RS 56
3.3.1 Categorization of Factors 57
3.3.2 Ranking of Factors 59
3.4 CONCEPTUAL CE0 LOGIC MODELS 60
3.4.1 Bedded Salt 61
v
__

r..
TABLE OF CONTENTS (cont.)
D3.4.2 Salt Domes 64
'
1.4.3 Shale 66 3
3.4.4 Igneous Rocks (Easalt Model) 68
C-4.0 ANALYSIS OF MICRATION POTENTIAL 71
4.1 MODES OF WATER CONTACT 71
4.2 EVALUATION OF LEACH RATES 78
4.2.1 In t roduction 78
4.2.2 Empirical teach Models 79 !
4.2.3 Theoretical Leach Models 82i
4.3 CEOSFHERE TRANSPORT THEORY ASSESSMENT 83
4.3.1 Rydroloty - Radionuclide Transport Model Review 85
4.4 MICRATION OF RADIONUCLIDES IN Tite CEOSPUERE 90 f4.4.1 Introductica 90 j
4.4.2 Results Using Analytical Model 95 [4.4.3 Results Using Numerical Model 104
4.5 COMPARISON OF THE EFTECT OF I4W-CRADE URANIUM~
ORE VS. AN HLW REPOSITORY 125
C-5.0 DOSE-TO-MAN CONSTDERATIONS 128 '
5.1 OBJECTIVES AND OVERVIEW 1289
5.1.1 Introduction and Purpose 128,
5.1.2 ' Opt ions an 3 Considerat ions for Haking Radiation,
Do n e A s s e s r,m en t s 129'
5.1. 3 Conditions of Exposure and Persons or Populatiot saat Risk 132
3.1.4 I=plications of the Use of a Linear-NonthresholdDose-Response 136 5
5.2 BASIS FVR DOSE-TO-MAN CALCULATIONS 117 j5.2.1 Introduction 137
A5.2.2 Repository Release Scenarios 138
5.2.3 Pathway Models 142 |,
U
A
vi s1
)J
___
<-
TABLE OF CONTENTS (cont.)
P,,,ar,,,
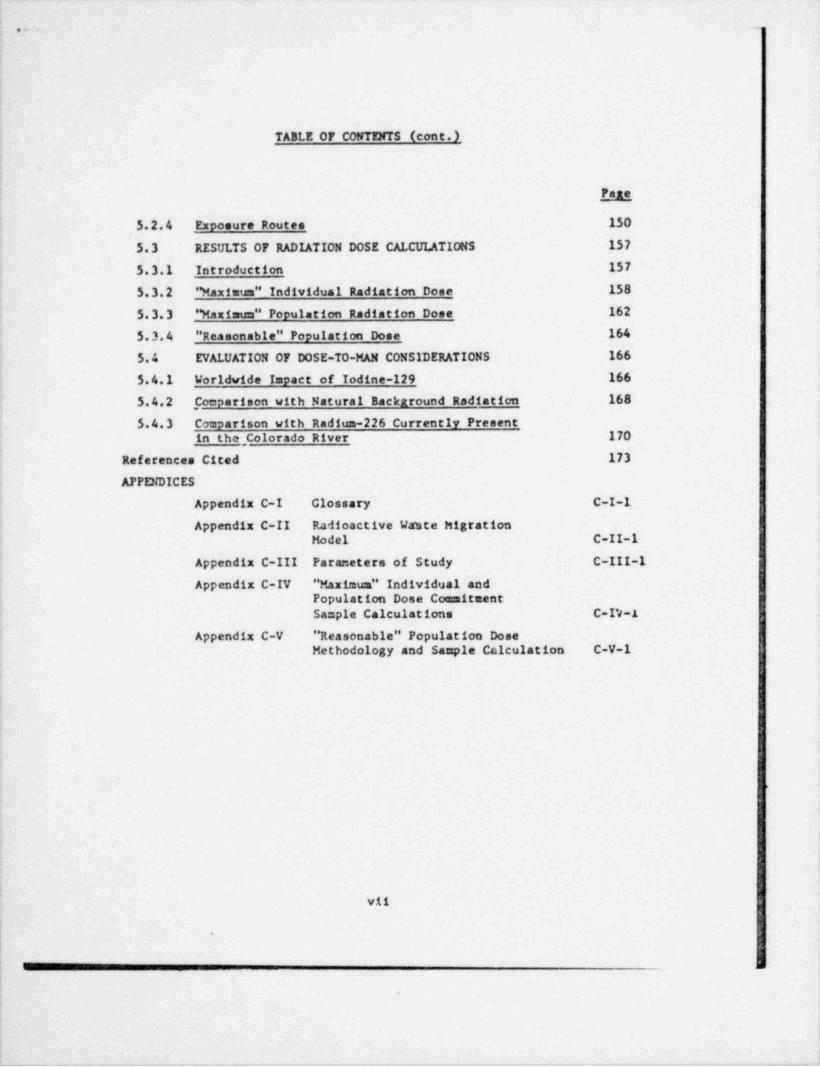
5.2.4 Exposure Routes 150
5.3 RESULTS OF RADIATION DOSE CALCULATIONS 157
5.3.1 Introduction 157
5.3.2 "Maximus" Individus1 Radiation Donc 158
5.3.3 " Maximum" Population Radiation Dose 162
5.3.4 " Reasonable" Population Dose 164
5.4 EVALUATION OF DOSE-TO-MAN CONSIDERATIONS 166
5.4.1 Worldwide Impact of Iodine-129 166
5.4.2 , Comparison with Natural Background Radiation 168
5.4.3 Comparison with Radium-226 Currently Presentin the Colorado River 170
References Cited 173
APPENDICES
Appendix C-I Clossary C-I-l
Appendix C-II Radioactive Waste MigrationModel C-II-l
Appendix C-III Paraneters of Study C-III-1
Appendix C-IV "Maximus" Individual and j
Population Dose CommitmentSample Calculations C-I's-1
Appendix C-V " Reasonable" Population DoseMethodology and Sample Calculation C-V-1
|
|,
,
i
h
!1
1
vii
:
d
.
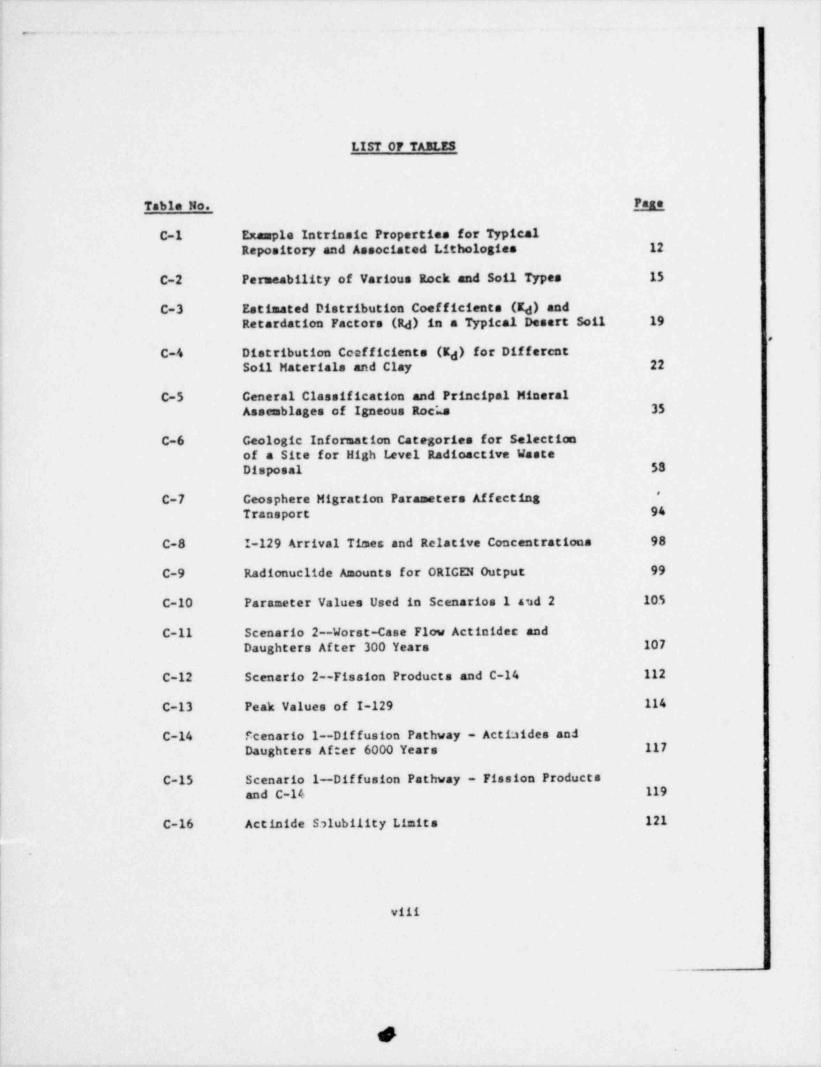
LIST OF TABLES
Table No. M
C-1 Example Intrinsic Properties for TypicalRepository and Associated Lithologies 12
C-2 Permeability of Various Rock and Soil Types 15
C-3 Estimated Distribution coefficients (K ) anddRetardation Factors (Rd) in a Typical Desert Soil 19
,
C-4 Distribution Coefficients (K ) for DifferentdSoil Materials and Clay 22
C-5 Ceneral Classification and Principal MineralAssemblages of Igneous RocLa 35
C-6 Geologic Information Categories for Selectionof a Site for High Level Radioactive WasteDisposal 53
'
C-7 Geosphere Higration Parameters AffectingTransport 94
C-8 I-129 Arrival Times and Relative Concentrations 98
C-9 Radionuclide Amounts for ORICEN Output 99
C-10 Parameter Values Used in Scenarios 1 and 2 105
C-11 Scenario 2--Worst-Case Flow Actinidet andDaughters After 300 Years 107
C-12 Scenario 2--Fission Products and C-14 112
C-13 Peak Values of I-129 114
C-14 Feenario 1--Dif fusion Pathway - Actiaides andDaughters Af:er 6000 Years 117
C-15 Scenario 1--Dif fusion Pathway - Fission Productsand C-14 119
C-16 Actinide S11ubility Limits 121
viii
_
,
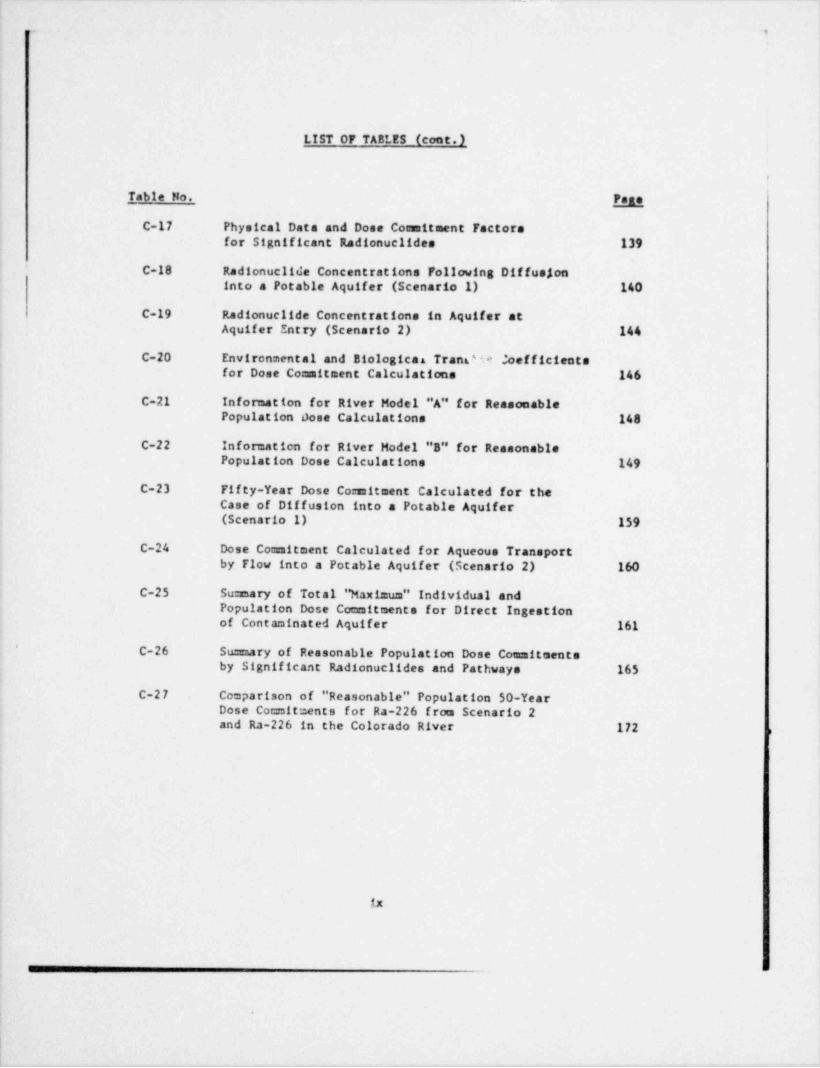
LIST OF TAELES (cont.)
.
Table No. MC-17 Physical Data and Dose Commitment Factora
for Significant Radionuclides 139
C-18 Radionuclide Concentrations Following Dif fusjoninto a Potable Aquifer (Scenario 1) 140
C-19 Radionuclide Concentrations in Aquifer atAquifer Entry (Scenario 2) 144
C-20 Environmental and Biologicas Trant'i- Joefficientsfor Dose Commitment Calculations 146
C-21 Information for River Model "A" for ReasonablePopulation Jose Calculations 148
C-22 Informatien for River Model "B" for ReasonablePopulation Dose Calculations 149
C-23 Fif ty-Year Dose Commitment Calculated for theCase of Diffusion into a Potable Aquifer(Scenario 1) 159
C-24 Dose Co=mitment Calculated for Aqueous Transportby Flow into a Potable Aquifer (Scenario 2) 160
C-25 Sumary of Total " Maximum" Individual and
Population Dose Commitments for Direct Ingestionof Contaminated Aquifer 161
'
C-26 Summary of Reasonable Population Dose Commitmentsby Significant Radionuclides and Pathways 165
C-27 Comparison of " Reasonable" Population 50-YearDose Cocmitments for Ra-226 from Scenario 2and Ra-226 in the Colorado River 172 .
$1

. . . .
LIST OF FICURES
Figure No. Py
C-1 Ranges of Distribution Coefficients forVarious Rock Types 21
C-2 Radioactive Waste Repository ConceptualModel in Tectonized Shale 41
C-3 Radioactive Waste Repository ConceptualModel in Salt Dome 44
C-4 Regions of the World in Which Major Earthquakesand Volcanoes occur 52
C-5 Radioactive Waste Repository O'nceptualModel in Bedded Salt 62
C-6 Radioactive Waste Repository ConceptualModel in Non-Tectontred Shale 67
C-7 Radioactive Waste Repository ConceptualModel in Easalt 70
C-8 Two Flow Regimes 73
C-9 Cross-Section Data for Evaluation of FlowRegimes 74
C-10 Calculated Interbed Velocities for Two Flow .
Regimes 76
C-11 Comparison of Laboratory and In-Situ Leach Data 81
C-12 Comparison of Leach Rates for Two Leach Models 84
C-13 Numerical Representation of Geologic Models 91
C-14 Effect of Leach Time and Migration on NuclideConcentration 101
C-15 Schematic Illustration of haxinum Individualand Upper Limit Population Dose by Diffusionto a Potable Aquifer (Scenario 1) 141
X
, - . . _ . . - . . ,_ _ _ _ . ... . . , _ . _ __. . . . ,,,
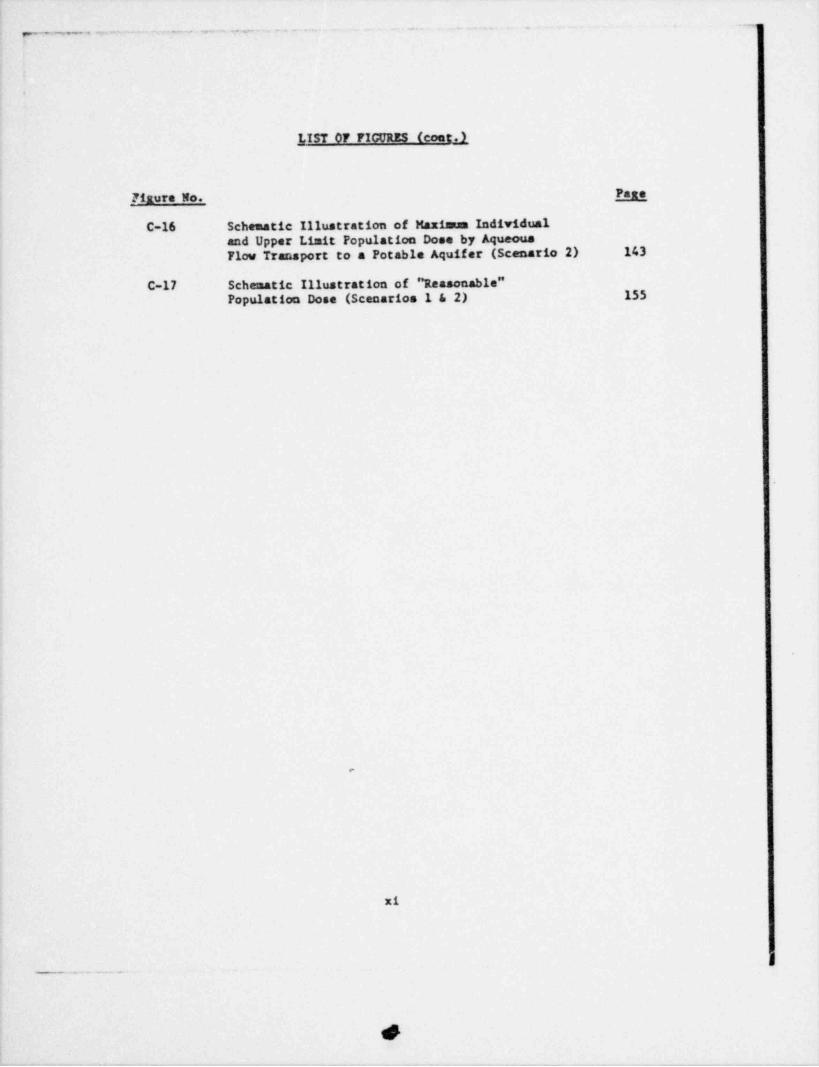
LIST OF FICURES (coat.)
_?fgure No. Page
C-16 Schematic Illustration of Maximum Individualand Upper Limit Population Dose by AqueousFlow Transport to a Potable Aquifer (Scenario 2) 143
C-17 Schesatic Illustration of " Reasonable"Population Dose (Scenarios 1 & 2) 155
,
xi
g. . . - - . .
6
. . ~ .
1
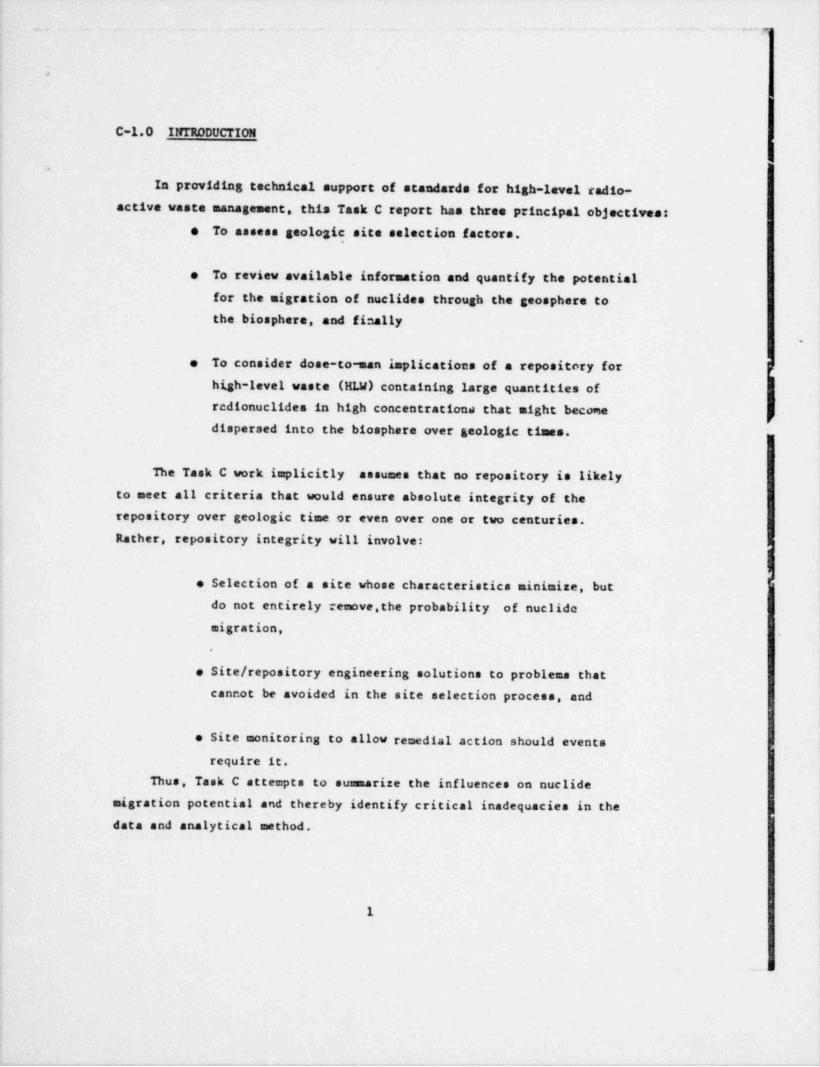
C-1.0 IrrrRODUCTION
.
In providing technical support of standards for high-level radio-active vaste management, this Task C report has three principal objectives:
e To assess geolo2ic site selection factors,
To review available information and quantify the potentiale
for the migration of nuclides through the geosphere tothe biosphere, and finally
.
To consider dose-to-man implications of a repository fore
high-level vaste (KLW) containing large quantities of -
redionuclides in high concentrations that might become,
dispersed into the biosphere over geologic tLoes. -
!
The Task C work implicitly assumes that no repository is likely j
to meet all criteria that would ensure absolute integrity of theu
'
repository over geologic time or even over one or two centuries.{
Rather, repository integrity will involve::
o Selection of a site whose characteristics minimize, butdo not entirely remove,the probability of nuclidemigration,
e Site / repository engineering solutions to problema thatcannot be avoided in the site selection process, and
e Site monitoring to allow remedial action should eventsrequire it.
Thus, Task C attempts to summarize the influences on nuclide
migration potential and thereby identify critical inadequacies in thedata and analytical method.
1
- -
C-2.0 SUMMARY AND CONCLUSIONS
C-2.1 ASSESSMENT OF CE0 LOGIC SITE SELECTION FACTORS
towhichgeologicmediacanservedabarrierstoradio-The extent
nuclide migration depends principally on the geologic properties of themedia and on the possibility of catastrophic geologic events. Suchfactors as lithology, stratigraphy, structure, hydrogeology, tectonics,erosion, and mineral resources--and the interrelationships among thesefactors--must be identified and evaluated from the perspective of radio-
nuclide transport or containment. .
The" ideal" land site for a high-level radioactive waste repository |
would be geologically stable and isolated from aquifers and from thebiosphere. The rock would be capable of adsorbing radionuclides and !
diffusing heat. Since an " ideal" site will not exist in rature, this I
ltask report identifies geologic factors that bear importantly on sitingdecisions in general. !
|
Siting factors rely on a detailed knowledge of hydrogeologic , geo-chemical, thermal, and engineering properties of the repository materialand of the surrounding rock. Of principal importance are the basic |
physical rock procerties, e.g., permeability, porosity, and fracture |
systems that determine the basic hydrologic parameters of a rock suite. I
flow rate through the rock most particularly. Other rock properties,'
,
1
e.g., geochenical and thermal operate to modify (largely to retard) therate of hydrologic transport of various species, e.g., chemical consti-
tuents as typified by radionuclides. Engineering properties of therepository host rock taken as a whole, are critical to the repository |itself and are, therefore, the most vital factor in the sense that they
are the initial determinant of repository integrity.
In examining a specific site, a number of basic studies are required,each designed to yield information sufficient to identify and evaluate
2
4
]
|
||
1, site seismicity characteristics, rock type, and distribution; the struc-
ture or physical arrangements of the rocks; tectonic processes, e.g..
volcanism; and sur;icial processes such as erosion. Inventories ofa
mineral resources and other near-sits activities such as oil and gas 4
drilling could also bear on site suitability.
The notion of site factor ranking should be avoided in other than J
site-specific cases since, any given site, one or another factor may 4
predominate. To suggest a generic ranking assumes a uniforalty and sin-plicity in nature that cannot be supported. For example, in a salt done,the plastic behavior of salt under thernal stress over long periods oftime is of greatest importance. In layered or bedded salt, the distri- )
bution and thickness of interlaminations of clays and shales with the ;
salt, as well as joint or fault systems, are of primary significance. 5
In basalt terrains, interlayers of rubble that may be aquifers are impor- i
tant, as well as joint or fault systems that could serve as conduits I,
from a repository to the biosphere. These several examples do not sug-gest that other factors can be neglected or in fact that in any given -
instance another factor or several factors might not predominate. Thesefactors reflect the inherently co= plex character of crustal rock, which
imakes investigation dif ficult. This complexity accounts as well forsuccess, or lack thereof, in drilling oil wells, unpredictable rock fall l
behavior in mines, and the profound difficulties encountered in earth- 1
quake prediction.
In order to facilitate understanding of these processes, general-ized models were developed that formed the conceptual background, util- ,
ized subsequently in the Task C Report for analysis of nigration fromthe repository through geologic media to the biosphere and for evaluationof the potential dose to man.
I
3 ,
-i
~. . .~

y--_. ,
pJ'
d
,
C-2,2 ANALYSIS OF MICRATION POTENTIAL,
The objective of this sub-task was to selecc a suitable model forquantitative prediction of the migration of radionuclides from a breached
HIN containment through the geologic environment and into communicationwith biosphere pathways to human consumption. The intention of the taskwas not to develop entirely new physical and analytical models, but ratherto review the applicability of existing nodels, and identify and select an
appropriate one for examination of parameters. The physical parameters of
the model were to be compatible with the several characteristics of acceptablegeologic media for siting o' an 6L9. and were to be definable as independent
variables.
A review of available models identified one as being generally
adequate. Sensitivity analyses were performed on the several param-
eters of this model, and appropriate ranges of values were found for
each parameter.
The simolified model for migration of radionuclides from the HLW
through the geosphere assumes ultimate failure of the primary contain-
ment system, and proceeds to estimate the concentrations of individual
radionuclides that vill escape from the repository by (a) leaching into
groundwater, (b) transport in snd/or through the groundwater in the vicinity
of the repository upward to an overlying squifer, and (c) lateral transport
in the aquifer to points at various distances from the repository site.
Mechanisms considered to af fect transport between the repository and the
overlying aquifer include permeability of the rock, convective water flowI
through fractured rock and, alternatively, diffusion of dissolved nuclides
through non-flowing water in that region. Mechanisms af fecting transport
in the aquifer include convective flow and retardation of ions by selective
adsorption.
Factors considered to affect the concentrations of individual radio-
nuclides occurring at various locations in the aquifer and at various,
points in time (up to 100,000 years after emplacement) include the mass
of each nuclide originally present in the HLW, radioactive decay and
growth, dilution by groundwater, and selective adsorption within the
aquifer. Calculations were performed, leading to predicted concentrations
4
_ __ .m
e
4

- 1
1i
of specific radionuclides at various points in the aquifer up to 8.0 km
(5 miles) distant from the repository. Only a few of the actinide and
fission product nuclides were predicted to exist at significant concen-
trations at distances beyond 1.6 km (1 mile) from the repository at any
time up to 100,000 years after e= placement. These nuclides were usedas the basis for calculating dose-to-man ef fects. In order to compare
i the concentrations of nuclides predicted to migrate to various pointsi
at distances away from the repository with those that might be expected
to be 1 cached away from a naturally-occurring uranium ore deposit of
comparable size and in the same location, calculations were made using
the same assumptions of factors affecting migration, and assuming a0.2% uranium ore deposit at the site of the HLW. The circumstances
assumed for the HLW case (Scenario 2) resulted in approif mately equal
concentrations of Ra-226 in the aquifer as for the uranium ore case.
C-2.3 DOSE-TO-MAN CONSIDDtATIONS
Considerations of alternatives for geologic emplacement of high-level
waste (HLW) lead en a limited range of possible circumstances for transport,
of radionuclides away from the repository site, once the primary contain-
ment system has been breached. Two sets of conditions were selected for.
modeling the circumstances for escape of radionuclides to the biosphere.
Those sets of conditions, labeled " Scenario 1" and " Scenario 2 " were
used to predict the concentrations of specific radionuclides occurringi
in potable aquifers at various distances from the repository site and
t at various times in the future..
Given the predicted levels of various radionuclides in the potable
aquifer under the conditions assumed for " Scenario 1" (dif fusive trans-
port to the aquifer) and " Scenario 2" (direct connective flow transport
to the aquifer), the possible rates for exposure of people to the radiation
dose resulting from ingestion of contaminated food or of the water itself
were examined. Calculations of anticipated human radiation dose consit-
ments were made for three different hypothetical cases:
e Human ingestion, for a period of one year, of water taken from
the contaminated aquifer at a p; int directly over the breached
repository.
5,
Iq
1
Ni _ . . _ . . -*
h
__.-.n.-...-- -- -
e Ib=a n ingestion of vegstables, milk from cows, and beef fromcattle that have served as biological transfer agents of radio-nuclides free contaminated water, ma well as sonne direct inger-tion of the water itself. Use of water from the river, in this
case, is predominantly for agricultural purposes, so radiation,
dose commitments to the af fected population are dominated by
crop-ingestion mechanisms. The contaminated water in this caseis assumed to be from a hypothetical river (River Model "A") thatintersects the contaminated aquifer at a point 1.6 km (1 mile)from the breached repository.
Conditions identical to the above, except that more of the watere
from the hypothetical river (River Model "B") is used for directhuman consumption than is the water from River Model "A."
Radionuclide concentrations in all three cases are calculated en the
basis of each of the two assumed mechanisms for aquifer contamination,
corresponding to Scenario 1 end Scenario 2. respectively.
The results of the analysis are given in terms of estimated 50-year
radiation dose cossaiteents to individuals and to populations of 250
people for the "naxin:un" dose ass:. caption and 10,000 people for the" reasonable" dose assumption, respectively. Ingestion of the radionu-clides is assumed to be for a period of one year, and dose commitments
are calculated for whole body, for bone, and for thyroid.
The principal radiation dose effects were found to be from a small
number of radionuclides, namely, strontium-90, iodine-129, radium-226,
neptunium-237 and plutonium-239 and -240. Several other nuclides were
included in the CF.ercise, based on their apparent importance in terns of
concentrations predicted in the aquifer at various times and places.
When ingestion and dose connaitment f actors were included, however, only
the named nuclides were found to contribute significantly to the dose-
to-man estimates. The relative in:portance of each of these nuclides was
found to change with time af ter es: placement. Cos:parisons were made of
the predicted radiation dose effects of nuclides escaping from the HLW
6 I
J Ji
. _
with those of the natural background radiation. Except for the extra-
ordinary circumstances postulated for calculations of the " mart =="~ individual dose coenitment for W ario 2. none of the modeled cases
led to predicted dose conniements as large as that due to the naturalbackground.
Comparisons were also made between the dose commitments predicted
from the case of River Model "A" and those calculated from actual con-centrations of radium in the Colorado River. (Characteristics of RiverModel "A" were based on actual characteristics of the Colorado Rivermainstream.) The radiation dose commitments estimated from present
actual radium concentrations were found to be 10,000 times greater than
those predicted for the marin= Ra-226 concentrations expected from theHLW 1eakage.
5 U B
7
. - . __. . _ . __1

..- _ _
1
C-3.0 ASSESSHENT OF CEOLOGIC SITE SELECTION FACTORS|
Task C-1 assesses deep geologic site selection factore and tr
provides conceptual geologic models for conditions where ELW reposi- ,
.
tories may be located. The scope includes evaluation of the existing $1
data on site selections, with no new development work. Much of thea
information is based on extensive studies conducted by contractors for ]itt.e Energy Research and Development Administration, especially Battelle
Northwest Laboratories and the U.S. Geological Survey.
The following are included in this subtask: 1
e Evaluation of available pertinent published |{reports from the United States and abroad and ;discussions with recognized authorities in '
various applicable technical areas.
1
e Determination and discussion of intrinsic proper- 1ties of geologic media which can serve as " barriers " sand/or " paths" to radionuclide migration. 9
4
Identification of geologic site selection factors,
3['e
including lithology, stratiarachy, structure,hydrogeology, tectonics, erosion, and mineral s
resources. ,
40
e Development of an investigative sequence for evaluatingsite selection factors, considering theirdirect impact on radionuclide tranoport and inter- y',relationships within the total geologic setting.
e Identification of general, but representative. 3geologic settings for developing illustrativeconceptual geologic models of likely disposal C,
areas, including bedded salt, salt domes, two gtypes of shale, and a profile consisting primar- Jily of basalt. 1
iThe major objective of disposal of HLW in deep geologic media is to
s,
provide containment until the radionuclides decay to an innocuous
level. For this study, the required containment period is considered to1be on the order of one million years. Containment is considered to mean 'i
8 a
4
_
D
~-'
.,
that no wastes (radionuclides) escape to the biosphere in concentrationan
deleterious to nutn or his environment.
SThe ideal ass. As one with an assured tectonic, hydrologic, and mechanical ystability, which is isolated f rom any type of pathway-to-groundwater 1
aquifers (rock or soil strata containing water that reaches the ground
surface in any natural or manmade manner) and from the bioschere. The neologic $Jmaterials should be capable of (1) adsorbing any radionuclides that ambegin to travel from their emplaced position and (2) diffusina 4
heat without impairing the integrity of the natural formation.(1)f:
Also, the ideal site would preserve for the longest period the integtity ?
of any other containment methods used; namely, the vitrification ofvaste and the encapsulation of the solidified radionuclides into metal '
containers, as discussed in the Task B report. Individual y
<sites that satisfy all individual objectives may not exist in 4nature, but a perfect site is not required so long as it has a proper
combination of the related factors. This subtask identifies those a
geologic factors that will determine a site's suitability and shows how the kfactors can be balanced to satisfy the basic disposal objective. Non- ,
geologic factors including thermal and engineering properties, are dis- f
cussed, but to a lesser extent. jY
]Control of radionuclide release from a repository must account for
several ground escape mechanisms:
Catastrophic but nongeologic events, such as a nete-*
orite impact. that could disrupt the repository. <
e Catastrophic, geologic-r*1 aced events, such as,
major fault displacement or volcanic eruption.
o Gradual processes which occur over long time fperiods. q
D
This geologic site selection study covers only the latter two types of,
occurrences. Gradual release mechanisms include transportation of
radionuclides through the geosphere. The transport mechanism can cen- [ceivably be through moving or stationary groundwater, moving or sta- ?
tionary gas within the pore spaces of. the geologic media, or by diffusion
9 [] * P D 9D N '\0 a 1
d. . _:2. W JU
i. -_ _
d

__
through the solid matsrial itself. Available studies identify ground-water as tha most important mechanism. Consequently, dispersion withmoving groundwater and/or diffusion through stationary pore water are,
considered as the only significant mechanisms. These phencuena are largely,
controlled by the hydrogeologic and geochemical properties of the
media as introduced in Section C-3.1.
Catastrophic geologic events are not dependent upon the intrinsicproperties of the host rock at the repository. Discussions cf tbasefactors are included in Sections C-3.2 and C-3.3, where the site selec-tion factors are introduced and evaluated.
Section C-3.4 identifies conceptually several types of settings fordeep geologic repositories. It should be recognized that no uniquesite factor ranking scheme is preferable to another since the site fac-
tors are not analytically related in a mathematical or absolute sense.
The basic utility of arraying factors is to assure completeness of th.
investigation.
C-3.1 IMPORTANT INTRINSIC PROPERTIES OF CEOLOGIC MIDIA
Unless a catastrophic event occurs, the escape of radio sclides willbe dependent on such forces as the pressure, temperatute, and chemicalconditions surrounding the repository as well as on the basic intrinsicproperties of the geologic nedia. Depending upon site-specificfactors, one or several of the following intrinsic properties nay
;take on greater importance.
The intrinsic properties of geologic media considered to be most i
important in relation to radioactive vaste storage are:i
Hydrogeologic properties, which determine the forms ine
which water, water vapor,or gases exist in pore spacesand the rate (s) at which they will flow through a |
'
geologic mediu:n.
10 '
i,
'
e Geochemical properties.which play a major role indetermining (1) the rate at which radionuclidamovement is retarded or accelerated, (2) how thegeologic material will behave when internal en-vironmental conditions are changed, and (3) thenature of chemical reactions that may result fromcontact of radionuclides with the geologic media.
* Thermal properties, which determine the physicaland chemical behavior of the media when heated andthe rate at which heat can be dissipated.
* Iheineering croperties, which deternine localstructural cenavlor at the disposal opening beforeand af ter it is backfilled and, more importantly,how the media will respond to displacement changesfrom larger-scale geologic events.
The following sections further describe these intrinsic properties and
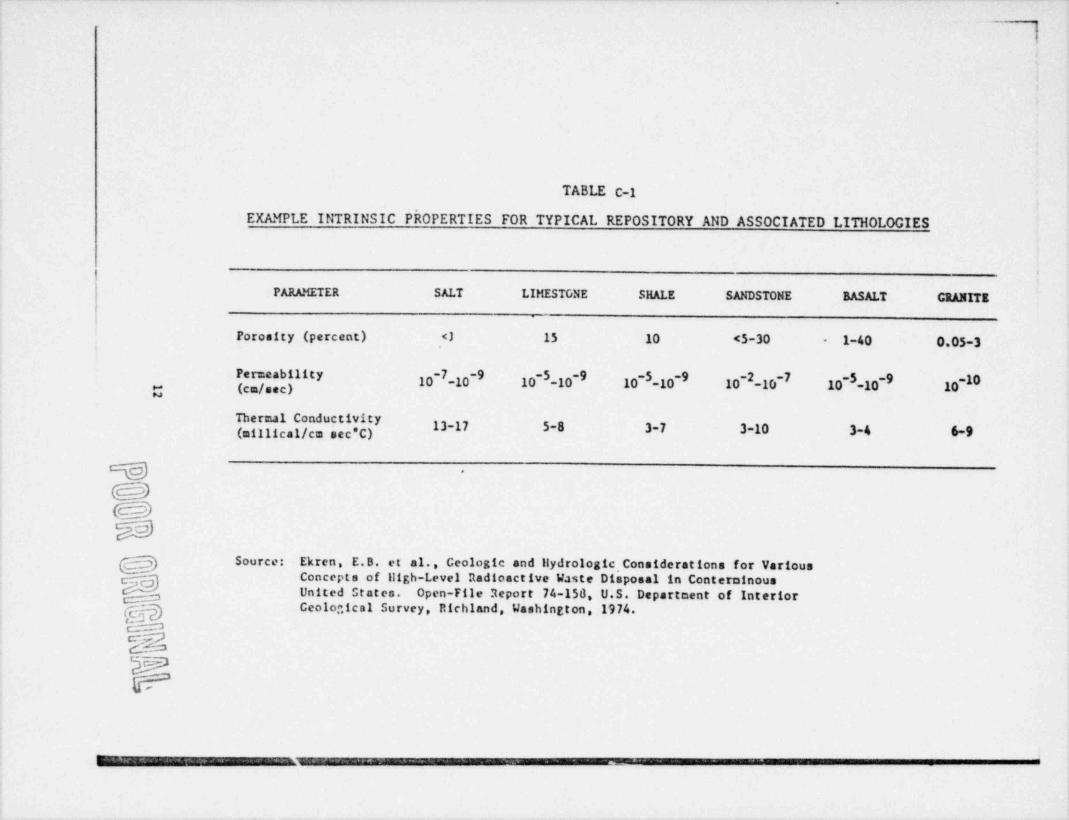
how they influence radionuclide migration potent'al. Table C-1 presents
typical ranges of certain intrinsic properties of several rock types.
C-3.1.1 Hydrogeologic Properties
Two basic hydrogeologic conditions govern the existence and/or novamentof groundwater:,
e The hydrologic properties and behavior ofintact, unfractured or unbroken rocks (primarycharacteristics); and
i e The hydrologic properties and behavior ofdisturbed zones (fractures, f aults, joints,
; stylolites, solution channels, etc.) where*
the extent of disturbance, and not the rockitself, predominates (secondary characteristics). ,
Groundwater moves from levels of higher pressure to lower pressure.
| The velocity of the flow (for laminar flow) is proportional to the
f pressure drop per unit length of distance traveled, i.e., the hydraulic;
gradient. This relationehip between the hydraulic gradient and thea
groundwater velocity is expressed by a relationship called Darcy's Law.( }
a_
.
-- -w_, .
|
TABLE C-1
EXAMPLE INTRINSIC PROPERTIES FOR TYPICAL REPOSITORY AND ASSOCIATED LITHOLOGIES
i
PARAMETER SALT LIMESTONE Sl{ ALE SANDSTONE BASALT GRANITE
I
Porosity (percent) <3 15 10 <5-30 - 1-40 0.05-3
Permeability10 -10'' 10 -10'' 10 -10'' 10 -10 10 -10 ' 10
~$ -5 -2 ~I~
-O~ ~
g (cm/sec)
Thermal Conductivity13-17 5-8 3-7 3-10 3-4 6-9(millical/cm sec C)
% -
@6:59ZEED
g Source: Ekren, E.B. et al., Ceologic and Ilydrologic, Considerations for VariousConcepts of 111gh-Level Radioactive Waste Disposal in ConterminousUnited States. Open-File Report 74-150 U.S. Department of InteriorCcolonical Survey, Richland, Washington, 1974.
-b
F
., --
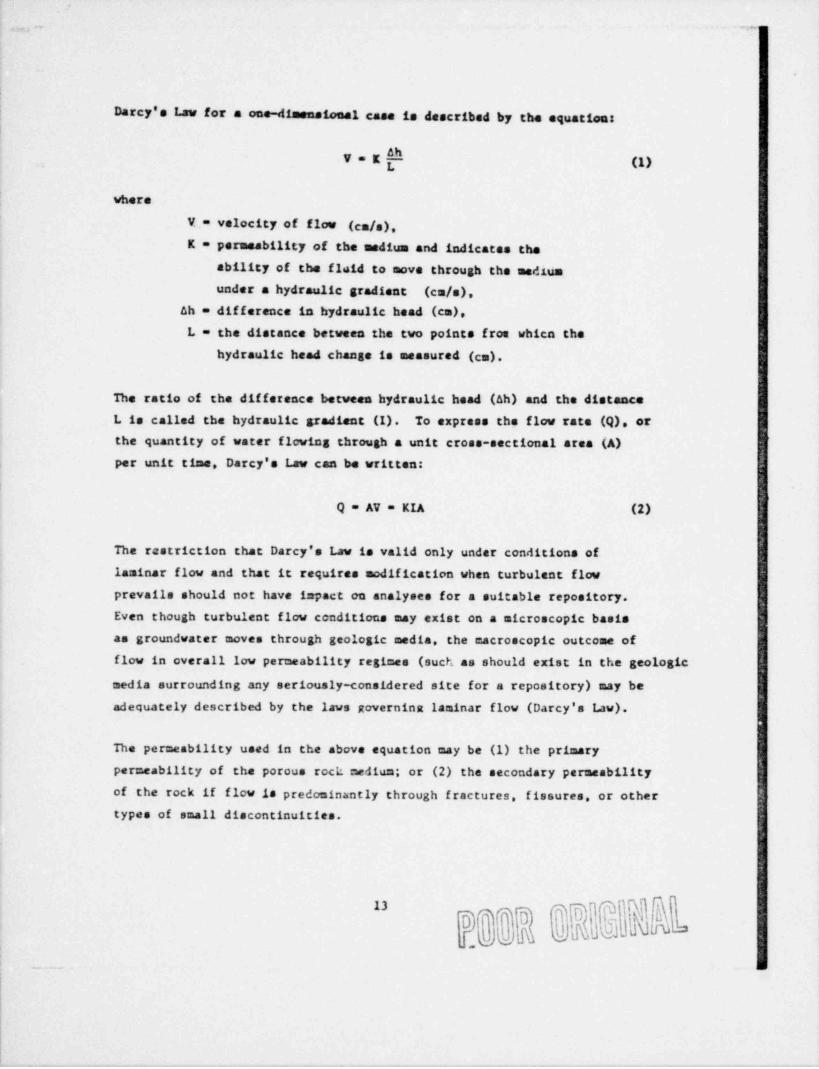
Darcy's Law for a one-dimensional case is described by the equation:
V=K (1)
where
V = velocity of flow (enf.),K = permeability of the medium and indicates tha
ability of the fluid to move through the mediumunder a hydraulic gradient (cm/s),
oh = difference in hydraulic head (cm).
L = the distance between the two points from whien thehydraulic head change is measured (cm).
The ratio of the difference between hydraulic head (ah) and the distance
L is called the hydraulic gradient (I). To express the flow rate (Q), or
the quantity of water fleving through a unit cross-sectional area (A)per unit time. Darcy's Law can be written:
Q = AV = KIA (2)
The restriction that Darcy's Law is valid only under conditions ofla:ninar flow and that it requires modification when turbulent flow
prevails should not have impact on analyses for a suitable repository.Even though turbulent flow conditions may exist on a microscopic basisas groundwater moves through geologic media, the macroscopic outcome of
flow in overall low permeability regimes (such as should exist in the geologicmedia surrounding any seriously-considered site for a repository) may be
adequately described by the laws governina laminar flow (Darcy's Law).
The permeability used in the above equation may be (1) the primarypermeability of the porous rock =edium; or (2) the secondary permeabilityof the rock if flow is predominantly through f ractures, fissures, or othertypes of small discontinuities.
-
-
. -- .,
+ r ,
.,
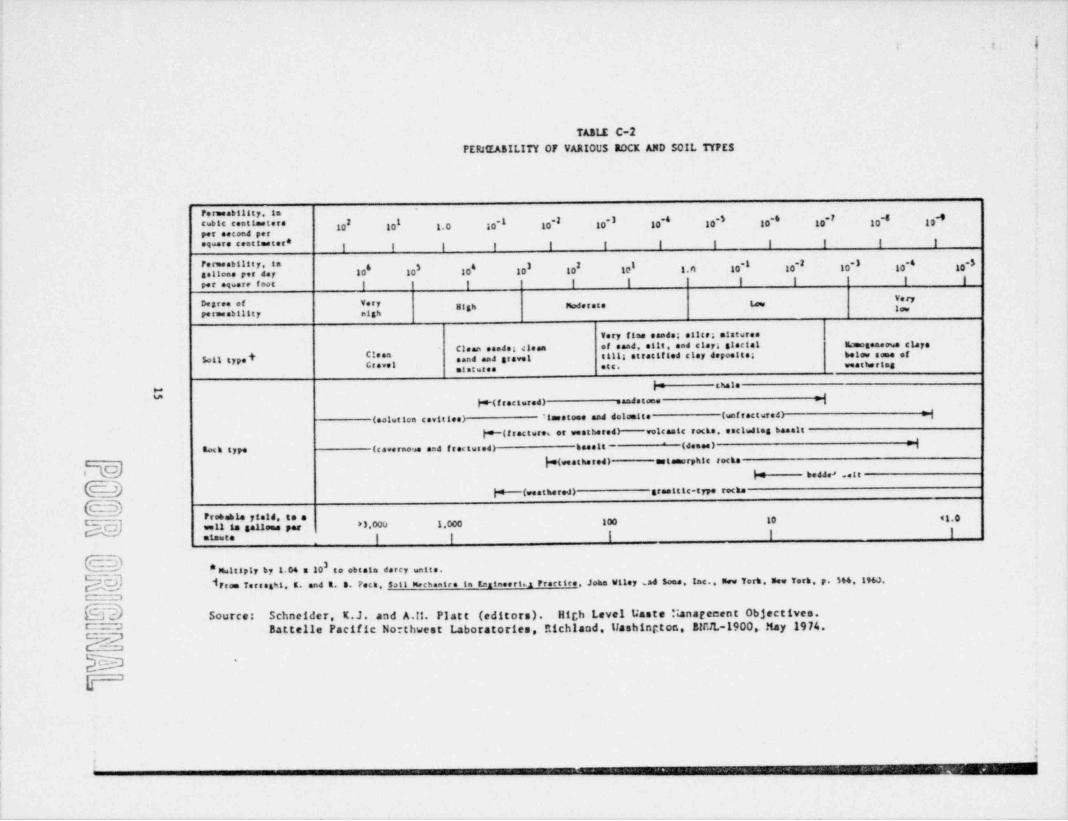
the magnitude of the primary permeability is most dependent upon thegrain size, the degree of crystallization, and/or cementation ant. compac- L
$tion. The lower end of the permeability ranges shown for various rock i
types in Table C-2 is primary permeability. '
1
Secondary permeability (resulting from cracks and fissures in the rock) i
ris likely to be of greater concern when considering potential ground- jwater flow through strata surrounding a HLW repository. Secondary ipermeability must usually be deteruined in the field from well-planned ,
boring drilled to intersect the predominant fractures in the id
rock. Careful attention must be given to the fracture orientations to a
facilitate recognition of preferred directions of permeability. Estab-
lished relationships exist for deducing overall permeability values from d
field permeability tests and pump testa. Also, if appropriate measure- [ments can be obtained from rock corings, the following equation can be <
used to estimate the secondary permeability value in fractured or fis- e
sured rock:(3
2 L
Re (3)g, , 12vb
where 1i
K' = equivalent permeability of a planar array of .'i
parallel smooth cracks (cm/s) ,g = gravitational acceleration (981 cm/s ), j2
e - opening of crscks or fissures (cm).v = the coefficient of kinematic viscosity
2(0.0101 cm /s for purewater at 20 'C. . )
b = spacing between cracks (cm).
.
|For calculating flow through fractured or fissured rock, the permeabilityin Equation (1) should be replaced by K' (secondary permeability).
i
!
14 |
kl -
.
w
? O
,
iTABLE C-2
FERIEABILITY OF VARICUS ROCK AND SOIL TYPES
Forneability, lac d ic centimeters 1 I *I -2 10 ' 10* 10 10-6 10* 10* to10 10 1.0 10 10
* 0per secoed persq.are centimeter *
9 9 g 9 y 9 g g g 9 9 9
Formeability, ta 0 I 10' 10 10 10 1.4 10 10 10*I 10 ' 10*II I *I -2 *
seltene per der 10 10per equere foot | | | | g | g g
yenDegree of very,,g, gg,,,,, L,,
lawpermeant 11ty nigh
Tery flee saads; etttt; alstures
Clean esades clean of osad, ette, and clay; 31 setal Emogemens clays5011 type t ',*" g sand and gravel tills strattfled clay depoette; below some of
.t.t.re. .u. .e. ~ ri.,
|C chale>*
%(fractured) .andstone ;|
(solution cavities; 'taestose and detonite (unf ract ured; ;|
W (fractures er weathered; volcaste rocks, escluetag basalt
EMk type (c averno se and f ractus ed) basalt (desee) rj
h(weathered) estamorphic rocks
v bedded .ett
- W (weatbared) greattic-type rocks
@__S rre. 1. ,isu, . .
k=r;) .eu la saus p., *).000 1.000 100 10 *1.0
*1*='* I I I I I
{.-7TE * N 1tsply by 1.04 a 10 to obeata darcy units.
hh irro. Ters.aws, s. and t. s. Peck, satt meeweatro in tamineeri. m Pr.e tre Joka valey ad seas. lac.. sev Yert, sev Tert. p. 564. 196J.cr aCQ&J c/ Source: Schneider E.J. and A.!!. Platt (editors). Hir,h Level Uaste ianarecent Objectives.e
Battelle Pacific No-thwest 1.aboratories, !!!chlande Uashington EtrJL-1900s May 1974.E_"A
e
d'
b
:- - - - - - - - _ _ _ _ _ _ _ _ _ _ _ _ _ g..__
_ _ _ ,
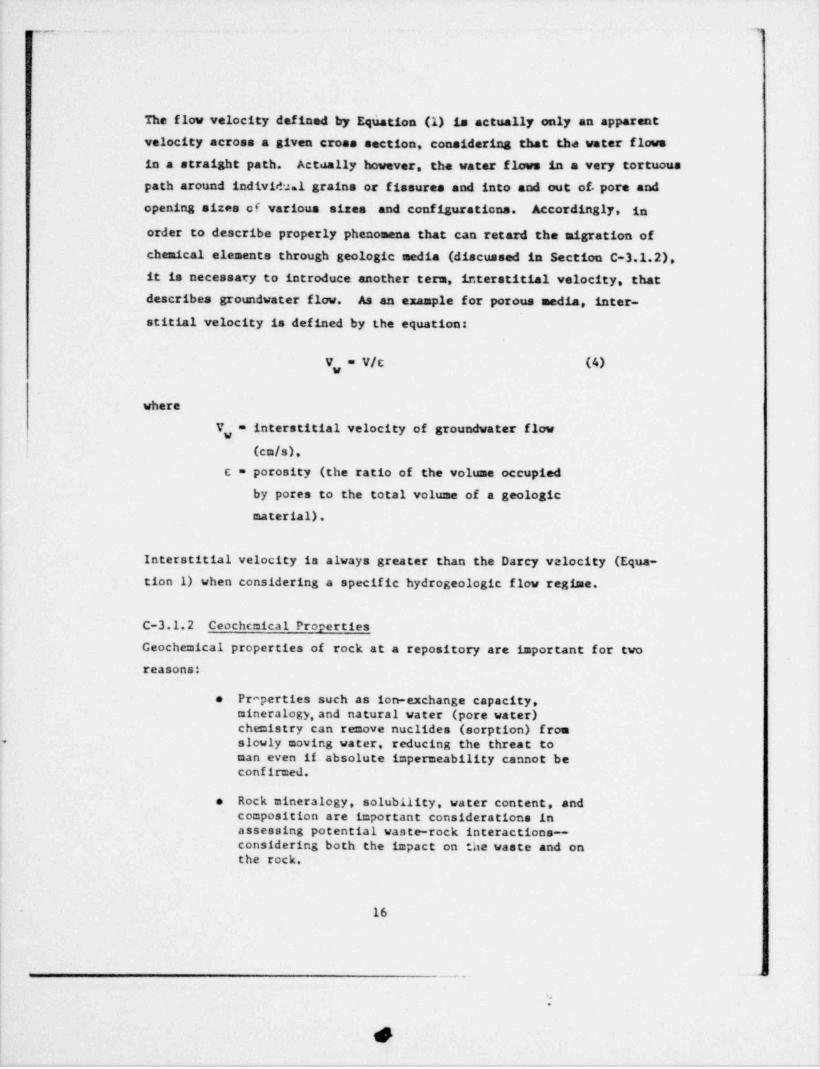
The flow velocity defined by Equation (1) is actually only an apparentvelocity across a given cross section, considering that tha water flowsin a straight path. Actually however, the water flows in a very tortuous
path around individu.1 grains or fissures and into and out of. pore andopening sizes of various sizes and configurations. Accordingly, in
order to describe properly phenomena that can retard the migration ofchemical elements through geologic media (discussed in Section C-3.1.2),it is necessary to introduce another term, interstitial velocity, thatdescribes groundwater flow. As an example for porous media, inter-stitial velocity is defined by the equation:
V,= V/c (4)
where
V ,= interstitial velocity of groundwater flow(cm/s),
c = porosity (the ratio of the volume occupiedby pores to the total volume of a geologic
material).
Interstitial velocity is always greater than the Darcy velocity (Equa-tion 1) when considering a specific hydrogeologic flow regime.
C-3.1.2 Ceochemical Properties
Geochemical properties of rock at a repository are important for tworeasons:
Praperties such as ion-exchange capacity,e
mineralogy,and natural water (pore water)chemistry can remove nuclides (sorption) fromslowly moving water, reducing the threat toman even if absolute impermeability cannot beconfirmed.
Rock mineralogy, solubility, water content, ande
composition are important considerations inassessing potential waste-rock interactions--considering both the impact on the waste and onthe rock.
16
- - - . +
e
-
C-3.1.2.1 Sorption Capacities of Geologic Materials
Section C-3.1.1 indicates that if water and a hydraulic gradient exist,some small flow can occur, even in very tight rock formations. This sec-tion shows that geologic media can act to impede radionuclide migra-tion to the biosphere, even if flow does occur. Dissolved radionuclides
may enter into complev physicochemical reactions with the geologicmaterials by phenomena such as adsorption, ion exchange, colloid filtra-tien, reversible precipitation, and irreversible mineralization. These
mechanisms are usually combined into one general tem called " sorption."In effect, the sorption phenomena cause ions to reve at much lower velo-cities than the medium (groundwater in this case) transporting them.
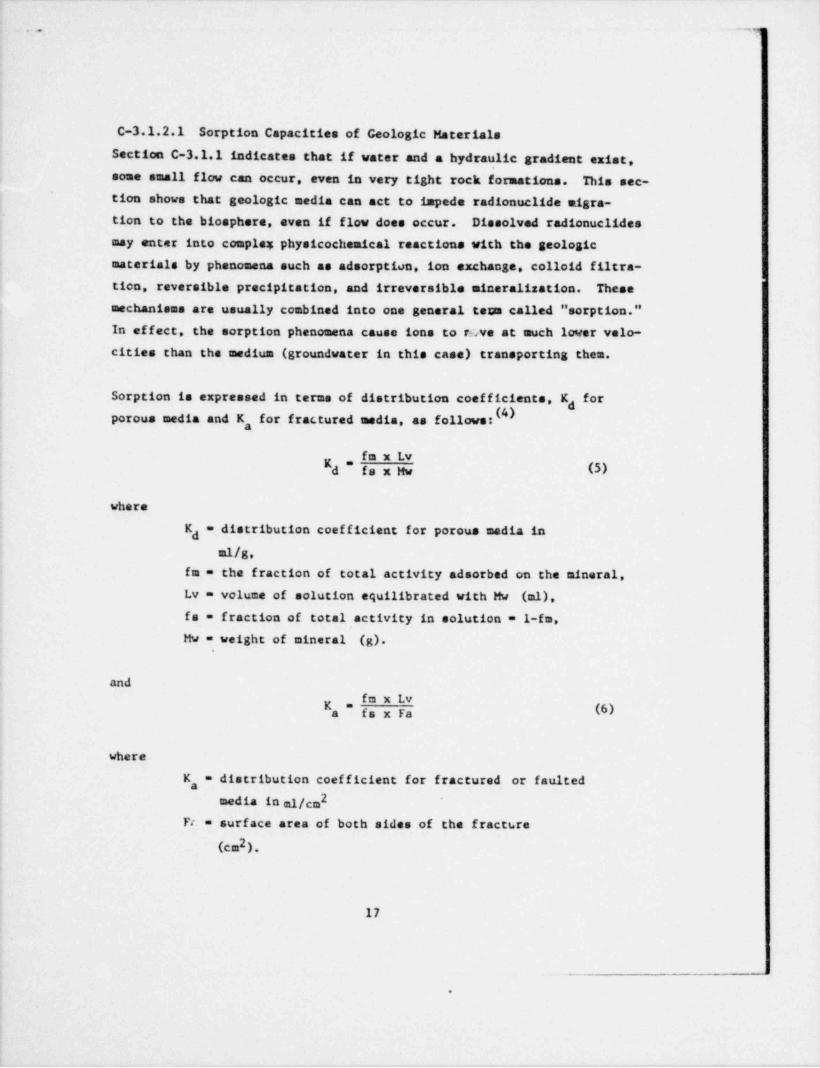
Sorption is expressed in terms of distribution coefficients, K #d
porous media and K, for fractured media, as follows:
fa x Lvd " fa x Mw (3)
where
K = distribution coefficient for porous media indal/g,
fm = the fraction of total activity adsorbed on the mineral,Lv = volume of solution equilibrated with Mw (ml),
fs = fraction of total activity in solution = 1-fm.
Hw = weight of mineral (g).
and* "
Ka fa x Fa (6)=
where
K, = distribution coefficient for fractured or faulted2media in al/cm
T.. = surface area of both sides of the fracts.re2(cm ),
17
__
S
n n . ,. _ -.--. .-.. ~ . .... _ ~ - - , . , .. .- . - -
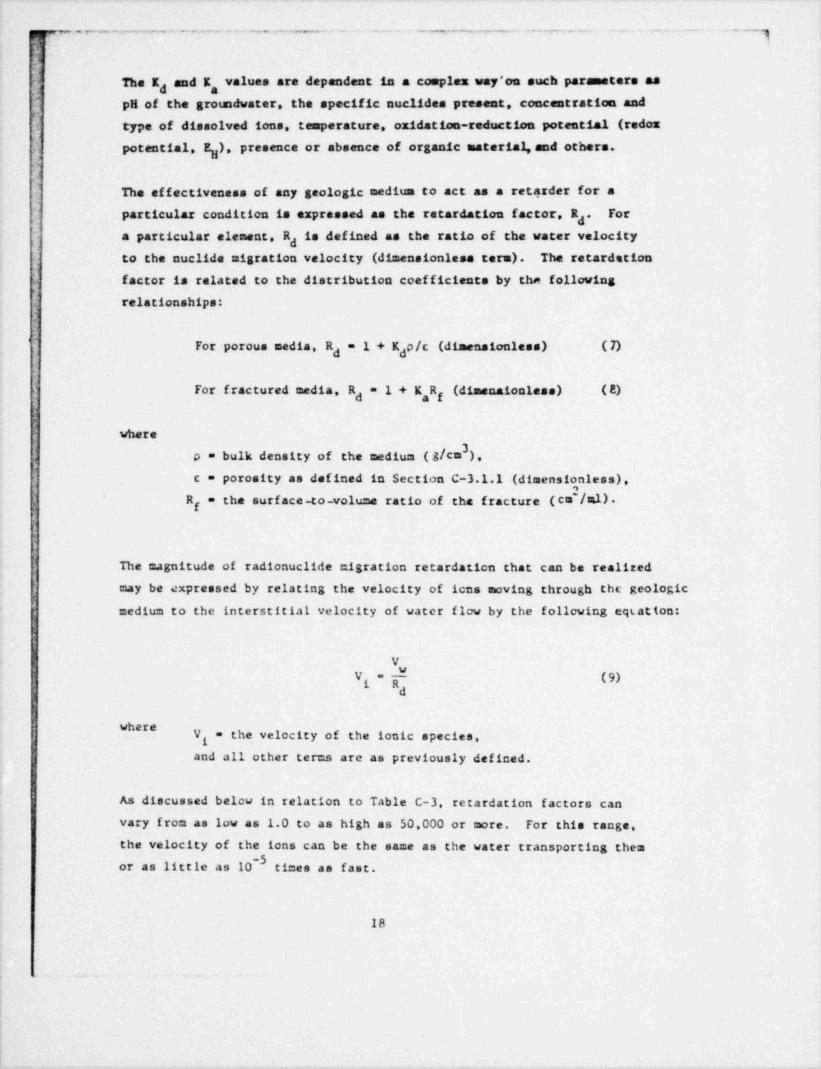
The Kd ""O V81Ue8 8re dependent in a coerplex way*on such paranneters asa
i pH of the groundwater, the specific nuclides present, concentration and-
type of dissolved ions, tecrperature, oxidation-reduction potential (redoxpotential, E ). Presence or absence of organic material, and others.
H
The effectiveness of any geologic medium to act as a retarder for aparticular condition is expressed as the retardation factor, R . Forda particular element, R is defined as the ratio of the water velocity
dto the nuclide migration velocity (dimensionless term). The retardation
factor is related to the distribution coefficients by the following
relationships:
For porous media, R =1+K"* "* " ***} (d d
For fractured media, Rd"1+KRa g (dimensionless) ( E)
where3j p = bulk density of the medium (:g/cm ),
c = porosity as defined in Section C-3.1.1 (dimensio,nless),R = the surf ace-to-volume ratio of the f racture ( ca'/ml) .g
The magnitude of radionuclide cigration retardation that can be realized
ctay be expressed by relating the velocity of icns moving through the geologic
medium to the interstitial velocity of water flow by the following eqtation:
V
(9)~
i
i,
" ***V = the velocity of the ionic species,
1'
and all other terms are as previously defined.
As discussed below in relation to Table C-3, retardation factors can
vary from as low as 1.0 to as high as 50,000 or more. For this range,
the velocity of the ions can be the same as the water transporting them-5
or as little as 10 times as fast.
18

, . .. .- . . - - , . - - .....-- .. -....- ._.
1
TABLE C-3
ESTIMATED DISTRIBITTION COEFFICIENTS ( ) ANDRETARDATION FACTORS (R ) IN A TY?ICAL D ERT SOILd
.
ATOMIC NO. E1.DtDfT K I'If8}* K vI/V".d d
1 Trittua 0 1 1
3 10,3~4 8ery11tua 75 330
d 6 Carbon 2 10 1x10-211 Sodium 10 50 2:1017 Chlorine 0 1 118 Argon 0 1 1 ,317 Potas..aa 35 170 6x10-220 Calcium 15 100 1:10426 Iron 150 3.300 3:10,327 Cobalt 25 330 3 10
3a10[228 Nickel 80 330.
34 Selenium 20 100 lato36 Krypton 0 1 1
32x10~2
37 Rubidium 125 500-38 Strontium 20 100 1 10 '~ 39 Yttrium 2.000 10.000 1 10 '-
40 Zirconium 2.000 10.000 1 10''41 Niobtus 2.000 10.000 1 10~-242 Holybdenus 5 25 4x10=? Technettus 0 1 1 ~
9:10 ''46 Palladium 250 1.10048 Cadstum 2.000 10.000 1 10~50 Tin 250 1.100 9x10~'51 Antimony 15 100 1 10-253 lodine 0 1 1
~355 Cestus 200 1.000 1x1061 Promethium 600 500 4x10'62 Samartua 600 2.500 4m1063 Europtuu 600 2.500 4x10,467 Holatum 600 2.500 4xlo,g81 Tha11tus 2 10 la1082 Lead 4.000 16.700 6:10~83 Bissuch 10 50 2x10~84 Polonium 25 110 9x1085 Astatine 0 1 186 Padon 0 1 187 Franctum 200 1.000 1x1088 Pad ium 100 500 2x10,489 Actinlum 1.000 5.000 2x10-590 Thortus 15.000 50.000 2x10,391 Protactintua 4.000 16.700 6x10 -592 Crantua 3.000 14.300 7:10-293 Neptuntus 15 100 1x10; 494 ; Plutonium 2.000 10.000 1x10,g95 Ameractus 2.000 10.000 1x10496 Curtus 600 3.300 3x10,497 Berke 11um 700 3.300 3x10
NOTES:
* Equi? tbrius distribution coef ficients between water a J soil.
iRetardation Factor (R ) * v"fvldfRelative transport rate of elements in assumed soil to thatin water.
Source: Modified after Denham et al. (6).
19
J
.

,, , _ _ . . -_ _ _ , , . - - - , - - . ~ . - - - - - -- - ~ . . ,
In the mechanism that permits sorption to function, exchangeable ionsare released from the host rock into the water in exchange for radio-
nuclides. As an example, the adsorption of cesium or strontium ions
by clay cr release sodium or potassium ions into the water. Thereafter,those relesstd ions, together with ions originally present in the groundwater, ;
compete with radionuclides for additional available exchange sites.(This process allows radionuclide migration to be greatly retarded for i
many conditions, but not necessarily eliminated.t
Distribution coefficients are variable and uniquely determined for only
a single set of physical and chemical conditions. Figure C-1 illustratesranges of distribution coefficients for tuff, granite, limestone and ,
dolomite, basalt, and soils in relation to cesium, mixed fission pro-
ducts, strontium, and iodine. For the cesium, mixed fission and
strontium cations (positively charged ions), granite possesses the
lowest distribution coefficient (10 to 10 al/g), while tuff and
soil exhibit the highest coefficients (10 to 10 * ml/g). It is
noteworthy that for the lodine anion (negativ-ly charged ion), thedistribution coefficient is close to 1 for the rock types, but from
about 10 to 10 * ml/g for sof18. Although very little research
has been conducted on anionic solutions, the available data indicatethat the mechanisms controlling retardation of cations may not readily
apply to retardation of anions.
As f urther relatec examples, Table C-3 lists estimated distribution coef-ficients for a typical desert soil for a wide variety of nuclides.
This table shows that the K can be as low as zero for tritium, variousd
noble gases, iodine and a few ether elements or as high as 4000 and
15,000 ml/g for protactinium and thorium, respectively.
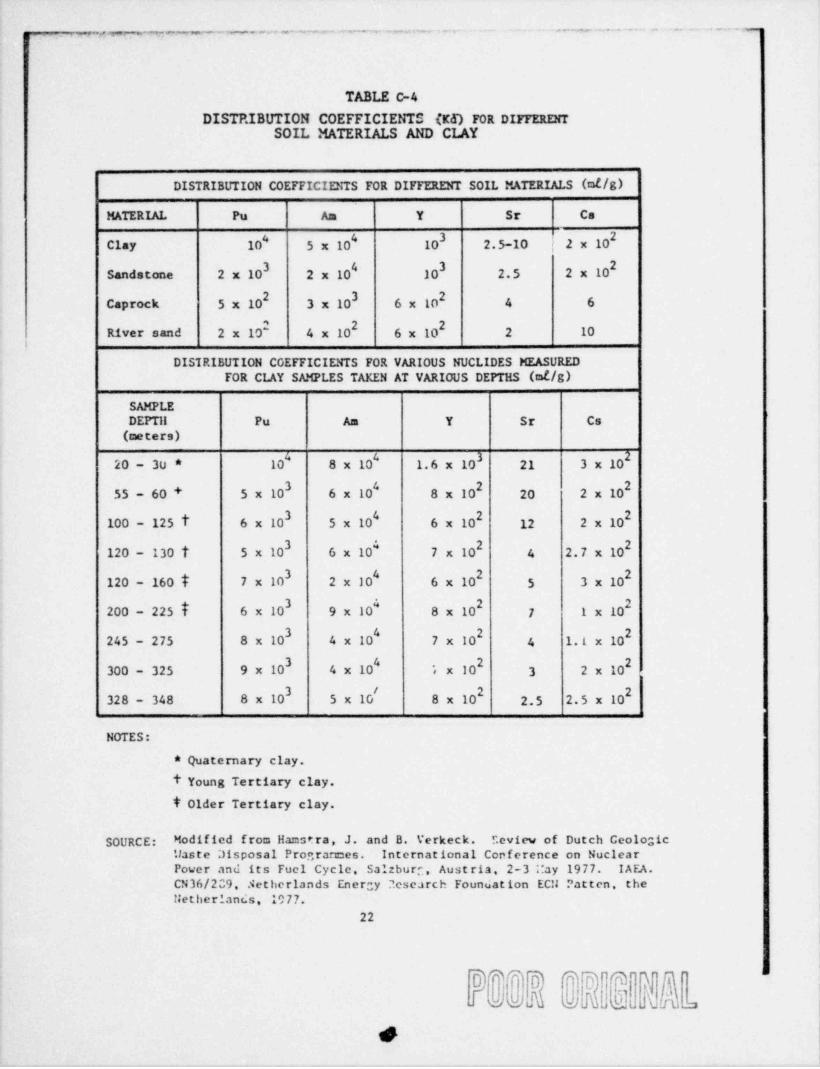
Table C-4 indicates distribution coefficients for different soil caterialsand for clay saaples taken at various depths for plutonium, americium,
}yttrium, strontium,and cesium. For these materials, strontium has a
very low K , ranging f rom 2 ml/g in river sand to aboutd
20
L

,_ . _ . . --_. . . . . _ . . . . _ _ . . . . . _ _ , _ , . , . . . m,.__ ._ __ _._,__- - .
TnN
Y_=osx
k 10* I -,''
{'z r >
, ,
10 h A U -8 -
m ,-
d_> .
=j- ; :, -- --
e(u.3 4
,^yc ~s .
u - - =,
h80' h yn .
g, g-
-toO g.s
CESIUM mixed-f 6SSION STRONTIUM ICQiNEPRODUCTS
NOTE:OtSTRIBUTKN COEFFICIENT VALUESFOR 60NS SHOWN
LEGEND
reem TUFF
Q GRANITELIMESTONE AND DOLOMITE
WJ BASALT
Q SOILS
SCLRCE:
SCHNEt0ER, K. J AND A M PL ATT (E OS.)HIGH-LEVEL WASTE MANAGEMENT ALTERNATIVES.BNwL-1900. DAT TEL L E PACIFIC NORTHWESTL ABOR ATORIES, RICHuhD, WASHINGTON, MAY l974
FICURE C-1 RANCES OF DISTRIBUTION COEFFICIENTSFOR VARIOUS ROCK TYPES
21
&' 'h}du r{um|,|tD"blGDe 3 e o
- ~. . _. .. . _ . - . , . _._. ,, - _ _ _- _- . _._. _ . _ .. ___ ,....
|
TABLE C-4
DISTRIBUTION COEFFICIENTS (KE) FOR DIFFERENTSOIL MATERIALS AND CLAY
DISTRIBUTION COEFFICIENTS FOR DIFFERENT SOIL MATERIALS (ml/g)
MATERIAL Pu Am Y Sr Cs
2Clay 10" 5 x 10' 10 2.5-10 2 x 10,
2Sandstone 2 x 10 2 x 10' 10 2.5 2 x 10
2 2Caprock 5 x 10 3 x 10 6 x 10 4 6
River sand 2 x 10 4 x 10 6 x 10 2 10
DISTRIEUTION COEFFICIENTS FOR VARIOUS NUCLIDES MEASUREDFOR CLAY SAMPLES TAKEN AT VARIOUS DEPTHS (of/g)
__
SAMPLEDEPTil Pu Am Y Sr Cs
(ceters)2
20 - 30 * 10' 8 x 10' 1.6 x 10 21 3 x 10
255 - 60 + 5 x 10 6 x 10' 8 x 10 20 2 x 10
3 2 2100 - 125 t 6 x 10 5 x 10' 6 x 10 12 2 x 10
2120 - 130 t 5 x 10 6 x 10 7 x 10 4 2.7 x 10
3 2120 - 160 t 7 x 10 2 x 10' 6 x 10 5 3 x 10
200 - 225 i 6 x 10 9 x 10' 8 x 10 7 1 x 10
245 - 275 8 x 10 4 x 10' 7 x 10 4 1.1 x 10²
300 - 325 9 x 10 4 x 10' ix 10 3 2 x 10³ 2
328 - 348 8 x 10 5 x 10' 8 x 10 2.5 2.5 x 10
NOTES:
* Quaternary clay,
t Young Tertiary clay,t Older Tertiary clay.
SOURCE: Modified from Hamstra, J. and B. Verkeck. T.eview of Dutch Ceolo;;1cMaste Disposal Prograrces. International Conference on NuclearPower and its Fucl Cycle. Salzbur,e, Aust ria. 2-3 ;:ay 1977. IAEA.
.
CN36/209, .4etherlands Energy 2cscarch Foundation ECU :'atten, theNetherlands, 1977.
22
d j :
.
,. ,_ _ . . - . . . . . ..
.
20 ml/g in clay naterial. Plutoniura and americitsa have the largest dis-tribution coefficients, reaching their maxf r=nne in clay at around 10 to10 al/g. The distribution coefficient values due to sorption are higherfor all of the radionuclides in clay material. No relationships *>etweenJt and depth are apparent from the data in Table C-4.
~
d
None of the distribution coefficients presented above as examples canbe used directly in determining the retardation factor in fractured orfissured media. Little work has been done to determina these values andrepresentative values are not reported in the literature. However, the'
distribution coefficient for fractured media for a particular nuclide
should be expected to be significantly lower than the distribution
coefficient for porous media for the same ion based only on the geometryof the two types of flow.
Retardation factors are also presented in Table C-3 for the correspondingdistribution coefficients. These are calculated for specific mediaporosities,ard bulk densities for illustrative purposes only. Consid-
cring the R f r th ri m (50,000) as an extrema exanple and using Equation (9),dit is apparent that the velocity (V ) at which thorium would move throughg
the tested caterial is a factor of 2 x 10 lower than the interstitial
velocity (V,) of the groundwater transporting it. For this case, radon
would move with the same velocity as the groundwater and cesium wouldmove at only 10~ times the rate of the groundwater.
The presence of organic material in soil has been found to reduce Kd
values significantly because of conplexing for sone radionuclides.
The influence of organic matter on radionuclide retention is an in-
[portant consideration that needs considerable attentiou et this time.
Recent studies with cobalt have shown that while cobalt has c relatively
high K value in s il free f rganics, the K value drops to nearlyd d
zero as a result of the cobalt conplexing with organic caterial.;
I
|
23 a
:1
1
.
, nm - - _ _ - - ,, - - .--
The oxidation potential (E ) is important for many of the radionuclides.H
*Depending upon oxidation state, some of the nuclides can exist in a
cation or anion form. In anion form,or a complexed form such asmentioned above, the K value may be rather low. In the cation form,dthe same nuclide may be etrongly retained by the rock or be limitedby its solubility. As a consequence, it is extremely important inmaking K easurements t rec gnize the oxidation potential of thednatural or modified groundwater environment. Examples of nuclides
that could be affected in terms of retention and/or solubility include ,many of the actinides as well as technicium.
The above discussion shows that 11thologic types possessing high" sorption" capabilities could have significant advantages for purposesof radionuclide retention in the geosphere, all other factors beingequal. The sorption capabilities expected for fractured or fissuredmedia where groundwater flow could be most important to containmantmay be significantly lower than the examples presented in Tables C-3 and C-4
for porous media, but this phenomenon would still be very important inthe overall potential for geologic materials to act as barriers to radio-nuclide migration.
|I C-3.1.2.2 Potential High-Level Waste-Rock Interac'.'oas
The two general categories of interactions considered under this sectionare:
Reactions caused by the geologic =aterials comprisinge
the repository horizon or their associated pore fluids.which have a corrosive effect on the waste containersand/or the waste form.
Reactions induced by heat and radioactivity generatede
by the waste material.which have a negative impact onthe repository stratum.
As discussed in Task B of this study, KLW may be placed into a repository
as a vitrified solid and/or in metal canisters. Both of these factorsadd containment capability beyond that provided by the geologic cedia.Accordingly, there is benefit in maintaining the integrity of theprimary contain=ent systems, particularly the vitrified state, as long as
24
.
- - - . - - - - . . -
I
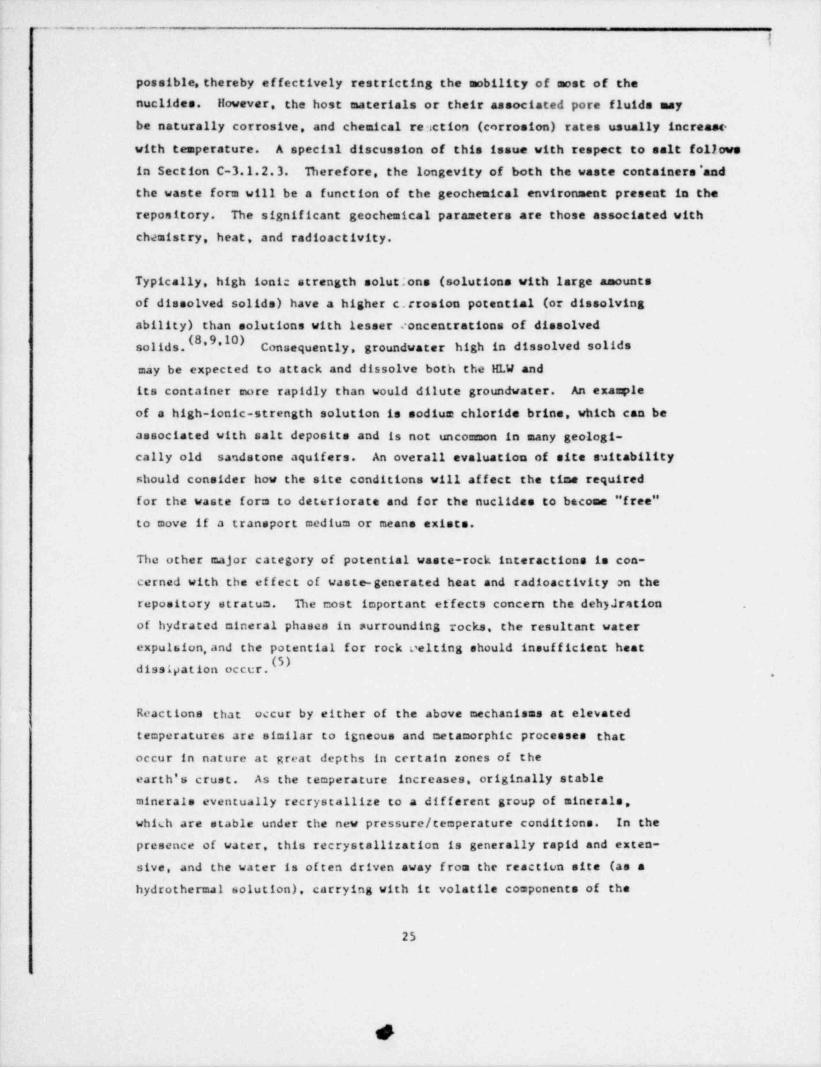
possible, thereby effectively restricting the mobility of most of the
nuclides. However, the host materials or their associated pore fluids maybe naturally corrosive, and chemical reaction (corrosion) rates usually increase
with temperature. A specisl discussion of this issue with respect to salt fo1Jows
in Section C-3.1.2.3. Therefore, the longevity of both the waste containers *andthe waste form will be a function of the geochemical environment present in the
repository. The significant geochemical parameters are those associated with
chemistry, heat, and radioactivity.
Typically, high ionic strength solut;ons (solutions with large amounts
of dissolved solide) have a higher c.rrosion potential (or dissolving
ability) than solutions with lesser concentrations of dissolved
solids.(8,9,10) Consequently, groundwater high in dissolved solidsmay be expected to attack and dissolve both the KLW andits container more rapidly than would dilute groundwater. An example
of a high-ionic-strength solution is sodium chloride brine, which can be
associated with salt deposits and is not uncommon in many geologi-cally old sandstone aquifers. An overall evaluation of site suitability
should consider how the site conditions will affect the time required
for the waste form to deteriorate and for the nuclides to become " free"to move if a transport medium or means exists.
The other major category of potential waste-rock interactions is con-
cerned with the ef fect of waste-generated heat and radioactivity an the
repository otratus. The cost important etfects concern the deh>Jration
of hydrated mineral phases in surrounding rocks, the resultant water
expulsion,and the potential for rock celting should insufficient heat
dissipation occur.,
Reactions that oecur by either of the above mechanisms at elevated
temperatures are similar to igneous and metamorphic processes that
occur in nature at great depths in certain zones of the
earth's crust. As the temperature increases, originally stable
minerale eventually recrystallize to a dif ferent group of minerals,
which are stable under the new pressure / temperature conditions. In the
presence of water, this recrystallization is generally rapid and exten-
sive, and the water is of ten driven away from the reaction site (as a
hydrothermal solution), carrying with it volatile co=ponents of the
25
Y

--
reacting rock mass. In a repository, the arpulsion of water (as aliquid or vapot) could provida a mechanism for transporting vaste
;
etaponents as well as a wide variety of trace elements. For example, ions
of elements with radioactive isotopes (as in HLW) are known to occur naturallyin hydrothermal solutions that have passed through several hundred meters ofnearly impermeable rock during geologic times and have eventually beendispersed to the environment through such mechanisms as groundwater
mixing and hot springs. These natural phenomena indicate that the
amount and characteristics of pore water and the hydrated mineral phases
of the host rock must be considered in site evaluation.
For the unlikely situation in which rock materials adjacent to the re-pository actually melt from heat buildup, it may be expected that re-crystallization will occur as the molten mass migrates a short distanceaway from the heat source. If radionuclides are incorporated into themelted rock material they would become part of the crystal structures ofnewly formed mineral phases, providing a relatively insoluble form forthe radionuclides.
C-3.1.2.3 Salt Solubility
The geologic occurrence and solubility of salt can lead to geochemical
consequences that could bear significantly on the integrity of an HLW
repos ito ry. The potential problems seem more acute in the case of
bedded salt as opposed to diapiric salt. The former is characterized
by heterogeneity, with interbeds of thin shales, other evaporites, and
limestone, the result of depositional processes. The geometry and precise
geologic detail of the interbeds are difficult to predict or even to.
map over any significant distance.
I1I)The Ad Hoc Panel noted, with respect to bedded salt that, "On a
microscopic scale it can be seen that many halite crystals contain liquid
(brine) or solid (anhydrite) inclusions. A recent report by Roeddar
and Belkin estimates the vcluse of these inclusions to be less than
12 but 'an additional possibly even greater volu=e % fluid is present
in situ, filling intergranular pores' ." The Panel noted the work
of Bredehoft et al., which showed that . . . "at 200*C, water in rocksalt including potassium and magnesium components can contain approximately
26
-
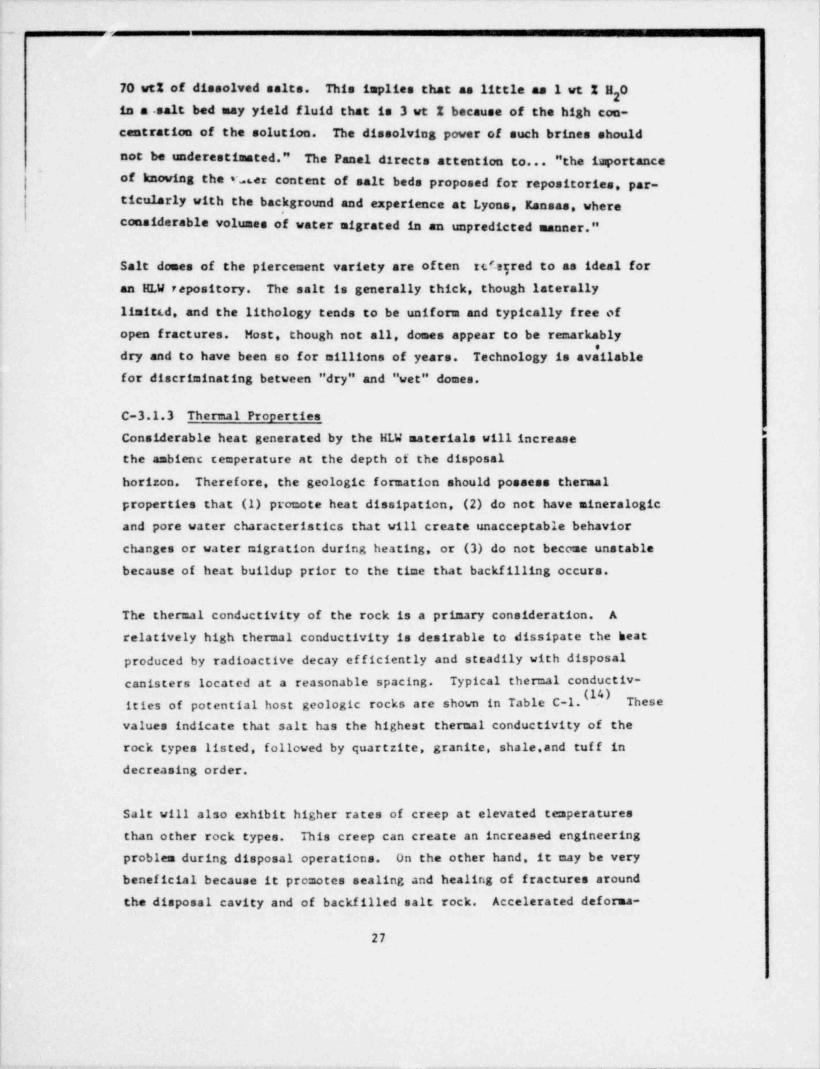
70 ve% of dissolved salts. This implies that as little am 1 vt % II 02
in a . salt bed may yield fluid that is 3 vt % because of the high con-centration of the solution. The dissolving power of such brines should
not be underestimated." The Panel directs attention to... "the importance
of knowing the ver content of salt beds proposed for repositories, par-ticularly with the background and experience at Lyons, Kansas, whereconsiderable volumes of water migrated in an unpredicted manner."
Salt domes of the piercement variety are often Icfryred to as ideal foran HLW repository. The salt is generally thick, though laterally
limittd, and the lithology tends to be uniform and typically free of
open fractures. Most, though not all, domes appear to be remarkablydry and to have been so for millions of years. Technology is available
for discriminating between " dry" and " vet" domes.
C-3.1.3 Thermal Properties'
Considerable heat generated by the HLW materials will increase
the ambient temperature at the depth of the disposal
horizon. Therefore, the geologic formation should possess thermal
properties that (1) promote heat dissipation, (2) do not have mineralogic
and pore water characteristics that will create unacceptable behavior
changes or water migration during heating, or (3) do not beco:se unstable
because of heat buildup prior to the time that backfilling occurs.
The thermal condactivity of the rock is a primary consideration. A
relatively high thermal conductivity is desirable to dissipate the heat
produced by radioactive decay efficiently and steadily with disposalcanis t e rs located at a reasonable spacing. Typical thermal conductiv-
ities of potential host geologic rocks are shown in Table C-1. These
values indicate that salt has the highest thernal conductivity of the
rock types listed, followed by quartzite, granite, shale,and tuf f in
decreasing order.
Salt will also exhibit higher rates of creep at elevated temperatures
than other rock types. This creep can create an increased engineeringProblem during disposal operations. On the other hand, it may be verybeneficial because it promotes sealing and healing of fractures aroundthe disposal cavity and of backfilled salt rock. Accelerated deforma-
27
j. '
r
t
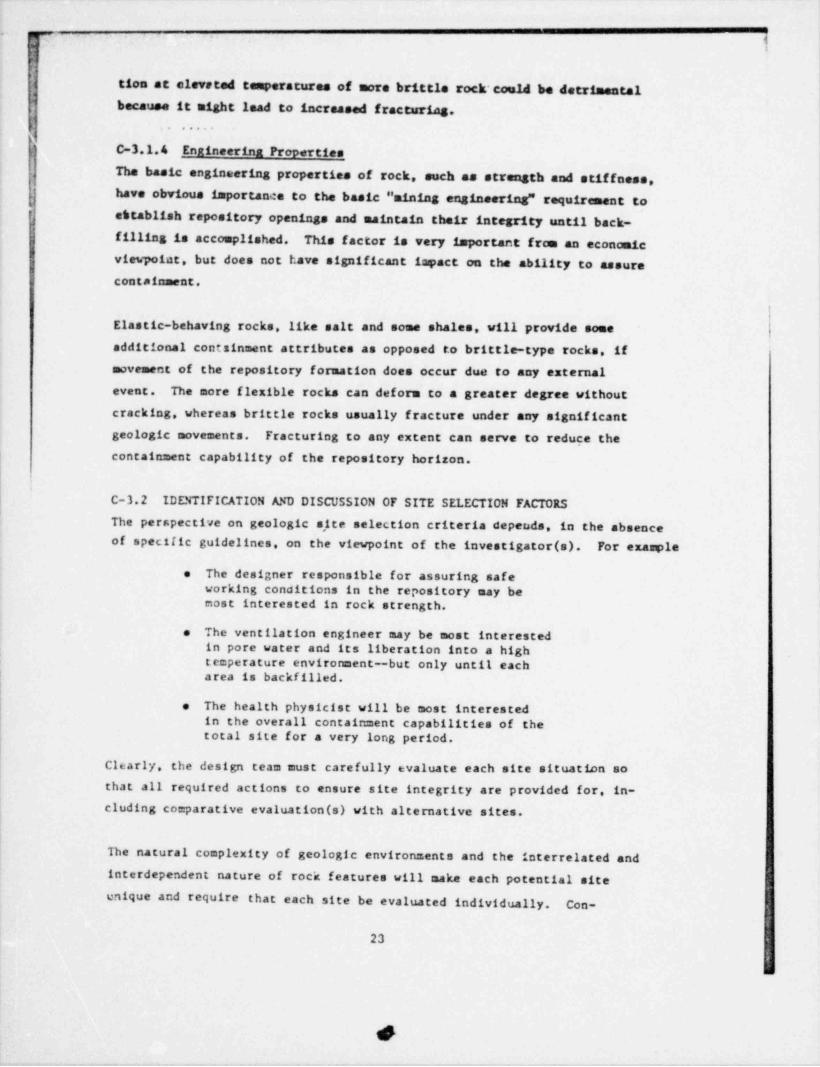
j tion at elevated temperatures of more brittle rock could be detrimentalbecause it might Isad to increased fracturing.
p ...
'
C-3.1.4 Engineering Properties
The basic engineering properties of rock, such as strength and stiffness,
J have obvious importance to the basic " mining engineering" requirement tofj efstablish repository openings and maintain their integrity until back-
4
filling is accomplished. This factor is very important frce an econcxmic! viewpoint, but does not have significant impact on the ability to assure
containment.
i
Elastic-behaving rocks, like salt and some shales, will provide someadditional contzinment attributes as opposed to brittle-type rocks, ifnovement of the repository formation does occur due to any externalevent. The more flexible rocks can deform to a greater degree withoutcracking, whereas brittle rocks usually fracture under any significantgeologic novements. Fracturing to any extent can serve to reduce thecontainment capability of the repository horizon.
C-3.2 IDENTIFICATION AND DISCUSSION OF SITE SEI.ECTION FACTORS
The perspective on geologic s,ite selection criteria depends, in the absenceof specific guidelines, on the viewpoint of the investigator (s). For exaciple
The designer responsible for assuring safee
working conditions in the repository may bemost interested in rock strength,
The ventilation engineer may be most interestede
in pore water and its liberation into a hightemperature environment-but only until eacharea is backfilled.
The health physicist will be most interestede
in the overall containment capabilities of thetotal site for a very long period.
Clearly, the design team must carefully evaluate each site situation sothat all required actions to ensure site integrity are provided for, in-cluding comparative evaluation (s) with alternative sites.
The natural complexity of geologic environments and the interrelated andinterdependent nature of rock features will make each potential site ienique and require that each site be evaluated individually. Con-
23
i
4
...s .
.. . . . .;
.
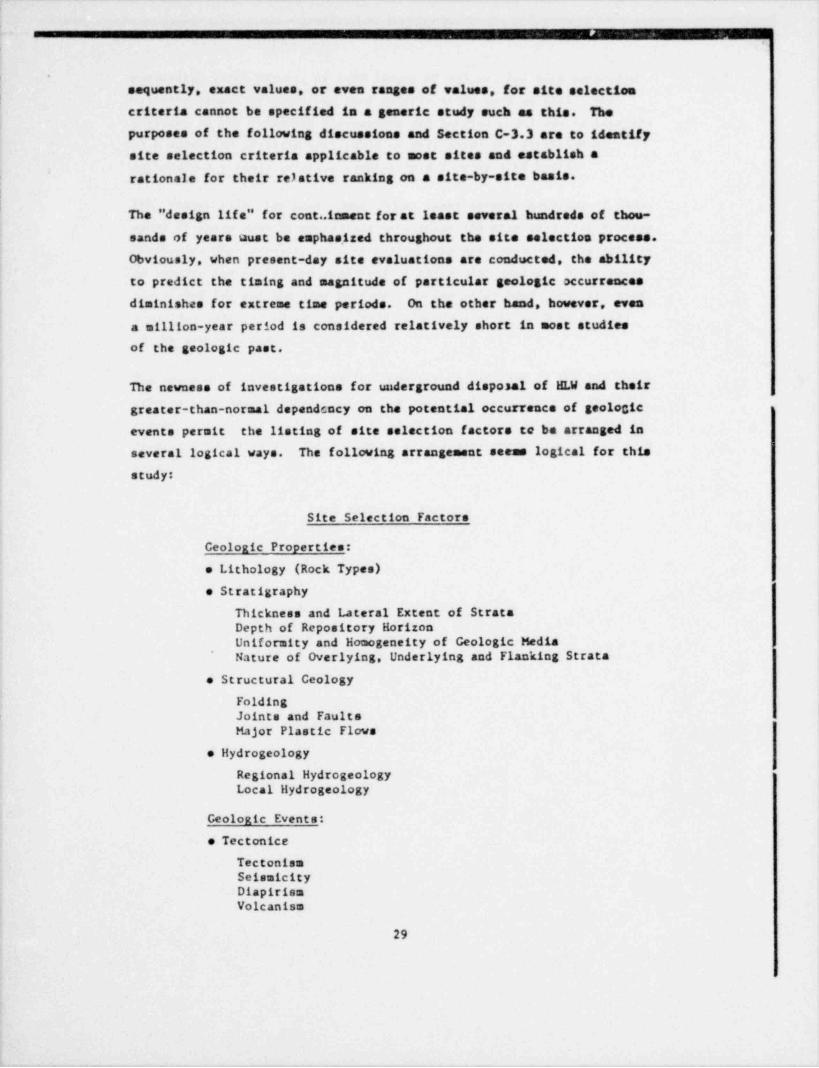
sequently, exact values, or even ranges of values, for site selection
criteria cannot be specified in a generic study such as this. The
purposes of the following discussions and Section C-3.3 are to identifysite selection criteria applicable to most sites and establish arationale for their rej stive ranking on a site-by-site basis.
The " design life" for cont..icment for at least several hundreds of thou-sands of years aust be emphas.1 zed throughout the site selection process.
Obviously, when present-day site evaluations are conducted, the abilityto predict the timing and magnitude of particular geologic accurrences
diminishes for extreme time periods. On the other hand, however, evena million-year period is considered relatively short in most studiesof the geologic past.
The newness of investigations for underground disposal of ELW and thstrgreater-than-normal dependcocy on the potential occurrence of geologicevents permit the listing of site selection factors to be arranged inseveral logical ways. The following arrangement seems logical for thisstudy:
Site Selection Factors
Geologic Properties:
e Lithology (Rock Types)e Stratigraphy
Thickness and Lateral Extent of StrataDepth of Repository HorizonUniformity and Homogeneity of Geologic MediaNature of Overlying, Underlying and Flanking Strata
e Structural Geology
FoldingJoints and FaultsMajor Plastic Flows
e Hydrogeology
Regional HydrogeologyLocal Hydrogeology
Geologic Events:
e Tectonice
TectonismSeismicityDiapirismVolcanism
29

. . .. -
J
1 e Erosion and Denudation
s Water FlowGlaciation
e Mineral Resources
E'ach of these items is related to time considerations and to intrinsicrock properties. Two additional descriptive categories--geometry and geography--were also considered as major elements in the selection factor list. For this
study, however, they are both incorporated into more traditional geologicterms. A different list, incorporating these and other logical breakdownswould not conflict with the following discussions. Mineral resource consider-ations are obviously not a geologie event. They are listed in the eventcategory.however, because in the context of an HLW repository, mineralresources represent a condition that could lead to an event with some
lj impact. Each property, event, and term is oefined and/or discussed 'in the
following subsections.
Establishing the site values for each of the above factors would require very
extensive and probably site-descriptive studies including seismic surveys,
core drillings, and others. A question arises with respect to the potential
for rendering the site reusable by the very studies desi3ned to illustrate
its integrity. Clearay, a balance must be struck reflecting this conflict,
which implies that a residual but acceptable level of uncertainty (e.g., risk)
will remain.
C-3.'2.1 Lithology
Lithology is a very important site selection factor,in thac it encom-
passes the detailed description of the rock's basic characteristics,
including mineralogic composition, grain size and cementation, and other
properties that determine how the material will behave when exposed to
external forces or changes in environmental conditions. Rock typesthat are representative of lithologies being considered for HLW repos-itories include salt, shale (argillaceous materials), limestone, and
igneous rocks. The following paragraphs summarize the salient features
for each of these lithologic types or groups. Individual characteristics
of any particular site will often vary from these capsule discussions,
but the basic features discussed represent a meaningful starting point.
30
;

--- . - -
C- 3. 2.1.1 Salt
Salt (Nacl or halite) is an evaporite type rock, originally ft rued inbasins that became isolated or partially isolated from the sea. Theisolation allowed evaporative concentration and then salt precipitationto occur. Salt is of ten found as relatively pure beds, but thin layersare sometimes interbedded with other rock types or other evaporites.
Stratigraphic and structural features of salt formations are discussedfurther in the next two sections. It is notable here that both beddedsalt and dome salt (formed from diapirism of deep bedded salt) are beingconsidered for HLW disposal.
Several basic properties of salt that are attractive for the locationof a repository are:
e Low porosity,Low permeability,ePlastic behavior for healing fractures, ande
e High thermal conductivity.
Some other characteristics of salt can cause special concern:
e High solubility,Mineral impurities in some deposits,eHigh corrosion potential, ando
e Low lon-exchange capacity.
Another unique feature of nalt is the potential presence of brinecavities filled with salt-saturated water. It has been shown that uponheating, the brine cavities can migrate toward the source of heat. (14)The mechanism for this migration is that the material at the hot side ofthe cavity (the side nearest the heat source) goes into solution, whilesalt precipitates at the cold side. In some locations, salt brinemigration may be the only possible source for the natural introductionof water into a repository.
Another potential natural source of water in many salt deposits may befrom hydrous mineral phases present as impurities in the formation.
31
- - ...-
r-
Water present in many of these minerals such as polyhalite and gypsum can be
released at only moderate temparatures. Cypsum, for example, will yieldapproximately 75% of its water when heated to 190 or 200*C. Water repre-
seats about 21% of the gypsum; if this mineral is present in a large quantity,it could release a significant volume of va:er into the repository. Howeve r,phase behavior of minerals under repository pressure and temperature condi-tions will not be the same as for ambient conditions. Therefore, water relessebase l on assumptions of ambient conditions may, or may not, model conditions inor near the repository.
C-3.2.1.2 ShaleShale is a general term for lithified clay or mud, although most shale
does contain varying amounts of silt and sand material. Some shales
have 6everal properties that . make them attractive for an HLW repository.! including:
e Low permeability,
Relatively good plastic behavior (though noteas good as salt),
High ion-exchange capacity, ande
Wide geographic distribution of nearly homogeneousematerial.
Potential negative characteristics of shale that must be investigatedinclude:
Many argillaceous rocks, especially those withe
relatively good plastic behavior, contain largequantities of hydrous minerals, such as montmo-rillonite that will release water when heated.
So=e shales contain petroleum or large amountse
of carbonaceous material that may yield co= bus-tible carbon compour.ds when heated.
Many shales are interbedded with more permeablee
rock types such as sandstone, limestone,and cos'..
e Most shales possess relatively low thermalconductivity.
.
!,
From the important viewpoint of water flow, marine shale sequences aregenerally free of interbedded coarser-grained rocks and can be less
32
. . .
9

c_ . _ ,
permeable than continental (interbedded) sequences. Shales are notself-healing like salta, however, and investigations to evaluate thepotential for groundwater flow must consider the potential for faultingor fracturing in the future, as well as the impact of frac-tures, joints or faults on secondary permeability (Section C-3.1.1).
C-3.2.1.3 Limestone
Limestone is a carbonate rock composed primarily of the mineral calcite,
(CACO ), usually with varying amounts or the mineral dolomite CaMg(CO )2'3 3When the latter is dominant, the rock is generally referred to,
I
as dolomite. Limestone can be attractive because:e
i
It sometimes exists over large areas as a thicke' homogeneous stratum,i
Its basic matrix is fine grained, so the rocke
can have a very low primary permeability.i
|
Several characteristics of limestone that may not be favorable are:
Carbonate rocks typically exhibit greatero
solubility than other non-evaporite typesedimentary rocks. Solutioning can greatlyincrease secondary permeability and, in turn,the overall capacity of a ilmestone formationto transmit groundwater.
Limestone is usually strong but brittle, soe
fracturing may occur from regional tectoniccovements.
Limestone does not possess significant sorptivee
properties except in areas of solutioning whereclay minerals are commonly concentrated. Sincethese areas of solutioning also represent avenuesfor Broundwater flow, the sorptive capacity pro-vided by clav filling may partly counterbalance.
the slow groundwater movement through the solutionchannels.
A somewhat special consideration associated with disposal ofHLW in carbonate rock is the potential for release of carbon dioxide
gas (CO ) r a the calcite and dolomite mineral phases. This could be2
33
4
12,
a
7
4
r-
~ caused by excessive beat buildup and could ultimately result in theavailability of gas as a transport mechanf am.
C-3.2.1.4 Igneous Rocks
The term igneous rocks refers to a group of rocks formed bythe solidification of molten rock. This group may be subdivided into
'A
J intrusive-type (plutonic) rocks, referring to those rocks which havesolidified below the earth's surf ace at various depths, and extrusive-
type (volcanic) rocks, which salidified after eruption onto the carth'ssurface.
Intrusive rocks can range from fine-to coarse-grained, depending upon thedepth of intrusion, rate of cooling.and presence of gaseous constituents;extrusive rocks are fine-grained or glassy and consist either ofrocks formed from lavas .that flowed onto the earth's surface or fromvolcanic ash that either flowed or was deposited on the earth's surf ace.
Table C-5 shows the general classification and orinciosi mineral esse =blePesof common plutonic and volcanic rocks.I ) It also shows the approximate
percentages of silica contained in each general type of rock.
Igneous rocks vary in hardness and strength, depending upon crystalsize, the mode of eruption.and the presence or absence of voids. Plu-
tonic rocks have generally low porosities and permeabilities, whereasthe volcanic rocks vary in these properties from very low to extremelyhigh. Plutonic rocks consist largely of granite, granodiorite, diorite,and gabbro. These rock types can generally be considered similar fromthe standpoint of mechanical strength and overall suitability for wastedisposal. Granites, however, have the lowest neiting points and aresomewhat weaker than the other rocks in this category. Volcanic rocksmay be chemically similar to the intrusive varieties but dif fer in theirtextures and physical properties.
Favorable characteristics of igneous rocks for rhc location of an KLW
repository are:
34
Im
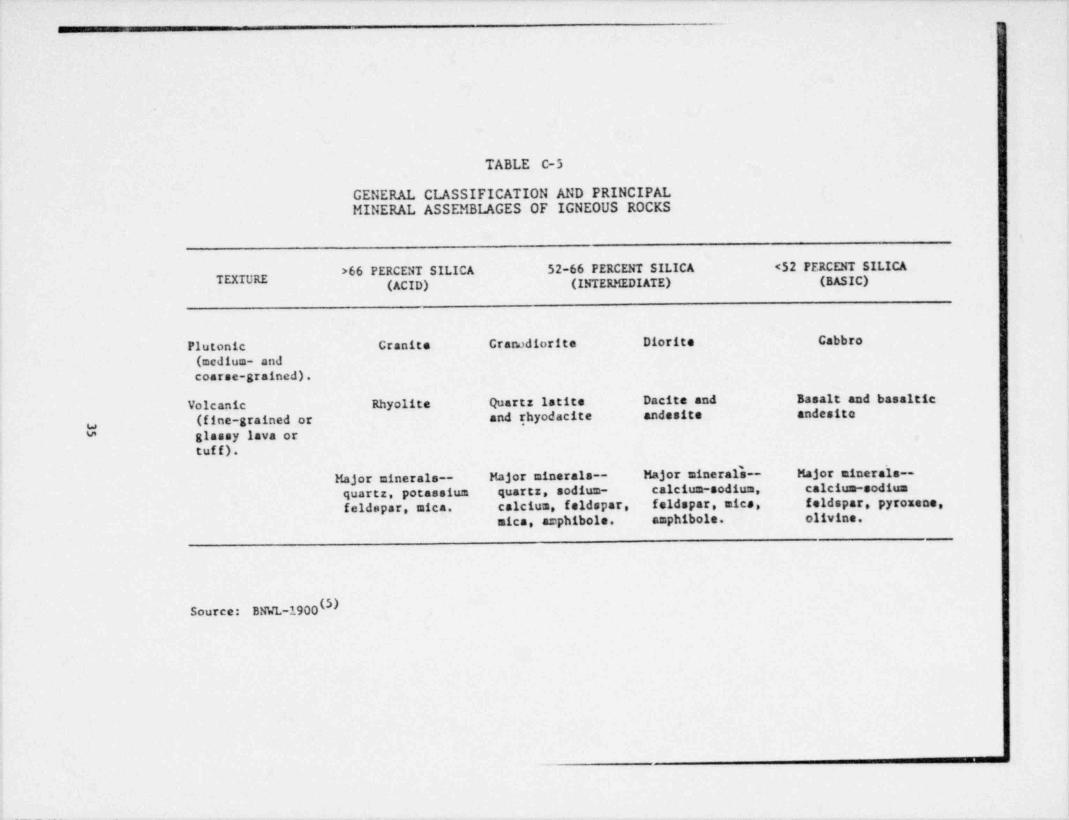
TABLE C-5
GENERAL CLASSIFICATION AND PRINCIPALMINERAL ASSEMBLAGES OF IGNEOUS ROCKS
>66 PERCENT SILICA 52-66 PERCENT SILICA <52 FERCENT SILICATUTL'RE (ACID) (INTERMEDIATE) (BASIC)
Plutonic Cranite Cranadiorite Diorite Cabbro
(medium- andcoarse-grained).
Volcanic Rhyolite Quartz latite Dacite and Basalt and basaltic
(fine-grained or and rhyodacite andesite andesitoy
glassy lava or*
tuff).
Major minerais-- Major minerais-- Major minerals- Major minerals--
quartz, potassium quartz, sodium- calcium-sodium, calcium-sodiumfeldepar, mica. calcium, feldspar, feldspar, mies, feldspar, pyroxene,
mica, arphibole, amphibole. olivine.
Source: BN'n'L-1900(5)
_

_
0
1
e High w haaie=1 strength,'
Low primary permeability,e, e Low porosity,
e The occurrence of thick rock bodies (with the,
I exception of certain volcanic flow deposits). ;
Unfavorable characteristics for the location of an EU repository include: l
Potential for high secondary permeability doeeto jointing and faulting,
o Low sorption potential (except for tuf faceousdeposits),
Relatively low thermal conductivity for heatedissipation.
For purposes of this study, basalt has been chosen to represent a typicaligneous rock type. Section C-3.4 vill discuss a typical geologic setting
in which basalt occurs in suitable geometry for location of a repository.
C-3.2.2 Stratigraphy
When considering any particular lithologic unit for location of an EU
repository, it is necessary to understand the host material itself and
| its relationship with surrounding geologic materials and condi-
tions. The study of the overall spatial and temporal relationships ofrock formations is called stratigraphy.
Deternination of stratigraphy is accomplished by a wide variety ofstudies. including review of existing site and regional geologic infor-nation, drilling and field testing progra=s and detailed data analysis.Important stratigraphic relationships are typically presented graphicall;as two-dimensional geologic cross sections or as block diagrams thatprovide a three-dimensional perspective. The pertinent characteristicsof the conceptual cross sections prepared for this study are discussedin Section C-3.4.
-
36
,
, -__ __m- --
N
|
Important stratigraphic elements relative to HLW repository sites arethickness and lateral extent of the host formation, ospth of the dis-posal zone, uniformity and homogeneity of the formation, and the natureand extent of underiying, overlying.and flanking strata. Thess param-eters are discussed in the fo11oving paragraphs.
C-3.2.2.1 Thickness and Lateral Extent of StrataA host rock formation continucus for very long distances inboth the horizontal and vertical direction would be ideal for almost alldesign criteria. This type of situation will probably not occur natur-ally, however, and the actual spatial extent of a host formation will be
a major investigation and design factor. For example, current detailed
siting investigations are considering both bedded salt and shale of
moderate thickness and great lateral extent, and salt domes with
pror.ounced lateral limits but thicknesses greater than 10,000 fest. The
minimum acceptable thicknees and lateral extent of any particular geologicforoation will depend on such characteristics as the thermal propertiesof the formation. A critical criterion for formation size is that it besufficiently large (thick and/or extensive) to assure adequate heatdissipation. For example, thinner deposits of salt may be utilized,whereas other rock types,such as basalt, may need to be considerablythicker because of their lower heat dissipation properties.
Lateral extent and thickness of the repository formation may also beimportant because of enhanced containment capability provided by high t
sorptive properties of certain rock types. The greater the pathway, the
greater the opportunity for radionuclide retardation by sorption processes
discuoused in Section C-3.1.2.
The minimum thickness or lateral axcent criterion cay also be dictated by:
e The distance required to protect the repositoryfrom groundwater flow or to account for unknownsabout thm material's purity that could affectgroundwater flow.
!
37i
,
.
im -- - ww_m_ - - - - - um s_ -m w - -
e The distance f rom the mined cavity to the extremitiesI of the formation to minimize the potential that
localized cracking or straining could open pathwaysbeyond the desirable containment tone.
C- 3. 2. 2. 2 Depth of Repository HorizonThe necessary depth of a vaste repository horiac1 will vary dependingupon many factors. Those factors associated with the host rock are:
e Location of suitable host rock,o Erosion and denudation potential,e Local groundwater conditions,e Depth of weathering,e Depth of open f racturing,e Ambient temperatures at depth, ande Short- and long-term mine stability considerations.
The actual dapth criteria for a specific location will be site related.
Mined openings in shale could possibly be extended deeper than in saltbecause of the differences in physical properties. Brittlerocks, such as limestone, granite.and basalt, can undoubtedly be minedmore easily at greater depths than would be practicable for shale orsalt. These " engineering" limitations must be considered in .he con-
text of c11 site selection criteria. The most commondepths for disposal may range f r< a atout 300 to 1500 meters, butshallower or deeper rocks may be suitable under certain site conditions.
C-3. 2. 2. 3 Uniformity and llomogeneity of Geologie MediaAll other f actors being equal, rocks having a high degree of uniformityand homogeneity are superior for emplacement of radioactive vastes. The
major reason for this conclusion is that greater accuracy of all conclu-sions from investigations and analyses may be achieved when site varia-bility is reduced; i.e., the chance of missing an Laportant factor is
greatly reduced when site conditions are uniform. Nonetheless, sites
that are neither uniform nor homogeneous may be suitable,1f otherconditions are particularly attractive.
38
M
..
The acceptable degree of inhomogeneity will vary, depending on such fac-tors as the nature and characteristics of rocks or minerals included inthe host rock and the location of potential pathways from the tepositoryarea. For example, it is cozznon to find thin partings of shale,several meters apart within a thick limestone or salt stratum. The
nature and location of these partings are important in mining. Whenvidely spaced, they can be used during the mining to form a smooth andcontinuous roof. On the other hand, depending on the nature and spacingof the partings, they may contribute to roof instability, act as pathwaysfor groundwater flow, or cause localized tracturing f rom differential
expansion with temperacure changes. Also, changes unrelated to layer-
ing, such as the occurrence of hydrated minerals, which can react adverse-
ly with vaste products or be a source of water under high temperature
conditions, may be significant. The importance of inhomogeneity must be'
decided on a site-by-site basis.
C-3.2.2.4 Nature of Overlying, Underlying and Flanking Strata
It is implied throughout the above paragraphs that acceptable conditions
of the host rock will often depend directly on the surrounding environ-
ment. Accordingly, it is necessary to determine the detailed stratigra-
phy of the formations overlying, underlying, and flanking the repository.
For example, thick beds of shale and/or other plastic-behaving rocksmay be desirable adjacent to the repository formation if they are:
relatively Dmpermeable to circulation of groundwater; have high radio-
nuclide retardation potential; and can be deformed without f racturing.
Probably the least desirable rocks surrounding the repository are
highly fractured and contain large quantities of groundwater.
C-3.2.3 Structural Geology
The subject or structural geology characterizes and describes features
of rock materials that have been created by earth movements. In additionto descriptions of existing conditions, structural geologic studies pro-
vide valuable interpretative information that can greatly facilitate pre-
diction of future events. The three major structural geologic aspects of
interest for this study are:
39
Y
.x m ---- _~--m m . . e w w e . : w. m pg w w . e,x.,,,ew . ,.. .~, . . .,
~
Folding of strata, which describes the spatialeorientation of bedding,
Fractures including priearily J-ints and faults,eoccurring in otherwise continu geologicmaterials.
Major plastic flow of caterials, such as dia-epirism in salt domes.
C-3.2.3.1 Folding
The degree to which strata have been folded is important because of theresulting inclination of bedding and fracturing of the rcck where it has
been fotced into a curved configuration. Figure C-2 presents an exampleof moderately folded shale and limestone. In this cross section, the
rocks have been deformed into an anticlinal s*ructure (a fold which isconvex upward).
From repository design and operations viewpoints, the preferred dip ofrocks (or strata inclination) should not exceed a few degrees. A nearlyhot azontal alignment facilitates hauling the excavated rock and
subsurface transport of the HLk' miterials. This considerat ion
can be of lesser importance for very thick, relative.. hr:carneous rockwhere the opening does not necessarily have to follev the <tratigraphichorizons or beds.
Sudden and frequent reversals of dip are not only 'r. es rtble for
design and operaticus, but the abrupt folding that caused the reversals
may have created undesirable secondary perne.ibility (secti<n C-3.1.1) inthe rock. This is particularly true for hard and brittle rccks in which
stress conditions at the time when folding occurred h ve usually in-creased the frequency of fractures in the formation, resu. ting in asignificant increase in the potential for groundwater =>vement. For
plastic-behaving rocks like salt. def orma tions accompanying m< derately g
40
D CP 0 @' 'K4'
b a t L:1 A "m

grc- ,% -g %-4-;,,. ,+ 4 .h, -..y g$,peeffh,ws g yp g -9,ygene;g . y,lpyg yr# p. t.. .
asass me num
n i rn. i n. i 5 i -
. -
'fv ju F r j T T T gI T T T|T U 1 y | T T T g[I T T U [t 5 7 3'
/ : '| - ,' i t' . % ' t]!) U ' ''' p! {']]I f% g(g*g '
li{h'
+' '' ' . | | ,
',. Y,'
, .
; h
) -}1 - 'n'
...!.ig :4 ' 'd i . e'p'.4 |, |
-' ....:-,i sl.lb;l ' o. '': e '.' ''. a i . ..
, , ' . g la1..[i;.'']jj,J,'.., , ',-].'
s , ,[1 ;j , ,q,
., ., ,*sy fl. i' ...e,L.., 'l''
j, [ g.
'' t ,k' ,.a.,i a
q , ,h. " h '.'
4,3u j:. ' ', p .' h g.j';[N, c.;:I, ,- es.,
,
i. . . . .. 4.
ng y h. ;. |- 4 , :' . i F. . ,,3.' a,"nt!U:t
"
,. cf. j .. .
.
icy,
s.:: t -f- '! 8
i ~ /. g , . . . f s,. m
/.
i../'. o| t / - '
Y |,!' |. -.i o,
| *i[: ;
' ./, .' !,-'"'
/' ,/ 7-f .. .4
ga / t/ .;- 4y' / . / ./ '
3i
/ .t - / - /i-. :i, . >-. a,
g / '/ ,-a - wI i 6 uj.
,' < / / ' , . . . I i 5-
| -
Q .E U,
[ f / =
./,
.h]' ' f. / ,/,f
' /. :: : ><, ./ j / x*a
! / t|| h*
:{ / [ / .X *5',
,
/ / / 3 2; .I 2~
.
[' ]I/ e / / 1 1, U e w' / / p ./ =
? .1 Ewc - .|/ s ,,
t ~ waE,
i 3 i j , - g}.} p. 4r
'- ' ' e' "I. a ;
)- % h
| 4
"6 M
, r / .|,. ] j 5 O- ,ay - e ww
n ' L,|'
: i "ci a. u
. - ,
g i /; * o- ~p | ., s g 6 Z
I e --.. c 00. , ,. .' *
|3 ( * - . ( 4 >-| |. f::.t 4 oua
* * *
I / t .,% / |
f.::'j:',|t n 5"*o . ,
f'~;
*.
*hW f5 ,i s *
i 2* 4- ss' O/ |3 ' | r - == -
::.5:.: E
-
/ /*/C; /
* /% / .~. . :. J.. ~,~.
,'' *
::t J: e.a,
s n%, ..>.=.s.. E us -
/>,- / q / ~-:2:: *- ; .c w'<
,# / / - .7:. E C'3-B
./ =. /.=. .:,. . . y | w 3, ..a
. , o/ ,/ / =| ::t=2= , c ;;--
/ l'
/-'t ; . :;=. x=s=. . . .--
<
:=;=:x.=,j=.2..:x:.:: :: =:.ga-
t/t f c
. r:. .=j.=:;: :.7===:t=:, O'| : ,. ;
'< . * * . :. :,. =:::: . :a .;' ' .
s : - :::.t:. - ' c=
I::..+: . =.:.. ; ?. = =.v =:.. .?.
| \ ,- ' > o ==::=.' '
- : '= . 2.: =. v.=. , &6., L. . . . , _ . , . ss, a
u ,- 1 : :- ::r:=. ~ ,:=..?:: - <
'r' . =::. :r . : * - : =.\:'
' _ _~a o'
y. . =:.\:: -\;==:5,:.=
\ ' \ N ;=.*
x ::.K..:='- - - = c.=;x. = g.-N st 3,
v.. "' W .\\, \ ., \ g ....;....7..
.
,3-
,
Il m ... 4 a.....-.u.m u>* ? ,6 3 3 2 f ^ *
g 9- . - .
(lasaan el Wh80

:m ~ -mm?+ + O W<m+aeH': M % "M & %wsn* % sa k%MfwA*
to steeply dipping beda may have little or no effect on water movementas fractures are healed with time. The resistance to fracturing ofstales lies between salt and the more brittle rocks, such as limestoneand basalt.
:
C-3.2.3.2 Joints and FaultsJoints and/or faults are co:xson geologic features in most rocks. Jointsare fractures in rock that have experienced no relative movenent betweenthe two sides, whereas faults are fractures along which relative movement
(vertical or horizontal) has occurred. The discussio.4 in thissection deals with existing fault conditions, while Section C-3.2.5discusses the potential for future faulting.
Joints are very common in all types of lithologies, ranging from volcanicrocks to unconsolidated sediments. Joints are most commonly oriented ap-proximately perpendicular to bedding, but they can be oriented in anydirection, depending upon the stresses or deformations that caused therock to crack. They may be open, having a space large enough for waterto pass, or they may be closed or filled with impermeable secondaryminerals, such as calcite or quartz. The open type are of primaryconcern because of their ability to transmit groundwater.
Some degree of jointing will usually be present in relatively shallowshales, limestones, basalts, and granites. The frequency of jointing andthe probability of joints being open usually decrease with depth. Theircharacteristics at any depth must always be deter;ined by boreholes andfield or laboratory testing. Sometimas open joints are found at depthsequal to or greater than those typically considered for HLWrepositories.
Ideally, a potential repository area should be virtually free of faults,whether active movement has occurred recently (within the past 20,000-30,000 years) or not. Minor, recently inactive faults in an area
j
, ..
_e mm _. - __ __.urwm y g u-_-g. g _u m ma,m A _ me----_
might be acceptable if it is possible to show that (1) the faults were
due to some tectonic force that it not likely to reoccur, (2) all
disturbance was outside of the actual disposal host rock or, (3) the
rocks are scaled against potential groundwater flow.
Any existing faults that have occurred in the recent geologic past maybe suf ficient cause to make the site unacceptable. At a minimum, re-
cently active faults require extensive investigations to ensure that
the host formation will not lose significant containment capability
through faulting during the facility's designed life.<
Major lineasents (1erEthy features on the earth's surface that may bestraight or slightly curved and can be observed on aerial photographsand satellite imagery) also fall within the broad category of frac-
tured rock. These lineaments may represent areas of increased
jointing in subsurf ace rocks or they may represent major faults. Unlesssuch features can be positively shown to have no effect on containment,they should be avoided in sets: ting areas for waste repositories.
C-3.2.3.3 Major Plastic Flows
Major structural features associated with upward plastic flow of geo-logic materials considered in this study are salt doses formed by anuplift mechanism called diapirism. Figure C-3 illustrates a geologiccross section of a salt dame. Note how the intruded strata flanking the
salt are folded and f aulted due to the uplif t pressures. Diapirism is
discussed in Section C-3.2.5.
C-3.2.4 Ilydrogeology
The concept of investigating and designing any facility with scientific i
confidence in its integrity for time periodP of perhaps hundreds of
thousands of years adds an unusual dimension to all aspects of selectinga site based on geologic characteristics. The impact of this extreme
tice constraint is possibly greatest for the consideration of ground-
water movement. For typical water supply or dewatering evaluations,
43
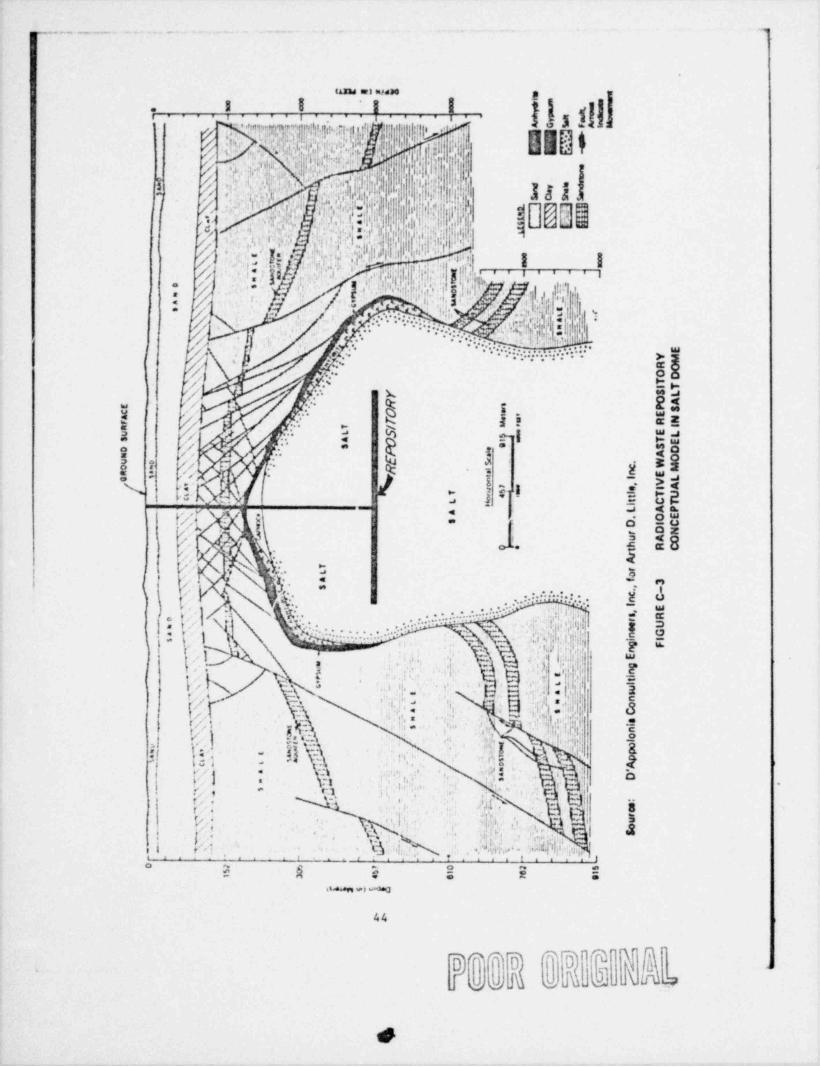
_ . . . _ . _ . .. ,
tAnd erI espaM g r
| I I I I it I3 Tfj:.
5i i i i i ~
? ..$gg$yygf' ggpp, ' ..,j I'g $
'
, .'e-
6, .i. %R p.
i
4j7 y, ,2'$y.1,|i $ ' " $,. . M ,'U,;pl, p.g1
i .
,4 f[ ! y!v,h.q 3a,p .. .M
1 . s '' ,, (,'; ,r;%j',Iih gf%f)w|.;,.b :p |h-; s
-
' A.--
,h, e' "m.,,.
". i d,,j:[-. : 4,y f,. p: g.q4 ,.,,,.g[,q.,,ia @].:j .
,.u 9, - g. ,
,.. ,
'[jih,.m.,,...jijgig1f |'';'fI$'.|j,f}'i
ef,, .. i.- 4
/, 1:'
f, , '.!h: 1 g' Q '' ''7<
.. n - - n
^ '
h [.. ' e ..rgGMj. " .
.
- ey,..a\pu.
. .. , . . ., ..
g- .
,/ . . - .
/.
.. y 4<. -. .. ..
-. . .v,. . . . ; : .. .. . - s...
/ -
.g. .-
Oc,/ AY , - bp*
/ y '.'. I K, e4 J
je4 t .j -3" e > . . .
,a t; g* ?, 4" : .
E, $ $,' '
5 ; ef i
~ !_g.
-_
I N *. 1 oE$h- - . =
gb~~' '.,ssA .
I/A . ;. .
= o o
!' r} ' . E $8'. ..,
r- .e.
1.h' Y ,.$t
'
3'. V: '
. *p3' "
| . . . . ,
t },A d:i. . . . . . . . . - ' p>'.: . y.. v h. .
'.i Yr,. .y t -g 2: -
, .h
- aj* 1 '* "% ~ '-
.','r# j j%.'.. g' ,,b- .. k- 3".; , .,. . y
.i e: ;'t, l'
w. !, -}N ]s' '', f .j .i. . ;h. , d,N[,@q'
2;
6, ) sy= .
$3.
.i ...,
I',$. Sh 3 !4'4L..., c .:7| e.34 ,a. |
.
.
/ a '
s4
q[ }J; 8jj * -T' .* *= t 'U|
-1,.
, ' . , >? :: 'g.s .-.
iii * 7 ]l .! Vj | ?,a
. . , , ' ! o',
r . ra ,,l' '.! , : g- if $ ,,
-4. h 4 --8''
;;[ \* i
x'r ^.i.
2 (. -.
\. .kp.- =>- -
gg-
ti . c,.* i c ,., g
||, bI ' ff.ih ,, .d.h,!,# , . 3Nr .,82,
e 4 s g 's 'd' '
.,,m
44
I D ~@''\.'
m o' O i
DE du .d _:
' a, .
aav
d

, _ ,._ _ . . . . _ _ . . - .,. - _ ..
t
water flow is considered relative to its volume per minute, day, or year.
However, over time periods of thousands or hundreds of thousands of years,water flow that is imperceptible on a per-day or even a per-year basismay be significant. In other words, rock permeability is a relative con-
cept and the aspect of time available for flow to occur is significant.
For a repository', a small volume of flow over each one thousand or ten-' thousand-year period could be important, if it could transport unaccept-
able levels of radioactive materials from their rcpository setting. To
evaluatetherequireddetailedhydrogeologyviilrequireextensiveinves-'
tigations. Relationships must be established among such factors as thefollowing:
e Regional groundwater conditions,
e Local (at the site) groundwater conditions,
Intrinsic hydrogeologic properties of theedisposal zone and associated strata.
~ Elements of intrinsic hydrogeologic properties were described in SectionC-3.1.1, and associated geochemical characteristics for retarding radio-nuclide travel were addressed in Section C-3.1.2. These basic data arenot repeated in the following broader description of hydrogeology.
C-3.2.4.1 Regional Hydrogeology
For this study, regional hydrogeology relates to the existence and e .-tent of all aquifers in the vicinity of a possible repository that
contain water that could flow above, below, or beside the repository
given any natural or man-caused event during its designed containmentlife. Depending on site location and the degree of detail of the invest-
igation, the study of regional hydrogeology can cover an area from severalhundred acres to hundreds of square miles. The area of interest probablyill be greatest where extensive sedimentary deposits are considered as
the host rock.
45
!
Ie
__ , _ . . . . _ . . . . . , _ . . , . _ _ . . . . . . . .. _. - . . _
. .
4
Important regional questions follows
e Where are any squifers and squieludes locatedin relation to the host formation?
e Where is the recharge area and what is the re-charge mechanism for each aquifer?
Is there natural flow in each aquifer system? If so,ewhat is the gradient causing flow and where are'
the discharge locations?
Where and why is there flow between separate aquifers,eincluding consideration of boreholes for water supply,gas and/or oil extraction,or mineral investigations?
3 What is the quality of groundwater in each'
aquifer; is it presently being used or does it1 have potential for exploitation by man for
irrigation, drinking, or other purposes 7
e Are there mechanisms that could provide a con-nection between any aquifers and the disposalformation, including geologic events that mayoccur at significant distance from the repository?
e How will extreme changes in the total hydrologic(precipitation-runoff-infiltration-evaporation)cycle in the region during the very long contain-ment period effect the regional hydrologic system?Both extremely wet and extremely dry periods mustbe considered.
Investigation of these regional conditions must always be carefullyplanned and executed. The program must then be continuously modifiedd
as new data are evaluated and new methods are proved. It is not prac-
i tical in a short period to determine regional hydrogeology by specific
field investigations. Conclusions must be developed based on:
The large volume of stratigraphic and structuralegeologic literature available.
'
e Logs of wells drilled in the area,
e Geologic data obtained frcm aerial photographsand Laagery interpretations along with fieldverification of important observations andevaluations, and
46
1
- .,. _ _ .. _ - __. _ _ _.. . __ _
,
1i
Site investigations at selected areas through-i eout the region of interest.
Somatf=2s tha deta vill be sufficient to rule out completely larga areasotherwise considered as potential repository sites. More often, however,the regional study will identify important factors for more detailed
local and site-specific studies.
C-3.2.4.2 Local Bydrogeology
The study of local hydrogeologic conditions brings together the regionalcharacter of aquifers and aquicludes and the intrinsic properties of the
host rock. Such a study is used to determine if:
. Groundwater can reach the extremities of thehost formation,
o Groundwater can pass through and escape fromthe host rock with the potential for trans-porting radionuclides, and
e Any radionuclides can leave the repository and goto an aquifer that may eventually transportthem out of the containment tone.
The key evaluations will usually be to determine if: (1) there is
any type of gradient (usually pressure gradient) that could move ground-
water through the containment area; (2) material permeabilities are such
that flow will be significant; and (3) benefits or detriments may be
realized from the geochemistry of the system. In the final analysia, the
most important hydrogeologic consideration is whether or not groundwater,
can transport an unacceptable level of radionuclides to the biosphere.
Local hydrogeologic studies begin with the regional information and usespecific infor=ation derived from boreholes, such as pressure measure-
ments, water level measurements, and water quality and temperature analyses.|
|
47i
|
. . - - _ - , _ . _ , . . - . , _ . . _ . . . . _ - , _ . - - -- . _ . _ _ .m._,
|
Hydrologic and geochemical modeling analyses and other site-specificinvestigations appropriate to defining existing and potential flowconditions are also employed. Detailed knowledge of stratigraphyand structural features at the repository site (Sections C-3.2.2and C-3.2.3) are necessary to the success of any local hydrogeologicstudy. .
Special note is made that the plugging of open boreholes or sealingaround installed piezometers and other instrumentation will be very in-portant for any repository investigation. New methods for sealing be-tween aquifers encountered in a single borehole are being developed forthis purpose.
C-3.2.5 Tectonics
This general site selection category deals with significant earth move-,
ments (geologic events) that could disrupt the repository in some mannerthat would reduce containment. The discussion is separated into foursubtopics:
Tectonism.which generally includen all types ofe
movements of the earth's crust. For repositoriesin rock formations, the definition can be limitedto (1) faults.which cause abrupt disruptions atthe fault displacement and increased brokennessat considerable distances and (2) less abruptmovement caused by folding, which can increasethe brokenness of rock, change erosion patternsand rates, and generally modify regional orlocal hydrologic systems.
Seismicity.which for repository site selectio..e
purposes is related to (1) the frequency ofearthquake activity that occurs in an area and(2) the magnitude of movement that occurs asthe result of an earthquake. The first relation-ship is closely related to the faultingof tectonism and is not discussed separately.The second relationship will have significantimportance on the engineering design of above-ground and underground facilities during therelatively short operating life of a repository,but little influence on containment for the verylong period after backfilling.
48

-. . -- - . . . _ - . - - - . - - -
,
e Dfe . frita, which for this study relates mainlyto the creation of salt domes by the upwardflow of this plastic rock from a deep-beddeddeposit.
e Vcleanism, which refers to processes wherebymagma (molten rock) and its associated gasesrise into the earth's cruat and are extrudedinto the atmosphere and onto the earth's surfacewhere rocks are formed as the magma cools.
C-3.2.5.1 Tectonism and SeismicityTectonism in the context of this study is related to fault disruptions
that actually cause abrupt movement between two portions of theearth's crust and/or significant folding of the crust with a resulting
increase in the brokenness of rock formations. Basic questions requiring
consideration in site selection are:
e How often, if ever, are significant movementsto be expected?
e What will the magnitude of movement be?
e Where will the movement be located?
e What are the potential impacts on thecontainment capability of a repository?
The second and third questions overlap significantly with seismology or
seismicity investigations that make possible predictions based on eval- '
Iuation of past conditions and the geologic setting. For purposes of this
study, discussions of tectonism and seismicity are combined..
An earthquake is a natural phenomenon in which significant rapid and/or
violent movement of the earth's surface occurs. Because earthquakeshave occurred in most areas of the United States during the relatively
short period of recorded history (approximately three centuries), theyare of icsediate concern in selecting a repository > site, particularly in
light of the desired long containment time period. The magnitude of carthquakedisturbance and the location and depth of movecent are quite variable for
different parts of .he country. Even in a given area, the potential for
.
49

,-
t
rock movement or fracturing as a result of a nearby aarthquake willdepend on such local factors as stratigrap':y (Section C-3.2.2) and
,
g stiffness or elasticity (Section C-3.1.4) of the affected recks.
The principal tasks in selecting a suitable site will include:
k e Quantification to the extent possible of the1 earthquake and faulting history of the site
region.
e Establishment of a geologic rationale for thehistorical behavior and using this ar a basisfor predicting probable future activity.
Areas of high seismic or fat.1 ting risk, such as portions of the west
coast of the United States, will have very low acceptability and
areas of low risk will appear favorable if other desirable geologic
characteristics are present. It is possible that slaost any area
may be acceptable from the seismicity viewpoint where it can bereasonably shown that movements at or near the repository cannot
occur with sufficient magnitude to reduce containment capability.
The prevailing geologic explanation for regions of the world within un-
usually high 3rthquake activity is centered on two concepts--continental
drift (15) (lo, Iand sea floor spreading which have been unified inthe theory of plate tectonics Continental drift was proposed in.
1912 by Ceman meteorologist Alfred Wegener who argued that the earth's
crustal rocks could flow laterally if they could flow vertically. Thus,
he postulated that all the continents had been joined 200 million years.
ago, after which they had broken apart. Alternative views to Vegener's
were postulated by Wilson ( ) and earlier by DuToit as well as others
to dispose of various problems that Wegener's model raised. Within
the past 20 years the theory of continental drift was placed on a firmer
foundation by development of the sea floor spreading hypothesis originally
proposed by Dr. Harry Hess of Princeton. This concept of sea floor
spreading was substantially confirmed by the work of F.J. Vine and D.H.
Matthews of the University of Cambridge. Magnetic data from the
vicinity of the oceanic ridges confirmed that sea floor opreading has
been going on during the past 200 million years at rates of between 2
and 18 centimeters per year. That is, crust has been more or less
continuously created during the past 200 million years, accounting for
50
$

-
most of the present areas of the oceans. Since evidence suggests thatthe earth h.'s not expanded more than 2% during the last 200 milliesyears, there arises the implication that crust has also been destroyed.i
I
Plate tectonic theory accounts for this implication.
The significance of plate tectonics to the vaste disposal issue lieslargely with the seismicity /carthquake phenomena related to platemovement /Foundaries. Dewey points out that "Most earthquakesoccur in narrow zones that join to form a continuous network boundingregione [the plates) that are seismically less active." Figure C-4illustrates the distribution of these zones and indicates the largerplates by name.
The concept of plate tectonics also relates to tectonism,which dealswith the structural folding of geologic formations over geologic time
Active folding or curving of a geologic formation is not usually a re-
pository design consideration, because even if in progress, it occurs
very slowly. Folding, however, may be a consideration for a repository
requiring controlled. containment for geologic periods of time.
Hajor considerations are:
can slow geologic deformations occur that haveethe potential to cause the rocks to fracture
|(crack), opening avenues for radionuclideescape?
e Are the host rocks and surrounding formationssuf ficiently ficxible (e.g., salt and shale)
' and scif-healing (e.g., salt) to withstandslow movements without any change in their
| contair. ment capabilities?
C-3.2.5.2 blapirism
Diapirism refers to the process in which geologic structures are formedas the result of the upward plastic flow of rock from deep to
shallower levels. For the selection of HLW disposal sites in the United
States, diapirism relates mainly to the salt domes in Teras andLouisiana and in the Paradox Basin of Utah. These salt domesformed as a result of tectonic downwarping of a bedded salt deposit,af ter which upward plastic flow occurred through overlyir.g strata. Theconceptual geologic model shown in Figure C-3 and discussed in Section
C-3.4.2 illustrates this type of geologic setting.
51
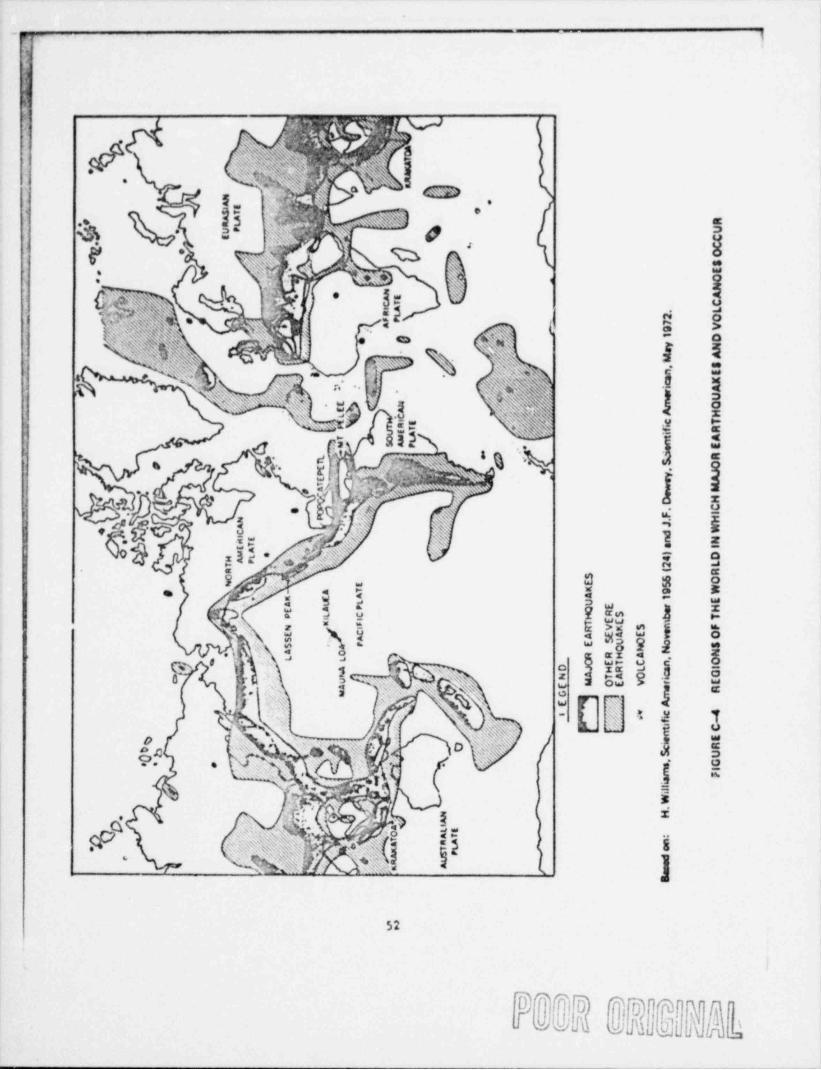
.--
,P
i
:
,. .? Ti V,-
.
'0,"'"u.;7' vf.' % 'h 'a' $kt
:' w % g,/
..
+ ep '"ggr. '
?.
Jhy4 g*,
5 2 |b s..
0'4 -
y'
J %V '
gA + y: . , , ,.
le &. g_
a.g @.> .
u!>s y
'
,' WI (; f f-.
Y art n. . ..
b : u "
g'
I'@E .i
'% * *:.
-
P h +d ,.y ~ , . - g, ~
I
Gp: ), gs, r$ } 8nu .
2.i= % ,' y [
'%~
52K0 ,s
h 1.''
< u,.
3c- %a p 2es 33 ,r *.. , s 2-
.'s M';- o. - =
e $ 0S. <#
s 5 5 2 %*s ,
3 5-
!p?e'
U $2 ?
, ' 8 9 g,e .e
i h, ? *
m ,.s *Es ( 55 3 a- -
a 3 y ~
e, xx a0 5- :W' .
OQ
Ob h )s.
c. aji
, , '
p-N w
%{b, g JL, * a 33' } g, W i. i / A' r. , aol6.4 e% Q ;5,t (
'g
w# kx!.
f#[;, e a=' ,Nas?%'j :f &, j2
..g".
1.
-
52
NJ \_
f
Ceologic considerations for a salt done are significantly different than*for bedded salt or other rock types. The domes often have a lateral.
extent of only about one or two kilometers, but are continuous verticallydownward for several kilometers. The selection of a done site willlargely be dependent upon the desirable lithologic properties of the salt(Section C-3.2.1). Stratigraphy (Section C-3.2.2) and regional and localhydrogeology (Section C-3.2.4) will be less important for evaluatingbasic containment potential.
A site selection criterion for any salt dome will.be the current statusof any local or nearby diapiric activity, or the potential for renewedactivity during the design life of the repository.
Another criterion of lesser importance vill be the assessment of possi-ble dispiric formation in regions that have no historic geologic
evidence of such structures. This concideration is related to the pos-sibility of disruption of the repository by upward flow of material.The prerequisites for such an event are a plastic-behaving rock buriedat great depth (up to 8000 meters or more),(25) under the requiredccmperature conditions (at least 300*C) and beneath the
prcper geologic strata. An early check on the potential for the neces-sary cot 31 nation of f actors will likely rule out the possibility ofdiapiriam occurring at most sites which do not now have any history ofsuch events.
C-3.2.5.3 Volctnism
Areas in which volcanism might reasonably be expected to occur withinthe next million years should be avoided in nelecting a HLW reposi-tory site. Obviously, the high degree of violent activity
assceiated with a volcanic eruption would affect the containment capabil-ity of a repository stratus in close proximity to the volcano.
53
$

--
hio basic types of landforma can result from volcanic activity.C In
some areas, molten rock has been extruded through extensive fissures in
the earth's surface and has built large plateaus (fissure eruptions).
In other regions, molten rock escaped from within the crust through
vents; around these vents ejected materials built up into landforms
called volcanoes.
A volcano is considered active if it is presently erupting or is expected
to do so. If it is not active but may well resume in the future, the
volcano may be termed dormant. If no signs of activity are present and
no activity is anticipated in the future, the volcano is considered
extinct.
Ninety-eight percent of all active volcanoes are located along plateboundaries where significant earthquake activity is also concentrated.The Western quarter of the United States is such a zone and includes
Lassen Peak in California, which was last active in 1917.
C-3.2.6 Erosion and Denudation
HLW repositories must be located in areas and at depths where waste will |
not be exposed as a result of erosional processes. Major erosional|
agents include rivers and streams, landslides and other mass movements; I
rain.which erodes by impact and surfacc flow; f rost action,which loosens I
surface materials; chemical weathering of surface materials; wind,which I
erodes by deflation and sand blasting; and glaciers,which erode by I
grinding and plucking. For this study, the important factors are eronton by,
river flow and denudation by glacial action.
i
Erosion is a continuously occurring process, the it: mediate results -
of which are nearly imperceptible, except in the case of mass movements.
However, over geologic time periods crosional effects can be quite |perceptibic- those highly evident results that can have marked effects I
on landforms are connoted by the term denudation. In evaluating erosion |
<
l
C
54 !
1
, , . . . . . . ~ ~ = " " . . . . , >-
and' denudation in the overall assessment of the suitability of a sitefor a HLW repository, careful consideratiori must be given to presenterosion rates and the potential for substantial increases in erosion
rates over long time periods.
Rates of erosion vary according to specific topographic location, rockhardness, rainfall, evaporation rates, type of vegetation and other fac-tors. As mentioned in Section C-3.2.5, factors such as tectonism can
cause broad uplif t of land surftces.which can lead to radical changes inerosion rates. T r example, the Crand Canyon portion of the ColoradoRiver has eroded to a depth of 2000 m during an estimated one millionyear period. The orm all rate of erosion in major river basins of
the United States averages about 60 m/million yaars. Erosionrates range from about 40 m/million years in the Columbia River
'basin to about 165 m/million years in the Colorado River basin.-
Since repositories will not be placed in areas where major
ground movements or river erosion can be hypothesized, erosion willusually not be a major site selection factor.
|
For many sites, potential glacial activity may be the most important
factor for evaluating erosion or denudation potential. Claciers often
deepen and widen valleys previously formed by streams; where tremen-dous thicknesses of ice occur, valleys may be deepcned to great depths.Examples are the fiords of Norway.which are estimated to have beenincised to depths of 1300 m by glacial activity. (2D
Four glacial periods have occurred in the northern United states auring tnepast million years. The occurrence of one or more additional glacial
periods during the next million years must be considered as a potentialfactor in the development of ar. HLW repository.
C-3.2.7 Hineral Resources
The attractiveness of many sites will be af fected by past or potential
future interest in a mineral resource. Mineral resource considerations
55

-. . , c. , . .. o. .
.v.
include surface and underground mining of solids, solution mining, andthe withdrawal of L beurface fluids, such as oil, gas,and water. Each
identified resource requires consideration of any past exploration orj recovery activities and an assessment of the potential for exploitation'
during the life of the repository.
The exact nature and locations of all existing mines and wells near
any site must be identified and their effect on the confinessent r.bility |
1of the site must be analyzed, This analysis should include effects ofsubsidence from mining or pumping, the extent and location of inducedpermeability, caused by hydrofracturing (fracturing rocks by injectingwater under high pressure), and the extent of exploratic,n testing (e.g.,borings, test wells, underground blasting for geophysics) that could have animpact on containment potential. At some locations, the measurementof existing conditions may present the greatest difficulty in certifying i
a site's suitability.
I
Any potentially valuable mineral in the formations above, I
|adjacent to or below the host rock presents two selection considerations:
The existence of the mineral raises the possi- 'e,
bility that man say disturb the containment in I
the distant future by exploring for or extracting |the mineral, and *
A necessary and valuable resource may be lest to |e
man because of its location close to a repository. '
I
C-3.3 CATEGORIZATION AND RANKING OF SITE SELECTION FACIORS
The discussion sequence in Sections C-3.1 and C-3.2 ranged f rom the
detailed examination of the intrinsic properties of the host rock to the larFer-scale evaluations of g-ologic settings and finally, geologic events.A logical procedure for locating and investigating potential repositorysites moves in the opposite sequence, from considerations of the large (scale settings or events to intrinsic properties. The following cectionspresent an appropriate starting procedure for most HLW repository siteselection programa. !
.
I
I
I
56 '
|
|
6

-
.. . .
.. .. . _. .. , .. . . . ....r.. . . . . . . . . .
C-3.3.1 Categorization of Factors
Table C-6 sunmarizes geologic information categories that are pertineneto selecting a site for a HLW repository. The categories are arranged
to suggest a logical investigative sequence (top to bottom in the table).The first stage of the investigation involves assessing the potential
for the occurrence of significant geologic events (including those so-
sociated with mineral resource exploitation or loss) in candidate re-
gions. Areas with a high prnhebility for such an event should be
eliminated from consideration; no further work would be perfermed rela-
exve to those sites.
The second phase of the investigative sequence would concentrate on theevaluation of the geologic setting for the remaining sites. This
phase of the study will (1) eliminate other sites on the basis
of negative regional or local geologic conditions, and (2) better
identify the most promising specific locations within accepta~ule
areas. It is important to begin a relative ranking of sites et
this stage in order that furtber detailed studies can be
tailored to the most promising areas. in an appropriatemanner. Each element within the geologic setting category (Table C-6)
should be fully addressed during the ranking process.
The final step in site selection will be to gather specific local data
for the best site (s). These investigations must provide detailed stra-
tigraphic, structural, and hydrogeologic des:riptions, as well as
quantitative information about the host rock's 11thology and intrinsic
properties. These final data. with appropriate analyseu and evaluations,
permit the identification of site limitations, special design, operation
and/or abandonment requirements, and allow final site ranking banal ongeologic considerations. Final site selection will require that the
geologic results be evaluated ir. conjunction with other seicetion
factors, such as transportation routes, and socio-economic considerations.
. 57
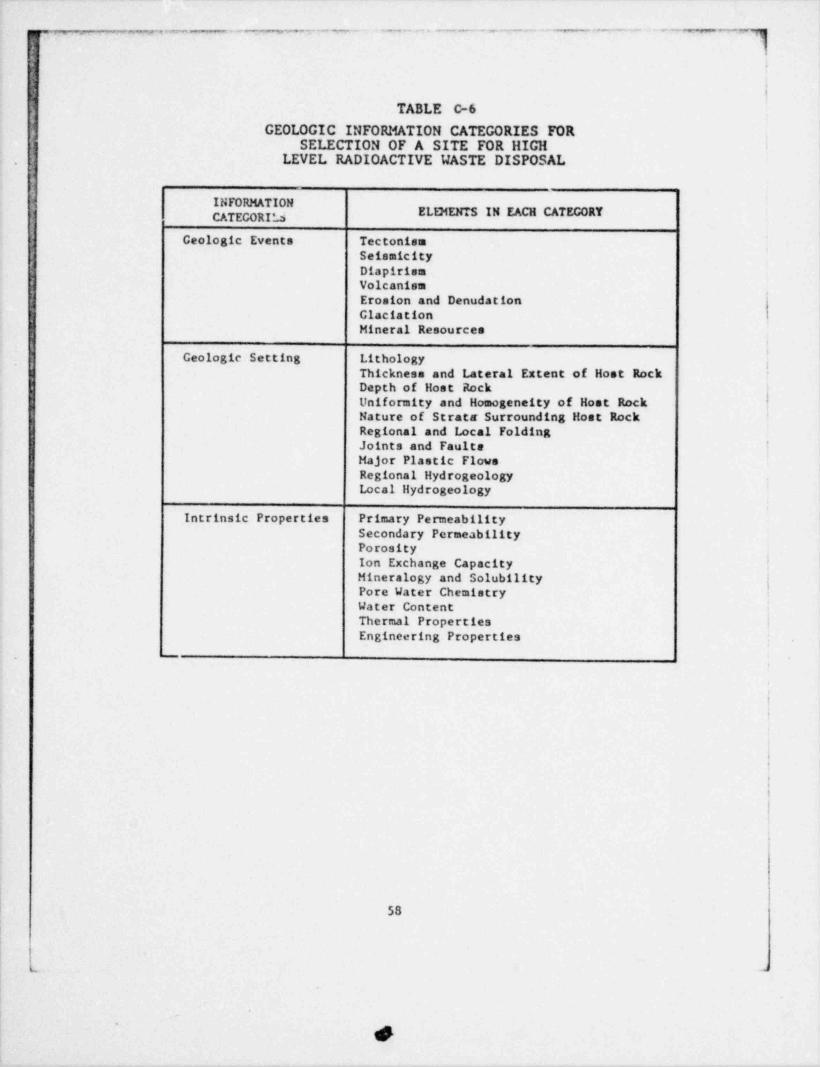
_. __ , . . . _ , . - - . _ ,, . . . - _ . ~ _ . . _ . _ .. ~ .-- . .___ - .,,7
.
'
i.
TABLE C-6GEOLOGIC INFORMATION CATEGORIES FOR
SELECTION OF A SITE FOR llICHLEVEL RADIOACTIVE WASTE DISPOSAL
ELEMENTS IN EACH CATECORYTECOR ,
Ceologic Events TectonismSeismicityDiapirismVolcanismErosion and Denudation |Claciation i
Hineral Resources
Geologic Setting Lithology.
'Thickness and Lateral Extent of Host RockDepth of Host Rock jUniformity and Homogeneity of Host Rock '
Nature of Strata Surrounding Host RockRegional and Local FoldingJoints and Faulte '
Hajor Plastic FlowsRegional Hydrogeology
| Local Hydrogeology
Intrinsic Properties Primary Pemea_bility' Secondary PermeabilityI
Porosity.
Ion Exchange Capacity '
Mineralogy and Solubility;
Pore Water ChemistryWater ContentThermal PropertiesEngineering Properties
-
.
4
;i
!,
S
58
m .a

-- _ _ _ . -- -
C-3.3.2 Ranking of Factors.
It is not practical to provide a quantitative ranking of geolcgic site'
selection factors presented in this study, because the emphasis requiredfor each factor will vary, depending upon the host-rock type and theregional and local geologic setting. However, it is reasonable todiscuss a logic for ranking the factors to provide a starting point forany specific study. .
The importance of any of the geologic event factors will depend on thearea being investigated. Not all geologic events will have the samelikelihood of occurring in specific geographic / geologic regions. Example
'; questions regardin't geologic event possibilities follev:
Does the region include any sites near geologiceplate boundaries (Section C-3.2.5) where theoccurrence of volcanic action or major faultingis highly likely?
Does the area contain conditions of known, activeediapirism?
Is it probable that future glaciation stages3 ewill cover the area?
Part of the overall ranking of events should consider the probabilitythat certain events will occur in some areas. For example:
Mineral resources will be a significant considera-otion for any area.
' Major faulting or folding will always be a con-e
sideration, but catastrophic earthquakes will notbe a significant consideratica everywhere,
e Cinciation, diapirism.and volcanism will be moregeographic and can be quickly ruled out for cer-tain areas.
Again, it is emphasized that the very long containment requirementk dictates that each investigation must initially consider all possible
geologic events.
.
1,

,
m 7- - -- --,
-w -,- MN P TP _ , , gegy, , _ _
- .
The following listing suggests a sequential procedure for considering,
geologic setting factors:
e Does the proper lithologic formation exist tofunction as a host rock for a llLW repository?3
Are there any rtructural features that mayeeliminate the site's potential?
e Do the stratigraphic and structural featurespresent any unusual groundwater characteristicsthat must be considered?
e Are the structural and hydrogeologic conditionssuitable for containment?
.
Ranking of the relative importance of intrinsic properties during the'
detailed site investigation phase will also be highly dependent onindividual site conditions. A reasonable cequence of corsiderations
'
for evaluating intrinsic properties follows:
1 e Does any mechanism exist such as groundwater} flow that could transmit radionuclides 7
Are there chemical or thermochemical properties of the wastee
that could accelerate exposure of radionuclides,
I to the host formation and cause an undesirablereaction with the host formation?
Are there geochemical properties of the hoste
formation and surrounding geologic media thatcould retard the migration of radionuclides ifa transport mechanism does exist?
Can the host formation and geologic surrounding 6e
dissipate heat from the vaste and are there anypotentially serious limitations of the host for-nation at hiRh temperature?,
Can the host material be engineered to obtain thee
required operating and abandonment characteristica?
C-3.4 CONCEPTUAL GEOLOGIC MODELS
| The conceptual models discussed in this section are illustrated in
60
o
_ _m --
;
s
J
f
Figures C- 2 through C-7. The models are general and broadly represent
various repository settings; nature Is vastly more complex. Th us ,
the models are provided only as a barts for discussing site-selection
factors for deep geologic disposal of HLW.
All of the conceptual models are presented at similar scales and eachhypothetical repository is located at a depth of about 500 meters.This depth is used solely for descriptive purposes, but is generallyconsidered reasonable for many site s. The depth at any given site will,
as prevously discussed, depend on the lithologic, mechanical and chemicalproperties of the host rock and the general geologic setting. The coo-ceptual models chosen for discussion follow:
e Tectonized Shale (Fiiare C-2)e Salt Domes (Figure C-3)e Bedded Salt (Figure C-5)e Non-Tectonized Shale (Figure C-6)o Basalt (Firure C-7);
C-3.4.1 Bedded Salt
Ssit deposits are considered as a leading candidate for HLW repositories.The conceptual geologic model for a repository (Figure C-5 is an essen-tially horizontal, relatively uniformly bedded salt deposit. At manylocations, the salt body would be characterized by an interbedded sequenceof salt (halite), gypsum, anhydrite, limestone, and in most cases,shale. Only two shale layers are shown in the conceptual model toillustrate some interbedding.
;
As discussed in previous sections, salt has several very attractivephysical and chemical characteristics for a disposal site. Salt pos-
sesses a very high thermal conductivity on the order of 15 millicaloriesper centimeters-second degrees C. This property, coupled with a
large lateral extent of a bedded salt formation, would be a viable mech-anism for dissipating the heat generated by the waste. The low permeabil-
~0ity (often much less than 10 centimeters per second) and the low
interstitial porosity (less than 1 percent) provide a significant bar-rier to fluid movement other than localized internal water.
61
B
e
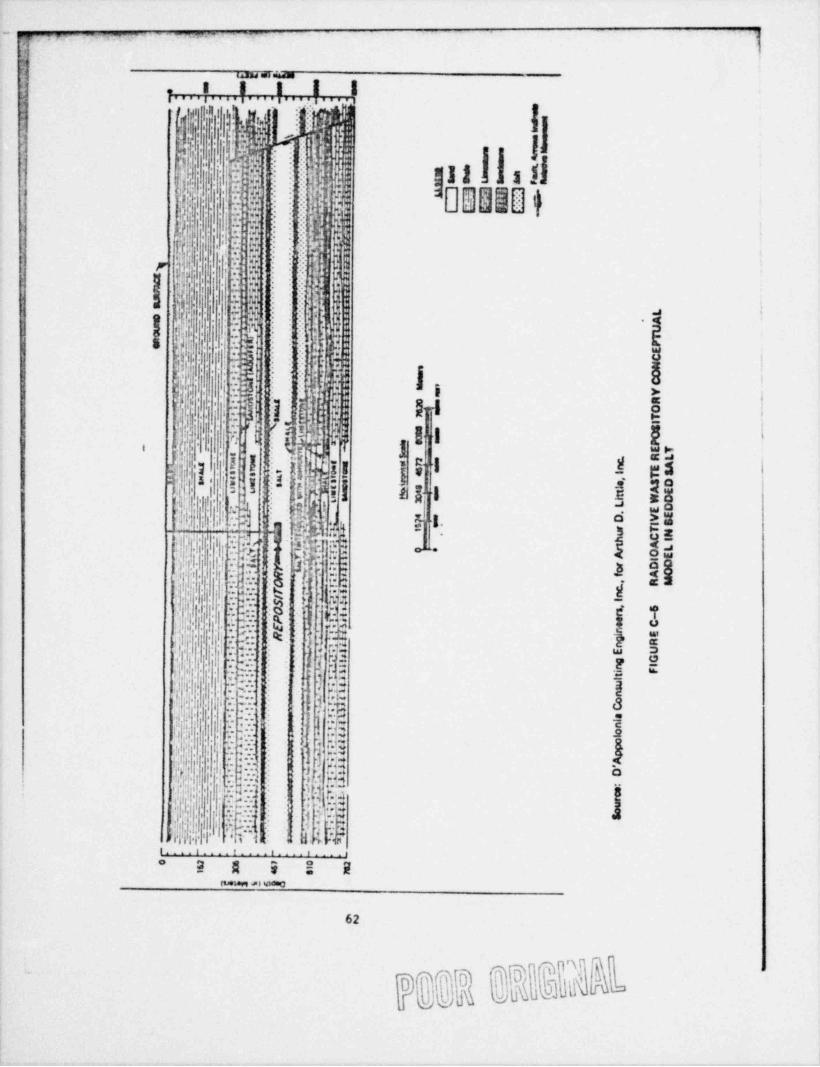
- ., ,- - -- m ._ d
r-
< wu .m
. . . . . . . . . . I. . . . I. . . . . I. . . . . I.s
u w tv si 1.
.
& , I::,ig jNai |Ii 11 s (I.
Q. V:v.-
t s, a,:,n ; .
u-
.-.-- - ,,
9 . :. s:: + ; :.lf;. Q;M ', j|-i L.
h. ! ,
; ,... <:: <
--|,i> <
'
3p l[-
p- *.rT ., , ?:: :-}
.,
$ ?: 14 :' .i :: e .S.J&
' "': o.:. :: : .
8 'Jr,j,j' .
I'
.f.T 1 :
i .,.
LP 5~?S .
;NI. .
a. j.: .h:g:p :t t.;,
s!'b t l' :.- !. -
::$:i [
.? ft.1 i >. .
(E{ :iu !
*:---
j $,.
':|| i f 7.
4) i J 1 :_;
N I $1 $71 5 !9, f'
, -:-3[cy] JiE- M ?:
h,hh;;,|
: s < ,
}UI b
,,
Ir b E ":i
l l}' I
l I h$ lf3 ! . ! ['.i l[m.Li%l s ..
s .
5 1 3- q' < ag
. ,L - x. g R. | p QwW|i -
:s ej mo2
%,..o ,e.': w , w aj. ~. . .
: . 01.'; ,- ;t. a J F 1. o 20: : ,
c# : +' awl T.d B bz-
;)g;.ffi||i|,l[,-?v[r3gi-J 0"3 j <3'.-
q , ...
j .r. :q *'- a": ,t ,. f|-[1
.
$$p.
! ,, a'- -.4.,
9':: : g;~ .
'h T; ; p3' "' .' ! :. *"
.
-: h , f~j, Id). i . I
'
. ::: ''
'
!, l. j, . .:: 6 y:|
3 u.|)V'
-| - ::.,
."y , y"3
, ! s'' . ||',: |- '.i.:. . |
..
! l- . 3..
i , |||-
" *' '3
, m|, - [P N.,
''lt, 1.i
; 7T '
3 p"I fa,
. * * E. l
f-[l'h -[Ifff:::::h.
l j $$ d.
a .Jn ,4bi.
: . .
, . -|} , 'JJS
! f: 1.. : ? 'fgI M ,|'!.|. '
!h !'!'|:|" 7-:.
'
4 if .
1: } ',,
?,R 63
|-. i '/; t-- .
9 Ih f4 0"
di-'
3 53@%! -::% [ jM.4.3m .; n.-x .
.
. m t to,i. .. . ... .,. .,
*2 A E !! H
~ . .
62
t
"
1
The presence of shale interbeda could retard radionuclide transport.
Although shale has a moderate interstitial porosity on the order of 5%,
it has . Iow permeability (usually less than 10 and often as low-6 -11as 10 to 10 cm/s) and a high sorption capacity, which would inhibit
the migration of radionuclides from the repository horizon. If the,
shale contained hydrous mineral. phases, a potential negative impact
results from the release of water by heat generated from the vaste decay. ,
|i
The conceptual model shows that the salt-shale sequence is overlaid by a
] limestone unit. If relatively unbroken and without unfilled solution
i channels or joint systems, the limestone should have a low permeabilityto retard radionuclide migration to the overlying sandstone aquifer.
The sandstone aquifer shown overlying the repository is postulated to
|have a relatively large lateral extent. Often such a layer can transmit
sufficient water for industrial and/or municipal uses. The aquifer is
shown at a depth, however, that would probably be uneconomical for farmi
and domestic use, especially with the presence of a thick, water-bearing i
sand near the surface. Since the region in which this model is postulated ;
is characterized by flat lying rocks, the sandstone aquifer will not|
crop out for at least tens of kilometers.
The sandstone aquifer in the conceptual bedded salt deposit is overlaidby a thick shale unit with very low permeability. This unit represents
a significant barrier to radionuclide migration. As a result, vaste
contamination to the biosphere could occur only where the sandstonecrops out, where the sandstone unit has been tapped for a water supplyin an area where the shale is excessively broken, or where a boreholecould allow vertical migration of fluids.
63

- 3 1
.I
!1
*f
A very old, inactive fault is shown on the right side of the conceptualmodel. The fault cuts several of the stratigraphic units, including the '
salt and the sandstone aquifer. The effects of the fault on the aquifercould be that it vould prevent horizontal radionuclide migration, but itmight enhance vertical migration to at least the overlying shale unit.For the case shown, the clays and silts forming the shale were depositedafter the tectonic activity that caused the fault had ceased.
A deep aquifer has been shown below the salt formation. This representsan additional potential escape route r" ..ar to the upper sandstone, butwith much less potential for reaching the surface. The pressure gradientbetween the upper and lower sandstone aquifers also represents a basis
for establishing whether water migration between the two, through the hostrock, should be a design consideration.
C-3.4.2 Salt Domes
A conceptual model for a salt dome waste repository is shown in Figure C-3The unique features of this model are:
e The intrusive nature of the salt into thesurrounding geologic formations; and
The large amount of faulting and fracturinge
present in the formations adjacent to andcverlying the salt dome.
As discussed in Section C-3.2.5, salt domes in the United States are
concentrated primarily in the coastal regions of Texas and Louisiana,
and to a lesser extent in the Paradox Basin, located 1srgely in Utah.The salt was originally deposited as a bedded sequence of halite, gypsum,anhydrite and shale. As a result of deep burial and differential pressures,
the salt intruded into the overlying sediments, eventually formingsalt domes.(
l
64
|
4

_ . .
. . .. .
. . - . - Ed
The fracturing and faulting shown overlying the salt dome are the resultof the forceful intrusion of the salt into the overlying sediments.These ft uits would not be expected to undergo movement once active doneemplacement has ceased. However, movements could occur from excessive
withdrawal of subsurface fluids, such as water, oil, gas, or brine. I
|
The dome in the conceptual model (see Figure C-3) is essentiallycircular in plan view, with the diameter on the order of 3000
meters. The salt dome is assumed to extend to a depth of at least4000 meters, which is not uncommon for Gulf Coast and Gulf Interior
i
Basin salt domen. The large vertical extent of the salt dome willlassist in the dissipation of heat generated by radioactive decay.
|
|
The salt dome is overlaid by caprock consisting of anhydrite and gypsum, i
Iwith minor amounts of calcite and sulfur. This type of caprock is j,
common and generally has very low, if any, measurable permeability. It
Caprock originates from accumulacion of the less soluble minerals of the ;
salt body as its original top was dissolved during emplacement.
The salt dome penetrates, and is in part overlaid by, a thick shaleformation. The shale will have the same type of mitigating effectson radionuclide migration as the shale discussed for the bedded salt
model, except that its permeability may be greater as a result of (|fracturing,which occurred during the emplacement process. ;
The lower aquifers are both faulted and folded upward as a result of thedoming process. Because sections of the aquifer have become effectivelycut of f f rom circulation and abut against the salt dome, stratigraphictraps can exist that may contain water, gas, and/or oil under pressure.
Conditions above a salt dome can vary greatly. depending on its depthand the last time that the dome was active in geologic time. Thesenear-surface conditions should not be important at a properly selecteddome because the principal geologic barrier against radionuclide migra-tion in this model is the salt.
65
_. . , ,
, -
2-- . .
|j-
If it is hypothesized that some radionuclides escape free the salt, .
their pathway to the surface would be dependent on the site-specificconditions and where the breaktLrcugh point occurs. As with the above
discussion for bedded salt:
Pathways to the surface could be greatly re-etarded by shale and clay layers that havelow permeability and porosity and a highradionuclide retardation capacity.
e The number and location of sandstone zones,
the amount and extent of brokenness of thesurrounding rock and the potential for bore-holes can contribute to increased pathways;again depending on site-specific conditions.
C-3.4.3 Shale
Sono shales have properties that maka them attractive for a wasterepository. The geologic potential of a shale body for a waste storage
$ site depends on dimensions of the formation,11thology, mineralogy,ij mechanical and hydrologic properties, structural and seismic hiatory and
the extent of drilling and/or mining.
The conceptual model for non-tectonized shale (Figure C-6) shows a relativelysimple stratigraphic sequence composed of a limestone unit overlaidby a sequence of shale and sandstone strata. Each sandstone unit isconsidered to be an aquifer. The two lower aquifers have been offset byan old, inactive fault, which would limit the horizontal flow throughthese strata. The uppermost sandstone aquifer was deposited aftermovement of the f ault had stopped, and it is considered continuousthroughout the region. This upper aquifer is typical of conditionsthat of ten provide a primary water supply for both domestic and muni-cipal use.
The principal factors for mitigating radionuclide migration from thisfirst conceptual repository in shale are associated directly and almostexclusively with the thick shale units; i.e. low permeability, favorable
sorption characteristics, and resistance to fracturing.
,
66'
..
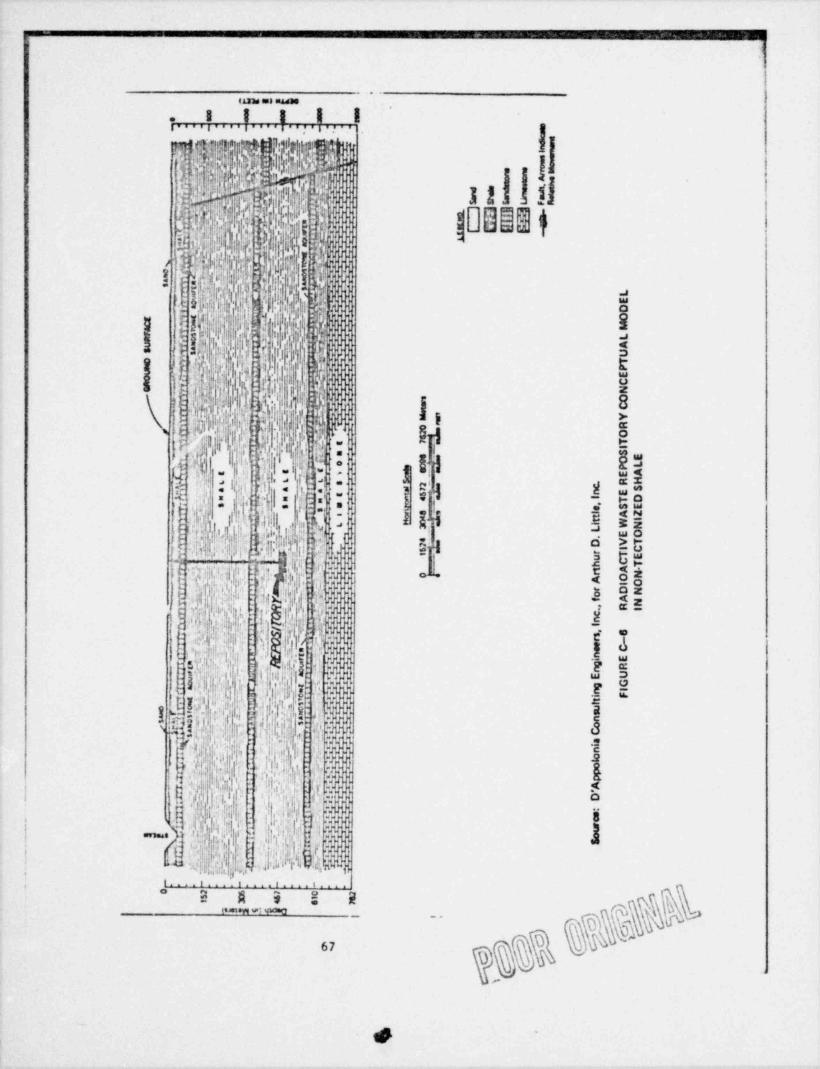
J - - | '; . . . As. . <,i..^'..P- ?, . ge #% ..g.* .t . } ,.
d
IL33s est mum
........i,....I.....I.. .in.
ullaig4pdilry::: . -V 5
A %. ,
1 ,
grh$jy .9h9 @ozg:u s 1 ag i e
[W; i ,lfjp]I- | Agsi ;ip.r
![-hg); f:@Ia-
fgy [|'
h h :# g
hj!!s$$)ji?:S
i%jj@gi,k;.g': ,
('qs, ;hm:(! Hj |i. ('
g U.l:l!.h',. g| y=yql.i:ig;L-1e.1 1,,i i 6, . N : ,10. ee
E :.' ,| *:F '
.
j sx i
I ,, !,$ m: g
l,'i,jf; * l ;,{:.[llid| ..i y'
,i l-~ *
'f ;..
h)* !q k1 3 sii*
+> s -
$vij,'$pp4/sp "q
@$M6j'did3 ;h:'4i.r; l ? E ,1 $ |oEi;-
f
s W!!'.$ h,,hj!:$d $ @kf ll'L
yg L- a e:1 v 4| l,.r,i|?.
.
b !;!:i.|,qM::=6{. - ==$
"F .i1 i y . . e!|1|.t#'ttda
it i:. ! I; , t - . !ig ,;
- d.lj :P ..;!|,s,|. y !/1 ptyd [-.,
fbgI.[" |i p ,'l .lf ,'.i , , "
}"@Q 2''
,_
fl. - t i Yllg !: 'tN., E' c:; im
|il!~
gi ,,4' h g. .y!. :+p:;| gi
''
-2y i ..j. .:43 ag
.chgg
~,
|f| hl m*m.
'i! I (:n~A h3[4g,$i|A]';:
5 -
gI
'i. 33,:. .;
+ .j'.. (*.ilfI!i4'.a' .tw3:.%p; g: .-
- 9
i'Ym
,Np; .' b1 '.
Ji 3;, '; ,f fdi <li$. iip;i|fd 6
Y,.n:.v |j!{Nes,:;
I ;$$ g< f: .'J.fi.;'I":| -,
~' hq|h}O,.
.. . I, '
: ; e:,n:,
'iI kI
m'.j 5h;
Opsi. .m.jg * sg:q1>
esistays wi w,,
de
67 DN-
.
~'
n':,w.r.c m ' - w m c., -m - ~ - - - - --
.
The second conceptual model in shale (Figure C-2)has been constructed ina tectonically-deformed shale unit, on the flank of a small anticline.The anticline is flanked by two high-angle faults. An obvious detrimentalfeature in this case is the presence of an extensive fault system thatcould present direct pathways for migration if groundwater were introduced>
,
into the repository. This cite would be acceptable for a repository in ageographic location with an arid climate, if absence of water in thesubsurface could be reliably predicted for the life of the repository.
Even if water were to occur deep in the subsurface, the thickness andgeochemical properties of the shale unit might be sufficient to retardnuclide migration. Substantial data would be required to demonstratethis conclusion.
Even without a widespread groundwater system, water could be generated ina shale repository through the dehydration of hydrous mineral phases ofthe rock. If this volume of water were small, no detrinental effects
would be produced. Again, however, detailed studies would be requiredto demonstrate the actual volume of water that could be developed
considering the temperature and size of the repository, and to evaluateany possible paths for radionuclides to be released from the repositoryalong faults or fractured zones in the tectonically-affected rock.
C-3.4.4 Igneous Rocks (Basalt Model)
One of the most promising of the igneous rock types being considered foran ELW repository is basalt. The most attractive property of basalt
appears to be its high strength for creating the mined cavities.
Potential undeairable properties requiring careful investigation and
evaluation are: basalt's relatively low thermal conductivity and its
relatively high linear thermal expansion coefficient, which could eitherproduce new fractures or expand existing fractures. Also, some basaltscontain minerals that will decompose if heated in the presence of water.
This is especis11y the case with pyroxenes and amphiboles.
68
- .- .- , . w . . s S . , e . 3 t. _ # _ . r . ,._ y . - c a . ; y w 3 ,. , ,
A conceptual model of a repository in basalt is illustrated in Figure C-7.The thick deposits were extruded as sheet type (plateau) flows. Theseare the fissure eruption type volcanic deposits mentioned in SectionC-3.2.5. The basalts shown are interbedded with fluvial sand deposits,which in some cases could also be lacustrine clay and silt deposits.In general, the clay and silt deposits would not be laterally extensive,but would form isolated lenses or pods between basalt flows. The sandunits as well as rubble layers overlying some of the basalt flowsof ten contain large amounts of water.I '} In one area, however, it
is suspected that this water may not be connected to the surface; thisis suggested by the age of the water, whien has,been dated as at least40,000 years. If this condition can be proved, it may be possible toconclude that these " trapped aquifers" are likely not connected to arecharge area and would have little likelihood of transmitting nuclidesto the biosphere. However, all considerations discussed for shales in
Section C-3.4.3 would still be important on a regional and local basis forbasalt.
69
s
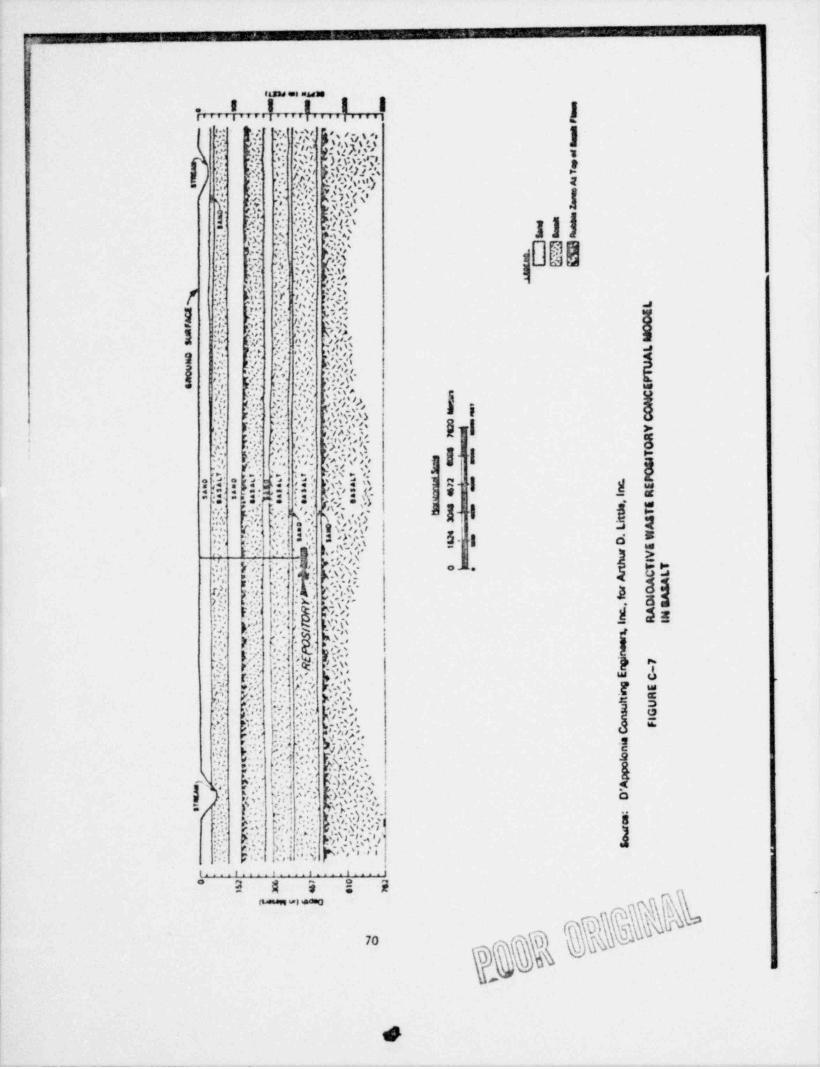
i
essas os madM
, , , , I, , , r i|g ''*
g., v t a, I q,,'d.','.,h't''''0 m
g|
... ,- ,,I4i s 9, fd Gl'|
}':. ,n.- :.: mi
hj%'s,,S**.
mcn[ *,. * r>4" 1 , (' I' s *e y *.,r
g ,.
[*. h;'*:,, '
7,kq
[.'# ,4,>E', ,.Q'.g'f'N,')k' ',i
/,' -3*
... ' ' ,. p,' .,'s .s
"-
,f- 1, .
'..c.. s'%-b s%.
cr * $, g(f - s*' > ' , :;?-|.'-'c:M
-
Ik * . , , .,? '.4.
t :.' m.p* s. . '.b,~5. - 1y4: s; ,, ,
*7o .
,(,- s. gw, <xp,., .,\ *. , . s.s - .
,I~~. pc ;o t ;-*-
( , . ' . W.y;3 ~*,',*;y,
,1, ,9'd-s ,r '
,
*/
.','s,,,*!, e,,.,. s.- ,,s a
'd f>w
6V";- Pc.' 9. ,. ,O -)h*o: p_':es
* ,
*.
'.'i " ',3 ', [ ,';',
) Y,'
>>.'.i. f,' , e,Ci.r,. ' . ' ..'2.f,-' . ' 'i
.~ s
Q .,' 7,t ', ; ;!. ,
, * , " , ' .> ,'/,9 '.b O,s',,,- -e. - c,' 'o :,"- ' I'.'{'
,' .},;,\ ow*,
y'jy.":. ,
. '~ ':' |$'u'3:' aj'
,
:i:4, 1. cae ~
I f.' , ,.
t'e ',,t ".s,,v)L
s- 3; * ,'
F;;',-s,. o a,i s e
.: r .~. _'e', fn g7g >,. ,
,e ,,v '.,, ', ,. 6nev,,
g, T,'.M ' , '''
p. t wi.'.
;*'* * f.,'s's',o @*, 3.,[
f ps-,
',,',
.
' ' ' kl | .,
|' * -
/. s ',Iv. i- 1 1 *; , g'|:N *1 '6,
,~
, 4 2 j~
y2 ;f I 3,' D$4 , ' ' [',')e 3 '. d. ,
c8 ;i3' E,
g =OF ',N' ,3 ' /,'-J. * s'', -
g. ghw%
<
i: ... oa r.\ ,#,
p. -'. , ,
l 's ,u',)p. , i
~.','Qs(.' ', . , * , ' . ,i:'' '* ' .a
~ , y'', L 5i | O 3:.
t'', it * .|.I. ,,,. :i y .*
y ,. m-,' , c,
n, ,, g'
_ ' #,\']' ' '<
p'*'~+~,
. i. >>Y r.*' }." ,4
.
.
:as o.,* *s, O =a:,*: . :. p :,- a. h:. . < ,
3 -1 . . -
,_ , .w ,k. 3Er,
. ,1: ; ..f
(| s. ;.g.r.i s.a
. , ,p.e'[,f... .l.h.gf'' .:.
. , , . , ; 9 ay'
,' z.hT. ' .
- _.
N i
f-
l'.1, t, , .,, i,;yU' b. s. ,i
. .. i,
E,e P m,..
. ? -' ss, e. . r,l..n
,- e . ,, , - w u.
-:' r,: '..
r? '. 'r,y' .i', I#.q,<
. . . .p;. , ',.f.. - ,, . ,
n e''i [:i.. h:-{.j,'E ' ),..,@ g a
-
, x 2.
,'. gC
,
,' ', ;, X.#, - - $.,,. .. b.s bs,.7,.'s ,p * g-
. ., q,
. .:,) C.:r,
.- a . . .
ik ,'g;p ,,.-s .9..*.z. c .- ,. ., c c
b,,; '.4
,k. s'.<' :. ,,~ s4 - it.r ,. ~,
u, ,',.,
- - ,, . , r. , , . ,
a# ,
t ,.*,,
t 5 .. 2.. #. : ,s -< > 0 * y, 'e , |
g :, -
y .- g os ;J.-: _ .~>fu. ,:- e., > . , t >*0','','',.\* .
f , G,)..,
C s.c;:s,st 's b--8'y r *; , C,, . ,..c e- r
.
p., ., p..... I '$ s , ., e .-
eV. :, 1 },
:.' ; ,,; o 's ' * =.
3(, ,I. f- ,' i1 1
* o m3 $ $ e A -'
Ch--
r [s ,N's %aWy\ g%
,
4
sem n -;;. ,n,; e . .u .y-- .:. , w a,~ + g. , a ve : .. . c . ,x w - ...,? - . : a . 5-us - :1 *:.
C-4.0 ANALYSIS OF HIGRATION POTENTIAL
The primary objective of this subtask is to review the available
information concerning, and quantify the potential for, migration of !
radionuclides through the geosphete. The greatest concern for such fImigration appears to be related to groundwater movement. The initial
groundwater flow conditions (perhaps better described as deep subsurfacewater zovement) at potential disposal sites are extremely important.The leaching characteristics of the high-level radioactive vaste (ELW)
are also important ?.o the migration.
The approach used in the nuclide migration analysis involves
several steps, including:
(1) Review of the available data on vaste leaching and
of empirical and theoretical models describing leach rate,
(2) Review of the available models of radionucliJe transportB
in the geosp!c.e, and
(3) Selection at.* use of transport models for sensitivity
analysis in order to identify the range of parameters
important in nuclide migration.
The calculations for this report are shovn to be applicable to the
conceptual models for each of the five potential geologic repository types
(summarized in Section C-3.4). A mathematical approximation of these
geologic strata was then used for nuclide migration calculations. Details
of this approach and the results are discussed in Sections C-4.3 and C-4.4.
C-4.1 MODES OF L%TER CONTACT
The pathway used throughout this analysis involves nuclide migration
to the earth's surface through geologic strata. In analyzing this pathway,
two processes have been erasined: flowing groundwater and dif fusion throughstatic groundwater. This section discusse the modes of possible water contact,
the probable natural water flow rates, and the techanisms whereby watermight come into contact with HLW after the closing of a waste repository.
It will be important to have minimal or no n. ural water movement in
the strata and interbeds of any potential reposit. y. Since it is highly
probable that in deep repositories there will be sate:-bearing strata
71
n.---
>
1
.
1
either above or below the potential repository area, water movement inthe potential repository strata and interbedded strata can be expectedto occur unless:
(1) the repository formation has no permeability to water, or(2) the permeable strata above and below the repository are in
hydrostatic equilibrium (i.e., water pressures dif fera
o. ly by the dif ference in elevation multiplied by wats
density).
There are probably no strata that satisfy the first criterion, but
the combination of extremely low permeability and little, if any, hydro-
{ static imbalance could create a situation of virtually no flow in a
l repository. At least the water velocity could be below the usualthreshold of hydrol ,1c flow measurements.
Two kinds of hydrologic flow regimes were postulated to calculatethe natural water velocity that might exist in a potential repositorystratum. These calculations were made with a conventional two-dimensional
f hydrologic flow model. Although no specification of site type - beddedsalt, salt dome, granite, basalt, shale, etc. - is intended, the exampleexamined corresponds more obviously to a bedded formation than to other i
types. Nevertheless, the intrusive types of geology could still have
water-bearing rocks above and below the potential repository area, thus,in both flow regimes, two aquifers were assumed to exist: one above and
one below the potential repository . strata. Two cases were investigated foreach flow regime, illustrated in Figure C-8. The cross-sect ion dataapplicable to each case are presented in Figure C-9.
In the first regt=e (Cases 1 and 2), flow in the two aquifers wasassumed to be isolated until it reached the upstream point of entry tothe region of interest in the model. At this point, a hydrostatic in-balance equivalent to 305 m of water (achieved by assuming an increase inupstream pressure in stratum 3 to 1403 m of water) was assumed to exist
tbetteen the upper acd lower aquifers (a cendition that could occur ati
specitic sites, although such sites would act be likely candidates forrepositories). Depending upon the permeability of the repository of the
72 c,,Nh'
.-
-.
W
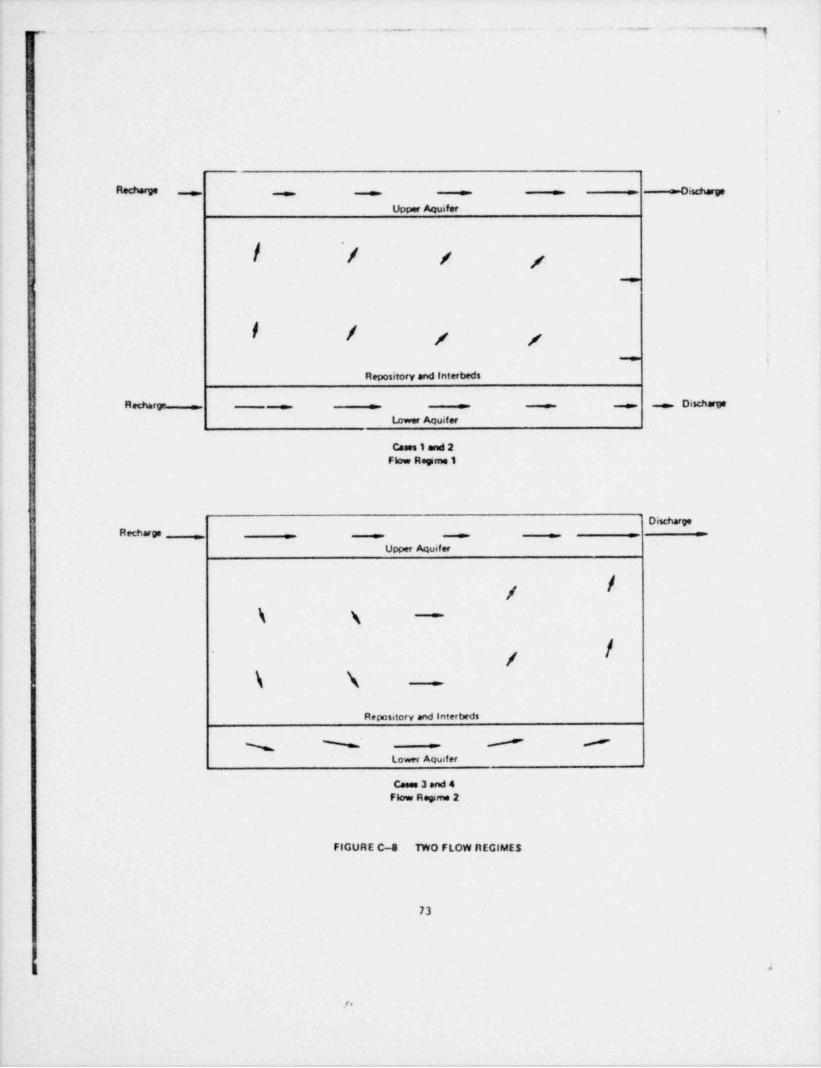
. . . - - . . . . . . . -..
,
1
!
Recharge . . : _ _ - nischarge-
Upper Aquifer
| / / /-
1
| |-- .
Repository and Interbeds
DischargeRedur% - - - :
Lower Aquifer
Cases 1 and 2Flow Reprne 1
DischargeRecharge
_ _ _
-
-
Upper Aquifw
|/\ \
|/\ \ =
Repository and Interbeds
# #% % -
Lows Aquifer
Casee 3 and 4Flow Reyme 2
FIGURE C-8 TWO FLOW REGIMES
73
I -
r.

,_ ., . . . . , , _ _ - , - . . _ . . . . _ . . . . . _ - . . _. _ . - . . _ . . - . - ~ .
[j
di.lv.a
;*ip,-
exl.e
,r; -#'
Upstroom Base Case (No Vertical Flow) %Potential Potentsal(m of Water) Stratum No. Thickness, m Permeatmhty. cm/s Poroerty. % (m of Water)
-
^1.
~ 782 - 1 Aquifer 30 10 35 _ 05'
,
,
' .$i
-
Reposetory and' ,~
930 : 2 Interbeds 305 10 1 1684
,
'1<
Distance 30?A0 m =
1008 3 Aquifer 30 10-5 15 - 336
1 .
Flow Regime Case No.. Change From Base Case
1 1 Upstream Potentist in Stratum 3 increased to 1403 m H O2
1 2 Stratum 2 Permeab hty Decreased to 100 cm/s
2 3 Same es Cass 1
2 4 Same as Case 3 but with Stratum 2 Permeatxtity Decreased to910 cm/s
a
f
6
.,
FIGURE C-9 CRGSSSECTION DATA FOR EVALUATION OF FLOW REGIMES
-r
w,\h74 9
i. . -

p._. __ . ._ ._m . _ _ . _ _ ,, . _ _ _ -
,
b
T2
:q
,
k
repository strata and interbeds, this hydrostatic pressure imbalance
dissipates as vertical flow occurs. The object of this set of calculations
was to ascertain the magnitude of the vertical velocity and the distance,
at which the hydrostatic imbalance is dissipated as a function of assumed'
'
repository strata permeability.
The second set of cross-sectional runs (Cases 3 and 4) used the-
same basic geometry, but flow was assumed to enter and leave only theupper aquifer, with no recharge or discharge into the lower layers.
Depending upon the permeability of the repository strata and interbeds,flow in the upper aquifer moved downward and spreads to the lower
aquifer as well. The primary objective of, these calculations was to-
ascertain the magnitude of the vertical velocity that might exist in
the repository strata and interbeds.
The permeabilities used for the three strata were characteristic
of the range for all of the strata types considered for HLW repositories.
The values used for esch case are illustrated in Figare C-9.
The calculated vertical velocities (Darcy or superficial, rather
than interstitial) in the repository strata are shown in Figure C-10.,
The vertical velocities at the upstream end for the high-permeability
cases (1 and 3) are larger by at least an order of magnitude than those,
'
of the low-permeability cases (2 and 4). But the hydrostatic pressure
imbalance decreases more rapidly in the high-permeability cases, and the
magnitudes of the vertical velocities decrease accordingly. Because of
the more rapid dissipation of the hydrostatic imbalance in the high-
a permeability case, there is a region where the vertical velocities in
the interbeds are actually higher for the low-permeability interbed
case than for the high-permeability case, as shown in Figure C-10. In
Cases 3 and 4, the vertical velocities reverse sign at the midpoint
| between the recharge and the discharge ends. The velocities are symmetrical
[ around the zero velocity point and are higher near the discharge for'
Case 3 (higher permeability) than for Case 4. In both these cases, the
calculated vertical velocity at the midpoint of the interval is less
than 10I ft/ day (Darcy velocity).
75
h
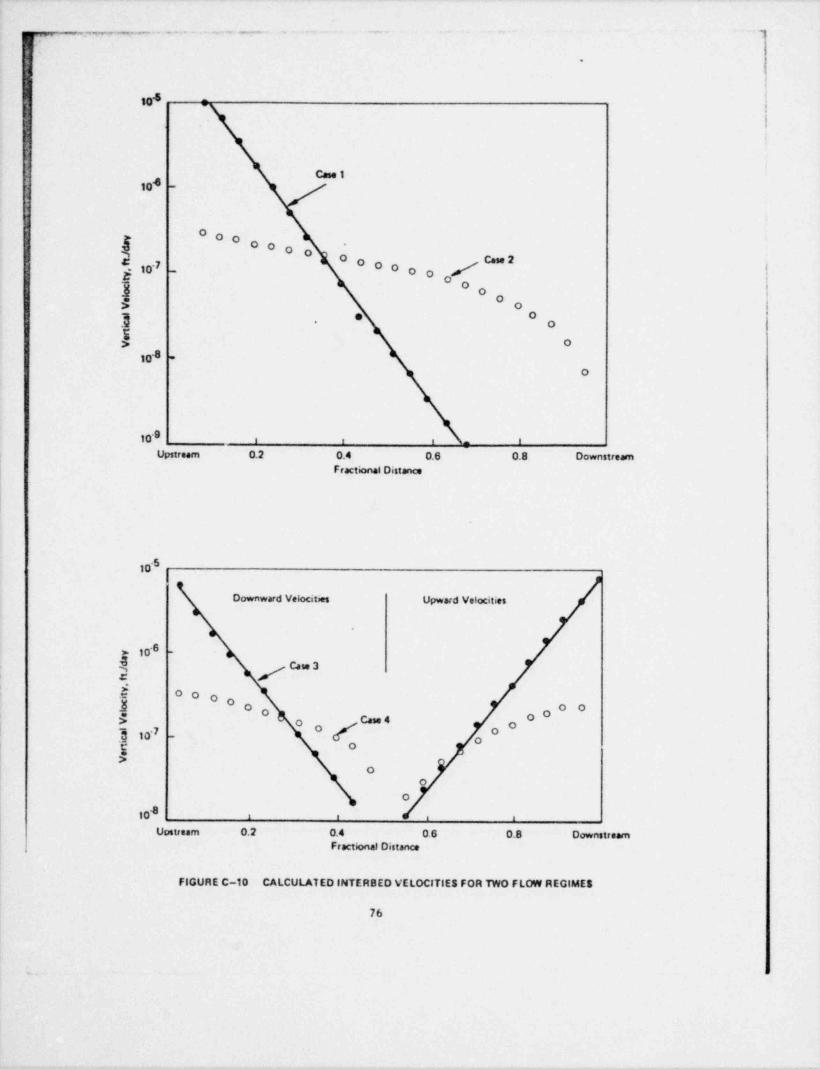
_ . . , - , - . . . . . . ~ . . - , -. q1
.
|
i ,
1 ,
[ 104)
0|r
|
Case 1410 -
0 0 OO O O O O Qw2
- 10'7 - 0 0 / !O O5 *O
|3 00$ 0
3 *O.
I> O
104 *
O
10'8 i e t - 'Upstream 0.2 0.4 0.6 0.8 Downstream
Fractional Distance
-510
Downward Velocites Upward Velocities
> 10'O -
5$ | Qw3k O O O$ O O O O$ C*'* A0 O3 10'7 -
OE o$
Oo
O
410 i ' ' t
Upstream 0.2 0.4 06 0.8 DownstreamFractional Distance
FIGURE C-10 CALCULAT ED INTERSED VELOCITIES FOR TWO FLOW REGIMES
76
-
-- - - ...
II
!
$
The calculated vertical velocities can be compared with what signt| be termed "significant" flows. One definition of a significant vertical
flow is one that would still allow a salt bed to exist over geologic time.A salt leach front (the point at which most of the soluble salt has
[ dissolved) will move at only a fraction of the natural water flow. This
leach-front velocity can be expressed approximately as:
' V , X,P1
4"(1-9)|V
Ps s
|
where:
v = Darcy velocity of water,
vg = leach front velocity,p, = water density,p, = solid salt density,X, = weight fraction of solid salt.
It should be noted that the salt porcsity, 4,, could probably be assumed
to be zero without significant loss in generality.
For typical values in the above expression, the leach front could
move about one-tenth as fast as the water velocity. At a natural
Darcy water velocity of 10~7 ft/ day, the salt leach front would
move only about 30 cm (1 f t)/30,000 years. Leach rates higher by two
orders of magnitude could probably be significant, but could probably not
exist in or near existing salt beds. Nuclide migration at natural flow
rates as low as 10'7 ft/ day should not be significent.since it wouldrequire almost 3 million years to flow 30.5 m (100 ft).
Another type of water movement in the repository strata, although
caused by the presence of the repository, might be terred " natural"flow. In considering potential repositories in certain existing salt
beds, the presence of small pockets or volumes of saturated or super-
saturated brine have been noted. These brine-saturated regions could
migrate slowly toward the repository because cf the temperature gra-
\
o%%g,
_
;-- - .-, ~..- . ~-7.- - . . _ , _ . .. - - - - . . . . , _
dient imposed by the radioactive wastes. Additional dissolution of
salt on the high-temperature side of the gradient, along with recrystal-lization on the low-temperature side, could cause migration of theliquid. Although this migration could create substantial v4.er contactwith the vaste, there would be no additional driving force for watermigration away from the repository.
Similarly, water movement due to thermal stress has been observed
for potential repositories in salt and shale. Again, these low-velocityflows would move toward the potential repository (heat source) ratherthan away.from it.
Even if highly selective siting criteria are applied, there can beextremely slow natural migration of water through the repository strata.If this occurs, then the velocity of this flow would have to be so low,that, even if the nuclides were in soluble form and no sorption tockplace, the migration would not be significant.
A repository containing HLW creates a substantial heat source.
The heat stress thus imposed may cause some fracturing of the repositoryand interbeds and open up a more permeable channel to an adjacentaquifer. Similarly, penetration by exploration or other types of holes,or failure of the repository entry shaf t seal could create a permeablearea above the repository. The importance of these areas of increasedpermeability in terms of nuclide migration is discussed in Section 4.4of this report.
C-4.2 EVALUATION OF LEACH RATES
C-4.2.1 Introduction
Most vaste forms for the radioactive nuclides are heterogeneous,
slightly porous solids. Leachint of the HOW form may include several
simultaneous, interdependent physical mechaniscs. The movement of
nuclides may occur inside crystal lattices, along crystal grain boundaries,
through porous regions, along pore surfaces, and through interparticlevoids and may involve other complex processes at the molecular level.
This movement is generally accompanied by ion-exchange type chemical
78
$

-- . - . . . _ . _ _ _ _ , , , , _ _. . . ~ _ _ . . , . _ , _ _ . . . . _ . . . _ _ _ . . . _ ,
reactions, vaporization and condensation, and dissolution and precipitationof leached isotopes. Typically, leaching rates are higher during initialcontact with water, dropping significantly shortly thereaf ter.
Factors that affect leachability are porosity and fractures in the
solid, temperature of the solid, chemical composition of the storage
matrix material, solubility of the isotope being leached, s.nd charac-teristics of the leaching solution such as pH, salinity, etc. Porosity
and fractures determine the solid surface area directly in contact with
the fluid. Solubility of the waste form depends upon temperature; a
temperature increase of 25-100 C can increase the leach rate and thetotal amount of material dissolved by factors of 10-100. Mor.,t latoratory
measurements have been made at tecperatures at or near 25 C, althoughthe waste material buried in a geologic formation vill probably be at
higher temperatures, in the leach model used for transport calcu-lations, a correction has been made to account for this temperature
effect. Because of the differences in solubility, leachabilities of
various isotopes in the same waste foru material are not the same.
This is especially true of the actinides, as will be discussed inSection C-4.4.
Principally because of dif ferences in experimental techniques,available leaching data are not always in agreement. The InternationalAtomic Inergy Agency (IAEA) adopted a standard procedure for measuringleachability of solids and expressing leach rates. Most of the publishedleach r te data are expressed in grams of solid leached /cm of surface area / dayIAEA has recommended plotting the volume of solid leached as em /(cm )(day),or cm/ day units, or alternatively as the fraction of initial radioactivityleached vs. the square root of time. A good sucmary of test methods andleach data has been published by Mendel.
C-4.2.2 E=pirical Leach Models
'Ihe most cocoonly used e=pirical model for quantity leached isexpressed as follows:
% -
a o\Y
79
'
9

-,m.-_. . - . - . . . -_ - - - y
L
~
Q = at + bt (10)where
Q = cumulative quantity leached,t = time, and
a, b = empirical constants.
The fit of this model to much of the experimental data shows that the ;<
variation of Q is proportional to t for short time periods and linearfor longer times. The above expression for cumulative quantity leachedwould indicate a constant leach rate is approached at lenger times.Pfuch of the data show this behavior af ter leach periods of only2500 days or less.
Leach data obtained at Oak Ridge National Laboratories have beenfitted to the equativn:
at" (11)Q =
A similar expression was used by Zagar and Schi11moeller for their datafor leaching frem glassb As pointed out in this work, when a is 0.5,the constant "a" can be related to a diffusivity in the porous solid.
Investigators at Atlantic Richfield Hanford Company have fittedexperimental data with a polynomial equation, attributing each tern !
.
in 'the equation to the leaching effect f rom a separate mechanism (32)|.
These eepirical leach models fit mush of the laboratory leach data.An important aspect of the problem, however, is how consistent these
.
laboratory data fit in situ waste leach rates. An in situ test has been I
Ithe Chalk River alte in Canada over the last 15 years (33)conducted at .
Data from this work appear to be consistent with the laboratoryleaching data on the same glass forn,as shown in Figure C-ll. A constant
leach rate was achieved in the in situ test after 6-8 years in place.These data show an extremely lov leach rate, stabilizing atabout 5 x 10-11g/cm / day.2
Leach rates at actual waste repositories would be even more complex,because of the substantial temperature effect from the radioactive decay.Based upon the expected temperature decline and changes in surface area
as a function of time, an empirical model for the f_n, situ waste form wasn
durived'in Task E, where:)
'
8O
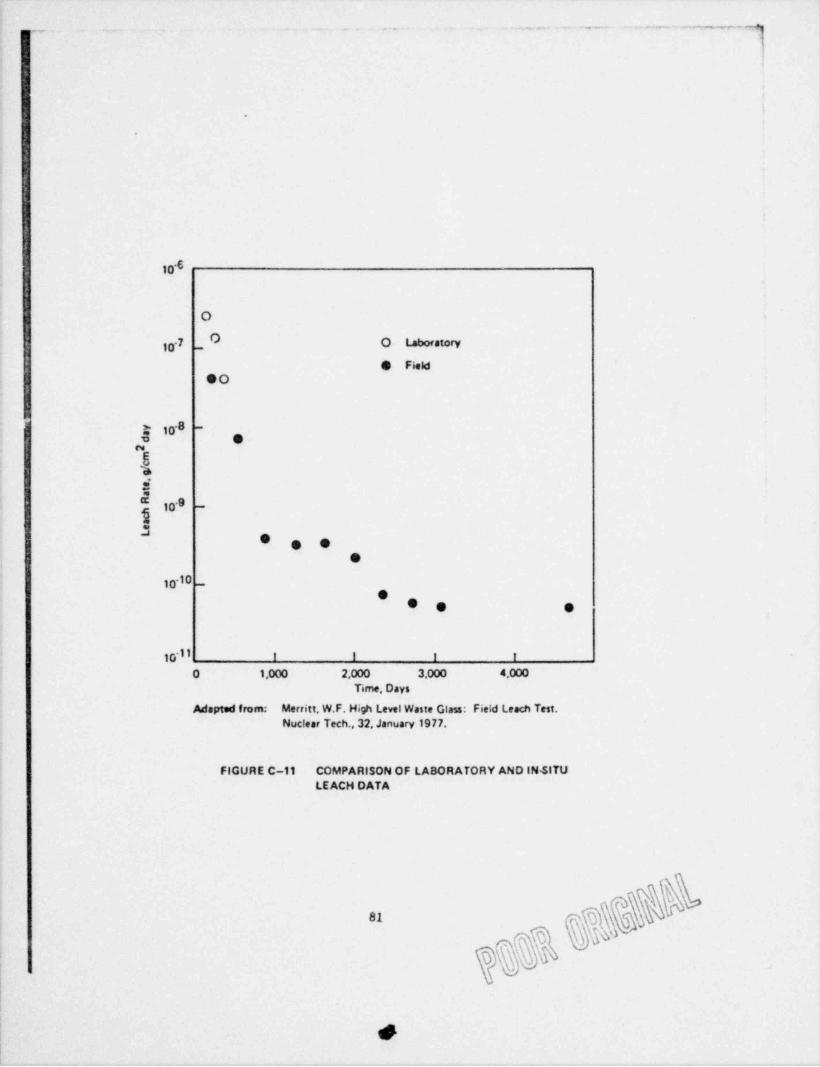
.. _ _ _ . , . . - . _ . - -.~__.___-m
!
10'6
O
10'7 O Laboratory-
e FieldOO
- g go8 -
y e8bd%
"g 10'8 -
.s * e ee
10 10 _
e* e e
10'11 f I I I
O 1,000 2,000 3.000 4.000Time, Days
Adapted from: Merritt, W.F. High Level Waste Glass: Field Leach Test.Nuclear Tech.,32, January 1977.
FIGURE C-11 COMPARISON OF LABORATORY AND IN. SITULEACH DATA
s
'
.

- j-
s :
I'
-
,
(1) For glass forms (standard and devitrified) the fraction leached
is proportional to the logarithm of time af ter water conta c
has occorred.
(2) For calcine forms, the fraction leached increases linearly andrelatively rapidly after water contact has occurred. No benefit
in terms of a decrease in leach rate due to decline in decayheat was assumed.
In addition, many of the radioactive nuclides in the actinide chains have
extremely limited solubility. Nuclides in other than the actinide chain can
also exhibit solubility limitations. Under oxidation-reduction conditions
existing in the natural groundwater, several nuclides might exist in a
relatively insoluble form. Such nuclides include Tc-99 and Np-237, whichunder some circumstances would not be strongly adsorbed. In the actinide
chains, U, Pu, Th. Am, and others might also be in a very insoluble form.Consequently, even though the waste form leaches, the nuclide may be presentin an i= mobile, insoluble form. The importance of this solubility limitatior
in the migration of the actinide series has been examined and the results
are discussed in Section C-4.4.
C-4.2.3 Theoretical Leach Models
Virtually all of the theoretical modeling efforts are solutions to'
one-dimensional dif ferential equations in linear, cylindrical, orspherical coordinates.(34) These equations describe dif fusion in a
slightly porous solid with decay and formation of radioactive isotopes;in these equations, dissolution of the solid is important. The resultingsolutions are complex because of the form of the equation and the initialand boundary conditions.
Solutions to the one-dinensional differential equations for theoret-
ical leach rate are consistent with the empirical models . ( 5),
These
solutions show an initial leach rate that decreases rapidly with time andleter becomes constant. The advantage of the theoretical solutions is
that the constants can be interpreted as phys' cal quantities, such as
the diffusion coef ficient.
82

4
i
The approach in modeling geosphere transport has been to use theleach rates defined in Task B. Two computer runs investigating different
j assumptions about waste leaching were made. One run was consistent with
!, Figure B-42 of the Task B report for the amount of glass leached as afunction of time. That curve represented a leach rate decreasing withtime only because of the changing surface-to-mass ratio. No separatecorrection for the temperature effect was made. The second run assumed
that the initial leach rate had been increased by a factor of four by therepository temperature increase. In this run, leach rates beyond 4000years were less chan those shown in Figure B-42 to remove some of the
conservatism. The fraction of the waste leached as a function of timefor both runs is plotted in Figure C-12.
C-4.3 GEOSPHERE TRANSPORT THEORY ASSESSMENT
As previously mentioned, the objective of this study has been toinvestigate non-site-specific parameters important in mitigatingradionuclide transport in tha geosphere. Formul. tion of the cases to be
examined with the model is strongly dependent upon this non-site specificity.A distinction should be made regarding the range of v61ues for in-
dividual parameters (permeability, porosity, adsorption, etc.) needed to
describe the classes of generic sites and the uncertainty in the identityof these same parameters once a specific site is selected. It. the former
case, the parameters might need to span the range of salt, basalt, granite,
and other types of formations. For the specific site case, a different
range of parameters may be needed to describe the uncertainty remair.fugsubsequent to a measurement program. Modeling by the petroleum industrysupports this conclusion.
>
These petroleum models solve a broad range of equations for simulta-neous three-phase flow, energy considerations in enhanced recoverymechanisms, multicomponent oil phases, and other complexities. In addition,a n cher of laboratory measurements, as well as in situ tests, are made in
83
-
4
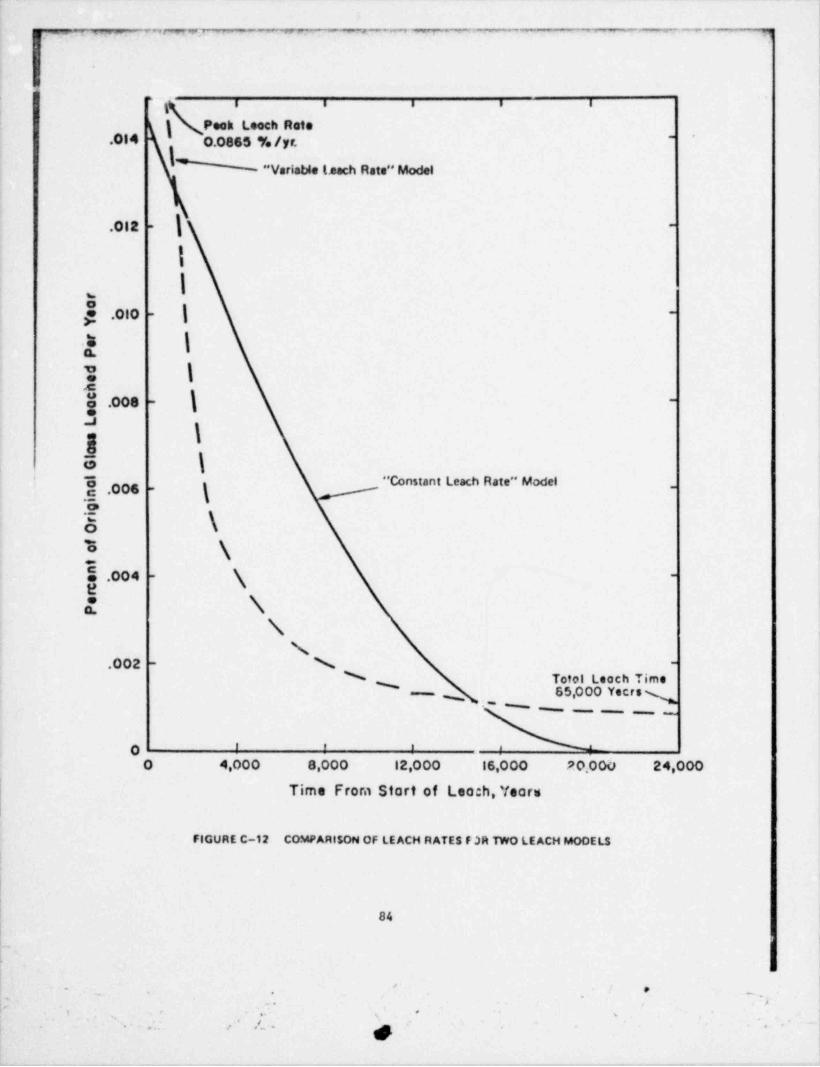
- .,- --,m,- - , , . r -- -- - _ -- - - - - -
4
': i i ig
} Peak Leoch Rote' .014 0.0865 % /yr. -
" Variable L.each Rate" Model
.012 - -
1
\* 010 ~-.
{.eQ.
\",e
k$ .008 --
.3\-
85 \
" Constant Leach Rate" Model, .
o
3 \'
\E .004 -
\-
e2 \
NN
N.002 - -
N Totol Leoch Time65,000 Yectss
* --- - - _ _
' ' ' '0O 4,000 0,000 12,000 16,000 20,000 24,000
Time From Start of Leo:h, Years
FIGURE C-12 COMPARISON OF LE ACH RATES F 3R TWO LEACH MODELS
84
'-
*-.
.
e #
$ % %
... . .c . 4

. ,
order to provida background data for these models. Significantly few, ifany, purely predictive models have been developed. On the contrary, themodels are first required to fit existing history concerning a specific
,
reservoir. Use of such models generally involves four steps:(1) Compile data concerning both the geologic description of the-
reservoir and the fluid properties.(2) Utilize these data in the model, and attempt to match model
output with the reservoir performance hiatory. (%1s would'
include production of oil, ga9, and water at each well, alongwith measured pressures with the wells either producing orshut-in).
(3) Adjust these data as necessary and to the extent consistentwith the geologic description in order to obtain the bestmatch to the existing reservoir history.
(4) Predict future reservoir performance.Petroleum industry reactice is cited to emphasize that uncertainty
in both field and laboratory measurecents is well recognized. nis doesf
not imply that the measurement itself is traccurate, but rather that it ||1s impossible to use these point-value measurements (whether laboratory
or i_n, situ) as necessarily representative of a geologic transport
response over an area of the size of a repository. Mathematical predic-tions for non-site-specific areas or for geologic strata for which theavailable data are limited must have considerable uncertainty. Sensitivitycalculations are, therefore, requi ed for a range of :he parameters impor-tant to the transport process.
We complexity of a model suitable for such non-site-specific calcula-tions is an important consideration. %ere is a potential for error inusing too sophisticated a model, thereby perhaps hiding some of the
uncertainty that actually exists, or in using too simple a model that maynot include potentially important parameters. De results of a rathercomplete revicw of models that could have application in radic2etivenuclidetransportwillsoonbepublishedh
C-4.3.1 Hydrology - Radionuclide Transport Model Review
An extensive review of hydrologic models has been completed by theHolcoe.bResearchInstitutewiththesupportofEPAh Resnits from this
85
'.
.
7
i
survey are not yet available in published fern, but summaries and conclusions
from that review were discussed with members of the review team.This review was quite comprehensive and conducted on a worldwide basis.
Questionnaires were mailed to groups known to be working in the field ofhydrology soliciting information concerning the types of modela developedand available. Later, workshop sessions were held at three locetions inthe United States in order to obtain additional information regarding
Those modelsactual applications and limitations of existing models.useful for geosphere radioactive nuclide transport are discussed here.
Any model to assess nuclide tr,ansport has two essential parts,(1) the aquifer flow; and (2) the transport, dispersion, sorption (including
Theseprecipitation), and radioactive decay of nuclides in this flow.Two criticaltwo parts can generally be uncoupled and solved independently.'
factors must be considered, however, before such uncoupling can be permitted.
The first critical factor to be considered is the concentration of theradionuclides. If the geologic strata represent a viable renository,nuclide concentrations will have to be so very small that they will notaf fect the density or viscosity of the water.
The second factor is the amount cf heat that will be generated as aTheresult of the energy released by decay of the radioactive nuclides.
density and/or water viscosity could be af fected by increases in temperature
and could ir.itiate natural convection. Since the leached nuclides shouldbe at trace concentrations in the water, however, the heat generation withinthe flowing water should be negligible, thus removing this possible barrier
This latter effect would not normally be negligible, butto uncoupling.it wou11 insteadinstead of coupling the water flow and nuclide transport,
couple flow with energy balance.The following comments are a summary of the review of available
models for geosphere nuclide migrations:A number of hydrologic flow models are available that consider(1)a rather complete range of spatial dimensions, inhomogeneities,
anicotropy, and other factors.
i
s
i
36.
, _ - ' ''* " ' " _ , _ '_ ' . ' . .A %FN'Y s " ,
m' ia_ . ,, . ,A _
'~1- r; - - - _-

i--
(2) A number of constituent transport models are also availablethat are less general than the flow models but are quiteusable for consideration of trace-level constituents thatunder8o simple radioactive decay.
(3) Only two models appear to include both the decay and growthexhibited during parent-daughter radioactive chain interactions.*These two models are quite different in approach.
One, developed at Battelle Northwest Laboratories, representsan analytical solution to the set of one-dimensional partialdifferential equations describing dispersion, sorption,convection and radioactive growth, as well as decay, of each
nuclide .(37) Since it is based upon an analytical solution, thismodel is limited to the following:
(a) Dissolution of the waste form at a constant rate(radioactive decay of the waste form is included).
(b) Water flow at s constant velocity.
(c) Trace levels of the nuclides are present, so non-
interactive equilibrium sorption can be assumed.(d) Hydrodynamic dispersion is treated as constant and
one-dimensional in the axial flow direction.
Other constituent transport models have been used by various authors*
to analyze radionuclide migration; however, these do not appear to
have included the interaction of complete parent-daughter chain reactions
(e.g., see (35) and (33)). It should be noted that most models that
include nuclide source and decay te .s could be used for fall parent-
daughter chains by a successive application of the nuclide balance
through the entire chain. Examples of models that have used this
concept include (39).
87,
"%, . . .=- .s . . _ _. - - - + - _ ,_ _, _ _ -_a- . . , - - _
_?_ ix : 4 '_w'.~
s n -' *_ . . a L 2 -
^ .'__ . a 'd2, - .

_
When restricted to constant flow velocity, the flow model can beuncoupled from the transport code, and the constant velocitywould be reduced to a simple steady-state flow approximation.For situations where the water velocity is not constant, however,the model could be used by assuming a representative, compositeaverage flow.
,
The other model, which includes complete geosphere transport ,
and decay chains, is one recently developed by INTERA EnvironmentalConsultants for Sandia Corporation on behalf of the U.S. NuclearRegulatory Commission (MRC) .(40) A briof summary of this model
appears as Appendix C-II of this report.
This model represents a numeriqa1 finite-difference solutionto the set of partial differential equations describing geospheret rans po rt. It uses second-order, correct spatial finite-dif ference
forms to eliminate numerical dispersion, although in doing so,
it places a limitation on the size of the grid block and the
tima step that can be used. The model, similar to the one
previously described, allows for hydrodynamic dispersion,sorption, convection, and the nuclide chain radioactive
!
decay and growth. This model offers considerably more flexibility, I
in that it is multidimensional and handles inhomogeneous geologicstrata or groups of strata. Moreover, the model c( uples the nuclide
transport code with a complete multidimensional water flow model. .
This model still assumes trace levels of radioactive constituents,
so the sorption properties can be treated as if in equilibrium
and non-interacting. Furthermore, the model can be used to examinethermal cor. vection effects or a constituent that af fects waterdensity, since it includes a total-energy balance and a major-
constituent balance.
For the present application involving geosphere transport, most of
the assessment was made for a one-dimensional geosphere pathway. As aconsequence, either the analytical transport model or the numerical
'transport model described above could have been used for the calculations.
|Actually, both codels have been used for this study: the analytical model
,
88
i
e
'--Wyn q ,. 7w--
5 q. . --
; --
-
for simple sensitivity calculations, and the more flexible numerical modelfor the actual inhomogeneous migration path from the repository to the ;
aquifer. Tuo scenarios have been calculated with the numerical model toprovide concentrations to the biosphere path,ey models for dose-to-mancalculations in Section C-5.
Most, if not all, of the models included in this review and discussedabove use a " continuum" approach (transport through a non-fractured porousmedium). Much of the transport in the immediate vicinity of a potentialrepository may be in multiple-channel frartured media, however. Further- ;
more, many potential repository rock types can exhibit natural permeabilityand/or flow characteristics based upon a fracture system. Nevertheless,many of the natural fracture systema containing petroleum reserves havebeen modeled using a continuum approach. Cas production in a number ofplaces has also been modeled with a continuum approach through a dualporosity system, with the fracture system characterized by significant perne-
ability despite a low porosity. Such fractures com=unicate by a diffusionalmechanism (cap 111arity, heat conduction, or component diffusion) with arock matrix that has porosity, but essentis11y no flow permeability.
The Office of k'aste Isolation recently sponsored a workshop on
" Movement of Fluids in Largely Impermeable Rocks".(41) The discussionfocused on water movement, largely through fracture systems, in low-
permeability rocks. One of the tasks in this workshop was to investigate
the role of numerical modeling in evaluating transport of chemical species
and heat in such an environment. The participants concluded that longer-term
effects (1000-1 million years) could perhaps be simulated by continuum
models. Shorter-term ef fects, however, might require models that include
the actual f racture networks.The mathematical description of laminar water flow in fractures
is not fundamentally different f rom that of continuum flow through aporous rock. That is, in both cases the flow velocity is proportionalto the hydraulic gradient (Darcy's Law). However, the permeability termin Darcy's Law then becomes proportional to a power (usually the square)of the fracture spacing. Thus, the question of fracture model versusthe continuum model for v ter flow is not a difference in model type
but rathe r a dif ference , how to characterize, from either deterministic
or stochastic considerations, the fracture spacing, width, and geometry.
89
, -
- .- , . w -a w _ _ - - -. ?- - - _- ;. __ _
- *. .\ ~'* '
_ _ _ 3_
.
..
Mathematical description of the nuclide transport would bedescribed essentially in the same way, whether the flow were in fracturesor in a porous medium. If the matrix blocks are not porous, only transportin the fracture system would be calculated. Nuclide adsorption on thefracture face would need to account for a different ratio of surface areato volume than for porous systems. In the case where the matrix blocks
'
include effective porosity, a dual porosity approach would be necessary.In this case, diffusion of nuclides inte the matrix blocks slows the net
transport rate of the nuclides in the fracture. In the present study, a
continuum model has been used to calculate the water and nuclide transport
in both porous and fractured systems. The ef fective porosity of thefracture systems has been assumed to be small, and no dif fusion into matrixblocks has been included. This is a conservative approach, in that it
allows the nuclides to move slightly faster than they actually would.
In the modeling used for this analysis of geosphere migration forfracture systems (whether naturally present or created subsequent torepository installation) the fractures are assumed to offer the permeabilityfor transport'but to have quite lou porosity. Consequently, the rate ofnuclide migration in these fractured regions can be significantly higherbecause of a higher interstitial or transport velocity. Another factorthat increases the transport rate of the radionuclides is the reducedadsorption that could take place on the fracture surface.
C-4.4 HIGRATION OF RADIONUCLIDES IN THE CE0 SPHERE
C-4.4.1 Introduction
C-4.4.1.1 Modeling Concepts'
In Section C-3.4 conceptual models were developed that are repre-
sentative, in a generic sense, of geologic media that could serve for HLWstorage. These potential repository strata icelude bedded salt, twotypen of shale, basalt, and an intrusive salt dome. For nuclide migrationmodeling, the essential aspects are the presence of adjacent aquifersabove and/or below the reposicory strata and the coccunication that existsor could develop between the repository formation and these aquifers.The interbedded layers between the repository strata and the t.quifer(s)also are an important part of this flow regime.
Each of the conceptual geologic models shown in Section C-3.4 isamenable to a similar type of calculational model for geosphere transport.This is illustrated in Figure C-13 as one-dimensional migration both in
90
~
''7 ,--r, - y -- (""' - -
" ' - ' .~~
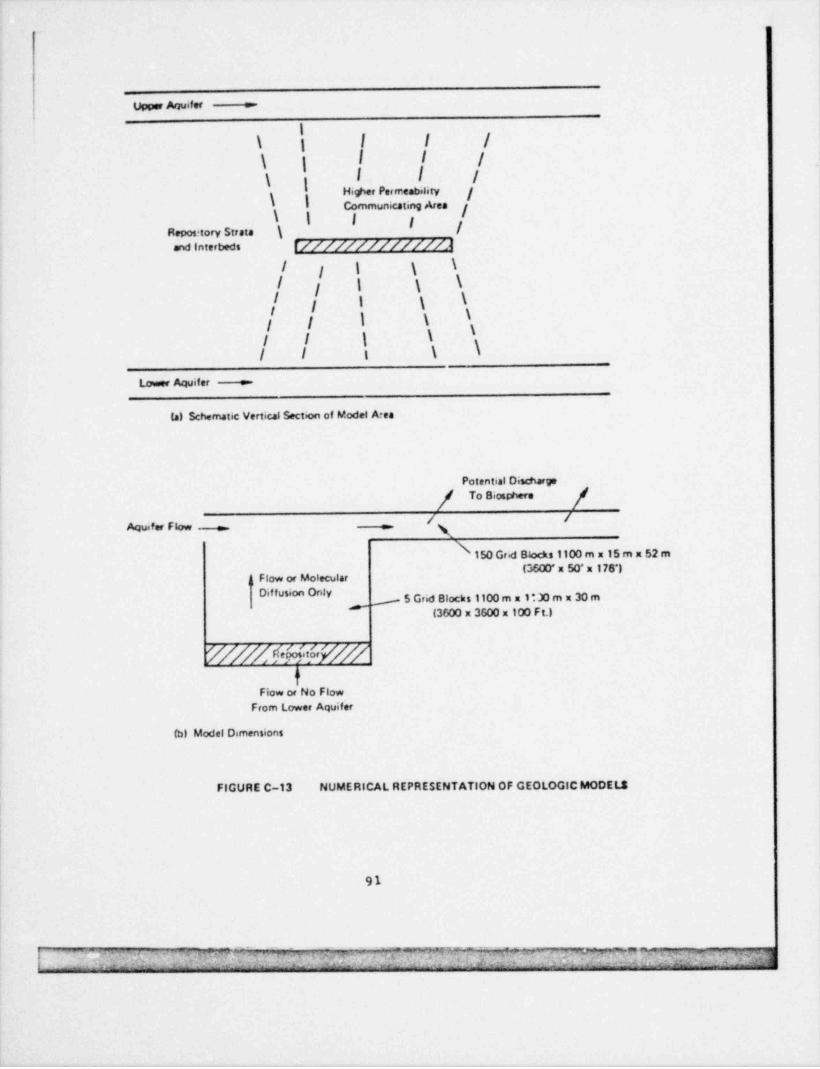
Upper Aquifer :
I\ l l I /
I / j\ | I I |\ gHigher Perrreability /Communicating Area 7I l l i
Repository Strata \ /and interbeds /////////////
y 1 \ \Ij t \ \/
[ / 1 \ \/ / I \ \
\I I \ \/ / i \ \
Lower Aquifer -
(a) Schematic Vertical Section of Model Area
Potential Discharge
[ To Biosphere/ /
Aquifer Flow -
\ 150 Grid Blocki 1100 m x 15 m x 52 mG600' x 50' x 178')
Flow or MolecularaDif fusion Only
-- 5 Grid Blocks 1100 m x 1:Jo m x 30 m,
(3600 x 3600 x 100 Ft.)
W/M %&W/#t
Fiow or No FlowFrom Lower Aquifer
M Model Dimensions
FIGURE C-13 NUMERICAL REPRESENTATION OF GEOLOGIC MODELS
91
- =cm-- ,_ , -- n- - ,, _, _
' vf. _ _.
' ; 1_; ,3, ,(: . n

.
the repository and interbedded strata, and in an aquifer. Although the
geometry modeled. appears more characteristic of the bedded geology, eventhe intrusive geologic models are not significantly dif ferent. The path-
way still involves movement through a region of higher permeability, whichmovement has been induced in the repository strata, with the nuclides
ifinally reaching an aquifer for horizontal migration. For modeling, there j
'
is little difference between the five geologic types as long as a continuum
approach is used to represent a fractured area. In the numerical trans-
port model the following factors can be included:
(1) Extremely low-velocity natural water flow in the
repository strata.|
(2) Possibility of cocaunication, because of thermal
stress or disruptive events, from the repositoryto the upper, lover, or both aquifer (s).
(a) This con:munication could consist of liquidcontact, but no flow, with liquid diffusion
of nuclides to the aquifer. |
(b) The cocnunication could allow a small flowfrom the aquifer down into the repository
;
and returning to the aquifer because of the
natural gradient in the aquifer.
(c) The coccnunication could allow flow from oneaquifer to the other through the repository !if there is a hydrostatic imbalance between
the aquifers.
'(3) Sorption of nuclides can be included or neglected in therepo itory and interbed layers independent of sorptionin the aquifer.
(4) Discharge from the geosphere to the biosphere can becalculated at many points along the pathway within theaqui.er.
In the analyses, properties of the communication area, as well as thoseof the aquifer, were varied in order to show the importance of theseeffects in geosphere transport.
92
:W, _ - . . . - --
- - - "-' " *.,
| _ s _ ., _ . _ __- > ~ ' _- - - w
'
6
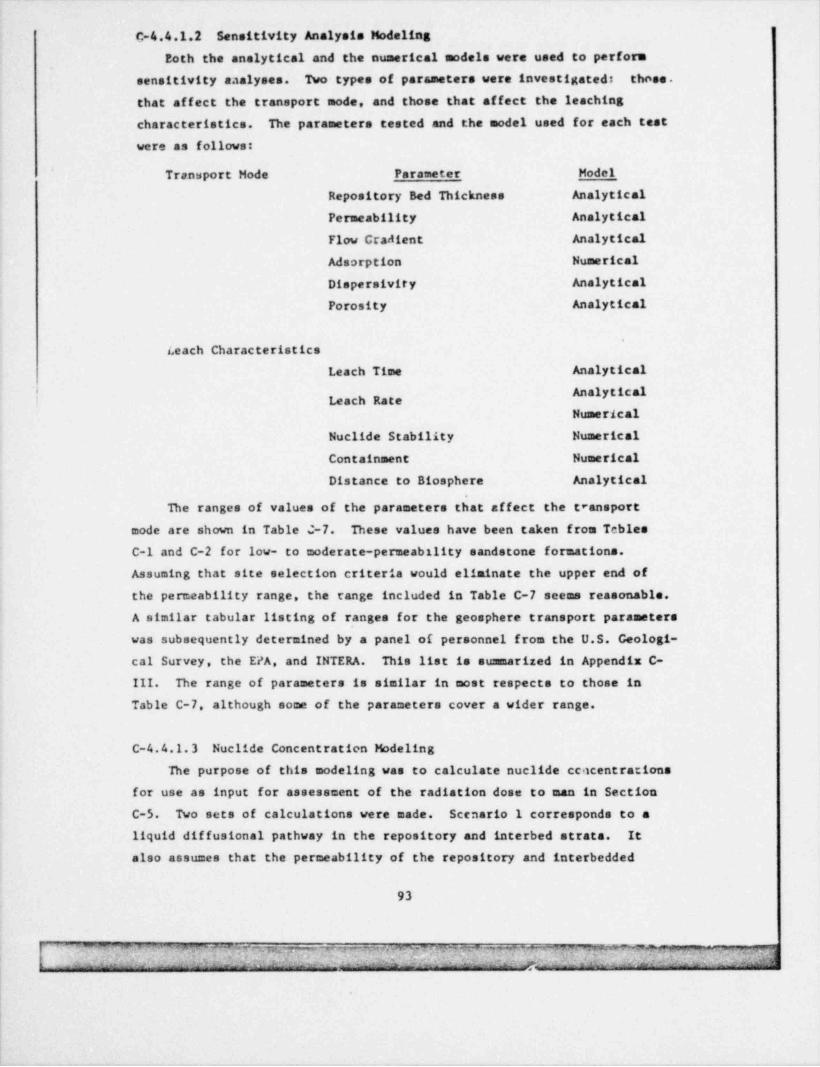
C-4.4.1.2 Sensitivity Analysis Modeling
Eoth the analytical and the numerical models were used to performsensitivity aaalyses. Two types of parameters were investigated: those.
that affect the transport mode, and those that affect the leaching
characteristics. The parameters tested and the model used for each testwere as follows:
Transport Mode Parameter _ Model
Repository Bed Thickness Analytical
Permeability Analytical
Flow Cradient Analytical
Adsorption Numerical
Dispersivity Analytical
Porosity Analytical
Leach CharacteristicsLeach Time Analytical
^"" I **Leach RateNumerical
Nuclide Stability Numerical
Containment Numerical
Distance to Biosphere Analytical
The ranges of values of the parameters that affect the transport
mode are shown in Table 0-7. These values have been taken from TeblesC-1 and C-2 for low- to moderate-permeability sandstone formations.
Assuming that site selection criteria would eliminate the upper end of
the permeability range, the range included in Table C-7 seems reasonable.
A similar tabular listing of ranges for the geosphere transport parameters
was subsequently determined by a panel of personnel from the U.S. Geologi-
cal Survey, the EPA, and INTERA. This list is summarized in Appendix C-
III. The range of parameters is similar in most respects to those in
Table C-7, although some of the parameters cover a wider range.
C-4.4.1.3 Nuclide Concentration Modeling
The purpose of this modeling was to calculate nuclide ccacentrations
for use as input for assessment of the radiation dose to man in Section
C-5. Two sets of calculations were made. Scenario 1 corresponds to a
liquid diffusional pathway in the repository and interbed strata. It
also assumes that the permeability of the repository and interbedded
93
-
: a., . . , . ng , ., .7,.,. . , vag n- - - . -,, . , . . . , , ,
a _., _,,i' , < .- . ia - ~f. *'h. S '' -- ' ' -' ""

|
!,
t
TABLE C-7
CEOSPHERE MICRATION PARAMETERS AFFECTING TRANSPORT
Parameter Range
"ariable Aquifer Comunicati' en Area
Thickness, m (ft) 15-45 (50-150) 150-450 (500-1500)-6 #Permeab(11ty*, cm/s 10 -10 10' -10"
~
(ft/ day) ~3 -6~
(2.8 x 10 -2.8 x 10 ) (2.8 x 10 -2.8 x 10- )
FI2v gradient,
m/m (ft/ft) 0.01-0.1 0-1.0
Adsorption, Kd (nl/g) (0.1-1.0)x(normal)** (0-2.0)x(normal)**
luspersion, m (f t) 6-60 (20-200) 60 (200) '
Porosi'ey % 15 1-10
* Vertical permeabilities were one-tenth that listed.
tFracture permeabilities in comunication area varied from 10- to10~S cm/s, and porosity values (including fracturing) were alwaystaken as 0.01.
**See Table C-3.
94
i
e-e.. qtene*-'"4 , ' { P '* ',.
~ ~ ~ --- , - - - - , ,-,7-ci,....-, ~ ,% , 47_ # t -% .,
. . . . ._ - .. .. w - ~

strata has been increased by |racturing to 100 times higher than normal.The scenario also uses the most permeable aquifer and highest flow gradientto develop the greatest case flow condition in the aquifer. The 100-foldincrease in permeability for an interbed region permeability (conductivity)of 10 cm/s assumes that a fracture of 0.1 mm every 3 m has been crestad~
throughout the region above the repository. The leach rate has been chesenas that for a standard glass waste form, with no solubility limitation.The throwaway cycle vaste started leaching at a vaste age of 200 years." Normal" adsorption (defined by the retardation factors) was used.
Scenario 2 utilizes the same aquifer flow conditions, but is basedupon what might be termed a " worst probable" case. It consists of |connecting a lower aquifer to an upper aquifer by flow through therepository.
Analysis of these two scenarios identified the nuclides mostimportant in the migration pathway. These nuclides tend to hsvesimilar characteristics, such as:
e low adsorption,
e long half-life,
they, or their parent components, are present ine
large initial amounts.
Migration of most important nuclides, such as: Np-237. I-129Sr-90, Ra-226 Cs-137. Tc-99 (when no adsorption is assumed) and someof the plutonium and uranium nuclides, is discussed in Sections 4.4.3.2and 4.4. 3. 3.
C-4.4.2 Results Using Analytien1 Model
With the analytical model, the sensitivity analysis examinedprimarily the following input variables:
e leach time,
hydrodyaamic dispersivity (a multiplier that is appliede
to velocity to produce a total dispersion coefficient),water migration rates (in turn a function of permeability,o
porosity, and hydraulic gradient),
95
99 ,- 7-m -.- , -._.,m+- . . , , - ~, .- ,.
' 1;- - >' a . . . . , , , _ .
h

e repository and interbed thickness, and
e distance to discharge to the biosphere.Two output values are important: (1) the initial arrival time at a
given distance from the repository, and (2) the dilution in nuclide
concentration that occurs during migration. The arrival time is most
affected by water migration rate and nuclide adsorptivity. Dilution isaffected by both these parameters and is also sensitive to leach timeand hydrodynamic dispersivity.
The partial differential equation describing nuclide transport and
the analytical solution for a single decaying adsorbing nuclide are
shown in Appendix C-It. When decay is not significant over the traveltime of the nuclide, the analytical solution'can be reduced to anextremely simple form for evaluation of arrival and dilution time:
Initial Arrival Time, r
LRd(12)r =
yv
where
distance to biosphere discharge,L =
adsorption retardation f actor, andR =d
v, the interstitial water velocity,=
Dilution v T
C,erf[g gh/ 4/a/L ]E (13)C =
dwhere
C the maximum concentration at L.=
C, the boundary concentration at the repository,=
the leach time,T =g
the hydrodynamic dispersivity, anda =
erf (x) = the standard tabulated error function.The approximate dilution expression above can be derived from the
analytical solution given in Appendix C-IIby noting that peak concentra-tion vill occur at the midpoint of the traveling body of material. These
expressions can be used to obtain a sensitivity analysis of several
variables.
96
-%."f--
-- .j, ,
- - 'y ~ :,, .
- . -
- 4: ,,.;: ' *. , sa.- ,_ c .
In all calculations, the repository geometry was assumed to be
constant and consistent with the repository handling wastes from reactors
charged with 50,000 IfnDf. For heat dissipation, the site was assumed tohave a loading of 150 kW/ acre. In the calculations for this study, thewaste was assumed to occupy a 300-acre site.
Table C-8 surmarizes the I-129 arrival times and relative concentra-tions at specified points. Iodine adsorption is zero. The two water
velocities correspond to the highest levels listed in Table C-7 for
conditions in the aquifer, i.e., a hydraulic permeability of 10 ' cm/sec,~
a gradient of 0.1 m/s, and a porosity of 15%; and to the lowest values,-6which are 10 cm/sec, 0.01 m/m. and 15% respectively. The travel times
to a point 1.6 km (1 nile) distant from the repository range from 77 yestsup to almost 77,000 years.
The masses of the significant actinide and fission product nuclides
initially present in the repository are listed in Table C-9. The mass of
I-129 present for the throwaway cycle is 1.16 x 10 g. The flow for a
15 m (50 ft)-thick aquifer over an 1100 m (3600 f t)-wide repository wouldbe approximately 144,000 liters / day and 144 liters / day for the high- andlow-flow cases, respectively. Consequently, if all of the I-129 is assumedto be leached at the high flow rr.te in one year, the average concentrationwould be 0.22 g/ liter and if leached in 100 years, the average concentrationwould be 0.0022 g/ liter. This results from the initial concentration being
inversely proportional to the product of water velocity multiplied by leach
time. T' ef fect of leach time on initial nuclide concentration is illustra-ted act.matica11y in Figure C-14. Thus, for a leach time of one year and a
dispersivity of 3 m, the maximum concentration of I-129 at 8 km (5 miles) from
the repository would be 0.0084 g/ liter. On the other hand, for the longerleach time of 100 years, even with no dispersion in the geosphere transport
path, the maximum concentration would be 0.0022 g/ liter. This is simply anindication that, for a soluble, non-sorbed, long-lived nuclide such as I-129,
the important reduction in nuclide concentration is due to the leaching rate
limitation. In case of the larger dispersivity of 30 m, the concentrations of
I-129 at 8 km (5 miles) distant f rom the repository are 0.0026 g/ liter and 0.0019
97
, ;- - ,, . - _ --
7 7 - ->- - -. 3, - .w- _
..
- - - <' - -
,y, _
_ ; . _ _ . e . -: d,

*no 5i - -
) et 0 0s va 2 1e i r 8 2l t t 8 2 0 0 x x 3 1 8 2i a n 3 1 0 6 0 0 3 1
0 0 0 8 8 2 0 0 0 0m l ee c
5 R n 0 0 1 0 3 1 0 0 0 0( o
Cmk e
m8 i)
- Tr 8e y 3 6c l( 8 3,n a 3a v 3t i 8 .s r 3i r y
rD A tn*
n eS o 5 rN l i - - aO e et 0 0 fI l va 1 1 iT i i r 5 7 uA m t t 5 7 0 6 x x 8 2 5 7 qR an 8 2 0 9 0 0 8 2 aT 1 l e 0 0 0 9 5 7 0 0 0 0N ( ec tE R n 0 0 1 0 8 2 0 0 0 0 aC m oN k C nO oC 6 e im tE 1 i) aV - Tr rI e y _t8 T c l( 7 _n- A n a 7 4 eC L a v 7 cE t i 6, nE R s r oL i r 6
B D D A cA N oT A t
S y eE t viD v itT i as) 3 0 3 0 3 0 3 0 3 0 lL rm 3 3 3 3 3 eA e( f( f{ j) rV p
I s eR i cR D nA at9 s
2 e i1 m d- iI T) cr I 0 0 0 ihy 0 0 0 fc( 1 1 0 ia 1 ce e
l ps
tr ae)t y naa oWd i
/ tl m aac 5 5 ri ( 7 7 tt 5 ni y 5 0 et t 0 csi nrc oeo Ctl *neI v
$
; , .\) '
< )
h: V;,
t, ' )
. ' , I ' ,[ - t m
$
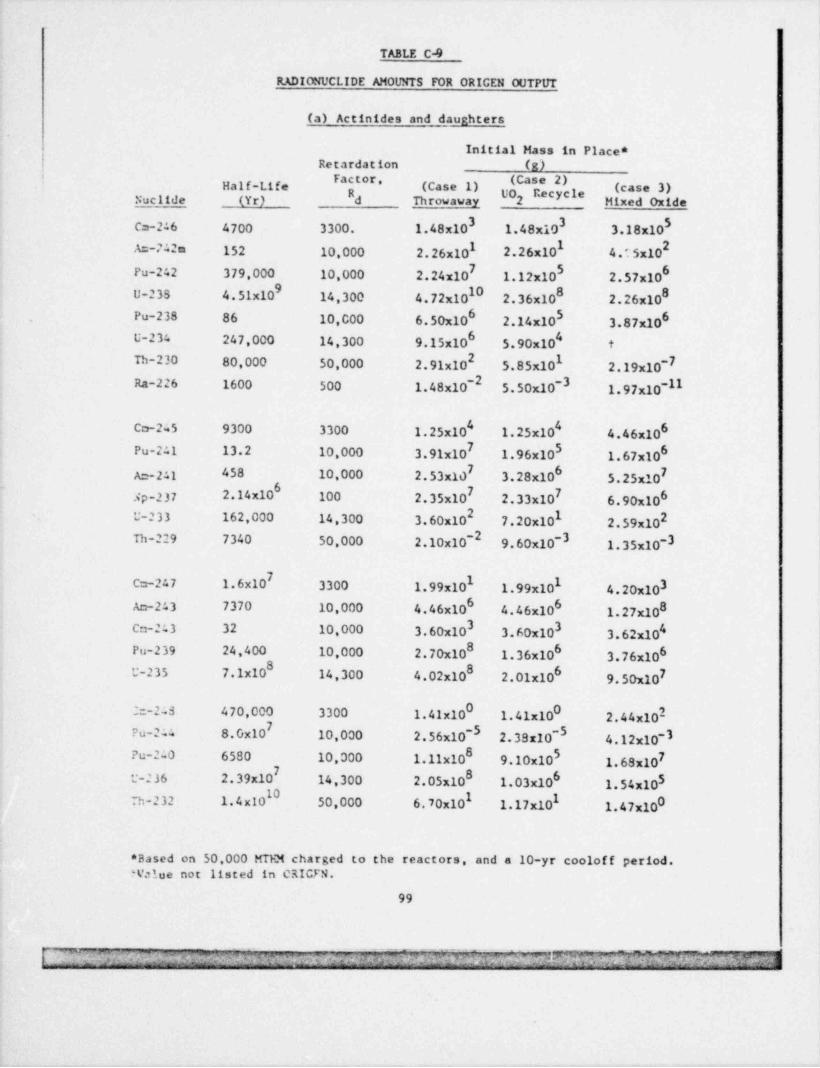
TABLE C-9
RADIONUCLIDE AMOUNTS FOR ORIGEN OUTPUT
(a) Actinides and daughters
Initial Hass in Place *| Retardation (g)' ^C ''Half-Life (Case 1) (case 3)y g,cycy,
Nuclide (Yr) d Throwaway 2 Hixed Oxide3 3C=-216 4700 3300. 1.48x10 1.48x10 3.18x101 1 2A:-242n 152 10,000 2.26x10 2.26x10 4. ". 5x10
6Pu-242 379,000 10,000 2.24x10 1.12x10 2.57x10⁹ 10 8 8U-23S 4.51x10 14,300 4.72x10 2.36x10 2.26x10
6 5 6Pu-238 86 10,000 6.50x10 2.14x10 3.87x10⁶U-234 247,000 14,300 9.15x10 5.90x10' t
2 1Th-230 80,000 50,000 2.91x10 5.85x10 2.19x10⁻⁷-2 -3Ra-226 1600 500 1.48x10 5.50x10 1.97x10-II
4 6Co-2 5 9300 3300 1.25x10 1.25x10' 4.46x10⁵ 6Pu-211 13.2 10,000 3.91x10 1.96x10 1.67x10⁶ 7A=-241 458 10,000 2.53x10 3.28x10 5.25x10
7 7 6Ap-237 2.14x10 100 2.35x10 2.33x10 6.90x10² 1 2t-233 162,000 14,300 3.60x10 7.20x10 2.59x10⁻²Th-229 7340 50,000 2.10x10 9.60x10⁻³ 1.35x10⁻³
1 1 3C=-247 1.6x10 3300 1.99x10 1.99x10 4.20x10⁶ 6 8Ac-243 7370 10,000 4.46x10 4.46x10 1.27x10³ 3 4Ca-243 32 10,000 3.60x10 3.60x10 3.62x10⁸ 6 6Pu-239 24,400 10,000 2.70x10 1.36x10 3.76x10⁸ 6 7U-235 7.1x10 14,300 4.02x10 2.01x10 9.50x10
0 0 22:-243 470,000 3300 1.41x10 1.41x10 2.44x10⁻⁵ -5Pu-244 8.0x10 10,000 2.56x10 2.38x10 4.12x10-38 5 7Pu-240 6580 10,000 1.11x10 9.10x10 1.6Sx108 6 5t-236 2.39x10 14,300 2.05x10 1.03x10 1.54x10
0 1 1 0Th-232 1.4x10 50,000 6.70x10 1.17x10 1.47x10
* Based on 50,000 MTF2( charged to the reactors, and a 10-yr coolof f period.Walue not listed in CRICFN.
99
- . _ _ , , - N -e -= . ~ ? *re"W - - d u 7 M< m r ' - ( a 3--. , .
,. g _; _ .
, . _ _ , -- s-1 ',
_ - _: =h- ta >

TABLE C-9(Continued)
(b) Fission Products
initial Mass in Place *
Retardation (g)Factor, ( se 2)Half-Life (Case 1) (Case 3)R .ccycl
Nuclide (Yrs) d Throwaway 2 Fixed Oxide3 2 2
11- 3 12.3 1 2.15x10 1.72x10 2.27x10² 1
C-14 5730 10 1.71x10 1.71x10 2.17x10
Kr-85 10.8 1 7.65x10 0 07 7
Sr-90 27.7 100 2.12x(0 2.12x10 1.23x10⁵ 1Tc-99 2.1x10 4.20x10 -- -
3300I-129 1.7x10 1 1.16x10 1.46x10 1.86x10
5 $Cs-134 2.05 1000 3.53x10 3.53x10 1.55x10
7 7Cs-137 30.0 1000 4.96x10 4.96x10 5.10x10
6 6 6Sm-151 87 2500 2.14x10 2.14x10 3.62x10
6 6 0Eu-154 16 2500 1.79x10 1.79x10 1.24x10
* Based on 50,000 tm Di charged to the reactors, and a 10-yr. cooloffperiod.
100
,, , , - m _4- - .- : ,, - --
- :.
,
6
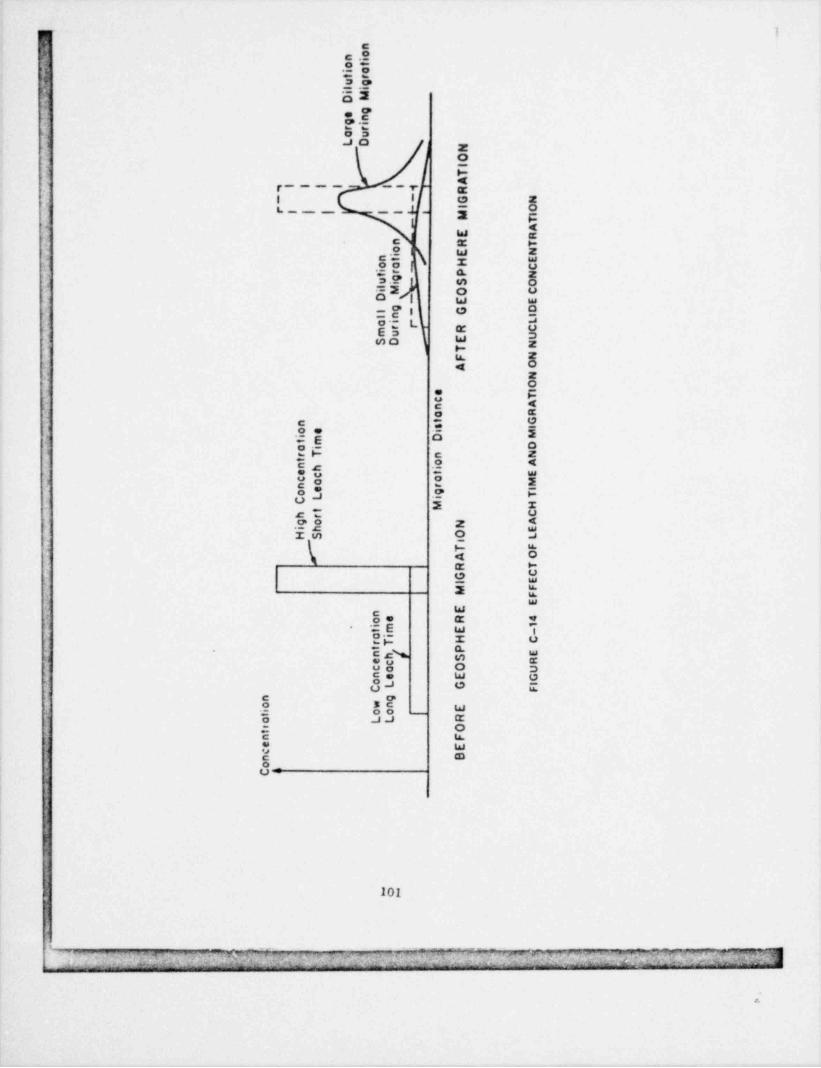
]= n
oni_ ot
- . iat r
, u gl i
iMDge ngi
r rou,
LD
A I O
, NO_
I
TA
,I i| 1 | , R- - G Ne1 g | | u M I
T- AE Rn R Tio
/_ E N
nt EHoa CP Nir
t g
lu iy-S O
iM O CD E E
. G Dg
csl n l
lai LR Crmu E U_
SD_ NTF NA O
NOIe Tc An
a RGtn
io e is I_
m D Mt
ai DT n Nr
t
eio Anh
c Et
c aa Mn reoI
Cig TLM H
t Ch rig o N A
h EHS O L
#I
FTA OR TG Ci E
M FFE
Eno e R 4
1im E -t
aerT H C
Pt
nhj ES. e c Rca O U-
n e E GoL G I
C F- n g
io wn Eoot
a LL Rr Ot
n Fe E
- cn BoCo
'
o
.|
I:, l - 1 N
i
, ,;<-, i
)
A,1 , -
J
'
,
,
, l F .p ' , ' , , . 4- ./
4 ~' , i'
.
3

- .
g/ liter, respectively, for the 1-year and 100-year leaching periods.
Even in this case, the reduction in concentration due to reduced leachrate has been larger tir.n that due to dispersion during migration.
at lower rates of nuclide migration, the reduction in concentration
in the geosphere pathway due to dispersion becomes relatively n: ore icportant.For the low rate illustrated in Table C-8, the end result is somewhat
surprising. It indicates that the increased dilution due to longer leachtimes is exactly compensated for by decreased dilution during the geospherepathway migration. This can be deduced from the dilution equation, sincethe boundary concentration leaving the repository (for this idealized" constant leach rate" case) would be inversely proportional to the water
velocity. The reduction in concentration during migration is proportional.
to the water velocity, which for small values is a linear proportion.
Thus, for small water velocities (or high retardation factors), there
will be an interdependence between time and flow rate. The ab ve effectcan be noted in Table C-8, where the result for a high flow rate and one-
year leach period is identical (in final concentration) to a flow rate
lower by a factor of one thousand and a leach period of 1000 years.
Table C-8 shows that for long-lived nuclides such as I-129, half-
life has little effect. (I-129 has a half-life of 1.7 x 10 years.) If
Np-237 were not strongly adsorbed, the result for this nuclide would bevirtually identical to that for I-129. A high degree of adsorption
(R = 100) reduces the concentration of this isotope af ter migrationd
through a distance of 8 km (5 miles) in the aquifer to only about 1.2%
of that leaving the repository, assuming high water flow, 100-year
leaching time, and a dispersivity of 30 m. Neglecting adsorption, (i.e.,
assuming Rd = 1), the concentration of Sr-90 at 8 km (5 miles) is reduced-5
to 3.5 x 10 of the initial concentration leaving the repository. Appli-.
|cation of the probable adsorption value for Sr-90. which is about equal to
j that for Np-237, would produce a further reduction in concentration at8 km.
These results lead to the following conclusions:
(1) If the leach time is more than 25% of the nuclide migration
time, hydrodynamic dispersion will be relatively unimportant.
102
- 6 , ': ,.. .- ,, ,
- :- - .--,
<-. .. ~x , m_ _ . . _: .- .w
'
I
i;
Reduction of concentration during geosphere transport willresult primarily from radioactive decay.
(2) Retardation of migration by adsorption in the geosphere isimportant in reducing concentrations of nuclides, as well asin delaying nuclide arrival time at specific points.
This effect on concentration is due to the increased timepermitted for dispersion to occur.
The effect of total distance--the thickness of the repository
itself and interbeds--between the repository and an aquifer is alsoimportant. The type of analysis examined above can be applied to thisvariable. Although the vertical path length in the repository-
interbed section would be considerably shorter than the harizontaldistances investigated above, the vertical permeability would alsobe much lower, and thus there is a compensating effect. There fore,a 150 m (500 f t) thickness for repository and interbed strata will
be similar in its ef fect on nuclide travel time to the distance between0 and 1.6 km (1 mile) in the aquifer, as illustrated in Table C-8.
Another variable concerns the effectiveness of the containment,
i.e., when leaching starts. For most radionuclides, later leach
initiation is advantageous, because concentrations have then decreased
because of radioactive decay. A few daughter nuclides, e.g. , radiu=-226
however, exhibit increases in concentration for up to 100,000 years
and subsequently start decreasing. In such circumstances, the early
release could reduce concentrations at a later time. Unless Ra-226
became the most critical nuclide from the standpoint of dose, early
release would be disadvantageous. The concentrations of most, if not
all, of the other critical nuclides decrease with time and their
earlier release would be highly disadvantageous.
No detailed set of calculations has been made for the fuel
cycles other than throwaway (Case 1, Task A Report). In general,
wastes from the other cycles have less of the critical nuclides, e.g.
I-129. Ra-226, Np-237 and plutonium isotopes. A few nuclides are
increased, e.g. Am-243. If such nuclides as Am-243 : entribute a
103
N. s .A E,_ '
>: . -_.
6

.
significant amount to the potential dose rate, these cycles should be
$nvestigated.The calculations discussed above used the analytical model previously
Jescribed. The rewaining calculation 4 were made with the numerical
nuclide transport model.
C-4.4.3 Results Using Numerieel Model ||
C-4.4.3.1 Parameters for Scenarios 1 and 2The waste form placed into the repository was assumed to be from
tha throwaway cycle. The amount of each nuclide used in the migrationcalculations is summarized in Table C-9, along with half-life and
retardation coefficient. Two additional types Of fuel procersing options
are also listed: uranium oxide recycle and mixed-oxide recycle (Cases 2 and3 of Task A report). The nuclides tested include four actinide chainsand the fission products that are important from the standpoint of amountsof each initially present, as well as of potential health effects.
The parameters used for Scenarios 1 and 2 are summarized in Table C-10.A comment should be made regarding " normal" adsorption. The sorption levels
(K ) in typicalused were taken from the estimated distribution coefficients d
desert soil shown in Table C-3. These values have been compared with
measurements for clay, sandstone, caprock, and river sand soil types(Table C-4) and, despite some differences, there are no consistent trendsfor either actinides or fission products. In some cases, the distribution
coefficients in sandstone are higher than the equivalent retardationfactors listed in Table C-9, and in other cases they are lower. The
(K ), rather than the retardation factor (R )*sorption distribution coefficient d d
has been reduced to 10% of the normal values for the sensitivity analysis.
(See equations 7 and 8 in Section C-3.1.2 for the relationship betweendistribution coefficient and retardation factor.) In the case of Tc-99,
the evidence supports a relatively high adsorption value (Kd 1 severalhundred)42 as well as the zero value given in Table C-3. Corresponding
Rd values of 3300 and 1.0 have been used for illustrative purposes incalculating concentrations of this nuclide.
104
-y -
~ ;w- ; 9;, - -
~c . . m - ,
_a _.;w. y . :.
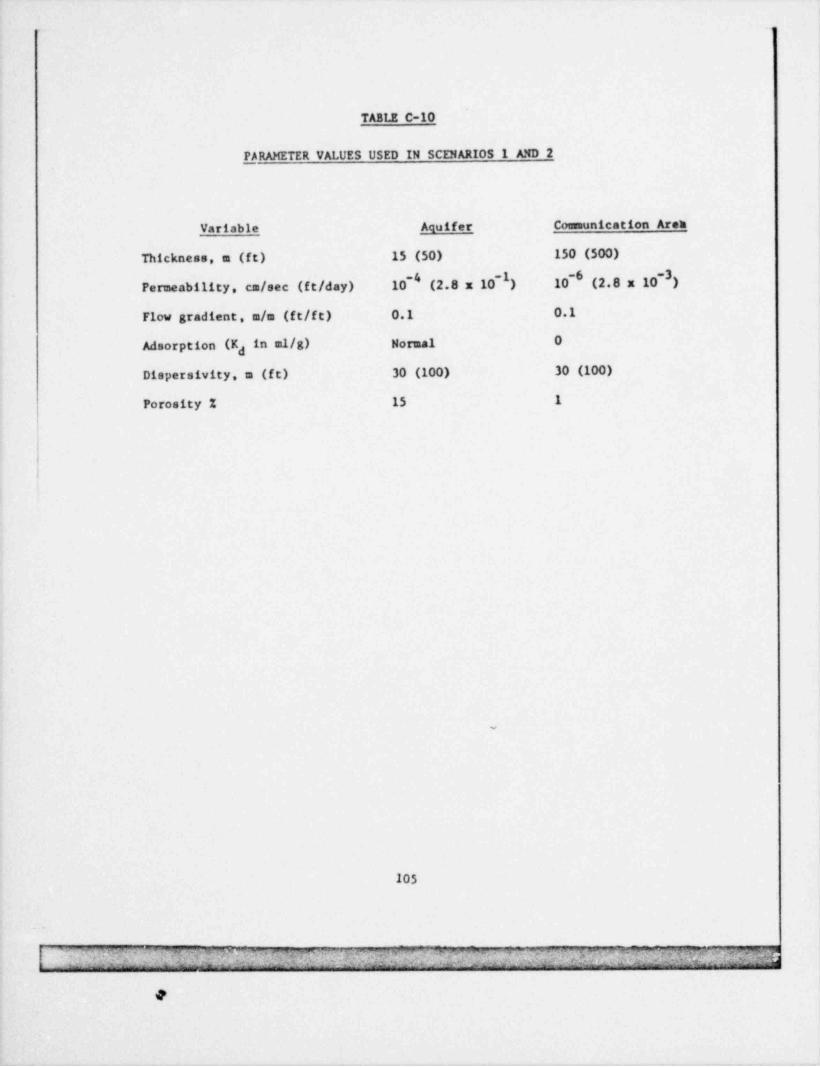
TABLE C-10
PARAMETER VALUES USED IN SCDIARIOS 1 AND 2
Variable Aquifer Comunication Area
Thickneas, m (f t) 15 (50) 150 (500)
Permeability, cm/sec (ft/ day) 10 ' (2.8 x 10 ) 10-6 (2.8 x 10 )-~
Flow gradient, m/m (ft/ft) 0.1 0.1
Adsorption (K in ml/8) Normal 0d
Dispersivity, m (ft) 30 (100) 30 (100)
Porosity % 15 1
!i
I
~
105
n, . - _ _
..__ y _ __ ,-- - - ,; , .s .- , - ,_
,
' ~'
'' '
-- % ^' L. .. . ,.~ _y, , , ,_ g ,
O
The grid used in the mathematical model consisted of five 30-m
(100-ft) blocks representing the repository and interbeds and 150 52-a
(176-ft) blocks representing the aquifer. Potential discharge pointswere examined in the aquifer at a point above the repository and at
each mile distant from the repository. Both the concentration of each|
nuclide and the aquifer flow rate were sumarized at each of these
potential discharge points.
C-4.4.3.2 Scenario 2 ResultsMigration of actinides and fission products as a function of time
and space for the worst probable case (Scenario 2) are sumarized in
Tables C-11 and C-12. The four actinide chains are shown in Table C-11for 300, 500, 6000, 30,000, and 100,000 years. Selected fission productsare shown in Table C-12 for 300, 500, and 1000 years.
Two leach rate models have been used. One assumes a " constantleach rate", with a correction for the changing surface-to-mass
ratio as a function of time. The resulting leach rate decreases approxi-
mately exponentially with time. In deriving this Icach model, a very
conservative leach rate was assumed, in order to account for early
temperature effects and possible glass devitrification later.
The second, " variable leach rate", model was a modification of the
first, used to define a more severe case during early time. The possible
temperature effects were accounted for by increasing the leach rate for
the first 4000 years, thus spanning the most important period with respect
to fission products. After 4000 years, a lower leach rate was used to
account for the probability that devitrification might not occur over
the leach time. The compa.rison of the fraction leached as a function of
time was given earlier in Figure C-12. Although the vaste form might
break down more rapidly than the Icach rate model indicates, solubilitywould then undoubtedly limit a number of the actinide concentrations in
the water leaving the repository. This effect was investigated in
another model analysis.
106
-
- - .w . - -- ._ .-,, p % r~ e *% -- , N 'n~~^~ '
,,
_
.
. . .. ..
.
.. . -
.
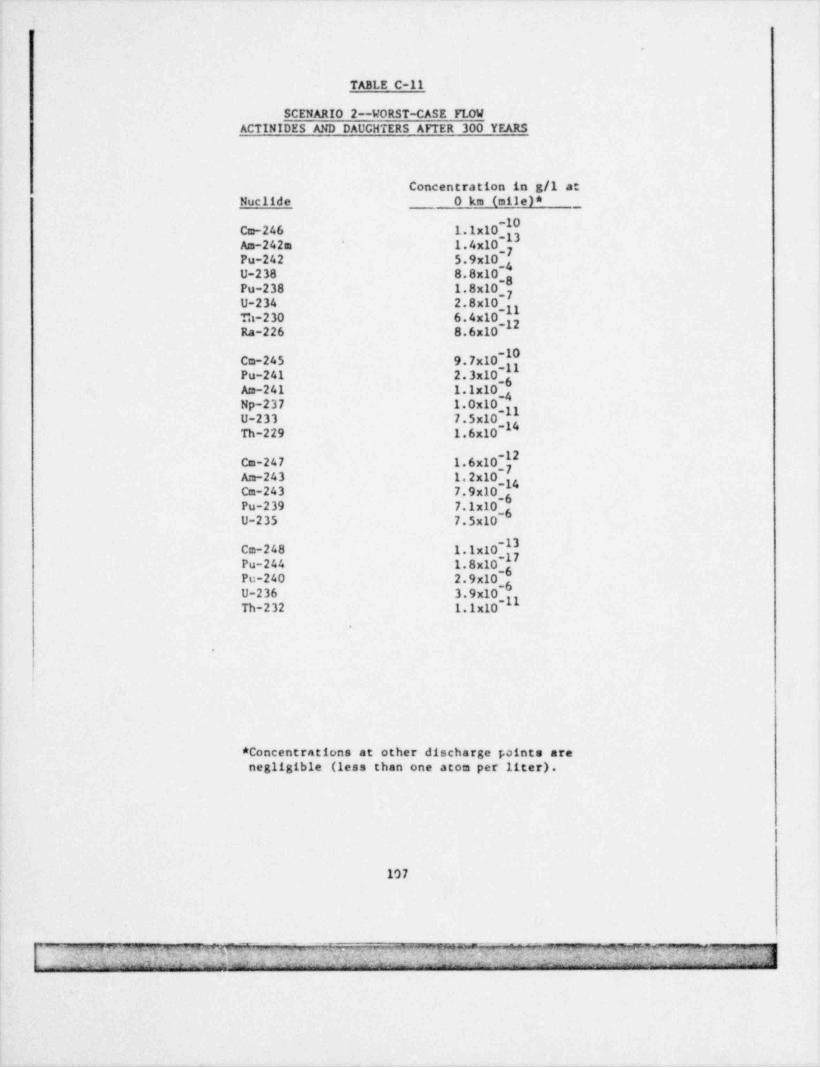
TABLE C-11
SCENARIO 2--k'ORST-CASE FLOWACTINIDES AND DAUGHTERS AFTER 300 YEARS
Concentration in g/l atNuclide 0 km (mile)*
1.1x10[10Cm-2461.4x10,7Am-242m
7Pu-242 5.9x10_4U-238 8.8x10
1.8x10,8-
Pu-2387
U-234 2.8x10,ggTh-230 6.4x10⁻¹²Ra-226 8.6x10
~10cm-245 9.7x10,gPu-241 2.3x10
-6Am-241 1.1x10_4Np-237 1.Ox10,yyU-233 7.5x10_g4Th-229 1.6x10
1.6x10[I2cm-2471.2x10_yAm-243 g4
cm-243 7.9x10⁻⁶Pu-239 7.1x10⁻⁶U-235 7.5x10
~I3cm-248 1.1x10
1.8x10f~
Pu-244Pu-240 2.9x10
-6U-236 3.9x10~IITh-232 1.1x10
* Concentrations at other discharge points arenegligible (less than one atom per liter).
I
107
-. m ,
, , . ,_ -agg _- . - . - . , - .mm - - + - , - .s -
.--
-
__
$ v . _ _ , ' n - _ mi- - ' - x~ 'S^ '
:,. _-
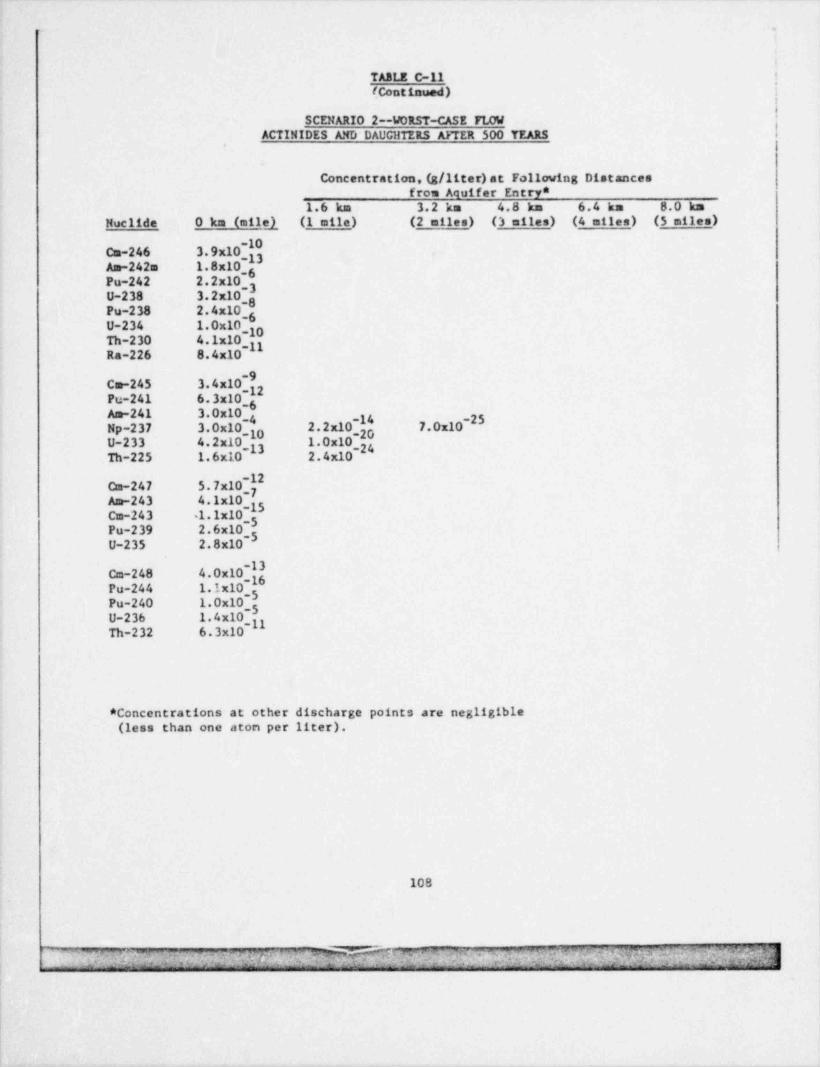
,
TABLE C-11 ;
(Continued)if
SCENARIO 2--WORST-CASE FLOWACTINIDES AND'DAUC11TERS AFTER 500 YEARS !
Concentration, (g/ liter) at Following Distancesfrom Aquifer Entrye
1.6 km 3.2 km 4.8 kn 6.4 km 8. 0 k:nNuclide 0 km (milel (1 mile) (2 miles) (3 miles) (4 miles) (5 miles)
Cm-246 3.9x10[Am-242m 1.8x10
2.2x10,6-
Pu-2423
U-238 3.2x10⁻⁸Pu-238 2.4x10⁻⁶U-234 1.0x10-
4.1x10_10Th-230 ggRa-226 8.4x10
~
cm-245 3.4x10⁻²Pu-241 6.3x10⁻⁶Am-241 3.0x10
-4 -14 -25Np-237 3.0x10 2.2 x10 7.0x10
-10 -20U-233 4.2x10_g3 1.0x10⁻²⁴Th-225 1.6x10 2.4x10
Ce247 5.7x10,12~
Am-243 4.1x10⁻¹⁵Cm-243 1.1x10
2.6x10[fPu-239U-235 2.8x10
cm-248 4.0x10[16Pu-244 1.1x10,3Pu-240 1.0x10-
1.4x10,5U-236 3Th-232 6.3x10
* Concentrations at other discharEe points are negligible(less than one aton per liter).
108
, -,, -- .,q.;- - vf, c- , , -
- - , ,; . %y , ' ,-'
, ,]',
,. q, ?-#-
'
, y , ,.
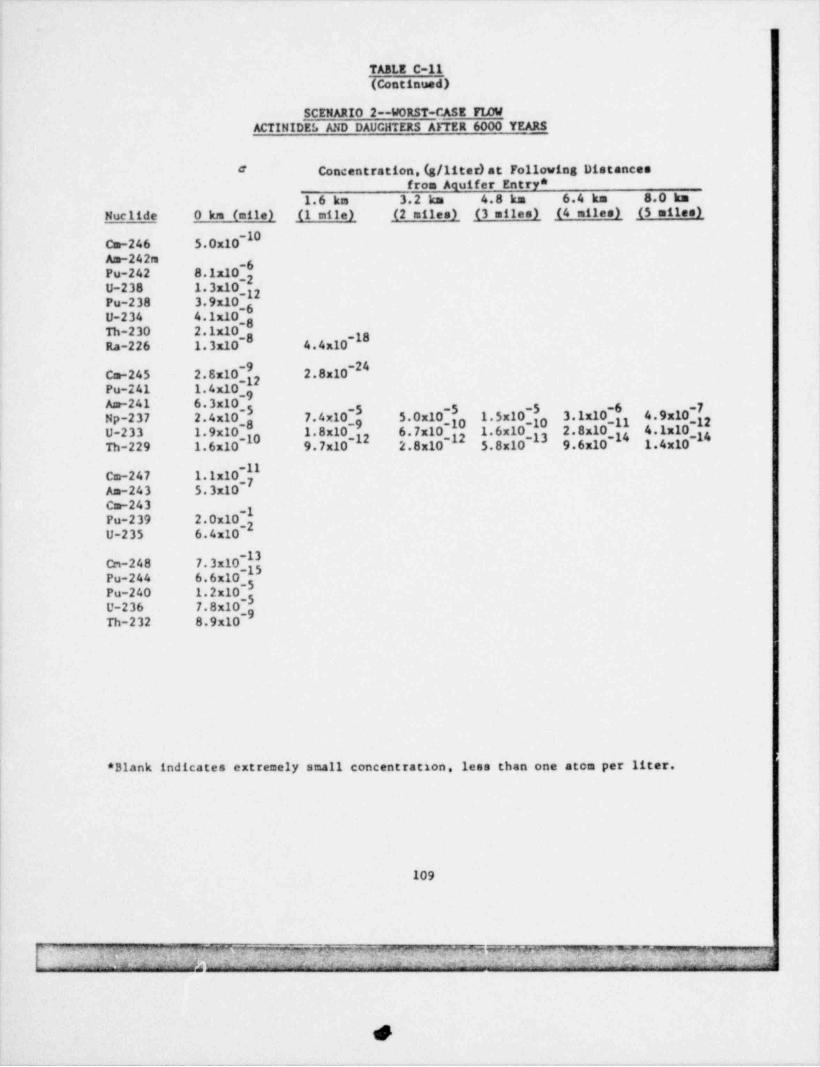
TABl.E C-11(Continued)
SCENARIO 2--WORST-CASE FIDWACTINIDE!, AND DAUCllTERS AFTER 6000 YEARS
Concentration. (g/ liter) at Following Dietances#
from Aquifer Entry *
1.6 kn 3.2 km 4.8 km 6.4 km 8.0 kmNuclide 0 km (mile) (1 mile)_ (2 miles) (3 miles) (4 miles) (5 miles)
-10Cm-246 5.0x10As-242m
-6Pu-242 8.1x10⁻²U-238 1.3x10⁻¹²Pu-238 3.9x10⁻⁶U-234 4.1x10
-8Th-230 2.1x10-0 -18Ra-226 1.3x10 4.4x10
-24Cm-245 2.8x10[ 2.8x10Pu-241 1.4x10_9Am-241 6.3x10
4.9x10[f21.5x10[f07.4x10[5~
3.1x105.0x10Np-237 2.4x10 10U-233 1.9x10 1.8x10 6.7x10 1.6x10 2.8x10 4.1x10
-10 -12 -l', -13 -14 -1Th-229 1.6x10 9.7x10 2.8x10 5.8x10 9.6x10 1.4x10
1.1x10[f1cm-247Am-243 5.3x10cm-243
2.0x10f~
Pu-239U-235 6.4x10
7.3x10[I3Cn-248 g3Pu-244 6.6x10 -5Pu-240 1.2x10 -5U-236 7.8x10-Th-232 8.9x10 '
* Blank indicates extremely small concentration, less than one atom per liter.
109
= ,', - ~ er.~ m -..,,. g 4 ,,, ,. w , _ m ,p ,,,,__, , _m._ , , ,
,
Ja* -L~
', ai .c __ _ . _.
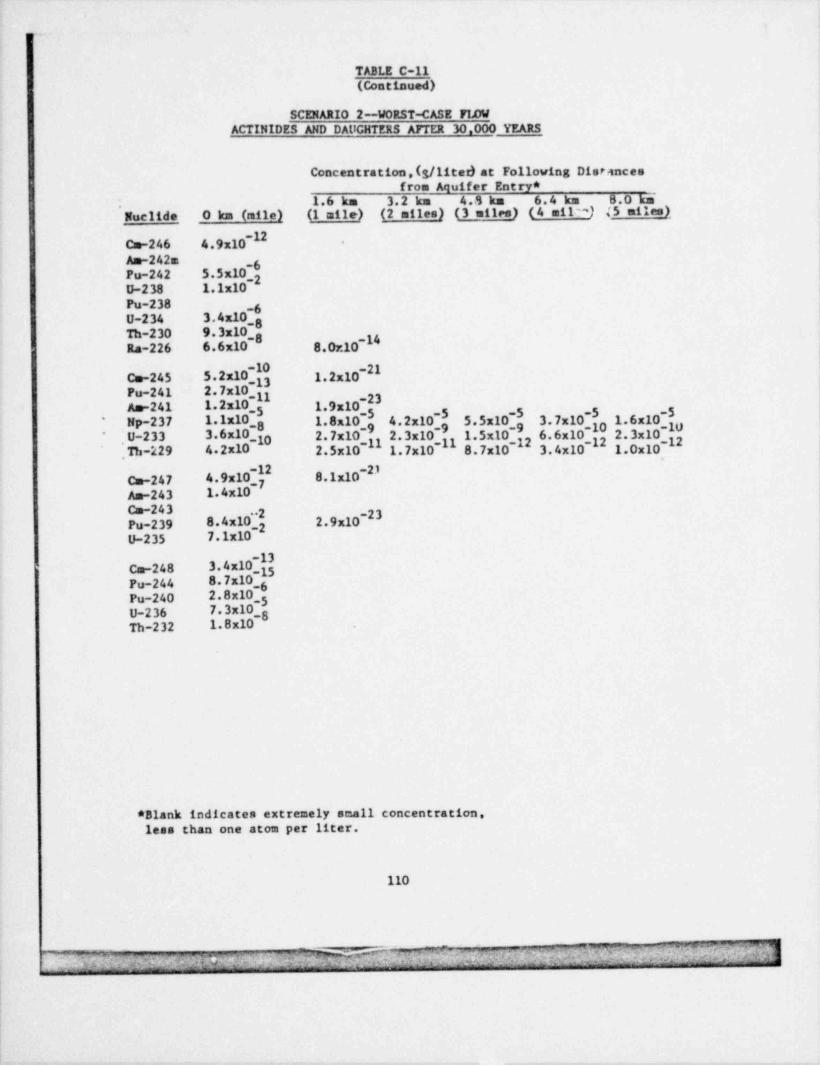
TABLE C-11(Continued)
SCENARIO 2-WORST-CASE FIEWj
ACTINIDES AND DAUGHTEKS AFTER 30.000 YEARS'
Concentration,(g/litet) at Following Dis *4ncesfrom Aquifer Entry *
1.6 km 3.2 km 4.S km 6.4 km B.O kmNuclide 0 km (raile) (1 mile) (2 miles) (3 miles) (4 mil") 45 miles)
-12Cm-246 4.9x10An-242m -6Pu-242 5.5x10⁻²U-238 1.1x10Pu-238 -6U-234 3.4x10⁻⁸Th-230 9.3x10⁻⁸ -14Ra-226 6.6x10 8.07.10
5.2x10[I-211.2x10Co-245 t
Pu-241 2.7x10~II -23An-241 1.2x10 1.9x10
-5 -5 -5 -5 ~3Np-237 1.1x10_a 1.8x10 4.2x10 5.5x10 3.7x10 1.6x10'
~9 -9 -9 -10 -IUU-233 3.6x10 2.7x10 2.3x10 1.5x10 6.6x10 2.3x10⁻¹⁰ -11 -II -12 -12 -12Th '429 4 2x10 2.5x10 1.7x10 8.7x10 3.4x10 1.0x10
4.9x10[f-2)8.1x10Cm-247
An-243 1.4x10Cm-243
8.4x10[2-232.9x10Pu-239 2
U-235 7.1x10
Co-248 3.4x10[Pu-244 8.7x10⁻⁶Pu-240 2.8x10
7.3x10_5-
U-236 gTh-232 1.8x10
* Blank indicates extremely small concentration,less than one atom per liter.
110
, ,3. _ __ . __ . .... _
. . . j ; ; ~ ~- [j% -
~- - ,- '==~
'- ',,
,
,_.
~ - ,
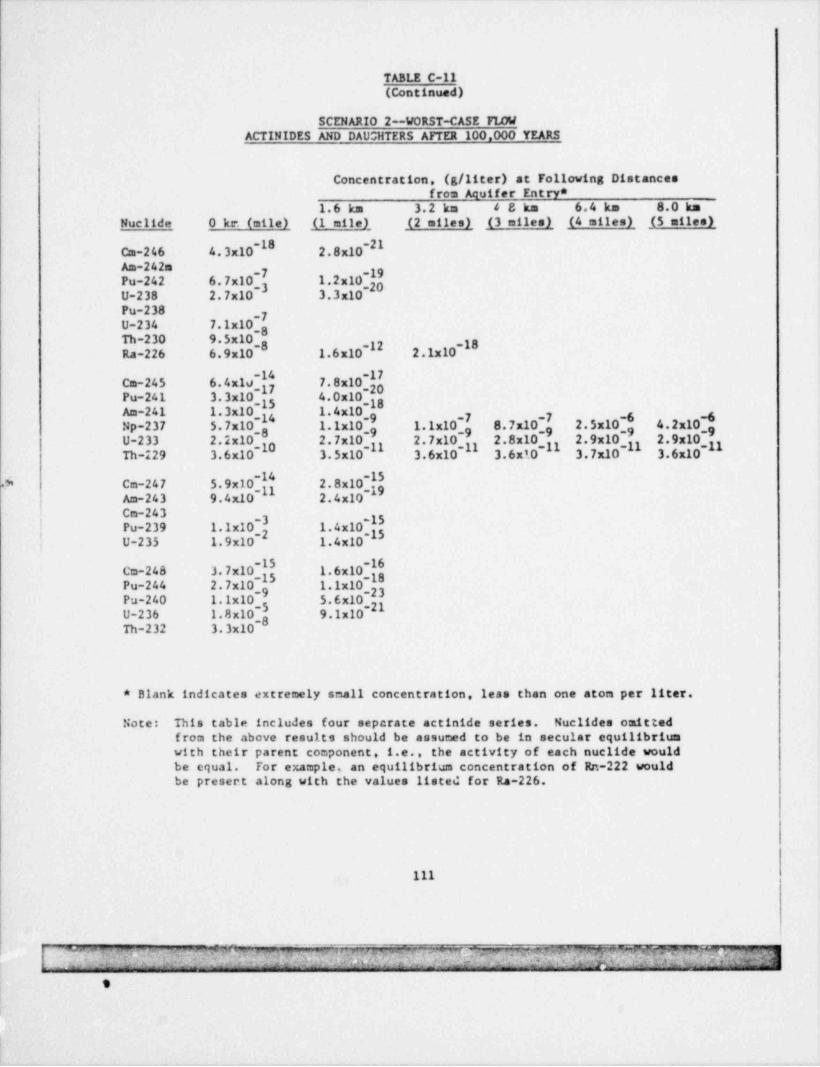
TABI.E C-11(Continued)
SCENARIO 2-VORST-CASE FIJ7JACTINIDES AND DAU';HTERS AFTER 100.000 YEARS
Concentration. (g/ liter) at Following Distancesfrom Aquifer Entry *
1.6 km 3.2 km 4 8 km 6.4 km 8.0 las
Nuclide 0 kr. (mile) (1 mile) (2 miles) (3 miles) (4 miles) (5 miles)-18 ~
Cm-246 4.3x10 2.8x10Am-242m
6.7x10,7 _19_
1.2x10Pu-2423 -20
U-238 2.7x10 3.3x10Pu-238 _7U-234 7.1x10
-8Th-230 9.5x10⁻⁸ -12 -18Ra-226 6.9x10 1.6 x10 2.1x10
cm-245 6.4xlo[ 7.8x10[2Pu-241 3.3x10- 4.0x10
1.3x10_15-181.4x10Am-241
1.1x10,9 1.1x10_7 8.7x10_7 2.5x10,6 4.2x10_6g4 - - - - -
Np-237 5.7x102.7x10_9 2.7x10_9 2.8x10_9 2.9x10_9 2.9x10_9
-8U-233 2.2x10 gg gg gy gg gg-10Th-229 3.6x10 3.5x10 3.6x10 3.6xt0 3.7x10 3.6x10
5.9x10[1 2.8x10[y* Cm-247Am-243 9.4x10 2.4x10Cm-243
II ~31.4x10'15Pu-239 1.1x10
' -2U-235 1.9x10 1.4x10-
2.7x10} 1.6x10[183.7x10Co-248Pu-244 1.1x10 -23Pu-240 1.1x10 5.6x10 -21U-236 1.8x10[8 9.1x10Th-232 3.3x10
* Blank indicates extremely small concentration. less than one aton per liter.
Note: This table includes four separate actinide series. Nuclides omittedfrom the above results should be assumed to be in secular equilibriumwith their parent component, i.e. , the activity of each nuclide wouldbe equal. For example. an equilibrium concentration of Rn-222 wouldbe presert along with the values listed for Ra-226.
111
3 - 4mr.- .- /T; , , : ?~;.m - . , wn mm wem,g y.v. r ,,-. .* o 'i "| $n'' ^h: - *
2.L . .7~~
_ .x_ .. - n. .
9

- ---_ _ _
.
TABLE C-12
I< SCENARIO 2--FISSION PRODUCTS AND C-14'; j -
.
.
Concentration, (g/ liter) at Following Dictances- from Aquifer Entry *
-J 1.6 km 3.2 km 4.8 km 6.4 km 8.0 km'
}, Time, yr Nuclide 0 km (mile) (1 mile) (2 miles) (3 miles) (4 miles) (5 miles)1
'Ti 300 C-14 1.7x10 '-
'J Sr-90 2.6x10[-
Tc-99Rt 6.7x10⁻⁴ -4 5.8x10,7 8.7x10,11 1.8x10 9.8x10
-11 -15 -21-
Tc-99N5.1 x10_4 1.3x10⁻⁵ 7 -16 -21I-129 1.4x10 3.7x10 1.6x10 2.4x10 4.9r10 2.7x10. ,
-0'
Cs-137 1.2x10" -8g Sm-151 2.0x10
1.3x10[f0500 C-14 1.2d0- Sr-90 5.3x10
2.4x10[f0* Tc-99R -4 -4 -4 > -6i ' " Tc-99N 3.2x10 3.6x10 4.7x10 3.6x10 6.9x10 ' 2.0x10-0 -0
8.7x.0[f0-5 ~I~
1.0x10 1.3x10 1.0x10 1.9x10 5.5x10I-129Cs-137 4.8x10
" ~
Sm-151 1.6x10
5.6x10_10-10 ~3' -
, 1x10 1.9x10 5.7x101000 C-14 '.
3.2x10 }0p Sr-90 -1~
Tc-99R 4.6x10
5.6x10|'
Tc-99N 1.5x10[ 1.6x10[ 1.8x10[~
2.0x10[ 2.3x10 2.6x10[5" I-129 4.2x10_g 4.5x10 5.0x10 6.3x10 7.2x10E. Cs-137 1.4x10⁻¹⁰
Sm-151 6.6x10'
.
,* Blank indicates extremely small concentrations, less than one atom per liter.Tc-99R represents an assumed chemical form of Tc-99 that is highly sorbed (Rd=3300).
~* Tc-99N represents a non-sorbed chemical form (Rdal).
R;c
%g
,

|
|
This second leach model is represented by the folicwing equation:
Fraction 1 cached = 0.173 in (1 + t/200) (14)where
t = time in years af ter first contact with water (200 years).
|
This equation shows that all the glass is leached at 65.000 years, with
the leaching period continuing over most of the time interval shown.The rate, hewever, decreased substantially from the start of leaching
at 200 years until the end of leaching at 65,000 years.
The results summarized in Table C-11 show signiticant amounts ofseveral nuclides entering the aquifer at 6000 years. For example, U-238and Pu-242 would have 1900 g/ day and 1.2 g/ day, respectively. These rates
-2were obtained by cultiplying the concentrations, 1.3 x 10 g/ liter and 8.1
-6x 10 g/ liter, respectively, by the water flow rate in the aquifer. 1.44 x 10
liter / day. The concentration of U-238 of 1.3 x 10- g/ liter translates
to 4300 picocuries/ liter (pCi/ liter) and of Pu-242 to 47,000 pCi/ liter.However, significant 1cvels of these nuclides never reach a point 1.6 km
(1 cile) from the repository even after 100,000 years or more. The worst
actinide migratien occurs with Np-237, About 3.5 g/ day are still
reaching the aquifer at 6000 years. The peak potential discharge rate
of Np-237 at a distance 1.6 kn (1 mile) from the repository would be
about 10 g/ day; at 3.2 km (2 miles), about 9 g/ day; and at 4.8 km (3 miles),
about 8 g/ day. Because U-233 and Th-229 are daughters of Np-237,
concent rations of these nuclides are found to have =oved substantially
farther than would have been expected.
The migration of fission products is su==arized in Table C-12 for
ti=es of 300, 500, and 1000 years. Significant amounts of I-129 are
present and are not adsorbed; hence this nuclide has substantial migration.
Table C-13 lists the =aximu= value of I-129 in both g/ liter and pCi/ liter,
calculated at various distances from the repository.
In Scenario 2 permeabil!ty of the repositcry strata was increased
by two orders of =agnitude. The highest interstitial horizontal permeability
listed for this strata was 10- cm/sec. The corresponding vertical
113
- . - - - ,--. . .
- - ;,, 7,,,---
m--- " Wh3, _ = -._
" df td#k. ..
, w hg a_) ,u'* ' [r-e OII -- "1'' - ' -' < z s e -- m' -
'
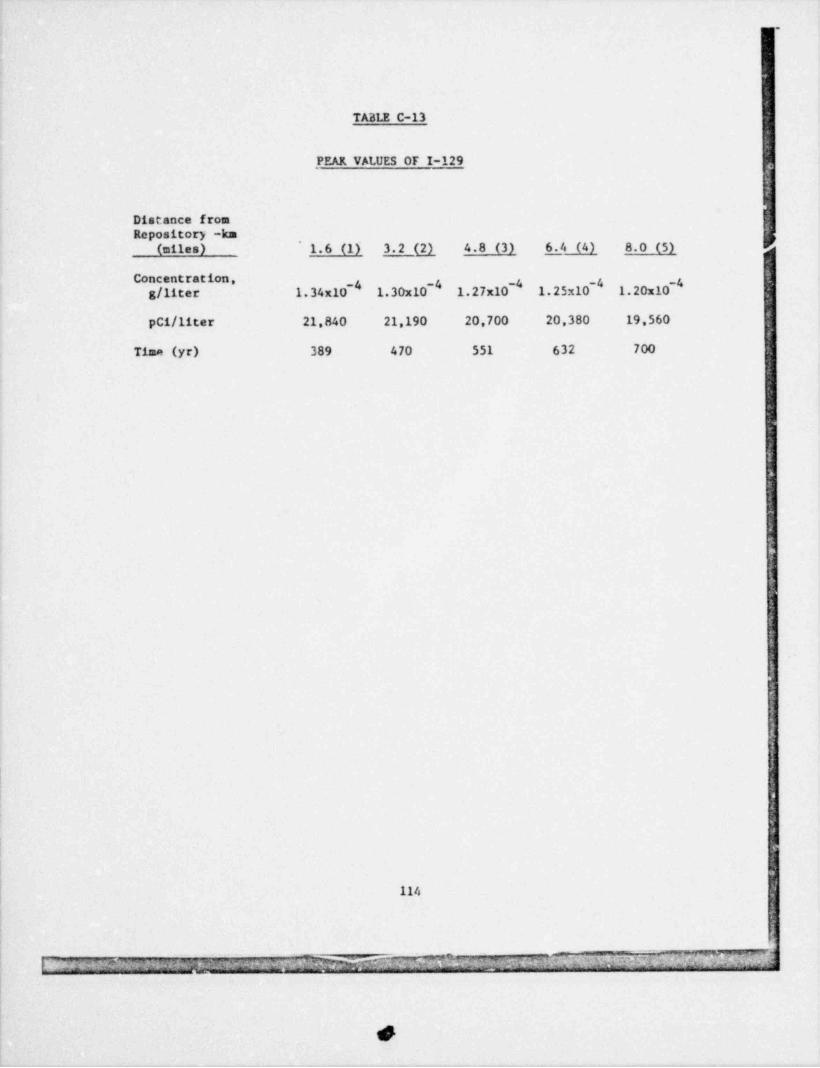
.
TABLE C-13
, PEAR VALUES OF I-129Ia
!
Distance from .|Repository -km
(miles) 1.6 (1) 3.2 (2) 4.8 (3) 6.4 (4) 8.0 (5) ,,
~ ~ ~ ~lConcentration,
g/ liter 1.34x10 ' 1.30x10 ' 1.27x10 ' 1.25x10~ 1.20x10 ' $o
pC1/11ter 21,840 21,190 20,700 20,380 19,560
Time (yr) 389 470 551 632 700 I
i
1
i,
e
|<
f
H
v
l'
r
il
'd
is4
114
1
1
v .n_- t - . : ~3 = = ~ ..e-. a=;% . ,.- u }_ %a. < .=. L a -
.a--
;_ - - -Q -
-_-.n,- - . , . - -
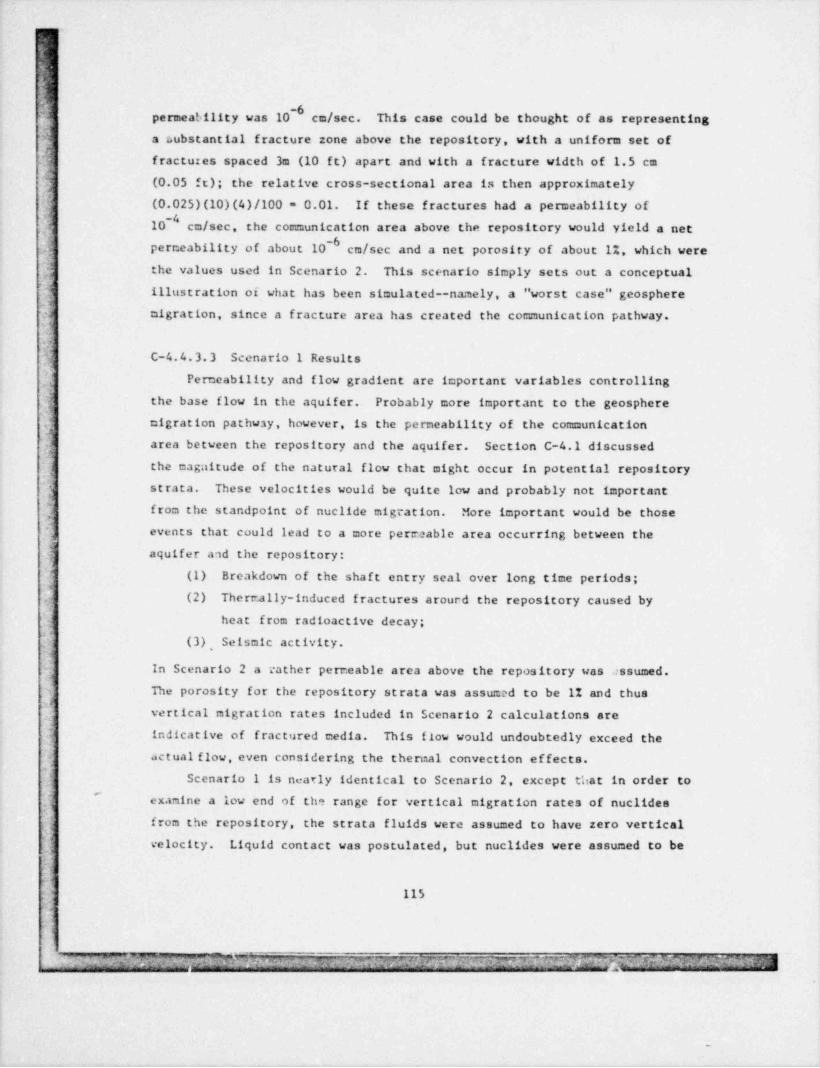
.
isgy:'
-6W permeability was 10 cm/sec. This case could be thought of as representing"q$ a Lubstantial fracture zone above the repository, with a uniform set of
fractures spaced 3m (10 f t) apart and with a fracture width of 1.5 cm
] (0.05 ft); the relative cross-sectional area is then approximately" (0.025)(10)(4) /100 = 0.01. If these fractures had a permeability of
-0- 10 cm/sec, the communication area above the repository would yield a net
-6permeability of about 10 cm/sec and a net porosity of about 1%, which were
. the values used in Scenario 2. This scenario simply sets out a conceptual
1 illustration of what has been simulated--namely, a " worst case" geospheremigration, since a f racture area has created the communication pathway.s
] C-4.4.3.3 Scenario 1 ResultsPermeability and flow gradient are important variables controlling
the base flow in the aquifer. Probably more important to the geospheremigration pathway, however, is the permeability of the communication
,
,
y area between the repository and the aquifer. Section C-4.1 discussedthe magnitude of the natural flow that might occur in potential repository
3 strata. These velocities would be quite low and probably not importantfrom the standpoint of nuclide migration. More important would be those,
events that could lead to a more perraable area occurring between they'
aquifer and the repository:
f (1) Breakdown of the shaft entry seal over long time periods;(2) Thermally-induced fractures arourd the repository caused by,
J heat from radioactive decay;
(3)a , Seismic activity.
In Scenario 2 a rather permeable area above the repository was .:ssumed.The porosity for the repository strata was assumed to be 1% and thus
a
vertical migration rates included in Scenario 2 calculations are
indicative of f ractured media. This flow would undoubtedly exceed theactual flow, even considering the thermal convection ef fects.
.
Scenario 1 is nearly identical to Scenario 2, except that in order to"
examine a low end of the range for vertical migration rates of nuclidesfrom the repository, the strata fluids were assumed to have zero vertical
; velocity. Liquid contact was postulated, but nuclides were assumed to be
115
l
_ yww-7m...pr=3myr iq~ <.gn - -~7m,mery x- * y yh t r R. * g.e. ) '-z. f . !y yCK _,-w, - , ,
_ _ _ _ _
, . - . <___w . - < - -.,
=

r{!O
h transported from the repository only by molecular diffusion in the liquid
-6 c ,2/sec was used inphase. A net diffusion coefficient equal to 10
titiscalculation. This net diffusivity is made up of an open-stream-6 c ,2/see and a tortuositymolecular diffusion coefficient of 5 x 10
'
factor equal to five.
Thc diffusion pathway in the repository strata should represent alower bound on the transport of nuclides from the repository to the aquifer
^ (unless these strata are also strongly adsorbing). However, in the absenceof a solubility limitation for the nuclides, even a dif fusional concer.tra-tion gradient will increase until the amount of nuclides diffusing from'
i
the repository equals the leach rate. Although there is a much longertime transient involved before the nuclide fluxes into the aquifer are
equal to the leach rate, the amounts entering the aquifer by either dif fu-sion or flow would eventually be the same--in the absence of a solubility
$ licatation. Calculations have been made to ascertain how long this time
transient might be.'
The results are tabulated in Table C-14 for the actinide series at6000 and 30,000 years. Np-237 has a conc.entration at the 0 km (mile)location of about two orders of magnitude less than the Scenario 2 flowat 6000 y. cars and about a factor of five less at 30,000 years. Np-237
~ was selmeted for the comparison because of its low adsorptivity and itsrelat4vely 12.rge contribution to dose.
The fission product results for the diffusion pathway (Scenario 1)
are tabulated in Table C-15. In this case, I-129 has a concentration aty
the 0 location of about eight orders of magnitude less than in Scenario
2 at 500 years, and six orders less at 1000 years. In Scenario 2, the,
peak I-129 concentration had already gone beyond the 6.4 km (4-mile)migration point in the aquifer at 1000 years. At 1000 years in Scenario
1, the concentrations are still increasing, but are neatly at their peak
values. The condition results from an interaction between the increasing
diffusien gradient and the decreasing leach Jate.
! These results indicate that over the time periods of interest for
i! either fission products or actinides, the concentrations migrating in an
aquifer would be at least a factor of five lower for the diffusion pathway
116
.
I,
2~ .- ' T- -p. - F -, ,7.- N .7
,
5
~# -'
.
/

Ia
TABLE C-14
SCENARIO 1--DIFFUSION PATHWAY - ACTINIDES AND DAUGHTERS AFTER 6000 YEARS
Concentrations (g/ liter) at Following Distancesfrom Aquifer Entry *
1.6 km 3.2 km 4.8 km 6.4 km 8.0 kmNuclide 0 km (mile) (1 mile) (2 miles) (3 miles) J4 miles) (5 miles) '
Co-246 4.0 x 10⁻¹³Am-242mPu-242 6.8 x 10⁻⁹U-238 1.0 x 10⁻⁵Pu-238 1.3 x 10⁻²⁰U-234 3.4 x 10⁻⁹Th-230 2.0 x 10⁻¹¹Ra-226 1.7 x 10⁻¹¹ 6.2 x 10⁻²⁴
Co-245 5.9 x 10⁻¹²Pu-241 2.8 x 10⁻¹⁵An-241 3.4 x 10⁻¹²Sp-237 3.2 x 10⁻⁷ 4.4 x 10⁻⁹ 5.0 x 10⁻¹²U-233 3.5 x 10⁻¹¹ 1.1 x 10⁻¹⁴ 9.9 x 10⁻¹⁸Th-229 1.5 x 10⁻¹³ 1.3 x 10⁻¹⁷ 9.5 x 10⁻²¹
Cm-241 1.6 x 10⁻¹⁴Am-24 3 6.8 x 10⁻¹⁰Co-243Pu-239 6.7 x 10⁻⁸U-235 1.0 x 10⁻⁷,
Co-248 1.2 x 10⁻¹⁵Pu-244 4.7 x 10⁻¹⁸Pu-240 1.6 x 10⁻⁸U-236 3.8 x 10⁻⁸Th-232 3.4 x 10⁻¹²
I
* Blank indicates extremely small concentration, less thanone atem per liter.
117
--
m&-% -. - -
,r;m- ,y w*:.e e p-.,r;-mem.m g yrms ,,. . - - z - - , A.,
,- t -
. A,. O* w.. _:,.
$

!
TATLE C-14(Continued)
SCENARIO 1-DIFFUSION PATWAY - ACTINIDES AND DAUGHTERS AI'IER 30,000 YEARS
Concentrations (g/ liter) at Following Distancesfrom Aquifer Entry *
1.6 km 3.2 km 4.8 km 6.4 km 8.0 km
Nuclide 0 km (mile) (1 mile) (2 miles) (3 miles) (4 miles) (5 miles)
Cm-246 3.5 x 10⁻¹³Am-242mPu-242 2.7 x 10⁻⁷U-238 4.7 x 10⁻⁴Pu-238U-234 1.4 x 10⁻⁷Th-230 3.7 7 10-9Ra-226 2.8 x 10⁻⁹ 5.5 x 10⁻¹⁶ 2.7 x 10⁻²⁴
cm-245 '2.8 x 10⁻¹¹Pu-241 1.4 x 10⁻¹⁴Am-241 5.3 x 10⁻¹³Np-237 2. 3 x 10⁻⁶ 2.0 x 10⁻⁶ 1.3 x 10⁻⁶U-233 5.5 x 10⁻⁹ 5.0 x 10⁻¹¹ 2.2 x 10⁻¹¹Th-229 6.1 x 10⁻¹¹ 2.9 x 10⁻¹³ 1.0 x 10⁻¹³
cm-247 4.4 x 10⁻¹³Am-243 3.4 x 10⁻⁹Co-243Pu-239 1.5 x 10⁻⁶U-235 5.5 x 10⁻⁶
Cm-248 3.0 x 10⁻¹⁴< 16Pu-244 7.2 x 10 8Pu-240 6.3 x 10-U-236 3.1 x 10-0Th-232 8.2 x 10⁻¹⁰
Blank indicates extremely small concentration, less than*
one atom per liter.
L
118.
,3--.
- -- -,]m ; .:
' ' ' , e, _ _. .,=ny ,
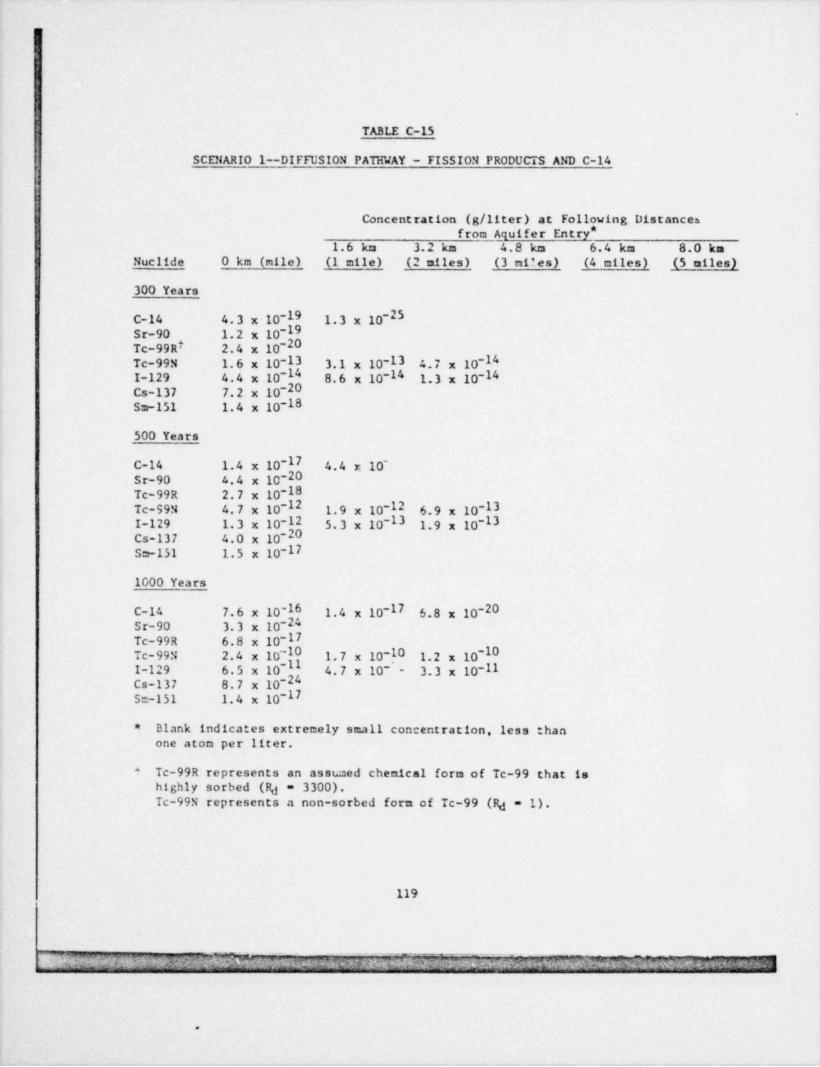
l'I
j
TABLE C-15
SCENARIO 1--DIFFUSION PATH'. LAY - FISSION PRODUCTS AND C-14
Concentration (g/ liter) at Following Distancesfrom Aquifer Entry *
1.6 km 3.2 km 4.8 km 6.4 km 8.0 kmNuclide 0 km (mile) (1 mile) (2 niles) (3 mi?es) (4 miles) (5 miles)
300 Years
C-14 4.3 x 10⁻¹⁹ 1.3 x 10-2519Sr-90
1.2 x 10 20Tc-99Rt 2.4 x 10-Tc-99N 1.6 x 10⁻¹³ 3.1 x 10⁻¹³ 4.7 x 10⁻¹⁴I-129 4.4 x 10⁻¹⁴ 8.6 x 10⁻¹⁴ 1.3 x 10⁻¹⁴Cs-137 7.2 x 10⁻²⁰Sm-151 1.4 x 10⁻¹⁸
500 Years
C-14 1.4 x 10⁻¹⁷ 4.4 x 10'Sr-90 4.4 x 10⁻²⁰Tc-99R 2.7 x 10⁻¹⁸Tc-S9N 4.7 x 10⁻¹² 1.9 x 10⁻¹² 6.9 x 10⁻¹³I-129 1.3 x 10⁻¹² 5.3 x 10⁻¹³ 1.9 x 10⁻¹³Cs-137 4.0 x 10⁻²⁰Sm-151 1.5 x 10⁻¹⁷
1000 Years
C-14 7.6 x 10⁻¹⁶ 1,4 x 10⁻¹⁷ 6.8 x 10⁻²⁰Sr-90 3.3 x 10⁻²⁴Tc-99R 6.8 x 10⁻¹⁷Tc-99N 2. 4 x 10 -10 1.7 x 10⁻¹⁰ 1.2 x 10⁻¹⁰-11I-129 6.5 x 10 4.7 x 10 - 3.3 x 10⁻¹¹Cs-137 8.7 x 10⁻²⁴S=-151 1.4 x 10⁻¹⁷
Blank indicates extrecely small concentration, less than*
one atom per liter.
Tc-99R represents an assumed chemical form of Tc-99 that is^
highly sorbed (Rd = 3300).Tc-99N represents a non-sorbed forn of Tc-99 (Rd " 1)-
119
', , gn_ [9" - ,['? " ;_ f'* ?'* ~ *f ' - 3U l'ltr"- '
.
l'
i
r
I
(Scenario 1) than for water flow through the repository (Scenario 2).Because of the high concentration levels necessary for the diffusionaltransport to be effective, solubility limitations will also be important
and will further reduce the concentration reaching .n aquifer.-
C.4.4.3.4 Sensitivity Analyses Using the Numerical Model
C-4.4.3.4.1 Ef fect of Leach Rate, Containment, and Nuclide Solubility
For the actinides, eolubility limits the actual leach rate below
that utilized in Scenario 2. In order to examine this effect, the
leach model usud in Scenario 2 includes the limitation that if a nuclide
concentration exceeds its solubility, only the soluble portion leaves the
repository. Th:D4 was accomplished by including a material balance of'
nuclides in the repository. These nuclides could exist in the solid
waste form (assumed here to be glass), in soluble form, or in an insoluble
form (precipitate) after the glass matrix has dissolved. The case chosen
for illustration is the actinide series Cm-246 and Am-242m. The solu-;
bility values used to limit these co=ponents are given in Table C-16
The figures taken were for the most soluble form of each nuclide at a
neutral,pH in fresh water, since this condition gave the highestsolubility values.
, The results are quite dramatic. The glass was co=pletely leached
at 65,000 years, but even t 100,000 years substantial amounts of uranium
and plutonium remained in an insoluble form in the repository. Thesenuclides would continue to leach very slowly over long periods of
time. In Scenario 2, 1900 g/ day of U-238 reached the aquifer at a ti=eof 6000 days; when the solubility limit was imposed, however, less than
-83 x 10 g/ day reached the aquifer. There is a similar, but not as
drastic, reduction in the concentration or plutonium reaching the aquifer.
The solubility limit will undoubtedly be an important influence in
controlling the leaching rate of the actinides.
The migration of fission products should be most sensitive to the
leach rate and to the effectiveness of containment. In order to investigate
120
= . - ; - w .- , ., ;- . ; rMc7L , p - -; . Q: _T 3-
h
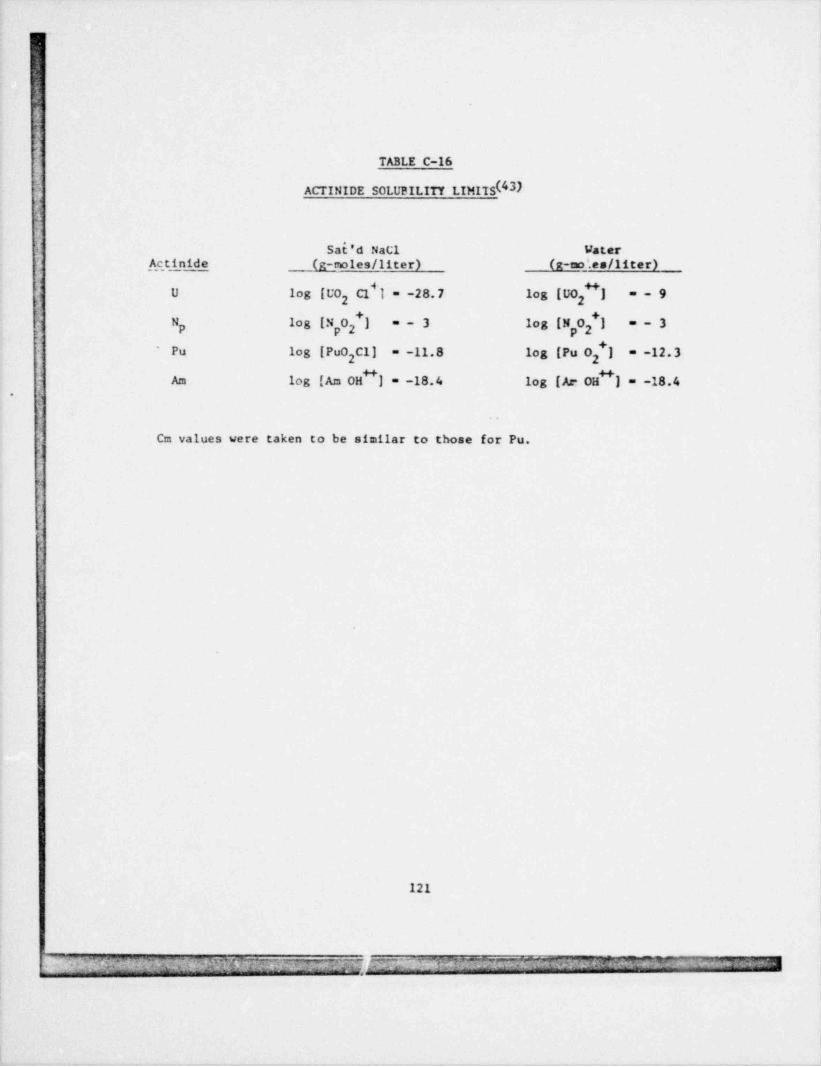
IE1<
i
va
j
TABLE C-16
ACTINIDE SOLUBILITY LIMITS (43)
Sat'd Nacl WaterA,ctinide (g-moles / liter) (R-tm '.e s /li te r)
U log [UO C1 1 - -28.7 log [UO *] =-92 y
N log [N 0 *] =-3 log [N 0 I ~~3p p2 2
log [PuO[]Pu log [Pu0 C1] = -11.8 = -12.37
Am log (Am OH ] = -18.4 log [Ar OH ] = -18.4-
,
Cm values were taken to be similar to those for Pu.
L
~
N
I
|
121
. - j ~ ~ e-__ 3
- =^-'; -
:. , --. _z,
c:7 - ' 's tv -?"~r%_
,, ,, . _ , _ ,_ _ _- mvr;:7 . ~~r
.
,
. v. - -_ . ~ -
- -
l'
J
this effect, a case was assumed where the important fission products werecompletely leached in a 25-year period. Leaching was started 50 yearsaf ter tM repository was closed. The results can be contrasted to
-4Scenario 2 in which the maximum I-129 concentration was about 1.3 x 10g/ liter at a distance 1 mile from the repository (see Table C-13). Withthe more rapid leach..ng rate and shorter cuntaincient period, the I-129 concen-tration at this same listance peaked at a concentration more than 20 eines higher,
~32.5 x 10 g/ liter. The concentration of Sr-90 entering the aquifer neverexceeded 3 x 10 g/ liter in Scenario 2, but with the shorter leach time and
-4containment, Sr-90 reached a level nearly 10 times higher at 2 x 10 g/ liter.
Sr-90 still would not present a problem, however, once migration into theaquifer takes place because of its high adsorption coefficient.
In Scenario 2, a standard glass form with leaching starting 200
years af ter emplacement was assumed; water contact was present when the
repository was sealed and the containment then broke down in 200 years.
The "varjable leach rate" model used gave higher leach rates than the" constant leach rate" model for periods up to 4000 years but then leachingdeclined. The total leach time was 65,000 years. (Sce Figure C-12).
A set of tensitivity calculations was perfortad using the same
conditions as in Scenario 2, except that the " constant leach rate" model
was used. In this instance, the waste form leached co=pletely in 20,000
years. Nevertheless, the results showed only small variances in nuclide
concentrations fron those resulting from the assumptions of Scenario2. At a similar discharge point no nuclide concentrations differed by morethan a factor of 2. The fission product concentrations were lower (as,
was expected) since the crossover point in leach rates is 4000 years; theconcentrations of radium-226 and neptunium-237 vere higher for the" constant leach rate" model than for the " variable leach rate" model,5 by less than a factor of 2.
As mentioned previously, solubility would undoubtedly limit the actualleach rate of actinides in either case. Thus, the ultic:ste differencebetween the two leach models would be even s= aller.
I
I
|
122
.
bf w. -
4 6 -
*
4
A,
Another factor associated with the source terms is the method ofreprocessing, if any, of the waste form before it is placed in the
repository. Three alternatives were discussed in Task A: (1) no
reprocessing, i.e., the " throwaway" cycle; (2) uranium recycle only,
(plutonium is also separated but not recycled), and (3) mixed uraniumand plutonium oxide recycle (see Table A-3). In the latter two cases,
the important radionuclides removed are plutonium, uranium, and iodine.Slight reductions in other nuclides also occur in these cases where recy-
..
cling is used. A few of the heavy nuclide concentrations are increased,
Am-243 perhaps being most important. The relative hazard from a recyclingcase should always be considerably less than in a " throwaway" case, and
thus no geosphere calculations were made for the recycle cases. An impor-tant reduction in the amount of I-129 from that initially present is obvious
from Table C-8. This reducticn of nearly three orders of magnitude in
the initial amount present in the waste form should decrease the I-129
concentrations along the geosphere pathway proportionately. The
nuclides whose quantities have increased from the amcunts initiallypresent in the vaste form are all actinides; from the previous calcu-
lations it appears that solubility would limit concentrations of these
nuclides in the geosphere transport pathway.
C-4.4.3.4.2 Effect of Adsorption
One highly uncertain factor is the adsorptive character of thefo rma t ion , including both the repository strata and interbeds, and<
| the aquifer. In Scenario 2, normal adsorption in the aquifer and nonein the communication area was assured. In order to examine theimportance of adsorption, computer runs were made using dif ferentsorption values.
In a low-sorption case, the aquifer was assur.ed to have much less
adsorption than in either Scenarios 1 or 2. The actinide chain beginning
with curium-246 was used in this illustration. Adsorption values basedon one-tenth the originni listribution coefficients (Table C-9) were
used for the aquifer. Again, no adsorption was assumed in the repositoryor in the communicating area.
123
, -, - ? H . r; w5^ nu > . a,
,7 m m:w ,r.~m-wr :g~ p m,-.~r::-
>'- ' e-mq- v.,,
..e - .u._ .,x

<
s
The results for this case indicate that even wi 5 much loweradsorption in the aquifer, the actinide series migration will be effectively
retarded. The two components of most concern from this actinide chain would
be radium-226 and plutoniEn-242. At a distance of 1.6 km (1 mile) fromthe repository at 6000 years, the concentration of Ra-226 had increased
to 1.9 x 10⁻⁹ g/ liter (2000 pci/l), which is a large increase (almostnine orders of magnitude) over that of Scenario 2. Pu-242 concentrationhad also undergone a large relative increase, but was still extremely
small. It should be emphasized that under idealized conditions of a
constant leach rate and virtually no decay, the adsorption Icvel in the
aquifer primarily af fects time of arrival rather than the concentration
level of a nuclide. In the above cases, the effect is larger, since the
leach rate is decreasing with time and the nuclides are either decaying
or b ting formed. As a result, the concentrations can be affected
substantially.
In the high-sorption case, the communicating area was assumed tohave substantial adsorption (as it would if the repository were
placed in shale). In this case, twice the original distribution
values were used in the com=unication area. Normal adsorption was
used in the aquifer.,
In this case, substantial decreases in nuclide concentrations
resulted from strong adsorption in the repository strata. The residence
time of components, suct as Ra-226, increased to 50,000 years compared
with' roughly 50 years ic the no-adsorption condition of Scenario 2.Decay, dispersion, and leach-rate changes are important over this
; increased residence time.a
5i
t.
<
124
T :^L ~ w s il X: ?- - = :s 3' - JO U-
_ .2.>- _
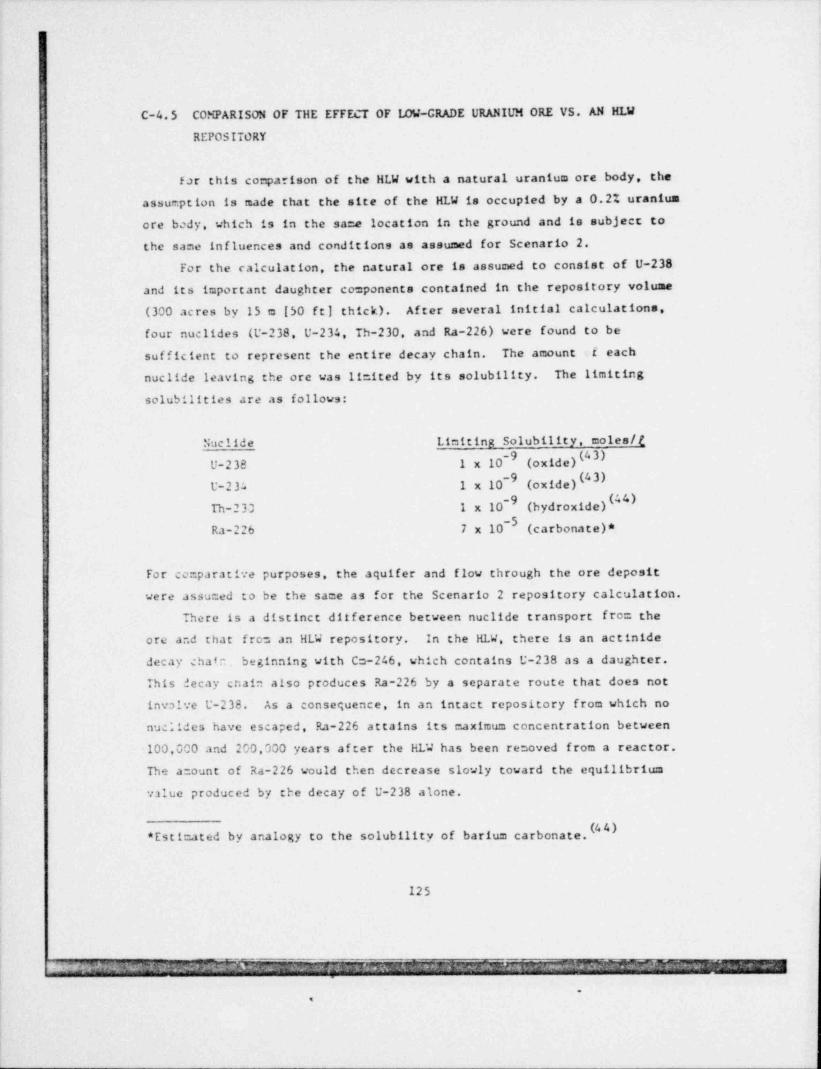
C-4.5 COMPARISON OF THE EFFECT OF IDW-CRADE URANIL?! ORE VS. AN HLW
REPOSITORY
f ar this co=parison of the HLW with a natural uranium ore body, theassumption is made that the site of the HLW is occupied by a 0.2% uraniumore body, which is in the sa e location in the ground and is subject tothe same influences and conditions as assumed for Scenario 2.
For the calculation, the natural ore is assumed to consist of U-238and its important daughter co=ponents contained in the repository volume(300 acres by 15 m [50 ft] thick). After several initial calculations,four nuclides (U-238, U-2 34. Th-230, and Ra-226) were found to be
sufficient to represent the entire decay chain. The amount .r' each
nuclide leaving the ore was limited by its solubility. The limitingsolubilities are as follows:
Nuclide Limiting Solubility, moles /t
}U-238 1 x 10~ (oxide)U-234 1 x 10⁻⁹ (oxide)( 3)Th-233 1 x 10⁻⁹ (hydroxide)
Ra-226 7 x 10" (carbonate)*
For ce=parative purposes, the aquifer and flow through the ore depositwere assu=ed to be the same as for the Scenario 2 repository calculation.
There is a distinct ditference between nuclide transport frc= the
ore and that frcs an HLW repository. In the KLW, there is an actinide
decay chair beginning with Co-246, which contains U-238 as a daughter.This decay chain also produces Ra-226 by a separate route that does not
involve U-238. As a consequence, in an intact repository from which no
nuclides have escaped, Ra-226 attains its maximum concentration between100,000 and 200,000 years after the KLW has been removed from a reactor.The a:ount of Ra-226 would then decrease slowly toward the equilibrium
value produced by the decay of U-238 alone.
*Esti=ated by analogy to the solubility of barium carbonate.
125
,L 7 32- f?%n , W.} H7_m- # Wr3n W ny _ qpTMm
.
$

1
In the ore deposit, the amount of Ra-226 initially present would be
only that quantity produced by the decay of the U-238. However, since'
the ore would not 'we confined by the kinds of barriers used in an !!LW|
repository, Ra-226 would be removed rapidly becausa of colubility in
water and the resulting equilibrba concentration of Ra-226 would be
controlled only by its rate of formation from decay of U-238.
For a moderately low-grade ore deposit (0.2% U-238), the area
equivalent to a repository would contain about the same mass of U-233as does the throwaway cycle !!LW. In this analysis, these amounts are
0 04.72 x 10 g for HLW and 7 x 10 g for the ore deposit. The followug
table su-mrizes the Ra-226 concentrations arriving at various distances
in the aquifer.
Ra-226 Concentrations (g/ liter)
Distance: Time, (years) Frem Ore Fron HLW__-8 -8
6,000 7.1 x 10 1.3 x 10
30,000 7.3 x 10 6.6 x 10"(0 m le)
| 100,000 7.3 x 10 6,6 x 10
-16,000 2.5 x 10 * 4.4 x 10
~
-1330,000 2.1 x 10 8.0 x F~1.6 km
(1 mile) _13I 100,000 2.6 x 10 1.8 x 1
.
In the above cocparison, the concentraticns of Ra-226 a sre
deposit are quite similar to those from the HL4; directly abo.. cherepository, the concentrations are virtually the same. At 1.6 km
(1 mile) distance, however, the concentrations of Ra-226 from the HLW
fare smaller than those from the ore for times up to 30,000 years but
i become larger after that. The reason for this is that the HLW containssubstantial initial inventories of Pu-238 and U-234 (both rarent nuclidesof Ra-226). As these parent nuclides decay, significant quantities ofRa-226 are created. In the ore deposit, only U-238 decay produces
y
Ra-226; thus, the concentrations at later times approach a constantvslue. The magnitude of this equilibrum concentration depends priearilyon the travel time and upon the decay rate of Ra-226.
126
mn- v=x - .a m 12 v zw. J;m u is .a-
__ : e n . w .- -

" 4
-
I
E
One additional factor should be mentioned. In the above analysis,
water was assumed to have come in contact with the ore (or with the HLU)'
at the noment calculation was started. It is equally reasonable to}
assur::e that water would have been flow ng through the ore continuouslyi.
,
over geologic time. In that event, the aquifer might be saturated with
respect to adsorptien of U-238 and its daughter products. This" saturation" would then cause water from this aquifer to have essentially
a constant ratio of U-238/Ra-226. This is in reasonable agreement with
an extensive data set collected by the U.S. Geological Survey.(45) The-6largest number of sa=ples typically had concentratiens of 1 x 10 g/l
~I1 U-238 and 1 x 10 g/l of Ra-226. For distances beyond roughly 1.6 km
(1 mile) from the ore, the U-238 that is first dissolved in the water
and t. hen adsorbed domstream can produce more Ra-226 in situ than isformed in the ore and then transported to the same point.
.
.i
127
,
l
,,N h7m*hMiktgTMTNrr3qar,r &ng ,yhkm*' .,Ay*t A - Y 13, , 7.21*' }6,.
J _&,"."Lr e v 21 k- - 1 - w - i 7 ,, '

)
C-5:0 DOSE-TO-MAN CONSIDERATIONS
C-5.1 OBJECIIVES AND OVERVIEW
C-5.1.1 Introduction and Purpose
A repository for high-level radioactive wastes will contain largequantities of radionuclides in high concentrations. Placement of the wastes
in deep geologic formations and in physical forms and containment structuresdesigned to minimize the chances of escape and transport in the environmentis being considered as a way of protecting the public from the potentialhazards associated with such vastes.,
,
The objective of this section of the Task C report is to provide a
basis on which to estimate the magnitudes of radiation doses that might result
from releases at any time in the future. More specifically, this part of theI project provides estimates of doses to individuals and populations as a'
result of radionuclides entering various environmental media and being trans-
ported through the biosphere via likely pathways. A further objective of
this task is to compare the calculated radiation doses resulting from the
potential repository leakage with radiation dose guides applicable to the
public and with radiation doses resulting f rom naturally-occurring radionu-
clides, and to assess the importance of these predicted radiation doses.
Because. of the long half-lives of so=e of the radionuclides that would
be placed in a geologic repository, the potential toxicity of those materials
persists for long periods. In general, the few nuclides that persist in the
repository will be the same as those that occur naturally in the earth, e.g. ,,
the uranium, thorium, neptunium, and actinium decay series. The long lifeof the high-level waste (HLW) necessitates the consideration of impacts on<
the biosphere, including radiation doses, over equally long tice spans.
Indeed, the National Environmental Policy Act of 1969 requires that suchprojections be made.
i
128
1
e
---,E oa 2- - - - ru e .~_u----um

la
C-5.1.2 Options and Considerations for Making Radiation Dose Assensments
In assessing the radiation impact of KLU on the public, the procedure is
to postulate a pathway by which radioactivity from an HLW repository can get into an
individual and to use a metabolic model to calculate the absorbed dose (rad),
or preferably the dose equivalent (rem, i e., the absorbed dose multiplied.
by a e,uality f actor) to a specific organ or to the whole body of the exposed
person (s). The dose equivalent is the important radiological quantity'
for estimating the health ef fects resulting from a particular radiation
exposure.*
For an individual, therefore, the magnitude, and hence the acceptability
or risk, of the radiation impact can be compared to the dose limits recommended
by national and international organizations. For the case of a group of persons,
i.e., a populati(n, a similar direct comparison is also desirable. This can
be done by invoking the concept of a dose equivalent to the population (the
unit used is person-rem), consisting of the sum of the dose equivalents to
each individual of the population. The collective effect of the dose equivalent -<
to this population is assumed to be independent of the dose equivalent distribu-tion in the population. The condition that permits such a dose equivalentcomparison is a linear-nonthreshold dose-response model of the biological ef-
fects of radiation. Such a model is mathe=atically convenient, is unlikely tounderestimate the health effects, aad permits direct comparisons to dose limits
and dose equivalents frem other sources, especially when the dose equivalentsare at or below the dose limits or are equivalent to those from natural causes.
(See Section C-5.1.4 for further discussion of the model and its implications.)Assessment of the radiation impact can be made by comparing the concen-
trations in drinking water of radionuclides derived from HLW with the maximum
permissible concentrations recoc= ended by national and international organiza-tions. Such a comparison can be useful, especially if drinking water is themain route of entry into persons. Iloweve r , the reco== ended concentrations are
based on dose liuits and again the comparison is really one of dose equivalents.
*While prediction of health effects is a subject that is beyond the scopeof this report, it is assumed that dose estimates will eventually be usedfor this purpose.
.
129,
.
M 9bD v --7t{ W EMh_h e 7 A A L L ML - hJn - A-EL# 1 1W hN ? E*LN2 " A U" -"1 a _q,
N
a
4
g; Further assessmerts can be made by comparing the dose equivalents due tothe HLW with dose equivalents due to natural background, especially thatdue to internel radiation f rom radionuclides such as carbon-14, potassium-40,and the uranium and thorium series.
Comparisons based on relative hazard indices are sometimes made as an
alternate approach and to avoid the necessity of making absolute health esti-mates. Such indices include:
(1) The total volume of water required to dilute the radioactivityin the HLU to the maximum permissible concentration for
drinking water I'0) or(2) The total number of " annual intake limits" contained in t ne
HLW for either the radiation worker or for a member of thegeneral public, or
(3) The ultimate number of cancer deaths that might be produced bya given quantity of HLW, if distributed in a large population
in such a way as to produce the maximum biological effect.(48)
While these indices may serve as extreme boundary conditions or maybe inte]lectually interesting, they are not very useful and can even be
misleading, since they omit all the transport processes and metabolic path-ways that affect different radionuclides in different ways in the final
calculations of dose equivalent.
I It is possible to make a relative comparison between important HLW
radionuclides and natural radionuclides, provided that the natural radionu-
clide is assumed to be placed in the repository along with the other radio-
nucli/es. The co=parison will not be a proper one if the natural radio-
nuclide is not exposed to the same transport processes as the HLW.
$
) C-5.1.2.1 Prediction of Pathways7 The transport processes described in Section C-4 are based on geological
4 considerations that are associated with long time periods in the past and|
|that will be generally applicable for the long time periods into the future
f associated with HLW disposal. Thus, the transport processes described andti discussed at present will presumably be unchanged for equivalent periods in
the future.
130
- - _ _
M =~^^$T ^^^''U - L | Y MMMT 9y1Mn Y y*-

)H
'
The analogous situation for predicting the pathways by which theradionuclides will disperse in the biosphere and enter people, and evenfor predicting human metabolism.does not have the same sound basis of
constancy with time. Society and the activities of people have been changingcontinually and quite rapidly in relation to time perf ods as long as thoseinvolved in HLW management. However, to make a dose equivalent calculation,a pathway and metabolic model must be postulated describing the conditionsunder which the radionuclides are introduced into people and how they aremetabolized. If society and the activities of people are known, realisticmodels can be postulated and the calculations made for the short term. For
the long ters assessment, on the other hand, it is nearly impossible to predictwhat society and the activities of people will be and, hence, no applicable
,1'
models have been postulated and no appropriate calculations can be made.
This inability to predict pathways and metabolism for the long term.,
poses great limitations for dose calculations. This concept is importantenough that it is described in greater detail in Section C-5.1.3 in order to
give a broeder perspective to the dose equivalent calculations that are madein a more conventional manner and are presented in Section C-5.2 and C-5.3.
C-5.1.2.2 Assumptions and Conditionn for the Dose Calculations
In spite of the difficulties of long-term predictions, estimates ofdose equivalents are needed to make an evaluation of the potential consequenceto populations in the future.
Dose equivalent calculations are expressed in terms of dose co=mitment.The latter is defined for the present purpose as the dose equivalent accumu-laced over a period of 50 years following the intake of radionuclides for aperiod of not more than one year. The dose equivalent, as defined, will varywith the age of the individual and is, therefore, age specific. The repre-sentative age chosen for this report is 21 years.
The models for the calculations involve two types of transport fromthe repository, three types of pathways to pecole,and three types of dosecommitment to these people. The transport scenarios both involve watergetting into the repository; in Scenario 1 there is water contact but noflow, and the radionuclides diffuse to an overlying aquifer; in Scenario 2,there is water flow from an aquifer below the repository, which carries the,-
radionuclides to an overlying aquifer. The model pathways to man include
131
w= rrre- m a - w.__--=,u ~.n -m -.n.aa -wn- - --
-
u
4
31q-,
direct access to the water in the aquife.r and via two types of river fed by the
1 aqui(er, one simulating a river like the Colorado River and the other simulatinga " midwestern river." In both the river models, radionuclides reach man through
direct ingestf on of river water and through crops, cattle, and milk. The path-
ways involving direct access to the aquifer results in a " maximum" individualdose commitmen' that is believed unrealistic and serves principally
as an upper limit value. For the river pathways, "maximus" and " reasonable"population dose commitments are calculated. The former is analogous to the" man = m" individual dose and again is an upper limit; the latter is an attempt
to represent realistic conditions whereby radionuclides will be introduced
into a population served by a particular body of water.
The radionuclides used in the dose calculations are those that persist
or grow over long time periods and that contribute hignificantly to the total
dose commitment. The times for the dose calculations are those tices in thefuture at which the concentrations of the radionuclides reach maximum values.
Thus, the dose calculations are made for present-day people, with present
metabolism and present modes of access to the radionuclides, using those radio-
nuclides that would be present in the future, at their maximum concentrations,
if they were indeed to move from the repository to a point accessible to such
people. Thb calculations must, therefore, be considered only as an illus-
trative exercise, based on a specific set of assumptions, which cannot in any
way be considered as predictive of actual occurrences in the future. Finally,
all the dose commitment values that are presented can be considered to represent
conservative values, partly because water has been assumed to enter the repositorypartly because of the use of the linear-nonthreshold dose-response codel, andpartly because of the transport and pathway assumptions. The expected doseco=mitments in a real situation would almost certainly be lower than those
predicted by'these illustrative models.
C-5.1.3 Conditions of Exposure and Persons or Populatiens at Risk,
) C-5.1.3.1 Usefulness of Modeling Short-Term Transport and Health Ef fectsI' Computerized simulation of the dynamics of environmental transport and
redistribution of radioactivity has been most useful and valid in the studiesi'
of potential impacts of specific facilities at specific locations. In these' situations, the existing environment can be investigated and substantially.
though not completely, quantified for use as input to a computer model.*
132
w._.-_-__ -- .,.---n- ___ n _ ,_ ---_ - ,+,w - a > ~v: < = , >-
d
1
1
The model can be used to evaluate critical pathways and thereby identify
the most appropriate locations for subsequent sampling and analysis. The
model can also be verified af ter its use by comparing measured concentrations
wit h those predicted by t he model.
The extensive computer modeling of health ef fects resulting from the
release of radionuclides to the c,vironment, as well as of the potential
meel misms by whteh such releases might occur, has been valuable in pointing
out areas that had been overlooked in previous evaluations of the song-term
impact of nuclear energy. For example, the potential health impacts of
nuclides such as carbon-14, technetium-99, todine-129, and neptunium-237were identified primarily as a result of computer modeling.
In nonspecific studies of facility types or typical operations, however,
come terized simulations are of limited value simply because they are so
critically dependent upon the assumptions of environmental conditions that
are used as input data. Acceptance or rejection of the results of such
nodeling will depend upon whether one accepts or rejects the assumptions
used as input to the model.
C-5.1.3.2 Problems in Modeling Long-Ters Transport and Health F.ffectsThe salidity of detailed redels for projecting transport and health
et'fects many nillenia into the future is certainly questionable. Relevant
deregrap'ie and socio-econoe.ie factors can be hypothesized for such distanta
tires, but cannot be forecast. The discussions in the following sub-sections
serve to illustrate this fact.
An extensive review of 83 documented computer codes for assessing
environ = ental transport and radiation doses from radioactivity released to
the environ =ent was published *ccently. The codes evaluated exhibited a
rather wide range of sophistication and capabilities. The environmental
transport models and supporting data represented by these computer codes are
generally similar in two respects: most of them are designed to evaluate
releases from point sources (i.e., specific surface facilities) directly into
the atnasphere or into a body of surface water, and = cst consider on'.y the
first cycle of radioactive =aterials through environmental pathways. No
docu=ented cocputer codes were found that were designed to handle releases
f rom dispersed underground sources or to consider recycling of extremely
long-lived radionuclides in the biosphere.
=- _m_ _ __
I.
C-5.1.3.2.1 Population Distributions
Geographic distributions of populations tend to change as environmental'
conditions and resource values change. For exa=ple, anyone making predictionsof present population distributions based on conditions existing more than 500years ago would not have extrapolated beyond his own country or at least hisown continent. As recently as 100 years ago, few people could have foreseen,
the city of Phoenix, Arizona. Even Las Vegas, Nevada, as it exists today,would have been considered unlikely as recently as 50 years ago, before theconstruction of Eoover Dam. In general, the fastest-growing cities in the
United States during recent decades either did not exist or were inconsequen-tial a cer.tury ago.
At the present time, the most rapid growth in the United States isoccurring in the southwestern (" sunbelt") regions. The principal limitationto growth in those areas is the supply of water. However, some of those,
' same areas may be considered for location of large Federal repositories forradioactive vaste. If a practic al systen were devised to divert water fros
the northwestern region of the county, or from the Hudson Bay area of Canada,, to the southwestern portion of the United States, it is entirely conceivablel
that extremely large metropolitan areas would develop in the Southwest. At|
the present ti=e, there is no way of predicting with a high degree of assurancethe population grewth or distribution for long periods into the future for thoseareas in which HI'J repositories may be considered.
C-5.1.3.2.2 Agricultural Distribution
The geographic distr.bution of agriculture in the United States has
changed significantly during the nation's history. Two hundred years ago,few would have predicted that the Imperial Valley of California would be amajor agricultural center. Also, few at that time would have predicted thct
the plains of Kansas Nebraska, th~e Dakotas, etc. , would be agriculturallyimportant to the United States and to the world. Just as the Icperial Valleyin California was changed by large-scale irrigatico practices, so also couldlarge portions of the southwest be changed by the importation of large quantitiesof water f rom core northern regions of the United States, or possibly Canada.As with population distribution, there is no assured way of predicting wha';the agricultural distribution might be around an HlW repository at times far
into the future.
O \ 134Oua m -
=mw--
_ _
=

9-
C-5.1.3.2.3 Agricultural Technology
Basic agricultural technology may change as a result of efforts to
feed larger numbers of people on smaller parcels of land. This would be
| particularly true if continued population growth caused more agricultural
land to be taken out of use for other purposes, such as residential, com-
mercial, or industrial uses. During the past century, especially during
the past few decades, a number of significant changes have been taking place
in agricultural technology, particularly in the areas of increased auto-
mation and artificial enhancement of food production.'
In recent years, many revolutionary procedures have been developed for
producing the world's food supplies with smaller cc=mitments of land and
in more stringently controlled environ =ents. Thus, it is entirely plausible
that within a few decades, or at most within a few centuries, present-day
concepts of transport of contaminants through food chains will be obsolete
and irrelevant. It is possible that food production will be very closely
controlled and managed in order to maximize its quantity and quality. At
chat time, the uncontrolled outdoor enviror. ment may have little or no inter-
action with the controlled agricultural environment.
Dietary and nutritional practices will undoubtedly change as the result
of changes in agricultural technology and distribution networks for food
products. In the past few decades, food chains have become more truly world-wide, as opposed to being localized within agricultural co=munities. At the
same time, however, there has been a massive increase in the control of food
ingredients and distribution.
C-5.1.3.2.4 Resource Conservation
As natural resources become more expensive to obtain, increased emphasisis placed on recycling. Not only mineral resources, but also organic materialsare being recycled; a common example is that of wood and fiber prcducts, suchas paper.
Another reaource that is being conserved and " recycled" in some partsof the country, out of sheer necessity, is water. As a nation we are rapidlyapproaching " limited pollution" releases with the long-range objective of"zero release." Admittedly, it will be a long tice before we arrive at "zerorelease," but as we approach this condition, the importance of contamiaationfrom outside sources will diminish.
135
0
_. ra : m - 7 m s_ . aM.i.. + - . - -. --- - -r:m-c - mwk' " n ww --
1
L
C-5.1.'3. 2 . 5 Medical Technology
One of the most important factors af fecting the significance of radi-
ation dose to the human race in the centuries and millenia to come is theeffect of progress in medical technolo2y. It is a =atter of record that the
progress achieved during the past several decades has already lengthened humanlife expectancy and increased the average age of the population. The successof medical science has also been felt in the increased numbers of people in
the procreative age group who have survived what wou?d once have been a fataldisease and who are now capabic of passing that hereditary defect on to their
offspring. It is entirely conceivable that, within the next century, the
somatic diseases caused by radiation will be treated successfully, so the per-
centage of people who have sustained some physiological, and perhaps even gen-
etic, damage and who are still able to produce children will increase. Ifin fact, the adverse health effects of radiation prove to be either prevent-
able or curable by advances in medical science, the t= pact of the radiation
doses resulting from long-tern storage of HLW cay be substantially altered.
Although none of these possible eventualities would af fect the radiation
doses received by future populations, the consequences of those doses couldobviously be very different.
C-5.1.4 Implications of the Use of a Linear-5cnthreshold Dose-Response
The linear-nonthreshold hypothesis is defined as: "the assumption that
a dose-effect curve derived from data in the high dose and high dose-rate
ranges may be extrapolated through the low dose and low dose-rate range to
zero, implying that, theoretically, any amount of radiation will cause some
damage."(50) To permit simplified calculatiens of the health impacts of
h small individual radiation doses delivered to large populations, it is
customary to assume that every increment of dose. represents the sa e impact,i regardless of when, where, how, and to whom it was deli <ered. At doses er
dose-rates to individuals that are small fractions of those due to naturalsources, the question of the validity of this assu=ptien is unresolved.
Inas=uch as a straight-line extrapolatien from the high-dose region down-
I ward through the origin would overestimate response effects in the low-dose
.
!1
'
i---[ ' -,

)~0;-
{} region, compared with a curvilinear form, it is generally agreed that the
" linear-nonthreshold" model provides a " conservative" basis for publicf
policy making. In addition, since this model, like all linear models, is
., intrinsically easy to understand and apply, there is a practical reason for
] preferring it to a more complicated one. The BEIR Cocciittee, (50) therefore,
y' recoccended its adoption, in spite of the fact that experimental evidence
indicated that some non-linear function would more accurately repre-t
sent the true dose-response relationship for human health effects. The-
Coccittee justified its recommendation on the basis that a "non-linear.
hypothesis for estimating risks in support of public policy would beimpractical in the present state of knowledge *, and partly because "the''
1 linear hypothesis, which allows the mean tissue dose to be used as the
appropriate measure of radiation exposure, provides the only workable *approach to numerical estimations of the risk in a population."
A further advantage of using the linear-nonthreshold model arises in
calculating limits of population radiation doses for circumstances where
populatten distributicns and radioco:iice concentrations may not be welldefined.
C-5.2 EASIS FOR DOSE-TO-MAN CALCU1ATIONS
C-5 2.1 Introduction
The preceding section has identified and emphasized the uncertaintiesand inadequacies inherent in modeling future events and consequences thatrequire detailed knowledge of the Flosphere and of human living conditionsin tines f ar into the futt.re. In spite of such limitations, there is a
distinct need for making reasonable projections related to the effects ofcurrent actions on future generations. In order to make such reasoned,
'
though limited, projections, one must rely on making explicit assumptionsand proceeding thereafter to evaluate consequences of an action or actionsbased en those assumptions.
1 Fct this report the dese-to-can consequences of IILW emplacement indeep geologic formations have been exemplified by stipulating a "mostlikely" release mechanism and by stipulating conditions whereby " maximumindividual dose" and " reasonable population dose" would occur. The general*Emp n is added
'
137
D D D , h, g\, -r r 1
4
i
u
ewJ J" - Udrdum
wm mm___ ___ - _ _ - - -
|s
1
J
l,
mechanisms and assumptions have been described briefly in Section 5.1.2.2.The most likely release mechanism is contact with, and subsequent leachingby, groundwater. Dose-to-man calculations have been made for two sub-categories of this release mechanism: transport by passive aqueous diffu-sion and by active flow of radionuclides in potable groundwater. In thefollowing sections, the assumptions made relative to the two release mech-anisms (scenarios), the three pathways, and the three categories of dosecalculations are discussed in greater detail,
,
a C-5.2.2 Repository Celease Scenarios
The two release scenarios used for this task are those termed '~ normal"as specified in Section C-4.4. Both scenarios consider groundwater in
contact with the repository waste materials, 1 caching of the vaste, andsubsequent transport through the geosphe.e to the biosphere. Leachingby groundwater appears to be the most likely failure mode for a wasterepository. In fact, some workers have concluded that eventual contactbetween groundwater and the repository will occur.( } The following
sections describe the two groundwater release scenarios upon which dose-to-man calculations are based. Table C-17 presents physical data and calculated
50-year dose-commitment factors for a number of long-lived radioruclidesthat will be present in the waste.
C-5.2.2.1 Diffusion to a Potable Aquifer (Scenario 1)
In this release scenario, radionuclides are transported from thevaste repository by way of diffusion in the water through the repository
|horizon, from which some of them gain access to an over-lying potable aquifer
I (See Figure C-15). Table C-18 shows tne concentrations of imporcant radio-
nuclides 'in the aquifer directly above the repository at time periods of300, 1000, and 30,000 years (f.imes refer to age of waste folicsing c= place-ment). The assumptions on which these concentrations are predicted includethe ef fects of sorption and dilution in the aquifer but not sorption inthe repository strata. After entering the aquifer, radionuclides move down
i the hydraulic gradient with the groundwater. Concentrations of importantradionuclides (i.e., those that are predicted to appear in significant quan-
' tities) one mile down gradient from the repository area are also shown in
138
Ii
J - ... . ~ . . . . ,
,,,

&9 ige O.
k'2!is tf/> ///Ikgj%x
gg V +4'gyj+gy' &//g<*,g?<w'
?'
_ EE _ A1,em
TEST TARGET (MT-3)
I.0 ,"! GS Mum ng g il:, =u
|,| |8" OE ,
'"'
l i.8
l.25 1.4 I.6
- s- =
MICROCOPY RESOLUTION TEST CHART
4% + #b*%f'5?' *$6%?b///
s#(;,6.
.#.o -
1'
]i i
i'
-_
s .. . ; - --
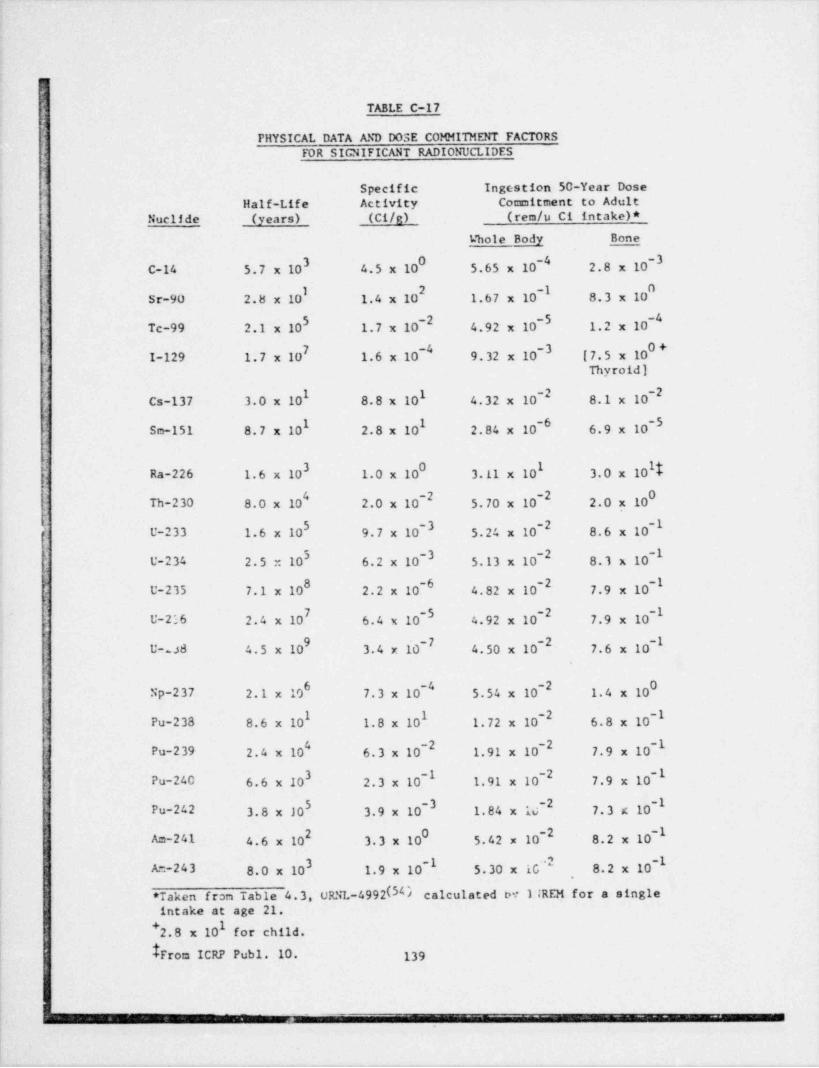
F,
TABLE C-17.
FHYSICAL DATA AND DOSE COMMITMENT FACTORSFOR SIGNIFICANT RADIONUCLIDES
Specific Ingostion 50-Year Dose
Half-Life Activity Coccitment to AdultNucifde (years) (C1/g) (ren/u Ci intake)*
L' hole Body Bone
0 -4 -3C-14 5.7 x 10 4.5 x 10 5.65 x 10 2.8 x 10
Sr-90 2.8 x 10 1.4 x 10 1.67 x 10~ 8.3 x 10
-2 -5 1.2 x 10 '-
Tc-99 2.1 x 10 1.7 x 10 4.92 x 10
0+I-129 1.7 x 10 1.6 x 10 9. 32 x 10' [7.5 x 10
Thyroid)
1 1 -2 -2Cs-137 3.0 x 10 8.8 x 10 4.32 x 10 8.1 x 10
1 -6 -5Sci-151 8.7 x 10 2.8 x 10 2.84 x 10 6.9 x 10
0 1Ra-226 1.6 x 10 1.0 x 10 3.11 x 10 3.0 x 10
0Th-230 8.0 x 10 2.0 x 10~ 5.70 x 10~ 2.0 x 10
U-233 1. 6 x 10 9.7 x 10~ 5.24 x 10~ 8.6 x 10
5 -3 -2U-234 2.5 - 10 6.2 x 10 5.13 x 10 8.1 x 10~8 -6U-235 7.1 x 10 2.2 x 10 4.82 x 10~ 7.9 x 10'
-SU-2'6 2.4 x 10 6.4 x 10 4.92 x 10~ 7.9 x 10";
9 -2 -1U .ad 4.5 x 10 3.4 x 10~ 4.50 x 10 7.6 x 10
6 - -2 0Np-237 2.1 x 10 7.3 x 10 ' 5.54 x 10 1.4 x 10
I 1 -2 ~1Pu-238 8.6 x 10 1.8 x 10 1.72 x 10 6.8 x 10
-2 -2Pu-239 2.4 x 10' 6.3 x 10 1.91 x 10 7.9 x 10~
-1 -2Pu-240 6.6 x 10 2.3 x 10 1.91 x 10 7.9 x 10
5 2Pu-242 3.8 x 10 3.9 x 10~ 1.84 x 17 7.3 x 10~
0 -2 ~1Am-241 4.6 x 10 3.3 x 10 5.42 x 10 8.2 x 10
3 ~1A.-243 8.0 x 10 1.9 x 10 5.30 x iG" 8.2 x 10
*Taken f ron Table 4.3, URNL-4992(54) calculated tw 11 REM for a singleintake at age 21.
+2.8 x 101 for child.
From ICRP Publ. 10. 139
-____
,. _ _ _ _ _ _ _ _ _ _ _ _
--- --
.- _ _
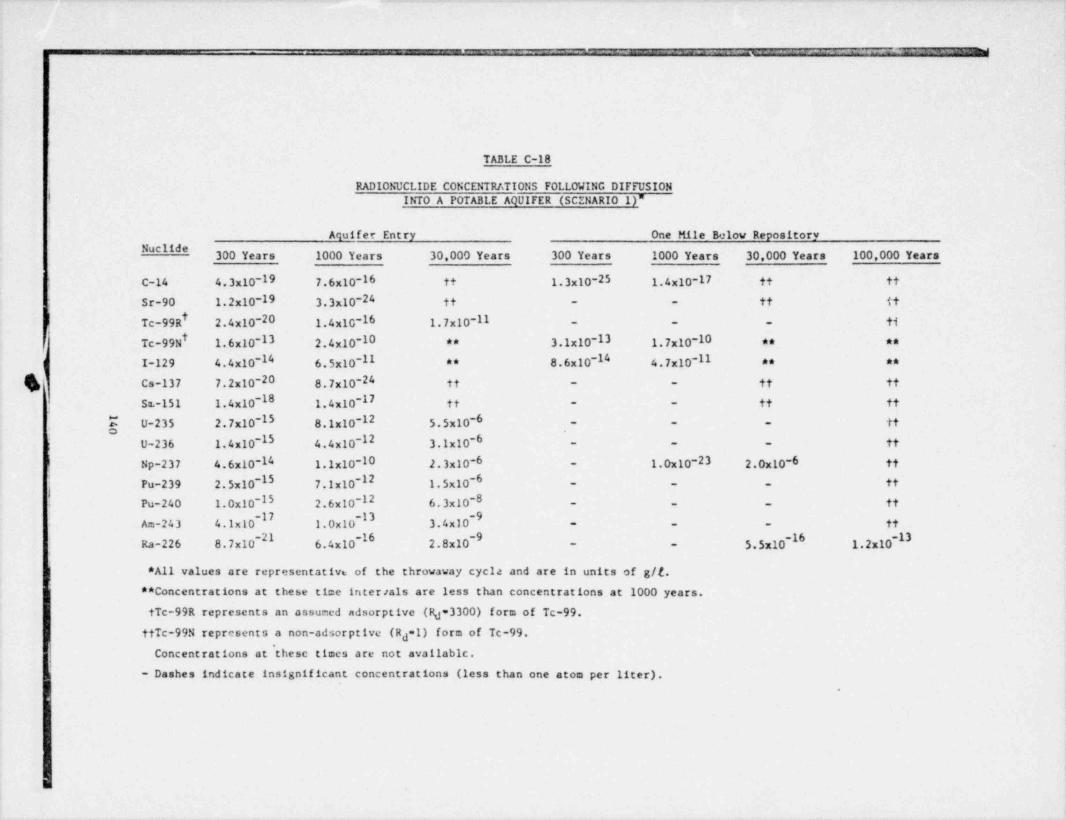
-- - _ - -a
TABLE C-18
RADIONUCLIDE CONCENTRATIONS FOLLOWING DIFFUSION'
INTO A POTABLE AQUIFER (SCENARIO 1)"
Aquifer Entry One Mile Below Repository" 'd*
300 Years 1000 Years 30,000 Years 300 Years 1000 Years 30,000 Years 100,000 Years
C-14 4.3x10⁻¹⁹ 7.6x10⁻¹⁶ tt 1.3x10⁻²⁵ 1.4x10⁻¹⁷ tt tt
Sr-90 1.2x10⁻¹⁹ 3.3x10⁻²⁴ tt - - tt it
i! Tc-99R 2.4x10⁻²⁰ 1.4x10⁻¹⁶ 1.7x10-Il - - - ti
i 3,1xio-13 1.7x10⁻¹⁰Tc-99N 1.6x10⁻¹³ 2.4x10⁻¹⁰ .. ....
8.6x10-l' 4.7x10-llj I-129 4.4x10-l' 6.5x10-Il ** ****
h Cs-137 7.2x10⁻²⁰ 8.7x10⁻²⁴ tt - - tt tt
Sa.-151 1.4x10⁻¹⁸ 1.4x10⁻¹⁷ tt - - tt tt
U-235 2.7x10⁻¹⁵ 8.1x10⁻¹² 5.5x10⁻⁶ - - - tt{: U-236 1.4x10⁻¹⁵ 4,4,1o-12 3,ixio-6 - - - tt
i Np-237 4.6x10-l' 1.1x10⁻¹⁰ 2.3x10⁻⁶ _ 1,oxio-23 2.0x10⁻⁶ tt
Pu-239 2.5x10⁻¹⁵ 7.1x10⁻¹² 1.5x10⁻⁶ _ _ _ ,,
Pu-240 1.0x10⁻¹⁵ 2.6x10⁻¹² 6.3x10-0 - - - tt
Am-243 4.1x10- 1.0x10- 3.4x10- tt- - -
-21 -6- -
-16 -13Ra-226 8.7x10 6.4x10 2.8x10- 5.5x10 1.2x10
*All values are representative of the throwaway cycla and are in units of g/t.
** Concentrations at these time interials are less than concentrations at 1000 years.
tTc-99R represents an assumed adsorptive (R =3300) form of Tc-99.d
ttTc-99N represents a non-adsorptive (R =1) form of Tc-99.d
Concentrations at'these times are not availabic.- Dashes indicate insignificant concentrations (less than one atom per liter).

9
),.
73,
; -
,
.M
9
INDIVIDUAL POPULATIONDIRECT. INGESTION DIRECT INGESTION
,
'
_
,
WATER SUPPLY WELL
4evaAwAwevumffewe <<we</Av Aw4 <f,r j ',,3ws </NA+hA'v4%wAw/S0lt j SOIL
*' RPOTABLE AQUlFER 'gOUND T
- - FLOW* :
Y . ' ' . ' ' _ f OlFFUSION OF RADIONUCLIOES*
..- ~ TO POTABLE AQUlFERVERY LOW . .
PERMEABILITY .- -
HLW REPOSITORY_ _gg j 'g. REPOSITORY STRATUM
_
__*
WITH INTER 8EOS ..,,,,,
. . R5L5T VELY SLOW LEACHINGIN REPOSITO97*** * * * '
..
" " LOW E R AbblFER * *=* =
__
,
Source: O'Appotonia Consu' ting engineers. Inc., for Arthur D. Little. Inc.
FIGURE C-15 SCHEMATIC ILLUSTR ATION OF MAXIMUMINDIVIDUAL AND UPPER LIMITPOPULATION DOSE BY DIFFUSION TO A POTABLE AQUlFER (SCENARIO 11
|
141
-ar m a m m _< ,2 r _x -w.- a ,
6
.

1'i
A
.
Table C-18 for time periods of 300,1000, 30,000 and 100,000 years,
following waste emplacement.
8
C-5.2.2.2 Flow to a Potable Aquifer (Scenario 2)
In this scenario, radionuclides are transported from the waste reposi-torj by groundwater from an underlying aquifer flowing through the repositoryto an overlying potable aquifer (See Figure C-16). When the nuclide-bearing
groundwater reaches the aquifer, movement is downgradient within that aquifer.
Table C-19 presents concentrations of important radionuclides in the aquifer
directly above the repository and in the aquifer or.t mile down gradient from
the repository. Concentrations at time periods of 300, 500, 6000, and
30,000 years are shown for the area overlying the repository site and
for 300, 500, 6000, 30,000, and 100,000 years one mile down gradient from
the repository. These cencentration estimates are based on assu=ptions
that include sorption and dilution in the aquifer.
C-3.2.3 Pathway Models
The intake of radionuclides by people is postulated to occur not by
direct access to the repository but by access through some pathway to the
aforementioned aquifer. Three routes have been chosen for consideration,
one of which (direct access tc the contaminated' aquifer) would require con-currence of several specific conditions or events and ray therefore be rather
unlikely, while the other two (river codels) are intuitively more plausible
and realistic. In each of the three cases, contamination of the aquifer
was assumed to occur by either the Scenario 1 or Scenario 2 mechanisms.
Infor=ation important to the use of all models for calculating dose com-
mitments is listed in Table C-20.
C-5.2.3.1 Direct Access to Aquifer
S In this case the assumption is made that water is obtained from a
l well that has been drilled into the aquifer, i.e., the resulting pathway
is that of direct ingestion of the contaminated water continuously for a
period of one year. This is a worst-case situation, most likely to be
prevented either by appropriate security or by the remoteness and lack of
142
--
_ _ _ -m -,
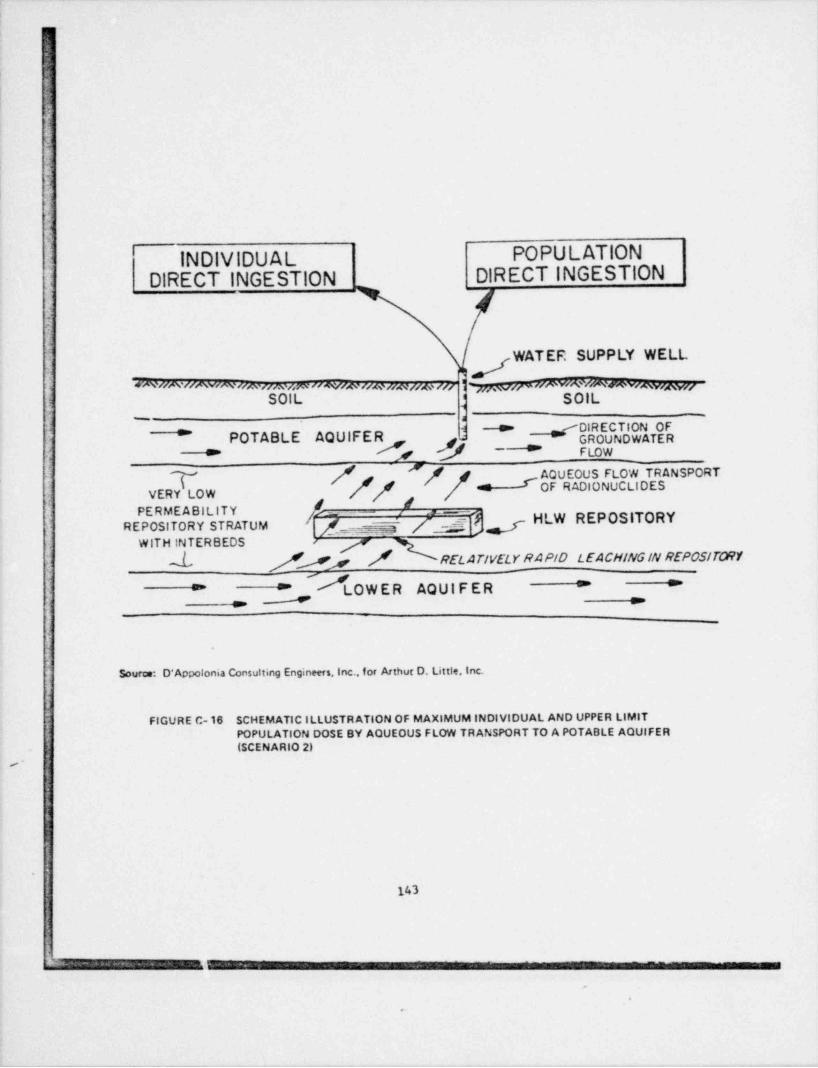
!.
.i-
.
.
J
INDIVIDUAL POPULATIONDIRECT INGESTION DIRECT INGESTION
WATEF. SUPPLY WELL-
1 i,,.wu-""w^*^'+wwnwsw/-manwnwmmismi,m umus um,wwww
SOIL j SOIL-- ,
_
8EPOTABLE AQUlFER -* noUND TR
T / ',/ AQUEOUS FLOW iRANSPORT#OF RADIONUCLIDES/ c
VERY LOW#
PERMEABILITY -_ , _ - .
HLW REPOSITORYREPOSITORY STRATUM g_ _ . _a fg g
WITH IN TER BEOS
i /f,ey/ REL ATIVELY RA PIO LEACHINGIN REPOSITO71
<
* ** " LOW E R AQUlFERu ==_
Souros: D'Appolonia Consulting Engineers. Inc., for Atthur D. Little. Inc.
FIGURE C-16 SCHEMATIC ILLUSTR ATION OF MAXIMUM INDIVIDUAL AND UPPER LIMITPOPULATION DOSE BY AQUEOUS FLOW TRANSPORT TO A POTABLE AQUlFER(SCENARIO 2)
-
i
143
: _ .- 1 =,_z--- -
.my. ,,.~:...e.....,.. _ .,. _......m _ . . . . , . . . . . . . _ . . . . - .. . , . -.
9
d
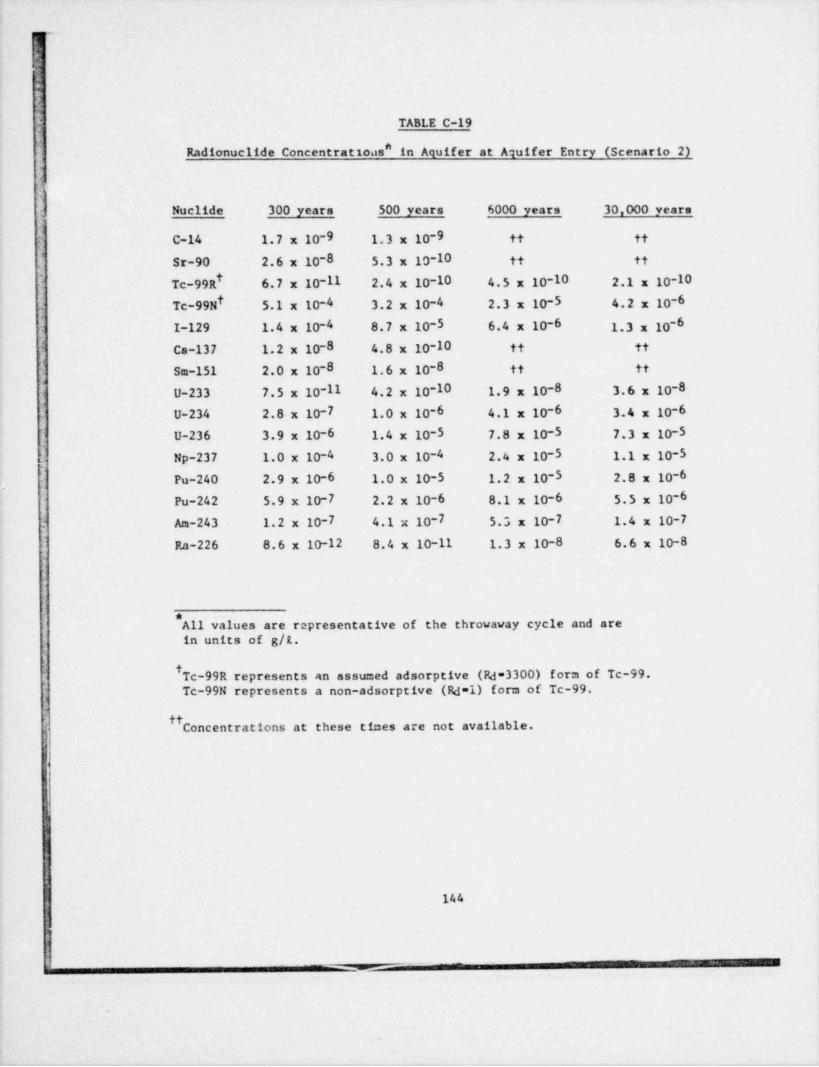
3:>.,
,4
TABLE C-19
Radionuclide Concentratioas* in Aquifer at Aquifer Entry (Scenario 2),
t
,Nuclide 300 years 500 years 6000 years 30,000 years
C-14 1.7 x 10⁻⁹ 1.3 x 10⁻⁹ ft tt
Sr-90 2.6 x 10⁻⁸ 5.3 x 10⁻¹⁰ tt tt"
'
i 6.7 x 10⁻¹¹ 2.4 x 10⁻¹⁰ 4.5 x 10⁻¹⁰ 2.1 x 10⁻¹⁰Tc-99R
Tc-99N 5.1 x 10⁻⁴ 3.2 x 10⁻⁴ 2.3 x 10⁻⁵ 4.2 x 10⁻⁶i
I-129 1.4 x 10⁻⁴ 8.7 x 10⁻⁵ 6.4 x 10⁻⁶ 1.3 x 10⁻⁶Cs-137 1. 2 x 10⁻⁸ 4.8 x 10⁻¹⁰ tt tt
Sm-151 2.0 x 10⁻⁸ 1.6 x 10⁻⁸ tt tt,
U-233 7.5 x 10⁻¹¹ 4.2 x 10⁻¹⁰ 1,9 x 10⁻⁸ 3.6 x 10⁻⁸
U-234 2.8 x 10⁻⁷ 1.0 x 10⁻⁶ 4.1 x 10⁻⁶ 3.4 x 10⁻⁶U-236 3.9 x 10⁻⁶ 1,4 x 10⁻⁵ 7.8 x 10⁻⁵ 7.3 x 10⁻⁵Np-237 1.0 x 10⁻⁴ 3.0 x 10⁻⁴ 2.4 x 10⁻⁵ 1.1 x 10⁻⁵
Pu-240 2.9 x 10⁻⁶ 1.0 x 10⁻⁵ 1.2 x 10⁻⁵ 2.8 x 10⁻⁶Pu-242 5.9 x 10⁻⁷ 2.2 x 10⁻⁶ 8.1 x 10⁻⁶ 5.5 x 10⁻⁶Am-243 1.2 x 10⁻⁷ 4.1 x 10⁻⁷ 5.3 x 10⁻⁷ 1.4 x 10⁻⁷
Ra-226 8.6 x 10⁻¹² 8.4 x 10⁻¹¹ 1.3 x 10⁻⁸ 6.6 x 10⁻⁸
*All values are representative of the throwaway cycle and arein units of g/1.
Tc-99R represents an assumed adsorptive (Rd=3300) form of Tc-99.Tc-99N represents a non-adsorptive (Rd=1) form of Tc-99.
Concentrations at these times are not available.
5
l1
i
144
'--
___ _ _ _ . _ _ _ __ __-
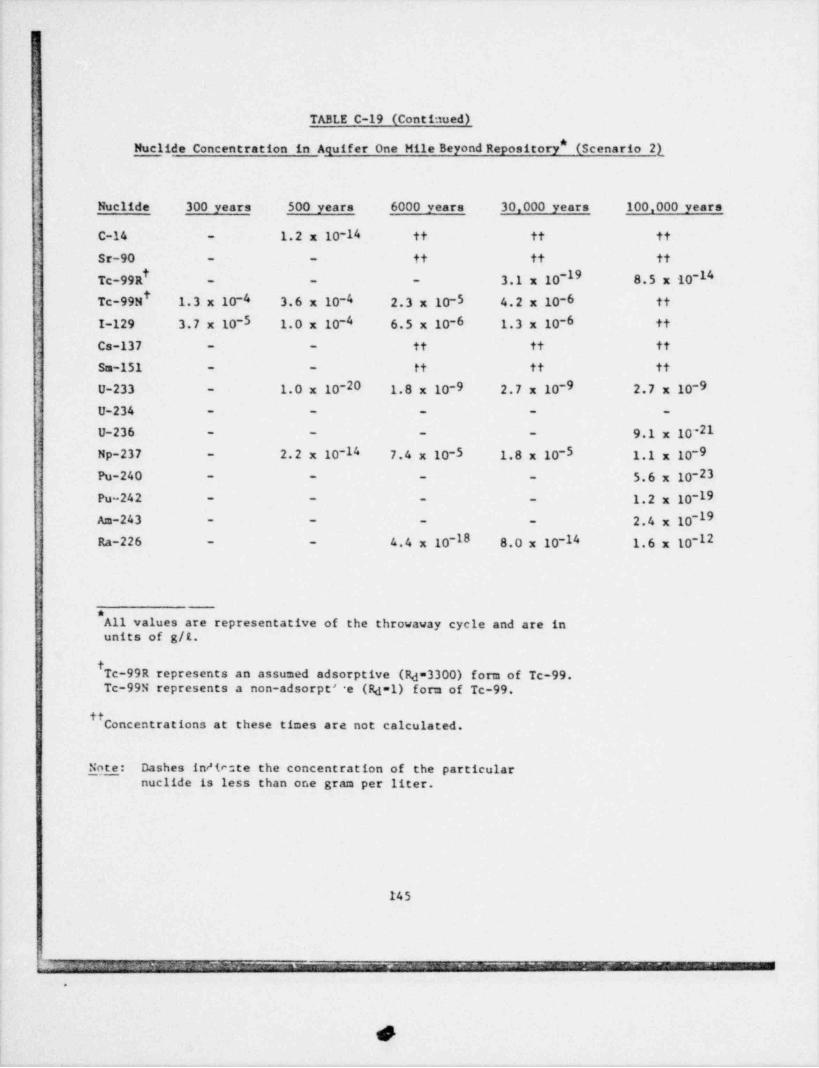
!
TABLE C-19 (Continued)
Nuclide Concentration in Aquifer One Mile Beyond Repository" (Scenario 2)_
Nuclide 300 years 500 years 6000 years 30,000 years 100,000 years
C-14 - 1.2 x 10⁻¹⁴ tt tt tt
Sr-90 - - tt tt tt
Tc-99R+ - - 3.1 x 10⁻¹⁹ 8.5 x 10⁻¹⁴-
ITc-99N 1.3 x 10⁻⁴ 3.6 x 10⁻⁴ 2.3 x 10⁻⁵ 4.2 x 10⁻⁶ tt
I-129 3.7 x 10⁻⁵ 1.0 x 10⁻⁴ 6.5 x 10⁻⁶ 1.3 x 10⁻⁶ tt
Cs-137 - - tt tt tt
Sm-151 - - tt tt tt
U-233 - 1.0 x 10⁻²⁰ 1.8 x 10⁻⁹ 2.7 x 10⁻⁹ 2.7 x 10⁻⁹U-234 - - - - -
- - - - 9.1 x 10⁻²¹U-236
Np-237 - 2.2 x 10⁻¹⁴ 7.4 x 10⁻⁵ 1.8 x 10⁻⁵ 1,1 x 10⁻⁹Pu-240 - - - - 5.6 x 10⁻²³Pu-242 - - - - 1.2 x 10⁻¹⁹An-243 - - - - 2.4 x 10⁻¹⁹Ra-226 - - 4.4 x 10⁻¹⁸ 8.0 x 10⁻¹⁴ 1.6 x 10⁻¹²
*
All values are representative of the throwaway cycle and are inunits of g/1.
tTc-99R represents an assumed adsorptive (R =3300) fom of Tc-99.dTc-99N represents a non-adsorpt' e (R =1) fom of Tc-99.d
" Concentrations at these times are not calculated.
|
pg: Dashes in/te te the concentration of the particularnuclide is less than one gram per liter.
145
, _g. mf c.q - _m .m -, -u , . - _e, , ~ ,., ..# c me am2r: r:- < - - -
.
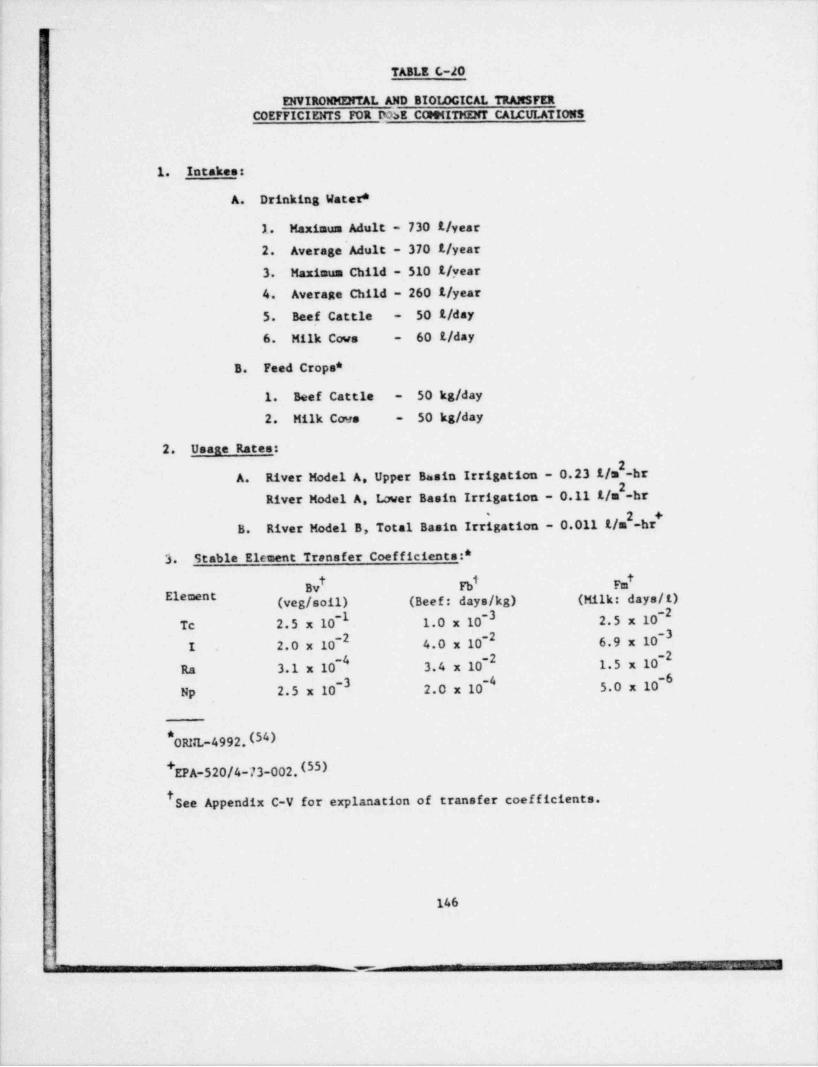
I,~
P
TABLE C-20
ENVIRONMENTAL AND BIOIDCICAL TRANSFERCOEFFICIENTS MR N:>E CCDMITHENT CALCULATIONS
<
1. Intakes:!
A. Drinking Water *
1. Maximum Adult - 7301/ year'
2. Average Adult - 3701/ year
3. Maximum Child - 5101/ year
4. Average Child - 2601/ year50 1/ day5. Beef Cattle -
6. Milk Cows - 60 1/ day
B. Feed Crops *
50 kg/ day1. Beef Cattle -
50 kg/ day2. Milk Coss -
2. Usage Rates:
A. River Model A. Upper Basin Irrigation - 0.231/3 -brRiver Model A. Imer Basin Irrigation - 0.11 1/m -br
2 +B. River Model B, Total Basin Irrigation - 0.011 t/m -br
3. Stable Element Transfer Coefficients:*i i
By Fb Fm
(veg/ soil) (Beef: days /kg) (Milk: days /t)**"
~1 -3 -2Tc 2.5 x 10 1.0 x 10 2.5 x 10
-2 ~3I 2.0 x 10~ 4.0 x 10 6.9 x 10
3.1 x 10 ' 3.4 x 10 1.5 x 10~~ ~
Ra-6
Np 2.5 x 10 2.0 x 10~ 5.0 x 10~
*I 0RNL-4992.(54)
! * EPA-520/4-73-002.(55)9' iSee Appendix C-V for explanation of transfer coefficients.
146
.
' f_ .- _. ~ ~-
|
1
usefulness of the repository area. it provides, for reference purposes,
an extreme case of human exposure to a contaminated aquifer, and producesan " unrealistically" high radiation dose commitment to affected individuals.
C-5.2 1.2 River Model "A"
This river model is constructed using data typical of the ColoradoRiver mainstream. Water from the aquifer is assumed to enter the riverone mile beyond the repository. Main water diversions (for populationuse) along the river are taken at five major locations.
The river model has an uppc. and lower basiu: the upper basin hasi
more rapid dilution via tributaries, and the lower basin nas a relativelyconstant flow and dilution factor. For this reason, two diversions wereused to represent use in the upper basin and one " total diversion" to
'
represent use in the lower basin. A dingle point diversion in the lower basin(at the river mouth) was used because the dilution factor throughout thelower basin is approximately constant. Other upper-basin characteristicsare high agricultural use and relatively snall populations ingesting water.
Dilution factors applicable at each diverrion were calculated using ageneral materials balance. Use along the river has been taken either fromexisting Colorado River data, as stated in Table C-21, or calculated fromstandard use and yield values. (51'4
C-5.2.3.3 River Model "B"
This model is for a hypothetical river having a population and usedistribution proportional to the river flow (i.e., proportional to thedilution factor). Water from the aquifer is assumed to enter the riverone mile beyond the repository. The codel was previously used for apurpose similar to its application in this assessment.( This hypo-
thetical river can be considered more typical of a midwestern river thanRiver Model "A" in that it is more heavily used for drinking water andless used for agricultural supply. Where available data are insufficient,the same assu=ptions and water use calculations made for River Model "A"are applied in River Model "B". Information important in using RiverModel "B" for calculating a reasonable population dose is listed inTable C-22.
147.
' 'P [Th E% "h. JM&y----- 7 )2- MY.m.m I*
w - _ . % _.- _ w - s' -m - a . - M_
i
.
O
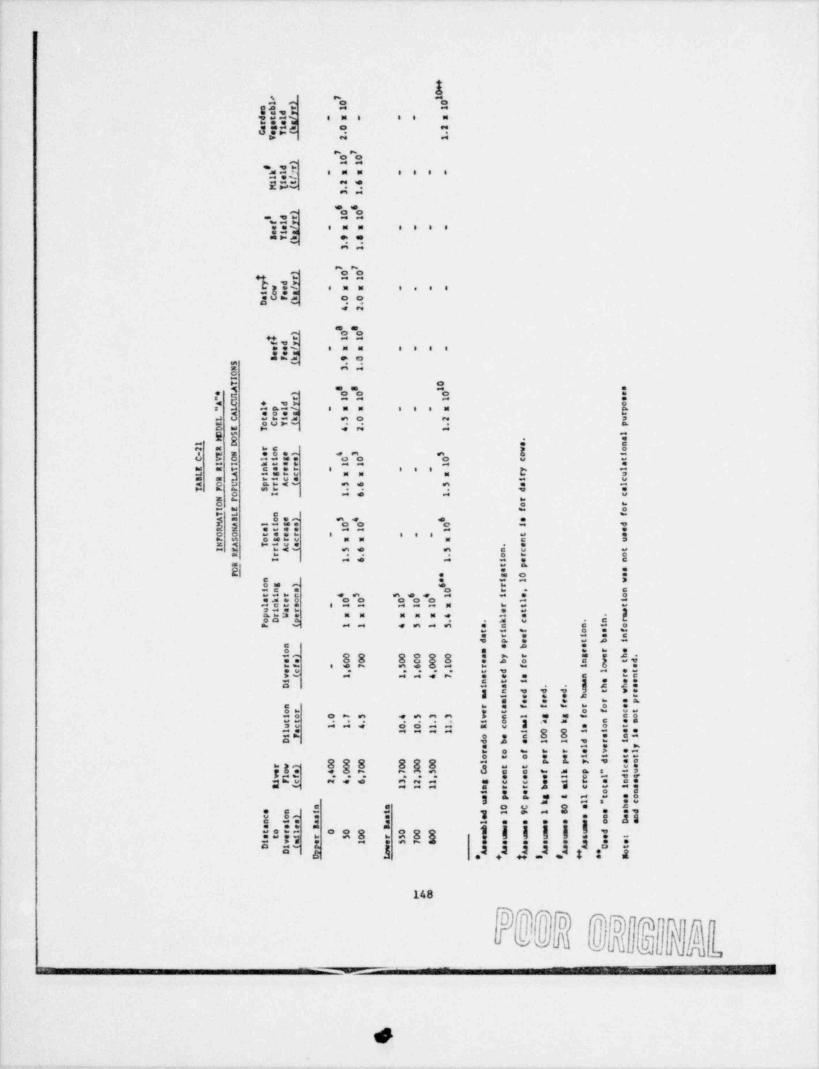
e I Il ) 0 0
sb r 1 1eedyd tl/ - a - - - are ea
0 2.,agikCof(
T 2 1
I I0 0
) 1 1, d rkl - - a a - - - -l a!
MI(2 6it t
,
3 1
6) 0 0
, dr 1 1fl yeef - a a - - - -eitSfk 9 8,
( .
3 1
I I) 0 0
% r 1 1y d y
rwe/ - m m - - - -ioemaCFk 0,. 0D (
4 2
8 8) 0 0r 1 1
fd yee/ - x a - - - -eemBFk 9, 0
S ( , ,
N 3 10!
T 0
"A!A
0 8 1 s4
!
+ d y c
) 0 0 0 et r 1 1 1 e41 l pl/ - x s - - - a p
". A aoem rt C t rik 5 0 2, uF oCY( . < pD E T 4 2 1
E O . aS l
1 D s n1 R rn w
io
- Y N eoe) 3 3 o'0 0 0 cC V O li ssI I k t a e 1 1 1
t
aE R T na er - - - - y l
ui grc a x a r uL
B R ric a t cA O t prA( 5 6., 5 e lT F P S r
. 6 1 cd a
O i 1N F r0 o rt E f of L n fA B oe) 5
'0e
M A li gs 0 0 l dR N at ae 1 1 1 eO 0 t aer - - - - t sF $ ogre s s x n uN A Tic e ,
c te
I F rA( 5 6,
t e n5 n
o r oP r. 6 1i 1
Mt pe e
* g 0 en * i 1 wog )
'0 rr ni n e
5 I * 1 i e. ot irc '0 0 0 '0 0 l iak eol nt e - 1 1 1 1 2 a r t t
uiar e t a,
l a , mprW e s a x s s 4,. k c , n roD p
P ( 1 1 4 5 1 5 a n n i ot i f o e f
a r e i e nd p e t b i
n s b so m e r ei) 0 0 0 0 0 0 a y r g e h .se 0 0 0 c 0 0 e b o n w td
7 r f i o erf - 6 5 6 0 1ee t d l etv( 1 1 1 4 7 s e a n r ni n t l a e ee
m n d d, m h bsD i a ,
d u t uee i e e e h r
m e e e r spn r a f f f r o eor e t o f ct
0., 7 5, 4 5 3 3 v n l g g f noi o, m i o a k k n e nt t
uc 1 1 4 0 0 1 1 R c m o ol a 1 1 1 1 i 0 0 t t teeiF o e n 0 0 e olD d b a 1 1 d r t
a l e yr o f r r e v elo t o e e i i t t
0 0 0 0 0 0 l p p y d anrw) 0 0 0 0 0 0 o t t c e
iueoe 4 0 7 7 3 5 C n n f k p "lvlf e e e l r d q
iFe 2 4 6 3 2 1 g c c e i r a oet ( 1 1 1 e r r b m c t t s
t e e o ns p p g t l t aou k l " ec
e a 0 C 0 a he n t t d 1 9 1 8 e sdc o) a s e s n ann is a a l e s e o e o Da
o e me s e s B b mmmm u dt ort 0 0 0 0 0 0 net ef r 5 0 r 5 0 0 e u s ei va e 2 e 5 7 S o o e a o s s
se
D i( p m m s s m A U tD y m '"*NA A * o*A i
AAt 1
g#)
@S 9 ,
p9-C E
E-E7 s
' '
'- |'js p; 4(<l

- . . - _ _ _
- , _ . .
.
.TABLE C-22
INFORMATION FOR RIVER MODEL "B"*
-
FOR REASONABLE POPULATION DOSE CALCULATIONS
Distance Population Total Dairy Cardento River Dilution Drinking Crop Beef Cow Beef + Milk Vegetable
Diversion Flow Factor Water Yield Feed Feed Yield Yield Yield(miles) (cfs) (persons) (kg/yr) (kg/yr) (kg/yr) (kg/yr) (t/yr) (kg/yr)
0 200 1.0 - - - - - - .
3 2 0~ 1 15 220 1.1 4.3 x 10 2.0 x 10 3.0 x 10' 6.2 x 10' 3.0 x 10 5.0 x 10 1.1 x 10³ 2 545 360 1.8 7.0 x 10 3.2 x 10 4.7 x 10' 9.8 x 10' 4.7 x 10 7.8 x 10' 1.8 x 10⁴ 5 580 700 3.5 1.8 x 10 8.4 x 10 1.2 x 10 2.5 x 10 1.2 x 10 2.0 x 10 4.7 x 10
h 6 5 6 0 0150 2,000 9.9 1.3 x 10 6.0 x 10 8.6 x 10 1.8 x 10 8.6 x 10 1.4 x 10 3.3 x 10⁷ 6 0 6 6} 250 5,200 26 3.3 x 10 1.5 x 10 2.2 x 10 4.6 x 10 2.2 x 10 3.7 x 10 8.6 x 10
j 6 6 0350 10,000 50 6.3 x 10 2.9 x 10 4.2 x 10 8.7 x 10 4.2 x 10' 7.0 x 10 1.6 x 10! 450 16,000 81 1.1 x 10 4.8 x 10 6.9 x 10 1.4 x 10 6.9 x 10' 1.1 x 10 2.7 x 10
0 0
1
Assembled using river in "CESM0" (NUREG-0002, Vol. 3).( 2)~ '
+ Assumer 1 kg beef per 100 kg feed.'
Assumes 80 t milk per 100 kg feed.
Note: Dashes indicate instances where the infor=ation was not used for calculationalpurposes and consequently is not presented.
3
;
>-
C-5.2.3.4 Accumulation of Radionuclides in Surface Soil
Continual irrigation with contaminated water produces a long-termbuildup of contaminants in surface soil. At the same time, contaminantsare continually removed by erosion, by uptake into plants, or by leaching belowthe root zones of plants (effective removal from food chains). There arefew data available to indicate the natural residence time of various elementsin tillable soils. For this study, a soil exposure time of 100 years wasused to allow for reasonable buildup of radioactive contaminants through time.For calculational purposes the midpoint of this time, 50 years, is usedas an average value for transfer coefficients from soil to plants. Thisis believed to be a conservative assumption, since,it is unlikely that mostnuclides will accumulate without dispersion for that period of time.
C-5.2.4. Exposure Routes
For the postulated "most likely" mechanisms for release of radio-nuclides f rom an HLW repository (i.e., leaching and transport by groundwater)the " maximum" individual and population doses can be app.oximated withoutdetailed pa'hway modeling. This results because, for most of the radionu-t
clides, direct exposure routes lead to much higher radiation doses thando the indirect exposure routes. The indirect routes, however, are themore likely ones whereby man could be exposed to HLW radionuclides.
One possible exception to the direct route being more important isi iodine-129 for which the radiation dose via the milk-to-human pathway can
be approximately 100 times greater (per unit of liquid ingested) than the
dose from direct ingestion of the radioiodine in drinking water. However,
such extreme differences between doses delivered by direct and indirectpathways occur only with the simultaneous existence of two or more rather
unlikely caximizing circumstances. For exa=ple, in order to have an annual
intake approximately 100 times greater than would be achieved by directingestion of the contaminated water, a child would have to drink nothing
but milk from cows whose only cource of feed was vegetation grown on landtotally irrigated with contaminated water at an irrigation rate of one meter /
150
_, _ _ _ _ _ m- -__ __ .- m ._ .._%. =w a

year and with a retention of radioiodine on the edible portions of the plantof 25% of the total amount sprinkled. In similar fashion, a child obtainingall its vegetable food products from land irrigated with contaminated waterunder the so e circumstances as described above would also receive a radiationdose approximately 100 times greater than that delivered by direct ingestionof the contaminated water. Such circumstances are not considered realisticfor purposes of dose estimations.
Models, assumptions, and data have beca prepared or collected by theU.S. Nuclear Regulatory Conmission (Nr.C? for the purpose of calculatingradiation doses to individuals and populations.(51) This information wasevaluated aid was determined to be adequate, reasonable, and realistic forthe purposer of this study. Consequently the NRC models, assumptions anddata have been utilized for dose calculations; these will be addressed
more explici'.ly in the subsequent sections.
The conversion f actors for the radiation dose to an individual, per
unit of radioactisity ingested or inhaled, are based on the Oak Ridgecomputer dose program INPEM as described in ORNL-5003( and as tabulated
in ORNL-4992,(54 ) The dose conversion f actors tabulated in ORNL-4992 are
50-year dose commitments to an individual at age 21. These conditions arefelt to be a suitable approximation for an average population when all
other uncertainties in the assumptions are considered.
Cencratized environmental transfer and bioaccumulation coefficients fora rather complete range of radionuclides have been used for environmental
modeling as shcwn in Table C-22 for River Model "B".(S1) These coeffi-cients are appropriate for use where site-specific data are not available;this certainly is the case for considerations relative to HLW repositoriesin geologic formations.
!C-5.2.4.1 " Maximum" Individual Radiation Dose
The " maximum" individual dose is calculated on the assumption that
an individual is present at the point or maximum environmental concentra-||
tion for a specified radionuclide and at the point in time for which thatI
nuclide reaches the maximum concentration. It is assumed, however, that
the individual ingests the contaminated material at an estimated maximum
151
- - 2 u z m m m _ . _ .;.. ,.,,. a a : = = n .:: c 7 m- m- ns-

(730 liters per year) and is an individual of average age in the popu-rate
lation. In this respect, the calculation should not be considered the " maxi-mum conceivable individual dose" but is more 'opropriately thought of as a"maxhnum dose to the typical individual."
The " maximum" individual dose calculations are based on the assumption
that an individual would obtain all drinking vara r f rom a well penetrating thecontaminated aquifer at the point of highest concentration in the vicinity
of the waste repository (see Figures C-15 and C-16). Thus, the maximum in-
dividual dose in this case ic calculated by assuwing that it results from
continuous consumption of water by a 21-year-old individual for a period of
! one year, that the water is contaminated to the maximum level in the aquifer,
ar:d that it produces a 50-year dose commitment during the lifetice
of the individual. For purposes of calculating a 50-year dose com-
mitment, an ingestion period of one year is considered to be the same as a
single instantaneous ingestion. The location of the well in the aquifer
is assumed to be directly above the repository where the radionuclides in the
aquifer are at the maximum concentration following initial dilution. The
times used for estimating the radionuclide concentrations in each scenario
are those that produce the maximum radionuclide dose commitments for fission
products and actinides, respectively.
C-5. 2. 4. 2 " Maximum" Population Radiation Dose
A " maximum" population dose is closely related to the "caximus"individual dose. In most cases of release of radionuclides into the envi-
ronment, the assumed conditions of release generate certain limitations
to the total population radiation dose that can be delivered, at least by
direct exposure pathways. Analogous to the "maximur." individual dose.
the " maximum" population dose is designed to represent an upper limit ofradiation dose to a population present at the time and location for which
the maximum impact might occur from a release of radionuclides from a
vaste repository. However, the population .'ensity and the environmental
transfer coetficients are assumed to be approximately average for cor.mun-ities that might be exposed, rather than the extrec:es that might produce
the " maximum conceivable" population dose. In the case of a contaminated
water body such as an aquifer, a surface reservoir, or a surface stream.
'
,_ _ . _ . _
u1
the " maximum" population radiation dose is equal to the " maximum" individ-ual radiation dose (i.e., the radiation dose to an individual drir. king amaximum quantity [ 730 t /yr] of the contaminated water exclusively) multi-1
plied by the population (250 persons) that could be supplied by the waterbody (see Figures C-15 and C-16), and reduced by a factor of two to allowfor a lower annual water intake of 370 (/ person. The upper limit of popu-lation that can be supplied b" a particular water body was estimated onthe basis of current per-capita domestic water consumption and the totalout flow volume of the hypothetical aquifer.
C-5.2.4.3 " Reasonable" Population Radiation Dose">!aximum" radiation doses to individuals and populations represent
upper bounds for the analysis of health consequences. Ilowever, they donot represent what night cautiously be called "most reasonable estimates"of radiat ion deses that might be expected f rom a geologic IIIM repository.It is highly ualikely that any individual or population group would bepresent at precisely the point of maximum environmental concentration inthe event of release of radionuclides from a repository. It seems more
' realistic to postula*e that populations would be exposed at some distancei
from the repository and through indirect pathways rather than by the mostdirect p a t i.wa y s . To :evelop such realistic population radiation dose
...tinates .r u.wpecified repository locations and indeterminate times
into tSe at r. It has been necessary to raake many simplif ying assumptions.
,pu;atita radiation doses are calculated on the basis. . , . . * ,
11 as that actually reach the biosphere under thec: t: e .-w -.
node, i.e., by discharge of a contaminated underground.,se,a es,es r s
a f ace stream. These few critical radionuclides areo;u: ' e r * . , ,
a s, , rem ts ..w ,it al pathway ,a n.1 reach typical populations (based*
int u uta an: .avironmental conditions) during the course of
their nf t. : st a d eur s t ! as t ' ward the ocean. The typical environmental
,,athways art -ir.,illfice, ,rimarily to ecphasize the fact that the cal-
nou.,ht of as highly accurate but as subject to.alations sacul.. not ' .
scne une.rtainty. P m ".e . .. t t c a dist ributions and densities, agricultural
practices, etc., are a3suned to be those common in cuch of the United
. _ . - . - . - - .
Statcs at present. No reasons could be found for anticipating particular
popolation densities or agricultural practices at times in the distant
future.
The " reasonable" population dose commitments for each scenario have
been calculated on the basis of the contaminated aquifer intersecting a
surface stream one mile down-gradient from the repository. Ingestion
pathways used in these calculations include:
(1) Direct ingestion of centaminateo river water;
(2) Ingestion of contaminaced crops;,
(3) Ingestion of contaminated beef; and
(4) Ingestion of contaminated milk.
These four pathways are illustrated schematically in Figure C-17
and are applied to the two river models.
The " reasonable" population dose commitment represents the 50-year
dose commitment to a population resulting from one year of intake via all
four pathways. Although the population is different for each pathway,
the population dose commitment (person-rem) can be added for different
pathways because of the assu=ed linear-nonthreshold dose relationship.
In almost all cases for which " reasonable" population radiation
doses are calculated, as well as for some of the cases for which " maximum" .
populatJon radiation doses are estimated, it was noted that size of
population may not necessarily be of great icportance when using the
assumed linear-nonthreshold model. In general, when local meteorological
or hydrological parameters are unknown, it could be assumed that radio-
nuclides released to the environcent would be distributed and diluted in
approximate proportion to the area involved; i.e. , the environmental
concentration would be inversely proportional to the area over which the
material was spread. On the other hand, lacking definite population dis-
tribution data, making an assumption of uniform population density would
imply that the affected population would increase in proportion to the
affected area. Thus, if the transfer coef ficients f rom environmental
media to human beings remain constant, the total population
radiation dose would tend to remain constant,regardless of the area
or the population over which a radioactive contaminant is spread.
While there are exceptions to this generalization, it is nevertheless
154
W, , _ - . . _ _ _ _. _ m , .~m
,

5i1 Surface Stream
w .47 W iry e s i s , p n v n z.,, g ,e y, psNO#" gl f,p'
3POTABLE N "#4 't b s
y c * # ,eAQUlFEP % f # #e 44
a-- ~ - ,! g., g g ,
*,
REPOSITORY trrigation ef#STRATUM AND dd py . u ingestion
JINTER 8EDS i"
gT p
kRepository pf J ' '
y7 [s Y fIngestion
- .L9 SCENARIO I - DIFFUSION
SCENARIO 2 - AQUEOUS FLOW k_Y ocatm
TRANSPORT [ POPULATION
LIVESTOCK_ . _ . - .
- - _ _ -
dMM'- ._inoe s""
_
m .,_e e = es e
VEGETATION " " ' " > LIVESTOCKA Oopeowe
. . . . . . . . ..
SURFACE WATER ""6 SOILa_ u _ _ _ _ .__ ?9erJ'
ee::ge7
_ . _ _ _ . . _ _ _ .__
SUBSURFACE WATERA , ;rotion
_ __
i RADIONUCLIDES
.Source: D'Appo;on;a Consultrg En; neers. inc., f or A*ttv D Litt.e, Inc.
,
FIGURE C-17 SCHEMATIC ILLUSTR ATION OF "R E ASONABLE"POPULATION DCSE (SCENARIO 31 & 2)
155,
j_ L _s Au n e 13 - w._i - - -, |' r . | ' ^
'' ' '''
.
"%
g -- .*J
d
i
useful in arriving at upper bound population radiation doses withoutspecific data on population distributions.
The population radiation dose from food crops grown on landcontaminated with irrigation water is inherently lietted by a nc=berof factors. The total amount of land that can be irrigated and, hence,the total amount of crops that can be grown are limited by the volumeof water available. If the volume of va er is increased, the concen-tration of radionuclides in the water,and subsequently in crops, decreasesproportionately, and the transfer of radionuclides to the total food chainremains essentially constant (the transfer coefficient from soil tovegetation being assumed to remain constant). Thus, the total
distribution of radionuclides to th'e population via first-cycle foodchains is inherently limited. The upper bound population dose commit-ment is obtained by assuming total ingestion of the leafy vegetablesthat can be grown regardless of the number of people consuming the foods.
C-5.2.4.4 Time Intervals for Dose Commitment CalculationsFor the calculations of dose commitment, it is necessary to make
some assumptions regarding duration of the exposure. It could betesumed, for instance, that future generations will be unable todetect and evaluate radioactive contaminants in water. In that case,
exposures could go on indefinitely. On the other hand, it could beassumed that, with continued expansion of human knowledge and technology,
the identification and elimination of environmental contaminants wouldbe essentially assured. Thus, for any group of exposed people, theduration of the exposure could range from days to a lifetime.
The age at which an individu.a1 ingests a radioactive materialdetermines, in part, the dose commitment from that intake. Detailedcalculations of population radiation doses for assured age distributions
,,
|-and life expectancies are not warranted, as previously discussed. Age21 is the youngest age of intake that could typically be considered|
average for a large population and still permit a lifetime dosei commitment of 50 years. By using the 50-year dose commitment
for an intake at age 21 for the entire population, instead of an
156
_
p' f
v
,
age-specific calculation for an assumed population, a realistic estimate
of the " reasonable" population radiation dose is attained.'
'All dose commitments are normalized on the basis-of a one-year intake
of water or food products. This duration of exposure is not unreasonable
and is also convenient for changing to other time periods if so desired.
Changes in the duration of exposure will produce proportionate changes in
the dose cocmitments. However, the conclusions in Section 5.4 would not
be affected even if the duration of exposure were changed by one or two,
orders of magnitude.
C-5.3 RESULTS OF RADIATION DOSE CALCULATIONS
C-5.3.1 Introduction
All dose calculations presented in the following ser'. ions are de-veloped from the geologic transport conditions described in Section C-4.Since the distribution of radionuclides in the biosphere is assumed to
be independent of the time or rate of release into a potable aquifer(except as time affects the repository inventory), any change in geologicassumptions would result in calculated doses that would be changed onlyby a linear scaling factor.
For all of the postulated ocenarios and pathways, only a few
radionuclides contribute essentially all of the rotential radiation dose.
The results of the radiation dose calculatiens are present for those
times at which each of these "important" nuclides reaches a maximum con-
centration in the aquifer. However, the total radiation dose given for
the whole body rad for each organ at each of these times includes not
only the radiation dose from the one "important" radionuclide that has
the maxi =um concentration at a particular time, but also radiation doses
f rom each of the other "important" radionuclides, whatever their concen-
trations at this time.
The tabulations shown in the following pages reveal that the "impor-tant" radionuclides from the standpoint of radiation dose commitment are
,
limited to strontium-90, iodine-129, radium-226, neptunium-237, and plu-tonium-239 and -240, each of which has a maximum contribution at a'
different point in time. Among the nuclides that were considered asi
j potentially important, but were subsequently shown.to be of relativelyminor significance (under the circumstances assumed for the purposes ofi
157
.
_ _ _ _ _ _ _ _ _ _ . . _ __- _ _ - -.
m
e
e*

E~!
this study), are technetium-99, cesium-137, uranii.m-236, and americium-
| 243.
C-5.3.2 " Maximum" Individual Radiat17n Dose,
The "=214 " radiation doses f.om various radionuclides that
would be delivered to an individual who obtained all drinking water
(730U year) from the aquifer directly above a repository are shown inTables C-23. C-24, and C-25. A sample calculation is included in
Appendix C-IV.
C-5.3.2.1 Diffusion to a Potable Aquifer (Scenario 1)
,
For the Scenario 1 (diffusion) case, the " maximum" dose coc= nit-i
ments are very anall (Table C-23) . The dose commitments from fission
products weea calculated at 300 years, a time when the concentrations
of these eclides in the aquifer are assumed to be ,at a maximum.
Some of the actinide elements also contribute substantially tothe total dose cocanitment at 300 years. The " maximum" individual whole
body radiation dose at 300 years is 9 x 10'' rem, consisting principallyof almost equal contributions from stronium-90 and plutonium-239 and-24 0. The same three radionuclides contribute most of the bone dose,,
calculated to be 4 x 10~ The thyroid dose resulting from iodine-rem.-8
129 at 300 years would be 4 x 10 rem.
Af ter 30,000 years, the fission products would no longer contri-bute significantly to the dose co=mitment of the whole body or
bone. The thyroid dose coc=nitment is maximum at 1,000 years, with a-5
value of 6 x 10 rem, and decreases with longer periods of time, be-
coming negligible with respect to the other dose commitments at 30,000
years. Scenario 1 indicates that the concentration of actinides in the
aquifer would increase continuously up to a maximum at approximately
30,000 years. At that time, the " maximum" individual whole body dose
commf: ment is calculated to be 60 rem, contributed primarily by
Ra-226. The maximum bone dese coc:mitment at that ilme is calculated to
be 100 rem, primarily from Ra-226 and Pu-_239.
C-5.3.2.2 Flow to a Potable Aquifer (Scenario 2)
For Scenario 2, understandably large values for the " maximum" indiv-
idual dose commitments are obtained (Table C-24). At 300 years, the
calculated " maximum" individual dose commitment is 500 rem to the whole
158
4-
- - . - _ - .-
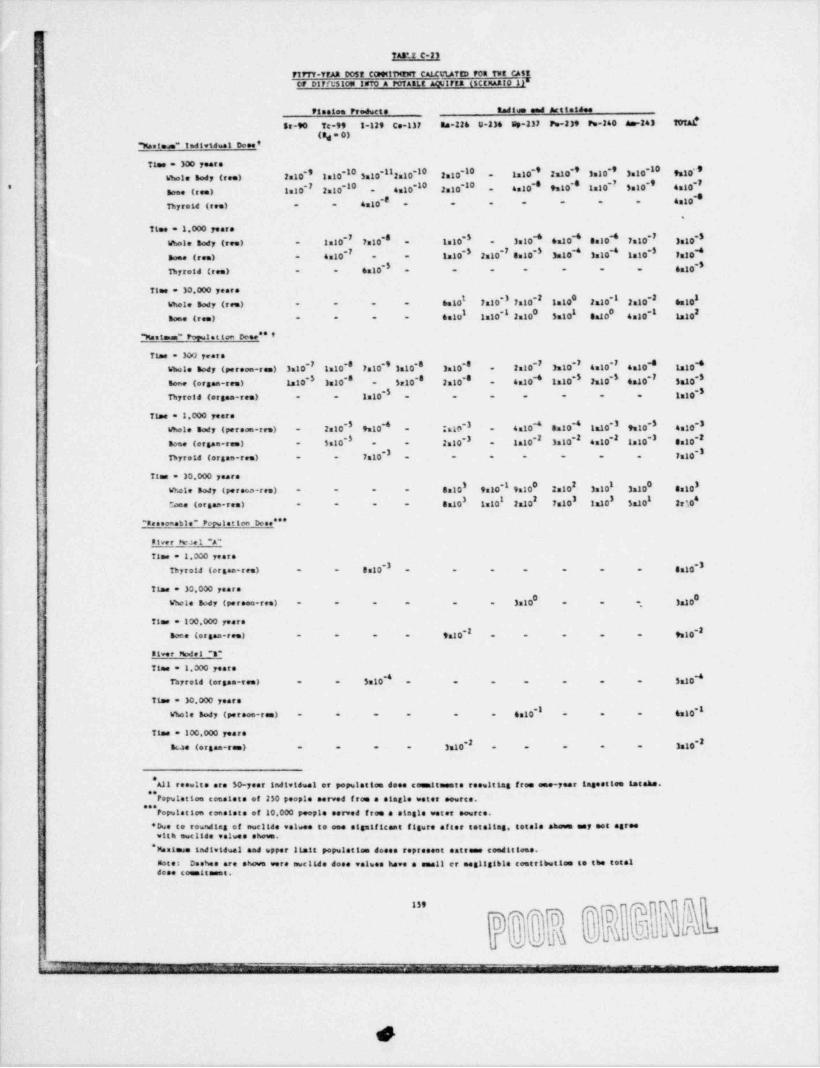
5
TAS' 2 C-23
71FTT-YFAR CO5E C0pm1TMT1r? CAI.Cruf tD FOR TWE CAlt
! C f Di f f t510W 1sTO A POTAalt AO7 Ff a 15(tuRIO 1[I
flestee Prodwete Radium eed Artteldee
$s-90 Tc-99 1-129 Co-137 34 226 U-236 sp-237 Po-239 Po-240 am-243 TotAf'
met iodieu.ai Oese'
Time = 300 yeere
h ie ledy (ree) 2:10 1:10 10 Sa10*II2 10 2:10 - 1 10'' 2m10'' 3 10 3a10-10 9:10''M -10 4
-10 -10 -10 10 * 9310'* 1a10'' Ss10'' 4:10*I*'
some tres) 1:10" 2a10 , ,,gg 2s10 - 4
*IThyroid (ree) - - 4:10 - - - - * * - 4:10
flee = 1.000 years*I
hie Body tree) - 3:10 7a10'* - 1:10'I - 3:10 6a10 8:10 7 10 3:10'
some (ree) - 4:10'I 1 10' 2:10'I 8:10*' 3s10'' 3:10'' 1 10*I falo- -
*I 6a10''Thyreld (ree) - - 6:10 - - - - - = =
flee = 30.000 yeare1 -2 0 *I -2 I
w ie Body (ree) - - - - 6 10 7:10'I 7:10 1a10 2a10 2 10 6:10I 0 I 0 2
Bome (ree) - - - - 4:10 la10'I 2:10 Ss10 ta10 se10* La10
*Mentem* %1e t ton Dese** '
TLee * 3&J yeere
mie Body (perece-res) 3a10'I 1:10"8 7s10'' 3 10'8 3:10'8 - 2 10" h10 4:10'I 4:10'O 1 10*I 4
tece (orgen-ree) is10-3 3:10'' - Sal 0 2:10'8 - 4a10 tal0 2a10'I ea20*I Sa10*I*I -S
-S 1:10'IThyreld (orgse-res) - - lalo - - - - - - -
Time = 1.000 yeere
Wie Body (person-res) - 2:10'I 9u 10'' - lala'I - 4:10 8:10'' tal0 9:10'I 4:104 *I *I
-S -2Some (erges-ree) - Salo - - 2:10*I - In10-2 3,gg-2 410-2 te10*I 0a10
- - 7a10'I - - - - - - - 7:10"IThyroid (ergeo-res)
Tine * 30.000 years*I 0 2 1 0 I
Whole Bety (perecn-res) - - - - 8:10* 9:10 9:10 2:10 3:10 3a10 4:10I 3 I.eae (orgae-ree) - - - - S a10' 1s10 2a10 7s10 ta10 Sa10 2 r '.0"
"Fenecmeble" Petulet ten Dese***
9tver helet "A"
Time = 1.000 yeare*I
Thyroid (ergen-res) - - 3:10'I - - - - - - - sat 0
TLae = 30.000 yeare0
Wie Body (peroee-ree) - - = = - - 3 10 - -. Salo
flee = 100.000 years
sone (organ-res) - - - - 9a10 - - - - - 9:10-2-2
31-er Ndel *R*
Time * 1.000 yeare
Thyre 14 (orgen-ree) - - 5:10'' - - - - - - - Sa10''
TLae * 30.000 years
en10*IWhole Body (persoe-ree) - = = - - - 4:10'I - - -
Time = 100.000 yearesue (orgae-ree) = - - - 3:10-2 - - - - - 3s10-2
eAll resette are 50-year indteid.el or populettee deee commattesete reewiting free one-year ingeottee tatehe.
eePepwlet toe tooeiste of 230 people served f ree a elegte water eeurce.
esePopulet ten eenstate of 10.000 people served f ree a stogle water severe.
'Dwe to roundtag of ewelide ealees to ese etgstticoat figure ef ter tote 11eg, totale abown any set agreewith awc tide eelves shows.
*Naimas indteidual and upper Itait populet tom desse represeet entreme seedia tees.sotes Deshes are shown were e,c1 Lee dose values heee e sea 11 er megilstble contributtee to the tetetdose commiteset.
D
. _ _ _ _ _ _

..
J(.
i
y tr e-24
rest wnw-I cuum r:e acertu TtansmT svFLIM INTO a POTAsLA aQ'Jirte (SCERAA10 2)"
Fiestem Prodwete gadt esa geggegg,,
Sr-90 Tc 99 I-129 Ca-132 Ra-226 U-234 up-232 rw-240 pe-242 am-243 Tera &*
*Mestsee" todletd.a t Dooe'
Time = 300 years 2I *I I *I 0 o 9sto'I Ss10
h ie tody (ree) 4:10 la10'I 2:10 3 10 2 10 3 10 ,,gg --
Sa10 as10 - La10 2a10'I 2 I2a10' ta10'I 2 10 lu to'II -_-Bose (ree) t
Thyre 14 (ree) - - lato - - - - - - - talo
Time = 6,000 years410 4:10'I 4a10 3,3 ,2I 0
bhte Sody (ree) = = = = 3:10 1a10 2 10*I# 0
2 1 I I I I
tone (res) - - - - 3:10 y,gg 2a10 3a10 2 10 ha10 2a100
Thyre 14 (ree) - - 6:10 - - - - = = - 6a10
_ Mas tase* pepwlst los Dose ** i*
Ttase = 100 yearsI 1 I I 2 I - - 6s10'
Whole Body (perose-ree) 6a10' es10 2a10 ea10 2 10 4 a10 la10-
Some (er58**ree) 3s10 la10 - ta10 2a10 - talo 5 10' - - 3a10'0 I
thyroid (orgam-see) - - 2 10' - - - - - - - 2a10'
Time = 6,000 years
h 1e Body (perose-ree) - - - - 4:10' 1:10 9 10 5 10 Sa10 5 10 Salo"2 I 3 I 2
I I I10' 2:10 2a10 2:30 2a10 2:10 2 10
tese (orgam-ree) - - - - 42
Thyroid (orgse-rumy - - 2:10 - - - - - - - 2:10I
"Resoceable" peestat ten Dose ***,
Sleer pbdel "A"Time = S00 yeare
- - - - 210Thyteld (orgas-ree) = = 2a10 - - -
flee = 6,000 years 2, , , g,gg 2
Whole sedy (perose-ree) - - = = - - 1 20
Time = 100,000 years 00tome (organ-ree) - - - - 1 10 - - - - - 1:10
River M el "B"IYtae = SCO yeare
Thyroid (ergam-ree) - - tal0 - - - - - - - lato
ITime * 6,000 years- 2:10 - - - 2:10
Wie Body (perece-res) - - - - -I
*ITime = 100,fW vears
- - - - 4x10'I - - - - - esto
Sese (er an-ram)e
All reesite are 50-year todividual er populattee dose censiteente recentias f ree one-year 1pseettee intake,'f,e
repelettee reesists of 250 people served f ree single water source.t me
erepulattee coastete of 10,000 people eerved f ree saaste water eserce.eee
'Dwe te rounding of ent11de values to see significent figure af ter totallas, totale shown any actagree with auc11de values shows.
t aalaan ladivideal and apper limit population desee represent entreme seeditissa,M
Deshes are aheve where awc11Je does volves have e ses11 er nogligible costributtee to they
het e rtotal deee teseiteemt.
160
| .
.
. . ,
p- - - - -
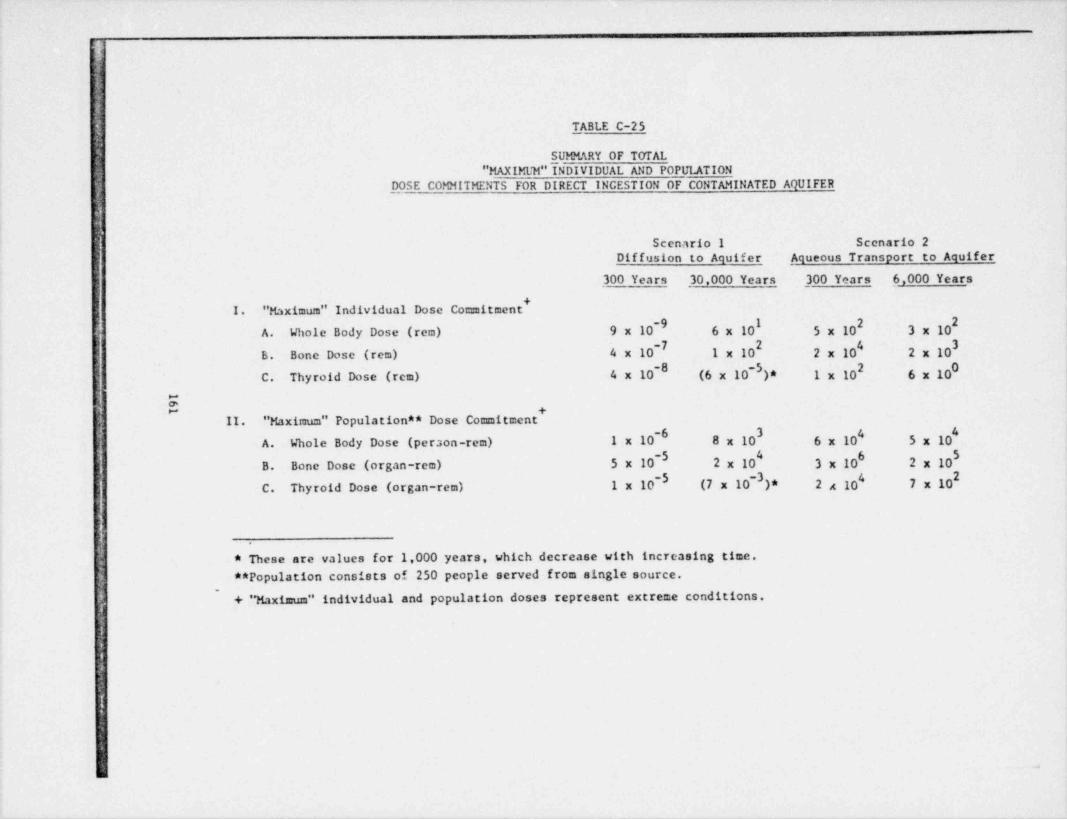
5
q
t
I 9TABLE C-25[
h SUMMARY OF TOTAL" MAXIMUM"5NDIVIDUAL AND POPULATION
'
_D_OSE COMMITMENTS FOR DIRECT INCESTION OF CONTAMINATED AQUIFERgt;,
Scenario 1 Scenario 2c
[Diffusion to Aquifer Aqueous Transport to Aquifer
1 300 Years 30,000 Years 300 Years 6,000 Years.
a +j I. " Maximum" Individual Dose Cocmitment
-9 1 2 2.
A. Whole Body Dose (rem) 9 x 10 6 x 10 5 x 10 3 x 10", -7 2 4 3'
* B. Bone Dose (rem) 4 x 10 1 x 10 2 x 10 2 x 10~0 2 0
C. Thyroid Dose (rem) 4 x 10 (6 x 10-5)* 1 x 10 6 x 10'b
:| r.
I ++
i, 11. " Maximum" Population ** Dose Commitment-6 3 4 4,' A. Whole Body Dose (person-rem) 1 x 10 8 x 10 6 x 10 5 x 10⁻⁵ 6
;L B. Bone Dose (organ-rem) 5 x 10 2 x 10 3 x 10 2 x 10⁻⁵ 2
0 C. Thyroid Dose (organ-rem) 1 x 10 (7 x 10-3)* 2 x 10' 7 x 10e
<
C
- * These are values for 1,000 years, which decrease with increasing time.g
** Population consists of 250 people served from single source.'
. + " Maximum" individual and population doses represent extreme conditions.ae
"I
1
f
5Pf
u
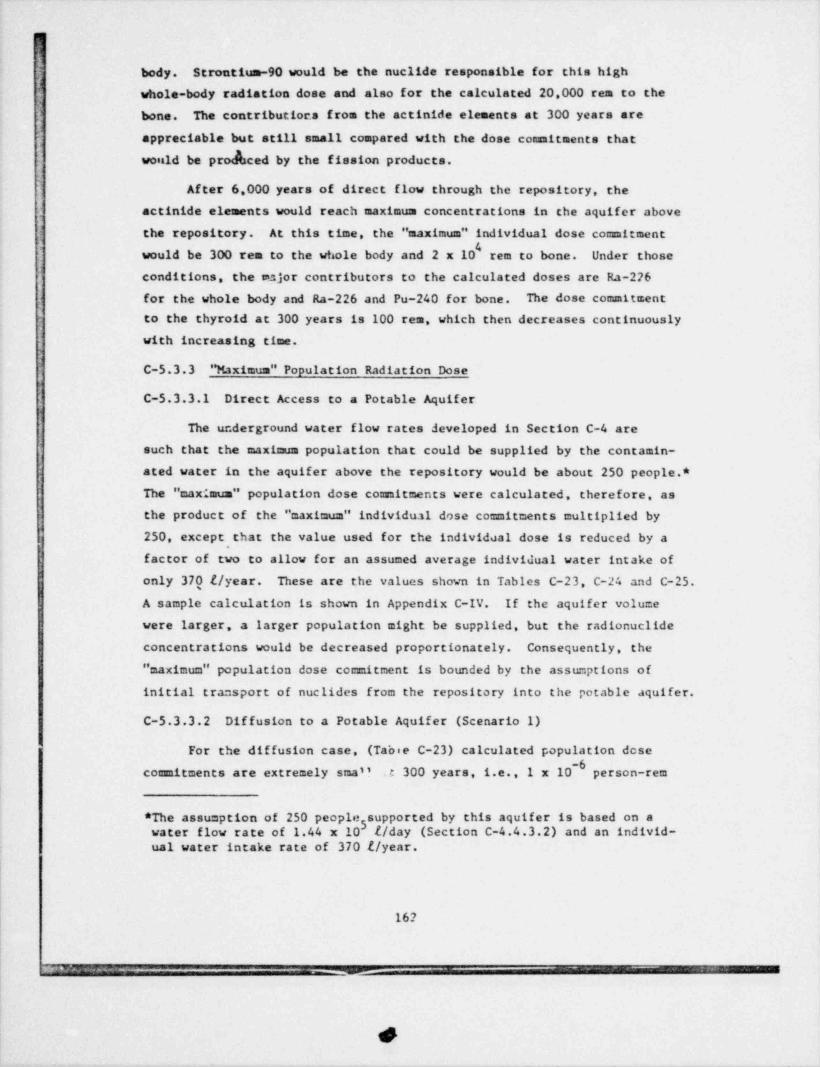
N'
I
'
body. Strontium-90 would be the nuclide responsible for this high
whole-body radiation dose and also for the calculated 20,000 rem to the
bone. The contributiots from the actinide elements at 300 years are
appreciable but still small compared with the dose con:mitments that
would be prodheed by the fission products.
Af ter 6,000 years of direct flow through the repository, the
actinide elements would reach maximum concentrations in the aquifer abovethe repository. At this time, the " maximum" individual dose commitment
would be 300 rem to the whole body and 2 x 10 rem to bone. Under those
conditions, the rejor contributors to the calculated doses are Ra-226
for the whole body and Ra-226 and Pu-240 for bone. The dose coc:mitment
to the thyroid at 300 years is 100 rem, which then decreases continuously
with increasing time.
C-5.3.3 'hximum" Population Radiation Dose
C-5.3.3.1 Direct Access to a Potable Aquifer
The underground water flow rates developed in Section C-4 are
such that the maxicum population that could be supplied by the contamin-
ated water in the aquifer above the repository would be about 250 people.*
The "maximus" population dose commitments were calculated, therefore, asthe product of the " maximum" individual dose co=mitments multiplied by
250, except, the value used for the individual dose is reduced by athat
factor of two to allow for an assumed average individual water intake of
only 370 4/ year. These are the values shown in Tables C-23, C-24 and C-25.A sample calculation is shown in Appendix C-IV. If the aquifer volume
were larger, a larger population might be supplied, but the radionuclide
concentrations would be decreased proportionately. Consequently, the
" maximum" population dose coc:mitment is bounded by the assu=ptions of
initial transport of nuclides from the repository into the potable aquifer.
C-5.3.3.2 Diffusion to a Potable Aquifer (Scenario 1)
For the diffusion case, (Tabee C-23) calculated population dose-6
coc:mitments are extre=ely smai' ,c 300 years, i.e., 1 x 10 person-rem
*The assumption of 250 people'5supp reed by this aquifer is based on awater flow rate of 1.44 x 10 t/ day (Section C-4.4.3.2) and an individ-ual water intake rate of 370 t/ year.
16?
w_; um_u - _ - -- --- _ _ _ , _ - _ , _ _ _ . . - - _ _ _ _ .-

5
Lj
-5to the whole body; 5 x 10~ organ-rem to bone; and 1 x 10 organ-rem>
to the thyroid. After 30,000 years, when the actinides have reached
maximum concentrations, the whole-body population dose commitment would
be 8 x 10 pet ;on-rem, mainly due to Ra-226, and the population Jose com-mitment to bone would be 2 x 10 organ-rem, mainly due to Ra-226. Pu-239,and -240. The dose concitment to the thyroid at 300 years would be1 x 10~ organ-rem, rising ts 7 x 10~ organ-rem at 1000 years and de-creasing thereafter to become negligible with respect to the other dose
commitments.
C-5.3.3.3 Flo'' to a Potable Aquifer (Scenario 2)
For the flow case, the " maximum" population dose commitments are on
g the order of tens of thousands of person-rem or organ-rem per year of6
intake. The largest calculated value is 3 x 10 organ-rem to bone at
300 years, entirely due to strontium-90. The bone dose commitment at
6000 years was calculated to be 2 x 10 organ-rem, primarily from plu-
teni"~~240, americium-243, and so=e radium-226.
It is not the purpose c. this task to go beyond dose calculations
and project health effects. It should be emphasized, however, that any
translation of " maximum" individual or population dose commitments toactual health ef fects based on the BEIR report's prediction of effectsof low 1cvels of radiation on large populations (50) are inappropriate.
The maximum doses calculated for Scenario 2 are such that, if those con-
ditions occurred, the health effects would be acute rather than longterm. Furthermore, the size of the population would be too small to
justify the use of large-population statistics. Instead of multiplying
the total number of person-res or organ-res by the risk factors indicated
in the BEIR report, it would be more realistic to conclude that, at
these concentrations, intake by 250 people over a period of a few yearswould result in 250 fatalities.
Under the " worst case" conditions assumed in Scenario 2, '' normal"adsorption was assumed in the aquifer, but none in the repository and
"the communicating channels to the aquifer. If " normal" adsorption were
to be assumed in either or both of the latter two regions, then the
163
, m n_ . w .= - . - - . - - . - . - - . . - . . = - . , - - . . - -
-
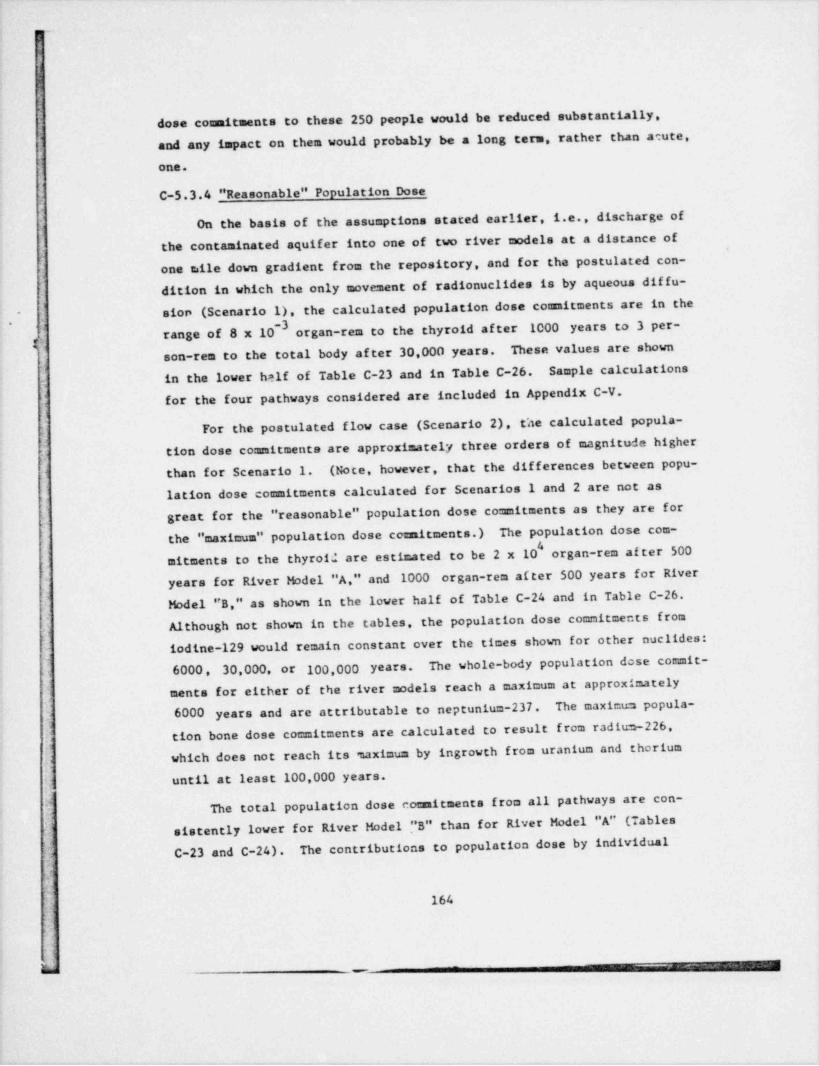
9-
J
dose commitments to these 250 people would be reduced substantially,
and any impact on them would probably be a long term, rather than acute,
one.
C-5.3.4 " Reasonable" Population Dose
On the basis of the assumptions stated earlier, i.e., discharge of
the contaminated aquifer into one of two river models at a distance ofone mile down gradient from the repository, and for the postulated con-dition in which the only movement of radionuclides is by aqueous dif fu-sion (Scenario 1), the calculated population dose commitments are in the
,' -3range of 8 x 10 organ-rem to the thyroid after 1000 years to 3 per-7 son-rem to the total body after 30,000 years. These values are shown
in the lower half of Table C-23 and in Table C-26. Sample calculations
for the four pathways considered are included in Appendix C-V.
For the postulated flow case (Scenario 2), the calculated popula-tion dose commitmente are approximately three orders of magnitude higher
than for Scenario 1. (Note, however, that the differences between popu-
lation dose commitments calculated for Scenarios 1 and 2 are not asgreat for the " reasonable" population dose commitments as they are forthe " maximum" population dose commitments.) The population dose com-mitments to the thyroid are estimated to be 2 x 10 organ-rem after 500years for River Model "A " and 1000 organ-rem after 500 years for RiverModel "B," as shown in the lower half of Table C-24 and in Table C-26.Although not shown in the tables, the population dose commitments from
iodine-129 would remain constant over the times shown for other nuclides:The whole-body population dose commit-6000, 30,000, or 100,000 years.
ments for either of the river models reach a maximum at approximatelyThe maximum popula-6000 years and are attributable to neptunium-237.from radium-226,
tion bone dose commitments are calculated to result<
which does not reach its maximum by ingrowth from uranium and thorium
until at least 100,000 years.
The total population dose commitments from all pathways are con-
sistently lower for River Model "B" than for River Model "A" (Tables
C-23 and C-24). The contributions to population dose by individual'
164
-- ___m m .. m
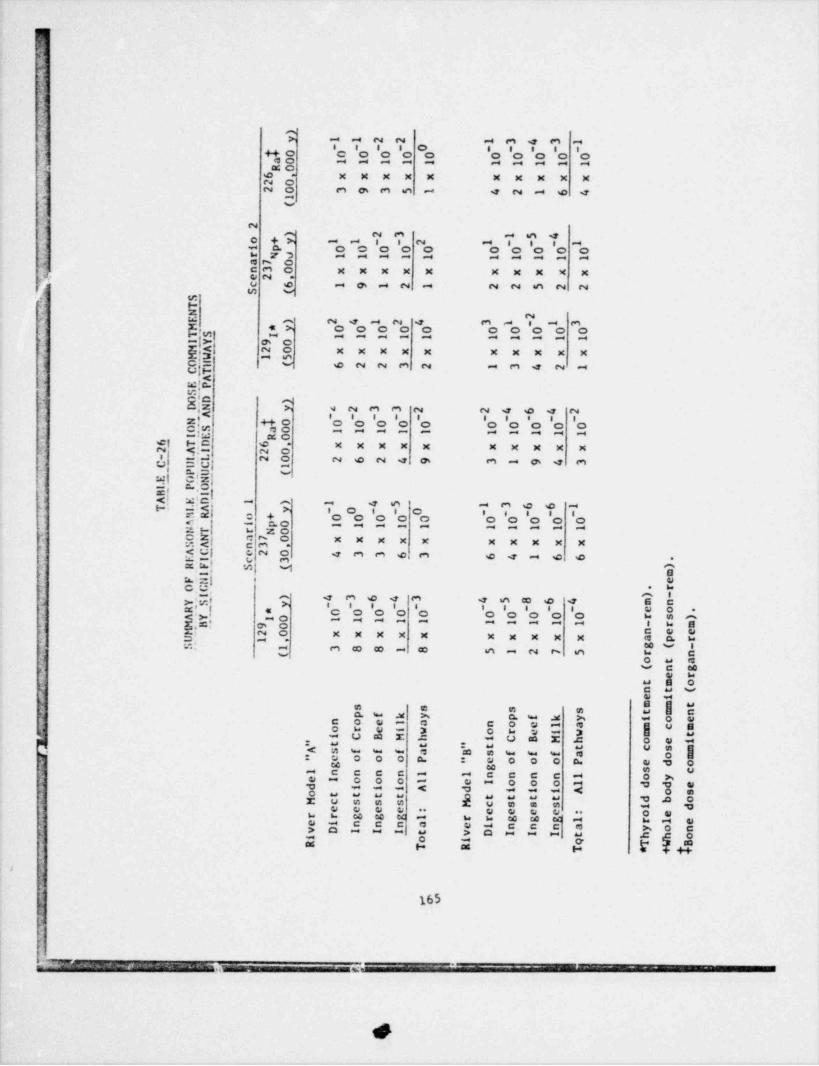
J'i
'-
_
/.
)_ y I I 2 2 I ' I
~ ~ - - 0 ~ ~ ~"0 "00 0 0 0 0 0. 0 0 0a0 1 1 1 1 1 1 1 1 1 1,
R 0,,
6 x x x x x x x x x x2 02 0 3 9 3 5 1 4 2 1 6 4
, 1
(
2) 2 3 I 5o ,y 1 - ~ 2 1 ~ - I
i p 0 0 0 0 0 0 0 0 0 0r ys 1 1 1 1 1 1 1 1 1 1a 7 0.
n 3 0, x x x x x x x x x x4 e 2c 6 1 9 1 2 1 2 2 5 2 2S (
S _
>
TN 2
_ E ) 2 1 2'0
3 I - I 3H , y 0 0 0 0 0 0 0 0 0TS 7 1 1 1 1 1 1 1 1 1 1" l Y 9 0iA 2 0 x x x x x x x x x xC W 1 5t
0H ( 6 2 2 3_ 2 1 3 4 2 1,
CT~ A" EP
SOD )DN y
A ' 2 3 2 2 ' 6 ' 2- - ~ - - '0 - ~ -N 0 0 0 0 0 0 0 0 0 0OS a0 1 1 1 1 1 1 1 1 1 1I E R0
6 TD 6 x x x x x x x x x x2 A. l. 2 0-
ltl 2 0 2 6 2 4 9 3 1 9 4 3C i C 1_
PlE. ONl (
l POi
_ A E. DIf
1 ) 4 I 6 6 I_ T l R o , 0 0 0 0 0A y ~ 0 ~ ~ 0 '0 '0 - - ~'l
0 0 0a, i p0 1 1 1 1 1 1 1 1 1 1if T r g0oN a 7 0, x x x x x x x x x xSA n 3'AC e 2 0 4 3 3 6 3 6 4 1 6 6 .I I c 3HF S 1 )
mI
FN e. rOGI ) 6 ' 8 6 ' m n
) -, YS y ~ ~ - ~ ~ "0 - -
0 0 '0 e o .R , 0 0 0 0 0 0 r s )AY 3 0 1 1 1 1 1 1 1 1 1 1 - r mMH 9 0M n e e0, x x x x x x x x x x a p r!
2t 1
g ( -S 1 3 8 8 1 8 5 1 2 7 5 r n( o t a( n g
~ e rt m o
- n t (e im n ts s s s t c nz
p f k y p f k y i o en o e l a n o e l a n c m. o r e w o r e i zi w c t- i C B M h i c B M h o e i1"A "B
t t t t c s as f f f a s f f f a o nni " e o o o P " e o o o P e d og g s cl n n n n l l n n n n l o ye I o o o l e I o o o l d d ed i i i A d i i i A o so t t t t o t t t t d b oM c s s s M c s s s i de e e e : e e e e : o er r g g g l r r g g g l r l ee i n n n a e i n n n a y o nv D I I I t v D I I I t h h oi o i o T W BR T R T * +~
&
~
~ iP !') i5 .? j h =
pathways, however, are in some cases larger for River Model "B" than
for River Hodel "A" (Table C-26). For River Model "A," the population
dosa commitments are dominated by the ingestion of crops; for River
Model "B," direct ingestion of water contributes essentially all of the
popdiation dose consniement. All of these "teasonable" calculated dosecoumaitments are actually unrealistically high because they assume thatdrinkf ag water is not pretreated and that vegetables are neither washednor cooked. The differences between the relative dose contributions
|from direct ingestion of water and from ingestion of crops are alsogreatly influenced by the assumptions that are made concerning the uset
of the river water. In both cases, however, ti.e more indirect pathways
(meat and milk consumption) do not contribute significantly to the cal-culated dose couaitment.
,
;,
C-5.4 EVALUATION OF DOSE-TU-HAN CONSIDERATIONS
]Besides the specific calculations for the various diation dose
categories presented in the preceding sections, other evaluations arei made in the following sections to bring the overall scope of the radio-
active vaste problem into focus. For example, I-129, because of its verylong half-life, should be considered beyond its initial entry into thebiosphere. An ultimate limit to the population dose from I-129 would beachieved only if it were all diluted by the stable iodine present insome fraction of the oceans' volume.
Naturally-occurring radium provides some clues as to the antici-pated behavior of actinides in the biosphere. Little radium reaches thebiosphere and average radiation doses to humans from radium are extremelysmall in spite of the large amounts in sofia and rocks.
Comparison of the impact of the "most likely" leakage from an HLMrepository with that calculated for sources of natural radioactivityindicates a very small impact from the vaste in comparison with thatfrom natural sources.
C-5.4.1 Worldwide Impact of Iodine-129
Of the fission products contained in HLW, the one that seems costlikely to reach the biosphere as a result of leaching by groundwater isI-129. This conclusio.. is based on the long half-life of I-129 (17 million
years) and the relatively high mobility of iodine (compared with the fewother long-lived fission products) in groundwater. The 50-year dose
166
- a

A,
commitment to the first generation exposed has been estinated by assumingtypical transfer coefficients to a population located in the vicinityof the release point.
The question of ultimate population dose cocanitment is also ofinterest. This concept has been called the " environmental dose cocznit-ment," although the dose referred to is to human populations and notthe " environ =ent." The ultimate population dose co=mitment can be de-
fined as the sum of the doses to all individuals at all future times thatwill result from a specified release of radioactivity to the environment.Although extremely easy to define conceptually, this dose commitment isimpossible to calculate meaningfully. The only quantitative dataavailable for the calculation are the physical decay rates for eachradionuclide and the abundances and relative distributions of stableelements in the biosphere.
The uncertainties involved in making estimates of future populationdistributions, agricultural practices, etc., have been discussed inSect ion C-5.1. 3. Even if one assumes that human populations and thegeneral biosphere will be the same at all future times as they are now,calculations of ultimate dose co:=nittents are limited by a lack of dataon environ: ental dispersion rates. The population dose rate at any timedepends only on the total a: ount of radioactivity in human beings atthat tice and not on the num'aer of people actually exposed or in thetotal population. (This assuces that age-dependent dose factors are
| averaged over suf ficiently large populations and are always in the same; proportions.) Calculations of ultimate dose commitments, therefore,
involve the estimation of the fraction of released radioactivity thatwill be available to, or actually in, human beings at any future time.
The ult; mate limit on population doses from I-129 released tothe biosphere would cost likely be due to the ulti= ate dilution by stableiodine in the earth's crust and in the oceans. The mobility of iodinein water is indicated by the fact that the iodine is more easily leachedand transported underground than other nuclides. The same relativecability could be assumed ic. surface waters, indicating that most of theiodine would eventually flow into the oceans. The average concentrationof stable iodine in the oceans is 0.06 ppm (g/m ). ) The total area
6of the oceans is 361 x 10 gc,2 (56) and, if one assumes a mixing depthof 0.1 km, the total volu=e available for mixing would be 36 x 106 km .At a mean concentration of 0.06 g/m , this top 0.1-km layer of the
167
, , , - - , ___.______._m_ . . . _ .. . _ _ _ . _ _ _ -- .
O

!15oceans' surfaces would contain approximately 2 x 10 g of stable iodine.
8This is approximately 10 times more than the total amount of 1-129 pro-jected to be contained in geologic repositories (Table C-9) as a resultof nuc1' ear power generation. Instead of the intrinsic specificactivity of 1.8 x 10 pC1/g, the effcetive specific activity of f-129
I would be reduced by roughly eight orders of magnitude to 2 pCi/g. Witha normal annual iodine intake of about 0.07 g (200 pg/ day), the totalannual intake would be approximately 0.14 pC1.
The average individual thyroid dose from 1-129 (if it returned tohuman beings af ter uniform dilution by the stable iodine in the ocean)would be 1 x 10 rem / year or about 5 x 10 rem in 50 years. For a
world population of 4 billion, the population dose commitment would beabout 4 x 10 organ-rem / year or 2 x 10' organ-rem in 50 years. The I-129could be assumed to be diluted into a smaller volume of seawater (e.g. , the
I top 0.1 km over only 1% of the earth's ocean surfaces). Under such anassumption, the average thyroid dose co:znitment to an individual could
' be larger, but the population exposed would be proportionately smaller,so the total population dose cocimitment calculated under such assumptions
awould not be greatly different from the previoua calculation.
As pointed out in an Environmental protection Agency (epa) report enthe concept of environmental dose cocimitment, no data are availablefrom which to base projections of redistribution of elements in thebiosphere over extended periods of time. All calculations containedin this report are based on assumptions considered to be conservativewith respect to the biosphere as it exists today, and the estimateddose commitments are believed to be upper limits for any reasonableaasumptions of redistribution. All calculations are made for the most
,
direct pathways to achieve maximum exposures and bence dose comnitments
for any tis af ter release of material fror the repository..
) C-5.4.2 Comparison with Natural Background Radiation
If radioactive wastes from a neolozic repository arecontacted and 1 cached by underground water, the subsequent transfer tothe biosphere and to human beings may be assumed to be similar to that ofnaturally-occurring radion'iclides. Radit=a is ubiquitous in the earth'scrust and occurs with a wide range of concentrations in many surface
Uranium ore of commercial grade typically containsstreams.
radium at concentrations of hundreds of pC1/g. of ten in contact with
| groundwater. Sedimentary rock and many surface soils contain radiumconcentrations in the range of 0.1 to at least 1 pCi/g.
16R
-
_

% Radium is less mobile in the biosphere than many lighter elements,M including most fission products, but is considerably more mobile thanmi most of the actinide elements that comprise the major portion of thehq very long-lived materials in radioactive wastes. Environmental transfer.,
{ data for the radionuclides of greatest significance are listed inMd Ta b l e C-20. The fact that the values for the actinides (represented byw
% neptunium-237) are generally smaller than those for rsdium indicatesh'
the lesser mobility of these nuclides in environmental media. Further-more, the f ractional uptake of the actinides f rom the human gastro-2
M intestir.a1 tract to blood is estimated by the International CommissionS on Radiological Protection to be 3 x 10~ , compared with 0.3 for9
radium. (58) In this respect, the behavior of radium in the biosphere.y.rD constitutes a very conservative basis for comparison of the prol:ced radiation') doses that would result from environmental contamination by actinides..f. The extent to wh .n radium in the environment is transferred toj people is indicated by data contained in a recent report of the Nationald
Council on Radiation Protection and Measurements. (5D The mean dieta nintake of radium from foods and drinking water is estimated t.o be 1.4,
b pCi/ day. The mean skeletal content, based on anat; sis of bone ash, is~3a approximately 5 x 10 pCi/g of bone. The same report provides an
'
absorbed dose conversion factor of 200 mrad yr. /pci g in bone.
If a conservative value for the quality factor is assu: red to be 10 for,
g radium at:d its decay products, the dose-equivalent corversion factorbecomes 2 res yr. /pCi g for bone. Thus the mean sks.letal doseequivalent to individuals in the United States is estimated to be:,
-35 x 10 pC1/g x 2 res yr. /pci g or approximately 10" rem / year.,
For approximately 200 million persons, the population bone dose equiva-lent is approximatcly 2 x 10 organ-rec /yr. or 10 organ-rem for 50years.
For the postulated transport of waste materials from a repositoryby flow (Scenario 2), the maximum population 50-year dose commitment to
6bone was calculated to be 3 x 10 organ-rem for an intake of one year,
(Tabic C-24). For a 50 year intake, the bone dose co=mitment a=ounts to1. 3 x 10 organ-rem, a vslae comparable to that from radium in thenatural environment. This calculation, of course, represents a " worstcase" in that it involves the direct censumption of water that hasflowed directly through the waste repository into the aquifer and hasL
subsequently undergone a minfoum loss of radionuclides by dilution oradsorptfon.
169.
*F r ? . o- T N {f,MM -, yawc- 7 ' # , - - ~ " - % --
4 a s-"-_ D_- z _ > 1~:;_-<-q ''
* ' 'a ' ' ' ~~ * " ^ ^,_ ,
^
hw M R"[ -.
5
iThe total radiation dose to bone from natural sources of radiation
includes external sources (cosmic and terrestrial) in addition to theinternal deposition of radium and other radionuclides. The total radia-
tion bone dose from natural scurces is comparable to the whole-body
radiation dose and is on the order of 0.1 rea/yr. to average individuals
in the United States population. The total population dose commitment
J, to bone for 200 million people is, then, approximately 2 x 10 organ-
rem /yr. and 10' organ-rem /50 years.
As indicated in previous sections of this report, the quantities
of actinides that could be expected to reach the biosphere under any
reasonable scenario for leaching by groundwater, would be orders ofmagnitude smaller than the activity of radius in the biosphere, even in
the imediate vicinity of a geologic waste , repository. Although it is
possible to hypothesize extrer.4 scenarios for which actinides (as well asfission products) could reach the biosphere in relatively high concentra-
tions, the number of people who might be exposed to such concentrations would4
be small. The largest population dose comitnent to the whole body, cal-
culated for Scenario 2 at 300 years, is 6 x 10 person-rem for a 1-year
intake. This number is equivalent to 0.3% of the annual population
dose comitment f rom natural radiation sources. For all other expected
times or modes of relcase of radionuclides from a repository, (i.e.,
transport by flow at otner times or diffusion at any time) the upper-limit
j hopulation dose commitments are smaller. Hence, the 50-year dose cocmit-ments calculated for " reasonable scenarios," 1.e., by contaminated surface
water and irrigated food pathways, are negligible in comparison with radia-
tion doses from natural sources.,
,C-5.4.3 Comparison With Radium-226 Current 1v Present in the Colorado River
A useful perspective is obtained by comparing the Ra-226 population
dose comitment calculated for Ra-226 concentrations presently occurringoj in the Colorado River with that obtained for Ra-226 using Scenario 2
|l (aqueous flow) and River Model "A". To make this comparison, actual
h Ra-226 concentrations in the Colorado River were used as input parameters"
to River Model "A". Dose comitments for Ra-226 for Scenario 2 using
River Model "A" were calculated as presented in Section 5.2.3.2.
170
_.a. - 7 - , 7 pr - 7_
q ~ f~ - - "' *; X J^
_
--
4

.,
n1
Table C-27 indicates the -+sults of calculations that compare theColorado River with Scenario 2 River Model "A". The total dose commit-
ment from all pathways from the Colorado River is 5 x 10 organ-rem,while the dose commitment f rom Scenario 2, River Model "A" is 1 organ-rem.
According to this calculation, the Colorado River now contribu* 10,000
times more radiation dose to the present population than would ma HLWrepository at the time of maximum concentration of Ra-226 in the biosphereto a population er.isting in the same location 100,000 years followingwaste emplacement.
The dose commitments calculated for the Colorado River are conser-vative because they do not account for radium removal during water treat-ment to remove hardness, which typically occurs before municipal utiliza-tion of this water. Nevertheless, the projected radiation doses from theproposed HLW release are still quite small compared with those arisingfrom tha Colorado River now.
i
li
|
|
1
171
-- - ;. ..- y- ;. ,.,y,..,-,c, . . _ . . , . . a -
, 7 ,.,_ ,wy . . . mmmq- --~ u~s -
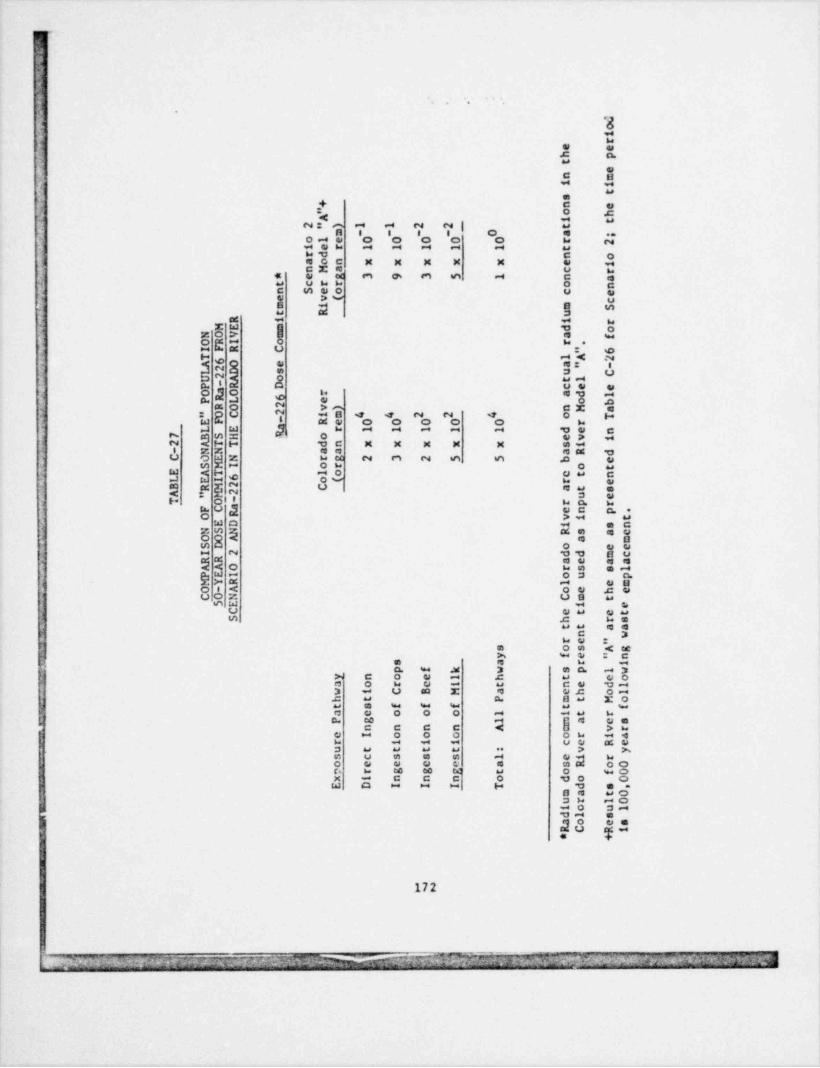
A<
t
._
*
d, oir- e e
h pt
en mi i
ts+ n e
"Ao hi t
2" ) 1 1 2 2 _ t_m - - - - 0 a ;
ol e 0 0 0 0 0 r 2i er 1 1 1 1 1 trd n oaon x x x x x e inMa c r* e g 3 9 3 5 1 n a
- t crr o nn S eo c ee v( cm i m St R u
R i i rM E m d oN O V = a fO R I o r .I F R CT l "A 6
2A 6 O e a -u"2L D s CU 2 A o tl- R D ce ePO a O r ad lP L 6 e o b
R2R O v) nM a
O C 2 im 4 4 2 2 4 o T"E F - Re 0 0 0 0 0 r_
L E a r 1 1 1 1 1 d e n7 B S l 3 o ev ii
2 A T T d n x x x x x si- N N aa aR dC O E N rg 2 3 2 5 5 b e
_ S M I or o tE A T l o et n6 o( r eL E IB R M 2 C at sA " M 2 u eT O - rp r.
F C a e n p .RO vi tE D i s n
N S N R s aeO O A a mS D o e eI 2 dd mcR R ae a aA A O rs slP E I ou pM Y R l em.O - A oe h eC 0 N C m t
_
5 E i eC et etS h rs
t t aan wre"As os g
y f e " ns a r ip f k w sp l wy n o e l h t eo
a o r e i t ne dlw i C B M a eh olh t P mt Mot s f f f t f
, a e o o o l it rP g l ma es,
n n n n A m vre I o o o or i ar i i i c e R eu t t t t : v ys c s s s l ei ro e e e e a sR o0r r g g g t o f0x i n n n o d o 0,E D I I I T d sma t0
ur l0i o u1
wdl sao esRC Ri
n, * +
-
}
, 1111d| {'grd Id ; 3]n. Np *: I iv J"" ' -
)i
{I - ; 1
(b11
lw? iN ( ,'I or
} , .
! >. .
i , 4
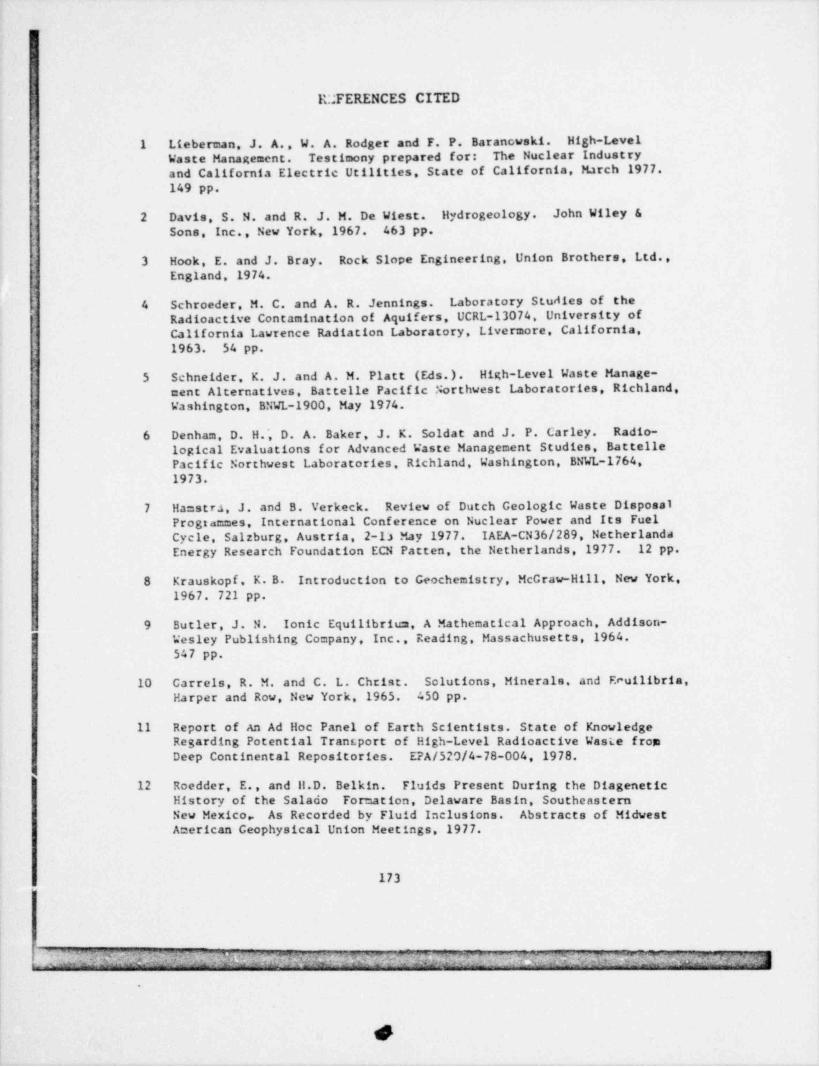
Fu
>
ICFERENCES CITED
1 Lieberman, J. A. , W. A. Rodger and F. P. Baranewski. High-LevelWaste Management. Testimony prepared for: The Nuclear Industryand California Electric Utilities, State of California, March 1977.149 pp.
2 Davis, S. N. and R. J. M. De Wiest. Hydrogeology. John Wiley &Sons Inc. , New York,1967. 463 pp.
3 Hook, E. and J. Bray. Rock Slope Engineering, Union Brothers, Ltd.,England, 1974.
4 Schroeder, M. C. and A. R. Jennings. Laboratory Studies of theRadioactive Contamination of Aquifers, UCRL-13074, University ofCalifornia Lawrence Radiation Laboratory, Livermore, California,1963. 54 pp.
5 Schneider. K. J. and A. M. Platt (Ed s . ) . High-Level Waste Manage-ment Alternatives, Battelle Pacific Northwest Laboratories, Richland,Washington, BNWL-1900, May 1974.
6 Denham, D. H., D. A. Baker, J. K. Soldat and J. P. Carley. Radio-logical Evaluations for Advanced Waste Management Studies. BattellePacific Northwest Laboratories, Richland, Washington, BNWL-1764,1973.
7 Hamstra, J. and B. Verkeck. Review of Dutch Geologic Waste DisposalProgrammes, International Conference on Nuclear Power and Its FuelCycle, Salzburg, Austria, 2-13 May 1977. IAEA-CN36/289, NetherlandaEnergy Research Foundation ECN Patten, the Netherlands, 1977. 12 pp.
8 Krauskopf, K. B. Introduction to Geochemistry, McGraw-Hill, New York,1967. 721 pp.
9 Butler, J. N. Ionic Equilibrium, A Mathematical Approach, Addison-| Wesley Publishing Co=pany, Inc., Reading, Massachusetts, 1964.
547 pp.-
10 Carrels, R. M. and C. L. Christ. Solutions, Minerals, and Ecuilibria,
|Harper and Row, New York,1965. 450 pp.
!
I 11 Report of An Ad Hoc Panel of Earth Scientists. State of KnowledgeRegarding Potential Trantport of High-Level Radioactive Wasie from
'
Deep Continental Repositories. EPA /579/4-78-004, 1978.
12 Roedder, E. , and II.D. Belkin. Fluids Present During the DiageneticHistory of the Salado Formation, Delaware Basin, SoutheasternNew Mexico, As Recorded by Fluid Inclusions. Abstracts of MidwestAmerican Ceophysical Union Meetings, 1977.
173
i f4'
Y!L ', , n . . - 'f~R , ' ' _ ~ T %&{'['# . <Me..
h

|,
1
13 Bredehoft, J.D. et al. Geologic Disposal of High-Level RadioactiveWaste - Earth Science Perspectives, Draft U.S. Geological SurveyCircular, 1978.
14 Ekren. E.B. et al. Geologic and Hydrologic Considerations forVarious Concepts of High-Level Radioactive Waste Disposal in Con-terminous United States. Op.n-File Report 74-158, U.S. Departmentof Interior Geological Survey, Richland, Washington,1974.
>
15 Runkorn, S.K. (Ed.). Continental Drift. Academic Press,1962.
16 Wilson, J.T. Continental Drift. Scientific American, April 1963.
- 17 Vine, F.J. Spreading of the Ocean Floor: New Evidence, Science,154, 1405-1415, 1966.
18 Dewey, J.F. Plate Tectonics. Scientific Ametican, May 1972.
19 Bird, J.M. and B. Isacks (Eds.). Plate Tectonics. AmericanCeophysical Union, Washington, D.C., 1972. 951 pp.
20 Wegener, A. The Origin of Continents and Oceans, 4th ed.,Dover, New York, 1966. 246 pp.
21 DuToit, A.L. Our Wandering Continents: An Hypothesis of ContinentalDrifting. Hafner Publishing Co., Inc. 1937.
22 Hess, H.H. The Oceanic Crust. J. Marine Research, 14, 423-439,1955.
23 Vice, F.J. and D.H. Matthews. Magnetic Anomolies Over Ocean Ridges.Nature, 199, 147-949, 1963.
24 Williams H. Volcanoes. Scientific American, November 1955.
25 Gussow, W.C. Salt Diapirism: Importance of Temperature, andEnergy Source of Emplacement. In: Diapirism and Diapirs: A Sym-posium. J. Braunstein and G.D. O'Brien (Eds.). The AmericanAssociation of Petroleum Geologists, Tulsa, Oklahoma, 1968.
26 Fenneman, N.M. Physiography of Western United States. McGraw-Hill3
Book Company, New York, 1931. 534 pp.
27 Lect, L.D. and S. Judson. Physical Geology, 3rd ed. Prentice-Hall, Inc. , Englewood Clif fs, New Jersey,1965. 40f. pp.
28 Gary, M. , R. McAfee and C.L. Wolf, (Eds.) G1cssary of Geology.American Geological Institute, Washington, D.C., 1974. 805 pp.
u
I
174,
~
Lui ' 5 %___ J '* .1 -" ? - u L_ ~ N -' ~2, > -
'
'
29 Atlantic Richfield Hanford Company, Preliminary Feasibility Studyon Storage of Radioactive Wastes in Columbia River Basalts.Research and Engineering Division, Richland, Washington,ARH-ST-137. UC-11, 'JC-70, November 1976.
30 Mendel, J. E. A Review of Leachir,g Test Methods and the Leachabilit/of Various Solid Media Containing Radioactive Wastes. BNWL 1765July 1973.
31 Zagar, L., and A. Schillmoeller. The Physical and Chemical ProcessesInvolved in the Leaching of Glass Surfaces by Water. Clastech. Ber. 33,1964.
32 Criffing D. E. Progress Report on the Development of Models for theDescription of Radionuclide Transport in Solids. ARH-SA-190 REV, 1974.
33 Merritt, W. F. High Level Waste Glass- Field Leach Test. NuclearTech. 32, January 1977.
34 Godbee, H. W., and D. S. Joy. Assessment of the Loss of RadioactiveIsetopes from Waste Solids to the Environment - Part I: Backgroundand Theory. O RNL-TM-4 333, 1974.
35 Lcgan, S. M. Draft Report on Implementation of a Technology Assess-cent for Radioactive Waste Management. Environmental Protection AgencyReport on Contract #68-01-3256, August 1976.
36 International Assessment of Groundwater Modeling as an Aid to WaterResource Management, Holcomb Research Institute, Butler University.Indianapolis, Indiana; sponsored by the Environmental ProtectionAgency. Report in preparation.
37 deMarsily, G., E. Ledous, A. Barbreau, J. Margot. Nuclear WasteDisposal: Can the Geologist Guarantee Isolation? Science 197.,August 1977.
38 Lester, D. H. , G. Jansen, and H. C. Burkholder. Migration ofRadionuclide Chains Througn an Ad3 orbing Medium. A1ChE SymposiumSeries lil Adsorption and Ion Exchanga, 1975. 71.
19 Duguid, J. O. and M. Reeves. Material Transport Through PorousMedia: A Finite-Element.Calerkin Model. Oak Ridge National Labora-cry, Oak Ridge Tennessee, ORNL 4928, 1976.
40 Risk Methodology for Geologic Disposal of Radioactive Waste: TheSandia Waste Isolation Flow and Transport (SWIFT) Model. SandiaLaboratories, Albuquerque, New Mexico. SAND-78-1267; NUREC/CR-0424.Cetober, 1978.
41 Su==ary Review of Movement of Fluids in Largely Impermeable Rocks,P. A. Witherspoon (Ed.), January 197 7.
175
T m m,' )7 .py mm. y ,a.. - .Mmw-''
_ ' w- u.~ w g .6; c 3,._ , x , _3 1~ .- }.. .. qr-y .'
- . ' .-
I
42 Ames L. L. and D. Rai. Radionuclide Interactions With Soil andy Rock Media. Battelle Pacific Northwest Laboratories, Richland,', Washington. EPA 520/6-78-007:1. August, 1978.
43 Ames L.L. , Dhanpat Rai, and R.J.Serne. A Review of Actinide SedicentReactions With Annotated Bibliography. BNWL-1983. February 1976.
44 Heites, L. (Ed.). Handbook of Analytical Chemistry. McGraw-Hill,New York. 1963.
|
45 Scott, R. C. and F. B. Barker. Data on Uranium and Radium inGround Water in the United States 1954-1957. U.S. GeologicalSurvey Paper No. 426. 1962.
46 U.S. Nuclear Regulatory Commission. Environmental Survey of theReprocessing and Waste Management Portions of the LWR Fuel Cycle.NUREC-0116, Washington, D.C., 1976.
47 Gera, F. Geochemical Behevior of Long-Lived Radioactive Wastes.Oak Ridge National Laboratory, Oak Ridge, Tennessee, ORNL-TM-4461,1975.
48 Cohen, B. L. High-Level Radioactive Waste from Light Water Reactors,Rev. Mod. Phys. 49:1-19, January, 1977.
49 Hoffman, F. O., et al. A Compilation of Documental Computer CodesApplicabic to Environmental Assessment of Radioactivity Release.Environmental Sciences Division, Oak Ridge National 'aboratory, OakRidge, Tennessee, ORNL-TM-5830,1977.
50 National Acadeey of Sciences. Biological Effects of Ionizing Radia-tion, Advisory Committee on (BEIR). The Effects on Populations ofExposure to Low Levels of Ionizing Radiation, National ResearchCouncil, Washington, D.C., 1972.
51 U.S. Nuclear Regulatory Co= mission. Regulatory Guide 1.109 Calcula-tion of Annual Doses to Man from Routine Releases of Reactor Effluentsfor the Purpose of Evaluating Compliance with 10 CFR Part 50,-
f Appendix I., Washington, D.C., 1976.
52 U.S. Nuclear Regulatory Co= mission. Final Generic EnvironmentalStatement on the Use of Recycle Plutonium in Mixed Oxide Fuel inLight Water Cooled Reactors ("GESM0") Health, Safety and Environment,Of fice of Nuclear Material Safety and Safeguards, Washington, D.C. ,NUREG-002, 3, 1976.
1
176
.
,f - f . , , p =-,I ^ -' '' 9,'
-
' '
, j
Y

_.
.-
Ad44
53 Killough, C. C. , P. S. Rohwen and W. D. Turner. INREN - A Fortran-1 Code Which Implements ICRP 2 Models of Internal Radiation Dose to
llan. Oak Ridge National Laboratory, Oak Ridge, Tennessee,ORNL-5003, 1975.
..
54 Killough, C. C. and L. R. McKay (compilers). A Methodology forCalculating Radiation Doses from Radioactivity Released to theEnvironment. Cak Ridge National Laboratorv, Oak Ridge Tennessee.ORNL-4992, 1976.
55 U.S. Environmental Protection Agency. Environmental Radiation DoseComitment: An Application to the Nuclear Power Industry. Officeof Radiation Programs, Criteria and Standards Division, Washington,D.C., EPA-520/4-73-002, 1974.
56' Weast, R. C. (Ed.). Handbook of Qiemistry and Physics, 57th ed.Chemical Rubber Company Press, Cleveland, Ohio, 1976.
57 National Council on Radiation Protection. Natural Background Radia-,,
;dtion in the United States. NCRP Report No. 45, National Council onRadiation Protection and Measurements. Washington, D.C., 1975.
58 International Coc: mission on Radiological Protection. Report ofComittee II on Pernissible Dose for Internal Radiation, HealthPhysics, 3,1960, ICRP Publ. No. 2. Pergamon Press, New York,1959.
-
|
1
177
,
, , J '' *, .
*- u
^ '
''
.

I1
i
5
APPENDIX C-I
CLOSSARYi1
I
vb
i
,
4
I
i
I
{
>
E, - 7
'
n ' .# -* * ' ), ;y " - - - ' ' . , ., 3 '' , ,, .. =,
, _.
*e fS,,,;
- . - , , . .- _, -. . , c ,- . .- . . . . ~

|
i
, APPENDIX C-I
CLOSSARY
Actinides: A series of elements in the periodic table, beginning withactinium (element No. 89) and continuing through lawrencium (elementNo. 103). The series includes uranium (element No. 92) and all ofthe man-made transuranium elements. All are radioactive.
Aquifer: Rock or soil strata containing water that reaches the groundsurface in any natural or man-made manner.
Argillaceous: Referring specifically to argillite, a rock formed fromclays, mud, and silt, but more coenacted and solidified than shaleor mudstone. Although the distinction between shale and argilliteis imprecise, it is used here to imply that the rock has sufficientstrength and rigidity to be mined, and that it bas not been meta-morphosed into slate, which has a platy cleavage.
Background radiation: The radiation in man's natural environment,including cosmic rays and radiation from the naturally radioactiveele =ents, both outside and inside the bodies of men and animals.
! It is also called natural radiation.
Basalt: A hard, dense, dark fine-grained igneous rock.
Bedded salt: Salt occurring in strata, cocmonly interspersed withlayers of shale or limestone.
Biosphere: Zone at and adjacent to the earth's surface where alllife exists.
Breccia pipe: A geologic formation composed of broken rock, breccia,filling a vertical cylindrical hole, or pipe. Such structures havealso been identified as Collapse Structures, Pseudo-Karst Fo rmationsand Dry Sinkholes. Their development is assu=ed to require the dis-solution of underlying rock by circulating groundwater, and collapseof the rock above into the cavity thus formed,
Curie: The basic unit to describe the intensity of radioactivity in ar
material. The curie is equal to 37 billion disintegrations per second,which is approximately the rate of decay of I gram of radium. A curieis also a quantity of any nuclide having 1 curie of radioactivity.The prefixes milli , micro , nano , and pico- are f requently used andindicate quantities of 10-3 curic, 10-0 curie, 10-9 curie, and 10-12curie, respectively.
Darev's Law: The relationship between the hydraulic gradient and thegroundwater velocity.
C-I-l
&"wm3 ,y-'
q_ ~*',_ J .-1, -m . -. - ~- ,
,| . J L ;-.,c.g,- - . . - _yf
' -2 ,, ....
Cs ,_L',_
>v |<*~' LC2 A'',, ,
h

1L51
!
1 Diapirism: The forceful intrusion of one geologic material into another,overlying material.
Distribution coefficients (Ka) and (K ): Sorptions or mechanisms causingions to move at lower velocities than the groundwarer transporting them.Kd = distribution coefficient for porous media; Ka = distribution coef-
ficient for faulted cr fractured media.
Fadit. A break in the continuity of a rock formation, caused by a shiftiegor dislodging of the earth's crust, in which adjacent surfaces are dif .
j ferentially displaced parallel to the plane of fracture.
Ceosphere: The solid earth, including rocks, soil, and water in theground, but excluding oceans (hydrosphere) and air (atmosphere).
Half-life (radioactive): The time required for one-half of an initiallyradioactive material to undergo nuclear transformation; the half-lifeis a measure of the persistence of radioactivity and is smique to eachradionuclide.
High-level vaste: The highly radioactive waste resulting from thereprocessing of spent fuel to separate uranium and plutonium fromthe fission products. The term includes the high-level liquidwastes (HLLW) produced directly in reprocessing, and the solidhigh-level wastes (ELW) which can be made therefrom.
9vdraulic gradient: The pressure drop per unit length of distancetraveled.
Igneous rocks: A group of rocka formed by the solidification of moltenrock. The group consists oT intrusive (plutonic) rocks which havesolidified below the earth's surface and extrusive (volcanic) rockswhich solidified after eruption.
Interstitial velocity: Groundwater flow through the pores and openingsand around individual grains of geologic media.
Ion: An atom or molecule that has lost or gained one or more electrons.
By this ionization, it becomes electrically charged. Examples : analpha particle, which is a helium atos minus two electrons; a proton,,
J which is a hydrogen atom minus its electron.
Isotope: One rf two or more ato=s with the same atomic number (the samechemical element) but with different atomic weights. Isotopes have
very nearly the same chemical properties, but dif ferent nuclear(radioactive-decay) properties. Thus, for the element carbon, forexample, the isotope of atomic weight 12 (C-12) and the isotope ofatomic weight 14 (C-14) behave identically in chemical reactions;but whereas C-12 is not radioactive, C-14 is radioactive, decayingwith a 5730-year half-life to stable nitrogen (N-14) with releaseof a beta particle.
C-I-2
w.,..-
_-- -w - , , ,_ _ __ _ ._ .- .
_
g. .! 4I s _y,' ,j _ I.( , , , _ , - g _e (C r.
Laminar flow: .fon-turbulent flow of fluid in layers near a boundary.
Limestone: A carbonate rock composed primarily of calcite, usuallywith varying amounts of dolomite.
Lithology: The study, description and classification of rock.
Nuclide: A general term applicable to all atomic forms of the elements.'
The term is of ten used erroneously as a sys.onym for " isotope," whichproperly has a more limited definition. Whereas isotopes are thevarious forms of a single element (hence are a family of nuclides)and all have the same atomic number and number of protons, nuclidescomprise all the isotopic forms of all the elements.
0xidr?'on-reduction potential: Energy gained in the transfer of one'
mole of electrons from an oxidant to hydrogen, expressed in volts.
Permeability: The ability of a fluid to move through a medium under ahydraulic gradient.
Radioactivity: The spontaneous decay or disintegration of an unstableatomic nucleus, usually accompanied by the emission of ionizingradiation.
,
Radioisotope: A radioactive isotope. An unstable isotope cf an elementthat decays or disintegrates spontaneously, emitting radiation. Morethan 1300 natural and artificial radioisotopes have been identified.-
d
Radionuclide: A radioactive nuclide. Thus, carbon-14 (C-14) is a radio-nuclide because it decays radioactively to nitrogen-14 (N-14).
Radwaste: A contraction of the term " radioactive waste."
Redox potential: Oxidation-reduction potential (q.v.).I
Ren: A dose unit which takes into account the relative biologicaleffectiveness (RSE) of the radiation. The rem (" roentgen e,quiva-lent opn") is defined as the dose of a particular type of radiationrequired to produce the same biological effect as one roentgen of
i
(0.25 Mev) ga==a radiation. A 1-rad dose of alpha particles is'
approximately equivalent in its biological effects to 10 rads ofgamma radiation, and hence may be expressed as 10 rems A milli-rem (crem) is one thousandth of a rem.
Retardation factor (Ra): Ratio of the water velocity to the nuclidemigration velocity.
Salt dome: A geologic salt formation in which a plug of salt has beenthrust up through rock at some depth, leading to a subterranean" cylinder" of salt which may be a mile or more in diameter andr.everal miles deep.
C-I-3
' Qn;''...n| } , & W ;a % - ;';C. y D,g7Z( f:k|j'[M f&.,_._ .- . - - - -,
, .
"
.O

Shsle: Lithified clay or mud, usually containing some sand and silt.
Seismicity: Caused by an earthquake or earth vibration.
. Stratigraphy: The study of rock strata, especially of their distribution,deposition and age.
Styolite: A small celumnar rock development in limestone and othercalcareous rocks.
Tectonic: Pertaining to the formation of the earth's crust; the forcesinvolved in or producing such deformation and the resulting forms.
Tuff: A rock composed of compacted volcanic ash varying in size fromfine sand to coarse graiel.
.
C-I-4
f7,' > i V' . s ]Q?fQ.; [EyYJg[[ W $%cf'L3Q b{7{V V. NkW|5*|[gfb;?, $ - &.
5
* 8
O
e
APPDfDIX C-II
RADI0 ACTIVE WASTE MICRATION MODEL
?
'
.- 2,8 7. 5 s~ 8 -m - u: : . ..t : .- c>=- "~
~:t .,. .,. . ,
<- 1 a- o __ . a _- .. = , . ' , - ~- -< :. u ...; ~ .' a,t
.. :_ -.,-.x n

9
APPENDIX C-IIi
RADIOACTIVE WASTE MICRATION HDDEl.
The radioactive vaste migration model used in this study is a
single-phase, numerical model for transport of fluid, energy, salinity,
I29}and radioactive nuclides in porous media Basic laws of physics.
are used to describe mathematically the cuelf de transport in geologic
fo r=a t ions. Thu model includes radioactive decay and generation (by
decay of other comporents) and adsorption of nuclides.The complete '' flow system" is described by three coupled partial
daf ferential equations for conservation of total fluid mass, energy,
and an inert component (e.g. brine). The equations are coupled through
fluid properties--density and viscosity. Calculation of radioactive
vaste transport, in addition to the above three equations, requires
separate solutions for each of the radioactivo constituents. Conse rvation
of mass of the species dissolved in the fluid phase and adsorbed on the
rock as well as radioactive decay and generation from other nuclides
are included.
Basic assumptions and model features can be summarized as
follows:
(1) Three-dimensional, transient, laminar flow.
(2) Three-dimensional Cartecian (x, y, z) or two-dimensional(r, z) coordinate description.
(3) Fluid density can be a function of pressure, temperatureand concentration of the inert component. Fluid viscositycan be a function of temperature and concentration.
(4) Waste dissolved in fluid is co=pletely miscible withthe in-place fluids.
(5) Aquifer properties are varied with position.(6) Hydrodynamic dispersion is described as a function of
fluid velocity.
(7) The energy equation can be described as "enthalpy in -enthalpy out a change in internal energy of thesystem". This is rigorois, except for kinetic
and potential energy, which have been neglected.(8) Boundary conditions allow natural water movement in
the aquifer, heat losses to the adjacent formations,
C-II-1
_ _.y . + ~ . :f ) ' w_ wy = f , - f=7 ^
-- -
:r 6%a
-
3- :y m : v c_v_-_
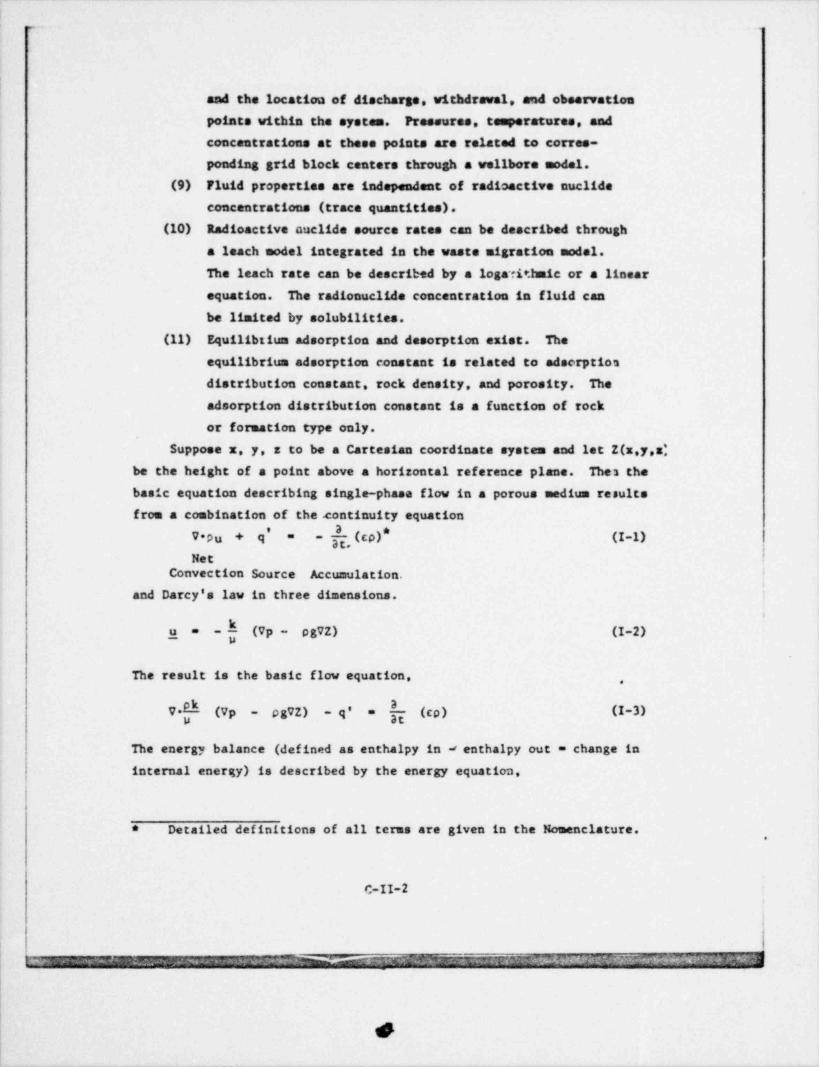
..
and the location of discharge, withdrawal, and observation
points within the system. Pressures, temperatures, and
concentrations at these points are related to corres-
ponding grid block centers through a wellbore model.
(9) Fluid properties are independent of radioactive nuclideconcentrations (trace quantities).
(10) Radioactive nuclide source rates can be described througha leach nodel integrated in the vaste migration model.
The leach rate can be described by a logafit.hmic or a linear
equation. The radionuclide concentration in fluid can
be limited by solubilities.
(11) Equilibtium adsorption and desorption exist. The
equilibrium adsorption constant is related to adserption
distribution constant, rock density, and porosity. The
adsorption distribution constant is a function of rock
or formation type only.
Suppose x, y, z to be a Cartesian coordinate system and let Z(x,y,z'
be the height of a point above a horizontal reference plane. Thes the
basic equation describing single-phase flow in a porous medium resultsfrom a conbination of the. continuity equation
9' (co)* (I-1)V*pu + = -
NetConvection Source Accumulation.
and Darcy's law in three dimensions,
-f(Vp- pgvZ) (I-2)u_=
The result is the basic flow equation,,
h (co) (I-3)V- (Vp - ogvZ) -q' =
The energy balance (defined as enthalpy in s enthalpy out = change in
internal energy) is described by the energy equation.
Detailed definitions of all terns are given in the Nomenclature.*,
c-II-2
t- _ ^------ . a _ :. 9m werg wmmsw = y _ :D ' ' m '; ' T . xaj-
._.
h

--.
Va(fH(Vp q'Eog7Z)) + V*F *VT q --- y*
Net Energy Conduction Hast Loss Enthalpy la
Convection to Sur- with Fluidrounding Strata Source q'
(1-4)
h(cpu +(1-c)foC)g)TqH =-p
Energy In AccumulationWithout Fluid
Input
A material balance for the solute results in the solute or concentrationequation
h(ocC) (I-5)V.pE*Vb q'bV'(pb(Vp-og7Z) =+ -
Net Solute Diffusion Source AccumulationConvection
A similar material for N radioactive components results in N componenti equations
N
E a )R)C peog7Z)] + V*pE 'VC qc +V-[pC -(Vp - g y-g g
j=1=
Net Component i Diffusion of Source of Generation of i
convection Component i Component i Component i bydecay of otherisotopes
(I-6)H
h (cpR C )E (ki incC=- ggg
k=1
Net Decay of AccumulationComponent i toOther Isotopes
where
ki s(1-c)C,(ki 1 ' i "kipcC + s #*8 g
and assumes the approximation
h(cpRC)g g (1 - c)p,C,(cpC ) +=
(1- c)p, dgThe equilibrium adsorption constant R =1+g
C-II-3
_
~ , _.;; T c _
c n;- , 3 ^ . ; ,_y - - r-x . rmyn.,3 , ,
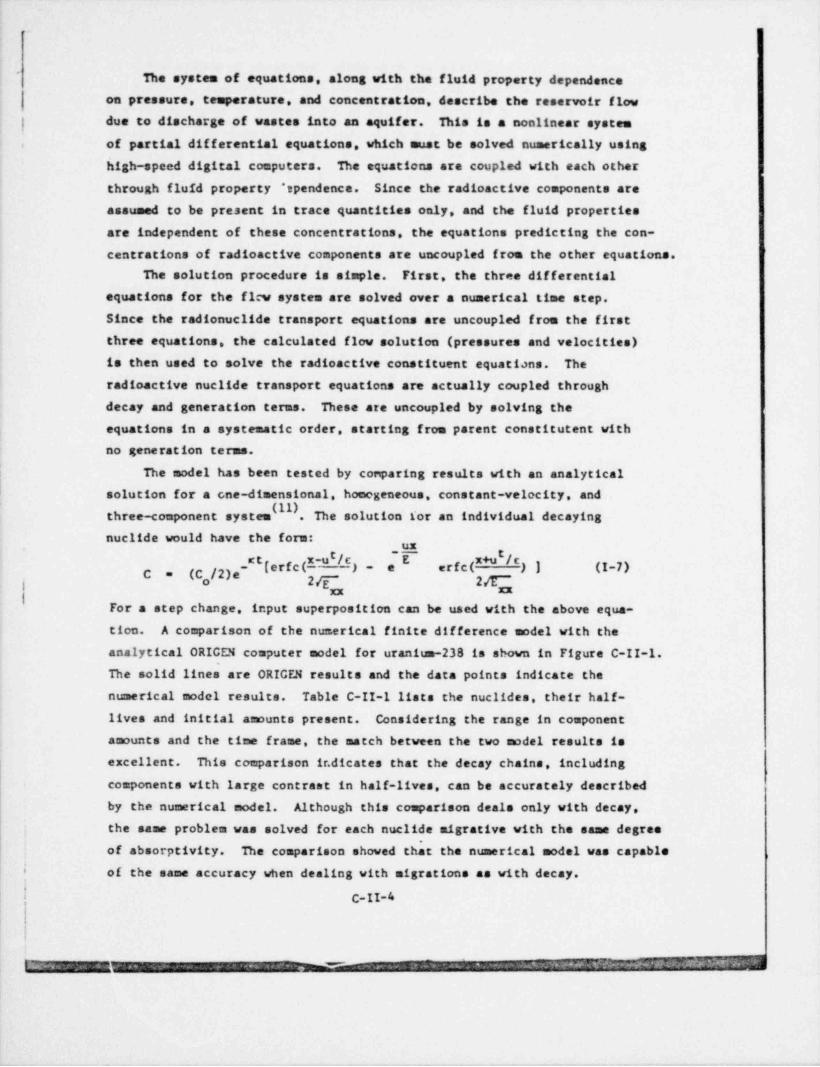
The system of equations, along with the fluid property dependence
| on pressure, temperature, and concentration, describe the reservoir flow
| due to discharge of wastes into an aquifer. This is a nonlinear systemof partial differential equations, which must be solved numerically using,
high-speed digital computers. The equations are coupled with each other
through fluid property "ependence. Since the radioactive components are
asaused to be present in trace quantities only, and the fluid properties
are independent of these concentrations, the equations predicting the con-
centrations of radioactive components are uncoupled from the other equations.
The solution procedure is simple. First, the three differential
equations for the f1:v system are solved over a numerical time step.Since the radionuclide transport equations are uncoupled from the first
three equations, the calculated flow solution (pressures and velocities)
is then used to solve the radioactive constituent equati.)ns. Theradioactive nuclide transport equations are actually coupled through
decay and generation terms. These are uncoupled by solving theequations in a systematic order, starting from parent constitutent with
no generation terms.
The model has been tested by coriparing results with an analyticalsolution for a cne-dimensional, homogeneous, constant-velocity, and
three-component system . The solution for an individual decaying
nuclide would have the form:
_" C [ e r f c (*- ') - erfc(* *) ] (I-7)e(C,/2)e yC =
I xx xx| For a step change, input superposition can be used with the above equa-
tion. A comparison of the numerical finite difference model with the
analytical ORICEN computer model for uranium-238 is shown in Figure C-II-1.The solid lines are ORICEN results and the data points indicate the
numerical model results. Table C-II-1 lists the nuclides, their half-
lives and initial amounts present. Considering the range in component
amounts and the time frame, the match between the two model results is
excellent. This comparison ir.dicates that the decay chains, including
components with large contrast in half-lives, can be accurately described
by the numerical model. Although this comparison deals only with decay,
the same problem was solved for each nuclide migrative with the same degreeof absorptivity. The comparison showed thEt the numerical model was capableof the same accuracy when dealing with migrations as with decay.'
| C-II-4II
mdu em 7 dr- . emm mm _.m . -w- C= m-

'l!
!100, a,
,,,
,U238 - ORIGEN -
Ie Intero Modsl -
0 )~
10-
i"
Pu 242 -, ,
,_ _
U 234 .
4' %
/ 1_
~ Am 242M-
-
2 A - --
Cm 246!
~*- e.
in'
O< 1 - I
J : I
a. Th 230 ;,
_
z!~
us 10'2 -
u, . .
l< -
3 .
Cf - 250 |,
10'4 i; -
, ;
. Ra 226 -,
(
1-
10-6 -
!'
- |-
k
.~
10-8 -
]_ Pb206 -
'-10 ~
10 - Rn 222
--
' ' ' ' ' ' '
122 3 4 5 6
1 10 go 10 10 10 10
TIME , YEARS
FIGURE C-II-1 COMPARISON OF ORif cN AND INTERA MODEL RESULTS FORSTATIC FLOW CONDITIONS
C-II-5
--
' = ' ' '
y .~ ..:~ .y Sg ,.,- -, _c ., . y -f 7 y -. . . 22 c, ' L ' , , _ b1
_ _
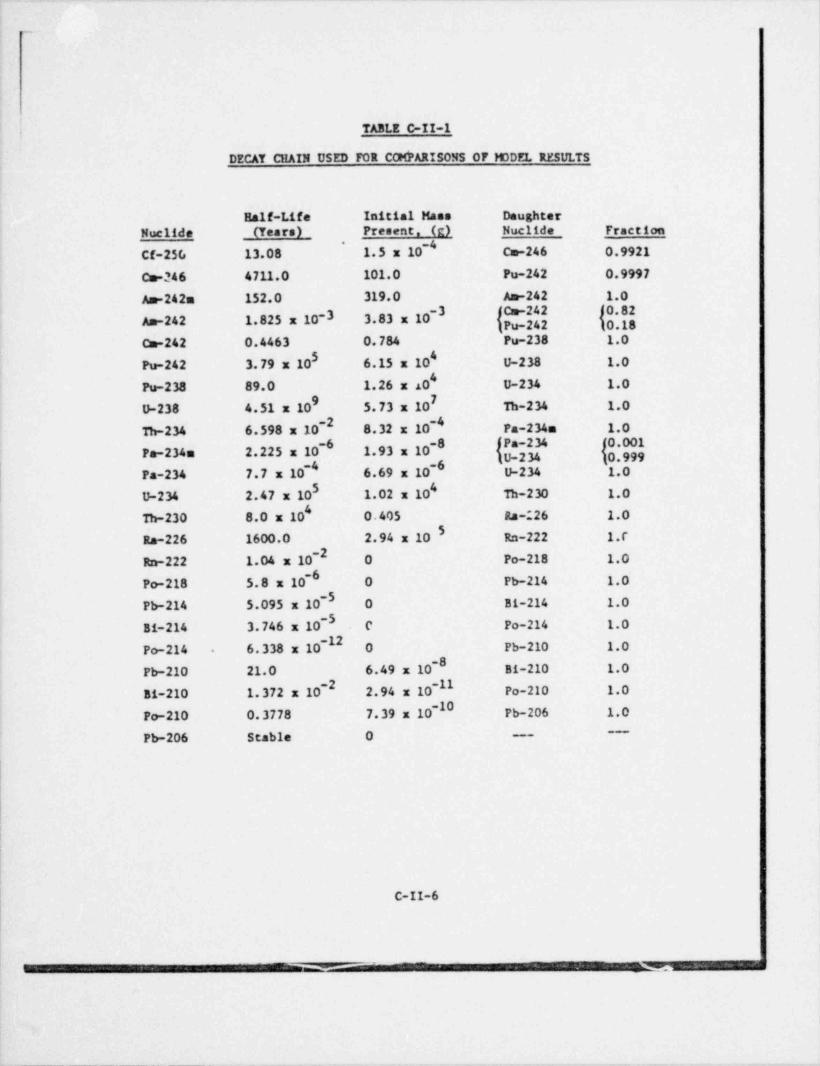
.
TABLE C-II-1
DECAY CHAIN USED FOR CCHPARISONS OF WDEL RESULTS
Half-Life Initial Mass DaughterNuclide (Years) Present. (g) Nuclide Fraction
Cf-25G 13.08 1.5 x 10 ' Cm-246 0.9921' ~
Co-246 4711.0 101.0 Pu-242 0.9997
An-242m 152.0 319.0 An-242 1.0-3 2 .82
An-242 1.825 x 10⁻³ 3.83 x 10 8
cm-242 0.4463 0.784 Pu-238 1.0
Pu-242 3.79 x 10 6.15 x 10' U-238 1.05
Pu-238 89.0 1.26 x AO' U-234 1.09 7
0-238 4.51 x 10 5.73 x 10 Th-234 1.0
Th-234 6.598 x 10 8.32 x 10 ' Pa-234a 1.0-2 ~
-6 8a;2Pa-234m 2.225 x 10 1.93 x 10
Pa-234 7.7 x 10 6.69 x 10 U-234 1.0
U-234 2.47 x 10 1.02 x 10' Th-230 1.05
Th-230 8.0 x 10' O.405 Ra .26 1.0
Ra-226 1600.0 2.94 x 10 Rn-222 1.0-2
Rn-222 1.04 x 10 0 Po-218 1.0-6
Po-218 5.8 x 10 0 Pb-214 1.0-5
Pb.-214 5.095 x 10 0 Bi-214 1.0~
Bi-214 3.746 x 10 C Po-214 1.0~
Po-214 6.338 x 10 0 Pb-210 1.0~0
Pb-210 21.0 6.49 x 10 Bi-210 1.0-2 ~11
51-210 1.372 x 10 2.94 x 10 Po-210 1.0-10
Po-210 0.3778 7.39 x 10 Pb-206 1.0-
Pb-206 Stable 0 -
C-II-6
. .A. , . < + . . . . . . . . . , , . . . . ... . . . . . . . . .- ..
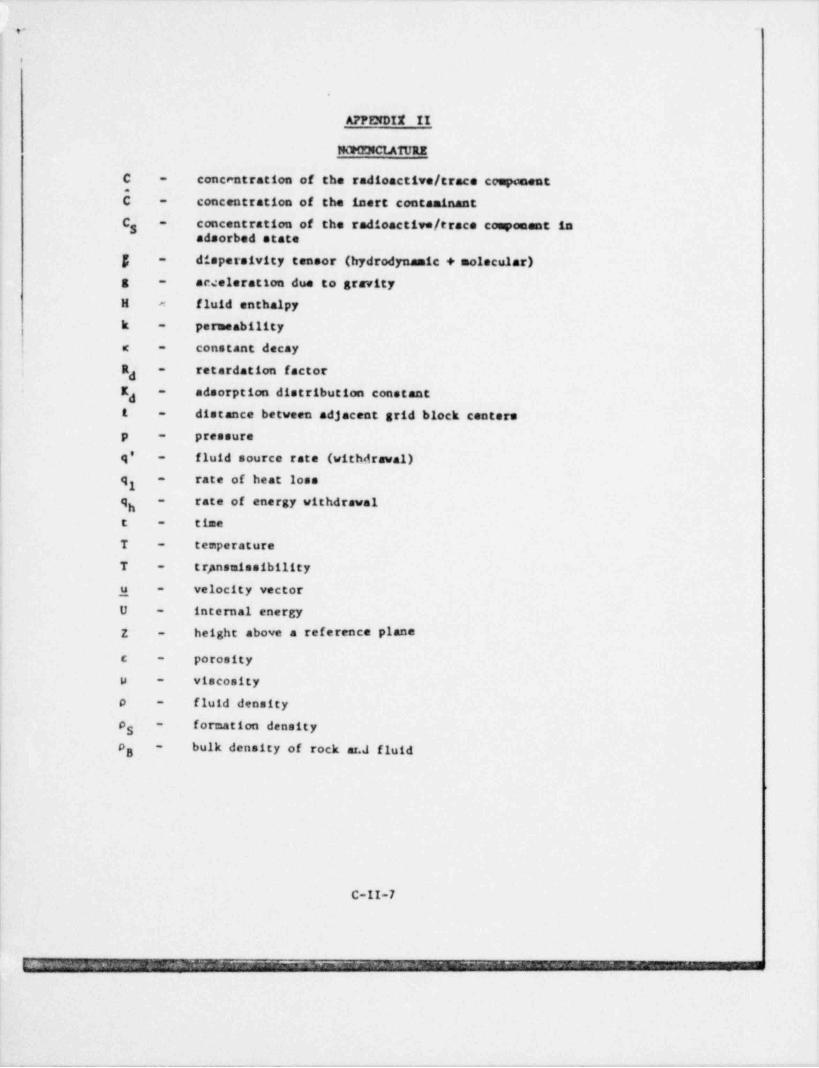
.,.
.
A7PENDIT II
PAT (ENCI.ATURE
C concentration of the radioactive / trace cemponent-
C concentration of the inert contaminant-
S concentration of the radioactive / trace component in-
adsorbed stateg dispersivity tensor (hydrodynamic + molecular)-
g aceeleration due to gravity-
H fluid enthalpy*
k permeability-
I constant decaye -
R retardation factor-
dK 8d8 rption distribution constant-
d1 distance between adjacent grid block centers-
p pressure-
q' fluid source rate (withdrawal)-
q rate of heat loss-
1g rate f energy withdrawal-
htimet -
T temperature-
T t rpnsmissibility-
velocity vectoru -
U - internal energy
height above a reference planeZ -
porosityc -
viscosity9 -
fluid density0 -
o - formation densityg
bulk density of rock ar.J fluido -g
C-II-7
. , _ _3'_=_?"r n rr- " m%r-~~ c. ' ' ^ u uw ~ 2 '> t ** ~ =WM1_. r ' -~~ ^'
-
subscripts
component (mass)c -
hast (energy)H -
rock (formation)R -
water (fluid) ;w -
,
!
I
t
C-II-8
"-* _ _ _ _ _ - . _ _ _
d
WW
APPD(DIX C-III
PARAMETERS OF STUUT
*,
M Nw, e g a ' .,.or.*-<* W... v. e ." ew, ,,- . - we - -. -$ e .. . ', .- .

- --
1
APPENDIZ C-IIIs
PARANETERS OF STUDYt
A meeting was held on January 9,1979, with personnel from EPA, the .i
|Coological Survey and INTERA. The objective of this meeting was to j.
establish reasonable bounds on the parameters (for such variables as per-meability, porosity, flow gradients, and distribution coefficiants) that !could significantly affect geosphere transport of radionuclidas. By this jdate, EPA had developed a p: Jabilistic risk redel for estimating the
|consequences associated with a high-level radioactive waste,repositerf.
In utilizing this risk model, sensitivity studies were to be pr_rformed ;
covering a range of the inportant parameters. This appendir; s:ssaarizes fthe results of these studies for cosparison with the values listed in
Tables C-7 and C-10. I
4
The panel concluded.that use of site criteria would establish at }1 east three factors. These are: ,
(1) Tields of ground water in aquifers or flow units
adjacent to the repository site would be extremely
low.
(2) The original ground water environment in the vicinity
of the repository would be a reducing one rather than~
- an oxidizing one.
(3) No organic naterial would be considered for storage in
the high-level repository.
The simplified diagram below characterizes and defines the variables
of interest in the geosphere pathways.
C-III-1
2

-- .
*.
- - /.
a.a. g u
.
!
I *w
e
' a a.
ar. th. pote.ti.1. at the1. the ahove diagra.. ... 1. .,. 3
surface, aquifer entry from repository, aquifer diach.rge. and repository.raapectively. k and c are the permeability and porosity of the aquiferg 3d the depth from surface to repository, and L the pathway length in theaquifer.
The following smrizes the values for the above variables
e-$g 2
L i L
-5 ~3 ~118 km (5 mi) 10 - 10 en/see 10 - 10 m/s
-2 -2(2.8 x 10 - 2.8 ft/ day) (Note: 10 had almost
equal support for theupper limit.)
k, (40 0 )/dc 3g
~
0.001 - 0.3 Sky (Max) 0 - 10 m/s
vertical permeabilityfrom repository to surface
e
0.01 - 0.3
(porosity forvertical pathway)
C-III-2

..
I.
1
In addition, the panel established the fellowing limitationst
. (1) Travel time in the aquifer should be greater than
1000 years (siting criteria would eliminate lower
travel times).
(2) Adsorption coefficients should be assumed as follows:
RNuclides d(Retardation Factor) ,
C-14 1
Kr 1
Tc 1
1-129 1
Sr 10, 103
Ca 10, 100
All actinides over a range of 1,10,1000 (fully correlated)
(3) Limit the nuclides leaving the repository by solu-
bility in a reducing environment.
The above criteria (3) would undoubtedly limit by solubility Tc, and the
actinide nuclides. It might also limit others depending upon anions
present. .
The above parameter ranges were provided by the panel to give guid-ance in the range of variables for EPA's sensitivity analysis. In somecases, e.g. , the adsorptivities, other values have been measured andreported. However, investigation over the above range should provadoguidance in establishing the range of nuclide concentratiers that mightreach the biosphere.
C-111-3
- -..
-
, wg---
APPENDIX C-IV
" MAXIMUM" INDIVIDUAL Ah7 PDFUIATI0ttDOSE COMNITHEZIT SAMPLE CALCULATIRIS
a. c n.. 4-;, ,. :.- ,
12, -, r,. . . . . v ,. ,' ' . s 3 , . .; ; a;-;t , .. +- . %, n . . ._f . . ;~- .r - ? ., r, - . - . -- ,
- * _7.: , + .- .-
.
2., ,
"+, ,
- .- .. . .. ca '3 ,.
$ -,.,3,
. us--...x.e .se
, .

. ":+
APPENDIX C-IV
"MAXIMUN" INDIVIDUAL AND POPU1ATIONDOSE C0fflITTENT SMtPLE CALCULATIONS
'
"MAXIHLH" INDIVIDUAL DOSE COMMITMENT
The " maximum" 50-year individual ingsstion dose constituent is cal-culated as the product of the drinking water activity (pci/1) times the-maximum annual individual intake (liters) times the 50-year adult inges-
tion dose factor (res/pci). For ingestion of strontium-90 at 300 yearsin Scenario 2 (aqueous transport), the whole-body dose commaitment is:
63.6 x 10 pCi/1 x 7301 x 1,66 x 10'I rem /pci = 4.4 x 10² ,,,
" MAXIMUM" POPULATION DOSE COMMITMENT
The " maximum" population 50-year ingestion dose comunitment is cal-
culated as the product of the drinking water activity (pC1/1) times theaverage annual individual intake (liters) times the population (persons)
times the 50-year adult ingestion dose factor. For ingestion of
strontium-90 at 300 years in Scenario 2 (aqueous transport), the whole-body dose co=mitment is:
0 ~
3.6 x 10 pC1/1 x 3701 x 250 persons x 1.66 x 10 res/pci
- 5.6 x 10 person rem
.
C-IV-1
'|:r . % .x d5): L &; "%8 7 1:$O''tS|-%~ Y-O* - ''
~
-. ,,
APPENDLI C-V
"RDSONABLE" POPULATION DOSE METHODOLOGY.
AND SAMPLE CALCULATION;
i
I
,
u,~ .- m ya ,.., ; -, ,,, .,,gn, . ., .,. k m,5 '
3- -. . , ( ., ..& , ... .',s,.i, .. ,_ c a. .r,
.- , . . ._ _ _
b e ; - '# =.'
-- g * , -N- I,%, h f ,. - A-_'. ,I . .P .. rw .,b. '' "Y J, ,,' gI?g j . 1, _
-4$'',
e
4

.
m-
.
APPENDIX C-V
" REASONABLE" POPUIATION DOSE METHODOLOGY AND SAMPLE CALCULATION
Case: Aqueous Flow Transport (Scenario 2), River Hodal "A" forneptunium-237 at 6,000 years.
From Table C-19, Np-23f has a concentration in the aquife; at onemile downgradient of the repository equal to 7.4 x 10 ' g/1. Using tha
~
specific activity of Np-237 (7.3 x 10 Ci/g), the activity in the
aquifer as it intersects the river is:
-87.4 x 10- g/L x 7.3 x 10 Ci/g = 5.4 x 10 Ci/1 or54,000 pCi/1 (1)
From Section C-4.4.2, the total discharge of the aquifer is 144,000liters per day (0.06 cfs). The river disc >arge at the aquifer intersect
3(from the river model) is 2,400 ft /sec (cfs). The initial activity
of Np-237 in the river is then:
~
(1 1/ day = 4.1 x 10 efs)
54,000 pCi/1 x 0.06 cfs = 1.3 pC1/1 (2)2,400 cfs + 0.06 cfs
A. Direct Inre fan Dose Co=mitmentThe 50-yea pulation dose comitment resulting from one-year in- ,
'i gestion of the river water is calculated as the product of the activity,
at the point of diversion for drinking water use (pCi/1) times theaverage individual's annual intake (1) times the population drinking thewater (persons) times the 50-year adult ingestion dose factor for Np-237(ren/pCi). j
IFor the first population (i.e., that at the first diversion only),,
drinking water below the aquifer intersect, the values used are:e Dilution factor = 1.7 (from river model)
~1Activity of diversion = 1.3 pC1/1 + 1.7 = 7.6 x 10 pci/1 ie
Average individual's annual intake = 370 liters (54)e
The population drinking river water = 1 x 10' persons 3e
(from the river model)e The 50-year adult ingestion dose factor for Np-237 = {
! 5.54 x 10 rem /pci (54) !~8
!
C-V-1
t
~
'* , p| ',,~ k'L^ 5,? 5' [ _~_- [[ $:' S y yf ** + ^ f N}f ?} '' O A' y j y._"u.- r e __ i
' su.,,
Y
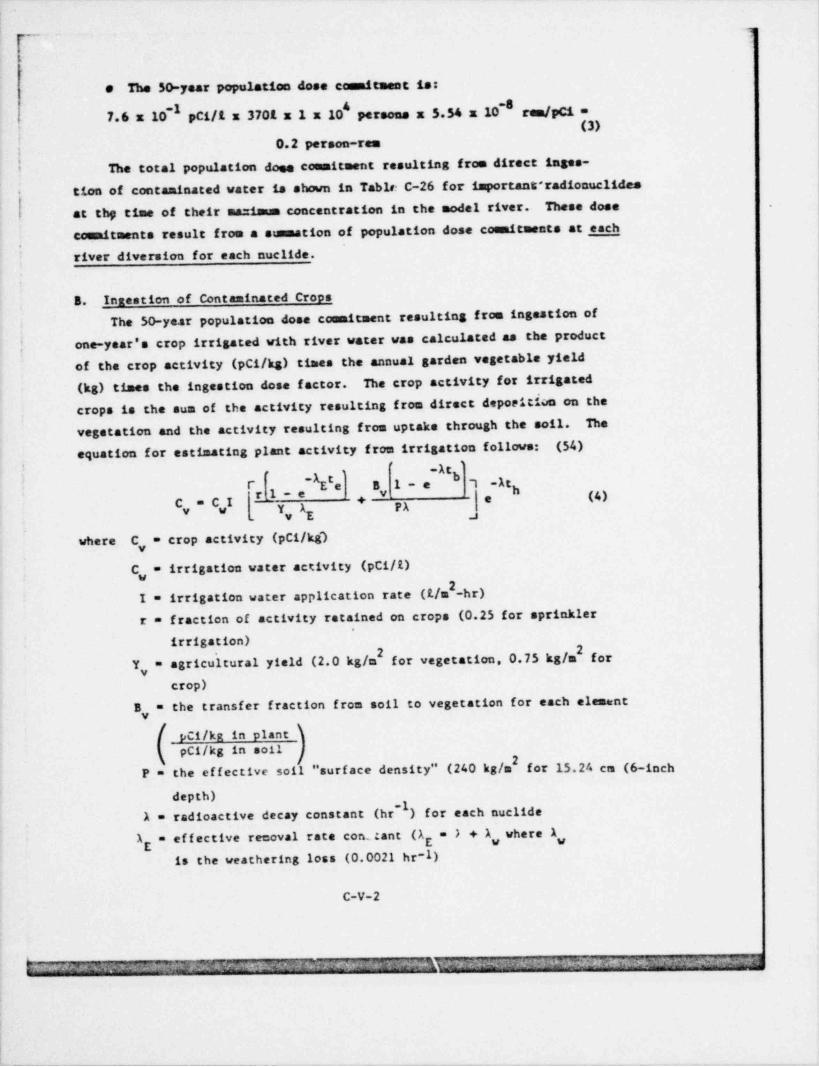
,_
t
e The 50-year population dose commitment is:-1 -8
7.6 x 10 pCi/1 x 3701 x 1 x 10 persons x 5.54 x 10 rem /pci =(3)
0.2 person-res.,
The total population dose commitment resulting from direct inges-tion of contaminated water is shown in Table: C-26 for important radionuclides.
These doseat thp time of their sa=imum concentration in the model river.coenitments result from a summation of population dose cossaicments at each
,
river diversion for each nuclide.
B. Ingestion of Contaminated CropsThe 50-year population dose c M ement resulting from ingestion of
. one-year's crop irrigated with river water was calculated as the product,'
of the crop activity (pCi/kg) times the annual garden vegetable yield(kg) times the ingestion dose f actor. The crop activity for irrigatedcrops is the sum of the activity resulting from direct depoeition on thevegetation and the activity resulting from uptake through the soil. The
equation for estimating plant activity from irrigation follows: (54)-At ''
'
, ,
br, t, 3 g_, ~1 -At3|e (4),
+C = C,I y y p3. v E a
C,= crop activity (pCi/kg)where
C, = irrigation water activity (pCi/1)I = irrigation water application rate (1/m -hr)r = fraction of activity ratained on crops (0.25 for sprinkler
irrigation)
Y = agricultural yield (2.0 kg/m for vegetation, 0.75 kg/m forcrop)
B = the transfer fraction from soil to vegetation for each element
[ pCi/kg in plant IpCi/kg in soil j
P = the effective soli " surf ace density" (240 kg/m for 15.24 cm (6-inch
depth)1 = radioactive decay constant (hr ) for each nuclide
A = effective tem val rate c rt ant (A =) + A, where 1gE
is the weathering loss (0.0021 hr-1)
C-V-2
b; > s ; , _ _ p.. - - -;- _ 3 __g .. . ,. 3 x ; 3-
< n ,, . , 7 ,,
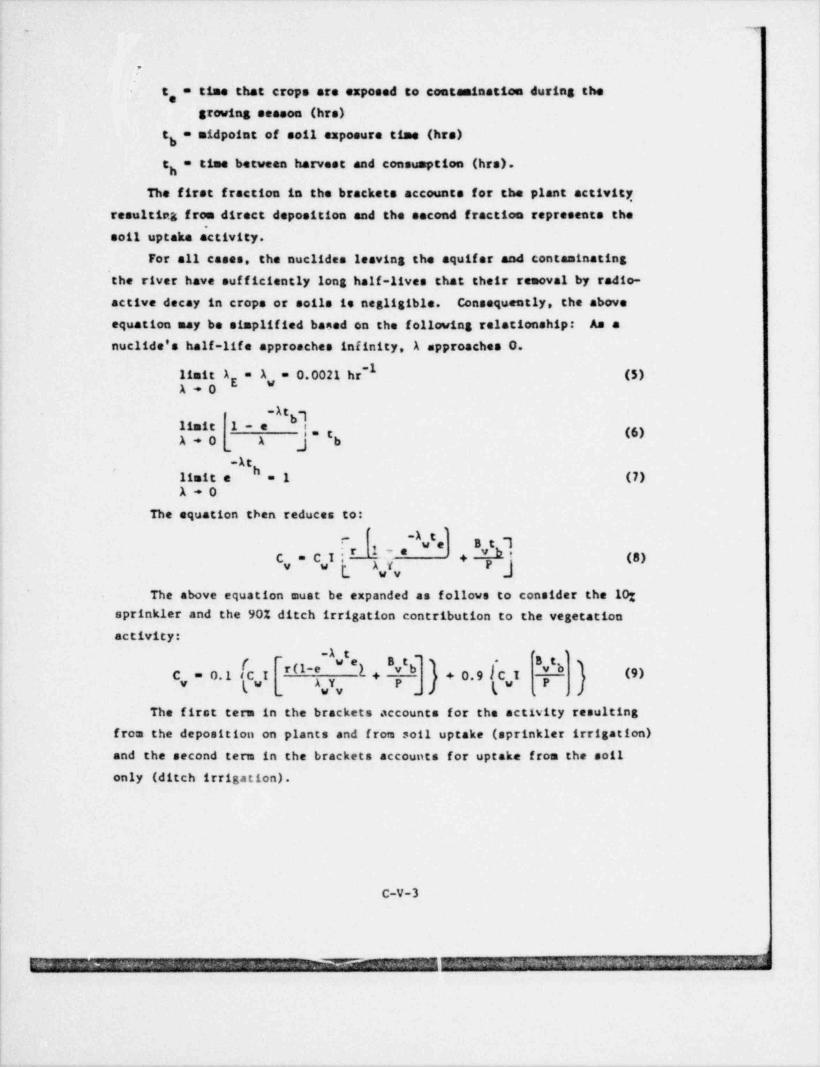
. .,
.
t, = time that crops are exposed to contaminatica during thegrowing season (hrs)
t = midpoint of soil exposure time (hre)b
t = time between harvest and consumption (hrs).h
The first fraction in the brackets accounts for the plant activity
resulting from direct deposition and the second fraction represents the
soil uptaka activity.
For all cases, the nuclides leaving the aquifer and contaminating
the river have sufficiently long half-lives that their removal by radio-
active decay in crops or soils to negligible. Consequently, the above
equation may be simplified baned on the following relationship: As a
nuclide's half-life approaches infinity, A approaches O.~1
limit 1 =A = 0.0021 hr (5)"A+0
-1tbl
limit 1-e !=t (6)A+0 A J b,
limit e h,3 (7)A+0
The equation then reduces to:
*"B t 7,we,vb# ''*C =CI: + (8)
]{ A,i Pv v
The above equation must be expanded as follows to consider the 10:sprinkler and the 90% ditch irrigation contribution to the vegetationactivity:
* *
( ~ we Btb+Btvb vb#(I~' + 0.9 CI (9)C = 0.1 dC I AI P P("
_ wv _ (w'. ,
The first term in the brackets accounts for the activity resulting
from the deposition on plants and from soil uptake (sprinkler irrigation)and the second term in the brackets accounts for uptake from the soil
only (ditch irrigation).
C-V-3
C = m c. . , :. im3x m:n_ M & :;, w & y ,. 1. n Or ;1:, _ f - J:P ~ ^ "Ch-
-

, . .. . .,
The following terms are constants in the above equation:r = 0.25 (sprinkler irrigation)
~11 ,= 0.0021 hr
t, = 1000 hrs2P = 240 kg/m
5t = 50 years or 4.4 x 10 hrs ,b
For neptunium-237 at the diversion in River Model "A" corresponding to a2
1.7 dilution factor, C = 0.76 pCi/t, I (f rom river acdel) = 0.231/n -hr,B = 2.5 x 10⁻³ (1), Y = 2.0 kg/m (1)y
Evaluation of terms in equation (9) resulte in the following:
w"*) , 0.25(1-e-0.0021 x 1 x 10 ) = 52 ha kg~
(10)r(1-e0.0021 x 2.0A ,Yy
*v b , 2.5 x 10 x 4.4 x 10 0= 4.6 x 10 ha kg (11)
C,= 0.1 {0.76(0.23) [52 + 4.6]} + 0.9 {0.76(0.23) (4.6)}(12)= 1.71 pct /kg
And the resulting dose commitment for a population of 10,000 persons is:-8
1.71 pC1/kg x 2.0 x 10 kg* x 5.54 x 10 rea/ pct = 1.9 person-rem.As in the dose comaltaants resulting from direct ingestion, the
population dose couaitsente resulting from ingestion of contaminatedcrops are sumed for all diversions along the model river.
C. Ingestion of Contaninated BeefThe 50-year population dose comitment resulting from ingestion of
contaminated beef is the product of the dose factor (res/pC1) times thebeef activity (pC1/kg) times the total population intaka (kg) for oneyear.
The beef activity, C , is calculated from the activities of theb
cattle drinking contaminated water and eating contaminated feed grainusing the following equation (1):
(13)b (C,1 , + C,I )C =Tb y
*Value f rom Table C-21, kg of vegetables per 10,000 people.
C-V-4
- - ---~ ~_,x n ,em _ w- v nr _, ,,_
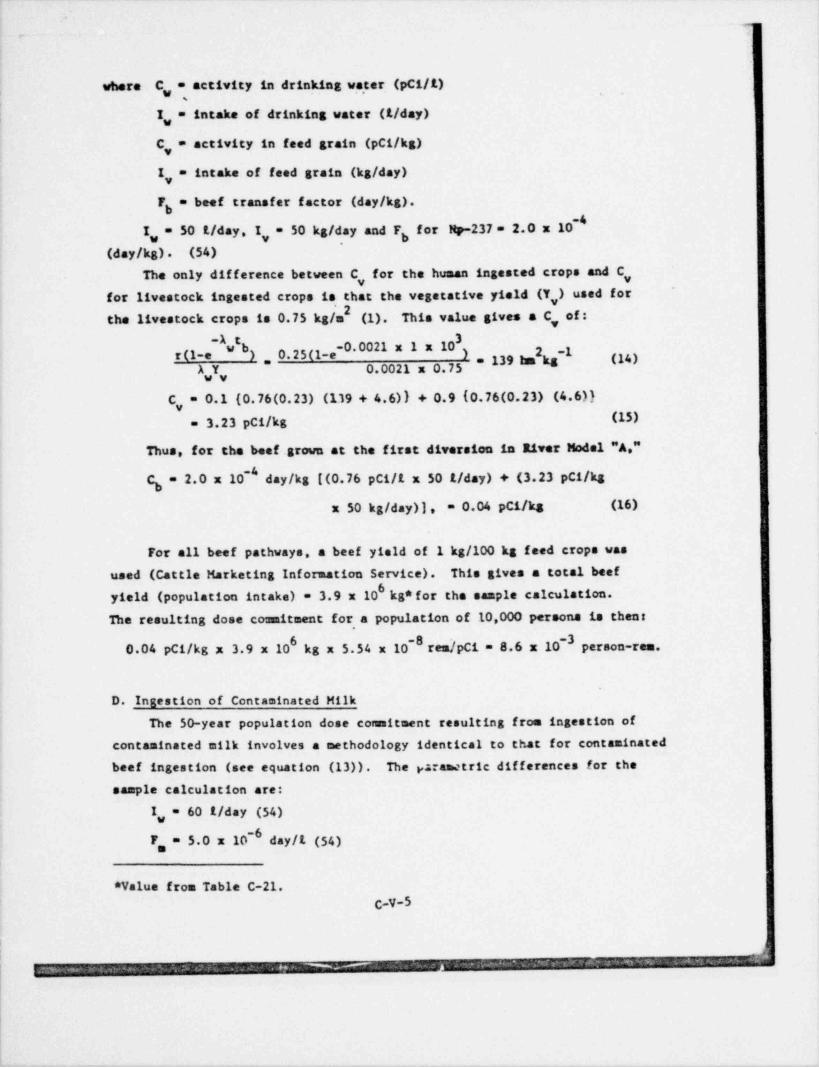
~
-.
where C, = activity in drinking va_ter (pC1/1)
I ,= intake of drinking water (1/ day)
C ,= activity in feed grain (pC1/kg)
I,= intake of feed grain (kg/ day)
F = beef transfer factor (day /kg).b
f r Np-237 - 2.0 x 10"I ,= 50 1/ day I,= 50 kg/ day and Fb(day /kg). (54)
The only dif ference between C for the human ingested crops and C,for livestock ingested crops is that the vegetative yield (Y,) used for
2the livestock crops is 0.75 kg/m (1). This value gives a C, of:*~
r(1-e w b) , 0.25(1-e-0.0021 x 1 x 10 ) = 139 ha kg (14)A,Y, 0.0021 x 0.75
C, = 0.1 {0.76(0.23) (119 + 4.6)} + 0.9 {0.76(0.23) (4.6)}= 3.23 pci/kg (15)
Thus, for the beef. grown at the first diversion in River Model "A "
C = 2.0 x 10" day /kg [(0.76 pci/1 x 50 1/ day) + (3.23 pC1/kgb
x 50 kg/ day)), = 0.04 pCi/kg (16)
For all beef pathways, a beef yield of 1 kg/100 kg feed crops wasused (Cattle Marketing Information Service). This gives a total beef
6yield (population intake) = 3.9 x 10 kg* for the sa=ple calculation.The resulting dose comitment for, a population of 10,000 persons is then:
0.04 pC1/kg x 3.9 x 10 kg x 5.54 x 10 rem /pci = 8.6 x 10'3~
person-rea.
D. Ingestion of Contaminated Milk
The 50-year population dose comitment resulting from ingestion ofcontaminated milk involves a methodology identical to that for contaminatedbeef ingestion (see equation (13)). The g rametric differences for thesample calculation are:
1,= 60 1/ day (54)-6F,= 5.0 x 10 day /1 (54)
*Value from Table C-21.C-y-5
-- ~ ~ s m c r' ='-W'- w ' ~ '~- '- '-
- ~_ - _ m _ m w .n sr n w vm .. w~e
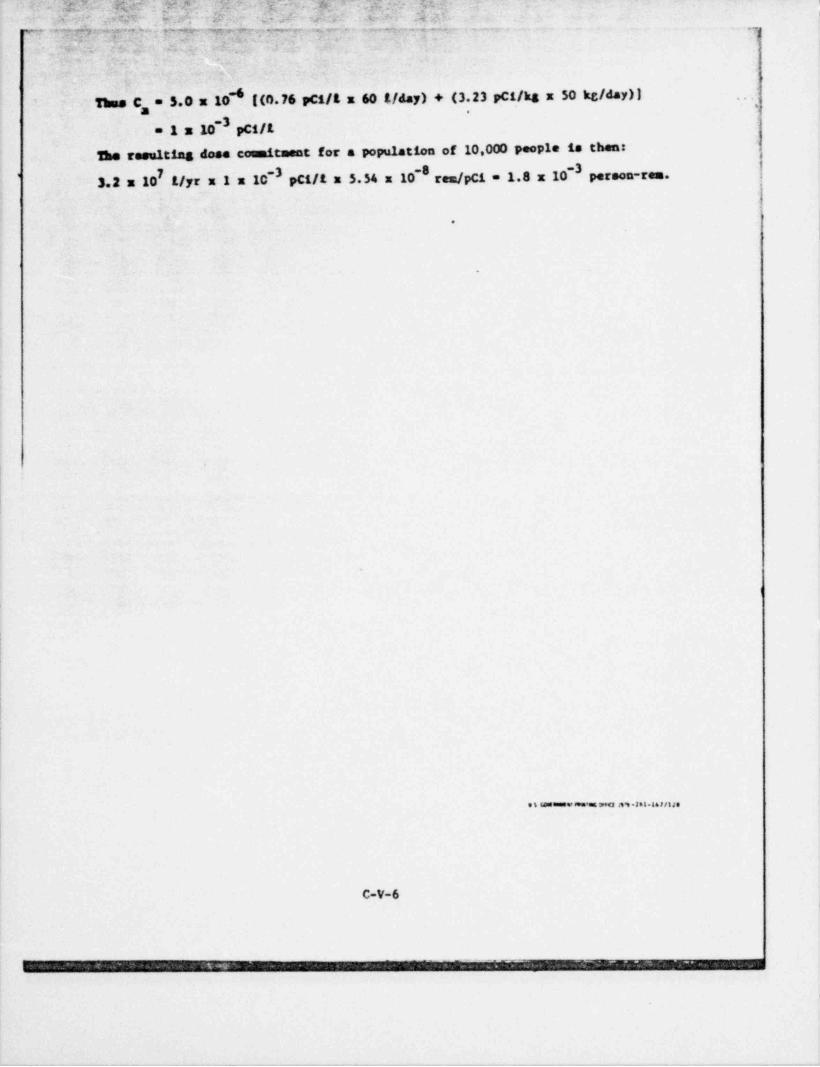
J:_ ' (q.: . 3v ,- , .. ~ -
x- :- -- ee - e. -,J 4g
-
n~g,..,-- ,,--_~,.n,=.-,, . -. .....- ,-,-.--..
.
..
NaC = 5.0 x 10 ((0.76 pC1/1 x 601/ day) + (3.23 pC1/kg x 50 kc/ day)],
a ,
-3= 1 x 10 pC1/1
h resulting dosa commitment for a population of 10,000 people is then7 -3 -8 -3
3.2 x 10 1/yr x 1 x 10 pC1/1 x 5.54 x 10 ren/pci = 1.8 x 10 person-rem.'
.
9 % WWW see'es pegg ag.3tg.ggggggg
C-V-6
, _ , _ , _ _ _ _ _ , . __-- - - - - - - - - - - _ . . _ _ ,. . ; ___;__ .,