Invesco Funds Audited Annual Report - Fundsquare
142
Invesco Funds Audited Annual Report Société d’Investissement à Capital Variable For the year ended 28 February 2011 (R.C.S. Luxembourg B34457)
-
Upload
khangminh22 -
Category
Documents
-
view
1 -
download
0
Transcript of Invesco Funds Audited Annual Report - Fundsquare

Invesco Funds Audited Annual ReportSociété d’Investissement à Capital Variable
For the year ended 28 February 2011
(R.C.S. Luxembourg B34457)

Registered Office:2-4 rue Eugène Ruppert, L-2453 Luxembourg
No subscription can be accepted on the basis of financial reports alone. Subscriptions, in order to be valid, must be made on the basis of the currentProspectus supplemented by a copy of the latest available Audited Annual Report and a copy of the latest Semi-Annual Report, if later than such AuditedAnnual Report.
Copies of the Prospectus, Audited Annual Report and Semi-Annual Report may be obtained at the Registered Office of the Company (Invesco Funds), 2-4rue Eugène Ruppert, L-2453 Luxembourg, as well as from the offices of the Global Distributor in Dublin. Notices of all General Meetings will be publishedin the Luxemburger Wort and, to the extent required by law, in the Mémorial, Recueil des Sociétés et Associations (“Mémorial”) and will be sent to holdersof registered Shares at their address in the Register of Shareholders by post at least 8 days prior to meetings. In the event of any discrepancy betweentranslations from English text into foreign languages, please note that the English text will prevail.
The notice required by Luxembourg law in respect of the issue and sale of Shares by the Fund has been deposited with the Greffe du Tribunald’Arrondissement of Luxembourg.
Equalisation is calculated for tax reporting purposes and is not disclosed in the Audited Annual Report.

3 Invesco Funds
ContentsPages(s)
Report of the Board of Directors 05
Statement of Investments
Equity Funds
GlobalInvesco Global Structured Equity Fund 9Invesco Emerging Market Quantitative Equity Fund 12
AmericaInvesco US Structured Equity Fund 16Invesco Latin American Equity Fund 18
EuropeInvesco Pan European Structured Equity Fund 20Invesco Pan European Equity Fund 23Invesco Pan European Small Cap Equity Fund 25Invesco European Growth Equity Fund 30Invesco Pan European Equity Income Fund 32Invesco Emerging Europe Equity Fund 35
JapanInvesco Nippon Small/Mid Cap Equity Fund 37Invesco Nippon Select Equity Fund 39
AsiaInvesco Asia Opportunities Equity Fund 41Invesco Greater China Equity Fund 43Invesco Asia Infrastructure Fund 45Invesco India Equity Fund 48Invesco Asia Consumer Demand Fund 50
Theme FundsInvesco Global Leisure Fund 53Invesco Energy Fund 55Invesco Asia Pacific Real Estate Securities Fund 57Invesco Global Income Real Estate Securities Fund 59Invesco Gold & Precious Metals Fund 63
Reserve FundsInvesco USD Reserve Fund 64Invesco Euro Reserve Fund 65
Bond FundsInvesco Global Bond Fund 66Invesco European Bond Fund 67Invesco Absolute Return Bond Fund 69Invesco Euro Corporate Bond Fund 71Invesco Euro Inflation-Linked Bond Fund 75Invesco UK Investment Grade Bond Fund 76Invesco Emerging Local Currencies Debt Fund 78Invesco Global Investment Grade Corporate Bond Fund 80Invesco Global Total Return (EUR) Bond Fund 83Invesco Global Unconstrained Bond Fund 84
Mixed FundsInvesco Capital Shield 90 (EUR) Fund 85Invesco Asia Balanced Fund 86Invesco Pan European High Income Fund 91Invesco Global Absolute Return Fund 95Invesco Balanced-Risk Allocation Fund 96

4 Invesco Funds
ContentsPages(s)
Financial Statements
Statement of Net Assets 97-103
Statement of Operations and Changes in Net Assets 104-110
Notes to the Financial Statements 111-135
Audit Report 136
Comparative Net Asset Values 137-140
Other Information (unaudited) 141
Board of Directors 142
Organisation 142

Report of the Board of Directors
5 Invesco Funds
Introduction
Dear Shareholders,
It was a volatile year for global equity markets, with momentum being primarily influenced by macro-economic newsflow and characterised by a 'risk-on,risk-off' market mentality. The first quarter of 2010 saw a continued recovery in global economic data, albeit from depressed levels a year earlier and, as aresult, global equity markets performed well, particularly at the cyclical end of the market. The period from April to July was dominated by the Europeansovereign debt concerns which came to define the financial landscape of last year. Greece's bailout in May failed to stem fears of contagion spreading toother troubled nations like Ireland, Portugal and Spain. This, coupled with a series of disappointing economic data releases including rising USunemployment and growing fears of a global double-dip recession, led to a period of risk aversion and equity market declines.
In the third quarter, however, markets entered a new phase of renewed risk appetite. Expectations about a further round of quantitative easing in the US andimproving economic data drove equity markets higher. By November, the Federal Reserve's decision to embark on the US$600bn round of QuantitativeEasing Phase 2 resulted in criticism at the time from a number of countries, having been interpreted as a means to devalue the dollar, giving US exporters acompetitive advantage over their foreign rivals. Indeed, US economic growth increased by 3.2% in the fourth quarter, attributed to consumers spending attheir fastest pace in four years. The economy grew by 2.9% during 2010, which was the strongest year of growth since 2005. Equity markets rallied and bythe end of last year, the S&P 500 index finally returned to pre-Lehman levels.
Meanwhile, as the end of the year approached, Europe's sovereign debt crisis once again began to unfold. This time it was Ireland making the headlines. Itembarked on one of the most draconian austerity programmes of any developed economy since the Second World War and was forced into accepting theEU-IMF's €85bn rescue deal. Yet the European corporate sector, in contrast, was in good shape financially, characterised by strong cash flows, attractivemargins, and increased earnings. The flurry of Mergers and Acquisitions activity at the end of the year was further sign of cash-rich corporates, strongbalance sheets and cheap valuations.
Meanwhile, inflationary pressures have continued to build around the world into 2011, posing a dilemma for policy makers balancing the need to containrising inflation without stifling economic recovery. UK inflation remained stubbornly high in February rising to 4%, the highest inflation rate in more thantwo years and well above the Bank of England's 2% target. While the UK has higher inflation than any other developed economy, it is a global story. The USand Europe, as well as fast-growing emerging markets such as China and Brazil, have also seen inflation increase, a consequence of rising oil prices andfood prices at an all-time high. The impact of rising food prices on inflation varies around the world. In the US and Europe, food accounts for as little as10%-15% of a family's regular shopping. But in countries such as India, Russia and China, it comprises up to 50%. Soaring inflation in the emerging worldhas seen policy makers in China and India forced to raise interest rates, which has been a contributory factor in the recent underperformance of emergingmarket equities.
Towards the end of the review period, geo-political tensions, as evidenced by the unpredictable nature of civil unrest in North Africa and the Middle East,came to dominate investor sentiment. However, the focus of attention for markets would soon turn to the broad sense of optimism about the US economicrecovery. Markets were given a lift by positive comments from William Dudley, president of the Federal Reserve Bank of New York, who said in Februarythat the outlook was "considerably brighter than six months ago" with signs of "broadening and strengthening" across the board.

Report of the Board of Directors (continued)
6 Invesco Funds
Fund Performance(expressed in terms of the share class currency, mid to mid, gross income reinvested) Percentage change from 28 February 2010
to 28 February 2011Funds %
Invesco Global Structured Equity A Dist USD 10.13Invesco Global Structured Equity A Acc Hedg (EUR) n/aInvesco Global Structured Equity C Dist USD 10.63Invesco Global Structured Equity C Acc Hedg (EUR) n/aInvesco Global Structured Equity C Acc Hedg (GBP) n/aInvesco Global Structured Equity E Acc EUR 7.78Invesco Emerging Market Quantitative Equity A Acc USD n/aInvesco Emerging Market Quantitative Equity A Acc Hedg (EUR) n/aInvesco Emerging Market Quantitative Equity C Acc USD n/aInvesco Emerging Market Quantitative Equity C Acc Hedg (EUR) n/aInvesco Emerging Market Quantitative Equity C Acc Hedg (GBP) n/aInvesco Emerging Market Quantitative Equity E Acc EUR n/aInvesco Emerging Market Quantitative Equity I Acc EUR n/aInvesco US Structured Equity A Acc USD 14.01Invesco US Structured Equity A Acc Hedg (EUR) 13.30Invesco US Structured Equity B Acc USD 13.08Invesco US Structured Equity C Acc USD 14.54Invesco US Structured Equity C Acc Hedg (EUR) 13.93Invesco US Structured Equity E Acc EUR 11.47Invesco US Structured Equity I Acc EUR 13.41Invesco Latin American Equity A Acc USD n/aInvesco Latin American Equity A Acc Hedg (EUR) n/aInvesco Latin American Equity C Acc USD n/aInvesco Latin American Equity C Acc Hedg (EUR) n/aInvesco Latin American Equity E Acc EUR n/aInvesco Pan European Structured Equity A Dist EUR n/aInvesco Pan European Structured Equity A Acc EUR 21.17Invesco Pan European Structured Equity B Acc EUR 20.05Invesco Pan European Structured Equity C Acc EUR 21.79Invesco Pan European Structured Equity E Acc EUR 19.83Invesco Pan European Equity A Dist EUR 22.78Invesco Pan European Equity A Acc EUR 22.79Invesco Pan European Equity A Dist USD 24.72Invesco Pan European Equity B Acc EUR 21.57Invesco Pan European Equity C Dist EUR 23.51Invesco Pan European Equity C Acc EUR 23.43Invesco Pan European Equity E Acc EUR 22.09Invesco Pan European Equity I Acc EUR 25.18Invesco Pan European Small Cap Equity A Acc EUR 28.43Invesco Pan European Small Cap Equity A Dist USD 30.55Invesco Pan European Small Cap Equity B Acc EUR 27.22Invesco Pan European Small Cap Equity C Acc EUR 29.21Invesco Pan European Small Cap Equity E Acc EUR 27.40Invesco European Growth Equity A Acc EUR 18.37Invesco European Growth Equity C Acc EUR 19.11Invesco European Growth Equity E Acc EUR 17.56Invesco European Growth Equity I Acc EUR 20.73Invesco Pan European Equity Income A Dist EUR 12.84Invesco Pan European Equity Income A Acc EUR 12.77Invesco Pan European Equity Income C Acc EUR 13.46Invesco Pan European Equity Income E Acc EUR 12.06Invesco Emerging Europe Equity A Acc USD 31.31Invesco Emerging Europe Equity B Acc USD 30.00Invesco Emerging Europe Equity C Acc USD 32.09Invesco Emerging Europe Equity E Acc EUR 28.24Invesco Nippon Small/Mid Cap Equity A Acc JPY 6.37Invesco Nippon Small/Mid Cap Equity B Acc JPY 5.43Invesco Nippon Small/Mid Cap Equity C Acc JPY 7.14Invesco Nippon Small/Mid Cap Equity E Acc EUR 13.57Invesco Nippon Small/Mid Cap Equity I Acc EUR 16.43Invesco Nippon Select Equity A Acc JPY 2.00Invesco Nippon Select Equity B Acc JPY 1.12Invesco Nippon Select Equity C Acc JPY 2.37Invesco Nippon Select Equity E Acc EUR 8.92Invesco Nippon Select Equity I Acc EUR 11.52Invesco Asia Opportunities Equity A Acc USD 20.48

Report of the Board of Directors (continued)
7 Invesco Funds
Fund Performance (continued)(expressed in terms of the share class currency, mid to mid, gross income reinvested) Percentage change from 28 February 2010
to 28 February 2011Funds %Invesco Asia Opportunities Equity B Acc USD 19.38Invesco Asia Opportunities Equity C Acc USD 21.28Invesco Asia Opportunities Equity E Acc EUR 17.61Invesco Greater China Equity A Acc USD 18.87Invesco Greater China Equity A Acc Hedg (EUR) n/aInvesco Greater China Equity B Acc USD 17.80Invesco Greater China Equity C Acc USD 19.58Invesco Greater China Equity C Acc Hedg (EUR) n/aInvesco Greater China Equity E Acc EUR 16.06Invesco Asia Infrastructure A Inc USD 19.94Invesco Asia Infrastructure A Acc USD 19.90Invesco Asia Infrastructure A Acc Hedg (EUR) n/aInvesco Asia Infrastructure C USD 20.73Invesco Asia Infrastructure C Acc Hedg (EUR) n/aInvesco Asia Infrastructure E EUR 17.06Invesco India Equity A Dist USD 13.53Invesco India Equity C Dist USD 14.20Invesco India Equity E Acc EUR 10.85Invesco Asia Consumer Demand A Dist USD 19.72Invesco Asia Consumer Demand A Acc USD 20.24Invesco Asia Consumer Demand A Acc Hedg (EUR) n/aInvesco Asia Consumer Demand C USD 20.99Invesco Asia Consumer Demand C Acc Hedg (EUR) n/aInvesco Asia Consumer Demand E Acc EUR 17.54Invesco Global Leisure A Acc USD 22.31Invesco Global Leisure B Acc USD 21.13Invesco Global Leisure C Acc USD 23.00Invesco Global Leisure E Acc EUR 19.41Invesco Energy A Dist USD n/aInvesco Energy A Acc USD 30.04Invesco Energy A Acc Hedg (EUR) 28.86Invesco Energy B Acc USD 28.69Invesco Energy C Acc USD 30.65Invesco Energy C Acc Hedg (EUR) 29.57Invesco Energy E Acc EUR 26.97Invesco Asia Pacific Real Estate Securities A Dist USD 16.05Invesco Asia Pacific Real Estate Securities A Acc USD 16.21Invesco Asia Pacific Real Estate Securities C Acc USD 16.88Invesco Asia Pacific Real Estate Securities E Acc EUR 13.75Invesco Global Income Real Estate Securities A Dist USD 18.64Invesco Global Income Real Estate Securities A Acc USD 18.55Invesco Global Income Real Estate Securities C Acc USD 19.19Invesco Global Income Real Estate Securities E Acc EUR 16.22Invesco Gold & Precious Metals A Acc USD n/aInvesco Gold & Precious Metals A Acc Hedg (EUR) n/aInvesco Gold & Precious Metals C Acc USD n/aInvesco Gold & Precious Metals C Acc Hedg (EUR) n/aInvesco Gold & Precious Metals E Acc EUR n/aInvesco USD Reserve A Acc USD 0.00Invesco USD Reserve B Acc USD (1.01)Invesco USD Reserve B1 Acc USD (0.05)Invesco USD Reserve C Acc USD 0.17Invesco USD Reserve E Acc EUR (1.69)Invesco Euro Reserve A Dist EUR n/aInvesco Euro Reserve A Acc EUR 0.19Invesco Euro Reserve B Acc EUR (0.90)Invesco Euro Reserve C Acc EUR 0.37Invesco Euro Reserve E Acc EUR 0.05Invesco Global Bond A Dist USD 5.58Invesco Global Bond A Acc USD 5.59Invesco Global Bond C Acc USD 5.87Invesco Global Bond E Acc EUR 3.70Invesco European Bond A Dist EUR 2.03Invesco European Bond A Acc EUR 2.05Invesco European Bond B Acc EUR 1.04Invesco European Bond C Acc EUR 2.30

Report of the Board of Directors (continued)
8 Invesco Funds
Fund Performance (continued)(expressed in terms of the share class currency, mid to mid, gross income reinvested) Percentage change from 28 February 2010
to 28 February 2011Funds %Invesco European Bond E Acc EUR 1.89Invesco Absolute Return Bond A Acc EUR (1.13)Invesco Absolute Return Bond C Acc EUR (0.94)Invesco Absolute Return Bond C Acc Hedg (GBP) n/aInvesco Absolute Return Bond E Acc EUR (1.38)Invesco Absolute Return Bond I Acc EUR (0.11)Invesco Euro Corporate Bond A Dist EUR 6.27Invesco Euro Corporate Bond A Acc EUR 6.13Invesco Euro Corporate Bond C Acc EUR 6.58Invesco Euro Corporate Bond E Acc EUR 5.85Invesco Euro Inflation-Linked Bond A Acc EUR 1.17Invesco Euro Inflation-Linked Bond C Acc EUR 1.56Invesco Euro Inflation-Linked Bond E Acc EUR 1.02Invesco Euro Inflation-Linked Bond I Acc EUR 2.24Invesco UK Investment Grade Bond A Dist GBP 4.98Invesco Emerging Local Currencies Debt A Dist USD 11.15Invesco Emerging Local Currencies Debt A Acc USD 10.98Invesco Emerging Local Currencies Debt A Acc Hedg (EUR) 10.08Invesco Emerging Local Currencies Debt A Dist Hedg (EUR) n/aInvesco Emerging Local Currencies Debt C Acc USD 11.66Invesco Emerging Local Currencies Debt C Acc Hedg (EUR) 10.59Invesco Emerging Local Currencies Debt E Acc EUR 8.74Invesco Global Investment Grade Corporate Bond A Dist USD 5.16Invesco Global Investment Grade Corporate Bond A Acc Hedg (EUR) 5.15Invesco Global Investment Grade Corporate Bond A Dist (USD) n/aInvesco Global Investment Grade Corporate Bond C Dist USD 5.60Invesco Global Investment Grade Corporate Bond C Acc Hedg (EUR) 5.60Invesco Global Investment Grade Corporate Bond C Acc Hedg (GBP) n/aInvesco Global Investment Grade Corporate Bond E Acc EUR 3.18Invesco Global Total Return (EUR) Bond A Acc EUR n/aInvesco Global Total Return (EUR) Bond C Acc EUR n/aInvesco Global Total Return (EUR) Bond E Acc EUR n/aInvesco Global Total Return (EUR) Bond E Dist EUR n/aInvesco Global Unconstrained Bond A Acc GBP n/aInvesco Global Unconstrained Bond A Acc Hedg (EUR) n/aInvesco Global Unconstrained Bond C Acc GBP n/aInvesco Global Unconstrained Bond C Acc Hedg (EUR) n/aInvesco Global Unconstrained Bond E Acc Hedg (EUR) n/aInvesco Capital Shield 90 (EUR) A Acc EUR 7.40Invesco Capital Shield 90 (EUR) C Acc EUR 7.74Invesco Capital Shield 90 (EUR) E Acc EUR 6.78Invesco Capital Shield 90 (EUR) I Acc EUR 8.56Invesco Asia Balanced A Dist USD 16.75Invesco Asia Balanced A Acc USD 17.27Invesco Asia Balanced A Acc Hedg (EUR) n/aInvesco Asia Balanced C Acc USD 17.87Invesco Asia Balanced C Acc Hedg (EUR) n/aInvesco Asia Balanced E Acc EUR 14.78Invesco Asia Balanced A Dist (HKD) n/aInvesco Pan European High Income A Dist EUR 14.60Invesco Pan European High Income A Acc EUR 15.25Invesco Pan European High Income C Acc EUR 15.65Invesco Pan European High Income E Acc EUR 14.60Invesco Global Absolute Return A Acc EUR 6.33Invesco Global Absolute Return C Acc EUR 7.20Invesco Global Absolute Return C Acc Hedg (USD) n/aInvesco Global Absolute Return E Acc EUR 5.74Invesco Global Absolute Return C Acc Hedg (JPY) n/aInvesco Balanced-Risk Allocation A Dist EUR n/aInvesco Balanced-Risk Allocation A Acc EUR 15.47Invesco Balanced-Risk Allocation A Acc Hedg (USD) n/aInvesco Balanced-Risk Allocation C Acc EUR 16.19Invesco Balanced-Risk Allocation C Acc Hedg (GBP) 16.07Invesco Balanced-Risk Allocation C Acc Hedg (USD) n/aInvesco Balanced-Risk Allocation E Acc EUR 14.83
Dated: 16 June, 2011

Invesco Global Structured Equity Fund
9 Invesco Funds
Statement of Investments as at 28 February 2011
Investment Nominal/Shares Market Value Net AssetsUSD %
TRANSFERABLE SECURITIES ADMITTED TO AN OFFICIAL STOCK EXCHANGE LISTING OR DEALT IN ON ANOTHERREGULATED MARKET
EQUITIESAUSTRALIAAmcor Ltd 32,177 226,051 0.80Ansell Ltd 4,891 67,926 0.24Caltex Australia Ltd 11,338 181,864 0.64Coca-Cola Amatil Ltd 27,523 331,107 1.17Cochlear Ltd 1,104 86,682 0.31Foster's Group Ltd 44,967 261,122 0.92Iluka Resources Ltd 25,286 272,364 0.96Metcash Ltd 28,167 116,097 0.41Origin Energy Ltd 11,766 199,480 0.70Ramsay Health Care Ltd 3,645 65,646 0.23TABCORP Holdings Ltd 17,530 135,432 0.48Telstra Corp Ltd 54,570 154,288 0.54Woolworths Ltd 8,337 227,506 0.80
2,325,565 8.20
BELGIUMBelgacom SA 3,955 148,785 0.52Colruyt SA 1,860 94,065 0.33Mobistar SA 3,165 200,392 0.71
443,242 1.56
BERMUDACatlin Group Ltd 31,435 191,333 0.68RenaissanceRe Holdings Ltd 2,200 147,686 0.52
339,019 1.20
CANADAAlimentation Couche Tard Inc 2,400 63,846 0.23BCE Inc 15,300 558,782 1.97CGI Group Inc 12,200 242,899 0.86Enbridge Inc 7,749 458,319 1.62Fairfax Financial Holdings Ltd 591 228,370 0.81Franco-Nevada Corp 3,300 110,991 0.39George Weston Ltd 2,100 147,681 0.52Intact Financial Corp 2,600 132,010 0.47Loblaw Cos Ltd 3,000 119,797 0.42Metro Inc 4,300 192,759 0.68Rogers Communications Inc 14,200 499,121 1.76SEMAFO Inc 13,600 143,744 0.51TELUS Corp 5,700 279,190 0.99TELUS Corp (Non-Voting) 2,600 121,944 0.43Tim Hortons Inc 3,800 164,585 0.58Valeant Pharmaceuticals International Inc 5,300 213,513 0.75
3,677,551 12.99
DENMARKColoplast A/S 798 112,860 0.40Novo Nordisk A/S 4,425 555,695 1.96
668,555 2.36
FINLANDKesko OYJ 2,925 125,317 0.44
FRANCESEB SA 1,038 100,836 0.36
GERMANYHannover Rueckversicherung AG 3,970 230,347 0.81
HONG KONGCLP Holdings Ltd 26,000 211,616 0.75

Invesco Global Structured Equity Fund
10 Invesco Funds
Statement of Investments as at 28 February 2011
Investment Nominal/Shares Market Value Net AssetsUSD %
HONG KONG (CONTINUED)Power Assets Holdings Ltd 40,000 261,503 0.92SJM Holdings Ltd 223,000 326,931 1.15
800,050 2.82
IRELANDKerry Group Plc 4,871 178,717 0.63Ryanair Holdings Plc 19,231 90,034 0.32
268,751 0.95
ITALYTerna Rete Elettrica Nazionale SpA 104,219 478,054 1.69
JAPANBenesse Holdings Inc 5,500 250,168 0.88Brother Industries Ltd 10,700 168,641 0.60Canon Inc 11,400 548,499 1.94Central Japan Railway Co 12 107,257 0.38Chubu Electric Power Co Inc 16,349 431,089 1.52Dainippon Screen Manufacturing Co Ltd 19,000 183,298 0.65Daito Trust Construction Co Ltd 3,400 277,704 0.98Electric Power Development Co Ltd 2,100 66,324 0.23Hisamitsu Pharmaceutical Co Inc 3,900 157,483 0.56Hokuriku Electric Power Co 2,800 70,595 0.25Kao Corp 13,800 371,217 1.31Kuraray Co Ltd 11,100 156,351 0.55Lawson Inc 5,600 275,601 0.97Makita Corp 3,700 156,080 0.55Miraca Holdings Inc 5,700 219,887 0.78Nippon Telegraph & Telephone Corp 11,400 556,514 1.96Osaka Gas Co Ltd 58,000 220,908 0.78Sega Sammy Holdings Inc 12,400 281,856 0.99Sekisui Chemical Co Ltd 23,000 181,109 0.64Takeda Pharmaceutical Co Ltd 11,400 567,317 2.00Tohoku Electric Power Co Inc 2,502 58,202 0.21Tokyo Gas Co Ltd 126,000 563,098 1.99TonenGeneral Sekiyu KK 18,000 212,056 0.75Yamada Denki Co Ltd 3,910 297,367 1.05Yamato Holdings Co Ltd 15,800 253,078 0.89
6,631,699 23.41
NETHERLANDSKoninklijke KPN NV 19,498 313,328 1.11
NEW ZEALANDTelecom Corp of New Zealand Ltd 84,770 132,769 0.47
PORTUGALEDP - Energias de Portugal SA 40,008 152,277 0.54
SWEDENSvenska Handelsbanken AB 16,474 550,050 1.94Swedish Match AB 5,888 182,244 0.64
732,294 2.58
SWITZERLANDAllied World Assurance Co Holdings Ltd 2,190 133,973 0.47Schindler Holding AG 753 83,789 0.30Swisscom AG 980 430,961 1.52
648,723 2.29
UNITED KINGDOMAstraZeneca Plc 11,076 529,444 1.87BT Group Plc 118,126 340,896 1.20De La Rue Plc 16,064 187,125 0.66

Invesco Global Structured Equity Fund
11 Invesco Funds
Statement of Investments as at 28 February 2011
Investment Nominal/Shares Market Value Net AssetsUSD %
UNITED KINGDOM (CONTINUED)Fresnillo Plc 5,452 140,831 0.50Mondi Plc 7,221 62,926 0.22Next Plc 6,009 193,647 0.68Petrofac Ltd 8,437 189,389 0.67Provident Financial Plc 6,083 100,503 0.35Reckitt Benckiser Group Plc 9,063 462,933 1.63Stagecoach Group Plc 120,721 402,328 1.42
2,610,022 9.20
UNITED STATESAMERIGROUP Corp 3,600 208,494 0.74Amgen Inc 7,000 365,855 1.29Ball Corp 4,200 151,725 0.54Biogen Idec Inc 8,500 576,087 2.03Cardinal Health Inc 13,700 565,125 1.99Cephalon Inc 9,300 523,264 1.85Chevron Corp 5,900 602,597 2.13Cooper Cos Inc 2,600 159,978 0.56Eli Lilly & Co 16,300 556,074 1.96Exxon Mobil Corp 4,400 375,562 1.33Forest Laboratories Inc 13,400 427,259 1.51Health Net Inc 4,700 139,449 0.49Hershey Co 3,300 171,551 0.61Humana Inc 8,700 544,751 1.92InterActiveCorp 16,600 520,742 1.84KBR Inc 8,300 272,074 0.96Lexmark International Inc 4,500 168,142 0.59Lincare Holdings Inc 12,300 363,649 1.28Magellan Health Services Inc 3,400 163,863 0.58ResMed Inc 17,124 54,065 0.19Sprint Nextel Corp 120,700 520,821 1.84Sunoco Inc 1,400 59,080 0.21
7,490,207 26.44
TOTAL EQUITIES 28,168,606 99.42
TOTAL TRANSFERABLE SECURITIES ADMITTED TO AN OFFICIAL STOCK EXCHANGELISTING OR DEALT IN ON ANOTHER REGULATED MARKET 28,168,606 99.42
TotalInvestments 28,168,606 99.42
The accompanying notes form an integral part of these financial statements.

Invesco Emerging Market Quantitative Equity Fund
12 Invesco Funds
Statement of Investments as at 28 February 2011
Investment Nominal/Shares Market Value Net AssetsUSD %
TRANSFERABLE SECURITIES ADMITTED TO AN OFFICIAL STOCK EXCHANGE LISTING OR DEALT IN ON ANOTHERREGULATED MARKET
EQUITIESBRAZILBanco Bradesco SA ADR 3,080 59,382 0.33Banco do Brasil SA 9,300 163,351 0.90Banco do Estado do Rio Grande do Sul 4,700 48,865 0.27BR Malls Participacoes SA 3,000 28,250 0.15Bradespar SA 5,500 142,262 0.78Cia de Bebidas das Americas 1,000 26,263 0.14Cia Siderurgica Nacional SA 2,600 41,408 0.23Cosan SA Industria e Comercio 22,000 333,307 1.83CPFL Energia SA 13,900 353,977 1.94Cyrela Brazil Realty SA Empreendimentos e Participacoes 6,200 63,361 0.35Investimentos Itau SA 28,100 201,499 1.11Klabin SA 14,200 53,197 0.29Localiza Rent a Car SA 10,200 138,525 0.76Lojas Renner SA 7,000 210,715 1.16Natura Cosmeticos SA 1,200 31,100 0.17Petroleo Brasileiro SA 7,400 127,331 0.70Porto Seguro SA 1,700 27,090 0.15Rossi Residencial SA 3,000 23,830 0.13Souza Cruz SA 7,300 352,467 1.93Suzano Papel e Celulose SA 37,000 308,815 1.69Vale SA 6,000 177,799 0.98Vivo Participacoes SA ADR 1,200 43,446 0.24
2,956,240 16.23
CAYMAN ISLANDSAgile Property Holdings Ltd 14,000 17,685 0.10Greentown China Holdings Ltd 22,000 21,916 0.12Tencent Holdings Ltd 2,800 74,263 0.41
113,864 0.63
CHILEAES Gener SA 112,334 57,971 0.32Enersis SA 520,461 205,224 1.13ENTEL Chile SA 2,298 37,949 0.21Sociedad Quimica y Minera de Chile SA 425 22,313 0.12
323,457 1.78
CHINABank of China Ltd 576,000 303,543 1.67Bank of Communications Co Ltd 58,000 55,993 0.31BBMG Corp 14,500 19,378 0.11China Communications Construction Co Ltd 33,000 24,635 0.13China Construction Bank Corp 407,000 355,033 1.95China Life Insurance Co Ltd 36,000 136,913 0.75China Merchants Bank Co Ltd 29,000 69,581 0.38China Petroleum & Chemical Corp 418,000 424,730 2.33Dongfeng Motor Group Co Ltd 38,000 65,857 0.36Guangzhou R&F Properties Co Ltd 22,000 29,401 0.16Industrial & Commercial Bank of China 506,000 388,127 2.13Jiangxi Copper Co Ltd 16,000 50,375 0.28PetroChina Co Ltd 32,000 43,586 0.24Sinopec Shanghai Petrochemical Co Ltd 50,000 26,670 0.15Weichai Power Co Ltd 8,000 53,302 0.29Zhejiang Expressway Co Ltd 22,000 19,742 0.11
2,066,866 11.35
COLOMBIACementos Argos SA 3,976 22,362 0.12

Invesco Emerging Market Quantitative Equity Fund
13 Invesco Funds
Statement of Investments as at 28 February 2011
Investment Nominal/Shares Market Value Net AssetsUSD %
EGYPTEgyptian Financial Group-Hermes Holding 2,553 11,455 0.06
HONG KONGChina Mobile Ltd 64,000 601,007 3.30CNOOC Ltd 205,000 463,972 2.55
1,064,979 5.85
INDONESIABank Mandiri Tbk PT 84,500 55,318 0.30Bank Negara Indonesia Persero Tbk PT 130,500 52,332 0.29Indo Tambangraya Megah PT 67,000 345,766 1.90Semen Gresik Persero Tbk PT 24,000 23,193 0.13
476,609 2.62
MALAYSIAAlliance Financial Group Bhd 38,000 38,866 0.21DiGi.Com Bhd 4,700 40,845 0.22Public Bank Bhd 14,600 62,507 0.34RHB Capital Bhd 11,100 28,619 0.16Sime Darby Bhd 12,200 35,974 0.20Telekom Malaysia Bhd 37,400 48,428 0.27Tenaga Nasional Bhd 18,550 38,341 0.21UMW Holdings Bhd 16,800 39,900 0.22
333,480 1.83
MEXICOAlfa SAB de CV 19,500 239,504 1.31America Movil SAB de CV ADR 10,700 601,714 3.30Grupo Aeroportuario del Pacifico SAB de CV ADR 700 26,033 0.14Grupo Mexico SAB de CV 7,700 28,837 0.16Industrias Penoles SAB de CV 2,045 70,312 0.39Kimberly-Clark de Mexico SAB de CV 5,300 31,042 0.17
997,442 5.47
PHILIPPINESMetropolitan Bank & Trust 28,000 36,758 0.20
POLANDGrupa Lotos SA 1,440 20,162 0.11Powszechna Kasa Oszczednosci Bank Polski SA 22,993 328,562 1.80Powszechny Zaklad Ubezpieczen SA 588 70,736 0.39
419,460 2.30
RUSSIALukoil OAO ADR 320 22,192 0.12Mechel ADR 1,500 44,400 0.24MMC Norilsk Nickel ADR 4,503 106,676 0.59Rosneft Oil Co GDR 50,393 477,348 2.62Severstal OAO GDR 1,679 30,885 0.17Tatneft ADR 9,477 382,918 2.10VTB Bank OJSC 33,338,078 114,526 0.63
1,178,945 6.47
SOUTH AFRICAAfrican Rainbow Minerals Ltd 2,924 87,025 0.48AngloGold Ashanti Ltd ADR 3,900 189,091 1.04ArcelorMittal South Africa Ltd 6,838 87,410 0.48Exxaro Resources Ltd 1,526 32,521 0.18FirstRand Ltd 23,687 64,811 0.36Imperial Holdings Ltd 9,569 149,132 0.82Kumba Iron Ore Ltd 3,013 202,603 1.11Liberty Holdings Ltd 34,637 372,663 2.04Woolworths Holdings Ltd 58,123 214,956 1.18
1,400,212 7.69

Invesco Emerging Market Quantitative Equity Fund
14 Invesco Funds
Statement of Investments as at 28 February 2011
Investment Nominal/Shares Market Value Net AssetsUSD %
SOUTH KOREABusan Bank 2,700 32,475 0.18Dongbu Insurance Co Ltd 1,610 65,155 0.36Dongkuk Steel Mill Co Ltd 2,630 83,247 0.46GS Holdings 813 50,099 0.27Hana Financial Group Inc 2,120 84,338 0.46Hankook Tire Co Ltd 1,450 38,060 0.21Hynix Semiconductor Inc 1,700 42,664 0.23Hyundai Heavy Industries Co Ltd 71 27,380 0.15Hyundai Motor Co 1,839 290,437 1.59Hyundai Motor Co (Preferred) 308 17,110 0.09Hyundai Securities Co 2,180 25,158 0.14Industrial Bank of Korea 1,650 24,670 0.14Kia Motors Corp 7,824 398,253 2.18KT Corp 2,220 76,859 0.42LG Chem Ltd 201 66,294 0.36LG Corp 236 16,237 0.09LG Display Co Ltd 1,690 53,643 0.29POSCO 144 58,658 0.32Samsung Electronics Co Ltd 807 660,672 3.62Samsung Engineering Co Ltd 141 22,393 0.12SK Innovation Co Ltd 124 19,199 0.11Woori Investment & Securities Co Ltd 1,380 24,913 0.14
2,177,914 11.93
TAIWANAdvanced Semiconductor Engineering Inc 161,794 181,391 0.99Chang Hwa Commercial Bank 69,000 50,740 0.28Chinatrust Financial Holding Co Ltd 40,000 31,264 0.17E.Sun Financial Holding Co Ltd 39,511 24,207 0.13Farglory Land Development Co Ltd 91,000 197,773 1.08Formosa Plastics Corp 28,000 93,704 0.51HTC Corp 2,100 75,008 0.41Hua Nan Financial Holdings Co Ltd 36,925 26,098 0.14Macronix International 23,000 16,643 0.09Mega Financial Holding Co Ltd 50,000 36,096 0.20Nan Ya Plastics Corp 17,000 49,005 0.27Powertech Technology Inc 92,000 319,326 1.75Qisda Corp 26,000 15,580 0.09Taishin Financial Holding Co Ltd 106,560 55,076 0.30Taiwan Semiconductor Manufacturing Co Ltd ADR 50,600 622,127 3.41Tripod Technology Corp 6,000 26,574 0.15TSRC Corp 19,000 43,720 0.24United Microelectronics Corp 391,000 202,092 1.11
2,066,424 11.32
THAILANDBangkok Bank PCL 11,200 59,944 0.33Banpu PCL 2,750 65,346 0.36Banpu PCL (Foreign line) 5,000 118,974 0.65Krung Thai Bank PCL 80,300 42,912 0.24
287,176 1.58
TURKEYTurk Telekomunikasyon AS 26,299 118,188 0.65Turkiye Halk Bankasi AS 5,257 37,109 0.20Turkiye Is Bankasi 13,448 42,498 0.23
197,795 1.08
TOTAL EQUITIES 16,131,438 88.51

Invesco Emerging Market Quantitative Equity Fund
15 Invesco Funds
Statement of Investments as at 28 February 2011
Investment Nominal/Shares Market Value Net AssetsUSD %
TOTAL TRANSFERABLE SECURITIES ADMITTED TO AN OFFICIAL STOCK EXCHANGELISTING OR DEALT IN ON ANOTHER REGULATED MARKET 16,131,438 88.51
OPEN-ENDED FUNDSFRANCELyxor ETF MSCI India 75,250 1,162,710 6.38
TOTAL OPEN-ENDED FUNDS 1,162,710 6.38
TotalInvestments 17,294,148 94.89
The accompanying notes form an integral part of these financial statements.

Invesco US Structured Equity Fund
16 Invesco Funds
Statement of Investments as at 28 February 2011
Investment Nominal/Shares Market Value Net AssetsUSD %
TRANSFERABLE SECURITIES ADMITTED TO AN OFFICIAL STOCK EXCHANGE LISTING OR DEALT IN ON ANOTHERREGULATED MARKET
EQUITIESBASIC MATERIALSEI du Pont de Nemours & Co 700 37,860 0.05Freeport-McMoRan Copper & Gold Inc 26,900 1,412,384 1.90International Paper Co 37,900 1,063,853 1.43Lubrizol Corp 600 65,034 0.09Newmont Mining Corp 9,200 500,986 0.67Teck Resources Ltd 7,400 409,553 0.55Titanium Metals Corp 29,500 564,777 0.76
4,054,447 5.45
COMMUNICATIONSAOL Inc 1,700 35,726 0.05AT&T Inc 75,800 2,132,633 2.87CBS Corp 33,000 776,325 1.04Gannett Co Inc 79,700 1,303,493 1.75InterActiveCorp 18,600 583,482 0.78Interpublic Group of Cos Inc 40,200 505,113 0.68JDS Uniphase Corp 6,600 163,647 0.22Liberty Media Corp - Interactive 20,900 352,270 0.47Sprint Nextel Corp 82,100 354,262 0.48Tellabs Inc 90,300 492,586 0.66Verizon Communications Inc 29,000 1,043,275 1.40
7,742,812 10.40
CONSUMER, CYCLICALAdvance Auto Parts Inc 800 50,080 0.07Ford Motor Co 101,400 1,526,577 2.05Harley-Davidson Inc 4,000 163,420 0.22Las Vegas Sands Corp 12,600 579,726 0.78Ltd Brands Inc 41,000 1,325,735 1.78Macy's Inc 47,800 1,128,797 1.52Magna International Inc 2,500 125,725 0.17TRW Automotive Holdings Corp 9,300 535,726 0.72Wyndham Worldwide Corp 18,200 570,661 0.77Wynn Resorts Ltd 4,200 511,854 0.69
6,518,301 8.77
CONSUMER, NON-CYCLICALAbbott Laboratories 4,100 195,386 0.26Amgen Inc 26,300 1,374,570 1.85Biogen Idec Inc 5,500 372,762 0.50Cardinal Health Inc 11,600 478,500 0.64Cephalon Inc 9,800 551,397 0.74Coca-Cola Co 12,600 810,747 1.09Eli Lilly & Co 34,600 1,180,379 1.59Forest Laboratories Inc 15,600 497,406 0.67Humana Inc 20,000 1,252,300 1.68Johnson & Johnson 34,000 2,028,610 2.73Pfizer Inc 6,600 124,443 0.17Philip Morris International Inc 27,300 1,699,289 2.28Procter & Gamble Co 34,900 2,193,290 2.95Tyson Foods Inc 38,100 718,376 0.96UnitedHealth Group Inc 32,200 1,369,949 1.84
14,847,404 19.95
ENERGYChevron Corp 24,200 2,471,667 3.32ConocoPhillips 26,100 2,017,399 2.71Exxon Mobil Corp 38,500 3,286,167 4.42National Oilwell Varco Inc 3,600 287,226 0.39Occidental Petroleum Corp 16,600 1,711,626 2.30Sunoco Inc 2,700 113,940 0.15

Invesco US Structured Equity Fund
17 Invesco Funds
Statement of Investments as at 28 February 2011
Investment Nominal/Shares Market Value Net AssetsUSD %
ENERGY (CONTINUED)Valero Energy Corp 7,700 219,874 0.29
10,107,899 13.58
FINANCIALAmerican Express Co 32,300 1,406,019 1.89Berkshire Hathaway Inc 10,300 874,470 1.17Capital One Financial Corp 22,400 1,119,888 1.50Citigroup Inc 194,600 913,647 1.23Equity Residential 2,800 149,366 0.20Fifth Third Bancorp 83,900 1,224,101 1.64Franklin Resources Inc 1,000 124,980 0.17Goldman Sachs Group Inc 3,450 569,785 0.77Huntington Bancshares Inc 28,200 195,567 0.26JPMorgan Chase & Co 14,900 695,830 0.93KeyCorp 77,700 721,445 0.97M&T Bank Corp 4,200 372,120 0.50NASDAQ OMX Group Inc 5,100 144,866 0.19Principal Financial Group Inc 3,200 108,544 0.15Prudential Financial Inc 21,000 1,359,960 1.83Public Storage 1,800 199,089 0.27Simon Property Group Inc 1,800 192,501 0.26Travelers Cos Inc 2,200 131,131 0.18Vornado Realty Trust 700 62,972 0.08Wells Fargo & Co 10,200 330,531 0.44
10,896,812 14.63
INDUSTRIALCaterpillar Inc 2,900 295,872 0.40Deere & Co 3,300 298,732 0.40Emerson Electric Co 600 36,003 0.05Flextronics International Ltd 38,800 315,250 0.42General Electric Co 15,600 325,182 0.44Joy Global Inc 6,200 582,335 0.78KBR Inc 16,400 537,592 0.72Tyco Electronics Ltd 8,600 306,805 0.41United Parcel Service Inc 9,200 675,970 0.91United Technologies Corp 6,900 575,460 0.77
3,949,201 5.30
TECHNOLOGYApple Inc 8,280 2,883,510 3.87CA Inc 6,200 153,419 0.21Dell Inc 37,600 568,700 0.76Intel Corp 83,300 1,820,521 2.45International Business Machines Corp 16,050 2,604,434 3.50Lam Research Corp 5,500 304,453 0.41Lexmark International Inc 20,300 758,510 1.02Microsoft Corp 86,200 2,289,041 3.08Novellus Systems Inc 3,100 124,914 0.17SanDisk Corp 18,500 928,422 1.25Teradyne Inc 10,000 186,350 0.25
12,622,274 16.97
UTILITIESExelon Corp 19,300 796,607 1.07
TOTAL EQUITIES 71,535,757 96.12
TOTAL TRANSFERABLE SECURITIES ADMITTED TO AN OFFICIAL STOCK EXCHANGELISTING OR DEALT IN ON ANOTHER REGULATED MARKET 71,535,757 96.12
TotalInvestments 71,535,757 96.12
The accompanying notes form an integral part of these financial statements

Invesco Latin American Equity Fund
18 Invesco Funds
Statement of Investments as at 28 February 2011
Investment Nominal/Shares Market Value Net AssetsUSD %
TRANSFERABLE SECURITIES ADMITTED TO AN OFFICIAL STOCK EXCHANGE LISTING OR DEALT IN ON ANOTHERREGULATED MARKET
EQUITIESARGENTINATelecom Argentina SA ADR 4,275 100,441 1.22
BERMUDACredicorp Ltd 1,150 114,937 1.39
BRAZILAliansce Shopping Centers SA 12,300 89,902 1.09Banco ABC Brasil SA 9,700 73,144 0.89Banco do Brasil SA 13,100 230,097 2.79Banco do Estado do Rio Grande do Sul 8,800 91,492 1.11BM&FBovespa SA 25,800 175,077 2.12BR Properties SA 9,600 99,290 1.20BRF - Brasil Foods SA 7,900 135,982 1.65Cia de Transmissao de Energia Electrica Paulista 4,200 126,593 1.54Cia Energetica de Minas Gerais 1,800 29,127 0.35Cia Hering 9,400 136,337 1.66Cia Siderurgica Nacional SA 12,300 195,890 2.38Contax Participacoes SA 4,500 76,430 0.93EcoRodovias Infraestrutura e Logistica SA 15,500 120,001 1.46EDP - Energias do Brasil SA 5,400 119,008 1.44Estacio Participacoes SA 6,400 92,363 1.12Even Construtora e Incorporadora SA 22,800 105,842 1.28Fibria Celulose SA 13,400 192,217 2.33Iguatemi Empresa de Shopping Centers SA 4,600 98,569 1.20Itau Unibanco Holding SA ADR 20,750 457,225 5.56JSL SA 18,000 113,271 1.37Multiplus SA 6,100 103,733 1.26Odontoprev SA 10,200 135,182 1.64OGX Petroleo e Gas Participacoes SA 25,900 295,599 3.59Parana Banco SA 10,400 81,830 0.99PDG Realty SA Empreendimentos e Participacoes 16,300 90,027 1.09Petroleo Brasileiro SA ADR 9,975 351,869 4.26Petroleo Brasileiro SA ADS 4,825 194,954 2.36QGEP Participacoes SA 8,600 108,521 1.32Souza Cruz SA 3,000 144,849 1.75Totvs SA 1,350 123,797 1.50TPI - Triunfo Participacoes e Investimentos SA 19,500 100,373 1.22Trisul SA 18,500 62,631 0.76Ultrapar Participacoes SA 9,200 143,836 1.74Vale SA ADR 19,650 673,503 8.17Vivo Participacoes SA ADR 3,900 141,200 1.71
5,509,761 66.83
CANADAAlamos Gold Inc 2,540 43,066 0.52C&C Energia Ltd 5,650 82,690 1.00Guyana Goldfields Inc 4,225 35,612 0.43Medoro Resources Ltd 17,150 40,662 0.49Silver Wheaton Corp 1,375 56,068 0.69
258,098 3.13
CHILECia Cervecerias Unidas SA 13,100 135,222 1.64
LUXEMBOURGTernium SA ADR 2,750 98,464 1.19
MEXICOAmerica Movil SAB de CV ADR 6,525 366,933 4.45Bolsa Mexicana de Valores SAB de CV 42,700 84,100 1.02

Invesco Latin American Equity Fund
19 Invesco Funds
Statement of Investments as at 28 February 2011
Investment Nominal/Shares Market Value Net AssetsUSD %
MEXICO (CONTINUED)Corp GEO SAB de CV 24,100 70,722 0.86El Puerto de Liverpool SAB de CV 13,100 94,848 1.15Embotelladoras Arca SAB de CV 15,700 85,667 1.04Genomma Lab Internacional SAB de CV 45,000 98,590 1.20Grupo Mexico SAB de CV 47,200 176,767 2.14Industrias CH SAB de CV 27,900 107,159 1.30Kimberly-Clark de Mexico SAB de CV 20,800 121,826 1.48Mexichem SAB de CV 36,500 129,535 1.57OHL Mexico SAB de CV 35,200 64,459 0.78Sare Holding SAB de CV 245,800 60,489 0.73Wal-Mart de Mexico SAB de CV 60,100 174,080 2.12
1,635,175 19.84
PANAMACopa Holdings SA 2,025 107,477 1.30
UNITED KINGDOMAntofagasta Plc 5,210 117,204 1.42
UNITED STATESGran Tierra Energy Inc 12,200 110,579 1.34
TOTAL EQUITIES 8,187,358 99.30
TOTAL TRANSFERABLE SECURITIES ADMITTED TO AN OFFICIAL STOCK EXCHANGELISTING OR DEALT IN ON ANOTHER REGULATED MARKET 8,187,358 99.30
TotalInvestments 8,187,358 99.30
The accompanying notes form an integral part of these financial statements.

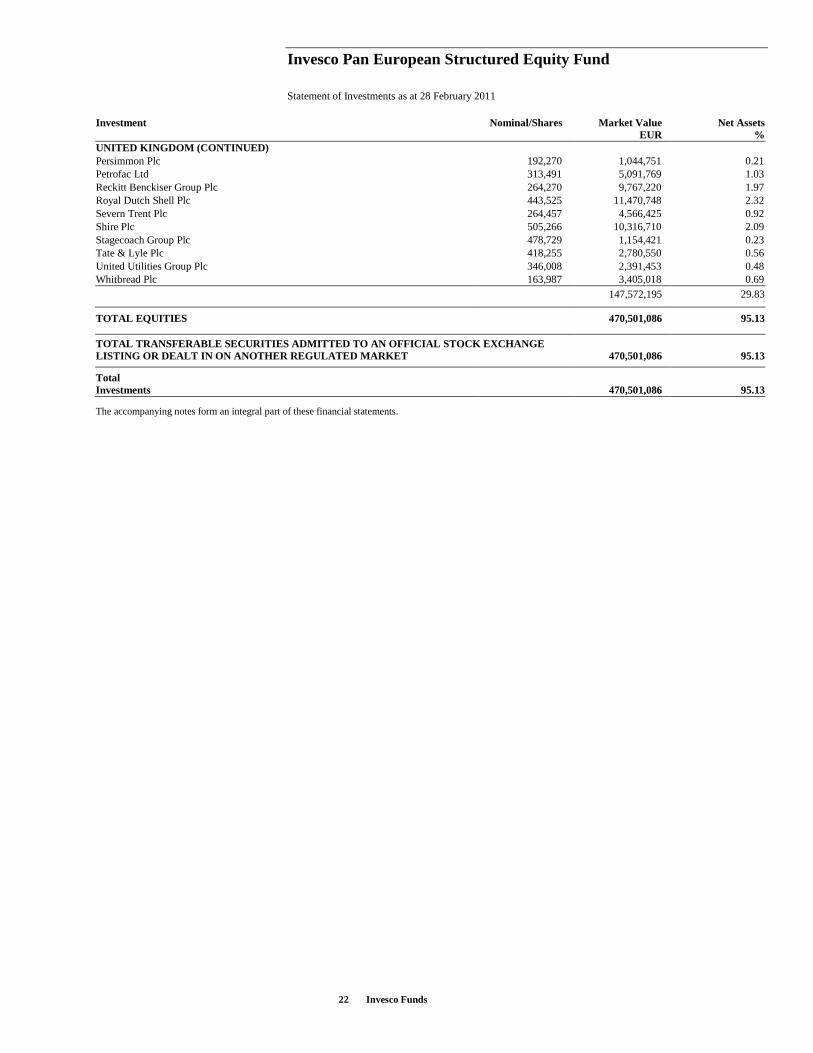
Invesco Pan European Structured Equity Fund
20 Invesco Funds
Statement of Investments as at 28 February 2011
Investment Nominal/Shares Market Value Net AssetsEUR %
TRANSFERABLE SECURITIES ADMITTED TO AN OFFICIAL STOCK EXCHANGE LISTING OR DEALT IN ON ANOTHERREGULATED MARKET
EQUITIESAUSTRIATelekom Austria AG 244,604 2,529,817 0.51
BELGIUMBelgacom SA 157,773 4,294,581 0.87Colruyt SA 47,833 1,750,329 0.35D'ieteren SA 27,380 1,336,007 0.27Mobistar SA 40,174 1,840,471 0.37
9,221,388 1.86
BERMUDALancashire Holdings Ltd 207,072 1,437,860 0.29
DENMARKCarlsberg A/S 48,953 3,783,388 0.76Christian Hansen Holding A/S 122,599 2,033,983 0.41Coloplast A/S 32,443 3,319,986 0.67Novo Nordisk A/S 134,781 12,246,970 2.48
21,384,327 4.32
FINLANDFortum OYJ 489,561 11,007,779 2.23Kesko OYJ 92,156 2,856,836 0.58Orion OYJ 74,455 1,227,018 0.25Sampo OYJ 344,429 7,687,655 1.55Stora Enso OYJ 1,319,361 10,884,728 2.20
33,664,016 6.81
FRANCEBureau Veritas SA 27,521 1,534,433 0.31Casino Guichard Perrachon SA 44,411 3,146,741 0.64Cie Generale d'Optique Essilor International SA 64,229 3,325,457 0.67France Telecom SA 195,578 3,106,757 0.63Metropole Television SA 43,416 780,945 0.16Sanofi-Aventis SA 187,729 9,247,061 1.87Schneider Electric SA 20,168 2,377,303 0.48SEB SA 63,075 4,433,542 0.90Societe BIC SA 23,873 1,481,081 0.30Valeo SA 22,025 984,848 0.20
30,418,168 6.16
GERMANYAurubis AG 23,521 891,858 0.18Axel Springer AG 8,589 1,014,576 0.20Bayer AG 198,485 10,835,296 2.19Deutsche Telekom AG 1,075,572 10,458,862 2.11Douglas Holding AG 26,153 1,028,271 0.21Fresenius Medical Care AG & Co KGaA 244,387 11,638,320 2.35Fresenius SE & Co KGaA 57,624 3,788,490 0.77Fuchs Petrolub AG 12,837 1,311,300 0.26Hannover Rueckversicherung AG 78,246 3,284,963 0.66Merck KGaA 143,507 9,317,910 1.88Muenchener Rueckversicherungs AG 90,913 10,952,744 2.21Rheinmetall AG 92,202 5,394,278 1.09Tognum AG 58,120 1,056,040 0.21
70,972,908 14.32
GREECEPublic Power Corp SA 194,181 2,169,973 0.44
IRELANDPaddy Power Plc 36,720 1,090,584 0.22
ITALYEnel SpA 1,038,713 4,432,188 0.90

Invesco Pan European Structured Equity Fund
21 Invesco Funds
Statement of Investments as at 28 February 2011
Investment Nominal/Shares Market Value Net AssetsEUR %
ITALY (CONTINUED)Mediaset SpA 221,938 1,022,690 0.21Terna Rete Elettrica Nazionale SpA 3,084,914 10,238,830 2.07
15,693,708 3.18
LUXEMBOURGTenaris SA 343,789 5,617,512 1.14
NETHERLANDSCSM 43,615 1,119,706 0.23Koninklijke Ahold NV 1,103,042 10,726,532 2.17Koninklijke KPN NV 866,008 10,069,508 2.04Nutreco NV 34,158 1,814,985 0.37
23,730,731 4.81
NORWAYTGS Nopec Geophysical Co ASA 535,195 9,988,753 2.02
PORTUGALEDP - Energias de Portugal SA 2,548,446 7,018,420 1.42Jeronimo Martins SGPS SA 148,355 1,722,402 0.35
8,740,822 1.77
SPAINAmadeus IT Holding SA 384,082 5,380,029 1.09Inditex SA 195,947 10,306,812 2.08Tecnicas Reunidas SA 12,494 523,749 0.11Viscofan SA 50,155 1,305,785 0.26
17,516,375 3.54
SWEDENAlfa Laval AB 406,369 5,924,709 1.20NCC AB 115,092 2,173,607 0.44Svenska Handelsbanken AB 439,677 10,622,184 2.15Swedish Match AB 278,425 6,235,502 1.26Tele2 AB 507,023 8,263,235 1.67
33,219,237 6.72
SWITZERLANDNovartis AG 257,527 10,327,032 2.09Roche Holding AG (Gebusscheine) 101,908 10,973,140 2.22Schindler Holding AG 45,541 3,666,678 0.74Swisscom AG 33,206 10,565,862 2.14
35,532,712 7.19
UNITED KINGDOMAdmiral Group Plc 133,319 2,606,587 0.53Aggreko Plc 157,212 2,639,099 0.53AMEC Plc 145,994 1,979,611 0.40ARM Holdings Plc 1,482,299 10,826,698 2.19Associated British Foods Plc 272,600 3,096,773 0.63AstraZeneca Plc (SE Line) 301,150 10,431,017 2.11Atkins WS Plc 146,652 1,190,543 0.24Berkeley Group Holdings Plc 105,390 1,236,443 0.25BT Group Plc 5,051,088 10,547,226 2.13Burberry Group Plc 190,812 2,652,145 0.54Centrica Plc 2,690,046 10,670,147 2.16Compass Group Plc 90,858 587,258 0.12Croda International Plc 132,710 2,436,885 0.49Experian Plc 526,823 4,758,202 0.96Fresnillo Plc 128,752 2,406,437 0.49IG Group Holdings Plc 199,475 1,048,500 0.21Imperial Tobacco Group Plc 474,328 11,015,792 2.23Intercontinental Hotels Group Plc 44,268 698,524 0.14J Sainsbury Plc 444,697 1,954,568 0.39John Wood Group Plc 345,644 2,682,493 0.54Mondi Plc 492,475 3,105,217 0.63Next Plc 300,757 7,012,965 1.42
Invesco Pan European Structured Equity Fund
22 Invesco Funds
Statement of Investments as at 28 February 2011
Investment Nominal/Shares Market Value Net AssetsEUR %
UNITED KINGDOM (CONTINUED)Persimmon Plc 192,270 1,044,751 0.21Petrofac Ltd 313,491 5,091,769 1.03Reckitt Benckiser Group Plc 264,270 9,767,220 1.97Royal Dutch Shell Plc 443,525 11,470,748 2.32Severn Trent Plc 264,457 4,566,425 0.92Shire Plc 505,266 10,316,710 2.09Stagecoach Group Plc 478,729 1,154,421 0.23Tate & Lyle Plc 418,255 2,780,550 0.56United Utilities Group Plc 346,008 2,391,453 0.48Whitbread Plc 163,987 3,405,018 0.69
147,572,195 29.83
TOTAL EQUITIES 470,501,086 95.13
TOTAL TRANSFERABLE SECURITIES ADMITTED TO AN OFFICIAL STOCK EXCHANGELISTING OR DEALT IN ON ANOTHER REGULATED MARKET 470,501,086 95.13
TotalInvestments 470,501,086 95.13
The accompanying notes form an integral part of these financial statements.

Invesco Pan European Equity Fund
23 Invesco Funds
Statement of Investments as at 28 February 2011
Investment Nominal/Shares Market Value Net AssetsEUR %
TRANSFERABLE SECURITIES ADMITTED TO AN OFFICIAL STOCK EXCHANGE LISTING OR DEALT IN ON ANOTHERREGULATED MARKET
EQUITIESFINLANDStora Enso OYJ 1,646,023 13,579,690 1.86UPM-Kymmene OYJ 1,235,324 17,819,549 2.45
31,399,239 4.31
FRANCEBNP Paribas 272,099 15,245,707 2.09Cie Générale des Etablissements Michelin 198,018 11,547,420 1.59Rhodia SA 730,691 15,434,021 2.12Safran SA 678,523 17,326,085 2.38Sociéte Générale 259,917 12,893,183 1.77
72,446,416 9.95
GERMANYBilfinger Berger AG 183,547 11,023,833 1.51Daimler AG 256,011 12,995,118 1.78Deutsche Boerse AG 263,664 14,683,448 2.02Deutsche Post AG 445,184 5,858,621 0.80Henkel AG & Co KGaA 148,072 6,443,723 0.88Kabel Deutschland Holding AG 26,154 1,025,368 0.14ThyssenKrupp AG 195,648 5,775,040 0.79
57,805,151 7.92
IRELANDC&C Group Plc 1,835,400 6,433,995 0.88Kingspan Group Plc 698,893 4,758,413 0.65
11,192,408 1.53
ITALYAtlantia SpA 437,706 7,237,469 0.99
NETHERLANDSASM International NV 286,711 8,338,989 1.14ASML Holding NV 405,186 12,743,100 1.75European Aeronautic Defence and Space Co NV 718,165 14,792,404 2.03ING Groep NV 2,009,704 17,961,729 2.47Koninklijke Ahold NV 1,292,117 12,565,192 1.72Reed Elsevier NV 1,293,211 12,285,504 1.69SBM Offshore NV 756,787 13,652,437 1.87Unilever NV 645,562 14,061,954 1.93
106,401,309 14.60
NORWAYOrkla ASA 1,299,560 8,567,637 1.18Storebrand ASA 2,626,307 16,087,818 2.21
24,655,455 3.39
PORTUGALGalp Energia SGPS SA 832,427 12,759,025 1.75
SPAINBanco Bilbao Vizcaya Argentaria SA 1,563,781 13,909,832 1.91Banco Santander SA 1,338,570 11,830,951 1.62Gestevision Telecinco SA 865,391 7,948,616 1.09International Consolidated Airlines Group SA 3,013,246 7,911,277 1.09Obrascon Huarte Lain SA 780,912 18,808,265 2.58Telefonica SA 1,051,443 19,196,721 2.63
79,605,662 10.92
SWEDENHusqvarna AB 1,338,529 7,743,665 1.06Telefonaktiebolaget LM Ericsson 1,063,361 9,729,703 1.34
17,473,368 2.40

Invesco Pan European Equity Fund
24 Invesco Funds
Statement of Investments as at 28 February 2011
Investment Nominal/Shares Market Value Net AssetsEUR %
SWITZERLANDNovartis AG 577,178 23,145,285 3.18Roche Holding AG (Gebusscheine) 251,463 27,076,762 3.72UBS AG 1,415,068 20,207,410 2.77
70,429,457 9.67
UNITED KINGDOMAstraZeneca Plc 334,225 11,559,861 1.59Aviva Plc 897,421 4,827,495 0.66BAE Systems Plc 3,852,655 14,805,529 2.03Balfour Beatty Plc 1,800,679 7,273,230 1.00BG Group Plc 1,015,591 17,780,277 2.44BP Plc 1,318,691 7,621,175 1.05British American Tobacco Plc 537,263 15,517,284 2.13BT Group Plc 8,032,856 16,773,484 2.30Capita Group Plc 659,413 5,666,063 0.78Centrica Plc 2,874,079 11,400,120 1.56Cobham Plc 2,072,524 5,454,184 0.75G4S Plc 4,238,473 13,137,116 1.80GKN Plc 2,009,881 4,837,269 0.66GlaxoSmithKline Plc 1,097,147 15,178,836 2.08Imperial Tobacco Group Plc 618,204 14,357,167 1.97Legal & General Group Plc 3,736,507 5,127,809 0.70N Brown Group Plc 1,554,765 5,037,797 0.69Provident Financial Plc 266,073 3,180,809 0.44Rentokil Initial Plc 7,417,509 7,907,209 1.09Resolution Ltd 2,256,818 7,510,892 1.03Rolls-Royce Group Plc 619,382 4,460,473 0.61RSA Insurance Group Plc 4,126,403 6,774,676 0.93Smith & Nephew Plc 892,383 7,437,893 1.02Vodafone Group Plc 7,322,540 14,859,222 2.04Yell Group Plc 5,109,318 436,030 0.06
228,921,900 31.41
TOTAL EQUITIES 720,326,859 98.84
TOTAL TRANSFERABLE SECURITIES ADMITTED TO AN OFFICIAL STOCK EXCHANGELISTING OR DEALT IN ON ANOTHER REGULATED MARKET 720,326,859 98.84
OTHER TRANSFERABLE SECURITIES
BONDSUNITED KINGDOMBarclays Bank Plc NTS 28/02/2019 (LAKE ACQ-CVR) 1,102,320 387,394 0.05
TOTAL BONDS 387,394 0.05
TOTAL OTHER TRANSFERABLE SECURITIES 387,394 0.05
TotalInvestments 720,714,253 98.89
The accompanying notes form an integral part of these financial statements.

Invesco Pan European Small Cap Equity Fund
25 Invesco Funds
Statement of Investments as at 28 February 2011
Investment Nominal/Shares Market Value Net AssetsEUR %
TRANSFERABLE SECURITIES ADMITTED TO AN OFFICIAL STOCK EXCHANGE LISTING OR DEALT IN ON ANOTHERREGULATED MARKET
EQUITIESBELGIUMAgeas 663,991 1,516,223 1.02D'ieteren SA 35,000 1,707,825 1.15RealDolmen NV/SA 30,140 456,772 0.31
3,680,820 2.48
BERMUDAAsia Offshore Drilling Ltd 193,191 736,361 0.50BW Offshore Ltd 382,837 706,109 0.48Dockwise Ltd 152,691 3,087,518 2.08Hiscox Ltd 86,411 380,408 0.26North Atlantic Drilling Ltd 489,515 673,593 0.45Omega Insurance Holdings Ltd 240,630 295,980 0.20Petra Diamonds Ltd 51,927 104,475 0.07Seawell Ltd 297,363 1,373,550 0.92
7,357,994 4.96
CANADAQuesterre Energy Corp 532,440 613,301 0.41Wentworth Resources Ltd 1,638,600 1,244,893 0.84
1,858,194 1.25
CAYMAN ISLANDSCoastal Energy Co 23,144 117,937 0.08Polarcus Ltd 2,233,790 2,142,992 1.45
2,260,929 1.53
CYPRUSProSafe SE 149,746 814,939 0.55Songa Offshore SE 565,967 2,482,634 1.67
3,297,573 2.22
DENMARKChristian Hansen Holding A/S 46,361 769,154 0.52FLSmidth & Co A/S 6,451 412,355 0.28TDC A/S 222,807 1,348,306 0.91Trigon Agri A/S 2,300,000 2,361,582 1.59
4,891,397 3.30
FINLANDOutotec OYJ 13,337 532,613 0.36UPM-Kymmene OYJ 54,334 783,768 0.53
1,316,381 0.89
FRANCE1855 9,578,929 766,314 0.52Bourbon SA 21,839 738,104 0.50Cap Gemini SA 32,337 1,351,362 0.90Eurofins Scientific 19,380 1,110,959 0.75Ingenico 34,939 952,612 0.64Neopost SA 11,697 798,086 0.54Rhodia SA 50,381 1,064,173 0.72Terreis 38,000 499,890 0.34UBISOFT Entertainment 55,034 438,979 0.30
7,720,479 5.21
GERMANYAixtron SE 55,413 1,644,935 1.11Asian Bamboo AG 96,279 3,447,511 2.33Bilfinger Berger AG 18,765 1,127,026 0.76Biotest AG 21,726 964,797 0.65Brenntag AG 48,209 3,623,629 2.44CTS Eventim AG 25,552 1,145,879 0.77Gerresheimer AG 32,932 1,057,529 0.71

Invesco Pan European Small Cap Equity Fund
26 Invesco Funds
Statement of Investments as at 28 February 2011
Investment Nominal/Shares Market Value Net AssetsEUR %
GERMANY (CONTINUED)Hansa Group AG 215,000 949,225 0.64Joyou AG 59,422 835,325 0.56Kabel Deutschland Holding AG 49,807 1,952,683 1.32Kinghero AG 54,798 1,535,715 1.04Kontron AG 235,254 2,078,469 1.40KUKA AG 89,156 1,521,670 1.03MTU Aero Engines Holding AG 14,455 695,249 0.47Nabaltec AG 162,812 1,134,800 0.77ProSiebenSat.1 Media AG 25,224 565,207 0.38Rheinmetall AG 26,367 1,542,601 1.04RIB Software AG 40,516 356,764 0.24Tom Tailor Holding AG 41,769 586,123 0.40Wirecard AG 233,130 2,757,928 1.86
29,523,065 19.92
GREECEFolli Follie Group 86,014 1,250,213 0.84
IRELANDDCC Plc 43,939 1,006,972 0.68
LUXEMBOURGAZ Electronic Materials SA 64,495 224,958 0.15GlobeOp Financial Services SA 73,825 358,902 0.24Northland Resources SA 355,875 772,482 0.52Prospector Offshore Drilling SA 500,000 1,259,756 0.85Subsea 7 SA 147,201 2,734,962 1.85
5,351,060 3.61
NETHERLANDSAerCap Holdings NV 161,164 1,636,073 1.11BinckBank NV 220,976 2,662,208 1.79Brunel International NV 12,571 359,311 0.24Koninklijke DSM NV 40,443 1,714,075 1.16LBi International NV 334,357 593,484 0.40Nutreco NV 15,965 848,300 0.57Spyker Cars NV 155,340 820,195 0.55STMicroelectronics NV 159,203 1,478,439 1.00
10,112,085 6.82
NORWAYAGR Group ASA 701,703 1,269,296 0.86Aker Drilling ASA Npv 229,118 562,464 0.38Badger Explorer ASA 358,787 1,302,641 0.88Copeinca ASA 76,449 498,821 0.34Pronova BioPharma AS 690,847 849,768 0.57Telio Holding ASA 129,500 537,102 0.36TGS Nopec Geophysical Co ASA 34,401 642,052 0.43
5,662,144 3.82
PAPUA NEW GUINEANew Britain Palm Oil Ltd 58,706 583,351 0.39
PORTUGALZon Multimedia Servicos de Telecomunicacoes e Multimedia SGPS SA 79,473 299,931 0.20
SPAINBolsas y Mercados Espanoles SA 58,345 1,300,364 0.88Grifols SA 180,317 2,109,258 1.42Obrascon Huarte Lain SA 54,201 1,305,431 0.88
4,715,053 3.18
SWEDENByggmax Group AB 97,727 619,851 0.42Lundin Petroleum AB 124,421 1,117,213 0.75
1,737,064 1.17

Invesco Pan European Small Cap Equity Fund
27 Invesco Funds
Statement of Investments as at 28 February 2011
Investment Nominal/Shares Market Value Net AssetsEUR %
SWITZERLANDAcino Holding AG 12,724 822,843 0.56Dufry Group 4,711 387,206 0.26Gategroup Holding AG 46,586 1,726,320 1.17Givaudan SA 1,954 1,406,612 0.95Julius Baer Group Ltd 25,241 810,338 0.54Micronas Semiconductor Holding AG 81,713 635,579 0.43Schmolz + Bickenbach AG 51,789 386,048 0.26Sika AG 381 599,984 0.40Swissquote Group Holding SA 14,134 648,148 0.44
7,423,078 5.01
UNITED KINGDOMAbbey Protection Plc 226,194 215,292 0.15Accsys Technologies Plc 6,718,462 1,066,556 0.72Advanced Medical Solutions Group Plc 558,369 490,576 0.33Afren Plc 144,561 270,530 0.18Alternative Networks Plc 189,982 437,320 0.29Amlin Plc 41,323 186,612 0.13Aveva Group Plc 19,953 375,970 0.25Axis-Shield Plc 63,327 234,423 0.16Babcock International Group Plc 233,476 1,517,956 1.03Beazley Plc 139,757 218,891 0.15Bellway Plc 7,754 60,041 0.04Berendsen Plc 37,122 210,279 0.14Brewin Dolphin Holdings Plc 187,309 376,311 0.25Britvic Plc 84,395 361,992 0.24Brooks Macdonald Group Plc 10,570 134,038 0.09BTG Plc 158,376 393,787 0.27Carillion Plc 116,522 509,963 0.34Chemring Group Plc 36,235 1,374,661 0.93CPP Group Plc 128,438 444,530 0.30Cranswick Plc 33,868 337,929 0.23Croda International Plc 60,901 1,118,293 0.76CSR Plc 75,016 340,481 0.23CVS Group Plc 151,368 170,006 0.11Dechra Pharmaceuticals Plc 148,867 888,082 0.60Devro Plc 168,540 525,180 0.35Dialog Semiconductor Plc 76,170 1,090,565 0.75Dignity Plc 62,403 504,221 0.34Diploma Plc 161,883 535,254 0.37Domino Printing Sciences Plc 111,303 849,464 0.57Dunelm Group Plc 81,123 386,778 0.26E2V Technologies Plc 142,626 187,129 0.13EMIS Group Plc 76,891 418,844 0.28Euromoney Institutional Investor Plc 13,552 111,644 0.08Faroe Petroleum Plc 46,912 104,346 0.07Fenner Plc 317,413 1,185,963 0.80Fidessa Group Plc 26,068 518,524 0.35Filtrona Plc 213,121 744,987 0.50FLEX LNG Ltd 1,975,093 1,390,803 0.94Gulfsands Petroleum Plc 123,659 457,759 0.31H&T Group Plc 128,267 432,181 0.29Hansard Global Plc 170,441 330,442 0.22Hargreaves Services Plc 17,009 186,251 0.13Hill & Smith Holdings Plc 45,583 150,983 0.10Holidaybreak Plc 83,441 310,102 0.21Homeserve Plc 270,996 1,430,785 0.97Howden Joinery Group Plc 328,666 446,041 0.30Hunting Plc 21,400 197,544 0.13Immunodiagnostic Systems Holdings Plc 26,399 257,297 0.17IQE Plc 557,104 323,862 0.22James Halstead Plc 100,112 496,665 0.34JD Wetherspoon Plc 91,448 474,089 0.32Jupiter Fund Management Plc 132,690 509,686 0.34

Invesco Pan European Small Cap Equity Fund
28 Invesco Funds
Statement of Investments as at 28 February 2011
Investment Nominal/Shares Market Value Net AssetsEUR %
UNITED KINGDOM (CONTINUED)Laird Plc 231,211 440,541 0.30Latchways Plc 11,923 152,941 0.10Mam Funds Plc 231,158 94,777 0.06Marston's Plc 221,345 258,646 0.17May Gurney Integrated Services Plc 203,032 596,983 0.40Mears Group Plc 187,100 679,727 0.46Melrose Plc 185,395 659,796 0.45Micro Focus International Plc 139,173 466,685 0.31Microgen Plc 189,575 310,909 0.21Mitie Group Plc 259,975 610,466 0.41Monitise Plc 313,274 92,205 0.06Morson Group Plc 122,558 144,288 0.10Mouchel Group Plc 134,686 243,372 0.16N Brown Group Plc 119,397 386,874 0.26NCC Group Plc 59,937 385,822 0.26Northgate Plc 75,215 271,931 0.18Pace Plc 140,692 353,608 0.24PayPoint Plc 83,322 323,325 0.22Phoenix IT Group Ltd 144,107 406,842 0.27Playtech Ltd 82,731 353,014 0.24Premier Oil Plc 32,961 800,624 0.55PZ Cussons Plc 38,749 159,759 0.11Renishaw Plc 13,630 246,608 0.17RM Plc 243,191 444,422 0.30Rotork Plc 22,225 466,165 0.31RPC Group Plc 27,663 81,582 0.06RPS Group Plc 50,111 117,170 0.08RSM Tenon Group Plc 437,140 224,678 0.15RWS Holdings Plc 105,954 449,934 0.30Salamander Energy Plc 121,547 434,776 0.29SDL Plc 50,796 377,708 0.25Senior Plc 284,370 501,187 0.34Serco Group Plc 103,785 673,243 0.45Spectris Plc 37,973 613,872 0.41Spirax-Sarco Engineering Plc 22,725 487,301 0.33Spirent Communications Plc 140,142 253,806 0.17Sportingbet Plc 35,274 19,272 0.01Staffline Group Plc 90,214 201,323 0.14Sthree Plc 38,435 183,588 0.12Synergy Health Plc 170,545 1,737,131 1.18Ultra Electronics Holdings Plc 20,660 424,022 0.29United Business Media Ltd 47,505 394,001 0.26Valiant Petroleum Plc 38,125 287,620 0.19Victrex Plc 29,065 435,817 0.29Xchanging Plc 103,893 67,394 0.05YouGov Plc 172,045 101,023 0.07
43,708,686 29.49
UNITED STATESKKR & Co LP 108,233 1,346,992 0.91Liberty Global Inc 50,280 1,555,097 1.05
2,902,089 1.96
TOTAL EQUITIES 146,658,558 98.93
WARRANTSUNITED KINGDOMClean Energy Brazil Plc WTS 18/12/2011 54,187 50 –
TOTAL WARRANTS 50 –
TOTAL TRANSFERABLE SECURITIES ADMITTED TO AN OFFICIAL STOCK EXCHANGELISTING OR DEALT IN ON ANOTHER REGULATED MARKET 146,658,608 98.93

Invesco Pan European Small Cap Equity Fund
29 Invesco Funds
Statement of Investments as at 28 February 2011
Investment Nominal/Shares Market Value Net AssetsEUR %
OTHER TRANSFERABLE SECURITIES
EQUITIESCYPRUSRemedial (Cyprus) Plc 220,000 – –
UNITED KINGDOMInvesco Continental Smaller Companies Trust (in liquidation) 4,250,000 – –
TOTAL EQUITIES – –
TOTAL OTHER TRANSFERABLE SECURITIES – –
TotalInvestments 146,658,608 98.93
The accompanying notes form an integral part of these financial statements.

Invesco European Growth Equity Fund
30 Invesco Funds
Statement of Investments as at 28 February 2011
Investment Nominal/Shares Market Value Net AssetsEUR %
TRANSFERABLE SECURITIES ADMITTED TO AN OFFICIAL STOCK EXCHANGE LISTING OR DEALT IN ON ANOTHERREGULATED MARKET
EQUITIESAUSTRIAAndritz AG 7,658 475,409 0.71
BELGIUMAnheuser-Busch InBev NV 26,073 1,044,550 1.57
BERMUDALancashire Holdings Ltd 102,196 709,626 1.06
CYPRUSProSafe SE 211,200 1,149,381 1.73
DENMARKNovo Nordisk A/S 15,108 1,372,799 2.06
FRANCEBNP Paribas 15,603 874,236 1.31Cap Gemini SA 14,357 599,979 0.90Cie Générale des Etablissements Michelin 5,961 347,616 0.52Danone 18,502 831,619 1.25Faurecia 14,633 413,675 0.62Lafarge SA 7,702 335,865 0.50Publicis Groupe SA 9,337 385,245 0.58Sa des Ciments Vicat 2,302 141,067 0.21Total SA 15,318 671,962 1.01
4,601,264 6.90
GERMANYBayer AG 11,878 648,420 0.97Bayerische Motoren Werke AG 13,576 786,797 1.18Deutsche Boerse AG 11,619 647,062 0.97Fresenius Medical Care AG & Co KGaA 13,806 657,476 0.99Puma AG Rudolf Dassler Sport 2,197 469,938 0.71SAP AG 16,424 714,937 1.07Wirecard AG 81,368 962,583 1.44
4,887,213 7.33
GREECEIntralot SA-Integrated Lottery Systems & Services 216,820 536,630 0.81JUMBO SA 69,788 394,651 0.59
931,281 1.40
IRELANDDCC Plc 39,723 910,352 1.37Paddy Power Plc 40,627 1,206,622 1.81
2,116,974 3.18
ITALYAnsaldo STS SpA 26,648 272,209 0.41
NETHERLANDSAalberts Industries NV 77,752 1,196,798 1.80Koninklijke Ahold NV 75,044 729,765 1.10Koninklijke KPN NV 52,605 611,665 0.92TNT NV 36,307 693,736 1.04Unilever NV 21,523 468,825 0.70
3,700,789 5.56
NORWAYTGS Nopec Geophysical Co ASA 87,889 1,640,340 2.46
RUSSIAGazprom OAO ADR 38,646 811,063 1.22VimpelCom Ltd ADR 43,299 436,578 0.66
1,247,641 1.88

Invesco European Growth Equity Fund
31 Invesco Funds
Statement of Investments as at 28 February 2011
Investment Nominal/Shares Market Value Net AssetsEUR %
SPAINProsegur Cia de Seguridad SA 10,260 419,480 0.63
SWEDENIntrum Justitia AB 78,884 815,570 1.22Kinnevik Investment AB 39,323 627,895 0.94Swedbank AB 10,779 135,816 0.20Telefonaktiebolaget LM Ericsson 60,628 554,743 0.83Volvo AB 40,112 492,634 0.74
2,626,658 3.93
SWITZERLANDABB Ltd 14,694 259,954 0.39Aryzta AG 43,817 1,461,297 2.19Dufry Group 12,886 1,059,126 1.59Julius Baer Group Ltd 18,258 586,156 0.88Nestle SA 29,015 1,185,039 1.78Novartis AG 21,990 881,816 1.32Roche Holding AG (Gebusscheine) 7,717 830,943 1.25Syngenta AG 2,302 563,395 0.85
6,827,726 10.25
TURKEYHaci Omer Sabanci Holding AS 372,610 1,057,016 1.59Tupras Turkiye Petrol Rafine 61,397 1,100,679 1.65
2,157,695 3.24
UNITED KINGDOMAmlin Plc 220,198 994,401 1.49Balfour Beatty Plc 208,927 843,889 1.27BG Group Plc 51,193 896,252 1.35British American Tobacco Plc 31,359 905,714 1.36Bunzl Plc 71,474 630,264 0.95Centrica Plc 248,279 984,806 1.48Chemring Group Plc 28,201 1,069,873 1.61Compass Group Plc 179,472 1,160,013 1.74Homeserve Plc 258,089 1,362,639 2.05IG Group Holdings Plc 194,987 1,024,909 1.54Imperial Tobacco Group Plc 56,703 1,316,870 1.98Informa Plc 252,396 1,279,657 1.92International Power Plc 220,100 859,239 1.29Kingfisher Plc 204,855 612,422 0.92Micro Focus International Plc 139,923 469,200 0.70Mitie Group Plc 362,372 850,912 1.28Next Plc 26,135 609,408 0.91Reckitt Benckiser Group Plc 10,570 390,659 0.59Reed Elsevier Plc 107,803 690,783 1.04Royal Dutch Shell Plc 28,443 730,614 1.10Shire Plc 87,183 1,780,135 2.67Tesco Plc 203,413 959,348 1.44Ultra Electronics Holdings Plc 53,283 1,093,570 1.64United Business Media Ltd 65,442 542,767 0.81Vodafone Group Plc 478,298 970,583 1.46William Hill Plc 140,232 313,436 0.47WPP Plc 84,857 830,038 1.25
24,172,401 36.31
TOTAL EQUITIES 60,353,436 90.61
TOTAL TRANSFERABLE SECURITIES ADMITTED TO AN OFFICIAL STOCK EXCHANGELISTING OR DEALT IN ON ANOTHER REGULATED MARKET 60,353,436 90.61
TotalInvestments 60,353,436 90.61
The accompanying notes form an integral part of these financial statements.

Invesco Pan European Equity Income Fund
32 Invesco Funds
Statement of Investments as at 28 February 2011
Investment Nominal/Shares Market Value Net AssetsEUR %
TRANSFERABLE SECURITIES ADMITTED TO AN OFFICIAL STOCK EXCHANGE LISTING OR DEALT IN ON ANOTHERREGULATED MARKET
EQUITIESBASIC MATERIALSFiltrona Plc 7,430 25,972 0.52UPM-Kymmene OYJ 4,757 68,620 1.39
94,592 1.91
COMMUNICATIONSBT Group Plc 26,880 56,129 1.14Eutelsat Communications 1,347 38,703 0.78Koninklijke KPN NV 5,174 60,161 1.22Mediaset SpA 6,456 29,749 0.60Reed Elsevier NV 6,231 59,195 1.20Telefonaktiebolaget LM Ericsson 4,997 45,722 0.93Telefonica SA 6,603 120,554 2.44Vivendi SA 4,222 86,456 1.75Vodafone Group Plc 60,219 122,199 2.47Yell Group Plc 102,172 8,719 0.18
627,587 12.71
CONSUMER, CYCLICALCarnival Plc 885 28,339 0.57Compass Group Plc 5,646 36,493 0.74Daimler AG 866 43,958 0.89DCC Plc 1,545 35,408 0.72Dixons Retail Plc 49,244 11,373 0.23Howden Joinery Group Plc 13,335 18,097 0.37Inditex SA 744 39,134 0.79
212,802 4.31
CONSUMER, NON-CYCLICALAstraZeneca Plc 2,337 80,830 1.64Atlantia SpA 4,672 77,252 1.56British American Tobacco Plc 2,838 81,967 1.66BTG Plc 8,083 20,098 0.41Bunzl Plc 2,092 18,448 0.37Capita Group Plc 3,683 31,647 0.64Carrefour SA 1,162 41,350 0.84G4S Plc 19,361 60,009 1.21GlaxoSmithKline Plc 6,594 91,227 1.85Husqvarna AB 9,465 54,757 1.11Imperial Tobacco Group Plc 3,286 76,314 1.55Koninklijke Ahold NV 7,699 74,869 1.52Novartis AG 4,445 178,248 3.61Reckitt Benckiser Group Plc 499 18,443 0.37Rentokil Initial Plc 43,156 46,005 0.93Reynolds American Inc 1,968 48,394 0.98Roche Holding AG (Gebusscheine) 1,992 214,492 4.34Securitas AB 449 3,744 0.08Smith & Nephew Plc 2,163 18,028 0.36Tesco Plc 5,423 25,576 0.52Unilever NV 2,753 59,967 1.21WM Morrison Supermarkets Plc 4,068 13,269 0.27
1,334,934 27.03
DIVERSIFIEDDrax Group Plc 4,230 19,484 0.39
ENERGYAltona Energy Plc 141,523 17,200 0.35
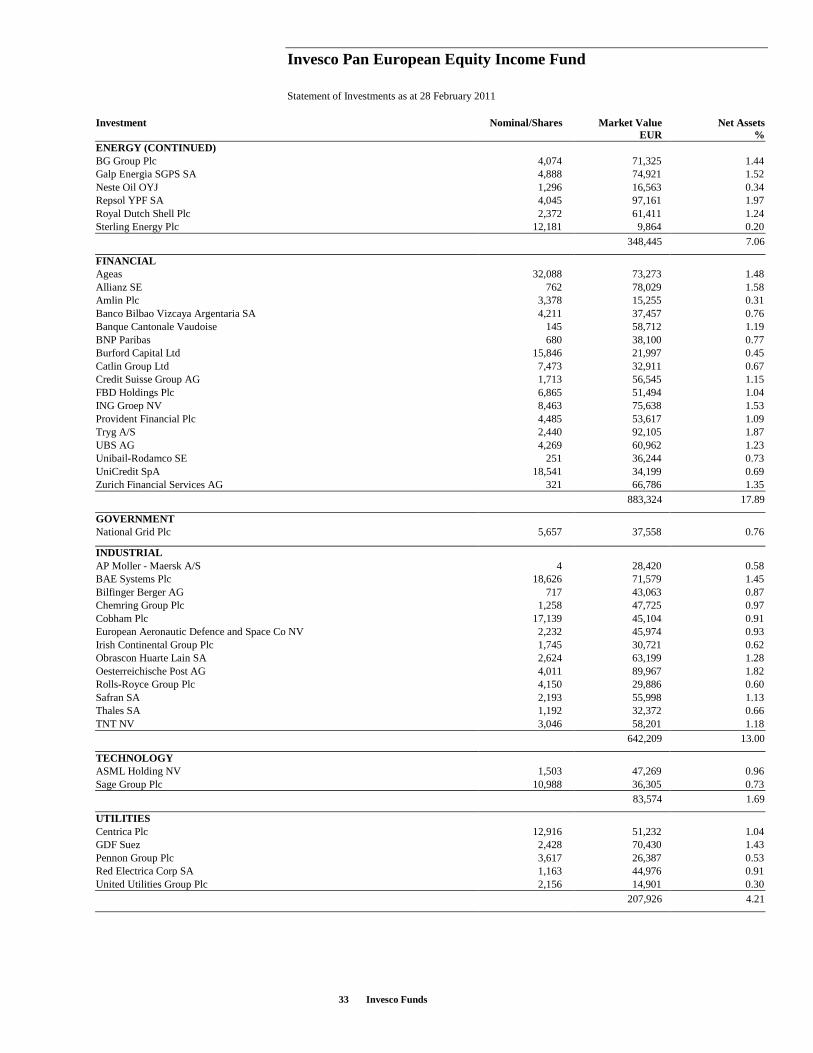
Invesco Pan European Equity Income Fund
33 Invesco Funds
Statement of Investments as at 28 February 2011
Investment Nominal/Shares Market Value Net AssetsEUR %
ENERGY (CONTINUED)BG Group Plc 4,074 71,325 1.44Galp Energia SGPS SA 4,888 74,921 1.52Neste Oil OYJ 1,296 16,563 0.34Repsol YPF SA 4,045 97,161 1.97Royal Dutch Shell Plc 2,372 61,411 1.24Sterling Energy Plc 12,181 9,864 0.20
348,445 7.06
FINANCIALAgeas 32,088 73,273 1.48Allianz SE 762 78,029 1.58Amlin Plc 3,378 15,255 0.31Banco Bilbao Vizcaya Argentaria SA 4,211 37,457 0.76Banque Cantonale Vaudoise 145 58,712 1.19BNP Paribas 680 38,100 0.77Burford Capital Ltd 15,846 21,997 0.45Catlin Group Ltd 7,473 32,911 0.67Credit Suisse Group AG 1,713 56,545 1.15FBD Holdings Plc 6,865 51,494 1.04ING Groep NV 8,463 75,638 1.53Provident Financial Plc 4,485 53,617 1.09Tryg A/S 2,440 92,105 1.87UBS AG 4,269 60,962 1.23Unibail-Rodamco SE 251 36,244 0.73UniCredit SpA 18,541 34,199 0.69Zurich Financial Services AG 321 66,786 1.35
883,324 17.89
GOVERNMENTNational Grid Plc 5,657 37,558 0.76
INDUSTRIALAP Moller - Maersk A/S 4 28,420 0.58BAE Systems Plc 18,626 71,579 1.45Bilfinger Berger AG 717 43,063 0.87Chemring Group Plc 1,258 47,725 0.97Cobham Plc 17,139 45,104 0.91European Aeronautic Defence and Space Co NV 2,232 45,974 0.93Irish Continental Group Plc 1,745 30,721 0.62Obrascon Huarte Lain SA 2,624 63,199 1.28Oesterreichische Post AG 4,011 89,967 1.82Rolls-Royce Group Plc 4,150 29,886 0.60Safran SA 2,193 55,998 1.13Thales SA 1,192 32,372 0.66TNT NV 3,046 58,201 1.18
642,209 13.00
TECHNOLOGYASML Holding NV 1,503 47,269 0.96Sage Group Plc 10,988 36,305 0.73
83,574 1.69
UTILITIESCentrica Plc 12,916 51,232 1.04GDF Suez 2,428 70,430 1.43Pennon Group Plc 3,617 26,387 0.53Red Electrica Corp SA 1,163 44,976 0.91United Utilities Group Plc 2,156 14,901 0.30
207,926 4.21

Invesco Pan European Equity Income Fund
34 Invesco Funds
Statement of Investments as at 28 February 2011
Investment Nominal/Shares Market Value Net AssetsEUR %
TOTAL EQUITIES 4,492,435 90.96
TOTAL TRANSFERABLE SECURITIES ADMITTED TO AN OFFICIAL STOCK EXCHANGELISTING OR DEALT IN ON ANOTHER REGULATED MARKET 4,492,435 90.96
OTHER TRANSFERABLE SECURITIES
BONDSFINANCIALBarclays Bank Plc NTS 28/02/2019 (LAKE ACQ-CVR) 17,697 6,219 0.13
TOTAL BONDS 6,219 0.13
TOTAL OTHER TRANSFERABLE SECURITIES 6,219 0.13
OPEN-ENDED FUNDSInvesco Perpetual Fixed Interest Investment Series - European High Yield Fund 94,812 41,406 0.84
TOTAL OPEN-ENDED FUNDS 41,406 0.84
TotalInvestments 4,540,060 91.93
The accompanying notes form an integral part of these financial statements

Invesco Emerging Europe Equity Fund
35 Invesco Funds
Statement of Investments as at 28 February 2011
Investment Nominal/Shares Market Value Net AssetsUSD %
TRANSFERABLE SECURITIES ADMITTED TO AN OFFICIAL STOCK EXCHANGE LISTING OR DEALT IN ON ANOTHERREGULATED MARKET
EQUITIESCAYMAN ISLANDSEurasia Drilling Co Ltd GDR 32,000 1,011,200 2.01
CYPRUSGlobaltrans Investment Plc GDR 56,100 950,895 1.89
CZECH REPUBLICKomercni Banka AS 3,200 759,939 1.51
GEORGIABank of Georgia JSC GDR 50,200 1,015,546 2.02
LUXEMBOURGMHP SA GDR 24,500 462,315 0.92
NETHERLANDSAmRest Holdings SE 14,100 366,891 0.73Cinema City International NV 39,700 524,998 1.04X5 Retail Group NV GDR 31,800 1,242,267 2.47
2,134,156 4.24
POLANDCyfrowy Polsat SA 114,000 591,290 1.17Eurocash SA 107,700 1,141,001 2.27KGHM Polska Miedz SA 37,000 2,197,573 4.37Mondi Swiecie SA 21,000 588,411 1.17Powszechna Kasa Oszczednosci Bank Polski SA 97,800 1,397,527 2.78Warsaw Stock Exchange 50,000 819,121 1.63
6,734,923 13.39
RUSSIAAeroflot - Russian Airlines OJSC 376,000 940,000 1.87Cherkizovo Group OJSC GDR 51,600 1,058,316 2.10Gazprom OAO ADR 105,500 3,060,027 6.08IDGC Holding JSC 289,000 49,564 0.10Lukoil OAO ADR 76,300 5,291,405 10.51MMC Norilsk Nickel ADR 96,400 2,283,716 4.54NovaTek OAO GDR 20,800 2,661,360 5.29Pharmstandard GDR 32,700 904,155 1.80Rosneft Oil Co GDR 331,600 3,141,081 6.24Sberbank of Russian Federation GDR 11,500 4,330,993 8.60Sistema JSFC GDR 77,000 1,941,555 3.86Surgutneftegas OJSC ADR 191,700 2,205,508 4.38Tatneft ADR 66,500 2,686,933 5.34Ulan-Ude Aviation Plant 335,000 787,250 1.56Uralkali GDR 40,000 1,596,000 3.17Vozrozhdenie Bank 10,000 410,000 0.81
33,347,863 66.25
TURKEYAkfen Holding AS 70,400 453,067 0.90Selcuk Ecza Deposu Ticaret ve Sanayi A.S. 112,400 159,385 0.32Tofas Turk Otomobil Fabrikasi AS 118,500 551,745 1.10Turk Traktor ve Ziraat Makineleri AS 22,400 343,116 0.68Turkiye Sinai Kalkinma Bankasi AS 465,000 752,125 1.49
2,259,438 4.49

Invesco Emerging Europe Equity Fund
36 Invesco Funds
Statement of Investments as at 28 February 2011
Investment Nominal/Shares Market Value Net AssetsUSD %
UNITED KINGDOMITE Group Plc 173,000 662,406 1.32United Co RUSAL Plc 626,000 1,053,567 2.09
1,715,973 3.41
TOTAL EQUITIES 50,392,248 100.13
TOTAL TRANSFERABLE SECURITIES ADMITTED TO AN OFFICIAL STOCK EXCHANGELISTING OR DEALT IN ON ANOTHER REGULATED MARKET 50,392,248 100.13
TotalInvestments 50,392,248 100.13
The accompanying notes form an integral part of these financial statements.

Invesco Nippon Small/Mid Cap Equity Fund
37 Invesco Funds
Statement of Investments as at 28 February 2011
Investment Nominal/Shares Market Value Net AssetsJPY %
TRANSFERABLE SECURITIES ADMITTED TO AN OFFICIAL STOCK EXCHANGE LISTING OR DEALT IN ON ANOTHERREGULATED MARKET
EQUITIESBASIC MATERIALSPolatechno Co Ltd 546 84,165,900 1.46Toda Kogyo Corp 202,000 173,114,000 3.00
257,279,900 4.46
COMMUNICATIONSCyberAgent Inc 1,311 342,629,850 5.95Dwango Co Ltd 492 114,709,800 1.99GMO internet Inc 318,700 157,597,150 2.73Gree Inc 57,300 76,094,400 1.32GungHo Online Entertainment Inc 204 50,184,000 0.87M3 Inc 352 152,680,000 2.65Rakuten Inc 4,131 300,736,800 5.22SBI Holdings Inc 12,771 164,682,045 2.86
1,359,314,045 23.59
CONSUMER, CYCLICALAmiyaki Tei Co Ltd 276 77,583,600 1.35Cosmos Pharmaceutical Corp 45,500 156,975,000 2.72Eagle Industry Co Ltd 182,000 185,276,000 3.21Nifco Inc 33,400 73,613,600 1.28Sugi Holdings Co Ltd 12,800 25,139,200 0.44TS Tech Co Ltd 16,100 27,877,150 0.48
546,464,550 9.48
CONSUMER, NON-CYCLICALDaiseki Co Ltd 29,000 47,009,000 0.82Eiken Chemical Co Ltd 118,400 123,017,600 2.13Nihon M&A Center Inc 151 74,745,000 1.30OncoTherapy Science Inc 818 157,628,600 2.74Sysmex Corp 16,200 86,022,000 1.49Tsumura & Co 33,100 87,764,650 1.52
576,186,850 10.00
FINANCIALGCA Savvian Group Corp 107 18,618,000 0.32Intellex Co Ltd 200 13,870,000 0.24Kenedix Inc 1,519 33,592,685 0.58Tosei Corp 1,715 67,185,125 1.17
133,265,810 2.31
INDUSTRIALAnritsu Corp 398,000 304,072,000 5.28Central Glass Co Ltd 291,000 106,069,500 1.84Dai-ichi Seiko Co Ltd 26,400 127,908,000 2.22Harmonic Drive Systems Inc 153 81,855,000 1.42Hisaka Works Ltd 121,000 141,146,500 2.45Maruwa Co Ltd 15,400 43,204,700 0.75Meiko Electronics Co 32,300 48,692,250 0.85Micronics Japan Co Ltd 17,400 19,227,000 0.33Nidec Copal Corp 77,900 95,622,250 1.66Nippon Ceramic Co Ltd 108,600 181,959,300 3.16NPC Inc 25,300 41,188,400 0.71Osaki Electric Co Ltd 104,000 80,548,000 1.40Sumitomo Precision Products Co Ltd 156,000 98,592,000 1.71Tamron Co Ltd 80,300 140,083,350 2.43Teikoku Electric Manufacturing Co Ltd 42,400 78,355,200 1.36Torishima Pump Manufacturing Co Ltd 102,300 154,063,800 2.67

Invesco Nippon Small/Mid Cap Equity Fund
38 Invesco Funds
Statement of Investments as at 28 February 2011
Investment Nominal/Shares Market Value Net AssetsJPY %
INDUSTRIAL (CONTINUED)Toyo Tanso Co Ltd 4,900 22,233,750 0.39
1,764,821,000 30.63
TECHNOLOGYMegachips Corp 107,300 189,974,650 3.30Melco Holdings Inc 29,500 92,261,250 1.60OBIC Business Consultants Ltd 37,100 200,154,500 3.47Sanken Electric Co Ltd 397,000 216,960,500 3.76Systena Corp 1,740 182,613,000 3.17UT Holdings Co Ltd 480 35,808,000 0.62
917,771,900 15.92
TOTAL EQUITIES 5,555,104,055 96.39
TOTAL TRANSFERABLE SECURITIES ADMITTED TO AN OFFICIAL STOCK EXCHANGELISTING OR DEALT IN ON ANOTHER REGULATED MARKET 5,555,104,055 96.39
TotalInvestments 5,555,104,055 96.39
The accompanying notes form an integral part of these financial statements

Invesco Nippon Select Equity Fund
39 Invesco Funds
Statement of Investments as at 28 February 2011
Investment Nominal/Shares Market Value Net AssetsJPY %
TRANSFERABLE SECURITIES ADMITTED TO AN OFFICIAL STOCK EXCHANGE LISTING OR DEALT IN ON ANOTHERREGULATED MARKET
EQUITIESBASIC MATERIALSNippon Steel Corp 644,000 190,624,000 2.07Shin-Etsu Chemical Co Ltd 64,600 302,974,000 3.29Taiyo Nippon Sanso Corp 179,000 130,222,500 1.42
623,820,500 6.78
COMMUNICATIONSDentsu Inc 76,300 197,998,500 2.15M3 Inc 707 306,661,250 3.33Rakuten Inc 5,517 401,637,600 4.36
906,297,350 9.84
CONSUMER, CYCLICALASKUL Corp 61,500 101,413,500 1.10Culture Convenience Club Co Ltd 585,600 349,310,400 3.80Descente Ltd 283,000 118,294,000 1.29Ichibanya Co Ltd 55,500 133,449,750 1.45Marubeni Corp 517,000 323,125,000 3.51Nishimatsuya Chain Co Ltd 102,500 76,465,000 0.83Oriental Land Co Ltd 27,900 228,361,500 2.48Toyota Tsusho Corp 261,800 404,481,000 4.40
1,734,900,150 18.86
CONSUMER, NON-CYCLICALHisamitsu Pharmaceutical Co Inc 60,200 198,810,500 2.16Ito En Ltd 165,800 240,410,000 2.61Secom Techno Service Co Ltd 25,000 87,187,500 0.95Tsumura & Co 146,000 387,119,000 4.21
913,527,000 9.93
FINANCIALFukuoka Financial Group Inc 626,000 231,307,000 2.51Mizuho Financial Group Inc 1,577,100 264,164,250 2.87Sumitomo Mitsui Financial Group Inc 99,500 307,206,250 3.34Tokyu Livable Inc 138,900 136,885,950 1.49
939,563,450 10.21
INDUSTRIALArt Corp 61,500 110,238,750 1.20East Japan Railway Co 45,000 256,050,000 2.78Hamamatsu Photonics KK 105,600 331,584,000 3.60Hitachi Construction Machinery Co Ltd 75,400 153,966,800 1.67Hoya Corp 113,600 221,406,400 2.41Keyence Corp 13,800 307,050,000 3.34Nidec Corp 15,300 116,127,000 1.26Optex Co Ltd 98,900 119,669,000 1.30SMC Corp 22,100 308,295,000 3.35Toshiba Plant Systems & Services Corp 115,000 127,765,000 1.39Wacom Co Ltd 1,259 155,360,600 1.69
2,207,512,550 23.99
TECHNOLOGYAxell Corp 47,800 110,059,500 1.20Canon Inc 99,700 392,319,500 4.26Fujitsu Ltd 248,000 136,772,000 1.49Ricoh Co Ltd 320,000 344,640,000 3.75Roland DG Corp 108,600 136,673,100 1.49Square Enix Holdings Co Ltd 177,100 269,280,550 2.93Tecmo Koei Holdings Co Ltd 350,600 239,635,100 2.60Works Applications Co Ltd 1,264 69,077,600 0.75

Invesco Nippon Select Equity Fund
40 Invesco Funds
Statement of Investments as at 28 February 2011
Investment Nominal/Shares Market Value Net AssetsJPY %
TECHNOLOGY (CONTINUED)Zuken Inc 131,000 84,953,500 0.92
1,783,410,850 19.39
TOTAL EQUITIES 9,109,031,850 99.00
TOTAL TRANSFERABLE SECURITIES ADMITTED TO AN OFFICIAL STOCK EXCHANGELISTING OR DEALT IN ON ANOTHER REGULATED MARKET 9,109,031,850 99.00
TotalInvestments 9,109,031,850 99.00
The accompanying notes form an integral part of these financial statements

Invesco Asia Opportunities Equity Fund
41 Invesco Funds
Statement of Investments as at 28 February 2011
Investment Nominal/Shares Market Value Net AssetsUSD %
TRANSFERABLE SECURITIES ADMITTED TO AN OFFICIAL STOCK EXCHANGE LISTING OR DEALT IN ON ANOTHERREGULATED MARKET
EQUITIESBERMUDACOSCO Pacific Ltd 772,000 1,485,608 0.93GOME Electrical Appliances Holdings Ltd 2,899,000 984,372 0.62Noble Group Ltd 1,402,000 2,266,474 1.42VTech Holdings Ltd 227,100 2,419,077 1.52
7,155,531 4.49
CAYMAN ISLANDSKingboard Chemical Holdings Ltd 220,500 1,170,495 0.73Tencent Holdings Ltd 119,700 3,174,752 1.99
4,345,247 2.72
CHINABank of China Ltd 7,804,300 4,112,751 2.58China Construction Bank Corp 5,612,890 4,896,224 3.07China Petroleum & Chemical Corp 2,048,000 2,080,972 1.30China Shenhua Energy Co Ltd 455,000 1,885,224 1.18Dongfang Electric Corp Ltd 307,000 1,178,406 0.74Gansu Qilianshan Cement Group Co Ltd 562,203 1,582,258 0.99GD Midea Holding Co Ltd 1,016,600 3,077,682 1.93Guangzhou Automobile Group Co Ltd 951,857 1,225,626 0.77Jiangxi Copper Co Ltd 1,067,000 3,359,377 2.11Qinghai Salt Lake Potash Co 164,000 1,441,703 0.90SAIC Motor Corp Ltd 368,550 1,034,719 0.65Weichai Power Co Ltd 181,000 1,205,955 0.76
27,080,897 16.98
HONG KONGChina Mobile Ltd 322,500 3,028,512 1.90Citic Pacific Ltd 504,000 1,315,062 0.82CNOOC Ltd 1,701,000 3,849,833 2.41Hong Kong Exchanges and Clearing Ltd 172,700 3,741,290 2.35Hutchison Whampoa Ltd 339,000 3,989,660 2.50MTR Corp 652,500 2,406,167 1.51
18,330,524 11.49
INDIAICICI Bank Ltd 201,134 4,329,535 2.71Tata Consultancy Services Ltd 188,000 4,616,087 2.89Tata Motors Ltd 120,322 2,872,139 1.80Titan Industries Ltd 13,739 1,008,383 0.63
12,826,144 8.03
INDONESIAAstra International Tbk PT 542,000 3,196,457 2.00Bank Mandiri Tbk PT 4,085,126 2,674,330 1.68Harum Energy Tbk PT 1,347,000 1,255,917 0.79Indosat Tbk PT 1,797,000 1,033,812 0.65
8,160,516 5.12
MALAYSIACIMB Group Holdings Bhd 1,157,700 3,047,484 1.91Gamuda Bhd 1,291,300 1,538,726 0.96
4,586,210 2.87
SINGAPOREKeppel Corp Ltd 384,000 3,404,443 2.13Overseas Union Enterprise Ltd 955,000 2,167,405 1.36SembCorp Industries Ltd 360,000 1,350,865 0.85United Overseas Bank Ltd 232,066 3,298,835 2.07
10,221,548 6.41
SOUTH KOREACheil Industries Inc 23,744 2,519,243 1.58

Invesco Asia Opportunities Equity Fund
42 Invesco Funds
Statement of Investments as at 28 February 2011
Investment Nominal/Shares Market Value Net AssetsUSD %
Hyundai Heavy Industries Co Ltd 6,669 2,571,818 1.61Hyundai Mobis 10,185 2,371,070 1.49Hyundai Motor Co 16,739 2,643,624 1.66LG Chem Ltd 6,706 2,211,765 1.39Mando Corp 13,582 1,765,967 1.11Samsung C&T Corp 38,765 2,309,792 1.45Samsung Electronics Co Ltd 4,687 3,837,140 2.41S-Oil Corp 37,151 3,546,733 2.22
23,777,152 14.92
TAIWANAsustek Computer Inc 268,000 2,421,252 1.52China Petrochemical Development Corp 3,883,000 4,415,318 2.77China Steel Corp 725,000 815,859 0.51Chinatrust Financial Holding Co Ltd 3,815,000 2,981,771 1.87Chroma ATE Inc 710,000 2,107,540 1.32Delta Electronics Inc 590,000 2,454,449 1.54Feng Hsin Iron & Steel Co 822,000 1,380,961 0.87First Steamship Co Ltd 847,000 1,746,846 1.09Foxconn Technology Co Ltd 649,000 2,307,182 1.45Taiwan Semiconductor Manufacturing Co Ltd 1,878,000 4,453,991 2.79Unimicron Technology Corp 1,649,000 3,057,194 1.92Uni-President Enterprises Corp 674,000 856,463 0.54Walton Advanced Engineering Inc 2,974,000 1,622,118 1.02Yuanta Financial Holding Co Ltd 3,522,000 2,400,529 1.50
33,021,473 20.71
THAILANDHome Product Center PCL 4,441,300 1,230,267 0.77Kasikornbank PCL 963,200 3,691,296 2.31Thai Oil PCL 1,239,400 2,992,668 1.88
7,914,231 4.96
TOTAL EQUITIES 157,419,473 98.70
WARRANTSUNITED STATESPunjab National Bank Ltd WTS 24/10/2012 1 23 –
TOTAL WARRANTS 23 –
TOTAL TRANSFERABLE SECURITIES ADMITTED TO AN OFFICIAL STOCK EXCHANGELISTING OR DEALT IN ON ANOTHER REGULATED MARKET 157,419,496 98.70
TotalInvestments 157,419,496 98.70
The accompanying notes form an integral part of these financial statements.

Invesco Greater China Equity Fund
43 Invesco Funds
Statement of Investments as at 28 February 2011
Investment Nominal/Shares Market Value Net AssetsUSD %
TRANSFERABLE SECURITIES ADMITTED TO AN OFFICIAL STOCK EXCHANGE LISTING OR DEALT IN ON ANOTHERREGULATED MARKET
EQUITIESBERMUDAGOME Electrical Appliances Holdings Ltd 44,647,200 15,160,208 2.60Orient Overseas International Ltd 906,000 7,318,746 1.26Yue Yuen Industrial Holdings Ltd 3,527,500 11,128,735 1.91
33,607,689 5.77
CAYMAN ISLANDSAsia Cement China Holdings Corp 26,289,500 13,719,180 2.36China High Speed Transmission Equipment Group Co Ltd 7,529,000 10,438,698 1.79Haitian International Holdings Ltd 13,178,000 14,802,764 2.54Hidili Industry International Development Ltd 4,681,000 3,875,999 0.67Li Ning Co Ltd 6,284,000 11,745,806 2.02Lifestyle International Holdings Ltd 3,024,500 7,497,580 1.29Minth Group Ltd 7,606,000 11,502,358 1.98Netease.com ADR 170,000 7,850,600 1.35New World Department Store China Ltd 2,119,000 1,443,117 0.25Stella International Holdings Ltd 2,390,000 4,909,114 0.84Uni-President China Holdings Ltd 16,438,000 8,219,430 1.41Vinda International Holdings Ltd 17,895,000 16,620,937 2.86WuXi PharmaTech Cayman Inc ADR 600,050 9,285,774 1.60Yingli Green Energy Holding Co Ltd ADR 500,000 6,177,500 1.06
128,088,857 22.02
CHINABank of China Ltd 26,256,000 13,836,524 2.38China Construction Bank Corp 30,956,170 27,003,618 4.64China International Marine Containers Group Co Ltd 4,174,959 9,081,949 1.56China National Materials Co Ltd 6,297,000 5,343,434 0.92China Oilfield Services Ltd 2,402,000 4,791,917 0.82China Petroleum & Chemical Corp 18,896,000 19,200,214 3.30China Shenhua Energy Co Ltd 2,032,000 8,419,285 1.45Chongqing Changan Automobile Co Ltd 6,851,579 5,985,550 1.03Chongqing Machinery & Electric Co Ltd 16,100,000 5,125,814 0.88Guangzhou Automobile Group Co Ltd 4,300,000 5,536,747 0.95Huadian Energy Co Ltd 2 1 –Industrial & Commercial Bank of China 25,763,965 19,762,227 3.40Jiangling Motors Corp Ltd 2,592,314 7,594,313 1.30PetroChina Co Ltd 8,078,000 11,002,833 1.89Ping An Insurance Group Co of China Ltd 370,000 3,797,567 0.65Shanghai Jinjiang International Hotels Development Co Ltd 5,036,382 8,997,496 1.55Weifu High-Technology Group Co Ltd 1 4 –Wuxi Little Swan Co Ltd 1,511,403 3,094,755 0.53
158,574,248 27.25
HONG KONGBOC Hong Kong Holdings Ltd 1,458,000 4,515,544 0.78Cheung Kong Holdings Ltd 208,000 3,234,983 0.56China Mobile Ltd 1,176,000 11,043,505 1.90China Resources Power Holdings Co Ltd 3,630,000 6,067,403 1.04CNOOC Ltd 8,042,000 18,201,268 3.13Dah Chong Hong Holdings Ltd 5,000,000 5,247,386 0.90Franshion Properties China Ltd 8,000,000 2,223,480 0.38Hang Seng Bank Ltd 155,000 2,471,374 0.42Lenovo Group Ltd 10,588,000 6,408,862 1.10Sun Hung Kai Properties Ltd 225,000 3,633,695 0.62Swire Pacific Ltd 298,000 4,164,185 0.72
67,211,685 11.55
TAIWANAsustek Computer Inc 810,000 7,317,964 1.26

Invesco Greater China Equity Fund
44 Invesco Funds
Statement of Investments as at 28 February 2011
Investment Nominal/Shares Market Value Net AssetsUSD %
TAIWAN (CONTINUED)Far Eastern New Century Corp 7,969,404 12,343,774 2.12Hon Hai Precision Industry Co Ltd 6,237,532 22,908,202 3.94Hotai Motor Co Ltd 5,566,000 16,231,903 2.79Largan Precision Co Ltd 549,000 14,976,752 2.57MediaTek Inc 940,273 10,565,308 1.82President Chain Store Corp 6,136,264 25,527,366 4.39Richtek Technology Corp 910,000 7,166,016 1.23Siliconware Precision Industries Co 3,202,000 4,399,830 0.76Silitech Technology Corp 3,415,000 8,650,291 1.49Simplo Technology Co Ltd 1,408,000 9,229,837 1.59Taiwan Semiconductor Manufacturing Co Ltd 5,809,872 13,779,084 2.37Wistron NeWeb Corp 3,996,000 13,104,170 2.25WPG Holdings Ltd 6,356,954 10,909,418 1.87Young Fast Optoelectronics Co Ltd 340,000 2,980,300 0.51Yuanta Financial Holding Co Ltd 5,843,000 3,982,479 0.68
184,072,694 31.64
UNITED STATESYahoo! Inc 210,000 3,463,950 0.59
TOTAL EQUITIES 575,019,123 98.82
WARRANTSUNITED STATESPing An Insurance Group WTS 17/01/2012 459,500 3,478,974 0.60
TOTAL WARRANTS 3,478,974 0.60
TOTAL TRANSFERABLE SECURITIES ADMITTED TO AN OFFICIAL STOCK EXCHANGELISTING OR DEALT IN ON ANOTHER REGULATED MARKET 578,498,097 99.42
TotalInvestments 578,498,097 99.42
The accompanying notes form an integral part of these financial statements.

Invesco Asia Infrastructure Fund
45 Invesco Funds
Statement of Investments as at 28 February 2011
Investment Nominal/Shares Market Value Net AssetsUSD %
TRANSFERABLE SECURITIES ADMITTED TO AN OFFICIAL STOCK EXCHANGE LISTING OR DEALT IN ON ANOTHERREGULATED MARKET
EQUITIESAUSTRALIAAdelaide Brighton Ltd 4,000,000 13,400,721 0.48ASX Ltd 493,000 18,228,087 0.65BHP Billiton Ltd 2,595,200 121,484,309 4.34Leighton Holdings Ltd 1,265,785 39,758,912 1.42Macquarie Group Ltd 990,073 38,064,205 1.36Map Group 8,552,727 26,829,793 0.96Rio Tinto Ltd 1,116,875 96,298,591 3.44Telstra Corp Ltd 5,100,000 14,419,480 0.52Woodside Petroleum Ltd 816,910 35,312,959 1.26WorleyParsons Ltd 1,476,445 45,191,716 1.61
448,988,773 16.04
BERMUDACOSCO Pacific Ltd 11,600,000 22,322,606 0.80Kunlun Energy Co Ltd 15,916,000 23,701,574 0.85Orient Overseas International Ltd 3,270,000 26,415,343 0.94
72,439,523 2.59
CAYMAN ISLANDSChina High Speed Transmission Equipment Group Co Ltd 15,688,000 21,750,869 0.78ENN Energy Holdings Ltd 3,578,000 10,667,959 0.38Sany Heavy Equipment International Holdings Co Ltd 24,292,000 33,430,535 1.19
65,849,363 2.35
CHINABaoshan Iron & Steel Co Ltd 23,170,871 24,487,493 0.88Beijing Capital International Airport Co Ltd 22,222,000 11,097,318 0.40China National Building Material Co Ltd 5,400,000 13,261,541 0.47China Oilfield Services Ltd 5,900,000 11,770,321 0.42China Petroleum & Chemical Corp 36,200,000 36,782,797 1.32China Shenhua Energy Co Ltd 5,436,500 22,525,317 0.80China Shipping Container Lines Co Ltd 43,000,000 18,658,229 0.67China XD Electric Co Ltd 19,494,501 25,378,260 0.91CSR Corp Ltd 25,458,000 28,220,967 1.01Dongfang Electric Corp Ltd 5,280,000 20,267,043 0.72Gansu Qilianshan Cement Group Co Ltd 8,099,918 22,796,316 0.81Harbin Power Equipment Co Ltd 2,572,000 3,042,647 0.11Jiangsu Expressway Co Ltd 24,782,000 26,930,759 0.96PetroChina Co Ltd 21,754,000 29,630,554 1.06Shanxi Lu'an Environmental Energy Development Co Ltd 3,399,928 30,858,405 1.10Shenzhen Expressway Co Ltd 10,000,000 6,020,854 0.22Sinoma International Engineering Co 1,999,919 14,519,496 0.52Sinopec Yizheng Chemical Fibre Co Ltd 28,000,000 12,724,671 0.45Weichai Power Co Ltd 4,400,000 29,316,040 1.05Yanzhou Coal Mining Co Ltd 11,400,000 34,099,345 1.22Zhejiang Expressway Co Ltd 13,554,000 12,162,698 0.43
434,551,071 15.53
HONG KONGChina Mobile Ltd 6,911,000 64,899,372 2.32Citic Pacific Ltd 14,750,000 38,486,449 1.38CNOOC Ltd 35,280,000 79,848,389 2.85Guangdong Investment Ltd 33,212,000 16,841,369 0.60Hong Kong Exchanges and Clearing Ltd 830,000 17,980,723 0.64Hutchison Whampoa Ltd 6,614,000 77,839,562 2.78MTR Corp 10,060,036 37,097,517 1.33Shanghai Industrial Holdings Ltd 4,600,000 16,475,830 0.59Swire Pacific Ltd 1,050,000 14,672,462 0.52
364,141,673 13.01
INDIABharat Heavy Electricals Ltd 932,600 41,398,153 1.48

Invesco Asia Infrastructure Fund
46 Invesco Funds
Statement of Investments as at 28 February 2011
Investment Nominal/Shares Market Value Net AssetsUSD %
INDIA (CONTINUED)Coal India Ltd 5,781,214 41,718,961 1.49Crompton Greaves Ltd 1,781,817 9,636,451 0.34Jindal Steel & Power Ltd 1,200,000 17,453,767 0.62Larsen & Toubro Ltd 1,587,000 53,535,717 1.92Oil & Natural Gas Corp Ltd 1,819,216 10,938,830 0.39Reliance Industries Ltd 2,111,000 44,862,994 1.60Tata Power Co Ltd 672,000 16,975,889 0.61
236,520,762 8.45
INDONESIAAgung Podomoro Land Tbk PT 62,000,000 2,442,328 0.09Astra International Tbk PT 5,000,000 29,487,614 1.05Bank Mandiri Tbk PT 37,784,085 24,735,372 0.88Indocement Tunggal Prakarsa Tbk PT 16,828,500 27,422,737 0.98Perusahaan Gas Negara PT 60,200,000 24,140,735 0.86Semen Gresik Persero Tbk PT 9,979,500 9,644,078 0.34United Tractors Tbk PT 31,011,666 80,943,555 2.90
198,816,419 7.10
MALAYSIAGamuda Bhd 36,920,000 43,994,249 1.57Genting Bhd 3,500,000 11,479,288 0.41Lafarge Malayan Cement Bhd 7,590,000 18,300,134 0.65Petronas Chemicals Group Bhd 8,299,800 17,127,468 0.61Puncak Niaga Holding Bhd 945,000 734,193 0.03Tenaga Nasional Bhd 5,000,000 10,334,391 0.37YTL Power International Bhd 9,800,000 7,276,526 0.26
109,246,249 3.90
NEW ZEALANDTelecom Corp of New Zealand Ltd 7,100,000 11,120,226 0.40
PAKISTANOil & Gas Development Co Ltd 7,500,000 12,772,195 0.46
PHILIPPINESCebu Air Inc 3,665,100 6,907,272 0.25Energy Development Corp 60,000,000 7,742,603 0.28Metro Pacific Investments Corp 126,601,000 9,947,430 0.35
24,597,305 0.88
SINGAPOREHyflux Ltd 4,500,000 6,814,503 0.24Keppel Corp Ltd 3,708,000 32,874,153 1.17SembCorp Industries Ltd 7,767,000 29,144,903 1.05Singapore Exchange Ltd 2,264,000 14,078,916 0.50Singapore Telecommunications Ltd 7,600,000 17,726,754 0.63SMRT Corp Ltd 11,400,000 17,532,447 0.63
118,171,676 4.22
SOUTH KOREACheil Industries Inc 280,000 29,708,057 1.06Hyundai Heavy Industries Co Ltd 195,000 75,199,352 2.69Hyundai Mipo Dockyard 151,712 23,288,090 0.83Hyundai Mobis 100,500 23,396,424 0.83KCC Corp 126,400 35,025,561 1.25LG Chem Ltd 326,000 107,520,928 3.84POSCO 80,150 32,648,706 1.17Samsung C&T Corp 200,000 11,916,892 0.43Samsung Electronics Co Ltd 41,000 33,565,763 1.20Samsung Engineering Co Ltd 193,000 30,651,884 1.10SK Innovation Co Ltd 93,000 14,399,282 0.51
417,320,939 14.91
TAIWANAsia Cement Corp 12,363,367 12,416,564 0.44BES Engineering Corp 47,600,000 15,049,516 0.54

Invesco Asia Infrastructure Fund
47 Invesco Funds
Statement of Investments as at 28 February 2011
Investment Nominal/Shares Market Value Net AssetsUSD %
TAIWAN (CONTINUED)China Steel Corp 8,780,500 9,880,902 0.35Chunghwa Telecom Co Ltd 6,771,096 20,064,949 0.71CTCI Corp 3,100,000 3,441,607 0.12Far Eastern New Century Corp 12,475,620 19,323,431 0.69Hon Hai Precision Industry Co Ltd 8,325,840 30,577,803 1.10Taiwan Fertilizer Co Ltd 3,586,000 11,120,733 0.40Taiwan Mobile Co Ltd 6,700,000 15,034,287 0.54Taiwan Semiconductor Manufacturing Co Ltd 21,102,073 50,047,098 1.79
186,956,890 6.68
THAILANDAdvanced Info Service PCL 3,000,000 7,807,649 0.28Kasikornbank PCL 5,900,000 22,610,724 0.80PTT Chemical PCL 2,530,300 11,929,917 0.43Siam Cement PCL 2,000,000 20,297,436 0.73Thai Oil PCL 4,800,000 11,590,130 0.41
74,235,856 2.65
UNITED ARAB EMIRATESDP World Ltd 17,666,667 9,495,834 0.34
TOTAL EQUITIES 2,785,224,754 99.51
TOTAL TRANSFERABLE SECURITIES ADMITTED TO AN OFFICIAL STOCK EXCHANGELISTING OR DEALT IN ON ANOTHER REGULATED MARKET 2,785,224,754 99.51
TotalInvestments 2,785,224,754 99.51
The accompanying notes form an integral part of these financial statements.

Invesco India Equity Fund
48 Invesco Funds
Statement of Investments as at 28 February 2011
Investment Nominal/Shares Market Value Net AssetsUSD %
TRANSFERABLE SECURITIES ADMITTED TO AN OFFICIAL STOCK EXCHANGE LISTING OR DEALT IN ON ANOTHERREGULATED MARKET
EQUITIESBASIC MATERIALSAsian Paints Ltd 77,000 4,088,480 1.87Coromandel International Ltd 750,000 4,243,962 1.94Hindalco Industries Ltd 650,000 2,898,431 1.32Jindal Steel & Power Ltd 320,000 4,654,338 2.13Tata Steel Ltd 455,000 6,125,689 2.80
22,010,900 10.06
BASIC RESOURCESCoal India Ltd 300,000 2,164,889 0.99
CONSUMER, CYCLICALBajaj Auto Ltd 275,000 7,702,465 3.52Hero Honda Motors Ltd 60,000 1,937,406 0.88Mahindra & Mahindra Ltd 405,000 5,474,251 2.50Pantaloon Retail India Ltd 320,000 1,851,794 0.85Sobha Developers Ltd 150,000 825,245 0.38Tata Motors Ltd 345,000 8,235,302 3.76
26,026,463 11.89
CONSUMER, NON-CYCLICALBajaj Corp Ltd 120,000 1,355,680 0.62Cadila Healthcare Ltd 90,000 1,473,004 0.67Dabur India Ltd 1,400,000 3,090,046 1.41Dr Reddy's Laboratories Ltd 160,000 5,467,560 2.50ITC Ltd 2,290,000 8,581,015 3.92Lupin Ltd 500,000 4,207,066 1.92
24,174,371 11.04
DIVERSIFIEDSintex Industries Ltd 1,250,000 4,055,885 1.85
ENERGYBharat Petroleum Corp Ltd 50,000 616,550 0.28Oil & Natural Gas Corp Ltd 320,000 1,924,140 0.88Reliance Industries Ltd 220,000 4,675,442 2.14
7,216,132 3.30
FINANCIALAxis Bank Ltd 235,000 6,305,292 2.88Bank of Baroda 342,795 6,590,246 3.01HDFC Bank Ltd 220,000 9,969,988 4.55Housing Development Finance Corp 450,000 6,284,232 2.87ICICI Bank Ltd 710,000 15,283,195 6.98Infrastructure Development Finance Co Ltd 650,000 2,088,940 0.95ING Vysya Bank Ltd 300,000 1,967,388 0.90Jammu & Kashmir Bank Ltd 245,000 4,092,453 1.87Mahindra & Mahindra Financial Services Ltd 212,000 3,274,159 1.50Punjab National Bank Ltd 127,000 2,953,202 1.35State Bank of India 100,000 5,841,857 2.67
64,650,952 29.53
INDUSTRIALBharat Heavy Electricals Ltd 35,000 1,553,652 0.71Crompton Greaves Ltd 650,000 3,515,340 1.61Cummins India Ltd 272,000 3,914,991 1.79Grasim Industries Ltd 73,593 3,692,058 1.69Larsen & Toubro Ltd 110,000 3,710,730 1.69Pidilite Industries Ltd 875,393 2,659,907 1.21

Invesco India Equity Fund
49 Invesco Funds
Statement of Investments as at 28 February 2011
Investment Nominal/Shares Market Value Net AssetsUSD %
INDUSTRIAL (CONTINUED)Titan Industries Ltd 60,000 4,403,738 2.01
23,450,416 10.71
TECHNOLOGYInfosys Technologies Ltd 225,000 14,938,482 6.82Tata Consultancy Services Ltd 570,000 13,995,582 6.39Wipro Ltd 435,000 4,205,009 1.92
33,139,073 15.13
UTILITIESGAIL India Ltd 350,000 3,305,180 1.51
TOTAL EQUITIES 210,194,261 96.01
TOTAL TRANSFERABLE SECURITIES ADMITTED TO AN OFFICIAL STOCK EXCHANGELISTING OR DEALT IN ON ANOTHER REGULATED MARKET 210,194,261 96.01
TotalInvestments 210,194,261 96.01
The accompanying notes form an integral part of these financial statements.

Invesco Asia Consumer Demand Fund
50 Invesco Funds
Statement of Investments as at 28 February 2011
Investment Nominal/Shares Market Value Net AssetsUSD %
TRANSFERABLE SECURITIES ADMITTED TO AN OFFICIAL STOCK EXCHANGE LISTING OR DEALT IN ON ANOTHERREGULATED MARKET
EQUITIESAUSTRALIAASX Ltd 400,000 14,789,523 1.47Australia & New Zealand Banking Group Ltd 824,000 20,185,466 2.01Foster's Group Ltd 2,150,000 12,485,005 1.24JB Hi-Fi Ltd 535,000 10,623,726 1.06Qantas Airways Ltd 5,600,000 13,303,261 1.32Westpac Banking Corp 585,000 13,974,363 1.39
85,361,344 8.49
BERMUDABrilliance China Automotive Holdings Ltd 8,134,000 6,656,863 0.66GOME Electrical Appliances Holdings Ltd 52,500,000 17,826,671 1.77Haier Electronics Group Co Ltd 9,000,000 8,365,008 0.83Yue Yuen Industrial Holdings Ltd 4,000,000 12,619,402 1.26
45,467,944 4.52
CAYMAN ISLANDSChina Resources Land Ltd 6,700,000 10,897,746 1.09Ctrip.com International Ltd ADR 400,000 15,914,000 1.58Hengan International Group Co Ltd 2,100,000 15,541,892 1.55Lifestyle International Holdings Ltd 3,900,000 9,667,900 0.96Longfor Properties Co Ltd 6,900,000 9,717,197 0.97Mewah International Inc 12,700,000 10,490,204 1.04Minth Group Ltd 4,800,000 7,258,916 0.72New World Department Store China Ltd 12,000,000 8,172,443 0.81Parkson Retail Group Ltd 7,400,000 10,459,341 1.04SA SA International Holdings Ltd 12,452,000 6,306,253 0.63Tencent Holdings Ltd 700,000 18,565,798 1.85Uni-President China Holdings Ltd 22,000,000 11,000,576 1.10Zhongsheng Group Holdings Ltd 5,700,000 10,910,327 1.09
144,902,593 14.43
CHINABank of China Ltd 46,000,000 24,241,320 2.41China Life Insurance Co Ltd 6,095,000 23,180,209 2.31Dongfeng Motor Group Co Ltd 5,300,000 9,185,333 0.91Guangzhou Automobile Group Co Ltd 8,130,558 10,469,033 1.04Industrial & Commercial Bank of China 31,725,500 24,335,017 2.42Ping An Insurance Group Co of China Ltd 1,500,000 15,395,543 1.53Sinopharm Group Co 3,700,000 13,454,170 1.34
120,260,625 11.96
HONG KONGAIA Group Ltd 4,400,000 12,836,359 1.28China Resources Enterprise Ltd 3,300,000 12,126,758 1.21Television Broadcasts Ltd 1,520,000 8,395,561 0.84Wharf Holdings Ltd 2,300,000 15,095,463 1.50
48,454,141 4.83
INDIADabur India Ltd 3,000,000 6,621,527 0.66Dr Reddy's Laboratories Ltd 380,000 12,985,455 1.29ICICI Bank Ltd 470,000 10,117,045 1.01ITC Ltd 5,200,000 19,485,275 1.94Lupin Ltd 1,430,000 12,032,208 1.20Mahindra & Mahindra Ltd 730,000 9,867,169 0.98Pantaloon Retail India Ltd 1,270,000 7,349,309 0.73State Bank of India 170,000 9,931,157 0.99

Invesco Asia Consumer Demand Fund
51 Invesco Funds
Statement of Investments as at 28 February 2011
Investment Nominal/Shares Market Value Net AssetsUSD %
INDIA (CONTINUED)Tata Motors Ltd 350,000 8,354,654 0.83Titan Industries Ltd 110,000 8,073,520 0.80
104,817,319 10.43
INDONESIAAstra International Tbk PT 2,080,000 12,266,847 1.22Bank Negara Indonesia Persero Tbk PT 31,700,003 12,711,983 1.27Indofood CBP Sukses Makmur TBK PT 21,000,000 10,831,491 1.08Indofood Sukses Makmur Tbk PT 19,357,000 10,450,344 1.04
46,260,665 4.61
MALAYSIAGenting Bhd 3,150,000 10,331,359 1.03RHB Capital Bhd 4,000,000 10,313,083 1.03Top Glove Corp Bhd 4,700,000 7,541,893 0.75
28,186,335 2.81
PHILIPPINESCebu Air Inc 5,680,680 10,705,848 1.07
SINGAPOREOverseas Union Enterprise Ltd 4,600,000 10,439,858 1.04SATS Ltd 4,900,000 9,848,677 0.98Singapore Airlines Ltd 940,000 10,064,145 1.00Yanlord Land Group Ltd 9,400,000 10,093,724 1.00
40,446,404 4.02
SOUTH KOREAAmorepacific Corp 8,500 7,738,227 0.77Grand Korea Leisure Co Ltd 600,000 10,034,111 1.00Hynix Semiconductor Inc 400,000 10,038,541 1.00Hyundai Home Shopping Network Corp 110,000 9,088,291 0.90Hyundai Mobis 83,500 19,438,820 1.94Hyundai Motor Co 135,000 21,320,825 2.12KB Financial Group Inc 270,000 13,217,117 1.32LG Electronics Inc 107,000 10,546,892 1.05Samsung Electronics Co Ltd 34,000 27,835,023 2.77Samsung Fire & Marine Insurance Co Ltd 62,000 12,291,233 1.22Shinhan Financial Group Co Ltd 317,000 13,249,878 1.32
154,798,958 15.41
TAIWANAcer Inc 5,500,000 13,284,531 1.32Asustek Computer Inc 1,550,000 14,003,511 1.39Cathay Real Estate Development Co Ltd 10,600,000 5,229,266 0.52Chinatrust Financial Holding Co Ltd 24,607,949 19,233,359 1.91D-Link Corp 8,550,000 7,422,722 0.74Hon Hai Precision Industry Co Ltd 4,955,608 18,200,158 1.81President Chain Store Corp 3,700,000 15,392,306 1.53Uni-President Enterprises Corp 10,249,132 13,023,738 1.30
105,789,591 10.52
THAILANDKasikornbank PCL 3,120,600 11,959,156 1.19Minor International PCL 23,300,000 8,110,640 0.81Pruksa Real Estate PCL 13,100,000 7,471,646 0.74
27,541,442 2.74
TOTAL EQUITIES 962,993,209 95.84

Invesco Asia Consumer Demand Fund
52 Invesco Funds
Statement of Investments as at 28 February 2011
Investment Nominal/Shares Market Value Net AssetsUSD %
WARRANTS/RIGHTSHONG KONGWharf Holdings Ltd (RTS) 230,000 431,826 0.04
UNITED STATESWuliangye Yibin Co Ltd WTS 20/01/2015 1,420,467 7,125,463 0.71
TOTAL WARRANTS/RIGHTS 7,557,289 0.75
TOTAL TRANSFERABLE SECURITIES ADMITTED TO AN OFFICIAL STOCK EXCHANGELISTING OR DEALT IN ON ANOTHER REGULATED MARKET 970,550,498 96.59
OPEN-ENDED FUNDSHONG KONGiShares FTSE A50 China Index ETF 9,000,000 15,100,919 1.50W.I.S.E. - CSI China Tracker Fund 2,300,000 11,190,573 1.11
TOTAL OPEN-ENDED FUNDS 26,291,492 2.61
TotalInvestments 996,841,990 99.20
The accompanying notes form an integral part of these financial statements.

Invesco Global Leisure Fund
53 Invesco Funds
Statement of Investments as at 28 February 2011
Investment Nominal/Shares Market Value Net AssetsUSD %
TRANSFERABLE SECURITIES ADMITTED TO AN OFFICIAL STOCK EXCHANGE LISTING OR DEALT IN ON ANOTHERREGULATED MARKET
EQUITIESCAYMAN ISLANDSBaidu Inc ADR 6,727 811,175 1.65
JAPANHonda Motor Co Ltd 22,517 976,007 1.98
MEXICOGrupo Televisa SA ADR 33,306 788,186 1.60
PANAMACarnival Corp 10,602 453,554 0.92
UNITED STATESAbercrombie & Fitch Co 9,582 544,401 1.11Amazon.com Inc 8,136 1,442,147 2.93Autoliv Inc 12,237 908,720 1.85Bed Bath & Beyond Inc 9,186 439,596 0.89Brinker International Inc 19,485 464,230 0.94Buffalo Wild Wings Inc 7,767 415,030 0.84CarMax Inc 27,393 965,466 1.96CBS Corp 26,236 617,202 1.25Chipotle Mexican Grill Inc 2,107 523,811 1.06Choice Hotels International Inc 9,532 372,320 0.76Coach Inc 9,338 509,341 1.04Comcast Corp 66,621 1,682,513 3.42Costco Wholesale Corp 8,612 633,628 1.29Darden Restaurants Inc 28,323 1,338,687 2.72DIRECTV 31,058 1,429,444 2.90Discovery Communications Inc 18,200 780,780 1.59Ford Motor Co 85,079 1,280,864 2.60Google Inc 769 469,086 0.95Hansen Natural Corp 9,177 541,397 1.10Harley-Davidson Inc 14,889 608,290 1.24Home Depot Inc 36,763 1,362,621 2.77Hyatt Hotels Corp 20,632 945,461 1.92Interpublic Group of Cos Inc 79,425 997,975 2.03Jack in the Box Inc 17,151 379,552 0.77Johnson Controls Inc 24,392 992,388 2.02Kohl's Corp 13,781 735,561 1.49Las Vegas Sands Corp 10,801 496,954 1.01Lowe's Cos Inc 49,947 1,262,410 2.56Macy's Inc 19,349 456,927 0.93Marriott International Inc 36,783 1,445,388 2.94McDonald's Corp 9,373 698,054 1.42MGM Resorts International 21,683 304,538 0.62Mohawk Industries Inc 15,183 888,054 1.80National CineMedia Inc 20,289 381,839 0.78NetFlix Inc 3,597 764,291 1.55NIKE Inc 14,407 1,267,744 2.58Nordstrom Inc 10,867 494,394 1.00Omnicom Group Inc 15,482 773,016 1.57Penn National Gaming Inc 18,930 659,521 1.34PF Chang's China Bistro Inc 10,781 502,772 1.02Polo Ralph Lauren Corp 4,384 549,118 1.12Rovi Corp 13,176 748,726 1.52Scripps Networks Interactive Inc 17,463 906,592 1.84Stanley Black & Decker Inc 6,975 523,788 1.06Staples Inc 32,783 686,312 1.39Starbucks Corp 37,912 1,232,709 2.50Starwood Hotels & Resorts Worldwide Inc 11,722 721,372 1.47

Invesco Global Leisure Fund
54 Invesco Funds
Statement of Investments as at 28 February 2011
Investment Nominal/Shares Market Value Net AssetsUSD %
UNITED STATES (CONTINUED)Target Corp 25,221 1,320,950 2.68Tiffany & Co 12,410 758,561 1.54Time Warner Cable Inc 7,647 545,193 1.11Time Warner Inc 24,903 943,948 1.92Urban Outfitters Inc 7,512 281,662 0.57Viacom Inc 'A' 10,385 528,493 1.07Viacom Inc 'B' 17,843 796,333 1.62Walt Disney Co 51,262 2,201,447 4.47Weight Watchers International Inc 12,811 788,261 1.60WMS Industries Inc 12,514 496,493 1.01
45,806,371 93.05
TOTAL EQUITIES 48,835,293 99.20
TOTAL TRANSFERABLE SECURITIES ADMITTED TO AN OFFICIAL STOCK EXCHANGELISTING OR DEALT IN ON ANOTHER REGULATED MARKET 48,835,293 99.20
TotalInvestments 48,835,293 99.20
The accompanying notes form an integral part of these financial statements.

Invesco Energy Fund
55 Invesco Funds
Statement of Investments as at 28 February 2011
Investment Nominal/Shares Market Value Net AssetsUSD %
TRANSFERABLE SECURITIES ADMITTED TO AN OFFICIAL STOCK EXCHANGE LISTING OR DEALT IN ON ANOTHERREGULATED MARKET
EQUITIESBERMUDASeadrill Ltd 114,961 4,382,888 0.91
CANADACanadian Natural Resources Ltd 107,968 5,340,871 1.11MEG Energy Corp 94,582 4,703,405 0.98Niko Resources Ltd 35,355 2,989,082 0.62Suncor Energy Inc 86,614 3,971,252 0.83Talisman Energy Inc 94,860 2,327,390 0.49
19,332,000 4.03
FRANCETotal SA ADR 70,491 4,247,435 0.88
HONG KONGCNOOC Ltd 1,634,000 3,698,194 0.77
NETHERLANDSCore Laboratories NV 46,093 4,694,572 0.98
NORWAYPetroleum Geo-Services ASA 217,901 3,608,926 0.75
SWITZERLANDTransocean Ltd 85,536 7,087,085 1.48Weatherford International Ltd 1,044,490 25,046,870 5.21
32,133,955 6.69
UNITED KINGDOMBG Group Plc 160,230 3,876,918 0.81Tullow Oil Plc 174,600 4,035,220 0.84
7,912,138 1.65
UNITED STATESAnadarko Petroleum Corp 286,720 23,280,230 4.85Apache Corp 130,408 16,106,040 3.35Arch Coal Inc 228,300 7,621,796 1.59Atwood Oceanics Inc 100,977 4,603,037 0.96Baker Hughes Inc 312,969 22,374,154 4.66Cabot Oil & Gas Corp 59,004 2,701,498 0.56Cameron International Corp 376,211 22,476,726 4.68Chevron Corp 140,277 14,327,191 2.98Concho Resources Inc 29,358 3,221,307 0.67Continental Resources Inc 37,831 2,609,582 0.54Dresser-Rand Group Inc 127,151 6,332,120 1.32Dril-Quip Inc 50,719 4,004,772 0.83EOG Resources Inc 196,039 21,885,794 4.56Exxon Mobil Corp 176,791 15,089,996 3.14FMC Technologies Inc 109,036 10,110,363 2.11Halliburton Co 610,433 28,711,716 5.98Helmerich & Payne Inc 183,285 11,875,952 2.47Hess Corp 53,962 4,575,168 0.95Key Energy Services Inc 192,565 2,943,356 0.61Marathon Oil Corp 51,405 2,499,568 0.52Murphy Oil Corp 31,994 2,349,959 0.49National Oilwell Varco Inc 352,930 28,158,520 5.86Newfield Exploration Co 132,501 9,554,647 1.99Occidental Petroleum Corp 177,762 18,329,040 3.82Oceaneering International Inc 66,356 5,472,048 1.14Patterson-UTI Energy Inc 168,296 4,642,445 0.97Peabody Energy Corp 281,324 18,367,644 3.82Petrohawk Energy Corp 112,240 2,422,700 0.50

Invesco Energy Fund
56 Invesco Funds
Statement of Investments as at 28 February 2011
Investment Nominal/Shares Market Value Net AssetsUSD %
UNITED STATES (CONTINUED)Plains Exploration & Production Co 177,194 6,767,925 1.41Pride International Inc 339,511 13,974,273 2.91Range Resources Corp 43,622 2,368,675 0.49Rowan Cos Inc 65,751 2,790,801 0.58Schlumberger Ltd 314,269 29,173,591 6.07Southwestern Energy Co 153,895 5,981,129 1.25Valero Energy Corp 192,294 5,490,955 1.14
383,194,718 79.77
TOTAL EQUITIES 463,204,826 96.43
TOTAL TRANSFERABLE SECURITIES ADMITTED TO AN OFFICIAL STOCK EXCHANGELISTING OR DEALT IN ON ANOTHER REGULATED MARKET 463,204,826 96.43
TotalInvestments 463,204,826 96.43
The accompanying notes form an integral part of these financial statements.

Invesco Asia Pacific Real Estate Securities Fund
57 Invesco Funds
Statement of Investments as at 28 February 2011
Investment Nominal/Shares Market Value Net AssetsUSD %
TRANSFERABLE SECURITIES ADMITTED TO AN OFFICIAL STOCK EXCHANGE LISTING OR DEALT IN ON ANOTHERREGULATED MARKET
EQUITIESAUSTRALIACFS Retail Property Trust 43,274 82,592 2.43Charter Hall Retail REIT 1,576 5,120 0.15Dexus Property Group 71,300 61,889 1.82Goodman Group 183,501 130,404 3.83ING Office Fund 67,655 41,897 1.23Stockland 41,479 160,017 4.70Westfield Group 18,949 187,562 5.51Westfield Retail Trust 21,779 59,034 1.73
728,515 21.40
CAYMAN ISLANDSAgile Property Holdings Ltd 38,000 48,003 1.41Evergrande Real Estate Group Ltd 75,000 35,239 1.04KWG Property Holding Ltd 12,500 8,056 0.24Shimao Property Holdings Ltd 21,000 28,738 0.84
120,036 3.53
HONG KONGChina Overseas Land & Investment Ltd 50,400 83,853 2.46Hang Lung Properties Ltd 33,000 140,861 4.14Henderson Land Development Co Ltd 5,000 31,741 0.93Hongkong Land Holdings Ltd 22,000 150,260 4.41Hysan Development Co Ltd 14,000 63,039 1.85Kerry Properties Ltd 15,500 75,067 2.20Link REIT 15,500 47,905 1.41New World Development Ltd 9,000 16,199 0.48Sino Land Co Ltd 34,000 61,762 1.81Sun Hung Kai Properties Ltd 17,000 274,546 8.06Wharf Holdings Ltd 19,000 124,702 3.66
1,069,935 31.41
JAPANAdvance Residence Investment Corp 7 14,503 0.43Aeon Mall Co Ltd 1,900 50,424 1.48Frontier Real Estate Investment Corp 1 9,470 0.28Japan Prime Realty Investment Corp 13 36,114 1.06Japan Real Estate Investment Corp 7 71,939 2.11Japan Retail Fund Investment Corp 15 25,705 0.76Kenedix Realty Investment Corp 8 37,489 1.10Mitsubishi Estate Co Ltd 10,000 204,010 5.99Mitsui Fudosan Co Ltd 13,000 275,863 8.10Nippon Building Fund Inc 7 73,265 2.15Orix J-REIT Inc 3 17,295 0.51Sumitomo Realty & Development Co Ltd 7,000 187,443 5.51Tokyu Land Corp 9,000 51,446 1.51
1,054,966 30.99
SINGAPORECapitaCommercial Trust 29,000 31,597 0.93CapitaLand Ltd 39,000 100,170 2.94CapitaMall Trust 31,530 45,019 1.32Global Logistic Properties Ltd 25,000 37,268 1.09Keppel Land Ltd 18,000 59,684 1.75

Invesco Asia Pacific Real Estate Securities Fund
58 Invesco Funds
Statement of Investments as at 28 February 2011
Investment Nominal/Shares Market Value Net AssetsUSD %
SINGAPORE (CONTINUED)Suntec Real Estate Investment Trust 41,000 47,896 1.41
321,634 9.44
TOTAL EQUITIES 3,295,086 96.77
RIGHTSHONG KONGWharf Holdings Ltd (RTS) 1,900 3,567 0.11
TOTAL RIGHTS 3,567 0.11
TOTAL TRANSFERABLE SECURITIES ADMITTED TO AN OFFICIAL STOCK EXCHANGELISTING OR DEALT IN ON ANOTHER REGULATED MARKET 3,298,653 96.88
OTHER TRANSFERABLE SECURITIES
EQUITIESAUSTRALIABGP Holdings 214,552 – –
TOTAL EQUITIES – –
TOTAL OTHER TRANSFERABLE SECURITIES – –
TotalInvestments 3,298,653 96.88
The accompanying notes form an integral part of these financial statements.

Invesco Global Income Real Estate Securities Fund
59 Invesco Funds
Statement of Investments as at 28 February 2011
Investment Nominal/Shares Market Value Net AssetsUSD %
TRANSFERABLE SECURITIES ADMITTED TO AN OFFICIAL STOCK EXCHANGE LISTING OR DEALT IN ON ANOTHERREGULATED MARKET
EQUITIESAUSTRALIABunnings Warehouse Property Trust 3,002 5,364 0.05CFS Retail Property Trust 43,242 82,531 0.81Challenger Diversified Property Group 52,804 26,803 0.26Charter Hall Group 8,156 20,203 0.20Charter Hall Retail REIT 12,373 40,196 0.39Commonwealth Property Office Fund 21,040 18,263 0.18Dexus Property Group 70,533 61,223 0.60Goodman Group 107,171 76,160 0.75GPT Group 6,304 19,840 0.19ING Office Fund 85,009 52,644 0.52Mirvac Group 15,150 19,994 0.20Stockland 31,566 121,775 1.19Westfield Group 12,190 120,660 1.18Westfield Retail Trust 12,508 33,904 0.33
699,560 6.85
AUSTRIAConwert Immobilien Invest SE 1,507 25,066 0.25
BELGIUMBefimmo SCA Sicafi 323 26,931 0.26Intervest Offices 824 27,018 0.26
53,949 0.52
BRAZILMultiplan Empreendimentos Imobiliarios SA 400 7,703 0.08
CANADAArtis REIT 3,800 52,793 0.52Brookfield Properties Corp 2,755 47,854 0.47Canadian Apartment Properties REIT 1,000 19,065 0.19Chartwell Seniors Housing REIT 4,900 43,309 0.42Cominar REIT 1,100 24,588 0.24Dundee REIT 1,600 50,962 0.50Morguard REIT 400 5,830 0.06Primaris REIT 2,900 60,798 0.60RioCan REIT 3,000 73,033 0.72
378,232 3.72
CAYMAN ISLANDSAgile Property Holdings Ltd 18,000 22,738 0.22Evergrande Real Estate Group Ltd 15,000 7,048 0.07KWG Property Holding Ltd 11,500 7,411 0.07Shimao Property Holdings Ltd 21,500 29,423 0.29
66,620 0.65
FINLANDSponda OYJ 5,469 29,818 0.29
FRANCEFonciere Des Regions 264 28,167 0.28Gecina SA 149 18,835 0.18Klepierre 1,095 42,234 0.41Mercialys SA 491 18,607 0.18Societe Immobiliere de Location pour l'Industrie et le Commerce 159 20,434 0.20Unibail-Rodamco SE 1,093 218,128 2.14
346,405 3.39
HONG KONGChina Overseas Land & Investment Ltd 22,480 37,401 0.37Hang Lung Properties Ltd 16,000 68,296 0.67Henderson Land Development Co Ltd 2,000 12,696 0.12

Invesco Global Income Real Estate Securities Fund
60 Invesco Funds
Statement of Investments as at 28 February 2011
Investment Nominal/Shares Market Value Net AssetsUSD %
HONG KONG (CONTINUED)Hongkong Land Holdings Ltd 11,000 75,130 0.74Hysan Development Co Ltd 7,000 31,520 0.31Kerry Properties Ltd 8,000 38,744 0.38Link REIT 12,500 38,633 0.38Sino Land Co Ltd 22,000 39,964 0.39Sun Hung Kai Properties Ltd 13,000 209,947 2.06Wharf Holdings Ltd 10,000 65,632 0.64
617,963 6.06
ITALYBeni Stabili SpA 14,612 14,823 0.15
JAPANAdvance Residence Investment Corp 12 24,863 0.24Aeon Mall Co Ltd 900 23,885 0.23Japan Prime Realty Investment Corp 18 50,004 0.49Japan Real Estate Investment Corp 4 41,108 0.40Japan Retail Fund Investment Corp 6 10,282 0.10Kenedix Realty Investment Corp 8 37,489 0.37Mitsubishi Estate Co Ltd 5,000 102,005 1.00Mitsui Fudosan Co Ltd 6,000 127,322 1.25Nippon Building Fund Inc 3 31,399 0.31Nomura Real Estate Office Fund Inc 3 20,432 0.20Orix J-REIT Inc 4 23,060 0.23Sumitomo Realty & Development Co Ltd 2,000 53,555 0.53Tokyu Land Corp 2,000 11,432 0.11United Urban Investment Corp 14 18,325 0.18
575,161 5.64
NETHERLANDSCorio NV 1,272 83,609 0.82Eurocommercial Properties NV 791 37,434 0.37Vastned Retail NV 384 27,082 0.27Wereldhave NV 608 61,043 0.60
209,168 2.06
NEW ZEALANDKiwi Income Property Trust 36,126 27,273 0.27
SINGAPOREAscendas Real Estate Investment Trust 12,000 18,927 0.19CapitaCommercial Trust 38,000 41,402 0.41CapitaLand Ltd 29,000 74,486 0.73CapitaMall Trust 33,000 47,117 0.46Fortune Real Estate Investment Trust 36,000 18,163 0.18Frasers Centrepoint Trust 17,000 20,127 0.20Global Logistic Properties Ltd 40,000 59,629 0.58Keppel Land Ltd 13,000 43,105 0.42Starhill Global REIT 54,000 27,081 0.27Suntec Real Estate Investment Trust 29,000 33,878 0.33
383,915 3.77
SWEDENCastellum AB 2,933 40,837 0.40
SWITZERLANDSwiss Prime Site AG 339 24,840 0.24
UNITED KINGDOMBig Yellow Group Plc 4,002 21,148 0.21British Land Co Plc 9,085 84,170 0.83Derwent London Plc 1,337 36,062 0.35Great Portland Estates Plc 2,939 18,157 0.18Hammerson Plc 6,374 47,119 0.46Hansteen Holdings Plc 8,966 12,393 0.12Land Securities Group Plc 7,036 85,605 0.84

Invesco Global Income Real Estate Securities Fund
61 Invesco Funds
Statement of Investments as at 28 February 2011
Investment Nominal/Shares Market Value Net AssetsUSD %
UNITED KINGDOM (CONTINUED)Segro Plc 4,878 24,984 0.24Shaftesbury Plc 2,921 22,168 0.22Unite Group Plc 4,986 16,472 0.16
368,278 3.61
UNITED STATESAcadia Realty Trust 1,065 20,837 0.20Alexandria Real Estate Equities Inc 500 39,125 0.38AvalonBay Communities Inc 334 39,432 0.39BioMed Realty Trust Inc 1,312 22,383 0.22Boston Properties Inc 500 46,832 0.46Camden Property Trust 1,500 87,337 0.86CBL & Associates Properties Inc 850 14,926 0.15DiamondRock Hospitality Co 2,100 24,706 0.24Digital Realty Trust Inc 1,200 69,528 0.68Equity Residential 1,100 58,680 0.58Essex Property Trust Inc 400 48,484 0.48Extra Space Storage Inc 800 15,308 0.15Health Care REIT Inc 1,500 76,238 0.75Hersha Hospitality Trust 500 3,253 0.03Highwoods Properties Inc 600 20,043 0.20Host Hotels & Resorts Inc 6,815 125,294 1.23Kilroy Realty Corp 200 7,638 0.07Kimco Realty Corp 5,300 100,011 0.98LaSalle Hotel Properties 500 13,930 0.14Liberty Property Trust 1,500 49,718 0.49Macerich Co 1,219 59,225 0.58Marriott International Inc 133 5,226 0.05Nationwide Health Properties Inc 900 35,041 0.34Piedmont Office Realty Trust Inc 1,200 23,466 0.23ProLogis 2,489 39,438 0.39Regency Centers Corp 900 39,897 0.39Retail Opportunity Investments Corp 414 4,531 0.04Simon Property Group Inc 1,265 135,285 1.33SL Green Realty Corp 700 51,114 0.50Starwood Hotels & Resorts Worldwide Inc 220 13,539 0.13Ventas Inc 300 17,149 0.17Vornado Realty Trust 770 69,269 0.68Washington Real Estate Investment Trust 800 24,412 0.24
1,401,295 13.75
TOTAL EQUITIES 5,270,906 51.70
BONDSBRAZILBR Malls International Finance Ltd 8.5% USD Perpetual 150,000 150,000 1.47BR Properties SA 9% USD Perpetual 150,000 147,000 1.44
297,000 2.91
UNITED KINGDOMHammerson Plc 4.875% EUR 19/06/2015 100,000 143,080 1.40
UNITED STATESBRE Properties Inc 6.75% USD Perpetual 2,900 70,905 0.70Corporate Office Properties Trust 7.625% USD Perpetual 2,600 65,569 0.64Duke Realty Corp 6.95% USD Perpetual 8,700 216,913 2.13Duke Realty Corp 7.25% USD Perpetual 6,400 160,800 1.58Duke Realty Corp 8.375% USD Perpetual 1,042 27,795 0.27Entertainment Properties Trust 9% USD Perpetual 3,900 108,264 1.06Health Care REIT Inc 7.625% USD Perpetual 2,900 74,196 0.73Kilroy Realty Corp 7.5% USD Perpetual 4,100 101,885 1.00Kilroy Realty Corp 7.8% USD Perpetual 8,300 210,280 2.06LaSalle Hotel Properties 7.25% USD Perpetual 4,700 113,129 1.11LaSalle Hotel Properties 7.5% USD Perpetual 1,200 29,970 0.29

Invesco Global Income Real Estate Securities Fund
62 Invesco Funds
Statement of Investments as at 28 February 2011
Investment Nominal/Shares Market Value Net AssetsUSD %
UNITED STATES (CONTINUED)LaSalle Hotel Properties Preferred 7.5% USD Perpetual 3,400 83,453 0.82National Retail Properties Inc 7.375% USD Perpetual 4,000 99,166 0.97Omega Healthcare Investors Inc 6.75% USD 15/10/2022 50,000 50,375 0.49Omega Healthcare Investors Inc 8.375% USD Perpetual 2,900 72,993 0.72PS Business Parks Inc 6.7% USD Perpetual 4,400 106,194 1.04PS Business Parks Inc 6.875% USD Perpetual 4,600 113,827 1.12PS Business Parks Inc 7.2% USD Perpetual 1,600 40,312 0.39PS Business Parks Inc 7.375% USD Perpetual 8,600 216,935 2.13Public Storage 6.625% USD Perpetual 6,700 170,264 1.67Public Storage 6.75% USD Perpetual 6,900 173,293 1.70Public Storage 6.875% USD Perpetual 2,100 54,285 0.53Public Storage 7.25% USD Perpetual 9,500 240,968 2.36Realty Income Corp 6.75% USD Perpetual 4,400 109,863 1.08SL Green Realty Corp 7.875% USD Perpetual 14,900 374,437 3.67Sunstone Hotel Investors Inc 8% USD Perpetual 4,200 103,740 1.02Vornado Realty Trust 6.625% USD Perpetual 3,800 91,485 0.90Vornado Realty Trust 7% USD Perpetual 6,100 153,842 1.51
3,435,138 33.69
TOTAL BONDS 3,875,218 38.00
WARRANTS/RIGHTSHONG KONGWharf Holdings Ltd (RTS) 1,100 2,065 0.02
TOTAL WARRANTS/RIGHTS 2,065 0.02
TOTAL TRANSFERABLE SECURITIES ADMITTED TO AN OFFICIAL STOCK EXCHANGELISTING OR DEALT IN ON ANOTHER REGULATED MARKET 9,148,189 89.72
OTHER TRANSFERABLE SECURITIES
EQUITIESAUSTRALIABGP Holdings 187,667 – –
TOTAL EQUITIES – –
BONDSUNITED STATESBank of America Lar Loan FRN USD 15/10/2019 100,000 90,988 0.89Bear Stearns Commercial Mortgage Securities 5.511% USD 12/04/2038 100,000 102,914 1.01DLJ Commercial Mortgage Corp 7.459% USD 10/06/2031 45,000 48,927 0.48GS Mortgage Securities 5.309% USD 10/01/2040 100,000 92,962 0.91GS Mortgage Securities 6.588% USD 05/08/2018 50,000 51,122 0.50JPMorgan Chase 8.369% USD 12/10/2037 66,394 67,263 0.66LB-UBS Commercial Mortgage Trust 4.31% USD 15/02/2030 8,772 8,782 0.09LB-UBS Commercial Mortgage Trust 5.081% USD 15/01/2036 90,000 94,467 0.93Merrill Lynch Collaterised Mortgage Obligations 0.446% USD 15/06/2022 50,000 45,088 0.44Merrill Lynch Trust FRN USD 15/06/2022 75,000 63,921 0.63Senior Housing Property Trust 4.3% USD 15/01/2016 100,000 99,203 0.97Wachovia Bank Commercial Mortgage Trust FRN USD 15/09/2021 50,000 46,772 0.46Wachovia Bank Commercial Mortgage Trust 4.107% USD 15/06/2035 20,000 20,437 0.20Wachovia Bank Commercial Mortgage Trust FRN USD 15/10/2041 44,000 41,073 0.40
873,919 8.57
TOTAL BONDS 873,919 8.57
TOTAL OTHER TRANSFERABLE SECURITIES 873,919 8.57
TotalInvestments 10,022,108 98.29
The accompanying notes form an integral part of these financial statements.

Invesco Gold & Precious Metals Fund
63 Invesco Funds
Statement of Investments as at 28 February 2011
Investment Nominal/Shares Market Value Net AssetsUSD %
TRANSFERABLE SECURITIES ADMITTED TO AN OFFICIAL STOCK EXCHANGE LISTING OR DEALT IN ON ANOTHERREGULATED MARKET
EQUITIESAUSTRALIABHP Billiton Ltd ADR 2,029 190,594 1.18Newcrest Mining Ltd 15,761 606,905 3.77
797,499 4.95
CANADAAgnico-Eagle Mines Ltd 8,166 565,169 3.51Alamos Gold Inc 21,716 368,196 2.28Aurizon Mines Ltd 75,212 538,518 3.34Barrick Gold Corp 14,759 765,992 4.75Cameco Corp 10,356 425,891 2.64Centerra Gold Inc 12,878 243,539 1.51Detour Gold Corp 20,856 670,810 4.16Eldorado Gold Corp 32,086 533,504 3.31Franco-Nevada Corp 9,814 330,080 2.05Goldcorp Inc 17,796 836,145 5.19Harry Winston Diamond Corp 9,635 117,822 0.73IAMGOLD Corp 37,117 779,666 4.84International Tower Hill Mines Ltd 16,230 151,588 0.94Kinross Gold Corp 13,976 224,296 1.39Minefinders Corp 41,028 474,489 2.94Osisko Mining Corp 41,294 569,249 3.53Pan American Silver Corp 14,008 533,215 3.31Queenston Mining Inc 15,738 97,838 0.61Silver Wheaton Corp 32,967 1,340,272 8.33Tahoe Resources Inc 17,659 283,403 1.76Yamana Gold Inc 57,714 727,485 4.51
10,577,167 65.63
PERUCia de Minas Buenaventura SA ADR 12,971 591,413 3.67
SOUTH AFRICAGold Fields Ltd ADR 24,102 424,556 2.64Harmony Gold Mining Co Ltd ADR 9,777 114,098 0.71Impala Platinum Holdings Ltd 10,221 295,370 1.83
834,024 5.18
UNITED KINGDOMRandgold Resources Ltd ADR 6,367 517,605 3.21
UNITED STATESCoeur d'Alene Mines Corp 3,366 93,104 0.58Freeport-McMoRan Copper & Gold Inc 9,588 503,418 3.12Newmont Mining Corp 11,157 607,554 3.77Stillwater Mining Co 24,478 584,657 3.63
1,788,733 11.10
TOTAL EQUITIES 15,106,441 93.74
STRUCTURED PRODUCTSIRELANDSource Physical Markets Secured Gold Linked Notes 4,679 657,470 4.08
TOTAL STRUCTURED PRODUCTS 657,470 4.08
TOTAL TRANSFERABLE SECURITIES ADMITTED TO AN OFFICIAL STOCK EXCHANGELISTING OR DEALT IN ON ANOTHER REGULATED MARKET 15,763,911 97.82
TotalInvestments 15,763,911 97.82
The accompanying notes form an integral part of these financial statements.

Invesco USD Reserve Fund
64 Invesco Funds
Statement of Investments as at 28 February 2011
Investment Nominal/Shares Market Value Net AssetsUSD %
MONEY MARKET INSTRUMENTS ELIGIBLE UNDER ARTICLE 41.1H OF THE LAW OF 20 DECEMBER 2002Australia & New Zealand C/P USD 02/08/2011 3,500,000 3,494,433 4.19Bank Of Western Australia C/P USD 06/07/2011 3,500,000 3,495,482 4.20BNP Paribas S.A. C/P USD 20/04/2011 3,000,000 2,998,843 3.60Caisse Des Depots C/P USD 10/03/2011 3,000,000 2,999,667 3.60Credit Agricole CIB Australia C/D USD 09/05/2011 2,000,000 1,998,841 2.40KFW Bankengruppe C/P USD 09/03/2011 3,000,000 2,999,833 3.60KFW Bankengruppe C/P USD 16/05/2011 3,000,000 2,998,107 3.60Lloyds TSB Bank C/P USD 01/04/2011 5,000,000 5,002,549 6.01Nordea Bank AB C/P USD 06/07/2011 3,500,000 3,495,897 4.20Royal Bank Of Scotland C/P USD 08/04/2011 6,500,000 6,501,747 7.81Treasury Corp Of Victoria C/P USD 15/04/2011 4,000,000 3,998,633 4.80Westpac Banking Corp C/P USD 02/03/2011 5,000,000 5,000,000 6.00
TOTAL MONEY MARKET INSTRUMENTS ELIGIBLE UNDER ARTICLE41.1H OF THE LAW OF 20 DECEMBER 2002 44,984,032 54.01
OPEN-ENDED FUNDSShort-Term Investments Co Global Series - US Dollar Liquidity Portfolio 8,500,000 8,500,000 10.20
TOTAL OPEN-ENDED FUNDS 8,500,000 10.20
TotalInvestments 53,484,032 64.21
The accompanying notes form an integral part of these financial statements.

Invesco Euro Reserve Fund
65 Invesco Funds
Statement of Investments as at 28 February 2011
Investment Nominal/Shares Market Value Net AssetsEUR %
TRANSFERABLE SECURITIES ADMITTED TO AN OFFICIAL STOCK EXCHANGE LISTING OR DEALT IN ON ANOTHERREGULATED MARKET
BONDSBNP Paribas 4.75% EUR 04/04/2011 2,186,000 2,193,841 0.62
TOTAL BONDS 2,193,841 0.62
TOTAL TRANSFERABLE SECURITIES ADMITTED TO AN OFFICIAL STOCK EXCHANGELISTING OR DEALT IN ON ANOTHER REGULATED MARKET 2,193,841 0.62
MONEY MARKET INSTRUMENTS ELIGIBLE UNDER ARTICLE 41.1H OF THE LAW OF 20 DECEMBER 2002Bank Of Tokyo Mitsubishi C/D EUR 19/04/2011 15,000,000 14,984,817 4.28Barclays Bank Plc C/P EUR 10/03/2011 15,000,000 14,997,435 4.28BNP Paribas C/P EUR 06/04/2011 10,000,000 9,992,205 2.85Bnz International C/P EUR 26/04/2011 15,000,000 14,983,404 4.28Cancara Asset Securitisation C/P EUR 21/03/2011 10,000,000 9,995,830 2.86Credit Agricole S.A. C/D EUR 01/04/2011 5,000,000 4,996,184 1.43Credit Agricole S.A. C/D EUR 01/06/2011 10,000,000 9,973,077 2.85HSBC Bank C/D EUR 07/03/2011 15,000,000 15,000,035 4.29Jupiter Securitization Corp C/P EUR 10/03/2011 10,000,000 9,997,950 2.86Nordea AB C/P EUR 01/03/2011 15,000,000 14,999,669 4.29Rabobank Nederland C/P EUR 22/03/2011 20,000,000 19,991,581 5.71Sheffield Receivables Corp C/P EUR 08/03/2011 10,000,000 9,998,694 2.86Societe Generale C/P EUR 01/04/2011 10,000,000 9,992,987 2.86Societe Generale C/P EUR 03/05/2011 10,000,000 9,983,967 2.85Solitaire Funding C/P EUR 21/03/2011 11,000,000 10,995,412 3.14Svenska Handel C/P EUR 07/03/2011 15,000,000 14,997,620 4.28Svenska Handel C/P EUR 11/05/2011 10,000,000 9,983,039 2.85Unilever Fin C/P EUR 08/03/2011 12,200,000 12,197,917 3.49
TOTAL MONEY MARKET INSTRUMENTS ELIGIBLE UNDER ARTICLE41.1H OF THE LAW OF 20 DECEMBER 2002 218,061,823 62.31
OPEN-ENDED FUNDSShort-Term Investments Co Global Series - Euro Liquidity Portfolio 33,625,000 33,625,000 9.61
TOTAL OPEN-ENDED FUNDS 33,625,000 9.61
TotalInvestments 253,880,664 72.54
The accompanying notes form an integral part of these financial statements.

Invesco Global Bond Fund
66 Invesco Funds
Statement of Investments as at 28 February 2011
Investment Nominal/Shares Market Value Net AssetsUSD %
TRANSFERABLE SECURITIES ADMITTED TO AN OFFICIAL STOCK EXCHANGE LISTING OR DEALT IN ON ANOTHERREGULATED MARKET
BONDSAbbey National Treasury Services Plc 5.75% GBP 02/03/2026 250,000 410,020 1.22Belgium Government Bond 3.25% EUR 28/09/2016 600,000 811,583 2.41BP Capital Markets Plc 5.25% USD 07/11/2013 500,000 542,320 1.61Bundesrepublik Deutschland 2.5% EUR 10/10/2014 1,000,000 1,409,758 4.19Bundesrepublik Deutschland 2.5% EUR 04/01/2021 1,000,000 1,308,606 3.89Canadian Government Bond 3.5% CAD 01/06/2020 1,000,000 1,043,267 3.10Citigroup Inc 5.25% GBP 14/06/2011 500,000 818,186 2.43European Financial Stability Facility 2.75% EUR 18/07/2016 500,000 687,866 2.04European Union 2.5% EUR 04/12/2015 1,000,000 1,373,990 4.08HBOS Plc FRN AUD 01/05/2017 1,000,000 867,057 2.58Hongkong & Shanghai Banking Corp Ltd FRN USD Perpetual 1,705,000 1,703,295 5.06Italy Buoni Poliennali Del Tesoro 3% EUR 15/04/2015 1,000,000 1,347,559 4.01Italy Buoni Poliennali Del Tesoro 3.75% EUR 01/03/2021 1,500,000 1,906,687 5.67Italy Buoni Poliennali Del Tesoro 4% EUR 01/09/2020 500,000 654,873 1.95JPMorgan Chase & Co 4.95% USD 25/03/2020 1,000,000 1,028,229 3.06Lloyds TSB Bank Plc 3.375% EUR 17/03/2015 500,000 683,844 2.03Lloyds TSB Bank Plc 5.8% USD 13/01/2020 250,000 249,091 0.74Merrill Lynch & Co Inc 5.75% GBP 12/12/2014 500,000 858,892 2.55Morgan Stanley 5.5% USD 26/01/2020 500,000 507,407 1.51National Australia Bank Ltd 3.625% GBP 08/11/2017 500,000 768,673 2.29Northern Rock Asset Management Plc 5.625% USD 22/06/2017 1,000,000 1,015,775 3.02Republic of Italy 5.375% USD 15/06/2033 400,000 399,600 1.19Royal Bank of Scotland FRN USD 11/04/2016 250,000 211,711 0.63Royal Bank of Scotland Plc 3.625% EUR 17/05/2013 500,000 690,165 2.05Spain Government Bond 2.75% USD 05/03/2012 1,000,000 1,009,870 3.00Spain Government Bond 3% EUR 30/04/2015 500,000 662,219 1.97Spain Government Bond 3.625% USD 17/06/2013 1,500,000 1,526,700 4.54Sweden Government Bond 4.5% SEK 12/08/2015 4,000,000 668,069 1.99United Kingdom Gilt 4.25% GBP 07/12/2040 500,000 793,027 2.36United States Treasury Note/Bond 2.625% USD 15/08/2020 1,000,000 941,680 2.80United States Treasury Note/Bond 3.5% USD 15/05/2020 1,000,000 1,018,203 3.03United States Treasury Note/Bond 3.875% USD 15/08/2040 1,000,000 897,773 2.67United States Treasury Note/Bond 4.125% USD 15/05/2015 600,000 658,570 1.96United States Treasury Note/Bond 4.25% USD 15/08/2015 520,000 573,564 1.70United States Treasury Note/Bond 4.5% USD 15/08/2039 2,000,000 2,005,078 5.96United States Treasury Note/Bond 4.625% USD 15/02/2017 800,000 896,937 2.67
TOTAL BONDS 32,950,144 97.96
TOTAL TRANSFERABLE SECURITIES ADMITTED TO AN OFFICIAL STOCK EXCHANGELISTING OR DEALT IN ON ANOTHER REGULATED MARKET 32,950,144 97.96
TotalInvestments 32,950,144 97.96
The accompanying notes form an integral part of these financial statements.

Invesco European Bond Fund
67 Invesco Funds
Statement of Investments as at 28 February 2011
Investment Nominal/Shares Market Value Net AssetsEUR %
TRANSFERABLE SECURITIES ADMITTED TO AN OFFICIAL STOCK EXCHANGE LISTING OR DEALT IN ON ANOTHERREGULATED MARKET
BONDSAbbey National Treasury Services Plc 3.375% EUR 08/06/2015 650,000 637,442 1.35Abbey National Treasury Services Plc 3.375% EUR 20/10/2015 270,000 258,374 0.55Anheuser-Busch InBev NV 7.375% EUR 30/01/2013 300,000 327,141 0.69ArcelorMittal 8.25% EUR 03/06/2013 350,000 388,657 0.82Ardagh Packaging Finance Plc 7.375% EUR 15/10/2017 100,000 103,810 0.22AXA SA FRN GBP Perpetual 400,000 421,951 0.89BAA Funding Ltd 6.25% GBP 10/09/2018 380,000 454,288 0.96Banco Popolare SC 6% EUR 05/11/2020 350,000 338,691 0.72Banco Santander Totta SA 3.75% EUR 12/06/2012 400,000 397,046 0.84Bank of America Corp 4.625% EUR 07/08/2017 600,000 598,860 1.27Banque PSA Finance 4.25% EUR 25/02/2016 350,000 350,353 0.74BAT International Finance Plc 5.875% EUR 12/03/2015 250,000 274,920 0.58Belgium Government Bond 4% EUR 28/03/2022 700,000 683,427 1.45Belgium Government Bond 5.5% EUR 28/09/2017 500,000 547,540 1.16British Telecommunications Plc 6.5% EUR 07/07/2015 200,000 223,595 0.47Bundesrepublik Deutschland 1.75% EUR 09/10/2015 6,830,000 6,688,243 14.15Bundesrepublik Deutschland 4.75% EUR 04/07/2040 3,950,000 4,777,525 10.11Casino Guichard Perrachon SA 4.481% EUR 12/11/2018 200,000 202,263 0.43Cloverie Plc for Zurich Insurance Co Ltd FRN EUR 24/07/2039 150,000 165,056 0.35Coca-Cola Enterprises Inc 3.125% EUR 29/09/2017 700,000 675,185 1.43CRH Finance UK Plc 8.25% GBP 24/04/2015 300,000 395,390 0.84European Investment Bank 2.5% CHF 08/02/2019 750,000 608,463 1.29F Van Lanschot Bankiers NV 3.5% EUR 02/04/2013 500,000 496,909 1.05FCE Bank Plc 5.125% GBP 16/11/2015 50,000 57,430 0.12Finland Government Bond 4.375% EUR 04/07/2019 200,000 216,737 0.46France Government Bond OAT 4% EUR 25/10/2038 460,000 461,854 0.98G4S Plc 7.75% GBP 13/05/2019 500,000 663,349 1.40Glencore Finance Europe SA 5.25% EUR 11/10/2013 400,000 420,930 0.89Glencore Finance Europe SA 7.125% EUR 23/04/2015 200,000 221,230 0.47Infinis Plc 9.125% GBP 15/12/2014 110,000 138,041 0.29ING Bank NV 3% EUR 30/09/2014 550,000 552,739 1.17International Power Finance 2010 Plc 7.25% EUR 11/05/2017 200,000 232,505 0.49Intesa Sanpaolo SpA 3.25% EUR 01/02/2013 500,000 499,703 1.06Intesa Sanpaolo SpA 6.625% EUR 08/05/2018 300,000 301,637 0.64ISS Financing Plc 11% EUR 15/06/2014 250,000 277,383 0.59Italy Buoni Ordinari Del Tesoro BOT 0% EUR 29/07/2011 2,500,000 2,487,813 5.26Italy Buoni Poliennali Del Tesoro 3.75% EUR 01/08/2016 800,000 796,012 1.69Italy Buoni Poliennali Del Tesoro 3.75% EUR 01/03/2021 2,330,000 2,142,994 4.54Italy Buoni Poliennali Del Tesoro 5% EUR 01/09/2040 550,000 509,658 1.08La Caja de Ahorros y Pensiones de Barcelona 3.125% EUR 16/09/2013 450,000 440,318 0.93Morgan Stanley 5.375% EUR 10/08/2020 250,000 247,183 0.52Netherlands Government Bond 4% EUR 15/07/2019 320,000 338,958 0.72OI European Group BV 6.75% EUR 15/09/2020 200,000 207,615 0.44Permanent Master Issuer Plc FRN EUR 15/07/2042 350,000 353,252 0.75Picard Bondco SA 9% EUR 01/10/2018 100,000 109,463 0.23Poland Government Bond 4.75% PLN 25/04/2012 2,110,000 531,276 1.12Portugal Treasury Bill 0% EUR 19/08/2011 1,000,000 986,975 2.09Praktiker Bau- und Heimwerkermaerkte Holding AG 5.875% EUR 10/02/2016 200,000 203,570 0.43Royal Bank of Scotland Plc 6.934% EUR 09/04/2018 200,000 193,259 0.41Schiphol Nederland BV 6.625% EUR 23/01/2014 305,000 336,395 0.71Scottish & Southern Energy Plc FRN GBP Perpetual 200,000 228,525 0.48SNS Bank NV 6.25% EUR 26/10/2020 400,000 332,000 0.70Societa Iniziative Autostradali e Servizi SpA 4.5% EUR 26/10/2020 350,000 330,769 0.70Spain Government Bond 4% EUR 30/04/2020 930,000 854,358 1.81Spain Government Bond 4.2% EUR 31/01/2037 800,000 614,288 1.30Spain Government Bond 5.5% EUR 30/04/2021 600,000 606,126 1.28SPI Australia Assets Pty Ltd 5.125% GBP 11/02/2021 200,000 236,295 0.50Suez Environnement Co FRN EUR Perpetual 250,000 242,500 0.51

Invesco European Bond Fund
68 Invesco Funds
Statement of Investments as at 28 February 2011
Investment Nominal/Shares Market Value Net AssetsEUR %
BONDS (CONTINUED)Telefonica Emisiones SAU 4.75% EUR 07/02/2017 200,000 202,844 0.43Telefonica Emisiones SAU 5.496% EUR 01/04/2016 200,000 211,648 0.45UniCredit Bank AG 6% EUR 05/02/2014 400,000 417,814 0.88United Kingdom Gilt 4.25% GBP 07/03/2036 660,000 758,111 1.60United Kingdom Gilt 4.25% GBP 07/12/2055 1,250,000 1,454,106 3.08United Kingdom Gilt 4.75% GBP 07/03/2020 1,990,000 2,538,475 5.37
TOTAL BONDS 42,971,267 90.93
TOTAL TRANSFERABLE SECURITIES ADMITTED TO AN OFFICIAL STOCK EXCHANGELISTING OR DEALT IN ON ANOTHER REGULATED MARKET 42,971,267 90.93
TotalInvestments 42,971,267 90.93
The accompanying notes form an integral part of these financial statements.
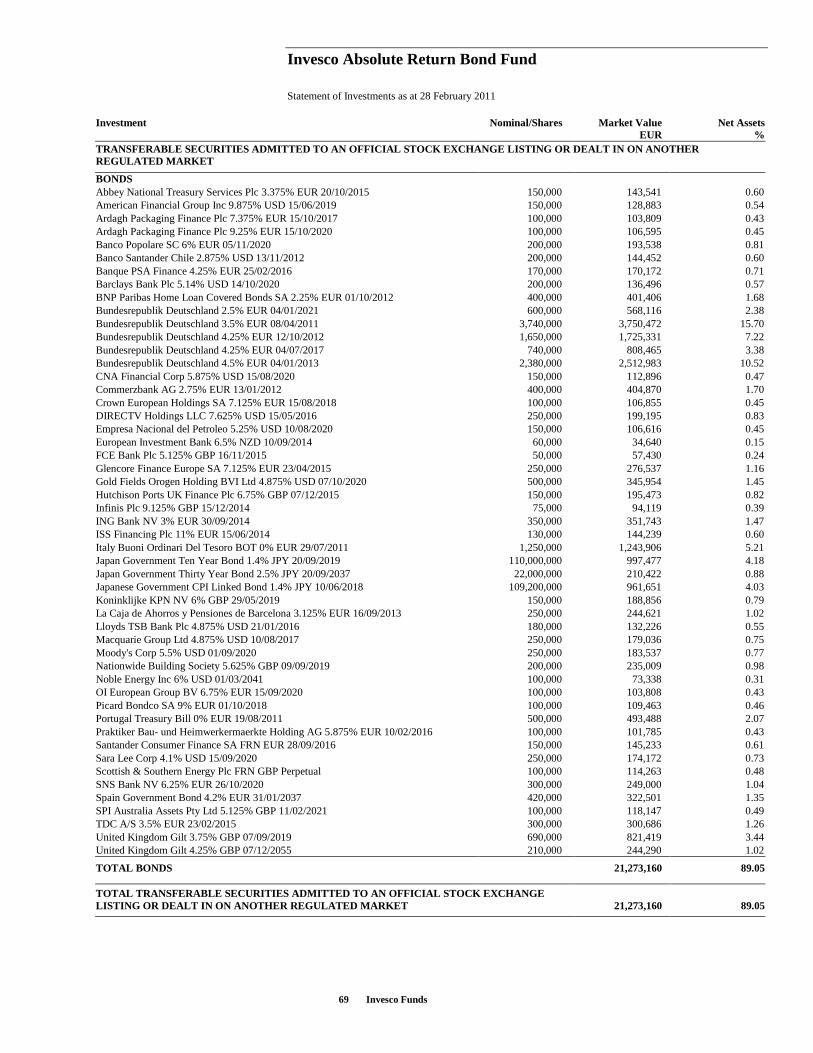
Invesco Absolute Return Bond Fund
69 Invesco Funds
Statement of Investments as at 28 February 2011
Investment Nominal/Shares Market Value Net AssetsEUR %
TRANSFERABLE SECURITIES ADMITTED TO AN OFFICIAL STOCK EXCHANGE LISTING OR DEALT IN ON ANOTHERREGULATED MARKET
BONDSAbbey National Treasury Services Plc 3.375% EUR 20/10/2015 150,000 143,541 0.60American Financial Group Inc 9.875% USD 15/06/2019 150,000 128,883 0.54Ardagh Packaging Finance Plc 7.375% EUR 15/10/2017 100,000 103,809 0.43Ardagh Packaging Finance Plc 9.25% EUR 15/10/2020 100,000 106,595 0.45Banco Popolare SC 6% EUR 05/11/2020 200,000 193,538 0.81Banco Santander Chile 2.875% USD 13/11/2012 200,000 144,452 0.60Banque PSA Finance 4.25% EUR 25/02/2016 170,000 170,172 0.71Barclays Bank Plc 5.14% USD 14/10/2020 200,000 136,496 0.57BNP Paribas Home Loan Covered Bonds SA 2.25% EUR 01/10/2012 400,000 401,406 1.68Bundesrepublik Deutschland 2.5% EUR 04/01/2021 600,000 568,116 2.38Bundesrepublik Deutschland 3.5% EUR 08/04/2011 3,740,000 3,750,472 15.70Bundesrepublik Deutschland 4.25% EUR 12/10/2012 1,650,000 1,725,331 7.22Bundesrepublik Deutschland 4.25% EUR 04/07/2017 740,000 808,465 3.38Bundesrepublik Deutschland 4.5% EUR 04/01/2013 2,380,000 2,512,983 10.52CNA Financial Corp 5.875% USD 15/08/2020 150,000 112,896 0.47Commerzbank AG 2.75% EUR 13/01/2012 400,000 404,870 1.70Crown European Holdings SA 7.125% EUR 15/08/2018 100,000 106,855 0.45DIRECTV Holdings LLC 7.625% USD 15/05/2016 250,000 199,195 0.83Empresa Nacional del Petroleo 5.25% USD 10/08/2020 150,000 106,616 0.45European Investment Bank 6.5% NZD 10/09/2014 60,000 34,640 0.15FCE Bank Plc 5.125% GBP 16/11/2015 50,000 57,430 0.24Glencore Finance Europe SA 7.125% EUR 23/04/2015 250,000 276,537 1.16Gold Fields Orogen Holding BVI Ltd 4.875% USD 07/10/2020 500,000 345,954 1.45Hutchison Ports UK Finance Plc 6.75% GBP 07/12/2015 150,000 195,473 0.82Infinis Plc 9.125% GBP 15/12/2014 75,000 94,119 0.39ING Bank NV 3% EUR 30/09/2014 350,000 351,743 1.47ISS Financing Plc 11% EUR 15/06/2014 130,000 144,239 0.60Italy Buoni Ordinari Del Tesoro BOT 0% EUR 29/07/2011 1,250,000 1,243,906 5.21Japan Government Ten Year Bond 1.4% JPY 20/09/2019 110,000,000 997,477 4.18Japan Government Thirty Year Bond 2.5% JPY 20/09/2037 22,000,000 210,422 0.88Japanese Government CPI Linked Bond 1.4% JPY 10/06/2018 109,200,000 961,651 4.03Koninklijke KPN NV 6% GBP 29/05/2019 150,000 188,856 0.79La Caja de Ahorros y Pensiones de Barcelona 3.125% EUR 16/09/2013 250,000 244,621 1.02Lloyds TSB Bank Plc 4.875% USD 21/01/2016 180,000 132,226 0.55Macquarie Group Ltd 4.875% USD 10/08/2017 250,000 179,036 0.75Moody's Corp 5.5% USD 01/09/2020 250,000 183,537 0.77Nationwide Building Society 5.625% GBP 09/09/2019 200,000 235,009 0.98Noble Energy Inc 6% USD 01/03/2041 100,000 73,338 0.31OI European Group BV 6.75% EUR 15/09/2020 100,000 103,808 0.43Picard Bondco SA 9% EUR 01/10/2018 100,000 109,463 0.46Portugal Treasury Bill 0% EUR 19/08/2011 500,000 493,488 2.07Praktiker Bau- und Heimwerkermaerkte Holding AG 5.875% EUR 10/02/2016 100,000 101,785 0.43Santander Consumer Finance SA FRN EUR 28/09/2016 150,000 145,233 0.61Sara Lee Corp 4.1% USD 15/09/2020 250,000 174,172 0.73Scottish & Southern Energy Plc FRN GBP Perpetual 100,000 114,263 0.48SNS Bank NV 6.25% EUR 26/10/2020 300,000 249,000 1.04Spain Government Bond 4.2% EUR 31/01/2037 420,000 322,501 1.35SPI Australia Assets Pty Ltd 5.125% GBP 11/02/2021 100,000 118,147 0.49TDC A/S 3.5% EUR 23/02/2015 300,000 300,686 1.26United Kingdom Gilt 3.75% GBP 07/09/2019 690,000 821,419 3.44United Kingdom Gilt 4.25% GBP 07/12/2055 210,000 244,290 1.02
TOTAL BONDS 21,273,160 89.05
TOTAL TRANSFERABLE SECURITIES ADMITTED TO AN OFFICIAL STOCK EXCHANGELISTING OR DEALT IN ON ANOTHER REGULATED MARKET 21,273,160 89.05

Invesco Absolute Return Bond Fund
70 Invesco Funds
Statement of Investments as at 28 February 2011
Investment Nominal/Shares Market Value Net AssetsEUR %
OTHER TRANSFERABLE SECURITIES
BONDSABN Amro Bank NV 3% USD 31/01/2014 220,000 159,791 0.67FNMA TBA 30yr 6% USD Perpetual 750,000 589,394 2.47Rockwood Specialties Group Inc 7.625% EUR 15/11/2014 150,000 154,500 0.64
TOTAL BONDS 903,685 3.78
TOTAL OTHER TRANSFERABLE SECURITIES 903,685 3.78
TotalInvestments 22,176,845 92.83
The accompanying notes form an integral part of these financial statements.

Invesco Euro Corporate Bond Fund
71 Invesco Funds
Statement of Investments as at 28 February 2011
Investment Nominal/Shares Market Value Net AssetsEUR %
TRANSFERABLE SECURITIES ADMITTED TO AN OFFICIAL STOCK EXCHANGE LISTING OR DEALT IN ON ANOTHERREGULATED MARKET
BONDSA2A SpA 4.5% EUR 02/11/2016 3,500,000 3,554,180 0.17Abbey National Treasury Services Plc 3.125% EUR 30/06/2014 10,000,000 9,862,350 0.46ABN Amro Bank NV FRN EUR Perpetual 9,000,000 6,974,955 0.32AGCO Corp 6.875% EUR 15/04/2014 2,727,000 2,788,358 0.13Alliander NV FRN EUR Perpetual 10,000,000 9,907,400 0.46America Movil SAB de CV 3.75% EUR 28/06/2017 10,000,000 9,990,100 0.47Anglo American Capital Plc 4.25% EUR 30/09/2013 4,000,000 4,160,540 0.19Anheuser-Busch InBev NV 4% EUR 26/04/2018 7,000,000 7,117,950 0.33AP Moller - Maersk A/S 4.375% EUR 24/11/2017 8,500,000 8,603,403 0.40AP Moller - Maersk A/S 4.875% EUR 30/10/2014 4,000,000 4,193,280 0.20Areva SA 3.875% EUR 23/09/2016 2,000,000 2,008,260 0.09Areva SA 4.375% EUR 06/11/2019 3,000,000 3,016,320 0.14ASML Holding NV 5.75% EUR 13/06/2017 8,500,000 9,079,317 0.42Assicurazioni Generali SpA 5.125% EUR 16/09/2024 2,500,000 2,538,587 0.12Australia & New Zealand Banking Group Ltd 3.75% EUR 10/03/2017 8,000,000 7,963,200 0.37Autoroutes du Sud de la France 4.125% EUR 13/04/2020 4,000,000 3,953,904 0.18Aviva Plc FRN EUR Perpetual 5,500,000 4,806,918 0.22AXA SA FRN EUR 16/04/2040 5,000,000 4,641,725 0.22Banco Popolare SC 6% EUR 05/11/2020 8,000,000 7,741,520 0.36Banco Popular Espanol SA 3.5% EUR 13/09/2013 15,000,000 14,552,310 0.68Bank of America Corp 4% EUR 23/03/2015 5,300,000 5,301,298 0.25Bank of America Corp 4.625% EUR 07/08/2017 10,000,000 9,981,000 0.46Bank of America Corp 4.75% EUR 03/04/2017 12,500,000 12,494,687 0.58Bank of America Corp 6.25% EUR 11/09/2018 4,000,000 4,336,800 0.20Bank of Scotland Plc FRN EUR 07/02/2035 14,324,000 10,420,710 0.49Barclays Bank Plc FRN EUR 20/04/2016 9,050,000 9,039,457 0.42Barclays Bank Plc FRN EUR 30/05/2017 10,000,000 9,579,820 0.45Barclays Bank Plc 4% EUR 20/01/2017 10,000,000 9,936,550 0.46Barclays Bank Plc FRN EUR Perpetual 50,730,000 36,289,959 1.69Barclays Bank Plc 4.875% EUR 13/08/2019 5,000,000 5,069,600 0.24BAT International Finance Plc 4.875% EUR 24/02/2021 3,000,000 3,132,360 0.15Bayer AG FRN EUR 29/07/2105 29,981,000 29,709,522 1.38BBVA Senior Finance SAU 3.25% EUR 23/04/2015 27,000,000 25,483,005 1.19BNP Paribas FRN EUR Perpetual 19,850,000 21,154,443 0.99BNP Paribas Capital Trust III FRN EUR Perpetual 5,000,000 5,011,750 0.23BPCE SA FRN EUR Perpetual 13,500,000 13,671,450 0.64Bradford & Bingley Plc FRN EUR 20/09/2011 3,550,000 3,484,875 0.16Bundesobligation 2.5% EUR 27/02/2015 40,000,000 40,650,600 1.89Bundesrepublik Deutschland 2.5% EUR 10/10/2014 40,000,000 40,802,000 1.90Bundesrepublik Deutschland 2.5% EUR 04/01/2021 120,000,000 113,623,200 5.29Caisse Centrale du Credit Immobilier de France 3.75% EUR 22/01/2015 5,000,000 4,961,400 0.23Caisse Centrale du Credit Immobilier de France 4% EUR 12/01/2018 10,000,000 9,681,100 0.45Carrefour SA 4% EUR 09/04/2020 5,000,000 4,944,550 0.23CDP Financial Inc 3.5% EUR 23/06/2020 41,950,000 40,615,990 1.89Celesio Finance B.V. 4.5% EUR 26/04/2017 8,000,000 7,952,360 0.37Cemex Espana Luxembourg 9.25% USD 12/05/2020 15,122,000 11,269,986 0.52CIBC World Markets Plc FRN EUR 22/06/2017 2,500,000 2,384,750 0.11Cie des Alpes 4.875% EUR 18/10/2017 8,000,000 7,954,080 0.37Citigroup Inc FRN EUR 25/02/2030 3,000,000 2,438,445 0.11Citigroup Inc 7.375% EUR 04/09/2019 2,000,000 2,295,690 0.11CL Capital Trust I FRN EUR Perpetual 18,560,000 18,357,139 0.86CNP Assurances FRN EUR 14/09/2040 10,000,000 9,747,700 0.45Coca-Cola HBC Finance BV 4.25% EUR 16/11/2016 4,000,000 4,094,080 0.19Commonwealth Bank of Australia FRN EUR 10/03/2016 5,000,000 4,736,750 0.22Commonwealth Bank of Australia FRN EUR 31/03/2016 3,000,000 2,842,800 0.13Commonwealth Bank of Australia 5.5% EUR 06/08/2019 2,000,000 2,070,190 0.10Co-Operative Bank Plc FRN EUR 18/05/2016 3,000,000 2,805,000 0.13Cooperative Centrale Raiffeisen-Boerenleenbank BA 3.75% EUR 09/11/2020 10,000,000 9,143,750 0.43

Invesco Euro Corporate Bond Fund
72 Invesco Funds
Statement of Investments as at 28 February 2011
Investment Nominal/Shares Market Value Net AssetsEUR %
BONDS (CONTINUED)Credit Agricole SA FRN EUR Perpetual 5,700,000 5,818,076 0.27Crown European Holdings SA 7.125% EUR 15/08/2018 3,000,000 3,205,650 0.15Danske Bank A/S FRN EUR 18/08/2014 2,000,000 2,011,667 0.09Deutsche Bank AG FRN EUR 22/09/2015 12,751,000 12,201,151 0.57Deutsche Bank AG FRN EUR 20/09/2016 500,000 473,334 0.02Deutsche Bank Capital Funding Trust XI 9.5% EUR Perpetual 5,000,000 5,405,375 0.25Deutsche Telekom International Finance BV 4.25% EUR 16/03/2020 4,000,000 3,981,300 0.19Deutsche Telekom International Finance BV 4.375% EUR 02/06/2014 5,000,000 5,214,550 0.24Deutsche Telekom International Finance BV 4.875% EUR 22/04/2025 9,000,000 8,874,450 0.41DONG Energy A/S 4.875% EUR 16/12/2021 3,000,000 3,099,645 0.14DONG Energy A/S FRN EUR 06/01/3010 7,000,000 7,408,422 0.35EADS Finance BV 4.625% EUR 12/08/2016 4,000,000 4,209,200 0.20EDF SA 4.5% EUR 12/11/2040 10,000,000 9,228,350 0.43EDF SA 4.625% EUR 26/04/2030 30,000,000 28,974,000 1.35Enagas 3.25% EUR 06/07/2012 2,500,000 2,526,262 0.12Fortis Bank SA/NV FRN EUR 14/02/2018 8,940,000 8,325,420 0.39France Telecom SA 3.875% EUR 09/04/2020 10,000,000 9,887,500 0.46Galeries Lafayette SA 4.5% EUR 28/04/2017 20,000,000 19,839,800 0.92Gas Natural Capital Markets SA 3.125% EUR 02/11/2012 1,500,000 1,505,152 0.07Gas Natural Capital Markets SA 5.125% EUR 02/11/2021 10,000,000 9,378,450 0.44GE Capital European Funding 4.25% EUR 01/03/2017 6,000,000 6,125,760 0.29General Electric Capital Corp FRN EUR 15/09/2066 5,999,000 5,388,782 0.25General Electric Capital Corp FRN EUR 15/09/2067 28,500,000 26,583,375 1.24General Motors Co 0% USD 01/12/2013 21,400 783,427 0.04GMAC International Finance BV 7.5% EUR 21/04/2015 10,000,000 10,672,150 0.50Groupe des Assurances Mutuelles Agricoles FRN EUR Perpetual 5,000,000 3,763,400 0.18Groupe des Assurances Mutuelles Agricoles FRN EUR 27/10/2039 8,000,000 7,823,640 0.36Hannover Finance Luxembourg SA FRN EUR 14/09/2040 8,000,000 7,680,560 0.36HBOS Plc 4.875% EUR 20/03/2015 1,500,000 1,445,108 0.07Hertz Holdings Netherlands BV 8.5% EUR 31/07/2015 3,500,000 3,825,220 0.18HSBC Bank Plc FRN EUR 18/03/2016 1,000,000 1,000,000 0.05HSBC Capital Funding LP FRN EUR Perpetual 20,000,000 19,735,100 0.92HSBC Capital Funding LP FRN EUR Perpetual 5,000,000 5,224,100 0.24Hutchison Whampoa Finance 09 Ltd 4.75% EUR 14/11/2016 8,000,000 8,308,960 0.39Iberdrola Finanzas SAU 3.875% EUR 10/02/2014 4,500,000 4,539,802 0.21Iberdrola Finanzas SAU 4.125% EUR 23/03/2020 4,500,000 4,227,367 0.20ING Groep NV FRN EUR Perpetual 2,000,000 1,720,010 0.08ING Verzekeringen NV 0% EUR 31/05/2011 13,000,000 12,916,150 0.60Intesa Sanpaolo SpA 5% EUR 27/01/2021 15,000,000 15,053,175 0.70Intesa Sanpaolo SpA FRN EUR Perpetual 9,000,000 8,777,880 0.41Iron Mountain Inc 6.75% EUR 15/10/2018 5,600,000 5,628,000 0.26Italy Buoni Poliennali Del Tesoro 2.25% EUR 01/11/2013 50,000,000 48,814,250 2.27Italy Buoni Poliennali Del Tesoro 3.75% EUR 01/03/2021 40,000,000 36,789,600 1.71JPMorgan Chase & Co 0% EUR 31/01/2014 2,800,000 2,554,972 0.12JPMorgan Chase & Co FRN EUR 30/01/2014 5,000,000 4,903,555 0.23JPMorgan Chase & Co 3.875% EUR 23/09/2020 17,000,000 16,142,350 0.75Koninklijke KPN NV 5.625% EUR 30/09/2024 7,000,000 7,478,450 0.35Lagardere SCA 4.875% EUR 06/10/2014 23,200,000 23,732,672 1.11LBG Capital No.1 Plc 6.439% EUR 23/05/2020 72,469,000 62,685,685 2.92Legrand France SA 8.5% USD 15/02/2025 3,000,000 2,553,436 0.12Lloyds TSB Bank Plc 6.375% EUR 17/06/2016 3,000,000 3,203,153 0.15Lloyds TSB Bank Plc 6.5% EUR 24/03/2020 20,000,000 19,126,680 0.89Lottomatica SpA 5.375% EUR 05/12/2016 9,000,000 9,131,625 0.43McDonald's Corp 4% EUR 17/02/2021 17,500,000 17,647,105 0.82Merck Financial Services GmbH 4.5% EUR 24/03/2020 5,000,000 5,144,650 0.24Merrill Lynch & Co Inc FRN EUR 14/09/2018 5,000,000 4,308,070 0.20Morgan Stanley FRN EUR 23/09/2019 10,000,000 9,935,000 0.46Morgan Stanley 4.5% EUR 29/10/2014 3,500,000 3,555,773 0.17Motability Operations Group Plc 3.75% EUR 29/11/2017 9,000,000 8,952,795 0.42National Australia Bank Ltd FRN EUR 07/04/2016 7,000,000 6,985,433 0.33National Australia Bank Ltd 3.5% EUR 23/01/2015 12,000,000 12,104,520 0.56

Invesco Euro Corporate Bond Fund
73 Invesco Funds
Statement of Investments as at 28 February 2011
Investment Nominal/Shares Market Value Net AssetsEUR %
BONDS (CONTINUED)National Australia Bank Ltd 4.625% EUR 10/02/2020 5,000,000 4,802,670 0.22National Capital Instruments Euro LLC 2 FRN EUR Perpetual 14,300,000 11,064,625 0.52Nationwide Building Society FRN EUR 22/12/2016 5,000,000 4,725,000 0.22Nationwide Building Society 3.75% EUR 20/01/2015 8,000,000 7,885,440 0.37Natixis FRN EUR 26/01/2017 3,000,000 2,895,042 0.13Nederlandse Waterschapsbank NV FRN EUR 15/08/2035 5,682,000 4,843,905 0.23Neste Oil OYJ 4.875% EUR 06/07/2015 10,000,000 10,231,960 0.48Nomura Bank International Plc FRN EUR 16/02/2017 10,000,000 9,763,550 0.45Nomura Bank International Plc FRN EUR 30/09/2019 6,000,000 6,165,000 0.29OI European Group BV 6.75% EUR 15/09/2020 5,000,000 5,190,375 0.24Parpublica - Participiacoes Publicas SGPS SA 3.25% EUR 18/12/2014 4,000,000 3,801,600 0.18Pernod-Ricard SA 4.875% EUR 18/03/2016 7,000,000 7,135,415 0.33Portugal Telecom International Finance BV 5% EUR 04/11/2019 6,000,000 5,458,230 0.25Prysmian SpA 5.25% EUR 09/04/2015 5,900,000 6,062,250 0.28Rabobank Nederland NV 4.375% EUR 05/05/2016 3,000,000 3,121,800 0.15Rheinmetall AG 4% EUR 22/09/2017 3,000,000 2,992,710 0.14Rhodia SA 7% EUR 15/05/2018 7,000,000 7,507,500 0.35Royal Bank of Scotland Plc 3% EUR 08/09/2016 20,000,000 19,495,500 0.91Royal Bank of Scotland Plc 3.625% EUR 17/05/2013 1,202,000 1,200,505 0.06Royal Bank of Scotland Plc FRN EUR 28/01/2016 1,000,000 851,193 0.04Royal Bank of Scotland Plc 4.875% EUR 20/01/2017 10,000,000 9,866,550 0.46Royal Bank of Scotland Plc 5.375% EUR 30/09/2019 10,000,000 9,739,250 0.45Royal Bank of Scotland Plc 5.5% EUR 23/03/2020 10,000,000 9,766,350 0.45Royal Bank of Scotland Plc FRN EUR 23/04/2023 750,000 708,750 0.03RWE AG FRN EUR Perpetual 30,000,000 28,981,950 1.35Sanofi-Aventis SA 4.125% EUR 11/10/2019 4,000,000 4,083,020 0.19Santander International Debt SA Unipersonal 2.875% EUR 20/09/2013 20,000,000 19,515,700 0.91Santander Issuances S.A. Unipersonal FRN EUR 24/10/2017 3,000,000 2,878,080 0.13Santos Finance Ltd FRN EUR 22/09/2070 13,000,000 13,126,828 0.61SAP AG 2.5% EUR 10/04/2014 6,000,000 5,973,000 0.28SAP AG 3.5% EUR 10/04/2017 5,000,000 4,944,350 0.23Schneider Electric SA 2.875% EUR 20/07/2016 2,000,000 1,959,160 0.09Scottish & Southern Energy Plc FRN EUR Perpetual 33,300,000 32,717,250 1.52SG Capital Trust III FRN EUR Perpetual 8,000,000 7,446,280 0.35Siemens Financieringsmaatschappij NV FRN EUR 14/09/2066 9,400,000 9,456,447 0.44Skandinaviska Enskilda Banken AB FRN EUR 28/09/2017 3,000,000 2,947,500 0.14Smiths Group Plc 4.125% EUR 05/05/2017 18,000,000 17,682,228 0.82Societe Des Autoroutes Paris-Rhin-Rhone 5% EUR 12/01/2017 10,000,000 10,233,550 0.48Societe Generale FRN EUR Perpetual 29,550,000 29,619,147 1.38Societe Generale FRN EUR Perpetual 20,000,000 21,806,200 1.02Societe Nationale des Chemins de Fer Francais 4.125% EUR 19/02/2025 10,000,000 10,098,500 0.47Standard Chartered Bank FRN EUR 03/02/2017 1,000,000 994,335 0.05Standard Chartered Plc 3.625% EUR 15/12/2015 5,000,000 5,028,050 0.23Standard Life Plc FRN EUR 12/07/2022 600,000 611,712 0.03Suez Environnement Co FRN EUR Perpetual 24,200,000 23,474,000 1.09Suez Environnement Co 5.5% EUR 22/07/2024 5,000,000 5,469,475 0.25TDC A/S 4.375% EUR 23/02/2018 7,000,000 7,078,855 0.33Telecom Italia SpA 5.25% EUR 10/02/2022 10,000,000 9,628,130 0.45Telecom Italia SpA 5.25% EUR 17/03/2055 22,300,000 16,831,705 0.78Telefonica Emisiones SAU 3.661% EUR 18/09/2017 15,000,000 14,262,975 0.66Telefonica Emisiones SAU 4.375% EUR 02/02/2016 5,000,000 5,057,650 0.24Telefonica Emisiones SAU 4.693% EUR 11/11/2019 20,850,000 20,547,258 0.96Telenor ASA 4.125% EUR 26/03/2020 3,000,000 2,985,930 0.14TeliaSonera AB 4.75% EUR 16/11/2021 2,500,000 2,572,400 0.12Telstra Corp Ltd 4.25% EUR 23/03/2020 8,000,000 7,979,600 0.37TenneT Holding BV 4.625% EUR 21/02/2023 6,300,000 6,377,931 0.30TenneT Holding BV FRN EUR Perpetual 10,000,000 10,629,650 0.50Thames Water Utilities Cayman Finance Ltd 3.25% EUR 09/11/2016 10,000,000 9,808,300 0.46UBS AG 3.22% EUR 31/07/2012 21,500,000 11,542,813 0.54UBS AG 4.28% FRN EUR Perpetual 1,000,000 894,995 0.04UBS AG 7.152% FRN EUR Perpetual 6,200,000 6,332,742 0.29

Invesco Euro Corporate Bond Fund
74 Invesco Funds
Statement of Investments as at 28 February 2011
Investment Nominal/Shares Market Value Net AssetsEUR %
BONDS (CONTINUED)UBS Capital Securities Jersey Ltd FRN EUR Perpetual 11,850,000 12,465,785 0.58Unibail-Rodamco SE 3.875% EUR 05/11/2020 3,500,000 3,395,350 0.16UniCredit International Bank Luxembourg SA FRN EUR Perpetual 13,000,000 12,831,455 0.60Unicredit SpA 5.25% EUR 30/04/2023 10,000,000 10,172,800 0.47Unitymedia Hessen GmbH & Co KG 8.125% EUR 01/12/2017 10,000,000 10,762,500 0.50Vale SA 4.375% EUR 24/03/2018 15,000,000 15,107,700 0.70Veolia Environnement 4.247% EUR 06/01/2021 7,000,000 6,970,775 0.32Vivendi SA 4% EUR 31/03/2017 7,000,000 7,010,010 0.33Wal-Mart Stores Inc 4.875% EUR 21/09/2029 58,000,000 59,821,780 2.79Wereldhave NV 2.875% EUR 18/11/2015 11,000,000 10,862,500 0.51Wesfarmers Ltd 3.875% EUR 10/07/2015 8,000,000 8,149,520 0.38Westpac Securities NZ Ltd 3.875% EUR 20/03/2017 4,000,000 3,938,100 0.18
TOTAL BONDS 2,011,804,058 93.72
TOTAL TRANSFERABLE SECURITIES ADMITTED TO AN OFFICIAL STOCK EXCHANGELISTING OR DEALT IN ON ANOTHER REGULATED MARKET 2,011,804,058 93.72
OTHER TRANSFERABLE SECURITIES
BONDSCattles Plc 7.125% GBP 05/07/2017 400,000 16,400 –Millipore Corp 5.875% EUR 30/06/2016 4,000,000 4,390,000 0.21Telefonica S.A. FRN EUR 02/03/2015 3,000,000 2,811,825 0.13
TOTAL BONDS 7,218,225 0.34
TOTAL OTHER TRANSFERABLE SECURITIES 7,218,225 0.34
TotalInvestments 2,019,022,283 94.06
The accompanying notes form an integral part of these financial statements.
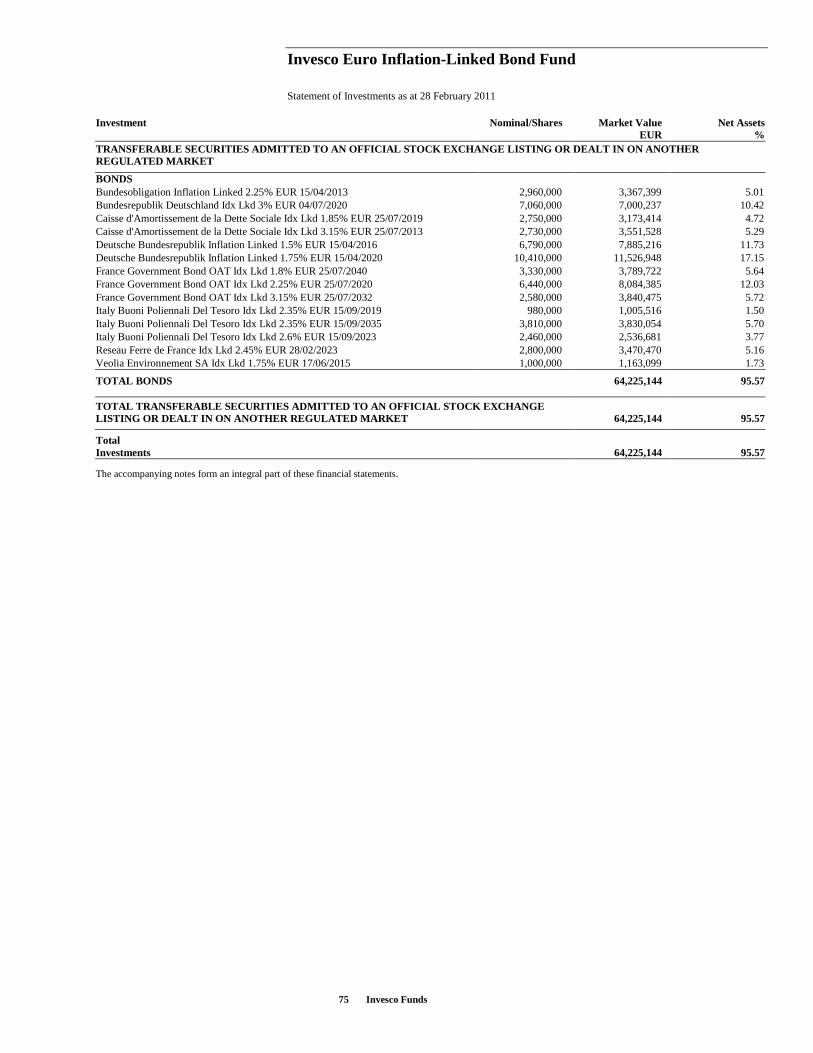
Invesco Euro Inflation-Linked Bond Fund
75 Invesco Funds
Statement of Investments as at 28 February 2011
Investment Nominal/Shares Market Value Net AssetsEUR %
TRANSFERABLE SECURITIES ADMITTED TO AN OFFICIAL STOCK EXCHANGE LISTING OR DEALT IN ON ANOTHERREGULATED MARKET
BONDSBundesobligation Inflation Linked 2.25% EUR 15/04/2013 2,960,000 3,367,399 5.01Bundesrepublik Deutschland Idx Lkd 3% EUR 04/07/2020 7,060,000 7,000,237 10.42Caisse d'Amortissement de la Dette Sociale Idx Lkd 1.85% EUR 25/07/2019 2,750,000 3,173,414 4.72Caisse d'Amortissement de la Dette Sociale Idx Lkd 3.15% EUR 25/07/2013 2,730,000 3,551,528 5.29Deutsche Bundesrepublik Inflation Linked 1.5% EUR 15/04/2016 6,790,000 7,885,216 11.73Deutsche Bundesrepublik Inflation Linked 1.75% EUR 15/04/2020 10,410,000 11,526,948 17.15France Government Bond OAT Idx Lkd 1.8% EUR 25/07/2040 3,330,000 3,789,722 5.64France Government Bond OAT Idx Lkd 2.25% EUR 25/07/2020 6,440,000 8,084,385 12.03France Government Bond OAT Idx Lkd 3.15% EUR 25/07/2032 2,580,000 3,840,475 5.72Italy Buoni Poliennali Del Tesoro Idx Lkd 2.35% EUR 15/09/2019 980,000 1,005,516 1.50Italy Buoni Poliennali Del Tesoro Idx Lkd 2.35% EUR 15/09/2035 3,810,000 3,830,054 5.70Italy Buoni Poliennali Del Tesoro Idx Lkd 2.6% EUR 15/09/2023 2,460,000 2,536,681 3.77Reseau Ferre de France Idx Lkd 2.45% EUR 28/02/2023 2,800,000 3,470,470 5.16Veolia Environnement SA Idx Lkd 1.75% EUR 17/06/2015 1,000,000 1,163,099 1.73
TOTAL BONDS 64,225,144 95.57
TOTAL TRANSFERABLE SECURITIES ADMITTED TO AN OFFICIAL STOCK EXCHANGELISTING OR DEALT IN ON ANOTHER REGULATED MARKET 64,225,144 95.57
TotalInvestments 64,225,144 95.57
The accompanying notes form an integral part of these financial statements.

Invesco UK Investment Grade Bond Fund
76 Invesco Funds
Statement of Investments as at 28 February 2011
Investment Nominal/Shares Market Value Net AssetsGBP %
TRANSFERABLE SECURITIES ADMITTED TO AN OFFICIAL STOCK EXCHANGE LISTING OR DEALT IN ON ANOTHERREGULATED MARKET
BONDSAnglo American Capital Plc 9.375% USD 08/04/2014 200,000 148,115 0.21Anheuser-Busch InBev Worldwide Inc 6.875% USD 15/11/2019 350,000 257,177 0.37Ardagh Packaging Finance Plc 7.375% EUR 15/10/2017 150,000 132,924 0.19Ardagh Packaging Finance Plc 9.25% EUR 15/10/2020 100,000 90,994 0.13BAA Funding Ltd 6.25% GBP 10/09/2018 490,000 500,057 0.71Banco Popolare SC 6% EUR 05/11/2020 500,000 413,031 0.59Banco Santander Chile 2.875% USD 13/11/2012 250,000 154,138 0.22Bank of America Corp 4.625% EUR 07/08/2017 450,000 383,409 0.55Bank of Scotland Plc 9.375% GBP 15/05/2021 500,000 552,476 0.79Banque PSA Finance 4.25% EUR 25/02/2016 550,000 469,978 0.67Barclays Bank Plc 5.14% USD 14/10/2020 400,000 233,038 0.33Barclays Bank Plc 5.75% GBP 17/08/2021 500,000 507,108 0.72Barclays Bank Plc 10% GBP 21/05/2021 300,000 368,439 0.52BAT International Finance Plc 6% GBP 24/11/2034 200,000 207,208 0.30BBVA International Preferred SA Unipersonal FRN GBP Perpetual 200,000 193,645 0.28BPCE SA FRN EUR Perpetual 350,000 302,569 0.43BSKYB Finance UK Plc 5.75% GBP 20/10/2017 400,000 430,667 0.61Cloverie Plc for Zurich Insurance Co Ltd FRN EUR 24/07/2039 200,000 187,865 0.27Compass Group Plc 7% GBP 08/12/2014 350,000 394,266 0.56CRH Finance UK Plc 8.25% GBP 24/04/2015 350,000 393,775 0.56Crown European Holdings SA 7.125% EUR 15/08/2018 150,000 136,824 0.19DIRECTV Holdings LLC 7.625% USD 15/05/2016 450,000 306,075 0.44DONG Energy A/S 5.75% GBP 09/04/2040 400,000 410,060 0.58EDF SA 6.25% GBP 30/05/2028 400,000 441,391 0.63European Bank for Reconstruction & Development 5.625% GBP 07/12/2028 500,000 565,037 0.80European Investment Bank 6% GBP 07/12/2028 1,350,000 1,584,235 2.26Experian Finance Plc 4.75% GBP 23/11/2018 170,000 170,662 0.24F Van Lanschot Bankiers NV 3.5% EUR 02/04/2013 600,000 509,019 0.72G4S Plc 7.75% GBP 13/05/2019 500,000 566,263 0.81GE Capital UK Funding 5.875% GBP 04/11/2020 650,000 687,140 0.98GE Capital UK Funding 8% GBP 14/01/2039 250,000 328,076 0.47Glencore Finance Europe SA 5.25% EUR 11/10/2013 400,000 359,324 0.51Glencore Finance Europe SA 6.5% GBP 27/02/2019 500,000 521,536 0.74Gold Fields Orogen Holding BVI Ltd 4.875% USD 07/10/2020 1,000,000 590,642 0.84HSBC Capital Funding LP FRN EUR Perpetual 250,000 200,264 0.29Hutchison Ports UK Finance Plc 6.75% GBP 07/12/2015 500,000 556,213 0.79Infinis Plc 9.125% GBP 15/12/2014 75,000 80,344 0.11Intesa Sanpaolo SpA 3.25% EUR 01/02/2013 700,000 597,194 0.85Iron Mountain Inc 7.25% GBP 15/04/2014 200,000 202,510 0.29ISS Financing Plc 11% EUR 15/06/2014 440,000 416,743 0.59Koninklijke KPN NV 6% GBP 29/05/2019 500,000 537,385 0.77Kreditanstalt für Wiederaufbau 5.5% GBP 07/12/2015 800,000 889,796 1.27Kreditanstalt für Wiederaufbau 5.55% GBP 07/06/2021 1,600,000 1,801,530 2.57La Caja de Ahorros y Pensiones de Barcelona 3.125% EUR 16/09/2013 800,000 668,221 0.95Lloyds TSB Bank Plc 4.875% USD 21/01/2016 700,000 438,953 0.63Man Group Plc 5% USD 09/08/2017 400,000 213,712 0.30McKesson Corp 4.75% USD 01/03/2021 360,000 225,452 0.32Merrill Lynch & Co Inc 7.75% GBP 30/04/2018 500,000 560,348 0.80Morgan Stanley 5.125% GBP 30/11/2015 500,000 516,122 0.74Motability Operations Group Plc 5.375% GBP 28/06/2022 400,000 409,251 0.58National Australia Bank Ltd 3.625% GBP 08/11/2017 770,000 731,165 1.04National Grid Plc 6.125% GBP 15/04/2014 300,000 325,305 0.46Nationwide Building Society 5.625% GBP 09/09/2019 700,000 702,147 1.00Noble Energy Inc 6% USD 01/03/2041 250,000 156,512 0.22OI European Group BV 6.75% EUR 15/09/2020 200,000 177,229 0.25Optus Finance Pty Ltd 4.625% USD 15/10/2019 400,000 247,731 0.35Picard Bondco SA 9% EUR 01/10/2018 150,000 140,163 0.20Praktiker Bau- und Heimwerkermaerkte Holding AG 5.875% EUR 10/02/2016 250,000 217,220 0.31

Invesco UK Investment Grade Bond Fund
77 Invesco Funds
Statement of Investments as at 28 February 2011
Investment Nominal/Shares Market Value Net AssetsGBP %
BONDS (CONTINUED)QBE Insurance Group Ltd 6.125% GBP 28/09/2015 500,000 526,716 0.75Rabobank Capital Funding Trust IV FRN GBP Perpetual 450,000 411,705 0.59Royal Bank of Scotland Plc 4.875% USD 16/03/2015 380,000 242,273 0.34Sara Lee Corp 4.1% USD 15/09/2020 600,000 356,835 0.51Scottish & Southern Energy Plc FRN GBP Perpetual 300,000 292,618 0.42SNS Bank NV 6.25% EUR 26/10/2020 550,000 389,688 0.56Societe Generale 3.5% USD 15/01/2016 790,000 480,998 0.69SPI Australia Assets Pty Ltd 5.125% GBP 11/02/2021 350,000 352,995 0.50Suncorp-Metway Group Ltd 5.125% GBP 27/10/2014 500,000 509,904 0.73TDC A/S 5.625% GBP 23/02/2023 530,000 538,732 0.77Telecom Italia SpA 7.375% GBP 15/12/2017 500,000 545,620 0.78Telefonica Emisiones SAU 4.75% EUR 07/02/2017 200,000 173,156 0.25Telefonica Emisiones SAU 5.496% EUR 01/04/2016 500,000 451,680 0.64Temasek Financial I Ltd 4.625% GBP 26/07/2022 300,000 303,847 0.43Total Capital SA 3.875% GBP 14/12/2018 300,000 297,698 0.42United Kingdom Gilt 3.75% GBP 07/09/2019 3,750,000 3,810,863 5.43United Kingdom Gilt 3.75% GBP 07/09/2020 1,000,000 1,006,020 1.43United Kingdom Gilt 4% GBP 07/09/2016 950,000 1,010,553 1.44United Kingdom Gilt 4% GBP 07/03/2022 1,500,000 1,522,785 2.17United Kingdom Gilt 4.25% GBP 07/06/2032 2,500,000 2,470,925 3.52United Kingdom Gilt 4.25% GBP 07/03/2036 3,950,000 3,873,133 5.52United Kingdom Gilt 4.25% GBP 07/12/2040 750,000 734,737 1.05United Kingdom Gilt 4.25% GBP 07/12/2055 600,000 595,818 0.85United Kingdom Gilt 4.5% GBP 07/12/2042 2,800,000 2,873,332 4.09United Kingdom Gilt 4.75% GBP 07/03/2020 2,300,000 2,504,516 3.57United Kingdom Gilt 4.75% GBP 07/12/2030 4,100,000 4,332,511 6.17United Kingdom Gilt 4.75% GBP 07/12/2038 4,250,000 4,518,812 6.44United Kingdom Gilt 5% GBP 07/03/2025 3,850,000 4,252,595 6.06United Kingdom Gilt 8.75% GBP 25/08/2017 1,900,000 2,556,070 3.64Virgin Media Secured Finance Plc 5.5% GBP 15/01/2021 490,000 485,394 0.69Waste Management Inc 4.6% USD 01/03/2021 390,000 242,328 0.35
TOTAL BONDS 67,173,530 95.70
TOTAL TRANSFERABLE SECURITIES ADMITTED TO AN OFFICIAL STOCK EXCHANGELISTING OR DEALT IN ON ANOTHER REGULATED MARKET 67,173,530 95.70
OTHER TRANSFERABLE SECURITIES
BONDSABN Amro Bank NV 3% USD 31/01/2014 700,000 434,013 0.62Rockwood Specialties Group Inc 7.625% EUR 15/11/2014 550,000 483,588 0.69Senior Housing Property Trust 4.3% USD 15/01/2016 500,000 306,371 0.43
TOTAL BONDS 1,223,972 1.74
TOTAL OTHER TRANSFERABLE SECURITIES 1,223,972 1.74
TotalInvestments 68,397,502 97.44
The accompanying notes form an integral part of these financial statements.

Invesco Emerging Local Currencies Debt Fund
78 Invesco Funds
Statement of Investments as at 28 February 2011
Investment Nominal/Shares Market Value Net AssetsUSD %
TRANSFERABLE SECURITIES ADMITTED TO AN OFFICIAL STOCK EXCHANGE LISTING OR DEALT IN ON ANOTHERREGULATED MARKET
BONDSAfrican Development Bank 12.5% ZMK 22/12/2011 9,220,000,000 2,022,152 0.33Argentina Bonos FRN ARS 04/02/2018 8,200,000 3,069,936 0.50Argentina Bonos 10.5% ARS 12/06/2012 34,525,000 8,352,799 1.36Banco Santander Chile 6.5% CLP 22/09/2020 1,200,000,000 2,344,392 0.38Barclays (Indonesia) 10% IDR 17/02/2028 80,000,000,000 9,159,440 1.49Barclays (Indonesia) 10.5% IDR 19/08/2030 57,500,000,000 6,860,369 1.11Barclays Bank (Indonesia) 10.25% IDR 19/07/2027 65,000,000,000 7,626,254 1.24Barclays Bank Plc 9.5% IDR 17/07/2031 120,000,000,000 12,956,979 2.10Brazil Notas do Tesouro Nacional Serie F 10% BRL 01/01/2017 52,500,000 28,997,729 4.71Brazilian Government International Bond 10.25% BRL 10/01/2028 8,400,000 5,177,384 0.84Brazilian Government International Bond 12.5% BRL 05/01/2016 14,800,000 10,223,603 1.66Brazilian Government International Bond 12.5% BRL 05/01/2022 17,150,000 12,143,176 1.97Centercredit 8.25% KZT 30/09/2011 294,000,000 2,034,114 0.33Colombia Government Bond 7.75% COP 14/04/2021 33,733,000,000 18,657,569 3.03Colombia Government Bond 12% COP 22/10/2015 13,650,000,000 8,987,801 1.46Egypt Government International Bond 8.75% EGP 18/07/2012 19,500,000 3,073,119 0.50European Investment Bank 5% PHP 03/08/2015 63,500,000 1,526,765 0.25European Investment Bank 11.25% BRL 14/02/2013 6,070,000 3,787,449 0.61Export-Import Bank Korea 5.1% INR 29/10/2013 33,200,000 694,033 0.11Export-Import Bank of Korea 4% PHP 26/11/2015 299,100,000 6,424,180 1.04Export-Import Bank of Korea 6.6% IDR 04/11/2013 51,000,000,000 5,511,804 0.89Hungary Government Bond 5.5% HUF 12/02/2014 2,400,000,000 11,804,700 1.92Hungary Government Bond 6.75% HUF 24/02/2017 1,300,000,000 6,450,553 1.05Hungary Government Bond 8% HUF 12/02/2015 2,774,800,000 14,592,794 2.37Malaysia Government Bond 3.741% MYR 27/02/2015 28,900,000 9,537,350 1.55Malaysia Government Bond 3.835% MYR 12/08/2015 82,480,000 27,521,416 4.47Malaysia Government Bond 4.012% MYR 15/09/2017 33,500,000 11,157,350 1.81Malaysia Government Bond 4.378% MYR 29/11/2019 12,630,000 4,229,483 0.69Malaysia Government Bond 5.094% MYR 30/04/2014 40,620,000 14,005,438 2.27Mexican Bonos 8% MXN 17/12/2015 214,000,000 18,585,057 3.02Mexican Bonos 8.5% MXN 13/12/2018 207,000,000 18,358,763 2.98Mexican Bonos 10% MXN 05/12/2024 161,700,000 15,909,133 2.58Mexico Udibonos 3.5% MXN 14/12/2017 13,000,000 5,051,748 0.82Peru Government Bond 7.84% PEN 12/08/2020 17,000,000 6,848,993 1.11Peru Government Bond 8.2% PEN 12/08/2026 16,800,000 6,929,037 1.12Peru Government Bond 8.6% PEN 12/08/2017 6,000,000 2,535,585 0.41Poland Government Bond 5% PLN 24/10/2013 76,120,000 26,339,779 4.28Poland Government Bond 5.5% PLN 25/04/2015 33,400,000 11,530,279 1.87Poland Government Bond 5.5% PLN 25/10/2019 21,400,000 7,086,813 1.15Poland Government Bond 6.25% PLN 24/10/2015 44,350,000 15,746,121 2.56Republic of Colombia 9.85% COP 28/06/2027 10,529,000,000 6,461,027 1.05RusHydro Finance Ltd 7.875% RUB 28/10/2015 521,700,000 17,831,552 2.90Russian Agricultural Bank OJSC Via RSHB Capital SA 7.5% RUB 25/03/2013 275,000,000 9,601,685 1.56South Africa Government Bond 6.75% ZAR 31/03/2021 123,000,000 15,283,566 2.48South Africa Government Bond 8.25% ZAR 15/09/2017 83,000,000 11,825,060 1.92South Africa Government Bond 10.5% ZAR 21/12/2026 95,000,000 15,363,028 2.49Thailand Government Bond 2.8% THB 10/10/2017 300,000,000 9,350,882 1.52Thailand Government Bond 3.625% THB 22/05/2015 175,000,000 5,759,528 0.94Thailand Government Bond 4.125% THB 18/11/2016 90,000,000 3,024,171 0.49Thailand Government Bond 5.25% THB 12/05/2014 240,000,000 8,282,609 1.34Turkey Government Bond 4% TRY 01/04/2020 14,500,000 10,451,429 1.70Turkey Government Bond 10% TRY 17/06/2015 5,350,000 3,418,875 0.56Turkey Government Bond 10.5% TRY 15/01/2020 32,516,000 21,635,386 3.51Turkey Government Bond 11% TRY 06/08/2014 12,000,000 7,898,504 1.28Turkey Government Bond 16% TRY 07/03/2012 6,000,000 4,023,113 0.65Turkey Government Bond 16% TRY 28/08/2013 5,250,000 3,780,375 0.61Ukreximbank Finanace PL 11% UAH 03/02/2014 23,850,000 2,997,391 0.49Uruguay Government International Bond 5% UYU 14/09/2018 92,390,000 7,553,208 1.23
TOTAL BONDS 558,392,828 90.66

Invesco Emerging Local Currencies Debt Fund
79 Invesco Funds
Statement of Investments as at 28 February 2011
Investment Nominal/Shares Market Value Net AssetsUSD %
TOTAL TRANSFERABLE SECURITIES ADMITTED TO AN OFFICIAL STOCK EXCHANGELISTING OR DEALT IN ON ANOTHER REGULATED MARKET 558,392,828 90.66
OTHER TRANSFERABLE SECURITIES
BONDSDeutsche Bank 5.5% UAH 01/09/2015 52,000,000 5,816,771 0.95ING Americas Issuance Bv 20% UAH 12/09/2012 30,000,000 4,311,508 0.70ING Bank NV 15% UAH 18/04/2011 20,000,000 2,543,440 0.41Inter-American Development Bank 2.5% INR 11/03/2013 81,000,000 1,675,239 0.27JPMorgan Chase Indonesian Government Linked Notes 8.375% IDR 17/09/2026 70,000,000,000 7,141,642 1.16JPMorgan Chase Indonesian Government Linked Notes 9.5% IDR 18/07/2023 41,000,000,000 4,717,451 0.77Sinochem Offshore Capital Co Ltd 1.8% CNY 18/01/2014 39,000,000 5,968,339 0.97Standard Chartered Bank 19% USD 14/01/2013 2,249,538 2,050,904 0.33Standard Chartered Bank 19% GHC 16/01/2013 3,800,000 2,763,251 0.45
TOTAL BONDS 36,988,545 6.01
TOTAL OTHER TRANSFERABLE SECURITIES 36,988,545 6.01
TotalInvestments 595,381,373 96.67
The accompanying notes form an integral part of these financial statements.

Invesco Global Investment Grade Corporate Bond Fund
80 Invesco Funds
Statement of Investments as at 28 February 2011
Investment Nominal/Shares Market Value Net AssetsUSD %
TRANSFERABLE SECURITIES ADMITTED TO AN OFFICIAL STOCK EXCHANGE LISTING OR DEALT IN ON ANOTHERREGULATED MARKET
BONDSAdvance Auto Parts Inc 5.75% USD 01/05/2020 250,000 263,537 1.36Aetna Inc 3.95% USD 01/09/2020 150,000 144,563 0.75Alliander NV FRN EUR Perpetual 50,000 68,462 0.35America Movil SAB de CV 4.75% EUR 28/06/2022 100,000 140,424 0.73American Tower Corp 4.625% USD 01/04/2015 300,000 312,548 1.61Anheuser-Busch Cos Inc 5.6% USD 01/03/2017 100,000 111,392 0.58Anheuser-Busch InBev Worldwide Inc 3.625% USD 15/04/2015 200,000 207,995 1.07Anheuser-Busch InBev Worldwide Inc 4.375% USD 15/02/2021 100,000 100,395 0.52ArcelorMittal 3.75% USD 05/08/2015 100,000 101,084 0.52ArcelorMittal 8.25% EUR 03/06/2013 100,000 153,470 0.79Avnet Inc 5.875% USD 15/06/2020 100,000 102,360 0.53BAA Funding Ltd 6.25% GBP 10/09/2018 90,000 148,701 0.77Banco Popolare SC 6% EUR 05/11/2020 150,000 200,609 1.04Banco Santander Chile 2.875% USD 13/11/2012 100,000 99,820 0.52Bank of America Corp 4.625% EUR 07/08/2017 50,000 68,971 0.36Bank of America Corp 5.875% USD 05/01/2021 150,000 158,943 0.82Bank of China Hong Kong Ltd 5.55% USD 11/02/2020 100,000 103,109 0.53Bank of Scotland Plc 9.375% GBP 15/05/2021 50,000 89,446 0.46Banque PSA Finance 4.25% EUR 25/02/2016 120,000 166,013 0.86Barclays Bank Plc 5% USD 22/09/2016 100,000 106,189 0.55Barclays Bank Plc 5.125% USD 08/01/2020 100,000 101,821 0.53Barclays Bank Plc 10% GBP 21/05/2021 50,000 99,417 0.51BAT International Finance Plc 6% GBP 24/11/2034 50,000 83,867 0.43Boston Scientific Corp 4.5% USD 15/01/2015 100,000 103,042 0.53BPCE SA FRN EUR Perpetual 50,000 69,980 0.36Casino Guichard Perrachon SA 4.481% EUR 12/11/2018 100,000 139,769 0.72Citigroup Inc 5.875% USD 29/05/2037 150,000 146,458 0.76CNA Financial Corp 5.875% USD 15/08/2020 150,000 156,028 0.81COX Communications Inc 5.45% USD 15/12/2014 200,000 220,850 1.14Credit Suisse AG 5.4% USD 14/01/2020 100,000 100,997 0.52CSX Corp 5.5% USD 15/04/2041 150,000 146,647 0.76CVS Caremark Corp 6.125% USD 15/08/2016 300,000 340,462 1.76DCP Midstream LLC 8.125% USD 16/08/2030 100,000 117,756 0.61Digital Realty Trust LP 5.875% USD 01/02/2020 100,000 105,478 0.54Elsevier Finance SA Via ELM BV 6.5% EUR 02/04/2013 100,000 148,534 0.77Empresa Nacional del Petroleo 5.25% USD 10/08/2020 150,000 147,348 0.76Enterprise Products Operating LLC 3.2% USD 01/02/2016 100,000 99,928 0.52Enterprise Products Operating LLC 6.45% USD 01/09/2040 100,000 104,412 0.54Expedia Inc 5.95% USD 15/08/2020 250,000 253,750 1.31F Van Lanschot Bankiers NV 3.5% EUR 02/04/2013 150,000 206,025 1.06G4S Plc 7.75% GBP 13/05/2019 50,000 91,678 0.47GDF Suez 6.375% EUR 18/01/2021 50,000 82,130 0.42General Electric Capital Corp 2.8% USD 08/01/2013 150,000 153,843 0.79General Electric Capital Corp 4.8% USD 01/05/2013 150,000 160,040 0.83General Electric Capital Corp 6% USD 07/08/2019 50,000 55,225 0.28General Electric Co 5.25% USD 06/12/2017 80,000 87,565 0.45Glencore Finance Europe SA 5.25% EUR 11/10/2013 50,000 72,718 0.38Glencore Finance Europe SA 7.125% EUR 23/04/2015 100,000 152,875 0.79Gold Fields Orogen Holding BVI Ltd 4.875% USD 07/10/2020 200,000 191,250 0.99Goldman Sachs Group Inc 5.375% USD 15/03/2020 100,000 102,263 0.53Goldman Sachs Group Inc 5.5% GBP 12/10/2021 50,000 75,647 0.39Holcim US Finance Sarl & Cie SCS 6% USD 30/12/2019 100,000 104,600 0.54HSBC Capital Funding LP FRN EUR Perpetual 100,000 129,691 0.67HSBC USA Inc 5% USD 27/09/2020 100,000 98,619 0.51Hutchison Whampoa International Ltd 4.625% USD 11/09/2015 100,000 106,037 0.55Imperial Tobacco Finance Plc 8.375% EUR 17/02/2016 100,000 166,766 0.86ING Bank NV 2% USD 18/10/2013 300,000 297,237 1.54International Power Finance 2010 Plc 7.25% EUR 11/05/2017 100,000 160,667 0.83

Invesco Global Investment Grade Corporate Bond Fund
81 Invesco Funds
Statement of Investments as at 28 February 2011
Investment Nominal/Shares Market Value Net AssetsUSD %
BONDS (CONTINUED)Intesa Sanpaolo SpA 3.25% EUR 01/02/2013 100,000 138,123 0.71Intesa Sanpaolo SpA 6.625% EUR 08/05/2018 50,000 69,479 0.36Intesa Sanpaolo SpA FRN EUR Perpetual 50,000 67,397 0.35JPMorgan Chase & Co 4.65% USD 01/06/2014 150,000 160,213 0.83JPMorgan Chase & Co 5.375% USD 01/10/2012 100,000 106,581 0.55JPMorgan Chase & Co FRN USD Perpetual 50,000 54,309 0.28KBC Internationale Financieringsmaatschappij NV 4% EUR 01/03/2013 150,000 209,194 1.08Kinder Morgan Energy Partners LP 6.375% USD 01/03/2041 100,000 100,268 0.52Koninklijke KPN NV 6% GBP 29/05/2019 100,000 174,005 0.90L-3 Communications Corp 4.95% USD 15/02/2021 100,000 101,553 0.52La Caja de Ahorros y Pensiones de Barcelona 3.125% EUR 16/09/2013 150,000 202,847 1.05Life Technologies Corp 3.5% USD 15/01/2016 100,000 99,927 0.52Life Technologies Corp 6% USD 01/03/2020 100,000 109,028 0.56Lloyds TSB Bank Plc 6.5% EUR 24/03/2020 100,000 132,170 0.68Macquarie Bank Ltd 6% EUR 21/09/2020 100,000 130,711 0.67Macquarie Group Ltd 4.875% USD 10/08/2017 150,000 148,462 0.77Man Group Plc 5% USD 09/08/2017 100,000 86,500 0.45Marathon Petroleum Corp 3.5% USD 01/03/2016 100,000 99,407 0.51Marsh & McLennan Cos Inc 5.375% USD 15/07/2014 100,000 106,807 0.55Massachusetts Electric Co 5.9% USD 15/11/2039 100,000 105,687 0.55McKesson Corp 3.25% USD 01/03/2016 35,000 35,193 0.18Merrill Lynch & Co Inc 6.11% USD 29/01/2037 100,000 95,239 0.49Moody's Corp 5.5% USD 01/09/2020 200,000 202,925 1.05Morgan Stanley 2.875% USD 24/01/2014 100,000 100,720 0.52Morgan Stanley 4.5% EUR 29/10/2014 100,000 140,407 0.72Morgan Stanley 5.375% EUR 10/08/2020 50,000 68,324 0.35Morgan Stanley 6.625% USD 01/04/2018 150,000 166,102 0.86Motability Operations Group Plc 5.375% GBP 28/06/2022 100,000 165,644 0.86National Rural Utilities Cooperative Finance Corp 1.125% USD 01/11/2013 100,000 99,249 0.51National Rural Utilities Cooperative Finance Corp 10.375% USD 01/11/2018 100,000 137,308 0.71Nationwide Building Society 5.625% GBP 09/09/2019 100,000 162,397 0.84Optus Finance Pty Ltd 4.625% USD 15/10/2019 100,000 100,269 0.52O'Reilly Automotive Inc 4.875% USD 14/01/2021 200,000 198,222 1.02OTE Plc 3.75% EUR 11/11/2011 50,000 69,025 0.36Petrobras International Finance Co - Pifco 6.75% USD 27/01/2041 100,000 102,201 0.53Petroleos Mexicanos 4.875% USD 15/03/2015 50,000 53,025 0.27PNC Funding Corp 4.375% USD 11/08/2020 150,000 150,174 0.78Prudential Financial Inc 2.75% USD 14/01/2013 200,000 202,754 1.05Qatari Diar Finance QSC 3.5% USD 21/07/2015 100,000 98,750 0.51QBE Insurance Group Ltd 6.125% GBP 28/09/2015 100,000 170,551 0.88Qtel International Finance Ltd 5% USD 19/10/2025 200,000 175,902 0.91Royal Bank of Scotland Plc 6.934% EUR 09/04/2018 100,000 133,547 0.69Russian Foreign Bond - Eurobond 3.625% USD 29/04/2015 100,000 100,005 0.52Santander Consumer Finance SA FRN EUR 28/09/2016 100,000 133,813 0.69Santander Issuances S.A Unipersonal FRN GBP 27/07/2019 50,000 80,777 0.42Schwab Capital Trust I FRN USD 15/11/2037 100,000 105,658 0.55Scottish & Southern Energy Plc FRN GBP Perpetual 50,000 78,958 0.41SNS Bank NV 6.25% EUR 26/10/2020 200,000 229,420 1.18Societa Iniziative Autostradali e Servizi SpA 4.5% EUR 26/10/2020 100,000 130,611 0.67Societe Generale 2.5% USD 15/01/2014 150,000 150,479 0.78Societe Generale FRN EUR Perpetual 50,000 58,834 0.30Spectra Energy Capital LLC 5.668% USD 15/08/2014 150,000 164,775 0.85SPI Australia Assets Pty Ltd 5.125% GBP 11/02/2021 100,000 163,285 0.84State Street Capital Trust III FRN USD Perpetual 60,000 60,176 0.31Suez Environnement Co FRN EUR Perpetual 50,000 67,029 0.35Suncorp-Metway Group Ltd 5.125% GBP 27/10/2014 50,000 82,553 0.43TDC A/S 4.375% EUR 23/02/2018 100,000 139,762 0.72TDC A/S 5.875% EUR 16/12/2015 100,000 150,361 0.78Telecom Italia SpA 6.375% GBP 24/06/2019 50,000 81,662 0.42Telefonica Emisiones SAU 4.75% EUR 07/02/2017 100,000 140,170 0.72Telefonica Emisiones SAU 5.496% EUR 01/04/2016 100,000 146,254 0.76

Invesco Global Investment Grade Corporate Bond Fund
82 Invesco Funds
Statement of Investments as at 28 February 2011
Investment Nominal/Shares Market Value Net AssetsUSD %
BONDS (CONTINUED)TenneT Holding BV 4.625% EUR 21/02/2023 150,000 209,872 1.08Thermo Fisher Scientific Inc 2.05% USD 21/02/2014 100,000 100,821 0.52Transocean Inc 4.95% USD 15/11/2015 250,000 264,768 1.37UBS AG 2.25% USD 12/08/2013 250,000 252,666 1.30UniCredit Bank AG 6% EUR 05/02/2014 100,000 144,360 0.75UnitedHealth Group Inc 3.875% USD 15/10/2020 200,000 192,515 0.99UnitedHealth Group Inc 5.95% USD 15/02/2041 200,000 202,665 1.05USB Capital XIII Trust 6.625% USD 15/12/2039 70,000 73,685 0.38Vale Overseas Ltd 6.875% USD 10/11/2039 100,000 108,005 0.56Virgin Media Secured Finance Plc 5.5% GBP 15/01/2021 100,000 160,378 0.83Wal-Mart Stores Inc 5.625% USD 01/04/2040 100,000 104,105 0.54Waste Management Inc 4.6% USD 01/03/2021 100,000 100,597 0.52Waste Management Inc 5% USD 15/03/2014 100,000 108,213 0.56Wells Fargo & Co 3.625% USD 15/04/2015 200,000 207,290 1.07Wells Fargo & Co 3.75% USD 01/10/2014 100,000 105,274 0.54Westpac Banking Corp 2.1% USD 02/08/2013 150,000 151,724 0.78Xerox Corp 4.25% USD 15/02/2015 50,000 52,670 0.27
TOTAL BONDS 18,064,237 93.31
TOTAL TRANSFERABLE SECURITIES ADMITTED TO AN OFFICIAL STOCK EXCHANGELISTING OR DEALT IN ON ANOTHER REGULATED MARKET 18,064,237 93.31
OTHER TRANSFERABLE SECURITIES
BONDSContinental Airlines 2009-2 Class A Pass Through Trust 7.25% USD 10/11/2019 48,619 54,088 0.28Continental Airlines 2010-1 Class A Pass Through Trust 4.75% USD 12/01/2021 100,000 99,250 0.51Life Technologies Corp 3.375% USD 01/03/2013 100,000 102,998 0.53Municipal Elec Auth Ga 6.637% USD 01/04/2057 100,000 100,223 0.52National Australia Bank Ltd 2.75% USD 28/09/2015 150,000 148,768 0.77Senior Housing Property Trust 4.3% USD 15/01/2016 200,000 198,406 1.02
TOTAL BONDS 703,733 3.63
TOTAL OTHER TRANSFERABLE SECURITIES 703,733 3.63
TotalInvestments 18,767,970 96.94
The accompanying notes form an integral part of these financial statements.

Invesco Global Total Return (EUR) Bond Fund
83 Invesco Funds
Statement of Investments as at 28 February 2011
Investment Nominal/Shares Market Value Net AssetsEUR %
TRANSFERABLE SECURITIES ADMITTED TO AN OFFICIAL STOCK EXCHANGE LISTING OR DEALT IN ON ANOTHERREGULATED MARKET
BONDSAbbey National Treasury Services Plc 4.375% EUR 24/01/2018 100,000 98,846 4.12Aguila 3 SA 7.875% CHF 31/01/2018 150,000 123,162 5.14Barclays Bank Plc FRN EUR Perpetual 100,000 71,536 2.98BNP Paribas Capital Trust III FRN EUR Perpetual 100,000 100,235 4.18Bundesrepublik Deutschland 2.5% EUR 04/01/2021 300,000 284,058 11.85Bundesschatzanweisungen 1% EUR 14/12/2012 100,000 99,284 4.14CL Capital Trust I FRN EUR Perpetual 100,000 98,907 4.13General Motors 0% USD 01/12/2013 1,450 53,083 2.21Crown Newco 3 Plc 7% GBP 15/02/2018 100,000 120,372 5.02Hannover Finance Luxembourg SA FRN EUR 14/09/2040 100,000 96,007 4.01Italy Buoni Poliennali Del Tesoro 3.75% EUR 01/03/2021 250,000 229,935 9.59LBG Capital No.1 Plc 7.867% GBP 17/12/2019 100,000 109,658 4.58LBG Capital No.1 Plc 11.04% GBP 19/03/2020 100,000 127,502 5.32Ono Finance II Plc 11.125% EUR 15/07/2019 100,000 107,325 4.48Royal Bank of Scotland Group Plc 5.25% EUR Perpetual 100,000 59,250 2.47RWE AG FRN EUR Perpetual 100,000 96,607 4.03Scottish & Southern Energy Plc FRN EUR Perpetual 100,000 98,250 4.10Suez Environnement Co FRN EUR Perpetual 100,000 97,000 4.05UBI Banca International SA 8.75% EUR 29/10/2012 50,000 35,375 1.48Wind Acquisition Finance SA 7.375% EUR 15/02/2018 100,000 103,688 4.33
TOTAL BONDS 2,210,080 92.21
TOTAL TRANSFERABLE SECURITIES ADMITTED TO AN OFFICIAL STOCK EXCHANGELISTING OR DEALT IN ON ANOTHER REGULATED MARKET 2,210,080 92.21
TotalInvestments 2,210,080 92.21
The accompanying notes form an integral part of these financial statements.

Invesco Global Unconstrained Bond Fund
84 Invesco Funds
Statement of Investments as at 28 February 2011
Investment Nominal/Shares Market Value Net AssetsGBP %
TRANSFERABLE SECURITIES ADMITTED TO AN OFFICIAL STOCK EXCHANGE LISTING OR DEALT IN ON ANOTHERREGULATED MARKET
BONDSAES Corp 8.375% GBP 01/03/2011 100,000 100,000 4.10Aguila 3 SA 7.875% CHF 31/01/2018 150,000 105,136 4.31ASIF III Jersey Ltd FRN ITL 09/04/2018 100,000,000 51,802 2.12Avis Finance Co Plc FRN EUR 31/07/2013 50,000 42,375 1.74Barclays Bank Plc FRN GBP Perpetual 50,000 64,558 2.65Bundesrepublik Deutschland 2.5% EUR 04/01/2021 100,000 80,828 3.31Crown Newco 3 Plc 7% GBP 15/02/2018 100,000 102,755 4.21General Motors Co 0% USD 01/12/2013 1,450 45,314 1.86ING Groep NV 8% EUR Perpetual 50,000 42,753 1.75Iron Mountain Inc 6.75% EUR 15/10/2018 50,000 42,896 1.76Italy Buoni Poliennali Del Tesoro 2% EUR 01/06/2013 400,000 334,114 13.69LBG Capital No.1 Plc 11.04% GBP 19/03/2020 150,000 163,262 6.69National Westminster Bank Plc 11.5% GBP Perpetual 100,000 107,750 4.41OI European Group BV 6.75% EUR 15/09/2020 100,000 88,615 3.63Old Mutual Capital Funding LP 8% USD Perpetual 150,000 91,144 3.73Ono Finance II Plc 11.125% EUR 15/07/2019 100,000 91,617 3.75Pearl Group Holdings Ltd No 1 FRN GBP Perpetual 42,500 27,625 1.13Scottish & Southern Energy Plc FRN GBP Perpetual 100,000 97,539 4.00SLM Corp FRN EUR 26/04/2011 100,000 85,066 3.49SMFG Preferred Capital FRN GBP Perpetual 50,000 59,674 2.45Societe Generale FRN EUR Perpetual 50,000 42,782 1.75Suez Environnement Co FRN EUR Perpetual 100,000 82,803 3.39UBI Banca International SA 8.75% EUR 29/10/2012 50,000 30,198 1.24Virgin Media Secured Finance Plc 7% GBP 15/01/2018 50,000 54,167 2.22Wereldhave NV 2.875% EUR 18/11/2015 100,000 84,297 3.45Wind Acquisition Finance SA 7.375% EUR 15/02/2018 100,000 88,513 3.63Xenon Capital Plc FRN CHF 20/12/2011 100,000 58,635 2.40
TOTAL BONDS 2,266,218 92.86
TOTAL TRANSFERABLE SECURITIES ADMITTED TO AN OFFICIAL STOCK EXCHANGELISTING OR DEALT IN ON ANOTHER REGULATED MARKET 2,266,218 92.86
TotalInvestments 2,266,218 92.86
The accompanying notes form an integral part of these financial statements.

Invesco Capital Shield 90 (EUR) Fund
85 Invesco Funds
Statement of Investments as at 28 February 2011
Investment Nominal/Shares Market Value Net AssetsEUR %
TRANSFERABLE SECURITIES ADMITTED TO AN OFFICIAL STOCK EXCHANGE LISTING OR DEALT IN ON ANOTHERREGULATED MARKET
STRUCTURED PRODUCTSETFS Agriculture DJ-UBSCI 1,054,293 7,327,159 4.33Gold Bullion Securities Ltd 101,529 10,089,003 5.95iPath Dow Jones-UBS Copper Subindex Total Return ETN 155,287 6,665,199 3.93UBS ETC WTI Crude Oil - USD 6,619 6,685,820 3.95
TOTAL STRUCTURED PRODUCTS 30,767,181 18.16
TOTAL TRANSFERABLE SECURITIES ADMITTED TO AN OFFICIAL STOCK EXCHANGELISTING OR DEALT IN ON ANOTHER REGULATED MARKET 30,767,181 18.16
MONEY MARKET INSTRUMENTS ELIGIBLE UNDER ARTICLE 41.1H OF THE LAW OF 20 DECEMBER 2002Barclays Bank Plc C/P EUR 10/03/2011 7,000,000 6,998,803 4.13HSBC Bank C/D EUR 07/03/2011 7,000,000 7,000,016 4.13LMA C/P EUR 10/03/2011 7,000,000 6,998,803 4.13Matchpoint Finance C/P EUR 11/04/2011 8,000,000 7,992,300 4.72Solitaire Funding C/P EUR 21/03/2011 5,000,000 4,997,915 2.95Svenska Handel C/P EUR 07/03/2011 7,000,000 6,998,889 4.13Thames Asset Gbl C/P EUR 04/03/2011 7,000,000 6,999,635 4.13Unilever Finance Intl C/P EUR 09/03/2011 7,500,000 7,498,870 4.42
TOTAL MONEY MARKET INSTRUMENTS ELIGIBLE UNDER ARTICLE41.1H OF THE LAW OF 20 DECEMBER 2002 55,485,231 32.74
OPEN-ENDED FUNDSShort-Term Investments Co Global Series - Euro Liquidity Portfolio 16,000,000 16,000,000 9.44
TOTAL OPEN-ENDED FUNDS 16,000,000 9.44
TotalInvestments 102,252,412 60.34
The accompanying notes form an integral part of these financial statements.
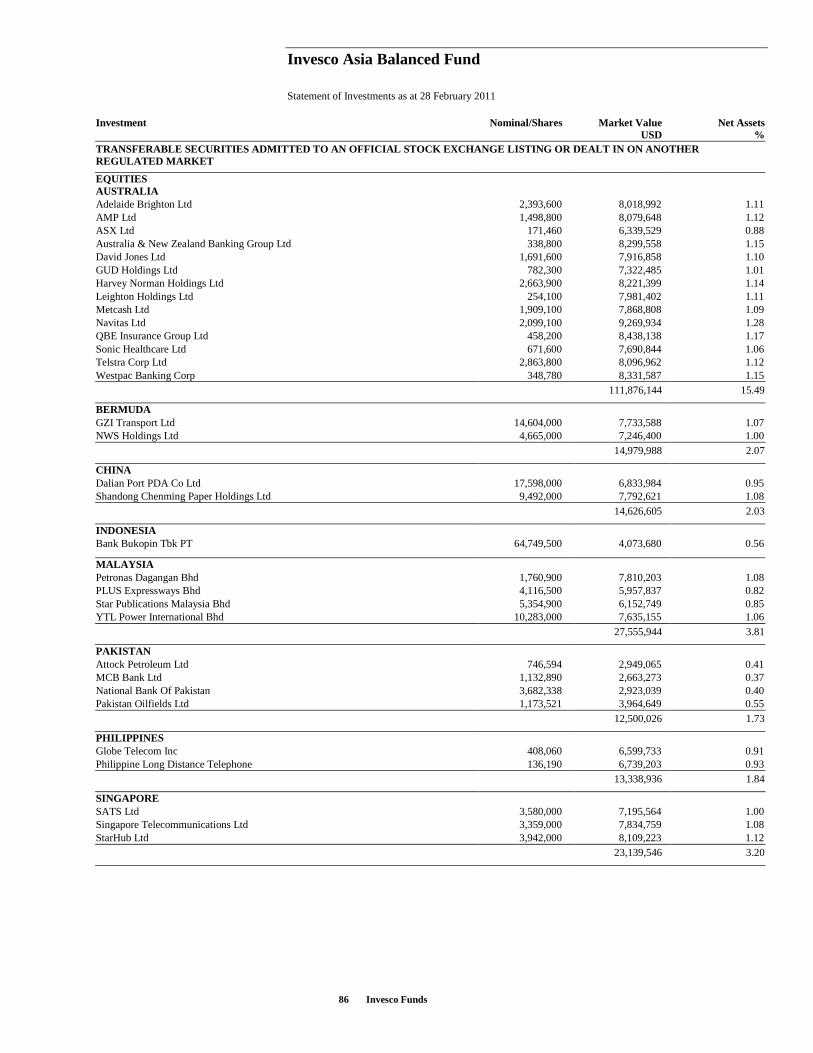
Invesco Asia Balanced Fund
86 Invesco Funds
Statement of Investments as at 28 February 2011
Investment Nominal/Shares Market Value Net AssetsUSD %
TRANSFERABLE SECURITIES ADMITTED TO AN OFFICIAL STOCK EXCHANGE LISTING OR DEALT IN ON ANOTHERREGULATED MARKET
EQUITIESAUSTRALIAAdelaide Brighton Ltd 2,393,600 8,018,992 1.11AMP Ltd 1,498,800 8,079,648 1.12ASX Ltd 171,460 6,339,529 0.88Australia & New Zealand Banking Group Ltd 338,800 8,299,558 1.15David Jones Ltd 1,691,600 7,916,858 1.10GUD Holdings Ltd 782,300 7,322,485 1.01Harvey Norman Holdings Ltd 2,663,900 8,221,399 1.14Leighton Holdings Ltd 254,100 7,981,402 1.11Metcash Ltd 1,909,100 7,868,808 1.09Navitas Ltd 2,099,100 9,269,934 1.28QBE Insurance Group Ltd 458,200 8,438,138 1.17Sonic Healthcare Ltd 671,600 7,690,844 1.06Telstra Corp Ltd 2,863,800 8,096,962 1.12Westpac Banking Corp 348,780 8,331,587 1.15
111,876,144 15.49
BERMUDAGZI Transport Ltd 14,604,000 7,733,588 1.07NWS Holdings Ltd 4,665,000 7,246,400 1.00
14,979,988 2.07
CHINADalian Port PDA Co Ltd 17,598,000 6,833,984 0.95Shandong Chenming Paper Holdings Ltd 9,492,000 7,792,621 1.08
14,626,605 2.03
INDONESIABank Bukopin Tbk PT 64,749,500 4,073,680 0.56
MALAYSIAPetronas Dagangan Bhd 1,760,900 7,810,203 1.08PLUS Expressways Bhd 4,116,500 5,957,837 0.82Star Publications Malaysia Bhd 5,354,900 6,152,749 0.85YTL Power International Bhd 10,283,000 7,635,155 1.06
27,555,944 3.81
PAKISTANAttock Petroleum Ltd 746,594 2,949,065 0.41MCB Bank Ltd 1,132,890 2,663,273 0.37National Bank Of Pakistan 3,682,338 2,923,039 0.40Pakistan Oilfields Ltd 1,173,521 3,964,649 0.55
12,500,026 1.73
PHILIPPINESGlobe Telecom Inc 408,060 6,599,733 0.91Philippine Long Distance Telephone 136,190 6,739,203 0.93
13,338,936 1.84
SINGAPORESATS Ltd 3,580,000 7,195,564 1.00Singapore Telecommunications Ltd 3,359,000 7,834,759 1.08StarHub Ltd 3,942,000 8,109,223 1.12
23,139,546 3.20

Invesco Asia Balanced Fund
87 Invesco Funds
Statement of Investments as at 28 February 2011
Investment Nominal/Shares Market Value Net AssetsUSD %
SOUTH KOREALG Uplus Corp 1,165,260 5,859,080 0.81
TAIWANAltek Corp 5,237,843 7,087,207 0.98Asia Cement Corp 7,231,023 7,262,137 1.01Chunghwa Telecom Co Ltd 2,602,541 7,712,171 1.07Cyberlink Corp 2,294,416 7,227,174 1.00Eternal Chemical Co Ltd 6,718,724 7,165,478 0.99Everlight Electronics Co Ltd 2,294,000 6,412,279 0.89Flytech Technology Co Ltd 1,430,000 3,816,922 0.53Fubon Financial Holding Co Ltd 5,020,000 6,345,244 0.88Getac Technology Corp 6,320,000 3,579,924 0.50Global Mixed Mode Technology Inc 1,249,000 5,615,818 0.78Greatek Electronics Inc 7,331,842 7,006,003 0.97I-Chiun Precision Industry Co Ltd 2,437,000 2,773,135 0.38Inventec Appliances Corp 7,697,750 5,880,638 0.81KYE Systems Corp 6,373,000 4,697,213 0.65LCY Chemical Corp 2,801,495 7,604,824 1.05MediaTek Inc 495,415 5,566,694 0.77Pou Chen Corp 7,221,000 6,305,357 0.87Shin Zu Shing Co Ltd 1,300,000 3,240,494 0.45Shiny Chemical Industrial Co Ltd 1,872,000 2,835,028 0.39Silitech Technology Corp 2,608,680 6,607,860 0.92Sonix Technology Co Ltd 1,545,000 2,963,063 0.41Taiwan Cement Corp 7,415,072 7,334,806 1.02Taiwan Mobile Co Ltd 3,394,000 7,615,876 1.05U-Ming Marine Transport Corp 3,714,000 7,403,777 1.03
140,059,122 19.40
THAILANDAdvanced Info Service PCL 2,970,000 7,729,573 1.07Bangkok Expressway PCL 12,014,500 7,363,030 1.02Electricity Generating PCL NVDR 661,000 2,146,981 0.30Electricity Generating PCL 1,759,700 5,845,057 0.81Hana Microelectronics PCL 8,474,800 7,028,863 0.97Kiatnakin Bank PCL 6,221,900 6,634,728 0.92MCOT PCL 7,310,000 7,018,509 0.97Ratchaburi Electricity Generating Holding PCL 5,396,900 6,725,178 0.93Siam City Cement PCL 1,137,000 7,748,473 1.07Ticon Industrial Connection PCL 17,566,900 7,263,321 1.01
65,503,713 9.07
TOTAL EQUITIES 433,512,784 60.01
BONDSAUSTRALIAMacquarie Group Ltd 7.3% USD 01/08/2014 2,000,000 2,229,854 0.31Macquarie Group Ltd 7.625% USD 13/08/2019 2,000,000 2,247,778 0.31National Australia Bank FRN USD Perpetual 2,000,000 2,200,210 0.30PTTEP Australia International Finance Proprietary Ltd 4.152% USD 19/07/2015 500,000 502,000 0.07Rio Tinto Finance USA Ltd 8.95% USD 01/05/2014 1,000,000 1,209,431 0.17
8,389,273 1.16
BERMUDALi & Fung Ltd 5.25% USD 13/05/2020 2,750,000 2,825,380 0.39

Invesco Asia Balanced Fund
88 Invesco Funds
Statement of Investments as at 28 February 2011
Investment Nominal/Shares Market Value Net AssetsUSD %
BERMUDA (CONTINUED)Noble Group Ltd 6.75% USD 29/01/2020 3,000,000 3,170,314 0.44
5,995,694 0.83
CAYMAN ISLANDSAgile Property Holdings Ltd 10% USD 14/11/2016 2,000,000 2,105,000 0.29China Overseas Finance Cayman II Ltd 5.5% USD 10/11/2020 1,000,000 985,455 0.14Country Garden Holdings Co 11.25% USD 22/04/2017 1,500,000 1,548,750 0.21Hongkong Land Finance Cayman Island Co Ltd 4.5% USD 07/10/2025 3,000,000 2,743,485 0.38Hutchison Whampoa Finance CI Ltd 7.45% USD 01/08/2017 1,000,000 1,192,779 0.17Hutchison Whampoa International Ltd 4.625% USD 11/09/2015 1,500,000 1,590,555 0.22Hutchison Whampoa International Ltd 5.75% USD 11/09/2019 1,000,000 1,085,702 0.15Hutchison Whampoa International Ltd FRN USD Perpetual 1,000,000 1,023,592 0.14Hutchison Whampoa International Ltd 7.45% USD 24/11/2033 1,000,000 1,240,130 0.17Hutchison Whampoa International Ltd 7.625% USD 09/04/2019 3,500,000 4,236,374 0.59Parkson Retail Group Ltd 7.875% USD 14/11/2011 1,000,000 1,035,807 0.14PHBS Ltd 6.625% USD Perpetual 3,000,000 2,759,062 0.38Swire Pacific MTN Financing Ltd 5.5% USD 19/08/2019 1,000,000 1,066,000 0.15Swire Pacific MTN Financing Ltd 6.25% USD 18/04/2018 2,000,000 2,220,270 0.31
24,832,961 3.44
HONG KONGBank of China Hong Kong Ltd 5.55% USD 11/02/2020 3,500,000 3,608,815 0.50Bank of East Asia Ltd FRN USD 22/06/2017 2,000,000 1,960,683 0.27Bank of East Asia Ltd 6.125% USD 16/07/2020 3,500,000 3,609,865 0.50Bank of East Asia Ltd FRN USD Perpetual 2,000,000 2,202,840 0.30Dah Sing Bank Ltd FRN USD 03/06/2016 2,000,000 2,000,027 0.28Dah Sing Bank Ltd FRN USD 18/08/2017 1,000,000 1,034,845 0.14Standard Chartered Bank Hong Kong Ltd 5.875% USD 24/06/2020 3,500,000 3,651,673 0.51
18,068,748 2.50
INDIABank of Baroda 5% USD 24/08/2016 2,000,000 2,001,470 0.28ICICI Bank Ltd FRN USD Perpetual 4,000,000 3,989,660 0.55State Bank of India 4.5% USD 23/10/2014 1,000,000 1,024,195 0.14
7,015,325 0.97
INDONESIAIndonesia Government International Bond 8.5% USD 12/10/2035 8,000,000 10,370,000 1.44Indonesia Government International Bond 10.375% USD 04/05/2014 3,000,000 3,653,070 0.51Indonesia Government International Bond 11.625% USD 04/03/2019 6,000,000 8,670,000 1.20
22,693,070 3.15
MALAYSIAAxiata SPV1 Labuan Ltd 5.375% USD 28/04/2020 2,000,000 2,048,250 0.28Malaysia Government International Bond 7.5% USD 15/07/2011 545,000 555,359 0.08Petronas Capital Ltd 7.875% USD 22/05/2022 2,000,000 2,569,104 0.36Public Bank Bhd FRN USD 20/06/2017 1,000,000 1,028,291 0.14
6,201,004 0.86
NETHERLANDSIndosat Palapa Co BV 7.375% USD 29/07/2020 500,000 552,500 0.08Majapahit Holding BV 7.25% USD 28/06/2017 1,000,000 1,097,566 0.15Majapahit Holding BV 7.75% USD 20/01/2020 1,000,000 1,127,500 0.16Majapahit Holding BV 8% USD 07/08/2019 2,250,000 2,565,000 0.36
5,342,566 0.75

Invesco Asia Balanced Fund
89 Invesco Funds
Statement of Investments as at 28 February 2011
Investment Nominal/Shares Market Value Net AssetsUSD %
PHILIPPINESPhilippine Government International Bond 6.375% USD 23/10/2034 1,395,000 1,463,322 0.20Philippine Government International Bond 6.5% USD 20/01/2020 1,500,000 1,713,750 0.24Philippine Government International Bond 9.5% USD 02/02/2030 2,000,000 2,850,000 0.39Philippine Government International Bond 9.875% USD 15/01/2019 2,000,000 2,702,042 0.37Philippine Government International Bond 10.625% USD 16/03/2025 4,000,000 6,065,000 0.84Philippine Long Distance Telephone Co 11.375% USD 15/05/2012 1,000,000 1,120,000 0.16
15,914,114 2.20
SINGAPOREBumi Capital Pte Ltd 12% USD 10/11/2016 1,000,000 1,161,680 0.16DBS Bank Ltd FRN USD 16/05/2017 2,000,000 2,066,927 0.29
3,228,607 0.45
SOUTH KOREAExport-Import Bank of Korea 4.125% USD 09/09/2015 3,000,000 3,051,603 0.42Export-Import Bank of Korea 5.875% USD 14/01/2015 1,000,000 1,088,244 0.15Kookmin Bank 7.25% USD 14/05/2014 2,000,000 2,256,774 0.31Korea Development Bank 4.375% USD 10/08/2015 4,000,000 4,091,744 0.57Korea Development Bank 5.3% USD 17/01/2013 1,000,000 1,057,279 0.15Korea East-West Power Co Ltd 4.875% USD 21/04/2011 1,000,000 1,002,596 0.14Korea Electric Power Corp 3% USD 05/10/2015 1,000,000 972,574 0.13Korea Finance Corp 3.25% USD 20/09/2016 4,000,000 3,806,316 0.53Korea Gas Corp 4.25% USD 02/11/2020 1,000,000 947,887 0.13Korea Hydro & Nuclear Power Co Ltd 3.125% USD 16/09/2015 2,000,000 1,955,489 0.27Korea Hydro & Nuclear Power Co Ltd 6.25% USD 17/06/2014 2,000,000 2,201,329 0.30Korea National Oil Corp 5.375% USD 30/07/2014 3,000,000 3,217,976 0.45Korea South-East Power Co Ltd 6% USD 25/05/2016 1,000,000 1,080,850 0.15Korea Southern Power Co Ltd 5.375% USD 18/04/2013 500,000 528,299 0.07KT Corp 4.875% USD 15/07/2015 2,000,000 2,094,138 0.29KT Corp 5.125% USD 11/04/2012 2,000,000 2,069,420 0.29National Agricultural Cooperative Federation 5% USD 30/09/2014 500,000 525,209 0.07POSCO 4.25% USD 28/10/2020 3,000,000 2,765,854 0.38POSCO 8.75% USD 26/03/2014 3,000,000 3,520,536 0.49Republic of Korea 4.875% USD 22/09/2014 1,000,000 1,061,918 0.15Republic of Korea 7.125% USD 16/04/2019 3,500,000 4,164,466 0.58Shinhan Bank 4.375% USD 15/09/2015 2,000,000 2,029,954 0.28Shinhan Bank FRN USD 02/03/2035 3,000,000 3,013,125 0.42Shinhan Bank 6% USD 29/06/2012 2,500,000 2,629,866 0.36Shinhan Bank FRN USD 20/09/2036 1,000,000 1,038,111 0.14Woori Bank 4.75% USD 20/01/2016 1,000,000 1,022,708 0.14Woori Bank 7% USD 02/02/2015 200,000 220,840 0.03Woori Bank 7.63% USD 14/04/2015 1,000,000 1,122,692 0.16
54,537,797 7.55
THAILANDBangkok Bank PCL 4.8% USD 18/10/2020 2,500,000 2,371,819 0.33PTT PCL 5.875% USD 03/08/2035 500,000 472,285 0.07
2,844,104 0.40
UNITED KINGDOMCNOOC Finance 2003 Ltd 5.5% USD 21/05/2033 1,950,000 1,956,122 0.27CNOOC Finance 2011 Ltd 4.25% USD 26/01/2021 2,000,000 1,960,024 0.27CNOOC Finance 2011 Ltd 5.75% USD 26/01/2041 2,000,000 2,027,730 0.28Hongkong Electric Finance Ltd 4.25% USD 14/12/2020 2,000,000 1,922,930 0.27Sinochem Overseas Capital Co Ltd 6.3% USD 12/11/2040 500,000 500,093 0.07

Invesco Asia Balanced Fund
90 Invesco Funds
Statement of Investments as at 28 February 2011
Investment Nominal/Shares Market Value Net AssetsUSD %
UNITED KINGDOM (CONTINUED)Standard Chartered Bank FRN USD Perpetual 5,500,000 6,112,859 0.85
14,479,758 2.01
UNITED STATESReliance Holdings USA Inc 6.25% USD 19/10/2040 2,000,000 1,880,886 0.26United States Treasury Note/Bond 2.25% USD 31/05/2014 2,000,000 2,061,797 0.29United States Treasury Note/Bond 3.875% USD 15/08/2040 2,000,000 1,795,547 0.25United States Treasury Note/Bond 4.5% USD 15/08/2039 2,000,000 2,005,078 0.28
7,743,308 1.08
TOTAL BONDS 197,286,329 27.35
TOTAL TRANSFERABLE SECURITIES ADMITTED TO AN OFFICIAL STOCK EXCHANGELISTING OR DEALT IN ON ANOTHER REGULATED MARKET 630,799,113 87.36
OTHER TRANSFERABLE SECURITIES
BONDSINDIAState Bank of India 4.5% USD 27/07/2015 2,000,000 2,030,240 0.28
MALAYSIATenaga Nasional Bhd 7.5% USD 01/11/2025 3,500,000 4,266,974 0.59
UNITED STATESCBA Capital Trust II FRN USD Perpetual 2,000,000 2,026,548 0.28Westpac Capital Trust III FRN USD Perpetual 3,500,000 3,543,750 0.49
5,570,298 0.77
TOTAL BONDS 11,867,512 1.64
TOTAL OTHER TRANSFERABLE SECURITIES 11,867,512 1.64
TotalInvestments 642,666,625 89.00
The accompanying notes form an integral part of these financial statements.

Invesco Pan European High Income Fund
91 Invesco Funds
Statement of Investments as at 28 February 2011
Investment Nominal/Shares Market Value Net AssetsEUR %
TRANSFERABLE SECURITIES ADMITTED TO AN OFFICIAL STOCK EXCHANGE LISTING OR DEALT IN ON ANOTHERREGULATED MARKET
EQUITIESFINLANDUPM-Kymmene OYJ 16,000 230,800 0.57
FRANCECie Générale des Etablissements Michelin 1,646 95,986 0.24Rhodia SA 7,953 167,987 0.41Safran SA 6,836 174,557 0.43
438,530 1.08
GERMANYBilfinger Berger AG 2,125 127,628 0.31Deutsche Boerse AG 6,000 334,140 0.82
461,768 1.13
IRELANDFBD Holdings Plc 13,750 103,139 0.25
NETHERLANDSASML Holding NV 5,000 157,250 0.39European Aeronautic Defence and Space Co NV 6,988 143,935 0.35ING Groep NV 12,142 108,519 0.27SBM Offshore NV 6,566 118,451 0.29Unilever NV 5,600 121,982 0.30
650,137 1.60
NORWAYStorebrand ASA 28,000 171,518 0.42
PORTUGALGalp Energia SGPS SA 5,900 90,432 0.22Portucel Empresa Produtora de Pasta e Papel SA 61,600 155,294 0.38
245,726 0.60
SPAINBanco Bilbao Vizcaya Argentaria SA 17,400 154,773 0.38Grupo Empresarial Ence SA 42,000 103,215 0.25International Consolidated Airlines Group SA 40,820 107,173 0.26Obrascon Huarte Lain SA 8,046 193,788 0.48Telefonica SA 9,709 177,262 0.44
736,211 1.81
SWITZERLANDNovartis AG 4,554 182,619 0.45Roche Holding AG (Gebusscheine) 1,792 192,957 0.48
375,576 0.93
UNITED KINGDOMG4S Plc 41,960 130,055 0.32
TOTAL EQUITIES 3,543,460 8.71
BONDSBERMUDAPetroplus Finance Ltd 9.375% USD 15/09/2019 300,000 227,380 0.56
CAYMAN ISLANDSUPCB Finance Ltd 7.625% EUR 15/01/2020 400,000 423,500 1.04
FRANCEAXA SA FRN GBP Perpetual 100,000 108,122 0.27BNP Paribas FRN GBP Perpetual 100,000 103,768 0.26BNP Paribas FRN EUR Perpetual 100,000 106,571 0.26

Invesco Pan European High Income Fund
92 Invesco Funds
Statement of Investments as at 28 February 2011
Investment Nominal/Shares Market Value Net AssetsEUR %
FRANCE (CONTINUED)BPCE SA FRN EUR Perpetual 100,000 87,232 0.21BPCE SA 13% USD Perpetual 154,500 123,249 0.30Cie Generale de Geophysique - Veritas 7.75% USD 15/05/2017 50,000 38,439 0.09Cie Generale de Geophysique - Veritas 9.5% USD 15/05/2016 100,000 81,582 0.20Credit Agricole SA FRN EUR Perpetual 1,200,000 1,224,858 3.02Credit Agricole SA 9.75% USD Perpetual 100,000 78,688 0.19EDF SA 4.5% EUR 12/11/2040 2,000,000 1,845,670 4.55Korreden SA FRN EUR 01/08/2014 26,667 10,000 0.02Rhodia SA 7% EUR 15/05/2018 200,000 214,500 0.53Societe Generale FRN EUR Perpetual 300,000 300,702 0.74Societe Generale FRN GBP Perpetual 100,000 117,914 0.29Societe Generale FRN EUR Perpetual 200,000 218,062 0.54SPCM SA 8.25% EUR 15/06/2017 250,000 273,125 0.67Suez Environnement Co FRN EUR Perpetual 1,000,000 970,000 2.39
5,902,482 14.53
GERMANYBundesrepublik Deutschland 2.5% EUR 04/01/2021 3,000,000 2,840,580 7.00RWE AG FRN EUR Perpetual 1,000,000 966,065 2.38Unitymedia GmbH 9.625% EUR 01/12/2019 300,000 337,210 0.83Unitymedia Hessen GmbH & Co KG 8.125% EUR 01/12/2017 300,000 322,875 0.79
4,466,730 11.00
IRELANDOno Finance II Plc 11.125% EUR 15/07/2019 100,000 107,325 0.26Smurfit Kappa Acquisitions 7.75% EUR 15/11/2019 300,000 321,798 0.79Smurfit Kappa Funding Plc 7.75% EUR 01/04/2015 250,000 257,503 0.63
686,626 1.68
ITALYIntesa Sanpaolo SpA FRN EUR Perpetual 1,000,000 975,320 2.40Italy Buoni Poliennali Del Tesoro 3.75% EUR 01/03/2021 2,000,000 1,839,480 4.53Lottomatica SpA FRN EUR 31/03/2066 200,000 206,458 0.51
3,021,258 7.44
LUXEMBOURGAguila 3 SA 7.875% CHF 31/01/2018 150,000 123,162 0.30Beverage Packaging Holdings Luxembourg II SA 9.5% EUR 15/06/2017 150,000 158,906 0.39Codere Finance Luxembourg SA 8.25% EUR 15/06/2015 400,000 415,000 1.02ConvaTec Healthcare E SA 7.375% EUR 15/12/2017 100,000 104,820 0.26Expro Finance Luxembourg SCA 8.5% USD 15/12/2016 500,000 371,731 0.92Mark IV Europe Lux SCA/Mark IV USA SCA 8.875% EUR 15/12/2017 100,000 108,505 0.27UBI Banca International SA 8.75% EUR 29/10/2012 100,000 70,750 0.17UniCredit International Bank Luxembourg SA FRN EUR Perpetual 1,000,000 987,035 2.43Wind Acquisition Finance SA 7.375% EUR 15/02/2018 100,000 103,688 0.26Wind Acquisition Finance SA 11.75% EUR 15/07/2017 300,000 345,750 0.85
2,789,347 6.87
NETHERLANDSIFCO Systems NV 10% EUR 30/06/2016 300,000 355,500 0.88ING Groep NV 8% EUR Perpetual 400,000 400,660 0.99Intergen NV 8.5% EUR 30/06/2017 200,000 215,000 0.53OI European Group BV 6.75% EUR 15/09/2020 100,000 103,807 0.26Pfleiderer Finance BV 7.125% EUR Perpetual 200,000 26,750 0.07UPC Holding BV 9.75% EUR 15/04/2018 150,000 164,371 0.40Wereldhave NV 2.875% EUR 18/11/2015 800,000 790,000 1.95
2,056,088 5.08
PORTUGALParpublica - Participiacoes Publicas SGPS SA 3.25% EUR 18/12/2014 500,000 475,200 1.17

Invesco Pan European High Income Fund
93 Invesco Funds
Statement of Investments as at 28 February 2011
Investment Nominal/Shares Market Value Net AssetsEUR %
SPAINAbengoa SA 8.5% EUR 31/03/2016 100,000 100,228 0.25BBVA International Preferred SA Unipersonal FRN GBP Perpetual 100,000 113,423 0.28Cemex Espana Luxembourg 9.25% USD 12/05/2020 158,000 117,753 0.29Santander Finance Preferred SA Unipersonal FRN GBP Perpetual 700,000 864,467 2.13
1,195,871 2.95
SWITZERLANDUBS AG 3.22% EUR 31/07/2012 500,000 268,438 0.66UBS AG FLTG FRN EUR Perpetual 100,000 89,499 0.22
357,937 0.88
UNITED KINGDOMAvis Finance Co Plc FRN EUR 31/07/2013 200,000 198,562 0.49Aviva Plc FRN EUR Perpetual 50,000 43,699 0.11Aviva Plc FRN GBP Perpetual 50,000 48,573 0.12Barclays Bank Plc 10% GBP 21/05/2021 80,000 115,095 0.28Care UK Health & Social Care Plc 9.75% GBP 01/08/2017 250,000 319,235 0.79Clerical Medical Finance Plc FRN GBP Perpetual 100,000 96,645 0.24Co-Operative Bank Plc FRN GBP Perpetual 100,000 97,230 0.24Eco-Bat Finance Plc 10.125% EUR 31/01/2013 109,500 110,394 0.27First Hydro Finance Plc 9% GBP 31/07/2021 100,000 141,745 0.35Friends Provident Group Plc 12% GBP 21/05/2021 53,000 79,081 0.19HSBC Capital Funding LP FRN EUR Perpetual 50,000 49,338 0.12Ineos Finance Plc 9.25% EUR 15/05/2015 200,000 221,830 0.55Ineos Group Holdings Plc 7.875% EUR 15/02/2016 400,000 394,480 0.97Investec Tier I FRN EUR Perpetual 50,000 43,760 0.11ISS Financing Plc 11% EUR 15/06/2014 200,000 221,906 0.55LBG Capital No.1 Plc 7.869% GBP 25/08/2020 200,000 218,183 0.54LBG Capital No.1 Plc 11.04% GBP 19/03/2020 250,000 318,756 0.78LBG Capital No.2 Plc 6.385% EUR 12/05/2020 200,000 172,281 0.42LBG Capital No.2 Plc 11.25% GBP 14/09/2023 200,000 248,465 0.61LBG Capital No.2 Plc 11.875% GBP 01/09/2024 200,000 253,619 0.62LBG Capital No.2 Plc 16.125% GBP 10/12/2024 200,000 312,777 0.77Legal & General Group Plc FRN GBP Perpetual 50,000 51,858 0.13Legal & General Group Plc FRN GBP 23/07/2041 200,000 286,810 0.71Nationwide Building Society FRN GBP Perpetual 100,000 116,898 0.29Northern Rock Asset Management Plc 9.375% GBP 17/10/2021 350,000 348,506 0.86Northern Rock Asset Management Plc 10.375% GBP 25/03/2018 600,000 650,155 1.60Pearl Group Holdings Ltd No 1 FRN GBP Perpetual 85,000 64,723 0.16Peel Land & Property Investments Plc 8.375% GBP 30/04/2040 100,000 119,621 0.29Prudential Plc 6.5% USD Perpetual 75,000 49,668 0.12Rexam Plc FRN EUR 29/06/2067 100,000 98,224 0.24Royal Bank of Scotland Plc FRN EUR 23/02/2045 300,000 208,500 0.51RSA Insurance Group Plc FRN GBP Perpetual 50,000 62,205 0.15Scottish & Southern Energy Plc FRN EUR Perpetual 1,000,000 982,500 2.42Standard Chartered Bank FRN USD Perpetual 200,000 160,838 0.40Standard Life Plc FRN EUR 12/07/2022 50,000 50,976 0.13UBS Capital Securities Jersey Ltd FRN EUR Perpetual 400,000 420,786 1.04Vedanta Resources Plc 8.75% USD 15/01/2014 100,000 77,783 0.19Virgin Media Finance Plc 8.875% GBP 15/10/2019 200,000 266,505 0.66Virgin Media Finance Plc 9.5% EUR 15/08/2016 200,000 230,870 0.57Virgin Media Secured Finance Plc 7% GBP 15/01/2018 250,000 317,268 0.78Yorkshire Building Society FRN GBP Perpetual 50,000 42,563 0.10
8,312,911 20.47
UNITED STATESAmerican International Group Inc FRN EUR 15/03/2067 300,000 254,850 0.63American International Group Inc FRN EUR 22/05/2038 150,000 153,750 0.38American International Group Inc FRN USD 15/05/2058 250,000 198,076 0.49Chesapeake Corp 7% EUR 15/12/2014 100,000 10,000 0.02Deutsche Bank Capital Funding Trust XI 9.5% EUR Perpetual 500,000 540,537 1.33

Invesco Pan European High Income Fund
94 Invesco Funds
Statement of Investments as at 28 February 2011
Investment Nominal/Shares Market Value Net AssetsEUR %
UNITED STATES (CONTINUED)Ford Motor Co 7.45% USD 16/07/2031 100,000 79,736 0.20General Electric Capital Corp FRN EUR 15/09/2067 107,000 99,804 0.25General Motors Co 0% USD 01/12/2013 5,750 210,500 0.52Hertz Corp 7.875% EUR 01/01/2014 50,000 51,125 0.13Motors Liquidation Co 8.375% EUR 05/07/2033 1,000,000 345,000 0.85RBS Capital Trust D 5.646% GBP Perpetual 100,000 84,930 0.21TRW Automotive Inc 6.375% EUR 15/03/2014 100,000 105,854 0.26
2,134,162 5.27
TOTAL BONDS 32,049,492 78.94
TOTAL TRANSFERABLE SECURITIES ADMITTED TO AN OFFICIAL STOCK EXCHANGELISTING OR DEALT IN ON ANOTHER REGULATED MARKET 35,592,952 87.65
OTHER TRANSFERABLE SECURITIES
BONDSLUXEMBOURGM&G Finance Luxembourg SA 7.5% EUR Perpetual 100,000 49,500 0.12
NETHERLANDSBoats Investments BV 11% EUR 31/03/2017 146,101 141,353 0.35Hollandwide Parent BV 0% EUR 01/08/2014 73,000 2,190 0.01
143,543 0.36
UNITED KINGDOMCattles Plc 7.125% GBP 05/07/2017 100,000 4,100 0.01
UNITED STATESBank of America Corp FRN USD Perpetual 100,000 76,530 0.19Jarden Corp 7.5% EUR 15/01/2020 500,000 524,675 1.29Nalco Co 6.875% EUR 15/01/2019 100,000 106,001 0.26
707,206 1.74
TOTAL BONDS 904,349 2.23
WARRANTSUNITED KINGDOMTaylor Wimpey WTS 15/05/2014 4,495 695 –
TOTAL WARRANTS 695 –
TOTAL OTHER TRANSFERABLE SECURITIES 905,044 2.23
TotalInvestments 36,497,996 89.88
The accompanying notes form an integral part of these financial statements.

Invesco Global Absolute Return Fund
95 Invesco Funds
Statement of Investments as at 28 February 2011
Investment Nominal/Shares Market Value Net AssetsEUR %
OPEN-ENDED FUNDSIRELANDShort-Term Investments Co Global Series - Euro Liquidity Portfolio 400,000 400,000 2.91
TOTAL OPEN-ENDED FUNDS 400,000 2.91
TotalInvestments 400,000 2.91
The accompanying notes form an integral part of these financial statements.

Invesco Balanced-Risk Allocation Fund
96 Invesco Funds
Statement of Investments as at 28 February 2011
Investment Nominal/Shares Market Value Net AssetsEUR %
TRANSFERABLE SECURITIES ADMITTED TO AN OFFICIAL STOCK EXCHANGE LISTING OR DEALT IN ON ANOTHERREGULATED MARKET
STRUCTURED PRODUCTSIRELANDSource Physical Markets Secured Gold Linked Notes 4,950 503,274 0.80
SWITZERLANDUBS ETC WTI Crude Oil - USD 3,520 3,555,535 5.66
UNITED KINGDOMETFS Agriculture DJ-UBSCI 637,000 4,427,043 7.05Gold Bullion Securities Ltd 56,000 5,564,757 8.87
9,991,800 15.92
UNITED STATESiPath Dow Jones-UBS Copper Subindex Total Return ETN 86,800 3,725,613 5.93
TOTAL STRUCTURED PRODUCTS 17,776,222 28.31
TOTAL TRANSFERABLE SECURITIES ADMITTED TO AN OFFICIAL STOCK EXCHANGELISTING OR DEALT IN ON ANOTHER REGULATED MARKET 17,776,222 28.31
TotalInvestments 17,776,222 28.31
The accompanying notes form an integral part of these financial statements.

Invesco Funds
Statement of Net Assets as at 28 February 2011
97 Invesco Funds
InvescoGlobal
StructuredEquity Fund
InvescoEmerging
MarketQuantitative
Equity Fund1*
InvescoUS Structured
Equity Fund
InvescoLatin American
Equity Fund2*
InvescoPan European
StructuredEquity Fund
InvescoPan European
Equity FundNotes USD USD USD USD EUR EUR
ASSETSInvestments at market value 2(b) 28,168,606 17,294,148 71,535,757 8,187,358 470,501,086 720,714,253
CURRENT ASSETSDue from brokers – – 2,373,714 43,424 – –Receivable for Shares issued 51,526 284 2,095,904 30,606 3,955,442 6,038,992Other debtors 105,658 84,536 124,198 69,374 1,169,600 1,706,873Bank balances 615,311 983,106 4,818,530 59,695 23,678,456 5,467,105Net unrealised gain on forward foreign exchangecontracts/futures contracts 7,8,2(i)&2(j) 146,946 2,658 2,941 1,010 – –Net unrealised gain on equity swaps 11&2(m) – – – – – –Net unrealised gain on credit default swaps 9&2(k) – – – – – –
Total Assets 29,088,047 18,364,732 80,951,044 8,391,467 499,304,584 733,927,223
CURRENT LIABILITIESBank overdraft – 53,337 – 25,947 – –Due to brokers – – 6,285,175 29,019 – 1,108,871Payable for Shares redeemed 35,966 60,515 197,411 69,682 4,264,028 3,690,851Other creditors 25,383 19,599 44,335 20,177 206,120 335,208Net unrealised loss on forward foreign exchangecontracts/future contracts 7,8,2(i)&2(j) 692,916 6,573 1,138 1,214 248,656 –Net unrealised loss on equity swaps 11&2(m) – – – – – –Net unrealised loss on credit default swaps 9&2(k) – – – – – –Net unrealised loss on interest rate swaps 10&2(l) – – – – – –
Total Liabilities 754,265 140,024 6,528,059 146,039 4,718,804 5,134,930
Net Assets 28,333,782 18,224,708 74,422,985 8,245,428 494,585,780 728,792,293
Number of Shares in issueDistribution A 226,154 – – – 1,625 1,918,507Accumulation A – 23,279 3,510,790 380,744 30,825,289 27,577,868Accumulation A Hedg (EUR) 2,345 69,226 44,005 31,104 – –Accumulation A Hedg (USD) – – – – – –Distribution A Hedg (EUR) – – – – – –Distribution A (USD) – – – – – 14,555Accumulation B – – 62 – 102 234,280Accumulation B1 – – – – – –Distribution C 662,830 – – – – 1,473,463Accumulation C – 1,114,352 1,024,796 200,803 17,483,190 20,780,617Accumulation C Hedg (EUR) 2,240 6,504 32,342 2,964 – –Accumulation C Hedg (GBP) 4,459 6,505 – – – –Accumulation C Hedg (USD) – – – – – –Accumulation E 20,429 194,030 598,708 126,841 2,746,817 7,699,025Accumulation I – 147,600 111 – – 99Accumulation C Hedg (JPY) – – – – – –Accumulation E Hedg (EUR) – – – – – –Distribution A (HKD) – – – – – –Distribution E – – – – – –
Net Asset Value per ShareDistribution A 29.72 – – – 9.57 11.25Accumulation A – 11.57 14.32 11.08 9.56 12.07Accumulation A Hedg (EUR) 22.34 9.26 7.92 8.42 – –Accumulation A Hedg (USD) – – – – – –Distribution A Hedg (EUR) – – – – – –Distribution A (USD) – – – – – 15.80Accumulation B – – 13.23 – 8.92 10.54Accumulation B1 – – – – – –Distribution C 31.22 – – – – 11.94Accumulation C – 11.61 14.89 11.11 10.06 12.80Accumulation C Hedg (EUR) 23.47 9.29 8.26 8.45 – –Accumulation C Hedg (GBP) 20.46 7.79 – – – –Accumulation C Hedg (USD) – – – – – –Accumulation E 22.17 8.34 9.72 7.99 8.70 11.44Accumulation I – 8.46 10.49 – – 12.33Accumulation C Hedg (JPY) – – – – – –Accumulation E Hedg (EUR) – – – – – –Distribution A (HKD) – – – – – –Distribution E – – – – – –
The accompanying notes form an integral part of the financial statements.
1 Invesco Emerging Market Quantitative Equity Fund launched on 21 June 20102 Invesco Latin American Equity Fund launched on 11 August 2010* Funds which swung the price on 28 February 2011 (see note 12)

Invesco Funds
Statement of Net Assets as at 28 February 2011
98 Invesco Funds
InvescoPan European
Small CapEquity Fund
InvescoEuropean
Growth EquityFund
InvescoPan EuropeanEquity Income
Fund
InvescoEmerging
Europe EquityFund
InvescoNippon
Small/Mid CapEquity Fund
InvescoNippon SelectEquity Fund
Notes EUR EUR EUR USD JPY JPYASSETSInvestments at market value 2(b) 146,658,608 60,353,436 4,540,060 50,392,248 5,555,104,055 9,109,031,850
CURRENT ASSETSDue from brokers 1,370,591 229,641 – 26,421 30,164,396 101,711,024Receivable for Shares issued 2,516 227,506 6,877 61,400 52,880,988 342,932Other debtors 47,033 103,051 49,831 8,314 5,298,595 11,066,093Bank balances 4,582,680 6,295,203 420,078 830,135 235,019,575 82,334,060Net unrealised gain on forward foreign exchangecontracts/futures contracts 7,8,2(i)&2(j) – – – 905 – –Net unrealised gain on equity swaps 11&2(m) – – – – – –Net unrealised gain on credit default swaps 9&2(k) – – – – – –Total Assets 152,661,428 67,208,837 5,016,846 51,319,423 5,878,467,609 9,304,485,959
CURRENT LIABILITIESBank overdraft 612,208 – – 255,233 1,670,329 5,413,214Due to brokers 1,243,558 425,574 29,917 210,656 52,840,387 24,091,692Payable for Shares redeemed 2,467,530 132,888 45,994 476,919 56,522,732 66,933,091Other creditors 89,253 43,496 2,201 50,987 4,273,217 6,701,154Net unrealised loss on forward foreign exchangecontracts/future contracts 7,8,2(i)&2(j) – – – – 18,618 –Net unrealised loss on equity swaps 11&2(m) – – – – – –Net unrealised loss on credit default swaps 9&2(k) – – – – – –Net unrealised loss on interest rate swaps 10&2(l) – – – – – –
Total Liabilities 4,412,549 601,958 78,112 993,795 115,325,283 103,139,151
Net Assets 148,248,879 66,606,879 4,938,734 50,325,628 5,763,142,326 9,201,346,808
Number of Shares in issueDistribution A – – 523,858 – – –Accumulation A 9,803,566 1,962,190 41,209 1,635,297 7,903,203 28,389,805Accumulation A Hedg (EUR) – – – – – –Accumulation A Hedg (USD) – – – – – –Distribution A Hedg (EUR) – – – – – –Distribution A (USD) 3,353 – – – – –Accumulation B 95,343 – – 131,395 125,080 308,964Accumulation B1 – – – – – –Distribution C – – – – – –Accumulation C 927,918 2,215,934 90 859,824 413,486 9,361,667Accumulation C Hedg (EUR) – – – – – –Accumulation C Hedg (GBP) – – – – – –Accumulation C Hedg (USD) – – – – – –Accumulation E 476,168 210,530 42,539 1,322,891 668,859 6,880,473Accumulation I – 78 – – 205 602Accumulation C Hedg (JPY) – – – – – –Accumulation E Hedg (EUR) – – – – – –Distribution A (HKD) – – – – – –Distribution E – – – – – –
Net Asset Value per ShareDistribution A – – 8.09 – – –Accumulation A 13.10 14.95 8.48 12.79 635 204Accumulation A Hedg (EUR) – – – – – –Accumulation A Hedg (USD) – – – – – –Distribution A Hedg (EUR) – – – – – –Distribution A (USD) 18.09 – – – – –Accumulation B 11.59 – – 11.57 563 180Accumulation B1 – – – – – –Distribution C – – – – – –Accumulation C 13.89 15.46 8.60 13.50 675 216Accumulation C Hedg (EUR) – – – – – –Accumulation C Hedg (GBP) – – – – – –Accumulation C Hedg (USD) – – – – – –Accumulation E 12.09 14.26 8.27 8.90 5.19 1.71Accumulation I – 15.26 – – 5.74 1.84Accumulation C Hedg (JPY) – – – – – –Accumulation E Hedg (EUR) – – – – – –Distribution A (HKD) – – – – – –Distribution E – – – – – –
The accompanying notes form an integral part of the financial statements.

Invesco Funds
Statement of Net Assets as at 28 February 2011
99 Invesco Funds
InvescoAsia
OpportunitiesEquity Fund
InvescoGreater China
Equity Fund
InvescoAsia
InfrastructureFund
InvescoIndia Equity
Fund
InvescoAsia ConsumerDemand Fund*
InvescoGlobal Leisure
FundNotes USD USD USD USD USD USD
ASSETSInvestments at market value 2(b) 157,419,496 578,498,097 2,785,224,754 210,194,261 996,841,990 48,835,293
CURRENT ASSETSDue from brokers 1,346,877 5,157,961 6,540,241 – 21,495,832 395,363Receivable for Shares issued 318,347 334,965 1,057,765 5,272,470 275,910 693,279Other debtors 210,638 266,528 7,256,897 43,983 2,045,775 37,536Bank balances 2,015,894 10,706,647 43,858,430 6,139,287 22,766,056 3,703,724Net unrealised gain on forward foreign exchangecontracts/futures contracts 7,8,2(i)&2(j) – 15,779 73,284 – 123,715 –Net unrealised gain on equity swaps 11&2(m) – – – – – –Net unrealised gain on credit default swaps 9&2(k) – – – – – –Total Assets 161,311,252 594,979,977 2,844,011,371 221,650,001 1,043,549,278 53,665,195
CURRENT LIABILITIESBank overdraft 44,821 2,781,655 10,795,565 129,878 12,376,076 –Due to brokers 1,339,000 5,843,207 9,566,259 2,235,520 9,883,521 2,511,281Payable for Shares redeemed 243,014 4,068,877 18,977,355 129,655 15,716,498 1,884,870Other creditors 193,917 390,338 5,720,732 219,088 653,466 38,722Net unrealised loss on forward foreign exchangecontracts/future contracts 7,8,2(i)&2(j) 116 4,620 22,399 – 78,752 2,009Net unrealised loss on equity swaps 11&2(m) – – – – – –Net unrealised loss on credit default swaps 9&2(k) – – – – – –Net unrealised loss on interest rate swaps 10&2(l) – – – – –
Total Liabilities 1,820,868 13,088,697 45,082,310 2,714,141 38,708,313 4,436,882
Net Assets 159,490,384 581,891,280 2,798,929,061 218,935,860 1,004,840,965 49,228,313
Number of Shares in issueDistribution A – – 27,300,437 4,098,119 3,488,307 –Accumulation A 531,847 8,480,172 101,085,052 – 38,164,995 2,206,180Accumulation A Hedg (EUR) – 86,691 1,147,681 – 3,019,648 –Accumulation A Hedg (USD) – – – – – –Distribution A Hedg (EUR) – – – – – –Distribution A (USD) – – – – – –Accumulation B 18,551 259,686 – – – 15,550Accumulation B1 – – – – – –Distribution C – – – 470,714 – –Accumulation C 940,384 3,128,298 23,031,343 – 19,232,537 168,575Accumulation C Hedg (EUR) – 27,623 148,993 – 438,805 –Accumulation C Hedg (GBP) – – – – – –Accumulation C Hedg (USD) – – – – – –Accumulation E 139,519 4,177,903 37,341,261 850,631 19,462,692 133,835Accumulation I – – – – – –Accumulation C Hedg (JPY) – – – – – –Accumulation E Hedg (EUR) – – – – – –Distribution A (HKD) – – – – – –Distribution E – – – – – –
Net Asset Value per ShareDistribution A – – 14.48 40.28 11.81 –Accumulation A 95.17 36.34 14.82 – 12.00 19.52Accumulation A Hedg (EUR) – 26.76 10.67 – 8.71 –Accumulation A Hedg (USD) – – – – – –Distribution A Hedg (EUR) – – – – – –Distribution A (USD) – – – – – –Accumulation B 85.01 31.97 – – – 17.08Accumulation B1 – – – – – –Distribution C – – – 43.74 – –Accumulation C 101.06 38.54 15.26 – 12.22 20.64Accumulation C Hedg (EUR) – 28.38 11.20 – 8.97 –Accumulation C Hedg (GBP) – – – – – –Accumulation C Hedg (USD) – – – – – –Accumulation E 63.59 24.35 10.36 28.31 8.51 13.04Accumulation I – – – – – –Accumulation C Hedg (JPY) – – – – – –Accumulation E Hedg (EUR) – – – – – –Distribution A (HKD) – – – – – –Distribution E – – – – – –
The accompanying notes form an integral part of the financial statements.
* Funds which swung the price on 28 February 2011 (see note 12)

Invesco Funds
Statement of Net Assets as at 28 February 2011
100 Invesco Funds
InvescoEnergy Fund
InvescoAsia PacificReal Estate
Securities Fund
InvescoGlobal Income
Real EstateSecurities Fund
InvescoGold & Precious
Metals Fund1,*
InvescoUSD Reserve
Fund
InvescoEuro Reserve
FundNotes USD USD USD USD USD EUR
ASSETSInvestments at market value 2(b) 463,204,826 3,298,653 10,022,108 15,763,911 53,484,032 253,880,664
CURRENT ASSETSDue from brokers – 4,584 424,910 8,430 – –Receivable for Shares issued 49,067,081 – 565 718,285 607,204 1,498,653Other debtors 239,204 56,830 28,722 62,411 83,825 260,839Bank balances 63,872,605 46,565 163,540 193,543 33,746,201 105,982,282Net unrealised gain on forward foreign exchangecontracts/futures contracts 7,8,2(i)&2(j) 251,693 – – 22,258 2,070 –Net unrealised gain on equity swaps 11&2(m) – – – – – –Net unrealised gain on credit default swaps 9&2(k) – – – – – –Total Assets 576,635,409 3,406,632 10,639,845 16,768,838 87,923,332 361,622,438
CURRENT LIABILITIESBank overdraft – – – – 565,116 –Due to brokers 95,883,122 – 395,667 258,671 – 9,997,950Payable for Shares redeemed 35,927 – 24,063 354,469 3,994,414 1,468,951Other creditors 240,552 1,897 23,800 22,071 63,428 177,789Net unrealised loss on forward foreign exchangecontracts/future contracts 7,8,2(i)&2(j) 130,613 – – 18,943 – –Net unrealised loss on equity swaps 11&2(m) – – – – – –Net unrealised loss on credit default swaps 9&2(k) – – – – – –Net unrealised loss on interest rate swaps 10&2(l) – – – – – –Total Liabilities 96,290,214 1,897 443,530 654,154 4,622,958 11,644,690
Net Assets 480,345,195 3,404,735 10,196,315 16,114,684 83,300,374 349,977,748
Number of Shares in issueDistribution A 765 151,556 676,783 – – 16Accumulation A 11,670,392 14,115 347,773 778,909 476,565 233,885Accumulation A Hedg (EUR) 1,251,775 – – 327,889 – –Accumulation A Hedg (USD) – – – – – –Distribution A Hedg (EUR) – – – – – –Distribution A (USD) – – – – – –Accumulation B 115,844 – – – 6,430 264Accumulation B1 – – – – 21,383 –Distribution C – – – – – –Accumulation C 1,152,861 150,000 647 32,622 312,043 677,138Accumulation C Hedg (EUR) 78,750 – – 6,504 – –Accumulation C Hedg (GBP) – – – – – –Accumulation C Hedg (USD) – – – – – –Accumulation E 1,612,510 30,668 89,822 142,814 133,123 158,170Accumulation I – – – – – –Accumulation C Hedg (JPY) – – – – – –Accumulation E Hedg (EUR) – – – – – –Distribution A (HKD) – – – – – –Distribution E – – – – – –
Net Asset Value per ShareDistribution A 31.09 9.72 8.74 – – 320.50Accumulation A 31.08 9.82 9.97 12.16 87.00 320.56Accumulation A Hedg (EUR) 16.43 – – 9.76 – –Accumulation A Hedg (USD) – – – – – –Distribution A Hedg (EUR) – – – – – –Distribution A (USD) – – – – – –Accumulation B 27.99 – – – 78.51 288.69Accumulation B1 – – – – 86.87 –Distribution C – – – – – –Accumulation C 32.65 9.97 10.25 12.21 89.46 331.73Accumulation C Hedg (EUR) 17.31 – – 9.80 – –Accumulation C Hedg (GBP) – – – – – –Accumulation C Hedg (USD) – – – – – –Accumulation E 20.81 7.03 6.52 8.77 62.86 318.01Accumulation I – – – – – –Accumulation C Hedg (JPY) – – – – – –Accumulation E Hedg (EUR) – – – – – –Distribution A (HKD) – – – – – –Distribution E – – – – – –
The accompanying notes form an integral part of the financial statements.
1 Invesco Gold & Precious Metals Fund was launched on 21 June 2010* Funds which swung the price on 28 February 2011 (see note 12)

Invesco Funds
Statement of Net Assets as at 28 February 2011
101 Invesco Funds
InvescoGlobal Bond
Fund
InvescoEuropean Bond
Fund
InvescoAbsolute Return
Bond Fund
InvescoEuro Corporate
Bond Fund*
InvescoEuro Inflation-
Linked BondFund
InvescoUK Investment
Grade BondFund
Notes USD EUR EUR EUR EUR GBPASSETSInvestments at market value 2(b) 32,950,144 42,971,267 22,176,845 2,019,022,283 64,225,144 68,397,502
CURRENT ASSETSDue from brokers 1,551,422 635,166 330,538 10,800,000 535,787 575,909Receivable for Shares issued 16,283 121,261 211,118 37,055,259 1,671,201 79,033Other debtors 425,063 790,862 334,158 49,709,913 909,491 1,231,592Bank balances 4,782,737 4,072,575 1,421,887 77,636,430 116,609 467,270Net unrealised gain on forward foreign exchangecontracts/futures contracts 7,8,2(i)&2(j) – 19,173 478,182 4,083,750 – 266,247Net unrealised gain on equity swaps 11&2(m) – – – – – –Net unrealised gain on credit default swaps 9&2(k) – – 67,034 – – –Total Assets 39,725,649 48,610,304 25,019,762 2,198,307,635 67,458,232 71,017,553
CURRENT LIABILITIESBank overdraft 2,134,897 476,786 178,098 – – –Due to brokers 3,618,456 232,250 585,493 49,568,308 – 485,629Payable for Shares redeemed 92,912 503,086 78,037 1,324,672 199,832 75,230Other creditors 49,665 37,905 39,288 890,364 36,538 36,526Net unrealised loss on forward foreign exchangecontracts/future contracts 7,8,2(i)&2(j) 192,259 37,747 196,692 – 16,625 151,101Net unrealised loss on equity swaps 11&2(m) – – – – – –Net unrealised loss on credit default swaps 9&2(k) – 65,346 43,564 – – 74,376Net unrealised loss on interest rate swaps 10&2(l) – – 8,415 – – –
Total Liabilities 6,088,189 1,353,120 1,129,587 51,783,344 252,995 822,862
Net Assets 33,637,460 47,257,184 23,890,175 2,146,524,291 67,205,237 70,194,691
Number of Shares in issueDistribution A 903,451 570,014 – 26,563,512 – 83,092,527Accumulation A 1,365,413 6,111,565 4,069,600 52,668,615 2,680,886 –Accumulation A Hedg (EUR) – – – – – –Accumulation A Hedg (USD) – – – – – –Distribution A Hedg (EUR) – – – – – –Distribution A (USD) – – – – – –Accumulation B – 23,539 – – – –Accumulation B1 – – – – – –Distribution C – – – – – –Accumulation C 1,383,553 1,794,754 737,387 47,266,438 389,164 –Accumulation C Hedg (EUR) – – – – – –Accumulation C Hedg (GBP) – – 37,423 – – –Accumulation C Hedg (USD) – – – – – –Accumulation E 1,053,477 1,052,709 3,802,404 38,989,041 1,576,686 –Accumulation I – – 347 – 69 –Accumulation C Hedg (JPY) – – – – – –Accumulation E Hedg (EUR) – – – – – –Distribution A (HKD) – – – – – –Distribution E – – – – – –
Net Asset Value per ShareDistribution A 5.2358 4.7406 – 11.1672 – 0.8448Accumulation A 7.4783 4.9407 2.7720 13.2858 14.4989 –Accumulation A Hedg (EUR) – – – – – –Accumulation A Hedg (USD) – – – – – –Distribution A Hedg (EUR) – – – – – –Distribution A (USD) – – – – – –Accumulation B – 4.3643 – – – –Accumulation B1 – – – – – –Distribution C – – – – – –Accumulation C 8.0109 5.0903 2.8831 13.4937 14.9503 –Accumulation C Hedg (EUR) – – – – – –Accumulation C Hedg (GBP) – – 2.3879 – – –Accumulation C Hedg (USD) – – – – – –Accumulation E 5.2286 4.8646 2.7292 13.1406 14.2808 –Accumulation I – – 2.8669 – 14.6618 –Accumulation C Hedg (JPY) – – – – – –Accumulation E Hedg (EUR) – – – – – –Distribution A (HKD) – – – – – –Distribution E – – – – – –
The accompanying notes form an integral part of the financial statements.
* Funds which swung the price on 28 February 2011 (see note 12)

Invesco Funds
Statement of Net Assets as at 28 February 2011
102 Invesco Funds
InvescoEmerging LocalCurrencies Debt
Fund
InvescoGlobal
InvestmentGrade
Corporate BondFund
InvescoGlobal Total
Return (EUR)Bond Fund1
InvescoGlobal
UnconstrainedBond Fund2
InvescoCapital Shield
90 (EUR) Fund*
InvescoAsia Balanced
Fund*Notes USD USD EUR GBP EUR USD
ASSETSInvestments at market value 2(b) 595,381,373 18,767,970 2,210,080 2,266,218 102,252,412 642,666,625
CURRENT ASSETSDue from brokers – 690,060 – – – –Receivable for Shares issued 4,700,984 186,340 – – – 12,560,428Other debtors 10,443,253 373,560 92,274 92,618 27,355 5,549,371Bank balances 11,446,345 482,728 414,880 190,174 66,219,968 62,154,556Net unrealised gain on forward foreign exchangecontracts/futures contracts 7,8,2(i)&2(j) 1,261,979 70,456 2,202 8,036 2,824,548 27,698Net unrealised gain on equity swaps 11&2(m) – – – – – –Net unrealised gain on credit default swaps 9&2(k) – – – 175 – –
Total Assets 623,233,934 20,571,114 2,719,436 2,557,221 171,324,283 722,958,678
CURRENT LIABILITIESBank overdraft 2,156,707 – – – 1,018,790 –Due to brokers – 727,842 265,107 30,160 – –Payable for Shares redeemed 3,653,096 11,982 – – 510,133 466,356Other creditors 366,964 22,090 42,693 30,792 83,063 375,356Net unrealised loss on forward foreign exchangecontracts/future contracts 7,8,2(i)&2(j) 1,143,738 449,580 4,053 14,076 243,805 9,027Net unrealised loss on equity swaps 11&2(m) – – – – – –Net unrealised loss on credit default swaps 9&2(k) – – 10,710 41,696 – –Net unrealised loss on interest rate swaps 10&2(l) – – – – – –
Total Liabilities 7,320,505 1,211,494 322,563 116,724 1,855,791 850,739
Net Assets 615,913,429 19,359,620 2,396,873 2,440,497 169,468,492 722,107,939
Number of Shares in issueDistribution A 30,819,445 485,593 – – – 31,321,745Accumulation A 3,758,412 – 224,942 44,453 6,330,803 7,554,391Accumulation A Hedg (EUR) 1,792,057 195,347 – 2,190 – 679,219Accumulation A Hedg (USD) – – – – – –Distribution A Hedg (EUR) 30,216 – – – – –Distribution A (USD) – 203,242 – – – –Accumulation B – – – – – –Accumulation B1 – – – – – –Distribution C – 290,250 – – – –Accumulation C 5,838,889 – 1,923 172,384 5,433,344 1,786,726Accumulation C Hedg (EUR) 1,935,558 429,479 – 2,190 – 3,618Accumulation C Hedg (GBP) – 12,589 – – – –Accumulation C Hedg (USD) – – – – – –Accumulation E 7,060,926 187,293 1,923 – 3,150,227 1,187,829Accumulation I – – – – 92 –Accumulation C Hedg (JPY) – – – – – –Accumulation E Hedg (EUR) – – – 2,190 – –Distribution A (HKD) – – – – – 753,357Distribution E – – 1,929 – – –
Net Asset Value per ShareDistribution A 10.8544 10.7987 – – – 15.55Accumulation A 14.2601 – 10.3892 10.8817 11.32 20.51Accumulation A Hedg (EUR) 7.9001 7.6542 – 13.0157 – 11.90Accumulation A Hedg (USD) – – – – – –Distribution A Hedg (EUR) 8.3176 – – – – –Distribution A (USD) – 10.4862 – – – –Accumulation B – – – – – –Accumulation B1 – – – – – –Distribution C – 10.8659 – – – –Accumulation C 14.5431 – 10.4106 10.9276 11.69 20.98Accumulation C Hedg (EUR) 8.8544 7.7020 – 13.0723 – 15.51Accumulation C Hedg (GBP) – 7.1423 – – – –Accumulation C Hedg (USD) – – – – – –Accumulation E 10.1732 7.9086 10.3772 – 10.88 12.04Accumulation I – – – – 11.68 –Accumulation C Hedg (JPY) – – – – – –Accumulation E Hedg (EUR) – – – 12.9737 – –Distribution A (HKD) – – – – – 121.12Distribution E – – 10.3444 – – –
The accompanying notes form an integral part of the financial statements.
1 Invesco Global Total Return (EUR) Bond Fund launched on 15 September 20102 Invesco Global Unconstrained Bond Fund launched on 21 June 2010* Funds which swung the price on 28 February 2011 (see note 12)

Invesco Funds
Statement of Net Assets as at 28 February 2011
103 Invesco Funds
InvescoPan European
High IncomeFund
InvescoGlobal Absolute
Return Fund
InvescoBalanced-Risk
Allocation Fund
28.02.2011Consolidated Net
Assets USDEquiv.
Notes EUR EUR EUR USDASSETSInvestments at market value 2(b) 36,497,996 400,000 17,776,222 12,560,550,871
CURRENT ASSETSDue from brokers 112,500 – 114,214 62,130,361Receivable for Shares issued 1,658,100 112,750 794,870 152,567,266Other debtors 827,425 31,606 55,147 107,414,333Bank balances 3,843,165 13,132,883 43,178,338 770,981,165Net unrealised gain on forward foreign exchangecontracts/futures contracts 7,8,2(i)&2(j) 123,545 87,036 1,808,763 15,476,368Net unrealised gain on equity swaps 11&2(m) – 706,717 – 976,722Net unrealised gain on credit default swaps 9&2(k) 31,708 – – 136,750Total Assets 43,094,439 14,470,992 63,727,554 13,670,233,836
CURRENT LIABILITIESBank overdraft – 43,370 720 34,625,991Due to brokers 2,138,260 – 408,284 231,783,681Payable for Shares redeemed 21,749 – 300,368 72,867,319Other creditors 30,640 21,290 74,637 11,702,546Net unrealised loss on forward foreign exchangecontracts/future contracts 7,8,2(i)&2(j) 8,221 48,079 162,651 4,357,348Net unrealised loss on equity swaps 11&2(m) – 605,480 – 836,807Net unrealised loss on credit default swaps 9&2(k) 289,689 – – 753,610Net unrealised loss on interest rate swaps 10&2(l) – – – 11,630
Total Liabilities 2,488,559 718,219 946,660 356,938,932
Net Assets 40,605,880 13,752,773 62,780,894 13,313,294,904
Number of Shares in issueDistribution A 1,090,717 – 135,393 135,393Accumulation A 532,117 143,320 857,837 857,837Accumulation A Hedg (EUR) – – – –Accumulation A Hedg (USD) – – 12,148 12,148Distribution A Hedg (EUR) – – – –Distribution A (USD) – – – –Accumulation B – – – –Accumulation B1 – – – –Distribution C – – – –Accumulation C 568,055 228,699 3,157,193 3,157,193Accumulation C Hedg (EUR) – – – –Accumulation C Hedg (GBP) – – 12,294 12,294Accumulation C Hedg (USD) – 5,231 6,452 6,452Accumulation E 1,076,539 162,925 989,140 989,140Accumulation I – – – –Accumulation C Hedg (JPY) – 845,029 – –Accumulation E Hedg (EUR) – – – –Distribution A (HKD) – – – –Distribution E – – – –
Net Asset Value per ShareDistribution A 10.95 – 12.10 12.10Accumulation A 13.30 9.91 12.09 12.09Accumulation A Hedg (EUR) – – – –Accumulation A Hedg (USD) – – 16.03 16.03Distribution A Hedg (EUR) – – – –Distribution A (USD) – – – –Accumulation B – – – –Accumulation B1 – – – –Distribution C – – – –Accumulation C 13.45 10.13 12.20 12.20Accumulation C Hedg (EUR) – – – –Accumulation C Hedg (GBP) – – 10.76 10.76Accumulation C Hedg (USD) – 13.45 16.19 16.19Accumulation E 12.95 9.76 12.00 12.00Accumulation I – – – –Accumulation C Hedg (JPY) – 1,120 – –Accumulation E Hedg (EUR) – – – –Distribution A (HKD) – – – –Distribution E – – – –
The accompanying notes form an integral part of the financial statements.

Invesco Funds
Statement of Operations and Changes in Net Assets for the period/year ended 28 February 2011
104 Invesco Funds
InvescoGlobal
StructuredEquity Fund
InvescoEmerging
MarketQuantitative
Equity Fund1
InvescoUS Structured
Equity Fund
InvescoUS 130/30
Equity Fund†
InvescoLatin American
Equity Fund2
InvescoPan European
StructuredEquity Fund
USD USD USD USD USD EUR
INCOME
Dividends 2(e) 726,349 121,110 1,369,303 78,466 60,221 8,055,762
Bond interest 2(e) – – – – – –
Bank interest 2(e) 26,091 148 15,732 57 3,567 51,382
Net interest received on swaps 2(k);2(l);2(m) – – – – – –
Other income – – – – – 733
752,440 121,258 1,385,035 78,523 63,788 8,107,877
EXPENSES
Management fees 3 211,180 58,771 763,433 54,725 53,575 3,610,060
Service Agent's fee 4 59,684 7,878 177,433 10,860 10,249 640,263
Custodian fee 4 14,655 11,955 9,292 2,902 2,590 38,770
Luxembourg taxes 5 17,248 5,038 33,464 2,094 2,139 164,570
Administration expenses 82,852 3,837 109,038 93,061 5,904 162,562
Amortisation of preliminary expenses 2(h) – 3,883 – 2,102 1,901 –
Net interest paid on Swaps 2(k);2(l);2(m) – – – 9,177 – –
385,619 91,362 1,092,660 174,921 76,358 4,616,225
Net investment income/(loss) for theyear/period 366,821 29,896 292,375 (96,398) (12,570) 3,491,652
Dividends paid and payable 6 (396,461) – – – – –
Net increase in provision for unrealised capitalgains tax – – – – – –
Net proceeds/(payments) fromissue/(redemption) of shares (3,867,258) 17,095,652 (73,659,617) (5,484,383) 8,046,339 166,408,514
Net realised surplus/(deficit) on disposal ofinvestments, derivatives and foreign currencies 1,025,334 94,421 12,120,341 1,177,207 (95,401) 31,277,594
Net change in unrealisedappreciation/depreciation on forward foreignexchange contracts and futures 2(i);2(j) (817,790) (3,915) (4,118) 1,914 (204) 693,036
Net change in unrealised appreciation on creditdefault swaps 2(k) – – – – – –
Net change in unrealised appreciation on interestrate swaps 2(l) – – – – – –
Net change in unrealised appreciation on equityswaps 2(m) – – – 4,720 – –
Net change in unrealisedappreciation/depreciation on investments 1,997,605 1,008,654 (5,398,355) (498,910) 307,264 23,805,131
Net assets at the beginning of the year/period 30,025,531 – 141,072,359 4,895,850 – 268,909,853
Net assets at the end of the year/period 28,333,782 18,224,708 74,422,985 – 8,245,428 494,585,780
The accompanying notes form an integral part of the financial statements.1 Invesco Emerging Market Quantitative Equity Fund was launched on 21 June 2010† Invesco US 130/30 Equity Fund ceased operations on 21 February 20112 Invesco Latin American Equity Fund was launched on 11 August 2010

Invesco Funds
Statement of Operations and Changes in Net Assets for the period/year ended 28 February 2011
105 Invesco Funds
InvescoPan European
Equity Fund
InvescoPan European
Small CapEquity Fund
InvescoEuropean
Growth EquityFund
InvescoPan EuropeanEquity Income
Fund
InvescoPan European130/30 Equity
Fund†
InvescoEmerging
Europe EquityFund
EUR EUR EUR EUR EUR USD
INCOME
Dividends 2(e) 13,780,506 1,770,384 2,245,891 144,581 123,433 580,682
Bond interest 2(e) – – – – – –
Bank interest 2(e) 16,887 13,290 26,532 214 1,780 255
Net interest received on swaps 2(k);2(l);2(m) – – – – – –
Other income – – – 5,874 100 –
13,797,393 1,783,674 2,272,423 150,669 125,313 580,937
EXPENSES
Management fees 3 7,655,628 1,612,780 914,635 65,388 47,823 650,289
Service Agent's fee 4 2,028,519 419,112 222,252 13,185 9,564 115,115
Custodian fee 4 74,363 19,356 16,840 4,015 2,729 45,824
Luxembourg taxes 5 284,790 51,594 34,729 2,039 1,721 19,332
Administration expenses 228,523 124,891 70,553 28,010 59,952 100,750
Amortisation of preliminary expenses 2(h) – – – 2,147 1,795 –
Net interest paid on Swaps 2(k);2(l);2(m) – – – – 9,846 –
10,271,823 2,227,733 1,259,009 114,784 133,430 931,310
Net investment income/(loss) for theyear/period 3,525,570 (444,059) 1,013,414 35,885 (8,117) (350,373)
Dividends paid and payable 6 (374,303) (3) – (36,393) – –
Net increase in provision for unrealised capitalgains tax – – – – – –
Net proceeds/(payments) fromissue/(redemption) of shares 164,403,202 3,842,072 (24,123,320) 426,372 (5,177,203) 7,339,584
Net realised surplus on disposal of investments,derivatives and foreign currencies 11,726,283 4,773,425 3,839,445 8,422 288,421 2,348,901
Net change in unrealised appreciation on forwardforeign exchange contracts and futures 2(i);2(j) – – – – – 905
Net change in unrealised appreciation on creditdefault swaps 2(k) – – – – – –
Net change in unrealised appreciation on interestrate swaps 2(l) – – – – – –
Net change in unrealised appreciation on equityswaps 2(m) – – – – 3,548 –
Net change in unrealised appreciation oninvestments 94,922,687 21,811,609 7,099,377 463,958 371,469 8,018,120
Net assets at the beginning of the year/period 454,588,854 118,265,835 78,777,963 4,040,490 4,521,882 32,968,491
Net assets at the end of the year/period 728,792,293 148,248,879 66,606,879 4,938,734 – 50,325,628
The accompanying notes form an integral part of these financial statements.
†Invesco Pan European 130/30 Equity Fund ceased operations on 21 February 2011

Invesco Funds
Statement of Operations and Changes in Net Assets for the period/year ended 28 February 2011
106 Invesco Funds
InvescoNippon
Small/Mid CapEquity Fund
InvescoNippon SelectEquity Fund
InvescoAsia
OpportunitiesEquity Fund
InvescoGreater China
Equity Fund
InvescoAsia
InfrastructureFund
InvescoIndia Equity
Fund
JPY JPY USD USD USD USD
INCOME
Dividends 2(e) 59,884,637 135,131,435 2,461,289 11,417,576 63,965,078 2,027,442
Bond interest 2(e) – – – – – –
Bank interest 2(e) 4,947 171,565 12,824 24,764 57,620 1,174
Net interest received on swaps 2(k);2(l);2(m) – – – – –
Other income 1,029,594 947,659 – – – –
60,919,178 136,250,659 2,474,113 11,442,340 64,022,698 2,028,616
EXPENSES
Management fees 3 78,400,128 146,170,248 1,830,256 8,741,756 44,733,084 2,614,294
Service Agent's fee 4 19,188,216 37,270,776 486,459 2,034,495 11,090,883 640,327
Custodian fee 4 939,959 1,715,832 83,505 300,473 1,295,190 158,180
Luxembourg taxes 5 2,263,029 4,967,635 72,301 266,029 1,392,035 83,723
Administration expenses 5,753,480 7,905,526 131,115 304,304 1,018,102 323,130
Amortisation of preliminary expenses 2(h) – – – – 2,915 –
Net interest paid on Swaps 2(k);2(l);2(m) – – – – – –
106,544,812 198,030,017 2,603,636 11,647,057 59,532,209 3,819,654
Net investment income/(loss) for theyear/period (45,625,634) (61,779,358) (129,523) (204,717) 4,490,489 (1,791,038)
Dividends paid and payable 6 – – – – (1,564,852) –
Net (decrease) in provision for unrealised capitalgains tax – – (61,787) – (4,092,698) –
Net proceeds/(payments) fromissue/(redemption) of shares (2,495,261,042) (2,244,598,213) 21,150,714 39,609,938 (416,947,886) 80,494,994
Net realised surplus/(deficit) on disposal ofinvestments, derivatives and foreign currencies (193,919,857) (42,738,820) 16,399,964 53,828,630 9,231,357 15,295,705
Net change in unrealisedappreciation/depreciation on forward foreignexchange contracts and futures 2(i);2(j) (18,618) – (116) 11,159 50,885 –
Net change in unrealised appreciation on creditdefault swaps 2(k) – – – – – –
Net change in unrealised appreciation on interestrate swaps 2(l) – – – – – –
Net change in unrealised appreciation on equityswaps 2(m) – – – – – –
Net change in unrealisedappreciation/depreciation on investments 483,935,861 196,738,119 8,008,871 29,506,050 487,590,824 (3,432,809)
Net assets at the beginning of the year/period 8,014,031,616 11,353,725,080 114,122,261 459,140,220 2,720,170,942 128,369,008
Net assets at the end of the year/period 5,763,142,326 9,201,346,808 159,490,384 581,891,280 2,798,929,061 218,935,860
The accompanying notes form an integral part of these financial statements.

Invesco Funds
Statement of Operations and Changes in Net Assets for the period/year ended 28 February 2011
107 Invesco Funds
InvescoAsia ConsumerDemand Fund
InvescoGlobal Leisure
FundInvesco
Energy Fund
InvescoAsia PacificReal Estate
Securities Fund
InvescoGlobal Income
Real EstateSecurities Fund
InvescoGold & Precious
Metals Fund1
USD USD USD USD USD USD
INCOME
Dividends 2(e) 11,200,687 423,401 2,462,912 104,705 302,759 15,039
Bond interest 2(e) – – – – 49,330 –
Bank interest 2(e) 37,221 9,923 27,737 89 786 87
Net interest received on swaps 2(k);2(l);2(m) – – – – – –
Other income – 10 – – – –
11,237,908 433,334 2,490,649 104,794 352,875 15,126
EXPENSES
Management fees 3 11,512,967 661,962 4,914,062 44,354 130,434 63,998
Service Agent's fee 4 2,847,918 132,707 941,510 12,049 30,785 12,338
Custodian fee 4 361,989 6,194 15,458 12,181 6,884 6,915
Luxembourg taxes 5 410,251 22,608 147,441 1,573 4,829 2,627
Administration expenses 311,536 84,036 234,111 33,787 60,986 6,411
Amortisation of preliminary expenses 2(h) 22,102 – – 1,669 – 2,117
Net interest paid on Swaps 2(k);2(l);2(m) – – – – – –
15,466,763 907,507 6,252,582 105,613 233,918 94,406
Net investment income/(loss) for theyear/period (4,228,855) (474,173) (3,761,933) (819) 118,957 (79,280)
Dividends paid and payable 6 (74,757) – – (710) (87,447) –
Net increase in provision for unrealised capitalgains tax 243,020 – – – – –
Net proceeds/(payments) fromissue/(redemption) of shares 634,471,443 7,243,595 65,003,049 (634,541) (1,380,899) 14,517,026
Net realised surplus on disposal of investments,derivatives and foreign currencies 30,530,805 2,582,623 30,791,609 159,625 1,574,207 688,012
Net change in unrealisedappreciation/depreciation on forward foreignexchange contracts and futures 2(i);2(j) 44,963 (2,009) 168,674 – – 3,315
Net change in unrealised appreciation on creditdefault swaps 2(k) – – – – – –
Net change in unrealised appreciation on interestrate swaps 2(l) – – – – – –
Net change in unrealised appreciation on equityswaps 2(m) – – – – – –
Net change in unrealised appreciation oninvestments 29,738,209 3,872,774 66,102,860 352,236 43,815 985,611
Net assets at the beginning of the year/period 314,116,137 36,005,503 322,040,936 3,528,944 9,927,682 –
Net assets at the end of the year/period 1,004,840,965 49,228,313 480,345,195 3,404,735 10,196,315 16,114,684
The accompanying notes form an integral part of these financial statements.
1 Invesco Gold & Precious Metals Fund was launched on 21 June 2010

Invesco Funds
Statement of Operations and Changes in Net Assets for the period/year ended 28 February 2011
108 Invesco Funds
InvescoUSD Reserve
Fund
InvescoEuro Reserve
Fund
InvescoGlobal Bond
Fund
InvescoEuropean Bond
Fund
InvescoAbsolute Return
Bond Fund
InvescoEuro Corporate
Bond Fund
USD EUR USD EUR EUR EUR
INCOME
Dividends 2(e) 24,011 168,458 – – – 2,690
Bond interest 2(e) 176,994 216,060 1,263,390 1,983,697 879,762 75,893,721
Bank interest 2(e) 71,746 467,431 18,425 11,578 20,179 378,787
Net interest received on swaps 2(k);2(l);2(m) – – – – – –
Other income – – – – 639 –
272,751 851,949 1,281,815 1,995,275 900,580 76,275,198
EXPENSES
Management fees 3 148,468 508,150 261,467 382,417 260,229 15,991,433
Service Agent's fee 4 – 179,277 75,898 107,208 64,148 3,387,689
Custodian fee 4 12,344 40,765 8,281 8,741 11,428 194,805
Luxembourg taxes 5 13,224 49,763 18,059 26,013 13,672 880,921
Administration expenses 125,116 187,700 107,205 67,284 49,296 447,535
Amortisation of preliminary expenses 2(h) – – – – – 4,429
Net interest paid on Swaps 2(k);2(l);2(m) – – – 8,333 28,068 –
299,152 965,655 470,910 599,996 426,841 20,906,812
Net investment income/(loss) for theyear/period (26,401) (113,706) 810,905 1,395,279 473,739 55,368,386
Dividends paid and payable 6 – – (93,253) (42) – (5,128,073)
Net increase in provision for unrealised capitalgains tax – – – – – –
Net proceeds/(payments) fromissue/(redemption) of shares (24,159,723) (2,094,900) (1,534,818) 1,626,651 (19,468,038) 935,651,830
Net realised surplus/(deficit) on disposal ofinvestments, derivatives and foreign currencies 157,017 917,478 1,705,504 30,227 (3,051,298) 32,579,846
Net change in unrealisedappreciation/depreciation on forward foreignexchange contracts and futures 2(i);2(j) 2,070 – (551,793) (57,447) 863,482 4,511,250
Net change in unrealisedappreciation/depreciation on credit default swaps 2(k) – – – (65,346) 39,358 –
Net change in unrealised appreciation on interestrate swaps 2(l) – – – – 4,068 –
Net change in unrealised appreciation on equityswaps 2(m) – – – – – –
Net change in unrealisedappreciation/depreciation on investments (102,293) 173,196 322,895 (339,603) 1,235,050 (8,541,023)
Net assets at the beginning of the year/period 107,429,704 351,095,680 32,978,020 44,667,465 43,793,814 1,132,082,075
Net assets at the end of the year/period 83,300,374 349,977,748 33,637,460 47,257,184 23,890,175 2,146,524,291
The accompanying notes form an integral part of these financial statements.

Invesco Funds
Statement of Operations and Changes in Net Assets for the period/year ended 28 February 2011
109 Invesco Funds
InvescoEuro Inflation-
Linked BondFund
InvescoUK Investment
Grade BondFund
InvescoEmerging LocalCurrencies Debt
Fund
InvescoGlobal
InvestmentGrade
Corporate BondFund
InvescoGlobal Total
Return (EUR)Bond Fund1
InvescoGlobal
UnconstrainedBond Fund2
EUR GBP USD USD EUR GBP
INCOME
Dividends 2(e) – – – – 168 141
Bond interest 2(e) 1,622,218 2,902,466 31,334,328 791,632 37,823 85,845
Bank interest 2(e) 3,321 22,149 132,772 3,953 7,135 953
Net interest received on swaps 2(k);2(l);2(m) – – – – 1,467 6,507
Other income – – – – – –
1,625,539 2,924,615 31,467,100 795,585 46,593 93,446
EXPENSES
Management fees 3 614,794 393,231 6,563,250 142,813 10,569 18,381
Service Agent's fee 4 148,437 125,543 907,966 39,308 2,102 2,030
Custodian fee 4 10,414 4,505 250,420 6,688 499 1,096
Luxembourg taxes 5 36,921 26,490 249,026 7,986 761 936
Administration expenses 65,393 43,225 351,577 14,119 4,883 1,798
Amortisation of preliminary expenses 2(h) – – 6,017 8,271 528 806
Net interest paid on Swaps 2(k);2(l);2(m) – 9,432 – – – –
875,959 602,426 8,328,256 219,185 19,342 25,047
Net investment income for the year/period 749,580 2,322,189 23,138,844 576,400 27,251 68,399
Dividends paid and payable 6 – (2,308,986) (11,105,370) (93,618) (59) –
Net increase in provision for unrealised capitalgains tax – – – – – –
Net proceeds/(payments) fromissue/(redemption) of shares (20,009,226) 21,897,763 398,547,622 7,873,678 2,307,152 2,226,827
Net realised surplus/(deficit) on disposal ofinvestments, derivatives and foreign currencies (44,177) 113,000 10,136,765 440,660 68,280 120,549
Net change in unrealisedappreciation/depreciation on forward foreignexchange contracts and futures 2(i);2(j) (16,625) 380,824 491,005 (681,127) (1,851) (6,040)
Net change in unrealised depreciation on creditdefault swaps 2(k) – (74,376) – – (10,710) (41,521)
Net change in unrealised appreciation on interestrate swaps 2(l) – – – – – –
Net change in unrealised appreciation on equityswaps 2(m) – – – – – –
Net change in unrealisedappreciation/depreciation on investments 200,661 (203,041) 3,868,372 251,845 6,810 72,283
Net assets at the beginning of the year/period 86,325,024 48,067,318 190,836,191 10,991,782 – –
Net assets at the end of the year/period 67,205,237 70,194,691 615,913,429 19,359,620 2,396,873 2,440,497
The accompanying notes form an integral part of these financial statements.
1 Invesco Global Total Return (EUR) Bond Fund was launched on 15 September 20102 Invesco Global Unconstrained Bond Fund was launched on 21 June 2010

Invesco Funds
Statement of Operations and Changes in Net Assets for the period/year ended 28 February 2011
110 Invesco Funds
InvescoCapital Shield 90
(EUR) Fund
InvescoAsia Balanced
Fund
InvescoPan European
High IncomeFund
InvescoGlobal Absolute
Return Fund
InvescoBalanced-Risk
Allocation Fund
28.02.2011Consolidated Net
Assets USDEquiv.
EUR USD EUR EUR EUR USD
INCOME
Dividends 2(e) 96,795 10,806,971 63,005 29,626 – 147,131,301
Bond interest 2(e) 36,082 8,212,730 1,912,003 – – 160,798,509
Bank interest 2(e) 295,903 67,054 24,926 37,384 103,868 2,570,211
Net interest received on swaps 2(k);2(l);2(m) – – – – – 12,562
Other income 194,387 – 22,474 1,798 – 336,539
623,167 19,086,755 2,022,408 68,808 103,868 310,849,122
EXPENSES
Management fees 3 2,296,877 4,892,799 384,955 142,992 269,886 140,512,303
Service Agent's fee 4 433,609 1,164,438 87,134 25,219 67,886 32,524,402
Custodian fee 4 27,173 131,609 2,394 7,557 9,939 3,434,343
Luxembourg taxes 5 89,635 219,947 15,707 3,911 17,534 5,437,733
Administration expenses 111,921 196,527 64,427 26,864 37,760 6,338,803
Amortisation of preliminary expenses 2(h) – – 1,003 4,012 10,002 85,335
Net interest paid on Swaps 2(k);2(l);2(m) – – 106,399 52,998 – 308,660
2,959,215 6,605,320 662,019 263,553 413,007 188,641,579
Net investment income/(loss) for theyear/period (2,336,048) 12,481,435 1,360,389 (194,745) (309,139) 122,207,543
Dividends paid and payable 6 – (7,857,224) (639,405) – – (33,550,693)
Net increase in provision for unrealised capitalgains tax – – – – – (3,911,465)
Net proceeds/(payments) fromissue/(redemption) of shares (125,801,610) 455,057,275 11,846,444 8,190,526 38,805,438 2,781,052,556
Net realised surplus on disposal of investments,derivatives and foreign currencies 13,789,659 33,463,542 1,174,680 437,837 1,134,943 357,897,136
Net change in unrealised appreciation on forwardforeign exchange contracts and futures 2(i);2(j) 3,036,079 18,671 72,395 32,267 1,790,098 14,434,792
Net change in unrealised depreciation on creditdefault swaps 2(k) – – (302,486) – – (656,410)
Net change in unrealised appreciation on interestrate swaps 2(l) – – – – – 5,622
Net change in unrealised appreciation on equityswaps 2(m) – – – 36,663 – 60,294
Net change in unrealisedappreciation/depreciation on investments (27,049) (5,797,209) 1,768,446 – 2,004,414 835,193,295
Net assets at the beginning of the year/period 280,807,461 234,741,449 25,325,417 5,250,225 19,355,140 9,240,562,234
Net assets at the end of the year/period 169,468,492 722,107,939 40,605,880 13,752,773 62,780,894 13,313,294,904
The accompanying notes form an integral part of these financial statements.

Notes to the Financial Statements
111 Invesco Funds
1. GeneralInvesco Funds (the “Fund”) is an investment company organised under part I of the Luxembourg Law on collective investment of December 20, 2002 as aSociété Anonyme qualifying as a Société d’Investissement à Capital Variable (“SICAV”). Invesco Funds is an umbrella fund, comprising 39 active sub-funds with each sub-fund being treated as a separate entity.
(a) Invesco India (Mauritius) LimitedInvestments in Indian securities are made through a wholly-owned Mauritian subsidiary, Invesco India (Mauritius) Limited (the "Subsidiary"), whose soleobject is to carry out investment activities on behalf of the Fund. The Subsidiary is wholly owned by Invesco India Equity Fund. The Subsidiary holds aCategory 1 Global Business Licence issued by the Mauritius Offshore Business Activities Authority. As a result it is subject to a reduced rate of Mauritianincome tax on its income. In addition, no capital gains tax will be payable in respect of the Subsidiary's investments in India and any dividends andredemption proceeds paid by the Subsidiary to the Invesco India Equity Fund will be exempt from Mauritian withholding tax.
(b) Classes of SharesThe Shares of some of the sub-funds are available in up to six classes (Class A, Class B, Class B1, Class C, Class E and Class I). Class A Shares areavailable without any restraints. Class B Shares are available to customers of distributors or intermediaries appointed specifically for the purpose ofdistributing the B Shares and only in respect of those Funds in respect of which distribution arrangements have been made with such distributors. Class CShares are available to all investors, which have a higher minimum initial subscription amount and benefit from reduced management charges, are intendedprimarily for larger or institutional investors. Class E Shares denominated in Euro have a lower initial subscription amount and higher annual managementfee than either the A or the C Class. Class B1 Shares are only available to customers of Merrill Lynch. Class I Shares are denominated in Euro and are onlyavailable to Institutional clients who have an Institutional Management Agreement in place with Invesco. There are distributing A & C Share Classes,Hedged Share Classes and Fixed Distribution Share Classes within some of the sub-funds.
Hedged Share Classes are available to investors on several sub-funds. For such classes of Shares, the SICAV may hedge the currency exposure of classes ofShares denominated in a currency other than the base currency of the relevant Fund, in order to attempt to mitigate the effect of fluctuations in the exchangerate between the Share class currency and the base currency.
(c) Activity of the FundA & C EUR Hedged Share ClassesEffective 31 March 2010, ‘A’ & ‘C’ Hedged Share Classes were launched on the following sub-funds:Invesco Asia Infrastructure FundInvesco Asia Consumer Demand FundInvesco Greater China Equity FundInvesco Asia Balanced Fund
‘A’ Annual Distribution Share ClassEffective 31 March 2010, ‘A’ Annual Distribution Share Class was launched on the following sub-funds:Invesco Euro Reserve FundInvesco Energy fund
Invesco Global Absolute Return FundEffective 29 April 2010, ’C’ USD Hedged Share Class was launched on the Invesco Global Absolute Return Fund.
Invesco Balanced-Risk Allocation FundEffective 29 April 2010, the following Share Classes were launched on the Invesco Balanced-Risk Allocation Fund:
- ‘A’ USD Hedged Share Class- ‘C’ USD Hedged Share Class- ‘A’ Annual Distribution Share Class
Invesco Global Investment Grade Corporate Bond FundEffective 29 April 2010, the following Share Classes were launched on the Invesco Global Investment Grade Corporate Bond Fund:
- ‘C’ GBP Hedged Share Class- ‘A’ USD Monthly Distribution Share Class
Invesco Global Structured Equity FundEffective 29 April 2010, the following Share Classes were launched on the Invesco Global Structured Equity Fund:
- ‘A’ EUR Hedged Share Class- ‘C’ EUR Hedged Share Class- ‘C’ GBP Hedged Share Class
Invesco Pan European Structured Equity FundEffective 29 April 2010, ‘A’ Annual Distribution Share Class was launched on the Invesco Pan European Structured Equity Fund.
Invesco Gold & Precious Metals FundThe Invesco Gold & Precious Metal Fund was launched on 21 June 2010.
Invesco Global Unconstrained Bond FundThe Invesco Global Unconstrained Bond Fund was launched on 21 June 2010.
Invesco Emerging Market Quantitative Equity FundThe Invesco Emerging Market Quantitative Equity Fund was launched on 21 June 2010.

Notes to the Financial Statements (continued)
112 Invesco Funds
1. General (continued)Invesco Latin American Equity FundThe Invesco Latin American Equity Fund was launched on 11 August 2010.
Invesco Absolute Return Bond FundEffective 11 August 2010, ‘C’ GBP Hedged Share Class was launched on Invesco Absolute Return Bond Fund.
Invesco Emerging Local Currencies Debt FundEffective 11 August 2010, ‘A’ EUR Hedged Monthly Distribution Share Class was launched on Invesco Emerging Local Currencies Debt Fund.
Invesco Global Total Return (EUR) Bond FundThe Invesco Global Total Return (EUR) Bond Fund was launched on 15 September 2010.
Invesco Global Absolute Return FundEffective 15 September 2010, ‘C’ JPY Hedged Share Class was launched on Invesco Global Absolute Return Fund.
Invesco US Structured Equity FundEffective 26 November 2010, all assets and liabilities of Invesco US Equity Fund, a sub-fund of Invesco Funds Series were contributed to Invesco USStructured Equity Fund.
Invesco Asia Balanced FundEffective 4 February 2011, ‘A’HKD Hedged Share Class was launched on Invesco Asia Balanced Fund.
Invesco US 130/30 Equity FundThe Invesco US 130/30 Equity Fund was liquidated on 21 February 2011
Invesco Pan European 130/30 Equity FundThe Invesco Pan European 130/30 Equity fund was liquidated on 21 February 2011.
Invesco Euro Inflation-linked Bond FundEffective 21 February 2011 ‘B’ Share Class was liquidated on Invesco Euro Inflation-linked Bond Fund.
Changes to organisation structureEffective 1 March 2010, the Administration Agent, Registrar and Transfer Agent changed from RBC Dexia Investor Services Bank S.A. to The Bank ofNew York Mellon (International) Limited (Luxembourg Branch).Effective 1 March 2010, the Domiciliary and Corporate Agent changed from RBC Dexia Investor Services Bank S.A. to The Bank of New York Mellon(International) Limited (Luxembourg Branch).Effective 1 March 2010, the Custodian and Paying Agent changed from J.P.Morgan Bank Luxembourg S.A. to The Bank of New York Mellon(International) Limited, Luxembourg Branch.Effective 1 March 2010, the Registered Office of Invesco Funds changed from 69, route d'Esch, L-1470 Luxembourg, Grand Duchy of Luxembourg to 46A,Avenue John F. Kennedy, L-1855 Luxembourg, Grand Duchy of Luxembourg. Effective 15 May 2010, the Registered Office changed to 2-4 rue EugèneRuppert, L-2453 Luxembourg, Grand Duchy of Luxembourg.
Activity on the Fund since 28 February 2011Share Class LaunchEffective 6 April 2011 'R' Share Class was launched for the following funds:
- Invesco Euro Corporate Bond Fund R Accumulation (EUR)- Invesco Euro Corporate Bond Fund R Monthly Distribution (EUR)- Invesco Emerging Local Currencies Debt Fund R Fixed Monthly Distribution (USD)- Invesco Global Total Return (EUR) Bond Fund R Monthly Distribution (EUR)- Invesco Euro Inflation Linked Bond Fund R Accumulation (EUR)- Invesco Balanced Risk Allocation Fund R Accumulation (EUR)- Invesco Pan European Equity Fund R Accumulation (EUR)- Invesco Pan European Structured Equity Fund R Accumulation (EUR)- Invesco Asia Balanced Fund R Accumulation (USD)- Invesco Asia Consumer Demand Fund R Accumulation (USD)- Invesco Asia Infrastructure Fund R Accumulation (USD)- Invesco Greater China Equity Fund R Accumulation USD- Invesco Energy Fund R Accumulation (USD)- Invesco Gold & Precious Metals Fund R Accumulation (USD)
Invesco Euro Short Term Bond FundThe Invesco Euro Short Term Bond Fund was launched on 4 May 2011.
Invesco Emerging Market Corporate Bond FundThe Invesco Emerging Market Corporate Bond Fund was launched on 4 May 2011.

Notes to the Financial Statements (continued)
113 Invesco Funds
1. General (continued)Upcoming Fund Changes:Share Class Launch- Effective 30 June 2011, ‘A’ Share Class will be launched on the following Funds:
Invesco Nippon Small Mid Cap Equity Fund A Annual Distributing (USD)Invesco Asia Infrastructure Fund A Accumulation (HKD)Invesco Indian Equity Fund A Accumulation (HKD)Invesco Asia Consumer Demand Fund A Accumulation (HKD)Invesco Energy Fund A Accumulation (HKD)Invesco Gold & Precious Metals Fund A Accumulation (HKD)Invesco Emerging Local Currencies Debt Fund A HKD MD
- Effective 30 June 2011, ‘C’ Share Class will be launched on the following Funds:Invesco Nippon Small Mid Cap Equity Fund C Annual Distribution (USD)
Invesco Asian Bond FundThe Invesco Asian Bond Fund will be launched on 30 June 2011.
Invesco Pan European Focus Equity FundThe Invesco Pan European Focus Equity Fund will be launched on 30 June 2011.
2. Summary of Significant Accounting Policies(a) The accompanying financial statements have been prepared in accordance with the format prescribed by Luxembourg regulations. Consolidation figuresappearing in the Statement of Net Assets and Statement of Operations and Changes in Net Assets are for statistical purposes only and should not be used byinvestors with holdings in one or more sub-funds.
(b) Valuation of investmentsInvestments, including financial derivative instruments, are valued on the basis of the latest dealing price or the latest available midmarket quotation (themidpoint between the latest quoted bid and offer prices) of the securities on the relevant securities market on which the investments of the Fund are traded,quoted or dealt as at the Valuation Point on that day. Where investments of a sub-fund are both listed on a stock exchange and dealt by market makersoutside the stock exchange on which the investments are listed, then the SICAV will determine the principal market for the investments in question and theyare valued at the latest available price in that market. Securities which are not quoted or dealt in any stock exchange but which are dealt in on any otherregulated market are valued in a manner as near as possible to that described above. If no price quotation is available for any of the securities held by a sub-fund or if the value as determined pursuant to the points above is not representative of the fair market value of the relevant securities, the value of suchsecurities is based on the reasonably foreseeable sales price determined prudently and in good faith. Short-term Money-Market Instruments are valued basedon amortised cost method.
The financial statements have been prepared on the basis of the last net asset values determined in the accounting period. In accordance with the Prospectus,net asset values were calculated by reference to the latest available prices at 10.00 a.m. (Dublin time) on 28 February 2011.
(c) Impact on ValuesBy way of information, if the Fund had calculated the net asset values solely with a view to publication, the market prices used to value the investmentportfolio would have been the closing prices on 28 February 2011 for the entire investment portfolio, including the American and European equities.However, these net asset values would not have been significantly different from those shown in these Annual Audited Accounts, except for the followingsub-funds:- Invesco Emerging Europe Equity Fund: an increase in the Net Asset Value of about 1.57% would have been observed.- Invesco Gold & Precious Metals Fund: an increase in the Net Asset Value of about 1.17% would have been observed.
(d) Cost of sales of investmentsAny surplus or deficit on sales of investments is determined on the basis of average cost.
(e) Income from investmentsDividend income is accounted for on an ex-dividend basis. Income arising on fixed interest securities and deposit interest is accrued on a day-to-day basis.
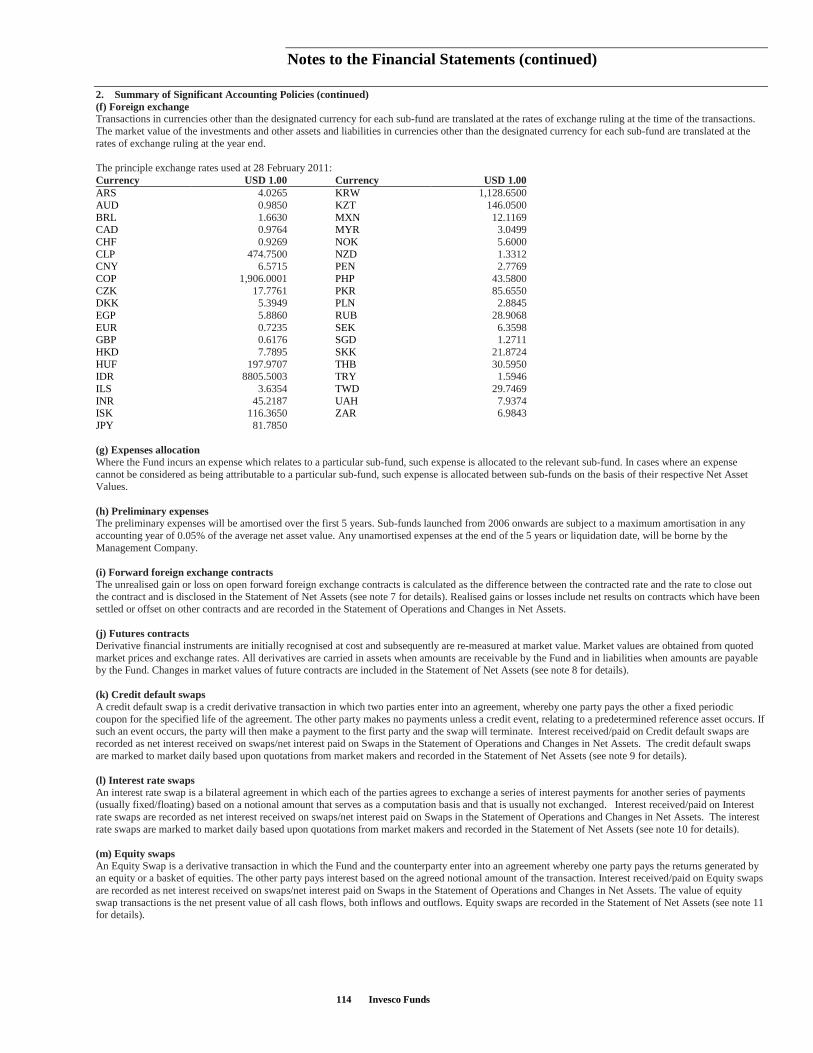
Notes to the Financial Statements (continued)
114 Invesco Funds
2. Summary of Significant Accounting Policies (continued)(f) Foreign exchangeTransactions in currencies other than the designated currency for each sub-fund are translated at the rates of exchange ruling at the time of the transactions.The market value of the investments and other assets and liabilities in currencies other than the designated currency for each sub-fund are translated at therates of exchange ruling at the year end.
The principle exchange rates used at 28 February 2011:Currency USD 1.00 Currency USD 1.00ARS 4.0265 KRW 1,128.6500AUD 0.9850 KZT 146.0500BRL 1.6630 MXN 12.1169CAD 0.9764 MYR 3.0499CHF 0.9269 NOK 5.6000CLP 474.7500 NZD 1.3312CNY 6.5715 PEN 2.7769COP 1,906.0001 PHP 43.5800CZK 17.7761 PKR 85.6550DKK 5.3949 PLN 2.8845EGP 5.8860 RUB 28.9068EUR 0.7235 SEK 6.3598GBP 0.6176 SGD 1.2711HKD 7.7895 SKK 21.8724HUF 197.9707 THB 30.5950IDR 8805.5003 TRY 1.5946ILS 3.6354 TWD 29.7469INR 45.2187 UAH 7.9374ISK 116.3650 ZAR 6.9843JPY 81.7850
(g) Expenses allocationWhere the Fund incurs an expense which relates to a particular sub-fund, such expense is allocated to the relevant sub-fund. In cases where an expensecannot be considered as being attributable to a particular sub-fund, such expense is allocated between sub-funds on the basis of their respective Net AssetValues.
(h) Preliminary expensesThe preliminary expenses will be amortised over the first 5 years. Sub-funds launched from 2006 onwards are subject to a maximum amortisation in anyaccounting year of 0.05% of the average net asset value. Any unamortised expenses at the end of the 5 years or liquidation date, will be borne by theManagement Company.
(i) Forward foreign exchange contractsThe unrealised gain or loss on open forward foreign exchange contracts is calculated as the difference between the contracted rate and the rate to close outthe contract and is disclosed in the Statement of Net Assets (see note 7 for details). Realised gains or losses include net results on contracts which have beensettled or offset on other contracts and are recorded in the Statement of Operations and Changes in Net Assets.
(j) Futures contractsDerivative financial instruments are initially recognised at cost and subsequently are re-measured at market value. Market values are obtained from quotedmarket prices and exchange rates. All derivatives are carried in assets when amounts are receivable by the Fund and in liabilities when amounts are payableby the Fund. Changes in market values of future contracts are included in the Statement of Net Assets (see note 8 for details).
(k) Credit default swapsA credit default swap is a credit derivative transaction in which two parties enter into an agreement, whereby one party pays the other a fixed periodiccoupon for the specified life of the agreement. The other party makes no payments unless a credit event, relating to a predetermined reference asset occurs. Ifsuch an event occurs, the party will then make a payment to the first party and the swap will terminate. Interest received/paid on Credit default swaps arerecorded as net interest received on swaps/net interest paid on Swaps in the Statement of Operations and Changes in Net Assets. The credit default swapsare marked to market daily based upon quotations from market makers and recorded in the Statement of Net Assets (see note 9 for details).
(l) Interest rate swapsAn interest rate swap is a bilateral agreement in which each of the parties agrees to exchange a series of interest payments for another series of payments(usually fixed/floating) based on a notional amount that serves as a computation basis and that is usually not exchanged. Interest received/paid on Interestrate swaps are recorded as net interest received on swaps/net interest paid on Swaps in the Statement of Operations and Changes in Net Assets. The interestrate swaps are marked to market daily based upon quotations from market makers and recorded in the Statement of Net Assets (see note 10 for details).
(m) Equity swapsAn Equity Swap is a derivative transaction in which the Fund and the counterparty enter into an agreement whereby one party pays the returns generated byan equity or a basket of equities. The other party pays interest based on the agreed notional amount of the transaction. Interest received/paid on Equity swapsare recorded as net interest received on swaps/net interest paid on Swaps in the Statement of Operations and Changes in Net Assets. The value of equityswap transactions is the net present value of all cash flows, both inflows and outflows. Equity swaps are recorded in the Statement of Net Assets (see note 11for details).

Notes to the Financial Statements (continued)
115 Invesco Funds
3. Management and Investment Advisor FeesThe Directors of the Fund (the “Directors”) are responsible for the investment policy, management and administration of the Fund. The Directors delegatethe day-to-day investment management of the securities portfolio of the Fund to Invesco Management S.A., (the “Management Company”).
In following the investment policy of the Directors, the Management Company seeks investment advice from, as appropriate, Invesco Asset ManagementLimited in the United Kingdom, Invesco Hong Kong Limited, Invesco Asset Management (Japan) Limited, Invesco Advisers in the United States, InvescoInstitutional in Canada and Invesco Asset Management Deutschland GmbH in Germany.
For its services the Management Company is paid by the Fund a percentage of the Net Asset Value of each sub-fund as set out in the table below:Sub-fund Management Management Management Management Management
Fee Fee Fee Fee FeeClass A Class B
(includes a 1%Distribution fee)
Class B1 Class C Class E
EQUITY FUNDSGlobalInvesco Global Structured Equity Fund 1.00% - - 0.60% 1.50%Invesco Emerging Market Quantitative Equity Fund 1.25% - - 0.75% 1.75%AmericaInvesco US Structured Equity Fund 1.00% 2.00% - 0.60% 1.50%Invesco US 130/30 Equity Fund 1.50% - - 1.00% 2.25%Invesco Latin American Equity Fund 1.50% - - 1.00% 2.25%EuropeInvesco Pan European Structured Equity Fund 1.30% 2.30% - 0.80% 2.25%Invesco Pan European Equity Fund 1.50% 2.50% - 1.00% 2.00%Invesco Pan European Small Cap Equity Fund 1.50% 2.50% - 1.00% 2.25%Invesco European Growth Equity Fund 1.50% - - 1.00% 2.25%Invesco Pan European Equity Income Fund 1.50% - - 1.00% 2.00%Invesco Pan European 130/30 Equity Fund 1.50% - - 1.00% 2.00%Invesco Emerging Europe Equity Fund 1.50% 2.50% - 1.00% 2.25%JapanInvesco Nippon Small/Mid Cap Equity Fund 1.50% 2.50% - 1.00% 2.25%Invesco Nippon Select Equity Fund 1.50% 2.50% - 1.00% 2.00%AsiaInvesco Asia Opportunities Equity Fund 1.50% 2.50% - 1.00% 2.25%Invesco Greater China Equity Fund 1.50% 2.50% - 1.00% 2.25%Invesco Asia Infrastructure Fund 1.50% - - 1.00% 2.25%Invesco India Equity Fund 1.50% - - 1.00% 2.25%Invesco Asia Consumer Demand Fund 1.50% - - 1.00% 2.25%THEME FUNDSInvesco Global Leisure Fund 1.50% 2.50% - 1.00% 2.25%Invesco Energy Fund 1.50% 2.50% - 1.00% 2.25%Invesco Asia Pacific Real Estate Securities Fund 1.50% - - 1.00% 2.00%Invesco Global Income Real Estate Securities Fund 1.25% - - 0.80% 1.75%Invesco Gold & Precious Metals Fund 1.50% - - 1.00% 2.00%RESERVE FUNDSInvesco USD Reserve Fund 0.45% 1.50% 0.50% 0.25% 0.50%Invesco Euro Reserve Fund 0.35% 1.45% - 0.15% 0.50%BOND FUNDSInvesco Global Bond Fund 0.75% - - 0.50% 0.90%Invesco European Bond Fund 0.75% 1.75% - 0.50% 0.90%Invesco Absolute Return Bond Fund 0.75% - - 0.50% 1.00%Invesco Euro Corporate Bond Fund 1.00% - - 0.65% 1.25%Invesco Euro Inflation-Linked Bond Fund 0.75% 1.75% - 0.50% 0.90%Invesco UK Investment Grade Bond Fund 0.625% - - - -Invesco Emerging Local Currencies Debt Fund 1.50% - - 1.00% 2.00%Invesco Global Investment Grade Corporate Bond Fund 1.00% - - 0.65% 1.25%Invesco Global Total Return (EUR) Bond FundInvesco Global Unconstrained Bond Fund
1.00%1.50%
--
--
0.65%1.00%
1.25%2.00%
MIXED FUNDSInvesco Capital Shield 90 (EUR) Fund 1.00% - - 0.60% 1.50%Invesco Asia Balanced Fund 1.25% - - 0.80% 1.75%Invesco Pan European High Income Fund 1.25% - - 0.80% 1.75%Invesco Global Absolute Return Fund 1.75%* - - 1.00%* 2.25%*Invesco Balanced-Risk Allocation Fund 1.25% - - 0.75% 1.75%
The management fees are calculated daily based on the Net Asset Value of each sub-fund on each business day and paid monthly. The fees of the InvestmentAdviser are paid out of the Manager's remuneration.
For the year under review, the Management Company partially waived the management fee for the Invesco USD Reserve Fund and Invesco Euro ReserveFund. This waiver applies equally across all Share Classes

Notes to the Financial Statements (continued)
116 Invesco Funds
3. Management and Investment Advisor Fees (continued)
There is no annual management fee for “I” Shares.
*Until October 27, 2010, the management fees for the sub-fund Invesco Global Absolute Return fund were as follow: class A: 2.25%, class C: 1.00%, classE: 2.80%.
4. Other FeesThe Manager is paid an additional fee by each Fund (the "Service Agent Fee"). The Service Agent Fee for A and E Shares shall not exceed 0.40% for EquityFunds or Theme Funds, 0.27% for Bond Funds, 0.20% for the Structured Funds, 0.13% for Reserve Funds 0.35% for Invesco Asia Balanced Fund andInvesco Balanced-Risk Allocation Fund and 0.40% for Invesco Pan European High Income Fund and Invesco Global Absolute Return Fund of the Net AssetValue of each Fund. The Service Agent Fee for B, B1 and C Shares shall not exceed 0.30% for Equity Funds and Theme Funds, 0.10% for Reserve Funds,0.20% for Bond Funds (except for Invesco Euro Inflation-Linked Bond Fund which shall not exceed 0.10%), 0.15% for Structured Funds and 0.30% for theMixed Funds of the Net Asset Value of each Fund. Out of this Service Agent Fee, the Manager discharges the fees of the Administration Agent, theDomiciliary & Corporate Agent and the Registrar & Transfer Agent as well as fees of service providers and fees incurred in places where the Fund isregistered. Each of these fees shall be calculated on each Business Day on the Net Asset Value of the sub-funds (at a rate which shall be agreed from time totime with the Manager) and paid monthly. Additionally, the Manager reimburses the expenses of the Fund's Hong Kong Sub-Distributor and Representative.
The Custodian will be paid a fee calculated on a monthly basis at a rate of up to a maximum of 0.0075% per annum of the net asset value of each Fund onthe last Business Day of each calendar month (or at such higher rate as the Custodian and the SICAV may at any time agree), plus VAT (if any) and will bepaid monthly. In addition, the Custodian will charge each Fund safekeeping and servicing fees at varying rates, depending on the country in which the assetsof a Fund are held and currently ranging from 0.001% to 0.45% of the net asset value of the assets invested in such country, plus VAT (if any), together withcharges at normal commercial rates in respect of investment transactions, as agreed with the SICAV from time to time. Sub-custodian fees are paid out ofthese safekeeping and servicing fees.
For the year under review, the Management Company has agreed at its discretion to pay the Operational Expenses charged to the Invesco USD ReserveFund and the Invesco Euro Reserve Fund.
The Management Company has agreed to cap operational expenses charged to the following sub-funds at its discretion, at the following annual rates:
Fund Date since capping is in place Annual RateInvesco Asia Pacific Real Estate Securities Fund 01/09/2010 0.10%Invesco Balanced-Risk Allocation Fund 09/10/2009 0.05%Invesco Global Absolute Return Fund 01/09/2010 0.10%Invesco Global Total Return (EUR) Bond Fund 15/09/2010 0.05%Invesco Global Unconstrained Bond Fund 21/06/2010 0.05%Invesco Gold & Precious Metals Fund 21/06/2010 0.15%Invesco Latin American Equity Fund 11/08/2010 0.15%Invesco Pan European Equity Income Fund 01/09/2010 0.10%Invesco Pan European High Income Fund 01/09/2010 0.05%Invesco Global Investment Grade Corporate Bond Fund 09/10/2009 0.05%Invesco Emerging Market Quantitative Equity Fund 21/06/2010 0.05%
5. Tax StatusThe Fund is registered under Luxembourg law as a collective investment undertaking. Accordingly, no Luxembourg income or capital gains tax is at presentpayable by the Fund. It is, however, subject to an annual “taxe d’abonnement” calculated at an annual rate of 0.05% of the Net Asset Value. The twoReserve sub-funds and “I” share classes are subject to a reduced annual rate of 0.01% of the Net Asset Value, such tax being payable quarterly on the basisof the Net Asset Value of the sub-funds at the end of the relevant quarter.
6. DividendsIn accordance with the distribution policy of the Fund, income is distributed by way of a dividend payment, only to holders of Class A and Class C Shares(Distribution Shares).
Invesco Emerging Local Currencies Debt Fund, Class A monthly distribution share class pays a distribution based on yield fixed annually by the Board ofDirectors. For the period from 1 March 2010 to 31 August 2010, the yield was fixed at 6.5%. As from 31 August 2010 the yield has been fixed at 5.50% bythe Board of Directors.
The income due to shareholders of Class A, Class C, Class E and Class I Shares (Accumulation Shares) is reinvested to enhance the value of Class A, ClassC, Class E and Class I Shares.
Type of Share Distribution Rate FrequencyDistribution
Ex Date Distribution Pay Date
Invesco Global Structured Equity Fund USD per ShareA Dist 0.2624 Annual 28 February 2011* 21 March 2011C Dist 0.4014 Annual 28 February 2011* 21 March 2011
Invesco Pan European Structured Equity Fund EUR per ShareA Dist 0.0484 Annual 28 February 2011* 21 March 2011
Invesco Pan European Equity FundA Dist 0.0581 Annual 28 February 2011* 21 March 2011C Dist 0.1276 Annual 28 February 2011* 21 March 2011A Dist (USD) 0.0843 Annual 28 February 2011* 21 March 2011
Invesco Pan European Equity Income Fund EUR per Share
A Dist 0.0730 Semi Annual 31 August 2010 21 September 2010
A Dist 0.0002 Semi Annual 28 February 2011* 21 March 2011

Notes to the Financial Statements (continued)
117 Invesco Funds
6. Dividends (continued)Type of Share Distribution Rate Frequency
DistributionEx Date Distribution Pay Date
Invesco Asia Infrastructure Fund USD per ShareA Dist 0.0499 Semi Annual 31 August 2010 21 September 2010
Invesco Asia Consumer Demand Fund USD per Share
A Dist 0.0283 Semi Annual 31 August 2010 21 September 2010Invesco Global Income Real Estate Securities Fund USD per Share
A Dist 0.0373 Quarterly 31 May 2010 21 June 2010A Dist 0.0206 Quarterly 31 August 2010 21 September 2010A Dist 0.0178 Quarterly 30 November 2010 21 December 2010A Dist 0.0290 Quarterly 28 February 2011* 21 March 2011
Invesco Global Bond Fund USD per ShareA Dist 0.0436 Semi Annual 31 August 2010 21 September 2010A Dist 0.0640 Semi-Annual 28 February 2011* 21 March 2011
Invesco European Bond Fund EUR per ShareA Dist 0.0622 Semi Annual 31 August 2010 21 September 2010A Dist 0.0633 Semi-Annual 28 February 2011* 21 March 2011
Invesco Euro Corporate Bond Fund EUR per ShareA Dist 0.0330 Monthly 31 March 2010 21 April 2010A Dist 0.0291 Monthly 30 April 2010 21 May 2010A Dist 0.0310 Monthly 31 May 2010 21 June 2010A Dist 0.0295 Monthly 30 June 2010 21 July 2010A Dist 0.0310 Monthly 30 July 2010 23 August 2010A Dist 0.0299 Monthly 31 August 2010 21 September 2010A Dist 0.0275 Monthly 30 September 2010 21 October 2010A Dist 0.0278 Monthly 29 October 2010 22 November 2010A Dist 0.0299 Monthly 30 November 2010 21 December 2010A Dist 0.0306 Monthly 31 December 2010 21 January 2011A Dist 0.0302 Monthly 31 January 2011 21 February 2011A Dist 0.0274 Monthly 28 February 2011* 21 March 2011
Invesco UK Investment Grade Bond Fund GBP per ShareA Dist 0.0086 Quarterly 31 May 2010 21 June 2010A Dist 0.0074 Quarterly 31 August 2010 21 September 2010A Dist 0.0080 Quarterly 30 November 2010 21 December 2010A Dist 0.0078 Quarterly 28 February 2011* 21 March 2011
Invesco Emerging Local Currencies Debt Fund USD and EUR per ShareA Dist (USD) 0.0628 Monthly 31 March 2010 21 April 2010A Dist (USD) 0.0638 Monthly 30 April 2010 21 May 2010A Dist (USD) 0.0602 Monthly 31 May 2010 21 June 2010A Dist (USD) 0.0603 Monthly 30 June 2010 21 July 2010A Dist (USD) 0.0628 Monthly 30 July 2010 23 August 2010A Dist (USD) 0.0630 Monthly 31 August 2010 21 September 2010A Dist (EUR) 0.0207 Monthly 31 August 2010 21 September 2010A Dist (USD) 0.0660 Monthly 30 September 2010 21 October 2010A Dist (EUR) 0.0304 Monthly 30 September 2010 21 October 2010A Dist (USD) 0.0496 Monthly 29 October 2010 22 November 2010A Dist (EUR) 0.0181 Monthly 29 October 2010 22 November 2010A Dist (USD) 0.0470 Monthly 30 November 2010 21 December 2010A Dist (EUR) 0.0363 Monthly 30 November 2010 21 December 2010A Dist (USD) 0.0483 Monthly 31 December 2010 21 January 2011A Dist (EUR) 0.0598 Monthly 31 December 2010 21 January 2011A Dist (USD) 0.0471 Monthly 31 January 2011 21 February 2011A Dist (EUR) 0.0312 Monthly 31 January 2011 21 February 2011A Dist (USD) 0.0475 Monthly 28 February 2011* 21 March 2011A Dist (EUR) 0.0294 Monthly 28 February 2011* 21 March 2011
Invesco Global Investment Grade Corporate Bond Fund USD per ShareA Dist 0.0814 Monthly 31 May 2010 21 June 2010A Dist 0.0370 Monthly 30 June 2010 21 July 2010A Dist 0.0197 Monthly 30 July 2010 23 August 2010A Dist 0.0308 Monthly 31 August 2010 21 September 2010A Dist. 0.0279 Monthly 30 September 2010 21 October 2010A Dist 0.0275 Monthly 29 October 2010 22 November 2010A Dist 0.0296 Monthly 30 November 2010 21 December 2010A Dist 0.0272 Monthly 31 December 2010 21 January 2011A Dist 0.0278 Monthly 31 January 2011 21 February 2011A Dist 0.0289 Monthly 28 February 2011* 21 March 2011A Dist 0.3581 Annual 28 February 2011* 21 March 2011C Dist 0.4043 Annual 28 February 2011* 21 March 2011
Invesco Asia Balanced Fund USD per ShareA Dist 0.1540 Quarterly 31 May 2010 21 June 2010A Dist 0.2063 Quarterly 31 August 2010 21 September 2010A Dist 0.1019 Quarterly 30 November 2010 21 December 2010A Dist 0.0630 Quarterly 28 February 2011* 21 March 2011

Notes to the Financial Statements (continued)
118 Invesco Funds
6. Dividends (continued)Type of Share Distribution Rate Frequency
DistributionEx Date Distribution Pay Date
Invesco Pan European High Income Fund EUR per ShareA Dist 0.1522 Quarterly 31 May 2010 21 June 2010A Dist 0.1153 Quarterly 31 August 2010 21 September 2010A Dist 0.0792 Quarterly 30 November 2010 21 December 2010A Dist 0.1147 Quarterly 28 February 2011* 21 March 2011
Invesco Asia Pacific Real Estate Securities Fund USD Per ShareA Dist 0.0199 Annual 28 February 2011* 21 March 2011
Invesco Global Total Return (EUR) Bond FundE Dist 0.0309 Quarterly 30 November 2010 21 December 2010E Dist 0.0764 Quarterly 28 February 2011* 21 March 2011
* Distributions with an ex date 28 February 2011 and pay date 21 March 2011 have not been reflected in the Financial Statements.# The first distribution was 31 August 2010.
7. Forward Foreign Exchange Contracts
Forward foreign exchange contracts open at 28 February 2011 were as follows;
Invesco Global Structured Equity FundUnrealised
Gain/(Loss)Details of Forward Foreign Exchange Contracts Counterparty USD Maturity Date
Buy 173,257 USD to Sell 107,000 GBP BNY Mellon 45 14/03/2011Buy 90,590 GBP to Sell 146,431 USD BNY Mellon 225 07/03/2011Buy 105,505 EUR to Sell 145,558 USD BNY Mellon 241 07/03/2011Buy 316,000 GBP to Sell 498,395 USD BNY Mellon 13,145 14/03/2011Buy 1,092,000 CHF to Sell 1,146,999 USD BNY Mellon 31,141 14/03/2011Buy 2,060,000 EUR to Sell 2,744,309 USD BNY Mellon 102,149 14/03/2011
Total unrealised gain on open forward foreign exchange contracts 146,946
Buy 4,523,253 USD to Sell 3,390,000 EUR BNY Mellon (160,966) 14/03/2011Buy 5,752,729 USD to Sell 482,574,000 JPY BNY Mellon (148,302) 14/03/2011Buy 3,208,902 USD to Sell 3,238,000 CAD BNY Mellon (106,376) 14/03/2011Buy 1,550,577 USD to Sell 1,520,000 CHF BNY Mellon (89,324) 14/03/2011Buy 2,759,238 USD to Sell 1,756,000 GBP BNY Mellon (83,370) 14/03/2011Buy 2,025,329 USD to Sell 2,062,000 AUD BNY Mellon (64,053) 14/03/2011Buy 587,979 USD to Sell 4,000,000 SEK BNY Mellon (40,504) 14/03/2011Buy 2,266 USD to Sell 1,408 GBP BNY Mellon (13) 07/03/2011Buy 2,204 USD to Sell 1,600 EUR BNY Mellon (7) 07/03/2011Buy 1,113 GBP to Sell 1,802 USD BNY Mellon (1) 07/03/2011
Total unrealised loss on open forward foreign exchange contracts (692,916)
Total net unrealised loss on open forward foreign exchange contracts (545,970)
Invesco Emerging Market Quantitative Equity FundUnrealised
Gain/(Loss)Details of Forward Foreign Exchange Contracts Counterparty USD Maturity Date
Buy 1,155 USD to Sell 712 GBP BNY Mellon 2 07/03/2011Buy 42,835 EUR to Sell 59,194 USD BNY Mellon 4 03/03/2011Buy 52,658 GBP to Sell 85,105 USD BNY Mellon 143 07/03/2011Buy 871,705 EUR to Sell 1,202,111 USD BNY Mellon 2,509 07/03/2011
Total unrealised gain on open forward foreign exchange contracts 2,658
Buy 246,947 USD to Sell 181,088 EUR BNY Mellon (3,300) 07/03/2011Buy 4,603 USD to Sell 2,863 GBP BNY Mellon (32) 07/03/2011Buy 824 GBP to Sell 1,335 USD BNY Mellon (1) 07/03/2011
Total unrealised loss on open forward foreign exchange contracts (3,333)
Total net unrealised loss on open forward foreign exchange contracts (675)

Notes to the Financial Statements (continued)
119 Invesco Funds
7. Forward Foreign Exchange Contracts (continued)
Invesco US Structured Equity FundUnrealised
Gain/(Loss)Details of Forward Foreign Exchange Contracts Counterparty USD Maturity Date
Buy 622,705 EUR to Sell 857,583 USD BNY Mellon 2,941 07/03/2011
Total unrealised gain on open forward foreign exchange contracts 2,941
Buy 11,342 USD to Sell 8,250 EUR BNY Mellon (59) 07/03/2011Buy 10,355 USD to Sell 7,509 EUR BNY Mellon (23) 02/03/2011Buy 2,057 USD to Sell 1,501 EUR BNY Mellon (17) 01/03/2011Buy 5,528 USD to Sell 4,000 EUR BNY Mellon (1) 03/03/2011
Total unrealised loss on open forward foreign exchange contracts (100)
Total net unrealised gain on open forward foreign exchange contracts 2,841
Invesco Latin American Equity FundUnrealised
Gain/(Loss)Details of Forward Foreign Exchange Contracts Counterparty USD Maturity Date
Buy 348,728 EUR to Sell 480,900 USD BNY Mellon 1,010 07/03/2011
Total unrealised gain on open forward foreign exchange contracts 1,010
Buy 86,977 USD to Sell 63,819 EUR BNY Mellon (1,214) 07/03/2011Buy 6,882 USD to Sell 4,980 EUR BNY Mellon – 03/03/2011
Total unrealised loss on open forward foreign exchange contracts (1,214)
Total net unrealised loss on open forward foreign exchange contracts (204)
Invesco Emerging Europe Equity FundUnrealised
GainDetails of Forward Foreign Exchange Contracts Counterparty USD Maturity Date
Buy 229,164 EUR to Sell 315,811 USD BNY Mellon 905 01/03/2011Total unrealised gain on open forward foreign exchange contracts 905
Invesco Nippon Small/Mid Cap Equity FundUnrealised
LossDetails of Forward Foreign Exchange Contracts Counterparty JPY Maturity Date
Buy 3,118,552 JPY to Sell 27,755 EUR BNY Mellon (18,618) 02/03/2011Total unrealised loss on open forward foreign exchange contracts (18,618)
Invesco Asia Opportunities Equity FundUnrealised
LossDetails of Forward Foreign Exchange Contracts Counterparty USD Maturity Date
Buy 40,354 USD to Sell 29,282 EUR BNY Mellon (116) 01/03/2011Total unrealised loss on open forward foreign exchange contracts (116)
Invesco Greater China Equity FundUnrealised
Gain/(Loss)Details of Forward Foreign Exchange Contracts Counterparty USD Maturity Date
Buy 4,056 EUR to Sell 5,605 USD BNY Mellon – 03/03/2011Buy 5,161 EUR to Sell 7,116 USD BNY Mellon 16 02/03/2011Buy 3,360,558 EUR to Sell 4,628,232 USD BNY Mellon 15,763 07/03/2011
Total unrealised gain on open forward foreign exchange contracts 15,779
Buy 382,035 USD to Sell 279,706 EUR BNY Mellon (4,494) 07/03/2011Buy 15,285 USD to Sell 11,151 EUR BNY Mellon (126) 01/03/2011Total unrealised loss on open forward foreign exchange contracts (4,620)
Total net unrealised gain on open forward foreign exchange contracts 11,159

Notes to the Financial Statements (continued)
120 Invesco Funds
7. Forward Foreign Exchange Contracts (continued)
Invesco Asia Infrastructure FundUnrealised
Gain/(Loss)Details of Forward Foreign Exchange Contracts Counterparty USD Maturity Date
Buy 13,688 EUR to Sell 18,915 USD BNY Mellon 1 03/03/2011Buy 4,631 EUR to Sell 6,386 USD BNY Mellon 14 02/03/2011Buy 15,208,391 EUR to Sell 20,943,386 USD BNY Mellon 73,269 07/03/2011
Total unrealised gain on open forward foreign exchange contracts 73,284
Buy 2,006,771 USD to Sell 1,467,225 EUR BNY Mellon (20,806) 07/03/2011Buy 125,588 USD to Sell 91,623 EUR BNY Mellon (1,039) 01/03/2011Buy 246,154 USD to Sell 178,508 EUR BNY Mellon (553) 02/03/2011Buy 21,947 USD to Sell 15,882 EUR BNY Mellon (1) 03/03/2011
Total unrealised loss on open forward foreign exchange contracts (22,399)
Total net unrealised gain on open forward foreign exchange contracts 50,885
Invesco Asia Consumer Demand FundUnrealised
Gain/(Loss)Details of Forward Foreign Exchange Contracts Counterparty USD Maturity Date
Buy 452,797 EUR to Sell 624,384 USD BNY Mellon 1,403 02/03/2011Buy 35,040,064 EUR to Sell 48,299,962 USD BNY Mellon 122,312 07/03/2011
Total unrealised gain on open forward foreign exchange contracts 123,715
Buy 6,891,299 USD to Sell 5,043,487 EUR BNY Mellon (78,355) 07/03/2011Buy 46,568 USD to Sell 33,974 EUR BNY Mellon (386) 01/03/2011Buy 174,272 USD to Sell 126,111 EUR BNY Mellon (11) 03/03/2011
Total unrealised loss on open forward foreign exchange contracts (78,752)
Total net unrealised gain on open forward foreign exchange contracts 44,963
Invesco Global Leisure FundUnrealised
LossDetails of Forward Foreign Exchange Contracts Counterparty USD Maturity Date
Buy 701,144 USD to Sell 508,776 EUR BNY Mellon (2,009) 01/03/2011Total unrealised loss on open forward foreign exchange contracts (2,009)
Invesco Energy FundUnrealised
Gain/(Loss)Details of Forward Foreign Exchange Contracts Counterparty USD Maturity Date
Buy 25,998 EUR to Sell 35,927 USD BNY Mellon 2 03/03/2011Buy 26,491,247 EUR to Sell 36,356,873 USD BNY Mellon 251,691 07/03/2011
Total unrealised gain on open forward foreign exchange contracts 251,693
Buy 6,849,436 USD to Sell 5,023,851 EUR BNY Mellon (93,083) 07/03/2011Buy 3,580,203 USD to Sell 2,611,952 EUR BNY Mellon (29,640) 01/03/2011Buy 3,508,799 USD to Sell 2,544,545 EUR BNY Mellon (7,883) 02/03/2011Buy 113,872 USD to Sell 82,402 EUR BNY Mellon (7) 03/03/2011
Total unrealised loss on open forward foreign exchange contracts (130,613)
Total net unrealised gain on open forward foreign exchange contracts 121,080

Notes to the Financial Statements (continued)
121 Invesco Funds
7. Forward Foreign Exchange Contracts (continued)
Invesco Gold & Precious Metals FundUnrealised
Gain/(Loss)Details of Forward Foreign Exchange Contracts Counterparty USD Maturity Date
Buy 1,544 EUR to Sell 2,129 USD BNY Mellon 5 02/03/2011Buy 4,118,742 EUR to Sell 5,669,484 USD BNY Mellon 22,253 07/03/2011
Total unrealised gain on open forward foreign exchange contracts 22,258
Buy 1,277,761 USD to Sell 937,931 EUR BNY Mellon (18,376) 07/03/2011Buy 68,332 USD to Sell 49,852 EUR BNY Mellon (566) 01/03/2011Buy 13,426 USD to Sell 9,715 EUR BNY Mellon (1) 03/03/2011Total unrealised loss on open forward foreign exchange contracts (18,943)
Total net unrealised gain on open forward foreign exchange contracts 3,315
Invesco USD Reserve FundUnrealised
GainDetails of Forward Foreign Exchange Contracts Counterparty USD Maturity Date
Buy 2,000 EUR to Sell 2,754 USD BNY Mellon 10 01/03/2011Buy 408,000 EUR to Sell 561,816 USD BNY Mellon 2,060 02/03/2011Total unrealised gain on open forward foreign exchange contracts 2,070
Invesco Global Bond FundUnrealised
LossDetails of Forward Foreign Exchange Contracts Counterparty USD Maturity Date
Buy 4,026,900 USD to Sell 3,000,000 EUR JP Morgan (118,018) 21/03/2011Buy 1,566,100 USD to Sell 1,000,000 GBP JP Morgan (52,697) 14/03/2011Buy 845,750 USD to Sell 850,000 AUD JP Morgan (12,013) 15/04/2011Total unrealised loss on open forward foreign exchange contracts (182,728)
Invesco European Bond FundUnrealised
Gain/(Loss)Details of Forward Foreign Exchange Contracts Counterparty EUR Maturity Date
Buy 3,850,000 SEK to Sell 434,077 EUR BNY Mellon 3,018 27/04/2011Buy 1,070,677 EUR to Sell 900,000 GBP Goldman Sachs 16,155 27/04/2011
Total unrealised gain on open forward foreign exchange contracts 19,173
Buy 900,000 GBP to Sell 1,074,242 EUR BNY Mellon (19,720) 27/04/2011Buy 433,216 EUR to Sell 3,850,000 SEK Citibank (3,879) 27/04/2011
Total unrealised loss on open forward foreign exchange contracts (23,599)
Total net unrealised loss on open forward foreign exchange contracts EUR (4,426)

Notes to the Financial Statements (continued)
122 Invesco Funds
7. Forward Foreign Exchange Contracts (continued)
Invesco Absolute Return Bond FundUnrealised
Gain/(Loss)Details of Forward Foreign Exchange Contracts Counterparty EUR Maturity Date
Buy 64,820,000 HUF to Sell 237,636 EUR BNY Mellon 99 10/03/2011Buy 1,053,599 USD to Sell 6,880,000 CNY BNY Mellon 733 16/05/2011Buy 524,819 USD to Sell 42,800,000 JPY BNY Mellon 1,059 10/03/2011Buy 471,469 EUR to Sell 128,000,000 HUF BNY Mellon 2,014 10/03/2011Buy 58,000,000 KZT to Sell 394,156 USD BNY Mellon 2,401 10/03/2011Buy 817,722 EUR to Sell 1,100,000 CAD BNY Mellon 2,624 10/03/2011Buy 2,310,000 SEK to Sell 259,986 EUR BNY Mellon 2,723 10/03/2011Buy 31,700,000 JPY to Sell 383,565 USD Goldman Sachs 2,938 10/03/2011Buy 3,020,000,000 IDR to Sell 334,256 USD BNY Mellon 3,102 10/06/2011Buy 686,483 USD to Sell 769,000,000 KRW BNY Mellon 3,624 10/03/2011Buy 18,400,000 JPY to Sell 219,411 USD BNY Mellon 4,040 10/03/2011Buy 130,000,000 CLP to Sell 266,940 USD BNY Mellon 4,828 10/03/2011Buy 496,411 EUR to Sell 12,000,000 CZK BNY Mellon 5,087 10/03/2011Buy 3,140,000 ZAR to Sell 441,103 USD BNY Mellon 5,607 10/03/2011Buy 2,100,000 NOK to Sell 264,278 EUR Goldman Sachs 6,938 10/03/2011Buy 769,000,000 KRW to Sell 670,451 USD BNY Mellon 7,978 10/03/2011Buy 344,055 EUR to Sell 430,000 CHF Royal Bank of Scotland 8,343 10/03/2011Buy 478,871 EUR to Sell 53,000,000 JPY Goldman Sachs 9,877 10/03/2011Buy 1,300,000 MYR to Sell 412,175 USD BNY Mellon 9,986 10/03/2011Buy 2,400,000 PEN to Sell 850,310 USD BNY Mellon 10,083 10/03/2011Buy 13,780,000 CNY to Sell 2,094,225 USD BNY Mellon 10,147 16/05/2011Buy 263,496 USD to Sell 400,000 TRY BNY Mellon 10,526 10/03/2011Buy 740,000 CHF to Sell 565,872 EUR BNY Mellon 11,864 10/03/2011Buy 337,283 EUR to Sell 3,140,000 ZAR BNY Mellon 12,464 10/03/2011Buy 3,490,000 SEK to Sell 383,085 EUR Goldman Sachs 13,821 10/03/2011Buy 2,503,581 EUR to Sell 2,120,000 GBP BNY Mellon 19,980 10/03/2011Buy 12,700,000 RUB to Sell 403,880 USD BNY Mellon 25,569 10/03/2011Buy 1,100,000 CAD to Sell 1,088,309 USD JP Morgan 27,526 10/03/2011Buy 2,480,939 EUR to Sell 275,210,000 JPY BNY Mellon 45,622 10/03/2011Buy 5,305,714 EUR to Sell 7,100,000 USD BNY Mellon 167,686 10/03/2011
Total unrealised gain on open forward foreign exchange contracts 439,289
Buy 4,571,799 USD to Sell 3,379,806 EUR BNY Mellon (71,351) 10/03/2011Buy 894,737 EUR to Sell 8,100,000 SEK BNY Mellon (26,449) 10/03/2011Buy 345,383 USD to Sell 350,000 AUD BNY Mellon (6,844) 10/03/2011Buy 264,228 USD to Sell 130,000,000 CLP BNY Mellon (6,791) 10/03/2011Buy 29,000,000 JPY to Sell 263,337 EUR BNY Mellon (6,718) 10/03/2011Buy 1,380,000 PLN to Sell 353,106 EUR BNY Mellon (6,233) 10/03/2011Buy 511,712 EUR to Sell 4,000,000 NOK BNY Mellon (4,889) 10/03/2011Buy 190,000 GBP to Sell 226,956 EUR Goldman Sachs (4,370) 10/03/2011Buy 533,200,000 COP to Sell 286,359 USD BNY Mellon (3,764) 10/06/2011Buy 341,880 USD to Sell 1,260,000 ILS Goldman Sachs (3,630) 10/03/2011Buy 350,305 USD to Sell 29,000,000 JPY CIBC (3,115) 10/03/2011Buy 12,000,000 CZK to Sell 494,285 EUR BNY Mellon (2,960) 10/03/2011Buy 400,000 TRY to Sell 253,012 USD BNY Mellon (2,940) 10/03/2011Buy 334,626 USD to Sell 3,020,000,000 IDR BNY Mellon (2,833) 10/06/2011Buy 270,000 GBP to Sell 318,697 EUR BNY Mellon (2,389) 10/03/2011Buy 248,013 EUR to Sell 2,200,000 SEK Goldman Sachs (2,185) 10/03/2011Buy 177,999 USD to Sell 500,000 PEN BNY Mellon (1,485) 10/03/2011Buy 2,720,000 ARS to Sell 675,469 USD BNY Mellon (1,324) 10/03/2011Buy 54,300,000 JPY to Sell 481,562 EUR Goldman Sachs (1,065) 10/03/2011Buy 188,167 USD to Sell 15,500,000 JPY Goldman Sachs (988) 10/03/2011Buy 280,263 USD to Sell 533,200,000 COP BNY Mellon (654) 10/06/2011Buy 1,260,000 ILS to Sell 347,538 USD BNY Mellon (464) 10/03/2011Buy 19,250,000 PHP to Sell 442,224 USD BNY Mellon (453) 10/03/2011Buy 89,156 GBP to Sell 104,545 EUR BNY Mellon (99) 07/03/2011Buy 1,055,207 USD to Sell 6,900,000 CNY BNY Mellon (319) 16/05/2011Buy 2,410,000 SEK to Sell 275,627 EUR Goldman Sachs (1,545) 10/03/2011
Total unrealised loss on open forward foreign exchange contracts (165,857)
Total net unrealised gain on open forward foreign exchange contracts 273,432

Notes to the Financial Statements (continued)
123 Invesco Funds
7. Forward Foreign Exchange Contracts (continued)
Invesco UK Investment Grade Bond FundUnrealised
Gain/(Loss)Details of Forward Foreign Exchange Contracts Counterparty GBP Maturity Date
Buy 688,720 GBP to Sell 800,000 EUR BNY Mellon 5,806 01/03/2011Buy 6,961,893 GBP to Sell 8,150,000 EUR BNY Mellon 6,394 01/06/2011Buy 950,000 EUR to Sell 802,517 GBP BNY Mellon 8,444 01/03/2011Buy 5,811,833 GBP to Sell 9,370,000 USD BNY Mellon 18,233 01/06/2011Buy 5,956,716 GBP to Sell 9,320,000 USD BNY Mellon 200,076 01/03/2011
Total unrealised gain on open forward foreign exchange contracts 238,953
Buy 6,993,588 GBP to Sell 8,300,000 EUR BNY Mellon (91,648) 01/03/2011Buy 9,320,000 USD to Sell 5,782,640 GBP BNY Mellon (26,000) 01/03/2011Buy 8,150,000 EUR to Sell 6,963,360 GBP BNY Mellon (6,170) 01/03/2011
Total unrealised loss on open forward foreign exchange contracts (123,818)
Total net unrealised gain on open forward foreign exchange contracts 115,135
Invesco Emerging Local Currencies Debt FundUnrealised
Gain/(Loss)Details of Forward Foreign Exchange Contracts Counterparty USD Maturity Date
Buy 219,689 EUR to Sell 303,589 USD BNY Mellon 20 03/03/2011Buy 223,388 EUR to Sell 308,041 USD BNY Mellon 692 02/03/2011Buy 91,462,000 CNY to Sell 14,000,000 USD JP Morgan 3,266 24/05/2011Buy 300,113 EUR to Sell 411,365 USD BNY Mellon 3,406 01/03/2011Buy 4,699,500 MYR to Sell 1,524,327 USD HSBC 13,342 14/04/2011Buy 516,075,000 KZT to Sell 3,500,000 USD Deutsche Bank 39,497 01/04/2011Buy 124,440,000 RUB to Sell 4,230,926 USD Barclays 61,019 11/04/2011Buy 6,247,090 USD to Sell 6,978,000,000 KRW Barclays 67,340 18/04/2011Buy 33,121,623 EUR to Sell 45,698,545 USD BNY Mellon 72,613 07/03/2011Buy 14,386,900 SGD to Sell 11,102,545 USD JP Morgan 217,975 13/04/2011Buy 153,875,000 RUB to Sell 5,000,000 USD Deutsche Bank 306,697 12/04/2011Buy 210,333,770 RUB to Sell 6,793,770 USD Citibank 476,112 17/03/2011
Total unrealised gain on open forward foreign exchange contracts 1,261,979
Buy 678,904,000 THB to Sell 22,600,000 USD JP Morgan (441,461) 05/04/2011Buy 12,000,000 USD to Sell 44,418,000 ILS HSBC (232,971) 01/03/2011Buy 18,396,740 PLN to Sell 4,700,000 EUR HSBC (119,784) 13/04/2011Buy 3,548,631 USD to Sell 2,650,000 EUR Citibank (112,920) 17/03/2011Buy 44,418,000 ILS to Sell 12,304,666 USD HSBC (71,696) 01/03/2011Buy 8,613,540 TRY to Sell 5,400,000 USD Citibank (70,685) 18/04/2011Buy 4,793,100 TRY to Sell 3,000,000 USD HSBC (50,127) 23/05/2011Buy 2,935,000 USD to Sell 1,407,332,500 CLP JP Morgan (22,106) 31/03/2011Buy 2,454,925 USD to Sell 1,787,965 EUR BNY Mellon (15,884) 07/03/2011Buy 6,978,000,000 KRW to Sell 6,185,622 USD Barclays (5,872) 18/04/2011Buy 24,270 USD to Sell 17,706 EUR BNY Mellon (201) 01/03/2011Buy 13,790 USD to Sell 10,000 EUR BNY Mellon (31) 02/03/2011Total unrealised loss on open forward foreign exchange contracts (1,143,738)
Total net unrealised gain on open forward foreign exchange contracts 118,241

Notes to the Financial Statements (continued)
124 Invesco Funds
7. Forward Foreign Exchange Contracts (continued)
Invesco Global Investment Grade Corporate Bond FundUnrealised
Gain/(Loss)Details of Forward Foreign Exchange Contracts Counterparty USD Maturity Date
Buy 89,291 GBP to Sell 144,330 USD BNY Mellon 223 07/03/2011Buy 20,000 GBP to Sell 31,372 USD BNY Mellon 1,008 01/03/2011Buy 5,188,611 EUR to Sell 7,159,764 USD BNY Mellon 10,438 07/03/2011Buy 736,813 EUR to Sell 999,966 USD BNY Mellon 18,345 01/03/2011
Total unrealised gain on open forward foreign exchange contracts 30,014
Buy 5,750,366 USD to Sell 4,390,000 EUR BNY Mellon (316,824) 01/03/2011Buy 1,710,253 USD to Sell 1,100,000 GBP BNY Mellon (70,648) 01/03/2011Buy 5,146,841 USD to Sell 3,740,000 EUR BNY Mellon (15,342) 01/06/2011Buy 567,810 USD to Sell 418,501 EUR BNY Mellon (10,522) 07/03/2011Buy 1,737,342 USD to Sell 1,080,000 GBP BNY Mellon (9,344) 01/06/2011
Total unrealised loss on open forward foreign exchange contracts (422,680)
Total net unrealised loss on open forward foreign exchange contracts (392,666)
Invesco Global Total Return (EUR) Bond FundUnrealised
Gain/(Loss)Details of Forward Foreign Exchange Contracts Counterparty EUR Maturity Date
Buy 74,581 EUR to Sell 100,000 USD Citibank 2,202 22/03/2011Total unrealised gain on open forward foreign exchange contracts 2,202
Buy 349,129 EUR to Sell 300,000 GBP Citibank (2,363) 04/04/2011Buy 115,794 EUR to Sell 150,000 CHF Citibank (1,378) 04/04/2011Buy 100,000 USD to Sell 72,691 EUR Citibank (312) 22/03/2011
Total unrealised loss on open forward foreign exchange contracts (4,053)
Total net unrealised loss on open forward foreign exchange contracts (1,851)
Invesco Global Unconstrained Bond FundUnrealised
Gain/(Loss)Details of Forward Foreign Exchange Contracts Counterparty GBP Maturity Date
Buy 1,093 EUR to Sell 920 GBP BNY Mellon 13 07/03/2011Buy 44,197 GBP to Sell 70,000 USD Citibank 952 22/03/2011Buy 161,499 GBP to Sell 250,000 USD JP Morgan 7,071 08/03/2011
Total unrealised gain on open forward foreign exchange contracts 8,036
Buy 1,183,448 GBP to Sell 1,400,000 EUR Citibank (11,518) 22/03/2011Buy 45,674 GBP to Sell 70,000 CHF Citibank (985) 22/03/2011Buy 41,898 GBP to Sell 50,000 EUR JP Morgan (780) 21/03/2011Buy 99,535 GBP to Sell 150,000 CHF JP Morgan (466) 01/04/2011Buy 70,000 USD to Sell 43,494 GBP Citibank (249) 22/03/2011Buy 84,348 EUR to Sell 72,079 GBP BNY Mellon (78) 07/03/2011
Total unrealised loss on open forward foreign exchange contracts (14,076)
Total net unrealised loss on open forward foreign exchange contracts (6,040)

Notes to the Financial Statements (continued)
125 Invesco Funds
7. Forward Foreign Exchange Contracts (continued)
Invesco Capital Shield 90 (EUR) FundUnrealised
Gain/(Loss)Details of Forward Foreign Exchange Contracts Counterparty EUR Maturity Date
Buy 31,000,000 JPY to Sell 273,648 EUR BNY Mellon 692 14/03/2011Buy 207,000 GBP to Sell 239,825 EUR BNY Mellon 2,682 14/03/2011Buy 144,511 EUR to Sell 15,700,000 JPY BNY Mellon 5,569 15/03/2011Buy 1,233,649 EUR to Sell 1,040,000 GBP BNY Mellon 15,254 14/03/2011Buy 2,248,399 EUR to Sell 248,000,000 JPY BNY Mellon 53,683 14/03/2011Buy 25,612,026 EUR to Sell 33,895,000 USD BNY Mellon 1,081,992 14/03/2011
Total unrealised gain on open forward foreign exchange contracts 1,159,872
Buy 254,000,000 JPY to Sell 2,302,557 EUR BNY Mellon (54,744) 14/03/2011Buy 888,000 GBP to Sell 1,049,859 EUR BNY Mellon (9,537) 14/03/2011Buy 489,466 EUR to Sell 419,000 GBP BNY Mellon (1,407) 14/03/2011Buy 460,915 EUR to Sell 52,200,000 JPY BNY Mellon (1,037) 14/03/2011
Total unrealised loss on open forward foreign exchange contracts (66,725)
Total net unrealised gain on open forward foreign exchange contracts 1,093,147
Invesco Asia Balanced FundUnrealised
Gain/(Loss)Details of Forward Foreign Exchange Contracts Counterparty USD Maturity Date
Buy 8,422,969 EUR to Sell 11,612,102 USD BNY Mellon 27,698 07/03/2011Total unrealised gain on open forward foreign exchange contracts 27,698
Buy 451,661 USD to Sell 332,509 EUR BNY Mellon (7,837) 07/03/2011Buy 115,762 USD to Sell 84,454 EUR BNY Mellon (958) 01/03/2011Buy 102,178 USD to Sell 74,098 EUR BNY Mellon (230) 02/03/2011Buy 23,216 USD to Sell 16,801 EUR BNY Mellon (2) 03/03/2011
Total unrealised loss on open forward foreign exchange contracts (9,027)
Total net unrealised gain on open forward foreign exchange contracts 18,671
Invesco Pan European High Income FundUnrealised
Gain/(Loss)Details of Forward Foreign Exchange Contracts Counterparty EUR Maturity Date
Buy 1,764,467 EUR to Sell 1,500,000 GBP Royal Bank of Scotland 7,229 07/03/2011Buy 3,675,660 EUR to Sell 3,100,000 GBP Royal Bank of Scotland 43,830 18/03/2011Buy 1,519,757 EUR to Sell 2,000,000 USD Royal Bank of Scotland 72,486 07/03/2011
Total unrealised gain on open forward foreign exchange contracts 123,545
Buy 697,674 EUR to Sell 600,000 GBP Royal Bank of Scotland (5,305) 31/03/2011Buy 232,757 EUR to Sell 300,000 CHF Royal Bank of Scotland (1,503) 18/03/2011Buy 107,941 EUR to Sell 140,000 CHF JP Morgan (1,413) 01/04/2011Buy 13,416 EUR to Sell 100,000 DKK Citibank – 05/05/2011
Total unrealised loss on open forward foreign exchange contracts (8,221)
Total net unrealised gain on open forward foreign exchange contracts 115,324

Notes to the Financial Statements (continued)
126 Invesco Funds
7. Forward Foreign Exchange Contracts (continued)
Invesco Global Absolute Return FundUnrealised
Gain/(Loss)Details of Forward Foreign Exchange Contracts Counterparty EUR Maturity Date
Buy 586,352 EUR to Sell 500,000 GBP BNY Mellon 535 01/04/2011Buy 762,967 EUR to Sell 86,000,000 JPY BNY Mellon 1,620 01/04/2011Buy 2,902,317 EUR to Sell 4,000,000 USD BNY Mellon 6,772 01/04/2011
Total unrealised gain on open forward foreign exchange contracts 8,927
Buy 948,407,482 JPY to Sell 8,434,037 EUR BNY Mellon (42,147) 07/03/2011Buy 500,000 CHF to Sell 391,684 EUR BNY Mellon (1,131) 01/04/2011Buy 221,155 EUR to Sell 300,000 CAD BNY Mellon (1,110) 01/04/2011Buy 70,455 USD to Sell 51,153 EUR BNY Mellon (169) 07/03/2011
Total unrealised loss on open forward foreign exchange contracts (44,557)
Total net unrealised loss on open forward foreign exchange contracts (35,630)
Invesco Balanced-Risk Allocation FundUnrealised
Gain/(Loss)Details of Forward Foreign Exchange Contracts Counterparty EUR Maturity Date
Buy 42,858 EUR to Sell 58,564 USD BNY Mellon 479 07/03/2011Buy 3,723,263 EUR to Sell 5,085,000 USD BNY Mellon 43,216 14/03/2011Buy 13,036,292 EUR to Sell 17,233,000 USD Royal Bank of Scotland 564,656 14/03/2011
Total unrealised gain on open forward foreign exchange contracts 608,351
Buy 355,804 USD to Sell 258,886 EUR BNY Mellon (1,415) 07/03/2011Buy 131,211 GBP to Sell 153,883 EUR BNY Mellon (169) 07/03/2011
Total unrealised loss on open forward foreign exchange contracts (1,584)
Total net unrealised gain on open forward foreign exchange contracts 606,767
8. Futures Contracts
DescriptionNumber of Contracts
Commitment in sub-fund BaseCcy Long/Short
Unrealised Gain/Loss in sub-fund Base Ccy
Invesco US Structured Equity Fund USD USDS&P 500 Emini Future 18/03/2011 38 2,498,263 Long (1,038)Total unrealised loss on futures contracts (1,038)
Invesco Emerging Market QuantitativeEquity Fund USD USDE-Mini MSCI Emerging Future 18/03/2011 12 661,620 Long (3,240)Total unrealised loss on futures contracts (3,240)
Invesco Pan European Structured EquityFund EUR EURDJ Euro Stoxx 50 Future 18/03/2011 381 11,336,655 Long (183,715)FTSE 100 Index Future 18/03/2011 84 5,848,511 Long (64,941)Total unrealised loss on futures contracts (248,656)
Invesco Global Bond Fund USD USDUS Long Bond (CBT) Future 21/06/2011 (10) (1,205,156) Short (9,531)Total unrealised loss on futures contracts (9,531)
Invesco European Bond Fund EUR EURLong Gilt Future 28/06/2011 (12) (1,641,553) Short (14,148)Total unrealised loss on futures contracts (14,148)

Notes to the Financial Statements (continued)
127 Invesco Funds
8. Futures Contracts (continued)
DescriptionNumber of Contracts
Commitment in sub-fund BaseCcy Long/Short
Unrealised Gain/Loss in sub-fund Base Ccy
Invesco Absolute Return Bond Fund EUR EUREuro Bond Future 08/03/2011 1 124,405 Long 665Euro-Schatz Future 08/03/2011 (19) (2,053,472) Short 2,423Euro-Bobl Future 08/03/2011 (21) (2,464,455) Short 35,805
Total unrealised gain on futures contracts 38,893
Long Gilt Future 28/06/2011 (11) (1,504,757) Short (12,969)US 10 Year Note Future 21/06/2011 (17) (1,467,133) Short (6,823)10 Year Mini JGB Future 09/03/2011 (14) (1,728,467) Short (6,573)US 5 Year Note (CBT) Future 30/06/2011 (18) (1,523,368) Short (3,816)Japan 10 Year Bond 10/03/2011 1 1,234,309 Long (654)
Total unrealised loss on futures contracts (30,835)
Total net unrealised gain on futures contracts 8,058
Invesco Euro Corporate Bond Fund EUR EUREuro Bond Future 08/03/2011 (2,250) (279,911,250) Short 4,083,750Total unrealised gain on futures contracts 4,083,750
Invesco Euro Inflation-Linked BondFund EUR EUREuro Bond Future 08/03/2011 (25) (3,110,125) Short (16,625)Total unrealised loss on futures contracts (16,625)
Invesco UK Investment Grade BondFund GBP GBPEuro-Bobl Future 08/03/2011 (39) (3,906,991) Short 27,294
Total unrealised gain on futures contracts 27,294
US 10 Year Note Future 21/06/2011 (45) (3,315,197) Short (15,407)Euro Bond Future 08/03/2011 (8) (849,580) Short (9,167)US 5 Year Note (CBT) Future 30/06/2011 (15) (1,083,677) Short (2,709)
Total unrealised loss on futures contracts (27,283)
Total net unrealised gain on futures contracts 11
Invesco Global Investment GradeCorporate Bond Fund USD USDCanada 10 Year Bond Future 21/06/2011 2 246,168 Long 552US Ultra Bond (CBT) Future 21/06/2011 1 123,516 Long 2,258US 2 Year Note (CBT) Future 31/03/2011 (22) (4,817,141) Short 6,750US Long Bond (CBT) Future 21/06/2011 9 1,084,641 Long 12,023US 5 Year Note (CBT) Future 30/06/2011 68 7,953,609 Long 18,859
Total unrealised gain on futures contracts 40,442
US 10 Year Note Future 21/06/2011 (65) (7,752,773) Short (20,082)10 Year Mini JGB Future 09/03/2011 4 682,521 Long (5,474)Long Gilt Future 28/06/2011 (2) (378,118) Short (1,344)Total unrealised loss on futures contracts (26,900)
Total net unrealised gain on futures contracts 13,542
Invesco Capital Shield 90 (EUR) Fund EUR EURUS 10 Year Note Future 21/06/2011 193 16,656,277 Long 94,917FTSE 100 Index Future 18/03/2011 130 9,051,267 Long 152,185Nikkei 225 Future 10/03/2011 174 8,172,307 Long 167,335DJ Euro Stoxx 50 Future 18/03/2011 238 7,081,690 Long 229,620S&P 500 Future 17/03/2011 76 18,074,808 Long 1,020,619Total unrealised gain on futures contracts 1,664,676
Euro Bond Future 08/03/2011 135 16,794,675 Long (177,080)
Total unrealised loss on futures contracts (177,080)
Total net unrealised gain on futures contracts 1,487,596

Notes to the Financial Statements (continued)
128 Invesco Funds
8. Futures Contracts (continued)
DescriptionNumber of Contracts
Commitment in sub-fund BaseCcy Long/Short
Unrealised Gain/Loss in sub-fund Base Ccy
Invesco Global Absolute Return Fund EUR EUREuro Bond Future 08/03/2011 (4) (497,620) Short 3,100FTSE 100 Index Future 18/03/2011 7 487,376 Long 6,33110 Year Mini JGB Future 09/03/2011 (19) (2,345,776) Short 8,335Nikkei 225 Future 10/03/2011 8 375,738 Long 11,316DJ Euro Stoxx 50 Future 18/03/2011 15 446,325 Long 13,735S&P 500 Emini Future 18/03/2011 12 570,838 Long 35,292
Total unrealised gain on futures contracts 78,109
US 10 Year Note Future 21/06/2011 (7) (604,114) Short (3,522)
Total unrealised loss on futures contracts (3,522)
Total net unrealised gain on futures contracts 74,587
Invesco Balanced-Risk Allocation Fund EUR EURTopix Index Future 10/03/2011 47 3,956,487 Long 225,711S&P 500 Emini Future 18/03/2011 76 3,615,305 Long 215,323Russell 2000 Mini Future 18/03/2011 49 2,907,989 Long 176,999Canada 10 Year Bond Future 21/06/2011 114 10,152,754 Long 145,958Australia 10 Year Bond Future 15/03/2011 129 9,842,212 Long 116,973DJ Euro Stoxx 50 Future 18/03/2011 110 3,273,050 Long 111,620Long Gilt Future 28/06/2011 64 8,754,949 Long 67,500US Long Bond (CBT) Future 21/06/2011 65 5,668,050 Long 58,138Hang Seng Index Future 30/03/2011 30 3,246,106 Long 55,538FTSE 100 Index Future 18/03/2011 52 3,620,507 Long 26,652
Total unrealised gain on futures contracts 1,200,412
Euro Bond Future 08/03/2011 91 11,320,855 Long (88,220)Japan 10 Year Bond 10/03/2011 15 18,514,642 Long (72,847)
Total unrealised loss on futures contracts (161,067)
Total net unrealised gain on futures contracts 1,039,345

Notes to the Financial Statements (continued)
129 Invesco Funds
9. Credit Default Swaps
Purchase/Sale Deal Expiry Nominal Currency Unrealisedof protection Denomination Counterparty Spread Date Value Loss
in sub-fundBase Ccy
Invesco European Bond Fund EURPurchase Market Itraxx Europe Crossover Deutsche Bank 5.00% 20/12/2015 1,500,000 EUR (65,346)Total unrealised loss on credit default swaps (65,346)
Purchase/Sale Deal Expiry Nominal Currency Unrealisedof protection Denomination Counterparty Spread Date Value Gain/(Loss)
in sub-fundBase Ccy
Invesco Absolute Return Bond Fund EURPurchase French Republic Deutsche Bank 0.25% 20/03/2016 1,500,000 USD 34,903Purchase French Republic Morgan Stanley 0.25% 20/12/2015 1,500,000 USD 32,131
Total unrealised gain on credit default swaps 67,034
Purchase Market Itraxx Europe Crossover Deutsche Bank 5.00% 20/12/2015 1,000,000 EUR (43,564)
Total unrealised loss on credit default swaps (43,564)
Total net unrealised gain on credit default swaps 23,470
Purchase/Sale Deal Expiry Nominal Currency Unrealisedof protection Denomination Counterparty Spread Date Value Loss
in sub-fundBase Ccy
Invesco UK Investment Grade Bond Fund GBPPurchase Market Itraxx Europe Crossover Deutsche Bank 5.00% 20/12/2015 2,000,000 EUR (74,376)Total unrealised loss on credit default swaps (74,376)
Purchase/Sale Deal Expiry Nominal Currency Unrealisedof protection Denomination Counterparty Spread Date Value Loss
in sub-fund
Base CcyInvesco Global Total Return (EUR) Bond Fund EURSale French Republic JP Morgan 0.25% 20/12/2015 500,000 USD (10,710)Total unrealised loss on credit default swaps (10,710)
Purchase/Sale Deal Expiry Nominal Currency Unrealisedof protection Denomination Counterparty Spread Date Value Gain/(Loss)
in sub-fundBase Ccy
Invesco Global Unconstrained Bond Fund GBPSale Markit Itraxx Europe Credit Suisse 1.00% 20/12/2015 500,000 EUR 175Total unrealised gain on credit default swaps 175
Sale French Republic JP Morgan 0.25% 20/12/2015 1,000,000 USD (18,285)Sale French Republic JP Morgan 0.25% 20/09/2015 1,000,000 USD (16,485)Sale Markit Itraxx Europe Hi Vol Credit Suisse 1.00% 20/12/2015 500,000 EUR (6,926)
Total unrealised loss on credit default swaps (41,696)
Total net unrealised loss on credit default swaps (41,521)

Notes to the Financial Statements (continued)
130 Invesco Funds
9. Credit Default Swaps (continued)
Purchase/Sale Deal Expiry Nominal Currency Unrealisedof protection Denomination Counterparty Spread Date Value Gain/(Loss)
in sub-fundBase Ccy
Invesco Pan European High Income Fund EURSale British Energy Deutsche Bank 4.55% 20/03/2013 300,000 EUR 25,968Sale Alliance & Leicester Credit Suisse 3.70% 20/06/2013 100,000 EUR 5,740
Total unrealised gain on credit default swaps 31,708
Purchase Markit Itraxx Europe Crossover Credit Suisse 5.00% 20/06/2015 4,800,000 EUR (289,689)Total unrealised loss on credit default swaps (289,689)
Total net unrealised loss on credit default swaps (257,981)
10. Interest Rate Swaps
Denomination Counterparty Expiry Nominal Currency UnrealisedDate Value in Loss
sub-fund Basecurrency
Invesco Absolute Return Bond Fund EURJPM IRS - Pay fixed 7.03% / Receive float HU 6 mth Libor JP Morgan 15/06/2016 150,000,000 HUF (6,102)JPM IRS - Pay fixed 6.87% / Receive float HU 6 mth Libor JP Morgan 15/06/2016 150,000,000 HUF (2,313)Total unrealised loss on interest rate swaps (8,415)
11. Equity Swaps
The counterparty for the below Equity Swaps is Morgan Stanley.
Underlyingequities
Quantity ofunderlying
shares
Currency Commitment inLocal Ccy
Commitment as% of NAV of the
sub-fund
UnrealisedGain/(Loss) insub-fund Base
CcyInvesco Global Absolute Return Fund EURAbertis Infraestructuras SA (2,446) EUR (35,589) (0.26%) 208Air Water Inc 4,000 JPY 4,324,000 0.28% 547Alere Inc (2,696) USD (102,569) (0.54%) 3,200Allied World Assurance Co Holdings Ltd 664 USD 40,620 0.21% 75Amazon.com Inc (1,200) USD (212,706) (1.12%) 7,190Anixter International Inc 900 USD 63,914 0.34% 5,830Ansaldo STS SpA (3,314) EUR (33,853) (0.25%) 2,900Ansell Ltd 6,325 AUD 86,526 0.46% 2,323Assurant Inc 1,100 USD 44,688 0.24% 1,698Atkins WS Plc 15,717 GBP 108,919 0.93% 2,370Auxilium Pharmaceuticals Inc (5,700) USD (127,823) (0.67%) 3,816Avnet Inc (1,500) USD (51,690) (0.27%) 2,434Banco Popolare SC (11,142) EUR (28,178) (0.20%) 1,926BCE Inc 3,900 CAD 139,074 0.75% 1,095Bekaert SA 490 EUR 37,612 0.27% 62BioMarin Pharmaceutical Inc (4,700) USD (115,550) (0.61%) 7,485Brinker International Inc 1,700 USD 40,503 0.21% 2,946Brother Industries Ltd 13,900 JPY 17,917,100 1.15% 4,966Caltex Australia Ltd 6,373 AUD 100,693 0.54% 8,976Cathay Pacific Airways Ltd (16,000) HKD (290,080) (0.20%) 7,538CenturyLink Inc (1,300) USD (52,539) (0.28%) 3,387CF Industries Holdings Inc (200) USD (27,995) (0.15%) 1,440CGI Group Inc 5,200 CAD 101,088 0.54% 3,880Chiyoda Corp (3,000) JPY (2,202,000) (0.14%) 426Christian Hansen Holding A/S 1,830 DKK 226,371 0.22% 687Chugai Pharmaceutical Co Ltd (9,500) JPY (14,905,500) (0.96%) 4,441

Notes to the Financial Statements (continued)
131 Invesco Funds
11. Equity Swaps (continued)Underlyingequities
Quantity ofunderlying
shares
Currency Commitment inLocal Ccy
Commitment as% of NAV of the
sub-fund
UnrealisedGain/(Loss) insub-fund Base
CcyInvesco Global Absolute Return Fund (Continued) EURCiena Corp (1,700) USD (46,878) (0.25%) 10Concur Technologies Inc (4,000) USD (205,500) (1.08%) 12,806Consol Energy Inc (1,500) USD (74,708) (0.39%) 2,041Cree Inc (4,900) USD (260,705) (1.37%) 7,650Dainippon Screen Manufacturing Co Ltd 27,000 JPY 21,303,000 1.37% 24,429Daito Trust Construction Co Ltd 500 JPY 3,340,000 0.21% 4,279Dillard's Inc 3,300 USD 138,518 0.73% 1,999Dolby Laboratories Inc (1,400) USD (71,757) (0.38%) 9,733Domtar Corp 2,800 USD 247,128 1.30% 10,230E*Trade Financial Corp (4,700) USD (74,707) (0.39%) 443EDP Renovaveis SA (10,859) EUR (46,802) (0.34%) 1,846Edwards Lifesciences Corp (700) USD (60,441) (0.32%) 908Equinix Inc (2,935) USD (256,768) (1.35%) 2,716First Quantum Minerals Ltd (200) CAD (23,335) (0.13%) 467Freenet AG (8,609) EUR (70,977) (0.52%) 1,339Frontier Communications Corp (12,800) USD (107,712) (0.57%) 8,899Gannett Co Inc 6,900 USD 112,850 0.59% 7,917Gap Inc 2,303 USD 52,382 0.28% 4,196Gentex Corp (5,400) USD (165,375) (0.87%) 8,127Genworth Financial Inc (8,800) USD (116,996) (0.62%) 1,797Givaudan SA (30) CHF (27,668) (0.16%) 1,229GlaxoSmithKline Plc (4,934) GBP (58,271) (0.50%) 3Hannover Rueckversicherung AG 1,955 EUR 82,076 0.60% 1,716Haseko Corp (141,000) JPY (10,645,500) (0.68%) 1,778Health Net Inc 1,200 USD 35,604 0.19% 244Heritage Oil Plc (8,005) GBP (21,525) (0.18%) 16,162Hershey Co 5,400 USD 280,719 1.48% 8,888Humana Inc 1,000 USD 62,615 0.33% 1,517Iluka Resources Ltd 10,408 AUD 110,429 0.59% 12,297IMMOFINANZ AG (16,522) EUR (52,441) (0.38%) 578Infineon Technologies AG 6,334 EUR 49,671 0.36% 3,404InterActiveCorp 8,500 USD 266,645 1.40% 15,383ITT Educational Services Inc 1,000 USD 75,470 0.40% 6,937JGC Corp (11,000) JPY (20,278,500) (1.30%) 17,827Kajima Corp (28,000) JPY (6,090,000) (0.39%) 3,849Kansai Paint Co Ltd (7,000) JPY (5,439,000) (0.35%) 3,114KBR Inc 2,500 USD 81,950 0.43% 645Keikyu Corp (21,000) JPY (14,185,500) (0.91%) 7,354Keyence Corp (770) JPY (17,132,500) (1.10%) 1,641Kloeckner & Co SE 1,390 EUR 32,481 0.24% 580Koninklijke Boskalis Westminster NV 971 EUR 36,357 0.26% 2,371K's Holdings Corp 3,200 JPY 8,811,200 0.57% 11,794Kyowa Hakko Kirin Co Ltd (9,000) JPY (7,488,000) (0.48%) 1,846Lafarge SA (1,485) EUR (64,757) (0.47%) 6,344Lexmark International Inc 2,200 USD 82,203 0.43% 2,018Macy's Inc 1,500 USD 35,423 0.19% 250Makita Corp 6,100 JPY 21,045,000 1.35% 3,976MDC Holdings Inc (6,800) USD (181,866) (0.96%) 21,602Mediaset SpA 25,061 EUR 115,481 0.84% 3,772Medicis Pharmaceutical Corp 5,800 USD 149,640 0.79% 330Merck & Co Inc (4,300) USD (138,438) (0.73%) 5,291Methanex Corp (3,500) CAD (98,438) (0.53%) 221Moody's Corp 2,384 USD 74,464 0.39% 2,963Mosaic Co (700) USD (59,434) (0.31%) 168NGK Insulators Ltd 3,000 JPY 4,459,500 0.29% 1,883Niko Resources Ltd (300) CAD (24,765) (0.13%) 3,782Nippon Shokubai Co Ltd 17,000 JPY 16,396,500 1.05% 8,750NKT Holding A/S (2,054) DKK (629,038) (0.61%) 2,624Noble Group Ltd (104,000) SGD (213,720) (0.88%) 15,357Novo Nordisk A/S 983 DKK 665,983 0.65% 3,821Oil States International Inc 2,000 USD 146,690 0.77% 10,346Old Republic International Corp (15,700) USD (196,329) (1.03%) 7,382Olympus Corp (3,600) JPY (8,586,000) (0.55%) 567Orient-Express Hotels Ltd (4,800) USD (61,176) (0.32%) 622Outotec OYJ (1,545) EUR (61,700) (0.45%) 5,044Owens-Illinois Inc (1,700) USD (51,774) (0.27%) 1,531

Notes to the Financial Statements (continued)
132 Invesco Funds
11. Equity Swaps (continued)Underlyingequities
Quantity ofunderlying
shares
Currency Commitment inLocal Ccy
Commitment as% of NAV of the
sub-fund
UnrealisedGain/(Loss) insub-fund Base
CcyInvesco Global Absolute Return Fund (continued) EURPeabody Energy Corp 1,400 USD 91,406 0.48% 3,432Pembina Pipeline Corp (7,000) CAD (152,845) (0.82%) 1,552Pernod-Ricard SA (834) EUR (55,815) (0.41%) 3,791Persimmon Plc 2,706 GBP 12,552 0.11% 163Pioneer Natural Resources Co 500 USD 51,405 0.27% 1,068PPG Industries Inc 1,300 USD 113,679 0.60% 4,061Primary Health Care Ltd (43,255) AUD (140,146) (0.75%) 20,022Quadra FNX Mining Ltd (8,100) CAD (109,634) (0.59%) 3,736Quanta Services Inc (5,500) USD (122,485) (0.64%) 1,115Randgold Resources Ltd (284) GBP (14,142) (0.12%) 553Randstad Holding NV (2,233) EUR (86,774) (0.63%) 3,640Reliance Steel & Aluminum Co 1,400 USD 77,168 0.41% 822ResMed Inc (506) USD (15,911) (0.08%) 663Rockwood Holdings Inc 2,400 USD 110,016 0.58% 8,237Royal Caribbean Cruises Ltd (500) USD (22,073) (0.12%) 1,969RR Donnelley & Sons Co 4,200 USD 77,406 0.41% 1,807Russel Metals Inc 8,800 CAD 220,748 1.19% 12,089Salesforce.com Inc (500) USD (69,388) (0.37%) 2,071Sekisui Chemical Co Ltd 12,000 JPY 7,728,000 0.50% 2,976Seven & I Holdings Co Ltd 5,200 JPY 11,845,600 0.76% 3,680Shire Plc 665 GBP 11,591 0.10% 538Showa Denko KK (80,000) JPY (14,360,000) (0.92%) 9,608SM Energy Co 4,000 USD 288,180 1.52% 43,049Smithfield Foods Inc 2,400 USD 54,924 0.29% 3,936Sony Financial Holdings Inc 28 JPY 9,723,000 0.63% 9,149Sunoco Inc 2,400 USD 101,280 0.53% 651Takeda Pharmaceutical Co Ltd 2,100 JPY 8,547,000 0.55% 1,678Thomas Cook Group Plc (25,754) GBP (48,340) (0.41%) 4,286Tokio Marine Holdings Inc 2,000 JPY 5,357,000 0.34% 2,223Tokyo Gas Co Ltd 14,000 JPY 5,117,000 0.33% 696TransAlta Corp (4,300) CAD (87,677) (0.47%) 4,931United Rentals Inc 8,300 USD 267,053 1.41% 41,288Valero Energy Corp 5,200 USD 148,486 0.78% 11,359Vestas Wind Systems A/S (6,548) DKK (1,187,807) (1.16%) 8,607Vishay Intertechnology Inc 8,000 USD 142,400 0.75% 8,320Volvo AB (3,774) SEK (405,705) (0.34%) 2,954Wilmar International Ltd (61,000) SGD (310,795) (1.29%) 17,695WMS Industries Inc (1,300) USD (51,578) (0.27%) 5,520Yamada Denki Co Ltd 2,720 JPY 16,918,400 1.09% 17,953Yamato Holdings Co Ltd 14,300 JPY 18,733,000 1.21% 11,350
Total unrealised gain on equity swaps 706,717
Alexion Pharmaceuticals Inc (1,400) USD (132,825) (0.70%) (8,714)Alfa Laval AB 4,570 SEK 585,646 0.48% (7,496)Alstom SA (2,727) EUR (117,275) (0.85%) (2,248)Amgen Inc 2,676 USD 139,861 0.74% (9,907)AstraZeneca Plc 648 GBP 19,132 0.16% (405)Atco Ltd 4,300 CAD 245,509 1.32% (15,826)Autoliv Inc 700 USD 51,982 0.27% (1,604)Autonomy Corp Plc (1,297) GBP (21,459) (0.18%) (2,898)Avery Dennison Corp 2,200 USD 86,570 0.46% (4,892)Billabong International Ltd (12,981) AUD (109,819) (0.59%) (3,087)Bunge Ltd (900) USD (64,323) (0.34%) (703)Canon Inc 5,700 JPY 22,429,500 1.44% (9,817)Cardinal Health Inc 6,400 USD 264,000 1.39% (499)Cephalon Inc 3,000 USD 168,795 0.89% (7,511)Cheesecake Factory Inc 2,500 USD 72,275 0.38% (2,838)Chugoku Electric Power Co Inc (13,000) JPY (22,756,500) (1.46%) (8,410)City Developments Ltd 7,000 SGD 78,190 0.32% (2,302)Clean Harbors Inc (400) USD (36,800) (0.19%) (2,237)CLP Holdings Ltd 16,000 HKD 1,014,400 0.69% (1,303)Coloplast A/S 410 DKK 312,830 0.31% (2,860)COMSYS Holdings Corp 3,400 JPY 2,818,600 0.18% (1,105)Constellation Energy Group Inc 500 USD 15,098 0.08% (724)Convergys Corp 2,800 USD 39,354 0.21% (949)Cookson Group Plc (2,187) GBP (14,265) (0.12%) (270)

Notes to the Financial Statements (continued)
133 Invesco Funds
11. Equity Swaps (continued)Underlyingequities
Quantity ofunderlying
shares
Currency Commitment inLocal Ccy
Commitment as% of NAV of the
sub-fund
UnrealisedGain/(Loss) insub-fund Base
CcyInvesco Global Absolute Return Fund (continued) EURCrucell NV (1,746) EUR (43,179) (0.31%) (576)Daicel Chemical Industries Ltd 7,000 JPY 3,927,000 0.25% (3,042)Deutsche Lufthansa AG 1,914 EUR 27,968 0.20% (3,967)Discovery Communications Inc (1,300) USD (55,770) (0.29%) (3,276)DR Horton Inc 5,600 USD 66,724 0.35% (5,784)Eli Lilly & Co 3,345 USD 114,115 0.60% (1,707)EOG Resources Inc (600) USD (66,984) (0.35%) (3,809)FamilyMart Co Ltd (2,200) JPY (6,803,500) (0.44%) (941)Finning International Inc 2,600 CAD 71,903 0.39% (1,037)FLIR Systems Inc (1,800) USD (57,591) (0.30%) (2,959)Forest Laboratories Inc 6,196 USD 197,559 1.04% (1,636)Fuji Electric Holdings Co Ltd (30,000) JPY (8,295,000) (0.53%) (5,208)George Weston Ltd 1,700 CAD 116,731 0.63% (6,400)Global Payments Inc (1,200) USD (57,522) (0.30%) (82)Groupe Eurotunnel SA (8,143) EUR (59,912) (0.44%) (4,654)Guess Inc (400) USD (18,320) (0.10%) (1,091)HMS Holdings Corp (800) USD (59,580) (0.31%) (4,413)Hokkaido Electric Power Co Inc (4,000) JPY (7,012,000) (0.45%) (2,357)Hoya Corp 6,900 JPY 13,448,100 0.87% (3,509)Hugo Boss AG 824 EUR 43,829 0.32% (799)Imagination Technologies Group Plc (8,477) GBP (34,565) (0.29%) (1,329)Ingram Micro Inc (13,200) USD (263,472) (1.39%) (6,106)InterDigital Inc/PA 2,000 USD 96,750 0.51% (1,831)Isetan Mitsukoshi Holdings Ltd (5,400) JPY (5,324,400) (0.34%) (1,407)ITC Holdings Corp (1,665) USD (112,795) (0.59%) (4,406)Ivanhoe Mines Ltd/CA (1,200) CAD (32,268) (0.17%) (674)Johnson Controls Inc (2,400) USD (97,644) (0.51%) (117)Kawasaki Heavy Industries Ltd (43,000) JPY (14,125,500) (0.91%) (17,460)KeyCorp 8,400 USD 77,994 0.41% (1,405)Konica Minolta Holdings Inc 4,500 JPY 3,372,750 0.22% (3,423)Lear Corp 500 USD 53,163 0.28% (1,079)LKQ Corp (1,400) USD (33,061) (0.17%) (87)Logitech International SA 2,185 CHF 38,773 0.22% (1,061)Mabuchi Motor Co Ltd 500 JPY 2,042,500 0.13% (329)Magellan Health Services Inc 2,400 USD 115,668 0.61% (5,122)Markel Corp (200) USD (82,194) (0.43%) (2,998)Martin Marietta Materials Inc (300) USD (26,407) (0.14%) (895)MEMC Electronic Materials Inc (17,500) USD (253,137) (1.33%) (38,032)Minerals Technologies Inc 1,000 USD 64,375 0.34% (2,012)Mitsubishi Tanabe Pharma Corp (4,400) JPY (6,100,600) (0.39%) (1,720)Navistar International Corp 1,400 USD 85,645 0.45% (1,644)Noble Corp (2,500) USD (110,488) (0.58%) (7,811)Novagold Resources Inc (5,600) CAD (75,488) (0.41%) (762)Oracle Corp Japan 1,400 JPY 5,404,000 0.35% (56)Oshkosh Corp 2,700 USD 96,323 0.51% (3,264)Overseas Shipholding Group Inc (1,400) USD (49,336) (0.26%) (354)Packaging Corp of America (2,900) USD (84,289) (0.44%) (1,409)Panalpina Welttransport Holding AG 1,339 CHF 158,738 0.90% (1,328)PetroBakken Energy Ltd (3,300) CAD (73,046) (0.39%) (2,161)Petrofac Ltd 6,256 GBP 86,739 0.74% (22,115)Petrohawk Energy Corp (1,129) USD (24,369) (0.13%) (1,525)Pulte Group Inc 10,500 USD 73,343 0.39% (12,022)QIAGEN NV (3,907) EUR (58,556) (0.43%) (2,627)Rakuten Inc (205) JPY (14,924,000) (0.96%) (1,198)Ralcorp Holdings Inc (1,000) USD (65,540) (0.34%) (2,239)Reckitt Benckiser Group Plc 1,136 GBP 35,841 0.31% (4,517)Rhodia SA 1,221 EUR 25,791 0.19% (4,008)Rio Tinto Ltd 485 AUD 41,191 0.22% (652)Royal Bank of Canada (900) CAD (51,071) (0.28%) (1,749)SandRidge Energy Inc (24,900) USD (261,948) (1.38%) (58,046)Sara Lee Corp 907 USD 15,551 0.08% (700)SBA Communications Corp (2,100) USD (88,967) (0.47%) (3,800)Schindler Holding AG 497 CHF 51,315 0.29% (1,332)SEACOR Holdings Inc 1,500 USD 144,083 0.76% (9,174)SEB SA 2,736 EUR 192,313 1.40% (12,556)Shimadzu Corp (6,000) JPY (4,344,000) (0.28%) (4,904)Shoppers Drug Mart Corp (5,300) CAD (216,558) (1.17%) (6,679)

Notes to the Financial Statements (continued)
134 Invesco Funds
11. Equity Swaps (continued)Underlyingequities
Quantity ofunderlying
shares
Currency Commitment inLocal Ccy
Commitment as% of NAV of the
sub-fund
UnrealisedGain/(Loss) insub-fund Base
CcyInvesco Global Absolute Return Fund (continued) EURSingapore Post Ltd 140,000 SGD 158,900 0.66% (4,435)SJM Holdings Ltd 36,000 HKD 411,120 0.28% (9,797)SKF AB 2,234 SEK 388,604 0.32% (4,283)Sky Deutschland AG (24,615) EUR (72,553) (0.53%) (9,838)Softbank Corp (500) JPY (1,677,500) (0.11%) (2,280)Spirit Aerosystems Holdings Inc (10,600) USD (276,342) (1.45%) (18,339)Sprint Nextel Corp 58,500 USD 252,428 1.33% (6,253)Stanley Black & Decker Inc (3,300) USD (247,814) (1.30%) (16,790)Stanley Electric Co Ltd 2,400 JPY 3,601,200 0.23% (1,751)Stericycle Inc (1,000) USD (85,840) (0.45%) (5,208)Stora Enso OYJ 12,540 EUR 103,455 0.75% (4,514)Sumitomo Chemical Co Ltd (15,000) JPY (6,592,500) (0.42%) (1,685)Svenska Handelsbanken AB 752 SEK 159,687 0.13% (953)Symantec Corp 849 USD 15,405 0.08% (51)Syngenta AG (831) CHF (260,560) (1.48%) (5,964)Telecom Corp of New Zealand Ltd 35,296 NZD 73,592 0.29% (3,614)Telephone & Data Systems Inc 2,846 USD 95,611 0.50% (6,211)Tellabs Inc 13,300 USD 72,552 0.38% (16,057)Terex Corp (3,600) USD (123,066) (0.65%) (3,977)Thomson Reuters Corp (2,100) CAD (80,619) (0.43%) (156)Tidewater Inc (4,600) USD (283,475) (1.49%) (20,824)Timken Co 1,600 USD 78,696 0.41% (675)Toro Co 1,400 USD 85,225 0.45% (1,134)TRW Automotive Holdings Corp 2,000 USD 115,210 0.61% (4,547)TUI AG 4,655 EUR 43,801 0.32% (4,937)United States Steel Corp (400) USD (22,710) (0.12%) (337)USS Co Ltd 900 JPY 5,953,500 0.38% (145)Valeo SA 764 EUR 34,162 0.25% (527)Vertex Pharmaceuticals Inc (347) USD (15,565) (0.08%) (1,222)Yamaha Motor Co Ltd (9,000) JPY (13,027,500) (0.84%) (4,228)Yangzijiang Shipbuilding Holdings Ltd 96,000 SGD 172,320 0.71% (9,702)Yaskawa Electric Corp (23,000) JPY (21,919,000) (1.41%) (19,069)
Total unrealised loss on equity swaps (605,480)
Total net unrealised gain on equity swaps 101,237
12. Swing Pricing PolicySecurities are valued as outlined in note 2(b). However, in order to mitigate the effects of dilution, the Fund has implemented a policy of "Swing Pricing" asfrom December 18, 2007.
In the best interest of Shareholders, the Directors may allow for the net asset value to be adjusted, using bid or ask market quotation rather than mid,depending on the net share activity arising from subscriptions, redemptions or switching in a sub-fund for a given business day.
The sub-funds operate partial swing only. That is the sub-funds will not swing to either a bid or ask price basis daily, but only when a pre determined level ofshareholder activity is exceeded. High redemption level triggers a swing to a bid price basis, whereas high subscription level triggers a swing to ask pricebasis. The Directors have the ability to place a sub-fund on constant swing depending on the recent trends in a subfund.
The reconciliation on 28 February 2011 of MID to BID/ASK pricing is as follow:
BID Pricing A Dist A Accum Dist A(HKD)
Accum AHedg
B Accum Distribution C C Accum C Hedg(EUR)
Accumulation CHedg (GBP)
E Accum I Accum
Invesco Capital Shield 90 (EUR) FundMid Valuation - 11.32 - - - - 11.69 - - 10.88 11.68Bid Valuation - 11.31 - - - - 11.69 - - 10.87 11.67
ASK PricingInvesco Latin American Equity FundMid Valuation - 11.08 - 8.42 - - 11.11 8.45 - 7.99 -Ask Valuation - 11.12 - 8.45 - - 11.16 8.49 - 8.02 -
Invesco Asia Consumer Demand FundMid Valuation 11.81 12.00 - 8.71 - - 12.22 8.97 - 8.51 -Ask Valuation 11.87 12.06 - 8.75 - - 12.28 9.01 - 8.55 -
Invesco Emerging Market Quantitative Equity FundMid Valuation - 11.57 - 9.26 - - 11.61 9.29 7.79 8.34 8.46Ask Valuation - 11.60 - 9.28 - - 11.64 9.32 7.81 8.36 8.48

Notes to the Financial Statements (continued)
135 Invesco Funds
12. Swing Pricing Policy (continued)
ASK Pricing A Dist A Accum Dist A(HKD)
Accum AHedg
B Accum Distribution C C Accum C Hedg(EUR)
Accumulation CHedg (GBP)
E Accum I Accum
Invesco Gold & Precious Metals FundMid Valuation - 12.16 - 9.76 - - 12.21 9.80 - 8.77 -Ask Valuation - 12.19 - 9.78 - - 12.24 9.82 - 8.79 -
Invesco Euro Corporate Bond FundMid Valuation 11.1672 13.2858 - - - - 13.4937 - - 13.1406 -Ask Valuation 11.2047 13.3304 - - - - 13.5390 - - 13.1847 -
Invesco Asia Balanced FundMid Valuation 15.55 20.51 121.12 11.90 - - 20.98 15.51 - 12.04 -Ask Valuation 15.60 20.58 121.52 11.93 - - 21.05 15.57 - 12.08 -
13. Changes in InvestmentsA list, specifying for each investment the total purchases and sales which occurred during the year under review, may be obtained, upon request and free ofcharge, at the Registered Office and the Hong Kong Representative Office of the Fund.
14. Stock LendingThe Fund entered into a stock lending agreement with State Street in December 2007.
Below are the Funds which had securities on loan at 28 February 2011.
Subs- funds Ccy Total Market Value of Securitieson loan at 28/2/2011
Cash and Letters of Credit heldas collateral in respect of these
SecuritiesInvesco Nippon Select Equity USD 14,205,106 14,956,117
Invesco Nippon Small- Mid Cap USD 9,328,877 9,818,281
Invesco European Growth Equity USD 910,302 958,271
Invesco Pan European Structures Equity USD 12,645,637 13,317,093
Security lending income is recorded under “Other Income” in the Statement of Operations and Changes in Net Assets.
15. Soft Commissions & Related Party TransactionsCertain subsidiaries of Invesco Ltd. (“the Group”) consistent with obtaining the best net result, including best execution, may enter into agreements withcounterparties whereby those counterparties may make payments for investment services provided to the Group.
Investment services are used by the Group to improve or add to the services provided to its clients. Although each and every service may not be used toservice each and every account managed by the Group, the Group considers that those investment services received are, in the aggregate, of significantassistance in fulfilling its investment responsibilities and are of demonstrable benefit to all clients. Only services that assist in the provision of investmentservices to the Group’s clients will be paid for by counterparties.
Allowable investment services include services that provide assistance to the Group in its investment performance. Those services include, but are notnecessarily limited to, furnishing analysis, research and advisory services including economic factors and trends, portfolio valuation and analysis,performance measurement, market prices services and the use of specialised computer software and hardware or other information facilities.
The Group will ensure adherence to its investment decision making responsibilities to its clients in accordance with the laws of the countries that havejurisdiction over its clients or business. This may vary in application with respect to the appropriateness of those investment services provided.
The Group selects counterparties to execute transactions on the basis that transactions will only be executed provided the placing of orders will not operateagainst the best interest of the Group’s clients and that the multiple is at a level which is generally accepted market practice. The Group will endeavour toobtain best execution on all transactions for all clients.
In addition, clients may direct the Group to pay commission to counterparties for products and services that would otherwise have to be paid for. In suchcases, the commission is used for the exclusive benefit of the client whose transactions generated that commission.
The Group will endeavour to maintain the highest possible regulatory standards worldwide.

hudit Report
To the Shareholders of
Invesco Funds
-- --,--.AM- -- ------a-
We have autliteil the accompanying firianciai statenients of Invirco Funds and c~f each of rts sub-fu~~ds, which comprix the statement of net assets a i d the
statement of investments as at 28 Fehntary 201 1 at:d the statement of ciperattons and changes in net assets for the year then ard& snd a 5vmrna-y of
sipificant accounting policies and other expianatory notes to the financial statements.
Re.sponstD~lip of'the &;ad ~fDirwto,.: UJ-IIZP SJCAI' for rh~/ inwci~?l stotewzmfs
The Board of Directors of the SlCAV is n-spons:bie for the preparation and fair presentation of these financial slatetnents in accurdance witb Luxembourg
legal and regulatory requirements relating to the p r ~ a m t i o n of t k financial statements and for such internal ccmtroi 8s the & w d of Directos of the SICAV deteamrnes is necessary tc, enable the preparation of fnmctal statements that are free from mtttrial misstatement, whether due fo h a d or m:.
Our r~.sponstbiiity 1s tcl express an opinion oil lhesi financ:al statemenis hazed on crur audit. We cunducted our audit in accor&we with international
Standards <a1 Aucl~hng as adopial for Lr:xerl~hourg by the "C<mnnisswn de Sunreillancr du Secteur Financier". Those standardssquite that we comply with
ethical rzquiret~ients and plan and perfami the aud~t to obtain reasonaSle assurance whether the financtdl stateruents are free from material rniustatemmt.
Ail audit involves performing pmcedures to obtain audit evidence about the umouuts and dsclosurzv in the financial s t r ~ f e n t s . The procedures selected
depend on the judgment of the "Riviseur d'entrepr~ses as&, including the assessment of tile risks of ~nateiinl tnisrctatement of the financial Satemeile,
whetlier due to fraud or mar. Ln making those risk assessinents, the "Riviseur d'entqrises a g r W considers internal control relevant to the etttlty's
preparaticin and f a r prtxentation of the finaxial statements in order to design audit procedum that are appropriate in the circumstances. hut not for the
puqosr of expressutg an opinion on the effectivenass of the entity's inlernal control. An audit also includes evahating the apprcyriareness of accounting
policies usat and the reawnahlenrss of accounilng estinlates made by the Board of Directors of the SKAV, as we11 as evaluating the ovetilli preqcntation of
the financial statcninits
We believe that the audit evidence we have obtained 1s sufficient and apprcrpiiare to provide a basis for our audit opinion.
Opitthn
In our opmlon. these financial statemenis give a true and fair view of the financial positton of lnvesco Funds and of each of its sub-funds as of 28 February
201 I . and of the results of rheir operations and changes In their net assets for the yesr then ended in accordance with L~ixembourg legal and regulatory
requlrermts relat~~ig to the preparation of the financial staternetits
Other matters
Supplementary infomation inatuded in the annual report tias been revrewtxl ~ r i rhe context of our manda:e but has not been subject to spectlic aud~t
pn~edures carr~ed out in accordance with the standaids described above. Consequently. we express no opinion on such information. However. we have no
ohservstion to mske concerning such mlorrnatioix in the cotitext of the financial staternenis taken as a whole.
P:icc~cotethou~ec'<~~pers S.a r.l., 400 Route d'Erch. B.P 1443. t,-1014 Luxenthourg
T': +352 494848 1. F i 3 5 2 49.1848 2900. ~ > ~ ~ . p & c , ! i ,
C'abrnrt de revislnn agr.CP Expert-comptable {autorisatic.n gouvrmementale .inOfJ1 73hc13i
I<.C.S Luxeriiboi~rg 13 65 377 - (';iprt;~I soc~al EUK 5 I6 ($50 - TLA L!,'I 7564447
126 Lnvmu Funds
Lcxembourq, 12 June 201 1

Comparative Net Asset Values for the year ended
137 Invesco Funds
28 February 2011Total NAVin sub-fund
currencyTotal
per Share 28 February 2010Total NAVin sub-fund
currencyTotal
per Share 28 February 2009Total NAVin sub-fund
currencyTotal
per Share
Invesco Global Structured Equity FundDistribution A 6,721,466 29.72 USD 6,591,198 27.34 USD 5,194,223 22.47 USDAccumulation A Hedg (EUR) 72,423 22.34 EUR – – – –Distribution C 20,693,507 31.22 USD 22,998,874 28.59 USD 14,937,830 23.41 USDAccumulation C Hedg (EUR) 72,666 23.47 EUR – – – –Accumulation C Hedg (GBP) 147,690 20.46 GBP – – – –Accumulation E 626,030 22.17 EUR 435,459 20.57 EUR 91,807 18.23 EURInvesco Emerging Market Quantitative Equity FundAccumulation A 269,278 11.57 USD - - - -Accumulation A Hedg (EUR) 885,703 9.26 EUR - - - -Accumulation C 12,941,898 11.61 USD - - - -Accumulation C Hedg (EUR) 83,539 9.29 EUR - - - -Accumulation C Hedg (GBP) 82,011 7.79 GBP - - - -Accumulation E 2,236,944 8.34 EUR - - - -Accumulation I 1,725,335 8.46 EUR - - - -Invesco US Structured Equity FundAccumulation A 50,268,415 14.32 USD 51,751,621 12.56 USD 103,603,823 8.93 USDAccumulation A Hedg (EUR) 481,961 7.92 EUR 284,844 6.99 EUR 155,754 5.06 EURAccumulation B 823 13.23 USD 728 11.70 USD 523 8.41 USDAccumulation C 15,256,143 14.89 USD 79,467,907 13.00 USD 73,674,162 9.22 USDAccumulation C Hedg (EUR) 369,183 8.26 EUR 1,719,069 7.25 EUR 4,684,013 5.22 EURAccumulation E 8,044,849 9.72 EUR 7,846,793 8.72 EUR 24,844,876 6.69 EURAccumulation I 1,611 10.49 EUR 1,397 9.25 EUR – –Invesco US 130/30 Equity FundDistribution A – – 1,939,686 7.76 USD 1,439,978 5.75 USDAccumulation A – – 67,415 7.76 USD 3,136 5.75 USDAccumulation A Hedg (EUR) – – 29,670 4.55 EUR 69,182 3.43 EURAccumulation C – – 2,769,145 7.84 USD 2,318,756 5.78 USDAccumulation C Hedg (EUR) – – 69,118 4.61 EUR – –Accumulation E – – 19,399 5.63 EUR 9,336 4.52 EURAccumulation I – – 1,417 5.71 EUR – –
Invesco Latin American Equity FundAccumulation A 4,217,151 11.08 USD - - - -Accumulation A Hedg (EUR) 361,952 8.42 EUR - - - -Accumulation C 2,231,882 11.11 USD - - - -Accumulation C Hedg (EUR) 34,624 8.45 EUR - - - -Accumulation E 1,399,819 7.99 EUR - - - -Invesco Pan European Structured Equity FundDistribution A 15,543 9.57 EUR – – – –Accumulation A 294,807,270 9.56 EUR 133,045,022 7.89 EUR 162,736,745 6.05 EURAccumulation B 913 8.92 EUR 761 7.43 EUR 19,870 5.76 EURAccumulation C 175,851,225 10.06 EUR 121,350,349 8.26 EUR 117,018,498 6.30 EURAccumulation E 23,910,829 8.70 EUR 14,513,721 7.26 EUR 7,583,258 5.62 EURInvesco Pan European Equity FundDistribution A 21,580,363 11.25 EUR 17,759,458 9.26 EUR 12,010,869 6.25 EURAccumulation A 332,804,683 12.07 EUR 227,676,495 9.83 EUR 148,008,109 6.64 EURDistribution A (USD) 166,406 15.80 USD 137,641 12.80 USD 145,790 8.05 USDAccumulation B 2,469,734 10.54 EUR 2,643,827 8.67 EUR 2,345,790 5.91 EURDistribution C 17,593,075 11.94 EUR 17,193,958 9.77 EUR 13,169,066 6.57 EURAccumulation C 266,082,588 12.80 EUR 129,059,728 10.37 EUR 108,073,331 6.96 EURAccumulation E 88,094,222 11.44 EUR 60,116,771 9.37 EUR 13,598,303 6.36 EURAccumulation I 1,222 12.33 EUR 976 9.85 EUR – –Invesco Pan European Small Cap Equity FundAccumulation A 128,451,671 13.10 EUR 106,730,870 10.20 EUR 50,505,776 5.89 EURDistribution A (USD) 43,893 18.09 USD 10,605 13.86 USD – –Accumulation B 1,104,808 11.59 EUR 1,087,570 9.11 EUR 843,040 5.32 EURAccumulation C 12,890,813 13.89 EUR 5,340,025 10.75 EUR 4,988,337 6.18 EURAccumulation E 5,757,694 12.09 EUR 5,096,765 9.49 EUR 2,493,814 5.53 EURInvesco European Growth Equity FundAccumulation A 29,344,226 14.95 EUR 30,802,948 12.63 EUR 18,242,704 8.78 EURAccumulation C 34,259,682 15.46 EUR 45,522,941 12.98 EUR 24,075,259 8.98 EURAccumulation E 3,001,773 14.26 EUR 2,451,082 12.13 EUR 1,941,108 8.50 EURAccumulation I 1,198 15.26 EUR 992 12.64 EUR – –Invesco Pan European Equity Income FundDistribution A 4,236,881 8.09 EUR 3,599,804 7.24 EUR 2,769,827 5.74 EURAccumulation A 349,260 8.48 EUR 298,814 7.52 EUR 231,911 5.88 EURAccumulation C 774 8.60 EUR 9,840 7.58 EUR – –Accumulation E 351,819 8.27 EUR 132,032 7.38 EUR 89,560 5.81 EUR
Invesco Pan European 130/30 Equity FundAccumulation A – – 581,763 4.74 EUR 379,301 3.37 EURAccumulation A (USD) – – 2,016,315 6.45 USD 1,745,700 4.27 USDAccumulation C – – 1,762,942 4.81 EUR – –Accumulation E – – 159,879 4.68 EUR 1,706,345 3.40 EURAccumulation I – – 983 4.75 EUR 39,088 3.35 EUR
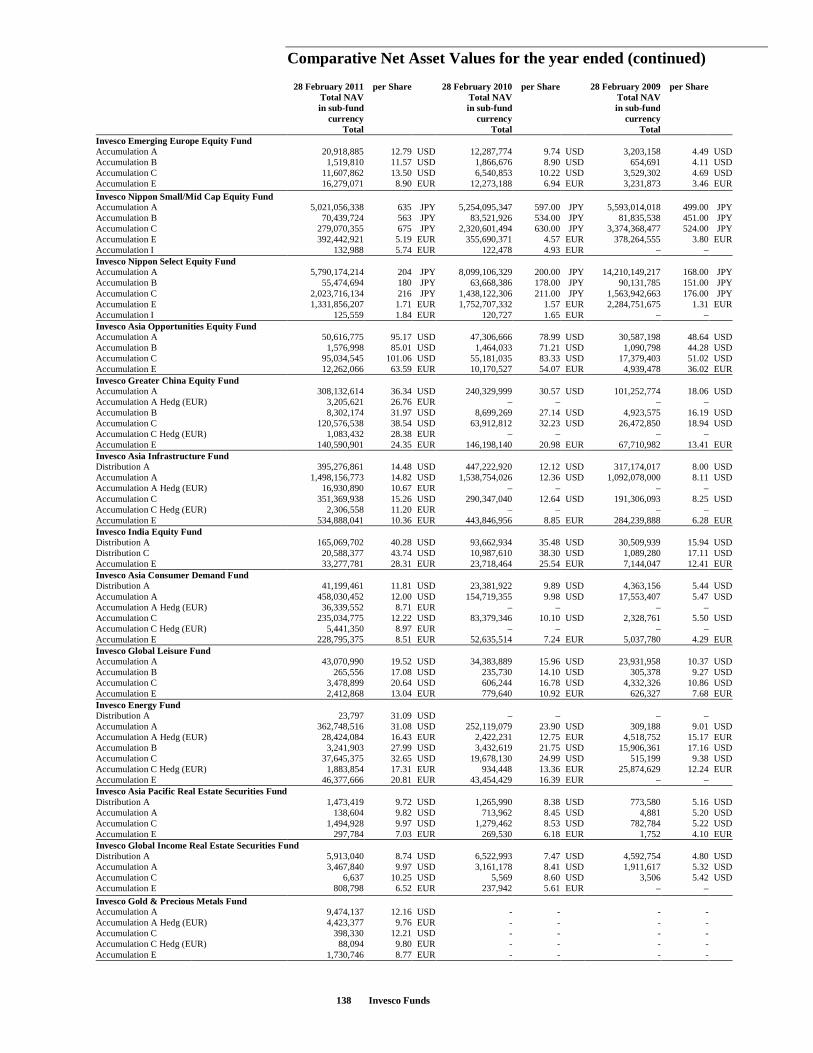
Comparative Net Asset Values for the year ended (continued)
138 Invesco Funds
28 February 2011Total NAVin sub-fund
currencyTotal
per Share 28 February 2010Total NAVin sub-fund
currencyTotal
per Share 28 February 2009Total NAVin sub-fund
currencyTotal
per Share
Invesco Emerging Europe Equity FundAccumulation A 20,918,885 12.79 USD 12,287,774 9.74 USD 3,203,158 4.49 USDAccumulation B 1,519,810 11.57 USD 1,866,676 8.90 USD 654,691 4.11 USDAccumulation C 11,607,862 13.50 USD 6,540,853 10.22 USD 3,529,302 4.69 USDAccumulation E 16,279,071 8.90 EUR 12,273,188 6.94 EUR 3,231,873 3.46 EUR
Invesco Nippon Small/Mid Cap Equity FundAccumulation A 5,021,056,338 635 JPY 5,254,095,347 597.00 JPY 5,593,014,018 499.00 JPYAccumulation B 70,439,724 563 JPY 83,521,926 534.00 JPY 81,835,538 451.00 JPYAccumulation C 279,070,355 675 JPY 2,320,601,494 630.00 JPY 3,374,368,477 524.00 JPYAccumulation E 392,442,921 5.19 EUR 355,690,371 4.57 EUR 378,264,555 3.80 EURAccumulation I 132,988 5.74 EUR 122,478 4.93 EUR – –Invesco Nippon Select Equity FundAccumulation A 5,790,174,214 204 JPY 8,099,106,329 200.00 JPY 14,210,149,217 168.00 JPYAccumulation B 55,474,694 180 JPY 63,668,386 178.00 JPY 90,131,785 151.00 JPYAccumulation C 2,023,716,134 216 JPY 1,438,122,306 211.00 JPY 1,563,942,663 176.00 JPYAccumulation E 1,331,856,207 1.71 EUR 1,752,707,332 1.57 EUR 2,284,751,675 1.31 EURAccumulation I 125,559 1.84 EUR 120,727 1.65 EUR – –Invesco Asia Opportunities Equity FundAccumulation A 50,616,775 95.17 USD 47,306,666 78.99 USD 30,587,198 48.64 USDAccumulation B 1,576,998 85.01 USD 1,464,033 71.21 USD 1,090,798 44.28 USDAccumulation C 95,034,545 101.06 USD 55,181,035 83.33 USD 17,379,403 51.02 USDAccumulation E 12,262,066 63.59 EUR 10,170,527 54.07 EUR 4,939,478 36.02 EUR
Invesco Greater China Equity FundAccumulation A 308,132,614 36.34 USD 240,329,999 30.57 USD 101,252,774 18.06 USDAccumulation A Hedg (EUR) 3,205,621 26.76 EUR – – – –Accumulation B 8,302,174 31.97 USD 8,699,269 27.14 USD 4,923,575 16.19 USDAccumulation C 120,576,538 38.54 USD 63,912,812 32.23 USD 26,472,850 18.94 USDAccumulation C Hedg (EUR) 1,083,432 28.38 EUR – – – –Accumulation E 140,590,901 24.35 EUR 146,198,140 20.98 EUR 67,710,982 13.41 EURInvesco Asia Infrastructure FundDistribution A 395,276,861 14.48 USD 447,222,920 12.12 USD 317,174,017 8.00 USDAccumulation A 1,498,156,773 14.82 USD 1,538,754,026 12.36 USD 1,092,078,000 8.11 USDAccumulation A Hedg (EUR) 16,930,890 10.67 EUR – – – –Accumulation C 351,369,938 15.26 USD 290,347,040 12.64 USD 191,306,093 8.25 USDAccumulation C Hedg (EUR) 2,306,558 11.20 EUR – – – –Accumulation E 534,888,041 10.36 EUR 443,846,956 8.85 EUR 284,239,888 6.28 EURInvesco India Equity FundDistribution A 165,069,702 40.28 USD 93,662,934 35.48 USD 30,509,939 15.94 USDDistribution C 20,588,377 43.74 USD 10,987,610 38.30 USD 1,089,280 17.11 USDAccumulation E 33,277,781 28.31 EUR 23,718,464 25.54 EUR 7,144,047 12.41 EURInvesco Asia Consumer Demand FundDistribution A 41,199,461 11.81 USD 23,381,922 9.89 USD 4,363,156 5.44 USDAccumulation A 458,030,452 12.00 USD 154,719,355 9.98 USD 17,553,407 5.47 USDAccumulation A Hedg (EUR) 36,339,552 8.71 EUR – – – –Accumulation C 235,034,775 12.22 USD 83,379,346 10.10 USD 2,328,761 5.50 USDAccumulation C Hedg (EUR) 5,441,350 8.97 EUR – – – –Accumulation E 228,795,375 8.51 EUR 52,635,514 7.24 EUR 5,037,780 4.29 EURInvesco Global Leisure FundAccumulation A 43,070,990 19.52 USD 34,383,889 15.96 USD 23,931,958 10.37 USDAccumulation B 265,556 17.08 USD 235,730 14.10 USD 305,378 9.27 USDAccumulation C 3,478,899 20.64 USD 606,244 16.78 USD 4,332,326 10.86 USDAccumulation E 2,412,868 13.04 EUR 779,640 10.92 EUR 626,327 7.68 EUR
Invesco Energy FundDistribution A 23,797 31.09 USD – – – –Accumulation A 362,748,516 31.08 USD 252,119,079 23.90 USD 309,188 9.01 USDAccumulation A Hedg (EUR) 28,424,084 16.43 EUR 2,422,231 12.75 EUR 4,518,752 15.17 EURAccumulation B 3,241,903 27.99 USD 3,432,619 21.75 USD 15,906,361 17.16 USDAccumulation C 37,645,375 32.65 USD 19,678,130 24.99 USD 515,199 9.38 USDAccumulation C Hedg (EUR) 1,883,854 17.31 EUR 934,448 13.36 EUR 25,874,629 12.24 EURAccumulation E 46,377,666 20.81 EUR 43,454,429 16.39 EUR – –Invesco Asia Pacific Real Estate Securities FundDistribution A 1,473,419 9.72 USD 1,265,990 8.38 USD 773,580 5.16 USDAccumulation A 138,604 9.82 USD 713,962 8.45 USD 4,881 5.20 USDAccumulation C 1,494,928 9.97 USD 1,279,462 8.53 USD 782,784 5.22 USDAccumulation E 297,784 7.03 EUR 269,530 6.18 EUR 1,752 4.10 EURInvesco Global Income Real Estate Securities FundDistribution A 5,913,040 8.74 USD 6,522,993 7.47 USD 4,592,754 4.80 USDAccumulation A 3,467,840 9.97 USD 3,161,178 8.41 USD 1,911,617 5.32 USDAccumulation C 6,637 10.25 USD 5,569 8.60 USD 3,506 5.42 USDAccumulation E 808,798 6.52 EUR 237,942 5.61 EUR – –
Invesco Gold & Precious Metals FundAccumulation A 9,474,137 12.16 USD - - - -Accumulation A Hedg (EUR) 4,423,377 9.76 EUR - - - -Accumulation C 398,330 12.21 USD - - - -Accumulation C Hedg (EUR) 88,094 9.80 EUR - - - -Accumulation E 1,730,746 8.77 EUR - - - -

Comparative Net Asset Values for the year ended (continued)
139 Invesco Funds
28 February 2011Total NAVin sub-fund
currencyTotal
per Share 28 February 2010Total NAVin sub-fund
currencyTotal
per Share 28 February 2009Total NAVin sub-fund
currencyTotal
per Share
Invesco USD Reserve FundAccumulation A 41,458,819 87.00 USD 69,324,553 87.00 USD 103,968,402 86.87 USDAccumulation B 504,841 78.51 USD 2,660,490 79.31 USD 1,968,846 80.10 USDAccumulation B1 1,857,542 86.87 USD 380,861 86.91 USD 9,869,727 86.82 USDAccumulation C 27,913,821 89.46 USD 23,484,913 89.31 USD 29,592,833 89.00 USDAccumulation E 11,565,351 62.86 EUR 11,578,887 63.94 EUR 10,439,323 68.55 EURInvesco Euro Reserve FundDistribution A 5,009 320.50 EUR – – – –Accumulation A 74,973,361 320.56 EUR 91,854,328 319.94 EUR 180,098,902 318.67 EURAccumulation B 76,192 288.69 EUR 76,883 291.31 EUR 77,499 293.65 EURAccumulation C 224,623,766 331.73 EUR 181,470,265 330.50 EUR 311,676,512 328.55 EURAccumulation E 50,299,420 318.01 EUR 77,694,204 317.86 EUR 223,787,153 317.07 EURInvesco Global Bond FundDistribution A 4,730,300 5.2358 USD 4,927,679 5.0519 USD 4,661,160 4.6996 USDAccumulation A 10,210,990 7.4783 USD 11,030,210 7.0821 USD 12,939,201 6.5327 USDAccumulation C 11,083,528 8.0109 USD 12,818,770 7.5664 USD 10,346,317 6.9678 USDAccumulation E 7,612,642 5.2286 EUR 4,201,361 5.0419 EUR 4,174,489 4.9968 EURInvesco European Bond FundDistribution A 2,702,184 4.7406 EUR 1,002 4.8416 EUR 25,080,703 4.4567 EURAccumulation A 30,195,518 4.9407 EUR 25,107,077 4.8416 EUR – –Accumulation B 102,728 4.3643 EUR 773,528 4.3193 EUR 961,201 4.0203 EURAccumulation C 9,135,799 5.0903 EUR 13,664,949 4.9759 EUR 16,439,880 4.5692 EURAccumulation E 5,120,955 4.8646 EUR 5,120,909 4.7743 EUR 3,643,741 4.4013 EURInvesco Absolute Return Bond FundAccumulation A 11,281,035 2.7720 EUR 14,219,493 2.8038 EUR 15,227,619 2.6876 EURAccumulation C 2,125,934 2.8831 EUR 11,590,463 2.9105 EUR 1,639,589 2.7832 EURAccumulation C Hedg (GBP) 104,684 2.3879 GBP – – – –Accumulation E 10,377,527 2.7292 EUR 17,982,862 2.7774 EUR 20,633,788 2.6593 EURAccumulation I 995 2.8669 EUR 996 2.8702 EUR – –
Invesco Euro Corporate Bond FundDistribution A 296,639,690 11.1672 EUR 47,147,666 10.8484 EUR 1,407,076 8.7268 EURAccumulation A 699,745,266 13.2858 EUR 278,175,622 12.5189 EUR 14,825,022 9.7177 EURAccumulation C 637,798,386 13.4937 EUR 460,300,904 12.6612 EUR 17,695,386 9.7946 EURAccumulation E 512,340,949 13.1406 EUR 346,457,883 12.4143 EUR 9,261,080 9.6606 EUR
Invesco Euro Inflation-Linked Bond FundAccumulation A 38,869,812 14.4989 EUR 38,988,448 14.3316 EUR 28,278,849 13.2875 EURAccumulation B – – 212,985 13.1691 EUR 199,397 12.3290 EURAccumulation C 5,818,114 14.9503 EUR 12,045,841 14.7213 EUR 5,655,678 13.6025 EURAccumulation E 22,516,293 14.2808 EUR 35,076,755 14.1366 EUR 19,656,367 13.1265 EURAccumulation I 1,018 14.6618 EUR 995 14.3402 EUR – –Invesco UK Investment Grade Bond FundDistribution A 70,194,691 0.8448 GBP 48,067,318 0.8371 GBP 46,042,753 0.8028 GBP
Invesco Emerging Local Currencies Debt FundDistribution A 334,526,694 10.8544 USD 36,371,109 10.4086 USD 36,997,085 7.9250 USDAccumulation A 53,595,396 14.2601 USD 17,358,753 12.8489 USD 13,410,047 9.2154 USDAccumulation A Hedg (EUR) 19,566,187 7.9001 EUR 4,520,788 7.1770 EUR 454,029 5.2200 EURDistribution A Hedg (EUR) 347,344 8.3176 EUR – – – –Accumulation C 84,915,716 14.5431 USD 15,174,514 13.0250 USD 16,996,948 9.3033 USDAccumulation C Hedg (EUR) 23,686,053 8.8544 EUR 105,624,497 8.0066 EUR – –Accumulation E 99,276,039 10.1732 EUR 11,786,530 9.3554 EUR 1,733,562 7.2300 EUR
Invesco Global Investment Grade Corporate Bond FundDistribution A - Annual Dist* 5,243,757 10.7987 USD 2,616,955 10.4327 USD – – –Accumulation A Hedg (EUR) 2,066,471 7.6542 EUR 991,449 7.2790 EUR – – –Distribution A (USD) – Monthly Dist* 2,131,240 10.4862 USD – – USD – – –Distribution C 3,153,816 10.8659 USD 2,454,496 10.4541 USD – – –Accumulation C Hedg (EUR) 4,571,629 7.7020 EUR 3,884,846 7.2937 EUR – – –Accumulation C Hedg (GBP) 145,578 7.1423 GBP – – – – –Accumulation E 2,047,129 7.9086 EUR 1,044,036 7.6651 EUR – – –Invesco Global Total Return (EUR) Bond FundAccumulation A 2,336,957 10.3892 EUR – – – –Accumulation C 20,015 10.4106 EUR – – – –Accumulation E 19,951 10.3772 EUR – – – –Distribution E 19,950 10.3444 EUR – – – –Invesco Global Unconstrained Bond FundAccumulation A 483,723 10.8817 GBP – – – –Accumulation A Hedg (EUR) 24,338 13.0157 EUR – – – –Accumulation C 1,883,742 10.9276 GBP – – – –Accumulation C Hedg (EUR) 24,438 13.0723 EUR – – – –Accumulation E Hedg (EUR) 24,256 12.9737 EUR – – – –
*Monthly distribution launched April 2010, Annual distribution launched September 2009

Comparative Net Asset Values for the year ended (continued)
140 Invesco Funds
28 February 2011Total NAVin sub-fund
currencyTotal
per Share 28 February 2010Total NAVin sub-fund
currencyTotal
per Share 28 February 2009Total NAVin sub-fund
currencyTotal
per Share
Invesco Capital Shield 90 (EUR) FundAccumulation A 71,655,051 11.32 EUR 178,689,607 10.54 EUR 249,091,178 10.73 EURAccumulation C 63,542,522 11.69 EUR 43,294,789 10.85 EUR 54,074,217 10.99 EURAccumulation E 34,269,847 10.88 EUR 58,822,078 10.19 EUR 142,774,355 10.42 EURAccumulation I 1,072 11.68 EUR 987 10.76 EUR 27,366,677 10.91 EURInvesco Asia Balanced FundDistribution A 486,935,300 15.55 USD 150,856,575 13.80 USD 79,650,415 9.50 USDAccumulation A 154,961,844 20.51 USD 50,285,157 17.49 USD 18,120,774 11.73 USDAccumulation A Hedg (EUR) 11,166,532 11.90 EUR – – – – – –Accumulation C 37,480,689 20.98 USD 29,630,466 17.80 USD 1,445,336 11.88 USDAccumulation C Hedg (EUR) 77,574 15.51 EUR – – – – – –Accumulation E 19,771,753 12.04 EUR 3,969,251 10.49 EUR 10,169 7.58 EURDistribution A (HKD) 11,714,247 121.12 HKD – – – – – –Invesco Pan European High Income FundDistribution A 11,945,444 10.95 EUR 11,612,299 9.97 EUR 3,099,580 5.88 EURAccumulation A 7,074,950 13.30 EUR 3,504,224 11.54 EUR 932,712 6.50 EURAccumulation C 7,639,153 13.45 EUR 6,482,520 11.63 EUR 5,601,684 6.52 EURAccumulation E 13,946,333 12.95 EUR 3,726,374 11.30 EUR 910,814 6.39 EURInvesco Global Absolute Return FundAccumulation A 1,420,703 9.91 EUR 1,903,891 9.32 EUR 10,433,467 9.62 EURAccumulation C 2,317,097 10.13 EUR 1,851,096 9.45 EUR 8,623,645 9.69 EURAccumulation C Hedg (USD) 50,893 13.45 USD – – – – – –Accumulation E 1,589,814 9.76 EUR 1,495,238 9.23 EUR 9,569,223 9.58 EURAccumulation C Hedg (JPY) 8,374,266 1,120 JPY – – – – – –Invesco Balanced-Risk Allocation FundDistribution A 1,638,061 12.10 EUR – – - – – –Accumulation A 10,373,368 12.09 EUR 548,365 10.47 EUR – – –Accumulation A Hedg (USD) 140,906 16.03 USD – – - – – –Accumulation C 38,527,292 12.20 EUR 17,714,820 10.50 EUR – – –Accumulation C Hedg (GBP) 154,898 10.76 GBP 544,927 9.27 GBP – – –Accumulation C Hedg (USD) 75,566 16.19 USD – – - – – –Accumulation E 11,870,803 12.00 EUR 547,028 10.45 EUR – – –

Other Information (unaudited)
141 Invesco Funds
UK Distributor StatusCertification as a "distributing fund" under the United Kingdom Income and Corpration Taxes Act 1988 for the purposes of UK taxation was sought and
gained for the year ended 28 February 2010. Application for Distributor Status will be sought for the year ended 28 February 2011.
Funds ClassesInvesco Global Structured Equity Fund A-Dist, C DistInvesco Pan European Structured Equity Fund A-Dist QDInvesco Pan European Equity Fund A-Dist, A (USD), C-DistInvesco Pan European Small Cap Equity Fund A-USD DistInvesco Asia Infrastructure Fund A DistInvesco Asia Consumer Demand Fund A-DistInvesco Energy Fund A-DistInvesco Euro Reserve Fund A-DistInvesco Global Bond Fund A-DistInvesco Euro Corporate Bond Fund A-Dist MDInvesco Emerging Local Currencies Debt Fund A-Dist MDInvesco Balanced Risk Allocation Fund A-DistInvesco Global Investment Grade Corporate Bond Fund A-Dist, C-DistInvesco India Equity Fund A-Dist, C-DistInvesco UK Investment Grade Bond Fund A-Dist QD
UK Reporting RegimeThe following sub-funds have lodged an initial application with HRMC to become Reporting funds for the purposes of UK taxation, for the period ended 28February 2012 and subsequent years.
Funds ClassesInvesco Global Structured Equity Fund A-Dist & C DistInvesco US Structured Equity A & CInvesco Pan European Structured Equity Fund A-Dist QD & CInvesco Pan European Equity Fund A-Dist, A (USD) & C-DistInvesco Pan European Small Cap Equity Fund A-USD, Dist-AD & CInvesco European Growth Equity Fund A & CInvesco Emerging Europe Equity Fund A & CInvesco Nippon Small/Mid Cap Equity A & CInvesco Greater China Equity A & CInvesco Asia Infrastructure Fund A Dist & C (Acc-USD)Invesco Asia Opportunities Equity Fund A & CInvesco Asia Consumer Demand Fund A-Dist & C (USD)Invesco Energy Fund A-Dist AD & CInvesco Emerging Markets Quantitative Equity A & CInvesco Gold and Precious Metals A & CInvesco USD Reserve A & CInvesco Euro Reserve Fund A-Dist AD & CInvesco Global Bond Fund A-Dist SDInvesco Absolute Return Bond Fund A & C (GBP Hdg)Invesco Euro Corporate Bond Fund A-Dist MD, A & CInvesco Euro Inflation-Linked Bond Fund A & CInvesco Emerging Local Currencies Debt A-Dist MD & CInvesco Global Total Return (EUR) Bond Fund A & CInvesco Global Unconstrained Bond C (GBP)Invesco Capital Shield 90 (EUR) Fund A &CInvesco Asia Balanced Fund A Dist-QD & CInvesco Balanced Risk Allocation Fund A-Dist & C (GBP Hdg)Invesco Global Investment Grade Corporate Bond Fund A-Dist & C-DistInvesco India Equity Fund A-Dist & C-DistInvesco UK Investment Grade Bond Fund A-Dist QD
PEA Disclosure (Plan d’Epargne en Actions)From the 1 March 2010 to 28 February 2011, the following sub-funds held the average percentage, as specified in the table, of their assets invested at anytime in PEA eligible securities as defined by the Article L.221-31 of the Code Monétaire et Financier. This is required by sub-funds registered in France thatmeet the Equity Savings Plan (PEA) requirements. The maximum percentage investments during this period are also provided:
Invesco Pan EuropeanStructured Equity Fund
Invesco Pan EuropeanEquity Income Fund
Invesco Pan EuropeanSmall Cap Equity Fund
Invesco Pan EuropeanEquity Fund
Minimum % 83.22 76.12 82.41 78.90Maximum % 90.87 83.99 88.96 90.11Average % 88.16 82.02 84.76 87.08
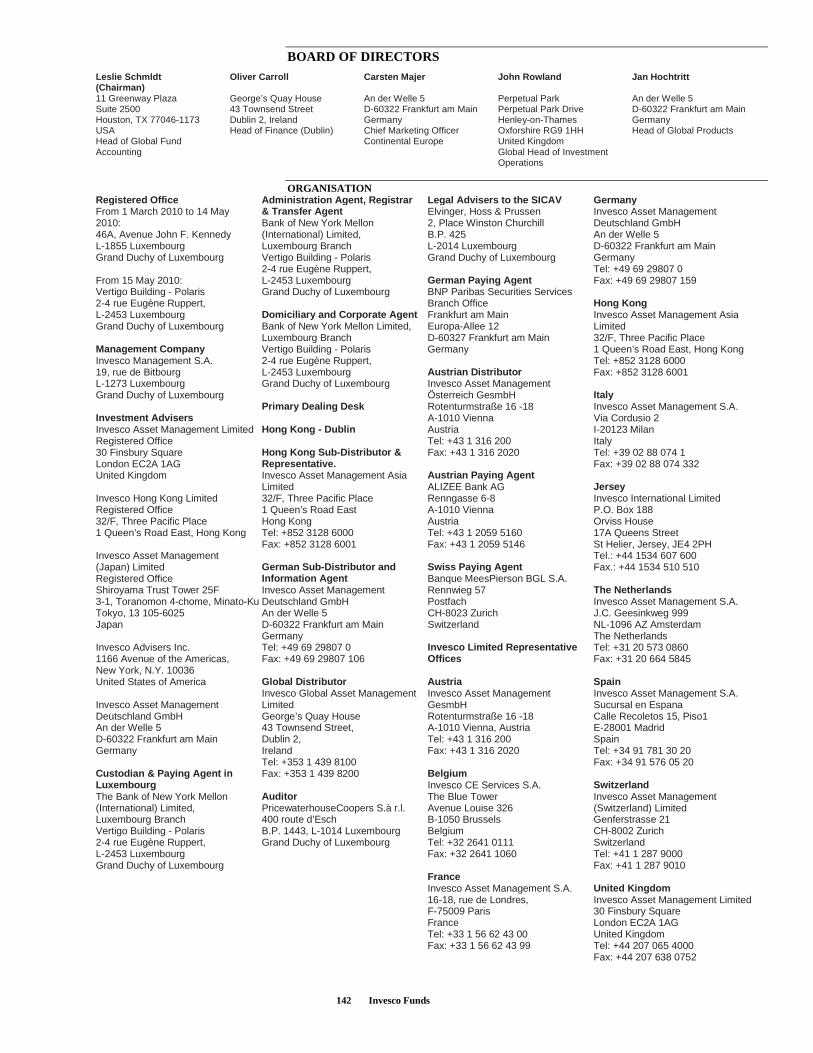
BOARD OF DIRECTORS
142 Invesco Funds
Leslie Schmldt(Chairman)11 Greenway PlazaSuite 2500Houston, TX 77046-1173USAHead of Global FundAccounting
Oliver Carroll
George’s Quay House43 Townsend StreetDublin 2, IrelandHead of Finance (Dublin)
Carsten Majer
An der Welle 5D-60322 Frankfurt am MainGermanyChief Marketing OfficerContinental Europe
John Rowland
Perpetual ParkPerpetual Park DriveHenley-on-ThamesOxforshire RG9 1HHUnited KingdomGlobal Head of InvestmentOperations
Jan Hochtritt
An der Welle 5D-60322 Frankfurt am MainGermanyHead of Global Products
ORGANISATIONRegistered OfficeFrom 1 March 2010 to 14 May2010:46A, Avenue John F. KennedyL-1855 LuxembourgGrand Duchy of Luxembourg
From 15 May 2010:Vertigo Building - Polaris2-4 rue Eugène Ruppert,L-2453 LuxembourgGrand Duchy of Luxembourg
Management CompanyInvesco Management S.A.19, rue de BitbourgL-1273 LuxembourgGrand Duchy of Luxembourg
Investment AdvisersInvesco Asset Management LimitedRegistered Office30 Finsbury SquareLondon EC2A 1AGUnited Kingdom
Invesco Hong Kong LimitedRegistered Office32/F, Three Pacific Place1 Queen’s Road East, Hong Kong
Invesco Asset Management(Japan) LimitedRegistered OfficeShiroyama Trust Tower 25F3-1, Toranomon 4-chome, Minato-KuTokyo, 13 105-6025Japan
Invesco Advisers Inc.1166 Avenue of the Americas,New York, N.Y. 10036United States of America
Invesco Asset ManagementDeutschland GmbHAn der Welle 5D-60322 Frankfurt am MainGermany
Custodian & Paying Agent inLuxembourgThe Bank of New York Mellon(International) Limited,Luxembourg BranchVertigo Building - Polaris2-4 rue Eugène Ruppert,L-2453 LuxembourgGrand Duchy of Luxembourg
Administration Agent, Registrar& Transfer AgentBank of New York Mellon(International) Limited,Luxembourg BranchVertigo Building - Polaris2-4 rue Eugène Ruppert,L-2453 LuxembourgGrand Duchy of Luxembourg
Domiciliary and Corporate AgentBank of New York Mellon Limited,Luxembourg BranchVertigo Building - Polaris2-4 rue Eugène Ruppert,L-2453 LuxembourgGrand Duchy of Luxembourg
Primary Dealing Desk
Hong Kong - Dublin
Hong Kong Sub-Distributor &Representative.Invesco Asset Management AsiaLimited32/F, Three Pacific Place1 Queen’s Road EastHong KongTel: +852 3128 6000Fax: +852 3128 6001
German Sub-Distributor andInformation AgentInvesco Asset ManagementDeutschland GmbHAn der Welle 5D-60322 Frankfurt am MainGermanyTel: +49 69 29807 0Fax: +49 69 29807 106
Global DistributorInvesco Global Asset ManagementLimitedGeorge’s Quay House43 Townsend Street,Dublin 2,IrelandTel: +353 1 439 8100Fax: +353 1 439 8200
AuditorPricewaterhouseCoopers S.à r.l.400 route d’EschB.P. 1443, L-1014 LuxembourgGrand Duchy of Luxembourg
Legal Advisers to the SICAVElvinger, Hoss & Prussen2, Place Winston ChurchillB.P. 425L-2014 LuxembourgGrand Duchy of Luxembourg
German Paying AgentBNP Paribas Securities ServicesBranch OfficeFrankfurt am MainEuropa-Allee 12D-60327 Frankfurt am MainGermany
Austrian DistributorInvesco Asset ManagementÖsterreich GesmbHRotenturmstraße 16 -18A-1010 ViennaAustriaTel: +43 1 316 200Fax: +43 1 316 2020
Austrian Paying AgentALIZEE Bank AGRenngasse 6-8A-1010 ViennaAustriaTel: +43 1 2059 5160Fax: +43 1 2059 5146
Swiss Paying AgentBanque MeesPierson BGL S.A.Rennwieg 57PostfachCH-8023 ZurichSwitzerland
Invesco Limited RepresentativeOffices
AustriaInvesco Asset ManagementGesmbHRotenturmstraße 16 -18A-1010 Vienna, AustriaTel: +43 1 316 200Fax: +43 1 316 2020
BelgiumInvesco CE Services S.A.The Blue TowerAvenue Louise 326B-1050 BrusselsBelgiumTel: +32 2641 0111Fax: +32 2641 1060
FranceInvesco Asset Management S.A.16-18, rue de Londres,F-75009 ParisFranceTel: +33 1 56 62 43 00Fax: +33 1 56 62 43 99
GermanyInvesco Asset ManagementDeutschland GmbHAn der Welle 5D-60322 Frankfurt am MainGermanyTel: +49 69 29807 0Fax: +49 69 29807 159
Hong KongInvesco Asset Management AsiaLimited32/F, Three Pacific Place1 Queen’s Road East, Hong KongTel: +852 3128 6000Fax: +852 3128 6001
ItalyInvesco Asset Management S.A.Via Cordusio 2I-20123 MilanItalyTel: +39 02 88 074 1Fax: +39 02 88 074 332
JerseyInvesco International LimitedP.O. Box 188Orviss House17A Queens StreetSt Helier, Jersey, JE4 2PHTel.: +44 1534 607 600Fax.: +44 1534 510 510
The NetherlandsInvesco Asset Management S.A.J.C. Geesinkweg 999NL-1096 AZ AmsterdamThe NetherlandsTel: +31 20 573 0860Fax: +31 20 664 5845
SpainInvesco Asset Management S.A.Sucursal en EspanaCalle Recoletos 15, Piso1E-28001 MadridSpainTel: +34 91 781 30 20Fax: +34 91 576 05 20
SwitzerlandInvesco Asset Management(Switzerland) LimitedGenferstrasse 21CH-8002 ZurichSwitzerlandTel: +41 1 287 9000Fax: +41 1 287 9010
United KingdomInvesco Asset Management Limited30 Finsbury SquareLondon EC2A 1AGUnited KingdomTel: +44 207 065 4000Fax: +44 207 638 0752