Indonesia Consumer Survey 2013 - doc .credit -suisse .com
96
DISCLOSURE APPENDIX CONTAINS ANALYST CERTIFICATIONS AND THE STATUS OF NON US ANALYSTS. FOR OTHER IMPORTANT DISCLOSURES, visit www.credit-suisse.com/researchdisclosures or call +1 (877) 291-2683 US Disclosure: Credit Suisse does and seeks to do business with companies covered in its research reports. As a result, investors should be aware that the Firm may have a conflict of interest that could affect the objectivity of this report. Investors should consider this report as only a single factor in making their investment decision. CREDIT SUISSE SECURITIES RESEARCH & ANALYTICS BEYOND INFORMATION ® Client-Driven Solutions, Insights, and Access 25 January 2013 Asia Pacific/Indonesia Equity Research Consumer Discretionary / Consumer Staples Indonesia Consumer Survey 2013 STRATEGY Maintaining confidence and optimism Research Analysts Ella Nusantoro 62 21 255 37917 [email protected] Priscilla Tjitra 62 21 255 37906 [email protected]
-
Upload
khangminh22 -
Category
Documents
-
view
3 -
download
0
Transcript of Indonesia Consumer Survey 2013 - doc .credit -suisse .com

DISCLOSURE APPENDIX CONTAINS ANALYST CERTIFICATIONS AND THE STATUS OF NON US ANALYSTS. FOR OTHER IMPORTANT DISCLOSURES, visit www.credit-suisse.com/researchdisclosures or call +1 (877) 291-2683 US Disclosure: Credit Suisse does and seeks to do business with companies covered in its research reports. As a result, investors should be aware that the Firm may have a conflict of interest that could affect the objectivity of this report. Investors should consider this report as only a single factor in making their investment decision.
CREDIT SUISSE SECURITIES RESEARCH & ANALYTICS BEYOND INFORMATION®
Client-Driven Solutions, Insights, and Access
25 January 2013Asia Pacific/Indonesia
Equity ResearchConsumer Discretionary / Consumer Staples
Indonesia Consumer Survey 2013
STRATEGY
Maintaining confidence and optimism
Research Analysts
Ella Nusantoro 62 21 255 37917
Priscilla Tjitra 62 21 255 37906

25 January 2013
Indonesia Consumer Survey 2013 2
Introduction We are delighted to publish the third edition of the Credit Suisse Global Emerging Consumer Survey and its accompanying Databook. At a time when investor confidence in the outlook for global growth is improving, it is opportune to review the dynamics and drivers of what is a key component of the prospects for global growth—the role played by the consumer in the emerging world. The analysis carried in this report provides insights not available from public sources of economic information.
To undertake this project, the Credit Suisse Research Institute had engaged the leading global market research firm Nielsen to conduct face-to-face interviews with over 14,000 consumers across eight emerging economies posing more than 125 questions to help reflect a granular picture of their spending habits, future intentions and importantly, the factors that influence them.
The 2013 survey has been refreshed to address new issues—social and economic—and alongside Brazil, China, India, Indonesia, Russia, Saudi Arabia and Turkey, we have added South Africa. The detailed analysis of the differing demographic, income and rural/urban characteristics underlines that these emerging consumers cannot be viewed in a generic fashion.
This report is a more granular version of the Credit Suisse Emerging Consumer Survey, focusing specifically on Indonesian consumption. We surveyed 1,531 consumers in the country across ten exclusive geographies, both urban and rural areas.
Telephone Email+44 20 7888 0313 [email protected]+44 20 7883 3773 [email protected]+44 20 7883 9247 [email protected]
Jo Walton (Healthcare) +44 20 7888 0304 [email protected]+852 2101 6554 [email protected]
Felix Rusli +852 2101 6482 [email protected]+1 212 538 6386 [email protected]
Arbin Sherchan +1 212 325 8967 [email protected] Takato +81 3 4550 9671 [email protected]
Brazil Andrew Campbell +55 11 3841 6313 [email protected] Federle +55 11 3841 6311 [email protected] Wigman +55 11 3841 6302 [email protected]
China Vincent Chan +852 2101 6568 [email protected] Salamatian +852 2101 7996 [email protected] Yin +852 2101 7655 [email protected] Chan +852 2101 6523 [email protected]
India Jatin Chawla +91 22 6777 3719 [email protected] Mitra +91 22 6777 3806 [email protected] Saxena +91 22 6777 3825 [email protected]
Indonesia Ella Nusantoro +62 21 255 37917 [email protected] Tjitra +62 21 255 37906 [email protected]
Russia Victoria Petrova +7 495 967 8393 [email protected] Bystrova +7 495 967 8244 [email protected]
South Africa Carlos Teixeira +27 11 012 80 54 [email protected] Bhundia +27 11 012 80 94 [email protected] Ginsberg +27 11 012 80 64 [email protected] Barker +27 11 012 80 51 [email protected]
Turkey Onur Muminoglu +90 212 349 0454 [email protected] Ozkan +90 212 349 0453 [email protected] Buldur +90 212 349 0459 [email protected]
Contributors
Kiranjot Grewal
Research analystRichard KersleyMujtaba Rana
Jahanzeb Naseer
Katie Iorio
Stefano Natella Co-head of Global Securities Research

25 January 2013
Indonesia Consumer Survey 2013 3
Credit Suisse Indonesia research analysts
Research analysts Telephone Email
Ella Nusantoro +62 21 2553 7917 ella.nusantoro@credit suisse.com
Teddy Oetomo +62 21 2553 7911 [email protected]
Ami Tantri +62 21 2553 7976 [email protected]
Dian Haryokusumo +62 21 2553 7974 [email protected]
Agus Sandianto +62 21 2553 7916 [email protected]
Colin McCallum +852 2101 6514 [email protected]
Paworamon Suvarnatemee +66 8 1814 4515 [email protected]
Timothy Ross +65 6212 3337 [email protected]
Robert Prior-Wandesforde +65 6212 3707 [email protected]

25 January 2013
Indonesia Consumer Survey 2013 4
Credit Suisse Indonesia Consumer Survey 2013: Key themes Figure 1: Key themes from Indonesia Consumer Survey 2013
Themes(1) Confidence and optimism continue to remain robust Indonesians are the second most confident people after Brazilians, with 64% of respondents
expecting a better income outlook over the next 12 months and 40% expecting a better personal finace outlook over the next six months.
(2) Higher income growth and expecting further hike This year, more respondents said that their income has increased in the past 12 months. Despite that, they expect to get a higher income in the next 12 months. We view this in line with the increase in minimum wages in 2012 and the expected increase in 2013.
(3) Shift towards higher discretionary spending continues This year spending on discretionaty items increased more than that on essentials, especially on fashion apparel and mobile phones.
(4) Consumer preferences lean towards local brands for essentials We found that indonesians prefer local brands for essential items. However, appetite for foreign brands is higher for discretionary items such as fashion apparel and cosmetics, especially among high income earners.
Source: Credit Suisse Indonesia Consumer Survey 2013
Figure 2: Indonesians are the most confident after Brazilians Figure 3: Outside Java earns more than Java
6764
53
42
26
19
58
47
55
3539
22
66
58
4036 38
22
0
10
20
30
40
50
60
70
80
Brazil Indonesia Saudi China India Russia
Inco
me
Out
look
nex
t 12M
(% o
f res
pond
ents
)
Better less worse 2012 Better less worse 2011 Better less worse 2010
3.2
3.5
2.5
3.0
3.5
0.0
0.5
1.0
1.5
2.0
2.5
3.0
3.5
4.0
Total Urban Rural Java Non-Java
Avg
mon
thly
inco
me
(Rp
mn/
mon
th)
Source: Credit Suisse Indonesia Consumer Survey 2013 Source: Credit Suisse Indonesia Consumer Survey 2013
Figure 4: Shift towards higher discretionary spending
continues
Figure 5: Consumers preferences lean towards local
brands for essentials
Carbonated drinks
Bottled Water
Dairy products
Instant Noodles
Cigarettes
Tissues Femine hygiene Cosmetics
Basic mobile phone
DVD PlayerTraditional TV
Smartphone
Fashion
Sport shoes & wear
WatchesJewellery
Perfumes
Cars
Internet Access
Property
-15
-10
-5
0
5
10
15
20
25
30
0 20 40 60 80 100
% c
hang
e fro
m la
st y
ear s
urve
y
% of respondent which have bought essentials and discretionary goods
80
85
90
95
100
<Rp1,000k
Rp1,000k -Rp1,500k
Rp1,500k -Rp2,000k
Rp2,000k -Rp3,000k
Rp3,000k -Rp5,000k
Rp5,000k -Rp7,500k
Rp10,000k-Rp15,000k
Rp10,000k -Rp15,000k
>Rp15,000k
% o
f res
pond
ents
buy
ing
loca
l bra
nds
Cigarette Instant noodles Bottled water
Source: Credit Suisse Indonesia Consumer Survey 2013 Source: Credit Suisse Indonesia Consumer Survey 2013

25 January 2013
Indonesia Consumer Survey 2013 5
Key themes from the eight emerging markets We highlight four key themes:
(1) Consumer confidence improving
The survey suggests that, after stalling in 2012, confidence is strengthening—a feature our macro views would endorse and expect. Some 37% believe their personal finances will improve over the next six months while 9% expect some deterioration. This marks a net expected improvement of 3% points on a like-for-like basis. However, our survey casts a spotlight on the striking contrasts across the emerging world.
Optimism is strongest and improving in Brazil, China and Indonesia. At the other end of the scale, the greatest degree of pessimism in financial prospects was recorded in South Africa, Russia and Turkey (albeit improving). Troubling are the effective “fault lines” that still seem to exist between rich and poor in some countries. For example, our survey revealed that nearly as many South Africans (22%) predicted a worse financial position as those who expected some improvement (28%). We remember—if in a far more extreme manner—how severe disparity in experience for Egypt stood out in our 2010 survey.
(2) Income trends are the key driver—who has it?
The outlook for and the distribution of income has replaced the influence of food prices as the determinant of optimism. The countries with the highest income growth expectations display the greatest optimism—Brazil, Indonesia and Saudi Arabia. Wage expectations remain relatively depressed in Turkey, Russia and South Africa. However, equally notable is the fact that the highest income earners are the most optimistic in every country. In certain countries, that is particularly stark—South Africa and India for example. In contrast, Brazil reflects far greater equality of expectations.
As much as regional contrasts in the income outlook, age profile within the countries is a notable differentiator. In a number of the countries, the high income consumers are clustered in the younger age brackets of the working population. China is a stand out example. Moreover, the incomes are not only higher but are typically growing more rapidly. This picture is in marked contrast to the West. The drivers at work in the emerging world are relative educational attainment, urban/rural migration and the necessity of technology based skill-sets.
(3) Discretionary spending back on track
Understanding what younger, wealthier and typically better educated consumers will spend their money upon is a key investment theme as this is where growth is likely to be strongest. This would structurally point to areas of discretionary spending. Our survey illustrates that this theory is borne out in practice. The survey asks consumers what categories of spending they have been spending most upon and effectively what they expect to prioritise looking forward. Having stalled last year, discretionary spending looks back on track and should maintain its momentum.
In terms of specifics, meat and protein gets a higher profile on the menu. A thirst for technology, smartphones and tablets, is supported by ever greater expansion in internet penetration. This was a theme last year and is if anything an even stronger one. Bigger ticket items such as cars and property also display strong prospects though notably without the typical appetite for borrowing we have historically seen in the West.
Interestingly, the outlook for services such as healthcare and education seems more muted. However, it seems the state is increasingly stepping in to supply the former while private educational spend has simply been exceptionally strong in recent years and seeing

25 January 2013
Indonesia Consumer Survey 2013 6
a moderation from a high base. It remains a structural story in our view, with India still displaying it best of all.
(4) Brand recognition … momentum and critical mass
The track record being built by the survey is allowing us to delve deeper into our analysis of brands. We can analyse with the help of our Databook brands displaying momentum, where local brands hold sway over global rivals and the income sensitivity of brands. Important themes have emerged: (i) the significance of the unbranded segment of spending; (ii) the resilience of domestic brands in the essential areas of spending space and their attractiveness to acquisitive global companies; and (iii) the aspirational quality (or lack thereof) of specific brands in the discretionary space, which plays to the international names.
With improving income trends being the key driver of the emerging consumer structurally, and also a key differentiator of the immediate outlook in the survey as suggested above, we specifically analyse brands with this theme in mind. With high income earners being where income growth expectations and optimism are the highest, we want to identify which brands exhibit momentum or dominance in this category. Equally, at the low income end where a transition from unbranded to branded products is likely, we wish to be positioned to exploit that. We would be concerned about brands that are losing momentum and also those whose attractions peter out markedly higher up the income scale given this is the direction of travel in emerging consumer markets.
Figure 6: Brands dominating their sector or having momentum within an income bracket
Low income High income Low income High income
AAPL US Apple Inc. x x Outperform
BMW.DE BMW x Outperform
BRBY L Burberry x Outperform
2319 HK China Mengniu Dairy Company x x Outperform
1929 HK Chow Tai Fook Jewellery x x x Neutral
HGTX3 BZ Cia. Hering x x x Neutral
DGE LN Diageo plc x x x x Outperform
HUVR IN Hindustan Unilever Limited x x x Outperform
005380 KS Hyundai Motor Co x x Outperform
2331 HK Li Ning x Neutral
LREN3 Lojas Renner x x Neutral
OR FP L'Oreal SA x x Neutral
AMAR3 Marisa Lojas SA x x x x Outperform
MSIL IN Maruti Suzuki India Ltd x x x Neutral
MDLZ Mondelēz International x x Outperform
NKE US Nike, Inc x x x x Neutral
RI FP Pernod Ricard x x Outperform
SAB L SAB Miller x x x x Outperform
005930 KS Samsung Group x x x x Outperform
UHR VX Swatch x x Outperform
ULVR Unilever x x Neutral
Ticker Company
Criteria
Trend DominatingCS Rating
Source: Credit Suisse Emerging Consumer Survey 2013
Country highlights Key highlights include:
Brazil: The beat goes on
The Brazilian consumer remains the most optimistic in our survey, with confidence raised year-on-year despite an economic slowdown. A definitive characteristic of this confidence is its breadth; both low and high income consumers are confident, unlike the findings for many other developing economies. Although an implicit savings ratio seems to have increased, it remains substantially lower than the other larger economies. Momentum

25 January 2013
Indonesia Consumer Survey 2013 7
remains in discretionary products such as technology, fashion and spirits. Education is also a priority. Key stock recommendations: Anhanguera, Brasil Foods, Hypermarcas, Marisa S.A., Qualicorp, SAB Miller, Cinemark, Casino Guichard, Nissan, Intertek
China: An educated consumer
Optimism amongst the Chinese consumer remains relatively robust against a weaker economic background. Much of this increased strength can be attributed to the low income brackets rather than the high. Attitudes surrounding savings remain unhindered, although the routes adopted to achieve this are changing; the increased role of the stock market and life products for savings. The key feature of spending is a heavy focus on technology and education, with the strongest spend in smartphones out of any country surveyed. Key stock recommendations: Belle, Intime, Tingyi, Chow Tai Fook, Naspers, Prada, Yum!, Mead Johnson, TOTO, HSBC, Richemont, Wynn, Las Vegas Sands, MGM resorts, Nissan India: A sum of different parts
Although the optimism of the Indian consumer remains robust, there is an increasing divergence between the confidence levels of rich and poor consumers: poor consumers demonstrate a sharp decline in confidence. Spending momentum in education continues to stride ahead, supported by a number of government initiatives. Discretionary spend categories are the stronger areas within India though appear relatively more mute vs. other countries, with India in fact being the only country surveyed showing a fall in the number of smartphones bought for example. Aggressive promotion of property investment has led to positive expectations for the direction of property prices. Key stock recommendations: ITC, Bajaj Auto, Emami, HDFC Bank, Titan, Shiseido, Tumi
Indonesia: BRIC becomes BIIC
The Indonesian consumer continues to grow increasingly confident, corresponding with the trend growth seen in the Indonesian economy. The increases in minimum wages have contributed to the relatively steeper growth in confidence amongst the lower earners. Rising incomes and lowered food prices have resulted in increased spending on discretionary goods, with fashion and holidays being items of choice. As the vast majority of Indonesia remains offline, technology growth remains concentrated in basic mobile phones rather than internet enabled devices such as smartphones. Key stock recommendations: Astra International, Indofood CBP, Erajaya Swasembada, Mitra Adiperkasa, Bank Central Asia, Unicharm, Daihatsu, Prudential, Sumitomo, Yakult
Russia: The poor BRIC relation
Low optimism, poor income growth and a large disparity between the expectations of rich and poor consumers characterised Russia in 2012. Inflation rates are forecast to be one of the highest out of our survey. With a large proportion of income being devoted to food, Russian consumers have been constrained in spending elsewhere though this should ease. At present, only discretionary spend categories in reach of the rich remain robust, with others on the whole weak. Technology is the strongest feature. Key stock recommendations: Magnit, MegaFon, MTS, Yandex, Mail.Ru, JT, Fast Retailing
Saudi Arabia: Contrasting fortunes
Although the Saudi Arabian consumer remains one of the most optimistic in our survey, optimism has dropped relatively year-on-year post 2011’s boost from the major government initiatives for employment and pay. It remains highly progressive in relation to incomes. There is high growth in highly penetrated markets, in particular, computers, smartphones, fashion apparel and perfumes. There remains considerable structural opportunity for the financial industry to tap into the deep pool of savings which are currently predominantly held in bank accounts. Key stock recommendations: Apple, Marriott, BMW, Accor, Ralph Lauren, Starwood, Saks

25 January 2013
Indonesia Consumer Survey 2013 8
South Africa: Challenges and opportunities
South Africa is a new edition to the Credit Suisse Emerging Consumer Survey for 2013. Consumer optimism levels in South Africa fall toward the lower end of the survey spectrum. The polarity of experience within the population is concerning. Nearly as many South African consumers predicted a worse financial position as those who expected some improvement. Despite broad pay rises for many, it does not appear to have completely assuaged negative perceptions of the financial outlook of low income earners which has impacted the pattern of spending and its relative position vs other countries in the survey. A major distinguishing feature of South Africa is the institutionalised savings and a more developed banking system. Key stock recommendations: Foschini, African Bank, Pick n Pay, Lewis, Medpro, SAB
Turkey: Potential emerging
While optimism is relatively weak compared to other countries in the survey, Turkey has seen an improvement in overall confidence, with greatest improvement amongst the higher earners. They are comparable with Saudi Arabia. Spending patterns more generally are beginning to look like those of a middle-income country, with smartphones, computers, internet access, cars and holidays seeing some of the strongest gains. Growth in alcohol spend has not been deterred by recent tax hikes. Bank penetration remains poor, indicating a structural opportunity. Key stock recommendations: Arcelik Coca Cola Icecek, Migros, Tofas, Telenor, Diageo

25 Janu
ary 2013
Ind
on
esia Co
nsu
mer S
urvey 2013
9
Stock recommendations: Emerging markets Figure 7: Plays on the developing consumer
Stock Country Investment story
Current Price (local CCY)
Target Price (Local CCY)
EV / Ebitda (2012e)
PE (2012e)
P/B (2012e)
ROE (2012e)
3 year EPS
growth
3 year Revenue growth
Rating
Anhanguera BrazilBenefit from recovering profitability and higher earnings visibility. 30% gross margin ramp up expected from integration of acquired assets. Campus maturation & improving intake cycle to expand gross margin.
34.3 40.0 16.9 117.0 2.5 2% 101% 20% Outperform
Brasil Foods BrazilSuperior product portfolio and distribution assets to continue driving market share gains and consensus beats. Expect positive earnings momentum due to normalisation of operations after asset sw ap.
45.1 45.0 15.5 28.7 2.8 10% 21% 10% Outperform
Hypermarcas Brazil#1 in OTC and branded generics drugs, #3 in generics. Capex and w orking capital requirements should start to ease and profitability is expected to be restored in both the pharma and consumer divisions.
16.2 16.0 16.2 33.9 1.8 5% - 12% Outperform
Marisa S.A. BrazilScope for acceleration in store productivity and prof itability as the company benefits from a rapidly maturing sales area, coupled w ith internally-driven initiatives to improve sales f loor eff iciency.
32.5 28.0 16.2 33.8 7.0 21% 27% 9% Outperform
Qualicorp BrazilBelieve there are signif icant opportunities in the aff inity market and in the convergence of health and f inancial services, both in w hich Qualicorp is w ell positioned to benefit.
22.4 22.5 36.3 66.5 3.1 5% 55% 23% Outperform
Belle ChinaRecovery in 1Q13 to be driven by easy comp base, cold w inter and Chinese New Year. Benefit from expected stronger underlying economy as translates into rising discretionary in 2H13 and onw ards.
18.0 19.0 20.0 28.6 6.3 22% 13% 15% Outperform
Chow Tai Fook ChinaMost established sales netw ork - currently w ith 1,700 stores and to increase store counts by 200pa. Strong brand recognition. Better access to new department stores and economies of scale.
13.2 12.1 15.2 19.2 4.2 22% 23% 29% Neutral
Intime ChinaNew ly matured stores are the most effective contributor to earnings grow th. Is developing modern shopping mall formats as a part of a large scale project - gives key advantage in obtaining prime location.
10.5 11.8 18.2 20.0 2.5 11% 15% 23% Outperform
Prada ChinaRising brand aw areness is expected to lead to the highest sales grow th among major luxury brands. Probability of positive earnings surprises in 2013 is high - may lead to consensus upgrades.
71.6 78.0 23.4 40.6 9.6 24% 47% 27% Outperform
Tencent ChinaStronger consumer confidence, higher discretionary spending and demand for brands may benefit Tencent as it is a strong Internet brand. Tencent should have different business cycle as compared to the economy.
269.0 292.0 27.9 39.3 13.8 36% 30% 38% Outperform
Tingyi ChinaLooking into 2013, w e expect Tingyi to deliver strong grow th on the back of (1) core business turnaround and (2) more synergy from Pepsi bottling business to emerge in the next 2-3 years.
21.5 27.0 16.9 39.6 7.4 19% 26% 20% Outperform
Bajaj Auto IndiaTw o w heeler market still has high grow th potential. Positive impact of long term upgradation trend in market as it is strongest in upper segments. Export volumes grow ing at over 15% CAGR.
2061.8 2537.0 14.6 19.6 9.8 50% 4% 15% Outperform
Emami IndiaStrong potential of the current pipeline of ramp ups. Likelihood of margin expansion ahead on low er input costs. Scope for re-rating as one the highest ROE's and dividend ratios but at discount to peers.
579.9 690.0 29.2 33.9 12.4 37% 20% 17% Outperform
HDFC Bank IndiaLeadership in the retail segment to continue to drive stronger than industry grow th. Profitability remains strong on healthy margins and low credit cost. Strong product origination and credit appraisal skills.
653.6 770.0 18.1 29.3 5.2 18% 29% 21% Outperform
ITC IndiaHas absolute pricing pow er as has 75% market share. Expect cigarette EBIT grow th to stay in a range of 15-20pc irrespective of increase in taxation. Built one of India's top 5 FMCG businesses.
288.7 329.0 26.5 36.6 12.0 33% 21% 16% Outperform
Titan IndiaHas very high grow th potential as over 90% of the market is unorganized. Company w ill continue to gain market share w ith aggressive additions in expanding retail space.
269.0 341.0 27.5 39.8 16.5 41% 28% 23% Outperform
Note: Current price as of market close on 21 January 2013. Source: Credit Suisse Emerging Consumer Survey 2013

25 Janu
ary 2013
Ind
on
esia Co
nsu
mer S
urvey 2013
10
Figure 8: Plays on the developing consumer
Stock Country Investment story
Current Price (local CCY)
Target Price (Local CCY)
EV / Ebitda (2012e)
PE (2012e)
P/B (2012e)
ROE (2012e)
3 year EPS
growth
3 year Revenue growth
Rating
Astra Intl. Indonesia Attractive exposure to consumer sector. Expect recovery in earnings grow th. Attractive entry point. 7750 9400 14.9 17.6 5.2 28% 20% 16% Outperform
Bank Central Asia
IndonesiaIndonesia’s largest transaction bank. As of 3Q12, BBCA has one of the low est LDR (68.9%) of the Indonesian banking system, w hich implies that they have one of the highest grow th capacites.
9300 11000 16.5 21.1 5.4 24% 12% 14% Outperform
Erajaya Sw asembada
IndonesiaBeneficiary of rising income. New handset import regulation to be effective by end-Mar. Forex risk w ill be borne by the principal.
2750 3300 20.2 31.2 3.7 18% 41% 40% Outperform
Indofood CBP IndonesiaNoodle is its major contributor and continue to provide healthy profitability. Dairy expansion to come on stream. New JVs to expand product portfolio.
7950 8100 14.2 23.5 4.5 19% 13% 12% Outperform
Mitra Adiperkasa
IndonesiaSpecialty stores continue to be the key driver. Strategic expansion. Limited and manageable impact on current regulation changes.
6400 8100 12.7 29.5 5.9 21% 26% 21% Outperform
Magnit RussiaExceptional grow th (c25% 3Y CAGR); excellent management execution and communication; and upside risks given supportive regulatory environment in the sector.
46.2 42.0 24.5 52.2 9.0 23% 34% 24% Outperform
Mail.Ru RussiaConsumer internet names strong beneficiaries of trends in mobile data as consumer internet stocks are highly geared to increasing mobile internet traff ic via online advertising and consumption spend.
33.7 55.0 14.6 33.7 1.8 6% 24% 29% Outperform
MegaFon Russia#1 position in mobile data position in Russia, better netw orks, strong execution and business concentration on the Russian market. Expect Russian mobile to deliver 20-25% CAGR over next 3ys.
25.9 30.0 4.5 11.1 1.8 37% 3% 8% Outperform
MTS RussiaMTS as a second w inner of the Russian smartphone trend w hich has also show n strong execution in mobile data segment and commitment to infrastructure build.
19.1 22.0 5.1 12.8 5.4 43% 11% 5% Outperform
Yandex RussiaConsumer internet names strong beneficiaries of trends in mobile data as consumer internet stocks are highly geared to increasing mobile internet traff ic via online advertising and consumption spend.
22.9 29.0 23.6 39.3 7.8 22% 34% 36% Outperform
African BankSouth Africa
Market leader in low er-income consumer f inance. It also ow ns a furniture retailer, Ellerines. Recent investor concerns about non-performing loans and slow ing asset grow th are overdone in our view .
31.0 49.5 5.6 9.0 1.7 20% 16% 18% Outperform
Cipla MedproSouth Africa
Grow th is supported by its supply agreement w ith Cipla India w hich gives it access to a large new product pipeline, w hile the low cost of the drugs it sources from Cipla India help to support margins.
8.9 9.5 9.2 15.3 2.0 12% 20% 17% Outperform
Lew is GroupSouth Africa
Valuation is attractive, and cheapest entry into SA retail sector. Dividend yield is attractive at c7%. We believe that risks associated w ith "credit life" revenues are over blow n.
68.9 90.0 6.5 7.9 1.3 16% 12% 8% Outperform
Naspers South Africa
Good balance betw een internet-driven earnings grow th and strong pay-TV cash f low , see strong grow th potential in Tencent from its mobile internet, online advertising and eCommerce investments.
548.0 500.0 9.3 43.7 4.4 10% 32% 17% Outperform
Pick n Pay Holdings
South Africa
32% market share and margins of 1.8%. New CEO w ith strong track record as a retailer should result in the group recovering signif icantly, w e estimate margin to more than double over the next 3yrs
44.6 49.0 10.4 31.1 8.8 26% 16% 10% Outperform
The Foschini Group
South Africa
Offering covers low er, middle and upper end consumers. Well positioned to take advantage of grow th prospects into Africa. Expect group to sell its stake in RCS w hich w ill release value.
125.2 158.0 10.1 16.2 4.1 25% 21% 14% Outperform
Arcelik TurkeyStrong brand aw areness, distribution pow er and R&D efforts. Grow th initiatives - have announced they may buy a premium brand in developed w orld or extend production into new emerging countries.
12.5 12.5 11.2 15.6 2.4 16% 15% 16% Outperform
Coca Cola Icecek
Turkeyc70% market share in Turkish sparkling beverages. CCI has market leading shares in some of the w orld’s least saturated markets. 60% of its 360mn population is below 30 years of age.
41.4 37.2 11.2 19.0 5.0 25% 6% 6% Neutral
Migros TurkeyIts strong brand name and best store locations enable up to 40% shelf price dif ferential. Its attractive store netw ork could mean a lot for a strategic investor looking for inorganic grow th in Turkey.
22.6 23.8 14.9 -14.4 3.0 5% NA 13% Outperform
Tofas TurkeyIts low -to-mid segment models could benefit from the potential car penetration grow th in Turkey in the long-run. c73% of the capacity is locked by take-or-pay export contracts.
11.1 11.4 8.9 10.8 3.1 24% 0% 6% Outperform
Note: Current price as of market close on 21 January 2013. Source: Credit Suisse Emerging Consumer Survey 2013

25 J
an
uary
201
3
Ind
on
esia
Co
ns
um
er S
urv
ey 2
01
3
11
The Credit Suisse Emerging Consumer Survey 2013 Figure 9: Countries surveyed
Source: Credit Suisse Emerging Consumer Survey 2013, IMF, EIU, UN

25 January 2013
Indonesia Consumer Survey 2013 12
Table of contents Key themes from Indonesia 13
The third Credit Suisse Indonesia Consumer Survey 14
Key sector selections 28
Automotive 29
Consumer 33
Telecoms 43
Healthcare 47
Property 51
Banks 53
Key stock selections 56
Astra International (ASII.JK / ASII IJ) 57
Indofood CBP (ICBP.JK / ICBP IJ) 59
Erajaya Swasembada Tbk (ERAA.JK / ERAA IJ) 61
Mitra Adiperkasa (MAPI.JK / MAPI IJ) 63
Bank Central Asia (BBCA.JK / BBCA IJ) 65
Appendix: Respondents’ summary 67

25 January 2013
Indonesia Consumer Survey 2013 13
Key themes from Indonesia ■ Confidence and optimism continue to remain robust. Indonesia is the second-
most confident country, after Brazil, among the eight emerging economies that we surveyed, with 64% consumers expecting better incomes over the next 12 months. Indonesians are also the second-most optimistic consumers within the eight emerging countries that we surveyed, with 40% of the respondents also having a better personal finance outlook over the next six months, in view the surge in minimum wages of an average 20% in 2013 (it ranges by province between 9% and 46%). This is despite Indonesia’s GDP per capita being the second-lowest among the eight countries that we surveyed.
■ Higher income growth and expecting a further hike. In the survey, more respondents said that their income has increased in the past 12 months compared with the previous years’ survey. The hike is observed to be particularly higher for those in the rural areas and in places outside Java. We believe that this is in view of the increase in the minimum wages of an average 10% in 2012 across the provinces (ranging between 3% and 19%). More people in the lower and middle income groups have seen their income increase versus last year, according to this year’s survey.
■ Shift towards higher discretionary spending continues. Overall spending on discretionary items has increased more than on the essentials. This bodes well with our thesis that the purchasing power of the middle income group is rising as the country’s GDP per capita has doubled over the past five years to US$3,680 in 2012.
■ Consumer preferences lean towards local brands for essentials. According to our survey, Indonesian consumers continue to prefer local brands for essential items such as instant noodles, bottled water and cigarettes. However, a different trend is observed in the purchase of discretionary items. We found that appetite for foreign brands is more for purchase of discretionary items such as fashion apparels and cosmetics, especially with the higher income group. This is consistent with the findings from our survey across the emerging countries, where consumers appear to stick with the local brands that they have always used for staples while foreign brands appeal more for discretionary items, especially with the higher income group.
■ Key stock preferences. We identify five stocks that bode well with the findings of this survey. They are: (1) Astra International, (2) Bank Central Asia, (3) Indofood CBP, (4) Mitra Adiperkasa, and (5) Erajaya Swasembada.
Indonesia is the second-most confident country among the eight emerging countries we surveyed
This year, Indonesians are earning a higher income and expect it to increase further
Spending on discretionary items has increased, as Indonesia’s GDP per capita rises
Indonesian consumers continue to prefer local brands for essentials

25 January 2013
Indonesia Consumer Survey 2013 14
The third Credit Suisse Indonesia Consumer Survey This report details the findings of the third Credit Suisse Indonesia Consumer Survey conducted around 3Q12, as part of the survey that Credit Suisse Research Institute conducts in eight emerging countries—Brazil, China, India, Indonesia, Russia, Saudi Arabia, Turkey, and South Africa (new addition). CS Research Institute engaged the leading global market research firm, AC Nielsen to conduct face-to-face interviews with over 14,000 consumers. The survey is a comprehensive and exclusive study of the consumption patterns in each country as well as individuals’ outlook about the future.
The third survey in Indonesia was carried out with 1,531 participants, across ten areas—six located in the Java area (including Jakarta, Botabek, Surabaya, Kab Gresik/Lamongan/Sidoarjo, Bandung, Kab Bandung) and four outside Java (including Medan, Kab Deli Serdang, Makasar, Kab Gowa). Participants from Java accounted for 70% of the total respondents, 66% lived in the urban areas and 49% were male. This composition is similar to our previous two surveys.
There were 125 questions posed to each respondent in 12 categories: (1) general income and wealth, (2) autos, (3) food & beverage, (4) personal care, (5) branded goods, (6) computers & TV, (7) mobile phones, (8) Internet, (9) travel, (10) property, (11) education, and (12) healthcare.
Figure 10: Indonesia survey summary and key economic statistics Statistics
GDP (2012) $894.9 billion
GDP per Capita (2012) $3,660
Population (2012) 244.5 million
Geographical Area 1.90 mn km2
Number of Cities (in excess of 2 million people)
5
Gini Coefficient (2009) 39.4
Average Inflation (2012E) 4.4%
Average Inflation (2013E) 5.1%
Real GDP Growth (2012E) 6.0%
Real GDP Growth (2013E) 6.3%
Real private consumption growth (2012E)
5.39%
Real private consumption growth (2013E)
5.61%
Consumption as a % of GDP (2012)
54.5%
2013 CS Consumer Survey
Number of Respondents : 1,531
Across 10 geographic locations
66% in Urban areas; 34% in Rural areas
Jakarta ( 20% )
GDP: $70.7bn
Botabek ( 10% )
Surabaya ( 13% )
Gresik, Lamongan ,
Sidoarjo ( 9% )
Medan ( 10% )
Deli Serdang ( 5% )
Makasar ( 10% )
Gowa ( 5% )Bandung ( 18% )
Note: 1. All city level GDP figures are 2010 nominal est. (MGI), total GDP for the country shown in nominal US$.2. * % of survey sampled from this area3. Country GDP, GDP per capita, inflation, population data from IMF, Gini from UNDP, area from CIA World
Factbook, city population from CityPopulation4. Real private consumption growth and consumption as a % of GDP from Oxford Economics
Source: Credit Suisse Indonesia Consumer Survey 2013, IMF, EIU, UN
The third Indonesia Consumer Survey …
... was conducted in ten areas—six in Java and four outside Java

25 January 2013
Indonesia Consumer Survey 2013 15
Confidence and optimism continue to remain robust Indonesia is the second-most confident country, after Brazil, among the eight emerging economies that we surveyed, with 64% respondents expecting a better income over the next 12 months. Indonesians are also the second-most optimistic consumers within the eight emerging countries that we surveyed, with 40% having a better personal finance outlook over the next six months, in line with the surge in minimum wages in 2013 of an average 20% (it ranges by province between 9% and 46%). This is despite Indonesia’s GDP per capita being the second-lowest among the eight countries that we surveyed.
Figure 11: Indonesia is most confident after Brazil… Figure 12: …despite the country’s low GDP per capita
6764
53
42
26
19
58
47
55
3539
22
66
58
4036 38
22
0
10
20
30
40
50
60
70
80
Brazil Indonesia Saudi China India Russia
Inco
me
Out
look
nex
t 12M
(% o
f res
pond
ents
)
Better less worse 2012 Better less worse 2011 Better less worse 2010
0
5000
10000
15000
20000
25000
Saudi Arabia
Russia
Brazil
Turkey
South Africa
China
Indonesia
India
2012
E G
DP
per c
apita
(USD
)
Source: Credit Suisse Indonesia Consumer Survey 2013 Source: Credit Suisse Indonesia Consumer Survey 2013
Figure 13: Do you think the state of your own personal finances over the next six months
will be better, worse or about the same?
63
40 39
3128
12
53
31 31 3236
16
59
28
39
32
40
17
0
10
20
30
40
50
60
70
Brazil Indonesia China Saudi India Russia
Pers
onal
Fin
ance
out
look
nex
t 6M
(% o
f res
pond
ents
)
Better less worse 2012 Better less worse 2011 Better less worse 2010
Source: Credit Suisse Indonesia Consumer Survey 2013
Higher income growth and expecting further hike This year’s survey reveals that more respondents saw their income increase in the past 12 months as compared with the previous years’ survey results. The hike is observed to be particularly higher for people living in the rural areas and outside Java. We view that this is in view of the increase in minimum wages of an average 10% in 2012 across the provinces, with the range between 3% and 19%. According to our survey, more people in
Indonesia is the second-most confident country among the eight countries we surveyed
Indonesians earned a higher income in FY12 due to the average 10% rise in the country’s minimum wage…

25 January 2013
Indonesia Consumer Survey 2013 16
the lower and middle income groups have seen their income increase in FY12 compared with the previous year’s survey results.
The respondents were also more optimistic about getting a higher income in the next 12 months, especially the lower and middle income group. We believe that this is on the back of an announcement of an increase in the minimum wage of an average 20% across provinces in 2013 (ranges from 9% to 46%). Our survey also indicated a higher percentage of respondents expecting an increase of more than 10% in their monthly income, as compared with the previous years’ study.
Figure 14: In the past 12 months, respondents’ income has risen ... Age Monthly income
% of respondents Total Urban Rural Java Non-Java 18-29 30-45 46-55 56-65 <Rp1.5mn Rp1.5-7.5mn >Rp7.5mn
2012
Down to flat 10 12 7 10 8 8 11 8 12 13 9 18
Flat to +10% 77 74 85 77 77 78 78 75 78 83 77 56
>+10% 13 14 8 12 15 13 11 16 10 5 14 26
2011
Down to flat 19 18 19 17 21 13 21 22 16 23 17 15
Flat to +10% 72 72 74 74 70 76 70 75 79 74 72 62
>+10% 9 10 7 9 9 11 10 3 5 3 11 23
2010
Down to flat 14 15 12 12 16 11 15 15 11 14 13 -
Flat to +10% 77 76 80 79 72 78 76 76 84 83 75 81
>+10% 9 9 9 9 12 11 9 9 5 4 11 19
Source: Credit Suisse Indonesia Consumer Survey 2013
Figure 15: ... and is expected to continue to rise in the next 12 months Age Monthly income
% of respondents Total Urban Rural Java Non-Java 18-29 30-45 46-55 56-65 <Rp1.5mn Rp1.5-7.5mn >Rp7.5mn
2012
Down to flat 3 3 2 3 2 3 2 4 1 4 2 8
Flat to +10% 57 51 65 55 59 54 57 53 64 71 54 35
>+10% 40 46 33 42 39 42 41 43 35 24 44 57
2011
Down to flat 6 7 5 5 10 4 8 6 6 5 6 15
Flat to +10% 69 67 76 71 67 70 65 79 77 77 69 30
>+10% 24 26 19 24 22 26 27 15 16 18 25 55
2010
Down to flat 4 4 2 3 4 2 4 4 4 6 4 -
Flat to +10% 70 69 77 73 67 72 70 71 81 80 68 57
>+10% 26 27 21 23 28 26 26 25 14 14 28 43
Source: Credit Suisse Indonesia Consumer Survey 2013
And expect higher income with an average 20% minimum wage increase in 2013

25 January 2013
Indonesia Consumer Survey 2013 17
Figure 16: Increase in minimum wages in 2012 Figure 17: Expected increase in minimum wages in 2013
-
2
4
6
8
10
12
14
16
18
20
North Sulaw
esiD
ki JakartaC
entral Kalimantan
North Sum
ateraBengkuluLam
pungSouth Sum
ateraW
est Kalimantan
West Sulaw
esiJam
biSouth East Sulaw
esiR
iauYogyakartaG
orontaloSouth Sulaw
esiW
est Sumatera
East Nusa Tenggara
South Kalimantan
BaliEast Kalim
antanBangka BelitungM
alukuN
orth Maluku
PapuaC
entral Sulawesi
West N
usa TenggaraBantenR
iau IslandsAcehW
est Papua
FY12
incr
ease
in m
in w
age
(%)
Average 10% increase
-
5
10
15
20
25
30
35
40
45
50
East Kalimantan
Jakarta
Riau Islands
Bengkulu
South Sulawesi
West Kalim
antan
West Sum
atera
Central Kalim
antan
Bangka Belitung
Jambi
Aceh
South Kalimantan
North Sulaw
esi
North Sum
atera
Papua
FY13
E in
crea
se in
min
. wag
e (%
)
Average 20% increase
Source: Directorate General for Industrial Relations and Manpower
Social Guarantee
Source: Directorate General for Industrial Relations and Manpower
Social Guarantee
Income of Indonesia-ex. Java population grew at a higher pace than that of Java As a result of the increase in minimum wage in 2012 by around 10%, our respondents’ average monthly income increased to Rp3.2 mn, compared with Rp2.9 mn in the previous survey. The urban area experienced a higher increase in the monthly income, while the rural area had a slightly lower monthly income. People located outside Java also saw their income grow faster than that in Java, and interestingly, it surpassed the figure in Java. The younger generation is earning more, according to this survey, compared with our previous surveys, and their income is rising at a much higher pace than the older generation. However, savings outside Java as a percentage of total income declined—from 15% to 12%—even though it is still higher than those in Java.
Figure 18: Respondents living outside Java earned more
than those in Java in 2012; urban income rising faster
Figure 19: Java-based people earned more in 2011
3.2
3.5
2.5
3.0
3.5
0.0
0.5
1.0
1.5
2.0
2.5
3.0
3.5
4.0
Total Urban Rural Java Non-Java
Avg
mon
thly
inco
me
(Rp
mn/
mon
th)
2.93.0
2.6
2.9 2.8
0.0
0.5
1.0
1.5
2.0
2.5
3.0
3.5
4.0
Total Urban Rural Java Non-Java
Avg
mon
thly
inco
me
(Rp
mn/
mon
th)
Source: Credit Suisse Indonesia Consumer Survey 2013 Source: Credit Suisse Indonesia Consumer Survey 2013
People living outside Java earned more in 2012

25 January 2013
Indonesia Consumer Survey 2013 18
Figure 20: Savings of respondents outside Java as a
percentage of total income declined ...
Figure 21: ... but still is higher than of Java residents
10.411.0
8.2
10.0
11.612.2
13.0
8.5
11.1
15.1
0
2
4
6
8
10
12
14
16
Total
Urban
Rural
Java
Non-Java
Total
Urban
Rural
Java
Non-Java
Savi
ng (a
s %
of t
otal
inco
me)
2012 2011
3.0
0.3
3.5
0.4
0
0.5
1
1.5
2
2.5
3
3.5
4
Income Saving
Java Non-Java
Source: Credit Suisse Indonesia Consumer Survey 2013 Source: Credit Suisse Indonesia Consumer Survey 2013
Figure 22: Income rising with the younger age group earning more …
2.5
2.6
2.7
2.8
2.9
3.0
3.1
3.2
3.3
3.4
2012 18-29 30-45 46-55 56-65 2011 18-29 30-45 46-55 56-65 2010 18-29 30-45 46-55 56-65
Avg
mon
thly
inco
me
(Rp
mn)
Source: Credit Suisse Indonesia Consumer Survey 2013
Food continues to be the largest component of spending, with the expectation of higher inflation With regard to spending, food continues to be the largest component, accounting for 28% of the total spending. This is followed by savings at 11%, healthcare at 7%, education and auto, each at 6%, housing and public utilities, each at 4%, and entertainment at 3%.
As in the previous years, respondents are expecting inflation to continue to rise. This might be underpinned by the rise in electricity tariffs and the removal of fuel subsidies that eventually did not happen the previous year. While the government has announced increased electricity tariffs for 2013, we will see if fuel subsidies are going to be removed. Potentially, this poses a threat to overall spending, as respondents expect higher inflation than in the past 12 months.
Interestingly, while the contributions of other categories are similar to those of the past two years’ surveys, only healthcare spending has witnessed an increase—4% of household spending on healthcare in 2010 rose to 5% in 2011 and 7% in 2012. We believe this is
Food continues to be the largest component of spending, with the expectation of higher inflation
Higher spending seen for healthcare

25 January 2013
Indonesia Consumer Survey 2013 19
underpinned by the rising wealth of consumers, thus triggering healthier lifestyles, as well as accessibility of state healthcare providers.
Figure 23: Food continues to be the largest component of
spending in 2012
Figure 24: Inflation is expected to rise further
Housing4%
Auto6%
Education6%
Food28%
Home & Personal Care
5%Health Care
7%
Savings11%
Entertainment3%
Public Utilities4%
Others26%
62
17
3
69
12
2
0
10
20
30
40
50
60
70
80
It will be higher than thelast 12 months
It will be the same as thelast 12 months
It will be lower than thelast 12 months
2012 2011
Source: Credit Suisse Indonesia Consumer Survey 2013 Source: Credit Suisse Indonesia Consumer Survey 2013
Figure 25: Monthly spending by category, 2010 Figure 26: Monthly spending by category, 2011
Housing7% Auto
6%Education
6%
Food26%
Home & Personal Care
5%
Health Care4%
Savings11%
Entertainment3%
Public Utilities0%
Others32%
Housing4%
Auto7%
Education7%
Food31%
Home & Personal Care
6%
Health Care5%
Savings12%
Entertainment3%
Public Utilities7%
Others18%
Source: Credit Suisse Indonesia Consumer Survey 2013 Source: Credit Suisse Indonesia Consumer Survey 2013
Better confidence for major purchases Nevertheless, despite the expectation of a higher inflation, respondents have better confidence to make major purchases this time compared with the previous year, even though it was still less confident than in 2010, the period of booming commodity prices. We believe that improving confidence is underpinned by the higher income that the respondents are expecting to receive.
Figure 27: Time to make a major purchase, by area 2012 2011 2010
Total Urban Rural Java Non-Java Total Urban Rural Java Non-Java Total Urban Rural Java Non-Java
Excellent time 3 3 5 4 3 3 3 2 2 5 6 7 5 6 7
Good time 30 27 35 27 36 26 26 27 19 44 50 48 54 56 40
Not such a good time 62 65 55 64 56 62 61 64 69 45 40 40 39 36 49
A bad time 5 5 5 6 4 9 10 8 10 6 4 5 3 4 6
Source: Credit Suisse Indonesia Consumer Survey 2013
This year is a better year to make major purchases compared with the past year, implying rising confidence

25 January 2013
Indonesia Consumer Survey 2013 20
Figure 28: Time to make a major purchase, by age 2012 2011 2010
% of respondents Total 18-29 30-45 46-55 56-65 Total 18-29 30-45 46-55 56-65 Total 18-29 30-45 46-55 56-65
Excellent time 3 3 4 3 3 3 2 3 4 3 6 6 6 6 6
Good time 30 33 26 33 22 26 28 25 27 23 50 53 49 50 45
Not such a good time 62 59 65 58 66 62 60 63 61 68 40 38 40 39 45
A bad time 5 5 5 5 8 9 10 9 8 7 4 3 5 4 4
Source: Credit Suisse Indonesia Consumer Survey 2013
Figure 29: Time to make a major purchase, by income 2012 2011 2010
% of respondents Total <Rp1.5 mn
Rp1.5-7.5 mn
>Rp7.5mn
Total <Rp1.5mn
Rp1.5-7.5mn
>Rp7.5mn
Total <Rp1.5 mn
Rp1.5-7.5mn
>Rp7.5mn
Excellent time 3 2 4 4 3 2 2 7 6 3 7 4
Good time 30 30 30 36 26 16 30 32 50 45 51 68
Not such a good time 62 61 62 58 62 69 59 54 40 46 38 21
A bad time 5 7 5 2 9 13 8 7 4 5 4 7
Source: Credit Suisse Indonesia Consumer Survey 2013
Rising income also leads to property upgrade There were fewer first-time home buyers in this survey versus last year, with more respondents looking to purchase property for an upgrade. Around 39% of the respondents are keen for an upgrade, up from 31% in the previous year, with 37% being first-time buyers, down from 45% last year. We believe this trend is due to property ownership being larger than in previous years, and rise in income coupled with a low interest rate environment.
According to our survey, people outside Java are more keen to purchase property than those in Java, despite them already owning property. According to our survey, people living outside Java are more keen to purchase property than those in Java, despite the previous already owning property. For those outside Java, the number of respondents opting for property upgrades were more than of first-time home buyers.
Figure 30: Property ownership and reason to purchase, by area 2012 2011 2010
% of respondents Total Urban Rural Java Non-Java Total Urban Rural Java Non-Java Total Urban Rural Java Non-Java
Property ownership 74 65 90 74 73 70 63 83 73 63 73 66 86 74 71
Planning to buy in next 2 years? 30 34 22 28 33 25 28 18 25 23 24 30 12 24 22
Reason to buy
Upgrade 39 34 53 36 44 31 32 28 33 26 38 39 35 39 37
First-time home buyer 37 39 30 38 35 45 46 42 43 51 33 32 37 32 35
Investment 15 16 12 14 16 17 16 19 17 16 13 12 18 12 18
Change of location 9 11 5 12 4 7 5 11 7 8 15 17 7 17 11
Source: Credit Suisse Indonesia Consumer Survey 2013
Figure 31: Property ownership and reason to purchase, by age 2012 2011 2010
% of respondents Total 18-29 30-45 46-55 56-65 Total 18-29 30-45 46-55 56-65 Total 18-29 30-45 46-55 56-65
Property ownership 74 70 72 84 86 70 65 68 78 81 73 67 70 86 92
Planning to buy in next 2 years? 30 30 33 29 15 25 27 27 20 11 24 23 27 22 11
Reason to buy
Upgrade 39 38 38 37 59 31 27 29 47 50 38 35 36 48 55
First-time home buyer 37 46 35 28 6 45 53 45 26 17 33 36 40 6 0
Investment 15 8 17 20 29 17 13 19 21 17 13 9 12 22 36
Change of location 9 6 10 14 6 7 7 7 6 17 15 19 9 24 9
Source: Credit Suisse Indonesia Consumer Survey 2013
Some 39% of the respondents are looking to upgrade property in the nexttwo years

25 January 2013
Indonesia Consumer Survey 2013 21
Figure 32: Property ownership and reason to purchase, by income 2012 2011 2010
% of respondents Total <Rp1.5mn
Rp1.5-7.5 mn
>Rp7.5mn
Total <Rp1.5mn
Rp1.5-7.5 mn
>Rp7.5mn
Total <Rp1.5mn
Rp1.5-7.5 mn
>Rp7.5mn
Property ownership 74 77 73 79 70 67 70 85 73 71 74 69
Planning to buy in next 2 years? 30 21 32 43 25 17 27 37 24 15 27 42
Reason to buy
Upgrade 39 51 38 26 31 32 31 10 38 42 37 55
First-time home buyer 37 36 37 39 45 53 44 10 33 48 31 18
Investment 15 2 17 22 17 8 17 80 13 2 15 27
Change of location 9 11 8 13 7 7 7 - 15 8 17 -
Source: Credit Suisse Indonesia Consumer Survey 2013
Shift towards higher discretionary spending continues Comparing the spending of the essentials and discretionaries, overall spending on discretionary items increased more than that on the essentials. This bodes well with our estimate that the middle class’ income is rising along with the country’s GDP/ capita, which has doubled over the last five year to reach US$3,660 in 2012.
Spending on discretionary items in categories such as fashion, smartphones and mobile phones were up, while spending on perfumes, sports shoes and apparels, TV, DVD player was lower. We believe following are the reasons for the rise in discretionary spend on: (1) fashion—changing lifestyles, along with the rising of income as well as higher confidence of better income in the coming months; and (2) mobile phones—low penetration and availability of more affordable handsets.
Consumers continued to spend on essentials such as instant noodles, carbonated drinks, dairy products, and bottled water, which remain popular items. Interestingly, cigarettes were less popular, even though they are still widely consumed.
Figure 33: Spending on fashion, mobile phones and smartphones increasing
Carbonated drinks
Bottled Water
Dairy products
Instant Noodles
Cigarettes
TissuesFemine hygiene
Cosmetics
Basic mobile phone
DVD Player
Traditional TV
Smartphone
Fashion
Sport shoes & apparel
WatchesJewellery
Perfumes
CarsInternet Access
Property
(15)
(10)
(5)
-
5
10
15
20
25
30
0 10 20 30 40 50 60 70 80 90 100
% c
hang
e fro
m la
st y
ear s
urve
y
% of respondent which have bought essentials and discretionary goods
Source: Credit Suisse Indonesia Consumer Survey 2013
We notice an increase in the spending on discretionary items, especially fashion

25 January 2013
Indonesia Consumer Survey 2013 22
Figure 34: Mobile phone penetration remains the lowest... Figure 35: …similarly on computer penetration
Brazil
China
IndiaIndonesiaRussia
Saudi
Turkey
South Africa
0
10
20
30
40
50
60
70
80
90
75 80 85 90 95 100 105
Smar
tpho
ne o
wne
rshi
p (%
)
Mobile phone ownership (%)
89 88
7770
57
33 31
20
0
10
20
30
40
50
60
70
80
90
100
China
Saudi
Russia
Brazil
Turkey
India
South Africa
Indonesia
Com
pute
r ow
ners
hip
(%)
Source: Credit Suisse Indonesia Consumer Survey 2013 Source: Credit Suisse Indonesia Consumer Survey 2013
Consumers prefer local brands for essentials Our survey confirmed that the Indonesian consumers prefer local brands for essential items such as instant noodles, bottled water and cigarettes. However, a different pattern is seen for the discretionary items. We found that appetite for foreign brands is higher in discretionary items such as fashion apparels and cosmetics, especially among higher income earners. This finding is in line with the findings across emerging countries in our survey, where consumers appear to stick with local brands, while foreign brands appeal more in the discretionary item category, especially for higher income consumers.
Figure 36: Local brands are preferred for essential items Figure 37: Appetite for foreign brands is higher in
discretionary items …
80
85
90
95
100
<Rp1,000k
Rp1,000k -
Rp1,500k
Rp1,500k -
Rp2,000k
Rp2,000k -
Rp3,000k
Rp3,000k -
Rp5,000k
Rp5,000k -
Rp7,500k
Rp10,000k-
Rp15,000k
Rp10,000k -
Rp15,000k
>Rp15,000k
% o
f res
pond
ents
buy
ing
loca
l bra
nds
Cigarette Instant noodles Bottled water
-
10
20
30
40
50
60
70
80
90
<Rp1,000k
Rp1,000k -
Rp1,500k
Rp1,500k -
Rp2,000k
Rp2,000k -
Rp3,000k
Rp3,000k -
Rp5,000k
Rp5,000k -
Rp7,500k
Rp10,000k-
Rp15,000k
Rp10,000k -
Rp15,000k
>Rp15,000k
% re
spon
dent
s bu
ying
loca
l bra
nds
Fashion Cosmetic
Source: Credit Suisse Indonesia Consumer Survey 2013 Source: Credit Suisse Indonesia Consumer Survey 2013
Our survey also found that for Indonesian consumers, branded products appeal more for essentials, as they are the basic needs such as dairy and soft drinks, while for discretionary items such as cosmetics, perfumes and fashion, the consumers in Indonesia still prefer “unbranded” products. We believe this is due to affordability, as for the higher income earners, this is on the other way around. Nevertheless, in general, compared to other emerging countries in our survey, Indonesians are still mostly using “unbranded” products.
Indonesians prefer local brands for essentials
Branded products appeal more for essentials while for discretionary items, consumers prefer “unbranded products”, mostly due to affordability

25 January 2013
Indonesia Consumer Survey 2013 23
Figure 38: Percentage of purchases by sector that are "unbranded" % of respondents Brazil China India Indonesia Russia Saudi Arabia Turkey South Africa
Dairy 3 8 19 9 30 2 14 20
Soft Drinks 2 2 4 8 13 1 4 8
Beer 0 5 2 n/a 10 n/a 3 0
Spirits 3 15 3 n/a 13 n/a 30 17
Cosmetics 4 10 11 27 15 13 10 40
Perfumes 7 30 56 71 39 29 57 42
Fashion 27 37 62 64 65 40 69 66
Leather Goods 39 40 36 42 82 38 46 58
Sportswear 19 9 25 29 34 17 31 23
Source: Credit Suisse Indonesia Consumer Survey 2013 Figure 39: Preference for branded goods pick up on higher income group
0
20
40
60
80
100
Less than1,000k
Rp1,000k -Rp1,500k
Rp1,500k-Rp2,000k
Rp2,000k -Rp3,000k
Rp3,000k -Rp 5,000k
Rp5,000k -Rp7,500k
Rp7,500k-Rp10,000k
Rp10,000 -Rp15,000k
More thanRp15,000k%
of p
urch
ases
that
are
"unb
rand
ed"
Fashion Leather goods, bag & shoes Sportswear Watches Perfumes
Source: Credit Suisse Indonesia Consumer Survey 2013

25 January 2013
Indonesia Consumer Survey 2013 24
Figure 40: Brand preference in different income segments Food and Beverages % penetration at
LOWER income % penetration at MIDDLE Income
%penetration at HIGHER income
Difference (LOW & HIGH)
Parent Company (if applicable
Listed Private
Noodles
Indomie 39 41 33 (6) Indofood CBP ICBP.JK
Mie Sedap 35 30 24 (11) Wings Group Private
Cigarettes
Djarum Super 5 4 2 (2) Djarum Private
Dji Sam Soe 9 9 10 1 HM Sampoerna HMSP.JK
Sampoerna Hijau 8 2 5 (3) HM Sampoerna HMSP.JK
Gudang Garam Filter 8 5 2 (6) Gudang Garam GGRM.JK
Gudang Garam Surya 18 7 8 (10) Gudang Garam GGRM.JK
Sampoerna A Mild 11 8 22 10 HM Sampoerna HMSP.JK
Soft drinks -
Coca-Cola 35 31 31 (3) Coca Cola Co Ltd Foreign listed
Fanta 26 28 27 1 Coca Cola Co Ltd Foreign listed
Sprite 25 27 26 0 Coca Cola Co Ltd Foreign listed
Bottled drinks -
Aqua 62 62 56 (6) Danone Company Private
Club 19 13 12 (7) Tirta Bahagia Private
Dairy products
Frissian Flag 34 34 28 (6) Frissian Flag Private
Indomilk 23 19 11 (11) Indomilk ICBP.JK
Milk Ultra 13 14 16 3 Ultrajaya ULTJ.JK
Personal care
Tissue
Paseo 26 33 31 (6) Pindo Deli Private
Mitu 17 18 21 (11) Megasari Makmur Private
Nice 13 15 18 3 Pindo Deli Private
Female hygiene
Laurier 26 29 31 (6) Kao Foreign listed
Charm 28 35 35 (11) Unicharm Foreign listed
Softex 24 15 12 3 Softex Indonesia Private
Hers Protex 8 5 - 4 Wings Group Private
Skin products
Ponds 13 20 18 (6) Unilever Indonesia UNVR.JK
Citra 21 21 21 (11) Unilever Indonesia UNVR.JK
Viva 15 8 5 3 PT Vitapharm Private
Technology
Internet provider
Speedy 36 23 50 14 Telkom Indonesia TLKM.JK
Telkom Flash 45 34 40 (5) Telkom Indonesia TLKM.JK
Mobile phone
Nokia 41 43 36 (5) Nokia Foreign listed
Samsung 7 9 7 1 Samsung Foreign listed
Nexian 8 6 4 (4) Metrotech Private
Blackberry 1 8 21 20 RIM Foreign listed
Mobile operator
Telkomsel 38 42 57 18 Telkom Indonesia TLKM.JK
Indosat 23 22 16 (7) Indosat ISAT.JK
Esia 7 6 4 (3) Bakrie Telecom BTEL.JK
Excel 16 12 6 (10) Excel Axiata EXCL.JK
Telkom Fleksi 7 5 6 (1) Telkom Indonesia TLKM.JK
Automotive
Car
Toyota - 29 31 31 Astra International ASII.JK
Daihatsu - 23 15 15 Astra International ASII.JK

25 January 2013
Indonesia Consumer Survey 2013 25
% Penetration at LOWER income
% penetration at Middle Income
%penetration at HIGHER income
Difference (LOW & HIGH)
Parent Company (if applicable)
Listed Private
Suzuki - 29 31 31 Indomobil IMAS.JK
Motorcycle
Honda 51 51 52 2 Astra International ASII.JK
Yamaha 36 37 45 8 Yamaha Indonesia Private
Suzuki 10 9 - (10) Indomobil IMAS.JK
Source: Credit Suisse Indonesia Consumer Survey 2013
Our stock preferences We identify five stocks that bode well with our findings on this survey. They are:
■ Astra International (ASII.JK, OUTPERFORM, TP Rp9,400.00): We continue to believe the stock remains a beneficiary of growing penetration in Indonesia’s auto segment. Its brands, Toyota in 4-W and Honda in 2-W, continue to lead in each of its segment. The auto segment of Astra should contribute 53% to its 2013E earnings. We believe the company is an attractive option for investors looking for exposure to the Indonesian consumer sector. Currently, Astra’s auto implied valuations exhibit the lowest 2013E multiple among all Indonesian consumer-related names under our coverage. Its auto business is trading at 11.4x 12-month forward P/E, versus historical peak of 17.8x in July 2011.
■ Bank Central Asia (BBCA.JK, OUTPERFORM, TP Rp11,000.00) remains our top pick in the Indonesian banking sector. BBCA has one of the highest growth capacity supported by its low LDR (68.9%). In addition, it also has one of the highest CASA contributions to total deposits (79.5%), allowing the bank to have one of the lowest CoF among Indonesian banks. Given their low LDR and low CoF, BBCA is well positioned to deliver above-industry growth, offering more competitive pricing to borrowers, while at the same time sustaining robust NIM. We believe BBCA exhibits one of the strongest fundamentals among the Indonesian banks under our coverage.
■ Within Indonesia food & beverage, we like Indofood CBP (ICBP.JK, OUTPERFORM, TP Rp8,100), as it is widely exposed to the products that consumers seek, such as instant noodles. It also has strong brand equity and continues to innovate products such as the beef-based noodle (Mie Goreng Rendang) and the recently launched Mie Goreng Cabe Ijo. Noodle is the highest contributor to the company, accounting for 64% of its revenue and 79% operating profit, with operating margin at 16.5% in 2013E. Within its product portfolio, Indofood CBP also includes dairy products. Dairy should be its second largest contributor, accounting for 20% of revenue and 12% of operating profit with margin at 8% in 2013E. The completion of its new factory should help boost volumes this year, with sales volume expected to surge 18% YoY, on a 3% ASP increase.
■ Mitra Adiperkasa (MAPI.JK, OUTPERFORM, TP Rp8,100): With the rise in the middle-class income and higher confidence among Indonesian consumers, this survey found that spending on discretionary items has been rising more than the essentials. Fashion apparel was recorded as having increased by close to 25%, highest among all items we surveyed. We believe this should benefit the mid- to high-end retailer, Mitra Adiperkasa. The company manages more than 100 world class brands across its divisions, with more than half of the revenue contribution coming from speciality stores, followed by department stores, and food & beverage. We expect strong SSG to continue, given the rising middle- and high-income segments, with a consolidated SSG of 14% as of FY12, with specialty stores posting the strongest SSG at 17%, followed by department stores at 13%, F&B at 9% and others at 3%. We expect its SSG to reach 13% this year.
Our stocks preference include: ASII, BBCA, ICBP, MAPI and ERAA
25 January 2013
Indonesia Consumer Survey 2013 26
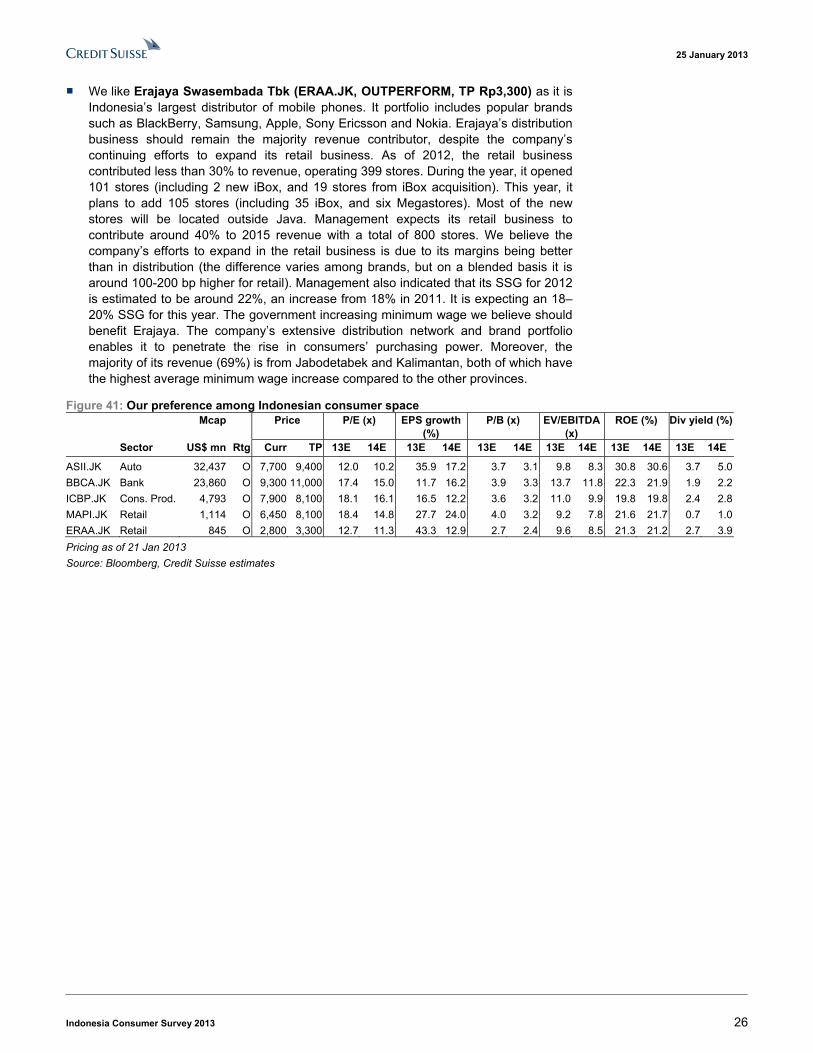
■ We like Erajaya Swasembada Tbk (ERAA.JK, OUTPERFORM, TP Rp3,300) as it is Indonesia’s largest distributor of mobile phones. It portfolio includes popular brands such as BlackBerry, Samsung, Apple, Sony Ericsson and Nokia. Erajaya’s distribution business should remain the majority revenue contributor, despite the company’s continuing efforts to expand its retail business. As of 2012, the retail business contributed less than 30% to revenue, operating 399 stores. During the year, it opened 101 stores (including 2 new iBox, and 19 stores from iBox acquisition). This year, it plans to add 105 stores (including 35 iBox, and six Megastores). Most of the new stores will be located outside Java. Management expects its retail business to contribute around 40% to 2015 revenue with a total of 800 stores. We believe the company’s efforts to expand in the retail business is due to its margins being better than in distribution (the difference varies among brands, but on a blended basis it is around 100-200 bp higher for retail). Management also indicated that its SSG for 2012 is estimated to be around 22%, an increase from 18% in 2011. It is expecting an 18–20% SSG for this year. The government increasing minimum wage we believe should benefit Erajaya. The company’s extensive distribution network and brand portfolio enables it to penetrate the rise in consumers’ purchasing power. Moreover, the majority of its revenue (69%) is from Jabodetabek and Kalimantan, both of which have the highest average minimum wage increase compared to the other provinces.
Figure 41: Our preference among Indonesian consumer space Mcap Price P/E (x) EPS growth
(%) P/B (x) EV/EBITDA
(x) ROE (%) Div yield (%)
Sector US$ mn Rtg Curr TP 13E 14E 13E 14E 13E 14E 13E 14E 13E 14E 13E 14E
ASII.JK Auto 32,437 O 7,700 9,400 12.0 10.2 35.9 17.2 3.7 3.1 9.8 8.3 30.8 30.6 3.7 5.0
BBCA.JK Bank 23,860 O 9,300 11,000 17.4 15.0 11.7 16.2 3.9 3.3 13.7 11.8 22.3 21.9 1.9 2.2
ICBP.JK Cons. Prod. 4,793 O 7,900 8,100 18.1 16.1 16.5 12.2 3.6 3.2 11.0 9.9 19.8 19.8 2.4 2.8
MAPI.JK Retail 1,114 O 6,450 8,100 18.4 14.8 27.7 24.0 4.0 3.2 9.2 7.8 21.6 21.7 0.7 1.0
ERAA.JK Retail 845 O 2,800 3,300 12.7 11.3 43.3 12.9 2.7 2.4 9.6 8.5 21.3 21.2 2.7 3.9
Pricing as of 21 Jan 2013
Source: Bloomberg, Credit Suisse estimates

25 January 2013
Indonesia Consumer Survey 2013 27
Figure 42: Indonesia consumer-related names Code Rtg Price Target Ups Mcap P/E (x) EPS growth
(%) P/B (x) EV/EBITDA
(x) Div yield (%) ROE (%) Ytd perf
US$mn 12E 13E 14E 12E 13E 14E 12E 13E 14E 12E 13E 14E 12E 13E 14E 13E 14E 12E 13E
Automobiles
ASII.JK O 7,700 9,400 22% 32,437 16.3 12.0 10.2 8 36 17 4.5 3.7 3.1 12.8 9.8 8.3 3.4 3.7 5.0 31 31 3% 1%
IMAS.JK U 5,300 4,800 -9% 1,525 14.1 12.3 7.7 8 14 60 2.4 2.2 1.8 17.9 14.5 8.4 1.2 1.3 1.6 18 23 -17% 0%
Banks
BBCA.JK O 9,300 11,000 18% 23,860 19.5 17.4 15.0 8 12 16 4.6 3.9 3.3 15.3 13.7 11.8 1.7 1.9 2.2 22 22 14% 2%
BMRI.JK O 8,550 11,000 29% 20,552 14.1 12.2 10.8 16 15 13 2.7 2.3 1.9 9.9 8.6 7.6 1.4 1.6 1.9 19 18 20% 6%
BBRI.JK O 7,900 9,100 15% 20,280 11.5 11.8 11.0 12 (2) 7 3.1 2.5 2.1 9.1 9.3 8.5 1.7 1.7 1.8 22 20 3%14%
BBNI.JK O 3,850 5,000 30% 7,396 10.5 9.5 8.2 17 11 16 1.8 1.5 1.3 7.9 7.4 6.4 3.3 3.7 4.3 16 16 -3% 4%
BTPN.JK N 5,250 5,800 10% 3,159 15.7 13.5 11.0 35 16 23 4.0 3.1 2.4 12.2 10.5 8.6 0.0 0.0 0.0 23 22 54% 0%
BBTN.JK N 1,540 1,600 4% 1,660 11.7 9.5 8.3 2 23 14 1.7 1.4 1.2 0.4 0.3 0.3 0.0 0.0 0.0 15 14 25% 6%
BJBR.JK O 1,180 1,420 20% 1,179 8.8 8.6 7.1 34 2 21 1.9 1.6 1.3 5.8 5.7 4.8 4.4 5.9 6.1 19 18 16%11%
Consumer
UNVR.JK U 23,000 15,725 -32% 18,261 35.8 33.0 30.8 21 9 7 31.6 29.3 27.6 25.7 23.8 22.1 2.4 2.8 3.0 89 90 11%10%
GGRM.JK U 53,700 44,600 -17% 10,752 25.1 20.5 17.4 (16) 22 18 3.9 3.4 3.1 15.6 13.2 11.5 1.9 1.6 2.0 17 18 -9% -5%
INDF.JK N 6,000 6,700 12% 5,482 15.7 14.8 14.2 9 6 5 2.5 2.3 2.1 5.6 5.2 5.0 2.9 3.2 3.4 15 15 27% 3%
KLBF.JK U 1,040 800 -23% 5,495 31.3 27.3 23.2 14 15 18 7.6 6.7 5.9 20.8 18.2 15.5 1.8 1.9 2.2 25 25 56% -2%
ICBP.JK O 7,900 8,100 3% 4,793 21.1 18.1 16.1 11 17 12 4.0 3.6 3.2 12.5 11.0 9.9 2.1 2.4 2.8 20 20 50% 1%
Retail
MAPI.JK O 6,450 8,100 26% 1,114 23.5 18.4 14.8 26 28 24 4.9 4.0 3.2 10.8 9.2 7.8 0.6 0.7 1.0 22 22 29% -3%
ACES.JK N 860 700 -19% 1,535 39.3 30.0 24.2 32 31 24 9.6 7.5 5.9 26.3 19.9 16.4 0.3 0.4 0.5 25 24 100% 5%
ERAA.JK O 2,800 3,300 18% 845 18.3 12.7 11.3 74 43 13 3.1 2.7 2.4 12.9 9.6 8.5 0.0 2.7 3.9 21 21 195% -5%
Media
MNCN.JK O 2,400 2,700 13% 3,485 21.3 17.8 14.3 46 20 24 4.6 4.0 3.4 13.1 11.3 9.3 1.4 2.1 2.5 22 24 91% -4%
SCMA.JK O 2,300 2,760 20% 2,334 22.2 18.3 15.1 10 21 21 14.0 12.4 10.9 15.8 13.3 11.1 4.5 5.5 6.6 68 72 43% 2%
IDKM.JK O 1,030 1,400 36% 1,086 23.7 15.5 11.8 554 53 31 18.5 8.4 4.9 16.4 11.2 8.8 0.0 0.0 1.0 54 42 78% 0%
Telco
TLKM.JK O 9,600 10,900 14% 20,139 14.8 13.2 12.4 16 12 6 3.7 3.4 3.2 5.1 4.7 4.5 4.4 5.3 6.4 26 26 28% 6%
EXCL.JK O 5,400 8,000 48% 4,791 15.4 12.2 10.9 6 26 11 2.9 2.6 2.4 5.5 4.9 4.5 2.3 4.1 5.5 22 22 26% -5%
ISAT.JK O 6,750 8,300 23% 3,817 24.0 16.5 13.8 83 46 20 1.9 1.8 1.7 5.6 5.2 4.8 2.1 1.7 3.5 11 12 14% 5%
TOWR.JK O 25,000 19,500 -22% 2,654 58.1 40.4 31.1 55 44 30 14.0 11.6 9.8 16.9 13.6 11.4 0.5 1.0 1.6 29 31 127%10%
TBIG.JK N 5,900 3,800 -36% 2,945 29.2 22.5 17.5 94 30 29 6.8 5.7 4.8 22.2 16.0 13.0 1.0 1.8 2.9 25 27 140% 4%
BTEL.JK U 50 50 0% 159 -1.3 -1.4 -1.4 (46) 8 5 0.4 0.6 1.1 7.0 7.5 6.9 0.0 0.0 0.0 -46 -79 -81% 0%
Airline
GIAA.JK O 650 900 38% 1,531 13.3 8.0 16.1 29 65 (50) 1.6 1.4 1.3 5.4 3.7 3.9 0.0 3.1 2.7 18 8 39% -2%
Pricing as of 21 Jan 2013.
Source: Bloomberg, Credit Suisse estimates

25 January 2013
Indonesia Consumer Survey 2013 28
Key sector selections

25 January 2013
Indonesia Consumer Survey 2013 29
Automotive sector Four-wheelers In Indonesia, car penetration is still low (based on our survey, only 6% of the respondents own a car); this suggests the market has more potential to grow with rise in income levels. Most of the car owners in our survey are high income earners and live in Java. Some 92% of those who own a car purchased it 4.7 years ago, even though car ownership turnover has improved slightly—from an average of 6.2 years to 5.9 years.
As confidence improves, there is an increase in the number of respondents who are willing to purchase a car in the next 12 months—from about 7% of respondents in last year’s survey to 11% this year. This could also be due to the availability of cheaper cars (priced as low as US$11,000/unit), thus making it more affordable.
Figure 43: Four-wheeler penetration in Indonesia has ample opportunity to grow Age Monthly income
Total Urban Rural Java Non-Java 18-29 30-45 46-55 56-65 <Rp1.5 mn Rp1.5-7.5 mn >Rp7.5 mn
2012
Four-wheeler ownership % respondents 6 6 4 6 5 5 7 3 6 - 6 29
No of cars per household
1 Car % car owners 92 91 94 91 95 88 92 100 100 - 93 85
>1 Car % car owners 8 9 6 9 5 12 8 - - - 7 15
When was the car purchased?
years ago 5 5 5 5 3 4 5 6 6 - 5 5
Car ownership turnover years 6 6 5 6 5 6 5 7 10 - 6 6
Prob of purchase in 12M
Potentially Yes % respondents 11 13 8 11 10 10 13 13 4 2 12 21
Unsure % respondents 32 34 30 34 28 33 33 32 27 36 31 40
Potentially No % respondents 57 54 62 55 61 57 55 55 69 62 57 40
2011
Four-wheeler ownership % respondents 5 6 3 4 5 5 5 3 4 0 5 50
No of cars per household
1 Car % car owners 89 88 93 86 96 92 86 86 100 100 91 83
>1 Car % car owners 11 12 7 14 4 8 14 14 - - 9 17
When was the car purchased?
years ago 4 5 3 5 4 4 5 5 5 4 5 4
Car ownership turnover years 6 6 6 6 6 5 7 6 2 9 6 7
Prob of purchase in 12M
Potentially Yes % respondents 7 9 3 6 7 7 9 2 5 2 8 30
Unsure % respondents 33 32 34 30 38 32 33 33 34 30 33 10
Potentially No % respondents 60 59 62 63 54 61 59 64 60 68 59 60
2010
Four-wheeler ownership % respondents 6 6 5 6 5 3 7 6 10 1 6 50
No of cars per household
1 Car % car owners 86 81 95 83 92 88 86 75 90 100 90 67
>1 Car % car owners 14 19 5 17 8 12 14 25 10 - 10 33
When was the car purchased?
years ago 4 4 4 4 3 4 3 5 4 5 4 3
Car ownership turnover years 6 7 6 7 6 7 5 9 7 5 7 6
Prob of purchase in 12M
Potentially Yes % respondents 7 8 5 6 9 5 8 10 6 3 8 39
Unsure % respondents 25 26 22 26 22 29 22 24 23 20 26 39
Potentially No % respondents 68 66 72 67 69 66 70 66 71 77 66 21
Source: Credit Suisse Indonesia Consumer Survey 2013
Low car penetration with increasing future purchases foreseen

25 January 2013
Indonesia Consumer Survey 2013 30
Toyota and Suzuki are the preferred four-wheeler brands in Indonesia, according to our survey. Suzuki is gaining popularity from the launch of its MPV, Suzuki Ertiga (priced at around US$15,000/unit, thus grabbing market share from Toyota Avanza), especially in Java. Toyota remains popular among the people of all income levels. It continues to lead in outside Java, with 43% non-Java respondents owning a Toyota car, while Suzuki dominates in Java. Daihatsu, on the other hand, still maintains its share at a similar level, and has become the third preferred brand for four-wheelers, after Toyota and Suzuki. Daihatsu is popular in the urban area, outside Java and among the middle-aged and middle-income earners.
When asked about their future purchase, most respondents chose Toyota as their preferred four-wheeler brand, with 42% of respondents in Java (the highest) willing to buy a Toyota car for their next purchase compared with only 33% non-Java respondents who said they were willing to do so. Contrary to its current position in terms of ownership, Daihatsu is the next most popular four-wheeler brand that the respondents want to own in Java and outside Java, while Suzuki remains as the third most popular brand for four-wheelers. Daihatsu is more popular in Indonesia-ex. Java than in Java. Some 15% of the respondents in our survey who live outside Java said they want to buy a Daihatsu car for their next purchase, compared with only 9% of the Java-based respondents. Suzuki is more popular in Java than outside Java, as 5% of Java respondents wanted to buy a Suzuki car as opposed to only 3% of the outside-Java respondents.
Figure 44: Suzuki gaining popularity ... % of respondents Age Monthly income
of car owner Total Urban Rural Java Non-Java 18-29 30-45 46-55 56-65 <Rp1.5 mn Rp1.5-7.5 mn >Rp7.5 mn
2012
Toyota 28 25 39 23 43 33 27 14 33 - 29 31
Daihatsu 22 25 11 19 28 21 19 43 17 - 23 15
Suzuki 28 25 39 32 19 25 35 14 17 - 29 31
Others 22 25 11 26 10 21 19 29 33 - 19 23
2011
Toyota 39 40 36 33 50 54 24 43 50 50 33 42
Daihatsu 23 23 21 24 21 23 24 14 25 50 24 17
Suzuki 15 17 7 17 12 12 24 - - - 20 -
Others 23 20 36 26 17 11 28 43 25 - 23 42
2010
Toyota 36 39 27 42 21 29 46 17 30 33 38 17
Daihatsu 24 30 9 17 37 35 14 42 20 - 24 33
Suzuki 11 6 23 10 13 6 11 - 30 33 10 8
Others 29 25 41 31 29 30 29 41 20 34 28 42
Source: Credit Suisse Indonesia Consumer Survey 2013
Figure 45: ... but Toyota is still a ‘dream car’ 2012 2011 2010
% of respondents Java Non-Java Java Non-Java Java Non-Java
Current Future Current Future Current Future Current Future Current Future Current Future
Toyota 23 42 43 33 33 50 50 35 42 47 21 64
Daihatsu 19 9 28 15 24 7 21 13 17 15 37 2
Suzuki 32 5 19 3 17 8 12 10 10 4 13 -
Others 26 45 10 49 26 35 17 41 31 34 29 34
Source: Credit Suisse Indonesia Consumer Survey 2013
Two-wheelers Two-wheeler penetration is much higher than four-wheelers in Indonesia; much of it because of the affordability. Some 78% of respondents claim they own a motorcycle in their household, a slight increase from 75% in the previous year’s survey. Those who own
Toyota and Suzuki are the preferred four-wheeler brands
Indonesia two-wheeler penetration is quite high at 78%

25 January 2013
Indonesia Consumer Survey 2013 31
more than one motorcycle also increased, from 29% in the previous survey to 33% in this year’s. This is due to the higher income received.
Currently, those who own two-wheelers had purchased it on average about 3.3 years ago and the ownership trend seems to have stabilised around 5.4-5.6 years. While previous year’s survey showed 5.4 years as average holding period, this year’s survey revealed a slightly longer time of 5.6 years. This indicates that some people may be postponing the replacement of their vehicles due to the Central Bank now imposing a minimum down-payment of 20-30% for purchase of a new two-wheeler.
Although already highly penetrated, the respondents are still keen to purchase motorcycles again in the next 12 months. This could also be for replacement purpose, in our view. Some 31% of the respondents are likely purchase in the next 12 months, up from 26% in the previous year’s survey, and mostly they are middle income earners and younger generation, located outside Java.
Figure 46: Two-wheeler ownership impacted by the newly imposed payment regulation
Age Monthly income
Total Urban Rural Java Non-Java 18-29 30-45 46-55 56-65 <Rp1.5 mn Rp1.5-7.5 mn >Rp7.5 mn
2012
2-wheeler ownerships % respondents 78 78 78 78 77 79 81 75 67 61 82 84
No of cars per household
1 motorcycle % car owners 67 67 67 66 70 66 73 59 60 85 64 56
>1 motorcycles % car owners 33 32 33 34 30 35 27 41 40 15 36 44
When was motorcycle purchased?
years ago 3 3 3 3 3 3 3 3 4 4 3 3
Motorcycle ownership turnover
years 6 6 5 6 5 5 6 7 7 6 6 6
Prob of purchase in 12M
Potentially Yes % respondents 31 32 31 29 36 38 29 28 17 24 33 31
Unsure % respondents 34 32 40 35 34 32 35 40 39 42 33 31
Potentially No % respondents 34 36 30 36 30 31 36 32 44 35 35 38
2011
2-wheeler ownerships % respondents 75 77 72 75 76 78 74 72 68 61 80 100
No of cars per household
1 motorcycle % car owners 71 66 80 70 73 77 69 66 62 88 65 33
>1 motorcycles % car owners 29 34 20 30 27 24 31 34 38 12 35 67
When was the motorcycle purchased?
years ago 3 3 4 3 3 3 3 3 4 4 3 2
Motorcycle ownership turnover
years 5 5 5 6 5 5 6 7 6 5 5 6
Prob of purchase in 12M
Potentially Yes % respondents 26 30 19 24 32 30 27 18 14 19 29 36
Unsure % respondents 29 25 37 30 28 29 29 27 37 35 27 18
Potentially No % respondents 45 45 44 47 41 41 44 55 49 45 45 45
2010
2-wheeler ownerships % respondents 73 74 70 72 74 73 72 80 63 54 79 92
No of cars per household
1 motorcycle % car owners 71 69 76 72 69 69 77 61 67 86 68 72
>1 motorcycles % car owners 29 31 24 28 31 31 23 39 33 14 32 28
When was the motorcycle purchased?
years ago 3 3 3 3 3 3 3 3 4 3 3 3
Motorcycle ownership turnover
years 6 5 6 6 6 5 6 7 6 5 6 6
Prob of purchase in 12M
Potentially Yes % respondents 26 29 22 29 24 23 31 22 27 16 28 55
Unsure % respondents 28 27 28 35 18 27 27 32 21 25 27 28
Potentially No % respondents 46 44 50 44 58 51 42 46 53 59 45 18
Source: Credit Suisse Indonesia Consumer Survey 2013
More respondents are looking to buy two-wheelers despite the already-high penetration

25 January 2013
Indonesia Consumer Survey 2013 32
Honda and Yamaha remain the two most preferred motorcycle brands. Honda is still dominant in both Java and outside Java markets, across all income and age groups. About 52% of the respondents in Java and 47% of the respondents outside Java own a Honda motorcycle. Yamaha comes second as the most preferred brand, with 37% of the respondents owning one, up from 33% in our first-year survey and 35% in our second-year survey. Suzuki’s popularity, on the other hand, has declined, with 9% of the respondents preferring the brand versus 13% in our previous survey.
Figure 47: Honda is the market leader in the Indonesia two-wheeler market % of respondents Age Monthly income
Own motorcycle Total Urban Rural Java Non-Java 18-29 30-45 46-55 56-65 <Rp1.5 mn Rp1.5-7.5 mn >Rp7.5 mn
2012
Honda 51 51 51 52 47 47 52 50 62 51 51 52
Yamaha 37 38 35 36 39 39 35 40 30 36 37 45
Suzuki 9 8 10 8 10 10 8 8 6 10 9 -
Others 3 3 4 3 4 4 5 2 2 3 4 3
2011
Honda 48 49 46 52 39 42 50 52 59 51 47 58
Yamaha 35 36 33 34 38 39 35 31 25 29 37 25
Suzuki 13 11 15 11 17 15 11 12 13 13 13 17
Others 4 4 6 3 5 4 4 5 3 6 3 0
2010
Honda 50 48 54 54 42 46 54 48 53 51 49 46
Yamaha 33 36 28 31 37 35 30 39 24 29 34 18
Suzuki 13 12 14 11 17 15 12 7 18 16 13 28
Others 4 4 4 4 4 4 4 6 5 4 4 8
Source: Credit Suisse Indonesia Consumer Survey 2013
Figure 48: Honda leads in both Java and outside Java markets 2012 2011 2010
% of respondents Java Non-Java Java Non-Java Java Non-Java
Current Future Current Future Current Future Current Future Current Future Current Future
Honda 52 59 47 48 52 52 39 38 54 49 42 35
Yamaha 36 28 39 41 34 35 38 46 31 34 37 49
Suzuki 8 5 10 5 11 7 17 12 11 10 17 10
Others 3 8 4 6 3 6 5 4 4 7 4 6
Source: Credit Suisse Indonesia Consumer Survey 2013
Key stocks Indonesians spend around 6% of their household spending on automobiles. This is relatively stable compared with our previous surveys. The still-low penetration of four-wheelers leads us to believe that Astra International (ASII.JK, OUTPERFORM, TP Rp9,400.00) should be a beneficiary of higher automobile penetration in Indonesia. Its brands, Toyota in four-wheelers and Honda in two-wheelers, continue to lead in each of its segment. Astra’s auto segment should contribute 53% to its earnings in 2013. We believe that the company is an attractive option for investors looking for exposure in the Indonesian consumer sector. Currently, Astra’s auto-implied valuation exhibits the lowest FY13E multiple among all Indonesian consumer-related names under our coverage. Its auto-implied P/E is 11.4x 12-month forward P/E, versus the historical peak of 17.8x in Jul-11.
Indomobil Sukses Internasional (IMAS.JK, UNDERPERFORM, TP Rp4,800.00) is also a potential beneficiary, although its share in four-wheelers is still minimal; thus Astra is our preferred pick. We believe that much of the bad news has been priced in, given its stock’s underperformance. While we recognise that an improvement in Nissan Evalia features could lead to higher sales volume of the model in 2Q13, we believe that the optimum sales volume potential has been somewhat curbed due to the introduction of several new models by competing brands in 4Q12 and 1Q13E.
Our top pick in the auto sector is Astra International with its brands, Toyota and Honda, leading the Indonesia auto market

25 January 2013
Indonesia Consumer Survey 2013 33
Consumer sector This survey found that with the rise in middle-income population and higher confidence among Indonesian consumers, spending on discretionary items is rising more than that on the essentials. Spending on fashion apparel has increased by about 25%, the highest among the items we surveyed. Basic mobile phones are still preferred to smartphones, which could be due to their affordability, and is seen to be rising less than 10% (versus smartphones by 5%).
Among the essentials, bottled water and carbonated drinks are two items that we continue to find interesting, given that both the items are growing at a faster pace than other essentials. Bottled water and carbonated drinks continue to gain popularity. Some 90% of the respondents have consumed bottled water in the past three months, with 61% looking to consume more; and 70% have consumed carbonated drinks, with 35% looking to consume more. We believe that this is due to lifestyle changes as income is rising.
Hence, due to the already-high penetration of noodles consumption, even though it is still widely consumed and remain the most popular staples product, its growth is slowing down. Some 95% of the respondents said that they have consumed instant noodles in the past three months, the highest among other staples.
Surprisingly, respondents are spending less on dairy products and cigarettes. We believe this could be due to the rise in skimmed milk prices and cigarettes. Some 66% of the respondents said that they have consumed dairy products in the past three months, compared with the 73% in the previous survey. And about 47% of the respondents said that they have consumed cigarettes in the past three months, down from 59% in the previous survey.
Nevertheless, we observe that meat consumption as a percentage of diet remains relatively low, which we believe is due to the pricing. This suggests the respondents are eating less meat than the last time. Food is still the largest component of household spending, accounting for 28% of the total spending.
Figure 49: Spending on fashion has risen much higher than that on other discretionary items
Carbonated drinks
Bottled Water
Dairy products
Instant Noodles
Cigarettes
TissuesFemine hygiene
Cosmetics
Basic mobile phone
DVD Player
Traditional TV
Smartphone
Fashion
Sport shoes & apparel
WatchesJewellery
Perfumes
CarsInternet Access
Property
(15)
(10)
(5)
-
5
10
15
20
25
30
0 10 20 30 40 50 60 70 80 90 100
% c
hang
e fro
m la
st y
ear s
urve
y
% of respondent which have bought essentials and discretionary goods
Source: Credit Suisse Indonesia Consumer Survey 2013
Spending on discretionary items is seen to be rising more than that on the essentials
For essentials, bottled water and carbonated drinks continue to gain popularity. Instant noodle remains the most popular staple, although growth is slowing down

25 January 2013
Indonesia Consumer Survey 2013 34
Figure 50: Meat consumptions as percentage of diet 2012 2011 2010
% of respondents Total Urban Rural Total Urban Rural Total Urban Rural
0% (0) 7 6 7 7 3 13 10 7 14
0-5% (2.5) 61 57 68 50 47 55 59 56 67
6-15% (10) 23 25 20 25 28 20 23 27 16
16-25% (20) 5 6 2 8 10 6 5 7 1
More than 25% (30) 3 4 1 9 11 5 2 3 1
Don’t know 2 2 1 1 1 1 1 1 1
Source: Credit Suisse Indonesia Consumer Survey 2013
Figure 51: Consumption of food and beverages 2012 2011
% of respondents Total Urban Rural Java Non-Java Total Urban Rural Java Non-Java
Carbonated drinks
Consumed in the past 3M 70 75 60 69 89 62 70 49 59 69
Consuming more in the next 3M 35 37 32 30 47 34 37 28 28 47
Bottled water
Consumed in the past 3M 90 94 82 92 85 84 90 76 90 71
Consuming more in the next 3M 61 66 51 59 65 47 53 37 48 44
Dairy products
Consumed in the past 3M 66 72 56 60 81 73 81 61 71 98
Consuming more in the next 3M 46 51 37 38 62 46 51 38 41 55
Instant noodles
Consumed in the past 3M 95 95 95 94 95 96 97 96 97 95
Consuming more in the next 3M 41 38 45 52 74 54 56 50 50 61
Cigarettes
Consumed in the past 3M 47 47 46 47 45 59 58 60 58 60
Consuming more in the next 3M 31 32 29 29 35 29 31 26 25 38
Source: Credit Suisse Indonesia Consumer Survey 2013
Figure 52: Consumption of personal care products 2012 2011
% of respondents Total Urban Rural Java Non-Java Total Urban Rural Java Non-Java
Tissues
Consumed in the past 3M 54 64 34 56 47 54 66 33 57 47
Consuming more in the next 3M 32 38 21 31 34 28 35 15 27 29
Feminine hygiene products
Consumed in the past 3M 76 82 65 75 80 77 82 67 78 74
Consuming more in the next 3M 45 51 33 40 57 37 40 32 35 42
Cosmetics & skin care
Consumed in the past 3M 62 65 57 63 60 62 66 55 63 60
Consuming more in the next 3M 38 40 34 36 42 30 32 28 34 34
Source: Credit Suisse Indonesia Consumer Survey 2013

25 January 2013
Indonesia Consumer Survey 2013 35
Figure 53: Consumption of durables 2012 2011
% of respondents Total Urban Rural Java Non-Java Total Urban Rural Java Non-Java
Fashion
Purch past 3M 75 76 75 70 87 51 55 43 52 48
Purch next 3M 64 65 63 73 78 65 69 57 66 61
Sport shoes & wear
Purch past 3M 20 25 12 21 19 23 27 15 23 21
Purch next 3M 17 21 10 23 18 20 25 11 27 18
Watches
Purch past 12M 17 20 9 15 19 16 21 6 14 19
Purch next 12M 14 16 11 12 19 10 12 5 8 14
Jewellery
Purch past 12M 14 16 10 14 13 14 15 11 14 13
Purch next 12M 16 17 14 16 16 17 20 13 18 15
Perfumes
Purch past 12M 38 44 28 37 42 47 57 28 46 47
Purch next 12M 35 40 25 32 39 45 55 26 45 45
Source: Credit Suisse Indonesia Consumer Survey 2013
Instant noodles: Still popular Among the staples that we surveyed, instant noodles continue to be the most popular. Some 95% of the respondents have consumed instant noodles in the past three months (the highest among staples) and 41% of them are looking to consume more. As a result of the already-high penetration, respondents’ desire to consume more is less than that for other staples; however, the popularity of instant noodles remains.
In terms of brand, Indomie maintains its popularity; in fact, its popularity has grown in this survey compared with the previous two surveys. About 41% of the respondents prefer Indomie, up from 36% in the previous year. Its popularity has risen the most in Java, among the mid-income earners. We believe that this is also due to the new flavour that the company introduced during the year (Mie Goreng Rendang, a beef-based flavour).
Indomie is Indofood CBP’s (ICBP.JK, OUTPERFORM, TP Rp8,100.00) main brand. Its other brands such as Sarimi, Supermi and Popmie are also doing well. Sarimi is gaining slightly as it launched Sarimi Mie Duo (two noodle blocks in one packet), which is popular among the low- to mid-income earners. Overall, 60% respondents in our survey prefer Indofood CBP’s products.
The second most popular instant noodle brand is Mie Sedap, manufactured by the Wings Group (not listed). Some 31% of our respondents have consumed this brand, which is more popular in rural areas among the low- to mid-income earners.
In 2012, we saw a hike in wheat prices, the main raw material for instant noodles, despite weakening palm oil prices. This has caused the cost of production of instant noodles to increase. Hence, we believe Indomie is more resilient given that its popularity has risen, while the smaller-sized noodle producers are actually losing market share.
Instant noodle remains popular—Indomie is still the preferred brand, followed by Mie Sedap

25 January 2013
Indonesia Consumer Survey 2013 36
Figure 54: Noodle consumption, by brand—Indomie is still preferred Age Monthly income
Total Urban Rural Java Non-Java 18-29 30-45 46-55 56-65 <Rp1.5 mn Rp1.5-7.5 mn >Rp7.5 mn
2012
Indomie 41 43 36 46 32 41 40 43 39 39 41 33
Mie Sedap 31 29 35 31 31 31 30 33 34 35 30 24
Sarimi 8 7 9 8 7 7 8 8 11 9 8 4
Supermi 8 9 6 7 9 8 8 6 9 8 8 12
Gaga Mie 0 0 0 0 1 - 1 - - 0 0 -
ABC 2 2 1 1 2 2 2 2 - 1 2 4
Popmie 3 4 1 4 3 4 3 1 2 2 3 12
Salam Mie 0 - 0 0 - - 0 - - - 0 -
Alhami 1 0 2 - 3 1 1 2 1 2 1 -
Mie 100 3 3 3 0 7 2 3 2 2 2 3 6
Others 4 3 5 3 6 5 4 2 2 4 4 4
2011
Indomie 36 40 30 39 31 36 36 36 40 35 36 47
Mie Sedap 32 27 41 32 31 32 32 33 33 39 30 34
Sarimi 7 4 13 8 5 7 8 8 7 10 6 -
Supermi 8 9 7 7 11 8 9 9 4 7 9 -
Gaga Mie 0 1 - 0 1 1 0 0 1 0 1 -
ABC 2 3 1 2 2 3 1 1 2 1 2 5
Popmie 3 4 1 3 3 5 2 2 2 1 3 11
Salam Mie 0 0 0 0 - - 0 - - - 0 -
Alhami 1 1 2 0 3 1 1 1 - 2 1 -
Mie 100 2 2 1 0 5 2 2 2 1 1 2 -
Others 8 9 5 7 9 6 8 9 11 4 9 3
2010
Indomie 37 40 31 41 30 38 36 39 37 35 38 39
Mie Sedap 29 26 35 28 31 30 28 29 36 33 28 24
Sarimi 7 5 10 8 5 6 8 7 7 9 6 4
Supermi 12 11 13 11 13 11 12 12 11 13 12 6
Gaga Mie 1 1 1 0 2 1 1 1 - 1 1 -
ABC 1 1 1 1 2 1 1 1 3 1 2 2
Popmie 3 4 1 4 2 4 3 2 1 1 4 6
Salam Mie 0 0 1 1 0 0 1 1 - 0 1 -
Alhami 1 1 1 0 2 0 1 1 - 1 1 -
Mie 100 2 3 1 0 6 3 2 1 1 2 2 -
Others 6 7 4 6 6 6 6 6 5 4 6 18
Source: Credit Suisse Indonesia Consumer Survey 2013
Figure 55: Wheat prices Figure 56: Palm oil prices
3
4
5
6
7
8
9
10
Jan-10 May-10 Sep-10 Jan-11 May-11 Sep-11 Jan-12 May-12 Sep-12 Jan-13
Wheat (USD/bushel)
2000
2200
2400
2600
2800
3000
3200
3400
3600
3800
4000
Feb-10 Jul-10 Dec-10 May-11 Oct-11 Mar-12 Aug-12 Jan-13
Palm Oil (MYR/ton)
Source: Bloomberg Source: Bloomberg

25 January 2013
Indonesia Consumer Survey 2013 37
Dairy products: SCM is still preferred Surprisingly, the respondents are spending less on dairy products which we believe could be due to increased skimmed milk prices. Some 66% of the respondents said that they have consumed dairy products in the past three months, compared with the 73% in the previous survey.
Among the brands mentioned in this survey, Frissian Flag (Bendera) remains the most popular. About 34% of the respondents favoured the brand, up from 30% in the previous year’s survey, as a majority of Indonesians still consume sweet condensed milk (SCM). Indofood CBP’s (ICBP.JK, OUTPERFORM, TP Rp8,100.00) product, Indomilk, maintains its position as the second most preferred dairy product, with 20% of the respondents favouring it.
Figure 57: Dairy products consumption, by brand Age Monthly income
% of respondents Total Urban Rural Java Non-Java 18-29 30-45 46-55 56-65 <Rp1.5 mn Rp1.5-7.5 mn >Rp7.5 mn
2012
Frissian flag (Bendera) 34 30 44 22 47 29 35 46 35 34 34 29
Indomilk 20 20 20 19 13 17 22 15 18 23 19 11
Milk Ultra 14 16 8 14 7 15 14 10 8 14 14 16
Nestle 13 13 11 12 8 14 12 8 13 11 13 9
Others 20 21 18 33 24 25 18 21 25 18 21 35
2011
Frissian flag (Bendera) 30 28 38 23 39 28 32 33 31 32 30 16
Indomilk 20 17 29 23 11 19 20 24 21 24 20 18
Milk Ultra 16 18 9 15 10 17 15 14 11 13 16 14
Nestle 10 12 7 8 12 11 11 8 8 7 11 12
Others 24 25 17 31 28 26 22 21 29 24 23 40
2010
Frissian flag (Bendera) 35 32 45 28 41 33 34 40 38 44 34 19
Indomilk 19 17 24 20 12 19 18 20 21 23 18 14
Milk Ultra 12 13 9 10 10 13 12 9 8 10 12 19
Nestle 10 11 7 10 8 11 10 9 9 5 11 14
Others 24 27 15 32 29 24 26 22 25 18 24 35
Source: Credit Suisse Indonesia Consumer Survey 2013
Cigarettes: White is getting popular? In this survey, fewer respondents said that they consumed cigarettes in the past three months, compared with the previous survey (47% versus 59%). However, there are more respondents who would like to consume more in the next three months (31% versus 29%). We believe that this is underpinned by the higher cigarette prices as well as the decline in the cheaper cigarettes due to the scarcity of clove and tobacco (main raw materials) during the period.
Among other cigarette types, SKM (machine made) full flavoured has maintained its dominance for the past three surveys, including the current one. Some 31% of the respondents prefer SKM, up from 29% in the previous survey. Surprisingly, this year’s survey showed that white cigarettes are gaining interest among the smokers, particularly in urban areas, such as Java, and among the younger smokers of higher income earners. About 8% of the respondents favour white cigarettes, up from 5% in the previous survey.
SKT (hand-rolled) is the second most popular type of cigarette, particularly among the older generation, while SKM low-tar, low-nicotine remains popular among the younger generation, in the urban areas. Some 27% of the respondents prefer SKT, down from 29% in the previous survey, while 23% of the respondents prefer SKM low-tar, low-nicotine, versus 24% of the respondents in the previous survey.
Respondents are spending less on dairy products, but a majority of Indonesians still consume sweet condensed milk (SCM)
Fewer smokers?
White cigarettes are getting more popularity among smokers …

25 January 2013
Indonesia Consumer Survey 2013 38
Figure 58: Cigarette consumption by age and income—preference still towards SKM full-flavoured Age Monthly income
% of respondents that smoke* Total Urban Rural Java Non-Java 18-29 30-45 46-55 56-65 <Rp1.5 mn Rp1.5-7.5 mn >Rp7.5 mn
2012
SKM full-flavored 31 28 33 32 26 28 31 34 20 31 30 18
SKT 27 27 24 30 15 17 29 36 52 29 26 21
SKM low-tar, low nicotine 23 28 17 21 27 31 23 9 5 19 24 30
White 8 10 6 11 7 14 8 3 5 4 10 21
Others 11 7 20 6 24 10 10 17 17 17 10 10
2011
SKM full-flavored 29 31 30 33 25 26 32 34 38 31 30 26
SKT 29 25 36 36 12 22 31 40 30 33 29 24
SKM low-tar, low nicotine 24 28 15 19 33 33 22 7 8 16 26 19
White 5 7 1 5 7 7 5 2 4 3 5 12
Others 12 9 18 7 23 12 10 16 20 18 10 19
2010
SKM full-flavored 41 38 46 42 36 38 42 46 35 44 38 27
SKT 29 29 33 34 16 21 33 37 54 30 30 16
SKM low-tar, low nicotine 23 26 14 18 38 34 19 5 12 17 25 38
White 5 6 3 5 4 5 4 6 - 3 5 19
Others 2 1 4 1 6 2 2 4 - 5 2 -
*SKM=machine-made cigarettes, SKT=hand-rolled cigarettes.
Source: Credit Suisse Indonesia Consumer Survey 2013
In view of the new tobacco regulation (PP No. 109/2012 dated 24 Dec 12), we asked respondents whether they consider packaging while purchasing cigarettes. The new regulation (please refer to our 14 January 2013 note, “Gudang Garam: New tobacco regulation—stricter packaging design within 18 months”) covers the production process of tobacco including instructions on the use of nicotine and tar-test contents, additional ingredients, as well as requiring cigarette manufacturers to put pictorial health warnings on their packaging, aiming to convey the danger of smoking to cigarette consumers. In addition, the new regulation also covers the distribution process which includes selling, advertising and promotion, as well as it requires health warnings to be displayed in all types of cigarette ads (printed, broadcast, etc.).
The majority (56% of our respondents) view that packaging is important in making a decision to purchase cigarettes. Also, majority of the respondents (51%) stated that if everything looks identical, the likelihood of switching to cheaper brands is high.
Figure 59: Decision to purchase and likelihood to switch Importance of packaging in decision to purchase If all things looked identical, the likelihood to switch to cheaper
brand? % of respondents that smoke Total Urban Rural % of respondents that smoke Total Urban Rural
Very important 20 22 15 Very likely 13 12 13
Quite important 36 29 48 Quite likely 38 34 45
Not very important 41 44 35 Not very likely 41 42 39
Irrelevant 1 1 1 Not at all likely 4 5 2
I don't know 3 4 1 I don't know 5 7 2
Source: Credit Suisse Indonesia Consumer Survey 2013
Nevertheless, among the brands, Dji Sam Soe (SKT), manufactured by HM Sampoerna (HMSP.JK) continues to lead. Sampoerna A-Mild (SKM low-tar, low-nicotine), also by HM Sampoerna, comes second. Gudang Garam Surya (SKM full-flavored) and Gudang Garam Filter (SKM full-flavored), made by Gudang Garam (GGRM.JK, UNDERPERFORM, TP Rp44,600.00) is the third and fourth most popular brand, respectively. Djarum Super (SKM full-flavoured), from the unlisted Djarum Group, is the fifth most popular brand, down from fourth in the previous survey.
According to the new tobacco regulation, cigarette manufacturers will put pictorial health warnings in every cigarette packaging
Packaging is important, as well as pricing

25 January 2013
Indonesia Consumer Survey 2013 39
About 17% and 16% of the respondents prefer Dji Sam Soe and Sampoerna A-Mild, up from 14% and 12% from the previous year’s survey, while GG Surya and GG Filter is favoured by 15% and 9% of the respondents, up from 11% and 9%, respectively. This is in line with the responses we received when price was not a consideration—majority of the respondents prefer Dji Sam Soe, followed by Sampoerna A-Mild and GG Surya.
Overall, HM Sampoerna’s products across various brands are favoured by 45% of the respondents, up from 37% in the previous year’s survey. Gudang Garam’s products are chosen by 24% of the respondents, up from 20% in the previous year’s survey. Djarum’s products, on the other hand, are favoured by 12% of our respondents, down from 18% in the previous year’s survey.
In the white cigarettes category, Marlboro from Philip Morris is the leading brand; 5% of the respondents favour the product, compared with the 4% in the previous year. This is in line with the response we received when price was not a consideration; Marlboro is the preferred white cigarette. Dunhill from Bentoel Intl (RMBA.JK), a BAT company, is the second most favoured white cigarette, with 2% of respondents favouring the brand.
Figure 60: If price was not a consideration, which cigarette brands would you purchase?
0%
2%
4%
6%
8%
10%
12%
14%
16%
18%
20%
Source: Credit Suisse Indonesia Consumer Survey 2013
HM Sampoerna’s products are favoured by most of the respondents, followed by Gudang Garam’s and Djarum’s products
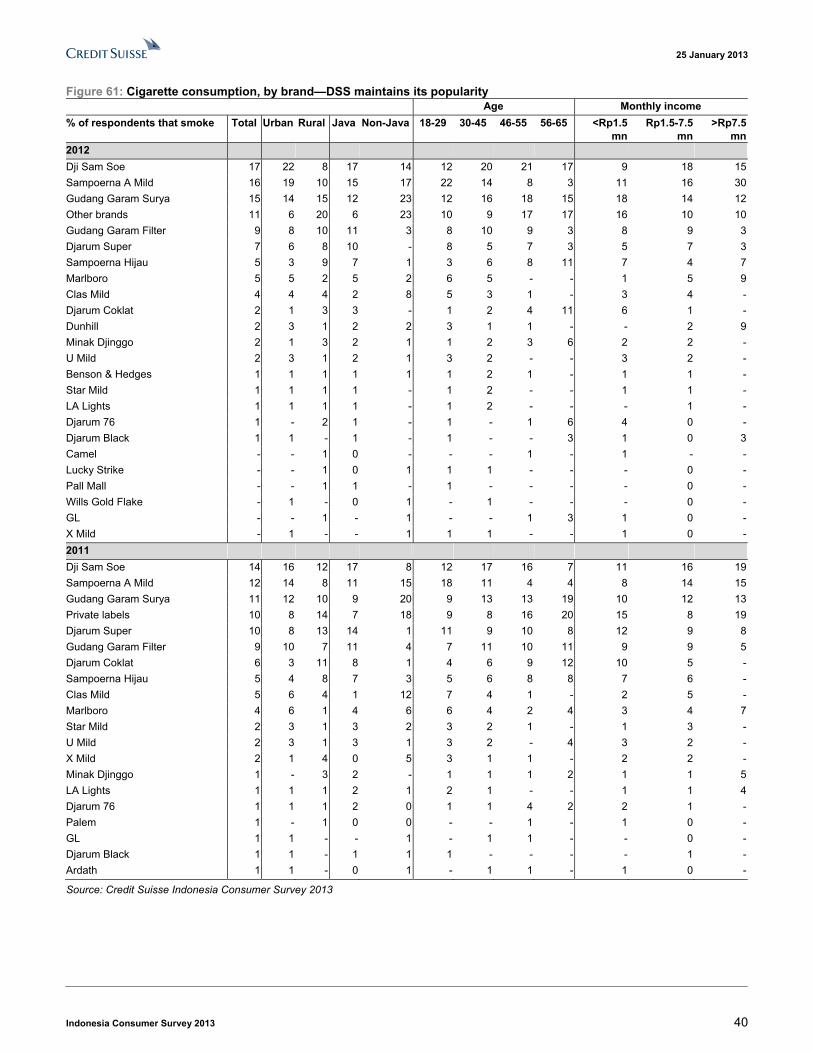
25 January 2013
Indonesia Consumer Survey 2013 40
Figure 61: Cigarette consumption, by brand—DSS maintains its popularity Age Monthly income
% of respondents that smoke Total Urban Rural Java Non-Java 18-29 30-45 46-55 56-65 <Rp1.5 mn
Rp1.5-7.5 mn
>Rp7.5 mn
2012
Dji Sam Soe 17 22 8 17 14 12 20 21 17 9 18 15
Sampoerna A Mild 16 19 10 15 17 22 14 8 3 11 16 30
Gudang Garam Surya 15 14 15 12 23 12 16 18 15 18 14 12
Other brands 11 6 20 6 23 10 9 17 17 16 10 10
Gudang Garam Filter 9 8 10 11 3 8 10 9 3 8 9 3
Djarum Super 7 6 8 10 - 8 5 7 3 5 7 3
Sampoerna Hijau 5 3 9 7 1 3 6 8 11 7 4 7
Marlboro 5 5 2 5 2 6 5 - - 1 5 9
Clas Mild 4 4 4 2 8 5 3 1 - 3 4 -
Djarum Coklat 2 1 3 3 - 1 2 4 11 6 1 -
Dunhill 2 3 1 2 2 3 1 1 - - 2 9
Minak Djinggo 2 1 3 2 1 1 2 3 6 2 2 -
U Mild 2 3 1 2 1 3 2 - - 3 2 -
Benson & Hedges 1 1 1 1 1 1 2 1 - 1 1 -
Star Mild 1 1 1 1 - 1 2 - - 1 1 -
LA Lights 1 1 1 1 - 1 2 - - - 1 -
Djarum 76 1 - 2 1 - 1 - 1 6 4 0 -
Djarum Black 1 1 - 1 - 1 - - 3 1 0 3
Camel - - 1 0 - - - 1 - 1 - -
Lucky Strike - - 1 0 1 1 1 - - - 0 -
Pall Mall - - 1 1 - 1 - - - - 0 -
Wills Gold Flake - 1 - 0 1 - 1 - - - 0 -
GL - - 1 - 1 - - 1 3 1 0 -
X Mild - 1 - - 1 1 1 - - 1 0 -
2011
Dji Sam Soe 14 16 12 17 8 12 17 16 7 11 16 19
Sampoerna A Mild 12 14 8 11 15 18 11 4 4 8 14 15
Gudang Garam Surya 11 12 10 9 20 9 13 13 19 10 12 13
Private labels 10 8 14 7 18 9 8 16 20 15 8 19
Djarum Super 10 8 13 14 1 11 9 10 8 12 9 8
Gudang Garam Filter 9 10 7 11 4 7 11 10 11 9 9 5
Djarum Coklat 6 3 11 8 1 4 6 9 12 10 5 -
Sampoerna Hijau 5 4 8 7 3 5 6 8 8 7 6 -
Clas Mild 5 6 4 1 12 7 4 1 - 2 5 -
Marlboro 4 6 1 4 6 6 4 2 4 3 4 7
Star Mild 2 3 1 3 2 3 2 1 - 1 3 -
U Mild 2 3 1 3 1 3 2 - 4 3 2 -
X Mild 2 1 4 0 5 3 1 1 - 2 2 -
Minak Djinggo 1 - 3 2 - 1 1 1 2 1 1 5
LA Lights 1 1 1 2 1 2 1 - - 1 1 4
Djarum 76 1 1 1 2 0 1 1 4 2 2 1 -
Palem 1 - 1 0 0 - - 1 - 1 0 -
GL 1 1 - - 1 - 1 1 - - 0 -
Djarum Black 1 1 - 1 1 1 - - - - 1 -
Ardath 1 1 - 0 1 - 1 1 - 1 0 -
Source: Credit Suisse Indonesia Consumer Survey 2013

25 January 2013
Indonesia Consumer Survey 2013 41
Personal care: Unilever dominates Majority of our respondents consume personal-care products; however, they are not looking to consume more than what they have been. Compared with the previous year’s survey, the respondents are looking to consume more.
In the cosmetics category, Unilever Indonesia’s (UNVR.JK, UNDERPERFORM, TP Rp15,725.00) products are dominant. Some 48% of the respondents are using cosmetics made by Unilever, up from 38% in the previous year’s survey. This stems from a combination of strong brand equity as well as its long existence in Indonesia (of nearly 80 years); thus, its brands are already widely recognised.
Citra, Unilever’s local skin care brand, is gaining share in this survey. Some 21% of the respondents are favouring Citra, up from 15% in the previous year’s survey. Citra has surpassed Ponds, which is favoured by 18% of the respondents, versus 17% in the previous year’s survey. Citra, which has been in the Indonesian skin care market since 1984, is made from Indonesian natural ingredients with a strong heritage, and is favoured in rural areas among the younger generation.
Figure 62: Cosmetics and skin care consumption, by brand—Unilever products are dominant Age Monthly income
% of respondents Total Urban Rural Java Non-Java 18-29 30-45 46-55 56-65 <Rp1.5 mn Rp1.5-7.5 mn >Rp7.5 mn
2012
Ponds 18 19 16 19 16 23 17 10 14 13 20 18
Citra 21 19 26 18 29 21 21 18 19 21 21 21
Viva 9 8 11 11 6 5 9 21 13 15 8 5
Lux 9 9 11 9 10 7 10 11 11 13 8 8
Sariayu 5 5 3 6 2 4 5 5 6 5 5 3
Others 38 40 33 38 37 39 38 35 37 33 38 45
2011
Ponds 17 17 16 18 16 20 17 12 7 15 17 16
Citra 15 14 18 12 20 15 16 12 14 14 15 6
Viva 9 7 14 12 4 6 9 17 15 14 7 4
Lux 6 7 4 6 6 6 5 7 5 7 5 7
Sariayu 4 5 3 5 2 3 4 5 5 3 4 2
Others 50 51 45 48 52 50 48 49 54 46 50 65
2010
Ponds 24 24 22 25 20 30 20 17 13 22 24 26
Citra 19 18 23 16 27 21 17 19 17 24 18 20
Viva 11 10 14 13 7 6 12 20 18 15 10 3
Lux 12 11 14 10 14 11 13 12 8 9 12 7
Sariayu 5 6 4 6 4 3 8 4 5 4 6 5
Others 29 32 24 30 28 28 31 28 38 27 30 38
Source: Credit Suisse Indonesia Consumer Survey 2013
Key stocks Within the Indonesia food and beverage sector, we like Indofood CBP (ICBP.JK, OUTPERFORM, TP Rp8,100.00) as it is widely exposed to the products that consumers seek to buy. It also has strong brand equity with innovative products such as the beef-based noodle (Mie Goreng Rendang) and the recently launched new product of Mie Goreng Cabe Ijo. Noodle is the highest contributor to the company, accounting for 64% of revenue with 79% of operating profit, and its operating margins stood at 16.5% in 2013E. Within its product portfolio, Indofood CBP also has dairy products as one of the category. Dairy will be its second largest contributor, accounting for 20% of revenue and 12% of operating profit with a margin at 8% in 2013E. The completion of its new factory should help boost volumes this year, with sales volume expected to rise 18% YoY, on a 3% ASP increase.
In the personal care category, Unilever’s products dominate
We like ICBP and MAPI—as we believe they are potential beneficiaries of rising consumption of Indonesians—not GGRM and UNVR due to their demanding valuations
25 January 2013
Indonesia Consumer Survey 2013 42
In the cigarettes space, we do not favour Gudang Garam (GGRM.JK, UNDERPERFORM, TP Rp44,600.00) due to valuation and still-limited exposure to the fastest growing category, even though its existing products continue to be favoured by our respondents. We also do not favour Unilever Indonesia (UNVR.JK, UNDERPERFORM, TP Rp15,725.00) due to its demanding valuation, despite its strong brand equity.
However, in view of the rising middle-income segment and higher confidence among Indonesian consumers, this survey found that spending on discretionary items is more than that on the essentials. Spending on fashion apparel has increased by about 25%, the highest among the items we surveyed. We believe this will benefit the mid- to high-end retailer Mitra Adiperkasa (MAPI.JK, OUTPERFORM, TP Rp8,100.00). The company is managing more than 100 global brands across its divisions, with more than half of the revenue contribution coming from speciality stores, followed by department stores and food and beverage. We expect its strong SSSG to continue due to rising middle- and high-income segments—with a consolidated SSSG of 14% as of FY12, and with specialty stores posting the strongest SSSG of 17%, followed by department stores 13%, F&B 9% and others 3%. We expect its SSSG to reach 13% this year.

25 January 2013
Indonesia Consumer Survey 2013 43
Telecoms sector In view of the rise of middle-income population and increased confidence among Indonesian consumers, spending on discretionary items is rising more than that on the essentials. Basic mobile phones are still preferred to smartphones, which could be due to their affordability; basic mobile phones are likely to rise by less than 10% (versus smartphones by 5%). Based on our survey, basic mobile phone penetration increased from 67% in 2010 to 79% in 2012. Similarly, smartphone users also increased from 13% in 2010 to 22% in 2012. On average, respondents have been using their current handsets for 21 months and will be looking to buy a new phone in the next 13 months, in line with our previous survey results.
On average, monthly phone bill has declined to Rp77,000 from Rp80,000, which we believe is due to the competition among telecoms providers. We also believe that the increasing use of data also contributes to the decline, as data is cheaper than voice.
Figure 63: Utilisation of mobile phone services Age Monthly income
Total Urban Rural Java Non-Java 18-29 30-45 46-55 56-65 <Rp1.5 mn
Rp1.5-7.5 mn
>Rp7.5 mn
2012
Mobile phone ownership % respondents 79 86 66 80 77 90 80 64 48 64 82 98
Is it a smartphone % respondents 22 26 13 21 25 26 21 16 15 13 22 45
Current handset age Months 21 21 20 21 20 18 22 22 25 20 21 19
Timing for next purchase Months 13 12 13 13 12 13 12 13 12 14 12 9
Upgrade to smartphone? % respondents 52 56 40 47 52 57 47 54 25 61 46 54
Av monthly mob phone bill Rp 77,334 81,104 68,051 77,290 77,441 74,174 81,897 70,377 85,577 58,284 77,808 125,000
Access to internet % respondents 9 12 4 90 91 14 8 5 4 4 10 19
2011
Mobile phone ownership % respondents 71 80 56 71 73 86 72 49 42 54 79 84
Is it a smartphone % respondents 17 17 15 15 21 19 16 14 13 10 17 57
Current handset age Months 20 20 20 20 20 18 21 22 24 18 20 19
Timing for next purchase Months 13 12 14 12 14 13 12 13 14 13 12 15
Upgrade to smartphone? % respondents 39 40 37 58 68 45 34 28 38 68 60 40
Av monthly mob phone bill Rp 79,934 85,172 66,582 78,479 83,410 77,831 80,374 90,991 70,745 61,914 82,653 185,714
Access to internet % respondents 15 20 5 86 83 25 13 3 3 5 18 54
2010
Mobile phone ownership % respondents 67 76 51 67 68 80 66 54 35 46 74 91
Is it a smartphone % respondents 13 14 9 12 14 14 13 6 14 10 12 38
Current handset age Months 19 19 19 19 21 18 21 19 22 19 20 16
Timing for next purchase Months 11 11 12 12 10 11 12 9 12 13 11 16
Upgrade to smartphone? % respondents 37 39 31 63 62 48 28 28 13 73 61 63
Av monthly mob phone bill Rp 79,568 82,643 70,865 77,049 85,280 75,915 82,143 82,056 86,806 61,319 82,129 141,667
Access to internet % respondents 14 18 5 87 86 26 8 3 1 7 15 37
Source: Credit Suisse Indonesia Consumer Survey 2013
Nokia remains popular and is still the market leader in Indonesia. Some 42% of the respondents own a Nokia handset, although this declined from its peak of 61% in 2010. Blackberry, on the other hand, is gaining popularity. Its market share in 2010 was only 1%, which rose to 8% in 2012. Samsung also grew its market share to 9% in 2012. Samsung is slightly more popular than Blackberry, given the price range of its handsets matches the varied income levels of Indonesians. In terms of the next purchase of the respondents, Nokia is still the most preferred brand at 47%, followed by Blackberry at 28% and Samsung at 10%.
Increased penetration of basic mobile phones and smartphones
Nokia remains popular, with Samsung and Blackberry gaining share

25 January 2013
Indonesia Consumer Survey 2013 44
Figure 64: Nokia remains popular ... Age Monthly income
Total Urban Rural Java Non-Java 18-29 30-45 46-55 56-65 <Rp1.5 mn
Rp1.5-7.5 mn
>Rp7.5 mn
2012
Nokia 42 40 49 38 53 38 42 57 44 41 43 36
Samsung 9 8 10 10 6 11 8 5 10 7 9 7
Blackberry 8 10 3 8 8 11 8 3 6 1 8 21
Nexian 6 6 7 8 1 8 4 6 6 8 6 4
Others 35 36 31 35 32 32 38 29 34 42 33 31
2011
Nokia 49 48 52 43 65 45 50 59 66 49 51 19
Samsung 4 4 2 4 2 4 3 4 4 2 4 14
Blackberry 3 4 - 4 2 3 3 4 - 1 3 33
Nexian 6 6 6 6 5 7 5 4 2 5 5 5
Others 38 38 40 43 26 41 39 29 28 43 37 28
2010
Nokia 61 59 67 57 72 57 61 71 78 61 61 67
Samsung 3 3 3 3 2 3 2 6 - 3 3 5
Blackberry 1 1 - 2 0 1 1 - - - 1 -
Nexian 5 5 4 5 5 6 5 2 3 7 5 5
Others 30 32 26 34 21 33 31 21 19 29 30 24
Source: Credit Suisse Indonesia Consumer Survey 2013
Figure 65: ... but BlackBerry is in the wish list
Total Urban Rural Java Non-Java 18-29 30-45 46-55 56-65 <Rp1.5mn Rp1.5-7.5mn >Rp7.5mn
2012
Nokia 47 41 59 38 65 37 46 76 76 60 44 50
Blackberry 28 33 17 32 17 34 26 13 10 17 29 29
Others 13 14 12 16 10 15 15 10 9 18 13 12
Samsung 10 11 9 12 6 13 11 - - 3 12 8
Nexian 2 1 3 2 2 1 2 1 5 3 2 -
2011
Nokia 58 52 70 53 68 53 61 63 68 61 58 27
Blackberry 15 19 6 17 12 20 12 8 5 6 17 47
Others 16 17 14 16 15 16 15 16 5 20 14 27
Samsung 5 7 2 7 2 4 6 8 11 5 5 -
Nexian 6 5 8 7 3 7 6 5 11 7 6 -
2010
Nokia 70 69 71 66 79 65 71 79 79 73 68 83
Blackberry 11 14 6 12 9 14 10 10 - 11 12 17
Others 13 11 16 14 8 14 13 6 21 11 14 -
Samsung 2 3 1 2 2 2 2 4 - 1 2 -
Nexian 4 3 6 5 2 5 4 1 - 4 4 -
Source: Credit Suisse Indonesia Consumer Survey 2013
Telkomsel remains the market leader among the mobile phone service providers. However, Telkomsel’s market share is slightly down from last year’s. Indosat, at the second position, is gaining market share, up from 19% to 23%. Excel is positioned third and has also gained market share from 9% to 12% this year.
On the other hand, CDMA operators such as Esia and Telkom Fleksi have seen market share declines, suggesting that CDMA in Indonesia is still less popular than GSM service. On an average, respondents spend Rp77,000/month on their mobile phone bill, with urban respondents spending around 20% higher than rural respondents and the trend is catching up as income levels go up. This is lesser than previous years’ Rp80,000/month.
Telkomsel remains the market leader; CDMA is less favoured

25 January 2013
Indonesia Consumer Survey 2013 45
For selecting the service provider, 29% of the respondents said that better network coverage is the most important attribute, while 27% said cheaper tariffs, and 20% said group user feature is the key. Better network coverage remains the key, especially among rural and outside Java respondents. This is why Telkomsel, which has better coverage, is still preferred by outside Java users (84% outside java vs 25% in Java). Respondents also demand cheaper tariffs. This is especially seen among younger respondents and the low-income group.
Figure 66: Telkomsel remains the market leader as a service provider, especially in the outside Java market, due to its
better coverage Age Monthly income
Total Urban Rural Java Non-Java 18-29 30-45 46-55 56-65 <Rp1.5 mn Rp1.5-7.5 mn >Rp7.5 mn
2012
Telkomsel 43 45 36 25 84 32 50 50 50 38 42 57
Indosat 23 17 37 30 6 26 19 22 25 23 22 16
Esia 6 7 3 9 - 4 7 12 6 7 6 4
Excel 12 12 12 15 3 15 11 7 8 16 12 6
Telkom Fleksi 5 6 2 6 1 3 6 8 4 7 5 6
Others 11 13 10 14 6 20 7 1 7 9 13 12
2011
Telkomsel 45 44 46 28 83 39 48 52 51 39 45 47
Indosat 19 16 26 25 3 24 15 13 13 22 18 29
Esia 13 16 6 18 2 11 15 13 19 11 14 10
Excel 9 9 9 11 6 11 8 6 6 10 9 10
Telkom Fleksi 9 9 10 11 5 7 10 12 11 11 9 5
Others 5 6 3 8 0 8 4 4 - 7 6 -
2010
Telkomsel 47 46 51 31 84 43 49 51 58 50 45 86
Indosat 18 17 22 25 3 22 17 12 14 15 19 5
Esia 12 15 5 17 2 10 14 17 11 9 14 5
Excel 9 9 11 11 4 12 9 3 3 14 9 5
Telkom Fleksi 8 8 8 10 5 6 8 15 11 8 9 -
Others 6 5 3 6 2 7 3 2 3 4 4 0
Source: Credit Suisse Indonesia Consumer Survey 2013
Figure 67: Desired attributes of telecommunications operators, 2012 Age Monthly income
Total Urban Rural Java Non-Java 18-29 30-45 46-55 56-65 <Rp1.5 mn Rp1.5-7.5 mn >Rp7.5 mn
Better coverage 29 29 31 29 32 27 31 31 32 29 30 29
Cheaper tariffs 27 25 30 28 24 29 25 26 21 29 26 25
Group user 20 21 20 22 18 19 20 25 25 23 20 22
Better voice services 9 9 8 8 9 8 10 7 10 7 9 8
Attractive promotions 7 7 6 6 8 9 5 6 3 6 7 7
Better data services 4 4 2 4 4 4 4 3 4 2 4 4
Better cust. service 3 4 2 2 5 3 3 1 4 3 3 4
Attractive handsets 1 0 1 1 1 1 1 0 - 1 1 1
Source: Credit Suisse Indonesia Consumer Survey 2013
Better coverage remains the most important attribute that customers look for

25 January 2013
Indonesia Consumer Survey 2013 46
Figure 68: Kinds of service on the Internet, 2012 Age Monthly income
Total Urban Rural Java Non-Java 18-29 30-45 46-55 56-65 <Rp1.5mn Rp1.5-7.5mn >Rp7.5mn
Social network 39 39 50 39 44 41 40 32 14 41 39 43
Instant messaging 27 27 27 31 20 27 27 32 14 37 27 30
Gaming 15 16 7 12 20 18 13 - 14 14 14 13
Shopping 8 9 7 8 9 9 6 16 - 5 9 9
Banking 6 6 7 8 3 1 9 16 57 - 6 4
Travel 4 4 3 3 5 3 5 5 - 5 4 -
Source: Credit Suisse Indonesia Consumer Survey 2013
Figure 69: Which is your Internet service provider?
0
10
20
30
40
50
60
70
Total Java Non-Java Total Java Non-Java Total Java Non-Java
Telkom Flash Speedy Fastnet (Firstmedia) IM2 Telkomnet
2012 2011 2010
Source: Credit Suisse Indonesia Consumer Survey 2013
Key stocks We like Erajaya Swasembada Tbk (ERAA.JK, OUTPERFORM, TP Rp3,300.00), Indonesia’s largest distributor of mobile phones; its portfolio includes popular brands such as BlackBerry, Samsung, Apple, Sony Ericsson and Nokia. Erajaya’s distribution business is the major contributor to its revenue, despite the company continuing to expand its retail business. Currently, its retail business contributes less than 30% to its revenue. As of end-2012, it operated 399 stores. During the year, it opened 101 stores (including two new iBox, and 19 stores from iBox acquisition). This year, it plans to add 105 stores (including 35 iBox and six Megastores). Most of the new stores will be located outside Java. Management expects its retail business to contribute around 40% to revenue by 2015 with a total of 800 stores. The expansion in the retail business makes sense as its margins are better than that in the distribution business (the difference varies between brands; however, on a blended basis, it is around 100-200 bp higher for retail). Management also estimates that the SSSG for 2012 is around 22%, versus 18% in 2011. It expects an 18-20% SSSG for this year. With the government increasing the minimum wage, we believe Erajaya could benefit. The company’s extensive distribution network and brand portfolio enable it to penetrate the rise in consumers’ purchasing power. Moreover, the majority of its revenue (69%) is derived from Jabodetabek and Kalimantan, both of which have the highest average minimum wage increase compared with other provinces.
We like ERAA as we believe it is a potential beneficiary of Indonesia’s rising mobile phone and telecommunications penetration

25 January 2013
Indonesia Consumer Survey 2013 47
Healthcare sector We believe the Indonesian healthcare sector still has significant growth potential due to the current low penetration of the sector. Indonesia’s per-capita healthcare expenditure is among the lowest compared to other countries. Although we observe increasing healthcare expenditure as a percentage of GDP in Indonesia over the years, the level is still the lowest compared with other countries.
Figure 70: Indonesia healthcare expenditure per capita is
among the lowest …
Figure 71: Healthcare expenditure as a percentage of GDP
is also the lowest among other countries … 990
678649
525
221
77 54
0
100
200
300
400
500
600
700
800
900
1000
Brazil Turkey SouthAfrica
Russia China Indonesia India
Hea
lth e
xpen
ditu
re p
er c
apita
(USD
)
9 9
7
5 5
4
3
0
1
2
3
4
5
6
7
8
9
10
Brazil SouthAfrica
Turkey China Russia India Indonesia
Hea
lth e
xpen
ditu
re a
s %
of G
DP
Source: World Bank data (2010) Source: World Bank data (2010)
Figure 72: Increasing trend of health expenditure as a percentage of GDP
1.0
1.5
2.0
2.5
3.0
3.5
303234
36384042
444648
50
1995 1996 1997 1998 1999 2000 2001 2002 2003 2004 2005 2006 2007 2008 2009 2010
Public health exp. as % of total health exp. Health exp. as % of GDP (RHS)
Source: Credit Suisse Indonesia Consumer Survey 2013
Indonesia is one market where our survey respondents registered higher spend on healthcare over the past two years, and this corresponds with the number of respondents reproving effectively lower access to state-funded pharmaceuticals and vaccines. Only about 35-40% of the respondents claimed access to state-funded healthcare against government statistics of around 46% of the population being covered by health insurance schemes. Quality healthcare services available close by in places such as Singapore has led to significant expenditure on health outside of the local market for the wealthier Indonesians.
Some 34% of the respondents reported to have access to State-funded healthcare, the lowest among emerging countries. Access to state-funded healthcare has declined in 2012 compared with 2011. We found that 34% and 49% of the respondents in the rural areas
We foresee significant growth potential in the healthcare sector given the current low penetration

25 January 2013
Indonesia Consumer Survey 2013 48
and outside Java utilise state healthcare facilities, while only 33% and 27% of the respondents in urban areas and in Java do so. This suggests that Java respondents prefer to use private healthcare facilities as they can afford it.
Figure 73: Access to state healthcare declining
34 33 34
27
49
4037
45
30
62
34 3533
27
51
0
10
20
30
40
50
60
70
Total2012
Urban Rural Java NonJava
Total2011
Urban Rural Java NonJava
Total2010
Urban Rural Java NonJava
People with access to State Healthcare (%)
2012 2011 2010
Source: Credit Suisse Indonesia Consumer Survey 2013
Since 2005, there is a government-funded healthcare scheme operating for the poor—Jamkesmas—which provides drugs from the Essential Drug List (EDL). There is also a health insurance scheme, Askes, which reimburses drugs from the broader Daftar Plafon Harga Obat (DPHO). Prices are not the same under each programme, and manufacturers of branded drugs can now price their products only up to 3x the price of molecules which are listed on the EDL.
Doctors dominate the medicine-brand decision-making in Indonesia, while the patient only decides 18% of the consumption by self. Poly pharmacy is popular with multiple scripts from doctors and high sales of antibiotics. Hospitals earn fees from dispensing and doctors also receive financial incentives for prescribing.
Only a small number of people expect to spend more on medicine in 2013, according to our survey. Our survey also found that people in the middle income group are willing to pay more for international brands of medicine.

25 January 2013
Indonesia Consumer Survey 2013 49
Figure 74: Doctors dominate medicine brand decisions in
Indonesia
Figure 75: Only a small number of people expect to spend
more on medicine
The doctor46%
The pharmacist36%
The patient18%
Medicine brand deciders
4 4 5 4 4
55 54 55 57
50
41 42 40 39
45
-
10
20
30
40
50
60
Total 2012 Urban Rural Java Non Java
% o
f res
pond
ents
More The same Less
Source: Credit Suisse Indonesia Consumer Survey Source: Credit Suisse Indonesia Consumer Survey
Figure 76: How much extra would you be willing to pay for an international medicine brand, rather than a locally
produced product?
Total Less than
1,000k Rp1,000 - 1,500k
Rp1,500-2,000k
Rp2,000 - 3,000k
Rp3,000 - 5,000k
Rp5,000 - 7,500k
Rp7,500-10,000k
Rp10,000 - 15,000k
More than Rp15,000k
Would prefer not to answer
Not prepared to pay extra 69 83 79 69 65 67 64 64 77 79 73
Prepared to pay 1-10% extra 24 16 18 24 27 25 26 20 15 7 20
Prepared to pay 11-20% extra 6 1 3 5 7 6 9 12 0 7 7
Prepared to pay 21-30% extra 1 0 0 1 0 2 1 0 0 7 0
Prepared to pay > 30% extra 0 0 0 1 0 0 0 4 8 0 0
Source: Credit Suisse Indonesia Consumer Survey 2013
The top 15 corporations account for around 55% of the market and multinationals account for around 33% of sales, slightly lower than five years ago due to growth in the local generics industry, part of which is state-owned.
Figure 77: % breakdown of disposable income spending Figure 78: IMS top corporations 2011
0%
5%
10%
15%
20%
25%
30%
35%
Hou
sing
+P
ublic
Util
ities
Foo
d
Ent
erta
inm
ent
Aut
os
Hea
lthca
re
Edu
catio
n
HP
C
Sav
ings
Mob
ile p
hone
Oth
er
2012 2011 2010
-
100
200
300
400
500
600
700
800
900
1,000
Kal
be P
harm
a
San
be
Dex
a
Soh
o
Pha
ros
Tem
po
GS
K
Abb
ott
Nov
artis
San
ofi
Fahr
enhe
it
Bay
er
Kim
ia
Inte
rbat
Pfiz
er
Sal
es $
bn
Source: Credit Suisse Indonesia Consumer Survey 2013 Source: IMS data, Credit Suisse estimates
25 January 2013
Indonesia Consumer Survey 2013 50
Key stocks Due to its demanding valuation, we do not favour Kalbe Farma (KLBF.JK, UNDERPERFORM, TP Rp800.00) despite the stock being a potential beneficiary of Indonesia’s rising exposure to healthcare and growing consumption. The implementation of universal healthcare coverage is expected to start in 2014. Management expects this to happen in stages and benefit mostly generic drugs. As such, it is ready to supply the drugs with the commencement of its new factory. Kalbe Farma has a 12% market share and will be competing with state-owned pharmaceutical companies such as Kimia Farma and Indofarma. Prescription pharma division accounts for 25% of its total revenue, of which 10% is from unbranded generics, 32% from licensed products and 58% from branded generics. The prescription pharma division accounts for 32% of its total gross profit, with gross margin, as of 9M12, at 62%. The recent weakness of the rupiah against the USD has prompted management to increase its pricing by around 3-5% in March/April for its generic drugs.
KLBF is a beneficiary of Indonesia’s rising healthcare and consumption. However, we do not favour the stock

25 January 2013
Indonesia Consumer Survey 2013 51
Property sector Our survey found that around 74% of respondents either have houses or their family members own houses. Indonesia has the highest respondents wanting to buy a house, compared with other countries in our survey. This is supported by the confidence seen in terms of income and personal finance outlook among the Indonesian respondents. Some 30% of the respondents plan to buy a house in the next two years, this is up from 25% in the previous survey. Of those, 37% are first-time home buyers, while 39% are looking to upgrade from their current property.
Penetration of mortgage in Indonesia is still low, at only 9%; a similar level was seen in our previous survey. This is likely to increase. Some 30% of the respondents said they plan to buy property in the next two years and from those, 33% said they are considering using mortgage to purchase their next property.
Figure 79: Property ownership and potential purchase % of respondents Total Urban Rural Java Non-Java 18-29 30-45 46-55 56-65 <Rp1.5mn Rp1.5-7.5mn >Rp7.5mn
2012
Property ownership 74 65 90 74 73 70 72 84 86 77 73 79
Planning to buy in next 2 yrs? 30 34 22 28 33 30 33 29 15 21 32 43
Reason to buy
Upgrade 39 34 53 36 44 38 38 37 59 51 38 26
First-time home buyer 37 39 30 38 35 46 35 28 6 36 37 39
Investment 15 16 12 14 16 8 17 20 29 2 17 22
Change of location 9 11 5 12 4 6 10 14 6 11 8 13
Holiday property - - 1 0 1 1 0 2 0 - 1 -
2011
Property ownership 70 63 83 73 63 65 68 78 81 67 70 85
Planning to buy in next 2 yrs? 25 28 18 25 23 27 27 20 11 17 27 37
Reason to buy
Upgrade 31 32 28 33 26 27 29 47 50 32 31 10
First-time home buyer 45 46 42 43 51 53 45 26 17 53 44 10
Investment 17 16 19 17 16 13 19 21 17 8 17 80
Change of location 7 5 11 7 8 7 7 6 17 7 7 -
Holiday property - - - - - 0 0 0 0 - - -
2010
Property ownership 73 66 86 74 71 67 70 86 92 71 74 69
Planning to buy in next 2 yrs? 24 30 12 24 22 23 27 22 11 15 27 42
Reason to buy
Upgrade 38 39 35 39 37 35 36 48 55 42 37 55
First-time home buyer 33 32 37 32 35 36 40 6 0 48 31 18
Investment 13 12 18 12 18 9 12 22 36 2 15 27
Change of location 15 17 7 17 11 19 9 24 9 8 17 -
Holiday property - - - - - 0 0 0 0 - - -
Source: Credit Suisse Indonesia Consumer Survey 2013
Figure 80: Percentage of respondents using financing facilities to acquire their property 2012 2011
% of respondents Total Urban Rural Java Non-Java Total Urban Rural Java Non-Java
Current 9 16 2 9 12 8 10 7 9 7
Future 33 38 17 31 37 40 45 27 40 40
Source: Credit Suisse Indonesia Consumer Survey 2013
Indonesia has the highest respondents wanting to buy a house, compared with other countries in our survey
Indonesia mortgage penetration is only 9%; however more people are considering mortgage to purchase their next property

25 January 2013
Indonesia Consumer Survey 2013 52
Figure 81: Indonesia has the highest respondent wanting
to buy a house
Figure 82: More people looking to upgrade houses
30
23
20 19
14
8
25 24
16 17
14
6
2422 22
10
13
7
0
5
10
15
20
25
30
35
Indonesia Brazil China Saudi India Russia
% o
f res
pond
ents
wan
ting
to b
uy a
hou
se in
nex
t 2 y
rs
2012 2011 2010
3937
15
9
31
45
17
7
0
5
10
15
20
25
30
35
40
45
50
Upgrade First-time homebuyer
Investment Change oflocation
2012 2011
Source: Credit Suisse Indonesia Consumer Survey 2013 Source: Credit Suisse Indonesia Consumer Survey 2013
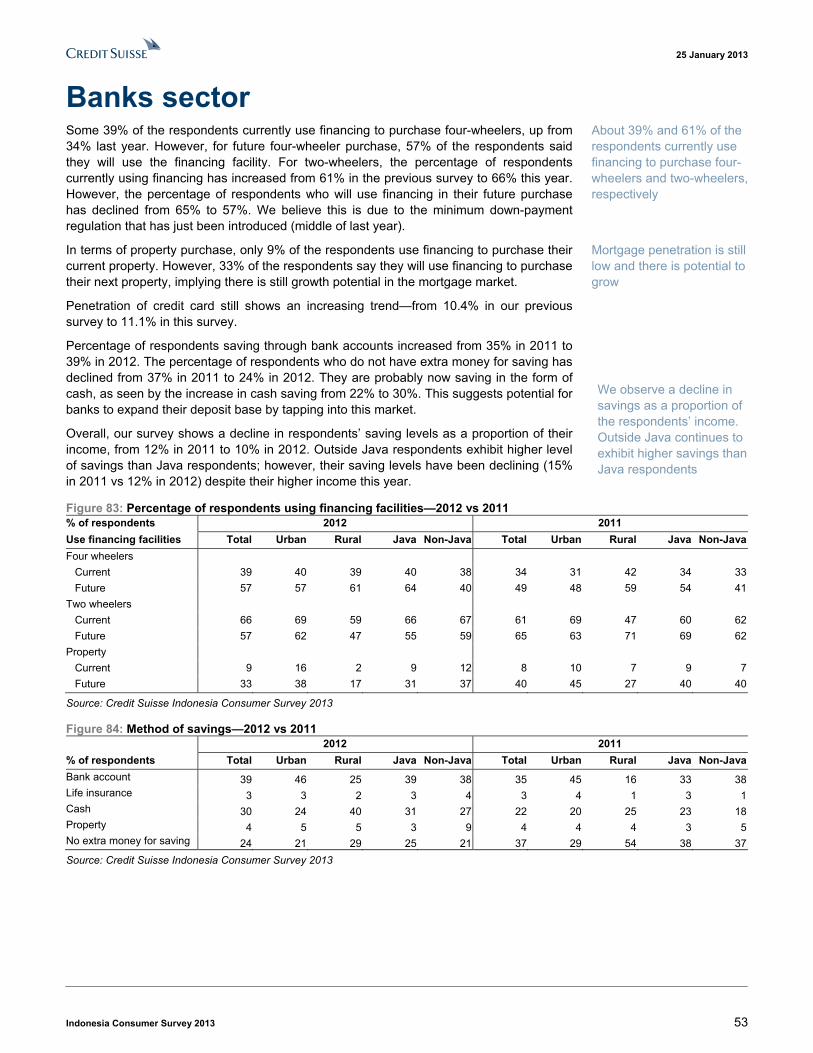
25 January 2013
Indonesia Consumer Survey 2013 53
Banks sector Some 39% of the respondents currently use financing to purchase four-wheelers, up from 34% last year. However, for future four-wheeler purchase, 57% of the respondents said they will use the financing facility. For two-wheelers, the percentage of respondents currently using financing has increased from 61% in the previous survey to 66% this year. However, the percentage of respondents who will use financing in their future purchase has declined from 65% to 57%. We believe this is due to the minimum down-payment regulation that has just been introduced (middle of last year).
In terms of property purchase, only 9% of the respondents use financing to purchase their current property. However, 33% of the respondents say they will use financing to purchase their next property, implying there is still growth potential in the mortgage market.
Penetration of credit card still shows an increasing trend—from 10.4% in our previous survey to 11.1% in this survey.
Percentage of respondents saving through bank accounts increased from 35% in 2011 to 39% in 2012. The percentage of respondents who do not have extra money for saving has declined from 37% in 2011 to 24% in 2012. They are probably now saving in the form of cash, as seen by the increase in cash saving from 22% to 30%. This suggests potential for banks to expand their deposit base by tapping into this market.
Overall, our survey shows a decline in respondents’ saving levels as a proportion of their income, from 12% in 2011 to 10% in 2012. Outside Java respondents exhibit higher level of savings than Java respondents; however, their saving levels have been declining (15% in 2011 vs 12% in 2012) despite their higher income this year.
Figure 83: Percentage of respondents using financing facilities—2012 vs 2011 % of respondents 2012 2011
Use financing facilities Total Urban Rural Java Non-Java Total Urban Rural Java Non-Java
Four wheelers
Current 39 40 39 40 38 34 31 42 34 33
Future 57 57 61 64 40 49 48 59 54 41
Two wheelers
Current 66 69 59 66 67 61 69 47 60 62
Future 57 62 47 55 59 65 63 71 69 62
Property
Current 9 16 2 9 12 8 10 7 9 7
Future 33 38 17 31 37 40 45 27 40 40
Source: Credit Suisse Indonesia Consumer Survey 2013
Figure 84: Method of savings—2012 vs 2011 2012 2011
% of respondents Total Urban Rural Java Non-Java Total Urban Rural Java Non-Java
Bank account 39 46 25 39 38 35 45 16 33 38Life insurance 3 3 2 3 4 3 4 1 3 1Cash 30 24 40 31 27 22 20 25 23 18Property 4 5 5 3 9 4 4 4 3 5No extra money for saving 24 21 29 25 21 37 29 54 38 37
Source: Credit Suisse Indonesia Consumer Survey 2013
About 39% and 61% of the respondents currently use financing to purchase four-wheelers and two-wheelers, respectively
Mortgage penetration is still low and there is potential to grow
We observe a decline in savings as a proportion of the respondents’ income. Outside Java continues to exhibit higher savings than Java respondents

25 January 2013
Indonesia Consumer Survey 2013 54
Figure 85: Higher saving level by outside Java people Figure 86: Increase penetration of credit card
1011
8
10
1212
13
9
11
15
-
2
4
6
8
10
12
14
16
Total
Urban
Rural
Java
Non-Java
Total
Urban
Rural
Java
Non-Java
Savi
ng (a
s %
of t
otal
inco
me)
2012 2011
11.1
10.4
9.4
8
8.5
9
9.5
10
10.5
11
11.5
2012 2011 2010
Aver
age
spen
ding
via
cre
dit c
ard
(%)
Source: Credit Suisse Indonesia Consumer Survey 2013 Source: Credit Suisse Indonesia Consumer Survey 2013
Key stocks In the banking sector, we continue to like Bank Central Asia (BBCA.JK, OUTPERFORM, TP Rp11,000.00) and Bank Mandiri (BMRI.JK, OUTPERFORM, TP Rp11,000.00). Indonesia’s loan- and deposit-to-GDP ratio remains the lowest in the region, implying the low penetration of the banking sector. We believe that both BBCA and BMRI are well-positioned to benefit from the increasing banking sector penetration in Indonesia. These two banks lead in terms of market share of loans, deposits and CASA compared to other banks in the country.
Consumer loans account for 28% and 14% of BBCA’s and BMRI’s total loans, respectively. BBCA continues to focus on the mortgage sector; its mortgage loans are one of the most preferred by customers due to its low and competitive rates. Our survey found that mortgage penetration in Indonesia is only 9%. Given this low penetration, we believe there is significant potential for BBCA to grow in this mortgage market. BMRI also has 5% exposure of its loan book to micro loans, which have been growing rapidly. Thus, BMRI also benefits from the increase in purchasing power in the mass market and the emergence of middle class in Indonesia.
BBCA remains our top pick in the banking sector as the bank has one of the highest growth capacities, supported by its low LDR (68.9%). It also has one of the highest CASA contributions to total deposits (79.5%), allowing the bank to have one of the lowest CoF (2.1%) of all Indonesian banks, making it well positioned to deliver above-industry growth, by offering more competitive pricing to borrowers while at the same time still sustaining robust NIM (5.1%).
We like BBCA and BMRI as potential beneficiaries of rising banking sector penetration in Indonesia
BBCA remains our top pick

25 January 2013
Indonesia Consumer Survey 2013 55

25 January 2013
Indonesia Consumer Survey 2013 56
Key stock selections

25 January 2013
Indonesia Consumer Survey 2013 57
Asia Pacific / IndonesiaAutomobile Manufacturers
Astra International (ASII.JK / ASII IJ)
Attractive option for consumer exposure
■ Attractive exposure to the consumer sector. The auto segment contributes 53% of ASII’s FY13E earnings. We believe ASII is an attractive option for investors looking for exposure to the Indonesian consumer sector. Currently, ASII and ASII’s auto implied valuations exhibit the lowest 2013E P/E among all Indonesian consumer-related names under our coverage.
■ Expect recovery in earnings growth. We expect ASII’s net income growth to recover from 8% in FY12E to 36% in FY13E, versus the historical average of 25%. Much of the resurgence in earnings growth is supported by our expectation of contribution from Low Cost Green Car (LCGC). We believe the Indonesian government will issue a regulation regarding LCGC in 1H13E, and given ASII’s solid track record, we expect it to roll out products by 2H13E while its competitor should only be able to do so by end-FY13E/early-FY14E. Thus, we expect Astra to capture 100% LCGC market share in FY13E.
■ Attractive entry point. ASII has underperformed the JCI by 5% in the past three months and by 13% in the past 12 months. Much of the underperformance in ASII’s share price has been due to the drag from its commodity segment: from AALI (CPO sector) and UNTR (mining contracting sector). We believe the heavy machinery sales of UNTR bottomed in FY12, and we expect improvement in sentiment on UNTR and, in turn, on ASII. ASII is trading at 11.9x 12-month forward P/E, down from the peak of 16.4x at January 2012. Similarly, ASII’s auto implied P/E is currently at 12.7x 12-month forward P/E, versus the historical peak of 17.8x in July 2011.
■ Maintain OUTPERFORM. We maintain our target price of Rp9,400, based on SOTP, implying 14.6x 2013E P/E. At the current price, Astra’s auto division trades at 11.4x forward P/E versus a historical peak of 17.8x.
Share price performance
80
100
120
140
4000
6000
8000
10000
Jan-11 May-11 Sep-11 Jan-12 May-12 Sep-12
Price (LHS) Rebased Rel (RHS)
The price relative chart measures performance against the JSX COMPOSITE INDEX which closed at 4418.73 on 23/01/13 On 23/01/13 the spot exchange rate was Rp9630./US$1
Performance Over 1M 3M 12M Absolute (%) 4.0 -1.9 -0.8 Relative (%) 0.0 -3.7 -11.4
Financial and valuation metrics
Year 12/11A 12/12E 12/13E 12/14ERevenue (Rp bn) 162,564.0 189,173.2 219,878.4 250,855.6EBITDA (Rp bn) 23,228.0 26,807.9 35,181.4 41,426.4EBIT (Rp bn) 17,832.0 19,832.9 25,636.4 29,972.3Net profit (Rp bn) 17,785.0 19,124.9 25,983.4 30,456.9EPS (CS adj.) (Rp) 439.31 472.41 641.83 752.33Change from previous EPS (%) n.a. 0 0 0Consensus EPS (Rp) n.a. 473 539 615EPS growth (%) 23.8 7.5 35.9 17.2P/E (x) 17.8 16.5 12.2 10.4Dividend yield (%) 2.6 3.4 3.6 4.9EV/EBITDA (x) 15.0 12.5 9.7 8.2P/B (x) 5.2 4.6 3.7 3.2ROE (%) 32.4 29.5 33.9 33.1Net debt/equity (%) 42.0 23.5 24.3 21.2
Source: Company data, Thomson Reuters, Credit Suisse estimates.
Rating OUTPERFORM* Price (23 Jan 13, Rp) 7,800.00 Target price (Rp) 9,400.00¹ Upside/downside (%) 20.5 Mkt cap (Rp bn) 315,771.7 (US$ 32.8) Enterprise value (Rp bn) 336,065 Number of shares (mn) 40,483.55 Free float (%) 45.2 52-week price range 8,200.0 - 6,240.0 ADTO - 6M (US$ mn) 27.0
*Stock ratings are relative to the coverage universe in each analyst's or each team's respective sector. ¹Target price is for 12 months.
Research Analysts
Teddy Oetomo 62 21 2553 7911
Dian Haryokusumo 62 21 255 37974

25 January 2013
Indonesia Consumer Survey 2013 58
Astra International ASII.JK / ASII IJ Price (23 Jan 13): Rp7,800.00, Rating: OUTPERFORM, Target Price: Rp9,400.00, Analyst: Teddy Oetomo Target price scenario
Scenario TP %Up/Dwn Assumptions Upside 12,700.00 62.82 FY13E ASII LCGC sales volume 550,000 units Central Case 9,400.00 20.51 FY13E ASII LCGC sales volume 166,760 units Downside 7,800.00 0 FY13E ASII LCGC sales volume 58,520 units
Key earnings drivers 12/11A 12/12E 12/13E 12/14ELCGC sales volume — — 166,760 273,086Conversion from sport 2W — — 0.20 0.20Real GDP growth — — 0.06 0.06Policy rate — — 0.07 0.06
— — — —
Income statement (Rp bn) 12/11A 12/12E 12/13E 12/14ESales revenue 162,564 189,173 219,878 250,856Cost of goods sold 130,530 153,522 176,702 201,719SG&A 14,202 15,818 17,540 19,165Other operating exp./(inc.) (5,396) (6,975) (9,545) (11,454)EBITDA 23,228 26,808 35,181 41,426Depreciation & amortisation 5,396 6,975 9,545 11,454EBIT 17,832 19,833 25,636 29,972Net interest expense/(inc.) 14.0 (256.8) (278.2) (342.8)Non-operating inc./(exp.) 7,954 7,379 10,795 12,872Associates/JV — — — —Recurring PBT 25,772 27,469 36,710 43,188Exceptionals/extraordinaries — — — —Taxes 4,695 5,004 6,688 7,868Profit after tax 21,077 22,465 30,022 35,320Other after tax income — — — —Minority interests 3,292 3,340 4,039 4,863Preferred dividends — — — —Reported net profit 17,785 19,125 25,983 30,457Analyst adjustments — — — —Net profit (Credit Suisse) 17,785 19,125 25,983 30,457
Cash flow (Rp bn) 12/11A 12/12E 12/13E 12/14EEBIT 17,832 19,833 25,636 29,972Net interest — — — —Tax paid — — — —Working capital (9,674) (2,810) (9,907) (10,955)Other cash & non-cash items 1,172 3,477 6,631 8,401Operating cash flow 9,330 20,500 22,361 27,419Capex (13,381) (15,080) (17,626) (19,121)Free cash flow to the firm (4,051) 5,420 4,735 8,298Disposals of fixed assets — — — —Acquisitions — — — —Divestments — — — —Associate investments — — — —Other investment/(outflows) 4,704 15,299 (2,327) 2,511Investing cash flow (8,677) 218 (19,952) (16,609)Equity raised 242.0 221.5 685.8 447.4Dividends paid (8,191) (10,671) (11,475) (15,590)Net borrowings 20,873 2,297 10,520 10,800Other financing cash flow (7,542) — — —Financing cash flow 5,382 (8,153) (269) (4,343)Total cash flow 6,035 12,566 2,139 6,467Adjustments 71.0 — — —Net change in cash 6,106 12,566 2,139 6,467
Balance sheet (Rp bn) 12/11A 12/12E 12/13E 12/14ECash & cash equivalents 13,111 25,677 27,816 34,283Current receivables 15,083 17,125 19,869 22,860Inventories 11,990 12,995 14,936 17,056Other current assets 25,794 28,733 34,319 40,584Current assets 65,978 84,530 96,940 114,782Property, plant & equip. 32,600 37,915 42,735 46,865Investments 16,997 17,410 19,533 22,083Intangibles — — — —Other non-current assets 37,946 29,858 41,001 48,017Total assets 153,521 169,714 200,209 231,747Accounts payable 15,542 16,931 19,340 22,201Short-term debt 21,040 26,765 30,993 34,989Current provisions 196.0 268.8 322.7 384.0Other current liabilities 11,593 15,352 17,670 20,172Current liabilities 48,371 59,316 68,326 77,746Long-term debt 23,950 19,206 22,142 25,202Non-current provisions 1,718 1,989 2,388 2,842Other non-current liab. 3,644 2,838 3,298 3,763Total liabilities 77,683 83,349 96,154 109,552Shareholders' equity 60,449 69,124 84,319 99,633Minority interests 15,389 17,240 19,736 22,562Total liabilities & equity 153,521 169,714 200,209 231,747
Per share data 12/11A 12/12E 12/13E 12/14EShares (wtd avg.) (mn) 40,484 40,484 40,484 40,484EPS (Credit Suisse) (Rp) 439 472 642 752DPS (Rp) 202 264 283 385BVPS (Rp) 1,493 1,707 2,083 2,461Operating CFPS (Rp) 230 506 552 677
Key ratios and valuation
12/11A 12/12E 12/13E 12/14E
Growth(%) Sales revenue 26.0 16.4 16.2 14.1EBIT 21.1 11.2 29.3 16.9Net profit 23.8 7.5 35.9 17.2EPS 23.8 7.5 35.9 17.2Margins (%) EBITDA 14.3 14.2 16.0 16.5EBIT 11.0 10.5 11.7 11.9Pre-tax profit 15.9 14.5 16.7 17.2Net profit 10.9 10.1 11.8 12.1Valuation metrics (x) P/E 17.8 16.5 12.2 10.4P/B 5.22 4.57 3.74 3.17Dividend yield (%) 2.59 3.38 3.63 4.94P/CF 33.8 15.4 14.1 11.5EV/sales 2.14 1.78 1.55 1.36EV/EBITDA 15.0 12.5 9.7 8.2EV/EBIT 19.5 16.9 13.3 11.4ROE analysis (%) ROE 32.4 29.5 33.9 33.1ROIC 15.3 15.1 17.8 17.7Asset turnover (x) 1.06 1.11 1.10 1.08Interest burden (x) 1.45 1.39 1.43 1.44Tax burden (x) 0.82 0.82 0.82 0.82Financial leverage (x) 2.02 1.97 1.92 1.90Credit ratios Net debt/equity (%) 42.0 23.5 24.3 21.2Net debt/EBITDA (x) 1.37 0.76 0.72 0.63Interest cover (x) 1,274 (77) (92) (87)
Source: Company data, Thomson Reuters, Credit Suisse estimates.
0
2
4
6
8
10
12
14
16
18
20
2008 2009 2010 2011 2012 2013
12MF P/E multiple
0.0
0.5
1.0
1.5
2.0
2.5
3.0
3.5
4.0
4.5
5.0
2008 2009 2010 2011 2012 2013
12MF P/B multiple
Source: IBES

25 January 2013
Indonesia Consumer Survey 2013 59
Asia Pacific / IndonesiaPackaged Foods
Indofood CBP (ICBP.JK / ICBP IJ)
Strengthening its position as the largest food producer
■ Noodle is its major contributor and continues to provide healthy profitability. We expect Noodle volume growth at a modest 5% this year, after an 11% increase last year, which was due to the lower-end product (Sarimi Mie Duo—two noodle blocks in one packet) lowering ASP. We expect a 2% ASP increase this year, after no increase last year due to product mix. The company’s launch of beef-based noodle (Mie Goreng Rendang) is being well received by the consumer—it recently launched a new product, Mie Goreng Cabe Ijo. We expect Noodle to account for 64% revenue and 79% of operating profit, and with operating margin at 16.5% in FY13.
■ Dairy expansion to come on stream. In FY13E, dairy should be its second largest contributor, accounting for 20% of revenue and 12% of operating profit with margin at 8%. The completion of its new factory should boost volume this year—we expect sales volume to surge 18% YoY, on 3% ASP increase.
■ New JVs to expand product portfolio. Last year, the company signed MoUs to set up separate JVs with Asahi (to manufacture and market non-alcoholic beverage) and Tsukishima Foods Industry (to manufacture and market a variety of margarines). Although details on the JVs are not yet available, we believe this is positive and will strengthen its position as Indonesia’s largest food producer.
■ Maintain OUTPERFORM. We continue to like Indofood CBP in the consumer space, with undemanding valuation compared to peers. Our SOTP-based target price at Rp8,100, implies 18.6x 2013E P/E with 14% estimated earnings growth over the next two years.
Share price performance
80100120140160
4000
6000
8000
10000
Jan-11 May-11 Sep-11 Jan-12 May-12 Sep-12
Price (LHS) Rebased Rel (RHS)
The price relative chart measures performance against the JSX COMPOSITE INDEX which closed at 4418.73 on 23/01/13 On 23/01/13 the spot exchange rate was Rp9630./US$1
Performance Over 1M 3M 12M Absolute (%) — 11.0 59.4 Relative (%) -4.0 9.2 48.8
Financial and valuation metrics
Year 12/11A 12/12E 12/13E 12/14ERevenue (Rp bn) 19,367.2 22,102.2 24,664.9 27,396.5EBITDA (Rp bn) 2,997.8 3,391.7 3,865.5 4,274.9EBIT (Rp bn) 2,608.0 2,890.8 3,331.6 3,703.7Net profit (Rp bn) 1,975.3 2,185.0 2,546.0 2,856.0EPS (CS adj.) (Rp) 338.77 374.72 436.63 489.81Change from previous EPS (%) n.a. 0 0 0Consensus EPS (Rp) n.a. 392 438 484EPS growth (%) -1.5 10.6 16.5 12.2P/E (x) 23.8 21.5 18.4 16.4Dividend yield (%) 1.4 2.1 2.3 2.7EV/EBITDA (x) 14.4 12.3 10.4 9.0P/B (x) 4.6 4.1 3.6 3.2ROE (%) 20.6 20.2 21.0 20.9Net debt/equity (%) net cash net cash net cash net cash
Source: Company data, Thomson Reuters, Credit Suisse estimates.
Rating OUTPERFORM Price (23 Jan 13, Rp) 8,050.00 Target price (Rp) 8,100.00¹ Upside/downside (%) 0.62 Mkt cap (Rp bn) 46,939.2 (US$ 4.9) Enterprise value (Rp bn) 41,616 Number of shares (mn) 5,830.95 Free float (%) 19.4 52-week price range 8,200.0 - 5,000.0 ADTO - 6M (US$ mn) 2.3
*Stock ratings are relative to the coverage universe in each analyst's or each team's respective sector. ¹Target price is for 12 months.
Research Analyst
Ella Nusantoro 62 21 255 37917

25 January 2013
Indonesia Consumer Survey 2013 60
Indofood CBP ICBP.JK / ICBP IJ Price (23 Jan 13): Rp8,050.00, Rating: OUTPERFORM, Target Price: Rp8,100.00, Analyst: Ella Nusantoro TP scenario Scenario TP %Up/Dwn Assumptions
Upside 8,800.00 9.32 Based on SOTP with 13E EV/EBITDA target of 13.6x for noodle, 7.9x for dairy, and 11x for food seasonings, snack foods, and nutrition and special foods
Central Case 8,100.00 0.62 Based on SOTP with 13E EV/EBITDA target of 12.4x for noodle, 7.2x for dairy, and 10x for food seasonings, snack foods, and nutrition and special foods
Downside 7,400.00 (8.07) Based on SOTP with 13E EV/EBITDA target of 11.2x for noodle, 6.5x for dairy, and 9x for food seasonings, snack foods, and nutrition and special foods
Key earnings drivers 12/11A 12/12E 12/13E 12/14EGDP growth 6.50 6.40 5.60 5.60Average inflation (%) — — — —Avg. exchange rate 3.90 5.00 7.00 7.00CPO price (MYR/tonne) 8,799 9,384 9,724 9,797Wheat flour price 3,200 3,300 3,300 3,000
Income statement (Rp bn) 12/11A 12/12E 12/13E 12/14ESales revenue 19,367 22,102 24,665 27,397Cost of goods sold 14,336 16,315 18,091 20,052SG&A 2,423 2,897 3,242 3,641Other operating exp./(inc.) (389.8) (501.0) (533.8) (571.2)EBITDA 2,998 3,392 3,865 4,275Depreciation & amortisation 389.8 501.0 533.8 571.2EBIT 2,608 2,891 3,332 3,704Net interest expense/(inc.) (136.9) (157.3) (220.0) (280.5)Non-operating inc./(exp.) — — — —Associates/JV — — — —Recurring PBT 2,745 3,048 3,552 3,984Exceptionals/extraordinaries — — — —Taxes 678.5 762.0 887.9 996.0Profit after tax 2,066 2,286 2,664 2,988Other after tax income — — — —Minority interests 91.0 101.1 117.8 132.1Preferred dividends — — — —Reported net profit 1,975 2,185 2,546 2,856Analyst adjustments — — — —Net profit (Credit Suisse) 1,975 2,185 2,546 2,856
Cash flow (Rp bn) 12/11A 12/12E 12/13E 12/14EEBIT 2,608 2,891 3,332 3,704Net interest 136.9 157.3 220.0 280.5Tax paid (678.5) (762.0) (887.9) (996.0)Working capital (387.5) (104.9) (291.7) (190.6)Other cash & non-cash items 523.5 504.8 707.7 629.7Operating cash flow 2,202 2,686 3,080 3,427Capex (226.9) (613.7) (700.9) (793.3)Free cash flow to the firm 1,975 2,072 2,379 2,634Disposals of fixed assets — — — —Acquisitions — — — —Divestments — — — —Associate investments — — — —Other investment/(outflows) (401.2) 55.3 (128.5) (30.8)Investing cash flow (628.1) (558.4) (829.5) (824.1)Equity raised — — — —Dividends paid (676) (988) (1,092) (1,273)Net borrowings (75.2) — — —Other financing cash flow 188.1 450.2 255.3 278.2Financing cash flow (563.3) (537.5) (837.2) (994.8)Total cash flow 1,011 1,590 1,413 1,608Adjustments — — — —Net change in cash 1,011 1,590 1,413 1,608
Balance sheet (Rp bn) 12/11A 12/12E 12/13E 12/14ECash & cash equivalents 4,421 6,011 7,424 9,032Current receivables 2,378 2,604 2,967 3,262Inventories 1,630 1,822 2,038 2,249Other current assets 151.4 170.3 188.1 207.0Current assets 8,580 10,607 12,618 14,750Property, plant & equip. 2,590 2,417 2,584 2,807Investments 83.2 87.4 91.7 96.3Intangibles 3,622 3,409 3,196 2,982Other non-current assets 346.8 395.8 441.7 490.6Total assets 15,223 16,916 18,931 21,126Accounts payable 1,429 1,637 1,810 2,009Short-term debt 424.1 407.2 407.2 407.2Current provisions — — — —Other current liabilities 1,135 1,048 1,182 1,316Current liabilities 2,989 3,092 3,398 3,732Long-term debt 145.5 298.0 298.0 298.0Non-current provisions — — — —Other non-current liab. 1,379 1,522 1,660 1,806Total liabilities 4,513 4,913 5,356 5,836Shareholders' equity 10,217 11,410 12,863 14,446Minority interests 492.9 594.0 711.8 843.9Total liabilities & equity 15,223 16,916 18,931 21,126
Per share data 12/11A 12/12E 12/13E 12/14EShares (wtd avg.) (mn) 5,831 5,831 5,831 5,831EPS (Credit Suisse) (Rp) 339 375 437 490DPS (Rp) 116 169 187 218BVPS (Rp) 1,752 1,957 2,206 2,478Operating CFPS (Rp) 378 461 528 588
Key ratios and valuation
12/11A 12/12E 12/13E 12/14E
Growth(%) Sales revenue 7.8 14.1 11.6 11.1EBIT 3.0 10.8 15.3 11.2Net profit 15.9 10.6 16.5 12.2EPS (1.5) 10.6 16.5 12.2Margins (%) EBITDA 15.5 15.3 15.7 15.6EBIT 13.5 13.1 13.5 13.5Pre-tax profit 14.2 13.8 14.4 14.5Net profit 10.2 9.9 10.3 10.4Valuation metrics (x) P/E 23.8 21.5 18.4 16.4P/B 4.59 4.11 3.65 3.25Dividend yield (%) 1.44 2.10 2.33 2.71P/CF 21.3 17.5 15.2 13.7EV/sales 2.23 1.88 1.63 1.41EV/EBITDA 14.4 12.3 10.4 9.0EV/EBIT 16.6 14.4 12.1 10.4ROE analysis (%) ROE 20.6 20.2 21.0 20.9ROIC 29.1 31.6 37.0 40.3Asset turnover (x) 1.27 1.31 1.30 1.30Interest burden (x) 1.05 1.05 1.07 1.08Tax burden (x) 0.75 0.75 0.75 0.75Financial leverage (x) 1.42 1.41 1.39 1.38Credit ratios Net debt/equity (%) (34.2) (44.3) (49.6) (54.6)Net debt/EBITDA (x) (1.22) (1.57) (1.74) (1.95)Interest cover (x) (19.0) (18.4) (15.1) (13.2)
Source: Company data, Thomson Reuters, Credit Suisse estimates.
0
5
10
15
20
25
Oct-10 Apr-11 Oct-11 Apr-12 Oct-12
12MF P/E multiple
0.0
0.5
1.0
1.5
2.0
2.5
3.0
3.5
4.0
Oct-10 Apr-11 Oct-11 Apr-12 Oct-12
12MF P/B multiple
Source: IBES

25 January 2013
Indonesia Consumer Survey 2013 61
Asia Pacific / IndonesiaDistributors
Erajaya Swasembada Tbk (ERAA.JK / ERAA IJ)
Beneficiary of rising income
■ Beneficiary of rising income. The government’s decision to increase minimum wages should benefit Erajaya, in our view. The company’s extensive distribution network and brand portfolio enables it to penetrate the rise in consumers’ purchasing power. Moreover, the majority of its revenue (69%) is from Jabodetabek and Kalimantan, which have seen the highest average minimum wage increase compared with the other provinces. In addition to distribution to third party, Erajaya operates 399 stores in Indonesia, which contribute less than 30% of its revenue.
■ New handset import regulation to be effective by end-March. The new handset import regulation requires each handset to be registered before it can be sold (used) in Indonesia. This is part of the government’s effort to reduce illegal import of handsets, which are estimated to be around 30% of the industry. We believe this should also benefit Erajaya.
■ Forex risks will be borne by the retail customers. As the company imports its handsets directly from the principals, with the exception of Samsung (priced in rupiah), it carries forex risks. Management indicate that it normally takes about one-two weeks for the company to pass on any cost to customers that arise from the need to pay the principal more in case of rupiah depreciation.
■ Maintain OUTPERFORM. Our target price of Rp3,300 equates to 15x 2013E P/E with 43% estimated earnings growth. This is implying JCI’s target multiple of 4,800. Compared to Indonesia’s other consumer and retailer stocks, Erajaya trades at an undemanding valuation with higher growth, making it an attractive choice in the space.
Share price performance
0100200300400
01000200030004000
Dec-11 Apr-12 Aug-12 Dec-12
Price (LHS) Rebased Rel (RHS)
The price relative chart measures performance against the JSX COMPOSITE INDEX which closed at 4418.73 on 23/01/13 On 23/01/13 the spot exchange rate was Rp9630./US$1
Performance Over 1M 3M 12M Absolute (%) 2.8 18.1 141.3 Relative (%) -1.2 16.3 130.7
Financial and valuation metrics
Year 12/11A 12/12E 12/13E 12/14ERevenue (Rp bn) 6,899.5 12,993.2 17,064.5 19,094.8EBITDA (Rp bn) 415.0 657.1 884.2 997.1EBIT (Rp bn) 385.0 633.2 855.8 964.1Net profit (Rp bn) 255.4 444.9 637.4 719.6EPS (CS adj.) (Rp) 88.07 153.41 219.80 248.13Change from previous EPS (%) n.a. 0 0 0Consensus EPS (Rp) n.a. 154 222 279EPS growth (%) 17.3 74.2 43.3 12.9P/E (x) 31.5 18.1 12.6 11.2Dividend yield (%) 0 0 2.8 4.0EV/EBITDA (x) 20.3 13.0 9.9 8.7P/B (x) 3.8 3.1 2.7 2.4ROE (%) 16.3 18.9 22.9 22.5Net debt/equity (%) 18.1 18.4 23.1 19.8
Source: Company data, Thomson Reuters, Credit Suisse estimates.
Rating OUTPERFORM Price (23 Jan 13, Rp) 2,775.00 Target price (Rp) 3,300.00¹ Upside/downside (%) 18.9 Mkt cap (Rp bn) 8,047.50 (US$ 0.84) Enterprise value (Rp bn) 8,523 Number of shares (mn) 2,900.00 Free float (%) 39.7 52-week price range 2,950.0 - 1,150.0 ADTO - 6M (US$ mn) 1.9
*Stock ratings are relative to the coverage universe in each analyst's or each team's respective sector. ¹Target price is for 12 months.
Research Analyst
Ella Nusantoro 62 21 255 37917

25 January 2013
Indonesia Consumer Survey 2013 62
Erajaya Swasembada Tbk ERAA.JK / ERAA IJ Price (23 Jan 13): Rp2,775.00, Rating: OUTPERFORM, Target Price: Rp3,300.00, Analyst: Ella Nusantoro Target price scenario Scenario TP %Up/Dwn Assumptions
Upside 1,700.0
0 (38.74) Increase in regional peers P/E
Central Case 3,300.0
0 18.92 Regional peers P/E
Downside 1,400.0
0 (49.55) Decrease in regional peers P/E
Key earnings drivers 12/11A 12/12E 12/13E 12/14EReal GDP growth (%) 6.50 6.40 5.60 5.60Inflation average (%) 5.40 4.50 6.20 6.20Sales volume growth (%) 4.7 50.8 6.6 6.7ASP growth (%) 37.4 14.7 1.2 2.6Average exchange rate 8,799 9,384 9,749 9,846
Income statement (Rp bn) 12/11A 12/12E 12/13E 12/14ESales revenue 6,900 12,993 17,064 19,095Cost of goods sold 6,151 11,824 15,520 17,367SG&A 356.3 579.4 688.6 763.9Other operating exp./(inc.) (22.4) (67.2) (28.4) (32.9)EBITDA 415.0 657.1 884.2 997.1Depreciation & amortisation 29.9 23.9 28.4 32.9EBIT 385.0 633.2 855.8 964.1Net interest expense/(inc.) 33.3 44.2 58.2 63.8Non-operating inc./(exp.) 1.3 4.7 — —Associates/JV — — — —Recurring PBT 353.0 593.8 797.5 900.3Exceptionals/extraordinaries — — — —Taxes 96.7 148.4 159.5 180.1Profit after tax 256.3 445.3 638.0 720.3Other after tax income — — — —Minority interests 0.91 0.45 0.61 0.68Preferred dividends — — — —Reported net profit 255.4 444.9 637.4 719.6Analyst adjustments — — — —Net profit (Credit Suisse) 255.4 444.9 637.4 719.6
Cash flow (Rp bn) 12/11A 12/12E 12/13E 12/14EEBIT 385.0 633.2 855.8 964.1Net interest (33.3) (44.2) (58.2) (63.8)Tax paid (96.7) (148.4) (159.5) (180.1)Working capital (790.4) (364.5) (566.8) (313.8)Other cash & non-cash items 22.8 71.4 27.8 32.2Operating cash flow (512.6) 147.5 99.1 438.7Capex (80.3) (99.0) (90.0) (90.0)Free cash flow to the firm (592.9) 48.6 9.1 348.7Disposals of fixed assets — — — —Acquisitions — — — —Divestments — — — —Associate investments — — — —Other investment/(outflows) (545.6) (56.1) (16.2) (20.6)Investing cash flow (625.9) (155.1) (106.2) (110.6)Equity raised 950.0 — — —Dividends paid — — (222.4) (318.7)Net borrowings 290.0 277.0 77.3 6.0Other financing cash flow 5.6 (0.3) — —Financing cash flow 1,246 277 (145) (313)Total cash flow 107.2 269.2 (152.3) 15.5Adjustments — — — —Net change in cash 107.2 269.2 (152.3) 15.5
Balance sheet (Rp bn) 12/11A 12/12E 12/13E 12/14ECash & cash equivalents 71.3 256.2 109.6 130.8Current receivables 1,024 1,302 1,629 1,822Inventories 790 910 1,194 1,336Other current assets 322.0 363.4 477.2 534.0Current assets 2,208 2,831 3,409 3,823Property, plant & equip. 108.9 198.9 275.4 347.5Investments 6.1 6.1 6.1 6.1Intangibles 495.6 649.8 627.6 605.4Other non-current assets 110.8 168.5 186.3 208.5Total assets 2,930 3,854 4,505 4,990Accounts payable 223.2 356.0 467.5 523.1Short-term debt 456.7 728.9 801.2 801.2Current provisions — — — —Other current liabilities 78.9 148.6 195.2 218.4Current liabilities 759 1,233 1,464 1,543Long-term debt 2.4 3.1 3.1 3.1Non-current provisions — — — —Other non-current liab. 20.9 25.1 30.2 36.2Total liabilities 782 1,262 1,497 1,582Shareholders' equity 2,133 2,578 2,993 3,394Minority interests 5.3 5.6 5.6 5.6Total liabilities & equity 2,930 3,854 4,505 4,990
Per share data 12/11A 12/12E 12/13E 12/14EShares (wtd avg.) (mn) 2,900 2,900 2,900 2,900EPS (Credit Suisse) (Rp) 88 153 220 248DPS (Rp) — — 77 110BVPS (Rp) 736 889 1,032 1,170Operating CFPS (Rp) (177) 51 34 151
Key ratios and valuation
12/11A 12/12E 12/13E 12/14E
Growth(%) Sales revenue 48.7 88.3 31.3 11.9EBIT 31.1 64.5 35.1 12.7Net profit 17.3 74.2 43.3 12.9EPS 17.3 74.2 43.3 12.9Margins (%) EBITDA 6.01 5.06 5.18 5.22EBIT 5.58 4.87 5.01 5.05Pre-tax profit 5.12 4.57 4.67 4.72Net profit 3.70 3.42 3.74 3.77Valuation metrics (x) P/E 31.5 18.1 12.6 11.2P/B 3.77 3.12 2.69 2.37Dividend yield (%) — — 2.76 3.96P/CF (15.7) 54.6 81.2 18.3EV/sales 1.22 0.66 0.51 0.46EV/EBITDA 20.3 13.0 9.9 8.7EV/EBIT 21.9 13.5 10.2 9.0ROE analysis (%) ROE 16.3 18.9 22.9 22.5ROIC 15.2 17.0 20.2 19.8Asset turnover (x) 2.36 3.37 3.79 3.83Interest burden (x) 0.92 0.94 0.93 0.93Tax burden (x) 0.73 0.75 0.80 0.80Financial leverage (x) 1.36 1.49 1.50 1.46Credit ratios Net debt/equity (%) 18.1 18.4 23.1 19.8Net debt/EBITDA (x) 0.93 0.72 0.79 0.68Interest cover (x) 11.6 14.3 14.7 15.1
Source: Company data, Thomson Reuters, Credit Suisse estimates.
0
2
4
6
8
10
12
14
16
Mar-12 May-12 Jul-12 Sep-12 Nov-12 Jan-13
12MF P/E multiple
0.0
0.5
1.0
1.5
2.0
2.5
3.0
Mar-12 May-12 Jul-12 Sep-12 Nov-12 Jan-13
12MF P/B multiple
Source: IBES

25 January 2013
Indonesia Consumer Survey 2013 63
Asia Pacific / IndonesiaRetailing Conglomerates
Mitra Adiperkasa (MAPI.JK / MAPI IJ)
Strong growth continues
■ Specialty stores continue to be the key driver. MAPI is currently managing more than 100 world class brands across its divisions, with more than half of the revenue contribution coming from speciality stores, followed by department stores, and food & beverage. We expect strong SSG to continue, given the rising middle- and high-income segments—MAPI’s target market—along with the rising Indonesian GDP per capita. MAPI had a consolidated SSG of 14% as of FY12, with specialty stores posting the strongest SSG at 17%, followed by department stores at 13%, F&B at 9% and others at 3%. We expect MAPI SSG to reach 13% this year.
■ Strategic expansion. MAPI pursues a strategy of expanding its specialty stores, this suggests smaller store size but higher margins, which we believe will enable the company to penetrate the market better. The company is actively expanding its sports and fashion lines, which contribute 50% and 45% of the specialty store segment, respectively. MAPI has also secured most of its expansion plan area, while new players may find it challenging to find strategic locations.
■ Limited and manageable impact on current regulation changes. Recently, GoI issued a revision of the regulation that manages franchise business in Indonesia. Points that may affect MAPI’s business: requirement for a franchise to use/sell minimum 80% local materials, equipment, and limitation of company-owned outlets to a maximum of 150. Only MAPI’s F&B business is under a franchisee agreement, thus the possible impact should be limited. As of 9M12, F&B accounted for 13% of gross sales and 0.4% of operating profit.
■ Maintain OUTPERFORM. We maintain our DCF-based target price at Rp8,100, implying 23x FY13E P/E, or a 0.8x FY13E PEG ratio. We believe the recent regulation changes on franchise business will have a limited and manageable impact on the company’s business, and believe MAPI will continue to post strong growth.
Share price performance
0100200300400
2000
4000
6000
8000
Jan-11 May-11 Sep-11 Jan-12 May-12 Sep-12
Price (LHS) Rebased Rel (RHS)
The price relative chart measures performance against the JSX COMPOSITE INDEX which closed at 4418.73 on 23/01/13 On 23/01/13 the spot exchange rate was Rp9630./US$1
Performance Over 1M 3M 12M Absolute (%) — -3.0 10.3 Relative (%) -4.0 -4.9 -0.3
Financial and valuation metrics
Year 12/11A 12/12E 12/13E 12/14ERevenue (Rp bn) 5,889.8 7,434.9 8,871.4 10,448.0EBITDA (Rp bn) 898.4 1,072.9 1,260.4 1,472.2EBIT (Rp bn) 622.3 774.8 932.3 1,105.9Net profit (Rp bn) 360.4 455.7 581.8 721.3EPS (CS adj.) (Rp) 217.12 274.53 350.50 434.52Change from previous EPS (%) n.a. 0 0 0Consensus EPS (Rp) n.a. 267 342 423EPS growth (%) 79.3 26.4 27.7 24.0P/E (x) 29.5 23.3 18.3 14.7Dividend yield (%) 0.31 0.59 0.75 0.96EV/EBITDA (x) 12.7 10.6 8.9 7.4P/B (x) 5.9 4.8 3.9 3.2ROE (%) 22.1 22.8 23.8 24.0Net debt/equity (%) 46.2 32.9 23.1 9.7
Source: Company data, Thomson Reuters, Credit Suisse estimates.
Rating OUTPERFORM Price (23 Jan 13, Rp) 6,400.00 Target price (Rp) 8,100.00¹ Upside/downside (%) 26.6 Mkt cap (Rp bn) 10,624.0 (US$ 1.1) Enterprise value (Rp bn) 11,348 Number of shares (mn) 1,660.00 Free float (%) 44.0 52-week price range 7,750.0 - 5,250.0 ADTO - 6M (US$ mn) 2.7
*Stock ratings are relative to the coverage universe in each analyst's or each team's respective sector. ¹Target price is for 12 months.
Research Analysts
Dian Haryokusumo 62 21 255 37974
Ella Nusantoro 62 21 255 37917

25 January 2013
Indonesia Consumer Survey 2013 64
Mitra Adiperkasa MAPI.JK / MAPI IJ Price (23 Jan 13): Rp6,400.00, Rating: OUTPERFORM, Target Price: Rp8,100.00, Analyst: Dian Haryokusumo Target price scenario Scenario TP %Up/Dwn Assumptions Upside
Central Case 8,100.0
0 26.56
Downside
Key earnings drivers 12/11A 12/12E 12/13E 12/14ESpeciality store - SSG 0.16 0.17 0.15 0.15Department store - SSG 0.13 0.09 0.10 0.10F&B - SSG 0.08 0.08 0.10 0.09Speciality store - area 150,932 170,932 185,932 200,932Department store - area 271,621 301,621 341,621 371,621
Income statement (Rp bn) 12/11A 12/12E 12/13E 12/14ESales revenue 5,890 7,435 8,871 10,448Cost of goods sold 2,847 3,566 4,294 5,051SG&A 2,420 3,094 3,645 4,291Other operating exp./(inc.) (276.1) (298.1) (328.1) (366.4)EBITDA 898 1,073 1,260 1,472Depreciation & amortisation 276.1 298.1 328.1 366.4EBIT 622 775 932 1,106Net interest expense/(inc.) 115.1 98.9 135.3 127.0Non-operating inc./(exp.) (22.6) (63.2) (14.8) (9.1)Associates/JV — — — —Recurring PBT 484.6 612.7 782.2 969.7Exceptionals/extraordinaries — — — —Taxes 124.1 157.0 200.4 248.4Profit after tax 360.4 455.7 581.8 721.3Other after tax income — — — —Minority interests 0.0001 0.0001 0.0001 0.0001Preferred dividends — — — —Reported net profit 360.4 455.7 581.8 721.3Analyst adjustments — — — —Net profit (Credit Suisse) 360.4 455.7 581.8 721.3
Cash flow (Rp bn) 12/11A 12/12E 12/13E 12/14EEBIT 622 775 932 1,106Net interest — — — —Tax paid — — — —Working capital — — — —Other cash & non-cash items 276.1 298.1 328.1 366.4Operating cash flow 898 1,073 1,260 1,472Capex (470.9) (600.0) (600.0) (549.6)Free cash flow to the firm 427.5 472.9 660.4 922.6Disposals of fixed assets — — — —Acquisitions — — — —Divestments — — — —Associate investments — — — —Other investment/(outflows) (153.2) (18.0) (16.4) (19.2)Investing cash flow (624.1) (618.0) (616.4) (568.8)Equity raised — — — —Dividends paid (33.2) (63.1) (79.8) (101.8)Net borrowings 184.6 390.3 150.0 —Other financing cash flow (65.5) — — —Financing cash flow 85.8 327.2 70.2 (101.8)Total cash flow 360.1 782.1 714.2 801.6Adjustments — — — —Net change in cash 360.1 782.1 714.2 801.6
Balance sheet (Rp bn) 12/11A 12/12E 12/13E 12/14ECash & cash equivalents 289 853 1,104 1,404Current receivables 194.6 203.7 243.1 286.2Inventories 1,378 1,514 1,823 2,145Other current assets 507.7 611.7 730.1 860.1Current assets 2,369 3,183 3,900 4,695Property, plant & equip. 1,487 1,789 2,060 2,244Investments — — — —Intangibles 58.0 38.7 19.5 —Other non-current assets 502.0 539.1 574.8 613.5Total assets 4,415 5,549 6,555 7,553Accounts payable 668 752 906 1,066Short-term debt 985.3 753.6 858.6 858.6Current provisions — — — —Other current liabilities 625 769 928 1,103Current liabilities 2,278 2,275 2,692 3,027Long-term debt 132.8 823.0 868.0 868.0Non-current provisions — — — —Other non-current liab. 210.7 254.6 295.5 339.0Total liabilities 2,621 3,352 3,856 4,234Shareholders' equity 1,794 2,197 2,699 3,318Minority interests 0.01 0.01 0.01 0.01Total liabilities & equity 4,415 5,549 6,555 7,553
Per share data 12/11A 12/12E 12/13E 12/14EShares (wtd avg.) (mn) 1,660 1,660 1,660 1,660EPS (Credit Suisse) (Rp) 217 275 350 435DPS (Rp) 20.0 38.0 48.0 61.3BVPS (Rp) 1,081 1,323 1,626 1,999Operating CFPS (Rp) 541 646 759 887
Key ratios and valuation
12/11A 12/12E 12/13E 12/14E
Growth(%) Sales revenue 25.0 26.2 19.3 17.8EBIT 38.6 24.5 20.3 18.6Net profit 79.3 26.4 27.7 24.0EPS 79.3 26.4 27.7 24.0Margins (%) EBITDA 15.3 14.4 14.2 14.1EBIT 10.6 10.4 10.5 10.6Pre-tax profit 8.2 8.2 8.8 9.3Net profit 6.12 6.13 6.56 6.90Valuation metrics (x) P/E 29.5 23.3 18.3 14.7P/B 5.92 4.84 3.94 3.20Dividend yield (%) 0.31 0.59 0.75 0.96P/CF 11.8 9.9 8.4 7.2EV/sales 1.94 1.53 1.27 1.05EV/EBITDA 12.7 10.6 8.9 7.4EV/EBIT 18.4 14.6 12.1 9.9ROE analysis (%) ROE 22.1 22.8 23.8 24.0ROIC 19.2 20.8 22.2 23.6Asset turnover (x) 1.33 1.34 1.35 1.38Interest burden (x) 0.78 0.79 0.84 0.88Tax burden (x) 0.74 0.74 0.74 0.74Financial leverage (x) 2.46 2.53 2.43 2.28Credit ratios Net debt/equity (%) 46.2 32.9 23.1 9.7Net debt/EBITDA (x) 0.92 0.67 0.49 0.22Interest cover (x) 5.40 7.83 6.89 8.71
Source: Company data, Thomson Reuters, Credit Suisse estimates.
0
5
10
15
20
25
30
2008 2009 2010 2011 2012 2013
12MF P/E multiple
0
1
2
3
4
5
6
2008 2009 2010 2011 2012 2013
12MF P/B multiple
Source: IBES

25 January 2013
Indonesia Consumer Survey 2013 65
Asia Pacific / IndonesiaRegional Banks
Bank Central Asia (BBCA.JK / BBCA IJ)
Fundamentals intact
■ Indonesia’s largest transaction bank. Bank Central Asia (BBCA) is the largest transaction bank in Indonesia with over 10 mn customer accounts. Indonesia’s loan and deposit to GDP ratio remains the lowest in the region, implying the low penetration of the banking sector. As a bank which is widely used for day-to-day transactions, BBCA stands to benefit from the increasing banking sector penetration in Indonesia.
■ Catering the Indonesian customers. BBCA’s exposure to consumer loans is 28% out of its total loan book. The bank’s focus on consumer loans remains on mortgages. BCA’s mortgage loans are one of the most preferred by customers due to its low and competitive rates. With the low mortgage penetration in Indonesia, we believe there is a huge potential for BBCA to grow further in the mortgage market.
■ Strong fundamentals. As of 3Q12, BBCA has one of the lowest LDR (68.9%) in the Indonesian banking system, which implies it has one of the highest growth potential. In addition, BBCA also has one of the highest CASA contributions to total deposits (79.5%), allowing the bank to have one of the lowest CoF (2.1%) among all Indonesian banks. Given its low LDR and low CoF, BBCA is well positioned to deliver above-industry growth, offering more competitive pricing to borrowers, while at the same time sustaining a robust NIM (5.1%).
■ Maintain OUTPERFORM. We believe BBCA exhibits one of the strongest fundamentals among the Indonesian banks under our coverage. We expect BBCA to continue delivering robust ROE (26%). Our target price for BBCA of Rp11,000, based on Gordon’s Growth value, implies 4.6x FY13E P/B and 20.6x FY13E P/E.
Share price performance
100110120130140
4000
6000
8000
10000
Jan-11 May-11 Sep-11 Jan-12 May-12 Sep-12
Price (LHS) Rebased Rel (RHS)
The price relative chart measures performance against the JSX COMPOSITE INDEX which closed at 4418.73 on 23/01/13 On 23/01/13 the spot exchange rate was Rp9630./US$1
Performance Over 1M 3M 12M Absolute (%) 4.5 14.1 14.8 Relative (%) 0.5 12.3 4.2
Financial and valuation metrics
Year 12/11A 12/12E 12/13E 12/14EPre-prov Op profit (Rp bn) 13,136.1 14,973.1 17,392.7 20,302.6Pre -tax profit (Rp bn) 13,618.8 14,749.1 16,483.7 19,152.8Net attributable profit (Rp bn) 10,819.3 11,716.7 13,091.2 15,210.7EPS (CS adj.) (Rp) 440.53 477.06 533.03 619.33Change from previous EPS (%) n.a. 0 0 0Consensus EPS (Rp) n.a. 467 545 642EPS growth (%) 27.6 8.3 11.7 16.2P/E (x) 21.1 19.5 17.4 15.0Dividend yield (%) 1.6 1.7 1.9 2.2CS adj. BVPS (Rp) 1,710.2 2,013.5 2,389.1 2,832.6P/B (x) 5.44 4.62 3.89 3.28ROE (%) 28.4 25.6 24.2 23.7ROA (%) 3.1 2.9 2.9 2.9Tier 1 Ratio (%) 12.0 12.2 12.5 13.0
Source: Company data, Thomson Reuters, Credit Suisse estimates.
Rating OUTPERFORM Price (23 Jan 13, Rp) 9,300.00 Target price (Rp) 11,000¹ Upside/downside (%) 18.3 Mkt cap (Rp bn) 229,291.6 (US$ 23.8) Number of shares (mn) 24,655.01 Free float (%) 55.9 52-week price range 9,500.0 - 6,900.0 ADTO - 6M (US$ mn) 9.5
*Stock ratings are relative to the coverage universe in each analyst's or each team's respective sector. ¹Target price is for 12 months.
Research Analyst
Teddy Oetomo 62 21 2553 7911

25 January 2013
Indonesia Consumer Survey 2013 66
Bank Central Asia BBCA.JK / BBCA IJ Price (23 Jan 13): Rp9,300.00, Rating: OUTPERFORM, Target Price: Rp11,000, Analyst: Teddy Oetomo Target price scenario Scenario TP %Up/Dwn Assumptions
Upside 13,000.
00 39.78
assuming 30% loan growth and +100bp increase in NIM
Central Case 11,000.
00 18.28
Downside 6,000.0
0 (35.48)
assuming 5% loan growth and -140bp decrease in NIM
Key earnings drivers 12/11A 12/12E 12/13E 12/14ELoans Growth (%) 31.7 22.5 23.9 21.5Net Interest Margin (%) 5.02 5.14 5.38 5.55Fee Growth (%) 4.95 4.11 3.75 4.52Cost to Income Ratio (%) 48.6 48.1 47.3 46.3P&L Provision (as % of (0.08) 0.25 0.45 0.45
Valuation 12/11A 12/12E 12/13E 12/14EEPS growth (%) 27.6 8.3 11.7 16.2P/E (x) 21.1 19.5 17.4 15.0P/B (x) 5.44 4.62 3.89 3.28P/TB (x) 5.44 4.62 3.89 3.28Dividend yield (%) 1.56 1.69 1.89 2.20
Income statement (Rp bn) 12/11A 12/12E 12/13E 12/14EInterest income 24,567 28,052 34,802 40,256Interest expense 7,730 8,236 11,219 12,295Net interest income 16,837 19,816 23,583 27,961Fee and commission income — — — —Trading income 2,632 2,383 2,322 2,322Insurance income (& premiums) — — — —Other income 6,066 6,673 7,073 7,498Total non-interest income 8,699 9,056 9,395 9,820Total income 25,535 28,872 32,978 37,781Personal expense 5,035 5,639 6,315 7,073Other expenses 7,365 8,260 9,270 10,405Total expenses 12,399 13,899 15,586 17,478Pre-provision profit 13,136 14,973 17,393 20,303Loan loss provisions (161) 645 1,431 1,754Operating profit 13,297 14,328 15,962 18,549Associates/JV — — — —Other non-operating inc./(exp.) 322.0 420.8 522.0 603.8Pre-tax profit 13,619 14,749 16,484 19,153Taxes 2,801 3,034 3,394 3,944Net profit before minorities 10,818 11,715 13,090 15,209Minority interests (1.5) (1.5) (1.5) (1.5)Preferred dividends — — — —Exceptionals/extraordinaries — — — —Reported net profit 10,819 11,717 13,091 15,211Analyst adjustments — — — —Net profit (Credit Suisse) 10,819 11,717 13,091 15,211
Balance sheet (Rp bn) 12/11A 12/12E 12/13E 12/14EAssets Gross customer loans 208,529 255,498 316,579 384,503Risk provisions 4,126 4,152 4,960 5,970Net customer loans 204,403 251,346 311,619 378,533Interbank Loans 7,549 8,681 9,549 10,504Investment & Securities 146,918 143,425 143,425 143,425Cash & cash equivalents 10,356 12,881 14,806 16,888Fixed Assets 4,145 4,478 4,811 5,145Intangibles — — — —Other assets 8,539 5,110 6,332 7,690Total assets 381,908 425,921 490,543 562,185Liabilities Interbank deposits — — — —Customer deposits 323,428 368,023 423,032 482,508Total deposits 323,428 368,023 423,032 482,508Other liabilities 16,453 8,422 8,809 10,085Total liabilities 339,881 376,445 431,842 492,593Shareholders' equity 42,003 49,452 58,677 69,568Minority interests 24.4 24.4 24.4 24.4Preferred stock — — — —Total liabilities & equity 381,908 425,921 490,543 562,185
Per share data 12/11A 12/12E 12/13E 12/14EShares (wtd avg.) (mn) 24,560 24,560 24,560 24,560EPS (Credit Suisse) (Rp) 440.53 477.06 533.03 619.33BVPS (Rp) 1,710 2,014 2,389 2,833Tangible BVPS (Rp) 1,710 2,014 2,389 2,833DPS (Rp) 145 157 176 204
Key ratios 12/11A 12/12E 12/13E 12/14EProfitability and margins ROE stated 28.4 25.6 24.2 23.7ROE - CS adj. 28.4 25.6 24.2 23.7ROA - CS adj. 3.06 2.90 2.86 2.89Gearing (x) 9.3 8.8 8.5 8.2Asset quality (%) NPL/ gross loans 0.63 0.63 0.63 0.63B/S loan loss coverage 255 210 202 200Loan/ deposit ratio 63.2 68.3 73.7 78.5Capital ratios (%) Capital adequacy ratio 13.3 13.5 13.9 14.3Tier 1 ratio 12.0 12.2 12.5 13.0Equity Tier 1 ratio 12.0 12.2 12.5 13.0Growth(%) Revenue 20.3 13.1 14.2 14.6Operating expense 18.1 12.1 12.1 12.1Pre-provision profit 22.5 14.0 16.2 16.7Net profit 27.6 8.3 11.7 16.2Deposit 16.5 13.8 14.9 14.1
Source: Company data, Thomson Reuters, Credit Suisse estimates.
0
5
10
15
20
25
2008 2009 2010 2011 2012 2013
12MF P/E multiple
0
1
2
3
4
5
6
2008 2009 2010 2011 2012 2013
12MF P/B multiple
Source: IBES

25 January 2013
Indonesia Consumer Survey 2013 67
Appendix: Respondents’ summary
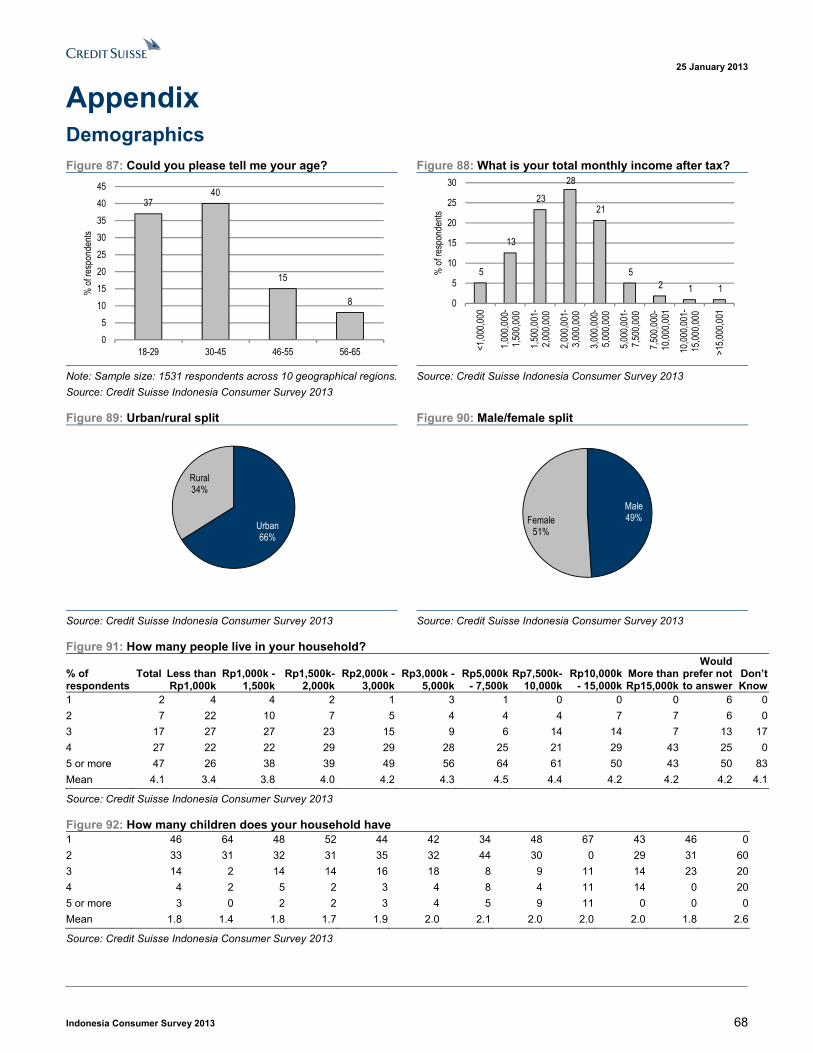
25 January 2013
Indonesia Consumer Survey 2013 68
Appendix Demographics
Figure 87: Could you please tell me your age? Figure 88: What is your total monthly income after tax?
3740
15
8
0
5
10
15
20
25
30
35
40
45
18-29 30-45 46-55 56-65
% o
f res
pond
ents
5
13
23
28
21
5 2 1 1
0
5
10
15
20
25
30
<1,0
00,0
00
1,00
0,00
0-1,
500,
000
1,50
0,00
1-2,
000,
000
2,00
0,00
1-3,
000,
000
3,00
0,00
0-5,
000,
000
5,00
0,00
1-7,
500,
000
7,50
0,00
0-10
,000
,001
10,0
00,0
01-
15,0
00,0
00
>15,
000,
001
% o
f res
pond
ents
Note: Sample size: 1531 respondents across 10 geographical regions.
Source: Credit Suisse Indonesia Consumer Survey 2013
Source: Credit Suisse Indonesia Consumer Survey 2013
Figure 89: Urban/rural split Figure 90: Male/female split
Urban66%
Rural34%
Male49%Female
51%
Source: Credit Suisse Indonesia Consumer Survey 2013 Source: Credit Suisse Indonesia Consumer Survey 2013
Figure 91: How many people live in your household?
% of respondents
Total Less than
Rp1,000k Rp1,000k -
1,500k Rp1,500k-
2,000kRp2,000k -
3,000kRp3,000k -
5,000kRp5,000k
- 7,500kRp7,500k-
10,000kRp10,000k
- 15,000k More than Rp15,000k
Would prefer not to answer
Don’t Know
1 2 4 4 2 1 3 1 0 0 0 6 0
2 7 22 10 7 5 4 4 4 7 7 6 0
3 17 27 27 23 15 9 6 14 14 7 13 17
4 27 22 22 29 29 28 25 21 29 43 25 0
5 or more 47 26 38 39 49 56 64 61 50 43 50 83
Mean 4.1 3.4 3.8 4.0 4.2 4.3 4.5 4.4 4.2 4.2 4.2 4.1
Source: Credit Suisse Indonesia Consumer Survey 2013
Figure 92: How many children does your household have 1 46 64 48 52 44 42 34 48 67 43 46 0
2 33 31 32 31 35 32 44 30 0 29 31 60
3 14 2 14 14 16 18 8 9 11 14 23 20
4 4 2 5 2 3 4 8 4 11 14 0 20
5 or more 3 0 2 2 3 4 5 9 11 0 0 0
Mean 1.8 1.4 1.8 1.7 1.9 2.0 2.1 2.0 2.0 2.0 1.8 2.6
Source: Credit Suisse Indonesia Consumer Survey 2013

25 January 2013
Indonesia Consumer Survey 2013 69
Figure 93: In your opinion, is it the right time to make a major purchase now?
1 3 4 3 4 4 4 7 0
31 29 25 31 34 30 2950
36
60 62 65 60 59 65 6443
64
8 6 6 63 1 4 0 0
0
20
40
60
80
100
Less than 1,000k Rp1,000k -Rp1,500k
Rp1,500k-Rp2,000k
Rp2,000k -Rp3,000k
Rp3,000k - Rp5,000k
Rp5,000k -Rp7,500k
Rp7,500k-Rp10,000k
Rp10,000k -Rp15,000k
More thanRp15,000k
% o
f res
pond
ents
Excellent time Good time Not such a good time A bad time
Source: Credit Suisse Indonesia Consumer Survey 2013
Figure 94: In your opinion, is now a good time to make a major purchase? Percentage of respondents who are positive
minus percentage of respondents who are negative
-36 -36-42
-32-24
-32 -35
14
-28
-50
-40
-30
-20
-10
0
10
20
Less than 1,000k Rp1,000k -Rp1,500k
Rp1,500k-Rp2,000k
Rp2,000k -Rp3,000k
Rp3,000k - Rp5,000k
Rp5,000k -Rp7,500k
Rp10,000k-Rp15,000k
Rp10,000k -Rp15,000k
More thanRp15,000k
% o
f res
pond
ents
Source: Credit Suisse Indonesia Consumer Survey 2013
Figure 95: Do you think the state of your own finances over the next six months will be better, worse or about same?
32 35 44 43 44 4054 57 57
62 63 54 56 54 5843 43 43
6 2 1 2 2 1 4 0 0
0
20
40
60
80
100
Less than 1,000k Rp1,000k -Rp1,500k
Rp1,500k-Rp2,000k
Rp2,000k -Rp3,000k
Rp3,000k - Rp5,000k
Rp5,000k -Rp7,500k
Rp7,500k-Rp10,000k
Rp10,000k -Rp15,000k
More thaRp15,000
% o
f res
pond
ents
Better About the same Worse
Source: Credit Suisse Indonesia Consumer Survey 2013
Figure 96: Do you think the state of your own finances over the next six months will be better, worse or about the
same? Percentage of respondents who are positive minus percentage of respondents who are negative
26
33
43 41 4239
5057 57
0
10
20
30
40
50
60
Less than 1,000k Rp1,000k -Rp1,500k
Rp1,500k-Rp2,000k
Rp2,000k -Rp3,000k
Rp3,000k - Rp5,000k
Rp5,000k -Rp7,500k
Rp10,000k-Rp15,000k
Rp10,000k -Rp15,000k
More thanRp15,000k
% o
f res
pond
ents
Source: Credit Suisse Indonesia Consumer Survey 2013

25 January 2013
Indonesia Consumer Survey 2013 70
Income and other
Figure 97: What savings or investment channels, if any, does your household use to save money?
% of respondents Total
Less than Rp1,000k
Rp1,000k - 1,500k
Rp1,500k- 2,000k
Rp2,000k - 3,000k
Rp3,000k - 5,000k
Rp5,000k - 7,500k
Rp7,500k-10,000k
Rp10,000k - 15,000k
More than Rp15,000k
Would prefer not to answer
Don’t Know
Bank account 45 12 20 32 48 64 79 61 79 86 44 33
Life insurance 3 0 2 1 3 5 6 32 14 21 0 0
Stock market 0 0 0 0 0 1 0 0 0 0 0 0
Cash 34 26 32 41 40 27 22 29 0 0 19 17
Mutual Fund 0 1 0 0 0 0 1 0 0 0 0 0
State Bonds 0 0 1 0 0 0 0 0 0 0 0 0
Property 5 4 4 4 4 8 4 18 14 7 0 17
No savings 27 60 46 30 20 17 12 18 14 7 38 67
Base : Unwtd 1531 78 192 357 433 316 77 28 14 14 16 6
Source: Credit Suisse Indonesia Consumer Survey 2013
Figure 98: To what extent has your household income changed in the last 12 months? Decline > 20% 1 0 1 1 1 0 1 0 0 0 0 0
-10% to -20% 3 1 3 2 2 3 5 7 0 7 6 0
-10% to flat 5 8 7 5 5 3 5 11 0 21 0 17
Unchanged 39 60 46 46 37 30 26 11 36 0 38 33
Flat to +10% 28 12 21 25 33 29 32 29 43 36 25 17
10-20% 9 3 4 6 8 15 18 25 0 14 19 0
20-30% 2 1 0 1 2 2 5 7 7 7 0 0
30%+ 0 0 0 1 0 1 0 0 0 0 0 0
Base : Unwtd 1531 78 192 357 433 316 77 28 14 14 16 6
Source: Credit Suisse Indonesia Consumer Survey 2013
Figure 99: In what way do you expect your household income to change in the next 12 months? Decline > 20% 0 0 0 0 0 0 0 4 0 0 6 0
-10% to -20% 1 1 1 0 1 0 5 4 7 0 0 0
-10% to flat 2 3 3 2 1 1 1 0 7 0 6 0
Unchanged 22 38 28 25 17 21 13 11 7 0 38 17
Flat to +10% 30 29 35 32 33 22 26 29 29 14 13 50
10-20% 21 12 11 18 25 24 26 21 29 57 6 17
20-30% 8 4 3 6 8 14 17 14 7 21 6 0
30%+ 8 5 8 8 8 10 10 11 7 0 19 0
Base : Unwtd 1531 78 192 357 433 316 77 28 14 14 16 6
Source: Credit Suisse Indonesia Consumer Survey 2013
Figure 100: How do you think your purchases on credit card are likely to change in the next 12 months? Rising 36 0 60 43 25 30 33 63 33 33 0 0
Staying the same 58 100 40 57 67 57 67 38 67 67 100 0
Decreasing 7 0 0 0 8 13 0 0 0 0 0 0
Base : Unwtd 66 1 5 7 12 23 3 8 3 3 1 0
Source: Credit Suisse Indonesia Consumer Survey 2013

25 January 2013
Indonesia Consumer Survey 2013 71
Automobiles
Figure 101: Does your household currently own a car that is driven for personal use?
% of respondents Total
Less than Rp1,000k
Rp1,000k - 1,500k
Rp1,500k-2,000k
Rp2,000k - 3,000k
Rp3,000k - 5,000k
Rp5,000k - 7,500k
Rp7,500k-10,000k
Rp10,000k - 15,000k
More than Rp15,000k
Would prefer not to answer
Don’t Know
Yes 6 0 0 2 5 10 11 32 20 30 13 0
No 94 100 100 98 95 90 89 68 80 70 88 100
Source: Credit Suisse Indonesia Consumer Survey 2013
Figure 102: Does your household own a motorcycle/two-wheeler for personal use? Yes 78 49 66 73 82 87 95 76 100 90 75 80
No 22 51 34 27 18 13 5 24 0 10 25 20
Source: Credit Suisse Indonesia Consumer Survey 2013
Figure 103: How many cars do you own in your household? 1 92 0 0 83 100 89 100 88 100 67 100 0
2 5 0 0 17 0 7 0 13 0 0 0 0
3 or more 3 0 0 0 0 4 0 0 0 33 0 0
Source: Credit Suisse Indonesia Consumer Survey 2013
Figure 104: How long ago did you purchase this car? 1 year or less 26 0 0 0 6 32 29 38 0 100 50 0
2 to 4 years 34 0 0 67 44 29 43 13 50 0 0 0
5 to 7 years 20 0 0 0 39 14 29 25 0 0 0 0
8 to 10 years 7 0 0 0 6 11 0 0 0 0 50 0
> 10 years 14 0 0 33 6 14 0 25 50 0 0 0
Base: unwtd 74 0 0 6 18 28 7 8 2 3 2 0
Source: Credit Suisse Indonesia Consumer Survey 2013
Figure 105: How did you finance it?
All cash 61 0 0 33 44 82 57 50 100 33 50 0
Cash+auto loan 30 0 0 67 44 11 14 38 0 67 50 0
All auto loan 9 0 0 0 11 7 29 13 0 0 0 0
Sum 100 0 0 100 100 100 100 100 100 100 100 0
Base: unwtd 74 0 0 6 18 28 7 8 2 3 2 0
Source: Credit Suisse Indonesia Consumer Survey 2013
Figure 106: Will you or your family purchase or replace a passenger car in the next 12 months?
0 0 1 1 25
0
10 10
1 27
11 12 11
20
0
20
33 34
28 3027
3532
50
40
1720
2723
30
21 20
40
20
43
3732 30
20 2124
0 00
10
20
30
40
50
60
Less than 1,000k Rp1,000k -Rp1,500k
Rp1,500k-Rp2,000k
Rp2,000k -Rp3,000k
Rp3,000k - Rp5,000k
Rp5,000k -Rp7,500k
Rp10,000k-Rp15,000k
Rp10,000k -Rp15,000k
More thanRp15,000k
% o
f res
pond
ent
Income Bracket
Definitely will Probably will Not sure Probably won't Definitely won't
Source: Credit Suisse Indonesia Consumer Survey 2013

25 January 2013
Indonesia Consumer Survey 2013 72
Figure 107: How do you plan to finance this upcoming car purchase?
% of respondents Total
Less than Rp1,000k
Rp1,000k - 1,500k
Rp1,500k-2,000k
Rp2,000k - 3,000k
Rp3,000k - 5,000k
Rp5,000k - 7,500k
Rp7,500k-10,000k
Rp10,000k - 15,000k
More than Rp15,000k
Would prefer not to answer
Don’t Know
All cash 42 100 25 44 39 46 40 20 100 33 50 0
Cash + auto loan 47 0 75 52 52 36 40 60 0 67 50 0
All auto loan 10 0 0 4 7 18 20 20 0 0 0 0
D.K 1 0 0 0 2 0 0 0 0 0 0 0
Sum 100 100 100 100 100 100 100 100 100 100 100 0
Base: unwtd 134 1 4 25 44 39 10 5 1 3 2 0
Source: Credit Suisse Indonesia Consumer Survey 2013
Figure 108: How much do you plan to spend on the car you or your household is planning to purchase? Up to Rp100 mn 22 0 50 24 27 21 10 0 0 0 0 0
Rp 100-200 mn 59 0 50 56 59 56 70 80 100 67 50 0
Rp 200-300 mn 10 0 0 12 7 10 10 20 0 33 0 0
Rp 300-400 mn 4 100 0 4 5 3 10 0 0 0 0 0
> Rp 400 mn 4 0 0 4 2 10 0 0 0 0 0 0
Don't know 1 0 0 0 0 0 0 0 0 0 50 0
Base : Unwtd 134 1 4 25 44 39 10 5 1 3 2 0
Source: Credit Suisse Indonesia Consumer Survey 2013

25 January 2013
Indonesia Consumer Survey 2013 73
Food and beverage
Figure 109: Have you purchased any of these products in the last three months?
% of respondents Total Less than Rp1,000k
Rp1,000k - 1,500k
Rp1,500k-2,000k
Rp2,000k - 3,000k
Rp3,000k - 5,000k
Rp5,000k - 7,500k
Rp7,500k-10,000k
Rp10,000k - 15,000k
More than Rp15,000k
Would prefer not to
answerDon’t Know
Drinks: Yes 70 55 59 66 74 76 73 65 89 75 82 100
Drinks: No 30 45 41 34 26 24 27 35 11 25 18 0
Drinks: Base 1043 53 146 259 285 208 44 17 9 8 11 3
Noodles: Yes 95 98 95 96 95 94 95 76 78 100 91 100
Noodles: No 5 2 5 4 5 6 5 24 22 0 9 0
Noodles: Base 1043 53 146 259 285 208 44 17 9 8 11 3
Bottled water: Yes 90 81 82 87 93 93 95 100 100 88 100 100
Bottled water: No 10 19 18 13 7 7 5 0 0 13 0 0
Bottled water: Base 1043 53 146 259 285 208 44 17 9 8 11 3
Cigarettes: Yes 47 38 38 47 51 44 59 53 67 63 27 67
Cigarettes: No 53 62 62 53 49 56 41 47 33 38 73 33
Cigarettes: Base 1043 53 146 259 285 208 44 17 9 8 11 3
Dairy: Yes 66 43 51 63 68 80 70 88 100 88 55 33
Dairy: No 34 57 49 37 32 20 30 12 0 13 45 67
Dairy: Base 1043 53 146 259 285 208 44 17 9 8 11 3
Source: Credit Suisse Indonesia Consumer Survey 2013
Figure 110: Have you purchased any of these products in the last three months? Drinks - foreign 91 87 94 90 91 92 94 90 95 95 93 80
Coca cola 32 33 35 30 33 33 32 26 33 21 36 40
Fanta 26 23 27 29 26 25 32 21 19 21 36 -
Sprite 25 29 24 28 24 24 25 24 29 32 21 20
Drinks - local 8 13 5 10 8 9 6 10 5 5 7 20
Drinks - base 726 29 86 172 212 158 32 11 8 6 9 3
Noodles - foreign 1 - 1 - 0 1 - - - - - -
Noodles - local 100 100 99 100 100 99 100 100 100 100 100 100
Indomie 41 42 38 40 41 42 45 31 32 37 53 60
Mie Sedap 31 39 33 32 29 32 22 24 21 26 29 20
Supermi 8 7 8 8 8 6 12 14 11 11 6 -
Sarimi 8 7 9 9 8 7 5 4 5 5 6 -
Noodles base 989 52 138 249 271 196 42 13 7 8 10 3
Water - foreign - - - 1 - - - - - - - -
Water - local 100 100 100 99 100 100 100 100 100 100 100 100
Aqua 61 53 65 63 60 62 68 58 53 54 47 60
Club 15 27 16 13 15 12 12 7 17 16 21 40
Vit 9 6 6 7 12 10 5 11 17 8 16 -
Water - base 934 43 119 225 265 193 42 17 9 7 11 3
Cigarettes - foreign 5 3 - 2 5 7 5 7 11 10 - -
Cigarettes - local 95 97 100 98 95 93 95 93 89 90 100 100
Dji Sam Soe 17 13 8 16 17 21 29 21 - 20 - -
Djarum Super 7 10 3 6 9 9 - 7 - - - -
Sampoerna Hijau 5 7 8 10 2 2 - 7 11 - - -
GG Surya 14 10 21 16 13 13 10 7 11 20 20 -
Cigarettes - base 487 20 56 122 146 92 26 9 6 5 3 2
Dairy - foreign 54 44 53 56 54 58 54 57 68 45 90 50
Dairy - local 46 56 47 44 46 42 46 43 32 55 10 50
Frissian Flag 33 36 34 40 30 32 35 27 25 36 20 50
Indomilk 19 22 23 20 19 18 14 8 19 9 10 50
Dairy - base 691 23 75 163 195 166 31 15 9 7 6 1
Source: Credit Suisse Indonesia Consumer Survey 2013

25 January 2013
Indonesia Consumer Survey 2013 74
Figure 111: Do you expect to spend more on any of these products in the next 12 months?
% of respondents Total Less than Rp1,000k
Rp1,000k - 1,500k
Rp1,500k-2,000k
Rp2,000k - 3,000k
Rp3,000k - 5,000k
Rp5,000k - 7,500k
Rp10,000k-15,000k
Rp10,000k - 15,000k
More than Rp15,000k
Would prefer not to
answerDon’t Know
Drinks: Yes 35 25 27 34 36 41 41 41 56 38 27 67
Drinks: No 65 75 73 66 64 59 59 59 44 63 73 33
Drinks: Base 1043 53 146 259 285 208 44 17 9 8 11 3
Noodles: Yes 59 55 53 61 60 62 61 47 56 50 64 67
Noodles: No 41 45 47 39 40 38 39 53 44 50 36 33
Noodles: Base 1043 53 146 259 285 208 44 17 9 8 11 3
Bottled water: Yes 61 43 52 55 65 70 70 71 78 50 55 67
Bottled water: No 39 57 48 45 35 30 30 29 22 50 45 33
Bottled water: Base 1043 53 146 259 285 208 44 17 9 8 11 3
Cigarettes: Yes 31 28 23 31 36 28 39 41 44 25 18 67
Cigarettes: No 69 72 77 69 64 72 61 59 56 75 82 33
Cigarettes: Base 1043 53 146 259 285 208 44 17 9 8 11 3
Dairy: Yes 46 32 38 44 43 59 43 59 78 63 36 33
Dairy: No 54 68 62 56 57 41 57 41 22 38 64 67
Dairy: Base 1043 53 146 259 285 208 44 17 9 8 11 3
Source: Credit Suisse Indonesia Consumer Survey 2013
Figure 112: What percentage of your diet is made up of meat? 0% 7 15 10 8 5 4 14 6 0 0 0 0
0-5% 61 66 69 61 65 54 41 59 56 75 36 100
6-15% 23 13 12 27 22 27 30 24 33 13 36 0
16-25% 5 2 1 2 6 10 7 0 11 0 9 0
More than 25% 3 2 3 2 2 3 9 12 0 13 9 0
Source: Credit Suisse Indonesia Consumer Survey 2013
Figure 113: How do you think your meat consumption is likely to change over the next 12 months?
9 15 18 20 2111
30 22 26
64 58 60 61 6568
59 6775
26 26 21 19 15 2112 11
0102030405060708090
100
Less than 1,000k Rp1,000k -Rp1,500k
Rp1,500k-Rp2,000k
Rp2,000k -Rp3,000k
Rp3,000k - Rp5,000k
Rp5,000k -Rp7,500k
Rp10,000k-Rp15,000k
Rp10,000k -Rp15,000k
More thanRp15,000k
% o
f res
pond
ents
More The same Less
Source: Credit Suisse Indonesia Consumer Survey 2013
Figure 114: Percentage of respondents planning on consuming more meat minus respondents planning less
-17
-11
-3
16
-10
18
11
26
-20-15-10-505
1015202530
Less than 1,000k Rp1,000k -Rp1,500k
Rp1,500k-Rp2,000k
Rp2,000k -Rp3,000k
Rp3,000k - Rp5,000k
Rp5,000k -Rp7,500k
Rp10,000k-Rp15,000k
Rp10,000k -Rp15,000k
More thanRp15,000k
% o
f res
pond
ents
Source: Credit Suisse Indonesia Consumer Survey 2013

25 January 2013
Indonesia Consumer Survey 2013 75
Personal care
Figure 115: Have you purchased any of these products in the last three months?
% of respondents Total Less than Rp1,000k
Rp1,000k - 1,500k
Rp1,500k-2,000k
Rp2,000k - 3,000k
Rp3,000k - 5,000k
Rp5,000k - 7,500k
Rp7,500k-10,000k
Rp10,000k - 15,000k
More than Rp15,000k
Would prefer not to
answerDon’t Know
Tissues: Yes 54 31 42 46 56 62 71 60 85 82 87 75
Tissues: No 46 69 58 54 44 38 29 40 15 18 13 25
Tissues: Base 1359 70 179 318 380 274 70 25 13 11 15 4
Fem hygiene: Yes 76 58 63 72 85 81 79 100 78 78 88 100
Fem hygiene: No 24 43 37 28 15 19 21 0 22 22 13 0
Fem hygiene: Base 686 40 99 154 193 129 34 9 9 9 8 2
Cosmetics: Yes 62 59 59 58 64 64 70 64 69 82 47 50
Cosmetics: No 38 41 41 42 36 36 30 36 31 18 53 50
Cosmetics: Base 1359 70 179 318 380 274 70 25 13 11 15 4
Source: Credit Suisse Indonesia Consumer Survey 2013
Figure 116: Which brands have you purchased in the last three months? Tissues - Foreign 5 5 10 5 1 3 3 - 5 12 - -
Tissues - Local 96 93 88 93 94 96 96 96 94 87 100 100
Paseo 32 30 25 34 33 33 34 46 20 19 53 29
Nice 15 9 14 15 16 14 13 21 10 25 18 14
Mitu 18 13 18 17 18 17 19 17 25 25 6 14
Tissues - Base 728 22 76 147 213 169 50 15 11 9 13 3
Fem Hygiene - Foreign 74 63 66 80 75 72 81 85 92 70 67 67
Charm 34 24 30 36 35 34 37 47 33 20 17 33
Laurier 28 28 26 30 31 26 28 31 33 30 17 17
Kotex 10 12 6 13 7 11 13 8 17 10 25 17
Fem Hygiene - Local 27 36 34 21 28 28 19 15 8 30 33 33
Softex 16 20 26 10 17 18 13 - 8 30 17 17
Hers Protex 6 16 5 6 6 5 4 - - - 8 17
Fem Hygiene - Base 524 23 62 111 164 105 27 9 7 7 7 2
Cosmetics - Foreign 42 25 44 43 41 44 49 58 35 43 48 57
Lux 9 9 15 8 8 9 9 11 6 5 14 14
Ponds 18 7 15 19 21 19 21 17 12 24 5 29
Cosmetics - Local 57 74 58 58 59 56 51 43 65 57 52 43
Citra 21 19 22 20 22 20 21 17 30 19 19 14
Viva 9 19 13 10 9 7 4 - 6 14 10 14
Cosmetics - Base 843 41 105 185 245 175 49 16 9 9 7 2
Source: Credit Suisse Indonesia Consumer Survey 2013
Figure 117: Do you expect to spend more on any of these products in the next 12 months? Tissues: Yes 32 26 22 29 31 41 43 16 62 36 33 25
Tissues: No 68 74 78 71 69 59 57 84 38 64 67 75
Tissues: Base 1359 70 179 318 380 274 70 25 13 11 15 4
Fem hygiene: Yes 45 30 34 42 47 55 59 44 78 11 38 0
Fem hygiene: No 55 70 66 58 53 45 41 56 22 89 63 100
Fem hygiene: Base 686 40 99 154 193 129 34 9 9 9 8 2
Cosmetics: Yes 38 31 30 37 42 42 50 20 38 18 20 25
Cosmetics: No 62 69 70 63 58 58 50 80 62 82 80 75
Cosmetics: Base 1359 70 179 318 380 274 70 25 13 11 15 4
Source: Credit Suisse Indonesia Consumer Survey 2013

25 January 2013
Indonesia Consumer Survey 2013 76
Figure 118: Tissue consumption, by brand Age Monthly income
% of respondents Total Urban Rural Java Non-Java 18-29 30-45 46-55 56-65 <Rp1.5mn Rp1.5-7.5mn >Rp7.5mn
2012
Paseo 32 32 32 33 29 32 33 28 42 26 33 31
Mitu 18 18 16 17 20 19 18 13 14 17 18 21
Nice 15 14 17 15 15 15 14 18 12 13 15 18
Other 35 35 35 35 36 34 35 41 31 44 34 30
2011
Paseo 29 30 30 28 33 32 26 32 30 29 30 26
Mitu 17 17 16 18 15 18 18 11 11 15 17 24
Nice 16 17 16 14 21 17 17 12 15 16 16 17
Other 37 36 38 40 32 33 39 45 44 40 36 33
2010
Paseo 30 31 28 32 26 30 31 28 27 23 32 23
Mitu 16 17 16 15 18 17 16 13 20 11 17 22
Nice 16 16 16 14 19 16 16 17 12 18 16 11
Other 38 36 40 38 38 37 36 42 42 47 36 44
Source: Credit Suisse Indonesia Consumer Survey
Figure 119: Feminine hygiene consumption, by brand Age Monthly income
% of respondents Total Urban Rural Java Non-Java 18-29 30-45 46-55 56-65 <Rp1.5mn Rp1.5-7.5mn >Rp7.5mn
2012
Charm 34 38 22 33 32 38 29 34 33 28 35 35
Laurier 28 28 28 26 36 27 31 24 17 26 29 31
Softex 16 14 24 15 20 10 19 28 28 24 15 12
Kotex 10 10 9 10 9 12 8 9 17 8 10 11
Others 12 10 16 16 3 12 12 6 6 13 11 11
2011
Charm 27 31 17 27 26 29 24 30 27 19 29 45
Laurier 30 31 28 25 41 29 30 32 18 30 29 50
Softex 18 15 23 19 14 19 16 14 27 19 17 5
Kotex 12 12 12 12 9 10 14 12 9 12 13 -
Others 13 11 20 17 10 13 15 11 18 20 12 -
2010
Charm 26 31 16 26 25 29 25 19 39 20 27 34
Laurier 30 31 29 26 41 29 32 28 16 30 30 40
Softex 18 15 22 16 20 14 19 24 22 17 18 13
Kotex 13 12 14 14 9 15 10 13 16 12 13 13
Others 13 11 18 17 6 14 14 15 6 22 11 0
Source: Credit Suisse Indonesia Consumer Survey 2013

25 January 2013
Indonesia Consumer Survey 2013 77
Luxury goods Figure 120: Have you purchased goods from any of the following categories in the past 3-12 months?
% of respondents Total
Less than Rp 1,000k
Rp 1,000k - 1,500k
Rp 1,500k - 2,000k
Rp 2,000k - 3,000k
Rp 3,000k - 5,000k
Rp 5,000k - 7,500k
Rp 7,500k - 10,000k
Rp 10,000k - 15,000k
More than Rp15,000k
Would prefer not to answer D.K
Fashion:Yes 75 65 67 72 79 79 81 87 92 73 75 100
Fashion:No 25 35 33 28 21 21 19 13 8 27 25 0
Fashion:Base 1289 69 171 302 355 266 62 23 12 11 12 6
Sportswear:Yes 20 16 14 15 21 27 27 39 33 18 17 33
Sportswear:No 80 84 86 85 79 73 73 61 67 82 83 67
Sportswear:Base 1289 69 171 302 355 266 62 23 12 11 12 6
Watches:Yes 17 10 8 11 15 25 31 39 67 27 0 67
Watches:No 83 90 92 89 85 75 69 61 33 73 100 33
Watches:Base 1289 69 171 302 355 266 62 23 12 11 12 6
Jewellery:Yes 16 4 12 16 15 20 23 17 42 27 0 17
Jewellery:No 84 96 88 84 85 80 77 83 58 73 100 83
Jewellery:Base 1289 69 171 302 355 266 62 23 12 11 12 6
Perfumes:Yes 35 20 23 31 35 40 53 70 75 64 8 50
Perfumes:No 65 80 77 69 65 60 47 30 25 36 92 50
Perfumes:Base 1289 69 171 302 355 266 62 23 12 11 12 6
Source: Credit Suisse Indonesia Consumer Survey 2013
Figure 121: If so, what brand was this/brands were these? Fashion-Foreign 32 11 29 20 27 35 48 61 35 51 33 46
Gucci 4 - 5 2 4 3 12 5 7 7 - 9
Guess 4 - 2 4 3 4 8 9 - 14 - 9
Fashion-Local 66 82 71 75 69 60 48 39 64 51 44 55
Nevada 11 14 13 11 12 10 9 5 28 22 11 9
Unbranded 34 46 44 46 33 29 17 9 14 14 22 27
Fashion-Base 972 45 114 216 282 211 50 20 11 8 9 6
Sportswear-Foreign 68 58 68 64 61 70 71 72 83 100 50 100
Adidas 19 33 27 26 17 16 15 11 33 67 - 20
Nike 14 8 7 12 12 15 18 22 17 33 50 20
Sportswear-Local 30 41 31 33 32 26 30 28 17 - 50 -
Hommy Ped 4 - - 2 4 7 4 - 17 - 50 -
Unbranded 8 33 14 12 9 4 8 6 - - - -
Sportswear-Base 261 11 24 44 73 73 17 9 4 2 2 2
Watches-Foreign 62 28 41 63 61 73 59 86 68 99 - 75
Seiko 13 - 7 12 11 12 22 20 - 33 - 13
Gucci 15 14 13 5 20 16 14 20 22 33 - 13
Watches-Local 32 72 40 34 35 27 36 13 34 - - 25
Unbranded 15 43 27 12 20 15 4 7 - - - 13
Watches-Base 213 7 13 32 52 66 19 9 8 3 - 4
Jewellery-Foreign 14 - 7 6 14 12 14 - - 50 - 50
Madonna 1 - - - 2 - - - - - - -
Swarovski 1 - - - - 2 - - - - - -
Jewellery-Local 87 100 86 89 87 80 87 100 100 50 - 50
Unbranded 81 80 86 89 79 73 80 100 100 50 - 50
Jewellery-Base 181 5 14 36 55 45 15 3 5 2 - 1
Perfume-Foreign 36 13 30 27 41 44 37 63 31 26 - 66
Kenzo 7 13 6 5 6 10 7 4 - 13 - 17
Hugo Boss 5 - 6 4 5 7 3 11 8 - - 17
Perfume-Local 61 87 64 71 57 54 64 37 69 75 100 33
Unbranded 26 47 33 33 24 23 18 15 23 25 - 17
Perfume-Base 496 15 43 99 138 126 36 16 11 8 1 3
Source: Credit Suisse Indonesia Consumer Survey 2013

25 January 2013
Indonesia Consumer Survey 2013 78
Figure 122: how much did you spend on these purchases?
% of respondents Less than Rp 1,000k
Rp 1,000k - 1,500k
Rp 1,500k - 2,000k
Rp 2,000k - 3,000k
Rp 3,000k - 5,000k
Rp 5,000k - 7,500k
Rp 7,500k - 10,000k
Rp 10,000k -15,000k
More than Rp15,000k
Would prefer not to answer
Don’t Know
Fashion:Up to Rp 500k 98 96 94 86 80 76 70 73 63 89 83
Fashion: Rp500–1,000k 2 4 5 11 15 12 15 9 38 11 0
Fashion: Rp1,000–2,000k 0 0 0 2 4 8 5 18 0 0 17
Fashion: R 2,000- 5,000k 0 0 0 0 1 4 5 0 0 0 0
Fashion: Mean Exp Rp 505,556 508,772 531,250 562,943 609,005 730,000 1,087,500 704,545 593,750 527,778 666,667
Sportswear: Up to Rp 500k 91 92 95 93 81 65 56 75 50 100 100
Sportswear: Rp500-1,000k 9 0 2 4 15 29 33 0 50 0 0
Sportswear: Rp1,000-2,000k 0 0 2 0 3 6 11 25 0 0 0
Sportswear: Mean Exp Rp 522,727 630,435 528,409 552,083 606,164 632,353 694,444 750,000 625,000 500,000 500,000
Watches: Up to Rp 500k 100 92 97 96 89 84 56 88 100 0 75
Watches: Rp500–1,000k 0 8 3 2 6 16 33 13 0 0 25
Watches: Rp1,000 – 2,000k 0 0 0 2 3 0 11 0 0 0 0
Watches: Rp2,000k –5,000k 0 0 0 0 2 0 0 0 0 0 0
Watches: Mean Exp Rp 500,000 519,231 507,813 524,039 590,909 539,474 694,444 531,250 500,000 - 562500
Jewellery: Up to Rp 500k 60 50 44 36 40 13 0 20 0 0 100
Jewellery: Rp500–1,000k 20 50 28 24 22 20 0 40 50 0 0
Jewellery: Rp1,000–2,000k 20 0 22 24 13 40 0 0 50 0 0
Jewellery: Rp2,000– 5,000k 0 0 3 13 16 20 100 40 0 0 0
Jewellery: Rp5,000-10,000k 0 0 0 4 4 7 0 0 0 0 0
Jewellery: Above Rp10,000k 0 0 0 0 2 0 0 0 0 0 0
Jewellery: Mean Exp Rp 750,000 625,000 885,714 1,431,818 1,704,546 2,016,667 3,500,000 1,800,000 1,125,000 - 500,000
Perfumes: Up to Rp 500k 100 100 99 97 92 94 94 100 100 100 100
Perfumes: Rp 500k–1,000k 0 0 0 1 3 3 6 0 0 0 0
Perfumes: Rp1,000k–2,000k 0 0 0 0 2 0 0 0 0 0 0
Perfumes: Mean Exp Rp 500,000 500,000 595,960 572,993 825,397 770,833 515,625 500,000 500,000 500,000 500,000
Source: Credit Suisse Indonesia Consumer Survey 2013
Figure 123: Are you planning to purchase any goods from the Fashion category in the next 12 months?
4656 61 67 68 73
87
6782
0
20
40
60
80
100
Less than 1,000k Rp1,000k -Rp1,500k
Rp1,500k-Rp2,000k
Rp2,000k -Rp3,000k
Rp3,000k - Rp5,000k
Rp5,000k -Rp7,500k
Rp7,500k-Rp10,000k
Rp10,000k -Rp15,000k
More thanRp15,000k
% o
f res
pond
ents
Source: Credit Suisse Indonesia Consumer Survey 2013
Figure 124: Are you planning to purchase any goods from the Leather goods category in the next 12 months?
714 17
22 2637
48
75
45
01020304050607080
Less than 1,000k Rp1,000k -Rp1,500k
Rp1,500k-Rp2,000k
Rp2,000k -Rp3,000k
Rp3,000k - Rp5,000k
Rp5,000k -Rp7,500k
Rp7,500k-Rp10,000k
Rp10,000k -Rp15,000k
More thanRp15,000k
% o
f res
pond
ents
Source: Credit Suisse Indonesia Consumer Survey 2013

25 January 2013
Indonesia Consumer Survey 2013 79
Figure 125: Are you planning to purchase any goods from the Watches category in the next 12 months?
10 9 12 14 15
26 26
67
18
010
20
30
4050
60
7080
Less than 1,000k Rp1,000k -Rp1,500k
Rp1,500k-Rp2,000k
Rp2,000k -Rp3,000k
Rp3,000k - Rp5,000k
Rp5,000k -Rp7,500k
Rp7,500k-Rp10,000k
Rp10,000k -Rp15,000k
More thanRp15,000k
% o
f res
pond
ents
Source: Credit Suisse Indonesia Consumer Survey 2013
Figure 126: Are you planning to purchase any goods from the Jewellery category in the next 12 months?
412
16 1520 23
17
42
27
0
10
20
30
40
50
Less than 1,000k Rp1,000k -Rp1,500k
Rp1,500k-Rp2,000k
Rp2,000k -Rp3,000k
Rp3,000k - Rp5,000k
Rp5,000k -Rp7,500k
Rp7,500k-Rp10,000k
Rp10,000k -Rp15,000k
More thanRp15,000k
% o
f res
pond
ents
Source: Credit Suisse Indonesia Consumer Survey 2013
Figure 127: Are you planning to purchase any goods from the Perfumes category in the next 12 months?
20 2331 35 40
53
70 7564
0
20
40
60
80
Less than 1,000k Rp1,000k -Rp1,500k
Rp1,500k-Rp2,000k
Rp2,000k -Rp3,000k
Rp3,000k - Rp5,000k
Rp5,000k -Rp7,500k
Rp7,500k-Rp10,000k
Rp10,000k -Rp15,000k
More thanRp15,000k
% o
f res
pond
ents
Source: Credit Suisse Indonesia Consumer Survey 2013
Figure 128: Are you planning to purchase any goods from the Sportswear category in the next 12 months?
10 813
1723 26
30
42
27
0
10
20
30
40
50
Less than 1,000k Rp1,000k -Rp1,500k
Rp1,500k-Rp2,000k
Rp2,000k -Rp3,000k
Rp3,000k - Rp5,000k
Rp5,000k -Rp7,500k
Rp7,500k-Rp10,000k
Rp10,000k -Rp15,000k
More thanRp15,000k
% o
f res
pond
ents
Source: Credit Suisse Indonesia Consumer Survey 2013

25 January 2013
Indonesia Consumer Survey 2013 80
Technology and Internet Figure 129: Personal computer, mobile phone and smartphone penetration
0
20
40
60
80
100
120
Less than 1,000k Rp1,500k- Rp2,000k Rp3,000k - Rp 5,000k Rp7,500k-Rp10,000k More than Rp15,000k
Elec
troni
c ow
ners
hip
(% o
f hou
seho
lds)
Computers Smartphones Phones
Source: Credit Suisse Indonesia Consumer Survey 2013
Figure 130: Which of the following electronic products/services are you most likely to purchase in the next 12 months?
Total Less than Rp 1,000k
Rp 1,000k - 1,500k
Rp 1,500k - 2,000k
Rp 2,000k - 3,000k
Rp 3,000k - 5,000k
Rp 5,000k - 7,500k
Rp 7,500k - 10,000k
Rp 10,000k -15,000k
More than Rp15,000k
Would prefer not to answer
Don’t Know
Blue-Ray DVD Player 1 1 0 0 1 0 0 0 0 0 0 0
Camcorder 0 0 0 0 0 0 0 0 0 0 0 0
Desktop computer 1 1 3 3 2 1 4 29 0 0 0 4
Digital Camera 1 1 1 2 3 1 0 0 8 0 17 1
DVD Player 8 5 4 5 5 7 4 0 0 0 0 5
E-Reader 0 0 0 0 0 0 0 0 0 0 0 0
Gaming facility 0 0 0 1 0 1 0 0 0 0 0 1
GPS/Navigation 0 0 0 0 0 0 0 0 0 0 0 0
Internet Service 0 1 1 0 0 1 0 0 0 0 0 1
Mobile Phone (Basic) 9 6 10 9 3 7 8 14 0 13 0 9
Smartphone 5 6 6 9 8 13 4 0 8 13 33 3
MP3 0 1 0 1 1 1 0 0 0 0 0 1
Netbook 0 0 1 1 1 4 8 0 0 0 0 1
Notebook PC 5 5 8 9 9 10 15 7 33 19 33 8
Stereo HiFi 0 0 0 0 1 0 0 7 0 0 0 1
Traditional TV 11 6 5 3 2 0 0 0 0 0 0 4
LCD TV 9 5 10 11 11 14 19 0 25 6 17 8
Flat screen TV 4 5 3 2 2 4 0 0 0 0 0 4
Tablet 0 0 1 2 3 4 12 7 0 0 0 0
None of these 53 68 52 53 56 46 50 50 33 56 50 58
Source: Credit Suisse Indonesia Consumer Survey 2013

25 January 2013
Indonesia Consumer Survey 2013 81
Figure 131: What services have you used in the last six months?
27 2836
117 5
159 77 5 5
73
86 88
50
0
10
20
30
40
50
60
70
80
90
100
% o
f res
pond
ents
Gaming Banking Shopping Travel Social network Instant messaging
2012 2011 2010
Source: Credit Suisse Indonesia Consumer Survey 2013
Figure 132: Do you have access to the internet?
Total Less than Rp 1,000k
Rp 1,000k - 1,500k
Rp 1,500k - 2,000k
Rp 2,000k - 3,000k
Rp 3,000k - 5,000k
Rp 5,000k - 7,500k
Rp 7,500k - 10,000k
Rp 10,000k - 15,000k
Above 15,000k
Would prefer not to answer
Don’t Know
Yes 9 3 5 6 7 15 23 15 29 15 19 33
No 91 97 95 94 93 85 77 85 71 85 81 67
Source: Credit Suisse Indonesia Consumer Survey 2013
Figure 133: If so, do you have broadband access already or expect to have it within 12 months? Yes 64 50 67 57 65 68 47 100 75 100 67 50
No 26 0 11 33 35 21 41 0 25 0 0 0
Don’t know 10 50 22 10 0 11 12 0 0 0 33 50
Source: Credit Suisse Indonesia Consumer Survey 2013
Figure 134: Which is your main Internet service provider? Telkom Flash 35 50 44 29 42 32 29 50 25 50 33 50
Speedy 27 0 44 24 16 28 24 50 50 50 67 0
CBN 0 0 0 0 0 0 0 0 0 0 0 0
Fastnet (Firstmedia) 1 0 0 0 0 2 0 0 0 0 0 0
IM2 9 0 0 14 16 4 12 0 0 0 0 50
Broadlink 0 0 0 0 0 0 0 0 0 0 0 0
Radnet 0 0 0 0 0 0 0 0 0 0 0 0
Ipnet 0 0 0 0 0 0 0 0 0 0 0 0
Biznet 1 0 0 0 0 2 0 0 0 0 0 0
Indonet 3 0 0 14 3 0 0 0 0 0 0 0
Telkomnet 4 0 0 0 3 4 6 0 25 0 0 0
Others 16 50 11 14 16 21 18 0 0 0 0 0
D.K. 5 0 0 5 3 6 12 0 0 0 0 0
Sum 100 100 100 100 100 100 100 100 100 100 100 100
Base : Unwtd 142 2 9 21 31 47 17 4 4 2 3 2
Source: Credit Suisse Indonesia Consumer Survey 2013

25 January 2013
Indonesia Consumer Survey 2013 82
Telecommunications Figure 135: Do you currently own and use a handset for personal use?
% of respondents Total Less than
1,000k Rp1,000k
-1,500kRp1,500k-
2,000kRp2,000k
- 3,000kRp3,000k - 5,000k
Rp5,000k - 7,500k
Rp7,500k-10,000k
Rp10,000k - 15,000k
More than Rp15,000k
Would prefer not to
answerDon’t Know
Yes, I pay for it 72 48 59 67 76 77 88 96 86 86 73 60
Yes, employer pays 0 1 1 0 0 0 0 0 0 0 0 0
Yes, somebody else pays 7 8 8 6 7 8 4 4 14 7 0 0
No I do not 21 43 33 26 16 15 8 0 0 7 27 40
Base : Unwtd 1450 75 187 336 403 300 73 28 14 14 15 5
Source: Credit Suisse Indonesia Consumer Survey 2013
Figure 136: What brand is your current mobile handset? Foreign 69 69 62 69 69 76 81 73 64 92 81 66
Nokia 42 51 38 46 40 43 48 32 43 38 45 33
Huawei 4 2 6 4 4 4 4 4 0 0 0 0
Local 28 26 37 30 32 22 16 25 36 8 18 33
Base 1146 43 126 247 338 256 67 28 14 13 11 3
Source: Credit Suisse Indonesia Consumer Survey 2013
Figure 137: Do you plan to upgrade to a smartphone in the next 12 months? Yes 52 38 40 45 54 64 59 44 67 33 80 0
No 48 63 60 55 46 36 41 56 33 67 20 100
Source: Credit Suisse Indonesia Consumer Survey 2013
Figure 138: Which brand of mobile handset will you buy? Foreign 89 93 82 89 91 94 97 100 100 100 100 100
Nokia 47 75 53 50 42 40 41 50 60 43 43 100
Blackberry 28 14 18 20 30 38 34 50 0 14 43 0
Local 5 4 10 4 7 3 0 0 0 0 0 0
Don't know 5 4 11 7 4 2 3 0 0 0 0 0
Base 603 28 66 137 185 121 32 12 5 7 7 3
Source: Credit Suisse Indonesia Consumer Survey 2013
Figure 139: Which mobile operator are you using? Telkomsel 43 37 39 41 41 45 46 61 43 62 36 0
Indosat 23 19 25 28 21 20 18 14 14 23 55 33
Esia 6 2 9 5 6 8 6 4 0 8 0 0
Excel 12 23 13 11 12 11 15 11 0 0 0 33
Telkom Fleksi 5 9 6 4 5 5 3 4 7 8 0 0
Smart 0 0 0 0 0 0 1 0 0 0 0 0
3 5 7 4 5 4 5 3 4 7 0 0 33
Fren 0 0 0 0 1 0 0 0 0 0 0 0
Smartfre 1 0 0 2 1 0 1 0 0 0 0 0
Others 6 2 5 4 8 5 6 4 29 0 9 0
D.K 0 0 0 0 0 0 0 0 0 0 0 0
Sum 100 100 100 100 100 100 100 100 100 100 100 100
Base : Unwtd 1146 43 126 247 338 256 67 28 14 13 11 3
Source: Credit Suisse Indonesia Consumer Survey 2013
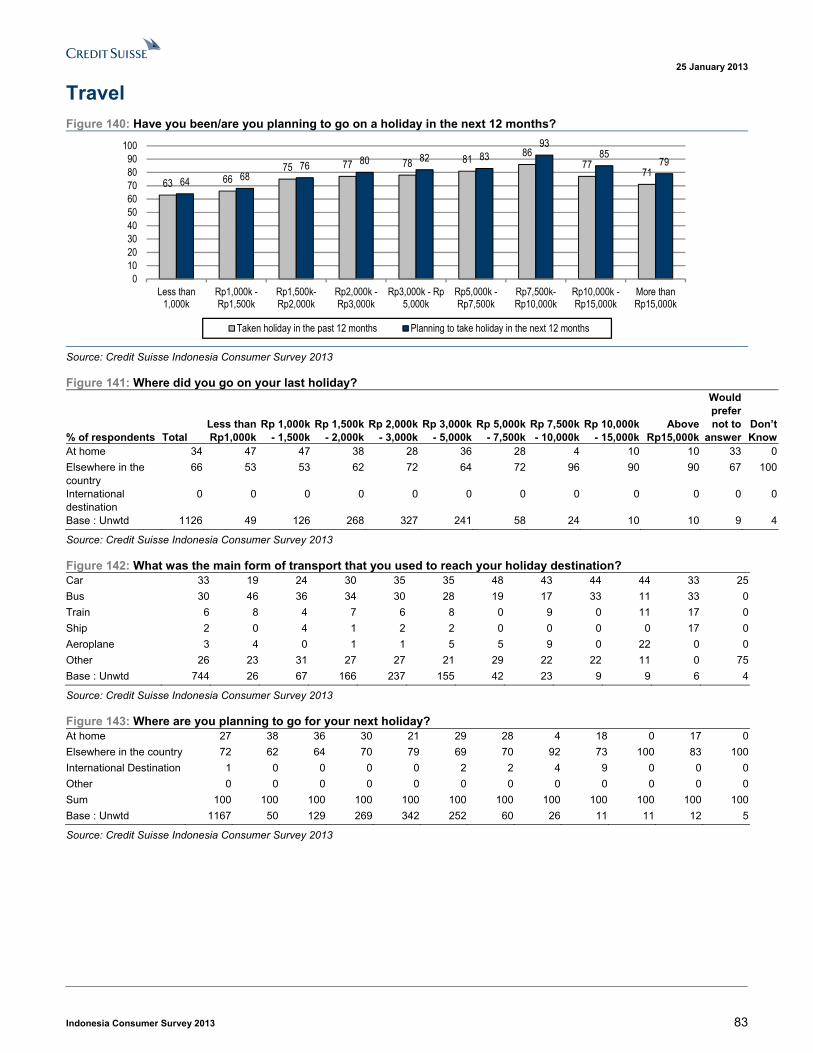
25 January 2013
Indonesia Consumer Survey 2013 83
Travel
Figure 140: Have you been/are you planning to go on a holiday in the next 12 months?
63 6675 77 78 81
8677
7164 68
76 80 82 8393
8579
0102030405060708090
100
Less than1,000k
Rp1,000k -Rp1,500k
Rp1,500k-Rp2,000k
Rp2,000k -Rp3,000k
Rp3,000k - Rp5,000k
Rp5,000k -Rp7,500k
Rp7,500k-Rp10,000k
Rp10,000k -Rp15,000k
More thanRp15,000k
Taken holiday in the past 12 months Planning to take holiday in the next 12 months
Source: Credit Suisse Indonesia Consumer Survey 2013
Figure 141: Where did you go on your last holiday?
% of respondents Total Less than Rp1,000k
Rp 1,000k - 1,500k
Rp 1,500k - 2,000k
Rp 2,000k - 3,000k
Rp 3,000k - 5,000k
Rp 5,000k - 7,500k
Rp 7,500k - 10,000k
Rp 10,000k - 15,000k
Above Rp15,000k
Would prefer not to
answerDon’t Know
At home 34 47 47 38 28 36 28 4 10 10 33 0
Elsewhere in the country
66 53 53 62 72 64 72 96 90 90 67 100
International destination
0 0 0 0 0 0 0 0 0 0 0 0
Base : Unwtd 1126 49 126 268 327 241 58 24 10 10 9 4
Source: Credit Suisse Indonesia Consumer Survey 2013
Figure 142: What was the main form of transport that you used to reach your holiday destination? Car 33 19 24 30 35 35 48 43 44 44 33 25
Bus 30 46 36 34 30 28 19 17 33 11 33 0
Train 6 8 4 7 6 8 0 9 0 11 17 0
Ship 2 0 4 1 2 2 0 0 0 0 17 0
Aeroplane 3 4 0 1 1 5 5 9 0 22 0 0
Other 26 23 31 27 27 21 29 22 22 11 0 75
Base : Unwtd 744 26 67 166 237 155 42 23 9 9 6 4
Source: Credit Suisse Indonesia Consumer Survey 2013
Figure 143: Where are you planning to go for your next holiday? At home 27 38 36 30 21 29 28 4 18 0 17 0
Elsewhere in the country 72 62 64 70 79 69 70 92 73 100 83 100
International Destination 1 0 0 0 0 2 2 4 9 0 0 0
Other 0 0 0 0 0 0 0 0 0 0 0 0
Sum 100 100 100 100 100 100 100 100 100 100 100 100
Base : Unwtd 1167 50 129 269 342 252 60 26 11 11 12 5
Source: Credit Suisse Indonesia Consumer Survey 2013
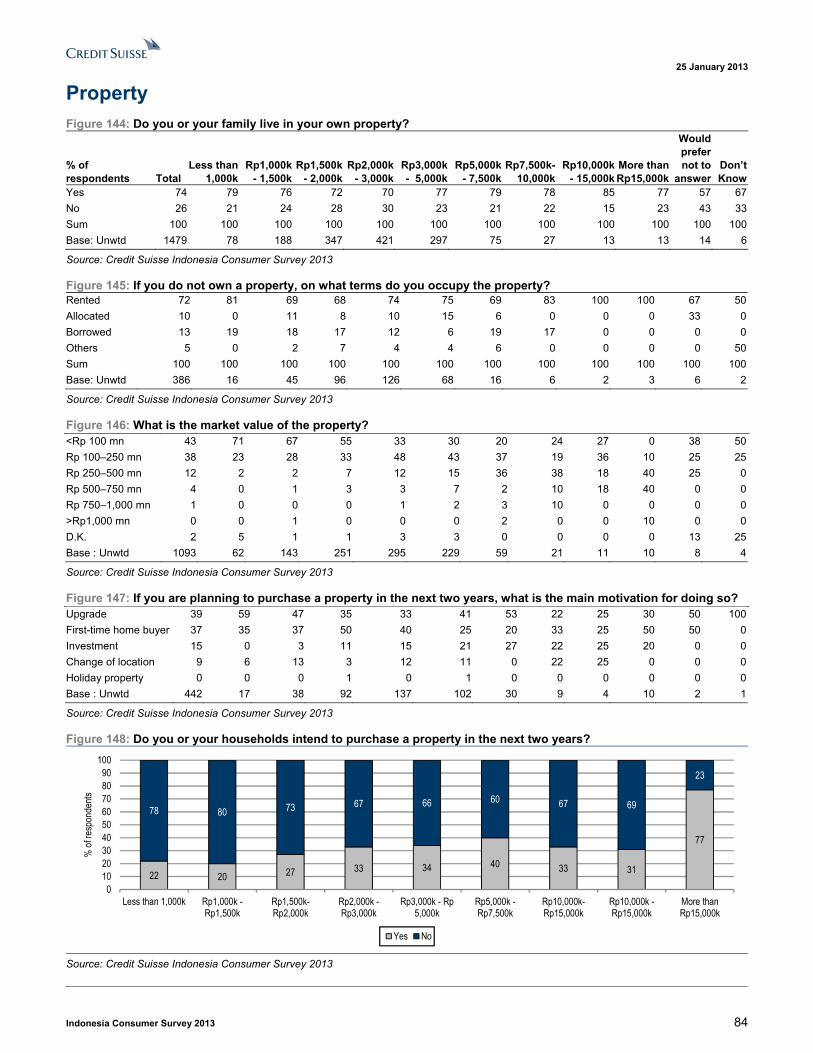
25 January 2013
Indonesia Consumer Survey 2013 84
Property
Figure 144: Do you or your family live in your own property?
% of respondents Total
Less than 1,000k
Rp1,000k - 1,500k
Rp1,500k- 2,000k
Rp2,000k - 3,000k
Rp3,000k - 5,000k
Rp5,000k - 7,500k
Rp7,500k-10,000k
Rp10,000k - 15,000k
More than Rp15,000k
Would prefer not to
answerDon’t Know
Yes 74 79 76 72 70 77 79 78 85 77 57 67
No 26 21 24 28 30 23 21 22 15 23 43 33
Sum 100 100 100 100 100 100 100 100 100 100 100 100
Base: Unwtd 1479 78 188 347 421 297 75 27 13 13 14 6
Source: Credit Suisse Indonesia Consumer Survey 2013
Figure 145: If you do not own a property, on what terms do you occupy the property? Rented 72 81 69 68 74 75 69 83 100 100 67 50
Allocated 10 0 11 8 10 15 6 0 0 0 33 0
Borrowed 13 19 18 17 12 6 19 17 0 0 0 0
Others 5 0 2 7 4 4 6 0 0 0 0 50
Sum 100 100 100 100 100 100 100 100 100 100 100 100
Base: Unwtd 386 16 45 96 126 68 16 6 2 3 6 2
Source: Credit Suisse Indonesia Consumer Survey 2013
Figure 146: What is the market value of the property? <Rp 100 mn 43 71 67 55 33 30 20 24 27 0 38 50
Rp 100–250 mn 38 23 28 33 48 43 37 19 36 10 25 25
Rp 250–500 mn 12 2 2 7 12 15 36 38 18 40 25 0
Rp 500–750 mn 4 0 1 3 3 7 2 10 18 40 0 0
Rp 750–1,000 mn 1 0 0 0 1 2 3 10 0 0 0 0
>Rp1,000 mn 0 0 1 0 0 0 2 0 0 10 0 0
D.K. 2 5 1 1 3 3 0 0 0 0 13 25
Base : Unwtd 1093 62 143 251 295 229 59 21 11 10 8 4
Source: Credit Suisse Indonesia Consumer Survey 2013
Figure 147: If you are planning to purchase a property in the next two years, what is the main motivation for doing so? Upgrade 39 59 47 35 33 41 53 22 25 30 50 100
First-time home buyer 37 35 37 50 40 25 20 33 25 50 50 0
Investment 15 0 3 11 15 21 27 22 25 20 0 0
Change of location 9 6 13 3 12 11 0 22 25 0 0 0
Holiday property 0 0 0 1 0 1 0 0 0 0 0 0
Base : Unwtd 442 17 38 92 137 102 30 9 4 10 2 1
Source: Credit Suisse Indonesia Consumer Survey 2013
Figure 148: Do you or your households intend to purchase a property in the next two years?
22 20 27 33 34 40 33 31
77
78 80 73 67 66 60 67 69
23
0102030405060708090
100
Less than 1,000k Rp1,000k -Rp1,500k
Rp1,500k-Rp2,000k
Rp2,000k -Rp3,000k
Rp3,000k - Rp5,000k
Rp5,000k -Rp7,500k
Rp10,000k-Rp15,000k
Rp10,000k -Rp15,000k
More thanRp15,000k
% o
f res
pond
ents
Yes No
Source: Credit Suisse Indonesia Consumer Survey 2013

25 January 2013
Indonesia Consumer Survey 2013 85
Figure 149: Property financing—all cash
87 9084 82 81
76 76
6470
88
68 6571
5967
33
75
90
0
10
20
30
40
50
60
70
80
90
100
Less than 1,000k Rp1,000k -Rp1,500k
Rp1,500k-Rp2,000k
Rp2,000k -Rp3,000k
Rp3,000k - Rp5,000k
Rp5,000k -Rp7,500k
Rp7,500k-Rp10,000k
Rp10,000k -Rp15,000k
More thanRp15,000k
% o
f res
pond
ents
Current house financing Future house financing
Source: Credit Suisse Indonesia Consumer Survey 2013
Figure 150: Property financing—cash + credit
53
59 8
5 59
0
12
18
30
2327
20
44
0
10
0
5
10
15
20
25
30
35
40
45
50
Less than 1,000k Rp1,000k -Rp1,500k
Rp1,500k-Rp2,000k
Rp2,000k -Rp3,000k
Rp3,000k - Rp5,000k
Rp5,000k -Rp7,500k
Rp7,500k-Rp10,000k
Rp10,000k -Rp15,000k
More thanRp15,000k
% o
f res
pond
ents
Current house financing Future house financing
Source: Credit Suisse Indonesia Consumer Survey 2013
Figure 151: Property financing—all credit
0 1 1 2 35 5
9
00
11
46
1310
2225
00
5
10
15
20
25
30
Less than 1,000k Rp1,000k -Rp1,500k
Rp1,500k-Rp2,000k
Rp2,000k -Rp3,000k
Rp3,000k - Rp5,000k
Rp5,000k -Rp7,500k
Rp7,500k-Rp10,000k
Rp10,000k -Rp15,000k
More thanRp15,000k
% o
f res
pond
ents
Current house financing Future house financing
Source: Credit Suisse Indonesia Consumer Survey 2013

25 January 2013
Indonesia Consumer Survey 2013 86
Education
Figure 152: What type of education institution do/will your children attend?
Total Less than
1,000k Rp1,000k
- 1,500k Rp1,500k-
2,000kRp2,000k
- 3,000kRp3,000k - 5,000k
Rp5,000k - 7,500k
Rp7,500k -10,000k
Rp10,000k - 15,000k
More than Rp15,000k
Would prefer not to
answerDon’t Know
Public 60 62 68 53 62 62 61 55 38 80 58 100
Private 37 24 26 38 38 37 41 55 63 40 33 0
Semi- Private 0 0 0 0 0 0 0 0 0 0 0 0
None of these 12 14 14 15 10 10 9 9 0 0 17 0
Sum 109 100 108 107 110 110 111 118 100 120 108 100
Base : Unwtd 1090 42 127 260 336 219 54 22 8 5 12 5
Source: Credit Suisse Indonesia Consumer Survey 2013
Figure 153: Do your children currently participate in any study or courses outside of their school? Yes 24 12 17 17 28 31 31 36 38 40 42 20
No 76 88 83 83 72 69 69 64 63 60 58 80
Sum 100 100 100 100 100 100 100 100 100 100 100 100
Base : Unwtd 1090 42 127 260 336 219 54 22 8 5 12 5
Source: Credit Suisse Indonesia Consumer Survey 2013
Figure 154: Do you yourself currently participate in any adult continuing education? Yes 2 0 2 2 2 4 1 4 17 0 7 17
No 98 100 98 98 98 96 99 96 83 100 93 83
Sum 100 100 100 100 100 100 100 100 100 100 100 100
Base : Unwtd 1474 74 189 350 423 298 68 27 12 12 15 6
Source: Credit Suisse Indonesia Consumer Survey 2013
Figure 155: Do you intend to spend more, or less, on education or training courses in the next 12 months?
0
5
10
15
20
25
30
35
Less than 1,000k Rp1,000k -Rp1,500k
Rp1,500k-Rp2,000k
Rp2,000k -Rp3,000k
Rp3,000k - Rp5,000k
Rp5,000k -Rp7,500k
Rp7,500k-Rp10,000k
Rp10,000k -Rp15,000k
More thanRp15,000k
Spen
ding
on
educ
atio
n an
d tra
inin
g in
the
next
12M
(% o
f res
pond
ents
)
More Less
Source: Credit Suisse Indonesia Consumer Survey 2013
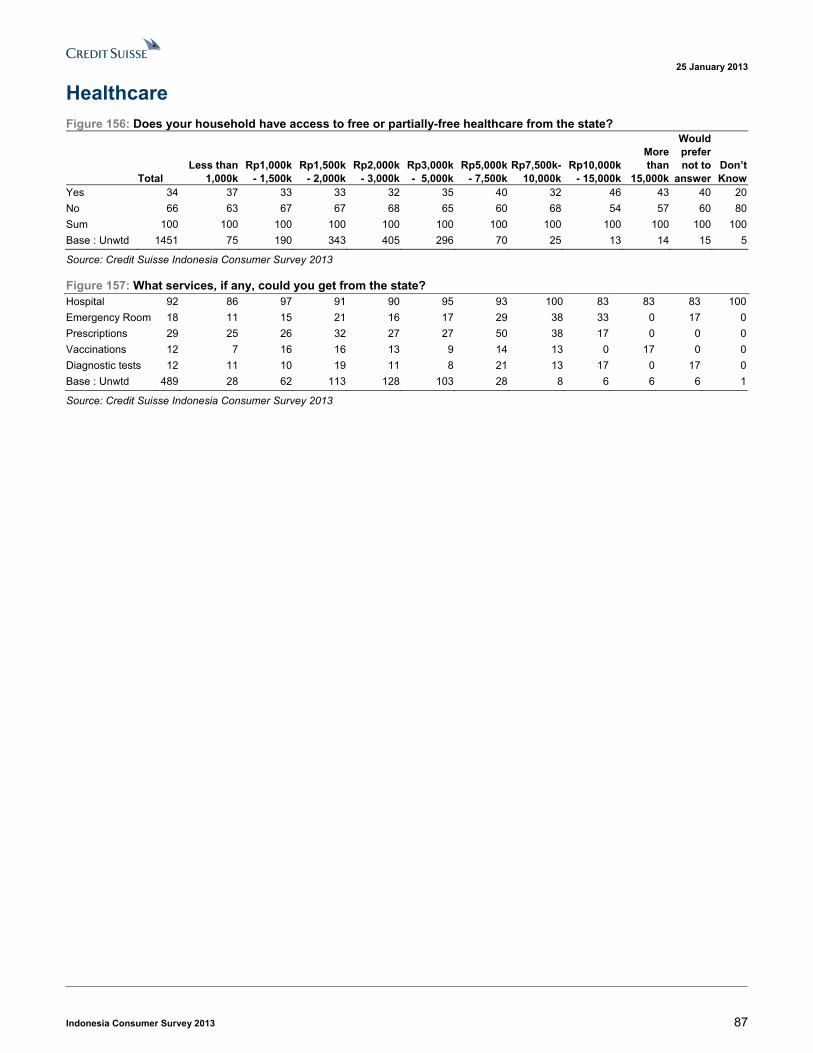
25 January 2013
Indonesia Consumer Survey 2013 87
Healthcare
Figure 156: Does your household have access to free or partially-free healthcare from the state?
Total Less than
1,000k Rp1,000k
- 1,500k Rp1,500k
- 2,000kRp2,000k
- 3,000kRp3,000k - 5,000k
Rp5,000k - 7,500k
Rp7,500k-10,000k
Rp10,000k - 15,000k
More than
15,000k
Would prefer not to
answerDon’t Know
Yes 34 37 33 33 32 35 40 32 46 43 40 20
No 66 63 67 67 68 65 60 68 54 57 60 80
Sum 100 100 100 100 100 100 100 100 100 100 100 100
Base : Unwtd 1451 75 190 343 405 296 70 25 13 14 15 5
Source: Credit Suisse Indonesia Consumer Survey 2013
Figure 157: What services, if any, could you get from the state? Hospital 92 86 97 91 90 95 93 100 83 83 83 100
Emergency Room 18 11 15 21 16 17 29 38 33 0 17 0
Prescriptions 29 25 26 32 27 27 50 38 17 0 0 0
Vaccinations 12 7 16 16 13 9 14 13 0 17 0 0
Diagnostic tests 12 11 10 19 11 8 21 13 17 0 17 0
Base : Unwtd 489 28 62 113 128 103 28 8 6 6 6 1
Source: Credit Suisse Indonesia Consumer Survey 2013

25 January 2013
Indonesia Consumer Survey 2013 88

25 January 2013
Indonesia Consumer Survey 2013 89

25 January 2013
Indonesia Consumer Survey 2013 90
Companies Mentioned (Price as of 23-Jan-2013) Samsung Electronics (005930.KS, W1,473,000) Kao (4452.T, ¥2,420) Sony (6758.T, ¥1,167) Nissan Motor (7201.T, ¥842) Toyota Motor (7203.T, ¥4,155) Honda Motor (7267.T, ¥3,285) Suzuki Motor (7269.T, ¥2,272) Yamaha Motor (7272.T, ¥1,022) Mitsubishi Corp (8058.T, ¥1,824) Unicharm (8113.T, ¥4,785) Apple Inc (AAPL.OQ, $504.77) ACE Hardware Indonesia (ACES.JK, Rp800) Astra International (ASII.JK, Rp7,800, OUTPERFORM, TP Rp9,400) Bank Central Asia (BBCA.JK, Rp9,300, OUTPERFORM, TP Rp11,000) Bank Negara Indonesia (BBNI.JK, Rp3,850) Bank Rakyat Indonesia (BBRI.JK, Rp7,800) Bank Tabungan Negara (BBTN.JK, Rp1,570) Bank Jabar Banten (BJBR.JK, Rp1,200) Bank Mandiri (Persero) (BMRI.JK, Rp8,450) Bakrie Telecom PT (BTEL.JK, Rp50) Bank Tabungan Pensiunan Nasional (BTPN.JK, Rp5,200) Erajaya Swasembada Tbk (ERAA.JK, Rp2,775, OUTPERFORM, TP Rp3,300) XL Axiata Tbk (EXCL.JK, Rp5,300) Smartfren (FREN.JK, Rp90) Gudang Garam (GGRM.JK, Rp51,600) HM Sampoerna (HMSP.JK, Rp63,100) Indofood CBP (ICBP.JK, Rp8,050, OUTPERFORM, TP Rp8,100) Indosiar Karya Media (IDKM.JK, Rp980) PT Indomobil Sukses Internasional (IMAS.JK, Rp5,150) Indofood Sukses Makmur (INDF.JK, Rp6,050) PT Indosat Tbk (ISAT.JK, Rp6,700) Kalbe Farma (KLBF.JK, Rp1,060) Mitra Adiperkasa (MAPI.JK, Rp6,400, OUTPERFORM, TP Rp8,100) Media Nusantara Citra (MNCN.JK, Rp2,425) Maruti Suzuki India Ltd (MRTI.BO, Rs1574.2) Nokia (NOK.N, $4.62) Research In Motion Limited (RIMM.OQ, $17.9) Bentoel Intl (RMBA.JK, Rp600) Surya Citra Media (SCMA.JK, Rp2,475) Tower Bersama (TBIG.JK, Rp5,900) PT Telkom (Telekomunikasi Indo.) (TLKM.JK, Rp9,600) PT Sarana Menara Nusantara (TOWR.JK, Rp25,000) Ultrajaya Milk (ULTJ.JK, Rp1,530) Unilever Indonesia (UNVR.JK, Rp22,450)
Disclosure Appendix
Important Global Disclosures
I, Ella Nusantoro, certify that (1) the views expressed in this report accurately reflect my personal views about all of the subject companies and securities and (2) no part of my compensation was, is or will be directly or indirectly related to the specific recommendations or views expressed in this report.

25 January 2013
Indonesia Consumer Survey 2013 91
Price and Rating History for Astra International (ASII.JK)
ASII.JK Closing Price Target Price Date (Rp) (Rp) Rating 01-Mar-10 3,685 4,340 O 03-May-10 4,640 5,200 N 30-Jul-10 5,070 5,400 16-Nov-10 5,600 6,400 13-Jul-11 6,800 7,800 * 29-Jul-11 7,050 7,920 27-Sep-11 6,055 7,400 O 01-Nov-11 6,650 7,879 N 08-Feb-12 7,485 6,589 U 14-Mar-12 7,305 6,589 N 25-Apr-12 7,090 6,700 27-Jul-12 6,650 6,850 04-Oct-12 7,750 9,000 O 29-Oct-12 7,850 9,400
* Asterisk signifies initiation or assumption of coverage.
Target Price Closing Price ASII.JK
1- Jul- 10 1- Jan- 11 1- Jul- 11 1- Jan- 12 1- Jul- 12 1- Jan- 133,500
5,500
7,500
9,500
O U T PERFO RMN EU T RA L
U N D ERPERFO RM
Price and Rating History for Bank Central Asia (BBCA.JK)
BBCA.JK Closing Price Target Price Date (Rp) (Rp) Rating 15-Apr-10 5,800 6,300 N 03-May-10 5,500 6,000 30-Jul-10 5,950 6,300 14-Sep-10 6,050 6,900 31-Jan-11 5,650 7,400 O 31-Mar-11 6,950 8,200 29-Apr-11 7,400 8,700 N 29-Jul-11 8,300 8,600 27-Sep-11 7,500 8,400 24-Oct-11 7,950 9,500 17-Feb-12 7,450 9,200 O 30-Mar-12 8,000 10,000 06-Aug-12 7,700 R 09-Aug-12 8,000 10,000 O 29-Oct-12 8,100 11,000
* Asterisk signifies initiation or assumption of coverage.
Target Price Closing Price BBCA.JK
1- Jul- 10 1- Jan- 11 1- Jul- 11 1- Jan- 12 1- Jul- 12 1- Jan- 134,500
7,000
9,500
12,000
N EU T RA L
O U T PERFO RMREST RICT ED
Price and Rating History for Erajaya Swasembada Tbk (ERAA.JK)
ERAA.JK Closing Price Target Price Date (Rp) (Rp) Rating 29-Feb-12 1,330 1,550 O * 02-May-12 1,620 2,000 31-Jul-12 2,100 2,000 N 14-Aug-12 2,225 2,000 O 15-Aug-12 2,200 2,000 N 07-Nov-12 2,475 3,300 O
* Asterisk signifies initiation or assumption of coverage.
Target Price Closing Price ERAA.JK
1- Mar- 12 1- May- 12 1- Jul- 12 1- Sep- 12 1- Nov- 12 1- Jan- 131,000
1,500
2,000
2,500
3,000
3,500
O U T PERFO RMN EU T RA L

25 January 2013
Indonesia Consumer Survey 2013 92
Price and Rating History for Indofood CBP (ICBP.JK)
ICBP.JK Closing Price Target Price Date (Rp) (Rp) Rating 10-Aug-11 5,600 7,300 O 11-Aug-11 5,750 * 03-Feb-12 5,150 7,300 O 01-May-12 5,750 7,350 03-Oct-12 6,600 8,100
* Asterisk signifies initiation or assumption of coverage.
Target Price Closing Price ICBP.JK
1- Oct- 11 1- Jan- 12 1- Apr- 12 1- Jul- 12 1- Oct- 12 1- Jan- 134,000
5,000
6,000
7,000
8,000
9,000
O U T PERFO RM
Price and Rating History for Mitra Adiperkasa (MAPI.JK)
MAPI.JK Closing Price Target Price Date (Rp) (Rp) Rating 04-Nov-11 5,050 6,000 O * 30-Mar-12 6,350 7,900 01-May-12 6,900 8,400 01-Nov-12 6,400 8,100
* Asterisk signifies initiation or assumption of coverage.
Target Price Closing Price MAPI.JK
1- Jan- 12 1- Apr- 12 1- Jul- 12 1- Oct- 12 1- Jan- 135,000
6,000
7,000
8,000
9,000
O U T PERFO RM
The analyst(s) responsible for preparing this research report received Compensation that is based upon various factors including Credit Suisse's total revenues, a portion of which are generated by Credit Suisse's investment banking activities
As of December 10, 2012 Analysts’ stock rating are defined as follows:
Outperform (O) : The stock’s total return is expected to outperform the relevant benchmark*over the next 12 months.
Neutral (N) : The stock’s total return is expected to be in line with the relevant benchmark* over the next 12 months.
Underperform (U) : The stock’s total return is expected to underperform the relevant benchmark* over the next 12 months. *Relevant benchmark by region: As of 10th December 2012, Japanese ratings are based on a stock’s total return relative to the analyst's coverage universe which consists of all companies covered by the analyst within the relevant sector, with Outperforms representing the most attractive, Neutrals the less attractive, and Underperforms the least attractive investment opportunities. As of 2nd October 2012, U.S. and Canadian as well as European ratings are based on a stock’s total return relative to the analyst's coverage universe which consists of all companies covered by the analyst within the relevant sector, with Outperforms representing the most attractive, Neutrals the less attractive, and Underperforms the least attractive investment opportunities. For Latin American and non-Japan Asia stocks, ratings are based on a stock’s total return relative to the average total return of the relevant country or regional benchmark; Australia, New Zealand are, and prior to 2nd October 2012 U.S. and Canadian ratings were based on (1) a stock’s absolute total return potential to its current share price and (2) the relative attractiveness of a stock’s total return potential within an analyst’s coverage universe. For Australian and New Zealand stocks, 12-month rolling yield is incorporated in the absolute total return calculation and a 15% and a 7.5% threshold replace the 10-15% level in the Outperform and Underperform stock rating definitions, respectively. The 15% and 7.5% thresholds replace the +10-15% and -10-15% levels in the Neutral stock rating definition, respectively. Prior to 10th December 2012, Japanese ratings were based on a stock’s total return relative to the average total return of the relevant country or regional benchmark.
Restricted (R) : In certain circumstances, Credit Suisse policy and/or applicable law and regulations preclude certain types of communications, including an investment recommendation, during the course of Credit Suisse's engagement in an investment banking transaction and in certain other circumstances.
Volatility Indicator [V] : A stock is defined as volatile if the stock price has moved up or down by 20% or more in a month in at least 8 of the past 24 months or the analyst expects significant volatility going forward.
Analysts’ sector weightings are distinct from analysts’ stock ratings and are based on the analyst’s expectations for the fundamentals and/or valuation of the sector* relative to the group’s historic fundamentals and/or valuation:
Overweight : The analyst’s expectation for the sector’s fundamentals and/or valuation is favorable over the next 12 months.
Market Weight : The analyst’s expectation for the sector’s fundamentals and/or valuation is neutral over the next 12 months.
Underweight : The analyst’s expectation for the sector’s fundamentals and/or valuation is cautious over the next 12 months.
25 January 2013
Indonesia Consumer Survey 2013 93
*An analyst’s coverage sector consists of all companies covered by the analyst within the relevant sector. An analyst may cover multiple sectors.
Credit Suisse's distribution of stock ratings (and banking clients) is:
Global Ratings Distribution
Rating Versus universe (%) Of which banking clients (%)
Outperform/Buy* 43% (53% banking clients)Neutral/Hold* 38% (47% banking clients)Underperform/Sell* 16% (42% banking clients)Restricted 3%*For purposes of the NYSE and NASD ratings distribution disclosure requirements, our stock ratings of Outperform, Neutral, and Underperform most closely correspond to Buy, Hold, and Sell, respectively; however, the meanings are not the same, as our stock ratings are determined on a relative basis. (Please refer to definitions above.) An investor's decision to buy or sell a security should be based on investment objectives, current holdings, and other individual factors.
Credit Suisse’s policy is to update research reports as it deems appropriate, based on developments with the subject company, the sector or the market that may have a material impact on the research views or opinions stated herein.
Credit Suisse's policy is only to publish investment research that is impartial, independent, clear, fair and not misleading. For more detail please refer to Credit Suisse's Policies for Managing Conflicts of Interest in connection with Investment Research: http://www.csfb.com/research and analytics/disclaimer/managing_conflicts_disclaimer.html
Credit Suisse does not provide any tax advice. Any statement herein regarding any US federal tax is not intended or written to be used, and cannot be used, by any taxpayer for the purposes of avoiding any penalties.
Price Target: (12 months) for Bank Central Asia (BBCA.JK)
Method: Our target price for BBCA of Rp11,000/share is derived based on Gordon's growth model assuming sustainable Return on Equity (ROE) of 26.9%, beta of 1x, risk free rate of 8.0%, market risk premium of 5% and cost of equity of 13.0%. Our target price for BBCA implies 4.6x 13E PBR and 20.6x 13E PER. We value BBCA at premium to its local peers given the bank's high growth capacity, strong low cost funding franchise and robust asset quality.
Risk: Risks to our estimates and target price of Rp11,000/share for BBCA includes: 1) longer than anticipated tight liquidity condition in Indonesia as well as faster than expected recovery of the currently tight liquidity condition, 2) significant changes in global sentiment, 3) significant changes in public's confidence in the bank, 4) risks relating to Indonesia, including macroeconomic, political and social risks, 5) risks of major changes in the bank's current management team, 6) currency risks
Price Target: (12 months) for Indofood CBP (ICBP.JK)
Method: Our target price is derived using the sum-of-the-parts (SOTP) method. For the noodle and dairy divisions, we are using regional valuation for the respective sectors, of 12.4x and 7.2x EV/EBITDA 2013E. And for the other businesses (food seasonings, snack foods and special foods), we are using 10x EV/EBITDA 2013x, based on the Indonesia's consumer sector under Credit Suisse coverage, excluding Unilever Indonesia (UNVR.JK). To the total value of Rp40.6 tn, we add Rp7.4 tn of cash and deduct Rp705 bn of debt for 2013E. Thus we arrive at a total value of Rp47.3 tn, which is equal to Rp8,100/share.
Risk: Risks that could impede achievement of our Rp8,100 target price for Indofood CBP include: (1) competition from both existing and new players, (2) fluctuation of commodity prices, (3) completion of new capacity, (4) Indonesia's macreconomic situation, (5) fluctuation of exchange rates, and (6) regulatory risks.
Price Target: (12 months) for Mitra Adiperkasa (MAPI.JK)
Method: Our target price of Rp8100 for Mitra Adiperkasa is based on DCF valuations. We assume 12.5x WACC (8% risk free rate, 1.2x Beta, and 5% risk premium). The implied multiples are 23.1x FY13E price to earnings ratio (P/E), and 11.0x FY13E EV/EBITDA.
Risk: Key risks to our Rp8100 target price for Mitra Adiperkasa include principal risks, forced into cannibalisation by the property boom, competition from both existing and new players, regulatory risks, and macro risks.
Price Target: (12 months) for Astra International (ASII.JK)
Method: Our Rp9,400/share target price for Astra International is based on our sum-of-the-parts valuation analysis. We value the automotive division by applying a FY13E price to earnings ratio (P/E) at 16.0x, agricultural division at 16.0x, financing division at 10.6x, heavy equipment division at 15.0x, and others at 11.8x.
Risk: Potential risks to our Rp9,400/share target price for Astra International include: competition risk, regulatory risk in the form of import duties, plus a significant deterioration in the macro economy, particularly at the consumer confidence level, which has a high correlation with car sales, and liquidity in auto financing, which has a high correlation with motorcycle sales volume.

25 January 2013
Indonesia Consumer Survey 2013 94
Price Target: (12 months) for Erajaya Swasembada Tbk (ERAA.JK)
Method: Our target price of Rp3,300 for Erajaya Swasembada is derived from the our JCI target price of 15.0x P/E 2013E, or at 44% and 64% discount to the average of Indonesia consumer and retail sector, under Credit Suisse coverage, accordingly.
Risk: Thre risk that may impede achievement of our Rp3,300 target price for Erajaya Swasembada are: (1) high reliance on third-party principals for products, (2) change in terms and conditions of agreement with third-party principals, (3) fluctuations in exchange rate, (4) competition, (5) regulatory risk, and (6) Indonesia's macro stability risk.
Please refer to the firm's disclosure website at www.credit-suisse.com/researchdisclosures for the definitions of abbreviations typically used in the target price method and risk sections.
See the Companies Mentioned section for full company names
The subject company (BBCA.JK, ICBP.JK, MAPI.JK, ERAA.JK, 005930.KS, 6758.T, 7203.T, 7267.T, BBRI.JK, AAPL.OQ, BBNI.JK, ISAT.JK, BBTN.JK, BTPN.JK, UNVR.JK, IDKM.JK, BMRI.JK, BTEL.JK, EXCL.JK, INDF.JK, MNCN.JK, RIMM.OQ, SCMA.JK, NOK.N, TLKM.JK, TOWR.JK) currently is, or was during the 12-month period preceding the date of distribution of this report, a client of Credit Suisse.
Credit Suisse provided investment banking services to the subject company (BBCA.JK, ICBP.JK, ERAA.JK, 7203.T, 7267.T, BBRI.JK, BBNI.JK, ISAT.JK, BBTN.JK, BTPN.JK, UNVR.JK, IDKM.JK, BMRI.JK, BTEL.JK, INDF.JK, SCMA.JK, NOK.N, TLKM.JK, TOWR.JK) within the past 12 months.
Credit Suisse provided non-investment banking services to the subject company (BBCA.JK, 005930.KS, 6758.T, 7203.T, 7267.T, AAPL.OQ, BBNI.JK, ISAT.JK, BMRI.JK, BTEL.JK, INDF.JK, NOK.N) within the past 12 months
Credit Suisse has managed or co-managed a public offering of securities for the subject company (BBCA.JK, 7203.T, 7267.T, BBNI.JK, BBTN.JK, BTPN.JK, IDKM.JK, SCMA.JK, NOK.N, TOWR.JK) within the past 12 months.
Credit Suisse has received investment banking related compensation from the subject company (BBCA.JK, ICBP.JK, ERAA.JK, 7203.T, 7267.T, BBRI.JK, BBNI.JK, ISAT.JK, BBTN.JK, BTPN.JK, UNVR.JK, IDKM.JK, BMRI.JK, BTEL.JK, INDF.JK, SCMA.JK, NOK.N, TLKM.JK, TOWR.JK) within the past 12 months
Credit Suisse expects to receive or intends to seek investment banking related compensation from the subject company (BBCA.JK, ICBP.JK, MAPI.JK, ERAA.JK, 005930.KS, 4452.T, 7201.T, 7203.T, MRTI.BO, 7267.T, 7269.T, 7272.T, BBRI.JK, AAPL.OQ, 8113.T, BBNI.JK, ISAT.JK, BBTN.JK, BTPN.JK, UNVR.JK, IDKM.JK, BMRI.JK, BTEL.JK, EXCL.JK, GGRM.JK, INDF.JK, MNCN.JK, RIMM.OQ, SCMA.JK, NOK.N, TLKM.JK, TOWR.JK) within the next 3 months.
Credit Suisse has received compensation for products and services other than investment banking services from the subject company (BBCA.JK, 005930.KS, 6758.T, 7203.T, 7267.T, AAPL.OQ, BBNI.JK, ISAT.JK, BMRI.JK, BTEL.JK, INDF.JK, NOK.N) within the past 12 months
As of the date of this report, Credit Suisse makes a market in the following subject companies (6758.T, 7201.T, 7203.T, 7267.T, AAPL.OQ, RIMM.OQ, NOK.N).
Credit Suisse may have interest in (BBCA.JK, ICBP.JK, MAPI.JK, ASII.JK, ERAA.JK, BBRI.JK, ACES.JK, BBNI.JK, ISAT.JK, BBTN.JK, BTPN.JK, UNVR.JK, IDKM.JK, BJBR.JK, BMRI.JK, BTEL.JK, EXCL.JK, GGRM.JK, IMAS.JK, INDF.JK, KLBF.JK, MNCN.JK, SCMA.JK, TBIG.JK, TLKM.JK, TOWR.JK)
As of the end of the preceding month, Credit Suisse beneficially own 1% or more of a class of common equity securities of (MRTI.BO, BTEL.JK).
Important Regional Disclosures
Singapore recipients should contact Credit Suisse AG, Singapore Branch for any matters arising from this research report.
The analyst(s) involved in the preparation of this report have not visited the material operations of the subject company (BBCA.JK, ICBP.JK, MAPI.JK, ASII.JK, ERAA.JK, 005930.KS, 4452.T, 6758.T, 7201.T, 7203.T, MRTI.BO, 7267.T, 7269.T, 7272.T, BBRI.JK, 8113.T, ACES.JK, BBNI.JK, ISAT.JK, BBTN.JK, BTPN.JK, UNVR.JK, IDKM.JK, BJBR.JK, BMRI.JK, BTEL.JK, EXCL.JK, GGRM.JK, IMAS.JK, INDF.JK, KLBF.JK, MNCN.JK, RIMM.OQ, SCMA.JK, TBIG.JK, NOK.N, TLKM.JK, TOWR.JK) within the past 12 months
An analyst involved in the preparation of this report has visited certain material operations of the subject company (AAPL.OQ) within the past 12 months
The travel expenses of the analyst in connection with such visits were not paid or reimbursed by the subject company, other than de minimus local travel expenses.
Restrictions on certain Canadian securities are indicated by the following abbreviations: NVS--Non-Voting shares; RVS--Restricted Voting Shares; SVS--Subordinate Voting Shares.
Individuals receiving this report from a Canadian investment dealer that is not affiliated with Credit Suisse should be advised that this report may not contain regulatory disclosures the non-affiliated Canadian investment dealer would be required to make if this were its own report.
For Credit Suisse Securities (Canada), Inc.'s policies and procedures regarding the dissemination of equity research, please visit http://www.csfb.com/legal_terms/canada_research_policy.shtml.
The following disclosed European company/ies have estimates that comply with IFRS: (7201.T).

25 January 2013
Indonesia Consumer Survey 2013 95
As of the date of this report, Credit Suisse acts as a market maker or liquidity provider in the equities securities that are the subject of this report.
Principal is not guaranteed in the case of equities because equity prices are variable.
Commission is the commission rate or the amount agreed with a customer when setting up an account or at any time after that.
To the extent this is a report authored in whole or in part by a non-U.S. analyst and is made available in the U.S., the following are important disclosures regarding any non-U.S. analyst contributors: The non-U.S. research analysts listed below (if any) are not registered/qualified as research analysts with FINRA. The non-U.S. research analysts listed below may not be associated persons of CSSU and therefore may not be subject to the NASD Rule 2711 and NYSE Rule 472 restrictions on communications with a subject company, public appearances and trading securities held by a research analyst account.
Credit Suisse Securities (Europe) Limited ................................................... Ella Nusantoro ; Teddy Oetomo ; Dian Haryokusumo ; Priscilla Tjitra
For Credit Suisse disclosure information on other companies mentioned in this report, please visit the website at www.credit-suisse.com/researchdisclosures or call +1 (877) 291-2683.

25 January 2013
Indonesia Consumer Survey 2013 96
References in this report to Credit Suisse include all of the subsidiaries and affiliates of Credit Suisse operating under its investment banking division. For more information on our structure, please use the following link: https://www.credit-suisse.com/who_we_are/en/.This report may contain material that is not directed to, or intended for distribution to or use by, any person or entity who is a citizen or resident of or located in any locality, state, country or other jurisdiction where such distribution, publication, availability or use would be contrary to law or regulation or which would subject Credit Suisse AG or its affiliates ("CS") to any registration or licensing requirement within such jurisdiction. All material presented in this report, unless specifically indicated otherwise, is under copyright to CS. None of the material, nor its content, nor any copy of it, may be altered in any way, transmitted to, copied or distributed to any other party, without the prior express written permission of CS. All trademarks, service marks and logos used in this report are trademarks or service marks or registered trademarks or service marks of CS or its affiliates. The information, tools and material presented in this report are provided to you for information purposes only and are not to be used or considered as an offer or the solicitation of an offer to sell or to buy or subscribe for securities or other financial instruments. CS may not have taken any steps to ensure that the securities referred to in this report are suitable for any particular investor. CS will not treat recipients of this report as its customers by virtue of their receiving this report. The investments and services contained or referred to in this report may not be suitable for you and it is recommended that you consult an independent investment advisor if you are in doubt about such investments or investment services. Nothing in this report constitutes investment, legal, accounting or tax advice, or a representation that any investment or strategy is suitable or appropriate to your individual circumstances, or otherwise constitutes a personal recommendation to you. CS does not advise on the tax consequences of investments and you are advised to contact an independent tax adviser. Please note in particular that the bases and levels of taxation may change. Information and opinions presented in this report have been obtained or derived from sources believed by CS to be reliable, but CS makes no representation as to their accuracy or completeness. CS accepts no liability for loss arising from the use of the material presented in this report, except that this exclusion of liability does not apply to the extent that such liability arises under specific statutes or regulations applicable to CS. This report is not to be relied upon in substitution for the exercise of independent judgment. CS may have issued, and may in the future issue, other communications that are inconsistent with, and reach different conclusions from, the information presented in this report. Those communications reflect the different assumptions, views and analytical methods of the analysts who prepared them and CS is under no obligation to ensure that such other communications are brought to the attention of any recipient of this report. CS may, to the extent permitted by law, participate or invest in financing transactions with the issuer(s) of the securities referred to in this report, perform services for or solicit business from such issuers, and/or have a position or holding, or other material interest, or effect transactions, in such securities or options thereon, or other investments related thereto. In addition, it may make markets in the securities mentioned in the material presented in this report. CS may have, within the last three years, served as manager or co-manager of a public offering of securities for, or currently may make a primary market in issues of, any or all of the entities mentioned in this report or may be providing, or have provided within the previous 12 months, significant advice or investment services in relation to the investment concerned or a related investment. Additional information is, subject to duties of confidentiality, available on request. Some investments referred to in this report will be offered solely by a single entity and in the case of some investments solely by CS, or an associate of CS or CS may be the only market maker in such investments. Past performance should not be taken as an indication or guarantee of future performance, and no representation or warranty, express or implied, is made regarding future performance. Information, opinions and estimates contained in this report reflect a judgment at its original date of publication by CS and are subject to change without notice. The price, value of and income from any of the securities or financial instruments mentioned in this report can fall as well as rise. The value of securities and financial instruments is subject to exchange rate fluctuation that may have a positive or adverse effect on the price or income of such securities or financial instruments. Investors in securities such as ADR's, the values of which are influenced by currency volatility, effectively assume this risk. Structured securities are complex instruments, typically involve a high degree of risk and are intended for sale only to sophisticated investors who are capable of understanding and assuming the risks involved. The market value of any structured security may be affected by changes in economic, financial and political factors (including, but not limited to, spot and forward interest and exchange rates), time to maturity, market conditions and volatility, and the credit quality of any issuer or reference issuer. Any investor interested in purchasing a structured product should conduct their own investigation and analysis of the product and consult with their own professional advisers as to the risks involved in making such a purchase. Some investments discussed in this report may have a high level of volatility. High volatility investments may experience sudden and large falls in their value causing losses when that investment is realised. Those losses may equal your original investment. Indeed, in the case of some investments the potential losses may exceed the amount of initial investment and, in such circumstances, you may be required to pay more money to support those losses. Income yields from investments may fluctuate and, in consequence, initial capital paid to make the investment may be used as part of that income yield. Some investments may not be readily realisable and it may be difficult to sell or realise those investments, similarly it may prove difficult for you to obtain reliable information about the value, or risks, to which such an investment is exposed. This report may provide the addresses of, or contain hyperlinks to, websites. Except to the extent to which the report refers to website material of CS, CS has not reviewed any such site and takes no responsibility for the content contained therein. Such address or hyperlink (including addresses or hyperlinks to CS's own website material) is provided solely for your convenience and information and the content of any such website does not in any way form part of this document. Accessing such website or following such link through this report or CS's website shall be at your own risk. This report is issued and distributed in Europe (except Switzerland) by Credit Suisse Securities (Europe) Limited, One Cabot Square, London E14 4QJ, England, which is regulated in the United Kingdom by The Financial Services Authority ("FSA"). This report is being distributed in Germany by Credit Suisse Securities (Europe) This report is being distributed in the United States and Canada by Credit Suisse Securities (USA) LLC; in Switzerland by Credit Suisse AG; in Brazil by Banco de Investimentos Credit Suisse (Brasil) S.A or its affiliates; in Mexico by Banco Credit Suisse (México), S.A. (transactions related to the securities mentioned in this report will only be effected in compliance with applicable regulation); in Japan by Credit Suisse Securities (Japan) Limited, Financial Instruments Firm, Director-General of Kanto Local Finance Bureau (Kinsho) No. 66, a member of Japan Securities Dealers Association, The Financial Futures Association of Japan, Japan Investment Advisers Association, Type II Financial Instruments Firms Association; elsewhere in Asia/ Pacific by whichever of the following is the appropriately authorised entity in the relevant jurisdiction: Credit Suisse (Hong Kong) Limited, Credit Suisse Equities (Australia) Limited, Credit Suisse Securities (Thailand) Limited, Credit Suisse Securities (Malaysia) Sdn Bhd, Credit Suisse AG, Singapore Branch, Credit Suisse Securities (India) Private Limited regulated by the Securities and Exchange Board of India (registration Nos. INB230970637; INF230970637; INB010970631; INF010970631), having registered address at 9th Floor, Ceejay House, Dr.A.B. Road, Worli, Mumbai - 18, India, T- +91-22 6777 3777, Credit Suisse Securities (Europe) Limited, Seoul Branch, Credit Suisse AG, Taipei Securities Branch, PT Credit Suisse Securities Indonesia, Credit Suisse Securities (Philippines ) Inc., and elsewhere in the world by the relevant authorised affiliate of the above. Research on Taiwanese securities produced by Credit Suisse AG, Taipei Securities Branch has been prepared by a registered Senior Business Person. Research provided to residents of Malaysia is authorised by the Head of Research for Credit Suisse Securities (Malaysia) Sdn Bhd, to whom they should direct any queries on +603 2723 2020. This research may not conform to Canadian disclosure requirements. In jurisdictions where CS is not already registered or licensed to trade in securities, transactions will only be effected in accordance with applicable securities legislation, which will vary from jurisdiction to jurisdiction and may require that the trade be made in accordance with applicable exemptions from registration or licensing requirements. Non-U.S. customers wishing to effect a transaction should contact a CS entity in their local jurisdiction unless governing law permits otherwise. U.S. customers wishing to effect a transaction should do so only by contacting a representative at Credit Suisse Securities (USA) LLC in the U.S. Please note that this research was originally prepared and issued by CS for distribution to their market professional and institutional investor customers. Recipients who are not market professional or institutional investor customers of CS should seek the advice of their independent financial advisor prior to taking any investment decision based on this report or for any necessary explanation of its contents. This research may relate to investments or services of a person outside of the UK or to other matters which are not regulated by the FSA or in respect of which the protections of the FSA for private customers and/or the UK compensation scheme may not be available, and further details as to where this may be the case are available upon request in respect of this report. CS may provide various services to US municipal entities or obligated persons ("municipalities"), including suggesting individual transactions or trades and entering into such transactions. Any services CS provides to municipalities are not viewed as "advice" within the meaning of Section 975 of the Dodd-Frank Wall Street Reform and Consumer Protection Act. CS is providing any such services and related information solely on an arm's length basis and not as an advisor or fiduciary to the municipality. In connection with the provision of the any such services, there is no agreement, direct or indirect, between any municipality (including the officials, management, employees or agents thereof) and CS for CS to provide advice to the municipality. Municipalities should consult with their financial, accounting and legal advisors regarding any such services provided by CS. In addition, CS is not acting for direct or indirect compensation to solicit the municipality on behalf of an unaffiliated broker, dealer, municipal securities dealer, municipal advisor, or investment adviser for the purpose of obtaining or retaining an engagement by the municipality for or in connection with Municipal Financial Products, the issuance of municipal securities, or of an investment adviser to provide investment advisory services to or on behalf of the municipality. If this report is being distributed by a financial institution other than Credit Suisse AG, or its affiliates, that financial institution is solely responsible for distribution. Clients of that institution should contact that institution to effect a transaction in the securities mentioned in this report or require further information. This report does not constitute investment advice by Credit Suisse to the clients of the distributing financial institution, and neither Credit Suisse AG, its affiliates, and their respective officers, directors and employees accept any liability whatsoever for any direct or consequential loss arising from their use of this report or its content. Principal is not guaranteed. Commission is the commission rate or the amount agreed with a customer when setting up an account or at any time after that.
Copyright © 2013 CREDIT SUISSE AG and/or its affiliates. All rights reserved.
Investment principal on bonds can be eroded depending on sale price or market price. In addition, there are bonds on which investment principal can be eroded due to changes in redemption amounts. Care is required when investing in such instruments. When you purchase non-listed Japanese fixed income securities (Japanese government bonds, Japanese municipal bonds, Japanese government guaranteed bonds, Japanese corporate bonds) from CS as a seller, you will be requested to pay the purchase price only.
II0040